Diagnosing a meander of the shelf break current in the Middle Atlantic Bight Robert S. Pickart, Daniel J. Torres, Theresa K. McKee, Michael J. Caruso, and Jennifer E. Przystup Woods Hole Oceanographic Institution, Woods Hole, Massachusetts Abstract. Two wintertime hydrographic crossings of the shelf break current in the Middle Atlantic Bight are analyzed. Separated by 3 days, the two sections sampled opposite phases of a meander of the current. The shipboard acoustic Doppler current profiler (ADCP) data reveal a strong, convergent jet during the first crossing, transporting 0.32 Sv of water equatorward. During the second crossing the transport is the same but the jet is weak and divergent. The measured Rossby numbers imply that the jet is significantly nonlinear in the convergent state. The associated potential vorticity Q distributions differ substantially; the core of the weak jet is characterized by a region of uniform Q, whereas the strong jet contains no such feature. Surface thermal imagery indicates that the leading edge of a steep meander trough was sampled during the first crossing, followed by a broad crest during the second crossing. This is consistent with the convergent versus divergent nature of the flow in the two sections. A nearby Gulf Stream ring likely caused the steepening of the trough. After integrating the spatially low-passed thermal wind shear, the resulting geostrophic sections are compared to the similarly low- passed ADCP fields. This, together with the scales of the meander deduced from the surface imagery, indicates that the trough was in gradient wind balance, whereas the crest was predominantly geostrophic. These observations are consistent with the structure and dynamics of modeled baroclinic jets. 1. Introduction The shelf break current of the Middle Atlantic Bight exhibits such complex, quickly evolving features that it is often difficult to obtain unambiguous measurements of the flow. Part of the difficulty is that the current is sensitive to numerous forcing mechanisms, all of which can significantly alter the configura- tion of the current. As a result, in situ measurements often catch only a glimpse of the behavior and evolution of the jet. Nonetheless, partly owing to the locus of such efforts, a clearer understanding is emerging of the current’s structure, variabil- ity, and dynamics. Because of the strong variability, it is difficult even to char- acterize the “undisturbed” basic state of the current. Burrage and Garvine [1988] present one mean view based on repeat hydrography, which nicely shows the summertime structure of the front. In their work, however, they point out the difficulty in interpreting a single synoptic section. This is partly due to the presence of high-frequency, superinertial motions, which can significantly alias synoptic scale measurements [see also Burrage and Garvine, 1987]. The most comprehensive mean view of the shelf break current is given by Linder and Gawark- iewicz [1998], who compiled all available hydrographic sections in the Middle Atlantic Bight between 1900 and 1990. The resulting mean fields quantitatively show the canonical sum- mer and winter configuration of the front and jet (Figure 1). In wintertime the density front extends throughout the water col- umn from the shelf break to the surface, whereas in summer a strong seasonal pycnocline develops isolating much of the front from the surface. Beardsley and Flagg [1976] nicely describe this seasonal evolution. The associated mean thermal wind fields from Linder and Gawarkiewicz [1998] imply that the jet is, on average, stronger in summer (Figure 1c). It remains an ongoing goal to characterize and ultimately understand the variability associated with the jet. This, for example, will help toward quantifying the cross-frontal ex- change of mass and properties. The basic state described above is baroclinically unstable [Flagg and Beardsley, 1978; Gawark- iewicz, 1991]. The jet also responds to local wind forcing [e.g., Houghton et al., 1988] as well as remote source water variations [e.g., Chapman and Beardsley, 1989; Petrie and Drinkwater, 1993]. Perhaps the biggest impact on the evolution of the jet, however, is from the surrounding slope water, particularly the presence of Gulf Stream eddies and rings [e.g., Ramp et al., 1983]. Despite the fact that there are so many factors exerting influence on the shelf break current, certain classes of frontal behavior are now fairly well established. For example, in the absence of rings the front is known to develop finite amplitude, westward propagating waves or meanders [Burrage and Gar- vine, 1988; Beardsley and Flagg, 1976]. These apparently de- velop into larger-amplitude, backward breaking waves, also called shelf break eddies [Garvine et al., 1988; Houghton et al., 1986]. It remains unclear how often such eddies actually detach from the front, though apparently this happens more fre- quently in summer [Wright, 1976]. When Gulf Stream rings approach the shelf break, the front can react in several ways. Streamers of shelf water often develop on the perimeter of the ring, leading to offshore transport [Halliwell and Mooers, 1979; Joyce et al., 1992]. The enhanced cross-stream gradients can also lead to energetic eastward propagating waves [Ramp et al., Copyright 1999 by the American Geophysical Union. Paper number 1998JC900066. 0148-0227/99/1998JC900066$09.00 JOURNAL OF GEOPHYSICAL RESEARCH, VOL. 104, NO. C2, PAGES 3121–3132, FEBRUARY 15, 1999 3121

Welcome message from author
This document is posted to help you gain knowledge. Please leave a comment to let me know what you think about it! Share it to your friends and learn new things together.
Transcript
Diagnosing a meander of the shelf break currentin the Middle Atlantic Bight
Robert S. Pickart, Daniel J. Torres, Theresa K. McKee, Michael J. Caruso,and Jennifer E. PrzystupWoods Hole Oceanographic Institution, Woods Hole, Massachusetts
Abstract. Two wintertime hydrographic crossings of the shelf break current in theMiddle Atlantic Bight are analyzed. Separated by 3 days, the two sections sampledopposite phases of a meander of the current. The shipboard acoustic Doppler currentprofiler (ADCP) data reveal a strong, convergent jet during the first crossing, transporting0.32 Sv of water equatorward. During the second crossing the transport is the same butthe jet is weak and divergent. The measured Rossby numbers imply that the jet issignificantly nonlinear in the convergent state. The associated potential vorticity Qdistributions differ substantially; the core of the weak jet is characterized by a region ofuniform Q, whereas the strong jet contains no such feature. Surface thermal imageryindicates that the leading edge of a steep meander trough was sampled during the firstcrossing, followed by a broad crest during the second crossing. This is consistent with theconvergent versus divergent nature of the flow in the two sections. A nearby Gulf Streamring likely caused the steepening of the trough. After integrating the spatially low-passedthermal wind shear, the resulting geostrophic sections are compared to the similarly low-passed ADCP fields. This, together with the scales of the meander deduced from thesurface imagery, indicates that the trough was in gradient wind balance, whereas the crestwas predominantly geostrophic. These observations are consistent with the structure anddynamics of modeled baroclinic jets.
1. Introduction
The shelf break current of the Middle Atlantic Bight exhibitssuch complex, quickly evolving features that it is often difficultto obtain unambiguous measurements of the flow. Part of thedifficulty is that the current is sensitive to numerous forcingmechanisms, all of which can significantly alter the configura-tion of the current. As a result, in situ measurements oftencatch only a glimpse of the behavior and evolution of the jet.Nonetheless, partly owing to the locus of such efforts, a clearerunderstanding is emerging of the current’s structure, variabil-ity, and dynamics.
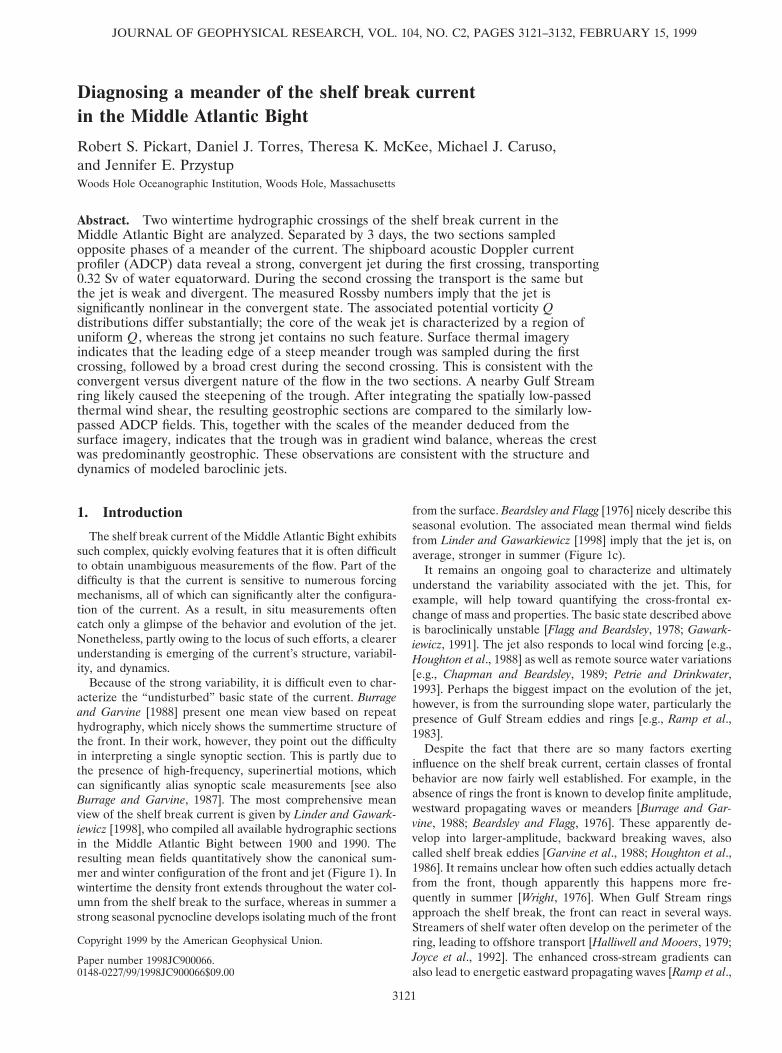
Because of the strong variability, it is difficult even to char-acterize the “undisturbed” basic state of the current. Burrageand Garvine [1988] present one mean view based on repeathydrography, which nicely shows the summertime structure ofthe front. In their work, however, they point out the difficultyin interpreting a single synoptic section. This is partly due tothe presence of high-frequency, superinertial motions, whichcan significantly alias synoptic scale measurements [see alsoBurrage and Garvine, 1987]. The most comprehensive meanview of the shelf break current is given by Linder and Gawark-iewicz [1998], who compiled all available hydrographic sectionsin the Middle Atlantic Bight between 1900 and 1990. Theresulting mean fields quantitatively show the canonical sum-mer and winter configuration of the front and jet (Figure 1). Inwintertime the density front extends throughout the water col-umn from the shelf break to the surface, whereas in summer astrong seasonal pycnocline develops isolating much of the front
from the surface. Beardsley and Flagg [1976] nicely describe thisseasonal evolution. The associated mean thermal wind fieldsfrom Linder and Gawarkiewicz [1998] imply that the jet is, onaverage, stronger in summer (Figure 1c).
It remains an ongoing goal to characterize and ultimatelyunderstand the variability associated with the jet. This, forexample, will help toward quantifying the cross-frontal ex-change of mass and properties. The basic state described aboveis baroclinically unstable [Flagg and Beardsley, 1978; Gawark-iewicz, 1991]. The jet also responds to local wind forcing [e.g.,Houghton et al., 1988] as well as remote source water variations[e.g., Chapman and Beardsley, 1989; Petrie and Drinkwater,1993]. Perhaps the biggest impact on the evolution of the jet,however, is from the surrounding slope water, particularly thepresence of Gulf Stream eddies and rings [e.g., Ramp et al.,1983].
Despite the fact that there are so many factors exertinginfluence on the shelf break current, certain classes of frontalbehavior are now fairly well established. For example, in theabsence of rings the front is known to develop finite amplitude,westward propagating waves or meanders [Burrage and Gar-vine, 1988; Beardsley and Flagg, 1976]. These apparently de-velop into larger-amplitude, backward breaking waves, alsocalled shelf break eddies [Garvine et al., 1988; Houghton et al.,1986]. It remains unclear how often such eddies actually detachfrom the front, though apparently this happens more fre-quently in summer [Wright, 1976]. When Gulf Stream ringsapproach the shelf break, the front can react in several ways.Streamers of shelf water often develop on the perimeter of thering, leading to offshore transport [Halliwell and Mooers, 1979;Joyce et al., 1992]. The enhanced cross-stream gradients canalso lead to energetic eastward propagating waves [Ramp et al.,
Copyright 1999 by the American Geophysical Union.
Paper number 1998JC900066.0148-0227/99/1998JC900066$09.00
JOURNAL OF GEOPHYSICAL RESEARCH, VOL. 104, NO. C2, PAGES 3121–3132, FEBRUARY 15, 1999
3121
1983]. The nearby presence of the Gulf Stream itself can alsostrongly impact the front, causing complex exchanges of shelfand Gulf Stream water [Gawarkiewicz et al., 1996]. Finally, theshelf break current responds to local winds, and observationsindicate that the jet fluctuates coherently over fairly largealong-stream scales [Houghton et al., 1988].
Less is known about the dynamics that accompany the dif-ferent types of shelf break current variability. The evolution ofthe front without external forcing (i.e., without rings, windevents, etc.) is likely due to baroclinic instability [Gawark-iewicz, 1991; Morgan, 1997]. The large-amplitude breakingwaves (or shelf break eddies) that ultimately develop can behighly nonlinear. For example, Houghton et al. [1986] mea-sured a Rossby number .0.7 associated with one such featureand suggested that the offshore flow of the eddy may be ingradient wind balance. Large Rossby numbers are regularly
observed in the jet, particularly in the cyclonic shear zone [e.g.,Burrage and Garvine, 1988; Linder and Gawarkiewicz, 1998].Spall [1995] has studied the evolution and dynamics of ba-roclinic jets within the framework of a primitive equationmodel, investigating the process of eddy detachment. In sub-sequent work with an imposed external confluent flow [Spall,1997], the jet develops breaking waves that are more reminis-cent of the observed shelf break eddies. The cross-stream sec-ondary circulation within these features consists of upwelling/downwelling cells, while the along-stream flow is inapproximate gradient wind balance.
The work reported in this paper falls into the above men-tioned category of only catching a glimpse of the frontal evo-lution. In fact, the observations presented here were not themajor thrust of the cruise. However, there are several uniqueaspects that were revealed by our shelf break measurements
Figure 1. Mean winter and summer sections of (a) temperature, (b) salinity, and (c) referenced geostrophicvelocity of the shelf break current [from Linder and Gawarkiewicz, 1998].
PICKART ET AL.: MEANDER OF THE SHELF BREAK CURRENT3122
that make them worth presenting. First, we show two highlyresolved, unambiguous acoustic Doppler current profiler(ADCP) velocity realizations of the shelf break jet, clearlyrevealing its two-dimensional structure. These are the first oftheir kind reported in the literature. Second, these transectswere taken during a time period when the front containedwestward propagating waves or meanders (i.e., prior to fullydeveloped shelf break eddies), and we sampled two differentphases of a meander. Last, we quantitatively compare the ther-mal wind fields to the full velocity fields and discuss the prob-able ageostrophic dynamics involved.
2. FieldworkFrom December 5–10, 1995, the initial field phase of the
Shelf Break PRIMER experiment was carried out aboard R/VEndeavor. PRIMER is a coordinated, multi-institutional effortto investigate both the acoustics and the physical oceanographyof the shelf break front in the Middle Atlantic Bight. Theexperiment included two intense field phases, one in summer1996 and one in winter 1997, employing acoustical arrays andSeaSoar measurements in the frontal region. Part of the focusof PRIMER includes investigation of the coupling between thefront and adjacent slope water, and toward this end a long-term moored array was set in the shelf break current andadjacent slope water prior to the two major field surveys. Thedeployment of this array was the primary purpose of the 6-day1995 Endeavor cruise.
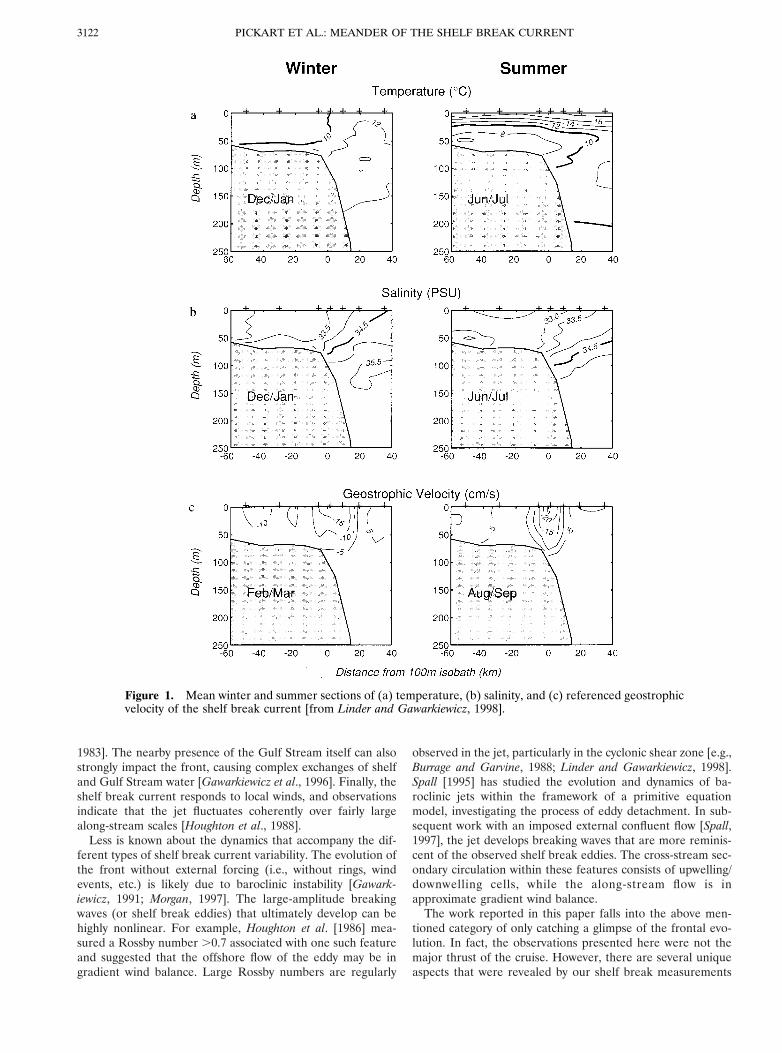
Before setting the array, a high-resolution expendablebathythermograph (XBT)/shipboard ADCP survey was carriedout across the shelf break front, partly to obtain an accuratebathymetric profile. The survey took approximately 6 hours. Atthe conclusion of the mooring work the XBT line was reoccu-pied using a Mark III conductivity-temperature-depth (CTD)(using the same 3.7-km spacing; see Figure 2). The secondcrossing took 13 hours. It is these two sections that are re-ported on here, separated by approximately 3 days. The veloc-ity structure of the jet is vastly different in the two occupations.
The CTD data were averaged into 2-dbar bins. Comparisonof the precruise and postcruise laboratory calibrations for tem-perature and conductivity indicate an accuracy of better than0.0018C for temperature and 0.02 practical salinity units (psu)for salinity. The XBT data were despiked and decimated every5 m; the accuracy of the thermistor probe is 0.18C. The ship-board ADCP was a narrowband 150-kHz unit mounted on thehull at 5 m depth. These data were averaged into 5-min en-sembles with a 4-m bin depth and processed with the CommonOceanographic Data Access System (CODAS) software pack-age (E. J. Firing et al., unpublished manual, 1995). The shal-lowest depth bin is centered at 15 m, and the region of gooddata extends to about 85% of the water depth. The lateralresolution on the first crossing was approximately 1.5 km andeven better on the second crossing (though it was subsequentlyinterpolated to match that of the first section).
Sources of error in the shipboard ADCP measurements aredue primarily to instrument error and from converting themeasured velocity into absolute velocity. The former is primar-ily due to scatter of the acoustic pulses and speed of soundvariations at the transducer. Using ensemble averaging andcalibrated speed of sound (from the shipboard thermosalino-graph and CTD stations) greatly reduces the relative velocityerror to as low as 1 cm/s. Transforming the measured velocityinto absolute velocity includes error from misalignment of the
transducer, ship heading inaccuracies (three-dimensionalGlobal Positioning System (GPS) was not available on thecruise), and ship speed error due to the differential GPS scat-ter. Both water- and bottom-track methods were used to cor-rect for the transducer misalignment, which was found to be23.98. This agrees quite well with a similar calibration per-formed on an earlier Endeavor cruise. The ship speed correc-tion was determined using Endeavor’s differential GPS. A pre-vious dockside test of this instrument quantified the associatedrms error, which was quite small (63.5 m). For the 5-minensemble averaging the associated velocity error is estimatedto be of the order of 2 cm/s. We were unable to correct for theship’s gyro error with any confidence. While the short-termgyro fluctuations are reduced by the temporal filtering in CO-DAS, any long-term biases remain. However, the overall con-sistency of the ADCP fields and associated transports pre-sented in section 3 attest to the smallness of any such error.
We did not correct the velocity data for tides. It should beremembered, however, that during the winter season (withouta shallow pycnocline present) the baroclinic tides will be re-duced. According to Moody et al. [1984], the zonal tidal am-plitude at 30 m near the location of our transect, in the waterdepth where we observed the jet, is approximately 5 cm/s. This
Figure 2. (a) Region of the Shelf Break PRIMER experi-ment, south of Cape Cod, Massachusetts. The displayed iso-baths are 50, 100, 1000, 2000, and 3000 m. (b) Detailed view ofthe two hydrographic crossings along the TOPEX altimeterline and the bathymetry of the shelf and slope. The location ofthe Nantucket wind buoy is indicated as well.
3123PICKART ET AL.: MEANDER OF THE SHELF BREAK CURRENT
is 10–15% of the observed core speed of the jet and hence doesnot significantly impact any of our conclusions. To verify thisfurther, we computed the M2 tidal amplitude from one of thePRIMER shelf break ADCP moorings (located at 168 m depthjust shoreward of the shelf break) deployed during the cruise.The autospectrum of the zonal velocity computed for the De-cember–January time period showed little variation through-out the water column. The associated mean tidal amplitudewas 5.1 cm/s, with a 95% confidence interval of 1.7 cm/s. Thisis consistent with the Moody et al. [1984] value. Internal tidesalso impact the vertical displacement of the shelf break densityfront. The horizontal wavelength of the first baroclinic mode ofthe internal tide was estimated using a simple, linear, flat-bottom model (J. Colosi, personal communication, 1998). Us-ing a buoyancy-frequency profile at the center of the jet fromthe second crossing, the wavelength was found to be 25 km.Hence this should not influence the overall tilt of the shelfbreak front seen in the CTD fields.
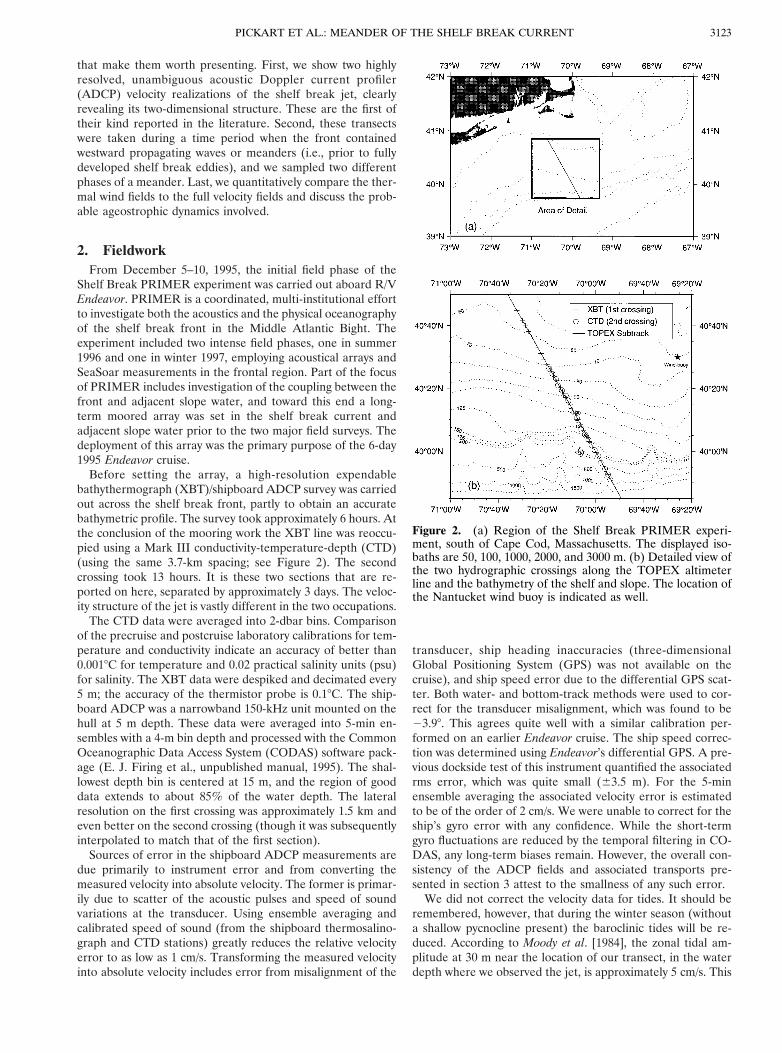
In situ winds were measured during the cruise using ananemometer located approximately 10 m above sea level.These data were converted to absolute winds using the navi-gation data and smoothed using a 1-hour filter. The Nantucketwind buoy is located roughly 75 km to the east of our shelfbreak section (Figure 2), which also provided a time series of
hourly winds 5 m above sea level. Overall, the agreementbetween the two data sets is quite favorable (Figure 3). Duringboth of the shelf break crossings the winds were directed fromthe east (or toward the west as in Figure 3), steadily increasingin strength. However, for the majority of the time period be-tween the two surveys, the wind was predominantly toward thesoutheast (Figure 3). The average wind stress over this periodwas 1.3 dyn/cm2, which implies an average offshore Ekmanvelocity of 4.8 cm/s over the depth of the mixed layer (;25 m).We believe that the observed evolution of the jet between thetwo crossings was not a result of the local winds. This idea isreinforced by examining the movement of the surface frontover this time period, which is opposite of the sense suggestedby wind forcing alone (section 4).
3. ADCP CrossingsThe hydrographic transect (Figure 2) is not oriented normal
to the mean angle of the bathymetry, as is typically the case forshelf break sections. This is because the PRIMER experimentincluded a remote sensing component, and it was decidedbeforehand to situate the long-term moored array along asubtrack of the TOPEX altimeter. The reasoning was that thein situ measurements might help ground truth the sea surfaceheight data (including removal of the tidal signal). Thus theassociated hydrographic crossings were also done along theTOPEX line.
Because of this, we employ a coordinate frame that is nor-mal to the local angle of the isobaths (where the rotation anglevaries as a function of along-track distance). A right-handedsystem is used where positive y and v are along-isobath dis-tance and velocity, respectively, in the equatorward directionand positive x and u are offshore distance and velocity, respec-tively. In order to do this, we required accurate bathymetry ofthe region. U.S. Geological Survey (USGS) soundings datawere obtained for the PRIMER area, which were subsequentlyinterpolated to a regular grid of 0.028 resolution (2.2 km). Theresulting bathymetric contours appear to be quite accurate. Wecompared closely the sounding depth along the TOPEX line tothat obtained using Endeavor’s chirp sonar during the XBTsurvey, and the agreement was excellent. There is also favor-able agreement between the soundings and the available Gen-eral Bathymetric Chart of the Oceans (GEBCO) data in theregion. To determine the appropriate coordinate rotation an-gle, a two-dimensional spline was fit to the USGS bathymetrygrid (after smoothing it with a Laplacian filter). This provideda functional relation between local isobath angle and stationposition along the transect.
The along-isobath ADCP velocity computed as such clearlyreveals the shelf break current in both crossings, though the jetstructure is substantially different in the two realizations (sep-arated by roughly 3 days; see Figure 4a). The jet is muchstronger and narrower in the first crossing on December 6; thepeak velocity is 66 cm/s and the e-folding width is 15 km. OnDecember 9 the jet is located 5 km farther onshore and has apeak velocity of only 36 cm/s and width of 25 km. The trans-port, however, has remained the same (computed over thee-folding width and to 100 m depth) and is 0.32 Sv in bothrealizations. This is comparable to the December/January cli-matological mean value for the region considered by Linderand Gawarkiewicz [1998] that encompasses the PRIMER line.(Both the winter transport value quoted by Linder andGawarkiewicz [1998] as well as the estimate presented here
Figure 3. Time series of (top) wind speed and (bottom) winddirection (plotted in the oceanographic convention). Circlesdenote the shipboard data (corrected for motion of the ship)and triangles are from the nearby Nantucket wind buoy. Thetime periods of the two shelf break hydrographic crossings areindicated by the shading.
PICKART ET AL.: MEANDER OF THE SHELF BREAK CURRENT3124
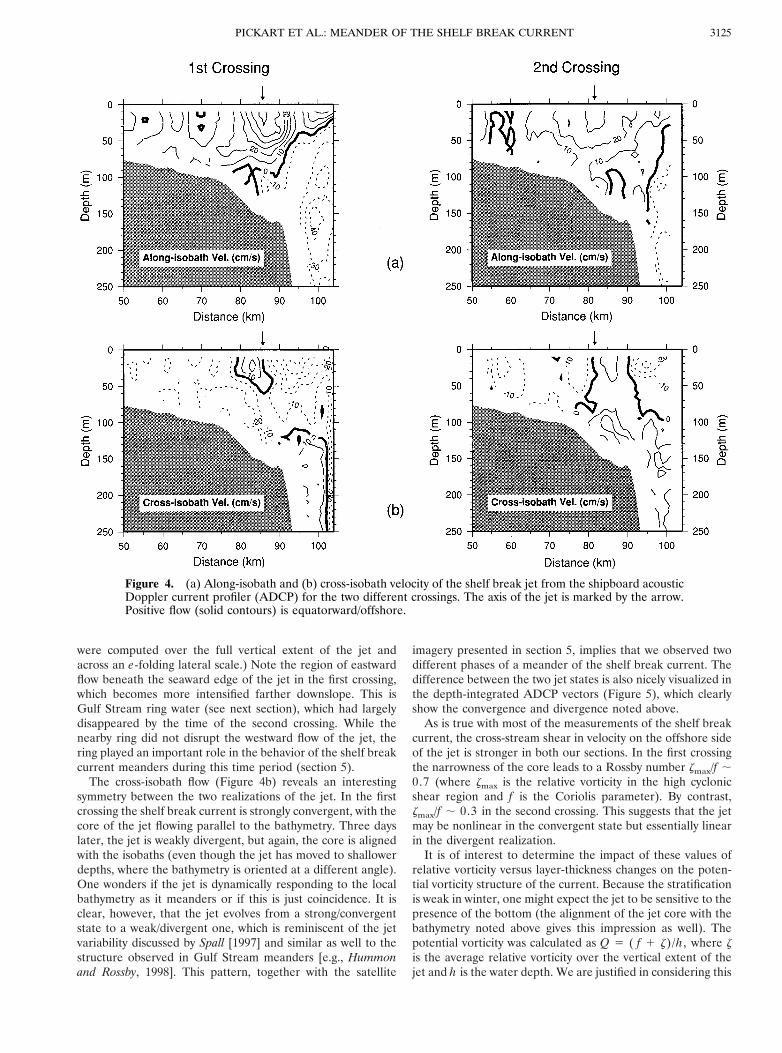
were computed over the full vertical extent of the jet andacross an e-folding lateral scale.) Note the region of eastwardflow beneath the seaward edge of the jet in the first crossing,which becomes more intensified farther downslope. This isGulf Stream ring water (see next section), which had largelydisappeared by the time of the second crossing. While thenearby ring did not disrupt the westward flow of the jet, thering played an important role in the behavior of the shelf breakcurrent meanders during this time period (section 5).
The cross-isobath flow (Figure 4b) reveals an interestingsymmetry between the two realizations of the jet. In the firstcrossing the shelf break current is strongly convergent, with thecore of the jet flowing parallel to the bathymetry. Three dayslater, the jet is weakly divergent, but again, the core is alignedwith the isobaths (even though the jet has moved to shallowerdepths, where the bathymetry is oriented at a different angle).One wonders if the jet is dynamically responding to the localbathymetry as it meanders or if this is just coincidence. It isclear, however, that the jet evolves from a strong/convergentstate to a weak/divergent one, which is reminiscent of the jetvariability discussed by Spall [1997] and similar as well to thestructure observed in Gulf Stream meanders [e.g., Hummonand Rossby, 1998]. This pattern, together with the satellite
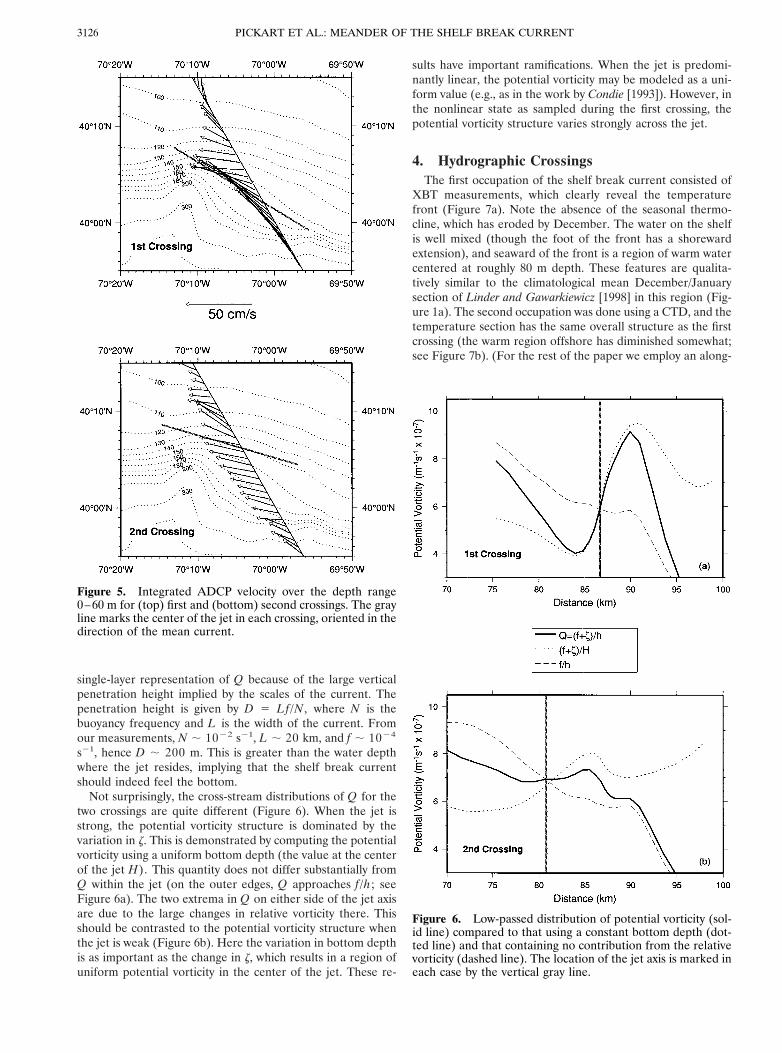
imagery presented in section 5, implies that we observed twodifferent phases of a meander of the shelf break current. Thedifference between the two jet states is also nicely visualized inthe depth-integrated ADCP vectors (Figure 5), which clearlyshow the convergence and divergence noted above.
As is true with most of the measurements of the shelf breakcurrent, the cross-stream shear in velocity on the offshore sideof the jet is stronger in both our sections. In the first crossingthe narrowness of the core leads to a Rossby number zmax/f ;0.7 (where zmax is the relative vorticity in the high cyclonicshear region and f is the Coriolis parameter). By contrast,zmax/f ; 0.3 in the second crossing. This suggests that the jetmay be nonlinear in the convergent state but essentially linearin the divergent realization.
It is of interest to determine the impact of these values ofrelative vorticity versus layer-thickness changes on the poten-tial vorticity structure of the current. Because the stratificationis weak in winter, one might expect the jet to be sensitive to thepresence of the bottom (the alignment of the jet core with thebathymetry noted above gives this impression as well). Thepotential vorticity was calculated as Q 5 ( f 1 z)/h , where zis the average relative vorticity over the vertical extent of thejet and h is the water depth. We are justified in considering this
Figure 4. (a) Along-isobath and (b) cross-isobath velocity of the shelf break jet from the shipboard acousticDoppler current profiler (ADCP) for the two different crossings. The axis of the jet is marked by the arrow.Positive flow (solid contours) is equatorward/offshore.
3125PICKART ET AL.: MEANDER OF THE SHELF BREAK CURRENT
single-layer representation of Q because of the large verticalpenetration height implied by the scales of the current. Thepenetration height is given by D 5 Lf/N , where N is thebuoyancy frequency and L is the width of the current. Fromour measurements, N ; 1022 s21, L ; 20 km, and f ; 1024
s21, hence D ; 200 m. This is greater than the water depthwhere the jet resides, implying that the shelf break currentshould indeed feel the bottom.
Not surprisingly, the cross-stream distributions of Q for thetwo crossings are quite different (Figure 6). When the jet isstrong, the potential vorticity structure is dominated by thevariation in z. This is demonstrated by computing the potentialvorticity using a uniform bottom depth (the value at the centerof the jet H). This quantity does not differ substantially fromQ within the jet (on the outer edges, Q approaches f/h; seeFigure 6a). The two extrema in Q on either side of the jet axisare due to the large changes in relative vorticity there. Thisshould be contrasted to the potential vorticity structure whenthe jet is weak (Figure 6b). Here the variation in bottom depthis as important as the change in z, which results in a region ofuniform potential vorticity in the center of the jet. These re-
sults have important ramifications. When the jet is predomi-nantly linear, the potential vorticity may be modeled as a uni-form value (e.g., as in the work by Condie [1993]). However, inthe nonlinear state as sampled during the first crossing, thepotential vorticity structure varies strongly across the jet.
4. Hydrographic CrossingsThe first occupation of the shelf break current consisted of
XBT measurements, which clearly reveal the temperaturefront (Figure 7a). Note the absence of the seasonal thermo-cline, which has eroded by December. The water on the shelfis well mixed (though the foot of the front has a shorewardextension), and seaward of the front is a region of warm watercentered at roughly 80 m depth. These features are qualita-tively similar to the climatological mean December/Januarysection of Linder and Gawarkiewicz [1998] in this region (Fig-ure 1a). The second occupation was done using a CTD, and thetemperature section has the same overall structure as the firstcrossing (the warm region offshore has diminished somewhat;see Figure 7b). (For the rest of the paper we employ an along-
Figure 5. Integrated ADCP velocity over the depth range0–60 m for (top) first and (bottom) second crossings. The grayline marks the center of the jet in each crossing, oriented in thedirection of the mean current.
Figure 6. Low-passed distribution of potential vorticity (sol-id line) compared to that using a constant bottom depth (dot-ted line) and that containing no contribution from the relativevorticity (dashed line). The location of the jet axis is marked ineach case by the vertical gray line.
PICKART ET AL.: MEANDER OF THE SHELF BREAK CURRENT3126
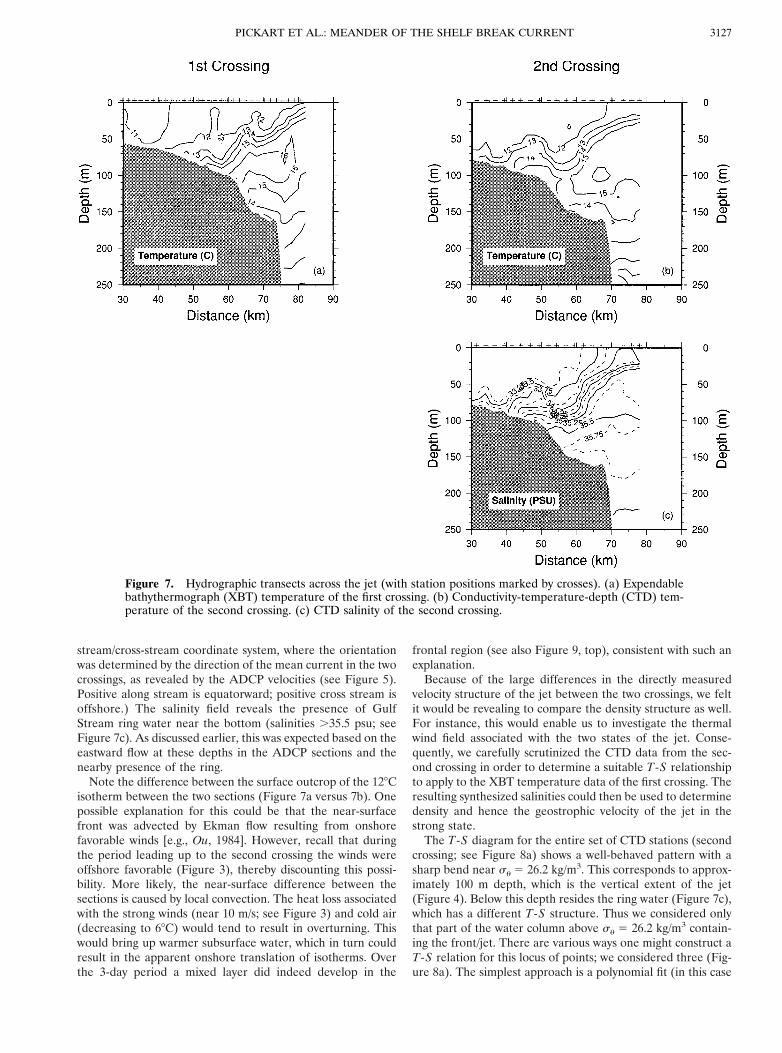
stream/cross-stream coordinate system, where the orientationwas determined by the direction of the mean current in the twocrossings, as revealed by the ADCP velocities (see Figure 5).Positive along stream is equatorward; positive cross stream isoffshore.) The salinity field reveals the presence of GulfStream ring water near the bottom (salinities .35.5 psu; seeFigure 7c). As discussed earlier, this was expected based on theeastward flow at these depths in the ADCP sections and thenearby presence of the ring.
Note the difference between the surface outcrop of the 128Cisotherm between the two sections (Figure 7a versus 7b). Onepossible explanation for this could be that the near-surfacefront was advected by Ekman flow resulting from onshorefavorable winds [e.g., Ou, 1984]. However, recall that duringthe period leading up to the second crossing the winds wereoffshore favorable (Figure 3), thereby discounting this possi-bility. More likely, the near-surface difference between thesections is caused by local convection. The heat loss associatedwith the strong winds (near 10 m/s; see Figure 3) and cold air(decreasing to 68C) would tend to result in overturning. Thiswould bring up warmer subsurface water, which in turn couldresult in the apparent onshore translation of isotherms. Overthe 3-day period a mixed layer did indeed develop in the
frontal region (see also Figure 9, top), consistent with such anexplanation.
Because of the large differences in the directly measuredvelocity structure of the jet between the two crossings, we feltit would be revealing to compare the density structure as well.For instance, this would enable us to investigate the thermalwind field associated with the two states of the jet. Conse-quently, we carefully scrutinized the CTD data from the sec-ond crossing in order to determine a suitable T-S relationshipto apply to the XBT temperature data of the first crossing. Theresulting synthesized salinities could then be used to determinedensity and hence the geostrophic velocity of the jet in thestrong state.
The T-S diagram for the entire set of CTD stations (secondcrossing; see Figure 8a) shows a well-behaved pattern with asharp bend near su 5 26.2 kg/m3. This corresponds to approx-imately 100 m depth, which is the vertical extent of the jet(Figure 4). Below this depth resides the ring water (Figure 7c),which has a different T-S structure. Thus we considered onlythat part of the water column above su 5 26.2 kg/m3 contain-ing the front/jet. There are various ways one might construct aT-S relation for this locus of points; we considered three (Fig-ure 8a). The simplest approach is a polynomial fit (in this case
Figure 7. Hydrographic transects across the jet (with station positions marked by crosses). (a) Expendablebathythermograph (XBT) temperature of the first crossing. (b) Conductivity-temperature-depth (CTD) tem-perature of the second crossing. (c) CTD salinity of the second crossing.
3127PICKART ET AL.: MEANDER OF THE SHELF BREAK CURRENT
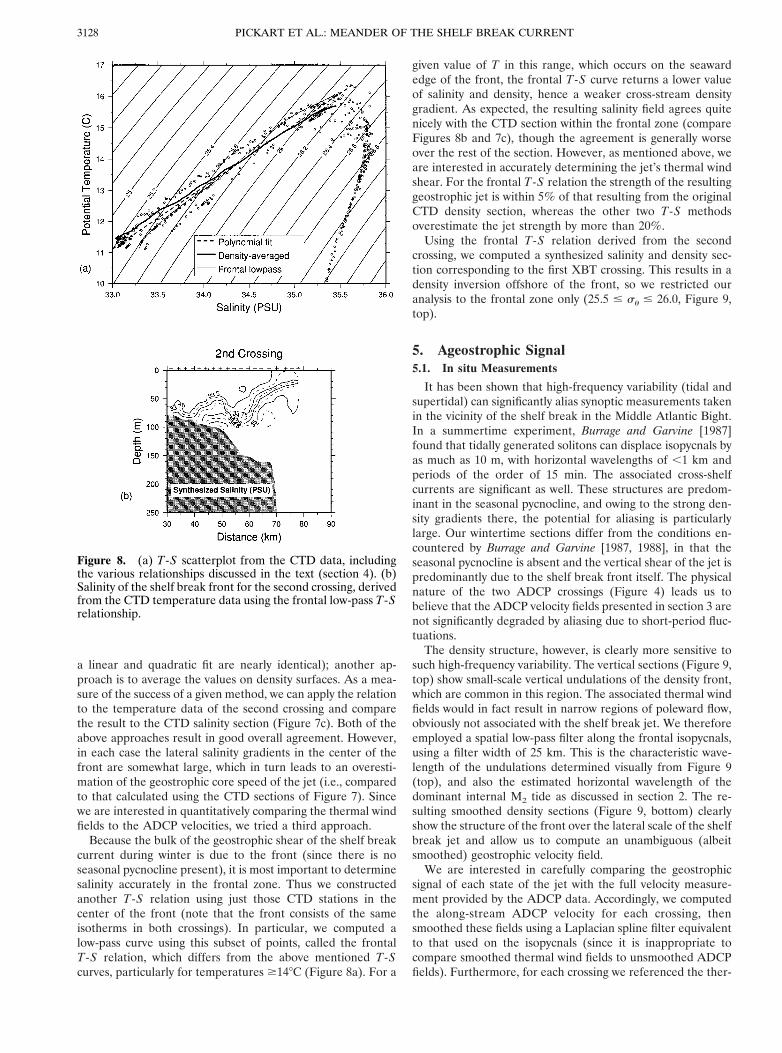
a linear and quadratic fit are nearly identical); another ap-proach is to average the values on density surfaces. As a mea-sure of the success of a given method, we can apply the relationto the temperature data of the second crossing and comparethe result to the CTD salinity section (Figure 7c). Both of theabove approaches result in good overall agreement. However,in each case the lateral salinity gradients in the center of thefront are somewhat large, which in turn leads to an overesti-mation of the geostrophic core speed of the jet (i.e., comparedto that calculated using the CTD sections of Figure 7). Sincewe are interested in quantitatively comparing the thermal windfields to the ADCP velocities, we tried a third approach.
Because the bulk of the geostrophic shear of the shelf breakcurrent during winter is due to the front (since there is noseasonal pycnocline present), it is most important to determinesalinity accurately in the frontal zone. Thus we constructedanother T-S relation using just those CTD stations in thecenter of the front (note that the front consists of the sameisotherms in both crossings). In particular, we computed alow-pass curve using this subset of points, called the frontalT-S relation, which differs from the above mentioned T-Scurves, particularly for temperatures $148C (Figure 8a). For a
given value of T in this range, which occurs on the seawardedge of the front, the frontal T-S curve returns a lower valueof salinity and density, hence a weaker cross-stream densitygradient. As expected, the resulting salinity field agrees quitenicely with the CTD section within the frontal zone (compareFigures 8b and 7c), though the agreement is generally worseover the rest of the section. However, as mentioned above, weare interested in accurately determining the jet’s thermal windshear. For the frontal T-S relation the strength of the resultinggeostrophic jet is within 5% of that resulting from the originalCTD density section, whereas the other two T-S methodsoverestimate the jet strength by more than 20%.
Using the frontal T-S relation derived from the secondcrossing, we computed a synthesized salinity and density sec-tion corresponding to the first XBT crossing. This results in adensity inversion offshore of the front, so we restricted ouranalysis to the frontal zone only (25.5 # su # 26.0, Figure 9,top).
5. Ageostrophic Signal5.1. In situ Measurements
It has been shown that high-frequency variability (tidal andsupertidal) can significantly alias synoptic measurements takenin the vicinity of the shelf break in the Middle Atlantic Bight.In a summertime experiment, Burrage and Garvine [1987]found that tidally generated solitons can displace isopycnals byas much as 10 m, with horizontal wavelengths of ,1 km andperiods of the order of 15 min. The associated cross-shelfcurrents are significant as well. These structures are predom-inant in the seasonal pycnocline, and owing to the strong den-sity gradients there, the potential for aliasing is particularlylarge. Our wintertime sections differ from the conditions en-countered by Burrage and Garvine [1987, 1988], in that theseasonal pycnocline is absent and the vertical shear of the jet ispredominantly due to the shelf break front itself. The physicalnature of the two ADCP crossings (Figure 4) leads us tobelieve that the ADCP velocity fields presented in section 3 arenot significantly degraded by aliasing due to short-period fluc-tuations.
The density structure, however, is clearly more sensitive tosuch high-frequency variability. The vertical sections (Figure 9,top) show small-scale vertical undulations of the density front,which are common in this region. The associated thermal windfields would in fact result in narrow regions of poleward flow,obviously not associated with the shelf break jet. We thereforeemployed a spatial low-pass filter along the frontal isopycnals,using a filter width of 25 km. This is the characteristic wave-length of the undulations determined visually from Figure 9(top), and also the estimated horizontal wavelength of thedominant internal M2 tide as discussed in section 2. The re-sulting smoothed density sections (Figure 9, bottom) clearlyshow the structure of the front over the lateral scale of the shelfbreak jet and allow us to compute an unambiguous (albeitsmoothed) geostrophic velocity field.
We are interested in carefully comparing the geostrophicsignal of each state of the jet with the full velocity measure-ment provided by the ADCP data. Accordingly, we computedthe along-stream ADCP velocity for each crossing, thensmoothed these fields using a Laplacian spline filter equivalentto that used on the isopycnals (since it is inappropriate tocompare smoothed thermal wind fields to unsmoothed ADCPfields). Furthermore, for each crossing we referenced the ther-
Figure 8. (a) T-S scatterplot from the CTD data, includingthe various relationships discussed in the text (section 4). (b)Salinity of the shelf break front for the second crossing, derivedfrom the CTD temperature data using the frontal low-pass T-Srelationship.
PICKART ET AL.: MEANDER OF THE SHELF BREAK CURRENT3128

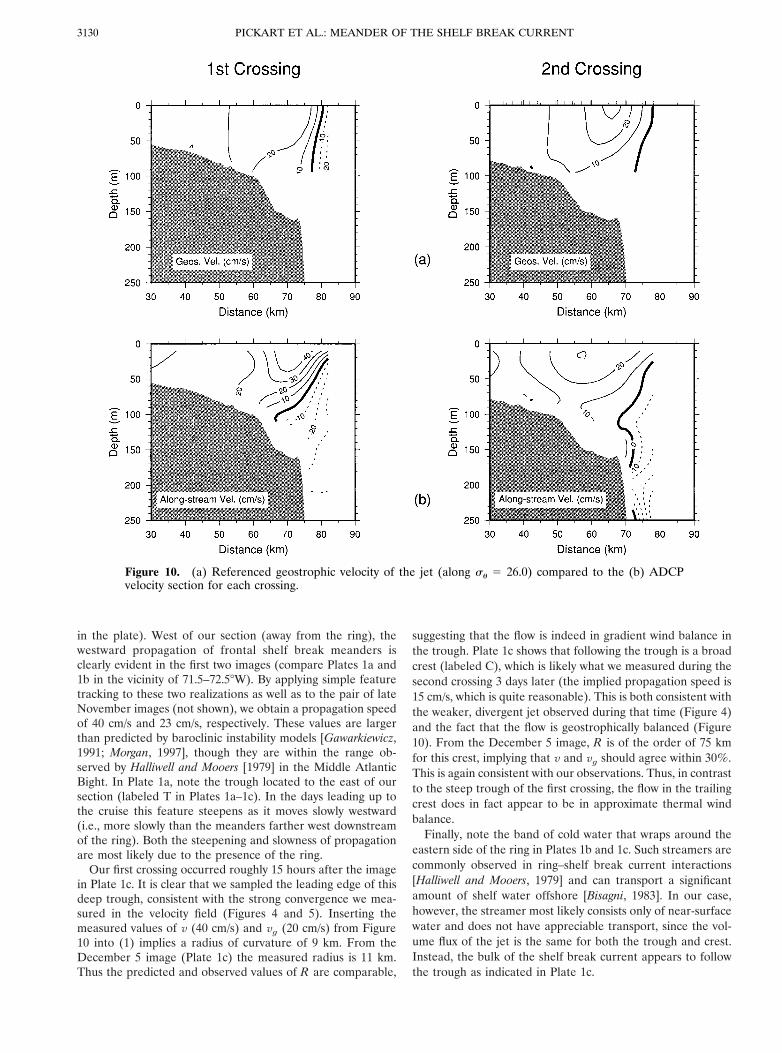
mal wind field to the ADCP velocity along the su 5 26.0surface, the argument being that at the base of the jet the flowshould be in geostrophic balance. We believe that these stepslead to the most accurate comparison. The results indicate thatduring the first crossing the ADCP signal is a factor of 2 largerthan the geostrophic signal, whereas during the second cross-ing the two signals are comparable (Figure 10). Thus, on thebasis of our best interpretation of the observations, the con-clusion is that the weak jet is geostrophically balanced, whilethe strong jet is significantly nonlinear. This is consistent withthe large difference in Rossby numbers between the two states(section 3).
5.2. Remote Sensing
Is the observed discrepancy between geostrophy and theADCP-measured core speed during the first crossing consis-tent with what is known about the dynamics of meanderingjets? In Spall’s [1997] primitive equation model, whose lateralscales apply roughly to the shelf break current, the flow nearthe leading edge of meander troughs is convergent, while forcrests it is divergent. This is true as well in the Gulf Stream,where numerous observations have revealed such a pattern[e.g., Bower, 1989; Hummon and Rossby, 1998]. For large
enough Rossby number the momentum balance normal to theflow is that of gradient wind [Holton, 1979],
v2/R 1 fv 5 fvg, (1)
where v is the along-stream current, R is the radius of curva-ture, and vg is the geostrophic signal. In troughs (R , 0) thegradient flow is greater than the geostrophic flow (v . vg),while the opposite is true in crests. This balance has beenshown to apply in the near-surface portion of the Gulf Stream[Johns et al., 1989] and is appropriate as well for the meandersin the model of Spall [1997]. In our first crossing, v . vg whenthe flow is strongly convergent (Figure 4), which is consistentwith these results. To determine if the magnitude of this mea-sured ageostrophic signal is plausible, we analyzed the avail-able advanced very high resolution radiometer (AVHRR) dataencompassing the time period of the cruise.
A series of three sea surface temperature (SST) imagestaken prior to our first crossing (Plate 1) clearly shows theevolution of the shelf break front and the influence of thenearby Gulf Stream ring. (Except for two other images in lateNovember, these are the only ones available for the 3-weekperiod centered on the cruise.) The clearest image of the ring(Plate 1b) shows it centered near 39815 N, 70815 W (denoted R
Figure 9. (top) Density of the shelf break front during the two transects. (bottom) Low-passed density frontas described in the text (section 5.1).
3129PICKART ET AL.: MEANDER OF THE SHELF BREAK CURRENT
in the plate). West of our section (away from the ring), thewestward propagation of frontal shelf break meanders isclearly evident in the first two images (compare Plates 1a and1b in the vicinity of 71.5–72.58W). By applying simple featuretracking to these two realizations as well as to the pair of lateNovember images (not shown), we obtain a propagation speedof 40 cm/s and 23 cm/s, respectively. These values are largerthan predicted by baroclinic instability models [Gawarkiewicz,1991; Morgan, 1997], though they are within the range ob-served by Halliwell and Mooers [1979] in the Middle AtlanticBight. In Plate 1a, note the trough located to the east of oursection (labeled T in Plates 1a–1c). In the days leading up tothe cruise this feature steepens as it moves slowly westward(i.e., more slowly than the meanders farther west downstreamof the ring). Both the steepening and slowness of propagationare most likely due to the presence of the ring.
Our first crossing occurred roughly 15 hours after the imagein Plate 1c. It is clear that we sampled the leading edge of thisdeep trough, consistent with the strong convergence we mea-sured in the velocity field (Figures 4 and 5). Inserting themeasured values of v (40 cm/s) and vg (20 cm/s) from Figure10 into (1) implies a radius of curvature of 9 km. From theDecember 5 image (Plate 1c) the measured radius is 11 km.Thus the predicted and observed values of R are comparable,
suggesting that the flow is indeed in gradient wind balance inthe trough. Plate 1c shows that following the trough is a broadcrest (labeled C), which is likely what we measured during thesecond crossing 3 days later (the implied propagation speed is15 cm/s, which is quite reasonable). This is both consistent withthe weaker, divergent jet observed during that time (Figure 4)and the fact that the flow is geostrophically balanced (Figure10). From the December 5 image, R is of the order of 75 kmfor this crest, implying that v and vg should agree within 30%.This is again consistent with our observations. Thus, in contrastto the steep trough of the first crossing, the flow in the trailingcrest does in fact appear to be in approximate thermal windbalance.
Finally, note the band of cold water that wraps around theeastern side of the ring in Plates 1b and 1c. Such streamers arecommonly observed in ring–shelf break current interactions[Halliwell and Mooers, 1979] and can transport a significantamount of shelf water offshore [Bisagni, 1983]. In our case,however, the streamer most likely consists only of near-surfacewater and does not have appreciable transport, since the vol-ume flux of the jet is the same for both the trough and crest.Instead, the bulk of the shelf break current appears to followthe trough as indicated in Plate 1c.
Figure 10. (a) Referenced geostrophic velocity of the jet (along su 5 26.0) compared to the (b) ADCPvelocity section for each crossing.
PICKART ET AL.: MEANDER OF THE SHELF BREAK CURRENT3130
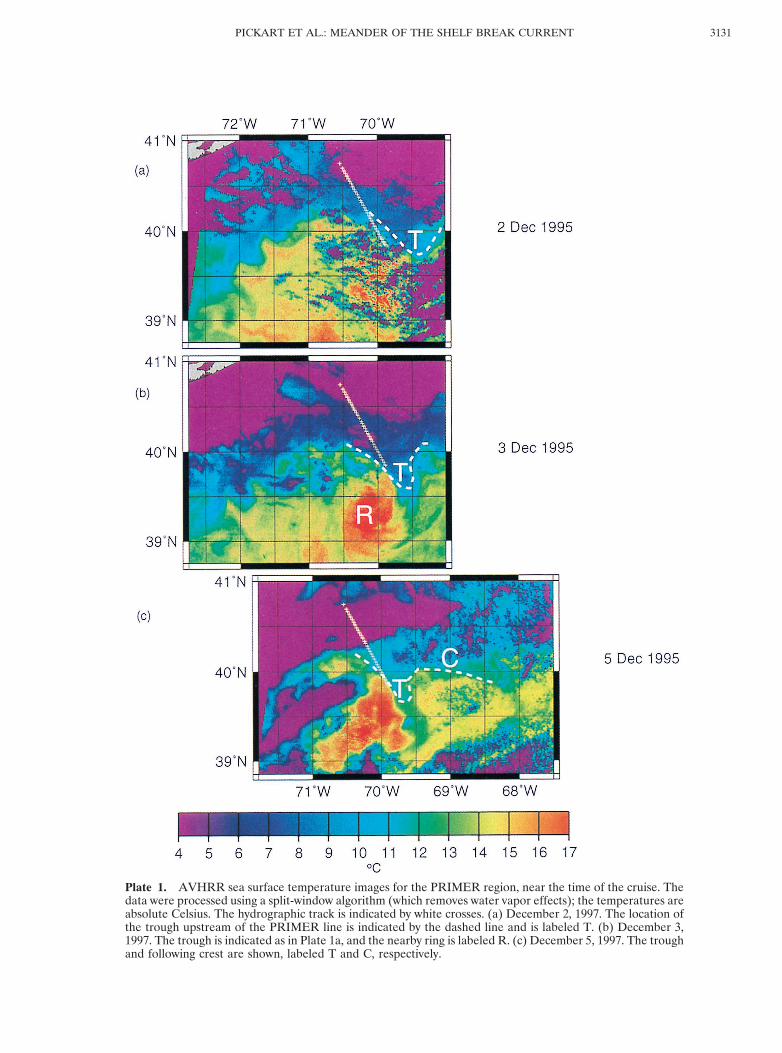
Plate 1. AVHRR sea surface temperature images for the PRIMER region, near the time of the cruise. Thedata were processed using a split-window algorithm (which removes water vapor effects); the temperatures areabsolute Celsius. The hydrographic track is indicated by white crosses. (a) December 2, 1997. The location ofthe trough upstream of the PRIMER line is indicated by the dashed line and is labeled T. (b) December 3,1997. The trough is indicated as in Plate 1a, and the nearby ring is labeled R. (c) December 5, 1997. The troughand following crest are shown, labeled T and C, respectively.
3131PICKART ET AL.: MEANDER OF THE SHELF BREAK CURRENT
6. SummaryWe have elucidated both the structure and dynamics of a
meander in the shelf break current south of New England,using a combination of in situ measurements and AVHRRimages. Two wintertime hydrographic/ADCP crossings of thecurrent, separated by 3 days, sampled vastly different states ofthe jet, which are likely the opposite phases of a meander. Inthe first section the current is strong and convergent, with thecore of the jet flowing along the isobaths; 3 days later, the flowis significantly weaker and divergent, with the core againaligned with the bathymetry. The Rossby number in the twocases differs by more than a factor of 2. This in turn leads tolarge changes in the potential vorticity structure of the currentin the two realizations and suggests that the flow is highlynonlinear in the convergent state while nearly linear during itsdivergent phase. (This is not to say that the flow cannot benonlinear in a crest, just not the broad crest we observed.)
Using a carefully constructed T-S relationship from theCTD data of the second crossing, which accurately capturesthe strength of the shelf break front, we converted the XBTdata of the first crossing into a synthesized salinity and densitysection. This enabled us to compute the thermal wind fields ofthe two sections and compare them to the ADCP-derivedvelocity fields. This comparison implied that a significantageostrophic component is present during the first crossingwhen the flow is strong but that the current is geostrophicallybalanced in the weaker state during the second crossing. Theavailable AVHRR data show the presence of a deep troughwhose leading edge was sampled by the first crossing, consis-tent with the strong convergence measured at that time. Theobserved radius of curvature from the AVHRR image agreeswith that predicted from gradient wind, explaining the mea-sured ageostrophic signal. By contrast, the second crossingappears to have sampled a broad, trailing crest, in concert withthe weak, divergent jet observed in the ADCP velocity field.The much larger radius of curvature based on the AVHRRimage implies a minimal ageostrophic component in this case,also as observed. The conclusion is that the first crossing sam-pled a highly nonlinear meander trough governed by gradientwind dynamics, while the second crossing sampled a broadmeander crest in approximate geostrophic balance.
These results have offered the first such quantitative glimpseof a finite amplitude meander of the shelf break current. In thiscase the steepening of the trough was likely influenced by thenearby Gulf Stream ring. Future work needs to address boththe impact of rings and the full three-dimensional structure ofsuch shelf break frontal variability. Results from the two mainPRIMER field studies will shed light on both these issues.
Acknowledgments. The authors wish to acknowledge the helpfulinsights of Glen Gawarkiewicz, who was consulted constantly duringthis work. We are thankful to the crew of R/V Endeavor for a highlysuccessful cruise. The National Oceanic and Atmospheric AssociationCoastwatch program provided the AVHRR imagery data. This workwas supported by ONR contract N00014-95-1-0575 as part of theShelfbreak PRIMER experiment.
ReferencesBeardsley, R. C., and C. N. Flagg, The water structure, mean currents,
and shelf/slope water front on the New England continental shelf,Mem. Soc. R. Sci. Liege Collect., 6, 209–225, 1976.
Bisagni, J. J., Lagrangian current measurements within the easternmargin of a warm-core Gulf Stream ring, J. Phys. Oceanogr., 13,709–715, 1983.
Bower, A. S., Potential vorticity balances and horizontal divergencealong particle trajectories in Gulf Stream meanders east of CapeHatteras, J. Phys. Oceanogr., 19, 1669–1681, 1989.
Burrage, D. M., and R. W. Garvine, Supertidal frequency internalwaves on the continental shelf south of New England, J. Phys.Oceanogr., 17, 808–819, 1987.
Burrage, D. M., and R. W. Garvine, Summertime hydrography at theshelfbreak front in the Middle Atlantic Bight, J. Phys. Oceanogr., 18,1309–1319, 1988.
Chapman, D. C., and R. C. Beardsley, On the origin of shelf water inthe Middle Atlantic Bight, J. Phys. Oceanogr., 19, 384–391, 1989.
Condie, S. A., Formation and stability of shelf break fronts, J. Geophys.Res., 98, 12,405–12,416, 1993.
Flagg, C. N., and R. C. Beardsley, On the stability of the shelf-water/slope-water front south of New England, J. Geophys. Res., 83, 4623–4631, 1978.
Garvine, R. W., K. C. Wong, G. G. Gawarkiewicz, R. K. McCarthy,R. W. Houghton, and F. Aikman III, The morphology of shelf breakeddies, J. Geophys. Res., 93, 15,593–15,607, 1988.
Gawarkiewicz, G., Linear stability models of shelf break fronts, J. Phys.Oceanogr., 21, 471–488, 1991.
Gawarkiewicz, G., T. G. Ferdelman, T. M. Church, and G. W. LutherIII, Shelf break frontal structure on the continental shelf north ofCape Hatteras, Cont. Shelf Res., 16, 1751–1773, 1996.
Halliwell, G. R., and C. N. K. Mooers, The space-time structure andvariability of the shelf water–slope water and Gulf Stream surfacetemperature fronts and associated warm-core eddies, J. Geophys.Res., 84, 7707–7725, 1979.
Holton, J. R., An Introduction to Dynamic Meteorology, 391 pp., Aca-demic, New York, 1979.
Houghton, R. W., D. B. Olson, and P. J. Celone, Observation of ananticyclonic eddy near the continental shelf break south of NewEngland, J. Phys. Oceanogr., 16, 60–71, 1986.
Houghton, R. W., F. Aikman, and H. W. Ou, Shelf-slope frontalstructure and cross-shelf exchange at the New England shelf-break,Cont. Shelf Res., 8, 687–710, 1988.
Hummon, J., and T. Rossby, Spatial and temporal evolution of a GulfStream crest—warm core ring interaction, J. Geophys. Res., 103,2795–2809, 1998.
Johns, E., D. R. Watts, and H. T. Rossby, A test of geostrophy in theGulf Stream, J. Geophys. Res., 94, 3211–3222, 1989.
Joyce, T. M., J. K. B. Bishop, and O. B. Brown, Observations ofoffshore shelf water transport induced by a warm-core ring, DeepSea Res., Part A, 39, suppl. 1, S97–S113, 1992.
Linder, C. A., and G. G. Gawarkiewicz, A climatology of the shelfbreak front in the Middle Atlantic Bight, J. Geophys. Res., 103,18,405–18,423, 1998.
Moody, J. A., et al., Atlas of tidal elevation and current observationson the Northeast American continental shelf and slope of NorthAmerica, U.S. Geol. Surv. Bull., 1611, 122 pp., 1984.
Morgan, D. T., Linear instability of the shelfbreak front off the south-ern flank of Georges Bank, Ph.D. thesis, 190 pp., Thayer Sch. ofEng., Dartmouth Coll., 1997.
Ou, H. W., Wind-driven motion near a shelf-slope front, J. Phys.Oceanogr., 14, 985–993, 1984.
Petrie, B., and K. Drinkwater, Temperature and salinity variability onthe Scotian Shelf and in the Gulf of Maine 1945–1990, J. Geophys.Res., 98, 20,079–20,089, 1993.
Ramp, S. R., R. C. Beardsley, and R. Legeckis, An observation offrontal wave development on a shelf slope/warm core ring front nearthe shelf break south of New England, J. Phys. Oceanogr., 13, 907–912, 1983.
Spall, M. A., Frontogenesis, subduction, and cross-front exchange atupper ocean fronts, J. Geophys. Res., 100, 2543–2557, 1995.
Spall, M. A., Baroclinic jets in confluent flow, J. Phys. Oceanogr., 27,1054–1071, 1997.
Wright, W. R., The limits of shelf water south of Cape Cod, 1941 to1972, J. Mar. Res., 34, 1–14, 1976.
M. J. Caruso, T. K. McKee, R. S. Pickart, J. E. Przystup, and D. J.Torres, Woods Hole Oceanographic Institution, Woods Hole, MA02543. ([email protected])
(Received July 18, 1997; revised May 27, 1998;accepted September 10, 1998.)
PICKART ET AL.: MEANDER OF THE SHELF BREAK CURRENT3132
Related Documents