DHIS2 Implementation Guide 2.5

Welcome message from author
This document is posted to help you gain knowledge. Please leave a comment to let me know what you think about it! Share it to your friends and learn new things together.
Transcript

DHIS2 Implementation Guide
2.5

2
© 2006-2011DHIS2 Documentation Team
Revision 408Version 2.5 2011-10-05 12:00:45
Warranty: THIS DOCUMENT IS PROVIDED BY THE AUTHORS ''AS IS'' AND ANY EXPRESSOR IMPLIED WARRANTIES, INCLUDING, BUT NOT LIMITED TO, THE IMPLIEDWARRANTIES OF MERCHANTABILITY AND FITNESS FOR A PARTICULAR PURPOSE AREDISCLAIMED. IN NO EVENT SHALL THE AUTHORS OR CONTRIBUTORS BE LIABLE FORANY DIRECT, INDIRECT, INCIDENTAL, SPECIAL, EXEMPLARY, OR CONSEQUENTIALDAMAGES (INCLUDING, BUT NOT LIMITED TO, PROCUREMENT OF SUBSTITUTEGOODS OR SERVICES; LOSS OF USE, DATA, OR PROFITS; OR BUSINESS INTERRUPTION)HOWEVER CAUSED AND ON ANY THEORY OF LIABILITY, WHETHER IN CONTRACT,STRICT LIABILITY, OR TORT (INCLUDING NEGLIGENCE OR OTHERWISE) ARISING INANY WAY OUT OF THE USE OF THIS MANUAL AND PRODUCTS MENTIONED HEREIN,EVEN IF ADVISED OF THE POSSIBILITY OF SUCH DAMAGE.
License: Permission is granted to copy, distribute and/or modify this document under the terms of theGNU Free Documentation License, Version 1.3 or any later version published by the Free SoftwareFoundation; with no Invariant Sections, no Front-Cover Texts, and no Back-Cover Texts. A copyof the license is included in the source of this documentation, and is available here online: http://www.gnu.org/licenses/fdl.html.
DHIS2 Implementation Guide Contents
iii
1. Recommendations for National HIS Implementations ............................................................................ 11.1. Database development ........................................................................................................... 11.2. Import and mapping of existing databases ................................................................................. 11.3. Securing necessary resources for the implementation ................................................................... 11.4. Integration of parallel systems ................................................................................................. 11.5. Setup of a reliable online national server ................................................................................... 21.6. Pilot phase ........................................................................................................................... 21.7. Roll out .............................................................................................................................. 21.8. Training .............................................................................................................................. 31.9. Decentralization of data capture and management ....................................................................... 31.10. Review and extension .......................................................................................................... 3
2. Conceptual Design Principles ............................................................................................................ 52.1. All meta data can be added and modified through the user interface ............................................... 52.2. A flexible data model supports different data sources to be integrated in one single data repository ........ 52.3. Data input != Data output ....................................................................................................... 62.4. Indicator-driven data analysis and reporting ............................................................................... 62.5. Maintain disaggregated facility-data in the database .................................................................... 72.6. Support data analysis at any level in the health system ................................................................ 7
3. Setting Up a New Database .............................................................................................................. 93.1. Strategies for getting started ................................................................................................... 93.2. Controlled or open process? ................................................................................................... 93.3. Steps for developing a database ............................................................................................... 9
3.3.1. The organisational hierarchy ....................................................................................... 103.3.2. Data Elements .......................................................................................................... 103.3.3. Data sets and data entry forms .................................................................................... 103.3.4. Validation rules ........................................................................................................ 113.3.5. Indicators ................................................................................................................ 113.3.6. Report tables and reports ........................................................................................... 113.3.7. GIS (Maps) ............................................................................................................. 113.3.8. Charts and dashboard ................................................................................................ 11
4. Deployment Strategies .................................................................................................................... 134.1. Offline Deployment ............................................................................................................. 134.2. Online deployment .............................................................................................................. 134.3. Hybrid deployment .............................................................................................................. 144.4. Server hosting .................................................................................................................... 14
5. DHIS 2 as Data Warehouse ............................................................................................................. 175.1. Data warehouses and operational systems ................................................................................ 175.2. Aggregation strategies in DHIS 2 ........................................................................................... 185.3. Data storage approach .......................................................................................................... 19
6. End-user Training .......................................................................................................................... 216.1. What training is needed ....................................................................................................... 216.2. Strategies for training .......................................................................................................... 21
6.2.1. Training of trainers ................................................................................................... 216.2.2. Workshops and on-site training ................................................................................... 216.2.3. Continuation of training ............................................................................................. 22
6.3. Material and courses ............................................................................................................ 227. Integration .................................................................................................................................... 23
7.1. Integration and interoperability .............................................................................................. 237.2. Benefits of integration .......................................................................................................... 237.3. What facilitates integration and interoperability ........................................................................ 247.4. Architecture of interoperable HIS ........................................................................................... 24
8. Installation ................................................................................................................................... 278.1. Server setup ....................................................................................................................... 278.2. DHIS 2 Live setup .............................................................................................................. 298.3. Backup .............................................................................................................................. 29
9. Support ........................................................................................................................................ 319.1. Home page: dhis2.org .......................................................................................................... 31

DHIS2 Implementation Guide Contents
iv
9.2. Collaboration platform: launchpad.net/dhis2 ............................................................................. 3110. Installation on Ubuntu 10.10 - Detailed guide ................................................................................... 33
10.1. Installing Java ................................................................................................................... 3310.2. Instaling PostgreSQL ......................................................................................................... 33
10.2.1. Set password for the system user> ............................................................................. 3310.2.2. Edit database users and create a database .................................................................... 3410.2.3. Open the server for connections ................................................................................. 3410.2.4. Define authorizations for the databases ....................................................................... 3510.2.5. Setting up ODBC Connections to the Postgresql server .................................................. 35
10.2.5.1. Setting up a Windows 7 (32 bit) ODBC connection ............................................. 3510.2.6. Performance tuning ................................................................................................. 36
10.2.6.1. Increase shared memory ................................................................................ 3610.2.6.2. Adjust PostgreSQL configurations ................................................................... 3710.2.6.3. Restart PostgreSQL ....................................................................................... 37
10.3. Installing pgAdmin ............................................................................................................ 3810.3.1. Create dhis2/databases folder .................................................................................... 3810.3.2. Create a server connectionin pgAdmin ........................................................................ 3810.3.3. Restore a database from pgAdmin .............................................................................. 3910.3.4. Plain text-restoration ................................................................................................ 40
10.3.4.1. Plain text-restoration with pgAdmin ................................................................. 4010.3.4.2. Plain text restoration from terminal .................................................................. 41
10.4. Installing Apache Tomcat ................................................................................................... 4110.4.1. Preparing Tomcat .................................................................................................... 4110.4.2. Reverse proxying with Tomcat and Apache ................................................................. 4210.4.3. Implementing SSL encryption ................................................................................... 4210.4.4. ............................................................................................................................. 4310.4.5. Performance tuning ................................................................................................. 43
10.5. Prepare for startup ............................................................................................................. 4310.5.1. Creating the DHIS2_HOME folder ............................................................................. 4310.5.2. Download and prepare DHIS 2 .................................................................................. 4410.5.3. Create the hibernate.properties file ............................................................................. 44
10.6. Run DHIS 2 ..................................................................................................................... 4410.6.1. Start Tomcat .......................................................................................................... 4410.6.2. Open DHIS 2 ......................................................................................................... 4410.6.3. Stop Tomcat .......................................................................................................... 44
10.7. Useful scripts .................................................................................................................... 4510.7.1. DHIS 2 start and stop script ...................................................................................... 45
10.7.1.1. The dhis script file ........................................................................................ 4510.8. Using Amazon Web services ............................................................................................... 46
11. Organisation Units ....................................................................................................................... 4911.1. Organisation unit hierarchy design ........................................................................................ 4911.2. Organisation unit groups and group sets ................................................................................ 50
12. Data Elements and Custom Dimensions ........................................................................................... 5112.1. Data elements ................................................................................................................... 5112.2. Categories and custom dimensions ....................................................................................... 5112.3. Data element groups .......................................................................................................... 52
13. Data Sets and Forms .................................................................................................................... 5313.1. What is a data set? ............................................................................................................ 5313.2. What is a data entry form? .................................................................................................. 53
13.2.1. Types of data entry forms ......................................................................................... 5313.2.1.1. Default forms ............................................................................................... 5313.2.1.2. Section forms ............................................................................................... 5313.2.1.3. Custom Forms ............................................................................................. 54
13.3. From paper to electronic form - Lessons learned ..................................................................... 5413.3.1. Identify self-contained data elements .......................................................................... 5413.3.2. Leave calculations and repetitions to the computer - capture raw data only ......................... 54
14. Data Quality ............................................................................................................................... 57
DHIS2 Implementation Guide Contents
DHIS2 Implementation Guide (2.5) v
14.1. Measuring data quality ....................................................................................................... 5714.2. Reasons for poor data quality .............................................................................................. 5714.3. Improving data quality ....................................................................................................... 5714.4. Using DHIS 2 to improve data quality .................................................................................. 57
14.4.1. Data input validation ............................................................................................... 5714.4.2. Min and max ranges ................................................................................................ 5814.4.3. Validation rules ...................................................................................................... 5814.4.4. Outlier analysis ....................................................................................................... 5814.4.5. Completeness and timeliness reports ........................................................................... 58
15. Indicators ................................................................................................................................... 5915.1. What is an indicator ........................................................................................................... 5915.2. Purposes of indicators ........................................................................................................ 5915.3. Indicator-driven data collection ............................................................................................ 5915.4. Managing indicators ........................................................................................................... 60
16. Users and User Roles ................................................................................................................... 6116.1. Users ............................................................................................................................... 6116.2. User Roles ....................................................................................................................... 61
17. Data Analysis Tools Overview ....................................................................................................... 6317.1. Data analysis tools ............................................................................................................. 63
17.1.1. Standard reports ...................................................................................................... 6317.1.2. Data set reports ...................................................................................................... 6317.1.3. Data completeness report .......................................................................................... 6317.1.4. Static reports .......................................................................................................... 6317.1.5. Organisation unit distribution reports .......................................................................... 6417.1.6. Report tables .......................................................................................................... 6417.1.7. Charts ................................................................................................................... 6417.1.8. Web Pivot tables ..................................................................................................... 6417.1.9. GIS ...................................................................................................................... 6417.1.10. My Datamart and Excel Pivot tables ......................................................................... 64
18. Pivot Tables and the MyDataMart tool ............................................................................................ 6718.1. Pivot table design .............................................................................................................. 6718.2. Connecting to the DHIS 2 database ...................................................................................... 6818.3. Dealing with large amounts of data ...................................................................................... 6818.4. The MyDatamart tool ......................................................................................................... 6818.5. Using Excel pivot tables and MyDatamart - a work-flow example .............................................. 69
18.5.1. Download and run the MyDatamart tool for the first time ............................................... 6918.5.2. Setup and distribute the pivot tables ........................................................................... 7018.5.3. Update MyDatamart ................................................................................................ 7018.5.4. Update the Pivot tables ............................................................................................ 7018.5.5. Repeat step 3 and 4 when new data is available on the central server ................................. 70


Recommendations for National HISImplementations
Database development
1
Chapter 1. Recommendations forNational HIS Implementations
The following text gives a brief overview of some of the key aspects of HIS implementations learned by HISPfrom numerous missions in developing countries. The various aspects can be used as input for planning of newimplementation efforts or evaluation of ongoing processes.
1.1. Database development
When developing a new database a natural start is to define the data elements for which to capture data and to designthe data entry forms. The data elements are the core building blocks of the database and must be reasonable stablebefore moving on. The next step could be to define validation rules based on the mentioned data elements to be ableto better ensure the correctness of the data being captured.
The other core component of the database is the organisational hierarchy which should be identified and set up in theinitial phase. The health facilities are generally the source of the data and the organisational hierarchy is locating thefacilities in both the geographical and in the administrative dimension. In most countries there is no strictly definedand continuously updated “master registry” for health facilities, hence this process needs to involve the differentstakeholders including the district level as they will be the ones who have best knowledge about the situation.
1.2. Import and mapping of existing databases
Bringing in existing data to the new system adds significant value in the initial phase as it makes it a lot easier todemonstrate analysis capabilities such as charts and reports. This improves the ability to convince stakeholders such ashealth programs and donors to support the new system. In most cases there exists a large amount of electronically storeddata from in-house database systems, excel sheets or other third party systems. This data should whenever possible beimported and mapped to the data elements and the organisational units (locations/facilities) of the new system withwhatever feasible technical solution. This should be regarded as a one-time job for boot-strapping the database anddoes not have to turn into an elegant and reusable routine.
1.3. Securing necessary resources for the implementation
Doing a national roll-out is an expensive effort which requires appropriate funding for aspects mentioned in thefollowing including procurement of hardware, server hosting, internal and external training workshops. The fundingcould be retrieved from the government budget and/or with help from external donors. It is vital that even relativelysmall amounts needed for instance for airtime for mobile Internet modem are budgeted for and provided in order toavoid frustrations and unnecessary problems for end users.
1.4. Integration of parallel systems
The typical government health domain has a lot of existing players and systems. Fist it is apparent that an integrateddatabase containing data from various sources becomes a lot more valuable and useful than fragmented and isolatedones. For instance it improves usefulness when analysis of epidemiological data is combined with specialized HIV/AIDS, TB, financial and human resource data, or when immunization is combined with logistics/stock data as it willgive a more complete picture of the situation. Second there is typically a lot of overlapping data elements being capturedby the various parallel systems. For instance will HIV/AIDS related data elements be captured both by both multiplegeneral counselling and testing programs and the specialized HIV/AIDS program, or data elements related to malariain pregnancy will be captured by both the reproductive health program and the malaria program. Harmonization thedata collection tools of such programs will reduce the total workload of the end users. This implies that such data

Recommendations for National HISImplementations
Setup of a reliable online national server
2
sources should be integrated into the national information system and harmonized with the existing data elements,which involves both data entry and data analysis requirements and requires a flexible and extensible information systemsoftware. It is thus important that individual discussions and work are done with all relevant stakeholders includingall health programs.
1.5. Setup of a reliable online national server
As the technological development moves on most countries have a mobile network and coverage for a certain part ofthe districts. The use of networked based information systems accessed over the Internet (also referred to as “cloudcomputing”) combined with Internet modems using the mobile network is a great approach for rapid scaling. Thisassumes a reliable online server at the national level. The recommended approach is to procure such hosting servicesfrom external providers (such as Linode and Amazon) which relieves the government of providing necessary featuressuch as back-up electricity solutions, regular data backup, server maintenance and security and reliable Internet/network access. A typical concern is policy and in-country location of the data storage but this can be mitigated withspecial arrangements with the provider.
1.6. Pilot phase
Before initiating the national system roll out a pilot phase is required, typically for all districts in a province/region. Theobjective is to field test and get feedback on the system from all stakeholders. Typically end users will provide feedbackon the data entry experience, involving the data entry form designs, the usability of the data entry functionality, contentof reports and other analysis tools, the feasibility of doing online data entry (modem and airtime accessibility) or offlinedata entry (reliability of local installation). Typically one will experience some resistance from end-users regarding thechange from paper based to electronic systems paradigms, for instance related to the decoupling of data entry formsand data analysis tools. One gets to test the feasibility of the network connectivity and the national server configurationwith regard to performance and up-time.
In the situation where one has a running legacy system it is vital to shut that system down in the pilot area. If the legacysystem is still in production the primary focus of the end users will be on entering data in that system and the pilotedsystem will get peripheral attention with suboptimal testing and learning as a result. If maintaining the legacy systemis a priority then the data should be transferred by the technical team without burdening the end users.
1.7. Roll out
The roll out process is traditionally associated with installation and basic training of the system. It is, however, usefulto consider it as a more comprehensive process involving multiple phases.
The first phase corresponds to the traditional activities where the first objective is about data completeness: To ensurethat close to 100% of the data is being collected. First this implies that the system should be implemented and used at alldistricts in the country. Second it implies that data for all data elements included in the forms are actually reported bythe districts or facilities. Data being reported within a reasonable time frame - timeliness - is also relevant in this context.
The second objective is related to data quality: To ensure that data capture errors are reduced to a minimum. Severalmeasures should be effected to achieve this: First data entry and data review should be done by skilled personnel.Second automatic data evaluation methods such as logical validation rules and outlier analysis should be applied tothe data.
The second phase is about enabling district and hospital officers to use standard analysis tools such as reports, chartsan pivot tables. Users should be able to find and execute those tools with relevant data. This must be followed by abasic understanding of the purpose, meaning and consequences of those tools and of the data being analyzed.
The third phase involves data usage: Regular use of data analysis to improve evaluation, planning and monitoring ofhealth activities at all levels. Data from the information system should be used to evaluate the effects of implementedmeasures by looking at key indicators. That learning should later be used to make informed decisions on future

Recommendations for National HISImplementations
Training
3
planning. For instance when low immunization rates are discovered through an immunization report coming from theinformation system an outreach vaccination campaign could be effectuated. The effects of the campaign could thenbe monitored and evaluated based on up-to-date reports and informed decisions made on whether to intensify or winddown. The system could later provide information regarding what quantity of vaccine doses which must be orderedfrom the supplier.
To accommodate for large-scale roll out processes a detailed plan must be made for training and follow-up as coveringall districts in a country represents a logistical challenge in terms of workshop venues, trainers, participants, equipmentand hardware. To speed up the process several teams could give parallel trainings.
1.8. Training
Most of the objectives mentioned in the roll out section depends heavily on appropriate user training. User trainingcan be conducted in several ways. An effective activity, especially for getting started, is training workshops. Userssuch as district and province record officers, district managers, data entry officers and health program managers aregathered and given training. Training should be done as a combination of theoretical lectures and hands-on practiseon relevant subjects mentioned in the roll out section such as data entry, validation and analysis. Participants shouldbe kept at a manageable number depending on the facilities and number of trainers available. Sufficient hardware forall participants to do practical work must be provided.
Another useful activity is on-the-job training which has the advantage that users get individual follow-up in their homeworking environment. This provides the ability to help with individual specific needs or questions and sort any issuesrelated to hardware. Also, giving individual support will often boost the motivation and ownership feeling of end users.
The period between a workshop and on the-the-job training can be used for home work assignments, where userstypically are assigned to create meaningful analysis for their district or province. This work can then be given feedbackon and used as basis for individual training.
1.9. Decentralization of data capture and management
Migrating from paper based systems or primitive databases to full-fledged web based health information systems andfrom capturing district based aggregated data to facility based data entails new possibilities for decentralized datamanagement which should be exploited. Firstly the facilities with sufficient hardware and network connectivity shouldbe tasked with entering their own data. This will reduce the workload of the district health records officer who mightuse the freed up time for data analysis, data use, feedback to facilities and data quality efforts. Secondly maintenanceof the facility hierarchy in terms of facility classification and health services provided at the facilities is a resourcedemanding task and should be decentralized and done as a joint effort by all district officers rather than by a singlenational team. This will make the facility information more correct and up to date since the district officers havebetter knowledge of their local situation and have incentives for proper management as it will eventually affect theirperformance indicators and data completeness scores.
1.10. Review and extension
A national HIS is a growing organism which needs to be maintained. As the system usage increases more requirementsand needs will emerge from new and existing stakeholders such as district record officers and health program staff.Regular review meetings including such stakeholders should take place where data capture tools, such as data elementsand forms, and data analysis tools, such as indicators and reports, should be revised and new tools potentially added.Also, new functionality requirements should be managed and appropriate software development resources should besecured. Such regular activities for supporting the extension and enhancement of the system are vital to maintain thecurrent momentum and learning processes and to improve long-term project sustainability.


Conceptual Design Principles All meta data can be added and modifiedthrough the user interface
5
Chapter 2. Conceptual Design PrinciplesThis chapter provides a introduction to some of the key conceptual design principles behind the DHIS 2 software.Understanding and being aware of these principles will help the implementer to make better use of the software whencustomising a local database. While this chapter introduces the principles, the following chapters will detail out howthese are reflected in the database design process.
The following conceptual design principles will be presented in this chapter:
• All meta data can be added and modified through the user interface
• A flexible data model supports different data sources to be integrated in one single data repository
• Data Input != Data Output
• Indicator-driven data analysis and reporting
• Maintain disaggregated facility-data in the database
• Support data analysis at any level in the health system
In the following section each principle is described in more detail.
2.1. All meta data can be added and modified through the user interface
The DHIS 2 application comes with a set of generic tools for data collection, validation, reporting and analysis, butthe contents of the database, e.g. what data to collect, where the data comes from, and on what format, will dependon the context of use. This meta data need to be populated into the application before it can be used, and this can bedone through the user interface and requires no programming. This allows for more direct involvement of the domainexperts that understand the details of the HIS that the software will support.
The software separates the key meta data that describes the raw data being stored in the database, which is the criticalmeta data that should not change much over time (to avoid corrupting the data), and the higher level meta like indicatorformulas, validation rules, and groups for aggregation as well as the various layouts for collection forms and reports,which are not that critical and can be changed over time without interfering with the raw data. As this higher levelmeta data can be added and modified over time without interfering with the raw data, a continuous customisationprocess is supported. Typically new features are added over time as the local implementation team learn to mastermore functionality, and the users are gradually pushing for more advanced data analysis and reporting outputs.
2.2. A flexible data model supports different data sources to be integratedin one single data repository
The DHIS 2 design follows an integrated approach to HIS, and supports integration of many different data sources intoone single database, sometime referred to as an integrated data repository or a data warehouse.
The fact that DHIS 2 is a skeleton like tool without predefined forms or reports means that it can support a lot ofdifferent aggregate data sources. There is nothing really that limits the use to the health domain either, although use inother sectors are still very limited. As long as the data is collected by and orgunit, described as a data element (possiblywith some disaggregation categories), and can be represented by a predefined period frequency, it can be collected andprocessed in DHIS 2. This flexibility makes DHIS 2 a powerful tool to set up integrated systems that bring togethercollection tools, indicators, and reports from multiple health programs, departments or initiatives. Once the data isdefined and then collected or imported into a DHIS 2 database, it can be analysed in correlation to any other data inthe same database, no matter how and by whom it was collected. In addition to supporting integrated data analysis andreporting, this integrated approach also helps to rationalise data collection and reduce duplication.

Conceptual Design Principles Data input != Data output
6
2.3. Data input != Data output
In DHIS 2 there are three dimensions that describe the aggregated data being collected and stored in the database;the where - organisation unit, the what - data element, and the when - period. The organisation unit, data element andperiod make up the three core dimensions that are needed to describe any data value in the DHIS 2, whether it is a ina data collection form, a chart, on a map, or in an aggregated summary report. When data is collected in an electronicdata entry form, sometimes through a mirror image of the paper forms used at facility level, each entry field in theform can be described using these three dimensions. The form itself is just a tool to organise the data collection andis not describing the individual data values being collected and stored in the database. Being able to describe eachdata value independently through a Data Element definition (e.g. ‘Measles doses given <1 year’) provides importantflexibility when processing, validating, and analysing the data, and allows for comparison of data across collectionforms and health programs.
This design or data model approach separates DHIS from many of the traditional HIS software applications whichthreat the data collection forms as the key unit of analysis. This is typical for systems tailored to vertical programs’needs and the traditional conceptualisation of the collection form as also being the report or the analysis output. Thefigure below illustrates how the more fine-grained DHIS design built around the concept of Data Elements is differentand how the input (data collection) is separated from the output (data analysis), supporting more flexible and varied dataanalysis and dissemination. The data element ‘Measles doses given <1 y’ is collected as part of a Child Immunisationcollection form, but can be used individually to build up an Indicator (a formula) called ‘Measles coverage <1y’ whereit is combined with the data element called ‘Population <1y’, being collected through another collection form. Thiscalculated Indicator value can then be used in data analysis in various reporting tools in DHIS 2, e.g. custom designedreports with charts, pivot tables, or on a map in the GIS module.
2.4. Indicator-driven data analysis and reporting
What is referred to as a Data Element above, the key dimension that describes what is being collected, is sometimesreferred to as an indicator in other settings. In DHIS 2 we distinguish between Data Elements who describe the the

Conceptual Design Principles Maintain disaggregated facility-data in thedatabase
7
raw data, e.g. the counts being collected, and Indicators, which are formula-based and describe calculated values, e.g.coverage or incidence rates that are used for data analysis. Indicator values are not collected like the data (element)values, but instead calculated by the application based on formulas defined by the users. These formulas are made upof a factor (e.g. 1, 100, 100, 100 000), a numerator and a denominator, the two latter are both expressions based onone or more data elements. E.g. the indicator "Measles coverage <1 year" is defined a formula with a factor 100, anumerator ("Measles doses given to children under 1 year") and a denominator ("Target population under 1 year"). Theindicator "DPT1 to DPT3 drop out rate" is a formula of 100 % x ("DPT1 doses given"- "DPT3doses given") / ("DPT1doses given"). These formulas can be added and edited through the user interface by a user with limited training, asthey are quite easy to set up and do not interfere with the data values stored in the database (so adding or modifyingan indicator is not a critical operation).
Indicators represent perhaps the most powerful data analysis feature of the DHIS 2, and all reporting tools support theuse of indicators, e.g. as displayed in the custom report in the figure above. Being able to use population data in thedenominator enables comparisons of health performance across geographical areas with different target populations,which is more useful than only looking at the raw numbers. The table below uses both the raw data values (Doses)and indicator values (Cov) for the different vaccines. Comparing e.g. the two first orgunits in the list, Taita TavetaCounty and Kilifi County, on DPT-1 immunisation, we can see that while the raw numbers (659 vs 2088) indicatemany more doses are given in Kilifi, the coverage rates (92.2 % vs 47.5 %) show that Taita Taveta are doing a better jobimmunising their target population under 1 year. Looking at the final column (Immuniz. Compl. %) which indicatesthe completeness of reporting of the immunisation form for the same period, we can see that the numbers are moreor less the same in the two counties we compared, which tells us that the coverage rates are comparable across thetwo counties.
2.5. Maintain disaggregated facility-data in the database
When data is collected and stored in DHIS 2 it will remain disaggregated in the database with the same level of detailas it was collected. This is a major advantage of having a database system for HIS as supposed to a paper-based oreven spreadsheet based system. The system is designed to store large amounts of data and always allow drill-downsto the finest level of detail possible, which is only limited by how the data was collected or imported into the DHIS 2database. In a perspective of a national HIS it is desired to keep the data disaggregated by health facility level, whichis often the lowest level in the orgunit hierarchy. This can be done even without computerising this level, through ahybrid system of paper and computer. The data can be submitted from health facilities to e.g. district offices by paper(e.g. on monthly summary forms for one specific facility), and then at the district office they enter all the facility datainto the DHIS 2 through the electronic data collection forms, one facility at a time. This will enable the districts healthmanagement teams to perform facility-wise data analysis and to e.g. provide print-outs of feedback reports generatedby the DHIS 2, incl. facility comparisons, to the facility in-charges in their district.
2.6. Support data analysis at any level in the health system
While the name DHIS indicates a focus on the District, the application provides the same tools and functionality to alllevels in the health system. In all the reporting tools the users can select which orgunit or orgunit level to analyse andthe data displayed will be automatically aggregated up to the selected level. The DHIS 2 uses the orgunit hierarchy in
Conceptual Design Principles Support data analysis at any level in thehealth system
8
aggregating data upwards and provides data by any orgunit in this hierarchy. Most of the reports are run in such a waythat the users will be prompted to select an orgunit and thereby enable reuse the same report layouts for all levels. Or ofdesired, the report layouts can be tailored to any specific level in the health system if the needs differ between the levels.
In the GIS module the users can analyse data on e.g. the sub-national level and then by clicking on the map (on e.g.a region or province) drill down to the next level, and continue like this all the way down to the source of the dataat facility level. Similar drill-down functionality is provided in the Excel Pivot Tables that are linked to the DHIS 2database.
To speed up performance and reduce the response-time when providing aggregated data outputs, which may includemany calculations (e.g. adding together 8000 facilities), DHIS 2 pre-calculates all the possible aggregate values andstores these in what is called a data mart. This data mart can be scheduled to run (re-built) at a given time interval,e.g. every night.

Setting Up a New Database Strategies for getting started
9
Chapter 3. Setting Up a New DatabaseThe DHIS 2 application comes with a set of tools for data collection, validation, reporting and analysis, but the contentsof the database, e.g. what data to collect, where the data comes from, and on what format will depend on the contextof use. This meta data need to be populated into the application before it can be used, and this can be done throughthe user interface and requires no programming. What is required is in-depth knowledge about the local HIS contextas well as an understanding of the DHIS 2 design principles (see the chapter “Key conceptual design principles inDHIS 2”). We call this initial process for database design or customisation. This chapter provides an overview of thecustomisation process and briefly explains the steps involved, in order to give the implementer a feeling of what thisprocess requires. Other chapters in this manual provide a lot more detail into some of the specific steps.
3.1. Strategies for getting started
The following section describes a list of tips for getting off with a good start when developing a new database.
1. Quickly populate a demo database, incl. examples of reports, charts, dashboard, GIS, data entry forms. Use realdata, ideally nation-wide, but not necessarily facility-level data.
2. Put the demo database online. Server hosting with an external provider server can be a solution too speed up theprocess, even if temporary. This makes a great collaborative platform and dissemination tool to get buy-in fromstakeholders.
3. The next phase is a more elaborate database design process. Parts of the demo can be reused of viable.
4. Make sure to have a local team with different skills and background: public health, data administrator, IT and projectmanagement.
5. Use the customisation and database design phase as a learning and training process to build local capacity throughlearning-by-doing.
6. The country national team should drive the database design process but be supported and guided by experiencedimplementers.
3.2. Controlled or open process?
As the DHIS 2 customisation process often is and should be a collaborative process, it is also important to have inmind which parts of the database that are more critical than others, e.g. to avoid an untrained user to corrupt the data.Typically it is a lot more critical to customise a database which already has data values, than working with meta dataon an “empty” database. Although it might seem strange, much customisation takes place after the first data collectionor import has started, e.g. when adding new validation rules, indicators or report layouts. The most critical mistakethat can be made is to modify the meta data that directly describes the data values, and these as we have seen above,are the data elements and the organisation units. When modifying these definitions it is important to think about howthe change will affect the meaning of the data values already in the system (collected using the old definitions). It isrecommended to limit who can edit these core meta data through the user role management, to restrict the access toa core customisation team.
Other parts of the system that are not directly coupled to the data values are a lot less critical to play around with, andhere, at least in the early phases, one should encourage the users to try out new things in order to create learning. Thisgoes for groups, validation rules, indicator formulas, charts, and reports. All these can easily be deleted or modifiedlater without affecting the underlying data values, and therefore are not critical elements in the customisation process.
Of course, later in the customisation process when going into a production phase, one should be even more careful inallowing access to edit the various meta data, as any change, also to the less critical meta data, might affect how datais aggregated together or presented in a report (although the underlying raw data is still safe and correct).
3.3. Steps for developing a database
The following section describes concrete steps for developing a database from scratch.

Setting Up a New Database The organisational hierarchy
10
3.3.1. The organisational hierarchy
The organisational hierarchy defines the organisation using the DHIS 2, the health facilities, administrative areas andother geographical areas used in data collection and data analysis. This dimension to the data is defined as a hierarchywith one root unit (e.g. Ministry of Health) and any number of levels and nodes below. Each node in this hierarchy iscalled an organisational unit in DHIS 2. The design of this hierarchy will determine the geographical units of analysisavailable to the users as data is collected and aggregated in this structure. There can only be one organisational hierarchyat the same time so its structure needs careful consideration.
Additional hierarchies (e.g. parallel administrative boundaries to the health care sector) can be modelled usingorganisational groups and group sets, but the organisational hierarchy is the main vehicle for data aggregation on thegeographical dimension. Typically national organisational hierarchies in public health have 4-6 levels, but any numberof levels is supported. The hierarchy is built up of parent-child relations, e.g. a Country or MoH unit (the root) mighthave e.g. 8 parent units (provinces), and each province again ( at level 2) might have 10-15 districts as their children.Normally the health facilities will be located at the lowest level, but they can also be located at higher levels, e.g.national or provincial hospitals, so skewed organisational trees are supported (e.g. a leaf node can be positioned atlevel 2 while most other leaf nodes are at level 5).
3.3.2. Data Elements
The Data Element is perhaps the most important building block of a DHIS 2 database. It represents the what dimension,it explains what is being collected or analysed. In some contexts this is referred to an indicator, but in DHIS 2 we callthis unit of collection and analysis a data element. The data element often represents a count of something, and itsname describes what is being counted, e.g. "BCG doses given" or "Malaria cases". When data is collected, validated,analysed, reported or presented it is the data elements or expressions built upon data elements that describes the WHATof the data. As such the data elements become important for all aspects of the system and they decide not only howdata is collected, but more importantly how the data values are represented in the database, which again decides howdata can be analysed and presented.
A best practice when designing data elements is to think of data elements as a unit of data analysis and not just as afield in the data collection form. Each data element lives on its own in the database, completely detached from thecollection form, and reports and other outputs are based on data elements and expressions/formulas composed of dataelements and not the data collection forms. So the data analysis needs should drive the process, and not the look anfeel of the data collection forms.
3.3.3. Data sets and data entry forms
All data entry in DHIS 2 is organised through the use of data sets. A data set is a collection of data elements groupedtogether for data collection, and in the case of distributed installs they also define chunks of data for export and importbetween instances of DHIS 2 (e.g. from a district office local installation to a national server). Data sets are not linkeddirectly to the data values, only through their data elements and frequencies, and as such a data set can be modified,deleted or added at any point in time without affecting the raw data already captured in the system, but such changeswill of course affect how new data will be collected.
Once you have assigned a data set to an organisation unit that data set will be made available in Data Entry (underServices) for the organisation units you have assigned it to and for the valid periods according to the data set's periodtype. A default data entry form will then be shown, which is simply a list of the data elements belonging to the dataset together with a column for inputting the values. If your data set contains data elements with categories such as agegroups or gender, then additional columns will be automatically generated in the default form based on the categories.In addition to the default list-based data entry form there are two more alternatives, the section-based form and thecustom form. Section forms allow for a bit more flexibility when it comes to using tabular forms and are quick andsimple to design. Often your data entry form will need multiple tables with subheadings, and sometimes you needto disable (grey out) a few fields in the table (e.g. some categpories do not apply to all data elements), both of thesefunctions are supported in section forms. When the form you want to design is too complicated for the default or sectionforms then your last option is to use a custom form. This takes more time, but gives you full flexibility in term of thedesign. In DHIS 2 there is a built in HTML editor (FcK Editor) for the form designer and you can either design theform in the UI or paste in your html directly (using the Source window in the editor.

Setting Up a New Database Validation rules
11
3.3.4. Validation rules
Once you have set up the data entry part of the system and started to collect data then there is time to define dataquality checks that help to improve the quality of the data being collected. You can add as many validation rules asyou like and these are composed of left and right side expressions that again are composed of data elements, with anoperator between the two sides. Typical rules are comparing subtotals to totals of something. E.g. if you have two dataelements "HIV tests taken" and "HIV test result positive" then you know that in the same form (for the same periodand organisational unit) the total number of tests must always be equal or higher than the number of positive tests.These rules should be absolute rules meaning that they are mathematically correct and not just assumptions or "mostof the time correct". The rules can be run in data entry, after filling each form, or as a more batch like process onmultiple forms at the same time, e.g. for all facilities for the previous reporting month. The results of the tests will listall violations and the detailed values for each side of the expression where the violation occurred to make it easy togo back to data entry and correct the values.
3.3.5. Indicators
Indicators represent perhaps the most powerful data analysis feature of the DHIS 2. While data elements represent theraw data (counts) being collected the indicators represent formulas providing coverage rates, incidence rates, ratiosand other formula-based units of analysis. An indicator is made up of a factor (e.g. 1, 100, 100, 100 000), a numeratorand a denominator, the two latter are both expressions based on one or more data elements. E.g. the indicator "BCGcoverage <1 year" is defined a formula with a factor 100, a numerator ("BCG doses given to children under 1 year")and a denominator ("Target population under 1 year"). The indicator "DPT1 to DPT3 drop out rate" is a formula of100 % x ("DPT1 doses given"- "DPT3 doses given") / ("DPT1 doses given").
Most report modules in DHIS 2 support both data elements and indicators and you can also combine these in customreports, but the important difference and strength of indicators versus raw data (data element's data values) is the abilityto compare data across different geographical areas (e.g. highly populated vs rural areas) as the target population canbe used in the denominator.
Indicators can be added, modified and deleted at any point in time without interfering with the data values in thedatabase.
3.3.6. Report tables and reports
Standard reports in DHIS 2 is a very flexible way of presenting the data that has been collected. Data can be aggregatedby any organisational unit or orgunit level, by data element, by indicators, as well as over time (e.g. monthly, quarterly,yearly). The report tables are custom data sources for the standard reports and can be flexibly defined in the userinterface and later accessed in external report designers such as iReport or BIRT. These report designs can then be setup as easily accessible one-click reports with parameters so that the users can run the same reports e.g. every monthwhen new data is entered, and also be relevant to users at all levels as the organisational unit can be selected at thetime of running the report.
3.3.7. GIS (Maps)
In the integrated GIS module you can easily display your data on maps, both on polygons (areas) and as points (healthfacilities), and either as data elements or indicators. By providing the coordinates of your organisational units to thesystem you can qucikly get up to speed with this module. See the GIS section for details on how to get started.
3.3.8. Charts and dashboard
On of the easiest way to display your indicator data is through charts. An easy to use chart dialogue will guide youthrough the creation of various types of charts with data on indicators, organisational units and periods of your choice.These charts can easily be added to one of the four chart sections on your dashboard and there be made easily availableright after log in. Make sure to set the dashboard module as the start module in user settings.


Deployment Strategies Offline Deployment
13
Chapter 4. Deployment StrategiesDHIS 2 is a network enabled application and can be accessed over the Internet, a local intranet and as a locallyinstalled system. The deployment alternatives for DHIS 2 are in this chapter defined as i) offline deployment ii) onlinedeployment and iii) hybrid deployment. The meaning and differences will be discussed in the following sections.
4.1. Offline Deployment
An offline deployment implies that multiple standalone offline instances are installed for end users, typically at thedistrict level. The system is maintained primarily by the end users/district health officers who enters data and generatereports from the system running on their local server. The system will also typically be maintained by a national super-user team who pay regular visits to the district deployments. Data is moved upwards in the hierarchy by the end usersproducing data exchange files which are sent electronically by email or physically by mail or personal travel. (Notethat the brief Internet connectivity required for sending emails does not qualify for being defined as online). This styleof deployment has the obvious benefit that it works when appropriate Internet connectivity is not available. On theother side there are significant challenges with this style which are described in the following section.
• Hardware: Running stand-alone systems requires advanced hardware in terms of servers and reliable power supplyto be installed, usually at district level, all over the country. This requires appropriate funding for procurement andplan for long-term maintenance.
• Software platform: Local installs implies a significant need for maintenance. From experience, the biggest challengeis viruses and other malware which tend to infect local installations in the long-run. The main reason is that endusers utilize memory sticks for transporting data exchange files and documents between private computers, otherworkstations and the system running the application. Keeping anti-virus software and operating system patches up todate in an offline environment are challenging and bad practises in terms of security are often adopted by end users.The preferred way to overcome this issue is to run a dedicated server for the application where no memory sticksare allowed and use an Linux based operating system which is not as prone for virus infections as MS Windows.
• Software application: Being able to distribute new functionality and bug-fixes to the health information software tousers are essential for maintenance and improvement of the system. Relying on the end users to perform softwareupgrades requires extensive training and a high level of competence on their side as upgrading software applicationsmight a technically challenging task. Relying on a national super-user team to maintain the software implies a lotof travelling.
• Database maintenance: A prerequisite for an efficient system is that all users enter data with a standardized meta-data set (data elements, forms etc). As with the previous point about software upgrades, distribution of changes tothe meta-data set to numerous offline installations requires end user competence if the updates are sent electronicallyor a well-organized super-user team. Failure to keep the meta-data set synchronized will lead to loss of ability tomove data from the districts and/or an inconsistent national database since the data entered for instance at the districtlevel will not be compatible with the data at the national level.
4.2. Online deployment
An online deployment implies that a single instance of the application is set up on a server connected to the Internet.All users (clients) connect to the online central server over the Internet using a web browser. This style of deploymentcurrently benefits from the huge investments in and expansions of mobile networks in developing countries. Thismakes it possible to access online servers in even the most rural areas using mobile Internet modems (also referredto as dongles).
This online deployment style has huge positive implications for the implementation process and applicationmaintenance compared to the traditional offline standalone style:
• Hardware: Hardware requirements on the end-user side are limited to a reasonably modern computer/laptop andInternet connectivity through a fixed line or a mobile modem. There is no need for a specialized server, any Internetenabled computer will be sufficient.

Deployment Strategies Hybrid deployment
14
• Software platform: The end users only need a web browser to connect to the online server. All popular operatingsystems today are shipped with a web browser and there is no special requirement on what type or version. Thismeans that if severe problems such as virus infections or software corruption occur one can always resort to re-formatting and installing the computer operating system or obtain a new computer/laptop. The user can continuewith data entry where it was left and no data will be lost.
• Software application: The central server deployment style means that the application can be upgraded and maintainedin a centralized fashion. When new versions of the applications are released with new features and bug-fixes it canbe deployed to the single online server. All changes will then be reflected on the client side the next time end usersconnect over the Internet. This obviously has a huge positive impact for the process of improving the system as newfeatures can be distributed to users immediately, all users will be accessing the same application version, and bugsand issues can be sorted out and deployed on-the-fly.
• Database maintenance: Similar to the previous point, changes to the meta-data can be done on the online serverin a centralized fashion and will automatically propagate to all clients next time they connect to the server. Thiseffectively removes the vast issues related to maintaining an upgraded and standardized meta-data set related to thetraditional offline deployment style. It is extremely convenient for instance during the initial database developmentphase and during the annual database revision processes as end users will be accessing a consistent and standardizeddatabase even when changes occur frequently.
This approach might be problematic in cases where Internet connectivity is volatile or missing in long periods of time.DHIS 2 however has certain features which requires Internet connectivity to be available only only part of the time forthe system to work properly, such as the MyDatamart tool presented in a separate chapter in this guide.
4.3. Hybrid deployment
From the discussion so far one realizes that the online deployment style is favourable over the offline style but requiresdecent Internet connectivity where it will be used. It is important to notice that the mentioned styles can co-exist ina common deployment. It is perfectly feasible to have online as well as offline deployments within a single country.The general rule would be that districts and facilities should access the system online over the Internet where sufficientInternet connectivity exist, and offline systems should be deployed to districts where this is not the case.
Defining decent Internet connectivity precisely is hard but as a rule of thumb the download speed should be minimum10 Kbyte/second and accessibility should be minimum 70% of the time.
In this regard mobile Internet modems which can be connected to a computer or laptop and access the mobile networkis an extremely capable and feasible solution. Mobile Internet coverage is increasing rapidly all over the world, oftenprovide excellent connectivity at low prices and is a great alternative to to local networks and poorly maintainedfixed Internet lines. Getting in contact with national mobile network companies regarding post-paid subscriptionsand potential large-order benefits can be a wort-while effort. The network coverage for each network operator in therelevant country should be investigated when deciding which deployment approach to opt for as it might differ andcover different parts of the country.
4.4. Server hosting
The online deployment approach raises the question of where and how to host the server which will run the DHIS 2application. Typically there are several options:
1. Internal hosting within the Ministry of Health
2. Hosting within a government data centre
3. Hosting through an external hosting company
The main reason for choosing the first option is often political motivation for having “physical ownership” of thedatabase. This is perceived as important by many in order to “own” and control the data. There is also a wish to buildlocal capacity for server administration related to sustainability of the project. This is often a donor-driven initiativesas it is perceived as a concrete and helpful mission.

Deployment Strategies Server hosting
15
Regarding the second option, some places a government data centre is constructed with a view to promoting andimproving the use and accessibility of public data. Another reason is that a proliferation of internal server environmentsis very resource demanding and it is more effective to establish centralized infrastructure and capacity.
Regarding external hosting there is lately a move towards outsourcing the operation and administration of computerresources to an external provider, where those resources are accessed over the network, popularly referred to as “cloudcomputing” or “software as a service”. Those resources are typically accessed over the Internet using a web browser.
The primary goal for an online server deployment is provide long-term stable and high-performance accessibility to theintended services. When deciding which option to choose for server environment there are many aspects to consider:
1. Human capacity for server administration and operation. There must be human resources with general skills inserver administration and in the specific technologies used for the application providing the services. Examples ofsuch technologies are web servers and database management platforms.
2. Reliable solutions for automated backups, including local off-server and remote backup.
3. Stable connectivity and high network bandwidth for traffic to and from the server.
4. Stable power supply including a backup solution.
5. Secure environment for the physical server regarding issues such as access, theft and fire.
6. Presence of a disaster recovery plan. This plan must contain a realistic strategy for making sure that the service willbe only suffering short down-times in the events of hardware failures, network downtime and more.
7. Feasible, powerful and robust hardware.
All of these aspects must be covered in order to create an appropriate hosting environment. The hardware requirementis deliberately put last since there is a clear tendency to give it too much attention.
Looking back at the three main hosting options, experience from implementation missions in developing countriessuggests that all of the hosting aspects are rarely present in option one and two at a feasible level. Reaching an acceptablelevel in all these aspects is challenging in terms of both human resources and money, especially when compared to thecost of option three. It has the benefit that is accommodates the mentioned political aspects and building local capacityfor server administration, on the other hand can this be provided for in alternative ways.
Option three - external hosting - has the benefit that it supports all of the mentioned hosting aspects at a very affordableprice. Several hosting providers - of virtual servers or software as a service - offer reliable services for running mostkinds of applications. Example of such providers are Linode and Amazon Web Services. Administration of such servershappens over a network connection, which most often anyway is the case with local server administration. The physicallocation of the server in this case becomes irrelevant as that such providers offer services in most parts of the world. Thissolution is increasingly becoming the standard solution for hosting of application services. The aspect of building localcapacity for server administration is compatible with this option since a local ICT team can be tasked with maintainingthe externally hosted server.
An approach for combining the benefits of external hosting with the need for local hosting and physical ownership isto use an external hosting provider for the primary transactional system, while mirroring this server to a locally hostednon-critical server which is used for read-only purposes such as data analysis and accessed over the intranet.


DHIS 2 as Data Warehouse Data warehouses and operational systems
17
Chapter 5. DHIS 2 as Data WarehouseThis chapter will discuss the role and place of the DHIS 2 application in a system architecture context. It will showthat DHIS 2 can serve the purpose of both a data warehouse and an operational system.
5.1. Data warehouses and operational systems
A data warehouse is commonly understood as a database used for analysis. Typically data is uploaded from variousoperational / transactional systems. Before data is loaded into the data warehouse it usually goes through variousstages where it is cleaned for anomalies and redundancy and transformed to conform with the overall structure of theintegrated database. Data is then made available for use by analysis, also known under terms such as data miningand online analytical processing. The data warehouse design is optimized for speed of data retrieval and analysis. Toimprove performance the data storage is often redundant in the sense that the data is stored both in its most granularform and in an aggregated (summarized) form.
A transactional system (or operational system from a data warehouse perspective) is a system that collects, stores andmodifies low level data. This system is typically used on a day-to-day basis for data entry and validation. The designis optimized for fast insert and update performance.
There are several benefits of maintaining a data warehouse, some of them being:
• Consistency: It provides a common data model for all relevant data and acts as an abstraction over a potentially highnumber of data sources and feeding systems which makes it a lot easier to perform analysis.
• Reliability: It is detached from the sources where the data originated from and is hence not affected if data in theoperational systems is purged or lost.
• Analysis performance: It is designed for maximum performance for data retrieval and analysis in contrast tooperational system which are often optimized for data capture.
There are however also significant challenges with a data warehouse approach:
• High cost: There is a high cost associated with moving data from various sources into a common data warehouse,especially when the operational systems are not similar in nature. Often long-term existing systems (referred to aslegacy systems) put heavy constraints on the data transformation process.
• Data validity: The process of moving data into the data warehouse is often complex and hence often not performedat regular and timely intervals. This will then leave the data users with out-dated and irrelevant data not suitable forplanning and informed decision making.
Due to the mentioned challenges it has lately become increasingly popular to merge the functions of the data warehouseand operational system, either into a single system which performs both tasks or with tightly integrated systems hosted

DHIS 2 as Data Warehouse Aggregation strategies in DHIS 2
18
together. With this approach the system provides functionality for data capture and validation as well as data analysisand manages the process of converting low-level atomic data into aggregate data suitable for analysis. This sets highstandards for the system and its design as it must provide appropriate performance for both of those functions; howeveradvances in hardware and parallel processing is increasingly making such an approach feasible.
In this regard, the DHIS 2 application is designed to serve as a tool for both data capture, validation, analysis andpresentation of data. It provides modules for all of the mentioned aspects, including data entry functionality and a widearray of analysis tools such as reports, charts, maps, pivot tables and dashboard.
In addition, DHIS 2 is a part of a suite of interoperable health information systems which covers a wide range ofneeds and are all open-source software. DHIS 2 implements the standard for data and meta-data exhange in the healthdomain called SDMX-HD. There are many examples of operational systems which also implements this standard andpotenitally can feed data into DHIS 2:
• iHRIS: System for management of human resource data. Examples of data which is relevant for a national datawarehouse captured by this system is "number of doctors", "number of nurses" and "total number of staff". This datais interesting to compare for instance to district performance.
• OpenMRS: Medical record system being used at hospital. This system can potentially aggregate and export data oninpatient diseases to a national data warehouse.
• OpenELIS: Laboratory enterprise information system. This system can generate and export data on number andoutcome of laboratory tests.
5.2. Aggregation strategies in DHIS 2
DHIS 2 is designed to run in low-end environments which puts certain restrictions on the performance. Two strategiesfor aggregation of data is offered: Real-time aggregation means that the system will generate aggregated data on-the-fly based on the low-level data every time a report is requested. This implies that the aggregate data will reflect thethe very latest captured data and is useful if producing reports immediately after data entry has been done is a priority.The downside is that this will not perform adequately on an online server where the database contains a large numberof records and there is high user concurrency.
Batch aggregation means that the system will generate aggregated data every night for a defined time-span (typicallythe last two years) based on the low-level data and write this data to a data mart. A data mart is a data store optimizedfor meeting the most common user requests for data analysis. The DHIS 2 data mart contains data aggregated in thespace dimension (the organisation unit hierarchy), time dimension (over multiple periods) and for indicator formulas

DHIS 2 as Data Warehouse Data storage approach
19
(mathematical expressions including data elements). This strategy for aggregation provides great performance even inhigh-concurrency environments since most requests for analysis can be served with a single, simple database queryagainst the data mart. The aggregation engine in DHIS 2 is capable of processing low-level data in the multi-millionsand manage most national-level databases, and it can be said to provide near real-time access to aggregate data. Thedownside of this approach is that captured data will not be available for aggregated analysis until the next day. However,for a routine system like DHIS 2 where data is typically collected with a monthly periodicity this is not a significantproblem.
Hint: The aggregation strategy can be set in “Settings” - “System settings”, while scheduling of data mart exports canbe enabled in “Reporting” - “Scheduling”.
5.3. Data storage approach
There are two leading approaches for storing data in a data warehouse, namely the normalized and dimensionalapproach. DHIS 2 lends a bit from the former but mostly from the latter. In the dimensional approach the data ispartitioned into dimensions and facts. Facts generally refers to transactional numeric data while dimensions are thereference data that gives context and meaning to the data. The strict rules of this approach makes it easy for users tounderstand the data warehouse structure and provides for good performance since few tables must be combined toproduce meaningful analysis, while it on the other hand might make the system less flexible and harder to change.
In DHIS the facts corresponds to the data value object in the data model. The data value captures data as numbers,yes/no or text. The compulsory dimensions which give meaning to the facts are the data element, organisation unithierarchy and period dimensions. These dimensions are referred to as compulsory since they must be provided forall stored data records. DHIS 2 also has a custom dimensional model which makes it possible to represent any kindof dimensionality. This model must be defined prior to data capture. DHIS 2 also has a flexible model of groups andgroup sets which makes it possible to add custom dimensionality to the compulsory dimensions after data capture hastaken place. You can read more about dimensionality in DHIS 2 in the chapter by the same name.


End-user Training What training is needed
21
Chapter 6. End-user TrainingThe following topics will be covered in this chapter:
• What training is needed
• Strategies for training
• Material and courses
6.1. What training is needed
In a large system like a country health information system, there will be different roles for different people. The differenttasks usually depends on two factors; what the person will be doing, i.e. mainly collect data, or analyse it, or maintainthe database, and where the person is located, like a facility, a district office, or at national level. A first task will thenbe to define the different users. The most common tasks will be:
• Data entry
• Data analysis processing, preparing reports and other information products
• Database maintenance - managing changes to the database
Data entry is typically decentralized to lower levels, such as a district. Data processing takes place at all levels, whiledatabase maintenance usually is centralized. The following table gives an example of user groups and what tasks theytypically have:
Note here that many of the tasks are not directly linked to the use of DHIS2. Data analysis, data quality assessment,preparing feedback and planning regular review meetings are all integral to the functioning of the system, and shouldalso be covered in a training strategy.
6.2. Strategies for training
To cover the wide array of tasks/users listed above, a training strategy is helpful. The majority of users will be atlower level; entering and using data. Only a few will have to know the database in-depth, usually at national level. Thefollowing are useful tips for end-user training strategies.
6.2.1. Training of trainers
Since the number of units and staff increase exponentially for each level (a country may have many provinces, eachwith many districts, each with many facilities), training of trainers is the first step. The number of trainers will vary,depending on the speed of implementation envisioned. As described below, both workshops and on-site training areuseful, and especially for the on-site training many people will be needed.
The trainers should be at least at the level of advanced users, in addition knowing how the database is designed, howto install and troubleshoot DHIS2, and some issues of epidemiology, i.e. concepts that are useful for monitoring andevaluation of health services. As the capabilities of the staff increase, the trainers would also need to increase their skills.
6.2.2. Workshops and on-site training
Experience has showed that training both in workshops/training sessions, and on-site in real work situations arecomplementary. Workshops are better for training many at the same time, and are useful early on in the trainingsessions. Preferably the same type of users should be trained.
On-site training takes place at the work-place of the staff. It is useful to have done more organized training session likein a workshop before, so that on-site training can focus on special issues the individual staff would need more trainingon. Training on-site will involve less people, so it will be possible to include different types of users. An example would

End-user Training Continuation of training
22
be a district training, where the district information officers and the district medical officer can be trained together.The communication between different users is important in the sense that it forms a common understanding of what isneeded, and what is possible. Training can typically be centred around local requirements such as producing outputs(reports, charts, maps) that would be useful for local decision-support.
6.2.3. Continuation of training
Training is not a one off thing. A multi-level training strategy would aim at providing regular training as the skills ofthe staff increase. For example, a workshop on data entry and validation should be followed by another workshop onreport generation and data analysis some time later. Regular training should also be offered to new staff, and whenlarge changes are made to the system, such as redesign of all data collection forms.
6.3. Material and courses
There is comprehensive material available for training and courses. The main source will be the three manuals availablefrom the DHIS2 documentation repository, to be found at here.
The user documentation covers the background and purpose of DHIS2 together with instructions and explanations ofhow to perform data entry, system maintenance, meta-data set-up, import and export of data, aggregation, reportingand other topics related to the usage of the software. The developer documentation covers the technical architecture,the design of each module and use of the development frameworks behind DHIS2. The implementation guide istargeted at implementers and super-users and addresses subjects such as system design, database development, dataharmonization, analysis, deployment, human resources needed and integration with other systems. The end user manualis a light-weight version of the user documentation meant for end users such as district records officers and data entryclerks. All can be opened/downloaded as both PDF and HTML, and are updated daily with the latest input from DHIS2users worldwide.
The development of these guides depend on input from all users. For information how to to add content to them, pleasesee the appendix on documentation in the User Documentation. Here you will also find information about how to makelocalized documentation, including versioning in different languages.
From 2011, regional workshops and courses will be held at least once a year by the international DHIS2 community.The goal is to have national technical teams working with DHIS2 customization and implementation. Sessions willalso include training and capacity building by these teams in-country. End-user training, i.e. training of district M&Eofficers, should take place in each county by these teams.

Integration Integration and interoperability
23
Chapter 7. IntegrationThis chapter will discuss the following topics:
• Integration and interoperability
• Benefits of integration
• What facilitates integration and interoperability
• Architecture of interoperable HIS
In the following each topic will be discussed in greater detail.
7.1. Integration and interoperability
In a country there will usually be many different, isolated health information systems. The reasons for this are many,both technical and organizational. Here the focus will be on what benefits integration of these systems will bring, andwhy it should be a priority. First, a couple of clarifications:
• When talking about integration, we think about the process of making different information systems appear as one,i.e. data from them to be available to all relevant users as well as the harmonization of definitions and dimensionsso that it is possible to combine the data in useful ways.
• A related concept is interoperability, which is one strategy to achieve integration. For purposes related to DHIS2, wesay that it is interoperable with other software applications if it is able to share data with this. For example, DHIS2and OpenMRS are interoperable, because there is support in both to share data definitions and data with each other.
To say that something is integrated, then, means that they share something, and that they are available from oneplace, while interoperability usually means that they are able to do this sharing electronically. DHIS2 is often usedas an integrated data warehouse, since it contains (aggregate) data from various sources, such as Mother and Childhealth, Malaria program, census data, and data on stocks and human resources. These data sources share the sameplatform, DHIS2, and are available all from the same place. These subsystems are thus considered integrated into onesystem. Interoperability will then be a useful way to integrate also those data sources available on also other softwareapplications. For example, if census data is stored in some other database, interoperability between this database andDHIS2 would mean census data would be accessible in both (but only stored one place).
7.2. Benefits of integration
There are several potential benefits related to integration of systems. The most important are:i
• Calculation of indicators: many indicators are based on numerators and denominators from different data sources.Examples include mortality rates, including some mortality data as numerator and population data as denominator,staff coverage and staff workload rates (human resource data, and population and headcount data), immunizationrates, and the like. For these to be calculated, you need both the numerator and denominator data, and they shouldthus be integrated into a single data warehouse. The more data sources that are integrated, the more indicators canbe generated from the central repository.
• Reduce manual processing and entering of data: with different data at the same place, there is no need to manuallyextract and process indicators, or re-enter data into the data warehouse. Especially interoperability between systemsof different data types (such as patient registers and aggregate data warehouse) allows software for subsystems toboth calculate and share data electronically. This reduces the amount of manual steps involved in data processing,which increases data quality.
• There are organizational reasons for integration. If all data can be handled by one unit in the ministry of health,instead of in various subsystems maintained by the health programs, this one unit can be professionalized. With staffwhich sole responsibility is data management, processing, and analysis, more specialized skills can be developedand the information handling be rationalized.

Integration What facilitates integration andinteroperability
24
7.3. What facilitates integration and interoperability
There are three levels that need to be addressed in this regard:
• The motivation and will to integrate (organizational level)
• Standard definitions (language level)
• Standard for electronic storage and exchange (technical level)
The first level is less of a topic in this guide, which takes as a point of departure that a decision has been taken aboutintegration of data. However, it is an important issue and usually the most complex to solve given the range of actorsinvolved in the health sector. Clear national policies on data integration, data ownership, routines for data collection,processing, and sharing, should be in place to address this issue. Often some period of disturbance to the normal dataflow will take place during integration, so for many the long-term prospects of a more efficient system will have tobe judged against the short-term disturbance. Integration is thus often a step-wise process, where measures need to betaken for this to happen as smoothly as possible.
At the language level, there is a need to be consistent about definitions. If you have two data sources for the same data,they need to be comparable. For example, if you collect malaria data from both standard clinics and from hospitals,this data need to describe the same thing if they need to be combined for totals and indicators. If a hospital is reportingmalaria cases by sex but not age group, and other clinics are reporting by age group but not sex, this data cannot beanalyzed according to either of these dimensions, though a total amount of cases will be possible to calculate. Thereis thus a need to agree on uniform definitions.
In addition to uniform definitions across the various sub-systems, data exchange standards must be adopted if datais to be shared electronically. The various software applications would need this to be able to understand each other.DHIS2 is supporting several data formats for import and export, but one standard format now supported by WHO iscalled SDMX-HD (Statistical Data and Metadata Exchange - Health Domain). Other software applications are alsosupporting this, and it allows the sharing of data definitions and aggregate data between them. For DHIS2, this means itsupports import of aggregate data that are supplied by other applications, such as OpenMRS (for patient management),iHRIS (for human resources management)
7.4. Architecture of interoperable HIS
Since there are many different use-cases for health information, such as monitoring and evaluation, budgeting, patientmanagement and tracking, logistics management, insurance, human resource management, etc, there will be manydifferent types of software applications functioning within the health sector. Above the issue of interoperability hasbeen addressed, and a plan or overview of the various interoperable software applications and their specific uses, alongwith what data should be shared between them, is termed an architecture for health information.
The role of the architecture is to function as a plan to coordinate the development and interoperability of various sub-systems within the larger health information system. It is advisable to develop a plan for the various components evenif they are not currently running any software, to be able to adequately see the requirements in terms of data sharing.These requirements should then be part of any specification for the software when such is developed or procured.
Below is a simple illustration of an architecture, with a focus on the data warehouse for aggregate data. The variousboxes represent use cases, such as managing logistics, tracking TB patients, general patient management, etc. All ofthese will share aggregate data with DHIS2. Note that the arrows are two-way, because there is also a synchronizationof meta-data (definitions) involved, to make sure that the right data is shared. Also, an example of the logistics andfinancial data applications sharing data is also shown, as there are strong links between procuring drugs and handlingthe budget for this. There will be many such instances of sharing data; the architecture helps us to plan better for thisbeing implemented as the ecosystem of software applications grow.

Integration Architecture of interoperable HIS
25

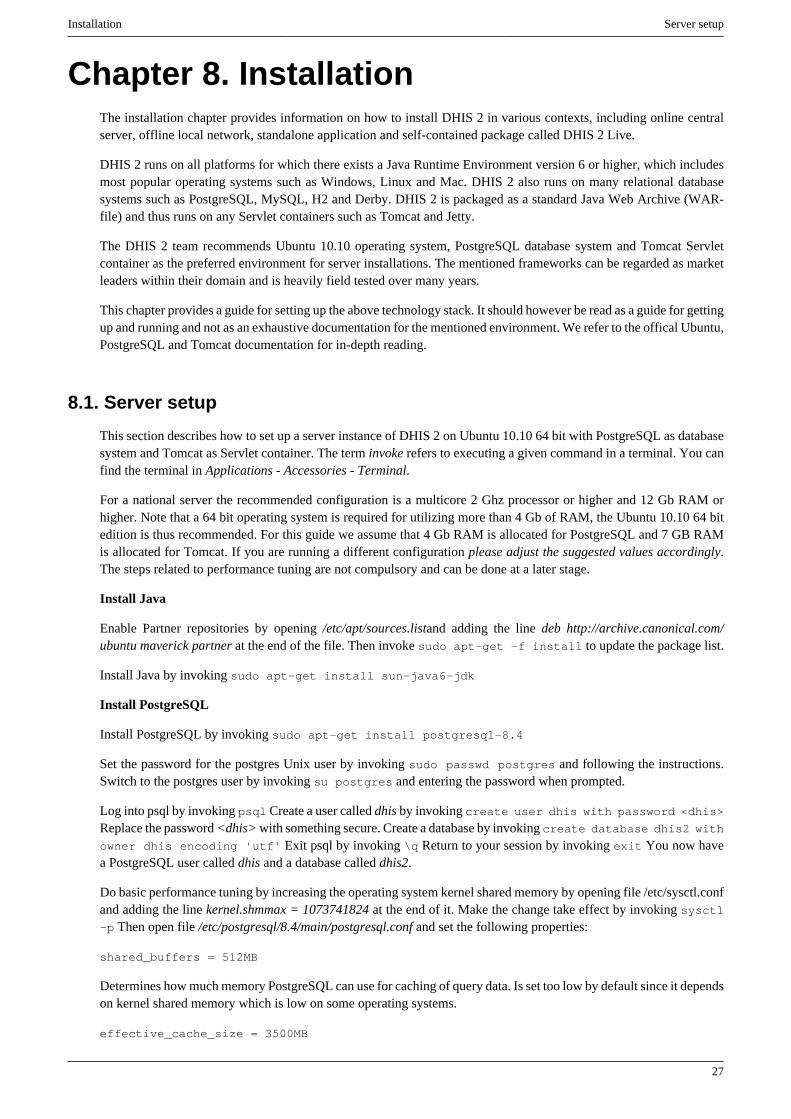
Installation Server setup
27
Chapter 8. InstallationThe installation chapter provides information on how to install DHIS 2 in various contexts, including online centralserver, offline local network, standalone application and self-contained package called DHIS 2 Live.
DHIS 2 runs on all platforms for which there exists a Java Runtime Environment version 6 or higher, which includesmost popular operating systems such as Windows, Linux and Mac. DHIS 2 also runs on many relational databasesystems such as PostgreSQL, MySQL, H2 and Derby. DHIS 2 is packaged as a standard Java Web Archive (WAR-file) and thus runs on any Servlet containers such as Tomcat and Jetty.
The DHIS 2 team recommends Ubuntu 10.10 operating system, PostgreSQL database system and Tomcat Servletcontainer as the preferred environment for server installations. The mentioned frameworks can be regarded as marketleaders within their domain and is heavily field tested over many years.
This chapter provides a guide for setting up the above technology stack. It should however be read as a guide for gettingup and running and not as an exhaustive documentation for the mentioned environment. We refer to the offical Ubuntu,PostgreSQL and Tomcat documentation for in-depth reading.
8.1. Server setup
This section describes how to set up a server instance of DHIS 2 on Ubuntu 10.10 64 bit with PostgreSQL as databasesystem and Tomcat as Servlet container. The term invoke refers to executing a given command in a terminal. You canfind the terminal in Applications - Accessories - Terminal.
For a national server the recommended configuration is a multicore 2 Ghz processor or higher and 12 Gb RAM orhigher. Note that a 64 bit operating system is required for utilizing more than 4 Gb of RAM, the Ubuntu 10.10 64 bitedition is thus recommended. For this guide we assume that 4 Gb RAM is allocated for PostgreSQL and 7 GB RAMis allocated for Tomcat. If you are running a different configuration please adjust the suggested values accordingly.The steps related to performance tuning are not compulsory and can be done at a later stage.
Install Java
Enable Partner repositories by opening /etc/apt/sources.listand adding the line deb http://archive.canonical.com/ubuntu maverick partner at the end of the file. Then invoke sudo apt-get -f install to update the package list.
Install Java by invoking sudo apt-get install sun-java6-jdk
Install PostgreSQL
Install PostgreSQL by invoking sudo apt-get install postgresql-8.4
Set the password for the postgres Unix user by invoking sudo passwd postgres and following the instructions.Switch to the postgres user by invoking su postgres and entering the password when prompted.
Log into psql by invoking psql Create a user called dhis by invoking create user dhis with password <dhis>Replace the password <dhis> with something secure. Create a database by invoking create database dhis2 withowner dhis encoding 'utf' Exit psql by invoking \q Return to your session by invoking exit You now havea PostgreSQL user called dhis and a database called dhis2.
Do basic performance tuning by increasing the operating system kernel shared memory by opening file /etc/sysctl.confand adding the line kernel.shmmax = 1073741824 at the end of it. Make the change take effect by invoking sysctl-p Then open file /etc/postgresql/8.4/main/postgresql.conf and set the following properties:
shared_buffers = 512MB
Determines how much memory PostgreSQL can use for caching of query data. Is set too low by default since it dependson kernel shared memory which is low on some operating systems.
effective_cache_size = 3500MB

Installation Server setup
28
An estimate of how much memory is available for caching (not an allocation) and is used by PostgreSQL to determinewhether a query plan will fit into memory or not (setting it too high might result in unpredicted and slow behavior).
checkpoint_segments = 32
PostgreSQL writes new transactions to a log file called WAL segments which are 16MB in size. When a number ofsegments have been written a checkpoint occurs. Setting this number to a larger value will thus improve performancefor write-heavy systems such as DHIS 2.
checkpoint_completion_target = 0.8
Determines the percentage of segment completion before a checkpoint occurs. Setting this to a high value will thusspread the writes out and lower the average write overhead.
wal_buffers = 4MB
Sets the memory used for buffering during the WAL write process. Increasing this value might improve throughputin write-heavy systems.
synchronous_commit = off
Specifies whether transaction commits will wait for WAL records to be written to the disk before returning to the clientor not. Setting this to off will improve performance considerably. It also implies that there is a slight delay betweenthe transaction is reported successful to the client and it actually being safe, but the database state cannot be corruptedand this is a good alternative for performance-intensive and write-heavy systems like DHIS 2.
wal_writer_delay = 10000ms
Speficies the delay between WAL write operations. Setting this to a high value will improve performance on write-heavy systems since potentially many write operations can be executed within a single flush to disk.
Restart PostgreSQL by invoking sudo /etc/init.d/postgresql restart
Set the database configuration
The database connection information is provided to DHIS 2 through a configuration file called hibernate.properties.Create this file and save it in a convenient location. A file corresponding to the above setup has these properties:
hibernate.dialect = org.hibernate.dialect.PostgreSQLDialect
hibernate.connection.driver_class = org.postgresql.Driver hibernate.connection.url =
jdbc:postgresql:dhis2 hibernate.connection.username = dhis hibernate.connection.password
= dhis hibernate.hbm2ddl.auto = update
Install Tomcat
Download the Tomcat binary distribution from http://tomcat.apache.org/download-70.cgi A useful tool fordownloading files from the web is wget. Extract to a convenient location. This guide assumes that you have navigatedto the root directory of the extracted archive.
Clear the pre-installed web applications by invoking rm -rf webapps/* Download the latest DHIS 2 WAR file fromhttp://dhis2.org/download and move it to the webapps directory.
Open file bin/setclasspath.sh and add the lines below. The first will set the location of your Java Runtime Environment,the second will dedicate memory to Tomcat and the third will set the location for where DHIS 2 will search for thehibernate.properties configuration file, note that you should adjust this to your environment:
JAVA_HOME='/usr/lib/jvm/java-6-sun' | JAVA_OPTS='-Xmx6000m -XX:MaxPermSize=1000m' |
DHIS2_HOME='/home/dhis/config'
To do basic performance tuning you can install the native APR library by invoking sudo apt-get install
libtcnative-1 Then open file bin/setclasspath.sh and add this line at the end of the file: LD_LIBRARY_PATH=/usr/lib:$LD_LIBRARY_PATH

Installation DHIS 2 Live setup
29
If you need to change the port of which Tomcat listens for requests you can open the Tomcat configuration file /conf/server.xml, locate the <Connector> element which is not commented out and change the port attribute value to thedesired port number.
To monitor the behavior of Tomcat the log is the primary source of information. The log can be easily viewed withthe command tail -f logs/catalina.out
Run DHIS 2
Make the startup script executable by invoking chmod 755 bin/* DHIS 2 can now be started by invoking bin/startup.sh The log can be monitored by invoking tail -f logs/catalina.out DHIS 2 can be stopped byinvoking bin/shutdown.sh
8.2. DHIS 2 Live setup
The DHIS 2 Live package is extremely convenient to install and run. It is intended for demonstrations, for users whowant to explore the system and for small, offline installations typically at districts or facilities. It only requires a JavaRuntime Environment and runs on all browsers except Internet Explorer 7 and lower.
To install start by downloading DHIS 2 Live from http://dhis2.org and extract the archive to any location. On Windowsclick the executable archive. On Linux invoke the startup.sh script. After the startup process is done your default webbrowser will automtically be pointed to http://localhost:8082 where the application is accessible. A system tray menuis accessible on most operating systems where you can start and stop the server and start new browser sesssions. Pleasenote that if you have the server running there is no need to start it again, simply open the application from the tray menu.
DHIS 2 Live is running on an embedded Jetty servlet container and an embedded H2 database. However it can easilybe configured to run on other database systems such as PostgreSQL. Please read the section above about serverinstallations for an explanation of the database configuration. The hibernate.properties configuration file is locatedin the conf folder. Remember to restart the Live package for your changes to take effect. The server port is 8082 bydefault. This can be changed by modifying the value in the jetty.port configuration file located in the conf directory.
8.3. Backup
Doing automated database backups for information systems in production is an absolute must, and might haveuncomfortable consequences if ignored. Backups have two main purposes: The primary is data recovery in case datais lost, the secondary purpose is archiving of data for a historical period of time.
Backup should be central in a disaster recovery plan. Even though such a plan should cover additional subjects, thedatabase is the key component to consider since this is where all data used in the DHIS 2 application is stored. Mostother parts of the IT infrastructure surrounding the application can be restored based on standard components.
There are of course many ways to set up backup; however the following describes a setup where the database is copiedinto a dump file and saved on the file system. This can be considered a full backup. The backup is done with a cronjob, which is a time-based scheduler in Unix/Linux operating systems.You can download both files from http://dhis2.com/download/pg_backup.zip
The cron job is set up with two files. The first is a script which performs the actual task of backup up the database. Ituses a PostgreSQL program called pg_dump for creating the database copy. The second is a crontab file which runsthe backup script every day at 23:00. Note that this script backs up the database file to the local disk. It is stronglyrecommended to store a copy of the backup at a location outside the server where the application is hosted. This canbe achieved with the scp tool.

Support Home page: dhis2.org
31
Chapter 9. SupportThe DHIS 2 community uses a set of collaboration and coordination platforms for information and provision ofdownloads, documentation, development, source code, functionality specifications, bug tracking. This chapter willdescribe this in more detail.
9.1. Home page: dhis2.org
The DHIS 2 home page is found at http://dhis2.orgThe download page provides downloads for the DHIS 2 Livepackage, WAR files, the mobile client, a Debian package, the source code, sample databases and a tool for editing theapplication user interface translations. Please note that the current latest release will be maintained until the next isreleased and both the actual release and the latest build from the release branch are provided. We recommend that youcheck back regularly on the download page and update your online server with the latest build from the release branch.The build revision can be found under Help - About inside DHIS 2.
The documentation page provides installation instructions, user documentation, this implementation guide,presentations, Javadocs, changelog, roadmap and a guide for contributing to the documentation. The userdocumentation is focused on the practical aspects of using DHIS 2, such as how to create data elements and reports.This implementation guide is addressing the more high-level aspects of DHIS 2 implementation, database developmentand maintenance. The change log and roadmap sections provide links to the relevant pages in the Launchpad sitedescribed later.
The functionality and features pages give a brief overview with screenshots of the main functionalities and features ofDHIS 2. A demo DHIS 2 application can be reached from the demo top menu link. These pages can be used when aquick introduction to the system must be given to various stakeholders.
The about page has information about the license under which DHIS 2 is released, how to sign up for the mailing lists,get access to the source code and more.
9.2. Collaboration platform: launchpad.net/dhis2
DHIS 2 uses Launchpad as the main collaboration platform. The site can be accessed at http://lanchpad.net/dhis2Launchpad is used for source code hosting, functionality specifications, bug tracking and notifications. The Bazaarversion control system is tightly integrated with Launchpad and is required for checking out the source code.
The various source code branches including trunk and release branches can be browsed at http://code.launchpad.net/dhis2
If you want to suggest new functionality to be implemented in DHIS 2 you can air your views on the developer mailinglist and eventually write a specification, which is referred to as blueprints in Launchpad. The bueprint will be consideredby the core development team and if accepted be assigned a developer, approver and release version. Blueprints canbe browsed and added at http://blueprints.launchpad.net/dhis2
If you find a bug in DHIS 2 you can report it at Launchpad by navigating to http://bugs.launchpad.net/dhis2 Your bugreport will be investigated by the developer team and be given a status. If valid it will also be assigned to a developerand approver and eventually be fixed. Note that bugfixes are incorporated into the trunk and latest release branch - somore testing and feedback to the developer teams leads to higher quality of your software.

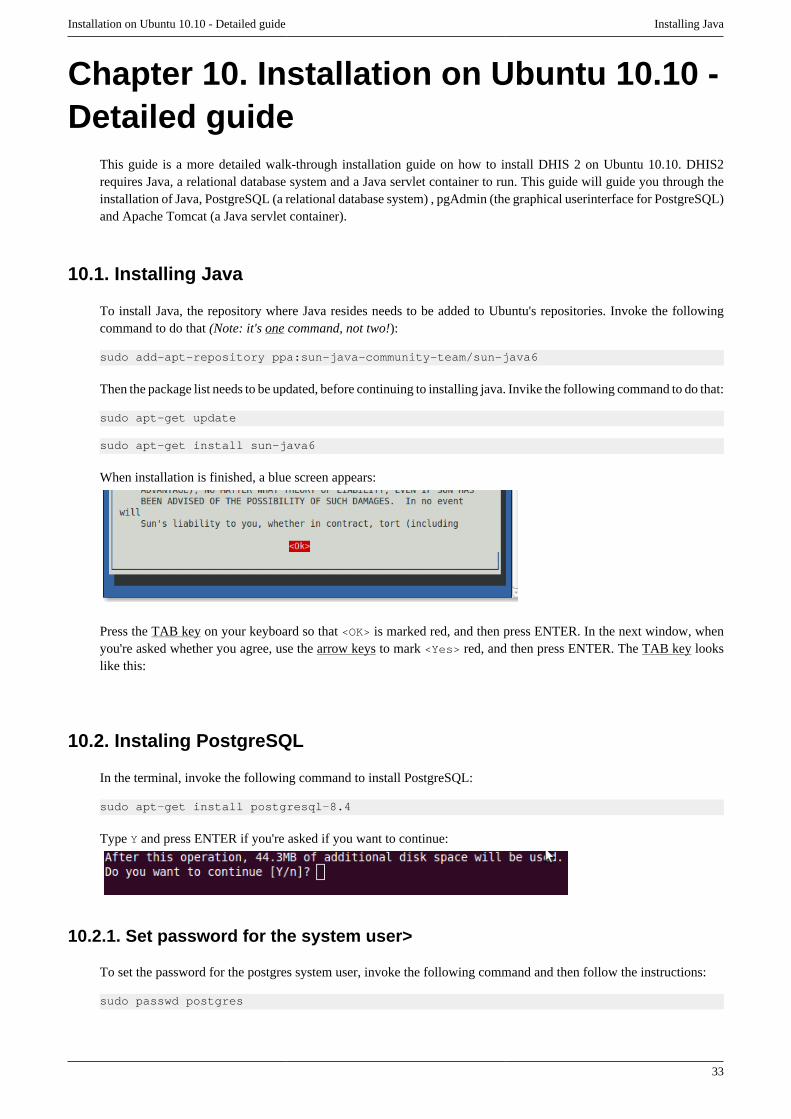
Installation on Ubuntu 10.10 - Detailed guide Installing Java
33
Chapter 10. Installation on Ubuntu 10.10 -Detailed guide
This guide is a more detailed walk-through installation guide on how to install DHIS 2 on Ubuntu 10.10. DHIS2requires Java, a relational database system and a Java servlet container to run. This guide will guide you through theinstallation of Java, PostgreSQL (a relational database system) , pgAdmin (the graphical userinterface for PostgreSQL)and Apache Tomcat (a Java servlet container).
10.1. Installing Java
To install Java, the repository where Java resides needs to be added to Ubuntu's repositories. Invoke the followingcommand to do that (Note: it's one command, not two!):
sudo add-apt-repository ppa:sun-java-community-team/sun-java6
Then the package list needs to be updated, before continuing to installing java. Invike the following command to do that:
sudo apt-get update
sudo apt-get install sun-java6
When installation is finished, a blue screen appears:
Press the TAB key on your keyboard so that <OK> is marked red, and then press ENTER. In the next window, whenyou're asked whether you agree, use the arrow keys to mark <Yes> red, and then press ENTER. The TAB key lookslike this:
10.2. Instaling PostgreSQL
In the terminal, invoke the following command to install PostgreSQL:
sudo apt-get install postgresql-8.4
Type Y and press ENTER if you're asked if you want to continue:
10.2.1. Set password for the system user>
To set the password for the postgres system user, invoke the following command and then follow the instructions:
sudo passwd postgres

Installation on Ubuntu 10.10 - Detailed guide Edit database users and create a database
34
10.2.2. Edit database users and create a database
To modify the databases and the database users, we need to log in as the postgres system user. We use the switch usercommand su as shown below. When the screen reads: Password:, type the password you created for the postgressystem user in the previous step. Invoke the following command (from terminal):
su postgres
Now your terminal should start with postgres=#
NB!!For the following three commands, please note:
• Remember the semi colons (;) at the end of the lines!
• Also remember to use the apostrophes (') where specified!
If something is unclear, consult the screen shot just below the commands.
To edit the password for the postgres database user, invoke the following command:
ALTER USER postgres WITH password '<a password of your choice>';
To create a new user, invoke:
CREATE USER <a user name> WITH PASSWORD '<a password of your choice>';
To create a new database, invoke:
CREATE DATABASE <a database name> WITH OWNER <a user name> ENCODING 'utf8';
To quit, type:
\q
In the terminal again, to log off the postgres system user, simply invoke:
exit
10.2.3. Open the server for connections
If the server is going to be open for connections, we need to modify the postgresql.conf file:
sudo gedit /etc/postgresql/8.4/main/postgresql.conf
In the window that appears, scroll down to
#-------------------------------CONNECTIONS AND AUTHENTICATION#-------------------------------
and change the line

Installation on Ubuntu 10.10 - Detailed guide Define authorizations for the databases
35
#listen_addresses = 'localhost' # what IP address(es) to listen on;
into:
listen_addresses = '*' # what IP address(es) to listen on;
Then save and exit.
10.2.4. Define authorizations for the databases
To define authorizations for the databases, we need to modify the pg_hba.conf file:
sudo gedit /etc/postgresql/8.4/main/pg_hba.conf
In the window that opens, scroll down to the bottom of the file and change ident into md5 for the bottom line ofthe following lines:
# TYPE DATABASE USER CIDR-ADDRESS METHOD
# "local" is for Unix domain socket connections only local all all ident
When you're done, it should look like this (the edited line is highlighted):
Save and exit.
10.2.5. Setting up ODBC Connections to the Postgresql server
Some implementations may require users to connect directly to the database with external software such as Excel,Stata, R or other analysis software. Using ODBC, a connection to the server can be established over the Internet orLAN, between the server and the clients computer.
10.2.5.1. Setting up a Windows 7 (32 bit) ODBC connection1. Download and install the current ODBC driver from this location.

Installation on Ubuntu 10.10 - Detailed guide Performance tuning
36
2. Execute from Start->Run this command to open the ODBC Data Source Administrator
%windir%\system32\odbcad32.exe
3. Click "Add" and choose the "Postgresql UNICODE" driver type and click "Finish".
4. Fill in the values in this dialog box.
• Data Source: The name of the ODBC data source.
• Database: The name of the database to connect to.This should be the name of the DHIS 2 database in most cases.
• Server: This should be the fully qualified domain name or the IP address of the server.
• User Name: The user name which has properly configured permissions to connect to the database. The user willneed to have the correct security settings (at least SELECT privileges) on the required tables.
• Description: You can include a description of the ODBC connection here.
• SSL mode: Determines whether to use an encrypted connection or not.
• Port: The connection port for the database server.
• Password: The password for the user which will be used to connec to the database.
5. Click the "Datasource" button, and be sure that the "Use Declare/Fech" option is enabled.
6. ClickOK to exit this dialog box, and the click "Test" to see if the connection works.
7. Click save to save the ODBC connection. The connection should be available to client applications such as Excelnow.
10.2.6. Performance tuning
If you want to increase the performance of PostgreSQL, you can do some changes in some configuration files.
10.2.6.1. Increase shared memory
The operating system has something that is called shared memory. By increasing this, applications can perform better.Invoke the following to open the sysctl.conf file:
sudo gedit /etc/sysctl.conf
At the bottom of the file, add the following line:
• If your computer has 12 GB of RAM, add

Installation on Ubuntu 10.10 - Detailed guide Performance tuning
37
kernel.shmmax = 1073741824
• If your computer has less RAM installed, adjust the value accordingly;
For example, for 4 GB of RAM, add
kernel.shmmax = 352321536
Save the file and exit.
For the changes to take effect, you need to invoke the following in the terminal:
sudo sysctl -p
10.2.6.2. Adjust PostgreSQL configurations
By adjusting some PostgreSQL settings, the system can perform even better. We can do this by editing thepostgresql.conf file. Invoke the following command to open the file:
sudo gedit /etc/postgresql/8.4/main/postgresql.conf
Now you need to locate some lines and edit them. Follow these steps:
• Locate the following line:
shared_buffers = 24MB # min 128kB
Change it so it reads (this assumes that your computer has 12 GB of RAM, if not, adjust the value accordingly):
shared_buffers = 512MB # min 128kB
• Then locate the following line:
#synchronous_commit = on # immediate fsync at commit
Change it so it reads:
synchronous_commit = off
• Now, locate the following line:
#wal_writer_delay = 200ms # 1-10000 milliseconds
Change it so it reads (your computer's RAM does not matter here):
wal_writer_delay = 10000ms # 1-10000 milliseconds
i.e. remove the first # and set the value to 10000ms (ten thousand)
• Finally, locate the following line:
#effective_cache_size = 128MB
Change it so it reads (for 12 GB of RAM):
effective_cache_size = 3750MB
i.e. remove the first # and set the value to 3750MB
Now, save the file and exit.
10.2.6.3. Restart PostgreSQL
For the changes made in the previous section to take effect, you need to restart the PostgreSQL server. You can dothat by invoking the following command:
sudo /etc/init.d/postgresql restart

Installation on Ubuntu 10.10 - Detailed guide Installing pgAdmin
38
10.3. Installing pgAdmin
10.3.1. Create dhis2/databases folder
Tip:
A wise thing to do, might be to create a folder called dhis2/databases in your local home folder where the databasebackups can be stored. To do that, in the terminal, invoke the following two commands:
mkdir ~/dhis2mkdir ~/dhis2/databases
Note: ~/ refers to the current user's home folder, i.e. /home/yourusername/
Alternatively, you can navigate to your home folder from Places in the panel. In your home folder you can right-clickto create a new folder
10.3.2. Create a server connectionin pgAdmin
Launch PgAdmin from the menu: Applications -> Programming -> pgAdmin III or from the terminal simply byinvoking:
pgadmin3
To create a server connection, click the button with the plug:
Enter the credentials
• Give the connection a name of your choice
• Host should be the ip address of the server (or localhost if you're running locally)
• Port is 5432 by default
• Let the Username be postgres, and
• provide the correct password
• You can choose whether or not to store the password.
(Note: The password will be saved in plain text. Avoid saving the password for an online server connection!)
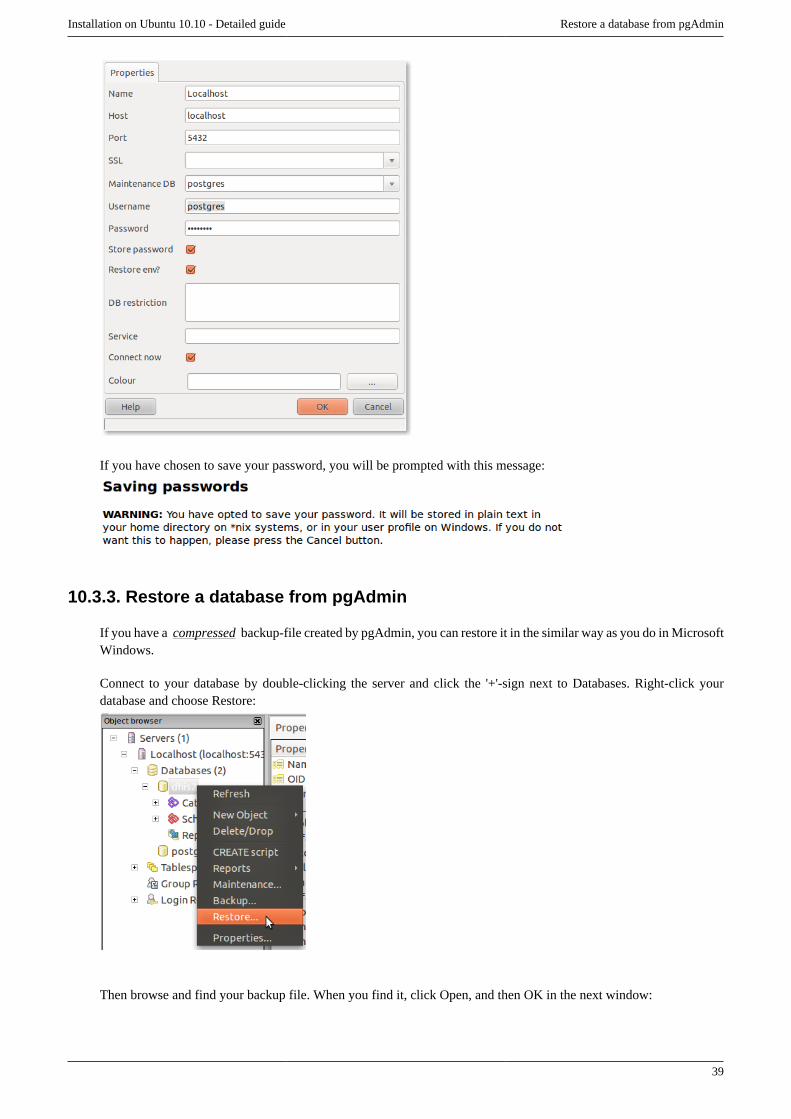
Installation on Ubuntu 10.10 - Detailed guide Restore a database from pgAdmin
39
If you have chosen to save your password, you will be prompted with this message:
10.3.3. Restore a database from pgAdmin
If you have a compressed backup-file created by pgAdmin, you can restore it in the similar way as you do in MicrosoftWindows.
Connect to your database by double-clicking the server and click the '+'-sign next to Databases. Right-click yourdatabase and choose Restore:
Then browse and find your backup file. When you find it, click Open, and then OK in the next window:
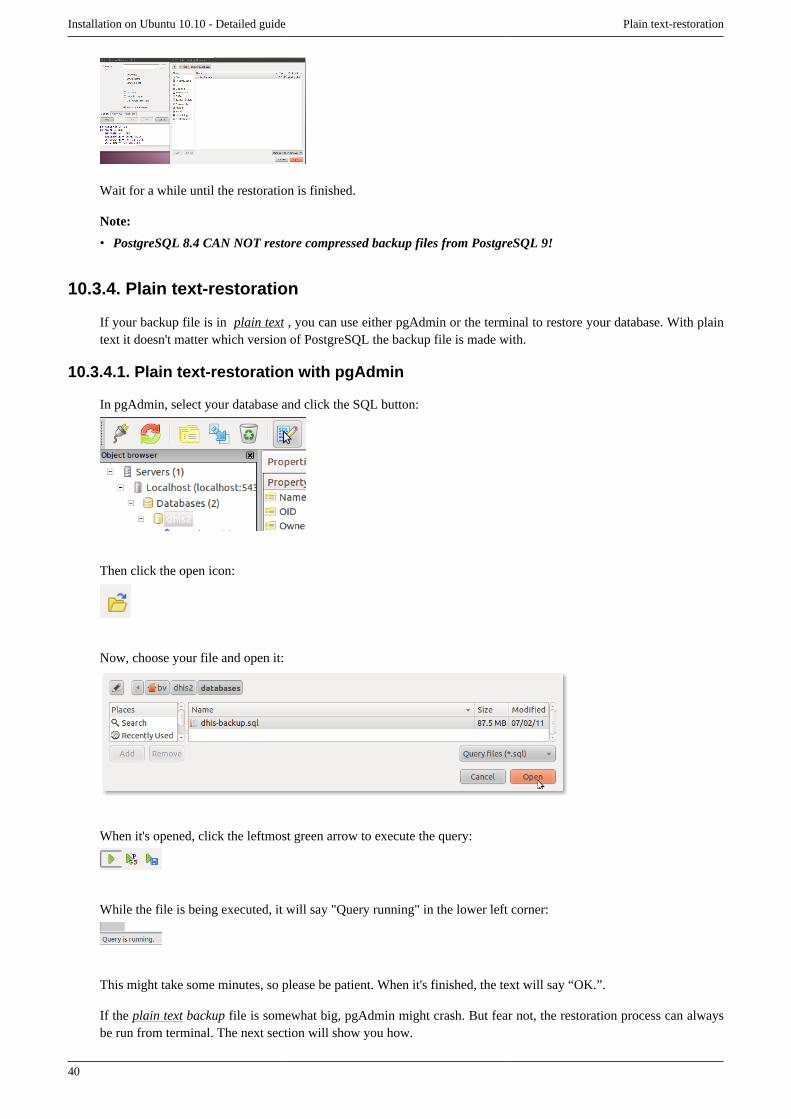
Installation on Ubuntu 10.10 - Detailed guide Plain text-restoration
40
Wait for a while until the restoration is finished.
Note:
• PostgreSQL 8.4 CAN NOT restore compressed backup files from PostgreSQL 9!
10.3.4. Plain text-restoration
If your backup file is in plain text , you can use either pgAdmin or the terminal to restore your database. With plaintext it doesn't matter which version of PostgreSQL the backup file is made with.
10.3.4.1. Plain text-restoration with pgAdmin
In pgAdmin, select your database and click the SQL button:
Then click the open icon:
Now, choose your file and open it:
When it's opened, click the leftmost green arrow to execute the query:
While the file is being executed, it will say "Query running" in the lower left corner:
This might take some minutes, so please be patient. When it's finished, the text will say “OK.”.
If the plain text backup file is somewhat big, pgAdmin might crash. But fear not, the restoration process can alwaysbe run from terminal. The next section will show you how.

Installation on Ubuntu 10.10 - Detailed guide Installing Apache Tomcat
41
10.3.4.2. Plain text restoration from terminal
The command for restoring a plain text backup file, is the following:
psql -d <database> -U <user> -f <file>
For example:
psql -d dhis2 -U dhis -f ~/dhis2/databases/dhis2-backup.sql
Note that the full path of the backup file must be provided! (~/ points to the current user's home folder)
10.4. Installing Apache Tomcat
To download Apache Tomcat, you can either do it from the terminal, or you can use your web browser to downloadthe latest release from http://tomcat.apache.org/download-70.cgi. If you use your web browser, download the tar.gzfile from the Core section. If you want to do it from terminal, invoke the following command (Note: it's one command,not two!):
wget http://apache.uib.no/tomcat/tomcat-7/v7.0.8/bin/apache-tomcat-7.0.8.tar.gz
If you downloaded the file from terminal, extract the file by invoking:
tar xvzf apache-tomcat-7.0.8.tar.gz
Else, if you used your web browser, and your file is stored in the Downloads folder under your home directory, youneed to adjust for that in the previous comment, by adding the full path to the downloaded file:
tar xvzf ~/Downloads/apache-tomcat-7.0.8.tar.gz
Note that you have to change the version number if you download a version different from 7.0.8!
After the files have been extracted, you can move the files to a folder of your choice. I choose /usr/local/apache-tomcat-7.0.8:
sudo mv apache-tomcat-7.0.8 /usr/local/apache-tomcat -7.0.8
If you want to delete the downloaded file, you can do that by invoking:
rm apache-tomcat-7.0.8.tar.gz
10.4.1. Preparing Tomcat
To prepare Tomcat for DHIS 2, we need to make some adjustments. Go to the Tomcat root folder by invoking:
cd /usr/local/apache-tomcat-7.0.8
We don't need anything else running than DHIS 2, so we can remove everything else from Tomcat's webapps folder:
rm -rf /webapps/*
Next, we want to create some environment variables that is used by Tomcat and DHIS 2. We're going to create a filecalled setenv.sh. If that file is placed in Tomcat's bin folder, it will be executed on startup. You can create the fileby invoking:
gedit bin/setenv.sh
In this file, we want to define three environment variables. Add the following three lines to the file:
export JAVA_HOME=/usr/lib/jvm/java-6-sunexport JAVA_OPTS=”-Xmx600m -XX:MaxPermSize=1000m”export DHIS2_HOME=/home/your-user-name/dhis2/DHIS2_HOME

Installation on Ubuntu 10.10 - Detailed guide Reverse proxying with Tomcat and Apache
42
Note that you must insert the user name for the user that is going to run DHIS 2 in the last name. In the last line above,change your-user-name to the actual user name, for example dhis.
JAVA_HOME will set the location of your Java Runtime Environment, JAVA_OPTS allocates memory to Tomcat, andDHIS2_HOME sets the location where the hibernate.properties file is stored (see section later on how to create this fileand the DHIS2_HOME folder).
10.4.2. Reverse proxying with Tomcat and Apache
Tomcat should be run as a non-privileged user and the service will usually run on port 8080. If you want to run theDHIS 2 server on the nomal HTTP port (80), you will need to configure a reverse proxy using the Apache HTTPDserver. First we need to install a few necessary programs.
sudo apt-get install apache2 libapache2-mod-proxy-html libapache2-mod-jka2enmod proxy proxy_ajp proxy_connect
The first command will install the necessary Tomcat modules and the second command will make them active.
Lets define an AJP connector which Apache HTTP server will use to connect to Tomcat with. The Tomcat server.xmlfile should be located in the /usr/local/apache-tomcat-7.0.8/conf/ directory. Be sure this line is uncommented.You canset the port to anything you like which is unused.
<Connector port="8009" protocol="AJP/1.3" redirectPort="8443" />
Now, we need to make the adjustments to the Apache HTTP server which will answer requests on port 80 and passthem to the Tomcat server through an AJP connector. Edit the file /etc/apache2/mods-enabled/proxy.conf so that itlooks like the example below. Be sure that the port defined in the configuration file matches the one from Tomcat.
<IfModule mod_proxy.c>ProxyPreserveHost OnProxyRequests OffProxyPass /dhis ajp://localhost:8009/dhisProxyPassReverse /dhis ajp://localhost:8009/dhisProxyVia On<Location "/dhis"> Order allow,deny Allow from all</Location> </IfModule>
You now can restart Tomcat and the Apache HTTPD server and your DHIS 2 instance should not be available onhttp://localhost/dhis.
10.4.3. Implementing SSL encryption
In certain deployments, data may need to be encrypted between the client and server. Using Apache and the reverseproxy setup described in the previous section, we can easily implement encrypted transfer of data between clients andthe server over HTTPS. This section will describe how to use self-signed certificates, although the same procedurecould be used if you have fully-signed certificates as well.
First (as root), generate the necessary private key files and CSR (Certificate Signing Request)
mkdir /etc/apache2/sslcd /etc/apache2/sslopenssl genrsa -des3 -out server.key 1024openssl req -new -key server.key -out server.csr
We need to remove the password from the key, otherwise Apache will not be able to use it.
cp server.key server.key.org
Installation on Ubuntu 10.10 - Detailed guide Performance tuning
43
openssl rsa -in server.key.org -out server.key
Next, generate a self-signed certificate which will be valid for one year.
openssl x509 -req -days 365 -in server.csr -signkey \ server.key -out server.crt
Now, lets configure Apache by enabling the SSL modules and creating a default site.
a2enmod ssla2ensite default-ssl
Now, we need to edit the default-ssl (located at /etc/apache2/sites-enabled/default-ssl) file in order toenable the SSL transfer functionality of Apache.
<VirtualHost *:443> ServerAdmin [email protected] SSLEngine On SSLCertificateFile /etc/apache2/ssl/server.crt SSLCertificateKeyFile /etc/apache2/ssl/server.key...
Be sure that the *:80 section of this file is changed to port *:443, which is the default SSL port. Also, be sure to changethe ServerAdmin to the webmaster's email.
Lastly, we need to be sure that the hostname is setup properly in /etc/hosts. Just under the "localhost" line, be sure toadd the server's IP address and domain name.
127.0.0.1 localhostXXX.XX.XXX.XXX foo.mydomain.org
Now, just restart Apache and you should be able to view https://foo.mydomain.org/dhis.
/etc/init.d/apache2 restart
10.4.5. Performance tuning
To increase Tomcat's performance, you can install the native APR library by invoking:
sudo apt-get install libtcnative-1
To make use of this, you need to edit the setclasspath.sh file in Tomcat's bin folder. Open it by invoking:
gedit bin/setclasspath.sh
Scroll down to the bottom of the file, and add the following line at the bottom :
LD_LIBRARY_PATH=/usr/lib:$LD_LIBRARY_PATH
Then save and exit.
10.5. Prepare for startup
This section will guide you through the last preparations you need to do before you can start using DHIS 2.
10.5.1. Creating the DHIS2_HOME folder
If you want to use your own database, DHIS 2 needs an environment variable called DHIS2_HOME. If you have notset this, see the section Preparing Tomcat to learn how you set this. If you have followed this guide, the DHIS2_HOMEenvironment variable points to the folder /home/your-user-name/dhis2/DHIS2_HOME. However, this folder has

Installation on Ubuntu 10.10 - Detailed guide Download and prepare DHIS 2
44
not yet been created, so you need to create the folder. From the terminal, invoke the following command to createthat folder:
mkdir ~/dhis2/DHIS2_HOME
10.5.2. Download and prepare DHIS 2
Download the latest built DHIS 2 .war file from http://dhis2.org/downloads
The 'Download' folder (in which the downloaded files probably are store) can be found by navigating to
• Places (on the menu bar) -> Downloads.
Copy the dhis.war file (Right-click on the file, and then click 'Copy'). Then go to the Tomcat webapps folder. Thewebapps folder can be found by navigating to:
• Places (on the menu bar) -> File System -> usr -> local -> apache-tomcat-7.0.8 -> webapps
To paste the file in the folder, right-click on a white space within the folder and click 'Paste'.
10.5.3. Create the hibernate.properties file
To create the hibernate.properties file, invoke the following command from the terminal:
gedit ~/dhis2/DHIS2_HOME/hibernate.properties
In the empty file, paste the following lines and adjust database-name, user and password:
hibernate.dialect = org.hibernate.dialect.PostgreSQLDialecthibernate.connection.driver_class = org.postgresql.Driverhibernate.connection.url = jdbc:postgresql:your-database-namehibernate.connection.username = your-database-userhibernate.connection.password = your-database-user-passwordhibernate.hbm2ddl.auto = update
Then save and exit.
10.6. Run DHIS 2
10.6.1. Start Tomcat
To start DHIS 2, you first need to start Apache Tomcat. Invoke the following command from the terminal to startTomcat:
sh /usr/local/apache-tomcat7.0.8/bin/startup.sh
10.6.2. Open DHIS 2
To start using DHIS 2, open a web browser and navigate to http://localhost:8080/dhis
The DHIS 2 team recommends Google's web browser Google Chrome for best experience with DHIS 2. You candownload it from http://www.google.com/chrome or by invoking the following command from the terminal:
sudo apt-get install google-chrome-stable
10.6.3. Stop Tomcat
To stop Apache Tomcat from running, invoke the following command from the terminal:

Installation on Ubuntu 10.10 - Detailed guide Useful scripts
45
sh /usr/local/apache-tomcat7.0.8/bin/shutdown.sh
10.7. Useful scripts
A script can be considered as a "shortcut" in Linux (or any other opreating systems). In a script file, we can writeseveral commands, and by calling the script file, all these commands will be executed automatically.
This section will teach you how to create some useful scripts to ease the startup and shutdown process.
10.7.1. DHIS 2 start and stop script
First of all, it can be wise to create a folder in which we can store all the scripts. I've chosen the folder ~/dhis2/scripts. To create this folder, from the terminal, invoke the following command:
Again, note that ~/ points to your local home folder. The full address will be /home/your-user-name/dhis2/scripts. Ubuntu understands however the ~/ shortcut, so it's no problem to use it.
mkdir ~/dhis2/scripts
Now we need to tell the system that we have scripts in this folder. We have to add the folder to the PATH environmentvariable. This can be done by editing the .bashrc file. Open it by invoking:
gedit .bashrc
At the bottom of the file, add the following line:
export PATH=~/dhis2/scripts:$PATH
Then save and exit.
10.7.1.1. The dhis script file
To create the file, invoke:
gedit ~/dhis2/scripts/dhis
In the file, paste the following lines:
if [[ $# > 0 && $1 == 'start' ]]then sh /usr/local/apache-tomcat-7.0.8/bin/startup.shelif [[ $# > 0 && 1 == 'stop' ]]then sh /usr/local/apache-tomcat-7.0.8/bin/startup.sh echo echo Please be patient while DHIS 2 is starting... sleep 1 echo Point your web browser to http://localhost:8080/dhis echoelse echo echo Wrong usage: echo You have to type dhis start or dhis stop echofi
Note: If you have installed Apache Tomcat in a different location from what is given in the example, you will needto change the path both places it say /usr/local/apache-tomcat-7.0.8/ in the example. Also, if your war fileis not called dhis.war, but something different, adjust the URL http://localhost:8080/dhis correspondingly.Note that .war is not supposed to be in the URL.

Installation on Ubuntu 10.10 - Detailed guide Using Amazon Web services
46
What's left now, is to make the file executable. To do that, invoke the following two commands from the terminal:
cd ~/dhis2/scriptschmod +x dhis
Now your script is ready to being executed. From the terminal, you can invoke the following commands to start orstop DHIS 2:
dhis startdhis stop
10.8. Using Amazon Web services
Amazon Web Services (AWS) offers virtual cloud-computing resources which allow developers and implementers toquickly scale an application, both horizontally and vertically, in a cost effective manner. AWS offers multiple operatingsystems and instance sizes depending on the exact nature of the deployment. This section will describe a basic setupwith the AWS Elastic Cloud Compute (EC2) system using the Basic 32 bit Amazon AMI, which is based on the RedHat Linux distribution.
Estimating the cost of an AWS instance can be performed using the "Simple Monthly Cal culator". AWS costs arebased entirely on usage. As your application usage grows, you can provision new servers.
1. You will need an existing AWS account. If you do not have one, you can create one here. Once you have createdand enabled your account, login to the AWS console.
2. Once you have logged in, select the "EC2" tab. You will need to select a region in which to instantiate your instance.Users in Europe and Africa, should probably use the EU West region, while users in Asia should probably use onof the Asia Pacific regions (either Singapore or Tokyo). Selection of the appropriate region will reduce latencybetween the server and clients.
3. Click the "Instances" link on the right menu, and then the "Launch Instances" button.
Select one of the AMIs for your server. Using either of the Basic Amazon AMIs (either 32 or 64 bit) is recommended,but you can use whichever AMI is most appropriate.
4. Next, you will need to select the size of your instance. The size of the instance selected will depend on the numberof anticipated users. Selecting the "Micro" size, will enable you to test DHIS 2 in the AWS environment for a periodof one year, at no cost if you use one of the "Free tier eligible" AMIs.
5. Once you have selected the instance size, you can select a specific kernel ID and RAM disk ID. If you do not havea specific reason, just use the defaults and proceed to the next dialog.
6. Next, you can add key-value pairs to help you to easily identify the instance. This is just metadata for your ownusage.

Installation on Ubuntu 10.10 - Detailed guide Using Amazon Web services
47
7. Next, you will need a key pair which will enable you to remotely access your instance. If you have an existing keypair you can use it, otherwise, you can create a new key pair.
8. You will need to assign a security group to the instance. Security groups can be used to expose certain services(SSH, HTTP, Tomcat, etc) to the Internet.With security groups, you can control which ports will be open to specificnetwork ranges. For DHIS 2, you would normally need at least port 22 (SSH) and port 80 (HTTP) open to theinternet or specific address ranges.
9. Finally, you can review and launch your instance.
10.Once the instance, has been launched, you can connect via PuTTY or any other SSH client to the instance usingthe instance's Public DNS, which is listed on the EC2 control panel. You will need to install a few packages if youare using the Amazon default AMI.
yum install jdk.i586 postgresql-server.i686 apache-tomcat-apis.noarch tomcat-native.i686 httpd.i686
11.Once you have installed these packages, you can follow the instructions provided in the previous section on settingup a server.


Organisation Units Organisation unit hierarchy design
49
Chapter 11. Organisation UnitsIn DHIS 2 the location of the data, the geographical context, is represented as organisational units. Organisationalunits can be either a health facility or department/sub-unit providing services or an administrative unit representing ageographical area (e.g. a health district).
Organisation units are located within a hierarchy, also referred to as a tree. The hierarchy will reflect the healthadministrative structure and its levels. Typical levels in such a hierarchy are the national, province, district and facilitylevels. In DHIS 2 there is a single organisational hierarchy so the way this is defined and mapped to the reality needscareful consideration. Which geographical areas and levels that are defined in the main organisational hierarchy willhave major impact on the usability and performance of the application. Additionally, there are ways of addressingalternative hierarchies and levels as explained in the section called Organisation unit groups and group sets furtherdown.
11.1. Organisation unit hierarchy design
The process of designing a sensible organisation unit hierarchy has many aspects:
• Include all reporting health facilities: All health facilities which contribute to the national data collection shouldbe included in the system. Facilities of all kinds of ownership should be incorporated, including private, public,NGO and faith-oriented facilities. Often private facilities constitute half of the total number of facilities in a countryand have policies for data reporting imposed on them, which means that incorporating data from such facilities arenecessary to get realistic, national aggregate figures.
• Emphasize the health administrative hierarchy: A country typically has multiple administrative hierarchies whichare often not well coordinated nor harmonized. When considering what to emphasize when designing the DHIS 2database one should keep in mind what areas are most interesting and will be most frequently requested for dataanalysis. DHIS 2 is primarily managing health data and performing analysis based on the health administrativestructure. This implies that even if adjustments might be made to cater for areas such as finance and local government,the point of departure for the DHIS 2 organisation unit hierarchy should be the health administrative areas.
• Limit the number of organisation unit hierarchy levels: To cater for analysis requirements coming from variousorganisational bodies such as local government and the treasury, it is tempting to include all of these areas asorganisation units in the DHIS 2 database. However, due to performance considerations one should try to limit theorganisation unit hierarchy levels to the smallest possible number. The hierarchy is used as the basis for aggregationof data to be presented in any of the reporting tools, so when producing aggregate data for the higher levels, theDHIS 2 application must search for and add together data registered for all organisation units located further downthe hierarchy. Increasing the number of organisation units will hence negatively impact the performance of theapplication and an excessively large number might become a significant problem in that regard.
In addition, a central part in most of the analysis tools in DHIS 2 is based around dynamically selecting the “parent”organisation unit of those which are intended to be included. For instance, one would want to select a province andhave the districts belonging to that province included in the report. If the district level is the most interesting levelfrom an analysis point of view and several hierarchy levels exist between this and the province level, this kind ofreport will be rendered unusable. When building up the hierarchy, one should focus on the levels that will be usedfrequently in reports and data analysis and leave out levels that are rarely or never used as this will have an impacton both the performance and usability of the application.
• Avoid one-to-one relationships: Another guiding principle for designing the hierarchy is to avoid connecting levelsthat have near one-to-one parent-child ratios, meaning that for instance a district (parent) should have on averagemore than one local council (child) at the level below before it make sense to add a local council level to the hierarchy.Parent-child ratios from 1:4 or more are much more useful for data analysis purposes as one can start to look at e.g.how a district’s data is distributed in the different sub-areas and how these vary. Such drill-down exercises are notvery useful when the level below has the same target population and the same serving health facilities as the parent.
Skipping geographical levels when mapping the reality to the DHIS 2 organisation unit hierarchy can be difficultand can easily lead to resistance among certain stakeholders, but one should have in mind that there are actually

Organisation Units Organisation unit groups and group sets
50
ways of producing reports based on geographical levels that are not part of the organisational hierarchy in DHIS2, as will be explained in the next section.
11.2. Organisation unit groups and group sets
In DHIS 2, organisation units can be grouped in organisation unit groups, and these groups can be further organised intogroup sets. Together they can mimic an alternative organisational hierarchy which can be used when creating reportsand other data output. In addition to representing alternative geographical locations not part of the main hierarchy,these groups are useful for assigning classification schemes to health facilities, e.g. based on the type or ownership ofthe facilities. Any number of group sets and groups can be defined in the application through the user interface, andall these are defined locally for each DHIS 2 database.
An example illustrates this best: Typically one would want to provide analysis based on the ownership of the facilities.In that case one would create a group for each ownership type, for instance “MoH”, “Private” and “NGO”. All facilitiesin the database must then be classified and assigned to one and only one of these three groups. Next one would createa group set called “Ownership” to which the three groups above are assigned, as illustrated in the figure below.
In a similar way one can create a group set for an additional administrative level, e.g. local councils. All local councilsmust be defined as organisation unit groups and then assigned to a group set called “Local Council”. The final step isthen to assign all health facilities to one and only one of the local council groups. This enables the DHIS 2 to produceaggregate reports by each local council (adding together data for all assigned health facilities) without having to includethe local council level in the main organisational hierarchy. The same approach can be followed for any additionaladministrative or geographical level that is needed, with one group set per additional level. Before going ahead anddesigning this in DHIS 2, a mapping between the areas of the additional geographical level and the health facilitiesin each area is needed.
A key property of the group set concept in DHIS 2 to understand is exclusivity, which implies that an organisation unitcan be member of exactly one of the groups in a group set. A violation of this rule would lead to duplication of datawhen aggregating health facility data by the different groups, as a facility assigned to two groups in the same groupset would be counted twice.
With this structure in place, DHIS 2 can provide aggregated data for each of the organisation unit ownership typesthrough the “Organisation unit group set report” in “Reporting” module or through the Excel pivot table third-partytool. For instance one can view and compare utilisation rates aggregated by the different types of ownership (e.g.MoH, Private, NGO). In addition, DHIS 2 can provide statistics of the distribution of facilities in “Organisation unitdistribution report” in “Reporting” module. For instance one can view how many facilities exist under any givenorganisation unit in the hierarchy for each of the various ownership types. In the GIS module, given that health facilitycoordinates have been registered in the system, one can view the locations of the different types of health facilities(with different symbols for each type), and also combine this information with a other map layer showing indicatorse.g. by district.

Data Elements and Custom Dimensions Data elements
51
Chapter 12. Data Elements and CustomDimensions
This chapter first discusses an important building block of the system: the data element. Second it discusses the categorymodel and how it can be used to achieve highly customized meta-data structure for storage of data.
12.1. Data elements
The data element is together with the organisation unit the most important building block of a DHIS 2 database. Itrepresents the what dimension and explains what is being collected or analysed. In some contexts this is referred to anindicator, however in DHIS 2 this meta-data element of data collection and analysis is referred to as a data element.The data element often represents a count of some event and its name describes what is being counted, e.g. "BCGdoses given" or "Malaria cases". When data is collected, validated, analysed or presented it is the data elements orexpressions built with data elements that describe what phenomenon, event or case the data is registered for. Hencethe data element become important for all aspects of the system and decide not only how data is collected, but moreimportantly how the data is represented in the database and how data can be analysed and presented.
An important principle behind designing data elements is to think of data elements as a self-contained description ofan phenomenon or event and not as a field in a data entry form. Each data element lives on its own in the database,completely detached and independent from the collection form. It is important to consider that data elements are useddirectly in reports, charts and other tools for data analysis, in which the context in any given data entry form is notaccessible nor relevant. In other words, it must be possible to clearly identify what event a data element represents byonly looking at its name. Based on this one can derive a rule of thumb saying that the name of the data element mustbe able to stand on its own and describe the data value also outside the context of its collection form.
For instance, a data element called “Malaria” might be concise when seen in a data entry form capturing immunizationdata, in a form capturing vaccination stocks as well as in a form for out-patient data. When viewed in a report, however,outside the context of the data entry form, it is impossible to decide what event this data element represents. If the dataelement had been called “Malaria cases”, “Malaria stock doses received” or “Malaria doses given” it would have beenclear from a user perspective what the report is trying to express. In this case we are dealing with tree different dataelements with completely different semantics.
12.2. Categories and custom dimensions
Certain requirements for data capture necessitates a fine-grained breakdown of the dimension describing the eventbeing counted. For instance one would want to collect the number of “Malaria cases” broken down on gender andage groups, such as “female”, “male” and “< 5 years” and “> 5 years”. What characterizes this is that the breakdownis typically repeated for a number of “base” data elements: For instance one would like to reuse this break-down forother data elements such as “TB” and “HIV”. In order to make the meta-data more dynamic, reusable and suitable foranalysis it makes sense to define the mentioned diseases as data elements and create a separate model for the breakdownattributes. This can be achieved by using the category model, which is described in the following.
The category model has three main elements which is best described using the above example:
1. The category option, which corresponds to “female”, “male” and “< 5 years” and “> 5 years”.
2. The category, which corresponds to “gender” and “age group”.
3. The category combination, which should in the above example be named “gender and age group” and be assignedboth categories mentioned above.
This category model is in fact self-standing but is in DHIS 2 loosely coupled to the data element. Loosely coupled inthis regard means that there is an association between data element and category combination, but this association maybe changed at any time without loosing any data. It is however not recommended to change this often since it makesthe database less valuable in general since it reduces the continuity of the data. Note that there is no hard limit on the

Data Elements and Custom Dimensions Data element groups
52
number of category options in a category or number of categories in a category combination, however there is a naturallimit to where the structure becomes messy and unwieldy.
A pair of data element and category combination can now be used to represent any level of breakdown. It is importantto understand that what is actually happening is that a number of custom dimensions are assigned to the data. Just likethe data element represents a mandatory dimension to the data values, the categories adds custom dimensions to it. Inthe above example we can now through the DHIS 2 output tools perform analysis based on both “gender” and “agegroup” for those data elements, in the same way as one can perform analysis based on data elements, organisationunits and periods.
This category model can be utilized both in data entry form designs and in analysis and tabular reports. For analysispurposes, DHIS 2 will automatically produce sub-totals and totals for each data element associated with a categorycombination. The rule for this calculation is that all category options should sum up to a meaningful total. The aboveexample shows such a meaningful total since when summarizing “Malaria cases” captured for “female < 5 years”,“male < 5 years”, “female > 5 years” and “male > 5 years” one will get the total number of “Malaria cases”.
For data capture purposes, DHIS 2 can automatically generate tabular data entry forms where the data elements arerepresented as rows and the category option combinations are represented as columns. This will in many situationslead to compelling forms with a minimal effort. It is necessary to note that this however represents a dilemma thesetwo concerns are sometimes not compatible. For instance one might want to quickly create data entry forms by usingcategories which does not adhere to rule of a meaningful total. We do however consider this a better alternative thanmaintaining two independent and separate models for data entry and data analysis.
An important point about the category model is that data values are persisted and associated with a category optioncombination. This implies that adding or removing categories from a category combination renders these combinationsinvalid and a low-level database operation much be done to correct it. It is hence recommended to thoughtfully considerwhich breakdowns are required and to not change them too often.
12.3. Data element groups
Common properties of data elements can be modelled through what is called data element groups. The groups arecompletely flexible in the sense that they are defined by the user, both their names and their memberships. Groupsare useful both for browsing and presenting related data, and can also be used to aggregate values captured for dataelements in the group. Groups are loosely coupled to data elements and not tied directly to the data values which meansthey can be modified and added at any point in time without interfering with the low-level data.

Data Sets and Forms What is a data set?
53
Chapter 13. Data Sets and FormsThis chapter discusses data sets and forms, what types of forms are available and describes best practises for the processof moving from paper based to electronic forms.
13.1. What is a data set?
All data entry in DHIS 2 is organised through the use of data sets. A data set is a collection of data elements groupedtogether for data collection, and in the case of distributed installs they also define chunks of data for export and importbetween instances of DHIS 2 (e.g. from a district office local installation to a national server). Data sets are not linkeddirectly to the data values, only through their data elements and frequencies, and as such a data set can be modified,deleted or added at any point in time without affecting the raw data already captured in the system, but such changeswill of course affect how new data will be collected.
A data set has a period type which controls the data collection frequency, which can be daily, weekly, monthly,quarterly, six-monthly, or yearly. Both the data elements to include in the data set and the period type is defined bythe user, together with a name, short name, and code. If calculated fields are needed in the collection form (and notonly in the reports), then indicators can be assigned to the data set as well, but these can only be used in custom forms(see further down).
In order to use a data set to collect data for a specific organisation unit the user must assign the organisation unit to thedata set. This mechanism controls which organisation units that can use which data sets, and at the same time definesthe target values for data completeness (e.g. how many health facilities in a district are expected to submit the RCHdata set every month).
A data element can belong to multiple data sets, but this requires careful thinking as it may lead to overlapping andinconstant data being collected if e.g. the data sets are given different frequencies and are used by the same organisationunits.
13.2. What is a data entry form?
Once you have assigned a data set to an organisation unit that data set will be made available in Data Entry (underServices) for the organisation units you have assigned it to and for the valid periods according to the data set's periodtype. A default data entry form will then be shown, which is simply a list of the data elements belonging to the dataset together with a column for inputting the values. If your data set contains data elements with categories such as agegroups or gender, then additional columns will be automatically generated in the default form based on the categories.In addition to the default list-based data entry form there are two more alternatives, the section-based form and thecustom form.
13.2.1. Types of data entry forms
DHIS 2 currently features three differnet types of forms which are described in the following.
13.2.1.1. Default forms
A default data entry form is simply a list of the data elements belonging to the data set together with a column forinputting the values. If your data set contains data elements with a non-default category combination, such as agegroups or gender then additional columns will be automatically generated in the default form based on the differentoptions/dimensions. If you use more than one category combination in a data set you will get one table per categorycombination in the default form, with different column headings for the options.
13.2.1.2. Section forms
Section forms allow for a bit more flexibility when it comes to using tabular forms and are quick and simple to design.Often your data entry form will need multiple tables with subheadings, and sometimes you need to disable (grey out) a

Data Sets and Forms From paper to electronic form - Lessonslearned
54
few fields in the table (e.g. some categories do not apply to all data elements), both of these functions are supported insection forms. After defining a data set you can define it's sections with subsets of data elements, a heading and possiblegrey fields i the section's table. The order of sections in a data set can also be defined. In Data Entry you can now startusing the Section form (should appear automatically when sections are available for the selected data set). You canswitch between default and section forms in the top right corner of the data entry screen. Most tabular data entry formsshould be possible to do with sections forms, and the more you can utilise the section forms (or default forms) theeasier it is for you as there is no need to maintain a fixed form design. If these two types of forms are not meeting yourrequirements then the third option is the completely flexible, although more time-consuming, custom data entry forms.
13.2.1.3. Custom Forms
When the form you want to design is too complicated for the default or section forms then your last option is to use acustom form. This takes more time, but gives you full flexibility in terms of the design. In DHIS 2 there is a built inHTML editor (CK Editor) in the form designer and you can either design the form in the GUI or paste in your htmldirectly (using the Source window in the editor. In the custom form you can insert static text or data fields (linked todata elements + category option combination) in any position on the form and you have complete freedom to designthe layout of the form. Once a custom form has been added to a data set it will be available in data entry and usedautomatically. You can switch back to default or section (if exists) forms in the top right corner of the data entry screen.
When using a custom form it is possible to use calculated fields to display e.g. running totals or other calculationsbased on the data captured in the form. This can e.g. be useful when dealing with stock or logistics forms that needitem balance, items needed for next period etc. In order to do so, the user must first define the calculated expressionsas indicators and then assign these indicators to the data set in question. In the custom form designer the user can thenassign indicators to the form the same way data elements are assigned. The limitation to the calculated expression isthat all the data elements use in the expression must be available in the same data set since the calculations are doneon the fly inside the form, and are not based on data values already stored in the database.
13.3. From paper to electronic form - Lessons learned
When introducing an electronic health information system the system being replaced is often paper based reporting.The process of migrating to electroic data capture and analysis has some challenges, for which the following suggestsbest practises on how to overcome.
13.3.1. Identify self-contained data elements
Typically the design of a DHIS 2 data set is based on some requirements from a paper form that is already in use. Thelogic of paper forms are not the same as the data element and data set model of DHIS, e.g. often a field in a tabularpaper form is described both by column headings and text on each row, and sometimes also with some introductorytable heading that provides more context. In the database this is captured in one atomic data element with no referenceto a position in a visual table format, so it is important to make sure the data element with the optional data elementcategories capture the full meaning of each individual field in the paper form.
13.3.2. Leave calculations and repetitions to the computer - capture raw dataonly
Another important thing to have in mind while designing data sets is that the data set and the corresponding data entryform (which is a data set with layout) is a data collection tool and not a report or analysis tool. There are other farmore sophisticated tools for data output and reporting in DHIS 2 than the data entry forms. Paper forms are oftendesigned with both data collection and reporting in mind and therefore you might see things such as cumulative values(in addition to the monthly values), repetition of annual data (the same population data reported every month) or evenindicator values such as coverage rates in the same form as the monthly raw data. When you store the raw data in theDHIS 2 database every month and have all the processing power you need within the computerised tool, there is noneed (in fact it would be stupid and most likely cause inconsistency) to register manually calculated values such asthe ones mentioned above. You only want to capture the raw data in your data sets/forms and leave the calculationsto the computer, and presentation of such values to the reporting tools in DHIS. Through the functionality of data set

Data Sets and Forms Leave calculations and repetitions to thecomputer - capture raw data only
55
reports all tabular section forms will automatically get extra columns at the far right providing subtotal and total valuesfor each row (data element).


Data Quality Measuring data quality
57
Chapter 14. Data QualityThis chapter discusses various aspects related to data quality.
14.1. Measuring data quality
Is the data complete? Is it collected on time? Is it correct? These are questions that needs to be asked when analysingdata. Poor data quality can take many shapes; not just incorrect figures, but a lack of completeness, or the data beingtoo old (for meaningful use).
14.2. Reasons for poor data quality
There are many potential reasons for poor quality data, including:
• Excessive amounts collected; too much data to be collected leads to less time to do it, and “shortcuts” to finishreporting
• Many manual steps; moving figures, summing up, etc. between different paper forms
• Unclear definitions; wrong interpretation of the fields to be filled out
• Lack of use of information: no incentive to improve quality
• Fragmentation of information systems; can lead to duplication of reporting
14.3. Improving data quality
Improving data quality is a long-term task, and many of the measures are organizational in nature. However, dataquality should be an issue from the start of any implementation process, and there are some things that can be addressedat once, such as checks in DHIS2. Some important data quality improvement measures are:
• Changes in data collection forms, harmonization of forms
• Promote information use at local level, where data is collected
• Develop routines on checking data quality
• Include data quality in training
• Implement data quality checks in DHIS 2
14.4. Using DHIS 2 to improve data quality
DHIS to has several features that can help the work of improving data quality; validation during data entry to make suredata is captured on the right format and within a reasonable range, user-defined validation rules based on mathematicalrelationships between the data being captured (e.g. subtotals vs totals), outlier analysis functions, as well as reports ondata coverage and completeness. More indirectly, several of the DHIS design principles contribute to improving dataquality, such as the idea of harmonising data into one integrated data warehouse, supporting local level access to dataand analysis tools, and by offering a wide range of tools for data analysis and dissemination. With more structuredand harmonised data collection processes and with strengthened information use at all levels, the quality of data willimprove. Here is an overview of the functionality more directly targeting data quality:
14.4.1. Data input validation
The most basic way of data quality check in DHIS 2 is to make sure that the data being captured is on the correctformat. The DHIS 2 will give the users a message that the value entered is not on the correct format and will not savethe value until it has been changed to an accepted value. E.g. text cannot be inputted in a numeric field. The differenttypes of data values supported in DHIS 2 are explained in the user manual in the chapter on data elements.

Data Quality Min and max ranges
58
14.4.2. Min and max ranges
To stop typing mistakes during data entry (e.g typing ‘1000’ instead of ‘100’) the DHIS 2 checks that the value beingentered is within a reasonable range. This range is based on the previously collected data by the same health facilityfor the same data element, and consists of a minimum and a maximum value. As soon as a the users enters a valueoutside the user will be alerted that the value is not accepted. In order to calculate the reasonable ranges the systemneeds at least six months (periods) of data.
14.4.3. Validation rules
A validation rule is based on an expression which defines a relationship between a number of data elements. Theexpression has a left side and a right side and an operator which defines whether the former must be less than, equalto or greater than the latter. The expression forms a condition which should assert that certain logical criteria are met.For instance, a validation rule could assert that the total number of vaccines given to infants is less than or equal tothe total number of infants.
The validation rules can be defined through the user interface and later be run to check the existing data. When runningvalidation rules the user can specify the organisation units and periods to check data for, as running a check on allexisting data will take a long time and might not be relevant either. When the checks are completed a report will bepresented to the user with validation violations explaining which data values that need to be corrected.
The validation rules checks are also built into the data entry process so that when the user has completed a form therules can be run to check the data in that form only, before closing the form.
14.4.4. Outlier analysis
The standard deviation based outlier analysis provides a mechanism for revealing values that are numerically distantfrom the rest of the data. Outliers can occur by chance, but they often indicate a measurement error or a heavy-taileddistribution (leading to very high numbers). In the former case one wishes to discard them while in the latter case oneshould be cautious in using tools or interpretations that assume a normal distribution. The analysis is based on thestandard normal distribution.
14.4.5. Completeness and timeliness reports
Completeness reports will show how many data sets (forms) that have been submitted by organisation unit and period.You can use one of three different methods to calculate completeness; 1) based on completeness button in data entry,2) based on a set of defined compulsory data elements, or 3) based on the total registered data values for a data set.
The completeness reports will also show which organisation units in an area that are reporting on time, and thepercentage of timely reporting facilities in a given area. The timeliness calculation is based on a system setting calledDays after period end to qualify for timely data submission.

Indicators What is an indicator
59
Chapter 15. IndicatorsThis chapter covers the following topics:
• What is an indicator
• Purposes of indicators
• Indicator-driven data collection
• Managing indicators in DHIS 2
The following describes these topics in greater detail.
15.1. What is an indicator
In DHIS 2 the indicator is a core element of data analysis. An indicator represent calculated formula based on dataelements, i.e it is not just a figure, but a proportion relating to something. It has a numerator which represents the dataelements being measured, and a denominator which the data element(s) is is measured as a proportion of). Indicatorsare thus made up of formulas of these data elements, in addition to a factor (e.g. 1, 100, 100, 100 000) to set the rightmeasurement. E.g. the indicator "BCG coverage <1 year" is defined a formula with a factor 100 (to get it as a per cent),a numerator ("BCG doses given to children under 1 year") and a denominator ("Target population under 1 year").The indicator "DPT1 to DPT3 drop out rate" is a formula of 100 % x ("DPT1 doses given"- "DPT3 doses given") /("DPT1 doses given").
Indicator = numerator / denominator x factor
Table 15.1. Indicator examples
Indicator Formula Numerator Denominator Factor
Fully immunized <1year
Fully immunized/Population < 1 yearx 100
Fully immunized Population < 1 100 (Percentage)
Maternal MortalityRate
Maternal deaths/Live births x 100000
Maternal deaths Live births 100 000 (MMR ismeasured per 100000)
15.2. Purposes of indicators
Indicators are a lot more useful for analysis than raw data. Since they are proportions, they are comparable across timeand space, which is very important since units of analysis and comparison, such as districts, vary in size and changeover time. A district with 100 cases of a disease may have a higher incidence rate than a district of 1000 cases, if thelatter district is more than 10 times as populous. An indicator measuring the incidence rate related to a population willbe possible for comparison no matter what the population might actually be.
Indicators thus allow comparison, and are the prime tool for data analysis. DHIS2 should provide relevant indicatorsfor analysis for all health programs, not just the raw data. Most report modules in DHIS 2 support both data elementsand indicators and you can also combine these in custom reports.
15.3. Indicator-driven data collection
Since indicators are more suited for analysis compared to data elements, the calculation of indicators should be themain driving force for collection of data. A usual situation is that much data is collected but never used in any indicator,which significantly reduces the usability of the data. Either the captured data elements should be included in indicatorsused for management or they should probably not be collected at all.

Indicators Managing indicators
60
For implementation purposes, a list of indicators used for management should be defined and implemented in DHIS2. For analysis, training should focus on the use of indicators and why these are better suited than data elements forthis purpose.
15.4. Managing indicators
Indicators can be added, deleted, or modified at any time in DHIS2 without affecting the data. Indicators are not storedas values in DHIS2, but as formlas, which are calculated whenever the user needs them. Thus a change in the formulaswill only lead to different data elements being called for when using the indicator for analysis, without any changesto the underlying data values taking place. For information how to manage indicators, please refer to the chapter onindicators in the DHIS2 user documentation.

Users and User Roles Users
61
Chapter 16. Users and User RolesDHIS 2 comes with an advanced solution for fine-grained management of users and user roles. The system is completelyflexible in terms of the number and type of users and roles allowed.
16.1. Users
A user in the DHIS 2 context is a human who is utilizing the software. Each user in DHIS 2 has a user account which isidentified by a username. A user account allows the user to authenticate to system services and be granted authorizationto access them. To log in (authenticate) the user is required to enter a valid combination of username and password. Ifthat combination matches a username and password registered in the database, the user is allowed to enter.
In addition, a user should be given a first name, surname, email and phone number. This information is important toget correct when creating new users since certain functions in DHIS 2 relies on sending emails to notify users aboutimportant events. It is also useful to be able to communicate to users directly over email and telephone to discuss datamanagement issues or to sort out potential problems with the system.
A user in DHIS 2 is associated with an organisation unit. This implies that when creating a new user account thataccount should be associated to the location where user works. For instance when creating a user account for a districtrecord officer that user account should be linked with the particular district where she works. The link between useraccount and organisation unit has several implications for the operation of the system:
• In the data entry module, a user can only be entering data for the organisation unit she is associated with and theorganisation units below that in the hierarchy. For instance, a district records officer will be able to register data forher district and the facilities below that district only.
• In the user module, a user can only create new users for the organisation unit she is associated with in addition tothe organisation units below that in the hierarchy.
• In the reports module, a user can only view reports her organisation units and those below. (This is something weconsider to open up to allow for comparison reports.)
A user role in DHIS 2 is also associated with a set of user roles. Such user roles are discussed in the following section.
16.2. User Roles
A user role in the DHIS 2 context is a group of authorities. An authority in this regard means the permission to performone or more specific tasks. For instance, a user role may contain authorities to create a new data element, update anorganisation unit or view a report. Such a group of authorities constitutes a user role.
In a health system the users are logically grouped with respect to the task they perform and the position they occupy.Examples of commonly found positions are:
1. National health managers
2. National health information system division officers (HISO)
3. Province health managers
4. District health records and information officers (DHRIO)
5. Facility health records and information officers (HRIO)
6. Data entry clerks
When creating user roles such positions within the health system should be kept in mind and it is often sensible tocreate a user role dedicated for each of those positions. The process of creating user roles should be aligned with theprocess of deciding which users are doing what tasks in the system.
First it should be defined which users should fulfill the role as system administrators. This will often a part of themembers of the national HIS division and should have full authority in the system. Second a user role should be created

Users and User Roles User Roles
62
roughly for each position. A sensible consideration of what authorities should be given each role must be done. Animportant rule is that each role should only be given the authorities which are needed to perform the job well - notmore. When operating a large, centralized information system there is a need to coordinate the work between the peopleinvolved. This is made easier if only those who are supposed to perform a task have the authorities to perform it.
An example might highlight this issue: The task of setting up the basic structure (meta-data) of the system is criticalto the system and should only be performed by the administrators of system. This means that the system administratoruser role should have the authority to add, update and delete the core elements of the system such as data elements,indicators and data sets. Allowing users outside the team of system administrators to modify these elements might leadto problems with coordination.
National and provincial health managers are often concerned with data analysis and monitoring. Hence this group ofusers should be authorized to access and use the reports module, GIS module, data quality module and dashboard.However they would not need authority to enter data or update data elements and data sets. District information officersare often tasked with both entering data into the system coming from facilities which are not able to do so directly aswell as monitoring, evaluation and analysis of data. This means that they will need access to all of the analysis andvalidation modules mentioned above in addition to the authority to access and use the data entry module.
In addition, a user role is associated with a collection of data sets. This affects the data entry module in that the useris only allowed to enter data for the data sets registered for her user role. This is often useful in situations where onewants to allow officers from health programs to enter data for their relevant data entry forms only.
A user can be granted one or any number of user roles. In the case of many user roles, the user is privileged with thesum of all authorities and data sets included in the user roles. This means that user roles can be mixed and matchedfor special purposes instead of merely creating new ones.
An important part of user management is to control which users are allowed to create new users with which authorities.In DHIS 2 one can control which users are allowed to perform this task. In this process the key principle is that a usercan only grant authorities and access to data sets that the user itself has. The users at national, province and districtlevel are often relatively few and can be created and managed by the system administrators. If a large part of thefacilities are entering data directly into the system the number of users might become unwieldy. Experience suggeststhat delegating and decentralizing this task to the district officers will make the process more efficient and supportthe facility users better.

Data Analysis Tools Overview Data analysis tools
63
Chapter 17. Data Analysis ToolsOverview
This chapter offers an overview of the available tools for data analysis provided by DHIS 2 along with a descriptionof the purpose and benefits of each. If you are looking for a detailed guide on how to use each tool we recommend tocontinue to read the user guide after finishing this chapter. The following list shows the various tools:
1. Standard reports
2. Data set reports
3. Data completeness reports
4. Static reports
5. Organisation unit distribution reports
6. Report tables
7. Charts
8. Web Pivot table
9. GIS
10.My Datamart and Excel pivot tables
17.1. Data analysis tools
The following section gives a description of each tool.
17.1.1. Standard reports
Standard reports are reports with predefined designs. This means that the reports are easily accessible with a few clicksand can be consumed by users at all levels of experience. The report can contain statistics in the form of tables and chartsand can be tailored to suit most requirements. The report solution in DHIS 2 is based on JasperReports and reports aremost often designed with the iReport report designer. Even though the report design is fixed, data can be dynamicallyloaded into the report based on any organisation unit from in the hierarchy and with a variety of time periods.
17.1.2. Data set reports
Data set reports displays the design of data entry forms as a report populated with aggregated data (as opposed tocaptured low-level data). This report is easily accessible for all types of users and gives quick access to aggregate data.There is often a legacy requirement for viewing data entry forms as reports which this tool efficiently provides for.The data set report supports all types of data entry forms including section and custom forms.
17.1.3. Data completeness report
The data completeness report produces statistics for the degree of completeness of data entry forms. The statisticaldata can be analysed per individual data sets or per a list of organisation units with a common parent in the hierarchy.It provides a percentage value for the total completeness and for the completeness of timely submissions. One can usevarious definitions of completeness as basis for the statistics: First based on number of data sets marked manually ascomplete by the user entering data. Second based on whether all data element defined as compulsory are being filledin for a data set. Third based on the percentage of number of values filled over the total number of values in a data set.
17.1.4. Static reports
Static reports provides two methods for linking to existing resources in the user interface. First it provides the possibilityto link to a resource on the Internet trough a URL. Second it provides the possibility to upload files to the system

Data Analysis Tools Overview Organisation unit distribution reports
64
and link to those files. The type of files to upload can be any kind of document, image or video. Useful examples ofdocuments to link to are health surveys, policy documents and annual plans. URLs can point to relevant web sites suchas the Ministry of Health home page, sources of health related information. In addition it can be used as an interfaceto third-party web based analysis tools by pointing at specific resources. One example is pointing a URL to a reportserved by the BIRT reporting framework.
17.1.5. Organisation unit distribution reports
The organisation unit distribution report provides statistics on the facilities (organisation units) in the hierarchy basedon their classification. The classification is based on organisation unit groups and group sets. For instance can facilitiesbe classified by type through assignment to the relevant group from the group set for organisation unit type. Thedistribution report produces the number of facilities for each class and can be generated for all organisation units andfor all group sets in the system.
17.1.6. Report tables
Report tables are reports based on aggregated data in a tabular format. A report table can be used as a stand-alonereport or can be used as data source for a more sophisticated standard report design. The tabular format can be cross-tabulated with any number of dimensions appearing as columns. It can contain indicator and data element aggregatedata as well as completeness data for data sets. It can contain relative periods which enables the report to be reused overtime. It can contain user selectable parameters for organisation units and periods to enable the report to be reused for allorganisation units in the hierarchy. The report table can be limited to the top results and sorted ascending or descending.When generated the report table data can be downloaded as PDF, Excel workbook, CSV file and Jasper report.
17.1.7. Charts
The chart component offers a wide variety of charts including the standard bar, line and pie charts. The charts cancontain indicators, data elements, periods and organisation units on both the x and y axis as well as a fixed horizontaltarget line. Charts can be view directly or as part of the dashboard as will be explained later.
17.1.8. Web Pivot tables
The web pivot table offers quick access to statistical data in a tabular format and provides the ability to “pivot” anynumber of the dimensions such as indicators, data elements, organisation units and periods to appear on columns androws in order to create tailored views. Each cell in the table can be visualized as a bar chart.
17.1.9. GIS
The GIS module gives the ability to visualize aggregate data on maps. The GIS module can provide thematic mappingof polygons such as provinces and districts and of points such as facilities in separate layers. The mentioned layerscan be displayed together and be combined with custom overlays. Such map views can be easily navigated back inhistory, saved for easy access at a later stage and saved to disk as an image file. The GIS module provides automaticand fixed class breaks for thematic mapping, predefined and automatic legend sets, ability to display labels (names) forthe geographical elements and the ability to measure the distance between points in the map. Mapping can be viewedfor any indicator or data element and for any level in the organisation unit hierarchy. There is also a special layer fordisplaying facilities on the map where each one is represented with a symbol based on the its type.
17.1.10. My Datamart and Excel Pivot tables
The purpose of the My Datamart tool is provide users with full access to aggregate data even on unreliable Internetconnections. This tool consists of a light-weight client application which is installed at the computer of the users. Itconnects to an online central server running a DHIS 2 instance, downloads aggregate data and stores it in a databaseat he local computer. This database can be used to connect third-party tools such as MS Excel Pivot tables, which is apowerful tool for data analysis and visualization. This solution implies that just short periods of Internet connectivity

Data Analysis Tools Overview My Datamart and Excel Pivot tables
65
are required to synchronize the client database with the central online one, and that after this process is done the datawill be available independent of connectivity. Please read the chapter dedicated to this tool for in-depth information.


Pivot Tables and the MyDataMart tool Pivot table design
67
Chapter 18. Pivot Tables and theMyDataMart tool
Excel Pivot Table (see screenshot below) is a powerful and dynamic data analysis tool that can be automatically linkedto the DHIS 2 data. While most reporting tools in DHIS 2 are limited in how much data they can present at the sametime, the pivot tables are designed to give nice overviews with multiple data elements or indicators, and organisationunits and periods (see example below). Furthermore, the dynamic features in pivoting and drill-down are very differentfrom static spreadsheets or many web reports, and his makes it a useful tool for information users that want to domore in-depth analysis and to manipulate the views on the data more dynamically. This combined with the well-knowncharting capabilities of Excel, the Pivot Table tool has made it a popular analysis tool among the more advanced DHISusers for a long time.
With the recent shift towards online deployments, the offline pivot tables in Excel also provide a useful alternative tothe online reporting tools as they allow for local data analysis without Internet connectivity, which can be an advantageon unstable or expensive connections. Internet is only needed to download new data from the online server, and assoon as the data exists locally, working with the pivot tables require no connectivity. The MyDatamart tool, which isexplained in detail further down, helps the users to maintain a local data mart file (small database) which is updatedover the Internet against the online server, and then used as an offline data source that feeds the pivot tables with data.
18.1. Pivot table design
Typically an Excel pivot table file set up for DHIS 2 will contain multiple worksheets with one pivot table on eachsheet. A table can consist of either raw data values (by data elements) or indicator values, and will usually be namedbased on which level of the organisation unit hierarchy the source data is aggregated by as well as the period type(frequency e.g. Monthly, Yearly) of the data. A standard DHIS 2 pivot table file includes the following pivot tables:District Indicators, District Data Monthly, District Data Yearly, Facility Indicators, Facility Data Monthly, FacilityData Yearly. In addition there might be more specialized tables that focus on specific programs and/or other periodtypes.
One popular feature of pivot tables is to be able to drag-and-drop the various fields between the three positions page/filter, row, and columns, and thereby completely change the data view. These fields can be seen as dimensions to thedata values and represent the dimensions in the DHIS data model; organisation unit (one field per level), data elementsor indicators, periods, and then a dynamically extended lists of additional dimensions representing organisation unit/

Pivot Tables and the MyDataMart tool Connecting to the DHIS 2 database
68
indicator/data element group sets and data element categories (see other chapters of this guide for details). In fact adynamic pivot table is an excellent tool to represent the many dimensions created in the DHIS 2, and makes it veryeasy to zoom in or out on each dimension, e.g. look at raw data values by individual age groups or just by its total, orin combination with other dimensions like gender. All the dimensions created in the DHIS 2 will be reflected in theavailable fields list of each pivot table, and then it is up to the user to select which ones to use.
It is important to understand that the values in the pivot tables are non-editable and all the names and numbers arefetched directly from the DHIS 2 database, which makes it different from a normal spreadsheet. In order to be edited,the contents of a pivot table must be copied to a normal spreadsheet, but this is rarely needed as all the names can beedited in DHIS 2 (and then be reflected in the pivot tables on the next update). The names (captions) on each fieldhowever are editable, but not their contents (values).
18.2. Connecting to the DHIS 2 database
Each pivot table has a connection to the DHIS 2 database and makes use of a pivot source view (SQL query) in thedatabase to fetch the data. These queries pull all their data from the data mart tables, so it is important to keep the datamart updated at all times in order to get the most recent data into the pivot tables. A pivot table can connect to a databaseon the local computer or on a remote server. This makes it well suitable for use in a local network where there is onlyone shared database and multiple client computers using pivot tables. Excel can also connect to databases runningon Linux. The database connection used in the pivot tables is specified in an ODBC data source on the Windowscomputers running pivot tables.
For online deployments the recommended way to connect to the DHIS 2 data is to make use of the MyDatamart tool,which creates and updates a local data mart file (database) that Excel can connect to. The MyDatamart tool will bedescribed in detail further down.
18.3. Dealing with large amounts of data
The amount of data in a DHIS 2 database can easily go beyond the capabilities of Excel. A table with around 1million values (rows of data) tend to become less responsive to updates (refresh) and pivoting operations, and on somecomputers Excel will give out of memory errors when dealing with tables of this size. Typically, the more powerfulthe computer, the more data can be handled, but the top limit seems to be around 1 million rows even on the high-end computers.
To deal with this problem the standard DHIS pivot table setup is to split the data over several pivot tables. There aredifferent ways of splitting the data; by organisation unit aggregation level (how deep), by organisation unit coverage/boundary area (how wide), by period (e.g. one year of data at a time), or by data element or indicator groups (e.g. byhealth programs or themes). Aggregating away the lowest level in the organisation unit hierarchy is the most effectiveapproach as it reduces the amount of data by a factor of the number of health facilities in a country. Typically thereis no need to look at all the health facilities in a country at the same time, but instead only for a limited area (e.g.district or province). And when there is a need for data for the whole country that can be provided with district levelaggregates or similar. At a district or province office the users will typically have facility level data only for their ownarea, and then for the neighboring areas the data will be aggregated up one or two levels to reduce the size of data, butstill allow for comparison, split into e.g. the two tables Facility Data and Data District Data, and similar for indicatorvalues. Splitting data by period or by data element/indicator groups work more or less in the same way, and can bedone either in combination with the organisation unit splitting or instead of it. E.g. if a health program wants to analysea few data elements at facility level for the whole country that can be possible. The splitting is controlled by the pivotviews in the database where one specifies which data values to fetch.
18.4. The MyDatamart tool
With online deployments and the use of one single central server (and database) the local use of pivot tables becomesmore difficult as Excel connects to the database directly to fetch the data. This means that Excel (and every local

Pivot Tables and the MyDataMart tool Using Excel pivot tables and MyDatamart - awork-flow example
69
computer using DHIS2) would need connection details and access to the database on the server, which is not alwayswanted. Furthermore, the refresh (update the pivot table) operation in Excel completely empties the table beforereloading all the data again (new and old), which leads to big and duplicated data downloads over the Internet whenconnecting to an online server. The solution to these problems has been to build up and maintain an updated "copy"of the central database in each local office where they use Excel pivot tables. These local databases are called datamarts and are built specifically for serving as data sources for data analysis tools like Excel. The MyDatamart tool isa newly developed (May 2011) tool that creates a datamart file on a local computer and helps the users to update thisagainst a central server. The pivot tables in Excel connect only to the local datamart and do not need to know aboutthe central server at all.
The use of MyDatamart dramatically reduces the download size when routinely updating the local Excel files againstthe central server compared to a direct connection from Excel. It also brings comfort to the local level users to have acopy of their data on their local computer and not to rely on a Internet connection or server up-time to access it. Thefigure below explains how the linking between the central online server (in the clouds) and the local offices works.
18.5. Using Excel pivot tables and MyDatamart - a work-flow example
The details of using the MyDatamart tool are explained in a separate user manual and this section only tries to explainthe typical work-flow involved in using the tool together with the pivot tables.
18.5.1. Download and run the MyDatamart tool for the first time
MyDatamart is a small tool that is easy to download and run immediately. Download mydatamart.exe to the Desktopand run it by double-clicking on the file. The first thing you need to do is to create a new datamart file, and then youtype in the login details needed to access the central server (url, username. password). The tool will connect to theserver (Internet connection needed at this point) and verify your credentials. The next step is to download all the meta-data from the server meaning all the organisation units, data elements, indicators, groups etc. This might take sometime depending on your computer's specifications and the speed of the connection, but is a step that is rarely neededafter this first download. Once the tool knows the organisation unit hierarchy you can specify which organisation unityou "belong" to and the analysis level you are interested in. These are settings that limit which organisation units you

Pivot Tables and the MyDataMart tool Setup and distribute the pivot tables
70
will download data for. The next thing is to download the data from the server, and then you must specify whichperiods to download.
18.5.2. Setup and distribute the pivot tables
The first thing needed is to download and install an ODBC driver for SQLite, which is the database server running thelocal datamart. The database connections in the pivot tables depend on this driver and will fail without installed.
The next thing is to set up the pivot tables themselves. This is a one-off job since the file can be reused as a template inall other locations connecting to the same central database. The MyDatamart tool can produce a skeleton Excel file foryou with all the necessary database connections already defined. This will help the process considerably and most ofthe work is to select which fields to use in each table and give them proper names. The user manual has all the detailedinstructions on how to set up a pivot table using the MyDatamart connections.
Once the template Excel file is available it is a matter of distributing it to all local offices that will use pivot tables andto make sure the connections are still valid on the local computers. The connection details in Excel depend on the odbcdriver being available and on the name and location of the datamart file. Either you can streamline all local datamartfiles (by name and location, e.g. "C:\dhis2\dhis2.dmart", or you can use the MyDatamart tool to update the connectiondetails in an existing Excel file to match the location of the local datamart file.
18.5.3. Update MyDatamart
Whenever there is new data available on the central server, e.g. every month, the users will have to open theMyDatamart tool, log on to the server, and then pick the months to download. Once the download has finished thedata is available locally in the datamart file.
18.5.4. Update the Pivot tables
Once the local datamart file has been update the users can update the pivot tables by using the Refresh function, onceper table. It is important to remember to save the Excel file after refreshing all the tables.
18.5.5. Repeat step 3 and 4 when new data is available on the central server
Whenever there is new data on the server repeat step number 3 and 4 (the two previous steps) in order to update thepivot tables and get access to the latest data.
Related Documents