dhacommunications.co.uk

Dhacommunications.co.uk. WHY KEY FACTS? Collective statistics on key performance data Changes to operating environment Advocacy tool – especially.
Dec 16, 2015
Welcome message from author
This document is posted to help you gain knowledge. Please leave a comment to let me know what you think about it! Share it to your friends and learn new things together.
Transcript

dhacommunications.co.uk

WHY KEY FACTS?
Collective statistics on key performance data
Changes to operating environment
Advocacy tool – especially to funders and government
dhacommunications.co.uk

METHODOLOGY Survey constructed to gather collective data on:
Live Performances – performances, attendance
Community – education and outreach
Orchestras in the world – international tours
Beyond the concert hall – video and audio, streaming and download
Creating Jobs – musicians employed, full-time, freelance, contract
Income – earned, contributed, public.
• 49 orchestras, 77% of total, between 22 August and 29 October (2012/13 data)
• Comparisons shown take 2011 Key Facts (2009/2010 data), subset of orchestras answering both surveys (39)
dhacommunications.co.uk

dhacommunications.co.uk
PERFORMANCESPERFORMANCES
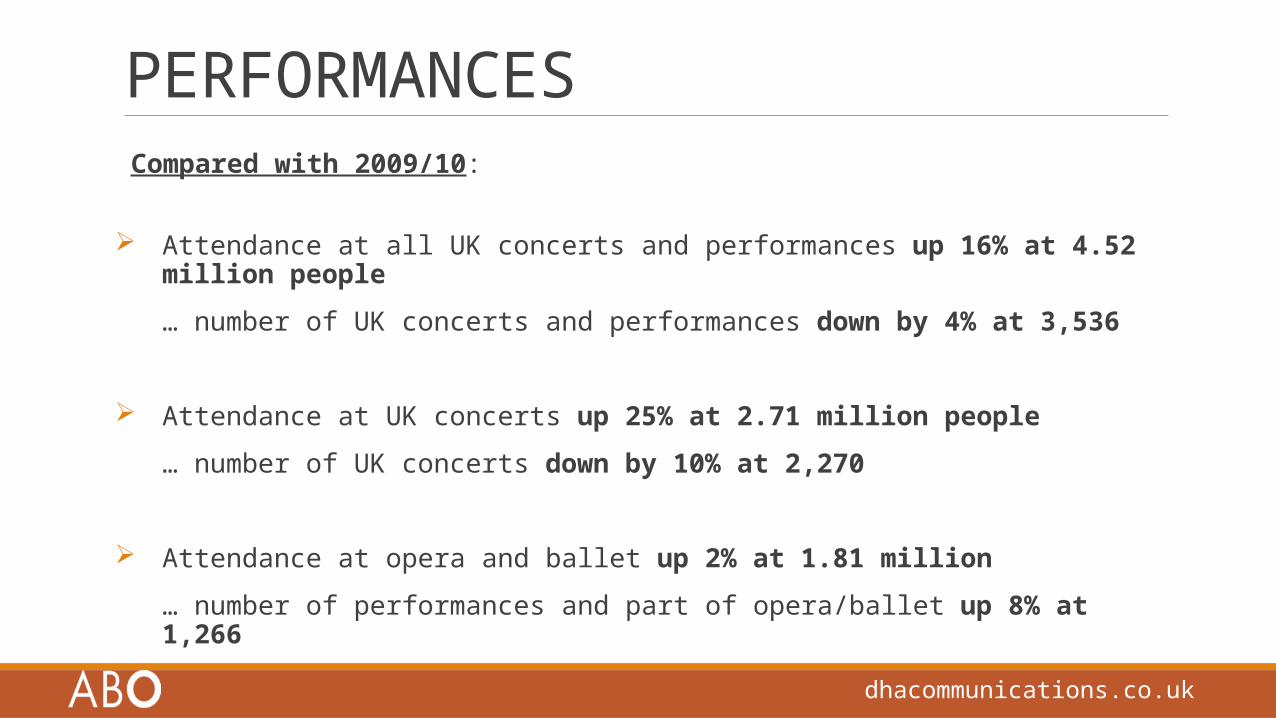
PERFORMANCES Compared with 2009/10:
Attendance at all UK concerts and performances up 16% at 4.52 million people
… number of UK concerts and performances down by 4% at 3,536
Attendance at UK concerts up 25% at 2.71 million people
… number of UK concerts down by 10% at 2,270
Attendance at opera and ballet up 2% at 1.81 million
… number of performances and part of opera/ballet up 8% at 1,266
dhacommunications.co.uk

dhacommunications.co.uk
COMMUNITY

COMMUNITY
Orchestras now give over 10,500 sessions, performances and events by, with and for the community and young people
Orchestras reach over 650,000 adults and young people in the community
Large proportion of 8,387 sessions for education, training or taking part come from In Harmony
dhacommunications.co.uk

dhacommunications.co.uk
ORCHESTRAS IN THE WORLD

ORCHESTRAS IN THE WORLD
International tours have remained consistent on 2009/10
10 orchestras have toured to China in the last year. Only 6 did so in 2009/10
Tours to the US are nearly twice as a high as in 2009/10
76% of countries toured to were in Europe in 2012/13
dhacommunications.co.uk

dhacommunications.co.uk
BEYOND THE CONCERT HALL

BEYOND THE CONCERT HALL
Significant increase in video recordings for streaming and/or download.
Up 119% on 2009/10
Only small change in radio/free audio for download up 2% on 2009/10
And also for paid CD and audio format at minus 1% on 2009/10
dhacommunications.co.uk

dhacommunications.co.uk
CREATING JOBS

CREATING JOBS
Orchestras provided over 10,000 employment opportunities in in 2012/2013
Orchestras are protecting their core artistic product; the players
Contract orchestras (997) and freelance orchestras (1016) gave specific number employed at end of financial year
Extra or deputy numbers (8,407) includes numbers of players taken on during whole year.
dhacommunications.co.uk
dhacommunications.co.uk
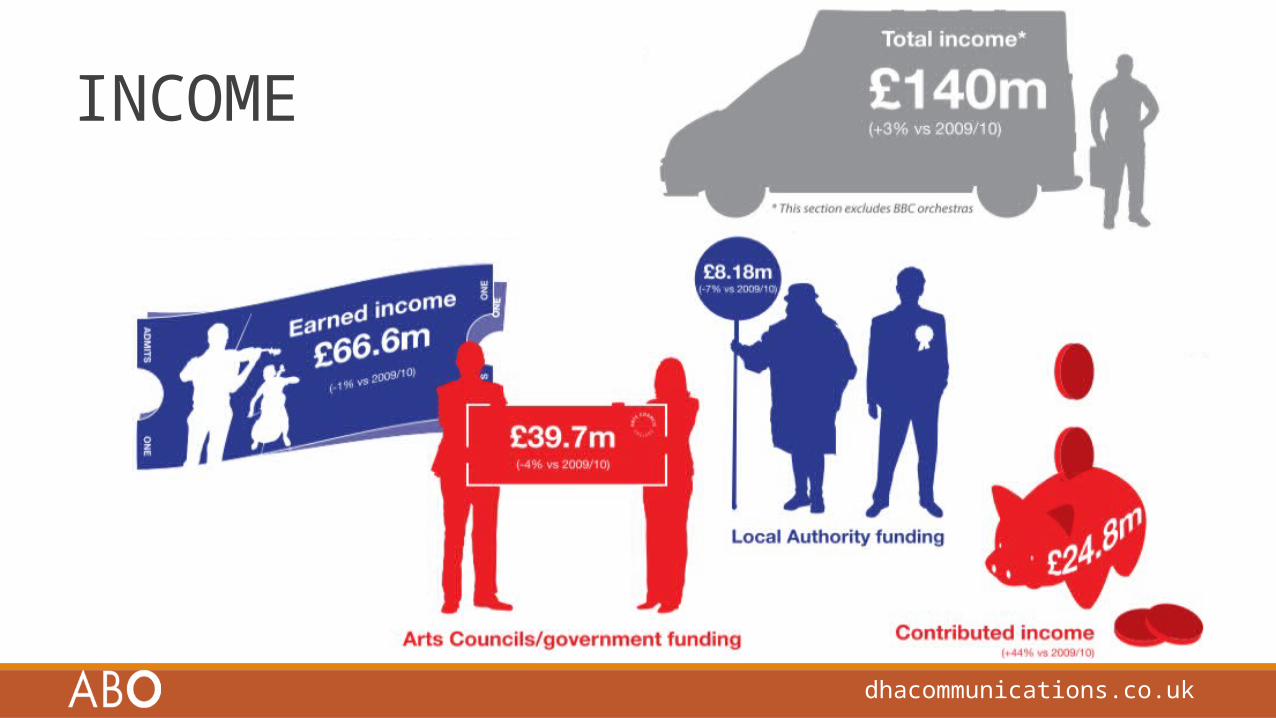
INCOME

INCOME
Taking each area of funding separately:
Total income is up by 3% on 2009/10
Earned income is down by 1% on 2009/10 Arts Council/Government income is down by 4% on 2009/10 Local authority funding is down by 7% on 2009/10 Contributed income is up by 44% on 2009/10
dhacommunications.co.uk

INCOME – INFLATION ADJUSTED
Adjusting income for inflation (CPI) gives a different picture:
Total income is down by 7% on 2009/10
Earned income is down by 11% on 2009/10 Arts Council/Government income is down by 14% on 2009/10 Local authority funding is down by 16% on 2009/10 Contributed income is up by 30% on 2009/10
dhacommunications.co.uk

dhacommunications.co.uk
PROPORTIONS OF TOTAL INCOME

INCOME In terms of proportion, contributed income has risen by 5% whilst public
investment has reduced by 3% as has earned income
Whilst the total pie has grown (up 3% on 2009/10) to £140 million, contributed income has become more important
Contributed income is still barely a fifth (18%) of total and public investment is down to 34% (from 37%) as a proportion of total
Earned income is close to 50% of total income, as a proportion of total.
dhacommunications.co.uk

dhacommunications.co.uk
CONTRIBUTED INCOME

CONTRIBUTED INCOME
Of orchestras’ contributed income, 38% is restricted to specific projects, particularly education, touring and building new facilities.
This means around £9.4m of orchestras’ £24.8m contributed income is restricted to be spent on particular projects and cannot be used to substitute directly for the fall in public investment.
dhacommunications.co.uk
IMPLICATIONSStrong narrative across most areas surveyedOrchestras delivering more:
Attendance up Huge community reach International tours strong Embracing new technology Artistic product protected Tackling challenge of reduced public funding
Contributed income has more than made up for reduced public investment in nominal terms – although there has been an overall fall in real terms.
Have orchestras shown the cuts are justified? Can they withstand more?
dhacommunications.co.uk

Arts Council England
GIA core income - excluding capital Income Inflation
Income at 10/11 rates
Cash change from 2010/11
Real terms change from 2010/11
2010/11 £465,563 Actual £465,563
2011/12 £375,768 Actual 2.33% £367,013 -19% -21%
2012/13 £344,898 Actual 1.77% £330,899 -26% -29%
2013/14 £331,779 Actual 2.00% £311,947 -29% -33%
2014/15 £322,668 Actual 2.10% £297,009 -31% -36%
2015/16 £312,284 Actual 1.50% £283,139 -33% -39%

dhacommunications.co.uk
Related Documents