EMBnet. journal 19.A POSTERS 57 DGW: an exploratory data analysis tool for clustering and visualisation of epigenomic marks Saulius Lukauskas 1 , Gabriele Schweikert 2 , Guido Sanguinetti 3 1 School of Informatics, University of Edinburgh, Edinburgh, United Kingdom 2 School of Informatics and Wellcome Trust Centre for Cell Biology, University of Edinburgh, Edinburgh, United Kingdom 3 School of Informatics & SynthSys, Synthetic and Systems Biology, University of Edinburgh, Edinburgh, United Kingdom Motivation and Objectives Novel sequencing based technologies such as ChIP-Seq and DNAse-Seq (reviewed e.g. in Furey 2012) are revolutionizing our understanding of chromatin structure and function, yielding deep insights in the importance of epigenomic marks in the basic processes of life. The emergent pic- ture is that gene expression is controlled by a complex interplay of protein binding and epi- genomic modification, leading to a hypothesis of a major regulatory role for the histone code of each gene (Wang et al., 2008). While histone marks (and other epigenomic marks) can be measured in a high throughput way, exploratory data analysis techniques for these data types are still largely lacking. Epigenomic marks ex- hibit characteristics that distinguish them funda- mentally from e.g. mRNA gene expression mea- surements: they are spatially extended across regions as wide as several kilobases, and often present interesting local structures, such as the presence of multiple peaks and troughs. These patterns often have a biological origin, such as the displacement of a nucleosome or the length of the first exon of a gene (Bieberstein et al., 2012), so that analysis tools that take into ac- count these spatial features would be desirable. However, each (combination of) epigenomic mark(s) at different locations in principle repre- sents a multivariate data point of different length (as peaks for the same mark in different locations can have widely differing lengths): this prevents the straightforward extension of well established data analysis techniques such as hierarchi- cal clustering to these data types. In this work, we present Dynamic Genome Warping (DGW), an open source clustering tool for epigenomic marks which addresses this problem by introduc- ing a local rescaling which allows to match (mul- tiple) epigenomic marks based on maximum similarity between shapes. DGW is based on Dynamic Time Warping, a well-established tech- nique in signal processing and speech recog- nition. Our tool handles simultaneously multiple epigenomic marks and is freely available as a Python stand-alone tool. It consists of a worker module, which distributes the computationally intensive parts across multiple processes auto- matically (thus using all available CPU cores), and an explorer module, which allows easy and adaptive inspection of the data set. Methods The basic algorithm underlying DGW is the classi- cal dynamic time warping algorithm (Sakoe and Chiba, 1978). This is a dynamic programming al- gorithm closely related to the classical sequence alignment algorithms. Specifically, given two se- quences a=(a1,…,aN) and b=(b1,…,bM), and a local distance between the elements of each sequence (e.g. Euclidean distance or Cosine distance), it constructs a warping path, i.e. a sequence of points in the two sequences that are mapped to each other. The warping path has the property of minimising the sum of the distances between the aligned points; further- more, it is monotonic (i.e. there are no inversions in each sequence) and maps the first and last point of sequence a to the first and last point of sequence b. The warping path also computes a warping distance between the two sequences (intuitively, how much one sequence has to be stretched to match the other). In order to avoid large stretches of a sequence being mapped to a single point of the other sequence, we imple- ment the constrained approach suggested in (Sakoe and Chiba, 1978). A modern review of the basic concepts can be found in e.g. (Muller 2007). DGW takes as input a series of genomic re- gions (as a bed file outputted by a peak finder, or as a set of predefined regions, e.g. defined win- dows around transcription start sites) and a num- ber of bam files for different epigenomic marks. Peaks are discretised in bins of 50 bp width. The DGW worker module then computes the warp-

Welcome message from author
This document is posted to help you gain knowledge. Please leave a comment to let me know what you think about it! Share it to your friends and learn new things together.
Transcript
EMBnet.journal 19.A Posters 57
DGW: an exploratory data analysis tool for clustering and visualisation of epigenomic marks
Saulius Lukauskas1, Gabriele Schweikert2, Guido Sanguinetti31School of Informatics, University of Edinburgh, Edinburgh, United Kingdom2School of Informatics and Wellcome Trust Centre for Cell Biology, University of Edinburgh, Edinburgh, United Kingdom3School of Informatics & SynthSys, Synthetic and Systems Biology, University of Edinburgh, Edinburgh, United Kingdom
Motivation and ObjectivesNovel sequencing based technologies such as ChIP-Seq and DNAse-Seq (reviewed e.g. in Furey 2012) are revolutionizing our understanding of chromatin structure and function, yielding deep insights in the importance of epigenomic marks in the basic processes of life. The emergent pic-ture is that gene expression is controlled by a complex interplay of protein binding and epi-genomic modification, leading to a hypothesis of a major regulatory role for the histone code of each gene (Wang et al., 2008). While histone marks (and other epigenomic marks) can be measured in a high throughput way, exploratory data analysis techniques for these data types are still largely lacking. Epigenomic marks ex-hibit characteristics that distinguish them funda-mentally from e.g. mRNA gene expression mea-surements: they are spatially extended across regions as wide as several kilobases, and often present interesting local structures, such as the presence of multiple peaks and troughs. These patterns often have a biological origin, such as the displacement of a nucleosome or the length of the first exon of a gene (Bieberstein et al., 2012), so that analysis tools that take into ac-count these spatial features would be desirable. However, each (combination of) epigenomic mark(s) at different locations in principle repre-sents a multivariate data point of different length (as peaks for the same mark in different locations can have widely differing lengths): this prevents the straightforward extension of well established data analysis techniques such as hierarchi-cal clustering to these data types. In this work, we present Dynamic Genome Warping (DGW), an open source clustering tool for epigenomic marks which addresses this problem by introduc-ing a local rescaling which allows to match (mul-tiple) epigenomic marks based on maximum similarity between shapes. DGW is based on Dynamic Time Warping, a well-established tech-
nique in signal processing and speech recog-nition. Our tool handles simultaneously multiple epigenomic marks and is freely available as a Python stand-alone tool. It consists of a worker module, which distributes the computationally intensive parts across multiple processes auto-matically (thus using all available CPU cores), and an explorer module, which allows easy and adaptive inspection of the data set.
MethodsThe basic algorithm underlying DGW is the classi-cal dynamic time warping algorithm (Sakoe and Chiba, 1978). This is a dynamic programming al-gorithm closely related to the classical sequence alignment algorithms. Specifically, given two se-quences a=(a1,…,aN) and b=(b1,…,bM), and a local distance between the elements of each sequence (e.g. Euclidean distance or Cosine distance), it constructs a warping path, i.e. a sequence of points in the two sequences that are mapped to each other. The warping path has the property of minimising the sum of the distances between the aligned points; further-more, it is monotonic (i.e. there are no inversions in each sequence) and maps the first and last point of sequence a to the first and last point of sequence b. The warping path also computes a warping distance between the two sequences (intuitively, how much one sequence has to be stretched to match the other). In order to avoid large stretches of a sequence being mapped to a single point of the other sequence, we imple-ment the constrained approach suggested in (Sakoe and Chiba, 1978). A modern review of the basic concepts can be found in e.g. (Muller 2007).
DGW takes as input a series of genomic re-gions (as a bed file outputted by a peak finder, or as a set of predefined regions, e.g. defined win-dows around transcription start sites) and a num-ber of bam files for different epigenomic marks. Peaks are discretised in bins of 50 bp width. The DGW worker module then computes the warp-
58 Posters EMBnet.journal 19.A
ing distance between each pair of peaks (to ac-count for antisense promoters, the distance is in fact computed also with peaks with direction re-versed). The worker module then computes and outputs a dendrogram, exactly as in hierarchical clustering.
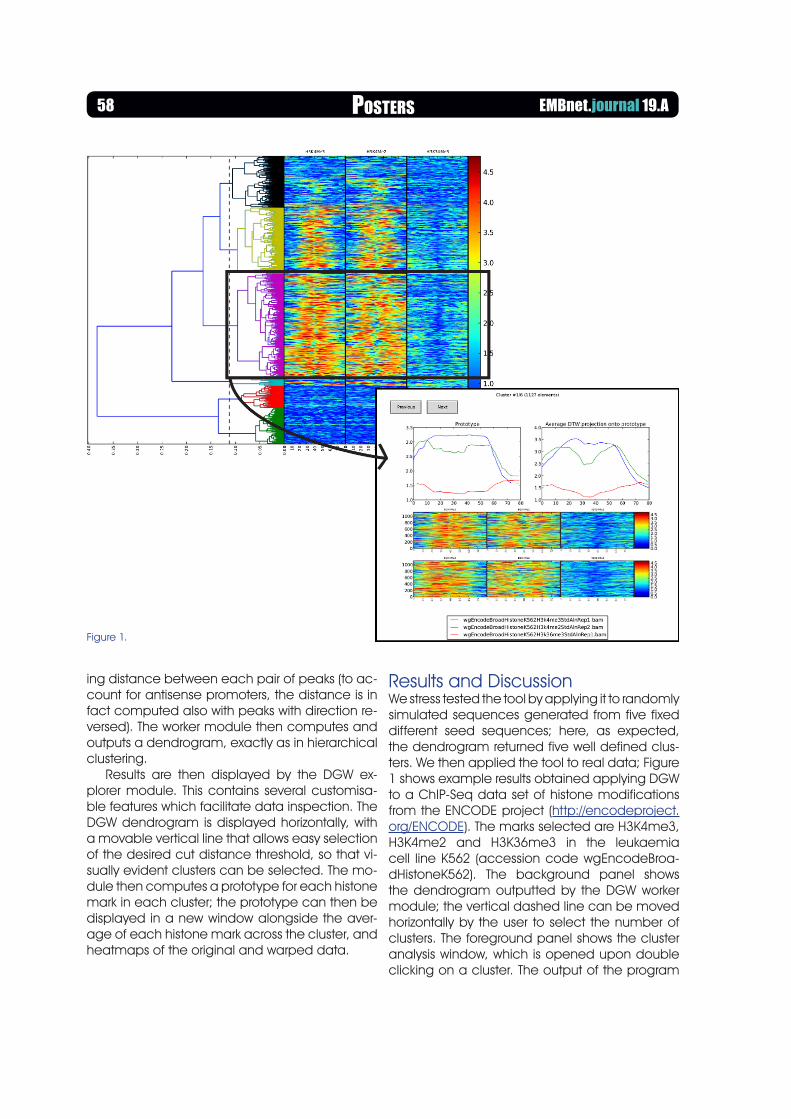
Results are then displayed by the DGW ex-plorer module. This contains several customisa-ble features which facilitate data inspection. The DGW dendrogram is displayed horizontally, with a movable vertical line that allows easy selection of the desired cut distance threshold, so that vi-sually evident clusters can be selected. The mo-dule then computes a prototype for each histone mark in each cluster; the prototype can then be displayed in a new window alongside the aver-age of each histone mark across the cluster, and heatmaps of the original and warped data.
Results and DiscussionWe stress tested the tool by applying it to randomly simulated sequences generated from five fixed different seed sequences; here, as expected, the dendrogram returned five well defined clus-ters. We then applied the tool to real data; Figure 1 shows example results obtained applying DGW to a ChIP-Seq data set of histone modifications from the ENCODE project (http://encodeproject.org/ENCODE). The marks selected are H3K4me3, H3K4me2 and H3K36me3 in the leukaemia cell line K562 (accession code wgEncodeBroa-dHistoneK562). The background panel shows the dendrogram outputted by the DGW worker module; the vertical dashed line can be moved horizontally by the user to select the number of clusters. The foreground panel shows the cluster analysis window, which is opened upon double clicking on a cluster. The output of the program
Figure 1.

EMBnet.journal 19.A Posters 59
can then be easily used with downstream tools to perform further biological analysis. The code is in the process of being released to GitHub (www.github.org) as an open source Python package.
The results clearly show that DGW provides a practical and user friendly tool for exploratory data analysis of high throughput epigenomic data sets, much like classical hierarchical clus-tering is for microarray time series. While evalua-tion of results is clearly an important step still to be performed, we believe the availability of explora-tory data analysis tools will play an important role in generating hypotheses and eventually clarify the role of epigenetics in fundamental biology.
AcknowledgementsG.Schw. acknowledges support from EC through the FP7- Marie Curie project “Epigenome
Informatics”. G.S. acknowledges support from the European Research Council through grant MLCS306999.
References Bieberstein N, Carrillo Oesterreich, F, Straube, K and
Neugebauer, K (2012). “First exon length controls active chromatin signatures and transcription”. Cell, 2 (1), 62-68.
Furey TS (2012) “ChIP-seq and beyond: new and improved methodologies to detect and characterize protein-DNA interactions.” Nat Rev Genet. 13:840-52.
Muller M, Dynamic Time Warping, Springer, 2007.Sakoe H and Chiba S (1978). “Dynamic programming algo-
rithm optimisation for spoken word recognition” IEEE Trans. On Speech, Acoustics and Signal Processing 26(1), 43-49.
Wang Z, Zang C, Rosenfeld JA, Schones DE, Barski A et al. (2008). “Combinatorial patterns of histone acetylations and methylations in the human genome.”. Nat Genet 40 (7): 897–903.
Related Documents