DFA Insurance Company Case Study, Part I: Reinsurance and Asset Allocation John C. Burkett, Ph.D., ACAS, MAAA, Thomas S. McIntyre, FCAS, MAAA and Stephen M. Sonlin, CFA 59

Welcome message from author
This document is posted to help you gain knowledge. Please leave a comment to let me know what you think about it! Share it to your friends and learn new things together.
Transcript

DFA Insurance Company Case Study, Part I: Reinsurance and Asset Allocation
John C. Burkett, Ph.D., ACAS, MAAA, Thomas S. McIntyre, FCAS, MAAA and
Stephen M. Sonlin, CFA
59

Dynamic Financial Analysis DFA Insurance Company Case Study
Part h Reinsurance and Asset Allocation
By John C. Burkett, Ph.D., ACAS, MAAA, Thomas S. Mclntyre, FCAS, MAAA
and Stephen M. Sonlin, CFA
Swiss Re Investors 111 S. Calvert Street, Suite 1800
Baltimore, MD 21202 Phone: (410) 369-2800
Fax: (410) 369-2900
Abstract
As a result of published papers, shared research and call paper programs such as this one, the technical specifications behind Dynamic Financial Analysis (DFA) have been well developed. This has led to a high level of convergence among many of the different concepts, models and processes behind DFA. The next logical step in promoting DFA is to show how these models and processes can be implemented to produce value to the insurance industry, its policyholders and its shareholders.
This paper has been submitted in response to the Committee on Dynamic Financial Analysis 2001 Call for Papers. The authors have applied dynamic financial analysis to DFA Insurance Company (DFAIC) to address the efficiency and effectiveness of DFAIC's reinsurance programs and asset allocation strategies. The DFA model used for this analysis was the Swiss Re Investors Financial Integrated Risk Management (FIRM TM) System. This paper is Part 1 of a two-part submission. Part 2 deals with using DFA to explore capital adequacy and capital allocation issues.
60

Dynamic Financial Analysis DFA Insurance Company Case Study
Part I: Reinsurance and Asset Allocation
By John C. Burkett, Ph.D., ACAS, MAAA, Thomas Mclntyre, FCAS, MAAA
and Stephen M. Sonlin, CFA
Preface
Dynamic Financial Analysis (DFA) is still fairly new to a property-casualty insurance industry whose roots can be traced back to the 17 ~ Century end earlier. As such it is not surprising that the industry is cautious about a technology that purports to look at their business in a whole new way. The Casualty Actuarial Society, being active in the formulation and development of DFA, has classified it as:
"a systematic approach to financial modeling in which financial results are projected under a variety of possible scenarios, showing how outcomes might be affected by changing internal and~or external conditions~."
As a result of published papers, shared research and call paper programs such as this one, the technical specifications behind DFA have been well developed. This has led to a high level of convergence among many of the different concepts, models and processes behind DFA. Unfortunately, while the details of DFA are better understood, the industry is still scratching its collective head on what to do with this new technology.
Part of the problem has to due with the fact that DFA is considered to be a modeling tool, one that can be used to supplement existing tools. While a modeling tool is essential for implementing dynamic financial analysis, it is just one element of a much grander picture. More than a model, dynamic financial analysis is a way of thinking that weaves through the entire operations of an insurance company. Effective dynamic financial analysis calls for dedicated and knowledgeable professionals who are trained in the intricacies of DFA and enabled to identify and take advantage of current industry and company inefficiencies. DFA promotes moving from existing structures designed to evaluate and reward the individual pieces of the business to a structure that encourages and rewards the evaluation of strategic decisions in a holistic, total company framework.
1 Casualty Actuarial Society Dynamic Financial Analysis Website, DFA Research Handbook, http:/Iwww.casact.orglRESEARCHIDFA
61

For these reasons we were excited to embrace this call paper program exercise. While the original concept may have been designed to evaluate different DFA modeling techniques and the resulting analyses as they relate to a common problem and common data, we decided it was a perfect opportunity to show how DFA might work in the insurance company of tomorrow. The ultimate benefit to the company is not just the final answer, but rather the increased understanding and the common grounds of communication that comes from going through the DFA process.
The proposed situation involves DFA Insurance Company (DFAIC), a multi-line property- casualty insurance company that is unknowingly the target of a potential acquisition. The analysis was conducted from the point of view of the acquiring company. We will define the acquiring company, Falcon, as a newly capitalized holding company that is organized and structured to run its business in a holistic manner. As such Falcon has a financial risk management unit led by its Chief Risk Officer (CRO) who reports directly to the CEO. The CEO has asked that the following questions about DFAIC be addressed:
1. Is the Company adequately capitalized? Is there excess capital? How much capital should the Company hold as a stand-alone insurer?
2. How should the capital be allocated to line of business?
3. What is the return distribution for each line of business and is it consistent with the risk for the line?
4. Should the Company buy more or less reinsurance? What type? How efficient is its current reinsurance program?
5. How efficient is the asset allocation?
In a traditional insurance company these questions would be farmed out to different business units within the organization. These units would include but not be limited to the actuarial department, the reinsurance department and the investment department. Each unit would perform their stand-alone analysis and report back to the CEO using terminology and metrics appropriate to their assigned task. The CEO would be left to assimilate all the individual analyses and use her professional judgment and insights to build a complete picture of the attractiveness of the potential acquisition.
Falcon, however, is organized in such a way that the complete analysis can be performed within the financial risk management unit with input from professionals in each of the above-mentioned departments. The results of the analysis can thus be presented to the CEO using a single set of terminology and metrics that consider both the individual and joint dynamics of the issues in question.
Due to the scope and breadth of the required analysis, we will present the DFA study in two papers. This paper will deal with the efficiency of the reinsurance and asset allocation strategies and a sister paper will concentrate on capital allocation and capital adequacy issues. Note that despite breaking the analysis up into two papers, the overall analysis is the result of a common DFA model and process.
DFA, being holistic, allows a company to deal with all of its major strategic decisions simultaneously within a single framework. As such it is not unusual to have an analysis
62
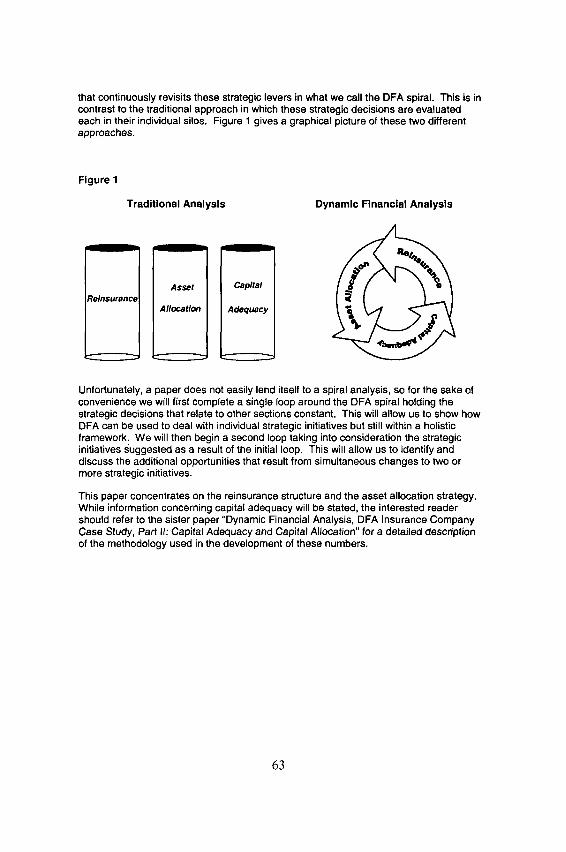
that continuously revisits these strategic levers in what we call the DFA spiral, This is in contrast to the traditional approach in which these strategic decisions are evaluated each in their individual silos. Figure 1 gives a graphical picture of these two different approaches.
Figure 1
Traditional Analysis Dynamic Financial Analysis
I I
Reinsurance Asset
Allocation
Capital I
Adequacy I
Unfortunately, a paper does not easily lend itself to a spiral analysis, so for the sake of convenience we will first complete a single loop around the DFA spiral holding the strategic decisions that relate to other sections constant. This will allow us to show how DFA can be used to deal with individual strategic initiatives but still within a holistic framework. We will then begin a second loop taking into consideration the strategic initiatives suggested as a result of the initial loop. This will allow us to identify and discuss the additional opportunities that result from simultaneous changes to two or more strategic initiatives.
This paper concentrates on the reinsurance structure and the asset allocation strategy. While information concerning capital adequacy will be stated, the interested reader should refer to the sister paper "Dynamic Financial Analysis, DFA Insurance Company Case Study, Part Ih Capital Adequacy and Capital Allocation" for a detai led description of the methodology used in the development of these numbers.
63

The DFA Process
The DFA process refers to a high-level overview of how current strategies are evaluated and how strategic alternatives are developed. We have outlined, in Figure 2, the DFA process that was used for the DFAIC analysis.
Figure 2
The Dynamic Financial Analysis Process
,
rate I
2. Collect I Data j
I 1, Set Goals and Objectives
Present Findings
The remainder of this paper will explore the assumptions and model details that we used in performing DFA on DFA Insurance Company. We will run through the seven steps of the DFA process and describe the work performed in each step. We will conclude this paper with some final thoughts on this exercise and on DFA in general.
Introduction to DFAIC
DFAIC is a privately held property-casualty insurance company operating in all fifty states, with business concentrations in the northeast and mid-west. The company writes personal and "main-street" commercial coverage through independent agents and
04

maintains an "A" rating from A.M. Best. The company's northeast and mid-west concentrations limit their exposure to severe catastrophes 2.
DFAIC's underwriting results have deteriorated recently, but the 1999 combined ratio, 105.1, was slightly better than the industry average, 107.83. DFAIC's balance sheet appears slightly leveraged versus the current industry average, but its premium-to- surplus and reserves-to-surplus ratios of 1.47 and 1.45, respectively, are low by historical standards. The company cedes a relatively small portion (8.5%) of its direct written premium to a combination of excess-of-loss (XOL), per risk excess and catastrophe reinsurance contracts.
DFAIC's invested assets are reportedly weighted toward tax-exempt municipal bonds (56%), with smaller allocations to government and corporate bonds and equities. The company's cash position is unusually large at 18% of invested assets, versus the industry average, 4.0% 4. Investment income earned in 1999 was 7.0% of terminal invested assets.
Step 1: Goals and Objectives
The DFA process starts with a thorough discussion and understanding of the goals, objectives, constraints and risk tolerance of the company. This step determines the metrics that will be most important in evaluating alternative strategic initiatives. It also tends to be a valuable exercise as it helps management think through, focus on, and communicate exactly those items that are most important to them as a company. These items are stated in terms of financial statement results and, once determined, provide a common set of metrics that can be applied to all of the company's financial strategic decisions.
There is no limit to the number and types of possible objective functions that can be used for evaluating strategic initiatives. Some simple objective functions might be defined as expected surplus (policyholder surplus, shareholders' equity, or economic value) for the reward measure, and the standard deviation of the surplus for the measure of risk. Alternatively, downside risk measures can be substituted for standard deviation or company-specific risk/reward functions can be defined.
2 We have assumed that DFAIC has no substantial earthquake exposure.
31999 industry excluding state funds combined ratio after policyholder dividends. "Best's Aggregates & Averages, Property-Casualty U.S.", 2000 Edition, p. 119.
4 "Best's Aggregates & Averages, Property-Casualty U.S.", 2000 Edition, p. 122.
5.5

In the case of the potential acquisition of DFAIC, the goals and objectives for the analysis would be set by Falcon's board and senior management team 5. As such, Falcon's objective is to undertake strategies that will maximize the economic value of the company at the end of a five-year time horizon.
The five-year horizon was chosen since it is consistent with Falcon senior management's business planning horizon and it allows them to benefit from time diversification. This also gives Falcon a competitive advantage over those companies that are forced to operate on a year-to-year basis due to shareholder, regulatory or company-imposed constraints.
Extending the time hodzon beyond the company's planning horizon increases the risk that business does not develop as planned, and can thus reduce the effectiveness of the analysis. Risk is defined as the standard deviation of economic value, as Falcon management believes that this is an indicator of true economic risk.
One criticism of economic value as an insurance company objective is that it does not reflect statutory or regulatory constraints. Further, it is not part of the required annual financial reporting of insurance companies and is therefore not standardized or completely understood. Thus, a second risk measure, which was treated as a constraint, dealt with the reality of statutory reporting and regulatory oversight. This was reflected in the calculation of the probability of the statutory surplus falling below a minimum threshold.
Step 2: Data Collection
Data collection and evaluation is a time-consuming but important part of DFA. Since DFA deals with all financial aspects of insurance company operations the data requirements can be significant ~. Published financial information, similar to data used in this case study, is readily available from organizations such as A.M. Best, One Source, shareholder reports, the SEC and numerous other sources. These sources streamline the data gathering and data entry required to feed (parameterize) DFA models. However, analyses based solely upon public databases and published financial information risk misinterpretation of events, trends, and on-going company operations. As such, DFA studies limited to public data are sub-optimal and if not carefully implemented and documented, can lead to inappropriate conclusions.
In this section, we discuss some of the.problems of using public data for the DFAIC case study. However, we must be careful to separate the real pitfalls of public data from the
s Since no specific guidelines for measuring the effectiveness or efficiency of the strategic initiatives have bean communicated in the instructions to the case study, we were free to elect measures that were in accordance with the holisti¢ nature of our newly capitalized holding company.
e The data collection for DFAIC was made simple in that it was completely provided by the CAS with instructions that no additional information would be made available. In the case of DFAIC only a smell portion of the plethoraof publicly available data was provided.
66
artificial ones introduced by the fictitious public data created for DFAIC. Artificial data problems are those leading to questions that could be resolved with additional public information 7. The information provided for DFAIC is more reflective of the limitations one might experience dealing with non-U.S, companies, where publicly available data is much more limited.
Despite the fact that this DFAIC case study does not require a formal data collection process, there are still the important chores of data evaluation and reconciliation of the DFAIC data. We have undertaken such processes and found a number of areas where additional data and research would be warranted. Since no additional research could be undertaken, we will note a few of these irregularities here and then make reasonable assumptions to correct for these inconsistencies.
A solid data evaluation process requires the reconciliation of the provided information to the company's last reported financial statements. In putting together this reconciliation, we found that the investment income earned on the portfolio is inconsistent with the stated asset allocation. The asset allocation for DFAIC is purported to be 70% fixed- income, four-fifths of which is in tax-exempt bonds. DFAIC's large allocation to tax- exempt bonds, given the lower yields on these securities, is inconsistent with its reported above-average investment income (7% versus 5% industry averageS). In order to reconcile the stated asset allocation to the reported investment income, the tax-exempt bonds would have to be earning a book yield in excess of 7.5%. Since market yields on tax-exempt municipal bonds were in the range of 3%-6% during 1999, the tax-exempt holdings of DFAIC would have to contain a large unrealized capital gain. However, the reported book and market values on these holdings are very close to each other: $3,327M and $3,478M, respectively, it is unlikely that the tax-exempt bonds could be providing such a contribution to investment income.
This inconsistency raises some serious concerns regarding data quality of the DFAIC asset portfolio. Examination of Schedule D reveals that over half of the bond holdings of DFAIC are classified in the "Special Rev & Assessment" category. This category typically contains taxable structured bonds (mortgage-backed and asset-backed securities). Since tax-exempt holdings are not specifically categorized in Schedule D, it is likely that some or all of the bond holdings of DFAIC that were reported to be tax- exempt bonds are actually taxable bonds.
Further evidence to support this theory lies in the fact that if all bonds were assumed to be taxable, the calculated investment income would reconcile with the reported investment income results. If complete statutory records for DFAIC were available, analysis of the Schedule D details would resolve any doubt about this inconsistency. Since no such details were available, professional judgment must guide us on how we should model DFAIC's current asset portfolio. Thus, given that the investment income, and book and market values of the asset portfolio can be directly traced to the provided
Because DFAIC is not a real company and it would have been impractical for the CAS to provide a complete DFAIC annual statement, there is no such additional information (e.g., prior years' annual statements, annual statement schedules).
e 1999 industry excluding state funds investment yield. "Best's Aggregates & Averages, Property- Casualty U.S.", 2000 Edition, p. 117.
67

financial statements, the most logical and consistent course of action is to assume that entire fixed-income portfolio of DFAIC is taxable.
In contrast to the artificial data problems introduced by fictional data, there were other issues raised by the reported DFAIC data that, if the option were available, could be resolved by talking to management. Prominent among those issues were (1) DFAIC's 18% allocation to cash and short-term investments (industry average is 4%) and; (2) reported changes in case reserve adequacy. These are the types of data analyses that are required at the front end of the DFA process to assure the robustness of the ultimate DFA findings.
Step 3: Model Parametedzation
Model parameterization refers to how the asset and liability variables are assumed to behave over the forecast horizon. Assumptions concerning the general economic and capital market environment as well as the specific assets and liabilities of DFAIC need to be parameterized. These assumptions can have a substantial impact on the evaluation and the recommended strategies. In the modeling world this risk is referred to as "parameter risk." The impact of parameter risk can be investigated and better understood through sensitivity testing.
Economic and capital market assumptions are an important part of any quantitative assessment of the potential rewards and risks associated with alternative strategic business decisions. These assumptions need to reflect both recent conditions and longer-term relationships inherent in the economy and capital markets. The simulations based on these assumptions should comprise a reasonable set of future paths that, while consistent with histodcal observations, reflect a prospective view of economic and capital market expectations and uncertainties.
The model that we used to generate our DFA economic and capital market simulations (FIRM TM Asset Model) differs from traditional mean/variance models in that economic variables, including interest rates and inflation, are explicitly modeled using accepted and rigorously tested stochastic processes. Capital market returns are then generated on a consistent basis with the underlying economic environment. This type of model has the following advantages over traditional mean/variance models:
• the explicit modeling of both economic and capital market variables;
• the ability to incorporate mean reversion in yields, providing for control over the serial correlation of capital market returns over time;
• multi-period simulation capabilities; and
• additional flexibility in modeling asset categories such as mortgage-backed securities and other securities with embedded options.
The economic and capital market parameterization process involved identifying and selecting asset classes that best represented the homogeneous groups of invested assets available to DFAIC. The twelve asset classes we defined and modeled were:
68
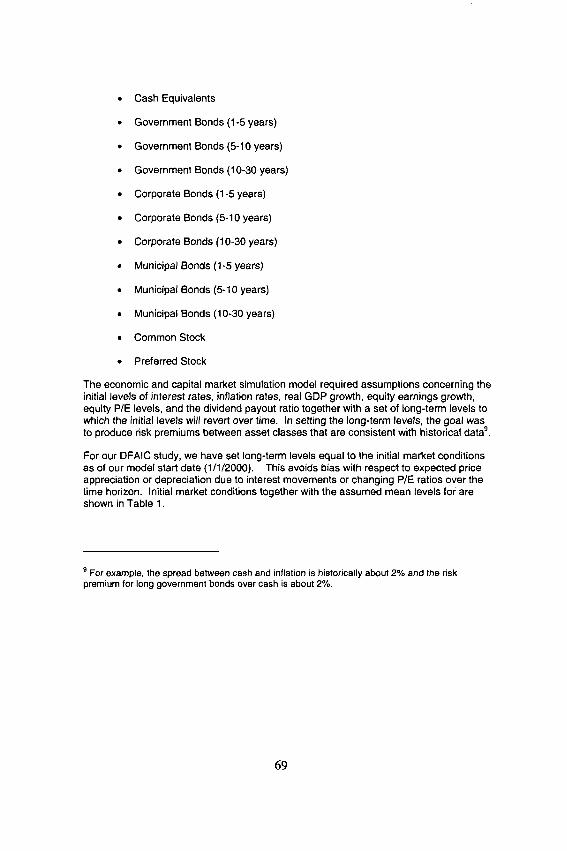
• Cash Equivalents
° Government Bonds (1-5 years)
• Government Bonds (5-10 years)
• Government Bonds (10-30 years)
• Corporate Bonds (1-5 years)
• Corporate Bonds (5-10 years)
• Corporate Bonds (10-30 years)
• Municipal Bonds (1-5 years)
• Municipal Bonds (5-10 years)
• Municipal Bonds (10-30 years)
• Common Stock
• Preferred Stock
The economic and capital market simulation model required assumptions concerning the initial levels of interest rates, inflation rates, real GDP growth, equity earnings growth, equity P/E levels, and the dividend payout ratio together with a set of long-term levels to which the initial levels will revert over time. In setting the long-term levels, the goal was to produce risk premiums between asset classes that are consistent with historical data 9.
For our DFAIC study, we have set long-term levels equal to the initial market conditions as of our model start date (1/1/2000). This avoids bias with respect to expected price appreciation or depreciation due to interest movements or changing P/E ratios over the time horizon. Initial market conditions together with the assumed mean levels fo~: are shown in Table 1.
9 For example, the spread between cash and inflation is historically about 2% and the risk premium for long government bonds over cash is about 2%.
69

Table 1: Initial and Mean Interest Rate and Share Assumptions
Variable Initial Conditions Mean 1111200010 Levels
Government Yields: 3-Month Interest Rate 5.53% 5.53% 1-Year Interest Rate 6.19% 3-Year Interest Rate 6.34% 5-Year Interest Rate 6.39% 10-Year Interest Rate 6.36% 30-Year Interest Rate 6.56% 6.56%
Corporate Yields: 3-Month Interest Rate 6.16% 6.16% 1-Year Interest Rate 6.70% 3-Year Interest Rate 6.99% 5-Year Interest Rate 7.11% 10-Year Interest Rate 7.28% 30-Year Interest Rate 7.65% 7.65%
Municipal Yields: 3-Month Interest Rate 3.91% 3.91% 1-Year Interest Rate 4.09% 3-Year Interest Rate 4.54% 5-Year Interest Rate 4.79% 10-Year Interest Rate 5.22% 30-Year Interest Rate 5.99% 5.99%
Expected Price Inflation 2.5% 2.5%
Expected Real GDP 2.5% 2.5%
S&P 500 P/E Ratio 32 32
S&P 500 Earnings Growth 9.0%
S&P 500 Dividend Payout Ratio 40% 40%
The returns for cash equivalents, bonds and common stock are directly controlled by the initial and mean assumptions shown in Table 1.
~ Source: Bloomberg
70
Cash Equivalent returns are the accumulation of 1-month government interest rates over time. Government Bond returns are a function of the applicable interest rate level, the change in the rate and the bond maturity. Corporate and Municipal Bond returns are modeled as a proxy to the US Single A corporate and the insured general obligation municipal bond markets respectively. They are calculated similarly to government bond returns. Corporate yields are modeled at a stochastic spread to government yields and municipal yields are modeled as a stochastic ratio to the government yields. Reported market yields on corporate bonds are adjusted to reflect historical defaults 11. Common Stock returns are modeled as a proxy to the S&P 500 index. The returns are composed of capital gains/losses plus dividends TM.
Table 2 shows the expected annual (arithmetic) and annualized compound (geometric) returns for each of the twelve modeled asset classes.
11 This is based on the lO-year cumulative default study for Single A bonds provided by Moodys. A 50% recovery rate on defaults is assumed.
Tz Because we are assuming that long-term mean PIE ratios are equal to initial PIE ratios, valuation changes are not reflected in the risk premium between stocks and bonds. Thus the modeled equity risk premium is less than the historical average (6-7%), but is in-line with the historical average when adjusted for valuation changes.
?1

Table 2: Simulated Five-Year Return StatlsUcs '3
Expected Annualized Annualized Annual Annual Compound Compound
Asset Class Return Std Dev Return Std Dev
Cash Equivalents 5.9% 1.9% 5.9% 1.4%
US Gov't Bonds (1-5) 6.5% 3.5% 6.5% 0.8% US Gov't Bonds (5-10) 6.9% 6.7% 6.7% 1.8% US Gov't Bonds (10-30) 7.4% 10.7% 6.9% 3.3%
US Corporate Bonds (1-5) 7.2% 3.6% 7.2% 0.9% US Corporate Bonds (5-10) 7.6% 6.8% 7.4% 1.9% US Corporate Bonds (10-30) 8.0% 10.8% 7.5% 3.3%
US Municipal Bonds (1-5) 4.9% 3.2% 4.8% 0.7% US Municipal Bonds (5-10) 6.1% 7.8% 5.8% 2.0% US Municipal Bonds (10-30) 7.0% 11.8% 6.4% 3.2%
US Stock 10.8% 20.0% 9.3% 7.6% Preferred Stock 8.3% 12.6% 7.7% 4.2%
The operations of insurance companies differ from other industries for a number of reasons. Prominent among these is the receipt of payment for a product before the magnitude or timing of the product's costs are known to the company (insurer). A reserve must be established to account for this contingent obligation. The importance of liabilities to the operations of an insurance company implies a similarly important role to an appropriate insurance company DFA model. Such items as payment patterns, loss ratios and reserves, expense ratios, and premiums are examples of obvious inputs to a DFA model. Further, one must apply these and other inputs within the context of other considerations such as line of business, whether we are generating results gross or net of reinsurance, or whether these parameters are applied to business already written or business to be written at some future time. This section will not focus on the details but rather present a general overview of the parameterization process for losses and liabilities as well as some of the more interesting particulars.
Our study of DFAIC's current reinsurance program and how it compares to alternative programs does not include loss portfolio transfers or other retrospective coverage. Hence existing business, with its attendant loss and unearned premium reserves, is modeled on a net of reinsurance basis. New business, however, is modeled on a gross basis. This allows us to vary prospective reinsurance strategies and compare the consequences of differing strategies. Since a principle focus of our paper is the current reinsurance program and its possible alternatives, we begin with a brief discussion of
'3 Expected annual return statistics are arithmetic averages and are indicative of risk and return expectations over a one-year holding period. Annuahzed compound return statistics are geometric averages and reflect the impact of time dwersification over the five-year holding period.
72

DFAIC's current reinsurance program and its implications for parameterizing our DFA model.
DFAIC's current reinsurance program includes excess of loss coverage for property, liability, and workers compensation risks, as well as coverage for catastrophes. In order to model the effects of these and alternative treaties, we generated individual large losses and occurrences on a gross of reinsurance basis. This necessitates the development of both frequency and severity probability distributions within the context of a collective risk model. Both company-specific and industry experience were gathered and analyzed for this purpose. Once the collective risk model was ready, individual large losses and catastrophes were generated stochastically and reinsurance covers were applied to obtain simulated losses net of reinsurance. Normally, company management would be consulted before finalizing company specific assumptions such as reinsurance arrangements or the frequency and severity of large losses and catastrophes.
In setting up our model, we condensed DFAIC's business into five distinct lines: Workers Compensation, Auto Liability (both personal and commercial), Property (homeowners and CMP property coverage), General Liability (other liability, product liability, special liability, and CMP liability coverage), and All Other (predominantly auto physical damage). Segregation of business into these five lines allows for the effective modeling of reinsurance programs without burying results within a mass of detail. Each of these five lines is assigned a set of descriptive parameters to appropriately model its constituent line of business. Needed parameterizations relate to such items as premiums, losses (including loss adjustment expenses), other expenses, and payment patterns, as well as their stochastic properties. A preliminary step in our analysis involved restating historical results to be consistent with our five modeled lines of business TM.
Projections of expected future premiums and loss ratios are in part based upon our assumed future business plans for DFAIC. An analysis of DFAIC's Schedule P reveals a recent deterioration Jn underwriting results and earned premium Jevels. Such a situation might indicate past DFAIC rate reductions made in an attempt to maihtain market share within a competitive environment. Falcon's business plan would be to raise rates thereby restoring loss ratios to DFAIC historical levels in three to five years. Anticipated effects of this business plan are reflected in our parameterization of future written premium levels.
14 E.g. CMP results were segregated into properly or casualty and allocated to our Property or General Liability lines of business, respectively.
"73

Table 3: Projected Growth Rates for Written Premium
Workers Comp Auto Liability Property General Liability All Other
2000 -2.5% -2.5% -2.5% -2.5% -2.5%
2001 -2.5% -2.5% -2.5% -2.5% -2.5%
2002 -2.5% -2.5% -2.5% -2.5% ' -2.5%
2003 0% 0% 0% 0% 0%
2004 2,5% 2.5% 2.5% 2.5% 2.5%
DFAIC's simulated losses have been modeled in two pieces, core and large. Bdefly, losses are categorized as large or core depending on magnitude. Large losses are simulated through a collective risk model, while core losses, specifically core loss ratios, are generated through a mean-reverting, momentum-driven random walk.
The model user determines the appropriate mean reversion factor, momentum factor and long term average core loss ratio. Considerations in selecting such parameter values might include an anticipated underwriting cycle or other market change. The actual simulated core loss ratio is generated from a user-selected distribution having a mean and a variance defined by the user. A blind algorithmic approach to selecting these parameters is not appropriate. As is true throughout the parameterization process, simulated results must be constantly checked to verify the reasonableness of results. For example, the variance of simulated, total loss ratios was checked against estimates of loss ratio volatility obtained from historical company results. Modeled gross accident year loss ratios by year and by line of business are shown in Table 3.
74
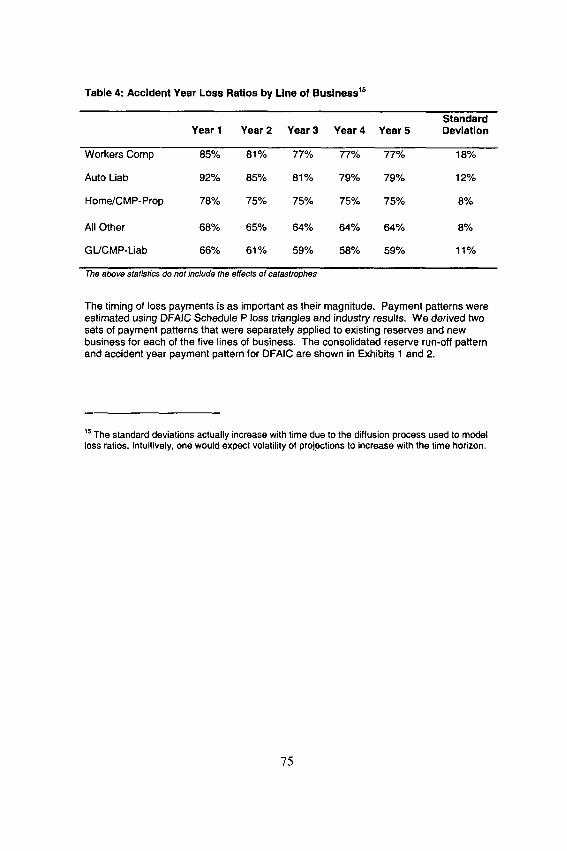
Table 4: Accident Year Loss Ratios by Line of Business is
Standard Year 1 Year 2 Year 3 Year 4 Year 5 Deviation
Workers Comp 85% 81% 77% 77% 77% 18%
Auto Liab 92% 85% 81% 79% 79% 12%
Home/CMP-Prop 78% 75% 75% 75% 75% 8%
All Other 68% 65% 64% 64% 64% 8%
GL/CMP-Liab 66% 61% 59% 58% 59% 11%
The above statistics do not include the effects of catastrophes
The timing of loss payments is as important as their magnitude. Payment patterns were estimated using DFAIC Schedule P loss triangles and industry results. We derived two sets of payment patterns that were separately applied to existing reserves and new business for each of the five lines of business. The consolidated reserve run-off pattern and accident year payment pattern for DFAIC are shown in Exhibits 1 and 2.
~5 The standard deviations actually increase with time due to the diffusion process used to model loss ratios. Intuitively, one would expect volatility of projf~ctions to increase with the time hodzon,
75

Exhibit I DFNC a Consolidated Reserve Run-off Pattern
40%,
35%-
30%-
__. 25%-
"~ 20%-
1 ,~ 15°/o .
10%-
5%-
0%
Duration 2 7 years
1 2 3 4 5 6 7 8 9 10 11 12 13 14 15
Year
Exhibit 2 DFAIC a Consolidated Accident Year Payment Pattern
s°%1~ I
,0% !
3 0 % o.
25%
~ 2 0 % . i n
' %NI I 10%-
5%-
0%-
Duration 2 1 years
I 2 3 4 5 6 7 8 9 10 11 12 13 14 15
Year
?6

Expenses, other than the loss adjustment expenses already incorporated into the loss ratios, were modeled as both fixed and variable. Actual values were again obtained through a combination of company-specific and industry statistics.
We have already discussed some of the randomness modeled into the projected core loss ratios. Further randomness is introduced to the model through the sensitivity of losses, expenses, and premiums to unexpected changes in the level of inflation. For DFAIC, we modeled the losses and fixed expenses as being immediately and fully responsive to unexpected changes in the level of inflation while premiums were partially responsive after a one-year time lag. Inflation sensitivity introduces a stochastic element affecting loss ratios, expenses, premiums, and payment patterns.
The simulations include a reasonable level of positive correlation between lines of business as indicated in Table 5.
Table 5: Ultimate Loss Ratio Correlation Coefficients
WC Auto Property GL Other
WC 1.0
Auto 0.3 1.0
Property 0.4 0.4
GL 0.4 0.5
Other 0.2 0.3
1.0
0.6 ° t .0
0.3 0.3 1.0
"Note that the GL/Property correlation coefficient is artificially inflated because CMP less ratios are a component of the loss ratios for both lines.
Such positive correlation between lines of business is commonly accepted. It is probably the result of several factors, including changes to overall pricing levels in the insurance market and unanticipated inflation impacting the loss ratios of all lines of business.
Assumptions concerning correlation between lines of business are part of a series of parameter assumptions important within the context of building an appropriate DFA model. Because of our inability to access DFAIC for further information, it is especially important that our assumptions ~re reasonable both in isolation and in conjunction with other assumptions. For example, our collective risk model for generating workers compensation losses gross of reinsurance appears reasonable when compared to industry and available DFAIC statistics. But just as important, when we used this loss model to develop pricing for the current workers compensation excess of loss cover, the indicated reinsurance premium was comparable to that indicated by DFAIC Annual Statement exhibits. Such observed consistencies build confidence in the model and its assumed parameter values.
?7

The analysis of alternative reinsurance structures is a key component in our DFA analysis. Such analyses are meaningless if not carried out under consistent and proper assumptions. In the particular case of the workers compensation loss model, we subsequently used this model to assist in pricing alternative reinsurance arrangements. If the same loss model is not used to price current and alternative reinsurance structures, then perceived differences in the efficiencies of these structures might be a function of different underlying loss models as opposed to true differences in efficiencies. Inconsistencies in actual reinsurance coverage and re~ated premiums available in the market surely exist. Our focus here, however, is to seek more efficient reinsurance structures, not over/under priced coverage.
Developing reasonable and consistent parameter assumptions for a DFA model is challenging at best, and can be particularly difficult when dealing with reinsurance arrangements. It is important to continually test for the reasonableness of assumptions both in isolation and in tandem with other assumptions.
Step 4: Running the Model
In order to become comfortable with a particular modeling system for implementing DFA, one must understand the system's underlying methodology and how that particular methodology will impact the results of the analysis. By DFA model methodology we refer to the specific technical implementation of the DFA process.
Whereas the general DFA process has become fairly standardized, there are still a number of different methodologies that are used in the technical implementation of a DFA model. Since the technical implementation of a model can have a significant impact on the results of an analysis, it is imperative that the users of a model sign off on the technical implementations and understand how the model's methodology will impact the analysis. The risk that model results are specific to a particular DFA methodology is referred to as "model risk." This is a difficult risk to evaluate; due to the time, effort and expense of performing DFA, it is often impractical to duplicate the analysis using different DFA modeling systems. As such, users should look for systems that provide a significant amount of flexibility and whose underlying fixed methodologies are consistent with their views of the insurance and financial markets.
At Swiss Re Investors, we developed our Financial Integrated Risk Management (FIRM TM) System as the modeling tool backing our DFA process. The FIRM System, like most DFA systems, uses simulation techniques to model both the assets and liabilities of an insurance company; The projected cash flows are transformed into future balance sheets and income statements that reflect GAAP, statutory, tax and economic viewpoints. The simulations are generated by a series of stochastic differential equations that are designed to allow the model user to reflect a full range of distributions, dynamics and relationships with respect to the underlying stochastic variables. The 'FIRM system is designed to allow a high level of flexibility in describing how the underlying stochastic variables behave in an attempt to minimize model risk. This
78

• increase in" flexibility, however, has the result of moving. 16 a significant burden from the model, to the model user and the model assumpt=ons .
Whereas the majority of the technical calculations are generated in Step 4 of the DFA process, after gaining an appropriate level of understanding of the modeling system, there is little the DFA professional is required to do in this step other than to tell the computer to begin processing.
Step 5: Analysis
The DFA process does not end with the running of the model; rather, the "analysis" phase within the DFA process begins. Dynamic financial analysis models generate large amounts of pro forma financial statement data. The Swiss Re Investors FIRM System, for example, generates financial statement details on a GAAP, statutory, tax and economic basis for each year and simulation. Since we are running a five-year horizon and 1000 simulations, we end up with over 20,000 individual pro forma financial statements. Thus, being able to work with such a large amount of data and condense it into a clear and concise analysis is key to successful DFA.
DFAIC's existing reinsurance programs include traditional forms of excess of loss, per risk excess and catastrophe coverage. As such, its ceded reinsurance program is fairly typical for a company of its size. The company ceded approximately 8% of its prior year's premium; it is not an extensive consumer of reinsurance when viewed relative to written premium. However, the company's seemingly modest reinsuran, ce program generated over $200 million in ceded premium in the prior year versus a statutory net income of $186 million, so it is material to their operations. 17
Like many of its peers' ceded reinsurance programs, DFAIC's is designed to manage volatility of each of its various LOBs (or small combinations thereof). I.e., it is a "silo" approach to ceded reinsurance purchasing. It should come as no surprise that a company management structure aligned with LOB will incent managers to purchase reinsurance that does not recognize the diversification that exists by simply writing multiple LOBs. In fact it would be unnatural to expect a line manager to act in a manner inconsistent with LOB results (e.g., accept highly volatile LOB results), even if it is in the best interest of the company. Many large insurers have gravitated toward centralized reinsurance purchasing to address this inefficiency. Curiously, small companies may be well equipped to make similar changes because of their limited resources. If one person must wear many hats, the management structure may already be centralized.
16 Interested readers can find additional information on the mechanics of the Swiss Re Investors FIRM System by' referring to the previous Swiss Re Investors DFA papers listed in the references to this paper.
~ Unfortunately, the Schedule P data provided for the case study included the impact of inter- company pooling, so DFAIC's actual 1999 ceded losses could not be determined.
79
Line-oriented management of ceded reinsurance will likely lead to a program that guards against large individual claims even in years where actual losses (in total) are lower than originally anticipated and/or in reinsurance that fails to recognize the diversification benefits of writing multiple LOBs. But this is nothing new, and it certainly does not require a DFA model to recognize that diversification exists whenever a company writes two or more LOBs. 18 We will show that the inefficiency goes beyond a missed opportunity (failing to recognize the diversification already present in their business), since for DFAIC their existing program actually impairs (slightly) certain capital adequacy measures.
We will demonstrate that Falcon's enterprise-level philosophy to managing risk with reinsurance is by far the most important element to building the efficient program that the company seeks. Given that DFAIC is large and well capitalized, by focusing on company-wide results rather than LOB results DFAIC could eliminate most of its current reinsurance programs without any significant increase in risk to the consolidated company loss ratio. We will also show that additional improvement can be achieved through new reinsurance structures that embrace enterprise-level rather than LOB-level reinsurance strategies. Thus, reinsurance in the "new" DFAIC will truly become a mechanism by which the enterprise forgoes part of its expected return ~9, in exchange for protection from events that jeopardize overall stability.
Before we begin, a discussion of the modeling of the reinsurance program and the alternatives is required. Almost any reinsurance program can be made to look exceptionally good or bad within a DFA model by simply mis-pricing the coverage. We modeled DFAIC's existing reiqsurance program which has a large component of per occurrence excess of toss coverage attaching at $500,000 in combination with a per risk excess cover on commercial property m and a property catastrophe cover attaching at $50 million. We created an alternative reinsurance structure wherein the per occurrence and per risk covers are replaced with an accident year aggregate stop loss contract covering 75% of 20 loss ratio points excess of 80.
In deriving the prices for the various reinsurance contracts, we erred on the side of conservatism specifically to avoid making the current program look bad or the alternative look good. That is, we priced the current program at a rate that we believe is slightly biased toward the low end of the reasonable range, thereby increasing overall ceded loss ratios. Likewise, we priced the aggregate contract in the alternative program toward
~8 Unless the LOBs are perfectly positively correlated, some diversification will be achieved.
~9 Throughout this case study we have assumed the company cannot achieve a gain by purchasing under-priced reinsurance.
2o We assumed that DFAIC's $20 million excess $1 million per risk excess cover applied exclusively to property m its CMP program. In doing so, we implicitly assumed that there was no homeowner exposure above $1 million. If this were a "live" DFA study this assumption might deserve additional consideration. Further, we assumed that the $50 million occurrence aggregate had a minimal impact on the coverage.
80

the higher end of the reasonable range 2~. Our intent was to make it slightly more difficult to discard the current program in favor of the alternative aggregate coverage.
Finally, the required capital under the current and alternative reinsurance programs is roughly one-third of DFAIC's statutory surplus. 22 Actual capital in excess of required capital was the only capital constraint that we imposed on the alternative reinsurance programs considered for DFAIC. We note that a capital-oriented approach, where alternative programs are judged by changes in the company's required capital, could have been employed to evaluate alternative reinsurance programs. Below we present one interesting reinsurance finding based on a capital-oriented approach, but we chose to define "efficiency" of the company's reinsurance program in terms of the stability of loss ratios and the shift in the company's efficient frontier for the remainder of the case study.
Risk Based Capital (RBC) was introduced by the NAIC in the 1990s to supplement the .then-existing solvency early warning tests. More recently, rating agencies including A.M. Best and S&P have introduced their own brand of capital adequacy ratio. The underlying tenet of these ratios is that the combined charges for various risk factors provide guidance as to the amount of capital required by an organization. The ratio of actual capital to capital required (as determined by the risk factor charges) is the "capital adequacy ratio". We can use these ratios to compare the expected performance of alternative reinsurance programs within the context of a DFA model.
Working with the NAIC RBC factors, we calculated the probability of DFAIC's actual capital falling below the required capital level at any time in:a five-year period under three scenarios: (1) no reinsurance; (2) current reinsurance; and (3) the alternative reinsurance program. The results are presented in the Table 6.
Table 6: Probability of Actual Capital Falling below the Required RBC Level
Scenario Probability*
No Reinsurance 1.2%
Current Reinsurance 1.6%
Alternative Reinsurance 0.4%
• Cumulative probability over five years.
21 The accident year aggregate cover provides approximately $375 million of coverage for approximately $94 million, a rate on line of roughly 25%. Considering the duration of the expected payments, we believe that this is a reasonably conservative price for the contract.
22 Philbnck, Stephen and Robert Painter, "DFA Insurance Company Case Study, Part Ih Capital Adequacy and Capital Allocation," Casualty Actuarial Society Forum, Summer 2001. Arlington, VA: Casualty Actuarial Society.
81

First, observe that these probabilities are very low. DFAIC is a strongly capitalized company with an RBC ratio of over 300% 23. Second, it is not surprising that the alternative reinsurance program reduces the likelihood of "impairing" surplus because it results in a more stable distribution of net loss ratios (see Table 7 below). Finally, the interesting conclusion is that DFAIC actually increases its chance of impairing surplus by purchasing its existing reinsurance program!
This somewhat odd finding occurs because the company "trades dollars" with its reinsurer, not because reinsurance is over priced 24. In other words, DFAIC reinsures losses that on average occur every year; they incur additional expenses (e.g., the reinsurer's profit) which increases their probability of failing the capital adequacy test. Capital testing, as in the RBC example above, can be used to choose between alternative reinsurance programs. However, we took a slightly different approach, by screening potential reinsurance programs based on loss ratio variability, then comparing selected programs based on economic risk/reward.
Note that we could just as easily have compared several alternative reinsurance programs based on the risk/reward analysis, using the economic value of surplus, statutory surplus, GAAP equity or some other metric, without reviewing loss ratio variability. In fact, screening reinsurance programs based on loss ratio variability arguably is not DFA because although the process includes the impact of the simulated economic conditions (i.e., inflation) on losses and premium, changes in asset values are ignored. Nonetheless, we have included it to emphasize that there are many ways to use DFA (in this case a single DFA model) to conduct such an analysis. Another, perhaps more important motivation for using the loss ratio analysis was that without a thorough understanding of the key drivers of our results, our analysis may be subject to criticism. As we will see the loss ratio analysis provides that understanding.
We screened several alternative reinsurance programs for possible use in the case study including two variants of DFAIC's existing program substituting $1 and $5 million retentions on the per occurrence contracts. We also considered and ultimately settled L~pon an accident year aggregate cover in place of all of the company's non-catastrophe coverage. To illustrate the process, the net loss ratios from accident year 2 and the corresponding standard deviations of net losses are summarized in Table 7.
23 DFAIC's statutory surplus is more than three times the minimum surplus, according to the risk based capital formula. Under the more conservative assumptions underlying the rating agency capital adequacy ratios, this ratio drops to roughly two times the minimum.
24 The ultimate ceded loss ratio modeled for the current program (including the catastrophe contract) was 80.6% versus 80.0% for the alternative program. The alternative program's ceded payments were much more volatile than under the current program but its duration was also much longer. We assumed that the longer duration adequately compensated the reinsurer for the increased volatility.
82

Table 7: DFAIC's Net Loss Ratio and Standard Deviation of Net Losses (Acc Yr 2)
Reinsurance Standard Deviation of Structure Description Net Loss Ratio Net Losses
-- G ross 81.4 136,172
1 Current 82.9 118,807
2 Current w/$1M Ret. 82.8 119,517
3 Current w/$5M Ret. 84.7 121,849
4 Aggregate 83.7 91,027
The holistic approach underlying structure 4 is primarily responsible for the improvement in net loss ratio standard deviations. That is, by focusing on the company's overall loss ratio and seeking to reinsure only those losses that in the aggregate (across LOBs), exceed acceptable limits, DFAIC improves the efficiency of its ceded reinsurance program. Exhibit 3 shows the variability in gross loss ratios by LOB and the corresponding reduction in variability of the overall loss ratio. Hence, DFAIC achieves most of its efficiency gain by merely recognizing the diversifying effect of writing more than one LOB and by purchasing reinsurance that recognizes this characteristic of their business.
83

Exhibit 3: DFAIC's Gross Loss Ratios by Line of Business
Penc~l~la - - 1.20 r'175ff~ to ~ lh
BSOth to 75th . t.t0
m25th to 50~h 100
O5th to 25~
o.go
Q ~, 0.00
0.70
Gross Loss Rat ios b y Une Accident Year 2
Workom Auzo LIa~]lty property Genor~ Ueio~Jity NI O~he¢ NI Una Comgemmtton Combln~
Une of Buslneu
Referring to Table 7, we compared net loss ratios to aetermine if the various programs were reasonably priced. Then we eliminated structures 2 and 3 from further consideration in the case study because they were not significantly different from the existing program. Finally, we selected structure 4 as the alternative structure for the case study because it produced a significant reduction in net losses' variability. The alternative reinsurance structure (structure 4) replaced the company's per risk and per occurrence coverage with an accident year aggregate stop loss; the catastrophe coverage was unchanged.
In our third and final approach, we reviewed the risk/reward profile of the current and alternative reinsurance programs. The process is illustrated herein .using one alternative to the current reinsurance program, but there is no limit on the number of such alternatives that could be considered. Our risk/reward analysis is based on the economic value of the company's surplus (reward) and the standard deviation of the same (risk). We plot these figures on a simple graph with risk on the X-axis and reward on the Y-axis (see Exhibit 4). Points that are up (greater reward) and to the left (lower risk) are preferable to those that are down and to the right (lower reward/greater risk).
84

Exhibit 4: Risk/Reward Plot of Alternative Reinsurance Programs
Risk /Reward Ana lys is of Re insurance St ra teg ies 3,650
3,600 c o
3,550
," 3,500
3,450 >
3,400
&- Gross of Reinsurance
I I Proposed Reinsurance I
• • Current Reinsurance _ _
' r - - - - - ,
800 850 900 950 1,000 1,050 1,100
Standard Deviation of Economic Value
E O 3,350 O o UJ 3,300
3,250
First observe that the gross result, being the highest and furthest to the right, provides the greatest return but at the greatest risk. This is consistent with our pricing assumption that the company cannot achieve an economic gain through cheap reinsurance. Of course, we could easily relax that assumption if market conditions justified it, but for the purposes herein we have not, Second, observe that current and alternative reinsurance programs have similar costs ~, but the alternative program has a significantly lower risk. That is, the alternative program produces roughly the same economic value but it does so more consistently. Hence the alternative program is more economically efficient than DFAIC's existing reinsurance.
Finally, we return to the CEO's reinsurance questions: do we have enough reinsurance,. is it efficient and what types should we consider? The company's likelihood of impairing its capital adequacy ratio (not probability of ruin) is very low (see Table 6) even without reinsurance, so it could be argued that from a rigid economic point of view, reinsurance is unnecessary. Such an approach might be deemed reckless by regulators and/or rating agencies, or management might prefer more stable earnings, so some reinsurance might be warranted. Based on the capital adequacy ratios, the current program provides sufficient coverage, however the alternative program also provides
2s The programs have similar costs in terms of the economic values that they produce even though the ceded premium in the alternative program is roughly 25% lower than for the existing program. This is because they have been priced to yield a similar overall return to the reinsurer. Hence, the reinsurer's rate of return is much larger on average under the alternative program to compensate for the increased volatility of the ceded losses.
85

such coverage and is superior based on the RBC test and in the economic risk/reward analysis. Hence, we would recommend that DFAIC adopt the alternative reinsurance program.
The analysis of loss ratios presented in the parameterization section of this paper hints at the reasons for preferring the alternative program. DFAIC's existing reinsurance program essentially covers each LOB individually. In doing so, it does not account for the diversifying effect of writing more than one LOB. In fact, it even provides coverage for large claims when aggregate losses in a particular line are lower than expected.
Thus far our discussion has focused on reinsurance, holding the company's asset allocation constant, but dynamic financial analysis can also be used to evaluate and set strategic asset allocation (SAA) guidelines for property-casualty insurance companies. Strategic asset allocation is the basis of a sound investment process that includes tactical asset allocation and security selection (see Figure 3). We will demonstrate that the company's reinsurance and asset strategies are interdependent and that by adopting the alternative reinsurance program DFAIC can alter its asset strategy to improve returns and reduce risk in both economic and statutory terms. Furthermore, our analysis of reinsurance and asset allocation will rely upon identical risk/reward metrics rather than traditional, but not comparable, strategy specific measures (e.g., loss ratios, return on assets, etc.).
Figure 3: Investment Process
86

Strategic asset allocation sets the investment targets, ranges, operational constraints and investment restrictions that are part of a company's investment policy statement. Tactical asset allocation (TAA), on the other hand, allows for shifts in the strategic asset allocation targets, subject to the strategic ranges, based on short- to intermediate-term economic and market outlooks. The goal of TAA is to outperform the results that would be achieved from strict adherence to the SAA. Security selection refers to the buying and selling of specific securities. Whereas tactical asset allocation attempts to add value by correctly adding to or reducing the amounts placed into individual asset classes, security selection attempts to add value by outperforming the benchmark indexes used to proxy the individual asset classes.
In this paper we deal with only the strategic asset allocation component of the investment process, as DFA is not an appropriate tool for performing tactical asset allocation or security selection. While many strategic questions could be addressed, given the limitations of information about DFAIC, we will concentrate on the following three major strategic investment issues:
• the target fixed-income duration;
• the target allocation to equities; and
• The target split between taxable and tax-exempt bonds.
To address these issues we will make use of the optimization algorithm within the FIRM system to identify DFAIC's efficient frontier ~. The objective function will be the one discussed in step 1 of the DFA process. Our first efficient frontier will be subject to the continuation of the current reinsurance program. Exhibit 5 shows DFAIC's economic value efficient frontier at the end of five years along with the position of their current asset allocation strategy.
z8 See Markowitz.
8"/

Exhibit 5: DFAIC's Economic Value Efficient Frontier
The economic value efficient frontier for DFAIC shows a low-risk, investment strategy (Strategy A) that consists of short duration, taxable fixed-income securities and no equities. Moving up the efficient frontier into higher return/higher risk strategies involves lengthening the duration of the fixed-income portfolio, moving into tax-exempt securities and increasing allocations to equities.
DFAIC Economic Value Efficient Frontier 5-Year Horizon
3.800
3,700
3,600 m E 3,500 == .~ 3,400 u ~ 3,300
~ 3,200
3,100 •
3,000
B J • Curr( nt Fort'o "o
. J 600 700 800 900 1,000 1,100 1,200 1,300 1,400
Standard Deviation of Economic Value (millions)
1,500
Current A B C D E F G H I J K Fixed Income:
Taxable 86.0 100.0 95.4 84.6 72.7 60.3 51.7 38.0 29.3 20.3 7,7 2.0 Tax-Exempt 4,0 10.0 18.9 20,0 35.1 37.1 39.5 47.3 48.0 Duration 5.0 0.3 2.1 2.6 3.2 4.1 4.0 6.1 6.0 6.0 6.6 6.4
Equity: 11.2 4.5 11.4 17.3 20.6 26.3 26.9 "33.6 40.2 45.0 50.0
To help understand the asset strategies on DFAIC's economic value efficient frontier it is necessary to understand DFAIC's risk exposures. Again, DFA can be used to do this through a technique called decomposition of risk. By applying decomposition of risk techniques we can identify the impact that various factors have on DFAIC's economic risk. We can then use this information to gain insights into the logic behind the strategies recommended by the economic value efficient frontier. 'Exhibit 6 shows the impact of real underwriting, inflation, discount rates, and asset returns on the economic
88

risk of DFAIC over one-year and f ive-year time horizons for the current investment strategy 27.
Exhibit 6: Decomposition of Economic Risk
350,000
c 3oo,ooo o . - - "¢= 250,000
200,000 a
150 ,000
"o ~: 100,000
(/ ') 50,000
Decomposition of Economic Risk
48.~_.
L _ m _ 2, o I 21%
1-Year 5-Year
[ ] Real Underwriting [ ] Inflation I [ ] Discount Rate I • Assets l
As can be seen from Exhibit 6, the impact of the four risk factors on economic risk depends on the time horizon. Neither inflation nor discount rates are significant risk factors over short t ime periods. The major risk to DFAIC over a one-year horizon is, not surprisingly, real underwriting uncertainty. The picture changes dramatically when considering a f ive-year time horizon. Underwrit ing risk tends to diversify over time whereas inflation risk will tend to accumulate. Thus, inflation uncertainty becomes the biggest risk to the economic well-being of DFAIC over the long term.
This explains why Iow-duralion, f ixed-income securit ies appear as the low-risk investment strategy on the f ive-year economic efficient frontier. Low-duration, cash equivalent investments tend to move hand-in-hand with inflation, helping to offset the impact of unexpected inflation. Unfortunately, low-duration f ixed- income strategies result in tow yields and low expected returns. Thus following a low-risk investment strategy is an expensive way of reducing the economic risk of DFAIC.
2~ Underwriting volatility typically includes the impact of inflation but for the purposes of asset strategy it is helpful to separate underwriting volatility into the amount due to inflation and the amount due to loss uncertainty net of inflation. Loss uncertainty net of inflation is assumed independent of asset strategy but loss uncertainty as a result of unexpected inflation is a risk that can be reduced through strategic asset allocation.
89

This also helps explain the role of equities across the efficient frontier. Equities, in addition to their higher expected returns, provide for a long-term inflation hedge. When the additional diversification benefits of equities are considered, it becomes clear why the addition of equities together with a reduction of the fixed-income duration results in a higher-reward, lower-risk investment strategy.
These results may be surprising to those who advocate duration-matching strategies as a way to minimize risk. Duration matching is predicated on the fact that interest rate sensitivity is the major source of economic risk. This is true for many financial instruments such as bonds where the future cash flows are fixed and certain. The liability characteristics of DFAIC, however, are anything but fixed and certain. Instead they are subject to substantial underwriting uncertainty as well as the whims of unexpected inflation. Because of the significant correlation between interest rates and inflation, changes in interest rates will typically be accompanied by changes in inflation rates. Further, higher inflation rates will lead to higher loss payments which will counteract the economic benefit of a higher discount rate. Thus, controlling only the interest rate risk through a duration matching strategy, when liabilities are inflation sensitive, is an ineffective and inappropriate way of controlling financial risk and can lead to an unintended and severe exposure to unexpected inflation zB.
The final issue to explore concerning DFAIC's economic value efficient frontier is the role of tax-exempt investments. As there were no tax statements provided for DFAIC, information concerning their tax position had to be gathered from their statutory filings. Before serious tax planning can occur, we would want additional information concerning DFAIC's tax reserves, net operating loss carryforwards (NOLs) and capital loss carryforwards. For this study, we assumed no operating loss or capital loss carryforwards and we estimated tax reserves to be a constant ratio to calculated statutory reserves.
The traditional approach for determining DFAIC's optimal allocation to tax-exempt investments is to adjust the tax-exempt allocation to the point that equates the regular tax liability to the alternative minimum tax liability under the company's deterministic budgeted forecast. This methodology for tax management planning can lead to an inefficient allocation to tax-exempt securities since it fails to take into consideration the volatility of the company's projected profitability and the changing relationship between taxable and tax-exempt yields over time.
A much more robust approach to determining the optimal tax-exempt allocation for DFAIC can be identified through the use of dynamic financial analysis. The yield relationships between taxable and tax-exempt fixed-income securities were first simulated based on a combination of historical yield analysis and current market conditions. Similarly, DFAIC's operating results were simulated based on their historical loss performance and current business plans. In this way the after-tax investment income penalty that results from holding tax-exempt securities in unprofitable years can be evaluated against the after-tax investment income advantage of holding tax-exempt
z8 Inflation sensitivity is a parameter in the Swiss Re FIRM system. Different inflation sensitivity assumptions will result in different efficient investment strategies. It liabilities are assumed to be insensitive to inflation, duration-matching strategies may be more effective at mitigating risk.
90

securities in profitable years. The model also determines whether the alternative minimum tax (AMT) is required and factors the AMT penalty into the analysis accordingly.
As a result, a prospective model of DFAIC's tax liabilities under many possible scenarios was evaluated. The optimization model found the allocation to tax-exempt securities that maximizes DFAIC's reward objective within the bounds of the company's risk tolerance. Based on our model of DFAIC and the assumed future business plans, the probabilities of negative taxable income for each of the next five years under the current asset investment strategy are indicated in Table 8.
Table 8: DFAIC's Taxable Income
Mean (000s) Probability of Negative
Year I 47,791 30%
Year 2 128,251 21%
Year 3 196,870 18%
Year 4 227,064 13%
Year 5 264,481 10%
The above table is consistent with the loss ratio improvements built into Falcon's business plan assumptions for DFAIC. The increasing expected income levels combined with the decreasing probability of negative income results suggests that tax- exempt investments should very well have a role in the investment strategy for DFAIC over the five-year planning horizon.
Now, assuming that Falcon management is happy with DFAIC's current risk tolerance level, the investment strategy can be adjusted to that indicated by Strategy D (see Exhibit 5). This would suggest increasing the equity allocation from 11.2% to 17.3%, reducing the fixed-income duration from 4.9 to 3.2 and allocating 10% of the fixed- income portfolio into tax-exempt securities.
The move to Strategy D results in a $67.8M increase in economic reward over the five- year horizon without any additional increase in economic risk. The next step is to examine the statutory implications of such a strategy. Exhibit 7 shows the impact to DFAIC's statutory surplus under both the current asset strategy and Strategy D.
91
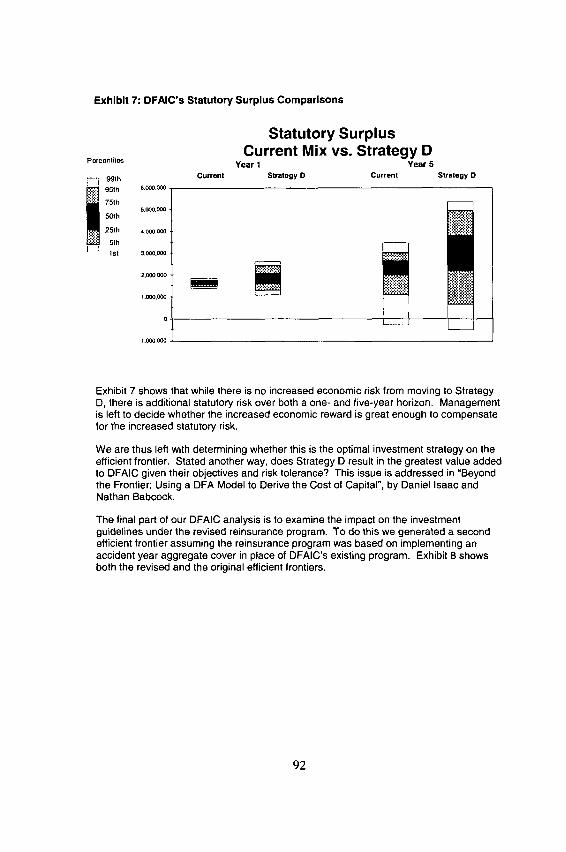
Exhibit 7: DFAIC's Statutory Surplus Comparisons
Statutory Surplus Current Mix vs. Strategy D
Porcontile~ Y e a r 1 Y e a r 5
Current Stretogy D Current . . . . 99 th
95 th
75 th
5Oth
25 th
5th 1St
6,(XX),000
5.{~o.0oo
4,(x~ 0co
3.0C~.OOO -
2,c~0 C~0 -
I,CCO,000 -
0 -
- 1.(~X},000
Strategy D
Exhibit 7 shows that while there is no increased economic risk from moving to Strategy D, there is additional statutory risk over both a one- and five-year horizon. Management is left to decide whether the increased economic reward is great enough to compensate for the increased statutory risk.
We are thus left with determining whether this is the optimal investment strategy on the efficient frontier. Stated another way, does Strategy D result in the greatest value added to DFAIC given their objectives and risk tolerance? This issue is addressed in "Beyond the Frontier: Using a DFA Model to Derive the Cost of Capital", by Daniel Isaac and Nathan Babcock.
The final part of our DFAIC analysis is to examine the impact on the investment guidelines under the revised reinsurance program. To do this we generated a second efficient frontier assuming the reinsurance program was based on implementing an accident year aggregate cover in place of DFAIC's existing program. Exhibit 8 shows both the revised and the original efficient frontiers.
92

Exhibi t 8: DFNC's Economic Efficient Frontier (Revised Reinsurance)
3,800
3,700 A
o~ 3,600 ~ 3.500
o 3,300
o ~ 3,200
3,100.
3,000 5O0
DFAIC Economic Value Efficient Frontier 5-Year Horizon
Revised Frorltler K ~ . I' J'= ~ , = " ~ "
C' " " " • Current Portfolio I Current Reinsurance
f Current Portfolio I Revised Reinsurance
A'
600 700 800 900 1,000 1,100 1,200 1,300 1,400
Standard Deviation of Economic Value (millions)
1,500
Current A' B' C' D' E' F" G' H' r J' K' Fixed Income:
Taxable 88.0 100.0 87.9 80.3 68.7 57.7 44.4 36.7 29.8 18.3 7.3 2.0 Tax-Exempt 1.7 9.6 17.3 22.0 32.9 34.2 34.2 43.4 47.8 48.0 Duration 5.0 0.3 1.6 3.1 4.0 4.5 5.6 5.5 5.4 6.5 6.6 6.4
Equity: 11.2 10.4 10.2 14.0 20.3 22.7 29.1 36.0 38.3 44.8 50.0
Exhibit 8 shows that the revised reinsurance program pushes the efficient frontier for DFAIC up and to the left. This is extremely desirable from Falcon management's perspective as this means that DFAIC can experience higher economic rewards at lower economic risk levels. The individual strategies that make up the revised efficient frontier tell a similar story to those on the original frontier. The overall lower risk profile as a result of the revised reinsurance structure, however, allows DFAIC to move to a more aggressive asset strategy without any more economic risk than the company is currently experiencing.
Again assuming that Falcon management is happy with DFAIC's current risk tolerance level, under the revised reinsurance program the investment strategy can be adjusted to that indicated by Strategy E'. This would suggest increasing the equity allocation from 11.2% to 20.3%, reducing the fixed-income duration from 4.9 to 4.5 and allocating 22% of the fixed-income portfolio into tax-exempt securities. The net effect of moving to the revised reinsurance'program and an asset strategy in line with that suggested by Strategy E' is an additional expected economic benefit of more than $121 M over the five-year planning horizon.
93

Returning again to the statutory implications, of this combined reinsurance and investment strategy. Exhibit 9 shows the impact to DFAIC's statutory surplus relative to the current asset strategy of changing only the investment strategy and of changing both the reinsurance and investment strategy.
Exhibit 9: DFAIC'a Statutory Surplus Comparisons
P°~en,,,.. Statutory Surplus Year I Year 5
6,000,000 99th
95th 75th
50th
25th
5th 1St
5,000,000
4,000,(~0
3,(~0.000
2,000.OGO
1,000,000
0
-1.0¢0.000
Reinsurance Strategy: Current Current Revised Investment Strategy: Current Strategy O Strategy E'
Current Current Revised Current Strategy C Strategy E'
By simultaneously increasing the efficiency of their reinsurance strategy and investment strategy, DFAIC accomplishes a better economic risk/reward profile and is able to achieve a better statutory profile at the end of the five-year horizon. Thus by considering DFAIC's business holistically, our analysis indicates that we can implement a revised reinsurance strategy and take a more aggressive asset strategy, resulting in an expected economic benefit and improved long-term statutory results.
Finally, using the Tail Conditional Expectation (1 -Year) approach from our sister paper ("DFA Insurance Company Case Study, Part I1: Capital Adequacy and Capital Allocation =, by S. Philbrick and R. Painter), we found that the new reinsurance program coupled with asset strategy E', increased the company's required capital by only 6%. Thus, DFAIC's actual capital is still significantly above the required minimum level. Additional details and changes in required capital under other capital adequacy measures (e.g., RBC capital adequacy ratios) can be found in that paper.
94

Step 6: Sensitivity Testing
Sensitivity testing is required to ascertain that the conclusions are not the product of a particular set of assumptions or the result of a particular set of random scenarios. This step in the DFA process requires the testing of key input factors such as renewal rates, inflation and interest rate sensitivity of future premiums and liability payments, changes in capital market equilibrium assumptions, and variability of loss ratios. Sensitivity testing highlights the major factors affecting each business segment and the degree to which those factors affect each segment. Each factor needs to be tested independently, and relevant factors should be tested in tandem. Sensitivity testing allows for the assessment of the individual as well as collective impact of modifying key factors by business segment.
Since the underlying framework for DFA is simulation, sensitivity testing should include research into the number of simulations required to assure that the results of the analysis are robust. The required number of simulations will depend on many factors such as whether the analysis is dealing with relative comparisons or absolute levels. The metrics used for the objectives and constraints will also impact the required number of simulations. For example, downside risk measures typically require more simulations than simple standard deviations. There is no magic number or formula that tells exactly how many simulations are required for a particular analysis, so the user is left to ascertain, through sensitivity testing, that the findings of the DFA study are robust and can be easily reproduced.
Step 7: Presentation of Findings
The importance of the presentation of DFA findings should not be underestimated. While the DFA professional has the benefit of months of analysis in developing understanding of the problems, issues and solutions, they must summarize and present their findings to the senior management or Board of the company briefly and succinctly. This is no easy undertaking. The presentation of the DFA study should do more than show the numbers and present the conclusions, rather the presentation should tell a story. The story should review the highlights of each step of the DFA process and lay out the logic that went into the analysis in such e way that the conclusions become evident before they are revealed. It is important to keep in mind that the value of DFA is not just in the answer but also in the increased understanding of the issues that lead to the answer and ultimate decision.
95

Conclusion
Armed with the DFA results, the CEO of Falcon is ready to move on to negotiation stage of the acquisition with the knowledge that his holistic approach to insurance company management can produce a better, more efficient DFAIC. However, the competitive advantage of a holistic approach to insurance company management anticipated by our fictional CEO might be short-lived. The ability to perform holistic analysis through DFA has largely been made possible by the recent advancements in computing power and speed. These advancements, combined with sophisticated DFA models and dedicated DFA professionals, have brought the power of Dynamic Financial Analysis to within reach of all interested property-casualty companies.
One final note: The results of this DFA study, while raising some general insurance industry issues, are specific to the objectives, characteristics and assumptions that we used for DFAIC. DFA is not a trivial endeavor. Even given a good DFA modeling system, the analysis that is performed can be poor. A good DFA analysis will tie the conclusions to the assumptions in a clear and concise manner. The impact of alternative strategic initiatives will be explained in such a way that someone who is unfamiliar with the details of DFA will still be able to follow, understand and ultimately accept the stated conclusions. While the undertaking is not trivial, the potential efficiencies that can be gained through a holistic approach to property-casualty insurance management can be significant to those who are willing to supply the effort.
96
References
Almagro, M. and Sonlin, S.M., "An Approach to Evaluating Asset Allocation Strategies for Property/Casualty Insurance Companies," Casualty Actuarial Society 1995 Discussion Paper Program on Incorporating Risk Factors in Dynamic Financial Analysis, pp 55-79.
Bowers, N.L.; Gerber, H.U.; Hickman, J.C.; Jones, D.A.; and Nesbitt, C.J., Actuarial Mathematics (Second Edition), 1997, Society of Actuaries.
Correnti S. and J.C. Sweeney (Proceedings of the 4th International AFIR Colloquium, 1994), "Asset-Liability Management and Asset Allocation for Property and Casualty Companies - The Final Frontier"
Correnti, S., and J.C. Sweeney, (Proceedings of the 5th International AFIR Colloquium, 1995),"The Dynamics of Interest Rate Movements and Inflation On Assets, Liabilities, and Surplus For Property and Casualty Insurers".
Correnti, S., P. Nealon and S. Sonlin, (Proceedings of the 6th International AFIR Colloquium, 1996),"Decomposing Risk to Enhance ALM and Business Decision Making for Insurance Companies".
Correnti, S., P. Nealon and S. Sonlin, (Proceedings of the 7th International AFIR Colloquium, 1997),"Total Integrative Risk Management: A Practical Application for Making Strategic Decisions".
Correnti, Salvatore, Stephen M. Sonlin and Daniel B. Isaac, UApplying a DFA Model to Improve Strategic Business Decisions," Casualty Actuarial Society Forum, Summer 1998, 15-51. Arlington, VA: Casualty Actuarial Society.
Dempster, M.A.H. and A.E. Thorlacius, (Proceedings of the 8th International AFIR Colloquium, 1998), "Stochastic Simulation of International Economic Variables and Asset Returns: The Falcon Asset Model
Feldblum, S., "Asset Liability Matching For Property/Casualty Insurers," Valuation Issues, CAS Special Interest Seminar, 1989, pp. 117-154.
Financial Economics, H. H. Panjer (ed.), The Actuarial Foundation, Schaumburg, Illinois, 1998.
Isaac, Daniel and Nathan Babcock., (Proceedings of the XXXII '~ International ASTIN Colloquium, 2001),"Beyond the Frontier: Using a DFA Model to Derive the Cost of Capital".
Lowe, S.P.; and Stanard, J.N., "An Integrated Dynamic Financial Analysis and Decision Support System for a Property Catastrophe Reinsurer," ASTIN Bulletin, Volume 27, Number 2, November 1997, pp. 339-371.
97

Markowitz, Harry M., Mean-Variance Analysis in Portfolio Choice and Capital Markets, Cambridge Mass: Basil Blackwell, 1987.
Philbrick, Stephen and Robert Painter, "DFA Insurance Company Case Study, Part I1: Capital Adequacy and Capital Allocation," Casualty Actuarial Society Forum, Summer 2001. Arlington, VA: Casualty Actuarial Society.
98
Related Documents


