Optimization for Centrifuge Dewatering WEFTEC New Orleans, Louisiana Rashi Gupta, P.E. Steve Walker, CWP Carollo Engineers September 28, 2016

Welcome message from author
This document is posted to help you gain knowledge. Please leave a comment to let me know what you think about it! Share it to your friends and learn new things together.
Transcript
Optimization for Centrifuge DewateringWEFTEC New Orleans, Louisiana
Rashi Gupta, P.E.
Steve Walker, CWPCarollo Engineers
September 28, 2016

File
nam
e.pp
t/2
Questions to Answer Today…
• Why is optimization important?
• What should I consider within my dewatering process?
• How do I systematically optimize the process?

File
nam
e.pp
t/3
Dewatering Costs a Lot
Annual Dewatering Cost = $3.7M
Case Study 1
File
nam
e.pp
t/4
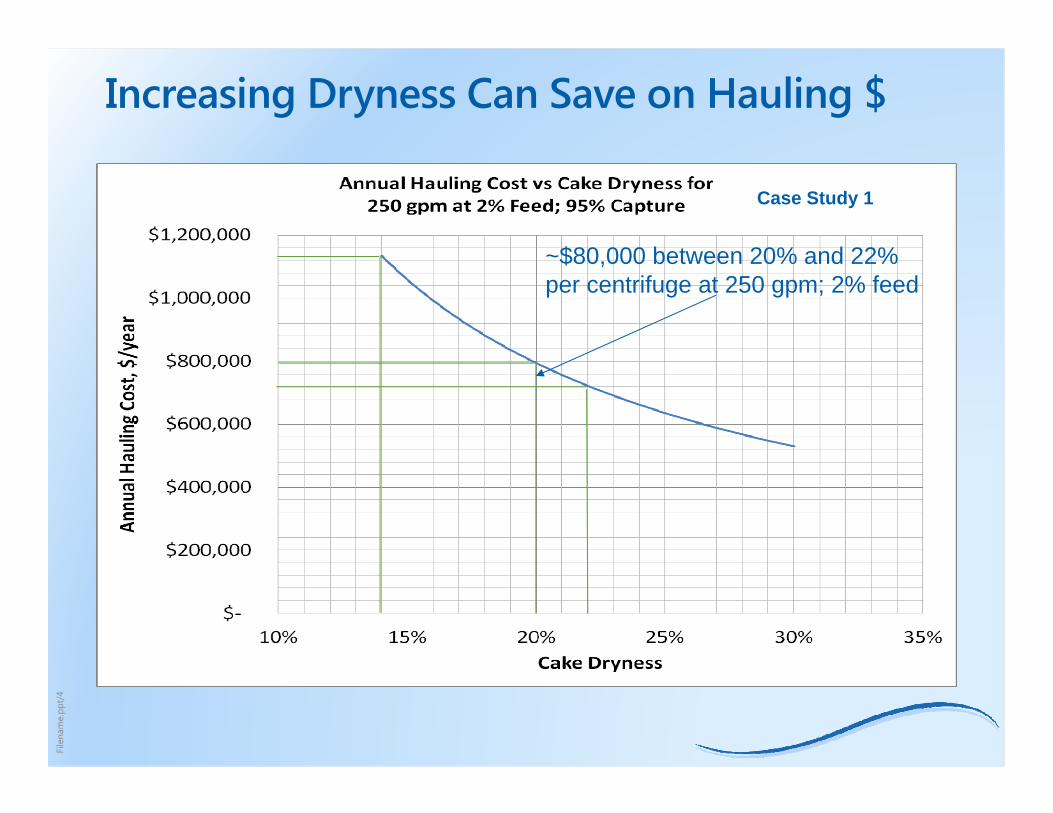
Increasing Dryness Can Save on Hauling $
~$80,000 between 20% and 22% per centrifuge at 250 gpm; 2% feed
Case Study 1

File
nam
e.pp
t/5
Reducing Polymer Can Save on Chemical $
~$20,000 between 38 lb act/DT and 40 lb act/DT per centrifuge at 250 gpm; 2% feed
Case Study 1

File
nam
e.pp
t/6
Maximizing Dryness Not Always the Answer
Case Study 2
File
nam
e.pp
t/7
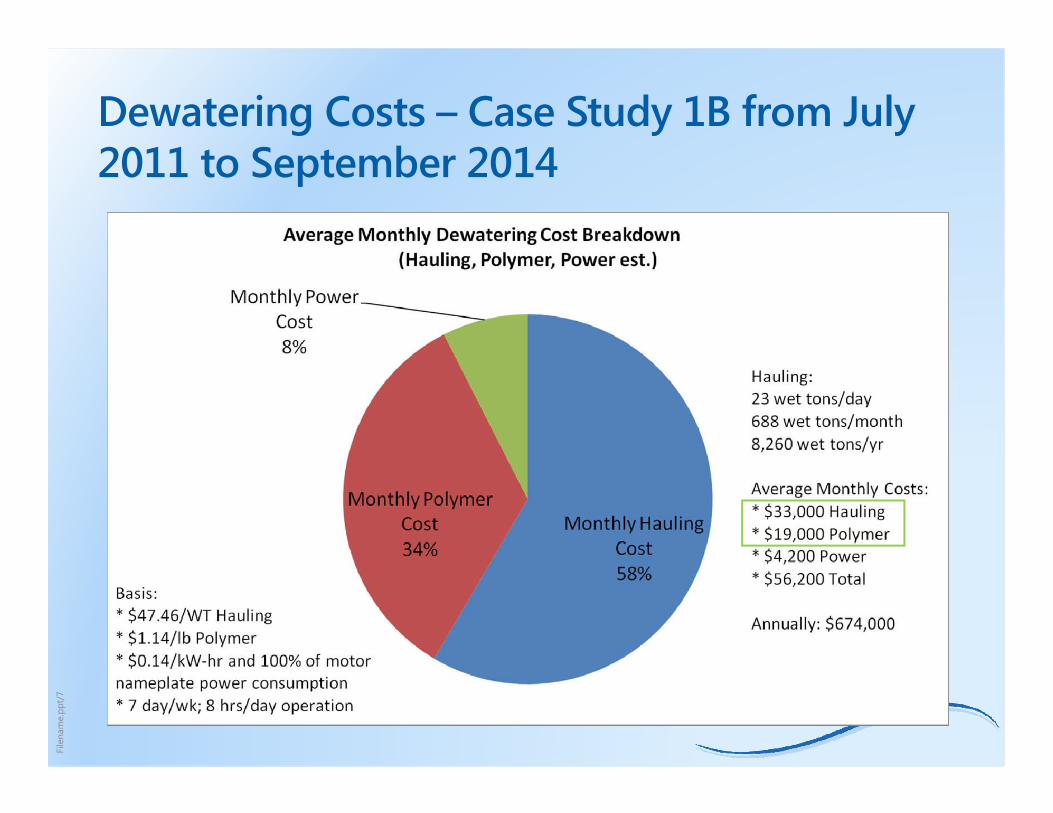
Dewatering Costs – Case Study 1B from July 2011 to September 2014
File
nam
e.pp
t/8
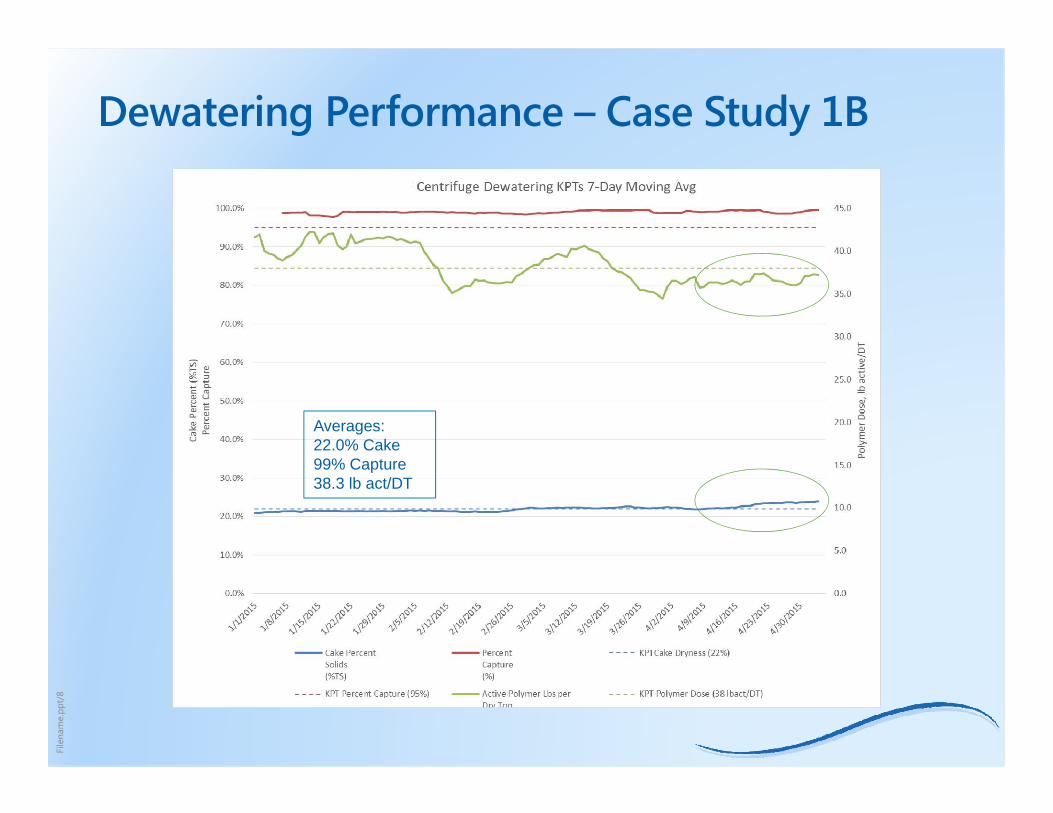
Dewatering Performance – Case Study 1B
Averages:22.0% Cake99% Capture38.3 lb act/DT
File
nam
e.pp
t/9
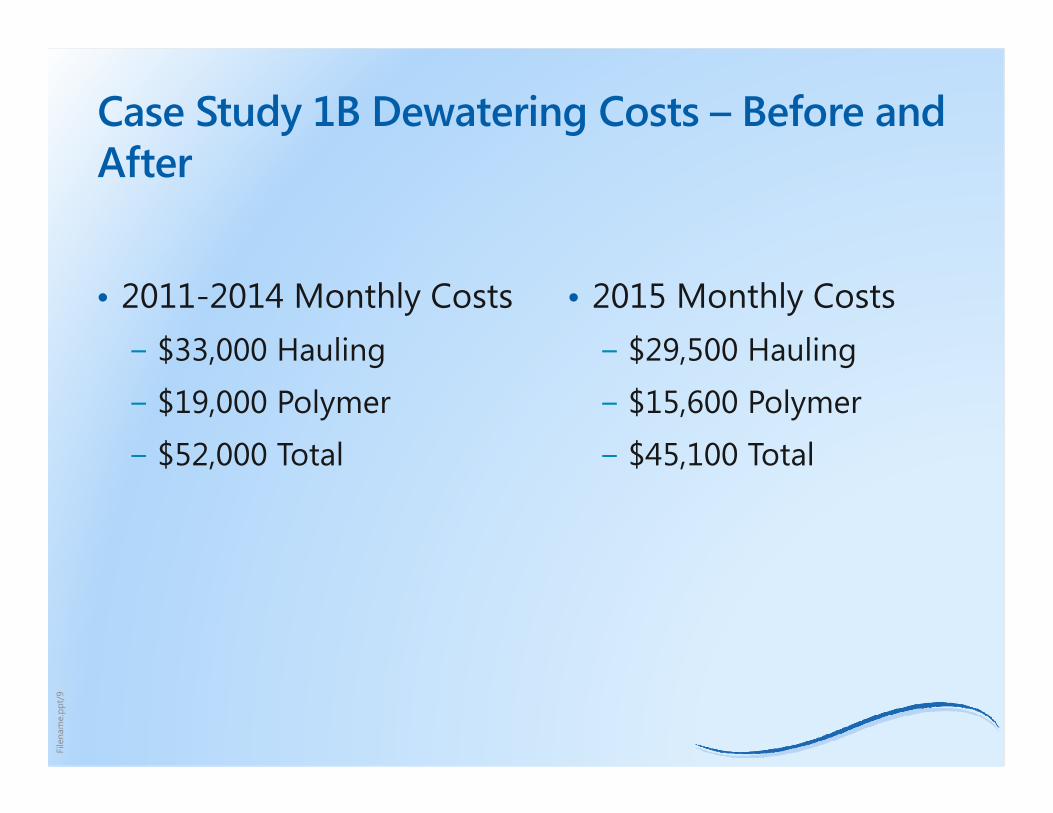
Case Study 1B Dewatering Costs – Before and After
• 2011-2014 Monthly Costs − $33,000 Hauling
− $19,000 Polymer
− $52,000 Total
• 2015 Monthly Costs− $29,500 Hauling
− $15,600 Polymer
− $45,100 Total

File
nam
e.pp
t/10
DEWATERING SYSTEM CONSIDERATIONS
File
nam
e.pp
t/11
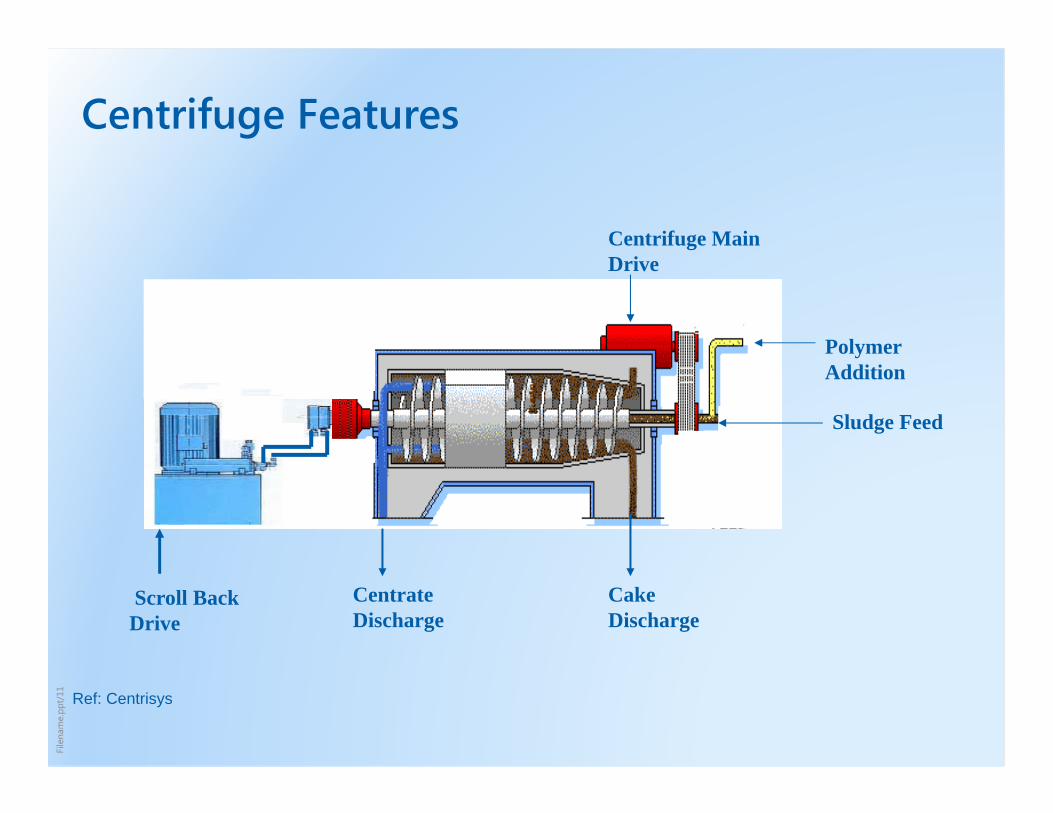
Centrifuge Features
Polymer Addition
Sludge Feed
Cake Discharge
Centrate Discharge
Centrifuge Main Drive
Scroll Back Drive
Ref: Centrisys
File
nam
e.pp
t/12
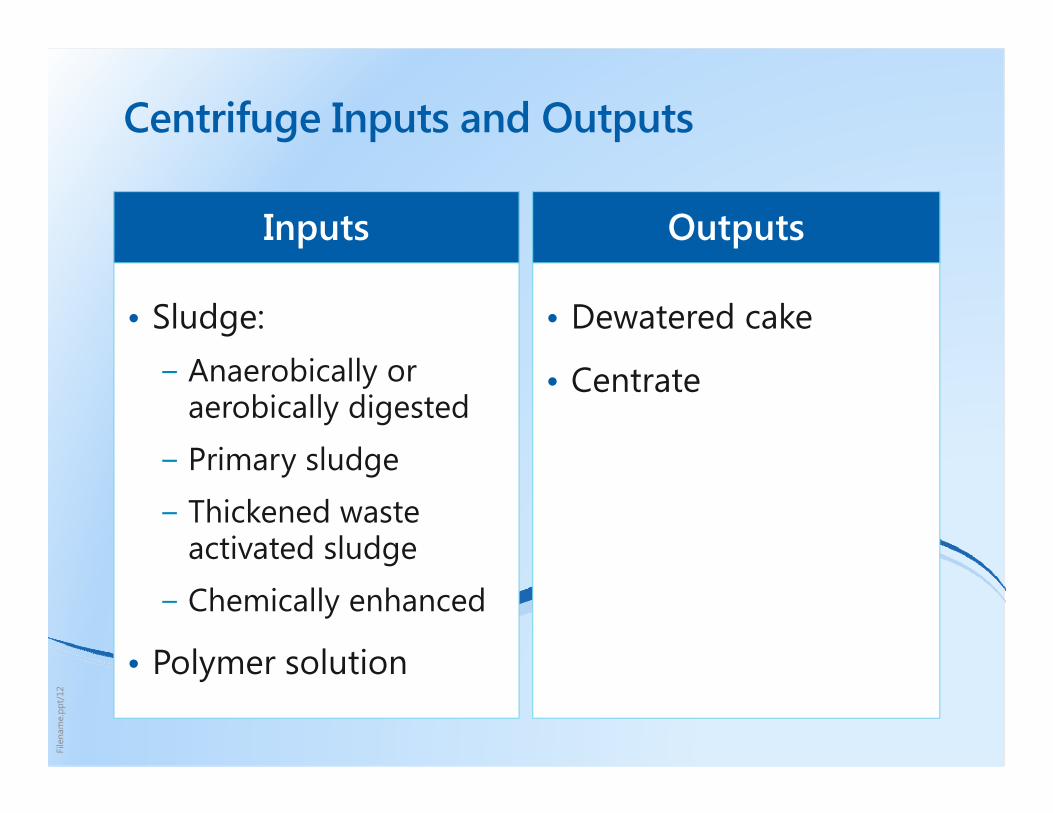
• Dewatered cake
• Centrate
• Sludge: − Anaerobically or
aerobically digested
− Primary sludge
− Thickened waste activated sludge
− Chemically enhanced
• Polymer solution
Centrifuge Inputs and Outputs
Inputs Outputs
File
nam
e.pp
t/13
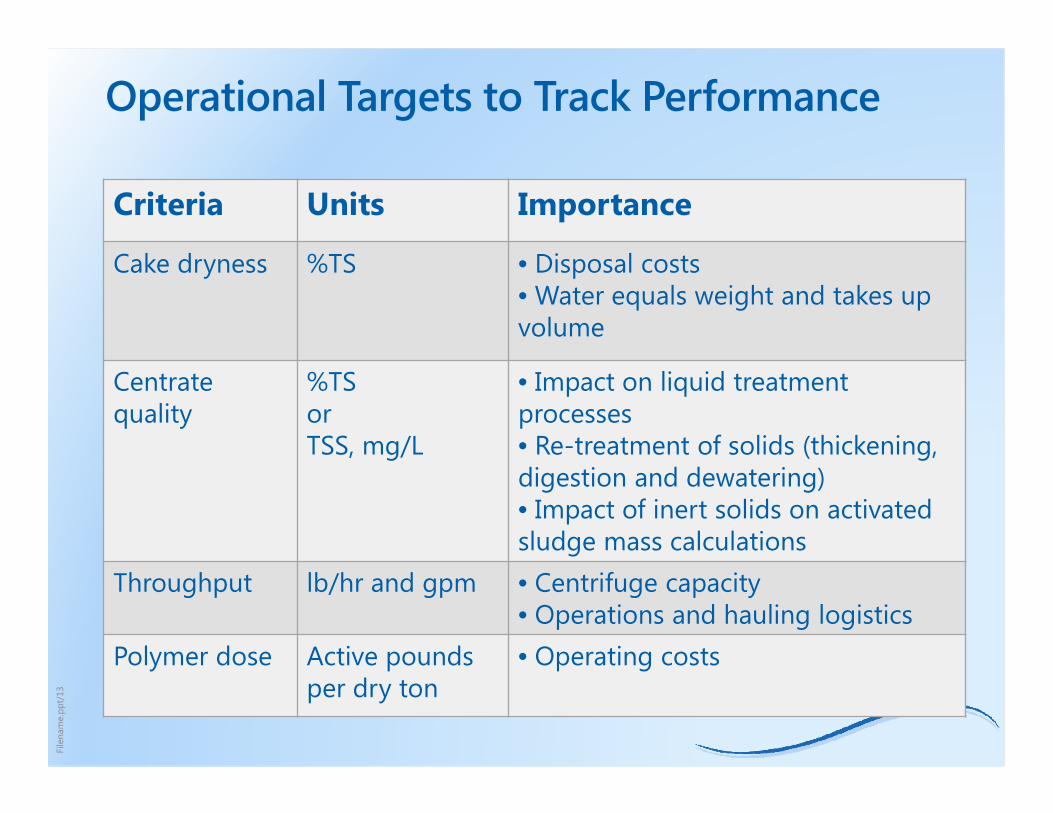
Operational Targets to Track Performance
Criteria Units Importance
Cake dryness %TS • Disposal costs • Water equals weight and takes up volume
Centrate quality
%TS or TSS, mg/L
• Impact on liquid treatment processes• Re-treatment of solids (thickening, digestion and dewatering) • Impact of inert solids on activated sludge mass calculations
Throughput lb/hr and gpm • Centrifuge capacity• Operations and hauling logistics
Polymer dose Active pounds per dry ton
• Operating costs
File
nam
e.pp
t/14
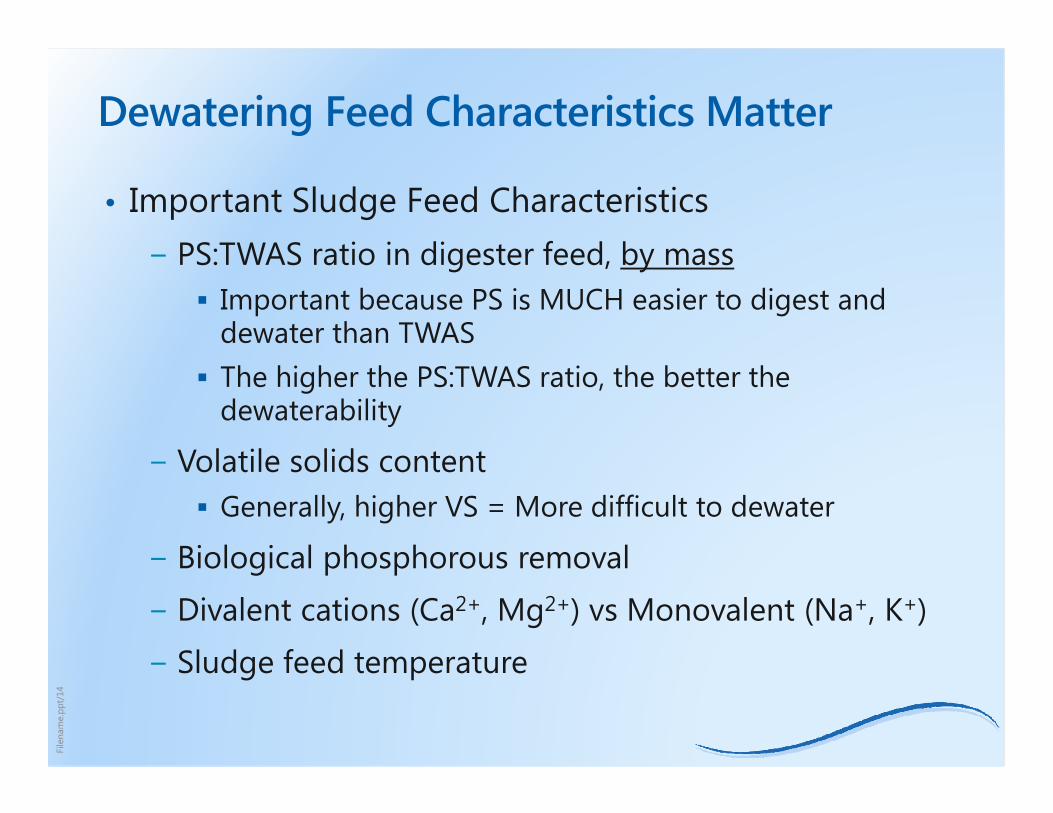
Dewatering Feed Characteristics Matter
• Important Sludge Feed Characteristics− PS:TWAS ratio in digester feed, by mass
Important because PS is MUCH easier to digest and dewater than TWAS
The higher the PS:TWAS ratio, the better the dewaterability
− Volatile solids content Generally, higher VS = More difficult to dewater
− Biological phosphorous removal
− Divalent cations (Ca2+, Mg2+) vs Monovalent (Na+, K+)
− Sludge feed temperature
File
nam
e.pp
t/15
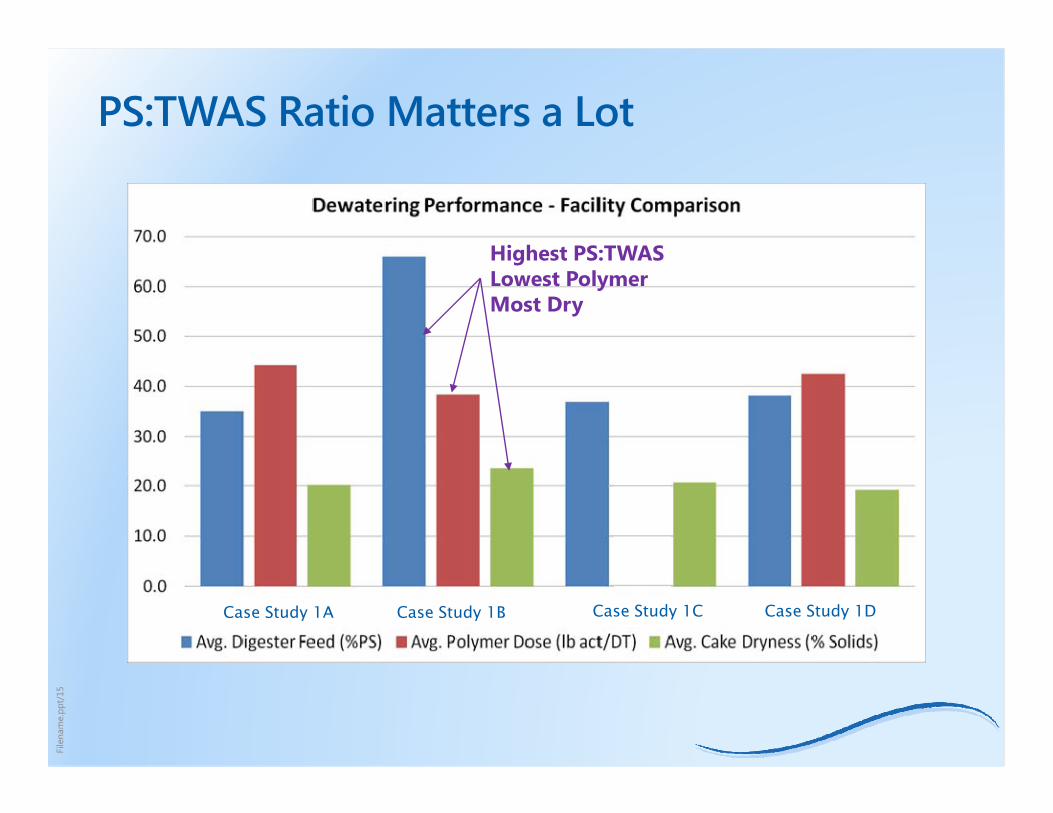
PS:TWAS Ratio Matters a Lot
Case Study 1A Case Study 1B Case Study 1C Case Study 1D
Highest PS:TWASLowest PolymerMost Dry

File
nam
e.pp
t/16
Understanding Polymer Basics Necessary to Assess Effectiveness
• “Neat” polymer − Oil, surfactants, water, and polymer
(emulsion as delivered)
• “Active” − What’s doing the work
− 40-50% typical for emulsion
− 90%+ typical for dry

File
nam
e.pp
t/17
Many Pieces to the Polymer Puzzle
• Procure the right polymer
• Select right dilution concentration for polymer solution
• Produce fully activated solution
• Find best polymer injection location
• Maintain req’d water pressure
• Check water characteristics (chlorine, hardness, temperature)
• Optimize polymer dose
File
nam
e.pp
t/18
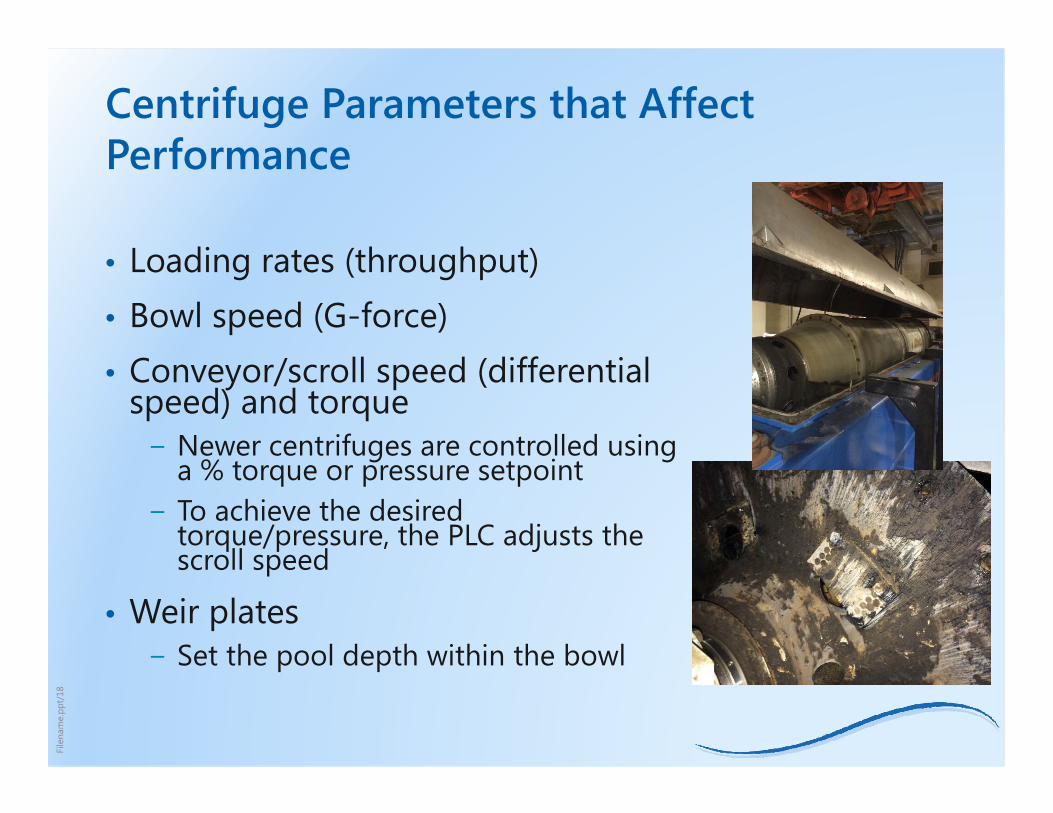
• Loading rates (throughput)• Bowl speed (G-force)• Conveyor/scroll speed (differential
speed) and torque− Newer centrifuges are controlled using
a % torque or pressure setpoint − To achieve the desired
torque/pressure, the PLC adjusts the scroll speed
• Weir plates− Set the pool depth within the bowl
Centrifuge Parameters that Affect Performance

File
nam
e.pp
t/19
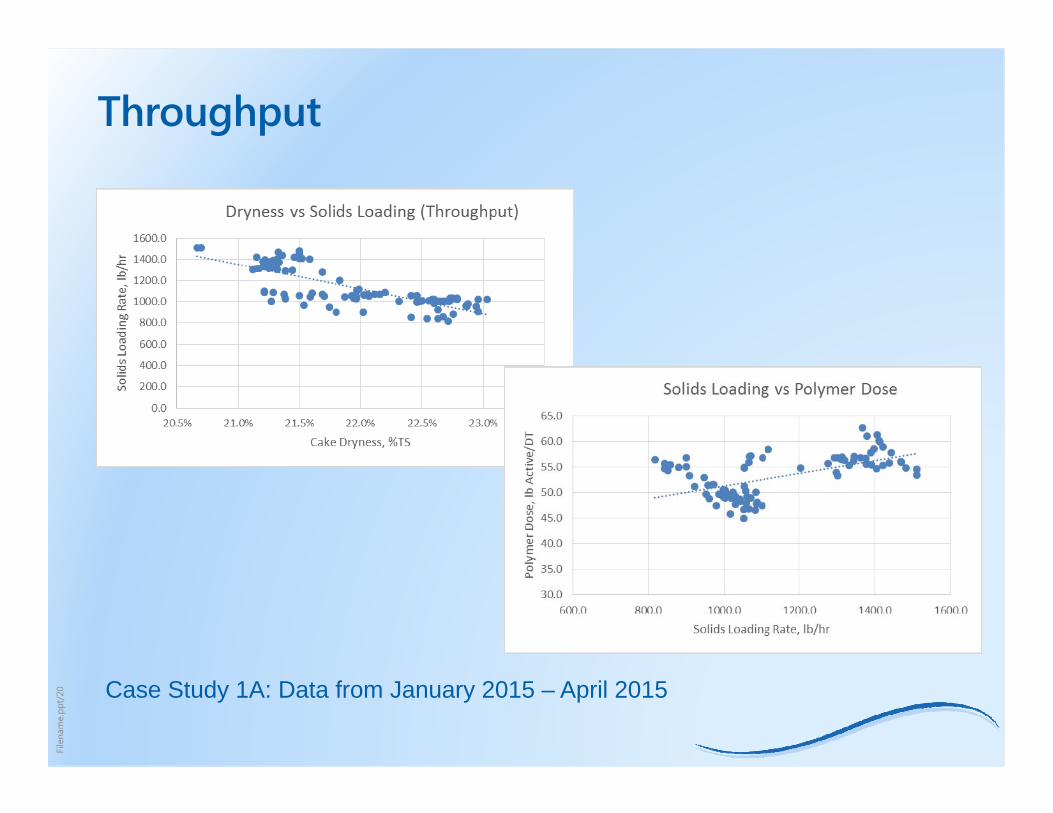
Throughput
• Need to stay within loading capacity
• Changing solids concentration impacts loading
File
nam
e.pp
t/20
Throughput
Case Study 1A: Data from January 2015 – April 2015

File
nam
e.pp
t/21
OPTIMIZATION APPROACH
File
nam
e.pp
t/22
Process Optimization
• Achieve: − Desired cake dryness and
centrate quality
− Lowest polymer cost
− Maximum throughput and efficiency
• Balancing act: Maximize one or more of the process parameters, while keeping all others within their constraints

File
nam
e.pp
t/23
Parameters used for Optimization
• Type of polymer
• Polymer dose
• Polymer dilution/solution concentration
• Polymer injection point
• Centrifuge torque/pressure
• Centrifuge pond depth
• Centrifuge bowl speed
• Sludge feed (throughput)
• Sludge characteristics
File
nam
e.pp
t/24
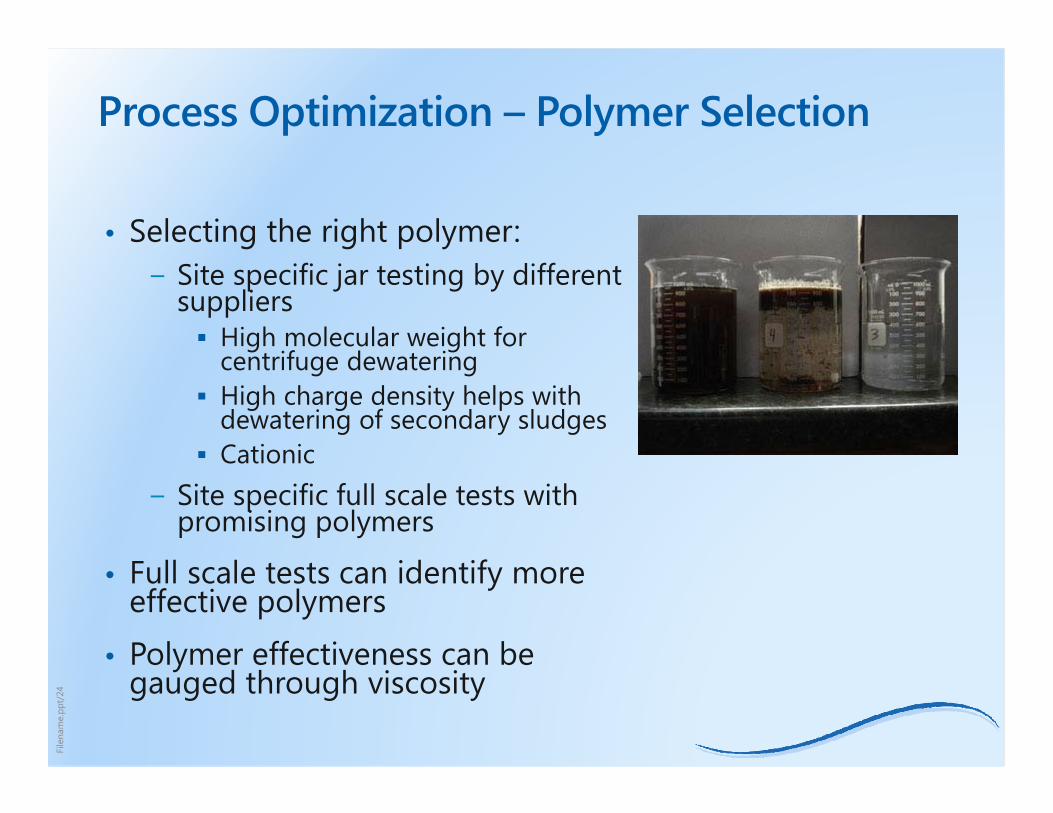
Process Optimization – Polymer Selection
• Selecting the right polymer:− Site specific jar testing by different
suppliers High molecular weight for
centrifuge dewatering High charge density helps with
dewatering of secondary sludges Cationic
− Site specific full scale tests with promising polymers
• Full scale tests can identify more effective polymers
• Polymer effectiveness can be gauged through viscosity
File
nam
e.pp
t/25
Polymer Contract Flexibility
• Establish Primary and Alternate supplies− Use two different suppliers rather than two different
products from the same supplier
• Determine if seasonal constraints support alternatives. For example:− An emulsion polymer may be more cost effective in
winter months
− A dry polymer may be more cost effective in the other months
File
nam
e.pp
t/26
Test Methodology – Phase 1 (Polymer Dose)• Batch polymer at preferred solution strength
• Set sludge feed rate
• Enter typical torque setpoint and bowl speed
• Set lowest polymer feed rate
• Run for a standard time (i.e., 45 minutes)
• Sample feed, centrate and cake for TS/TSS. − Feed solids concentration used to calculate throughput
• Run through sequence for at least 5 polymer feed rates
• Calculate associated dose and plot results
File
nam
e.pp
t/27
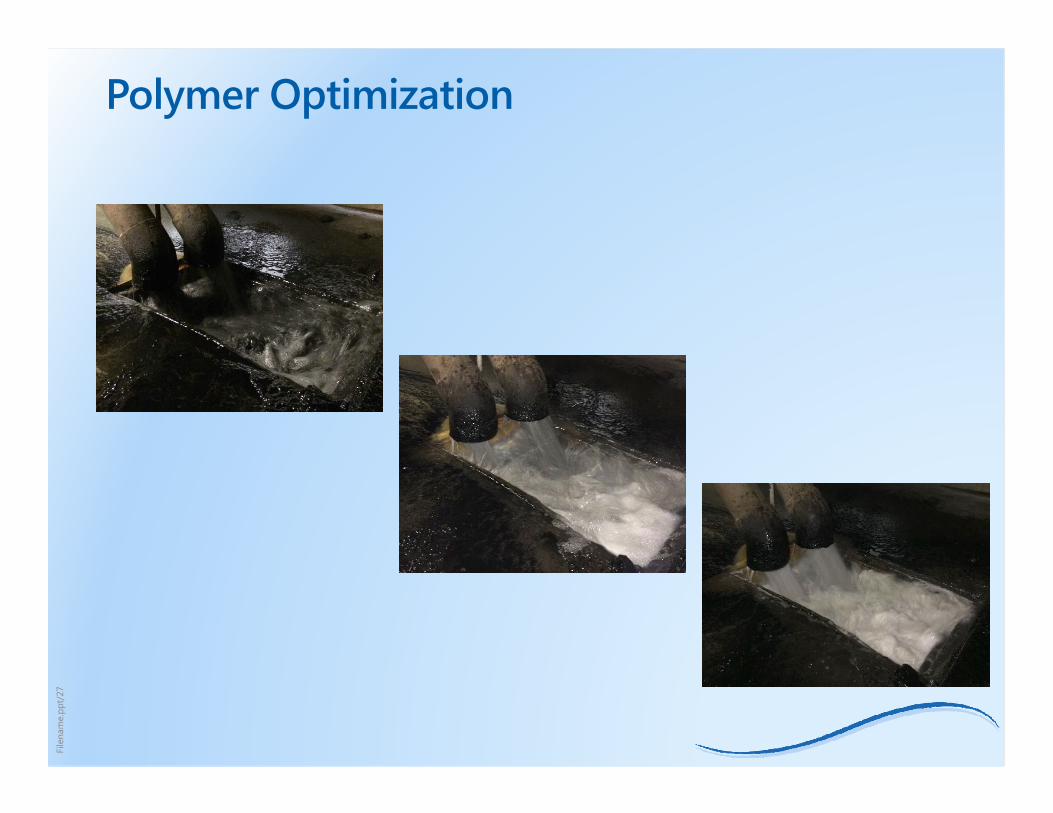
Polymer Optimization

File
nam
e.pp
t/28
Performance Curve - Polymer
80
82
84
86
88
90
92
94
96
98
100
10
15
20
25
30
35
1 2 3 4 5 6
lb/t
on o
r %
TS
Dose v. % Recovery
Dose, lb/ton Cake Recovery
24
File
nam
e.pp
t/29
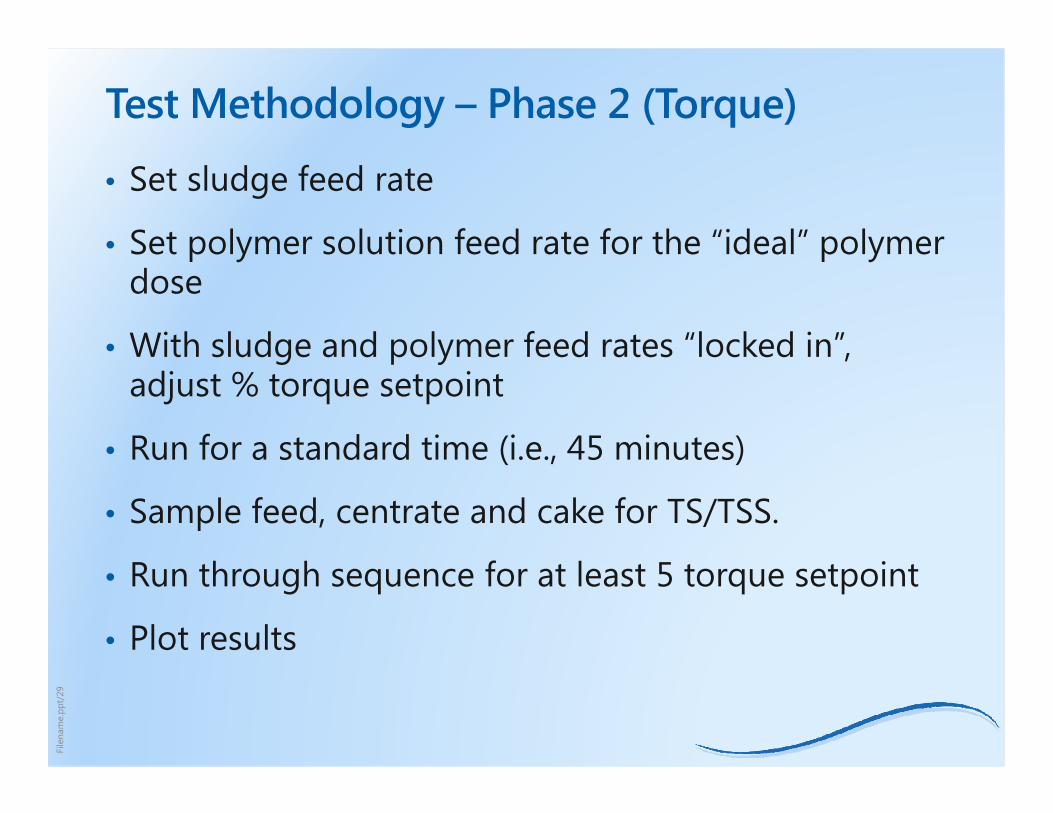
Test Methodology – Phase 2 (Torque)
• Set sludge feed rate
• Set polymer solution feed rate for the “ideal” polymer dose
• With sludge and polymer feed rates “locked in”, adjust % torque setpoint
• Run for a standard time (i.e., 45 minutes)
• Sample feed, centrate and cake for TS/TSS.
• Run through sequence for at least 5 torque setpoint
• Plot results
File
nam
e.pp
t/30
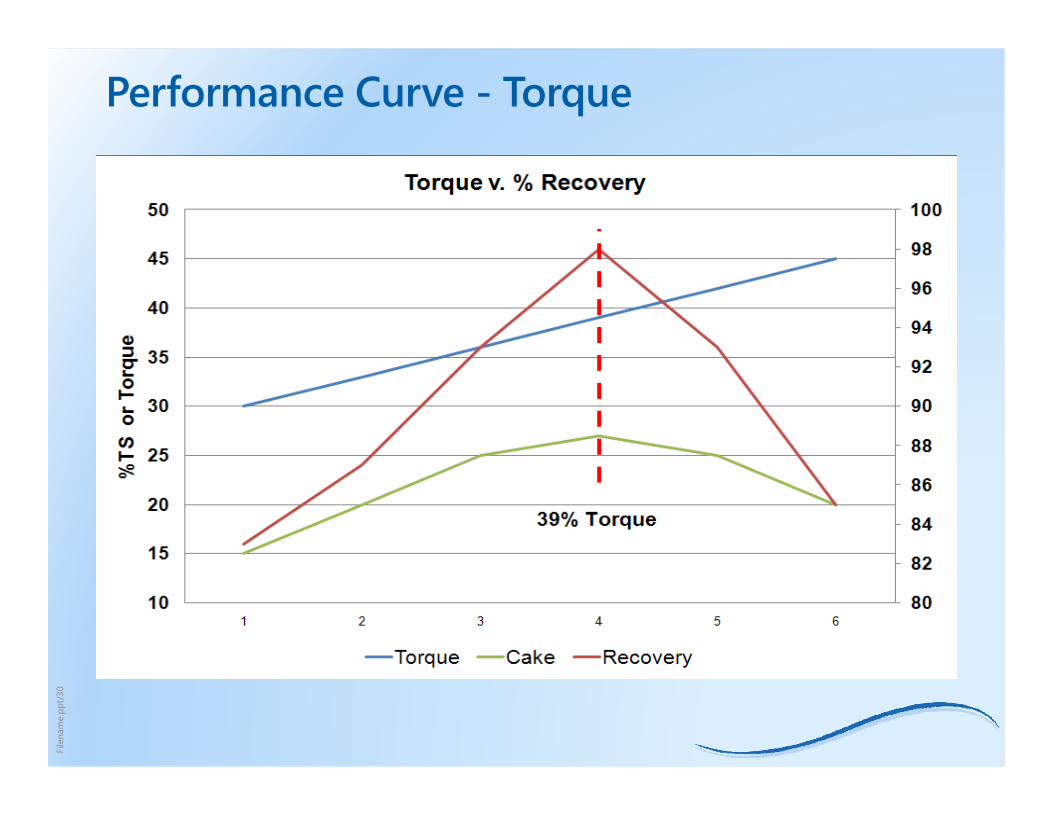
Performance Curve - Torque
80
82
84
86
88
90
92
94
96
98
100
10
15
20
25
30
35
40
45
50
1 2 3 4 5 6
%TS
or
Torq
ue
Torque v. % Recovery
Torque Cake Recovery
39% Torque
File
nam
e.pp
t/31
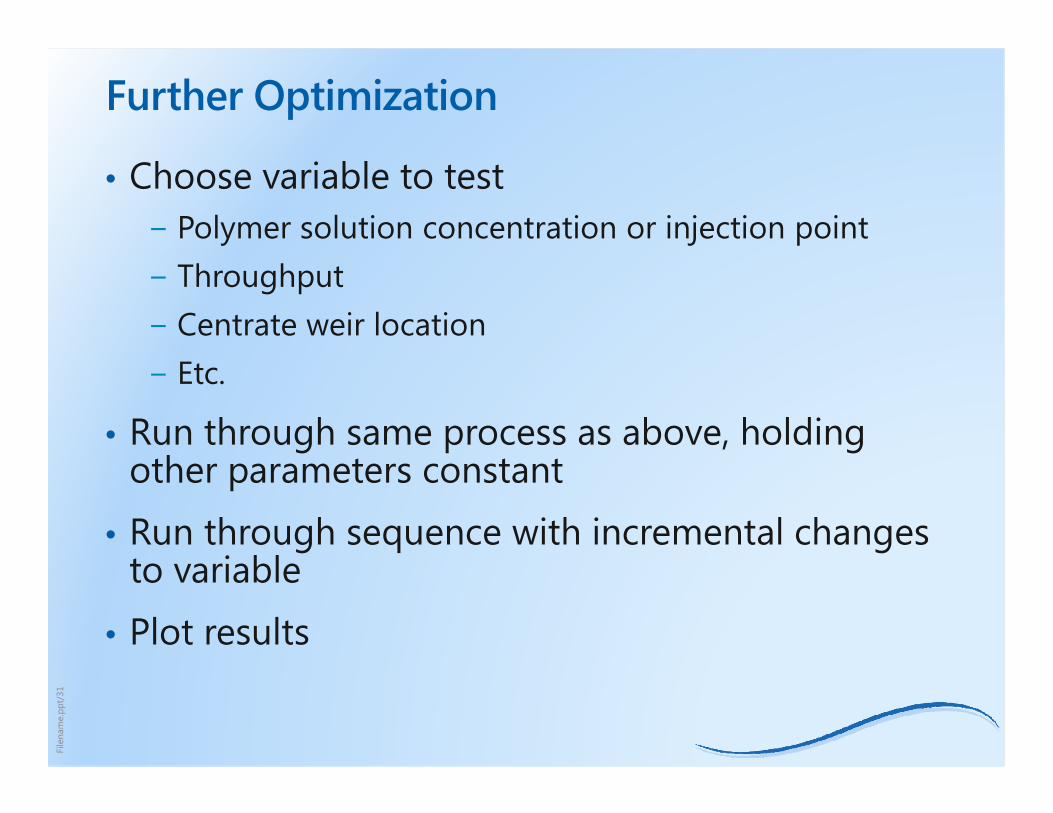
Further Optimization
• Choose variable to test− Polymer solution concentration or injection point− Throughput− Centrate weir location− Etc.
• Run through same process as above, holding other parameters constant
• Run through sequence with incremental changes to variable
• Plot results
File
nam
e.pp
t/32
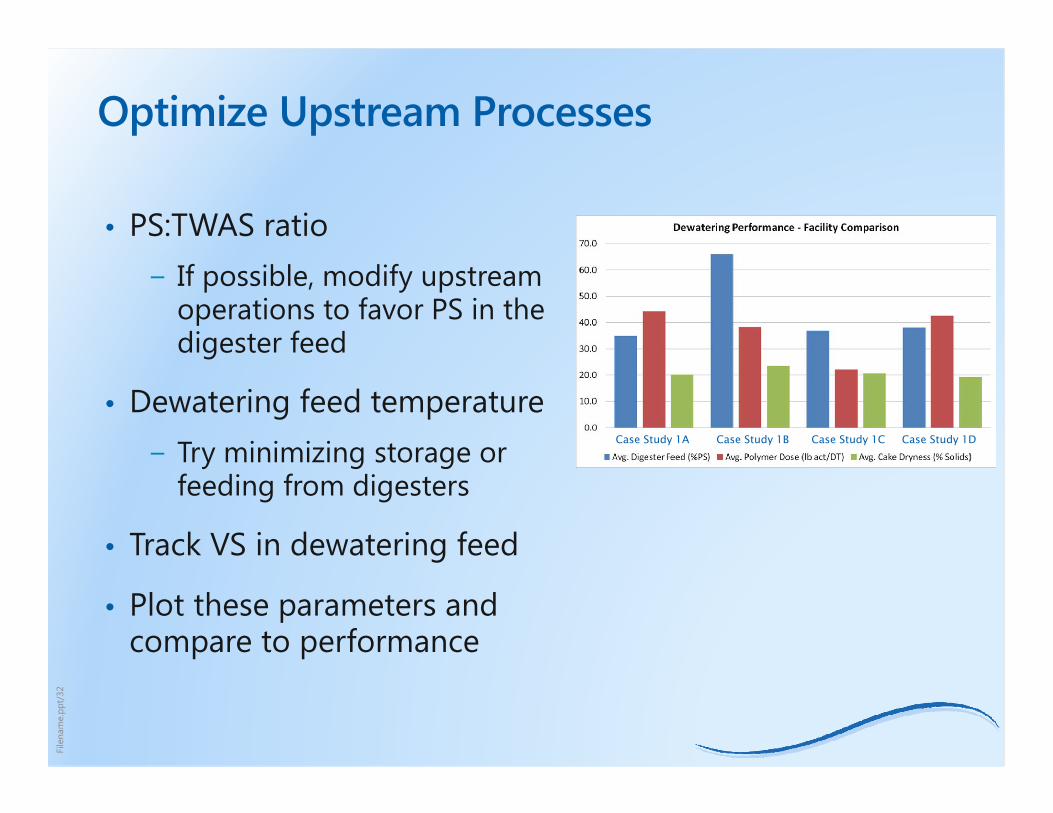
Optimize Upstream Processes
• PS:TWAS ratio− If possible, modify upstream
operations to favor PS in the digester feed
• Dewatering feed temperature − Try minimizing storage or
feeding from digesters
• Track VS in dewatering feed
• Plot these parameters and compare to performance
Case Study 1A Case Study 1B Case Study 1C Case Study 1D
File
nam
e.pp
t/33
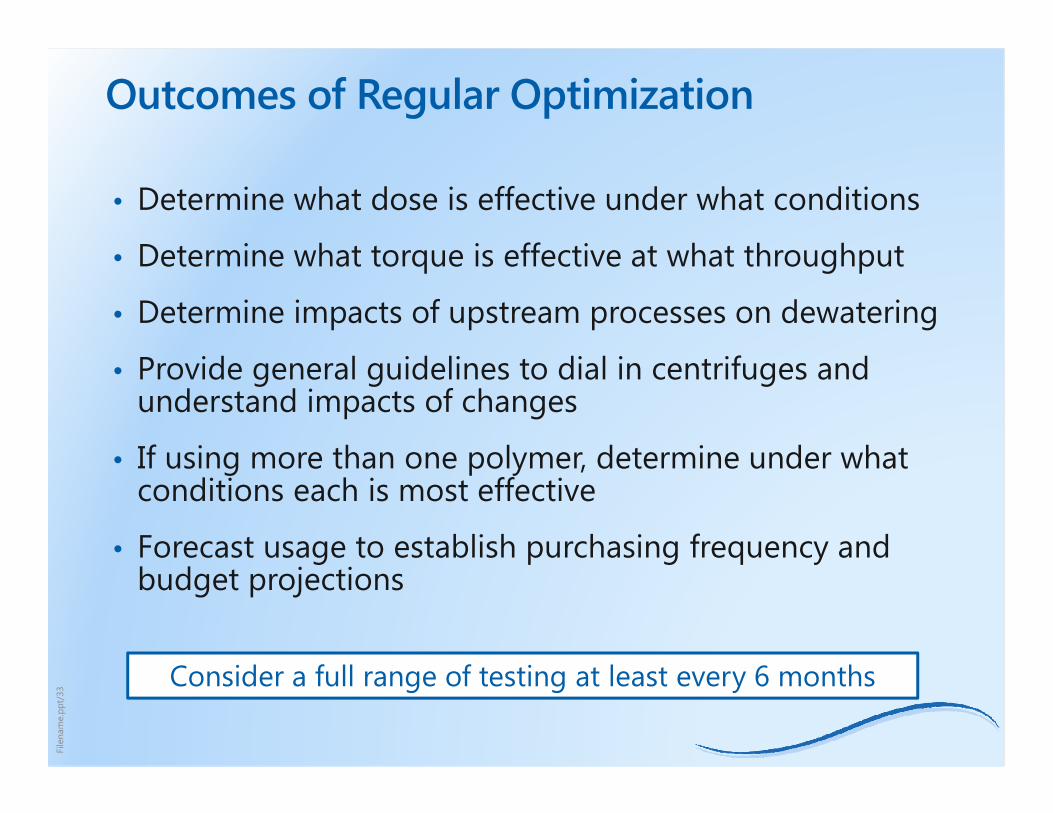
Outcomes of Regular Optimization
• Determine what dose is effective under what conditions
• Determine what torque is effective at what throughput
• Determine impacts of upstream processes on dewatering
• Provide general guidelines to dial in centrifuges and understand impacts of changes
• If using more than one polymer, determine under what conditions each is most effective
• Forecast usage to establish purchasing frequency and budget projections
Consider a full range of testing at least every 6 months

File
nam
e.pp
t/34
Track Performance and Publish Results Relative to Targets
File
nam
e.pp
t/35
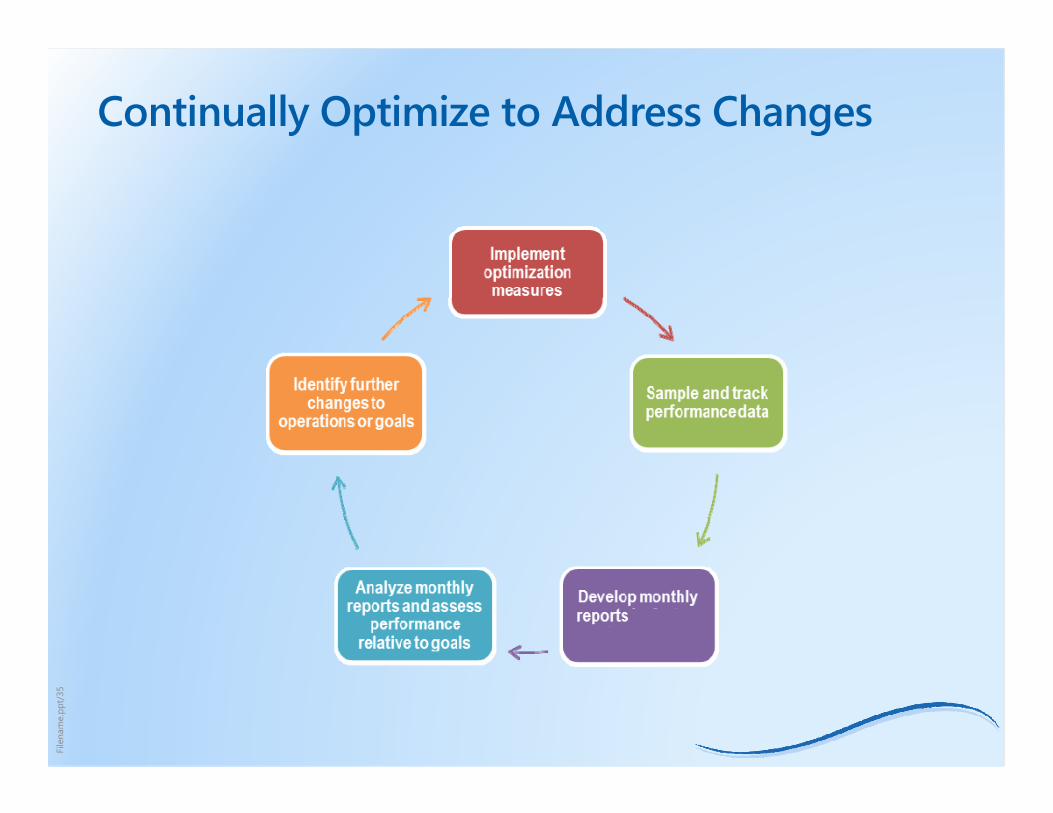
Continually Optimize to Address Changes
File
nam
e.pp
t/36
Optimization for Centrifuge Dewatering
Thank you for being a wastewater treatment professional.
Steve Walker [email protected] 303-635-1220Rashi Gupta [email protected] 714-593-5100
Related Documents


