Developments in Pipeline Column Separation Experimentation SUMMARY By Angus R. SIMPSON and Anton BERGANT Department of Civil Engineering, University of Adelaide, GPO Box 498, Adelaide, South Australia 5001 1 This paper summarises developments in column separation experimentation in pipes at University of Adelaide, South Australia. An experimental apparatus with a 37.2 m copper pipe of 22 mm diameter has been constructed. A very fast closure ball valve has been developed which provides a closure time of 5 to 10 milliseconds. Two proble ms in the development of the experimental apparatus are discussed in detail. First a problem was encountered with the placement of two 150 mm long flow visualisation polycarbonate sections in the pipeline. The discrete vapour cavity numerical model is used to simulate th e effect of the presence of the poly carbonate sections in the experimental apparatus. Second, probl ems in obtaining accurate pressure readings from strain-gage type pressure transducers have also occurred. Analysis of the experimental results has led to the development of solutions to overcome these problems when investigating column separation in pipelines. 1 Introduction This paper describes developments in experimentation for column separation in pipes as a result of research undertaken at the University of Adelaide in South Australia. Col- umn separation in pipelines occurs during unsteady pipeline flow or water hammer when the pressure drops to the vapour" pressure head of the fluid. The pipeline configuration (e.g. -high point or sloping pipe), type of transient -and boundary conditions (e.g. fast closure of a valve or pump trip) may result in different types of cavitation in pipelines. These include local vapour cavities and distributed vaporous cavitation (Simpson 1986 [8], Simpson and Wylie 1991 [9]). An experimental apparatus has been constructed. The main features of the apparatus and two significant problems that emerged during the initial testing of the apparatus are described in detail in this paper. The primary objective of the on-going column separation research is to develop an improved understanding of the effect of the presence of distributed vaporous cavitation on subsequent maximum pressures in a pipeline. The collapse of local vapour cavities at high points or at the extremities of a pipeline can result in large pressures. Martin (6], Simpson (8], Simpson and Wylie (9] have shown that short duration pressure pulses may occur in pipelines that exceed the pressure associated with the Joukowsky pressure rise due to a fast valve closure. The occurrence of distributed vaporous cavitation in long sections along the pipeline appears to eliminate short duration pressure pulses (Simpson [8], Simpson and Wylie [9]).

Welcome message from author
This document is posted to help you gain knowledge. Please leave a comment to let me know what you think about it! Share it to your friends and learn new things together.
Transcript

Developments in Pipeline Column Separation Experimentation
SUMMARY
By Angus R. SIMPSON and Anton BERGANT
Department of Civil Engineering, University of Adelaide, GPO Box 498, Adelaide, South Australia 5001
1
This paper summarises developments in column separation experimentation in pipes at th~ University of Adelaide, South Australia. An experimental apparatus with a 37.2 m copper pipe of 22 mm diameter has been constructed . A very fast closure ball valve has been developed which provides a closure time of 5 to 10 milliseconds. Two problems in the development of the experimental apparatus are discussed in detail. First a problem was encountered with the placement of two 150 mm long flow visualisation polycarbonate sections in the pipeline. The discrete vapour cavity numerical model is used to simulate the effect of the presence of the poly carbonate sections in the experimental apparatus. Second, problems in obtaining accurate pressure readings from strain-gage type pressure transducers have also occurred . Analysis of the experimental results has led to the development of solutions to overcome these problems when investigating column separation in pipelines.
1 Introduction
This paper describes developments in experimentation for column separation in pipes as a result of research undertaken at the University of Adelaide in South Australia. Column separation in pipelines occurs during unsteady pipeline flow or water hammer when the pressure drops to the vapour" pressure head of the fluid. The pipeline configuration (e.g. -high point or sloping pipe), type of transient -and boundary conditions (e.g. fast closure of a valve or pump trip) may result in different types of cavitation in pipelines. These include local vapour cavities and distributed vaporous cavitation (Simpson 1986 [8], Simpson and Wylie 1991 [9]). An experimental apparatus has been constructed. The main features of the apparatus and two significant problems that emerged during the initial testing of the apparatus are described in detail in this paper.
The primary objective of the on-going column separation research is to develop an improved understanding of the effect of the presence of distributed vaporous cavitation on subsequent maximum pressures in a pipeline. The collapse of local vapour cavities at high points or at the extremities of a pipeline can result in large pressures. Martin (6], Simpson (8], Simpson and Wylie (9] have shown that short duration pressure pulses may occur in pipelines that exceed the pressure associated with the Joukowsky pressure rise due to a fast valve closure. The occurrence of distributed vaporous cavitation in long sections along the pipeline appears to eliminate short duration pressure pulses (Simpson [8], Simpson and Wylie [9]).

2
2 The Experimental Apparatus
An experimental apparatus has been designed to investigate water hammer and column separation events in pipelines. The apparatus comprises a 37.2 m long sloping pipeline of 22 mm internal diameter and a 1.63 mm wall thickness connecting two pressurized tanks (Fig. 1). The pipe slope is constant at about 1 (vertical) to 20 (horizontal). The design pressure of the pipeline is 5000 kPa while for the pressurized tanks is 690 kPa. Demineralized water is used as the fluid.
A water hammer event and subsequent column separation is initiated by the fast closure of a 22 mm one-quarter turn ball valve. A flexible design of the apparatus allows the valve to be positioned at either end of the pipeline or at the middle of the pipeline (Fig. 1). As a consequence the experimental simulation of various types of hydraulic systems (e.g. pumping systems, gravitati}mal flow systems and more complex systems) may be performed. In addition the initial steady state flow can be in either direction so both an upward and a downward sloping pipe configuration can be studied.
Pressure transducers are located at 5 equidistant points along the pipeline including the end points. In addition the water temperature in one of the tanks is continuously monitored and the valve position during closure is measured precisely using optical sensors. Data acquisition and processing are performed with a Concurrent 6655 real time UNIX data acquisition computer.
Two flow visualisation polycarbonate (Lexan) block sections of 150 mm length and 22 mm internal diameter are also incorporated into the pipeline system. Fig. 2 shows the position of the flow visualisation blocks for the situation where water flows from Tank 2 to Tank 1. One block is positioned adjacent to the fast-closure ball valve while the other is located at the mid-point of the pipeline. After initial testing and subsequent investigation the central polycarbonate block section was removed due to the adverse affect on the transient. Brass inserts were manufactured to replace either or both the polycarbonate block sections. Use of the brass inserts enabled the identification of the source of the problem associated with the polycarbonate blocks. Details are given later in the paper. A high speed video has been used to photograph the evolution of the formation and collapse of vapour cavities at the valve. Intense lighting is required to insure adequate visualisation of cavitation events. The maximum rate for the high speed video is 6000 frames per second.
2.1 Pressure Regulation
A precise computer controlled pressure regulation system has been developed to enable a required initial steady state velocity to be established in the pipeline. Pressures in both tanks are set to different values to obtain a pressure gradient from one tank to the other depending on the desired flow direction (Fig. 1). This feature enables testing of water hammer and column separation in an upwards or downwards sloping. pipe.
The pressures at the bottom of both tanks are measured by diaphragm-type straingage pressure transducers. Measured and desired set values of pressures in both tanks are compared by a 12 bit AID chip controller. Softwar2 written in assembler language

'-'
CONCURRENT 6655 COMPUTER Data acquisition and processing
a PR1T
IrANK 1 '0' \ - tp
tP2 EL2.0Qt, I tP3 tP4
\ PSA T ~ ~ , Pn Flow / Fast-closure
valve Pipeline: L=37.2 Ill, D=22 nun
I I Pressure regulation ,
Valve can be moved to P or P as well. 3 5
I I
tPR2
TANIO v
-lao.o
tPn
P to P = pressure transducers at equidistant pipe sections 1 5
P • P = pressure tranducers in tanks Tl 1'2
P • P = regulated air pressure Rl R2
<X = valve position during closure
T = temperature
Figure 1: Experimental apparatus layout
3

4
TANKl
Initial flow
Flow visualisation blocks
Figure 2: Position of flow visualisation blocks for flow from Tank 2 to Tank 1
has been developed for pressure regulation. According to the difference between the measured and set pressure in a tank an electronically controlled pressure regulator and exhaust valve are operated to attempt to achieve the set pressure. The regulation system has been tested for velocities of up to 2.0 m/s for steady state flows in either direction. The pressures in both tanks can be regulated from 20 to 620 kPa to simulate both low-head and medium-head systems.
2.2 Fast Valve Closure
A 22 mm diameter ball valve is used to initiate water hammer and column separation in the pipeline. A ball valve was chosen because it has both negligible frictional losses and minimal flow separation for steady state flow. In addition the ball valve has small local inertial effect during valve closure.
Fast closure of the valve is desirable to obtain a sharp water hammer wave front. The valve may be either closed manually or by a torsional spring actuator. The use of the actuator is preferable because it provides a constant and repeatable valve closure time. As a result, duplicate experiments for the same initial steady state velocity and valve closure time and pattern can be studied.
An extensive investigation of various types of fast-closing actuators was carried out. Solenoid and pneumatic actuators could only achieve a valve closure time of the order of 50 milliseconds. As the pipeline is short with a 2L/a (2 x 37.2/1328) of 56 milliseconds in which L=pipe length and a=wave speed in the fluid. It follows then that a valve closure time of 50 ms is too large to produce sharp pressure pulses. To overcome this problem a torsional spring actuator was designed to close in less than 10 ms. The valve can be closed in as little as 5 ms when the spring is pre-tensioned.
Due to the fast closure time, optical detectors with a response time of 10-6 seconds have been installed to measure the position of the valve during the valve closure. Four optical detectors equidistant along a 90 degree arc have been used.

5
2.3 . Measurement of Pressure, Velocity and Temperature
Continuous measurement of pressure in the pipeline during transient events is carried out by diffused semiconductor strain-gage transducers located in the pipeline adjacent to both tanks, at quarter, mid and three-quarter points (Fig. 1). Transducers rated to 6000 kPa are installed flush with the inner surface of the transducer blocks which have an internal diameter of 22 mm which is the same as for the pipeline. However, the diaphragm of the transducer is 24 mm back from the end of the transducer (Fig. 3). As a result of the water filled cavity in the transducer the natural frequency of the transducer has been found to be 4.2 kHz when responding to a sharp pressure pulse. This problem is described in more detail later in the paper.
Transducer block ,------ End of the transducer
Water-filled cavity
Transducer diaphragm
'------- Transducer
Figure 3: Transducer with a water filled cavity
The steady state fluid velocity in pipeline is measured by a v?lumetric method. The change of water level over a specified period of time is proportional to the flow velocity in the pipe. The steady state velocity may be also predicted from the loukowsky water hammer equation for a fast valve closure (~V = -g~H/a in which ~V=change of velocity, g=gravitational acceleration, ~H=pressure head rise and a=wave speed) given the pressure head rise and wave speed from experimental measurements. An electromagnetic flow meter is envisaged as a further step to facilitate more accurate measurement of steady state flow velocity.
Continuous measurement of temperature is performed by a hot-film thermal probe. The probe is inserted at the bottom of Tank 1 (Fig. 1).
2.4 Computer data acquisition system
Data acquisition and processing of continuously measured pressures, temperature and valve position during closure is performed with a Concurrent real-time UNIX data acquisition computer (colour workstation, 25 MHz CPU 68030 chip, 8 MB random access memory, 2 by 142 MB 'Winchester disk drives, 150 MB cartridge tape). The data acquisition system is capable of a total sampling rate of 1 MHz directly to disk. Laboratory

6
Workbench (LWB) software [5] is used for setting up and controlling the data acquisition hardware. The software is extremely sophisticated and has a very powerful graphic display interface for easily prescribing the data acquisition and analysis options.
3 Problems in the Development of the Experimental Apparatus
Several experimental tests were carried out in order to identify water hammer and column separation events in the apparatus for various flow conditions. Fast valve closure experiments were carried out for the flow in both an upwards and downwards sloping pipe with a valve located at the downstream end. Fast valve closures were performed both manually and by the torsional spring actuator. The following undesirable effects were identified in the experiments:
• a short duration decrease in pressure occurred when both polycarbonate flow visualisation blocks were present in the apparatus (see Fig. 2) .
• overshoot and ringing at all 5 diffused semiconductor strain-gage transducers along the pipeline was identified when a sharp wave front passed the transducers.
3.1 Short duration decrease in pressure
(a) Experimental Results
A short duration pressure decrease was observed to occur whenever both polycarbonate sections were used for flow visualisation blocks in the pipeline. The occurrence of the pressure decrease following rapid closure of a downstream valve was evident for 2 different configurations. First the valve was installed at Tank 1 for simulation of an upward sloping pipeline. Second the valve was installed at Tank 2 for simulation of a downward sloping pipe. A detailed analysis of the sequence of events for the upwards sloping pipeline case (Fig. 2) follows.
Fig. 4 shows a short duration pressure decrease of the hydraulic grade line (HGL) at all five pressure transducer positions along the pipe for the following flow conditions: 1) initial steady state velocity in pipe Vo=0.55 mis, 2) hydraulic grade line in Tank 2 HGLT2 =23.6 m, 3) valve closure time tc=O.OlO s, and 4) measured wave speed a=1328 m/s. A method of characteristics plane diagram with the position of all five pressure transducers along the pipeline is also shown in Fig. 4. The valve starts to close at time t=O.O s. It may be seen from Fig. 4 that the valve effectively reduces the pipe flow between t=0.006 sand t=O.OlO seconds. Therefore the effective valve closure time is 0.004 s.
An analysis of the timing of the short duration pressure decrease in Fig. 4 at all 5 pressure transducer positions shows that the pressure decrease is initiated at the middle of the pipeline at transducer P3 (point a). Figure 5 shows a photograph of the polycarbonate tube and the transducer block at this point. A partial short duration release of pressure in the copper pipe upstream of the travelling wave front is caused by the movement of the polycarbonate section as the first high pressure water hammer wave reaches the mid-point of the pipeline. Due to the fluid-structure interaction effects of the copper pipes upstream and downstream of the polycarbonate block and the block itself, only

7
120.0 120.0
90.0 90.0 --.. c --.. 8 60.0 8 60.0 '-" '-"
...... N ...J ...J 0 30.0 0 30.0 :r:: :r::
0.0 0.0
-30.0 -30.0 -0.01 0.04 0.09 -0.01 0.04 0.09
Time (s) Time (s)
120.0 120.0
90.0 a e 90.0 --.. ,.--..
8 60.0 8 60.0 '-" '-" ('<) "'¢
...J .....:l 0 30.0 ~ 30.0 :r::
0.0 0.0
-30.0 -30.0 -0.01 0.04 0.09 -0.01 0.04 0.09
Time (s) Time (s)
120.0 Initial flow ... 90.0 3
I - - --,.--..
8 60.0 '--" V)
1 ,....,
2 .....:l C<3
' 0 30.0 1. -:r:: d)' d - 1 0.0 g. ...
-30.0 0.09 0 -0.01 0.04
Time (s) PI P2 P4 Ps
Figure 4: Measured HGLs along the pipeline with two polycarbonate sections (upwards sloping pipe, valve at downstream end, 11;,=0.55 mis, tc=O.Ol s)

8
the' upstream pipeline is exposed to the short duration pressure pulse. The release of pressure is not detected at the pressure transducer P3 located between the upstream pipe and the polycarbonate section at the mid-point. This occurs because the transducer at P3 is mounted in a solid brass block. The short duration pressure decrease wave travels from the mid-point towards the transducer P2 where the first evidence of the pressure decrease is detected (point b). The pressure decrease travels from P2 towards PI and reflects at Tank 1 (point c). The reflected wave travels along the pipeline (points d, e, f) towards Tank 2 where it reflects again (point g). Shortly after that, the wave reaches a vaporous cavitation region.
The short duration pressure decrease was eliminated by replacing the polycarbonate block at the mid-point by a brass insertion.
~ .t.. , .. . . ~":.., "" ~ , ...• -="'......;~ . .
;
Figure 5: Photograph of polycarbonate tube and transducer block
(b) Numerical Modelling
A mathematical analysis of the fluid-structure interaction phenomena requires coupled analysis of the structure and fluid motion [7], [14]. While the structural properties of copper are well known, an understanding of the viscoelastic behaviour of polycarbonate is more complex. However, the fluid-structure interaction phenomena which takes place in the experimental apparatus may be modelled by a simple internal boundary condition incorporated into the discrete vapour cavity numerical model (DVCM) [11], [12J, [15J.
In the first instance, the effect of the different wave speeds in the copper pipe (a=1328 m/s) and polycarbonate sections (a=432 mis, assumed to be one-third of the copper pipe value) were modelled using the DVCM with 620 reaches. Two reaches were used for each of the poly carbonate tube sections. A plot of the variation of HGL versus time at the

9
valve for the same flow conditions as the experimental run (Fig. 4) is shown in Fig. 6. The initial steady state flow was Vo=O.55 mis, hydraulic grade line HGLT2=23.6 m and the valve closure time tc=O.Ol s . . There is no evidence of a short duration pressure decrease in this plot.
120.0
90.0 ,.........
8 60.0 '-"
.....4 U 0 30.0 ::c 0.0
-30.0 -0.01 0.04 0.09
Time (s)
Figure 6: Numerical model results for different wave speeds: HGL at the valve (upwards sloping pipe, valve at the downstream end, Vo=O.55 mis, tc=O.Ol s
The boundary condition in the numerical model is located at the polycarbonate section at the mid-point of the pipeline (Fig. 2). The sharp pressure wave arriving at the pipe mid-point is detected at the internal boundary after valve closure. A partial release of pressure in the copper pipe upstream of the travelling wave front is then calculated. First the discharge and head at the downstream side (in terms of the direction of the travelling wave away from the valve) of the internal boundary section are calculated (C+ and C- in Fig. 7) by the standard water hammer solution for internal pipe sections [15]. Then a partial decrease of discharge at the upstream side of the boundary section is applied to give a short duration pressure head decrease. By trial and error it was found that a 10% decrease of discharge at the upstream side of the boundary section results in an 8% short duration pressure decrease corresponding to the values measured experimentally at different flow conditions. At the time steps following the occurrence of the short duration pressure decrease in the numerical model a standard water hammer solution with allowance for column separation [15] is applied to both the upstream and the downstream side of the "fluid-structure interaction" boundary condition at the polycarbonate section.
Results of the DVCM numerical model simulation with the internal boundary condition are shown in Fig. S for the same flow conditions as the experimental run (Fig. 4) .

TANK!
copper polycarbonate
Detail A TANK 2
Internal boundary computational section
Figure 7: Internal boundary condition for DVCM
10
The initial steady state flow was Vo=0.55 mis, hydraulic grade line HGLT2 =23.6 m and the valve closure time tc=O.OI s. The results in Fig. 8 can be compared with Fig. 4. The simplified numerical model reproduces the actual fluid-structure interaction phenomena as measured in the experimental apparatus.
3.2 Overshoot and ringing of strain-gage type transducers
Overshoot and ringing at all the strain-gage pressure transducers installed along the pipe was detected in experimental runs. A significant overshoot and ringing was observed particularly when a sharp front passed the transducer after a local vapour cavity collapsed. The overshoot of pressure transducers in water hammer and column separation experiments has been reported by other researchers [3], [4]. The conclusions of the researchers [3] was that high-frequency pressure transducers with a flush connection of a piezo-electric type (rather than a strain-gage type) should be used for water hammer and column separation measurements. The problem with piezo-electric pressure transducers is that the pressure is measured indirectly and that charge can dissipate very quickly if the electronics becomes damp.
Diffused semiconductor strain-gage pressure transducers with a pressure range of o to 6000 kPa were selected for use in the University of Adelaide apparatus because of the problems of charge leakage experienced for piezo-electric transducers by the first author in the development of an experimental apparatus at The University of Michigan [8]. The resonant frequency of the 0 to 6000 kPa transducer is quoted as 210 kHz in the manufacturer's literature. The manufacturer was asked to verify the 210 kHz value and provided results of a balloon-burst test which showed the resonant frequency of a much

120.0
90.0 ~
8 60.0 '-' ...... ....J 0 30.0 ::c -..-J
0.0
-30.0 -0.01
120.0
90.0 ~
8 60.0 ........ ("')
....J 0 30.0 ::c
0.0
-30.0 -0.01
120.0
90.0 ,-,.
8 60.0 ........ VI
....J 0 30.0 ::c
0.0
-30.0 -0.01
a
6 c
0.04 Time (s)
1.:\
. . 0.04
Time (s)
0.04 Time (s)
, 0.09
e
L ,
0.09
I <!>
g
0.09
120.0
90.0 ~
8 60.0 '-'
....J~ 0 30.0 ::c
0.0
-30.0 -0.01
120.0
90.0 ~
8 60.0 ........ '<t
....J 0 30.0-~
0.0
-30.0 -0.01
3
-'""' 2 C<::I -d - 1 ....
0 PI
.
-
. .
b d
0.04 Time (s)
. 0.04
Time (s)
Initial flow ~
I - -
P2 P3
11
0.09
I
7 l . .
0.09
P4 Ps
Figure 8: Numerical model HGLs along the pipeline with two polycarbonate sections (upwards sloping pipe, valve at downstream end, 1<,=0.55 mis, tc=O.Ol s)

12
150.0 I
100.0 seeA~ --.. a I '-' V) 50.0 I .....l
0 I x
0.0
-50.0 -0.1 0.0 0.1 0.2 0.3 0.4 0.5 0.6 0.7 0.8
Time (s)
150.0 A
100.0 --.. a '-'
V) 50.0 seeB~ .....l 0 :r: I
0.0
-50.0 0.34 0.35 0.36 0.37 0.38
Time (s)
150.0 B
100.0 --.. a '-'
V) 50.0 .....l 0 :r: .
0.0
-50.0 0.35 0.36
Time (s)
Figure 9: HGLs measured by the strain-gage pressure transducer (downwards sloping pipe, valve at downstream end, Vo=O.76 mis, tc=O.Ol s)

13
lower pressure range transducer (0 to 70 kPa) was 48 kHz. The manufacturer concluded, that as the 0 to 6000 kPa range transducer has a stiffer sensing diaphragm (Fig. 3), the resonant frequency should be at least of similar magnitude as for the lower range pressure transducer that was tested. It appears as if the manufacturer's tests were carried out for a transducer with the diaphragm directly exposed to the sharp pressure shock. The difficulty with the strain-gage design of the transducers installed in the experimental apparatus is that there is a cylindrical cavity between the end of the transducer and the sensing diaphragm (Fig. 3). This cavity is 24 mm long and 3 mm in diameter and appears to reduce the overall natural frequency of the transducer very significantly [1], [2]. As a result a 4.2 kHz ringing occurs for the strain-gage type transducer. The 4.2 kHz signal is superimposed on the actual pressure variation due to the water hammer and column separation in the pipe. The theoretical resonant frequency of a tube of the same dimensions as the cavity in front of the strain-gage diaphragm in the pressure transducer is approximately 15 kHz from:
a f= 4L (1)
in which a=wave speed in the fluid and L=length of the cavity between the end of the transducer and the diaphragm. Following the observation of the overshoot and ringing in column separation pressure traces measured with the strain-gage type pressure transducers a piezo-electric pressure transducer was installed at the valve flush with the inside of the transducer block directly opposite the strain-gage type pressure transducer. The idea was to compare directly the pressure traces from 2 different types of transducers. The piezo-electric type transducer has a natural frequency of 200 kHz. The trace from the piezo-electric transducer did not exhibit the 4.2 kHz overshoot and ringing observed for the strain-gage type pressure transducer. As a result of this adverse experience with the strain-gage pressure transducers it is intended to eventually replace all transducers in the experimental apparatus with high-quality pressure transducers with a high overall natural frequency.
~ discussion of the results for a fast closure of the flow in the downwards sloping pipe with the valve at the downstream end (as per Fig. 1) follows. The flow conditions were: 1) steady-state velocity in pipe 11;,=0.76 mis, 2) hydraulic grade line at Tank 1 HGLT1 = 8.2 m, 3) valve closure time tc=O.OlO s. A sampling frequency of fs=20 kHz was chosen in order to record the detailed behaviour when overshoot and ringing occurs.
Fig. 9 shows the hydraulic grade line at the valve HGLs measured by the straingage transducer. The pressure trace exhibits overshoot and ringing. A blow-up part of the trace at HGLs where the overshoot and ringing occurs, shows that the strain- gage transducer responded with a ringing [2] when a sharp pressure wave passed the transducer. The observed overall resonant frequency of the strain-gage transducer is fr=4.2 kHz. The sampling frequency of fs=20 kHz is well above the minimum required sampling rate to avoid aliasing [10J of 2fr=2 x 4.2=8.4 kHz.
The pressure time trace for the piezo-electric pressure transducer showed that there was no such overshoot or ringing at HGLs for the same transient event (see Fig. 10).

14
Figure 10: HGLs measured by the piezo-electric pressure transducer (downwards sloping pipe, valve at downstream end, Vo=0.76 mis, Tc=O.Ol)

15
4 . Conclusions
This paper has considered developments in column separation experimentation in pipelines in the research program currently being undertaken at the University of Adelaide. Problems associated with the construction of an experimental apparatus for studying column separation have been highlighted. The use of considerably different pipeline materials such as copper and polycarbonate must be tested carefully. Overshoot or ringing of pressure transducers is also a potential problem in an experimental apparatus. It may be concluded that for sharp pressure pulses, a flush mounted pressure transducer with high overall natural frequency and corresponding dynamic performance should be used.
5 Acknowledgements
This research has been supported by the Australian Research Council. Their support is gratefully acknowledged.
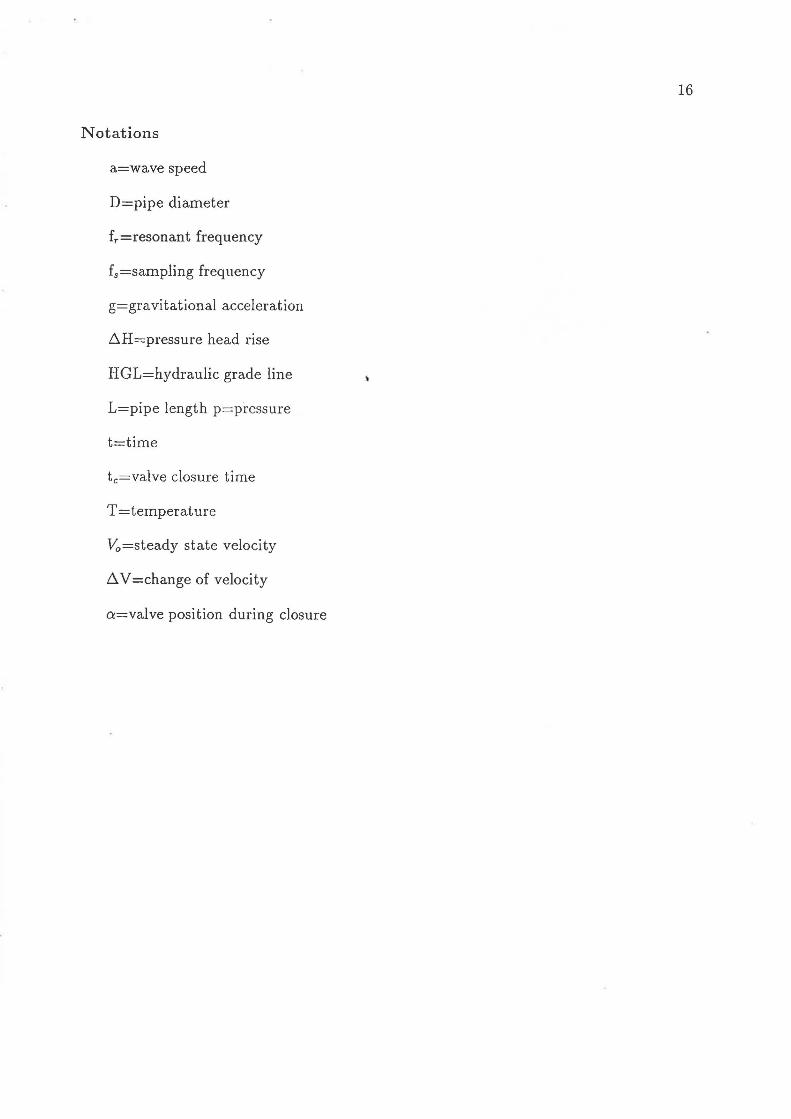
Notations
a=wave speed
D=pipe diameter
fr=resonant frequency
fs=sampling frequency
g=gra vi tational acceleration
6.H=pressure head rise
HGL=hydraulic grade line
L=pipe length p=pressure
t=time
tc=valve closure time
T=temperature
Vo=steady state velocity
6. V =change of velocity
a=valve position during closure
16

17
References IBi blio graphie
- . [1) Anderson, R.C., Englund, D.R. (1971). Liquid-filled transient pressure measurement
systems: a method for determining frequency response. NASA TN D-6605, NASA, Langley, 26p.
[2) Doeblin, E. (1983). j\1easurement systems. Application and design. McGraw-Hill Book Co., New York, 876p.
[3J Graze, H.R., and Horlacher, H.B. (1983). Pressure transients following the collapse of vapour cavities. 6th International Symposium on Hydraulic Transients in- Power Stations, IAHR, Gloucester, England, 15p.
[4J Holombe, E.L. and Roleau, W.T. (1961'). The effect of viscous shear on transients in liquid lines. Journal of Basic Engineering, ASME, 89(1), 174-180.
[5J Johnston, M. (1988). Laboratory Workbench. Version 2. Release Notes. MASSCOMP (now Concurrent Computer Corporation), Tinton Falls, NJ.
[6J Martin, C.S. (1983). Experimental investigation of column separation with rapid closure of downstream valve. Proceedings 4th International Conference on Pressure Surges, BHRA, Bath, England, 77-88.
, [7J Rachid, F.B.F. and Stuckenbruck, S. (1989). Transients in liquid and structure in vis
coelastic pipes. Proceedings 6th International Conference on Pressure Surges, BHRA, Cambridge, 69-84.
[8] Simpson, A.R. (1986). Large water hammer pressures due to column separation in sloping pipes. Ph.D. Thesis, Department of Civil Engineering, The University of Michigan, Ann Arbor, Michigan, 228pp.
[9] Simpson, A.R., vVylie, E.B. 1991 Large Pressures in Column Separation in Pipelines, ~ournal of Hydraulic Engineering, 110(10), 1310-1316.
[10J Stanley, vV.D., Dougherty, G.R., Dougherty, R. (1984). Digital signal processing. Reston Publishing Co., Inc., Reston, Virginia, 514p.
[l1J Streeter, V.L. (1969). vVater hammer analysis. Journal of Hydraulics Division, ASCE, 95(HY6), 113-120.
[12J Streeter, V.L. (1972). Unsteady flow calculations by numerical methods. Journal of Basic Engineering, ASME, 94(2), 457-466.
[13] Streeter, V.L. (1983). Transient cavitating pipe flow. Journal of Hydraulic Engineering, ASCE , 109(HY11) , 1407-1423.
[14J Tijsseling, A.S. and Lavooij, C.S.W. (1990). Waterhammer with fluid-structure interaction. Applied Scientific Research, 47, 273-285.
[15] vVylie, E.B. and Streeter, V.L. (1983). Fluid transients. FEB Press, Ann Arbor, Michigan, 384p.
Related Documents