Developmental Screening and Nutritional Intervention of Severe Acute Malnourished Children in Southern Punjab, Pakistan PhD Scholar: Dr. Javeria Saleem Research Supervisor: Dr. Rubeena Zakar A thesis submitted to the University of the Punjab in accordance with the requirements of the degree of Doctor of Philosophy in Public Health April 2018

Welcome message from author
This document is posted to help you gain knowledge. Please leave a comment to let me know what you think about it! Share it to your friends and learn new things together.
Transcript
Developmental Screening and Nutritional Intervention of Severe Acute
Malnourished Children in Southern Punjab, Pakistan
PhD Scholar: Dr. Javeria Saleem
Research Supervisor: Dr. Rubeena Zakar
A thesis submitted to the University of the Punjab
in accordance with the requirements of the degree of
Doctor of Philosophy in Public Health
April 2018

1
DECLARATION
I declare that the work in this thesis was carried out in accordance with the regulations of
University of Punjab and all the work in this thesis apart from the help and advice
acknowledged unless indicated is entirely my own contribution and is a record of work
performed by me in the department Public Health. This thesis has not been presented to
any other University for examination either in the Pakistan or overseas. No portion of the
work referred to in this research project has been submitted in support of an application
for another degree or qualification of this or any other university or institute of learning.
Signed …………………………………… Date ……………………………….
I certify that the work reported in this thesis has been performed by Dr Javeria Saleem
and during the period of study she has fulfilled the conditions of the ordinances and
regulations governing the Degree of Doctor of Philosophy, University of Punjab.
Signed …………………………………… Date ……………………………….
2
ABSTRACT
Background: Malnutrition in the early years of child life can cause long-lasting
deleterious effects which may prevent behavioural, motor, cognitive development,
educational achievement and reproductive health. Children with severe acute malnutrition
(SAM), which is associated with delayed growth and development, often have multiple
micronutrient deficiencies, including vitamin D deficiency. According to UNICEF and WHO
joint malnutrition estimates for 2016 in Pakistan, 10.5% of children are wasted, 45% are
stunted and 31.6% are underweight. If untreated, severe under-nutrition can progress to
irreversible effects, with delay in development thereby declining upcoming productivity of
these children and worsen the economic burden of country. Therefore, it is important to
find predictors for malnutrition to properly address this problem. There are insufficient
national statistics on the developmental outcome of severe acute malnutrition (SAM)
among children in Pakistan as well as randomized control trials of vitamin D
supplementation in growth along with development of SAM children are lacking. So we
have tried to explore in this study whether supplementation of vitamin D3 (cholecalciferol),
in combination with “ready-to-use therapeutic food (RUTF)”, would increase child growth
along with developmental status during the rehabilitation phase of SAM. Clinical trials in
SAM with supplementation of vitamin D have not carried out in this population before.
Methods: This study was designed in to two phases. First phase was cross- sectional
with the aim to reveal the impact of malnutrition on development quotient of children and
to explore the dietary and socio demographic factors responsible for severe acute
malnutrition and developmental quotient of children. In second phase of study we carried
out a “randomised, placebo-controlled, trial of vitamin D3 supplementation” in 185 children
3
between 6-59 months of age with uncomplicated severe acute malnutrition, in southern
Punjab, Pakistan. Children were randomly allocated to receive either two oral doses of
200,000 IU vitamin D3, or placebo, along with RUTF, at 2 and 4 weeks. Participants and
study staff were unacquainted of treatment assignment. The primary outcome was the
proportion with weight gain >15% of baseline and the secondary outcome were mean
weight-for-height/length z-score and global developmental status. Developmental quotient
of children (Assessed with the Denver Development Screening Tool II) were done at start
of study and at end of 2 months. Structured sociodemographic and nutritional
questionnaire were used to collect information for predictors on same trial population. “This
study is registered with ClinicalTrials.gov, number NCT03170479”.
Findings: Out of 194 kids initially randomly enrolled in the study, 185 kids completed
follow-up and data records of these 185 kids were included in the analysis. So out of 185
children, 69 (37.3%) have normal developmental, 108 (58.4%) had suspected delayed
development and 8 (4.3%) had untestable profile in overall developmental score. Random
allocation of children were done in vitamin D3 group (n=93) or placebo group
(n=92).Vitamin D3 did not influence the proportion of SAM kids gaining >15% weight from
baseline (relative risk [RR] 1.04, 95% CI 0.94-1.15, p=0.47) but it did increase weight-for-
height/length z-score (adjusted mean difference 1.07, 95% CI 0.49-1.65, p<0.001) and
reduce the proportion of participants with delayed global development (adjusted RR [aRR]
0.49, 95% CI 0.31-0.77, p=0.002), delayed gross motor development (aRR 0.29, 95% CI
0.13-0.64, p=0.002), delayed fine motor development (aRR 0.59, 95% CI 0.38-0.91,
p=0.018) and delayed language development (aRR 0.57, 95% CI 0.34-0.96, p=0.036). In
sociodemographic and nutritional questionnaire results indicate that weight for height is
4
strongly associated with the family income β - 0.16 with {95% CI (-0.89 to -0.04) p=0.03}
and weaning practices β -0.21 {95% CI (-1.14 to 0.19) p=0.01}.In length/height for age
(stunting) z-score the significant factors are,family monthly income β -0.16 {95%CI (0.26
to 1.08)p=0.04} mother knowledge of complimentary diet β 0.15 {95%CI (0.25 to 0.96)
p=0.03} house hold food security β 0.16 {95%CI (0.11 to 1.48) p=0.02} and exclusive
breast feeding practices, β -0.22 {95%CI (-1.47 to -0.30) p=0.00}.
Conclusion: There was not any significant difference among two groups in the primary
outcome, however high-dose vitamin D3 supplementation increased mean weight gain
and the developmental status of children receiving standard therapy for uncomplicated
SAM in Pakistan. Further researches are required to determine whether positive outcomes
can be replicated in other settings. Moreover, developmental screening ought to be vital
for primary healthcare system, specifically in high risk malnourished children and policy
makers considering for betterment in children nutritional status should promote health-
seeking practices and knowledge of families in this regard in Pakistan.
Keywords: Vitamin D supplementation, Severe Acute Malnutrition, Predictors of
malnutrition, Child Development delay, Pakistan.

5
ACKNOWLEDGEMENTS
Firstly, all praises go to Allah the most Gracious and the most Merciful, who gave me the
strength, good health, endurance and aptitude to complete this thesis.
Secondly, it is a privilege to thank everyone who helped me as I compiled my thesis and
without whom its successful accomplishment would never have happened. I would like to
show my gratitude towards my supervisors, Dr. Rubeena Zakar, Head of the department
of Public Health and Professor Dr. Muhammad Zakria Zakar, Dean Institute of Social and
Cultural Studies, University of the Punjab, for their continuous support and insightful input
throughout my PhD process. Their constructive comments and suggestions contributed
substantially to raising the quality of this research. This thesis could not have been
completed without their guidance, patience, time and enthusiasm throughout the various
stages of my PhD.
I would like to give my appreciation to Professor Adrian Martineau, The Barts and London
School of Medicine and Dentistry, Queen Marry University of London for his support and
expertise in the trial section of research and particularly for his supervision during the data
analysis stage of the work. I am grateful and thankful for his guidance and support, which
made this part of my PhD studies most enjoyable and memorable. Big thanks and much
love to all my friends and colleagues from the UK and at Queen Marry University of London
specially, Dr Robert Scragg, Dr Mulgeta Belay, Dr Julie Dermaret and Christos Stefanidis

6
for their support and continuous input for my study and also who made being away from
home for months so much easier.
I would like pay my special gratitude to Higher Education Commission of Pakistan for
awarding me IRSIP scholarship to spend six productive months as a research fellow at
Queen Marry University of London. Without HEC scholarship I would not have the
opportunity to undertake the blood analysis of children in UK in this research.
I also thank the families who took part in this study. I am grateful to Ms. Shazia Mughal
and other staff at the Integrated Reproductive Maternal Newborn Child Health & Nutrition
Program (IRMNCH), Punjab for their help in conducting the trial; Dr. Mashal Waqas
(Nishtar Hospital, Multan) and Mrs. Haseeb Bano (Mayo Hospital, Lahore) for conducting
developmental assessments; Mr. Arslan Chugtai (Rashid Latif Medical Collage, Lahore)
for generating the randomization sequence; Mr. Asif Hanif for giving his valuable
suggestions in trial protocol; Mr. Qasim Usman (GT Pharma) and Dr. Hafiz Farrukh and
Dr. Munazza Batool (Shahroze Hospital, Dera Ghazi Khan district) for preparing and
labelling syringes containing study medication according to the randomization code; Dr.
Tahir Fareed (Nishtar lab Dera Ghazi Khan) and Kashaf Junaid (University of the Punjab,
Lahore) for centrifuging blood samples;
I would like to pay me appreciativeness to my whole family without whom I would not be
the person I am today. With special thanks to my parents for theirs continuous, unwavering
support and prayers in every step of my life and for always being there with hugs and
brilliant, out-of-the-box advice; to my siblings for being such awesome people and so
special to me; to my all cousins for supporting me in all ways so well and Mr. and Mrs.
Azhar, Mr. and Mrs. Shahbaz, in UK for making home seem much less far away by always

7
being on the other end of the phone for coming to visit me and giving me occasion and
opportunity to see the rest of the beautiful England.
Finally, I’d like to thank my beloved husband Arshad Hasan, who is my best friend and
who has supported me in so many ways through this journey of learning: countless hours
of proofreading almost everything I’ve ever written and critical discussion and many
encouraging words at times when things felt too hard. Thank you so much for being you.
8
Table of Contents
1. DECLARATION .................................................................................................................... 1
2. ABSTRACT........................................................................................................................... 2
3. LIST OF TABLES ............................................................................................................... 13
4. LIST OF FIGURES .............................................................................................................. 14
5. LIST OF ABBREVIATIONS ................................................................................................ 15
6. THESIS ARRANGEMENT .................................................................................................. 17
7. 1.INTRODUCTION .............................................................................................................. 20
1.1 Background of the study ......................................................................................... 22
1.2 Malnutrition: Global Public health implication .......................................................... 24
1.3 Malnutrition: Public Health significance in Pakistan ................................................ 25
1.4 Community Management of Acute Malnutrition ...................................................... 25
1.5 RUTF - A Therapeutic approach for treatment of SAM ........................................... 30
1.6 Defining Growth and Development ......................................................................... 35
1.6.1 Growth .......................................................................................................... 35
1.6.2 Periods of growth spurts ............................................................................... 36
1.6.3 Different pattern of growth ............................................................................. 36
1.6.4 Development ................................................................................................. 36
1.6.5 Normal development ..................................................................................... 37
1.6.6 Developmental Milestones ............................................................................ 38
1.6.7 Evaluation of Development ........................................................................... 40
1.7 Development Screening ......................................................................................... 40
1.7.1 Test for Screening of Developmental Delays ................................................ 41
1.7.2 Denver Developmental Screening Test II ...................................................... 41
1.7.3 Purpose of DDST II ....................................................................................... 42
1.7.4 Advantage and disadvantage of DDST- II ..................................................... 43
1.8 Malnutrition impact on child Growth and Development ........................................... 44
1.9 Child Development in: Developing Countries .......................................................... 45
1.10 Vitamin D Overview ................................................................................................ 46
1.11 Global Prevalence for Vitamin D deficiency ............................................................ 50
1.12 Vitamin D deficiency: Prevalence in Pakistan ......................................................... 53
9
1.13 Classification Vitamin D Levels in the body ............................................................ 56
1.14 Vitamin D deficiency manifestations: in children ..................................................... 57
1.15 Possible side effects: for vitamin D supplementation .............................................. 59
1.16 Intervention of Vitamin D with Ready to use therapeutic food ................................. 60
1.17 Statement of the Problem ....................................................................................... 62
1.18 Research in Context ............................................................................................... 63
1.18.1 Evidence before this study .......................................................................... 63
1.18.2 Added value of this study ............................................................................ 63
1.18.3 Implications of all the available evidence .................................................... 64
1.19 Objectives of the Study ........................................................................................... 65
1.20 Research Questions ............................................................................................... 65
2. LITERATURE REVIEW ....................................................................................................... 66
2.1 Developmental Screening, Predictors and Intervention .......................................... 66
2.2 Vitamin D deficiency and Supplementation ............................................................. 84
2.3 CMAM / Ready to use Therapeutic Food (RUTF) ................................................... 96
2.4 Dietary and socio demographic predictors of malnutrition ..................................... 108
2.5 Discussion of Literature Review............................................................................ 122
3. METHODOLOGY .............................................................................................................. 123
3.1 Research Settings ................................................................................................ 123
3.1.1 Study Country ............................................................................................. 123
3.1.2 Study Area .................................................................................................. 125
3.2 Study Design ........................................................................................................ 126
3.3 Study Population .................................................................................................. 128
3.4 Inclusion and Exclusion Criteria ............................................................................ 128
3.5 Baseline assessment for eligibility criteria ............................................................. 128
3.6 Outcome measures .............................................................................................. 130
3.7 Biochemical Results ............................................................................................. 130
3.8 Sample size .......................................................................................................... 131
3.9 Sampling Technique ............................................................................................. 132
3.10 Procurement of Sample ........................................................................................ 132
3.11 Trial Design, Approvals, Consent Processes and Registration ............................. 133
3.12 Training of CMAM study staff ............................................................................... 133
3.12.1 Consenting and socio-demographic form .................................................... 134
10
3.12.2 Clinical examination of children: at CMAM centers ...................................... 134
3.12.3 Development assessment of children at the CMAM centers ........................ 134
3.12.4 Collection of venous blood samples ............................................................ 135
3.13 Screening of Children ........................................................................................... 135
3.14 Nutritional Assessment ......................................................................................... 137
3.15 Development screening ........................................................................................ 139
3.15.1 How to Administer DDST - II ....................................................................... 141
3.15.2 Interpretation of Denver - II ......................................................................... 142
3.15.3 Scoring of items .......................................................................................... 142
3.15.4 Denver - II Final Interpretation ................................................................... 142
3.16 Randomization and allocation ............................................................................... 143
3.17 Blinding ................................................................................................................ 144
3.18 Interventions ......................................................................................................... 144
3.19 Follow-up of study participants ............................................................................. 145
3.20 Vitamin D or Placebo Administration .................................................................... 147
3.21 Vitamin D Adverse Effects .................................................................................... 147
3.22 Collection of Blood samples for Biochemical Analysis .......................................... 148
3.23 Laboratory Methods .............................................................................................. 149
3.23.1 Quantitation of Vitamin D ............................................................................ 149
3.23.2 LC-MS/MS Principle .................................................................................... 150
3.23.3 Description Solid-Phase Extraction ............................................................. 150
3.24 Medications during study Period for any co-morbidity ........................................... 150
3.25 Risk factors for Malnutrition and Development Delay ............................................ 151
3.26 Procedure for data entry and processing .............................................................. 153
3.27 Study Timeline ...................................................................................................... 154
4. RESULTS ......................................................................................................................... 155
4.1 Results of Developmental Screening .................................................................... 155
4.2 Analysis of predictors of Development Delay ........................................................ 157
4.2.1 Comparison of socio-demographic characteristics ...................................... 157
4.2.2 Comparison of Medical history and Behavioral practices ............................ 159
4.3 Multivariate analysis - Predictors of development delay ........................................ 161
4.4 Results of Randomized control trial ...................................................................... 163
4.4.1 Trial profile .................................................................................................. 163
11
4.4.2 Baseline characteristics of participants........................................................ 165
4.5 Statistical analysis for primary and secondary outcome ........................................ 170
4.6 Analysis of Risk factors for severity of malnutrition ............................................... 174
4.6.1 Statistical analysis for predictors for severity of malnutrition ........................ 175
4.6.2 Analysis of risk factors for weight for length/height Z-score ......................... 176
4.6.3 Analysis of risk factors - Weight for Age Z- Score ....................................... 180
4.6.4 Analysis of risk factors - length/height for age Z- Score ............................... 184
5. DISCUSSION .................................................................................................................... 189
5.1 Developmental screening of severe acute malnourished children ......................... 189
5.1.1 Developmental Screening ........................................................................... 190
5.1.2 Predictors of development Delays ............................................................... 193
5.2 Randomized Trial ................................................................................................. 197
5.2.1 Primary and secondary outcomes ............................................................... 197
5.2.2 Serum Biochemical levels ........................................................................... 202
5.2.3 Vitamin D adverse effects ........................................................................... 203
5.2.4 Experiences of health care providers .......................................................... 204
5.2.5 Strength and limitation of trial ...................................................................... 205
5.2.6 Generalizability of the findings .................................................................... 206
5.3 Analysis of predictors for severity of malnutrition .................................................. 208
5.3.1 Determinants of Weight for height z– score ................................................. 210
5.3.2 Determinants of height for age z – score ..................................................... 211
5.3.3 Determinants of Weight for Age Z- Score .................................................... 214
6. SUMMARY, CONCLUSION AND RECOMMENDATIONS ................................................ 217
6.1 Summary .............................................................................................................. 217
6.1.1 Developmental Screening and its Predictors ............................................... 217
6.1.2 Randomized Clinical Trial............................................................................ 218
6.1.3 Predictors of severity of malnutrition ........................................................... 219
6.2 Conclusion ........................................................................................................... 221
6.3 Recommendations................................................................................................ 222
6.3.1 Development Screening: ............................................................................. 222
6.3.2 Randomized Trial ........................................................................................ 223
6.3.3 Predictors of malnutrition ............................................................................ 225
REFERENCES ........................................................................................................................ 229
ANNEXURE 1 - ENROLLMENT PROFORMA ........................................................................ 261
12
ANNEXURE 2 - QUESTIONNAIRE ........................................................................................ 263
ANNEXURE 3 - TIMETABLE AND OUTCOME MEASURES ................................................. 266
ANNEXURE 4 - CONSENT FORM ......................................................................................... 267
ANNEXURE 5 - RUTF RATION FOR OTP ............................................................................. 268
ANNEXURE 6 - NUTRITIONAL COMPOSITION OF RUTF .................................................... 269
ANNEXURE 7 - ROUTINE MEDICAL PROTOCOL FOR OTP ............................................... 270
ANNEXURE 8 - DENVER II FORM ......................................................................................... 271
ANNEXURE 9 - DPCC LETTER ............................................................................................. 273
ANNEXURE 10 - Ethical Review of Paper ............................................................................ 274
ANNEXURE 11 - IRMNCH PERMISSION LETTER ................................................................ 275
ANNEXURE 12 - HIGHER EDUCATION COMMISSION LETTER ......................................... 276
ANNEXURE 13 - 6 MONTHS FELLOWSHIP AT QMUL ........................................................ 277
ANNEXURE 14 - CLINICAL TRIAL REGISTRATION ............................................................ 278
13
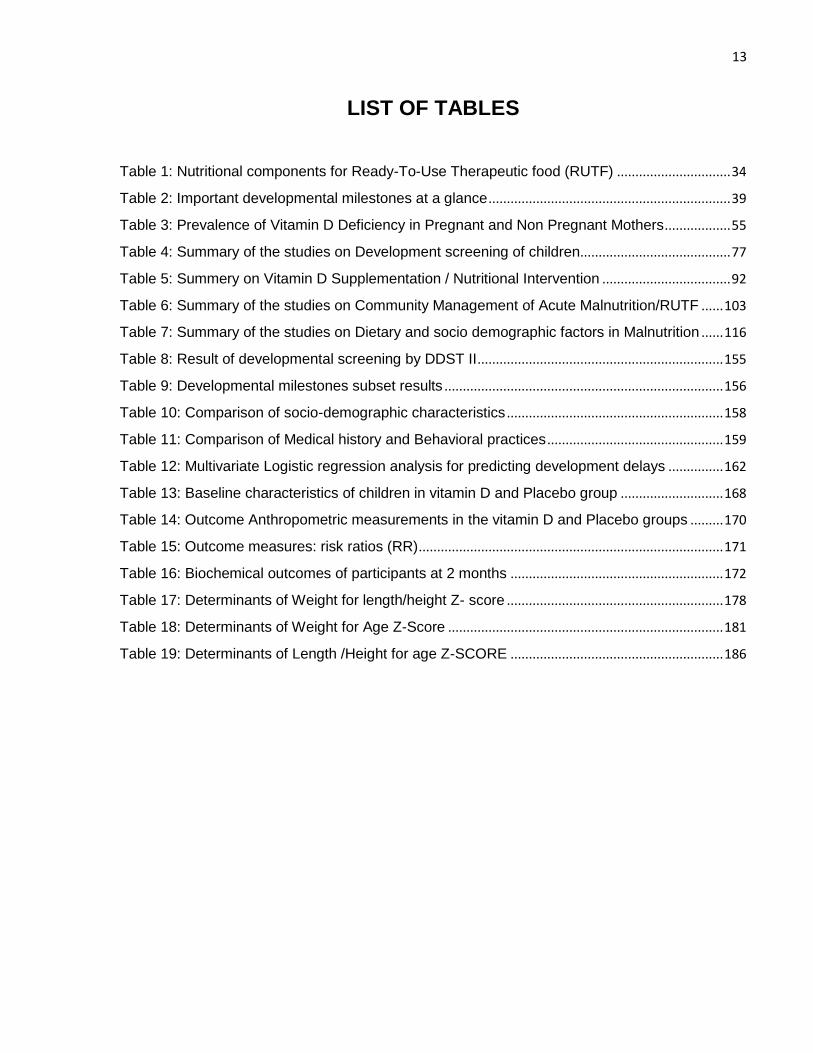
LIST OF TABLES
Table 1: Nutritional components for Ready-To-Use Therapeutic food (RUTF) ............................... 34
Table 2: Important developmental milestones at a glance .................................................................. 39
Table 3: Prevalence of Vitamin D Deficiency in Pregnant and Non Pregnant Mothers .................. 55
Table 4: Summary of the studies on Development screening of children......................................... 77
Table 5: Summery on Vitamin D Supplementation / Nutritional Intervention ................................... 92
Table 6: Summary of the studies on Community Management of Acute Malnutrition/RUTF ...... 103
Table 7: Summary of the studies on Dietary and socio demographic factors in Malnutrition ...... 116
Table 8: Result of developmental screening by DDST II ................................................................... 155
Table 9: Developmental milestones subset results ............................................................................ 156
Table 10: Comparison of socio-demographic characteristics ........................................................... 158
Table 11: Comparison of Medical history and Behavioral practices ................................................ 159
Table 12: Multivariate Logistic regression analysis for predicting development delays ............... 162
Table 13: Baseline characteristics of children in vitamin D and Placebo group ............................ 168
Table 14: Outcome Anthropometric measurements in the vitamin D and Placebo groups ......... 170
Table 15: Outcome measures: risk ratios (RR) ................................................................................... 171
Table 16: Biochemical outcomes of participants at 2 months .......................................................... 172
Table 17: Determinants of Weight for length/height Z- score ........................................................... 178
Table 18: Determinants of Weight for Age Z-Score ........................................................................... 181
Table 19: Determinants of Length /Height for age Z-SCORE .......................................................... 186
14
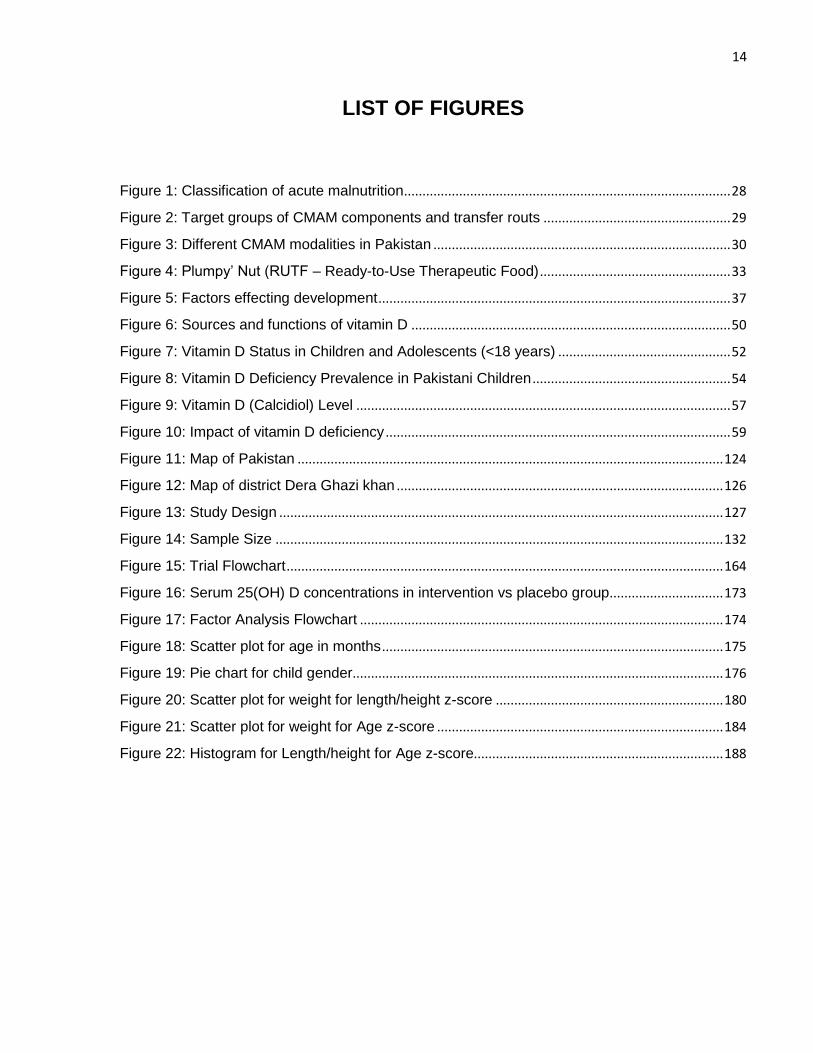
LIST OF FIGURES
Figure 1: Classification of acute malnutrition ......................................................................................... 28
Figure 2: Target groups of CMAM components and transfer routs ................................................... 29
Figure 3: Different CMAM modalities in Pakistan ................................................................................. 30
Figure 4: Plumpy’ Nut (RUTF – Ready-to-Use Therapeutic Food) .................................................... 33
Figure 5: Factors effecting development ................................................................................................ 37
Figure 6: Sources and functions of vitamin D ....................................................................................... 50
Figure 7: Vitamin D Status in Children and Adolescents (<18 years) ............................................... 52
Figure 8: Vitamin D Deficiency Prevalence in Pakistani Children ...................................................... 54
Figure 9: Vitamin D (Calcidiol) Level ...................................................................................................... 57
Figure 10: Impact of vitamin D deficiency .............................................................................................. 59
Figure 11: Map of Pakistan .................................................................................................................... 124
Figure 12: Map of district Dera Ghazi khan ......................................................................................... 126
Figure 13: Study Design ......................................................................................................................... 127
Figure 14: Sample Size .......................................................................................................................... 132
Figure 15: Trial Flowchart ....................................................................................................................... 164
Figure 16: Serum 25(OH) D concentrations in intervention vs placebo group............................... 173
Figure 17: Factor Analysis Flowchart ................................................................................................... 174
Figure 18: Scatter plot for age in months ............................................................................................. 175
Figure 19: Pie chart for child gender..................................................................................................... 176
Figure 20: Scatter plot for weight for length/height z-score .............................................................. 180
Figure 21: Scatter plot for weight for Age z-score .............................................................................. 184
Figure 22: Histogram for Length/height for Age z-score.................................................................... 188
15
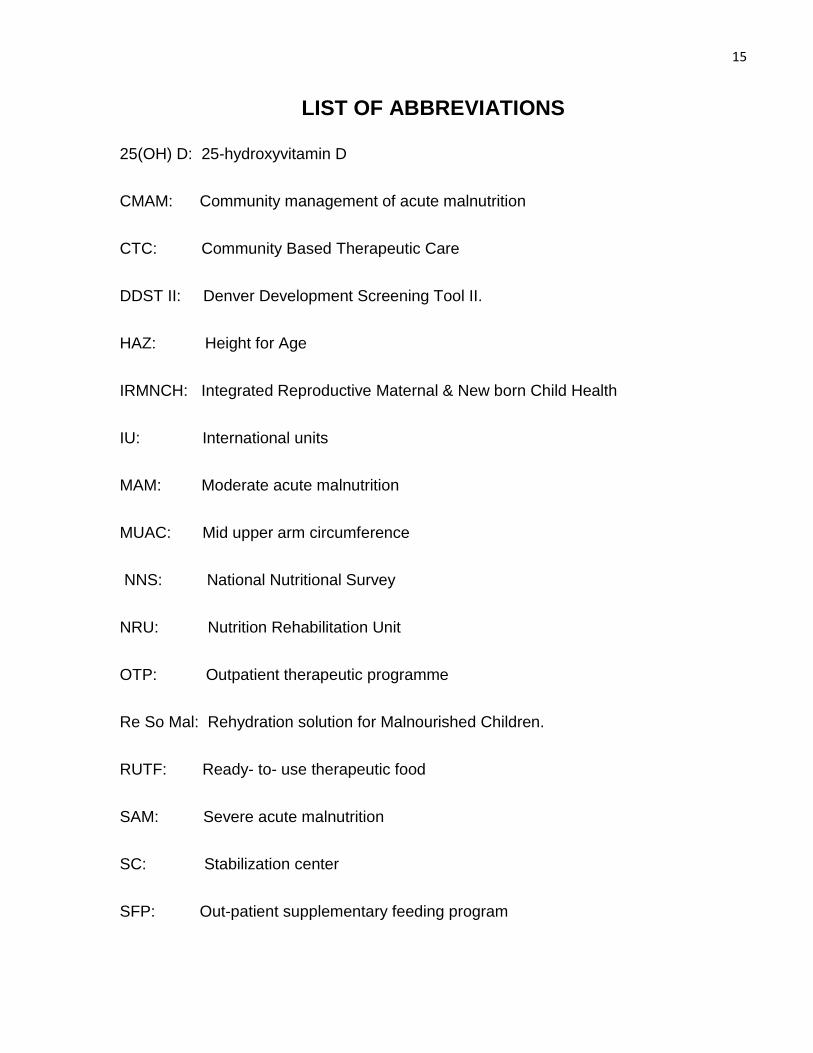
LIST OF ABBREVIATIONS
25(OH) D: 25-hydroxyvitamin D
CMAM: Community management of acute malnutrition
CTC: Community Based Therapeutic Care
DDST II: Denver Development Screening Tool II.
HAZ: Height for Age
IRMNCH: Integrated Reproductive Maternal & New born Child Health
IU: International units
MAM: Moderate acute malnutrition
MUAC: Mid upper arm circumference
NNS: National Nutritional Survey
NRU: Nutrition Rehabilitation Unit
OTP: Outpatient therapeutic programme
Re So Mal: Rehydration solution for Malnourished Children.
RUTF: Ready- to- use therapeutic food
SAM: Severe acute malnutrition
SC: Stabilization center
SFP: Out-patient supplementary feeding program

16
SPE: Solid-Phase Extraction
TFC: Therapeutic Feeding Centre
UNICEF: United Nations Children Fund
WAZ: Weight for Age
WHO: World Health Organisation
WHZ: Weight for Height
17
THESIS ARRANGEMENT
This thesis is written and divided in to six main chapters
Chapter One: states brief introduction of the problem and background info to
comprehend, the children theory of malnutrition. Particularly, the narrative will investigate
the accessible data in broad-spectrum for understanding the universal impact of
malnutrition in children and severe acute malnutrition (SAM) specifically. Literature will
also narrate that, how malnutrition impacts on child existence and development. Moreover,
child growth and development with developmental screening by Denver developmental
screening tools II were briefed. Furthermore, Vitamin D, mechanism in body, its deficiency
globally and at national level, with manifestation of child vitamin D deficiency on children
and particularly on SAM have been discussed. The management of SAM, applying a
community treatment based model, with vitamin D intervention, which is the main field of
study, is too illustrated. By utilizing previous data and literature, the requisite of this study
with implementation for community-management based model and the therapeutic doses
of vitamin D in management of children with SAM is rationalized. Research objectives with
specific research questions are summarized in the concluding section of 1st chapter.
Chapter Two: represents data investigated from the review of literature after applying
a systematic approach with narrative evince methodology. This chapter is divided in to
four parts, 1st part describes the developmental screening with its different tools and
impact of malnutrition and other socio-demographic factors responsible for delay in child
development. 2nd part explains different Vitamin D trials to understand the manifestations
of its deficiencies and to improve child health at global level by intervention of vitamin D in
18
different diseases in the world. In 3rd part of the chapter the enormity of the evidence that
occur in effect of community-management based model programs for SAM, with
interventions done in this programmer at global level were narrated. Last 4th part briefed
the different socio-demographic and dietary factors responsible for severity of malnutrition
in children at national and global level. The aim of literature review was to identify the
breaches that can be focused in this current research.
Chapter Three: defines the methodology followed in this research for assessment of
developmental screening, anthropometry, identification of SAM and methods used to
collect and analyze data, with recognition of risk factors for malnutrition and development
delay with all complete procedure of conducting trial in the community based malnutrition
treatment programmer in Punjab, Pakistan.
Chapter Four: explains the three components of the research that were conducted
comprising the findings of these studies and the main results of these three components,
i.e. results of developmental screening, main trial finding and predictors for severity of
acute malnutrition as well as an interpretation of these results.
Chapter Five: Discussed study findings, integration with previous literature cited and
summarizes the main findings of the different study parts, as well as an explanation of how
this study results were incorporated to stipulate an explanation of what worked, how and
why intervention should be done in the community based programs. Study limitations and
strengths are also presented in this section.
Chapter Six: Comprises of brief summary of the thesis followed by conclusion of
subject. Also few strategies implemented in Pakistan for child health, growth along with

19
development are discussed as well as few recommendations for making policies with
practices are stated in the concluding section of 6th chapter. Important related documents
and testimonials are attached in appendix.
20
CHAPTER ONE
1. INTRODUCTION
Nearly 20 million children suffer from severe acute malnutrition (SAM) worldwide: the
majority of cases arise in low- and middle-income countries in Asia and Africa. SAM affects
an estimated 1.4 million children in Pakistan, where it has been reported to carry a 6.2%
case fatality rate (WHO, 2013). Malnutrition is the most important key public health issue
in all over the developing countries of the world. If untreated, SAM can exhibit deleterious
consequences on child health along with development and also increases susceptibility to
infectious diseases (Duggan, 2003). Severe malnutrition is responsible approximately
deaths of two million, under 5 years aged children per annum and is accountable for
almost 22% of disability-adjusted life years globally in less than 5 years of age children
(Schubl, 2010; Black et al., 2013). According to UNICEF and WHO joint malnutrition
estimates for 2016 in Pakistan, 10.5% of children are wasted, 45% are stunted and 31.6%
are underweight (UNICEF, 2016). Children who survive an acute episode of SAM are at
increased risk of experiencing long-term adversative impacts on their physical fitness
along with mental vigour (Lelijveld et al., 2016; Galler et al., 2012) which may also
compromise their economic productivity as adults. (Galler et al., 2012).
First United Nations Millennium Development Goal (MDGs) aims at eradication of extreme
poverty and hunger and its objectives include fifty percent reduction in the population
facing hunger for the years 1990 to 2015. Despite its global precedence, hunger still
prevails in lower and middle-income countries all over the globe (Travis et al., 2004).
Presently 1.02 billion people throughout the world, mainly in underdeveloped countries,
21
suffer from hunger. Hunger is mostly described with reference to under nutrition. This word
comprises various situations, from slight under-nutrition to episodes of severe acute
malnutrition (SAM). Under nourished individuals are slower in physical and mental vigor.
Their immune system is also weak, that makes them prone to infections and illnesses
(Black et al., 2013). Famished of the satisfactory nutrition, persons will die from diseases
like measles or diarrhea.
Globally severe acute malnutrition is the most important reason accountable for the
morbidity and mortality of children under the age of five years. SAM is a lethal ailment, if
prompt treatment is not provided; then many cases of SAM will go on to develop
complications like diarrhea, anemia, edema, anorexia, acute respiratory infection,
septicemia, shock and death. Emaciation or wasting is a severe form of SAM
characterized by outcome of decline in energy intake, collective with an inequity in the
consumption of carbohydrates, lipids and proteins, and micronutrients deficiencies (WHO,
2013). The term “Marasmus” is frequently applied to this kind of malnutrition. It is mostly
the consequences of starvation or illnesses (or collectively both of them). Severe under-
nutrition can progress to irreversible effects, resulting in slowing up the metabolism in effort
to preserve energy and a slowing of protein turnover. The body then becomes incapable
of temperature regulation. Neuromuscular functions weaken and immune system
becomes ineffectual. This also affects the vital organs and may cause death by cardiac
overload, hypoglycemia, or hypothermia or by an infection (WHO, 2009). Hunger and
malnutrition are among the greatest threats for the health of growing children, especially
in developing countries like Pakistan (Poverty, 2015).
22
The following parameters are utilized to identify severe acute malnutrition “a very low
weight-for-height (below -3 SD of the median WHO growth standards) visible severe
wasting, the presence of bilateral pitting edema known as edematous malnutrition
(WHO,1999) and a mid-upper arm circumference lower than 11.5 cm in children under
five years of age” (UNHCR,1999). Chronic malnutrition also known as stunted growth is
described by utilizing the indicator of height-for-age. Moreover, a complex type of
malnutrition together stunting with wasting is identified by the classification of weight- for-
age.
Descriptions for classifications of nutritional status in 0-59 month old children are (WHO,
1995):
a. “Wasting (acute malnutrition) is defined as a weight for height (WHZ) of < -2
whereas severe wasting is considered if WHZ was < -3 OR if mid upper arm
circumference (MUAC) < 11.5 cm”.
b. “Stunting (chronic malnutrition) is defined as a height for age (HAZ) of < -2 whereas
severe stunting is considered if HAZ was < -3”.
c. “Underweight (mixed acute and chronic malnutrition) is defined as a weight for age
WAZ of < -2 whereas severe underweight is considered if WAZ was < -3”.
d. “MUAC criteria for diagnosis: severe acute malnutrition is < 11.5 and moderate
acute malnutrition is 11.5 to 12.5 (WHO, 1983)”.
1.1 Background of the study
In recent years, Pakistan has faced natural calamities like floods, famine/drought and
earthquake. The most alarming consequence of these disasters is increasing malnutrition
in children. National Nutrition Survey (2011) disclosed that approximately sixty percent of
23
people in Pakistan confront food insecurity and out of them while fifty percent of these
children and women are suffering from malnutrition. Other critical finding of the survey
(NNS, 2011) exhibit that in Pakistan stunting in addition to wasting and micronutrient
deficiencies are prevalent. More than half of the children in Pakistan are unable to grow
to their full physical and mental potential owing to malnutrition.
Acute Malnutrition is a problem which requires a comprehensive integrated public health
approach to address it. Acute malnutrition is a result of food consumption deficiency or
poor health causing both moderate-acute-malnutrition (MAM) as well as severe-acute
malnutrition (SAM). The assessment of nutritional outcome of under-five aged children
particular into countryside area is important determinant of child survival and to be also
considered as one of the most important indicator of a household's living standard. The
reasons are basically poverty, illiteracy, poor public health strategies and social
segregation. From them many cases can be averted by implementing planned public-
health policies to enhance only dietary quantity and quality, without any requisite of
medical input and economic development. The management of SAM comprises a unique
stance among clinical treatment and public health and requires specialized medication
and prevention interventions. Effective interventions for the management of SAM could
prevent millions of child deaths each year and contribute to achieve MDGs, for reduction
of child morbidity and mortality.
On the basis of experience, Community based approach of CMAM has been found to be
successful and cost effective solution to the problem. Community-based-therapeutic
approach employs ready-to-use therapeutic food as a vital nutritional element for the
prevention and treatment of malnutrition. This strategy comprises both assessment and
24
timely identification of children with SAM and house care of those without complications.
The children with complications will still need facility based treatment. Home based care
therapy for severe malnutrition in children is doing well in different ways for the last five 5
years (Manary, Ndkeha, Ashorn, Maleta & Briend, 2004).
1.2 Malnutrition: Global Public health implication
Malnutrition in its acute form is an important public health concern. Globally 26% aged
below five year’s children are suffering from moderate or severe malnutrition.
Approximately 9% of children in Africa sub-Saharan region and roughly 15% children in
territory of south Asia have diagnosed with moderate acute malnutrition (Onis, 2003) and
around 2% of children in developing world have in distress because of SAM. Lancet (2008)
highlighted that Indo Pak region experience the maximum proportion of child population
with severe wasting. However, seventy-eight percent of global children with wasting
belong to India, Pakistan and Bangladesh. Whereas 2·8 percent below five years of age
children in India facing severe wasting. SAM is the main reason of paediatric hospital
admissions in several poverty-stricken countries like Malawi. These figures exclude
children mortality because of oedematous malnutrition also known as kwashiorkor,
underrating the proportion of child mortality related to acute malnutrition. This will be also
the one of the major factor involved in delayed development of children in all four domain
of development including “Gross Motor, Fine Motor, Language and personal social
contact” affecting also intelligent quotient of children.
25
1.3 Malnutrition: Public Health significance in Pakistan
The prevalence of underweight, stunted and wasted children is higher in South-eastern
Asia as compared to other regions of the world and prevalence of malnutrition also
increases in Pakistan. According to the national nutritional 2011 survey, 31.1 % of children
less than 5 years are underweight, 43.7% children below five have stunting in 2011 in
contrast to 41.6% in 2001. Likewise, 15.1% children are wasted in 2011 against 14.3% in
2001. In Pakistan females and children are also highly deficits in essential micronutrients
(NNS, 2011). The national nutritional 2011 survey, also revealed the bio chemical values
of Vitamin D3 inadequacy 1st time on a big scale for that vitamin D concentrations were
examined on the samples obtained from the mothers and children. At national level vitamin
D3 insufficiency prevalence was 41.1% between index children. Vitamin D3 deficiency is
from the main factors involved in delayed growth as well as in child development. To
comprehend the health profile of under 5 year children, mortality rate of children under the
age of five years are deemed to be the crucial marker for health evaluation in this age
group population. The under 5 mortality Rate in Pakistan is 84/1000 live births (World
Bank, 2012). This glimpse of health profile depicts that Pakistan is still far away from
attaining the health associated Millennium Development goals targets. Pakistan is
signatory of the Millennium declaration intent to reduce maternal and child mortality.
1.4 Community Management of Acute Malnutrition
Community management of acute malnutrition (CMAM) is the treatment of acute
malnutrition in the community by giving all treatment services at the doorstep of the
patient’s residence. Conventionally, SAM children are cured in “centre-based care:
26
paediatric ward, therapeutic feeding centre (TFC), nutrition rehabilitation unit (NRU), other
inpatient care places”. This concept terribly reduces coverage and impact. The centre
based treatment approach practise the World Health Organization (WHO) protocol for
SAM treatment. In 2001 CTC (Community Based Therapeutic Care) model was presented
in emergency conditions and showed spectacular expand of program coverage and figure
of effectively treated children. Community based malnutrition management were
developed from the concept of Community–Based-Therapeutic Care (CTC).
The community-based management of malnutrition concept is a public-health paradigm,
were planned for delivering effectual treatment for severely malnourished children as
outpatient programme, by means of community mobilisation to involve families of
concerned children to provide them maximum attention and treatment plan (WHO, 2007;
Collins et al., 2006). This model is based on: timely case finding and management of the
identified children having severe acute malnutrition with no medical complications through
ready-to-use therapeutic foods and with regular prescription (Collins et al., 2006).
Investigators with health workers comprising Collins along with others explored that
majority of almost > 90 percent children diagnosed with malnutrition without any medical
complications come to hospital for treatment and will require specific hospital treatment
from the time when they are capable to take regular energy dense diets in their home
(Collins, 2001).
Investigators, explore that domestic approach to treat these children can minimize the risk
of cross and hospital acquired infections and in turn reducing the mortality because of
severe acute malnutrition and as well as decreasing the burden of pediatrics ward
admissions in developing countries. This model admits children right away into
27
community-based management programs having age between 6-59 months without
medical complications. Children’s having medical complications like bilateral pitting grade
three edema, convulsions, unconsciousness, severe anemia, hypoglycemia, hypothermia
< 35 c, loss of appetite, intractable vomiting, lethargy not alert, severe dehydration with
electrolytes imbalance ,lower respiratory- tract infections and high-grade fever >39c are
managed in stabilization centers as an in-patient care by following the WHO guidelines
till they are sufficiently well for shifting in community-based programs (WHO, 2009). The
model is created on the rule that each child diagnosed with any form of malnutrition should
get proper attention and support on time without delay, irrespective of each child
geographical site (Collins et al., 2006). It also realizes the social and financial conditions
of people concerned for their child who are suffering from malnutrition, along with hurdles
to gain access to look after in hospital (Briend, 2001). Therapeutic-programs are extended
by utilizing respective model for decreasing terrestrial hurdles and involve concentrated
community approach with community mobilization to enhance acknowledgment and
contribution (Briend, 2001; Briend et al., 2006; Collins et al, 2006).
28
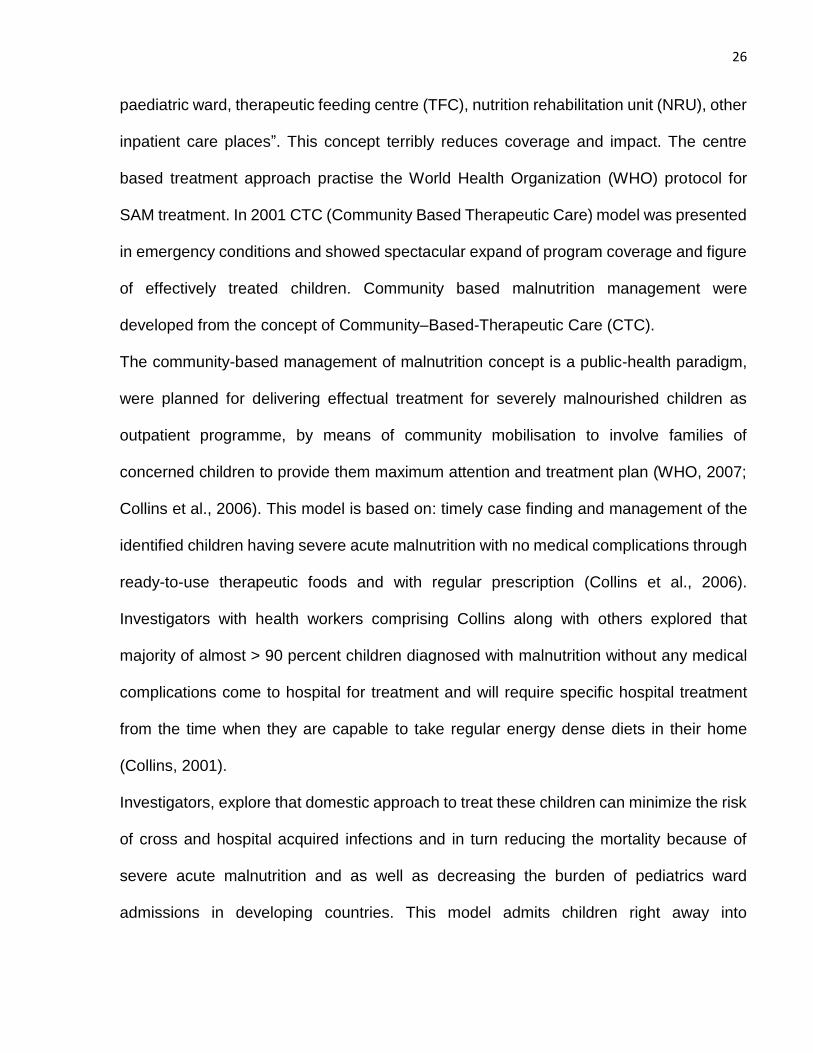
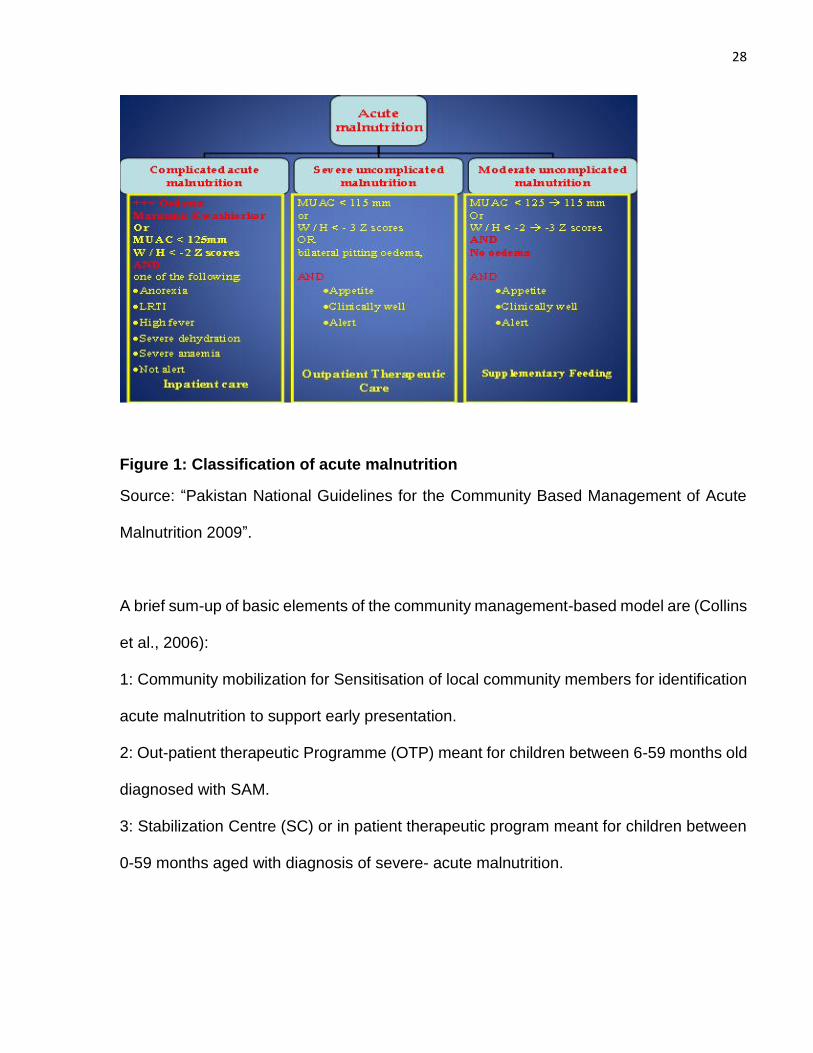
Figure 1: Classification of acute malnutrition
Source: “Pakistan National Guidelines for the Community Based Management of Acute
Malnutrition 2009”.
A brief sum-up of basic elements of the community management-based model are (Collins
et al., 2006):
1: Community mobilization for Sensitisation of local community members for identification
acute malnutrition to support early presentation.
2: Out-patient therapeutic Programme (OTP) meant for children between 6-59 months old
diagnosed with SAM.
3: Stabilization Centre (SC) or in patient therapeutic program meant for children between
0-59 months aged with diagnosis of severe- acute malnutrition.
29
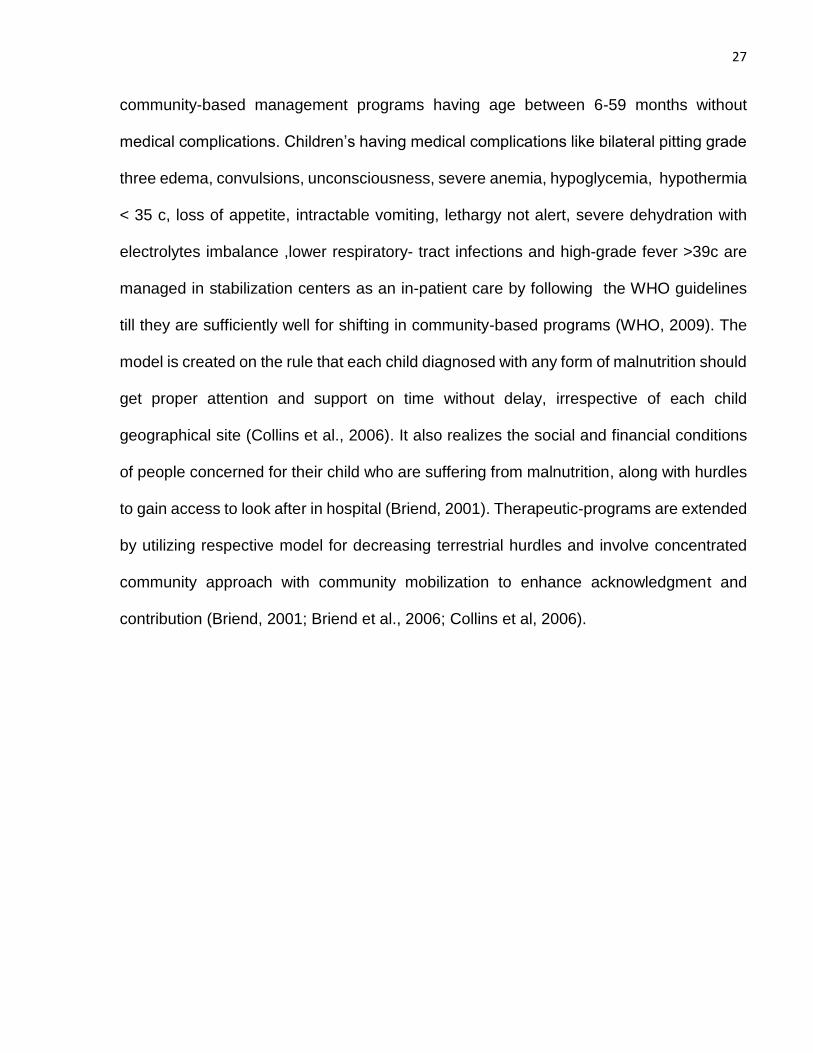
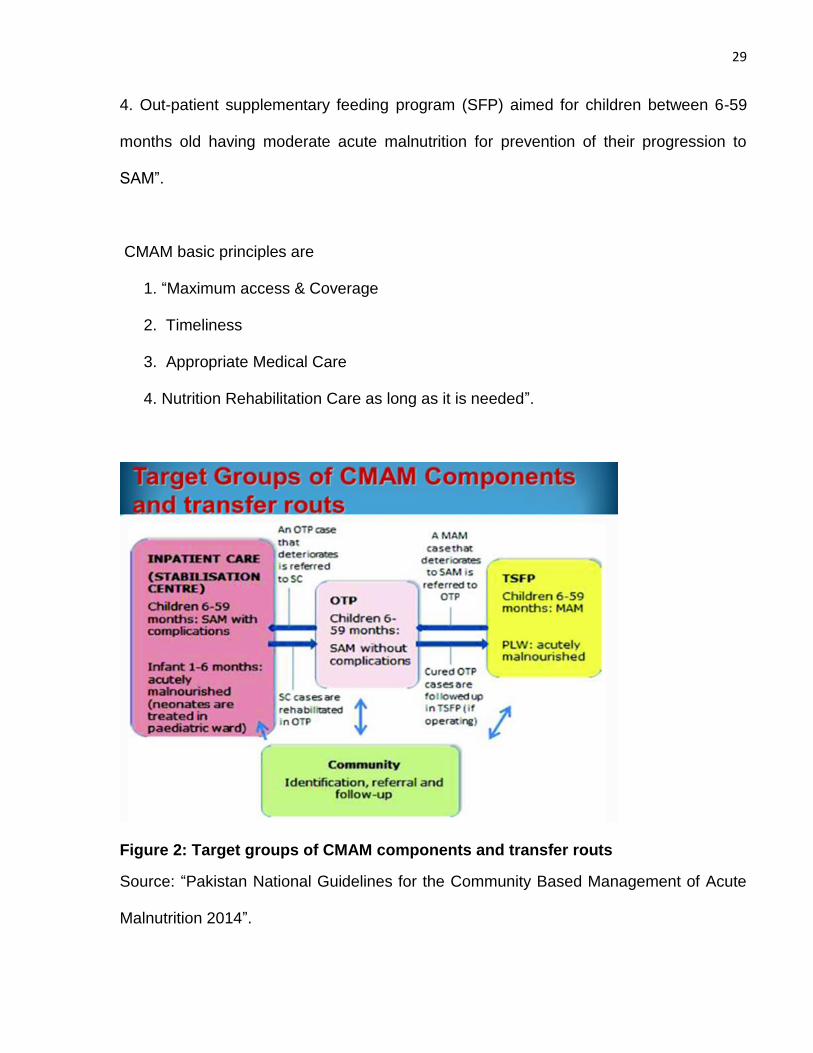
4. Out-patient supplementary feeding program (SFP) aimed for children between 6-59
months old having moderate acute malnutrition for prevention of their progression to
SAM”.
CMAM basic principles are
1. “Maximum access & Coverage
2. Timeliness
3. Appropriate Medical Care
4. Nutrition Rehabilitation Care as long as it is needed”.
Figure 2: Target groups of CMAM components and transfer routs
Source: “Pakistan National Guidelines for the Community Based Management of Acute
Malnutrition 2014”.
30
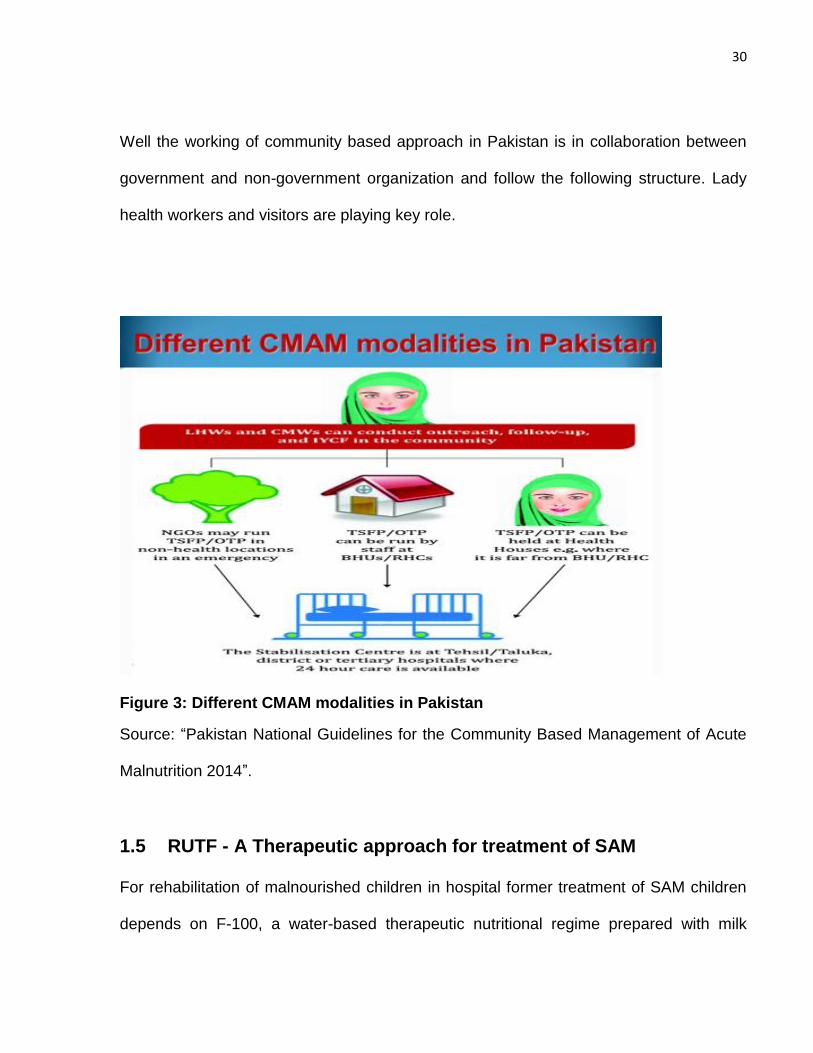
Well the working of community based approach in Pakistan is in collaboration between
government and non-government organization and follow the following structure. Lady
health workers and visitors are playing key role.
Figure 3: Different CMAM modalities in Pakistan
Source: “Pakistan National Guidelines for the Community Based Management of Acute
Malnutrition 2014”.
1.5 RUTF - A Therapeutic approach for treatment of SAM
For rehabilitation of malnourished children in hospital former treatment of SAM children
depends on F-100, a water-based therapeutic nutritional regime prepared with milk
31
powder and sugar supplemented with micronutrients (WHO, 1999). Even though this
ready to use therapeutic diet has been effectual for boosting speedy nutritional healing in
mal-nourished children, it has many confronts like, its preparation requires safe hygienic
environment to prevent bacterial contamination. Uncontaminated water is prerequisite for
preparing this liquid and after preparation this liquid should be drunk in few hours.
Remaining should be put for storage in fridge, if not must be throw away (Briend, 2001;
Collins et al., 2006). So, the usage of F-100 diet is limited in hospitals only where children
should live till their revival, or should arrange hygienic storage means. These prerequisites
limit utilization of F-100 in community based approach for recovering children as numerous
countryside villages in the under-developing countries are not capable for these simple
preparation and storage precondition because shortage of nontoxic drinking water,
electricity and suitable hygiene environment (UNICEF, 2006).
Central to outpatient care is the innovation of “Ready- to-use therapeutic food (RUTF), it
is lipid-based nutrient-dense solid diet, with similar nutrient profile but greater energy and
nutrient density than F-100 and mineral and vitamins enriched food specially designed to
treat SAM. It is prepared from a mixture of peanut butter, powdered milk, powdered sugar,
vegetable oil supplemented with micronutrients” (Briend et al., 1999). As Ready- to-use-
therapeutic food (RUTF) is an oil based paste, having minimal water content, with shelf
life of three to five months when tears and have no risk of bacterial contamination even
when unintentionally adulterated (Briend, 1997; Briend, 2001). It did not require any
preparation before eating due to very low water content, it resists significant bacterial
growth. Hence, it can be utilized securely at home with no need of refrigeration and without
any optimum hygienic situations and also do not need any specific expertise to give them
32
to their child (MSF, 2008). They are design in a way that child can eat by their own without
help, only young infants require help to eat. Ultimately, the making of RUTF is simple and
the items utilized are made by local community by easy processing. The ultimate invention
before eating need no cooking or heating (Nutriset, 2000).
Plumpy-nut is a specimen of normally used lipid-based RUTF. It contains high amount of
protein and energy with a peanut based paste wrapped in foil. It comprises a balance of
all macronutrients and micronutrients. It is a very high energy dense food contains around
5.5 kcal/g comprising weight of 92 grams (Collins, 2001). Plumpy nut effectiveness has
been verified in many states such as India, Malawi, Niger, Ethiopia, and Sudan. So the
intervention of (RUTF) had mostly solved the difficulties in offering appropriate high
nutrient energy dense diet and are secure to utilize in community based approach for cure
of SAM children. The Ashworth appraisal specifies that the new development of RUTF has
significantly reduced the complexities linked with giving an appropriate high-energy,
nutrient-dense diet that is secure for consumption in outpatient programs. RUTF have
same nutrient formulation but high energy and nutrient density in comparison with F100,
the therapeutic diet advised by the WHO in the recovery period of SAM management
(Briend at al., 1999). As RUTF is consumed without any prior cooking, heat-labile vitamins
are remaining intact in preparation and the labor, energy and water needs on poor families
are minimized. The manufacturing procedure is easy and RUTF can be produced from
native crops with simple technology that is easily accessible in developing countries
(Manary, 2006).
33
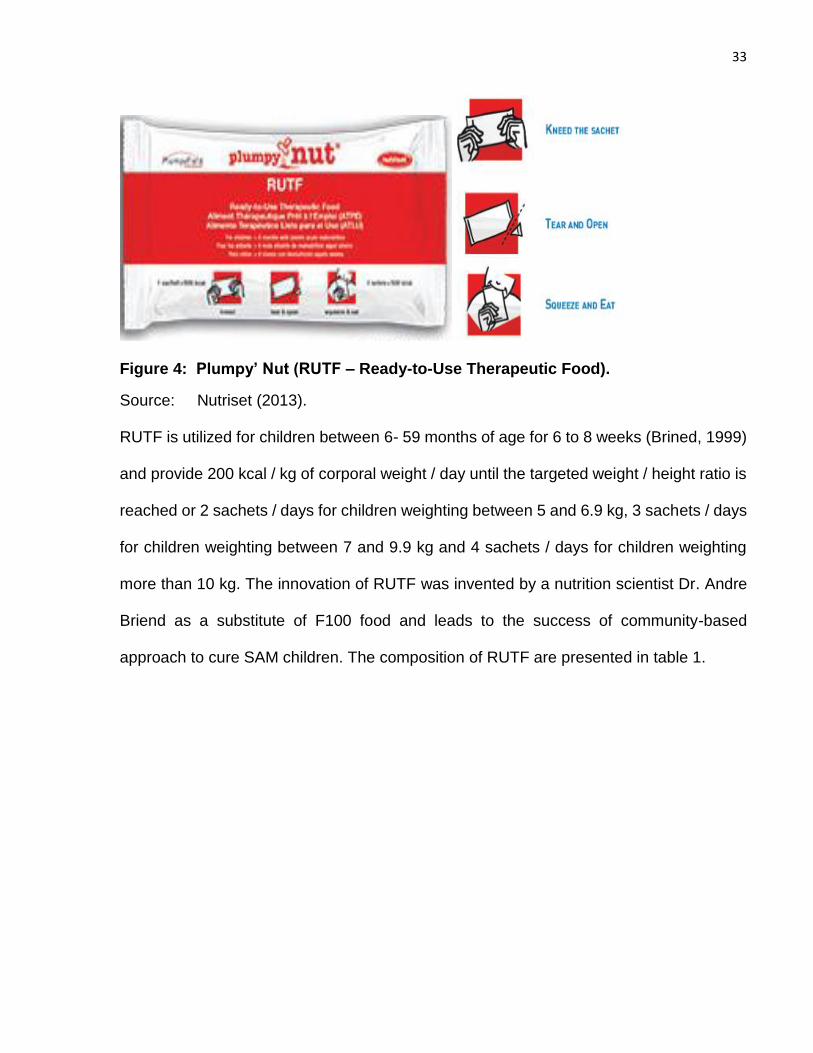
Figure 4: Plumpy’ Nut (RUTF – Ready-to-Use Therapeutic Food).
Source: Nutriset (2013).
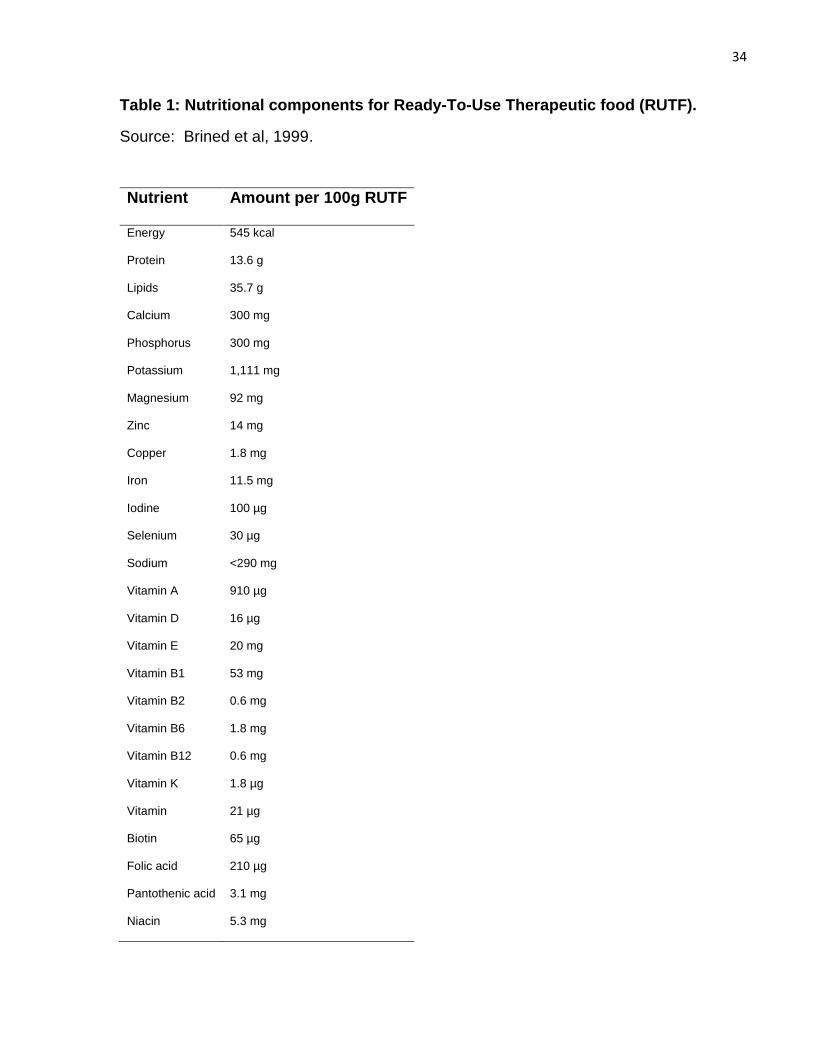
RUTF is utilized for children between 6- 59 months of age for 6 to 8 weeks (Brined, 1999)
and provide 200 kcal / kg of corporal weight / day until the targeted weight / height ratio is
reached or 2 sachets / days for children weighting between 5 and 6.9 kg, 3 sachets / days
for children weighting between 7 and 9.9 kg and 4 sachets / days for children weighting
more than 10 kg. The innovation of RUTF was invented by a nutrition scientist Dr. Andre
Briend as a substitute of F100 food and leads to the success of community-based
approach to cure SAM children. The composition of RUTF are presented in table 1.
34
Table 1: Nutritional components for Ready-To-Use Therapeutic food (RUTF).
Source: Brined et al, 1999.
Nutrient Amount per 100g RUTF
Energy
Protein
Lipids
Calcium
Phosphorus
Potassium
Magnesium
Zinc
Copper
Iron
Iodine
Selenium
Sodium
Vitamin A
Vitamin D
Vitamin E
Vitamin B1
Vitamin B2
Vitamin B6
Vitamin B12
Vitamin K
Vitamin
Biotin
Folic acid
Pantothenic acid
Niacin
545 kcal
13.6 g
35.7 g
300 mg
300 mg
1,111 mg
92 mg
14 mg
1.8 mg
11.5 mg
100 µg
30 µg
<290 mg
910 µg
16 µg
20 mg
53 mg
0.6 mg
1.8 mg
0.6 mg
1.8 µg
21 µg
65 µg
210 µg
3.1 mg
5.3 mg
35
1.6 Defining Growth and Development
1.6.1 Growth
Growth is defined as the “a measure of physical maturation, signifies an increase in size
of body and its various organs, it can be measured in terms of centimeters and kilograms”.
It can be also defined as the “growth represents the summation of all the processes that
convert fetus through childhood to a sexually mature adult by increase in cell number,
increase in cell size and increase in inter-cellular matrix in prenatal and postnatal period”.
Growth is mainly due to multiplication of cells and increase in intracellular substances.
Growth is a systematic phenomenon, proceeding in orderly fashion. Rates with different
patterns of growth are particular with specific parts of the body. Broad individualistic
differences occur in growth rates (Karlberg & Albertsson, 1995) like postnatal phase
comprises of three distinct phases infancy, childhood and puberty (ICP model).
According to David Sinclair (2006) “Growth never lasts from conception to death it goes in
to stages like early embryonic (everything is growth and there is no function) growth and
function lasts up to maturity, functional activity and replacement at its lowest level”. Growth
is sensitive indicator of health and nutritional status during childhood (WHO, 1995).
Divergence in growth particularly in reduced growth are linked with an added risk of
illnesses mutually in short as well as in long term. Growth monitoring is a valuable tool in
examine the health and fitness of children specifically in countries where other diagnostic
tools are sparse. It is also an essential parameter in advance clinical setting but mostly it
is neglected in to the determinant of more advanced assessment. Early growth is linked
with long term development and health. Wide individual differences exist in growth rates
because of different causes.
36
Growth and development are influenced by multiple factors, like nutritional, socio-
economic, environmental and seasonal factors, chronic illness, genetic factors, prenatal
and intrauterine, emotional, health, exercise, sleep, hormonal and growth potential factors.
Growth spurts or acceleration of growth consist of three periods. Accelerated growth
velocity is growth spurts and includes different periods and patterns.
1.6.2 Periods of growth spurts
Infantile growth spurts 0 – 1 years
Mid growth spurts 6 – 8 years
Adolescent growth spurts 10 – 14 years
1.6.3 Different pattern of growth
Somatic growth
(“Weight, height, mid arm circumference, head circumference,
Chest circumference, body mass index and skin fold thickness”).
Neural growth
Lymphatic growth
Reproductive growth
1.6.4 Development
Development is defined as “acquisition of qualitative and quantitative skills and
competencies in a social milieu”. It depends on maturation and myelination of brain. It is a
continuous process. “Child development refers to how a child becomes able to do more
complex things as they get older”. Development process is different from growth
phenomenon; growth only indicates that the child is becoming bigger in size both
interrelated impossible to separate. Development process advances from simple to
37
multiplex and from general to peculiar. Growth and development are influenced by multiple
factors.
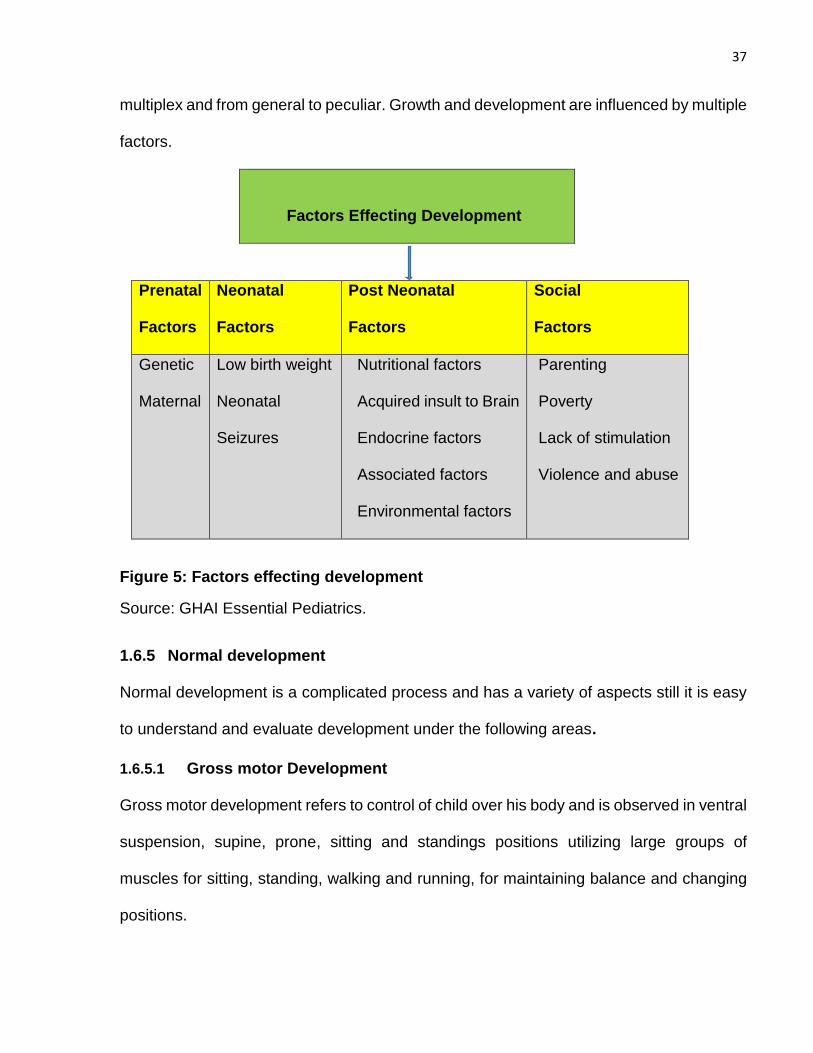
Factors Effecting Development
Prenatal
Factors
Neonatal
Factors
Post Neonatal
Factors
Social
Factors
Genetic
Maternal
Low birth weight
Neonatal
Seizures
Nutritional factors
Acquired insult to Brain
Endocrine factors
Associated factors
Environmental factors
Parenting
Poverty
Lack of stimulation
Violence and abuse
Figure 5: Factors effecting development
Source: GHAI Essential Pediatrics.
1.6.5 Normal development
Normal development is a complicated process and has a variety of aspects still it is easy
to understand and evaluate development under the following areas.
1.6.5.1 Gross motor Development
Gross motor development refers to control of child over his body and is observed in ventral
suspension, supine, prone, sitting and standings positions utilizing large groups of
muscles for sitting, standing, walking and running, for maintaining balance and changing
positions.

38
1.6.5.2 Fine motor skill Development
Fine motor skill development refers to good coordination of eyes, hand-eye, hand-mouth
and skills for manipulation with hands like utilizing hands for eating, drawing, dressing,
playing and writing as well as for doing various other things.
1.6.5.3 Language Development
Language development refer to hearing sounds, understanding, true speech and speaking
by applying body language with gestures, communication and understanding with others.
1.6.5.4 Personal and Social Development
Personal and social development refer to interpersonal and social skills like social smile,
mimicry, waving bye-bye and interaction with others. It also comprises family relationships,
dealing with friends and teachers, collaborating and reacting with others emotions.
1.6.6 Developmental Milestones
“Developmental milestones are a set of functional skills or age-specific tasks that most
children can do at a certain age range” (Anderson, 1998). Mostly pediatrician applies
milestones to examine child development. Though every single milestone has a specific
age level, the definite age when a normal developing child attains that milestone can differ
a bit. As each child is exceptional the developmental milestones impart a broad indication
of the expected changes as child grows older, but it is not alarming if child development
proceeds in a marginally different direction. Every individual child proceeds at her own
rate, so, if child shows possibly developmental delay signs for particular age limit they
should be kept under supervision for screening of developmental delay for that specific
age group.
39
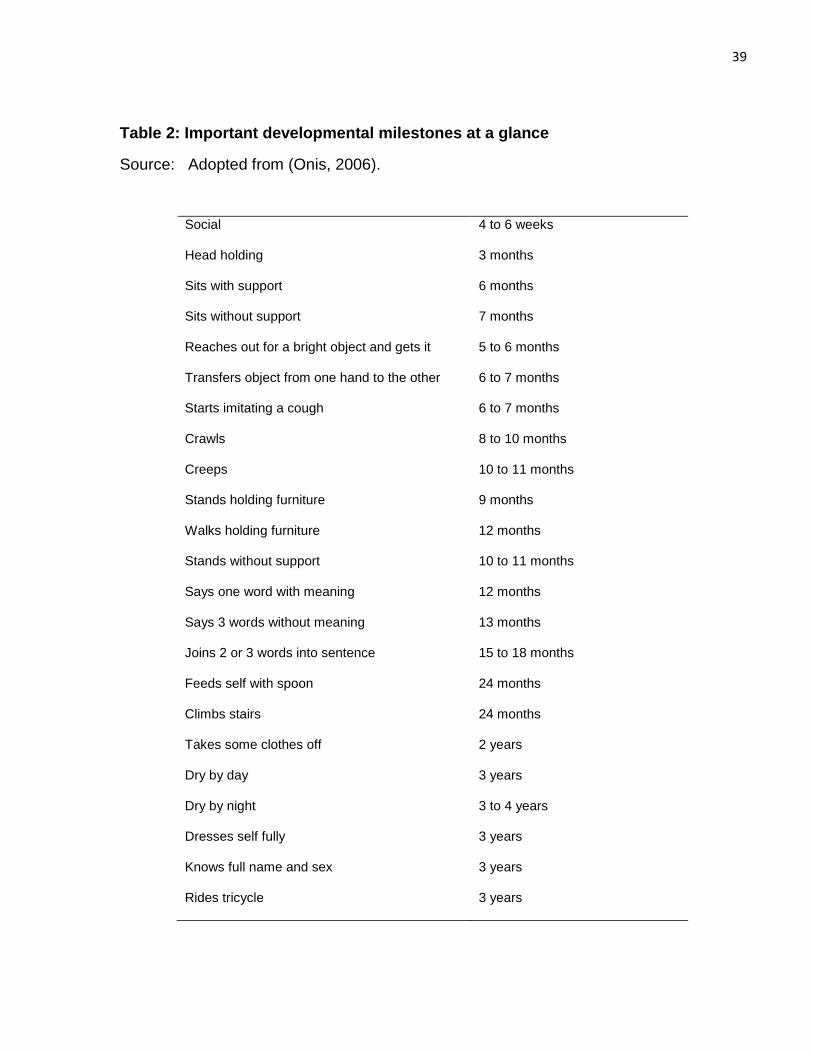
Table 2: Important developmental milestones at a glance
Source: Adopted from (Onis, 2006).
Social
Head holding
Sits with support
Sits without support
Reaches out for a bright object and gets it
Transfers object from one hand to the other
Starts imitating a cough
Crawls
Creeps
Stands holding furniture
Walks holding furniture
Stands without support
Says one word with meaning
Says 3 words without meaning
Joins 2 or 3 words into sentence
Feeds self with spoon
Climbs stairs
Takes some clothes off
Dry by day
Dry by night
Dresses self fully
Knows full name and sex
Rides tricycle
4 to 6 weeks
3 months
6 months
7 months
5 to 6 months
6 to 7 months
6 to 7 months
8 to 10 months
10 to 11 months
9 months
12 months
10 to 11 months
12 months
13 months
15 to 18 months
24 months
24 months
2 years
3 years
3 to 4 years
3 years
3 years
3 years
40
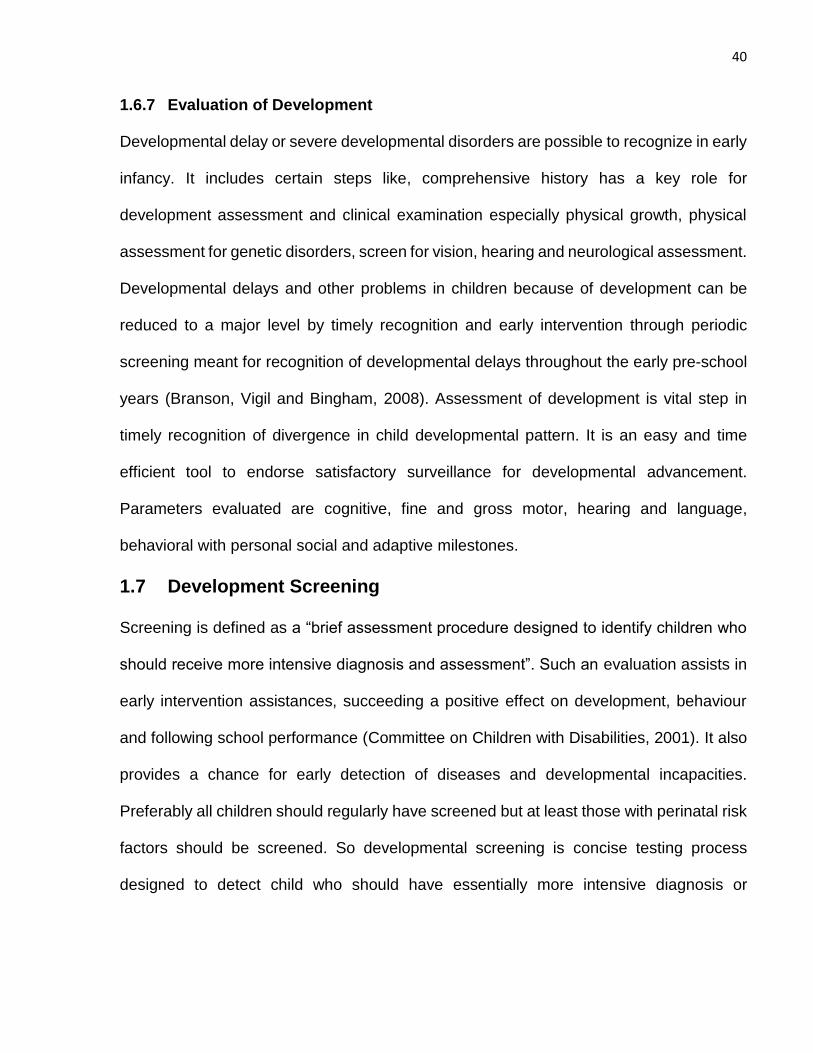
1.6.7 Evaluation of Development
Developmental delay or severe developmental disorders are possible to recognize in early
infancy. It includes certain steps like, comprehensive history has a key role for
development assessment and clinical examination especially physical growth, physical
assessment for genetic disorders, screen for vision, hearing and neurological assessment.
Developmental delays and other problems in children because of development can be
reduced to a major level by timely recognition and early intervention through periodic
screening meant for recognition of developmental delays throughout the early pre-school
years (Branson, Vigil and Bingham, 2008). Assessment of development is vital step in
timely recognition of divergence in child developmental pattern. It is an easy and time
efficient tool to endorse satisfactory surveillance for developmental advancement.
Parameters evaluated are cognitive, fine and gross motor, hearing and language,
behavioral with personal social and adaptive milestones.
1.7 Development Screening
Screening is defined as a “brief assessment procedure designed to identify children who
should receive more intensive diagnosis and assessment”. Such an evaluation assists in
early intervention assistances, succeeding a positive effect on development, behaviour
and following school performance (Committee on Children with Disabilities, 2001). It also
provides a chance for early detection of diseases and developmental incapacities.
Preferably all children should regularly have screened but at least those with perinatal risk
factors should be screened. So developmental screening is concise testing process
designed to detect child who should have essentially more intensive diagnosis or
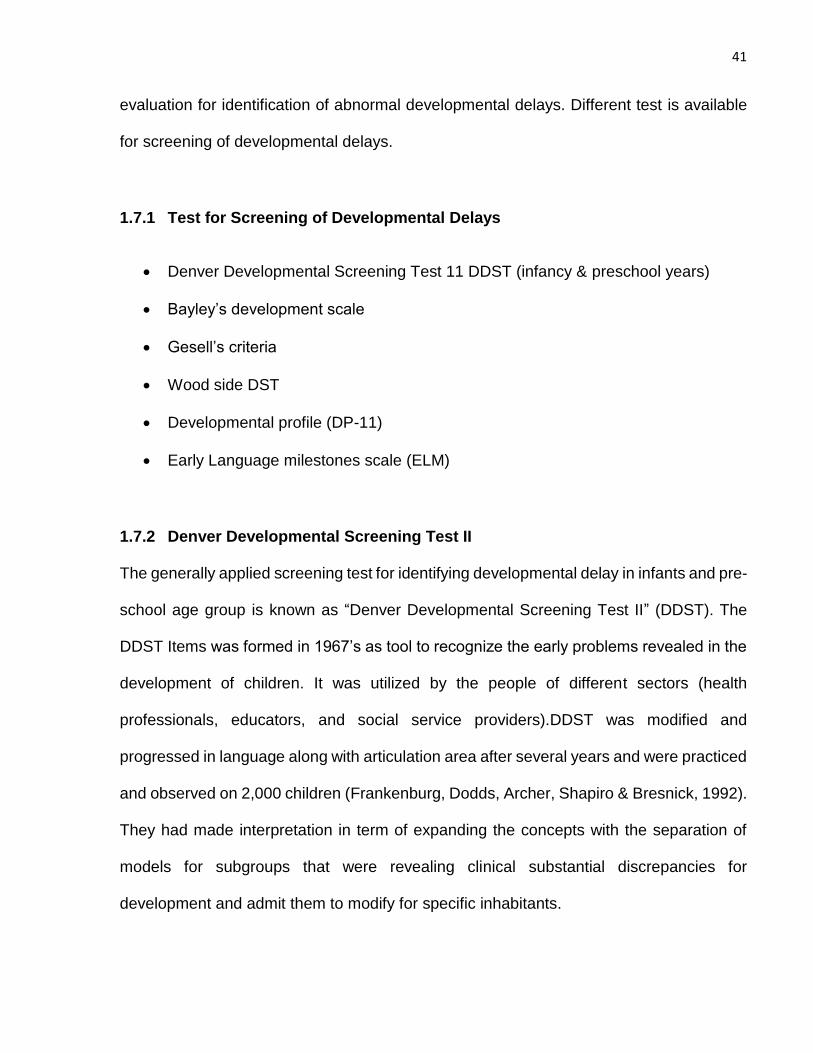
41
evaluation for identification of abnormal developmental delays. Different test is available
for screening of developmental delays.
1.7.1 Test for Screening of Developmental Delays
Denver Developmental Screening Test 11 DDST (infancy & preschool years)
Bayley’s development scale
Gesell’s criteria
Wood side DST
Developmental profile (DP-11)
Early Language milestones scale (ELM)
1.7.2 Denver Developmental Screening Test II
The generally applied screening test for identifying developmental delay in infants and pre-
school age group is known as “Denver Developmental Screening Test II” (DDST). The
DDST Items was formed in 1967’s as tool to recognize the early problems revealed in the
development of children. It was utilized by the people of different sectors (health
professionals, educators, and social service providers).DDST was modified and
progressed in language along with articulation area after several years and were practiced
and observed on 2,000 children (Frankenburg, Dodds, Archer, Shapiro & Bresnick, 1992).
They had made interpretation in term of expanding the concepts with the separation of
models for subgroups that were revealing clinical substantial discrepancies for
development and admit them to modify for specific inhabitants.
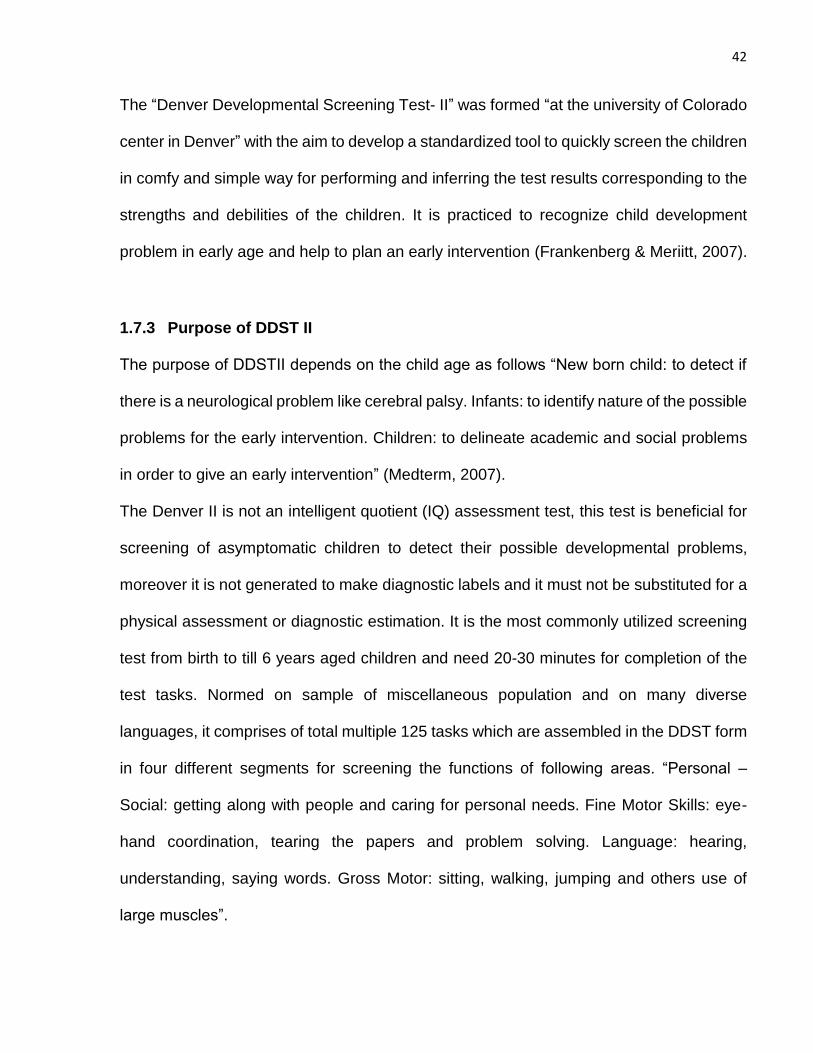
42
The “Denver Developmental Screening Test- II” was formed “at the university of Colorado
center in Denver” with the aim to develop a standardized tool to quickly screen the children
in comfy and simple way for performing and inferring the test results corresponding to the
strengths and debilities of the children. It is practiced to recognize child development
problem in early age and help to plan an early intervention (Frankenberg & Meriitt, 2007).
1.7.3 Purpose of DDST II
The purpose of DDSTII depends on the child age as follows “New born child: to detect if
there is a neurological problem like cerebral palsy. Infants: to identify nature of the possible
problems for the early intervention. Children: to delineate academic and social problems
in order to give an early intervention” (Medterm, 2007).
The Denver II is not an intelligent quotient (IQ) assessment test, this test is beneficial for
screening of asymptomatic children to detect their possible developmental problems,
moreover it is not generated to make diagnostic labels and it must not be substituted for a
physical assessment or diagnostic estimation. It is the most commonly utilized screening
test from birth to till 6 years aged children and need 20-30 minutes for completion of the
test tasks. Normed on sample of miscellaneous population and on many diverse
languages, it comprises of total multiple 125 tasks which are assembled in the DDST form
in four different segments for screening the functions of following areas. “Personal –
Social: getting along with people and caring for personal needs. Fine Motor Skills: eye-
hand coordination, tearing the papers and problem solving. Language: hearing,
understanding, saying words. Gross Motor: sitting, walking, jumping and others use of
large muscles”.
43
It also includes five “Test Behavior” test items to detect child on task completion of 25%,
75% and 90% and after that “scored as concern if child completing task in shaded area
(75-90%) scored as failure if not completed by time (90% complete)”. Referrals are justified
for one failure or maximum two concerns. Prematurity are corrected till the chronological
age of 2 years.
1.7.4 Advantage and disadvantage of DDST- II
It is a standardized tool that has been tested on a different population. It can be applied in
a quick and easy way by the skilled professional and para-professional workers. The
DDST had been critiqued for lack of sensitivity in children screening who might be
problematic for later developmental outcome or in school performance. It can be directed
and score as needed, but mostly cultural problems effect the results (Barlow, 2007). The
strength of DDST- II aimed for testing the development of wide variety of diverse
proficiencies in less time. It was not planned to test for single, or a few theoretical
hypotheses like intelligence level, motor functioning and social-skills.
This tool was standardized on 2,000 children representative of Colorado before its validity
(Denver, 2007). The inter rater and 7 to 10 day’s test retesting on same assessor and
same viewer consistency was verified for all 141 possible items. Out of all, 125 tasks
chosen in favor of final version, 107 ensured superb inter-rater consistency, 63 held
outstanding and remaining 25 exhibited moderate to good testing, retesting consistency
(Denver, 2007). But in few cases DDST-II worker should be familiar with cultural aspects
of the area such as difference in urban and the village life that can influence the
assessment results such as in certain areas numerous children were taught to eat by using
44
right hand because of cultural and religious aspects without using fork and spoon.
Moreover, there are not any other easy as well as quick developmental screening tool for
recognition of range of disorder as “intelligence, language, mental health, and motor and
self-help skills adapted to the developmental ranges of norms”. This test skilled the
administrator to recognize immediately the children strengths and weaknesses. It provides
chances for additional inspection in particular area of concern (Franckenburge & Merriit,
2007).
1.8 Malnutrition impact on child Growth and Development
UNICEF report that rudest impact of malnutrition ensues before birth, when fetus cannot
grow properly as well as in children initial life years, when child physical or mental
development is delayed. If not prevented or cured, malnutrition can cause harmful effects
on child development, growth and overall health. Kauffman, Jones and Kluger (1986)
observed that malnutrition may possibly reduce child capability to react against trauma,
and child become more prone towards infectious diseases. Golden (2000) reveals that
one of the major risk factor for child high morbidity and mortality is severe malnutrition and
further brief that if child is severely wasted his immunity against infections is reduced and
child become more susceptible to diseases like diarrhea, respiratory tract infections and
other infectious ailments and child mortality rate enhanced.
Kaufmann and coworkers also explained that consequences of malnutrition lead to
alteration in the immune system response that causes weakened lymphocyte response,
compromised phagocytosis consequential to reduced complement of specific cytokines
and also diminished secretory immunoglobulin. These alterations prone children to
45
infections both acute and chronic (Kaufmann et al., 1986). Pipes explained further that
chronic infections because of a compromised immune system leads towards low
nutritional status in children, causing loss of appetite, reduced nutrient absorption,
enhanced metabolic demands and more nutrient loss (Pipes & Trahms,1993). WHO
(2005), state if child is malnourished before their 2nd birthday, they undergo irreparable
physical and cognitive impairment, which can affect their health and development later on
in life. Black with their associates brief that severely malnourished children who live in this
state mostly are stunted in their parenthood and in turn may deliver low-birth weight or
small children (Black et al., 2008; Bennett, 2009).
Malnutrition have social, behavioral and psychological impact, children with malnutrition
reveal apparent behavioral transforms in the critical stages (Graham et al., 1983). They
noticed that child with diagnosis of malnutrition is more lethargic, irritable and less
energetic in comparison with the well-nourished children. It also depicts that such children
in comparison with normally nourished counterparts have poor intelligent quotient and
have delay in achievement of developmental milestone. Tomkins (1993), add-on that
when these children confront iron and other micronutrient deficiencies, they incline to have
learning difficulties in later life. Black et al. (2008) approximated that malnutrition single
handedly were responsible around twenty-two % of disability-adjusted life years at global
level for under five aged children.
1.9 Child Development in: Developing Countries
Child development represents community as well economic development, as efficient
children become the basis of an affluent and maintainable society. In developing world
46
children less than five years are in danger to several risks, comprising poverty,
undernutrition with ill health and discouraging home atmosphere which damages their
development in cognitive, motor and social-emotional area. These deprived children
probably have bad school performance and because of that reason suffer from high fertility
rate, poor income and deliver inadequate care to their offspring’s therefore influencing for
the inter-generational spread of poverty (Chattopadhyay & Saumitra, 2016).
1.10 Vitamin D Overview
Vitamin D is an essential micronutrient also known a prohormone or sunlight hormone.
Vitamin D is acknowledged as fat-soluble vitamin and it crucial function is regulation of
bone mineralization (Laaksi et al., 2007). Vitamin D role is significant in skeletal
development, cellular functions, calcium homeostasis and for promotion of calcium
absorption in intestine (Ward, Gaboury, Ladhani & Zlotkin, 2007). Its key role is in the
growth and preservation of bones (Cantorna, 2000; Rockett et al., 1998). Now a day’s
vitamin D role in linking Toll-Like receptors activation with antimicrobial responses for
innate immunity is also proven (Laaksi et al., 2007).
The major resources for vitamin D in human being are foods and supplements and the
endogenous production (Huh & Gordon, 2008). Vitamin D key source is endogenous and
it is mostly generated in the skin after ultraviolet B rays’ exposure, if because of any reason
sun exposure is inadequate, it can be provided through the exogenous sources by eating
vitamin D enriched foods and supplements (Ward et al., 2007).
Fischer, Thacher and Pettifor (2008) stated that vitamin D is attainable mostly from oily
fish with the limit excess in eggs and liver. Breast milk also is not a good supplier of vitamin

47
D. Another dietetic suppliers of vitamin D comprise diets enriched with vitamin D2 or
vitamin D3. “Vitamin D2 is (ergocalciferol generated through the ultraviolet irradiation of
ergosterol by using yeast) and Vitamin D3 is (cholecalciferol generated through the
ultraviolet irradiation of 7-dehydrocholesterol using lanolin)” for examples cereals, dairy
foodstuffs, infant formula milk having fortification with vitamin D (Huh & Gordon, 2008;
Fischer et al., 2008). More than ninety percent of vitamin D is obtaining by endogenous
synthesis in humans and rest of amount almost lower than ten percent is gained by mean
of food resources (Misra, Pacaud, Petryk, Collett & Kappy, 2008).
There are numerous stages in endogenous production of vitamin D and the most essential
segment is assimilation of “Ultraviolet B radiations (wave lengths 290-310 nm) through 7–
dehydro-cholesterol 27 in the skin to procedure pro-vitamin D3”. There is quick conversion
of “pro-vitamin D3 to vitamin D3” (Fischer et al., 2008). Ultraviolet rays activate production
in the skin, but in people having dark skin this process is lowered (Holick, 1995; Clemens,
Henderson, Adams & Holick, 1982). Mostly in winters when there is inadequate sun
exposure and Vitamin D3 is produced in the body naturally in low amount then it is
liberated by body fat store to carry out essential functions in the body (Fischer et al., 2008).
Vitamin D2 or D3 once generated in the body will have to pass by the liver for hydroxylation
to generate 25-hydroxyvitamin D. The next step is to promote hydroxylation in kidneys to
generate “1, 25 di-hydorxy vitamin D, which is the active metabolite of vitamin D”.
Generally circulatory amount for “intermediate metabolite of vitamin D (25 hydorxyvitamin
D”) is utilized like good marker for vitamin D level in the body (Pettifor, 2004; Kochupillai,
2008; Thacher, Fischer, Strand & Pettifor, 2006).
48
Factors responsible for reduction of absorption of the ultraviolet radiations in skin are
mostly winter climate, dark skin pigmentation, by application of sunscreen, high altitude
(northern latitude), atmospheric air pollution, limit to indoors activities, skin wrapped with
clothes and skin infections like ichthyosis (Huh & Gordon, 2008).The ultra violet light
needed in winter season is decreases by distance from the equator to 0 at high altitude
above 50° (Thacher et al., 2006). Hepatic ailments and in malabsorption illness like cystic
fibrosis, intestinal absorption of vitamin D is decreased (Fischer et al., 2008). By
considering the difference in people skin pigmentation along with the intensity of sunlight
exposure in different altitude, sunlight exposure required in big child are around five to
thirty minutes, minimum two times a week in noontime for arms and legs. In infants, also
two times exposure of head and shoulder in a week are perhaps adequate for accelerating
satisfactory production for vitamin D3 (Fischer et al., 2008).
Moreover, the intense outcome of vitamin D on human immunity, working as a modulator
of immune system has been gradually recognized, inhibiting unnecessary expression of
“inflammatory cytokines and enhancing the oxidative burst potential of macrophages” thus
enhancing the killing of bacteria (Otsuji et al.,2013).
Current data, points the finger at vitamin D role in adaptive immunity, for its effect on the
differentiation of T cells among the regulatory along with pro-inflammatory subset. The
known outcomes of vitamin D is linked with calcium absorption and osteoblastic activity.
Furthermore, vitamin D has a significant role, in maintenance of calcium homeostasis and
also enhance the calcium with phosphorus, intestinal absorption. The process of
absorption occurs in small intestine by “binding of (1, 25-Dihydroxyvitamin D) to vitamin D
receptors to promote trans-cellular absorption of calcium and phosphorus” (Kochupillai,
49
2008). Broad observation is that deficiency of calcium enhances the child demand for
vitamin D, as well as also put child at risk to minor insufficiency of vitamin D (Fischer et
al., 2008). It has been proven in different researches that low ingestion of calcium
increases the catabolism of 25(0H) vitamin D by the stimulation of 24-hydorxylase as an
outcome of raised 125-Dihydroxy vitamin D absorption (Pettifor, 2007).
Vitamin D has an important part in mineralization and development of skeleton
(Kochupillai, 2008). Production of vitamin D is also altered by genetic factors in the body.
Its key function has been explained as polymorphism of enzyme “7-dehydrocholestrol
reductase in the skin, cytochrome p450 25-hyroxylase in the liver and vitamin D binding
protein in the circulation”. These aspects can alter functions of vitamin D, moreover by
intruding with up taking of 25(0H) D in target cells, or by altering effectiveness of
hydroxylation to generate the active metabolite of vitamin D{125(0H) 2D} (Thacher &
Clarke, 2011).It is documented that non-calcemic role of vitamin D in the body involve
every tissue and each cell comprising immune cells, brain cells, breast cells ,colon,
prostate and several more with vitamin D receptors (Holick ,2010).It was discovered by
many researches that upwards of two thousands genes are controlled by 1,25(OH)2D by
direct or indirect way (Nagpal & Rathnachalam, 2005).
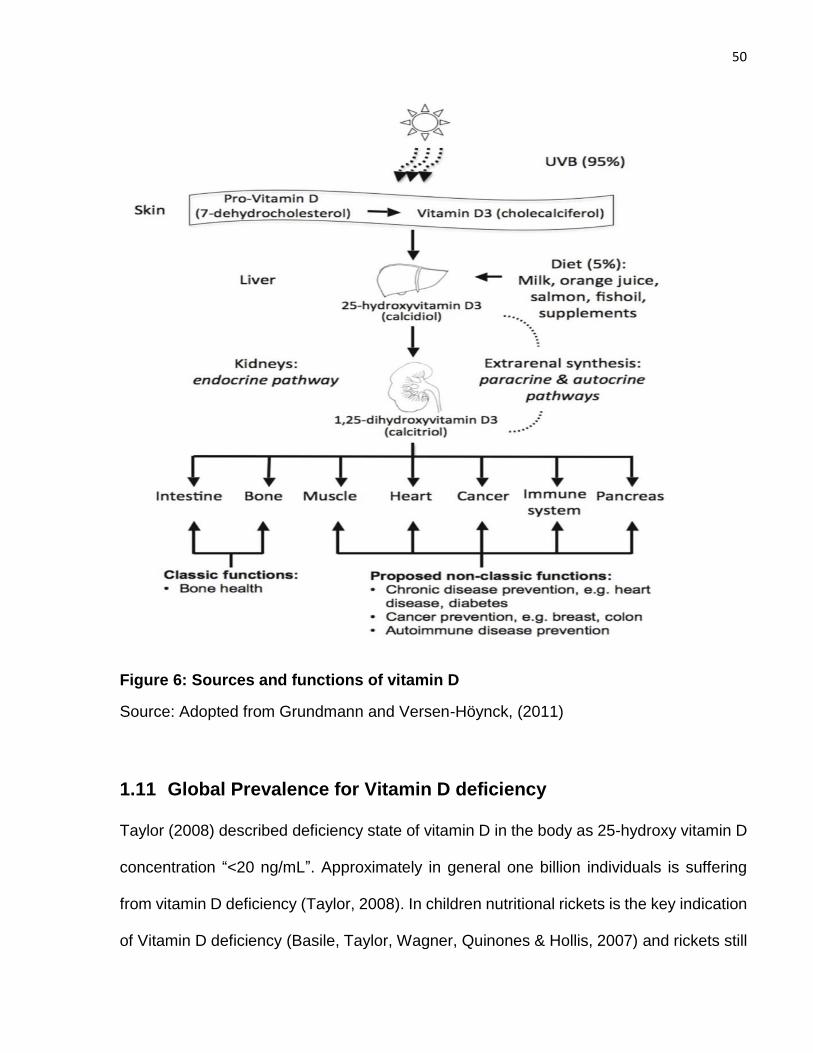
50
Figure 6: Sources and functions of vitamin D
Source: Adopted from Grundmann and Versen-Höynck, (2011)
1.11 Global Prevalence for Vitamin D deficiency
Taylor (2008) described deficiency state of vitamin D in the body as 25-hydroxy vitamin D
concentration “<20 ng/mL”. Approximately in general one billion individuals is suffering
from vitamin D deficiency (Taylor, 2008). In children nutritional rickets is the key indication
of Vitamin D deficiency (Basile, Taylor, Wagner, Quinones & Hollis, 2007) and rickets still
51
is a widespread problem round the world (Huh & Gordon, 2008). The occurrence of rickets
in children because of vitamin D deficiency, is most frequent diagnosis in several emerging
states, deficiency ranges in children aged under five years between 5 to 45% even though
in the presence of sufficient sunlight: Turkey (Ozgür, Sümer & Koçoğlu, 1996)) Saudi
Arabia (Elidrissy, Sedrani & Lawson,1984) India, (Ghai & Koul, 1991), Iran (Salimpour,
1975), China (Zhao, 1991) Mongolia, Algeria (Maroof, 2011) and Nigeria (Akpede,
Omotara & Ambe, 1999).
Rickets persists an endemic disease in several emerging countries and has relapsed in
various developed countries as well (Pettifor, 2008). The common risk factors for rickets
involved in infancy are exclusive breastfeeding without vitamin D supplementations, dark
skin pigmentation, reduced sunlight exposure, winter climates, high altitudes and
deficiency of vitamin D in mothers (Balasubramanian, Shivbalan & Kumar, 2006; Huh &
Gordon, 2008). Approximately more than 1 billion population on the earth is suffering from
inadequate circulatory vitamin D status. Dietetic calcium inadequacy is more in emerging
states. Around half population of North American kids are vitamin D deficient and kids of
the European states are also in danger in spite of constant supplementation (Fischer et
al., 2008). In neonates deficiency of vitamin D because of inadequate concentration of
vitamin D in mothers during pregnancy is not unusual. Comparison with cow milk, breast
milk has low vitamin D level, so continued breastfeeding in many areas has been linked
with vitamin D insufficiency (Fischer et al., 2008).
Concentration of 25(0H) vitamin D in new born babies, are almost two third of the maternal
level and the “half-life of 25(0H) D” is about for three weeks, for that reason newly born
child will require vitamin D from exogenous source after some weeks of birth
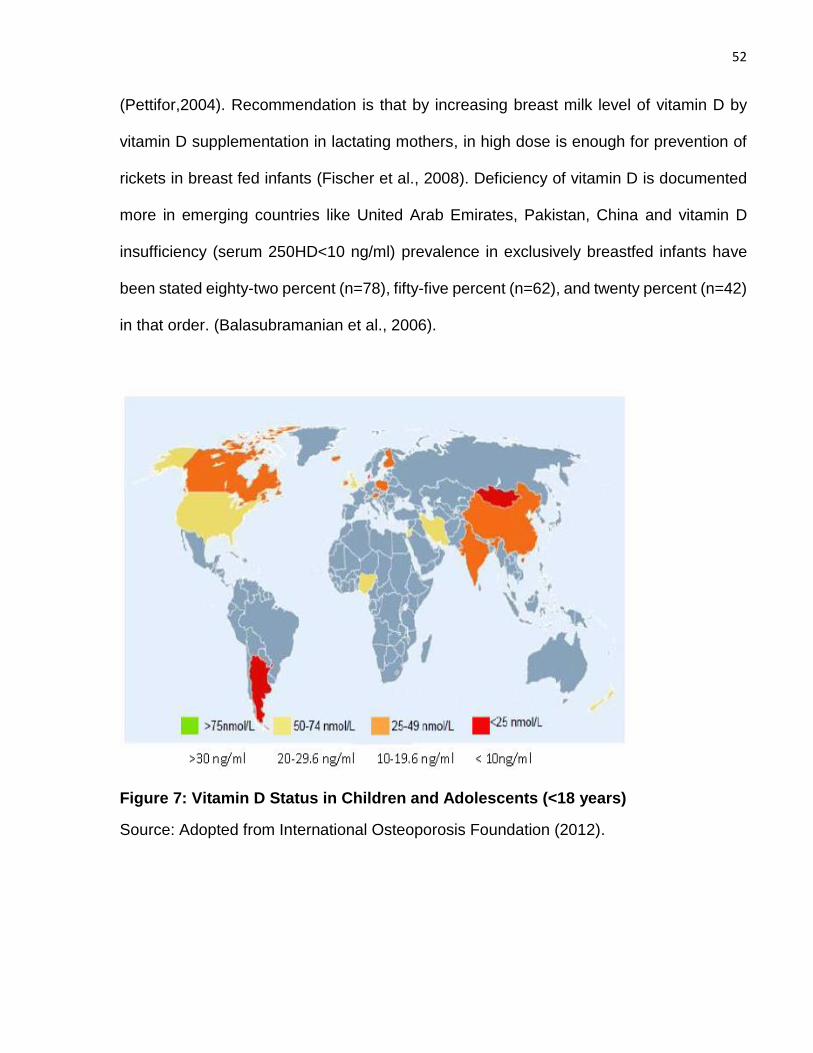
52
(Pettifor,2004). Recommendation is that by increasing breast milk level of vitamin D by
vitamin D supplementation in lactating mothers, in high dose is enough for prevention of
rickets in breast fed infants (Fischer et al., 2008). Deficiency of vitamin D is documented
more in emerging countries like United Arab Emirates, Pakistan, China and vitamin D
insufficiency (serum 250HD<10 ng/ml) prevalence in exclusively breastfed infants have
been stated eighty-two percent (n=78), fifty-five percent (n=62), and twenty percent (n=42)
in that order. (Balasubramanian et al., 2006).
Figure 7: Vitamin D Status in Children and Adolescents (<18 years)
Source: Adopted from International Osteoporosis Foundation (2012).
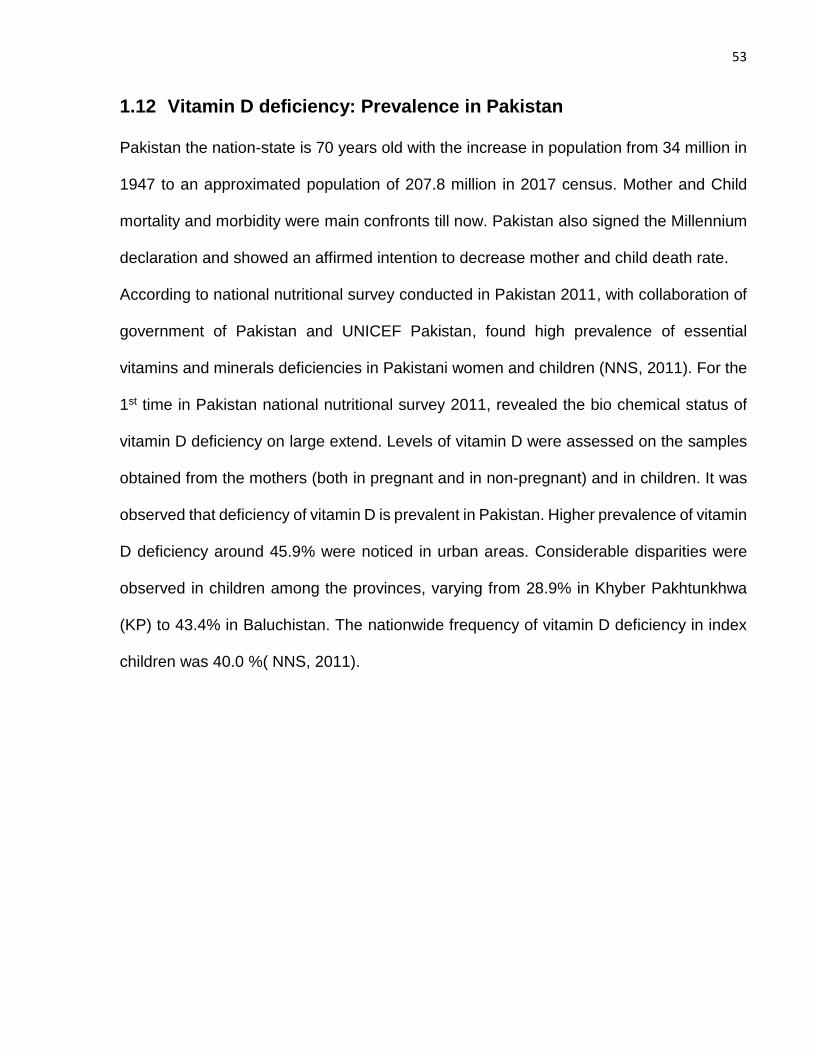
53
1.12 Vitamin D deficiency: Prevalence in Pakistan
Pakistan the nation-state is 70 years old with the increase in population from 34 million in
1947 to an approximated population of 207.8 million in 2017 census. Mother and Child
mortality and morbidity were main confronts till now. Pakistan also signed the Millennium
declaration and showed an affirmed intention to decrease mother and child death rate.
According to national nutritional survey conducted in Pakistan 2011, with collaboration of
government of Pakistan and UNICEF Pakistan, found high prevalence of essential
vitamins and minerals deficiencies in Pakistani women and children (NNS, 2011). For the
1st time in Pakistan national nutritional survey 2011, revealed the bio chemical status of
vitamin D deficiency on large extend. Levels of vitamin D were assessed on the samples
obtained from the mothers (both in pregnant and in non-pregnant) and in children. It was
observed that deficiency of vitamin D is prevalent in Pakistan. Higher prevalence of vitamin
D deficiency around 45.9% were noticed in urban areas. Considerable disparities were
observed in children among the provinces, varying from 28.9% in Khyber Pakhtunkhwa
(KP) to 43.4% in Baluchistan. The nationwide frequency of vitamin D deficiency in index
children was 40.0 %( NNS, 2011).
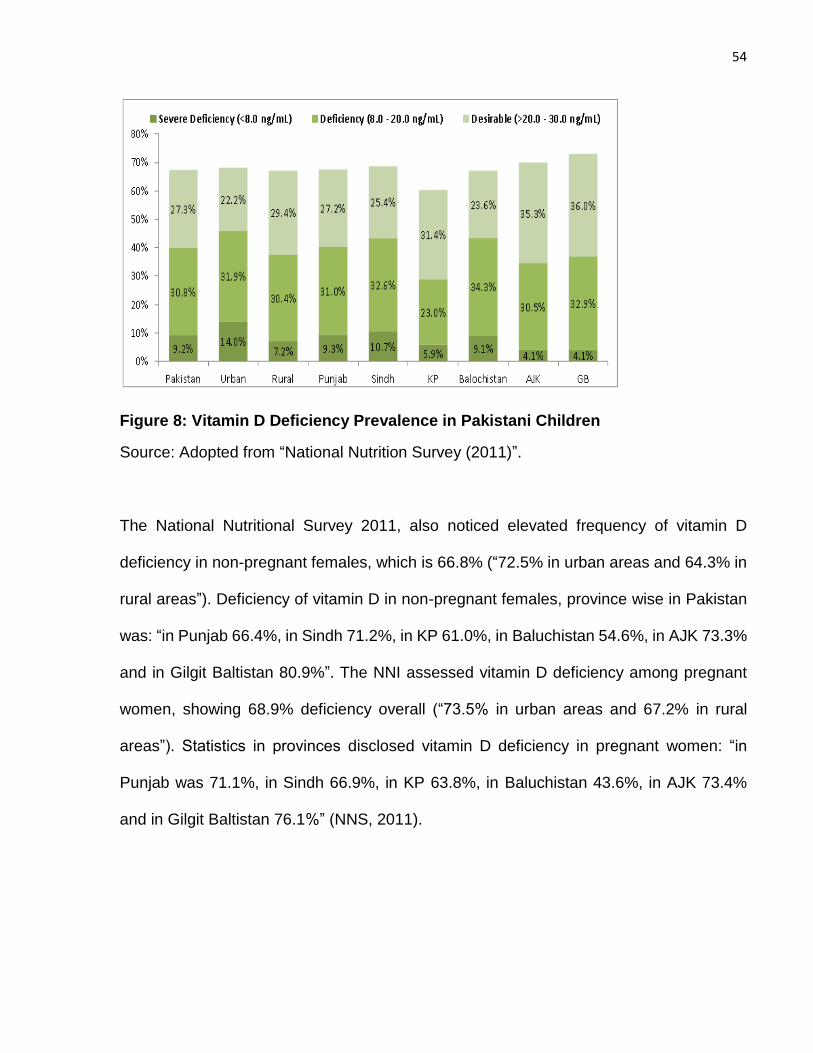
54
Figure 8: Vitamin D Deficiency Prevalence in Pakistani Children
Source: Adopted from “National Nutrition Survey (2011)”.
The National Nutritional Survey 2011, also noticed elevated frequency of vitamin D
deficiency in non-pregnant females, which is 66.8% (“72.5% in urban areas and 64.3% in
rural areas”). Deficiency of vitamin D in non-pregnant females, province wise in Pakistan
was: “in Punjab 66.4%, in Sindh 71.2%, in KP 61.0%, in Baluchistan 54.6%, in AJK 73.3%
and in Gilgit Baltistan 80.9%”. The NNI assessed vitamin D deficiency among pregnant
women, showing 68.9% deficiency overall (“73.5% in urban areas and 67.2% in rural
areas”). Statistics in provinces disclosed vitamin D deficiency in pregnant women: “in
Punjab was 71.1%, in Sindh 66.9%, in KP 63.8%, in Baluchistan 43.6%, in AJK 73.4%
and in Gilgit Baltistan 76.1%” (NNS, 2011).
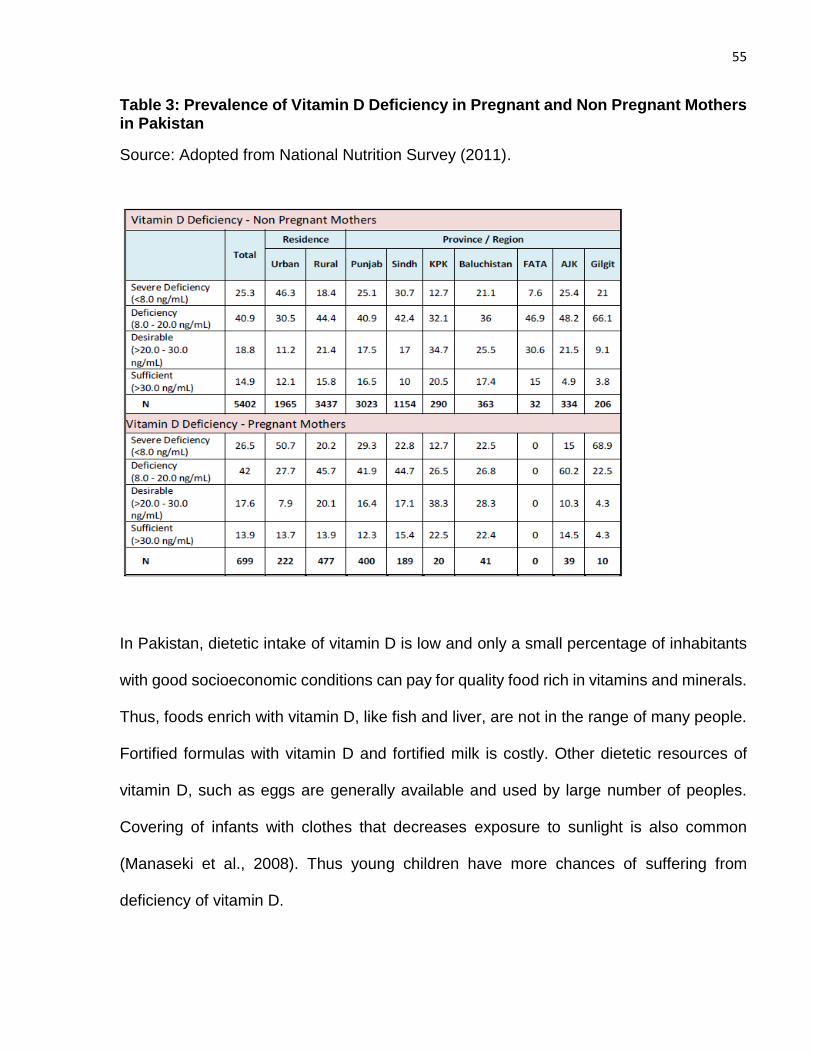
55
Table 3: Prevalence of Vitamin D Deficiency in Pregnant and Non Pregnant Mothers in Pakistan
Source: Adopted from National Nutrition Survey (2011).
In Pakistan, dietetic intake of vitamin D is low and only a small percentage of inhabitants
with good socioeconomic conditions can pay for quality food rich in vitamins and minerals.
Thus, foods enrich with vitamin D, like fish and liver, are not in the range of many people.
Fortified formulas with vitamin D and fortified milk is costly. Other dietetic resources of
vitamin D, such as eggs are generally available and used by large number of peoples.
Covering of infants with clothes that decreases exposure to sunlight is also common
(Manaseki et al., 2008). Thus young children have more chances of suffering from
deficiency of vitamin D.
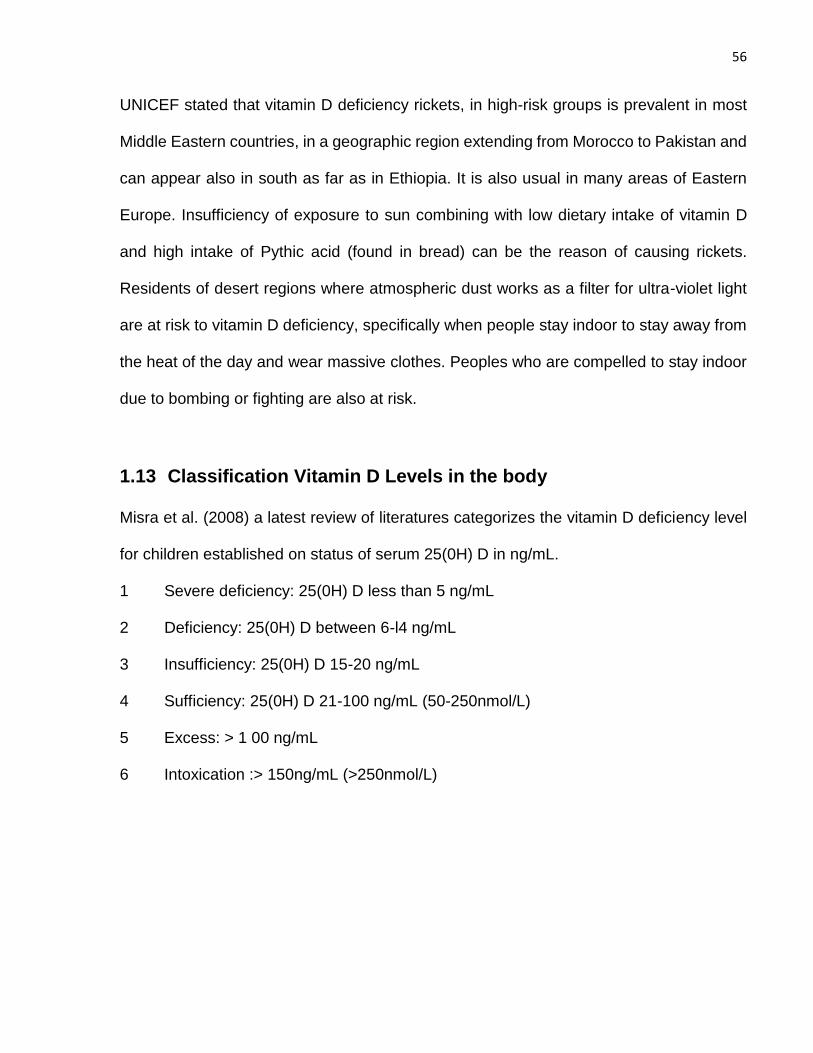
56
UNICEF stated that vitamin D deficiency rickets, in high-risk groups is prevalent in most
Middle Eastern countries, in a geographic region extending from Morocco to Pakistan and
can appear also in south as far as in Ethiopia. It is also usual in many areas of Eastern
Europe. Insufficiency of exposure to sun combining with low dietary intake of vitamin D
and high intake of Pythic acid (found in bread) can be the reason of causing rickets.
Residents of desert regions where atmospheric dust works as a filter for ultra-violet light
are at risk to vitamin D deficiency, specifically when people stay indoor to stay away from
the heat of the day and wear massive clothes. Peoples who are compelled to stay indoor
due to bombing or fighting are also at risk.
1.13 Classification Vitamin D Levels in the body
Misra et al. (2008) a latest review of literatures categorizes the vitamin D deficiency level
for children established on status of serum 25(0H) D in ng/mL.
1 Severe deficiency: 25(0H) D less than 5 ng/mL
2 Deficiency: 25(0H) D between 6-l4 ng/mL
3 Insufficiency: 25(0H) D 15-20 ng/mL
4 Sufficiency: 25(0H) D 21-100 ng/mL (50-250nmol/L)
5 Excess: > 1 00 ng/mL
6 Intoxication :> 150ng/mL (>250nmol/L)
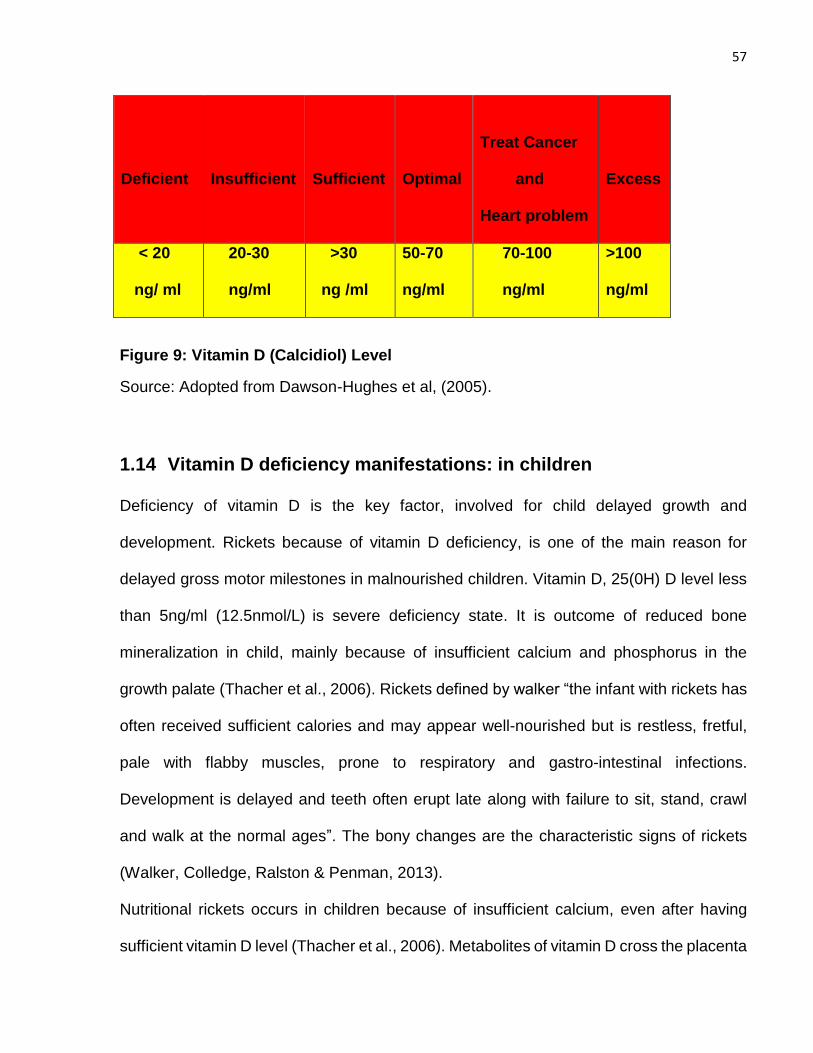
57
Deficient
Insufficient
Sufficient
Optimal
Treat Cancer
and
Heart problem
Excess
< 20
ng/ ml
20-30
ng/ml
>30
ng /ml
50-70
ng/ml
70-100
ng/ml
>100
ng/ml
Figure 9: Vitamin D (Calcidiol) Level
Source: Adopted from Dawson-Hughes et al, (2005).
1.14 Vitamin D deficiency manifestations: in children
Deficiency of vitamin D is the key factor, involved for child delayed growth and
development. Rickets because of vitamin D deficiency, is one of the main reason for
delayed gross motor milestones in malnourished children. Vitamin D, 25(0H) D level less
than 5ng/ml (12.5nmol/L) is severe deficiency state. It is outcome of reduced bone
mineralization in child, mainly because of insufficient calcium and phosphorus in the
growth palate (Thacher et al., 2006). Rickets defined by walker “the infant with rickets has
often received sufficient calories and may appear well-nourished but is restless, fretful,
pale with flabby muscles, prone to respiratory and gastro-intestinal infections.
Development is delayed and teeth often erupt late along with failure to sit, stand, crawl
and walk at the normal ages”. The bony changes are the characteristic signs of rickets
(Walker, Colledge, Ralston & Penman, 2013).
Nutritional rickets occurs in children because of insufficient calcium, even after having
sufficient vitamin D level (Thacher et al., 2006). Metabolites of vitamin D cross the placenta
58
that’s why infants are usually defended from rickets in the early months of life. Children
between the ages of nine to eighteen months are more susceptible to rickets (Pettifor,
2004). Rickets because of nutritional origin is more common in developing countries but it
is not properly addressed and reported there. Particularly in Muslim countries because of
traditional practices, females cover herself properly by wearing heavy clothing which
reduces sunlight exposure to females and their kids (Balasubramanian & Ganesh, 2008).
A research conducted in Saudi Arabia, in one of an urban hospital discovered that fifty-
nine percent of females were (n= 1 00) giving birth and out of them seventy percent of
their new born babies were deficient in vitamin D with level < 25 nmol/L (Thacher et al.,
2006).
Deficiency of vitamin D is also linked with delayed milestones in children and there is high
probability that the minor cases will be overlooked. Like a flabby baby at the end of the 1st
year, is incapable to pull itself up, fretful, irritable, showed delayed dentition and
predisposed to profuse sweating and should always be expected to have rickets (Mann &
Truswell,2012). Other epidemiological researches strongly recommend that deficiency of
vitamin D inclines towards viral respiratory tract and mycobacterial infections, as increased
levels of calcitriol in serum have been demonstrated in patients with both tuberculosis and
hypocalcaemia (Chocano & Bedoya, 2009). Manifestations of vitamin D inadequacy in
different infectious etiology comprises, inadequate vitamin D uptake or metabolism and
manifest an essential role in the progression of many diseases involving the central
nervous system (CNS), skeleton with various organs where metabolic disturbances might
play a part in the advancement of tumors (Roukos, 2011). To sum up in children a link
concerning nutritional rickets with respiratory compromise has been established from long
59
time (Walker & Modlin, 2009). Latest epidemiological findings prove the association
among vitamin D inadequacy and the increase prevalence of respiratory diseases with the
effect of vitamin D in the host defense reaction to infection. In vitamin D insufficiency
infants and children are more prone to viral instead of bacterial infections. The link among
vitamin D, infections and role of immune system in children indicate vitamin D
supplementation for possible interventions and adjuvant treatments (Walker & Modlin,
2009).
Figure 10: Impact of vitamin D deficiency
Source: Adopted from Karlic and Varga (2011).
1.15 Possible side effects: for vitamin D supplementation
Because of vitamin D hypercalcemic impacts, it may produce acute as well as chronic
intoxication primarily. “Acute intoxication is linked with nausea, vomiting, dehydration,
anorexia, apathy, polyuria, polydipsia, hypertonia, constipation, corneal clouding and
60
hypercalcemia” (Cranney, Weiler, Donnell & Puil, 2008; Orbak et al., 2006). Continued
vitamin D intoxication have an effect on kidneys causing nephron calcinosis, renal colic,
renal failure and neurological illnesses (Vieth, 2007; Chiricone, Santo & Cirillo, 2003).
Research paying attention on evaluation of vitamin D, side effects are still deficient.
Problems of acute along with chronic intoxication of vitamin D in adults as well as in
children were recorded by many register cases from various states (Ko, Liberman &
Salzmann, 1991). A review of twenty one different clinical experiments, associating the
possibility of vitamin D toxicity from a low dosage on a daily basis (3800 IU/day) to a very
high dosage on a daily basis (100,000 IU/day) in adults, accomplished that persisted
consumption of (10,000 IU/day) as upper limit of vitamin D has slightest possibility to
enhance the probability of side effects in the public, though the ability of circulating vitamin
D binding-protein might affect the safety regarding vitamin D supplementation (Hathcock,
Shao, Vieth & Heaney, 2007).
1.16 Intervention of Vitamin D with Ready to use therapeutic food
“Ready-to-use therapeutic food (RUTF)” is an energy dense micronutrient-enriched paste
represents the mainstay for community treatment of uncomplicated SAM (i.e. where
children are clinically well and alert, with good appetite). The World Health Organisation
(WHO) has highlighted the need for research to identify adjunctive therapies that may
improve response to RUTF, including administration of broad-spectrum antibiotics and
high-dose vitamin A (WHO, 2013). The potential for adjunctive vitamin D to improve weight
gain and developmental outcomes in children with SAM has been overlooked. However
this is surprising because rickets and deficiency of vitamin D are common among SAM
61
children (Raghuramulu & Reddy, 1980; Berkley et al., 2016; Ejaz & Latif, 2010). Vitamin
D deficiency associates with severe wasting in malnourished children (Jones et al., 2017)
and vitamin D supplementation has been proven to increase weight gain in low birthweight
infants (Kumar et al., 2011). Vitamin D have also been indicated to produce favourable
outcomes on function of skeletal muscle, (Hazell, DeGuire & Weiler, 2012)
neurodevelopment (Eyles et al., 2009) as well as immune function (Martineau et al., 2017;
Coussens et al., 2012) its anti-inflammatory and antimicrobial actions might enhance
response to standard therapy for SAM, a condition in which both increased systemic
inflammation and infections associate with adverse outcome (Attia et al., 2016).
Although RUTF contains modest amounts of vitamin D (15 micrograms [600 IU] per
sachet) we questioned whether intake from this source would be sufficient to elevate
“circulating levels of 25-hydroxyvitamin D (25[OH]D)” into the optimal range in children
with SAM in Pakistan, given the particularly low baseline levels reported locally
(Raghuramulu & Reddy,1980: Berkley et al.,2016) with the presence of a systemic
inflammatory response that possibly will dysregulate metabolism of vitamin D and increase
vitamin D requirements (Mangin, Sinha & Fincher,2014).
Plumpy nut effectiveness has been demonstrated in many countries such as India, Malawi,
Niger, Ethiopia, and Sudan. No sufficient data available on its effect on development of
children as compared to growth of children. As well as no data available as intervention of
vitamin D in therapeutic with RUTF to accelerate growth and development of children.
Although, vitamin D role in growth and development of children is already proven.
62
1.17 Statement of the Problem
In Pakistan, floods of 2010 hit gravely in the month of July & August affecting millions of
people economically and socially in Pakistan and recent flood in 2014 worsen this
situation. In 2010 unfortunately, the flood affected districts in Punjab were those where
indicators of maternal, new born and child health were not good even before they became
flood-hit. The children are severely suffered from malnutrition in the said areas causing
their delayed growth and development. In Pakistan 90% population are suffering from
deficiency of vitamin D and this deficiency does not only affect the growing bone of children
but also presents with others varying signs and symptoms inclining the children towards
various others illnesses and skeletal deformities. These children are more prone to
respiratory and gastro intestinal infections playing a major role in vicious circle of
malnutrition. Because of this development of children is delayed, tooth usually erupt late
and there is failure in sitting, standing, crawling and walking at the normal ages. Affected
children are also retarded in growth.
As the Ministry of Health, Government of Pakistan plan to incorporate “Community
management of acute malnutrition (CMAM)” in to existing regular health services for
children under 5 years and to expand “community management of acute malnutrition” all
over the country. The knowledge obtained from this study may guide policy makers in
future decisions regarding the inclusion of therapeutic doses of vitamin D with RUTF
because of significant improvement in development quotient of child with growth, depict in
this study. Development screening of child before and after RUTF therapy also highlighted
the RUTF effect on it with or without vitamin D intervention.
63
1.18 Research in Context
1.18.1 Evidence before this study
Rickets and deficiency of vitamin D have long been recognized to be existed in children
with severe acute malnutrition in both Asia and Africa, and deficiency of vitamin D has
been proven to associate with severe wasting in malnourished children. “Ready-to use
therapeutic food (RUTF)”, the mainstay of therapy for SAM, contains relatively modest
quantity of vitamin D that are insufficient to elevate “circulating levels of 25-hydroxyvitamin
D (25[OH] D)” into the optimal physiological range. High-dose supplementation of vitamin
D has been proven to have anti-inflammatory and antimicrobial actions that could enhance
response to standard therapy for SAM, a condition in which both increased systemic
inflammation and infections associate with adverse outcome. However, randomized
controlled trials evaluating effects of high dose supplementation of vitamin D in children
with SAM have not previously been done.
1.18.2 Added value of this study
This is the first randomized trial to assess the outcomes of high-dose vitamin D
supplementation in children with SAM. In a cohort of children aged 6-58 months in
Pakistan receiving RUTF for the treatment of uncomplicated SAM, we report that
administration of adjunctive high-dose vitamin D affected in a large increase for mean
weight-for-height/length z-score at 2 months. It also significantly reduced the proportion of
participants with delayed global, motor and language development at 2 months.
64
1.18.3 Implications of all the available evidence
Vitamin D content of “Ready-to-use therapeutic food” may not be optimal to support weight
gain along with development in children with SAM. Further trials are required to conclude
whether high-dose vitamin D can improve weight gain along with developmental indices
in children with SAM in other settings.
65
1.19 Objectives of the Study
To examine the impact of malnutrition on development quotient of children
To determine the effectiveness of ready to use therapeutic food (RUTF) in improving
the development quotient of severe acute malnourished children under five year of
age.
To investigate the outcome of Vitamin D therapeutic doses intervention with RUTF
rehabilitation on growth and development of malnourished children.
To explore the dietary and socio demographic factors responsible for severe acute
malnutrition and delayed development in children.
1.20 Research Questions
i. Is there any impact of malnutrition on development quotient of the children?
ii. Is there any improvement in development quotient of children after treating
malnutrition with high caloric RUTF?
iii. Is RUTF rehabilitation with vitamin D therapeutic doses more effective to accelerate
growth and development quotient of children?
iv. Are the dietary and socio demographic factors responsible for severe acute
malnutrition and delayed development in children?
66
CHAPTER TWO
2. LITERATURE REVIEW
This chapter briefs data investigated from the literature review after applying a systematic
approach with narrative evince methodology. This chapter is divided in to four parts, 1st
part describes the developmental screening with its different tools with impact of
malnutrition and other socio-demographic factors responsible for delay in child
development. 2nd part explains different vitamin D trials to understand the manifestations
of its deficiencies and to improve child health at global level by intervention of vitamin D in
different diseases in the world. In 3rd part of the chapter the enormity of the evidence that
occur because of effect of “community based management treatment programs” for
severe acute malnutrition and interventions done in this program at global level were
narrated. Last 4th part briefed the different socio-demographic and dietary factors
responsible for severity of malnutrition in children at national and global level. The aim of
literature review was to identify the breaches that can be focused in this current research.
2.1 Developmental Screening, Predictors and Intervention
Studies of factors associated with developmental screening in Pakistan are scant.
However similar studies elsewhere in the world shows these following results.
Ozkan, Senel, Arslan and Karacan (2012) planned a study to identify the socio-economic
and biological risk factors associated with developmental delay in socioeconomically
disadvantaged (3 months–5 years) old children in Ankara, Turkey. The consequences of
biological and, socio-economic risk factors on developmental delay were studied in 692

67
children by utilizing the Denver II screening test. Results depict that low level mother
education as well as low-level of father education, low family income and more than 3
children in the family were strongly linked with abnormal Denver II test results. Based on
univariate analysis in biological risk factors, comprising birth weight with gestational age
at birth, and maternal age less than 20 years at birth, were associated with suspected
delay on Denver II test results. Low level of mother education, premature birth: 32–36
weeks of gestation have strong association with abnormal results on Denver II screening
test. On multivariate analysis with low father education, low family income, premature birth
with low weight on birth and mother age at birth <20 years were also strongly related with
suspected delay on Denver II screening test results. It was concluded that socio-economic
risk factors were considered as significant as biological risk factors in the development of
3 months to 5 years old children.
Simon, Pastor, Avila and Blumberg (2013) studied the relationship among socio-economic
disadvantage and developmental delay in US children. For this to accomplish they had
categorized all children from 18 months to 5 years old in to 3 groups on the probability of
development delay from “2007 National Survey of Children’s Health” by utilizing the
revised survey report of the “Parents’ Evaluation of Developmental Status questionnaire”.
On applying bivariate and multivariate multinomial logistic regressions it was suggested
that older children had increased chances of probable delay in comparison with unlikely
delay, other important factors were, low birth weight ethnicity of non-Hispanic black or
Hispanic in a non-English-speaking people vs non-Hispanic white with low family income.
To wrap up four features older, male, low birth weight and Hispanic living in a non-English-
speaking household respectively were related to more odds of possible delay compared
68
with unlikely delay. Conclusion were made that demographic features and markers of
social disadvantage, differentiate children with possible developmental delay from them
unlikely to have developmental delay.
Mangani et al. (2013) investigated that whether addition of nutrient supplements which is
lipid based (LNS) in the dietary regime of infants and young child were still effective after
achieving of their particular developmental milestones. For this purpose, total (840)
healthy infants aged 6 months were registered for a randomised trial. No supplementation
was given to control participants but for 12 month’s study arm were supplemented with
milk-containing lipid based nutrient supplements, soy-containing nutrient supplements
which is lipid based (LNS) or corn-soy blend (CSB). Outcomes of study were the specific
age for attaining of an important milestone like, motor: standing, walking alone or with the
help of assistance, running etc., social: includes that one is drinking by using cup as well
as eating by own, language: by waving goodbye and by uttering particular single
understandable words. This study concluded that no effect was observed in young
offspring of rural Malawi after giving tested formulations and with micronutrient fortified
with LNS or CSB dosages after achieving of their particular developmental milestones.
Paiva, Lima and Eickmann (2010) performed a study on population belongs to low
socioeconomic conditions to explore various poverty settings and to determine their
impact on the neuro psychomotor development of infants. They had suggested that child
development is associated negatively with various risk elements related to poverty and
highlighted the significance of the population with low socioeconomic conditions. They
have selected 136 infants in Recife, Brazil between 9 to 12 months of age from four
different units dealing with family health. Socio-economic class was evaluated by means
69
of specific index along with child development by using the “Bayley III screening test”. This
study disclosed that the maximum number of tots having receptive communication alleged
delay belongs to families of lowest socio-economic class. Unemployment of both mother
and father have negative effect on the receptive communication along with cognition. The
families without mobile handset represent the lowest socioeconomic level and is related
to poor cognitive and gross motor function. While the male infant’s revealed high incidence
of suspected delay in receptive communication. This study has suggested to initiate the
development surveillance and intervention programs for the target subgroup to deliver the
infants an increased probability of becoming fruitful nationals in the coming years.
Afarwuah et al. (2007) in Ghana piloted a randomized trial to evaluate three kinds of
micronutrient supplements as a complementary food which is home based for assessing
its effect on child growth along with motor development. They had examined that whether
adding multiple micronutrients to complementary diets which are made at home would
improve growth along with good impact on motor development and whether that result
would enhance with addition of extra energy from fat. For that 313 Ghanaian infants aged
between 6 to 12 months have given random allocation to get on daily basis
correspondingly potential low cast solution to complementary diets with sprinkle powder,
crushable nutri-tabs, or fat base high energy (108Kcal/d) nutri- butter comprising of six,
sixteen, and nineteen vitamins with minerals. Anthropometric measurements were
evaluated at six, nine, and twelve months, micronutrient profile at six and twelve months,
development of motor milestones at twelve months and any morbidity on weekly basis.
Total 96 Infants who were not chosen for the intervention randomly (non-intervention) were
also evaluated at twelve months. They had made conclusion that all three supplements
70
had effected positively on achieving motor developmental milestone at twelve months in
comparison with infants received no intervention, but out of these supplements only fat
base nutri butter (NB) have been proven for affecting growth positively.
Nahar et al. (2009) designed time-lagged controlled research in children between six to
twenty-four months of age suffering from severe malnutrition and admitted in Nutritional
Rehabilitation Unit of Dhaka hospital. The purpose of research is to integrate stimulation
in to the standard treatment protocol of children diagnosed as having severe malnutrition
in nutrition unit with assessment of its outcome on child growth along with development.
The control group of forty-three children was investigated firstly, pursued by group of fifty-
four children getting intervention and all children were also receiving routine nutritional
care. The involved mothers and children took part in study for two weeks in hospital for
daily group meetings with exclusive play gatherings and were also followed for six months
at home. Child growth was evaluated and “Bayley Scales of Infant Development” were
applied for determination of development. In both groups primarily children had same
developmental achieves and anthropometry but six months later, the group received
intervention had recovered better in comparison with the controls group with an average
of weight-for-age z scores. In finale psychosocial stimulation incorporated in hospital for
management of severely malnourished children with six months monitoring at home visit,
were successful in increasing child growth along with development and recommendation
were given for inclusion of this as an essential part in their management.
Yousafzai, Rasheed, Rizvi, Armstrong and Bhutta (2014) investigated the outcome of
integrated responsive stimulation and nutrition intervention to boost child health outcomes,
growth along with development in Pakistan. To execute this study, they have designed a
71
“cluster-randomized factorial effectiveness trial” which are community based into the
program of Lady Health Worker of rural Sindh. They did random allocation of 80 clusters
of children (1489 registered mother and infant) to obtain regular health along with nutrition
services and nutrition education with multiple micro-nutrient powders, responsive
stimulation or combining both interventions in 1:20 allocation ratio with no indications of
any serious impairments. Interventions given to the families having child till the age of 24
months by the Lady Health workers in regular per month group meetings and at home
visits. The main outcome of study was assessment of child development by the “Bayley
Scales of Infant and Toddler Development at 12 and 24 months of age” along with growth
assessment at age of 24 months. They have revealed that kids who had obtained
responsive stimulation have considerably high developmental attains at age of twelve and
twenty- four months on their cognitive outcome, language milestones along with motor
scales and at age of twelve months on the achievements of social-emotional development
in comparison with those who had not received intervention. Moreover, children who have
taken increased nutrition had notably high developmental attains on the cognitive
outcome, language milestones and achievements of social-emotional development at age
of twelve months in comparison with control group but language scores were still notably
high at 24 months of age. But additional benefits of combining responsive stimulation with
nutrition interventions were not recorded. In term of growth children getting enhanced
nutrition had considerably improved height-for-age z scores at 6 months and 18 months
than control group. Conclusion were made that the responsive stimulation intervention
was delivered successfully by LHWs with positive developmental outcomes.
72
Kar, Rao and Chandramouli (2008) did a study on children in India to assess the impact
of “chronic protein energy malnutrition on cognitive development”. By applying
neuropsychological measures, they have observed the impact of stunted growth on the
cognitive process of developmental quotient of kids. They have enrolled 20 malnourished
and 20 well- nourished children among the age category of five to seven and eight to ten
years in the study. They have used the methodology of NIMHANS neuropsychological
battery based on trials of “motor speed, attention, visuospatial ability, executive functions,
comprehension, learning and memory for children” susceptible of the consequences for
brain dysfunction along with age associated productivity. It has been evaluated that
cognitive development seemed to be controlled together by age plus nutritional status.
Children having malnutrition shows poor performance in all aspects of attention,
visuospatial ability, working memory, learning and memory and only excluding the trial of
coordination with motor speed. To wrap up it was evaluated that children having
malnutrition performed poorly in comparison with the functioning of children who are well
nourished. So inference depict that chronic protein-energy malnutrition also known as
(stunting) alters the continued developmental process of advance cognitive functions in
early years of kids to certain extent that simply indicate a generalized cognitive loss.
Stunting also slows down the age linked performance in a few but not in all high class
cognitive functions and end up in longstanding cognitive damage.
Manno et al. (2012) planned a randomised double blinded control trial to judge the
hypothesis that plentiful fortification of micronutrients in diets produced at local level did
not improve mental as well as motor development in Zambian children. They have
assessed the outcome for the rich fortification of micronutrient and porridge fortified with
73
basal on mental along with psychomotor development in children of Zambia.Total six
months old 743 kids were randomized and took the rich micronutrient fortified or the diet
fortified with basal and monitored till the age of 18 months. Each infant was assessed on
a monthly basis for attainment of different developmental milestones in order. The “Bayley
scales of infant development II” have been applied on a group of 502 children at six, twelve
and eighteen months. They have judged that rich fortification with micronutrient had not
any considerable effect upon the subsequent parameters like attainment of different
developmental milestones, age of walking without any support and speaking 3 or 4 clear
words “with mental development index (MDI) and psychomotor development index (PDI)
of the Bayley scales”. To sum up the findings did not prove the hypothesis that Zambian
children mental along with motor development were improved with plentiful micronutrient
fortification.
Phuka et al. (2012) piloted a trial on Malawian children aged 18 months with the main
objective to assess their improvement in development quotient after one-year
consumption of complementary feeding enriched with nutrient supplements which are
lipid-based or micronutrient fortified corn-soy flour porridge. The other purpose of this
study were to reveal the socioeconomic aspects linked by developmental outcomes in the
similar inhabitants. They had registered 163 rural Malawian 6 months old children in a
randomized control trial in which the control children’s took corn-soy flour around 71 gram
having 282 kcal [“Likuni Phala (LP)”] supplements on daily basis and children’s of the
intervention block took lipid-based nutrient supplement around 50 gram having 264 kcal
calories on daily basis (FS50) or 25 grams of lipid-based nutrient supplement of 130 kcal
(FS25). They applied “Griffiths developmental scores at 0–2 years” to determine main
74
outcome measures. Analysis of variance were used for independent comparison of study
groups and “mean raw scores, quotients, or mental ages” has been evaluated. Correlation
for development results with risk factors were researched by applying multiple regression.
At the age of 18 months, the mental ages in the “LP, FS50 and FS25” groups were
significant (P > 0.99). At 18 months’ length/age z-score improvement throughout the study
duration and maternal literacy were linked with results in development quotient. Wrapping
up, rural Malawian infants getting the nutrient diets which are lipid based or fortified corn-
soy flour as a 12 month’s supplements on daily basis have comparable development
outcomes at age of 18 months.
Chattopadhyay and Saumitra (2016) did a review on developmental outcome in
malnourished children. They have searched for related literature on different relevant
websites. They have presented in their results the effect of nutrition on the developing
brain and showed that malnutrition especially in fetal and initial couple of years of postnatal
life, is a main threat for weak neurodevelopment, indicating delay in motor milestone,
speech and cognitive development with the behavioral problems along with learning
debilities. “Macro and micro-nutrients like proteins, Iron, Iodine, Zinc, Vitamins-B, C and
D, choline and essential fatty acids” are important for brain good development.
Supplementation of several micro-nutrients specifically “Iron, Iodine, vitamins B12 with
Folate and choline” among susceptible population most likely in pregnant and lactating
mothers, infants and in toddlers group had shown favorable outcomes. They have
concluded that adding dietary supplements for lactating and expecting mothers, infants
and tots beside with a pleasant socioemotional environment combined with cognitive
75
stimulation starting an initial years of life can show long term effect on high risk child for
attaining his developmental potential.
Larson and Yousafzai (2017) work out on meta-analysis of nutrition interventions in lower
and middle-income states on mental development of under two years aged children. They
have planned this meta-analysis with the fact in mind that these nutrition interventions can
enhance nutritional outcomes of young offspring’s in lower and middle income states and
also may add up in the improvement of their mental along with motor development. This
current meta-analysis answered two important queries regarding that did pre-natal and
post-natal nutritional efforts progress mental development and dose these outcomes of
mental development linked with both hypothetically attention-grabbing mediators known
as physical growth plus motor development?. They have evaluated that out of ten pre-
natal and twenty-three post-natal nutrition interventions, the commonly utilized were “zinc,
iron, folic acid and vitamin A or multiple micronutrients, with a few tested macronutrients”.
So it was answered that motor development, without growth status, were considerably
linked through mental development in post-natal interventions. In short nutritional
interventions had minor impacts on mental development. Upcoming researches may show
more impact if they concentrate on macro-nutrient insufficiencies and combining child
stimulation, hygiene in conjunction with sanitation interventions.
In this section we have discussed the development screening of children along with its
predictors in many studies from different areas of the world by using different
developmental screening test according to study and local requirement. We have also
found that different attempts are made to enhance child development by using different
76
therapies like nutritional and stimulation therapies and its effect were measured on
development. Impact of malnutrition on development quotient of children were also
checked by different countries in many studies. We have also made an attempt to screen
the severe acute malnutrition children for their development quotient as in our country
there are limited statistical data available for developmental profile of under nutrition
children. We have also tried to find socio-demographic factors responsible for delay along
with malnutrition for making policies to overcome this problem and give society a healthy
wealthy children. As these type of studies were not conducted in our study area before,
so results of this study will be helpful for policy makers in this context.
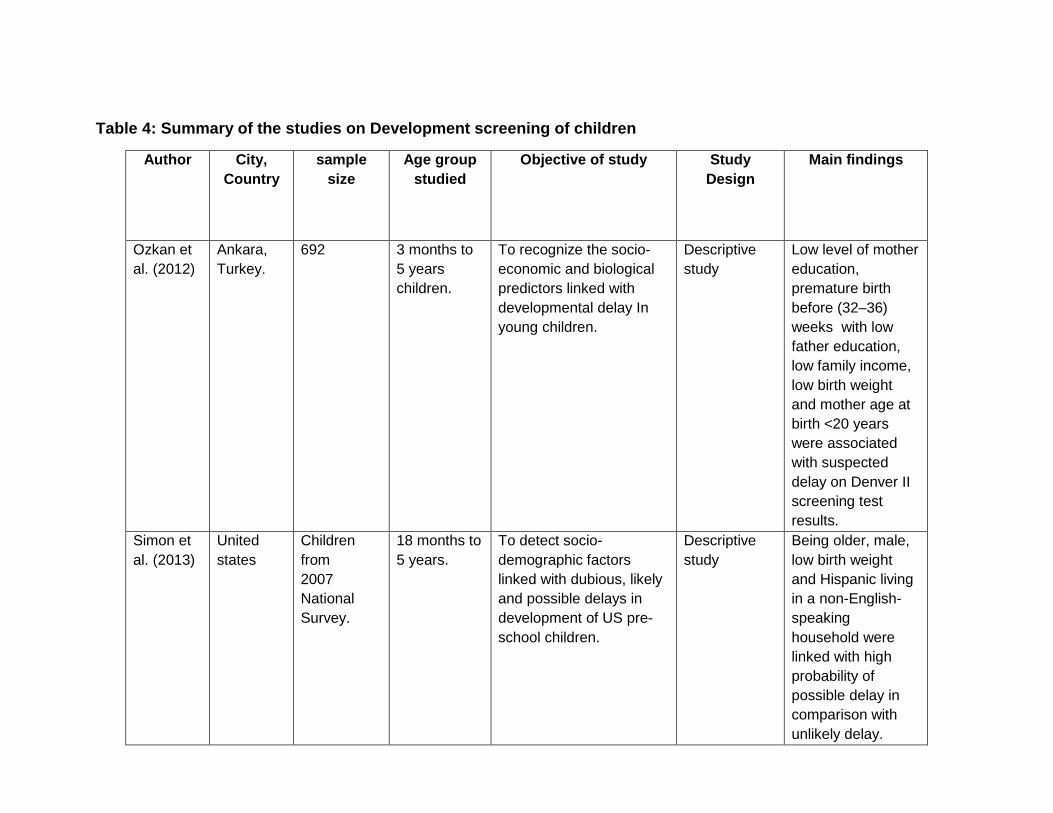
Table 4: Summary of the studies on Development screening of children
Author City,
Country
sample
size
Age group
studied
Objective of study Study
Design
Main findings
Ozkan et
al. (2012)
Ankara,
Turkey.
692 3 months to
5 years
children.
To recognize the socio-
economic and biological
predictors linked with
developmental delay In
young children.
Descriptive
study
Low level of mother
education,
premature birth
before (32–36)
weeks with low
father education,
low family income,
low birth weight
and mother age at
birth <20 years
were associated
with suspected
delay on Denver II
screening test
results.
Simon et
al. (2013)
United
states
Children
from
2007
National
Survey.
18 months to
5 years.
To detect socio-
demographic factors
linked with dubious, likely
and possible delays in
development of US pre-
school children.
Descriptive
study
Being older, male,
low birth weight
and Hispanic living
in a non-English-
speaking
household were
linked with high
probability of
possible delay in
comparison with
unlikely delay.
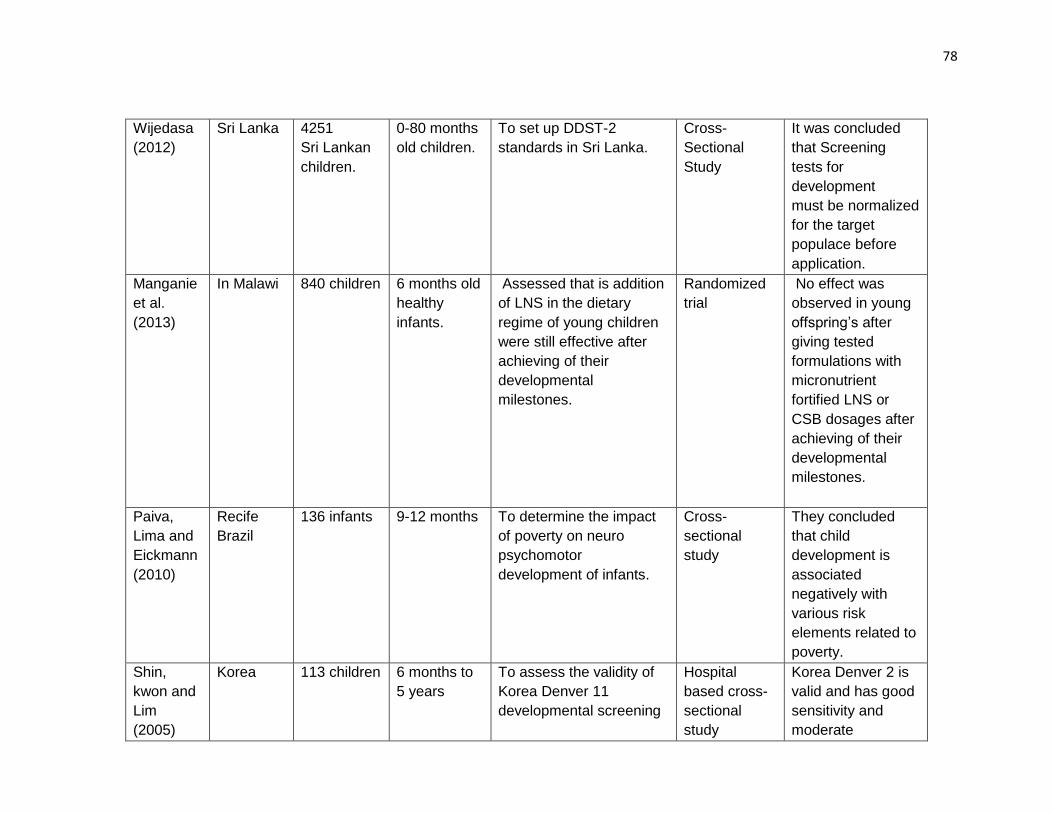
78
Wijedasa
(2012)
Sri Lanka 4251
Sri Lankan
children.
0-80 months
old children.
To set up DDST-2
standards in Sri Lanka.
Cross-
Sectional
Study
It was concluded
that Screening
tests for
development
must be normalized
for the target
populace before
application.
Manganie
et al.
(2013)
In Malawi 840 children 6 months old
healthy
infants.
Assessed that is addition
of LNS in the dietary
regime of young children
were still effective after
achieving of their
developmental
milestones.
Randomized
trial
No effect was
observed in young
offspring’s after
giving tested
formulations with
micronutrient
fortified LNS or
CSB dosages after
achieving of their
developmental
milestones.
Paiva,
Lima and
Eickmann
(2010)
Recife
Brazil
136 infants 9-12 months To determine the impact
of poverty on neuro
psychomotor
development of infants.
Cross-
sectional
study
They concluded
that child
development is
associated
negatively with
various risk
elements related to
poverty.
Shin,
kwon and
Lim
(2005)
Korea 113 children 6 months to
5 years
To assess the validity of
Korea Denver 11
developmental screening
Hospital
based cross-
sectional
study
Korea Denver 2 is
valid and has good
sensitivity and
moderate
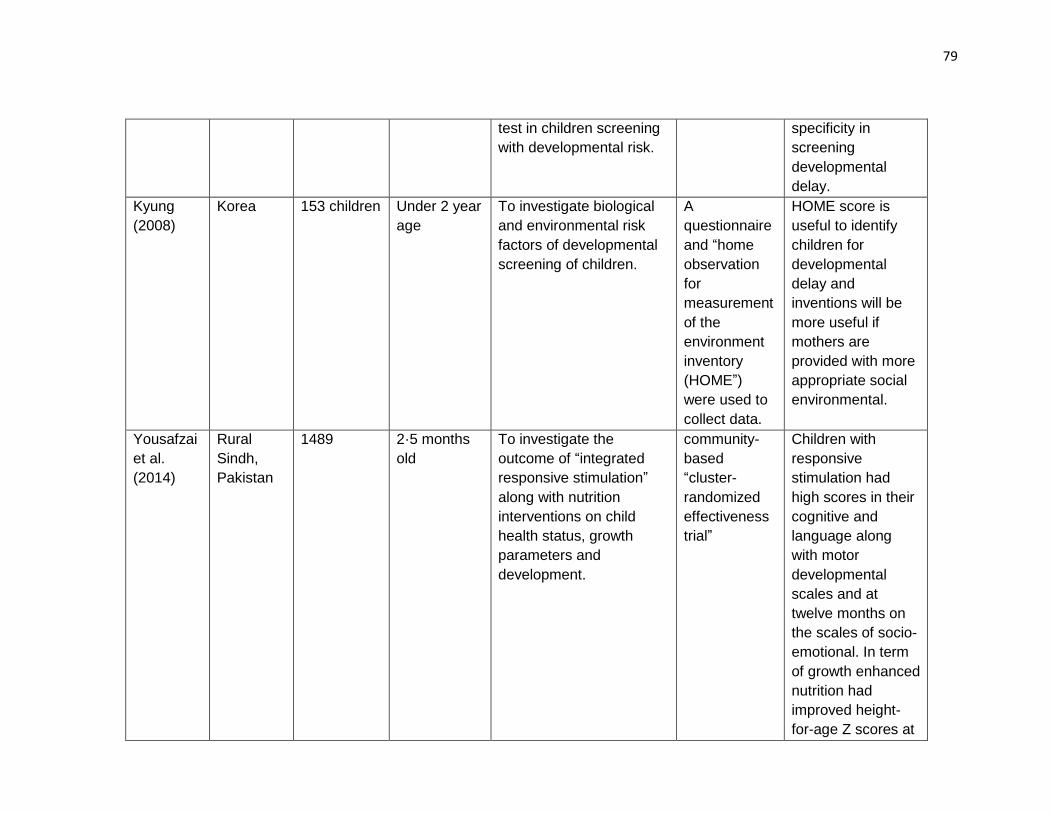
79
test in children screening
with developmental risk.
specificity in
screening
developmental
delay.
Kyung
(2008)
Korea 153 children Under 2 year
age
To investigate biological
and environmental risk
factors of developmental
screening of children.
A
questionnaire
and “home
observation
for
measurement
of the
environment
inventory
(HOME”)
were used to
collect data.
HOME score is
useful to identify
children for
developmental
delay and
inventions will be
more useful if
mothers are
provided with more
appropriate social
environmental.
Yousafzai
et al.
(2014)
Rural
Sindh,
Pakistan
1489 2·5 months
old
To investigate the
outcome of “integrated
responsive stimulation”
along with nutrition
interventions on child
health status, growth
parameters and
development.
community-
based
“cluster-
randomized
effectiveness
trial”
Children with
responsive
stimulation had
high scores in their
cognitive and
language along
with motor
developmental
scales and at
twelve months on
the scales of socio-
emotional. In term
of growth enhanced
nutrition had
improved height-
for-age Z scores at
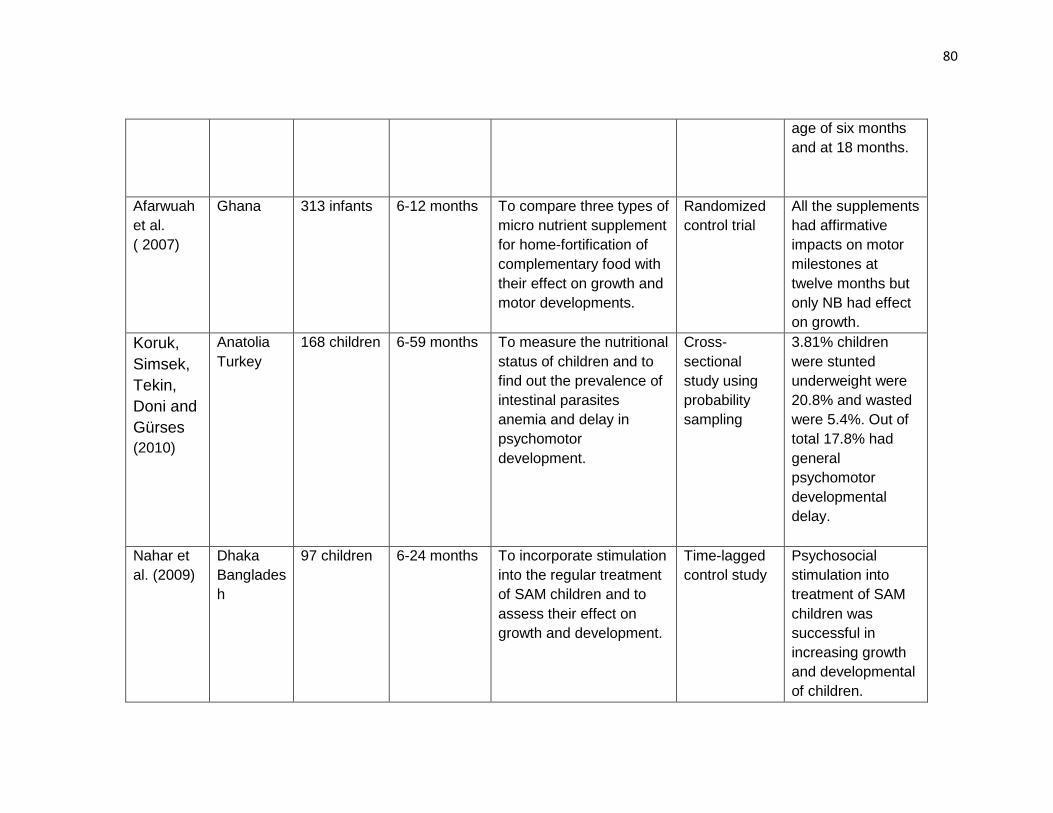
80
age of six months
and at 18 months.
Afarwuah
et al.
( 2007)
Ghana 313 infants 6-12 months To compare three types of
micro nutrient supplement
for home-fortification of
complementary food with
their effect on growth and
motor developments.
Randomized
control trial
All the supplements
had affirmative
impacts on motor
milestones at
twelve months but
only NB had effect
on growth.
Koruk,
Simsek,
Tekin,
Doni and
Gürses
(2010)
Anatolia
Turkey
168 children 6-59 months To measure the nutritional
status of children and to
find out the prevalence of
intestinal parasites
anemia and delay in
psychomotor
development.
Cross-
sectional
study using
probability
sampling
3.81% children
were stunted
underweight were
20.8% and wasted
were 5.4%. Out of
total 17.8% had
general
psychomotor
developmental
delay.
Nahar et
al. (2009)
Dhaka
Banglades
h
97 children 6-24 months To incorporate stimulation
into the regular treatment
of SAM children and to
assess their effect on
growth and development.
Time-lagged
control study
Psychosocial
stimulation into
treatment of SAM
children was
successful in
increasing growth
and developmental
of children.
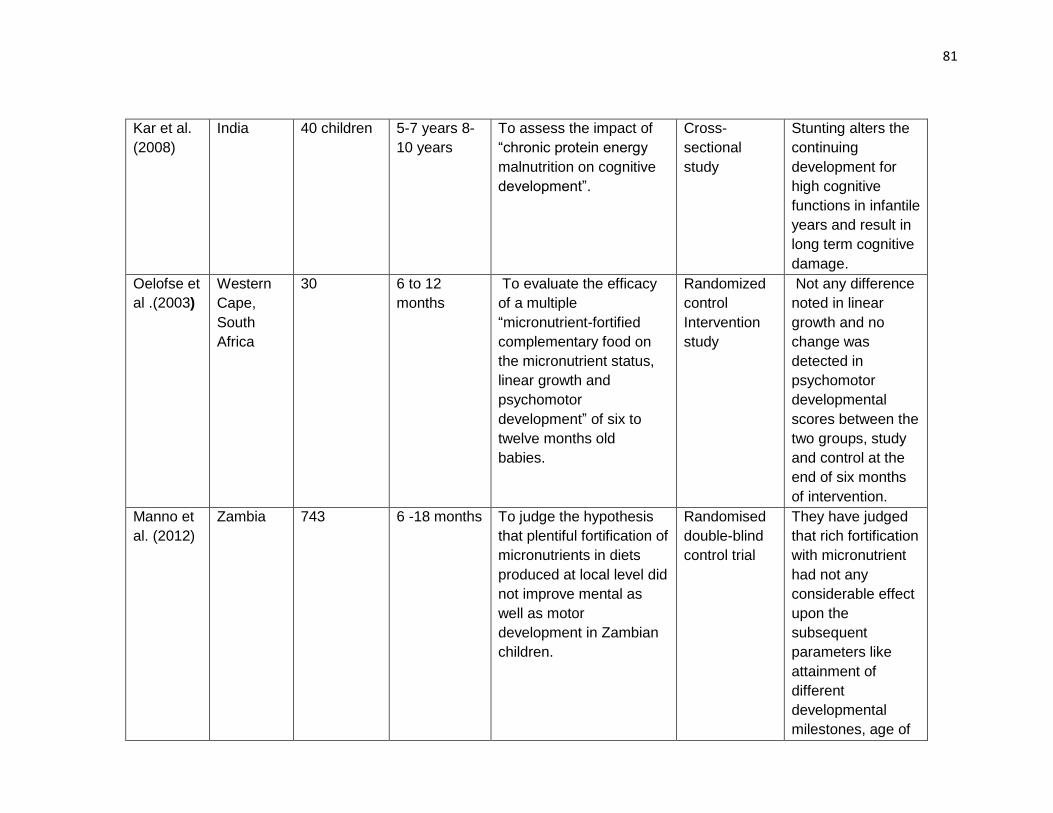
81
Kar et al.
(2008)
India 40 children 5-7 years 8-
10 years
To assess the impact of
“chronic protein energy
malnutrition on cognitive
development”.
Cross-
sectional
study
Stunting alters the
continuing
development for
high cognitive
functions in infantile
years and result in
long term cognitive
damage.
Oelofse et
al .(2003)
Western
Cape,
South
Africa
30 6 to 12
months
To evaluate the efficacy
of a multiple
“micronutrient-fortified
complementary food on
the micronutrient status,
linear growth and
psychomotor
development” of six to
twelve months old
babies.
Randomized
control
Intervention
study
Not any difference
noted in linear
growth and no
change was
detected in
psychomotor
developmental
scores between the
two groups, study
and control at the
end of six months
of intervention.
Manno et
al. (2012)
Zambia 743 6 -18 months
To judge the hypothesis
that plentiful fortification of
micronutrients in diets
produced at local level did
not improve mental as
well as motor
development in Zambian
children.
Randomised
double-blind
control trial
They have judged
that rich fortification
with micronutrient
had not any
considerable effect
upon the
subsequent
parameters like
attainment of
different
developmental
milestones, age of
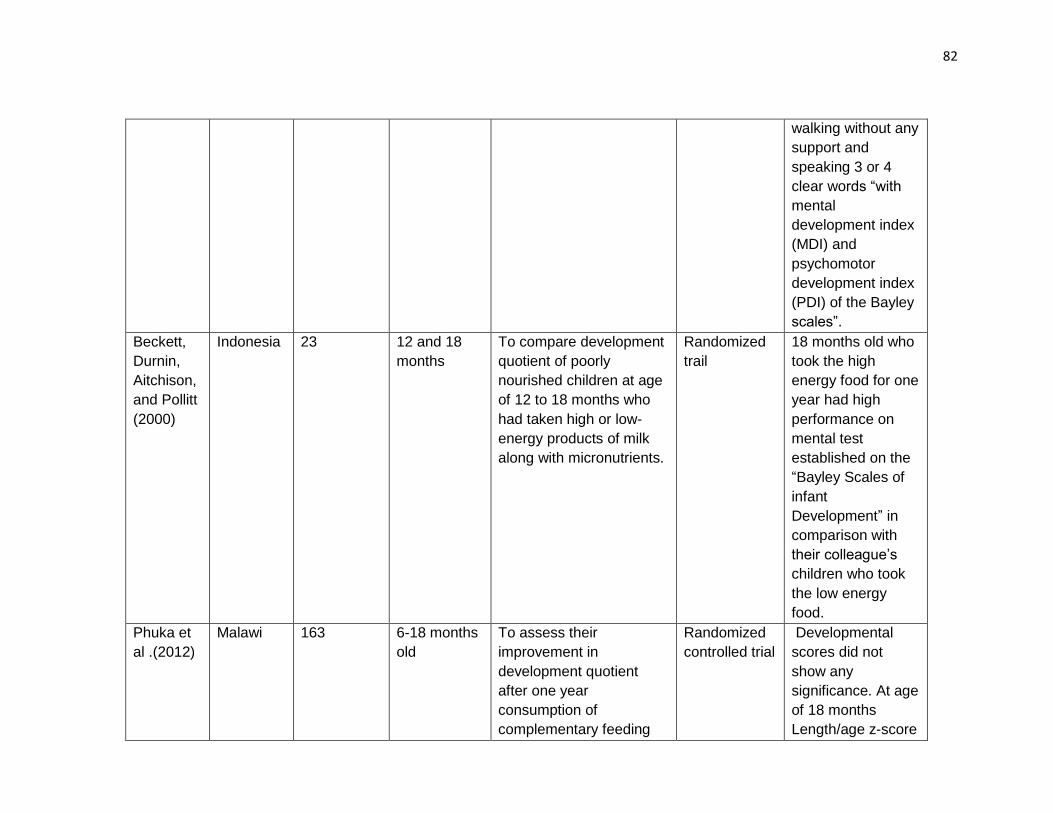
82
walking without any
support and
speaking 3 or 4
clear words “with
mental
development index
(MDI) and
psychomotor
development index
(PDI) of the Bayley
scales”.
Beckett,
Durnin,
Aitchison,
and Pollitt
(2000)
Indonesia 23 12 and 18
months
To compare development
quotient of poorly
nourished children at age
of 12 to 18 months who
had taken high or low-
energy products of milk
along with micronutrients.
Randomized
trail
18 months old who
took the high
energy food for one
year had high
performance on
mental test
established on the
“Bayley Scales of
infant
Development” in
comparison with
their colleague’s
children who took
the low energy
food.
Phuka et
al .(2012)
Malawi 163 6-18 months
old
To assess their
improvement in
development quotient
after one year
consumption of
complementary feeding
Randomized
controlled trial
Developmental
scores did not
show any
significance. At age
of 18 months
Length/age z-score
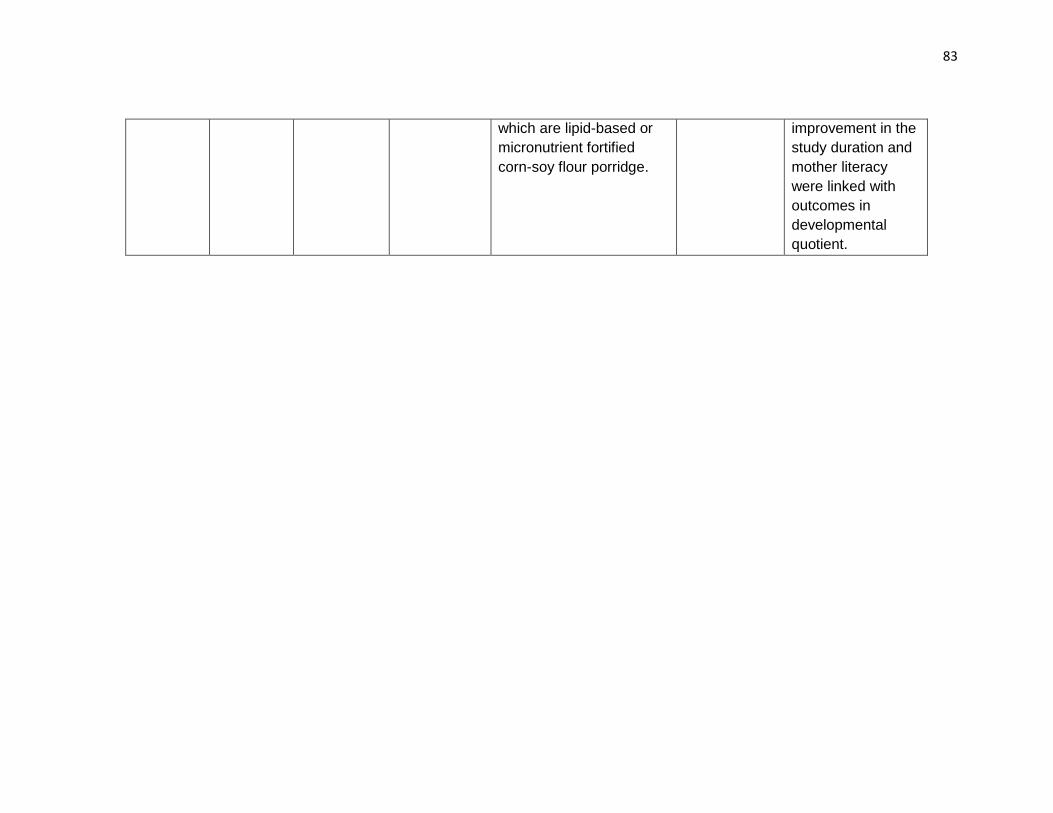
83
which are lipid-based or
micronutrient fortified
corn-soy flour porridge.
improvement in the
study duration and
mother literacy
were linked with
outcomes in
developmental
quotient.
2.2 Vitamin D deficiency and Supplementation
In this section we have described different vitamin D trails on child health (infectious and
noninfectious) along with growth and development at global level.
Kumar et al. (2011) designed a randomized control trial in India on term infants who are
low birth weight till the age 6 months to explore the impact of supplementation of vitamin
D on weekly basis on infant’s mortality and morbidity along with growth. Around 2079
participants “low birthweight infants born at term: >37 weeks’ gestation” were enrolled
from a big hospital operated by government in New Delhi with aim to find primary
outcome of hospital admissions and deaths in the initial six months of life and growth
were the secondary outcome to follow. They have intervened with weekly vitamin D
supplementation up to six months at a dose of 35 μg/week and one recommended
nutrient intake on daily basis. Infants were followed on weekly basis at home to witness
supplementation and were carried to the treatment center every month for medical
evaluations and anthropometric assessments. They have made assessment from this
trial that in respect of death or hospital admissions or transfer to the out-patient center
for moderate morbidity among groups no significant difference was noted but vitamin D
administration would have showed improved vitamin D levels among groups at six
months as measured by the status of plasma calcidiol in the body. Moreover,
supplementation of vitamin D considerably improved z- scores at six months for weight
combined with length and mid arm circumference as well as reduced the percentage of
kids with stunted growth. So it was determined that vitamin D doses on a weekly basis
were good enough to enhance vitamin D levels but not succeeded to reduce the
frequency of mortality or acute morbidity between term young infants with low birth
weight.
85
Manaseki et al. (2010) experimented a “double-blinded individually randomized placebo
controlled trial” in Kabul to explore the outcome of supplementation for vitamin D (100,000
IU) in total 453 children with diagnosis of pneumonia. Data were collected from outpatient
clinics and inpatient department in an inner-city Kabul hospital, Afghanistan. Inclusion
criteria were children aged from one to thirty-six months, resident of known high vitamin D
deficiency area and clinically detected with pneumonia severe or non-severe. The
rationale for this trail is to assess the role of vitamin D in regulating immune function as
well as also to evaluate its deficiency as a probability for incidence of pneumonia in
children. The authors explored that supplementation of “100 000 IU of vitamin D3” with
antibiotics decreases the time of disease in children diagnosed with pneumonia and also
vitamin D3 supplementation decreases the risk of recurrence of disease. Results depict
that for treatment of pneumonia one high dose vitamin D3 oral supplementation in child
with antibiotic combination does not alter length of pneumonia, but decrease the risk of
relapse of pneumonia episodes.
Brehm et al. (2010) explored potential benefits of vitamin D supplementation for children
with asthma. Researchers got data from 103 asthma patients and 102 normal controls. All
samples were assembled in the winter and in early spring season in Denver, Colorado.
The authors discovered that serum vitamin D concentration in asthmatics were not
different from general population. Almost 50% of study subjects in both groups had serum
concentration of vitamin D in the deficiency range (<20ng/ml). At the same time the results
of this study reveal higher prevalence for vitamin D inadequacy in adults then in children
and prevalence for deficiency of vitamin D in children older than 12 years was proved to
be same as adults. Since in this study all samples were gathered during the season when
skin production of vitamin D is minimum, the results highlight the significance of nutrition
86
and life style aspects that influence high serum vitamin D status in children. The author’s
judgments recommend that vitamin D administrations in asthmatic children may improve
corticosteroid response, control atopy and could increase asthma control.
Bergman et al. (2012) with his colleagues “at Karolinska institute and Karolinska University
hospital” planned a study in patients who were prone to infections to evaluate vitamin D
effect for avoidance of respiratory tract infections in them. Giving high doses of vitamin D
in infection-prone patients for a period of twelve months declines their odds of acquiring
infections of respiratory tract and subsequently their needs for antibiotics. They argued
that, their study showed a significant outcome in patients suffering from recurrent
infections, with low immunity along with lack of antibodies and also proved to be helpful in
prevention of increase antibiotics resistance due to their misuse. Contrary to, in favor of
notion that vitamin D3 is beneficial for healthful people having normal respiratory tract with
acute infections did not prove anything worth noted. It was also established that low levels
for vitamin D can enhance the possibility of infections and sufficient level of vitamin D can
also activate the immune system. So they conclude that supplementation with vitamin D3
may decrease disease burden in ill peoples having recurrent infections of respiratory tract.
Kutluk, Çetinkaya and Basak (2002) studied that vitamin D, oral supplementation of
100,000 IU for 3 months have evidenced to be secure and effectual for relieving
insufficiency of vitamin D in high-risk healthy kids or in kids diagnosed with rickets. For
this a randomized controlled experimental hospital base study were conducted in Istanbul,
Turkey to evaluate the outcome of combine form, intake of calcium orally along with
vitamin D in high dose for cure of nutritional rickets in forty-two children between the age
of six to thirty months. It was discovered from this study that an only one, high dose for
87
vitamin D in intramuscular form (300,000 IU) administration in combination with oral
calcium were secure and effectual regime for rickets in children.
Zeghoud, Mekhbi, Djeghri and Garabedian (1994), in Paris by randomized control trial
asses the “subclinical vitamin D deficiency in neonates” and examine their reaction against
the vitamin D supplementation. Thirty neonates were allocated only one dose of 5mg (200
000 IU) cholecalciferol at birth or to 2.5mg cholecalciferol at birth, three months and six
months after birth. Samples from venous blood were taken from each child after each dose
and for several times to assess serum vitamin 25(0H) D. It was revealed that both regimes
give same protection against vitamin D insufficiency without any risk of vitamin D toxicity.
Manaseki et al. (2012) carry out research in Afghanistan, the neighboring country of
Pakistan in winter during the year of 2005 to prove, that the population of Kabul district
have high occurrence for vitamin D insufficiency. The “serum 25-hydroxyl vitamin D
concentration” was examined and found “5ng/ml (range 2-25ng/ml”) in 108 kids having
age between six to forty-eight months. Out of all, 104 (96.2%) had level lower then
15ng/ml, the lowest value measured to be adequate, and 79 (73%) had level lower then
8ng/ml, a value believed to be considerably inadequate.
Pawley and Bishop (2004) state that “prenatal vitamin D status appears to affect postnatal
mineral homeostasis” and can also alter growth process. Post-natal levels of vitamin D
influence process of growth, additionally important for mineral homeostasis and
consequently might be also effecting bone mass. Undoubtedly further information on
functional outcomes in infants and children, perhaps extension up to the adolescence, are
desirable for determining the impacts of supplementation of diverse amounts of vitamin D
in condition of pregnancy. Currently it is not feasible to recommend a single general advice
88
for supplementing vitamin D in pregnancy state, though supplementing with “400-1000
IU/d” in the last trimester in those having more odds of suffering from deficiency, might be
secure and beneficial.
Brehm et al. (2010) piloted a research to evaluate the association amid serum vitamin D
levels and consequential acute asthma exacerbations. Data collected from 1024
participants to assess “25-hydroxyvitamin D levels” in sera assembled with mild-to-
moderate unremitting asthma on the time of registration in a multicenter clinical trial of
participants randomized to take budesonide, nedocromil, or placebo in the “Childhood
Asthma Management Program”. Applying multivariate modeling, they analyzed the
association among baseline vitamin D levels and the probabilities of any hospitalization or
admission in emergency throughout the period of around four years of trial they have found
that 35% participants were vitamin D insufficient. Mean vitamin D levels remained low in
African American citizens and high in white citizens. Subsequently modifying for age,
gender, BMI, income and treatment group, inadequate vitamin D concentration were
linked with a high chance for any hospitalization or admission in emergency. So they infer
that in children of North America deficiency of vitamin D is widespread along with mild to
moderate asthma which is persistent in nature and also linked with high chances of severe
acute exacerbations around the time of four years.
Trilok et al. (2015) conducted a randomized control trial follow-up “to assess the effects of
vitamin D supplementation in infancy on growth, bone parameters, body composition and
gross motor development at age 3–6 years”. The Delhi Infant Vitamin D Supplementation
“(DIVIDS-2) study” tracked the “DIVIDS children”, those at that time grows up to age of
three to six years, to reveal long-lasting impacts of vitamin D supplementation. Thy have
followed, 446 kids among the group of vitamin D and 466 kids between the placebo group,
89
from DIVID children. They have collected data about anthropometric measurements,
blood pressure, gross motor milestones, bone structure along with bone strength by using
“quantitative ultrasound” and draw samples from blood for estimating vitamin D levels, and
deuterium dilution scan for body composition on a subgroup of 229 children. They have
concluded that body mass index z- scores was low in the vitamin D group in comparison
with the placebo group because of marginally low gain in weight and a little increase in
height. The arm of vitamin D also showed low “thigh circumference” including “arm muscle
area” and marginal low “mid-upper arm circumference” (MUAC). Not any significant arm
difference was found in “body fat percentage”, bone structure and strength by using
quantitative ultrasound or by measuring blood pressure but a slight difference is observed
in development of motor milestones. They have made conclusion that vitamin D
administration in low birth-weight babies during infant-hood period ensuing children
thinner at the age of 3–6 years without any differences being observed in functional
outcomes.
Rejnmark (2011) did a review from randomized-controlled trials to assess “the effects of
vitamin D on muscle function and performance”. It was proven in the meta-analyses of
RCT’s that there was, low probability of falls in elder person who were supplemented with
vitamin D, possibly will because of improvement in “neuromuscular function” after having
sufficient vitamin D levels. In many researches which are observational in nature, vitamin
D levels in the body have positive relation with “muscle strength and postural stability” and
also physical activation is linked by way of vitamin D levels and muscle strength, assessed
in different randomized control trial. In systematic approach of 16 randomized controlled
trials “on the effects of treatment with vitamin D on muscle function” were found and out
of them only one study was done on participants above 50 years of age. In seven studies
90
from these studies, a progressive outcome of treating with vitamin D was recorded for
“muscle strength of the lower legs and physical performance”. To sum up, data from
randomized controlled trials (RCTs) supported the results of supplementing with vitamin
D for muscle strength along with function in old persons, but dilemma is that many
published reports depicts no useful effects than researches proving beneficiary outcomes.
Still data is deficit for potential outcomes in young person’s so more trials required in this
context.
Walli, Munubhi, Aboud & Manji (2017) conducted a cross-sectional study to estimate the
vitamin D levels in under 5 years malnourished children admitted in a Tertiary Care Center
at Tanzania. For this they have measured serum vitamin D status, alkaline phosphatase
and X-ray wrist were done on 134 children. They have evaluated that vitamin D deficiency
(VDD) were present in 41 (30.6%) children with the mean vitamin D value of 74.8 nmol/l.
The mean alkaline phosphatase measure was 176.6U/l. Severe stunting were diagnosed
in 64 (48%) children out of them 20 (31.2%) were vitamin D deficient. Moreover, they have
revealed that marasmic child had high odds of vitamin D deficiency with comparison of
other types of malnutrition. They have suggested that malnourished children have higher
pervasiveness of vitamin D deficiency and highlights the importance for effective
surveillance and aggressive management.
Saad et al. (2016) designed a double-blinded, randomized control clinical trial (RCT) for
vitamin D administration in kids having “autism spectrum disorder” (ASD). The present trial
enrolled 109 kids diagnosed with “autism spectrum disorder” among three to ten years of
age (85 boys and 24 girls). The objective of the trial was to evaluate the outcomes, for
vitamin D administration in the kids for autism signs around four month’s period. The
91
serum status for vitamin D were evaluated at trial start and at end. Childhood Autism
Rating Scale (CARS), were used for assessing the acuteness of autism. The ASD kids,
social maturity was evaluated through “Aberrant Behavior Checklist (ABC), Social
Responsiveness Scale (SRS) and the Autism Treatment Evaluation Checklist (ATEC)”.
They have concluded that administration of vitamin D daily doses (“300 IU vitamin
D3/kg/day, not to exceed 5,000 IU/day”) was tolerated satisfactorily by the autism
spectrum disorder kids. The autism core symptoms of the children were recovered
considerably, in 4 months of vitamin D3 administrations compared with, placebo arm. This
trail proves the effectiveness and acceptability of high doses for vitamin D3 in ASD kids
based upon parameters evaluated in this trail. It was revealed that, vitamin D
administration in oral form can securely recover signs along with symptoms for ASD and
may perhaps suggested for ASD kids.
In this section we have described different vitamin D trails on child health (infectious and
noninfectious) along with growth and development. We have seen that these trials were
conducted according to different functions of vitamin D on the body. But trials on vitamin
D role in undernutrition is still lacking and need consideration in this context. As we
searched that the nutritional composition of RUTF and requirements of children with SAM
are largely based on expert opinion rather than trials with actual functional outcomes. The
mechanistic rationale for this trial of vitamin D with using a placebo control is an attempt
to give a more scientific view. We have tried in our present trail to fulfill this gap to some
extent.
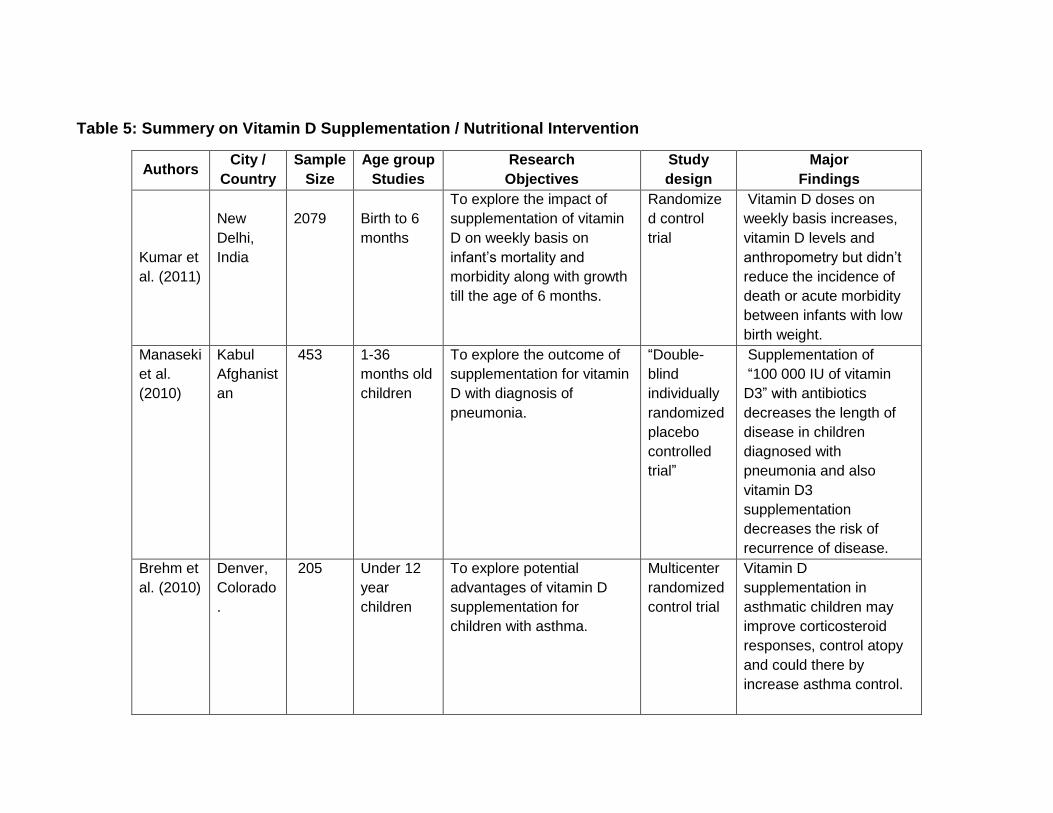
Table 5: Summery on Vitamin D Supplementation / Nutritional Intervention
Authors City /
Country
Sample
Size
Age group
Studies
Research
Objectives
Study
design
Major
Findings
Kumar et
al. (2011)
New
Delhi,
India
2079
Birth to 6
months
To explore the impact of
supplementation of vitamin
D on weekly basis on
infant’s mortality and
morbidity along with growth
till the age of 6 months.
Randomize
d control
trial
Vitamin D doses on
weekly basis increases,
vitamin D levels and
anthropometry but didn’t
reduce the incidence of
death or acute morbidity
between infants with low
birth weight.
Manaseki
et al.
(2010)
Kabul
Afghanist
an
453 1-36
months old
children
To explore the outcome of
supplementation for vitamin
D with diagnosis of
pneumonia.
“Double-
blind
individually
randomized
placebo
controlled
trial”
Supplementation of
“100 000 IU of vitamin
D3” with antibiotics
decreases the length of
disease in children
diagnosed with
pneumonia and also
vitamin D3
supplementation
decreases the risk of
recurrence of disease.
Brehm et
al. (2010)
Denver,
Colorado
.
205 Under 12
year
children
To explore potential
advantages of vitamin D
supplementation for
children with asthma.
Multicenter
randomized
control trial
Vitamin D
supplementation in
asthmatic children may
improve corticosteroid
responses, control atopy
and could there by
increase asthma control.
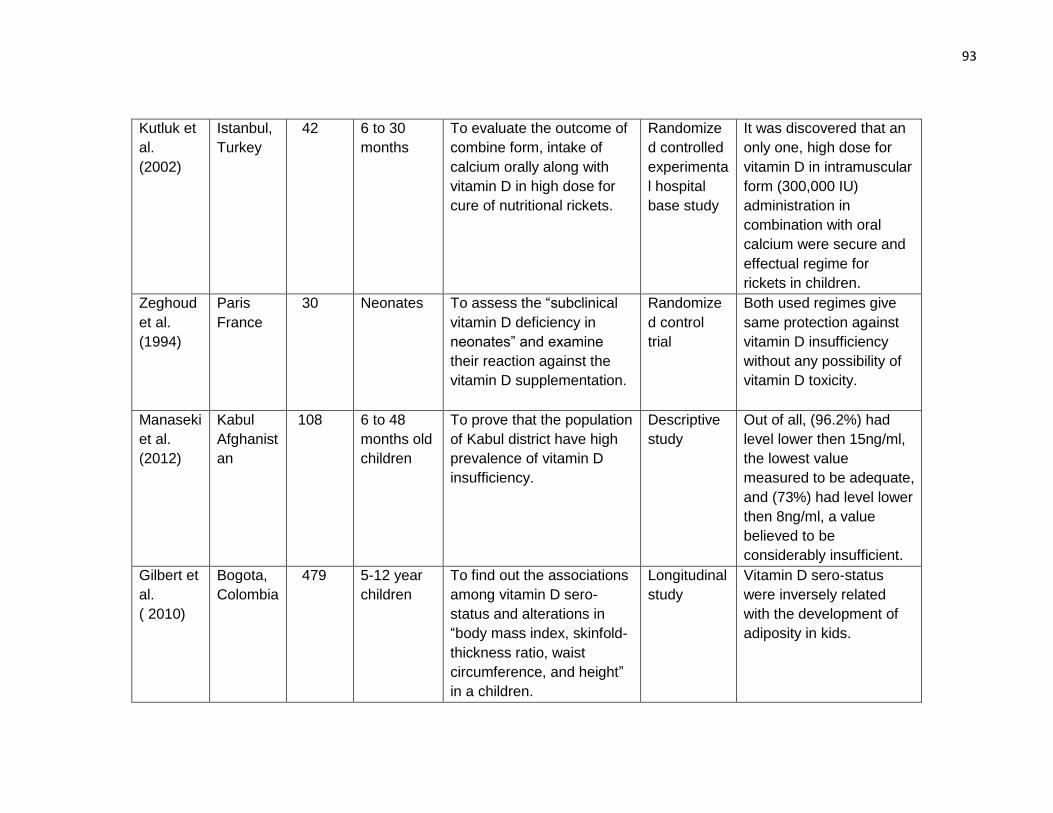
93
Kutluk et
al.
(2002)
Istanbul,
Turkey
42 6 to 30
months
To evaluate the outcome of
combine form, intake of
calcium orally along with
vitamin D in high dose for
cure of nutritional rickets.
Randomize
d controlled
experimenta
l hospital
base study
It was discovered that an
only one, high dose for
vitamin D in intramuscular
form (300,000 IU)
administration in
combination with oral
calcium were secure and
effectual regime for
rickets in children.
Zeghoud
et al.
(1994)
Paris
France
30 Neonates To assess the “subclinical
vitamin D deficiency in
neonates” and examine
their reaction against the
vitamin D supplementation.
Randomize
d control
trial
Both used regimes give
same protection against
vitamin D insufficiency
without any possibility of
vitamin D toxicity.
Manaseki
et al.
(2012)
Kabul
Afghanist
an
108 6 to 48
months old
children
To prove that the population
of Kabul district have high
prevalence of vitamin D
insufficiency.
Descriptive
study
Out of all, (96.2%) had
level lower then 15ng/ml,
the lowest value
measured to be adequate,
and (73%) had level lower
then 8ng/ml, a value
believed to be
considerably insufficient.
Gilbert et
al.
( 2010)
Bogota,
Colombia
479 5-12 year
children
To find out the associations
among vitamin D sero-
status and alterations in
“body mass index, skinfold-
thickness ratio, waist
circumference, and height”
in a children.
Longitudinal
study
Vitamin D sero-status
were inversely related
with the development of
adiposity in kids.
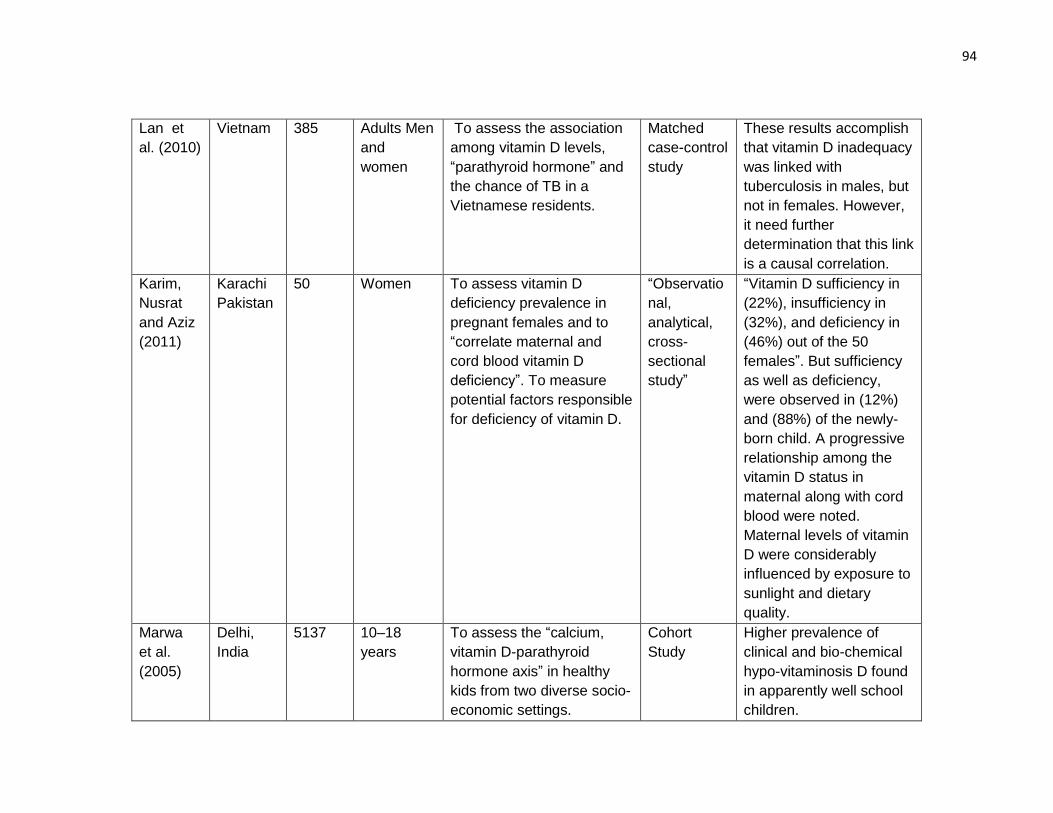
94
Lan et
al. (2010)
Vietnam 385 Adults Men
and
women
To assess the association
among vitamin D levels,
“parathyroid hormone” and
the chance of TB in a
Vietnamese residents.
Matched
case-control
study
These results accomplish
that vitamin D inadequacy
was linked with
tuberculosis in males, but
not in females. However,
it need further
determination that this link
is a causal correlation.
Karim,
Nusrat
and Aziz
(2011)
Karachi
Pakistan
50 Women To assess vitamin D
deficiency prevalence in
pregnant females and to
“correlate maternal and
cord blood vitamin D
deficiency”. To measure
potential factors responsible
for deficiency of vitamin D.
“Observatio
nal,
analytical,
cross-
sectional
study”
“Vitamin D sufficiency in
(22%), insufficiency in
(32%), and deficiency in
(46%) out of the 50
females”. But sufficiency
as well as deficiency,
were observed in (12%)
and (88%) of the newly-
born child. A progressive
relationship among the
vitamin D status in
maternal along with cord
blood were noted.
Maternal levels of vitamin
D were considerably
influenced by exposure to
sunlight and dietary
quality.
Marwa
et al.
(2005)
Delhi,
India
5137 10–18
years
To assess the “calcium,
vitamin D-parathyroid
hormone axis” in healthy
kids from two diverse socio-
economic settings.
Cohort
Study
Higher prevalence of
clinical and bio-chemical
hypo-vitaminosis D found
in apparently well school
children.
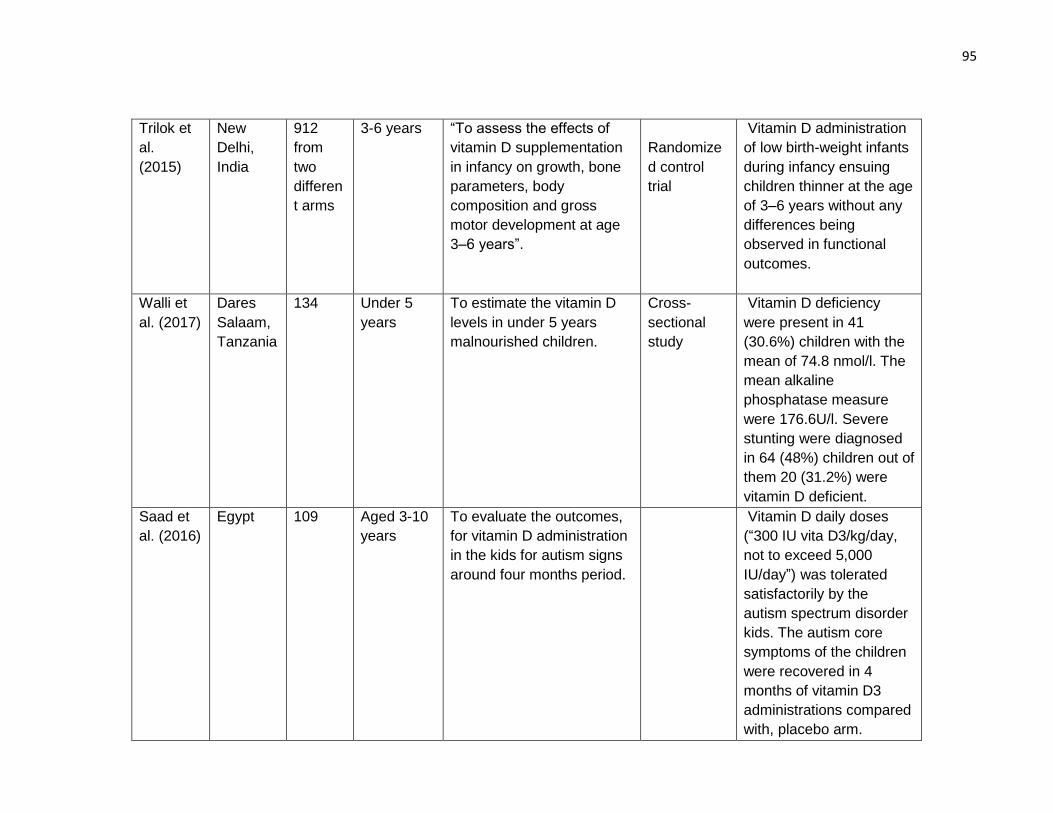
95
Trilok et
al.
(2015)
New
Delhi,
India
912
from
two
differen
t arms
3-6 years “To assess the effects of
vitamin D supplementation
in infancy on growth, bone
parameters, body
composition and gross
motor development at age
3–6 years”.
Randomize
d control
trial
Vitamin D administration
of low birth-weight infants
during infancy ensuing
children thinner at the age
of 3–6 years without any
differences being
observed in functional
outcomes.
Walli et
al. (2017)
Dares
Salaam,
Tanzania
134 Under 5
years
To estimate the vitamin D
levels in under 5 years
malnourished children.
Cross-
sectional
study
Vitamin D deficiency
were present in 41
(30.6%) children with the
mean of 74.8 nmol/l. The
mean alkaline
phosphatase measure
were 176.6U/l. Severe
stunting were diagnosed
in 64 (48%) children out of
them 20 (31.2%) were
vitamin D deficient.
Saad et
al. (2016)
Egypt 109 Aged 3-10
years
To evaluate the outcomes,
for vitamin D administration
in the kids for autism signs
around four months period.
Vitamin D daily doses
(“300 IU vita D3/kg/day,
not to exceed 5,000
IU/day”) was tolerated
satisfactorily by the
autism spectrum disorder
kids. The autism core
symptoms of the children
were recovered in 4
months of vitamin D3
administrations compared
with, placebo arm.
2.3 CMAM / Ready to use Therapeutic Food (RUTF)
In this section we have searched the literature and existing data for treating “children aged
6-59 months with severe acute malnutrition” by using CMAM model with RUTF effect, on
global level.
Akparibo, Harris, Blank, Campbell and Holdsworth (2017) piloted a study in Ghana to
explore the effectiveness of “community-based-management of severe acute malnutrition
programme” in under five years aged children in nonemergency standard community
health-care setting. They have designed a “retrospective cohort study” on 488 kids among
6–59 months of age who are getting treatment under CMAM programme. They have
collected data from enrolment cards of 56 out-patient centres for recovery rate, default
and mortality rates. It was observed that satisfactory recovery rates of children were 71.8%
with seven time greater odds of recovery in children who were entered with high MUAC of
>11.5 in comparison with children of having low MUAC of < 11.5. Moreover, children
without diagnosis of malaria at baseline have odd ratio of recovery, OR = 30, p < .001,
more in comparison with children diagnosed with malaria. The “average weight gain was
4.7 g−1·kg−1·day−1”, which were affected by MUAC value at entry with diagnosis of
malaria and total duration of stay in programme. Furthermore, the default rate was high
and mortality rate was low than international standards references by Sphere. So they
have concluded that “community based management of severe acute malnutrition” have
same success rate when given in routine nonemergency settings.
Kerac et al. (2009) designed a “double blinded, randomised, placebo-controlled efficacy
trial in 795 Malawian” children from the age range of 5-168 months to measure the “clinical
and nutritional effectiveness of a probiotic and prebiotic functional food for treating severe
acute malnutrition” in HIV dominant area. After initial stabilization phase of giving milk
97
feeds, random allocation of children was done for “ready-to-use therapeutic food” (RUTF)
by giving symbiotic or without symbiotic. The primary outcome of study included were
weight-for-height >80% for two sequential visits in outpatient clinic. Secondary outcomes
comprised mortality, gain in weight, time taken for treatment, along with clinical symptoms.
The results show nutritional cure were same in symbiotic and control groups. Secondary
outcomes were also same in both groups. HIV positive children showed worse outcomes
on the whole, however did not change or perplex the adverse outcome. Subgroup
evaluations points out potential developments to decreased out-patient death rate in the
symbiotic group. So it is concluded that symbiotic did not affects severe acute malnutrition
outcomes.
Irena et al. (2013) planned a “non-blinded, parallel group, cluster randomized, controlled,
equivalence experimental study” to evaluate the efficacy of a “milk-free soy-maize-
sorghum-based, ready-to-use therapeutic food to standard RUTF” food with twenty five
percent milk for nutritional treatment of severe acute malnourished kids in Zambia. An
analyst randomly allocated health centers either one to the “soy-maize-sorghum-based
ready-to-use therapeutic food (SMS-RUTF) (n = 12; 824 enrolled) or peanut-based RUTF
(P-RUTF) (n = 12; 1103 enrolled)”. All severe acute malnourished children who were
entered for admission at the health centers, were registered for study. Result were
analyzed on individualistic grounds. The primary outcome for the study were recovery rate
and gain in weight. “The recovery rates for milk-free soy-maize-sorghum-based ready-to-
use therapeutic food and P-RUTF were 53.3% and 60.8% for the intention-to-treat analysis
and 77.9% and 81.8% for per protocol assays”, correspondingly. This study did not
succeed to prove the theory of equivalence between “milk-free soy-maize-sorghum-based
98
ready-to-use therapeutic foods to standard RUTF” food with twenty-five percent milk for
nutritional management of severe acute malnourished children.
Bhutta et al. (2008) studied interventions in Aga khan university Karachi that influence
maternal and child undernutrition and nutrition-related problems. These intercessions
involve support of breastfeeding, approaches to enhance complementary feeding
practices, with or without food supplement, micronutrient interventions and tactics to
enhance family and community nutrition with decrease in disease load. They proved that
policies in support of breastfeeding had great outcome upon survival, but for stunting they
have shown minimum effect. WHO instructions “for management of severe acute
malnutrition” decreased case-fatality rate around 55%, and “ready-to-use therapeutic
foods, can be used in community to improve severe acute malnutrition”. Iron folate
supplements is good for pregnant women and for children advised micronutrient
interventions consist of supplements of vitamin A, zinc, iron supplementations and iodised
salt. They applied a cohort model in children of the thirty-six countries having 90% of
children with stunted linear growth to evaluate the probable outcome of these
interventions. It was proved that current interventions that were planned to enhance
nutrition with prevention of associated disease could decrease stunting, mortality and
disability-adjusted life-years. These interventions should be enhanced to reduce stunting
in the long run by amendments in the causes of undernutrition, that include affluence, poor
education, disease load and lack of women's encouragement.
Lundgren and Uhrenfeldt (2014) supervised a field research to explain the health care of
malnourished children by using qualitative method in Uganda. Data has been gathered by
using unstructured observations, talks with parents, health care consultants by following
99
instructions and records utilized by the MNU, Mulago Hospital. They have utilized WHO
child growth standards, “mid-upper-arm circumference tape” and clinical assessment of
oedema bilaterally for determining the type and severity of malnutrition. The management
comprised at the MNU were therapeutic milk and “ready to use therapeutic food (RUTF)”.
Parents plays significant part for care of child in hospital as well as health experts work
out preventively by increasing parent’s knowledge of malnutrition. Parents were imparted
with knowledge and education focusing, nutrition, hygiene, communication of infectious
diseases. They have also included preventive programme as community outreach, with
purpose to enhance the health of people in rural settings. To sum up they have explored
many reasons of malnutrition and found it complicated with different influencing causes.
The study analysis explained the important role of parents as custodians and low
economic reserves, lack of knowledge were main reasons affecting child health. They
concluded that by approaching people with limited approach to health services many
significant measures will accomplished in the battle of prevention of malnutrition.
Jones et al. (2015) planned a “randomized controlled trial in children having severe acute
malnutrition in rural Kenya” for developing “Ready to use therapeutic food” with high short
chain, n-3 polyunsaturated fatty acid. For its evaluation on outcomes, in “treatment of
severe acute malnutrition” they have applied by adding and by without adding fish oil
supplementation, on kid’s polyunsaturated fatty acid levels. They have enrolled sixty
children from six to fifty months of age and they were randomized to take ready- to -use
therapeutic food with regular composition “RUTF with high short chain n-3 PUFA or RUTF
with high short chain n-3” polyunsaturated fatty acid in addition to fish oil capsules.
Children’s were monitored for three months. The study primary outcome has been
erythrocyte polyunsaturated fatty acid composition. They have found that “Erythrocyte
100
docosahexaenoic acid (DHA)” dropped in two arms who were not taking fish oil, even from
the reference point. “Erythrocyte long-chain n-3 polyunsaturated fatty acid” after treatment
were notably high for children’s in group taking fish oil in comparison with those in the
group taking “RUTF with high short chain n-3” polyunsaturated fatty acid or regular RUTF
only. To sum up, “ready to use therapeutic food with high short chain n-3 polyunsaturated
fatty acid” and fish oil capsules were suitable for children’s and there were no considerable
differences in safety results.
Van et al. (2016) researched in Goronyo the outcome of “supplementation with ready-to-
use therapeutic food (RUTF) and a micronutrient powder (MNP)” on the prevalence of
malnutrition in sick pediatric patients coming to out-patient department. A “three-armed,
partially-blinded, randomized controlled trial” was piloted in pediatric patients with
diagnosis of malaria, diarrhea and lower respiratory-tract infections. Children between six
to fifty-nine months of age were randomized to any one arm from the three arms and
received one packet per day of RUTF, two packets per day of micro-nutrients or in control
arm received no supplementation around 14 days and in illness for six months. The
primary outcome of the trail was the occurrence of 1st adverse nutritional outcome in six-
month monitoring. Negative nutritional outcome was a study-specific measure and a sign
of malnutrition and it has been classified as low “weight-for-height z-score, mid-upper arm
circumference <115 mm, or edema”, whatever appear firstly. Total 2,213 children were
randomized, and the incidence rate was 0.92 for “ready to use therapeutic food” vs.
control, 0.87 for micronutrient powder versus control and 1.06 for “ready to use therapeutic
food” vs. micronutrient powder. A subgroup evaluation revealed no relations, no
confounding and not any unique efficacy for supplementing in participants in moderate
malnutrition in contrast with well malnourished at admission. So it was concluded that
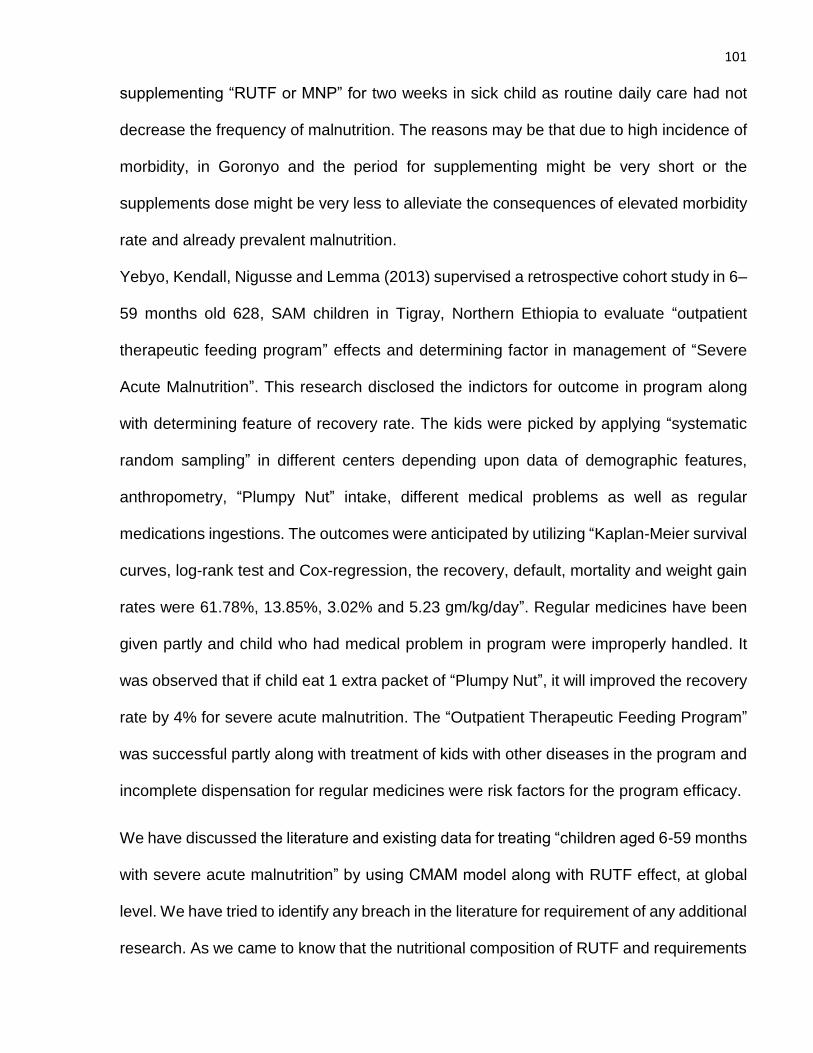
101
supplementing “RUTF or MNP” for two weeks in sick child as routine daily care had not
decrease the frequency of malnutrition. The reasons may be that due to high incidence of
morbidity, in Goronyo and the period for supplementing might be very short or the
supplements dose might be very less to alleviate the consequences of elevated morbidity
rate and already prevalent malnutrition.
Yebyo, Kendall, Nigusse and Lemma (2013) supervised a retrospective cohort study in 6–
59 months old 628, SAM children in Tigray, Northern Ethiopia to evaluate “outpatient
therapeutic feeding program” effects and determining factor in management of “Severe
Acute Malnutrition”. This research disclosed the indictors for outcome in program along
with determining feature of recovery rate. The kids were picked by applying “systematic
random sampling” in different centers depending upon data of demographic features,
anthropometry, “Plumpy Nut” intake, different medical problems as well as regular
medications ingestions. The outcomes were anticipated by utilizing “Kaplan-Meier survival
curves, log-rank test and Cox-regression, the recovery, default, mortality and weight gain
rates were 61.78%, 13.85%, 3.02% and 5.23 gm/kg/day”. Regular medicines have been
given partly and child who had medical problem in program were improperly handled. It
was observed that if child eat 1 extra packet of “Plumpy Nut”, it will improved the recovery
rate by 4% for severe acute malnutrition. The “Outpatient Therapeutic Feeding Program”
was successful partly along with treatment of kids with other diseases in the program and
incomplete dispensation for regular medicines were risk factors for the program efficacy.
We have discussed the literature and existing data for treating “children aged 6-59 months
with severe acute malnutrition” by using CMAM model along with RUTF effect, at global
level. We have tried to identify any breach in the literature for requirement of any additional
research. As we came to know that the nutritional composition of RUTF and requirements
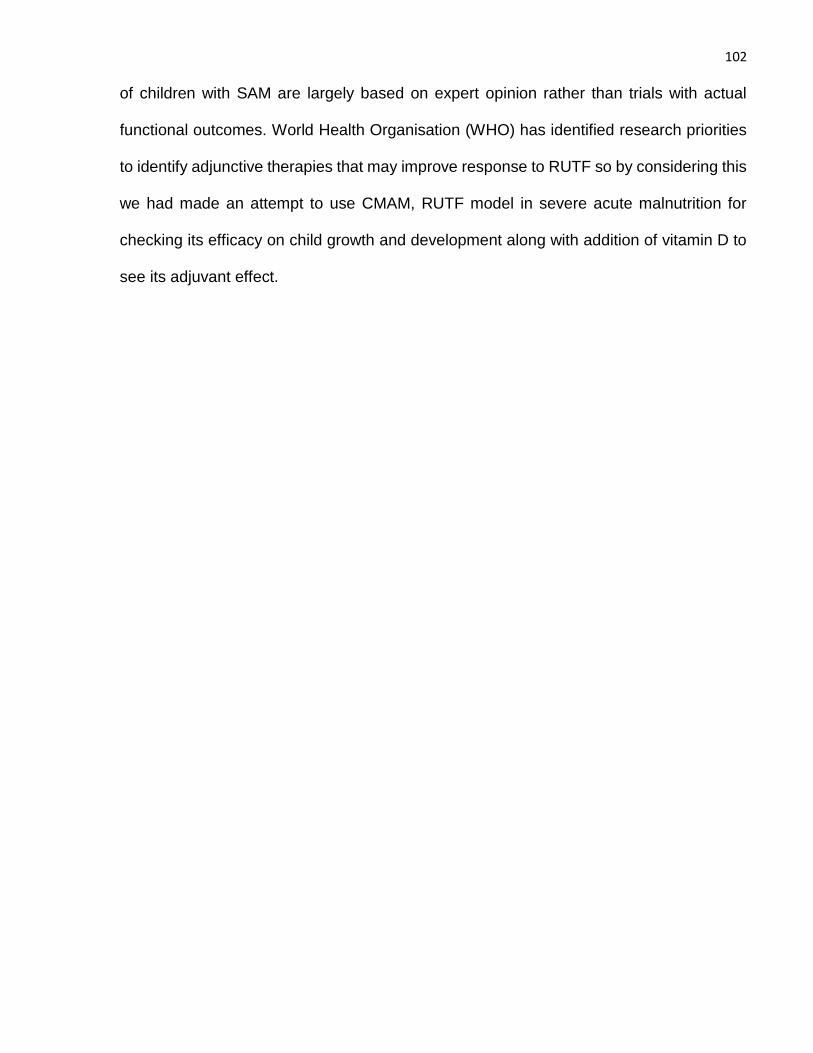
102
of children with SAM are largely based on expert opinion rather than trials with actual
functional outcomes. World Health Organisation (WHO) has identified research priorities
to identify adjunctive therapies that may improve response to RUTF so by considering this
we had made an attempt to use CMAM, RUTF model in severe acute malnutrition for
checking its efficacy on child growth and development along with addition of vitamin D to
see its adjuvant effect.
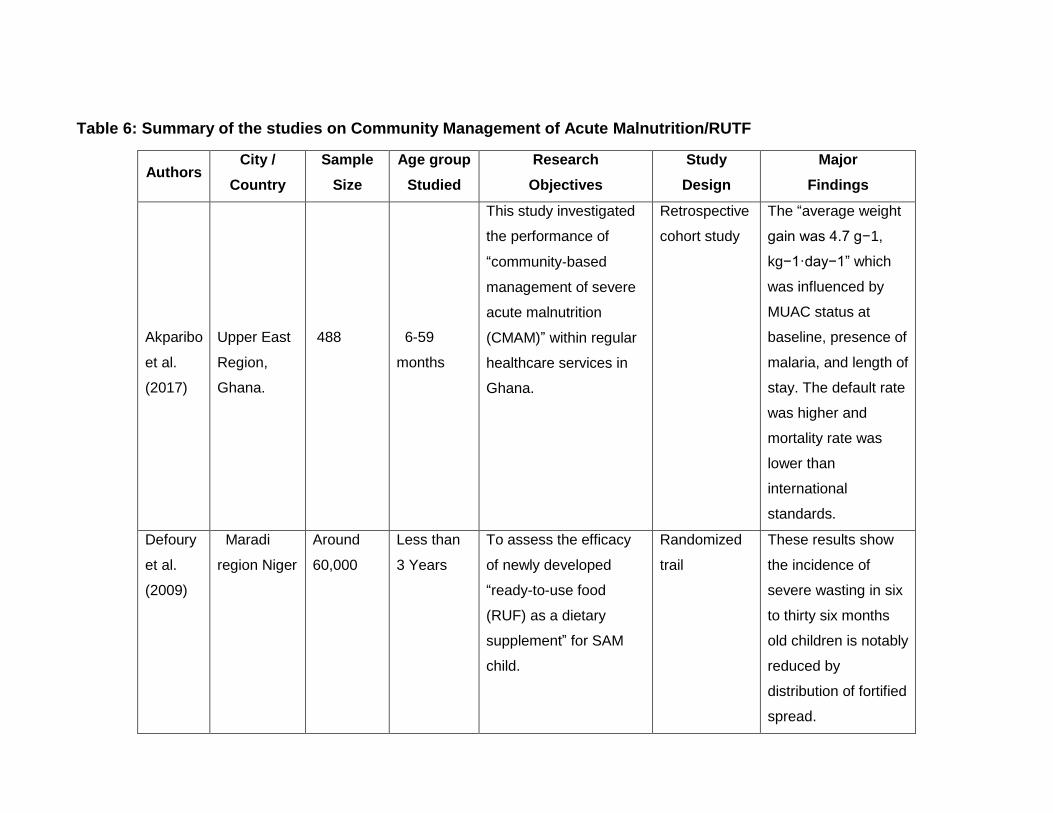
Table 6: Summary of the studies on Community Management of Acute Malnutrition/RUTF
Authors City /
Country
Sample
Size
Age group
Studied
Research
Objectives
Study
Design
Major
Findings
Akparibo
et al.
(2017)
Upper East
Region,
Ghana.
488
6-59
months
This study investigated
the performance of
“community‐based
management of severe
acute malnutrition
(CMAM)” within regular
healthcare services in
Ghana.
Retrospective
cohort study
The “average weight
gain was 4.7 g−1,
kg−1·day−1” which
was influenced by
MUAC status at
baseline, presence of
malaria, and length of
stay. The default rate
was higher and
mortality rate was
lower than
international
standards.
Defoury
et al.
(2009)
Maradi
region Niger
Around
60,000
Less than
3 Years
To assess the efficacy
of newly developed
“ready-to-use food
(RUF) as a dietary
supplement” for SAM
child.
Randomized
trail
These results show
the incidence of
severe wasting in six
to thirty six months
old children is notably
reduced by
distribution of fortified
spread.
104
Kerac et
al.
(2009)
Malawi 795 5 to 168
months
To measure the “clinical
and nutritional
effectiveness of a
probiotic and prebiotic
functional food” in
treating SAM.
Double-blind,
randomised,
placebo-
controlled
efficacy trial
Symbiotic did not
affects “severe acute
malnutrition”
outcomes in HIV
dominant areas.
Oakley
et al.
(2010)
Malawi 1874 Under 5
year of age
To compare that two
locally produced RUTF
having 10 % milk is less
effectual than having
25% Milk for treating
severe malnourished
children.
“Randomized,
double-blind,
controlled,
clinical, quasi-
effectiveness
trial”.
Children getting 25 %
milk RUTF shows
more recovery and
increase in their
weight and height
then children getting
10 % milk RUTF. It
were concluded that
RUTF with 25% milk
is the standard home
based treatment for
SAM.
Irena et
al.
(2013)
Zambia 1927 Under 5
years of
age
To assess the efficacy
“of a milk-free soy-
maize-sorghum-RUTF”
(SMS-RUTF) to
standard 25% milk
RUTF (P-RUTF) in
“Non-blinded,
parallel group,
cluster
randomized,
controlled,
This trial did not
prove the hypothesis
for equivalence in
“SMS-RUTF and P-
RUTF in SAM
management”.
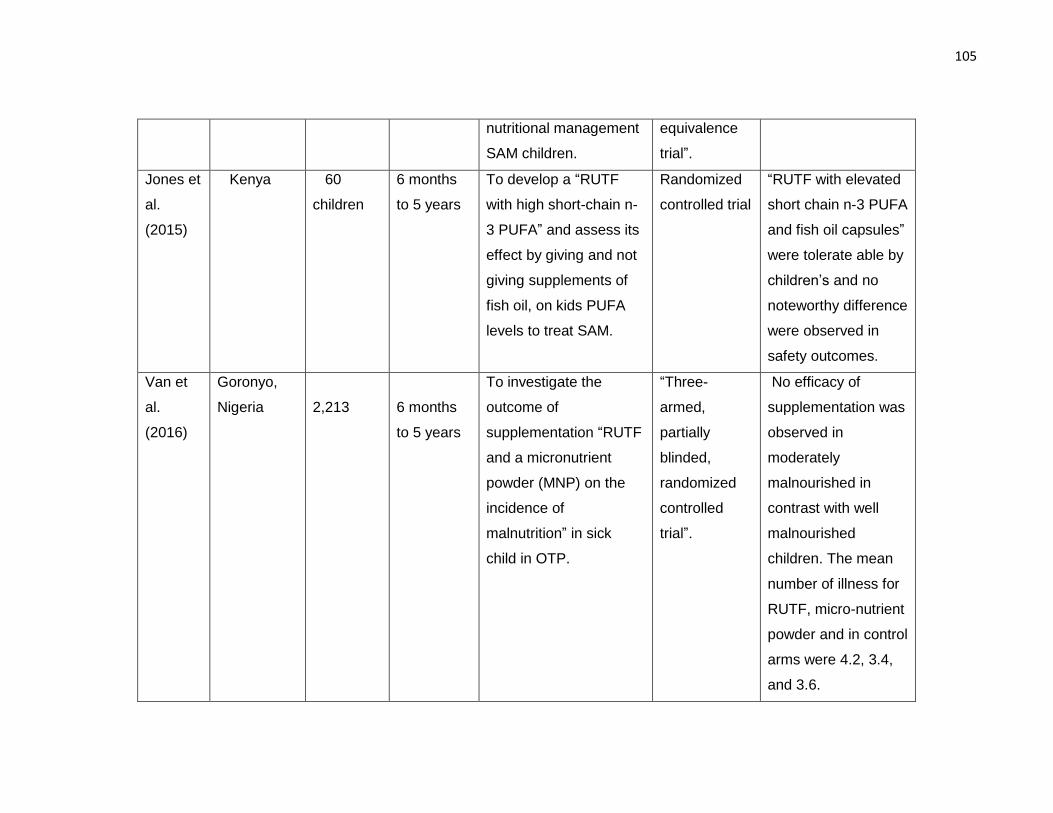
105
nutritional management
SAM children.
equivalence
trial”.
Jones et
al.
(2015)
Kenya 60
children
6 months
to 5 years
To develop a “RUTF
with high short-chain n-
3 PUFA” and assess its
effect by giving and not
giving supplements of
fish oil, on kids PUFA
levels to treat SAM.
Randomized
controlled trial
“RUTF with elevated
short chain n-3 PUFA
and fish oil capsules”
were tolerate able by
children’s and no
noteworthy difference
were observed in
safety outcomes.
Van et
al.
(2016)
Goronyo,
Nigeria
2,213
6 months
to 5 years
To investigate the
outcome of
supplementation “RUTF
and a micronutrient
powder (MNP) on the
incidence of
malnutrition” in sick
child in OTP.
“Three-
armed,
partially
blinded,
randomized
controlled
trial”.
No efficacy of
supplementation was
observed in
moderately
malnourished in
contrast with well
malnourished
children. The mean
number of illness for
RUTF, micro-nutrient
powder and in control
arms were 4.2, 3.4,
and 3.6.
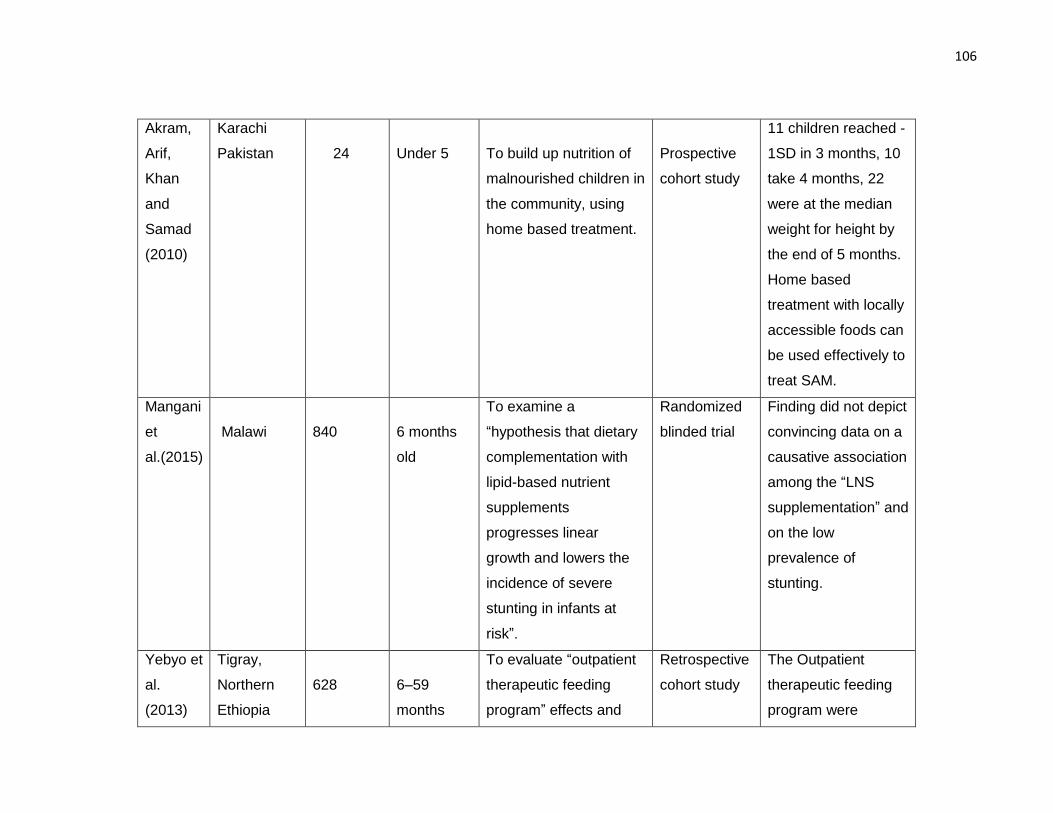
106
Akram,
Arif,
Khan
and
Samad
(2010)
Karachi
Pakistan
24
Under 5
To build up nutrition of
malnourished children in
the community, using
home based treatment.
Prospective
cohort study
11 children reached -
1SD in 3 months, 10
take 4 months, 22
were at the median
weight for height by
the end of 5 months.
Home based
treatment with locally
accessible foods can
be used effectively to
treat SAM.
Mangani
et
al.(2015)
Malawi
840
6 months
old
To examine a
“hypothesis that dietary
complementation with
lipid-based nutrient
supplements
progresses linear
growth and lowers the
incidence of severe
stunting in infants at
risk”.
Randomized
blinded trial
Finding did not depict
convincing data on a
causative association
among the “LNS
supplementation” and
on the low
prevalence of
stunting.
Yebyo et
al.
(2013)
Tigray,
Northern
Ethiopia
628
6–59
months
To evaluate “outpatient
therapeutic feeding
program” effects and
Retrospective
cohort study
The Outpatient
therapeutic feeding
program were
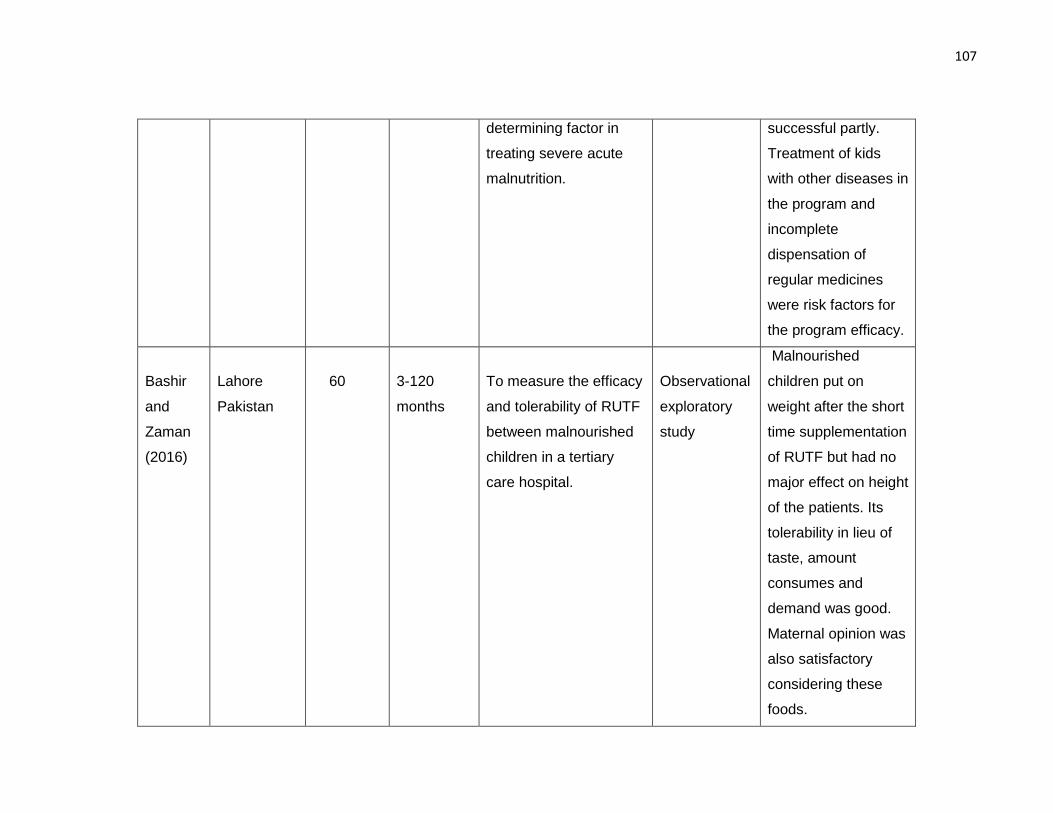
107
determining factor in
treating severe acute
malnutrition.
successful partly.
Treatment of kids
with other diseases in
the program and
incomplete
dispensation of
regular medicines
were risk factors for
the program efficacy.
Bashir
and
Zaman
(2016)
Lahore
Pakistan
60
3-120
months
To measure the efficacy
and tolerability of RUTF
between malnourished
children in a tertiary
care hospital.
Observational
exploratory
study
Malnourished
children put on
weight after the short
time supplementation
of RUTF but had no
major effect on height
of the patients. Its
tolerability in lieu of
taste, amount
consumes and
demand was good.
Maternal opinion was
also satisfactory
considering these
foods.
2.4 Dietary and socio demographic predictors of malnutrition
In this section of dietary and socio demographic predictors of malnutrition we have pointed
the severity and multi-dimensionality of the problems and its effects on child health and
their upcoming productivity in later life.
Valente et al. (2016) piloted a “cross-sectional population-based” study in Sao Tome
among 1285 children (0 to 5 years) of age with the aim to measure the nutritional
parameters (acute and chronic malnutrition) of children with their predictors. Children
anthropometry were done and z-score calculated for global chronic malnutrition, “height
for age (HAZ), weight for height” for global acute malnutrition (WHZ) and body mass index.
They have defined in their study “global acute undernutrition (weight for height <_1 Z-
score and wasting < _2 Z-scores) and global chronic undernutrition as (length/height for
age <_1 Z-score and stunting < _2 Z-scores”).
For collection of others related information children health records were consulted and
from mothers answers were gathered on a specific questionnaire. They have reveled in
their study that for global acute malnutrition % is high with 30.9% in <24 months and 21.9%
in children above 24 months and global chronic undernutrition were found in 32.5% in <24
months and 41.1% in children above 24 months. They have observed that in children >12
month’s required correct birth “weight for gestational-age” is a protective factor for acute
as well as chronic malnutrition along with weight improvement more than “0.67 z-score in
the 1st semester of life” is also a protective factor in the same age group children. Among
all socio-demographic factors in logistic regression analysis mother education were
deemed to be protective factor for both acute malnutrition and chronic malnutrition in this
population of 0-5 year’s old children. They have concluded that child birth weight,
nutritional status with weight improvement specifically in the life first years and mother's
109
education were significant protecting variables against malnutrition in infancy and
childhood. They have highlighted that attention should be given on these variables for
preventing acute as well as chronic malnutrition in kids.
Fakir and Khan (2015) conducted a research in Bangladesh to investigate the
determinants of malnutrition between children in urban slum. They have explored the
effect of child and maternal along with household factors on children “weight-for-age
nutritional status” by anthropometry for an ordered logistic analysis. To comprehend the
effects of health knowledge in child health they have used covariates of “health-seeking
practices guide, child health precautions index and medical cost information index”. To
understand the gender inequalities in nutritional function difference they have also applied
the gender specific regressions. They have presented in their results that child health
recovers significantly by “per capita income but household assets” do not have any
considerable influence on child health and indices regarding health knowledge that also
appreciably enhance children health. But after adjusting “for health knowledge and health-
seeking behavior”, the effect of mother’s education has no significance on children health.
Moreover, in gender analysis they have notice that boys were more considerate to "child
health precautions" along with "medical cost knowledge", while girls were more
considerate to "health-seeking practices".
So they had made conclusion that impact of “health knowledge on child health” holds a
substantial part on education effect and to enhance the nutritional parameters of girl child
in comparison with boy child in study area, strategies concentrating on health-seeking
practices should be promoted.
110
Ayana, Hailemariam and Melke (2015) piloted a case control study in public hospitals,
West Ethiopia with the aim to explore the determinants of acute-malnutrition between six
to fifty-nine months aged children. This “hospital based un-matched case control study”
enrolled 339 children of respective age group. Data has been gathered by utilizing “a pre
tested structured questionnaire and by mid upper arm circumference (MUAC)”. For
statistical analysis the multivariable logistic regression to estimate “odds ratio with 95 %
confidence interval” were used to recognize determining factors for acute malnutrition also
known as wasting. They have found that the associating factors with acute malnutrition
were having diarrheal diseases in last couple of weeks, maternal bad practices for not
washing hands, no exclusive breastfeeding, having large family size, uneducated mothers,
no facility of latrine and febrile because of infection in the last couple of weeks. So they
wrap-up, that wasting was significantly linked with these above factors in the concerned
population and they have suggested that a systematized attempt should be done on all
points to enhance mothers along with children health services, for prevention of the child
acute malnutrition.
Jamro, Junejo, Bouk, Lal and Jamro (2012) conducted a prospective descriptive study in
Sukkur, Pakistan in six to fifty-nine months old kids to identify causes for severe acute
malnutrition. Two hundred seventy children admitted in nutrition stabilization center were
enrolled on WHO criteria for diagnosis of “severe acute malnutrition (weight for height
measurement of < 70% of the median or > 3 SD or the presence of bilateral pitting edema
of nutritional origin”). They have revealed the results that maternal illiteracy was present
in 80% children, paternal illiteracy in 66.7% cases, large family size with 66.7% cases and
73.3% children parent’s income was less than 5000 monthly. Only 25.9% children were
exclusively breast feed with presence of delayed weaning in 55.6% children and recurrent
111
diarrhea was seen in 44.4% children. So it was concluded that common risk factors linked
with severe acute malnutrition were parent’s illiteracy, large family size, poverty, non-
exclusive breast feeding and recurrent diarrhea. To overcome this problem of severe acute
malnutrition attention should be focused on encouragement of exclusive breast feeding
and parental education.
Afzal (2012) studied the determining factors for child health along with nutritional level in
Punjab, Pakistan with the aim to detect the socio-economic causes that influence children
health at the domestic level and suggest creating strategies forming on its results. The
investigator of study has applied the instrumental variable technique for assessment
purpose. The data of this study were gathered from the domestic level. Data set collected
“by the Punjab Bureau of Statistics”, for multiple Indicator cluster survey in 2007 and 2008.
The study’s findings suggest that among others substantial indicators mother education
and health knowledge are significant determinants of child health.
Kavosi et al. (2014) planned a cross-sectional door to door survey by multistage sampling
in Iran to conclude the prevalence and determinants of undernutrition in kids under six
year of age. A total of 15408 children, of concerned age group were nutritionally assessed
for wasting, stunting and underweight. Structured questionnaire was used for
sociodemographic measures. It was determined from this survey that “prevalence of
stunting, underweight and wasting were 9.53, 9.66, and 8.19%”, in that order. Stunting
were more prevalent in male children with comparison to female’s children and stunting
were also notably related to low income of family along with low maternal literacy. In factor
analysis it was discovered that residing in urban area, coupled with poor supply of water
had been significantly linked with all three types of childhood malnutrition. It was
recommended that no access for getting health services had been also linked to wasting
112
and having big family was associated to under-weight. So conclusion was made that the
population under study have low income status and focusing factors for development of
the public preventive policies to constraint childhood undernutrition in the study area
contains gender, residing area, big family, less family earning, mother literacy along with
health services and safe source of water.
Panda, Benjamin, Singh and Zachariah (2000) piloted a descriptive study in India to
evaluate health along with nutritional parameters of five to sixteen-year-old school children
to discover their pattern of morbidity in a secondary school of Ludhiana city. Total of 776
students (462) boys and (314) girls were participated in study. Variables in study were
“height, weight, medical history and general physical examination”. Results shows that
girls of all ages except the 14 years old had lower mean weight for age in comparison to
mean height, as compared to expected weight for age as per ICMR standards. The
“expected height for age as per ICMR standards” were also low in both sexes in all ages,
excluding only the 15 and 16 years old youngsters. The “prevalence of wasting and
stunting in these children was high (52.2% wasted and 26.3% stunted”), with boys and
girls suffering almost equally and 11-15 years old participants were more affected. Out of
all, at examination time around 72.4% kids were having any illness as 26% had anemia,
and females suffering more (30.5%) compares to males (22.9%). The analysis reveals the
low nutritional profile along with health status of study school children. Isolating this class
for pointed services in intention to improve their health along with nutritional status, in a
highly developed and economically well off part of Punjab, the granary of India, highlighting
the prerequisite for enhanced, concentrated attempts for improvement of their nutrition.
Rodríguez, Cervantes and Ortiz (2011) define the relationship among “malnutrition and
immune system dysfunction” and ways by which this association effects child resistance
113
“to bacterial gastrointestinal and respiratory infections”. This research has been carried by
México, “National Council of Science and Technology”. In this paper they examine the
cyclic association among under-nutrition, immune response dysfunction, raised
vulnerability towards infectious diseases, plus metabolic reactions affecting the child
nutritional status. Moreover, they studied the raised mortality caused by infectious
diseases in malnourished children. They have concluded that impact of malnutrition was
wide and involved, low immunity against infection, delay child development, raised
mortality rate and individual’s dysfunction.
Pathak and Singh (2011) inspects the associations between economic status of people
and patterns of financial variations with child malnutrition in India. They have assessed
figures gathered by “National Family and Health Survey (NFHS)” in the period of 1992–
2006.The percentage of under-weight kids both acute as well chronic malnourished were
dependent variable in this study. The wealth indicator is utilized as alternative for financial
status of the people and were assessed by way of secure asset possession, approach to
utilities and public services. The home characteristics of participants during survey were
analyzed “by principal component” after applying different variables. They have applied
“bi-variate analyses for poor-rich proportion and concentration indicators” to recognize the
pattern of economic inequalities particular to child malnutrition. To analyze the changed
outcome of economic status with time on child under-nutrition “pooled logistic regression
models” were used. The result depicts in this regard towards children malnutrition in India
in period of 1992–2006 proved slow change linked with concurrent increase in economic
inequalities. The problem of malnutrition has been excessively assembled between poor
class kids and mean reduction in malnutrition obscure high financial disproportion by
space and time.
114
Mishra, Kumar, Basu, Rai and Aneja (2014) designed a “hospital-based case-control
study” to reveal the potential determining factors of severe acute malnutrition in under five
aged children in north India. All SAM children of concerned age group admitted in a
hospital were diagnosed as per WHO criteria and were compared with age-matched
controls according to WHO 2006 growth standards of weight for height < -2SD. By using
“univariate and multivariate logistic regression” models data about sociodemographic
factors, feeding practices and vaccination has been contrasted among the (76) cases and
(115) controls. They have found that among analyzed variables maternal illiteracy, large
family size, per day family income under 200 Indian rupees, lack of exclusive breast feed
in first 6 months, bottle feeding, by giving pre-lacteals, depriving from colostrum and
incomplete vaccination were important risk factors for SAM. Concerning complementary
feeding practices, it was the consistency, rather than the age of starting complimentary
feeding, frequency and variety which depict a significant effect on incidence of SAM. They
have recommended that by determining these risk factors, policy makers linked with SAM
children in India should give attention to these factors during health planning.
Mengistu, Alemu and Destaw (2013) directed a “community based cross-sectional study”
in 820 kids aged six to fifty-nine months to measure the prevalence of malnutrition along
with correlated factors at Oromia Regional State Ethiopia. Multistage sampling technique
were used for selection of households and simple random sampling were utilized to select
children. For collection of data structured questionnaire and anthropometric
measurements (“z-scores of the indices; height-for-age, weight-for-height and weight-for-
age”) were applied. For statistical analysis “bivariate and multivariate logistic regressions”
have been utilized to recognize factors linked with malnutrition. In analysis they have found
that the stunting was 47.6%, underweight were 30.9% and wasted were 16.7%, among
115
children respectively. The key variable associated with stunting have been found as child
age, earning of family per month, pre-lacteal feeding along with family planning. Under-
weight was linked to more number of children and infants who have taken butter in per-
lacteal feed. For wasting only significant variables was treatment of water. So it was
concluded in this study that malnutrition still is a main problem in children aged six to fifty-
nine months and special consideration is requisite for intervention of malnutrition.
The cited literature revealed the severity and multi-dimensionality of the problems and its
effects on child health and their upcoming productivity in later life. This cited literature
showed that this scenario is worst in Asian particularly south Asian and African countries.
In developing countries this is deemed to be a serious public health issue even though
these studies have just revealed the tip of the ice berg but it need serious and urgent
consideration at national and global level. We had made an attempt to find predictors of
malnutrition according to our sociocultural context at our local level and give clear picture
to policy makers for addressing this problem for health of children in Pakistan and
increasing their upcoming productivity for better future of Pakistan.
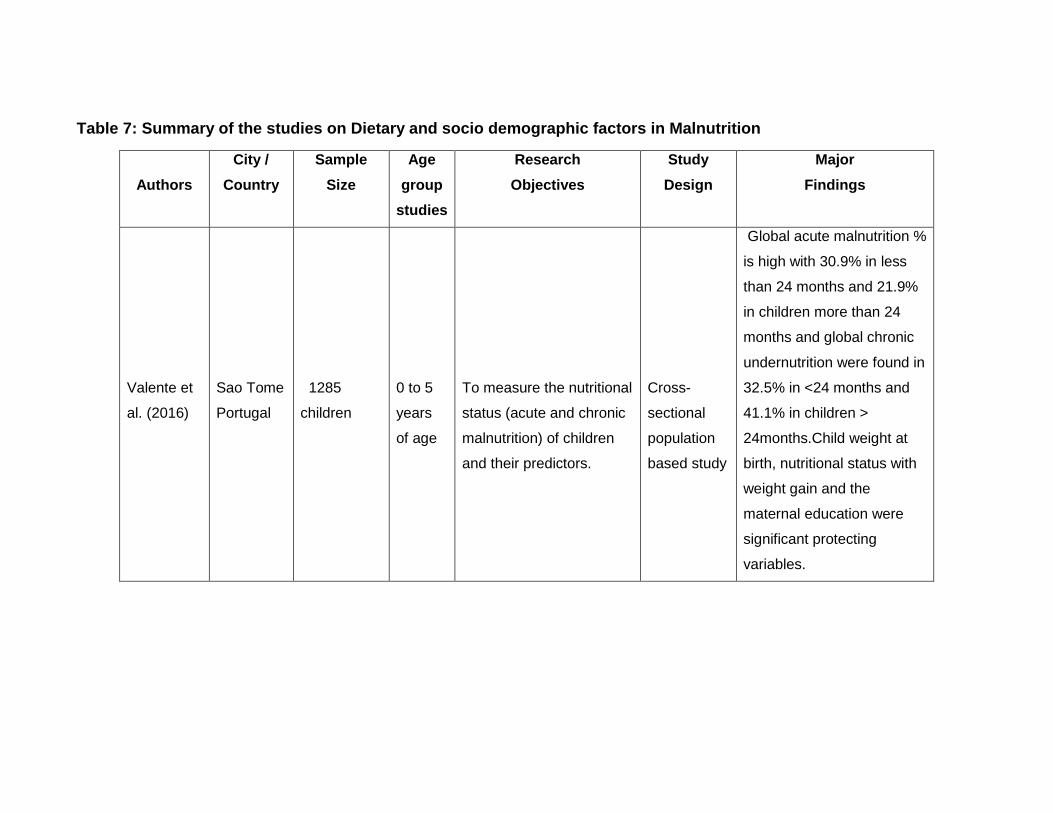
Table 7: Summary of the studies on Dietary and socio demographic factors in Malnutrition
Authors
City /
Country
Sample
Size
Age
group
studies
Research
Objectives
Study
Design
Major
Findings
Valente et
al. (2016)
Sao Tome
Portugal
1285
children
0 to 5
years
of age
To measure the nutritional
status (acute and chronic
malnutrition) of children
and their predictors.
Cross-
sectional
population
based study
Global acute malnutrition %
is high with 30.9% in less
than 24 months and 21.9%
in children more than 24
months and global chronic
undernutrition were found in
32.5% in <24 months and
41.1% in children >
24months.Child weight at
birth, nutritional status with
weight gain and the
maternal education were
significant protecting
variables.
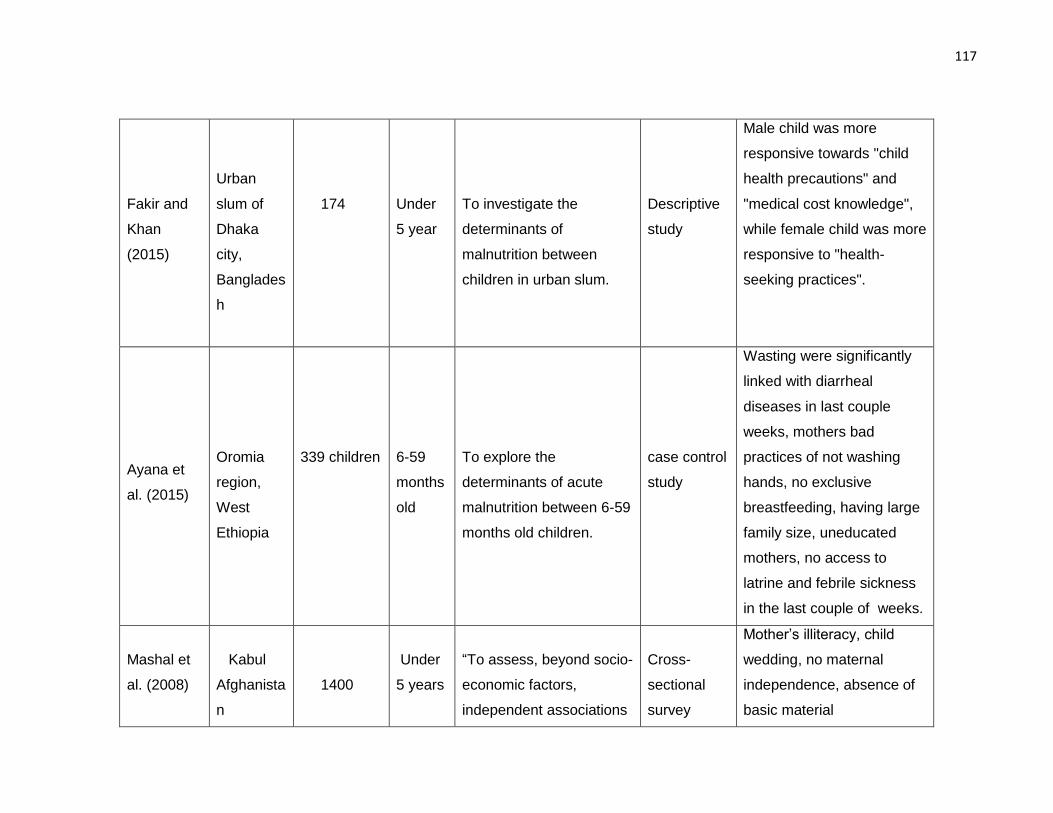
117
Fakir and
Khan
(2015)
Urban
slum of
Dhaka
city,
Banglades
h
174
Under
5 year
To investigate the
determinants of
malnutrition between
children in urban slum.
Descriptive
study
Male child was more
responsive towards "child
health precautions" and
"medical cost knowledge",
while female child was more
responsive to "health-
seeking practices".
Ayana et
al. (2015)
Oromia
region,
West
Ethiopia
339 children
6-59
months
old
To explore the
determinants of acute
malnutrition between 6-59
months old children.
case control
study
Wasting were significantly
linked with diarrheal
diseases in last couple
weeks, mothers bad
practices of not washing
hands, no exclusive
breastfeeding, having large
family size, uneducated
mothers, no access to
latrine and febrile sickness
in the last couple of weeks.
Mashal et
al. (2008)
Kabul
Afghanista
n
1400
Under
5 years
“To assess, beyond socio-
economic factors,
independent associations
Cross-
sectional
survey
Mother’s illiteracy, child
wedding, no maternal
independence, absence of
basic material
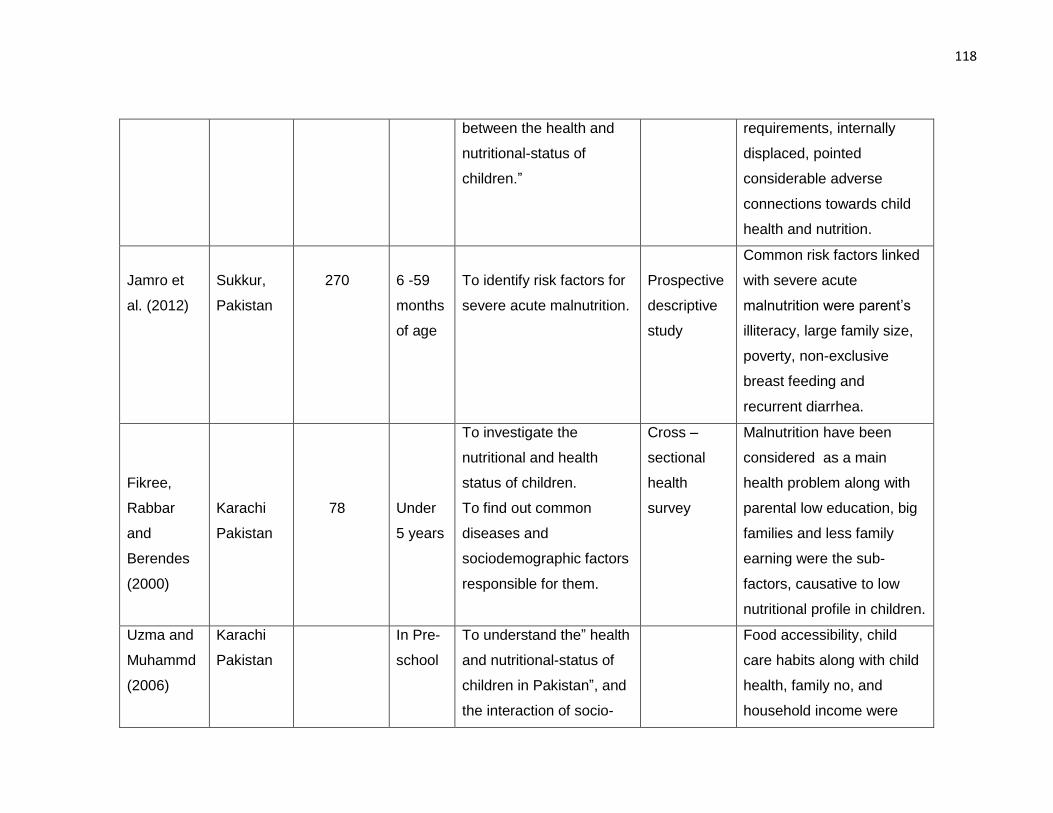
118
between the health and
nutritional-status of
children.”
requirements, internally
displaced, pointed
considerable adverse
connections towards child
health and nutrition.
Jamro et
al. (2012)
Sukkur,
Pakistan
270
6 -59
months
of age
To identify risk factors for
severe acute malnutrition.
Prospective
descriptive
study
Common risk factors linked
with severe acute
malnutrition were parent’s
illiteracy, large family size,
poverty, non-exclusive
breast feeding and
recurrent diarrhea.
Fikree,
Rabbar
and
Berendes
(2000)
Karachi
Pakistan
78
Under
5 years
To investigate the
nutritional and health
status of children.
To find out common
diseases and
sociodemographic factors
responsible for them.
Cross –
sectional
health
survey
Malnutrition have been
considered as a main
health problem along with
parental low education, big
families and less family
earning were the sub-
factors, causative to low
nutritional profile in children.
Uzma and
Muhammd
(2006)
Karachi
Pakistan
In Pre-
school
To understand the” health
and nutritional-status of
children in Pakistan”, and
the interaction of socio-
Food accessibility, child
care habits along with child
health, family no, and
household income were
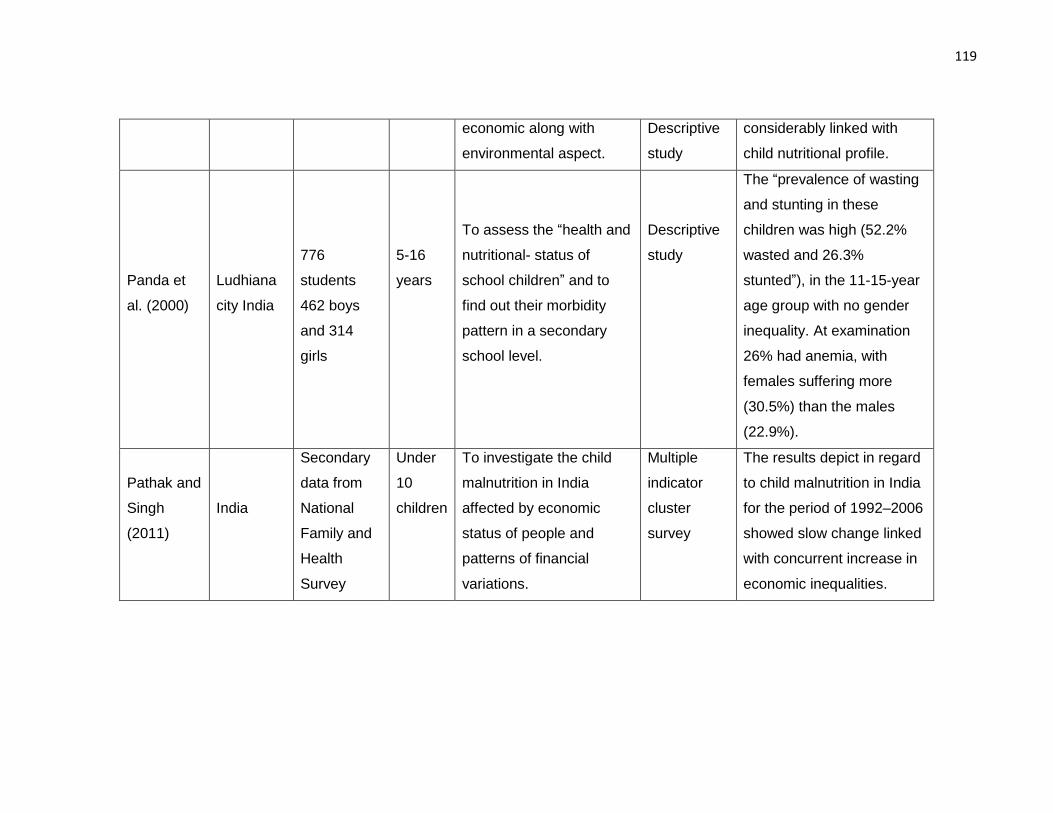
119
economic along with
environmental aspect.
Descriptive
study
considerably linked with
child nutritional profile.
Panda et
al. (2000)
Ludhiana
city India
776
students
462 boys
and 314
girls
5-16
years
To assess the “health and
nutritional- status of
school children” and to
find out their morbidity
pattern in a secondary
school level.
Descriptive
study
The “prevalence of wasting
and stunting in these
children was high (52.2%
wasted and 26.3%
stunted”), in the 11-15-year
age group with no gender
inequality. At examination
26% had anemia, with
females suffering more
(30.5%) than the males
(22.9%).
Pathak and
Singh
(2011)
India
Secondary
data from
National
Family and
Health
Survey
Under
10
children
To investigate the child
malnutrition in India
affected by economic
status of people and
patterns of financial
variations.
Multiple
indicator
cluster
survey
The results depict in regard
to child malnutrition in India
for the period of 1992–2006
showed slow change linked
with concurrent increase in
economic inequalities.
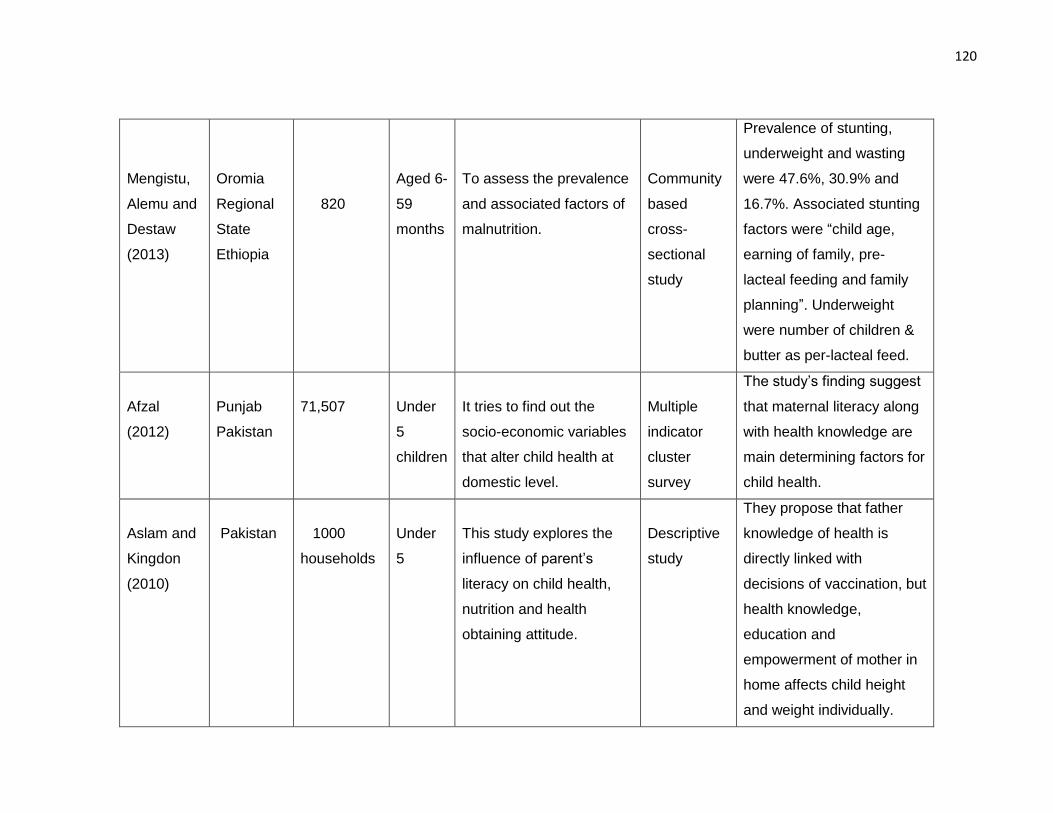
120
Mengistu,
Alemu and
Destaw
(2013)
Oromia
Regional
State
Ethiopia
820
Aged 6-
59
months
To assess the prevalence
and associated factors of
malnutrition.
Community
based
cross-
sectional
study
Prevalence of stunting,
underweight and wasting
were 47.6%, 30.9% and
16.7%. Associated stunting
factors were “child age,
earning of family, pre-
lacteal feeding and family
planning”. Underweight
were number of children &
butter as per-lacteal feed.
Afzal
(2012)
Punjab
Pakistan
71,507
Under
5
children
It tries to find out the
socio-economic variables
that alter child health at
domestic level.
Multiple
indicator
cluster
survey
The study’s finding suggest
that maternal literacy along
with health knowledge are
main determining factors for
child health.
Aslam and
Kingdon
(2010)
Pakistan
1000
households
Under
5
This study explores the
influence of parent’s
literacy on child health,
nutrition and health
obtaining attitude.
Descriptive
study
They propose that father
knowledge of health is
directly linked with
decisions of vaccination, but
health knowledge,
education and
empowerment of mother in
home affects child height
and weight individually.
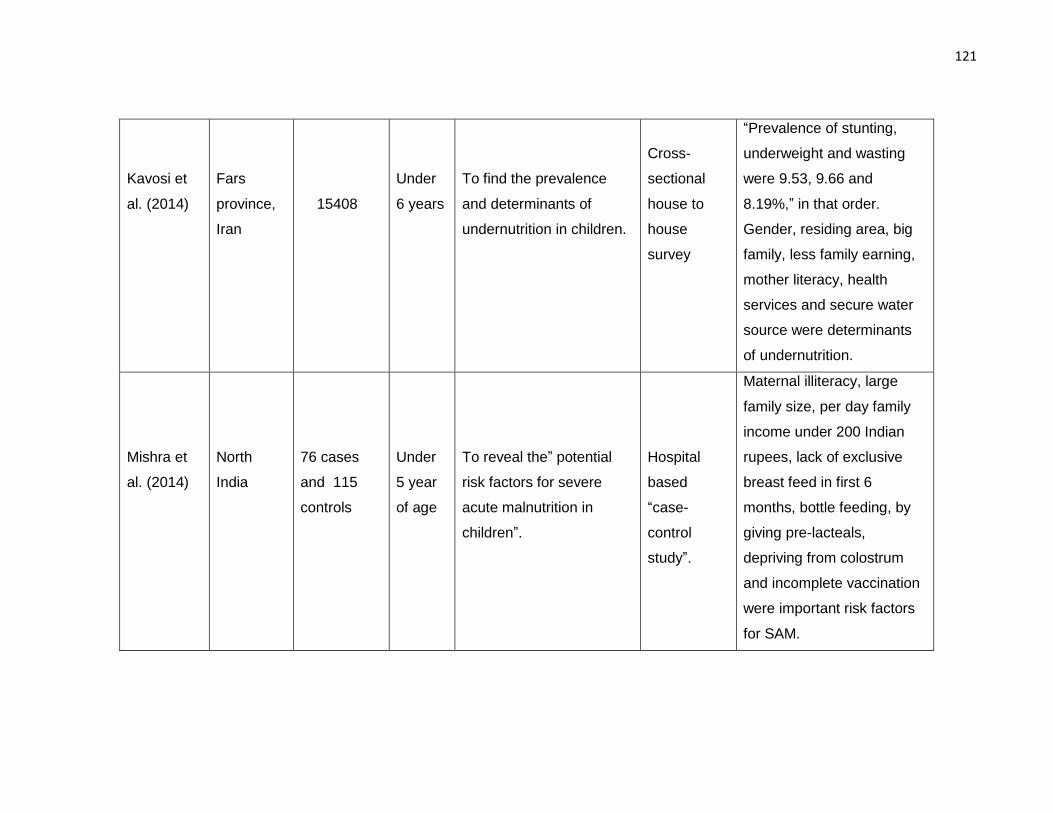
121
Kavosi et
al. (2014)
Fars
province,
Iran
15408
Under
6 years
To find the prevalence
and determinants of
undernutrition in children.
Cross-
sectional
house to
house
survey
“Prevalence of stunting,
underweight and wasting
were 9.53, 9.66 and
8.19%,” in that order.
Gender, residing area, big
family, less family earning,
mother literacy, health
services and secure water
source were determinants
of undernutrition.
Mishra et
al. (2014)
North
India
76 cases
and 115
controls
Under
5 year
of age
To reveal the” potential
risk factors for severe
acute malnutrition in
children”.
Hospital
based
“case-
control
study”.
Maternal illiteracy, large
family size, per day family
income under 200 Indian
rupees, lack of exclusive
breast feed in first 6
months, bottle feeding, by
giving pre-lacteals,
depriving from colostrum
and incomplete vaccination
were important risk factors
for SAM.
2.5 Discussion of Literature Review
The objective of the review in this chapter was, to search the literature and existing data
for treating “children aged 6-59 months with severe acute malnutrition” by using CMAM
model. RUTF effect, severe acute malnutrition impact on child development, socio-
demographic predictors of malnutrition and vitamin D trials on children’s health at global
level were also searched with the aim to identify any breach in the literature for
requirement of any additional research. The keywords created and utilised to do the
search for identification of the related papers for inclusion in the literature review were,
malnutrition, severe-acute malnutrition, wasting, community-based treatment, out-patient
care, ready-to-use therapeutic foods, RUTF, CMAM, development screening,
development delay, DDSTII, vitamin D, randomized control trial, vitamin D trials, predictors
of malnutrition, malnutrition impact on development, under 5 children.
The review of literature has recognized many research gaps and areas that need to be
investigated for proper documentation and propagation in child growth and development
in Pakistan and worldwide. We have designed this trial to determine if high dose vitamin
D supplementation can accelerate the growth and development of malnourished children.
Though there are currently no suggested guidelines for this approach. The World Health
Organisation (WHO) has identified research priorities to identify adjunctive therapies that
may improve response to RUTF, including administration of broad-spectrum antibiotics
and high-dose vitamin A. Thus, well-designed randomized-control trials are requisite to
assess vitamin D role in SAM. The results of this study should give more understanding
into the possible causal relationship among vitamin D status, growth and development of
severe acute malnourished children and fulfil the research gap in this area.

123
CHAPTER THREE
3. METHODOLOGY
This chapter defines the methodology followed in this research for assessment of
developmental screening, anthropometry, identification of SAM, methods used to collect
and analyse data, with recognition of risk factors for malnutrition and development delay
with all complete procedure of conducting trial in the community based malnutrition
treatment programme.
3.1 Research Settings
3.1.1 Study Country
Pakistan became an independent country on 14th August 1947, after the partitioning of
the Indian subcontinent that were governed by the British Empire. The 4000 year’s history
of area comprising Pakistan dating from brick cities such as Mohen-jo-Daro and Harappa
to the Hindu civilization and the Buddhists contemporaneous to the birth of Christianity.
Location of Pakistan is in the north western part of the South Asian subcontinent. The
entire state area is 796,096 square Kilometers, it includes a diversified land and
geography. The Indus river flows within the Pakistan approximately 2500 kilometer start
off from Himalayas to the Karakoram mountain range in north and the Arabian Sea in
south. The northern side of Pakistan have 5 of the world’s 14 tallest mountain peaks.
Country is situated amid 24 degrees and 37-degree north latitude and amid 61 degrees
and 75-degree east longitude. India is situated in Pakistan east and south east,
Afghanistan lies in the north and the northwest, Iran lies to the west and Arabian Sea in
the south. State has a communal frontline with China on the border of its Gilgit territory in
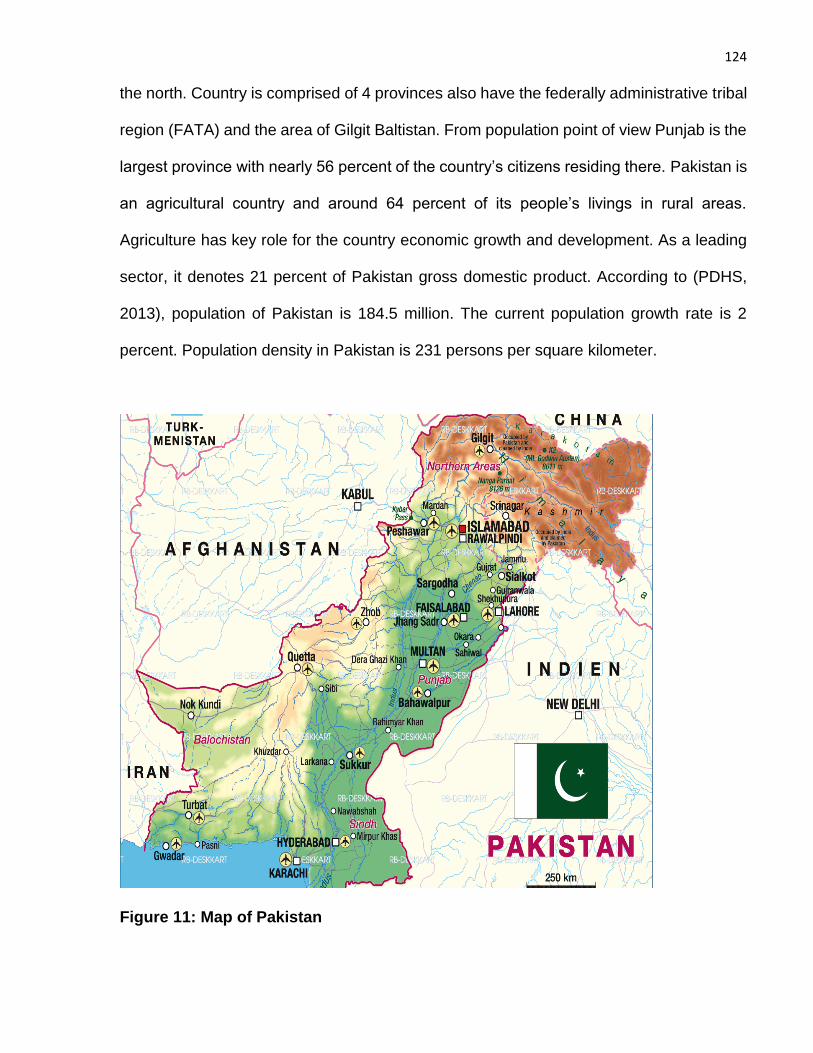
124
the north. Country is comprised of 4 provinces also have the federally administrative tribal
region (FATA) and the area of Gilgit Baltistan. From population point of view Punjab is the
largest province with nearly 56 percent of the country’s citizens residing there. Pakistan is
an agricultural country and around 64 percent of its people’s livings in rural areas.
Agriculture has key role for the country economic growth and development. As a leading
sector, it denotes 21 percent of Pakistan gross domestic product. According to (PDHS,
2013), population of Pakistan is 184.5 million. The current population growth rate is 2
percent. Population density in Pakistan is 231 persons per square kilometer.
Figure 11: Map of Pakistan
125
3.1.2 Study Area
This study was conducted in Southern Punjab of Pakistan. Southern Punjab comprises of
4 divisions and 11 districts. The total area of South Punjab is 99,572 km and it consist of
48.5% of the entire Punjab region. By area the South Punjab zone comprises of
approximately half of Punjab Province. Population of South Punjab is 29.74 million. Most
of the people are attached with farming business. There are about 15,455 primary schools
and 86 health facilities are located in Southern Punjab. Southern Punjab has the highest
percentage of 43% living below poverty line.
This study was conducted in District Dera Ghazi Khan of Southern Punjab, having land
area around 5,306 square meter. It is a long strip of country about 198 kilometers long and
it slopes steadily starting the hills, which make its western border and on the east is river
Indus.This is the most backward area of southern Punjab affected by flood and hill
tolerance almost every year. Out of 16, four functional outpatients therapeutic programme
centre (OTPs) in DG Khan district run by the “National Program for Family Planning and
Primary Health Care” at basic health Units (BHU) Samina, Jhokutra, Aaliwala and one
OTP Kotchutta at rural health Centre (RHC) were included for collection of children having
severe acute malnutrition. These selected areas are under developed, by substandard
housing, squalor, lacking in tenure security, over-crowded have poor socio-economic
conditions, illiteracy, and unhygienic living conditions.
.

126
Figure 12: Map of district Dera Ghazi khan
3.2 Study Design
This study was designed in to 2 phases, 1st phase is “cross –sectional study design” and
second is “Randomized controlled trial”.
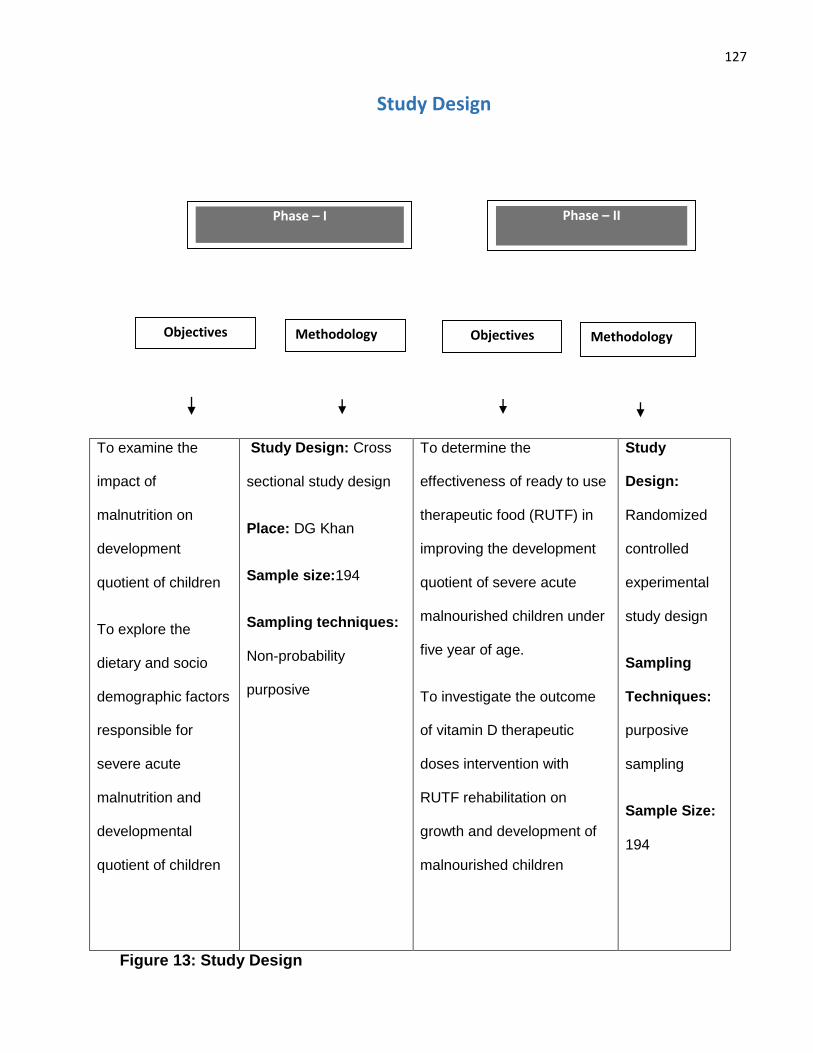
127
To examine the
impact of
malnutrition on
development
quotient of children
To explore the
dietary and socio
demographic factors
responsible for
severe acute
malnutrition and
developmental
quotient of children
Study Design: Cross
sectional study design
Place: DG Khan
Sample size:194
Sampling techniques:
Non-probability
purposive
To determine the
effectiveness of ready to use
therapeutic food (RUTF) in
improving the development
quotient of severe acute
malnourished children under
five year of age.
To investigate the outcome
of vitamin D therapeutic
doses intervention with
RUTF rehabilitation on
growth and development of
malnourished children
Study
Design:
Randomized
controlled
experimental
study design
Sampling
Techniques:
purposive
sampling
Sample Size:
194
Figure 13: Study Design
Study Design
Phase – I
Objectives Objectives Methodology Methodology
Phase – II
128
3.3 Study Population
Children between “6-59 months of age” having “severe acute malnutrition” without
complications living in district Dera Ghazi khan of selected areas.
3.4 Inclusion and Exclusion Criteria
Inclusion criteria were as follows: age at enrolment between 6-59 months; severe
malnutrition without complications, as defined by the World Health Organization (i.e.
children with “mid-upper arm circumference (MUAC) <115 mm or weight-for-height z-
score <-3” or grade 1-2 bilateral edema, who were clinically well and alert with good
appetite); parental consent for child to participate. Exclusion criteria were ingestion of a
dose of vitamin D >200,000 IU (5 mg) per month in the last three months or presence of
complications of severe malnutrition (severe dehydration, severe anemia, severe pitting
edema, anorexia, hypothermia, high pyrexia, acute lower respiratory infection or
hypoglycemia).
3.5 Baseline assessment for eligibility criteria
Children aged 6-59 months whose parents gave consent for them to participate
underwent the following baseline assessment. A structured socio-demographic and
nutritional questionnaire was administered to capture information on participants’
demographic details, parental occupation, education and monthly income and nutritional
intake. Gestational age was taken from the antenatal record where delivery occurred in
hospital, and based on maternal report for home deliveries. For children aged up to 24
months of age who were born prematurely (<37 weeks’ gestation) age was corrected by
subtracting the number of weeks of missed gestation from the current age. A history was
129
taken to assess for symptoms suggesting that the child was not clinically well (cough,
shortness of breath, diarrhea, fever and anorexia); children assessed as being clinically
unwell on the basis of these symptoms were excluded from the trial and referred to a
stabilization center for further assessment. An appetite test was performed by offering
children a small sample of ready-to-use therapeutic food to eat. Children who did not eat
at least one third of a packet (3 teaspoons,30 g) of ready-to-use therapeutic food after
three feeding attempts were classified as having poor appetite, excluded from the study
and referred for in-patient management. (“Child’s mother is given a sachet of RUTF and
is asked to sit with the child at a calm place and give it to the child with plenty of water.
The child should eat at least one third of a packet or three teaspoons from a pot of RUTF
to pass the test. The health care provider observes the child eating the RUTF and decides
whether the child passes or fails. This is the only reliable way to access the child’s appetite
and if he/she eats half or more, it signifies a good appetite”). A physical examination was
then performed. Children were assessed for the following sings of rickets: bow legs, knock
knees, windswept deformity of the knees and proximal myopathy. The child’s alertness
was assessed: children who were lethargic, apathetic or unconscious or who had seizures
were deemed to be non-alert, and excluded from the trial. The child’s hydration status was
assessed: children with a history of recent watery diarrhea associated with eyelid
retraction, weak/absent radial pulse, absence of tears, cold peripheries, lethargy or
absence of urinary output were deemed to have severe dehydration and excluded from
the trial. Children were assessed for the presence of palmar pallor: those whose palms
were very pale, or so pale that they looked white, were deemed to have severe anemia
and were excluded from the trial (WHO, 2013). Children were assessed for the presence
of pitting edema: thumb pressure was applied to the tops of the feet for three seconds,
130
and pitting edema was judged to be present where a thumb impression remained for a
few seconds on both feet. Edema was graded as mild (Grade 1, affecting both feet/ankles),
moderate (Grade 2, affecting both feet, plus lower legs, hands and lower limbs) or severe
(Grade 3, generalized edema including both feet, plus legs, arms and face). Children with
severe (Grade 3) pitting edema were excluded from the trial. Vital signs (temperature,
pulse and respiratory rate) were recorded: children who were hypothermic or who had
hyperpyrexia (axillary temperature <35°C or >39°C respectively) were excluded from the
trial. Children with tachypnea (>50 breaths per minute for those aged <12 months, >40
breaths per minute for those aged 12-59 months), chest in-drawing, wheeze or stridor
were classified as having a likely acute lower respiratory infection and excluded from the
trial. A heel finger-prick was performed to check for hypoglycemia using a Dextrostix
reagent strip: children with a heel-prick glucose concentration of <3 mmol/l were
considered to be hypoglycemic and excluded from the trial.
3.6 Outcome measures
The primary outcome measure was the proportion of participants gaining >15% of their
baseline weight at 2-month follow-up (WHO, 2013). Secondary outcomes were mean
weight and mean weight-for-height/length z-score at 2 months; proportion of participants
with delayed development (“global, gross motor, fine motor, language and
personal/social”) at 2 months; and mean “serum levels of 25(OH)D, corrected calcium”,
albumin and prealbumin at 2 months (n=90 sub-set); and proportion of participants with
“serum 25(OH)D concentration ≥50 nmol/L” at 2 months (n=90 sub-set).
3.7 Biochemical Results
Vitamin D deficiency is classified as per < 50 ng/L in this randomized control trial. Other
biochemical level of corrected calcium less than 2.20 -2.26 mmol/L, level of Pre albumin
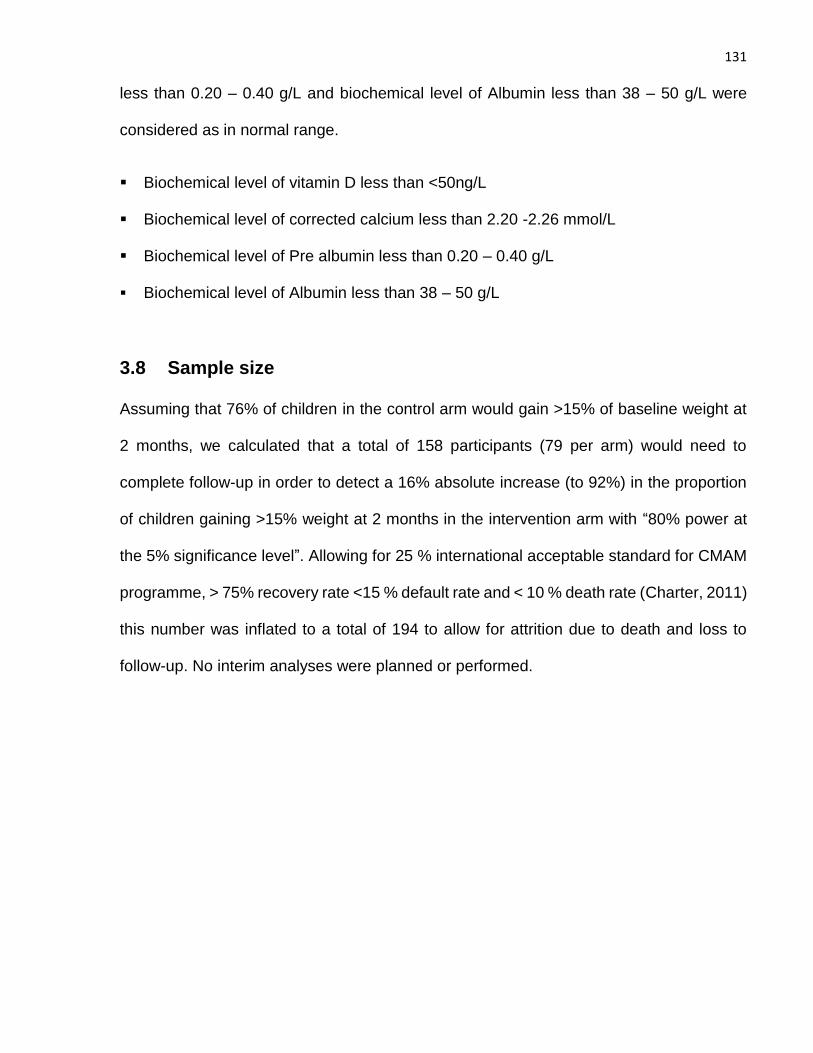
131
less than 0.20 – 0.40 g/L and biochemical level of Albumin less than 38 – 50 g/L were
considered as in normal range.
Biochemical level of vitamin D less than <50ng/L
Biochemical level of corrected calcium less than 2.20 -2.26 mmol/L
Biochemical level of Pre albumin less than 0.20 – 0.40 g/L
Biochemical level of Albumin less than 38 – 50 g/L
3.8 Sample size
Assuming that 76% of children in the control arm would gain >15% of baseline weight at
2 months, we calculated that a total of 158 participants (79 per arm) would need to
complete follow-up in order to detect a 16% absolute increase (to 92%) in the proportion
of children gaining >15% weight at 2 months in the intervention arm with “80% power at
the 5% significance level”. Allowing for 25 % international acceptable standard for CMAM
programme, > 75% recovery rate <15 % default rate and < 10 % death rate (Charter, 2011)
this number was inflated to a total of 194 to allow for attrition due to death and loss to
follow-up. No interim analyses were planned or performed.
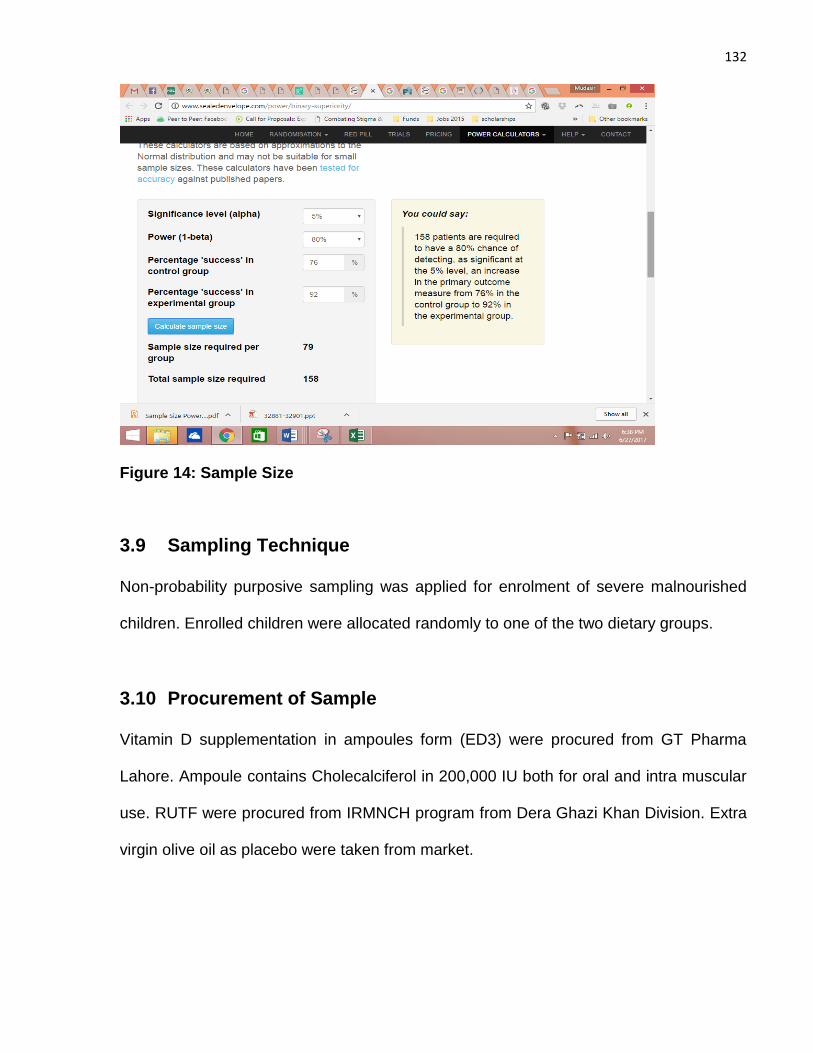
132
Figure 14: Sample Size
3.9 Sampling Technique
Non-probability purposive sampling was applied for enrolment of severe malnourished
children. Enrolled children were allocated randomly to one of the two dietary groups.
3.10 Procurement of Sample
Vitamin D supplementation in ampoules form (ED3) were procured from GT Pharma
Lahore. Ampoule contains Cholecalciferol in 200,000 IU both for oral and intra muscular
use. RUTF were procured from IRMNCH program from Dera Ghazi Khan Division. Extra
virgin olive oil as placebo were taken from market.
133
3.11 Trial Design, Approvals, Consent Processes and Registration
We conducted a two-arm parallel randomized placebo-controlled trial with a one-to-one
allocation ratio. The study was “approved by the Ethical Review and Advanced Study
Research Board” of the University of Punjab Pakistan (reference 9/2352-ACAD). The
“Integrated Reproductive Maternal & Newborn Child Health (IRMNCH) & Nutrition
Program”, Punjab, Pakistan and the District Health Officer of the Dera Ghazi Khan District,
Punjab, Pakistan grant permission to use their centers and staff for study. Parents were
provided with information about the study in their native language by a doctor or a health
visitor at participating outpatient therapeutic program (OTP) centers and informed consent
confirmed by signature or thumb impression was taken from those who gave permission
for their child to take part in the study. Sign or thumbprint consent was taken from each
child’s parents at outpatient therapeutic centers after the child fulfilled the study inclusion
criteria and one of the parents signed the consent form (in Urdu) or was briefed about
consent in their native language (Urdu and Saraiki) to remove language barrier by the
doctor or Lady Health visitor of the center (Annexure attach). “This study is registered
with ClinicalTrials.gov, number NCT03170479”
3.12 Training of CMAM study staff
From May - June 2015, 4 CMAM (nutritional supervisor) already trained staff at CMAM
OTP centers were briefed and given refresher training about CMAM guidelines and
standard operating procedures of the trial individually at their centers by the principal
investigator. Staff worked individually at center and learnt how to assess weight, height,
MUAC and conducting an appetite test. Additionally, the study staff at field were given
demonstration of all anthropometric measurements with assessment of clinical
complications in children coming to selected CMAM, OTP centers.
134
3.12.1 Consenting and socio-demographic form
The study staff exercised the procedure of consenting and taking written consent on center
in front of principal investigator. The study staff were trained on their respective centers
for the procedure of filling concerned information’s in all study questionnaires along with
the consent form. Study questionnaires and consent form were briefed to participant’s
parents in to their native language (saraiki) and were pretested. Throughout the practice
of study staff, all staff did the interview of parents for fulfilling the socio-demographic form,
and all staff interviewed parents with study forms. After every day practice, study staff
discussed their results with the principal investigator and the study forms were modified if
required.
3.12.2 Clinical examination of children: at CMAM centers
The research protocol along with standard operating methods and the study
questionnaires were briefed to the four nutritional supervisors, study staff and local LHW
of the area. Then they were guided with field workers in CMAM protocol by the help of
video clips and clinical demonstration. The reliability in assessing edema, with others
complications was judged by the study clinicians and principal investigator.
3.12.3 Development assessment of children at the CMAM centers
One experienced nurse and pediatricians in assessment of child development by using
Denver development tool with the principal investigator were trained for applying DDST II
by using Denver video demonstration with training and technical manual. The training was
consisted of basic guidelines of assessing development with completion of Denver forms.
After that we have pretested this DDST 11 in Mayo hospital Lahore, largest CMAM center
in Punjab with more patient turn over on complicated, un complicated SAM and on children
from well-baby clinic, inter-observer agreements were assessed randomly among
135
children. This tool was translated in to local language for removing language barrier and
better understanding of parents and children.
3.12.4 Collection of venous blood samples
One male nurse was instructed to obtain consent for collection of blood samples and also
briefed about the method of taking care of collected blood samples before transferring for
“centrifugation and freezing” to the concerned laboratory.
3.13 Screening of Children
This study was accomplished in a community setting, between 6 to 59 months old children
who had “mid upper arm circumference (MUAC) ≤11.5 cm or z-score of weight for height<-
3SD”. They were detected in community setting through active screening accomplished
by house‐to‐house survey by community‐based lady health workers who are an essential
part of the healthcare delivery system in Pakistan. Active screening of the study areas was
done after approval from district health officer in lieu to get sample for study. The lady
health workers were already trained on the “Community management of acute malnutrition
(CMAM) approach”, but further instructions were given by principal investigator in order to
identify the malnutrition.
After the tutoring, the LHW went house‐to‐house to sensitized community members and
detect malnourished children. LHW, s screened the children by utilizing a colour- labelled
MUAC tape, along with checking for clinical signs of oedema. They send all children who
fulfil the criteria for admission into the CMAM programme (<11.5 cm) of an out-patient
therapeutic centre for assessment by a qualified nutritional supervisor to confirm Severe
acute malnutrition (SAM). At the “basic health unit (BHU) or rural health centre (RHC)”
136
level, the health worker (lady health visitor or nutritional supervisor) were trained on
assessment of nutritional parameters in children under the age of five years and also
instructed by principal investigator to measure the weight, height and MUAC of the referred
children and recognize any medical conditions, including bilateral pitting oedema and
other complications of malnutrition (WHO, 2009).
An appetite assessment of all children was done by an appetite test who met the
enrolment criteria before any treatment started. Children who were identified with
complicated severe acute malnutrition were send to the stabilization centre in “tertiary care
hospital” for management, according to the national CMAM guidelines. As per study
inclusion criteria, children who did not have a severe medical complications and who have
passed an appetite test was enrolled in study and CMAM programme to get treatment
(194 in study).
“Ready‐to‐use therapeutic food (RUTF’s)” was used with vitamin D and placebo group in
the therapeutic intervention for SAM. RUTFs are now recommended by the WHO as a
therapeutic diet that can be used at community level to treat children (WHO, 2009).
RUTF’s have a good shelf life once opened and are also resistant to bacterial
contamination (Briend et al., 1999). Trained staff at these centres supplied RUTF’s to
parents weekly, the amount depending on the child's body weight. Every week, parents of
the child were followed by lady health worker at home for sending child to the centre,
where the nutritional supervisor assessed the child's weight, MUAC and other comorbidity.
The LHV used a CMAM OTP chart to supply RUTF to the parents according to child
weight for 7 days. Parents were told to come back to the centre at 7th day for re-evaluation
of the children health along with nutritional status. The mother was also counselled about
137
advantage of giving diet to child. Child was cured at home by their parents after taking
“RUTF”, with the instruction of how to give it to their child. Identified children with non‐
complicated disease before enrolment have taken medication according to the given
recommendations of Integrated Community Management of severe acute malnutrition.
Children were followed for two months minimum or until they achieved 15% weight gain
of the initial weight. Children who completed the programme cycle without meeting the
recovery criteria were referred to a stabilization centre for further treatment.
3.14 Nutritional Assessment
Proforma regarding baseline data, overall health of child, history of illness, nutritional plan,
intake of medications along with anthropometric assessments and other characteristics
were noted before commencing the actual study. Follow up of patients for two months and
for recording of their weight Community management of acute malnutrition forms was
applied. Baseline data were gathered for all concerned children like demographic details,
occupation, education and monthly income of parents. Clinical examination was
conducted for the presence of any illness, including fever, vomiting, diarrhoea with their
nutritional status assessment by anthropometric measurements and compared with Z-
score chart for grading of their nutritional status. Structured socio-demographic and
nutritional evaluation questionnaire were used for data collection.
The anthropometric assessments were “weight, height and mid-upper- arm circumference
(MUAC)”. Anthropometric measurements were conducted by out-patient clinic staff who
were specifically trained to make these measurements. Their competence in measuring
weight, height and MUAC was assessed and confirmed by the principal investigator.
Double measurements were taken by a staff member. If they differed from each other,
additional measurements were made until an exact value was replicated. The replicated
138
value was then recorded. Recommended procedure and apparatus was used. Weight of
the children were assessed and recorded by UNISCALE (de Onis, Onyango, Van den
Broeck, Chumlea & Martorell, 2004). Children were weighed to the nearest 10g unclothed
or in very light clothing with a UNISCALE, which was adjusted by a standard weight and
calibrated to zero before each measurement. For infants and children who could not stand,
the UNISCALE was used to measure the mother’s weight alone. The mother was then
handed the undressed baby / child, while standing on the scales, and the combined weight
of the mother and baby was measured. The baby / child’s weight was calculated as the
difference between these two readings. Recumbent length of children ≤87 cm in height
was measured to the nearest 0.1 cm using a length measuring board with an affixed
headrest and a movable foot piece (SECA GmbH & Co. KG, Hamburg, Germany), placed
on a flat surface. Child head was hold carefully in an “upward upright position, by stretching
legs to a full extent and feet at right angles with legs”. After child proper placement foot
end piece was pulled for touching the feet and the length was measured “to the nearest
0.1 cm”. Child with above 87cm height, the assessment was done with the child in standing
position after removing shoes on a “horizontal flat plate” fixed to the measuring board base
with both heels together. The child was carefully monitored to confirm that the “heels
should be on the plate and the head in upright position” throughout the assessment. The
headpiece was then carried down on the head of child and measurement recorded.
MUAC of each child was “measured to the nearest 0.1 cm” with colour- labelled MUAC
tape at the midpoint between the olecranon process and the acromion process. Care was
taken that during measurement children arm were bent and uncovered till shoulder with
the lower arm resting transversely on the stomach whereas the child should be seeing
ahead straight. “The tip of the bones at the elbow and top of the shoulder had pinpointed
139
and the distance among the two indicated tips was calculated and divided by two to get
midway point. Then the child’s arm was hang down at the sides”. The tape was positioned
across the arm on the labelled mid-point and cautiously tape fitted without any discomfort
round the arm that should be, not too tight or too loose. MUAC were measured for child
nutritional status assessment. Children were categorized by their nutritional status. Age
were asked verbally from mother because of non-availability of neonatal cards.
Standard guidelines for classification of malnutrition by WHO were applied in this
randomized trial.” Wasting (acute malnutrition) is a weight for height z-score (WHZ) of < -
2 as well as severe wasting is considered if WHZ was < -3 or if MUAC < 11.5 cm, Stunting
(chronic malnutrition) is a height for age z-score (HAZ) of < -2 as severe stunting is
considered if HAZ was < -3 and underweight (mixed acute and chronic malnutrition) is
weight for age z-score (WAZ) of < -2 as severe underweight is considered if WAZ was < -
3.”. (Onis, 2006; WHO, 1995). Classification of nutritional status was done with WHO
ANTHRO, version 3.2.2.
3.15 Development screening
Developmental screening was done by standard protocol of Denver development
screening tool II. The DDST- II were created in Denver (Frankenburg, 1992) by the
University of Colorado as an instrument to identify the early problems in child
development. It was practiced by the health care providers, teachers and social workers
(Frankenburg & Dodds, 1967). It can be conducted in home visit in community. DDST- II
recognize possible developmental problems for timely intervention of child. DDST-II were
classified as normal development, suspected development delay and untestable.
Development profile covers, motor, personal social and language milestones of children
140
(Mayson, Harris & Bachman, 2007). The purpose of tool, for use in the study was to check
the outcome of energy dense food and vitamin D on child development. On random visits
principal investigator also reassessed the child development by the same tool for checking
the accuracy and consistency of Denver results. This tool was purchased on line for use
in study from Denver website.
There is also a “testing behavior observation” section in the form end and completed by
supervisor of the test .In DDST- II Child accurate age were estimated and wrote on the
Denver form and for premature born infants age were adjusted by subtracting the digit of
premature months from the chronological child’s age. Administrator governs the preferred
task for all functional areas depending on intersection of age line. The administrator can
then decide “if child's responses fall into or outside of the normal guessed range of
achievement on that task for the child’s age”. The total numbers of task on which the child
attains less than the estimated age decides, that is child categorized as inside the “normal
range, suspected, or delayed”. Kids with suspected scores are frequently examined and
kids with delayed scores are referred for more advance evaluation.
Children who were found to be eligible to participate in the trial also underwent a baseline
developmental assessment using the standard protocol of the Denver Development
Screening Tool II (DDST-II), performed by a nurse with specific training in child
development or a pediatrician, both of whom were blinded to participants’ allocation. This
instrument assesses the ability of children aged up to 6 years to perform a range of tasks
as compared with a standardized population of children of the same age. Tasks are
grouped into four categories (social contact, fine motor skills, language, and gross motor
skills) and include items such as ‘smiles spontaneously’ (performed by 90% of three-
month-olds), ‘bangs two cubes held in hands’ (90% of 13-month-olds), ‘speaks three
141
words other than dada/mama’ (90% of 21-month-olds), or ‘hops on one leg’ (90% of 5-
year-olds). Following a standardized algorithm, children are assessed as having ‘no
delay’, ‘caution’ (an intermediate classification) or ‘delay’ in each category. These category
assessments are then used to classify global developmental status as normal (no category
delayed and no more than one category classified as ‘caution’), suspect (at least two
cautions or at least one delay) or untestable (based on a specific pattern of refusals). Of
note, some patterns of refusals may allow a category assessment but preclude a global
assessment of developmental status according to DDST-II algorithms. Where children
were classified as having ‘untestable’ global developmental status at screening,
developmental assessments were repeated 2 days later; if global developmental status
was still untestable at this point, the assessment was repeated again 2 days after that.
With regard to the timing of developmental assessments relative to commencement of
ready-to-use therapeutic food and study medication: all children commenced ready-to-use
therapeutic food as soon as the diagnosis of uncomplicated severe acute malnutrition was
made, but no child was randomised or commenced study medication until baseline
assessment of developmental status was complete.
3.15.1 How to Administer DDST - II
Tool was translated in to local language to remove language barrier before administration.
“It can be done in community setting at home visit and other busy setting like day care
center in the presence of teachers, caregivers or whoever will be aware of child, with or
without presence of parents”. Parents were also questioned later if any other info are
required for child assessment. “It can be performed through anybody familiar with the child
and will pursue the guidelines of DDST-II”. However usually the para-professional and the
qualified staff applied this tool (Murphy, 2001).

142
3.15.2 Interpretation of Denver - II
Like a growth curve the results were reported as age norms. The more task child fails to
do that were passed by 90% of child age mates, showed highly significant developmental
deviation that need further assessment. In each area “at least three items nearest to and
left of age line should be performed by child, all tasks on intersecting the age line continue
till 3 fails occur”. Three attempts were permitted to do each item and after conducting test
“Test Behavior Rating” were also recorded.
3.15.3 Scoring of items
“P for PASS, the child successfully performs or the caregiver reports (as appropriate).
F for FAIL, the child does not successfully perform an item or the caregiver reports.
NO for NO OPPORTUNITY (this is used on report items only).
R for REFUSAL, the child refuses to attempt items, cannot be use on report items”.
3.15.4 Denver - II Final Interpretation
We have interpreted scores by Denver criteria as follows in
Normal
“No delay and maximum one caution
Conduct routine rescreening at next well-child visit”.
Suspect
“Two or more caution or one or more delay
Rescreening in 1-2 weeks to rule out temporary factors such as fatigue, fear, illness”.
Untestable
“Refusal scores on one or more items completely to the left of the age line or on more than
one item intersected by the age line in the 75%-90% area. Rescreen in 1-2 weeks”.
143
Gestational age was taken from the antenatal record where delivery occurred in hospital,
and based on maternal report for home deliveries. For children aged up to 24 months who
were born prematurely (<37 week’s gestation) age was corrected by subtracting the
number of weeks of missed gestation from the current age. Where children were classified
as having ‘untestable’ global developmental status at screening, developmental
assessments were repeated 2 days later; if global developmental status was still
untestable at this point, the assessment was repeated again 2 days after that .In present
trial in developmental screening of 185 children before intervention 69 children were have
normal development, 108 have suspected development and 8 were untestable even after
rescreen in to 1-2 weeks but these children were not excluded from study, nor referred to
other centres, they remained in the study, followed and completed all protocol of study in
the end they were screened again with other children’s and out of them only 3 remain
untestable at the end in final score, these three were then referred to higher specialized
centre for further assessment.
3.16 Randomization and allocation
The random allocation sequence was generated in an Excel spread sheet by a statistician
who was independent of the study (Mr. Arslan Chughtai, Rashid Latif Medical Collage,
and Lahore). Consecutive numbers from 001 to 200 were assigned to active vs. placebo
in equal numbers. No restrictions (e.g. stratification, block size) were applied. This
sequence was used by the study pharmacy to label pairs of syringes containing active and
placebo medication with a study number assigned to active and placebo arms,
respectively. Participants were enrolled by four health workers in “community
management of acute malnutrition” (CMAM) programme. These staff assigned
144
consecutive ID numbers to participants according to the sequence in which they were
enrolled and the hospital pharmacy then supplied syringes of placebo medication bearing
this ID number. The syringes were freshly prepared and transported to the study site after
every 2 weeks. The randomisation was implemented by simply assigning consecutive ID
numbers to participants on their CMAM enrolment card by study staff at study site in
recruitment period as they went along and then those participants received the study
medication labelled with that ID number as prepared by Pharmacy. In each round every
child was administered vitamin D or placebo (containing extra virgin Dalda olive oil®) by a
syringe with his or her exclusive ID number by a study staff. Firstly, study staff verified the
syringe label for the similar ID number recorded in the CMAM enrolment card and then
once again confirmed the ID number before administrating the syringe content to the
particular child.
3.17 Blinding
Parents / guardians of all study participants were blinded to allocation, as were the health
workers and staff who enrolled participants and performed study assessments. Active and
placebo medication were presented identically in 1 ml syringes and had identical
appearance and texture.
3.18 Interventions
All participants were treated with RUTF provided by UNICEF at community centres
according to WHO guidelines. {World Health Organisation, 2013 #2925}. RUTF was
supplied to parents according to the child’s body weight (2 sachets/day for children
weighing 5-6.9 kg, 3 /day for those weighing 7-9.9 kg, 4/day for those weighing ≥10 kg)
on a weekly basis by suitably trained staff who provided parents with information regarding
145
benefits of RUTF and advice as to how it should be taken. Participants randomised to the
intervention arm of the trial additionally took two oral doses of 200,000 IU (5 mg) vitamin
D3 (cholecalciferol) in 1 ml olive oil, administered via a syringe at 2 and 4 week’s post-
initiation of RUTF. This solution of vitamin D was manufactured by GT Pharma (Pvt) Ltd
Lahore and quality accredited by Ministry of National Health services of Pakistan.
Participants randomised to the control arm of the trial received two oral doses of placebo
(1 ml extra virgin Dalda olive oil®) via a syringe at 2 and 4 week’s post-initiation of RUTF.
Study medication was packed and sealed in two 1 ml plastic syringes at the pharmacy in
Shehroz Hospital, Dera Ghazi Khan District, by a registered pharmacist. Syringes
containing active vs. placebo medication were labelled with a unique identification number
according to the randomisation code, as described above and stored in a dry, cool
environment for up to eight weeks as recommended by the manufacturer.
Four lady health workers of CMAM programme were trained by the principal investigator
for the standard operating protocol of the study and recruited children from June 2015 to
June 2016. After getting consent from caregiver first bolus dose of Vitamin D3 or placebo
were given orally under direct supervision. On random interrogation of study staff and
caregiver of child, no clues were detected at any stage that parents or LHW identify which
child may have received placebo or vitamin D. Only principal investigator knows about
allocation procedure. GT pharma and local hospital pharmacy involved for syringe
preparation have no other rule in trial.
3.19 Follow-up of study participants
Study participants were given a CMAM enrolment card and family members were assisted
in bringing children for visits to the study outpatient therapeutic centres. According to
standard practice, children were monitored weekly throughout the whole study period at
146
the centres which provided their RUTF diet and assessed for any medical or nutritional
complications, with recording of serious adverse events and referral to a tertiary care
hospital if necessary. Parents were encouraged to come to the outpatient centres for any
ailments affecting their child and treatment was free of charge for study children during
the trial duration. Anthropometry and developmental assessments were performed at 2
months: all 2-month anthropometric assessments were made by CMAM health workers
who were blinded to allocation. All 2-month developmental assessments were conducted
by a research nurse or a paediatrician, both of whom were also blinded to allocation. A 3
ml blood sample was taken from a sub-set of 90 participants at 2-month follow-up and
centrifuged after clotting; serum samples were aspirated and frozen at -20°C pending
biochemical analysis. (We have requested all parents for their consent to obtain blood
sample. Finally, 116 participated voluntarily. Initial 9 were examined in Pakistan, but we
did not include these in our analysis because of different laboratory method. Few samples
were clotted and some were unable to examine due to insufficient blood, making the final
sample to 90.)
All staff members were trained in taking anthropometric measurements, identification of
the malnutrition signs and symptoms. There was additional supervision by the principle
investigator on random visits to the study sites to ensure that study protocol was being
followed vigorously. Verbal autopsy interview with health worker of concerned child centre
who have attended the child during illness and lost him during the study period were
conducted after two weeks of the child's death because of absence of parents. WHO-
standard verbal autopsy form was used for interrogation and questions were asked in
native language.
147
3.20 Vitamin D or Placebo Administration
Recommended trial doses of Vitamin D3 (2 00,000 IU) and Placebo were efficaciously
given to children, who were enrolled in the trial for both times of vitamin D3 administration.
Only some breach in trial protocol happened and these were instantly reported and
recorded by principal investigator. As we discussed earlier, the same vitamin D dose (2
00,000 IU D3) from GT pharma were filled in syringes in local hospital pharmacy by a
registered pharmacist for each round of study and they filled the syringes by utilizing the
same randomization list generated by an independent statistician. Random quality check
of the fillings of syringes were not done because of it high cost but we have collected
random blood samples from 116 children from both groups at the end of follow up to
compare the serum vitamin D level in study and control group. The difference of the serum
vitamin D values in both groups was utilized as an alternate to assess the quality and
fillings of the syringes. The procedure of giving the syringe contents were: first removing
the syringe cap, with the position of the child nearly flat in the mother's arms, put the
syringe in the child's mouth and gently press the plunger so that the fluid goes in the child
mouth and is swallowed by the child. Did this very slowly and carefully to avoid any chid
dribbling and spitting.
3.21 Vitamin D Adverse Effects
Throughout the study period of 18 months, no signs of vitamin D3 supplementation over
dosage or adverse effects identified or reported. All study staff and study supervisors
strictly observed the syringes content administration to identify any sign of over dosage.
The contents were given to child after assessing child for any sign of vomiting. If the child
has vomiting on the day of giving drug it was assessed by giving a spoon of water, if this
148
was vomited after ten minute’s mother was called back after a week and drug was given
and completed recruitment. If child had no vomiting on the day of administration then the
contents of a syringe were given to child orally for both times, the concerned study staff
monitored the children for an hour for any sign and symptom of vitamin D over dosage
(rash, difficulty in breathing, swelling of the body or any other unusual symptoms) and
check if child vomit within half an hour of administration. Mothers or caretakers of the child
were briefed to watch out for any unusual new symptoms with any delayed adverse events
in the child and contact immediately the health canter staff. The finding was discussed in
discussion chapter.
3.22 Collection of Blood samples for Biochemical Analysis
For biochemical outcome measures we have collected 116 venous blood samples
randomly from children in each of the vitamin D and placebo groups at the end of study to
measure the serum 25-hydroxyvitamin D, calcium, albumin and pre albumin
concentrations, but not at baseline because of non-availability of funds for biochemical
analysis. From every child approximately 3 ml blood was drawn and stored in a vacutainer
tubes within the cold vaccine carrying box before transferring all samples to a local
laboratory. In the laboratory samples were instantly centrifuged and the plasma was kept
in a separate tube. Both the nurse and staff in the laboratory documented child's unique
ID, amount of blood and plasma drawn and the date. All centrifuged samples were
transferred to Microbiology laboratory of Punjab University, refrigerated and store there. A
total of 116 blood samples were drawn, of which 90 were able to be tested. The remaining
samples were not sufficient for processing. The samples list was provided to the lab
technologist without revealing the study codes.
149
At the end of follow up Homerton lab participates in “Vitamin D External Quality
Assessment Scheme (DEQAS)”. All Serum samples were centrifuged, before transfer to
the laboratory at “Homerton University Hospital NHS Foundation Trust London UK” for
measurement of 25-hydroxyvitamin D by Automated “Solid-Phase Extraction and
LC/MS/MS”.
3.23 Laboratory Methods
Serum 25-hydroxyvitamin D concentrations were calculated by “liquid chromatography
tandem mass spectrometry in the Department of Clinical Biochemistry at the Homerton
University Hospital NHS Foundation Trust, London, UK, which participates in the
Vitamin D External Quality Assessment Scheme (www.deqas.org/”).Serum
concentrations of albumin, prealbumin and calcium were measured in the same laboratory
using an Architect ci8200 analyser (Abbott Diagnostics). “Corrected calcium was
calculated using the formula corrected Ca [mmol/L] = measured calcium [mmol/L] +
0.020*(40 - albumin [g/L])”.
3.23.1 Quantitation of Vitamin D
High-pressure “liquid chromatography tandem mass spectrometry (LC-MS/MS) was
applied for the testing of total serum 25[OH] D concentration”. The LC-MS/MS assays of
assessment has been authenticated in contrast to other commercially available
techniques and is considered as the most suitable and reliable method for analyzing the
of “Vitamin D metabolites” (Snellman et al., 2010).
150
3.23.2 LC-MS/MS Principle
“LC-MS/MS combines the resolving capability of liquid chromatography with the mass
analysis ability of mass spectrometry. Thus, the process can be normally categorized into
the separation step (step 1), ionization step (step 2) and the mass analysis section (step
3). In step 1 the sample (i.e. vitamins purified from serum) is forced at high pressure by a
liquid (mobile phase) into a column (solid phase) to allow separation. In step 2, the sample
is charged via atmospheric pressure chemical ionization (APCI), during which a solvent
reagent (to allow detection in the final step) ionizes the analyte. In step 3, the ions are
separated according to their mass-to-charge ratio in an analyzer by electromagnetic fields.
The ions are detected by a quantitative method and the signal is then processed into mass
spectra” (Shah, James, Barker, Petroczi & Naughton, 2011).
3.23.3 Description Solid-Phase Extraction
Solid-Phase Extraction (SPE) “is a sample preparation technique that utilizes the solid
particles, chromatographic packing material”, normally enclosed in a “cartridge type
device, to chemically split up the different components of a sample”. At all times Samples
are mostly in the liquid state (though specialty applications might be run with few samples
in the gas phase).
3.24 Medications during study Period for any co-morbidity
Following medicine were allowed during the study period according to CMAM protocol
(WHO, 2009) “7‐day course of the antibiotics Amoxicillin (60 g−1·kg−1·day−1, three times
a day) for children having a mild form of diarrhoea and other infections. A single dose of
artesunate–amodiaquine combined therapy to treat children diagnosed with malaria,
whereas paracetamol syrup to control fever (temp >37.5°C)”. Children who showed signs
151
of dehydration were given oral rehydration salt solution, made from ReSoMal (Rehydration
solution for Malnourished Children).
3.25 Risk factors for Malnutrition and Development Delay
Children aged 6-59 months whose parents gave consent for them to participate underwent
the baseline assessment. A structured socio-demographic and nutritional questionnaire
was administered to capture information on participant’s demographic details, parental
occupation, education, monthly income and nutritional intake. Data on children
sociodemographic status with dietary history, medical history and anthropometry were
collected once at the start of study on the child enrolment date with an interview of parents.
The well-being status of the families was assessed by household total monthly income
from all sources. The range from least poor to poorest was adjusted according to minimum
monthly salary of a person in Pakistan, because whole study area belongs to people with
low socio-economic status. Age of children (from child birth card if available, otherwise
were inquired from the mothers verbally) with parents education, occupation, family
structure and persons sharing the same house was assessed at enrolment as a potential
risk factors. Mother's child birth was inquired by questioning about total alive and died
children and currently how many children under the age of five years she had.
Child dietary history, exclusive breastfeeding status and if not breastfeeding what type of
feeding was given to the child with the frequency, quantity and dilution of milk in case of
artificial feeding were asked as influencing factors for malnutrition and development delay.
The time of starting complimentary feeding with the recommended quantity, variety and
frequency of semisolid diet were asked. Mother knowledge were determined about “infant
and young-child feeding practices (IYCF)”. Hygienic ways of the mother were assessed
with the habits of hand washing of mother and child before eating food and after using
152
toilet. Proper utensil washing before cooking and hygienic preparation of food with food
storage was also inquired. Food security of the family were assessed by the access to
food for their dietary needs. Baseline nutritional parameters of the child was evaluated by
measuring “weight, height and MUAC” of children at recruitment.
A detailed medical history of the child, with access to health care were also questioned in
this study. Child frequent visits to hospital or any health provider for diarrhea and
respiratory infections with any other illness was assessed by checking from medical
records of the child. Child immunization status were also evaluated from vaccination card
with physical presence of BCG scar. Child detailed history of intestinal parasites, scabies
with other skin infections, measles, history of pica (ingestion of non-nutritive substances)
and history of TB contact with any smear positive TB adult family member treated for
tuberculosis at home were taken. Child briefed physical examination were done for any
sign of malnutrition, skin and hair changes (flag sign in hairs, skin pigmentation), checking
for pallor (pallor in palms of hand, conjunctiva of eyes) and presence of bilateral pitting
edema. Any other child less than 5 year treated for malnutrition or have malnutrition in the
family at the same time were inquired as a potential risk factor.LHW (lady health workers)
visit at home after every three months, a part of primary health care in Pakistan were also
questioned from families for assessment of health education of mothers from them.
Families were also probed about their knowledge of vitamin D or sunlight importance with
awareness of vitamin D enriched food and exposure of their houses to sunlight. Proforma
attach in appendix.
153
3.26 Procedure for data entry and processing
On daily basis all forms used for collecting data were manually verified and mistakes were
corrected by the study staff. Some forms that were incomplete or needed cross-checking
were completed by consulting again with the families. Only the study staff of concerned
centre who filled the form initially was permitted for correction of data in particular form. If
the relevant study staff was not available, the principal investigator was allowed to rectify
the data errors if applicable. All data were verified again at the time of data entry. Data
were first cleaned and inserted in “excel spread sheet” and after that transferred to SPSS
for further processing. All forms were entered and checked twice by the principal
investigator to avoid any error in data entry. If any error were identified by the software,
the investigator again rechecks the form to find the problem and correct it. To prevent any
data loss, the database was backed daily. Statistical analyses were conducted by original
assigned group using “Statistical Package for the Social Sciences (SPSS) version 23”.
Stata/IC version 12.1 (StataCorp, Texas, USA). Z-scores for anthropometric outcomes
were calculated using WHO Anthro v3.2.2. The primary outcome was analyzed by
calculation of a risk ratio with 95% CI comparing the proportion of children in each arm
gaining ≥15% in weight at 8-week follow-up vs. baseline. The effect of allocation on
continuous outcomes that were assessed both at baseline and at the end of the study (e.g.
weight and weight-for-height z-score at 8 weeks) was analyzed using linear regression,
adjusting for the baseline value. The effect of allocation on categorical outcome variables
that were assessed both at baseline and at the end of the study (e.g. developmental
status) were analyzed with generalized linear models with a log link and binomial
distribution to yield a risk ratio adjusted for the baseline value with 95% CI and P value .
Mean values of continuous outcomes measured at 8 weeks but not at baseline (e.g. serum
154
concentrations of 25[OH] D, calcium, albumin and pre-albumin at 8 weeks) were compared
between active vs. placebo groups using unpaired Student’s t tests to yield a mean
difference between study arms with 95% CI for that difference. Statistical significance was
inferred where P <0.05. No sub-group analyses were conducted.
“Qualitative data” was represented in shape of frequency and percentage and “quantitative
data” was represented in form of mean ± S.D. For analysis of predictors of development
delay, univariate risk ratios for normal development were calculated, along with the chi
square value and “fisher exact test”. Logistic regression were applied in multivariable
analyses to calculate adjusted odd-ratios from covariates.
For analysis of predictors of malnutrition in univariate analysis for measure of malnutrition
as a dependent factor with different individual sociodemographic independent factors
Independent T Test / One Way ANOVA were applied. Their “numbers, mean, standard
deviation mean difference with (95% CI) and p value” are presented. To analyse the effect
of multiple demographic factors on malnutrition in multiple analysis linear regression were
used because of continuous dependent variables. Their β with (95% CI) and p value was
presented.
3.27 Study Timeline
The study started recruiting children from June 2015 to June 2016. Follow-up ended in
November 2016. Data entry, cleaning, processing and analysis was completed in May
2017.
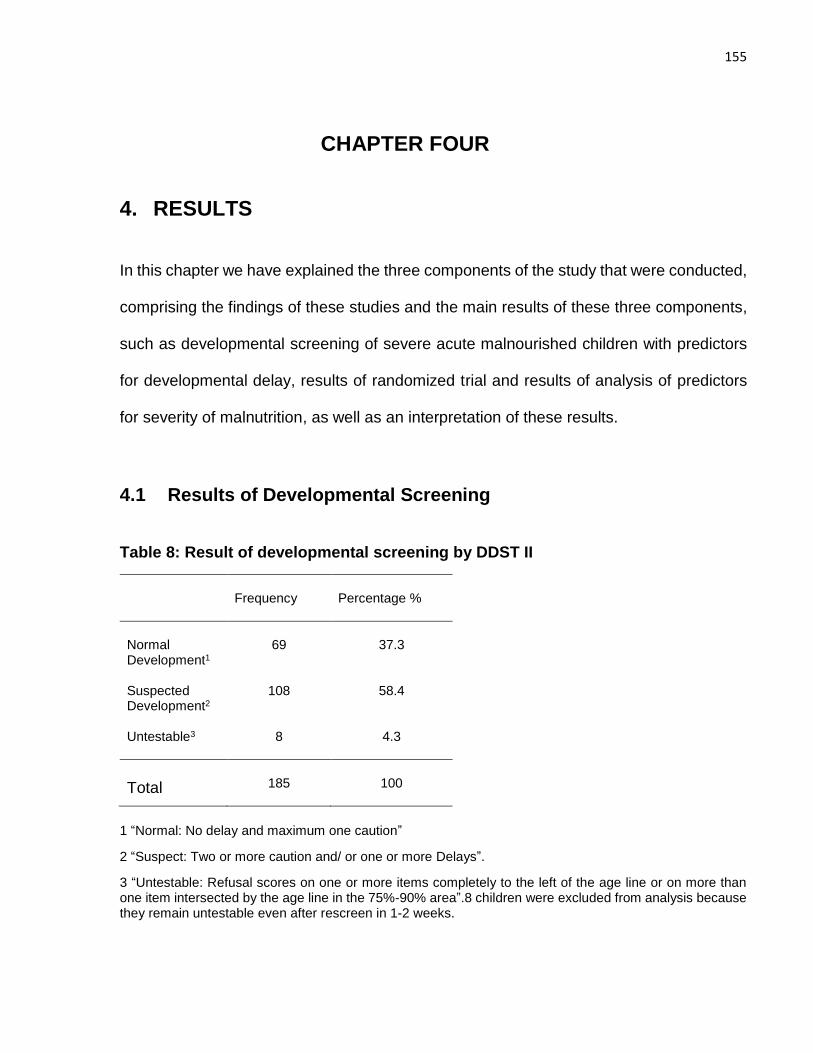
155
CHAPTER FOUR
4. RESULTS
In this chapter we have explained the three components of the study that were conducted,
comprising the findings of these studies and the main results of these three components,
such as developmental screening of severe acute malnourished children with predictors
for developmental delay, results of randomized trial and results of analysis of predictors
for severity of malnutrition, as well as an interpretation of these results.
4.1 Results of Developmental Screening
Table 8: Result of developmental screening by DDST II
1 “Normal: No delay and maximum one caution”
2 “Suspect: Two or more caution and/ or one or more Delays”.
3 “Untestable: Refusal scores on one or more items completely to the left of the age line or on more than one item intersected by the age line in the 75%-90% area”.8 children were excluded from analysis because they remain untestable even after rescreen in 1-2 weeks.
Frequency
Percentage %
Normal Development1
69
37.3
Suspected Development2
108 58.4
Untestable3 8 4.3
Total
185
100
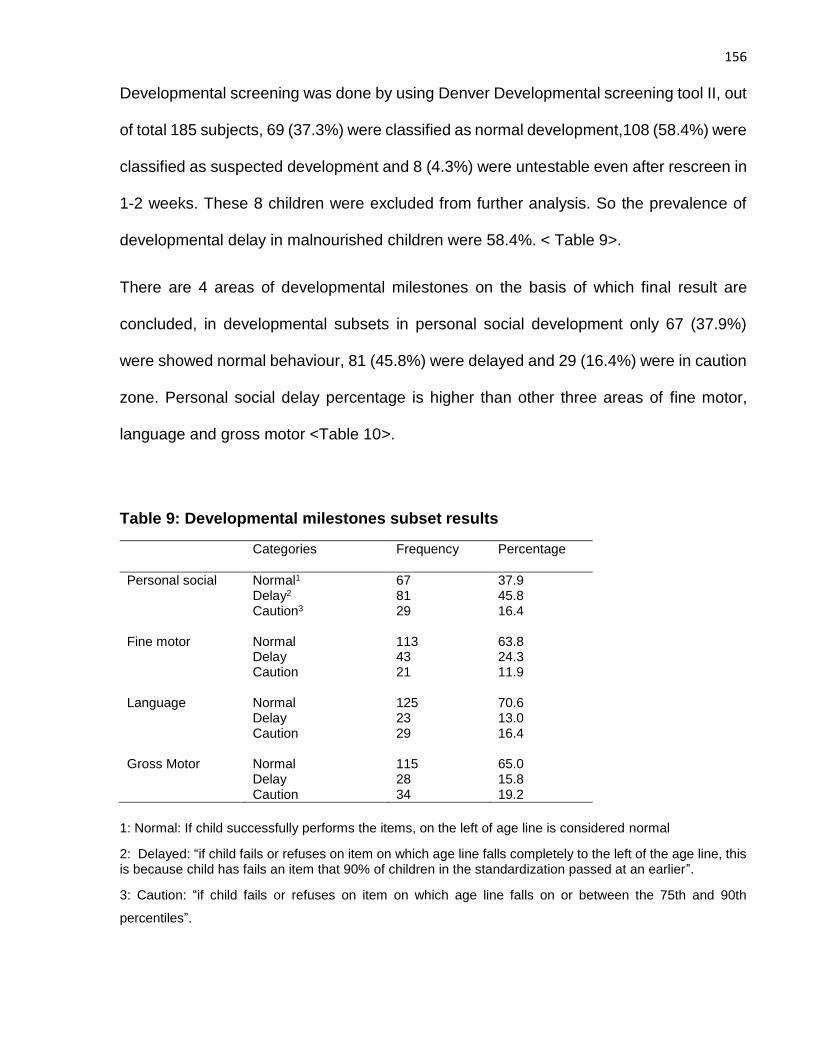
156
Developmental screening was done by using Denver Developmental screening tool II, out
of total 185 subjects, 69 (37.3%) were classified as normal development,108 (58.4%) were
classified as suspected development and 8 (4.3%) were untestable even after rescreen in
1-2 weeks. These 8 children were excluded from further analysis. So the prevalence of
developmental delay in malnourished children were 58.4%. < Table 9>.
There are 4 areas of developmental milestones on the basis of which final result are
concluded, in developmental subsets in personal social development only 67 (37.9%)
were showed normal behaviour, 81 (45.8%) were delayed and 29 (16.4%) were in caution
zone. Personal social delay percentage is higher than other three areas of fine motor,
language and gross motor <Table 10>.
Table 9: Developmental milestones subset results
Categories Frequency Percentage
Personal social Normal1 67 37.9 Delay2 81 45.8 Caution3
29 16.4
Fine motor Normal 113 63.8 Delay 43 24.3 Caution
21 11.9
Language Normal 125 70.6 Delay 23 13.0 Caution
29 16.4
Gross Motor Normal 115 65.0 Delay 28 15.8 Caution 34 19.2
1: Normal: If child successfully performs the items, on the left of age line is considered normal
2: Delayed: “if child fails or refuses on item on which age line falls completely to the left of the age line, this is because child has fails an item that 90% of children in the standardization passed at an earlier”.
3: Caution: “if child fails or refuses on item on which age line falls on or between the 75th and 90th
percentiles”.
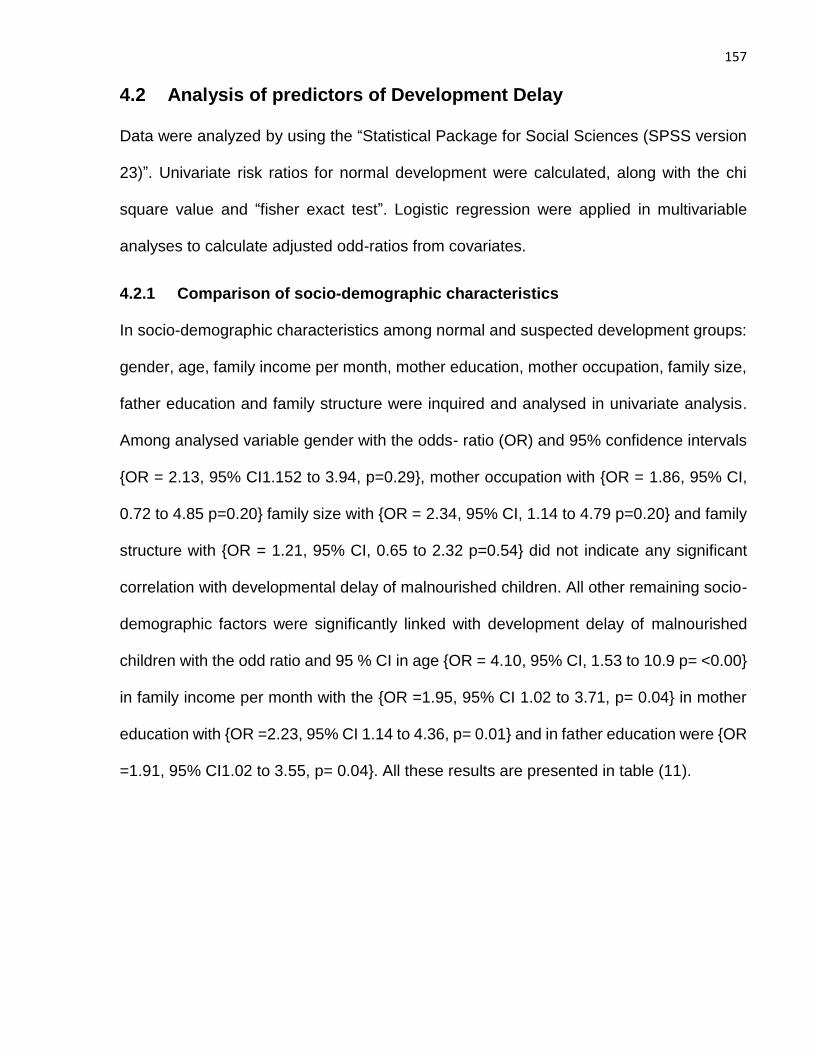
157
4.2 Analysis of predictors of Development Delay
Data were analyzed by using the “Statistical Package for Social Sciences (SPSS version
23)”. Univariate risk ratios for normal development were calculated, along with the chi
square value and “fisher exact test”. Logistic regression were applied in multivariable
analyses to calculate adjusted odd-ratios from covariates.
4.2.1 Comparison of socio-demographic characteristics
In socio-demographic characteristics among normal and suspected development groups:
gender, age, family income per month, mother education, mother occupation, family size,
father education and family structure were inquired and analysed in univariate analysis.
Among analysed variable gender with the odds- ratio (OR) and 95% confidence intervals
{OR = 2.13, 95% CI1.152 to 3.94, p=0.29}, mother occupation with {OR = 1.86, 95% CI,
0.72 to 4.85 p=0.20} family size with {OR = 2.34, 95% CI, 1.14 to 4.79 p=0.20} and family
structure with {OR = 1.21, 95% CI, 0.65 to 2.32 p=0.54} did not indicate any significant
correlation with developmental delay of malnourished children. All other remaining socio-
demographic factors were significantly linked with development delay of malnourished
children with the odd ratio and 95 % CI in age {OR = 4.10, 95% CI, 1.53 to 10.9 p= <0.00}
in family income per month with the {OR =1.95, 95% CI 1.02 to 3.71, p= 0.04} in mother
education with {OR =2.23, 95% CI 1.14 to 4.36, p= 0.01} and in father education were {OR
=1.91, 95% CI1.02 to 3.55, p= 0.04}. All these results are presented in table (11).
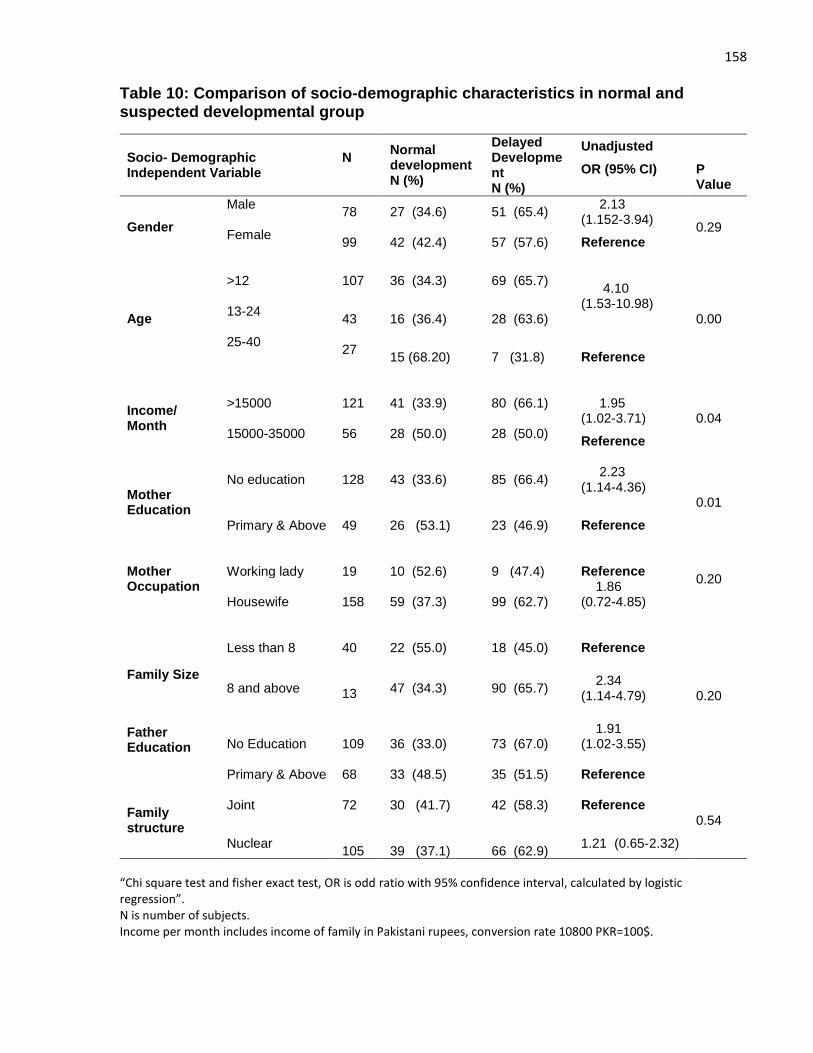
158
Table 10: Comparison of socio-demographic characteristics in normal and suspected developmental group
Socio- Demographic Independent Variable
N
Normal development N (%)
Delayed Development N (%)
Unadjusted
OR (95% CI)
P Value
Gender
Male
78 27 (34.6) 51 (65.4) 2.13 (1.152-3.94)
0.29 Female
99 42 (42.4) 57 (57.6) Reference
Age
>12
107 36 (34.3) 69 (65.7) 4.10 (1.53-10.98)
0.00 13-24
43 16 (36.4) 28 (63.6)
25-40
27
15 (68.20) 7 (31.8) Reference
Income/ Month
>15000
121 41 (33.9) 80 (66.1)
1.95 (1.02-3.71) 0.04
15000-35000
56 28 (50.0)
28 (50.0)
Reference
Mother Education
No education
128 43 (33.6) 85 (66.4)
2.23 (1.14-4.36)
0.01 Primary & Above
49 26 (53.1) 23 (46.9) Reference
Mother Occupation
Working lady
19
10 (52.6)
9 (47.4)
Reference
0.20 Housewife
158
59 (37.3)
99 (62.7)
1.86 (0.72-4.85)
Family Size
Father Education
Less than 8
40
22 (55.0)
18 (45.0)
Reference
0.20 8 and above
13 47 (34.3) 90 (65.7)
2.34 (1.14-4.79)
No Education 109 36 (33.0) 73 (67.0)
1.91 (1.02-3.55)
Primary & Above 68 33 (48.5) 35 (51.5) Reference
Family structure
Joint 72
30 (41.7) 42 (58.3) Reference 0.54
Nuclear 105
39 (37.1)
66 (62.9)
1.21 (0.65-2.32)
“Chi square test and fisher exact test, OR is odd ratio with 95% confidence interval, calculated by logistic regression”. N is number of subjects. Income per month includes income of family in Pakistani rupees, conversion rate 10800 PKR=100$.
159
4.2.2 Comparison of Medical history and Behavioral practices
In comparison of child medical history and behavioural practices between suspected and
normal groups, in univariate analysis complimentary feeding practices, hygienic practices,
history of TB contact, history of parasites in intestine, history of measles, history of
scabies, morbidity incidence in terms of frequent hospital visits, feeding practices,
immunization, history of pica and pallor were assessed and included.
Table 11: Comparison of Medical history and Behavioral practices in normal and suspected developmental group
Variables for Medical history and Behavioural practices
N
Normal development
N (%)
Delayed Development
N (%)
Univariate Analysis OR (95%CI)
P Value
Complementary feeding Practices1
Poor
136 18 (43.9) 23 (56.1) 1.30 (0.64-2.65)
0.46 Good
41 51 (37.5) 85 (62.5) Reference
Hygienic Practices2
Poor
157
8 (40.0)
12 (60.0) 1.05 (0.41-2.71)
0.92 Good
20 61(38.9) 96 (61.1) Reference
History of TB contact3
Yes
77 22 (28.6)
55 (71.4) 2.22 (1.18-4.17)
0.01 No
100 47 (47.0)
53 (53.0) Reference
History of Parasites in Intestine
Yes
41
12 (29.3)
29 (70.7) 1.74 (0.82-3.71)
0.14 No
136 57 (41.9) 79(58.1) Reference
History of Measles
Yes
26 9 (34.6)
17(65.4) 1.24 (0.52-2.98)
0.62 No
151 60 (39.7) 91(60.3) Reference
History of scabies Yes
26 13 (50.0) 13(50.0) Reference
0.22
No
151 56 (37.1) 95(62.9) 1.70 (0.73-3.91)
Hospital visits4
1-7
95
44(46.3)
51(53.7)
Reference
0.03
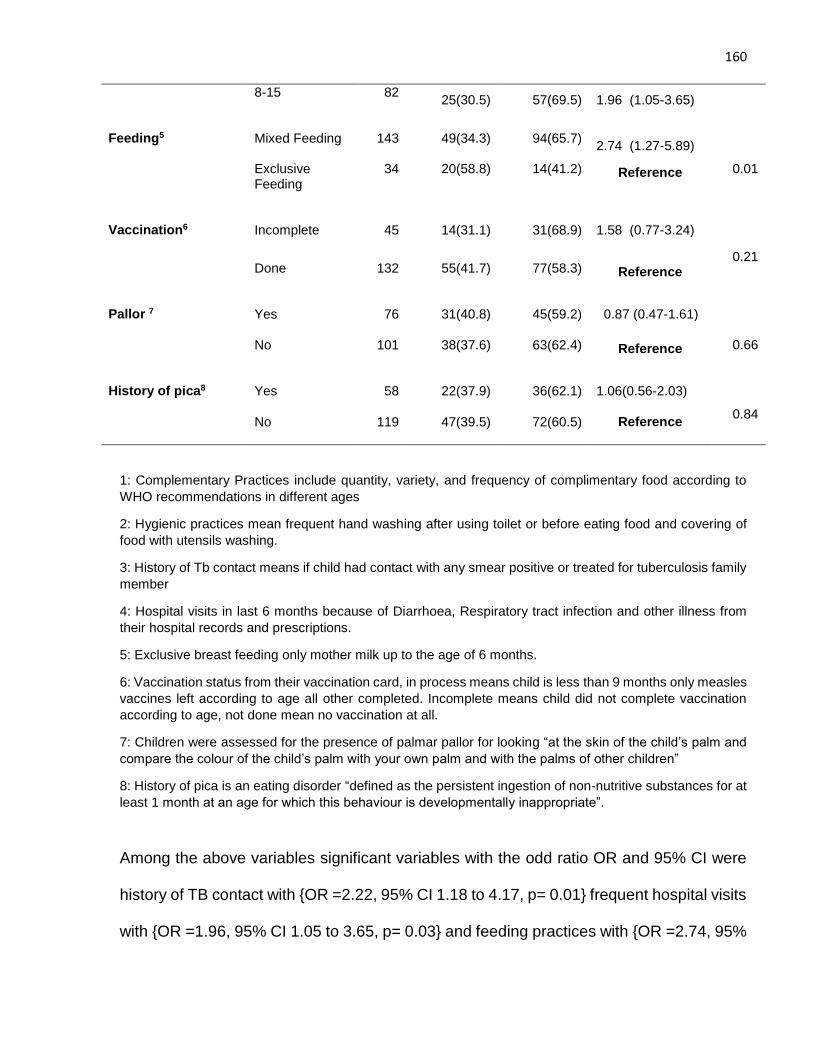
160
8-15
82 25(30.5) 57(69.5) 1.96 (1.05-3.65)
Feeding5
Mixed Feeding
143
49(34.3)
94(65.7)
2.74 (1.27-5.89)
0.01 Exclusive
Feeding
34 20(58.8) 14(41.2) Reference
Vaccination6
Incomplete
45
14(31.1)
31(68.9)
1.58 (0.77-3.24)
0.21
Done
132 55(41.7) 77(58.3) Reference
Pallor 7 Yes
76 31(40.8) 45(59.2) 0.87 (0.47-1.61)
0.66
No
101 38(37.6) 63(62.4) Reference
History of pica8 Yes
58 22(37.9) 36(62.1) 1.06(0.56-2.03)
0.84
No 119 47(39.5) 72(60.5) Reference
1: Complementary Practices include quantity, variety, and frequency of complimentary food according to
WHO recommendations in different ages
2: Hygienic practices mean frequent hand washing after using toilet or before eating food and covering of
food with utensils washing.
3: History of Tb contact means if child had contact with any smear positive or treated for tuberculosis family
member
4: Hospital visits in last 6 months because of Diarrhoea, Respiratory tract infection and other illness from
their hospital records and prescriptions.
5: Exclusive breast feeding only mother milk up to the age of 6 months.
6: Vaccination status from their vaccination card, in process means child is less than 9 months only measles
vaccines left according to age all other completed. Incomplete means child did not complete vaccination
according to age, not done mean no vaccination at all.
7: Children were assessed for the presence of palmar pallor for looking “at the skin of the child’s palm and
compare the colour of the child’s palm with your own palm and with the palms of other children”
8: History of pica is an eating disorder “defined as the persistent ingestion of non-nutritive substances for at
least 1 month at an age for which this behaviour is developmentally inappropriate”.
Among the above variables significant variables with the odd ratio OR and 95% CI were
history of TB contact with {OR =2.22, 95% CI 1.18 to 4.17, p= 0.01} frequent hospital visits
with {OR =1.96, 95% CI 1.05 to 3.65, p= 0.03} and feeding practices with {OR =2.74, 95%
161
CI 1.27 to 5.89, p= 0.01}.All others variables did not show any significance on univariate
analysis as weaning practices with the {OR =1.30, 95% CI 0.64 to 2.65, p= 0.46} hygienic
practices {OR =1.05, 95% CI 0.41 to 2.71, p= 0.92} history of parasites in intestine {OR
=1.74, 95% CI 0.82-3.71, p= 0.14} history of measles {OR =1.24, 95% CI 0.52 to 2.98 , p=
0.62} history of scabies {OR =1.70, 95% CI0.73 to3.91 , p= 0.22} vaccination of child with
{OR =1.58, 95% CI 0.77 to 3.24 , p= 0.21} pallor with {OR =0.87, 95% CI 0.47 to1.61, p=
0.66} and history of pica with {OR =1.06, 95% CI 0.56 to 2.03, p= 0.84}. All these results
are presented in table (12).
4.3 Multivariate analysis - Predictors of development delay
In order to assess the association between child delayed development, socio–
demographic, behavioural and medical factors logistic regression analyses were done. In
logistic regression numerous independent variables make it complex to find meaningful
predictive factors, so in our study between these factors models were adjusted for any
variables that were significantly associated with p<0.20 with the dependent variable in
bivariate analysis (Bursac, Gauss, Williams & Hosmer, 2008). In multivariate analysis after
adjusting for odd ratio following factors shows significance. Age was significant in
multivariate analysis with the AOR and 95% CI {AOR 3.95, 95%CI 1.40 to 11.14. p=
<0.00}.
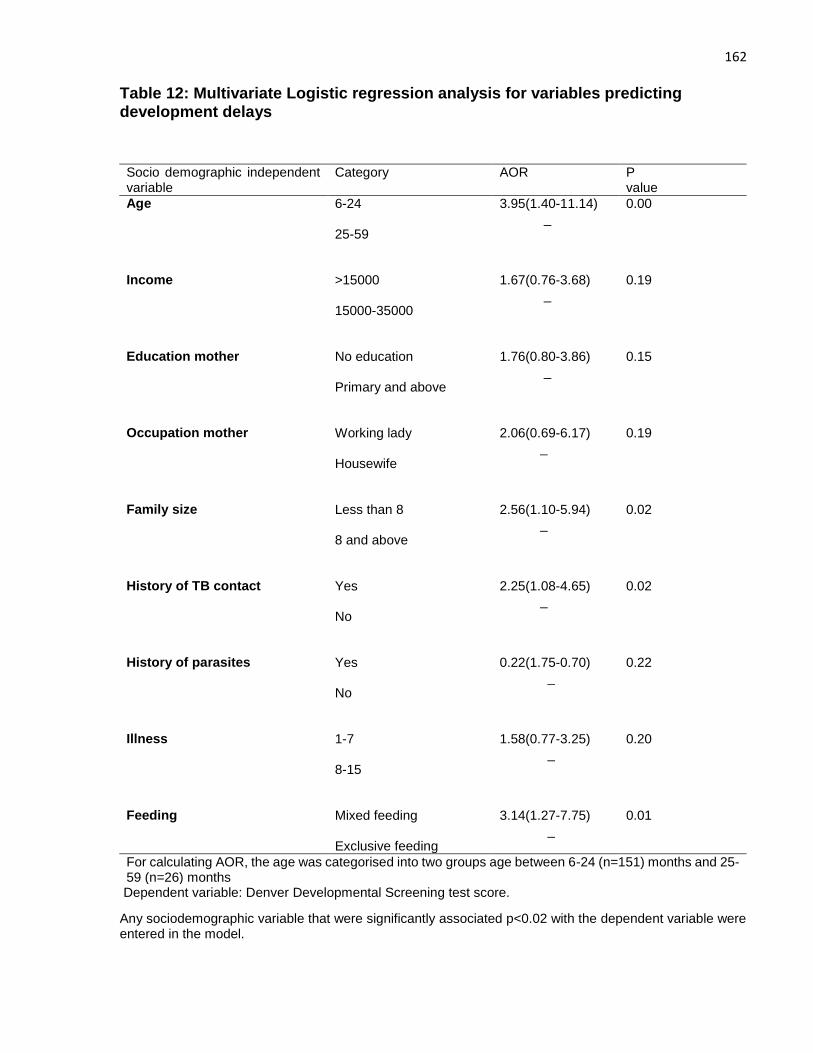
162
Table 12: Multivariate Logistic regression analysis for variables predicting development delays
Dependent variable: Denver Developmental Screening test score.
Any sociodemographic variable that were significantly associated p<0.02 with the dependent variable were entered in the model.
Socio demographic independent variable
Category AOR P value
Age 6-24 25-59
3.95(1.40-11.14) _
0.00
Income
>15000 15000-35000
1.67(0.76-3.68) _
0.19
Education mother
No education Primary and above
1.76(0.80-3.86) _
0.15
Occupation mother
Working lady Housewife
2.06(0.69-6.17) _
0.19
Family size Less than 8 8 and above
2.56(1.10-5.94) _
0.02
History of TB contact
Yes No
2.25(1.08-4.65) _
0.02
History of parasites
Yes No
0.22(1.75-0.70) _
0.22
Illness
1-7 8-15
1.58(0.77-3.25) _
0.20
Feeding
Mixed feeding Exclusive feeding
3.14(1.27-7.75) _
0.01
For calculating AOR, the age was categorised into two groups age between 6-24 (n=151) months and 25-59 (n=26) months
163
Family size was insignificant in univariate analysis but became significant in multivariate
analysis after adjusting for others potential covariate with {AOR 2.56, 95%CI 1.10 to 5.94
p= 0.02}. History of TB contact as in univariate analysis were still significant in multivariate
analysis with {AOR 2.25, 95%CI1.08 to 4.65 p= 0.02} and exclusive breastfeeding with
{AOR 3.14, 95%CI 1.27 to 7.75 p= 0.01}. All others variables in multivariate model were
insignificant. The “odds ratios (OR) and 95% confidence intervals” (C.I.) of developmental
delays are presented in (Table 13).
4.4 Results of Randomized control trial
4.4.1 Trial profile
After community mobilization by CMAM staff in 4 selected study areas, total 252 children
were assessed, at the CMAM centre after referral by lady health workers in pursuit of initial
assessment of child at their homes, Out of 252 total, 58 were not included, either because
they were ineligible (11 having severe acute malnutrition with complications, 31 moderate
acute malnutrition, 3 below 6-month age and 7above 5-year age) or did not wish to
participate, leaving 194 children who were randomized to either vitamin D (n=97) or
placebo (n=97). Those who declined to participate (6 families), did not want to go to study
hospital and some of them refused to participate without any reason. One child in the
vitamin D group died (before taking the first vitamin D dose) because of diarrhoea and
dehydration during the two month’s follow-up, but there were no other reported adverse
events in either group that were life-threatening, that resulted in admission in hospital or
prolong stay of already admitted children in hospital or that caused a persistent or major
inability or considerable disorder that outcomes as incapacity to normal life function. The
number of children lost to follow up and defaulters after initial two weeks of treatment was
small and similar in the vitamin D (3 loss to follow-up and one death) and placebo groups
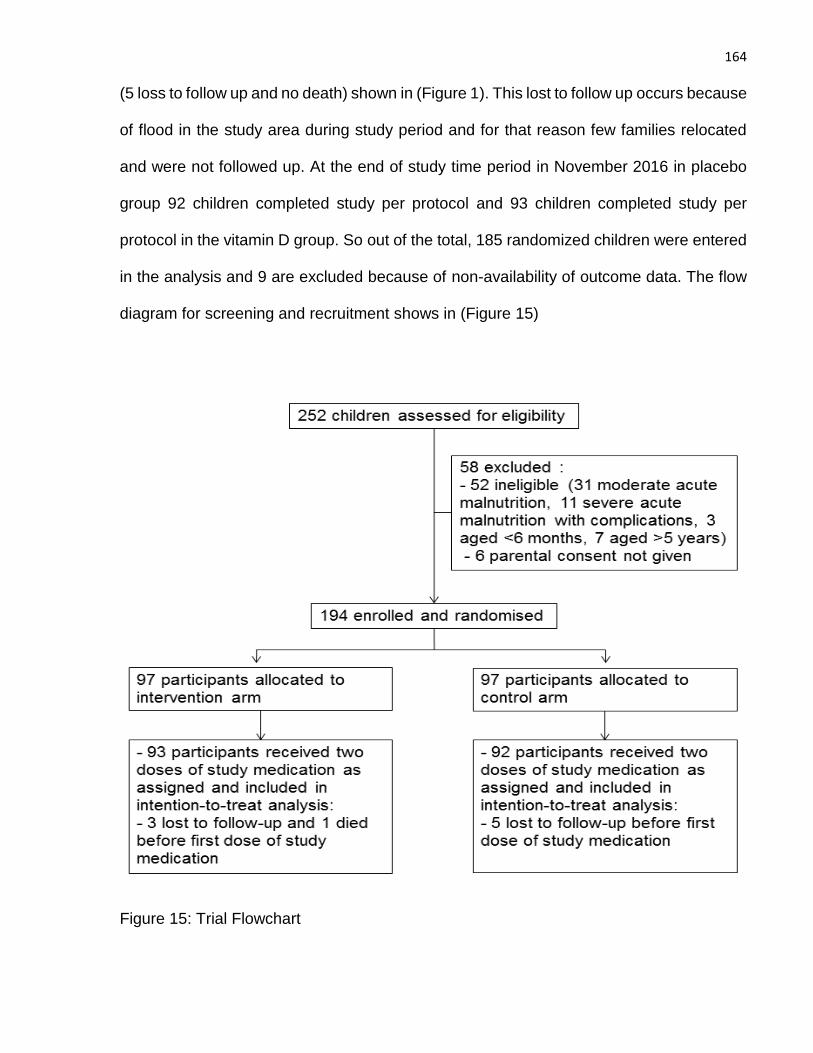
164
(5 loss to follow up and no death) shown in (Figure 1). This lost to follow up occurs because
of flood in the study area during study period and for that reason few families relocated
and were not followed up. At the end of study time period in November 2016 in placebo
group 92 children completed study per protocol and 93 children completed study per
protocol in the vitamin D group. So out of the total, 185 randomized children were entered
in the analysis and 9 are excluded because of non-availability of outcome data. The flow
diagram for screening and recruitment shows in (Figure 15)
Figure 15: Trial Flowchart
165
4.4.2 Baseline characteristics of participants
4.4.2.1 Socio-demographic characteristics of study children
Total no of participants in Vitamin D group were (n=93) and in placebo group were (n=92).
The mean age for study children in vitamin D group was 15.72 months (SD: 10.84) and
for children in placebo group was 14.99 months (SD: 9.62) at recruitment (Table 14). In
both vitamin D and placebo groups almost more than half of the children were female
(54.8% and 57.6% respectively). Family monthly income below 15000 were (76.3%) in
families in vitamin D and (62.0%) in placebo group families. Only (20.4%) children have
exclusive breastfeeding (only mother milk up to the age of 6 month) in the vitamin D group
and (18.5%) have exclusive breast feeding in placebo group. Rate of exclusive
breastfeeding is pretty low in both groups. Weaning practices that include quantity, variety
and frequency of complimentary food according to WHO recommendations in different
ages, only (25.8%) mothers following these recommended good practices in vitamin D
group and (22.8%) mothers in placebo group. Parents and care givers in both vitamin D
and placebo group had no knowledge about vitamin D enriched foods and overall
importance of vitamin D for health. Only (6.5%) families in vitamin D and (3.3%) in placebo
group have knowledge of vitamin D. Sociodemographic characteristics shown in (Table
13).
4.4.2.2 Medical history in study children
Out of 93 children in vitamin D group (14.0%) have history of measles present and out of
92 children in placebo group (16.3%) have presence of measles history. In vitamin D and
placebo group history of presence of intestinal parasites was (20.4% and 25.0%
respectively). History of TB contact of child with smear positive adult TB patient was found
in (35.5%) children in vitamin D group and (52.2%) in children in placebo group. History of
166
scabies was present in (22.6%) children in vitamin D and (7.6%) in placebo group.
Vaccination status of the children were checked from their vaccination card, BCG scar
was checked physically on the child arm and vaccination status was pursued according to
following categories like, in process means child is less than 9 months only measles
vaccine left according to age and all other completed, incomplete means child did not
complete vaccination according to age, not done mean no vaccination at all. In vitamin D
group vaccination done/in process was tracked in (69.9%) children and in placebo group
(80.4%) children (Table 13). Hospital visits in last 6 months because of diarrhoea,
respiratory tract infections and other illness from their hospital records and prescriptions
were checked and asked from parents and revealed that (38.7%) children had
approximately 8-15 times visits to hospital and health care providers in the vitamin D group
and (53.3%) in the placebo group.
4.4.2.3 Anthropometric measurements in study children
Nutritional status was measured by baseline mid upper arm circumference (MUAC),
“weight for height z-score for acute malnutrition (wasting), height for age z-score for
chronic malnutrition (stunting) and weight for age z-score for underweight”. Nutritional
status was analysed by their mean and SD in both groups. Mean MUAC in cm in vitamin
D group was (10.47) and in the placebo group was (9.91). Mean “weight for height, z-
score” in vitamin D group was (-3.76) and in the placebo group was (-4.05), mean “height
for age, z-score” in vitamin D group was (-3.94) and in the placebo group was (-3.69) and
mean “weight for age, z-score” in the vitamin D and placebo group was (-4.48 and -4.63
respectively) presented in (table13).
167
4.4.2.4 Baseline Developmental status of study children
Global development proportion delayed (%) in children from baseline assessment in
vitamin D group was (57.0%) and for placebo group was (59. 8%).In assessment of
different areas of milestones like in fine motor milestones proportion delayed was (37.6%)
in vitamin D group and (40.2%) in placebo group. In language milestones proportion
delayed was assessed in (33.3%) children in vitamin D and (31.5%) in placebo group.
Personal social milestones proportion delayed in vitamin D and placebo group was (63.4%
and 64.1% respectively). Gross motor milestones proportion delayed was found in (39.8%)
children in vitamin D group and (34.8%) children in placebo group. 8 children were
untestable even after rescreen at 1-2 visits in global development but these untestable
children were also followed for whole study period for any improvement in the score. The
baseline characteristics for socio-demographic status, weight, developmental milestones
and medical history were similar between the two groups and presented in (Table 13).
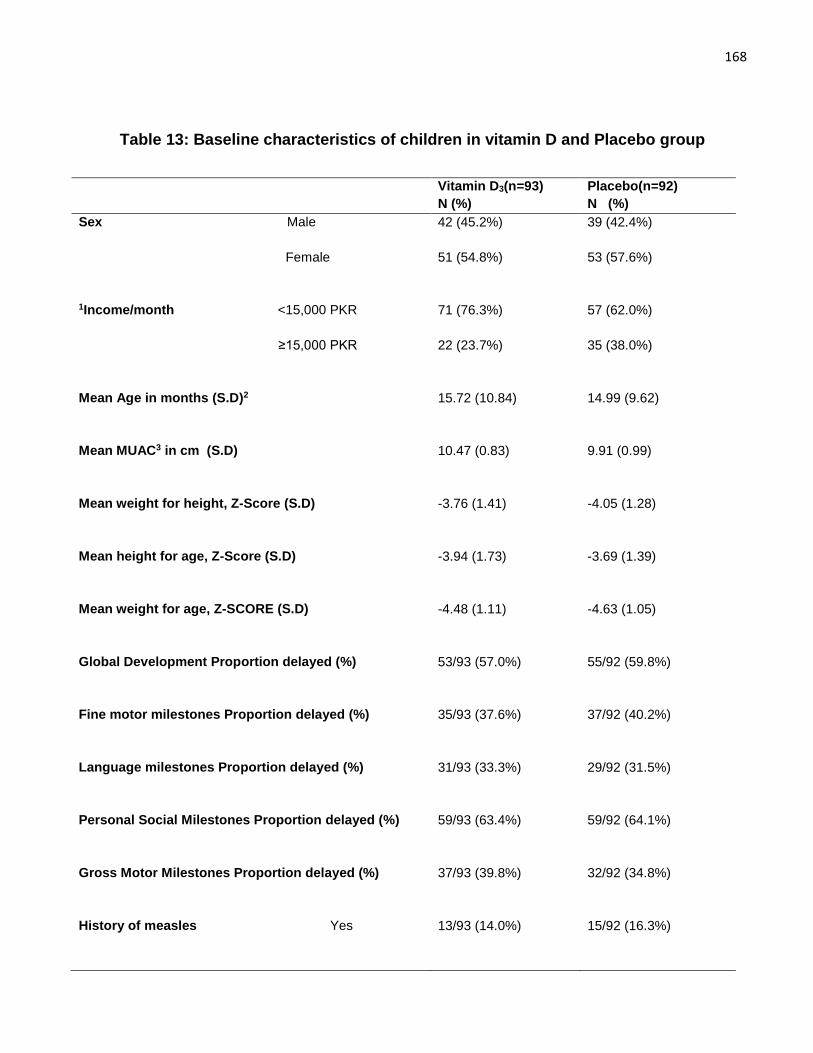
168
Table 13: Baseline characteristics of children in vitamin D and Placebo group
Vitamin D3(n=93)
N (%)
Placebo(n=92)
N (%)
Sex Male
42 (45.2%) 39 (42.4%)
Female
51 (54.8%)
53 (57.6%)
1Income/month <15,000 PKR
71 (76.3%) 57 (62.0%)
≥15,000 PKR
22 (23.7%)
35 (38.0%)
Mean Age in months (S.D)2
15.72 (10.84) 14.99 (9.62)
Mean MUAC3 in cm (S.D)
10.47 (0.83) 9.91 (0.99)
Mean weight for height, Z-Score (S.D)
-3.76 (1.41) -4.05 (1.28)
Mean height for age, Z-Score (S.D)
-3.94 (1.73) -3.69 (1.39)
Mean weight for age, Z-SCORE (S.D)
-4.48 (1.11) -4.63 (1.05)
Global Development Proportion delayed (%)
53/93 (57.0%) 55/92 (59.8%)
Fine motor milestones Proportion delayed (%)
35/93 (37.6%) 37/92 (40.2%)
Language milestones Proportion delayed (%)
31/93 (33.3%) 29/92 (31.5%)
Personal Social Milestones Proportion delayed (%)
59/93 (63.4%) 59/92 (64.1%)
Gross Motor Milestones Proportion delayed (%)
37/93 (39.8%) 32/92 (34.8%)
History of measles Yes
13/93 (14.0%) 15/92 (16.3%)
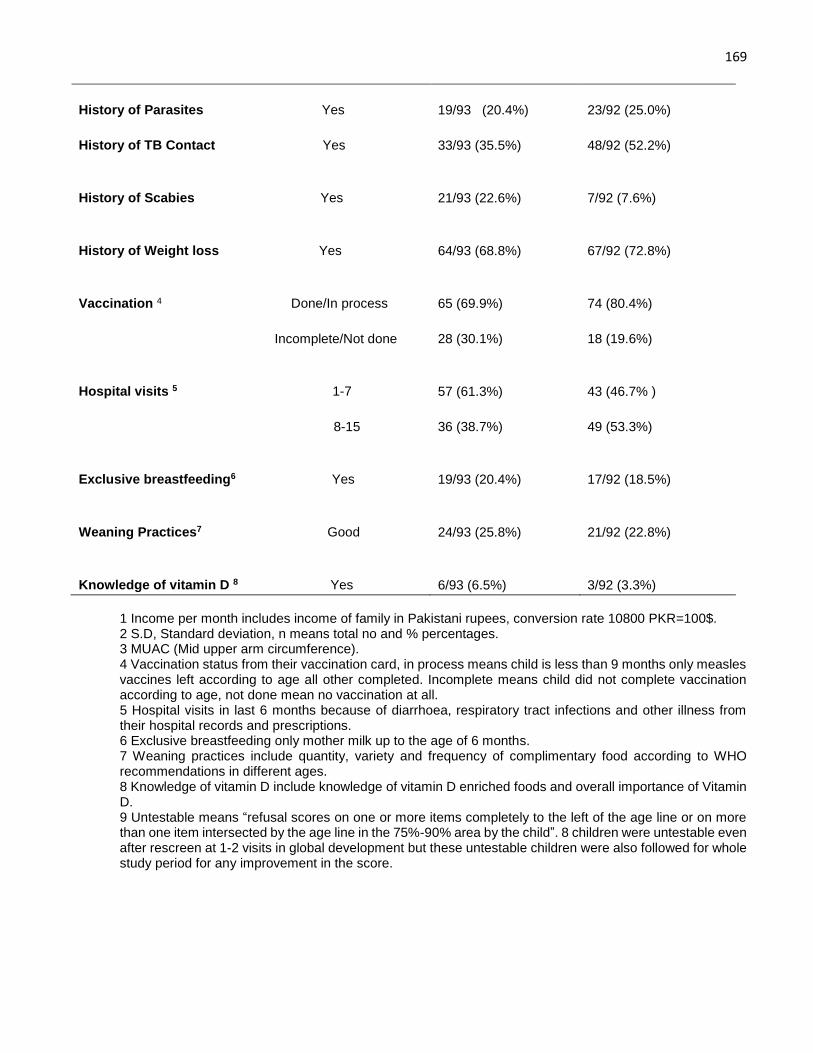
169
History of Parasites Yes
19/93 (20.4%)
23/92 (25.0%)
History of TB Contact Yes
33/93 (35.5%) 48/92 (52.2%)
History of Scabies Yes
21/93 (22.6%) 7/92 (7.6%)
History of Weight loss Yes
64/93 (68.8%) 67/92 (72.8%)
Vaccination 4 Done/In process
65 (69.9%)
74 (80.4%)
Incomplete/Not done
28 (30.1%)
18 (19.6%)
Hospital visits 5 1-7 57 (61.3%)
43 (46.7% )
8-15
36 (38.7%) 49 (53.3%)
Exclusive breastfeeding6 Yes
19/93 (20.4%) 17/92 (18.5%)
Weaning Practices7 Good
24/93 (25.8%) 21/92 (22.8%)
Knowledge of vitamin D 8 Yes 6/93 (6.5%) 3/92 (3.3%)
1 Income per month includes income of family in Pakistani rupees, conversion rate 10800 PKR=100$. 2 S.D, Standard deviation, n means total no and % percentages. 3 MUAC (Mid upper arm circumference). 4 Vaccination status from their vaccination card, in process means child is less than 9 months only measles vaccines left according to age all other completed. Incomplete means child did not complete vaccination according to age, not done mean no vaccination at all. 5 Hospital visits in last 6 months because of diarrhoea, respiratory tract infections and other illness from their hospital records and prescriptions. 6 Exclusive breastfeeding only mother milk up to the age of 6 months. 7 Weaning practices include quantity, variety and frequency of complimentary food according to WHO recommendations in different ages. 8 Knowledge of vitamin D include knowledge of vitamin D enriched foods and overall importance of Vitamin D. 9 Untestable means “refusal scores on one or more items completely to the left of the age line or on more than one item intersected by the age line in the 75%-90% area by the child”. 8 children were untestable even after rescreen at 1-2 visits in global development but these untestable children were also followed for whole study period for any improvement in the score.
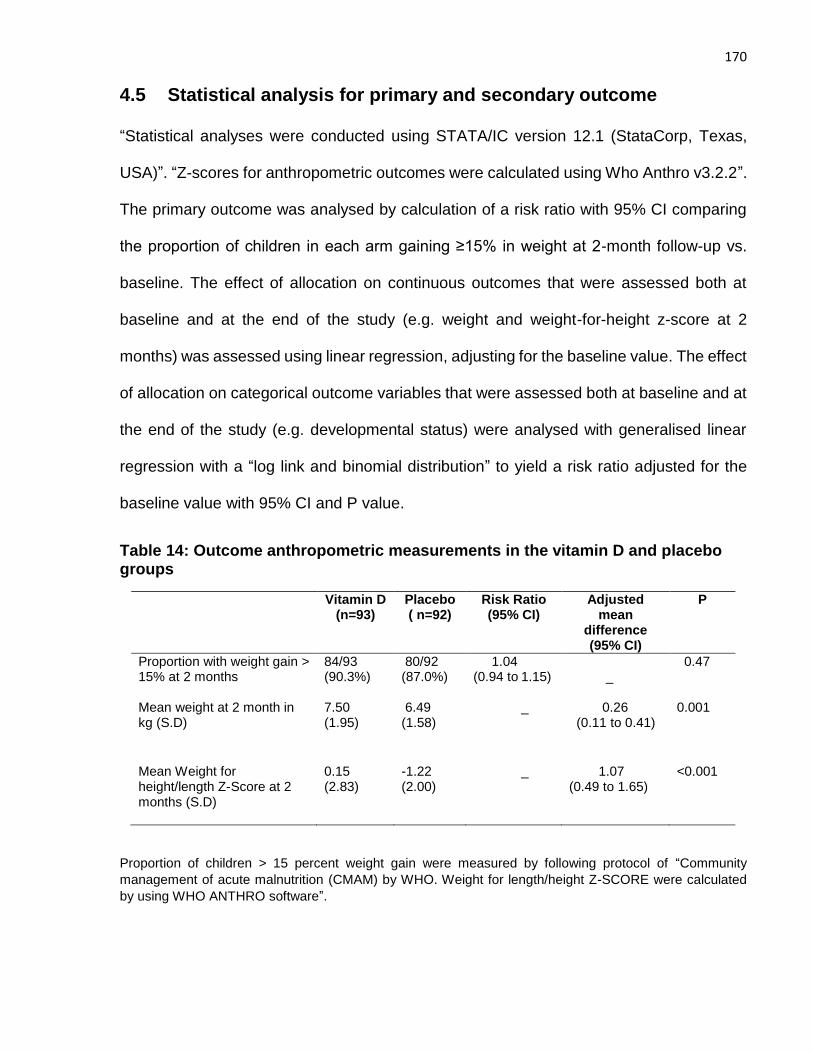
170
4.5 Statistical analysis for primary and secondary outcome
“Statistical analyses were conducted using STATA/IC version 12.1 (StataCorp, Texas,
USA)”. “Z-scores for anthropometric outcomes were calculated using Who Anthro v3.2.2”.
The primary outcome was analysed by calculation of a risk ratio with 95% CI comparing
the proportion of children in each arm gaining ≥15% in weight at 2-month follow-up vs.
baseline. The effect of allocation on continuous outcomes that were assessed both at
baseline and at the end of the study (e.g. weight and weight-for-height z-score at 2
months) was assessed using linear regression, adjusting for the baseline value. The effect
of allocation on categorical outcome variables that were assessed both at baseline and at
the end of the study (e.g. developmental status) were analysed with generalised linear
regression with a “log link and binomial distribution” to yield a risk ratio adjusted for the
baseline value with 95% CI and P value.
Table 14: Outcome anthropometric measurements in the vitamin D and placebo groups
Vitamin D (n=93)
Placebo ( n=92)
Risk Ratio (95% CI)
Adjusted mean
difference (95% CI)
P
Proportion with weight gain > 15% at 2 months
84/93 (90.3%)
80/92 (87.0%)
1.04 (0.94 to 1.15)
_
0.47
Mean weight at 2 month in kg (S.D)
7.50 (1.95)
6.49 (1.58)
_ 0.26 (0.11 to 0.41)
0.001
Mean Weight for height/length Z-Score at 2 months (S.D)
0.15 (2.83)
-1.22 (2.00)
_ 1.07 (0.49 to 1.65)
<0.001
Proportion of children > 15 percent weight gain were measured by following protocol of “Community
management of acute malnutrition (CMAM) by WHO. Weight for length/height Z-SCORE were calculated
by using WHO ANTHRO software”.
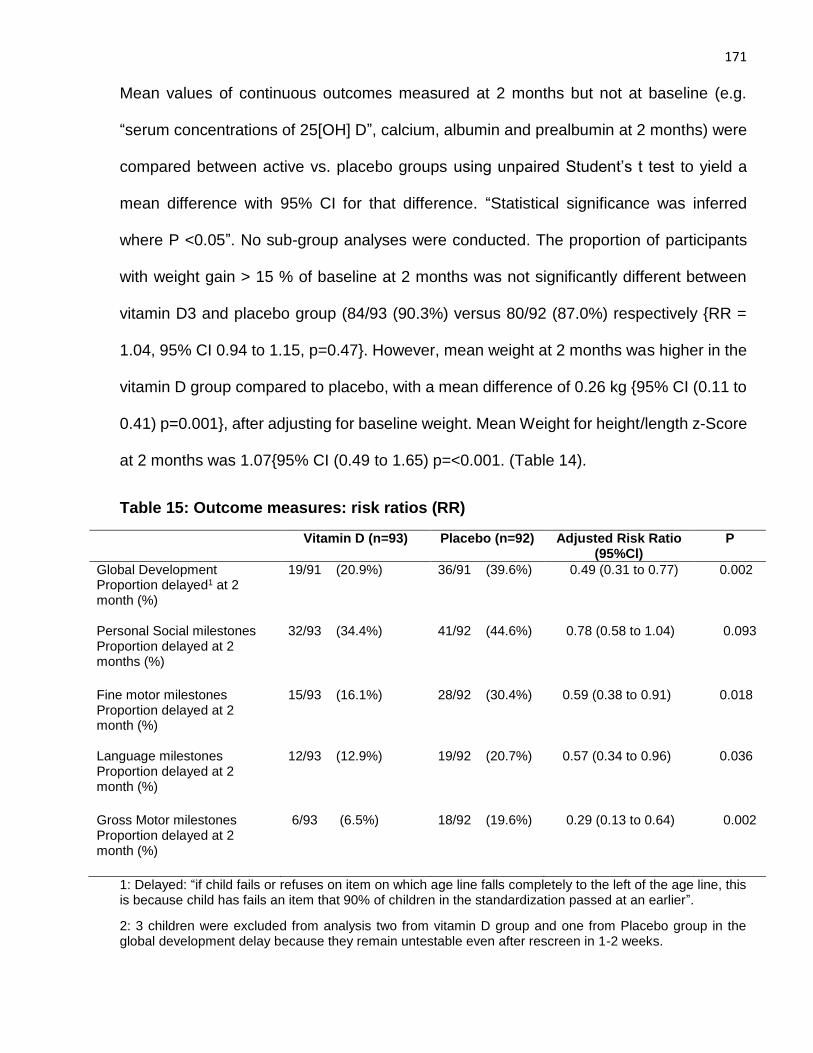
171
Mean values of continuous outcomes measured at 2 months but not at baseline (e.g.
“serum concentrations of 25[OH] D”, calcium, albumin and prealbumin at 2 months) were
compared between active vs. placebo groups using unpaired Student’s t test to yield a
mean difference with 95% CI for that difference. “Statistical significance was inferred
where P <0.05”. No sub-group analyses were conducted. The proportion of participants
with weight gain > 15 % of baseline at 2 months was not significantly different between
vitamin D3 and placebo group (84/93 (90.3%) versus 80/92 (87.0%) respectively {RR =
1.04, 95% CI 0.94 to 1.15, p=0.47}. However, mean weight at 2 months was higher in the
vitamin D group compared to placebo, with a mean difference of 0.26 kg {95% CI (0.11 to
0.41) p=0.001}, after adjusting for baseline weight. Mean Weight for height/length z-Score
at 2 months was 1.07{95% CI (0.49 to 1.65) p=<0.001. (Table 14).
Table 15: Outcome measures: risk ratios (RR)
Vitamin D (n=93) Placebo (n=92) Adjusted Risk Ratio (95%Cl)
P
Global Development Proportion delayed1 at 2 month (%)
19/91 (20.9%) 36/91 (39.6%) 0.49 (0.31 to 0.77)
0.002
Personal Social milestones Proportion delayed at 2 months (%)
32/93 (34.4%) 41/92 (44.6%) 0.78 (0.58 to 1.04)
0.093
Fine motor milestones Proportion delayed at 2 month (%)
15/93 (16.1%) 28/92 (30.4%) 0.59 (0.38 to 0.91) 0.018
Language milestones Proportion delayed at 2 month (%)
12/93 (12.9%) 19/92 (20.7%) 0.57 (0.34 to 0.96)
0.036
Gross Motor milestones Proportion delayed at 2 month (%)
6/93 (6.5%) 18/92 (19.6%) 0.29 (0.13 to 0.64)
0.002
1: Delayed: “if child fails or refuses on item on which age line falls completely to the left of the age line, this is because child has fails an item that 90% of children in the standardization passed at an earlier”.
2: 3 children were excluded from analysis two from vitamin D group and one from Placebo group in the global development delay because they remain untestable even after rescreen in 1-2 weeks.
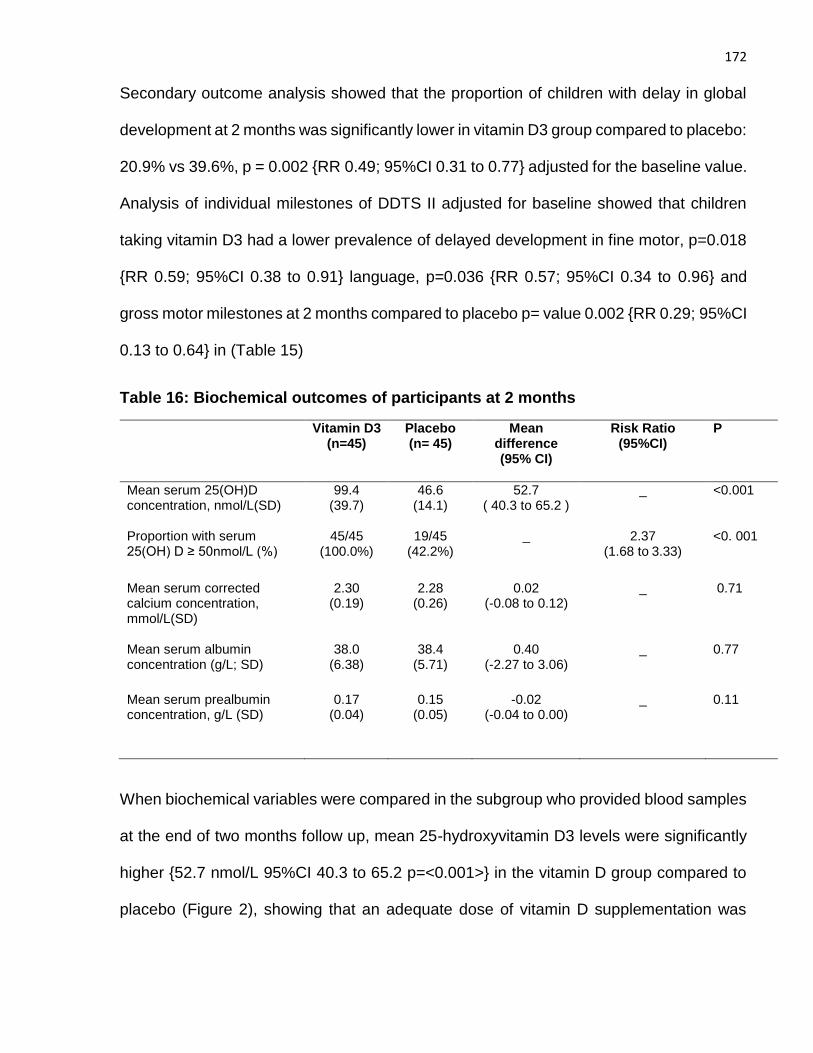
172
Secondary outcome analysis showed that the proportion of children with delay in global
development at 2 months was significantly lower in vitamin D3 group compared to placebo:
20.9% vs 39.6%, p = 0.002 {RR 0.49; 95%CI 0.31 to 0.77} adjusted for the baseline value.
Analysis of individual milestones of DDTS II adjusted for baseline showed that children
taking vitamin D3 had a lower prevalence of delayed development in fine motor, p=0.018
{RR 0.59; 95%CI 0.38 to 0.91} language, p=0.036 {RR 0.57; 95%CI 0.34 to 0.96} and
gross motor milestones at 2 months compared to placebo p= value 0.002 {RR 0.29; 95%CI
0.13 to 0.64} in (Table 15)
Table 16: Biochemical outcomes of participants at 2 months
Vitamin D3 (n=45)
Placebo (n= 45)
Mean difference (95% CI)
Risk Ratio (95%CI)
P
Mean serum 25(OH)D concentration, nmol/L(SD)
99.4 (39.7)
46.6 (14.1)
52.7 ( 40.3 to 65.2 )
_ <0.001
Proportion with serum 25(OH) D ≥ 50nmol/L (%)
45/45 (100.0%)
19/45 (42.2%)
_ 2.37 (1.68 to 3.33)
<0. 001
Mean serum corrected calcium concentration, mmol/L(SD)
2.30 (0.19)
2.28 (0.26)
0.02 (-0.08 to 0.12)
_ 0.71
Mean serum albumin concentration (g/L; SD)
38.0 (6.38)
38.4 (5.71)
0.40 (-2.27 to 3.06)
_ 0.77
Mean serum prealbumin concentration, g/L (SD)
0.17 (0.04)
0.15 (0.05)
-0.02 (-0.04 to 0.00)
_ 0.11
When biochemical variables were compared in the subgroup who provided blood samples
at the end of two months follow up, mean 25-hydroxyvitamin D3 levels were significantly
higher {52.7 nmol/L 95%CI 40.3 to 65.2 p=<0.001>} in the vitamin D group compared to
placebo (Figure 2), showing that an adequate dose of vitamin D supplementation was
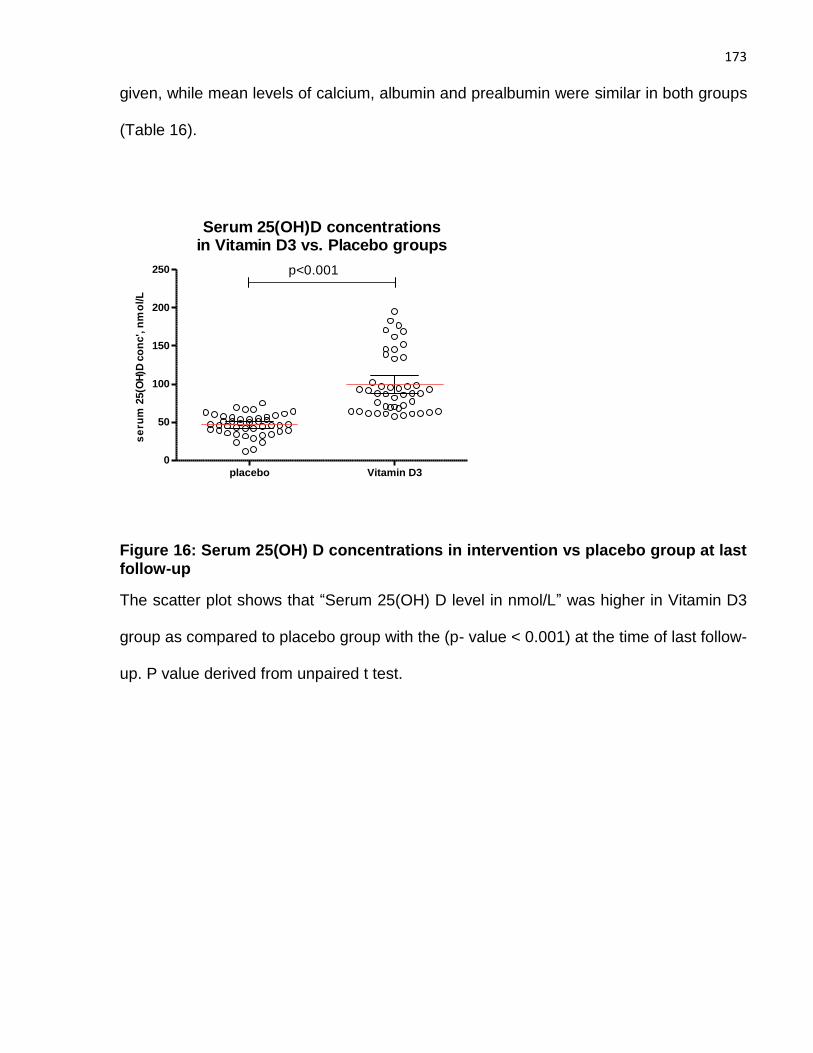
173
given, while mean levels of calcium, albumin and prealbumin were similar in both groups
(Table 16).
placebo Vitamin D3
0
50
100
150
200
250
Serum 25(OH)D concentrationsin Vitamin D3 vs. Placebo groups
p<0.001
se
rum
25(O
H)D
co
nc', n
mo
l/L
Figure 16: Serum 25(OH) D concentrations in intervention vs placebo group at last follow-up
The scatter plot shows that “Serum 25(OH) D level in nmol/L” was higher in Vitamin D3
group as compared to placebo group with the (p- value < 0.001) at the time of last follow-
up. P value derived from unpaired t test.
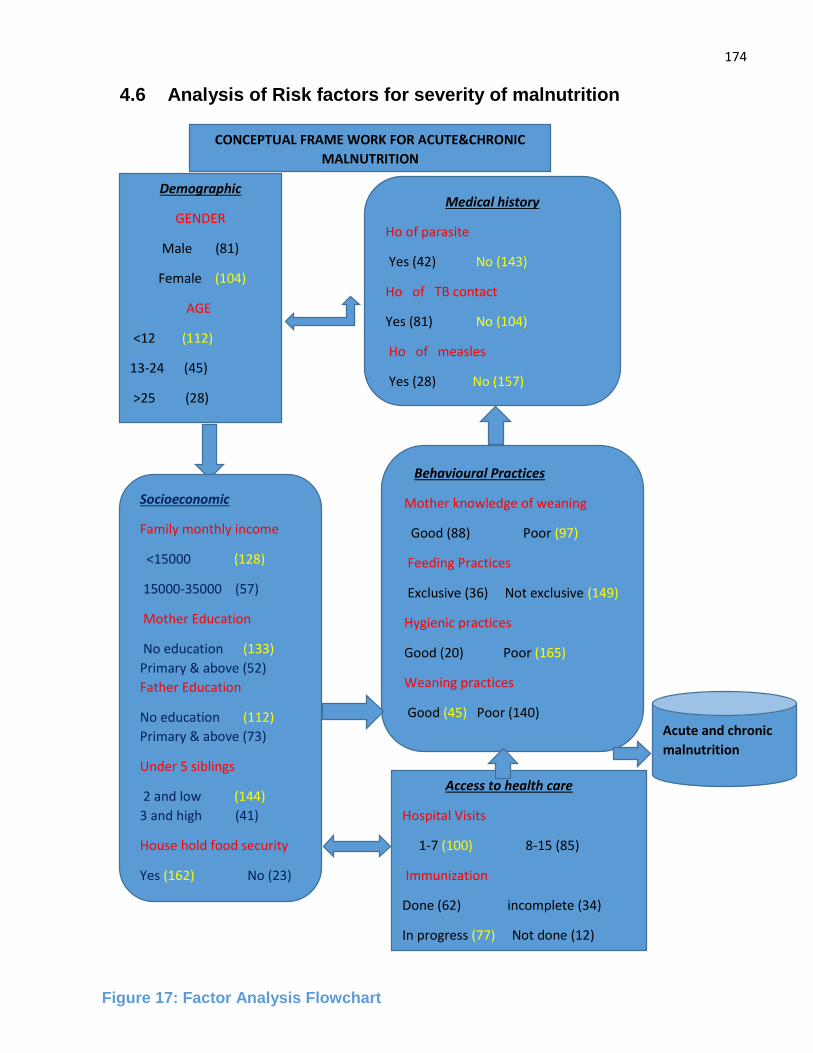
174
4.6 Analysis of Risk factors for severity of malnutrition
Demographic
GENDER
Male (81)
Female (104)
AGE
<12 (112)
13-24 (45)
>25 (28)
Medical history
Ho of parasite
Yes (42) No (143)
Ho of TB contact
Yes (81) No (104)
Ho of measles
Yes (28) No (157)
Behavioural Practices
Mother knowledge of weaning
Good (88) Poor (97)
Feeding Practices
Exclusive (36) Not exclusive (149)
Hygienic practices
Good (20) Poor (165)
Weaning practices
Good (45) Poor (140)
Access to health care
Hospital Visits
1-7 (100) 8-15 (85)
Immunization
Done (62) incomplete (34)
In progress (77) Not done (12)
Acute and chronic
malnutrition
CONCEPTUAL FRAME WORK FOR ACUTE&CHRONIC
MALNUTRITION
Socioeconomic
Family monthly income
<15000 (128)
15000-35000 (57)
Mother Education
No education (133)
Primary & above (52)
Father Education
No education (112)
Primary & above (73)
Under 5 siblings
2 and low (144)
3 and high (41)
House hold food security
Yes (162) No (23)
Figure 17: Factor Analysis Flowchart
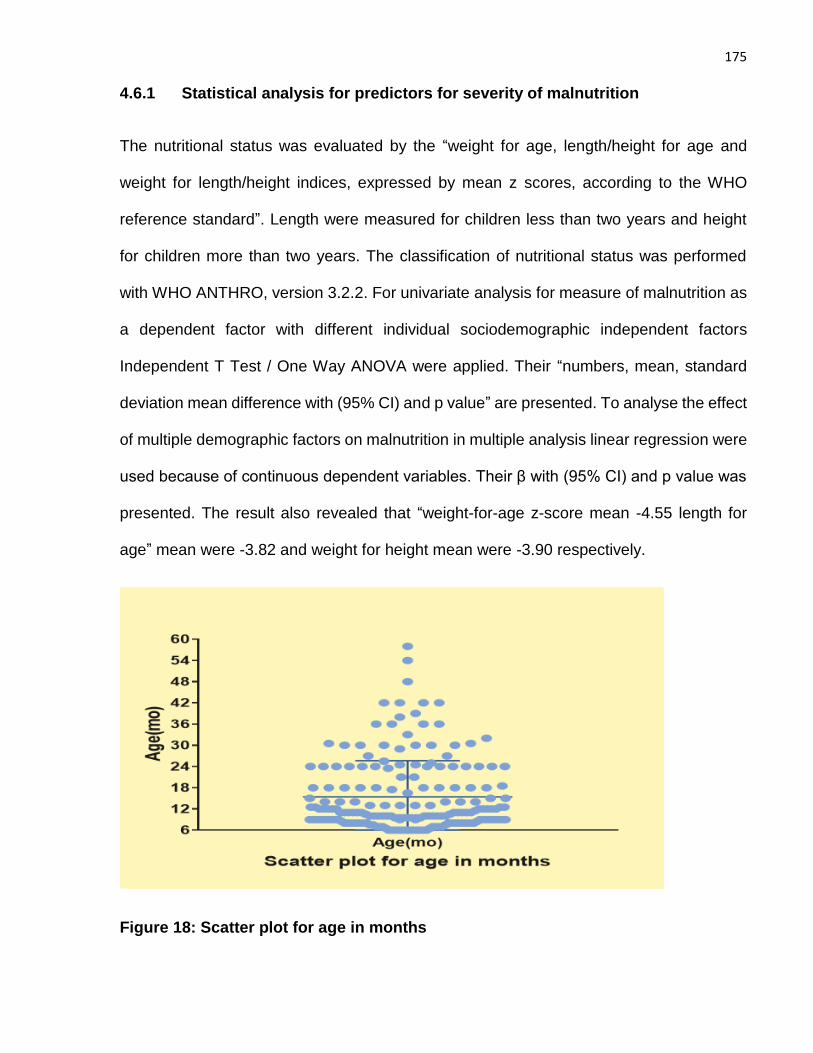
175
4.6.1 Statistical analysis for predictors for severity of malnutrition
The nutritional status was evaluated by the “weight for age, length/height for age and
weight for length/height indices, expressed by mean z scores, according to the WHO
reference standard”. Length were measured for children less than two years and height
for children more than two years. The classification of nutritional status was performed
with WHO ANTHRO, version 3.2.2. For univariate analysis for measure of malnutrition as
a dependent factor with different individual sociodemographic independent factors
Independent T Test / One Way ANOVA were applied. Their “numbers, mean, standard
deviation mean difference with (95% CI) and p value” are presented. To analyse the effect
of multiple demographic factors on malnutrition in multiple analysis linear regression were
used because of continuous dependent variables. Their β with (95% CI) and p value was
presented. The result also revealed that “weight-for-age z-score mean -4.55 length for
age” mean were -3.82 and weight for height mean were -3.90 respectively.
Figure 18: Scatter plot for age in months
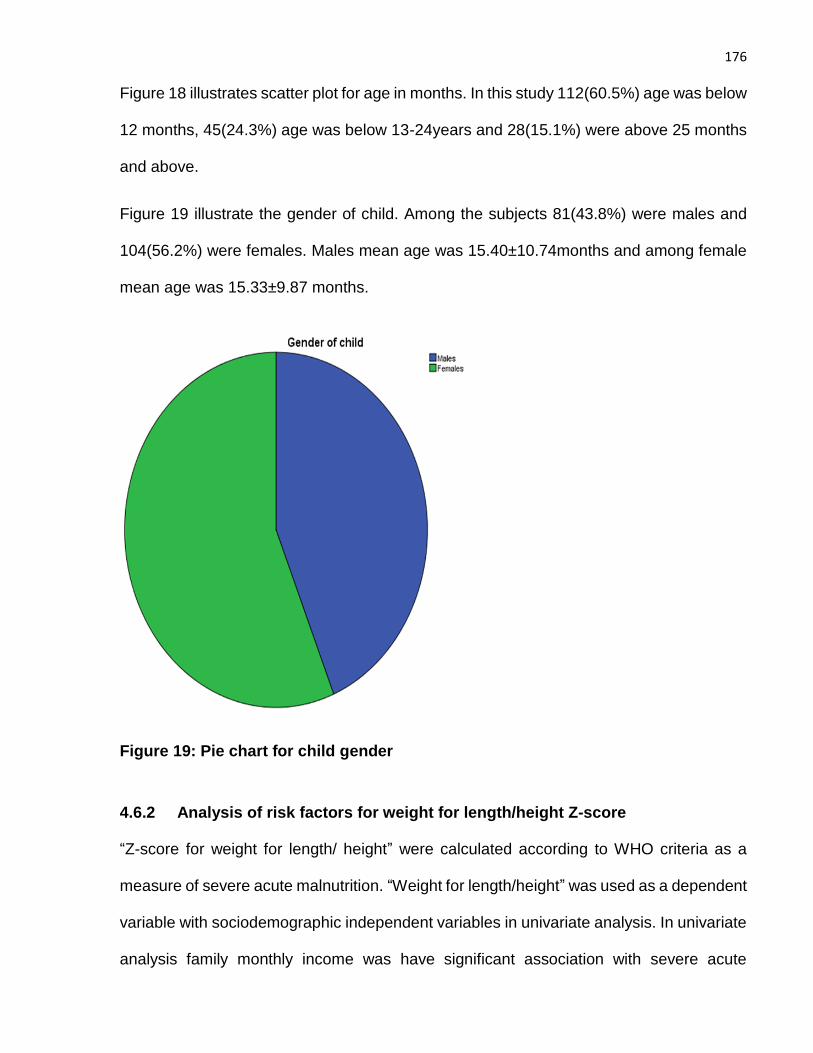
176
Figure 18 illustrates scatter plot for age in months. In this study 112(60.5%) age was below
12 months, 45(24.3%) age was below 13-24years and 28(15.1%) were above 25 months
and above.
Figure 19 illustrate the gender of child. Among the subjects 81(43.8%) were males and
104(56.2%) were females. Males mean age was 15.40±10.74months and among female
mean age was 15.33±9.87 months.
Figure 19: Pie chart for child gender
4.6.2 Analysis of risk factors for weight for length/height Z-score
“Z-score for weight for length/ height” were calculated according to WHO criteria as a
measure of severe acute malnutrition. “Weight for length/height” was used as a dependent
variable with sociodemographic independent variables in univariate analysis. In univariate
analysis family monthly income was have significant association with severe acute
177
malnutrition with the mean difference of 0.43 {95% CI (0.01 to 0.85) p=0.04}.Weaning
practices that include quantity, variety and frequency of complimentary feeding according
to WHO recommendation was also show statistical significance with measure of acute
malnutrition with the mean difference of 0.51 {95% CI (0.05 to 0.96) p=0.03}.None of
others variable shows any statistical significance with “weight for length /height z-score”
on univariate analysis .By applying linear regression for multivariate analysis both family
monthly income and weaning practices still shows significance but no other factor show
any significance. In multivariate analysis family income have β - 0.16 with {95% CI (-0.89
to -0.04) p=0.03} p value is slightly increase in multivariate analysis as compared to
univariate. Weaning practices on multivariate analysis have β -0.21 {95% CI (-1.14 to 0.19)
p=0.01} p value also increases in weaning practices in multivariate analysis. Others non-
significant factors in both univariate and multivariate analysis were gender, age, history of
parasites in Intestine, TB contact history, measles history, immunization status and
hospital visits in last 6 months. Their mean difference with (95% CI) and p value in
univariate and β with (95% CI) and p value in multivariate analysis were presented in
(Table 17).
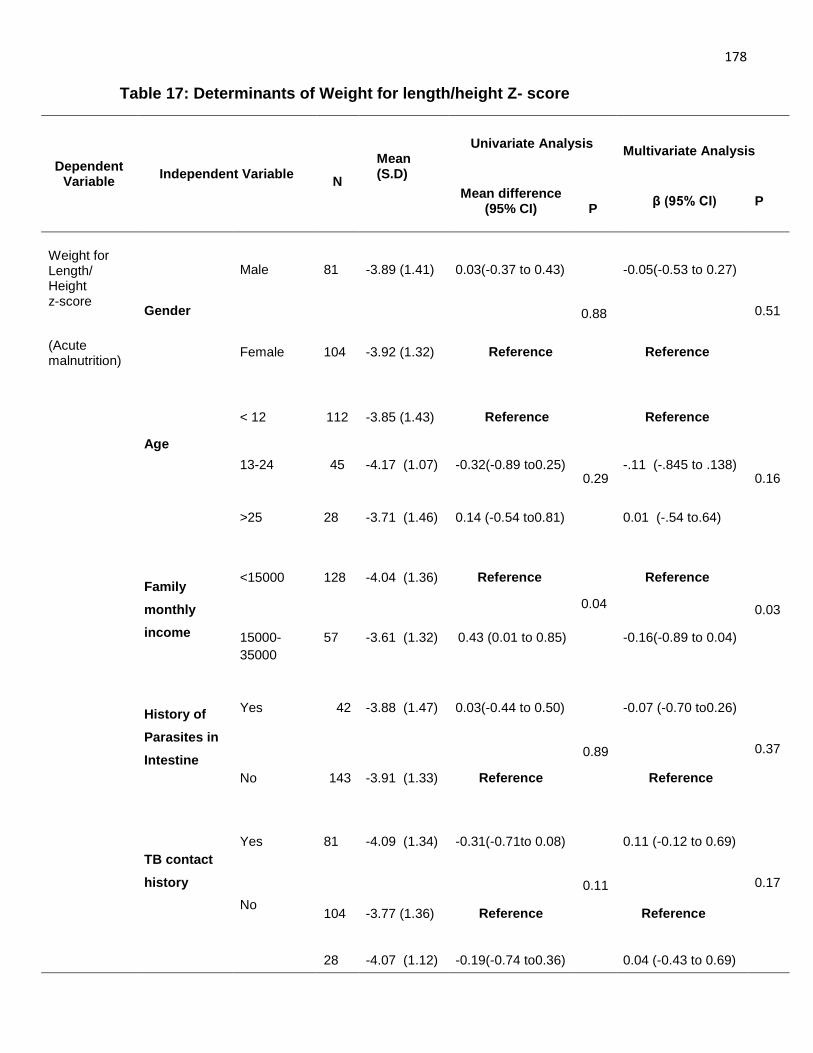
178
Table 17: Determinants of Weight for length/height Z- score
Dependent Variable
Independent Variable
N
Mean (S.D)
Univariate Analysis
Multivariate Analysis
Mean difference (95% CI)
P
β (95% CI) P
Weight for Length/ Height z-score
Gender
Male 81 -3.89 (1.41) 0.03(-0.37 to 0.43)
0.88
-0.05(-0.53 to 0.27)
0.51
(Acute malnutrition)
Female
104
-3.92 (1.32)
Reference Reference
Age
< 12 112 -3.85 (1.43) Reference
0.29
Reference
0.16
13-24
45
-4.17 (1.07)
-0.32(-0.89 to0.25)
-.11 (-.845 to .138)
>25
28
-3.71 (1.46)
0.14 (-0.54 to0.81)
0.01 (-.54 to.64)
Family
monthly
income
<15000
128
-4.04 (1.36)
Reference
0.04
Reference
0.03
15000-
35000
57
-3.61 (1.32)
0.43 (0.01 to 0.85) -0.16(-0.89 to 0.04)
History of
Parasites in
Intestine
Yes 42 -3.88 (1.47) 0.03(-0.44 to 0.50)
0.89
-0.07 (-0.70 to0.26)
0.37
No
143 -3.91 (1.33)
Reference
Reference
TB contact
history
Yes 81 -4.09 (1.34) -0.31(-0.71to 0.08)
0.11
0.11 (-0.12 to 0.69)
0.17
No
104
-3.77 (1.36)
Reference
Reference
28 -4.07 (1.12) -0.19(-0.74 to0.36) 0.04 (-0.43 to 0.69)
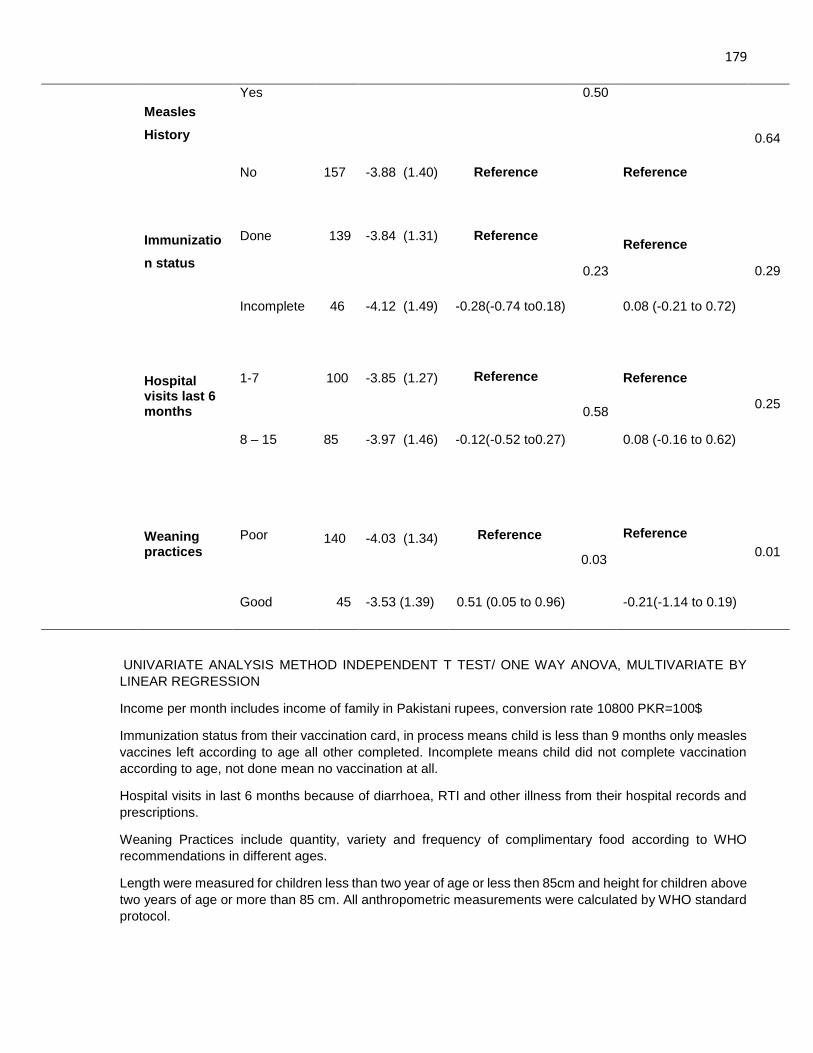
179
Measles
History
Yes
0.50
0.64
No 157 -3.88 (1.40) Reference Reference
Immunizatio
n status
Done 139 -3.84 (1.31) Reference
0.23
Reference
0.29
Incomplete 46
-4.12 (1.49)
-0.28(-0.74 to0.18)
0.08 (-0.21 to 0.72)
Hospital visits last 6 months
1-7
100
-3.85 (1.27)
Reference
0.58
Reference
0.25
8 – 15 85 -3.97 (1.46) -0.12(-0.52 to0.27) 0.08 (-0.16 to 0.62)
Weaning practices
Poor
140
-4.03 (1.34)
Reference
0.03
Reference
0.01
Good
45
-3.53 (1.39)
0.51 (0.05 to 0.96)
-0.21(-1.14 to 0.19)
UNIVARIATE ANALYSIS METHOD INDEPENDENT T TEST/ ONE WAY ANOVA, MULTIVARIATE BY
LINEAR REGRESSION
Income per month includes income of family in Pakistani rupees, conversion rate 10800 PKR=100$
Immunization status from their vaccination card, in process means child is less than 9 months only measles
vaccines left according to age all other completed. Incomplete means child did not complete vaccination
according to age, not done mean no vaccination at all.
Hospital visits in last 6 months because of diarrhoea, RTI and other illness from their hospital records and
prescriptions.
Weaning Practices include quantity, variety and frequency of complimentary food according to WHO
recommendations in different ages.
Length were measured for children less than two year of age or less then 85cm and height for children above
two years of age or more than 85 cm. All anthropometric measurements were calculated by WHO standard
protocol.
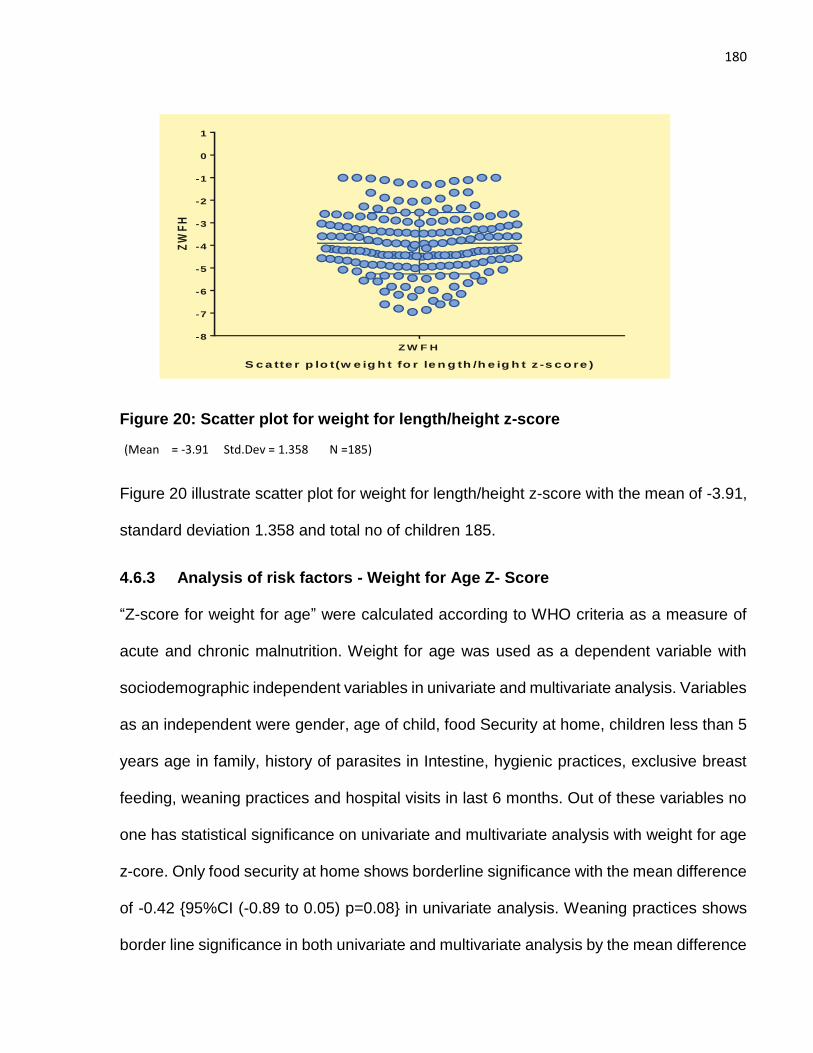
180
Figure 20: Scatter plot for weight for length/height z-score
(Mean = -3.91 Std.Dev = 1.358 N =185)
Figure 20 illustrate scatter plot for weight for length/height z-score with the mean of -3.91,
standard deviation 1.358 and total no of children 185.
4.6.3 Analysis of risk factors - Weight for Age Z- Score
“Z-score for weight for age” were calculated according to WHO criteria as a measure of
acute and chronic malnutrition. Weight for age was used as a dependent variable with
sociodemographic independent variables in univariate and multivariate analysis. Variables
as an independent were gender, age of child, food Security at home, children less than 5
years age in family, history of parasites in Intestine, hygienic practices, exclusive breast
feeding, weaning practices and hospital visits in last 6 months. Out of these variables no
one has statistical significance on univariate and multivariate analysis with weight for age
z-core. Only food security at home shows borderline significance with the mean difference
of -0.42 {95%CI (-0.89 to 0.05) p=0.08} in univariate analysis. Weaning practices shows
border line significance in both univariate and multivariate analysis by the mean difference
Z W F H
-8
-7
-6
-5
-4
-3
-2
-1
0
1
S c a tte r p lo t(w e ig h t fo r le n g th /h e ig h t z -s c o re )
ZW
FH
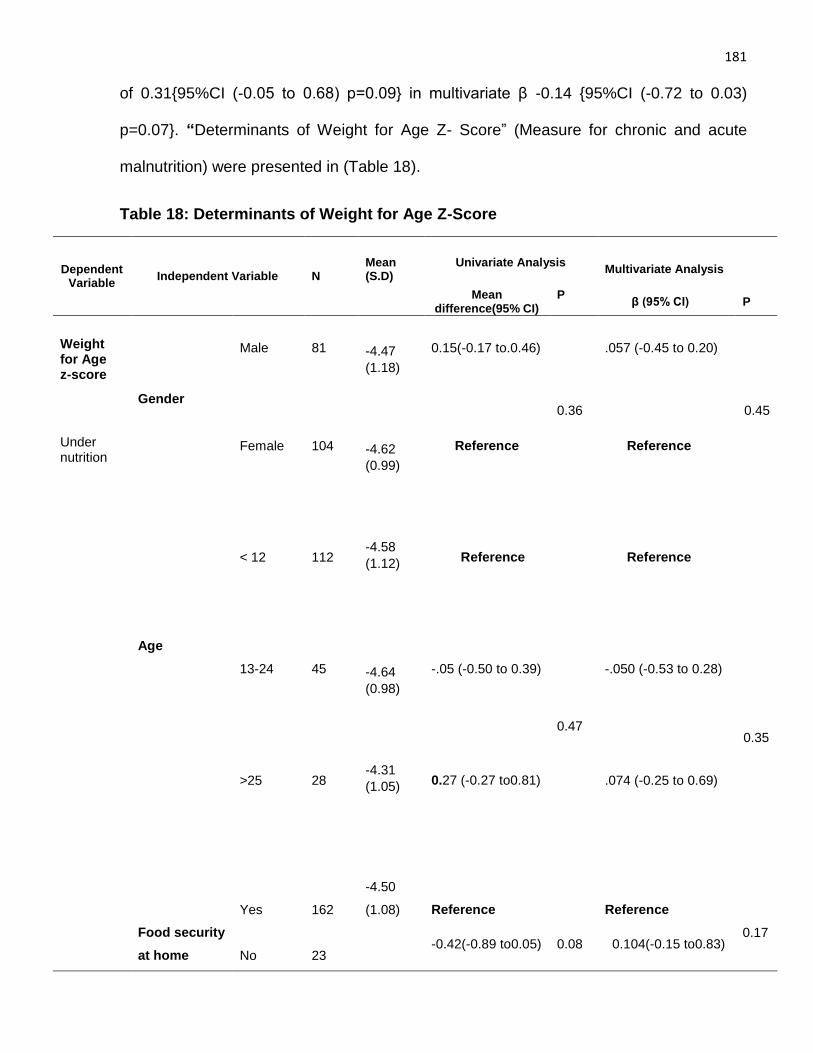
181
of 0.31{95%CI (-0.05 to 0.68) p=0.09} in multivariate β -0.14 {95%CI (-0.72 to 0.03)
p=0.07}. “Determinants of Weight for Age Z- Score” (Measure for chronic and acute
malnutrition) were presented in (Table 18).
Table 18: Determinants of Weight for Age Z-Score
Dependent Variable
Independent Variable N Mean (S.D)
Univariate Analysis
Multivariate Analysis
Mean difference(95% CI)
P
β (95% CI) P
Weight for Age z-score
Gender
Male 81
-4.47
(1.18)
0.15(-0.17 to.0.46)
0.36
.057 (-0.45 to 0.20)
0.45
Under nutrition
Female 104
-4.62
(0.99)
Reference Reference
Age
< 12 112
-4.58
(1.12)
Reference
0.47
Reference
0.35
13-24 45
-4.64
(0.98)
-.05 (-0.50 to 0.39) -.050 (-0.53 to 0.28)
>25
28
-4.31
(1.05)
0.27 (-0.27 to0.81) .074 (-0.25 to 0.69)
Food security
at home
Yes
162
-4.50
(1.08)
Reference
0.08
Reference
0.17
No
23
-0.42(-0.89 to0.05) 0.104(-0.15 to0.83)
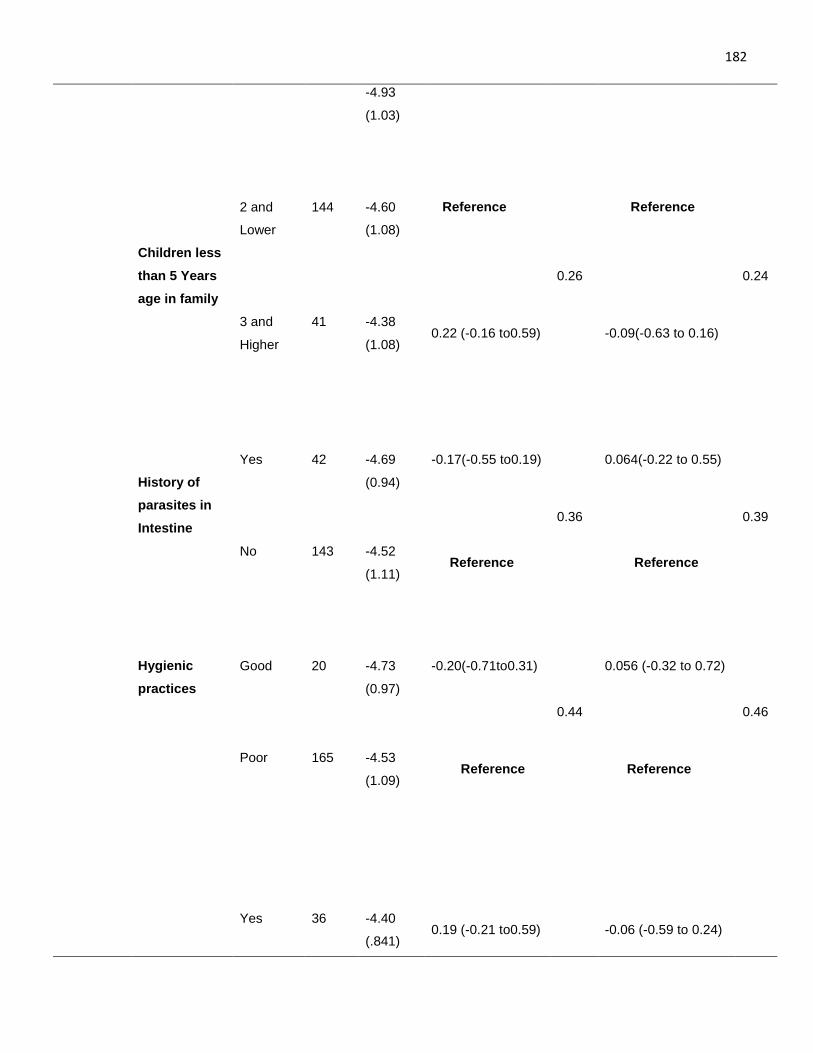
182
-4.93
(1.03)
Children less
than 5 Years
age in family
2 and
Lower
144
-4.60
(1.08)
Reference
0.26
Reference
0.24
3 and
Higher
41
-4.38
(1.08)
0.22 (-0.16 to0.59) -0.09(-0.63 to 0.16)
History of
parasites in
Intestine
Yes
42
-4.69
(0.94)
-0.17(-0.55 to0.19)
0.36
0.064(-0.22 to 0.55)
0.39
No
143
-4.52
(1.11)
Reference Reference
Hygienic
practices
Good
20
-4.73
(0.97)
-0.20(-0.71to0.31)
0.44
0.056 (-0.32 to 0.72)
0.46
Poor
165
-4.53
(1.09)
Reference Reference
Yes
36
-4.40
(.841)
0.19 (-0.21 to0.59)
-0.06 (-0.59 to 0.24)
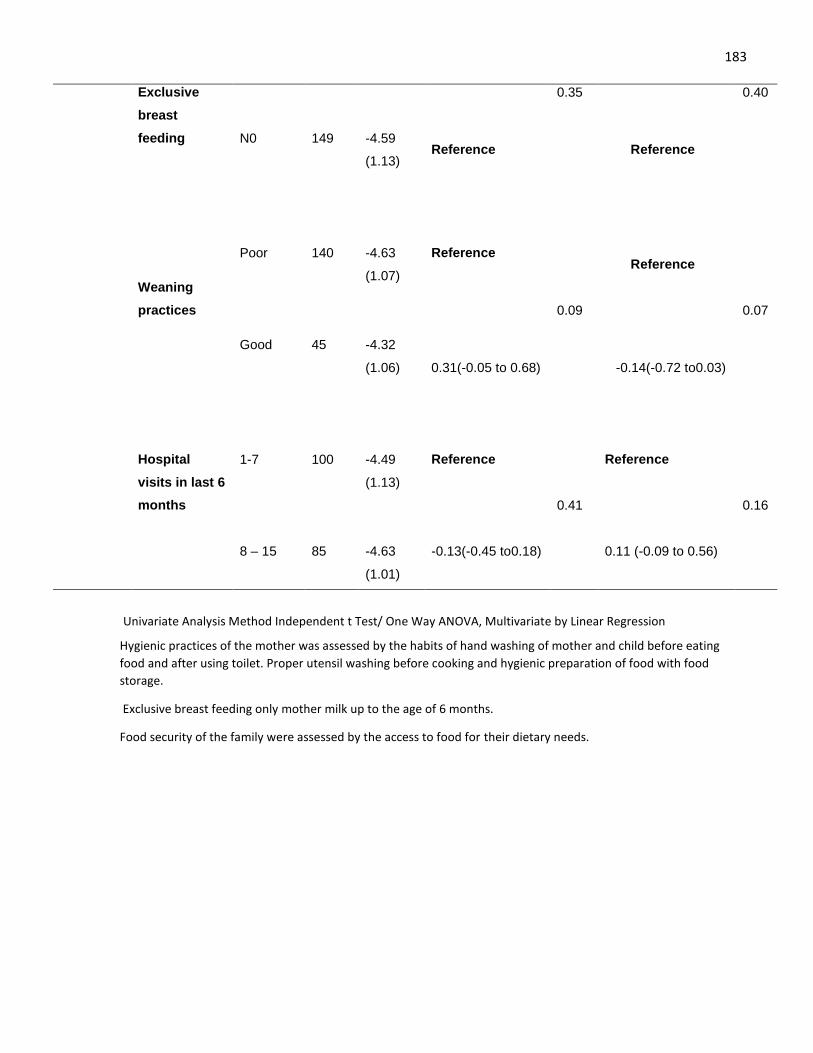
183
Exclusive
breast
feeding
0.35
0.40
N0
149
-4.59
(1.13)
Reference Reference
Weaning
practices
Poor
140
-4.63
(1.07)
Reference
0.09
Reference
0.07
Good 45 -4.32
(1.06)
0.31(-0.05 to 0.68) -0.14(-0.72 to0.03)
Hospital
visits in last 6
months
1-7
100
-4.49
(1.13)
Reference
0.41
Reference
0.16
8 – 15
85
-4.63
(1.01)
-0.13(-0.45 to0.18) 0.11 (-0.09 to 0.56)
Univariate Analysis Method Independent t Test/ One Way ANOVA, Multivariate by Linear Regression
Hygienic practices of the mother was assessed by the habits of hand washing of mother and child before eating
food and after using toilet. Proper utensil washing before cooking and hygienic preparation of food with food
storage.
Exclusive breast feeding only mother milk up to the age of 6 months.
Food security of the family were assessed by the access to food for their dietary needs.
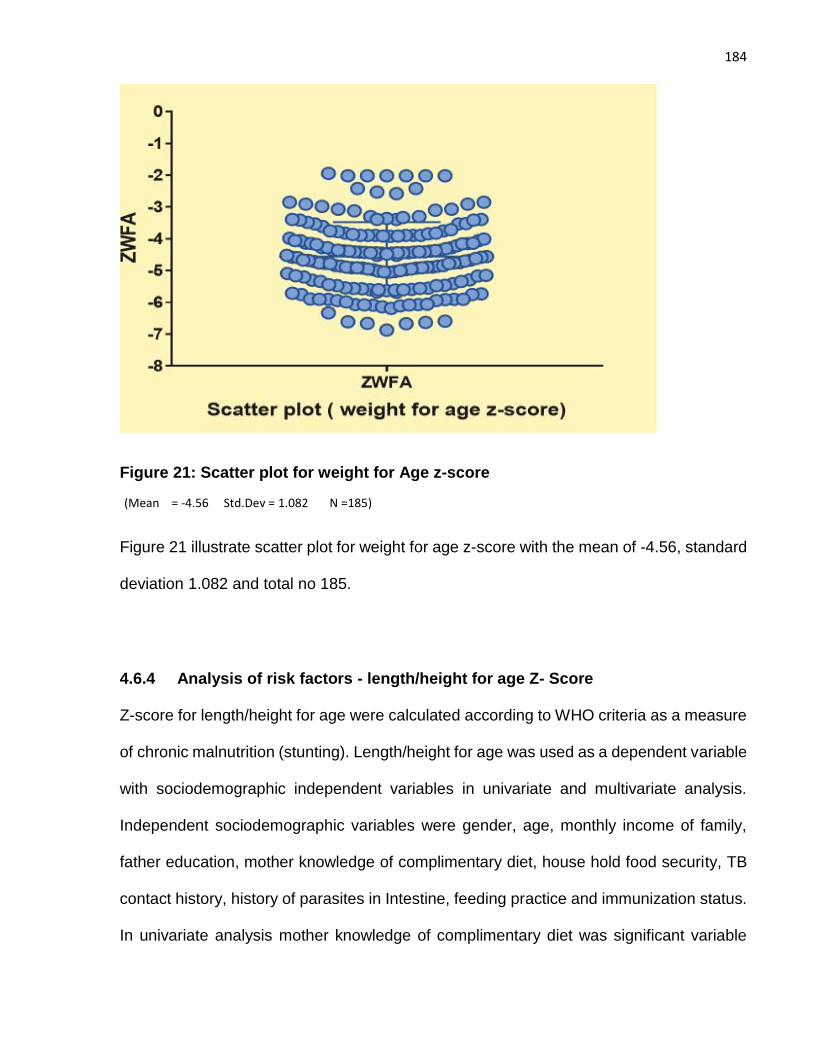
184
Figure 21: Scatter plot for weight for Age z-score
(Mean = -4.56 Std.Dev = 1.082 N =185)
Figure 21 illustrate scatter plot for weight for age z-score with the mean of -4.56, standard
deviation 1.082 and total no 185.
4.6.4 Analysis of risk factors - length/height for age Z- Score
Z-score for length/height for age were calculated according to WHO criteria as a measure
of chronic malnutrition (stunting). Length/height for age was used as a dependent variable
with sociodemographic independent variables in univariate and multivariate analysis.
Independent sociodemographic variables were gender, age, monthly income of family,
father education, mother knowledge of complimentary diet, house hold food security, TB
contact history, history of parasites in Intestine, feeding practice and immunization status.
In univariate analysis mother knowledge of complimentary diet was significant variable
185
with the mean difference of -0.50 {95%CI (-0.95 to 0.05) p= 0.03}, house hold food security
also show statistical significance in univariate analysis with the mean difference of 0.79
{95%CI (-1.48 to -0.11) p= 0.02} and exclusive breast feeding practices was significant
with the mean difference of 0.75 {95%CI (0.18 to 1.31) p= 0.01}.
History of TB contact in univariate analysis showed borderline significance with the mean
difference of 0.41 {95%CI (-0.53 to 0.86) p= 0.08}.In multivariate analysis by using linear
regression family monthly income become significant with the β -0.16 {95%CI (0.26 to
1.08)p=0.04} mother knowledge of complimentary diet with the β 0.15 {95%CI (0.25 to
0.96) p=0.03} house hold food security with the β 0.16 {95%CI (0.11 to 1.48) p=0.02} and
exclusive breast feeding practices with the β -0.22 {95%CI (-1.47 to -0.30) p=0.00} also
show statistical significance in multivariate analysis. Father education show borderline
significance in multivariate analysis with the β -0.15 {95%CI (-0.99 to 0.01) p=0.05}. All
other independent variables did not show significant association with length/height for age
z-score for measure of chronic malnutrition. Analysis of length/height for age z-score with
socio-demographic variables was presented in (Table 19).
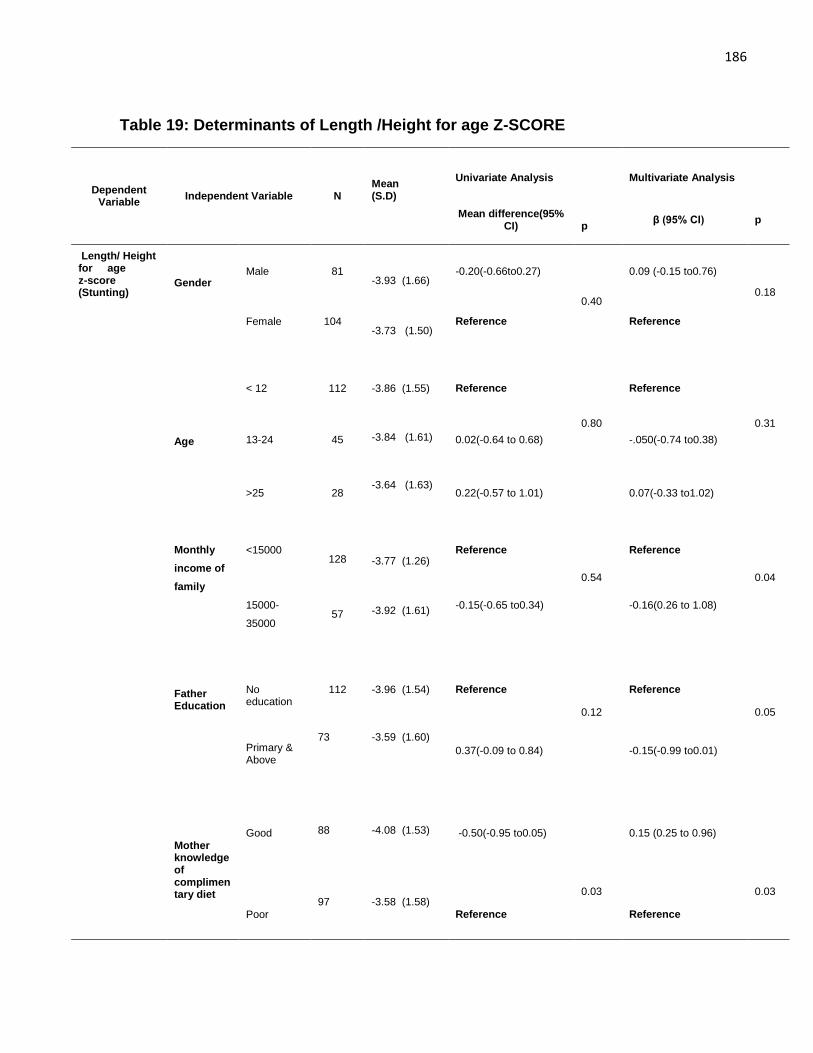
186
Table 19: Determinants of Length /Height for age Z-SCORE
Dependent Variable
Independent Variable N Mean (S.D)
Univariate Analysis
Multivariate Analysis
Mean difference(95% CI)
p
β (95% CI) p
Length/ Height for age z-score (Stunting)
Gender
Male 81
-3.93 (1.66) -0.20(-0.66to0.27)
0.40
0.09 (-0.15 to0.76)
0.18
Female 104
-3.73 (1.50) Reference Reference
Age
< 12
112
-3.86 (1.55)
Reference
0.80
Reference
0.31
13-24 45
-3.84 (1.61) 0.02(-0.64 to 0.68) -.050(-0.74 to0.38)
>25
28
-3.64 (1.63)
0.22(-0.57 to 1.01)
0.07(-0.33 to1.02)
Monthly
income of
family
<15000
128
-3.77 (1.26)
Reference
0.54
Reference
0.04
15000-
35000
57
-3.92 (1.61) -0.15(-0.65 to0.34) -0.16(0.26 to 1.08)
Father Education
No education
112
-3.96 (1.54)
Reference
0.12
Reference
0.05
Primary & Above
73 -3.59 (1.60)
0.37(-0.09 to 0.84) -0.15(-0.99 to0.01)
Mother knowledge of complimentary diet
Good
88
-4.08 (1.53) -0.50(-0.95 to0.05)
0.03
0.15 (0.25 to 0.96)
0.03
Poor
97 -3.58 (1.58) Reference Reference
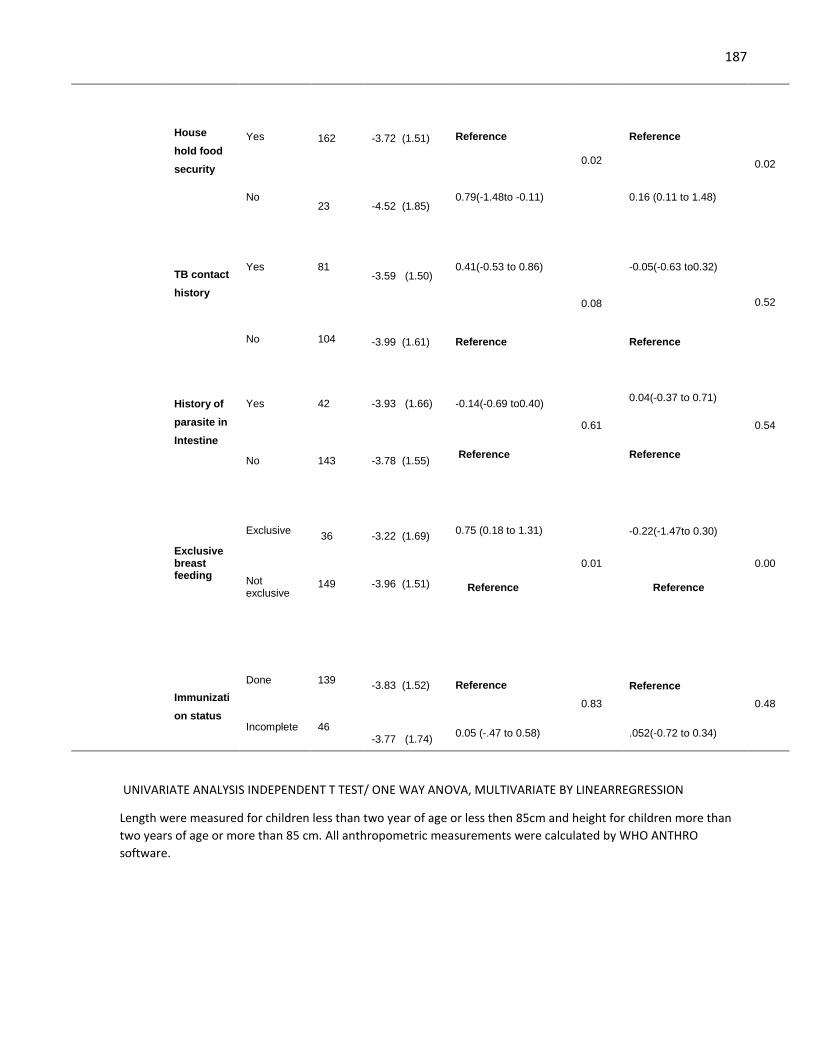
187
House
hold food
security
Yes
162
-3.72 (1.51)
Reference
0.02
Reference
0.02
No
23
-4.52 (1.85) 0.79(-1.48to -0.11) 0.16 (0.11 to 1.48)
TB contact
history
Yes 81
-3.59 (1.50) 0.41(-0.53 to 0.86)
0.08
-0.05(-0.63 to0.32)
0.52
No 104 -3.99 (1.61) Reference Reference
History of
parasite in
Intestine
Yes
42 -3.93 (1.66)
-0.14(-0.69 to0.40)
0.61
0.04(-0.37 to 0.71)
0.54
No
143 -3.78 (1.55)
Reference Reference
Exclusive breast feeding
Exclusive
36
-3.22 (1.69)
0.75 (0.18 to 1.31)
0.01
-0.22(-1.47to 0.30)
0.00
Not exclusive
149
-3.96 (1.51)
Reference Reference
Immunizati
on status
Done
139
-3.83 (1.52)
Reference
0.83
Reference
0.48
Incomplete 46 -3.77 (1.74)
0.05 (-.47 to 0.58) .052(-0.72 to 0.34)
UNIVARIATE ANALYSIS INDEPENDENT T TEST/ ONE WAY ANOVA, MULTIVARIATE BY LINEARREGRESSION
Length were measured for children less than two year of age or less then 85cm and height for children more than
two years of age or more than 85 cm. All anthropometric measurements were calculated by WHO ANTHRO
software.
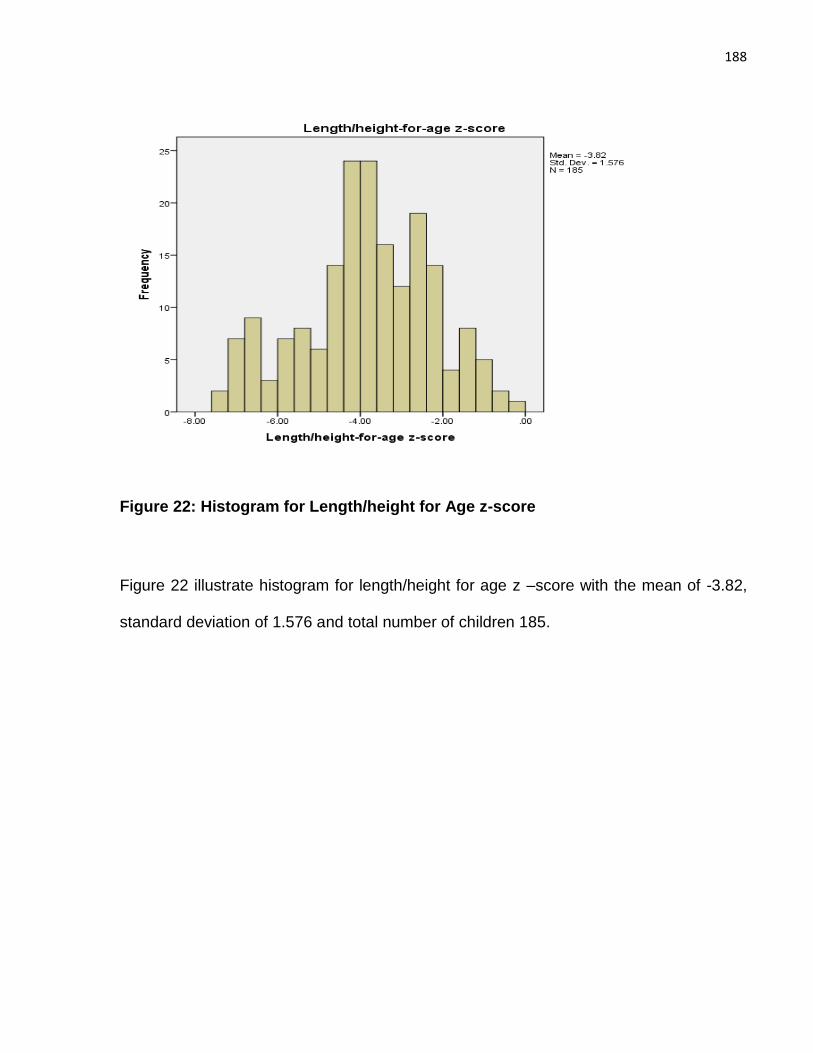
188
Figure 22: Histogram for Length/height for Age z-score
Figure 22 illustrate histogram for length/height for age z –score with the mean of -3.82,
standard deviation of 1.576 and total number of children 185.
189
CHAPTER FIVE
5. DISCUSSION
In this chapter we have discussed study findings in to three parts, developmental
screening of severe acute malnourished children with predictors for developmental delay,
discussion on randomized trial, discussion on analysis of predictors for severity of
malnutrition in integration with previous literature cited and summarizes the main findings
of the different study parts, as well as an explanation of how this study results were
incorporated to stipulate an explanation of what worked, how and why intervention should
be done in the community-based programmes. Study limitations and strengths are also
discussed in this section.
5.1 Developmental screening of severe acute malnourished children
Different brain functions in early childhood are affected by the deficiency of various
nutrients, like protein-energy malnutrition is a reason for global deficits (Chattopadhyay &
Saumitra, 2016).Protein calorie malnutrition shrinks brain size, causes dendritic
arborization and cell maturation (Chertoff, 2015). Iron deficiency in the neonatal period
causes myelination, monoamine neurotransmitter synthesis and hippocampal energy
metabolism have an effect on motor development, cognition and memory. Vitamin D
deficiency is the reason of delayed motor milestones because of it neuromuscular effect.
Zinc insufficiency modifies autonomic nervous system control and hippocampal with
cerebellar development. For synaptogenesis, membrane function and potentially for
myelination essential role is played by long-chain polyunsaturated fatty acids
(Chattopadhyay & Saumitra, 2016). The time period of start of diet constraint is significant
to understand the damaging effects of low protein calorie diet on brain function (Chertoff,
190
2015). Thus, early childhood development is affected by deficiency of various nutrients,
overall nutritional status, child attributes with family socio demographic characteristics,
and environment factors. There are insufficient national indicators on the developmental
outcome of severe acute malnourished children in Pakistan. We thus, explored the early
childhood wasting in families having low socioeconomic status in rural setting to assess
the impact of malnutrition and sociodemographic risk factors on developmental potential
of children. This study aimed to stipulate intuition into the early detection and timely
intervention for child development by concentrating and analysing risk factors to which
children are exposed under 5 years of age and that affect large numbers of young children
in developing countries.
5.1.1 Developmental Screening
The one objective of the current study was to examine the impact of malnutrition on
developmental milestones of children with their sociodemographic predictors. Thus in our
study we found that out of total 185 subjects, 69 (37.3%) classified as normal
development, 108 (58.4%) classified as having suspected developmental delays and 8
(4.3%) were untestable even after rescreen in 1-2 weeks. So the prevalence of
developmental delay in malnourished children was 58.4%. In present study we have
revealed that severe uncomplicated malnutrition was significantly linked with increased
risk for developmental problems. As previously, (Grantham, 1999) concluded in his study
that severe malnourished children showed significant behavioural abnormalities in the
acute stage. They are more apathetic, less active and least interested in the surrounding
environment, both in quantity and complexity, in comparison with other children. They
show less agony on hospital admission and more petulant when disturbed in contrast with
children with other diseases. Walker et al. (2007) too stated that in young children,
191
underweight and stunting are also linked with apathy, low positive affect, reduce levels of
play and increase insecure attachment.
In studies from Jamaica and Bangladesh also revealed that under nutrition also influences
the temperament and behaviour of children. Children having less height for age z-score
(stunted) were found to be less happy and passionate, more apathetic, less sociable than
well-nourished children (Liu & Raine, 2006). Malnutrition effects brain development and
specifically, protein calorie malnutrition is the main cause of abnormal development with
behavioral effects. More over as an outcome of failure in normal development, social and
behavioral debilities occur and it’s also effects the adulthood period (Chertoff, 2015).
Sitaresmi, Ismail and Wahab (2016) observed that children having malnutrition in infant
age have increased risk for developmental delay. The have also stated that malnourished
child has poor attention and poor social relations at school age with their normal fellows.
Our study results correlate with these studies results because in milestones assessment,
45.8 % children showed delayed response in personal social behavioural development
and 16.4% were in caution zone in personal-social development.
As well as, low weight-for-age (Underweight) and height-for-age (Stunting) were also
reported to be associated with developmental delay from studies piloted in India, Ethiopia
and Bangladesh assessing that malnutrition is associated with poor development, in both
cognitive and motor milestones (Vazir, Naidu & Vidyasagar , 1998; Hamadani et al., 2001;
Hamadani, Fuchs, Osendarp, Huda & Grantham, 2002). Furthermore (Hill, 2001) proved
in his study that lower z-scores for height, weight and head circumference were linked with
higher incidence of delayed motor and language skills. Cheung, Yip and Karlberg (2001)
in his longitudinal study conducted in Pakistan concluded that in larger perspective both
fetal and early postnatal growth can affect motor development of infants. They have
192
evaluated age at start of independent walking and age at onset of building a 3-cube tower
individually as a markers of gross and fine motor development. They revealed that
shortness and thinness at birth with postnatal wasting were inversely linked to the age at
onset of development of gross and fine motor milestones. Other longitudinal studies
piloted in, Guatemala, Peru and Jamaica also indicated effect of malnutrition in relation
with age of walking (gross motor milestones), cognition, intelligence quotient (IQ), school
enrolment and failure to school performance (Kuklina, Ramakrishnan, Stein, Barnhart &
Martorell, 2004; Berkman, Lescano, Gilman, Lopez & Black, 2002; Martorell, 1992).
Stunting in postnatal period was also inversely associated to the age at initiation of a gross
motor milestone. Our study results also correlate with this previous study in Pakistan and
other studies because in our study, 36.2% children in fine motor milestones and 35%
children in gross motor milestones were in delayed/caution zone because of severe
wasting and moderate to severe stunting.
International adopted children (IAC) do research on a large extend in association between
malnutrition and poor development and found significant association between growth
retardation, global development delay with particularly delay in motor and cognitive
development, such as attention deficit disorder, reduced school performance, low scores
in intelligent quotient (IQ), impaired language development ,social skills, reduced memory
with learning disabilities and problem solving skills, which probably is a consequence of
the malnutrition because of hidden infections and psychosocial deprivation (Johnson et
al., 1992; Albers, Johnson, Hostetter, Iverson, & Miller 1997). In our study with others
delays, 23 (13.0%) shows delayed language milestones and 29 (16.4%) were in caution
zone for language milestones so our results concedes with these findings as malnutrition
impact the language development of children.
193
In one research, malnourished children were examined on Gesell’s development schedule
between four to fifty-two weeks of age and determined that children having grades 2 and
3 malnutrition had poor development in all areas including behavior, gross motor, fine
motor-adaptive, language and personal social skills (Upadhyay, Agarwal & Agarwal,
1989). Researches on the developmental outcome in children with malnutrition were done
in many countries and severe malnutrition were identified as a primary risk factor for
developmental delays (Grantham, 1995). Our findings are consistent with other studies
because 58.4% children with severe acute malnutrition, shows suspected global
developmental delays with individual delays in motor, personal- social skills and language
milestones. Malnutrition and developmental challenges are main health problems of
childhood, specifically affecting the developing world (Chattopadhyay & Saumitra, 2016).
Developmental delays hamper child’s educational attainment and reproductive health,
therefore deteriorating future productivity and more over worsen the situation in already
resource scarce countries. Despite the fact that malnutrition is a serious problem in
Pakistan, there are insufficient national indictors for the development of severe
malnourished children. Early detection of developmental disabilities is essential for the
welfare of children and their families in country like Pakistan so, developmental screening
for early detection and regular examination are prerequisite for high risk groups such as
malnourished children and should be the part of primary and secondary health care.
5.1.2 Predictors of development Delays
Consequences of severe malnutrition are intricately mingled by the drifts of socio-cultural
disadvantage in the deprived families. The effect of different nutrients on permanent
cognitive damage is also induced by several other factors for example level of deficiency,
timing of deficiency, environmental stimulation, wealth less, inadequate health care and
194
maternal education (Chattopadhyay & Saumitra, 2016). So, compromised development in
the early five years of life are commonly linked to various social factors in relation with
nutritional status like, exclusive breast feeding, socioeconomic status, large family size
and history of morbidity incidence (Bradley & Corwyn, 2002).Various environmental
factors supposed to cause delay in child development are linked with the socioeconomic
status of families because child from low income families are assumed to be more
susceptible to malnutrition and its associated complications. This risk may increase
because low socioeconomic status mothers mostly do not have satisfactory adequate
prenatal care and are at risk of giving birth to preterm or low birth weight children (Moore,
Bocchini & Raphael, 2016).
Child from low income families are more subject to have less access to medical care,
malnourished and have lack of immunizations coverage (Herbst & Baird, 1983). Our study
results correlate with these findings because our study children belongs to low income
families with illiterate mothers or having very low educational status of mothers. In present
study age of child, family size and parental education, low family income, hospital visits,
exclusive breast feeding and history of TB contact were significantly associated with
developmental delay in univariate analysis and these results also supports other studies
like in one study in Korea, mother education and presence of mother illness were linked
among normal and suspected delay developmental groups (Bang, 2008). Sonnander and
Claesson (1999) conducted, development screening on children at 18 months and
monitored school performance later and determined that prenatal and postnatal condition
and mother education comprised the best analysts of school learning problems. Education
of mother is directly related with good ante-natal care, small family size, optimal nutrition
and healthcare of the child. Offspring of educated mothers have high levels of cognitive
195
development (Barros, Matijasevich, Santos & Halpern, 2009). Even high-risk children
exhibit better developmental outcome when born to educated mothers (Wang & Huang,
2008). In our study almost all mothers were illiterate or have just a primary education with
dependence on a husband as house wife and family size, age of child, exclusive
breastfeeding and history of TB contact were significantly associated with developmental
delay in multivariate analysis after adjusting for other factors.
In many studies correlation between breastfeeding and development of child has been
confirmed because of the nutritive value of mother milk and enhanced emotional bonding
between mother and child. Around the globe researches have explained strong
association between duration of exclusive breast feeding and progressed developmental
outcome in all age groups and at all geographical settings. Duration of exclusive
breastfeeding also has a remarkable impact on cognitive development (Rao, Hediger,
Levine, Naficy & Vik, 2002). In Republic of Belarus “a cluster-randomized trial of a
breastfeeding promotion intervention” also generated significant finding yielding on the
long-term health and neuro-developmental outcome (Kramer et al., 2008). In this study on
multivariate logistic regression model breast feeding shows significant effect on
development so this study results co-relate with other studies.
In present study, history of tuberculosis contact is significant in both univariate and
multivariate model not proved by other studies, so further research in this context is
needed. International adopted children revealed characteristics of growth retardation and
developmental delays as a result of the psychosocial deprivation, under nutrition and
illnesses, which probably is a consequence of the malnutrition with infections (Johnson et
al., 1992; Albers et al., 1997). As discussed above, that more researches should be done
to understand this as TB is infectious diseases and probability is that these children may
196
be suffering from latent tuberculosis because of low immune status, malnutrition and
presence of smear positive contact, so detailed physical examination for tuberculosis with
laboratory investigation should be required to diagnose these children further but this is
beyond the scope of our study, so studies should be conducted to understand this
phenomenon completely.
In multivariate result of our study, it is proven that young age children have more risk of
development delay. Rydz et al. (2006) stated that delayed developmental in younger
children is an indicator of serious physical or psycho social problems. As development
throughout infancy and in toddler period is rapid and cumulative and easily effected by
social-demographic factors. Delayed development sometimes also known as “failure to
thrive” because of multiple physical and psycho social problems may also signal
the presence of serious neglect or maltreatment in this age group (Wet herby et al.,
2004).So this age group is most vulnerable for early screening and detection of problem
for timely intervention.(Bradley & Corwyn, 2002) describe the relationship between socio-
economic status and family size with child development delay as low family economic
status and large family size is directly related in term of child malnutrition and development
delay as in our study large family size are associated with delay development of children
consistent with other studies.
In findings of our study, it is proven that malnutrition with sociodemographic risk factors
such as age, large family size, exclusive breast feeding and history of TB contact are
associated with child developmental delay. Though children already have nutritional risk
factors, it can be intruded by other environmental factors. It is recommended that
developmental screening should be used in a primary health care setting for children in
197
Pakistan, specifically for the susceptible group of children under five year of age to identify
developmental problems timelier and provide proper interventions.
The findings from this study reveal that severe malnutrition, age, family size, with exclusive
breast feeding and history of TB contact were the most meaningful prognostic factors for
child development. These results propose that malnutrition had adverse effect on early
child development and developmental screening is crucial for all children, specifically for
malnourished children. Replication study with large sample size and prospective studies
are required to confirm our findings and to advancement of further interventions.
5.2 Randomized Trial
We have designed this trial to determine if high dose vitamin D supplementation can
accelerate the growth and development of malnourished children. Though there are
currently no suggested guidelines for this approach. The World Health Organisation
(WHO) has identified research priorities to identify adjunctive therapies that may improve
response to RUTF, including administration of broad-spectrum antibiotics and high-dose
vitamin A. The results of this study give more understanding into the possible causal
correlation among between vitamin D levels and growth and development of severe acute
malnourished children.
5.2.1 Primary and secondary outcomes
To our knowledge, this is the first randomised controlled trial to investigate the effects of
high-dose vitamin D supplementation in children with severe acute malnutrition. Among
children with uncomplicated SAM in Pakistan, we have found that administrating two oral
doses of 200,000 IU (5 mg) vitamin D3 in addition to RUTF resulted in clinically significant
improvements in mean weight and mean weight-for-height z-score at 2-month follow-up.
High-dose vitamin D supplementation also resulted in substantial reductions in the
198
proportion of children with delayed global developmental status, delayed gross and fine
motor development and delayed language development at 2 months.
Vitamin D supplementation has previously been reported to improve weight gain and
growth in children: in a randomised controlled trial conducted in 2,079 low birthweight term
infants in New Delhi, India, Kumar and colleagues reported that a weekly oral dose of
1,400 IU vitamin D3 improved z-scores for weight, length and arm circumference by 0.11-
0.12 points at 6 months (Kumar et al., 2011). Our study extends this finding that, in a
clinically distinct population of children with uncomplicated SAM, administration of a much
higher dose of vitamin D was well-tolerated and resulted in substantial and clinically
meaningful increases in weight (0.26 kg absolute increase in weight, 1.07-point increase
in weight-for-height/length z-score). In other clinical contexts, vitamin D has been shown
to protect against acute infections and accelerate resolution of inflammation: both
infections and increased systemic inflammation associate with adverse outcome in SAM
(Attia et al., 2016) and it may be because of these immunomodulatory actions of vitamin
D that cause improvement in weight gain that we observed.
In keeping in view, the reports of other trials in children being treated for SAM (Grantham,
Schofield & Harris, 1983; Nahar et al., 2009) we have observed longitudinal improvements
in developmental status in both arms of the study. However, the improvements that we
observed among participants randomised to high-dose vitamin D3 were significantly
greater than those seen in the control arm. Improvements in gross motor development
that we observed in intervention vs. control arms are likely – at least in part - to reflect
recognised benefits of vitamin D supplementation for skeletal muscle function (Hazell et
al., 2012). However, our finding of a favourable effect of vitamin D supplementation on
language development provides novel and unequivocal evidence of neurodevelopmental
199
benefits of vitamin D supplementation in children. This finding complements results of
studies demonstrating the importance of vitamin D for brain development in rats (Eyles et
al., 2009) and lends weight to the emerging paradigm that vitamin D has significant effects
on development and functioning of the central nervous system in humans (Wrzosek et al.,
2013). Taken together, our positive findings suggest that current vitamin D content of
RUTF is not optimal, at least in the population that we studied.
In a follow-up study of DIVIDS 2 (Kumar et al.,2015) found that vitamin D supplementation
in infancy reduced body mass index (BMI) at three to six years of age, although no long-
term effects from early vitamin D supplementation were seen on body composition. In
addition, a few long- term differences in motor development were observed later in follow-
up but these were small. In contrast, our study found significant effects of vitamin D
supplementation on motor developmental milestones at 2 months, but long term follow up,
such as by Kumar et al, is beyond the scope of our present study.
Our study results are also strengthened by the results of (Dhesi et al., 2004) who showed
in a double-blind RCT that vitamin D administration enhances neuro-muscular or neuro-
protective function in older patients and protect them from falls. We found significant
differences in fine and gross motor milestones between vitamin D and placebo group,
showing a neuromuscular effect from vitamin D supplementation in SAM children.
A related outcome relevant to our findings is the decreased risk of pneumonia relapse in
Afghan children aged 1-36 months residing in areas of high vitamin D deficiency after
supplementation with vitamin D3 (Manaseki et al., 2010) showing anti-inflammatory and
immune modulatory effect of vitamin D. Vitamin D has vital function in calcium metabolism
and bone health (White, 2008). A randomized control trial, in India reported that
200
supplementation with vitamin D in low birthweight infants improved growth, probably
because of vitamin D function in bone health, but did not reduce mortality and severe
morbidity (Kumar et al., 2011). Additionally, vitamin D performs an active part in the
immune system (Van Etten, Stoffels, Gysemans, Mathieu & Overbergh, 2008) and vitamin
D deficiency is linked with enhanced risk of infectious disease (Roth, Shah, Black & Baqui,
2010).
Our findings are potentially important because vitamin D is crucial for calcium and
phosphorous homeostasis and has an important role in skeletal mineralization.
Inadequacy of vitamin D is a reason for rickets in children and osteomalacia in adults
(White, 2008). Previous research has shown that 1, 25-dihydroxyvitamin D3, the active
metabolite of vitamin D, is essential for raising and controlling immune responses (Rockett
et al., 1998; Cantorna, 2000; Pichler, 2002). Subclinical vitamin D insufficiency has been
linked with an increase odds of tuberculosis in adults by alteration of polymorphisms in the
vitamin D receptor (Wilkinson et al., 2000). For children, serum levels of vitamin D less
than 20 ng ⁄ ml are a known index of suboptimal vitamin D level and levels less 12 ng ⁄ ml
are associated with rickets (Misra et al., 2008).
Low vitamin D levels has also linked with malnutrition. A case-control research conducted
in India has previously reported that malnourished children, both with and without rickets,
are at increased risk of severe vitamin D deficiency compared to normal children
(Raghuramulu & Reddy, 1980). Walli et al. (2017) piloted a cross-sectional research in
Tanzania reported that 30.6% of malnourished children aged <5 years had co-existing
severe vitamin D deficiency (<50 nmol/l). In Pakistan study of micronutrient deficiency in
malnourished children, 36% of malnourished children were found to be suffering from
nutritional rickets (Ejaz & Latif, 2010). Increase frequency of rickets (61%) was also
201
reported in study of malnourished children in western Kenya (Kwena et al., 2003). In
contrast, a cross-sectional study of hospitalized children in Uganda did not observe any
significant difference in vitamin D levels between well-nourished and malnourished
children (Nabeta, Kasolo, Kiggundu, Kiragga & Kiguli, 2015).
A study conducted in Ayub medical college Abbottabad, Pakistan found that rickets is
common in Hazara division children, affecting them to different diseases and skeletal
deformities, they are lacking in vitamin D even in the presence of abundant sun shine.
Lack of awareness to sun, malnutrition and antenatal factors may be the important reasons
for the progression of nutritional rickets.
Another study conducted in department of pediatrics, services institute of medical
sciences Lahore, Pakistan in June 2008 for analysis of predictors of vitamin D deficiency
rickets in children below two years of age concluded that main risk factors for vitamin D
deficiency rickets in children are aged six to eleven months, male gender, prematurity, not
timely complementary feeding, drinking unfortified animal milk, lack of sunlight exposure
and absence of dietary supplementation of vitamin D.
Department of pediatrics post graduate medical institute Lady reading hospital, Peshawar
Pakistan, conducted study in March 2004 on vitamin D deficiency to find out of rickets in
admitted patients and found that most cases of rickets are nutritional and receptive to
treatment of vitamin D supplementation.
The Kharadar general hospital arranged a seminar “on the prevalence of vitamin D
deficiency in Pakistan” with collaboration of Aga Khan University Hospital Karachi
discussed that” In Pakistan 90% population is suffering from vitamin D deficiency and this
deficiency does not only affect the growing bone of children but also contributes to develop
202
diabetes, hypertension, pneumonia, depression and cancer”. All these studies strengthen
our study finding, our positive findings suggest that due to high prevalence of vitamin D
deficiency in Pakistani children and among them in most vulnerable SAM children current
vitamin D content of RUTF is not optimal, for treatment and additional doses needed to
enhance the growth and developmental status of children at least in the population that
we studied.
5.2.2 Serum Biochemical levels
A 3 ml blood sample was taken at 2-month follow-up from a sub-set of 116 participants
whose parents gave additional consent for blood sampling and out of them sufficient
serum for biochemical analyses was available for 90/116 sampled participants. In the sub-
set of 90 participants for whom biochemical analyses were performed, mean 2-month
serum 25(OH) D levels were significantly high in participants randomized to intervention
verses control group. High-dose vitamin D3 was effective in eliminating vitamin D
deficiency among those whose vitamin D status was tested: 45/45 (100%) of sampled
participants randomized to the intervention arm had serum 25(OH)D concentrations >50
nmol/L, as compared with 19/45 (42%) sampled participants randomized to placebo.
Children in intervention group had a high concentration of serum vitamin D3 after
supplementation of vitamin D3 contrasted to that in placebo group. This advocates that
there was no protocol breach of allocation to particular study groups and also the vitamin
D administrations was effectual to raise the serum vitamin D status.
Furthermore, a high serum vitamin D3 status in intervention group recommend the
reliability of syringe contents. Despite the relatively high dose of vitamin D administered,
no suspected or actual adverse reactions were reported and no hypercalcaemia was
observed among a sub-set of 90 participants who gave safety blood samples at 2 months.
203
But, if there were any chronic toxic outcome of vitamin D3 after the study, we were not
able to trace them. In respect to previous researches reveling that 100,000 IU vitamin D
could give a good protection against vitamin D3 deficiency without any risk of adverse
effects in infants (Zeghoud et al., 1994). Our trial also noticed a required level of vitamin
D between intervention groups with no adverse effect. 0ur positive findings suggest that
current vitamin D content of RUTF is not optimal, at least in the population that we studied
and additional therapeutic doses needed in this SAM group for sufficient level of vitamin
D. This proposes that such dosages might enhance vitamin D status to a sufficient level
in SAM children with certain socio-demographic and health background and this should
be deemed in future studies.
Moreover, no statistically significant difference in mean serum concentrations of corrected
calcium, albumin or pre-albumin were seen for participants randomized to intervention vs.
control arms of the trial at 2-month follow-up.
5.2.3 Vitamin D adverse effects
Only one serious adverse event occurred during this study: one participant died, because
of severe dehydration secondary to acute gastroenteritis. This event occurred after
randomisation but before any dose of study medication was administered. No actual or
suspected adverse reactions arose during the trial. Even though vitamin D excess is
theoretically possible, it can be minimized by utilizing standard guidelines of
supplementation for vitamin D (Zeghoud et al., 1994). Previous studies have not reported
adverse outcomes from the high dose of vitamin D supplementation similar to that used in
our study. A study from low socioeconomic areas in sunny Istanbul found that one single
204
intramuscular injection of (300,000 IU) was safe and effective for treating nutritional rickets
in children aged six to thirty months (Kutluk et al, 2002).
Another study in France found that giving daily supplementation of vitamin D in a
recommended dose (500–1000 IU ⁄ day), in addition to 120 000 IU for 3 months through
milk fortified with vitamin D, did not cause toxicity in infants with baseline 25-
hydroxyvitamin D in the normal range (Vervel et al., 1997) even after continuous maternal
antenatal vitamin D supplementation during summer (Zeghoud et al., 1997). In other study
one high dose for 3 months in a controlled environment, were more effective for
compliance than a daily dose and was successful for maintaining the serum vitamin D
level in normal range for two to three months in French high-risk infants (Manaseki et al.,
2010). Hence, these findings from other studies indicate that the dosing regimen used in
our study is likely to be safe in SAM children. Many developing countries like Pakistan do
not have the opportunity to test people for vitamin D levels before giving supplementation
because of the high cost of the test. In this scenario and because of insufficient published
data for safety of higher doses in children, more trials are needed before justifying giving
high doses of vitamin D to young SAM children.
5.2.4 Experiences of health care providers
During the course of study, we did discussions with nutrition experts and pediatricians
from large tertiary care hospitals treating malnourished children and others nutritional
disorders to sightsee their mindsets about adverse outcome of vitamin D after
supplementation of the dose we have administer in our study children. They have shared
their views from their clinical experience, that they have never faced a case of vitamin D
over dosage even after 3 consecutive doses of 600,000 IU vitamin D in their patients
especially in treatments of rickets. In discussion with CMAM stabilization center staff in
205
tertiary care hospital it was found that they give vitamin D mega dose on admission to all
patients with complicated SAM with therapeutic milk based on their clinical experience and
due to the fact that there is severe deficiency of vitamin D in common peoples in
developing countries as well as in Pakistan according to different local studies and national
nutritional survey 2011.
Furthermore, according to their experiences most children with SAM have malabsorption
due to a variety of reasons (zinc deficiency, recurrent diarrheas, TB etc.) and immune
system is compromised because of reductive adaptation. So RDA is not sufficient to meet
the demands and they required therapeutic doses. Due to poor economic status and lack
of facilities, they are not in position to document vitamin D levels of each child before and
after treatment. So there is no documented evidence in support of this practice but clinical
improvement is highly favorable. They advocated that they have never confronted any
vitamin D adverse effect after giving therapeutic dose of vitamin D with therapeutic milk
which contain 3 times RDA dose of vitamin D on daily basis as RUTF. They have proposed
that some children may develop in long term some chronic conditions, such as kidney
diseases, which might require added investigation after the completion of study. They
believed that, it would be a good notion to compare between the study and control group,
level of vitamin D in serum tests incorporated in this study at the end of follow up to find
out if there might be any correlation of over dosage with high therapeutic dose.
5.2.5 Strength and limitation of trial
Our study has several strengths. Developmental testing was conducted by well-trained
clinical staff using established protocols (Frankenburg et al., 1992) in order to minimise
missing data, they repeated developmental assessments up to two times in children
whose status was initially assessed as being ‘untestable’. Administration of study
206
medication was directly observed, allowing for 100% adherence, and the intervention
regimen was effective in elevating 25(OH) D concentrations >50 nmol/L in all participants
assigned to take it. Rate of loss to follow-up were low and serum 25(OH) D concentrations
were measured using gold standard methodology in a laboratory participating in a
reputable external quality assessment scheme. Our study also has some limitations. The
proportion of participants gaining >15% of their baseline weight at 2 months was higher
than anticipated, making it difficult to demonstrate an additional benefit of the intervention
on the primary outcome.
The study duration was relatively short and this precluded an assessment of whether the
striking early benefits on anthropometric and developmental outcomes that we
demonstrated could be sustained and translated into long-term benefits on growth and
neuropsychiatric function. It would have been interesting to conduct exploratory analyses
to determine whether effects of vitamin D supplementation varied according to baseline
serum 25(OH) D concentrations or developmental status. However, vitamin D status was
not measured at baseline and the study was powered to allow for detection of biologically
plausible interaction effects in sub-group analyses. Recognition of these limitations
suggests potential directions for future research: larger trials with longer follow-up are
needed, both in this population (to explore long-term outcomes and potential sub-group
effects) and in others (to determine whether favourable effects of high-dose vitamin D are
demonstrable in populations where vitamin D deficiency is less prevalent).
5.2.6 Generalizability of the findings
Recognition of these limitations suggests potential directions for future research: larger
trials with longer follow-up are needed, both in this population (to explore long-term
outcomes and potential sub-group effects) and in others (to determine whether favourable
207
effects of high-dose vitamin D are demonstrable in populations where vitamin D deficiency
is less prevalent). Results from this study could be inferred on people with same
background features residing in similar settings, but due to possibility of genetic variations,
these results might not be generalizable to children in different settings, specifically to
settings where the incidence of malnutrition and risk of vitamin D deficiency is low. Due to
deficit research in Pakistan, it is tough to recognize likenesses and differences of socio-
economic status between different parts within the country. In conclusion, it is
misappropriate to generalize results of this study done in few low socio-economic rural
areas of southern Punjab to the whole population in country.
Pakistan is a poor country with lack of quality food, access to health care, illiteracy and
proper living conditions, but results from this study showed that population in our study
areas were extremely poor and a large proportion of study children were severely wasted
with high rate of severe stunting, reveled they are also suffering from acute on chronic
malnutrition. For that reason, they possibly will not be a good representative of children of
same age group residing in other areas of the country, where socio-economic conditions
with access to health facilities are much better like in urban areas of country. We observed
that vitamin D supplementation with RUTF enhanced serum vitamin D in intervention
group in comparison with control arm (i.e. after taking up to 2,400 IU vitamin D per day via
RUTF) indicates that baseline vitamin D status is likely to have been very low in this cohort.
Thus biologically, it may give same findings if we conduct such trials in other areas of the
country in severely malnourished children with the hypothesis that Pakistani malnourished
children are sharing same genetic features, however it may not be appropriate for children
in neighboring countries where their immune system may respond differently in reaction
to vitamin D administration.
208
In spite of all these realities vitamin D enhance growth and developmental status in
malnourished child; vitamin D supplementation could be a low-cost and effective
intervention for improvement of vitamin D status in poor settings like Pakistan,
predominantly due to the fact that such countries have poor access to quality food, such
as fortified milk and calcium enriched food sources and normal level of serum vitamin D is
a crucial for proper intestinal absorption of calcium. Children in poor countries could benefit
if they are provided with oral vitamin D supplementation because we have reveled in our
study that administration of high-dose vitamin D in addition to RUTF, safely and
significantly enhanced weight gain and developmental status of children with
uncomplicated SAM living in Pakistan. Larger trials with longer follow-up in different
settings are needed to explore these promising findings.
This trial showed that 200,000 IU supplementation of vitamin D3, given in bolus doses,
improved weight gains and developmental status at 2 months among children with SAM
in Pakistan. These results advocate that vitamin D administration can improve
rehabilitation from malnutrition when targeted at children with high risk of vitamin D
deficiency. However, more studies needed to determine whether effects can be replicated.
The outcome of vitamin D supplementation for children in other diseases should be
researched to evaluate the full potential of this intervention to enhance children health at
a global level.
5.3 Analysis of predictors for severity of malnutrition
Malnutrition is anticipated to cause around more than one third of all child deaths globally
(Black et al., 2013) and among them acute child malnutrition in children under the age of
five years is the major public-health concern in the developing territories (Black et al.,
2008). Because of their inherent frailty, susceptibility and dependency, the nutritional
209
status of children specifically under the age of 5 years, is a complex indictor of country
health condition (WHO, 2011). Thus, growth assessment is commonly utilized not only for
the evaluation of the personage nutritional-status, health and development, on the other
hand also for the assessment of nutritional-status and health of inhabitants (Srivastava,
Mahmood, Srivastava, Shrotriya & Kumar, 2012).
In under develop countries, malnutrition in children aged under 5 years be contingent on
the interaction of multiple factors like poverty with ill health and decreased energy and
protein consumption (Munthali, Jacobs, Sitali, Dambe & Michelo, 2015; Egata, Berhane &
Worku, 2014). The severity and degree of malnutrition is directly linked with increase
mortality rate in these countries (Mohamed, 2015). Literature from different studies has
already recognized that numerous other factors were closely linked with child malnutrition,
such as poverty and family income (Van de, Hosseinpoor, Speybroeck, Van Ourti, & Vega,
2008; Vitolo, Gama, Bortolini, Campagnolo & Drachler, 2008; Fotso & Defo, 2005) number
of siblings (Black et al., 200; Vitolo et al., 2008) and poor infant and child feeding practices
(Jones et al., 2014).
Dereje (2014) stated that severe acute malnutrition (SAM) is very lethal condition in
children. It kills children by increasing the case mortality of common childhood infections
and consequently it is directly related to an immediate reason of child death. Malnourished
children, who are suffering from illness die just because of their malnutrition. Mortality
rates in children with severe acute malnutrition are 9 times high in comparison with well-
nourished children. To prevent this, it is very important to find its determinants for policy
makers to implement prevention strategies. So we make an attempt in our study to find
predictors responsible for this problem in study area.
210
5.3.1 Determinants of Weight for height z– score
In our finding of risk factor for severe acute malnutrition (wasting), family monthly income
have significant association with severe acute malnutrition with the mean difference of
0.43 {95% CI (0.01 to 0.85) p=0.04}. So our finding is consistent with others studies from
different regions of the world that poverty and family income is directly related with the
severity and degree of child malnutrition. All our children’s in study have severe acute
malnutrition (wasting) weight for age z-score less than -3 SD belongs to low income
families. Our result is strengthening by the literature stated on low income from others
regions of world on degree of malnutrition.
Other significant factor for wasting in our study on multivariate analysis were weaning
practices have β -0.21 {95% CI (-1.14 to 0.19) p=0.01} that include quantity, variety and
frequency of feeding by WHO recommended guidelines on infant and young child feeding
practices (WHO, 2014). Dereje (2014) discovered that severe acute malnutrition is linked
with sub optimal frequency of complementary feeding such as less than or equal to two
times per day were on three times increase risk of severe wasting than children who took
complimentary feeding 3-5 times in one day. This complimentary feeding practices was
also related with lower child weight for height z-scores in Zambia and Zimbabwe (Jones
et al., 2014). So our findings are also consistent with the finding of others studies that
complimentary feeding practices are associated with severe acute malnutrition (wasting).
(Dereje, 2014; Vitolo et al., 2008; Ayana et al, 2015) reveled in their studies about the
association of maternal illiteracy and maternal autonomy in decision making with wasting.
Well in our study almost all mothers are illiterate or have very basic education of primary
with mostly house wife and head of the family is male partner with autonomy of decision
making so these two factors are already present in our study population. Jamro et al.
211
(2012) in Pakistan also relate mother illiteracy and poverty with severe acute malnutrition
in children (Ayana et al, 2015) in their study also find that frequent diarrhea and febrile
illness association with wasting, but our study did not find it significant, it may be because
of different geographical and genetic reason of study population. Smith, Ruel & Ndiaye
(2005) state that many others factors should be investigated for child malnutrition in rural
area as compared to urban areas like family health seeking behavior. Our study population
belongs to rural areas but in severe acute malnutrition, we did not find any other significant
factor in relation to wasting like health seeking behavior and gender in respect of more
gender discrimination in low income rural, uneducated family in Pakistan and other under
developed countries (Shaikh & Hatcher, 2004; Momsen, 2004).
Hazarika (2000), stated in gender discrimination in children's nutrition and access to health
care in Pakistan in respect to revealing parents drives in favor of sons in South Asia that
between 0 to 5-year-old children, boys are more valued in the provision of health care
though, girls seems to be as nourished as or well-nourished than boys. This finding seems
to be consistent with ours, though the number of boys in our study were 81 and no of girls
were 104 but we did not find any significant difference between their nutritional profiles.
To sum up this study has recognized low family income, sub optimal practices of
complementary feeding with others risk factors as significant determinants of severe acute
malnutrition in children under the age of 5 years.
5.3.2 Determinants of height for age z – score
Child malnutrition is universally acknowledged important public health concern and its
consequences are justifiably recognized in regard to human functioning, health and
existence (Grantham et al., 2007; Sudfeld et al., 2015; Adair et al., 2013). In spite of the
economic development in recent days in emerging countries, a high frequency of
212
malnutrition is noticed, specifically stunting, chronic malnutrition (Said, Micklesfield,
Pettifor & Norris, 2015). Even in Pakistan this figure of stunting increases from previous
years in 2001 from 41.5 % to 44.8% in 2011 (NNI, 2011).The age range of 0 to 5 years
recognized as the time of high susceptibility for growth and development in children.
Chronic malnutrition (stunting) in this duration, particularly in the 1st two years of life, can
cause irreparable damage with significant after-effects for the potential health of the
people in upcoming period of life (Onis & Branca, 2016; Wamani, Åstrøm, Peterson,
Tumwine & Tylleskär, 2007; Uauy, Kain & Corvalan, 2011). Furthermore, stunting too rises
the odds of obesity and non-communicable diseases in future life (Keino, Plasqui, Ettyang
& van den Borne, 2014). So it turn out to be indispensable to describe the nutritional-
status in this particular age period and detect potential elements happening in this critical
period of life, thus in this study we have tried to explain the possible determinants of
chronic malnutrition in this geographical area.
Kavosi et al. (2014) reveled in their study in multivariate model in Iran that stunting is
associated with family income, child gender, type of settlement, low maternal
education.Well these finding are consistent with our study regarding to family income, low
maternal education and type of settlement because in our study mothers belongs to rural
areas having no education or very basic primary level of education with low income in
family. In our multivariate analysis by using linear regression family monthly income
become significant with the β -0.16 {95%CI (0.26 to 1.08) p=0.04} mother knowledge of
complimentary diet with the β 0.15 {95%CI (0.25 to 0.96) p=0.03} which was directly linked
with mother education as educated mothers have adequate knowledge about their
children’s health and nutrition.
213
Another study in a rural community of Osun state, Nigeria, investigated the effect of socio-
economic factors on nutritional status of children and found that children of mothers who
were not educated more than secondary school level had one and a half to two times the
prevalence rate of stunting in contrast with well-educated mothers. House hold food
security with the β 0.16 {95%CI (0.11 to 1.48) p=0.02} was significant linked also with low
family income. But gender difference is not significant in our study in comparison with
(kavosi et al., 2014) study. Mengistu et al. (2013) in their study indicated that child age,
family monthly income was significantly associated with stunting, but in our study we did
not find any significant association of age with stunting, this may be because of different
area or genetic reason of study population children (Asres & Eidelman,2011).
Jesmin, Yamamoto, Malik and Haque (2011); Souza, Benício, Castro, Muniz and Cardoso
(2012) in their studies present significant association of father education with chronic
malnutrition consistent with our study as father’s education can affect the child’s health
and nutritional status, for its role in family income and his decision in purchasing family
food. Father education show significance in multivariate analysis with the β -0.15 {95%CI
(-0.99 to 0.01) p=0.05}. In our study exclusive breast feeding practices with the β -0.22
{95%CI (-1.47 to -0.30) p=0.00} show statistical significance in multivariate analysis
contrary to finding of these studies by (Asres & Eidelman, 2011) that no association were
found by pattern or duration of breastfeeding and with stunting in infants above 6 months
of age. Valente et al. (2016) findings are also not consistent with our study, they found
exclusive breast feeding association with acute malnutrition not with stunting. History of
TB contact in univariate analysis showed borderline significance with the mean difference
of 0.41 {95%CI (-0.53 to 0.86) p= 0.08}. This finding was not described in others studies
according to our knowledge but this may be linked with the presence of infectious
214
diseases, as these children are at increased risk of active tuberculosis or latent
tuberculosis because of low immune status and history of smear positive TB person
contact with child malnutrition. But we did not conduct blood and other examination for
diagnosis of TB in these children because this is beyond the scope of our present study.
Moreover, research in this context is needed to clarify this finding in our study.
Black et al. (2013) reveled that maternal undernutrition during pregnancy is a contributing
factor in fatal growth restriction, which enhances the risk of neonatal deaths and, for those
who survive the risk of stunting increases up to 2 years and in childhood. But, it was not
possible in our study to retract the nutritional status in pregnancy and because of lack of
most mother’s antenatal records as this is least developed area of country. Therefore most
deliveries occur at home so no hospital data were available for antenatal record and we
did not collect this information of mother’s undernutrition in relation to child stunting. In
short we have found socioeconomic status, mother’s knowledge about complimentary
feeding practices, food security, father education as a significant contributing factor with
chronic malnutrition and these findings are consistent with others studies. Few of our
finding like TB contact history and exclusive breastfeeding practices are not consistent
with other studies, hence further explanation needed in this context to find out the
geographical difference. Because of our study limitations, we missed the significant finding
of association of mother undernutrition with child malnutrition (stunting) as presented in
other studies.
5.3.3 Determinants of Weight for Age Z- Score
The economic growth in South Asian region in the past years have not been sufficiently
manifested in improving the figures in child nutrition (Lau et al., 2007). Undernutrition not
only constitutes the child more susceptible to morbidity and mortality (Fenske, Burns,
215
Hothorn & Rehfuess, 2013) but also has been associated to poor educational achievement
(Islam, Angeles, Mahbub, Lance & Nazem, 2006) delayed mental development (Moestue
& Huttly, 2008) low intellectual and physical capacities in adult hood (Siddiqi, Haque &
Goni, 2011). Height for- age and weight-for-age thus assess child growth in relation to
suggesting chronic and acute nutritional deficiency.
Frost, Forste and Haas (2005) and Hall et al. (2001) both investigated broadly to recognize
the reasons of malnutrition in children, in combination with the UNICEF malnutrition model,
isolating them as immediate (at individual level), intermediary (individual and domestic
level) and basic (maternal, domestic and local) factors. Nutrient insufficiencies in utero
(Fenske et al., 2013) insufficient nutrition after breastfeeding and early life infections were
considered as immediate reasons. After these immediate factors were the intermediary
and basic factors which contain, but are not constrained to child care practices, food
security, family income, maternal literacy, health services and hygienic practices, all of
these are surrounded with the larger socio-economic, environment and political sphere
(Goudet et al., 2015). In review with these finding in our study, we were not successful to
prove these factors as a significant relation with weight for age z-score but only household
food security with the mean difference of -0.42 {95%CI (-0.89 to 0.05) p=0.08} in univariate
analysis and weaning practices shows borderline significance in both univariate and
multivariate analysis by the mean difference of 0.31{95%CI (-0.05 to 0.68) p=0.09} in
multivariate β -0.14 {95%CI (-0.72 to 0.03) p=0.07}. All others factors are not proven in
our study.
Siddiqi, Haque, and Goni (2011) disclosed that poor fetal growth or malnutrition in the
early child years causes irreparable damage triggering shorter adult height as well as
216
lower weight but as we discussed above this is our limitation of study to retract the
nutritional status in pregnancy and because of lack of most mother’s antenatal records.
Fakir and Khan (2015) presented in their study for analysis of weight for age z-scores the
impact of maternal education on child nutritional status is gender specific and children with
older siblings have better nutritional status and this is suggestive for both girls and boys.
These results are also not consistent with our results. To sum up in weight for age z-score
our study did not prove any significant association with factors which are proven in others
studies, this may be because of different region or sociodemographic back ground of our
study population from others studies population.
In summary, family monthly income, food security, paternal knowledge, mother knowledge
and practices about infant and young child feeding like appropriate practices for
complimentary feeding and exclusive breast feeding, were important variables for both
acute (wasting) chronic malnutrition (stunting) and undernutrition in infancy and childhood
period. So policy makers looking for improvement in the nutritional status of children
should promote health-seeking practices and knowledge of families in this regard.
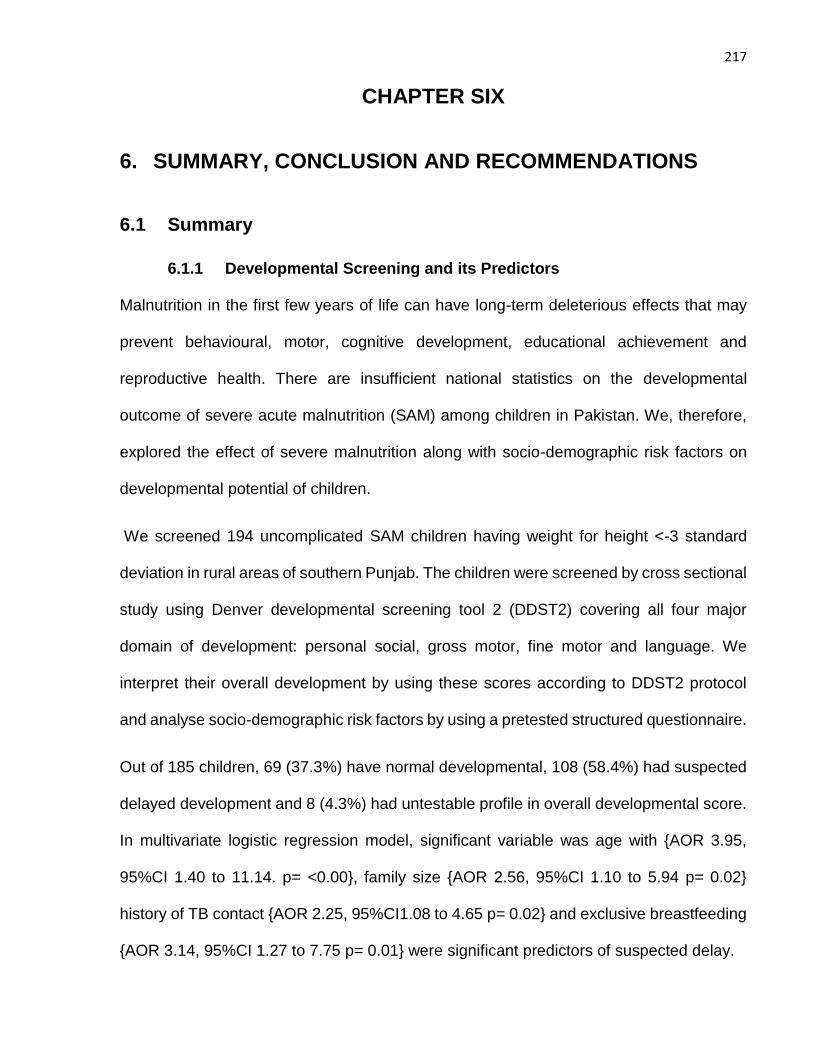
217
CHAPTER SIX
6. SUMMARY, CONCLUSION AND RECOMMENDATIONS
6.1 Summary
6.1.1 Developmental Screening and its Predictors
Malnutrition in the first few years of life can have long-term deleterious effects that may
prevent behavioural, motor, cognitive development, educational achievement and
reproductive health. There are insufficient national statistics on the developmental
outcome of severe acute malnutrition (SAM) among children in Pakistan. We, therefore,
explored the effect of severe malnutrition along with socio-demographic risk factors on
developmental potential of children.
We screened 194 uncomplicated SAM children having weight for height <-3 standard
deviation in rural areas of southern Punjab. The children were screened by cross sectional
study using Denver developmental screening tool 2 (DDST2) covering all four major
domain of development: personal social, gross motor, fine motor and language. We
interpret their overall development by using these scores according to DDST2 protocol
and analyse socio-demographic risk factors by using a pretested structured questionnaire.
Out of 185 children, 69 (37.3%) have normal developmental, 108 (58.4%) had suspected
delayed development and 8 (4.3%) had untestable profile in overall developmental score.
In multivariate logistic regression model, significant variable was age with {AOR 3.95,
95%CI 1.40 to 11.14. p= <0.00}, family size {AOR 2.56, 95%CI 1.10 to 5.94 p= 0.02}
history of TB contact {AOR 2.25, 95%CI1.08 to 4.65 p= 0.02} and exclusive breastfeeding
{AOR 3.14, 95%CI 1.27 to 7.75 p= 0.01} were significant predictors of suspected delay.
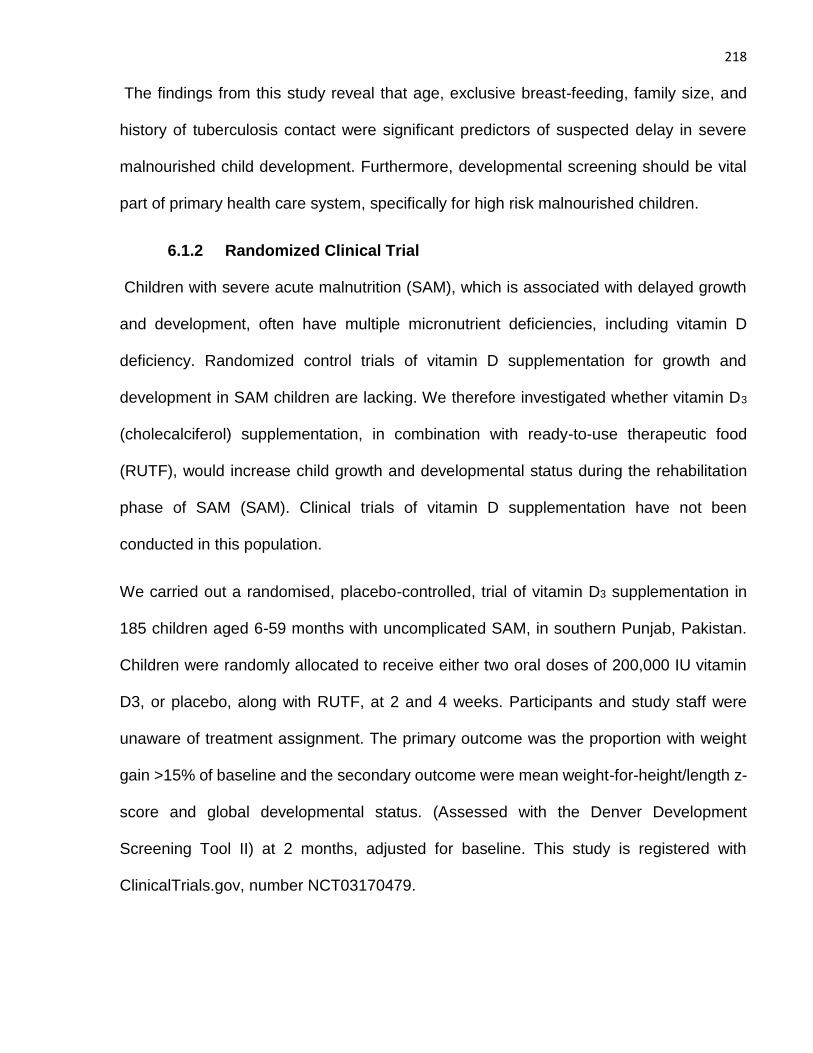
218
The findings from this study reveal that age, exclusive breast-feeding, family size, and
history of tuberculosis contact were significant predictors of suspected delay in severe
malnourished child development. Furthermore, developmental screening should be vital
part of primary health care system, specifically for high risk malnourished children.
6.1.2 Randomized Clinical Trial
Children with severe acute malnutrition (SAM), which is associated with delayed growth
and development, often have multiple micronutrient deficiencies, including vitamin D
deficiency. Randomized control trials of vitamin D supplementation for growth and
development in SAM children are lacking. We therefore investigated whether vitamin D3
(cholecalciferol) supplementation, in combination with ready-to-use therapeutic food
(RUTF), would increase child growth and developmental status during the rehabilitation
phase of SAM (SAM). Clinical trials of vitamin D supplementation have not been
conducted in this population.
We carried out a randomised, placebo-controlled, trial of vitamin D3 supplementation in
185 children aged 6-59 months with uncomplicated SAM, in southern Punjab, Pakistan.
Children were randomly allocated to receive either two oral doses of 200,000 IU vitamin
D3, or placebo, along with RUTF, at 2 and 4 weeks. Participants and study staff were
unaware of treatment assignment. The primary outcome was the proportion with weight
gain >15% of baseline and the secondary outcome were mean weight-for-height/length z-
score and global developmental status. (Assessed with the Denver Development
Screening Tool II) at 2 months, adjusted for baseline. This study is registered with
ClinicalTrials.gov, number NCT03170479.
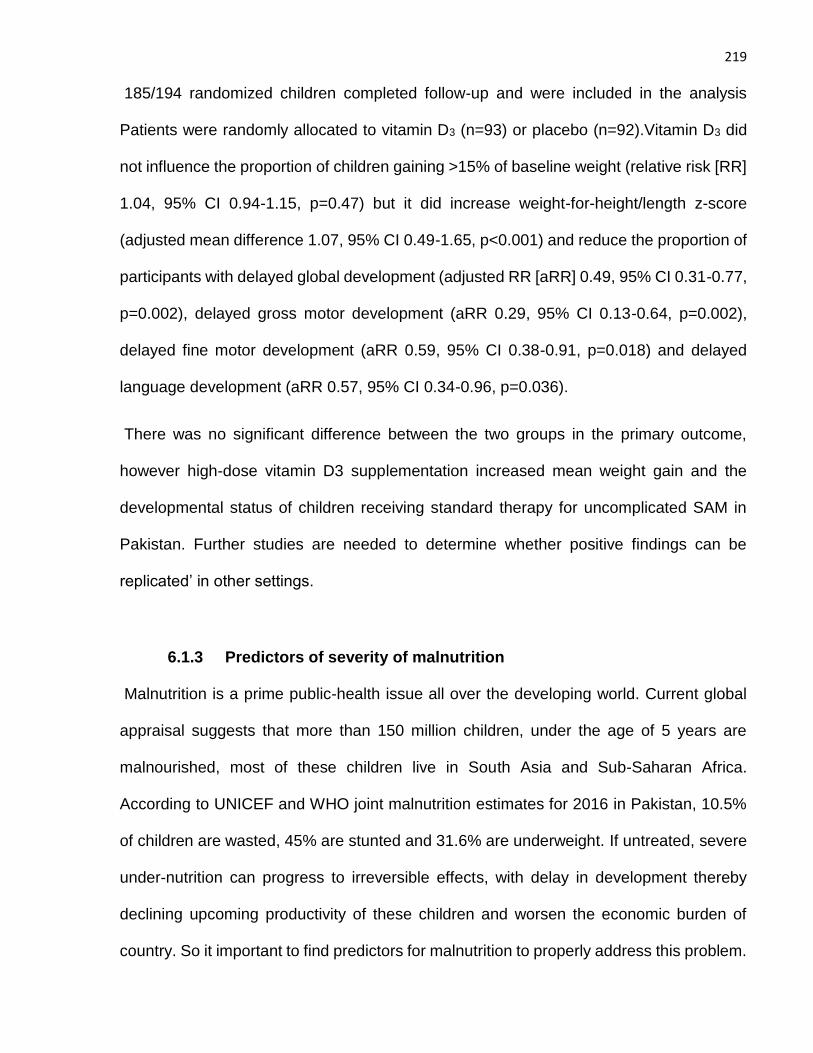
219
185/194 randomized children completed follow-up and were included in the analysis
Patients were randomly allocated to vitamin D3 (n=93) or placebo (n=92).Vitamin D3 did
not influence the proportion of children gaining >15% of baseline weight (relative risk [RR]
1.04, 95% CI 0.94-1.15, p=0.47) but it did increase weight-for-height/length z-score
(adjusted mean difference 1.07, 95% CI 0.49-1.65, p<0.001) and reduce the proportion of
participants with delayed global development (adjusted RR [aRR] 0.49, 95% CI 0.31-0.77,
p=0.002), delayed gross motor development (aRR 0.29, 95% CI 0.13-0.64, p=0.002),
delayed fine motor development (aRR 0.59, 95% CI 0.38-0.91, p=0.018) and delayed
language development (aRR 0.57, 95% CI 0.34-0.96, p=0.036).
There was no significant difference between the two groups in the primary outcome,
however high-dose vitamin D3 supplementation increased mean weight gain and the
developmental status of children receiving standard therapy for uncomplicated SAM in
Pakistan. Further studies are needed to determine whether positive findings can be
replicated’ in other settings.
6.1.3 Predictors of severity of malnutrition
Malnutrition is a prime public-health issue all over the developing world. Current global
appraisal suggests that more than 150 million children, under the age of 5 years are
malnourished, most of these children live in South Asia and Sub-Saharan Africa.
According to UNICEF and WHO joint malnutrition estimates for 2016 in Pakistan, 10.5%
of children are wasted, 45% are stunted and 31.6% are underweight. If untreated, severe
under-nutrition can progress to irreversible effects, with delay in development thereby
declining upcoming productivity of these children and worsen the economic burden of
country. So it important to find predictors for malnutrition to properly address this problem.
220
We conducted a cross sectional study in 4 tehsils of southern Punjab and identified 194
acute malnourished children to find the predictors for severity of malnutrition. Structured
sociodemographic and nutritional questionnaire were used to collect information. Before
entering in study anthropometry were done and nutritional status was evaluated by the
weight for age, length/height for age, and weight for length/height indices, expressed by
mean z- scores according to the WHO standard reference. Nine, children were excluded
from analysis because of incomplete and missing data.
For analysis Independent t Test / One Way ANOVA and linear regression were used. In
findings mean, weight-for-age z-score were -4.55, length for age mean were -3.82, and
weight for height mean were -3.90 respectively. Results indicate that weight for height is
strongly associated with the family income β - 0.16 with {95% CI (-0.89 to -0.04) p=0.03}
and weaning practices β -0.21 {95% CI (-1.14 to 0.19) p=0.01}.In length/height for age z-
score the significant factors are family monthly income β -0.16 {95%CI (0.26 to
1.08)p=0.04} mother knowledge of complimentary diet β 0.15 {95%CI (0.25 to 0.96)
p=0.03} house hold food security β 0.16 {95%CI (0.11 to 1.48) p=0.02} and exclusive
breast feeding practices, β -0.22 {95%CI (-1.47 to -0.30) p=0.00} .In weight for age z-score
no variable show any significant association with the independent variables.
These results emphasize the importance of women's appropriate knowledge and practices
on infant and young child feeding with improved economic status of family in order to
prevent global acute and chronic malnutrition in infancy and childhood. Emphasis should
be given at national level for creating families awareness in this context.
221
6.2 Conclusion
We concluded that malnutrition has high impact in causing delayed development in
malnourished children and developmental screening with other strategies is crucial for all
children, specifically for malnourished children.Therefore nutritional and environmental
stimulation interventions need to be created and utilized for facilitating the child nurturing
environment. The problem of poor child development will remain exist until extensive effort
is made to affix proper integrated strategies. This is evident that timely interventions can
help to avert the loss of potential in concerned children and recoveries can happen
speedily. In regard of the high cost of delayed child development, economically in terms
of justice, individual well-being and the accessibility of effectual interventions, we can no
longer defend inactivity in country like Pakistan.
In this regard high dose therapeutic supplementation 200.000 IU vitamin D with RUTF at
2 and 4 weeks after initiation of RUTF treatment shown to be a safe intervention for
maintaining a preferred level of serum vitamin D for protection against vitamin D deficiency
and in growth and development of SAM children. Additional investigations are desirable
in order to establish a better dosage and dosage frequency to produce a desirable vitamin
D functions and addition of vitamin D therapeutic doses like vitamin A in CMAM guidelines.
In appropriate complimentary feeding practices with lack of exclusive breastfeeding,
maternal knowledge and low family income were significant contributing factors in
causation of severity of malnutrition.
These findings highlight the significance of women's appropriate knowledge and practices
on infant and young child feeding with improved economic status of family for child growth
during the initial vulnerable years of life and for prevention of global acute and chronic
malnutrition during infancy and childhood period. In this respect policy makers working in
222
Pakistan on improvement of nutritional outcomes of children along with development
should promote health-seeking practices and knowledge of families.
Results from this study could be generalized on a same setting and on a same populace
and may not be generalized to settings with different socio-demographic and biological
features because of differences in genetic traits among peoples of different countries, it
might be worth replicating such a study in other parts of the world to improve child health
at global level.
6.3 Recommendations
This present study is consequential because it studies multifaceted nutritional and
environmental variables all together, like screening of children for delayed development
and explores risk factors for malnutrition along with developmental delays. Also did
interventions for child growth combined with development and because this kind of study
is still very limited in Pakistan.
6.3.1 Development Screening:
Developmental screening is unique approach in the prevention and improvement of
developmental delays. In this context, to detect developmental disorders and to avoid
complications, the estimates of risk factors are also crucial. Multifaceted associations
among biological and environmental factors are identified effecting the developmental
sequences and outcomes. Early detection of developmental disabilities is essential for the
welfare of children and their families. It is a vital function of the primary care medical home
and an apt liability of all paediatric health care experts to identify this delays as early as
possible.

223
The result of this study propose that malnutrition had adverse effect on early child
development and developmental screening is crucial for all children, specifically for
malnourished children. So proper strategies should be made with full support of
government for early screening. For this all private and government organizations should
work in collaboration to combat this problem. Government can integrate screening as a
regular part of primary and secondary health care by training doctors, social worker,
childcare workers, teachers and paramedics.
By advancing school health care with proper training of teachers for initial development
assessment will be very helpful and economical for Pakistan. Different workshops and
training sessions with parent and teacher’s interaction should be conducted at regular
interval. For high risk children this should be done in hospital as a routine care and even
government can incorporate this in to existing health care CMAM services as with growth,
development should be the part of their follow up and treatment. Print and electronic media
can also be used for awareness of families and society at broad level. In regard of the high
cost of delayed child development, both economically and in terms of justice and individual
well-being and the accessibility of effectual interventions, we can no longer defend
inactivity in countries like Pakistan.
6.3.2 Randomized Trial
In our study, CMAM guidelines were used for the treatment of malnutrition and
development outcome. We observed a successful treatment of malnutrition in the OTP
component in both intervention and controls groups likened to the previous appraisals.
The marked improvement in the nutritional status of children is might be because of quality
of services we delivered, such as community mobilization, accurate anthropometry, proper
referral to stabilization center uninterrupted supply of ready to use therapeutic food, proper
224
follow up of children at their homes to reduce default rate, providing treatment for
associated illness like diarrhea, using a standard protocol for diagnosis and treatment of
the cases and conclusively accessibility to health care in need. The last point is more
important that, I have observed while working in these remote area of southern Punjab is
interrupted supply of RUTF, shortage of recommended medicine, not proper diagnosis
and referral for illness because health staff could not be accessed always except the
official time they work in a basic health unit.
So we strongly recommend based on our knowledge we have gained in this study that
government of Pakistan should give appropriate attention to above mentioned problems
at OTP’s and CMAM centers to increase the ratio of children with successful treatment of
malnutrition at national level. Furthermore long term follow up at home after completion of
treatment should be the part of CMAM project to prevent and decrease the proportion of
children with relapse.
As we find that vitamin D administration was successful for improving growth along with
development, so after conducting more trials at government level, vitamin D should be
included in the routine CMAM guidelines recommendations as iron, vitamin A and zinc.
This should be counted as an essential micronutrient for SAM children after considering
the NNS 2011 report of prevalence of vitamin D deficiency in Pakistani population as this
is already overlooked micronutrient in Pakistan.
This story should not be ended here we should try more trials with combination of multiple
micro and macronutrients along with environmental stimulation for improving the growth
parameters and development status of this high risk SAM population.
According to UNICEF Pakistan has the third highest proportion of stunted children globally
(9.6 million), with considerable disparity among urban and rural areas (37% vs 46%,
225
respectively).There is an utmost requirement to search for new approaches to prevent
stunting and treat wasting, but we deficit in required knowledge of the utmost tractable
pathways for intervention. Our aim should be the better understanding of the pathogenesis
of stunting and wasting and identify mechanisms to target them. So with SAM attention
should be given to combat the problems of chronic malnutrition known as (stunting) in
Pakistan. Vitamin D role with other interventional strategies should be designed for this
huge problem to enhance child survival, health and potential by finding new
interdisciplinary tactics for stunting and wasting, to effect the sustainable development
goals. We need new approaches to management of complicated SAM to reduce mortality
and improve long-term outcomes.
6.3.3 Predictors of malnutrition
Caregiver attitudes, behaviors and capabilities during recovery from SAM: The
psychosocial environment gravely affects retrieval from SAM. Child stimulation through
caregivers in hospital and in rehabilitation phase is recommended by WHO to fasten
recovery; but, its adoption is probably reliant on conducive maternal attitudes, behaviors
and capabilities.
We should therefore give valuable attention to impart this knowledge among mothers of
children recovering from SAM to characterize maternal attitudes, behaviors and
capabilities. Maternal capabilities mostly signify the skills and attributes that conclude a
mother’s ability to care for a young child, comprising her “mental health; social support;
autonomy; workload and time stress; gender norms attitudes; and mothering self-efficacy”.
Caregiving habits and attitudes are decisively shaped by caregiver capabilities. Maternal
attitudes, behaviors and capabilities that hamper best childcare may need particular
interventions to modulate them before an infant stimulation intervention can be effective.
226
Thus by reinforcing caregiver capabilities and accomplishing by behavior change to
provide a package of care for the child could improve long-term outcomes during SAM.
To combat malnutrition in Pakistan an effectual culturally applicable behavioral change
communication approach must be executed and maintained. For this to avoid extra
financial burden on country we can utilize already existing programmes in Pakistan like,
the “National Program for Family Planning and Primary Health Care” working in Pakistan.
With the objective to access reproductive health and nutrition services, improving
maternal, new-born and child health, providing family planning services (family planning
reduces the number of unplanned pregnancies, abortions among women, and allows
women the opportunity to choose when the time is right to have a child) for improving
healthy pregnancy and healthy fetal outcome.
The other programme are “National Maternal and Newborn Child Health (MNCH) Program
and Leady health worker program” (each LHW conducted one health session with married
women of reproductive age on daily basis for promotion of family planning and exclusive
breast feeding up to six months).“Poverty alleviation programs” also working in country
like social safety nets like (Baitul Maal, Zakat programs or the Benazir Income Support
programs) have massive potential for reaching those trapped in the spiral of food poverty.
“Integrated management of child hood illness (IMCI)” is also working in country was first
introduced in mid 1990s by WHO and UNICEF. Pakistan adapted it in 1998-2000 to
contribute to healthy growth and development of children and in order to decrease
mortality due to pneumonia, diarrhea, measles, malaria and malnutrition through
227
immunization, counseling and case management components. In immunization WHO
recommends polio, tuberculosis, measles, pertussis, diphtheria, tetanus, vaccines for
prevention of childhood mortality and morbidity. Hib and pneumococcal conjugate
vaccines are newly introduced in Pakistan for prevention of pneumonia.
Nutrition Program by giving preventive services are being delivered in 36 districts of
Punjab through lady health workers (LHWs) which include screening of under 5 children
and pregnant and lactating mothers (PLWs), infant and young feeding (IYCF) counselling,
provision of iron, vitamin-A and MMS to mother and child. Improvement of child nutritional
status by implementing CMAM program in all districts of Pakistan including stabilization
center, OTP, supplementary feeding program with community mobilization. By using this
already existed programme in Pakistan, we should therefore give valuable attention to
impart this knowledge among mothers of children recovering from SAM to characterize
maternal attitudes, behaviors and capabilities for prevention of malnutrition. Healthcare
providers must be proficient in strategies that support nutrition sufficiency for mothers and
children, comprising those that promote healthy lifestyles, nutrition and physical activity.
In country like Pakistan religious leaders, school teachers and social mobilisers can also
show an influential role in endorsing exclusive breastfeeding and recommended
complementary feeding. Consistent monitoring and liability is important if Pakistan have
to break the deadlock for focusing on malnutrition issue. There is a requisite to confirm
regular data on nutrition indicators with more distinct regional or district level info. This
scenario is apt for change with more importance on nutrition and invention of several
228
national and provincial nutrition focused policies. Moreover, there is demand for
incorporating many different segments and plans to attain the preferred outcomes
effectively and efficiently as various determining and influencing factors are outside the
health sector. It is very important that policymakers recognize the significance of
improvement in child health and nutritional status for national growth and as a vital
contributor to accomplishing Pakistan’s sustainable development goals.
229
REFERENCES
Adair, L. S., Fall, C. H., Osmond, C., Stein, A. D., Martorell, R., Ramirez-Zea, M. & Micklesfield,
L. (2013). Associations of linear growth and relative weight gain during early life with adult
health and human capital in countries of low and middle income: findings from five birth
cohort studies. The Lancet, 382(9891), 525-534.
Adu-Afarwuah, S., Lartey, A., Brown, K. H., Zlotkin, S., Briend, A., & Dewey, K. G. (2007).
Randomized comparison of 3 types of micronutrient supplements for home fortification of
complementary foods in Ghana: effects on growth and motor development. The American
journal of clinical nutrition, 86(2), 412-420.
Afzal, U. (2012). The Determinants of Child Health and Nutritional Status in Punjab: An Economic
Analysis. Centre for Research in Economics and Business, Lahore School of Economics.
Agarwal, K. S., Mughal, M. Z., Upadhyay, P., Berry, J. L., Mawer, E. B., & Puliyel, J. M. (2002).
The impact of atmospheric pollution on vitamin D status of infants and toddlers in Delhi,
India. Archives of disease in childhood, 87(2), 111-113.
Akparibo, R., Harris, J., Blank, L., Campbell, M. J., & Holdsworth, M. (2017). Severe acute
malnutrition in children aged under 5 years can be successfully managed in a non‐
emergency routine community healthcare setting in Ghana. Maternal & Child Nutrition.
Akpede, G. O., Omotara, B. A., & Ambe, J. P. (1999). Rickets and deprivation: A Nigerian
study. The journal of the Royal Society for the Promotion of Health, 119(4), 216-222.
Akram, D. S., Arif, F., Khan, D. S., & Samad, S. (2010). Community based nutritional
rehabilitation of severely malnourished children. JPMA. The Journal of the Pakistan
Medical Association, 60(3), 179.
230
Albers, L. H., Johnson, D. E., Hostetter, M. K., Iverson, S., & Miller, L. C. (1997). Health of
children adopted from the former Soviet Union and Eastern Europe: comparison with
preadoptive medical records. Jama, 278(11), 922-924.
Anderson, V. (1998). Assessing executive functions in children: Biological, psychological, and
developmental considerations. Neuropsychological rehabilitation, 8(3), 319-349.
Ashworth, A. (2006). Efficacy and effectiveness of community-based treatment of severe
malnutrition. FOOD AND NUTRITION BULLETIN-UNITED NATIONS UNIVERSITY-
, 27(3), S24.
Asres, G., & Eidelman, A. I. (2011). Nutritional assessment of Ethiopian Beta-Israel children: a
cross-sectional survey. Breastfeeding Medicine, 6(4), 171-176.
Valente, A., Silva, D., Neves, E., Almeida, F., Cruz, J. L., Dias, C. C., .. & Guerra, A. (2016).
Acute and chronic malnutrition and their predictors in children aged 0–5 years in São
Tomé: a cross-sectional, population-based study. Public health, 140, 91-101.
Attia, S., Versloot, C. J., Voskuijl, W., van Vliet, S. J., Di Giovanni, V., Zhang, L., ... & van
Rheenen, P. F. (2016). Mortality in children with complicated severe acute malnutrition is
related to intestinal and systemic inflammation: an observational cohort study. The
American journal of clinical nutrition, 104(5), 1441-1449.
Ayana, A. B., Hailemariam, T. W., & Melke, A. S. (2015). Determinants of acute malnutrition
among children aged 6–59 months in public hospitals, Oromia region, West Ethiopia: a
case–control study. BMC Nutrition, 1(1), 34.
Balasubramanian, S., Shivbalan, S., & Kumar, P. S. (2006). Hypocalcemia due to vitamin D
deficiency in exclusively breastfed infants. Indian pediatrics, 43(3), 247.
231
Bang, K. S. (2008). Analysis of risk factors in children with suspected developmental delays on
the Denver developmental screening test. 아동간호학회지 제, 14(3).
Barros, A. J., Matijasevich, A., Santos, I. S., & Halpern, R. (2009). Child development in a birth
cohort: effect of child stimulation is stronger in less educated mothers. International
Journal of Epidemiology, 39(1), 285-294.
Bashir, A., & Zaman, S. (2016). Effectiveness and Acceptability of Ready-To-Use Therapeutic
foods among malnourished Children in a tertiary care hospital. Journal of Ayub Medical
College Abbottabad, 28(3), 501-505.
Basile, L. A., Taylor, S. N., Wagner, C. L., Quinones, L., & Hollis, B. W. (2007). Neonatal vitamin
D status at birth at latitude 32 72′: evidence of deficiency. Journal of Perinatology, 27(9),
568-571.
Baur, J. A., Pearson, K. J., Price, N. L., Jamieson, H. A., Lerin, C., Kalra, A., ... & Pistell, P. J.
(2006). Resveratrol improves health and survival of mice on a high-calorie
diet. Nature, 444(7117), 337.
Beckett, C., Durnin, J. V., Aitchison, T. C., & Pollitt, E. (2000). Effects of an energy and
micronutrient supplement on anthropometry in undernourished children in
Indonesia. European journal of clinical nutrition, 54, S52-9.
Bennett, E. M. (2009). Understanding childhood malnutrition in a Maya village in Guatemala: A
syndemic perspective. ProQuest.
Bergman, P., Norlin, A. C., Hansen, S., Rekha, R. S., Agerberth, B., Björkhem-Bergman, L. &
Andersson, J. (2012). Vitamin D3 supplementation in patients with frequent respiratory
232
tract infections: a randomised and double-blind intervention study. BMJ open, 2(6),
e001663.
Berkley, J. A., Ngari, M., Thitiri, J., Mwalekwa, L., Timbwa, M., Hamid, F., ... & Alphan, H. (2016).
Daily co-trimoxazole prophylaxis to prevent mortality in children with complicated severe
acute malnutrition: a multicentre, double-blind, randomised placebo-controlled trial. The
Lancet Global Health, 4(7), e464-e473.
Berkman, D. S., Lescano, A. G., Gilman, R. H., Lopez, S. L., & Black, M. M. (2002). Effects of
stunting, diarrhoeal disease, and parasitic infection during infancy on cognition in late
childhood: a follow-up study. The Lancet, 359(9306), 564-571.
Bhutta, Z. A., Ahmed, T., Black, R. E., Cousens, S., Dewey, K., Giugliani, E., & Maternal and
Child Undernutrition Study Group. (2008). what works? Interventions for maternal and
child undernutrition and survival. The Lancet, 371(9610), 417-440.
Bhutta, Z.A, (2000). Why has so little changed in maternal and child health in south Asia. Br.
Med. J. 321: 809-812.
Black, R. E., Allen, L. H., Bhutta, Z. A., Caulfield, L. E., De Onis, M., Ezzati, M., ... & Maternal
and Child Under nutrition Study Group. (2008). Maternal and child under nutrition: global
and regional exposures and health consequences. The lancet, 371(9608), 243-260.
Black, R. E., Victora, C. G., Walker, S. P., Bhutta, Z. A., Christian, P., De Onis, M., ... & Uauy, R.
(2013). Maternal and child undernutrition and overweight in low-income and middle-
income countries. The lancet, 382(9890), 427-451.
Bradley, R. H., & Corwyn, R. F. (2002). Socioeconomic status and child development. Annual
review of psychology, 53(1), 371-399.
233
Branson, D., Vigil, D. C., & Bingham, A. (2008). Community childcare providers’ role in the early
detection of autism spectrum disorders. Early Childhood Education Journal, 35(6), 523-
530.
Brehm, J. M., Schuemann, B., Fuhlbrigge, A. L., Hollis, B. W., Strunk, R. C., Zeiger, R. S., ... &
Childhood Asthma Management Program Research Group. (2010). Serum vitamin D
levels and severe asthma exacerbations in the Childhood Asthma Management Program
study. Journal of Allergy and Clinical Immunology, 126(1), 52-58.
Briend, A., Lacsala, R., Prudhon, C., Mounier, B., Grellety, Y., & Golden, M. H. (1999). Ready-
to-use therapeutic food for treatment of marasmus. The Lancet, 353(9166), 1767-1768.
Briend, A. (2001). Highly nutrient-dense spreads: a new approach to delivering multiple
micronutrients to high-risk groups. British Journal of Nutrition, 85(S2), S175-S179.
Bursac, Z., Gauss, C. H., Williams, D. K., & Hosmer, D. W. (2008). Purposeful selection of
variables in logistic regression. Source code for biology and medicine, 3(1), 17.
Cantorna, M. T. (2000). Vitamin D and autoimmunity: is vitamin D status an environmental factor
affecting autoimmune disease prevalence? Proceedings of the society for Experimental
Biology and Medicine, 223(3), 230-233.
Carrie, Frankenburg & Alicia, Merrit. Denver Developmental Materials, Inc. 2002-2007, DDM, Inc.
Charan, G. S., & Vagha, J. (2016). Study of perinatal factors in children with developmental
delay. International Journal of Contemporary Pediatrics, 4(1), 182-190.
Charter, H. (2011). Minimum Standards in Humanitarian Response. Northampton, United
Kingdom: The Sphere Project.
234
Chattopadhyay, N., & Saumitra, M. (2016). Developmental Outcome in Children with
Malnutrition. Journal of Nepal Paediatric Society, 36(2), 170-177.
Chertoff, M. (2015). Protein Malnutrition and Brain Development. Brain Disord. Ther, 4.
Cheung, Y. B., Yip, P. S. F., & Karlberg, J. P. E. (2001). Fetal growth, early postnatal growth and
motor development in Pakistani infants. International Journal of Epidemiology, 30(1), 66-
72.
Chiricone, D., De Santo, N. G., & Cirillo, M. (2003). Unusual cases of chronic intoxication by
vitamin D. Journal of nephrology, 16(6), 917-922.
Chocano-Bedoya, P., & Ronnenberg, A. G. (2009). Vitamin D and tuberculosis. Nutrition
reviews, 67(5), 289-293.
Ciliberto, M. A., Manary, M. J., Ndekha, M. J., Briend, A., & Ashorn, P. (2006). Home‐based
therapy for oedematous malnutrition with ready‐to‐use therapeutic food. Acta
Paediatrica, 95(8), 1012-1015.
Ciliberto, M. A., Sandige, H., Ndekha, M. J., Ashorn, P., Briend, A., Ciliberto, H. M., & Manary,
M. J. (2005). Comparison of home-based therapy with ready-to-use therapeutic food with
standard therapy in the treatment of malnourished Malawian children: a controlled, clinical
effectiveness trial. The American journal of clinical nutrition, 81(4), 864-870.
Clemens, T. L., Henderson, S. L., Adams, J. S., & Holick, M. F. (1982). Increased skin pigment
reduces the capacity of skin to synthesise vitamin D 3. The Lancet, 319(8263), 74-76.
Collins, S. (2001). Changing the way we address severe malnutrition during famine. The
Lancet, 358(9280), 498-501.
235
Collins, S., & Sadler, K. (2002). Outpatient care for severely malnourished children in emergency
relief programmes: a retrospective cohort study. The Lancet, 360(9348), 1824-1830.
Collins, S., Dent, N., Binns, P., Bahwere, P., Sadler, K., & Hallam, A. (2006). Management of
severe acute malnutrition in children. The Lancet, 368(9551), 1992-2000.
Committee on Children with Disabilities. (2001). Developmental surveillance and screening of
infants and young children. Pediatrics, 108(1), 192-195.
Coussens, A. K., Wilkinson, R. J., Hanifa, Y., Nikolayevskyy, V., Elkington, P. T., Islam, K., ... &
Darmalingam, M. (2012). Vitamin D accelerates resolution of inflammatory responses
during tuberculosis treatment. Proceedings of the National Academy of
Sciences, 109(38), 15449-15454.
Cranney, A., Weiler, H. A., O'Donnell, S., & Puil, L. (2008). Summary of evidence-based review
on vitamin D efficacy and safety in relation to bone health. The American journal of clinical
nutrition, 88(2), 513S-519S.
Darnton-Hill (2006). Solutions to Nutrition-related Health Problems of Preschool Children:
Education and Nutritional Policies for Children. New York. Pp: 14.
Dawson-Hughes, B., Heaney, R. P., Holick, M. F., Lips, P., Meunier, P. J., & Vieth, R. (2005).
Estimates of optimal vitamin D status. Osteoporosis international, 16(7), 713-716.
de Onis, M., Onyango, A. W., Van den Broeck, J., Chumlea, C. W., & Martorell, R. (2004).
Measurement and standardization protocols for anthropometry used in the construction of
a new international growth reference. Food and nutrition bulletin, 25(1_suppl1), S27-S36.
236
Defourny, I., Minetti, A., Harczi, G., Doyon, S., Shepherd, S., Tectonidis, M., & Golden, M. (2009).
A large-scale distribution of milk-based fortified spreads: evidence for a new approach in
regions with high burden of acute malnutrition. PLoS One, 4(5), e5455.
Denver Developmental Screening Test Definition. 1996- 2007, Medicine Net, Inc. Retrieved,
03,10,2007.
Denver, I. I. (1989). Denver Developmental Materials Retrieved March 28, 2007 from http://www.
denverii.com.
Dereje, N. (2014). Determinants of severe acute malnutrition among under five children in
Shashogo Woreda, Southern Ethiopia: A community based matched case control study.
Dhesi, J. K., Jackson, S. H., Bearne, L. M., Moniz, C., Hurley, M. V., Swift, C. G., & Allain, T. J.
(2004). Vitamin D supplementation improves neuromuscular function in older people who
fall. Age and ageing, 33(6), 589-595.
DHS, M. (2013). Demographic and health surveys. Calverton: MEASURE DHS.
Duggan, M. B. (2003). Nutritional update: relevance to maternal and child health in East
Africa. African health sciences, 3(3), 136-145.
Egata, G., Berhane, Y., & Worku, A. (2014). Predictors of acute undernutrition among children
aged 6 to 36 months in east rural Ethiopia: a community based nested case-control
study. BMC pediatrics, 14(1), 91.
Ejaz, M. S., & Latif, N. (2010). Stunting and micronutrient deficiencies in malnourished
children. JPMA, 60(543).
Elidrissy, A. T., Sedrani, S. H., & Lawson, D. E. (1984). Vitamin D deficiency in mothers of rachitic
infants. Calcified tissue international, 36(1), 266-268.
237
Eyles, D. W., Feron, F., Cui, X., Kesby, J. P., Harms, L. H., Ko, P., ... & Burne, T. H. J. (2009).
Developmental vitamin D deficiency causes abnormal brain
development. Psychoneuroendocrinology, 34, S247-S257.
Fakir, A. M., & Khan, M. W. R. (2015). Determinants of malnutrition among urban slum children
in Bangladesh. Health economics review, 5(1), 22.
Fenske, N., Burns, J., Hothorn, T., & Rehfuess, E. A. (2013). Understanding child stunting in
India: a comprehensive analysis of socio-economic, nutritional and environmental
determinants using additive quantile regression. PloS one, 8(11), e78692.
Fikree, F.F., M.H. Rabbar and H.W. Berendes (2000). Risk factors for stunting and wasting at
age six, twelve and twenty-four months for squatter children of Karachi, Pakistan. J. Pak.
Med. Assoc., 50: 341-8
Fischer, P. R., Thacher, T. D., & Pettifor, J. M. (2008). Pediatric vitamin D and calcium nutrition
in developing countries. Reviews in Endocrine and Metabolic Disorders, 9(3), 181-192.
Fotso, J. C., & Kuate-Defo, B. (2005). Measuring socioeconomic status in health research in
developing countries: Should we be focusing on households, communities or both?. Social
Indicators Research, 72(2), 189-237.
Frankenburg, W. K., Dodds, J., Archer, P., Shapiro, H., & Bresnick, B. (1992). The Denver II: a
major revision and restandardization of the Denver Developmental Screening
Test. Pediatrics, 89(1), 91-97.
Frankenburg, W. K., & Dodds, J. B. (1967). The Denver developmental screening test. The
Journal of pediatrics, 71(2), 181-191.
238
Frankenburg, W. K., Dodds, J. B., Fandal, A. W., Kazuk, E., & Cohrs, M. (1973). Denver
developmental screening test. LADOCA Project & Publishing Foundation, Incorporated.
Frost, M. B., Forste, R., & Haas, D. W. (2005). Maternal education and child nutritional status in
Bolivia: finding the links. Social science & medicine, 60(2), 395-407.
Galler, J. R., Bryce, C. P., Zichlin, M. L., Fitzmaurice, G., Eaglesfield, G. D., & Waber, D. P.
(2012). Infant malnutrition is associated with persisting attention deficits in middle
adulthood. The Journal of nutrition, 142(4), 788-794.
Galler, J. R., Bryce, C., Waber, D. P., Zichlin, M. L., Fitzmaurice, G. M., & Eaglesfield, D. (2012).
Socioeconomic outcomes in adults malnourished in the first year of life: a 40-year
study. Pediatrics, 130(1), e1-e7.
Gilbert-Diamond, D., Baylin, A., Mora-Plazas, M., Marin, C., Arsenault, J. E., Hughes, M. D., &
Villamor, E. (2010). Vitamin D deficiency and anthropometric indicators of adiposity in
school-age children: a prospective study. The American journal of clinical nutrition, 92(6),
1446-1451.
Ginjinder Kaur, Harmander Singh Kang, Pushpa Singal and S.P. Singh (2005). Nutritional Status:
Anthropometric Perspective of Pre-School Children. 7(2): 99-10
Golden, M. H. N. (1997). Protein-energy interactions in the management of severe malnutrition.
Clinical nutrition, 16, 19-23.
Goudet, S. M., Griffiths, P. L., Bogin, B. A., & Madise, N. J. (2015). Nutritional interventions for
preventing stunting in children (0 to 5 years) living in urban slums. The Cochrane Library.
Grantham-McGregor, S. (1995). A review of studies of the effect of severe malnutrition on mental
development. The Journal of nutrition, 125(8 Suppl), 2233S-2238S.
239
Grantham-McGregor, S. M., Fernald, L. C., & Sethuraman, K. (1999). Effects of health and
nutrition on cognitive and behavioural development in children in the first three years of
life. Part 1: Low birthweight, breastfeeding, and protein-energy malnutrition. Food and
nutrition Bulletin, 20(1), 53-75.
Grantham-McGregor, S., Cheung, Y. B., Cueto, S., Glewwe, P., Richter, L., Strupp, B., &
International Child Development Steering Group. (2007). Developmental potential in the
first 5 years for children in developing countries. The lancet, 369(9555), 60-70.
Grantham-McGregor, S., Schofield, W., & Harris, L. (1983). Effect of psychosocial stimulation on
mental development of severely malnourished children: An interim
report. Pediatrics, 72(2), 239-243.
Grundmann, M., & von Versen-Höynck, F. (2011). Vitamin D-roles in women's reproductive
health. Reprod Biol Endocrinol, 9, 146
Guideline, W. H. O. (2013). Updates on the management of severe acute malnutrition in infants
and children. Geneva: World Health Organization, 55-59.
Hall, A., Khanh, L. N., Son, T. H., Dung, N. Q., Lansdown, R. G., Dar, D. T., ... & Bundy, D. A.
(2001). An association between chronic undernutrition and educational test scores in
Vietnamese children. European journal of clinical nutrition, 55(9), 801-804.
Hamadani, J. D., Fuchs, G. J., Osendarp, S. J., Huda, S. N., & Grantham-McGregor, S. M. (2002).
Zinc supplementation during pregnancy and effects on mental development and behaviour
of infants: a follow-up study. The Lancet, 360(9329), 290-294.
Hamadani, J. D., Fuchs, G. J., Osendarp, S. J., Khatun, F., Huda, S. N., & Grantham-McGregor,
S. M. (2001). Randomized controlled trial of the effect of zinc supplementation on the
240
mental development of Bangladeshi infants. The American journal of clinical
nutrition, 74(3), 381-386.
Hathcock, J. N., Shao, A., Vieth, R., & Heaney, R. (2007). Risk assessment for vitamin D. The
American journal of clinical nutrition, 85(1), 6-18.
Hazarika, G. (2000). Gender differences in children's nutrition and access to health care in
Pakistan. The Journal of Development Studies, 37(1), 73-92.
Hazell, T. J., DeGuire, J. R., & Weiler, H. A. (2012). Vitamin D: an overview of its role in skeletal
muscle physiology in children and adolescents. Nutrition reviews, 70(9), 520-533.
Herbst, D. S., & Baird, P. A. (1983). Nonspecific mental retardation in British Columbia as
ascertained through a registry. American journal of mental deficiency..
Hill, E. L. (2001). Non-specific nature of specific language impairment: a review of the literature
with regard to concomitant motor impairments. International Journal of Language &
Communication Disorders, 36(2), 149-171.
Holick, M. F. (2010). The vitamin D deficiency pandemic: A forgotten hormone important for
health. Public Health Rev, 32(1), 267-28.
Huh, S. Y., & Gordon, C. M. (2008). Vitamin D deficiency in children and adolescents:
epidemiology, impact and treatment. Reviews in Endocrine and Metabolic Disorders, 9(2),
161-170.
Irena, A. H., Bahwere, P., Owino, V. O., Diop, E. I., Bachmann, M. O., Mbwili‐Muleya, C., ... &
Collins, S. (2013). Comparison of the effectiveness of a milk‐free soy‐maize‐sorghum‐
based ready‐to‐use therapeutic food to standard ready‐to‐use therapeutic food with 25%
241
milk in nutrition management of severely acutely malnourished Zambian children: an
equivalence non‐blinded cluster randomised controlled. Maternal & child nutrition.
Islam, N., Angeles, G., Mahbub, A., Lance, P., & Nazem, N. I. (2006). Slums of urban
Bangladesh: mapping and census 2005.
Jamro, B., Junejo, A. A., Lal, S., Bouk, G. R., & Jamro, S. (2012). Risk factors for severe acute
malnutrition in children under the age of five years in Sukkur. Pakistan Journal of Medical
Research, 51(4), 111.
Jesmin, A., Yamamoto, S. S., Malik, A. A., & Haque, M. A. (2011). Prevalence and determinants
of chronic malnutrition among preschool children: a cross-sectional study in Dhaka City,
Bangladesh. Journal of health, population, and nutrition, 29(5), 494.
Johnson, D. E., Miller, L. C., Iverson, S., Thomas, W., Franchino, B., Dole, K., & Hostetter, M. K.
(1992). The health of children adopted from Romania. Jama, 268(24), 3446-3451.
Jones, A. D., Ickes, S. B., Smith, L. E., Mbuya, M. N., Chasekwa, B., Heidkamp, R. A., ... &
Stoltzfus, R. J. (2014). World Health Organization infant and young child feeding indicators
and their associations with child anthropometry: a synthesis of recent findings. Maternal &
child nutrition, 10(1), 1-17.
Jones, G., Steketee, R. W., Black, R. E., Bhutta, Z. A., Morris, S. S., & Bellagio Child Survival
Study Group. (2003). How many child deaths can we prevent this year?
Jones, K. D., Ali, R., Khasira, M. A., Odera, D., West, A. L., Koster, G., & Thitiri, J. (2015). Ready-
to-use therapeutic food with elevated n-3 polyunsaturated fatty acid content, with or
without fish oil, to treat severe acute malnutrition: a randomized controlled trial. BMC
medicine, 13(1), 1.
242
Jones, K. D., Hachmeister, C. U., Khasira, M., Cox, L., Schoenmakers, I., Munyi, C., ... & Berkley,
J. A. (2017). Vitamin D deficiency causes rickets in an urban informal settlement in Kenya
and is associated with malnutrition. Maternal & Child Nutrition.
Kapil, U. (2009). Ready to use therapeutic food (RUTF) in the management of severe acute
malnutrition in India. Indian Pediatr, 46(5), 381-2.
Kar, B. R., Rao, S. L., & Chandramouli, B. A. (2008). Cognitive development in children with
chronic protein energy malnutrition. Behav Brain Funct, 4(31), 1-31.
Karim, S. A., Nusrat, U., & Aziz, S. (2011). Vitamin D deficiency in pregnant women and their
newborns as seen at a tertiary-care center in Karachi, Pakistan. International Journal of
Gynecology & Obstetrics, 112(1), 59-62.
Karlberg, J., & Albertsson-Wikland, K. (1995). Growth in full-term small-for-gestational-age
infants: from birth to final height. Pediatric research, 38(5), 733-739.
Karlic, H., & Varga, F. (2011). Impact of vitamin D metabolism on clinical epigenetics. Clinical
epigenetics, 2(1), 55-61.
Kauffman, C. A., Jones, P. G., & Kluger, M. J. (1986). Fever and malnutrition: endogenous
pyrogen/interleukin-1 in malnourished patients. The American journal of clinical nutrition,
44(4), 449-452.
Kavosi, E., Rostami, Z. H., Kavosi, Z., Nasihatkon, A., Moghadami, M., & Heidari, M. (2014).
Prevalence and determinants of under-nutrition among children under six: a cross-
sectional survey in Fars province, Iran. International journal of health policy and
management, 3(2), 71.
243
Keino, S., Plasqui, G., Ettyang, G., & van den Borne, B. (2014). Determinants of stunting and
overweight among young children and adolescents in sub-Saharan Africa. Food and
Nutrition Bulletin, 35(2), 167-178.
Kerac, M., Bunn, J., Seal, A., Thindwa, M., Tomkins, A., Sadler, K., & Collins, S. (2009).
Probiotics and prebiotics for severe acute malnutrition (PRONUT study): a double-blind
efficacy randomised controlled trial in Malawi. The Lancet, 374(9684), 136-144.
Ko, M. L., Liberman, M. M., & Salzmann, M. (1991). Chronic vitamin D overdosage: a reminder.
Archives of disease in childhood, 66(8), 1002.
Kochupillai, N. (2008). The physiology of vitamin D: current concepts. Indian Journal of Medical
Research, 127(3), 256.
Koruk, I., Simsek, Z., Tekin Koruk, S., Doni, N., & Gürses, G. (2010). Intestinal parasites,
nutritional status and physchomotor development delay in migratory farm worker's
children. Child: Care, Health and Development, 36(6), 888-894.
Kramer, M. S., Aboud, F., Mironova, E., Vanilovich, I., Platt, R. W., Matush, L., ... & Collet, J. P.
(2008). Breastfeeding and child cognitive development: new evidence from a large
randomized trial. Archives of general psychiatry, 65(5), 578-584.
Kuklina, E. V., Ramakrishnan, U., Stein, A. D., Barnhart, H. H., & Martorell, R. (2004). Growth
and diet quality are associated with the attainment of walking in rural Guatemalan
infants. The Journal of nutrition, 134(12), 3296-3300.
Kumar, G. T., Sachdev, H. S., Chellani, H., Rehman, A. M., Singh, V., Arora, H., & Filteau, S.
(2011). Effect of weekly vitamin D supplements on mortality, morbidity, and growth of low
244
birthweight term infants in India up to age 6 months: randomised controlled trial. Bmj, 342,
d2975.
Kutluk, G., Çetinkaya, F., & Basak, M. (2002). Comparisons of oral calcium, high dose vitamin D
and a combination of these in the treatment of nutritional rickets in children. Journal of
tropical pediatrics, 48(6), 351-353.
Kwena, A. M., Terlouw, D. J., De Vlas, S. J., Phillips-Howard, P. A., Hawley, W. A., Friedman, J.
F., ... & TER KUILE, F. O. (2003). Prevalence and severity of malnutrition in pre-school
children in a rural area of western Kenya. The American journal of tropical medicine and
hygiene, 68(4_suppl), 94-99.
Laaksi, I., Ruohola, J. P., Tuohimaa, P., Auvinen, A., Haataja, R., Pihlajamäki, H., & Ylikomi, T.
(2007). An association of serum vitamin D concentrations< 40 nmol/L with acute
respiratory tract infection in young Finnish men. The American journal of clinical nutrition,
86(3), 714-717.
LaGrone, L. N., Trehan, I., Meuli, G. J., Wang, R. J., Thakwalakwa, C., Maleta, K., & Manary,
M. J. (2012). Novel fortified blended flour, corn-soy blend “plus-plus,” is not inferior to lipid-
based ready-to-use supplementary foods for the treatment of moderate acute malnutrition
in Malawian children. The American journal of clinical nutrition, 95(1), 212-219.
Larson, L. M., & Yousafzai, A. K. (2017). A meta‐analysis of nutrition interventions on mental
development of children under‐two in low‐and middle‐income countries. Maternal & child
nutrition, 13(1).
Lau, D. C., Douketis, J. D., Morrison, K. M., Hramiak, I. M., Sharma, A. M., Ur, E., & members of
the Obesity Canada Clinical Practice Guidelines Expert Panel. (2007). 2006 Canadian
245
clinical practice guidelines on the management and prevention of obesity in adults and
children [summary]. Canadian Medical Association Journal, 176(8), S1-S13.
Lelijveld, N., Seal, A., Wells, J. C., Kirkby, J., Opondo, C., Chimwezi, E & Kerac, M. (2016).
Chronic disease outcomes after severe acute malnutrition in Malawian children
(ChroSAM): a cohort study. The Lancet Global Health, 4(9), e654-e662.
Liu, J., & Raine, A. (2006). The effect of childhood malnutrition on externalizing behavior. Current
opinion in pediatrics, 18(5), 565-570.
Lundgren, K., & Uhrenfeldt, E. (2014). A Field Study of Malnutrition among Children in Uganda.
Manary, M. J., Ndkeha, M. J., Ashorn, P., Maleta, K., & Briend, A. (2004). Home based therapy
for severe malnutrition with ready-to-use food. Archives of Disease in Childhood, 89(6),
557-561.
Manary, M. J. (2006). Local production and provision of ready-to-use therapeutic food (RUTF)
spread for the treatment of severe childhood malnutrition. Food and nutrition
bulletin, 27(3_suppl3), S83-S89.
Manaseki-Holland, S., Maroof, Z., Bruce, J., Mughal, M. Z., Masher, M. I., Bhutta, Z. A., &
Chandramohan, D. (2012). Effect on the incidence of pneumonia of vitamin D
supplementation by quarterly bolus dose to infants in Kabul: a randomised controlled
superiority trial. The Lancet, 379(9824), 1419-1427.
Manaseki‐Holland, S., Qader, G., Isaq Masher, M., Bruce, J., Zulf Mughal, M., Chandramohan,
D., & Walraven, G. (2010). Effects of vitamin D supplementation to children diagnosed
with pneumonia in Kabul: a randomised controlled trial. Tropical Medicine & International
Health, 15(10), 1148-1155.
246
Mangani, C., Maleta, K., Phuka, J., Cheung, Y. B., Thakwalakwa, C., Dewey, K., & Ashorn, P.
(2015). Effect of complementary feeding with lipid‐based nutrient supplements and corn–
soy blend on the incidence of stunting and linear growth among 6‐to 18‐month‐old infants
and children in rural Malawi. Maternal & child nutrition, 11(S4), 132-143.
Mangin, M., Sinha, R., & Fincher, K. (2014). Inflammation and vitamin D: the infection
connection. Inflammation Research, 63(10), 803-819.
Mann, J., & Truswell, S. (2012). Essentials of human nutrition. Oxford University Press.
Manno, D., Kowa, P. K., Bwalya, H. K., Siame, J., Grantham-McGregor, S., Baisley, K., & Filteau,
S. (2012). Rich micronutrient fortification of locally produced infant food does not improve
mental and motor development of Zambian infants: a randomised controlled trial. British
Journal of Nutrition, 107(04), 556-566.
Maroof, Z. (2011). The effects of vitamin D supplementation on the incidence of pneumonia in
infants and young children in Kabul, Afghanistan: a double blind randomized controlled
trial. London School of Hygiene and Tropical Medicine (University of London).
Martineau, A. R., Jolliffe, D. A., Hooper, R. L., Greenberg, L., Aloia, J. F., Bergman, P., ... &
Goodall, E. C. (2017). Vitamin D supplementation to prevent acute respiratory tract
infections: systematic review and meta-analysis of individual participant data. bmj, 356,
i6583.
Martorell, R. (1992). Long-term consequences of growth retardation during early
childhood. Human growth: basic and clinical aspects, 143-149.
247
Marwaha, R. K., Tandon, N., Reddy, D. R. H., Aggarwal, R., Singh, R., Sawhney, R. C., ... &
Singh, S. (2005). Vitamin D and bone mineral density status of healthy schoolchildren in
northern India. The American journal of clinical nutrition, 82(2), 477-482.
Mashal, T., Takano, T., Nakamura, K., Kizuki, M., Hemat, S., Watanabe, M., & Seino, K. (2008).
Factors associated with the health and nutritional status of children under 5 years of age
in Afghanistan: family behaviour related to women and past experience of war-related
hardships. BMC Public Health, 8(1), 301.
Mayson, T. A., Harris, S. R., & Bachman, C. L. (2007). Gross motor development of Asian and
European children on four motor assessments: a literature review. Pediatric Physical
Therapy, 19(2), 148-153.
McGregor, G. (1983). Listeners' comments on conversation. Language & Communication, 3(3),
271-304.
Meade Barlow, (2007). Notes on cultural issues with Denver II developmental assessments in
Addis Ababa.
Mengistu, K., Alemu, K., & Destaw, B. (2013). Prevalence of malnutrition and associated factors
among children aged 6-59 months at Hidabu Abote District, North Shewa, Oromia
Regional State. J nutr disorders ther, 1, 1-15.
Mishra, K., Kumar, P., Basu, S., Rai, K., & Aneja, S. (2014). Risk factors for severe acute
malnutrition in children below 5 y of age in India: A case-control study. The Indian Journal
of Pediatrics, 81(8), 762-765.
248
Misra, M., Pacaud, D., Petryk, A., Collett-Solberg, P. F., & Kappy, M. (2008). Vitamin D deficiency
in children and its management: review of current knowledge and recommendations.
Pediatrics, 122(2), 398-417.
Moestue, H., & Huttly, S. (2008). Adult education and child nutrition: the role of family and
community. Journal of epidemiology & community health, 62(2), 153-159.
Momsen, J. H. (2004). Gender and development. Psychology Press.
Moore, Q., BoCChini, C., & Raphael, J. (2016). Development of an Evidence-Based Early
Childhood Development Strategy.
Munthali, T., Jacobs, C., Sitali, L., Dambe, R., & Michelo, C. (2015). Mortality and morbidity
patterns in under-five children with severe acute malnutrition (SAM) in Zambia: a five-year
retrospective review of hospital-based records (2009–2013). Archives of Public
Health, 73(1), 23.
Nabeta, H. W., Kasolo, J., Kiggundu, R. K., Kiragga, A. N., & Kiguli, S. (2015). Serum vitamin D
status in children with protein-energy malnutrition admitted to a national referral hospital
in Uganda. BMC research notes, 8(1), 418.
Nagpal, S., Na, S., & Rathnachalam, R. (2005). Noncalcemic actions of vitamin D receptor
ligands. Endocrine reviews, 26(5), 662-687
Nahar, B., Hamadani, J. D., Ahmed, T., Tofail, F., Rahman, A., Huda, S. N., & Grantham-
McGregor, S. M. (2009). Effects of psychosocial stimulation on growth and development
of severely malnourished children in a nutrition unit in Bangladesh. European Journal of
Clinical Nutrition, 63(6), 725-731.
249
Neumann, C. G., Bwibo, N. O., Murphy, S. P., Sigman, M., Whaley, S., Allen, L. H., ... &
Demment, M. W. (2003). Animal source foods improve dietary quality, micronutrient
status, growth and cognitive function in Kenyan school children: background, study design
and baseline findings. The Journal of Nutrition, 133(11), 3941S-3949S.
Nguefack, S., Kamga, K. K., Moifo, B., Chiabi, A., Mah, E., & Mbonda, E. (2013). Causes of
developmental delay in children of 5 to 72 months old at the child neurology unit of
Yaounde Gynaeco-Obstetric and Paediatric Hospital (Cameroon). Open Journal of
Pediatrics, 3(03), 279.
Oakley, E., Reinking, J., Sandige, H., Trehan, I., Kennedy, G., Maleta, K., & Manary, M. (2010).
A ready-to-use therapeutic food containing 10% milk is less effective than one with 25%
milk in the treatment of severely malnourished children. The Journal of nutrition, 140(12),
2248-2252.
Oelofse, A., Van Raaij, J. M. A., Benade, A. J. S., Dhansay, M. A., Tolboom, J. J. M., & Hautvast,
J. G. A. J. (2003). The effect of a micronutrient-fortified complementary food on
micronutrient status, growth and development of 6-to 12-month-old disadvantaged urban
South African infants. International journal of food sciences and nutrition, 54(5), 399-407.
Onis, M. (2006). WHO Child Growth Standards based on length/height, weight and age. Acta
paediatrica, 95(S450), 76-85.
Onis, M. (2006). WHO Motor Development Study: Windows of achievement for six gross motor
development milestones. Acta Paediatrica, 95(S450), 86-95.
Onis, M., & Branca, F. (2016). Childhood stunting: a global perspective. Maternal & child
nutrition, 12(S1), 12-26.
250
Orbak, Z., Doneray, H., Keskin, F., Turgut, A., Alp, H., & Karakelleoglu, C. (2006). Vitamin D
intoxication and therapy with alendronate (case report and review of literature). European
journal of pediatrics, 165(8), 583-584.
Otsuji, T., Nagai, Y., Sho, K., Tsumura, A., Koike, N., Tsuda, M., & Takahashi, K. (2013). Initial
non-responders to ranibizumab in the treatment of age-related macular degeneration
(AMD). Clinical ophthalmology (Auckland, NZ), 7, 1487.
Ozgür, S., Sümer, H., & Koçoğlu, G. (1996). Rickets and soil strontium.Archives of disease in
childhood, 75(6), 524-526.
Ozkan, M., Senel, S., Arslan, E. A., & Karacan, C. D. (2012). The socioeconomic and biological
risk factors for developmental delay in early childhood. European journal of
pediatrics, 171(12), 1815-1821
Paiva, G. S. D., Lima, A. C. V. M. D., Lima, M. D. C., & Eickmann, S. H. (2010). The effect of
poverty on developmental screening scores among infants. Sao Paulo Medical
Journal, 128(5), 276-283.
Panda, P., Benjamin, A. I., Singh, S., & Zachariah, P. (2000). Health status of school children in
Ludhiana City. Indian journal of community medicine, 25(4), 150-155.
Pawley, N., & Bishop, N. J. (2004). Prenatal and infant predictors of bone health: the influence
of vitamin D. The American journal of clinical nutrition, 80(6), 1748S-1751S.
Pettifor, J. M. (2004). Nutritional rickets: deficiency of vitamin D, calcium, or both? The American
journal of clinical nutrition, 80(6), 1725S-1729S.
Phuka, J. C., Gladstone, M., Maleta, K., Thakwalakwa, C., Cheung, Y. B., Briend, A., & Ashorn,
P. (2012). Developmental outcomes among 18‐month‐old Malawians after a year of
251
complementary feeding with lipid‐based nutrient supplements or corn‐soy flour. Maternal
& child nutrition, 8(2), 239-248.
Pichler, J., Gerstmayr, M., Szépfalusi, Z., Urbanek, R., Peterlik, M., & Willheim, M. (2002). 1α,
25 (OH) 2D3 inhibits not only Th1 but also Th2 differentiation in human cord blood T
cells. Pediatric research, 52(1), 12-18.
Pipes, P. L., & Trahms, C. M. (1993). Nutrient needs of infants and children.
Poverty, E. (2015). Millennium development goals. United Nations. Available online: http://www.
un.org/millenniumgoals/(accessed on 23 August 2011).
Raghuramulu, N., & Reddy, V. (1980). Serum 25-hydroxy-vitamin D levels in malnourished
children with rickets. Archives of disease in childhood, 55(4), 285-287.
Rao, M. R., Hediger, M. L., Levine, R. J., Naficy, A. B., & Vik, T. (2002). Effect of breastfeeding
on cognitive development of infants born small for gestational age. Acta
Paediatrica, 91(3), 267-274.
Rejnmark, L. (2011). Effects of vitamin D on muscle function and performance: a review of
evidence from randomized controlled trials. Therapeutic advances in chronic
disease, 2(1), 25-37.
Rockett, K. A., Brookes, R., Udalova, I., Vidal, V., Hill, A. V., & Kwiatkowski, D. (1998). 1, 25-
Dihydroxyvitamin D3 induces nitric oxide synthase and suppresses growth of
Mycobacterium tuberculosis in a human macrophage-like cell line. Infection and
immunity, 66(11), 5314-5321.
252
Rodríguez, L., Cervantes, E., & Ortiz, R. (2011). Malnutrition and gastrointestinal and respiratory
infections in children: a public health problem. International journal of environmental
research and public health, 8(4), 1174-1205.
Roth, D. E., Shah, R., Black, R. E., & Baqui, A. H. (2010). Vitamin D status and acute lower
respiratory infection in early childhood in Sylhet, Bangladesh. Acta Paediatrica, 99(3),
389-393.
Roukos, D. H. (2011). Translating epigenetics into an anticancer drug pipeline for solid tumors.
Expert review of medical devices, 8(4), 409-413.
Rydz, D., Srour, M., Oskoui, M., Marget, N., Shiller, M., Birnbaum, R., ... & Shevell, M. I. (2006).
Screening for developmental delay in the setting of a community pediatric clinic: a
prospective assessment of parent-report questionnaires. Pediatrics, 118(4), e1178-
e1186.
Saad, K., Abdel‐Rahman, A. A., Elserogy, Y. M., Al‐Atram, A. A., El‐Houfey, A. A., Othman, H.
A., ... & Ahmad, F. A. (2016). Randomized controlled trial of vitamin D supplementation in
children with autism spectrum disorder. Journal of Child Psychology and Psychiatry.
Said-Mohamed, R., Micklesfield, L. K., Pettifor, J. M., & Norris, S. A. (2015). Has the prevalence
of stunting in South African children changed in 40 years? A systematic review. BMC
public health, 15(1), 534.
Salimpour, R. (1975). Rickets in Tehran. Study of 200 cases. Archives of disease in
childhood, 50(1), 63-66.
Schubl, C. (2010). Management of severe malnutrition. South African Journal of Clinical
Nutrition, 23(1).
253
Shah, I., James, R., Barker, J., Petroczi, A., & Naughton, D. P. (2011). Misleading measures in
Vitamin D analysis: a novel LC-MS/MS assay to account for epimers and isobars. Nutrition
Journal, 10(1), 46.
Shaikh, B. T., & Hatcher, J. (2004). Health seeking behaviour and health service utilization in
Pakistan: challenging the policy makers. Journal of public health, 27(1), 49-54.
Shin, H., Kwon, B., & Lim, S. (2005). Validity of Korean version of denver II in screening children
with developmental risk. Korean Journal of Child Health Nursing, 11(3), 316-321.
Siddiqi, M. N. A., Haque, M. N., & Goni, M. A. (2011). Malnutrition of under-five children: evidence
from Bangladesh. Asian Journal of Medical Sciences, 2(2), 113-119.
Simon, A. E., Pastor, P. N., Avila, R. M., & Blumberg, S. J. (2013). Socioeconomic disadvantage
and developmental delay among US children aged 18 months to 5 years. J Epidemiol
Community Health, jech-2013.
Sitaresmi, M. N., Ismail, D., & Wahab, A. (2016). Risk factors of developmental delay: a
community-based study. Paediatrica Indonesiana, 48(3), 161-5.
Smith, L. C., Ruel, M. T., & Ndiaye, A. (2005). Why is child malnutrition lower in urban than in
rural areas? Evidence from 36 developing countries. World Development, 33(8), 1285-
1305.
Snellman, G., Melhus, H., Gedeborg, R., Byberg, L., Berglund, L., Wernroth, L., & Michaelsson,
K. (2010). Determining vitamin D status: a comparison between commercially available
assays. PloS one, 5(7), e11555.
254
Sonnander, K., & Claesson, M. (1999). Predictors of developmental delay at 18 months and later
school achievement problems. Developmental Medicine and Child Neurology, 41(3), 195-
202.
Souza, O. F. D., Benício, M. H. D. A., Castro, T. G. D., Muniz, P. T., & Cardoso, M. A. (2012).
Malnutrition among children under 60 months of age in two cities of the state of Acre,
Brazil: prevalence and associated factors. Revista Brasileira de Epidemiologia, 15(1),
211-221.
Srivastava, A., Mahmood, S. E., Srivastava, P. M., Shrotriya, V. P., & Kumar, B. (2012).
Nutritional status of school-age children-A scenario of urban slums in India. Archives of
Public Health, 70(1), 8.
Sudfeld, C. R., McCoy, D. C., Fink, G., Muhihi, A., Bellinger, D. C., Masanja, H., ... & Fawzi, W.
W. (2015). Malnutrition and its determinants are associated with suboptimal cognitive,
communication, and motor development in Tanzanian children. The Journal of
nutrition, 145(12), 2705-2714.
Thacher, T. D., & Clarke, B. L. (2011, January). Vitamin D insufficiency. In Mayo Clinic
Proceedings (Vol. 86, No. 1, pp. 50-60). Elsevier.
Thacher, T. D., Fischer, P. R., Strand, M. A., & Pettifor, J. M. (2006). Nutritional rickets around
the world: causes and future directions. Annals of tropical paediatrics, 26(1), 1-16.
Tomkins, A. (1993). Environment, season and infection. Seasonality and human ecology, 123-
134.
255
Travis, P., Bennett, S., Haines, A., Pang, T., Bhutta, Z., Hyder, A. A., & Evans, T. (2004).
Overcoming health-systems constraints to achieve the Millennium Development
Goals. The Lancet, 364(9437), 900-906.
Pathak, P. K., & Singh, A. (2011). Trends in malnutrition among children in India: growing
inequalities across different economic groups. Social science & medicine, 73(4), 576-585.
Trilok-Kumar, G., Kaur, M., Rehman, A. M., Arora, H., Rajput, M. M., Chugh, R., & Filteau, S.
(2015). Effects of vitamin D supplementation in infancy on growth, bone parameters, body
composition and gross motor development at age 3–6 years: follow-up of a randomized
controlled trial. International journal of epidemiology, 44(3), 894-905.
Uauy, R., Kain, J., & Corvalan, C. (2011). How can the Developmental Origins of Health and
Disease (DOHaD) hypothesis contribute to improving health in developing countries? The
American journal of clinical nutrition, 94(6 Suppl), 1759S-1764S.
Upadhyay, S. K., Agarwal, K. N., & Agarwal, D. K. (1989). Influence of malnutrition on social
maturity, visual motor coordination & memory in rural school children. The Indian journal
of medical research, 90, 320-327.
Uzma Iram, Muhammad S. Butt, (2006) "Understanding the health and nutritional status of
children in Pakistan: A study of the interaction of socioeconomic and environmental
factors", International Journal of Social Economics, Vol. 33 Iss: 2, pp.111 – 131
Van de Poel, E., Hosseinpoor, A. R., Speybroeck, N., Van Ourti, T., & Vega, J. (2008).
Socioeconomic inequality in malnutrition in developing countries. Bulletin of the World
Health Organization, 86(4), 282-291.
256
Van der Kam, S., Salse-Ubach, N., Roll, S., Swarthout, T., Gayton-Toyoshima, S., Jiya, N. M., &
Shanks, L. (2016). Effect of short-term supplementation with ready-to-use therapeutic food
or micronutrients for children after Illness for prevention of malnutrition: a randomised
controlled trial in Nigeria. PLoS Med, 13(2), e1001952.
Van Etten, E., Stoffels, K., Gysemans, C., Mathieu, C., & Overbergh, L. (2008). Regulation of
vitamin D homeostasis: implications for the immune system. Nutrition
Reviews, 66(suppl_2), S125-S134.
Vazir, S., Naidu, A. N., & Vidyasagar, P. (1998). Nutritional status, psychosocial development
and the home environment of Indian rural children. Indian pediatrics, 35(10), 959-966.
Vervel, C., Zeghoud, F., Boutignon, H., Tjani, J. C., Walrant-Debray, O., & Garabedian, M.
(1997). Fortified milk and supplements of oral vitamin D. Comparison of the effect of two
doses of vitamin D (500 and 1,000 UI/d) during the first trimester of life. Archives de
pediatrie: organe officiel de la Societe francaise de pediatrie, 4(2), 126-132.
Vieth, R. (2007). Vitamin D toxicity, policy, and science. Journal of Bone and Mineral Research,
22(S2), V64-V68.
Vitolo, M. R., Gama, C. M., Bortolini, G. A., Campagnolo, P. D., & Drachler, M. D. L. (2008).
Some risk factors associated with overweight, stunting and wasting among children under
5 years old. Jornal de pediatria, 84(3), 251-257.
Walker, B. R., Colledge, N. R., Ralston, S. H., & Penman, I. (2013). Davidson's principles and
practice of medicine. Elsevier Health Sciences.
257
Walker, S. P., Wachs, T. D., Gardner, J. M., Lozoff, B., Wasserman, G. A., Pollitt, E &
International Child Development Steering Group. (2007). Child development: risk factors
for adverse outcomes in developing countries. The lancet, 369(9556), 145-157.
Walker, V. P., & Modlin, R. L. (2009). The vitamin D connection to pediatric infections and immune
function. Pediatric research, 65, 106R-113R.
Walli, N. Z., Munubhi, E. K., Aboud, S., & Manji, K. P. (2017). Vitamin D Levels in Malnourished
Children under 5 Years in a Tertiary Care Center at Muhimbili National Hospital, Dar es
Salaam, Tanzania—A Cross-sectional Study. Journal of tropical pediatrics, 63(3), 203-
209.
Wamani, H., Åstrøm, A. N., Peterson, S., Tumwine, J. K., & Tylleskär, T. (2007). Boys are more
stunted than girls in sub-Saharan Africa: a meta-analysis of 16 demographic and health
surveys. BMC pediatrics, 7(1), 17.
Wang, L. W., Wang, S. T., & Huang, C. C. (2008). Preterm infants of educated mothers have
better outcome. Acta Paediatrica, 97(5), 568-573.
Ward, L. M., Gaboury, I., Ladhani, M., & Zlotkin, S. (2007). Vitamin D–deficiency rickets among
children in Canada. Canadian Medical Association Journal, 177(2), 161-166.
White, J. H. (2008). Vitamin D signaling, infectious diseases, and regulation of innate
immunity. Infection and immunity, 76(9), 3837-3843.
Wijedasa, D. (2012). Developmental screening in context: adaptation and standardization of the
Denver Developmental Screening Test‐II (DDST‐II) for Sri Lankan children. Child: care,
health and development, 38(6), 889-899.
258
Wilkinson, R. J., Llewelyn, M., Toossi, Z., Patel, P., Pasvol, G., Lalvani, A., & Davidson, R. N.
(2000). Influence of vitamin D deficiency and vitamin D receptor polymorphisms on
tuberculosis among Gujarati Asians in west London: a case-control study. The
Lancet, 355(9204), 618-621.
World Health Organisation. Complementary feeding. [Cited 2017 10th July]; Available from:
http://www.who.int/nutrition/topics/complementary_feeding/en/
World Health Organization, & UNICEF. (2007). Community-based management of severe acute
malnutrition: a joint statement by the World Health Organization, the World Food
Programme, the United Nations System Standing Committee on Nutrition and the United
Nations Children's Fund.
World Health Organization, & UNICEF. (2009). WHO child growth standards and the identification
of severe acute malnutrition in infants and children: joint statement by the World Health
Organization and the United Nations Children's Fund.
World Health Organization. (1995). Physical status: The use of and interpretation of
anthropometry, Report of a WHO Expert Committee.
World Health Organization. (2011). Global prevalence of vitamin A deficiency in populations at
risk 1995-2005. WHO Global Database on Vitamin A Deficiency. 2009. World Health
Organization: Geneva.
World Health Organization. (2013). Guideline: updates on the management of severe acute
malnutrition in infants and children. World Health Organization.
259
Wrzosek, M., Łukaszkiewicz, J., Wrzosek, M., Jakubczyk, A., Matsumoto, H., Piątkiewicz, P., &
Nowicka, G. (2013). Vitamin D and the central nervous system. Pharmacological
Reports, 65(2), 271-278.
Yebyo, H. G., Kendall, C., Nigusse, D., & Lemma, W. (2013). Outpatient therapeutic feeding
program outcomes and determinants in treatment of severe acute malnutrition in tigray,
northern ethiopia: a retrospective cohort study. PloS one, 8(6), e65840.
Yousafzai, A. K., Obradović, J., Rasheed, M. A., Rizvi, A., Portilla, X. A., Tirado-Strayer, N., &
Memon, U. (2016). Effects of responsive stimulation and nutrition interventions on
children's development and growth at age 4 years in a disadvantaged population in
Pakistan: a longitudinal follow-up of a cluster-randomised factorial effectiveness trial. The
Lancet Global Health, 4(8), e548-e558.
Yousafzai, A. K., Rasheed, M. A., Rizvi, A., Armstrong, R., & Bhutta, Z. A. (2014). Effect of
integrated responsive stimulation and nutrition interventions in the Lady Health Worker
programme in Pakistan on child development, growth, and health outcomes: a cluster-
randomised factorial effectiveness trial. The Lancet, 384(9950), 1282-1293.
Zeghoud, F., Ben-Mekhbi, H., Djeghri, N., & Garabedian, M. (1994). Vitamin D prophylaxis during
infancy: comparison of the long-term effects of three intermittent doses (15, 5, or 2.5 mg)
on 25-hydroxyvitamin D concentrations. The American journal of clinical nutrition, 60(3),
393-396.
Zeghoud, F., Vervel, C., Guillozo, H., Walrant-Debray, O., Boutignon, H., & Garabédian, M.
(1997). Subclinical vitamin D deficiency in neonates: definition and response to vitamin D
supplements. The American journal of clinical nutrition, 65(3), 771-778.
260
Zhao, X. H. (1991). Nutritional situation of Beijing residents. The Southeast Asian journal of
tropical medicine and public health, 23, 65-68.

261
ANNEXURE 1 - ENROLLMENT PROFORMA
ENROLLMENT PROFORMA
Health Facility: Dist.:
GROUP:
A. Basic Demography
Name Reg. No
Mother/Caregiver
Name
Date of
Admission
Address (Village) Time to
Travel to Site
Age (months) Sex* M / F Mother Alive Yes No
Admission* Direct from
Community
From
SFP
From
SC
Readmission
(Relapse) SC Refusal
Additional
Information:
Father’s Occupation ________________
Monthly Income _________________
No. of Siblings __________________
Mother’s Education: Nil <= 5 5-10 Higher
Father’s Education: Nil <= 5 5-10 Higher
B. Admission
Anthropometry
Bilateral Pitting
Oedema + ++ +++
MUAC (cm) Weight
(kg)
Height/
Length
(cm)
Weight
for
Height
(WFH)
Admission Criteria Oedema MUAC WFH Other
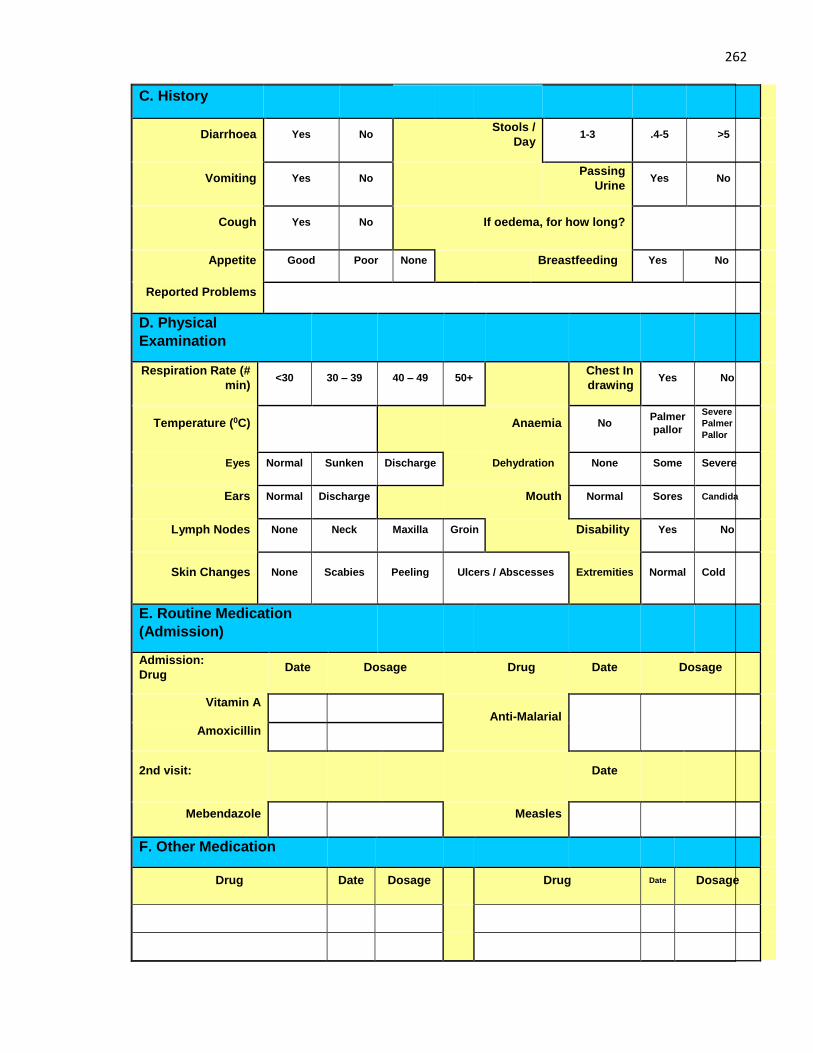
262
C. History
Diarrhoea Yes No Stools /
Day 1-3 .4-5 >5
Vomiting Yes No Passing
Urine Yes No
Cough Yes No If oedema, for how long?
Appetite Good Poor None Breastfeeding Yes No
Reported Problems
D. Physical
Examination
Respiration Rate (#
min) <30 30 – 39 40 – 49 50+
Chest In
drawing Yes No
Temperature (0C) Anaemia No Palmer
pallor
Severe
Palmer
Pallor
Eyes Normal Sunken Discharge Dehydration None Some Severe
Ears Normal Discharge Mouth Normal Sores Candida
Lymph Nodes None Neck Maxilla Groin Disability Yes No
Skin Changes None Scabies Peeling Ulcers / Abscesses Extremities Normal Cold
E. Routine Medication
(Admission)
Admission:
Drug Date Dosage Drug Date Dosage
Vitamin A
Anti-Malarial
Amoxicillin
2nd visit: Date
Mebendazole Measles
F. Other Medication
Drug Date Dosage Drug Date Dosage

263
ANNEXURE 2 - QUESTIONNAIRE
SOCIO-DEMOGRAPHIC AND NUTRITIONAL
EVAULATION OF CHILD
Serial # ____________________ Name of Child: ____________________________
Child Age: ____________________ Sex: ____________________________
Address: __________________________________________________________________
Father’s Name: __________________ Father Occupation: _______________________
Father Education: NO Education Primary Middle Secondary Higher
Mother Name: ___________________ Mother occupation: _______________________
Mother Education: NO Education Primary Middle Secondary Higher
Socio-Economic Status: Lowest Second Middle Fourth Highest
Number of Living Children: ___________ Child Number in Siblings: _____________________
Number of Children less than 5 years of age: _________________________________________
Family Size: ____________________ Family: Joint Nuclear
Child Weight (kg): ____________________ Length/Height (cm): _______________________
Z Sore/WH%: ______________________ MUAC: _____________________________
Initial Assessment of Child
History
Intestinal parasites: Yes No
Oedema: Yes/ No If yes for how long: ______________________
Skin changes: None Scabies Peeling Ulcer Abscess
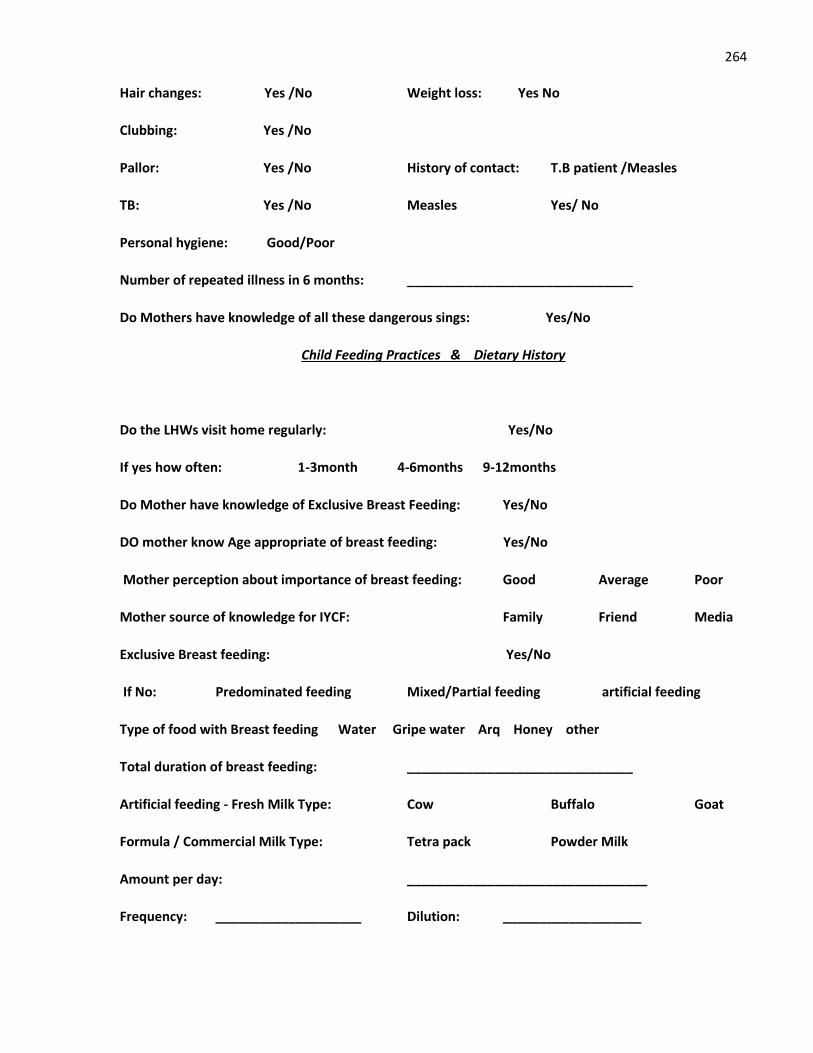
264
Hair changes: Yes /No Weight loss: Yes No
Clubbing: Yes /No
Pallor: Yes /No History of contact: T.B patient /Measles
TB: Yes /No Measles Yes/ No
Personal hygiene: Good/Poor
Number of repeated illness in 6 months: _______________________________
Do Mothers have knowledge of all these dangerous sings: Yes/No
Child Feeding Practices & Dietary History
Do the LHWs visit home regularly: Yes/No
If yes how often: 1-3month 4-6months 9-12months
Do Mother have knowledge of Exclusive Breast Feeding: Yes/No
DO mother know Age appropriate of breast feeding: Yes/No
Mother perception about importance of breast feeding: Good Average Poor
Mother source of knowledge for IYCF: Family Friend Media
Exclusive Breast feeding: Yes/No
If No: Predominated feeding Mixed/Partial feeding artificial feeding
Type of food with Breast feeding Water Gripe water Arq Honey other
Total duration of breast feeding: _______________________________
Artificial feeding - Fresh Milk Type: Cow Buffalo Goat
Formula / Commercial Milk Type: Tetra pack Powder Milk
Amount per day: _________________________________
Frequency: ____________________ Dilution: ___________________
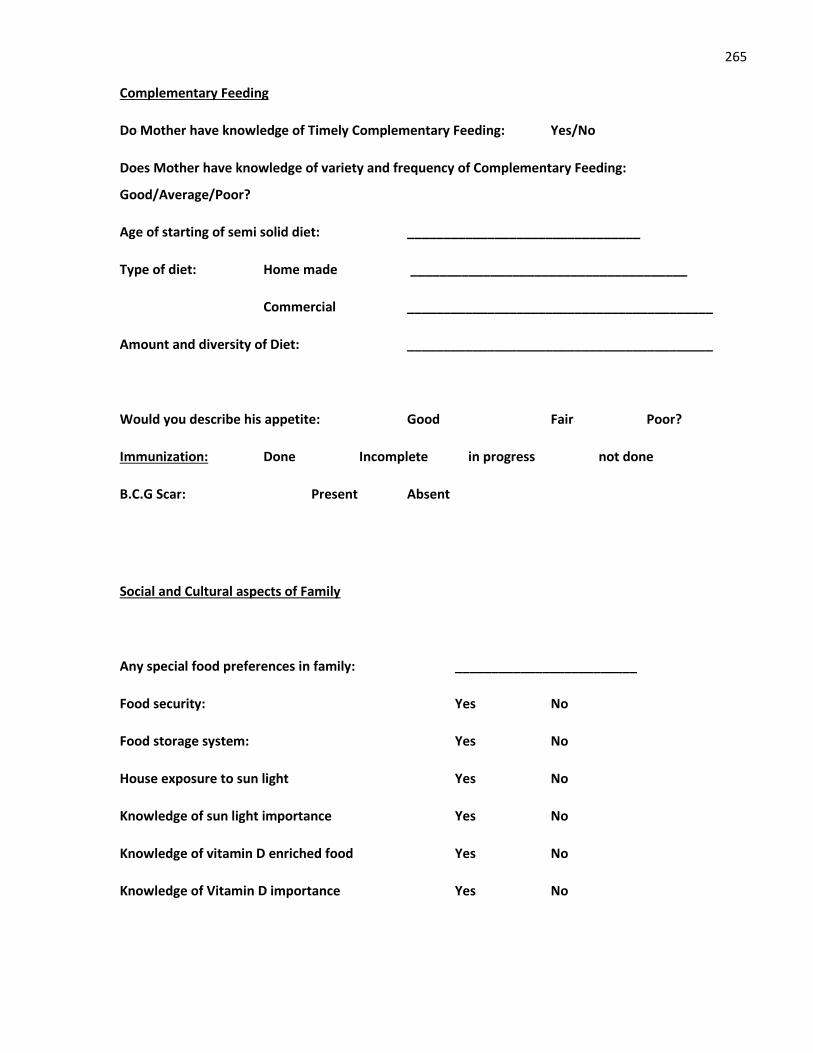
265
Complementary Feeding
Do Mother have knowledge of Timely Complementary Feeding: Yes/No
Does Mother have knowledge of variety and frequency of Complementary Feeding:
Good/Average/Poor?
Age of starting of semi solid diet: ________________________________
Type of diet: Home made ______________________________________
Commercial __________________________________________
Amount and diversity of Diet: __________________________________________
Would you describe his appetite: Good Fair Poor?
Immunization: Done Incomplete in progress not done
B.C.G Scar: Present Absent
Social and Cultural aspects of Family
Any special food preferences in family: _________________________
Food security: Yes No
Food storage system: Yes No
House exposure to sun light Yes No
Knowledge of sun light importance Yes No
Knowledge of vitamin D enriched food Yes No
Knowledge of Vitamin D importance Yes No
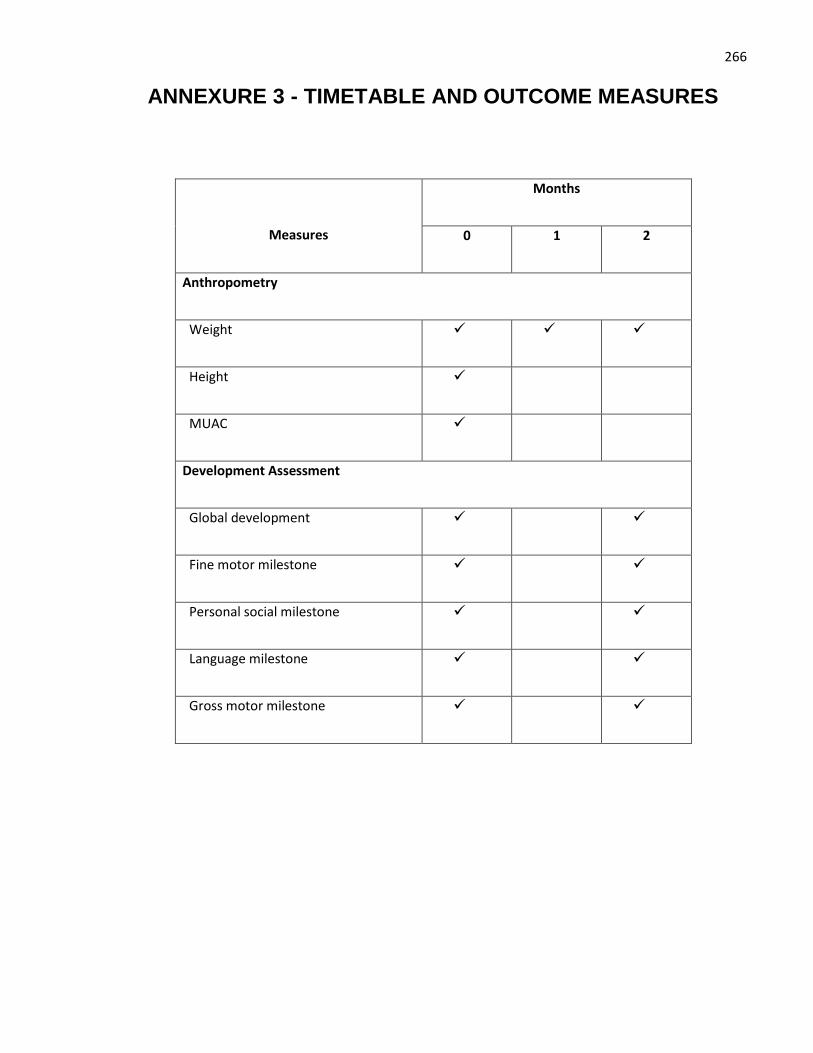
266
ANNEXURE 3 - TIMETABLE AND OUTCOME MEASURES
Measures
Months
0 1 2
Anthropometry
Weight
Height
MUAC
Development Assessment
Global development
Fine motor milestone
Personal social milestone
Language milestone
Gross motor milestone

267
ANNEXURE 4 - CONSENT FORM
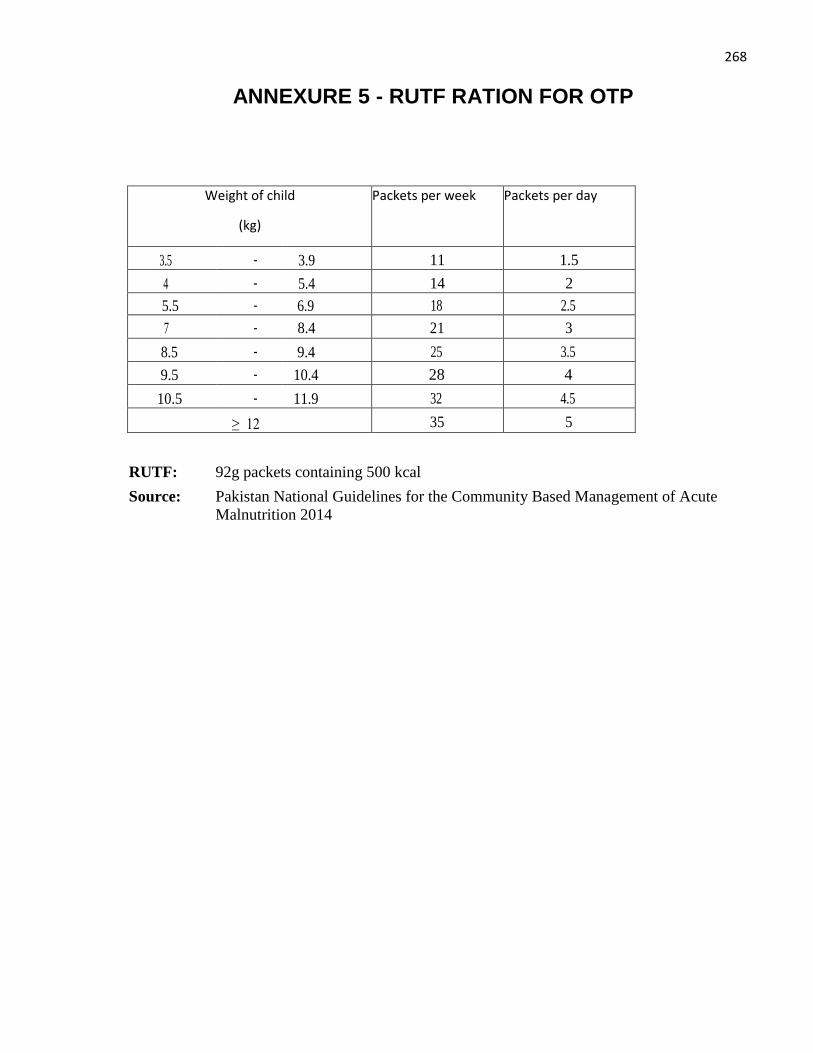
268
ANNEXURE 5 - RUTF RATION FOR OTP
Weight of child
(kg)
Packets per week Packets per day
3.5 - 3.9 11 1.5
4 - 5.4 14 2
5.5 - 6.9 18 2.5
7 - 8.4 21 3
8.5 - 9.4 25 3.5
9.5 - 10.4 28 4
10.5 - 11.9 32 4.5
≥ 12 35 5
RUTF: 92g packets containing 500 kcal
Source: Pakistan National Guidelines for the Community Based Management of Acute
Malnutrition 2014
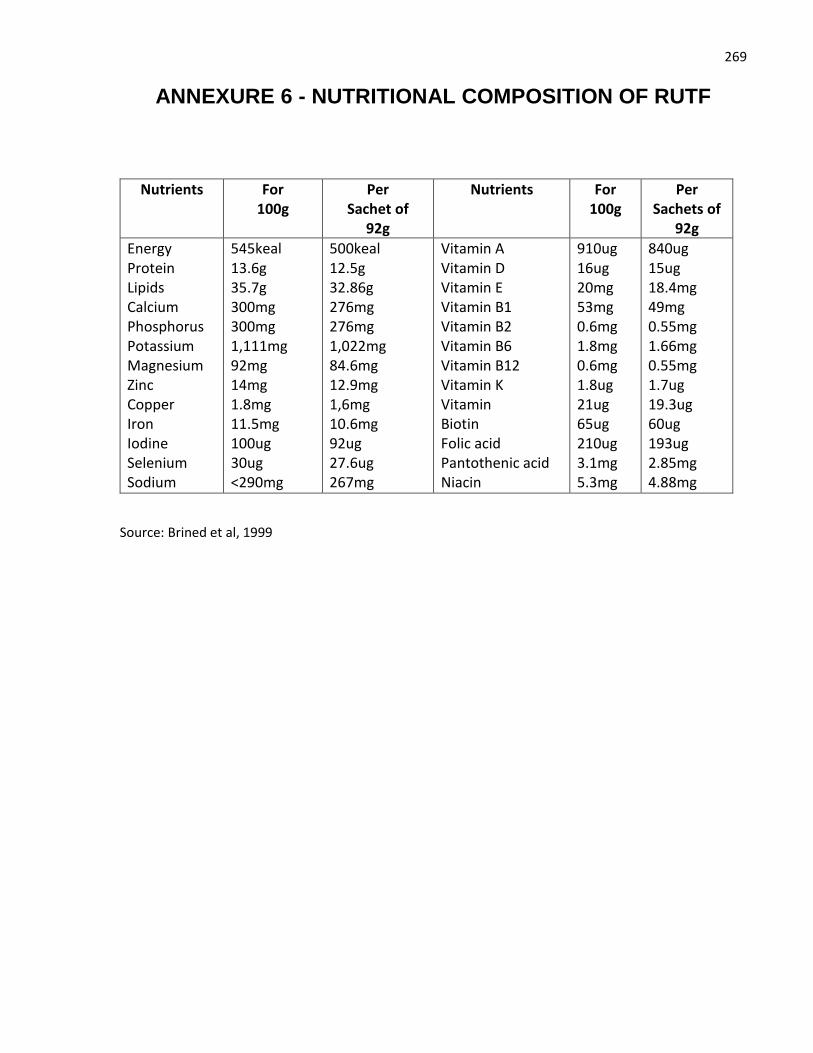
269
ANNEXURE 6 - NUTRITIONAL COMPOSITION OF RUTF
Nutrients For 100g
Per Sachet of
92g
Nutrients For 100g
Per Sachets of
92g
Energy Protein Lipids Calcium Phosphorus Potassium Magnesium Zinc Copper Iron Iodine Selenium Sodium
545keal 13.6g 35.7g 300mg 300mg 1,111mg 92mg 14mg 1.8mg 11.5mg 100ug 30ug <290mg
500keal 12.5g 32.86g 276mg 276mg 1,022mg 84.6mg 12.9mg 1,6mg 10.6mg 92ug 27.6ug 267mg
Vitamin A Vitamin D Vitamin E Vitamin B1 Vitamin B2 Vitamin B6 Vitamin B12 Vitamin K Vitamin Biotin Folic acid Pantothenic acid Niacin
910ug 16ug 20mg 53mg 0.6mg 1.8mg 0.6mg 1.8ug 21ug 65ug 210ug 3.1mg 5.3mg
840ug 15ug 18.4mg 49mg 0.55mg 1.66mg 0.55mg 1.7ug 19.3ug 60ug 193ug 2.85mg 4.88mg
Source: Brined et al, 1999
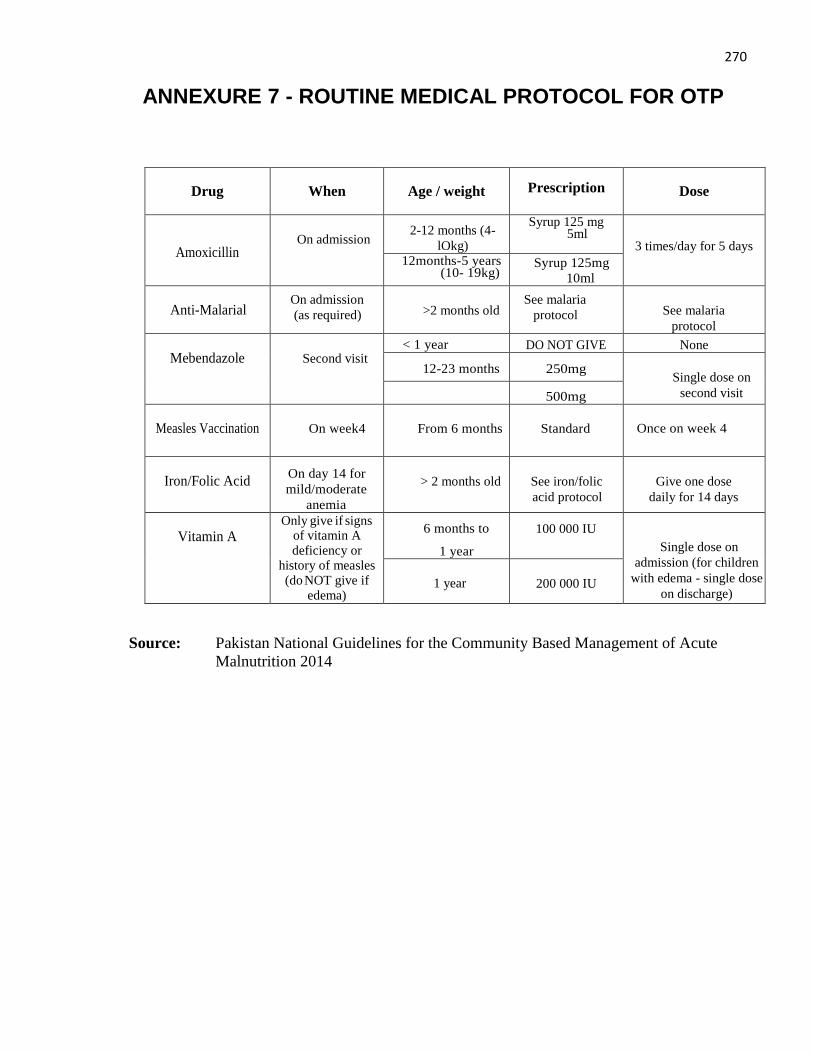
270
ANNEXURE 7 - ROUTINE MEDICAL PROTOCOL FOR OTP
Drug
When
Age / weight
Prescription
Dose
Amoxicillin
On admission 2-12 months (4-
lOkg)
Syrup 125 mg 5ml
3 times/day for 5 days 12months-5 years
(10- 19kg) Syrup 125mg
10ml
Anti-Malarial
On admission
(as required)
>2 months old See malaria
protocol
See malaria
protocol
Mebendazole
Second visit < 1 year DO NOT GIVE None
12-23 months
250mg
Single dose on
second visit 500mg
Measles Vaccination
On week4
From 6 months
Standard
Once on week 4
Iron/Folic Acid
On day 14 for
mild/moderate
anemia
> 2 months old
See iron/folic
acid protocol
Give one dose
daily for 14 days
Vitamin A
Only give if signs of vitamin A deficiency or
history of measles (do NOT give if
edema)
6 months to
1 year
100 000 IU
Single dose on
admission (for children
with edema - single dose
on discharge)
1 year
200 000 IU
Source: Pakistan National Guidelines for the Community Based Management of Acute
Malnutrition 2014
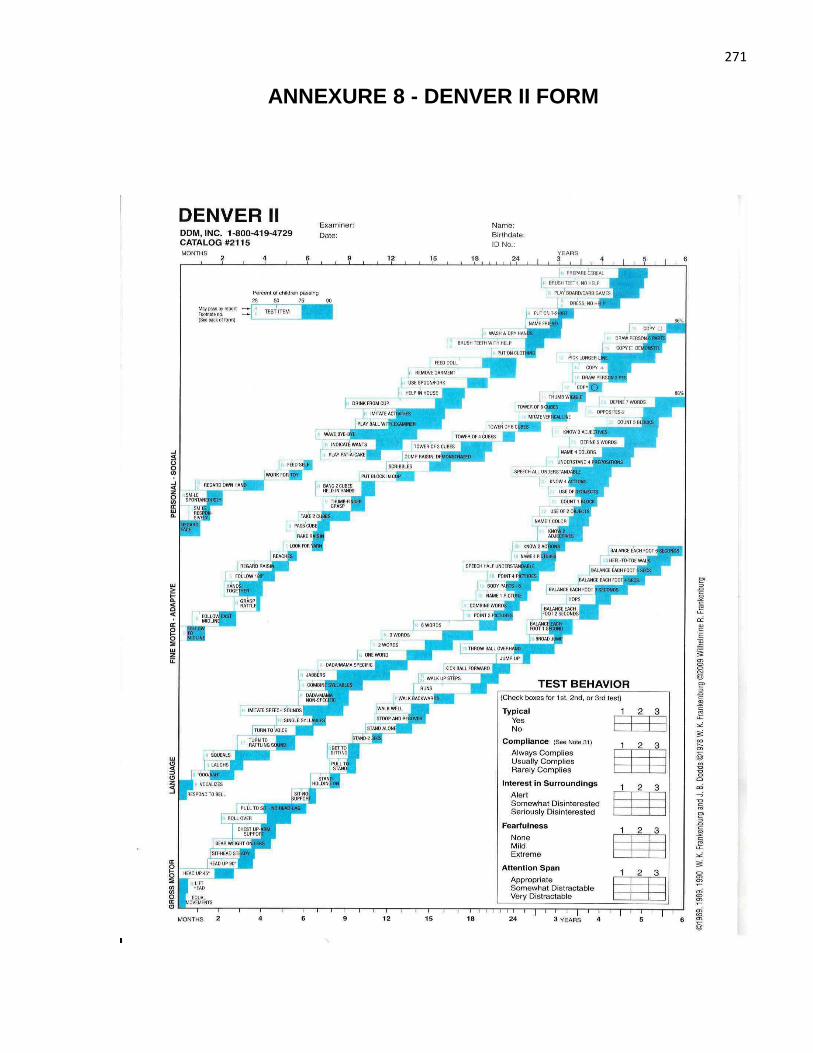
271
ANNEXURE 8 - DENVER II FORM

272

273
ANNEXURE 9 - DPCC LETTER

274
ANNEXURE 10 - Ethical Review of Paper

275
ANNEXURE 11 - IRMNCH PERMISSION LETTER

276
ANNEXURE 12 - HIGHER EDUCATION COMMISSION LETTER
277
ANNEXURE 13 - 6 MONTHS FELLOWSHIP AT QMUL
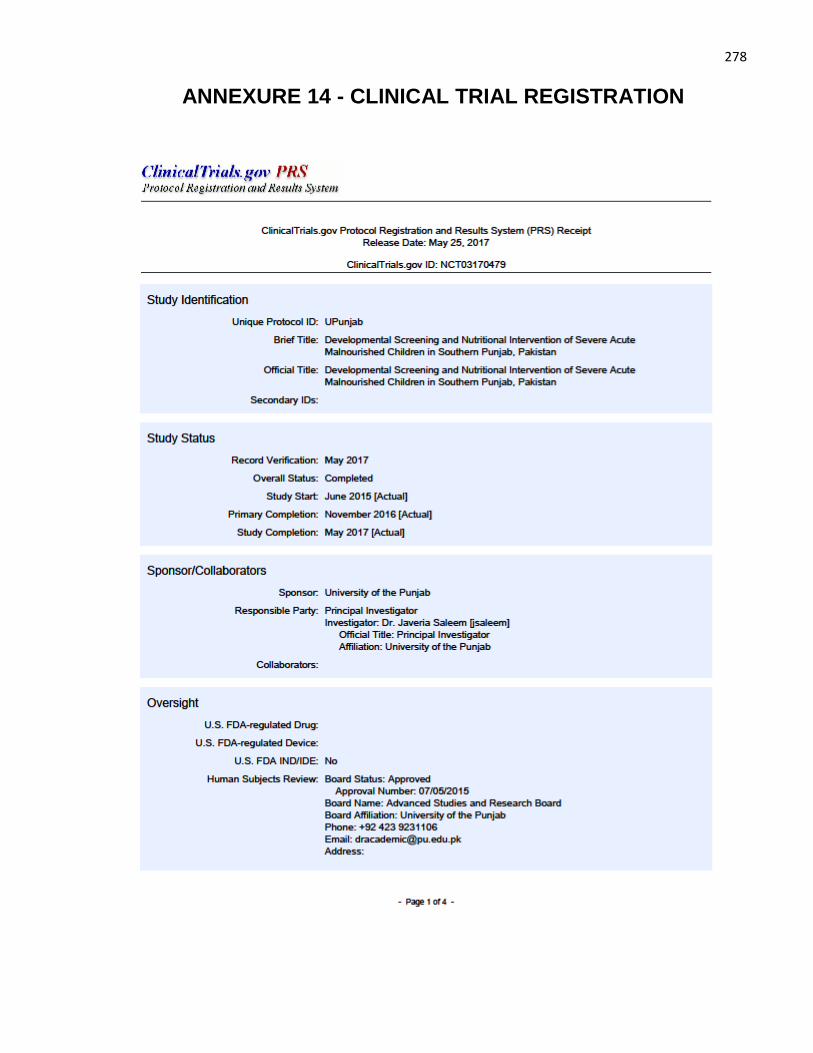
278
ANNEXURE 14 - CLINICAL TRIAL REGISTRATION
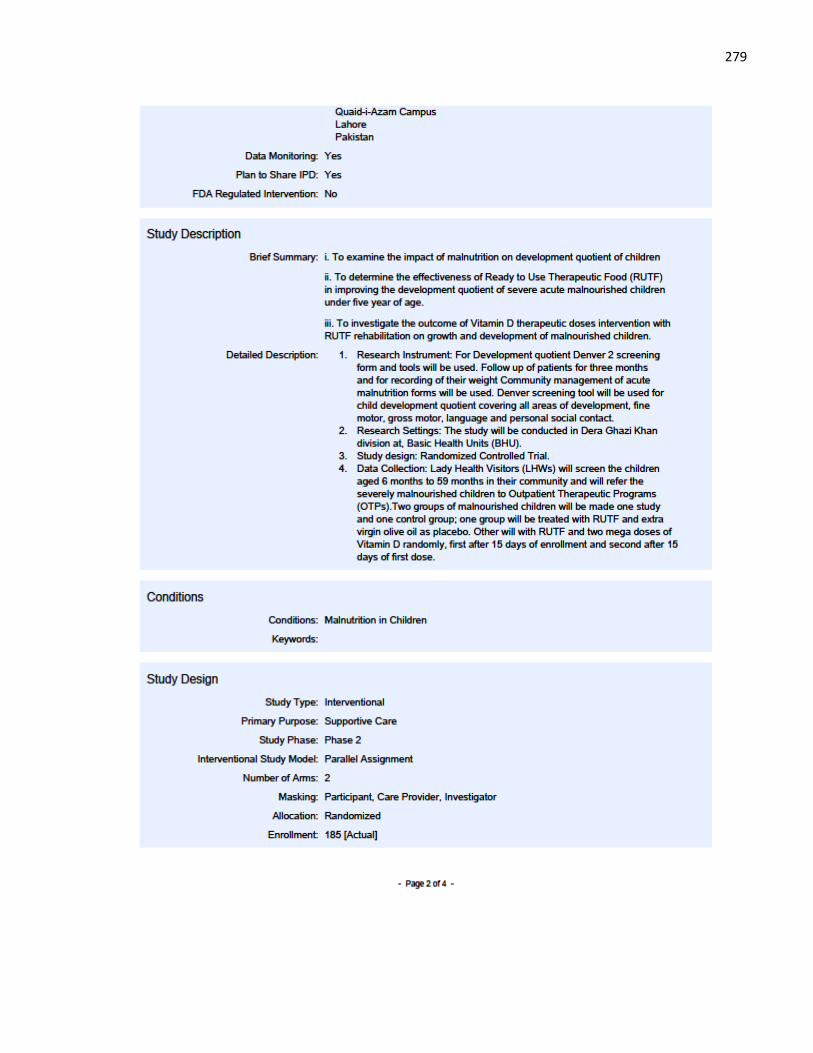
279
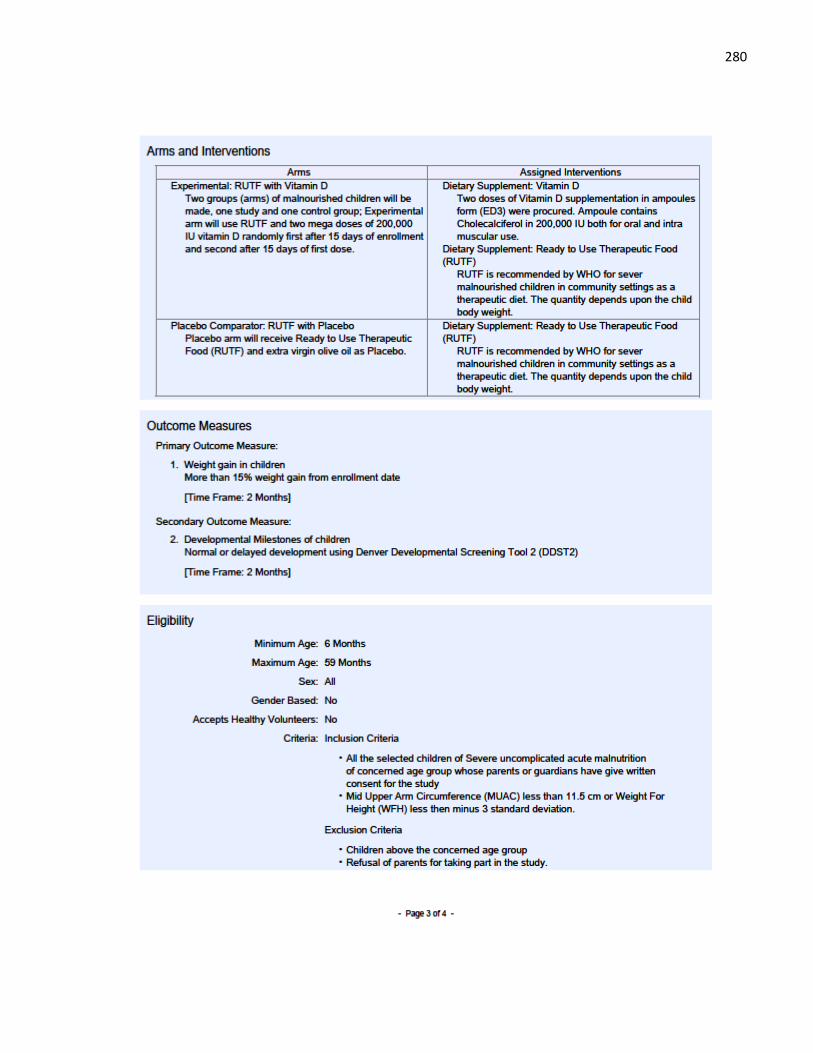
280
281
Related Documents


![Supportive Nutritional Intervention in Pediatrie Cancer1 · [CANCER RESEARCH (SUPPL.) 42, 766s-773s, February 1982] 0008-5472/82/0042-OOOOS02.00 Supportive Nutritional Intervention](https://static.cupdf.com/doc/110x72/5e54de10ae6c922dcf35ce94/supportive-nutritional-intervention-in-pediatrie-cancer1-cancer-research-suppl.jpg)


