Developmental changes in refractoriness of the cortical auditory evoked potential Phillip M. Gilley a, * , Anu Sharma a , Michael Dorman b , Kathryn Martin a a Callier Advanced Hearing Research Center, School of Behavioral and Brain Sciences, University of Texas at Dallas, 1966 Inwood Road, Dallas, TX 75235, USA b Department of Speech and Hearing Science, Arizona State University, Tempe, AZ 85287, USA Accepted 16 September 2004 Available online 5 November 2004 Abstract Objective: This study examined morphological changes in the cortical auditory evoked potential (CAEP) waveform as a function of varying stimulation rate. Stimuli were presented in a paradigm which indirectly assesses the refractory properties of the underlying neuronal generators. Methods: CAEPs were recorded in 50 normal-hearing children (3–12 years) and 10 young adults (24–26 years). A speech sound was presented in a stimulus train with sequentially decreasing inter-stimulus intervals (ISIs) of 2000, 1000, 560, and 360 ms. Latencies and amplitudes of the P1, N1, and P2 components at the Cz electrode were examined as a function of stimulus rate and age. Results: Results revealed significant changes in the CAEP as a function of age and stimulation rate. At younger ages the N1–P2 component was elicited only at the slowest stimulation rates, and was more clearly apparent at successively faster stimulation rates as age increased. Conclusions: We have described a stimulus paradigm that allows examination of the development of refractoriness by highlighting the interaction between age and rate on CAEP morphology. Significance: Complex maturational patterns of CAEP components are best understood when the effects of both age and stimulus rate on the CAEP waveform are considered. q 2004 International Federation of Clinical Neurophysiology. Published by Elsevier Ireland Ltd. All rights reserved. Keywords: Refractoriness; Development; Auditory evoked potentials; Central auditory system; Stimulation rate 1. Introduction In a series of papers, we have investigated aspects of maturation of the human central auditory pathways (Sharma et al., 1997, 2002a–c). Our measures of central auditory system maturation are the age-related changes in the morphology, latency, and amplitude of the P1, N1, and P2 components of the cortical auditory evoked potential (CAEP). P1, N1, and P2 are obligatory components of the CAEP that are generated with input from auditory thalamo- cortical and cortico-cortical pathways, primary auditory cortex, and various association cortices (Ceponiene et al., 1998; Naatanen and Picton, 1987; Ponton et al., 2002). Several studies have examined the development of the P1, N1, P2 CAEP components with widely varying results (Albrecht et al., 2000; Ceponiene et al., 2002; Eggermont and Ponton, 2003; Musiek et al., 1988; Ponton et al., 1996b, 2000, 2002; Sharma et al., 1997; Surwillo, 1981). For example, the development of P1 latency has been shown to vary anywhere from 14 to 26 years and beyond (Eggermont, 1988; Ponton et al., 1996b, 2000; Sharma et al., 1997, 2002a). Similarly, the age of first appearance of the N1 and P2 components in young children is debated with some authors noting that it first appears around 3–8 years, while others have suggested that the N1 component is absent in young children Clinical Neurophysiology 116 (2005) 648–657 www.elsevier.com/locate/clinph 1388-2457/$30.00 q 2004 International Federation of Clinical Neurophysiology. Published by Elsevier Ireland Ltd. All rights reserved. doi:10.1016/j.clinph.2004.09.009 * Corresponding author. Tel.: C1 214 905 3185; fax: C1 214 905 3146. E-mail address: [email protected] (P.M. Gilley).

Welcome message from author
This document is posted to help you gain knowledge. Please leave a comment to let me know what you think about it! Share it to your friends and learn new things together.
Transcript
Developmental changes in refractoriness of the cortical
auditory evoked potential
Phillip M. Gilleya,*, Anu Sharmaa, Michael Dormanb, Kathryn Martina
aCallier Advanced Hearing Research Center, School of Behavioral and Brain Sciences,
University of Texas at Dallas, 1966 Inwood Road, Dallas, TX 75235, USAbDepartment of Speech and Hearing Science, Arizona State University, Tempe, AZ 85287, USA
Accepted 16 September 2004
Available online 5 November 2004
Abstract
Objective: This study examined morphological changes in the cortical auditory evoked potential (CAEP) waveform as a function of
varying stimulation rate. Stimuli were presented in a paradigm which indirectly assesses the refractory properties of the underlying neuronal
generators.
Methods: CAEPs were recorded in 50 normal-hearing children (3–12 years) and 10 young adults (24–26 years). A speech sound was
presented in a stimulus train with sequentially decreasing inter-stimulus intervals (ISIs) of 2000, 1000, 560, and 360 ms. Latencies and
amplitudes of the P1, N1, and P2 components at the Cz electrode were examined as a function of stimulus rate and age.
Results: Results revealed significant changes in the CAEP as a function of age and stimulation rate. At younger ages the N1–P2
component was elicited only at the slowest stimulation rates, and was more clearly apparent at successively faster stimulation rates as age
increased.
Conclusions: We have described a stimulus paradigm that allows examination of the development of refractoriness by highlighting the
interaction between age and rate on CAEP morphology.
Significance: Complex maturational patterns of CAEP components are best understood when the effects of both age and stimulus rate on
the CAEP waveform are considered.
q 2004 International Federation of Clinical Neurophysiology. Published by Elsevier Ireland Ltd. All rights reserved.
Keywords: Refractoriness; Development; Auditory evoked potentials; Central auditory system; Stimulation rate
1. Introduction
In a series of papers, we have investigated aspects of
maturation of the human central auditory pathways (Sharma
et al., 1997, 2002a–c). Our measures of central auditory
system maturation are the age-related changes in the
morphology, latency, and amplitude of the P1, N1, and P2
components of the cortical auditory evoked potential
(CAEP). P1, N1, and P2 are obligatory components of the
CAEP that are generated with input from auditory thalamo-
cortical and cortico-cortical pathways, primary auditory
1388-2457/$30.00 q 2004 International Federation of Clinical Neurophysiology.
doi:10.1016/j.clinph.2004.09.009
* Corresponding author. Tel.: C1 214 905 3185; fax: C1 214 905 3146.
E-mail address: [email protected] (P.M. Gilley).
cortex, and various association cortices (Ceponiene et al.,
1998; Naatanen and Picton, 1987; Ponton et al., 2002).
Several studies have examined the development of the P1,
N1, P2 CAEP components with widely varying results
(Albrecht et al., 2000; Ceponiene et al., 2002; Eggermont and
Ponton, 2003; Musiek et al., 1988; Ponton et al., 1996b, 2000,
2002; Sharma et al., 1997; Surwillo, 1981). For example, the
development of P1 latency has been shown to vary anywhere
from 14 to 26 years and beyond (Eggermont, 1988; Ponton
et al., 1996b, 2000; Sharma et al., 1997, 2002a). Similarly,
the age of first appearance of the N1 and P2 components in
young children is debated with some authors noting that it
first appears around 3–8 years, while others have suggested
that the N1 component is absent in young children
Clinical Neurophysiology 116 (2005) 648–657
www.elsevier.com/locate/clinph
Published by Elsevier Ireland Ltd. All rights reserved.
P.M. Gilley et al. / Clinical Neurophysiology 116 (2005) 648–657 649
(Ceponiene et al., 1998; Pang and Taylor, 2000; Sharma
et al., 1997; Tonnquist-Uhlen et al., 2003).
It is likely that variations in stimulation rate underpin
some of the differences in outcome. Only a handful of
studies have examined the development of the P1, N1, and
P2 responses in childhood as a function of stimulation rate
(Ceponiene et al., 1998, 2002; Surwillo, 1981; Wible et al.,
2002). Surwillo reported that a systematic decrease in the
latency of the N1 component occurred with an increase in
inter-stimulus interval (ISI) (from 250 to 1000 ms) for
children aged 9–13 years, but not for adults. Surwillo
suggested that the refractory properties of the underlying
neural components involved in the N1 response may not be
fully developed in children since cortical processing of
stimuli at faster rates revealed a less robust CAEP response
in children.
Ceponiene et al. (1998) examined CAEPs in 7–9 year old
children at 3 different ISIs of 1400, 700, and 350 ms. As the
ISI was decreased, the latency of the P1 and N1 increased.
Interestingly, the authors observed that the N1 component
was not present at the fastest stimulation rate (350 ms). The
N1 component began to emerge as the ISI was slowed from
350 to 700 ms, and was more robust at the slowest rate
(1400 ms ISI). Based on this finding, the authors suggested
that the indiscernible N1 response at rapid stimulation rates
indicates that the neural generators of the N1 response
undergo significant developmental changes in refractoriness
in early childhood.
As described by Naatanen and Picton (1987), the N1
wave of the CAEP has at least 3 distinct generators giving
rise to 3 obligatory components. Component 1 of the N1
wave is thought to be most sensitive to amplitude changes as
a result of differences in stimulation rate, particularly when
the ISI is relatively short (Naatanen and Picton, 1987).
Components 2 and 3 of the N1 wave are less likely to be
affected by changes in ISI, and are thought to represent
processes of attention (component 2) or an orienting
response (component 3) (Naatanen and Picton, 1987). The
changes in the CAEP waveform described above are likely
driven by changes in refractoriness of component 1
generators.
Only a few studies in adults have attempted to
differentiate the effects of refractoriness (the time needed
for a neural population to recover after generating a
response to a stimulus) from long-term habituation
(a decrease in waveform amplitude with continuous,
repeated stimulation) on CAEP waveform morphology
(Budd et al., 1998; Roeser and Price, 1969; Roth et al.,
1976). Roth et al. (1976) examined CAEP responses to
stimuli presented in different combinations of ISIs (3, 1.5,
and 0.75 s) and showed that amplitude changes were
dependent only on the stimulus immediately preceding the
stimulus used to elicit the CAEP response and not other
preceding stimuli. The amplitude changes were attributed to
refractoriness in the N1 and P2 components rather than to
effects of long-term habituation. Habituation would have
resulted in continuous amplitude decrements over the
course of all the stimuli preceding the one used to elicit
the CAEP response (Roeser and Price, 1969). These results
were later replicated by Budd et al. (1998) who used
stimulus blocks differing in ISI and containing a randomly
interleaved deviant sound. They compared the amplitude of
responses immediately following the deviant sound to the
responses not following the deviant. The authors reported
that the changes in N1 amplitude were specific to the ISI
condition and were not affected by the deviant stimulus. In
their study, the authors concluded that N1 amplitude
decrements reflect a refractory process from the preceding
stimulus rather than habituation. Taken together, these
studies suggest that a stimulation paradigm in which the ISI
just preceding the stimulus used to elicit the CAEP response
is varied (e.g. a ‘stimulus train’) can be used to study the
effects of neuronal refractoriness on CAEP morphology
separate from the effects of long-term habituation.
We examined the development of the CAEP response
morphology in a paradigm which examines the effects of
refractoriness separate from long-term habituation. We used
a train of brief vowels [uh] presented at sequentially
decreasing inter-stimulus intervals (2000, 1000, 510, and
360 ms) to elicit CAEPs. In this manner, the ISI just
preceding the stimulus used to elicit the CAEP was varied to
better examine the effects of refractoriness on CAEP
components (Budd et al., 1998; Roth et al., 1976).
Responses were recorded from Cz to highlight refractory
changes in component 1 of the N1 response. Our aim was to
examine the developmental pattern of changes in CAEP
morphology as a function of age and stimulation rate in
normal-hearing children aged 3–12 years and young adults.
2. Methods
2.1. Subjects
CAEPs were recorded in 50 normal-hearing children
ranging in age from 3 to 12 years, and from 10 normal-
hearing young adults ranging from 24 to 26 years of age. All
subjects and parents of subjects under the age of 18 years
received informed consent prior to participation in any of
the experimental procedures. All procedures and protocols,
including informed consent procedures used in the present
study, received prior approval by the University of Texas at
Dallas and its Institutional Review Board. Subjects had no
reported history of neurological pathology or severe head
injury, and no reported speech, language, or learning
impairments. Subjects were divided into 6 groups based
on age. Table 1 provides a summary of these age groups.
2.2. Stimulus paradigm
Cortical auditory evoked responses were recorded in
response to a natural speech syllable [uh]. The duration of
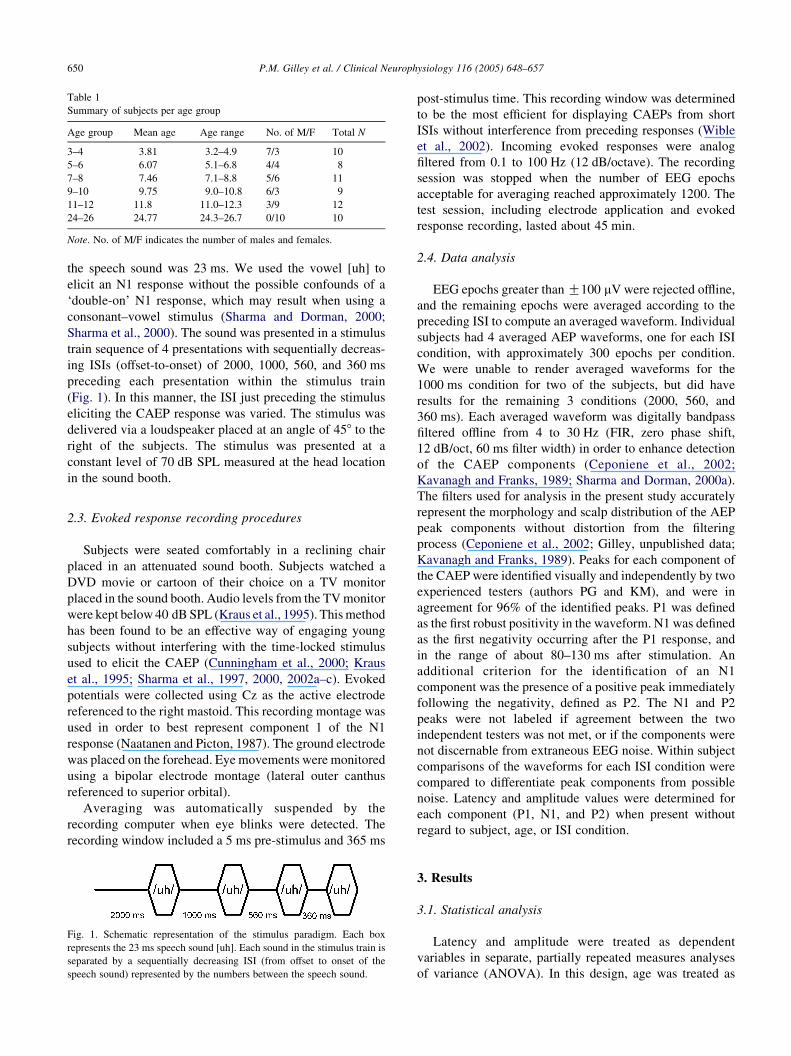
Table 1
Summary of subjects per age group
Age group Mean age Age range No. of M/F Total N
3–4 3.81 3.2–4.9 7/3 10
5–6 6.07 5.1–6.8 4/4 8
7–8 7.46 7.1–8.8 5/6 11
9–10 9.75 9.0–10.8 6/3 9
11–12 11.8 11.0–12.3 3/9 12
24–26 24.77 24.3–26.7 0/10 10
Note. No. of M/F indicates the number of males and females.
P.M. Gilley et al. / Clinical Neurophysiology 116 (2005) 648–657650
the speech sound was 23 ms. We used the vowel [uh] to
elicit an N1 response without the possible confounds of a
‘double-on’ N1 response, which may result when using a
consonant–vowel stimulus (Sharma and Dorman, 2000;
Sharma et al., 2000). The sound was presented in a stimulus
train sequence of 4 presentations with sequentially decreas-
ing ISIs (offset-to-onset) of 2000, 1000, 560, and 360 ms
preceding each presentation within the stimulus train
(Fig. 1). In this manner, the ISI just preceding the stimulus
eliciting the CAEP response was varied. The stimulus was
delivered via a loudspeaker placed at an angle of 458 to the
right of the subjects. The stimulus was presented at a
constant level of 70 dB SPL measured at the head location
in the sound booth.
2.3. Evoked response recording procedures
Subjects were seated comfortably in a reclining chair
placed in an attenuated sound booth. Subjects watched a
DVD movie or cartoon of their choice on a TV monitor
placed in the sound booth. Audio levels from the TV monitor
were kept below 40 dB SPL (Kraus et al., 1995). This method
has been found to be an effective way of engaging young
subjects without interfering with the time-locked stimulus
used to elicit the CAEP (Cunningham et al., 2000; Kraus
et al., 1995; Sharma et al., 1997, 2000, 2002a–c). Evoked
potentials were collected using Cz as the active electrode
referenced to the right mastoid. This recording montage was
used in order to best represent component 1 of the N1
response (Naatanen and Picton, 1987). The ground electrode
was placed on the forehead. Eye movements were monitored
using a bipolar electrode montage (lateral outer canthus
referenced to superior orbital).
Averaging was automatically suspended by the
recording computer when eye blinks were detected. The
recording window included a 5 ms pre-stimulus and 365 ms
Fig. 1. Schematic representation of the stimulus paradigm. Each box
represents the 23 ms speech sound [uh]. Each sound in the stimulus train is
separated by a sequentially decreasing ISI (from offset to onset of the
speech sound) represented by the numbers between the speech sound.
post-stimulus time. This recording window was determined
to be the most efficient for displaying CAEPs from short
ISIs without interference from preceding responses (Wible
et al., 2002). Incoming evoked responses were analog
filtered from 0.1 to 100 Hz (12 dB/octave). The recording
session was stopped when the number of EEG epochs
acceptable for averaging reached approximately 1200. The
test session, including electrode application and evoked
response recording, lasted about 45 min.
2.4. Data analysis
EEG epochs greater than G100 mV were rejected offline,
and the remaining epochs were averaged according to the
preceding ISI to compute an averaged waveform. Individual
subjects had 4 averaged AEP waveforms, one for each ISI
condition, with approximately 300 epochs per condition.
We were unable to render averaged waveforms for the
1000 ms condition for two of the subjects, but did have
results for the remaining 3 conditions (2000, 560, and
360 ms). Each averaged waveform was digitally bandpass
filtered offline from 4 to 30 Hz (FIR, zero phase shift,
12 dB/oct, 60 ms filter width) in order to enhance detection
of the CAEP components (Ceponiene et al., 2002;
Kavanagh and Franks, 1989; Sharma and Dorman, 2000a).
The filters used for analysis in the present study accurately
represent the morphology and scalp distribution of the AEP
peak components without distortion from the filtering
process (Ceponiene et al., 2002; Gilley, unpublished data;
Kavanagh and Franks, 1989). Peaks for each component of
the CAEP were identified visually and independently by two
experienced testers (authors PG and KM), and were in
agreement for 96% of the identified peaks. P1 was defined
as the first robust positivity in the waveform. N1 was defined
as the first negativity occurring after the P1 response, and
in the range of about 80–130 ms after stimulation. An
additional criterion for the identification of an N1
component was the presence of a positive peak immediately
following the negativity, defined as P2. The N1 and P2
peaks were not labeled if agreement between the two
independent testers was not met, or if the components were
not discernable from extraneous EEG noise. Within subject
comparisons of the waveforms for each ISI condition were
compared to differentiate peak components from possible
noise. Latency and amplitude values were determined for
each component (P1, N1, and P2) when present without
regard to subject, age, or ISI condition.
3. Results
3.1. Statistical analysis
Latency and amplitude were treated as dependent
variables in separate, partially repeated measures analyses
of variance (ANOVA). In this design, age was treated as
P.M. Gilley et al. / Clinical Neurophysiology 116 (2005) 648–657 651
the between-subject condition and ISI was treated as the
within-subject condition. In addition, if an N1 component
was present, then the N1–P2 peak-to-peak amplitude values
were computed for each subject in each ISI condition.
3.2. Waveform morphology
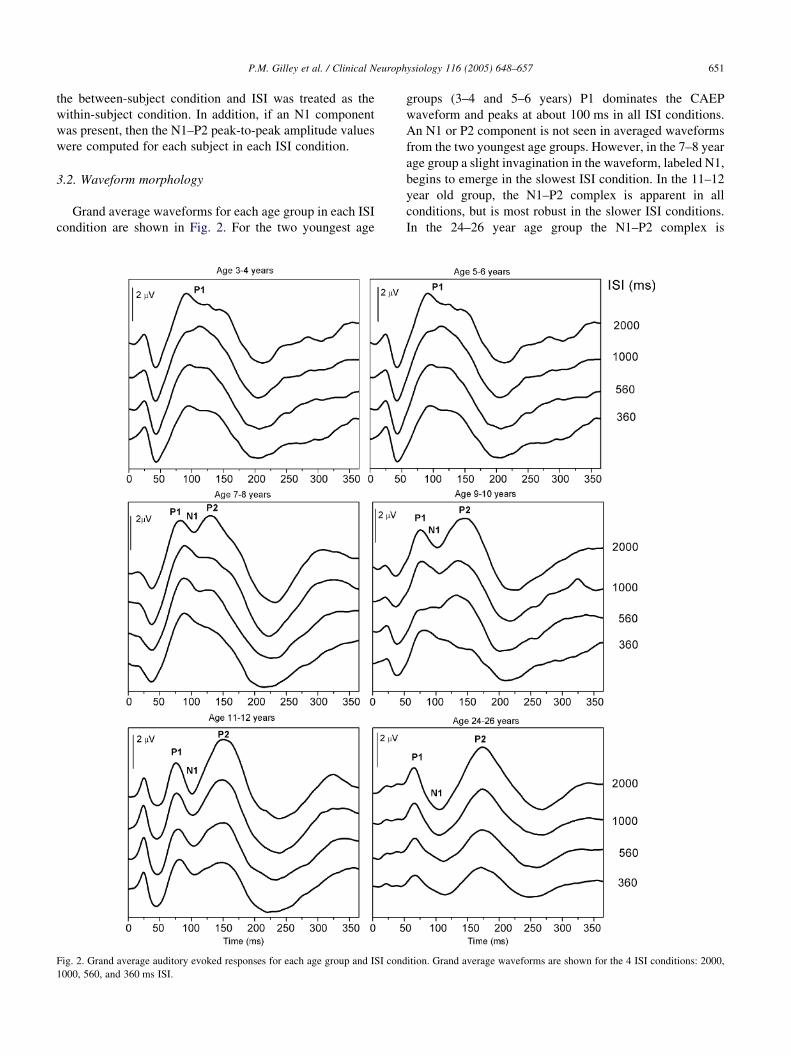
Grand average waveforms for each age group in each ISI
condition are shown in Fig. 2. For the two youngest age
Fig. 2. Grand average auditory evoked responses for each age group and ISI cond
1000, 560, and 360 ms ISI.
groups (3–4 and 5–6 years) P1 dominates the CAEP
waveform and peaks at about 100 ms in all ISI conditions.
An N1 or P2 component is not seen in averaged waveforms
from the two youngest age groups. However, in the 7–8 year
age group a slight invagination in the waveform, labeled N1,
begins to emerge in the slowest ISI condition. In the 11–12
year old group, the N1–P2 complex is apparent in all
conditions, but is most robust in the slower ISI conditions.
In the 24–26 year age group the N1–P2 complex is
ition. Grand average waveforms are shown for the 4 ISI conditions: 2000,
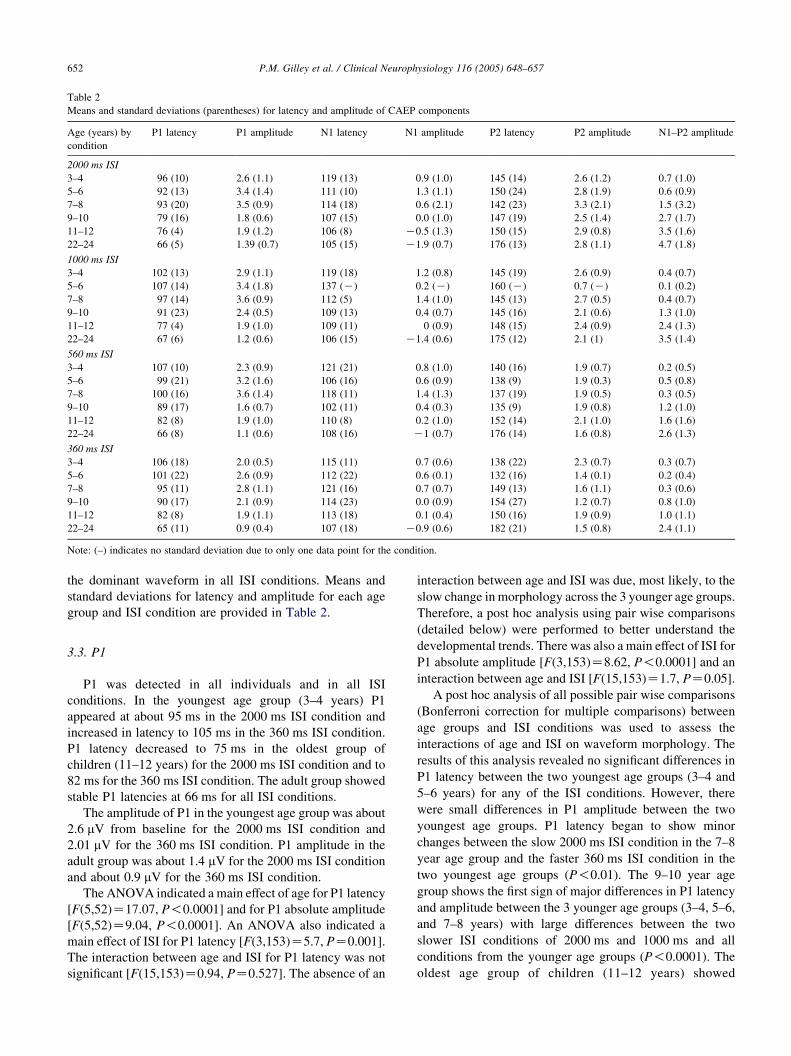
Table 2
Means and standard deviations (parentheses) for latency and amplitude of CAEP components
Age (years) by
condition
P1 latency P1 amplitude N1 latency N1 amplitude P2 latency P2 amplitude N1–P2 amplitude
2000 ms ISI
3–4 96 (10) 2.6 (1.1) 119 (13) 0.9 (1.0) 145 (14) 2.6 (1.2) 0.7 (1.0)
5–6 92 (13) 3.4 (1.4) 111 (10) 1.3 (1.1) 150 (24) 2.8 (1.9) 0.6 (0.9)
7–8 93 (20) 3.5 (0.9) 114 (18) 0.6 (2.1) 142 (23) 3.3 (2.1) 1.5 (3.2)
9–10 79 (16) 1.8 (0.6) 107 (15) 0.0 (1.0) 147 (19) 2.5 (1.4) 2.7 (1.7)
11–12 76 (4) 1.9 (1.2) 106 (8) K0.5 (1.3) 150 (15) 2.9 (0.8) 3.5 (1.6)
22–24 66 (5) 1.39 (0.7) 105 (15) K1.9 (0.7) 176 (13) 2.8 (1.1) 4.7 (1.8)
1000 ms ISI
3–4 102 (13) 2.9 (1.1) 119 (18) 1.2 (0.8) 145 (19) 2.6 (0.9) 0.4 (0.7)
5–6 107 (14) 3.4 (1.8) 137 (K) 0.2 (K) 160 (K) 0.7 (K) 0.1 (0.2)
7–8 97 (14) 3.6 (0.9) 112 (5) 1.4 (1.0) 145 (13) 2.7 (0.5) 0.4 (0.7)
9–10 91 (23) 2.4 (0.5) 109 (13) 0.4 (0.7) 145 (16) 2.1 (0.6) 1.3 (1.0)
11–12 77 (4) 1.9 (1.0) 109 (11) 0 (0.9) 148 (15) 2.4 (0.9) 2.4 (1.3)
22–24 67 (6) 1.2 (0.6) 106 (15) K1.4 (0.6) 175 (12) 2.1 (1) 3.5 (1.4)
560 ms ISI
3–4 107 (10) 2.3 (0.9) 121 (21) 0.8 (1.0) 140 (16) 1.9 (0.7) 0.2 (0.5)
5–6 99 (21) 3.2 (1.6) 106 (16) 0.6 (0.9) 138 (9) 1.9 (0.3) 0.5 (0.8)
7–8 100 (16) 3.6 (1.4) 118 (11) 1.4 (1.3) 137 (19) 1.9 (0.5) 0.3 (0.5)
9–10 89 (17) 1.6 (0.7) 102 (11) 0.4 (0.3) 135 (9) 1.9 (0.8) 1.2 (1.0)
11–12 82 (8) 1.9 (1.0) 110 (8) 0.2 (1.0) 152 (14) 2.1 (1.0) 1.6 (1.6)
22–24 66 (8) 1.1 (0.6) 108 (16) K1 (0.7) 176 (14) 1.6 (0.8) 2.6 (1.3)
360 ms ISI
3–4 106 (18) 2.0 (0.5) 115 (11) 0.7 (0.6) 138 (22) 2.3 (0.7) 0.3 (0.7)
5–6 101 (22) 2.6 (0.9) 112 (22) 0.6 (0.1) 132 (16) 1.4 (0.1) 0.2 (0.4)
7–8 95 (11) 2.8 (1.1) 121 (16) 0.7 (0.7) 149 (13) 1.6 (1.1) 0.3 (0.6)
9–10 90 (17) 2.1 (0.9) 114 (23) 0.0 (0.9) 154 (27) 1.2 (0.7) 0.8 (1.0)
11–12 82 (8) 1.9 (1.1) 113 (18) 0.1 (0.4) 150 (16) 1.9 (0.9) 1.0 (1.1)
22–24 65 (11) 0.9 (0.4) 107 (18) K0.9 (0.6) 182 (21) 1.5 (0.8) 2.4 (1.1)
Note: (–) indicates no standard deviation due to only one data point for the condition.
P.M. Gilley et al. / Clinical Neurophysiology 116 (2005) 648–657652
the dominant waveform in all ISI conditions. Means and
standard deviations for latency and amplitude for each age
group and ISI condition are provided in Table 2.
3.3. P1
P1 was detected in all individuals and in all ISI
conditions. In the youngest age group (3–4 years) P1
appeared at about 95 ms in the 2000 ms ISI condition and
increased in latency to 105 ms in the 360 ms ISI condition.
P1 latency decreased to 75 ms in the oldest group of
children (11–12 years) for the 2000 ms ISI condition and to
82 ms for the 360 ms ISI condition. The adult group showed
stable P1 latencies at 66 ms for all ISI conditions.
The amplitude of P1 in the youngest age group was about
2.6 mV from baseline for the 2000 ms ISI condition and
2.01 mV for the 360 ms ISI condition. P1 amplitude in the
adult group was about 1.4 mV for the 2000 ms ISI condition
and about 0.9 mV for the 360 ms ISI condition.
The ANOVA indicated a main effect of age for P1 latency
[F(5,52)Z17.07, P!0.0001] and for P1 absolute amplitude
[F(5,52)Z9.04, P!0.0001]. An ANOVA also indicated a
main effect of ISI for P1 latency [F(3,153)Z5.7, PZ0.001].
The interaction between age and ISI for P1 latency was not
significant [F(15,153)Z0.94, PZ0.527]. The absence of an
interaction between age and ISI was due, most likely, to the
slow change in morphology across the 3 younger age groups.
Therefore, a post hoc analysis using pair wise comparisons
(detailed below) were performed to better understand the
developmental trends. There was also a main effect of ISI for
P1 absolute amplitude [F(3,153)Z8.62, P!0.0001] and an
interaction between age and ISI [F(15,153)Z1.7, PZ0.05].
A post hoc analysis of all possible pair wise comparisons
(Bonferroni correction for multiple comparisons) between
age groups and ISI conditions was used to assess the
interactions of age and ISI on waveform morphology. The
results of this analysis revealed no significant differences in
P1 latency between the two youngest age groups (3–4 and
5–6 years) for any of the ISI conditions. However, there
were small differences in P1 amplitude between the two
youngest age groups. P1 latency began to show minor
changes between the slow 2000 ms ISI condition in the 7–8
year age group and the faster 360 ms ISI condition in the
two youngest age groups (P!0.01). The 9–10 year age
group shows the first sign of major differences in P1 latency
and amplitude between the 3 younger age groups (3–4, 5–6,
and 7–8 years) with large differences between the two
slower ISI conditions of 2000 ms and 1000 ms and all
conditions from the younger age groups (P!0.0001). The
oldest age group of children (11–12 years) showed
P.M. Gilley et al. / Clinical Neurophysiology 116 (2005) 648–657 653
significant differences in both P1 latency and P1 amplitude
for all ISI conditions relative to all other conditions from the
younger age groups with the exception of the 2000 ms
condition in the 9–10 year age group (P!0.0001). The adult
group showed significant differences for P1 latency
and P1 amplitude compared to all of the child age groups
(P!0.0001).
3.4. N1/P2
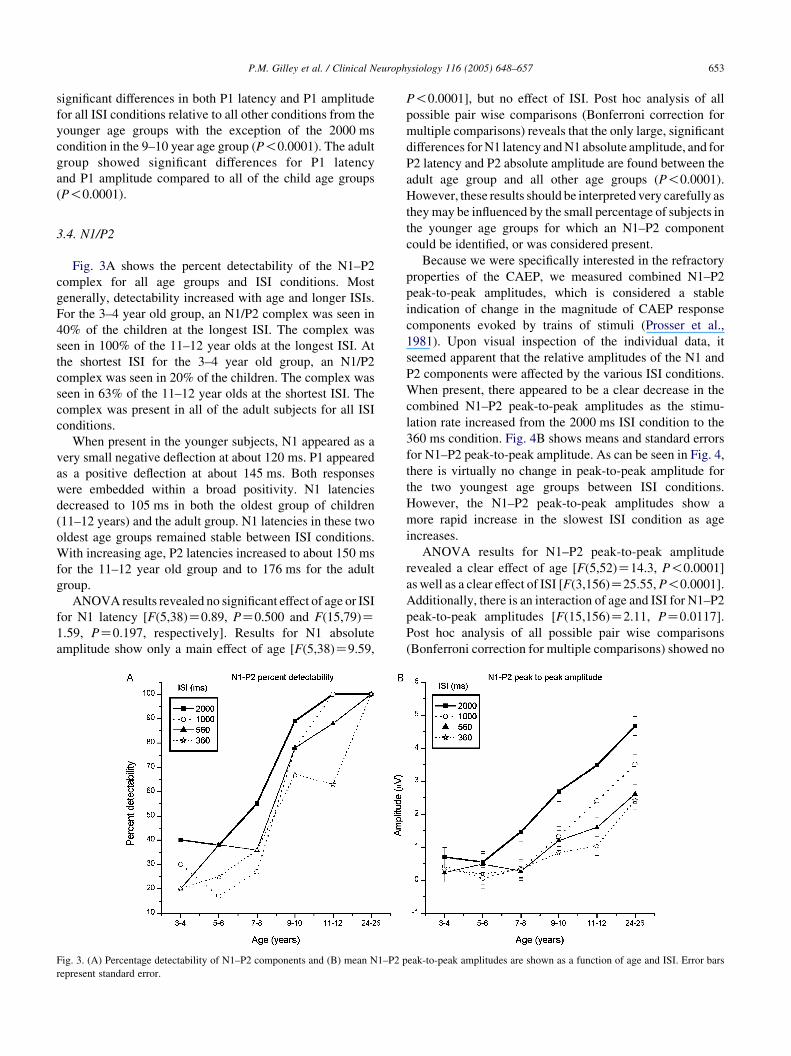
Fig. 3A shows the percent detectability of the N1–P2
complex for all age groups and ISI conditions. Most
generally, detectability increased with age and longer ISIs.
For the 3–4 year old group, an N1/P2 complex was seen in
40% of the children at the longest ISI. The complex was
seen in 100% of the 11–12 year olds at the longest ISI. At
the shortest ISI for the 3–4 year old group, an N1/P2
complex was seen in 20% of the children. The complex was
seen in 63% of the 11–12 year olds at the shortest ISI. The
complex was present in all of the adult subjects for all ISI
conditions.
When present in the younger subjects, N1 appeared as a
very small negative deflection at about 120 ms. P1 appeared
as a positive deflection at about 145 ms. Both responses
were embedded within a broad positivity. N1 latencies
decreased to 105 ms in both the oldest group of children
(11–12 years) and the adult group. N1 latencies in these two
oldest age groups remained stable between ISI conditions.
With increasing age, P2 latencies increased to about 150 ms
for the 11–12 year old group and to 176 ms for the adult
group.
ANOVA results revealed no significant effect of age or ISI
for N1 latency [F(5,38)Z0.89, PZ0.500 and F(15,79)Z1.59, PZ0.197, respectively]. Results for N1 absolute
amplitude show only a main effect of age [F(5,38)Z9.59,
Fig. 3. (A) Percentage detectability of N1–P2 components and (B) mean N1–P2 p
represent standard error.
P!0.0001], but no effect of ISI. Post hoc analysis of all
possible pair wise comparisons (Bonferroni correction for
multiple comparisons) reveals that the only large, significant
differences for N1 latency and N1 absolute amplitude, and for
P2 latency and P2 absolute amplitude are found between the
adult age group and all other age groups (P!0.0001).
However, these results should be interpreted very carefully as
they may be influenced by the small percentage of subjects in
the younger age groups for which an N1–P2 component
could be identified, or was considered present.
Because we were specifically interested in the refractory
properties of the CAEP, we measured combined N1–P2
peak-to-peak amplitudes, which is considered a stable
indication of change in the magnitude of CAEP response
components evoked by trains of stimuli (Prosser et al.,
1981). Upon visual inspection of the individual data, it
seemed apparent that the relative amplitudes of the N1 and
P2 components were affected by the various ISI conditions.
When present, there appeared to be a clear decrease in the
combined N1–P2 peak-to-peak amplitudes as the stimu-
lation rate increased from the 2000 ms ISI condition to the
360 ms condition. Fig. 4B shows means and standard errors
for N1–P2 peak-to-peak amplitude. As can be seen in Fig. 4,
there is virtually no change in peak-to-peak amplitude for
the two youngest age groups between ISI conditions.
However, the N1–P2 peak-to-peak amplitudes show a
more rapid increase in the slowest ISI condition as age
increases.
ANOVA results for N1–P2 peak-to-peak amplitude
revealed a clear effect of age [F(5,52)Z14.3, P!0.0001]
as well as a clear effect of ISI [F(3,156)Z25.55, P!0.0001].
Additionally, there is an interaction of age and ISI for N1–P2
peak-to-peak amplitudes [F(15,156)Z2.11, PZ0.0117].
Post hoc analysis of all possible pair wise comparisons
(Bonferroni correction for multiple comparisons) showed no
eak-to-peak amplitudes are shown as a function of age and ISI. Error bars
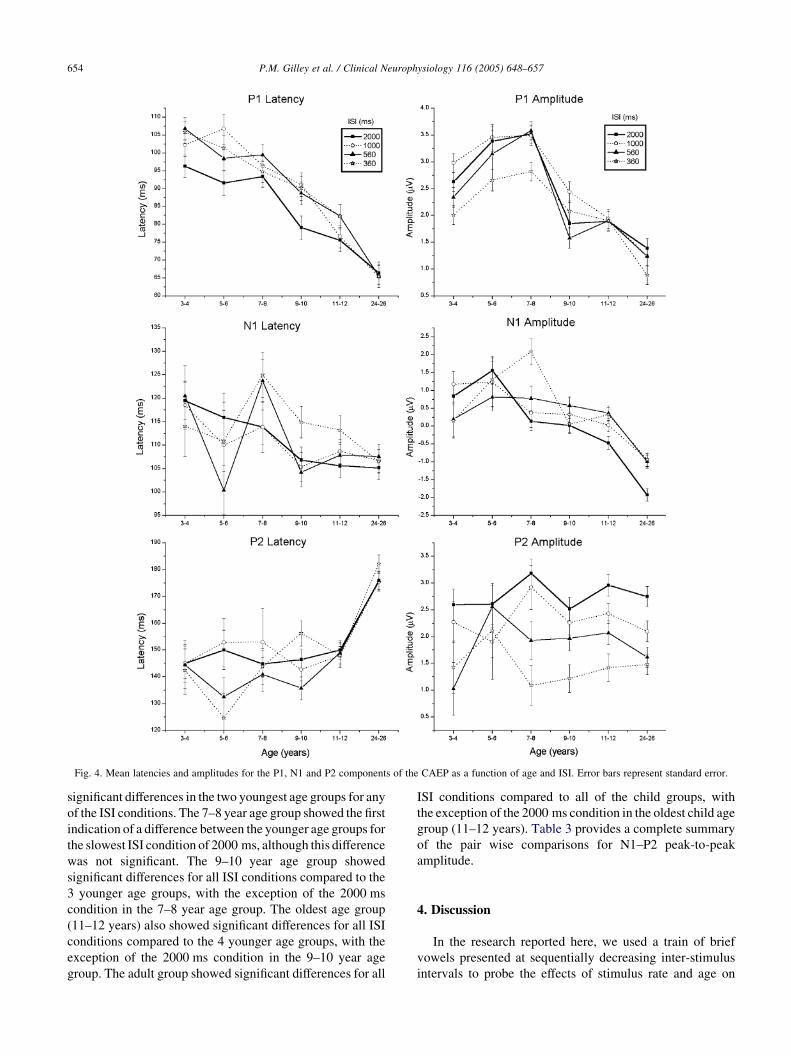
Fig. 4. Mean latencies and amplitudes for the P1, N1 and P2 components of the CAEP as a function of age and ISI. Error bars represent standard error.
P.M. Gilley et al. / Clinical Neurophysiology 116 (2005) 648–657654
significant differences in the two youngest age groups for any
of the ISI conditions. The 7–8 year age group showed the first
indication of a difference between the younger age groups for
the slowest ISI condition of 2000 ms, although this difference
was not significant. The 9–10 year age group showed
significant differences for all ISI conditions compared to the
3 younger age groups, with the exception of the 2000 ms
condition in the 7–8 year age group. The oldest age group
(11–12 years) also showed significant differences for all ISI
conditions compared to the 4 younger age groups, with the
exception of the 2000 ms condition in the 9–10 year age
group. The adult group showed significant differences for all
ISI conditions compared to all of the child groups, with
the exception of the 2000 ms condition in the oldest child age
group (11–12 years). Table 3 provides a complete summary
of the pair wise comparisons for N1–P2 peak-to-peak
amplitude.
4. Discussion
In the research reported here, we used a train of brief
vowels presented at sequentially decreasing inter-stimulus
intervals to probe the effects of stimulus rate and age on
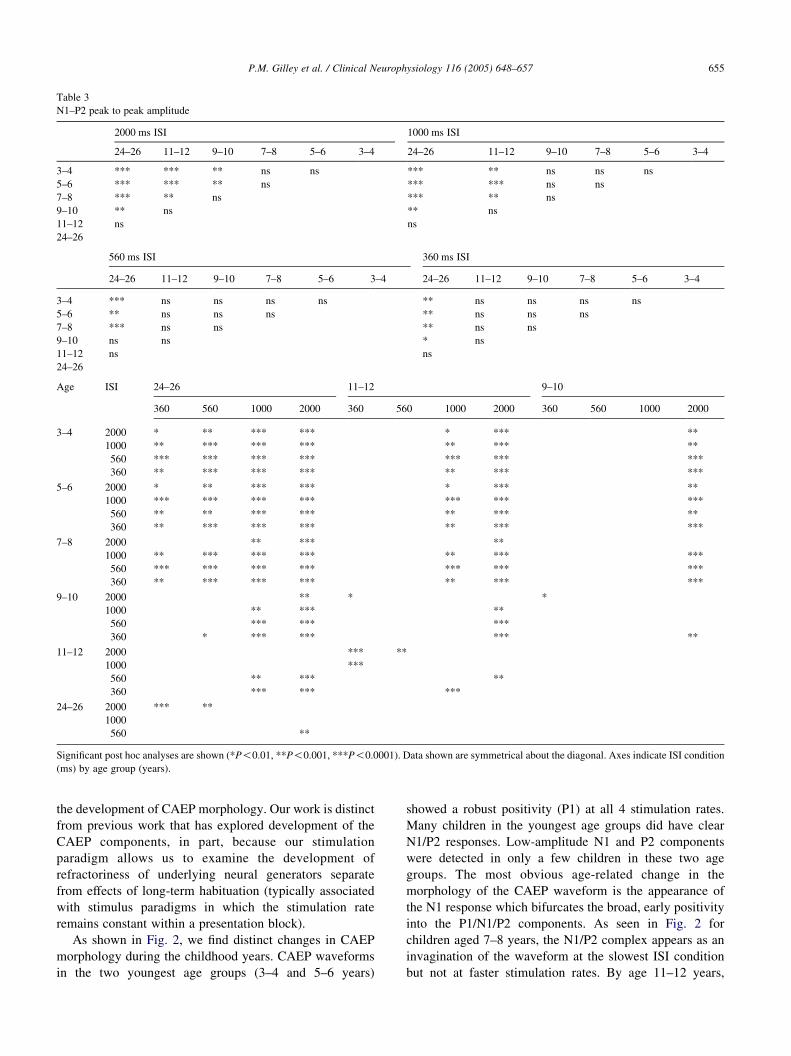
Table 3
N1–P2 peak to peak amplitude
2000 ms ISI 1000 ms ISI
24–26 11–12 9–10 7–8 5–6 3–4 24–26 11–12 9–10 7–8 5–6 3–4
3–4 *** *** ** ns ns *** ** ns ns ns
5–6 *** *** ** ns *** *** ns ns
7–8 *** ** ns *** ** ns
9–10 ** ns ** ns
11–12 ns ns
24–26
560 ms ISI 360 ms ISI
24–26 11–12 9–10 7–8 5–6 3–4 24–26 11–12 9–10 7–8 5–6 3–4
3–4 *** ns ns ns ns ** ns ns ns ns
5–6 ** ns ns ns ** ns ns ns
7–8 *** ns ns ** ns ns
9–10 ns ns * ns
11–12 ns ns
24–26
Age ISI 24–26 11–12 9–10
360 560 1000 2000 360 560 1000 2000 360 560 1000 2000
3–4 2000 * ** *** *** * *** **
1000 ** *** *** *** ** *** **
560 *** *** *** *** *** *** ***
360 ** *** *** *** ** *** ***
5–6 2000 * ** *** *** * *** **
1000 *** *** *** *** *** *** ***
560 ** ** *** *** ** *** **
360 ** *** *** *** ** *** ***
7–8 2000 ** *** **
1000 ** *** *** *** ** *** ***
560 *** *** *** *** *** *** ***
360 ** *** *** *** ** *** ***
9–10 2000 ** * *
1000 ** *** **
560 *** *** ***
360 * *** *** *** **
11–12 2000 *** **
1000 ***
560 ** *** **
360 *** *** ***
24–26 2000 *** **
1000
560 **
Significant post hoc analyses are shown (*P!0.01, **P!0.001, ***P!0.0001). Data shown are symmetrical about the diagonal. Axes indicate ISI condition
(ms) by age group (years).
P.M. Gilley et al. / Clinical Neurophysiology 116 (2005) 648–657 655
the development of CAEP morphology. Our work is distinct
from previous work that has explored development of the
CAEP components, in part, because our stimulation
paradigm allows us to examine the development of
refractoriness of underlying neural generators separate
from effects of long-term habituation (typically associated
with stimulus paradigms in which the stimulation rate
remains constant within a presentation block).
As shown in Fig. 2, we find distinct changes in CAEP
morphology during the childhood years. CAEP waveforms
in the two youngest age groups (3–4 and 5–6 years)
showed a robust positivity (P1) at all 4 stimulation rates.
Many children in the youngest age groups did have clear
N1/P2 responses. Low-amplitude N1 and P2 components
were detected in only a few children in these two age
groups. The most obvious age-related change in the
morphology of the CAEP waveform is the appearance of
the N1 response which bifurcates the broad, early positivity
into the P1/N1/P2 components. As seen in Fig. 2 for
children aged 7–8 years, the N1/P2 complex appears as an
invagination of the waveform at the slowest ISI condition
but not at faster stimulation rates. By age 11–12 years,
P.M. Gilley et al. / Clinical Neurophysiology 116 (2005) 648–657656
the P1, N1, and P2 components are clearly apparent for all
ISIs, but the N1 and P2 components are most robust in the
slowest ISI conditions. In the 24–26 year old group, the
N1–P2 complex (as opposed to the P1 component) is
the dominant waveform at all stimulation rates. This overall
pattern of development of CAEP morphology is consistent
with previous studies (Ceponiene et al., 1998; Cunningham
et al., 2000; Ponton et al., 1996b, 2000; Sharma et al., 1997).
Our results provide some insight into apparent disagree-
ments in previous findings. For example, prior studies have
reported that P1 latencies reach adult-like values at ages
ranging anywhere from 14 to 20 years and beyond
(Cunningham et al., 2000; Ponton et al., 1996a,b; Sharma
et al., 1997, 2002b). However, the stimulation rates varied
substantially across those studies and, in light of the present
results, which show a clear dependence of P1 latency on
stimulation rate, we suggest that the exact developmental
trajectory for P1 latency will be influenced by stimulation
rate. We emphasize the importance of examining the
interaction between stimulation rate and age-related devel-
opment when charting the developmental trajectories of
CAEP components.
As was the case for P1, previous studies provide
conflicting reports about the detectability of the N1 response
in school-aged children. For example, Sharma et al. (1997)
reported N1 responses in 61% of children aged 6–7 years
and 69% of children aged 10–12 years using an ISI of
510 ms. Cunningham et al. (2000) reported N1 responses in
45% of children aged 5–7 years and 55% of children aged
11–12 years using an ISI of 490 ms. We find increasing
detectability of N1 with increasing age but also find a
significant interaction with stimulation rate. For example, in
the 360 ms ISI condition the N1–P2 was detected in 25% of
children aged 5–6 years and in 65% of children aged 11–12
years. In the 560 ms ISI condition the N1–P2 was detected
in 38% of children aged 5–6 years and in 85% of children
aged 11–12 years. Only in the young adult group was the N1
present in 100% of the cases and did not vary as a function
of stimulation rate.
It is reasonable to assume that age-related changes in
myelination, synaptic refinement and cortical fiber density
underlie the age-related changes in latency, amplitude and
refractoriness of CAEP components that we have found
(Huttenlocher and Dabholkar, 1997; Moore and Guan, 2001;
Salamy, 1978). The formation of myelin along the axon
increases the conduction velocity of a signal in transmission,
and consequently affects the timing of subsequent signal
propagation (Sabatini and Regehr, 1999; Salamy, 1978;
Sanes et al., 2000). Because the latency and synchrony of the
neuronal signal are affected by myelination, the evoked
potentials will reveal shorter latencies, increased amplitude,
and a more defined waveform morphology with maturation
(Musiek et al., 1988). The amount of activity incurred from
signal transmission influences the degree to which synapto-
genesis occurs (Huttenlocher et al., 1997; Rakic et al.,
1986). The organization of synapses is refined with
maturation of the central auditory system, and thus increases
the neuronal synchrony of the generators, which underlie the
CAEP components. Refinement of synaptic organization
also increases the amount of neuronal information trans-
ferred resulting in a faster rise in postsynaptic potentials
(Eggermont, 1988). Thus, in the immature central auditory
system, incomplete myelination and synaptogenesis will
lead to longer neuronal refractory periods and lower cortical
excitability (Surwillo, 1981). Both factors may contribute to
greater refractoriness of the CAEP.
In particular, the time line for synaptic refinement bears a
broad similarity to the time line for changes in refractori-
ness. Huttenlocher and Dabholkar (1997) reported that after
age 4 synaptic refinement begins to take place by means
of synaptic elimination and is relatively complete by about
12 years of age. Synaptic refinement continues at much
slower rates through adolescence and into adulthood. One
explanation for our finding of an increase in refractoriness
over time is that synaptic refinement increases efficiency of
the synaptic mechanisms that underlie the CAEP.
Changes in axonal density in the auditory cortex also
follow a time line similar to that for changes in refractori-
ness. Moore and Guan (2001) reported a steady increase in
axonal density until about 5 years of age. After age 5, the
auditory cortex begins to develop a more complex network
of axons throughout the superficial layers, which reaches
adult like density by about age 11 years. The axonal density
at ages 11–12 years closely resembles that of young adults
up to at least age 27 years. The increased axonal density
would increase the efficiency of signal transmission by
providing a more mature network of connections within the
auditory cortical layers. As the efficiency of these timing
mechanisms is increased, we would expect to see com-
ponents of the CAEP recover at faster rates.
In summary, our results show that the complex matura-
tional patterns of the CAEP components are best understood
when the effects of both age and rate on waveform
morphology are considered. We have described a stimu-
lation paradigm that allows us to examine the development
of refractoriness by highlighting the interaction between age
and rate on CAEP morphology. Future studies should assess
the value of this stimulus paradigm in diagnosing children
who are at risk for abnormal central auditory development
such as children with hearing impairment or children with
auditory processing problems.
Acknowledgements
We gratefully acknowledge the following persons for
their input and assistance during the preparation of this
manuscript: Philip Loizou, James Jerger, Herve Abdi, Erin
Schafer, William Cooper, Paul Dybala, and Kristi Buckley.
We also wish to thank the children and their families for
their enthusiastic participation in this study.
P.M. Gilley et al. / Clinical Neurophysiology 116 (2005) 648–657 657
References
Albrecht R, Suchodoletz W, Uwer R. The development of auditory evoked
dipole source activity from childhood to adulthood. Clin Neurophysiol
2000;111(12):2268–76.
Budd TW, Barry RJ, Gordon E, Rennie C, Michie PT. Decrement of the N1
auditory event-related potential with stimulus repetition: habituation vs.
refractoriness. Int J Psychophysiol 1998;31(1):51–68.
Ceponiene R, Cheour M, Naatanen R. Interstimulus interval and auditory
event-related potentials in children: evidence for multiple generators.
Electroencephalogr Clin Neurophysiol 1998;108(4):345–54.
Ceponiene R, Rinne T, Naatanen R. Maturation of cortical sound
processing as indexed by event-related potentials. Clin Neurophysiol
2002;113(6):870–82.
Cunningham J, Nicol T, Zecker S, Kraus N. Speech-evoked neurophysio-
logic responses in children with learning problems: development and
behavioral correlates of perception. Ear Hear 2000;21(6):554–68.
Eggermont JJ. On the rate of maturation of sensory evoked potentials.
Electroencephalogr Clin Neurophysiol 1988;70(4):293–305.
Eggermont JJ, Ponton CW. Auditory-evoked potential studies of cortical
maturation in normal hearing and implanted children: correlations with
changes in structure and speech perception. Acta Otolaryngologica
2003;123(2):249–52.
Huttenlocher PR, Dabholkar AS. Regional differences in synaptogenesis in
human cerebral cortex. J Comp Neurol 1997;387(2):167–78.
Kavanagh KT, Franks R. Analog and digital filtering of the brain stem
auditory evoked response. Ann Otol Rhinol Laryngol 1989;98(7 Pt 1):
508–14.
Kraus N, McGee T, Carrell TD, Sharma A. Neurophysiologic bases of
speech discrimination. Ear Hear 1995;16(1):19–37.
Moore JK, Guan YL. Cytoarchitectural and axonal maturation in human
auditory cortex. J Assoc Res Otolaryngol 2001;2(4):297–311.
Musiek FE, Verkest SB, Gollegly KM. Effects of neuromaturation on
auditory-evoked potentials. Semin Hear 1988;9(1):1–13.
Naatanen R, Picton T. The N1 wave of the human electric and magnetic
response to sound: a review and an analysis of the component structure.
Psychophysiology 1987;24(4):375–425.
Pang EW, Taylor MJ. Tracking the development of the N1 from age 3 to
adulthood: an examination of speech and non-speech stimuli. Clin
Neurophysiol 2000;111(3):388–97.
Ponton CW, Don M, Eggermont JJ, Waring MD, Kwong B, Masuda A.
Auditory system plasticity in children after long periods of complete
deafness. Neuroreport 1996a;8(1):61–5.
Ponton CW, Don M, Eggermont JJ, Waring MD, Masuda A. Maturation of
human cortical auditory function: differences between normal-hearing
children and children with cochlear implants. Ear Hear 1996b;17(5):
430–7.
Ponton CW, Eggermont JJ, Kwong B, Don M. Maturation of human central
auditory system activity: evidence from multi-channel evoked poten-
tials. Clin Neurophysiol 2000;111(2):220–36.
Ponton CW, Eggermont JJ, Khosla D, Kwong B, Don M. Maturation of
human central auditory system activity: separating auditory evoked
potentials by dipole source modeling. Clin Neurophysiol 2002;113(3):
407–20.
Prosser S, Arslan E, Michelini S. Habituation and rate effect in the auditory
cortical potentials evoked by trains of stimuli. Arch Otorhinolaryngol
1981;233(2):179–87.
Rakic P, Bourgeois JP, Eckenhoff MF, Zecevic N, Goldman-Rakic PS.
Concurrent overproduction of synapses in diverse regions of the
primate cerebral cortex. Science 1986;232(4747):232–5.
Roeser RJ, Price LL. Effects of habituation on the auditory evoked
response. J Auditory Res 1969;9:306–13.
Roth WT, Krainz PL, Ford JM, Tinklenberg JR, Rothbart RM, Kopell BS.
Parameters of temporal recovery of the human auditory evoked
potential. Electroencephalogr Clin Neurophysiol 1976;40(6):623–32.
Sabatini BL, Regehr WG. Timing of synaptic transmission. Annu Rev
Physiol 1999;61:521–42.
Salamy A. Commissural transmission: maturational changes in humans.
Science 1978;200(4348):1409–11.
Sanes DH, Reh TA, Harris WA. Development of the nervous system. San
Diego, CA: Academic Press; 2000.
Sharma A, Dorman MF. Neurophysiologic correlates of cross-language
phonetic perception. J Acoust Soc Am 2000;107(5 Pt 1):2697–703.
Sharma A, Kraus N, McGee TJ, Nicol TG. Developmental changes in P1
and N1 central auditory responses elicited by consonant–vowel
syllables. Electroencephalogr Clin Neurophysiol 1997;104(6):540–5.
Sharma A, Marsh CM, Dorman MF. Relationship between N1 evoked
potential morphology and the perception of voicing. J Acoust Soc Am
2000;108(6):3030–5.
Sharma A, Dorman MF, Spahr AJ. A sensitive period for the development
of the central auditory system in children with cochlear implants:
implications for age of implantation. Ear Hear 2002a;23(6):532–9.
Sharma A, Dorman MF, Spahr A, Todd NW. Early cochlear implantation in
children allows normal development of central auditory pathways. Ann
Otol Rhinol Laryngol Suppl 2002b;189:38–41.
Sharma A, Dorman MF, Spahr AJ. Rapid development of cortical auditory
evoked potentials after early cochlear implantation. Neuroreport 2002c;
13(10):1365–8.
Surwillo WW. Recovery of the cortical evoked potential from auditory
stimulation in children and adults. Dev Psychobiol 1981;14(1):1–12.
Tonnquist-Uhlen I, Ponton CW, Eggermont JJ, Kwong B, Don M.
Maturation of human central auditory system activity: the T-complex.
Clin Neurophysiol 2003;114(4):685–701.
Wible B, Nicol T, Kraus N. Abnormal neural encoding of repeated speech
stimuli in noise in children with learning problems. Clin Neurophysiol
2002;113(4):485–94.
Related Documents


