DEVELOPMENT STRATEGY FOR NIGERIA MOSES AKPOBASAH AT A 2-DAY NIGERIA MEETING ORGANIZED BY THE OVERSEAS DEVELOPMENT INSTITUTE, LONDON, 16-17 JUNE 2004 Contact: [email protected] Moses Akpobasah at is a Consultant, Nigeria Economic Summit Group, DFID Consultant member, Drafting Committee on Nigeria’s Economic Empowerment & Development Strategy (NEEDS). former lecturer in Economics and former senior public servant THE DEVELOPMENT STRATEGY FOR NIGERIA PAPER PRESENTED BY MOSES AKPOBASAH AT THE OVERSEAS DEVELOPMENT/NIGERIAN ECONOMIC SUMMIT GROUP MEETING ON NIGERIA, LONDON, JUNE 16-17, 2004

Welcome message from author
This document is posted to help you gain knowledge. Please leave a comment to let me know what you think about it! Share it to your friends and learn new things together.
Transcript
DEVELOPMENT STRATEGY FOR NIGERIA
MOSES AKPOBASAH
AT A 2-DAY NIGERIA MEETING ORGANIZED BY THE OVERSEAS DEVELOPMENT INSTITUTE, LONDON, 16-17 JUNE 2004
Contact: [email protected] Moses Akpobasah at is a Consultant, Nigeria Economic Summit Group, DFID Consultant member, Drafting Committee on Nigeria’s Economic Empowerment & Development Strategy (NEEDS). former lecturer in Economics and former senior public servant
THE DEVELOPMENT STRATEGY FOR NIGERIA PAPER PRESENTED BY MOSES AKPOBASAH
AT THE OVERSEAS DEVELOPMENT/NIGERIAN ECONOMIC SUMMIT GROUP
MEETING ON NIGERIA, LONDON, JUNE 16-17, 2004
1
BACKGROUND Nigeria has an estimated population of about 125 million people and a land area of about 924 square kilometres, a large proportion of which is arable. It has large deposits of oil, gas and solid minerals and a sizeable educated and skilled workforce. It also has a sizeable educated and skilled work force. Despite these, the country has not been able to effectively harness its endowment to develop the economy sufficiently to improve the welfare of its people. With an estimated population growth rate of 2.8% and a GDP growth rate of about 2.5%, per capita income growth was negative for the greater part of the 1990s. Nigeria’s urbanisation rate of 5.3% is one of the highest in the world leading to loss of virile labour force for agriculture. Besides, the rate of job creation has been far less than the rate of growth of the urban labour force. This combined with an education system that is not attuned to the production of the appropriate manpower required to support robust growth has led to high levels of unemployment and underemployment. Income distribution in the country is also highly skewed such that probably less than 15% of the population actually benefits from the GDP growth. The country has a debt overhang of about US $30 billion with high servicing requirements. Currently about 65- 70% of the population lives below the poverty line, half of which probably lives on less than half a dollar per day. The situation rather than improve has been worsening over time. This has become a source of embarrassment for a country that is relatively so well endowed. The weakness of the Nigerian economy in the past three decades is not unrelated to its dependence on oil. Indeed, the country is a textbook example of an economy under the influence of the Dutch Disease with its deleterious impact on the development of other aspects of the real sector. Oil generates about 90% of foreign exchange earnings and 75% of government revenues. It contributes about 30% of GDP but employs only about 3% of the labour force. For several years therefore, the development challenge for Nigeria became the diversification of the productive base away from oil. Successive governments took up this challenge in the design and implementation of several plans and policies. However, the attempts at achieving a more rapid growth of the industrial sector led to investment in several projects that turned out to be “white elephants”. Two factors probably contributed to this development. First, the capacity to design/execute such projects was lacking. Secondly, the soft funds needed to sustain the projects after they were started dried up following the collapse of oil prices in the early eighties. But there is an even more significant development resulting from the attempt to put the economy right. Government inadvertently became the dominant force in the economy employing about one million people. The huge resources accruing to government turned it into a centre for rent seeking and corruption. Though Nigeria’s rating in world corruption table is often contested, the government has acknowledged that the situation is sufficiently bad to warrant a frontal attack. These provide the background for the recently launched economic reform agenda, the National Economic Empowerment and Development Strategy (NEEDS). The Obasanjo regime has also taken other measures such as the establishment of an Independent Corrupt Practices Commission (ICPC), the Economic and Financial Crimes Commissions (EFCC), and a Due Process Office to screen contracts prior to execution. Nigeria’s Experience with Reforms Nigeria has implemented several ad hoc stabilization or reform measures in the past. Therefore the current reform programme is not the first in Nigeria. However, a major reform package that may be recalled was the structural adjustment programme. Following the collapse of the oil market in the early 80s which saw Nigeria’s per capita income plummet from about $1,000 to about $300 and the
2
drastic fall in the level of foreign exchange earnings and government revenues, the country was forced to embark on a Structural Adjustment Programme (SAP) in 1986. The emphasis of the SAP was on deregulation, market liberalization, demand management through appropriate prizing, floating of the exchange rate and the promotion of agriculture and other rural based export oriented economic activities. It was also expected to promote the growth of resource based industrialisation in place of the then prevailing import substitution strategy which had become unsustainable due to foreign exchange scarcity and the consequent inability to import needed raw materials, spare parts, skilled labour etc to support industrial production. Inability to stay the course of reforms, low levels of investment and large fiscal imbalances, among other reasons, prolonged the life of the programme, which was originally designed to last for 2 years to 8 years until there was a regime change. Despite the regime change, the features of that programme have remained to date with significant elements of it reflected in Vision 2010. The Vision was also essentially pro deregulation/liberalisation and generally reform biased but it got literally aborted before its implementation ever began. The current reforms strategy has drawn inspiration from the Vision and it has the advantage of being launched at a time when other stop gap measures had failed, and there appears to be a consensus on the need for change and the way forward. The democratic environment promoted greater interaction and freer expression of ideas which enriched the NEEDS formulation process. Features of NEEDS Nigeria’s new reform programme NEEDS, designed to last from 2004 to 2007 has several distinctive features, which distinguishes it from the erstwhile National Rolling Plans that it is replacing, namely:
i. It is Nigeria’s Poverty Reduction Strategy and gains inspiration from the poverty reduction strategy paper (PRSP) which had been under preparation since 2001
ii. It is a reform programme aimed at re-engineering the growth process iii. Its formulation process has been largely participatory iv. The President has expressed his commitment to the programme and has set up an economic
team to drive it v. The States have also broadly agreed to design the States Economic Development Strategy
(SEEDS) to complement the NEEDS. The local governments are also expected to prepare local government components “LEEDS” There is of course no information yet on the degree of compliance, the NEEDS having been launched only on May 29, 2004
vi. The NEEDS focuses on strategy and policy directions rather than programmes and projects. It signals a shift in the direction of decentralised project planning and execution
vii. Implementation of aspects of the NEEDS began even before the formal lunching of the document
Objective/Policy Thrust
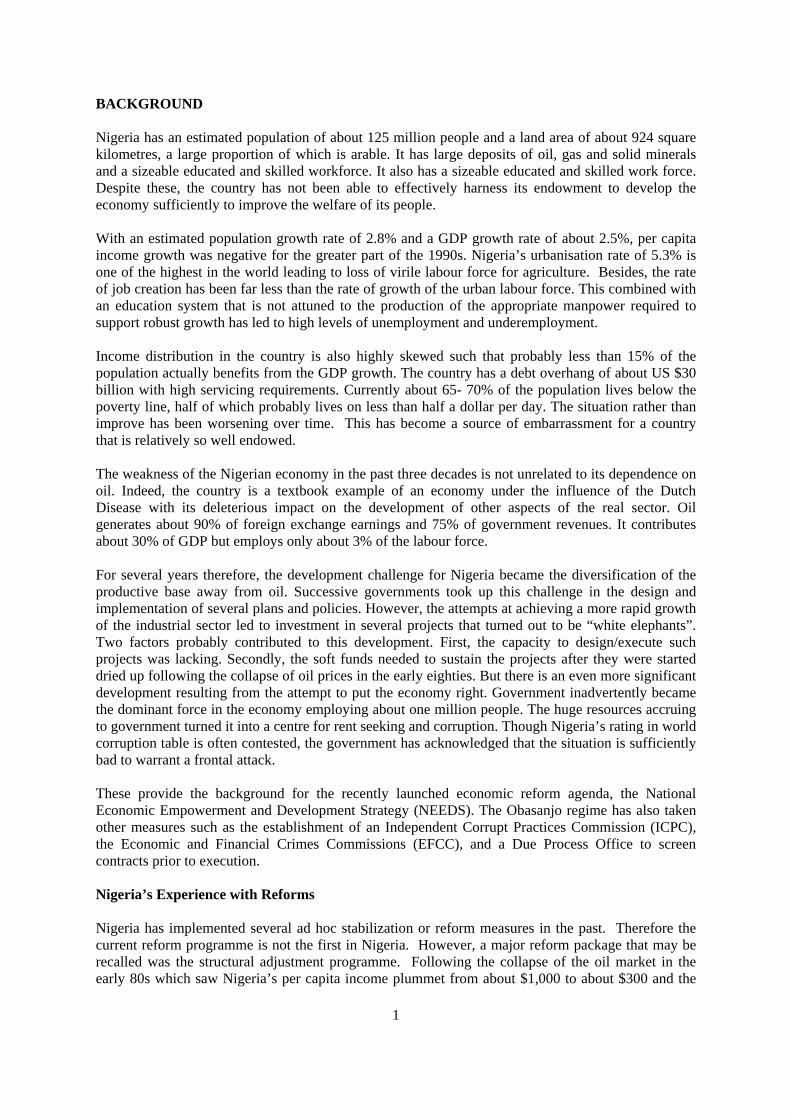
The objective of NEEDS is to enable Nigeria achieve a turn around and grow a broad based market-oriented economy that is private sector - led and in which people can be empowered so that they can, as a minimum, afford the basic needs of life. It is therefore a pro-poor development strategy with sources of economic empowerment being gainful employment and provision of social safety nets for vulnerable groups. NEEDS at a Glance The diagram below tells the whole story about NEEDS
1
Figure 1: The NEEDS at a Glance
GOALS Wealth Creation Employment Generation Poverty Reduction Value Re-Orientation
Social Charter: Human Devt Agenda
Health Education Integrated Rural Development Housing Development Employment & Youth Devt Safety Nets Gender and Geopolitical Bal
Pension Reforms
Growing the Private Sector • Security & Rule of Law • Infrastructure • Finance • Sectoral Strategies • Privatisation and
liberalization • Trade, Regional Integration
Reforming Government and Institutions
Public Sector Reforms Privatization/Liberalization Governance, Transparency
and Anti-Corruption Service Delivery
Financing and Plan Implementation Strategies
Vision, Values and Principles
Macroeconomic Framework
2
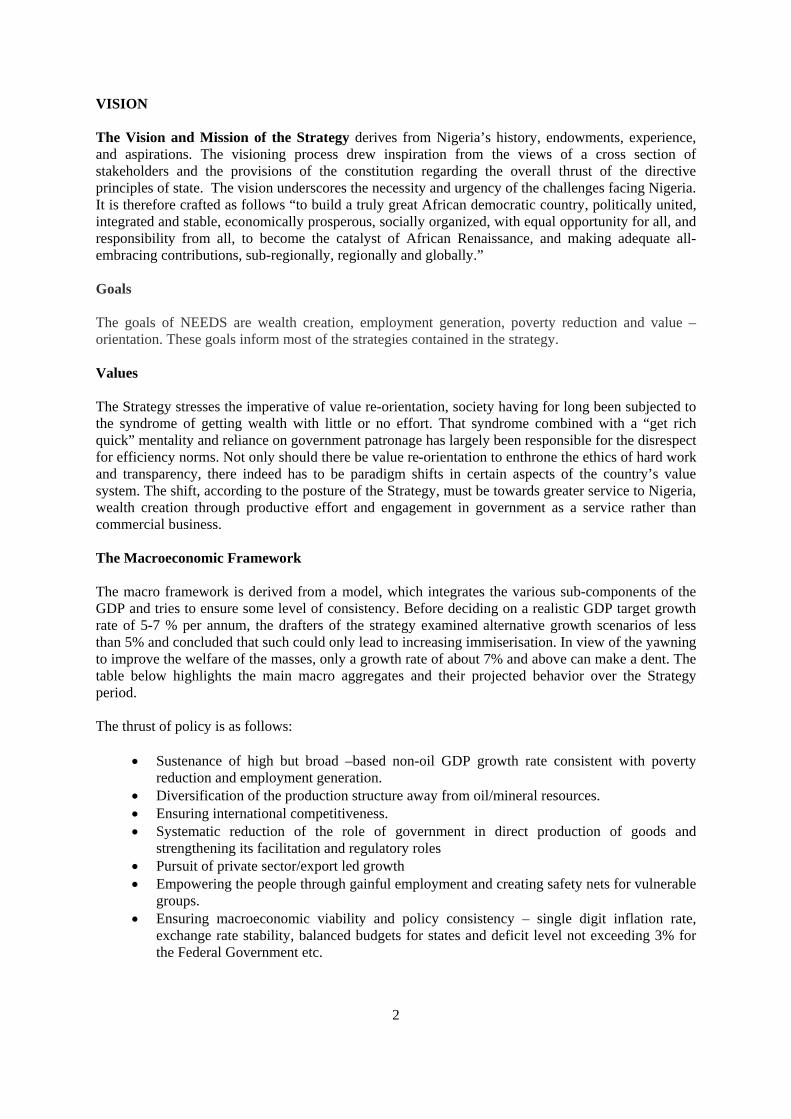
VISION The Vision and Mission of the Strategy derives from Nigeria’s history, endowments, experience, and aspirations. The visioning process drew inspiration from the views of a cross section of stakeholders and the provisions of the constitution regarding the overall thrust of the directive principles of state. The vision underscores the necessity and urgency of the challenges facing Nigeria. It is therefore crafted as follows “to build a truly great African democratic country, politically united, integrated and stable, economically prosperous, socially organized, with equal opportunity for all, and responsibility from all, to become the catalyst of African Renaissance, and making adequate all-embracing contributions, sub-regionally, regionally and globally.” Goals The goals of NEEDS are wealth creation, employment generation, poverty reduction and value – orientation. These goals inform most of the strategies contained in the strategy. Values The Strategy stresses the imperative of value re-orientation, society having for long been subjected to the syndrome of getting wealth with little or no effort. That syndrome combined with a “get rich quick” mentality and reliance on government patronage has largely been responsible for the disrespect for efficiency norms. Not only should there be value re-orientation to enthrone the ethics of hard work and transparency, there indeed has to be paradigm shifts in certain aspects of the country’s value system. The shift, according to the posture of the Strategy, must be towards greater service to Nigeria, wealth creation through productive effort and engagement in government as a service rather than commercial business. The Macroeconomic Framework The macro framework is derived from a model, which integrates the various sub-components of the GDP and tries to ensure some level of consistency. Before deciding on a realistic GDP target growth rate of 5-7 % per annum, the drafters of the strategy examined alternative growth scenarios of less than 5% and concluded that such could only lead to increasing immiserisation. In view of the yawning to improve the welfare of the masses, only a growth rate of about 7% and above can make a dent. The table below highlights the main macro aggregates and their projected behavior over the Strategy period. The thrust of policy is as follows:
• Sustenance of high but broad –based non-oil GDP growth rate consistent with poverty reduction and employment generation.
• Diversification of the production structure away from oil/mineral resources. • Ensuring international competitiveness. • Systematic reduction of the role of government in direct production of goods and
strengthening its facilitation and regulatory roles • Pursuit of private sector/export led growth • Empowering the people through gainful employment and creating safety nets for vulnerable
groups. • Ensuring macroeconomic viability and policy consistency – single digit inflation rate,
exchange rate stability, balanced budgets for states and deficit level not exceeding 3% for the Federal Government etc.
3
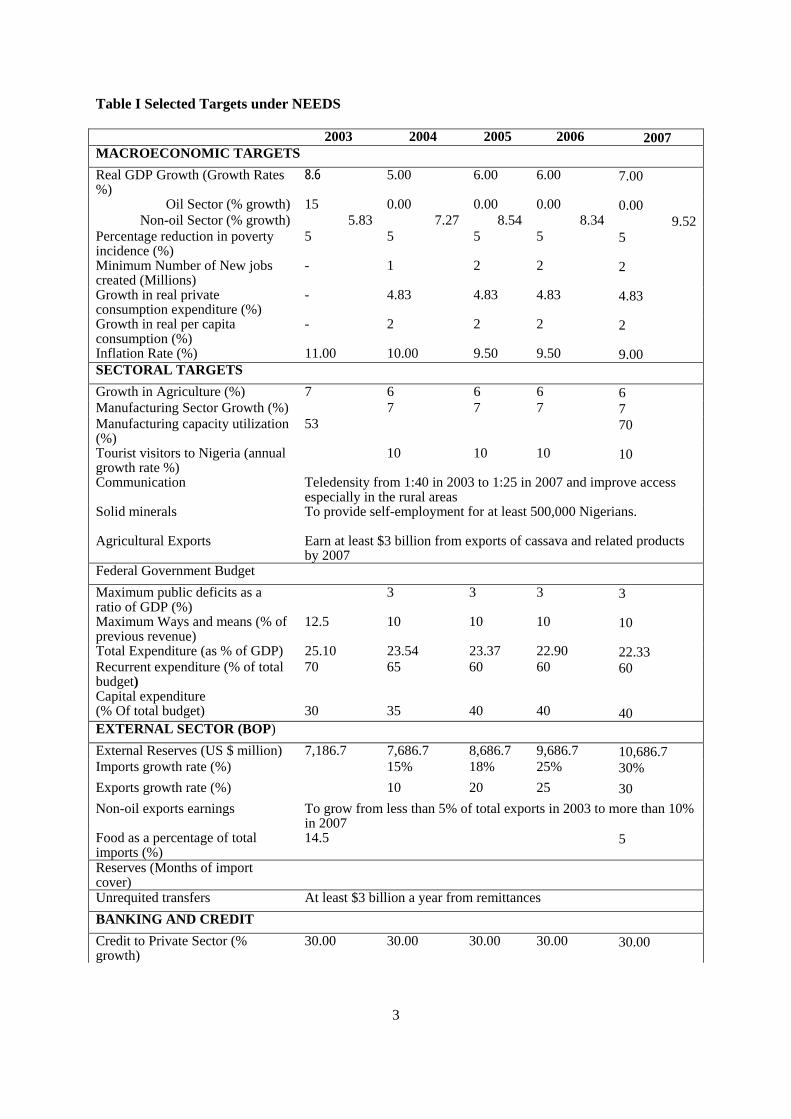
Table I Selected Targets under NEEDS
2003 2004 2005 2006 2007 MACROECONOMIC TARGETS Real GDP Growth (Growth Rates %)
8.6 5.00 6.00 6.00 7.00
Oil Sector (% growth) 15 0.00 0.00 0.00 0.00 Non-oil Sector (% growth) 5.83 7.27 8.54 8.34 9.52
Percentage reduction in poverty incidence (%)
5 5 5 5 5
Minimum Number of New jobs created (Millions)
- 1 2 2 2
Growth in real private consumption expenditure (%)
- 4.83 4.83 4.83 4.83
Growth in real per capita consumption (%)
- 2 2 2 2
Inflation Rate (%) 11.00 10.00 9.50 9.50 9.00 SECTORAL TARGETS Growth in Agriculture (%) 7 6 6 6 6 Manufacturing Sector Growth (%) 7 7 7 7 Manufacturing capacity utilization (%)
53 70
Tourist visitors to Nigeria (annual growth rate %)
10 10 10 10
Communication Teledensity from 1:40 in 2003 to 1:25 in 2007 and improve access especially in the rural areas
Solid minerals Agricultural Exports
To provide self-employment for at least 500,000 Nigerians. Earn at least $3 billion from exports of cassava and related products by 2007
Federal Government Budget Maximum public deficits as a ratio of GDP (%)
3 3 3 3
Maximum Ways and means (% of previous revenue)
12.5 10 10 10 10
Total Expenditure (as % of GDP) 25.10 23.54 23.37 22.90 22.33 Recurrent expenditure (% of total budget)
70 65 60 60 60
Capital expenditure (% Of total budget)
30
35
40
40
40
EXTERNAL SECTOR (BOP) External Reserves (US $ million) 7,186.7 7,686.7 8,686.7 9,686.7 10,686.7 Imports growth rate (%) 15% 18% 25% 30% Exports growth rate (%) 10 20 25 30 Non-oil exports earnings To grow from less than 5% of total exports in 2003 to more than 10%
in 2007 Food as a percentage of total imports (%)
14.5 5
Reserves (Months of import cover)
Unrequited transfers At least $3 billion a year from remittances BANKING AND CREDIT Credit to Private Sector (% growth)
30.00 30.00 30.00 30.00 30.00
4
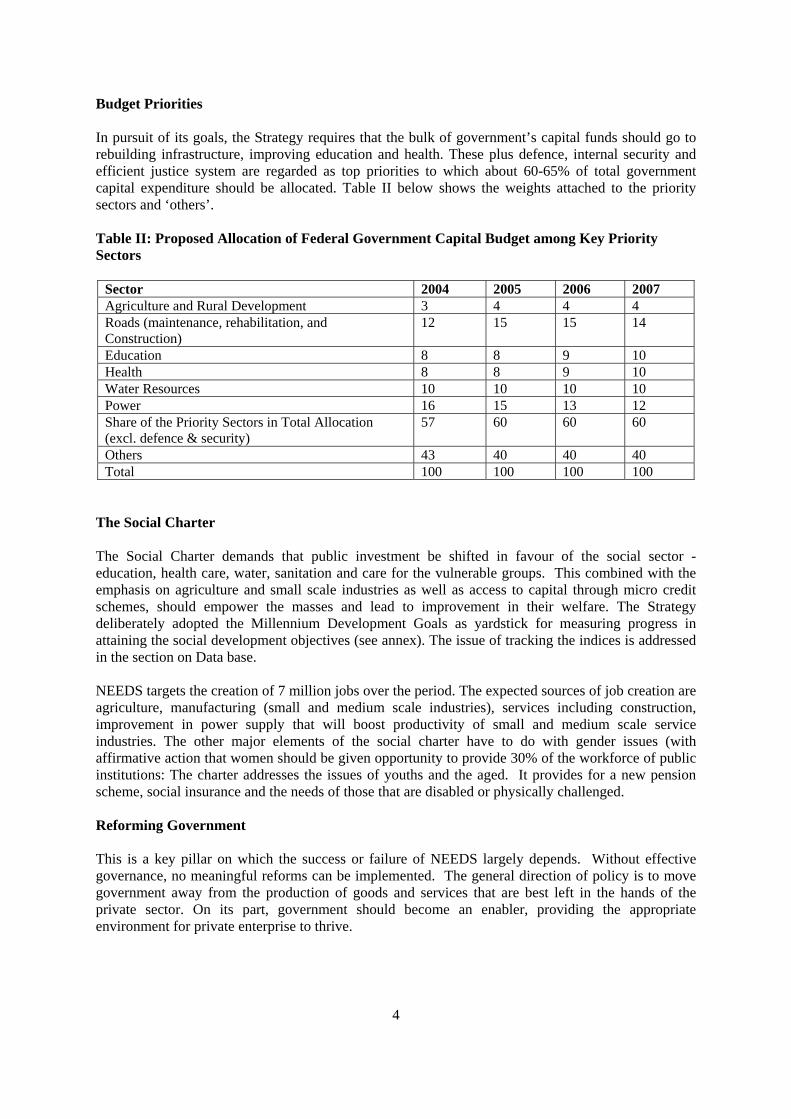
Budget Priorities In pursuit of its goals, the Strategy requires that the bulk of government’s capital funds should go to rebuilding infrastructure, improving education and health. These plus defence, internal security and efficient justice system are regarded as top priorities to which about 60-65% of total government capital expenditure should be allocated. Table II below shows the weights attached to the priority sectors and ‘others’. Table II: Proposed Allocation of Federal Government Capital Budget among Key Priority Sectors
Sector 2004 2005 2006 2007 Agriculture and Rural Development 3 4 4 4 Roads (maintenance, rehabilitation, and Construction)
12 15 15 14
Education 8 8 9 10 Health 8 8 9 10 Water Resources 10 10 10 10 Power 16 15 13 12 Share of the Priority Sectors in Total Allocation (excl. defence & security)
57 60 60 60
Others 43 40 40 40 Total 100 100 100 100
The Social Charter The Social Charter demands that public investment be shifted in favour of the social sector - education, health care, water, sanitation and care for the vulnerable groups. This combined with the emphasis on agriculture and small scale industries as well as access to capital through micro credit schemes, should empower the masses and lead to improvement in their welfare. The Strategy deliberately adopted the Millennium Development Goals as yardstick for measuring progress in attaining the social development objectives (see annex). The issue of tracking the indices is addressed in the section on Data base. NEEDS targets the creation of 7 million jobs over the period. The expected sources of job creation are agriculture, manufacturing (small and medium scale industries), services including construction, improvement in power supply that will boost productivity of small and medium scale service industries. The other major elements of the social charter have to do with gender issues (with affirmative action that women should be given opportunity to provide 30% of the workforce of public institutions: The charter addresses the issues of youths and the aged. It provides for a new pension scheme, social insurance and the needs of those that are disabled or physically challenged. Reforming Government This is a key pillar on which the success or failure of NEEDS largely depends. Without effective governance, no meaningful reforms can be implemented. The general direction of policy is to move government away from the production of goods and services that are best left in the hands of the private sector. On its part, government should become an enabler, providing the appropriate environment for private enterprise to thrive.

5
NEEDS therefore emphasizes:
• Reform of the civil service to make it more effective and result-oriented. • Right sizing the public work force and equipping it with modern gadgets. • Reduction of wastage in governance and enthroning transparency and accountability. • Qualitative service delivery • Gradually replacing “personal governance” with e-governance and less physical contact with
government officials Government has already monetised fringe benefits that were either provided in kind or which were so open ended that expenditures on them were abused. Examples include expenditure on rent (housing), furniture, vehicles etc. The restructuring programme for public institutions has taken off with 5 pilot cases and an agency to coordinate the process has been put in place and established new procurement procedures in an effort to achieve this goal Growing the Private Sector The NEEDS hinges the growth of the economy on private investment. It therefore stresses the evolution of a private sector led, market -oriented economy with competition as a driving force. The strategy provides for reduction of the cost of doing business in Nigeria through
• Improvement in infrastructure • Putting in place investor-friendly tax and general incentives regime • Provision of an enabling environment to generate investor confidence and attract greater flow
of Foreign Direct Investment (FDI) with Nigerians playing key role. • Promotion of greater partnership between government and the private sector • Privatization of public enterprises and eliminating laws that prevent entry into any sector of
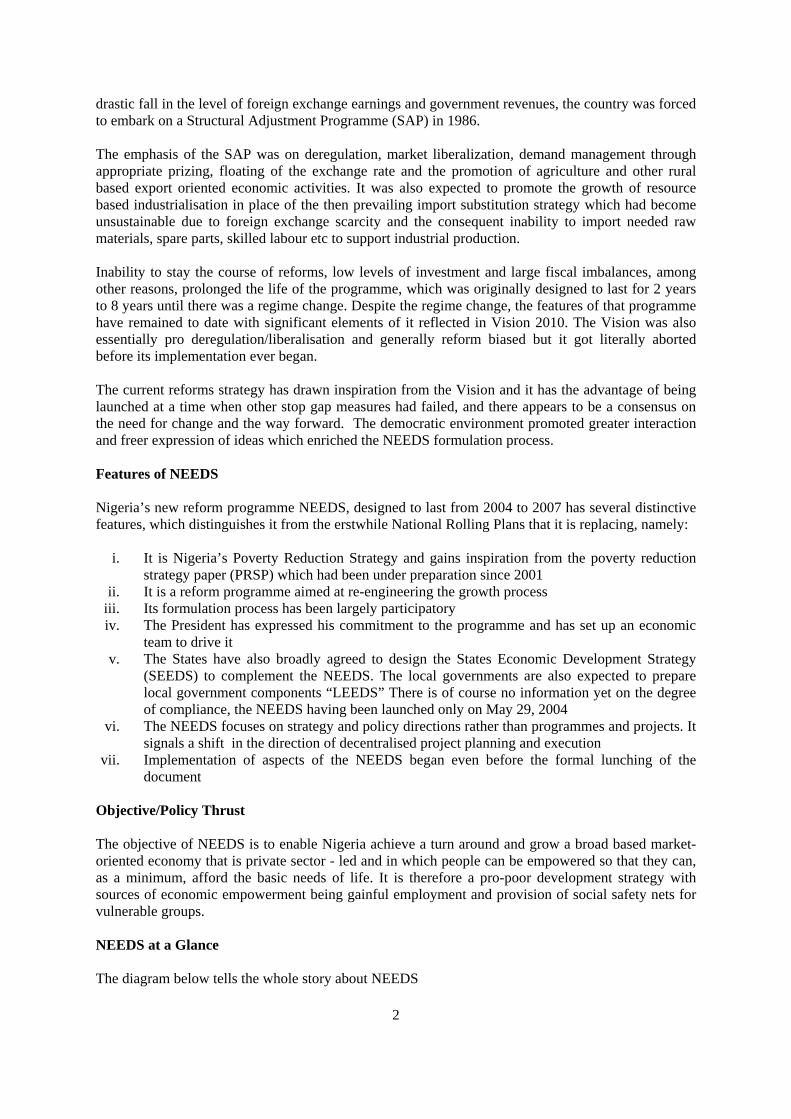
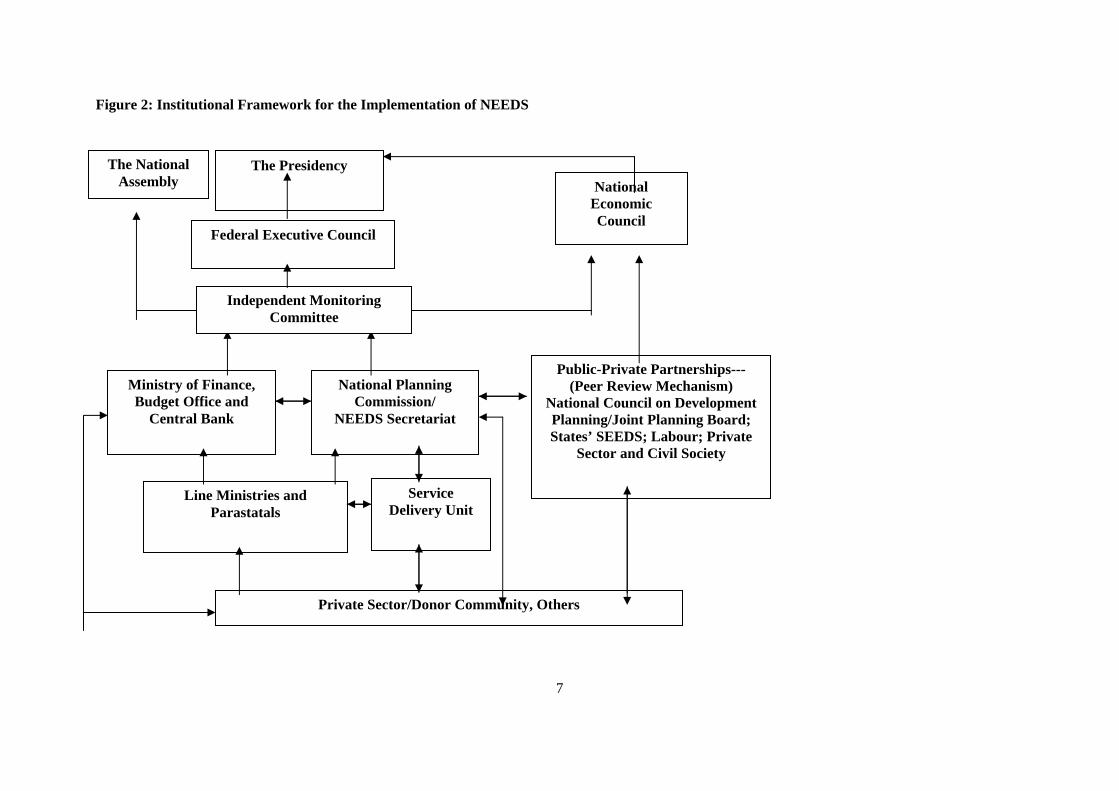
the economy (other than defence) by the private sector. It provides for export led growth in place of the previous import substitution strategy and calls on the government and the private sector to seize the opportunities offered by regional economic groupings and bilateral as well as global trade arrangements to promote its exports. Implementation The figure below highlights the institutional framework for the implementation of the NEEDS. It emphasizes the need for programme coordination, implementation monitoring and evaluation. The responsibility for this rests with the planning authorities and institutions. The President sits at the apex of the implementation ladder. He has put together an economic team to assist him, beside the Council of Ministers. The planning organs saddled with implementation include the National Economic Council chaired by the Vice President with all the state governors as members, the National Council on Development Planning, and the Joint Planning Board. These organs are serviced by the National Planning Commission, which serves as secretariat. A novelty in the arrangement is the establishment of an independent monitoring framework that will involve a broad spectrum of stakeholders. The second innovation is the establishment of a Peer Review Mechanism that will provide an avenue for heads of government of the federation to review progress, problems and learn from the experiences of one another.
6
Financing The NEEDS emphasizes resource enhancement through greater prudence, and efficiency in the use of public funds, reduction/elimination of leakages in the system, greater efficiency in the collection of revenues due to government and increased revenues from the oil sector arising from the implementation of the Extractive Industries Transparency Initiative (EITI) to which government has subscribed in an effort to ensure that it gets all that is due to it from the extractive industries, particularly oil and gas.. However with all the prudence that the Strategy envisages there is still a financing gap currently estimated at 4.5 billion dollars? The existing external debt burden has to be lightened if the goals of NEEDS are to be fully realised. Built into the resource projection is significant debt relief and inflow of foreign direct investment (FDI). The expectation is that if the various elements are effectively implemented, the targeted debt relief package and FDI flows will be realised such that the financing gap will be narrowed, if not eliminated. The current price of oil, of about $35.00 pb, if sustained, could also help bridge the gap. The Socio -economic database The drafters of the Reform strategy had difficult time obtaining relevant and timely data to design appropriate analytical and projection models to provide realistic quantitative benchmarks for the NEEDS. A kind of special task force had to be set up within the Federal Office of Statistics to upgrade the data base and time series. By the time the drafting was completed the Task Force had come up with updated statistics in areas such as the National Accounts (with its various components), population characteristics, producer prices, oil sector basic data, electricity production etc. The office has now published a fact sheet of up-dated data. (See annex II for extracts from the fact sheet). The coverage however remained narrow. The problem of accessing direct information on private sector contribution to capital formation also remains a problem. The inherited approach is to account for public sector investment and treat the private sector as a residual. This is one area where improvement is needed. Agriculture surveys, oil sector data and, to a lesser degree, establishment surveys do provide working data for the real sectors but it is far from what is required to estimate disaggregated savings, investment, consumption, etc. Most of the targets in the NEEDS document are set in quantitative terms. Their achievement must also be tracked in quantitative terms. The essential pro-poor growth indices are largely what is classified as socioeconomic data; they include access to employment, income and consumption per capita, access to basic education, health care, (mortality rates, HIV/AIDS prevalence, general health status, life expectancy etc) water, and accommodation and indeed the structure of the distribution of income between one period and another in order to capture the changes arising from the implementation of reforms.
7
Figure 2: Institutional Framework for the Implementation of NEEDS
The Presidency National
Economic Council
Public-Private Partnerships--- (Peer Review Mechanism)
National Council on Development Planning/Joint Planning Board; States’ SEEDS; Labour; Private
Sector and Civil Society
Ministry of Finance, Budget Office and
Central Bank
National Planning Commission/
NEEDS Secretariat
Line Ministries and Parastatals
Private Sector/Donor Community, Others
Service Delivery Unit
Federal Executive Council
Independent Monitoring Committee
The National Assembly
8
The pursuit of the millennium goals requires that the population size, structure and spatial distribution characteristics etc be accurately captured. Where the capacity for data collection, storage, retrieval and analysis is weak, initiatives must be embarked upon to provide or strengthen the process; otherwise the millennium goals may just be lip service with each country presenting its scorecard in qualitative terms that can not be precisely measured. The Federal Office of Statistics and the Central Bank of Nigeria are the key institution for data collection in the country. The Federal Office has monopoly over non monetary data such as national accounts and its components, imports and exports, inflation indices and other socio economic data. The Central Bank, on the other hand has very firm grip on monetary data. The focus for now should be on measures to increase the capacity of the FOS to meet the needs of NEEDS. There is an ongoing programme to restructure the statistical office, professionalise its manpower, and provide it with better accommodation, equipment and increased funding. In my view, statistical development to meet the MDGs has to be a collaborative effort amongst the public and private sectors as well as the international community. That will provide a better guarantee for the production of qualitative and timely data for research decision-making and the measurement of change over time. A lot of data on the operations of oil companies, external trade flows, capital flight, foreign direct investment, etc can be tracked externally by researchers located in other countries but there has to be a mechanism for data sharing. For the short to medium term reliance would have to be placed on case studies, and sample surveys, apart from administrative statistics. The opportunity provided by the ODI through this meeting is very timely. It should lead to networking and the eventual establishment of a website that will provide country indices on the MDGs, in particular, and economic data generally. Equally important is the need to provide financial and technical assistance to developing countries to which data generation is largely of lesser priority than providing clean water for their masses. The Nigerian Economic Summit Group has also been planning a private sector data bank to complement the economy wide data bank of the public sector. Such a venture will call for collaboration and support from donors, as it is an expensive project. IMPLEMENTATION CHALLENGES Doubts have been raised on the ability of Nigeria to implement its new reform programme, given its track record of not being steadfast in implementing its previous plans and reform programmes. There are worries about policy instability and resistance by interest groups that maybe bent on maintaining the status quo or distorting the reforms to maximise their own benefit at the expense of the rest of society. That is a challenge that the government must address. The President has expressed his unflinching commitment to the reform programme, the legislature, and the state governments must also commit to it, including the larger society. This informed the extensive consultations that were embarked upon in preparing the NEEDS document. But that is not enough to ensure success. There has to be persistent mass mobilisation to achieve greater buy-in. The legislatures at federal and state levels have to be part of the implementation process. The Strategy has identified the various legislative measures that must be put in place in support of the Reforms. Eight other areas of concern can be summarized as follows:
1. The NEEDS is novel in that it deviates from the planning system that was in practice prior to its adoption. What prevailed between 1990 and 1999 was a three – year annual rolling plans that placed heavy emphasis on programmes and projects coordinated by federal and state planning agencies, The Reforms point to a much more decentralized planning framework

9
which will give the line ministries and state governments greater freedom to articulate their policies and programmes within set guidelines and the policy thrust of the strategy. This will pose a major challenge to the existing economic management structure, framework and institutions.
2. The second has to do with the response of the states to the imperatives of NEEDS. The issue is whether the states and local governments have the will and capacity to prepare their SEEDS and LEEDS that are compatible with the thrust of the NEEDS. There will be need for technical assistance for some of them.
3. A third challenge is the data situation. The social charter sets a number of quantitative targets that need to be monitored in assessing achievements over time. For example there is the target of the creation of 7 million jobs, 2% growth in per capita consumption per year, and attaining a proportionate share of the millennium development goals between 2004 and 2007. The benchmark for most of the data are as far back as 1996, while the task force set up to up date the data for NEEDS only succeeded in moving the benchmarks to 1999. That, by our standard was a giant stride, but it is not enough. The challenge is to develop time series that will enable progress or lack of it to be monitored over time.
4. The fourth has to do with the public sector reforms programme. Experience shows that reform of public services worldwide is a herculean task; yet the success of the Strategy rests critically on the public sector reforms. So far, government has expressed its commitment and has indeed embarked on aspects of the reforms and set up structures to sustain it; but it is too early to assess the likely degree of success.
5. Fifth is the issue of growing the private sector, which depends critically on improvement in infrastructure, a more conducive macroeconomic environment, a supportive bureaucracy, and very importantly, the flow of investible funds. Measures are being pursued in these directions. There are chances that the Strategy could achieve greater success than its predecessors.
6. Sixth is the issue of political will and stability. For any plan to be realized, its basic parameters must be stable, especially political/policy stability. The government is hopeful that stability will prevail and that fiscal and monetary policies will be properly harmonized to stimulate investment and growth.
7. Seventh is the challenge of how to achieve “quick wins” to build confidence and sustain the momentum. Reforms are often bitter, early returns are needed as palliatives to encourage people to stay the cause of reforms.
8. Finally is the constitutional and legal hurdle of a democratic federation, which requires elaborate consultation and consensus building for effecting changes in the status quo to occur. With the substantial control of the executive arms of the government at the center, states and local government levels, the federal legislature and the State Assemblies by one dominant political party, the chances of scaling the hurdles may be minimized, but it remains an issue that the federal government must confront as a vital element in the implementation of the Reform Programme
Conclusion: The President and members of his economic team leave no one in doubt about the government’s commitment to the reform programme. The challenge is for the Nigerian people and the international community to respond positively. There is general agreement on the causes of Nigeria’s malaise. The NEEDS with its relative flexibility does provide a platform and an opportunity for Nigeria to move forward. Her Majesty, Queen Elizabeth II reminded Nigerians, at the recent Meeting of the Commonwealth Heads of State and Government (CHOGOM) December 2003, of the proverb ‘…never start a journey if you have no plan to finish it…’ For me NEEDS is a task that has started and should be finished. It calls for teamwork; the country’s development partners should be worthy players in that team,
10
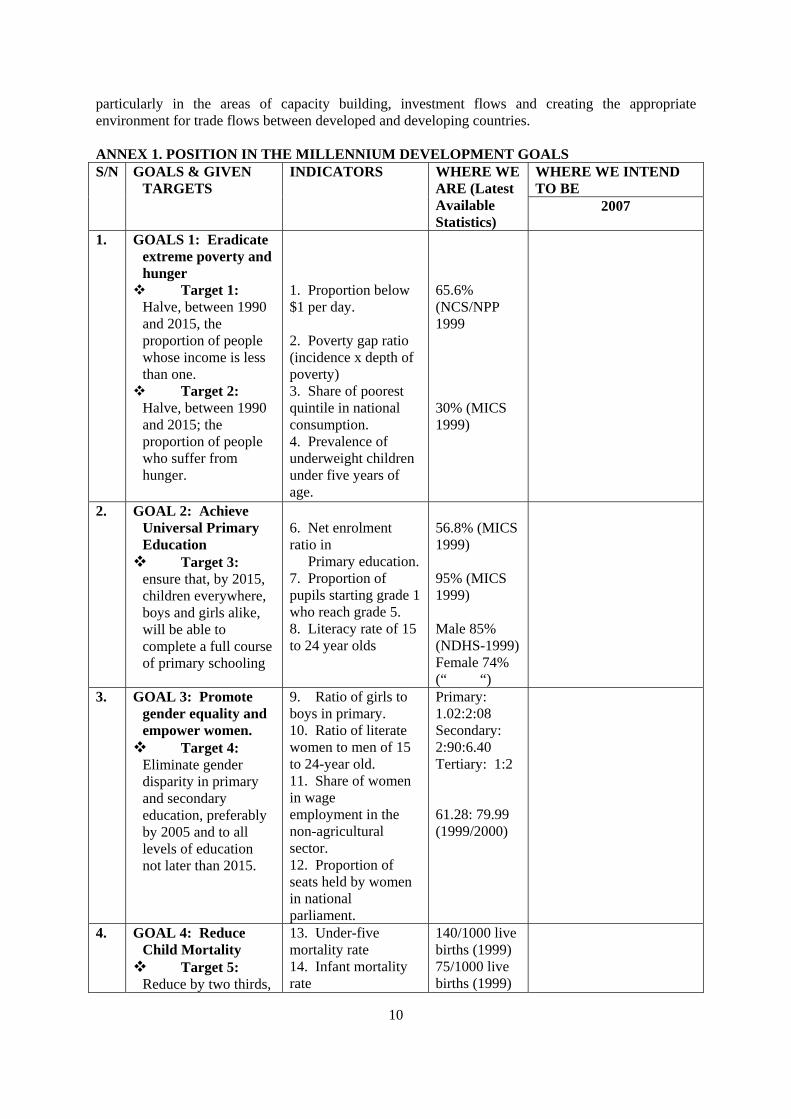
particularly in the areas of capacity building, investment flows and creating the appropriate environment for trade flows between developed and developing countries. ANNEX 1. POSITION IN THE MILLENNIUM DEVELOPMENT GOALS
WHERE WE INTEND TO BE
S/N GOALS & GIVEN TARGETS
INDICATORS WHERE WE ARE (Latest Available Statistics)
2007
1. GOALS 1: Eradicate extreme poverty and hunger Target 1: Halve, between 1990 and 2015, the proportion of people whose income is less than one. Target 2: Halve, between 1990 and 2015; the proportion of people who suffer from hunger.
1. Proportion below $1 per day. 2. Poverty gap ratio (incidence x depth of poverty) 3. Share of poorest quintile in national consumption. 4. Prevalence of underweight children under five years of age.
65.6% (NCS/NPP 1999 30% (MICS 1999)
2. GOAL 2: Achieve Universal Primary Education Target 3:
ensure that, by 2015, children everywhere, boys and girls alike, will be able to complete a full course of primary schooling
6. Net enrolment ratio in Primary education. 7. Proportion of pupils starting grade 1 who reach grade 5. 8. Literacy rate of 15 to 24 year olds
56.8% (MICS 1999) 95% (MICS 1999) Male 85% (NDHS-1999) Female 74% (“ “)
3. GOAL 3: Promote gender equality and empower women. Target 4:
Eliminate gender disparity in primary and secondary education, preferably by 2005 and to all levels of education not later than 2015.
9. Ratio of girls to boys in primary. 10. Ratio of literate women to men of 15 to 24-year old. 11. Share of women in wage employment in the non-agricultural sector. 12. Proportion of seats held by women in national parliament.
Primary: 1.02:2:08 Secondary: 2:90:6.40 Tertiary: 1:2 61.28: 79.99 (1999/2000)
4. GOAL 4: Reduce Child Mortality Target 5:
Reduce by two thirds,
13. Under-five mortality rate 14. Infant mortality rate
140/1000 live births (1999) 75/1000 live births (1999)

11
WHERE WE INTEND TO BE
S/N GOALS & GIVEN TARGETS
INDICATORS WHERE WE ARE (Latest Available Statistics)
2007
between 1990 and 2015, the under-five mortality rate.
15. Proportion of 1-year-old children immunized against measles
10.1% (MICS-1999)
5. GOAL 5: Improve Maternal Health Target 6:
Reduce by three quarters, between 1990 and 2015 the maternal mortality ratio
16. Maternal mortality ratio 17. Proportion of births attended by skilled health personnel.
704/100,000 live birth 42%
6. GOAL 6: Combating HIV/AIDS, Malaria and other disease. Target 7: Have halted by 2015 and begun to reverse the spread Target 8:
Have halted by 2015 and begun to reverse the incidence of malaria and other major diseases.
18. HIV prevalence among 15 to 24-year-old pregnant women. 19. Condom use rate of the contraceptive prevalence rate. 20. Number of children orphaned by HIV/AIDs 21. Prevalence and death rates associated with malaria. 22. Proportion of population in malaria – risk area using effective malaria prevention and treatment measures. 23. Prevalence and death rate associated with malaria. 24. Proportion of tuberculosis cases detected and cured under directly observed treatment short course.
1n 2002 5.8% of population between 15 to 49 years. 6.3% of antenatal care patients aged between 20 and 24 years are infected with HIV Urban Men 11.5% “ Women 2.5% N/A
7. GOAL 7: Ensure Environmental Sustainability Target 9: Integrate the principles of sustainable development into
25. Proportion of land area covered by forest. 26. Ratio of area protected to maintain biological diversity to surface area. 27. Energy use (kg
Forest & Woodland 11.02% Arable + Permanent Pasture 7.62%
12
WHERE WE INTEND TO BE
S/N GOALS & GIVEN TARGETS
INDICATORS WHERE WE ARE (Latest Available Statistics)
2007
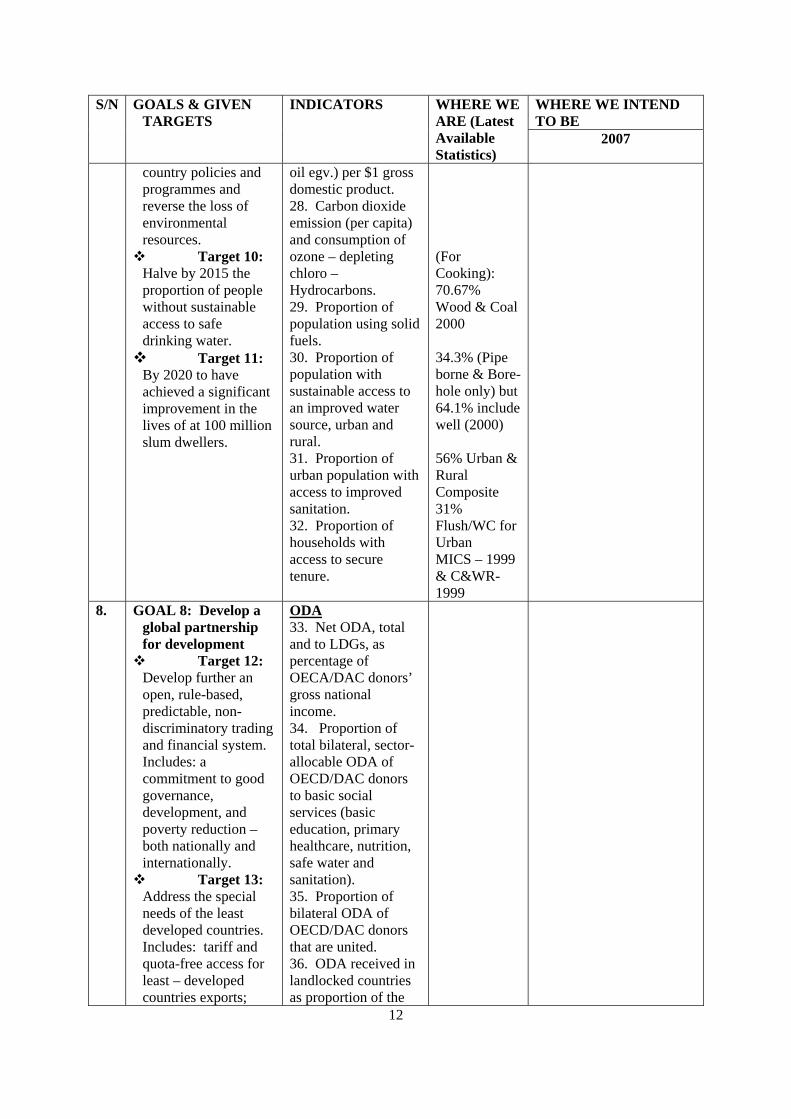
country policies and programmes and reverse the loss of environmental resources. Target 10: Halve by 2015 the proportion of people without sustainable access to safe drinking water. Target 11:
By 2020 to have achieved a significant improvement in the lives of at 100 million slum dwellers.
oil egv.) per $1 gross domestic product. 28. Carbon dioxide emission (per capita) and consumption of ozone – depleting chloro – Hydrocarbons. 29. Proportion of population using solid fuels. 30. Proportion of population with sustainable access to an improved water source, urban and rural. 31. Proportion of urban population with access to improved sanitation. 32. Proportion of households with access to secure tenure.
(For Cooking): 70.67% Wood & Coal 2000 34.3% (Pipe borne & Bore-hole only) but 64.1% include well (2000) 56% Urban & Rural Composite 31% Flush/WC for Urban MICS – 1999 & C&WR-1999
8. GOAL 8: Develop a global partnership for development Target 12: Develop further an open, rule-based, predictable, non-discriminatory trading and financial system. Includes: a commitment to good governance, development, and poverty reduction – both nationally and internationally. Target 13: Address the special needs of the least developed countries. Includes: tariff and quota-free access for least – developed countries exports;
ODA 33. Net ODA, total and to LDGs, as percentage of OECA/DAC donors’ gross national income. 34. Proportion of total bilateral, sector-allocable ODA of OECD/DAC donors to basic social services (basic education, primary healthcare, nutrition, safe water and sanitation). 35. Proportion of bilateral ODA of OECD/DAC donors that are united. 36. ODA received in landlocked countries as proportion of the
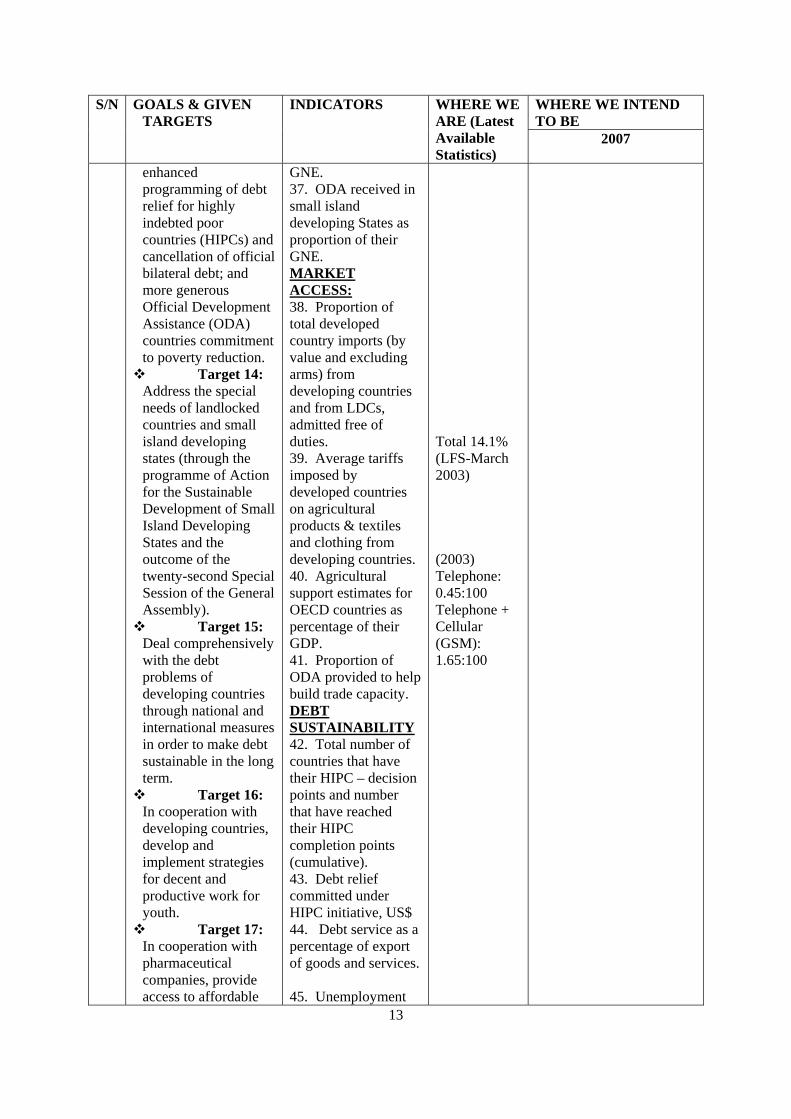
13
WHERE WE INTEND TO BE
S/N GOALS & GIVEN TARGETS
INDICATORS WHERE WE ARE (Latest Available Statistics)
2007
enhanced programming of debt relief for highly indebted poor countries (HIPCs) and cancellation of official bilateral debt; and more generous Official Development Assistance (ODA) countries commitment to poverty reduction. Target 14: Address the special needs of landlocked countries and small island developing states (through the programme of Action for the Sustainable Development of Small Island Developing States and the outcome of the twenty-second Special Session of the General Assembly). Target 15: Deal comprehensively with the debt problems of developing countries through national and international measures in order to make debt sustainable in the long term. Target 16: In cooperation with developing countries, develop and implement strategies for decent and productive work for youth. Target 17: In cooperation with pharmaceutical companies, provide access to affordable
GNE. 37. ODA received in small island developing States as proportion of their GNE. MARKET ACCESS: 38. Proportion of total developed country imports (by value and excluding arms) from developing countries and from LDCs, admitted free of duties. 39. Average tariffs imposed by developed countries on agricultural products & textiles and clothing from developing countries. 40. Agricultural support estimates for OECD countries as percentage of their GDP. 41. Proportion of ODA provided to help build trade capacity. DEBT SUSTAINABILITY 42. Total number of countries that have their HIPC – decision points and number that have reached their HIPC completion points (cumulative). 43. Debt relief committed under HIPC initiative, US$ 44. Debt service as a percentage of export of goods and services. 45. Unemployment
Total 14.1% (LFS-March 2003) (2003) Telephone: 0.45:100 Telephone + Cellular (GSM): 1.65:100

14
WHERE WE INTEND TO BE
S/N GOALS & GIVEN TARGETS
INDICATORS WHERE WE ARE (Latest Available Statistics)
2007
essential drugs in developing countries. Target 18:
In cooperation with the private sector, make available the benefits of new technologies, especially in information and communication.
rate of 15 to 24-years old, each sex and total. 46. Proportion of population with access to affordable essential drugs on a sustainable basis. 47. Telephone lines and cellular subscribers per 100 populations. 48. Personal computers in use per 100 population and Internet users per 100 populations.

15
Annex II: Table 1 Macroeconomic and other indicators
A. MACROECONOMIC AGGREGATES
Real growth rate (%): 1999 2000 2001 2002 2003Real GDP growth rate 0.40 5.40 4.60 3.50 10.23Oil sector growth rate -7.50 11.10 5.20 -5.70 23.90Non-oil sector growth rate 4.40 2.90 4.30 7.96 4.44Agric Sector growth rate 5.29 2.90 3.90 4.30 7.00National disposable income growth rate 0.20 4.30 4.60 3.90 4.40Real gross fixed capital formation growth rate -2.90 17.00 15.20 11.20 3.50 Savings and Investment: Savings (Billion Naira) 89.4
3 78.36 63.15 74.07
87.43
Gross fixed capital formation (Billion Naira) 35.3
3 41.34 47.61 52.93 54.8 Savings - investment gap (Billion Naira)
54.10 37.02 15.54 21.14 32.63
Inflation rate (%): All items 6.60 6.00 18.90 12.90 14.00
All items less farm produce 15.7
0 13.30 6.00 12.50 27.20Food 1.00 -4.20 28.00 13.10 6.00 B. MONETARY INDICATORS:
Monetary indicators (growth rate %): 1999 2000 2001 2002 2003Money supply (M1) 18 62.2 28.1 15.9 29.5Currency (M2) 31.7 48.1 27.0 21.6 24.1Net domestic credit 30.0 -25.3 79.9 64.6 32.7External reserves (US$) 48 81.8 5.1 -26.3 -2.8Interest rate (%):
Minimum rediscount rate 20.7
0 14.00 20.50 16.50 15.00
Time deposited (over 12 month) 15.3
0 11.20 16.40 12.60 12.30
Lending rate (Prime) 22.5
0 21.30 26.00 20.60 19.60Nominal exchange rate Naira/US Dollar:
IFEM/DAS 96.1
0 101.70 111.70 120.50 129.30
Bureau de change 92.2
0 111.10 132.60 136.80 141.40 C. INDUSTRIAL SECTOR: Oil sector (Indicators) 1999 2000 2001 2002 2003
Contribution to GDP (%) 30.8
0 32.80 32.70 30.60 33.70Crude oil production (growth rate %) -3.90 6.90 3.80 -15.60 23.90
Gas production (growth rate %) 17.8
0 -2.10 22.70 -8.10 10.50
16
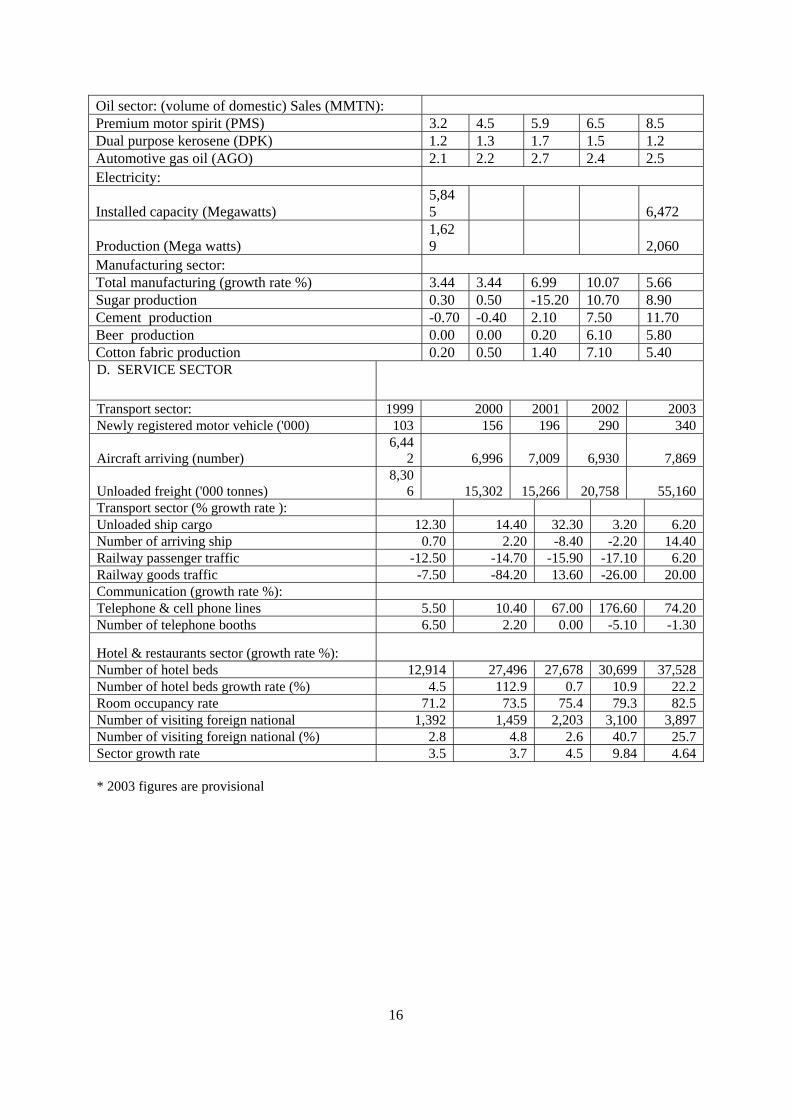
Oil sector: (volume of domestic) Sales (MMTN): Premium motor spirit (PMS) 3.2 4.5 5.9 6.5 8.5 Dual purpose kerosene (DPK) 1.2 1.3 1.7 1.5 1.2 Automotive gas oil (AGO) 2.1 2.2 2.7 2.4 2.5 Electricity:
Installed capacity (Megawatts) 5,845 6,472
Production (Mega watts) 1,629 2,060
Manufacturing sector: Total manufacturing (growth rate %) 3.44 3.44 6.99 10.07 5.66 Sugar production 0.30 0.50 -15.20 10.70 8.90 Cement production -0.70 -0.40 2.10 7.50 11.70 Beer production 0.00 0.00 0.20 6.10 5.80 Cotton fabric production 0.20 0.50 1.40 7.10 5.40 D. SERVICE SECTOR
Transport sector: 1999 2000 2001 2002 2003Newly registered motor vehicle ('000) 103 156 196 290 340
Aircraft arriving (number) 6,44
2 6,996 7,009 6,930 7,869
Unloaded freight ('000 tonnes) 8,30
6 15,302 15,266 20,758 55,160Transport sector (% growth rate ): Unloaded ship cargo 12.30 14.40 32.30 3.20 6.20Number of arriving ship 0.70 2.20 -8.40 -2.20 14.40Railway passenger traffic -12.50 -14.70 -15.90 -17.10 6.20Railway goods traffic -7.50 -84.20 13.60 -26.00 20.00Communication (growth rate %): Telephone & cell phone lines 5.50 10.40 67.00 176.60 74.20Number of telephone booths 6.50 2.20 0.00 -5.10 -1.30
Hotel & restaurants sector (growth rate %): Number of hotel beds 12,914 27,496 27,678 30,699 37,528Number of hotel beds growth rate (%) 4.5 112.9 0.7 10.9 22.2Room occupancy rate 71.2 73.5 75.4 79.3 82.5Number of visiting foreign national 1,392 1,459 2,203 3,100 3,897Number of visiting foreign national (%) 2.8 4.8 2.6 40.7 25.7Sector growth rate 3.5 3.7 4.5 9.84 4.64 * 2003 figures are provisional
17
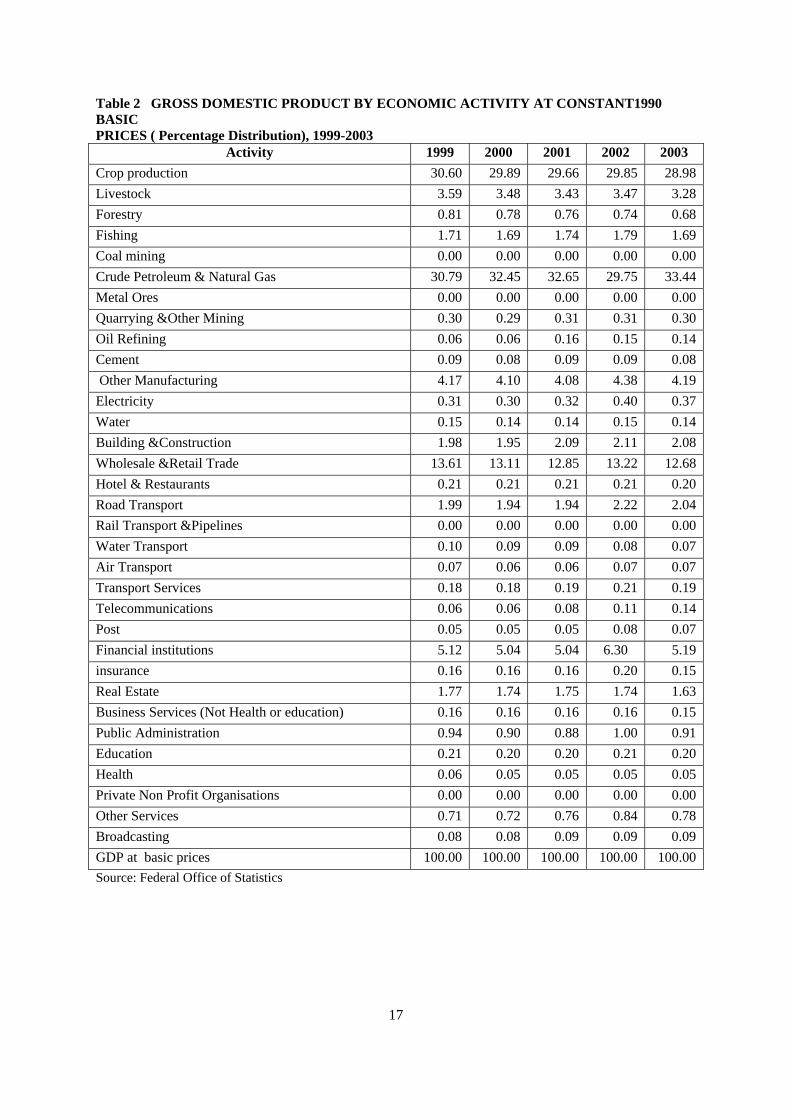
Table 2 GROSS DOMESTIC PRODUCT BY ECONOMIC ACTIVITY AT CONSTANT1990 BASIC PRICES ( Percentage Distribution), 1999-2003
Activity 1999 2000 2001 2002 2003 Crop production 30.60 29.89 29.66 29.85 28.98Livestock 3.59 3.48 3.43 3.47 3.28Forestry 0.81 0.78 0.76 0.74 0.68Fishing 1.71 1.69 1.74 1.79 1.69Coal mining 0.00 0.00 0.00 0.00 0.00Crude Petroleum & Natural Gas 30.79 32.45 32.65 29.75 33.44Metal Ores 0.00 0.00 0.00 0.00 0.00Quarrying &Other Mining 0.30 0.29 0.31 0.31 0.30Oil Refining 0.06 0.06 0.16 0.15 0.14Cement 0.09 0.08 0.09 0.09 0.08 Other Manufacturing 4.17 4.10 4.08 4.38 4.19Electricity 0.31 0.30 0.32 0.40 0.37Water 0.15 0.14 0.14 0.15 0.14Building &Construction 1.98 1.95 2.09 2.11 2.08Wholesale &Retail Trade 13.61 13.11 12.85 13.22 12.68Hotel & Restaurants 0.21 0.21 0.21 0.21 0.20Road Transport 1.99 1.94 1.94 2.22 2.04Rail Transport &Pipelines 0.00 0.00 0.00 0.00 0.00Water Transport 0.10 0.09 0.09 0.08 0.07Air Transport 0.07 0.06 0.06 0.07 0.07Transport Services 0.18 0.18 0.19 0.21 0.19Telecommunications 0.06 0.06 0.08 0.11 0.14Post 0.05 0.05 0.05 0.08 0.07Financial institutions 5.12 5.04 5.04 6.30 5.19insurance 0.16 0.16 0.16 0.20 0.15Real Estate 1.77 1.74 1.75 1.74 1.63Business Services (Not Health or education) 0.16 0.16 0.16 0.16 0.15Public Administration 0.94 0.90 0.88 1.00 0.91Education 0.21 0.20 0.20 0.21 0.20Health 0.06 0.05 0.05 0.05 0.05Private Non Profit Organisations 0.00 0.00 0.00 0.00 0.00Other Services 0.71 0.72 0.76 0.84 0.78Broadcasting 0.08 0.08 0.09 0.09 0.09GDP at basic prices 100.00 100.00 100.00 100.00 100.00Source: Federal Office of Statistics
18
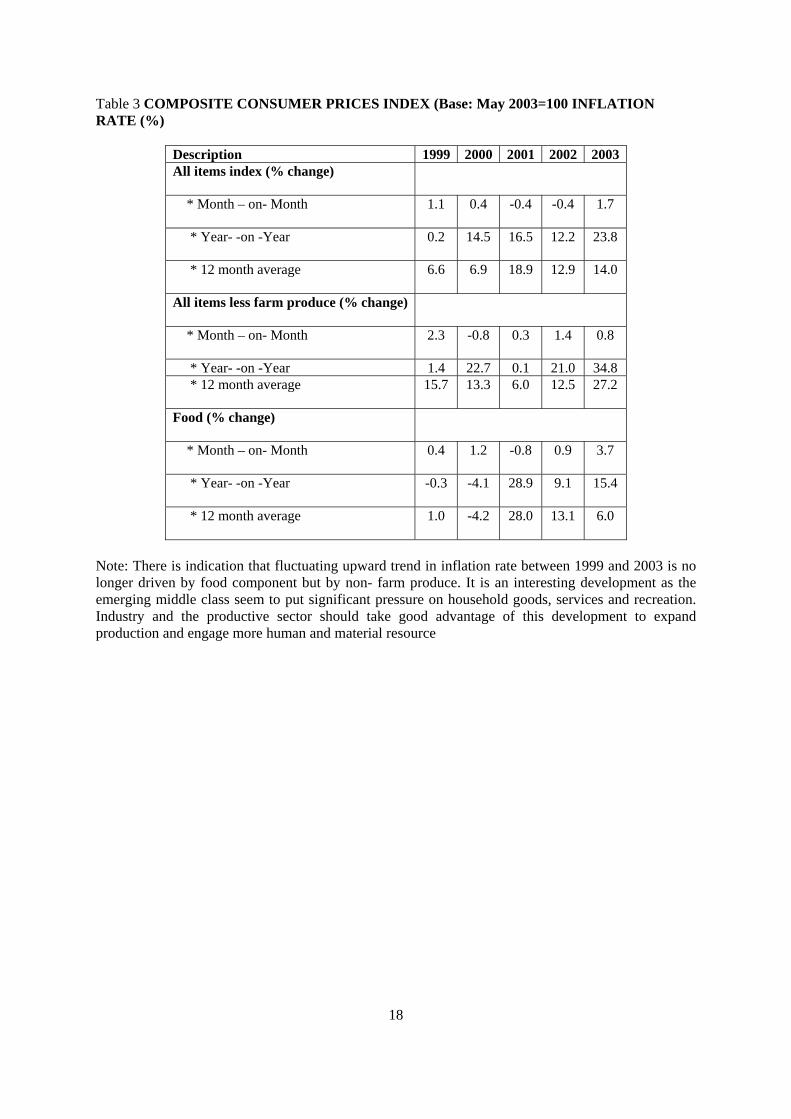
Table 3 COMPOSITE CONSUMER PRICES INDEX (Base: May 2003=100 INFLATION RATE (%)
Description 1999 2000 2001 2002 2003 All items index (% change)
* Month – on- Month
1.1 0.4 -0.4 -0.4 1.7
* Year- -on -Year
0.2 14.5 16.5 12.2 23.8
* 12 month average
6.6 6.9 18.9 12.9 14.0
All items less farm produce (% change)
* Month – on- Month
2.3 -0.8 0.3 1.4 0.8
* Year- -on -Year 1.4 22.7 0.1 21.0 34.8 * 12 month average 15.7
13.3 6.0 12.5 27.2
Food (% change)
* Month – on- Month 0.4
1.2 -0.8 0.9 3.7
* Year- -on -Year -0.3
-4.1 28.9 9.1 15.4
* 12 month average 1.0
-4.2 28.0 13.1 6.0
Note: There is indication that fluctuating upward trend in inflation rate between 1999 and 2003 is no longer driven by food component but by non- farm produce. It is an interesting development as the emerging middle class seem to put significant pressure on household goods, services and recreation. Industry and the productive sector should take good advantage of this development to expand production and engage more human and material resource
19
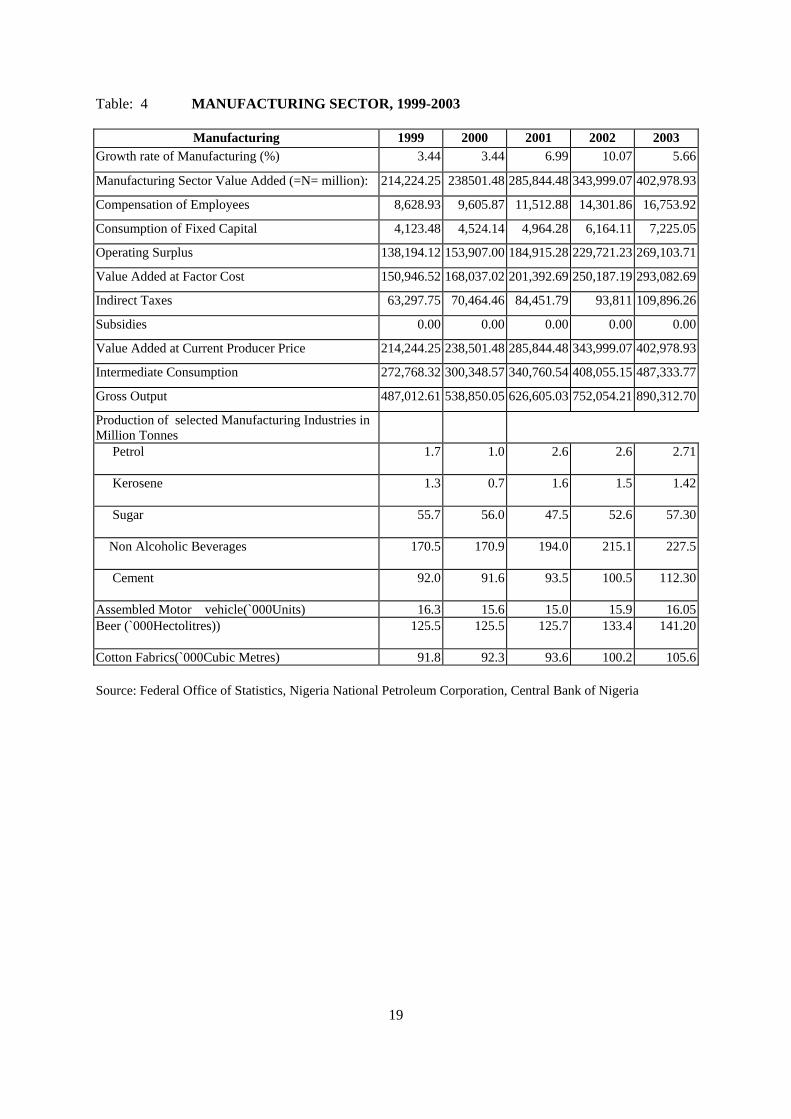
Table: 4 MANUFACTURING SECTOR, 1999-2003
Manufacturing 1999 2000 2001 2002 2003 Growth rate of Manufacturing (%) 3.44 3.44 6.99 10.07 5.66
Manufacturing Sector Value Added (=N= million): 214,224.25 238501.48 285,844.48 343,999.07 402,978.93
Compensation of Employees 8,628.93 9,605.87 11,512.88 14,301.86 16,753.92
Consumption of Fixed Capital 4,123.48 4,524.14 4,964.28 6,164.11 7,225.05
Operating Surplus 138,194.12 153,907.00 184,915.28 229,721.23 269,103.71
Value Added at Factor Cost 150,946.52 168,037.02 201,392.69 250,187.19 293,082.69
Indirect Taxes 63,297.75 70,464.46 84,451.79 93,811 109,896.26
Subsidies 0.00 0.00 0.00 0.00 0.00
Value Added at Current Producer Price 214,244.25 238,501.48 285,844.48 343,999.07 402,978.93
Intermediate Consumption 272,768.32 300,348.57 340,760.54 408,055.15 487,333.77
Gross Output 487,012.61 538,850.05 626,605.03 752,054.21 890,312.70
Production of selected Manufacturing Industries in Million Tonnes
Petrol 1.7 1.0 2.6 2.6 2.71
Kerosene 1.3 0.7 1.6 1.5 1.42
Sugar 55.7 56.0 47.5 52.6 57.30
Non Alcoholic Beverages 170.5 170.9 194.0 215.1 227.5
Cement 92.0 91.6 93.5 100.5 112.30
Assembled Motor vehicle(`000Units) 16.3 15.6 15.0 15.9 16.05Beer (`000Hectolitres)) 125.5 125.5 125.7 133.4 141.20
Cotton Fabrics(`000Cubic Metres) 91.8 92.3 93.6 100.2 105.6 Source: Federal Office of Statistics, Nigeria National Petroleum Corporation, Central Bank of Nigeria
20
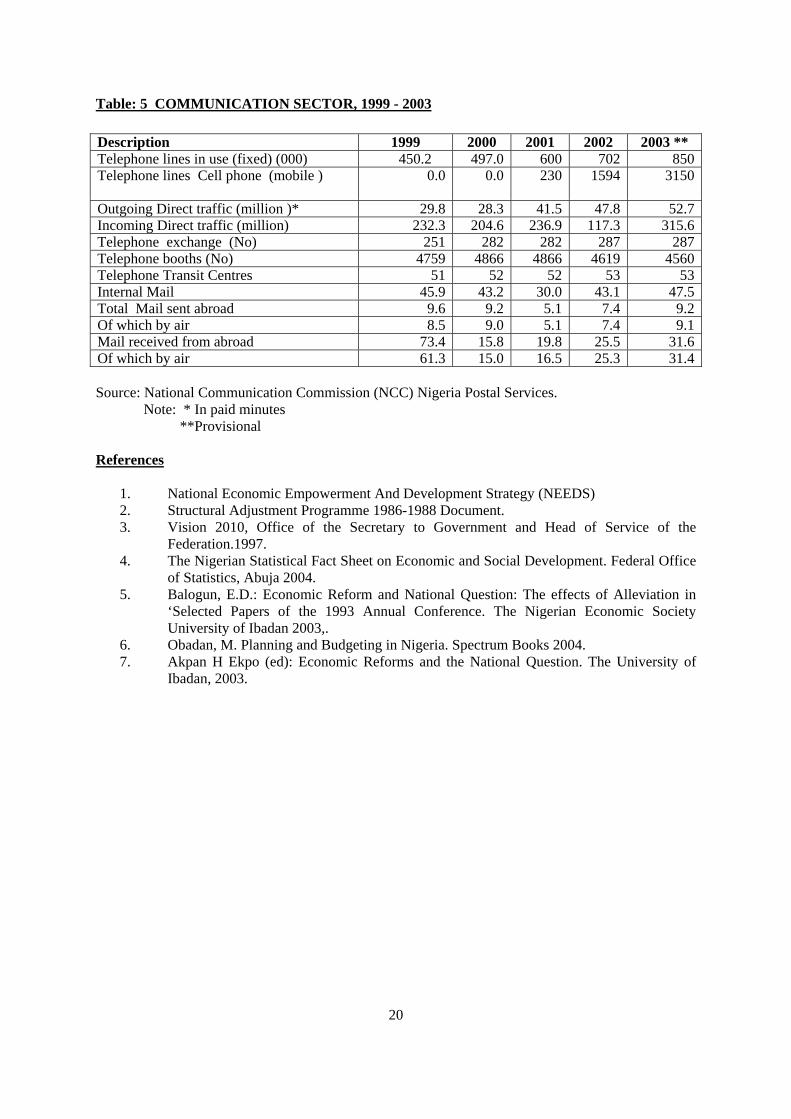
Table: 5 COMMUNICATION SECTOR, 1999 - 2003
Source: National Communication Commission (NCC) Nigeria Postal Services. Note: * In paid minutes **Provisional References
1. National Economic Empowerment And Development Strategy (NEEDS) 2. Structural Adjustment Programme 1986-1988 Document. 3. Vision 2010, Office of the Secretary to Government and Head of Service of the
Federation.1997. 4. The Nigerian Statistical Fact Sheet on Economic and Social Development. Federal Office
of Statistics, Abuja 2004. 5. Balogun, E.D.: Economic Reform and National Question: The effects of Alleviation in
‘Selected Papers of the 1993 Annual Conference. The Nigerian Economic Society University of Ibadan 2003,.
6. Obadan, M. Planning and Budgeting in Nigeria. Spectrum Books 2004. 7. Akpan H Ekpo (ed): Economic Reforms and the National Question. The University of
Ibadan, 2003.
Description 1999 2000 2001 2002 2003 **Telephone lines in use (fixed) (000) 450.2 497.0 600 702 850Telephone lines Cell phone (mobile ) 0.0 0.0 230 1594 3150
Outgoing Direct traffic (million )* 29.8 28.3 41.5 47.8 52.7Incoming Direct traffic (million) 232.3 204.6 236.9 117.3 315.6Telephone exchange (No) 251 282 282 287 287Telephone booths (No) 4759 4866 4866 4619 4560Telephone Transit Centres 51 52 52 53 53Internal Mail 45.9 43.2 30.0 43.1 47.5Total Mail sent abroad 9.6 9.2 5.1 7.4 9.2Of which by air 8.5 9.0 5.1 7.4 9.1Mail received from abroad 73.4 15.8 19.8 25.5 31.6Of which by air 61.3 15.0 16.5 25.3 31.4
Related Documents


![Self-Help as a Strategy for Rural Development in Nigeria ...1].pdf · Self -Help as a Strategy for Rural Development in Nigeria: A Bottom Up Approach 90 hunger, malnutrition, poor](https://static.cupdf.com/doc/110x72/5b546bc57f8b9a0d398d0295/self-help-as-a-strategy-for-rural-development-in-nigeria-1pdf-self-help.jpg)

