Free download from www.hsrcpress.ac.za

Welcome message from author
This document is posted to help you gain knowledge. Please leave a comment to let me know what you think about it! Share it to your friends and learn new things together.
Transcript
Free
dow
nloa
d fr
om w
ww
.hsr
cpre
ss.a
c.za
Published by HSRC PressPrivate Bag X9182, Cape Town, 8000, South Africawww.hsrcpress.ac.za
© 2006 Human Sciences Research Council
First published 2006
All rights reserved. No part of this book may be reprinted or reproducedor utilised in any form or by any electronic, mechanical, or other means,including photocopying and recording, or in any information storage orretrieval system, without permission in writing from the publishers.
ISBN 0-7969-2123-7
Copyedited by Laurie Rose-InnesDesign and typesetting by Christabel HardacreCover by Elize Schultz, cover artwork by Ros StockhallPrint management by comPress
Distributed in Africa by Blue Weaver Marketing and DistributionPO Box 30370, Tokai, Cape Town, 7966, South AfricaTel: +27 +21 701-4477Fax: +27 +21 701-7302email: [email protected]
Distributed worldwide, except Africa, by Independent Publishers Group814 North Franklin Street, Chicago, IL 60610, USAwww.ipgbook.com To order, call toll-free: 1-800-888-4741All other inquiries, Tel: +1 +312-337-0747 Fax: +1 +312-337-5985email: [email protected]
Free
dow
nloa
d fr
om w
ww
.hsr
cpre
ss.a
c.za
Contents
List of tables and figures vi
Abbreviations and acronyms x
1 Development discourses in post-apartheid South Africa 1Vishnu Padayachee
Section 1 Contemporary debates in a global context
2 Post-apartheid developments in historical and comparative perspective 13Gillian Hart
3 Development theories, knowledge production and emancipatory practice 33 Dani Wadada Nabudere
Section 2 Macroeconomic balance and microeconomic reform
4 Reflections on South Africa’s first wave of economic reforms 55Rashad Cassim
5 Macroeconomic reforms and employment: what possibilities for South Africa? 86 Jonathan Michie
6 Operationalising South Africa’s move from macroeconomic stability tomicroeconomic reform 108Kuben Naidoo
7 Sequencing micro and macro reforms: reflections on the South Africanexperience 126Michael Carter
Section 3 Distributive issues in post-apartheid South Africa
8 Constructing the social policy agenda: conceptual debates around poverty and inequality 143Julian May
9 Gender and social security in South Africa 160Francie Lund
Free
dow
nloa
d fr
om w
ww
.hsr
cpre
ss.a
c.za
Section 4 Industrial upgrading and innovation
10 The noledge of numbers: S&T, R&D and innovation indicators in South Africa 183Jo Lorentzen
11 The role of government in fostering clusters: the South African automotive sector 201Mike Morris, Glen Robbins and Justin Barnes
Section 5 Municipal governance and development
12 Local economic development in post-apartheid South Africa:a ten-year research review 227Christian M Rogerson
13 Local economic development: utopia and reality – the example ofDurban, KwaZulu-Natal 254Benoît Lootvoet and Bill Freund
Section 6 Labour, work and the informal economy
14 Labour supply and demand constraints on employment creation:a microeconomic analysis 275Haroon Bhorat
15 Definitions, data and the informal economy in South Africa:a critical analysis 302 Richard Devey, Caroline Skinner and Imraan Valodia
Section 7 Population, health and development
16 Coping with illnesses and deaths in post-apartheid South Africa:family perspectives 327Akim Mturi, Thokozani Xaba, Dorothy Sekokotla and Nompumelelo Nzimande
17 Are condoms infiltrating marital and cohabiting partnerships? Perspectives of couples in KwaZulu-Natal, South Africa 349Pranitha Maharaj and John Cleland
18 Framing the South African AIDS epidemic: a social science perspective 361Eleanor Preston-Whyte
19 Economic and development issues around HIV/AIDS 381Alan Whiteside and Sabrina Lee
iv
Free
dow
nloa
d fr
om w
ww
.hsr
cpre
ss.a
c.za
Section 8 Social movements and democratic transition
20 Social movements in South Africa: promoting crisis or creating stability? 397Richard Ballard, Adam Habib and Imraan Valodia
21 Democracy and social movements in South Africa 413Dale McKinley
22 Post-apartheid livelihood struggles in Wentworth, South Durban 427Sharad Chari
23 Rural development in South Africa: tensions between democracy andtraditional authority 444Lungisile Ntsebeza
List of contributors 461
Index 464
v
Free
dow
nloa
d fr
om w
ww
.hsr
cpre
ss.a
c.za
List of tables and figures
Tables
Table 4.1 Average annual percentage growth in value added, 1991–2003 (1995 constant prices) 58
Table 4.2 Gross fixed capital formation as a proportion of gross domestic fixedinvestment, R million (1995 constant prices) 59
Table 4.3 Average annual growth rate of exports and imports (1996 constant prices) 61
Table 4.4 Average annual growth in export/output and import penetration ratios,1991–2003 (1995 constant prices) 61
Table 4.5 Tariff phase-down under the WTO 64
Table 4.6 South Africa’s most favoured nation (MFN) tariff schedule, 2003 (R billion current prices) 65
Table 4.7 South Africa’s MFN, EU and SADC tariff schedules, 2003 (R billion current prices) 65
Table 4.8 Weighted average effective rates of protection for non-service sectors inthe South African economy by percentage, 1996, 2000 and 2003 66
Table 4.9 Percentage change in value added, 1992–2003 67
Table 4.10 Average annual growth in capital stock, 1992–2003 (1995 constant prices) 68
Table 4.11 Average annual growth in capital stock, 1992–2003 (1995 constant prices) 69
Table 4.12 Relative contribution of capital, labour and TFP to growth, South Africa,Ireland and China 76
Table 4.13 Relative contribution of capital, labour and TFP to growth,East Asia, 1960–1994 76
Table 6.1 The unwinding of economic growth (annual average GDP growth) 111
Table 6.2 Selected fiscal indicators, National Accounts data 113
Table 6.3 Selected economic data (annual average growth rates unless otherwiseindicated) 114
Table 9.1 Incidence and value of the main social assistance grants,February 2003 162
vi
Free
dow
nloa
d fr
om w
ww
.hsr
cpre
ss.a
c.za
Table 9.2 Parental status of children younger than seven years of age (percentages),Umkhanyakude study 167
Table 10.1 Data used in the Polt et al. (2001) study on ISRs 189
Table 10.2 Available research on national innovation systems in select latecomercountries 192
Table 10.3 Indicators of South Africa’s knowledge infrastructure and performance,1999–2001 194
Table 11.1 Learning and operational performance change of firms in clusters 210
Table 14.1 A snapshot of key labour market trends, 1995–2002 276
Table 14.2 Share of employment by main sector and three skills categories 279
Table 14.3 Distribution of the unemployed across households, by household expenditure category 281
Table 14.4 Individual and household characteristics of the unemployed by household expenditure category 284
Table 14.5 Public and private service access amongst unemployed households 286
Table 14.6 Determinants of the household unemployment rate 288
Table 14.7 The impact of Bargaining Council agreements on employment (percentage shares) 292
Table 14.8 The impact of the LRA and BCEA on employment levels,by proportion of firms 293
Table 14.9 Reported responses to impact of labour regulations, by category 294
Table 14.10 Most significant responses to labour regulations 295
Table 14.11 An estimation of retrenchment costs, by occupation 296
Table 14.12 Impact of labour regulations on employment expansion and production costs 298
Table 15.1 Formal and informal economy labour market trends, 1997–2004 304
Table 15.2 Registration of business, by employment category 306
Table 15.3 Employment in wholesale and retail stores and in street vending,changes over time 308
Table 15.4 Enterprise-based versus employment-based definition 312
Table 15.5 Enterprise and worker characteristics, by type of worker 313
Table 15.6 Work arrangement of formal and informal workers 314
Table 15.7 Characteristics of employees, by employment category 315
vii
Free
dow
nloa
d fr
om w
ww
.hsr
cpre
ss.a
c.za
Table 15.8 Formal–informal index for formal and informal workers 316
Table 15.9 Comparison of selected indicators for ‘formal-like’ informal workers and all informal workers 317
Table 16.1 Distribution of discussions and interviews 332
Table 16.2 Distribution of families visited, by family head 333
Table 16.3 Types of injury adult respondents reported 334
Table 16.4 Amount paid by adult-headed families towards burial cover (R per month) 340
Table 16.5 Amount paid by elderly-headed families towards burial cover (R per month) 341
Table 16.6 How much adult-headed families pay for burial ceremonies (R) 345
Table 17.1 Profiles of condom use and related attitudinal factors 353
Table 17.2 The odds ratios of reported condom use by wives, results from logisticregression 355
Table 19.1 HIV prevalence by province among antenatal clinic attendees, SouthAfrica, 1994–2003 382
Table 19.2 Number of estimated HIV-infected women, men and children, SouthAfrica, 2002/03 383
Table 19.3 Human Development Index and life expectancy data, 1998 and 2002 386
Table 19.4 Macroeconomic studies in South Africa, 2000/01 388
Figures
Figure 2.1 A periodisation of ‘big D’ and ‘little d’ development, 1940s–2000s 16
Figure 4.1 Export/import to GDP ratios 59
Figure 4.2 Nominal and real effective exchange rates, 1994–2003 (1995=100) 60
Figure 6.1 Percentage growth in gross fixed capital formation 119
Figure 6.2 Unemployment rates by age and qualification 121
Figure 6.3 Unemployment rates by age, 1995 and 2002 123
Figure 7.1 Hypothetical asset dynamics 129
Figure 7.2 Estimated livelihood growth 132
Figure 11.1 An industrial policy and cluster strategy levers framework 220
T H E D E V E L O P M E N T D E C A D E ? S O U T H A F R I C A , 1 9 9 4 – 2 0 0 4
viii
Free
dow
nloa
d fr
om w
ww
.hsr
cpre
ss.a
c.za
Figure 14.1 Estimated mean employment and unemployment rates by householdexpenditure category 282
Figure 14.2 Unemployed households with employed or union members resident,by household expenditure category 285
Figure 15.1 Total employment in South Africa, 1997–2004 303
Figure 15.2 Informal employment in South Africa, 1997–2004 305
Figure 15.3 Informal employment in South Africa, excluding February 2001 LFS 308
Figure 16.1 Types of illness respondents suffer from 333
Figure 16.2 Where adults go for treatment 335
Figure 16.3 Where the elderly go for treatment 335
Figure 16.4 Reasons for the elderly not seeking treatment 336
Figure 16.5 Reasons for adults not seeking treatment 337
Figure 16.6 Adult-headed families with burial society cover 339
Figure 16.7 Elderly-headed families with burial society cover 339
Figure 16.8 Affordability of burial society contributions, adult-headed families 342
Figure 16.9 Affordability of burial society contributions, elderly-headed families 342
Figure 16.10 Where adult-headed families get assistance with funerals 343
Figure 16.11 Where elderly-headed families get assistance with funerals 343
Figure 16.12 Reasons why adult-headed families delay burying their dead 344
Figure 18.1 Structural vulnerabilities associated with the global spread of HIV/AIDS 367
Figure 18.2 Global and local levels of analysis 373
Figure 18.3 Pressure on established patterns of interaction at the local level 374
Figure 19.1 Antenatal HIV sero-prevalence trend in South Africa, 1990–2003 382
Figure 19.2 HIV prevalence trends by age group among antenatal clinic attendees,South Africa, 1994–2003 383
Figure 19.3 Epidemic curves, HIV, AIDS and impact 385
Figure 19.4 Relative mortality rates for females 1994–2000 compared to 1985 386
ix
Free
dow
nloa
d fr
om w
ww
.hsr
cpre
ss.a
c.za
Abbreviations and acronyms
ANC African National Congress
ANC antenatal clinic
ARV antiretroviral
BAG Basic Asset Grant
BCEA Basic Conditions of Employment Act
BDS business development services
BEE black economic empowerment
BIG Basic Income Grant
BSR business–science relationship
CBO community-based organisation
CCF Concerned Citizens Forum
CDL chronic diseases of lifestyle
CEIWU Chemical, Engineering and Industrial Workers’ Union
Contralesa Congress of Traditional Leaders of South Africa
Cosatu Congress of South African Trade Unions
CSG Child Support Grant
CSO civil society organisations
DA Democratic Alliance
DAC Durban Auto Cluster
DG Disability Grant
DPLG Department of Provincial and Local Government
DTI Department of Trade and Industry
EAP economically active population
EPWP Extended Public Works Programme
EU European Union
FDI foreign direct investment
FET further education and training
FGD focus-group discussions
Fosatu Federation of South African Trade Unions
GDS Growth and Development Summit
GEAR Growth, Employment and Redistribution
GJA Greater Johannesburg Area
x
Free
dow
nloa
d fr
om w
ww
.hsr
cpre
ss.a
c.za
HIPC highly indebted poor countries
IBRD International Bank for Reconstruction and Development
ICLS International Conference for Labour Statistics
IDI individual in-depth interviews
IDP integrated development plan
IFP Inkatha Freedom Party
ILO International Labour Organisation
IMF International Monetary Fund
ISRDS Integrated Sustainable Rural Development Strategy
KZN KwaZulu-Natal
LED local economic development
LFS Labour Force Survey
LRA Labour Relations Act
MDG Millennium Development Goal
MERG Macroeconomic Research Group
MFA Multi-Fibre Agreement
MFN most favoured nation
MIDP Motor Industry Development Programme
NAIRU non-accelerating inflation rate of unemployment
NDA National Development Agency
Nedlac National Economic Development and Labour Council
NES National Enterprise Survey
NGO non-governmental organisation
NIC newly industrialised country
NIS national innovation system
NRDS National Rural Development Strategy
OAP old age pension
OECD Organisation for Economic Co-operation and Development
OEM original equipment manufacturer
OHS October Household Survey
PLU poverty-line unit
PPP public–private partnership
PRSP Poverty Reduction Strategy Paper
PSLSD Project for Statistics on Living Standards and Development
R&D research and development
xi
Free
dow
nloa
d fr
om w
ww
.hsr
cpre
ss.a
c.za
RDP Reconstruction and Development Programme
S&T science and technology
SACP South African Communist Party
SADC Southern African Development Community
Saldru Southern African Labour and Development Research Unit
Sanco South African National Civics Organisation
Sangoco South African National NGO Coalition
SARB South African Reserve Bank
SDCEA South Durban Community Environmental Alliance
SDI Spatial Development Initiative
SMMEs small, medium and micro enterprises
SOE state-owned enterprise
SPF Sector Partnership Fund
StatsSA Statistics South Africa
STD sexually transmitted disease
STI sexually transmitted infection
TAC Treatment Action Campaign
TFP total-factor productivity
TRC Transitional Rural Council
TrepC Transitional Representative Council
UNAIDS Joint United Nations Programme on HIV/AIDS
UNIDO United Nations Industrial Development Organisation
WBLMS World Bank Large Manufacturing Firm Survey
WDF Wentworth Development Forum
WHO World Health Organization
WSSD World Summit for Social Development (1995)
WSSD World Summit on Sustainable Development (2002)
WTO World Trade Organization
T H E D E V E L O P M E N T D E C A D E ? S O U T H A F R I C A , 1 9 9 4 – 2 0 0 4
xii
Free
dow
nloa
d fr
om w
ww
.hsr
cpre
ss.a
c.za
1 Development discourses in post-apartheid South Africa
Vishnu Padayachee
For at least some of the contributors to this book, the question of whether or not thedecade 1994–2004 can be characterised unambiguously or largely as a developmentsuccess story remains an open one.1 My sense is that in the first five years, South Africanswere preoccupied with getting the model of development right – balancing the pres-sures, both direct and indirect, emanating from global sources and powerful local inter-est groups (especially internationally mobile white capital) with the need to address theappalling legacy of apartheid, a racially skewed history of oppression and exploitation,which left large swathes of the population marginalised, poor and without any or adequate health, housing and water.
So, the academic and policy debate was joined, often fiercely, around the competingmodels that did emerge. Initially, these included the contest between the economic ideasof the old regime – the neo-liberal Normative Economic Model, 1993, and those of theAfrican National Congress (ANC) – the Keynesian approach of the MacroeconomicResearch Group (MERG), 1993, and the Reconstruction and Development Programme(RDP), 1994. There was an equally fierce debate within the movement over economicpolicy – both MERG and the RDP were hotly debated between an older left-tradition andan increasingly powerful neo-liberal political elite within the Congress Alliance compris-ing the ANC, the Congress of South African Trade Unions (Cosatu) and the SouthAfrican Communist Party (SACP). In the internal ANC debate, it was those within thelatter camp who triumphed. MERG was dropped a few days before the TransitionalExecutive Council was launched on 7 December 1993. The RDP was (still is) occasionallytrotted out as representing the real development agenda of the ANC alliance, but the newANC-led government quickly moved to consolidate its economic strategy in the form ofthe Growth, Employment and Redistribution (GEAR) plan, which was put together by ateam of mostly white, male economists,2 and announced to the world as ‘non-negotiable’.However, in the run-up to GEAR and even in the immediate post-GEAR period, aca-demic articles, policy debate and party discussion documents still reflected the sense thatthe model of development was something still worth contesting.
This period in post-apartheid South Africa reminds one of what Philippe Hugon,writing about Francophone thinking in development economics, calls the ‘period ofmodelisation’, the years between the mid-to-late 1970s and 1990 when debate was joinedin French scholarship between orthodox policies and alternative models of develop-ment. Nevertheless, and despite the rising power of neo-liberal orthodoxy, the outcomeof this contestation, as Hugon (1991: 100) notes in the French case, was that:
1
Free
dow
nloa
d fr
om w
ww
.hsr
cpre
ss.a
c.za
the Francophone tradition continues to give prominence to the questions that setdevelopment economics apart as a specific discipline. It takes into account thespecificity of the basic units and of their architecture; it adopts a long-term per-spective and tackles the historical density of society. It takes account of spatialasymmetries and dynamics.
All of these traditions were unequivocally part of the South African debate in the periodI have referred to elsewhere as the ‘decade of liberation’, 1985–1995 (Padayachee 1998):specificity; the long term; historical density; spatial dynamics. Politics, power and classwere also essential elements in the writings of the academics and activists of the time.This was evident in the papers presented at annual conferences of the Association forSociology in Southern Africa; in the articles in the South African Review, publishedannually between 1983 and 1994, as well as those that appeared in the monthly maga-zine Work-in-Progess; in books such as South Africa’s Economic Crisis edited by StephenGelb (1991); at Federation of South African Trade Unions (Fosatu) and Congress ofSouth African Trade Unions (Cosatu) workshops; and at hundreds of activist meetings,both public and underground.
Are these traditions important in shaping South African development policy today? Iwould say yes. This ‘political economy’ approach to development at that time was tosome extent ensured in the debates since the mid-1980s by the leading role that Cosatuplayed in the debate about economic transformation, both through the nature and char-acter of its struggles, and through its active role in harnessing the expertise of progres-sive South African and foreign economists, many of whom were Marxist, in support oftheir thinking and strategy.
Has the post-apartheid development debate retained any of this tradition? I would saythat the answer to this is a lot less clear. Cosatu’s own strength and space for independ-ent action has been weakened within the alliance, and the influence of the South AfricanCommunist Party (SACP) within the alliance has also declined. The new social move-ments remain fragmented and issue-based, although improved relations between thesemovements, Cosatu, to some extent even the SACP, and a small, but growing cadre ofprogressive academics may signal the beginnings of a more invigorated, deeper andbroad-based debate over development strategy. Those former progressive economistswho have joined the state bureaucracy have (perhaps understandably) to tow the line orhave become university-based or private-sector consultants seeking out lucrative statecontracts. Operating in this world, they came quickly to realise that their best interestswould be served by punting simplistic, but politically attractive, economic solutions ofthe ‘win-win’ kind, working in the narrow and technical arena of supporting ‘policy-making’.
In a blistering polemic, Desai and Bohmke (1997) capture what they term the ‘retreat’ inthe thinking and practice of the progressive South African economists from the mid-1980s. The mainly white, male economists in the Economic Trends (ET) research group,they observe, were initially closely allied to the non-racial trade union movement, and
T H E D E V E L O P M E N T D E C A D E ? S O U T H A F R I C A , 1 9 9 4 – 2 0 0 4
2
Free
dow
nloa
d fr
om w
ww
.hsr
cpre
ss.a
c.za
distinguished themselves by being unafraid to criticise the tactics and strategies of theANC-led liberation movement, when they felt this necessary. An anti-apartheid,‘Bohemian-style’ subculture, Desai and Bohmke assert, knitted this exclusive grouptogether. However, with the demise of apartheid, beginning around 1990, the ‘bottomfell out of their market’. As the ‘new government moved to the right’, so the researchwork and theoretical disposition of progressive economists ‘moved in tandem’ (Desai &Bohmke 1997: 30–1). Most of the ET group, they contend, tossed their main weapon –critique – into the sea and sought their political rehabilitation, as the balance of powershifted to the ANC, by quickly becoming consultants to the ANC, and then by provid-ing academic rationalisation for the neo-liberal economic philosophy of the new ANC-led government. ‘Because this same set had so dominated left-thinking in South Africa,their betrayal has all but crushed a critique of the transition’ (Desai & Bohmke 1997: 32).
What I intend to do now is to make some comments about development studies as asubject area of study, especially in the context of the way things have unfolded in theperiod of South Africa’s transition to democracy. I would argue that some of the keyconcerns in what, following Bernstein, could be called the ‘founding moment’ of devel-opment studies remain the enduring issues at the heart of development studies today,despite 60 or more years of attempting to turn ideas and policy into sustained improve-ments in the quality of life of people in the ‘Third World’:
[T]he founding moment of Development Studies was one of world-historicaldrama, as appreciated by those who shaped the contemporary intellectual frame-works of the meanings and means of development, and engaged in their contes-tations. This was a moment, then, of asking big questions and pursuing big ideas,with an expansive intellectual agenda that sought to identify and explain keyprocesses of change in the formation of the modern world and their effects.(Bernstein 2005: 5)
I intend freely and somewhat randomly to explore some of these issues at both theglobal and South African levels, making four main points.
The first is the focus, indeed preoccupation, which I detect globally and in South Africa,on matters of measurement. The emphasis on measurement and getting data right is notnew. After industrial capitalism was thoroughly rooted into European economic life, andin the midst of Marx’s critique of it, the attention of some prominent social scientiststurned to issues of measurement. The question, as AJ Taylor (1962: 380) puts it, was this:‘Did the condition of the working classes improve or deteriorate during the period ofrapid industrial change between 1780 and 1850?’ To answer this, it was necessary tomeasure changes in living standards through the movement of real wages, throughchanges in the patterns of working-class consumption, and via health and longevityindicators.
More recently, in 1988, the World Bank initiated the Living Standards MeasurementStudy, which was linked to the Bank’s assessment of structural adjustment programmesand was undertaken in over 100 developing countries. It should come as no surprise that
D E V E L O P M E N T D I S C O U R S E S I N P O S T- A PA R T H E I D S O U T H A F R I C A
3
Free
dow
nloa
d fr
om w
ww
.hsr
cpre
ss.a
c.za
a similar study (the Project for Statistics on Living Standards and Development) wascommissioned for South Africa at the request of the ANC ‘government-in-waiting’ onthe eve of democratic elections. This 1993 study was conducted – not by the World Bankitself – but by the Southern African Labour and Development Research Unit at theUniversity of Cape Town (perhaps a further recognition of South African exceptional-ism!). However, the Bank provided ‘technical assistance’ to the project, which wasfunded by the governments of Denmark, the Netherlands and Norway (Klasen 1997: 52;May 2005).
It is essential to recognise the enormous value of this aspect of our work as social scien-tists. The Economic Development Strategic Initiative at the University of KwaZulu-Natal, for example, hosted an important and useful workshop called ‘Making Data Workfor Development’ in December 2003. My point is that measurement, data and defini-tions should not be allowed to deflect the discourse into narrow, technical culs-de-sac.There are limits to what can usefully be achieved by aiming for some kind of perfectionin measurement, and the development context into which such work fits should alwaysbe remembered. Thus, for example, Martin Greeley (1994) warns of the limitations andrisks inherent in trying to measure indicators of welfare broader than income (such asgood governance and quality of life), especially in situations where reductions inabsolute poverty are still primary considerations of policy interventions.
South African development discourse displays signs of many of the trends just noted.Our core concerns today appear to be with issues such as: What is the level/rate of unem-ployment? How big is the informal economy? Are poverty and inequality getting worse?How large is the social wage? How many people have died of AIDS? How accurate areCPIX and growth figures? How accurate is the Gini coefficient? Patrick Bond (2004: 9)provides an example, which incidentally illustrates this (absurd) preoccupation withmeasurement, definitions and data:
In late 2003, Pretoria decided to tackle critics who argued that the ANC govern-ment was creating poverty through its macroeconomic policies. Governmentideologue Joel Netshitenzhe and policy analyst Andrew Merrifield relied uponStellenbosch University professor Servaas van der Berg, who also consulted to theWorld Bank. Van der Berg tweaked the ‘Gini coefficient’ (the main measure ofinequality) by measuring the impact of state spending on the ‘social wage’ anddrawing inferences for inequality in the wake of government redistribution.Before this exercise, according to the UNDP, the Gini coefficient had risen from0.59 to 0.64, with the Eastern Cape and Free State recording levels above 0.65. Incontrast, Van der Berg determined that between 1993 and 1997, social spendingincreased for the poorest 60% of households, especially the poorest 20% andespecially the rural poor, and decreased for the 40% who were better off, leadingto a one-third improvement in the Gini coefficient. Merrifield borrowed themethodology and updated it, arriving at a 41% improvement in the Gini from the1994 base year. However, he conceded to ThisDay newspaper, ‘There were certainconcerns voiced about us using the [Statistics SA] expenditure survey. Some
T H E D E V E L O P M E N T D E C A D E ? S O U T H A F R I C A , 1 9 9 4 – 2 0 0 4
4
Free
dow
nloa
d fr
om w
ww
.hsr
cpre
ss.a
c.za
researchers have doubts about the statistical validity of its samples. We were nothappy about using it and we said so, but it was the best data they had.’
A second point to be made is about the danger (which has to be resisted) in the attemptto ‘cleanse’ development studies of considerations of power, class and politics. JamesFerguson (1990) has brilliantly captured this trend in his notion of the ‘anti-politicsmachine’ that ‘depoliticises’ development, and:
marginalizes or displaces investigation and understanding of the sources, dynam-ics and effects of typically savage social inequality in the South, and of no lesssavage relations of power and inequality in the international economic and polit-ical system. It elides consideration of the violent social upheavals and strugglesthat characterize the processes and outcomes of the development of capitalism.(Bernstein 2005: 14)
For Gill Hart, a focus on what she calls ‘small d’ development, ‘the development ofcapitalism as a geographically uneven, profoundly contradictory set of historicalprocesses’, and on ‘non-reductionist understandings of class and power, constitutes avitally important terrain for engagement in a world of profound injustice and materialinequality’ (Hart 2001: 650, 655).
Thirdly, if politics, class, power and struggle have gone out the window in developmentdiscourse in many parts of the world, mainstream economics has jumped into develop-ment thinking and policy (including in South Africa recently) in a big way. Economics(certainly political economy) has significant strengths to bring to the complex processof understanding development and to making and implementing policy, but it cannotdo it alone (Kanbur 2002) – especially not the virulent brand of neoclassical economicsthat one finds dominating development discourse today. According to Bernstein:
Another type of constraint on intellectual work in Development Studies stemsfrom the hegemonism of neo-classical economics which has spiralled during theneo-liberal ascendancy, including the latest manifestations … of its ambition tosubsume much of sociological and political inquiry within its own paradigm …And neo-classical economics provides intellectual support, with more or lessplausibility, to the good intentions of ‘win-win’ discourse of development policy.(2005: 18)
The insistence within neoclassical economics on the primacy of mathematical model-ling and econometrics is also problematic and limiting. While one has to recognise theusefulness and importance of modelling for some purposes, one must also understandits limitations. One of the economics profession’s most celebrated mathematicians anda Nobel Prize winner, Wassily Leontief complained in a 1970 address to economists that‘the mathematical-model-building industry has grown into one of the most prestigious,possibly the most prestigious branch of economics. [Unfortunately] uncritical enthusi-asm for mathematical formulation tends often to conceal the ephemeral content of theargument’ (in Jacoby 1996: 159).
D E V E L O P M E N T D I S C O U R S E S I N P O S T- A PA R T H E I D S O U T H A F R I C A
5
Free
dow
nloa
d fr
om w
ww
.hsr
cpre
ss.a
c.za
Fourthly, while I would accept the argument that development studies must be multidisciplinary and cross-disciplinary and should remain open to many social sciencedisciplines, there are dangers in this that must be guarded against. Ravi Kanbur puts itthis way:
The social sciences need to come together to address specific and general prob-lems in development studies and development policy. [But] there is the ever-present danger of the lowest common denominator. Instead of the strengths ofeach discipline, we may pick up the weaknesses of each. In the end, disciplinarynarrowness may simply be replaced by lack of clarity. (2002: 484–5)
Worse still is the tendency capriciously and randomly to add more and more topics orto tack on issues that may be the current fad, all of which will make the field incoherentand chaotic. In my view, some disciplinary ‘spine’ is essential. This could differ fromplace to place or school to school in a university context – anthropology or politicaleconomy here, politics there – depending on structural and other factors linked to contemporary development challenges in particular contexts and times.
If the field of development studies is to have a distinct place within the social sciencemilieu, it should be to raise, analyse, interrogate and always keep within view the ‘big’questions of our day, equivalent to those posed at the founding moment of the disciplinein the early post-war years, and to use the appropriate tools, methods and techniques inthe service of larger intellectual and policy challenges.
I would contend that, by and large, the chapters in this volume are true to this under-standing; perhaps the hesitancy (even paralysis) that characterised the thinking, writingand actions of many social science scholars working on South African development inthe early years of the new democracy is coming to an end. Despite success in some areasof economic and social change since 1994, the scale of the development challenge thatthis country still faces, the stimulus being generated by social re-mobilisation amongstour people, a somewhat more conducive global context, and some signs that the gov-ernment may be thinking about development in a more heterodox manner, could allcontribute to a more creative and innovative response to South African developmentchallenges by social scientists, here and abroad.
Let us end this chapter by looking briefly at the main themes and issues that are raisedin this book.
Contemporary debates in a global context
Chapter 2 by US-based South African political economist Gill Hart, and Chapter 3 byDani Nabudere, who is based at the Afrika Study Centre in Uganda, are an examinationof African and South African development discourse within the context of a critique ofthe major theories of development that have emerged in the last 60 years, and the rise,fall and resurrection (as it were) of ‘development theory’ in the post-war period, as wellas continuities and discontinuities in the way these theories have impacted on countries
T H E D E V E L O P M E N T D E C A D E ? S O U T H A F R I C A , 1 9 9 4 – 2 0 0 4
6
Free
dow
nloa
d fr
om w
ww
.hsr
cpre
ss.a
c.za
in the South, especially in Africa. Hart examines the relationships between these globaldevelopment discourses and the post-war South African experience; Nabudere stressesthe implications of the failure of development theory and practice to understand thelocal conditions of non-Western societies.
Macroeconomic balance and microeconomic reform
Managing the balance of macroeconomic and microeconomic policies became an issueduring the first ten years of South Africa’s democracy. The first two chapters in thissection examine the initial wave of economic reforms in South Africa after the transitionin 1994, focusing on macroeconomic reform. In Chapter 4, Rashad Cassim, Head of theSchool of Economics at Wits University, provides a rich and detailed account of theSouth African economic reform process, while the British economist, Jonathan Michie,looks at the employment effects of macroeconomic reforms (in terms of both the performance over the first decade of reform, and the possible options for the future) inChapter 5. The correct identification of the microeconomic problematique and theimplications of the policy sequence chosen, which emphasises macroeconomic stabilityover microeconomic reform, are the concern of the two other chapters in this section.The National Treasury’s Kuben Naidoo and US economist Michael Carter reflect inChapters 6 and 7 on the underlying nature of economic transactions in South Africaduring the past decade, taking account of the legacies of previous policies of protection,regulation and division.
Distributive issues in post-apartheid South Africa
One of the key expectations of the new government was that it would address the lega-cies of racially determined poverty and inequality. What has its performance been in thelast ten years? What policies and programmes have made a difference? What are some ofthe policy dilemmas around alternative uses of resources? In Chapter 8, Julian May, thecurrent Head of the School of Development Studies (SDS) at the University of KwaZulu-Natal (UKZN), sets the scene by considering the conceptual debates around poverty andinequality, and how the social policy agenda is constructed. Chapter 9 by Francie Lund,also from the SDS, critically reviews social security spending in South Africa, one of thefew countries in the world to experience a growth in such expenditure.
Global competitiveness, industrial upgrading and innovation
In the early 1990s, South African industry had to rapidly shift from an import-substituting industrialisation growth path towards one of engaging with the competi-tiveness demands of the global economy. A new industrial policy environment and newgovernment support measures were meant to assist manufacturing enterprises inmeeting these challenges, but only a few pockets of industry managed the upgrading andinnovation transition to manufacturing excellence. Many firms have remained back-
D E V E L O P M E N T D I S C O U R S E S I N P O S T- A PA R T H E I D S O U T H A F R I C A
7
Free
dow
nloa
d fr
om w
ww
.hsr
cpre
ss.a
c.za
ward and uncompetitive. Chapter 10 by Jo Lorentzen of the Human Sciences ResearchCouncil (HSRC) grapples with the question of how demand for knowledge, especiallyby firms, is incorporated and articulated within discrete national and regional contexts.Chapter 11 by Morris, Robbins and Barnes, each now or once a member of staff of theSDS, examines the role of government in facilitating cluster development, with a focuson the auto sector in developing countries.
Municipal governance and development
The 1996 Constitution fundamentally changed local government into an independentsphere of government, described as the ‘hands and feet’ of reconstruction and develop-ment in South Africa. This is in line with an international trend to decentralise govern-ment. One of the new roles assigned to local government is the promotion of localeconomic development (LED). Wits University geographer, Chris Rogerson, in Chapter12 critically reviews LED research agendas in South Africa over the last ten years. Frencheconomist Benoît Lootvoet and UKZN economic historian Bill Freund examine the‘fluid’ concept of LED, with a focus on the port city of Durban, in Chapter 13.
Labour, work and the informal economy
Over the last ten years, there has been substantial debate about developments in thelabour market, given especially the inheritance of apartheid policy and the rapid changesin the technological and skills requirements of the domestic economy, newly reinsertedinto the global economy. In Chapter 14, University of Cape Town (UCT) economist,Haroon Bhorat, conducts a microeconomic analysis of the labour supply and demandconstraints on job creation. In South Africa, there has been a significant reconceptuali-sation of the notion ‘informal economy’. In Chapter 15, SDS researchers Richard Devey,Caroline Skinner and Imraan Valodia examine trends in labour market data generallyand specifically in the informal economy in South Africa since 1994.
Population, health and development
Most countries are concerned about how to incorporate health practices and healthtechnology into the everyday life of all segments of society. Health has also been animportant catalyst between population and sustainable development. SDS populationexpert Akim Mturi, with Thokozani Xaba, Dorothy Sekokotla and Nompu Nzimande,assess how families cope with illnesses and deaths, with a focus on diseases other thanHIV/AIDS (Chapter 16). Pranitha Maharaj of the SDS and London School of Hygieneand Tropical Medicine’s John Cleland look at the impact of men’s and women’s attitudesand perceptions on condom use, using surveys from cohabiting couples in KwaZulu-Natal (Chapter 17). One arena in which the performance of the new South African government has been highly contested, both locally and internationally, is that ofHIV/AIDS. Two chapters by UKZN researchers examine the trajectory of the political
T H E D E V E L O P M E N T D E C A D E ? S O U T H A F R I C A , 1 9 9 4 – 2 0 0 4
8
Free
dow
nloa
d fr
om w
ww
.hsr
cpre
ss.a
c.za
and socio-economic aspects of HIV/AIDS in South Africa since 1994. SDS researcherEleanor Preston-Whyte frames her analysis of this epidemic from a sociological perspective (Chapter 18), while Alan Whiteside and Sabrina Lee of UKZN’s HealthEconomics and HIV/AIDS Research Unit focus on the more economic and develop-mental implications of the epidemic (Chapter 19).
Social movements and democratic transition
Two poles of opinion can be identified with regard to civil society. One view is that civilsociety should be a unified volunteer sector that aims to assist the democratic state toimplement its agenda; the other is that civil society should constitute itself as a set ofcountervailing forces that can and should challenge state and corporate power. Chapter20 by Habib (now at the HSRC), Imraan Valodia and Richard Ballard (both at the SDS)reviews these new social movements and assesses their significance for the consolidationof South African democracy. Independent writer and researcher Dale McKinley asks inChapter 21 why the new social movements are likely to remain outside of the main-stream of the country’s institutional politics and why the poor may no longer view activeparticipation within our ‘representative democracy’ as being in their interests. InChapter 22, London School of Economics geographer, Sharad Chari, explores two terrains of struggle in Wentworth, South Durban, a militant form of labour unionismand an environmental justice activism. There remain questions about the role of tradi-tional authorities in rural development, and their relationship with democraticallyelected local government structures; UCT sociology professor Lungisile Ntsebeza dealswith this important aspect of democratic transition and consolidation in Chapter 23,which focuses on the role of traditional authorities in rural development in the formerbantustans since 1994.
Notes
1 For their ideas and inputs, I would like to thank my colleagues Julian May, Imraan Valodia,
Caroline Skinner and Sharad Chari. None of them has read even a draft of this chapter, so must
clearly be excluded from any culpability on matters of fact, interpretation or logic.
2 The late Professor Guy Mhone is, of course, the exception here. By all accounts his highly
thoughtful contributions were sidelined within GEAR.
References
Bernstein H (2005) Development Studies and the Marxists, in U Kothari (ed.) A radical history of
Development Studies: Individuals, institutions and ideologies. London: Zed Books.
Bond P (2004) From racial to class apartheid: A critical appraisal of South Africa’s transition. Paper
presented to the AIDC’s 10 years of democracy conference, Cape Town, 27 November.
Desai A & Bohmke H (1997) The death of the intellectual, the birth of the salesman, Debate 3: 10–34.
D E V E L O P M E N T D I S C O U R S E S I N P O S T- A PA R T H E I D S O U T H A F R I C A
9
Free
dow
nloa
d fr
om w
ww
.hsr
cpre
ss.a
c.za
Ferguson J (1990) The anti-politics machine: ‘Development’, depoliticization and bureaucratic power in
Lesotho. Cambridge: Cambridge University Press.
Gelb S (1991) South Africa’s economic crisis. Cape Town/London: David Philip/Zed Books.
Greeley M (1994) Measurement of poverty and poverty of measurement, IDS Bulletin 25: 50–8.
Hart G (2001) Development critiques in the 1990s: Culs de sac and promising paths, Progress in
Human Geography 25: 3–8.
Hugon P (1991) The three periods of Francophone thinking in development economics, European
Journal of Development Research 3, December.
Jacoby R (1996) The last intellectuals, American culture in the age of academe. New York:
The Noonday Press.
Kanbur R (2002) Economics, social science and development, World Development 30: 497–509.
Klasen S (1997) Poverty, inequality and deprivation in South Africa: An analysis of the 1993 SALDRU
Survey, Social Indicators Research 41: 51–94.
May J (2005) Persistent poverty in South Africa: Assets, livelihoods and accumulation in KwaZulu-
Natal, 1993–2001. Draft PhD thesis, University of KwaZulu-Natal.
Padayachee V (1998) Progressive academic economists and the challenge of development in South
Africa’s decade of liberation, Review of African Political Economy 25: 431–50.
Taylor A (1962) Progress and poverty in Britain, 1978–1985: A reappraisal, in E Carus-Wilson (ed.)
Essays in economic history, Vol. 3. London: E Arnold.
T H E D E V E L O P M E N T D E C A D E ? S O U T H A F R I C A , 1 9 9 4 – 2 0 0 4
10
Free
dow
nloa
d fr
om w
ww
.hsr
cpre
ss.a
c.za
Section 1Contemporary debates in a global context
11
Free
dow
nloa
d fr
om w
ww
.hsr
cpre
ss.a
c.za

Free
dow
nloa
d fr
om w
ww
.hsr
cpre
ss.a
c.za
2 Post-apartheid developments in historical and comparative perspective
Gillian Hart
Introduction
Political liberation in South Africa in the early 1990s coincided with the zenith of markettriumphalism, the death of post-war ‘Developmentalism’, the end of the Cold War, andconfident declarations of the ‘end of history’.1 Over the past ten years, the global picturehas shifted quite dramatically. The World Bank and other agencies have retreated fromthe harsh neo-liberal prescriptions of the Washington Consensus in favour of kinder,gentler discourses of social inclusion and poverty alleviation that are reminiscent insome ways of the decade of ‘Basic Needs’ in the 1970s. With the invasions of Afghanistanand Iraq we are also witnessing the resurgence of a virulent form of American imperial-ism, framed in terms of liberal civilising missions, regime change and nation building,and projects of reconstruction and ‘development’ spearheaded by Bechtel and Halli-burton, along with the wholesale plunder of Iraqi resources.
Significant, if less dramatic, shifts have also taken place over the past decade in SouthAfrica. The move from the neo-Keynesian Reconstruction and DevelopmentProgramme to the Growth, Employment and Redistribution (GEAR) plan appears inretrospect as a sort of belated replay of the death of Developmentalism that accompa-nied the neo-liberal counter-revolution in the early 1980s. The 2004 election heraldeda series of policy shifts that signify a retreat on certain fronts from the high GEAR phase of the mid-to-late 1990s. Articulated in Thabo Mbeki’s State of the Nationaddress and again in his opening of Parliament in May 2004, they include an increasein government spending, a slowdown in the privatisation of key parastatals, anexpanded public works programme, extending the social security net (although noBasic Income Grant), and new layers of bureaucracy in the form of community devel-opment workers who will help identify the unregistered ‘indigent’ and draw them intosocial security nets and municipal indigent policies. This apparent reversion to anearlier phase of Developmentalism is cast in the remarkably retro terms of ‘First’ and‘Second’ Economies – a reinvention of the dualistic categories through which dis-courses of Development have operated since the 1940s. It is also eerily reminiscent ofthe First-World–Third World paradigm that the apartheid state deployed as part of itsreformist strategy in the 1980s.2
In South Africa, as well as more generally, these sorts of shifts are the subject of consid-erable debate. On the one hand, there are those who welcome what they see as the
13
Free
dow
nloa
d fr
om w
ww
.hsr
cpre
ss.a
c.za
(somewhat belated) arrival of Third Way-ism in the Third World and, on the other,those who dismiss them as sheep’s clothing draped over a neo-liberal capitalist wolf. Ona visceral level, I tend toward the latter interpretation. Yet I also think it dangerouslycrude, because it abstracts from the emergence of new forms of governmental power, aswell as from the slippages, openings and contradictions that are crucial to any effort tograpple with possibilities for more far-reaching social change.
This brings me to the near-impossible brief I was assigned for this chapter – namely, ‘acritique of the major theories of development that have emerged over the past 60 years’.What I am going to try to do, of necessity in extremely broad brush strokes, is identify a series of key turning points since 1944, and suggest their relevance for contending with contemporary questions of Development in the era of neo-liberal capitalism, bothglobally and in South Africa.
Building on an earlier set of arguments (Hart 2001, 2002a, 2004), I also want to suggesta framework for thinking about these moments of crisis and redefinition that distin-guishes between ‘big D’ and ‘little d’ development, but understands them as dialecticallyinterconnected. I define ‘big D’ Development as a post-World War II project of inter-vention in the Third World that emerged in the context of decolonisation and the ColdWar. ‘Little d’ development refers to the development of capitalism as geographicallyuneven, profoundly contradictory historical processes of creation and destruction.Although state-led Developmentalism had been thoroughly discredited by the 1980s,official discourses and practices of Development have re-emerged in old and new guisesin the era of neo-liberal capitalism, precisely in order to mediate its destructive fallout.While the intent of these interventions is clearly depoliticising, they also open up newpossibilities.
Periodising post-war D/developments
The distinction I am suggesting between Development and development shares certainaffinities with Cowen and Shenton’s (1996) distinction between development as anintentional practice and an immanent process, but also departs from it in some impor-tant ways. Cowen and Shenton contend that development understood as intentionalintervention – what they aptly call ‘trusteeship’ – was present at the very birth of indus-trial capitalism to confront the depredations and social disorder wrought by ‘progress’(see also Kitching 1982). Thus, they insist, ‘the idea of the intentional practice of devel-opment was not an invention of the post-1945 international order’ (Cowen & Shenton1996: 60).
Yet Cowen and Shenton are strangely silent on Karl Polanyi’s (1944) monumental andrelated contributions in the form of what he called capitalism’s ‘double movement’.3 Theunleashing of markets for labour, land/nature and money, Polanyi maintained, wreaksprofound havoc and generates counter-tendencies and demands for intervention andsocial protection. Far from the counter-movement representing some sort of externalintervention in an inexorably unfolding teleology, these opposing tendencies are con-
T H E D E V E L O P M E N T D E C A D E ? S O U T H A F R I C A , 1 9 9 4 – 2 0 0 4
14
Free
dow
nloa
d fr
om w
ww
.hsr
cpre
ss.a
c.za
tained within capitalism. By the same token, the conditions for global capital accumula-tion must be actively created and constantly reworked.
What I am calling ‘little d’ development refers not to an immanent process, but to thesesimultaneously creative and destructive tendencies. Equally, I want to insist on thespecificity of interventions made in the name of ‘big D’ Development as a distinctivefeature of the post-war international order, while at the same time focusing on the instability and constant redefinitions of official discourses and practices ofDevelopment. For proponents of the ‘post-Development’ critique, the birth ofDevelopment can be timed quite precisely: ‘We propose to call the age of developmentthat particular historical period which began on 20 January, 1949, when Harry STruman for the first time declared, in his inauguration speech, the Southern hemi-sphere as “underdeveloped areas”’ (Sachs 1992: 2; see also Escobar 1995: 3). From theperspective of post-Development, Truman’s promise of an enlightened ‘West’ bringingprogress to a benighted ‘Rest’ inaugurated Development as a discursive formationthrough which the Third World came to be defined as backward and in need of inter-vention and guidance along the path to modernity.
While the Cold War and Truman’s Point IV Programme are crucial elements of post-warDevelopment, the post-Development critique deploys a remarkably top-down concep-tion of power. In a far more nuanced analysis, Fred Cooper locates the origins ofDevelopment in the imperial crisis of the late 1930s and 1940s, brought on by a series ofstrikes and boycotts in the West Indies and different regions of Africa. He shows howDevelopment ‘did not simply spring from the brow of colonial leaders, but was to a significant extent thrust upon them, by the collective action of workers located withinhundreds of local contexts as much as in an imperial economy’ (Cooper 1997: 85). Inthe post-World War II period, Development became a means by which Britain andFrance sought to hang on to their African colonies. They did so in part through the con-solidation and management of an urban African working class – precisely the oppositeof the apartheid ‘solution’ to labour uprisings in South Africa after the war.4 Yet, colonialambitions to create a docile class of urban citizens were thwarted by nationalist leaders,trade unionists and anti-colonial movements, deploying precisely these a-cultural discourses of Development in order to stake claims and demands.
Beyond illuminating African decolonisation struggles, Cooper’s intervention under-scores how Development can operate as much as a discourse of entitlement as a dis-course of control. This alternative understanding also makes clear the limits of critiquesby Wolfgang Sachs, Arturo Escobar, and others who define Development in terms of apower/knowledge system originating in the West that seamlessly produces subjects whodefine themselves as backward and underdeveloped.
More generally, I suggest, Development is most usefully understood in terms of the exer-cise of power in multiple, interconnected arenas, inseparably linked with the socially andspatially uneven dynamics of capitalist development. Part of what is useful about thissort of framing is its capacity to illuminate key turning points in official discourses and
P O S T- A PA R T H E I D D E V E L O P M E N T S
15
Free
dow
nloa
d fr
om w
ww
.hsr
cpre
ss.a
c.za
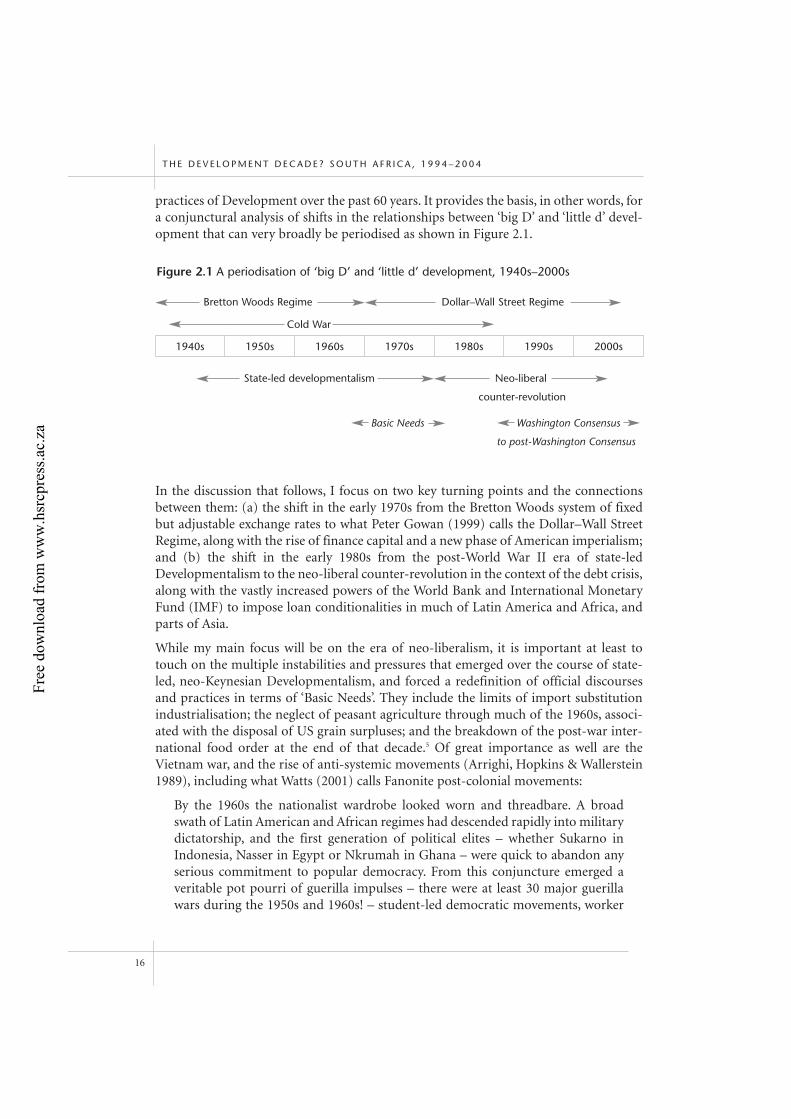
practices of Development over the past 60 years. It provides the basis, in other words, fora conjunctural analysis of shifts in the relationships between ‘big D’ and ‘little d’ devel-opment that can very broadly be periodised as shown in Figure 2.1.
In the discussion that follows, I focus on two key turning points and the connectionsbetween them: (a) the shift in the early 1970s from the Bretton Woods system of fixedbut adjustable exchange rates to what Peter Gowan (1999) calls the Dollar–Wall StreetRegime, along with the rise of finance capital and a new phase of American imperialism;and (b) the shift in the early 1980s from the post-World War II era of state-ledDevelopmentalism to the neo-liberal counter-revolution in the context of the debt crisis,along with the vastly increased powers of the World Bank and International MonetaryFund (IMF) to impose loan conditionalities in much of Latin America and Africa, andparts of Asia.
While my main focus will be on the era of neo-liberalism, it is important at least totouch on the multiple instabilities and pressures that emerged over the course of state-led, neo-Keynesian Developmentalism, and forced a redefinition of official discoursesand practices in terms of ‘Basic Needs’. They include the limits of import substitutionindustrialisation; the neglect of peasant agriculture through much of the 1960s, associ-ated with the disposal of US grain surpluses; and the breakdown of the post-war inter-national food order at the end of that decade.5 Of great importance as well are theVietnam war, and the rise of anti-systemic movements (Arrighi, Hopkins & Wallerstein1989), including what Watts (2001) calls Fanonite post-colonial movements:
By the 1960s the nationalist wardrobe looked worn and threadbare. A broadswath of Latin American and African regimes had descended rapidly into militarydictatorship, and the first generation of political elites – whether Sukarno inIndonesia, Nasser in Egypt or Nkrumah in Ghana – were quick to abandon anyserious commitment to popular democracy. From this conjuncture emerged averitable pot pourri of guerilla impulses – there were at least 30 major guerillawars during the 1950s and 1960s! – student-led democratic movements, worker
T H E D E V E L O P M E N T D E C A D E ? S O U T H A F R I C A , 1 9 9 4 – 2 0 0 4
16
Figure 2.1 A periodisation of ‘big D’ and ‘little d’ development, 1940s–2000s
Bretton Woods Regime Dollar–Wall Street Regime
Cold War
State-led developmentalism Neo-liberal
counter-revolution
Basic Needs Washington Consensus
to post-Washington Consensus
1940s 1950s 1960s 1970s 1980s 1990s 2000s
Free
dow
nloa
d fr
om w
ww
.hsr
cpre
ss.a
c.za
and union struggles, and nascent ‘culturalisms’ seen in the rise of the Muslimbrotherhoods and aggressive ethnic communalism for whom corrupt state appa-ratuses, and a questionable record of nation-building, provided the fuel for theirpolitical aspirations. Whatever their obvious ideological and tactical differences,Maoist militants in Peru, middle-class students in Mexico City, Naxalite organiz-ers in India and Muslim reformists in Cairo all shared a radical disaffection fromthe postcolonial state and the decrepit political cronyism of peripheral capitalism.(Watts 2001: 172)
Black Consciousness, the Durban strikes and the Soweto uprising can – for all their localspecificity – be located on this larger canvas.
These pressures are central to grasping the redefinition of Development, exemplified byRobert McNamara’s accession to the presidency of the World Bank in 1968. No doubtBob’s efforts to expiate his guilt for war crimes in Vietnam played into the new empha-sis on poverty, inequality and unemployment, but it was the conjunctural crisis thatcreated the conditions for the shift. The intellectual ethos of ‘Basic Needs’ hinged on theneo-populist claim that small-scale forms of production are relatively more efficient,and on the inversion of earlier dualisms. In place of notions that growth of the‘advanced’ sector would drain the swamp of surplus labour lurking in the ‘backward’sector, the ‘informal’ sector came to embody all the virtues lacking in its clunky, ineffi-cient counterpart. The simultaneous discovery of hard-working women and peasantscontributed to the mix, as did the widespread availability of Green Revolution graintechnologies, which seemed to promise a quick solution to the world food crisis, as wellas redistributive forms of production.
While discourses and policies of ‘Basic Needs’ in general fell far short of their stated aimof poverty alleviation, they were accompanied by massive resource flows. Between 1970and 1980, according to Wood (1986: 83), total flows of financial resources to ‘less devel-oped countries’ burgeoned from around $17 billion to $85 billion. Over the same period,loans grew from 79 per cent of total resource flows to 91.4 per cent. The most dramaticincrease was in commercial bank lending and portfolio investment, which rose from $777million in 1970 to nearly $18 billion in 1980. Medium- and long-term public debt shotup from $75.1 billion in 1970 to $634.4 billion in 1983 (Wood 1986: 130). It was the so-called ‘Volcker shock’ (1979–1982), when the US Federal Reserve base rate rose from anaverage of 8 per cent in 1978 to over 19 per cent in 1982, that ushered in the debt crisis,the neo-liberal counter-revolution and vastly changed roles of the World Bank and theIMF in Latin America, Africa and parts of Asia.
From Bretton Woods to the Dollar–Wall Street Regime
The passage from the collapse of the Bretton Woods system in August 1971 to the onset ofthe debt crisis in the early 1980s is a tale typically told in the following terms. First, theNixon administration’s ending of dollar convertibility and the devaluation of the dollarrepresented a defeat for a weakened American capitalism, battered, on the one hand, by
P O S T- A PA R T H E I D D E V E L O P M E N T S
17
Free
dow
nloa
d fr
om w
ww
.hsr
cpre
ss.a
c.za
competitive pressures associated with the economic ascendance of Germany and Japanand, on the other, by the quagmire in Vietnam and the rise of oppositional movements.Second, while the devaluation of the dollar created the conditions for the OPEC oil pricerise, the escalation of oil prices in 1973 was carried out by the Gulf states as part of an anti-Israel and anti-US policy connected to the Yom Kippur wars. Third, the flood of petro-dollars pouring into commercial banks created the economic incentive for massive loansto Third World governments during the 1970s that paved the way for the debt crisis.
This narrative is often linked to a related set of claims about the collapse of the BrettonWoods system presaging the decline, if not the disappearance, of the nation state, andthe slide into a chaotic non-system driven by relentless technological and market forces.These are precisely the ingredients of what I have elsewhere called the ‘impact model’ ofglobalisation (Hart 2002b).
In his brilliant book The Global Gamble (1999), Peter Gowan offers a revisionist inter-pretation that carries vitally important implications for grasping contemporary forms ofimperialism. First, he contests the widely held view that the ending of dollar convert-ibility represented the decline of US hegemonic power. Instead, Gowan (1999: 19) maintains that ‘the Nixon administration was determined to break out of a set of insti-tutionalised arrangements which limited US dominance in international monetary politics in order to establish a new regime which would give it monocratic power overinternational monetary affairs’. He concedes that US capital was indeed being challengedby its capitalist rivals in product markets at the time, in the context of a generalised crisisof accumulation, but argues that ‘the breakup of the Bretton Woods system was part ofa strategy for restoring the dominance of US capital through turning the internationalmonetary system into a dollar-standard regime’ (Gowan 1999: 19).6
Gowan also maintains that the Nixon administration exercised direct influence on theOPEC oil price rise – initially with the intention of whacking Germany and Japan, andsubsequently insisting that petrodollars be recycled through commercial banks:
The Nixon administration’s second step was to try to ensure that internationalfinancial relations should be taken out of the control of state central banks andshould be increasingly centred upon private financial operators. It sought toachieve this goal through exploiting US control over international oil supplies. Yetas we now know, the oil price rises were the result of US influence on the oil statesand they were arranged in part as an exercise in economic statecraft directedagainst America’s ‘allies’ in Western Europe and Japan. And another dimension ofthe Nixon administration’s policy on oil price rises was to give a new role,through them, to the US private banks in international financial relations.(Gowan 1999: 21)7
As early as 1972, the Nixon administration planned for US private banks to recyclepetrodollars to non-oil-producing states; other governments wanted petrodollars recy-cled through the IMF, but the US rejected this. At the same time, Gowan points out, USbanks were hesitant to lend to Third World governments, and had to be provided with
T H E D E V E L O P M E N T D E C A D E ? S O U T H A F R I C A , 1 9 9 4 – 2 0 0 4
18
Free
dow
nloa
d fr
om w
ww
.hsr
cpre
ss.a
c.za
incentives. These included the abolition of capital controls in 1974, scrapping the ceilingon bank loans to a single borrower, and repositioning the IMF to structure bail-outarrangements that shifted the risk of such loans to the populations of borrowing coun-tries. While ensuring the banks would not lose, these arrangements also meant thatfinancial crises in the South provoked capital flight of private wealth-holders that endedup strengthening Wall Street.8
In other words, the recycling of petrodollars through the private banking system toThird World governments was not simply the product of economic incentives.9 Instead,it was a key element of the re-engineering of international monetary and financialarrangements that undergird ‘the new imperialism’.10 A related and crucially importantpoint is that what has come to be called neo-liberal globalisation emerges from thisanalysis not as a set of inexorable technological and market forces increasingly divorcedfrom state–political controls, but as the product of deliberate power ploys that couldhave gone in other directions.
Reconfigurations of international financial arrangements in the wake of the collapse ofthe Bretton Woods regime also signalled a shift from gold to oil as the key global com-modity – developments that have, of course, been of vital significance to South Africa.Prior to 1971, the fixed international price of gold minimised the fluctuations of SouthAfrica’s export earnings – a situation that, as Gelb (1991) points out, distinguishedSouth Africa from other primary-commodity exporters in the post-war era. The bene-fits to South Africa from the increase in the gold price after 1971 were far outweighed,he argues, by the destabilising effects of fluctuating prices of gold and other commodi-ties, and ‘the behaviour of the South African economy has become more like that ofother primary exporters’ (Gelb 1991: 22).11
As South Africa staggered through amplifying economic and political crises in the 1970sand 1980s, other African, Asian, Latin American and Middle Eastern countries werebecoming sharply bifurcated according to ‘how well the state concerned coped with thevolatile and often savage dynamics of the new Dollar-Wall Street Regime’ (Gowan 1999:48). Those countries that had taken the borrowing course became entrapped by debt,and hauled through the stabilisation (IMF) and structural adjustment (World Bank)wringer. In many Latin American countries, the 1980s became known as the ‘lostdecade’. For many in Africa, the 1980s were the start of an ongoing nightmare. A numberof East Asian countries, in contrast, were able to avoid the debt trap.
The reasons for these divergent trajectories are subject to intense debate. In the earlyphases of the neo-liberal counter-revolution, key figures in the World Bank invokedrapid East Asian growth as incontrovertible evidence of the superiority of ‘the market’over ‘the state’.12 This interpretation came under fire from a number of academics whoinvoked Chalmers Johnson’s (1982) notion of the ‘developmental state’ to assert thepowerful role of the state in East Asian accumulation.13
It was in the context of growing tension between the US and Japan over the deregula-tion of financial markets that the battle over the interpretation of East Asian ‘miracles’
P O S T- A PA R T H E I D D E V E L O P M E N T S
19
Free
dow
nloa
d fr
om w
ww
.hsr
cpre
ss.a
c.za
moved into top gear, culminating in the World Bank’s publication of The East AsianMiracle in 1993. Funded by Japan, this awkward, heavily vetted text conceded to stateintervention in East Asian economies, but held firmly to a ‘market-friendly’ interpreta-tion. Robert Wade’s (1996) fascinating account of the production of this text illuminateshow key figures within the Bank sought to fend off the Japanese challenge to neo-liberalorthodoxy, and the larger configurations of power within which this challenge unfolded.The story of The East Asian Miracle, he argues, shows the determining force of US valuesand interests in the functioning of the Bank. Yet, this influence does not simply reflectdirect pressure from US government officials. It operates primarily through the Bank’sreliance on world financial markets, and ‘the self-reinforcing congruence between thevalues of the owners and managers of financial capital and those of the US’ (Wade 1996:35). This process of prising open capital markets in East and Southeast Asia fed into theAsian financial crisis of the late 1990s – and, as we shall see later, to mounting calls frominfluential quarters for a ‘post-Washington consensus’.
First, though, let us focus attention on how the so-called ‘Chicago Boys’ in Chile formedthe advance guard of neo-liberal market triumphalism, and how the Chilean experimenthelped shape the specific but interconnected forms of neo-liberal capitalism in key partsof the ‘advanced core’ as much as in large swathes of the ‘periphery’.
Neo-liberal D/developments
The neo-liberal ideological wave that inundated the United States following theelection of Ronald Reagan, and Great Britain under the Thatcher government …began in Chile in 1974 not simply as a set of economic measures, but rather as abroad, revolutionary ideology … In the context of violent change in politicalpower structures, it was used by the new military rulers as the requisite substancefor radical transformation of the state. (Valdés 1995: 5)
When the CIA-sponsored military coup headed by Augusto Pinochet overthrew social-ist president Salvador Allende’s government on 11 September 1973, a group of between50 and 100 Chilean economists, trained at the University of Chicago since the late 1950s,was waiting in the wings. The Chicago Boys moved quickly to dismantle Allende’s pro-gramme, and launch what was then the most radical free-market strategy anywhere inthe world. Funded by US government representatives in Chile who sought to combat‘socialist ideology’, the Chicago Boys were the product of close connections betweenconservative forces in Chile and key figures in the Department of Economics at theUniversity of Chicago (Valdés 1995).
At the height of Keynesian influence in the post-war period, the University of Chicagobecame a bastion within the walls of which neo-liberal tenets were forged. In Capitalismand Freedom (1982: vi), Milton Friedman recalled how, in the 1950s, ‘Those of us whowere deeply concerned about the danger to freedom and prosperity from the growth ofgovernment, from the triumph of the welfare state and Keynesian ideas, were a small
T H E D E V E L O P M E N T D E C A D E ? S O U T H A F R I C A , 1 9 9 4 – 2 0 0 4
20
Free
dow
nloa
d fr
om w
ww
.hsr
cpre
ss.a
c.za
beleaguered minority regarded as eccentrics by the great majority of our fellow intellec-tuals’, while his colleague Harry Johnson spoke of ‘the small band of the initiate’ who‘kept alive the understanding of the fundamental truth through the dark ages ofKeynesian despotism’ (in Valdés 1995: 60). They included the Austrian economistFreidrich von Hayek, Keynes’ right-wing rival since the 1930s, who moved to theUniversity of Chicago in 1952.
Of course, the discrediting of Keynesianism in the 1970s was bound up with broadereconomic crises, but Chicagoans contributed to the assault and marched into the breachbrandishing a version of market fundamentalism far more radical than nineteenth- andearly twentieth-century economic liberalism. They also provided direct and activesupport for their Chilean advance guard following the 1973 coup: ‘Key figures likeMilton Friedman, Hayek himself, and Arnold Harberger, a Chicago economist marriedto a Chilean who was the spiritual godfather of many of the Chicago Boys, appeared inChile, often to throw their weight behind their protégés at crucial moments’ (O’Brien &Roddick 1983: 57).
Thus, at precisely the moment that global financial arrangements were being reconfig-ured, Chile provided the testing grounds upon which neo-liberal doctrines gained trac-tion, and from which they were picked up and used in other parts of the world. Whenthe debt crisis hit in the early 1980s, IMF and World Bank economists made extensiveuse of the Chilean ‘success’ – along with the twisted interpretation of East Asian ‘mira-cles’ mentioned earlier – to set in place the harsh stabilisation and structural adjustmentpolicies of the 1980s in many other parts of Latin America and in Africa. The Chileanexperiment also played into the rise of Thatcherism and Reaganism (Valdés 1995).
The way neo-liberalism took hold in the 1980s in Aoteroa-New Zealand – one of themajor sites of Keynesian welfarism in the post-war period – is particularly interestingfrom a South African perspective, precisely because it was not imposed by the IMF andWorld Bank. In his compelling analysis of the connections between Chile and NewZealand, Len Richards (2003: 130) observes that:
Neoliberalism arrived in New Zealand, like Chile, as the result of a ‘calculated bid’to implant it, but it arrived at its destination via the Trojan Horse of the 1983–90Labour Government rather than at the point of a gun. The role of the LabourParty was crucial. The implementation of policies that attacked the very mecha-nisms of class compromise in New Zealand would probably have required …some form of dictatorship if not carried out by what is putatively the workingclass’s ‘own’ political party.
The key to ‘success’ in the introduction of neo-liberal policies in New Zealand, he pointsout, was the role played by trade union leadership in ‘the muting and pacification ofpotential organised working class resistance’ (Richards 2003: 129).
Taken together, the Chilean and New Zealand experiments offer two particularly usefulinsights into broader questions of neo-liberalism. First, neo-liberal forms of capitalism did
P O S T- A PA R T H E I D D E V E L O P M E N T S
21
Free
dow
nloa
d fr
om w
ww
.hsr
cpre
ss.a
c.za
not simply arise in the ‘core’ and spread from there to the ‘periphery’, as many observerssuppose. Instead, they are more usefully seen as the product of power-laden practices andprocesses of spatial interconnection. In addition, as Richards aptly notes, ‘It is importantto understand that the Chilean and New Zealand experiences were constituent elements in the creation of the Washington Consensus, not just formal applications of some pre-existing plan’ (2003: 128). The core-centric model of neo-liberal diffusion is closely analogous to the ‘impact model’ of globalisation mentioned earlier, both of which portrayneo-liberal globalisation in terms of inexorable technological and market forces.
Second, as Gramsci pointed out some time ago with reference to earlier forms of eco-nomic liberalism, ‘laissez-faire too is a form of State “regulation”, introduced and main-tained by legislative and coercive means’ (1971: 160). It is, he went on to insist, a politicalprogramme and not the spontaneous, automatic expression of ‘economic facts’.Experience in Chile and New Zealand makes clear how the installation of neo-liberalforms of capitalism articulates with the political structure of the state and the balance ofpolitical forces in complicated and widely varied ways.14
A third set of considerations turns around the concept of governmentality, originallyderived from Foucault and now widely deployed in some circles as an analytic constructwith which to come to grips with contemporary questions of neo-liberalism. As I havediscussed more fully elsewhere (Hart 2004), notions of governmentality are also becom-ing increasingly prominent in the Development literature, partly in reaction to therather crude top-down notions of power that inform the post-Development critique.
Governmental power, in this view, operates not through imposition or repression, butrather by cultivating the conditions in which non-sovereign subjects conduct them-selves. In addition, the concept of governmentality decisively decentres the state as amonolithic source of power, a move that opens up for examination not only diverse government agencies but also a multiplicity of other sites. The concept of governmen-tality calls for precise diagnoses of the rationalities of rule, the forms of knowledge andexpertise they construct, and the specific and contingent assemblages of practices,materials, agents and techniques through which these rationalities operate to producegovernable subjects.
In opposition to those who see neo-liberalism simply or primarily in terms of a retreatof ‘the state’ from ‘the market’ (or the economy), proponents of governmentality placeprimary emphasis on neo-liberalism ‘as promoting what might be called an autono-mization of society through the invention and proliferation of new quasi-economicmodels of action for the independent conduct of its activities’ (Burchell 1993: 274).Rather than less government, neo-liberalism, in this view, represents a new modality ofgovernment predicated on interventions to create the organisational and subjectiveconditions for entrepreneurship – not only in terms of extending the ‘enterprise model’to schools, hospitals, housing estates and so forth, but also in inciting individuals tobecome entrepreneurs for themselves. In addition, this process of ‘responsibilisation’often goes hand in hand with new or intensified invocations of ‘community’ as a sector
T H E D E V E L O P M E N T D E C A D E ? S O U T H A F R I C A , 1 9 9 4 – 2 0 0 4
22
Free
dow
nloa
d fr
om w
ww
.hsr
cpre
ss.a
c.za
‘whose vectors and forces can be mobilized, enrolled, deployed in novel programmesand techniques which encourage and harness active practices of self-management andidentity construction, of personal ethics and collective allegiances’ (Rose 1999: 176).
Fierce debates are currently raging over whether Gramsci or Foucault provides greateranalytical traction into neo-liberalism, and over whether (and, if so, how) it is possibleto combine their insights. While the scope of this paper precludes my engaging in thisdebate in any depth, other than to signal my Gramscian predilections, I do want to maketwo related points.
First, attention to technologies and rationalities of rule is undoubtedly useful but also,in my view, quite limited. O’Malley, Weir and Shearing (1997: 514) point to the dangerof governmentality studies degenerating into ‘ritualized and repetitive accounts of “gov-erning” in increasingly diverse contexts’ – a danger, they argue, that derives from the tendency to define politics in terms of mentalities of rule, to emphasise the program-matic nature of rule and to rely heavily on texts of rule. Deliberate distancing frommessy processes of implementation means that the constitutive role of contestationdrops out of sight, and what remains is an ‘insular and episodic vision of rule’ (1997:512). In the critical Development literature there is far greater attention to these messyprocesses of implementation. Li (1999), for example, distinguishes betweenDevelopment as governmental projects of rule and their actual and often precariousaccomplishment in practice (see also Moore 2000). In similar vein, Gupta draws on anethnographic study of a childcare scheme in India to illustrate ‘how governmentality isitself a conjunctural and crisis-ridden enterprise, how it engenders its own mode ofresistance and makes, meets, molds, or is contested by new subjects’ (2001: 69).
Second, while these arguments are clearly important, the question remains as to whetherand how one situates Development projects in relation to the multiple-scaled processesof capital accumulation that I am calling ‘little d’ development. Prominent neo-Foucauldian proponents of governmentality such as Nikolas Rose would strenuouslyoppose any such move, smacking as it does of Marxism. Yet, these Eurocentric analysesof neo-liberal governmentality in ‘advanced liberal democracies’ are incapable ofcoming to grips with the social dislocation and disruption that have accompanied theunleashing of neo-liberal forms of capitalism in different regions of the world, and withthe rise of an enormous array of oppositional movements.15
These and other instabilities, dislocations and struggles are crucial to grasping the resur-gence – especially since the mid-to-late 1990s – of official discourses and practices ofDevelopment, and their relationship to ‘the new imperialism’. Elsewhere, I have tracedsome key processes through which the market orthodoxy that seemed so firmlyentrenched in the early 1990s has given way to far more overtly interventionist moves tocontain disruptive tendencies, with multilateral and bilateral aid agencies activelyreasserting and extending their mission of trusteeship in the name of Development(Hart 2001). These dynamics go a long way towards explaining the paradox to whichHenry Bernstein has recently called attention:
P O S T- A PA R T H E I D D E V E L O P M E N T S
23
Free
dow
nloa
d fr
om w
ww
.hsr
cpre
ss.a
c.za
Freeing the market to carry out the tasks of economic growth for which it isdeemed uniquely suited rapidly escalated into an extraordinarily ambitious, orgrandiose, project of social engineering … Comprehensive market reform con-fronted similarly comprehensive state reform (rather than simply contraction) asa condition of the former; in turn, the pursuit of ‘good governance’ quicklyextended to, and embraced, notions of ‘civil society’ and social institutions moregenerally. In short, the terrain of development discourse and the range of aid-funded interventions have become ever more inclusive to encompass the re-shaping, or transformation, of political and social (and, by implication, cultural)as well as economic institutions and practices. (2005: 11–12)
Such considerations are also directly relevant to grappling with changes over the first tenyears of the post-apartheid order.
Unfolding post-apartheid D/developments
Now, this is, as it were, the modern part of South Africa, with your aeroplanes andyour computers and the people sitting around this room, who read and write andso on. We, all of us, we are this modern sector … So, you then have this large partof South Africa, which is relatively uneducated. It is unskilled. It is not requiredin terms of modern society. I am saying ‘required’ in the sense of employability.So, we have recognised this from the beginning, that large numbers of our peopleare poor and are in this condition. You can make the interventions we make aboutmodernisation of the economy and so on, but it wouldn’t necessarily have animpact on them, because of that degree of marginalisation. Therefore, youneeded to make different sorts of intervention.16
The media briefing by President Thabo Mbeki (from which the above extract is taken)following the Cabinet Lekgotla on 29 July 2003 is enormously significant, inaugurating(as far as I can tell) official discourses of a First and Second Economy. This dichotomyfigured prominently in the ANC’s Ten Year Review later in 2003, its manifesto for the2004 election, Mbeki’s State of the Nation address in February 2004, his opening addressto Parliament in May 2004 and a slew of statements by lesser luminaries.17 From the per-spective of what I am calling ‘big D’ Development, one of the clearest and strongestarticulations can be found in ‘Transform the Second Economy’ on the ANC Todaywebsite:
Contrary to arguments about minimal state intervention in the economy, wemust proceed on the basis of the critical need for the state to be involved in thetransformation of the Second Economy. This state intervention must entaildetailed planning and implementation of comprehensive development pro-grammes, fully accepting the concept of a developmental state.18
Retreat from the GEAR-style neo-liberal orthodoxy of the mid-1990s began several yearsearlier. Padayachee and Valodia (2001) discerned signs of ‘changing GEAR’ in the 2001
T H E D E V E L O P M E N T D E C A D E ? S O U T H A F R I C A , 1 9 9 4 – 2 0 0 4
24
Free
dow
nloa
d fr
om w
ww
.hsr
cpre
ss.a
c.za
Budget – including an economic growth strategy that suggested a retreat from theWashington Consensus, and a more interventionist stance in infrastructural develop-ment, industrial policy and labour market concerns. Over the next two years thesetrends continued. Even so, the First/Second Economy discourse, with its insistence onactive state intervention to improve the Second Economy, seems to herald a qualitativelynew phase in the post-apartheid order, at the same time as it reverts to a much olderDevelopment lexicon of a dual economy, as well as the imperatives for ‘detailed planningand implementation of comprehensive development programmes’ (ANC Today 26November 2004).
Most press commentary seems to have ranged from cautious optimism to celebration.In one of the few more critical takes, Lukano Mnyanda (Sunday Times 13 June 2004)called into question official claims that these shifts have been made possible by fiscalprudence, and cast doubt on portrayals of a structural divide between the First andSecond Economies:
The SA that used to have an economy characterised by massive inequalitieslargely mirroring racial and ethnic differences, has been transformed overnightinto one with two distinct economies, co-existing side by side. When were theyseparated, and who gains from this separation? Who belongs to which economy?Is the second economy simply a separate entity that needs to be pulled up by thefirst as an act of charity or are the linkages more profound? One can’t help but besuspicious that the talk of two economies could turn out to be nothing more pro-found than a politically convenient excuse for the failure so far to deliver on thecountry’s great challenges – to reduce poverty and unemployment.
Building on the earlier discussion of the dialectical interconnections between ‘big D’ and‘little d’ development, one can suggest several additional considerations and angles ofanalysis. From a broadly Polanyian perspective, recent shifts can be seen at least in partas an effort to contain the pressures emanating from the rise of oppositional movementsprotesting the inadequacies of service provision, the snail’s pace of land redistribution,failures to provide antiretrovirals, and the absence of secure jobs – as well as pressuresfrom within the ANC–SACP–Cosatu Alliance. As I have argued more fully elsewhere(Hart 2005), the Bredell land occupation in July 2001 signified a profound moral crisisof the post-apartheid state. Coming as it did barely a month before the WorldConference Against Racism, Bredell also fuelled a series of spectacular and highlyembarrassing protests. These, in turn, contributed to the formation of transnationalconnections, such as the Landless People’s Movement’s links with the BrazilianMoviemento Sem Terra. A year later, in August 2002, the World Summit for SustainableDevelopment (WSSD) provided a venue for extending and intensifying these protestsand connections.
In the period following the WSSD, senior government officials launched concertedattacks on the ‘ultra-left’, excoriating the ‘anti neo-liberal coalition’ and accusing it ofacting in alliance with ‘real neo-liberals’ (i.e. the Democratic Party) and foreign elements
P O S T- A PA R T H E I D D E V E L O P M E N T S
25
Free
dow
nloa
d fr
om w
ww
.hsr
cpre
ss.a
c.za
hostile to the national democratic revolution.19 Along with strenuous denials of chargesof neo-liberalism – and disciplinary threats against those in the Alliance attaching thislabel to the ANC – Mbeki and others issued a series of statements emphasising that theANC has never been socialist, and staking out a social democratic position along with arenewed emphasis on the ‘National Democratic Revolution’.20 The ‘Strategy and Tactics’document prepared for the December 2002 conference of the party describes the ANCas the ‘leader of the national democratic struggle, a disciplined force of the Left, organ-ised to conduct consistent struggle in the interests of the poor’.
The debut of First/Second Economy discourses in the middle of the following year canbe seen precisely as an effort to contain these challenges and render them subject to gov-ernment intervention. The operative question, then, is not whether the First/SecondEconomy is an accurate portrayal of reality, but rather how it is being constructed anddeployed to do political – or, perhaps more accurately, depoliticising – work. What is significant about this discourse is the way it defines a segment of society that is super-fluous to the ‘modern’ economy, and in need of paternal guidance. As Mbeki makes clearin his press statement cited earlier, those falling within this category are citizens, butsecond class. As such, they are deserving of a modicum of social security, but on tightlydisciplined and conditional terms. To qualify for a range of targeted programmes, theymust not only be identified and registered, but also defined as indigent. The role of anewly defined cadre of community development workers in tracking down ‘the indigent’and tying them into structures of social security is of great significance here, as is thegrowing emphasis on public works.
These strategies for identifying and treating a ‘backward’ segment of society provide anexplanation for the vehemence with which powerful figures in the ANC have dismissedthe Basic Income Grant (BIG). Mbeki’s response to a question about the BIG at the July2003 press conference on the Cabinet Lekgotla is quite revealing: ‘To introduce a systemof social support, which indiscriminately gives to a millionaire R100 and to this poor oldlady on a pension R100, it really doesn’t make sense.’ Charles Meth (2005: 3) has recentlytaken the president to task for this and other misrepresentations of the BIG, arguing thatuniversal grants are preferable because ‘they do not stigmatise recipients in the same waythat targeted grants do’. He also makes a compelling argument as to why a BIG is likelyto be far more effective in addressing poverty than the much-vaunted Extended PublicWorks Programme. The reason why the ANC government rejects the BIG, I suggest, isprecisely because it is a universal grant – and therefore lacks points of leverage for instill-ing in its recipients the ‘correct’ attitudes and aspirations. This consideration goes a longway towards explaining former Minister of Trade and Industry, Alec Erwin’s remark that‘the problem with the BIG is not the money but the idea’.21
It is one thing to identify the depoliticising intent of discourses of a Second Economy,and quite another to presume that such intentions are necessarily secured in practice.These discourses, I suggest, represent not so much a shift from race to class apartheid asa re-articulation of race and class that is shot through with tensions as well as possibili-ties for contestation. For example, black economic empowerment its uneasily astride the
T H E D E V E L O P M E N T D E C A D E ? S O U T H A F R I C A , 1 9 9 4 – 2 0 0 4
26
Free
dow
nloa
d fr
om w
ww
.hsr
cpre
ss.a
c.za
discursive divide between the First and Second Economies, serving to underscore thedeeply conservative character of post-apartheid race–class articulations. In addition,precisely because the notion of a Second Economy carries with it the implications ofsecond-class citizenship, it becomes vulnerable in terms of the ANC’s own invocation ofits position as the standard-bearer of the national democratic revolution.
In these and other ways, what James Ferguson (1990) termed the ‘anti-politics machine’of Development could become part of a revitalised politics to press for greater economicjustice to realise the promises of democracy. Whether and to what extent these possibil-ities are realised in practice will hinge crucially on the capacity of popular movementsand critical forces within the Alliance to forge connections with one another.
Notes
1 For constructive comments and criticisms, I am grateful to Henry Bernstein, Vishnu Padayachee,
David Szanton and other participants at the conference on ‘Reviewing the First Decade of
Development and Democracy in South Africa’, Durban, 21–22 October 2004. Thanks also to
Saul Wainwright for excellent research assistance in preparing this paper.
2 For an incisive analysis of the establishment of the Development Bank of Southern Africa in the
1980s, as part of an effort by apartheid state officials to ‘depoliticise development in the interests
of neutrality, professionalism and technical competence’, see Sharp (1988).
3 One can take Polanyi to task on a number of points, while also recognising the power and
contemporary salience of his analysis – see, for example, Burawoy (2003), Silver & Arrighi
(2003) and De Angelis (2004) for recent engagements with Polanyi within a broadly Marxist
lineage.
4 ‘British and French officials both thought that the solution to the social problem [of the
emergence of a militant urban working class] lay in European knowledge of how to manage a
working class. They began to separate out a compact body of men who would benefit from
improved urban housing and resources and higher pay, who would acquire an interest in a
specific career line, and who would bring their families to the city and become socialized and
acculturated to urban life and industrial labor over generations. Officials thought trade unions
would not only mold grievances into defined categories to which employers would respond, but
that they would provide institutions through which workers would feel socially rooted in the
city.’ (Cooper 1997: 74)
5 For an interesting take on import substitution industrialisation, see Maxfield & Nolt (1990).
Friedmann (1982) provides a brilliant analysis of the global structure of grain production and
distribution, and its breakdown in the late 1960s and early 1970s.
6 He notes, for example, that ‘The August 1971 decision to “close the gold window” meant that the
US was no longer subject to the discipline of having to try to maintain a fixed par value of the
dollar against gold or anything else; it could let the dollar move as the US Treasury wished and
pointed towards the removal of gold from international monetary affairs. It thus moved the
world economy on to a pure dollar standard’ (Gowan 1999: 19–20). As John Williamson (of
Washington Consensus fame) put it, ‘the central political fact is that the dollar standard places
P O S T- A PA R T H E I D D E V E L O P M E N T S
27
Free
dow
nloa
d fr
om w
ww
.hsr
cpre
ss.a
c.za
the direction of the world monetary policy in the hands of a single country, which thereby
acquires great influence over the economic destiny of others’ (in Gowan 1999: 20).
7 The denomination of oil in terms of dollars is, of course, one of the key reasons why the US is
able to run huge deficits with the rest of the world.
8 For example, during the debt crisis of the early 1980s, the capital outflow from Argentina,
Mexico and Venezuela has been estimated at $58.8 billion (Gowan 1999: 35).
9 While borrowing from Wall Street was both easy and economically rational in the conditions of
the 1970s, borrowing governments failed to grasp that the entire macroeconomic framework
could be transformed by ‘political decisions about the dollar price and interest rates of the US
government transmitted through the world economy by the DWSR [Dollar Wall Street Regime]’
(Gowan 1999: 48 italics in original).
10 This is the term used by both Biehl (2000) and Harvey (2003). Indeed, Harvey draws directly on
Gowan in his analysis of how the shift from the Bretton Woods regime to the Wall Street/US
Treasury/IMF regime has served as a ‘formidable instrument of economic statecraft to drive
forward both the globalization process and the associated neoliberal domestic transformations’
(Harvey 2003: 129).
11 For an analysis of shifts in South Africa’s international financial relations from 1970 to 1990, see
Padayachee (1991).
12 See, for example, Balassa (1981) and Krueger (1981).
13 They include Amsden (1989), Wade (1990), Castells (1992) and Evans (1995). Yet, as Gore
(1996) has argued, the construction of East Asian debates in terms of ‘states versus markets’ fails
to recognise how East Asian strategies ‘are based on an explanatory framework which analyses
national patterns and processes within a global context, and a nationalist normative framework
which seeks national economic development through rapid industrialization’ (Gore 1996: 78).
14 In drawing on Gramsci to come to grips with Thatcherism, Stuart Hall (1988) made a very
similar point.
15 At the risk of oversimplifying, one can point to the so-called IMF bread riots in the 1980s in the
many parts of Africa and Latin America that were subjected to harsh stabilisation and structural
adjustment measures; the myriad environmental movements fighting against the destruction of
nature; struggles unleashed by the privatisation of water and other basic services; the rise of
militant land movements such as the Moviemento Sem Terra in Brazil; and, of course, the anti-
capitalist/anti-globalisation movements that burst onto the international stage in Seattle in 1999.
In addition, as Paul Lubeck (2000), Michael Watts (2003) and others have suggested, the rise of
Political Islam understood as an ‘anti-systemic movement’ is intimately linked with the crisis of
the secular nationalist Development project. Elements of this crisis include what Watts calls the
‘decrepit rentier capitalism’ associated with the oil boom; the petro-bust of the mid-1980s that
brought IMF/World Bank-led austerity and neo-liberal reforms crashing down on a number of
Middle Eastern and West Asian states; and the complex geopolitics of the region: ‘The historical
confluence of these powerful forces – all saturated with an American presence in the form of oil
companies, global regulatory institutions, foreign investment, and military commitments –
crippled, one might say destroyed, a secular nationalist project that was, in any case, of shallow
provenance’ (Watts 2003: 65).
T H E D E V E L O P M E N T D E C A D E ? S O U T H A F R I C A , 1 9 9 4 – 2 0 0 4
28
Free
dow
nloa
d fr
om w
ww
.hsr
cpre
ss.a
c.za
16 <www.info.gov.za/speeches/2003/03080511461001.htm> Accessed 30 June 2004.
17 For documentation, see the references provided by the South African Regional Poverty Network
<www.sarpn.org.za/documents/d0000830/index.php> Accessed 30 June 2004.
18 <www.anc.org.za/ancdocs/anctoday/2004/text/at47.txt> Acessed 19 December 2004.
19 In September 2002, the Political Education Unit of the ANC issued a document entitled
Contribution to the NEC/NWC Response to the ‘Cronin Interviews’ on the Issue of
Neoliberalism; see also Dumisani Makhaye, Left Factionalism and the NDR: The ANC must
Respond to Professionals of the ‘Left’ <www.anc.org.za/ancdocs/anctoday/docs/
atsup021129.htm>.
20 For an insightful discussion of how critiques from the left were sidelined at the national
conference, see William Mervin Gumede, Who Would Dare Lean to the Left Here? (Sowetan
23 December 2002); and for a clear statement of the disciplining of the left, see Dumisani
Makhaye, Left, Right in Combat (Sowetan 19 December 2002).
21 Mentioned by Francie Lund, in a debate on the BIG at the University of Natal, Durban,
31 October 2002.
References
Amsden A (1989) Asia’s next giant: South Korea and late industrialization. New York: Oxford
University Press.
Arrighi G, Hopkins T & Wallerstein I (1989) Antisystemic movements. London: Verso.
Baer W (1983) Import substitution and industrialization in Latin America: Experiences and
interpretations, in M Todaro (ed.) The struggle for economic development. New York: Longman.
Balassa B (1981) The newly industrializing countries in the world economy. New York: Pergamon Press.
Barry A, Osborne T & Rose N (eds.) (1996) Foucault and political reason: Liberalism, neoliberalism
and the arts of government. Chicago: University of Chicago Press.
Bernstein H (2005) Development studies and the Marxists, in U Kothari (ed.) A radical history of
Development Studies: Individuals, institutions and ideologies. London: Zed Books.
Biehl R (2000) The new imperialism: Crisis and contradictions in North–South relations. London:
Zed Books.
Burawoy M (2003) For a sociological Marxism: The complementary convergence of Antonio
Gramsci and Karl Polanyi, Politics and Society 31: 193–261.
Burchell G (1993) Liberal government and techniques of the self, Economy and Society 22: 267–82.
Castells M (1992) Four Asian tigers with a dragon head: A comparative analysis of the state,
economy, and society in the Asian Pacific Rim, in R Appelbaum & J Henderson (eds.) States and
development in the Asian Pacific Rim. Newbury Park, CA: Sage.
Cooper F (1997) Modernizing bureaucrats, backward Africans, and the development concept,
in F Cooper & R Packard (eds.) International development and the social sciences: Essays on the
history and politics of knowledge. Berkeley: University of California Press.
Cowen M & Shenton R (1996) Doctrines of development. London: Routledge.
P O S T- A PA R T H E I D D E V E L O P M E N T S
29
Free
dow
nloa
d fr
om w
ww
.hsr
cpre
ss.a
c.za
De Angelis M (2004) Separating the doing and the deed: Capital and the continuous character of
enclosures, Historical Materialism 12: 57–87.
Escobar A (1995) Encountering development: The making and unmaking of the Third World. Princeton,
NJ: Princeton University Press.
Evans P (1995) Embedded autonomy: States and industrial transformation. Princeton, NJ: Princeton
University Press.
Ferguson J (1990) The anti-politics machine: ‘Development’, depoliticization, and bureaucratic power in
Lesotho. Cambridge: Cambridge University Press.
Foucault M (1991) Governmentality, in G Burchell , C Gordon & P Miller (eds.) The Foucault effect:
Studies in governmentality. Chicago: University of Chicago Press.
Friedman M & Friedman R (1982) Capitalism and freedom. Chicago: University of Chicago Press.
Friedmann H (1982) The political economy of food: The rise and fall of the post-war international
food order, American Journal of Sociology 88: 248–286.
Gelb S (1991) South Africa’s economic crisis: An overview, in S Gelb (ed.) South Africa’s economic
crisis. Cape Town: David Philip.
Gore C (1996) Methodological nationalism and the misunderstanding of East Asian
industrialization, European Journal of Development Research 8: 77–122.
Gowan P (1999) The global gamble: Washington’s Faustian bid for world dominance. London: Verso.
Gramsci A (1971) Selections from the prison notebooks. London: Lawrence & Wishart.
Gupta A (2001) Governing population: The integrated child development services in India,
in T Hansen & F Stepputat (eds.) States of imagination: Ethnographic explorations of the
postcolonial state. Durham, NC: Duke University Press.
Hall S (1988) The hard road to renewal: Thatcherism and the crisis of the left. London: Verso.
Hart G (2001) Development debates in the 1990s: Culs-de-sac and promising paths, Progress in
Human Geography 25: 605–14.
Hart G (2002a) Development/s beyond neoliberalism? Power, culture, political economy, Progress in
Human Geography 26: 812–22.
Hart G (2002b) Disabling globalization: Places of power in post-apartheid South Africa. Berkeley:
University of California Press.
Hart G (2004) Geography and development: Critical ethnographies, Progress in Human Geography
28: 91–100.
Hart G (2005) Denaturalising dispossession: Critical ethnography in the age of resurgent
imperialism, in Centre for Civil Society From local processes to global forces. Research Reports
Volume 1. Durban: University of KwaZulu-Natal.
Harvey D (2003) The new imperialism. Oxford: Oxford University Press.
Johnson C (1982) MITI and the Japanese miracle: The growth of industrial policy, 1925–75. Stanford,
CA: Stanford University Press.
T H E D E V E L O P M E N T D E C A D E ? S O U T H A F R I C A , 1 9 9 4 – 2 0 0 4
30
Free
dow
nloa
d fr
om w
ww
.hsr
cpre
ss.a
c.za
Kitching G (1982) Development and underdevelopment in historical perspective. London: Methuen.
Krueger A (1981) Loans to assist the transition to outward-looking policies, The World Economy 4:
271–82.
Li T (1999) Compromising power: Development, culture, and rule in Indonesia, Cultural
Anthropology: Journal of the Society for Cultural Anthropology 14: 295–322.
Lubeck P (2000) The Islamic revival: Antimonies of Islamic movements under globalization,
in R Cohen & S Rai (eds.) Global social movements. London: Athlone.
Maxfield S & Nolt J (1990) Protectionism and the internationalization of capital: US sponsorship of
import substitution industrialization in the Philippines, Turkey, and Argentina, International
Studies Quarterly 34: 49–81.
Meth C (2005) Ideology and social policy: ‘Handouts’ and the spectre of ‘dependency’,
Transformation 56: 1–30.
Moore D (2000) The crucible of cultural politics: Reworking ‘development’ in Zimbabwe’s Eastern
Highlands, American Ethnologist 26: 654–89.
O’Brien P & Roddick J (1983) Chile, the Pinochet decade: The rise and fall of the Chicago Boys.
London: Latin American Bureau.
O’Malley P, Weir L & Shearing C (1997) Governmentality criticism, politics, Economy and Society 26:
501–17.
Padayachee V (1991) The politics of South Africa’s international financial relations, 1970–1990,
in S Gelb (ed.) South Africa’s economic crisis. Cape Town: David Philip.
Padayachee V & Valodia I (2001) Changing Gear? The 2001 budget and economic policy in South
Africa, Transformation 46: 71–83.
Polanyi K (1944) The great transformation, 2001 edition. Boston, MA: Beacon Press.
Richards L (2003) Class struggle and travelling theory: From the Chile experience to the New
Zealand experiment, New Zealand Sociology 18: 115–34.
Rose N (1999) The powers of freedom. Cambridge: Cambridge University Press.
Sachs W (ed.) (1992) The development dictionary: A guide to knowledge as power. London: Zed Books.
Sharp J (1988) Two worlds in one country: ‘First World’ and ‘Third World’ in South Africa,
in E Boonzaier & J Sharp (eds.) South African keywords: The uses and abuses of political concepts.
Cape Town: David Philip.
Silver B & Arrighi G (2003) Polanyi’s ‘double movement’: The belles époques of British and US
hegemony compared, Politics and Society 31: 325–55.
Valdés J (1995) Pinochet’s economists: The Chicago School in Chile. Cambridge: Cambridge University
Press.
Wade R (1990) Governing the market: Economic theory and the role of government in East Asian
industrialization. Princeton: Princeton University Press.
P O S T- A PA R T H E I D D E V E L O P M E N T S
31
Free
dow
nloa
d fr
om w
ww
.hsr
cpre
ss.a
c.za
Wade R (1996) Japan, the World Bank, and the art of paradigm maintenance – The East Asian
miracle in political perspective, New Left Review 217: 3–36.
Watts M (2001) 1968 and all that, Progress in Human Geography 25: 157–88.
Watts M (2003) Development and governmentality, Singapore Journal of Tropical Geography 24: 1–35.
Wood R (1986) From Marshall Plan to debt crisis: Foreign aid and development choices in the world
economy. Berkeley: University of California Press.
T H E D E V E L O P M E N T D E C A D E ? S O U T H A F R I C A , 1 9 9 4 – 2 0 0 4
32
Free
dow
nloa
d fr
om w
ww
.hsr
cpre
ss.a
c.za
3 Development theories, knowledge production and emancipatory practice
Dani Wadada Nabudere
Introduction
Development theory can now be declared dead but not yet buried. It can be declareddead because it has been a mismatch between theory and practice, wherever it has beenapplied. It is not yet buried because its ghosts still linger on in abstruse policy declara-tions by those forces that stand to gain most through its perpetuation in their ‘develop-ment projects’. It is now widely acknowledged that development theory rose but then fellbecause, as Colin Leys noted, its practical ambitions had, over the years, been increas-ingly reduced (Leys 1976; see also Norgaard 1994; Hettne 1995; Nabudere 1997; Arif2002). In its trails of failed applications, it has left behind it skeletons of developmentexperiences that were never replicated according to the evolutionist conceptions ofsociety upon which these theories were constructed.
These theories were based on misconceptions about human behaviour and the diversehuman capacity to implement programmes that were supposed to be for their good,based as they were on sound scientific understanding of their societies and cultures bythose who knew about them from outside. In fact, the very idea that the peoples ofAfrica, the Near East, Asia and Latin America knew what was good society, was dismissed as being an illusion, since these others were judged by European modernity tobe incapable of self-rule or progressive action. All these societies were thought capableof was despotism. As the late Palestinian scholar Edward Said (1992), has observed of theEuropean understanding of the ‘Orient’, the issue of Orientalism as a category of under-standing of the other arose in the context of the attempt by European imperialism todislodge and disorient the ‘Orients’ in order to control the production of knowledgeabout them and then exercise power over them.
Said goes on to observe that the supremacy that Britain assumed over Egypt was seen interms of British knowledge of Egypt. Initially, the British were not concerned principallywith military or economic power over Egypt, but their knowledge of the ‘Orients’ was aform of power. The second theme was for the British to rise above immediacy, beyondself, into the foreign and distant. Here the importance of having such knowledge aboutthe distant other was to be able to dominate it and exert authority over it. In effect, thismeant denying autonomy over the object of domination since its existence was onlyrecognised inasmuch ‘as we know it’ (Said 1992; 1994).
Thus, it is not surprising that the first discourse and discipline of knowledge ofthe colonisers about the distant others was Orientalism. Then came anthropology, a
33
Free
dow
nloa
d fr
om w
ww
.hsr
cpre
ss.a
c.za
discipline dedicated to the study of ‘primitive societies’ in Africa and the Americas.Development theories are an evolution of these two disciplines. In their turn, these theories were a summation of the Western worldview in their self-conception and ‘devel-opment’ experience. The theories are derived from a large stock of information drawnfrom Western countries, which include their traditions, ethnic structures, populations,manners, behaviours, economic conditions and lifestyles, which were assumed to be‘universal’ in their essence (Arif 2002).
The problem with this development experience, however, was that when the theories onwhich the experience was based came to be exported to non-Western societies, the localconditions were ignored. This arose out of the fact that Western theorists believed thatsince the model was a ‘scientific’ one, it reflected a universal human experience, whichcould be replicated elsewhere. In other words, if the conditions were not the same asthose of Europe, then those non-Western, ‘backward’ conditions had to be changed inorder to accord with the Western conditions. In this case, it was argued that the experi-ences of these other countries did not count as a distinct scholarly category from whichtheories of development could be drawn (Arif 2002). In short, the experiences of theAsian, African and native Americans were regarded as incapable of producing reliableknowledge on their own, but the Western experience, since it was based on a sound scientific-knowledge base, was supposed to be applicable universally because it could betested and empirically observed in practice.
The impasse of development theory that later came to be acknowledged did not, there-fore, spring from its supposed weaknesses, but from the core of the theory itself (Booth1985). The impasse, according to Booth, arose out of a widespread disillusionment withconventional development and development failures. It also arose out of the crisis andeventual eclipse of socialism as an alternative path, the growing economic diversity ofcountries within the Third World, the increasing concern with the need for environ-mental sustainability, the increasing assertiveness of voices from below, and the rise ofthe post-modern challenge to the universalising theories and conventional practices ofdevelopment. This then proved that the universalising of Western experience and itsapplication to other societies was in itself a myth and a superstition of a similar natureto those of that Max Weber attributed to traditional societies. The failure proved thatwhat was required was the recognition of the knowledge that existed in other humanconditions as constituting a good basis for social transformation and development intheir own contexts.
Knowledge production as a form of commodity production
Dead but not buried
However, it is not so simple to dismiss this Western experience out of hand, because itrepresents a political, military, economic and social system that is increasingly beingreferred to under different labels and names, such as globalisation, global village orCoca-Cola culture. This is why I began by saying that although development theory is
T H E D E V E L O P M E N T D E C A D E ? S O U T H A F R I C A , 1 9 9 4 – 2 0 0 4
34
Free
dow
nloa
d fr
om w
ww
.hsr
cpre
ss.a
c.za
pronounced dead, it is yet to be buried and the effects of its roving ghosts can havefateful consequences. Within these new conceptual and theoretical labels is implied asystem of theory that is put under different guises, such as structural adjustment, policydialogues, humanitarian assistance, pre-emptive intervention and millennium develop-ment programmes. There is a line of connection between these new formulations andthe previous theories of development. Hence, it is important to comprehend how thesystem came about and how it operates under conditions of crisis. This gives us an ideaof how it continuously manages to frustrate alternative paths of human endeavour andtransformation in order to remain dominant and able to manufacture new knowledge.
Extroversion of knowledge production
Paulin Hountondji (2002: 26) has argued that Third World countries, especially in Africa,‘are tied hand and foot to the apron strings of the West [through the] logic of extrover-sion’. This extroversion, according to him, arose because the European colonisers did notrecognise that Africa was capable of developing on its own. According to Basil Davidson(1992), no African peasant society was thought by the European colonisers to have anydevelopment potential at all. The modernised African elite also bought the lie and con-tinues to argue, on behalf of the colonisers and on their own behalf, that for Africa todevelop it has to emulate the Western experience.
Modernisation, therefore, implied a process of colonisation and this, in turn, implied theneed for a theoretically articulated and well-planned strategy of colonisation by abureaucracy that the previous mercantilist imperialism did not have. This strategy of the‘civilising mission’ went straight to the destruction and abolition of existing African reli-gions, philosophies and institutions of governance as well as the economy. In their place,a new system of ‘scientific knowledge and modern production’ was installed for the pur-poses of domination.
In the field of knowledge production, it sought to silence local voices for the purposes ofexerting control over resources. The process of extroverting knowledge production forthe sake of extroverting its resources to the European centres was begun. This is where theresources could be processed and produced as final products. According to PaulinHountondji (2002), the manner in which that activity was introduced into Africancolonies by Europe ensured that all knowledge production would be carried out inEurope. Africa was to be used as a ‘data collection outpost’ of research centres. However,the decisive stage of interpreting that raw data – the theoretical processing of the data –was undertaken elsewhere, in the capitals of Europe:
[T]he one essential shortcoming of scientific activity in the colonies was the lackof this intermediate stage. We missed the central operation of theory-building.We only had the first and third stages of the process: (i) the data collection, thefeverish gathering of all supposed useful information, and (ii) a partial, occa-sional and limited application of the research outcome to some local issues.The medium stage took place in the so-called ‘mother country,’ the colonial
D E V E L O P M E N T T H E O R I E S
35
Free
dow
nloa
d fr
om w
ww
.hsr
cpre
ss.a
c.za
metropolis. The data collection was immediately exported to laboratories orresearch centres in the ruling countries … for theoretical or experimental pro-cessing and interpretation. The colony itself lacked laboratories and other facili-ties necessary for basic research; it even lacked universities, or, when it had any,they were so poorly developed that they could only promote, at best, the proto-theoretical procedures necessary to enlighten the data-collection process, and thepost-theoretical procedures necessary for applied research in its final stages.(Hountondji 2002: 27–8)
Hountondji adds that besides centres in the metropoles, specifically designed foranalysing raw data collected from the colonies, there was also the institutional frame-work of colonial science, which included the whole educational system in the colonies.For example, the University of Dakar in Senegal was created during this period to bringin students from French West Africa, and also from French Equatorial Africa, for thepurposes of instruction. This is the same role that Makerere College in Kampala,Uganda, fulfilled for the British colonial powers in Uganda, Kenya and Tanganyika.Thus, right from the word go, the colonial production enterprises were controlled fromthe centres of metropolitan Europe. Hountondji bemoans the fact that this science andresearch activity conducted in the colonies was nothing like an endogenous initiative,but this was not its purpose, as he himself points out.
Hountondji points to the three stages in knowledge production and notes that Africaplayed a part in only two: the first and the third. The first was concerned with datacollection, and here the colonies played the role of providing the raw data fromprimary field investigations on crops and soils. This feverish phase of collectinguseful information was crucial for the second phase, from which Africans wereexcluded. This was the stage of analysis of the raw data. This phase took place in themother country, and in the Academy, where the data was sent to the laboratories orresearch centres for theoretical and experimental processing and interpretation,analysis and documentation.
The third phase was limited to the interests of the mother country, but Africa occasion-ally had the benefit of a partial and limited application of the results of the research tolocal institutions in the form of training and use in production, but always under thecoloniser’s control. This, according to Hountondji, produced a ‘colonial pact’ underwhich the colonies did not consume what they produced. The products were intendedfor export to the mother country. Economic activity was ‘extroverted’ and the Africanscholars who were socialised in this form of knowledge production were co-opted sothat what we call the brain drain today is but an expression of this overall functioningof world scientific endeavour (Hountondji 2002).
Commodity production and knowledge production
Using Louis Althusser’s concept of knowledge production as a specific kind of economiccommodity production activity, Hountondji also argues that what happened in the area
T H E D E V E L O P M E N T D E C A D E ? S O U T H A F R I C A , 1 9 9 4 – 2 0 0 4
36
Free
dow
nloa
d fr
om w
ww
.hsr
cpre
ss.a
c.za
of knowledge production was actually part and parcel of the production of materialgoods, as well as being in the intellectual and cultural arenas:
This theoretical vacuum was substantially the same as the industrial vacuum thatused to characterise economic activity. Countries under colonial dominationserved primarily, as we well know, as sources of raw materials and incidentally asnew markets for the finished products of the metropolitan industry. The rawmaterials produced locally through mining and agriculture were exported to beprocessed in the factories in the ruling country, partly for its own consumptionand partly for re-export as finished products. Historians of colonisation call thismode of production the ‘Colonial Pact’. (Hountondji 2002: 28)
This entire process was based on the control of knowledge production, both at the centreand at the periphery of the system, which constituted the colonial pact. From the pactarose what Hountondji calls the extroversion of African knowledge production and eco-nomic activity. Africa lost the independence to produce its own knowledge to serve itsown economy, but this process did not end with the colonial pact. It was introverted andinternalised by the African elite in post-colonial Africa who continued the colonial pactin their own interest and that of their former masters. This explains the brain drain andthe extroversion of large amounts of funds that are stolen by the African elite to followthe colonial pact, which in turn partly explains Africa’s lack of transformation and devel-opment. According to some estimates, currently the African political and economicelites have extroverted 40 per cent of African financial wealth to the developed world,while Asia has only 3 per cent of its financial resources outside its countries.
Modernisation and development theories
Political development
Development theory was an aspect of this extroversion and introversion. To be sure, itcame clothed with new needs and new demands arising out of the developments in thecrisis of colonialism, which included the way the colonial powers were to deal with thecrisis of decolonisation. Already in the 1920s, and arising out of the colonial experience,the British imperial power had put in place colonial development programmes intendedto orient the colonies to new forms of production to meet the empire’s needs after WorldWar I. What came to be subsumed under the theory of political development was in facta developmental paradigm based on state intervention to promote ‘development’ and‘nation building’ in the colonies. This is what Low and Lonsdale called the ‘innovatorypaternalism of the second colonial occupation’ (1976: 3). According to the two authors,this paradigm had its origin in the great World Depression and the West Indies riots of1938, which had resulted in the crystallisation of a new set of attitudes to Britain’sdependent empire.
This was a new order, which arose out of the struggles of the colonial peoples for inde-pendence after World War II, and was not motivated by the need for development of the
D E V E L O P M E N T T H E O R I E S
37
Free
dow
nloa
d fr
om w
ww
.hsr
cpre
ss.a
c.za
colonies as such. It was to facilitate a political development in the image of the colonialpowers such as democratisation, political mobilisation, secularisation, nation building,administrative and legal development and equality (Leys 1996). These rights had beendenied before and they were now being introduced as part of a wider empire reformagenda, which necessitated the importation into the colonies of large numbers of colo-nial technocrats to manage the change from direct colonialism to a neocolonial orderthat would continue to extrovert Africa’s resources under multilateral imperialism underUS hegemony. The strategy was also intended to contain communism and radicalnationalism.
There were two other considerations. The first was the conclusion that new ‘nations’would require large human and economic investments before they could be consideredfit for self-government and independence. The second was that, as far as the British wereconcerned, there was a belief that as Africans became more ‘detribalised’, the state wouldhave to assume the social welfare functions formerly performed by the tribal social secu-rity systems. It was to this end that the Development and Welfare Act of 1940 was passedby the British Parliament, and through which state investments were made in thecolonies in the form of ten-year development plans drawn up by the new class ofbureaucrats under the new ‘colonial occupation’. The French enacted similar legislationand structures for their own colonies.
This political development propelled by the British and French was soon joined by mod-ernisation theories worked out by a new US modernisation school. These theories alsoemerged out of the need by the US to extend its influence in the former Europeancolonies. This was, in fact, a third colonial occupation crafted under President HarryTruman’s ‘Four Point’ policy outlined in the International Development Act of 1950,under which the US stipulated that ‘foreign assistance’ would be one of the cornerstonesof US foreign policy to enable the new nations to improve their conditions of living.New schools and disciplines emerged to back up these US foreign policy frameworks inthe context of the Cold War, and WW Rostow’s (1960) The Stages of Economic Growth:A Non-Communist Manifesto, which tried to counterbalance the Marxist five modes ofproduction, was part of the ideological baggage to back up the new approach.
According to Richard Higgot, modernisation arose out of the success of industrial soci-eties in overcoming major economic problems and severe inequalities. This led to a sensein which issues were seen in technical terms and were regarded as being solved withgrowing technological expertise. They were not viewed as problems of major philosoph-ical or normative implications. All that was needed was to improve the techniques. Withvictory over fascism in Europe, the liberal democracy project also appeared assured:
Advanced industrial Western society was established as the good society to whichthe colonial peoples could be steered by a process of guidance and diffusion. Thisbackground is particularly important for the growth of the study of developingcountries. It is against such a background that modernisation was seen. (Higgot1983: 15)
T H E D E V E L O P M E N T D E C A D E ? S O U T H A F R I C A , 1 9 9 4 – 2 0 0 4
38
Free
dow
nloa
d fr
om w
ww
.hsr
cpre
ss.a
c.za
Modernisation was seen as a process of change towards those types of social, economicand political systems that had developed in Western Europe and North America betweenthe seventeenth and nineteenth centuries and then spread to other European countriesand, in the nineteenth and twentieth centuries, to the South American, Asian andAfrican continents. Borrowing from the nineteenth-century evolutionary theorists, ascheme was built up based on comparisons of ideal–typical variables of tradition andmodernity. The American political science discipline built its modernisation theories on this basis and one of the leading lights in this field, Gabriel Almond, applying behaviourist approaches, improved on the dichotomy created by Max Weber betweentradition and modernity by constructing models of traditional and modern forms ofsociety and polity (Higgot 1983: 16; see also Eisenstadt 1966; Almond et al. 1973).
US modernisation theory and social change
Thus, based on this dualistic sociological ‘grand theory’ of modernity and tradition, theUS Social Science Research Council, which promoted the project on comparative poli-tics under Almond’s leadership between 1945 and 1963, tried to promote a model basedon US liberal democracy and ideology and export it to the rest of the formerly colonisedworld. The economists tried to develop their own models, such as Rostow’s on ‘stages of growth’, also based on the same evolutionary theories, and other models based on the-ories of development and the ideology of developmentalism. What was worse was thatthe Weberian dichotomy between tradition and modernity was based on a false charac-terisation of tradition as being pre-state, pre-rational and pre-industrial. However, verysoon, this false dichotomous approach and characterisation was questioned along withthe false optimis of the 1950s on which it was erected. This questioning exposed the falsethesis that the transition from tradition to modernity was purely a technical problem.The optimism disappeared with the growing disillusionment over the actual perform-ance of new states in the post-independence period:
In the mid-1960s it was recognised that simplistic attempts to classify societies interms of certain pattern variables is unacceptable as a form of analysis. Equallyunacceptable was the assumption that the advance from tradition to modernitywould be a simple linear progression. (Higgot 1983: 18)
Still, this questioning did not go to the root of the matter about the need to look at ‘tradition’ as a basis for the non-European countries’ own programmes of social trans-formation. The challengers of the theory, such as Samuel Huntington, instead craftednew theories aimed at creating ‘order’ and ‘stability’ for Third World regimes threatenedby social upheavals by liberation movements in Asia, Africa and Latin America. TheIndo-Chinese war was at its height and the Cuban revolution had just taken place. Theobjective of Huntington’s (1968) Political Order in Changing Society was, therefore, todeal with this new situation.
Huntington rejected the notion of political development that was advanced by Britishorthodoxy. Instead, he advanced a new concept, which he called ‘social change’, as a
D E V E L O P M E N T T H E O R I E S
39
Free
dow
nloa
d fr
om w
ww
.hsr
cpre
ss.a
c.za
controlled process that at the same time would ensure that the new countries did notslide into ‘political decay’, by which he meant a state of unrest, violence, corruption andmilitary coups. It was a concern for the need for order and stability in the new nationsthreatened by new anti-colonial movements influenced by socialist ideology. Thisunrest, in his view, was caused in part by the earlier optimism created by the politicaldevelopment theories, which advocated rapid economic development. This did nothappen and, therefore, the correct response to the new situation was to ensure the main-tenance of order and stability of the institutions of the new states with liberal-mindedleaders, so that they could impose their will on their societies. As Higgot (1983)observed, this was a transition from democracy as a value to order as a value. Even then,he argued, the countries that exhibited a more rapid growth were not politically stable,whereas those with the lowest per capita incomes were more stable.
Thus, modernisation theory dealt a blow to political development theory based onthe idea that new African states could develop on a democratic basis. What Hunting-ton suggested became the basis of US government counter-insurgency policy in Indo-China. His solution was to embark on a special form of development based on‘forced-draft urbanisation and modernisation, which rapidly brings the country inquestion out of the phase in which rural revolutionary movements can hope to gen-erate sufficient strength to come to power’ (Huntington 1968: 650). Thus, the mod-ernisation theorists stumbled on a contradictory situation for political developmentin the new nations, never faced by the earlier European modernisation experience.David Apter pointed out this contradiction when he observed that whereas in theearlier European phase modernisation created activities of an integrative kind byvirtue of the need for multiple sources of information and a systems’ tendencytowards some form of democracy, in the post-modernist period in which the newnations appeared, the tendency, on the contrary, was towards coercion (1968). In thisphase, modernisation requires governments to organise and integrate the varioussectors of the community instead of this being left to the social process. Apter con-cluded that:
If this assumption is correct, the transition to industrialisation requires an excep-tionally well organised political system able to maintain a high degree of control.It is because the problem is so complex that I suggest that high control systemsare necessary to make the transition to industrialisation. (Apter 1968: 334)
The modernisation theorists of the post-colonial period agreed on one thing – democ-racy was incompatible with post-modernist economic development. Authoritarian rulewas needed to speed up industrialisation and, thereafter, according to Apter, there wouldbe a need for greater decentralisation of high control systems. What was required was acontrolled and ‘forced-draft urbanisation and modernisation’ that would ensure orderand stability in the new states. This implied authoritarian rule, which became charac-teristic of the US drive against communism in the Third World countries where militarydictators were backed so long as they defended ‘freedom’ made in America.
T H E D E V E L O P M E N T D E C A D E ? S O U T H A F R I C A , 1 9 9 4 – 2 0 0 4
40
Free
dow
nloa
d fr
om w
ww
.hsr
cpre
ss.a
c.za
Under these conditions, it is not surprising that in the post-structural-adjustmentperiod, reliance on economic globalisation has been placed in the hands of the so-called‘new breed’ of leaders such as those in power in Uganda, Ethiopia, Rwanda and else-where. They can run one-party states under different guises without being challenged bythe West because they stand for order and stability in their countries, which foreigndirect investment needs for the economic globalisation process to succeed. So long asthese leaders pursue ‘modernisation’ under the new conditions of globalisation, they arerewarded by the multilateral institutions and the donor community in general. This iswhy authoritarian rule seems to be a necessary consequence of later capitalism.
Policy dialogue and structural development
Reform without development theory
Faced with the failure of the development programmes advocated by the donor com-munity, the World Bank and the International Monetary Fund (IMF), the two multilat-eral institutions, published a number of reports in the early-to-mid 1990s in which theyadvised governments to begin to reform and eventually to restructure their economiesand institutions according to new prescriptions. The first strategy they adopted waswhat they called ‘policy dialogue’, which meant a new orientation in the economic poli-cies of African governments towards free markets. Under the new approach and in thisnew direction, they encouraged the production of cash crops for export in the hope thatthis strategy would enable African countries to increase their foreign exchange earningsto repay their growing external debts; but the terms of trade increasingly worsened forthe African countries, partly because monopoly pricing of industrial products under-mined the purchasing power of Africa’s agricultural exporters.
These adverse terms of trade resulted in a fall in Africa’s capability to purchase foreigngoods and services for their projected development. Between 1973 and 1981, low-income African countries lost as much as 23 per cent of their purchasing power throughlow prices paid for their primary products. This performance fell further to the lowestpost-war level in 1982 and subsequent years. This worsening economic situation becamea further basis for the World Bank to exert pressure on African governments to engagein ‘policy reform’.
Under pressure from the Reagan administration to force a restructuring of the ThirdWorld, the Bank pushed through a series of policies that were contained in the fivemajor reports on Africa referred to earlier. These reports introduced new forms ofcontrol of African economies by encouraging them to engage in ‘policy dialogue’, whichthe Bank began to use to get African governments to revise their policies in the newdirection. In its annual report for 1980, the Bank pointed out that whereas its oldapproach was based on short-term, crises-oriented projects, the new approach was to bemore far-reaching and long-term, but with the purpose of bringing about structuralreforms. A new loan scheme called ‘Structural Adjustment Lending’ was used to encour-age this ‘dialogue’.
D E V E L O P M E N T T H E O R I E S
41
Free
dow
nloa
d fr
om w
ww
.hsr
cpre
ss.a
c.za
In 1979 the IMF reinforced the World Bank’s policy dialogue through its own economicstabilisation programmes, assisted by the new ‘facilities’ it created for this purpose. TheIMF conditionality came in as part of this package as a bait to encourage the ‘policyreform dialogue’ strategy among weak economic states. In fact, the ground was beinglaid for the economic globalisation of the African economies under a neo-liberal ideol-ogy of structural adjustment. The IMF conditionalities were handed down through‘standby arrangements’ that were based on a ‘stabilisation programme’ and ‘hand-to-mouth’ tactics. In this way, and applying the inbuilt control mechanisms, which ensuredthat African countries not merely promised to carry out adjustments, but actually did sobefore they were given further handouts for the stabilisation programme, the multilat-eral institutions were able to arm-twist these governments into submission. The realobjective was not only to control Third World economies in the direction of globalisa-tion, but also to directly manage them.
The convergence of the two policy instruments imposed by these two multilateral institutions was used effectively by the US under its Baker Plan to resist any debt cancellation demands by the African and other Third World governments. The plancalled for disbursing US$29 billion in new loans to a selected number of ‘least developedcountries’, of which Africa had a high proportion. Of this amount, US$20 billion was tocome from commercial banks and US$9 billion from the World Bank and the IMF.The loans required that the recipient nations adopt free-market economic policies, stemcorruption and capital flight, and encourage greater domestic savings and investment.These multilateral demands did not reflect any scientific theory, but were policydemands imposed by the donor community.
Faced with the failure of all the blueprints of the multilateral institutions in 1989, theWorld Bank sought to provide a more comprehensive theoretical and ideological positionto further propel the process, alongside the failed political development, into a moreauthoritarian mould. In its more professional and less polemical report, From Crisis toSustainable Growth (IBRD 1989), the Bank developed what Beckman (1992: 83) correctlycalled ‘a political theory of adjustment’. The new report adopted a broader outlook byraising social, political and cultural issues in seeking ways to resolve the crisis.
Indeed, the very objective of the World Bank was to try to reorganise the Africaneconomies as well as downsize the role of the African state and create conditions for theemergence of a new breed of African leaders who would push through the new reformswithout questions being asked. If we may borrow from Low and Lonsdale’s (1976)concept of the second colonial occupation, the period was a new stage in the reorganisa-tion of the African state towards the third colonial occupation. This was necessary inorder to bring these states in line with the new globalising order. Unlike the earlier occu-pation, the new one took the form of privatisation and liberalisation of the economies,with a new team of technocrats in the form of consultants and high-flying MBA finan-cial wizards. This had the effect of creating a new colonial invasion, without much foreigncapital, taking over former state enterprise, since the liberalisation and privatisation offormer state enterprises could be had for a song. In the words of Beckman (1992: 83):
T H E D E V E L O P M E N T D E C A D E ? S O U T H A F R I C A , 1 9 9 4 – 2 0 0 4
42
Free
dow
nloa
d fr
om w
ww
.hsr
cpre
ss.a
c.za
The new focus of the World Bank is on the restructuring of the African state inorder to make it supportive of its long-term strategy for the liberation of themarket forces and entrepreneurial potentials of African society. The reportexplains the failure of the state and the need to cut it down to size, thereby releas-ing the creative forces that have suffered under its oppressive dead weight.
The rationale of the third colonial occupation was logical enough. Apart from the neweconomic and technological forces that were compelling the breaking down ofnational frontiers in terms of financial movements, trade flows and production strate-gies, the African nation-state was a real deadweight against these new developmentsand its own population. Basil Davidson (1992) had correctly characterised this state ofaffairs and the role of the African nation-state in it as a curse afflicting the Africanpeople.
As noted earlier, the second colonial occupation sought to do away with the old colonialpolicy; liberating the state from the policies of native authority and indirect rule basedon the intermediary role of traditional chiefs. The colonial powers sought to reform thatsystem in order to bring in new democratic institutions of representation in order tohasten ‘economic and political development’ on the basis of state capitalism. Now, thethird colonial occupation wanted to downsize that state, ‘release the economic potentialof the people’ in order to ‘liberate the market forces’ by empowering civil society,especially at the grassroots in rural areas, and ‘liberate national market forces’ from theshackles of that state.
The third colonial occupation sought further to de-legitimise nationalism and thenation-building project that had been initiated by late British, and to some extentFrench, colonial policy. Instead, the third colonial occupation put in place a neo-liberalideology, which idealised the freedom of market forces vis-à-vis the economic role of thepost-colonial state. By so doing, it also sought to de-legitimise institutions of popularresistance against imperialism and neocolonialism as well as destroy the politicalachievements of the African people in their earlier resistance against colonialism. It wasa form of revisionist history that wanted to restore the glory of colonial dependencyunder new conditions by highlighting the glory of the free market.
This is why it declared that behind the litany of Africa’s development problems was acrisis of governance. It saw the failure of public institutions as a root cause of Africa’sweak economic performance. The Bank’s new missionaries pronounced that the qualityof government had deteriorated with bureaucratic obstruction, pervasive rent seeking,weak judicial systems and arbitrary decision-making. The new analysis said that the red tape and corruption pervading the state had imposed heavy costs on the privatesector, thereby undercutting its international competitiveness. The breakdown ofthe judicial system had also scared off foreign investors who fear that contracts can-not be enforced. The contracts became a new god. Moreover, structural adjustment programmes, according to the Bank, could not work without a well-functioning statesystem. Therefore, a new political theory of the state was essential.
D E V E L O P M E N T T H E O R I E S
43
Free
dow
nloa
d fr
om w
ww
.hsr
cpre
ss.a
c.za
The Bank could not correctly trace the origins and root cause of these problems. Instead,it blamed the first generation of African political leaders for distrusting foreign businessand investment. It also declared that the new states were poorly rooted in Africansociety, but it did not explain which forces were responsible for this development. Here,in fact, was the root of the African crisis. The demonstrative effect of consumption bythese leaders, which the report criticised, was also not properly explained. It evenblamed these leaders for couching their political vision in the idiom of Northern values,institutions and technology, as if these were not the very parameters the leaders wereexpected to imbue under modernisation theories and paradigms.
Therefore, the Bank blamed the leaders for adopting poor foreign models for theirdevelopment programmes, when the Bank was the very institution responsible for suchmodels. The Bank finally blamed the leaders for a kind of thinking that was dominatedby the dichotomy between capitalist and socialist development models, when the major-ity of them had followed the capitalist models. In any case, the leaders did not advocatethe statist approach to development. As we have seen, it was the Keynesian theories ofdevelopment and the British-propelled political development approaches that werebehind the second colonial occupation.
Based on these wrong analyses, the Bank (IBRD 1989: 37–5, 55) again points to wrongconclusions, which were supposed to guide African leaders. These guidelines did notseek to root the new ideas in African societies based on their cultures and value systems.Rather, the Bank implored the leaders to abide by the worldwide trend towards privati-sation, another wrong Northern model. Thus, the World Bank, in developing a politicaltheory of adjustment, wanted to de-legitimise nationalism and the nation-buildingproject of the second colonial occupation and put in its place a new theory of colonialoccupation. It was also intended to develop new agencies for this stage, apart from theconsultants and financial wizards. These new agencies were new civic organisations. Theold civic organisations such as trade unions were attacked as having encouraged statistdevelopment.
Good governance and civil society
In place of democracy, the Bank now theorised the concept of ‘good governance’, butthis concept carried a different meaning. Private sector initiative and market mecha-nisms were now required to go hand in hand with good governance by governments,mediated by intermediaries such as civic societies and NGOs. These institutions couldcreate a link both upward and downward in society and voice local concerns moreeffectively than grassroots institutions, which tend to be localised. It was in the samespirit that corruption of the leadership could be combated, argued the Bank. The Bankdid not correctly locate the sources of the power of corruption as lying within thestructural adjustment policies. As we have seen, the Bank connected corruption withthe tendencies towards patronage and the maintenance of power, but this is the effectof undemocratic power rather than its cause, for it is a modern political truism thatundemocratic power corrupts and absolute power corrupts absolutely.
T H E D E V E L O P M E N T D E C A D E ? S O U T H A F R I C A , 1 9 9 4 – 2 0 0 4
44
Free
dow
nloa
d fr
om w
ww
.hsr
cpre
ss.a
c.za
The positions the Bank was now advancing tended to reinforce authoritarian rule inAfrica and not good governance as it claimed. The retreat of the state was based on theidea that the same state and its political agents should legislate to advance economicglobalisation, and this could only be done with the existence of ‘strong leaders’. In short,it was not the state, as such, that was to be downsized, but particular types of activity.The state was now argued to support ‘liberalisation’ and ‘privatisation’. Moreover, ‘strongleaders’ meant the emergence of the new breed of military-cum-democratically electedleaders who would be powerful enough to push through the new orthodoxy.
In this way, the Bank took political and ideological sides in the contending politicalstruggles between the neo-liberal free-market ideology and the nationalist ideology andaspirations for the implementation of the social agenda for which nationalism stood.That is why the empowerment of the new order is counterpoised to what the Bank callsthe vested interests of the old order, which benefited from the state intervention in theeconomy.
In fact, these ideological positions of the World Bank were adopted from the moderni-sation ideas of the past. According to Gibbon, Bangura and Ofstad (1992), there weretwo perspectives that US political scientists and the UNICEF in this period were pursu-ing. These political scientists were trying to update the theory of modernisation byworking on issues of rural and agrarian crisis in the Third World. They used neo-liberalpublic choice and political economy theories and frameworks of analysis to achieve theirnew explanations.
Their main concern was with the way power was obtained and distributed in post-colonial Africa, which had adversely affected agriculture and rural incomes. It was theresearch of these political science scholars that gave impetus to the argument of the urbanbias of early African political classes. It was argued that rural poverty was the result of dis-criminatory trade and pricing policies in the 1960s and 1980s, during which the peasantshad suffered a raw deal because they were not represented in the urban political coalitions.
The first of these perspectives was the ‘public choice’ theory, which tried to analyse thedistribution of ‘gains and losses’ among competing social groups in economic terms.The concepts of ‘gainers and losers’ were derived from the types of commodity that individuals produced and consumed – although these were, in fact, historically and culturally determined – and the nature of factor mobility between different sectors ofthe economy and the way the commodities were distributed. This was done in a closedmarket that had no adverse linkages globally. The dangerous conclusion or assumptionderived from this kind of political, economistic analysis was that it regarded those whogained as the ‘good winners’ and those who lost as the ‘bad losers’.
The real problem was that the new modernising theorists wanted the gainers to bedefended by the state against the losers. This is what led the World Bank to adopt thefunctionalist and technocratic political agenda that led to the shift in the balance ofsocial forces in favour of the new coalitions of gainers who were expected to sustain thereform programme (Gibbon et al. 1992).
D E V E L O P M E N T T H E O R I E S
45
Free
dow
nloa
d fr
om w
ww
.hsr
cpre
ss.a
c.za
The second new orthodox political science perspective was advanced by a group ofpolitical scientists who looked at the emergent informal sector as the means for thestrengthening of civil society and democracy. Chazan (1988: 130) saw in these informalactivities the survival of democratic tradition that was ‘ensconced in local political cultures’. He saw in this development the emergence of ‘alternative institutions and patterns of interactions separate from those that have developed in the formal arena’.
This one-sided point of view, although containing strong elements of truth, gave theimpression that these ‘alternative’ structures were essentially liberating, which could leadto the local autonomy of civil society. These kinds of arguments were cashed in on bythe World Bank in its 1989 report where it asserted that modernisation theories in theearly years of independence tended to make a rigid distinction between modern(Western) societies and pre-modern or (traditional) societies. According to the Bank,this approach ‘led to many mistakes, especially in land reform, livestock projects, con-solidation of rural populations, and integrated rural development’ (IBRD 1989: 60).
The Bank advocated the recognition of future development strategies that, far fromimpeding development, could be supported by indigenous African values and institu-tions. It argued that while the modern sector had been in depression, the informalsector, strongly rooted in the community, had been vibrant. In particular, according tothe Bank, it had shown a capacity to respond flexibly to changing circumstances. Thiswas another populist overstatement that did not fully comprehend the problems of theinformal sector, which were basically survival activities of the poor communities. Thesecould only develop into alternative models of local economy if they were left unmolestedby the modern sector. The Bank argued that the modern sector should support the traditional sector, instead of seeking to replace it but, at the same time, it stated:
In some spheres, however, there can be no compromise. The family and ethnicties that strengthen communal action have no place in central government agen-cies, where staff must be selected on merit and where public and private moniesmust not be confused. (IBRD 1989: 60)
This was the crux of the matter, because it showed that the Bank, just like the old colo-nialists, could not accept traditional structures being the agents of change and socialtransformation. The Bank still drew a distinction, despite its earlier pretensions, betweenmodernity and tradition and wanted the former to prevail. It did this although it advo-cated that traditions were good for change. In many ways, the radical nationalist leadersin the early years of independence had adopted the same attitude towards traditionalstructures and institutions.
The criminalisation of the African developmental state
Since the 1990s, there has emerged a new state of despondency that seeks to locate theAfrican developmental crisis within African cultures and the long durée of Africanhistory. The new ‘Africanist’ concern is agonising over how the African crisis can be
T H E D E V E L O P M E N T D E C A D E ? S O U T H A F R I C A , 1 9 9 4 – 2 0 0 4
46
Free
dow
nloa
d fr
om w
ww
.hsr
cpre
ss.a
c.za
explained from a new paradigm in order to reveal how Africa works (Chabal & Daloz1999). However, the discourse is one of despair and no new ideas, which can even under-stand the roots of the crisis, are forthcoming from that new paradigm. We are presentedwith some exotic theories advanced by the French Africanists, such as the ‘politics of thebelly’ mechanistically drawn from an African proverb to constitute a basis for explain-ing the crisis of the state in Africa.
In talking about the ‘paradigm of the yoke’ to explain how Europe tried to destroyAfrica’s historicity, Bayart (1993) fails to come to the real conditions of the African crisis.He points out that Western anthropology has continued to occupy the prime position inthe study of Africa, and despite the immense progress made by the Africanist historiansto put Africa on the world map of knowledge, the study of Africa, by and large, has yetto be fully integrated into contemporary political studies. In short, even the attempt tounderstand the African past and its history and society through its own epistemologyhas proved abortive; the Africanist attempt has always proved fruitless, rendering Africastill a continent in the dark as far as their knowledge of it is concerned. In his ownattempt to understand the African post-colonial state, Bayart and his team of Africanistshave swung with the pendulum in order to understand Africa as it (really) is and attemptto create new paradigms to explain the present predicament into which Africa has fallen,as they see it on the surface.
From this Africanist standpoint, Africa is said to have failed to pass the test of civilisa-tion because Africans themselves appear to be the problem. For example, in trying toexplain the state in former Zaire, Bayart argues that the failure of political developmentin Zaire was due to the fact that Mobutu built up a kleptocracy based on ‘politics of thebelly’, in which all the social struggles that make up the quest for hegemony and the production of the state ‘bear the hallmarks of the rush for spoils in which all actors –rich and poor – participate in the world of the network’ (Bayart 1993: 235). He does notexplain how Mobutu was able to play this role while at the same time being an agent ofUS domination in Africa. If Africa is, therefore, a ‘failed’ continent then their own theo-rising is what leads them to that conclusion.
With this failure, there appears to be no room for the well-meaning and paternalisticAfricanists to try and put Africa back on the map, because to do so would require a com-pletely new epistemology for understanding Africans and their ways of survival. Suchattempts, which they continue to market for their own intellectual survival, like seeingthe African post-colonial state as a ‘rhizome state’ and a ‘felonious’ and ‘criminal state’(Bayart, Ellis & Hibou 1999), do not take Africa any further than the anthropologistsand developmentalists did in the past.
It follows that Cheick Anta Diop (1974) was correct after all when he challengedAfricans to be at the forefront of the writing of their history, starting with ancient Egypt.To undertake such a gigantic task, and it must be undertaken, African scholars will haveto purge themselves of the infection of Eurocentricism (which has continued to claimthe right to know Africa) if Africa is to be retrieved from the Curse of Ham.
D E V E L O P M E N T T H E O R I E S
47
Free
dow
nloa
d fr
om w
ww
.hsr
cpre
ss.a
c.za
Knowledge production and emancipatory practice
For the crisis of Africa to be tackled, the European and now joint Western grip on thecontinent must be brought to an end. To achieve this, the African people must bebrought to the centre of their own transformation through their own perceptions ofthe path and direction of that transformation. Africa must reclaim the right to its own knowledge production, self-direction and self-determination. The call by PresidentMbeki of South Africa for an African Renaissance will be meaningless unless this rightto self-knowledge and self-determination is reclaimed, and this cannot be done until theAfrican intelligentsia move in the direction of emboldening people to chart such a pathalong with the African masses. Knowledge production and knowledge generationcannot be undertaken without an African epistemological foundation. We must stopthat process whereby the collective memory of imperialism is perpetuated through theways in which knowledge about the indigenous peoples was collected, classified, andthen presented in various ways back to the West, and then, through the eyes of the West,back to those who had been colonized (Smith 1999). To do this, we must, as Africanscholars, look at Africa through our collective eyes and world view together with theAfrican masses. This implies developing an African epistemology through which we cansharpen our own self-perception and that of others.
Therefore, in seeking to do research in African communities, we must avoid doing thosethings that will immediately alienate us as researchers from the communities in whichwe work. This means that we must take into account certain ethical dos and don’ts thatwill vary from place to place; hence, the first thing to do before going into a particularcommunity is to familiarise ourselves with the community, the cultural sensitivities andshort histories, which must be taken into account as one enters into intersubjective com-munication with them.
Firstly, the researcher must acknowledge the contextual validity of African knowledgeand wisdom, and respect the uniqueness of its contributions to knowledge productionand practice through the centuries. This also means we must adopt a different episte-mology for accessing and comprehending it as a basis for utilising the expertise and skillsin it for human transformation.
Secondly, as scholars, we should avoid using concepts and theories that are alien to thesituation in African cultural contexts. Academic analyses based on abstract theories andconcepts, common among scholars who carry out research as their main profession, arecounterproductive. In the real world of African communities, people are able to consti-tute their first-order understandings of their social worlds through their own reflexivity,cognition and action. However, these first-order understandings have no logical or necessary connection to the second-order analyses, which researchers and analysts con-struct and which they call ‘scientific knowledge’. Community first-order understandingsmay sometimes include, but are by no means dominated by, abstract reasoning strate-gies like those used by scholars and analysts. Therefore, the analyst’s second-orderunderstandings sometimes lead to a systematic misrepresentation of the concrete waysin which people create knowledge and engage in action within their first-order worlds.
T H E D E V E L O P M E N T D E C A D E ? S O U T H A F R I C A , 1 9 9 4 – 2 0 0 4
48
Free
dow
nloa
d fr
om w
ww
.hsr
cpre
ss.a
c.za
Thirdly, in order to escape this vicious circle, researchers should make every effort tounderstand how people go about understanding and creating their own meanings andlife-worlds in their own cultural contexts and lived experiences. One guideline to help tolocalise research in the communities is to treat research not merely as an intellectualactivity as understood in academia, but as a joint effort between the scholar and thecommunities mediated through their own languages. This will enable the scholar andresearcher to discover their lived truths. The arrogance scholars adopt in this respect, orwhat Pierre Bourdieu called the ‘illusion of the omnipotence of thought’ is, in his words,a ‘dangerous delusion’, which confuses academic analyses with social change and maylead some scholars to believe that one can change the world by merely changing words(Bourdieu 1977). This falsehood also leads scholars into a further illusion of believingthat by subverting terms, categories and discourses it is possible to subvert or dent objec-tive structures of existing systems of domination and power relations. One hallmark ofsuch scholastic attitude is that it encourages the pursuit of academic activities as ends inthemselves, leading the scholar to engage in endless research upon research rather thanworking with communities to explore community understandings and meanings uponwhich community and local actions for meaningful social transformation can takeplace.
Fourthly, research and knowledge production in African communities should seek toembolden and empower the marginalised African masses. Therefore, methods ofresearch should aim at generating or validating existing practical and emancipatoryknowledge about the forces that impact on the ‘life chances’ of the masses according totheir own understandings. Furthermore, the understanding generated from this exerciseshould act as a guide to enable us to describe and analyse the empirical reality identifiedfrom the data gathered through those methods. This will assist us to gather testablehypotheses operationalising the variables obtained so that those variables can be testedempirically. In this case, practical knowledge, according to Kershaw (1998: 29), ‘helps togenerate new concepts, variables and ultimately Afrocentric theories which aregrounded in the attitudes, behaviours, and historical relationships of the people beingstudied’. Most importantly, this method enables us to identify from the data obtainedapparent contradictions as well as convergences of the communities’ first-order under-standings and their ‘objective’ reality. When a convergence occurs, validity results, butwhere it does not, further inquiry is held until convergence is obtained or a theory foundto explain the contradiction.
Fifthly, in order to move forward the resultant technical, practical and emancipatoryknowledge and make it contribute to the existing body of knowledge through its utili-sation and critique, the scholar should be conscious of the relationships between theoryand practice. The researcher should participate in a programme of education and actionwith the communities by presenting and disseminating the findings and the new knowl-edge produced to them in a culturally appropriate manner in order to enable them toidentify contradictions in the findings so that they can take action to rectify the situa-tion. Actions should particularly aim at emancipating the African masses as a steptowards humanising the whole world, because by asserting their own humanness
D E V E L O P M E N T T H E O R I E S
49
Free
dow
nloa
d fr
om w
ww
.hsr
cpre
ss.a
c.za
through struggle and action they can make a contribution to the emergence of a betterworld based on the humanistic African philosophy of Ubuntu. This implies developingdialogical relationships between the scholars and the researched communities. In thisway, as noted earlier, the researcher participates, on an equal basis, in the discussion inthe community and, where necessary, in activities aimed at changing existing oppressiverelationships.
Sixthly, in going further to utilise the results of the research, it is vital that thescholar/researcher discusses with the community the use to which the product isintended be put. If the scholar wishes to publish the results and/or put them to produc-tive use as an innovation, then the scholar should realise that the community has jointintellectual property rights to it in the form of copyrights, trademarks and/or patentrights. The scholar/researcher should explain these rights to them so their interests areprotected and compensatory arrangements concluded with them. The knowledgeproduct from the community is a joint/collective property of the researcher and thecommunity. This approach will dispose of the prejudice held by the Eurocentric view-point that African cultures are an impediment, detrimental and/or opposed to develop-ment, since, in this case, the social transformation will result from knowledgeproduction in which they were recognised and respected as subjects rather than objectsto be ‘known’ and then ‘developed’ through a civilising mission.
Conclusion
This chapter began with the proposition that although development theory can bedeclared to be dead, it is at the same time true to say that it is yet to be buried. Hence,we need to be awake to its continuing influence and reproduction in global policiesaffecting countries of the South. The oppressed and marginalised communities mustseek to reassert their power over the production of knowledge that the imperialists suppressed in order to impose their own world view over them and, through such imposition, to control and exploit them. In so doing, they built power biases that con-tinue to affect the relations between these former imperialist powers and the oppressedpeoples of the South, including the elite.
Secondly, we have to recognise the historical roots of phenomena in their societal con-texts. This enables the scholar to reveal a phenomenon’s bases, roots and evolutionarystages, enabling the best possible understanding of it; for no human phenomenon orideological theory exists unexpectedly or without precedent (Arif 2002).
Thirdly, we have to deal with the phenomenon under study or research in the light of itsenvironment and societal patterns. Economic, social, cultural and political phenomenado not exist in a vacuum; they constitute part and parcel of an existing and extendedsocial texture, affecting it and being affected by it. Our role is two-dimensional – todefine the environment or the social pattern of the phenomenon, and to define theeffects of the environment on the phenomenon. This is vitally important in post-colonial and post-traditional situations that characterise our existence in Africa today.
T H E D E V E L O P M E N T D E C A D E ? S O U T H A F R I C A , 1 9 9 4 – 2 0 0 4
50
Free
dow
nloa
d fr
om w
ww
.hsr
cpre
ss.a
c.za
Finally, it should be realised that these cultural biases that are built into the power rela-tions that block people’s self-transformation are tied to systems of domination andexploitation, which are ideologised as ‘universal’ or ‘scientific’ knowledge. The best wayto neutralise these biases is to approach each community as unique, with its own existential experiences. This requires that we must recognise that people’s physical andspiritual bearings are the first orders of dealing with their realities through their eschato-logical world, which explores their metaphysical dimensions of life that are reflected intheir statements, concepts and constituents (Arif 2002).
References
Almond G, Flanagan S & Mundt R (eds.) (1973) Crisis, choice and change: Historical studies of
political development. Boston: Little, Brown.
Apter D (1968) Some conceptual approaches to the study of modernisation. Engelwood Cliffs:
Prentice-Hall.
Arif N (2002) The disenchantment of political development: Epistemes, cultures, and policies. New York:
University Press of America.
Bayart J-F (1993) The state in Africa: The politics of the belly. London: Longman.
Bayart J-F, Ellis S & Hibou B (1999) The criminalization of the state in Africa. Bloomington: Indiana
University Press.
Beckman B (1992) Empowerment or repression? The World Bank and the politics of African
adjustment, in P Gibbon Y Bangura & A Ofstad (1992) Authoritarianism, democracy and
adjustment: The politics of economic reform in Africa. Seminar Proceedings No. 26, Institute of
African Studies, Uppsala.
Booth D (1985) Marxism and development sociology: Interpreting the impasse, World Development
13: 761–87.
Bourdieu P (1977) Outline of a theory of practice. Cambridge: Cambridge University Press.
Chabal P & Daloz J-P (1999) Africa works: Disorder as political instrument. Bloomington/London:
Indiana University Press/James Currey.
Chazan N (1988) Ghana: Problems of governance and the emergence of civil society, in L Diamond,
J Linz & S Lipset (eds.) Democracy in developing countries, Vol. 2, Africa. Boulder CO:
Lynne Rienner.
Davidson B (1992) The black man’s burden: The curse of the African nation-state. London:
James Currey.
Diop C (1974) The African origin of civilisation: Myth and reality. Chicago: Lawrence Hill Books.
Eisenstadt (1966) Modernisation: Protest and change. Engelwood Cliffs: Prentice-Hall.
Gibbon P, Bangura Y & Ofstad A (eds.) (1992) Authoritarianism, democracy and adjustment:
The politics of economic reform in Africa. Seminar Proceedings No. 26, The Institute of African
Studies, Uppsala.
Hettne B (1995) Development theory and the three worlds. London: Longman.
D E V E L O P M E N T T H E O R I E S
51
Free
dow
nloa
d fr
om w
ww
.hsr
cpre
ss.a
c.za
Higgot R (1983) Political development theory. London: Groom Helm.
Hountondji P (2002) Introduction: Decentring Africa, in P Hountondji (ed.) Endogenous knowledge:
Research trails. Dakar, Senegal: CODESRIA Book Series.
Huntington S (1968) Political order in changing society. New Haven: Yale University Press.
IBRD (International Bank for Reconstruction and Development) (1989) From crisis to sustainable
growth.
Kershaw T (1998) Afrocentricism and the Afrocentric method, in J Hamlet (ed.) Afrocentric visions:
Studies in culture and communication. London: Sage.
Leys C (1996) The rise and fall of development theory. London: James Currey.
Low D & Lonsdale J (1976) Introduction: Towards the New Order, in L Dow & A Smith History of
East Africa, Volume III. Oxford: Oxford University Press.
Nabudere D (1997) Beyond modernisation and development, or why the poor reject development,
Geografiska Anneler, Series B: Human Geography 79(4), Svenska Sallskapet for Anthropologi och
Geografi, Goteborg.
Norgaard R (1994) Development betrayed. London: Routledge.
Said E (1992) Orientalism. London: Penguin.
Said E (1994) Culture and imperialism. London: Vintage.
Smith L (1999) Decolonizing methodologies: Research and indigenous peoples. London: Zed Press.
T H E D E V E L O P M E N T D E C A D E ? S O U T H A F R I C A , 1 9 9 4 – 2 0 0 4
52
Free
dow
nloa
d fr
om w
ww
.hsr
cpre
ss.a
c.za

Section 2Macroeconomic balance and microeconomic reform
53
Free
dow
nloa
d fr
om w
ww
.hsr
cpre
ss.a
c.za

Free
dow
nloa
d fr
om w
ww
.hsr
cpre
ss.a
c.za
4 Reflections on South Africa’s first wave of economic reforms
Rashad Cassim
Introduction
This chapter looks at economic reform against the backdrop of lower employment andincreasing skills intensity in the economy, and a consistently high level of inequality. Byand large, there have been marginal improvements in interracial equality in South Africabut, in general, inequality has remained consistently high. Two fundamental factors contribute to poverty and inequality – firstly, large numbers of people, specifically in theinformal sector of South Africa, who earn well below the breadline and, secondly, a significant number of unemployed people with no income whatsoever. The objective ofeconomic reform, ultimately, is to turn these statistics around. Thus, the ultimate test ofreform is the impact it has on the poorest segments of society. The problem, however, isthat policy changes could have an adverse effect on income distribution and poverty inthe short to medium term.
While the chapter attempts to grapple with the rationale and significance of economicreform in South Africa in the last decade, it is important to bear in mind that the conceptof economic reform is an all-encompassing term, which has a variety of elements thatmay be difficult to capture in one coherent analysis. Consequently, a few important areasof economic reform that have the potential to significantly affect the economy, prima-rily from an efficiency point of view, are highlighted. Indeed, introducing efficiency-enhancing policies in an economy with high levels of inequality and poverty lies at thecore of the post-apartheid economic reform dilemma.
Notwithstanding the narrowing down of focus, the chapter is still characterised bybreadth of coverage, often at the cost of not being able to probe more deeply into oneparticular kind of reform process. Such an attempt to cover a wide range of policies inorder to assess the overall experience of economic reform over a specific time period isbound to be anecdotal in parts and perhaps more probing in other aspects.
There are various ways of looking at South Africa’s reform process. One could ask whatthe major factors are that drove the reform process in the last ten years. Typically, if onesurveys the international literature, short-run stabilisation problems (such as growingmacroeconomic instability, external pressure, balance of payments crisis and exchangerate volatility), rather than long-run structural problems (such as inequality and sus-tained low growth), provide the major catalyst to reform.1 The rationale for economicreform in South Africa, however, is easy to understand in some respects. There was
55
Free
dow
nloa
d fr
om w
ww
.hsr
cpre
ss.a
c.za
simply the birth of a new democratic government with a completely different objectivefunction to its predecessors as it was confronted with the dual challenge of low growthand massive, racially configured inequality and poverty.
In one sense, there is consensus as to how we may define the first wave of economicreforms in the last ten years in South Africa. It can be characterised as a pro-growthstrategy entailing fiscal prudence, trade reform and public-sector reform with the aim ofcreating a more market-friendly, efficient economy. What is more controversial is theextent to which this reform was pro-poor or not. A standard criticism levelled againstthe government is that the reform path chosen may have induced modest growth in theeconomy, but at a high cost to employment creation. A counter-argument is that thepace of reform was too slow, leading to a limited impact on investment and high growthrates that would have begun to significantly affect poverty, on the assumption that highgrowth rates ought to have some trickle-down effects. Is this a fair assessment? Thischapter will attempt to confront some of these hard issues.
Economic reform in South Africa: background, context and rationale
The democratic government has carried out various policies and has re-prioritisedresources in the economy, through changing policy incentives, as well as changingbudget priorities. It is important to bear in mind that post-apartheid South Africawas characterised by the process of dismantling a myriad of policies that containedvery specific distributional privileges for a white minority (see Klaasen 2002). More-over, these old policies evolved in a less constrained fiscal and political environment.In the past, the high revenue generated by mineral wealth (coupled with limitedexpenditure on and investment in human capital, for example) for a small segmentof the population allowed the economy to sustain itself with the presence of majordistortions, such as excessive protection in some parts of the economy, distortedcapital markets as a result of the provision of loans at high negative real interest rates,and the allocation of resources to inefficient state-owned companies. What is strik-ing is that for the period 1970–1993 the average annual export/output ratio was closeto 100 per cent for the primary export sector and 17.5 per cent for the secondarysector (UNDP 2003: 180).
The African National Congress (ANC) government identified the need to introducereform that was aimed at inducing greater efficiency in an economy that suffered notonly massive unemployment and inequality, but also a specific history of racial dis-crimination that emphasised the racial character of inequality. As a backdrop to thisoverwhelming legacy, the South African economy has experienced an average annualgrowth of about 2.3 per cent in real terms over the last ten years. In spite of aninvestor-friendly macro policy, the economy is characterised by extremely low levels ofinvestment, and an increase in output that has resulted in a less than proportionateincrease in employment. Dealing with these challenges has led to a strong shift in
T H E D E V E L O P M E N T D E C A D E ? S O U T H A F R I C A , 1 9 9 4 – 2 0 0 4
56
Free
dow
nloa
d fr
om w
ww
.hsr
cpre
ss.a
c.za
focus from macro stability to micro reforms, and specifically to product markets,factor markets, services and the overall effects of regulation on various sectors of theeconomy as a whole.
The recognition of the need to deal with major inefficiencies in the economy manifestsin a range of reform initiatives, specifically at the microeconomic level. These includetrade reform, domestic reform (competition policy), the reform of services or utilitiesevinced through privatisation or market structure changes, as well as social reforms thatare quite critical to economic development, such as public-sector reform, education andhealth. However, this chapter will focus on some of the more direct economic policylevers aimed at inducing more efficiency in the economy, while giving consideration toredistributive issues.
A focus on a few policy levers in itself places severe limitations on the way we measuretheir impact. Hence, we need to be extremely cautious about the way we assess thislimited set of reforms. Here, the focus will be on a set of reforms that accounts for a sub-stantial part of the overall reforms necessary to induce significant levels of efficiency intothe economy. A large part of this chapter is about the efficiency to enhance competi-tiveness for long-run growth. Many of the reforms reviewed are inherently efficiencyenhancing, with their impact on welfare largely undefined. Admittedly, to have efficiencyitself as a major objective is meaningless.2 It is important from the outset to understandwhat the basis of any assessment of reform is all about. For example, if economic reformin South Africa achieved a massive reduction in inequality and the incidence of poverty,then there would be less of a sceptical view of the current reform path. However, underthe circumstances, there is understandably a widespread concern as to whether thecurrent reform strategy is capable of moving the economy on to a new equilibrium.
The performance of the South African economy in the last decade is well known. It is afamiliar story of low growth, low investment and static or moderate growth in employ-ment. So how can we characterise the South African economy ten years after democracy?On a steady-state low-level equilibrium? Is it in adjustment and/or transitional mode,with more promising future prospects? Defining these parameters will critically influ-ence our assessment of the strengths and weaknesses of the reform processes.
If we had the luxury of turning back the clock to 1994, would we have done things dif-ferently on the policy front? For example, if we had an economy with consistently lowreal interest rates, higher fiscal deficits and a stable, competitive exchange rate, would theeconomy today look considerably different to what it is now? Or if we maintained hightariffs or protection, would we have secured more jobs than is the case currently? Indeed,these counterfactuals are hard to answer, but it may be useful to bear these questions inmind when reading the chapter. We do not take on macroeconomic policy issues here,but operate on the assumption that whatever direction fiscal policy may have taken, it ishard to imagine an economy experiencing sustained growth if supply-side structuralproblems in the economy persist.
S O U T H A F R I C A’ S F I R S T WAV E O F E C O N O M I C R E F O R M S
57
Free
dow
nloa
d fr
om w
ww
.hsr
cpre
ss.a
c.za
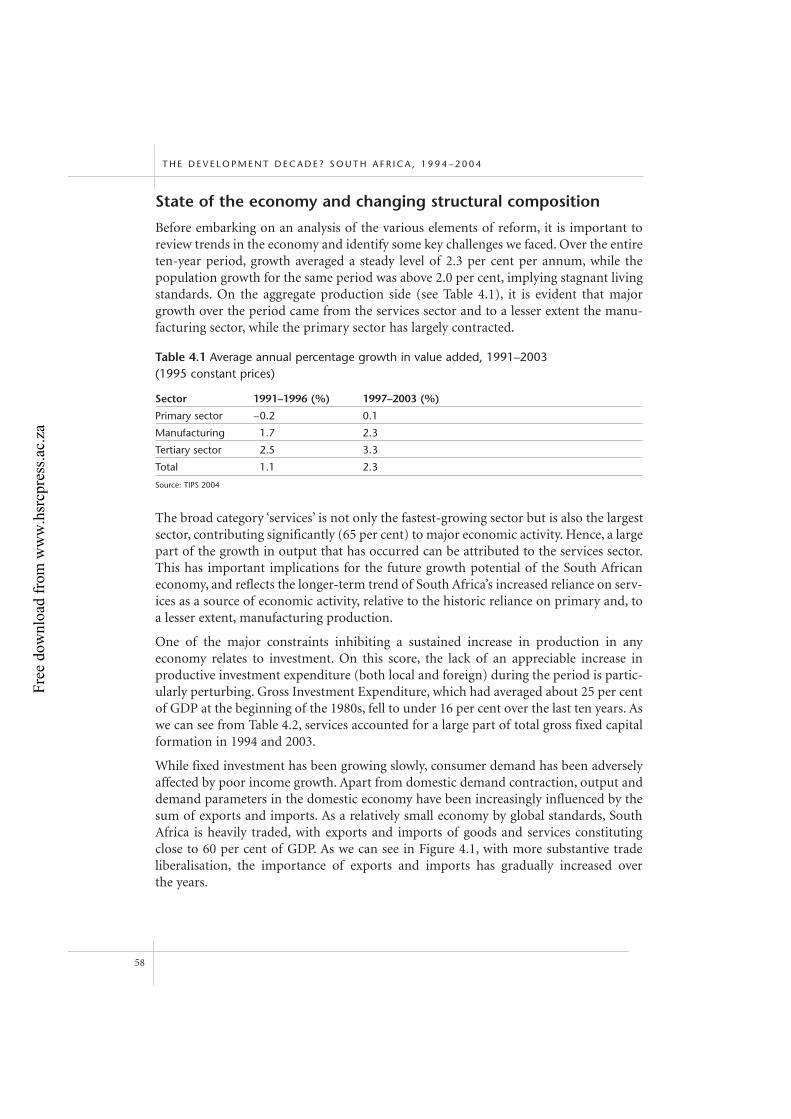
State of the economy and changing structural composition
Before embarking on an analysis of the various elements of reform, it is important toreview trends in the economy and identify some key challenges we faced. Over the entireten-year period, growth averaged a steady level of 2.3 per cent per annum, while thepopulation growth for the same period was above 2.0 per cent, implying stagnant livingstandards. On the aggregate production side (see Table 4.1), it is evident that majorgrowth over the period came from the services sector and to a lesser extent the manu-facturing sector, while the primary sector has largely contracted.
The broad category ‘services’ is not only the fastest-growing sector but is also the largestsector, contributing significantly (65 per cent) to major economic activity. Hence, a largepart of the growth in output that has occurred can be attributed to the services sector.This has important implications for the future growth potential of the South Africaneconomy, and reflects the longer-term trend of South Africa’s increased reliance on serv-ices as a source of economic activity, relative to the historic reliance on primary and, toa lesser extent, manufacturing production.
One of the major constraints inhibiting a sustained increase in production in anyeconomy relates to investment. On this score, the lack of an appreciable increase in productive investment expenditure (both local and foreign) during the period is partic-ularly perturbing. Gross Investment Expenditure, which had averaged about 25 per centof GDP at the beginning of the 1980s, fell to under 16 per cent over the last ten years. Aswe can see from Table 4.2, services accounted for a large part of total gross fixed capitalformation in 1994 and 2003.
While fixed investment has been growing slowly, consumer demand has been adverselyaffected by poor income growth. Apart from domestic demand contraction, output anddemand parameters in the domestic economy have been increasingly influenced by thesum of exports and imports. As a relatively small economy by global standards, SouthAfrica is heavily traded, with exports and imports of goods and services constitutingclose to 60 per cent of GDP. As we can see in Figure 4.1, with more substantive trade liberalisation, the importance of exports and imports has gradually increased over the years.
T H E D E V E L O P M E N T D E C A D E ? S O U T H A F R I C A , 1 9 9 4 – 2 0 0 4
58
Table 4.1 Average annual percentage growth in value added, 1991–2003 (1995 constant prices)
Sector 1991–1996 (%) 1997–2003 (%)
Primary sector –0.2 0.1
Manufacturing 1.7 2.3
Tertiary sector 2.5 3.3
Total 1.1 2.3
Source: TIPS 2004
Free
dow
nloa
d fr
om w
ww
.hsr
cpre
ss.a
c.za
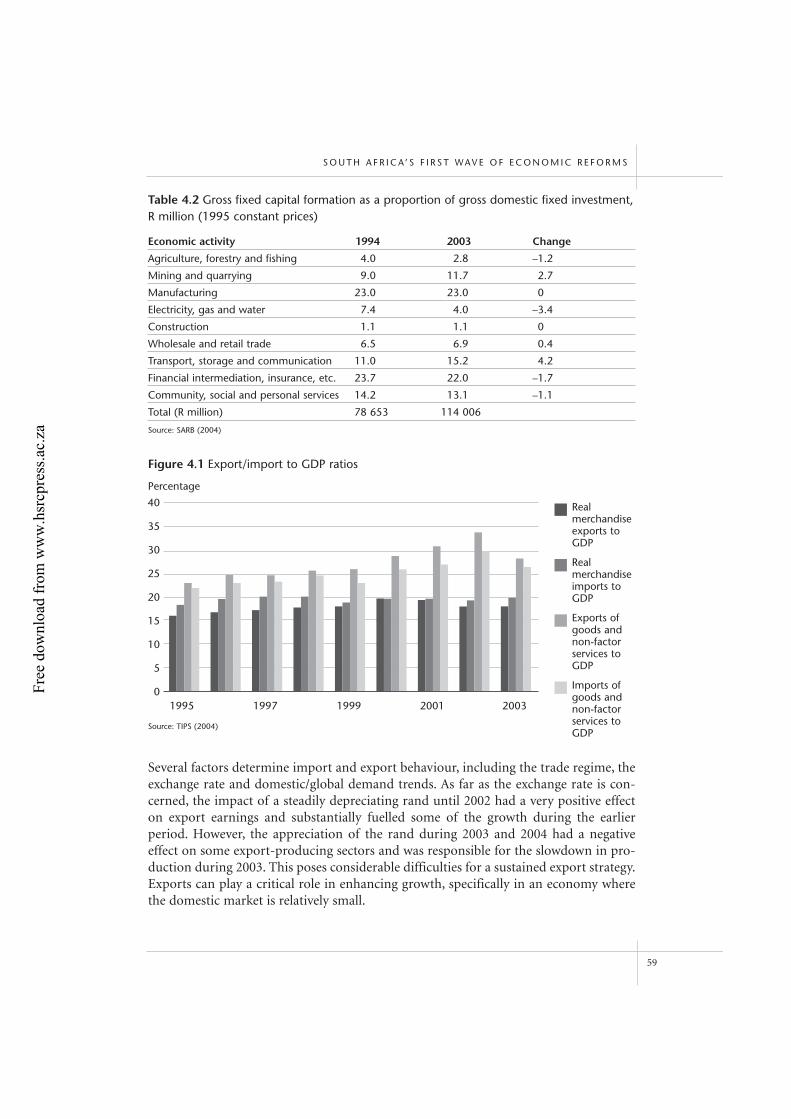
Several factors determine import and export behaviour, including the trade regime, theexchange rate and domestic/global demand trends. As far as the exchange rate is con-cerned, the impact of a steadily depreciating rand until 2002 had a very positive effecton export earnings and substantially fuelled some of the growth during the earlierperiod. However, the appreciation of the rand during 2003 and 2004 had a negativeeffect on some export-producing sectors and was responsible for the slowdown in pro-duction during 2003. This poses considerable difficulties for a sustained export strategy.Exports can play a critical role in enhancing growth, specifically in an economy wherethe domestic market is relatively small.
S O U T H A F R I C A’ S F I R S T WAV E O F E C O N O M I C R E F O R M S
59
Table 4.2 Gross fixed capital formation as a proportion of gross domestic fixed investment,R million (1995 constant prices)
Economic activity 1994 2003 Change
Agriculture, forestry and fishing 4.0 2.8 –1.2
Mining and quarrying 9.0 11.7 2.7
Manufacturing 23.0 23.0 0
Electricity, gas and water 7.4 4.0 –3.4
Construction 1.1 1.1 0
Wholesale and retail trade 6.5 6.9 0.4
Transport, storage and communication 11.0 15.2 4.2
Financial intermediation, insurance, etc. 23.7 22.0 –1.7
Community, social and personal services 14.2 13.1 –1.1
Total (R million) 78 653 114 006
Source: SARB (2004)
40
35
30
25
20
15
10
5
01995 1997 1999 2001 2003
Figure 4.1 Export/import to GDP ratios
Source: TIPS (2004)
Realmerchandiseexports toGDP
Realmerchandiseimports toGDP
Exports ofgoods andnon-factorservices toGDP
Imports ofgoods andnon-factorservices toGDP
Percentage
Free
dow
nloa
d fr
om w
ww
.hsr
cpre
ss.a
c.za
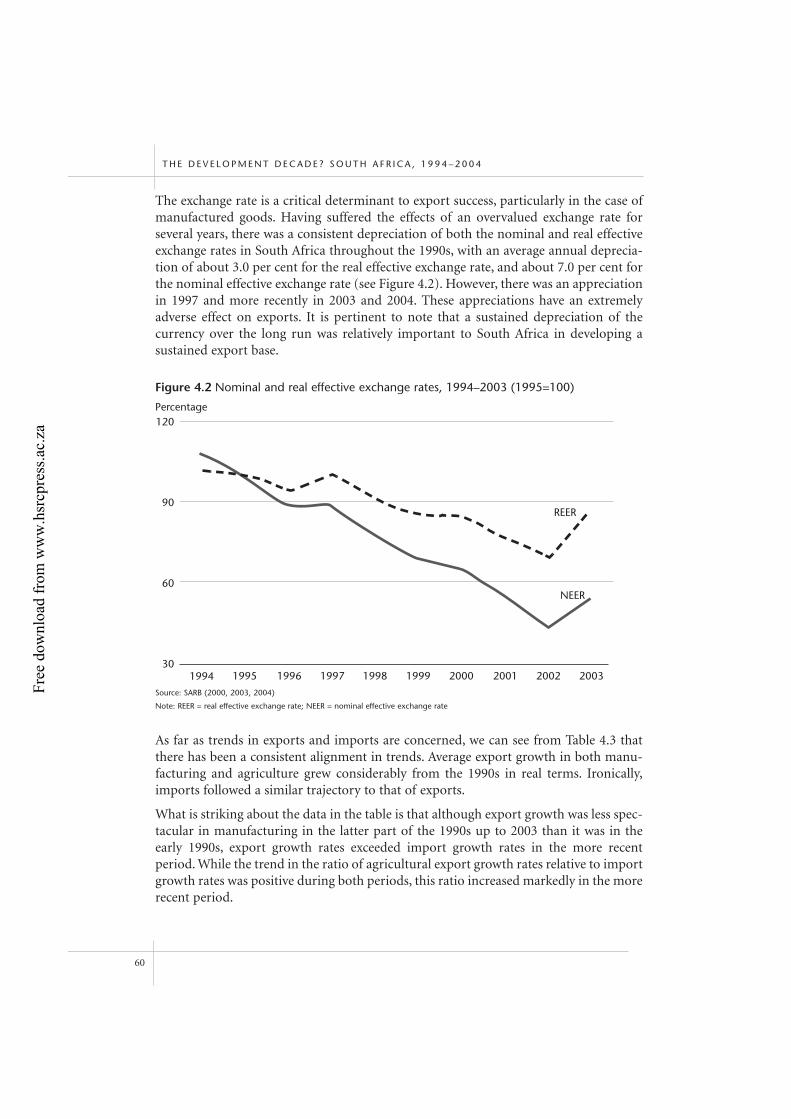
The exchange rate is a critical determinant to export success, particularly in the case ofmanufactured goods. Having suffered the effects of an overvalued exchange rate forseveral years, there was a consistent depreciation of both the nominal and real effectiveexchange rates in South Africa throughout the 1990s, with an average annual deprecia-tion of about 3.0 per cent for the real effective exchange rate, and about 7.0 per cent forthe nominal effective exchange rate (see Figure 4.2). However, there was an appreciationin 1997 and more recently in 2003 and 2004. These appreciations have an extremelyadverse effect on exports. It is pertinent to note that a sustained depreciation of the currency over the long run was relatively important to South Africa in developing a sustained export base.
As far as trends in exports and imports are concerned, we can see from Table 4.3 thatthere has been a consistent alignment in trends. Average export growth in both manu-facturing and agriculture grew considerably from the 1990s in real terms. Ironically,imports followed a similar trajectory to that of exports.
What is striking about the data in the table is that although export growth was less spec-tacular in manufacturing in the latter part of the 1990s up to 2003 than it was in theearly 1990s, export growth rates exceeded import growth rates in the more recentperiod. While the trend in the ratio of agricultural export growth rates relative to importgrowth rates was positive during both periods, this ratio increased markedly in the morerecent period.
T H E D E V E L O P M E N T D E C A D E ? S O U T H A F R I C A , 1 9 9 4 – 2 0 0 4
60
120
90
60
301994 1995 1996 1997 1998 1999 2000 2001 2002 2003
REER
NEER
Figure 4.2 Nominal and real effective exchange rates, 1994–2003 (1995=100)
Source: SARB (2000, 2003, 2004)
Note: REER = real effective exchange rate; NEER = nominal effective exchange rate
Percentage
Free
dow
nloa
d fr
om w
ww
.hsr
cpre
ss.a
c.za
The sector that stands out as far as disappointing performance is concerned is themining sector. This sector experienced continually negative growth rates in exports,from an average annual decline of –0.5 between 1991 and 1996, to –2.1 between 1997and 2003. The simultaneous growth in imports and exports implies that, with the excep-tion of 2002, the country has always had a negative balance on the current account as apercentage of GDP. While this is meaningless, in the medium run, from an economichealth point of view, or could be a sign of robust growth in the economy, the extent towhich exports have been able to provide impetus to the much-needed growth in theeconomy has been limited. Exports certainly have been a potential source of economicgrowth and have been responsible for at least superseding low domestic demand in theeconomy. One certainly has to look to exports as a source of rapidly rising growth. Aswe can see from Table 4.4, export/output ratios increased consistently but so did importpenetration ratios.
Average annual growth in real exports in the 1990s was about 5.0 per cent, and it wasdouble that for manufactured exports. The problem is that manufactured exports(where most of dynamic growth originates) are equal to about 12 per cent of GDP, whilenet exports (exports less imports) of manufacturers are about –1.0 per cent of GDP.Although an increase in the simultaneous growth of manufactured imports and exportsis healthy and a sign of trade specialisation and growing efficiency, from a macro-accounting point of view, in order to claim that exports are a major impetus to growth,we would have to see a dramatic growth in net exports, specifically in manufacturingand to some extent in services. In other words, net exports of South African manufac-turers relative to overall GDP are too low to affect aggregate economic performance ina major way. Thus, if we want to achieve more dramatic overall growth in manu-facturing exports, the critical question is how we increase our net manufacturing
S O U T H A F R I C A’ S F I R S T WAV E O F E C O N O M I C R E F O R M S
61
Table 4.4 Average annual growth in export/output and import penetration ratios,1991–2003 (1995 constant prices)
Sector Export/output ratio Import-domestic demand ratio
Agriculture, forestry and fishing 13.0 7.5
Manufacturing 20.0 27.0
Source: Cassim & Van Seventer (2004)
Table 4.3 Annual average growth rate of exports and imports (1996 constant prices)
1991–1996 1997–2003Sector Exports Imports Exports Imports
Agriculture 17.3 12.5 5.4 1.7
Mining –0.5 5.0 –2.1 4.6
Manufacturing 10.5 13.8 4.4 2.2
Total 9.0 10.0 2.6 3.0
Source: TIPS (2004)
Free
dow
nloa
d fr
om w
ww
.hsr
cpre
ss.a
c.za
exports. Alternatively, do we have to look at services exports such as tourism and financial services?
Elements of economic reform in the post-apartheid era
A myriad of reform initiatives characterise the post-apartheid period. These includereforms at the macro level, national micro level, regional level and local level.Attempting to measure the impact of various policy reforms carried out simultaneouslyis very difficult for several reasons. First, many reforms are at different stages of devel-opment, implying that it may be premature to measure their impact. Second, the complexity of the economy as a whole means that we have to dig into various parts ofthe economy in some detail before we aggregate the impact of the reform package as awhole. Finally, apart from the obvious economic reforms such as macro-policy, tradereform and deregulation, other critically important policies such as tax reform, public-sector reform, land reform, as well as black economic empowerment, education andhealth are critical to the first wave of reforms (although beyond the scope of thischapter).
I will focus on some of the more important reform initiatives. First, I will review SouthAfrica’s trade regime. Needless to say, the trade regime is an important driver of effi-ciency and productivity as it provides, crudely speaking, the key instrument to protectfirms against international competition. This will be followed by a consideration ofsector reforms, particularly in trade and manufacturing. Other wider influences on economic growth, such as competition policy and services reform, which are equally critical to the country’s growth prospects, will be looked at briefly. Then, after surveyingthe various reform initiatives, I look at growth issues and assess the extent to which thereforms have been conducive to growth, adopting a classic growth accounting frame-work. Finally, the distributional impact of growth is reviewed.
Changing incentives in the trade regime
The last decade can be described as a period that aimed at creating an environment toimprove the incentive to export through real exchange rate depreciation, a reduction innominal tariffs and, in certain cases, sector-specific instruments to create incentivesbeyond tariff liberalisation for exports.3 Trade liberalisation in pre-1990 South Africawas based primarily on export-promotion measures and less on import liberalisation.South African trade reform for the period 1994–2004 can be characterised, at best, as aprocess of gradual import liberalisation. This entailed several policy changes. Firstly,there was a process of reduction in nominal tariffs, particularly in manufacturing, whichhas historically been the most protected sector. Secondly, in conjunction with the reduc-tion in tariffs, a declining dispersion of the number of tariff bands and categories wasobserved, which automatically enhanced protection in the economy. Thirdly, surchargesand quantitative controls, particularly in agriculture, were eliminated.
T H E D E V E L O P M E N T D E C A D E ? S O U T H A F R I C A , 1 9 9 4 – 2 0 0 4
62
Free
dow
nloa
d fr
om w
ww
.hsr
cpre
ss.a
c.za
While quite significant import controls and surcharges in manufacturing were graduallyphased out by the beginning of the 1990s, the trade regime in agriculture was still gov-erned by quotas. Not surprisingly, the major process of trade reform in agricultureentailed a conversion of quantitative restrictions into tariffs. This represented a majorlandmark for the agricultural sector. The second phase comprised some liberalisation ofagricultural tariffs. The process of ‘tariffication’ commenced in 1992 and was essentiallycompleted by 1994. By the end of the decade, agricultural tariffs were fairly low, with theexception of a number of highly protected commodities such as sugar (40 per cent),dairy (20 per cent), beef and veal (20 per cent), mutton (50 per cent) and wheat (20 percent). A more significant concern was the cumbersome nature of South Africa’s tariffstructure.
In 1990 there were 12 500 tariff lines and 200 tariff bands. Subsequently, in the periodbetween 1996 and 2003, more significant uniformity of the tariff structure transpired. A30 per cent decline in the number of commodity lines from 1990 to 1996 continued witha further reduction to 7 900 lines in 2003.
South Africa’s trade reform is locked into the country’s commitment to the World TradeOrganisation (WTO). This commitment was made in 1993 against a backdrop of manytariff peaks in a range of sectors, as well as a highly cumbersome and a dispersed tariffstructure with over 200 tariff categories. The country’s offer consisted of reducing thenumber of tariff categories to six, at the rates of 0 per cent, 5 per cent, 10 per cent,15 per cent, 20 per cent and 30 per cent, with no discretionary changes to the systembeing allowed (Cassim & Van Seventer 2004). The tariff phase-down schedule under theWTO is shown in Table 4.5. As a result, South Africa’s average tariff declined from about12 per cent in 1994 to about 5 per cent in 2003. South Africa’s commitment to phasedown tariffs was to last for approximately ten years.
This phase down of tariffs was essentially a good proxy for de facto liberalisation of theeconomy, as South Africa, by and large, adhered to its commitments with only a fewareas where the implementation by Customs and Excise has been slow. A detailedproduct breakdown of South Africa’s most current tariffs is given in Table 4.5. As we cansee, the so-called sensitive products that receive relatively high protection are in cloth-ing, textiles and footwear.
Another way of presenting de facto protection in the economy is to look at both thenumber of tariff lines and the percentage of imports in different tariff bands. The tariffschedule, however, has not significantly changed in the last two to three years, specifi-cally between 2000 and 2003. Approximately 40 per cent of the commodity lines identi-fied in the schedule are zero-rated. More than 20 per cent have a non-ad valorem tariffand about 8 per cent of lines occupy the 15–19 per cent range, about 7 per cent occupythe 10–14 per cent range and 5 per cent occupy the 5–9 per cent range. Just 1.7 per centof the lines are associated with tariffs in the 1–4 per cent range (see Table 4.6).
However, as is evident in Table 4.7, de facto protection is even greater if we take cogni-sance of the fact that South Africa entered into two free trade agreements with the
S O U T H A F R I C A’ S F I R S T WAV E O F E C O N O M I C R E F O R M S
63
Free
dow
nloa
d fr
om w
ww
.hsr
cpre
ss.a
c.za
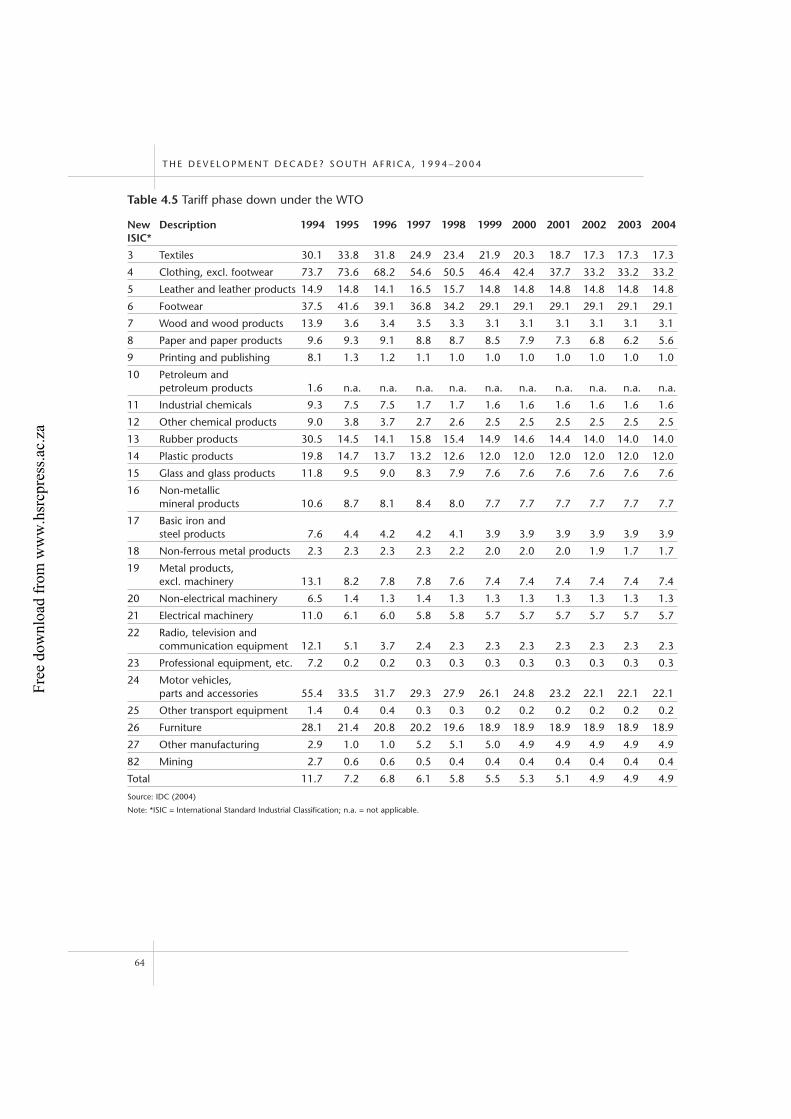
T H E D E V E L O P M E N T D E C A D E ? S O U T H A F R I C A , 1 9 9 4 – 2 0 0 4
64
Table 4.5 Tariff phase down under the WTO
New Description 1994 1995 1996 1997 1998 1999 2000 2001 2002 2003 2004ISIC*
3 Textiles 30.1 33.8 31.8 24.9 23.4 21.9 20.3 18.7 17.3 17.3 17.3
4 Clothing, excl. footwear 73.7 73.6 68.2 54.6 50.5 46.4 42.4 37.7 33.2 33.2 33.2
5 Leather and leather products 14.9 14.8 14.1 16.5 15.7 14.8 14.8 14.8 14.8 14.8 14.8
6 Footwear 37.5 41.6 39.1 36.8 34.2 29.1 29.1 29.1 29.1 29.1 29.1
7 Wood and wood products 13.9 3.6 3.4 3.5 3.3 3.1 3.1 3.1 3.1 3.1 3.1
8 Paper and paper products 9.6 9.3 9.1 8.8 8.7 8.5 7.9 7.3 6.8 6.2 5.6
9 Printing and publishing 8.1 1.3 1.2 1.1 1.0 1.0 1.0 1.0 1.0 1.0 1.0
10 Petroleum and petroleum products 1.6 n.a. n.a. n.a. n.a. n.a. n.a. n.a. n.a. n.a. n.a.
11 Industrial chemicals 9.3 7.5 7.5 1.7 1.7 1.6 1.6 1.6 1.6 1.6 1.6
12 Other chemical products 9.0 3.8 3.7 2.7 2.6 2.5 2.5 2.5 2.5 2.5 2.5
13 Rubber products 30.5 14.5 14.1 15.8 15.4 14.9 14.6 14.4 14.0 14.0 14.0
14 Plastic products 19.8 14.7 13.7 13.2 12.6 12.0 12.0 12.0 12.0 12.0 12.0
15 Glass and glass products 11.8 9.5 9.0 8.3 7.9 7.6 7.6 7.6 7.6 7.6 7.6
16 Non-metallic mineral products 10.6 8.7 8.1 8.4 8.0 7.7 7.7 7.7 7.7 7.7 7.7
17 Basic iron and steel products 7.6 4.4 4.2 4.2 4.1 3.9 3.9 3.9 3.9 3.9 3.9
18 Non-ferrous metal products 2.3 2.3 2.3 2.3 2.2 2.0 2.0 2.0 1.9 1.7 1.7
19 Metal products, excl. machinery 13.1 8.2 7.8 7.8 7.6 7.4 7.4 7.4 7.4 7.4 7.4
20 Non-electrical machinery 6.5 1.4 1.3 1.4 1.3 1.3 1.3 1.3 1.3 1.3 1.3
21 Electrical machinery 11.0 6.1 6.0 5.8 5.8 5.7 5.7 5.7 5.7 5.7 5.7
22 Radio, television and communication equipment 12.1 5.1 3.7 2.4 2.3 2.3 2.3 2.3 2.3 2.3 2.3
23 Professional equipment, etc. 7.2 0.2 0.2 0.3 0.3 0.3 0.3 0.3 0.3 0.3 0.3
24 Motor vehicles, parts and accessories 55.4 33.5 31.7 29.3 27.9 26.1 24.8 23.2 22.1 22.1 22.1
25 Other transport equipment 1.4 0.4 0.4 0.3 0.3 0.2 0.2 0.2 0.2 0.2 0.2
26 Furniture 28.1 21.4 20.8 20.2 19.6 18.9 18.9 18.9 18.9 18.9 18.9
27 Other manufacturing 2.9 1.0 1.0 5.2 5.1 5.0 4.9 4.9 4.9 4.9 4.9
82 Mining 2.7 0.6 0.6 0.5 0.4 0.4 0.4 0.4 0.4 0.4 0.4
Total 11.7 7.2 6.8 6.1 5.8 5.5 5.3 5.1 4.9 4.9 4.9
Source: IDC (2004)
Note: *ISIC = International Standard Industrial Classification; n.a. = not applicable.
Free
dow
nloa
d fr
om w
ww
.hsr
cpre
ss.a
c.za
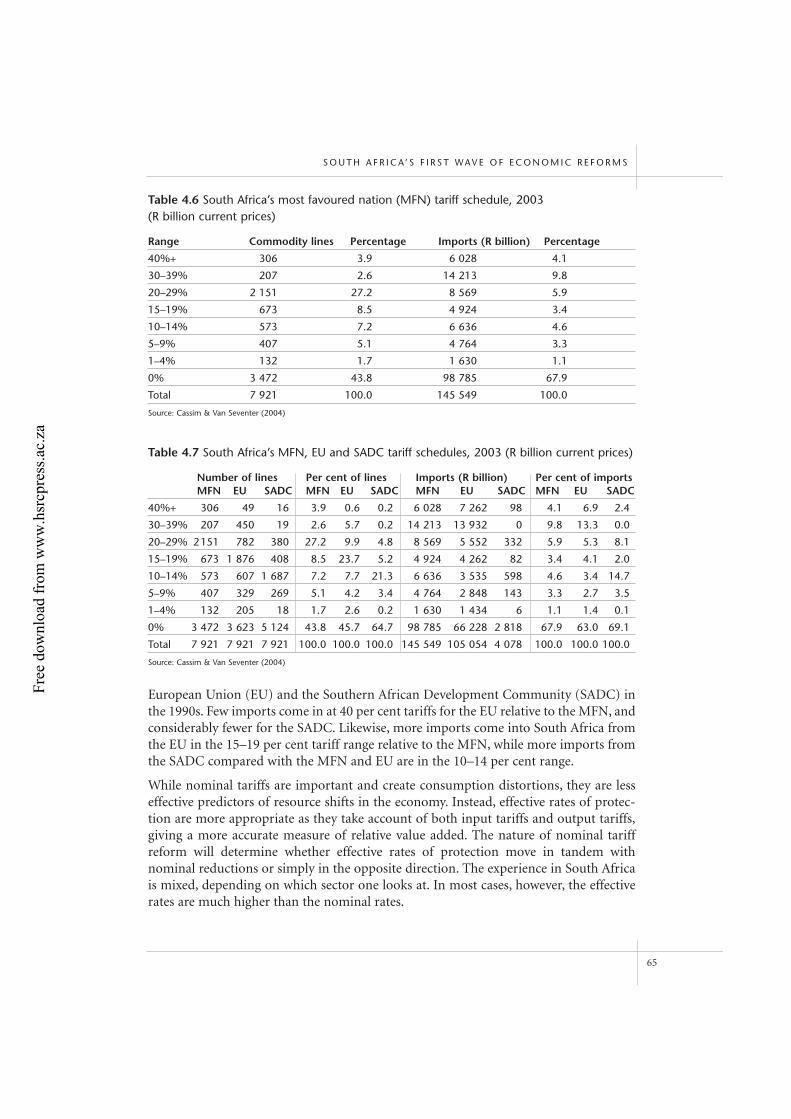
European Union (EU) and the Southern African Development Community (SADC) inthe 1990s. Few imports come in at 40 per cent tariffs for the EU relative to the MFN, andconsiderably fewer for the SADC. Likewise, more imports come into South Africa fromthe EU in the 15–19 per cent tariff range relative to the MFN, while more imports fromthe SADC compared with the MFN and EU are in the 10–14 per cent range.
While nominal tariffs are important and create consumption distortions, they are lesseffective predictors of resource shifts in the economy. Instead, effective rates of protec-tion are more appropriate as they take account of both input tariffs and output tariffs,giving a more accurate measure of relative value added. The nature of nominal tariffreform will determine whether effective rates of protection move in tandem withnominal reductions or simply in the opposite direction. The experience in South Africais mixed, depending on which sector one looks at. In most cases, however, the effectiverates are much higher than the nominal rates.
S O U T H A F R I C A’ S F I R S T WAV E O F E C O N O M I C R E F O R M S
65
Table 4.7 South Africa’s MFN, EU and SADC tariff schedules, 2003 (R billion current prices)
Number of lines Per cent of lines Imports (R billion) Per cent of importsMFN EU SADC MFN EU SADC MFN EU SADC MFN EU SADC
40%+ 306 49 16 3.9 0.6 0.2 6 028 7 262 98 4.1 6.9 2.4
30–39% 207 450 19 2.6 5.7 0.2 14 213 13 932 0 9.8 13.3 0.0
20–29% 2151 782 380 27.2 9.9 4.8 8 569 5 552 332 5.9 5.3 8.1
15–19% 673 1 876 408 8.5 23.7 5.2 4 924 4 262 82 3.4 4.1 2.0
10–14% 573 607 1 687 7.2 7.7 21.3 6 636 3 535 598 4.6 3.4 14.7
5–9% 407 329 269 5.1 4.2 3.4 4 764 2 848 143 3.3 2.7 3.5
1–4% 132 205 18 1.7 2.6 0.2 1 630 1 434 6 1.1 1.4 0.1
0% 3 472 3 623 5 124 43.8 45.7 64.7 98 785 66 228 2 818 67.9 63.0 69.1
Total 7 921 7 921 7 921 100.0 100.0 100.0 145 549 105 054 4 078 100.0 100.0 100.0
Source: Cassim & Van Seventer (2004)
Table 4.6 South Africa’s most favoured nation (MFN) tariff schedule, 2003 (R billion current prices)
Range Commodity lines Percentage Imports (R billion) Percentage
40%+ 306 3.9 6 028 4.1
30–39% 207 2.6 14 213 9.8
20–29% 2 151 27.2 8 569 5.9
15–19% 673 8.5 4 924 3.4
10–14% 573 7.2 6 636 4.6
5–9% 407 5.1 4 764 3.3
1–4% 132 1.7 1 630 1.1
0% 3 472 43.8 98 785 67.9
Total 7 921 100.0 145 549 100.0
Source: Cassim & Van Seventer (2004)
Free
dow
nloa
d fr
om w
ww
.hsr
cpre
ss.a
c.za
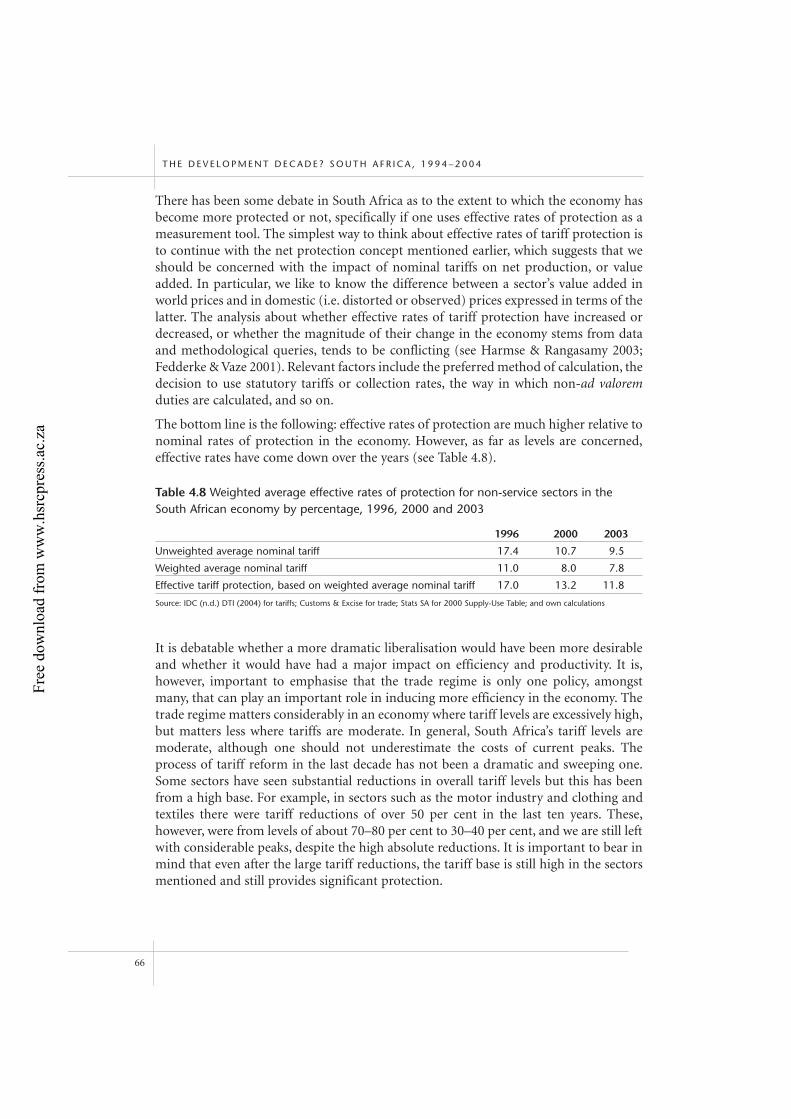
There has been some debate in South Africa as to the extent to which the economy hasbecome more protected or not, specifically if one uses effective rates of protection as ameasurement tool. The simplest way to think about effective rates of tariff protection isto continue with the net protection concept mentioned earlier, which suggests that weshould be concerned with the impact of nominal tariffs on net production, or valueadded. In particular, we like to know the difference between a sector’s value added inworld prices and in domestic (i.e. distorted or observed) prices expressed in terms of thelatter. The analysis about whether effective rates of tariff protection have increased ordecreased, or whether the magnitude of their change in the economy stems from dataand methodological queries, tends to be conflicting (see Harmse & Rangasamy 2003;Fedderke & Vaze 2001). Relevant factors include the preferred method of calculation, thedecision to use statutory tariffs or collection rates, the way in which non-ad valoremduties are calculated, and so on.
The bottom line is the following: effective rates of protection are much higher relative tonominal rates of protection in the economy. However, as far as levels are concerned,effective rates have come down over the years (see Table 4.8).
It is debatable whether a more dramatic liberalisation would have been more desirableand whether it would have had a major impact on efficiency and productivity. It is,however, important to emphasise that the trade regime is only one policy, amongstmany, that can play an important role in inducing more efficiency in the economy. Thetrade regime matters considerably in an economy where tariff levels are excessively high,but matters less where tariffs are moderate. In general, South Africa’s tariff levels aremoderate, although one should not underestimate the costs of current peaks. Theprocess of tariff reform in the last decade has not been a dramatic and sweeping one.Some sectors have seen substantial reductions in overall tariff levels but this has beenfrom a high base. For example, in sectors such as the motor industry and clothing andtextiles there were tariff reductions of over 50 per cent in the last ten years. These,however, were from levels of about 70–80 per cent to 30–40 per cent, and we are still leftwith considerable peaks, despite the high absolute reductions. It is important to bear inmind that even after the large tariff reductions, the tariff base is still high in the sectorsmentioned and still provides significant protection.
T H E D E V E L O P M E N T D E C A D E ? S O U T H A F R I C A , 1 9 9 4 – 2 0 0 4
66
Table 4.8 Weighted average effective rates of protection for non-service sectors in theSouth African economy by percentage, 1996, 2000 and 2003
1996 2000 2003
Unweighted average nominal tariff 17.4 10.7 9.5
Weighted average nominal tariff 11.0 8.0 7.8
Effective tariff protection, based on weighted average nominal tariff 17.0 13.2 11.8
Source: IDC (n.d.) DTI (2004) for tariffs; Customs & Excise for trade; Stats SA for 2000 Supply-Use Table; and own calculations
Free
dow
nloa
d fr
om w
ww
.hsr
cpre
ss.a
c.za
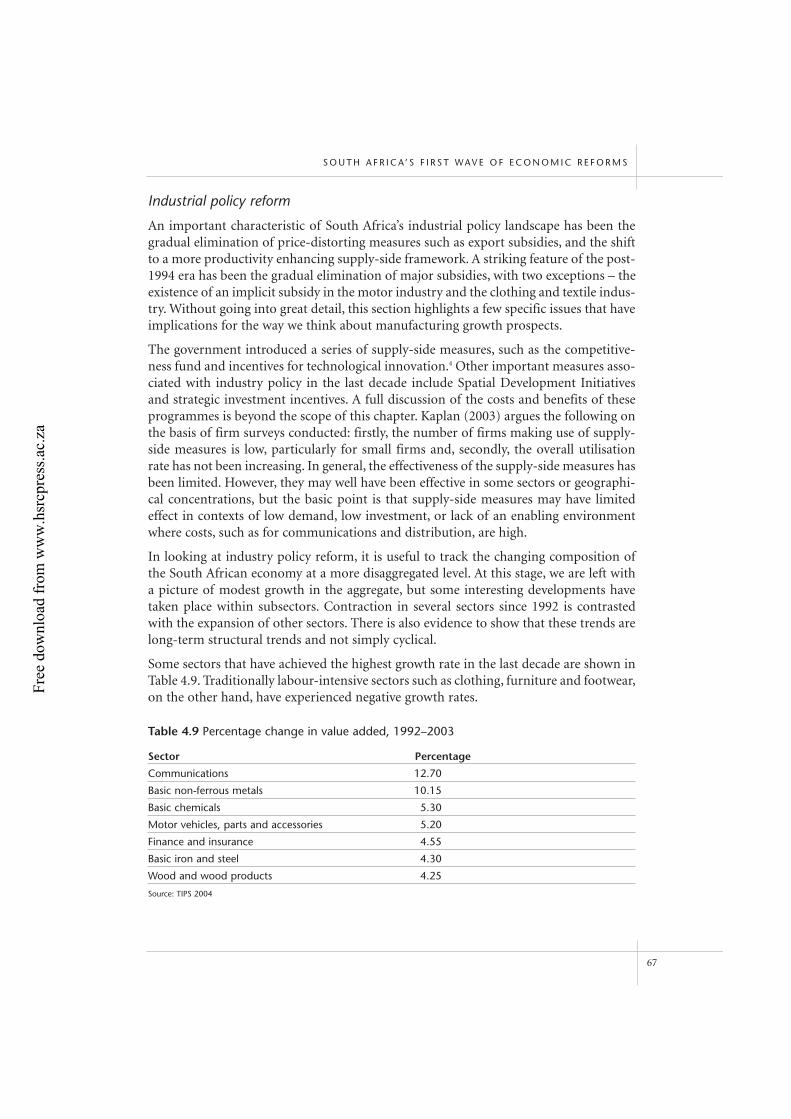
Industrial policy reform
An important characteristic of South Africa’s industrial policy landscape has been thegradual elimination of price-distorting measures such as export subsidies, and the shiftto a more productivity enhancing supply-side framework. A striking feature of the post-1994 era has been the gradual elimination of major subsidies, with two exceptions – theexistence of an implicit subsidy in the motor industry and the clothing and textile indus-try. Without going into great detail, this section highlights a few specific issues that haveimplications for the way we think about manufacturing growth prospects.
The government introduced a series of supply-side measures, such as the competitive-ness fund and incentives for technological innovation.4 Other important measures asso-ciated with industry policy in the last decade include Spatial Development Initiativesand strategic investment incentives. A full discussion of the costs and benefits of theseprogrammes is beyond the scope of this chapter. Kaplan (2003) argues the following onthe basis of firm surveys conducted: firstly, the number of firms making use of supply-side measures is low, particularly for small firms and, secondly, the overall utilisationrate has not been increasing. In general, the effectiveness of the supply-side measures hasbeen limited. However, they may well have been effective in some sectors or geographi-cal concentrations, but the basic point is that supply-side measures may have limitedeffect in contexts of low demand, low investment, or lack of an enabling environmentwhere costs, such as for communications and distribution, are high.
In looking at industry policy reform, it is useful to track the changing composition ofthe South African economy at a more disaggregated level. At this stage, we are left witha picture of modest growth in the aggregate, but some interesting developments havetaken place within subsectors. Contraction in several sectors since 1992 is contrastedwith the expansion of other sectors. There is also evidence to show that these trends arelong-term structural trends and not simply cyclical.
Some sectors that have achieved the highest growth rate in the last decade are shown inTable 4.9. Traditionally labour-intensive sectors such as clothing, furniture and footwear,on the other hand, have experienced negative growth rates.
S O U T H A F R I C A’ S F I R S T WAV E O F E C O N O M I C R E F O R M S
67
Table 4.9 Percentage change in value added, 1992–2003
Sector Percentage
Communications 12.70
Basic non-ferrous metals 10.15
Basic chemicals 5.30
Motor vehicles, parts and accessories 5.20
Finance and insurance 4.55
Basic iron and steel 4.30
Wood and wood products 4.25
Source: TIPS 2004
Free
dow
nloa
d fr
om w
ww
.hsr
cpre
ss.a
c.za
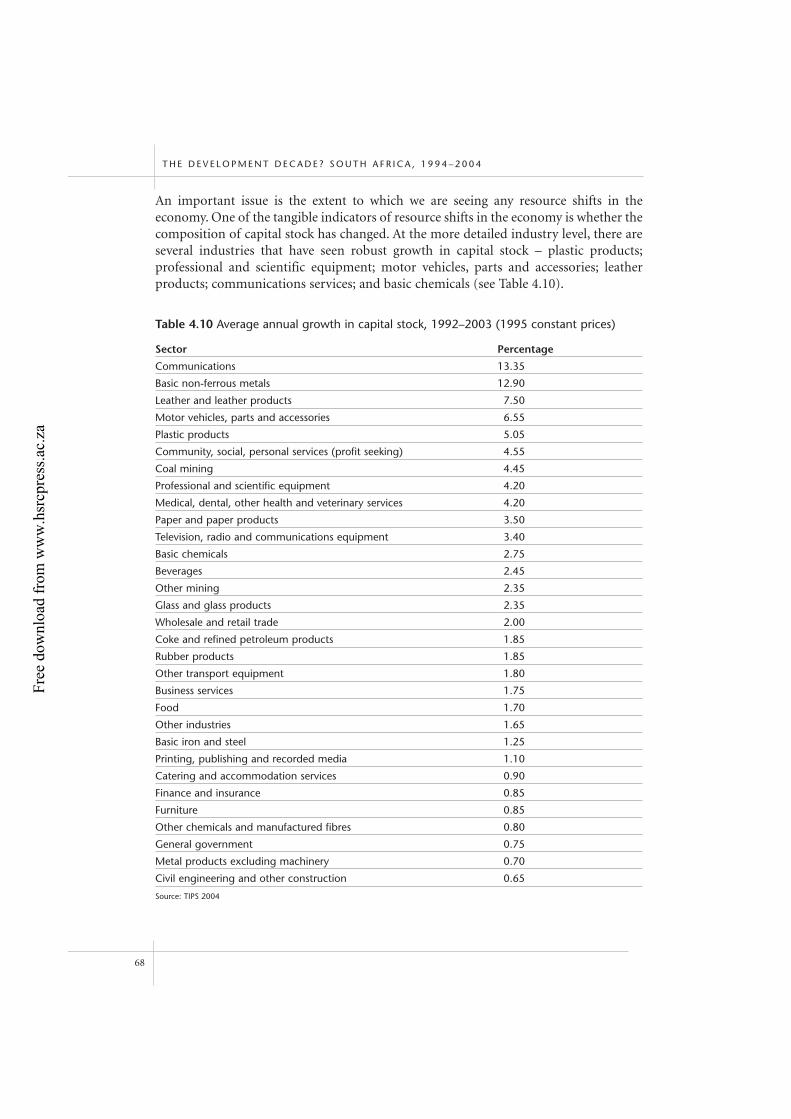
An important issue is the extent to which we are seeing any resource shifts in theeconomy. One of the tangible indicators of resource shifts in the economy is whether thecomposition of capital stock has changed. At the more detailed industry level, there areseveral industries that have seen robust growth in capital stock – plastic products;professional and scientific equipment; motor vehicles, parts and accessories; leatherproducts; communications services; and basic chemicals (see Table 4.10).
T H E D E V E L O P M E N T D E C A D E ? S O U T H A F R I C A , 1 9 9 4 – 2 0 0 4
68
Table 4.10 Average annual growth in capital stock, 1992–2003 (1995 constant prices)
Sector Percentage
Communications 13.35
Basic non-ferrous metals 12.90
Leather and leather products 7.50
Motor vehicles, parts and accessories 6.55
Plastic products 5.05
Community, social, personal services (profit seeking) 4.55
Coal mining 4.45
Professional and scientific equipment 4.20
Medical, dental, other health and veterinary services 4.20
Paper and paper products 3.50
Television, radio and communications equipment 3.40
Basic chemicals 2.75
Beverages 2.45
Other mining 2.35
Glass and glass products 2.35
Wholesale and retail trade 2.00
Coke and refined petroleum products 1.85
Rubber products 1.85
Other transport equipment 1.80
Business services 1.75
Food 1.70
Other industries 1.65
Basic iron and steel 1.25
Printing, publishing and recorded media 1.10
Catering and accommodation services 0.90
Finance and insurance 0.85
Furniture 0.85
Other chemicals and manufactured fibres 0.80
General government 0.75
Metal products excluding machinery 0.70
Civil engineering and other construction 0.65
Source: TIPS 2004
Free
dow
nloa
d fr
om w
ww
.hsr
cpre
ss.a
c.za
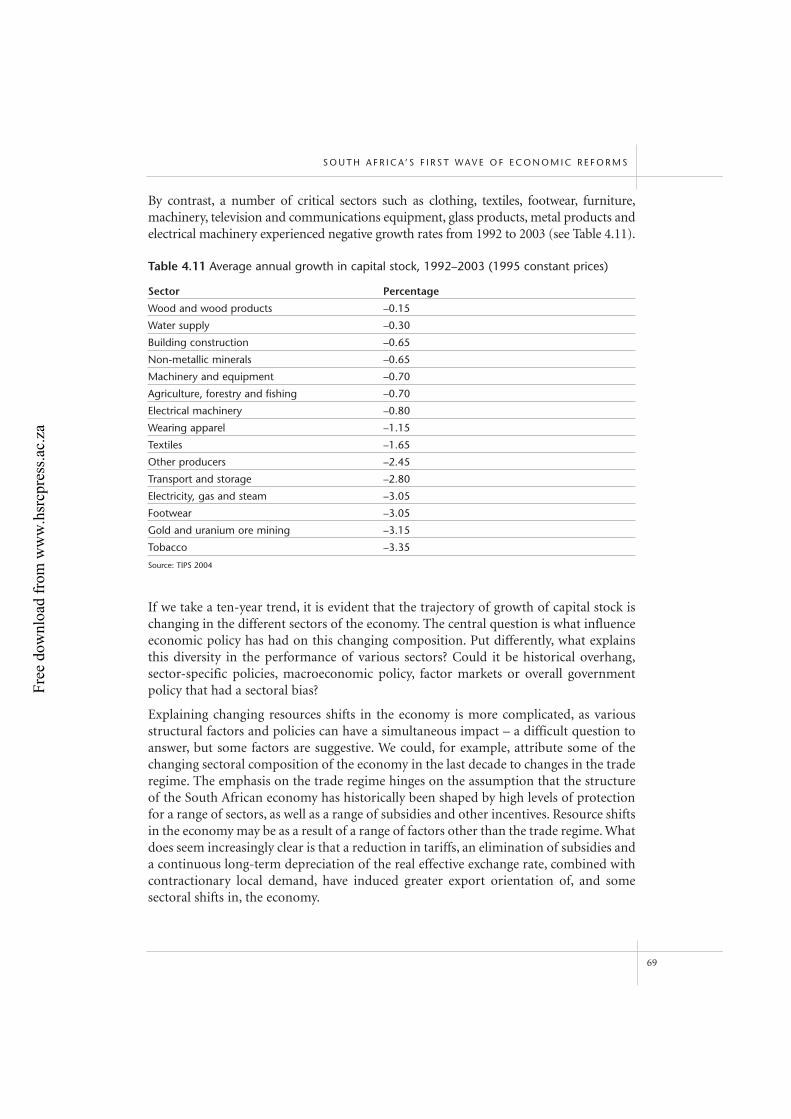
By contrast, a number of critical sectors such as clothing, textiles, footwear, furniture,machinery, television and communications equipment, glass products, metal products andelectrical machinery experienced negative growth rates from 1992 to 2003 (see Table 4.11).
If we take a ten-year trend, it is evident that the trajectory of growth of capital stock ischanging in the different sectors of the economy. The central question is what influenceeconomic policy has had on this changing composition. Put differently, what explainsthis diversity in the performance of various sectors? Could it be historical overhang,sector-specific policies, macroeconomic policy, factor markets or overall governmentpolicy that had a sectoral bias?
Explaining changing resources shifts in the economy is more complicated, as variousstructural factors and policies can have a simultaneous impact – a difficult question toanswer, but some factors are suggestive. We could, for example, attribute some of thechanging sectoral composition of the economy in the last decade to changes in the traderegime. The emphasis on the trade regime hinges on the assumption that the structureof the South African economy has historically been shaped by high levels of protectionfor a range of sectors, as well as a range of subsidies and other incentives. Resource shiftsin the economy may be as a result of a range of factors other than the trade regime. Whatdoes seem increasingly clear is that a reduction in tariffs, an elimination of subsidies anda continuous long-term depreciation of the real effective exchange rate, combined withcontractionary local demand, have induced greater export orientation of, and some sectoral shifts in, the economy.
S O U T H A F R I C A’ S F I R S T WAV E O F E C O N O M I C R E F O R M S
69
Table 4.11 Average annual growth in capital stock, 1992–2003 (1995 constant prices)
Sector Percentage
Wood and wood products –0.15
Water supply –0.30
Building construction –0.65
Non-metallic minerals –0.65
Machinery and equipment –0.70
Agriculture, forestry and fishing –0.70
Electrical machinery –0.80
Wearing apparel –1.15
Textiles –1.65
Other producers –2.45
Transport and storage –2.80
Electricity, gas and steam –3.05
Footwear –3.05
Gold and uranium ore mining –3.15
Tobacco –3.35
Source: TIPS 2004
Free
dow
nloa
d fr
om w
ww
.hsr
cpre
ss.a
c.za
Industries with relatively large capital stocks and previous state involvement, such asmining, basic iron and steel, petroleum refineries and electricity, have seen their growthin capital stock reduce (or turn negative) during the second half of the full period,although basic chemicals is an exception to this rule. Roberts (2004) suggests that thegrowth of sectors in the post-apartheid era has characteristics of path-dependence,because previous government measures, such as support given to develop basic chemi-cals, have resulted in competitive firms like Sasol.
Another important sector that has grown considerably is the motor industry. In SouthAfrica, the industry has been the subject of heated debate. Underlying this is that thespecificities of the industry have relevance to broad policy considerations about thecompetitiveness of South Africa’s industrial structure, and the role and impact of policyin altering the course of the sector. The industry is central to the debate on industrialpolicy, and is consistently seen as a model to replicate in other sectors.
The Motor Industry Development Programme (MIDP), introduced in 1995, is asystem of incentives based on selective import duty reductions, which provides sub-stantial subsidies to investment and exports in return for the production and sale ofmotor vehicles in the protected domestic market.5 Among the main features of theMIDP was the reduction of tariff protection on fully built-up vehicles from an effec-tive 115 per cent in 1994 to 65 per cent in July 1995, 61 per cent in January 1996, andultimately 40 per cent by 2002. Similarly, duty on completely knocked-down kits fellto 49 per cent over the same time span, with the ultimate objective of enhancing inter-national competitiveness. In addition, the MIDP also aimed to reduce the number oflocally produced vehicle models from 39 to 15 between 1995 and 2003, with duty-freeincentives being used to enhance the sale of high-volume models at the expense oflow-volume ones.
The motor industry has been singled out because it has enjoyed considerable exportsuccess, although this success has not been based purely on competition. In strict text-book terms, the industry enjoys both infant industry protection as well as an implicitsubsidy. There is an ongoing debate about the costs and benefits of such a programme.What is quite important is that whatever perspective one may adhere to, very few willdisagree with the fact that the benefits of the MIDP have to outweigh the costs. Theproblem is how these benefits and costs are measured. Put another way, if the sectorbecomes competitive under a free-trade regime, what has been the cost of this to theeconomy and could this have been achieved in a less costly way – either through a reduc-tion in tariffs without subsidies or a different industrial policy?6
Economists’ obsession with the costs of a programme that seems to be working well stemsfrom the fact that its success lies in distorted incentives based on two sets of costs –tariff protection, which has a price-raising effect for consumers, and an implicit subsidyto investments and exports. Flatters (2003) argues that the value of these subsidies restson rents created by continued import protection for vehicles and components in thedomestic markets. They gain their effect through transfers from South African vehicle
T H E D E V E L O P M E N T D E C A D E ? S O U T H A F R I C A , 1 9 9 4 – 2 0 0 4
70
Free
dow
nloa
d fr
om w
ww
.hsr
cpre
ss.a
c.za
buyers and they encourage economic inefficiency through the cost of production ofvehicles and components in South Africa.
Black and Mitchell (2003), on the other hand, attempt to provide a theoretical frame-work to determine if there is a welfare-enhancing case for the MIDP, despite the fact thatprices are well above international prices. They argue that under certain assumptions thecost reductions resulting from higher-volume production can be welfare enhancing evenwhere prices remain above world prices. Implicit in this view is that, notwithstandingthe cardinal rule of the cost-distorting impact of protection in international trade, theremay be some merit in the attempt by the government to introduce a scheme thatencourages a reduction in the long-run average costs of firms by encouraging economiesof scale through export incentives.
Their argument implies that the exclusive focus on static costs of protection may be tooshort-sighted. The major benefits of the policies may be costly in the short run, but mayproduce externalities, learning effects and so on in the long term. The question iswhether there are more efficient ways of doing this. This can only be answered empiri-cally, and work is being done to demonstrate exactly the extent to which we are able totrack benefits in the motor industry. This will be an important input into furtherdebates about the industry. Contradictory evidence is emerging on the sector, with somearguing that productivity improvements and innovations are part of the externalitiesthat the sector is benefiting from, while others argue that the direct cost per job created,for example, in the motor industry appears to be very high and the indirect costs toemployment in other sectors might also be high.
As mentioned earlier, the motor industry was singled out because it has been seen as anindustrial policy success and as being of relevance to other sectors. Naturally, manyother interesting policies exist in other sectors that ought to be looked at to get a morecomprehensive feel for the diversity of sectors, but it is extremely difficult to provide acomprehensive analysis of the individual growth trajectories of the various sub-sectors.In general, however, some interesting trends have emerged. Some sectors have grown inresponse to trade liberalisation, others have grown in response to protection, and othershave declined despite protection. Moreover, the fate of many wage-goods sectors, suchas clothing and textiles, has been determined partly by a contraction in output or con-sumer demand, while the growth of services, for example, has been determined partlyby deregulation, changing demand trends and technological innovation.
Competition policy
One of the most significant developments in South Africa in the area of industry reform hasbeen the development of an effective competition policy. The legal framework is set out bythe Competition Act of 1998, which came into full effect on 1 September 1999. Three insti-tutional bodies were established by the Act: the Competition Commission, the CompetitionTribunal and the Competition Appeal Court. This represents an important departure fromthe past, in that the government is now more accountable for rulings or decisions.
S O U T H A F R I C A’ S F I R S T WAV E O F E C O N O M I C R E F O R M S
71
Free
dow
nloa
d fr
om w
ww
.hsr
cpre
ss.a
c.za
Competition policy is central to creating greater efficiency in the economy, in view of thefact that one of the major concerns in the economy is the presence of mark-ups result-ing from lack of contestability in markets. This reverberates throughout the economy ina number of goods and services sectors. A critical evaluation of judgements passed bythe Tribunal or the Appeal Court is beyond the scope of this study, but a casual reviewof the cases that have gone through the Tribunal underlines the important role of gov-ernment policy in ensuring contestability amongst firms that would have generallyenjoyed high profits and rents owing to abuse of dominance. For example, the Tribunalruled against the merger of two furniture retailers on the grounds that it would have ledto less competition in the sector as the market share of the merged stores would haveranged from 40 per cent to 60 per cent in several of the product markets. There havebeen other prominent cases in sugar, packaging and alcoholic beverages, for example,where horizontal mergers were prevented on anti-competitive grounds. Similarly,several vertical mergers were blocked on the grounds that they would have enhancedmarket power because of the links between competing in a market and being able tosource inputs or effectively supply customers.7
While there have been some obviously positive spin-offs from the practice of competi-tion policy in South Africa, the economy still suffers major structural problems of amarket-power nature. For example, Roberts (2004) shows how the absence of competi-tion policy in the South African steel sector has been at a considerable cost to theeconomy. The steel example demonstrates two important policy lessons: firstly, ensur-ing contestability of markets is a core function of government and, secondly, trade policyis an ineffective form of competition policy in specific circumstances.
The steel industry has been dominated by a previously state-owned company that wasprivatised in 1989. Apart from its monopoly status, the industry enjoyed high levels oftariff protection at about 30 per cent until the mid-1990s, with a substantial reductionto 5 per cent in 1996. What is particularly important to bear in mind is that the cost ofsteel has a major impact on metal products, accounting for approximately 42 per cent ofinputs into structural metal products and 38 per cent of inputs into fabricated metalproducts (Roberts 2004).
The major economic costs of steel are that prices on the domestic market are well aboveinternational prices and, more importantly, well above the tariff wedge of 5 per cent; inother words, the industry prices at import-parity, which includes the price that domes-tic firms would pay if they were to import steel, taking into consideration transport andother associated costs. Essentially, what this implies is that industry is pricing well aboveits marginal costs. Apart from the general deadweight loss to the economy of these highprices, this has also had adverse effects on downstream sectors relying on steel. Onceagain, this is an example of cost inefficiencies in the economy that the reform processhas not been able to take on squarely. There are many other more serious examples,specifically in services regulation, as we will see in the next section.
T H E D E V E L O P M E N T D E C A D E ? S O U T H A F R I C A , 1 9 9 4 – 2 0 0 4
72
Free
dow
nloa
d fr
om w
ww
.hsr
cpre
ss.a
c.za
Privatisation and services regulatory reform
Major inefficiencies exist not only in South African product markets but in services too.8
As tariffs (primarily an instrument to protect the goods sector) come down steadily inSouth Africa, more and more attention has been focused on regulatory barriers in serv-ices and utilities. An interesting aspect of economic policy change in the last few yearshas been the increasing importance of services and utilities in employment, output andefficiency terms. Two central tenets of policy change in services and utilities have beenprivatisation and the reduction of barriers to entry, in order to reduce market power invarious sectors.
Four key parastatals in the electricity, transport, telecommunications and defencesectors – which accounted for 86 per cent of aggregate state-owned enterprise (SOE)turnover, 94 per cent of total SOE income, 77 per cent of total SOE employment, and 91per cent of total SOE assets – really matter for the privatisation process in South Africa.A few isolated incidents of privatisation in the 1980s aside, a programme of privatisa-tion and restructuring of South African SOEs was undertaken in the mid-1990s.
There were several facets to the privatisation programme. These consisted of a combi-nation of privatisation and strategic equity partnerships, often with a significant minority stake for foreign investor or strategic management partners, with the precisemix tailored to the industry in question.
The privatisation process in South Africa has been focused largely on divestiture of ‘non-core businesses’, such as resorts, broadcasting stations and related services in the trans-port sector, as well as the restructuring of utilities by selling minority stakes to strategicequity partners and black economic empowerment (BEE) groupings. SOEs that werefully privatised between 1997 and 2000 include the South African BroadcastingCorporation, Sun Air, Transnet’s Production House, Chemical Services and TransmedAdministrator. It is important to note that in most cases only sections of the SOE wereearmarked for sale and that the privatisation was generally part of a broader processincluding the restructuring and corporatisation of South African SOEs (Department ofPublic Enterprises 2001a).
Of the four priority SOEs, three were earmarked for (partial) privatisation. Theseincluded parts of Transnet, approximately 50 per cent of Telkom and a small part ofDenel. Eskom was to be deeply restructured, but not necessarily privatised, althoughmore recently it has transpired that 30 per cent of Eskom Generation will ultimately bein private hands. A strategic equity partner has purchased 30 per cent of Telkom andanother 3 per cent was sold to BEE partners.
A key problem in utilities has been the way the sequencing has evolved with somelevel of privatisation but without any changes in market structure. Partial sale toprivate investors has simply transformed the public monopoly into a private one,without creating the incentives for efficiency or innovation that competition couldspark. In sum, what is most striking about the restructuring process in South Africa
S O U T H A F R I C A’ S F I R S T WAV E O F E C O N O M I C R E F O R M S
73
Free
dow
nloa
d fr
om w
ww
.hsr
cpre
ss.a
c.za
is the fact that little emphasis has been placed on the introduction of competition inthe sectors concerned. It is common knowledge that privatisation per se does notmake companies more competitive or industries more efficient. In South Africa,partial privatisation has been given priority in the utility sectors. In some cases, itcould be argued, this has been at the expense of competition and regulation, as strate-gic equity partners demanded extended monopoly rights or were guaranteed limited(price) regulation.
It is important to bear in mind that many of the state-owned sectors, specifically utilities and other services sectors, constitute a large part of the South African economyin output and employment terms. Hence, what happens in services has profound implications for the future prospects of the economy. Moreover, services and utilities areimportant inputs in the manufacturing sectors and matter for the competitiveness ofthese economies. While these complex issues should be the focus of a separate study, afew brief examples of how many of the efficiency losses borne by the South Africaneconomy are caused by inertia in utilities and services are instructive.
The restructuring of telecommunications will have a critical impact on reducing com-munication costs in the economy, as there is strong evidence to suggest that the currentprices of fixed lines, mobile services and Internet access are above international prices.The introduction of competition may lead to significant changes in price structures,service levels and technology (see Hodge 2002b). In transport, the transaction costsassociated with delays at harbours for imports and exports are high and this could be significantly affecting South Africa’s trade. Shipping costs are high and affect an estimated 60 per cent of exports of many manufactured and primary products. As far asenergy restructuring is concerned, the current price levels are considered below totalsocial cost (i.e. including negative externalities), which may lead to sub-optimal invest-ment decisions (Bhorat & Cassim 2004).
Another important services sector that has implications for both distribution and effi-ciency is the South African financial services sector. Access to capital plays an importantrole in sustaining firms as well as influencing their ability to be competitive. The SouthAfrican financial sector has been undergoing a process of gradual liberalisation.Considerable regulatory changes have taken place in this sector, particularly in openingit to foreign investment. An important development was the repealing of a regulationthat prevented foreign competition in the banking sector. However, although foreigncompetition has raised the stakes in providing services for the public and corporatesectors and for wealthy individuals, increased competition for the lower income markethas not been forthcoming. The issue of anti-competitive behaviour by local banks is acontentious one, particularly with respect to their control of the national paymentssystem. While it is difficult to establish the extent to which local banks are complicatingthe entry of new participants and, hence, whether their behaviour constitutes a signifi-cant market access limitation, the national payments system is effectively owned bythose who run it (Cassim & Steuart 2005).
T H E D E V E L O P M E N T D E C A D E ? S O U T H A F R I C A , 1 9 9 4 – 2 0 0 4
74
Free
dow
nloa
d fr
om w
ww
.hsr
cpre
ss.a
c.za
There are several areas where further reform, specifically of the banking sector, couldplay a critical role in reducing the costs of banking services, reducing borrowing andlending spreads as well as providing more competition at the lower segment of themarket to provide opportunities for those who do not have a bank account. There is aview that the costs of banking are a great deterrent to low-income people being able tosave. The lack of competition in banking can significantly constrain the growth of theeconomy, in that access to capital is important both for the expansion of firms and forthe growth of small enterprises.
The treatment here of these important themes emerging from services and utilityreforms is somewhat superficial and incomplete, as this ought to be treated as a subjecton its own. Nevertheless, the main aim was to contextualise the issues of utility and services reforms in the broader growth and economic reform debate by identifying howthese can have an influence on growth and how the absence of reform can be detrimen-tal to getting the economy on a far more significant growth path.
Economic reform and the growth predicament
An assessment of the cluster of reforms reviewed here needs to take cognisance of themajor factors that act as a constraint to growth. Many of these have been mentionedearlier, such as low investment or capital accumulation, low levels of human capital andtechnological innovation and low levels of efficiency in the economy. A slightly differentline of inquiry to the one pursued so far would be to review the major constraints faced by the ANC government since it came into power in the 1990s and to assess how government policies have either contributed to or deterred growth.
It is important to question why government policy was ineffective in accelerating growth,at least in the medium run (within a decade of democracy), and to ask what the circum-stances were that led to the outcome we have experienced so far. Needless to say, this critical form of inquiry can only be grasped if we clearly understand what drives growth inthe economy and the extent to which conditions were met for the take-off of a sustained,long-term growth trajectory. Striking at the heart of South Africa’s growth predicament isthe problem of low investment in the economy. What measures could be taken to encour-age investment? This is what ought to be the central preoccupation of policy-makers.
Pro-growth reforms assume that growth in a small or middle-income open economylike South Africa’s is dependent on increasing efficiency and productivity, whichdepends on a range of factors, including improved education and human capital, infra-structural investment, trade reform and the existence of contestable markets, generallyachieved though competition policy. An important conceptual way to think about therelative importance of different policy variables to growth is to think about GDP growthand the degree of significance of policy changes in augmenting growth.
We know that savings/investment in physical capital, human capital formation and tech-nological change are the main sources of growth. If the economy were to have grown at
S O U T H A F R I C A’ S F I R S T WAV E O F E C O N O M I C R E F O R M S
75
Free
dow
nloa
d fr
om w
ww
.hsr
cpre
ss.a
c.za
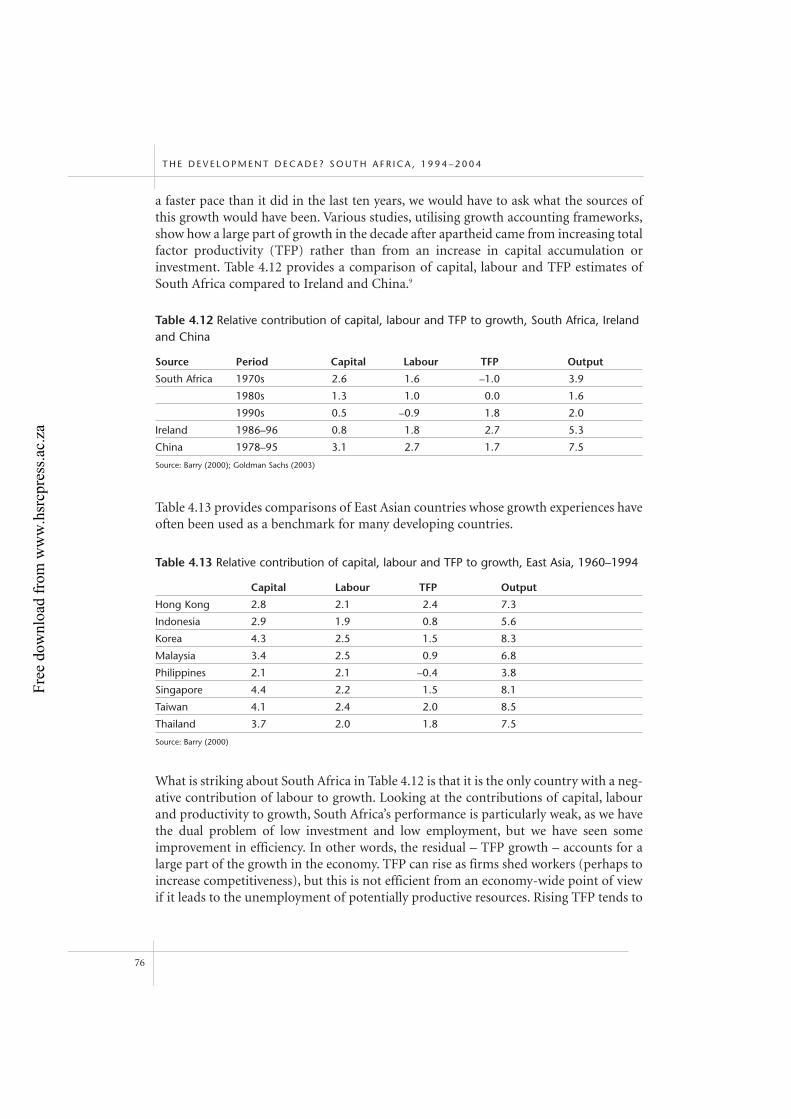
a faster pace than it did in the last ten years, we would have to ask what the sources ofthis growth would have been. Various studies, utilising growth accounting frameworks,show how a large part of growth in the decade after apartheid came from increasing totalfactor productivity (TFP) rather than from an increase in capital accumulation orinvestment. Table 4.12 provides a comparison of capital, labour and TFP estimates ofSouth Africa compared to Ireland and China.9
Table 4.13 provides comparisons of East Asian countries whose growth experiences haveoften been used as a benchmark for many developing countries.
What is striking about South Africa in Table 4.12 is that it is the only country with a neg-ative contribution of labour to growth. Looking at the contributions of capital, labourand productivity to growth, South Africa’s performance is particularly weak, as we havethe dual problem of low investment and low employment, but we have seen someimprovement in efficiency. In other words, the residual – TFP growth – accounts for alarge part of the growth in the economy. TFP can rise as firms shed workers (perhaps toincrease competitiveness), but this is not efficient from an economy-wide point of viewif it leads to the unemployment of potentially productive resources. Rising TFP tends to
T H E D E V E L O P M E N T D E C A D E ? S O U T H A F R I C A , 1 9 9 4 – 2 0 0 4
76
Table 4.12 Relative contribution of capital, labour and TFP to growth, South Africa, Irelandand China
Source Period Capital Labour TFP Output
South Africa 1970s 2.6 1.6 –1.0 3.9
1980s 1.3 1.0 0.0 1.6
1990s 0.5 –0.9 1.8 2.0
Ireland 1986–96 0.8 1.8 2.7 5.3
China 1978–95 3.1 2.7 1.7 7.5
Source: Barry (2000); Goldman Sachs (2003)
Table 4.13 Relative contribution of capital, labour and TFP to growth, East Asia, 1960–1994
Capital Labour TFP Output
Hong Kong 2.8 2.1 2.4 7.3
Indonesia 2.9 1.9 0.8 5.6
Korea 4.3 2.5 1.5 8.3
Malaysia 3.4 2.5 0.9 6.8
Philippines 2.1 2.1 –0.4 3.8
Singapore 4.4 2.2 1.5 8.1
Taiwan 4.1 2.4 2.0 8.5
Thailand 3.7 2.0 1.8 7.5
Source: Barry (2000)
Free
dow
nloa
d fr
om w
ww
.hsr
cpre
ss.a
c.za
go with rising unemployment and thus does not denote rising economic efficiency,whereas stagnant TFP often accompanies rising economic efficiency. None of theseparadoxes holds in the long run, though.10
What is interesting about Ireland is the low contribution from capital accumulation andthe high contribution from labour inputs. Barry (2000) attributes the high contributionof labour inputs to the fact that unemployment and low participation rates prevailed atthe beginning of the period, as well as to the elastic supply of labour from the emigrantcommunity abroad. By Irish standards, East Asian growth was not that spectacular.
It is clear from the growth accounting exercise that the underlying problem in SouthAfrica is the low level of capital accumulation, which is the most important determinantof accelerating growth. Indeed, the question to ask is whether the policies were far-reaching enough to address the problem of low investment. In other words, do majordistortions still exist in South Africa’s capital, labour and output markets? Or is theabsence of demand-side stimulation a major cause of low investment?
The thrust of macroeconomic policy and its role in stimulating demand has been thesubject of considerable debate in South Africa. Any brief discussion of macro-policyruns the risk of a crude and oversimplified interpretation, but there needs to be a debateabout what the appropriate level of real interest rates ought to be, and what the costs andbenefits would be of a more expansionary fiscal policy than has been the case so far. Asmentioned earlier, notwithstanding this important debate, there is no getting away fromsome of the significant supply-side constraints that persist in the South Africaneconomy. One particular aspect of macroeconomic policy that has had an adverse effecton competitiveness and exports is exchange rate volatility. The problem is that theexchange rate is viewed as a variable, the management of which involves balance ofpayments equilibrium and inflation targeting.
A stable and competitive exchange rate is important in view of the fact that demand con-siderations become less of a constraint for a small, open economy where trade barriershave come down enormously in the last two decades. It is hard to reap the benefits ofopenness if we cannot maintain a competitive exchange rate. This could keep aggregatedemand high. Gelb (2004) argues that one of the major problems with regard to mone-tary and exchange policy in South Africa in the post-apartheid era has been the failureof the authorities to take on the problem of external volatility.
Although South Africa has its economic fundamentals right, growth and employmentcreation and many other factors may have an influence on growth parameters that arebeyond the cluster of policy measures examined here. The extent of the skills constrainton growth is hard to measure but it plays an important role; moreover, the skills con-straint is likely to become more binding if growth accelerates. The role of other factorscan be equally overwhelming in dampening growth prospects. Factors such as propertyrights, appropriate regulatory structures, and quality and independence of the judiciaryhave been identified in the international literature as major contributors to growth. It isnot clear to what extent these matter in South Africa but they certainly play some role.
S O U T H A F R I C A’ S F I R S T WAV E O F E C O N O M I C R E F O R M S
77
Free
dow
nloa
d fr
om w
ww
.hsr
cpre
ss.a
c.za
Bhorat and Cassim (2004) identify a few factors that seriously dampen growth. Theseinclude uncertainty, crime and HIV/AIDS, to name a few. Various firm surveys (WorldBank 1999; Gelb 2001) and econometric analyses (Fedderke 2001) conducted in the lastfew years point out that uncertainty remains one of the key deterrents to investmentand, therefore, to growth. Identifying sources of uncertainty is quite complex becausethe notion of uncertainty is amorphous, at best, and it is interpreted in different waysby investors. There is a range of highly subjective factors that underpin the role ofuncertainty as a deterrent to growth and investment. For example, the credibility ofgovernment policies may be questioned or uncertainty may be brought about by policies that could be reversed, such as the erratic liberalisation of utilities or tradereform. Perceptions of a weak property-rights regime or poor governance are equallyimportant to investor perceptions. Although there is not authoritative literature on thisaspect, uncertainty clearly has a critical effect on investment in the South African manufacturing industry. The threshold rate of return to investment is increased toprovide for uncertainty; in other words, uncertainty implies risk that puts a higherpremium on the rate of return to investment compared with a risk-free environment(Fedderke 2001).
Another important deterrent to investment in South Africa is violent crime. The economic impact of crime as a deterrent to growth should not be underestimated. Actualstatistics on crime are riddled with problems such as the capacity to record crime, the wayit is reported, identifying the specific nature of the crime, as well as lack of reporting byvictims. Notwithstanding these problems, the evidence suggests that crime is an over-whelming problem in South Africa by any standards. For example, United Nations statis-tics for 2000 show that South Africa has the highest rate of murder in the world – 60 per100 000 of the population (followed by Columbia at 55 per 100 000 and Peru at 10 per100 000). It is hard to conceive of an economy growing at the expected levels withoutdealing with the nature of violent crime. The World Bank and the Greater JohannesburgMetropolitan Council conducted a series of firm surveys in 1999, the details of which wenoted earlier. A key finding of the studies was that crime and theft were rated as the mostimportant constraints on firm growth by most of the CEOs interviewed. For example,based on the sample, 83 per cent of firms experienced crime in 1998 and over 60 per centexperienced break-ins and property theft (Bhorat & Cassim 2004).
There is limited empirical work on how exactly crime affects growth in South Africa.Nevertheless, from casual evidence it is clear that there are essentially three ways inwhich crime impacts on investment, efficiency and skills levels. Firstly, crime contributesto systemic uncertainty in the economy owing to risk to both lives and private property.Secondly, it raises the operational cost of firms. Crime prevention can also be considereda drain on resources and is, therefore, a constraint on growth. Thirdly, crime contributesto the emigration of skilled people (Bhorat & Cassim 2004).
The spread of HIV/AIDS in South Africa has put the economy under serious strain.South Africa has one of the largest infected populations in the world, with almost 20 percent of adults carrying of the disease. There are several ways in which AIDS impacts on
T H E D E V E L O P M E N T D E C A D E ? S O U T H A F R I C A , 1 9 9 4 – 2 0 0 4
78
Free
dow
nloa
d fr
om w
ww
.hsr
cpre
ss.a
c.za
economic performance. Apart from the serious loss of human capital, there are highlabour market costs as well as the pressure to direct more resources to medication, careand prevention. These resources could otherwise have gone towards growth-enhancingexpenditure. Arndt and Lewis (2002) point out that AIDS is more prevalent amongyoung adults. This not only reduces overall life expectancy and the rate of populationgrowth, but also increases the burden of the working population, who are required tocare for those affected. Moreover, HIV-positive individuals are likely to have declininglabour productivity. Based on their model, Arndt and Lewis argue that GDP growth islikely to be affected by 1.0 per cent every year if we factor in the AIDS pandemic.
The impact on GDP growth of the issues raised here could be considerable. The cumu-lative effects of these deterrents to growth and investment imply that any type of policytargeting structural supply-side problems will have an impact on growth in the longterm only. What the policy response ought to be is a difficult issue.
Economic reform and the problem of employment and poverty
It is sometimes tempting to argue that one thing worse than no growth is low growth. Itis clear that South Africa needs above 5 per cent growth a year to make a significantimpact; low levels of 2–3 per cent create some complacency. There are several obviouspaths that one would have liked to see the economy take in the last ten to twelve years.One path is increasing employment growth often associated with robust output growth.An alternative, within a stagnant economy, is increasing opportunities for labour-intensive jobs, specifically through the creation of small, medium and micro enterprises(SMMEs), or increasing labour intensity of the economy. By and large, these have nothappened – the question is why.
So far, this chapter has looked at ways of increasing efficiency in the economy, but has notsaid much about redistribution. It is important to remember that income inequality inSouth Africa pre-dates the first wave of economic reforms; in fact, income inequalitylargely took place in a closed import-substitution industrialisation context.11 It is hard toimagine that the policies needed to create more efficiency, as well as enhance productivity,would turn distribution around in a significant way within a decade. The major risk wasthat they might actually worsen poverty or inequality. In fact, there is strong evidence tosuggest that the impact of growth on poverty depends, to a large extent, on the initialincome level in a country (see Adams 2004). Hence, to say that the first wave of reformscould not impact on income distribution in a significant way is a moot point.
Most of the policies that have been discussed are, in some senses, not intended to inducemajor redistribution in the economy, although in the long run this ought to be their keyobjective. For example, if one looks at trade liberalisation in the South African economy,it is difficult to assert that, in the medium run, liberalisation either significantly con-tributed to or undermined job creation. Various studies have emerged in the last decademaking use of a range of different techniques, ranging from econometric estimates toinput/output decomposition calculations and labour-demand decomposition methods.
S O U T H A F R I C A’ S F I R S T WAV E O F E C O N O M I C R E F O R M S
79
Free
dow
nloa
d fr
om w
ww
.hsr
cpre
ss.a
c.za
A review of the evidence on the relationship between trade, employment and earningsin South Africa during the 1990s yields mixed evidence. However, it can be concludedthat, in the main, trade liberalisation has had little effect on employment or poverty inthe economy.
The major factors that determine increasing capital intensity in the economy, or unem-ployment, are technological changes, labour market factors (skills constraints and labourlegislation) and low demand (Cassim, Onyango & Van Seventer 2003). Similarly, in thearea of privatisation, one of the key, contentious issues is what the implications are ofintroducing more privatisation and competition into an economy where the distributionof income is highly skewed. Central to this is whether increasing privatisation leads tomore or less universal access to services for the poor, relative to job creation or loss effects.It is clear that, similar to trade liberalisation in goods liberalisation, services liberalisationmay lead to job losses as we liberalise inefficient sectors. In some ways, job losses are fareasier to track if you are talking of one monopoly and its eventual liberalisation, as isoften the case in utilities. Access to services for the poor has improved considerably in thelast decade. However, as would be expected, this came about less because of policychanges within utilities than because of changing budget and expenditure priorities.
The way in which the democratic government dealt with this issue of distribution wasto resort to the budget and public expenditure side. Indeed, this is an area where thebreak from the previous government is starkly evident. In particular, two characteristicsof the expenditure patterns were increasing resources for social expenditure andexpanding the social net to the whole population (see Gelb 2004). In fact, the govern-ment developed a substantial social security system with a social pension, a disabilitypension and a child support grant (see Hirsch 2004). It also steadily allocated an increas-ing amount of resources to social investment. For example, social security as a percent-age of GDP increased from less than 2 per cent in the early 1980s to about 4 per cent in 2003. Similarly, expenditure on health and education increased considerably.More than R5 billion was spent in the last five years on land reform (SundayIndependent, 19 September 2004). Significant amounts were spent on housing. Despitethe re-orientation of expenditure, the problem of asset accumulation for the poorremains a persistent problem (Gelb 2003).
With hindsight, could government have done more about redistribution? Klaasen(2002) argues that in reviewing South Africa’s economic reform strategy from a welfarepoint of view, the government has not had much choice in a world of increasing global-isation and factor mobility to introduce far-reaching redistributive measures.Notwithstanding this, he argues, a great focus on equity was needed, specifically in theredistribution of assets. He admits, however, that potentially important areas of redis-tribution are constrained. For example, land reform is based on the willing seller andwilling buyer principle, meaning that the pace of redistribution will be slow. Similarly,human capital is likely to be more equitably distributed for the next generation, but‘current inequalities are likely to persist through intergenerational household effects andremaining inequality in school quality’ (Klaasen 2002: 631).
T H E D E V E L O P M E N T D E C A D E ? S O U T H A F R I C A , 1 9 9 4 – 2 0 0 4
80
Free
dow
nloa
d fr
om w
ww
.hsr
cpre
ss.a
c.za
SMMEs constitute another important element of redistributive reform. Again, this is anarea where several initiatives were present but with limited impact, for reasons that arenot completely clear. SMMEs have been actively promoted since 1994 on the groundsthat they could play a critical role in both enhancing the competitiveness of the economyand contributing to employment generation and income distribution. Many issues arisein relation to the slow growth of the SMME sector. Some critical findings are that thecost of finance rather than access to it remains a problem, access to product markets islimited in some sectors, and overall economic stagnation in the economy means thatdemand-side impetus for growth in the sector is limited (see Berry, Cassim, Kesper, VanSeventer & Von Blottnitz 2002).
Not much has been said so far about the labour market and its contribution to growthand employment in the economy. The impact of the labour market on growth is diffi-cult to assess. What is more important, however, is that the theoretical literature demon-strates that labour market policies in most country settings have less of a direct link togrowth than to poverty and inequality (Rama 2001).12
An assessment of the role of economic policy in effecting better distribution in theeconomy is made difficult by the myriad of simultaneous policies that may inducecounter-effects, and inter-temporal problems as to the short- and long-term impacts ofpolicies, often with worsening distribution in the short run and no obvious evidencethat this will improve in the long run. The problem is compounded by the fact thatmeasurement of poverty can take many forms (changes in per capita income, access toservices and increases in the minimum wage).
The case for devoting increasing resources to poverty alleviation is made stronger by thefact that the government has not resorted to using, for example, tax policy or the publicsector for major labour absorptive purposes. On the other hand, social relief is not sus-tainable in the long run, and greater attention is needed on tracing the extent to whichre-prioritising social expenditures will lead to long-run changes in distribution.
Conclusion
If we agree that the major objective is to get growth up in the economy, our assessmentof the first wave of economic reforms ultimately depends on whether policies havereally been conducive to growth, and effective in reducing poverty. This, in turn,depends on how much weight one attaches to demand-side or supply-side factors indeterring growth. It is clear that South Africa faces low aggregate demand in the shortrun and also has a long-term structural supply problem, and these two factors are crit-ical to driving economic growth. However, the long-term structural supply problem ismore critical (see Lewis 2001). It is important to emphasise that the South Africaneconomy is not experiencing a recession, but a long-run structural decline in growth.This is borne out by a consistently low GDP growth rate for the last two decades(Bhorat & Cassim 2004).
S O U T H A F R I C A’ S F I R S T WAV E O F E C O N O M I C R E F O R M S
81
Free
dow
nloa
d fr
om w
ww
.hsr
cpre
ss.a
c.za
Three important areas of economic reform were identified – macroeconomic policy;industry and trade policy; and regulation, competition and services. In looking atreform, the chapter distinguished between two sets or clusters of policies. First, policiesaimed at improving productivity and efficiency. These are very much a sine qua non forlong-term growth. Second, social policies aimed at addressing the problem of distribu-tion. An important issue that was emphasised was that both supply-side and demand-side policies have limited impact if there are major distortions in the economy, includingthe skills constraint, problems of trade facilitation and exchange rate volatility, and persisting lack of contestability in output markets. Moreover, many other deterrents togrowth, such as crime and the inefficient functioning of parts of the public sector,further entrench the binding constraint that the traditional economic policies have ongrowth and distribution.
The performance of the South African economy has improved in the last five years, andthis may signal positive spin-offs from some of the policy reforms. In fact, currentgrowth levels have been quite remarkable if we take into consideration the low levels ofinvestment in the economy. The key question to ask is what contributes to a sociallyunstable environment that profoundly affects business decisions and confidence in theeconomy. Indeed, various firm surveys and other econometric work point to a range offactors that need to be addressed and that policies have not been able to take on directly.
In sum, we are still left with the dual challenge of injecting more efficiency and produc-tivity into the economy while ensuring that distribution does not worsen. These neednot necessarily be trade-offs, as may have been implied in the chapter. For these poten-tially conflicting policies to reinforce each other, we need to chip away at every aspect ofpolicy and fully appreciate their short- and long-run benefits and what role there is forthe state in managing distributional conflicts that may arise from more ambitiousreform.
One way to move ahead is to identify policies that may be both welfare and efficiencyenhancing for the whole economy with no negative distributional implications, exceptfor small interest groups. For example, growth is fundamentally dependent on a rangeof issues beyond macro, trade or labour-market policies. In particular, the role of insti-tutions, governance, property rights, appropriate regulatory structures, quality andindependence of the judiciary, and bureaucratic capacity, which should not be taken forgranted in many settings, are of the utmost importance to initiating and sustaininggrowth.
The actual impacts of these reforms vary, with some likely to have a more direct effecton the growth and efficiency of the economy while others are likely to impact moredirectly on welfare or poverty.
T H E D E V E L O P M E N T D E C A D E ? S O U T H A F R I C A , 1 9 9 4 – 2 0 0 4
82
Free
dow
nloa
d fr
om w
ww
.hsr
cpre
ss.a
c.za
Notes
1 For a comprehensive discussion of the process of economic reform, see Fanelli & Popov (2003).
2 Most economists, however, would argue that if efficiency leads to more growth this would
reduce poverty, in the sense of rising per capita incomes (see Adams 2004). The more critical
issue is the extent to which it reduces poverty.
3 This section draws liberally from Cassim & Van Seventer (2004).
4 For a detailed discussion see Kaplan (2003).
5 See Flatters (2003) for an extended discussion of this.
6 Infant industries should show a more rapid rate of cost decline than other industries.
7 For a full discussion of this see Chabane, Machaka, Molaba & Taka (2003).
8 This section draws heavily from Cassim & Teljeurs (2003).
9 Various other studies on South African growth yield similar results to the Goldman Sachs
results, demonstrating consistently increasing growth from capital relative to labour, throughout
the 1970s to the 1990s.
10 Discussions with Albert Berry.
11 For a more comprehensive political economy analysis of the roots of inequality in South Africa,
see Gelb (2003), specifically pages 18–21.
12 The South African labour market debate is too complex to capture here, and is beyond the scope
of this chapter.
References
Adams R (2004) Economic growth, inequality and poverty: Estimating the growth elasticity of
poverty, World Development 32: 1989–2163.
Arndt C & Lewis J (2002) The HIV/Aids pandemic in South Africa: Sectoral impacts and
unemployment. Discussion paper. Washington, DC: World Bank.
Ayogu M (2001) Debating ‘privatisation’ of network utilities in South Africa: Theories, fables, facts,
other. Unpublished paper, Trade and Industrial Policy Strategies (TIPS) Annual Forum.
Barnes J, Kaplinsky R & Morris M (2003) Industrial policy in developing economies: Developing
comparative advantage in the South African automobile sectors <http://www.ids.ac.uk/ids/global/pdf>
Barry F (2000) Foreign direct investment, cost competitiveness and the transformation of the Irish
economy, Development Southern Africa 17: 289–305.
Berry A, Cassim R, Kesper A, Van Seventer D & Von Blottnitz M (2002) The economics of small and
medium enterprises in South Africa. Occasional Paper. Johannesburg: TIPS.
Bhorat H & Cassim R (2004) The challenge of growth, employment and poverty in the South African
economy since democracy: An exploratory review of selected issues, Development Southern
Africa 21: 59–85.
Black A & Mitchell S (2003) Policy in the South African motor industry: Goals, incentives and
outcomes, South African Journal of Economics 70: 8.
S O U T H A F R I C A’ S F I R S T WAV E O F E C O N O M I C R E F O R M S
83
Free
dow
nloa
d fr
om w
ww
.hsr
cpre
ss.a
c.za
Cassim R (2003) The pace, nature and impact of trade policy in South Africa in the 1990s, South
African Journal of Economic History 18: 76–85.
Cassim R & Oyango D (2003) Subsidies review of South Africa. Unpublished paper, TIPS.
Cassim R, Onyango D & Van Seventer D (2003) The state of trade policy in South Africa.
Johannesburg: TIPS.
Cassim R & Teljeurs E (2003) Privatisation and competition: the last decade. Unpublished paper,
TIPS.
Cassim R & Van Seventer D (2004) Trade policy since democracy. Unpublished paper.
Cassim R & Steuart I (2005) Opportunities and risks of liberalising trade in services. Issue Paper No. 2,
February. Geneva: International Centre for Trade and Sustainable Development.
Chabane N, Machaka J, Molaba N & Taka M (2003) 10 Year Review: Industrial Structure and
Competition Policy. http://www.hsrc.ac.za
Chandra V, Moorty L, Rajaratnam B & Schaefer K (2000) Constraints to growth and employment in
South Africa. Report 1: Statistics from the large manufacturing survey, World Bank Discussion
Paper 14. Washington: World Bank.
Department of Public Enterprises (2001a) An accelerated agenda towards the restructuring of SOEs.
<http://www.dpe.gov.za>
Department of Public Enterprises (2001b) Programme for 2001/2; Presentation by Minister Radebe,
6 March 2001. <http://www.dpe.gov.za>
DTI (Department of Trade and Industry) (2004) Internal documents. Pretoria.
Edwards L (2002) South African international cost competitiveness and productivity: A sectoral
analysis. Unpublished paper prepared for the South African National Treasury.
Fanelli J & Popov V (2003) On the philosphical, political and methodological underpinnings of reform.
New Delhi: Global Development Network .
Fedderke J (2001) Towards an understanding of South Africa’s growth absence. Unpublished paper,
TIPS Annual Forum.
Fedderke J & Vaze P (2001) The nature of South Africa’s trade patterns, by economic sector and the
extent of trade liberalisation during the course of the 1990s. Econometric Research Southern
Africa, Policy Paper 3. <http://www.wits.ac.za/economics/ersa/Policy%20Papers/tradlib1.pdf.>
Flatters F (2002a) SADC Rules of Origin: Undermining regional free trade. TIPS Forum.
<http://www.tips.org.za/research/papers/getpaper.asp?id=604>
Flatters F (2002b) From import substitution to export promotion: Driving the South African motor
industry. SADC Secretariat. <http://qed.econ.queensu.ca/faculty/flatters/writings/
ff_is_the_midp_a_model.pdf>
Flatters F (2003) Is the MIDP a model for selective industrial policy? <http://qed.econ.queensu.ca/pub/
faculty/flatters/writings/ff_is_the_midp_a_model.pdf>
Gelb S (2001) National enterprise survey. Unpublished document. Pretoria: The President’s Office.
Gelb S (2003) Inequality in South Africa: Nature, causes and responses: DFID policy initiative on
addressing inequality in middle-income countries. Johannesburg: The Edge.
T H E D E V E L O P M E N T D E C A D E ? S O U T H A F R I C A , 1 9 9 4 – 2 0 0 4
84
Free
dow
nloa
d fr
om w
ww
.hsr
cpre
ss.a
c.za
Gelb S (2004) The South African economy: An overview, 1994–2004, in J Daniel, J Lutchman &
R Southall (eds.) The state of the nation: South Africa 2004–05. Cape Town/Michigan:
HSRC Press/Michigan State University Press.
Goldman Sachs (2003) South African growth and unemployment: A ten-year outlook, Global
Economics, Paper No. 3. Johannesburg: Goldman Sachs International.
Harmse C & Rangasamy L (2003) The extent of trade liberalisation in the 1990s: Revisited, South
African Journal of Economics 71: 705–28.
Hirsch (2004) The Presidents review: 10 years on. Unpublished paper. The President’s Office,
Pretoria.
Hodge J (1999) The state of the telecommunications industry and the potential costs/benefits of
liberalisation. Pretoria: TIPS.
Hodge J (2002a) Promoting competitive outcomes in the fixed line telecommunications sector in
South Africa. Pretoria: TIPS.
Hodge J (2002b) Extending telecoms ownership in South Africa: Policy, performance and future
options. University of Cape Town.
IDC (Industrial Development Corporation) (2004) Tariff data. Johannesburg: IDC.
IDC (n.d.) Unpublished reports, Research Unit.
Kaplan D (2003) Manufacturing policy and performance in South Africa. Pretoria: TIPS.
Klaasen S (2002) Social, economic and environmental limits for the newly enfranchised in South
Africa? Economic Development and Cultural Change 50: 607–42.
Lewis J (2001) Reform and opportunity: The changing role and patterns of trade in South Africa and
SADC, a synthesis of World Bank Research, World Bank, Africa Region Working Paper Series 14.
<http://www.tips.afrihost.com/research/papers/pdfs/381.pdf>
Rama M (2001) Globalisation, inequality and labour market policies. DPRU Annual Conference,
keynote address, Johannesburg. <http://www.commerce.uct.ac.za/DPRU/>
Roberts S (2004) The role for competition policy in economic development: The South African
experience, Development Southern Africa 21: 227–43.
Rodrik D (2004) Growth strategies. <http://www.ksg.harvard.edu/rodrik/>
SARB (South African Reserve Bank) (2000, 2003, 2004) Quarterly Bulletin. Pretoria: SARB.
TIPS (Trade and Industrial Policy Strategies) (2004) Standardised Industry Database.
<http://www.tips.org.za>
UNDP (2003) The challenge of sustainable development in South Africa: Unlocking people’s creativity.
Cape Town: Oxford University Press, Southern Africa.
Van Seventer D (2002) The level and variation of tariff rates: An analysis of nominal and effective tariff
rates in South Africa for the years 2000 and 2001. Working paper, Trade and Industrial Policy
Strategies (TIPS). <http://www.tips.org.za/research/papers/showpaper.asp?ID=554>
World Bank (1999) World Bank large manufacturing survey for the Gauteng Region. Survey conducted
with the Greater Johannesburg Metropolitan Council. Washington, DC: World Bank.
S O U T H A F R I C A’ S F I R S T WAV E O F E C O N O M I C R E F O R M S
85
Free
dow
nloa
d fr
om w
ww
.hsr
cpre
ss.a
c.za
5 Macroeconomic reforms and employment: what possibilities for South Africa?
Jonathan Michie
Introduction
Ten years ago, a vision for economic development in post-apartheid South Africa was setout by the ANC in its Reconstruction and Development Programme and by theMacroeconomic Research Group. The economic policies pursued by the ANC govern-ment have been more cautious and orthodox. The results have been positive, in so far aseconomic and political stability has been maintained, but there is a continuing legacy ofunemployment and underemployment, as well as continued inequality. The key ques-tion is whether these problems of unemployment and inequality can be tackled withoutthreatening financial stability.1
The June 2003 Growth and Development Summit (GDS), conducted under the auspicesof the National Economic Development and Labour Council (Nedlac), agreed a targetof halving unemployment by 2014. But how can the necessary degree of investment beachieved? Six areas that may be relevant to finding an answer, and which deserve a con-tinuing policy effort, are: firstly, the use of targeted interest rates; secondly, the use offoreign direct investment (FDI); thirdly, acting on investment levels directly; fourthly,encouraging the ‘3rd Sector’; fifthly, public works; and sixthly, the development of ‘high-commitment work systems’.
A better-trained workforce combined with an appropriate organisation of work canusually improve organisational performance, and if the workforce is committed andmotivated, productivity will be further raised. For this to translate into output andemployment gains requires demand to rise faster than productivity; and for this to becombined with stable or falling inflation requires cost-absorbing new capacity andinnovation.
To be sustainable, the country’s productive infrastructure needs to be continuallyrenewed. This links to education, housing, FDI, entrepreneurship and an almost endlessrange of inherently interrelated economic and social factors. The key point is to under-stand that these links are there, and that they ought properly to be the focus of activeand joined-up policy development. Within this context, detailed research and policywork is necessary to advance our knowledge and understanding of how such policy canbest be developed in each of these areas within the context of current-day South Africa.
86
Free
dow
nloa
d fr
om w
ww
.hsr
cpre
ss.a
c.za
Create employment or contain inflation?There is no clear consensus within economic theory about the inflation–unemploymentrelationship. In so far as there has been a dominant view, this itself has altered over time.As for the theory that informs the anti-inflation activities of central banks, this is rarelymade explicit. Thus, for example, when the South African Reserve Bank (SARB) raisesinterest rates in the face of inflationary concerns, is this in order to reduce the moneysupply, which is thought to be a direct determinant of inflation, or is it to reduce con-sumer and/or investment demand and hence slow down the economy, or are othercausal processes believed to be at play?
Keynesianism and the Philips curve
During the Keynesian consensus of the 1960s, the macroeconomic role of governmentswas generally thought to be to maintain full employment and stable inflation, along witheconomic growth, balanced trade, the provision of welfare state services, and possiblysome redistributive (egalitarian) goals. The key beliefs as regards the unemployment-inflation relationship were, firstly, that it was possible to achieve both goals (i.e. toachieve and maintain full employment, without inflation accelerating) and, secondly,that there was some degree of trade-off, but within acceptable ranges, as regards bothunemployment and inflation. In other words, it was thought possible to eliminateunemployment while maintaining broadly stable inflation rates.
Of course, even during this era of full employment, there was always some degree ofunemployment. In part, this was just the ‘frictional’ unemployment of people movingfrom job to job with a period of unemployment in-between. There might also have beenmore serious ‘pockets’ of unemployment in certain regions, but this was regarded as aproblem for regional policy to tackle. The ‘demand deficient’ unemployment of the1930s, where people were unemployed because the level of aggregate demand in theeconomy was below that required to fully employ the workforce, was thought to be athing of the past.
In this context, if inflation rose, it was interpreted in one of two ways. Firstly, it might bedue to some exogenous factors, such as increased international raw material prices,which would either pass or could be dealt with or, secondly, if there was persistent inflationary pressure, then this would be interpreted as evidence that the economy wasoverheating, with ‘over-full’ employment. Keynes had spelled out the policies that wouldbe required to maintain full employment, but he had also stressed the importance ofpreventing aggregate demand from rising above its full-employment level, as this wouldlead to inflation.
Thus, such inflation was interpreted as having been caused by the economy havingmoved up the Philips curve to the left, with higher inflation and lower unemployment.What was needed in such a situation was to move back down the Philips curve to theright, to the previous levels of unemployment and inflation.
M A C R O E C O N O M I C R E F O R M S A N D E M P L O Y M E N T
87
Free
dow
nloa
d fr
om w
ww
.hsr
cpre
ss.a
c.za
This trade-off between unemployment and inflation was depicted by the Philips curve,after Philips (1958) plotted unemployment against the rate of (money wage) inflationfor the United Kingdom. Philips actually used pre-World War I data to construct thecurve, which was then superimposed on the inter-war data, which fitted, although in aclustered fashion, with the data from the 1920s generally above the curve and the datafor the 1930s generally below. Lipsey (1960) did test for inter-war data, but without significant results for unemployment.2
Interestingly, though, the impact that this view of the world had on policy responses toeither inflation or unemployment tended not to be for governments to simply choose tomove to a different point on the given trade-off curve. In other words, were inflation to rise, it might be thought that the Philips curve model would suggest that this must bedue to the economy having moved up the Philips curve to the left, so the policy responseshould be to move the economy back down to the right, increasing unemployment.However, the Philips curve tended not to be interpreted so mechanistically. This may be,in part, because reality never did fit the curve particularly closely. Thus, if inflation rose,it would often be the case that there would have been no concomitant fall in unemploy-ment. Instead, it would have been caused by a rise in international fuel prices, or inwages, or in taxes imposed by the government. Therefore, policies would tend to beintroduced to tackle these problems directly, without seeking to raise the rate of unem-ployment in search of a different ‘trade-off ’ point. Thus, particularly in the UK of the1960s and 1970s, prices and incomes policies might be introduced, whereby wage riseswould be limited to a certain ceiling, possibly with additional payments allowed ifmatched by productivity gains (so that unit labour costs did not rise), and likewise firmswould be forbidden to raise prices by more than a certain prescribed percentage.
In other words, if inflation began rising, the policy reaction would be to attempt torestrain inflation directly, through prices and incomes policy, rather than to allow unem-ployment to rise. The exception was if the economy was thought to be genuinely over-heating, with over-full employment, in which case monetary and/or fiscal measureswould be used to slow down the economy and allow employment to fall back to its ‘full-employment’ level.
Thus, the policy for maintaining full employment was broadly believed to be to maintainlevels of aggregate demand sufficient to ensure that the available workforce was fullyemployed. In addition, it was thought likely that some unemployment would be caused byregional problems and industrial restructuring, which should be tackled through regionaland industrial policies. If demand-deficient unemployment was thought to be appearing,then the government would take policy action to boost demand. This might include fiscaland interest rate policies, but would not be limited to these. It would also include, forexample, regulatory changes to affect how easily consumers could buy goods on credit.
Likewise with inflation, if this rose, the response was not always to increase interest rateswith a view to slowing down the economy and thus increasing unemployment, in orderto move to a new unemployment–inflation trade-off. On the contrary, inflation would
T H E D E V E L O P M E N T D E C A D E ? S O U T H A F R I C A , 1 9 9 4 – 2 0 0 4
88
Free
dow
nloa
d fr
om w
ww
.hsr
cpre
ss.a
c.za
be targeted directly, for example through prices and incomes policies. Generally, thesewould start with a freeze on increases in wages or prices, for say six months, in order tobreak any inflationary spiral, following which wages could only be increased by eithersome flat rate or percentage amount, or in some cases a mixture of the two. Generally,wage rises above these limits would be allowed if accompanied by productivity deals.Provided productivity rose, then the increased wage would not necessarily increase unitlabour costs or prices.3
To the extent that such policies were effective, in either reducing inflation withoutincreasing unemployment, or reducing unemployment without increasing inflation,then clearly this would affect the shape of any Philips curve. Some trade-off mightremain, though, since when the economy grows faster and unemployment falls, itbecomes easier for workers to gain wage rises and for firms to raise prices, either to passon increased costs or even to raise profit margins. This is particularly so if bottlenecksoccur because of insufficient capacity. If there is a shortage of a particular type of skilledlabour, for example, then their wage rates are likely to be bid up as firms compete toattract and retain them. If demand outstrips supply for office or other space, rents willbe bid up. And so on. The key to achieving sustainable, non-inflationary growth is toensure that industrial and economic capacity expands in line with demand.4
Monetarism and the ‘natural rate’
The first Thatcher government was elected in Britain in 1979 on the promise of squeez-ing inflation out of the system. The policy instrument for doing this was to be controlof the money supply. The theoretical framework was Milton Friedman’s monetarismand associated ‘natural rate of unemployment’. This posited that there was no Philipscurve trade-off between unemployment and inflation over the long run. Any such trade-off would be a short-term effect, whereby lowering unemployment below its natural ratewould lead not just to higher inflation but to accelerating inflation. Since acceleratinginflation is not sustainable, unemployment would need to be allowed to increase back tothe natural rate to bring the rate of growth of inflation back to zero. To reduce the rateof inflation itself (as opposed to its rate of growth), unemployment would have to riseabove the natural rate.
The reasoning was that it was only at the natural rate of unemployment that people’sexpectations about inflation would match the actual outcomes. If unemployment fell,then inflation would rise as one moved up the Philips curve but, crucially, this wasargued to be a short-term possibility. Any given Philips curve would be based on a singleexpected rate of inflation, namely, the rate of inflation that the (short-run) Philips curvein question demonstrated at the natural rate of unemployment. If one moved up thatcurve to the left, with unemployment falling below the ‘natural rate’, then inflationwould rise above that expected rate. Once people realised that inflation was higher thanthey had expected, they would adjust their behaviour accordingly. In particular, theywould adjust their wage demands upwards. As expectations of future inflation adjusted
M A C R O E C O N O M I C R E F O R M S A N D E M P L O Y M E N T
89
Free
dow
nloa
d fr
om w
ww
.hsr
cpre
ss.a
c.za
upwards, one would move up to a higher short-run Philips curve corresponding to thishigher rate of expected inflation. So long as the rate of unemployment remained belowthe natural rate of unemployment, it was argued, inflation would continue to rise, withactual inflation always outstripping expectations, which in turn would be revisedupwards, a process that would itself give a further upward twist to inflation.5
Thatcher’s premiership ended with inflation at around the same level she inherited in1979. The annual increase in the Retail Price Index stood at 10.3 per cent when the firstThatcher government took office in May 1979, and when Mrs Thatcher left office inNovember 1990 it was 9.7 per cent. The initial belief that targeting the growth in themoney supply directly (in terms of the quantity of money) would eliminate inflationgave way to old-style policies of high interest rates and deflation combined with labour-market policies to restrain wages.
The non-accelerating inflation rate of unemployment
The problem for the monetarist model was that in the equation MV = PT, there was nological reason why the direction of causation should run from M (the money supply, orits rate of growth) to P (the price level, or inflation), T being the number of transactions.There was also no necessary reason for V (velocity of circulation) to remain constant ifM was altered by policy intervention, even if it had been constant previously(Goodhart’s Law).
These weaknesses in the theory and problems with the practice led to monetarism beingreplaced by the non-accelerating inflation rate of unemployment (NAIRU). Like thenatural rate and unlike the original Philips curve, the NAIRU was taken to be vertical,allowing only one rate of unemployment at which inflation would be stable. But like theoriginal Philips curve, and unlike the natural rate, the theoretical framework for theNAIRU was not market-clearing equilibrium but rather a recognition that wage andprice setting are influenced by market structure and bargaining power. Different levelsof unemployment will produce different degrees of bargaining power on the part oflabour, and hence correspond to different degrees of wage pressure, which results in justone level of unemployment (the NAIRU) corresponding to stable inflation, with unem-ployment either higher or lower, resulting in a lower or higher bargaining power, respec-tively, and hence falling or rising inflation.
The NAIRU approach assumes that as output and employment expand in an upswing,the bargaining wage will rise as labour becomes scarcer and the bargaining position ofemployees strengthens. The ‘feasible’ wage is defined as the wage that firms are able topay, without having to raise prices. In the upswing, as the bargaining wage rises, the fea-sible wage fails to rise in line. The point where the two curves (for the bargaining wageand the feasible wage) intersect will be an equilibrium at which employers will be ableto pay the bargaining wage without having to raise prices. There will be no tendency forinflation to rise (or fall). Hence, the level of unemployment that this point representswill be the NAIRU.6
T H E D E V E L O P M E N T D E C A D E ? S O U T H A F R I C A , 1 9 9 4 – 2 0 0 4
90
Free
dow
nloa
d fr
om w
ww
.hsr
cpre
ss.a
c.za
Therefore, the level of the NAIRU can be altered by any factors that are able to shifteither the feasible or bargaining wage. These factors include labour-market structuresand institutions such as trade unions and industrial relations systems. If these institu-tions remain unchanged, then they will reinforce the existing NAIRU. On the otherhand, policy can reduce the NAIRU, and/or reduce inflation, by acting on such factors.
The NAIRU approach thus emphasises how policy might shift the NAIRU, rather thanaccepting it as ‘given’. If competition between firms can be enhanced through, forexample, reducing the degree of industrial concentration, thereby reducing firms’ mark-up over costs, then the economy will be able to operate at a lower rate of unemploymentwithout inflation rising. Likewise, if aggregate investment could be increased, raisingproductivity and competitiveness, then the feasible wage that firms would be able to paywould rise. This again would allow the economy to operate at lower rates of unemploy-ment, without inflationary pressures developing. Enhancing productive capabilitiesshifts the NAIRU curve to the left.
The implication of this for policies to cut unemployment without risking inflationarypressures is that the bargaining wage has to be reduced or the feasible wage has to beincreased. The bargaining wage could be reduced through a national labour accord forthis purpose. The feasible wage can be raised by upgrading productive capabilities,productivity and value added, so that firms are able to pay higher wages.
Beyond NAIRU
Within the NAIRU approach, as unemployment falls, the ‘feasible wage’ that employerscan afford to pay without increasing prices fails to rise. It is supposed that as firmsincrease their level of output, productivity fails to rise. But in economic expansions,output per head generally does rise. This increase in productivity is explained by the factthat capital is operated at a higher level of utilisation as demand increases and firmsinvest in more modern and productive equipment. The more reasonable assumptionthat productivity, and hence the ‘feasible wage’, increases with output thus underminesthe NAIRU approach. If increased capacity utilisation and, over the longer term, anincreased and more technologically advanced capacity allows a growth of the feasiblewage, then there may be no unique ‘equilibrium’ point (NAIRU) with only that one levelof unemployment associated with non-accelerating inflation. Thus, even if the bargain-ing and feasible wages happened to coincide at a given level of unemployment, if unem-ployment falls with the feasible wage increasing (due to increased productivity) morethan the increase in the bargaining wage, then such a model would actually predict thatthe reduction in unemployment would result in inflation falling rather than rising.7
While the NAIRU appears to suggest that unemployment cannot be cut below its non-inflationary rate without rising inflationary pressures, in practice the sort of economicmodernisation policies that governments in any case tend to promote – to encourageinvestment, research and development, and training – are precisely those that wouldboost the feasible wage and hence bring down the NAIRU.8
M A C R O E C O N O M I C R E F O R M S A N D E M P L O Y M E N T
91
Free
dow
nloa
d fr
om w
ww
.hsr
cpre
ss.a
c.za
Segmented labour markets
In the non-market clearing world of the NAIRU, the labour market is recognised to besegmented in various ways: between ‘insiders’ and ‘outsiders’, between the economicallyactive and inactive, and by the whole range of factors that tend to differentiate labour inthe employment market. The theory of labour-market segmentation actually pre-datesthat of the NAIRU, and includes broader sociological and institutional factors than areusually included in the NAIRU literature. This segmentation analysis:
disputes the neoclassical view that the structure of pay reflects primarily thestructure of relative labour efficiency, and argues that the number of good jobsin the economy is mainly determined by the development of the industrial andtechnological structure largely independent of labour supply … The existenceof segments of the labour force with different labour market status may alsocreate the situation where jobs are classified not by their content but accordingto the labour market position of the workers normally undertaking the work.Thus jobs are secondary because they are performed by workers generally con-sidered secondary: jobs are regarded as unskilled because they are feminisedand not feminised because they are unskilled. Moreover, the existence of non-competing groups may be of considerable social and political importance forthe maintenance of labour market segmentation. The role of class divisions andracial and sexual discrimination as a means of legitimising and enforcinginequalities in the labour market is central. (Craig, Rubery, Tarling & Wilkinson1982: 77)
This segmentation of labour markets means that policy goals of targeting certain levelsof unemployment need to take account of the various segmented labour markets andwhat the public policy goals should be with respect to each. It also means that a pre-requisite for such a policy agenda is detailed research into the segmented labour market:what those segmented labour markets are in any given country at any particular time;what the levels of pay, employment, productivity, labour turnover and so on are in eachof those markets; what the degree of mobility is between the various segments of thelabour market; and, crucially, how policy might be tailored to tackle the specifics thatsuch research uncovers.
Competition policy and regulated prices
When market-clearing assumptions are dropped, and the reality of industrial concen-tration and mark-up pricing is acknowledged, then competition policy becomes relevant to the issue of inflation. Certainly, there has been renewed emphasis in the UKand across Europe recently on how increased competition can drive down prices, as wellas deliver other economic benefits, including increased employment:
It is worth emphasising the commitment of the Labour Government since 1997to increased product market competition. There was a new Competition Act that
T H E D E V E L O P M E N T D E C A D E ? S O U T H A F R I C A , 1 9 9 4 – 2 0 0 4
92
Free
dow
nloa
d fr
om w
ww
.hsr
cpre
ss.a
c.za
included significantly increased powers for the Office of Fair Trading. Mergerpolicy was firmly driven by competition considerations. In the utilities competi-tion was pursued rigorously, with the fostering of domestic competition for gasand electricity and the introduction of the New Electricity TradingArrangements. (Corry 2003: 17)
The degree of market concentration is clearly an empirical one, which in any givencountry will vary between industries and over time. The impact of market concentra-tion is not just that firms will be able to charge higher prices than would otherwise bethe case, but also that their reaction to events will differ – they may be more able topass on increased costs, thus exacerbating an inflationary spiral, and may also be lessresponsive to increased interest rates, or at least the nature of their response may bedifferent, postponing investment rather than cutting prices to maintain marketshares.9
This is, therefore, an area that would require detailed research on an industry-by-industry basis to determine the degree of market concentration, and on a firm-by-firmbasis to establish the implications of any such concentration on pricing and investmentdecisions in the face of changes in input costs or interest rate changes. Clearly, the mostimportant industries in this regard are those with pricing behaviour that can haveeconomy-wide effects – such as food, energy and the utilities.10
The specifics of South Africa
There are questions over the reliability of data on unemployment in South Africa, butthere is no doubt that unemployment is a serious problem.11 The 2003 GDS, held underthe auspices of Nedlac, agreed on actions to accelerate the growth and developmentprocess, and to halve the rate of unemployment by 2014.
What implications does this commitment have for inflation? There are two possible con-nections. Firstly, it may be that achieving such a reduction will require either a cut ininterest rates or a fall in the value of the rand against other currencies; in either case, thismight tend to raise the rate of inflation. Secondly, it may be that a fall in the level ofunemployment might itself have inflationary consequences. This might operate throughthe NAIRU-type processes of increased wage pressures. Alternatively, there may beinsufficient productive capacity in the economy to sustain the higher levels of employ-ment, in which case inflationary pressures would result from supply shortages. We consider these labour market, capacity and interest rate issues in turn.
Unemployment, wage growth and productivity
In an analysis of South African labour-market processes, and in particular the relation-ship between unemployment, wage growth and productivity, Wakeford (2003) foundthat unemployment ‘has little or no effect in terms of restraining real wage growth’.Wakeford found that increased productivity allowed, and led to, an increase in real
M A C R O E C O N O M I C R E F O R M S A N D E M P L O Y M E N T
93
Free
dow
nloa
d fr
om w
ww
.hsr
cpre
ss.a
c.za
wages, although not fully proportional, so that, had this been tested for, we would expectthat part of the gains from productivity would feed through to increased profits.
The implications for inflation and unemployment are as follows. Increased productivityallows increased real wages. This can come through one of two routes. Increased pro-ductivity may boost profits and wages. Alternatively, increased productivity allows pricesto be cut, hence increasing the real value of any given money wage. Either way, the resultwill be to prevent or at least reduce pressure for increased money wages. The target realwage will have been delivered through increased productivity. Thus, the outcome will bereduced inflationary pressure.
The degree to which increased productivity can pay for increased wages without theneed to increase prices will depend on how costly or otherwise the increased productiv-ity was to the company. At one extreme, a gain in productivity might be entirely costless,for example if it resulted simply from being able to expand output in response toincreased demand at a time when resources were otherwise lying idle. On the otherhand, if the rise in productivity is the end product of costly investment in research anddevelopment, product and process development, work reorganisation and staff training,then these additional costs might absorb the whole of the increased value added result-ing from the increased productivity.
The outcome on employment will depend on the extent to which the increased produc-tivity leads to increased sales. These can come from increased exports or increaseddomestic sales, which can be achieved because the increased productivity allows forlower prices or better quality or both. In some cases, the increased productivity will beassociated with innovation, in which case whole new markets may be created. Thus,increases in output per head (productivity) tend to be associated with increased salesand hence higher output. The relative size of these two effects (increased sales and higherproductivity) will determine whether the increased output levels will involve higher orlower employment.
Thus, there is no reason to suppose that achieving lower unemployment would lead toinflation. That will depend on the behaviour of a number of other economic variables,including the ‘bargaining’ and ‘feasible’ wage levels. Lower unemployment might even beassociated with lower inflation. The key issue is whether the economy’s productivecapacity is expanded in line with increased employment, with the necessary levels ofinvestment in new infrastructure, capital equipment, research and development, andtraining.
Investment and productive capacity
Whether firms will increase or reduce their prices as demand for their goods and serv-ices rises depends crucially on whether they are expanding their own productive capac-ity. Increased productivity from newer ‘vintages’ of capital equipment and more modernequipment and productive facilities, generally, may lead to falling costs and prices.12 If
T H E D E V E L O P M E N T D E C A D E ? S O U T H A F R I C A , 1 9 9 4 – 2 0 0 4
94
Free
dow
nloa
d fr
om w
ww
.hsr
cpre
ss.a
c.za
firms also have an incentive to cut prices to gain market share, then this may have afurther counter-inflationary impact.
On the other hand, if the expansion in employment occurs without sufficient expansionin investment, this may lead to available capacity becoming fully utilised, creating infla-tionary bottlenecks. The term ‘investment’ covers a range of activities – not just corporateinvestment in premises, machinery and equipment, but also investment in infrastructure,in research and development, and in training and human capital development. In theseareas, the government and other public agencies have a part to play.
The government needs to facilitate the necessary developments so that this economiccapacity, broadly defined, can be enhanced in a balanced fashion across the economy.This is the surest way to bring about the desired non-inflationary growth in output andemployment.
Interest rates, investment and demand
Will the necessary investment decisions be made and sustained in the face of high inter-est rates? The preferred outcome would clearly be to enhance economic capacity so as toreduce inflationary pressures, thus avoiding the need to raise interest rates. However, iffor whatever reason inflation rises, then there is indeed a danger that if interest rates areraised in response, this may choke off the capacity-enhancing investment that isrequired to increase employment in the economy.13
Therefore, to increase interest rates to reduce inflation is, at best, a rather ‘blunt instru-ment’, working as it does through depressing the real economy. If it is the only option,then so be it; but, if the actual processes can be identified, it may be that more targetedpolicy could achieve the same anti-inflationary gain with less depressed real output pain.In other words, the increased interest rate will impact on various sectors of the economy.Each will suffer some degree of ‘pain’ in the sense of increased costs of investment andpossibly a reduction in their expected future sales if the increased interest rate impactson demand. Each may also, therefore, reduce their employment or planned employ-ment. In each case, there may be some downward effect on prices in that sector, but thesize of these effects may differ from sector to sector.
Firstly, different sectors may experience different degrees of ‘pain’. Secondly, for anygiven fall in output, the corresponding reduction in employment may differ. Thirdly, forany given fall in output and employment, the degree to which there is any counter-inflationary gain may differ.
If the size of these three effects were known on a sector-by-sector basis, then it might bepossible to target policy more accurately, either by taking action to slow down thosesectors from which most inflationary gain would be expected, or by attempting toprotect those sectors from which there would be little to be gained from squeezing. Thelatter might be attempted, for example, by somehow sheltering those sectors from theimpact of an increase in the general rate of interest.
M A C R O E C O N O M I C R E F O R M S A N D E M P L O Y M E N T
95
Free
dow
nloa
d fr
om w
ww
.hsr
cpre
ss.a
c.za
If a rise in interest rates depresses investment – either directly, because of its increasedcosts, or indirectly by depressing the general level of activity, which will cause investmentplans to be scaled downward – then this will lead to a lower level of economic capacitythan would otherwise have been the case. In addition, the capital stock will be older, onaverage, than it would have been had there been greater investment in new machinery.Likewise, if investment in people is scaled down, then the labour force may be less skilledthan otherwise. The first effect of a lower level of economic capacity is that in any subsequent economic expansion, capacity constraints and bottlenecks are likely to be hit sooner than would otherwise have been the case, and these capacity constraints and bottlenecks are generally sources of inflationary pressure.
The second effect of depressed productivity is that firms are left less able to absorb anyincrease in costs that might come from raw material prices, wages or some other source.A greater proportion of any such increase in input costs is likely to be passed through inincreased output prices. These longer-term effects of increased interest rates may leavethe economy less well placed to deliver non-inflationary growth in the future, despiteany short-term effect of depressing the rate of inflation.
Policy implications
The policy implications of the above are as follows. In the first place, achieving increasedproductivity is an important way of maintaining low rates of inflation. If input costs arerising, then a firm with rising productivity may be able to absorb these increased inputcosts, while a firm with stagnant productivity will have to pass them on in increasedprices. Increased productivity, though, generally requires investment in capital andpeople. Hence, it is important to keep interest rates as low as is practically possible toencourage such investment. High interest rates may also dampen growth rates and,perhaps even more crucially, expectations about the growth of demand. If so, this willtend to inhibit the sort of investment and expansion plans that generally deliverincreased productivity.
There is a paradox. Interest rates are raised to avoid inflation, but productivity-enhancing investment and expansion may be inhibited. Yet, these productivity gains arecrucial for avoiding inflationary pressures over the longer term. Thus, the short-term anti-inflationary gain from raising interest rates may lead to longer-term inflationary pain.
The key policy question for South Africa, therefore, is: If interest rates were cut in orderto encourage productivity-enhancing investment and expansion, would this lead to ashort-run rise in inflation, before the inflation-absorbing benefits of the increased productivity came on stream? If the answer to this is yes – that there would be a dangerof a short-term rise in inflation – then are there other policies that might be pursued tocontain inflation in the short term? Are there policies, other than the Reserve Bankcutting interest rates, that might be pursued to encourage increased productivity andexpansion?
T H E D E V E L O P M E N T D E C A D E ? S O U T H A F R I C A , 1 9 9 4 – 2 0 0 4
96
Free
dow
nloa
d fr
om w
ww
.hsr
cpre
ss.a
c.za
Policies to contain short-term inflationary pressures
Of course, the Reserve Bank’s interest rate decisions do impact upon the exchangerate, and this also affects inflation. However, to the extent that this is pursued as ashort-term anti-inflation measure, the implications for interest rate policy are similarto the use of interest rates to target inflation directly – an increase in interest ratesaimed at curbing inflation will also tend to strengthen the value of the currency, andthis, in turn, will have an anti-inflationary impact in the short term. The medium- andlonger-term effects may include the same problems as are caused by the high interestrates themselves, namely a depressing effect on output and investment, and thus oncapacity levels.
In principle, the value of the exchange rate can be influenced by exchange controls,although in practice South Africa is not likely to consider their use.
Other possible anti-inflationary measures have already been referred to:• Incomes policies have been used extensively in the past across the world, but have
generally fallen out of favour. There may be scope for developing a national accordon wages and prices, but international experience suggests that this would mostlikely only work if it is part of a more general package of measures aimed atsecuring non-inflationary growth of output and employment.
• Administered prices can and have been used by governments to restrain inflation.• In some cases, increased prices can be offset by cuts in taxes on affected goods, but
this is likely to be only a short-term option, appropriate perhaps if there areparticular inflationary pressures that are believed to be one-off or short-term, andwhich could be counteracted in this way.
• Finally, there is the point mentioned earlier about increasing competitivepressures in markets. This may be particularly important in cases where inputcosts rise, for example because of increased fuel prices. In an uncompetitivesector, there will be a tendency to pass on increased costs in price rises. In a morecompetitive market, this will not be done without serious thought about whatcompetitors might do.
Policies to boost productivity and expansion
If the above policies are not thought to be adequate to allow the Reserve Bank to cutinterest rates to the level that would maximise productivity-enhancing investment andexpansion, then are there other policy initiatives that could be taken to act directly onsuch investment decisions? Six areas that may be relevant, and which deserve a contin-uing policy effort, are considered next.
Targeted interest rates
It is important to recognise that the interest rate actually faced by any corporation thatis considering whether or not to embark on what might be a costly and long-terminvestment programme will vary from company to company. In other words, we cannot
M A C R O E C O N O M I C R E F O R M S A N D E M P L O Y M E N T
97
Free
dow
nloa
d fr
om w
ww
.hsr
cpre
ss.a
c.za
read off directly from the interest rate set by the Reserve Bank to that which will be influ-encing these key corporate decisions, on which the future productivity levels of theeconomy will depend. The actual interest rates faced will depend on a range of factors,such as a particular company’s credit rating.
The important point for this chapter, though, is that there may be some scope for publicpolicy to circumvent the potential damage that high interest rates might otherwise haveon investment decisions by providing lower interest rate arrangements for specific proj-ects, along the lines of the cheap finance that has been made available in the past by theIndustrial Development Corporation.
Determinants of FDI
The determinants of investment by overseas corporations may differ from those ofdomestic companies, not least because in the former case there is the decision ofwhether to invest in the country at all, or whether to continue with any existing invest-ment, and also, crucially, to decide on where in the value-added chain the investmentsin any one economy should fit within the multinational corporation’s overall produc-tion networks. These latter decisions will determine not just the degree of multi-national enterprise investment in the domestic economy, but also its nature and theextent to which it contributes to, say, research and development or human capitalenhancement.14
The impact of multinational enterprise activities on the generation and upgrading ofemployment and on the building up of skills in host countries varies:
according to the type or motivation of FDI, the industries in which multinationalenterprises invest, the strategies they adopt, and host country conditions. Theyalso depend significantly on the policies of host countries on FDI for increasingemployment quantity, improving employment quality and strengthening humancapital resource capabilities and for minimizing any negative effect that FDI mayhave in these respects. (UNCTAD 1999: 258)
Determinants of investment
One might expect investment decisions to be determined by the state of aggregatedemand, on the one hand, and the cost of capital, on the other. However, even given thelevel of these determinants, the actual level of investment has still been found to varyover time, for the UK at least (Driver & Michie 1998). Such variation may be due, inpart, to the prevailing corporate culture, which will be influenced by factors such as pastexperience. There may be ways in which public policy can encourage a more investment-friendly corporate culture, given the rate of interest; in other words, to encourage higherlevels of investment without having to reduce the rate of interest. Research within theSouth African context would need to estimate how far investment decisions are actuallydetermined by interest rate and demand levels, and how far other factors influence theseprocesses (see Gilbert 2003).
T H E D E V E L O P M E N T D E C A D E ? S O U T H A F R I C A , 1 9 9 4 – 2 0 0 4
98
Free
dow
nloa
d fr
om w
ww
.hsr
cpre
ss.a
c.za
A key determinant of the scale and scope of investment decisions will be the expected growthof the markets that firms expect to be selling in. The greater the expected growth in demand,the greater will be the planned investment to meet it. The scope and nature of those invest-ments are also likely to be affected. Investment in new technology is sometimes consideredto be job destroying. The reason for this perception is obvious when high levels of un-employment are accompanied by new technology and mechanisation replacing employeeswith machinery. On the other hand, every period of rapid output and employment growthin history is also one of technological advance and investment in labour-saving new technology. This is partly why output growth tends to lead to productivity growth.
So what is the link between new technology and jobs?15 The relationship is a complexone, but investment decisions will be affected by expected growth rates in two ways: thehigher the expected growth of demand for a firm’s products, the higher will be the firm’sinvestments, but if demand is expected to be low, firms will concentrate on trying tosurvive. This means not only that investment levels will be lower, but also that the natureof the investment projects will be different. There will tend to be less investment inresearch and development and new products, and a greater emphasis on cost-savinginvestment through process innovation and downsizing. There is, thus, a double incen-tive to try to maintain expected growth of demand: firstly, to encourage investment and,secondly, to encourage product innovation and market-creating investments, ratherthan defensive cost-cutting investments. This means avoiding, if at all possible, mone-tary policies that might slow the growth of demand and bias firms towards the moredefensive mindset. There may also be more proactive opportunities for industrial,labour-market and innovation policies to encourage firms to invest in the high-roadoption of product innovation, research and development, and skills formation, so thatnew technology is accompanied by expanding and even new markets, with increasedoutput and employment.
Encouraging the ‘3rd Sector’
In Europe, the ‘3rd Sector’ operates alongside the public and private sectors, and is con-stituted of ‘social enterprises’, co-operatives, ‘mutuals’, NGOs, charities and so forth. Theimportance of this sector varies between countries, but in some, such as Italy, it is fairlysignificant in terms of both output and employment.16
In South Africa, this sector is relatively small in terms of employment. However, the ‘3rdSector’ is significant in terms of the unemployment–inflation relationship, preciselybecause the existence of these organisations is due to a rather different logic than generally applies to the private sector. Thus, if the goal is to expand employment in anon-inflationary way, and if private-sector employment is broadly influenced by inter-est rate policy, then, given whatever interest rate is prevailing, the ‘3rd Sector’ potentiallyrepresents an opportunity to add to the amount of employment at that rate of interest.In other words, it may represent economic activity and employment that would not otherwise have been forthcoming at that rate of interest.
M A C R O E C O N O M I C R E F O R M S A N D E M P L O Y M E N T
99
Free
dow
nloa
d fr
om w
ww
.hsr
cpre
ss.a
c.za
Any development of this sector is likely to result in a win-win situation as far as theemployment–inflation trade-off is concerned. There may be particular potential forexpansion of this sector in delivering, and participation in, social services, construction,and food production and distribution, for example with producer co-operatives in thesupply chain for food products (Altman 2003b).
Public works
The use of public works to tackle unemployment is usually associated with JohnMaynard Keynes’ original argument that the workings of free market economies will notof themselves result in full employment. In The General Theory of Employment, Interestand Money he argued that the level of unemployment will depend on how muchemployment is required to produce the level of goods and services that are, in aggregate,demanded (or, even more precariously, on the level of demand that companies expect toface). If the level of aggregate demand is below that required to fully employ the entireworkforce, then unemployment will result; and expectations can prove self-fulfilling, ineither a positive or negative fashion. If the ‘animal instincts’ of investors take a cautiousturn, then the resulting cutbacks in investment and orders will themselves create a fall in demand, which will further dampen expectations. What is required for a return to full employment is a boost in effective demand, and public works is one way in whichgovernments can help to deliver the necessary boost to demand.
More recently, attention has focused on how to attract foreign capital, and on how toimprove the domestic economy’s international competitiveness. An efficient, productiveinfrastructure – transport, communications, education and training, security, and so on –is key. Here again, the role of public works is vital, given the ‘public good’ nature of muchof this infrastructure work.
Public works thus play a dual role: on the one hand, they improve the underlying economic infrastructure and, on the other, they can be part of an active labour-marketpolicy.
There are short-term choices to be made, though, as to how labour- or capital-intensivecivil works should be. The Department of Public Works is currently looking at whethera clear commitment could be given by the government to ensure that such works aremade as labour intensive as is practicable and appropriate.
The GDS saw the government agreeing to extend the public works and infrastructureinvestment programme that was already to be found in the Medium Term ExpenditureFramework. For some, the benefits from this are no doubt thought to be the job-creationeffects of the programmes themselves, as well as the contribution that the works mightmake to living standards if they are delivering housing or water, for example. However,such programmes, particularly those involving the productive infrastructure, do alsoplay an important role within the unemployment–inflation relationship, by creating theconditions for higher productivity over the medium and longer term, hence alleviating
T H E D E V E L O P M E N T D E C A D E ? S O U T H A F R I C A , 1 9 9 4 – 2 0 0 4
100
Free
dow
nloa
d fr
om w
ww
.hsr
cpre
ss.a
c.za
the danger of inflationary pressures at the same time as creating the conditions forhigher levels of employment:
To promote sustainability and a virtuous circle of growth, such a programme willrequire a detailed understanding of the dynamics of the targeted industries,in order to ensure that increased expenditure is matched by enhanced supplycapacity, including appropriately skilled and accredited labour. This requires anindustrial strategy for each sector, in addition to the more narrow focus onincreasing the demand for goods and services through the expansion of govern-ment expenditure. Government can only go so far in stimulating jobs directly.Ultimately, deeper linkages are required. It is often forgotten that employment isabout all the linkages that occur in response to an investment. The more credibleand sustained a programme is, the more the private sector will respond, not justby delivering the procured service, but by mobilizing investment resources toprovide inputs, logistics, and related goods and services – these are the desiredspin-offs that are required to enhance the ability of the economy to create morejobs. (Altman 2003b: 8)
Thus, public works can influence the employment–inflation agenda in a number of dif-ferent ways. Firstly, public works can directly affect the level of unemployment, via theirdirect employment effects. Secondly, by enhancing the productive infrastructure, SouthAfrican industries can be made more competitive internationally and, consequently,may increase their market shares in export as well as domestic markets (in competitionwith imports). This will lead to increased employment. Thirdly, by addressing real needswithin society, public works may help foster and develop new markets and areas of eco-nomic activity that otherwise would not have existed, and this might prove sustainableover the longer term.
High-commitment work systems
What have been termed ‘high-commitment work systems’ aim to enhance employees’skills and productive capacity, motivation and commitment, and opportunities to raiseproductivity. There is evidence that an appropriate mix of human resources and otherpractices can enhance productive outcomes (see, for example, Michie & Sheehan-Quinn2001).
Where employment is expanded as a result of such policies having been successfullypursued, this would most likely be in the context of increased output and productivity,thus creating the conditions for non-inflationary, or even actively counter-inflationary,economic expansion. Of course, human capital development is at a far lower level inSouth Africa than in the USA or Europe.17 However, this does not mean that high-commitment work systems will not be relevant. Firstly, at any workplace, the degree ofmotivation is important for a range of reasons, including retention, absenteeism and soon. Secondly, for some sectors of the economy, namely the high value added, manufac-turing, traded goods sector, such human resources practices will be key in ensuring the
M A C R O E C O N O M I C R E F O R M S A N D E M P L O Y M E N T
101
Free
dow
nloa
d fr
om w
ww
.hsr
cpre
ss.a
c.za
sort of productivity and quality levels, and the degree of innovation that is necessary tocompete internationally.
Further research
This chapter has sketched out the key issues that need to be analysed to establish howthe target of halving unemployment might be achieved in a non-inflationary manner, asfollows:• What would high-commitment work systems look like in the South African
context? Might employee share ownership have a role to play in enhancingemployee commitment and motivation, and hence work effort and productivity?
• How might corporate investment decisions be encouraged to enhance productivecapacity in order to expand employment in a non-inflationary context, inparticular in the face of possible interest rate rises in the future?
• How might the co-operative, mutual and social sectors of the economy beexpanded so as to provide employment through enterprises providing goods andservices that might otherwise not have been provided (i.e. as additional rather thanreplacement economic activity)?
• The causal mechanisms whereby an increase in interest rates is thought to impacton the economy need to be researched and established empirically.
• Policy needs to take account of the segmented labour markets – what thosesegmented labour markets are at any particular time; what the levels of pay,employment, productivity, labour turnover and so on are in each of those markets;what the degree of mobility is between the various segments of the labour marketand, crucially, how policy might be tailored to the specifics that such researchuncovers.
• The impact of market concentration is not just that firms will be able to chargehigher prices than would otherwise be the case, but also that their reaction toevents will differ – they may be more likely to pass on increased costs, thusexacerbating an inflationary spiral.
• Understanding the role that FDI plays within the South African economy requiresdetailed research on not just the degree of such investment but also its nature.
Conclusion
Discussing whether monetary policy is different for the SARB than for other centralbanks, Ian Plenderleith (2003), a deputy governor of the Reserve Bank, concludes thatwhile the task is broadly comparable, the context is different. One of these differences isthe greater need, in South Africa, to establish policy credibility, so the SARB should bemore cautious than central banks elsewhere. On the other hand, another differencePlenderleith notes is the greater susceptibility of the South African economy to supplyshocks, and ‘higher interest rates will not help to make the maize crop grow higher’.
T H E D E V E L O P M E N T D E C A D E ? S O U T H A F R I C A , 1 9 9 4 – 2 0 0 4
102
Free
dow
nloa
d fr
om w
ww
.hsr
cpre
ss.a
c.za
While central banks tend nowadays to prioritise the policy target of achieving and main-taining a low rate of inflation, within or around some inflation target, in practice otherfactors undoubtedly impinge on their decision-making processes to some degree – thelevel of the exchange rate, the rate of growth of the economy, the rate of unemploymentand so on.18 Padayachee (2001) argues that this broader agenda should be made moreexplicit. Epstein (2002) asserts that employment should be made an explicit target; ineffect, though, this would simply be to shift the emphasis from inflation to employment,while retaining a focus on the whole range of economic variables being targeted (or atleast influencing the decision-making processes), since Epstein acknowledges that anyemployment target would need to be subject to some inflationary ceiling or limit.However, even such a shift in emphasis, Epstein suggests, would help change the culturewithin the SARB and elsewhere, leading to research becoming more focused on theemployment consequences of policy actions.
It is certainly true that the general macroeconomic and public policy culture can play animportant role in setting the agenda for research and policy development, encouragingcertain avenues to be explored and closing down others. It is also the case that if there isgoing to be a serious effort across the economic, political and social community toachieve major policy goals, such as the halving of unemployment while maintaining thecurrent 3–6 per cent inflation target range, and also pursuing other major goals likeblack empowerment and employment, it will be important to develop ‘joined-up’ think-ing and action between the various departments and sections of government, otherpublic agencies, quasi-public bodies, the corporate sector, trade unions, communitybodies and others.
This chapter has avoided listing the huge number of policy areas that would need to bebrought in on any such major policy development, but any one of the few topics men-tioned, such as developing high-commitment work systems, would involve a wide rangeof different actors, across the private and public sectors, and across corporate, tradeunion and governmental bodies. Just this area alone might involve legislative change,regulatory action, trade union involvement, corporate decisions and so on.
The institutional underpinnings of the unemployment–inflation relationship are key tothe functioning of any economy, but they are not simple. Neither are they given or static.These relationships are constantly evolving. They are subject and amenable to changeand development. Such change and development can and should be actively fostered,not only to bring about better outcomes for, say, the labour market, but also to con-tribute to economic development more fundamentally, through the interconnectionsreferred to earlier between such processes and other economic outcomes.
Thus, a better-trained workforce is a classic ‘public good’. Combined with an appropri-ate organisation of work, this can translate into a private good for the employers, and ifthe workforce is committed and motivated, productivity will be further raised.
For this combination to translate into macroeconomic output and employment gainswill require demand to rise faster than productivity; and for this to be combined with
M A C R O E C O N O M I C R E F O R M S A N D E M P L O Y M E N T
103
Free
dow
nloa
d fr
om w
ww
.hsr
cpre
ss.a
c.za
stable or falling inflation will require cost-absorbing new capacity and innovation. To besustainable, the country’s productive infrastructure needs to be continually renewed.This narrative could continue through the links to education, housing, entrepreneurshipand an almost endless range of inherently interrelated economic and social factors. Thekey point, though, is to understand that these links are there, and that they ought properly to be the focus of active and joined-up policy development.
Notes
1 I am grateful for advice and suggestions from Dr Miriam Altman, Jackie Cook, Dr Evan Gilbert,
Dr Simon Roberts and Professor Vishnu Padayachee. I have also drawn on work undertaken
jointly with Professor Frank Wilkinson.
2 See Michie (1987), which discusses this in more detail.
3 For a detailed discussion of the theory and practice of incomes policies, see Parkin & Sumner
(1972).
4 For a detailed discussion, see Michie & Grieve Smith (1996).
5 For a detailed analysis and discussion of the natural rate of unemployment hypothesis, see Cross
(1995).
6 For a detailed textbook presentation and discussion of the NAIRU, see Carlin & Soskice (1990).
7 For a discussion of the ‘natural rate’ and NAIRU literatures, see Sawyer (2001).
8 This is assuming, of course, that the NAIRU is vertical. Setterfield and Leblond (2003) suggest
that for USA 1990s data it is not, and there is a policy trade-off available. Hodge (2002) failed to
detect a stable short-run trade-off between inflation and either unemployment or employment
in South Africa (1970–2000) but did find a significantly positive relationship between inflation
and growth. Nell (2000) also found that inflation within the single-digit zone may be beneficial
to growth.
9 There is a large literature on the pricing reaction of oligopolists, including that around the
‘kinked demand curve’ (see Michie 2001 and the further references given and discussed there).
10 The Statements of the SARB’s Monetary Policy Committee (e.g. 16 October 2003) often discuss
the degree to which inflationary pressures have come through from specific sectors.
11 For a discussion of how to define and interpret unemployment and underemployment in South
Africa, see Standing, Sender & Weeks (1996).
12 See Salter (1969) for an analysis of the role of investment in economic performance, and a
discussion of the ‘vintages’ model of capital investment.
13 Aron & Muellbauer (2002) find important and persistent effects of high real interest rates, which
significantly constrained South African economic growth in the 1990s.
14 See Michie (2002) for further discussion.
15 See Michie, Oughton & Pianta (2002) for a discussion.
16 For a discussion of the ‘mutual’ sector in the UK, see Cook, Deakin, Michie & Nash (2003).
T H E D E V E L O P M E N T D E C A D E ? S O U T H A F R I C A , 1 9 9 4 – 2 0 0 4
104
Free
dow
nloa
d fr
om w
ww
.hsr
cpre
ss.a
c.za
17 As witnessed, for example, by the large proportion of employees without employment contracts
(Altman 2003a).
18 For a discussion of whether inflation targeting is appropriate for South Africa, see Absa (2002).
References
Absa (2002) Focus article – Inflation targeting: Appropriate for South Africa? Economic Perspective,
4th Quarter. <http://www.finforum.co.za/econanal/2002q4focus.pdf>
Altman M (2003a) Jobless or job creating growth? Some preliminary thoughts. Paper presented at
the TIPS/DPRU Annual Forum, 8–10 September.
Altman M (2003b) Background document – Framework for immediate job creation. Submission to
National Treasury and Department of Public Works, South Africa.
Aron J & Muellbauer J (2002) Interest rate effects on output: Evidence from a GDP forecasting model for
South Africa, University of Oxford Centre for Economic Policy Research (CEPR) Discussion
Paper No. 3595.
Carlin W & Soskice D (1990) Macroeconomics and the wage bargain. Oxford: Oxford University Press.
Cook J, Deakin S, Michie J & Nash D (2003) Trust rewards: Realising the mutual advantage. London:
Mutuo.
Corry D (2003) Running the utilities, New Economy 10: 16–20.
Craig C, Rubery J, Tarling R & Wilkinson F (1982) Labour market structure, industrial organisation
and low pay. Cambridge: Cambridge University Press.
Cross R (1995) The natural rate of unemployment: Reflections on 25 years of the hypothesis.
Cambridge: Cambridge University Press.
Driver C & Michie J (1998) The capacity stance of firms, ESRC Centre for Research on Innovation and
Competition Working Paper, University of Manchester.
Epstein G (2002) Employment-oriented central bank policy in an integrated world economy: A reform
proposal for South Africa, Political Economy Research Institute (PERI) Working Paper No. 39,
University of Massachusetts at Amherst.
Friedman M & Schwartz A (1991) Alternative approaches to analysing economic data, American
Economic Review 81: 39–49.
Gilbert E (2003) Do managers of South African manufacturing firms make optimal capital
investment decisions? Unpublished paper, University of Cape Town Graduate Business School.
Hodge D (2002) Inflation versus unemployment in South Africa: Is there a trade-off? South African
Journal of Economics 70: 417–43.
Itano N (2003) Central Bank in South Africa is expected to cut key rate, New York Times, 10
September.
Jossa B (2001) Phillips curve, in J Michie (ed.) The reader’s guide to the social sciences. London:
Fitzroy Dearborn & Routledge.
M A C R O E C O N O M I C R E F O R M S A N D E M P L O Y M E N T
105
Free
dow
nloa
d fr
om w
ww
.hsr
cpre
ss.a
c.za
Kingdon G & Knight J (2000) Are searching and non-searching unemployment distinct states when
unemployment is high? The case of South Africa, Centre for the Study of African Economies
Working Paper No. 2000–2, Economics Department, University of Oxford.
Kingdon G & Knight J (2001) Unemployment in South Africa: The nature of the beast, Centre for the
Study of African Economies Working Paper No. 2000–15, Economics Department, University
of Oxford.
Lipsey R (1960) The relationship between unemployment and the rate of change of money wage
rates in the UK 1862–1957, Economica 41: 62–70.
Machaka J, Mainga W & Roberts S (2003) Globalisation and employment in South Africa: A review
of the issues. Paper commissioned by the Department of Labour, South Africa, May.
Michie J (1987) Wages in the business cycle: An empirical and methodological analysis. London: Frances
Pinter Publisher.
Michie J (2001) Oligopoly and vertical integration, in J Michie (ed.) The reader’s guide to the social
sciences. London: Fitzroy Dearborn & Routledge.
Michie J (2002) Foreign direct investment and ‘human capital enhancement’ in developing countries,
Competition & Change 6: 363–72.
Michie J & Grieve Smith J (1996) Creating industrial capacity: Towards full employment. Oxford:
Oxford University Press.
Michie J, Oughton C & Pianta M (2002) Innovation and the economy, International Review of
Applied Economics 16: 253–64.
Michie J & Sheehan-Quinn M (2001) Labour market flexibility, human resource management and
corporate performance, British Journal of Management 12: 287–306.
Michie J & Wilkinson F (1992) Inflation policy and the restructuring of labour markets, in J Michie
(ed.) The economic legacy: 1979–1992. London: Academic Press.
Nell K (2000) Is inflation a precondition for faster growth? The case of South Africa, Department of
Economics Discussion Paper 00/11, University of Kent. <http://www.kent.ac.uk/
economics/papers/papers00.html#0011>
Padayachee V (2001) Central bank transformation in a globalized world: The Reserve Bank in post-
apartheid South Africa, Journal of International Development 13: 741–65.
Parkin M & Sumner M (eds.) (1972) Incomes policies and inflation. Manchester University Press.
Philips A (1958) The relationship between unemployment and the rate of change of money wages in
the UK 1861–1957, Economica 25: 283–99.
Plenderleith I (2003) Is monetary policy different in Africa? Speech to a symposium, Monetary Policy
and Uncertainty: Adapting to a Changing Economy, organised by the Federal Reserve Bank of
Kansas City at Jackson Hole, Wyoming, USA, August 28–30. <http://www.kc.frb.org/publicat/
sympos/2003/pdf/Plenderleith.0911.2003.pdf>
Salter W (1969) Productivity and technical change, Second edition. Cambridge: Cambridge University
Press.
T H E D E V E L O P M E N T D E C A D E ? S O U T H A F R I C A , 1 9 9 4 – 2 0 0 4
106
Free
dow
nloa
d fr
om w
ww
.hsr
cpre
ss.a
c.za
SARB (2003) Annual report 2003. South African Reserve Bank.
Sawyer M (2001) Natural rate of unemployment and NAIRU, in J Michie (ed.) The reader’s guide to
the social sciences. London: Fitzroy Dearborn & Routledge.
Setterfield M & Leblond K (2003) The Philips curve and US macroeconomic performance during the
1990s, International Review of Applied Economics 14: 361–76.
Standing G, Sender J & Weeks J (1996) Restructuring the labour market: The South African challenge,
an ILO country review. Geneva: International Labour Organisation.
UNCTAD (1999) World investment report – Foreign direct investment and the challenge of
development. Geneva: UNCTAD.
Wakeford J (2003) The productivity-wage relationship in South Africa: An empirical investigation.
Paper prepared for the TIPS/DPRU Conference, Johannesburg, September.
M A C R O E C O N O M I C R E F O R M S A N D E M P L O Y M E N T
107
Free
dow
nloa
d fr
om w
ww
.hsr
cpre
ss.a
c.za
6 Operationalising South Africa’s move from macroeconomic stability to microeconomic reform
Kuben Naidoo
Introduction
If this chapter is going to be about clichés, let me state immediately that we (myselfincluded) will all become very bored. So, let me put the clichés behind us and get on withthe task of contributing to the intellectual engagement on the future path of SouthAfrica’s economic policy agenda. Macroeconomic stability is a necessary condition forfaster economic growth; it is, however, not a sufficient condition for higher growth.There, I said it, clichés out of the way.
The purpose here is to contribute to debate on the future path of South Africa’s eco-nomic reform agenda.1 What are the policy options for raising the level of growth, andhow do we achieve a sustained rise in living standards of the poor? Let me put this moreclearly: one of the main objectives of the government’s economic policy must be toreduce the level of poverty on a sustainable basis. The contention spelled out below isthat it is only possible to reduce poverty sustainably if employment rises, and employ-ment will only rise significantly if the economy grows faster. While this may seemobvious, the government’s economic policy is inherent in the statement.
To unpack the statement, the government’s economic policy is premised on the fact thatlong-term poverty alleviation is only possible through a sustained rise in employment.Any other solution is second best. While social grants and better health care and housingare important elements of a solution, these programmes do not reduce poverty, and theydo not solve long-term and deep-rooted poverty.
The second part of the statement says that employment can only rise if two things happen –the economy grows consistently and faster, and the microeconomic blockages to employmentcreation and broad-based empowerment are removed. We need higher rates of economicgrowth and we need stable growth or the absence of boom–bust cycles. We also need growthof a type that creates employment, raises skills levels and productivity and deconcentrateswealth and economic opportunities. Implicit in this policy approach is that the governmentcannot increase employment on its own and that the private sector will not increase employ-ment unless profitability is rising and structural market failures are addressed.
If we accept this policy approach, and I accept that not everyone will, the question thenbecomes how we raise the level of economic growth and what type of interventions willallow for job-creating growth.
108
Free
dow
nloa
d fr
om w
ww
.hsr
cpre
ss.a
c.za
Because South Africa has been able to achieve a degree of macroeconomic stability, thepolicy room to implement a series of microeconomic reforms to make the economymore dynamic, responsive and labour-absorbing is much wider than ever before. Themicroeconomic challenges that face South Africa deal with structural inefficiencies invarious markets. The most critical of these inefficiencies lie in the education and skillsdevelopment nexus and in the labour market. Other areas of reform include competi-tion and trade policy, spatial and public transport services, access to land and agricul-tural markets, crime and a series of inefficiencies in the public sector.
The developmental state
In various political and economic policy statements, the South African government hascharacterised itself as a developmental state. The idea of the developmental state is mostclosely associated with Chalmers Johnson and his seminal analysis of Japan’s very rapid,highly successful post-war reconstruction and re-industrialisation (1982). Johnson’scentral contention was that Japan’s quite remarkable and historically unparalleledindustrial renaissance was neither a fluke nor inevitable, but a consequence of the effortsof a developmental state. A developmental state was one that was determined to influ-ence the direction and pace of economic development by directly intervening in thedevelopment process, rather than relying on the uncoordinated influence of marketforces to allocate resources. The developmental state took upon itself the task of estab-lishing social and economic goals with which to guide the process of development andsocial mobilisation. The most important of these goals, in Japan’s case, was the recon-struction of its industrial capacity, a process made easier by widespread consensus aboutthe importance of industrial development.
The definition of a developmental state and the concept espoused by South Africanpolicy-makers is broader than Johnson’s narrow definition. While Johnson emphasisedthe importance of the state in driving economic growth, the need for social developmenthas also been brought into the equation. This different interpretation of the develop-mental state is in line with the evolution of the concept in the latter part of the twentieth century. Patrick Heller (2001), director of Browns University’s DevelopmentStudies Programme, defines the developmental state as one that has been able to managethe delicate balance between economic growth and social development.
Amartya Sen, in his book Development as Freedom, says that ‘development can be seen… as a process of expanding real freedoms that people enjoy’ (1999: 3). He goes on tosay that ‘development requires the removal of major sources of unfreedom: poverty aswell as tyranny, poor economic opportunities as well as social deprivation, neglect ofpublic facilities as well as intolerance or over-activity of repressive states’.
In defining the South African concept of a developmental state, Sen’s concept of remov-ing poverty and tyranny is central, expanding economic opportunities and fightingsocial deprivation are critical, and providing public facilities and services to the poor isparamount. Fundamentally, the developmental state must balance the promotion of
M A C R O E C O N O M I C S TA B I L I T Y T O M I C R O E C O N O M I C R E F O R M
109
Free
dow
nloa
d fr
om w
ww
.hsr
cpre
ss.a
c.za
economic growth with social development. It must also balance investment in long-termgrowth such as human capital development with shorter-term investments in economicinfrastructure.
In order to embark on creative and innovative methods of fighting poverty and socialexclusion, one needs a stable macroeconomic environment. The government can onlysuccessfully sustain interventions in economic development such as those referred to byJohnson if the foundations of the macroeconomy are sound. Without this stable macroenvironment, there is little room for experimentation and unconventional policies thatadvance redistribution and inclusion.
The South African economy in 1994
In assessing the appropriateness of a particular economic policy approach, an analysis ofthe situation is required. In 1994, the South African economy was literally on its knees.The short-term issues it faced were the after-effects of a severe drought in 1992, a globaleconomic recession, political strife and economic policy uncertainty at home, a largebudget deficit, almost no foreign exchange reserves (less than a week of import cover),a private sector creaking under high interest rates, inflation of about 15 per cent andmassive outflows of currency. According to the South African Reserve Bank (SARB), thelongest downward phase in the country since 1945 lasted from March 1989 to May 1993(see Table 6.1).
While these short-term issues suggested a crisis mode, the longer-term structural weaknesses in the economy, going back to the early 1980s, were even more serious.Investment and employment were in a long-term structural decline from the early1980s. Large monopolies developed behind high tariff walls. Capital became concen-trated in relatively few hands. The education system was churning out people totallyinappropriately equipped for an industrialising country. A large portion of the indus-trial sector was built on the back of either military and armaments requirements for theAngolan/Namibian war or energy self-sufficiency. The mining sector was in decline dueto diminishing gold reserves and delayed investment, the financial services sector waswell developed but with very high cost structures, and manufacturing was being decimated.
These long-term structural weaknesses were less obvious than the short-term economicproblems, but were far more serious and difficult to fix. To complicate matters, the newdemocratic government had very little credibility in the area of economic management.So serious was this problem that President Mandela appointed a Minister of Financefrom the old ruling order. The perception of many international and domestic investorswas that the ANC would adopt socialist economic policies that would result in rising taxrates, rising interest costs and increased state intervention in the economy. White capitalwas hugely sceptical of the new government, pledging support for democracy in publicwhile disinvesting from the economy both legally and illegally.
T H E D E V E L O P M E N T D E C A D E ? S O U T H A F R I C A , 1 9 9 4 – 2 0 0 4
110
Free
dow
nloa
d fr
om w
ww
.hsr
cpre
ss.a
c.za
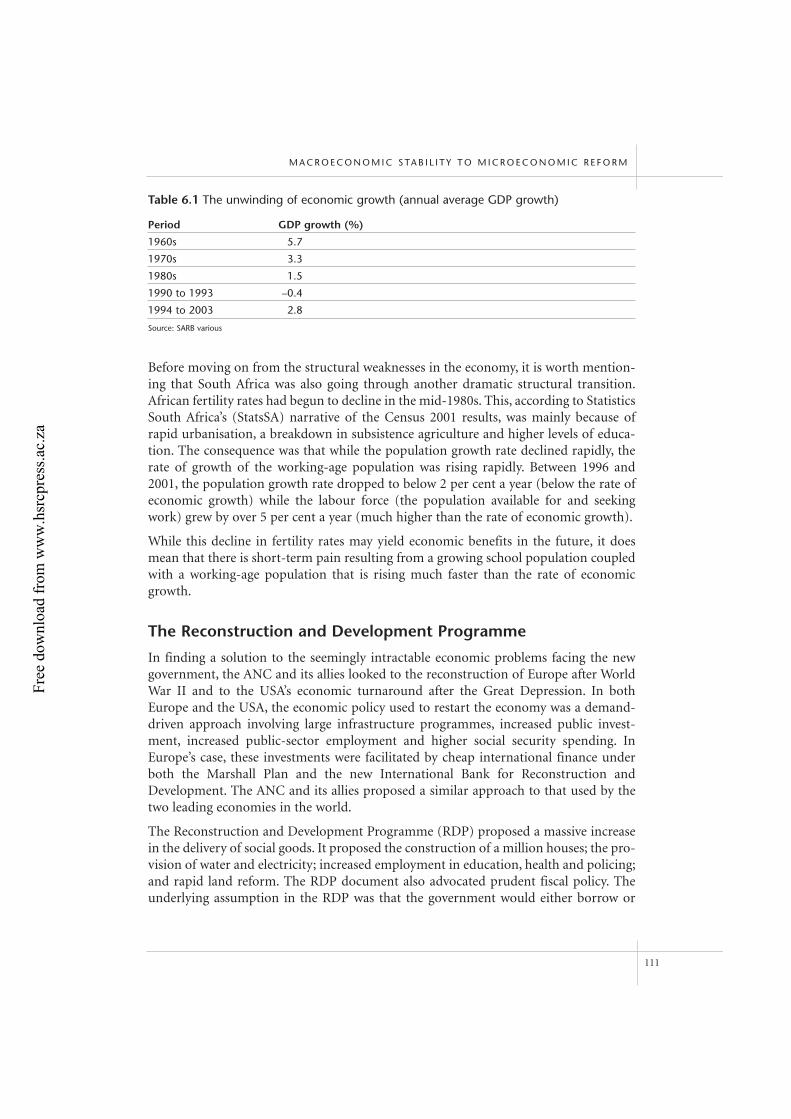
Before moving on from the structural weaknesses in the economy, it is worth mention-ing that South Africa was also going through another dramatic structural transition.African fertility rates had begun to decline in the mid-1980s. This, according to StatisticsSouth Africa’s (StatsSA) narrative of the Census 2001 results, was mainly because ofrapid urbanisation, a breakdown in subsistence agriculture and higher levels of educa-tion. The consequence was that while the population growth rate declined rapidly, therate of growth of the working-age population was rising rapidly. Between 1996 and2001, the population growth rate dropped to below 2 per cent a year (below the rate ofeconomic growth) while the labour force (the population available for and seekingwork) grew by over 5 per cent a year (much higher than the rate of economic growth).
While this decline in fertility rates may yield economic benefits in the future, it doesmean that there is short-term pain resulting from a growing school population coupledwith a working-age population that is rising much faster than the rate of economicgrowth.
The Reconstruction and Development Programme
In finding a solution to the seemingly intractable economic problems facing the newgovernment, the ANC and its allies looked to the reconstruction of Europe after WorldWar II and to the USA’s economic turnaround after the Great Depression. In bothEurope and the USA, the economic policy used to restart the economy was a demand-driven approach involving large infrastructure programmes, increased public invest-ment, increased public-sector employment and higher social security spending. InEurope’s case, these investments were facilitated by cheap international finance underboth the Marshall Plan and the new International Bank for Reconstruction andDevelopment. The ANC and its allies proposed a similar approach to that used by thetwo leading economies in the world.
The Reconstruction and Development Programme (RDP) proposed a massive increasein the delivery of social goods. It proposed the construction of a million houses; the pro-vision of water and electricity; increased employment in education, health and policing;and rapid land reform. The RDP document also advocated prudent fiscal policy. Theunderlying assumption in the RDP was that the government would either borrow or
M A C R O E C O N O M I C S TA B I L I T Y T O M I C R O E C O N O M I C R E F O R M
111
Table 6.1 The unwinding of economic growth (annual average GDP growth)
Period GDP growth (%)
1960s 5.7
1970s 3.3
1980s 1.5
1990 to 1993 –0.4
1994 to 2003 2.8
Source: SARB various
Free
dow
nloa
d fr
om w
ww
.hsr
cpre
ss.a
c.za
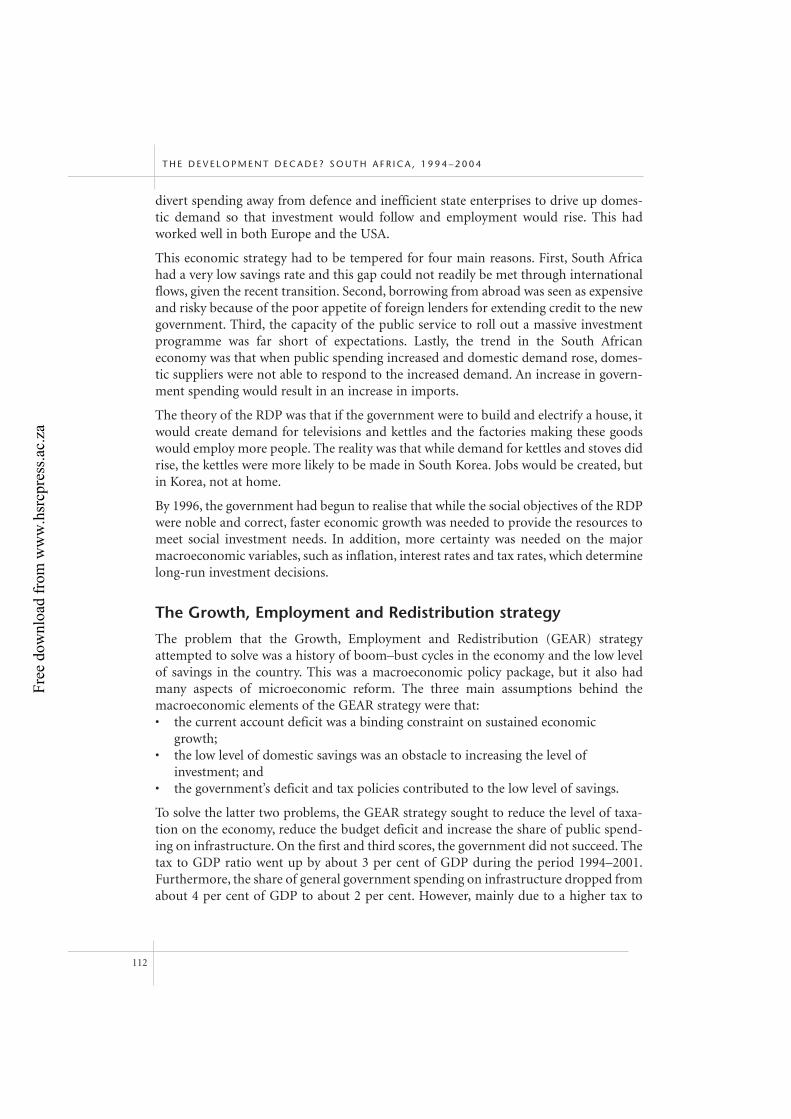
divert spending away from defence and inefficient state enterprises to drive up domes-tic demand so that investment would follow and employment would rise. This hadworked well in both Europe and the USA.
This economic strategy had to be tempered for four main reasons. First, South Africahad a very low savings rate and this gap could not readily be met through internationalflows, given the recent transition. Second, borrowing from abroad was seen as expensiveand risky because of the poor appetite of foreign lenders for extending credit to the newgovernment. Third, the capacity of the public service to roll out a massive investmentprogramme was far short of expectations. Lastly, the trend in the South Africaneconomy was that when public spending increased and domestic demand rose, domes-tic suppliers were not able to respond to the increased demand. An increase in govern-ment spending would result in an increase in imports.
The theory of the RDP was that if the government were to build and electrify a house, itwould create demand for televisions and kettles and the factories making these goodswould employ more people. The reality was that while demand for kettles and stoves didrise, the kettles were more likely to be made in South Korea. Jobs would be created, butin Korea, not at home.
By 1996, the government had begun to realise that while the social objectives of the RDPwere noble and correct, faster economic growth was needed to provide the resources tomeet social investment needs. In addition, more certainty was needed on the majormacroeconomic variables, such as inflation, interest rates and tax rates, which determinelong-run investment decisions.
The Growth, Employment and Redistribution strategy
The problem that the Growth, Employment and Redistribution (GEAR) strategyattempted to solve was a history of boom–bust cycles in the economy and the low levelof savings in the country. This was a macroeconomic policy package, but it also hadmany aspects of microeconomic reform. The three main assumptions behind themacroeconomic elements of the GEAR strategy were that:• the current account deficit was a binding constraint on sustained economic
growth;• the low level of domestic savings was an obstacle to increasing the level of
investment; and• the government’s deficit and tax policies contributed to the low level of savings.
To solve the latter two problems, the GEAR strategy sought to reduce the level of taxa-tion on the economy, reduce the budget deficit and increase the share of public spend-ing on infrastructure. On the first and third scores, the government did not succeed. Thetax to GDP ratio went up by about 3 per cent of GDP during the period 1994–2001.Furthermore, the share of general government spending on infrastructure dropped fromabout 4 per cent of GDP to about 2 per cent. However, mainly due to a higher tax to
T H E D E V E L O P M E N T D E C A D E ? S O U T H A F R I C A , 1 9 9 4 – 2 0 0 4
112
Free
dow
nloa
d fr
om w
ww
.hsr
cpre
ss.a
c.za
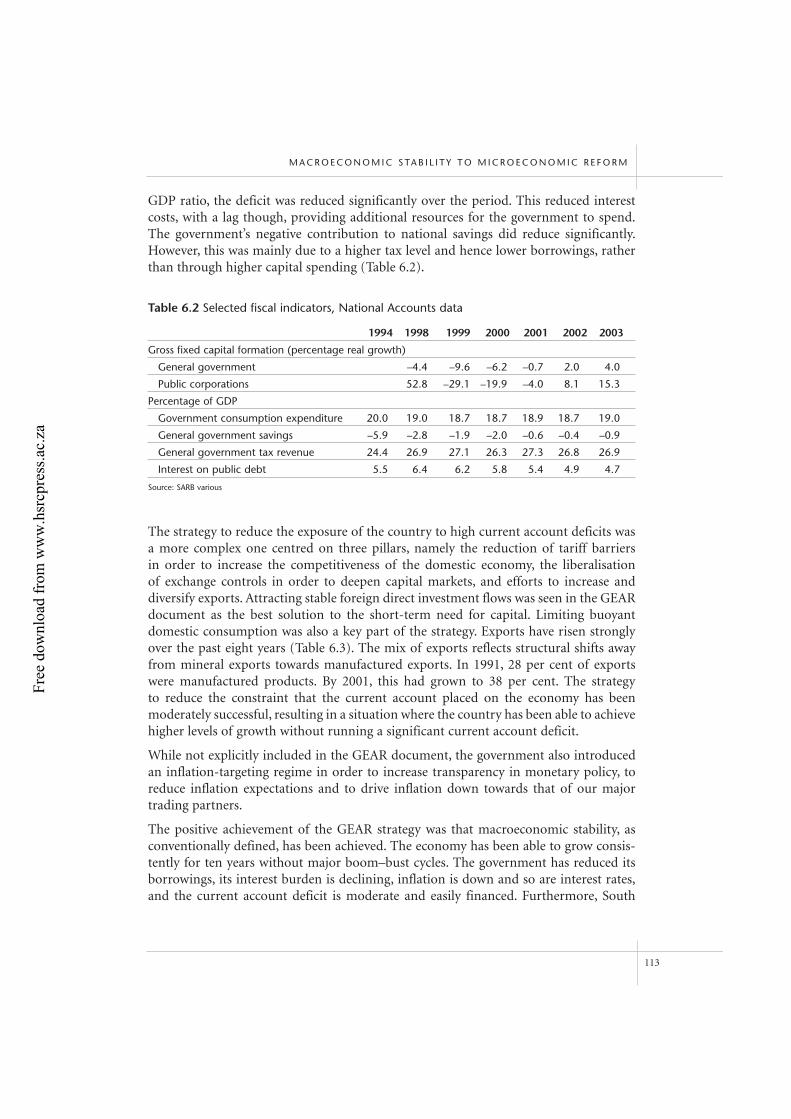
GDP ratio, the deficit was reduced significantly over the period. This reduced interestcosts, with a lag though, providing additional resources for the government to spend.The government’s negative contribution to national savings did reduce significantly.However, this was mainly due to a higher tax level and hence lower borrowings, ratherthan through higher capital spending (Table 6.2).
The strategy to reduce the exposure of the country to high current account deficits wasa more complex one centred on three pillars, namely the reduction of tariff barriers in order to increase the competitiveness of the domestic economy, the liberalisation of exchange controls in order to deepen capital markets, and efforts to increase anddiversify exports. Attracting stable foreign direct investment flows was seen in the GEARdocument as the best solution to the short-term need for capital. Limiting buoyantdomestic consumption was also a key part of the strategy. Exports have risen stronglyover the past eight years (Table 6.3). The mix of exports reflects structural shifts awayfrom mineral exports towards manufactured exports. In 1991, 28 per cent of exportswere manufactured products. By 2001, this had grown to 38 per cent. The strategy to reduce the constraint that the current account placed on the economy has been moderately successful, resulting in a situation where the country has been able to achievehigher levels of growth without running a significant current account deficit.
While not explicitly included in the GEAR document, the government also introducedan inflation-targeting regime in order to increase transparency in monetary policy, toreduce inflation expectations and to drive inflation down towards that of our majortrading partners.
The positive achievement of the GEAR strategy was that macroeconomic stability, asconventionally defined, has been achieved. The economy has been able to grow consis-tently for ten years without major boom–bust cycles. The government has reduced itsborrowings, its interest burden is declining, inflation is down and so are interest rates,and the current account deficit is moderate and easily financed. Furthermore, South
M A C R O E C O N O M I C S TA B I L I T Y T O M I C R O E C O N O M I C R E F O R M
113
Table 6.2 Selected fiscal indicators, National Accounts data
1994 1998 1999 2000 2001 2002 2003
Gross fixed capital formation (percentage real growth)
General government –4.4 –9.6 –6.2 –0.7 2.0 4.0
Public corporations 52.8 –29.1 –19.9 –4.0 8.1 15.3
Percentage of GDP
Government consumption expenditure 20.0 19.0 18.7 18.7 18.9 18.7 19.0
General government savings –5.9 –2.8 –1.9 –2.0 –0.6 –0.4 –0.9
General government tax revenue 24.4 26.9 27.1 26.3 27.3 26.8 26.9
Interest on public debt 5.5 6.4 6.2 5.8 5.4 4.9 4.7
Source: SARB various
Free
dow
nloa
d fr
om w
ww
.hsr
cpre
ss.a
c.za
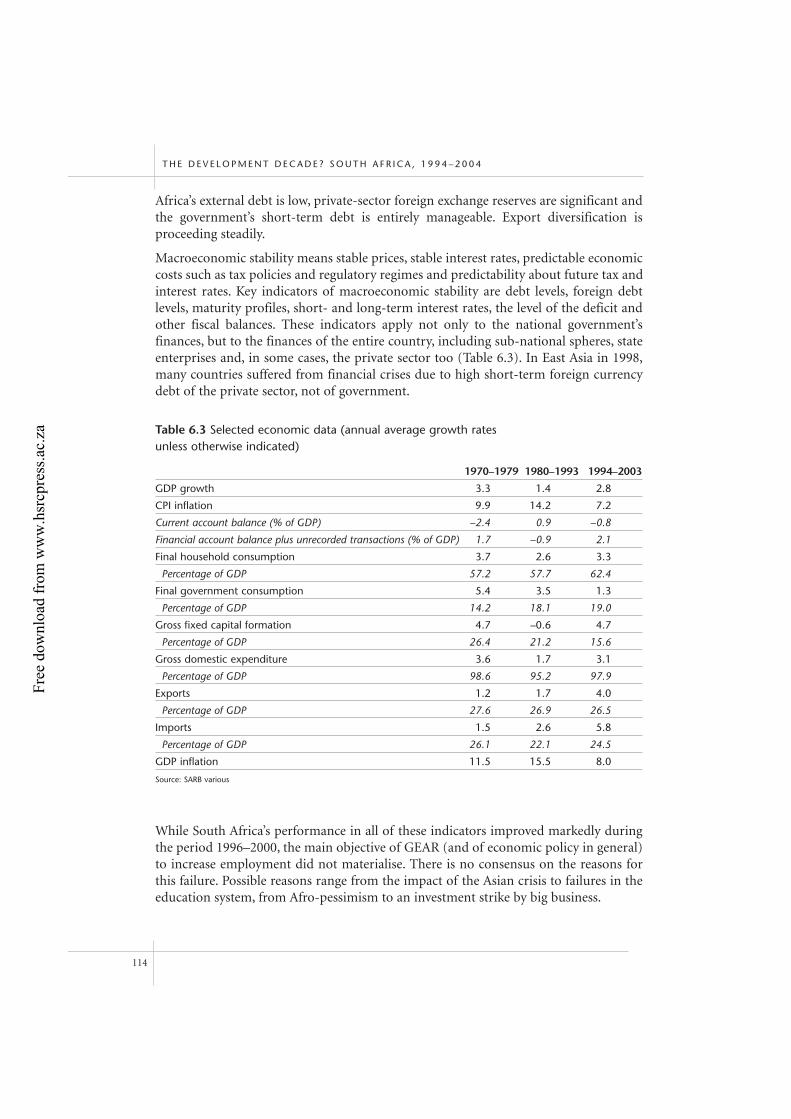
Africa’s external debt is low, private-sector foreign exchange reserves are significant andthe government’s short-term debt is entirely manageable. Export diversification is proceeding steadily.
Macroeconomic stability means stable prices, stable interest rates, predictable economiccosts such as tax policies and regulatory regimes and predictability about future tax andinterest rates. Key indicators of macroeconomic stability are debt levels, foreign debtlevels, maturity profiles, short- and long-term interest rates, the level of the deficit andother fiscal balances. These indicators apply not only to the national government’sfinances, but to the finances of the entire country, including sub-national spheres, stateenterprises and, in some cases, the private sector too (Table 6.3). In East Asia in 1998,many countries suffered from financial crises due to high short-term foreign currencydebt of the private sector, not of government.
While South Africa’s performance in all of these indicators improved markedly duringthe period 1996–2000, the main objective of GEAR (and of economic policy in general)to increase employment did not materialise. There is no consensus on the reasons forthis failure. Possible reasons range from the impact of the Asian crisis to failures in theeducation system, from Afro-pessimism to an investment strike by big business.
T H E D E V E L O P M E N T D E C A D E ? S O U T H A F R I C A , 1 9 9 4 – 2 0 0 4
114
Table 6.3 Selected economic data (annual average growth rates unless otherwise indicated)
1970–1979 1980–1993 1994–2003
GDP growth 3.3 1.4 2.8
CPI inflation 9.9 14.2 7.2
Current account balance (% of GDP) –2.4 0.9 –0.8
Financial account balance plus unrecorded transactions (% of GDP) 1.7 –0.9 2.1
Final household consumption 3.7 2.6 3.3
Percentage of GDP 57.2 57.7 62.4
Final government consumption 5.4 3.5 1.3
Percentage of GDP 14.2 18.1 19.0
Gross fixed capital formation 4.7 –0.6 4.7
Percentage of GDP 26.4 21.2 15.6
Gross domestic expenditure 3.6 1.7 3.1
Percentage of GDP 98.6 95.2 97.9
Exports 1.2 1.7 4.0
Percentage of GDP 27.6 26.9 26.5
Imports 1.5 2.6 5.8
Percentage of GDP 26.1 22.1 24.5
GDP inflation 11.5 15.5 8.0
Source: SARB various
Free
dow
nloa
d fr
om w
ww
.hsr
cpre
ss.a
c.za
While macroeconomic stability had been achieved, the economy had grown and theinstitutions that manage the economy had built up a high degree of credibility, therewere microeconomic blockages that prevented the economy from growing faster andcreating jobs. Various analysts emphasised different microeconomic blockages; the mainones listed as policy challenges were:• the functioning of the skills system, including workplace skills initiatives;• the spatial development patterns that apartheid planning introduced, resulting in
inefficient urban planning and high transportation costs;• poor passenger and freight transportation systems;• poorly regulated monopoly markets in key areas such as telecommunications and
energy, and little competition in many private goods markets;• labour markets that do not clear for both supply- and demand-side reasons;• high levels of poverty, which prevents people from seeking employment or
engaging in entrepreneurial activity;• perceived inequities in the tax system that discourage new investment;• low productivity in certain industries, especially those with high tariff barriers;• low levels of efficiency in the public sector, including poorly run state enterprises
and weak municipal government; and• high levels of crime, which reduces the quality of life of the poor and vulnerable
and deters investment.
This list of microeconomic market failures seems long, but these issues go to the heartof the problems facing an economy coming out of a long period of structural decline.The government has achieved a level of macroeconomic stability. With this level ofstability, the government can now focus on fixing the numerous failings in varioussectors of the economy. The objective of this microeconomic reform agenda would beno different from the economic objectives set out earlier; that is, poverty reductionthrough increased employment in an economy that is growing faster, but also absorbingmore labour. The government can now use the stability in the economy as a platform toaddress both economic inefficiencies and social policy objectives.
Economic policy options for the next decade
Having attained macroeconomic stability, there are broadly three approaches open tothe government to raise the level of growth. The first is to pursue a microeconomicreform strategy. The government adopted the microeconomic reform stance in 2001 andan integrated manufacturing strategy shortly thereafter. Policy-makers recognised thatwhile the microeconomic reform agenda has strong theoretical underpinnings, its prac-tical implementation is difficult, and it must be accepted that correcting market failurestakes many years, sometimes decades.
The second and third options are what economists sometimes refer to as ‘shock options’or ‘demand shocks’. The first of these two shock options is called a ‘consumption shock’.The proponents of this option argue that the government should raise the level of
M A C R O E C O N O M I C S TA B I L I T Y T O M I C R O E C O N O M I C R E F O R M
115
Free
dow
nloa
d fr
om w
ww
.hsr
cpre
ss.a
c.za
domestic consumption through higher social security grants and higher consumptionexpenditure. A consumption shock can also be achieved by lower tax rates and/or lowerinterest rates, though the benefits of this type of consumption shock accrue to a differ-ent set of people relative to a social grant increase. The theory behind this type of shockis that in a relatively short period of time, the government can raise demand and bringthe poor into the money economy, and the private sector will respond through manu-facturing more and employing more people in the process. Proponents of this argumentalso point out that economic activity in rural and poor areas will be given a boostthrough the higher levels of income.
The second type of shock is an ‘investment shock’. This option entails a rapid and significant increase in investment spending, driven initially by the government andstate-owned enterprises but followed soon after by the private sector. This optionrequires the investment to be of a nature that crowds in private-sector investment. Thereare two types of infrastructure investment that could achieve this. Investment in lower-ing the cost of doing business will increase rates of return and this may increase private-sector investment due to the higher rates of return. This category of investment mayinclude telecommunications, transport, freight logistics and energy. A very large road-building programme (highways) is both achievable and can be rolled out quickly. Thesecond type of infrastructure that could crowd in private investment is housing andmunicipal investment that increases employment and uses mainly domestic resources.A significant increase in housing, waterworks, township roads and other communityfacilities can achieve this.
The investment shock option is only possible today due to the stable fiscal position,greater openness of the economy and greater resilience to cope with higher currentaccount deficits. If such an investment were to have been carried out in 1994, it wouldhave resulted in a boom–bust scenario.
While the three options available for raising the level of growth and employment do notseem mutually exclusive, it is practically impossible for the government to have theresources to support a consumption and an investment shock. At this point, it must beaccepted that the two shock options are mutually exclusive. The microeconomic reformagenda, however, is not exclusive of either of the two shock options. In most cases, asound microeconomic reform agenda does not require significant financial resources. Itoften requires strong leadership, sound policy and intelligent capacity to implement thepolicy sensibly. While economists may argue about exactly which microeconomicreforms are more important, there are few who will disagree that all countries, at allstages of development, face the challenge of managing market failures, improving theperformance of the public sector and removing blockages from various value chains.After selecting which microeconomic reforms are most critical, it is important to decideon whether this strategy is the only strategy or whether also pursuing one of the shockoptions is necessary. This chapter will evaluate the two shock options and then concludewith a discussion about which microeconomic reforms are most critical.
What type of shock is likely to provide the desired result?
T H E D E V E L O P M E N T D E C A D E ? S O U T H A F R I C A , 1 9 9 4 – 2 0 0 4
116
Free
dow
nloa
d fr
om w
ww
.hsr
cpre
ss.a
c.za
Consumption shock
As pointed out earlier, a consumption shock could be achieved by lower tax rates, lowerinterest rates, higher social grants, higher public-sector employment or a large increasein government spending on goods and services. The first two methods would see mainlyricher people taking advantage of easier credit conditions or more disposable income to increase consumption spending, as is presently being done in the USA to feed a consumption boom, in the hope that investment will rise and employment will follow.
The hope is that while imports may rise at first, the local manufacturing sector wouldsoon respond by raising investment to meet the higher domestic demand. In the USAexample, the public sector takes on the financing risk but the benefits accrue mainly tothe richer people. Given the nature of goods that the wealthy consume in South Africa,it is debatable whether domestic manufacturing would be able to substitute for this classof imports. If local production did not materialise, the country would have a growingcurrent account deficit and rising inflation, forcing interest rates (or tax rates) to rise,bringing an end to the consumption shock. In the South African context, this type of aconsumption shock is not likely to result in a sustained increase in investment andemployment.
The second method of achieving a consumption shock is to increase social grantexpenditure or raise government consumption spending, including an increase inpublic employment. For this to happen, the government would have to borrow fromcapital markets and divert resources towards the poor. The expectation is that demandfrom the poor for goods and services would result in an increase in investment in predominantly poor areas to meet the demand. It is assumed that the positive benefitfrom increased investment and employment in poor areas would offset the decrease ininvestment due to higher interest rates. However, if production did not increase,inflation would soon erode the higher level of spending in poorer areas. If interestrates rose to counter both higher government borrowing and inflation, there would bea net decrease in investment. Some people argue that while there might be a decline ininvestment, the poor demand goods such as food and clothing that are labour inten-sive in their production, so employment may rise anyway. This scenario is unlikely, asfood markets in South Africa are highly commercialised operations, the costs of whichare often determined by capital inputs, fuel and fertilisers. These commercialisedoperations employ relatively few people. Other goods consumed by the poor, such asclothing and kitchen appliances, are often imported from markets with lower produc-tion and labour costs like East Asia.
While this type of consumption shock seems appealing from a political perspective, asthe poor receive more money, the real effect on investment (even in poorer areas) andjob creation is likely to be negative. If investment and growth slowed as a result of thispolicy approach, the medium-term effects on the welfare and living standards of thepoor may be negative.
M A C R O E C O N O M I C S TA B I L I T Y T O M I C R O E C O N O M I C R E F O R M
117
Free
dow
nloa
d fr
om w
ww
.hsr
cpre
ss.a
c.za
Investment shock
South Africa’s investment rate fell from about 25 per cent of GDP in the early 1980sto about 16 per cent of GDP in 2004. To sustain a higher growth rate, it is importantto raise the level of investment back towards 25 per cent of GDP. A consumption shockis not likely to provide the impetus for a sustained rise in investment. Economic policyhas to shift to force a higher level of investment. In the long term, a rise in investmentcan only be sustained by rising rates of return on investment, which are only likely tobe achieved through microeconomic reforms aimed at lower production costs andreducing obstacles to investment and through higher demand for goods and services.While strong domestic demand is important, access to international markets andrising global demand provide a much larger source of demand for South Africangoods. Domestic consumption on its own is unlikely to achieve a sustained rise indemand to provide the economies of scale necessary for higher investment. Whilemicroeconomic reforms are likely to provide the impetus for a slow rise in investment,the government can introduce policies that raise investment levels relatively quickly.Such policies would include higher levels of government investment in economicinfrastructure, sound fiscal and monetary policy that ensures a competitive currencyand lower real interest rates, and tax policies that incentivise investment as opposed toconsumption.
Through a programme of higher borrowing by the government for economic infra-structure and through tax reform, the government could engineer a higher level ofinvestment. However, higher taxes may limit domestic consumption and limit the profitability of enterprises. Any shift in the tax structure would need to be gradual andmoderate. Higher borrowing also needs to be done carefully so that domestic interestrates do not rise or the currency does not appreciate.
If higher foreign borrowing goes into investment, there is not likely to be an apprecia-tion of the currency, as the imported content of investments will offset the impact ofimporting capital. Inherent in this policy approach is an assertion that South Africa cannow sustain a higher current account deficit, whereas this was not possible a decade ago.The contention here is that such a strategy to raise investment is only possible becauseof the macroeconomic environment that exists today.
Higher investment by the government should be concentrated in two areas: economicinfrastructure that will crowd in private-sector investment and municipal infrastructurethat has a higher domestic content and is labour intensive. Investment in transportinfrastructure, water storage, energy and regulatory changes to unlock investment intelecommunications could lower the cost of doing business in South Africa and lay thebasis for a sustained rise in private-sector investment.
Municipal infrastructure such as housing, township roads, water and sanitation systems,community centres and government services (policing, schooling and health care) couldhave economic and social benefits for the country. While the government has spent bil-lions on these services, it is possible to significantly raise the level of investment in poor
T H E D E V E L O P M E N T D E C A D E ? S O U T H A F R I C A , 1 9 9 4 – 2 0 0 4
118
Free
dow
nloa
d fr
om w
ww
.hsr
cpre
ss.a
c.za
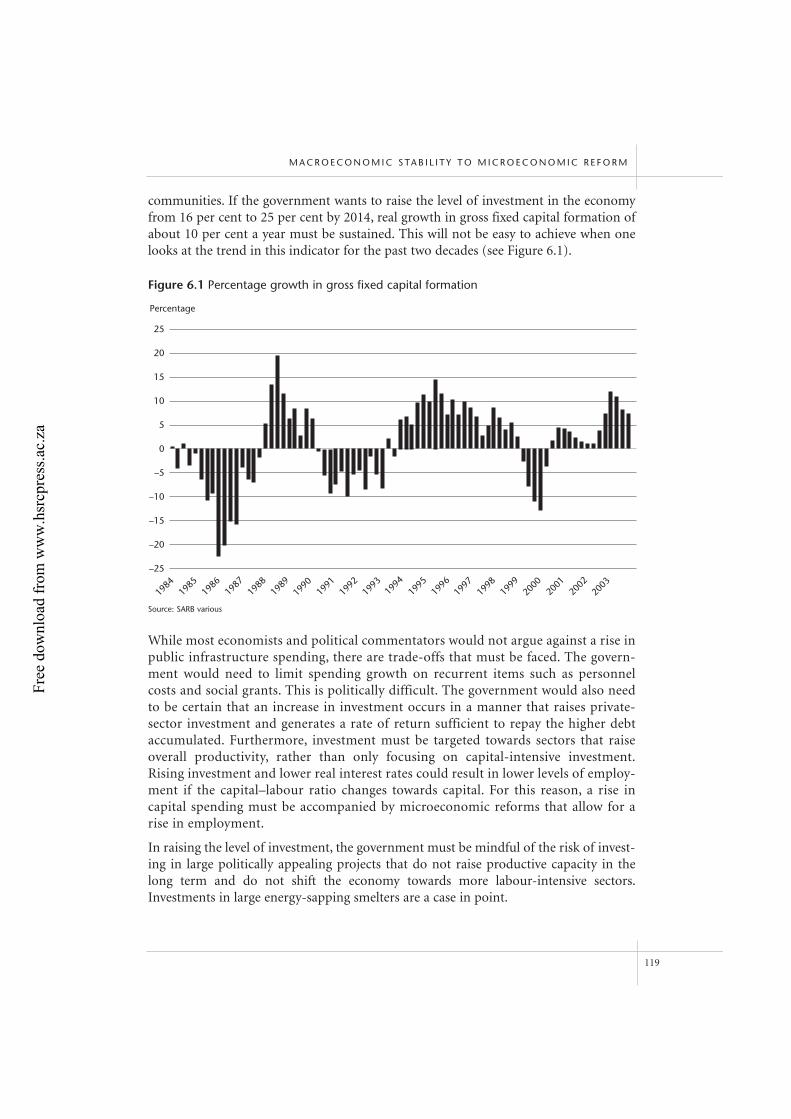
communities. If the government wants to raise the level of investment in the economyfrom 16 per cent to 25 per cent by 2014, real growth in gross fixed capital formation ofabout 10 per cent a year must be sustained. This will not be easy to achieve when onelooks at the trend in this indicator for the past two decades (see Figure 6.1).
While most economists and political commentators would not argue against a rise inpublic infrastructure spending, there are trade-offs that must be faced. The govern-ment would need to limit spending growth on recurrent items such as personnelcosts and social grants. This is politically difficult. The government would also needto be certain that an increase in investment occurs in a manner that raises private-sector investment and generates a rate of return sufficient to repay the higher debtaccumulated. Furthermore, investment must be targeted towards sectors that raiseoverall productivity, rather than only focusing on capital-intensive investment.Rising investment and lower real interest rates could result in lower levels of employ-ment if the capital–labour ratio changes towards capital. For this reason, a rise incapital spending must be accompanied by microeconomic reforms that allow for arise in employment.
In raising the level of investment, the government must be mindful of the risk of invest-ing in large politically appealing projects that do not raise productive capacity in thelong term and do not shift the economy towards more labour-intensive sectors.Investments in large energy-sapping smelters are a case in point.
M A C R O E C O N O M I C S TA B I L I T Y T O M I C R O E C O N O M I C R E F O R M
119
25
20
15
10
5
0
–5
–10
–15
–20
–25
1984
1985
1986
1987
1988
1989
1990
1991
1992
1993
1994
1995
1996
1997
1998
1999
2000
2001
2002
2003
Percentage
Figure 6.1 Percentage growth in gross fixed capital formation
Source: SARB various
Free
dow
nloa
d fr
om w
ww
.hsr
cpre
ss.a
c.za
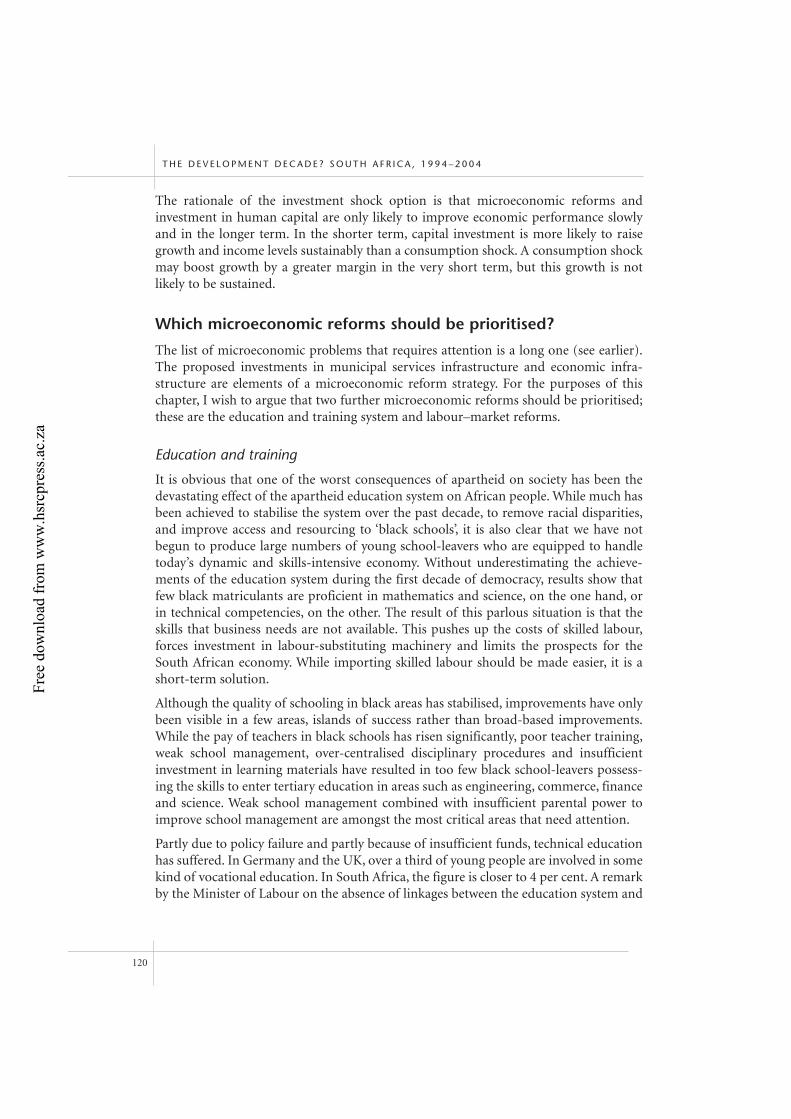
The rationale of the investment shock option is that microeconomic reforms andinvestment in human capital are only likely to improve economic performance slowlyand in the longer term. In the shorter term, capital investment is more likely to raisegrowth and income levels sustainably than a consumption shock. A consumption shockmay boost growth by a greater margin in the very short term, but this growth is notlikely to be sustained.
Which microeconomic reforms should be prioritised?
The list of microeconomic problems that requires attention is a long one (see earlier).The proposed investments in municipal services infrastructure and economic infra-structure are elements of a microeconomic reform strategy. For the purposes of thischapter, I wish to argue that two further microeconomic reforms should be prioritised;these are the education and training system and labour–market reforms.
Education and training
It is obvious that one of the worst consequences of apartheid on society has been thedevastating effect of the apartheid education system on African people. While much hasbeen achieved to stabilise the system over the past decade, to remove racial disparities,and improve access and resourcing to ‘black schools’, it is also clear that we have notbegun to produce large numbers of young school-leavers who are equipped to handletoday’s dynamic and skills-intensive economy. Without underestimating the achieve-ments of the education system during the first decade of democracy, results show thatfew black matriculants are proficient in mathematics and science, on the one hand, orin technical competencies, on the other. The result of this parlous situation is that theskills that business needs are not available. This pushes up the costs of skilled labour,forces investment in labour-substituting machinery and limits the prospects for theSouth African economy. While importing skilled labour should be made easier, it is ashort-term solution.
Although the quality of schooling in black areas has stabilised, improvements have onlybeen visible in a few areas, islands of success rather than broad-based improvements.While the pay of teachers in black schools has risen significantly, poor teacher training,weak school management, over-centralised disciplinary procedures and insufficientinvestment in learning materials have resulted in too few black school-leavers possess-ing the skills to enter tertiary education in areas such as engineering, commerce, financeand science. Weak school management combined with insufficient parental power toimprove school management are amongst the most critical areas that need attention.
Partly due to policy failure and partly because of insufficient funds, technical educationhas suffered. In Germany and the UK, over a third of young people are involved in somekind of vocational education. In South Africa, the figure is closer to 4 per cent. A remarkby the Minister of Labour on the absence of linkages between the education system and
T H E D E V E L O P M E N T D E C A D E ? S O U T H A F R I C A , 1 9 9 4 – 2 0 0 4
120
Free
dow
nloa
d fr
om w
ww
.hsr
cpre
ss.a
c.za
the skills development strategy and the programmes of the Sector Education andTraining Authorities reinforces the point. Education authorities have not changed thecurricula in the schooling area (or technical educational arena) to meet the needs ofindustry. There are two effects of this policy failure: public further education and train-ing (FET) organisations cannot attract private funding and the graduates of these FETcolleges are unable to get employment easily.
Why do I say that this area of social policy requires a microeconomic solution? There aretwo market failures in the education system. The first is that the poor, on their own, withtheir limited financial resources, are unlikely to consume the quantum of education thatsociety needs. One solution to this problem is to provide publicly funded educationopportunities for the poor. In South Africa, we have achieved this, but the quality ofeducation has been poor. Many people propose various administrative and bureaucraticreforms to improve the quality of schooling. An alternative approach is to provide amore pro-poor funding arrangement but to allow the private sector to deliver educationto poor learners. This is a politically controversial solution in the near term. A middle-road approach of publicly provided education with greater parental oversight overschool governance should be considered. While we have an elaborate system of schoolgoverning bodies, the power of these bodies and the capacity to improve school man-agement and resource allocation is constrained.
The second market failure is that the quality of schooling does not meet the require-ments of society. Here, the state plays or should play an important standard-setting role.Because education is mainly publicly provided, it is necessary for the state to play aquality-control function. Information asymmetries in the perceived and real quality ofschool education mean that the private sector does not trust the schooling system (or
M A C R O E C O N O M I C S TA B I L I T Y T O M I C R O E C O N O M I C R E F O R M
121
70
60
50
40
30
20
10
0
Figure 6.2 Unemployment rates by age and qualification
20–24 25–34 35–44 45–54
Percentage
Less than matric
Matric
Diploma
Degree
Age groupSource: StatsSA 2002
Free
dow
nloa
d fr
om w
ww
.hsr
cpre
ss.a
c.za
matric certificate) to provide an indication of quality. Similarly, the schooling system isnot able to get across its skills needs to the training providers. Addressing these infor-mation asymmetries is essential if the outputs from the schooling (or training) systemare to be relevant to the economy and to society in the long term.
Labour-market reforms
In analysing the historical reasons for South Africa’s unusually high unemployment rate,three main factors stand out – the decimation of the African peasantry between the1860s and 1960s, an extremely poor skills set as referred to earlier and a rapid expansionin the labour force due to demographic and migratory factors. Poor economic growthand low levels of investment lead to cyclical fluctuations in employment, but the threereasons outlined above partly explain the structural reasons for the high unemployment.
While it is clear that a more skilled labour force would lead to higher growth andemployment, it is not realistic to increase the skills profile of the country in a shortperiod of time. Investment in human capital often takes generations to yield results.Shorter-term training options, such as vocational training or workplace skills training,are costly due to the poor skills base and are always likely to be limited in their impact.
Other labour supply-side programmes, such as job placement services, programmes toreduce information asymmetries and the training options listed earlier, are likely to playa role in reducing unemployment and raising living standards. However, none of thesesupply-side measures on its own is likely to make a meaningful impact on the unem-ployment rate. None of these measures is likely to lead to a halving of the unemploy-ment rate over the next decade, which is the express intention of the government.Labour-market reforms that increase the demand for labour are also necessary.
In the mid-1990s, as South Africa was drafting its labour laws, the overriding objectivewas to increase stability in the labour market. The history of industrial relations in thelate 1970s and 1980s was characterised by massive strikes, both politically motivated and arising from shop-floor issues. Excluding those of a political nature, strikes aroseover remuneration and employee benefit issues, union recognition, procedures used todismiss employees and retrenchments. The 1996 Labour Relations Act and the BasicConditions of Employment Act were designed to reduce instability in industrial rela-tions through putting in place procedures for collective bargaining, regulating employeebenefits including minimum wages and, most importantly, introducing a set of disputeresolution mechanisms based on a Northern European model of dispute resolution. Inaddition, the Employment Equity Act attempted to deracialise the workplace. The effectof this legislative framework has been a remarkable degree of stability in the labour forceand a dramatic reduction in work days lost to strikes.
While many large corporations supported the legislative framework, many sectors inbusiness argued that the labour laws benefited organised labour and big business asopposed to small- and medium-sized businesses, because only companies that employed
T H E D E V E L O P M E N T D E C A D E ? S O U T H A F R I C A , 1 9 9 4 – 2 0 0 4
122
Free
dow
nloa
d fr
om w
ww
.hsr
cpre
ss.a
c.za
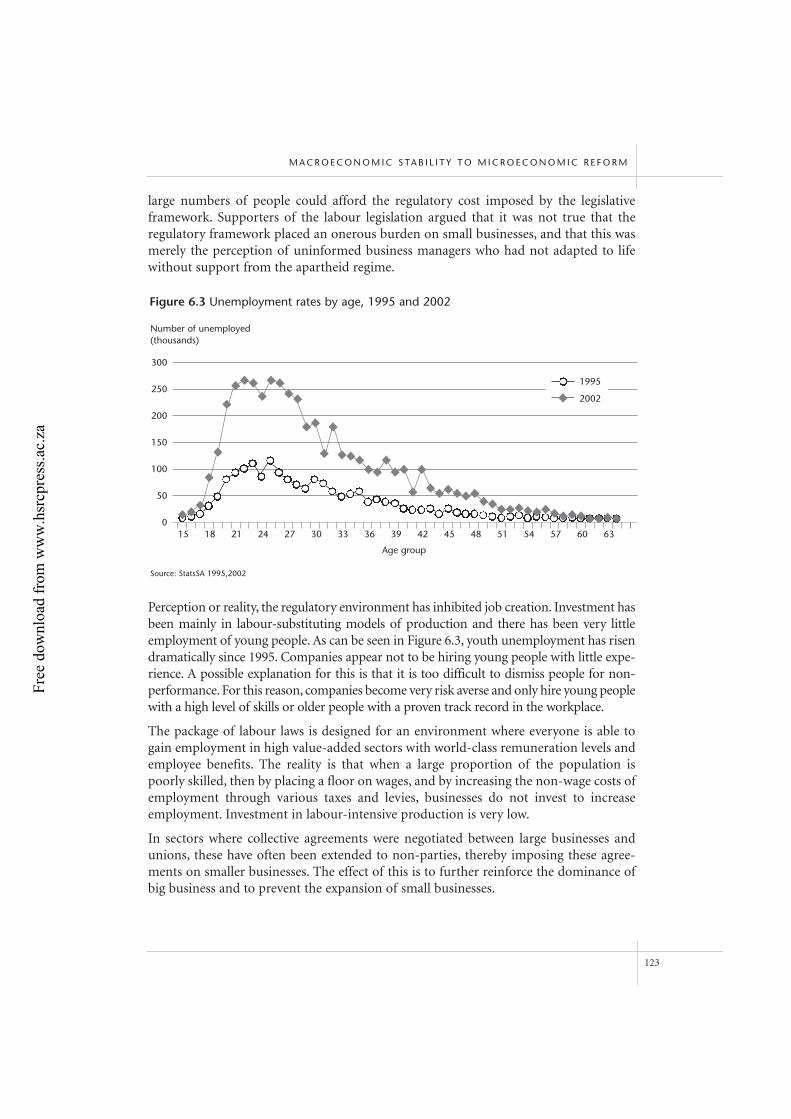
large numbers of people could afford the regulatory cost imposed by the legislativeframework. Supporters of the labour legislation argued that it was not true that the regulatory framework placed an onerous burden on small businesses, and that this wasmerely the perception of uninformed business managers who had not adapted to lifewithout support from the apartheid regime.
Perception or reality, the regulatory environment has inhibited job creation. Investment hasbeen mainly in labour-substituting models of production and there has been very littleemployment of young people. As can be seen in Figure 6.3, youth unemployment has risendramatically since 1995. Companies appear not to be hiring young people with little expe-rience. A possible explanation for this is that it is too difficult to dismiss people for non-performance. For this reason, companies become very risk averse and only hire young peoplewith a high level of skills or older people with a proven track record in the workplace.
The package of labour laws is designed for an environment where everyone is able togain employment in high value-added sectors with world-class remuneration levels andemployee benefits. The reality is that when a large proportion of the population ispoorly skilled, then by placing a floor on wages, and by increasing the non-wage costs ofemployment through various taxes and levies, businesses do not invest to increaseemployment. Investment in labour-intensive production is very low.
In sectors where collective agreements were negotiated between large businesses andunions, these have often been extended to non-parties, thereby imposing these agree-ments on smaller businesses. The effect of this is to further reinforce the dominance ofbig business and to prevent the expansion of small businesses.
M A C R O E C O N O M I C S TA B I L I T Y T O M I C R O E C O N O M I C R E F O R M
123
300
250
200
150
100
50
0
Figure 6.3 Unemployment rates by age, 1995 and 2002
15
Number of unemployed(thousands)
1995
2002
18 21 24 27 30 33 36 39 42 45 48 51 54 57 60 63
Age group
Source: StatsSA 1995,2002
Free
dow
nloa
d fr
om w
ww
.hsr
cpre
ss.a
c.za
The effect of minimum wages on labour-intensive sectors has been mixed. Whileemployment in domestic work has not declined, employment in agriculture appears tohave fallen, though minimum wages are but one part of the reason for this decline.
The regulatory framework is also designed to limit casual work. Consequently, youngpeople cannot get even part-time work in order to build up a body of experience. Mostyoung people are caught in a cycle where they cannot get their foot in the door of thelabour market, as employers seek people with experience. While the learnership andinternship programmes are aimed at reducing this problem, they do not provide a large-scale solution for young people. Even if all the targets set for these programmes are met,they will not reduce the unemployment rate significantly.
In order to raise the level of employment, both supply- and demand-side policies arerequired. While it will be politically difficult to make major changes to the legislativeframework, four areas do require attention: the cost of dismissing people for non-performance, the effect of extending collective agreements to non-parties (small- andmedium-sized businesses), the rate at which minimum wages are increased and theimpact of the legislative framework on youth employment.
While the first two issues are self-explanatory, the government needs to broaden the def-inition and the exemption of small businesses from aspects of the regulatory framework.As a country, we have accepted the principle of minimum wages, but it is important thatemployers be given long-term certainty. It is important that minimum wages should notrise much faster than the overall rate of inflation, after taking account of productivitygains. Lastly, the principle of the leanership programme can be expanded to make iteasier for companies to hire young people or allow for some amount of casual employ-ment for younger people.
These changes to the labour-relations regime will not alter the overall stance of the regulations, which will still contribute towards sound dispute resolution and a stableindustrial-relations environment. While there will be criticisms of the types of changesproposed, raising the level of employment, especially amongst youth, is an objective thatjustifies ruffling the feathers of the present ‘insiders’ in the labour market.
Conclusion
The role of the developmental state is to make the appropriate interventions in eco-nomic policy that will allow for the promotion of economic growth and social develop-ment. Balancing these two objectives is critical to the achievement of the long-termobjectives of reducing poverty, unemployment and social deprivation. While a soundmacroeconomic policy provides a firm foundation for these interventions to be intro-duced, the government still needs to balance the promotion of economic growth andsocial development. The promotion of economic growth takes place through bothshort-term measures such as higher infrastructure spending and longer-term measuressuch as better education and regulatory reform.
T H E D E V E L O P M E N T D E C A D E ? S O U T H A F R I C A , 1 9 9 4 – 2 0 0 4
124
Free
dow
nloa
d fr
om w
ww
.hsr
cpre
ss.a
c.za
Most countries that have made meaningful reductions in poverty have done so withmeans that are seen to be less than conventional. Japan’s use of high tariff barriers,China’s manipulation of ownership structures and its monetary policy, Malaysia’s use ofstate enterprises and exchange controls and South Korea’s use of trade policy and stateenterprises are all examples of policies that are not advocated by the textbooks. Even inEurope and the USA, policies on trade and agriculture, and exchange rates and foreignpolicy are not the ones espoused in the economics literature. Yet, all these countries havebeen able to grow and raise living standards.
Many interpret this phenomenon as an opportunity to advocate policies that are con-sidered unconventional. The lesson drawn from this experience is that it is only possibleto make unconventional interventions in the economy if the macroeconomic platformis stable and robust. Only then can the state advocate policies aimed at redistribution,black economic empowerment or changing regional development patterns. Japan,China, Korea, the USA and Europe all introduced unconventional economic interven-tions on the back of a very stable macroeconomy. These economic interventions weremade possible by the stable platform.
In the sequencing of economic reforms, achieving macroeconomic stability has to be anearly objective. Once this is achieved, it is possible to accelerate microeconomic reforms topromote the functioning of markets, raise employment, increase redistribution andimprove the performance of the public sector. The method to achieve these objectivesneeds to be adapted to local circumstances. With a sound macroeconomy, the governmentcan use various methods to achieve the objectives listed earlier, but these microeconomicpolicies have a greater chance of success alongside sound macroeconomic policy.
Note
1 The views expressed in this chapter are my own. They do not purport to be those of the
National Treasury or the Ministry of Finance.
References
Bruggemans C (2003) Change of pace: South Africa’s economic revival. Johannesburg:
Wits University Press.
Heller P (2001) Moving the state: The politics of democratic decentralisation in Kerala, South Africa
and Porto Alegre, Politics and Society 29: 131–63.
Johnson C (1982) MITI and the Japanese miracle: The growth of industrial policy 1925–1975.
Stanford: Standford University Press.
Sen A (1999) Development as freedom. Oxford: Oxford University Press.
South African National Treasury, Budget Review, various editions.
SARB (South African Reserve Bank) Quarterly Bulletin, various editions.
StatsSA (Statistics South Africa) (1995) October Household Survey.
StatsSA (2002) Labour Force Survey, September.
M A C R O E C O N O M I C S TA B I L I T Y T O M I C R O E C O N O M I C R E F O R M
125
Free
dow
nloa
d fr
om w
ww
.hsr
cpre
ss.a
c.za
7 Sequencing micro and macro reforms: reflections on the South African experience
Michael Carter
Introduction
In earlier work, Julian May, Vishnu Padayachee and I argued that South Africa’s inabil-ity to generate pro-poor economic growth warranted a reopening of the economicpolicy debate (Carter, May & Padayachee 2002). While the South African economicframework since the mid-1990s has been focused on fiscal and other macroeconomictargets, we argued that it was time to pay systematic attention to the microeconomicconstraints that limit the ability of less well-off households to constructively engage withthe South African economy. The recent calls by South African policy-makers to tend tomicroeconomics similarly reflect a disappointment with the anaemic growth andpoverty alleviation performance of the South African economy.1
The South African record and ensuing debate about the wisdom of stepping beyond themacroeconomic confines of the Washington Consensus is a microcosm of a more globaldebate. Recent discussions, both popular and academic, are filled with often vitriolic dis-course about the income distribution implications of globalisation and liberal economicpolicies.2 Ravallion (2001) offers a particularly trenchant perspective on this debate.Ravallion notes that while, on average, growth has brought reductions in poverty, a lookbeyond the averages reveals a great deal of heterogeneity, with growth sometimes bring-ing strong reductions in poverty, and other times hardly any reduction at all.
Ravallion argues that this heterogeneity indicates that the relationship between growthand poverty reduction (the extent to which growth is pro-poor) is strongly conditionedby the microeconomic foundations of the economy. If this suggestion is correct, thengetting the micro-foundations of the economy ‘right’ before, or at least in sequence with,macroeconomic reform may be necessary if the desiderata of pro-poor growth is to beachieved.
While macroeconomic reforms are well understood, the concept of microeconomicreforms is less well developed and understood. Microeconomic reforms are here under-stood as policies that create a more inclusive economy, one in which time and marketswork as an arena for economic betterment for all citizens. As I will discuss later, theinclusive economy requires a minimum asset base for all citizens and access of low-wealth people to markets from which they are traditionally excluded, especially themarkets for credit and insurance.
126
Free
dow
nloa
d fr
om w
ww
.hsr
cpre
ss.a
c.za
Against this backdrop, the goal of this chapter is to use recent South African experienceto better understand the sequencing of micro and macro reforms. The chapter will speakto three questions:• Is sequencing of macro and micro reform policies necessary to achieve pro-poor
growth? (To which the answer will be: Yes, at least in inegalitarian economies.)• Does poor policy sequencing create persistent costs that make it difficult to later
correct its effects? (To which the answer will be: Yes, in all probability.)• What are South African options for moving forward with inclusive micro reforms?
(To which the answer will be: It is time to move beyond income support grants,even in the form of the BIG, Basic Income Grant, to consider a BAG, Basic AssetGrant, and systematic levelling of access to financial markets.)
The remainder of this chapter is organised as follows. First, we discuss the micro-economic conditions under which the conventional macroeconomic policies associatedwith the so-called Washington Consensus can be coherently argued to lead to pro-poorgrowth without any particular attention to microeconomic reforms. Then we examineasset and livelihood dynamics in South Africa over the 1993–1998 period. In contrast toa convergent, pro-poor pattern, econometric estimates reveal the existence of a low-levelpoverty trap toward which many poor and near-poor South African households arebeing pulled. These estimates, together with new data on constraints to self- and infor-mal employment, suggest that it is indeed the exclusionary micro-foundations of theSouth African economy that underlie this poor poverty-alleviation performance. Thenext section asks what we know about sequencing micro with macro reforms in orderto enhance the poverty-alleviating effects of growth. While there is still much to learn onthis account, the section does argue that attention to micro reforms becomes more vital,and the costs of mal-sequenced reforms, in the form of irreversible asset losses, becomehigher. Finally, we look forward and consider the range of microeconomic policies andpriorities that would seem appropriate for South Africa.
Pro-poor growth and poverty alleviation under the Washington Consensus
John Williamson (2003), who coined the term ‘Washington Consensus’ in 1990, hasrecently suggested that we jettison the term, given that it has come to take on multi-ple, ideologically charged meanings.3 While Williamson’s recent suggestion surely hasmerit, the Washington Consensus continues to be useful shorthand for the set ofpolicies that Williamson argued (as an empirical proposition) constituted sharedeconomic wisdom in the early 1990s. A quick review of those policies reveals them toconstitute the core of a macroeconomic reform agenda, with scant attention tomatching or sequenced microeconomic reforms. That said, the WashingtonConsensus does implicitly contain an intellectually coherent structural approach topoverty alleviation, based on both enhancing the returns that poor householdsreceive on their assets and facilitating their accumulation of productive assets. More
S E Q U E N C I N G M I C R O A N D M A C R O R E F O R M S
127
Free
dow
nloa
d fr
om w
ww
.hsr
cpre
ss.a
c.za
specifically, the macro reforms of the Washington Consensus can be hypothesised tocombat poverty by:• ‘Getting prices right’ through trade liberalisation, which according to conventional
trade theory should be expected to raise returns to unskilled labour, the mostabundant factor in poor countries and the most abundant endowment of poorhouseholds within those countries.4
• ‘Getting institutions right’ by assigning secure, private property rights to land andother productive assets, a move hypothesised to bolster investment andaccumulation, especially by poor households that most often experience insecureownership rights.5
• Deregulation and elimination of financial-market interventions in order to openthe way to private-sector providers able to meet the capital and risk managementneeds of poor households, further spurring savings and accumulation by poorhouseholds.
Thus, while Washington Consensus policies contain an intellectually coherent theory ofpro-poor growth, the accuracy of this theory will depend on the economy’s underlyingmicro-foundations. If the economist’s fictive world of full and complete markets is moreor less correct, and financial markets respond to the demands of low-wealth households,then the Washington Consensus theory of poverty alleviation should work effectively.
However, the Washington Consensus can fail as a pro-poor growth strategy if its micro-economic assumptions are wrong. In particular, if underlying markets systematicallyexclude low-wealth households, then the hypothesised asset accumulation of poorhouseholds is unlikely to occur. This countervailing perspective is reflected in theemerging economic theory of poverty traps. As detailed by Carter and Barrett (2005) intheir recent review paper, the theory of poverty traps suggests that inadequate access tocapital and insurance will continue to render infeasible the hypothesised asset accumu-lation by poor households even in the wake of successful macroeconomic reforms. Ifcorrect, this perspective implies a critical minimum asset threshold below which accu-mulation is not possible.6 Instead of a pro-poor growth process in which the less well-off catch up or converge with their better-off neighbours, the theory of poverty trapsimplies a pattern of divergence in which those above the minimum threshold improvetheir economic situation, and those below stagnate or decline. From the perspective ofpoverty-trap theory, inclusive microeconomic reforms that enhance credit and insur-ance access are necessary if growth is to be pro-poor.
In principle, testing between the Washington Consensus and poverty-trap theoriesshould be relatively straightforward. The former hypothesises that the poor shouldexperience increases in the number of, and returns on, the assets that they hold (includ-ing unskilled labour power). The latter hypothesises that they will not.
To empirically distinguish between these two hypotheses, it would be useful to devise anasset index that permits us to explore accumulation of assets by poor families and the evolution of the returns they receive on their assets. Specifically, we need to devise an index
T H E D E V E L O P M E N T D E C A D E ? S O U T H A F R I C A , 1 9 9 4 – 2 0 0 4
128
Free
dow
nloa
d fr
om w
ww
.hsr
cpre
ss.a
c.za
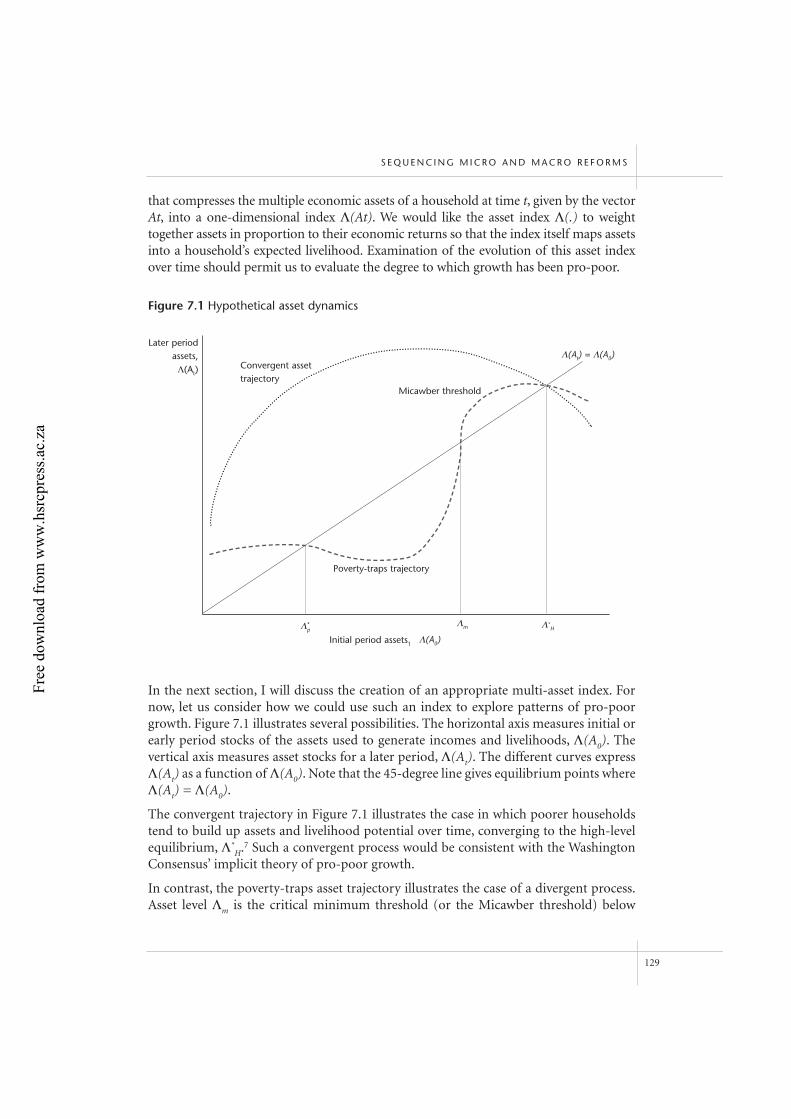
that compresses the multiple economic assets of a household at time t, given by the vectorAt, into a one-dimensional index Λ(At). We would like the asset index Λ(.) to weighttogether assets in proportion to their economic returns so that the index itself maps assetsinto a household’s expected livelihood. Examination of the evolution of this asset indexover time should permit us to evaluate the degree to which growth has been pro-poor.
In the next section, I will discuss the creation of an appropriate multi-asset index. Fornow, let us consider how we could use such an index to explore patterns of pro-poorgrowth. Figure 7.1 illustrates several possibilities. The horizontal axis measures initial orearly period stocks of the assets used to generate incomes and livelihoods, Λ(A0). Thevertical axis measures asset stocks for a later period, Λ(At). The different curves expressΛ(At) as a function of Λ(A0). Note that the 45-degree line gives equilibrium points whereΛ(At) = Λ(A0).
The convergent trajectory in Figure 7.1 illustrates the case in which poorer householdstend to build up assets and livelihood potential over time, converging to the high-levelequilibrium, Λ*
H.7 Such a convergent process would be consistent with the WashingtonConsensus’ implicit theory of pro-poor growth.
In contrast, the poverty-traps asset trajectory illustrates the case of a divergent process.Asset level Λm is the critical minimum threshold (or the Micawber threshold) below
S E Q U E N C I N G M I C R O A N D M A C R O R E F O R M S
129
Later periodassets,Λ(At)
Convergent assettrajectory
Micawber threshold
Λ(At) = Λ(A0)
Poverty-traps trajectory
Initial period assets1 Λ(A0)
Λm Λ∗HΛ*
p
Figure 7.1 Hypothetical asset dynamics
Free
dow
nloa
d fr
om w
ww
.hsr
cpre
ss.a
c.za
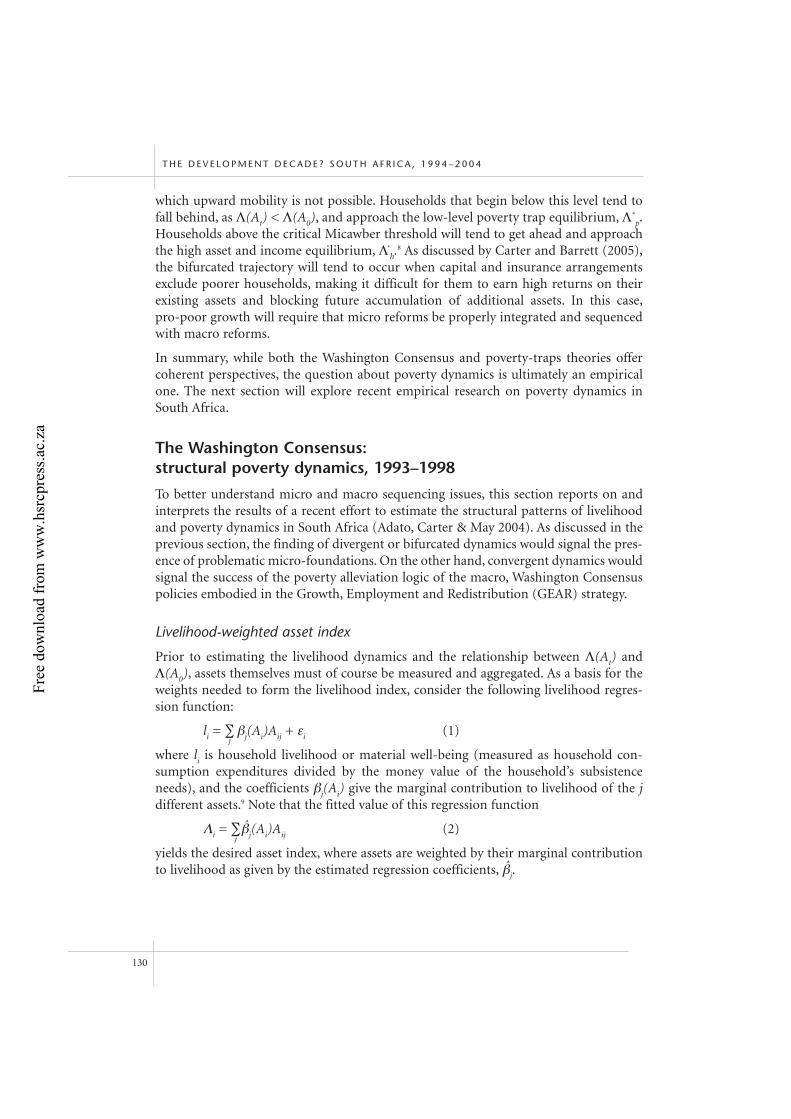
which upward mobility is not possible. Households that begin below this level tend tofall behind, as Λ(At) < Λ(A0), and approach the low-level poverty trap equilibrium, Λ*
p.Households above the critical Micawber threshold will tend to get ahead and approachthe high asset and income equilibrium, Λ*
h.8 As discussed by Carter and Barrett (2005),
the bifurcated trajectory will tend to occur when capital and insurance arrangementsexclude poorer households, making it difficult for them to earn high returns on theirexisting assets and blocking future accumulation of additional assets. In this case,pro-poor growth will require that micro reforms be properly integrated and sequencedwith macro reforms.
In summary, while both the Washington Consensus and poverty-traps theories offercoherent perspectives, the question about poverty dynamics is ultimately an empiricalone. The next section will explore recent empirical research on poverty dynamics inSouth Africa.
The Washington Consensus: structural poverty dynamics, 1993–1998
To better understand micro and macro sequencing issues, this section reports on andinterprets the results of a recent effort to estimate the structural patterns of livelihoodand poverty dynamics in South Africa (Adato, Carter & May 2004). As discussed in theprevious section, the finding of divergent or bifurcated dynamics would signal the pres-ence of problematic micro-foundations. On the other hand, convergent dynamics wouldsignal the success of the poverty alleviation logic of the macro, Washington Consensuspolicies embodied in the Growth, Employment and Redistribution (GEAR) strategy.
Livelihood-weighted asset index
Prior to estimating the livelihood dynamics and the relationship between Λ(At) andΛ(A0), assets themselves must of course be measured and aggregated. As a basis for theweights needed to form the livelihood index, consider the following livelihood regres-sion function:
li = ∑jβj(Ai)Aij + εi (1)
where li is household livelihood or material well-being (measured as household con-sumption expenditures divided by the money value of the household’s subsistenceneeds), and the coefficients βj(Ai) give the marginal contribution to livelihood of the jdifferent assets.9 Note that the fitted value of this regression function
Λi = ∑jβ̂j(Ai)Aij (2)
yields the desired asset index, where assets are weighted by their marginal contributionto livelihood as given by the estimated regression coefficients, β̂j.
T H E D E V E L O P M E N T D E C A D E ? S O U T H A F R I C A , 1 9 9 4 – 2 0 0 4
130
Free
dow
nloa
d fr
om w
ww
.hsr
cpre
ss.a
c.za
The advantages of the livelihood-weighted asset index Λi are several. First, its weightscan be estimated quite flexibly, such that returns to assets depend on levels of otherassets. In addition, the coefficients can be permitted to vary over different years as macropolicy and other changes influence the returns on assets and endowments. Second, theindex is expressed in a convenient livelihood metric. In the particular application usedhere, the asset index is expressed in poverty-line units (PLUs), such that a value of 1.0means that the particular bundle predicts a poverty level of material well-being, a valueof 0.5 would mean that the assets predict a livelihood at half the poverty line, and so on.
Estimated South African livelihood dynamics
Adato et al. (2004) estimate the livelihood index for the 1 036 households represented inthe KwaZulu-Natal Income Dynamics Study (KIDS).10 They then use those estimates to explore the livelihood dynamics and degree to which the South African economyoperated in the pro-poor fashion hypothesised by the Washington Consensus.11
Their primary estimates reveal that the South African income distribution is followingthe poverty-traps trajectory illustrated in Figure 7.1. The dynamics implied by thisfigure are precisely those of the hypothetical case of bifurcated dynamics. The Micawberthreshold is estimated to be at an asset level that predicts a level of well-being that isabout twice the poverty line. Households with assets below that level would be expectedto experience deterioration in their position, heading back toward the low-level poverty-trap equilibrium at a level well-being of about 90 per cent of the poverty line.Households with asset indices above the Micawber threshold would be expected to movetoward an upper equilibrium asset level that predicts a living standard of about 5.0PLUs. Households that begin in abject poverty with asset indices less than 90 per cent ofthe poverty line would be expected to improve their situations, moving toward thepoverty-trap equilibrium.
Figure 7.2 uses the econometric results from Adato et al. (2004) to extract informationabout the speed of asset accumulation and de-accumulation. The figure displays boththe gross five-year rate of growth in the asset index, as well as an annualised rate ofgrowth. A household that began just above the Micawber threshold (with an asset indexof, say, 2.5 PLUs) would have a predicted annual growth in assets of about 2.5 per cent(or over five years would experience a 15 per cent increase in expected well-being) –meaning that its level of well-being would be expected to rise from 2.5 to almost 2.9PLUs. A household that began below the Micawber threshold (at an asset level of, say,1.5 PLUs) would be expected to fall backwards and have assets that predict a living standard of only 1.25 times the poverty line after five years.
Figure 7.2 is as striking for what it does not show as for what it does. Given the low stan-dard of living and the high levels of unemployment suffered by households in our sample,it is surprising that these figures do not exhibit significant asset accumulation by less well-off households. Such households would appear to have every incentive to accumulate anysurplus resources that could be profitably brought into use. Their failure to do so would
S E Q U E N C I N G M I C R O A N D M A C R O R E F O R M S
131
Free
dow
nloa
d fr
om w
ww
.hsr
cpre
ss.a
c.za
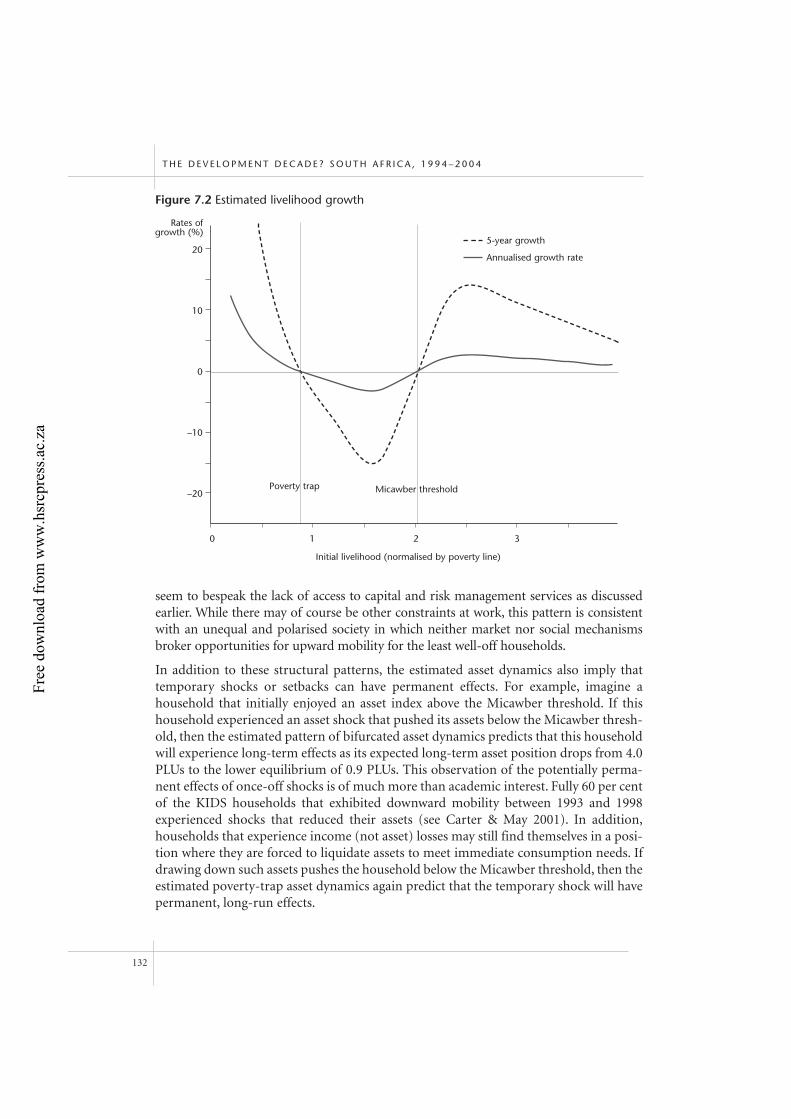
seem to bespeak the lack of access to capital and risk management services as discussedearlier. While there may of course be other constraints at work, this pattern is consistentwith an unequal and polarised society in which neither market nor social mechanismsbroker opportunities for upward mobility for the least well-off households.
In addition to these structural patterns, the estimated asset dynamics also imply thattemporary shocks or setbacks can have permanent effects. For example, imagine ahousehold that initially enjoyed an asset index above the Micawber threshold. If thishousehold experienced an asset shock that pushed its assets below the Micawber thresh-old, then the estimated pattern of bifurcated asset dynamics predicts that this householdwill experience long-term effects as its expected long-term asset position drops from 4.0PLUs to the lower equilibrium of 0.9 PLUs. This observation of the potentially perma-nent effects of once-off shocks is of much more than academic interest. Fully 60 per centof the KIDS households that exhibited downward mobility between 1993 and 1998experienced shocks that reduced their assets (see Carter & May 2001). In addition,households that experience income (not asset) losses may still find themselves in a posi-tion where they are forced to liquidate assets to meet immediate consumption needs. Ifdrawing down such assets pushes the household below the Micawber threshold, then theestimated poverty-trap asset dynamics again predict that the temporary shock will havepermanent, long-run effects.
T H E D E V E L O P M E N T D E C A D E ? S O U T H A F R I C A , 1 9 9 4 – 2 0 0 4
132
Micawber threshold
5-year growth
Annualised growth rate
Rates ofgrowth (%)
Initial livelihood (normalised by poverty line)
Poverty trap
10 2 3
20
10
0
–10
–20
Figure 7.2 Estimated livelihood growth
Free
dow
nloa
d fr
om w
ww
.hsr
cpre
ss.a
c.za
Micro-foundations of poverty-trap asset dynamics
While striking in its display that the South African economy did not work well for thosebelow the estimated Micawber threshold, the econometric results in the prior sectioncry out for further explanation. This section reflects on one part of that explanation,relating it to the failure to match macro reforms with the micro reforms that wereneeded to make it possible for less well-off households to grab a hold of new opportu-nities.
How then do we understand the collapse of livelihoods just above the poverty line?Seidman-Makgetla (2004: 269, Table 7) calculates that formal sector employment fell by125 000 jobs per annum from 1996 to 1999, roughly the period covered by the dynamicpoverty analysis reported earlier. In marked contrast to other countries, this collapse informal employment has not been matched by an expansion of informal and self-employment. Kingdon and Knight (2004) note that whereas informal and self-employ-ment is 57 per cent of total employment in Latin America, 63 per cent in Asia and 75 percent elsewhere in sub-Saharan Africa, it is only 19 per cent in South Africa. Reflectingthe debility of the informal sector, measured open unemployment in South Africa is awhopping 30–40 per cent (in contrast to 5–16 per cent in the other regions).
While it is possible that unemployment has been mis-measured in South Africa, and thatsome fraction of the unemployed are either voluntarily unemployed or involved in unre-ported activities, Kingdon and Knight, among others, argue that this is not the problem.If they are correct, then a big part of the puzzle would seem to be why the response ofinformal and self-employment has been so weak in the face of collapsing formalemployment.
In an effort to gain some insight on this question, the recently completed third round ofthe KIDS survey asked households that had successfully entered self-employment to listthe constraints that had made it difficult for them to achieve this status. More than 50per cent of the respondents indicated that access to capital had been a major barrier totheir ability to open their own business. Lack of profitable business opportunities waslisted by a similar number of respondents as constituting the other major barrier to self-employment.
While further analysis of these data is called for, on the face of it they point squarely toinherited market structures that were not well equipped to deal with the demands (andsupplies) of small-scale enterprise. Against this backdrop, it is not surprising that macroreforms that reduced formal-sector employment as part of structural adjustment leftmany households with few other viable economic options. In retrospect, an economicpolicy regime that prioritised the creation of inclusive market structures before, orsimultaneously with, macro reforms might have led to poverty dynamics quite differentfrom those shown in Figure 7.2.
S E Q U E N C I N G M I C R O A N D M A C R O R E F O R M S
133
Free
dow
nloa
d fr
om w
ww
.hsr
cpre
ss.a
c.za
The irreversible costs of poorly sequenced micro and macro reforms
The analysis presented in the previous section indicates that, at least until 1998, themacroeconomic reforms of the GEAR worked poorly for large segments of the SouthAfrican population, trapping them at a low standard of living. This finding, whichstands in marked contrast to the expectations of Washington Consensus-type policies,suggests that the South Africa of the mid-1990s did not have the inclusive micro-foundations needed for pro-poor growth.
These observations raise a series of questions about the sequencing of macro reformswith microeconomic policies designed to lay the foundations for pro-poor growth.Looking backwards, could South African growth have contributed more to povertyreduction if the macro reforms had been preceded by, or at least accompanied by, inclu-sive microeconomic reforms? Looking forward, how costly will the failure to havesequenced micro with macro reforms prove to be? What priority should be given nowto reforming the micro-foundations of the South African economy?
Unfortunately, these are difficult questions, and this chapter cannot pretend to fullyanswer them. However, hopefully it can at least help structure our thinking on theseissues as we move forward in both research and policy realms.
Perhaps the key issue to ponder is whether poorly sequenced reforms (meaning macroreforms undertaken without policies designed to alter an economy’s micro-founda-tions) lead to destructive, irreversible effects. An example drawn from historical experi-ence with agricultural reforms may help clarify the issues.
In a paper entitled ‘Level Playing Fields and Laissez Faire’, Brad Barham and I (1996)reported on the results of a series of microeconometric studies that looked at the impactof economic liberalisation in the 1980s on highly inegalitarian economies in LatinAmerica. Like the more general suite of macro reforms that would later be dubbed theWashington Consensus, these liberalising ‘modernisation reforms’ (as they were oftencalled) posited that they would induce pro-poor or poverty-reducing growth. De Janvryand Sadoulet (1993) make this claim quite explicit in their essay entitled ‘RelinkingAgrarian Growth with Poverty Reduction’. Our own work, however, indicated that thepoverty-reducing potential of these reforms was cut short, or even reversed, becausethey were not properly sequenced with the microeconomic reforms needed to create atruly level playing field for low-wealth rural households. Our research found that, in theshort term, the new opportunities afforded by liberalisation were grabbed by those producers with established access to credit, technology and instruments to manage risk.In our language, the reform-induced growth had a short-term class basis that wasunfavourable from a poverty-reduction perspective.
More importantly, over the medium term, this pattern of class-based growth under-wrote a pattern of class-biased growth in which the originally advantaged larger-scaleproducers were positioned to further expand their ownership of land. Rising land prices,fuelled by new opportunities, squeezed out smaller-scale producers, cutting off their
T H E D E V E L O P M E N T D E C A D E ? S O U T H A F R I C A , 1 9 9 4 – 2 0 0 4
134
Free
dow
nloa
d fr
om w
ww
.hsr
cpre
ss.a
c.za
opportunities for asset accumulation and livelihood improvement. Stepping back, thepursuit of liberalisation on an un-level microeconomic playing field not only skewed theimmediate benefits of growth, but created a quasi-irreversible medium-term structuralsituation in which lower-wealth households confronted the future with fewer assets andopportunities than they would have had.12 We went on to argue however, that a morecareful sequencing of reforms, which assured that small-scale producers had adequateaccess to capital and insurance, could reverse these patterns and create the basis for pro-poor growth.
While there is much to these Latin American cautionary tales that is specific to agricul-ture (because larger and smaller producers were competing for a scarce factor of pro-duction, land), they do help point us in the right direction for thinking about moregeneral micro–macro reform sequencing issues. The key question is whether poorlysequenced reforms create only short-term income losses, or whether they also cut offpatterns of asset accumulation and longer-term livelihood advance.
One area in which poorly sequenced reforms may be having longer-term effects in SouthAfrica is education and human capital attainment. Some commentators have noted howthe anti-apartheid struggle created a lost generation of human capital accumulation.However, have the income distribution dynamics discussed earlier created a second gen-eration of lost human capital accumulation? Are households that find their livelihoodscollapsing toward the ‘poverty-trap’ equilibrium able to continue their investment intheir children’s educational future? Does the fact that some initially better-off house-holds have been able to advance generate price changes (analogous to the land priceincreases discussed in the Latin American examples) that push quality education furtherout of the reach of households in the poverty trap?13 If so, then the apparently poorlysequenced economic reforms of South Africa have created the sorts of irreversible effectsthat merit immediate attention as we look forward to future economic policy.
Solidifying the microeconomic reform agenda: from BIG to BAG and beyond
In the September 2003 issue of its popular periodical Finance & Development, theInternational Monetary Fund published a set of papers that revisit the wisdom of theWashington Consensus. Included among them is a piece in which Trevor Manuel (2003)argues that the government needs to take a more proactive stance than foreseen in theWashington Consensus, and must now take affirmative steps to ensure that citizens arepositioned to be able to respond to the new opportunities provided by the liberalised,post-apartheid economy. In the same issue of Finance & Development, John Williamson(2003) more pointedly says that governments must assure that citizens have theminimum asset base and market access required to save, accumulate and succeed in amarket economy.
While not cast explicitly as such, these statements by Manuel and Williamson reflectexperience with what this chapter has called poorly sequenced economic reforms in
S E Q U E N C I N G M I C R O A N D M A C R O R E F O R M S
135
Free
dow
nloa
d fr
om w
ww
.hsr
cpre
ss.a
c.za
highly inegalitarian economies (Manuel in the context of South Africa, of course, andWilliamson in the context of Latin America). The research reported in this chapter indi-cates that South African families which had asset bases predicting livelihoods less thantwice the poverty line fell swiftly behind toward a sub-poverty line standard of livingover the 1990s. Additional research is needed to confirm whether or not this is a con-tinuing problem, and whether or not it has been accompanied by the sort of irreversibleinvestment losses that compromise the livelihoods of the next generation. While thisresearch is currently under way, with the recently collected third round of the KIDS dataused for this study, my intuition suggests that we will indeed find important elements ofcontinuity and irreversible costs of mal-sequenced reforms. More importantly, govern-ments need to act in the policy present rather than in the imagined future of empiricalcertainty desired by researchers.
So what is to be done? The empirical analysis identifies a minimum asset bundle withoutwhich families have a hard time advancing. Consistent with John Williamson’s sugges-tion, this evidence indicates that a BAG is needed if people are to successfully navigatethe economic terrain of contemporary South Africa. This emphasis on a minimum assetbundle stands in contrast to the notion of a BIG, which has played a role in recent SouthAfrican discussions. In addition to the experience with land reform programmes (whichattempt to provision rural households with a BAG), contemporary social welfare discussion in the USA and the UK has begun to shift toward asset provisioning asopposed to income grants.
While a focus on BAG programmes is warranted, treating the 2.0 PLU asset minimum(empirically identified here) as exogenously fixed is also misleading. As theoretical workon the dynamics of asset accumulation has helped clarify, asset minima emerge only inthe presence of weak markets for capital and insurance. This finding prioritises the sortsof inclusive microeconomic reforms that broaden access to capital and insurance. Inprinciple, success in this realm should reduce the size of the BAG needed for a family touse time and markets to their own advantage.
This asset focus also suggests that a slightly different optic be used in the design andevaluation of income-based social transfer programmes. Has the Child Support Grant(CSG), for example, functioned to keep children in school and prevent the creation ofanother lost generation of human capital accumulation?14 More pointedly, could theCSG be redesigned in a budgetary-neutral fashion that would improve its ability toreduce the irreversible costs of mal-sequenced economic reform?15
The German philosopher GWF Hegel somewhere remarked that the ‘owl of Minervaflies only by night’, meaning that wisdom is achieved retrospectively only after the dayhas passed. While it would be interesting to speculate on what South African income andpoverty dynamics distribution would have looked like if more thorough micro reformshad been more carefully sequenced with macro reforms in the 1990s, the forward-looking message has to be that microeconomic reforms that lay the basis for an inclu-sive market economy are now more important than ever. They need to be an intrinsic
T H E D E V E L O P M E N T D E C A D E ? S O U T H A F R I C A , 1 9 9 4 – 2 0 0 4
136
Free
dow
nloa
d fr
om w
ww
.hsr
cpre
ss.a
c.za
part of economic policy. They are not a secondary consideration that can be postponed,without cost, to some future date. While there is still much to learn about how toconduct the micro reforms, some important first steps have been taken. Building onthose steps, and embedding them in a framework that explicitly recognises their designand priority, is the best chance we have for seeing a South Africa in which time andmarkets work for all families.
Notes
1 In his State of the Nation speech in early 2001, President Thabo Mbeki pointed to the need to
move attention to appropriate microeconomic measures as essential ingredients in the fight
against poverty and unemployment. Also in early 2001, Finance Minister Trevor Manuel released
the most expansionary Budget seen since the change of government in 1994, an action that was
repeated in 2002. In the minister’s 2001 Budget speech, the shift from macroeconomic
stabilisation to ‘microeconomic reform’ was taken further with rural infrastructure, employment
subsidies via the tax system, support for targeted industries, tax concessions and special
depreciation allowances to stimulate investment, especially for small and medium enterprises,
and broadening access to markets being some of the new measures and policies mentioned.
2 See, for example, the debate surrounding Milanovic’s (2002) study, which showed that world
income distribution became less equal over the 1990s.
3 This and the section that follows draw liberally on Carter & Barrett (2005) and Adato, Carter &
May (2005).
4 Within the theory of international trade, the so-called factor price equalisation theorem
embodies this notion that trade liberalisation reduces inequality in lower-income countries.
Wood (1997) discusses this theorem, and evidence concerning it, in some detail. De Janvry and
Sadoulet (1993) apply the logic of the factor price equalisation theorem to a discussion about
how macro reforms should serve to re-link growth with poverty reduction.
5 Hernando de Soto (2000) is perhaps the most visible proponent of this view. Empirical evidence
supporting this perspective is, however, mixed. For example, see the review by Feder and Akihiko
(1996) and the recent empirical contributions by Fields (2003) and Carter and Olinto (2003).
6 Zimmerman and Carter (2003) dubbed this level the ‘Micawber threshold’ as it is the level of
asset poverty below which virtuous Victorian asset accumulation, of the sort espoused by
Charles Dickens’ character Micawber in David Copperfield, is not possible.
7 Note that Λ∗H is at equilibrium because it lies on the 45-degree line where Λ(A2) = Λ(A0); hence,
an individual with an initial stock of A0 would tend to remain at that asset and livelihood level
over time.
8 There is no significance to the fact that the upper equilibrium is drawn to be the same for both
convergent and bifurcated dynamics – this merely eliminates clutter in the graph.
9 This notation indicates the use of flexible regression techniques so that marginal livelihood
contribution of an asset depends on the full vector of assets, Ai, controlled by the household.
S E Q U E N C I N G M I C R O A N D M A C R O R E F O R M S
137
Free
dow
nloa
d fr
om w
ww
.hsr
cpre
ss.a
c.za
10 KIDS households were originally selected at random in 1993 from the population of KwaZulu-
Natal households (as part of the national-level Saldru survey), and were again interviewed in
1998. A third round of surveys was completed in July 2004.
11 For reasons discussed in Carter and Barrett (2004), flexible, non-parametric methods are used
and offer significant advantages in estimating the sort of non-linear relationships that are
hypothesised to characterise asset dynamics.
12 It is of course possible that over the very long term, rapid growth could fuel economy-wide
capital accumulation, absorbing the poor into new employment opportunities.
13 Chiu (1998) models this phenomenon.
14 Preliminary analysis reported by Aguero, Carter and Woolard (2004) identifies a small positive
impact of the CSG on the nutritional status of young children.
15 See, for example, the burgeoning literature on the Mexican Progressa programme, especially
Sadoulet & De Janvry (2003).
References
Adato M, Carter M & May J (2004) Sense in sociability: Social exclusion and persistent poverty in
South Africa. Paper prepared for the BASIS Persistent Poverty Conference, 15–16 November,
Washington, DC.
Aguero J, Carter M & Woolard I (2004) Evaluating the impact of South Africa’s Child Support Grant.
Paper presented to the Economic Development Workshop, University of Wisconsin-Madison.
Carter M & Barham B (1996) Level playing fields and laissez faire: Post-liberal development strategies
in inegalitarian agrarian economies, World Development 24: 1133–50.
Carter M & Barrett C (2004) The economics of poverty traps and persistent poverty: An asset-based
approach. Paper prepared for the BASIS Persistent Poverty Conference, 15–16 November,
Washington, DC.
Carter M & May J (2001) One kind of freedom: Poverty dynamics in post-apartheid South Africa,
World Development 29: 1987–2006.
Carter M, May J & Padayachee V (2002) Sweetening the bitter fruit of liberty: Markets and poverty
reduction in post-apartheid South Africa. Background paper prepared for the South African
Human Development Report.
Carter M & Olinto P (2003) Getting institutions right for whom? Credit constraints and the impact
of property rights on the quantity and composition of investment, American Journal of
Agricultural Economics 85: 173–86.
Chiu W (1998) Income inequality, human capital accumulation and economic performance,
Economic Journal 108: 44–59.
De Janvry A & Sadoulet E (1993) Relinking agrarian growth with poverty reduction, in M Lipton &
J Van der Gaag (eds.) Including the poor. Washington, DC: World Bank.
De Soto H (2000) The mystery of capital: Why capitalism triumphs in the West and fails everywhere
else. New York: Basic Books.
T H E D E V E L O P M E N T D E C A D E ? S O U T H A F R I C A , 1 9 9 4 – 2 0 0 4
138
Free
dow
nloa
d fr
om w
ww
.hsr
cpre
ss.a
c.za
Feder G & Akihiko N (1996) The benefits of land titling and registration: Economic and social
perspectives, Land Policy Studies 15: 25–43.
Fields E (2003) Entitled to work: Urban property rights and labor supply in Peru. Working paper,
Harvard University.
Kingdon G & Knight J (2004) Unemployment in South Africa: The nature of the beast, World
Development 32: 391–408.
Kurczynski P & Williamson J (2003) After the Washington Consensus: Restarting growth and reform in
Latin America. Washington, DC: Institute for International Economics.
Lybbert T, Barrett C, Desta S & Coppock D (2004) Stochastic wealth dynamics and risk management
among a poor population, Economic Journal October: 750–77.
Manuel T (2003) Africa and the Washington Consensus: Finding the right path, Finance &
Development September: 18–20.
Milanovic B (2002) True world income distribution, 1988 and 1993: First calculations based on
household surveys alone, Economic Journal 112: 51–92.
Ravallion M (2001) Growth, inequality and poverty: Looking beyond averages, World Development
29: 1803–16.
Sadoulet E & De Janvry A (2003) Targeting and calibrating educational grants for greater efficiency.
Working paper, Department of Agricultural and Resource Economics, University of California-
Berkeley.
Seidman-Makgetla N (2004) The post-apartheid economy, Review of African Political Economy 100:
263–81.
Williamson J (2003) From reform agenda: A short history of the Washington Consensus and
suggestions for what to do next, Finance & Development September: 10–13.
Wood A (1997) Openness and wage inequality in developing countries: The Latin American
challenge to the East Asian wisdom, World Bank Economic Review 11: 33–58.
Zimmerman R & Carter M (2003) Asset smoothing, consumption smoothing and the reproduction
of inequality under risk and subsistence constraints, Journal of Development Economics 71:
233–60.
S E Q U E N C I N G M I C R O A N D M A C R O R E F O R M S
139
Free
dow
nloa
d fr
om w
ww
.hsr
cpre
ss.a
c.za

Free
dow
nloa
d fr
om w
ww
.hsr
cpre
ss.a
c.za
Section 3Distributive issues in post-apartheid South Africa
141
Free
dow
nloa
d fr
om w
ww
.hsr
cpre
ss.a
c.za

Free
dow
nloa
d fr
om w
ww
.hsr
cpre
ss.a
c.za
8 Constructing the social policy agenda: conceptual debates around poverty and inequality
Julian May
Introduction
The World Summit for Social Development held in Copenhagen in 1995 recognised the‘urgent need for national strategies to reduce overall poverty substantially, includingmeasures to remove the structural barriers that prevent people from escaping poverty,with specific time-bound commitments to eradicate absolute poverty by a target date tobe specified by each country in its national context’ (WSSD 1995: Paragraph 25).Perhaps the single most important commitment made by governments in relation topoverty eradication is contained in both the Copenhagen Declaration, Commitment2(a), and the Programme of Action, Paragraph 26(b). In these documents, participatinggovernments pledged to develop:
national poverty eradication plans to address the structural causes of poverty,encompassing action on the local, national, sub-regional and international levels.These plans should establish, within each national context, strategies and afford-able time-bound goals and targets for the substantial reduction of poverty andthe eradication of absolute poverty.
These commitments were later confirmed by the UN General Assembly in its resolution50/107 (1996) and, subsequently, the UN declared 1997–2006 the ‘Decade for PovertyEradication’. Momentum has been added by the Highly Indebted Poor Countries initia-tive, and the requirement of this initiative that Poverty Reduction Strategy Papers beprepared by countries seeking debt relief.
More recently, the Development Assistance Committee of the Organisation forEconomic Co-operation and Development proposed the Millennium DevelopmentGoals (MDGs) as targets for poverty reduction by 2015, which included halving the pro-portion of people living in extreme poverty, the provision of universal primary educa-tion in all countries, the reduction of the infant and under-five child mortality rate bytwo-thirds and the reduction of maternal mortality by three-fourths. The ‘Decade’ hasalso coincided with the publication of a second World Development Report on poverty,the Social Summit +5, and the release of a UNDP report on poverty (World Bank 2000;UNDP 2000). In South Africa, post-apartheid governments continue to emphasisepoverty reduction as a national priority and have committed the country to achievingthe MDGs. The Poverty and Inequality Report prepared for the government in 1998noted the wide range of policies that had been introduced to address poverty since 1994,
143
Free
dow
nloa
d fr
om w
ww
.hsr
cpre
ss.a
c.za
while the government’s Ten Year Review charts progress in the delivery of social servicesto the country’s population in the first decade of democracy (May 2000; Government ofSouth Africa 2003).
The events that have culminated in the ‘War on Terror’ and the subsequent diversion ofresources away from development interventions could not be foreseen by the delegatesat Copenhagen in 1995 nor even by those at the Social Summit +5 in Geneva.Nonetheless, the Decade for Poverty Eradication takes place at a time when both inter-national and national commitment to poverty reduction appears high. This chapterreviews conceptual debates that have informed the analysis of poverty in the previousdecade, and examines how these may shape future agendas in the development of socialpolicy.
Achieving poverty reduction
The release of better quantitative data with which to monitor the extent of poverty on aglobal, regional and national basis has been a useful resource in assessing the scale of thetask, as well as for analysing the options for poverty reduction (Deininger & Squire 1996;Ravallion & Chen 1997; Chen & Ravallion 2004). Notwithstanding continued debate overthe methodologies used for measurement, the most recent analysis of the available datashows a reduction in the proportion of the world’s population who live on less than $1per day (at 1993 purchasing power parity, [PPP]) from 32.8 per cent in 1984 to 21.1 percent in 2001 (Chen & Ravallion 2004: 30). The same data show that the absolute numberof people living below $1 also declined by 189 million people between 1984 and 2001, andthat the number stood at just over 1 billion people in 2001. At a less frugal poverty line of$2 at 1993 PPP, the proportion of those categorised as poor declined from 63.7 per centof the world’s population in 1984 to 52.9 per cent in 2001, while the absolute numberincreased by 255 million people to reach 2.7 billion people in 2001. However, there arealso important regional differences in which the gains made in China and in the MiddleEast and North Africa are offset by rising poverty in sub-Saharan Africa. In this region,the proportion of the poor has been relatively stable at some 46 per cent ($1) or 76 percent ($2) through this period, while the absolute numbers have increased from 198.3million in 1984 to 313 million in 2001 ($1) or from 326 million to 516 million ($2).
The paucity of accurate data means that comparable figures for apartheid-era SouthAfrica are difficult to come by. Simkins (1984: 181) suggests that some 81 per cent ofhouseholds living in the former homeland areas could be categorised as living in direpoverty in 1980, which would have been equal to some 8.7 million people, while Wilsonand Ramphele (1989: 17) provide an estimate for the same year of 50 per cent of thetotal population of South Africa, approximately 13 million people. In the post-apartheidperiod, Hoogeveen and Özler (2004: 38) adopt an approach to measurement similar tothat used by Chen and Ravallion (2004), and calculate that there was an increase of 1.8million people living in poverty between 1995 and 2000, with 12.6 million people livingon less than PPP$1 per day in 1995, 31.0 per cent of the population, compared to 14.4
T H E D E V E L O P M E N T D E C A D E ? S O U T H A F R I C A , 1 9 9 4 – 2 0 0 4
144
Free
dow
nloa
d fr
om w
ww
.hsr
cpre
ss.a
c.za
million in 2000, equal to 32.1 per cent of the population. At the less austere povertythreshold, they find that 22.9 million South Africans were living on less than PPP$2 perday in 1995 rising to 25.2 million in 2000, an increase of 2.3 million.
Chen and Ravallion (2004) attribute this failure to reduce poverty in all parts of theworld to two proximate causes:• Although the global economy grew at around an average of 2.5 per cent per annum
during most of this period, this growth was not evenly distributed and insufficientgrowth took place in the poorest countries.
• Persistent inequalities within the poorest countries meant that the poor wereunable to participate fully in the benefits of the growth that did take place.
While the second statement seems intuitively correct, empirical evidence supporting thisview is less conclusive and has been the topic of a sometimes stormy debate over the pastdecade, and especially during the lead-up to the World Bank’s second WorldDevelopment Report on poverty reduction. Specifically, the microeconomic and insti-tutional mechanisms that link persistent poverty and inequality remain an inadequatelyresearched area. Moreover, as Deininger and Olinto (2000) point out, little analysis hastaken account of the distribution of wealth/assets and, instead, income inequality hastended to be the favoured measure of inequality. Furthermore, there is inadequateunderstanding of the ways in which economic markets are structured so that the poorare not able to benefit from economic growth, and of the ways in which governmentscan influence this outcome, often through social policies that attempt to better redis-tribute government funds towards those who are least resourced.
Despite the energy directed towards poverty reduction, the prognosis for success is notpromising. Calculating poverty elasticities and projecting human development indica-tors, and employing alternative projected long-term regional economic growth rates,Hamner, De Jong, Kurian and Mooli (1999: 561) conclude that a reduction in incomepoverty by 50 per cent by 2015 is unlikely for most developing countries. Indeed, the sit-uation for sub-Saharan Africa is particularly dismal, and there is little chance that any ofthe poverty reduction targets will be met, including those for human development (seeMay & Roberts 2005 for a discussion of the example of Lesotho). In reality, the situationmay be far worse than this, given that these projections are based on trends prior to 1993and, thus, do not take account of the direct impact of HIV/AIDS on life expectancy, letalone its secondary impacts on livelihoods and well-being. Moreover, Hamner et al.(1999) stress that the pattern of growth is important, with pro-poor growth, in whichthere is a high elasticity of the poverty incidence with respect to GDP per capita, yield-ing more promising results.1
The global data suggest that achieving economic growth, and ensuring that the distri-bution of the benefits of this growth reach the poor, are critical issues in the design of public policy that aspires to achieve a reduction in poverty. This raises a concern over the limits to government action to maximise the poverty-reducing potential ofeconomic growth.
C O N S T R U C T I N G T H E S O C I A L P O L I C Y A G E N D A
145
Free
dow
nloa
d fr
om w
ww
.hsr
cpre
ss.a
c.za
When is growth pro-poor?
Conventionally, economic growth is thought to have taken place if the total value of allgoods and services exchanged or purchased in an economy increases over some agreedtime frame. Growth implies that resources have been used or transformed in somefashion that makes the end result more valuable in monetary terms. Changes in tech-nology may mean that resources are used more efficiently, with the result that fewerresources are needed for the same or a better end product. As researchers concerned withsustainable development are quick to point out, it makes no difference whether the extragoods and services are good or useful, or are ones that it may have been better for theenvironment or for some segment of the population not to have been produced.Economic growth is also associated with other transformations, including the accumu-lation of physical and human capital, shifts in the structure of economic productionfrom agriculture to industry, and then to services, and lessening reliance on naturalresources (Kuznets 1955; Kaldor 1963). Finally, growth leads to increasingly complexinstitutions regulating the activities of individuals, states and markets. Growth is oftenaccompanied by increasing urbanisation, increased water and energy usage, and moresolid and water-borne waste. These transformations also bring dynamics that impactupon the net result of economic growth and the distribution of its costs and benefits.
Turning to the question of how growth might benefit the poor, that is to say be pro-poor,the current consensus among many development economists insists that poverty reduc-tion is mainly the result of economic growth, which in turn is the result of good eco-nomic policies. Empirical studies have shown that effective economic policies forgrowth include adherence to fiscal discipline and, thus, low budget deficits, maintaininga competitive currency and a positive balance of payments, low and stable inflationrates, openness to trade and the protection of property rights. Other policy optionsbeing recommended include privatisation, tax reforms and the removal of market con-trols such as subsidies on food and essential services, minimum wages and currencyrestrictions. In the light of this, it might be thought that pro-poor growth is also bestachieved by the consistent application of these economic policies.
Without disputing the value of sound economic policies, the notion of ‘good growth andbad growth’ developed by ‘green economists’ can be usefully extended beyond the issuesof sustainable development that are their immediate concern (Douthwaite 2002). Thequestions become, instead, how economic growth might translate into increased incomefor the poor, as well as into greater benefits from the other aspects of improved well-being that are considered part of poverty reduction. Longer and healthier lives; access toinformation and the knowledge of how to use it; improved capacity as citizens, parentsor neighbours; safety from crime, violence and hazardous employment practices may allbe other characteristics of good growth. Alternatively, questions may be concerned withthe causes of bad growth, from which the poor benefit only in terms of certain aspectsof well-being, such as income, while losing out on others, such as health status or,indeed, experience forms of growth that actually produce poverty.
T H E D E V E L O P M E N T D E C A D E ? S O U T H A F R I C A , 1 9 9 4 – 2 0 0 4
146
Free
dow
nloa
d fr
om w
ww
.hsr
cpre
ss.a
c.za
There are other ways in which ‘good growth’ might take place. In many developing coun-tries where the subsistence economy has collapsed, the most direct way in which growthassists the poor takes place through the formal jobs that are created. This is particularlyso when growth occurs in labour-absorbing sectors of the economy, such as agriculture,construction and clothing and textile manufacturing. Dealing with high and persistentunemployment is often used as the motivation for pursuing policies that seek to attractforeign investment and to promote exports. This is certainly true of South Africa, whereemployment creation remains at the top of the agenda of both the government and thetrade unions, and where unpopular macroeconomic structural reforms were introducedlike the Growth, Employment and Redistribution (GEAR) strategy.
A second route is by creating a better environment for the entrepreneurship and indus-try of the poor themselves. This would apply to many of the chronically poor who, dueto their low skills and resource base, probably have little potential to obtain employmenteven if the economy expands. Although the informal and subsistence agricultural sectorsare often not included in the calculation of GDP, many countries recognise the impor-tant role that is played by such production in boosting the incomes of the poor. Indeed,in South Africa, increasing employment in the informal sectors has been held out as evi-dence of successful job creation brought about by macroeconomic reforms, rather thanas being one of the possible costs of adopting such policies where certain jobs are infor-malised. This route relies upon policies that build assets as well as improve the returnson the assets of the poor, and frequently makes use of various ‘market assisted’ strategiesfor intervention.
Also of help for the chronically poor, meaning those who are trapped in poverty andunable to improve their position through their own efforts, the greater revenue collectedby the state through taxation on the expanded activity can be used for increased socialspending and on further improvements to infrastructure utilised by the poor for pro-duction and reproduction. With growth, such expenditure can be achieved without thecost of increasing the Budget deficit. Broadening systems of social security, such as theChild Support Grant introduced in South Africa in 1998, are among the policy optionsthat might be considered, as are policies that ensure the provision of basic services, suchas South Africa’s Community Water Supply and Sanitation Scheme.
A less direct impact is through the trickle-down impact of the improved circumstancesof the less poor and the rich who are able to consume and invest more. This mightincrease domestic demand, especially for services like domestic labour and recreation,and promote the growth of labour-intensive small- and medium-sized business.
Finally, there may be indirect benefit through a general impact of the policies that havebeen adopted to promote growth, such as more stable prices, better access to the cheapergoods being imported, cheaper credit and reduced political instability and violence. Thismight be thought of as an indirect benefit of South Africa’s GEAR, which has had somesuccess in achieving stability in terms of inflation, the long-term exchange rate and otherimportant macroeconomic indicators.
C O N S T R U C T I N G T H E S O C I A L P O L I C Y A G E N D A
147
Free
dow
nloa
d fr
om w
ww
.hsr
cpre
ss.a
c.za
In contrast, ‘bad growth’ may be characterised as including greater output beingachieved through unsustainable degradation of the environment or working conditions.The first of these, environmental degradation, has consistently received attention asawareness continues to be raised concerning pollution levels, the devastation of forestsand other natural habitats and water crises in developing countries. Without effectivecontrol by governments, many countries are sacrificing their natural capital in the effortto attract investment and reach short-term targets for job creation. While the long-termconsequences of this are clear, such degradation also brings short-term costs to segmentsof the population who still rely upon the environment for aspects of their livelihoods oras the source for meeting their basic needs. Furthermore, the least well off tend to bethose who are forced to work in, or to live near, hazardous environments due to theabsence of alternatives. Environmental catastrophes resulting from inadequate safetyregulations also impact disproportionately on the poor. While Bhopal is probably thebest known of these, many examples may be given, including asbestos poisoning in theNorthern Cape province of South Africa. The degradation of working conditions maytake place in more overt forms through the neglect of safety procedures, the use of childlabour and low pay, as well as through the casualisation of work that removes workersfrom a regulated environment and ostensibly transforms them into self-exploitingentrepreneurs stripped of any employment benefits.
A second characteristic of bad growth relates to the increased costs arising from struc-tural changes in the economy. For example, while the urbanisation that accompanieseconomic growth may bring better opportunities for employment and work, an unin-tended consequence is that many services once obtained directly from the environmentmust now be purchased. There are also new costs levied on obtaining services. Usertariffs on water supply and the escalating cost of water provided through the privatesector is an example. Once again, South Africa provides a useful illustration – it isclaimed that the recently privatised water supply in Johannesburg compelled the munic-ipality to cut the water supply of 800 households per day as a result of non-payment(McDonald 2002).
Mass-produced products may ‘crowd out’ local production and local technologies. If thisdoes take place, there is a good chance that labour-absorbing forms of production anddistribution may be negatively affected, and local entrepreneurship displaced. A SouthAfrican example would be the collapse of the low-cost clothing industry in the provinceof KwaZulu-Natal in the face of cheap imports, and the subsequent loss of thousands ofjobs in this sector.
The ‘crowding on’ of costs to future generations, other countries or other sectors is afeature of economic growth that is often overlooked. The assumption that the adoptionof growth-friendly policies by all countries or regions results in a win-win situation fliesin the face of much economic theory, which holds that there are almost always winnersand losers. At best, such policies might simply defray the costs associated with theiradoption (the example of environmental degradation has already been mentioned), or‘crowd on’ the costs to other regions, or to those less able to influence policy. An example
T H E D E V E L O P M E N T D E C A D E ? S O U T H A F R I C A , 1 9 9 4 – 2 0 0 4
148
Free
dow
nloa
d fr
om w
ww
.hsr
cpre
ss.a
c.za
would be small-town industries unable to compete with mass-produced imports, norable to lever mediating support from the government.
The presence of poverty-producing forces, as described by Øyen (2002), can have theconsequence of growth in some sectors either requiring immiseration elsewhere orhaving the unintended consequence of this. The development of South Africa’s minerals industry is a glaring example of the adoption of poverty-producing policies bythe apartheid government to ensure a supply of cheap labour to the mines. Other exam-ples include the impact of environmental degradation on indigenous populations in South America and the forced removal of populations arising from the constructionof large dams in Asia. Structural reforms that lead to the closure of labour-intensiveindustries are also poverty-producing forces that may be unavoidable. The case of theclothing sector in KwaZulu-Natal is an example of the removal of tariff barriers andapartheid-era incentives resulting in massive job losses.
Having outlined some of the mechanisms that condition whether growth is good or bad,meaning pro-poor as opposed to poverty producing, it is now necessary to look moreclosely at the recent evidence that argues that even distribution-neutral growth wouldbe good for the poor. This might provide some clues as to the role that could be playedby social policies to ensure that poverty reduction is maximised.
Growth, distribution and poverty reduction
An important resource now available to researchers concerned with poverty reductionand growth is the large multi-country database of household surveys and national statistics compiled by the World Bank (Deininger & Squire 1996). With the correctionof these data to ensure that variations in price and methodology can be taken intoaccount, and the use of econometric modelling techniques, comparative analysis cannow be undertaken of trends and the impact of differing contexts or different policyoptions. After a careful analysis of the relationship between changes in per capita GDPon the incomes of those at the bottom end of the income distribution, World Bankeconomists Dollar and Kraay (2000) use these data to conclude that the effect of growthon the incomes of the poor is no different in rich countries than in poor ones, and thatthe poverty–growth relationship has remained consistent over time. They then gofurther to claim that policy-induced growth is as good for the poor as it is for the overalleconomy. Despite making a number of bold policy statements on the basis of their find-ings, they actually conclude that very little is known about the causes of changes in thedistribution of income.
Dollar and Kraay use per capita GDP as a measure of growth, and their results refer tothe elasticity of average incomes in the bottom quintile with respect to overall averageincome. That is to say, poverty is defined in a relative sense and is a constant proportionfor all the countries in their data regardless of the level of income. Growth is seen to begood for the poor if the average per capita income of the bottom quintile increases atthe same rate as, or by more than, the average per capita income of the total population.
C O N S T R U C T I N G T H E S O C I A L P O L I C Y A G E N D A
149
Free
dow
nloa
d fr
om w
ww
.hsr
cpre
ss.a
c.za
They say that improvement in the incomes of the poor from growth is not sequencedand, thus, is not due to the trickle-down effect in which improved benefits to the richeventually lead to benefits being accrued by the poor. Instead, it is argued to follow froman improved environment for the poor to increase their own production and income.
Dollar and Kraay claim that 80 per cent of the variation in the incomes of the poor isdue to variation in overall per capita income, and that just under half of the growth inthe incomes of the poor is explained by growth in mean income. They show that theincome of the poor does not fall disproportionately to the average person during crisis;that is, in times of recession, the average income of the poor does not fall more than theaverage income of the non-poor. They use this to disprove the notion that crises are particularly hard on the poor, although they do concede that a proportional fall at alower income might be harder on the poor. Indeed, it is worth remembering that onereason why household per capita income might increase is because a member of thefamily has died from an illness relating to poverty.
Having shown that increased economic output has a positive impact on the income ofthe poorest quintile of the income distribution, Dollar and Kraay then try to identify thepolicies being adopted by countries that have managed to achieve this. A core set ofinstitutions and policies is examined, including the usual formula – fiscal discipline,macroeconomic stability, openness to trade and the protection of property rights. Fewmight be surprised to learn that the adoption of these policies is found to contributetowards increasing the likelihood that the incomes of the poor benefit from an increasein average incomes. Finally, Dollar and Kraay investigate the impact of social spendingand of formal democratic institutions using an index of voice and accountability.They describe the reduction of government consumption as being ‘super pro-poor’ andconclude that the income of the poor is not influenced by the presence of democraticinstitutions. However, once again they do point to the fact that research has been mixedabout the impact of social spending and say that such expenditure may not have beenwell targeted towards the poor.
Dollar and Kraay conclude that the standard pro-growth macroeconomic policies aregood for the poor, as they raise mean income with no significant effect on the distribu-tion of income. At one level, this is a simple and useful message. There is nothing intrin-sically negative about raising mean income in terms of its effect in raising the income of the poorest quintile of the population. However, this statement is undermined by aconsistent tendency to overstate the implications of their findings and understate thelimitations of their methodology. In particular, they tend to blur the difference betweentheir measure of poverty (the income of the poorest quintile) and the broader notion ofimproved well-being of those in absolute or chronic poverty. Finally, their concern with‘debunking myths’ leads their analysis back into the restrictive mantra of ‘fiscal disci-pline, macroeconomic stability, openness to trade and protection of property rights’ andinto some sweeping statements derived from doubtful indicators of social and politicalstructures.
T H E D E V E L O P M E N T D E C A D E ? S O U T H A F R I C A , 1 9 9 4 – 2 0 0 4
150
Free
dow
nloa
d fr
om w
ww
.hsr
cpre
ss.a
c.za
However, by demonstrating that there is nothing inherently wrong with the expectationthat expanding economic output will lead to a reduction in poverty, in other words thatgrowth is distribution-neutral at least in terms of income, this research does allow afresh start to the examination of what then does constitute growth that is both pro-poorand distributive. Admittedly, to move from accepting that growth does lead to animprovement in the incomes of the poor to an assertion that growth is the solution topoverty reduction is questionable. In their conclusion, Dollar and Kraay are in factcareful to note that growth is not all that is needed to improve the quality of life of thepoor, though they make no mention of what else might be needed. As already men-tioned, other researchers have noted that poverty elasticities of growth vary widely andthat the impact of growth on absolute poverty is thus unclear.2 Empirical studies usethese results to demonstrate that the MDG of halving poverty cannot be achieved simplythrough growth and that the poverty-reducing impact of growth depends crucially onthe distribution of income (Ravallion 1997; Hamner et al. 1999; Hamner & Naschold2000; Dagdeviren, Van der Hoeven & Weeks 2000).
If anything, the Dollar/Kraay analysis demonstrates that there is a need to look beyondthe broad policies that facilitate economic growth, and that deeper investigation isrequired to identify the different benefits and costs of growth and how these are distrib-uted. Obviously, it is essential to recognise that promoting growth through the standardpackage of economic policies is important. However, this should not be at the cost ofother public-sector actions that might better reduce poverty in a sustainable fashion.Instead, there is a need to find the correct balance between those interventions conven-tionally described as economic and those often branded rather disparagingly as socialpolicy.
As Lipton (1997) has shown, it is evident that the major thrust of the developmentdebate over the past decade regarding the relationship between growth, developmentand the reduction of poverty and inequality has shifted significantly. Traditionally, therewas a broad consensus that growth would be helped by and/or associated with increas-ing inequality, a notion often linked to the (in)famous hypothesis of Kuznets (1955) tothis effect. This was contested by scholars emphasising the importance of ‘growth withequity’ and redistribution as a basis for subsequent growth (Adelman 1995). Morerecently, theoretical arguments that link aggregate growth to inequality have led torenewed interest in this debate. A conclusive, empirically-based analysis of the correla-tion between particular rates of growth and rates of inequality, especially in terms ofassets, has yet to be presented.3 While some models maintain that redistribution wouldreduce growth (Persson & Tabellini 1994), a broad stream of literature now suggests thatredistributive efforts by the government could, through increased investment by thepoor, actually lead to higher growth (see Aghion et al. 1999; Bardhan et al. 1999). Indeed,the positive impact of growth upon the reduction of poverty may be dampened athigher levels of inequality (Bruno et al. 1996). This is because inequalities in physical,financial and human assets may result in microeconomic inefficiencies that constrainpoor people from participating effectively and efficiently in the economy, which could
C O N S T R U C T I N G T H E S O C I A L P O L I C Y A G E N D A
151
Free
dow
nloa
d fr
om w
ww
.hsr
cpre
ss.a
c.za
lead either to inequitable growth or, depending on the depth of poverty and inequality,to low growth.
The UNDP (1997: 74) has offered several explanations as to why a converse relationshipmight hold, that is, that poverty reduction might facilitate economic growth. Several ofthese lend support to the view that asset distribution, accumulation and use are centralto the growth–poverty reduction nexus. As poverty tends to result in behaviour basedon risk aversion, the reduction of poverty might increase willingness to take entrepre-neurial risks. Poverty also tends to restrict spatial mobility, as those who are poor lackthe resources required to move in search of better opportunities, transport their produceto markets, or carry the costs of a sustained job search. In addition, high levels of povertylimit the investment in human capital, especially in terms of the education and healthstatus of children. Finally, poverty also brings with it increased vulnerability, with theresult that assets are permanently lost when households face shocks such as injury, theftor natural disasters.
In support of this view, Deininger and Olinto (2000) point out an important shortcom-ing of much of the analysis linking growth and inequality. Although most of the theo-retical analysis concerning the relationship between growth and inequality identifies thelink between distributional issues and economic growth as being through differentialaccess to assets, the majority of empirical studies look only at income. This can be takenone step further since the ways in which assets are used and accumulated may result inthe persistence of poverty over time, forcing our attention onto the processes thatdetermine household livelihoods and the markets that structure the relationshipbetween assets and income.
The experience of the East Asian countries, in particular, indicates that one of thedimensions buttressing their high economic growth rates has been the implementationof policies that focus on more equitable human resources development and on assetredistribution. Increasing the access of the poor sections of the society to productiveassets is a related dimension. Specifically, the newly industrialised countries of East Asiahad a range of state-led interventionist policies, which focused on human resourcesdevelopment, mild financial repression such as keeping interest rates low but positive,directed credit and selected industrial promotion policies that focused on non-traditional exports (Chandra 1997). In many cases, government action went well beyondthe conventional set of stabilising macroeconomic policies to include asset redistribu-tion, in which land reform and investment in human capital was common. This raisesthe question of whether conditions have changed to the point that such action is nolonger possible or desirable for poverty reduction.
Are economic policies sufficient for poverty reduction?
To achieve poverty reduction, most IMF and World Bank economists recommend thestandard set of economic policies mentioned earlier that are expected to produce specific economic reforms. Macroeconomic policies focus on monetary, fiscal and
T H E D E V E L O P M E N T D E C A D E ? S O U T H A F R I C A , 1 9 9 4 – 2 0 0 4
152
Free
dow
nloa
d fr
om w
ww
.hsr
cpre
ss.a
c.za
exchange rate policies that achieve macroeconomic stability. The macro imbalances tobe avoided include high and variable inflation, high government deficits, the over-valuation of currency and restrictions placed on the movement of capital. Structuraleconomic reforms refer to policies that promote efficient resource usage and provideincentives for competition and for private enterprise. These include policies that removebarriers to trade and to investment, and promote the transfer of ownership of certainstate enterprises to the private sector.
Although this ‘Washington Consensus’ is frequently disparaged, few policy analystswould disagree with the underlying potential of such macroeconomic policies in avoid-ing bad, poverty-producing growth. High inflation negatively affects those who relyupon wages as the principal source of income, and who are unable to save in high inter-est-earning accounts. It also prejudices those with a limited ability to purchase goods oncredit, while eroding the tax base and, consequently, the ability of the government tosustain social expenditure. High inflation has an adverse impact on the investment deci-sions of the rich and the poor. While the wealthy may try to invest in offshore accounts,the poor may invest in unproductive stockpiles as a hedge against future price increases.Overvaluation of an exchange rate can negatively affect the incomes of the rural poorwhose livelihoods are often dependent upon exports of agricultural commodities, andwill also reduce the competitiveness of other low-cost exports. Of course, under-evaluation can also prejudice the poor by raising the costs of imported inputs, such asoil and technology, while also increasing the costs of products that are consumednationally as well as being exported. An example is food, especially grains, in SouthAfrica where the exchange rate crisis in 2001 provided a boom for exporters, but alsohad a knock-on effect whereby local food prices increased by 20 per cent during 2002.
Government spending that is far beyond available resources may lead to excessive borrowing from banks by the government, which in turn fuels inflation and results ina substantial portion of the government’s resources being allocated to servicing inter-est payments. No one would deny that countries need to balance their budgets, and thatbudget deficits should stay small. However, as Jeffery Sachs (2001) has argued, thebudget austerity that this requires means that impoverished countries cannot keeptheir populations alive because budgets for essential services such as health, education,food transfers and so forth are too small. Debt servicing further erodes these budgets,while policies designed to seduce international investors may cause resources to be allocated towards meeting the needs of the wealthy and the foreign. Chossudovsky(1998) notes that cutting expenditure on these services also impairs the collection ofinformation on poverty, resulting in the irony of a decline in recorded infant mortalityin sub-Saharan Africa in the face of closing health clinics and the laying off of healthprofessionals.
Perhaps ironically, then, calls for government action on poverty reduction, such asthose contained in the Copenhagen Declaration, have come at a time when it is alsoclear that the options for such action have become increasingly constrained. The influence that governments can bring to bear on the path of economic growth and,
C O N S T R U C T I N G T H E S O C I A L P O L I C Y A G E N D A
153
Free
dow
nloa
d fr
om w
ww
.hsr
cpre
ss.a
c.za
particularly, on the ways in which the distribution of the benefits of growth are deter-mined has been eroded throughout the 1980s and 1990s. Traditionally, resource limi-tations have been the constraint most often cited by governments. These include thelack of financial resources as well as institutional capacity with which to implementpolicy. While these remain important, global trends, macroeconomic conditions andthe changing institutional context are also believed to have closed off possibilities whilenarrowing the range of policy options open to governments. For much of the 1990s,‘globalisation’ became a new rallying call for advocacy concerned with the plight ofdeveloping countries.
In line with this, economists from the perspectives of both neoclassical economics andpolitical economy have argued that economic reform and fiscal prudence are notenough to achieve pro-poor growth. Examples of the former include Ul Haque (1994)and Goldsmith (1995), while a special edition of Third World Quarterly in 1996 providesan edited volume with examples of the latter analysis. Dutt, Kim and Singh (1994)provide useful empirical support from both perspectives, while the events leading up tothe preparation of the 2001 World Development Report showed that the debate is farfrom being resolved (Kanbur & Lustig 1999; Dollar & Kraay 2000).
Responding to this challenge, Sachs (2001) sees four pillars to the escape from poverty,of which economic reform is only one. A second pillar is having a population that ishealthy and educated enough to participate in the global economy. This is a tall ordergiven the need for several forms of literacy, including computer and communicationsproficiency, not to mention a high degree of economic literacy. Many poor countriesface widespread disease (malaria, AIDS, TB and cholera, to name a few), they havedegraded tropical soils or, in the case of South Africa, soils degraded by policies of forcedovercrowding into labour reserves, and they have scarce clean water. Many believe thatpoor countries cannot clear these hurdles on their own and that budget support ratherthan project support is needed.
The third pillar identified by Sachs is technology. Despite the rhetoric of the ‘market’,developed countries spend substantial public funds on research and design. With theirbudget constraints, there is no way in which this can happen in poor countries in whichuniversities and other research institutions remain critically short of research capacity.Linked to technology is access to information at a cost affordable to the poor and in amedium accessible to the poor.
The fourth pillar is structural adjustment. This does not refer to the structural adjust-ment promoted by the IMF and World Bank during the previous two decades, whichmany argue has contributed towards diminished capacity for governance and increasingpoverty. Instead, in this context, structural adjustment refers to policies that change theunderlying structures that produce goods and services in an economy and that distrib-ute the benefits of this production. This might mean export diversification, or movingup value chains in which more processed goods are produced, or identifying new sectorsin which a competitive edge can be achieved. Movement up a value chain implies that
T H E D E V E L O P M E N T D E C A D E ? S O U T H A F R I C A , 1 9 9 4 – 2 0 0 4
154
Free
dow
nloa
d fr
om w
ww
.hsr
cpre
ss.a
c.za
raw materials are further processed within the country and that higher-value items arethus exported. This increases the jobs resulting from the production or extraction of rawmaterials. A South African example is the export of wood pulp rather than timber forpaper production. This is a question about the type of growth that is being pursued, andidentifying sectors and forms of production that have displayed the characteristic ofreducing poverty. The underlying rationale is to move away from a limited base ofprimary commodities, already shown to contain ‘growth-retarding’ and ‘poverty-producing’ tendencies, and gain access to the markets of rich countries that are shelteredby tariffs. Equally important are mechanisms for avoiding, or at least managing, thedestruction of local industries through imports from other poor countries, equally desperate to find markets in places more open than Europe and the USA. Not men-tioned by Sachs, but potentially a component of structural adjustment, is the possibleneed for considered policies that promote the redistribution of assets, whether land,education or access to finance, and policies that provide for social protection, such asprovision for old age, the support of children and the regulation of the workplace.
A fifth pillar, also not mentioned by Sachs, is recognition of the historical slate. Manypoor countries are plagued by the results of disastrous policies of previous regimes,often arising from the absence of democratic rule. The impact of apartheid in SouthAfrica is an example; the impact of wars in many other parts of Africa is another.Decisions to bow down to the bad advice of international agencies by governments toodisempowered to disagree, or by former elites who stand to gain by kowtowing in thisfashion, might be a third example. However, a clean slate is obviously an unachievablerequirement; instead, what is required is the recognition that the context within whichpolicies are expected to operate will vary from country to country, and will change overtime. This is another reason why generalised analyses such as the Dollar/Kraay study failto provide sufficient information for policy development in the context of the ‘real’world in which history, power and politics matter.
Conclusion
While it is encouraging that research has shown that economic growth does not neces-sarily prejudice the poor, at least in terms of consumption-based indicators, it does notseem unreasonable to also conclude that the role of government in facilitating pro-poorgrowth is more complex than neo-liberal polemic would have us believe. Instead, theresults of high economic growth and rapid reduction in poverty and inequality havebeen achieved through a combination of market-oriented and interventionist policies.It also does not seem evident that distribution-neutral growth will be sufficient topermit poverty reduction, other than in the narrowest sense, or that even in this narrowsense, significant poverty reduction will occur in anything like a reasonable timehorizon, or that existing levels of inequality will have a neutral effect on poverty-reduction outcomes from growth. In particular, inequalities in asset distribution havebeen found to be negatively related to poverty reduction. Of interest then is how statesand markets operate to support or hinder pro-poor growth that is more than simply
C O N S T R U C T I N G T H E S O C I A L P O L I C Y A G E N D A
155
Free
dow
nloa
d fr
om w
ww
.hsr
cpre
ss.a
c.za
distribution-neutral. This implies balancing the previous focus on macroeconomicpolicy with appropriate microeconomic interventions.
To the extent that Sachs’ four (or five) pillars provide some direction, market and socialpolicy reforms as well as direct state intervention will be required if the poor are to pushahead. These would need to involve redistribution measures that improve the access ofthe poor to productive assets, such as through land reform, the delivery of infrastructureand financial market reform. Other supply-side measures will be needed that reduce thecosts of production, including transaction and information costs, as well as interven-tions that ensure protection during childhood, working life and old age. Social policiesof protection and regulation that assist those at the bottom of the income distributionto better manage both adverse and positive events that might occur during their lives arealso required, along with economic reforms that help them to derive greater benefitswhen using the assets that they do possess.
In South Africa, some of these policies are already in place to some extent. However, inthe case of others, for example land reform, implementation has been slow, or the ben-efits have been captured largely by the non-poor, for example through privatisation(Bond 2000; Cousins 2000). In addition, coverage of South Africa’s social policy hasbeen described as ‘neither adequate nor comprehensive’, the efficiency of the delivery ofservices has been questioned, while the impact of HIV/AIDS on all aspects of SouthAfrica’s policy for poverty reduction remains uncertain (Bond 2000; Whiteside 2002).Furthermore, the development of appropriate policies continues to rest on an inade-quate knowledge base. The linkages between macroeconomic and microeconomic poli-cies have received little attention globally, and the real operation of markets remainsanother area in which insufficient information has been collected. In many instances,the determinants of the behaviour of poor producers and consumers are assumedwithout being empirically analysed. To fill this gap in South Africa and elsewhere, betterdata are required, along with a rigorous microeconomic analysis of the asset accumula-tion behaviour of poorly resourced households and the impact of existing governmentinterventions. Without this, the agenda for appropriate social policy remains little morethan an outline of possible options without any mechanism through which these can bejudged.
Acknowledgements
Support received from the Comparative Research Program on Poverty and the Centre for
International Poverty Studies at the University of Bergen is acknowledged.
Notes
1 In these circumstances where growth is not simply distribution-neutral, consistent per capita
growth rates of 2.0–2.8 per cent would achieve the international targets for income poverty by
2015 (Hamner et al. 1999: 556).
T H E D E V E L O P M E N T D E C A D E ? S O U T H A F R I C A , 1 9 9 4 – 2 0 0 4
156
Free
dow
nloa
d fr
om w
ww
.hsr
cpre
ss.a
c.za
2 Poverty elasticities refer to the percentage change in the proportion of people below a poverty
threshold produced by a percentage change in economic growth. Poverty elasticities may be
thought of as a measure of ‘good growth’.
3 The UNDP, the World Bank and independent researchers have undertaken various studies.
See, for example, Bruno, Ravallion & Squire (1996), Anand & Kanbur (1993a, 1993b) and
Bourguignon, De Melo & Morrisson (1991). Lipton (1997) provides a useful summary of the
emerging consensus about the definition, measurement and policies for the reduction of
poverty, while Piketty (1999) brings together the theoretical literature in support of this
argument.
References
Adelman I (1995) Redistribution before growth: A strategy for developing countries, The selected essays
of Irma Adelman, Volume 2: Institutions and development strategies. Aldershot: Edward Elgar.
Aghion P, Caroli E & Garcia-Peñalosa C (1999) Inequality and economic growth: The perspective of
the new growth theories, Journal of Economic Literature 37: 1615–60.
Anand S & Kanbur S (1993a) The Kuznets process and the inequality development relationship,
Journal of Development Economics 40: 25–52.
Anand S & Kanbur S (1993b) Inequality and development: A critique, Journal of Development
Economics 41: 19–43.
Bardhan P, Bowles S & Gintis H (1999) Wealth inequality, wealth constraints and economic
performance, in A Atkinson & F Bourguignon (eds.) Handbook on income distribution.
Amsterdam: North Holland.
Bond P (2000) Elite transition: From apartheid to neoliberalism in South Africa. Johannesburg:
Wits University Press.
Bourguignon F, De Melo J & Morrisson C (1991) Poverty and income distribution during
adjustment: Issues and evidence from the OECD project, World Development 19: 1485–508.
Bruno M, Ravallion M & Squire L (1996) Equity and growth in developing countries: Old and new
perspectives on the policy issues. Policy Research Working Paper No. 1563. Washington DC:
World Bank.
Chandra V (1997) Redistribution with growth: Relevance of East Asian experience for South Africa.
Mimeo. Washington DC: World Bank.
Chen S & Ravallion M (2004) How have the world’s poorest fared since the 1980s? Research Observer
19: 141–69. Washington, DC: World Bank, Development Research Group.
Chossudovsky M (1998) Global poverty in the late 20th century, Journal of International Affairs
52: 293–311.
Cousins B (2000) At the crossroads: Land and agrarian reform in South Africa into the 21st century.
Occasional paper. Bellville: Programme for Land and Agrarian Studies, University of the
Western Cape.
C O N S T R U C T I N G T H E S O C I A L P O L I C Y A G E N D A
157
Free
dow
nloa
d fr
om w
ww
.hsr
cpre
ss.a
c.za
Dagdeviren H, Van der Hoeven R & Weeks J (2000) Redistribution matters: Growth for poverty
reduction, Employment Paper 2000/10. Geneva: International Labour Office.
Deininger K & Olinto P (2000) Asset distribution, inequality and growth. Washington, DC: World
Bank. <http://wbln0018.worldbank.org/Research/workpapers.nsf/>
Deininger K & Squire L (1996) A new data set measuring income inequality, The World Bank
Economic Review 10: 565–91.
Dollar D & Kraay A (2000) Growth is good for the poor. Washington, DC: Development Research
Group, World Bank. <http://wbln0018.worldbank.org/Research/workpapers.nsf/>
Douthwaite R (2002) Good growth and bad growth.<http://www.aislingmagazine.com/anu/
articles/TAM27/Growth.html>
Dutt A, Kim K & Singh A (1994) The state, markets and development: Beyond the neoclassical
dichotomy. Vermont: Edward Elgar.
Goldsmith A (1995) The state, the market and economic development: A second look at Adam Smith
in theory and practice, Development and Change 26: 633–50.
Government of South Africa (2003) Towards ten years of development – Progress in the first decade –
Challenges of the second decade. <http://www.gcis.gov.za/docs/publications/10yrstab.pdf>
Hamner L, De Jong N, Kurian R & Mooli J (1999) Are the DAC targets achievable? Poverty and
human development in the year 2015, Journal of International Development 11: 547–63.
Hanmer L & Naschold F (2000) Attaining the international development targets: Will growth be
enough, Development Policy Review 18: 11–36.
Hoogeveen J & Özler B (2004) Not separate, not equal: Poverty and inequality in post-apartheid
South Africa. <http://www.hec.ca/neudc2004/fp/ozler_bert_juillet_8.pdf>
Kaldor N (1963) Capital accumulation and economic growth, in F Lutz & D Hague (eds.) Proceedings
of a conference held by the International Economics Association. London: MacMillan.
Kanbur R & Lustig N (1999) Why is inequality back on the agenda? Paper presented at the Annual
Bank Conference on Development Economics, World Bank, Washington, DC.
Kuznets S (1955) Economic growth and income inequality, American Economic Review 49: 1–28.
Lipton M (1997) Editorial: Poverty – Are there holes in the consensus? World Development
25: 1003–6.
May J (2000) Poverty and inequality in South Africa: Meeting the challenge. Cape Town/London:
David Philip/Zed Press.
May J & Roberts B (2005) Poverty diagnostics using poor data: A case study of the Lesotho Poverty
Reduction Strategy, Paper accepted by Social Indicators Research, 08/06/04.
McDonald D (2002) You get what you pay for: Cost recovery and the crisis of service delivery in South
Africa, (Harold Wolpe Memorial Lecture). <http://www.und.ac.za/und/cadds/ccs.htm>
Øyen E (2002) Poverty production: A different approach to poverty understanding. <http://www.
crop.org/publications/files/report/Poverty_production.pdf >
Persson T & Tabellini G (1994) Is inequality harmful for growth? American Economic Review 84:
600–21.
T H E D E V E L O P M E N T D E C A D E ? S O U T H A F R I C A , 1 9 9 4 – 2 0 0 4
158
Free
dow
nloa
d fr
om w
ww
.hsr
cpre
ss.a
c.za
Piketty T (1999) Theories of persistent inequality and intergenerational mobility, in A Atkinson &
F Bourguignon (eds.) Handbook on income distribution. Amsterdam: North Holland.
Ravallion M (1997) Can high-inequality developing countries escape absolute poverty? Washington,
DC: World Bank.
Ravallion M & Chen S (1997) What can new survey data tell us about recent changes in distribution
and poverty? World Bank Economic Review 11: 357–82.
Sachs J (2001) Keynote address: A new global consensus on helping the poorest of the poor,
in B Pleskovic & N Stern (eds.) Annual World Bank conference on development economics, 2000.
World Bank, July.
Simkins C (1984) Some aspects of the Carnegie Conference. Development Southern Africa 1: 180–95.
Ul Haque I (1994) International competitiveness: The state and the market, in AKDutt, KS Kim &
A Singh The state, markets and development: Beyond the neoclassical dichotomy. Vermont:
Edward Elgar.
UNDP (1997) Human development report – 1997. New York: United Nations Development
Programme, Oxford University Press.
UNDP (2000) Overcoming human poverty. <http://www.undp.org/povertyreport/>
Whiteside A (2002) Poverty and HIV/AIDS in Africa, Third World Quarterly 23: 313–32.
Wilson F & Ramphele M (1989) Uprooting Poverty: The South African Challenge. Cape Town:
David Philip.
World Bank (2000) World development report 2000/2001: Attacking poverty. New York: Oxford
University Press.
WSSD (World Summit on Social Development) (1995) Copenhagen declaration on social
development, Chapter Two, Eradication of poverty. <http://www.un.org/esa/soc_dev/
wssd/agreements/index.html>
C O N S T R U C T I N G T H E S O C I A L P O L I C Y A G E N D A
159
Free
dow
nloa
d fr
om w
ww
.hsr
cpre
ss.a
c.za
9 Gender and social security in South Africa
Francie Lund
Introduction
There has been a great deal of interest, at the end of the first decade of democracy inSouth Africa, in establishing what distributive gains there have been to poorer people, interms of allocation and reallocation of resources, and the impact this has had. The SouthAfrican system of state social assistance has become the focus of attention, as it has beenacknowledged to contribute effectively to both poverty alleviation and reduction. Withrenewed global attention to the role of the state in interventions that provide pathwaysout of poverty, the pensions and grants attract the interest of international scholars anddevelopment agencies. South Africa is one of the few countries that has experienced a sig-nificant growth in social security spending, and one of the very few that has recentlyintroduced a wholly new social benefit, the Child Support Grant (CSG). However, therehas as yet been no gendered analysis of the scope, coverage and impact of the main components of social assistance, and this chapter attempts to lay the basis for this. As preliminary as this analysis is, its purpose is to draw attention to the many research gapsthat exist, in the hope that a comprehensive programme may be stimulated.
An approach to the gendered analysis of social security
Some core dimensions of a gendered analysis are identified below. The point of entry ofthis approach, however, must be the reality of the AIDS epidemic. This is introducingnew demographic patterns, and affects men and women differently. It is exerting socialand economic pressures in the labour market and in the domestic sphere, affecting bothproduction and reproduction. This has an impact on the needs for and the responses tosocial security. Each of the dimensions that follow is influenced by the epidemic.
The social assistance component of social security, which is funded solely by the state,has to do with addressing the situation of people who are poor. Patterns of poverty aredeeply gendered: women tend to be poorer than men, girls more vulnerable than boys,older widows more vulnerable than older widowers. In South Africa, the gendered pat-terns interact with racial patterns, with race having been the determining feature for theallocation of resources and opportunities under colonialism and then apartheid.
All social security systems are designed around assumptions about the gendered divisionof labour in the family, and are premised on the idea that those who work are able to get
160
Free
dow
nloa
d fr
om w
ww
.hsr
cpre
ss.a
c.za
some access to social benefits through work. In countries with histories of colonialism,systems of social security and assistance in general were modelled on those of the colo-nial state, and this was the case in South Africa. From the beginning of the twentiethcentury, the early programmes of state social assistance were designed to protect thewhite population against poverty, and the system gradually grew in scope and coverageto include all the racially classified ‘population groups’. As in Britain, social security wasbased on the ‘male breadwinner model’, which contained assumptions of a nuclearfamily in which the male head would be in full employment, and the mother’s primaryrole would be homemaker and child-rearer. The work of the male head of the householdwould give access to work-related benefits such as unemployment insurance, workerscompensation, and savings for retirement through pensions and annuities, and somefamily benefits, including maternity benefits for those women who did work.
Worldwide changes in the nature of work and employment have had an effect onworking people’s access to work-related social security. As summarised by Lund andSrinivas (2000), there has been a decrease in the numbers of people, proportionate to thewhole workforce, who are in the kind of formal employment that offers basic social benefits such as pension provision, compensation for work-related disability, healthinsurance and maternity benefits. The benefits of many formal workers are capped;other formal workers keep doing the same work but lose the benefits in the process ofcontractualisation. New entrants to the labour market are less likely ever to get access tosuch benefits. Through all these processes, employers have less responsibility for the‘social wage’. This has happened at the same time (and as part of the same neo-liberalmacroeconomic policies) as the reductions in social spending by many industrialisedand developing countries. A gendered analysis of social security would seek to under-stand how these changes in the labour market and in state provision differentially affectmen and women, in other words, to understand how the labour market itself is a gendered institution.
The labour market is of course also a provider of social security and social services, andin this respect is also deeply gendered. Most workers in the welfare, social security, healthand education services are women, and there is strong gender segmentation with regardto status and income level in ‘the helping professions’. These professions have presentedcareer opportunities for women of all races. Those at the top of these professional hier-archies are more likely to be men, who control the setting of standards, service prioritiesand budget allocations.
The state, as provider of health and welfare, can decide to privatise aspects of provision,for example of welfare services. That which the state or the formal private sector pro-vides in the fields of health and welfare is only a small fraction of the caring work thatgets done in a society; the rest of that work is overwhelmingly done by women, as familymembers or as voluntary workers. Thus, the interaction between social security and thecare economy – the unpaid, non-market work done in people’s homes – must be woveninto a gendered analysis. The care economy refers to ‘the economic costs and benefits ofcare, the division of labour involved in various types of care, and the contribution of
G E N D E R A N D S O C I A L S E C U R I T Y I N S O U T H A F R I C A
161
Free
dow
nloa
d fr
om w
ww
.hsr
cpre
ss.a
c.za
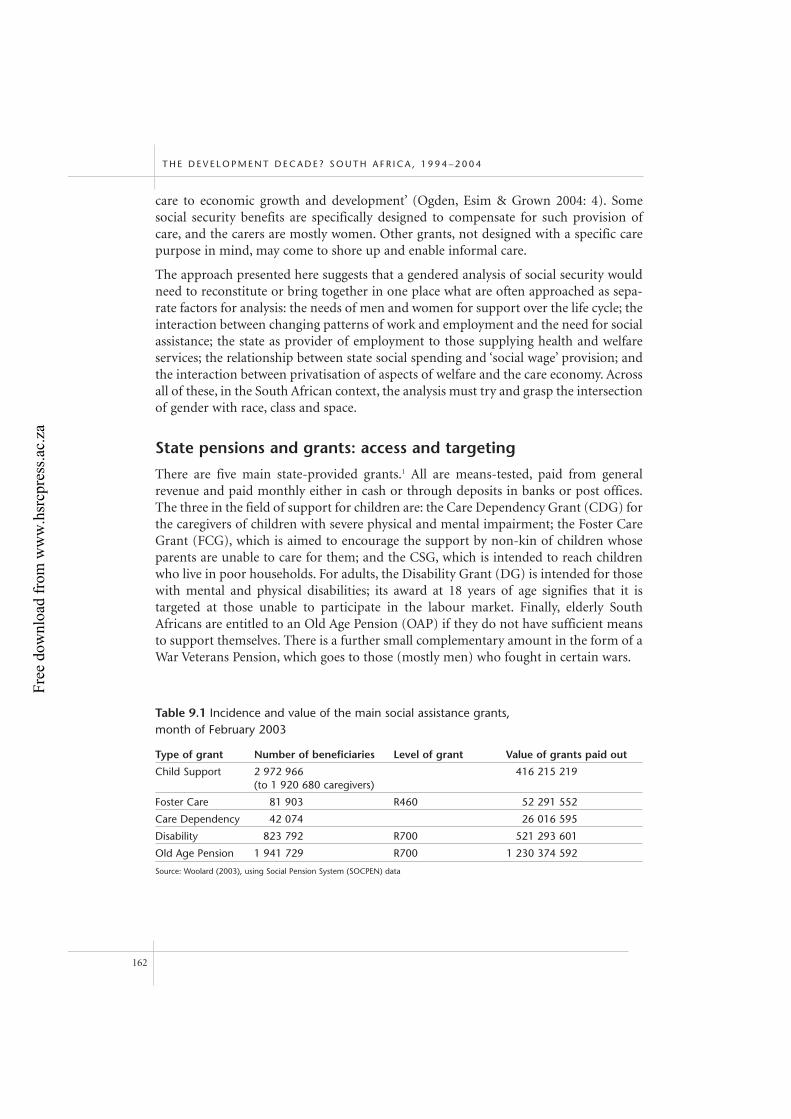
care to economic growth and development’ (Ogden, Esim & Grown 2004: 4). Somesocial security benefits are specifically designed to compensate for such provision ofcare, and the carers are mostly women. Other grants, not designed with a specific carepurpose in mind, may come to shore up and enable informal care.
The approach presented here suggests that a gendered analysis of social security wouldneed to reconstitute or bring together in one place what are often approached as sepa-rate factors for analysis: the needs of men and women for support over the life cycle; theinteraction between changing patterns of work and employment and the need for socialassistance; the state as provider of employment to those supplying health and welfareservices; the relationship between state social spending and ‘social wage’ provision; andthe interaction between privatisation of aspects of welfare and the care economy. Acrossall of these, in the South African context, the analysis must try and grasp the intersectionof gender with race, class and space.
State pensions and grants: access and targeting
There are five main state-provided grants.1 All are means-tested, paid from generalrevenue and paid monthly either in cash or through deposits in banks or post offices.The three in the field of support for children are: the Care Dependency Grant (CDG) forthe caregivers of children with severe physical and mental impairment; the Foster CareGrant (FCG), which is aimed to encourage the support by non-kin of children whoseparents are unable to care for them; and the CSG, which is intended to reach childrenwho live in poor households. For adults, the Disability Grant (DG) is intended for thosewith mental and physical disabilities; its award at 18 years of age signifies that it is targeted at those unable to participate in the labour market. Finally, elderly SouthAfricans are entitled to an Old Age Pension (OAP) if they do not have sufficient meansto support themselves. There is a further small complementary amount in the form of aWar Veterans Pension, which goes to those (mostly men) who fought in certain wars.
T H E D E V E L O P M E N T D E C A D E ? S O U T H A F R I C A , 1 9 9 4 – 2 0 0 4
162
Table 9.1 Incidence and value of the main social assistance grants, month of February 2003
Type of grant Number of beneficiaries Level of grant Value of grants paid out
Child Support 2 972 966 416 215 219(to 1 920 680 caregivers)
Foster Care 81 903 R460 52 291 552
Care Dependency 42 074 26 016 595
Disability 823 792 R700 521 293 601
Old Age Pension 1 941 729 R700 1 230 374 592
Source: Woolard (2003), using Social Pension System (SOCPEN) data
Free
dow
nloa
d fr
om w
ww
.hsr
cpre
ss.a
c.za
Ingrid Woolard (2003) uses government data to show the number of beneficiaries, thelevel of the monthly grants and the amount aid out for the five main grants, for themonth of February 2003. Table 9.1 shows that just short of six million people receivedgrants, which were worth a total of R2 250 million in that month. Woolard has estimatedthat the grants allocations constituted about 3 per cent of GDP, and about 13 per centof all government spending in March 2004.2
The pensions and grants are intended as a mechanism of redistribution, especially inaddressing racial and spatial patterns of poverty and inequality. How many of thoseentitled to receive benefits actually do so? The OAP is probably the easiest for which toestimate the take-up rate, though two assumptions have to be made: that chronologicalage is accurately reported and recorded, and that the means test is fairly applied. TheOAP is received by more than 80 per cent of all elderly South Africans, the vast major-ity of whom are African. It is received by more women than men, and women receive thepension earlier than men, and for longer, given their greater longevity (Ardington &Lund 1995).
The take-up rate for the DG is more difficult to estimate. First, the assessment ofdisability is objectively more difficult to establish than chronological age, and gate-keepers may apply more rigid or more flexible rules depending on their disposition.The racially separate apartheid welfare administrations applied different criteria for theextent of disability necessary for the award of a grant, and it is clear that administrativediscretion has been at work for many years. Take-up rates remain particularly high incertain magisterial districts of the Northern Cape, for example, whereas there is noreason to expect that disability should be distributed according to magisterial districtboundaries.
There has been little if any research on the differential access of men and women to the DG,nor on the articulation between compensation for work-related injury (which men receivemore of, as they are more likely to be in the kinds of formal work covered by such indus-trial legislation) and patterns of receipt of the DG. The AIDS epidemic will mean that manymore people (and more women than men) will be eligible for the benefit. By the end of2004, only the Western Cape province had stipulated conditions for eligibility. A tragicimpasse is looming: the government has to identify an objective criterion for eligibility; theblood-count threshold is such an objective criterion; a person with an AIDS-related illnessneeds food to remain well nourished to keep the blood count high; a poor person will findthe DG an indispensable source of income to keep healthy; yet for eligibility for the DG, theblood count has to be so low that the person is well on the way to death.
The three child-oriented grants pose different problems in terms of estimation of cov-erage. The CDG is intended for children with severe mental or physical impairment,such that they require full-time care (which is usually done by women). Indeed, theintention behind the grant is that it will obviate the need for a child to be admitted tomore expensive full-time institutional care. Take-up rates are very low, and this ispartly because in the past the grant was effectively not available to rural black South
G E N D E R A N D S O C I A L S E C U R I T Y I N S O U T H A F R I C A
163
Free
dow
nloa
d fr
om w
ww
.hsr
cpre
ss.a
c.za
Africans, and was extremely costly to apply for. Applications for the grant haveincreased rapidly recently, probably largely because of better public knowledge aboutit since 1994, as well as through more children becoming eligible because of AIDS-related impairments.
The CSG was introduced in April 1998 as a means-tested monthly cash benefit of R100,payable to the primary caregiver of children up to their seventh birthday (the levelincreased to R180 in March 2005 and the age of eligibility was extended to 14 years). Itwas intended to go to about 50 per cent of all children up to seven years, that is, it wasestimated that at least half of all South African children of that age group were poor. AsTable 9.1 shows, as of February 2003 it was awarded to 1.9 million caregivers on behalfof nearly 3 million children.
An investigation of the roll-out of the CSG was undertaken in the approximately 11 000households in a district of KwaZulu-Natal (Case, Hosegood & Lund 2005). This study,undertaken through the Africa Centre for Health and Population Studies, will hence-forth be called ‘the Umkhanyakude study’. In 2002, four years after the CSG was intro-duced, about one-third of the 12 000 children up to the age of seven in this remote ruralarea had applied for or were receiving the grant. Applications were being processedrapidly, and nearly everyone who applied was awarded the grant. There were no differ-ences between girls and boys as to grant application or receipt.
Some of the barriers to access to the CSG appear to be related to patterns of maleauthority in interlinked relationships in domestic and working life, and within formaland informal administrative rules.3 Women working on commercial farms are depend-ent on male employers for transport to application points and pay points; in someprovinces, women have to show proof they have applied for private maintenance fromfathers; in some towns, affidavits about parenthood have to be issued at police stations,where the majority of staff are men, rather than at the welfare department. In all of thesesituations, women applicants are operating from a subordinate position of power.
With regard to targeting of the OAP and CSG, it has been well established that the grantsare going to the poor households for which they are intended (see Case & Deaton 1998for evidence on the OAP). Woolard (2003) uses data from the 2000 Income andExpenditure Survey to show that 66.8 per cent of reported income for the poorest quin-tile of households comes from grants, 13.4 per cent for the next poorest quintile, withthe other three quintiles together reporting only 8.0 per cent of total income from thissource. She also assesses the poverty impact of the OAP and the CSG, in particular,which again strikingly demonstrates how many more elderly and poorer children wouldbe in poverty without the grants. The Umkhanyakude study showed that the CSG wastargeted at poorer households (Case et al. 2005). Given that nearly everyone who appliedfor a CSG was awarded it, it was apparent that a process of self-selection was at work,with the grant amount being so low that only poorer people were applying.
Compared to both the OAP and the CSG, relatively little is known about how the DG istargeted. As regards pooling of the DG, Schneider and Marshall (1998) hold that there
T H E D E V E L O P M E N T D E C A D E ? S O U T H A F R I C A , 1 9 9 4 – 2 0 0 4
164
Free
dow
nloa
d fr
om w
ww
.hsr
cpre
ss.a
c.za
is clear evidence of income sharing, but there is nothing in their study or in others onthe gender dynamics of this.
With regard to the scope of state social assistance, then, millions of South Africansdirectly receive state social assistance, and the next section will discuss how many morepeople in the households of beneficiaries are reached. Relative to other countries withsimilar levels of development, the assistance is extensive. However, many millions morepoor South Africans do not receive assistance (Meth, cited in Hunter et al. 2004). Thesystem is uneven and patchy, and this provided the central motivation for the TaylorCommittee’s recommendation for a Basic Income Grant. Little attention has yet beengiven to modelling the likely gendered effects of this universal grant, should it be intro-duced.
Caring for children
For many years, the bulk of spending on social assistance was on pensions for elderlypeople, and for adults with disabilities. State Maintenance Grants (SMGs) were availablefor less than half a million women and children, with a marked racial inequity, in thatblack Africans had scarcely any access. The SMG was phased out at the same time as theCSG was introduced. The introduction of the CSG, the phasing out of the SMG, and therapid increase in allocations for the FCG and the CSG have shifted the composition ofsocial assistance spending more towards children, especially towards black children inrural areas. At the same time, there have been reforms in the system of private parentalmaintenance. These reforms combine to present a host of questions about gender andsocial security in the field of child support.
Fertility and support for women and children
For centuries there has been controversy about the relationship between financialsupport to women and fertility rates and family structure. The introduction of the CSGin South Africa has been accompanied by popular concern that it will lead women to getpregnant, and this appears to have taken on the status of urban and rural legend. Someanchor their unease in a broader concern about the fertility rate, identifying high population growth as a barrier to development, or as a cause of continuing poverty.Others express a conservative moral worry, fearing that cash benefits will ‘cause permis-sive behaviour’. Yet others quite specifically worry that the CSG will ‘cause teenage pregnancy’, and this is grounded either in fears that it will encourage permissiveness, orin the fact that girls become mothers before they themselves have matured, with nega-tive implications for the health and well-being of both mother and child.
Concern about fertility rates has a long history in South African racial politics. In the1960s, whites were infamously called on by the Vorster government to have more chil-dren; the Population Policy under PW Botha’s government was intended to reduce blackfertility rates, and the rationale provided was that South Africa was going to run out of
G E N D E R A N D S O C I A L S E C U R I T Y I N S O U T H A F R I C A
165
Free
dow
nloa
d fr
om w
ww
.hsr
cpre
ss.a
c.za
water! The history of the SMG is illuminating in that it shows how income given tomothers and children appeared to have no effect on the fertility rates of the differentpopulation groups. Up until 1996, this grant was payable to mothers and their depend-ent children, where the spouse/father of the children had died, had abandoned thefamily, or had been committed to a prison or mental hospital for more than six months.Where a mother qualified for a grant for herself and four (later two) children, theamount received was higher than the OAP.
By the 1980s, all population groups were legally entitled to the SMG, but it was receivedpredominantly by the coloured and Indian population. Whites were largely means testedout of access, and African people were simply unable to access the grant except in a fewmostly urban areas. The Indian fertility rate decreased in the presence of the SMG, andthe white fertility rate decreased in its absence. The fertility rate of coloured peopledeclined in the substantial presence of the SMG. The African fertility rate declined, butmore slowly than the coloured rate, in the absence of the SMG. There was, however, anexceptionally high teenage pregnancy rate among the African population. Driving thiswas a combination of factors, among others the lack of empowerment of girls, the lackof information amongst boys and girls, the high levels of personal and domestic sexualviolence and coerced sex, unprotected sex with multiple sexual partners, and probablythe lack of decent role models for boys. These deeply troubling factors continue to exist,and are related to lack of choice, lack of empowerment and of employment, and lack ofparental guidance. These problems, which existed prior to the CSG, merit seriousresearch and intervention.
Missing fathers
Apartheid policies of residential segregation and the migrant labour system did lastingdamage to South African family life. Colonialism and then apartheid imposed a systemof family separation, and the legacy of fractured families remains. The Umkhanyakudestudy on the CSG was able to investigate the parental status of children in the AfricaCentre’s demographic surveillance area, using the Centre’s database. This has informa-tion on the parental status of all children in the area. A child’s parents can be classifiedas resident, non-resident, dead, or a fourth category, which is not resident, not non-resident, and not known to be dead. For convenience that fourth category can bereferred to as ‘missing’.
As can be seen in Table 9.2, in the Africa Centre’s demographic surveillance area, 82 percent of the children for whom a CSG grant was reported, and 67 per cent for whomgrants were not reported, were resident with their mothers. A very high proportion ofchildren had fathers reported as ‘missing’ – 52 per cent of the children for whom theCSG was reported, and 60 per cent of the children for whom grants had not beenreported. Thus, the father’s whereabouts was simply not known for more than half ofchildren younger than seven years old in this area, and in more cases where children hadnot been in contact with the CSG than where they had. There appears to be no reason
T H E D E V E L O P M E N T D E C A D E ? S O U T H A F R I C A , 1 9 9 4 – 2 0 0 4
166
Free
dow
nloa
d fr
om w
ww
.hsr
cpre
ss.a
c.za
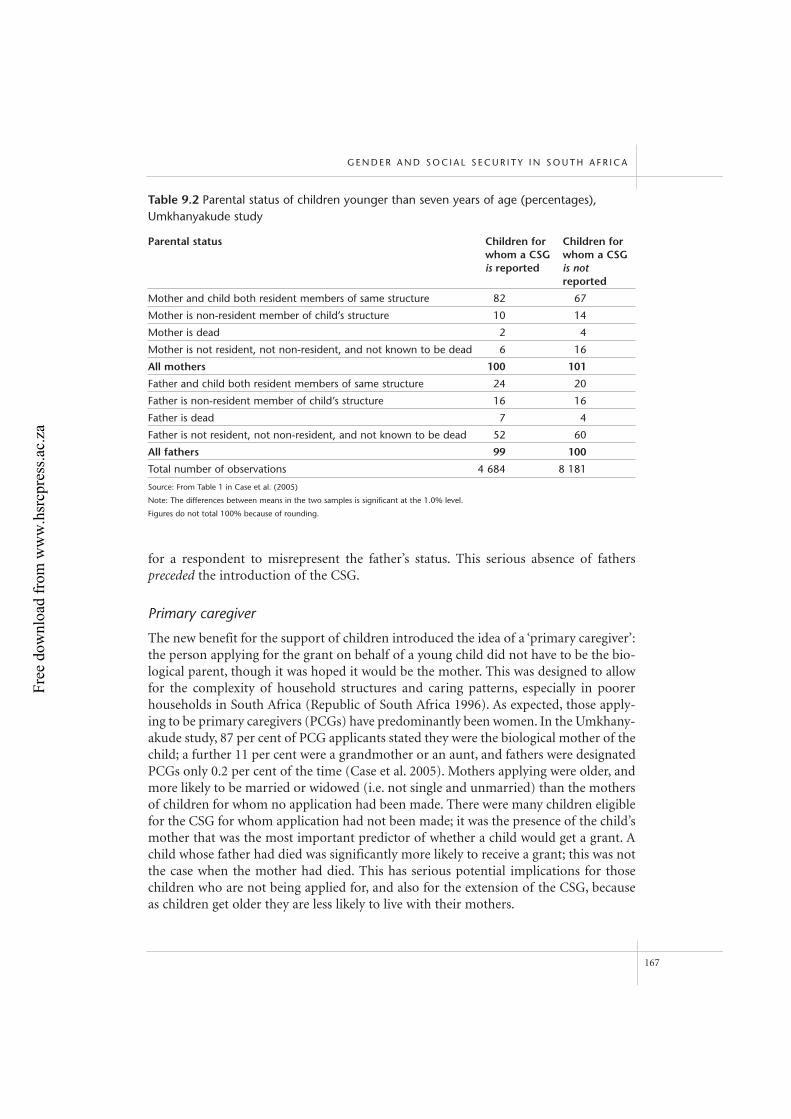
for a respondent to misrepresent the father’s status. This serious absence of fathers preceded the introduction of the CSG.
Primary caregiver
The new benefit for the support of children introduced the idea of a ‘primary caregiver’:the person applying for the grant on behalf of a young child did not have to be the bio-logical parent, though it was hoped it would be the mother. This was designed to allowfor the complexity of household structures and caring patterns, especially in poorerhouseholds in South Africa (Republic of South Africa 1996). As expected, those apply-ing to be primary caregivers (PCGs) have predominantly been women. In the Umkhany-akude study, 87 per cent of PCG applicants stated they were the biological mother of thechild; a further 11 per cent were a grandmother or an aunt, and fathers were designatedPCGs only 0.2 per cent of the time (Case et al. 2005). Mothers applying were older, andmore likely to be married or widowed (i.e. not single and unmarried) than the mothersof children for whom no application had been made. There were many children eligiblefor the CSG for whom application had not been made; it was the presence of the child’smother that was the most important predictor of whether a child would get a grant. Achild whose father had died was significantly more likely to receive a grant; this was notthe case when the mother had died. This has serious potential implications for thosechildren who are not being applied for, and also for the extension of the CSG, becauseas children get older they are less likely to live with their mothers.
G E N D E R A N D S O C I A L S E C U R I T Y I N S O U T H A F R I C A
167
Table 9.2 Parental status of children younger than seven years of age (percentages),Umkhanyakude study
Parental status Children for Children for whom a CSG whom a CSGis reported is not
reported
Mother and child both resident members of same structure 82 67
Mother is non-resident member of child’s structure 10 14
Mother is dead 2 4
Mother is not resident, not non-resident, and not known to be dead 6 16
All mothers 100 101
Father and child both resident members of same structure 24 20
Father is non-resident member of child’s structure 16 16
Father is dead 7 4
Father is not resident, not non-resident, and not known to be dead 52 60
All fathers 99 100
Total number of observations 4 684 8 181
Source: From Table 1 in Case et al. (2005)
Note: The differences between means in the two samples is significant at the 1.0% level.
Figures do not total 100% because of rounding.
Free
dow
nloa
d fr
om w
ww
.hsr
cpre
ss.a
c.za
While it is known that few men are applying to be the caregivers, little if anything isknown about how decisions are being made about who applies to be the primary care-giver. Are there discussions about who should apply? Do men put up a fight? If men doaccept that women should apply, what is their understanding of why this is acceptable?Is it because it is about child support, supposedly the woman’s domain? And is there anyrelationship between the CSG going to female PCGs and the pervasiveness of the erro-neous belief about the CSG ‘causing teenage pregnancy’?
The loss of the State Maintenance Grant
The SMG was phased out over a period of three years, and it is certain this would have occasioned a financial crisis for the majority of the approximately 200 000 womenbeneficiaries. There has been no systematic investigation of the effects on women andchildren of the loss of this source of income. What happened to those who lost the grant?Who found work, what sort of work, and how did they find the work? Did householdssplit up and recompose? Were there movements to town from rural areas? How haveother grants been relied on to substitute for it? What has the effect been on children’sprogress in school? Have the effects been different for girls and for boys? Some ten yearslater, there is still time for good qualitative retrospective research about the effects of theloss of this form of state support.
Child-headed households
The HIV/AIDS epidemic is leading to very high rates of orphanhood, raising concernsabout who will look after children over the next decades. Child-headed households havebecome visible as a policy issue, but there is as yet little research that identifies how bigthe problem in fact is, because losing one or both parents does not equate directly withlosing household membership. The Africa Centre’s demographic surveillance areacovers some 11 000 households (a few urban, but mostly rural) in an area with excep-tionally high AIDS rates, and where AIDS appeared early. Only six of these householdswere recorded as child-headed in 2002 data collection. Even one child-headed house-hold is cause for concern, and is one too many. However, an additional, urgent policyissue is how to support and encourage those extended families who keep orphaned chil-dren, and especially how this impacts on the roles and responsibilities of grandparents(particularly grandmothers), when the middle generation succumbs to AIDS-related illnesses. Furthermore, there is an urgent need to anticipate, now, what will happen tocaring patterns and capacities over the next three decades, as the children of AIDSorphans will not have grandmothers to care for them.
The private maintenance system and parental custody
The private maintenance system is the means through which a spouse and parent canclaim for material maintenance for themselves and for their children from the formerpartner. Interest groups in civil society have worked over the years for the reform of the
T H E D E V E L O P M E N T D E C A D E ? S O U T H A F R I C A , 1 9 9 4 – 2 0 0 4
168
Free
dow
nloa
d fr
om w
ww
.hsr
cpre
ss.a
c.za
system, which historically has worked to make already vulnerable women even furthervulnerable (for example, a mother has to prove that the father is working by approach-ing his employer for proof). There have been important recent legal reforms, but muchdiscretion remains in the hands of the (mostly male) clerks of the courts, it remainscostly to women to apply for maintenance, and the system still exposes them to risk. Inparallel to this reform of private maintenance, there have been several court cases in which fathers have contested their exclusion from equitable access to their children inthe case of separation and divorce.
Pensions for elderly women and elderly men
By far the largest amount spent on social assistance goes to the pensions for elderlypeople (see Table 9.1); in 2001, the OAP received just over 5 per cent of all governmentexpenditure (Hunter et al. 2004). Some ten years ago, the pensions for elderly peoplewere held to be:
a significant source of income, with marked distributive effects; they are a reliablesource of income, which leads to household security; they are the basis of creditfacilities in local markets, further contributing to food security; they deliver cashinto remote areas where no other institutions are; they are gender sensitivetowards women; and they reach rural areas as few other services do. (Ardington& Lund 1995: 571)
These arguments were based on triangulating results from a number of local, provincialand national data sets; subsequent research has upheld these findings (see especially Vander Berg 1997; Case & Deaton 1998; Moller & Ferreira 2003).
There is great interest in the effect of the OAP on the status of older people in households,older women in households, and whether households restructure in response to the pres-ence or withdrawal of a pension. Many older people receiving pensions live in three-generation families, and these were a feature of African household structures before thepension came to be of any significant size. There are more young children in householdswith pensioners (Case & Deaton 1998). Some research suggests that households composethemselves around pensioners (likening them to a ‘magnet’), but it is difficult to provecausal relationships here. Until recently, restrictions on the black population’s labour andresidential mobility, and on access to land, kept people trapped in certain areas of thecountry, laying down historical patterns that may yet take some years to change.
Several studies (for example, Moller & Sotshongaye 1996) point to the self-esteem thatthe pension bestows on elderly people in their households, and the point sometimes alsogets made that this must be important for the position of elderly women. Many womenwith pensions are household heads, but most became household heads through widow-hood, not through setting up their own households ab initio. Some have described theconflicts that occur around the pension, especially the way in which younger unem-ployed men lean on pensioners for some share of the monthly amount (Breslin, Delius
G E N D E R A N D S O C I A L S E C U R I T Y I N S O U T H A F R I C A
169
Free
dow
nloa
d fr
om w
ww
.hsr
cpre
ss.a
c.za
& Madrid 1997). Not nearly enough is known, however, about the intra-householddynamics surrounding the pension – status, roles and decisions about how the pensiongets spent. Especially, there is a lacuna in knowledge about the inter-generationaldynamics between older and younger women in the same household. It is customary inrural areas for a woman to join her husband’s household on marriage, and the youngerwoman is in a subordinate position relative to her mother-in-law. The dynamic of thisrelationship may now begin to be influenced by the fact that some younger women canreceive the CSG money in their own right.
The gender sensitivity of the old age pensions
The OAP has been held to be ‘gender sensitive’ in that it goes to women earlier than tomen (at 60 for women compared to 65 for men), and as women live longer than men,they receive it for more years (Ardington & Lund 1995). Two factors, one demographicand the other constitutional, may change this situation. More women than men arebeing infected with HIV, and women’s life-expectancy rates have fallen lower than men’s.There will be fewer pensioners, overall, and there will be a shift in the proportion ofwomen to men who receive the OAP, with fewer women receiving pensions. The pro-women bias in the OAP will also be affected if there is a change in the age of eligibility.Some have tried to argue that the younger age of eligibility for women can be seen as anex post facto redressing of some of the accumulated disadvantages that they face, and thatother countries have this pattern as well. It is very probably unconstitutional, however,and may be challenged. Given the decrease in life expectancy for both women and men,it is easier now to argue that if there is gender equalisation, it should be in the downwarddirection, that is, at age 60 for both sexes.
The socio-economic effects in households of pooling pensions
The South African pensions system has presented a fertile laboratory for research aboutthe impact of sizeable state programmes of support. Three strands of research suggestthat: first, pension money buys general household goods, and enhances health and foodsecurity for the whole household; second, and furthermore, pension money that goes towomen is spent better than that which goes to men; and, third, pension money that goesto women gets preferentially spent on granddaughters over grandsons.
Numerous studies have dealt with the first and second items together – that pensionmoney buys general household goods and enhances household and food security, andthat which goes to women pensioners buys ‘better things’ or ‘gets spent better’ thanmoney which goes to men pensioners. Anne Case (2001) investigated the relationshipbetween pension income and health in black and coloured households in Langeberg,Western Cape. Households were compared according to whether pension income waspooled or not (84 per cent and 16 per cent of households respectively). Whether pen-sions were pooled or not, they had beneficial effects on the health of the pensionersthemselves. This included, importantly, a significant effect on decreasing depression. In
T H E D E V E L O P M E N T D E C A D E ? S O U T H A F R I C A , 1 9 9 4 – 2 0 0 4
170
Free
dow
nloa
d fr
om w
ww
.hsr
cpre
ss.a
c.za
non-pooling households, these effects were only experienced by the pensioners them-selves. In pooling households, for both black people and coloured people, the pensionincome protected the health of all adult household members, and the presence of a pen-sioner was positively and significantly correlated with an increase in children’s height.The effects were more marked when the pensioner was a woman. Regarding the effectson children, Case held: ‘That the pension is protective of children’s height, and thus ofchildren’s long-run nutritional status, may prove important in a country where manyAIDS orphans will live with elderly relatives in the next decade’ (2001: 18).
Esther Duflo (2003) used the Project for Statistics on Living Standards andDevelopment (PSLSD) data to investigate the relationship between the OAP and thehealth and nutrition status of children. She demonstrated that there was a link betweengrandmothers and granddaughters, or to put it simply, that ‘grandmothers prefer girls’,as evidenced by the better nutritional status of granddaughters whose grandmotherswere receiving pensions. This finding is puzzling in that it runs counter to the widelyheld view that girl children do not receive preference over boy children with respect towhat is given them to eat; in fact, if there were thought to be a bias, it would go in theother direction, towards boy children. It would be useful to push for better understand-ing of this, using other data sets.
The Umkhanyakude study of the CSG found that there was a positive and significantassociation between grant receipt and enrolment in school, with grant receipt leading toan 8 per cent increase in enrolment (Case et al. 2003). This is particularly remarkablegiven that the parents of the children who receive grants were less well educated, and thechildren lived in poorer households.
Pensions and labour supply
Fraser and Gordon (1994) provide a historical review of the enduring debate aboutwhether welfare ‘creates dependency’ on the state, a debate that has been expressed indifferent ways at different times. Underpinning this is the fear that those on welfare benefits will not need to work or, worse still, not want to work. In South Africa, theapartheid policy of racial capitalism underdeveloped and distorted markets in ruralareas, and imposed a migrant labour system in which (mostly) rural men were awayfrom home most of the time, in order to have work. High rural unemployment ratescoexisted with large numbers of non-resident or absent household members. The omis-sion of employment data relating to migrants, which happens in many surveys, can leadto serious errors of interpretation, as: ‘Migrants are not an average cross-section of theeconomically active age group. They are predominantly male, employed and better edu-cated than their peers who remain at home’ (Ardington & Lund 1996: 40–41).
A recent study (Bertrand, Mullainathan & Miller 2003) sought to investigate the associ-ation between the South African pension and the participation of other householdmembers in the labour market. Their research asked whether there were others apartfrom the pensioner who benefited from the OAP, and whether certain family members
G E N D E R A N D S O C I A L S E C U R I T Y I N S O U T H A F R I C A
171
Free
dow
nloa
d fr
om w
ww
.hsr
cpre
ss.a
c.za
were more able to reduce their labour supply than others. They looked at the laboursupply of relatives living with a pensioner, using the PSLSD data set for KwaZulu-Natal.Their hypothesis was that ‘such large pension transfers could be expected to result inintrahousehold redistribution that leads to significant behavioural responses, such as areduced willingness to participate in the labour force among family members not orig-inally targeted by policymakers’ (Bertrand et al. 2003; 29).
They found that the pensions dramatically reduced the labour supply of prime-age adultmembers, especially men, and that the pensions ended up being ‘captured’ by a groupnot originally targeted (Bertrand et al. 2003). Their ‘reduced willingness to participate inthe labour force’ echoes the concern about welfare creating dependency. Yet, unemploy-ment is so high, and the search for jobs is so desperate, that it seemed less than crediblethat all these men would voluntarily leave the labour market. Further investigationrevealed that non-resident household members had been omitted from the analysis,partly because the PSLSD survey from which the data were drawn did not ask foremployment-related information from such people. In that survey, three-quarters of thenon-resident members surveyed were absent specifically for the purpose of obtainingemployment. In KwaZulu-Natal rural African households, there are more people absent,looking for work, than there are people resident and working.
A re-analysis of the same data led to different conclusions (Posel, Fairburn & Lund2004). There does indeed seem to be a relationship between a pension coming into thehousehold and labour supply, but of a different order, with different gender implica-tions. There is an association between women receiving the pension, and youngerwomen in the household going in search of work. It is impossible to tell, given this dataset, whether the pension pays for the costs of job search, or whether the pensionsomehow changes household dynamics about childcare, enabling young mothers toleave young children in the care of older women.
The pension-day markets
Pensions and grants may be paid into banks or post office accounts; in rural areas theyare largely paid monthly in cash at pension pay points. In 1995, the main economictransactions on pension days appeared to be between pensioners (or their householdmembers) and vendors; observations of pension payouts in 2001 and thereafter showedhow much they had grown, and that now the whole community was involved in thepension-day markets (Adato, Lund & Mhlongo 2004). Retailers brought goods in bulkinto the area, and the research team could do no household interviewing on this day asall households were doing their general household shopping. In an area in the north ofKwaZulu-Natal, traders from at least two other countries were present (from nearbySwaziland and remote Botswana). Local people sold goods they had produced or pro-cured locally, including vegetables from household plots and from communal gardens,livestock that had been raised in a project supported by the Department of Agriculture,and natural resources such as honey and indigenous herbs.
T H E D E V E L O P M E N T D E C A D E ? S O U T H A F R I C A , 1 9 9 4 – 2 0 0 4
172
Free
dow
nloa
d fr
om w
ww
.hsr
cpre
ss.a
c.za
The introduction of the CSG has brought changes to pension-day markets. Youngerwomen (primary caregivers of children receiving the CSG) are now present and thisgives the day a very different feel and flavour. One can speculate that this new collectiveevent for younger women must have an impact on social relationships (by analogy, theincreasing numbers of funerals must have changed social and economic relationships).Many women are involved in small businesses at the markets, while the larger retailerscoming in from outside tend to be men. Adato, Lund and Mhlongo (2004) describe thesituation as follows:
In this same research site, there was a noticeably better-off area, where houseswere large and solid. A knowledgeable local informant was asked to explain howthe owners of the large houses had accumulated their wealth. In all cases, theanswer was the same: either a household member had a job in governmentemployment, or someone had started with small retailing at the pension market,and grown the enterprise from there. In two of the latter cases, people had growntheir enterprises to substantial fixed shops.
It would be extremely difficult to do a detailed gendered analysis of the employment-creating effects of the pension-day markets. There is much suspicion and tension on thosedays, because of the amounts of money involved, and because there appears to be a degreeof complicity between some in government and selected private insurance providers ingiving access to the pensioners who have just received their state social assistance.
The interaction between public and private provision of social security
A recurring theme in this chapter is the relationship between work and social security:how social security schemes were built with reference to assumptions made about whowas in work, for how long, and with what dependents. The labour market is itself adeeply gendered institution, in terms of who participates, on what terms and with whatrewards and disadvantages, at what stages of their lives. While the focus here has beenon public aspects of social provision, a gendered analysis would be incomplete withoutconsidering, even if not fully discussing, aspects of work-related provision that impactdifferentially on men and on women.
Contributions are made by employers and employees, with a subsidy from the govern-ment, to the Unemployment Insurance Fund (UIF). There are five statutory benefits forcategories of formally employed workers – unemployment, illness, maternity, adoption,and dependents of deceased contributors (Norton 2002). Of the approximately 5million contributors to the UIF, a larger percentage of economically active men thanwomen contribute, which one would expect given the patterns of men and women informal employment. In the past, poorer workers (who are more likely to be women)received smaller benefits. Amendments to legislation in 2001 brought significantimprovements for all covered by the scheme, and especially to those on low incomes andto women. Higher payment now goes to lower income workers, and domestic workers
G E N D E R A N D S O C I A L S E C U R I T Y I N S O U T H A F R I C A
173
Free
dow
nloa
d fr
om w
ww
.hsr
cpre
ss.a
c.za
(the vast majority of whom are women) and seasonal workers are now eligible for benefits. In the past, the maternity benefit was linked to the unemployment benefit andso discriminated massively against women, who got reduced entitlements to the unem-ployment benefit if claiming the maternity benefit. The two have now been separated.With regard to the adoption benefit, all those currently claiming are women (Hunter etal. 2004).
Occupationally-related social security is an important pillar of the overall system, but itcovers less than 10 per cent of all workers in South Africa. State social assistance, andespecially the OAP and DG, is compensating for severe deficits in coverage. In the Socio-Economic Persistence of Poverty and Inequality study,4 for example, the following wasrecorded about a pensioner called Philip:
Philip lives in the Newcastle area, and worked for Spoornet for 17 years. He wasretrenched with a package of R17 000. He has a state old age pension. His daugh-ter is employed in a garment factory in Newcastle. When work is available sheworks seven days a week with no days off, and gets paid around R90 a week. Shefell in the factory and had to go to hospital for two weeks. It was clearly a work-related injury. Her father’s state pension was used for her transport to hospital,her treatment, and her medication. (Interview 19 September 2001)
In this cameo, the state pension clearly plays a role when there is an accident at theworkplace and there is no employment-related compensation for workers. The contri-butions formerly paid by employers to insure people of working age have been substi-tuted by a state payment to elderly people.
There is a need for much deeper analysis of the interaction between private and publicsystems of social provision. There is a need for better questions in national surveys, aswell as rigorous qualitative studies of, for example, how people cope when provision dis-appears, and how patterns of informal care compensate for inadequate coverage by thestate and the private sector.
Work and employment in the welfare sector
The civil service is the largest employer in South Africa, and is virtually the only formalsource of employment in most rural areas. It employs women in large numbers,especially in the professions of nursing, teaching and social work, as well as in adminis-trative positions. There is strong gender differentiation between the ‘social cluster’ ofhealth, welfare and education, and the more ‘male’ occupations such as engineering. Thestarting salary of a newly qualified engineer was R125 000 per year in 2004. That was thesame salary level as a senior social worker, with the same years of university training,who had ten years of working experience, and was supervising and managing a team ofother professional and administrative staff.
Two recent trends in South Africa have gendered effects on the employment of thosewho provide welfare services. The first has been the large-scale outsourcing of the
T H E D E V E L O P M E N T D E C A D E ? S O U T H A F R I C A , 1 9 9 4 – 2 0 0 4
174
Free
dow
nloa
d fr
om w
ww
.hsr
cpre
ss.a
c.za
delivery of the state pensions, which formerly was done by government personnel. Thelarge and profitable contracts have gone to the male-dominated world of security firms.The pension queues have come to be guarded by armed personnel hanging out ofarmoured cars and helicopters – a paramilitary escort delivering cash to the poor andvulnerable. The second trend has been the privatisation of residential facilities forelderly people. The apartheid welfare services developed an extensive system of govern-ment-subsidised homes for mostly white elderly people. With subsidies now declining,many facilities have been privatised. Some elderly residents simply bought their placesin the facilities; others, however, had to return to or be taken into private homes offamily members. This is likely to have increased the demand for unpaid care by (female)family members or for low-paid (female) carers.
Towards improved understanding of social security
A social programme of this size and importance merits serious and ongoing assessment.The system rapidly drew attention over the last decade or so, and will continue to do so.Future research needs to correct a number of problems of interpretation that, ifunchecked, could have serious implications for social policies.
First, there has been an incremental misinterpretation of the historical growth of thesystem. Racial discrimination in the system was finally overcome in 1993; a number ofauthors have misinterpreted this to mean that there were fundamental changes, espe-cially in the level of the pension, from 1993 onwards. There is a certain convenience tothis, in that 1993 was the year that the creditable PSLSD survey was done. However, tointerpret this as meaning that ‘before 1993 there was nothing, then there was everything’is seriously misleading. The pension reform was a gradual process that started in themid-1980s. One understands how it is quite unbelievable to people (South Africans andothers) that the social security system was put in place, and equalised, by the apartheidgovernment.
Second, as a source of income, pensions and grants are consistently overestimated rela-tive to other sources of income, for the following reasons (Ardington & Lund 1996; Lund1999): the amount of a social assistance benefit is common public knowledge, and inmany areas the means test is not really applied, so it does not have to be estimated by theinterviewer or the interviewee in the complex way that income from other sources hasto be estimated; income from informal activities, from agriculture and from illegal activ-ities is consistently underestimated; and income and assets from migrants is consistentlyunderestimated, probably mostly through problems of recall, and because it is no longersent as regularly as in the past. The importance of the pensions as a source of householdincome thus ‘stands out’, and this tendency is stronger the lower the income level.
This, in turn, reinforces statements about the so-called ‘generosity’ of the system, whichnow appear in many assessments. There has been a tendency to focus on poverty inAfrican households only. Authors then compare the size of the OAP income only toAfrican incomes and, in some cases, only to African incomes in rural areas, and find the
G E N D E R A N D S O C I A L S E C U R I T Y I N S O U T H A F R I C A
175
Free
dow
nloa
d fr
om w
ww
.hsr
cpre
ss.a
c.za
amount of money ‘very generous’ or ‘large’, for example saying that it is twice the medianper capita income in rural areas. Yet, markets in rural areas were intentionally distorted –this was one of the hallmark policies of the apartheid government, leading to themassive unemployment that there still is today, especially in the former homeland areas.The OAP is a redistributive measure, and it would be better to compare the size of theOAP with overall median incomes.
Third, the focus on the OAP has detracted attention from the many other needs ofelderly people, and obscures the fact that there are few other services for older people asolder people. One of the arguments used by a number of researchers (the present authorincluded) to support the pension for elderly people was its effect not only on the statusand well-being of pensioners themselves, but also indirectly on the whole household.The pension ‘bought’ a significant amount of care for other household members, it hada demonstrably positive effect on the health status of other household members, it hada role in start-up costs of small businesses and enterprises, and it secured agriculturalinputs (for a summary of some research in this area, see Lund 2002b). These effects havebeen used to buttress arguments for continuing state spending on this social securitymeasure. However, elderly people really do need financial and other forms of supportfor themselves, and the focus on its efficacy for the household at large obscures this. Theamount available to older people is substantially reduced by the sharing.
Conclusion
This chapter has attempted to lay the basis for a gendered approach to the study of socialsecurity in South Africa. ‘Gender’ is often used as if it is something about women, andas if women are a homogeneous category. However, it is about the analysis of relation-ships of power between men and women, and between women of different generationsand classes. The system of state social assistance is of immense material importance tothe poor who receive its benefits, and is a significant mechanism of redistribution,especially in the context of the AIDS epidemic. The gendered approach taken here hashelped draw attention to the serious gaps in knowledge about the scope of the systemand its socio-economic effects.
The overview of research has shown how much the focus has been on the OAP and theCSG, and the lacunae that exist for the other grants. Further work is needed not just ona grant-by-grant basis, as it were, but also in exploring how different sources of incomein households interact with each other, and how intrahousehold decision-making aboutthese sources takes place. More work is also needed on the welfare system as a providerof employment, on the effects of the balance of public- versus private-sector provisionon gendered patterns of employment, on the dynamics of the care economy, and on theinteraction between these.
T H E D E V E L O P M E N T D E C A D E ? S O U T H A F R I C A , 1 9 9 4 – 2 0 0 4
176
Free
dow
nloa
d fr
om w
ww
.hsr
cpre
ss.a
c.za
Notes
1 Hunter (2002) provides an annotated bibliography of recent research on the impact of social
security, and Hunter and Rushby (2002) do the same for research on living conditions of those
who receive social assistance. Van der Berg and Bredenkamp (2002) give a concise yet
comprehensive overview of the nature and coverage of both private and public social security
provision. A Social Protection Expenditure Review (Hunter et al. 2004) provides details of
state- and occupation-related social spending, giving allocation by sex where possible.
2 Ingrid Woolard, personal communication, 2005.
3 I am grateful to Beth Goldblatt for bringing this observation to my attention.
4 This study was nested in the larger KwaZulu-Natal Income Dynamics Study study which was a
2001 collaboration between the School of Development Studies, the International Food Policy
Research Institute, the Catholic University of Peru, Lima, and the University of Madison-
Wisconsin.
References
Adato M, Lund F & Mhlongo P (2004) Capturing ‘work’ in South Africa: Evidence from a study in
KwaZulu-Natal. Unpublished paper, School of Development Studies, University of KwaZulu-
Natal and IFPRI Washington, DC.
Ardington E & Lund F (1995) Pensions and development: Social security as complementary to
programmes of reconstruction and development, Development Southern Africa 12: 557–77.
Ardington E & Lund F (1996) Questioning rural livelihoods, in M Lipton, F Ellis & M Lipton (eds.)
Land, labour and livelihoods in rural South Africa, Volume Two: KwaZulu-Natal and Northern
Province. Durban: Indicator Press.
Barrientos A & Dejong J (2004) Child poverty and cash transfers. CHIP Report No. 4. London:
Child Poverty Research and Policy Centre.
Bertrand M, Mullainathan S & Miller D (2003) Public policy and extended families: Evidence from
pensions in South Africa, The World Bank Economic Review 17: 27–50.
Breslin E, Delius P & Madrid C (1997) Strengthening institutional safety nets in South Africa:
Sharing Operation Hunger’s insights and experiences, Development Southern Africa 14: 21–41.
Case A (2001) Health income and economic development. Paper prepared for the ABCDE
Conference, World Bank 1–2 May. < http://wws.princeton.edu/rpds/downloads/
case_economic_development_abcde.pdf>
Case A & Deaton A (1998) Large cash transfers to the elderly in South Africa, Economic Journal 108:
1330–61.
Case A, Hosegood V & Lund F (2005) The reach and impact of the Child Support Grant in South
Africa: Evidence from KwaZulu-Natal, Development Southern Africa 22: 467–82.
Department of Social Development (2002) Transforming the present – Protecting the future.
Consolidated report of the committee of inquiry into a comprehensive system of social security
for South Africa. Pretoria: DoSD
G E N D E R A N D S O C I A L S E C U R I T Y I N S O U T H A F R I C A
177
Free
dow
nloa
d fr
om w
ww
.hsr
cpre
ss.a
c.za
Duflo E (2003) Grandmothers and granddaughters: Old-age pensions and intrahousehold allocation
in South Africa, The World Bank Economic Review 17: 1–25.
Fraser N & Gordon L (1994) ‘Dependency’ demystifies: Inscriptions of power in a keyword of the
welfare state, Social Politics 1: 14–31.
Hunter N & Rushby J (2002) Annotated bibliography of recent research on the living conditions of the
main target groups of social security grants. CSDS Research Report No. 53. Durban: School of
Development Studies, University of Natal.
Hunter N (2002) Annotated bibliography of recent research on the impact of social security grants. CSDS
Research Report No. 52. Durban: School of Development Studies, University of Natal.
Hunter N, Hyman I, Krige D & Olivier M with Dekker A, Khandlela M & May J (2004) South African
social protection and expenditure review. Durban/Johannesburg: School of Development Studies,
UKZN/Centre for International and Comparative Labour and Social Security Law, RAU.
ILO (2002) Women and men in the informal economy: A statistical picture. Geneva: International
Labour Office, Employment Sector.
Jensen R (2003) Do private transfers ‘displace’ the benefits of public transfers? Evidence from South
Africa, Journal of Public Economics 88: 89–112.
Leatt A (2004) Granting assistance: An analysis of the Child Support Grant and its extension to seven
and eight year olds. Children’s Institute Working Paper No. 2. Cape Town: Children’s Institute,
UCT.
Lund F (1999) Understanding South African social security through recent household surveys:
New opportunities and continuing gaps, Development Southern Africa 16: 55–67.
Lund F (2002a) Social security and the changing labour market: Access for non-standard and
informal workers in South Africa, Social Dynamics 28: 177–206.
Lund F (2002b) Crowding in care, security and micro-enterprise formation: Revisiting the role of the
state in poverty reduction, and in development, Journal of International Development 14: 1–14.
Lund F & Srinivas S (2000) Learning from experience: A gendered approach to social protection for
workers in the informal economy. Geneva: International Labour Organisation.
Meintjes H, Budlender D, Giese S & Johnson L (2003) Children ‘in need of care’ or in need of cash?
Questioning social security provisions for orphans in the context of the South African AIDS
pandemic. Joint Working Paper. Cape Town: Children’s Institute, and Centre for Actuarial
Research, UCT.
Moller V & Ferreira M (2003) Non-contributory pensions and poverty study (NCPPS): South African
survey report. Grahamstown/Cape Town: Institute of Social and Economic Research, Rhodes
University/Institute of Ageing in Africa, UCT.
Moller V & Sotshongaye X (1996) ‘My family eat this money too’: Pension sharing and self-respect
among Zulu grandmothers, Southern African Journal of Gerontology 5: 9–19.
Norton D (2002) Better benefits beat blue card blues, SA Labour Bulletin 26: 59–62.
Ogden J, Esim S & Grown C (2004) Expanding the care continuum for HIV/AIDS: Bringing carers into
focus. Horizons Report. Washington, DC: Population Council and International Centre for
Research on Women.
T H E D E V E L O P M E N T D E C A D E ? S O U T H A F R I C A , 1 9 9 4 – 2 0 0 4
178
Free
dow
nloa
d fr
om w
ww
.hsr
cpre
ss.a
c.za
Orloff A (2000) The significance of changing gender relations and family forms for systems of social
protection. Background paper prepared for the World Labour Report 1999–2000. Geneva:
International Labour Office.
Posel D (2001) How do households work? Migration, the household and remittance behaviour in
South Africa, Social Dynamics 27: 165–89.
Posel D, Fairburn J & Lund F (2004) Labour migration and households: A reconsideration of the
effects of the social pension on labour supply in South Africa. Working Paper.
Republic of South Africa (1996) Report of the Lund Committee on Child and Family Support. Pretoria:
Government Printer.
Reynaud E (2002) The extension of social security coverage: the approach of the International Labour
Office. Extension of Social Security (ESS) Working Paper Series No. 3. Geneva: International
Labour Office.
Sagner A (2000) Ageing and social policy in South Africa: Historical perspectives with particular
reference to the Eastern Cape, Journal of Southern African Studies 26: 523–53.
Schneider M & Marshall S (1998) Social security for people with disabilities. Johannesburg:
Community Agency for Social Enquiry.
Sharp J & Spiegel A (1990) Women and wages: Gender and the control of income in farm and
bantustan households, Journal of Southern African Studies 16: 527–49.
Valodia I (2001) Economic policy and women’s informal work in South Africa, Development and
Change 32: 871–92.
Van der Berg S (1997) Social security under apartheid and beyond, Development Southern Africa
14: 481–503.
Van der Berg S & Bredenkamp C (2002) Devising social security interventions for maximum poverty
impact, Social Dynamics 28: 39–68.
Woolard I (2003) Impact of government programmes using administrative data sets: Social Assistance
Grants. Second draft, 19 June 2003. Project 6.2 of the Ten Year Review Research Programme.
http://www.sarpn.org.za/documents/d0000946/index.php.
G E N D E R A N D S O C I A L S E C U R I T Y I N S O U T H A F R I C A
179
Free
dow
nloa
d fr
om w
ww
.hsr
cpre
ss.a
c.za

Free
dow
nloa
d fr
om w
ww
.hsr
cpre
ss.a
c.za

Section 4Industrial upgrading and innovation
181
Free
dow
nloa
d fr
om w
ww
.hsr
cpre
ss.a
c.za

Free
dow
nloa
d fr
om w
ww
.hsr
cpre
ss.a
c.za
10The noledge of numbers: S&T, R&D and innovation indicators in South Africa
Jo Lorentzen
Introduction
The technological trajectories of countries depend on a multitude of factors. Key amongthem is knowledge, and more specifically its production, absorption and exploitation.Although this is an important recognition in its own right, it raises more questions thanit answers – what sort of knowledge, produced by whom and for what purpose, and withwhat time value? Knowledge is ‘roots and rocket science’, in other words, it spans tradi-tional and tacit insights into the therapeutic properties of indigenous plants shared by acommunity at one end, and the results of rational scientific discovery and their codifi-cation in individual intellectual property rights at the other. The producers of knowl-edge advance our understanding of how things work, and why; the outcome may beanything from the hydrogen bomb to the hydrogen car or even the supply of safe drink-ing water to the 1.2 billion people in the world currently without access to it. Finally,much like any other asset, intellectual capital is subject to depreciation, and successfulpast practices in agriculture or industry are no guarantee against technological lock-ins.
Knowledge needs to be understood to become useful. Its absorption, the process oflearning, takes place in more or less formalised ways. Indigenous knowledge is oftenpassed on through the spoken word, and the relationship between teacher and appren-tice may be highly idiosyncratic. By contrast, knowledge transmission and generation inhighly organised societies tends to be structured around a system with various layers ofeducation, training and investment in research. Learning ‘happens’ within this knowl-edge infrastructure. This goes, inter alia, for kids in more or less well-equipped schools,students in technical colleges with more or less relevant curricula, managers in firmswith a more or less developed understanding of the international technology frontier intheir product range, and scientists in public research institutes with a more or lessmission-oriented remit concerning the applicability of their discoveries.
Hence, technological trajectories result, in part, from the quality of the knowledge infra-structure and the degree and the rate of absorption of both the existing stock of knowl-edge and additions to it. This has systemic character – with little or no communicationbetween a scientist in an experimental lab and a design engineer in a firm, even a prom-ising invention may never make it to market. Put differently, an excellent knowledgeinfrastructure does little for technological accumulation unless it accommodates,facilitates and promotes learning across the constituent elements of the system.
183
Free
dow
nloa
d fr
om w
ww
.hsr
cpre
ss.a
c.za
In view of the importance of knowledge for technological progress, the Organisation forEconomic Co-operation and Development (OECD) has been monitoring the perform-ance of the knowledge infrastructure of member countries since the 1960s. At about thesame time, a few academics in North America and Europe began a research tradition inthe economics of technical change, which by the 1980s had matured into a widespreadand influential preoccupation with national innovation systems (NIS). Thanks to anumber of large-scale comparative research programmes, there is now a rich body ofliterature that links learning, or absorptive capacity, with knowledge infrastructures.Governments are eager to exploit this information because the literature suggestsimportant links between learning and international competitiveness.
More recently, the increase in global competition and the popularisation of the notionof the knowledge society have spurred on the efforts of developing countries to gain abetter understanding of their knowledge infrastructure. South Africa is no exception.From the 1996 White Paper on Science and Technology (DACST 1996) to the 2001/02R&D Survey (DST 2004) the country has come a long way in terms of creating an inven-tory of its knowledge supply. The format of the inventory allows for international comparisons and is designed to influence science and technology (S&T) policy.However, it is not clear that these benchmarking efforts by themselves make much senseand, worse, they may actually lead to ill-conceived policy conclusions, because they takeplace in the absence of an understanding of how learning occurs, especially insofar asindustrial firms are concerned. This shortcoming is the focus of the chapter.
The chapter is structured as follows. First, it reviews a key instance of learning, namelybusiness–science relationships (BSRs) and their relative importance in innovation. Itdescribes international experiences with BSRs and discusses attempts to compare themacross countries. It then contrasts what is known about South Africa’s knowledge infrastructure with what is not known about the dynamics of learning within it, andshows why one without the other makes for incomplete or outright bad policy advice.The concluding section points to the need for more research into local learning.
Business–science relationships in the knowledge economy
It is easy to establish why, in principle, science matters for economic growth and develop-ment. Economic growth depends prominently on the creation and exploitation of knowl-edge. Science institutions such as universities are repositories of knowledge. They alsoadvance science and create new technologies that, especially if transferred to the businesssector, help firms to innovate. Firms, in turn, are the most important agents of technolog-ical innovation. Of course, the private sector has always commercialised science, albeit tovarying degrees, depending on sector, country and historical period (Nelson 1993), andfirms have sometimes pioneered technological developments without much interactionwith university scientists. However, it is beyond doubt that BSRs have grown in impor-tance over the last 25 years or so. Evidence shows a rise in the share of new products andprocesses in a wide range of industries developed in reference to recent academic research,
T H E D E V E L O P M E N T D E C A D E ? S O U T H A F R I C A , 1 9 9 4 – 2 0 0 4
184
Free
dow
nloa
d fr
om w
ww
.hsr
cpre
ss.a
c.za
along with a decline in the time lag between academic research results and their commer-cial offspring (Mansfield 1998; see also Furman, Porter & Stern 2002; and OECD 2004a:Figure 3). Industry has been funding a growing share of public research and development(R&D), which in the OECD averages at just above 5 per cent (OECD 2004b: 17).
The division of labour between researchers in universities, public labs and industry isless clear-cut than in the past. It has become more difficult to distinguish between basicand applied research. The blurring between curiosity in academia, mission orientationin the public sector and profit orientation in industry – exemplified by fields such asstructural genomics – complicates the interface between science systems and industrialinnovation, and has given rise to much soul-searching regarding the design andexpected benefits of science and innovation policy (OECD 2004a).
Figuring out the dynamics of BSRs presupposes an understanding of the changing characteristics and interests of the various actors involved in innovation (see Agrawal2001 for a good overview of the literature, or Bozeman 2000 for a review of the USAexperience). First, in the presence of increased competition and more rapid product lifecycles – along with the standard market failures that bedevil R&D – innovative firmssucceed best if they can focus their own research competence as well as access andexploit external knowledge, possibly in conjunction with other firms. Benefits accrue toresearch synergies that manifest themselves in cost savings or improved R&D produc-tivity, R&D cost sharing and keeping up to date with major technological developments.In short, thanks to co-operative R&D, firms learn, make better products and employbetter processes (Caloghirou, Tsakanikas & Vonortas 2001). Especially in view of thetacit nature of much of the transferable knowledge concerned, the connection to theopen science community is important for the utilisation of university research(Cockburn & Henderson 1998 in Agrawal 2001).
Second, although many knowledge transfer channels between universities and publicresearch organisations, on the one hand, and industry, on the other, continue to beinformal, formal technology alliances between science institutions and firms are on therise, as are spin-off companies run by academic entrepreneurs, all this in the context ofgenerally accommodating intellectual property regimes and expanding markets fortechnology. Lee (2000) reports for the USA that these relationships are sustainablebecause academics and managers allow the partner the pursuit of his or her own inter-ests while also contributing to the mutual goal. Conversely, when academics fear thatworking with industry (regardless of whether this happens independently or in thecontext of reduced public funding) may impact negatively on education, research andgeneral university integrity, they are less willing to support co-operation (Lee 1996).
These alliances have undoubtedly changed the face of universities, although concernsabout a shift to more applied research at the expense of basic research seem, at least onaverage, unfounded. The explanation for the growth in licensing patented inventionsoriginating in academic research lies rather with an increased inclination of the inven-tors to patent and of firms to outsource R&D (Thursby & Thursby 2000 in Agrawal
T H E N O L E D G E O F N U M B E R S
185
Free
dow
nloa
d fr
om w
ww
.hsr
cpre
ss.a
c.za
2001). This question cannot be solved theoretically; more empirical research is neededto assess the possibly deleterious effects of BSRs on the quality and quantity of funda-mental science, the research infrastructure, and the relative freedom from restrictions onresearch uses by peers (Poyago-Theotoky, Beath & Siegel 2002; see also OECD 2004a).
Third, apart from the direct relationship between science and industry, the spatially con-centrated knowledge spillovers associated with it influence the location of innovativeactivity (see, for example, Audretsch & Feldman 1996 in Agrawal 2001). Smart regionsare more likely to benefit from smart investments, although it would be naïve to believethat university–industry–government links would always be more than the sum of theirparts (Hagen 2002). Nonetheless, this implies that those regions and countries most inneed of innovative activity do not stand much of a chance to get it at all.
Finally, regions once characterised by a record of innovative activity may lose their edge.Best and Forrant (2000) recount the attempts by the University of Massachusetts Lowellto stem and reverse the decline of the Merrimack Valley by imbuing university labs andtraditionally blueprint-reading supplier firms with a sense of strategic direction.Absorptive capacities thus matter for both the realisation of and the possible gains fromBSRs. Clearly, this has implications for developing countries.
International BSR benchmarks
Many countries eagerly evaluate their innovation record against their competitors. Forexample, in 2000, Taiwanese engineers ranked tenth in terms of the number of paperspublished in the Engineering Index, up from thirteenth place in 1993. Taiwanese inven-tors also registered more patents in the USA than any other country, except for the USA,Japan and Germany. Yet, the majority of critical components and manufacturing tech-nologies used in Taiwan are imported. In view of fiercer competition from China andother parts of Southeast Asia, this raises the question as to why an impressive R&D performance does not translate into more much-needed, widespread improvements ininnovations and technological capabilities among Taiwanese firms, and to what extentthe interaction between industry, universities and public research institutes is at fault(Chang & Hsu 2002). In sum, both the successes and the shortcomings of innovationperformance are relative measures that make little sense when looked at in isolation.
In theory, the rationale behind comparisons of BSRs is twofold. First, we want to findout about the relative efficiency of the interaction in meeting the aims and objectives ofthe concerned stakeholders. Thus, governments are interested in the social return onpublic investment in research, and expect BSRs to address systemic failures in economy-wide knowledge generation and diffusion. Universities hope for financial supportbeyond core funding and aim to ensure promising employment prospects for their grad-uates. Firms, in turn, are keen on well-trained human capital and useable scientificknowledge. Second, we want to tie observable differences in performance to observablecharacteristics of BSRs (OECD 2002). In principle, this would allow us to conclude thatone type of BSR is better than another.
T H E D E V E L O P M E N T D E C A D E ? S O U T H A F R I C A , 1 9 9 4 – 2 0 0 4
186
Free
dow
nloa
d fr
om w
ww
.hsr
cpre
ss.a
c.za
However, in practice this runs the risk of becoming an apple-and-orange exercise. Thereis no sound case for the existence of one best innovation practice – perhaps the singlemost important reason for benchmarking (Kastrinos 2001). Global pressures on inno-vation do provide a common motivation in favour of science–industry collaboration,which over time may well lead to similar manifestations of knowledge management andindeed break down select barriers to cross-border knowledge sharing. However, BSRsare part of larger innovation systems, and we know that despite (and in some sensebecause of) globalisation the constituents and characteristics of these systems continueto differ in major ways across countries. This applies, inter alia, to the managerial, organ-isational and technological make-up of firms and how they respond to incentives forinnovation; the public institutions that perform and fund R&D; the trends drivingfunding and performance patterns of R&D; and also the scientific disciplines in whichcountries are historically specialised in the first place (see Carayannis, Alexander &Ioannidis 2000; OECD 2002).
Hence, it is undoubtedly possible to compare select inputs and outputs of innovationsystems, but it is far from certain that the resulting crude indicators would lead toinsights that lend themselves to formulating sound and sensible policy. This is becausethe ratio of one output variable amongst many (e.g. scientific publications or patents)over one input variable amongst many (e.g. public spending on basic research), as frequently used for measuring differential productivity levels of countries, flies in theface of the complexity of interactions that make up an innovation system (see Barré2001 for an entertaining mockery of an official British attempt to establish the superiorefficiency of public research spending in the UK compared to France).
For a start, to be valid, any relative measure requires that one compares like with like. Apharmaceutical company in Country A may be as inclined to explore patentable mole-cules as a rival in Country B; but if Country A excels in rocket science while Country B is a society of poets and sopranos, a comparison of overall patent productivity would have little or no heuristic value. In other words, since R&D intensity varies from sector to sector, and industrial specialisation varies from country to country, aggregatecomparisons of R&D intensity are only relatively meaningful. Similarly, if a pharmaceu-tical firm manages to commercialise a new drug derived from a bio-diverse region indeveloping Country C, while failing to do so in developing Country D, a whole host ofexplanations may apply. Only one relies on an institutional framework more conduciveto innovation activities in Country C. Others would be that Country D is better at protecting its resources against bio-piracy by foreign firms, or that commercialisation isbased on an indigenous knowledge tradition that contradicts the requirement that apatentable product be ‘new’ or, finally, that there is a strong public interest againstaffording the product in question temporary monopoly rights. Therefore, country preferences matter, as do the regulatory frameworks through which they are mediated,both nationally and multilaterally.
In sum, the existence of systematic differences among firms, sectors and countries mustbe acknowledged. Comparisons must be sensitive to the conceptual and data problems
T H E N O L E D G E O F N U M B E R S
187
Free
dow
nloa
d fr
om w
ww
.hsr
cpre
ss.a
c.za
this raises. A good comparative analysis will attempt to look at systems as a whole andnot discount, but focus on, their heterogeneity (Smith 2001). Contextualisation isimperative. Only then are comparisons likely to yield meaningful and useful lessonsabout the underlying dynamics among actors that ultimately account for innovation.
This is easier said than done. Developing input and outcome metrics is an exercisefraught with conceptual problems even if the unit of analysis under observation is technology transfer activities between science and industry within one country.Counting instances of technology transfer is one thing, establishing process metrics andmeasuring outcome metrics quite another, and there is no generally agreed theoreticallysatisfactory standard (Carayannis & Alexander 1999). Shifting the unit of analysis tocountries compounds the difficulties. Roughly a decade into research of nationalsystems of innovation, Patel and Pavitt (1994) called for an improvement of the empirical basis for evaluating these systems, including a better understanding of thedynamics of technological learning; another ten years on, this challenge rings just as true(see also Carlsson et al. 2002).
The most promising work in this area combines a conviction that much can be learnedabout different systems by comparing them, with a willingness to assemble data that areat least in part hard to get and a healthy dose of caution with respect to the level of gen-eralisation their analysis permits. In a benchmarking study commissioned by theEuropean Commission and the Austrian Federal Ministry of Economy and Labour, Poltet al. (2001, especially in Figure 2) evaluated what they termed industry–science relations (ISRs) – defined as institutionalised forms of learning that provide a specificcontribution to the stock of economically useful knowledge – along three dimensions,namely the nature and relative channels of interaction; the characteristics of the mainactors and the demand and supply they represent on the knowledge market; and theframework conditions, replete with incentive structures, that provide the setting for theknowledge market. Table 10.1 illustrates the mass of data used to describe the threedimensions in select EU countries, the USA and Japan. Yet, while the researchers suggestthat levels of ISRs may indeed inform the knowledge-production structures of countriesvarying from high-technology specialisation (e.g. Finland) via cumulative developmentalong traditional technology trajectories (e.g. Germany) to fast-follower strategiesaimed at technology diffusion in traditional industries (e.g. Italy), they caution againstconcluding that a higher level of ISR somehow necessarily translates into a better innovation system. Firms can obviously exploit other avenues of knowledge acquisition;a low level of ISRs could go hand in hand with an intensive intra-industry R&D co-operation (Polt et al. 2001).
All countries covered in the aforementioned study are advanced OECD economies withcomplex innovation systems. It makes sense to study BSRs, or any other subsystem forthat matter, within the context of the broader knowledge infrastructure. The focus on scientific knowledge is warranted insofar as these countries embody knowledge-intensive production. What happens within their BSRs is likely to affect large and increas-ing parts of the national economy. By the same token, the dynamics of BSRs are likely to
T H E D E V E L O P M E N T D E C A D E ? S O U T H A F R I C A , 1 9 9 4 – 2 0 0 4
188
Free
dow
nloa
d fr
om w
ww
.hsr
cpre
ss.a
c.za
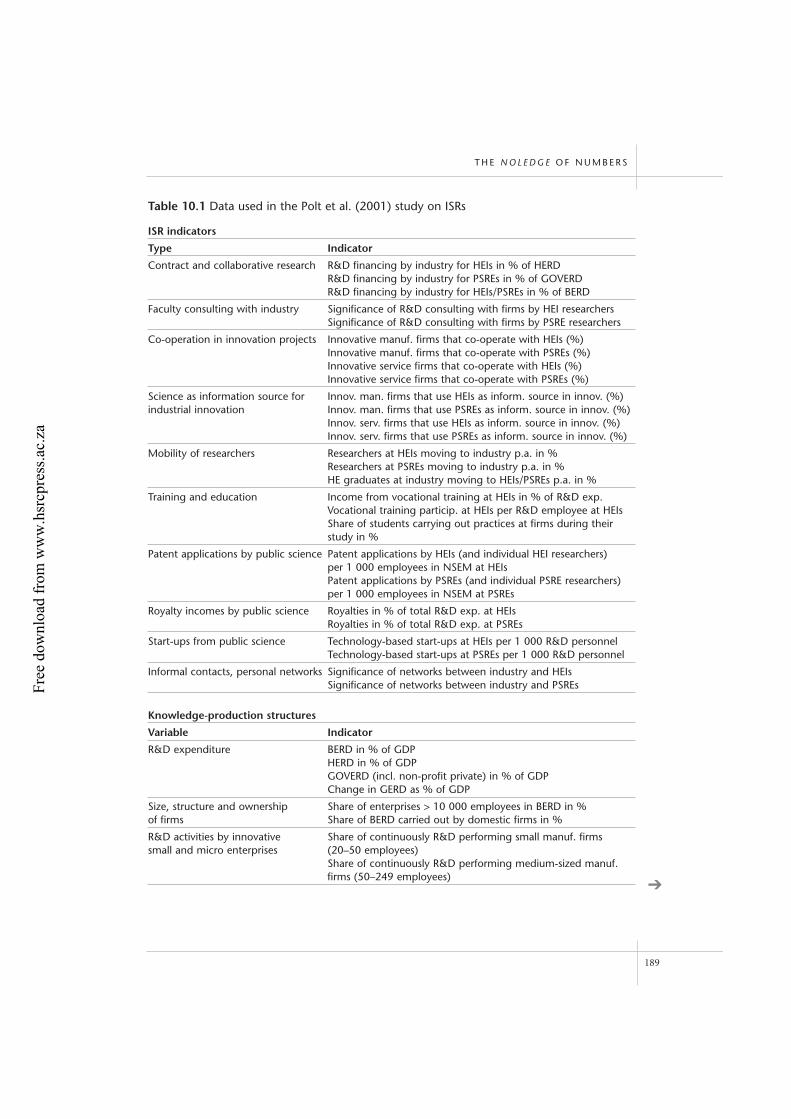
T H E N O L E D G E O F N U M B E R S
189
Table 10.1 Data used in the Polt et al. (2001) study on ISRs
ISR indicators
Type Indicator
Contract and collaborative research R&D financing by industry for HEIs in % of HERDR&D financing by industry for PSREs in % of GOVERDR&D financing by industry for HEIs/PSREs in % of BERD
Faculty consulting with industry Significance of R&D consulting with firms by HEI researchersSignificance of R&D consulting with firms by PSRE researchers
Co-operation in innovation projects Innovative manuf. firms that co-operate with HEIs (%)Innovative manuf. firms that co-operate with PSREs (%)Innovative service firms that co-operate with HEIs (%)Innovative service firms that co-operate with PSREs (%)
Science as information source for Innov. man. firms that use HEIs as inform. source in innov. (%)industrial innovation Innov. man. firms that use PSREs as inform. source in innov. (%)
Innov. serv. firms that use HEIs as inform. source in innov. (%)Innov. serv. firms that use PSREs as inform. source in innov. (%)
Mobility of researchers Researchers at HEIs moving to industry p.a. in %Researchers at PSREs moving to industry p.a. in %HE graduates at industry moving to HEIs/PSREs p.a. in %
Training and education Income from vocational training at HEIs in % of R&D exp.Vocational training particip. at HEIs per R&D employee at HEIsShare of students carrying out practices at firms during their study in %
Patent applications by public science Patent applications by HEIs (and individual HEI researchers) per 1 000 employees in NSEM at HEIsPatent applications by PSREs (and individual PSRE researchers) per 1 000 employees in NSEM at PSREs
Royalty incomes by public science Royalties in % of total R&D exp. at HEIsRoyalties in % of total R&D exp. at PSREs
Start-ups from public science Technology-based start-ups at HEIs per 1 000 R&D personnelTechnology-based start-ups at PSREs per 1 000 R&D personnel
Informal contacts, personal networks Significance of networks between industry and HEIsSignificance of networks between industry and PSREs
Knowledge-production structures
Variable Indicator
R&D expenditure BERD in % of GDPHERD in % of GDPGOVERD (incl. non-profit private) in % of GDPChange in GERD as % of GDP
Size, structure and ownership Share of enterprises > 10 000 employees in BERD in %of firms Share of BERD carried out by domestic firms in %
R&D activities by innovative Share of continuously R&D performing small manuf. firms small and micro enterprises (20–50 employees)
Share of continuously R&D performing medium-sized manuf. firms (50–249 employees)
➔
Free
dow
nloa
d fr
om w
ww
.hsr
cpre
ss.a
c.za
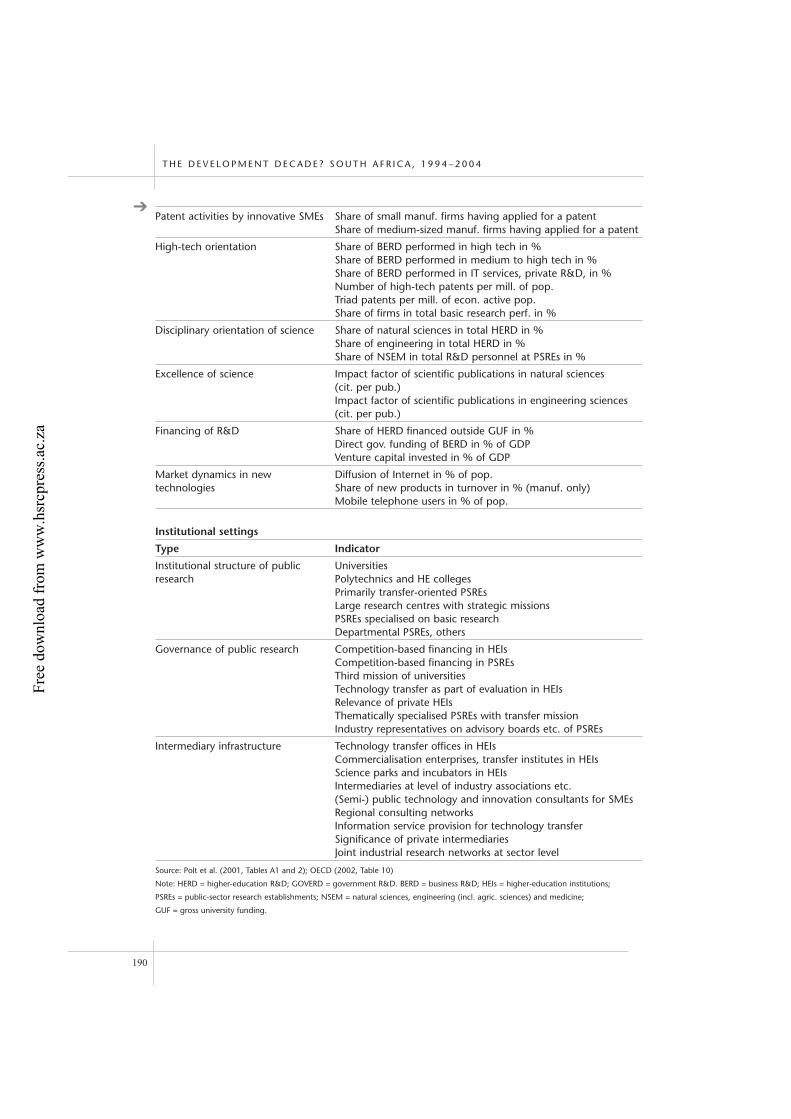
T H E D E V E L O P M E N T D E C A D E ? S O U T H A F R I C A , 1 9 9 4 – 2 0 0 4
190
Patent activities by innovative SMEs Share of small manuf. firms having applied for a patentShare of medium-sized manuf. firms having applied for a patent
High-tech orientation Share of BERD performed in high tech in %Share of BERD performed in medium to high tech in %Share of BERD performed in IT services, private R&D, in %Number of high-tech patents per mill. of pop.Triad patents per mill. of econ. active pop.Share of firms in total basic research perf. in %
Disciplinary orientation of science Share of natural sciences in total HERD in %Share of engineering in total HERD in %Share of NSEM in total R&D personnel at PSREs in %
Excellence of science Impact factor of scientific publications in natural sciences (cit. per pub.)Impact factor of scientific publications in engineering sciences (cit. per pub.)
Financing of R&D Share of HERD financed outside GUF in %Direct gov. funding of BERD in % of GDPVenture capital invested in % of GDP
Market dynamics in new Diffusion of Internet in % of pop.technologies Share of new products in turnover in % (manuf. only)
Mobile telephone users in % of pop.
Institutional settings
Type Indicator
Institutional structure of public Universitiesresearch Polytechnics and HE colleges
Primarily transfer-oriented PSREsLarge research centres with strategic missionsPSREs specialised on basic researchDepartmental PSREs, others
Governance of public research Competition-based financing in HEIsCompetition-based financing in PSREsThird mission of universitiesTechnology transfer as part of evaluation in HEIsRelevance of private HEIsThematically specialised PSREs with transfer missionIndustry representatives on advisory boards etc. of PSREs
Intermediary infrastructure Technology transfer offices in HEIsCommercialisation enterprises, transfer institutes in HEIsScience parks and incubators in HEIsIntermediaries at level of industry associations etc.(Semi-) public technology and innovation consultants for SMEsRegional consulting networksInformation service provision for technology transferSignificance of private intermediariesJoint industrial research networks at sector level
Source: Polt et al. (2001, Tables A1 and 2); OECD (2002, Table 10)
Note: HERD = higher-education R&D; GOVERD = government R&D. BERD = business R&D; HEIs = higher-education institutions;
PSREs = public-sector research establishments; NSEM = natural sciences, engineering (incl. agric. sciences) and medicine;
GUF = gross university funding.
➔
Free
dow
nloa
d fr
om w
ww
.hsr
cpre
ss.a
c.za
be relevant to consumers and producers regardless of the extent of their direct exposureto them. In short, analyses of BSRs are justified in high-income countries simply becausewhat goes on in these relationships matters for how most people live and work.
The picture is much more complicated when we look at developing countries. At thebottom of the technological ladder, the emphasis on science and R&D is meaningless. Incountries where most people cannot read and write, scientific knowledge is not the mostimportant source of innovation, much like intellectual property is obviously not the most important right in need of legal protection. Without incorporating local andtraditional knowledge one cannot hope to grasp the dynamics of innovation in societieswhere, say, the preparation and therapeutic use of a plant-based ointment with pallia-tive properties is passed on from mother to daughter while its molecular structure is notjust unknown but also beyond the realm of anyone’s curiosity. This presents a challengefor NIS research because its subject – advanced industrial economies – introduced a biasin favour of scientific knowledge that influenced its heuristic focus and attendantmethodologies. It is clearly easier to study the interaction between foreign technologiesand local knowledge when both can be talked about in the language of scientific discov-ery. For example, although lean management was pioneered by Japanese car makers,industrial and production engineers in the USA and Europe were able to analyse itsprocesses and implement its features in their own automotive plants. What happenswhen a bio-prospector from a pharmaceutical firm in the North hires the mother anddaughter to find out which leaves they collect for their herbal medicine, complicates theinteraction conceptually and raises problems of empirical verification that the NISframework is only beginning to appreciate (see Arocena & Sutz 2000; Lundvall, Johnson,Sloth Andersen & Dalum 2002). The continuing relevance of the NIS approach willdepend on how successfully it addresses these issues.
In advanced latecomer countries, universities and other science institutions exist along-side industrial firms, and it is instructive to analyse how efficiently they contribute to theproduction and use of knowledge (for an example, see Passos, Terra, Furtado, Vedovello& Plonski 2004). Presumably, in this relationship lies part of the explanation for theabove-average growth rates of patent registrations at the European Patent Office and the US Patent and Trademark Office by firms from developing countries as diverse asArgentina, Romania and South Africa (OECD 2003: Table A.12.2). However, the degreeto which BSRs directly or indirectly contribute to human livelihoods is arguably moreimportant. In highly unequal or dualist societies, BSRs often contribute at best to iso-lated pockets of excellence. For example, analyses of the pharmaceutical sector in Brazilor India are woefully inadequate if they ignore indicators such as infant mortality or,more generally, access to the gains from BSRs in the domestic market. Both countriescommit roughly one per cent of GDP to R&D and are important manufacturers ofgeneric drugs, but only Brazil provides HIV-positive people with free antiretrovirals. Tothe extent that science and industry rely on a broad-based knowledge infrastructureacross a range of simple skills and advanced competencies, BSRs constitute at worst justanother cathedral in the desert.
T H E N O L E D G E O F N U M B E R S
191
Free
dow
nloa
d fr
om w
ww
.hsr
cpre
ss.a
c.za
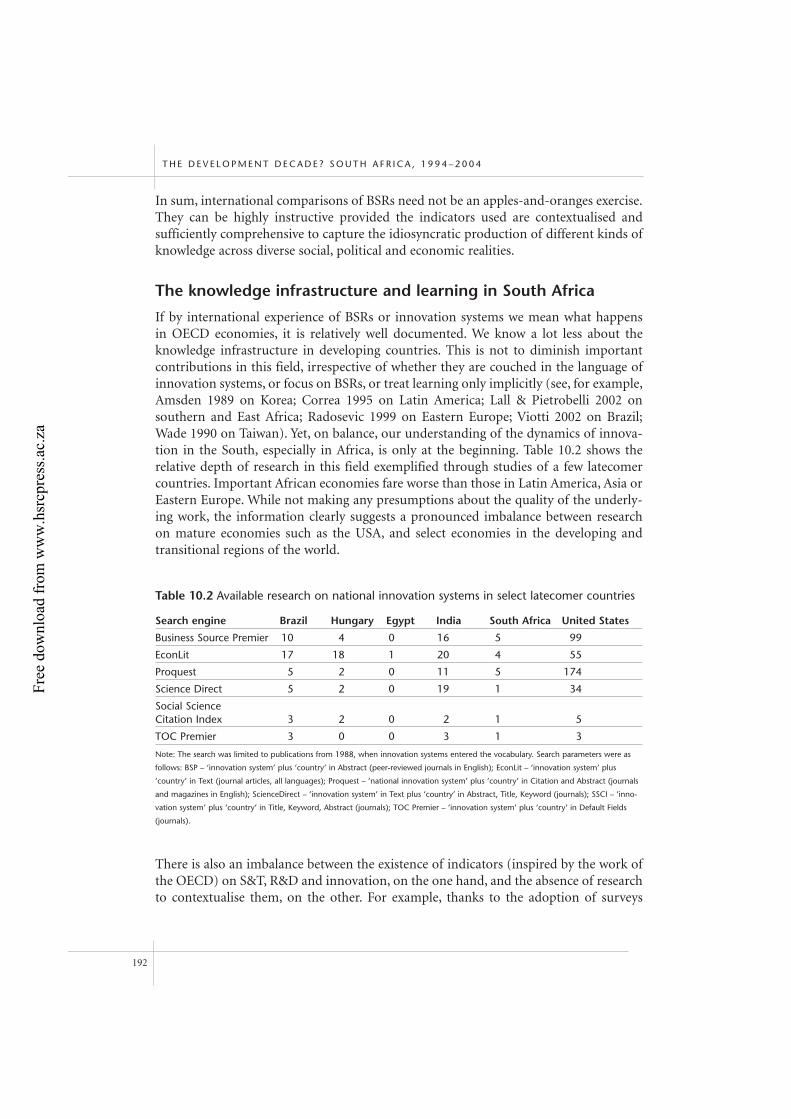
In sum, international comparisons of BSRs need not be an apples-and-oranges exercise.They can be highly instructive provided the indicators used are contextualised and sufficiently comprehensive to capture the idiosyncratic production of different kinds ofknowledge across diverse social, political and economic realities.
The knowledge infrastructure and learning in South Africa
If by international experience of BSRs or innovation systems we mean what happens in OECD economies, it is relatively well documented. We know a lot less about theknowledge infrastructure in developing countries. This is not to diminish importantcontributions in this field, irrespective of whether they are couched in the language ofinnovation systems, or focus on BSRs, or treat learning only implicitly (see, for example,Amsden 1989 on Korea; Correa 1995 on Latin America; Lall & Pietrobelli 2002 onsouthern and East Africa; Radosevic 1999 on Eastern Europe; Viotti 2002 on Brazil;Wade 1990 on Taiwan). Yet, on balance, our understanding of the dynamics of innova-tion in the South, especially in Africa, is only at the beginning. Table 10.2 shows the relative depth of research in this field exemplified through studies of a few latecomercountries. Important African economies fare worse than those in Latin America, Asia orEastern Europe. While not making any presumptions about the quality of the underly-ing work, the information clearly suggests a pronounced imbalance between research on mature economies such as the USA, and select economies in the developing and transitional regions of the world.
There is also an imbalance between the existence of indicators (inspired by the work ofthe OECD) on S&T, R&D and innovation, on the one hand, and the absence of researchto contextualise them, on the other. For example, thanks to the adoption of surveys
T H E D E V E L O P M E N T D E C A D E ? S O U T H A F R I C A , 1 9 9 4 – 2 0 0 4
192
Table 10.2 Available research on national innovation systems in select latecomer countries
Search engine Brazil Hungary Egypt India South Africa United States
Business Source Premier 10 4 0 16 5 99
EconLit 17 18 1 20 4 55
Proquest 5 2 0 11 5 174
Science Direct 5 2 0 19 1 34
Social Science Citation Index 3 2 0 2 1 5
TOC Premier 3 0 0 3 1 3
Note: The search was limited to publications from 1988, when innovation systems entered the vocabulary. Search parameters were as
follows: BSP – ‘innovation system’ plus ‘country’ in Abstract (peer-reviewed journals in English); EconLit – ‘innovation system’ plus
‘country’ in Text (journal articles, all languages); Proquest – ‘national innovation system’ plus ‘country’ in Citation and Abstract (journals
and magazines in English); ScienceDirect – ‘innovation system’ in Text plus ‘country’ in Abstract, Title, Keyword (journals); SSCI – ‘inno-
vation system’ plus ‘country’ in Title, Keyword, Abstract (journals); TOC Premier – ‘innovation system’ plus ‘country’ in Default Fields
(journals).
Free
dow
nloa
d fr
om w
ww
.hsr
cpre
ss.a
c.za
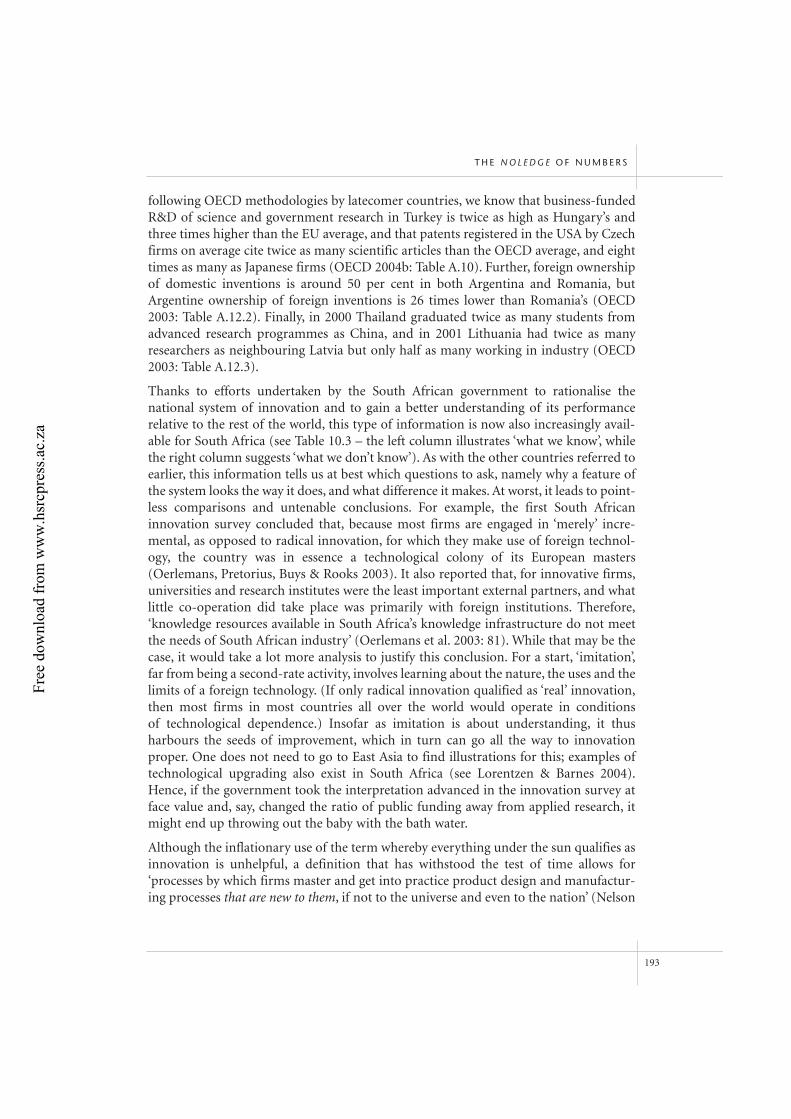
following OECD methodologies by latecomer countries, we know that business-fundedR&D of science and government research in Turkey is twice as high as Hungary’s andthree times higher than the EU average, and that patents registered in the USA by Czechfirms on average cite twice as many scientific articles than the OECD average, and eighttimes as many as Japanese firms (OECD 2004b: Table A.10). Further, foreign ownershipof domestic inventions is around 50 per cent in both Argentina and Romania, butArgentine ownership of foreign inventions is 26 times lower than Romania’s (OECD2003: Table A.12.2). Finally, in 2000 Thailand graduated twice as many students fromadvanced research programmes as China, and in 2001 Lithuania had twice as manyresearchers as neighbouring Latvia but only half as many working in industry (OECD2003: Table A.12.3).
Thanks to efforts undertaken by the South African government to rationalise thenational system of innovation and to gain a better understanding of its performance relative to the rest of the world, this type of information is now also increasingly avail-able for South Africa (see Table 10.3 – the left column illustrates ‘what we know’, whilethe right column suggests ‘what we don’t know’). As with the other countries referred toearlier, this information tells us at best which questions to ask, namely why a feature ofthe system looks the way it does, and what difference it makes. At worst, it leads to point-less comparisons and untenable conclusions. For example, the first South African innovation survey concluded that, because most firms are engaged in ‘merely’ incre-mental, as opposed to radical innovation, for which they make use of foreign technol-ogy, the country was in essence a technological colony of its European masters(Oerlemans, Pretorius, Buys & Rooks 2003). It also reported that, for innovative firms,universities and research institutes were the least important external partners, and whatlittle co-operation did take place was primarily with foreign institutions. Therefore,‘knowledge resources available in South Africa’s knowledge infrastructure do not meetthe needs of South African industry’ (Oerlemans et al. 2003: 81). While that may be thecase, it would take a lot more analysis to justify this conclusion. For a start, ‘imitation’,far from being a second-rate activity, involves learning about the nature, the uses and thelimits of a foreign technology. (If only radical innovation qualified as ‘real’ innovation,then most firms in most countries all over the world would operate in conditions of technological dependence.) Insofar as imitation is about understanding, it thus harbours the seeds of improvement, which in turn can go all the way to innovationproper. One does not need to go to East Asia to find illustrations for this; examples oftechnological upgrading also exist in South Africa (see Lorentzen & Barnes 2004).Hence, if the government took the interpretation advanced in the innovation survey atface value and, say, changed the ratio of public funding away from applied research, itmight end up throwing out the baby with the bath water.
Although the inflationary use of the term whereby everything under the sun qualifies asinnovation is unhelpful, a definition that has withstood the test of time allows for‘processes by which firms master and get into practice product design and manufactur-ing processes that are new to them, if not to the universe and even to the nation’ (Nelson
T H E N O L E D G E O F N U M B E R S
193
Free
dow
nloa
d fr
om w
ww
.hsr
cpre
ss.a
c.za
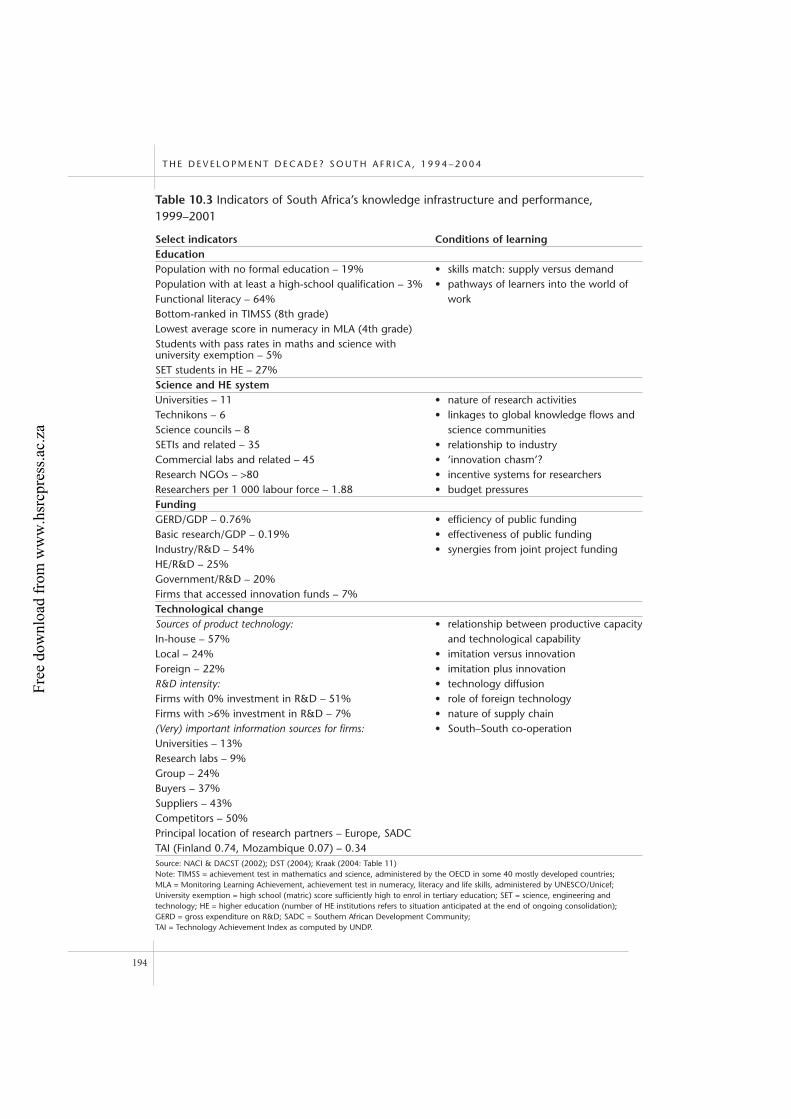
T H E D E V E L O P M E N T D E C A D E ? S O U T H A F R I C A , 1 9 9 4 – 2 0 0 4
194
Table 10.3 Indicators of South Africa’s knowledge infrastructure and performance,1999–2001
Select indicators Conditions of learningEducationPopulation with no formal education – 19% • skills match: supply versus demandPopulation with at least a high-school qualification – 3% • pathways of learners into the world ofFunctional literacy – 64% workBottom-ranked in TIMSS (8th grade)Lowest average score in numeracy in MLA (4th grade)Students with pass rates in maths and science with university exemption – 5%SET students in HE – 27%Science and HE systemUniversities – 11 • nature of research activitiesTechnikons – 6 • linkages to global knowledge flows andScience councils – 8 science communitiesSETIs and related – 35 • relationship to industryCommercial labs and related – 45 • ‘innovation chasm’?Research NGOs – >80 • incentive systems for researchersResearchers per 1 000 labour force – 1.88 • budget pressures FundingGERD/GDP – 0.76% • efficiency of public fundingBasic research/GDP – 0.19% • effectiveness of public fundingIndustry/R&D – 54% • synergies from joint project fundingHE/R&D – 25%Government/R&D – 20%Firms that accessed innovation funds – 7%Technological changeSources of product technology: • relationship between productive capacityIn-house – 57% and technological capabilityLocal – 24% • imitation versus innovationForeign – 22% • imitation plus innovationR&D intensity: • technology diffusionFirms with 0% investment in R&D – 51% • role of foreign technologyFirms with >6% investment in R&D – 7% • nature of supply chain(Very) important information sources for firms: • South–South co-operationUniversities – 13%Research labs – 9%Group – 24%Buyers – 37%Suppliers – 43%Competitors – 50%Principal location of research partners – Europe, SADCTAI (Finland 0.74, Mozambique 0.07) – 0.34Source: NACI & DACST (2002); DST (2004); Kraak (2004: Table 11)Note: TIMSS = achievement test in mathematics and science, administered by the OECD in some 40 mostly developed countries; MLA = Monitoring Learning Achievement, achievement test in numeracy, literacy and life skills, administered by UNESCO/Unicef;University exemption = high school (matric) score sufficiently high to enrol in tertiary education; SET = science, engineering andtechnology; HE = higher education (number of HE institutions refers to situation anticipated at the end of ongoing consolidation);GERD = gross expenditure on R&D; SADC = Southern African Development Community; TAI = Technology Achievement Index as computed by UNDP.
Free
dow
nloa
d fr
om w
ww
.hsr
cpre
ss.a
c.za
& Rosenberg 1993: 4, emphasis added). That this definition was coined for a volumedealing with advanced economies is testimony to the fact that innovation does notalways push the technology frontier and that learning happens in relation to, but notonly at, the frontier, that it involves not only so-called high-tech sectors, and that devel-oping countries do not require such a watered-down definition as to render the conceptmeaningless.
Likewise, the apparent mismatch between the country’s knowledge resources and theneeds of industry does not necessarily suggest that higher education institutions andscience institutes are somehow unqualified to fulfil the expectations of firms, or thatthey are too inept even to understand what these expectations might be. Other explana-tions are equally plausible. With the liberalisation of the South African economy in theearly 1990s, export-oriented firms had no time to waste to upgrade their operations. Inmany instances, it may have been more feasible to draw on knowledge and otherresources invested in global supply chains rather than on those closer to home, simplybecause the higher education and science sector was not in a position comprehensivelyto marshal the capital outlays for instrumentation, and so on, demanded in the shortrun by multinational principals. Hence, this would not be a case of the academy indenial of its role in economic development, generally, and in technological upgrading,in particular, but much more a bread-and-butter issue of objectively more or less avail-able resources. It is important to understand this difference, especially in view of theofficially endorsed national strategic objective to emulate South Korea’s technologicaltrajectory with its focus on advanced manufacturing and on creating a knowledge basefor industrial innovation (NACI & DACST 2002). In turn, there is nothing wrong per sewith South African firms exploiting foreign sources of knowledge. What would bewrong unequivocally is if they contented themselves with sub-standard knowledge; this,too, is a complex issue in need of further analysis.
In short, for the increasingly widely available indicators on knowledge production tocontribute to fruitful comparisons of national innovation systems more generally, andto inform policy, they must be contextualised. In turn, this requires attention to howdemand for knowledge, especially by firms, is actually articulated in discrete nationaland regional contexts.
Future research
Learning takes place when firms identify, absorb and exploit relevant knowledge. Theobject of learning can be process or product innovations, or also pre-commercial knowl-edge. Learning is a purposeful act in that it aims at doing things differently – masteringtechnical change is an example. In this definition ‘learning by doing’ is merely animprovement of static efficiencies and not strictly a form of learning. Prior knowledge,which depending on industry characteristics may be rather costly to accumulate,facilitates learning. R&D also stimulates learning insofar as it helps in staying abreast oftechnological changes and deciding on the most relevant knowledge to absorb and
T H E N O L E D G E O F N U M B E R S
195
Free
dow
nloa
d fr
om w
ww
.hsr
cpre
ss.a
c.za
adapt. Therefore, R&D is not only – and often not even primarily – about generatingnew information.
Learning is also a by-product of manufacturing operations. Solving production prob-lems allows firms to identify new information relevant to a product market. Finally,advanced technical training creates skills that make learning easier. Firms that are goodlearners have a high absorptive capacity, which makes it more likely that they appreciateemerging technological opportunities. Conversely, those with underdeveloped absorp-tive capacities risk ending up in technological culs-de-sac (Cohen & Levinthal 1989,1990). Firms must walk a fine line between potential and realised absorptive capacity; abeautiful idea that never makes it to the market is no good (Zahra & George 2002).
The institutional milieu within which firms operate influences the modalities withwhich they internalise knowledge. Opportunistic suppliers or buyers, mismatched skillssets from the education sector, an indifferent science sector, and a regulatory and tradeenvironment that either errs on the side of too little or too much competition are notconducive to investing in knowledge acquisition. Likewise, structural mismatchesbetween the various constituents of the knowledge infrastructure may bedevil a virtuous interaction. When scientists, engineers, and managers do not speak the samelanguage and when they cannot rely on an institution that helps them to communicateabout new information, its operationalisation and eventual marketability, then individ-ually successful instances of learning by any one actor are unlikely to translate into thecollective mastery of innovation that drives the technological trajectory of countries.
Unfortunately, there is as yet no generally agreed notion of national absorptive capacityaggregated upwards from firm-level competencies. However, it would be possible sys-tematically to link absorptive capacities of firms with formal and informal skills profilesand with higher-order knowledge production in the tertiary education and sciencesector. Stage-based models of development that offer conjectures, however tentative,about how a country moves from a lower to a higher level of technological activity byconceptualising the import of both internally generated and foreign knowledge, wouldprovide a useful framework (Narula & Dunning 2000).
BSRs are but one part of national or regional innovation systems. This chapter hasargued that the study of BSRs, or indeed any interpretation of S&T and R&D or inno-vation indicators, must be embedded in more comprehensive assessments of knowledgecreation and use in a society. This is especially pertinent in the South African contextwhere relevance ‘to the real needs of society’ – the cui bono? of technological progress –is part of the official definition of innovation. In particular, it needs a micro-foundationof the dynamics of learning that involves the absorptive capacities of all actors andorganisations that matter to the system, inter alia, in schools, firms, colleges and univer-sities, and other science institutions. If, how, and why they interact, what hinders theircommunication, and to what extent linkages (including to foreign sources of knowl-edge) between them produce more or less desirable outcomes, and for whom, mustinform the research question.
T H E D E V E L O P M E N T D E C A D E ? S O U T H A F R I C A , 1 9 9 4 – 2 0 0 4
196
Free
dow
nloa
d fr
om w
ww
.hsr
cpre
ss.a
c.za
The creation of internationally comparable indicators is welcome as long as countryrankings – the noledge of numbers – do not substitute for proper policy analysis andadvice. Much more relevant than South Africa’s relative position in the global R&Dcharts is what difference this expenditure makes to the country’s hoped-for catching up,at what cost, to whose benefit and with what time horizon. Once these issues becomeclearer, relating one’s own to international practice can become a learning experiencefrom which lessons can be derived for better policy at home and perhaps elsewhere. Theconsequences of the un-reflected adoption of alleged best global practices may be deleterious. The good news is that there is a strong emerging interest in the functioningof national innovation systems in developing and latecomer countries. Hence, there is agrowing body of knowledge to draw on, and research into absorptive capacities is likelyto benefit from comparing research designs and results, and perhaps aligning method-ologies. It will take some time before our understanding of technological learning in theSouth catches up with the attendant literature on the North. On the other hand, it tookonly some two decades to move from initial formulations of the innovation systemconcept to a broadly accepted and influential body of knowledge concerning advancedeconomies. If the catch-up logic applies to academic research, the low level of researchproductivity illustrated in Table 10.2 should translate into higher rates of productivitygrowth, with a resulting cottage industry of analyses of learning and innovation indeveloping countries.
What an exciting prospect…
Note
This chapter is an expanded version of Lorentzen (2005). I am grateful to Larry Westphal for
insightful and encouraging comments on an earlier draft, to the School of Development Studies for
inviting me to a very interesting conference and to Mike Morris for putting together a stimulating
panel. As for slips, crass misinterpretations and logical fallacies – mea culpa.
References
Agrawal A (2001) University-to-industry knowledge transfer: Literature review and unanswered
questions, International Journal of Management Reviews 3: 285–302.
Amsden A (1989) Asia’s next giant: South Korea and late industrialization. New York: Oxford
University Press.
Arocena R & Sutz J (2000) Looking at national systems of innovation from the South, Industry and
Innovation 7: 55–75.
Audretsch D & Feldman M (1996) R&D spillovers and the geography of innovation and production,
American Economic Review 86: 630–40.
Barré R (2001) Sense and nonsense of S&T productivity indicators, Science and Public Policy 28:
259–66.
T H E N O L E D G E O F N U M B E R S
197
Free
dow
nloa
d fr
om w
ww
.hsr
cpre
ss.a
c.za
Best M & Forrant R (2000) Regional industrial modernization programmes: Two cases from
Massachusetts, European Planning Studies 8: 211–23.
Bozeman B (2000) Technology transfer and puiblic policy: A review of research and theory,
Research Policy 29: 627–55.
Caloghirou Y, Tsakanikas A & Vonortas N (2001) University–industry cooperation in the context of
the European framework programmes, Journal of Technology Transfer 26: 153–61.
Carayannis E & Alexander J (1999) Secrets of success and failure in commercializing US Government
R&D laboratory technologies: A structured case study approach, International Journal of
Technology Management 18: 246–69.
Carayannis E, Alexander J & Ioannidis A (2000) Leveraging knowledge, learning, and innovation in
forming strategic government–industry (GIU) R&D partnerships in the US, Germany, and
France, Technovation 20: 477–88.
Carlsson B, Jacobsson S, Holmén M & Rickne A (2002) Innovation systems: Analytical and
methodological issues, Research Policy 31: 233–45.
Chang P-L & Hsu W-S (2002) Improving the innovative capabilities of Taiwan’s manufacturing
industries with university–industry research partnerships, International Journal of Advanced
Manufacturing Technology 19: 775–87.
Cockburn I & Henderson R (1998) Absorptive capacity, coauthoring behaviour, and the organization
of research in drug discovery, Journal of Industrial Economics 46: 157–82.
Cohen W & Levinthal D (1989) Innovation and learning: The two faces of R&D, Economic Journal
99: 569–96.
Cohen W & Levinthal D (1990) Absorptive capacity: A new perspective on learning and innovation,
Administrative Science Quarterly 35: 128–52.
Correa C (1995) Innovation and technology transfer in Latin America: A review of recent trends and
policies, International Journal of Technology Management 10: 815–45.
DACST (1996) White Paper on Science & Technology. Pretoria: Department of Arts, Culture,
Science and Technology.
DST (2004) South African national survey of research and experimental development (R&D)
(2001/02 fiscal year). Pretoria: Department of Science and Technology.
Furman J, Porter M & Stern S (2002) The determinants of national innovative capacity, Research
Policy 31: 899–933.
Hagen R (2002) Globalization, university transformation and economic regeneration. A UK case
study of public/private sector partnership, International Journal of Public Sector Management
15: 204–18.
Kastrinos N (2001) Contribution of socio-economic research to the benchmarking of RTD policies
in Europe, Science and Public Policy 28: 238–46.
Kraak A (2004) An overview of South African human resources development. Cape Town: HSRC Press.
T H E D E V E L O P M E N T D E C A D E ? S O U T H A F R I C A , 1 9 9 4 – 2 0 0 4
198
Free
dow
nloa
d fr
om w
ww
.hsr
cpre
ss.a
c.za
Lall S & Pietrobelli C (2002) Failing to compete: Technology development and technology systems in
Africa. Cheltenham: Elgar.
Lee Y (1996) ‘Technology transfer’ and the research university: A search for the boundaries of
university–industry collaboration, Research Policy 25: 843–63.
Lee Y (2000) The sustainability of university–industry research collaboration: An empirical
assessment, Journal of Technology Transfer 25: 111–33.
Lorentzen J (2005) Apples and oranges: Local learning and international experiences in higher
education–industry relationships, Industry and Higher Education 19: 104–08.
Lorentzen J & Barnes L (2004) Learning, upgrading, and innovation in the South African automotive
industry, European Journal of Development Research 16: 463–95.
Lundvall B, Johnson B, Sloth Andersen E & Dalum B (2002) National systems of production,
innovation and competence building, Research Policy 31: 213–31.
Mansfield E (1998) Academic research and industrial innovation: An update of empirical findings,
Research Policy 26: 773–6.
NACI & DACST (2002) South African science and technology: Key facts and figures 2002. Pretoria:
National Advisory Council on Innovation and Department of Arts, Culture, Science and
Technology.
Narula R & Dunning J (2000) Industrial development, globalization and multinational enterprises:
New realities for developing countries, Oxford Development Studies 28: 141–67.
Nelson R (ed.) (1993) National innovation systems. Oxford: Oxford University Press.
Nelson R & Rosenberg N (1993) Technical innovation and national systems, in R Nelson (ed.)
National innovation systems. Oxford: Oxford University Press.
OECD (2002) Benchmarking industry–science relationships. Paris: OECD.
OECD (2003) STI scoreboard: Creation and diffusion of knowledge. Paris: OECD.
OECD (2004a) Science and innovation policy. Paris: OECD.
OECD (2004b) Science and technology statistical compendium. Paris: OECD.
Oerlemans L, Pretorius M, Buys A & Rooks G (2003) Industrial innovation in South Africa 1998–2000.
Pretoria: Department of Arts, Culture, Science and Technology.
Passos C, Terra B, Furtado A, Vedovello C & Plonski G (2004) Improving university–industry
partnership: the Brazilian experience through the scientific and technological support program
(PADCT III), International Journal of Technology Management 27: 475–87.
Patel P & Pavitt K (1994) National innovation systems: Why they are important, and how they might
be measured and compared, Economics of Innovation and New Technology 3: 77–95.
Polt W, Rammer C, Gassler H, Schibany A & Hartinger D (2001) Benchmarking industry–science
relations: The role of framework conditions, Science and Public Policy 28: 247–58.
Poyago-Theotoky J, Beath J & Siegel D (2002) Universities and fundamental research: Reflections on
the growth of university–industry partnerships, Oxford Review of Economic Policy 18: 10–21.
T H E N O L E D G E O F N U M B E R S
199
Free
dow
nloa
d fr
om w
ww
.hsr
cpre
ss.a
c.za
Radosevic S (1999) The Eastern European latecomer firm and technology transfer: From ‘muddling
through’ to ‘catching up’, in G Bugliarello, N Pak, Z Alferov & J Moore East-West technology
transfer. Dordrecht: Kluwer.
Smith K (2001) Comparing economic performance in the presence of diversity, Science and Public
Policy 28: 267–76.
Thursby J & Thursby M (2000) Who is selling the ivory tower? Sources of growth in university licensing.
Working Paper No. 7718, NBER, Cambridge.
Viotti E (2002) National learning systems: A new approach on technological change in late
industrializing economies and evidences from the cases of Brazil and South Korea,
Technological Forecasting & Social Change 69: 653–80.
Wade R (1990) Governing the market: Economic theory and the role of government in East Asian
industrialization. Princeton, NJ: Princeton University Press.
Zahra S & George G (2002) Absorptive capacity: A review, reconceptualization, and extension,
Academy of Management Review 27: 185–203.
T H E D E V E L O P M E N T D E C A D E ? S O U T H A F R I C A , 1 9 9 4 – 2 0 0 4
200
Free
dow
nloa
d fr
om w
ww
.hsr
cpre
ss.a
c.za
11The role of government in fostering clusters: the South African automotive sector
Mike Morris, Glen Robbins and Justin Barnes
Introduction
This chapter has a discrete, bounded and limited focus. It is about the role of govern-ment in facilitating cluster development in developing country contexts. Therefore, it isconcerned with asking a number of interconnected questions around the role of indus-trial policy and government interventions in creating and facilitating industrial cluster-ing and networking between firms. Within the ambit of industrial policy, it seeks tolocate government’s role in facilitating clustering in order for the firms to learn throughnetworking how to become more internationally competitive. The chapter attempts tothrow light on this issue by focusing on the experience that two of the authors have hadin setting up and running a number of clusters in the automotive sector in South Africa,and the third author’s work in local government with the brief to accelerate local eco-nomic development and foster clustering in selected sectors.
By the 1980s, the dominance of the Washington Consensus had by and large relegatedindustrial policy to a minor and subsidiary role in the armoury of developing-countrypolicies. The power of markets over the role of state resource allocation has become the dominant orthodoxy – trade-policy liberalisation, deregulation, and dismantling of policy/administrative regimes designed to promote industrial development.Consequently, trade policy has come to dominate industrial policy in the discourseabout promoting industrial development. The World Bank’s study on industrial policyin East Asia (World Bank 1993) concluded that targeted industrial policies had been afailure, and the only positive role that the governments had played was to promotegeneric economy-wide incentives, such as education and research and development(R&D), to compensate for market failures. Insofar as industrial policy interventions hadbeen successful, the capacity demands on government were so stringent as to excludemost developing countries from being able to adopt them (Pack 2000). Hence, in anenvironment poor in state resources such as sub-Saharan Africa, which lacks robust andskilled political and administrative systems, there is extreme scepticism that the EastAsian approach could be utilised (Wood 2002).
The last couple of decades have witnessed the emergence of a considerable body ofresearch and academic writing making the case for theorists, government policy-makers,strategy implementers, organised business formations and firms to pay more attentionto matters of inter-firm co-operation, networks, devolution of industrial policy and
201
Free
dow
nloa
d fr
om w
ww
.hsr
cpre
ss.a
c.za
instruments to the local level, regional collaboration and clusters as playing a crucial rolein assisting firms to become more internationally competitive (Bessant & Kaplinsky1995; Bell & Albu 1999; Humphrey & Schmitz 1996; Lawson & Lorenz 1999; Maskell,Eskelinen, Hannibaldson, Malmberg & Vatne 1999; Nadvi 1999; Nadvi & Schmitz 1999;Porter 1990; Schmitz 1999a, 1999b). How does the prevailing orthodoxy square with thediscussion around the importance of clusters and learning networks in helping devel-oping country firms co-operate and become more internationally competitive? Clearly,if such co-operative clusters and networks can be created then it requires some form of purposive action. Well, the World Bank accepts the role that clusters and learning networks can play in assisting industrialisation in developing countries, but its answer isvery much in line with the generally dominant orthodoxy on industrial policy. As the1997 World Development Report argues:
High-intensity initiatives should be approached cautiously, or not at all, unlesscountries have unusually strong institutional capability: strong administrativecapability, commitment mechanisms that credibly restrain arbitrary governmentaction, the ability to respond flexibly to surprises, a competitive business envi-ronment and a track record of public–private partnership…[instead] light-touchinitiatives [those that are inexpensive, and supportive rather than restrictive orcommand-oriented] offer more flexibility. (World Bank 1997: 75)
In discussing the role of public policy in respect of clusters in developing countries, theWorld Bank (2004) argues for a redefinition of the role of the government as a facilita-tor of networking, as a catalyst of dynamic comparative advantage and as an institutionbuilder, creating an efficient incentive structure to remove systemic and market ineffi-ciencies in (national) systems of innovation. However, for the Bank, this redefinitionmeans that the creation of clusters should not be a government-driven effort but shouldbe the result of market-induced and market-led initiatives. Developing countries muststrategically shift from policies of direct intervention to ones of indirect inducement (e.g. creating supporting network, dialogue and knowledge exchange structures andschemes). The Bank is quite definite that the role of the government should be verylimited. Clusters should not be government-driven. The government should not sub-sidise firms or sectors in setting up clusters, nor should cluster policy be about limitingmarket rivalry. Furthermore, it warns that the government should not try to create clus-ters from ‘scratch’ in declining markets and industries. The government also should nottry to take the direct lead or ownership in cluster initiatives; instead, it should work as a catalyst, a broker bringing actors together, creating forums for dialogue, supplyingsupporting structures and incentives to facilitate the clustering and innovation process.
What is the position of those who would regard themselves as falling outside this para-digmatic ambit, and who still consider industrial policy and government interventionsto bolster it as important levers for developing countries to utilise?
Part of the problem in counteracting this prevailing orthodoxy is that industrial policyis often discussed on very practical terrains. It is often about concrete industrial
T H E D E V E L O P M E N T D E C A D E ? S O U T H A F R I C A , 1 9 9 4 – 2 0 0 4
202
Free
dow
nloa
d fr
om w
ww
.hsr
cpre
ss.a
c.za
policies in particular economies, which then takes the form of an empirical assessmentof the efficacy of state intervention in particular contexts, and hence whether it is generalisable to other countries and sectors (see Dutt, Kim & Singh 1994). In thesecases, discussion takes the form of enumerating and evaluating particular policy orstrategy measures: financial incentives, human resources development, investment(including foreign direct investment) incentives, infrastructural investment, publicprocurement, R&D support and incentives, various firm-level subsidies, export pro-motion, merger and competition policies, small and medium enterprise support,industrial agglomeration policies, and so on. This runs the danger of becoming a listwith no end or beginning, no form of organisational or conceptual classification, andincluding anything that has a bearing on industrial development. As Chang (1994: 59)who has presented the most comprehensive discussion of the various usages of indus-trial policy observes, this ‘overloads the concept of industrial policy, rendering theconcept meaningless’.
Instead, Chang (1994: 59–60) cautions against a wide perspective that comprises a‘catch-all term for all policies affecting industrial performance’; instead, we should‘define industrial policy as a policy aimed at particular industries (and firms as theircomponents) to achieve the outcomes that are perceived by the state to be efficient for theeconomy as a whole’ (emphasis in the original).1 His solution to the problem of ensuringthat industrial policy avoids being a ‘catch-all term’ for every economic policy ‘affectingindustrial performance’ is to restrict it, first and foremost, to policies aimed at particu-lar, designated industries.
Clearly, placing the emphasis on policies or strategies that are aimed at particular indus-tries is an important step in avoiding conceptual meaninglessness and the inclusion ofall economic measures within the rubric of industrial policy because they impact onindustrial development. But what about general policies that support individual firms toupgrade or groups of firms to co-operate (i.e. form clusters or learning networks), whichare very clearly aimed at fostering industrial competitiveness but which in their formu-lation are not sectorally specific? For example, within the framework of an industrialpolicy, creating government strategic levers (e.g. financial support, incentives andknowledge flows) to assist firms to co-operate, set up clusters for collective action, orsimply learning networks. These may well be taken up, more or less enthusiastically andsuccessfully, by any particular industrial sector or may involve firm activities acrosssectors. Ultimately, the conceptual differentiation that determines whether a policy is anindustrial policy must lie in its general aims, objectives and implementing strategiesrather than the particularity of the targeted industry/sector.
Wade (1990) provides some basis for starting a conceptual classification of these dif-ferent kinds of industrial policy. Although his aim is somewhat different and he doesnot discuss the conceptual issue in great detail, he distinguishes between ‘functionalor horizontal’ industrial policies versus ‘selective or industry-specific’ policies andsays these are differentiated by their respective impact. In our opinion, the mostuseful systemisation of these different aspects of industrial policy, which allows one
T H E R O L E O F G O V E R N M E N T I N F O S T E R I N G C L U S T E R S
203
Free
dow
nloa
d fr
om w
ww
.hsr
cpre
ss.a
c.za
to differentiate in a hierarchical manner according to source, aims, objectives andimpact, lies in the work of Lall and Teubal (1998). They distinguish between threetypes of policy, namely:• ‘functional’ policies, which improve market operations – for example, policies
designed to enhance competitive pressures (competitions policy, lowering tariffs);• ‘horizontal’ policies, which cross sectors – such as generalised incentives to
promote greater R&D and training; and• ‘selective’ policies designed to promote the advance of particular sectors (for
example, preferential access to capital or sector-specific subsidies) or particularfirms (for example, the promotion of ‘national champions’ such as the Proton autofirm in Malaysia).
Where would we place policies and strategy levers to foster clusters in this schema?Although in their implementation and take-up by firms, they tend more often than notto be sector specific, the general policy formulation and support mechanisms generallyfall into the ‘horizontal’ category of industrial policy, which cuts across sectors.
So what do those analysts advocating industrial policy in developing countries have tosay about the role of public policy and government levers to facilitate and support clus-ters, collective action and learning networks in developing countries? Well, there is a lotabout the importance of clusters, and even a fair amount about what should be done tomaintain them. However, there is much less about how to create them. Surprisingly,given the plethora of literature on the subject of clusters, there seems not an enormousamount that, in identifying various policy measures, specifically targets the role of gov-ernment, or locates this role within the general ambit of industrial policy, or takes onboard the World Bank orthodoxy of a very limited role for government in fosteringcluster development.
It is not our intention to provide a long review of this literature. However, we presentsome of the key alternative positions that set out a clear role for government and publicpolicy in facilitating clusters. In their survey of cluster initiatives in Latin America,Altenburg and Meyer-Stamer (1999) identify the following areas in which governmentcan help the advancement of clusters: promoting an environment for business, stimu-lating inter-firm co-operation, information and advisory services, training, R&D andtechnology. In advocating their Triple-C approach, Humphrey and Schmitz (1995)mention a number of policy measures to facilitate and solidify cluster development but,as they say, what government should do about it is less clear. Lall (2004) makes the casefor the importance of treating cluster facilitation as a part of industrial policy, andstresses the role of clusters in building absorptive capacity both in firms and in govern-ment. Helmsing (2001) makes a case for significant public-policy adjustments andstresses the importance of the state’s role in the process, particularly in its regional andlocal form. He also makes a case for the development of new government arrangementswithin the private sector to facilitate learning and networking processes, as well as newgovernance relationships between the state and the private sector in the form of part-nerships geared towards the facilitation of networking and learning activities. Morosini
T H E D E V E L O P M E N T D E C A D E ? S O U T H A F R I C A , 1 9 9 4 – 2 0 0 4
204
Free
dow
nloa
d fr
om w
ww
.hsr
cpre
ss.a
c.za
(2004), in his general, comprehensive review of public policy around clustering, posits arange of roles that public policy-makers, through government interventions, can play infostering the development of clusters and associated learning activities. These include arole for government in terms of facilitation and resource allocation, general promotionincluding the accruing of benefits, co-ordinating certain cluster-related activities, andacting as the manager of cluster processes.
The United Nations Industrial Development Organisation (UNIDO) has a comprehen-sive website (www.unido.org/clusters) with a detailed policy framework for supportingand facilitating cluster development in developing countries. The approach and specifi-cation of stages and responsibilities is extremely useful for those involved in building up clusters. The importance of neutral external intermediaries and brokers in buildingcluster co-operation is a strong thrust of the policy recommendations. However, much ofthe UNIDO literature is silent on allocating specific responsibilities to external public--sector role-players (such as government, donors, business associations and internationalagencies) and, especially, on the specific role that developing country governments can orshould play in the process.
Our aim here is to use this literature to isolate some key questions on what the role of gov-ernment should be in fostering clusters, and to apply these to the case studies of clusteringin the South African automotive industry. Apart from the clear premises of distanceemanating from the World Bank orthodoxy, in general the literature on agency andpolicy in cluster facilitation tends not to differentiate clearly between the roles played bygovernment versus private-sector facilitators (business development services). It tendsnot to be specific on the different roles for central versus local government; and withrespect to real processes of implementation, it is fairly silent on the necessary institu-tional arrangements to ensure that public–private partnerships work in practice. Finally,it focuses more often than not on policy prescription and tends to be somewhat shorton detailed examination of problems encountered in actual cases of public–privateinterventions to foster clustering and networking.
Hence, our task is to focus on the following three issues concerning government imple-mentation of policies to foster clustering and co-operative networking activitiesamongst firms:• The gap between the policy supportive framework and the institutional
arrangements the state puts in place to implement them. How can it be ensuredthat state cluster-support policy is implemented in a way that facilitates policyobjectives rather than obstructs them?
• The relative places and functions of actors in the real process of creating andsupporting clusters in public–private-sector partnerships. Is this a twosome orthreesome in bed with each other and who does what to whom?
• The appropriate levels of state-led implementation of policies. Is it sensible tocentralise the activities of policy formulation, resource allocation, and supportingimplementation in the central organs of government? Can we differentiate andspecify different places and functions for different activities?
T H E R O L E O F G O V E R N M E N T I N F O S T E R I N G C L U S T E R S
205
Free
dow
nloa
d fr
om w
ww
.hsr
cpre
ss.a
c.za
The South African cluster policy context
The industrial policy designed by the Industrial Strategy Project (see Joffe, Kaplan,Kaplinsky & Lewis 1995) and adopted by the new democratic South African regimewas founded on a view that ‘competitive advantage must also be derived from intra andinter firm cooperation’ (Hirsch & Hannival 1998). In its early democratisation phase(1994–1999), the Department of Trade and Industry (DTI) developed a considerablelevel of interest in the facilitation of national-level clusters to improve the competi-tiveness of key sectors aligned with its export-oriented goals. Hence, the DTI saw arole for itself in facilitating intra- and inter-firm processes to ensure that strategicinformation was exchanged between the stakeholders, as well as to enable greatercollaboration at plant level, within supply chains and amongst firms in similarsectors. The case for this was based on work by Porter (1990), Best (1990) and othersthat highlighted the importance of exogenous factors as being essential to firms’ability to compete, the importance of collaborative inter-firm processes in theirability to succeed on matters such as training, supply-chain co-operation and avariety of other aspects. Hence, in line with similar initiatives in other countries, theDTI embarked on encouraging the formation of nationally driven ‘cluster’ processesby setting up financial and incentive support via matching-grant funding schemes,such as the Sector Partnership Fund (SPF), the Workplace Challenge, andCompetitiveness Fund schemes, which aimed to boost the intra- and inter-firm co-operation that many South African firms lacked.
The DTI began to roll out a series of supply-side support programmes that were seen asless distorting than the demand-side interventions that had prevailed prior to the onsetof democracy. In this context, the work of Michael Porter on comparative and compet-itive advantage and his ‘five forces’ framework played a significant part in DTI attemptsto analyse activities of potential within priority sectors and to identify obstacles toimproved performance within value chains at a relatively generic product level. Throughsponsoring detailed sectoral analyses, the DTI shared research with industry leaders inwhat were commonly referred to as ‘clusters’ in that they brought together select repre-sentatives of suppliers, buyers, related and supporting industries, government and attimes competitors. This entailed aligning some considerable level of ‘kick-start’ fundingwith active support and involvement of DTI staff in cluster processes that commonlyaligned themselves closely with national industry associations of the relevant sectors andinvolved high-level participation of dominant companies. The DTI worked to popu-larise the concept of clusters through hosting a series of workshops with key sectorgroups in the main manufacturing regions. These were, in some instances, further supported in the form of funds and facilitation through the DTI’s Spatial DevelopmentInitiative projects, which allowed nascent cluster processes to take on more of a regionalcharacter in some instances. However, while the studies and their related disseminationprocesses contributed to the development of a shared strategic perspective of variousindustries in the country, they did not, in most instances, translate into any sustainedcollective action by the stakeholders concerned.
T H E D E V E L O P M E N T D E C A D E ? S O U T H A F R I C A , 1 9 9 4 – 2 0 0 4
206
Free
dow
nloa
d fr
om w
ww
.hsr
cpre
ss.a
c.za
Despite high-level involvement of dominant industry players and considerable directattention of policy-makers, the successes of the DTI’s direct association with clusterprocesses were muted, one critical reason being the lack of a clear funding programmebacking up the state’s promotional hype about the importance of clustering. It wasalmost as if the government thought it sufficient to simply promote the policy, andthen expected industry to implement and fund it. Despite the failure of many of thenational processes to sustain themselves beyond initial research phases, and regionalprocesses to develop on more self-sufficient paths, the exercise by the DTI is seen tohave had some benefits. It resulted in a substantial escalation of working relationshipsbetween firms involved and DTI officials to the benefit of both parties, in that DTIofficials had an opportunity to be exposed to industry knowledge and insights toinform their policy choices, and industry players gained an improved understandingof the DTI and its programmes and policies.2 However, this was nullified by the inability of the DTI to retain its sector-specific staff and the constant process ofdepartmental reorganisation, which resulted in those remaining being shifted to otherpositions or departments.
The launching of the SPF (a DTI/firm matching-grant funding scheme on a 65%/35%basis to assist five or more firms to co-operate jointly on a project) in the second half ofthe 1990s created an opportunity for sector stakeholders to build a collective agendaaround matters of competitiveness. However, the bulk of applications through thescheme resulted in one-off projects rather than sustained networking (e.g. stainless steeland jewellery clusters), or where networking was sustained it did not extend beyondsingle-issue processes (e.g. the Port Elizabeth Auto Cluster with its focus on logistics).The creation, by the DTI, of a dedicated team to promote cluster initiatives yielded littlemore than further analytical studies and workshops. Participants in these processes fromindustry often complained of a DTI obsession with setting cluster agendas and of failingto recognise the importance of building trust and shared governance of processes. Anexample of this can be seen in processes that sought to establish a cluster-type partner-ship between key industrial chemical stakeholders in the Durban region, where the government’s overriding interest was in collective action to boost investment andexports, while industry participants were calling for the process to focus on resolvingenvironmental management issues as a priority.
Participants in these cluster processes, which had their origin in national processes,identified the following as core weaknesses:3
• DTI’s attempts to impose an agenda on firms;• lack of relationship (trust) building process;• lack of evidence of ‘quick wins’;• a cluster model founded on national priorities as opposed to localised common
concerns between firms, leaving firms disconnected from the agenda;• a government-driven governance model without the creation of real partnerships;
and• lack of credibility/knowledge of DTI facilitators.
T H E R O L E O F G O V E R N M E N T I N F O S T E R I N G C L U S T E R S
207
Free
dow
nloa
d fr
om w
ww
.hsr
cpre
ss.a
c.za
The result of this less than spectacular engagement with cluster processes was that theDTI took less of a direct interest in what were conventionally framed as cluster processesor inter-firm networks. This decision was perhaps contributed to by the loss of skilledstaff, who had acquired detailed sector knowledge and built relationships with someindustry role-players. The DTI seemed to have drawn the wrong conclusion from thefailure of its short-lived policy emphasis on clustering – namely, that the fault lay withclustering per se – rather than reflecting on the role of its own mistakes in the way it formulated the cluster programme. In marked contrast to the Taiwanese experience (seeLall 2004), the DTI focused on promotional tours, provided no implementation plansand no funding. However, this loss of interest in such processes by the DTI did notprevent other role-players from continuing to seek opportunities in inter-firm co-operation.
At the turn of the millennium, the DTI underwent a sustained period of restructuringaimed at allowing it to finally shed the institutional baggage of apartheid-era industrialpolicies. The DTI also shifted away from cluster processes, which were often viewed asexcessively resource intensive and as yielding less tangible results than more direct inter-ventions on an individual basis with leading sector players. While the latest policy offer-ings re-emphasise the thrust towards clusters, it remains a concept founded on strategicnational processes with key role-players in day-to-day implementation terms.
A further complication, and one that has in all probability hindered significant advanceson industrial policy content and innovation in South Africa from its early post-apartheid formulations, has been the highly centralised approach of the DTI, which hasresulted in very little meaningful interaction with other spheres of government and evenless ‘grassroots’ interaction with firms in their specific locations. The resultant impacthas been little intergovernmental co-ordination and a policy orientation with a strongtop-down delivery bias.
Within this context, it is noteworthy that very little direct interest has been shown by theDTI in processes relating to decentralisation, both for its own benefit (in terms ofimproving its intelligence base) and in terms of benefits to customers. It has also notreally engaged with the notions of how important localised processes and various net-works can be to local, regional and even national economic development. In this regard,its programmes and activities can still be characterised as highly centralised, macro-leveland generally not informed by the dynamics of space and place, and offering little interms of support to networking and clustering activities on a discrete regional basis.
The experience of the auto benchmarking clubs
During the mid-1990s, the South African automotive sector was in the midst of a substantial crisis. The Uruguay Round-related reduction of tariff protection, behind theprotection of which a domestic industry had prospered, was a major contributor to this crisis in which the volume of imported vehicles and components increased whileperformance and productivity gaps in assemblers and component producers made
T H E D E V E L O P M E N T D E C A D E ? S O U T H A F R I C A , 1 9 9 4 – 2 0 0 4
208
Free
dow
nloa
d fr
om w
ww
.hsr
cpre
ss.a
c.za
successful entry into global markets as exporters a difficult, if not impossible, exercise.However, the development by the DTI of a sector-specific restructuring support programme, in the form of the Motor Industry Development Programme (MIDP), soonbegan to encourage significant assembler production-for-export commitments in someof the major firms. While the structuring of the MIDP favoured the assemblers, the programme contributed significantly to an output turnaround and, hence, created awindow of opportunity for component suppliers in their value chains to realign them-selves with new opportunities (Barnes, Kaplinsky & Morris 2004).
In the mid-1990s, research by academics at the University of Natal on the internationalcompetitiveness of local component suppliers’ performance, fed back in a number ofworkshops, shocked the industry and spurred the formation of a nascent partnershipbetween the researchers and some firms. Under pressure from the firms to assist them,the researchers, acting as external intermediaries, formed a separate business develop-ment services company (Benchmarking and Manufacturing Analysts), and played therole of cluster facilitators. In order to set up the cluster, the SPF was used to leveragematching finance from the government (65 per cent) and the member auto firms (35 percent). Consequently, the KwaZulu-Natal (KZN) Auto Benchmarking Club became oper-ational in January 1998 after struggling for seven months to break through governmentred tape surrounding accessing financial support. This regionally-based continuousimprovement cluster was designed to help firms learn how to upgrade their operationalperformance in order to approach the international competitiveness frontier. By the endof the decade, based on its operational success, two other sister clusters were formed inthe Eastern Cape and Gauteng (Barnes & Morris 1999; Morris & Barnes 2004).
These clubs have proved to be highly successful continuous improvement clusters,judged on a number of criteria: increased knowledge sharing, as firms shared their experiences through workshops and firm visits; learning, as the newsletters diffused toother layers of management within firms; significant improvement in operational performance; increasing membership growth; and financial self-sufficiency as governmentwithdrew its financial support.
The clubs are primarily based on firms wanting to ensure continuous improvement andoperational performance enhancement in order to make themselves more internation-ally competitive. The driving force underlying knowledge sharing and upgrading of thelearning network is the process of benchmarking the operational performance ofmember firms against other club members as well as against international comparators.Therefore, the best quantitative indicator is the impact they have had on the competi-tiveness of the cluster members as measured by improvements in the operational performance of member firms. Although a wealth of information is available and isshared with firms on a regular basis, only the overall summary of progress in process-upgrading of club member firms, both in relation to their own improvements and relative to an international sample of benchmarked firms, is presented here (see Table11.1).
T H E R O L E O F G O V E R N M E N T I N F O S T E R I N G C L U S T E R S
209
Free
dow
nloa
d fr
om w
ww
.hsr
cpre
ss.a
c.za
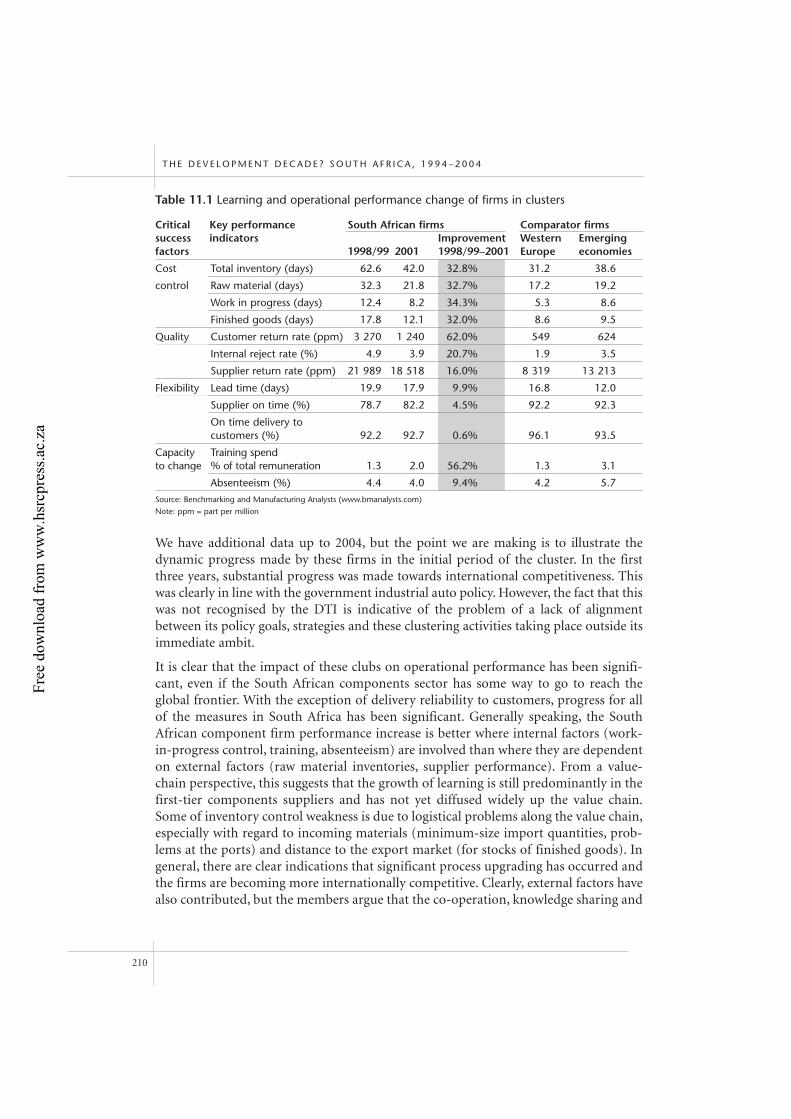
We have additional data up to 2004, but the point we are making is to illustrate thedynamic progress made by these firms in the initial period of the cluster. In the firstthree years, substantial progress was made towards international competitiveness. Thiswas clearly in line with the government industrial auto policy. However, the fact that thiswas not recognised by the DTI is indicative of the problem of a lack of alignmentbetween its policy goals, strategies and these clustering activities taking place outside itsimmediate ambit.
It is clear that the impact of these clubs on operational performance has been signifi-cant, even if the South African components sector has some way to go to reach theglobal frontier. With the exception of delivery reliability to customers, progress for allof the measures in South Africa has been significant. Generally speaking, the SouthAfrican component firm performance increase is better where internal factors (work-in-progress control, training, absenteeism) are involved than where they are dependenton external factors (raw material inventories, supplier performance). From a value-chain perspective, this suggests that the growth of learning is still predominantly in thefirst-tier components suppliers and has not yet diffused widely up the value chain.Some of inventory control weakness is due to logistical problems along the value chain,especially with regard to incoming materials (minimum-size import quantities, prob-lems at the ports) and distance to the export market (for stocks of finished goods). Ingeneral, there are clear indications that significant process upgrading has occurred andthe firms are becoming more internationally competitive. Clearly, external factors havealso contributed, but the members argue that the co-operation, knowledge sharing and
T H E D E V E L O P M E N T D E C A D E ? S O U T H A F R I C A , 1 9 9 4 – 2 0 0 4
210
Table 11.1 Learning and operational performance change of firms in clusters
Critical Key performance South African firms Comparator firmssuccess indicators Improvement Western Emerging factors 1998/99 2001 1998/99–2001 Europe economies
Cost Total inventory (days) 62.6 42.0 32.8% 31.2 38.6
control Raw material (days) 32.3 21.8 32.7% 17.2 19.2
Work in progress (days) 12.4 8.2 34.3% 5.3 8.6
Finished goods (days) 17.8 12.1 32.0% 8.6 9.5
Quality Customer return rate (ppm) 3 270 1 240 62.0% 549 624
Internal reject rate (%) 4.9 3.9 20.7% 1.9 3.5
Supplier return rate (ppm) 21 989 18 518 16.0% 8 319 13 213
Flexibility Lead time (days) 19.9 17.9 9.9% 16.8 12.0
Supplier on time (%) 78.7 82.2 4.5% 92.2 92.3
On time delivery to customers (%) 92.2 92.7 0.6% 96.1 93.5
Capacity Training spend to change % of total remuneration 1.3 2.0 56.2% 1.3 3.1
Absenteeism (%) 4.4 4.0 9.4% 4.2 5.7Source: Benchmarking and Manufacturing Analysts (www.bmanalysts.com)
Note: ppm = part per million
Free
dow
nloa
d fr
om w
ww
.hsr
cpre
ss.a
c.za
learning embedded in the operations of the clubs have played a major and critical rolein the process.
From the perspective of our focus here, the key question to answer is how we assess thegovernment’s institutional levers in assisting the process. On the positive side, it is clearthat without the existence of a sympathetic industrial policy incorporating, and theability of the service providers to access, financial support for clustering – i.e. the SPF –this network would never have seen the light of day. However, the inability of the government to come to grips with putting in place the appropriate institutional arrange-ments to create a truly enabling institutional environment also nearly killed the cluster.
One of the most striking problems experienced in terms of the establishment and initialfunctioning of the club was the institutional difficulties associated with the supply-sidesupport received from the national government. The economy may have radicallybroken with import-substituting industrialisation, and new personnel may have beenengaged in the DTI, but the department’s administrative structure of doing businessremained intact. While new policies were put in place, there was insufficient reconcep-tualisation of the deployment implications of these new policies and, hence, reconfigur-ing of the institutional arrangements to ensure that implementation followed the policyshift. As such, the supply-side support measures that replaced the previous protectiveregime were immersed in bureaucratic red tape, to the extent that it was very difficultfor firms to access them. The long lead times associated with the department’s previousdemand-side operations – basically lobbying for administrative decisions regardingtariff protection or requesting various licensing permits – were no longer adequate inthe face of the international competitiveness demands being placed on the firms relyingon some level of government support. In addition, the knowledge implications of itsshift in policy also required retraining of government staff, shifting their centre ofgravity from ‘paper pushers’ to ‘agents of change’ fully attuned to the competitivenessdemands being placed on South African firms.
Therefore, while it was very easy obtaining formal government support for the club,given its new policy reorientation and industrial development agenda, it was extremelydifficult to obtain the practical supply-side support required for the establishment of theclub. This is borne out by the fact that the club was launched seven months later thanoriginally envisaged and that it took nearly five months from the club’s launch to receivethe first disbursement of government money. Moreover, as time progressed, the clubsdiscovered that the provision of a 65 per cent subsidy proved a double-edged sword, forthe DTI invariably took between three to six months to reimburse them (and, in turn,the service providers) for expenditures incurred. Consequently, the service providersfacilitating club activities constantly experienced cash-flow crises. Very lengthy proce-dures created considerable periods of uncertainty, and payment delays threatened toderail activities and result in loss of confidence by participants. Furthermore, the factthat business services companies, such as B & M Analysts, had to pay VAT on invoice(not in and of itself a problem created by the DTI) and not on receipt of governmentfunds (which came on average three months later) placed further pressures on the
T H E R O L E O F G O V E R N M E N T I N F O S T E R I N G C L U S T E R S
211
Free
dow
nloa
d fr
om w
ww
.hsr
cpre
ss.a
c.za
viability of the clusters, absorbing excessive amounts of time in seeking to generateresource certainty. When, in 2003, the DTI suddenly reneged on promises to providemore secure three-year funding outside of the SPF bureaucratic nightmare, the clubswere faced with collapse. In 2004, the clusters abandoned seeking any national DTIsupport and became completely self-financing from member-firm payments. This wasnot without its problems but it did finally seem to allow them to solve the continuous,recurring cash-flow crises engendered by the government.
However, as if in order to drive the bureaucratic bungling point home, the DTI’s cum-bersome rules and procedures made it as difficult to end state support as it was to main-tain it. The rules required auditing as the final step, but no funds were allocated in theinitial budgets for this process. The DTI informed the clubs in writing that it wouldcover the full SPF closure auditing costs. Despite this assurance, when the invoices weresent to the DTI they claimed that their known rules only allowed them to pay 65 per centof costs. Thus, notwithstanding the fact that they took four months to decide this andthe clubs/service providers incurred an additional 20 per cent interest charges for latepayment, the DTI induced a further cash-flow crisis by reneging on a further 35 per centof the auditing costs to wind down their very own SPF mechanism.
The experience of the Durban Auto Cluster
In 2001, a significant development occurred when the Durban Metropolitan Council’sEconomic Development Department took a high-level interest in the potential to widenthe scope of the KZN Benchmarking Club into a broader cluster taking on a greatervariety of automotive problems in the region. Municipal seed funding was provided,which resulted in the launch of the Durban Auto Cluster (DAC) in January 2002 based on four foci – supplier development, logistics, human resources development andoperational performance.
Early collective gains, such as more favourable freight rates and shared training infra-structure and programmes, soon encouraged firms to extend the scope of work of theDAC by contributing increasing levels of funding. Since its formal establishment, thecluster has grown to incorporate in excess of 35 firms, and sources the bulk of itsfunding from firm contributions and local state authority (the metropolitan govern-ment), with minor contributions having come from the provincial government and verymuch smaller amounts from the DTI. It has developed an array of programmes rangingfrom highly technical, specialised training interventions that might benefit a handful offirms to more generic initiatives such as programmes to support new entrants into thesector, especially emerging black-owned firms. It is widely viewed as an example of ahighly effective cluster (Bessant, Kaplinsky & Morris 2003).
It is also important to note that the DAC processes were not undertaken under thebanner of any industry association. Earlier Benchmarking Club processes had revealedthat industry associations were very much caught up in lobbying exercises and issuesrelating to national collective bargaining processes. They had traditionally kept their
T H E D E V E L O P M E N T D E C A D E ? S O U T H A F R I C A , 1 9 9 4 – 2 0 0 4
212
Free
dow
nloa
d fr
om w
ww
.hsr
cpre
ss.a
c.za
noses out of the firms’ internal operational matters, with the exception of industrial rela-tions issues and wage-setting processes. By and large, the industry associations, in theirregional form, supported the cluster activities, and it was made clear that their role wasin no way being directly threatened. No direct endorsement was sought from the associations, as the cluster focused on inclusiveness as a key principle to avoid beingdirectly associated with any one industry body.
This sensitivity about the nature and form of association was also extended to theinvolvement of original equipment manufacturers (OEMs), in particular Toyota SouthAfrica, in the processes. Compared to other cluster initiatives in the auto sector in thecountry, the emphasis in the DAC was on the interests of the layers of suppliers to the OEMs. While Toyota’s express support for the efforts of the DAC were sought at thestart, it was agreed by all that Toyota would be an active participant, but not exercise anydominant responsibilities in the process. This enabled suppliers to feel comfortableworking together on strategies to ensure that they could embark on improving theirnegotiating position in relation to the automotive value chain so dominated by theOEMs. It also enabled Toyota to continue to pursue its own corporate strategies withoutany sense of threat to its commercial imperatives.
The governance structure of the cluster involves the firms electing an executive, which issupplemented by local, provincial and (nominally) national government representa-tives. This executive guides the work of the facilitators and allocates resources accordingto the needs of the firm-driven working groups that are associated with each pro-gramme area of the cluster.
For some time, the DTI has offered inconsistent support and shown erratic interest inthe workings of the DAC. This has translated into the DTI representatives rarely partic-ipating in the Durban-based activities of the cluster and DTI funding making up thesmallest portion of public-sector contributions to the DAC since its establishment. This‘distance’ of DTI staff responsible for sector activities (including the DAC), aggravatedby substantial turnover of DTI staff and associated loss of experience, has been felt in anumber of ways by the DAC participants and business service facilitators. Responses toapplications for funds have not been dealt with timeously, and have often been misun-derstood, as those dealing with the applications have little direct experience of thecluster or its participants. Requests for more direct involvement in cluster processes haveoften been met with a perspective that the DTI has a responsibility to maintain somedistance from regional processes and direct its attention to strategic national activities.These perspectives remain common today, despite the fact that the cluster is arguablyone of the most successful cluster projects the government has had, in terms of thenumber of firms involved, the level of partnership funding committed by firms and thediversity of active programmes.
In similar fashion to the experience of the auto clubs, and stemming from the same baseproblem, this ‘distance’ was complicated by the DTI’s internal procedures relating tofunding of such initiatives, which had to meet criteria too precise to allow for the flexi-
T H E R O L E O F G O V E R N M E N T I N F O S T E R I N G C L U S T E R S
213
Free
dow
nloa
d fr
om w
ww
.hsr
cpre
ss.a
c.za
bility necessary in facilitating such firm-based processes. Despite numerous promises,the DAC never received a cent of earmarked funds from the DTI. Due to the constantnagging of the Metro official responsible for initiating the cluster, and sympatheticsenior officials in the DTI, the Metro was able to draw down R250 000 from the DTI,which was originally earmarked for corridor development purposes.
Notwithstanding their irregular participation, when the DTI’s national auto sector rep-resentatives did arrive at meetings they often expressed considerable surprise at the scaleand scope of the DAC activities, and repeatedly made the point that the experience couldoffer valuable pointers to evolving DTI perspectives on policy and associated imple-mentation. The existence of the DAC reinforced the credibility and authority of the DACfacilitators in their engagement with national policy processes, but once again this didnot yield any more substantial direct DTI engagement with the local processes.
The DAC’s relationship with its provincial government funder (the KZN Departmentfor Economic Development and Tourism) has exhibited similar inflexibility. This wasalso beset by delays and uncertainty with respect to funding and support. Furthermore,the provincial department, in return for funding, was wont to issue policy directives thatrequired the DAC to focus attention of matters it did not initially see as its core business,in the form of issues that had more to do with emerging policy framework than theimmediate needs of firms. For instance, the KZN Department for EconomicDevelopment and Tourism was keen to financially support only programmes directed atensuring more active involvement of black economic empowerment concerns andblack-owned businesses, but simultaneously struggled with the time frames the DACsuggested would be required to ensure that such enterprises, which were marginal to therapidly globalising auto sector, could meaningfully be included in the automotive valuechain. It was a continuous struggle (and remains so today) to get the government abovethe local level to agree to provide some sort of subsidy to the running costs of the clusterand to its core business of competitiveness support programmes, despite very obvioussigns of early gains and signs of willingness by the DAC participants to engage with newpolicy directions.
The relationship with the local Metro-level government tier stands in marked contrastto that of central government and the provincial authority. The local Metro government,as a result of being deeply embedded in the problems Durban was having in regenerat-ing its industrial base, was acutely aware of the importance of the local automotiveindustry and had been having discussions with Toyota SA, which was situated in itsmunicipal boundaries, about how to sustain the future of the sector. It was also veryaware, as a result of numerous interactions, of the sustainability of the KZNBenchmarking Club. This institutional intimacy meant that the Metro was able to playa proactive role in suggesting and providing seed funds for a feasibility, pilot set-upphase for the DAC. Moreover, after the pilot set-up phase, the local authority has pro-vided the bulk of public funding to ensure that the cluster remains sustainable. It isinstructive that since the Metro government has become almost the sole source of publicfunding (as opposed to firm members’ dues) for the DAC, the incessant cash-flow
T H E D E V E L O P M E N T D E C A D E ? S O U T H A F R I C A , 1 9 9 4 – 2 0 0 4
214
Free
dow
nloa
d fr
om w
ww
.hsr
cpre
ss.a
c.za
problems experienced through accessing national government funds have ceased. Therelationship between the DAC, the local business development services facilitators andthe Metro representative on the executive goes beyond simply being regular participantson the executive committee. The Metro is embedded in the DAC, and this is apparentfrom the continuous presence of its representatives at the quarterly report-back sessions,as well as the number of times these have been opened by prominent Metro representa-tives (e.g. the deputy mayor and the Metro CEO). The service providers meet fairly regularly with the Metro division head responsible for funding the DAC to discuss avariety of relevant issues, and consequently, apart from formal evaluations, an informalmonitoring process is embedded in this working relationship.
Conclusion
So what do we learn from the experience of setting up and running these competitive-ness learning networks and clusters? Let us first focus on the three issues we set up at theoutset. These were:• translating policy into the institutional arrangements in government to ensure
implementation;• clarifying the terms of the pubic–private relationship between government, firms
and business development services; and • isolating the appropriate levels of government for locating different intervention
levers.
Institutional arrangements for implementation
The immediate lesson that is clearly apparent from this experience is that there has beenno correspondence between the cluster policy framework set out by the government andthe institutional arrangements put in place to ensure that the strategic goals containedtherein are implementable. While it is indisputable that without the ability to access sup-portive finances made available through the industrial policy framework, these clusterswould never have got off the ground, it does however also seem clear that the clustershave succeeded in spite of, rather than because of, the manner in which these resourceshave been institutionally distributed. There are a number of reasons for this implemen-tation failure, as well as policy lessons that flow from them.
Firstly, the DTI did not take seriously the need to reconfigure its institutional arrange-ments to create a flexible delivery mechanism. Instead, it wrapped the process up inbureaucracy and time-consuming, unnecessary activities. This is ironic given the firstlesson of lean manufacturing that it was preaching to the firms – reconfigure your inter-nal manufacturing operations to ensure flexibility and quick response time! The lessonin this is crystal clear – practise what you preach.
Secondly, the DTI, as the government department responsible, lacked the humancapacity skills required and, rather than investing in sector-specific training and
T H E R O L E O F G O V E R N M E N T I N F O S T E R I N G C L U S T E R S
215
Free
dow
nloa
d fr
om w
ww
.hsr
cpre
ss.a
c.za
building up a stable, experienced civil service steeped in an understanding ofsector/firm issues and able to react to them, the upper echelons spent the past fewyears continuously restructuring and reorganising departments and staff, repetitivelydissolving sector-specific directorates and then reconstituting them, and so on. Theresult was that any specific industrial and sector training invested in the sector directorates was wasted, and the DTI bled demoralised staff at an alarming rate.Consequently, industrial policy requires more than simply formulating capacity; italso requires trained, and continuously learning, sector-based government staff withan embedded knowledge of their sector’s dynamics. It also involves having such staffwho are passionately committed to the development of those sectors they are respon-sible for and who make this obvious to industry in a manner that fires the latter’sconfidence in government alignment with industry goals.
Thirdly, the DTI was unable to build internal institutional arrangements tying the hor-izontal policy agenda into the selective sectoral policy framework. In other words, theauto cluster initiatives were institutionally dislocated (in funding, accountability andreport-back relationships) from the general operations and thrust of the MIDP. Therewas no structural linkage between these two levels of industrial policy, and it alldepended in the end on the personal initiative of the senior members of the sector divi-sion of the DTI. Notwithstanding a short period when the personal attempts of thedeputy director general in charge of sector policy managed to bridge this gap and itseemed that the cluster process would be permanently built into the DTI’s auto sectorpolicy framework, it all came to naught; indeed, the structural linkages disintegratedand the DTI lost any relation to the clusters when he resigned. Where horizontal indus-trial policy measures have led to sector-based clustering, these should be integrated withany sector-selective industrial policy framework in existence.
Finally, the failure of the DTI to set in place appropriate institutional arrangements, andthe ability of the local Metro to do so, points to location issues. The central governmentwas simply too far away, too distant from the real firm-based co-operative activities ofthese clusters. It was unable to be institutionally embedded in their needs, problems,requirements and cluster activities. It was unable to monitor and appreciate their suc-cesses, and to track the trajectory of the cluster member firms’ movement towards inter-national competitiveness. In short, it lacked what we call the necessary institutionalintimacy to set up appropriate institutional arrangements of implementation. Deliveryagencies do not have to be located at the same government level as resource allocatingtiers. The DAC experience provides a valuable lesson in this respect. DTI national fundswere accessed by the Metro and used for kick-starting the DAC process. This illustratesthe importance of locating a resource-allocation mechanism at central level but allow-ing its drawdown and implementation interventions to occur at lower governmentlevels. Unfortunately, since this was purely accidental and ad hoc, it also illustrates theweaknesses and policy irrelevance of the process.
T H E D E V E L O P M E N T D E C A D E ? S O U T H A F R I C A , 1 9 9 4 – 2 0 0 4
216
Free
dow
nloa
d fr
om w
ww
.hsr
cpre
ss.a
c.za
Public–private partnerships and business development services
The experience of these auto clusters raises an important issue concerning governmentsupport for, and the place of, business development services (BDS) within the privatesector. It is clear that industrial policy has been designed for a new competitive and co-operative manufacturing economy, but has it been designed to create a holisticallyenabling environment? Certainly, on the financial side of resource allocation, earmarkedfunds have been set aside by central government to support and assist firms with variousmatching grant schemes. The buzzwords are ‘public–private-sector partnerships’, but arethe only parties that need to be brought to the table the government and manufacturingenterprises? In other words, is this a partnership between two or three parties? Whatabout the BDS firms, the industrial restructuring consulting companies and the indus-try cluster facilitators, all of whom are supposed to provide the actual support for indus-trial restructuring, cluster facilitation and network learning to ensure that firms eitherindividually or collectively make the transition towards the frontier of internationalcompetitiveness? They are part of the private sector, but they form a distinctively sepa-rate group from the manufacturing enterprises who are the real targets of industrial andcluster policy. Their task is to do the work of assisting manufacturing enterprises toupgrade, co-operate and become more competitive. In that sense, they are the conduitsof such policy, creating the link between the state and the private manufacturing sector.They are the third arm of the triangle, linking the state’s enabling environment and supportive financial structure and the manufacturing enterprises. Where do they fit intothe conception of public–private partnerships and cluster industrial policy?
In this respect, the real problem, and lesson from the experience of the auto clusters, isthat the DTI has not tried to close the magic triangle and build a relationship betweenitself setting an enabling framework and making financial support measures available,the enterprises receiving financial support and requiring practical value-added servicesand knowledge assistance, and the BDS sector providing the range of facilitating andpractical value-added restructuring services. By suggesting that somehow the govern-ment will provide the necessary ‘value-added services’, the new DTI policy has allowed acentral question concerning the enabling environment to slip away: how does industrialpolicy build an effective business services sector to assist enterprises in building this newmanufacturing economy? Supporting the private sector and creating public–privatepartnerships requires the government to recognise, support and reward the importantrole of the business services sector in delivering the sorts of direct interventions to raisethe competitiveness levels of industry that government requires but is actually incapableof providing.
The appropriate levels of government intervention
It is clear that the initiative for these cluster processes is often one that emerges fromlocal processes and is rarely successfully the product of national cluster interventions.The reason for this revolves around the need for any interventionist bodies to be
T H E R O L E O F G O V E R N M E N T I N F O S T E R I N G C L U S T E R S
217
Free
dow
nloa
d fr
om w
ww
.hsr
cpre
ss.a
c.za
institutionally embedded and to have a degree of institutional intimacy with local firms,facilitators and supporting organisations. However, a lack of co-ordination and interaction between spheres of government weakens both the policy content and theimplementation effectiveness of government interventions. From a national policy perspective, the development of policy should ideally be informed by the varying con-ditions in the different regions/localities and by regular and direct interactions with thesupposed beneficiaries of such interventions, namely the BDS facilitators and the firmsthemselves. Consequently, the failure to participate in local cluster processes reduces theexposure of responsible officials to firms and their issues and undermines the potentialof the government benefiting from learning networks of firms.
The corollary of this need for institutional embeddedness and intimacy with the localstakeholders, facilitators and firms is that it is usually better to have government institu-tions that operate at a lower level than the national structures involved in creating ormaintaining clusters. Whether this should be provincial or local government depends onthe resource capabilities of the various institutional levels. In large urban areas, it isusually the metropolitan government that has existing capacity, is more attuned to thelocal-sector situation, and has the greatest incentive to ensure that local economic devel-opment initiatives get off the ground. In more rural areas and country towns, the localmunicipalities are nothing more than services collection agencies and the provincialgovernment has a major role to play in assisting firms to join up into learning networks.Alternatively, where a cluster draws its members from a broader geographical base thanthe large urban centre, it makes the most logical, but not necessarily practical, sense forthe provincial tier of government to play the interventionist role. However, this is notalways possible, because (as is apparent in the case of the DAC, which draws membersfrom all over KwaZulu-Natal province) the provincial authorities may simply lack thecapacity, interest or knowledge base to perform this function.
A lack of a policy delivery presence at a local level results in a substantial disconnectionbetween national policy and the effectiveness of its implementation. Distant and un-responsive bureaucratic structures do little to enhance the building of relations essentialto the uptake of programmes deemed priorities at a national level. Barriers of space andconsequent reductions in levels of contact between firms and government officials dolittle to enhance the trust and mutual learning that is seen to be an essential ingredientin successful networking and clustering processes.
The tendency for national government to concentrate competitiveness resources in itsown hands and then set up bureaucratically obstructive accessing mechanisms has amajor debilitating impact on firms and cluster facilitators’ ability to gain from network-ing arrangements. Likewise, the hierarchical relationship between provincial and localgovernment can have the same effect. This is especially the case where metropolitan orcity governments are better placed (i.e. institutionally embedded and able to express thenecessary institutional intimacy) to make appropriate decisions regarding firms and thecapabilities of local service providers/facilitators. The other side of the coin is that poorlevels of interaction between national and provincial and local government spheres
T H E D E V E L O P M E N T D E C A D E ? S O U T H A F R I C A , 1 9 9 4 – 2 0 0 4
218
Free
dow
nloa
d fr
om w
ww
.hsr
cpre
ss.a
c.za
reduce the potential for the sharing of insights and strategies that, in turn, can allow forimproved allocations of state resources and more informed interventions.
The government has to understand the difference between policy formulation, policydesign, policy promotion and policy implementation. Policy formulation is usuallyundertaken by externally-based researchers/consultants on commission from and in co-operation with central DTI functionaries, which results in the formulation of a set of policy principles and guidelines that are adopted with suitable modification by thegovernment. Policy design requires translating this into a legal framework, which thenbecomes the codified policy of the government – a process that is undertaken by centralbureaucrats and legislative experts. Policy promotion is the dissemination of the policyto all interested stakeholders inviting them to participate. It can be delivered by thenational government but, given the greater institutional intimacy of lower levels, it isusually better placed in a centrally-located information clearing house funded and con-trolled by provincial government. Policy implementation is ensuring that the bureau-cratic processes are in place to easily deliver on the various policy promises and ensurethat the policy objectives are met. This requires the government department(s) to reor-ganise internal institutional arrangements, train staff, change civil servant mindsets,speed up processes and so on, in order to ensure that the policies can be easily accessed,the various activities (whether they be funding or reporting or concrete interventions)delivered to the relevant parties in the correct time frames, and the results monitoredand evaluated.
Unfortunately, most policy processes stop at policy promotion, government bureaucratsassuming that dissemination equals implementation, and the crucial issue of ensuringthat the necessary institutional arrangements have been put in place to implement theobjectives is ignored. The experience of the DAC and the principles of institutional inti-macy/embeddedness suggest that these institutional arrangements and interventionistfoci are best located within specialised government agencies/departments at the provin-cial or Metro level. A consequence of doing this is that the increased interaction withactors and institutions in the region and locality results in the building of knowledgeand capacity within the regional system of innovation.
These experiences and lessons concerning locating appropriate levels of policy and strat-egy intervention levers at different government tiers are summed up in Figure 11.1.4
In conclusion, what do these case studies tell us about the debate regarding evaluatingindustrial policy and the role of the government in fostering clusters? Do they say any-thing of substance about whether the prevailing orthodoxy of leaving everything to themarket is correct or whether the proponents of industrial policy interventions are right?That is still pretty much an open question. In fact, a case could be made that these expe-riences tell us that while it is often clear when the state is obstructing network formationand clustering, it is less clear what the state should be doing to create an environment inwhich such processes can flourish. Hence, there is a tendency to argue that the less thegovernment does to intervene and participate in such processes the more likely they are
T H E R O L E O F G O V E R N M E N T I N F O S T E R I N G C L U S T E R S
219
Free
dow
nloa
d fr
om w
ww
.hsr
cpre
ss.a
c.za
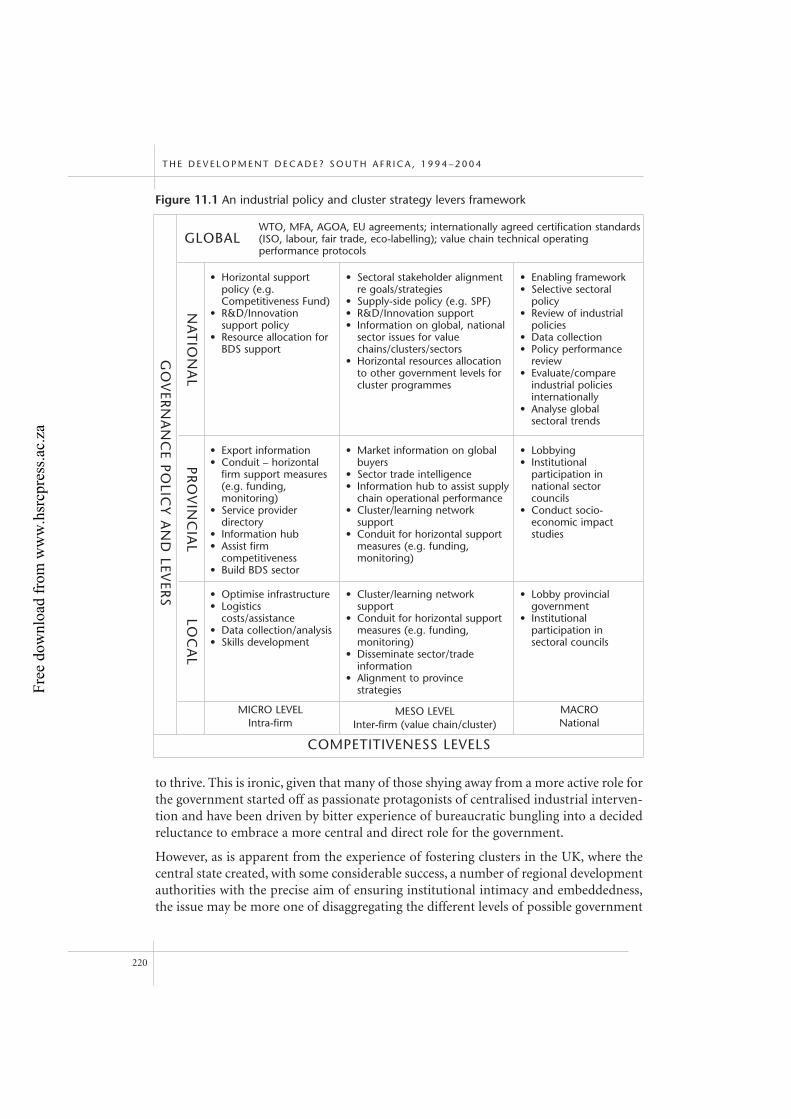
to thrive. This is ironic, given that many of those shying away from a more active role forthe government started off as passionate protagonists of centralised industrial interven-tion and have been driven by bitter experience of bureaucratic bungling into a decidedreluctance to embrace a more central and direct role for the government.
However, as is apparent from the experience of fostering clusters in the UK, where thecentral state created, with some considerable success, a number of regional developmentauthorities with the precise aim of ensuring institutional intimacy and embeddedness,the issue may be more one of disaggregating the different levels of possible government
T H E D E V E L O P M E N T D E C A D E ? S O U T H A F R I C A , 1 9 9 4 – 2 0 0 4
220
Figure 11.1 An industrial policy and cluster strategy levers framework
• Horizontal supportpolicy (e.g.Competitiveness Fund)
• R&D/Innovationsupport policy
• Resource allocation forBDS support
• Enabling framework• Selective sectoral
policy• Review of industrial
policies• Data collection• Policy performance
review• Evaluate/compare
industrial policiesinternationally
• Analyse global sectoral trends
• Export information • Conduit – horizontal
firm support measures(e.g. funding,monitoring)
• Service providerdirectory
• Information hub • Assist firm
competitiveness• Build BDS sector
• Market information on globalbuyers
• Sector trade intelligence• Information hub to assist supply
chain operational performance • Cluster/learning network
support• Conduit for horizontal support
measures (e.g. funding,monitoring)
• Lobbying• Institutional
participation innational sector councils
• Conduct socio-economic impactstudies
• Optimise infrastructure• Logistics
costs/assistance• Data collection/analysis• Skills development
MICRO LEVELIntra-firm
COMPETITIVENESS LEVELS
MESO LEVELInter-firm (value chain/cluster)
MACRONational
• Cluster/learning networksupport
• Conduit for horizontal supportmeasures (e.g. funding,monitoring)
• Disseminate sector/tradeinformation
• Alignment to provincestrategies
• Lobby provincialgovernment
• Institutionalparticipation in sectoral councils
WTO, MFA, AGOA, EU agreements; internationally agreed certification standards(ISO, labour, fair trade, eco-labelling); value chain technical operatingperformance protocols
GO
VER
NA
NC
E POLIC
Y AN
D LEV
ERS
NA
TIO
NA
LPR
OV
INC
IAL
LOC
AL
GLOBAL
• Sectoral stakeholder alignmentre goals/strategies
• Supply-side policy (e.g. SPF)• R&D/Innovation support• Information on global, national
sector issues for valuechains/clusters/sectors
• Horizontal resources allocationto other government levels forcluster programmes
Free
dow
nloa
d fr
om w
ww
.hsr
cpre
ss.a
c.za
intervention, and differentiating between direct and indirect enabling and resource-allocating roles, than a blanket embracement or rejection of a role for the government.It may also well be more a matter of the government finding new ways of working withfirms and BDS companies and other public and private partners, at appropriately dif-ferent levels of government, to enable it to be relevant in a positive manner to suchprocesses. It may be that involvement in such processes is less about state-led policiesbeing jammed down the throats of facilitators and manufacturing enterprises and moreabout different government levels engaging in their own learning and response cycles insuch processes. Finally, it may be that a core element of becoming relevant in this frame-work of operation requires the state to embrace processes of decentralisation of itsindustrial policy activities where appropriate, as it is often at the local level that the stateneeds to find a place for itself in cluster and networking processes.
Hence, what the South African auto cluster experience really shows is that clusters canwork and deliver on substantial competitiveness improvements for industry in a rela-tively short period of time. It also shows the importance of creating genuinepublic–private partnerships, but also the need for the government to differentiatebetween industrial firms and BDS companies and to provide targeted and specialisedsupport mechanisms for each. The experience demonstrates a clear supporting role forthe national government – providing an enabling environment, especially a resource-allocation framework. It is also, in our opinion, the only way for the government (at alllevels) to learn and build absorptive capacity within its own ranks.5 Unfortunately, thepractical experience of the auto clusters reveals that this has been neither understoodnor acknowledged by the principal government department that could play a leadingrole, the DTI. Hence, it seems to have fallen on the side of the prevailing ideologicalorthodoxy of limited industrial policy intervention. The failure to effectively implementclustering as part and parcel of industrial policy has been perceived as the failure ofindustrial policy per se. The thrust of our analysis, however, has been to use the experi-ence of the auto clusters to argue the case for an integrated industrial policy consistingof the alignment of functional, horizontal interventions with selective sector policy insupport of cluster development.
Notes
1 See, also, Chang (1998, 2002). In his extensive discussions of industrial policy, he surprisingly
makes no reference to the role of clusters as a form of sector-specific intervention.
2 The DTI has done little in terms of documenting its policy intent and activities, evaluating
performance and measuring how its policy initiatives match up to international experience. One
is, therefore, left to the documentation produced by those who have worked for and with the
DTI in the past decade or so (Hirsch & Hannival 1998; Kaplinsky & Morris 1997; Kaplan 2003).
3 Personal interviews and feedback to Glen Robbins who was at the time working in the Durban
Metro responsible for initiating these processes.
4 This Figure is a symbolic representation of various levels and levers that could be utilised. Many
things could be added and subtracted depending on its intended utilisation in actual situations.
T H E R O L E O F G O V E R N M E N T I N F O S T E R I N G C L U S T E R S
221
Free
dow
nloa
d fr
om w
ww
.hsr
cpre
ss.a
c.za
5 As Lall (2004) points out, it was this interactive process between state and the private sector that
allowed the governments of Korea and Taiwan to build an effective and knowledgeable cadre of
state bureaucrats.
References
Altenburg T & Meyer-Stamer J (1999) How to promote clusters: Policy experiences from Latin
America, World Development 27: 1693–713.
Barnes J, Kaplinsky R & Morris M (2004) Industrial policy in developing economies: Developing
dynamic comparative advantage in the South African automobile sector, Competition and
Change 8: 153–72.
Barnes J & Lorentzen J (2003) Learning, upgrading and innovation in the South African automotive
industry. Unpublished discussion paper, School of Development Studies, University of Natal.
Barnes J & Morris M (1999) Improving operational competitiveness through firm level clustering:
A case study of the KwaZulu-Natal Benchmarking Club, Working Paper 24, School of
Development Studies, University of Natal.
Bell M & Albu M (1999) Knowledge systems and technological dynamism in industrial clusters in
developing countries, World Development 27: 1715–34.
Bessant J & Kaplinsky R (1995) Industrial restructuring: Facilitating organisational change at the
firm level, World Development 23: 129–42.
Bessant J, Kaplinsky R & Morris M (2003) Developing capability through learning networks,
International Journal of Technology Management and Sustainable Development 2: 19–38.
Best M (1990) The new competition: Institutions of industrial restructuring. Cambridge: Polity Press.
Chang H-J (1994) The political economy of industrial policy. New York: St Martin’s Press.
Chang H-J (1998) Evaluating the current industrial policy of South Africa, Transformation 36: 51–72.
Chang H-J (2002) Kicking away the ladder: Development strategy in historical perspective. Wimbledon:
Anthem Press.
Dutt A, Kim K & Singh A (1994) The state, markets and development: Beyond the neoclassical
dichotomy. Cambridge: Edward Elgar.
Helmsing A (2001) Externalities, learning and governance: New perpectives on local economic
development, Development and Change 32: 277–308.
Hirsch A & Hannival S (1998) South African industrial policy. Paper presented at the TIPS annual
conference.
Humphrey J & Schmitz H (1995) Principles for promoting clusters and networks of SMEs. Vienna:
UNIDO.
Humphrey J & Schmitz H (1996) The ‘triple’ approach to local industrial policy, World Development
24: 407–26.
Humphrey J & Schmitz H (2002) How does insertion in global value chains affect upgrading in
industrial clusters, Regional Studies 36: 1017–27.
T H E D E V E L O P M E N T D E C A D E ? S O U T H A F R I C A , 1 9 9 4 – 2 0 0 4
222
Free
dow
nloa
d fr
om w
ww
.hsr
cpre
ss.a
c.za
Joffe A, Kaplan D, Kaplinsky R & Lewis D (1995) Improving manufacturing performance in South
Africa: Report of the Industrial Strategy Project. Cape Town: UCT Press.
Kaplan D (2003) Manufacturing performance and policy in South Africa – A review. Paper presented
at the TIPS/DPRU annual conference.
Kaplinsky R & Morris M (1997) The formulation of industrial policy in South Africa: A view from the
edge. Working Paper 15, School of Development Studies, University of Natal.
Kaplinsky R & Morris M (2001) A handbook for value chain research.
<http://www.ids.ac.uk/ids/global>
Lall S (2004) Reinventing industrial strategy: The role of government policy in building industrial
competitiveness. TIPS Working Paper 9.
Lall S & Teubal M (1998) ‘Market stimulating’ technology policies in developing countries:
A framework with examples from East Asia, World Development 26: 1369–86.
Lawson C & Lorenz E (1999) Collective learning, tacit knowledge and regional innovative capacity,
Regional Studies 33: 5305–7.
Maskell P, Eskelinen H, Hannibaldson I, Malmberg A & Vatne E (1998) Competitiveness. Localized
learning and regional development: Specialization and prosperity in small open economies. London:
Routledge.
Morosini P (2004) Industrial clusters, knowledge integration and performance, World Development
32: 305–26.
Morris M & Barnes J (2004) Policy lessons in organising cooperation and facilitating networked learning
in value chains and industrial clusters. <http://www.ukzn.ac.za/csds>
Nadvi K (1999) Shifting ties: Social networks in the surgical instrument cluster of Sialkot, Pakistan,
Development and Change 30: 141–75.
Nadvi K & Schmitz H (1999) Clustering and industrialisation, World Development 27: 1503–14.
Pack H (2000) Industrial policy: Growth elixir or poison, World Bank Research Observer 15: 47–67.
Porter M (1990) The competitive advantage of nations. New York: Free Press.
Schmitz H (1999a) Collective efficiency and increasing returns, Cambridge Journal of Economics 23:
465–83.
Schmitz H (1999b) Global competition and local cooperation: Success and failure in the Sinos Valley,
Brazil, World Development 27: 1627–50.
Wade R (1990) Governing the market: Economic theory and the role of government in East Asian
industrialization. Princeton: Princeton University Press.
Wood A (2002) Could Africa be like America? Proceedings of the Annual World Bank Conference on
Development, Economics, April–May. Washington, DC: World Bank.
World Bank (1993) The East Asian miracle: Economic growth and public policy. New York:
Oxford University Press.
World Bank (1997) World development report. Washington, DC: Oxford University Press.
World Bank (2004) Program and project options: Implementing LED. More information on cluster
and/or sector development. <http://www.worldbank.org/urban/led/cluster2.html>
T H E R O L E O F G O V E R N M E N T I N F O S T E R I N G C L U S T E R S
223
Free
dow
nloa
d fr
om w
ww
.hsr
cpre
ss.a
c.za

Free
dow
nloa
d fr
om w
ww
.hsr
cpre
ss.a
c.za
Section 5Municipal governance and development
225
Free
dow
nloa
d fr
om w
ww
.hsr
cpre
ss.a
c.za

Free
dow
nloa
d fr
om w
ww
.hsr
cpre
ss.a
c.za
12Local economic development in post-apartheidSouth Africa: a ten-year research review
Christian M Rogerson
Introduction
Under the combined impetus of structural adjustment programmes seeking to reformthe public sector, of market liberalisation and of globalisation processes, issues of localeconomic development (LED) planning have acquired great significance as a wave ofdecentralisation swept across the South (Rogerson 1995a; Helmsing 2001a, 2001b,2003). Another trigger for LED initiatives stems from the limited governance and deliv-ery capacity at national level in many developing countries, which prompts local actorsto get involved in development activities as the problems of poverty and unemploymentare felt most acutely at the local level (Meyer-Stamer 2003a). The growth of LED in theSouth cannot be separated from its new-found status as ‘one of the highly fashionableissues of international development cooperation’ (Meyer-Stamer 2004a: 1).
Within Africa, the greatest progress in decentralisation is recorded in post-apartheidSouth Africa (Ndegwa 2002) and, significantly, the country now is emerging as a pioneerin terms of LED planning on the African continent (Nel & Rogerson 2005). Several features of the South African LED experience already have been ‘exported’ to surround-ing countries in the region of southern Africa. Potential lessons can be learned from theSouth African record for informing the development of poverty reduction strategypapers in Africa (Hunter, May & Padayachee 2003). Within the international experienceof LED planning, the South African experience also must be considered as notable, espe-cially for the innovation of recent initiatives instituted for so-termed ‘pro-poor LED’.The aim in this analysis is twofold. First, it is to furnish an introductory overview of LEDinitiatives in the country, in particular highlighting the growing significance of a variednumber of pro-poor interventions, which must be set against the existing mainstreamof pro-business or market-led LED interventions. Second, it is to provide a bibliographicreview of scholarship on the existing body of LED research in South Africa as evidencedin post-1994 writings.
LED in South African development planning
Under apartheid spatial planning, heavy emphasis was given to top-down regionalpolicy interventions that were centred upon promoting industrial decentralisation in the country’s peripheral homelands or bantustan regions (Rogerson 1994a, 1994b).Local economic development planning was undeveloped in the apartheid era and
227
Free
dow
nloa
d fr
om w
ww
.hsr
cpre
ss.a
c.za
confined largely to a scatter of small initiatives focused upon place marketing that wasdesigned to attract inward investment (Rogerson 1999a). In post-apartheid SouthAfrica, however, LED planning has gained considerable prominence in developmentplanning with several initiatives, especially in cities to promote them as centres of pro-duction, consumption, knowledge, information processing and foci of governmentsurplus (Rogerson 1997a). The official South African conception of LED accommodateselements of what in international scholarship are referred to as market-led and market-critical approaches towards LED (Scott & Pawson 1999). Although the roles of theprivate sector, NGOs and other stakeholders are discussed, local government is at theheart of LED development-planning debates in contemporary South Africa (Nel 2001a;Odendaal 2002). Indeed, local government officials are now forced to confront the issueof local government assuming the role of potential catalyst for local economic growth(Robbins 2003).
In this section, a review is presented of the evolution of LED planning followed by ananalysis of the broad directions pursued in pro-growth and pro-poor LED planning. Acomplete understanding of the present South African emphasis on LED, argues Simon(2003), must be set within global changes affecting the country, contemporary interna-tional debates on the meaning and nature of ‘development’, and of local politico-economic and social transformation.
The advance of LED in development planning
In terms of the rise of LED planning, it is evident that since the 1994 democratic tran-sition, the promotion of LED initiatives has emerged as a central facet of policy andplanning for both urban and rural reconstruction (Nel 2001a, 2001b; Philander &Rogerson 2001; Rogerson 2002a). In several cases the onset of a local economic crisislinked to mine closures or de-industrialisation has been a compelling force for proactiveLED initiatives (Nel & Hill 2003; Hill, Trotter & Nel 2003; Nel 2005).
The fresh emphasis upon promoting LED is inseparable from the changed processes thathave been shaping the economy during the post-apartheid period (Bloch 2000). Ofspecial significance is the implementation since 1996 of the country’s Growth,Employment and Redistribution macroeconomic strategy, which aimed to accommo-date the forces of globalisation and to ensure South Africa’s re-entry into the globaleconomy, making the country attractive to international investors, enhancing the role ofthe private sector and reducing the role of the central state (DBSA 2000). Hall andRobbins observe that within this changing context South African localities:
have been forced to engage in serious soul-searching about their role in a newpolitical order while facing up to complex and dynamic global forces. While theSouth African local state has certainly been an influential economic player in thepast, it is only now that an attempt is being made to ensure that economic devel-opment is not merely the consequence of traditional local government activities(regulation, service provision, infrastructure maintenance and planning). Rather,
T H E D E V E L O P M E N T D E C A D E ? S O U T H A F R I C A , 1 9 9 4 – 2 0 0 4
228
Free
dow
nloa
d fr
om w
ww
.hsr
cpre
ss.a
c.za
economic development has become a guiding rationale behind the myriad ofexisting, and a host of new, responsibilities. (2002: 43)
Importantly, the landmark 1998 White Paper on Local Government introduced theconcept of ‘developmental local government’, which was defined as ‘local governmentcommitted to working with citizens and groups within the community to find sustainableways to meet their social, economic and material needs and improve the quality of theirlives’ (RSA 1998: 17). The statutory principles for operationalising these concepts of devel-opmental local government are contained in the Municipal Systems Act of 2000 (RSA2000a). A critical feature of this Act is the notion of promoting so-termed ‘integrateddevelopment planning’ in terms of which LED is regarded as a key element (Harrison2001; Odendaal 2002; Hindson 2003). In South Africa, integrated development planningis defined as a ‘participatory approach to integrate economic, sectoral, spatial, social, insti-tutional, environmental and fiscal strategies in order to support the optimal allocation ofscarce resources between sectors and geographical areas and across the population in amanner that provides sustainable growth, equity and the empowerment of the poor andthe marginalized’ (DPLG 2000: 15). In essence, according to the Department of Provincialand Local Government (DPLG), the integrated development plan (IDP) is ‘conceived as atool to assist municipalities in achieving their developmental mandates’ (DPLG 2000: 21),and as a planning and implementation instrument designed to bring together the variousfunctions and development objectives of municipalities (Pycroft 1998; 2000a). Despitethese developments, as was shown in Mpumalanga, many municipalities remain ‘deeplyuncertain as to what LED means, what they are supposed to do and how they are supposedto organise it’ (Meyer-Stamer 2002: 3).
Since 1995, the lead actor and institution in developing a national framework for LEDhas been the Department of Provincial and Local Government (formerly theDepartment of Constitutional Development), which has produced a series of policystatements (Nel 2001a) culminating during 2002 in the release and workshopping of adraft national framework document on LED. By the end of 2004, however, no commonpolicy framework document had been finalised and South Africa still did not have anyagreed national policy to co-ordinate the proliferating developmental planning activitiesof local governments (Nel & Rogerson 2005). The (belated) finalisation and release bythe national government of a framework document for guiding LED occurred in mid-2005. The core vision that is contained in the DPLG’s Policy Guidelines forImplementing Local Economic Development in South Africa is of creating ‘robust andinclusive local economies that exploit local opportunities, address local needs and contribute to national development objectives such as economic growth and povertyeradication’ (DPLG 2005: 10).
Institutionally, several line departments of the national government assume importantroles in the landscape of LED intervention. In addition to the DPLG, other national gov-ernment departments undertake important programmes that impact upon the planningof LED. For example, the activities undertaken by the Department of EnvironmentalAffairs and Tourism, in terms of providing a framework for tourism-led LED initiatives,
L O C A L E C O N O M I C D E V E L O P M E N T: A R E S E A R C H R E V I E W
229
Free
dow
nloa
d fr
om w
ww
.hsr
cpre
ss.a
c.za
and of the Department of Public Works, in terms of a roll-out of infrastructure pro-grammes, are of increasing importance. Nevertheless, the most important departmentof national government influencing LED (apart from the DPLG) is the Department ofTrade and Industry (DTI). For several years, the DTI has been expanding its role forinfluencing LED in South Africa, variously through its responsibilities for spatial devel-opment initiatives, tax holidays, cluster initiatives and small business development(Bloch 2000).
Overall, a striking divide occurs between the activities for LED by the DPLG and theDTI, with the former concentrating on issues of poverty alleviation and the latter morestrongly oriented towards the promotion of economic growth (Rogerson 2002a). Forsome observers, the focus upon issues of direct poverty alleviation and of conceptualis-ing LED as social policy is seen even as ‘the predominant pattern in South Africa’ and asdiverting attention away from business development (Meyer-Stamer 2004b: 8). In auseful intervention, Marriott (2004) cautions against the danger of LED debates gettingbogged down in terms of searching for an equitable or desirable balance between programmes that promote growth and competitiveness, on the one hand, as opposed to poverty reduction, on the other hand. Equally, it is important to avoid taking the position that it is possible or acceptable to achieve both global competitiveness andpoverty reduction independently of one another. Failure to move beyond considerationsof a ‘balancing act’ potentially will perpetuate the widely accepted notion that povertyreduction programmes are for the poor and global competitiveness projects are for thenon-poor (Marriott 2004). In terms of moving the debate forward, researchers shouldaddress the more difficult question of how South African municipalities – collectively orindividually – can achieve a pro-poor growth path that operates simultaneously toachieve the desired goals of economic growth, competitiveness and poverty reduction.
Pro-growth initiatives
The mainstream of LED planning in South Africa continues to be dominated by market-led activities that are geared towards achieving sustainable, high economic growth rates(Nel & Rogerson 2005). The creation of a sound governance environment provides thestarting point or foundation for LED activities (Bloch 2000; Robbins 2003). Existingplanning interventions across South Africa parallel the international record, with mosturban areas initiating LED activities in support of building local competitiveness, manylaunching city improvement programmes and the majority seeking to support thegrowth potential of the small, medium and micro enterprise (SMME) economy. Severalvariants of ‘place entrepreneurialism’ can be identified, with the most important relat-ing to promoting localities as competitive spaces for production, consumption andknowledge-based activities (Rogerson 1997a; 2000).
Despite a highly competitive global environment, the retention and promotion of man-ufacturing continues to be a significant LED activity, which is centred upon economicrestructuring, promoting collective learning in industrial agglomerations, and maximis-
T H E D E V E L O P M E N T D E C A D E ? S O U T H A F R I C A , 1 9 9 4 – 2 0 0 4
230
Free
dow
nloa
d fr
om w
ww
.hsr
cpre
ss.a
c.za
ing the development of firm competencies at the local level (Dorfling 2001; Machaka &Roberts 2004). Recent work in Ekurhuleni suggests an important role for a LED modelthat would effectively implement an industrial policy for broad-based industrial devel-opment and employment creation (Machaka & Roberts 2004). Elements of such amodel include collective action by the government and firms to support the ‘learning’ offirms in developing production capacities, the building of institutions to support theinterests of local manufacturers, and provision of appropriate institutions to supportfirms that adopt constructive strategies that enhance performance, including skills andtechnology development (Machaka & Roberts 2004; Pogue & Maharajh 2004). Supportfor integration both within industrial agglomerations and into the global economy isseen as requiring a partnership between national and local development planning (Zalk2004). An important intervention is the establishment of industrial development zones,which represent a South African variant of export processing zones in which locationalcompetitiveness is not rooted in cheap labour or fiscal incentives but instead on the efficiency of a locality for export-led growth, based, for example, upon high-qualityinfrastructure or streamlined bureaucratic processes (Rogerson 1999c; SACN 2004). Theprogramme of spatial development initiatives has offered a base for several localities,such as East London and Nelspruit, to establish pro-growth LED activities (Adams &Moila 2003; Morrow & Engel 2003).
Across South Africa’s leading cities, there is growing acknowledgement of the imperativeto respond to situations of weak demand and microeconomic constraints on local productive capacity (SACN 2004). One core response has been for localities to gear intoexports and seek to fix microeconomic constraints in order to engage competitively inthe global economy, not least in the league of ‘world-city’ players (Rogerson 2005).Microeconomic reforms designed to make local economies more productive have beenan important focus of LED intervention (SACN 2004). All South Africa’s leading citiesare seeking to attract or retain agglomerations of ‘knowledge-based activities’ as well asto widen and deepen their pool of local skills. In particular, there is intense competitionemerging between the ambitions of Cape Town and Johannesburg to be the majornational axis for high technology manufacturing and information technology activities(Rogerson 2002d). Another critical facet of efforts to attract knowledge-based economicactivities is local-level interventions that are crafted to improve the local skills base forthe nurturing of clusters of innovation and research and development activity.
The IDPs and broader restructuring plans of major centres highlight the issue of posi-tioning the city in the global economy (see Hall & Robbins 2002; Nel, Hill & Maharaj2003). Commonly, this has been associated with sectoral targeting or ‘picking a numberof winning sectors or sub-sectors that the municipality believes through targetedsupport, may become their city’s competitive advantage in the global economy’ (SACN2004: 67). Typically, the outline City Development Strategy for Tshwane, which is focusedon Pretoria, stresses ‘strengthening key economic clusters to gain leverage from growthtrends in manufacturing, government and business services’, with identified actions toinclude ‘city support for the automotive, defence and metal industries clusters, all of
L O C A L E C O N O M I C D E V E L O P M E N T: A R E S E A R C H R E V I E W
231
Free
dow
nloa
d fr
om w
ww
.hsr
cpre
ss.a
c.za
which have the potential for further growth and increased global competitiveness, includ-ing potentially forming a “super cluster” with mutually reinforcing initiatives’ (SACN2004: 68). The growing targeting of sectors is reflected also in the sophisticated strategiesfor investment attraction used by many localities, as is exemplified in the special atten-tion given by Cape Town to attracting investors into the city’s expanding film industry,the targeting by both Cape Town and Johannesburg of the labour-intensive call-centreindustry, and the competition by all South Africa’s major cities for the lucrative businessof convention tourism (Gelling 2004; Lootvoet & Freund 2004).
Currently, with the growth in significance of tourism as a new economic driver for thepost-apartheid economy, there is considerable local activity and emphasis upontourism-led LED planning across large cities, smaller localities and rural areas (Nel & Binns 2002b; Binns & Nel 2002b, 2003; Rogerson 2002c; Visser 2003; Ndlovu &Rogerson 2004). The attraction of business tourism through the building of new convention centres, of leisure tourists through new waterfront redevelopment pro-grammes, the hosting of festivals or the establishment and branding of themed routes,and of maximising the benefits of shopping tourism flows from sub-Saharan Africa arecentral elements of an array of LED activities anchored upon local tourism promotion(Rogerson 2002c; Visser 2002; Nel, Hill & Maharaj 2003; Rogerson & Visser 2004).Further, the hosting of ‘mega-events’ such as the Rugby and Cricket World Cups, theWorld Summit on Sustainable Development and the forthcoming 2010 FIFA World Cupoffers added opportunities for maximising tourism-led growth opportunities in severalSouth African cities.
Finally, in the search for more productive and competitive cities, other notable LED pro-growth interventions have been instituted. The South African Cities Network review(SACN 2004) draws attention to three key themes. First, a set of initiatives gearedtowards enhancing institutional efficiency and the efficiency of the urban form in termsof, for example, interventions designed to reduce the local cost of doing business in aparticular locality or of improving local ‘logistical pathways’ in order to strengthen therelationship between economic growth and infrastructure investment. Second, a seriesof initiatives focused on improving safety and security through the installation ofclosed-circuit television in city centres that are responding to the findings from surveysthat disclosed perceptions of crime and actual crime against businesses as major deter-rents to business investment (Chandra, Moorty, Rajaratnam & Schaefer 2001). Third,another popular LED initiative amongst several of South Africa’s largest cities is theoperationalisation of the American model of Business Improvement Districts for thephysical upgrading of inner-city areas (SACN 2004).
Towards pro-poor initiatives
Although the major directions taken by LED planning in South Africa’s cities evidencea strong pro-growth bias, it is clear that a priority for the national government in termsof the outcomes of LED is that it should contribute towards addressing severe problems
T H E D E V E L O P M E N T D E C A D E ? S O U T H A F R I C A , 1 9 9 4 – 2 0 0 4
232
Free
dow
nloa
d fr
om w
ww
.hsr
cpre
ss.a
c.za
of unemployment and poverty (Abrahams 2003a; Nel & Binns 2003; Nel & Rogerson2005). During 2002, an important national LED policy document entitled ‘RefocusingDevelopment on the Poor’ was drafted (DPLG 2002). Anchored upon the work of Bond(2002, 2003), this document argued a case for promoting a ‘pro-poor’ LED that wouldexplicitly target low-income communities and the marginalised as the focus of govern-ment policy. The following ‘developmental’ LED strategies were put forward forsupport: community-based economic development; linkage; human capital develop-ment; infrastructure and municipal services; leak plugging in the local economy; andretaining and expanding local economic activity. This document offered a potentialnational framework for LED activity by municipalities to be wedded to a strong pro-poor focus in terms of sustaining a developmental approach to their local economies(Bond 2003).
Since 1994, a pro-poor dimension has emerged in the LED operations undertaken bymany (if not most) South African local governments (Abrahams 2003a; Nel & Rogerson2005). At local level, the question of addressing the apartheid poverty legacy has beenmet in several different ways (Rogerson 2003a). Udesh Pillay (2004) recently has high-lighted the role of locally-based associational arrangements in addressing poverty alle-viation in a more inclusive manner in South African cities. The most widespread formof pro-poor intervention has been to strengthen the ‘asset base’ of poor communities(see Moser 1996, 1998).
Three critical policy areas are those that relate to improving regulatory frameworks,municipal services delivery, and issues of employment creation through the stimulationof local economic activities. In terms of regulatory frameworks, the core questions relateto land management and improving the access of the poor to new or improved sourcesof shelter. As shown by Beall and Todes (2004) from the experience of Cato Manor, agender-aware approach can have positive pro-poor outcomes. A critical policy area ofregulation relates to urban agriculture, which is seen widely as an important element inthe survival strategy of many poor women and poor households more generally. Thesetting aside of land for the promotion of urban agriculture or community gardens is agrowing element in pro-poor LED activities across South Africa (Rogerson 1999b,2003c).
Another option for expanding the asset base of the urban poor is to enhance theirlimited access to the full range of municipal services, which would generally includewater supply, sanitation, refuse removal, drainage, flood protection, local roads, publictransport, street lighting and traffic management (Bond 2003). The limited access of thepoor to such services is often aggravated by a tendency for design and service standardsto be unaffordable or not planned to allow for incremental upgrading as poor commu-nities improve and expand their willingness to pay for services. Important opportunitiesare identified in programmes of developmental service delivery for promoting new jobopportunities as well as addressing poverty alleviation. In terms of infrastructure pro-grammes, the opportunities exist at all stages of a project cycle, beginning in the stage ofconstruction and continuing through the phases of implementation and maintenance of
L O C A L E C O N O M I C D E V E L O P M E N T: A R E S E A R C H R E V I E W
233
Free
dow
nloa
d fr
om w
ww
.hsr
cpre
ss.a
c.za
services. According to the findings of a recent survey, the application of public worksprogrammes for job creation and infrastructure provision were identified as the twomost popular individual LED strategies used by South African local authorities (Nel &Binns 2003).
For the poor, their greatest asset is their capacity for labour. In an International LabourOrganisation investigation, unemployment was acknowledged to be the number onepriority issue of local concern in most South African municipalities (ILO 2002). Thus,municipal actions targeted at creating employment represent important options forpoverty alleviation. Nattrass (2003) and Lee (2004) point to a critical developmentdilemma, namely that in South Africa effective LED cannot be attained without address-ing HIV/AIDS and that HIV/AIDS cannot be addressed without poverty alleviation and employment creation. A range of local government interventions can facilitate jobcreation in poor communities (Parnell & Pieterse 1999a, 1999b; DBSA 2000). The keysphere for policy consideration relates to the activities of the survivalist informaleconomy, including street trading, home-based enterprises, and micro-enterprise activ-ities (Skinner 2000; Xaba, Horn & Motala 2002; Skinner & Valodia 2003; Lund &Skinner 2004). The existing support or policy interventions are either indirect or direct.In terms of indirect support for job creation, there are several areas of local governmentpolicy intervention that provide a more facilitative environment, especially for the functioning of both survivalist and growing micro-enterprises. The forms of policyintervention range from the development of a local information base, zoning changes,marketing support and promotion, facilitation of periodic markets, and assistance fordevelopment of appropriate vocational training (Skinner 2000; Gibb 2004).
Direct support for the poor can include local measures to improve the built environ-ment for the activities of emerging entrepreneurs, including the facilitation of smallbusiness hives, incubators or nurseries, the provision of markets, or making availablepremises for use as local business information, support or advice centres (DTI 2004). Ofcritical significance as a pro-poor LED initiative is the application of public-sector pro-curement to support the development of black-owned small enterprises, in particular. Ithas been shown that South Africa’s new programme of ‘targeted procurement’ enablespublic-sector procurement to be applied as a policy instrument by local governments inan efficient and effective manner, as well as facilitating the further implementation ofthe national government’s programmes for assisting poor and historically disadvantagedcommunities (Rogerson 2004c). Further local job-creation initiatives in poor commu-nities focus on improving the skills base or raising the value of human capital of poorcommunities (Cachalia, Jocum & Rogerson 2004; Gibb 2004). Finally, sectoral initiativesare emerging, which are targeted to support particularly those economic activities inwhich there is a high level of labour absorption of poor communities (Rogerson 2003a).In addition to support for the informal economy, other examples include clothing,tourism and urban cultivation (Rogerson 2003a, 2004a). In particular, the promotion oftourism and support for pro-poor tourism is another emerging facet of pro-poor LEDplanning (Rogerson & Visser 2004).
T H E D E V E L O P M E N T D E C A D E ? S O U T H A F R I C A , 1 9 9 4 – 2 0 0 4
234
Free
dow
nloa
d fr
om w
ww
.hsr
cpre
ss.a
c.za
For some observers, ‘LED is increasingly being used by central government to shift tolocal government some of the responsibility for dealing with unemployment andpoverty’ (Tomlinson 2003: 113). From the national government there continues to be astream of programmes that reinforce LED towards a more pro-poor focus. First, in orderto provide financial support for LED endeavours, the central government introduced anLED Fund in 1999, which is largely targeted at providing support for poverty-reliefschemes (Binns & Nel 2002a). Second, the Expanded Public Works Programme, anationwide large-scale programme launched in 2004, applies labour-intensive methodsto upgrade rural infrastructure and absorb significant numbers of the unemployed intoproductive employment, albeit of a temporary character (McCord 2004; Phillips 2004).Third, the national government’s Urban Renewal Programme contains an explicit focuson issues of urban regeneration and targeted support for township areas, especially forthose localities, such as Alexandra or Mdantsane, most disadvantaged under apartheid.Fourth is the parallel Integrated Sustainable Rural Development Strategy (ISRDS),which is anchored on the notion that ‘local demand-driven development in the contextof empowered local government should provide the fulcrum around which sectoraldepartmental delivery would be coordinated, resulting in more integrated (and respon-sive) development’ (Everatt, Dube & Ntsime 2004: 9). Essentially, the ISRDS aims tobuild upon existing support programmes ‘through a well-coordinated, bottom-upapproach to rural local economic development’ (RSA 2000b: vii). None the less, it hasbeen observed that, until recently, LED initiatives ‘have been unsuccessful in integratingtheir plans with poverty reduction programmes, and this is largely attributable to thelack of appropriate experience and capacity at the local government level’ (Hunter et al.2003: 30).
Lastly, and potentially of considerable significance, is the redesign and relaunch in 2004of the national government’s support framework for small business development.Although the final details of the restyled Integrated Small Business DevelopmentStrategy are still to be released, it is known that the new strategy accords recognition tothe demonstrated importance of local-level interventions for supporting the SMMEeconomy (DTI 2004). In particular, the critical role of local governments in terms of theexpansion of business infrastructure facilities, in the making of IDPs and in shapinglocal regulatory frameworks that directly affect the performance of small businesses,especially of those working in the informal economy (Xaba et al. 2002), is now openlyacknowledged. Additionally, local government assistance for SMME development can befound in support for the Local Business Service Centres, which represent a decentralisedsupport network for the provision of non-financial services to entrepreneurs. Currently,the national government is redesigning and rolling out a flagship pilot programme on LED to assist further the strengthening of the implementation capacities of local government for SMME development through focused support for capacity building andmicro-finance, which has been identified as a critical support need for emerging micro-enterprises.
L O C A L E C O N O M I C D E V E L O P M E N T: A R E S E A R C H R E V I E W
235
Free
dow
nloa
d fr
om w
ww
.hsr
cpre
ss.a
c.za
The development and content of South African research on LED
The first academic research published on LED in South Africa was that of Claassen(1991) whose analysis of early LED initiatives in the era of late apartheid stressed correctly that as local governments were not democratically elected, their developmentefforts would be biased towards the enfranchised portion of their cities. Another pioneering contribution to debates about shifts from regional to local developmentplanning was made by Tomlinson (1993, 1994). Since the 1994 democratic transition, agrowing number of research investigations have interrogated aspects of the unfoldingLED policy and practice in South Africa. With contributions coming from a range of social science disciplines – planning, economics, sociology and, especially, human geography – the volume of available LED scholarship in South Africa is now impressive.Indeed, in terms of the developing world it is probably true to say that South Africa currently offers the best-documented experience of LED in any country of the South.
This bibliographic review of the first decade of research and debate on LED policy andexperience aims to provide a guide or primer to the existing literature. As the boundariesof research on LED clearly are ill-defined and flow into wider literatures on, for example,small business development, tourism studies, spatial economic change or infrastructuredevelopment, the focus here is on those writings in which there is an explicit focus onquestions regarding LED. In surveying this extensive body of material, it is useful at theoutset to identify several themes and sub-themes in the writings on South African LED.Although areas of overlap occur, it is useful to categorise the existing sets of studies intofour key themes:• Writings that debate the evolving development and national directions of LED
policy and planning;• Locality-focused investigations of the LED experience and implementation in the
country’s major urban centres and secondary cities;• Locality-focused investigations of the LED experience and implementation in the
country’s small towns and rural areas; and• Areas of neglect concerning thematic, sectoral or impact investigations
surrounding the implementation of specific forms of LED.
These four major categories represent the organisational framework for this biblio-graphic survey.
Research on the development and national directions of LED
It is interesting to record that while the activity of LED was marginalised in terms ofdevelopment planning in the apartheid period, from the early 1920s through to thebeginnings of apartheid there is evidence in a range of different South African localitiesof what has been termed ‘incipient LED’. The works of Robinson (1996), Nel andRogerson (1995, 1996) and Freund (2002) focus upon this historical phase of LED inSouth Africa in which place entrepreneurialism generally was coincident with placemarketing initiatives for inward investment. Other writings draw attention to the
T H E D E V E L O P M E N T D E C A D E ? S O U T H A F R I C A , 1 9 9 4 – 2 0 0 4
236
Free
dow
nloa
d fr
om w
ww
.hsr
cpre
ss.a
c.za
linkage between the demise of top-down spatial policy in the apartheid era, whichcreated new space for local initiatives, and the accompanying awakening of early formsof LED, which once again were primarily centred around place marketing and place re-imaging in order to attract external investors (Rogerson 1994a, 1994b).
With the transition to democracy and the enactment of the 1998 White Paper, a newburst of interest was evident in the changed directions of development planning withinwhich LED was a new buzzword and focus for vibrant debate. Between 1994 and 2000,there appeared several studies in which South Africa’s new policy discovery of a devel-opmental role for locality was reviewed and the early post-apartheid experiences wererecorded and debated (Nel 1994, 1995, 1999, 2000; Rogerson 1997a; Nel & Humphrys1999; Parnell & Pieterse 1999a; Bloch 2000; DBSA 2000). Considerable importance wasplaced upon issues of local responses to globalisation processes and on South Africa’sreinsertion in the global economy after several decades of increased isolation (CDE1996a, 1996b, 1997; Rogerson 1997a; DBSA 2000). Some researchers looked to lessonsfrom the experience of LED planning in other countries to inform South African policydiscussions (Rogerson 1993, 1995b, 1995c; Maharaj & Ramballi 1996). Within this firstwave of writings, the stress primarily was directed at the pro-growth axis of LED policyand intervention (Rogerson 1999a) and at the role played by the private sector in localdevelopment processes (Rogerson 1996a). None the less, a small number of studiesraised questions concerning the role of LED in poverty alleviation and in the develop-ment of the poorest areas of South African cities (Harrison, Todes & Watson 1997;Isandla Institute 1999; Parnell & Pieterse 1999b; Rogerson 1999b; DBSA 2000). In ruralSouth Africa, the emphasis on poverty issues was more pronounced, especially in worksby Binns and Nel on community self-reliance initiatives (Binns & Nel 1999, 2000).
Taken together, these initial nationally focused works provided a solid foundation uponwhich more detailed and critical debates would occur surrounding the new system oflocal government, which came into effect on 6 December 2000 after the first fully dem-ocratic local government elections (Naude 2001; Nel 2001a, 2001b, 2002; Rogerson2002a; Hindson 2003; Tomlinson 2003). For example, Naude and Krugell (2003) explorethe extent to which the newly elected local authorities are able to generate local eco-nomic growth and development that will reduce current levels of spatial inequality inthe country as a whole. Major debates were launched by the attempts made since 2002to draft a coherent national framework document for LED (Bond 2002, 2003; Abrahams2003a), which contained a strong pro-poor dimension, and by central governmentefforts to introduce a national fund in support of LED projects (Binns & Nel 2002a).
Other emerging themes surrounded research to contextualise evolving LED policy inSouth Africa within wider international debates (Simon 2003), to track the diverse rangeof LED initiatives across the country (Rogerson 2000) and to monitor on a more scien-tific basis the overall national direction of LED as pursued in the activities of SouthAfrican municipalities (Nel & Binns 2003). A further important stream of researchcentred on investigating the restructuring of local government and the associated experience and problems surrounding IDP development and integration (Pycroft 1998,
L O C A L E C O N O M I C D E V E L O P M E N T: A R E S E A R C H R E V I E W
237
Free
dow
nloa
d fr
om w
ww
.hsr
cpre
ss.a
c.za
1999, 2000a, 2000b; DBSA 2000; Harrison 2001; Robinson, Brown, Todes & Kitchin2003). Finally, attention should be drawn to the recent appearance of a synthesis volumethat catalogues the development and national directions of LED during the first decadeof democratic rule (Nel & Rogerson 2005).
A locality focus for LED in large cities and secondary cities
It is apparent that the capacity and resource availability for pursuing developmentallocal government is most in evidence in South Africa’s largest metropolitan centres and,to a lesser extent, in the secondary centres. The evolving directions of LED in thecountry’s major cities – particularly Johannesburg and Durban – have been a majorfocus in South African LED writings over the last decade.
From the first detailed case studies on LED in South Africa’s cities, the pro-growth orpro-business bias in municipal interventions was already clear (Tomlinson 1994). Thefindings of the major national survey of ‘putting developmental local government inpractice’ once more demonstrated the dominance of pro-business interventions inevolving LED policy across South Africa’s largest urban centres (Nel & Binns 2003). Theearly pro-growth emphasis was demonstrated clearly in focused works on Durban (CDE1996b; Maharaj & Ramballi 1998), Johannesburg (Rogerson 1996b), Pretoria (CDE1998), Port Elizabeth (Dorfling 2001), Cape Town (Marks & Bezzoli 2001) and Benoni(Walker 2000) as well as in broader overviews of the LED experience in a range of largeand secondary cities in South Africa (CDE 1996a; Rogerson 2000). Since 2000, thecountry’s large cities have continued with a strong LED focus on promoting competi-tiveness across various sectors and on repositioning themselves in the changing globaleconomy (SACN 2004). In Durban research, the promotion of the competitiveness ofthe local economy has been reaffirmed through a range of flagship property develop-ment projects, including a new convention centre and tourism developments (Hall &Robbins 2002; Lootvoet & Freund 2004) and with the suggestion offered that thesedevelopment projects represent the beginnings of creating a new alliance between oldand new business elites in the city (Moffett & Freund 2004). In Ekurhuleni, the core LEDemphasis has been reviving the industrial base and supporting the competitiveness ofthe existing cluster of manufacturing enterprises (CDE 1997; Machaka & Roberts 2004).In the case of Johannesburg, the explicit focus is upon the search for ‘world city status’through enhanced competitiveness of targeted sectors (CDE 2002; Rogerson 2004a,2005) and with solid support from the economic development interventions launchedby Blue IQ, the provincial development planning agency for Gauteng (Rogerson 2004b).
Outside of the major metropolitan centres of South Africa, in the secondary cities, theimperative for implementing what Pundy Pillay (2004) describes as ‘productive development policies’ is stressed, particularly as a defence against the threat of economicmarginalisation. Indeed, over the past decade, many of South Africa’s secondary citieshave confronted serious challenges of readjustment to a decline in the major element oftheir local economic base, as is shown by Mosiane (2000, 2002) in the cases of Mafikeng,
T H E D E V E L O P M E N T D E C A D E ? S O U T H A F R I C A , 1 9 9 4 – 2 0 0 4
238
Free
dow
nloa
d fr
om w
ww
.hsr
cpre
ss.a
c.za
Rustenburg and Klerksdorp, by P Pillay (2004) for Witbank and Newcastle, and by Binnsand Nel (2001) and Nel and Binns (2002a) for the Free State Goldfields.
Notwithstanding this pro-growth bias of LED in South Africa’s large cities, there is anevolution of initiatives that would be viewed as embodying a pro-poor orientation. Oneof the first studies was by Nel and Meston (1996) of Atlantis, Cape Town, which trackedthe development of a series of community-led initiatives to transform this apartheid‘ethno-city’. The use of sectoral targeting as a potential vehicle for pro-poor planning hasbeen highlighted from Johannesburg evidence (Rogerson 2003a). Several of the smalltypes of pro-poor initiative would fall into the category of ‘area-targeted initiatives’,which are linked to inner-city renewal programmes taking place in Durban (Khosa &Naidoo 1998) and Johannesburg (Rogerson 2001a; Cachalia et al. 2004), and oftenembodying a strong focus upon the upgrading of small enterprise clusters such as in theexample of Johannesburg’s fashion district (Rogerson 2004c). In Cape Town, initiativesto regenerate the former decentralisation node of Atlantis exhibited early features of pro-poor intervention (Nel & Meston 1996). Moreover, the former municipality ofMidrand in Gauteng Province has been shown as particularly innovative in terms ofimplementing eco-development approaches as a base for certain pro-poor interventions(Rogerson 2003b). In addition, in a Cape Town case study, Gibb (2004) has documentedthe critical importance of skills upgrading and training as a potentially pro-poor LEDintervention.
Finally, in a rich and critical analysis of the building of a developmental local govern-ment to fight poverty, using Johannesburg as a case study, Parnell (2004a) moves thefocus from the small-scale level to the larger questions of mainstreaming a develop-mental agenda that will enhance the lives of the urban poor. Parnell (2004a) highlightsthat the institutional frameworks of city government in South Africa are poorly constructed for the large-scale roll-out of municipal initiatives to fight poverty. It isargued that ‘in South Africa, as in many post-colonial contexts, state apparatus especiallyat the sub-national level is inadequately configured for implementing a developmentalagenda’ (Parnell 2004b: 2).
A locality focus for LED in small towns and rural areas
As the relative proportion of the population classed as poor or very poor is highest inSouth Africa’s small towns and rural areas, it is perhaps not surprising that most local-ity-based writings on LED in these areas necessarily encompass a focus that is orientedtowards pro-poor interventions (Binns & Nel 1999, 2000). In the majority of SouthAfrican small towns and rural areas, the most important local development issues arecentred upon dealing with economic decline, job losses and problems of often severepoverty in a situation of limited capacity and resource constraints (see Nel 1995, 1997,1999; Xuza 1999; Lloyd & Horn 2001; Seethal 2002; Nel, Hill, Aitchison & Buthelezi2003; Nel 2005). A search for new drivers for small-town economic regeneration is acommon focus (Hill et al. 2003).
L O C A L E C O N O M I C D E V E L O P M E N T: A R E S E A R C H R E V I E W
239
Free
dow
nloa
d fr
om w
ww
.hsr
cpre
ss.a
c.za
In terms of the prospects for LED as an elixir for small-town South Africa, considerableearly promise was attached to the encouraging record shown by the small Eastern Capetown of Stutterheim as documented by Nel (1994), Maqwangqana (1995) and Nel andMcQuaid (2001). Nevertheless, major elements of the Stutterheim ‘success story’ werechallenged by other works (Bond 1998). Another promising experience of small-townLED was documented in the example of Port Shepstone in KwaZulu-Natal (Harrison &Naidoo 2000). The local development trajectory of Orania, the first town of the envis-aged Afrikaner homeland, provides a case study of small-town reconstruction with itsroots in ‘ideological and political conviction’ (Kotze 2003: 170). LED initiatives focusedupon agriculture by municipalities are a common theme, especially in poorer provinces(Eastern Cape Province 2003).
Entrepreneurship development is widely accepted as a critical step for LED program-ming across rural South Africa (Meyer-Stamer 2003b) and is a theme accorded promi-nence in the new national Integrated Small Business Strategy. In the search for economicrevival through LED, many South African small towns have turned to the prospectsoffered by tourism-led development, a theme that has been recorded in a number ofsmall-town case studies (Khumalo 1998; Nel & Binns 2002b; Abrahams 2003b; Binns &Nel 2003; Nel 2005) as well as rural community-based tourism projects (Ntshona &Lahiff 2003; Ndlovu & Rogerson 2004). The potential for linking together the attractionsof a number of small towns or rural communities into themed or branded routes fortourists is another popular LED focus (Rogerson 2002b, 2004d). Other alternative basesfor economic revival of small-town and rural localities have been documented in casestudies of agriculture-led development (Nel 2005). However, for many rural communi-ties across South Africa, the LED activity is often conditional upon successful landreform or land restitution processes (Philander & Rogerson 2001).
Development from below and the issue of local ‘self-reliance’ by ordinary residents arethemes stressed in the experience of a number of locality-focused case studies of small-town or rural LED across South Africa (Nel & Hill 1996; Nel, Hill & Binns 1997; Xuza1999). Indeed, the observation has been made that the emergence of rural informalactivities, communal farming and various forms of community survival must be inter-preted as a ‘development from below’ style of LED that is strongly characteristic morebroadly of small-town or rural areas in the developing world (Binns & Nel 1999). Withinthese small-town and rural case studies, a heavy onus of responsibility often is placedupon the actual residents of the locality or the initiative of community-based organisa-tions in achieving local self-reliance (Gibb 2004). The significance of ‘social capital’ incommunity-based initiatives and small-town LED has been highlighted (Nel &McQuaid 2001).
Some research gaps
Several aspects of the LED experience in South Africa remain under-researched.The most undeveloped aspect of South African research on LED relates to thematic or
T H E D E V E L O P M E N T D E C A D E ? S O U T H A F R I C A , 1 9 9 4 – 2 0 0 4
240
Free
dow
nloa
d fr
om w
ww
.hsr
cpre
ss.a
c.za
sectorally-based investigations. As has been shown, national-level debates on evolvingpolicy have been extensively documented and researched. In addition, there is a consid-erable volume of case study material that interrogates at locality level particular experiences of LED in specific spaces. By contrast to this continuing stream of nationalpolicy research debates and locality-based investigations, only a relatively small numberof thematic or sectorally-based research investigations of issues pertaining to the SouthAfrican LED experience have been undertaken so far.
One of the most important elements for municipal governments and LED implementa-tion is the question of financing. The critical theme of financing for LED across SouthAfrica has been addressed recently in important research produced by Nel and Rogerson(2004). Overall, their study concluded that there existed major lacunae in the existingstructures and frameworks that have been established, primarily by central government,in order to support the mix of pro-growth and pro-poor interventions as pursued bySouth African localities. The importance of local-level initiatives to support technolog-ical progress as a key ingredient for sustainable local economic growth and developmenthas been highlighted in a useful contribution by Pogue and Maharajh (2004).
Currently, there exists only limited available sectoral or thematic research that exploresthe application of a particular form of LED intervention across a range of South Africanlocalities. The most well-documented intervention at present is tourism promotion(Rogerson 2002c; Binns & Nel 2002b; Rogerson & Visser 2004), in which there has alsoappeared a useful subsectoral analysis of the potential of budget tourism in the form ofbackpacking in terms of its local developmental impacts (Visser 2003, 2004; Visser &Barker 2004). The key findings suggest that tourism – or, more correctly, different formsof tourism – potentially can be a lever for both pro-growth and, importantly, a set ofpro-poor initiatives for local development. Other sectoral work has addressed construc-tion as a lead sector for LED through the application of targeted procurement measuresthat particularly support emerging enterprises and local labour in poor communities(Rogerson 2004e). The linkages between defence conversion and LED have also been thestart of some exploratory research investigations (Rogerson 1996c; Abrahams 2003b).Small business development issues and local economic development are emerging as akey research nexus for the next decade and already have generated a number of usefulcontributions (Rogerson 1997b, 2002e; Skinner & Valodia 2003; Jackson 2004; Lund &Skinner 2004; Rogerson 2004c). The provision of business development services toSMMEs appears to be one of the most likely growth areas for future LED research (DTI2004). The potential for urban agriculture to be a focus for pro-poor urban develop-ment planning has been investigated in a national analysis and remains a key issue(Rogerson 2001b, 2003c).
The last theme, of considerable neglect, concerns impact evaluations of LED interven-tions. As Meyer-Stamer (2003a) points out, given the significant interest in and growingcommitment of resources to LED activities, it is remarkable how little evidence exists onthe impact of particular forms of intervention. More controversially, elsewhere Meyer-Stamer claims that from the experience of urban areas, at present, ‘there is little good
L O C A L E C O N O M I C D E V E L O P M E N T: A R E S E A R C H R E V I E W
241
Free
dow
nloa
d fr
om w
ww
.hsr
cpre
ss.a
c.za
practice in LED in South Africa’ (Meyer-Stamer 2003b: 5). Such claims appear, however,to be rather overstated and certainly do not justify the wholesale jettisoning of existingstrategic planning approaches in South Africa. For Meyer-Stamer (2003a, 2003b, 2003c,2003d, 2004a), the only option is the Participatory Appraisal of Competitive Advantageapproach, a methodology developed and promoted by him and his consultancy part-nership with the support of funders, GTZ.
In the final analysis, it must be concluded that while there have been many disappoint-ments and failures in LED projects implemented in the first decade of democratic SouthAfrica, at the same time there are several success stories, or at least promising interven-tions, that can be learning sources for LED practice. Among the most notable of these‘good practices’ are the growth-promoting activities of Blue IQ in Gauteng (Rogerson2004c), the trajectory of pro-poor growth exhibited by Johannesburg’s emerging fashiondistrict (Rogerson 2004c), the rich experience of area-targeted renewal and support forthe informal economy in Durban (Khosa & Naidoo 1998; Skinner 2000; Lund & Skinner2004), and the positive impacts of several tourism-led LED initiatives (Nel 2001a; Nel &Binns 2002b; Rogerson & Visser 2004; Nel & Rogerson 2005).
Conclusion
This chapter has sought to offer a perspective on the ‘state of the art’ of research anddebate concerning LED in South Africa since the transition to democracy. In the wakeof the growing policy significance attached to LED planning, it has been documentedthat LED issues have become a vital focus for South African researchers, particularlywithin economic geography (Rogerson 2002f). The remarkable total of over 120 academic articles, monographs and three books (Tomlinson 1994; Nel 1999; Nel &Rogerson 2005) precipitated by the rise of LED planning in South Africa are clear evidence of the continued vibrancy of local debates. Overall, since 1994 the pages of thejournal Urban Forum1 have emerged as, perhaps, the critical focal point for keeping upwith debates, changing directions and research on issues of LED scholarship in SouthAfrica.
Several key themes have been highlighted in this research review. First, driven by manda-tory legal requirements, the origins of much LED activity in democratic South Africadiffer from the situation in many parts of the developing world where LED was launchedout of sheer necessity or desperation (Meyer-Stamer 2003c). Second, South Africa isincreasingly seen as a leader, or laboratory, in terms of its emerging LED experience withpotential lessons that might inform LED planning in other parts of the South wheredecentralisation is making advances (Nel & Rogerson 2005). Third, during the first tenyears of democracy, the LED experience in South Africa was extensively debated andresearched across a range of different aspects of policy development and implementa-tion experience. It is argued that the record of LED implementation has been uneven,with the most successful initiatives occurring in the larger and more well-resourcedmetropoles. Fourth, while the overall weight of LED interventions has been towards
T H E D E V E L O P M E N T D E C A D E ? S O U T H A F R I C A , 1 9 9 4 – 2 0 0 4
242
Free
dow
nloa
d fr
om w
ww
.hsr
cpre
ss.a
c.za
pro-growth or pro-business, there is an emerging set of pro-poor interventions for LED,which has attracted the beginnings of research attention. Important question markshave been raised, however, regarding the structural and institutional capacity of the localstate for driving an inclusive economic development agenda (Parnell 2004b). Finally,the research frontiers in South African LED are clear – now dominated by issues anddebates concerning the imperative for pro-poor growth as well as the need for more sectorally-focused research and impact evaluations or closer monitoring of the progressof different forms of intervention.
Acknowledgements
For financial support of my current research on local economic development under Gun Award
2054064, thanks are due to the National Research Foundation, Pretoria.
Notes
1 This journal originally was produced by Witwatersrand University Press, 1989–2000. Since 2001,
Urban Forum has been published on a quarterly basis by Transaction Periodicals, Rutgers
University, New Jersey, USA. Between 1994 and 2004, at least 27 research articles of direct
relevance to South African LED debates appeared in Urban Forum.
References
Abrahams D (2003a) Local economic development in South Africa: A useful tool for sustainable
development, Urban Forum 14: 185–200.
Abrahams D (2003b) Military base conversion and tourism: The case of Port St Johns, Africa Insight
33: 136–41.
Adams W & Moila B (2003) Executive summary of Nelspruit (Mbombela) case study.
<http://www.sarpn.org.za>
Beall J & Todes A (2004) Gender and integrated area development projects: Lessons from Cato
Manor, Durban, Cities 21: 301–10.
Binns T & Nel E (1999) Beyond the development impasse: The role of local economic development
and community self-reliance in rural South Africa, Journal of Modern African Studies 37:
389–408.
Binns T & Nel E (2000) Rural self-reliance strategies in South Africa: Community initiatives and
external support in the former black homelands, Journal of Rural Studies 16: 367–77.
Binns T & Nel E (2001) ‘Gold loses its shine’: Decline and response in the South African goldfields,
Geography 86: 255–60.
Binns T & Nel E (2002a) Supporting local economic development in post-apartheid South Africa,
Local Economy 17: 8–24.
Binns T & Nel E (2002b) Tourism as a local development strategy in South Africa, Geographical
Journal 168: 235–47.
L O C A L E C O N O M I C D E V E L O P M E N T: A R E S E A R C H R E V I E W
243
Free
dow
nloa
d fr
om w
ww
.hsr
cpre
ss.a
c.za
Binns T & Nel E (2003) The village in a game park: Local response to the demise of coal mining in
KwaZulu-Natal, South Africa, Economic Geography 79: 41–66.
Bloch R (2000) Subnational economic development in present-day South Africa, Urban Forum 11:
227–71.
Bond P (1998) Local economic development and the municipal services crisis in post-apartheid
South Africa: The case of Stutterheim, Urban Forum 9: 159–96.
Bond P (2002) Debates in local economic development policy and practice: Reversing uneven
development and reactivating municipal services for a ‘post-Washington’ economic epoch.
Municipal Services Project, Research Series Occasional Paper, Johannesburg, University of the
Witwatersrand.
Bond P (2003) Debates in local economic development: Policy and practice, Urban Forum 14:
147–64.
Cachalia F, Jocum M & Rogerson C (2004) ‘The urban edge of African fashion’: The evolution of
Johannesburg’s planned fashion district, in D McCormick & C Rogerson (eds.) Clothing and
footwear in African industrialisation. Pretoria: Africa Institute of South Africa.
CDE (1996a) Cities and the global economy: New Challenges for South Africa. Johannesburg:
Centre for Development and Enterprise.
CDE (1996b) Durban: South Africa’s global competitor. Johannesburg: Centre for Development and
Enterprise.
CDE (1997) The East Rand: Can South Africa’s workshop be revived? Johannesburg: Centre for
Development and Enterprise.
CDE (1998) Pretoria: From apartheid’s model city to a rising African star? Johannesburg: Centre for
Development and Enterprise.
CDE (2002) Johannesburg: Africa’s world city – a challenge to action. Johannesburg: Centre for
Development and Enterprise.
Chandra V, Moorty L, Rajaratnam B & Schaefer K (2001) Constraints to growth and employment in
South Africa: Report No. 1: Statistics from the large manufacturing firm survey. Discussion Paper
No. 14, informal discussion papers of the aspects of the economy of South Africa, Washington
DC, World Bank Southern Africa Department.
Claassen P (1991) The role of local governments in local economic development, in E Beukes,
W Davies, R Van der Kooy & L Van Wyk (eds.) Development, employment and the new South
Africa. Innesdale: Development Bank of Southern Africa.
DBSA (2000) Building developmental local government. Midrand: Development Bank of Southern
Africa.
Dorfling T (2001) Developing industry for local economic development in South Africa,
Africa Insight 31: 35–42.
DPLG (2000) A policy paper on integrated development planning. Pretoria: Department of Provincial
and Local Government.
DPLG (2002) Draft local economic development policy. Pretoria: Department of Provincial and Local
Government.
T H E D E V E L O P M E N T D E C A D E ? S O U T H A F R I C A , 1 9 9 4 – 2 0 0 4
244
Free
dow
nloa
d fr
om w
ww
.hsr
cpre
ss.a
c.za
DPLG (2005) Policy guidelines for implementing local economic development in South Africa 2005.
Pretoria: Department of Provincial and Local Government.
DTI (2004) Annual review of small business in South Africa – 2003. Pretoria: Enterprise Development
Unit, Department of Trade and Industry.
Eastern Cape Province (2003) Strategy framework for growth and development 2004–2014.
<http://www.sarpn.org.za>
Everatt D, Dube N & Ntsime M (2004) Integrated Sustainable Rural Development Programme
Phase I Evaluation: Nodal Review. Unpublished report prepared for the Independent
Development Trust.
Freund B (2002) City hall and the direction of development: The changing role of the local state as a
factor in economic planning and development in Durban, in B Freund & V Padayachee (eds.)
(D)urban vortex: South African city in transition. Pietermaritzburg: University of Natal Press.
Gelling J (2004) Business tourism in South Africa – structure, geography and transformation.
Unpublished Honours dissertation, University of the Witwatersrand, Johannesburg.
Gibb M (2004) Local development: A response to economic challenges in Noordhoek Valley,
Cape Town. Unpublished Masters thesis, Rhodes University, Grahamstown.
Hall P & Robbins G (2002) Economic development for a new era: An examination of the adoption of
explicit economic development strategies by Durban local government since 1994, in B Freund
& V Padayachee (eds.) (D)urban vortex: South African city in transition. Pietermaritzburg:
University of Natal Press.
Harrison P (2001) The genealogy of South Africa’s Integrated Development Plan, Third World
Planning Review 23: 175–93.
Harrison P & Naidoo J (2000) Chimera or guiding vision? Local economic development and the
town of Port Shepstone in KwaZulu-Natal, Urban Forum 11: 119–32.
Harrison P, Todes A & Watson V (1997) Transforming South Africa’s cities: Prospects for the
economic development of urban townships, Development Southern Africa 14: 43–60.
Helmsing A (2001a) Externalities, learning and governance: New perspectives on local economic
development, Development and Change 32: 277–308.
Helmsing A (2001b) Partnerships, meso-institutions, and learning: New local and regional economic
development initiatives in Latin America. Unpublished paper, Institute of Social Studies,
The Hague.
Helmsing A (2003) Local economic development: New generations of actors, policies and
instruments for Africa, Public Administration and Development 23: 67–76.
Hill T, Trotter D & Nel E (2003) De-industrialisation and local response in South Africa: The case of
Mooi River, KwaZulu-Natal, Africa Insight 33: 40–6.
Hindson D (2003) Connecting economic growth with poverty alleviation: South Africa’s LED
challenge, Hologram, 1 Newsletter 4. <http://www.ksp.org.za/holonl04.htm>.
Hunter N, May J & Padayachee V (2003) Lessons for PRSP from Poverty Reduction Strategies in
South Africa. Paper prepared for the Economic Commission for Africa, Third Meeting of the
African Learning Group on the Poverty Reduction Strategy Papers, Addis Ababa, 3–5 December.
L O C A L E C O N O M I C D E V E L O P M E N T: A R E S E A R C H R E V I E W
245
Free
dow
nloa
d fr
om w
ww
.hsr
cpre
ss.a
c.za
ILO (2002) South Africa small towns LEED project – concept paper. Unpublished paper, Pretoria,
International Labour Organisation, South Africa Office.
Isandla Institute (1999) Linking local economic development to poverty alleviation. Pretoria:
Department of Constitutional Development.
Jackson P (2004) Entrepreneurial support in South Africa: A case study of a small enterprise support
centre in Johannesburg. Unpublished Masters dissertation, School of Public Policy, University of
Birmingham, England.
Khosa M & Naidoo K (1998) Urban renewal in inner-city Durban: The Warwick Avenue area,
Urban Forum 9: 225–39.
Khumalo D (1998) Small towns and rural development in KwaZulu-Natal: A case study of Pongola.
Unpublished Honours dissertation, University of Natal, Durban.
Kotze N (2003) Changing economic bases: Orania as a case study of small-town development in
South Africa, Acta Academica Supplementum 1: 159–72.
Lee S (2004) HIV/AIDS in the informal economy: An analysis of local government’s role in
addressing the vulnerability of women street traders in Durban. Unpublished Masters thesis,
University of KwaZulu-Natal, Durban.
Lloyd H & Horn G (2001) Local economic development in rural South African towns, Africa Insight
31: 59–65.
Lootvoet B & Freund B (2004) Local economic development: utopia and reality in South Africa:
The example of Durban, KwaZulu-Natal. Paper presented at the conference on the First Decade
of Democracy and Development in South Africa, Durban, 20–22 October.
Lund F & Skinner C (2004) Integrating the informal economy in urban planning and governance:
A case study of the process of policy development in Durban, South Africa, International
Development Planning Review 26: 431–56.
Maharaj B & Ramballi K (1996) Recent trends in local economic development in the United States:
Policy implications for urban reconstruction and development in South Africa, Urban Forum 7:
159–82.
Maharaj B & Ramballi K (1998) Local economic development strategies in an emerging democracy:
The case of Durban in South Africa, Urban Studies 35: 131–48.
Machaka J & Roberts S (2004) Addressing the apartheid industrial legacy: Local economic
development and industrial policy in South Africa – the case of Ekurhuleni. Paper presented at
the Wits–Ekurhuleni Symposium on Sustainable Manufacturing, Brakpan, 10–11 June.
Maqwangqana C (1995) Local economic development in Stutterheim, in E Nel (ed.) Local economic
development in South Africa: A review of current policy and applied case studies. Johannesburg:
Friedrich Ebert Stiftung and South African National Civics Organisation.
Marks R & Bezzoli M (2001) Palaces of desire: Century City, Cape Town and the ambiguities of
development, Urban Forum 12: 27–47.
T H E D E V E L O P M E N T D E C A D E ? S O U T H A F R I C A , 1 9 9 4 – 2 0 0 4
246
Free
dow
nloa
d fr
om w
ww
.hsr
cpre
ss.a
c.za
Marriott A (2004) What should be the balance of emphasis in South African cities between economic
development programmes focused on poverty reduction and those aimed at building globally
competitive economic environments? Unpublished paper, School of Development Studies,
University of KwaZulu-Natal, Durban.
McCord A (2004) Public works and overcoming under-development in South Africa. Paper presented
at the conference on Overcoming Underdevelopment in South Africa’s Second Economy,
Midrand, 28–29 October.
Meyer-Stamer J (2002) Current challenges from local economic development in South Africa: Experience
from Mpumalanga. <http://www.mesopartner.com>
Meyer-Stamer J (2003a) Why is local economic development so difficult and what can we do to make it
more effective. Mesopartner Working Paper No. 4, Duisburg.
Meyer-Stamer J (2003b) Stimulating rural enterprises in South Africa: Lessons from local economic
development. <http://www.mesopartner.com>
Meyer-Stamer J (2003c) Participatory appraisal of competitive advantage (PACA): Launching local
economic development initiatives. Mesopartner Working Paper No. 1, Duisburg.
Meyer-Stamer J (2003d) The hexagon of local economic development and LED in South Africa.
Mesopartner Working Paper No. 5, Duisburg.
Meyer-Stamer J (2004a) Governance and territorial development: Policy, politics and polity in local
economic development. Mesopartner Working Paper No. 7, Duisburg.
Meyer-Stamer J (2004b) Regional value chain initiatives: An opportunity for the application of the
PACA approach. Mesopartner Working Paper No. 6, Duisburg.
Moffett S & Freund B (2004) Elite formation and elite bonding: Social structure and development in
Durban, Urban Forum 15: 134–61.
Morrow S & Engel K (2003) Ten year review – Buffalo City. <http://www.sarpn.org.za>
Moser C (1996) Confronting crisis: A comparative study of household responses to vulnerability in four
poor urban communities. Washington DC: World Bank.
Moser C (1998) The asset vulnerability framework: Reassessing urban poverty reduction strategies,
World Development 26: 1–19.
Mosiane B (2000) The evolving local economic development process in Mafikeng: A contested terrain
between political and profit interests, South African Geographical Journal 82: 13–20.
Mosiane B (2002) Motsetoropofatso: Reconceptualising urban-rural change in North-West Province,
in R Donaldson & L Marais (eds.) Transforming rural and urban spaces in South Africa during the
1990s reform, restitution, restructuring. Pretoria: Africa Institute of South Africa.
Nattrass N (2003) The moral economy of AIDS in South Africa. Cape Town: Centre for Social and
Economic Research, University of Cape Town.
Naude W (2001) Local government transformation in South Africa: Implications for regional and
local economic development, Development Issues 3: 1 and 10.
Naude W & Krugell W (2003) An inquiry into cities and their role in subnational economic growth
in South Africa, Journal of African Economies 12: 476–99.
L O C A L E C O N O M I C D E V E L O P M E N T: A R E S E A R C H R E V I E W
247
Free
dow
nloa
d fr
om w
ww
.hsr
cpre
ss.a
c.za
Ndegwa S (2002) Decentralization in Africa: A stocktaking survey. Africa Working Paper Series No. 40.
Washington, DC: World Bank.
Ndlovu N & Rogerson C (2004) The local economic impacts of rural community-based tourism in
the Eastern Cape, in C Rogerson & G Visser (eds.) Tourism and development issues in
contemporary South Africa. Pretoria: Africa Institute of South Africa.
Nel E (1994) Local development initiatives in Stutterheim, Development Southern Africa 11: 363–78.
Nel E (ed.) (1995) Local economic development in South Africa: A review of current policy and applied
case studies. Johannesburg: Friedrich Ebert Stiftung and South African National Civics
Organisation.
Nel E (1997) NGO-facilitated local economic development: The case of Seymour, Urban Forum 8:
277–93.
Nel E (1999) Regional and local economic development in South Africa: The experience of the Eastern
Cape. Aldershot: Ashgate.
Nel E (2000) Economic restructuring and local economic development in South Africa, in M Khosa
(ed.) Infrastructure mandates for change 1994–1999. Pretoria: Human Sciences Research Council.
Nel E (2001a) Local economic development: A review and assessment of its current status in South
Africa, Urban Studies 38: 1003–24.
Nel E (2001b) Initiating ‘developmental local government’ in South Africa: Evolving local economic
development policy, Regional Studies 35: 355–62.
Nel E (2002) Applying developmental local government: An overview of the state and status of local
economic development in South Africa. Unpublished paper, Rhodes University, Grahamstown.
Nel E (2005) Local economic development in South African small towns, in E Nel & C Rogerson
(eds.) Local economic development in the developing world: The experience of Southern Africa.
London: Transaction Press.
Nel E & Binns T (2002a) Decline and response in South Africa’s Free State goldfields: Local economic
development in Matjhabeng, Third World Planning Review 24: 249–69.
Nel E & Binns T (2002b) Place marketing, tourism promotion and community-based local economic
development in post-apartheid South Africa: The case of Still Bay – the ‘Bay of Sleeping Beauty’,
Urban Affairs Review 32: 184–208.
Nel E & Binns T (2003) Putting ‘developmental local government’ into practice: The experience of
South Africa’s towns and cities, Urban Forum 14: 165–84.
Nel E & Hill T (1996) Rural development in Hertzog, Eastern Cape: Successful local economic
development? Development Southern Africa 13: 860–70.
Nel E & Hill T (2003) De-industrialisation and local economic development alternatives in KwaZulu-
Natal, South Africa, Geography 86: 356–59.
Nel E, Hill T, Aitchison K & Buthelezi S (2003) The closure of coal mines and local economic
development responses in Coal-Rim cluster, northern KwaZulu-Natal, South Africa,
Development Southern Africa 20: 369–85.
T H E D E V E L O P M E N T D E C A D E ? S O U T H A F R I C A , 1 9 9 4 – 2 0 0 4
248
Free
dow
nloa
d fr
om w
ww
.hsr
cpre
ss.a
c.za
Nel E, Hill T & Binns T (1997) Development from below in the ‘new’ South Africa: The case of
Hertzog, Eastern Cape, Geographical Journal 163: 57–74.
Nel E, Hill T & Maharaj B (2003) Durban’s pursuit of economic development in the post-apartheid
era, Urban Forum 14: 223–43.
Nel E & Humphrys G (1999) Local economic development: Policy and practice in South Africa,
Development Southern Africa 16: 277–89.
Nel E & McQuaid R (2001) Critical reflections on the evolution of experience of local economic
development in Stutterheim, South Africa and the role of social capital, Economic Development
Quarterly 16: 60–74.
Nel E & Meston A (1996) Transforming Atlantis, South Africa, through local economic development,
GeoJournal 39: 89–96.
Nel E & Rogerson C (1995) Incipient local economic development in the Eastern Cape 1909–1947,
Contree: Journal of South African Urban and Regional History 37: 1–9.
Nel E & Rogerson C (1996) The application of local economic development initiatives in East
London, South Africa, 1927–1955, Urban Forum 7: 69–87.
Nel E & Rogerson C (2004) Research on framework conditions for local economic development and
case studies of selected local economies in South Africa as well as international models and state
of the art practices regarding local economic development. Unpublished report for Kreditanstalt
für Wiederaufbau, Development Bank of Southern Africa and Department of Provincial and
Local Government.
Nel E & Rogerson C (eds.) (2005) Local economic development in the developing world: The experience
of Southern Africa. London: Transaction Press.
Ntshona Z & Lahiff E (2003) Community-based ecotourism on the Wild Coast, South Africa: The case
of the Amadiba Trail. Brighton, Institute of Development Studies, Sustainable Livelihoods in
Southern Africa Research Paper No. 7.
Odendaal M-J (2002) The role of local government in local economic development, in R Donaldson
& L Marais (eds.) Transforming rural and urban spaces in South Africa during the 1990s reform,
restitution, restructuring. Pretoria: Africa Institute of South Africa.
Parnell S (2004a) Building developmental local government to fight poverty: Institutional change in
the city of Johannesburg, International Development Planning Review 26: 377–99.
Parnell S (2004b) Constructing a developmental nation – the challenge of including the poor in the
post-apartheid city. Paper presented at the conference on Overcoming Underdevelopment in
South Africa’s Second Economy, Midrand, 28–29 October.
Parnell S & Pieterse E (1999a) Developmental local government: The second wave of post-apartheid
transformation, Africanus 29: 61–86.
Parnell S & Pieterse E (1999b) Municipal poverty reduction framework: Technical reports on municipal
poverty reduction frameworks for the Cape Metropolitan Area. Cape Town: Isandla Institute.
Philander D & Rogerson C (2001) Rural local economic development and land restitution in South
Africa: The case of Schmidtsdrift, Northern Cape, Singapore Journal of Tropical Geography 22:
74–89.
L O C A L E C O N O M I C D E V E L O P M E N T: A R E S E A R C H R E V I E W
249
Free
dow
nloa
d fr
om w
ww
.hsr
cpre
ss.a
c.za
Phillips S (2004) The Expanded Public Works Programme (EPWP). Paper presented at the
conference on Overcoming Underdevelopment in South Africa’s Second Economy, Midrand,
28–29 October.
Pillay P (2004) Secondary cities and economic development in South Africa.
<http://www.ksp.org.za/holores_seccity.htm>
Pillay U (2004) Towards alternative conceptions of local economic reform in the developing world:
The case of South Africa, South African Geographical Journal 86: 39–43.
Pogue T & Maharajh R (2004) Technological change for local economic growth and development.
Paper presented at the Wits–Ekurhuleni Symposium on Sustainable Manufacturing, Brakpan,
10–11 June.
Pycroft C (1998) Integrated development planning or strategic paralysis? Municipal development
during the local government transition and beyond, Development Southern Africa 15: 151–63.
Pycroft C (1999) Restructuring non-metropolitan local government in South Africa, Public
Administration and Development 19: 179–92.
Pycroft C (2000a) Integrated development planning and rural local government in South Africa,
Third World Planning Review 22: 87–102.
Pycroft C (2000b) Democracy and delivery: The rationalization of local government in South Africa,
International Review of Administrative Sciences 66: 143–59.
Robbins G (2003) Local government as a catalyst for economic growth, IMFO Summer: 12–15.
Robinson J (1996) ‘Progressive Port Elizabeth’: Liberal politics, local economic development and the
territorial basis of racial domination, GeoJournal 22: 293–303.
Robinson P, Brown A, Todes A & Kitchin F (2003) Methods of achieving integration in development
planning: Early experiences from South African municipalities, International Development
Planning Review 25: 263–81.
Rogerson C (1993) Industrial districts: Italian experience, South African policy issues, Urban Forum
4: 37–53.
Rogerson C (1994a) Democracy, reconstruction and changing local and regional economic planning
in South Africa, Regional Development Dialogue 15: 102–18.
Rogerson C (1994b) South Africa: From regional policy to local economic development initiatives,
Geography 79: 180–83.
Rogerson C (1995a) Local economic development planning in the developing world, Regional
Development Dialogue 16: v–xv.
Rogerson C (1995b) International issues, strategies and models, in E Nel (ed.) Local economic
development in South Africa: A review of current policy and applied case studies. Johannesburg:
Friedrich Ebert Stiftung and South African National Civics Organisation.
Rogerson C (1995c) Local economic strategies in South Africa: Lessons from Britain’s local enterprise
boards, Africa Insight 25: 129–34.
Rogerson C (1996a) The private sector and local economic development in South Africa, GeoJournal
39: 97–104.
T H E D E V E L O P M E N T D E C A D E ? S O U T H A F R I C A , 1 9 9 4 – 2 0 0 4
250
Free
dow
nloa
d fr
om w
ww
.hsr
cpre
ss.a
c.za
Rogerson C (1996b) Image enhancement and local economic development in Johannesburg, Urban
Forum 7: 139–56.
Rogerson C (1996c) Defence economic restructuring and conversion in South Africa, GeoJournal 39:
1–12.
Rogerson C (1997a) Local economic development and post-apartheid South Africa, Singapore Journal
of Tropical Geography 18: 175–95.
Rogerson C (1997b) Local government and the SMME economy in South Africa, Africa Insight 27:
63–72.
Rogerson C (1999a) Place marketing for local economic development in South Africa, South African
Geographical Journal 81: 32–43.
Rogerson C (1999b) Local economic development and urban poverty: The experience of post-
apartheid South Africa, Habitat International 23: 511–34.
Rogerson C (1999c) Planning spatial development initiatives: South Africa's industrial development
zones, Urban Forum 10: 259–73.
Rogerson C (2000) Local economic development in an era of globalisation: The case of South
African cities, Tijdschrift voor Economische en Sociale Geografie 91: 397–411.
Rogerson C (2001a) Inner-city economic revitalization through cluster support: The Johannesburg
clothing industry, Urban Forum 12: 49–70.
Rogerson C (2001b) Urban agriculture and poverty alleviation, Africa Insight 30: 66–72.
Rogerson C (2002a) Planning local economic development: Policy challenges from the South African
experience, Africa Insight 32: 39–45.
Rogerson C (2002b) Tourism and local economic development: The case of the Highlands Meander,
Development Southern Africa 19: 143–67.
Rogerson C (2002c) Tourism-led local economic development: The South African experience,
Urban Forum 13: 95–119.
Rogerson C (2002d) Knowledge-based regions in the global periphery: The case of South Africa,
in R Hayter & R Le Heron (eds.) Knowledge, industry and environment: Institutions and
innovation in territorial perspective. Aldershot: Ashgate.
Rogerson C (2002e) Urban economic restructuring: The changing SMME economy of inner-city
Johannesburg, in R Donaldson & L Marais (eds.) Transforming rural and urban spaces in South
Africa during the 1990s reform, restitution, restructuring. Pretoria: Africa Institute of South Africa.
Rogerson C (2002f) The economic geography of South Africa: International parallels and local
difference, South African Geographical Journal 84: 58–66.
Rogerson C (2003a) Towards pro-poor local economic development: The case for sectoral targeting
in South Africa, Urban Forum 14: 53–79.
Rogerson C (2003b) Local economic development in Midrand, South Africa’s ecocity, Urban Forum
14: 201–22.
Rogerson C (2003c) Towards ‘pro-poor’ urban development in South Africa: The case for urban
agriculture, Acta Academica 1: 130–58.
L O C A L E C O N O M I C D E V E L O P M E N T: A R E S E A R C H R E V I E W
251
Free
dow
nloa
d fr
om w
ww
.hsr
cpre
ss.a
c.za
Rogerson C (2004a) Towards the world class African city: Planning local economic development in
Johannesburg, Africa Insight 34:12–21.
Rogerson C (2004b) From spatial development initiative to blue IQ: Sub-national economic planning
in Gauteng, Urban Forum 15: 74–101.
Rogerson C (2004c) Pro-poor local economic development in post-apartheid South Africa: The
Johannesburg fashion district, International Development Planning Review 26: 401–29.
Rogerson C (2004d) Tourism and uneven local economic development: The experience of route
tourism in South Africa, in C Rogerson & G Visser (eds) Tourism and development issues in
contemporary South Africa. Pretoria: Africa Institute of South Africa.
Rogerson C (2004e) Pro-poor local economic development planning in South Africa: The application
of public procurement, Urban Forum 15: 180–210.
Rogerson C (2005) Globalization, economic restructuring and local response in Johannesburg –
the most isolated ‘world city’, in K Segbers, S Raiser & K Volkmann (eds.) Public problems –
private solutions? New trends from globalizing cities in the South. Aldershot: Ashgate.
Rogerson C & Visser G (eds.) (2004) Tourism and development issues in contemporary South Africa.
Pretoria: Africa Institute of South Africa.
RSA (Republic of South Africa) (1998) Local Government White Paper. Pretoria: Government Printer.
RSA (2000a) Local Government: Municipal Systems Act. Pretoria: Government Printer.
RSA (2000b) The integrated sustainable rural development strategy. Pretoria: Department of Water
Affairs.
SACN (2004) State of the cities. Cape Town: South African Cities Network.
Scott G & Pawson E (1999) Local development initiatives and unemployment in New Zealand,
Tijdschrift voor Economische en Sociale Geografie 90: 184–95.
Seethal C (2002) Regenerating rural economies: The case of Limehill, South Africa, GeoJournal 57:
65–77.
Simon D (2003) Contextualising South African local economic development planning within current
development debates: The international setting, Urban Forum 14: 127–46.
Skinner C (2000) Getting institutions right? Local government and street traders in four South
African cities, Urban Forum 11: 49–71.
Skinner C & Valodia I (2003) Local government support for women in the informal economy in
Durban, South Africa, International Journal of Politics, Culture and Society 16: 431–44.
Tomlinson R (1993) From regional planning to local development planning, Development Southern
Africa 10: 167–75.
Tomlinson R (ed.) (1994) Urban development planning: Lessons for the reconstruction of South Africa’s
cities. Johannesburg: Witwatersrand University Press.
Tomlinson R (2003) The local economic development mirage in South Africa, Geoforum 34: 113–22.
Visser G (2002) Gay tourism in South Africa: Issues from the Cape Town experience, Urban Forum
13(1): 85–94.
T H E D E V E L O P M E N T D E C A D E ? S O U T H A F R I C A , 1 9 9 4 – 2 0 0 4
252
Free
dow
nloa
d fr
om w
ww
.hsr
cpre
ss.a
c.za
Visser G (2003) The local development impacts of backpacker tourism: Evidence from the South
African experience, Urban Forum 14: 264–93.
Visser G (2004) The developmental impacts of backpacker tourism in South Africa, GeoJournal 60:
283–99.
Visser G & Barker C (2004) Backpacker tourism in South Africa: Its role in an uneven tourism space
economy, Acta Academica 36: 97–143.
Walker M (2000) Place marketing and local proactivity in the economic development of Benoni,
Urban Forum 11: 73–99.
Xaba J, Horn P & Motala S (2002) The informal sector in sub-Saharan Africa. Geneva: Employment
Sector Working Paper on the Informal Economy, International Labour Office.
Xuza P (1999) Rural institutional arrangements for local economic development (LED): A case study
of Elim. Paper presented at the Local Economic Development Workshop, Rhodes University,
Grahamstown, July.
Zalk N (2004) Promoting competitiveness and equity in a complex environment. Paper presented at
the Wits–Ekurhuleni Symposium on Sustainable Manufacturing, Brakpan, 10–11 June.
L O C A L E C O N O M I C D E V E L O P M E N T: A R E S E A R C H R E V I E W
253
Free
dow
nloa
d fr
om w
ww
.hsr
cpre
ss.a
c.za
13 Local economic development: utopia and reality– the example of Durban, KwaZulu-Natal
Benoît Lootvoet and Bill Freund
Introduction
This chapter seeks to explore the meaning of the currently prevalent if fluid concept oflocal economic development (LED) and to examine how it is being applied in thecontext of a particular developing country, South Africa. Within South Africa, we shallfocus on Durban, the Indian Ocean port and one of the six metropolitan super munic-ipalities established in 2000 to accord with the requirements of the post-apartheidConstitution finalised in 1996, in order to evaluate progress and prospects in this area.The chapter tries to demonstrate that the local government bases its approach to LEDissues on the promotion of public–private partnerships.
Patrick Bond,1 prolific left critic of the ANC-controlled government of South Africa, hasdescribed LED as ‘a discipline still coming into its own, with competing strands of argu-mentation still generating conflict’ (Bond 2001). In fact, it is easier to see LED as a plantthat has grown in the ruins of the earlier paradigms of planning and spatial manage-ment. Indeed, it is notable that the authoritative LED textbook in the USA represents are-editing of what was originally a text on planning.2 Between 1970 and 1990, the pow-erful post-World War II planning paradigm, which assumed that a central state couldchoose an industrial policy or develop a region around the systematic implantation of,for instance, heavy industry, was subjected to so much criticism and evoked so muchscepticism that it has become impossible to pursue in any overt way. Large-scale publichousing, aid projects, and steel mills designed to anchor the spread of modern industryhave failed in their objectives too many times to convince planning contemporaries thatthere is a working paradigm available to them any more.
Not merely in the US literature but also as a generic concept propounded by the WorldBank and other international agencies, LED has diffused widely. At first sight, it fits wellsome of the critical developments that have affected the planning literature. It goes wellwith decentralisation and the critique of the central state as the driver of uniform top-down planning initiatives. It also can easily be adapted to freeing up the initiatives of theprivate sector at whatever scale seems interesting, where belief in the generative capac-ity of the public sector has faded. However, LED offers no comprehensive model that allcan follow comfortably.3
In fact, there are three particularly obvious, and indeed often contradictory, aspects thatquickly emerge in the literature. First, LED lacks specificity as to what is intended by
254
Free
dow
nloa
d fr
om w
ww
.hsr
cpre
ss.a
c.za
‘local’. Local can variously be defined in terms of anything from large-scale regions orprovinces through substantial cities down to small neighbourhoods within localities.Second, the LED discourse is often fuelled by the same state apparatuses that the previ-ous central-planning discourse was. Naturally, the role of the state is defined now asfacilitative and regulatory, at most, no longer even as indicative, but the personnelresponsible (and their intentions) often remain the same as before. There is a reluctanceto admit that, consequently, the results of LED planning may be no better than its pred-ecessor. Third, while the LED concept is applied to very different situations, there is nosystematic differentiation made between applications in wealthy countries with a richrange of human and financial resources and very impoverished ones where resources areextremely scarce. A codicil might also be appended: as Jörg Mayer-Stamer (2003: 2) putsit, LED is not really a discipline at all – the ‘political economy of economic promotionwhich it reflects is in the last analysis not a scientific exercise, but rather part of theeveryday political struggle’.
We might further consider some of the different approaches in the way LED has beendiscussed in contemporary literature:• LED understood as the encouragement of industrial clusters, as opposed to sites of
heavy industry, which can be facilitated by decisive strategic and creative interventions.4
• LED understood as the revival of communities affected by the decline of particularindustries and industrial processes. This may involve the attraction of new sourcesof domestic and especially foreign investment and export-oriented industries, theformulae that worked in the initial Industrial Revolution two centuries ago. On thelevel of the city or city neighbourhood, this may capture what has been calledgentrification on the American model.5
• LED understood in terms of dynamic populist community initiatives. Here there isthe assumption of accumulation strategies ‘from below’, with subsequently widercurrency and beneficial effect especially on employment figures.6
• LED understood in terms of community initiatives linked to the provision of basicservices that resource-poor and/or corrupt governments cannot deliver in ThirdWorld countries. This involves theorising about the use of locally generated formsof organisation and co-operative behaviour to provide self-help answers to basicproblems. However, there is also an increasingly appended economic dimensionfocused on local specialisation, household diversification and institution building.7
• LED conveniently assimilated earlier paradigms that no longer read well but havenot genuinely been rejected. Thus, LED may be assimilated into models of tax-freeenterprise zones or activity corridors focused on anchor industries on a very largescale. LED may be assimilated in the urban context into the delivery of standardservices such as electrification (sometimes with exaggerated hopes concerning theeconomic multiplier consequences of such service provision) or with themanoeuvres of urban officials along furrows that have actually been ploughed for along time. These may in fact include long-familiar relations with the private sector,conventionally taking the form of lobbying, which now are being theorised in aparticularly beneficial way as though they were novel.
L O C A L E C O N O M I C D E V E L O P M E N T: U T O P I A A N D R E A L I T Y
255
Free
dow
nloa
d fr
om w
ww
.hsr
cpre
ss.a
c.za
Thus, the interest in LED is not really in the application of a well-honed and compre-hensive theoretical policy tool but rather in understanding how LED is interpreted in aparticular concrete situation and what its chances of success might be.
Local economic development in South Africa: what’s at stake?
One reason why South Africa makes a unique and interesting platform from which towitness LED is that it is a mixture of developed country and developing country phenomena and stratagems. It enables comparisons with very poor countries and withOrganisation for Economic Co-operation and Development members. In addition, ithas been the site of recent dramatic political shifts.
With the change of regime in 1994, national reconstruction has been based on a democ-ratisation of political and social life and on the proclamation of a politics of develop-ment, which would come to permit apartheid’s victims to emerge from poverty.Symbolically, this was heralded by the adoption of the Reconstruction and DevelopmentProgramme (RDP) as an election manifesto in 1994 on the part of the ANC. The socialpolicy section of the RDP contains lengthy discussion of the injustices and inequalitiesin South African social conditions and calls for remedial efforts in numerous directions.It is true that the RDP, in the view of radical critics, was largely shunted to one side in favour of fiscal conservatism and policies that fit the economic trends dominant inthe world of the Washington Consensus symbolised by the Growth, Employment andRedistribution strategy the policy adopted in 1994 (but not very different from the neglected economic section of the RDP manifesto, in fact).8 It is also true that clearly theANC has concerned itself – some would say primarily – with the creation of a blackbusiness elite that leans on the new state to create possibilities for itself.9 None the less,the continued emphasis on redistribution has never been lost, as witnessed in SouthAfrica’s progressive income tax policy or the large sums made available for social expen-diture. Recently, a critical view described South Africa as more of a welfare state than anyother country in its category of per capita income.
Of particular importance is what South Africans call ‘delivery’. By this is meant the pro-vision of infrastructure, standard for the areas inhabited under the apartheid system bythe white minority but only provided to a very inadequate extent for the majority of thepeople. In particular, the provision of safe water, electrification and the construction offormal housing is intended, although school and health clinic construction also features.But where does the capacity to provide ‘delivery’ lie? Where are the linkages towardsachieving rapid economic growth for the benefit of all?
In the spirit of the RDP, a process of decentralisation has been initiated, including thecreation of local governments with more capacity and means than most of their equiv-alents on our planet. In the South African case, as with other examples in the Anglo-Saxon world, some measure of decentralisation has been a long tradition, although the1910–1994 Union/Republic of South Africa was not genuinely a federal state comparedto Canada, Australia or the USA. Municipalities, however, with a financial basis in the
T H E D E V E L O P M E N T D E C A D E ? S O U T H A F R I C A , 1 9 9 4 – 2 0 0 4
256
Free
dow
nloa
d fr
om w
ww
.hsr
cpre
ss.a
c.za
collection of rates from property owners, had long held distinctive properties and con-siderable capacities to promote urban economic and social development (Freund 2002).This followed from the English model, already known in Victorian times from the moreenterprising examples by the somewhat uncomplimentary term ‘municipal trading’(Daunton 2000). The big South African towns contain considerable human as well as financial capital and experience in terms of construction and maintenance ofinfrastructure including housing, performed on contract in the past for the apartheidgovernment.
In the South African case, municipalities and provinces were constitutionally declared tobe co-equal generators of development with the central government, and this clearlyrepresents, in part, the intention that they should play the critical role in the actual provision of politically urgent delivery imperatives. In the first years of democratic rule,the delivery process appeared to be running very slowly, with unused national andprovincial budgets building up further pressure for effective action. One cause was, in asense, a perverse effect of democratisation due to the lengthy phase of research andpopular consultation, especially with regard to basic service provision and the manage-ment of development projects on the ground. Yet, one can still question whether givingvoice to ‘the community’ – the previously disadvantaged population of colour – throughgranting the right to elect political representatives they have chosen, local representativesincluded, has given to them the capacity to turn themselves into effective promoters ofeconomic and social development.
Already from the 1960s, theoretical discussions were held on the need to provide aneffective, spatially-defined impulse to development, the more so if it were to come fromthe private sector. There was by then the recognition that space was organised in a waythat obstructed development planning (Glaser 1988). A fundamental change that had tobe put into motion was the restructuring of political space. Under apartheid, territoryhad to be defined racially, creating artificial boundaries from the perspective of devel-opment trajectories and zones of economic activity. The creation of Joint ServiceCouncils and other regional structures in the last phase of apartheid was the earliestattempt to get around the problem without introducing any democratic input. From1994 to 1996, de-racialised local government, while still accepting certain inequalities in representation, was introduced nationally, amalgamating the racially fractured territories. After the 2000 elections, in harmony with the 1996 Constitution, the stateproceeded further to try to eliminate financially unviable municipalities but, above all,to consolidate the social and economic coherence of the municipal areas in order toincrease the capacity of local governments to influence their development.
The question of capacity has a different resonance if one compares a poor, denselypeopled rural district and a metropolis such as Durban, the principal container port inAfrica with a diversified industrial base and well-established tourist facilities.10 Thus, weneed to distinguish our analysis clearly as one focusing on the largest units. In Durban,the metropolitan government proposes to be, if not the sole regulator of local economicdevelopment, at least a catalyst for initiatives leading to dynamic growth. Is this vision
L O C A L E C O N O M I C D E V E L O P M E N T: U T O P I A A N D R E A L I T Y
257
Free
dow
nloa
d fr
om w
ww
.hsr
cpre
ss.a
c.za
justified and can it be concretised? In effect, LED can be interpreted in two ways, whichmay have the same desired goal but proceed in different political modalities: one, thepromotion of growth through the competitiveness of the economy; and two, the struggle against poverty. Which of these two (amongst the international meanings andinterpretations of LED) is preferable? Are these two goals both possible to achieve at thesame time?
In order to take on board these questions, however, first one has to grasp that themeaning of LED is in dispute between different planning practitioners. Bond (2001) seesthis dispute in the following terms. There are those who favour older approaches to localplanning, notably export tax-haven zones and activity corridors focused on large-scaleindustries intended to attract foreign investment. He is certainly correct that these wereheavily promoted in the early phases of South African democratisation. The former hassince then become less prominent in the international literature, as its early successeshave not been replicated very effectively. However, support for the corridor or SpatialDevelopment Initiative approach has been slower to decline. One linchpin, the CoegaHarbour project near Port Elizabeth, is beset by difficulties but continues to be thoughtof as an answer to the problems of poverty and lack of industrial direction in theprovince of the Eastern Cape. Bond (2001) portrays some of the problems inherent inthese approaches.
In contrast to these, Bond poses community-led development initiatives intended toindigenise and widen the accumulation process. He terms this an alternative strategy –‘municipal community services’-based LED – as opposed to what he calls ‘orthodoxLED’ (Bond 2001: 20). His assumption is that state-led but community-directed projectsin areas such as construction and electrification can serve as effective motors of eco-nomic growth. Here, as in some LED literature, the emphasis is on self-help and a smallscale, as well as a benevolent public environment hovering in the background.
By drawing this contrast, however, Bond tends to neglect another aspect of the LEDdebate – the well-developed already existing public–private co-operation that has beencritical in South African urban development for many decades. In the case of Durban, itwas early in the transition period (1990) that Operation Jumpstart, functioning in athreatening political void, brought ANC politicians together with existing big businessto develop some common goals as well as to begin to create a new and acceptable publicdiscourse (Robinson & Boldogh 1994). For a long time, the city of Durban had used itsconsiderable control over land sites to establish mutually beneficial relations with poten-tial employers. The city had long committed itself to the tourist industry, especially interms of the upkeep of the beachfront. This support had branched out in time to assist-ing in the promotion and display of sporting activity and to developing sites suitable forholding international conventions and conferences. Ability to make land available tobuilders was crucial to the exertion of influence by City Hall.
T H E D E V E L O P M E N T D E C A D E ? S O U T H A F R I C A , 1 9 9 4 – 2 0 0 4
258
Free
dow
nloa
d fr
om w
ww
.hsr
cpre
ss.a
c.za
The municipality of Durban and the local economy
The government of a metropolitan area such as Durban (eThekwini MetropolitanMunicipality) is a producer of services but these are largely limited to the provision ofelectricity and water, not negligible sectors, since the privatisation of the municipal pas-senger transport company in 2003. However, is the city otherwise limited to passivity ineconomic interventions?
In fact, the ways in which the local state can respond to economic challenges are several.First of all, it has the ability to produce a discourse. In this regard, the metropolitan government of Durban is prolific in producing literature aimed at attracting investorsor holidaymakers, offering views of one of the richest and most attractive port cities inAfrica to their gaze. Second, it can impose itself as a necessary intermediary for theprivate sector, and can in some circumstances play the key role in large-scale projectseven when the majority investors are, in fact, from the private sector.
Before detailing the content of the involvement of the local state in the sphere of themetropolitan economy, we are going to present its principal characteristics.
Reflections on the Durban metropolitan economy
Durban is incontestably the major economic pole of KwaZulu-Natal, which itselfextends through 92 100 km2 (7.6 per cent of the national territory) and has a populationof 9.43 million inhabitants (21 per cent of the national population) according to the2001 Census. However, KwaZulu-Natal contributes only 15 per cent of the GNP, farbehind the 40 per cent of Gauteng, where industry, commerce and the headquarters ofenterprises are concentrated (DEDT 2002). The Durban metropole, which extends over2 300 km2, includes a population of 3.1 million inhabitants, in other words, one-third of the population of KwaZulu-Natal. However, it represents some 60 per cent of theprovincial contribution to the GNP. One cannot really consider the provincial economymonocentric,11 but the weight of Durban within it is very considerable and the stronggrowth of the Gross Provincial Product can be credited largely to Durban. Nonetheless,this growth pattern should not hide the slackness of the labour market or the impera-tive of restructuring the industrial sector, which historically has been the motor of thelocal economy.
With a contribution of 30 per cent to the gross metropolitan product, industry has a rel-atively heavier weight than in any of the other South African metropolitan areas(Morris, Barnes & Dunne 2002). Historically, the industrial development of Durbanmanifested itself particularly in sectors strongly dependent on imported inputs: chemi-cals, textiles, garments, shoes, automobile components, food and drink, paper and printing, metallurgy, and so on. An exception should be noted here – Durban being thecentre of the sugar belt, local inputs have been critical in agro-industrial production.
The six most important industrial sectors are agro-industry, clothing, chemicals, textiles,metallurgical products and paper. Three of these – clothing, textiles and metallurgical
L O C A L E C O N O M I C D E V E L O P M E N T: U T O P I A A N D R E A L I T Y
259
Free
dow
nloa
d fr
om w
ww
.hsr
cpre
ss.a
c.za
products – have wages and salaries valued at more than half the value added in total (63per cent, 57 per cent and 55 per cent, respectively). Thus, until recently, they were allconsidered to be sectors with a high labour content. However, they are industries thattook off in the apartheid era under the cushion of strong tariff protection. The changeof regime in 1994 has brought about a shift from import-substitution production toexport promotion in a market more and more open to the rest of the world. Entiresectors, notably clothing,12 have been destabilised through the sudden waves of compe-tition coming from countries such as China, India and Taiwan. Those sectors potentiallymost vulnerable include the textile sector, clothing, automobiles and agro-industry.These represent about one-third of local industrial production and 45 per cent of indus-trial employment. Consequently, production shifts have been put into place aimed atincreasing productivity, often with losses in the numbers employed.
Other industrial sectors are competitive, for instance petrochemicals and other sub-sectors of the chemicals industry. They are, however, and increasingly so, capital-intensive sectors. They cannot be expected to maintain, still less to increase, industrialemployment. As the figures that follow show, the employment situation is desperate inSouth African metropoles generally, and in Durban particularly. According to the(admittedly controversial) results of the last Census,13 the rate of employment in thepopulation described as active fell from 68 per cent in 1997 to 57 per cent in 2001.
None the less, it is possible to paint a brighter picture of the vitality of the Durbaneconomy if we shift to the incontestable advantage that lies in the presence of the port.The port is the principal link between the economy of South Africa and the rest of theworld. This is a position that has been true since early in the twentieth century. Alreadyby 1915, the Durban port attracted more traffic than all of the Cape ports (Jones 2002).
The port of Durban takes in most of the petroleum (and its derivatives) consumed inSouth Africa, including Gauteng with which it is linked by pipeline, as well as in neigh-bouring countries. However, it is particularly because Durban has benefited from thecontainer revolution of the 1960s that the port has been able to become the premier portof the southern hemisphere.14 In 2000, container traffic represented 1.2 million TEUS.15
To handle this, the Durban port (before extensions) contained 66 specialised cargo sitsover its 15 km course. By comparison, Cape Town has 35 such sites, Richards Bay 17 andLagos 36 (Jones 2002).
Trevor Jones (2002) has attempted to measure, in part, the impact of the port on themetropolitan economy on the basis of 1994 statistics. With regard to activities takingplace directly at the port itself, 360 public and private enterprises could be located, witha workforce of 24 000 people and a wage bill of one billion (1994) rand. The multipliereffect of these wages on the urban economy was estimated at R2.5 billion. If one adds onthe jobs offered by subcontractors or indirect beneficiaries of port activities and those atthe refiners directly dependent on the presence of the port, port activities could be saidto generate at least 40 000 jobs. While many of these firms have since concerned them-selves with increasing productivity at the expense of employment, this tendency has
T H E D E V E L O P M E N T D E C A D E ? S O U T H A F R I C A , 1 9 9 4 – 2 0 0 4
260
Free
dow
nloa
d fr
om w
ww
.hsr
cpre
ss.a
c.za
been partially ameliorated by the absolute and incessant increase in traffic and, thus, ofthe level of activity engendered.
The historical experience
Without claiming to offer a complete picture of the metropolitan economy, the preced-ing discussion aimed at reminding us that Durban can rest on a solid industrial base,although constrained by the difficulties of restructuring due to the liberalisation of theeconomy and its opening to the world since the change of regime. Financial and othersectors have developed along with the needs generated by industry. The port continuesto manifest an incontestable vitality and constitutes the economic lungs of the metro-politan area, the province, the region and even the country. Generally, commerce inDurban benefits from the opportunities offered by the port. Despite this and the preva-lence of wealth (sometimes considerable in certain social categories) that this economicdynamism generates, the statistics reveal chronic unemployment and, consequently, anendemic poverty for which the state, including the local state, is held responsible by thepublic.
What hold does the local government have on the local economy if it does not have thecapacity to make the slightest intervention on its motor? The port is administered by aparastatal company, Transnet, responsible solely to the central government. Whatchance would the local government have of assisting the auto-making sector, organisedaround the Toyota factory (around 6 000 jobs) and the complex of subcontractorslocated in the southern and western industrial districts of the metropolis? Not much, forif Toyota Japan controls less than 30 per cent of Toyota SA (which belongs, for the mostpart, to Wesco, listed on the Johannesburg Securities Exchange), exports from theDurban factory, so closely linked to its capacity for further development, are stronglycontingent on the franchising contract that links it to the Japanese mother firm.
Thus, the possibilities for the local state to affect the destiny of the metropolitaneconomy are reduced, on the one side, to legitimising a political vision of developmentfor a variety of actors and, on the other, to sponsoring catalytic measures ranging fromthe provision of ad hoc structures, which may be taken up in regular form with time, orthe financing of particular operations.16
Apart from the prerogatives and autonomy guaranteed to local governments throughthe Constitution, the local government in Durban has, through long usage, a historicallygenerated visibility and plausibility.17 Quite unlike other parts of Africa, where munici-pal authority was established late and incompletely in the colonial era without adequatefinancial resources, Durban has long ago integrated local government into publicauthority more generally. In this context, an administrative elite succeeded in placingitself alongside (and even, in some respects, above) a political and an economic elite. Onthis foundation, bolstered at times by events and local-scale crises, the modern localstate was relatively successful in sustaining its legitimacy, notably in areas of economicintervention. Indeed, despite what common sense might suggest, after 1994 the major-
L O C A L E C O N O M I C D E V E L O P M E N T: U T O P I A A N D R E A L I T Y
261
Free
dow
nloa
d fr
om w
ww
.hsr
cpre
ss.a
c.za
ity of the population quickly reconstructed in its mind the link between the local government’s obligations with regard to public service and its role as promoter of localdevelopment.
In analysing the structure of the local state from a historical perspective, Bill Freund(2002) has made clear some of the lines of force around which the municipality ofDurban was constructed. In the nineteenth century, the city prospered on the base ofcommercial activities around the port. Thus, it is not surprising that the City Councilfrom its creation in 1854 was composed in good part of merchants concerned that thedevelopment of infrastructure would correspond with their needs in assisting their busi-nesses to grow. Therefore, the link between municipal administration and economicdevelopment has been established almost from the origins of the city.
One of the other aspects underlined by Freund is the origin of the population dominat-ing municipal government in early Durban. Durban, unlike the other big South Africancities, particularly before the 1940s, had a white population overwhelmingly of British,rather than Afrikaner, origin. Local elites had a measured response to the nationalistdemands of Afrikaners and remained very permeable to British influence so that a‘British style municipal bureaucracy’ was imposed on Durban (Freund 2002). In 1920,the Municipal Treasurer founded a section of the British Institute of MunicipalTreasurers and Accountants. This move lay at the origins of the creation of a virtual casteof municipal administrators such as Ossie Gorven, head of the Treasury Departmentfrom 1962 to 1985. They had strong links with the university (Freund 2002). Gorvencreated a Capital Fund managed in such a way that financial revenues were in excess ofthe debts of the city accrued through development requirements from 1978. Durbandeveloped an enviable reputation for the state of its finances.
Of course, good management cannot be divorced from the political ends that it serves.Historical analysis tends to confirm that, as generally within the English tradition, thelocal state was torn between two directions that it had to reconcile, laissez-faire andinterventionism. These directions are less contradictory when the goal is to promotepositive externalities, if private enterprise is integrated satisfactorily into its strategies.Here the question becomes whether the local state of Durban, in its initiatives, sub-ordinates itself to powerful local economic operators, or if it genuinely belongs to an independent plan of action.
Between ‘municipal trading’ and the politics of development
Since December 2000, metropolitan government in Durban has taken the form of aMetropolitan Council with 200 elected representatives, but most powers are in factretained by a subordinate authority, the Executive Committee, and the MunicipalCouncil itself can call on the services of an administration that employs some 20 000people, well-equipped under the leadership of Michael Sutcliffe, the City Manager, awhite former academic with a strong ANC history.18 He was formerly the powerful pres-ident of the Demarcation Board, which the national government used to sort out the
T H E D E V E L O P M E N T D E C A D E ? S O U T H A F R I C A , 1 9 9 4 – 2 0 0 4
262
Free
dow
nloa
d fr
om w
ww
.hsr
cpre
ss.a
c.za
boundaries of South African municipalities, in particular the drastic revision that tookplace before the 2000 elections.
From creating a discourse and establishing institutional arrangements…
Within the municipal administration, there are voices which, while making reference torecent theoretical developments concerning economic globalisation and local govern-ment (see, for example, Cox 1997; Storper 1997; Eisinger 1998; Scott 1998), argue infavour of proactive intervention for economic purposes. Thus, for instance, two employ-ees in the Economic Development Department of the city administration, Hall andRobbins (2002), have conceptualised globalisation, following the work of Kiel (1998), asplacing cities in permanent competition while offering them opportunities that theymay be able to seize. This perspective calls for a response on the part of local govern-ment. Thus, ‘globalisation makes states’, in other words, globalisation invests new powersin the local sphere of government. The most recent integrated development plan (IDP2003–2007) of the eThekwini Municipality is one of the clearest official documents thusfar with regard to the role of local government in development. It puts clearly into printone of the main challenges facing the metropolitan government: ‘Clearly the welfare andquality of life of all our citizens, as well as the ability of the Council to meet their needs,is largely dependent on the ability of our City’s economic base to generate jobs andincome’ (eThekwini Municipality 2003: 7). Therefore, the city cannot rest at the whimof market forces. The first of eight points from which flows the argument of the IDPstresses ‘sustainable development’, which must mean the economic growth of themetropole from the point of view of both employment and city revenue.
Since 1997, the municipality has had a Department of Economic Development, onefunction of which is to co-ordinate the municipal inter-services committee that presidesover the application of the Council’s Affirmative Procurement and Tendering Policy,aimed at favouring small, labour-intensive black businesses in the expenditure of cityfunds. Municipal intervention in local development is not concentrated only in thedirect line structure; to create or sustain linkage for the administration, local govern-ment has created a variety of agencies over which it assumes political control throughthe roles played by influential members of the City Council on their boards. Thus, themayor himself presides over the Durban Events Corporation, which is meant topromote and organise international-scale events in Durban. Another example is thePoint Development Company, which is undertaking the restructuring of a large part ofthe beachfront through the addition of new infrastructure (oceanographic museum andtheme park, marina, hotel and high-class shops) in order to attract high-value tourism.The mayor is also a member of the administrative council of the Durban InvestmentPromotion Agency as well as of the Foundation for Social Investment. The first deputymayor represents the municipality on the board of the municipal tourist agency, DurbanAfrica. Six municipal councillors participate on the board of the eThekwini BusinessDevelopment Centre. All of these agencies are subsidised by the city; for instance, withan annual R15 million for Durban Africa and R7.5 million for the Durban Investment
L O C A L E C O N O M I C D E V E L O P M E N T: U T O P I A A N D R E A L I T Y
263
Free
dow
nloa
d fr
om w
ww
.hsr
cpre
ss.a
c.za
Promotion Agency, both essentially lobbying agencies. Beyond this, the capacity of themunicipality to intervene in the economic sphere is closely tied to budget allocations.
...to financing activities
In the 2002/03 Budget year, already, the big South African municipalities, except for PortElizabeth, were provided with budget spending of above R3 000 per capita, a ratio morethan 50 times higher than the government of Dakar in Senegal and between 14 and 20times higher than the government of Abidjan in Ivory Coast, to take two African paral-lels.19 Their total budget amounted to more than R47 billion, about one-third of the totalfor the nine provincial budgets.20
There is, moreover, a major difference between metropolitan and provincial budgets.The provinces are dependent for 96.1 per cent of their budgets on transfers from thecentre (National Treasury Database 2002/03). By contrast, the big cities are largelydependent on revenues derived from taxes on property, whether or not developed, andon fees recovered in payment for the provision of services.
The budget structure calculated for the 2003/04 fiscal year underlines the choices thatcouncillors and administrators have made with regard to development. The budgetapproaches R10 billion, 20 per cent calculated as an investment budget and 80 per centas operating budget. Transfers from the national government, R349 million, amount toonly some 4 per cent of the municipal budget. Thus, Durban is only marginally depend-ent on the national Budget. Between the 2002/03 Budget and the subsequent one therewas a strong increase of 25 per cent on the investment side. This will have an automaticknock-on effect on working budget interest and other costs (maintenance, depreciation,financial charges and so on).
Durban’s operating budget revenues derive for the most part (50.2 per cent in 2003/04)from paid services, of which the most important are electricity (35 per cent) and water(15 per cent). Rates contribute approximately 30 per cent to the budget. The only tax(very much restricted by the Constitution) that the municipality can raise on industrialor economic activity, the Business Service Levy, brings in R455 million, of which R135million goes to the operating budget and R320 million to the investment budget.
Turning to expenditures (and thus to potential local government initiatives) one mustfirst note the anxiety felt by the municipal administration regarding the apparentlyexcessive part played by the total of wages and salaries (28.3 per cent in 2003/04). Thisexcess is supposed to be checked through the work of a newly formed Internal Audit andPerformance Management service funded with a budget of R17 million. Analysis of thebudget confirms the concern of the municipality about infrastructural maintenance(electricity and water maintenance, sanitation, road and traffic signs and signals, and soon), representing 57 per cent of the expenses of metropolitan operations. The salaries ofthe employees in the various technical services bring the total up to 60 per cent. Some9.8 per cent of the investment budget is measured through several line categories
T H E D E V E L O P M E N T D E C A D E ? S O U T H A F R I C A , 1 9 9 4 – 2 0 0 4
264
Free
dow
nloa
d fr
om w
ww
.hsr
cpre
ss.a
c.za
devoted to the potable water supply (connections and various other infrastructuralexpenditures) and 14.5 per cent to the electric services. Also to be stressed is the largesum of R510 million assigned to public housing (destruction of slums, construction ofnew housing), representing more than 25 per cent of the investment budget for 2003/04.
Expenditures on health, safety and security and other social services, together withexpenditure on leisure activities, come to the substantial figure of R1.4 billion (16 percent of the total gross working expenses). That this figure is not very much higher owesitself to the fact that education and health are largely the remit of the province. Also significant is the figure of R400 million that Durban devotes to the functioning of themunicipal police force. After the end of apartheid, this traditional Durban feature wasdescribed as having an ‘economic objective’ in assisting the national police force inassuring the security of areas frequented by tourists, especially the beachfront, andindustrial zones.
This budget analysis shows that Durban, far from being dependent on other spheres ofgovernment, instead tends to make up for their deficiencies. Thus, in the 2003/04Budget, it was the municipal authorities who felt constrained to assume the provision ofotherwise ‘unfunded mandates’ for reasons of local social and political regulation, whichconstitutionally ought to have been provided for out of provincial or national funds. Ifthe city had not paid these sums, it could have put approximately R500 million intoother expenditures, notably for social benefits.21
An assessment of the preceding figures indicates that the local state places great empha-sis on social expenditure defined in terms of basic public services. This corresponds toconstitutional requirements but also to a logic of political sustainability in covering themost obviously economic elements in the politics of local development.
Flagship projects
The economic strategy of the local government places itself directly in the context of aDurban growth coalition, which it has promoted in association with the Chamber ofCommerce and Industry, numerous individual actors and the provincial government.The Third Economic Growth Summit, which it helped to organise in 2003, contributedtowards shaping its policy of sustaining the economy through concentrating its energies,both in terms of political leadership and financial resources, on a limited number oflarge projects, while appealing to the private sector for support and aiming at maximumlocal, national and international visibility.
The two flagship projects focused on here are symbolically important: the enlargement ofthe International Conference Centre (ICC) and the redeployment or development of thebeachfront tourist infrastructure (leisure activities, commerce, hospitality services) to arun-down area on the edge of the port (uShaka Island and the Point PrecinctDevelopment). There are two distinct logics in these big projects. First, they represent anaggressively competitive response to initiatives from other centres to attract the flow of
L O C A L E C O N O M I C D E V E L O P M E N T: U T O P I A A N D R E A L I T Y
265
Free
dow
nloa
d fr
om w
ww
.hsr
cpre
ss.a
c.za
wealth expected from international tourism, conferencing and big intercontinental sport-ing events. Second, they are promoted by local government because they are expected tohave a beneficial effect on increasing employment and the gross local product.
Some R280 million has already been allocated to the Durban investment budget (sharedbetween three budgets for the fiscal years through to 2006) for the ICC extension. TheICC is already the biggest conference centre on the African continent but it is nowthreatened by projects creating equivalent facilities in Cape Town and Johannesburg. Onthe basis of the extension, the ICC could accommodate conferences attended by up to10 000 people on a site of 32 000 m2, thus trumping South African competitors. Theextension, to be completed in 2006, is supposed to create 23 000 jobs in ten years andinject R612 million into the gross local product from the first year. According to themayor’s office, the contribution over ten years is estimated at R21.6 billion (The Mercury12 November 2003). This announcement was accompanied by a decision to add a largesports complex to the ICC as well as a luxury hotel complex. This complementary programme, the costs of which have not been placed in the investment columns of themunicipal budget so far, will supposedly provide 15 000 jobs. The uShaka Marine World,only one part of the set of beachfront rehabilitation projects that will cost the city R300million (according to the 2003–2006 investment budgets) is scheduled to attract 1.4million annual paying visitors from the first year, a figure expected to grow by 8 per centper annum for the first decade after opening. The concessionary company hopes to earnR130 million in the first year and double that figure by 2016 (Business Report, 5 June2003).
There is a final project to which some local forces are strongly attracted that deservesmentioning although it has been mooted for almost 30 years – the iDube Tradeport.Presented as the most ambitious initiative of its kind ever in Africa, the project consistsof the establishment of a new international airport to the north of the city, joined to aso-called cyberzone of industrial development. This space would be integrated into newroad and rail linkages connecting it to the mineral port of Richards Bay as well as anexpanded Durban port. The local government lacks the means to provide the leadershiphere, which would depend on national and provincial commitment and the interest ofinternational investors. However, the project has been provisionally provided with R50million in the 2004/05 and 2005/06 development budgets, amounts that could be sub-stantially increased under favourable circumstances. In addition, the local governmenthas engaged in considerable lobbying in this regard. This is hardly surprising if one con-siders that a feasibility study published by local and international consultants claimedthat the construction of the airport would require the employment of at least 100 000people directly and indirectly, and the only increase in taxes anticipated would comprisea successful return on investment by the standards of the private sector. Tax on land herewould bring in R130 million per annum, approximately one-tenth of the amount of thetax on the actual property (The Mercury 3 March 2004).
However, in conformity with the IDP, the city seeks an equilibrium between these newdevelopment possibilities based on criteria of ‘economic rationality’ and the political
T H E D E V E L O P M E N T D E C A D E ? S O U T H A F R I C A , 1 9 9 4 – 2 0 0 4
266
Free
dow
nloa
d fr
om w
ww
.hsr
cpre
ss.a
c.za
imperative to rearrange and desegregate metropolitan space. Thus, in the developmentbudgets of recent years and the projections for coming years, there is some evidence ofthe intention to rehabilitate or revitalise former residential areas and, most notably, theCentral Business District and the Southern Industrial Basin of the metropolis.
Conclusion: control of local development through public–private partnerships?
It is striking that the different initiatives of the municipality in local economic develop-ment are conceived of as modalities within a partnership of the public and privatesectors. In South Africa, the concept of public–private partnership (PPP) has been putforth as a principle in government documents.22 This principle is already in play, ascertain sensitive functions of government have been allocated to renewable private sub-contracting. The recovery of debt payments, the reading of water and electricity meterson which the payments to the municipality are based, and the use of private securitycompanies working under contract to the local police are examples.
The extension of such measures is being studied, as is the establishment of opportuni-ties for Civil Society Partnerships and PPPs along the lines envisioned in the LocalGovernment Municipal Systems Act of 1999. The partnership that has been proposedbetween the local government and insurance companies in order to create a special Anti-Hijack Unit23 would represent a new and striking linkage, especially if it were to beextended to emergency services, for instance anti-fire protection.
With regard to PPPs, let us sketch three possible scenarios. The first is represented by anequitable and harmonious compromise between the private and public sectors on thebasis of common activities benefiting the largest number of citizens. The second is a scenario attacked by the more radical enemies of neo-liberalism. Here, partnershipreally is just a slip that effectively masks not just the privatisation of public services but,more seriously, the public sphere generally. Perhaps it is naïve, but let us introduce athird scenario, whereby the public authorities, through participation in a multiplicity ofpartnerships with the private sector would acquire, or re-enforce the acquisition of, acapacity to control or regulate sectors of activity that are critical to social and economicdevelopment as a whole. In the specific case of Durban, this is a hypothesis that has beenexplored recently with reference to public passenger transport (Bellengere, Khan,Lootvoet & Vermeulin, forthcoming). In 2003, Durban privatised its municipal buscompany while creating a Transport Authority, an agency of regulation only, which hasthe ambition to oversee the entire system of metropolitan transport. Is this not, in fact,what is being put in play in the areas where the local state has chosen to intervene moregenerally in Durban? Of course, to sustain this third scenario postulates that the localpolitical class is capable of resisting provincial and national pressures in this regard.
It is still much too soon, given the extreme youth of the post-apartheid municipal dispensation, to know if the central government will choose in future to neutralise polit-ically and institutionally those who may come to benefit from the autonomy generated
L O C A L E C O N O M I C D E V E L O P M E N T: U T O P I A A N D R E A L I T Y
267
Free
dow
nloa
d fr
om w
ww
.hsr
cpre
ss.a
c.za
by local economic development deriving from the possibilities of empowerment at the local level (in the sense of Kiel 1998). The ruling party in South Africa is stronglycentralist in origins, but it is the scene of internal tensions and has constitutionallyempowered the local prerogatives of government, although their realisation is rarely a subject of discussion. None the less, there remains the task of measuring the real economic effects of displacing a part of public decision-making about developmentfrom a centre to various peripheries.
Economic theory does not allow us to measure reliably the relationship between eco-nomic growth and the equilibration of institutions. Of course, local political authoritiesin Durban do not concern themselves with such theoretical considerations, or theimprecision of LED more generally, but they do affirm some determination to give LEDa tangible reality. To this end, they forge alliances with private operators in the mount-ing of large-scale projects, which has the effect, amongst others, of consolidating a newand politically useful local economic elite. One can imagine, beyond the PPP frame-work, an alliance between the old (and white) elite and the new elite (of colour) thatmight be forged in the future (Freund & Moffett 2004). The consequences for the massof disinherited Durbanites, however, are more uncertain. Despite all the extremely positive projections that have been noted, the employment possibilities on offer for theunskilled and poorest strata of the population are unclear. This casts a sharp light on theambiguities and uncertainties of the LED discourse. Can the privileged and unprivilegedbenefit equally?24 The near future will probably make it clearer whether the local state isable to be more than a mere master of ceremonies presiding over the efflorescence ofprofitable or risk-free activities on the part of the private sector, or whether the thirdscenario suggested earlier can find in Durban an effective stage for its performance.
Notes
1 Author of Elite transition: From apartheid to neo-liberalism in South Africa and other books,
most recently Unsustainable South Africa.
2 Blakeley (1994) Planning local economic development: Theory and practice.
3 This lack of theoretical consistency is openly accepted in, for instance, Bingham & Mier (1995).
4 For instance, see Mayer-Stamer (2003) and Schmitz (1995). Mayer-Stamer’s deep understanding
of the issues around LED influences these pages more generally. For texts that helped shape the
cluster and value-chain family of approaches, see Piore & Sabel (1984), Porter (1990) and the
largely very critical Amin (1994).
5 Powerfully critiqued by Logan & Molotch (1987) in a classic analysis, amongst many others.
6 Bond (2001) provides such a model in a critique of other approaches.
7 For a general introduction, see Helmsing (2003).
8 In defence of the RDP, see Bond (2000). For key assessments of this shift, see Marais (1998 and
subsequent editions) and Cling (2000).
9 For an early statement of this, see Adam, Van Zyl Slabbert & Moodley (1997).
T H E D E V E L O P M E N T D E C A D E ? S O U T H A F R I C A , 1 9 9 4 – 2 0 0 4
268
Free
dow
nloa
d fr
om w
ww
.hsr
cpre
ss.a
c.za
10 A recent assessment of the capacity of municipalities to provide benefits for their citizens shows
a range between six metropolitan zones spending an average of R2 525 per capita, and 28 Class
V towns with R313 to spend and, at bottom, 30 Class VII new urban zones spending a mere R2
per capita, as of 2000/01 (presentation by Michael Sutcliffe, CEO, Ethekwini Municipality, 4 May
2004, School of Development Studies, University of KwaZulu-Natal).
11 There are two significant secondary economic poles, the political capital, Pietermaritzburg (with
a little more than a half million inhabitants in 2001), now the Msunduzi Municipality integrated
into the Umgungnudlovu District Municipality after 2000, and Richards Bay (approximately
290 000 inhabitants in 2001), re-baptised Umhltathuze Municipality and integrated into
Uthingulu District Municipality, where the largest mineral export port of South Africa is situated.
12 According to Morris et al. (2002), this sector consisted of 525 enterprises in KwaZulu-Natal, of
which 416 were in Durban, employing 32 409 workers, and accounting for 79 per cent of the
gross product and 76 per cent of the wages in the province.
13 One criticism directed at the Census is that it has not been very successful at capturing activities
in the so-called informal sector.
14 Measured in terms of freight handled, because the mineral volume of Richards Bay places it well
ahead of Durban in pure volume. Approximately only 10–15 per cent of the merchandise
handled in Durban, excluding petrol, consists of unprocessed primary materials.
15 Twenty Foot Equivalent Units, the international measure used for container traffic.
16 Although it could be said, as well, that this applies to national governments, including those in
wealthy and industrialised countries. If European countries are so impotent when it comes to
putting into practice policies intended to launch growth (in effect, the politics of development),
it is because they are less and less able to be effective actors in a system of globalised production
and can only marginally influence the evolution of the market for capital, goods and services.
17 Here we are referring to the white core of Durban from the apartheid era.
18 Sometimes too well-equipped; for instance, as at 2001 no less than 30 GIS services were in use in
different departments, suggesting a lack of rationalisation of information in the municipality as
a whole.
19 These figures were calculated by Benoît Lootvoet. Those for Abidjan apply to the situation
before the national crisis of recent years.
20 This amounted to approximately R145 billion, according to the Medium Term Expenditure
Framework of the Ministry of Finance.
21 These items included spending on libraries (R104 million), health (R171 million), fire services
(R125 million), reconstruction after storms, etc. (R4 million), museums (R25 million), transport
(R70 million) and habitat/hostels/townships (R36 million).
22 For instance, with reference to local government, one can cite the White Paper on Local
Government of 1998 or the White Paper on Municipal Service Partnerships in 2000 as examples.
23 The statistics related to car thefts and other equally economically disruptive crimes suggest such
high figures that their diminution would probably have a very beneficial political and social
effect for the state and a financial one for the insurance companies.
24 For a sceptical point of view on this question, see Bouillon (2002).
L O C A L E C O N O M I C D E V E L O P M E N T: U T O P I A A N D R E A L I T Y
269
Free
dow
nloa
d fr
om w
ww
.hsr
cpre
ss.a
c.za
References
Adam H, Van Zyl Slabbert F & Moodley K (1997) Comrades in business: Post-liberation politics in
South Africa. Cape Town: Tafelberg.
Amin A (1994) Post-Fordism: A reader. Oxford: Blackwells.
Bellengere A, Khan S, Lootvoet B & Vermeulin S (forthcoming) Privatiser pour mieux réguler?
Le pari de Durban, Afrique du Sud, en matière de transport public, in Transports au Sud:
Pouvoirs, lieux et liens, Autrepart, Paris: L’Aube.
Bingham R & Mier R (eds.) (1995) Theories of local economic development, perspectives from across the
disciplines. Newbury Park: Sage.
Blakeley E (1994) Planning local economic development: Theory and practice. Thousand Oaks: Sage.
Bond P (2000) Elite transition: From apartheid to neo-liberalism in South Africa. London: Pluto Press.
Bond P (2001) Local economic debates in South Africa. Municipal Services Project, Occasional Paper
No. 6.
Bond P (2003) Unsustainable South Africa. Pietermaritzburg: University of Natal Press.
Bouillon A (2002) Citizenship and the city: The Durban centre-city in 2000, Transformation 48: 1–37.
Cling J-P (2000) L’économie Sud-Africaine au sortir de l’apartheid. Paris: Karthala.
Cox R (ed.) (1997) Spaces of globalization: Reasserting the power of the local. New York: Guildford
Press.
Daunton M (ed.) (2000) Cambridge urban history of Britain, III. Cambridge: Cambridge University
Press.
DEDT (2002) KwaZulu-Natal economic review: 2002. KwaZulu-Natal: Department of Economic
Development and Tourism.
Eisinger P (1998) The rise of the entrepreneurial state. Madison: University of Wisconsin Press.
eThekwini Municipality (2003) Integrated development plan 2003–07. <http://www.durban.gov.za/
eThewini/Municipality/policy/policy/idp/IDP2003.pdf>
Freund B (2002) City hall and the direction of development: The changing role of the local state as a
factor in economic planning and development in Durban, in B Freund & V Padayachee (eds.)
D(urban) vortex. South African city in transition. Pietermaritzburg: University of Natal Press.
Freund B & Moffett S (2004) Elite formation and elite bonding: Social structure and development in
Durban, Urban Forum 15: 134–61.
Glaser D (1988) The state, capital and decentralisation policy in South Africa 1932–85. MA thesis,
University of the Witwatersrand.
Hall P & Robbins G (2002) Economic development for a new era. An examination of the adoption of
explicit economic development strategies by Durban local government since 1994, in B Freund
& V Padayachee (eds.) (D)urban vortex. South African city in transition. Pietermaritzburg:
University of Natal Press.
Helmsing A (2003) Local economic development: New generations of actors, policies and
instruments for Africa, Public Administration and Development 23: 64–76.
T H E D E V E L O P M E N T D E C A D E ? S O U T H A F R I C A , 1 9 9 4 – 2 0 0 4
270
Free
dow
nloa
d fr
om w
ww
.hsr
cpre
ss.a
c.za
Jones T (2002) The port of Durban: Lynchpin of the local economy? in B Freund & V Padayachee
(eds.) (D)urban vortex. South African city in transition. Pietermaritzburg: University of
Natal Press.
Khan S & Lootvoet B (2002) Infrastructure, service delivery and local development: A few
considerations from Durban, South Africa, in A Bouillon, B Freund, D Hindson & B Lootvoet
(eds.) Governance, urban dynamics and economic development: A comparative analysis of the
metropolitan areas of Durban, Abidjan and Marseilles. Durban: Plumbline Publishing.
Kiel R (1998) Globalization makes states: Perspectives of local governance in the age of the world
city, Review of International Political Economy 5: 616–46.
Logan J & Molotch H. (1987) Urban fortunes. Berkeley: University of California Press.
Lootvoet B & Guyot S (2002) Le local et l’économie les capacités d’action du gouvernement
métropolitain. Durban. Afrique du Sud, L’Espace Géographique 1: 49–61.
Marais H (1998) South Africa: The limits to change. London: Zed Press.
Mayer-Stamer J (2003) Why is local economic development so difficult? Unpublished paper.
Morris M, Barnes J & Dunne N (2002) From import substituting industrialisation to globalised
international competitiveness. Industrial restructuring in a South African city, in B Freund &
V Padayachee (eds.) (D)urban vortex. South African city in transition. Pietermaritzburg:
University of Natal Press.
Padayachee V (2002) Financing Durban’s development 1970–99, in B Freund & V Padayachee (eds.)
(D)urban vortex. South African city in transition. Pietermaritzburg: University of Natal Press.
Piore M & Sabel C (1984) The second industrial divide: Possibilities for prosperity. New York:
Basic Books.
Porter M (1990) The competitive advantage of nations. New York: Free Press.
Robinson J & Boldogh C (1994) Operation Jumpstart: An economic growth initiative in the Durban
Functional Region, in R Tomlinson (ed.) Urban development planning. Johannesburg:
Witwatersrand University Press.
Schmitz H (1995) Global competition and local co-operation, success and failure in the Sinos Valley,
Brazil, World Development 26: 1627–50.
Scott A (1998) Regions and the world economy: The coming shape of global production, competition and
political order. New York: Oxford University Press.
Storper M (1997) The regional world: Territorial development in a global economy. New York:
Guildford Press.
L O C A L E C O N O M I C D E V E L O P M E N T: U T O P I A A N D R E A L I T Y
271
Free
dow
nloa
d fr
om w
ww
.hsr
cpre
ss.a
c.za

Free
dow
nloa
d fr
om w
ww
.hsr
cpre
ss.a
c.za
Section 6Labour, work and the informal economy
273
Free
dow
nloa
d fr
om w
ww
.hsr
cpre
ss.a
c.za

Free
dow
nloa
d fr
om w
ww
.hsr
cpre
ss.a
c.za
14 Labour supply and demand constraints onemployment creation: a microeconomic analysis
Haroon Bhorat
Introduction
The democratic government inherited a labour market that had been subject to thelong-run effects of structural shifts and technological change in the domestic economy.The former was represented by the shift in output away from the primary sectors towardthe services sectors, while the latter has been manifested in the onset of the micro-electronics revolution as well as significant increases in capital–labour ratios. The labourmarket consequence of these changes has been to increase the demand for highly skilledworkers, combined with large-scale attrition at the bottom end of the labour market.1
The post-apartheid period has also been marked by the addition of one crucial causalvariable – the relatively poor performance in economic growth. There can be no doubtthat this low level of output expansion has impacted negatively on the propensity of theeconomy to create employment. The purpose of this paper then is threefold. Firstly, toprovide a brief descriptive overview of shifts in employment and the trajectory of labourdemand in the period 1995–2002. We then go on to consider two composite micro-economic constraints that operate on the labour supply and labour demand side respec-tively. The former will examine the nature of households that the unemployed reside in,and the latter examines the constraints that firms may be facing with respect to thelabour regulatory environment. These two microeconomic constraints, it is argued, maylie at the heart of the employment challenge facing the country.
Post-apartheid labour supply trends
Table 14.1 presents a snapshot of the key labour market statistics for the period1995–2002. Concentrating on the labour force data, according to the expanded defini-tion of unemployment (the ‘unofficial’ definition), it is evident that over this period theeconomy created about 1.6 million jobs. While the sectoral and skills detail of thisgrowth did of course vary, it is clear that the notion of aggregate ‘jobless growth’ in theSouth African economy is erroneous. The economy, in the aggregate, has been creatingjobs rather than shedding them.
It is important though to try and place this absolute expansion of employment incontext. Specifically, it is necessary to assess the number of jobs that have been created,relative to the new entrants that have come into the labour market annually between1995 and 2002. The data indicate that between 1995 and 2002, the number of new
275
Free
dow
nloa
d fr
om w
ww
.hsr
cpre
ss.a
c.za
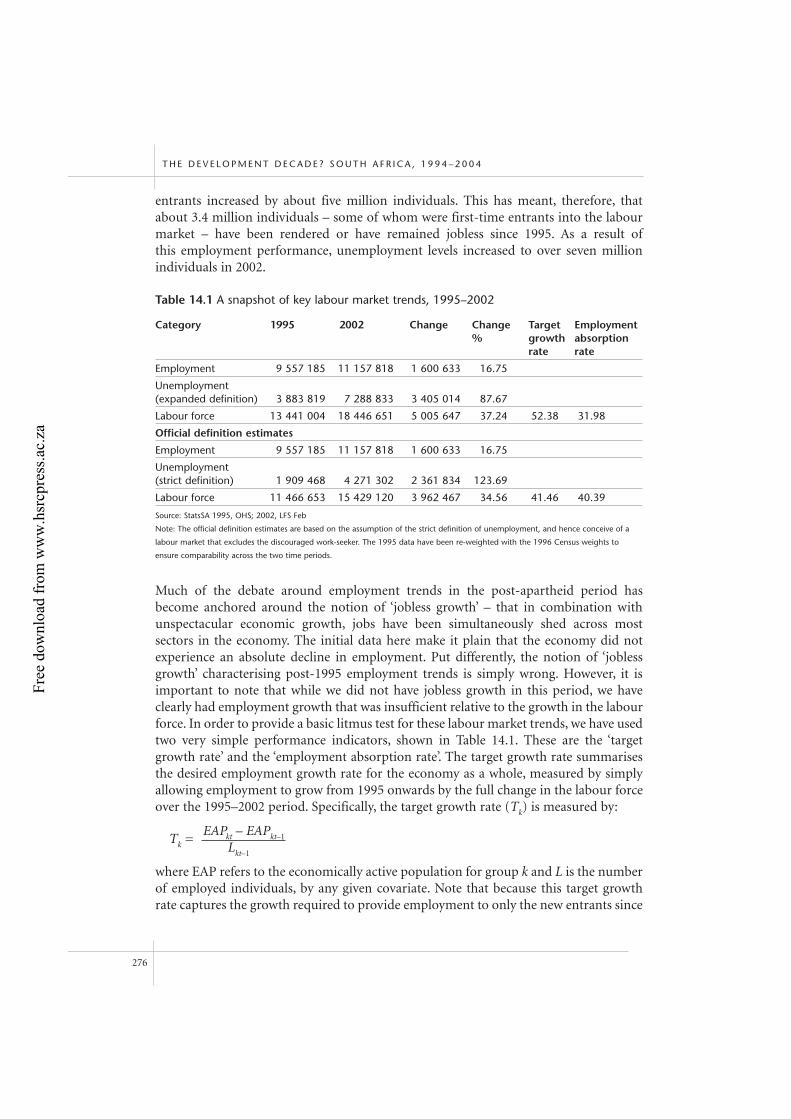
entrants increased by about five million individuals. This has meant, therefore, thatabout 3.4 million individuals – some of whom were first-time entrants into the labourmarket – have been rendered or have remained jobless since 1995. As a result ofthis employment performance, unemployment levels increased to over seven million individuals in 2002.
Much of the debate around employment trends in the post-apartheid period hasbecome anchored around the notion of ‘jobless growth’ – that in combination withunspectacular economic growth, jobs have been simultaneously shed across mostsectors in the economy. The initial data here make it plain that the economy did notexperience an absolute decline in employment. Put differently, the notion of ‘joblessgrowth’ characterising post-1995 employment trends is simply wrong. However, it isimportant to note that while we did not have jobless growth in this period, we haveclearly had employment growth that was insufficient relative to the growth in the labourforce. In order to provide a basic litmus test for these labour market trends, we have usedtwo very simple performance indicators, shown in Table 14.1. These are the ‘targetgrowth rate’ and the ‘employment absorption rate’. The target growth rate summarisesthe desired employment growth rate for the economy as a whole, measured by simplyallowing employment to grow from 1995 onwards by the full change in the labour forceover the 1995–2002 period. Specifically, the target growth rate (Tk) is measured by:
Tk =EAPkt – EAPkt–1
Lkt–1
where EAP refers to the economically active population for group k and L is the numberof employed individuals, by any given covariate. Note that because this target growthrate captures the growth required to provide employment to only the new entrants since
T H E D E V E L O P M E N T D E C A D E ? S O U T H A F R I C A , 1 9 9 4 – 2 0 0 4
276
Table 14.1 A snapshot of key labour market trends, 1995–2002
Category 1995 2002 Change Change Target Employment% growth absorption
rate rate
Employment 9 557 185 11 157 818 1 600 633 16.75
Unemployment(expanded definition) 3 883 819 7 288 833 3 405 014 87.67
Labour force 13 441 004 18 446 651 5 005 647 37.24 52.38 31.98
Official definition estimates
Employment 9 557 185 11 157 818 1 600 633 16.75
Unemployment(strict definition) 1 909 468 4 271 302 2 361 834 123.69
Labour force 11 466 653 15 429 120 3 962 467 34.56 41.46 40.39
Source: StatsSA 1995, OHS; 2002, LFS Feb
Note: The official definition estimates are based on the assumption of the strict definition of unemployment, and hence conceive of a
labour market that excludes the discouraged work-seeker. The 1995 data have been re-weighted with the 1996 Census weights to
ensure comparability across the two time periods.
Free
dow
nloa
d fr
om w
ww
.hsr
cpre
ss.a
c.za
1995, it is essentially the rate of growth required to absorb all net new entrants, inde-pendent of the unemployment numbers existent in the base year, namely 1995. Theemployment absorption rate (ERk) is the ratio between the actual employment growthand the desired (or ‘target’) rate, and is expressed as a percentage. Hence, it is simply:
Lkt – Lkt–1
ERk =Lkt–1 =
Lkt – Lkt–1
Tg EAPkt – EAPkt–1
The closer the employment absorption rate is to 100, the better the actual relative to thedesired employment performance. These figures are critical as they are predictors of rel-ative employment performance – something that the standard growth rates do not yield.
The data from Table 14.1 thus suggest that while employment grew at 17 per cent overthe period, if all the new entrants were to have been placed into employment since 1995,employment would have had to grow by 52 per cent over the period. In other words, inorder to maintain unemployment at its 1995 levels, employment should have risen byjust over three times the existing rate. In terms of the employment absorption rate, thedata suggest that over the period the economy has been able to provide 32 jobs for every100 economically active individuals in the labour market. Even by the strict definition ofunemployment, which is the government’s official representation of the labour market,the economy has created only 40 jobs for every 100 members of the labour force.
How poor has employment growth been?
The above figures clearly point to the growing numbers of unemployed individuals, asa result of employment growth not keeping pace with the growth in the labour force.It is important, however, to note that ultimately the demand for labour is a deriveddemand for labour – growth in jobs is inextricably linked to the growth in output. Pooreconomic growth will deliver (controlling for factor ratios) low levels of employmentexpansion. Indeed, this line of reasoning falls empirically within the domain ofoutput–employment elasticities. Generation of these elasticities falls outside thedomain of this chapter, but what is attempted is an indicative assessment of how pooremployment growth has really been in the domestic economy since 1995. An importantpoint of departure in this regard is to examine national economic growth rates over thisperiod. Data reveal that over the 1995–2002 period, economic growth rates hovered ina band between 0.8 per cent and 4.3 per cent, with an annualised mean of 2.8 per centover the period. Employment growth over this period grew, as indicated earlier, by16.75 per cent, which is a mean rate of about 2.1 per cent per annum. In very simplis-tic terms, this comparison indicates that for the level of output growth recorded for theeconomy, employment expansion has not been as dismal as is often indicated.
The critical caveats to the above representation are fourfold. Firstly, the relationshipbetween output and employment will, and indeed does, vary across sectors. Hence, wemay find that sectoral output growth in some sectors results, through changing factor
L A B O U R S U P P LY A N D D E M A N D C O N S T R A I N T S O N E M P L O Y M E N T
277
Free
dow
nloa
d fr
om w
ww
.hsr
cpre
ss.a
c.za
proportions, in a relatively inelastic employment response. A sectoral division of theemployment–output relationship, therefore, may reveal ‘jobless growth’ in some sectors.Thus, it remains important to keep in mind that while in the aggregate the employmentperformance of the economy has not been as abysmal as is frequently suggested, the sectoral evidence in some cases may reject this notion.
Secondly, we cannot be sure if the growth in employment is primarily a function ofinformal sector expansion. Hence, output growth may in fact be associated with growinginformal employment, but aggregate contraction of formal sector employment.2
Thirdly, the growth in employment recorded is for all workers, irrespective of theirsupply characteristics. Hence, as discussed later, the nature of employment growth maybe biased towards skilled and semi-skilled workers, with unskilled workers still losingtheir jobs over this period. Put differently, the basic output–employment relationshipreferred to earlier may mask specific skills preferences in the labour demand trajectoryof the economy.
Finally, the above estimates do not reveal anything about possible changes in the qualityof employment. Quality of employment may be affected through, for example, theincreased prevalence of part-time work, reduction in benefits offered to the workforce,greater outsourcing, and so on. Lundall, Majeke and Poswell (2004) and Hinks (2004)provide preliminary evidence on the growth of atypical forms of employment.
Ultimately, though, the aggregate data suggest that while employment expansion hasbeen recorded since the first majority government, we need to be mindful that in termsof the economically active population and its growth over time, this job performancehas been far from adequate. In the lexicon of this chapter, what this suggests is that thecurrent level and trajectory of economic growth has not been conducive to employmentexpansion. While this analysis falls well short of providing formal output–employmentelasticities, it provides fairly powerful, albeit initial, evidence of the fact that thegrowth–employment relationship in this seven-year period has been notably inelastic.Put differently, the economy’s low and single-digit growth rates have been consistentlyunable to act as a generator of a sufficient quantum of employment in the domesticeconomy. It needs to be remembered, though, and this is discussed in the data thatfollows, that in addition to the problem of low growth inhibiting labour-demand expan-sion, significant labour supply-side constraints continue to exist and also inhibitemployment. These are manifest in the form of inadequate supply characteristicsamongst a large number of the unemployed in the face of what has now been well documented for South Africa as skills-biased employment growth.
Skills-biased employment shifts
As alluded to earlier, together with output expansion at the sectoral level, what is alsorelevant in terms of labour demand patterns is the particular configuration of skillsneeds that can be identified within each sector. This provides another important layer in
T H E D E V E L O P M E N T D E C A D E ? S O U T H A F R I C A , 1 9 9 4 – 2 0 0 4
278
Free
dow
nloa
d fr
om w
ww
.hsr
cpre
ss.a
c.za
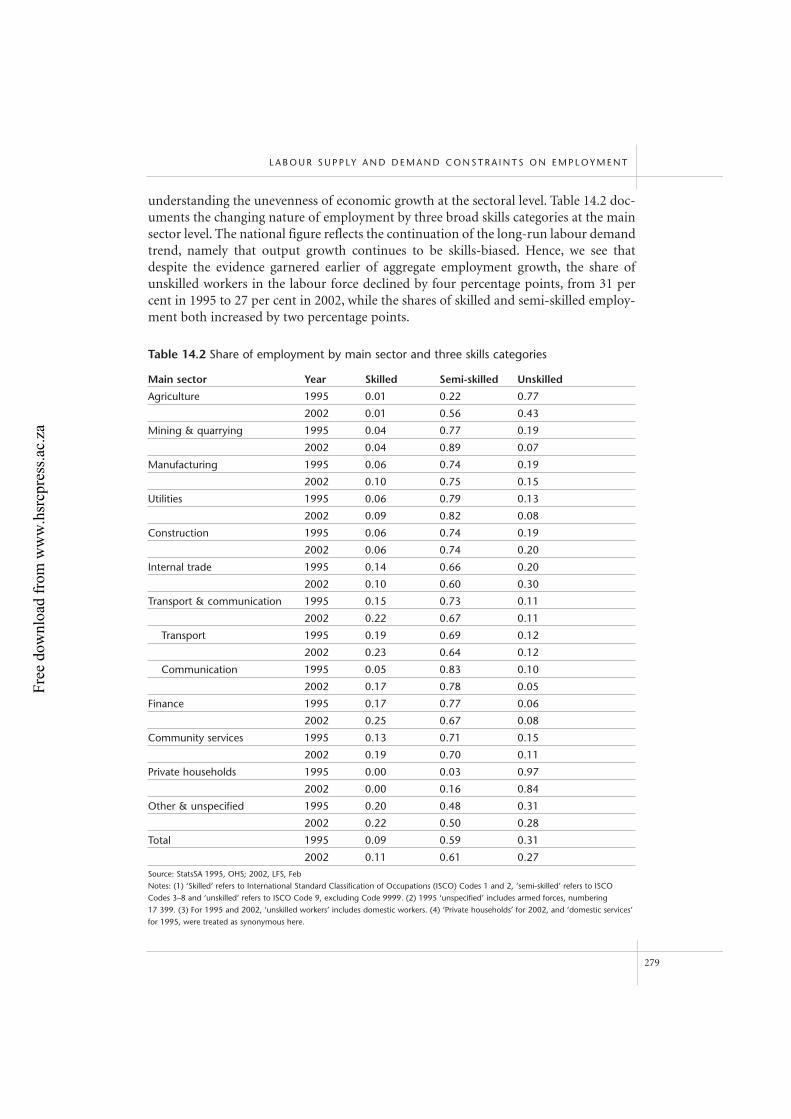
understanding the unevenness of economic growth at the sectoral level. Table 14.2 doc-uments the changing nature of employment by three broad skills categories at the mainsector level. The national figure reflects the continuation of the long-run labour demandtrend, namely that output growth continues to be skills-biased. Hence, we see thatdespite the evidence garnered earlier of aggregate employment growth, the share ofunskilled workers in the labour force declined by four percentage points, from 31 percent in 1995 to 27 per cent in 2002, while the shares of skilled and semi-skilled employ-ment both increased by two percentage points.
L A B O U R S U P P LY A N D D E M A N D C O N S T R A I N T S O N E M P L O Y M E N T
279
Table 14.2 Share of employment by main sector and three skills categories
Main sector Year Skilled Semi-skilled Unskilled
Agriculture 1995 0.01 0.22 0.77
2002 0.01 0.56 0.43
Mining & quarrying 1995 0.04 0.77 0.19
2002 0.04 0.89 0.07
Manufacturing 1995 0.06 0.74 0.19
2002 0.10 0.75 0.15
Utilities 1995 0.06 0.79 0.13
2002 0.09 0.82 0.08
Construction 1995 0.06 0.74 0.19
2002 0.06 0.74 0.20
Internal trade 1995 0.14 0.66 0.20
2002 0.10 0.60 0.30
Transport & communication 1995 0.15 0.73 0.11
2002 0.22 0.67 0.11
Transport 1995 0.19 0.69 0.12
2002 0.23 0.64 0.12
Communication 1995 0.05 0.83 0.10
2002 0.17 0.78 0.05
Finance 1995 0.17 0.77 0.06
2002 0.25 0.67 0.08
Community services 1995 0.13 0.71 0.15
2002 0.19 0.70 0.11
Private households 1995 0.00 0.03 0.97
2002 0.00 0.16 0.84
Other & unspecified 1995 0.20 0.48 0.31
2002 0.22 0.50 0.28
Total 1995 0.09 0.59 0.31
2002 0.11 0.61 0.27Source: StatsSA 1995, OHS; 2002, LFS, Feb
Notes: (1) ‘Skilled’ refers to International Standard Classification of Occupations (ISCO) Codes 1 and 2, ‘semi-skilled’ refers to ISCO
Codes 3–8 and ‘unskilled’ refers to ISCO Code 9, excluding Code 9999. (2) 1995 ‘unspecified’ includes armed forces, numbering
17 399. (3) For 1995 and 2002, ‘unskilled workers’ includes domestic workers. (4) ‘Private households’ for 2002, and ‘domestic services’
for 1995, were treated as synonymous here.
Free
dow
nloa
d fr
om w
ww
.hsr
cpre
ss.a
c.za
In turn, it is evident that these patterns of declining proportions of unskilled workersand higher shares of semi-skilled and skilled employees are reinforced at the sectorallevel. In manufacturing, for example, the share of skilled workers in employmentincreased from 6 per cent to 10 per cent, while that of unskilled workers declined from19 per cent to 15 per cent. There was then essentially a redistribution of jobs withinManufacturing away from unskilled workers toward skilled workers. This pattern isreplicated noticeably in sectors that reported a reduction in aggregate employment.Hence, in mining & quarrying, communication and community services there has been a movement away from unskilled workers toward semi-skilled and/or skilledemployees. Interestingly, in the internal trade sector, the reverse seems to haveoccurred, where the share of skilled workers declined and that of unskilled employeesincreased. A telling statistic is that in 7 of the 12 sectors there was a decline in the shareof unskilled workers.
The above indicates a dual challenge for the domestic economy, in terms of producingan adequate economic growth strategy. Firstly, there is the challenge of converting thecurrent low and erratic levels of economic growth to higher and more consistent ratesof output expansion. Secondly, it remains likely that the nature of labour demanduptake as a result of economic growth will continue – namely, the disproportionateuptake of semi-skilled and skilled workers, relative to unskilled workers. This uneven-ness of growth requires the upgrading of the supply characteristics of those individualsentering the labour market each year in search of employment.
Household- and firm-level constraints on employment generation
Within the environment briefly sketched above of positive but wholly inadequateemployment growth, this section intends to examine a series of microeconomic con-straints are analysed as one subset of a much larger quantum of possible obstacles tolong-term employment generation. A set of supply- and demand-side constraints thatare existent at the household and firm levels in the domestic economy. The constraintson the supply side will focus on the degree to which the unemployed and the character-istics of the households they reside in may militate against any swift absorption into thelabour market. The demand-side constraints will concentrate exclusively on the role ofregulation in the labour market in possibly acting as a microeconomic constraint onlong-term employment generation.
‘Unemployed households’ as a supply-side constraint
Within the context of a supply-side constraint to employment creation, it is clear thatfor the unemployed, their individual supply characteristics (most notably the level ofhuman capital accumulation) remain critical to ensuring an improved probability offinding employment. In the South African context, the pattern of skills-biased employ-ment shifts noted earlier, re-emphasises the relevance of these supply characteristics.
T H E D E V E L O P M E N T D E C A D E ? S O U T H A F R I C A , 1 9 9 4 – 2 0 0 4
280
Free
dow
nloa
d fr
om w
ww
.hsr
cpre
ss.a
c.za
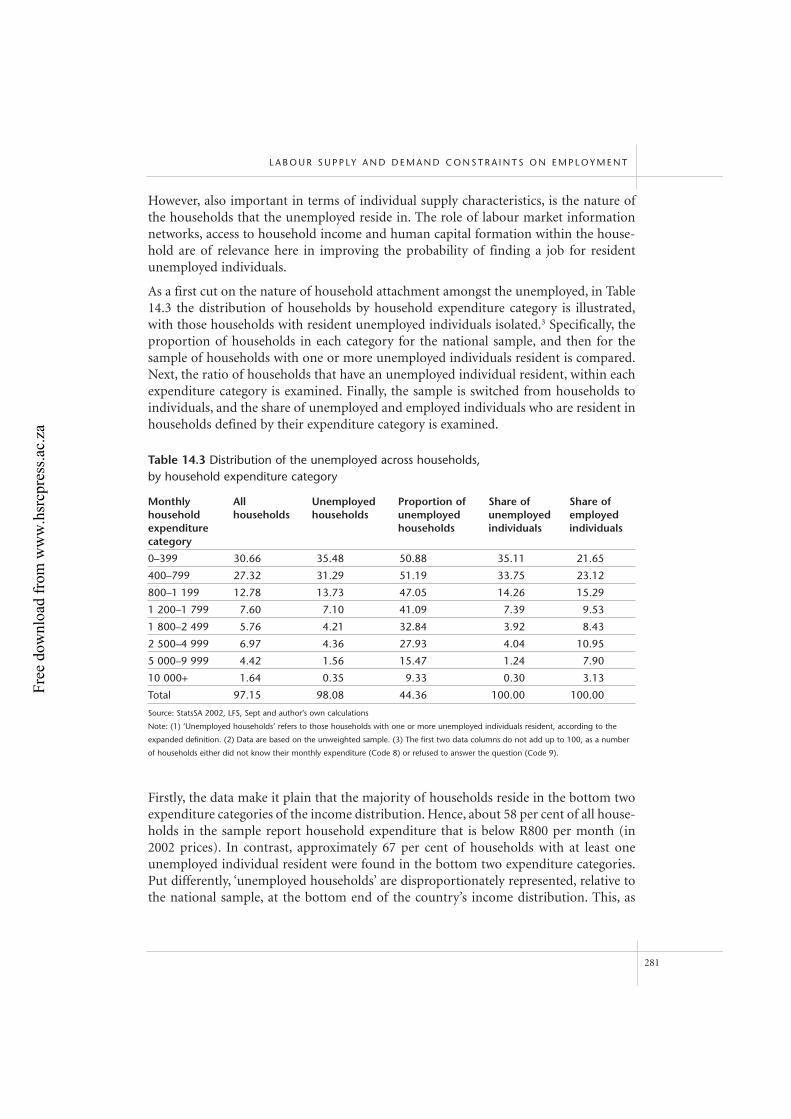
However, also important in terms of individual supply characteristics, is the nature ofthe households that the unemployed reside in. The role of labour market informationnetworks, access to household income and human capital formation within the house-hold are of relevance here in improving the probability of finding a job for residentunemployed individuals.
As a first cut on the nature of household attachment amongst the unemployed, in Table14.3 the distribution of households by household expenditure category is illustrated,with those households with resident unemployed individuals isolated.3 Specifically, theproportion of households in each category for the national sample, and then for thesample of households with one or more unemployed individuals resident is compared.Next, the ratio of households that have an unemployed individual resident, within eachexpenditure category is examined. Finally, the sample is switched from households toindividuals, and the share of unemployed and employed individuals who are resident inhouseholds defined by their expenditure category is examined.
Firstly, the data make it plain that the majority of households reside in the bottom twoexpenditure categories of the income distribution. Hence, about 58 per cent of all house-holds in the sample report household expenditure that is below R800 per month (in2002 prices). In contrast, approximately 67 per cent of households with at least oneunemployed individual resident were found in the bottom two expenditure categories.Put differently, ‘unemployed households’ are disproportionately represented, relative tothe national sample, at the bottom end of the country’s income distribution. This, as
L A B O U R S U P P LY A N D D E M A N D C O N S T R A I N T S O N E M P L O Y M E N T
281
Table 14.3 Distribution of the unemployed across households, by household expenditure category
Monthly All Unemployed Proportion of Share of Share of household households households unemployed unemployed employed expenditure households individuals individualscategory
0–399 30.66 35.48 50.88 35.11 21.65
400–799 27.32 31.29 51.19 33.75 23.12
800–1 199 12.78 13.73 47.05 14.26 15.29
1 200–1 799 7.60 7.10 41.09 7.39 9.53
1 800–2 499 5.76 4.21 32.84 3.92 8.43
2 500–4 999 6.97 4.36 27.93 4.04 10.95
5 000–9 999 4.42 1.56 15.47 1.24 7.90
10 000+ 1.64 0.35 9.33 0.30 3.13
Total 97.15 98.08 44.36 100.00 100.00
Source: StatsSA 2002, LFS, Sept and author’s own calculations
Note: (1) ‘Unemployed households’ refers to those households with one or more unemployed individuals resident, according to the
expanded definition. (2) Data are based on the unweighted sample. (3) The first two data columns do not add up to 100, as a number
of households either did not know their monthly expenditure (Code 8) or refused to answer the question (Code 9).
Free
dow
nloa
d fr
om w
ww
.hsr
cpre
ss.a
c.za
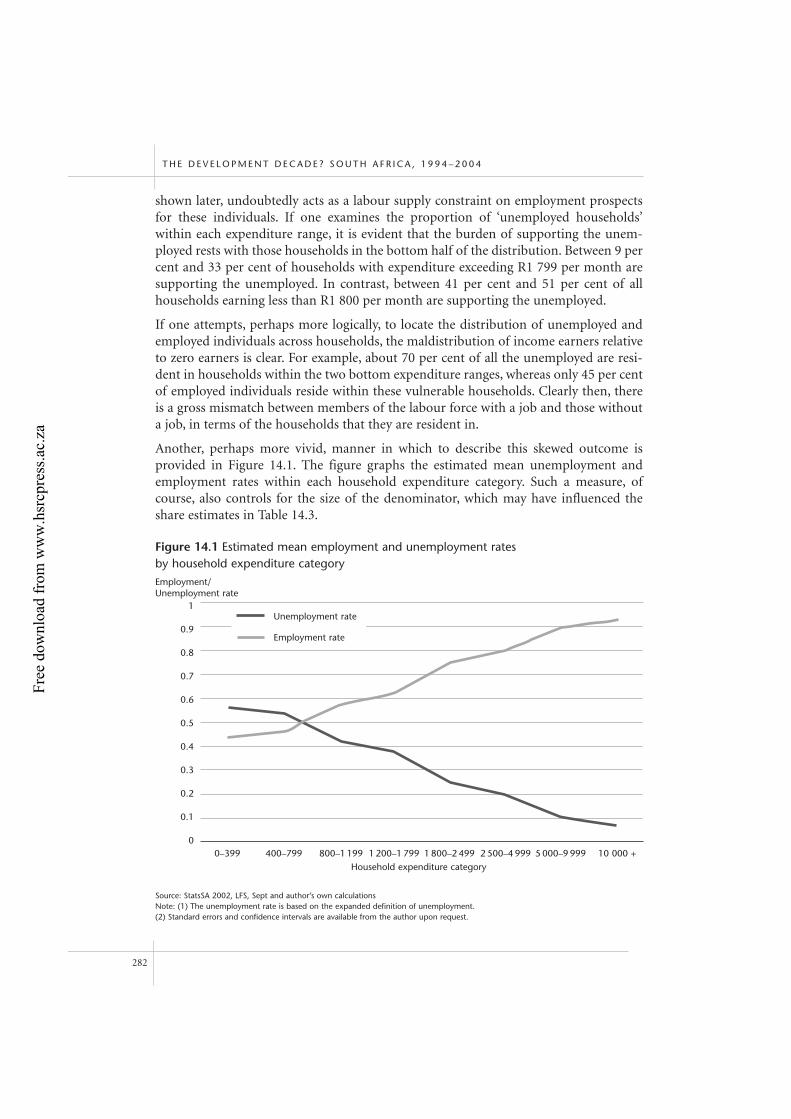
shown later, undoubtedly acts as a labour supply constraint on employment prospectsfor these individuals. If one examines the proportion of ‘unemployed households’within each expenditure range, it is evident that the burden of supporting the unem-ployed rests with those households in the bottom half of the distribution. Between 9 percent and 33 per cent of households with expenditure exceeding R1 799 per month aresupporting the unemployed. In contrast, between 41 per cent and 51 per cent of allhouseholds earning less than R1 800 per month are supporting the unemployed.
If one attempts, perhaps more logically, to locate the distribution of unemployed andemployed individuals across households, the maldistribution of income earners relativeto zero earners is clear. For example, about 70 per cent of all the unemployed are resi-dent in households within the two bottom expenditure ranges, whereas only 45 per centof employed individuals reside within these vulnerable households. Clearly then, thereis a gross mismatch between members of the labour force with a job and those withouta job, in terms of the households that they are resident in.
Another, perhaps more vivid, manner in which to describe this skewed outcome is provided in Figure 14.1. The figure graphs the estimated mean unemployment andemployment rates within each household expenditure category. Such a measure, ofcourse, also controls for the size of the denominator, which may have influenced theshare estimates in Table 14.3.
T H E D E V E L O P M E N T D E C A D E ? S O U T H A F R I C A , 1 9 9 4 – 2 0 0 4
282
Figure 14.1 Estimated mean employment and unemployment rates by household expenditure categoryEmployment/Unemployment rate
1
0.9
0.8
0.7
0.6
0.5
0.4
0.3
0.2
0.1
00–399 400–799 1 800–2 499 2 500–4 999 5 000–9 999 10 000 +
Unemployment rate
Employment rate
Source: StatsSA 2002, LFS, Sept and author’s own calculationsNote: (1) The unemployment rate is based on the expanded definition of unemployment. (2) Standard errors and confidence intervals are available from the author upon request.
800–1 199 1 200–1 799Household expenditure category
Free
dow
nloa
d fr
om w
ww
.hsr
cpre
ss.a
c.za
The figure is striking in terms of characterising how fewer opportunities in the labourmarket for individuals are also manifest at the household level, in terms of higher levelsof vulnerability. Hence, the data in the figure show that the estimated mean unemploy-ment rate is 56 per cent amongst households in the R0–399 category, declining mono-tonically to 7 per cent amongst households in the highest expenditure range. Conversely,employment rates are at their lowest in the R0–399 category, at 44 per cent, and increaseto 93 per cent amongst households spending R10 000 or more per month. Interestingly,the national unemployment rate of 42.3 per cent is most closely matched by thosehouseholds in the R800–1 199 expenditure range. While differential unemploymentrates by individual characteristics such as race, gender and education level are common,the evidence suggests that the household characteristics – here defined purely in termsof monthly expenditure – are also a key variable in understanding the uneven distribu-tion and experience of unemployment.
Before expanding in more detail on the specific set of labour supply constraints that theabove data suggests, some of the individual and household characteristics that differen-tiate those vulnerable unemployed from the less vulnerable in this cohort are compared.Table 14.4 compares different characteristics of the unemployed in households earningless than R800 per month with those in households spending R800 or more per month.In effect, the former household expenditure cohort represents, as noted earlier, about 70per cent of all the unemployed.
In terms of the individual characteristics of the unemployed across these two householdtypes, there appears to be no significant mean age difference, as both household typesreport a mean age of about 30. The most powerful labour supply characteristic remains,of course, the individual’s years of schooling. In the evidence presented here, the unem-ployed from the bottom end of the expenditure categories have, at the mean, the equiva-lent of a Grade 7 level of education. In contrast, the mean years of schooling for theremaining unemployed is the equivalent of Grade 10. This difference is significant at the1 per cent level. Close inspection of the data, though, also reveals that nearly a third of allthe unemployed in the richer households possess a matric, compared with 19 per cent ofthe unemployed in the bottom two expenditure category households. In trying to capturethe racial and gender marker associated with the lowest probability of finding employ-ment, the share of the unemployed who were African and female across these householdswas examined. The data illustrate that African females constitute a larger share (53 percent as opposed to 46 per cent) of the unemployed cohort in households that are poorer.
The share of workers who are categorised as discouraged is an important indicator ofthe heterogeneity of unemployment across these household types. In the poorer house-holds, 41 per cent of the unemployed individuals are those who would like to work buthave given up searching for employment. In contrast, less than a third of the unem-ployed in richer households report being discouraged. It is important to remember,however, that 70 per cent of all the unemployed are resident in these poorer households.What this implies is that of the approximately 7.9 million individuals reported to beunemployed in September 2002, 4.8 million are resident in the two lowest household
L A B O U R S U P P LY A N D D E M A N D C O N S T R A I N T S O N E M P L O Y M E N T
283
Free
dow
nloa
d fr
om w
ww
.hsr
cpre
ss.a
c.za
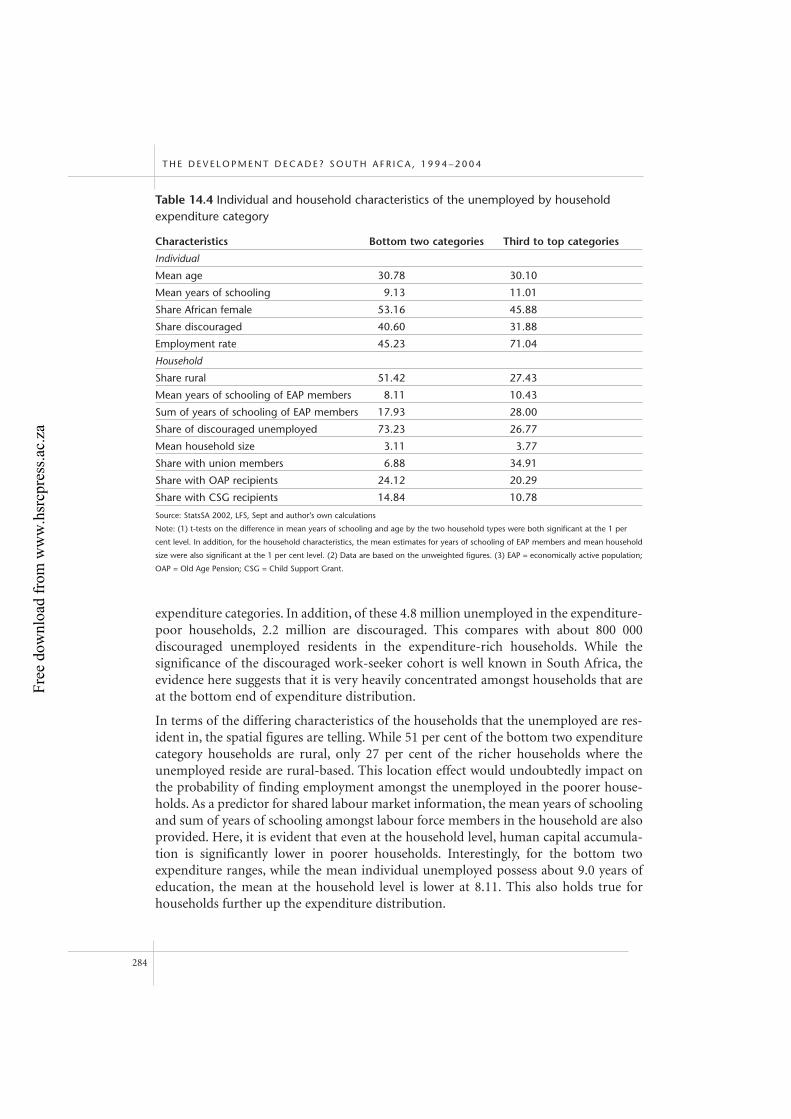
expenditure categories. In addition, of these 4.8 million unemployed in the expenditure-poor households, 2.2 million are discouraged. This compares with about 800 000 discouraged unemployed residents in the expenditure-rich households. While the significance of the discouraged work-seeker cohort is well known in South Africa, theevidence here suggests that it is very heavily concentrated amongst households that areat the bottom end of expenditure distribution.
In terms of the differing characteristics of the households that the unemployed are res-ident in, the spatial figures are telling. While 51 per cent of the bottom two expenditurecategory households are rural, only 27 per cent of the richer households where theunemployed reside are rural-based. This location effect would undoubtedly impact onthe probability of finding employment amongst the unemployed in the poorer house-holds. As a predictor for shared labour market information, the mean years of schoolingand sum of years of schooling amongst labour force members in the household are alsoprovided. Here, it is evident that even at the household level, human capital accumula-tion is significantly lower in poorer households. Interestingly, for the bottom two expenditure ranges, while the mean individual unemployed possess about 9.0 years ofeducation, the mean at the household level is lower at 8.11. This also holds true forhouseholds further up the expenditure distribution.
T H E D E V E L O P M E N T D E C A D E ? S O U T H A F R I C A , 1 9 9 4 – 2 0 0 4
284
Table 14.4 Individual and household characteristics of the unemployed by householdexpenditure category
Characteristics Bottom two categories Third to top categories
Individual
Mean age 30.78 30.10
Mean years of schooling 9.13 11.01
Share African female 53.16 45.88
Share discouraged 40.60 31.88
Employment rate 45.23 71.04
Household
Share rural 51.42 27.43
Mean years of schooling of EAP members 8.11 10.43
Sum of years of schooling of EAP members 17.93 28.00
Share of discouraged unemployed 73.23 26.77
Mean household size 3.11 3.77
Share with union members 6.88 34.91
Share with OAP recipients 24.12 20.29
Share with CSG recipients 14.84 10.78
Source: StatsSA 2002, LFS, Sept and author’s own calculations
Note: (1) t-tests on the difference in mean years of schooling and age by the two household types were both significant at the 1 per
cent level. In addition, for the household characteristics, the mean estimates for years of schooling of EAP members and mean household
size were also significant at the 1 per cent level. (2) Data are based on the unweighted figures. (3) EAP = economically active population;
OAP = Old Age Pension; CSG = Child Support Grant.
Free
dow
nloa
d fr
om w
ww
.hsr
cpre
ss.a
c.za
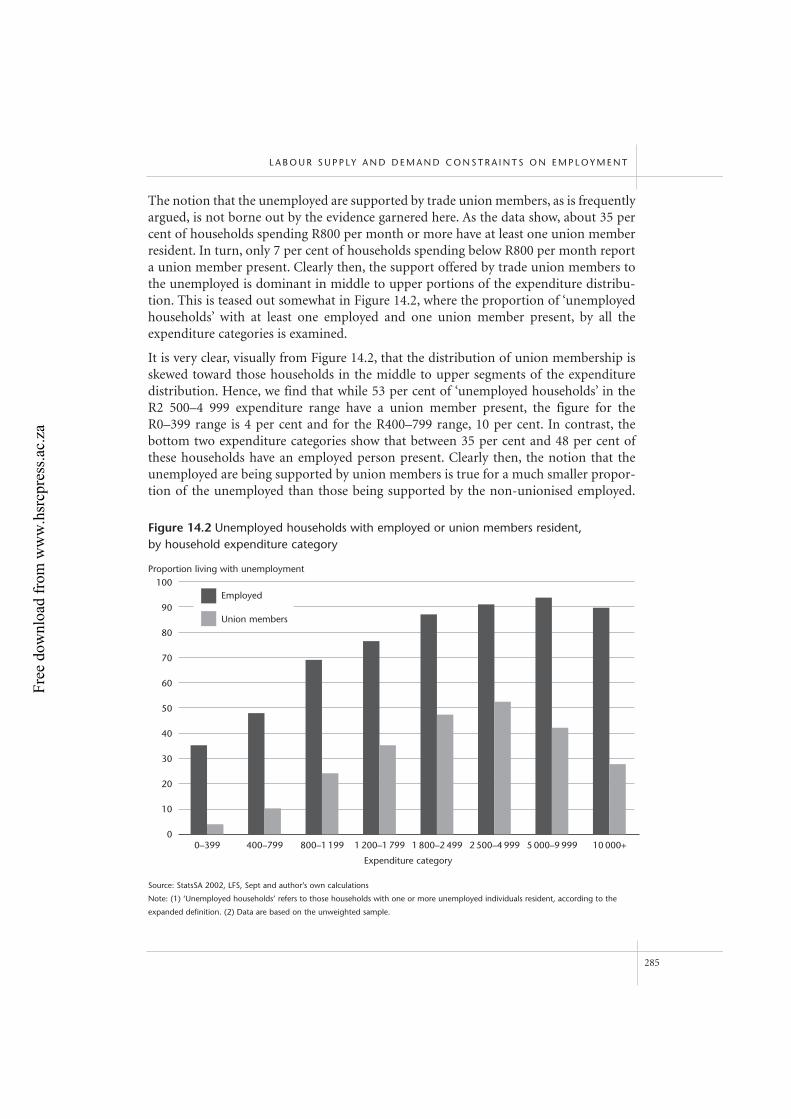
The notion that the unemployed are supported by trade union members, as is frequentlyargued, is not borne out by the evidence garnered here. As the data show, about 35 percent of households spending R800 per month or more have at least one union memberresident. In turn, only 7 per cent of households spending below R800 per month reporta union member present. Clearly then, the support offered by trade union members tothe unemployed is dominant in middle to upper portions of the expenditure distribu-tion. This is teased out somewhat in Figure 14.2, where the proportion of ‘unemployedhouseholds’ with at least one employed and one union member present, by all theexpenditure categories is examined.
It is very clear, visually from Figure 14.2, that the distribution of union membership isskewed toward those households in the middle to upper segments of the expendituredistribution. Hence, we find that while 53 per cent of ‘unemployed households’ in theR2 500–4 999 expenditure range have a union member present, the figure for theR0–399 range is 4 per cent and for the R400–799 range, 10 per cent. In contrast, thebottom two expenditure categories show that between 35 per cent and 48 per cent ofthese households have an employed person present. Clearly then, the notion that theunemployed are being supported by union members is true for a much smaller propor-tion of the unemployed than those being supported by the non-unionised employed.
L A B O U R S U P P LY A N D D E M A N D C O N S T R A I N T S O N E M P L O Y M E N T
285
Figure 14.2 Unemployed households with employed or union members resident, by household expenditure category
Source: StatsSA 2002, LFS, Sept and author’s own calculations
Note: (1) ‘Unemployed households’ refers to those households with one or more unemployed individuals resident, according to the
expanded definition. (2) Data are based on the unweighted sample.
100
90
80
70
60
50
40
30
20
10
0
Proportion living with unemployment
0–399 400–799 800–1 199 1 200–1 799 1 800–2 499 2 500–4 999 5 000–9 999 10 000+
Expenditure category
Employed
Union members
Free
dow
nloa
d fr
om w
ww
.hsr
cpre
ss.a
c.za
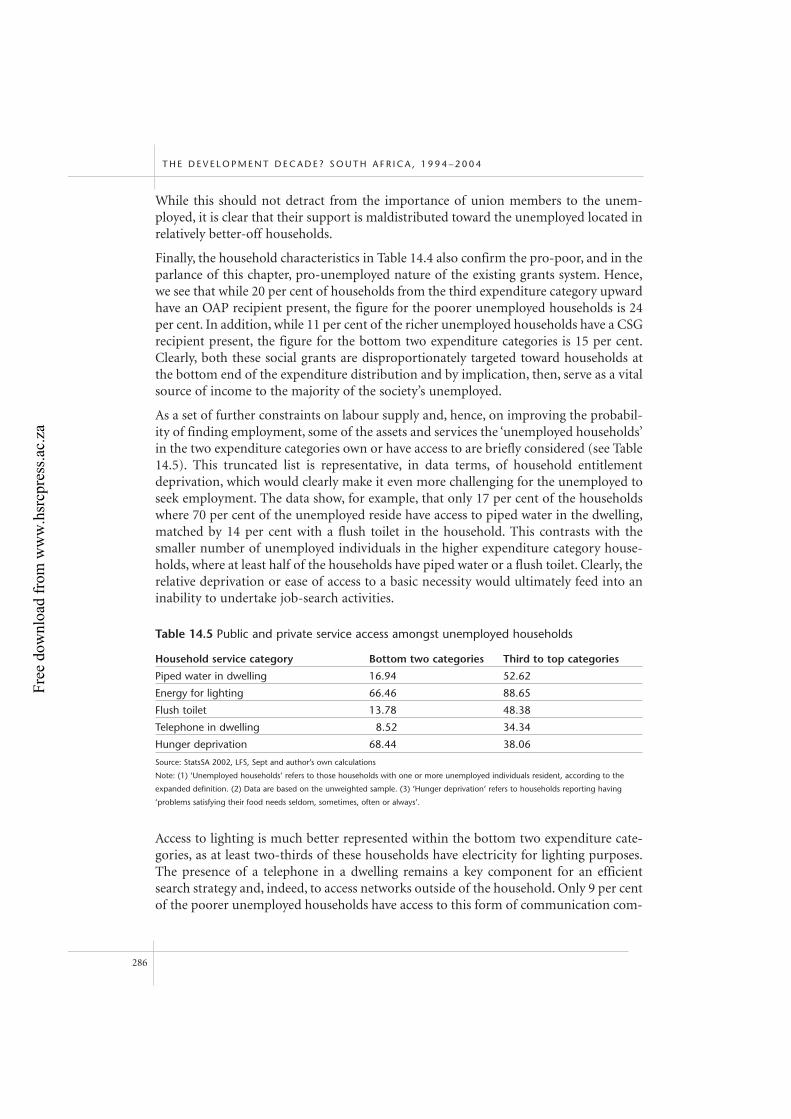
While this should not detract from the importance of union members to the unem-ployed, it is clear that their support is maldistributed toward the unemployed located inrelatively better-off households.
Finally, the household characteristics in Table 14.4 also confirm the pro-poor, and in theparlance of this chapter, pro-unemployed nature of the existing grants system. Hence,we see that while 20 per cent of households from the third expenditure category upwardhave an OAP recipient present, the figure for the poorer unemployed households is 24per cent. In addition, while 11 per cent of the richer unemployed households have a CSGrecipient present, the figure for the bottom two expenditure categories is 15 per cent.Clearly, both these social grants are disproportionately targeted toward households atthe bottom end of the expenditure distribution and by implication, then, serve as a vitalsource of income to the majority of the society’s unemployed.
As a set of further constraints on labour supply and, hence, on improving the probabil-ity of finding employment, some of the assets and services the ‘unemployed households’in the two expenditure categories own or have access to are briefly considered (see Table14.5). This truncated list is representative, in data terms, of household entitlement deprivation, which would clearly make it even more challenging for the unemployed toseek employment. The data show, for example, that only 17 per cent of the householdswhere 70 per cent of the unemployed reside have access to piped water in the dwelling,matched by 14 per cent with a flush toilet in the household. This contrasts with thesmaller number of unemployed individuals in the higher expenditure category house-holds, where at least half of the households have piped water or a flush toilet. Clearly, therelative deprivation or ease of access to a basic necessity would ultimately feed into aninability to undertake job-search activities.
Access to lighting is much better represented within the bottom two expenditure cate-gories, as at least two-thirds of these households have electricity for lighting purposes.The presence of a telephone in a dwelling remains a key component for an efficientsearch strategy and, indeed, to access networks outside of the household. Only 9 per centof the poorer unemployed households have access to this form of communication com-
T H E D E V E L O P M E N T D E C A D E ? S O U T H A F R I C A , 1 9 9 4 – 2 0 0 4
286
Table 14.5 Public and private service access amongst unemployed households
Household service category Bottom two categories Third to top categories
Piped water in dwelling 16.94 52.62
Energy for lighting 66.46 88.65
Flush toilet 13.78 48.38
Telephone in dwelling 8.52 34.34
Hunger deprivation 68.44 38.06
Source: StatsSA 2002, LFS, Sept and author’s own calculations
Note: (1) ‘Unemployed households’ refers to those households with one or more unemployed individuals resident, according to the
expanded definition. (2) Data are based on the unweighted sample. (3) ‘Hunger deprivation’ refers to households reporting having
‘problems satisfying their food needs seldom, sometimes, often or always’.
Free
dow
nloa
d fr
om w
ww
.hsr
cpre
ss.a
c.za
pared with 34 per cent of the better-off unemployed households. All the same, acrossboth unemployed household types, such an essential component of an effective labourmarket information tool is largely absent. Finally, the notion that household povertytraps are intrinsic to understanding the difficulty faced by the majority of the unem-ployed is manifest in the hunger deprivation figures. Here, we see that close to 70 percent of the bottom two expenditure categories have experienced problems with satisfy-ing nutritional needs, to differing degrees of intensity. This compares with 38 per centof the better-off unemployed households. A household that often or sometimes faces therisk of hunger clearly disables the resident unemployed individual from engaging in anyform of income-draining job-search behaviour.
Multivariate analysis
The above is clearly suggestive of a variety of different factors, captured here as poten-tial labour supply constraints, operating at the household level, that may impact onmeasured unemployment levels and rates within the household. In what follows, aninitial estimation, within a multivariate framework, of how these different variables maybe predictive of a household’s unemployment rate is attempted.
The equations estimated are based on the notion that:
uh* = f (Xh,Sh) |uh
* > 0 (1)
where uh* is the household unemployment rate, viewed here as a function of a set of
‘individual effects’ within the household (Xh) and the household’s access to a specific setof assets or services, Sh. Given that unemployed households only are considered, as withthe earlier discussion, the estimation was set up on the basis that the household unem-ployment rate is greater than zero. In turn, note that:
uh* =
[ ] (2)
which simply reflects the fact that the number of unemployed within each household aresummed and using, as the denominator, the number of economically active individualswithin the given household, the household unemployment rate is derived. Based on theabove then, the estimation equations are as follows:
uh* = α + ß1EXPEh + ß2RURDUMh + ß3SCHOOLh + ß4AVAGEh + ß5HHSIZEh +
ß6RACEDUMh + ß7GENDERDh + ß8OAPDh + ß9CSGDh + ß10UNIONDh + εh
(3)
L A B O U R S U P P LY A N D D E M A N D C O N S T R A I N T S O N E M P L O Y M E N T
287
q r
∑j=1
ujh +∑k=l
njh
q
∑ujhj=1
Free
dow
nloa
d fr
om w
ww
.hsr
cpre
ss.a
c.za
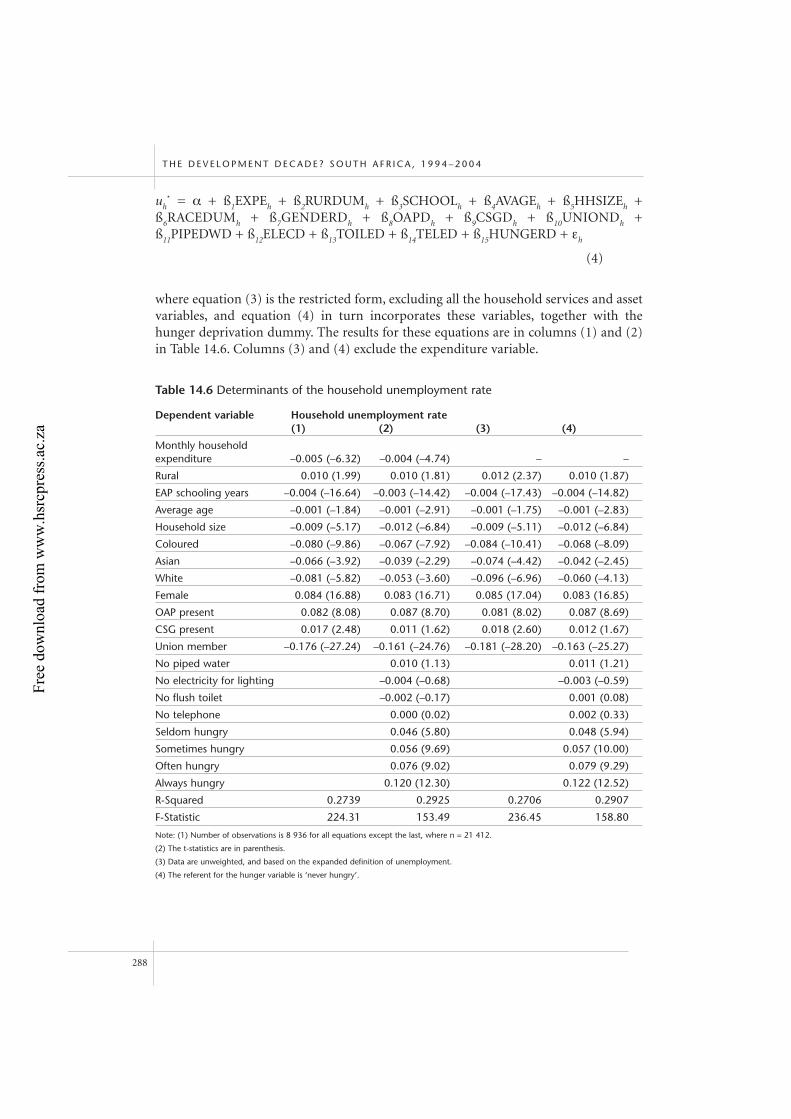
uh* = α + ß1EXPEh + ß2RURDUMh + ß3SCHOOLh + ß4AVAGEh + ß5HHSIZEh +
ß6RACEDUMh + ß7GENDERDh + ß8OAPDh + ß9CSGDh + ß10UNIONDh +ß11PIPEDWD + ß12ELECD + ß13TOILED + ß14TELED + ß15HUNGERD + εh
(4)
where equation (3) is the restricted form, excluding all the household services and assetvariables, and equation (4) in turn incorporates these variables, together with thehunger deprivation dummy. The results for these equations are in columns (1) and (2)in Table 14.6. Columns (3) and (4) exclude the expenditure variable.
T H E D E V E L O P M E N T D E C A D E ? S O U T H A F R I C A , 1 9 9 4 – 2 0 0 4
288
Table 14.6 Determinants of the household unemployment rate
Dependent variable Household unemployment rate(1) (2) (3) (4)
Monthly household expenditure –0.005 (–6.32) –0.004 (–4.74) – –
Rural 0.010 (1.99) 0.010 (1.81) 0.012 (2.37) 0.010 (1.87)
EAP schooling years –0.004 (–16.64) –0.003 (–14.42) –0.004 (–17.43) –0.004 (–14.82)
Average age –0.001 (–1.84) –0.001 (–2.91) –0.001 (–1.75) –0.001 (–2.83)
Household size –0.009 (–5.17) –0.012 (–6.84) –0.009 (–5.11) –0.012 (–6.84)
Coloured –0.080 (–9.86) –0.067 (–7.92) –0.084 (–10.41) –0.068 (–8.09)
Asian –0.066 (–3.92) –0.039 (–2.29) –0.074 (–4.42) –0.042 (–2.45)
White –0.081 (–5.82) –0.053 (–3.60) –0.096 (–6.96) –0.060 (–4.13)
Female 0.084 (16.88) 0.083 (16.71) 0.085 (17.04) 0.083 (16.85)
OAP present 0.082 (8.08) 0.087 (8.70) 0.081 (8.02) 0.087 (8.69)
CSG present 0.017 (2.48) 0.011 (1.62) 0.018 (2.60) 0.012 (1.67)
Union member –0.176 (–27.24) –0.161 (–24.76) –0.181 (–28.20) –0.163 (–25.27)
No piped water 0.010 (1.13) 0.011 (1.21)
No electricity for lighting –0.004 (–0.68) –0.003 (–0.59)
No flush toilet –0.002 (–0.17) 0.001 (0.08)
No telephone 0.000 (0.02) 0.002 (0.33)
Seldom hungry 0.046 (5.80) 0.048 (5.94)
Sometimes hungry 0.056 (9.69) 0.057 (10.00)
Often hungry 0.076 (9.02) 0.079 (9.29)
Always hungry 0.120 (12.30) 0.122 (12.52)
R-Squared 0.2739 0.2925 0.2706 0.2907
F-Statistic 224.31 153.49 236.45 158.80
Note: (1) Number of observations is 8 936 for all equations except the last, where n = 21 412.
(2) The t-statistics are in parenthesis.
(3) Data are unweighted, and based on the expanded definition of unemployment.
(4) The referent for the hunger variable is ‘never hungry’.
Free
dow
nloa
d fr
om w
ww
.hsr
cpre
ss.a
c.za
The results for the ‘individual effects’ at the household level corroborate much of thedescriptive evidence garnered. Hence, we see in both equations (1) and (2) that monthlyhousehold expenditure is negatively related to the household unemployment rate. Putdifferently, the higher the household expenditure, the lower the matching unemploy-ment rate. The location dummy confirms the evidence around locational constraints, asrural-based households are associated with higher unemployment rates relative to urbanhouseholds. In turn, the human capital variable illustrates that the greater the sum ofschooling years amongst labour force members of the household, the lower the recordedhousehold unemployment rate. This variable is significant and negative across all fourspecifications.
The average age within the household is negatively related to the household unemploy-ment rate. Put differently, the higher the average household age, the lower the recordedunemployment rate within the sample of ‘unemployed households’. This reflects thestrong youthful dimension of unemployment, which is a well-known feature of SouthAfrica’s unemployment patterns. The race variable refers to the race of the householdhead, where the referent is an African-headed-household. The evidence, as one wouldexpect, shows very clearly that non-African headed households yield a lower householdunemployment rate relative to African-headed households. The regressions for (1) and(2) were run for African-headed households only, with very similar results beingreported, with all the same signs and significance levels on the coefficients. In terms ofgender, it is evident that female-headed households have a higher household unemploy-ment rate than male-headed households, across all four specifications.
The last three individual effect variables are particularly interesting, and possibly themost pertinent in the context of this chapter. It is clear that the coefficient on both socialgrant dummies (where no recipient of an OAP or CSG is present) is significant and pos-itive. This implies, critically, that the presence of an OAP or CSG recipient is associatedwith a higher household unemployment rate. Put differently, these grants appear to bereaching higher unemployment rate households and, by implication, poorer householdsas well. In contrast, however, the union dummy is negative and significant for all speci-fications of the model. Hence, the presence of a union member is associated with a lowerhousehold unemployment rate. Union membership is biased toward a lower unemploy-ment rate and, therefore, better-off households.
The household asset and services variables include whether a household has access topiped water in the dwelling, electricity for lighting, a flush toilet within the householdand finally a telephone within the dwelling. The coefficients on all these variables forboth equations (2) and (4) are not significant. Hence, these assets and services are notstrongly associated with a given household unemployment rate. This suggests that whencontrolling for household expenditure levels, the household unemployment rate is notclosely related to the degree of asset and service vulnerability within the dwelling.However, the hunger deprivation variable is significant. The results suggest that an‘unemployed household’ reporting being hungry seldom, sometimes, often or always islikely to yield a higher household unemployment rate relative to those ‘unemployed
L A B O U R S U P P LY A N D D E M A N D C O N S T R A I N T S O N E M P L O Y M E N T
289
Free
dow
nloa
d fr
om w
ww
.hsr
cpre
ss.a
c.za
households’ that never have a hunger problem. This, of course, reinforces the notion thatbudget-constrained households are very likely to be trying to meet their basic needs, somaking it even less likely that the resident jobless will have the resources to search foremployment.
The preceeding descriptive and econometric evidence has attempted, in a variety ofdifferent ways, to reflect on the set of household-level constraints that may be faced bythe majority of the economy’s unemployed. Firstly, it is evident that the majority of theunemployed – 70 per cent of the eight million jobless – are in severely deprived house-holds, where expenditure levels are below R800 per month. This serves as a vital imped-iment to improving employment probabilities. The cost of consistent and effective jobsearching is immediately undermined in households with scarce resources. The fact thathalf of these poorer ‘unemployed households’ are in rural areas only adds to the cost ofjob search and, indeed, reduces the probability of finding employment in these areas oflow economic activity. This labour supply constraint is not only operative for thebottom expenditure categories, as a fair number of the unemployed in richer house-holds also face this spatial labour market constraint. The large numbers of discouragedwork-seekers in the bottom two expenditure categories are reflective of the outcomesthat these labour supply constraints have created.
In terms of another potential route to finding employment, namely accessing the infor-mation and knowledge networks of employed individuals in the household, the employ-ment rate and union membership data are striking. Here it is clear that the minority ofthe unemployed (those resident in the richer set of households) would have some prob-ability of accessing job opportunities through this information network, given that theemployed and union members are disproportionately represented in these households.For a large segment of the 4.8 million unemployed at the bottom end of the expendituredistribution, however, such information and knowledge networks are rarely available.Thus, probably one of the most effective and costless mechanisms for finding employ-ment is not present for many of these individuals. Ultimately, then, the combination ofbeing search-, mobility- and information-constrained, intermediated through living invulnerable households, represents a severe labour supply obstacle to improving theprobability of finding a job for the majority of the domestic economy’s unemployed.
The labour regulatory environment as a demand-side constraint
It is clear from the introductory analysis on employment trends that the South Africanlabour market cannot be said, with any degree of certainty, to have experienced joblessgrowth since 1995. However, it is also evident that this debate, in the context of thesociety’s long-term welfare, is secondary to the fact that a poor labour absorptive capac-ity born out of tepid growth rates lies at the heart of the extraordinary unemploymentlevels present in South Africa. In this context, attention has begun to shift toward possi-ble interventions that could substantially raise South Africa’s inadequate single-digitgrowth rates. This remains within the view that economic growth is a necessary, but not
T H E D E V E L O P M E N T D E C A D E ? S O U T H A F R I C A , 1 9 9 4 – 2 0 0 4
290
Free
dow
nloa
d fr
om w
ww
.hsr
cpre
ss.a
c.za
sufficient, condition to maximising employment creation in the domestic economy. Theconstraints on growth on the demand side of the economy range from issues of con-centration levels and volatility in the exchange rate accessing credit for entrepreneurs.4
The intention in this section is to focus on one of these constraints, namely the view thatsignificant regulatory rigidity exists in the labour market. Hence, an attempt is madehere to relate the evidence that is available on the sensitivity of the legislation governingemployment to the empirical reality of a labour-surplus economy. An overview of thissort cannot even begin to do justice to this potentially vast question. What is done here,though, is to garner at least some initial primary and some secondary evidence reflect-ing on whether laws governing employer–employee relations in the South Africanlabour market may or may not be inimical to long-run employment growth and, conse-quently, serve as micro-level labour demand constraints.
Employers’ perceptions of the labour legislative regime
The obvious starting point would be to try and assess what employers’ views are on thelabour legislation that governs their hiring and firing of workers. Detailed employersurveys on this sort of issue are scarce for South Africa. Indeed, firm surveys in general(outside of those undertaken for the National Accounts) are notably absent for SouthAfrica. We are forced, therefore, to rely on two of the very few such firm surveys, namelythe World Bank Large Manufacturing Firm Survey (WBLMS) (World Bank 1999) andthe National Enterprise Survey (NES) run under the auspices of the President’s Office ofSouth Africa (Office of the President 1999).
The WBLMS was conducted under the joint auspices of the City of GreaterJohannesburg and the World Bank. The survey firm contracted to undertake the taskwas the Bureau for Market Research. The survey went into the field in 1999, and 325firms within the manufacturing sector in the Greater Johannesburg Area (GJA) weresurveyed. The sampling design ensured that eight manufacturing subsectors were repre-sented. The survey was then further stratified by employment size, namely small (50–99workers), medium (100–199 workers) and large (200+ workers). Stratification byemployment size within the different subsectors was accordingly proportional to size.Finally, within these multi-strata, simple random sampling was performed. The surveyteam started from a national census of 6 174 manufacturing firms, broken down by sub-sector and size class. This was then used to create a sample frame of 2 346 such firmswithin the GJA. On the basis of the latter number, 369 firms were actually approached,with 325 full responses obtained (the sample sizes in the tables that follow reflect thatsome firms may not have responded to the specific question in the survey, so loweringthe response number to less than 325).
The NES was designed to give a nationally representative profile of large manufacturingand service enterprises. In total, 1 428 firms constituted the survey sample: 75 per centof the firms were classified as service enterprises, and the remaining quarter were desig-nated as manufacturing enterprises. Four distinct questionnaires were deployed in the
L A B O U R S U P P LY A N D D E M A N D C O N S T R A I N T S O N E M P L O Y M E N T
291
Free
dow
nloa
d fr
om w
ww
.hsr
cpre
ss.a
c.za
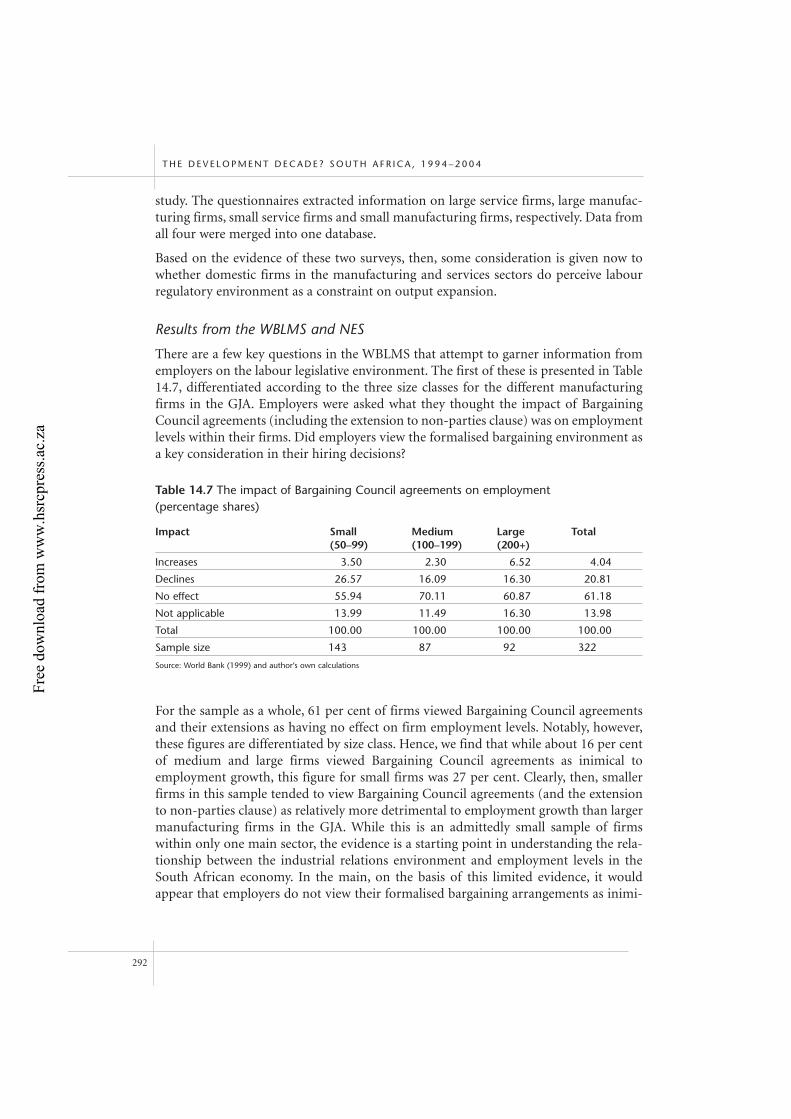
study. The questionnaires extracted information on large service firms, large manufac-turing firms, small service firms and small manufacturing firms, respectively. Data fromall four were merged into one database.
Based on the evidence of these two surveys, then, some consideration is given now towhether domestic firms in the manufacturing and services sectors do perceive labourregulatory environment as a constraint on output expansion.
Results from the WBLMS and NES
There are a few key questions in the WBLMS that attempt to garner information fromemployers on the labour legislative environment. The first of these is presented in Table14.7, differentiated according to the three size classes for the different manufacturingfirms in the GJA. Employers were asked what they thought the impact of BargainingCouncil agreements (including the extension to non-parties clause) was on employmentlevels within their firms. Did employers view the formalised bargaining environment asa key consideration in their hiring decisions?
For the sample as a whole, 61 per cent of firms viewed Bargaining Council agreementsand their extensions as having no effect on firm employment levels. Notably, however,these figures are differentiated by size class. Hence, we find that while about 16 per centof medium and large firms viewed Bargaining Council agreements as inimical toemployment growth, this figure for small firms was 27 per cent. Clearly, then, smallerfirms in this sample tended to view Bargaining Council agreements (and the extensionto non-parties clause) as relatively more detrimental to employment growth than largermanufacturing firms in the GJA. While this is an admittedly small sample of firmswithin only one main sector, the evidence is a starting point in understanding the rela-tionship between the industrial relations environment and employment levels in theSouth African economy. In the main, on the basis of this limited evidence, it wouldappear that employers do not view their formalised bargaining arrangements as inimi-
T H E D E V E L O P M E N T D E C A D E ? S O U T H A F R I C A , 1 9 9 4 – 2 0 0 4
292
Table 14.7 The impact of Bargaining Council agreements on employment (percentage shares)
Impact Small Medium Large Total(50–99) (100–199) (200+)
Increases 3.50 2.30 6.52 4.04
Declines 26.57 16.09 16.30 20.81
No effect 55.94 70.11 60.87 61.18
Not applicable 13.99 11.49 16.30 13.98
Total 100.00 100.00 100.00 100.00
Sample size 143 87 92 322
Source: World Bank (1999) and author’s own calculations
Free
dow
nloa
d fr
om w
ww
.hsr
cpre
ss.a
c.za
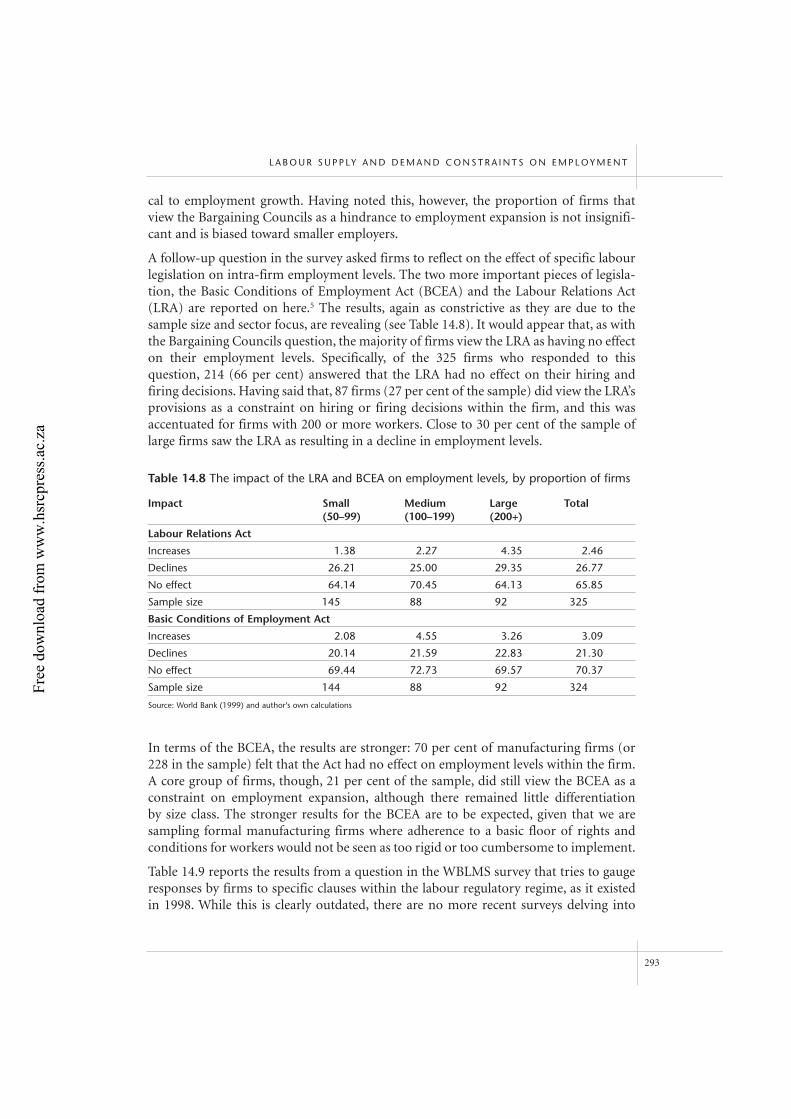
cal to employment growth. Having noted this, however, the proportion of firms thatview the Bargaining Councils as a hindrance to employment expansion is not insignifi-cant and is biased toward smaller employers.
A follow-up question in the survey asked firms to reflect on the effect of specific labourlegislation on intra-firm employment levels. The two more important pieces of legisla-tion, the Basic Conditions of Employment Act (BCEA) and the Labour Relations Act(LRA) are reported on here.5 The results, again as constrictive as they are due to thesample size and sector focus, are revealing (see Table 14.8). It would appear that, as withthe Bargaining Councils question, the majority of firms view the LRA as having no effecton their employment levels. Specifically, of the 325 firms who responded to this question, 214 (66 per cent) answered that the LRA had no effect on their hiring andfiring decisions. Having said that, 87 firms (27 per cent of the sample) did view the LRA’sprovisions as a constraint on hiring or firing decisions within the firm, and this wasaccentuated for firms with 200 or more workers. Close to 30 per cent of the sample oflarge firms saw the LRA as resulting in a decline in employment levels.
In terms of the BCEA, the results are stronger: 70 per cent of manufacturing firms (or228 in the sample) felt that the Act had no effect on employment levels within the firm.A core group of firms, though, 21 per cent of the sample, did still view the BCEA as aconstraint on employment expansion, although there remained little differentiation by size class. The stronger results for the BCEA are to be expected, given that we are sampling formal manufacturing firms where adherence to a basic floor of rights andconditions for workers would not be seen as too rigid or too cumbersome to implement.
Table 14.9 reports the results from a question in the WBLMS survey that tries to gaugeresponses by firms to specific clauses within the labour regulatory regime, as it existedin 1998. While this is clearly outdated, there are no more recent surveys delving into
L A B O U R S U P P LY A N D D E M A N D C O N S T R A I N T S O N E M P L O Y M E N T
293
Table 14.8 The impact of the LRA and BCEA on employment levels, by proportion of firms
Impact Small Medium Large Total(50–99) (100–199) (200+)
Labour Relations Act
Increases 1.38 2.27 4.35 2.46
Declines 26.21 25.00 29.35 26.77
No effect 64.14 70.45 64.13 65.85
Sample size 145 88 92 325
Basic Conditions of Employment Act
Increases 2.08 4.55 3.26 3.09
Declines 20.14 21.59 22.83 21.30
No effect 69.44 72.73 69.57 70.37
Sample size 144 88 92 324
Source: World Bank (1999) and author’s own calculations
Free
dow
nloa
d fr
om w
ww
.hsr
cpre
ss.a
c.za
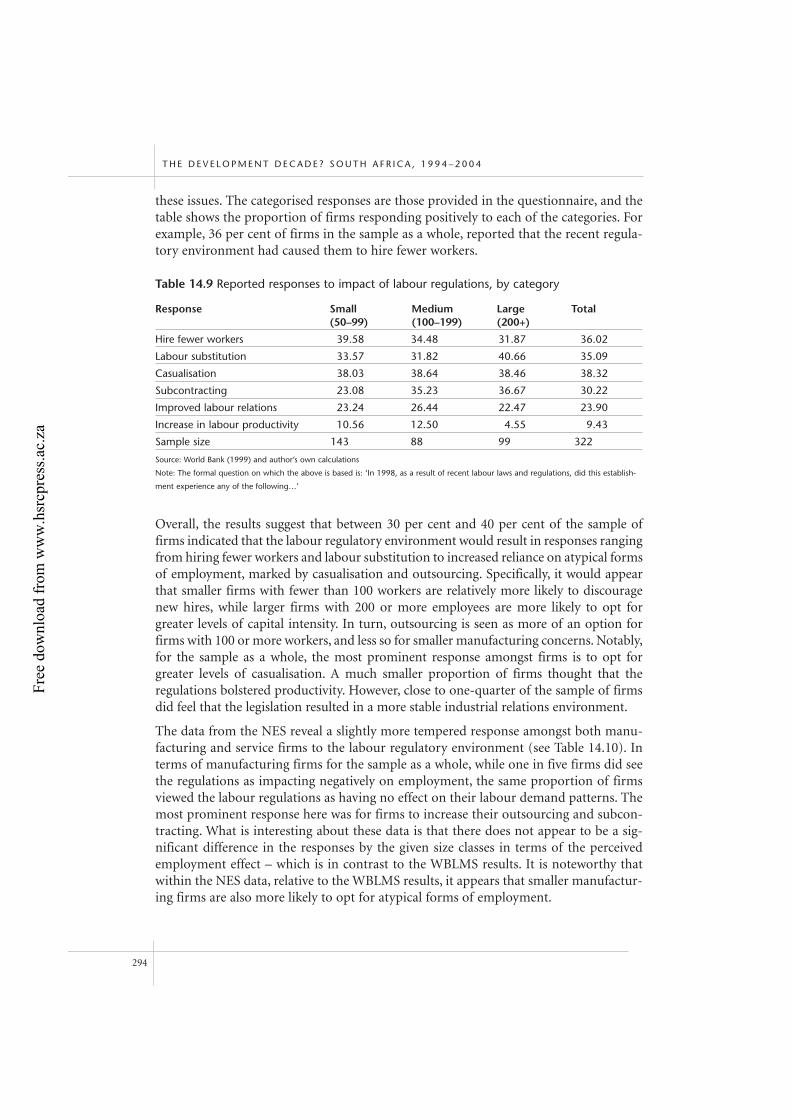
these issues. The categorised responses are those provided in the questionnaire, and thetable shows the proportion of firms responding positively to each of the categories. Forexample, 36 per cent of firms in the sample as a whole, reported that the recent regula-tory environment had caused them to hire fewer workers.
Overall, the results suggest that between 30 per cent and 40 per cent of the sample offirms indicated that the labour regulatory environment would result in responses rangingfrom hiring fewer workers and labour substitution to increased reliance on atypical formsof employment, marked by casualisation and outsourcing. Specifically, it would appearthat smaller firms with fewer than 100 workers are relatively more likely to discouragenew hires, while larger firms with 200 or more employees are more likely to opt forgreater levels of capital intensity. In turn, outsourcing is seen as more of an option forfirms with 100 or more workers, and less so for smaller manufacturing concerns. Notably,for the sample as a whole, the most prominent response amongst firms is to opt forgreater levels of casualisation. A much smaller proportion of firms thought that the regulations bolstered productivity. However, close to one-quarter of the sample of firmsdid feel that the legislation resulted in a more stable industrial relations environment.
The data from the NES reveal a slightly more tempered response amongst both manu-facturing and service firms to the labour regulatory environment (see Table 14.10). Interms of manufacturing firms for the sample as a whole, while one in five firms did seethe regulations as impacting negatively on employment, the same proportion of firmsviewed the labour regulations as having no effect on their labour demand patterns. Themost prominent response here was for firms to increase their outsourcing and subcon-tracting. What is interesting about these data is that there does not appear to be a sig-nificant difference in the responses by the given size classes in terms of the perceivedemployment effect – which is in contrast to the WBLMS results. It is noteworthy thatwithin the NES data, relative to the WBLMS results, it appears that smaller manufactur-ing firms are also more likely to opt for atypical forms of employment.
T H E D E V E L O P M E N T D E C A D E ? S O U T H A F R I C A , 1 9 9 4 – 2 0 0 4
294
Table 14.9 Reported responses to impact of labour regulations, by category
Response Small Medium Large Total(50–99) (100–199) (200+)
Hire fewer workers 39.58 34.48 31.87 36.02
Labour substitution 33.57 31.82 40.66 35.09
Casualisation 38.03 38.64 38.46 38.32
Subcontracting 23.08 35.23 36.67 30.22
Improved labour relations 23.24 26.44 22.47 23.90
Increase in labour productivity 10.56 12.50 4.55 9.43
Sample size 143 88 99 322
Source: World Bank (1999) and author’s own calculations
Note: The formal question on which the above is based is: ‘In 1998, as a result of recent labour laws and regulations, did this establish-
ment experience any of the following…’
Free
dow
nloa
d fr
om w
ww
.hsr
cpre
ss.a
c.za
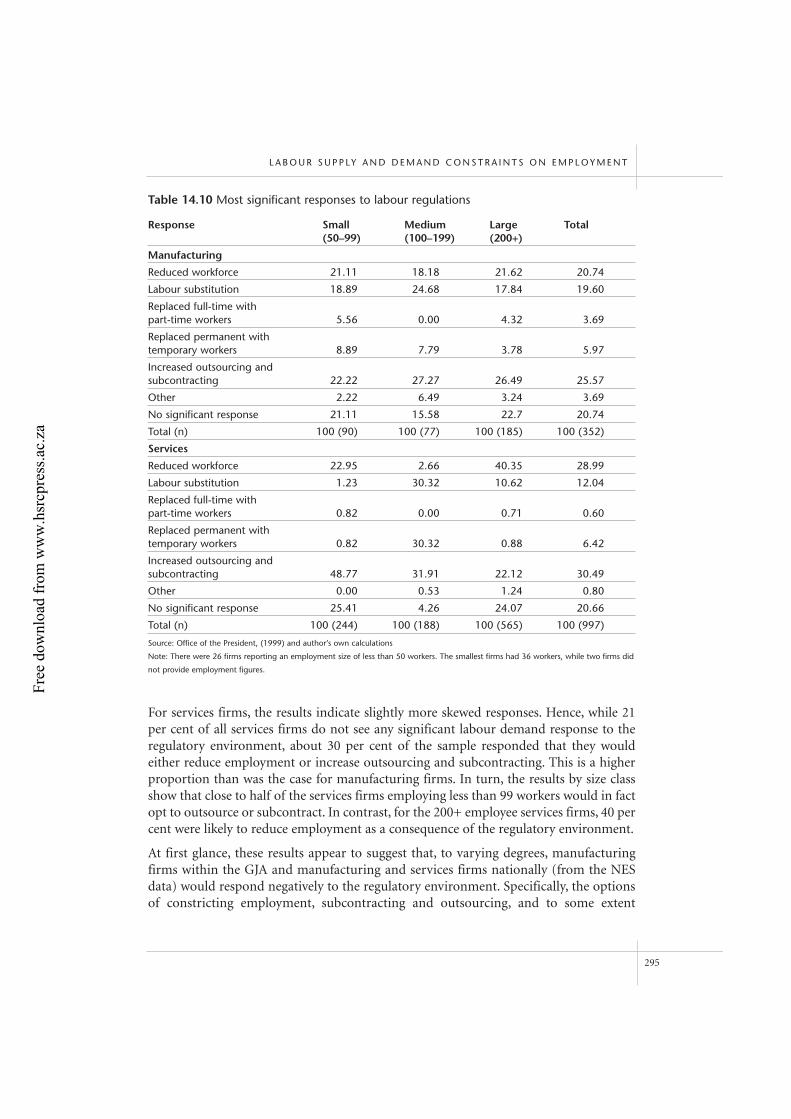
For services firms, the results indicate slightly more skewed responses. Hence, while 21per cent of all services firms do not see any significant labour demand response to theregulatory environment, about 30 per cent of the sample responded that they wouldeither reduce employment or increase outsourcing and subcontracting. This is a higherproportion than was the case for manufacturing firms. In turn, the results by size classshow that close to half of the services firms employing less than 99 workers would in factopt to outsource or subcontract. In contrast, for the 200+ employee services firms, 40 percent were likely to reduce employment as a consequence of the regulatory environment.
At first glance, these results appear to suggest that, to varying degrees, manufacturingfirms within the GJA and manufacturing and services firms nationally (from the NESdata) would respond negatively to the regulatory environment. Specifically, the optionsof constricting employment, subcontracting and outsourcing, and to some extent
L A B O U R S U P P LY A N D D E M A N D C O N S T R A I N T S O N E M P L O Y M E N T
295
Table 14.10 Most significant responses to labour regulations
Response Small Medium Large Total(50–99) (100–199) (200+)
Manufacturing
Reduced workforce 21.11 18.18 21.62 20.74
Labour substitution 18.89 24.68 17.84 19.60
Replaced full-time with part-time workers 5.56 0.00 4.32 3.69
Replaced permanent with temporary workers 8.89 7.79 3.78 5.97
Increased outsourcing and subcontracting 22.22 27.27 26.49 25.57
Other 2.22 6.49 3.24 3.69
No significant response 21.11 15.58 22.7 20.74
Total (n) 100 (90) 100 (77) 100 (185) 100 (352)
Services
Reduced workforce 22.95 2.66 40.35 28.99
Labour substitution 1.23 30.32 10.62 12.04
Replaced full-time with part-time workers 0.82 0.00 0.71 0.60
Replaced permanent with temporary workers 0.82 30.32 0.88 6.42
Increased outsourcing and subcontracting 48.77 31.91 22.12 30.49
Other 0.00 0.53 1.24 0.80
No significant response 25.41 4.26 24.07 20.66
Total (n) 100 (244) 100 (188) 100 (565) 100 (997)
Source: Office of the President, (1999) and author’s own calculations
Note: There were 26 firms reporting an employment size of less than 50 workers. The smallest firms had 36 workers, while two firms did
not provide employment figures.
Free
dow
nloa
d fr
om w
ww
.hsr
cpre
ss.a
c.za
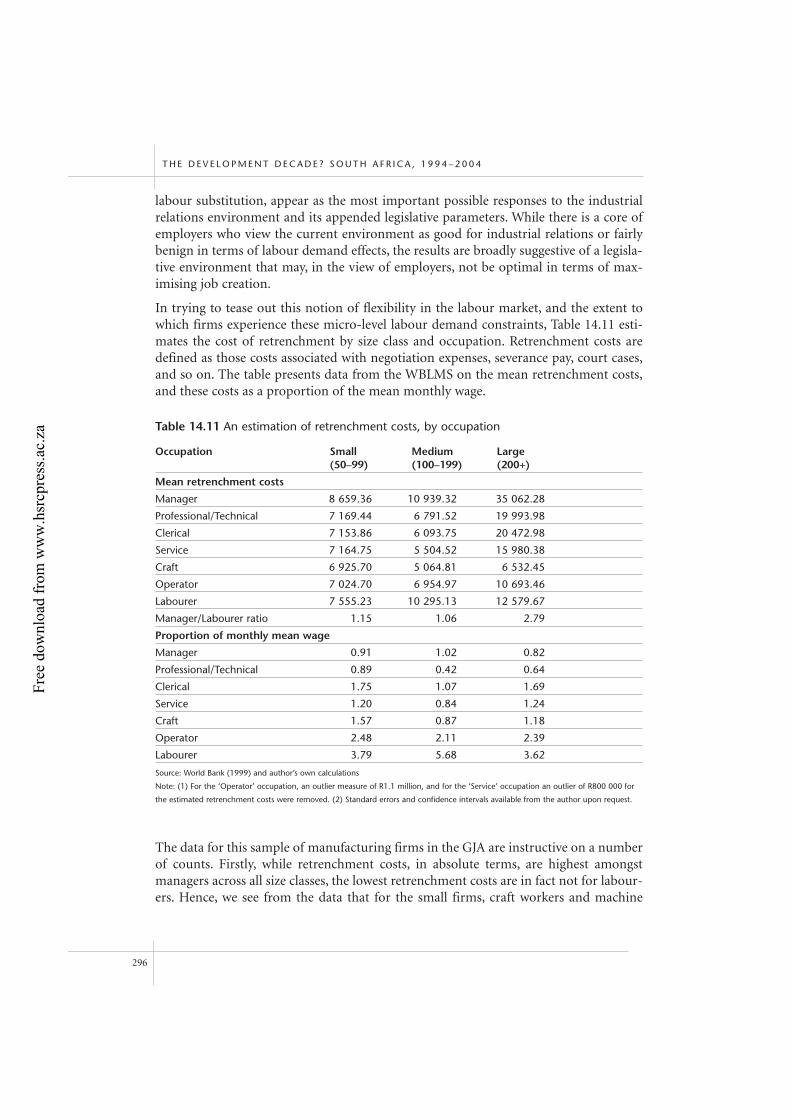
labour substitution, appear as the most important possible responses to the industrialrelations environment and its appended legislative parameters. While there is a core ofemployers who view the current environment as good for industrial relations or fairlybenign in terms of labour demand effects, the results are broadly suggestive of a legisla-tive environment that may, in the view of employers, not be optimal in terms of max-imising job creation.
In trying to tease out this notion of flexibility in the labour market, and the extent towhich firms experience these micro-level labour demand constraints, Table 14.11 esti-mates the cost of retrenchment by size class and occupation. Retrenchment costs aredefined as those costs associated with negotiation expenses, severance pay, court cases,and so on. The table presents data from the WBLMS on the mean retrenchment costs,and these costs as a proportion of the mean monthly wage.
The data for this sample of manufacturing firms in the GJA are instructive on a numberof counts. Firstly, while retrenchment costs, in absolute terms, are highest amongst managers across all size classes, the lowest retrenchment costs are in fact not for labour-ers. Hence, we see from the data that for the small firms, craft workers and machine
T H E D E V E L O P M E N T D E C A D E ? S O U T H A F R I C A , 1 9 9 4 – 2 0 0 4
296
Table 14.11 An estimation of retrenchment costs, by occupation
Occupation Small Medium Large (50–99) (100–199) (200+)
Mean retrenchment costs
Manager 8 659.36 10 939.32 35 062.28
Professional/Technical 7 169.44 6 791.52 19 993.98
Clerical 7 153.86 6 093.75 20 472.98
Service 7 164.75 5 504.52 15 980.38
Craft 6 925.70 5 064.81 6 532.45
Operator 7 024.70 6 954.97 10 693.46
Labourer 7 555.23 10 295.13 12 579.67
Manager/Labourer ratio 1.15 1.06 2.79
Proportion of monthly mean wage
Manager 0.91 1.02 0.82
Professional/Technical 0.89 0.42 0.64
Clerical 1.75 1.07 1.69
Service 1.20 0.84 1.24
Craft 1.57 0.87 1.18
Operator 2.48 2.11 2.39
Labourer 3.79 5.68 3.62
Source: World Bank (1999) and author’s own calculations
Note: (1) For the ‘Operator’ occupation, an outlier measure of R1.1 million, and for the ‘Service’ occupation an outlier of R800 000 for
the estimated retrenchment costs were removed. (2) Standard errors and confidence intervals available from the author upon request.
Free
dow
nloa
d fr
om w
ww
.hsr
cpre
ss.a
c.za
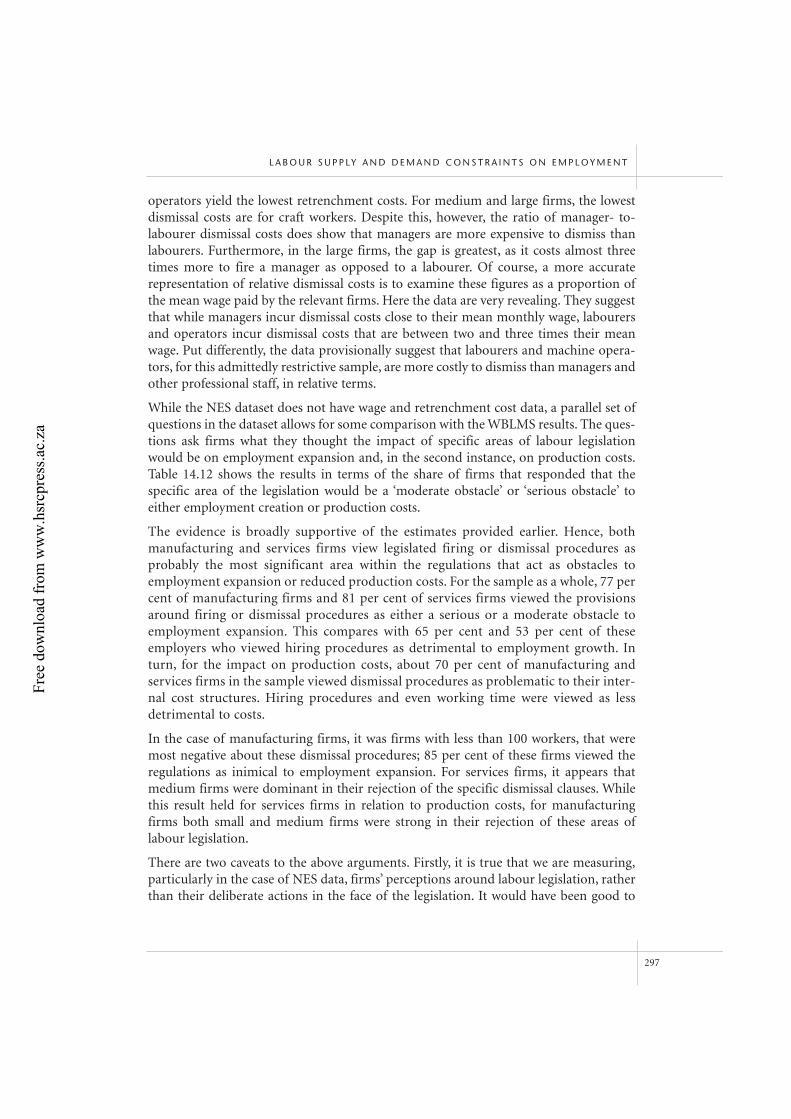
operators yield the lowest retrenchment costs. For medium and large firms, the lowestdismissal costs are for craft workers. Despite this, however, the ratio of manager- to-labourer dismissal costs does show that managers are more expensive to dismiss thanlabourers. Furthermore, in the large firms, the gap is greatest, as it costs almost threetimes more to fire a manager as opposed to a labourer. Of course, a more accurate representation of relative dismissal costs is to examine these figures as a proportion ofthe mean wage paid by the relevant firms. Here the data are very revealing. They suggestthat while managers incur dismissal costs close to their mean monthly wage, labourersand operators incur dismissal costs that are between two and three times their meanwage. Put differently, the data provisionally suggest that labourers and machine opera-tors, for this admittedly restrictive sample, are more costly to dismiss than managers andother professional staff, in relative terms.
While the NES dataset does not have wage and retrenchment cost data, a parallel set ofquestions in the dataset allows for some comparison with the WBLMS results. The ques-tions ask firms what they thought the impact of specific areas of labour legislationwould be on employment expansion and, in the second instance, on production costs.Table 14.12 shows the results in terms of the share of firms that responded that the specific area of the legislation would be a ‘moderate obstacle’ or ‘serious obstacle’ toeither employment creation or production costs.
The evidence is broadly supportive of the estimates provided earlier. Hence, bothmanufacturing and services firms view legislated firing or dismissal procedures asprobably the most significant area within the regulations that act as obstacles toemployment expansion or reduced production costs. For the sample as a whole, 77 percent of manufacturing firms and 81 per cent of services firms viewed the provisionsaround firing or dismissal procedures as either a serious or a moderate obstacle toemployment expansion. This compares with 65 per cent and 53 per cent of theseemployers who viewed hiring procedures as detrimental to employment growth. Inturn, for the impact on production costs, about 70 per cent of manufacturing andservices firms in the sample viewed dismissal procedures as problematic to their inter-nal cost structures. Hiring procedures and even working time were viewed as lessdetrimental to costs.
In the case of manufacturing firms, it was firms with less than 100 workers, that weremost negative about these dismissal procedures; 85 per cent of these firms viewed theregulations as inimical to employment expansion. For services firms, it appears thatmedium firms were dominant in their rejection of the specific dismissal clauses. Whilethis result held for services firms in relation to production costs, for manufacturingfirms both small and medium firms were strong in their rejection of these areas oflabour legislation.
There are two caveats to the above arguments. Firstly, it is true that we are measuring,particularly in the case of NES data, firms’ perceptions around labour legislation, ratherthan their deliberate actions in the face of the legislation. It would have been good to
L A B O U R S U P P LY A N D D E M A N D C O N S T R A I N T S O N E M P L O Y M E N T
297
Free
dow
nloa
d fr
om w
ww
.hsr
cpre
ss.a
c.za
T H E D E V E L O P M E N T D E C A D E ? S O U T H A F R I C A , 1 9 9 4 – 2 0 0 4
298
Table 14.12 Impact of labour regulations on employment expansion and production costs
Regulation Small Medium Large Total(50–99) (100–199) (200+)
Impact on employment expansion
Manufacturing
Hiring procedures 61.29 62.50 68.25 65.40
Firing or dismissal procedures 84.95 73.75 74.07 76.57
Working time 53.76 55.00 50.26 52.59
Leave provision 36.56 25.00 30.69 31.06
Rights to collective action 51.61 42.50 39.68 43.87
Affirmative action provisions 72.04 55.00 60.32 61.85
Services
Hiring procedures 60.47 34.21 55.44 53.06
Firing or dismissal procedures 79.40 96.32 76.49 80.87
Working time 57.48 3.16 73.16 56.17
Leave provision 18.60 1.58 42.28 28.28
Rights to collective action 39.20 63.68 62.28 55.98
Affirmative action provisions 97.01 64.21 54.91 68.52
Impact on production costs
Manufacturing
Hiring procedures 50.54 52.50 52.91 52.04
Firing or dismissal procedures 69.89 70.00 65.61 67.57
Working time 65.59 70.00 60.32 63.76
Leave provision 48.39 42.50 42.86 43.87
Rights to collective action 43.01 42.50 41.27 42.23
Affirmative action provisions 64.52 52.50 57.14 57.49
Services
Hiring procedures 77.74 92.63 44.21 62.39
Firing or dismissal procedures 41.86 94.21 75.26 69.18
Working time 40.20 93.16 74.21 67.95
Leave provision 38.54 62.11 62.63 55.70
Rights to collective action 38.21 61.05 52.63 50.05
Affirmative action provisions 58.47 93.68 45.96 58.06
Source: Office of the President (1999) and author’s own calculations
Note: (1) The table reflects the share reporting a specific regulation as a ‘serious’ or ‘moderate’ obstacle. (2) The sample size for the serv-
ices firms was between 946 and 1001 firms, depending on the specific sub-question. In the case of manufacturing firms, the sample
ranged from 352 to 361 firms. (3) There were 26 firms reporting an employment size of less than 50 workers. The smallest firms had 36
workers while two firms did not provide employment figures.
Free
dow
nloa
d fr
om w
ww
.hsr
cpre
ss.a
c.za
have compared actual employment changes in the period from 1998 onwards to estab-lish whether firms in fact did reduce employment or experience higher production costsas a result of the dismissal and other clauses. Such comparative data, however, do notexist. Yet, it must be borne in mind that, in and of themselves, firms’ perceptions aroundthe legislation can and often do have real effects in terms of labour market outcomes. Asecond concern around this data is that they do not cover the period after 1998, whensignificant amendments to the LRA and other labour legislation occurred. In the case ofdismissals, the amendments to the LRA in 2002 would appear to have induced greaterlevels of consultation and consensus seeking amongst the bargaining parties. This, it hasbeen argued, has resulted in a set of retrenchment clauses that, on balance, favouremployees (Godfrey & Theron 2004) and, in fact, may have increased the opportunitycost and financial cost of dismissing workers.
The evidence may begin to isolate one possible source of the notion that the labourmarket is inflexible – implicitly moving away from concerns around wage rates and levels.The above data, therefore, provide tentative evidence that the financial costs associatedwith dismissals within the country’s industrial relations environment may ultimately beantithetical to employment expansion and reduced production costs. Importantly, thesecosts may be incurred in areas that do not financially benefit the individual and, indeed,may be a reflection of the perceived procedural and other inefficiencies that exist in theindustrial relations environment.
Conclusion
Within a context of perceptions that the post-apartheid labour market has experienced‘jobless growth’, it has ben argued, through the use of data for the period 1995–2002, thatthis notion is erroneous. Instead, the labour market since 1995 appears to have yieldedpositive employment growth rates but, importantly, these remain grossly insufficient togenerate employment for all work-seekers in the economy. Accompanying this result isthe continued evidence of skills-biased employment shifts for the domestic economy,placing a further burden on the ability of the economy to match labour demand trendswith appropriately qualified individuals.
The second part of the chapter showed that, in terms of both labour supply and labourdemand, there exist significant microeconomic constraints, operating at the level of thehousehold and firm, which remain a constraint on employment creation. The laboursupply evidence makes it clear that 70 per cent of the broadly unemployed reside inhouseholds that are in the bottom two expenditure categories of the distribution. These‘unemployed households’ lack the resources to fund job-search activities, as householdbudgets are often utilised for meeting basic needs. In effect, the data are a reflection ofhow the presence of household poverty traps results in a constraint on unemployedindividuals’ search for employment.
In addition, it is clear that the role of information and knowledge networks (overlaid byspatial location) was severely undermined for this 70 per cent of the unemployed, as the
L A B O U R S U P P LY A N D D E M A N D C O N S T R A I N T S O N E M P L O Y M E N T
299
Free
dow
nloa
d fr
om w
ww
.hsr
cpre
ss.a
c.za
employed and union members were predominantly located in the middle-to-upper endof the expenditure distribution.
Finally, it is clear that the ‘pro-poor’ orientation of the social grants has a labour marketvariant, in that both the OAP and the CSG were shown to be biased toward the unem-ployed resident in the poorest households in the society. Matching this composite set ofconstraints on ‘unemployed households’, it is also clear that firms report facing labourdemand constraints operating within the labour regulatory environment. Specifically,manufacturing firms in the GJA and manufacturing and service firms nationally reportvery strongly on the fact that dismissal clauses within the LRA are inimical to bothemployment creation and the reduction of their internal production costs. This evi-dence is perhaps most powerfully displayed in the retrenchment cost data, which showthat the dismissal cost for labourers within manufacturing firms in the GJA stands atthree times the mean wage of these workers.
Therefore, the combination of firms’ difficulties with retrenchment procedures andother legislative provisions, and the majority of the unemployed being resident inseverely deprived households, suggests that microeconomic constraints on employmentcreation must feature in policy interventions designed to overcome the country’scurrent unemployment crisis.
Notes
1 For a historical account of these shifts and their impact on the South African labour market,
see Bhorat & Hodge (1999), Bhorat (2000) and Edwards (2001).
2 The poor coverage of the informal sector in the October Household Survey for 1995 makes this
comparison of formal versus informal sector employment growth very difficult. However, there
would seem to be indicative evidence that both organic growth in informal employment and
better capturing by Statistics South Africa have yielded a rapid expansion in informal
employment.
3 The expenditure categories defined in the table are those provided in the Labour Force Survey
questionnaire, with no question present on point estimates of household income or expenditure.
4 A more detailed overview of these constraints on long-term economic growth can be found in
Bhorat & Cassim (2004)
5 The employment effects of the Skills Development Act and the Employment Equity Act were
also raised in the survey, although as expected the overwhelming majority of firms viewed these
laws as having no effect on employment levels.
T H E D E V E L O P M E N T D E C A D E ? S O U T H A F R I C A , 1 9 9 4 – 2 0 0 4
300
Free
dow
nloa
d fr
om w
ww
.hsr
cpre
ss.a
c.za
References
Bhorat H (2000) The impact of trade and structural changes on sectoral employment in
South Africa, Development Southern Africa 17: 437–66.
Bhorat H & Cassim R (2004) The challenge of growth, employment and poverty in the South African
economy since democracy: An exploratory review of selected issues, Development Southern
Africa 17: 815–29.
Bhorat H & Hodge J (1999) Decomposing shifts in labour demand in South Africa, South African
Journal of Economics 67: 348–80.
Chandra V, Moorty L, Rajaratnam B & Schaefer K (2000) Constraints to growth and employment in
South Africa. Report 1: Statistics from the Large Manufacturing Survey. World Bank Discussion
Paper 14, World Bank, Washington.
Edwards L (2001) Globalisation and the skill bias of occupational employment in South Africa.
Unpublished paper. University of Cape Town, South Africa.
Godfrey S & Theron J (2004) An analysis of the impact of legislation and policy on the labour
market since 1994. Unpublished mimeo, University of Cape Town.
Hinks T (2004) The changing nature of work and ‘atypical’ forms of employment in South Africa:
Prevalence/magnitude of casualisation and externalisation in South Africa. Commissioned
research project undertaken for the Department of Labour, Republic of South Africa.
Lundall P, Majeke A & Poswell L (2004) Atypical employment and labour market flexibility:
Experiences of manufacturing firms in the greater Cape Town metropolitan area.
Office of the President, South Africa (1999) National Enterprise Survey for South Africa. Pretoria:
The Presidency.
StatsSA (Statistics South Africa) (1995) October Household Survey. Pretoria: Statistics South Africa.
StatsSA (2002) Labour Force Survey: February 2002; September 2002. Pretoria: Statistics South Africa.
World Bank (1999) World Bank Large Manufacturing Survey for the Gauteng Region. Washington DC:
World Bank.
L A B O U R S U P P LY A N D D E M A N D C O N S T R A I N T S O N E M P L O Y M E N T
301
Free
dow
nloa
d fr
om w
ww
.hsr
cpre
ss.a
c.za
15Definitions, data and the informal economy in South Africa: a critical analysis
Richard Devey, Caroline Skinner and Imraan Valodia
Introduction
In post-apartheid South Africa there has been an intense debate about the extent ofemployment and unemployment. Much of this debate is related to the impact of gov-ernment policy – whether the effects of policy have resulted in higher levels of employ-ment or not. Three issues relevant to this chapter have characterised this debate. First,interest groups have selectively manipulated some of the data to support their ownpolicy objectives. Second, it is apparent that questions may be asked about whether ornot the labour market data in South Africa are a reliable estimate of actual developmentsin employment and unemployment. Third, the trend in employment in the informaleconomy and the reliability of this trend may determine whether or not employment isrising. This chapter is concerned primarily with addressing the reliability or otherwiseof data on informal employment in South Africa in the post-apartheid period.
This chapter is divided into two sections. We begin by outlining basic labour market datain South Africa, and examine the controversies surrounding informal economy employ-ment data. We show that estimates of the level of informal economy employment inSouth Africa are highly variable. We then outline how estimates of informal employ-ment are derived by Statistics South Africa (StatsSA) and explore why these estimates areso variable, and investigate certain inconsistencies in the data. We end the first section ofthe chapter, after having examined the controversies associated with the extent of infor-mal economy employment, by concluding that we are unsure of the precise level andextent of informal employment in South Africa. As such, any policy discussions onemployment, and more specifically on informal employment, should be conducted withcaution.
The second section of the chapter discusses the difficulties of defining informal work andexplores whether the distinction that is drawn between formal and informal employmentis a realistic one in the South African setting. This leads us to a discussion of whether theenterprise-based definition of informal work currently employed in South Africa isappropriate for classifying workers. Using indicators that measure characteristics of theenterprise and the worker, we show that significant proportions of workers classified asinformal display characteristics of formal work. We then draw attention to researchdemonstrating that an increasing number of formal jobs are characterised by conditionsthat are typical of informal work. Thus, we argue that a definition based on work char-
302
Free
dow
nloa
d fr
om w
ww
.hsr
cpre
ss.a
c.za
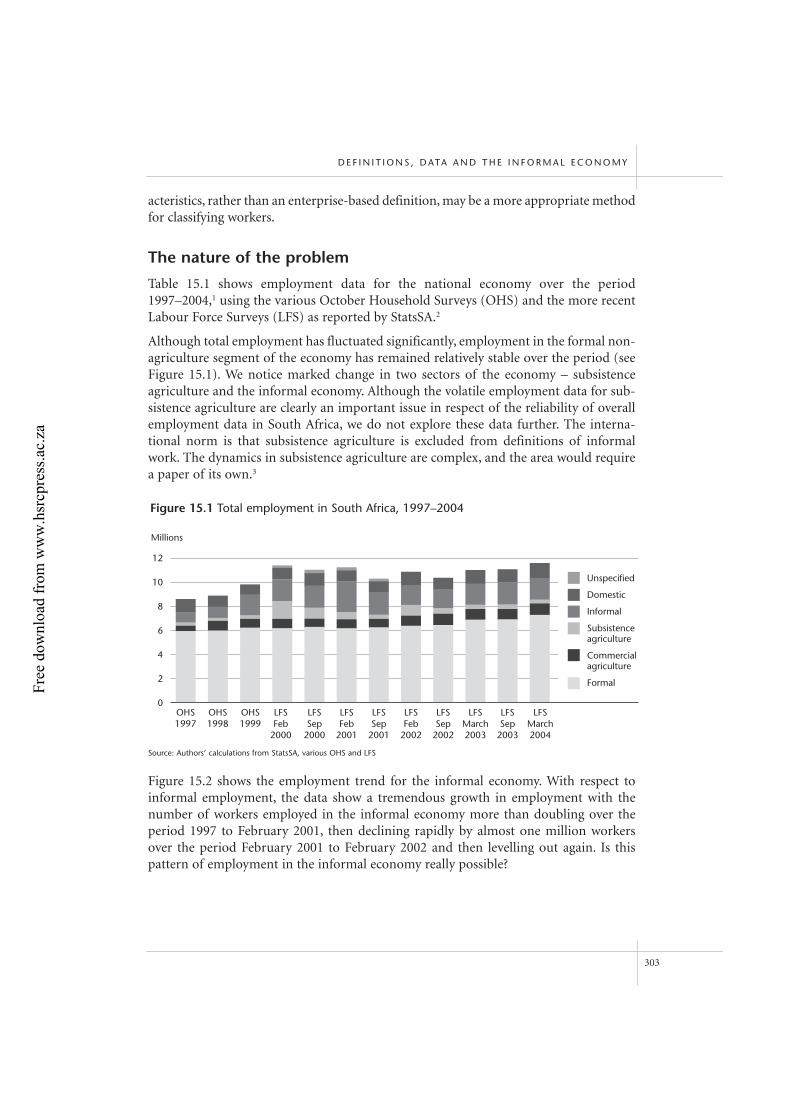
acteristics, rather than an enterprise-based definition, may be a more appropriate methodfor classifying workers.
The nature of the problem
Table 15.1 shows employment data for the national economy over the period1997–2004,1 using the various October Household Surveys (OHS) and the more recentLabour Force Surveys (LFS) as reported by StatsSA.2
Although total employment has fluctuated significantly, employment in the formal non-agriculture segment of the economy has remained relatively stable over the period (seeFigure 15.1). We notice marked change in two sectors of the economy – subsistence agriculture and the informal economy. Although the volatile employment data for sub-sistence agriculture are clearly an important issue in respect of the reliability of overallemployment data in South Africa, we do not explore these data further. The interna-tional norm is that subsistence agriculture is excluded from definitions of informalwork. The dynamics in subsistence agriculture are complex, and the area would requirea paper of its own.3
Figure 15.2 shows the employment trend for the informal economy. With respect toinformal employment, the data show a tremendous growth in employment with thenumber of workers employed in the informal economy more than doubling over theperiod 1997 to February 2001, then declining rapidly by almost one million workersover the period February 2001 to February 2002 and then levelling out again. Is thispattern of employment in the informal economy really possible?
D E F I N I T I O N S , D ATA A N D T H E I N F O R M A L E C O N O M Y
303
12
10
8
6
4
2
0
Figure 15.1 Total employment in South Africa, 1997–2004
OHS1998
OHS1997
OHS1999
LFSFeb
2000
LFSSep
2000
LFSFeb
2001
LFSSep
2001
LFSFeb
2002
LFSSep
2002
LFSMarch2003
LFSSep
2003
LFSMarch2004
Millions
Unspecified
Domestic
Informal
Subsistenceagriculture
Commercial agriculture
Formal
Source: Authors’ calculations from StatsSA, various OHS and LFS
Free
dow
nloa
d fr
om w
ww
.hsr
cpre
ss.a
c.za
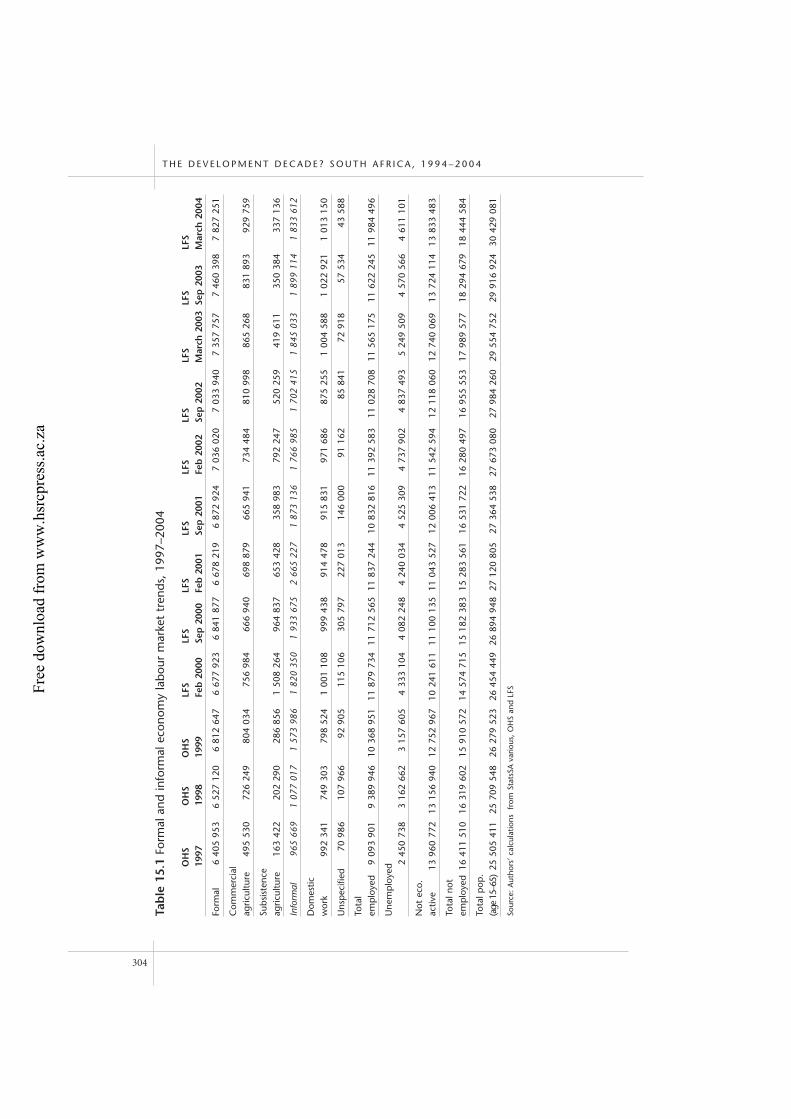
T H E D E V E L O P M E N T D E C A D E ? S O U T H A F R I C A , 1 9 9 4 – 2 0 0 4
304
Tab
le 1
5.1
Form
al a
nd in
form
al e
cono
my
labo
ur m
arke
t tr
ends
, 19
97–2
004
OH
S O
HS
OH
S LF
S LF
S LF
S LF
S LF
S LF
S LF
S LF
S LF
S 19
9719
9819
99Fe
b 2
000
Sep
200
0Fe
b 2
001
Sep
200
1Fe
b 2
002
Sep
200
2M
arch
200
3Se
p 2
003
Mar
ch 2
004
Form
al6
405
953
6 52
7 12
06
812
647
6 67
7 92
36
841
877
6 67
8 21
96
872
924
7 03
6 02
07
033
940
7 35
7 75
77
460
398
7 82
7 25
1
Com
mer
cial
ag
ricul
ture
495
530
726
249
804
034
756
984
666
940
698
879
665
941
734
484
810
998
865
268
831
893
929
759
Subs
iste
nce
agric
ultu
re16
3 42
220
2 29
028
6 85
61
508
264
964
837
653
428
358
983
792
247
520
259
419
611
350
384
337
136
Info
rmal
965
669
1 07
7 01
71
573
986
1 82
0 35
01
933
675
2 66
5 22
71
873
136
1 76
6 98
51
702
415
1 84
5 03
31
899
114
1 83
3 61
2
Dom
estic
wor
k99
2 34
174
9 30
379
8 52
41
001
108
999
438
914
478
915
831
971
686
875
255
1 00
4 58
81
022
921
1 01
3 15
0
Uns
pec
ified
70 9
8610
7 96
692
905
115
106
305
797
227
013
146
000
91 1
6285
841
72 9
1857
534
43 5
88
Tota
lem
plo
yed
9 09
3 90
19
389
946
10 3
68 9
5111
879
734
11 7
12 5
6511
837
244
10 8
32 8
1611
392
583
11 0
28 7
0811
565
175
11 6
22 2
4511
984
496
Une
mp
loye
d 2 45
0 73
83
162
662
3 15
7 60
54
333
104
4 08
2 24
84
240
034
4 52
5 30
94
737
902
4 83
7 49
35
249
509
4 57
0 56
64
611
101
Not
eco
. ac
tive
13 9
60 7
7213
156
940
12 7
52 9
6710
241
611
11 1
00 1
3511
043
527
12 0
06 4
1311
542
594
12 1
18 0
6012
740
069
13 7
24 1
1413
833
483
Tota
l not
em
plo
yed
16 4
11 5
1016
319
602
15 9
10 5
7214
574
715
15 1
82 3
8315
283
561
16 5
31 7
2216
280
497
16 9
55 5
5317
989
577
18 2
94 6
7918
444
584
Tota
l pop
.(a
ge 1
5–65
)25
505
411
25 7
09 5
4826
279
523
26 4
54 4
4926
894
948
27 1
20 8
0527
364
538
27 6
73 0
8027
984
260
29 5
54 7
5229
916
924
30 4
29 0
81
Sour
ce:
Aut
hors
’ cal
cula
tions
fr
om S
tats
SA v
ario
us,
OH
S an
d LF
SFree
dow
nloa
d fr
om w
ww
.hsr
cpre
ss.a
c.za
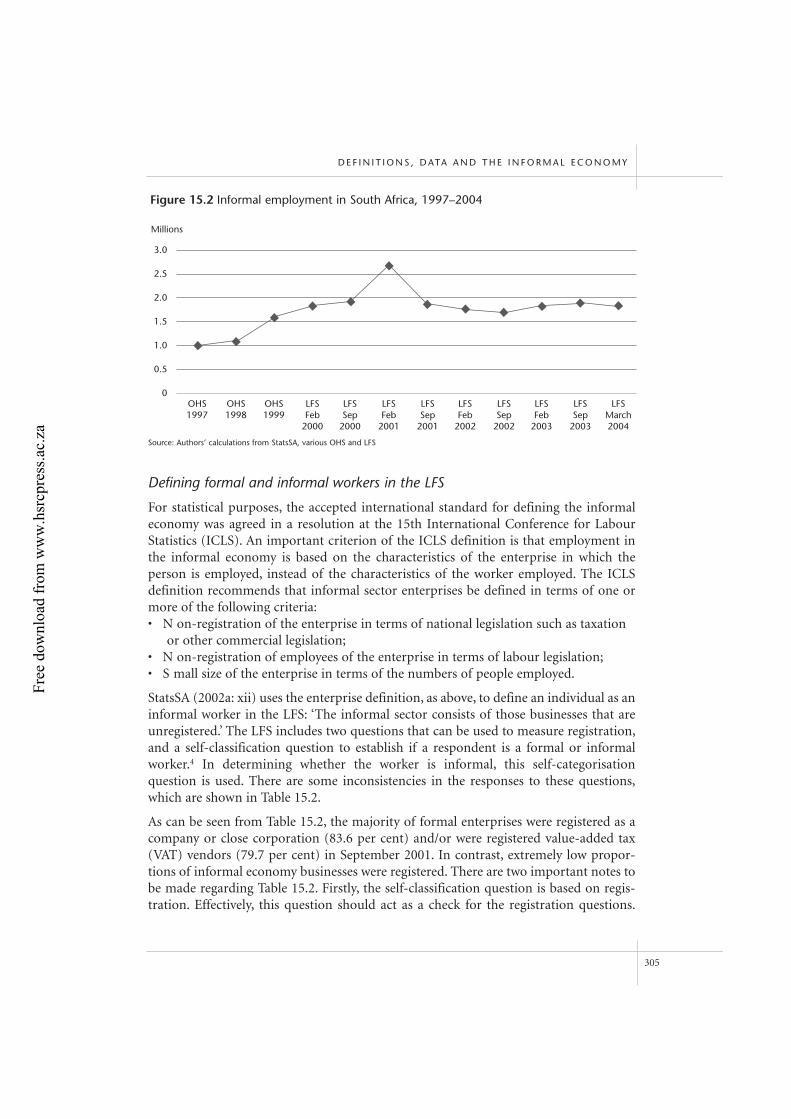
Defining formal and informal workers in the LFS
For statistical purposes, the accepted international standard for defining the informaleconomy was agreed in a resolution at the 15th International Conference for LabourStatistics (ICLS). An important criterion of the ICLS definition is that employment inthe informal economy is based on the characteristics of the enterprise in which theperson is employed, instead of the characteristics of the worker employed. The ICLS definition recommends that informal sector enterprises be defined in terms of one ormore of the following criteria:• N on-registration of the enterprise in terms of national legislation such as taxation
or other commercial legislation;• N on-registration of employees of the enterprise in terms of labour legislation;• S mall size of the enterprise in terms of the numbers of people employed.
StatsSA (2002a: xii) uses the enterprise definition, as above, to define an individual as aninformal worker in the LFS: ‘The informal sector consists of those businesses that areunregistered.’ The LFS includes two questions that can be used to measure registration,and a self-classification question to establish if a respondent is a formal or informalworker.4 In determining whether the worker is informal, this self-categorisation question is used. There are some inconsistencies in the responses to these questions,which are shown in Table 15.2.
As can be seen from Table 15.2, the majority of formal enterprises were registered as acompany or close corporation (83.6 per cent) and/or were registered value-added tax(VAT) vendors (79.7 per cent) in September 2001. In contrast, extremely low propor-tions of informal economy businesses were registered. There are two important notes tobe made regarding Table 15.2. Firstly, the self-classification question is based on regis-tration. Effectively, this question should act as a check for the registration questions.
D E F I N I T I O N S , D ATA A N D T H E I N F O R M A L E C O N O M Y
305
OHS1998
OHS1997
OHS1999
LFSFeb
2000
LFSSep
2000
LFSFeb
2001
LFSSep
2001
LFSFeb
2002
LFSSep
2002
LFSFeb
2003
LFSSep
2003
LFSMarch2004
3.0
2.5
2.0
1.5
1.0
0.5
0
Figure 15.2 Informal employment in South Africa, 1997–2004
Millions
Source: Authors’ calculations from StatsSA, various OHS and LFS
Free
dow
nloa
d fr
om w
ww
.hsr
cpre
ss.a
c.za
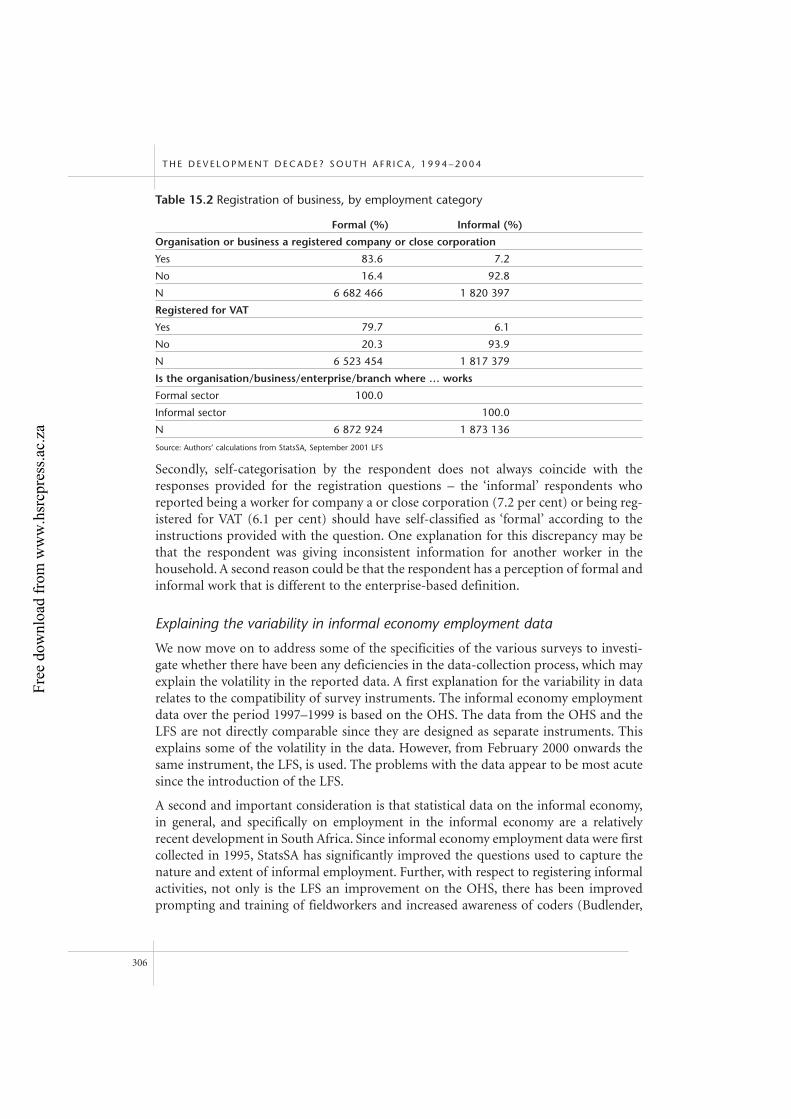
Secondly, self-categorisation by the respondent does not always coincide with theresponses provided for the registration questions – the ‘informal’ respondents whoreported being a worker for company a or close corporation (7.2 per cent) or being reg-istered for VAT (6.1 per cent) should have self-classified as ‘formal’ according to theinstructions provided with the question. One explanation for this discrepancy may bethat the respondent was giving inconsistent information for another worker in thehousehold. A second reason could be that the respondent has a perception of formal andinformal work that is different to the enterprise-based definition.
Explaining the variability in informal economy employment data
We now move on to address some of the specificities of the various surveys to investi-gate whether there have been any deficiencies in the data-collection process, which mayexplain the volatility in the reported data. A first explanation for the variability in datarelates to the compatibility of survey instruments. The informal economy employmentdata over the period 1997–1999 is based on the OHS. The data from the OHS and theLFS are not directly comparable since they are designed as separate instruments. Thisexplains some of the volatility in the data. However, from February 2000 onwards thesame instrument, the LFS, is used. The problems with the data appear to be most acutesince the introduction of the LFS.
A second and important consideration is that statistical data on the informal economy,in general, and specifically on employment in the informal economy are a relativelyrecent development in South Africa. Since informal economy employment data were firstcollected in 1995, StatsSA has significantly improved the questions used to capture thenature and extent of informal employment. Further, with respect to registering informalactivities, not only is the LFS an improvement on the OHS, there has been improvedprompting and training of fieldworkers and increased awareness of coders (Budlender,
T H E D E V E L O P M E N T D E C A D E ? S O U T H A F R I C A , 1 9 9 4 – 2 0 0 4
306
Table 15.2 Registration of business, by employment category
Formal (%) Informal (%)
Organisation or business a registered company or close corporation
Yes 83.6 7.2
No 16.4 92.8
N 6 682 466 1 820 397
Registered for VAT
Yes 79.7 6.1
No 20.3 93.9
N 6 523 454 1 817 379
Is the organisation/business/enterprise/branch where … works
Formal sector 100.0
Informal sector 100.0
N 6 872 924 1 873 136
Source: Authors’ calculations from StatsSA, September 2001 LFS
Free
dow
nloa
d fr
om w
ww
.hsr
cpre
ss.a
c.za
Buwembo & Shabalala 2001). Thus, part of the volatility in the data, in particular theincrease in informal employment, is a reflection of improved data collection.
Sampling frame, sampling method and size of sample are important determinants ofvalidity and reliability of a survey. The number of households surveyed by the OHS andLFS has changed over time, primarily for financial reasons. StatsSA itself and otherresearchers report problems with the various OHS and LFS datasets (see Budlender &Hirschowitz 2000). The problems cited are either conceptual (for example, ineffective def-inition of the informal economy) or technical (for example, data contain inconsistencies).
As is clear from Figure 15.2, the February 2001 LFS reports the highest level of informalemployment – a peak of 2 665 227. This appears to be inconsistent with other LFSs.Analysis of the data indicates that the February 2001 LFS appears to reverse the trend ofmale/female employment in the informal economy, reporting an inordinately high levelof female informal employment. Further, informal employment in KwaZulu-Natalprovince for the February 2001 LFS appears to be high, as does the number of thoseemployed in the wholesale and retail sector.
A major limitation of the LFS design is that it facilitates the measure of a main job only.In reality, there are certainly workers who hold more than one job and this could includecases where one job is formal and the other informal. What we do not know is how manyworkers have more than one job. In the February 2001 LFS, fieldworkers were offeredincentives to survey informal workers. The use of incentives may have resulted in ahigher number of informal workers. However, we would then expect to find a concomi-tant decrease in the number of formal workers. This is not the case (see Table 15.1), sothe suggestion of incentives causing fieldworkers to report formal workers as informaldoes not explain the sharp rise in informal workers in February 2001.
Incorrect weighting is another possible factor that could produce changes in distribu-tion. We find incorrect weighting does not successfully explain the marked change indistribution. Analysis of the February 2001 LFS demonstrated that for informal workersaged 15–65, the unweighted distribution of males and females was 46.3 per cent and 53.7per cent, respectively. The weighted distribution for the same group was 47.4 per centand 52.6 per cent. This was in contrast to the unweighted and weighted distribution in September 2000 and September 2001, where the distribution was reversed for malesand females; for example, for workers aged 15–65, the distribution (unweighted) inSeptember 2000 of males and females was 53.8 per cent and 46.2 per cent, respectively.Effectively, the difference lies in the underlying sample distribution, and this carriesthrough to the weighted data.
StatsSA (2002a) provided a number of reasons for the significant increase in the numberof informal workers: a follow-up survey focused on self-employment and small busi-nesses resulting in greater numbers of workers self-classifying themselves as informal; achange in sampling frame producing a new distribution; and significant fluctuations innumbers because entry into and exit from the sector is easy and common. Although thelabour statistics show some fluctuation after February 2001, the number of informal
D E F I N I T I O N S , D ATA A N D T H E I N F O R M A L E C O N O M Y
307
Free
dow
nloa
d fr
om w
ww
.hsr
cpre
ss.a
c.za
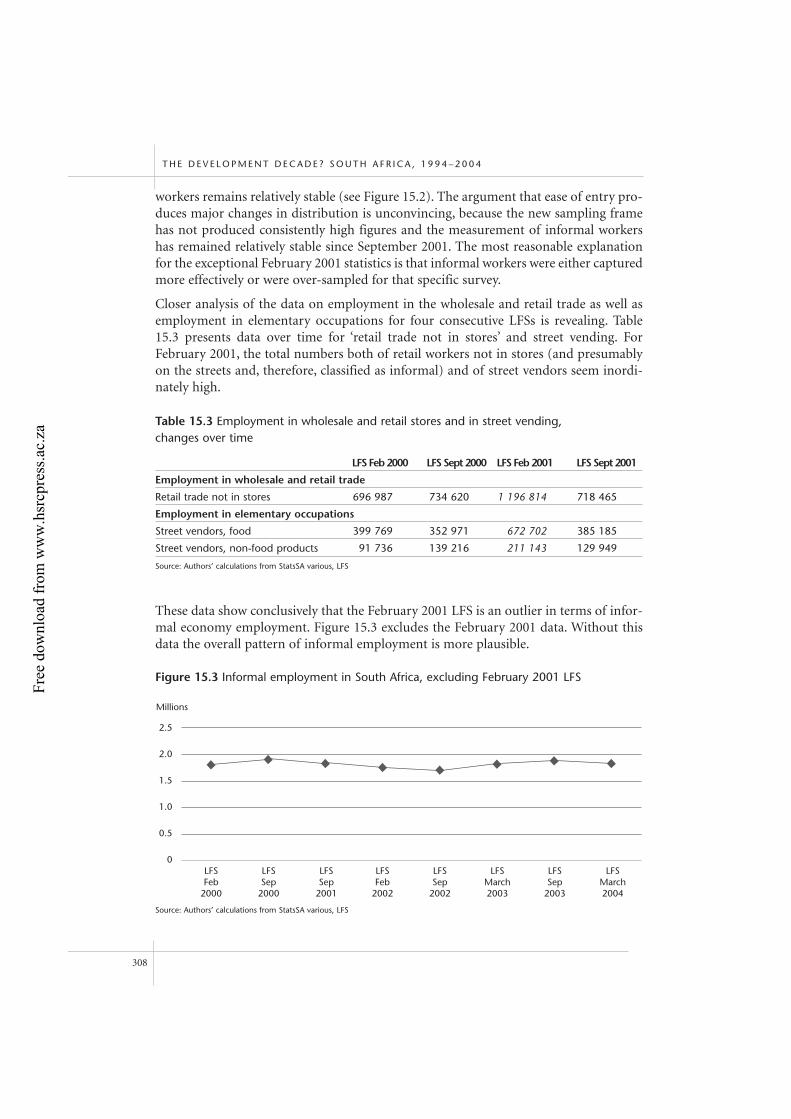
workers remains relatively stable (see Figure 15.2). The argument that ease of entry pro-duces major changes in distribution is unconvincing, because the new sampling framehas not produced consistently high figures and the measurement of informal workershas remained relatively stable since September 2001. The most reasonable explanationfor the exceptional February 2001 statistics is that informal workers were either capturedmore effectively or were over-sampled for that specific survey.
Closer analysis of the data on employment in the wholesale and retail trade as well asemployment in elementary occupations for four consecutive LFSs is revealing. Table15.3 presents data over time for ‘retail trade not in stores’ and street vending. ForFebruary 2001, the total numbers both of retail workers not in stores (and presumablyon the streets and, therefore, classified as informal) and of street vendors seem inordi-nately high.
These data show conclusively that the February 2001 LFS is an outlier in terms of infor-mal economy employment. Figure 15.3 excludes the February 2001 data. Without thisdata the overall pattern of informal employment is more plausible.
T H E D E V E L O P M E N T D E C A D E ? S O U T H A F R I C A , 1 9 9 4 – 2 0 0 4
308
Table 15.3 Employment in wholesale and retail stores and in street vending, changes over time
LFS Feb 2000 LFS Sept 2000 LFS Feb 2001 LFS Sept 2001
Employment in wholesale and retail trade
Retail trade not in stores 696 987 734 620 1 196 814 718 465
Employment in elementary occupations
Street vendors, food 399 769 352 971 672 702 385 185
Street vendors, non-food products 91 736 139 216 211 143 129 949
Source: Authors’ calculations from StatsSA various, LFS
LFSFeb
2000
LFSSep
2000
LFSSep
2001
LFSFeb
2002
LFSSep
2002
LFSMarch2003
LFSSep
2003
LFSMarch2004
2.5
2.0
1.5
1.0
0.5
0
Figure 15.3 Informal employment in South Africa, excluding February 2001 LFS
Millions
Source: Authors’ calculations from StatsSA various, LFS
Free
dow
nloa
d fr
om w
ww
.hsr
cpre
ss.a
c.za
However, although the February 2001 LFS is clearly an outlier, we are unsure if this LFSrather than all of the other estimates is closest to the true level of informal employmentin South Africa. In other words, it may be the case that the February 2001 LFS is actu-ally the ‘correct’ estimate, with all of the other estimates significantly under-representingthe true level of informal employment in South Africa. StatsSA (2002a) notes that in theFebruary 2001 LFS more probing questions were asked about self-employment andsmall businesses in a follow-up survey, which may have led to a larger number of respon-dents than usual classifying themselves as employed in the informal economy. Hence,the February 2001 LFS may well be the most accurate estimate of informal employment.
A remaining puzzle that needs some explanation is the significant drop in informalemployment in the September 2001 LFS. In other words, if the February 2001 estimateof informal employment is the most accurate estimate, why do we observe a fall from2.6 million to 1.8 million in September 2001? We would expect the September 2001 esti-mate to be relatively close to the February 2001 estimate. According to StatsSA (2002a),in September 2001 a new sample was drawn due to interviewee fatigue and, once again,respondents may have classified themselves as not economically active rather thanemployed in the informal sector. Thus, because a new sample was drawn and the issuesof self-employment and small business were not explored in a follow-up survey, as wasthe case for February 2001, September 2001 may be a significant underestimation of thetrue level of informal employment in South Africa. Furthermore, a new field team wasused for the September 2001 LFS, which may well have resulted in issues of informalemployment not being sufficiently canvassed.
These problems raise the issue of validity and reliability of these surveys and the esti-mates of informal employment in South Africa. While it can be argued that observedgrowth in informal employment over the period 1997–2004 could be a reflection of bothactual growth and improved data collection, it is evident that there are substantial prob-lems with the estimates of informal employment in South Africa and that these datashould be treated with caution. In particular, any policy discussions regarding the effec-tiveness or otherwise of the government’s employment-creation strategies that rely onthese estimates of informal employment, which much of the recent policy debate does,should really be based on more reliable data.
‘Informal sector’: debates about definitions
In the previous section, the suggested reasons for inaccurate measurement of the infor-mal worker are largely technical, including a restrictive survey design that capturesinformation for main job only and an apparent change in sampling frame. In thissection, we shift to conceptualisation of the informal economy, and assess whether thedivide between formal and informal employment is an appropriate demarcation ofemployment characteristics in the South African economy. Can alternative definitionsgive us a better measure of the formal and informal economies? Formal employment isconsidered to be secure, protected by labour legislation, better paid and subject to
D E F I N I T I O N S , D ATA A N D T H E I N F O R M A L E C O N O M Y
309
Free
dow
nloa
d fr
om w
ww
.hsr
cpre
ss.a
c.za
‘normal’ benefits such as annual leave and pension provision. In terms of the ICLS rec-ommendation, formal employment is deemed to be in registered enterprises. Informalemployment, on the other hand, is deemed to be in unregistered enterprises and doesnot enjoy the benefits and security associated with formal employment. Using the enter-prise-based definition as a starting point, this section of the chapter addresses whetheror not this distinction between formal and informal employment can be preciselydefined, and whether StatsSA’s enterprise-based definition of formal and informalemployment is appropriate.
At this point, it is useful to clarify what the informal economy, or the informal sector, iscomposed of. Despite Peattie’s (1987) critique of the term ‘informal sector’ as an ‘utterlyfuzzy’ concept and her suggestion that those interested in policy and analysis of this phe-nomenon should start by abandoning the concept, it continues to be used. Since KeithHart (1973) first coined the phrase ‘informal sector’ in the early 1970s to describe therange of subsistence activities of the urban poor, there has been considerable debateabout what exactly the term refers to. The most quoted definition is that contained inthe International Labour Organisation’s (ILO) Kenya Report (1972: 6) in which infor-mal activities are defined as ‘a way of doing things’, characterised by ‘ease of entry;reliance on indigenous resources; family ownership of enterprises; small scale of opera-tion; labour intensive and adapted technology; skill acquired outside of the formalschool system and unregulated and competitive markets’.
The definition has evolved over the years, as has the character of the phenomenon itaims to describe. Increasingly, informal activities are the result of formal firms ‘infor-malising’. Further, there are supply relations from the formal to the informal. Thesetrends render some of the characteristics identified in the ILO definition nonsensical.Lund and Srinivas (2000: 9) point out that ‘we do not think of formal sector procurersof fruit and vegetables from agribusiness who supply to informal traders as “trading inindigenous resources”’. A machinist doing piecework in the clothing industry is as likelyto have acquired her skills in the formal education system as outside of it.
Castells and Portes (1989: 12) describe the informal economy as a ‘common sense’notion that cannot be captured by a strict definition. Although the main writings on thedefinition of the informal sector differ markedly as to what criteria they use to define the ‘informal sector’, and as to the relative weighting of different criteria, a criterioncommon to all definitions is that these are economic activities that are small-scale andelude certain government requirements or, as Castells and Portes (1989: 12) put it, are‘unregulated by the institutions of society, in a legal and social environment in whichsimilar activities are regulated’. Examples of such requirements are registration, tax andsocial security obligations and health and safety rules.
For our purposes, two important points are worth noting. Firstly, the term ‘informalsector’ disguises a significant degree of heterogeneity. Informal activities encompass dif-ferent types of economic activity (trading, collecting, providing a service and manufac-turing), different employment relations (the self-employed, paid and unpaid workers
T H E D E V E L O P M E N T D E C A D E ? S O U T H A F R I C A , 1 9 9 4 – 2 0 0 4
310
Free
dow
nloa
d fr
om w
ww
.hsr
cpre
ss.a
c.za
and disguised wage workers) and activities with different economic potential (survival-ist activities and successful small enterprises). A second and related problem is the distinction between the formal and informal ‘sectors’ as if there was a clear line dividingthe two. Closer analysis of this phenomenon demonstrates that they are integrallylinked. With the exception of illegal activities, there are few examples of informal operators who are not linked (through either supply or customer networks) into theformal economy. As Peattie (1987: 858) points out, ‘if we think about the world in termsof a formal and informal sector we will be glossing over the linkages which are criticalfor a working policy and which constitute the most difficult elements politically inpolicy development’.
Using the term ‘informal economy’ rather than ‘informal sector’ partially addresses suchconcerns. The word ‘economy’ implies a greater range of activities than ‘sector’. If bothformal and informal activities are seen as part of the economy, we are better able to seethe linkages between the two. Implied in the notion informal is that there is a formal, anorm, against which these other activities can be compared. As with any norm, this willbe time and context specific. With respect to the labour market, Eapen (2001) notes howsome analysts (for example, Papola 1980; Banerjee 1985) have defined informality interms of the absence of characteristics that belong to ‘formal’ activities like security orregularity of work, better earnings, existence of non-wage and long-term benefits,protective legislation and union protection. She goes on to point out that in a situationin which a number of activities within the formal sector are getting ‘informalised’, andprivate, small-scale processing and manufacturing enterprises are growing, the border-line becomes blurred. Considering this issue from another angle, Bromley (1995: 146)asks: ‘If an enterprise is required to have six official permits, for example, but only hasfive, should it be considered informal even when the sixth derives from a moribund reg-ulation that most entrepreneurs ignore?’ He concludes that ‘formality and informalityare really the opposite poles of a continuum with many intermediate and mixed cases’.
The ILO (2002b) has recently proposed a definition of the informal economy that isbased on the employment characteristics of the worker. The 2002 International LabourConference states:
The term ‘informal economy’ refers to all economic activities by workers and eco-nomic units that are – in law or in practice – not covered or insufficiently coveredby formal arrangements. Their activities are not included in the law, which meansthat they are operating outside the formal reach of the law; or they are notcovered in practice, which means that – although they are operating within the formal reach of the law, the law is not applied or not enforced; or the law discourages compliance because it is inappropriate, burdensome, or imposesexcessive costs. (2002b: 5)
The difference between these definitions is captured in Table 15.4. The enterprise-baseddefinition, currently used by StatsSA, is made up of cells 3 and 4 with the enterprisebeing the unit of analysis. In contrast, the new employment-based definition, now
D E F I N I T I O N S , D ATA A N D T H E I N F O R M A L E C O N O M Y
311
Free
dow
nloa
d fr
om w
ww
.hsr
cpre
ss.a
c.za
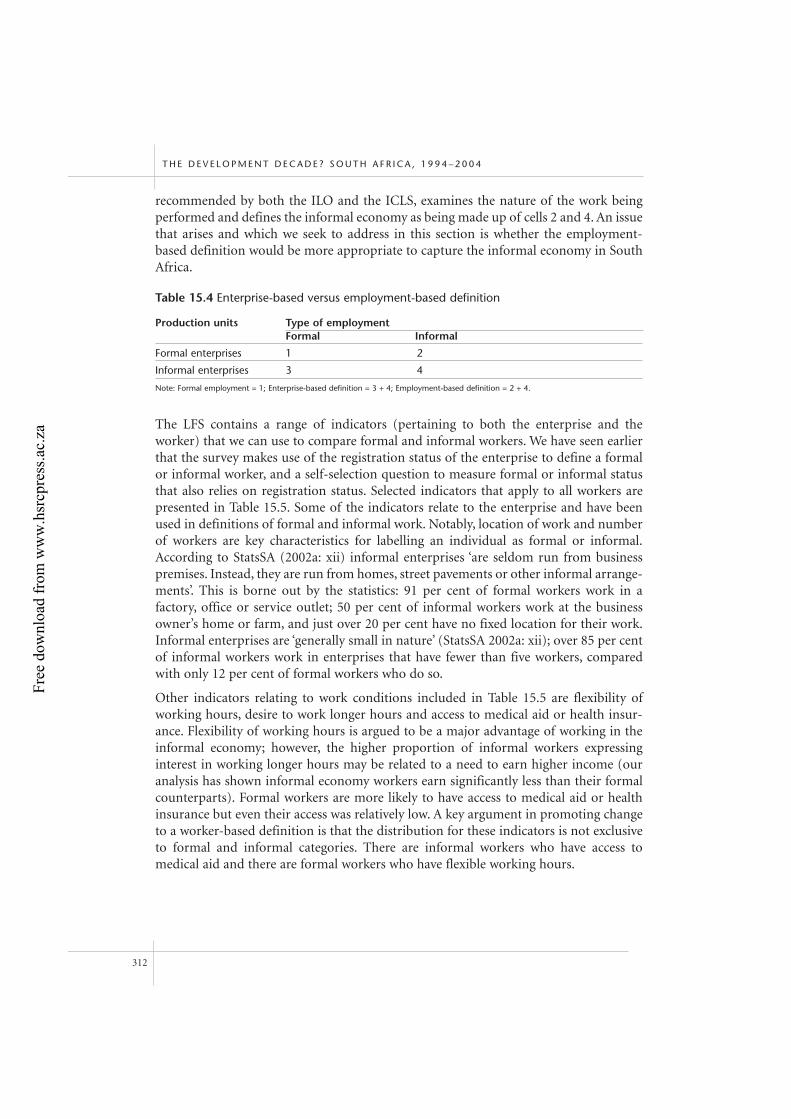
recommended by both the ILO and the ICLS, examines the nature of the work beingperformed and defines the informal economy as being made up of cells 2 and 4. An issuethat arises and which we seek to address in this section is whether the employment-based definition would be more appropriate to capture the informal economy in SouthAfrica.
The LFS contains a range of indicators (pertaining to both the enterprise and theworker) that we can use to compare formal and informal workers. We have seen earlierthat the survey makes use of the registration status of the enterprise to define a formalor informal worker, and a self-selection question to measure formal or informal statusthat also relies on registration status. Selected indicators that apply to all workers arepresented in Table 15.5. Some of the indicators relate to the enterprise and have beenused in definitions of formal and informal work. Notably, location of work and numberof workers are key characteristics for labelling an individual as formal or informal.According to StatsSA (2002a: xii) informal enterprises ‘are seldom run from businesspremises. Instead, they are run from homes, street pavements or other informal arrange-ments’. This is borne out by the statistics: 91 per cent of formal workers work in afactory, office or service outlet; 50 per cent of informal workers work at the businessowner’s home or farm, and just over 20 per cent have no fixed location for their work.Informal enterprises are ‘generally small in nature’ (StatsSA 2002a: xii); over 85 per centof informal workers work in enterprises that have fewer than five workers, comparedwith only 12 per cent of formal workers who do so.
Other indicators relating to work conditions included in Table 15.5 are flexibility ofworking hours, desire to work longer hours and access to medical aid or health insur-ance. Flexibility of working hours is argued to be a major advantage of working in theinformal economy; however, the higher proportion of informal workers expressinginterest in working longer hours may be related to a need to earn higher income (ouranalysis has shown informal economy workers earn significantly less than their formalcounterparts). Formal workers are more likely to have access to medical aid or healthinsurance but even their access was relatively low. A key argument in promoting changeto a worker-based definition is that the distribution for these indicators is not exclusiveto formal and informal categories. There are informal workers who have access tomedical aid and there are formal workers who have flexible working hours.
T H E D E V E L O P M E N T D E C A D E ? S O U T H A F R I C A , 1 9 9 4 – 2 0 0 4
312
Table 15.4 Enterprise-based versus employment-based definition
Production units Type of employmentFormal Informal
Formal enterprises 1 2
Informal enterprises 3 4
Note: Formal employment = 1; Enterprise-based definition = 3 + 4; Employment-based definition = 2 + 4.
Free
dow
nloa
d fr
om w
ww
.hsr
cpre
ss.a
c.za
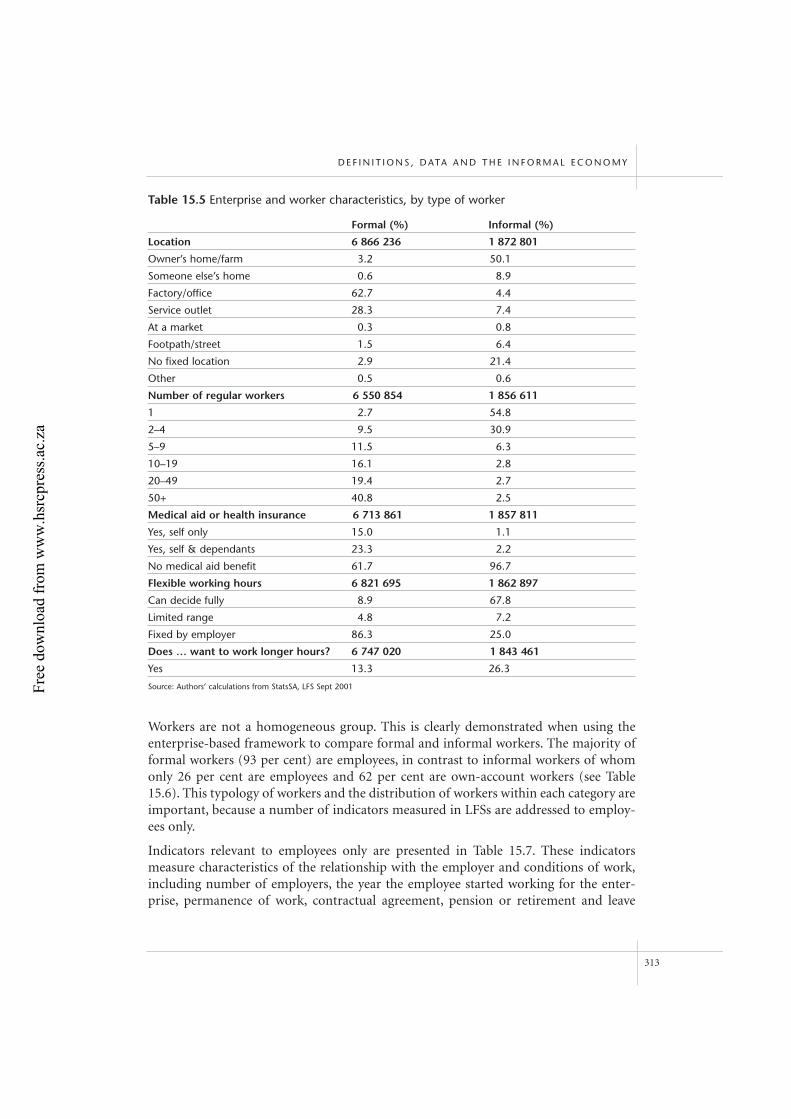
Workers are not a homogeneous group. This is clearly demonstrated when using theenterprise-based framework to compare formal and informal workers. The majority offormal workers (93 per cent) are employees, in contrast to informal workers of whomonly 26 per cent are employees and 62 per cent are own-account workers (see Table15.6). This typology of workers and the distribution of workers within each category areimportant, because a number of indicators measured in LFSs are addressed to employ-ees only.
Indicators relevant to employees only are presented in Table 15.7. These indicatorsmeasure characteristics of the relationship with the employer and conditions of work,including number of employers, the year the employee started working for the enter-prise, permanence of work, contractual agreement, pension or retirement and leave
D E F I N I T I O N S , D ATA A N D T H E I N F O R M A L E C O N O M Y
313
Table 15.5 Enterprise and worker characteristics, by type of worker
Formal (%) Informal (%)
Location 6 866 236 1 872 801
Owner’s home/farm 3.2 50.1
Someone else’s home 0.6 8.9
Factory/office 62.7 4.4
Service outlet 28.3 7.4
At a market 0.3 0.8
Footpath/street 1.5 6.4
No fixed location 2.9 21.4
Other 0.5 0.6
Number of regular workers 6 550 854 1 856 611
1 2.7 54.8
2–4 9.5 30.9
5–9 11.5 6.3
10–19 16.1 2.8
20–49 19.4 2.7
50+ 40.8 2.5
Medical aid or health insurance 6 713 861 1 857 811
Yes, self only 15.0 1.1
Yes, self & dependants 23.3 2.2
No medical aid benefit 61.7 96.7
Flexible working hours 6 821 695 1 862 897
Can decide fully 8.9 67.8
Limited range 4.8 7.2
Fixed by employer 86.3 25.0
Does … want to work longer hours? 6 747 020 1 843 461
Yes 13.3 26.3
Source: Authors’ calculations from StatsSA, LFS Sept 2001Free
dow
nloa
d fr
om w
ww
.hsr
cpre
ss.a
c.za
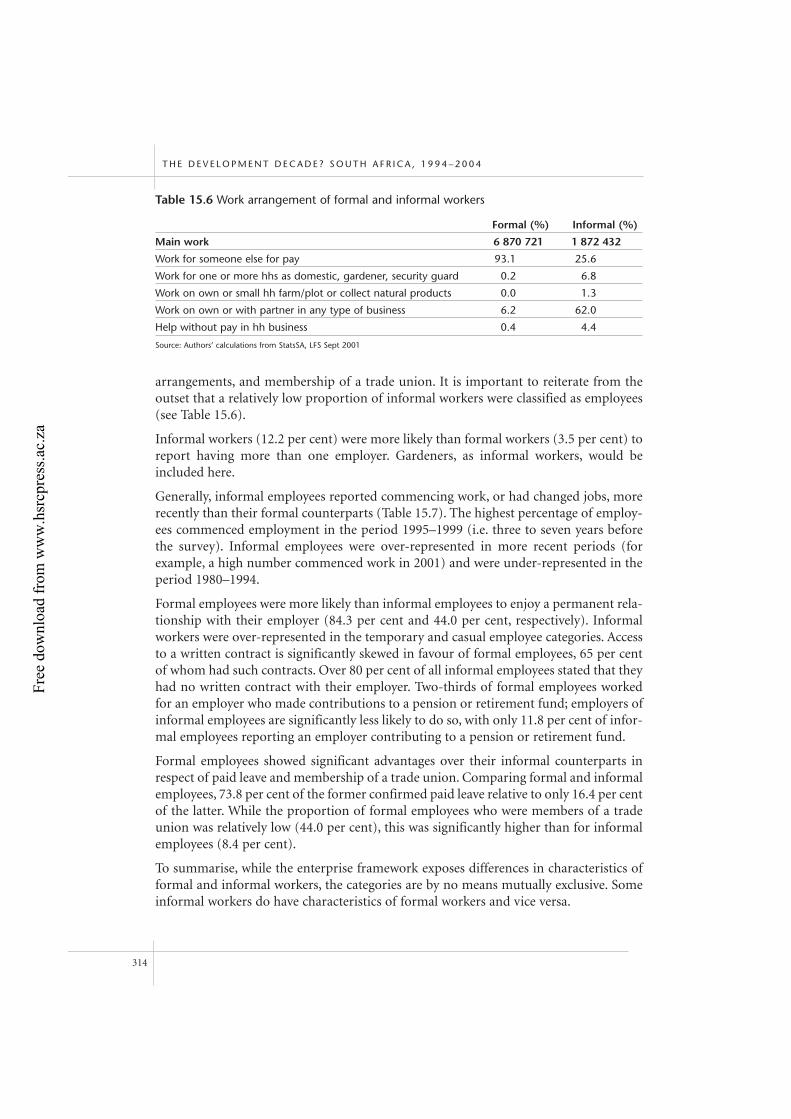
arrangements, and membership of a trade union. It is important to reiterate from theoutset that a relatively low proportion of informal workers were classified as employees(see Table 15.6).
Informal workers (12.2 per cent) were more likely than formal workers (3.5 per cent) toreport having more than one employer. Gardeners, as informal workers, would beincluded here.
Generally, informal employees reported commencing work, or had changed jobs, morerecently than their formal counterparts (Table 15.7). The highest percentage of employ-ees commenced employment in the period 1995–1999 (i.e. three to seven years beforethe survey). Informal employees were over-represented in more recent periods (forexample, a high number commenced work in 2001) and were under-represented in theperiod 1980–1994.
Formal employees were more likely than informal employees to enjoy a permanent rela-tionship with their employer (84.3 per cent and 44.0 per cent, respectively). Informalworkers were over-represented in the temporary and casual employee categories. Accessto a written contract is significantly skewed in favour of formal employees, 65 per centof whom had such contracts. Over 80 per cent of all informal employees stated that theyhad no written contract with their employer. Two-thirds of formal employees workedfor an employer who made contributions to a pension or retirement fund; employers ofinformal employees are significantly less likely to do so, with only 11.8 per cent of infor-mal employees reporting an employer contributing to a pension or retirement fund.
Formal employees showed significant advantages over their informal counterparts inrespect of paid leave and membership of a trade union. Comparing formal and informalemployees, 73.8 per cent of the former confirmed paid leave relative to only 16.4 per centof the latter. While the proportion of formal employees who were members of a tradeunion was relatively low (44.0 per cent), this was significantly higher than for informalemployees (8.4 per cent).
To summarise, while the enterprise framework exposes differences in characteristics offormal and informal workers, the categories are by no means mutually exclusive. Someinformal workers do have characteristics of formal workers and vice versa.
T H E D E V E L O P M E N T D E C A D E ? S O U T H A F R I C A , 1 9 9 4 – 2 0 0 4
314
Table 15.6 Work arrangement of formal and informal workers
Formal (%) Informal (%)
Main work 6 870 721 1 872 432
Work for someone else for pay 93.1 25.6
Work for one or more hhs as domestic, gardener, security guard 0.2 6.8
Work on own or small hh farm/plot or collect natural products 0.0 1.3
Work on own or with partner in any type of business 6.2 62.0
Help without pay in hh business 0.4 4.4
Source: Authors’ calculations from StatsSA, LFS Sept 2001
Free
dow
nloa
d fr
om w
ww
.hsr
cpre
ss.a
c.za
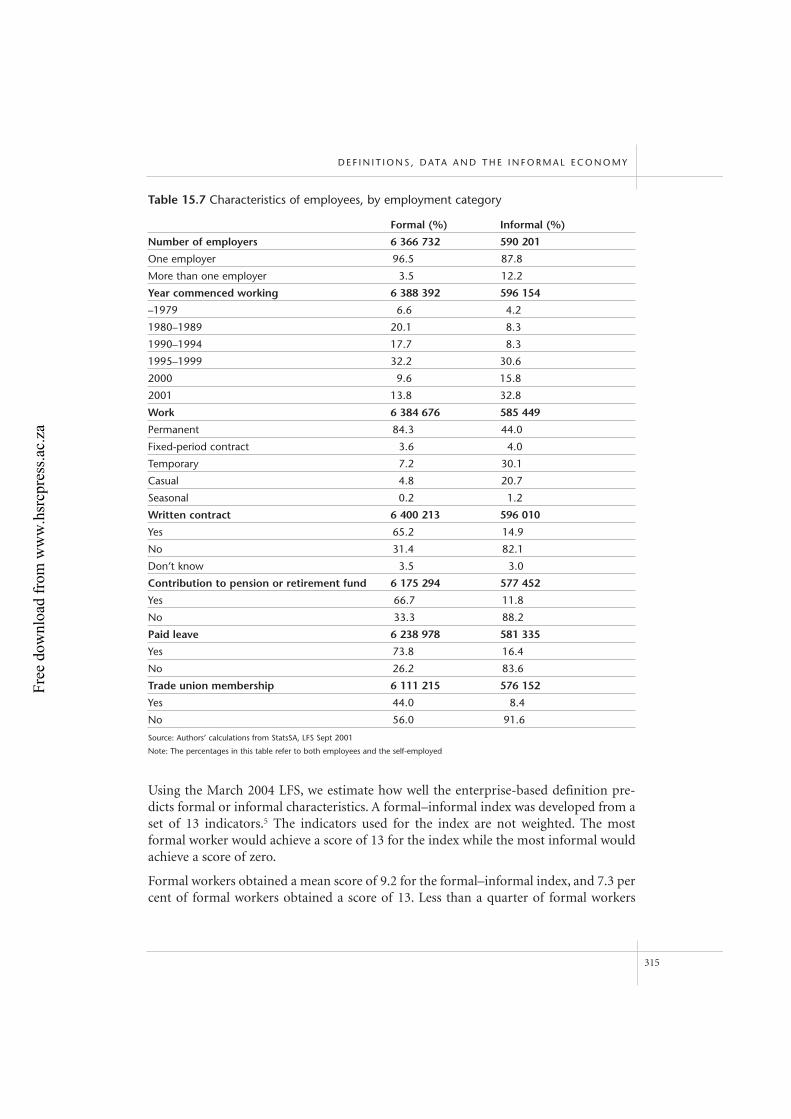
Using the March 2004 LFS, we estimate how well the enterprise-based definition pre-dicts formal or informal characteristics. A formal–informal index was developed from aset of 13 indicators.5 The indicators used for the index are not weighted. The mostformal worker would achieve a score of 13 for the index while the most informal wouldachieve a score of zero.
Formal workers obtained a mean score of 9.2 for the formal–informal index, and 7.3 percent of formal workers obtained a score of 13. Less than a quarter of formal workers
D E F I N I T I O N S , D ATA A N D T H E I N F O R M A L E C O N O M Y
315
Table 15.7 Characteristics of employees, by employment category
Formal (%) Informal (%)
Number of employers 6 366 732 590 201
One employer 96.5 87.8
More than one employer 3.5 12.2
Year commenced working 6 388 392 596 154
–1979 6.6 4.2
1980–1989 20.1 8.3
1990–1994 17.7 8.3
1995–1999 32.2 30.6
2000 9.6 15.8
2001 13.8 32.8
Work 6 384 676 585 449
Permanent 84.3 44.0
Fixed-period contract 3.6 4.0
Temporary 7.2 30.1
Casual 4.8 20.7
Seasonal 0.2 1.2
Written contract 6 400 213 596 010
Yes 65.2 14.9
No 31.4 82.1
Don’t know 3.5 3.0
Contribution to pension or retirement fund 6 175 294 577 452
Yes 66.7 11.8
No 33.3 88.2
Paid leave 6 238 978 581 335
Yes 73.8 16.4
No 26.2 83.6
Trade union membership 6 111 215 576 152
Yes 44.0 8.4
No 56.0 91.6
Source: Authors’ calculations from StatsSA, LFS Sept 2001
Note: The percentages in this table refer to both employees and the self-employed
Free
dow
nloa
d fr
om w
ww
.hsr
cpre
ss.a
c.za
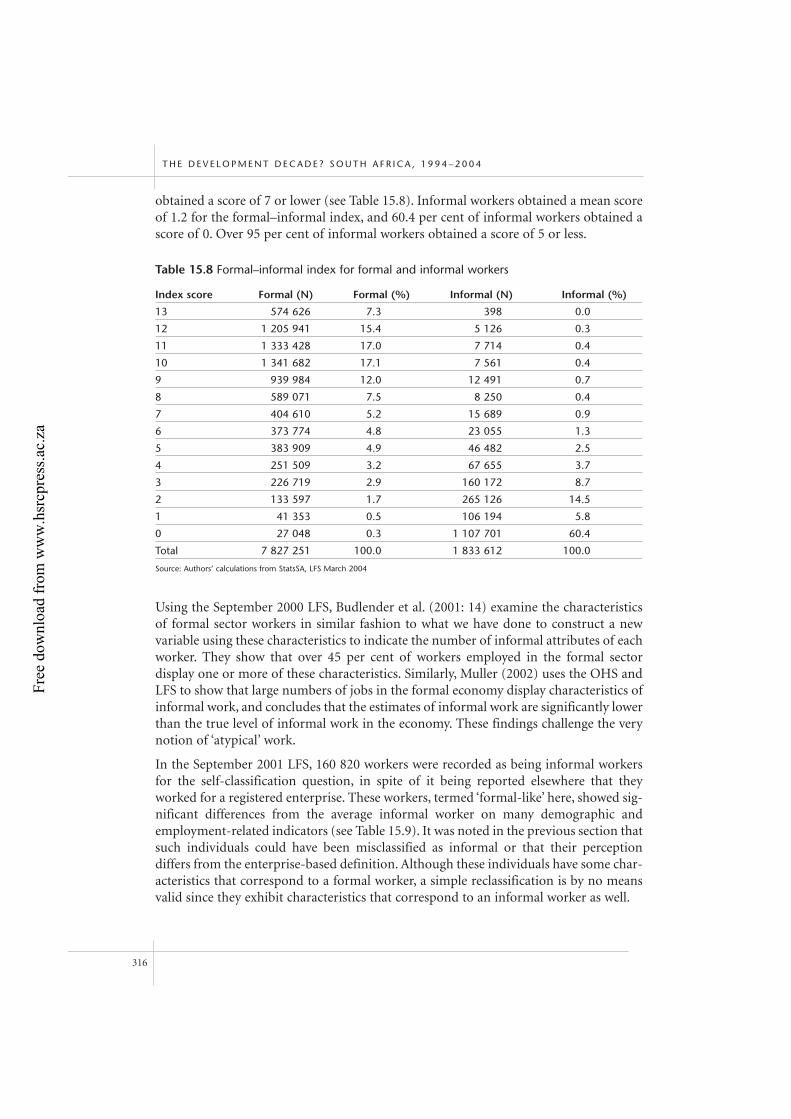
obtained a score of 7 or lower (see Table 15.8). Informal workers obtained a mean scoreof 1.2 for the formal–informal index, and 60.4 per cent of informal workers obtained ascore of 0. Over 95 per cent of informal workers obtained a score of 5 or less.
Using the September 2000 LFS, Budlender et al. (2001: 14) examine the characteristicsof formal sector workers in similar fashion to what we have done to construct a newvariable using these characteristics to indicate the number of informal attributes of eachworker. They show that over 45 per cent of workers employed in the formal sectordisplay one or more of these characteristics. Similarly, Muller (2002) uses the OHS andLFS to show that large numbers of jobs in the formal economy display characteristics ofinformal work, and concludes that the estimates of informal work are significantly lowerthan the true level of informal work in the economy. These findings challenge the verynotion of ‘atypical’ work.
In the September 2001 LFS, 160 820 workers were recorded as being informal workersfor the self-classification question, in spite of it being reported elsewhere that theyworked for a registered enterprise. These workers, termed ‘formal-like’ here, showed sig-nificant differences from the average informal worker on many demographic andemployment-related indicators (see Table 15.9). It was noted in the previous section thatsuch individuals could have been misclassified as informal or that their perceptiondiffers from the enterprise-based definition. Although these individuals have some char-acteristics that correspond to a formal worker, a simple reclassification is by no meansvalid since they exhibit characteristics that correspond to an informal worker as well.
T H E D E V E L O P M E N T D E C A D E ? S O U T H A F R I C A , 1 9 9 4 – 2 0 0 4
316
Table 15.8 Formal–informal index for formal and informal workers
Index score Formal (N) Formal (%) Informal (N) Informal (%)
13 574 626 7.3 398 0.0
12 1 205 941 15.4 5 126 0.3
11 1 333 428 17.0 7 714 0.4
10 1 341 682 17.1 7 561 0.4
9 939 984 12.0 12 491 0.7
8 589 071 7.5 8 250 0.4
7 404 610 5.2 15 689 0.9
6 373 774 4.8 23 055 1.3
5 383 909 4.9 46 482 2.5
4 251 509 3.2 67 655 3.7
3 226 719 2.9 160 172 8.7
2 133 597 1.7 265 126 14.5
1 41 353 0.5 106 194 5.8
0 27 048 0.3 1 107 701 60.4
Total 7 827 251 100.0 1 833 612 100.0
Source: Authors’ calculations from StatsSA, LFS March 2004
Free
dow
nloa
d fr
om w
ww
.hsr
cpre
ss.a
c.za
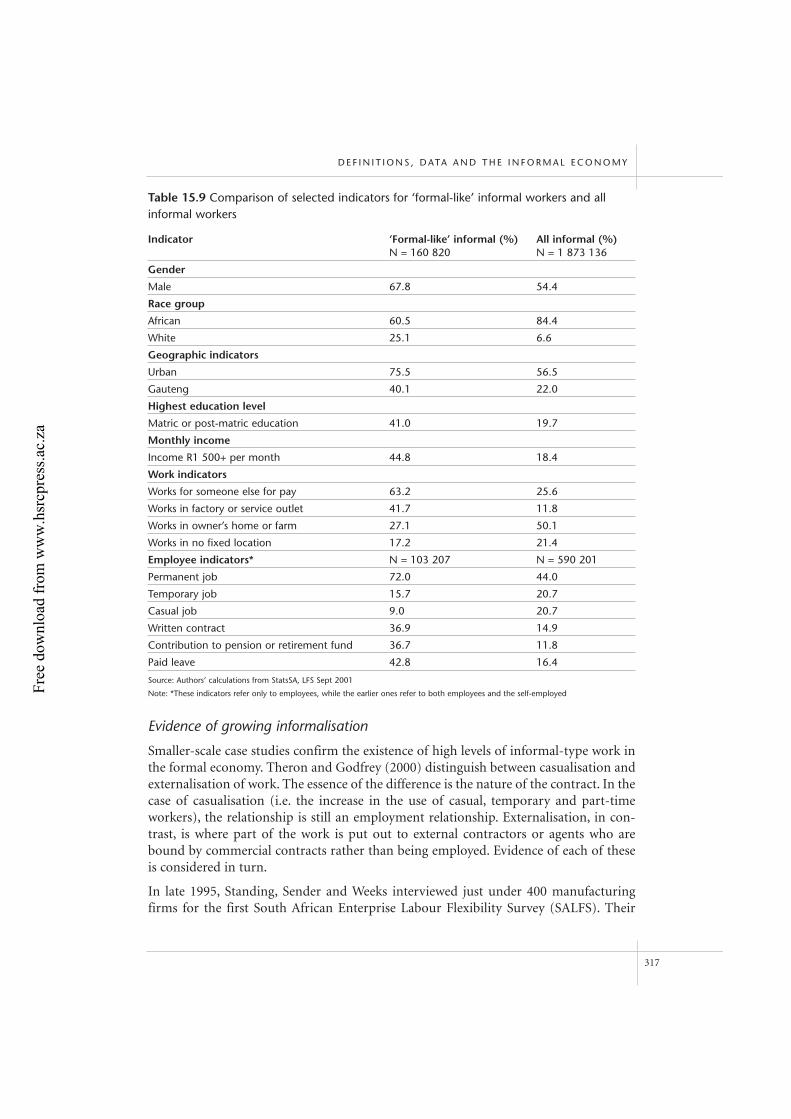
Evidence of growing informalisation
Smaller-scale case studies confirm the existence of high levels of informal-type work inthe formal economy. Theron and Godfrey (2000) distinguish between casualisation andexternalisation of work. The essence of the difference is the nature of the contract. In thecase of casualisation (i.e. the increase in the use of casual, temporary and part-timeworkers), the relationship is still an employment relationship. Externalisation, in con-trast, is where part of the work is put out to external contractors or agents who arebound by commercial contracts rather than being employed. Evidence of each of theseis considered in turn.
In late 1995, Standing, Sender and Weeks interviewed just under 400 manufacturingfirms for the first South African Enterprise Labour Flexibility Survey (SALFS). Their
D E F I N I T I O N S , D ATA A N D T H E I N F O R M A L E C O N O M Y
317
Table 15.9 Comparison of selected indicators for ‘formal-like’ informal workers and allinformal workers
Indicator ‘Formal-like’ informal (%) All informal (%)N = 160 820 N = 1 873 136
Gender
Male 67.8 54.4
Race group
African 60.5 84.4
White 25.1 6.6
Geographic indicators
Urban 75.5 56.5
Gauteng 40.1 22.0
Highest education level
Matric or post-matric education 41.0 19.7
Monthly income
Income R1 500+ per month 44.8 18.4
Work indicators
Works for someone else for pay 63.2 25.6
Works in factory or service outlet 41.7 11.8
Works in owner’s home or farm 27.1 50.1
Works in no fixed location 17.2 21.4
Employee indicators* N = 103 207 N = 590 201
Permanent job 72.0 44.0
Temporary job 15.7 20.7
Casual job 9.0 20.7
Written contract 36.9 14.9
Contribution to pension or retirement fund 36.7 11.8
Paid leave 42.8 16.4
Source: Authors’ calculations from StatsSA, LFS Sept 2001
Note: *These indicators refer only to employees, while the earlier ones refer to both employees and the self-employedFree
dow
nloa
d fr
om w
ww
.hsr
cpre
ss.a
c.za
report (1996: 330) noted that the firms came disproportionately from the upper end ofthe industrial sector, a segment of the sector they argued that is likely to be relativelygood in terms of their employment and labour practices. In the survey, about a quarter(26.8 per cent) of firms reported that they used part-time workers, and 82.5 per cent ofall firms had employed temporary or casual labour in the recent past.
Labour force statistics largely do not capture trends in externalisation of work. Othermeans of assessing prevalence and quantifying changes have to be used. Data can be gath-ered either from firms or at an industry level to assess the demand for intermediaries(labour brokers and employment agencies), and/or the number and size of intermedi-aries can be assessed in terms of the supply of their services. With respect to demand forlabour intermediaries, Standing et al. (1996) note that there is an increase in externalisa-tion of work both in sectors that traditionally have used contract labour and in those thattraditionally have not. Mines, for example, have for many years used contract workers forcertain specialist tasks. In the 1980s and 1990s, mines not only contracted out all theirnon-core tasks (catering, ground maintenance, office cleaning) but also started usingcontract workers for core mining activities. In gold mining, contract employees consti-tuted 3 per cent of the workforce in 1987. By 1994, this had risen to 10 per cent. In coalmining, 5 per cent of the workforce were contract employees, and by 1994 they accountedfor 16 per cent of the workforce (Standing et al. 1996: 302). The use of labour brokers hasproliferated in recent years (Stratton 1997; Hemson 2002). In her analysis of the retailsector, Kenny (2000: 3) not only demonstrates that casual and subcontracted labour con-stitutes up to 65 per cent of total employment, but highlights how core tasks like shelfpacking are increasingly done by employees of labour brokers, contracted by suppliers.
A sector that traditionally did not externalise work is manufacturing. The SALFS foundthat 45.4 per cent of firms used contract labour (Standing et al. 1996: 343). These trendsare confirmed in Theron and Godfrey’s (2000) more qualitative study, in which inter-views were conducted with key informants in retail, mining, manufacturing, cateringand accommodation, construction and transport. Almost all informants reported anincrease in the use of labour brokers and employment agencies (Theron & Godfrey2000).
There is less information on the supply side of these part-time, flexible and contractlabour markets. Naidoo (1994) found that there were 1 200 labour brokers registeredwith the Department of Labour, 800 of which were operational. The author estimatedthat there were a further 2 000 unregistered labour brokers. Rees (1997: 31) morerecently noted that the majority of brokers are not registered, but estimated thatbetween 3 000 and 5 000 brokers supply 100 000 to 120 000 temporary workers to companies in South Africa. In the iron and steel sector alone, there are 600 brokers sup-plying between 30 000 and 60 000 workers. Theron and Godfrey (2000) also state thatthere is clearly an increase in the number and size of intermediaries such as employmentagencies and labour brokers. They give the example of Privest Outsourcing, which in thespace of nine years has grown to be a listed company operating nationally. The growthin labour brokering is an issue where further analysis is necessary.
T H E D E V E L O P M E N T D E C A D E ? S O U T H A F R I C A , 1 9 9 4 – 2 0 0 4
318
Free
dow
nloa
d fr
om w
ww
.hsr
cpre
ss.a
c.za
Another form of externalisation is the process of setting up independent contractors.The dependence or independence of these contractors varies. On one end of the spec-trum, a system of independent contracting can be set up simply to avoid labour legisla-tion, with there being no substantive change in the employment relationship. Thecontractor is still completely dependent on the ‘employer’ who then does not have to payany benefits. On the other end of the spectrum are those contractors who genuinelyestablish small businesses. They may start with only one source of work but then expandto service a number of different clients.
Once again, it is very difficult to assess these trends through national labour force sta-tistics or even through sector analyses. Case study material, however, demonstrates thatsubcontracting relationships are on the increase. Skinner and Valodia’s (2001) analysisof the Confederation of Employers of South Africa (Cofesa), a labour consultancy thatassists companies to restructure their workforce, to change from employees to contrac-tors and to outsource production to them, is a case in point. Companies restructure theirworkforce into a system of independent contractors, thereby bypassing provisions of theLabour Relations Act. Cofesa firms no longer have to adhere to collective agreements onminimum wages or contribute to any of the benefit or training schemes. In the work-place, other than changes in labour conditions, everything else remains the same.Skinner and Valodia (2001) demonstrate how, in recent years, Cofesa has experienceddramatic growth. By the end of 2000, they estimated that this had resulted in the estab-lishment of over 700 000 independent contractors. Cofesa members are involved inmany different sectors.
A system of establishing independent contractors has been used in agriculture for manyyears. The Centre for African Research and Transformation (CART 2000) outlines howall the large forestry companies (Mondi, Safcol and Sappi) now hire contractors to carryout planting, tending and silvicultural operations. CART estimates that the outsourcingof forestry activities has created an industry with an annual turnover of R600 millionand 35 000 employees. A similar system operates in the sugar industry.
Standing et al. (1996: 345) conclude: ‘In sum, South African industry has resorted fairlyextensively to external flexibility, and there is clearly no strong barrier to doing so.’
Conclusion
Given the size and growing importance of the informal economy, it is important tomeasure it accurately. Accurate measurement will facilitate improved predictions andmodelling of economic performance and market behaviour (ILO 2002a: 13). It is in theinterests of numerous role-players to obtain accurate measurement of the informaleconomy. Governments would benefit from more accurate economic indicators, labourorganisations such as the ILO would obtain a solid grounding for policy development,and organisations representing workers would have empirical data to expose andcounter exclusion, exploitation and market biases.
D E F I N I T I O N S , D ATA A N D T H E I N F O R M A L E C O N O M Y
319
Free
dow
nloa
d fr
om w
ww
.hsr
cpre
ss.a
c.za
Our analysis in this chapter points to two important conclusions. First, the estimates ofinformal employment in South Africa, and hence of total employment, are variable andunreliable. Ideally, any policy discussions based on these data should come with thehealth warning: ‘The total number of workers in the informal economy cannot be pre-cisely determined.’ Second, some workers classified in the informal economy displaycharacteristics of work that are considered to be formal, and large numbers of workersclassified in the formal economy display characteristics of work commonly associatedwith informal work. Thus, South Africa should consider adopting a work characteris-tics-based definition of informal work.
Acknowledgements
The authors acknowledge the kind permission of StatsSA to use data from the October Household
and Labour Force Surveys. The results presented in the chapter are based on the authors’ own data
computations. Views expressed are the authors’ own and should not be attributed to StatsSA.
Notes
1 Unfortunately we cannot reflect on a full ten-year period, as the informal economy cannot be
measured accurately from StatsSA’s 1995 and 1996 OHS (for details, see Budlender &
Hirschowitz 2000).
2 In the reported statistics on the labour market in South Africa, StatsSA uses two categories of
formal worker and three categories of informal worker. Formal workers are either formal or
commercial agricultural workers. Informal workers are informal, subsistence agriculture and
domestic workers. The justification for treating agricultural workers (commercial and
subsistence) as separate categories is that agriculture represents primary production. Domestic
workers represent a large, unique group within the informal economy. The South African
government has introduced legislation to improve the working conditions of domestic workers.
The legislation requires the employer to register the domestic worker for unemployment
insurance. A written contract between employer and employee and a minimum wage are also
required. These contractual changes would give the domestic worker a more formal status;
however, establishing what proportion of domestic workers have been registered and whether
employers are recognising written contracts and minimum wages is beyond the scope of this
chapter. All statistics reported in the chapter exclude agricultural activities (both commercial
and subsistence) and domestic workers, except for Table 15.1 and Figure 15.1.
3 See Aliber (2003) for an analysis of employment trends in subsistence agriculture.
4 The self-selection question reads: ‘Is the organisation/business/enterprise/branch where …
works’, with responses 1 = In the formal sector; 2 = In the informal sector (including domestic
work); and 3 = Don’t know. Information for the fieldworker includes: ‘Formal sector
employment is where the employer (institution, business or private individual) is registered to
perform the activity. Informal sector employment is where the employer is not registered’
(StatsSA 2001d).
T H E D E V E L O P M E N T D E C A D E ? S O U T H A F R I C A , 1 9 9 4 – 2 0 0 4
320
Free
dow
nloa
d fr
om w
ww
.hsr
cpre
ss.a
c.za
5 The indicators were: permanence of work (permanent = 1, fixed contract, temporary, casual,
seasonal = 0); written contract (yes = 1, no = 0); employer contributes to pension or retirement
fund (yes = 1, no = 0); paid leave (yes = 1, no = 0); membership of trade union (yes = 1;
no = 0); number of regular workers in enterprise (50 or more = 1, 1–49 = 0); works for a
registered company or close corporation (yes = 1, no = 0); employer makes UIF deductions
(yes = 1, no = 0); employer makes medical aid or health insurance payments (yes = 1, no = 0);
enterprise is registered to pay VAT (yes = 1, no = 0); location of work (factory, office, service
outlet = 1, own home or farm, market, footpath, street, no fixed location = 2); number of
employers (1 or more = 1, other = 0); who pays wage (employer, labour broker, agency = 1,
other = 0).
References
Aliber M (2003) Small-scale agriculture as revealed by the Labour Force Survey. Unpublished
mimeograph, Human Sciences Research Council.
Banerjee N (1985) Women workers in the unorganised sector. Hyderabad: Sangam Books.
Bromley R (1978) Introduction – The urban informal sector: Why is it worth discussing?
World Development 6: 1033–9.
Bromley R (1995) Informality, de Soto style: From concept to policy, in C Rakowski (ed.)
Contrapunto: The informal sector debate in Latin America. Albany: State University Press
of New York.
Budlender D, Buwembo P & Shabalala N (2001) The informal economy: Statistical data and research
findings. Country case study: South Africa. Document prepared for Women in Informal
Employment: Globalising and Organising (WIEGO).
Budlender D & Hirschowitz R (2000) Household surveys in post-apartheid South Africa.
Paper presented at the Commonwealth Conference of Statisticians, Botswana.
CART (2000) Forestry contracting in South Africa. Paper produced for CSIR Forestry Enterprise
Development Office, Centre for African Research and Transformation.
Castells M & Portes A (1989) World underneath: The origins, dynamics, and effects of the informal
economy, in A Portes, M Castells & L Benton (eds.) The informal economy. Baltimore:
Johns Hopkins University Press.
Charmes J (2000) Size, trends and productivity of women’s work in the informal sector and in old
and new forms of informal employment. An outlook of recent empirical evidence. Paper
presented at the International Association for Feminist Economics, Istanbul, August.
Eapen M (2001) Women in informal sector in Kerala: Need for re-examination, Economic and
Political Weekly, 30 June.
Hart K (1973) Informal income opportunities and urban employment in Ghana, Journal of Modern
African Studies 11: 61–89.
Hemson D (2002) Breaking the impasse, beginning the change: Labour market, unions and social
initiative in Durban, in B Freund & V Padayachee (eds.) D(urban) vortex. South African city in
transition. Pietermaritzburg: University of Natal Press.
D E F I N I T I O N S , D ATA A N D T H E I N F O R M A L E C O N O M Y
321
Free
dow
nloa
d fr
om w
ww
.hsr
cpre
ss.a
c.za
ILO (1972) Employment, incomes and equality: A strategy for increasing productive employment in
Kenya. Geneva: International Labour Office.
ILO (2002a) Women and men in the informal economy: A statistical picture. Geneva: International
Labour Office.
ILO (2002b) Resolution concerning decent work and the informal economy. Adopted by the
International Labour Conference at its 90th Session, June.
Kenny B (2000) ‘We are nursing these jobs’: The implications of labour market flexibility on East
Rand retail sector workers and their households. Paper presented at the Annual Conference of
the Sociological Association, Cape Town, July.
Lund F (1998) Women street traders in urban South Africa: A synthesis of selected research findings.
CSDS Research Report No. 15. Durban: School of Development Studies, University of Natal.
Lund F & Srinivas S (2000) Learning from experience: A gendered approach to social protection for
workers in the informal economy. Geneva: International Labour Organisation.
Muller C (2002) Measuring South Africa’s informal sector: An analysis of national household
surveys. Paper presented at the DPRU Conference on Labour Markets and Poverty in South
Africa, Glenburn Lodge, Johannesburg, October.
Naidoo R (1994) Labour brokers: Issues and options. Johannesburg: National Labour and Economic
Development Institute.
Papola T (1980) Informal sector: Concept and policy, Economic and Political Weekly, 3 May.
Peattie L (1987) An idea in good currency and how it grew: The informal sector, World Development
15: 851–60.
Rees R (1997) Flexible labour: Meeting the challenge, SA Labour Bulletin 21: 30–6.
Skinner C & Valodia I (2001) Labour market policy, flexibility, and the future of labour relations:
The case of clothing, Transformation 50: 56–76.
Standing G, Sender J & Weeks J (1996) Restructuring the labour market: The South African challenge.
Geneva: International Labour Organisation.
StatsSA (1998) October Household Survey 1998. Questionnaire. Pretoria: Statistics South Africa.
StatsSA (1999) October Household Survey 1996. Statistical release P0317. Pretoria: Statistics South
Africa
StatsSA (2000a) October Household Survey 1998. Statistical release P0317. Pretoria: Statistics South
Africa
StatsSA (2000b) October Household Survey 1999. Statistical release P0317. Pretoria: Statistics South
Africa
StatsSA (2001a) Labour Force Survey: September 2000. Discussion paper one, Comparative labour
statistics, Labour Force Survey: First round pilot, September 2000.
StatsSA (2001b) Labour Force Survey: February 2001. Statistical Release P0210. Pretoria: Statistics
South Africa.
T H E D E V E L O P M E N T D E C A D E ? S O U T H A F R I C A , 1 9 9 4 – 2 0 0 4
322
Free
dow
nloa
d fr
om w
ww
.hsr
cpre
ss.a
c.za
StatsSA (2001c) September 2001 Labour Force Survey. Metadata. Pretoria: Statistics South Africa.
StatsSA (2001d) September 2001 Labour Force Survey. Questionnaire. Pretoria: Statistics South Africa.
StatsSA (2002a) Labour Force Survey: September 2001. Statistical release P0210. Pretoria: Statistics
South Africa.
StatsSA (2002b) Labour Force Survey: February 2002. Statistical release P0210. Pretoria: Statistics
South Africa.
StatsSA (2004) Labour Force Survey: March 2004. Statistical release P0210. Pretoria: Statistics South
Africa.
Stratton S (1997) Regulating casualisation: The Dock Labour Scheme, SA Labour Bulletin 21: 61–4.
Swaminathan M (1991) Understanding the informal sector: A survey. WIDER Working Paper 95.
Massachusetts: Centre for International Studies, M.I.T.
Theron J & Godfrey S (2000) Protecting workers on the periphery. Development and Labour
Monologues I, Institute of Development and Labour Law, University of Cape Town.
D E F I N I T I O N S , D ATA A N D T H E I N F O R M A L E C O N O M Y
323
Free
dow
nloa
d fr
om w
ww
.hsr
cpre
ss.a
c.za

Free
dow
nloa
d fr
om w
ww
.hsr
cpre
ss.a
c.za
Section 7Population, health and development
325
Free
dow
nloa
d fr
om w
ww
.hsr
cpre
ss.a
c.za

Free
dow
nloa
d fr
om w
ww
.hsr
cpre
ss.a
c.za
16Coping with illnesses and deaths in post-apartheid South Africa: family perspectives
Akim Mturi, Thokozani Xaba, Dorothy Sekokotla and Nompumelelo Nzimande
Introduction
Illnesses and deaths are events that families have had to cope with since the forma-tion of the family as a unit; however, these events remain difficult to deal with as theytend to affect the core of the functioning of the family. Sociological models of familyoperation introduced by Parsons (1949) and economic models such as Becker’s(1981) have described the family as functioning like an institution. As with othersocial institutions, each family member has a role to play in the optimal functioningof this institution. These roles are often not easily replaceable and losing one memberdisturbs the equilibrium. Furthermore, an ill member of the family who is unable toperform his or her roles and duties affects the operation of the family, and someoneelse has to perform those duties. Death has a similar effect families, only there is theadded loss that is often psychologically challenging to overcome. Models of familyformation and operation do not elaborate on how families cope with such events,probably because, in the past, terminal illnesses and deaths happened mostly in oldage.
Coping with illness and death may involve several adjustments within the family unit. Ifa deceased member of the family was not a key financial provider, his or her death willmostly affect the family emotionally. However, if an individual who is ill is a key con-tributor to the material functioning of the family, then the family financial pool suffers,even more so if the individual requires care. In the absence of family members who canprovide care, the family has to purchase care – the use of the extended family for thispurpose has been shown to be lessening because of the overburden of care due toHIV/AIDS (Baier 1997). The same scenario holds for death. However, in the absence ofa life-threatening or incapacitating epidemic, illnesses and deaths usually occur amongolder people. In this case, the family has to provide care for the ill elderly person. Socialstructures have made some provisions to accommodate this through old-age homes incases where the family is unable to care for their elderly family member. Furthermore,the death of an elderly person is often expected, and families tend to have some form offuneral cover to finance the funeral service. Such arrangements are often not made foryoung adults, since death is less expected. This makes coping with the illness or death ofa younger person more difficult.
327
Free
dow
nloa
d fr
om w
ww
.hsr
cpre
ss.a
c.za
Diseases that incapacitate a person tend to have both of the effects mentioned earlier onthe family. Included here are individuals disabled by accidents or diseases in theiradvanced stages, such as amputations due to diabetes or cancer in a developed stage.Individuals with AIDS also fall into this category, although here the effect is most pro-foundly felt since the disease affects the younger population in the economically activeages. HIV/AIDS poses the additional challenge of a sick person in advanced stages of thedisease requiring constant care and support. This creates a burden on the family, whichincludes losing an economically viable person, having to arrange a carer for the ill familymember, and having the psychological burden of knowing that the person will eventu-ally die due to the disease.
The question this chapter aims to address is how families cope with illness and deathboth financially and otherwise. Families that are economically challenged, with minimalresources to care for ill members, also tend to have less access to medical care, and donot have adequate resources to afford a funeral service for their deceased loved ones. ForHIV/AIDS and other related diseases that affect the economically active population,these family members are more likely to be the main contributors to the pool ofresources in the family. These events have a ‘period effect’ on a family, since the familyhas to cope with loss of capital from the removal, through illness or death, of a youngermember, but the family also carries this effect for some time after the death, since thefamily will be in an economically compromised position after losing a member whocontributes or has the potential to contribute to the resource pool.
The chapter deals with how people cope with illness and death in three provinces ofSouth Africa (KwaZulu-Natal, the Eastern Cape and Limpopo), and reports on findingsof a study that reviews people’s opinions on how the South African health system oper-ates and the gaps observed.1 It is important to consider what achievements have beenmade in the last decade and what areas still need to be addressed. The next section considers the major health problems that face the South African population. This is followed by a brief presentation on a family structures research project before discussingits findings.
The chapter intentionally does not engage in a full discussion on the effect of theHIV/AIDS epidemic, because this is covered in other chapters in this volume, but it isnecessary to note that coping with illnesses and deaths is worsened by the epidemic.More family members are ill and the death rate is now much higher. Unfortunately, it isthe reproductive ages, which are also the active ages in the labour market, that are mostaffected.
Major health problems in South Africa
Overview
According to Bradshaw and Nannan (2004) there has been a rapid decline in the SouthAfrican population’s health in the last decade. This decline is evidenced by a decreasing
T H E D E V E L O P M E N T D E C A D E ? S O U T H A F R I C A , 1 9 9 4 – 2 0 0 4
328
Free
dow
nloa
d fr
om w
ww
.hsr
cpre
ss.a
c.za
life expectancy as a result of the rapid spread of HIV/AIDS. A quadruple burden (char-acterised by poverty-related conditions, emerging chronic diseases of lifestyle, theimpact of HIV/AIDS, and high rates of injury) was demonstrated by the Burden ofDisease study (Bradshaw, Schneider, Laubscher & Nojilana 2002). Therefore, it becomesnecessary to tackle multiple burdens simultaneously. These include the high injuryburden, the unfinished agenda of poverty-related illness, which remains an issue,the substantive burden due to emerging chronic diseases, as well as the HIV/AIDS epidemic, which has fuelled the TB epidemic and has also resulted in increased deathsdue to pneumonia and diarrhoea. Thus, the complex pattern of disease in South Africaplaces high demands on health services that are undergoing transformation in the faceof shrinking budgets and other infrastructure development demands.
Symptoms of a population acquiring an unhealthy pattern of living is an increase inhabits being acquired at a very early age, including smoking tobacco, consuming atypical Western diet and following a sedentary lifestyle. These risky behaviours result inthe emergence of a range of risk factors, including tobacco addiction, and being hyper-tensive, diabetic or obese. The presence of these risk factors over many decades leads toever-increasing numbers of patients presenting with chronic diseases of lifestyle such asheart attacks, strokes, smoking-related diseases and other conditions. Bradshaw, Bourne,Schneider and Sayed (1999) posited that in developing countries the rise of chronic diseases such as heart disease, strokes and cancer were seen as more advanced causes ofdeath and disability than infectious diseases and malnutrition.
The World Health Organisation (WHO 2003) has suggested that the burden of chronicdiseases is increasing rapidly worldwide. It has been reported that almost half of thedeaths due to chronic disease are attributable to cardiovascular diseases, while obesityand diabetes are also worrying because they have started to appear among youngerpeople. Risk behaviours such as patterns of modern dietary and physical activity travelacross countries and are transferable from one population to another. For many years,diet was known to be a key risk factor for chronic diseases but now physical inactivity isalso recognised as an increasingly important determinant of health, mainly due to pro-gressive shifts of lifestyle towards more sedentary patterns, especially in developingcountries. Thus, it is likely that a combination of these and other risk factors such as theuse of tobacco will have a multiplier effect that is capable of accelerating the pace atwhich chronic disease emerges. The increasing burden of chronic diseases in turn createsa major public health threat, and demands effective action.2
The burden of chronic diseases of lifestyle
Steyn (2001) and the Department of Health (2001) have defined chronic diseases oflifestyle (CDL) as a group of diseases that share similar risk factors due to a long periodof exposure to unhealthy diets, lack of exercise and the possibility of stress.
CDL has become a major health problem in both developing and developed countries.About 79 per cent of the deaths occurring in developing countries have been attributed
C O P I N G W I T H I L L N E S S E S A N D D E AT H S
329
Free
dow
nloa
d fr
om w
ww
.hsr
cpre
ss.a
c.za
to chronic diseases; demographic and dietary transitions, as well as the globalisation ofeconomic processes, were contributors towards this rising trend (Yach & Puska 2002).Badham (2000) reported that the health profile in South Africa reflects a society that isin transition. Under-nutrition was associated with increased rates of cardiovasculardisease and non-insulin dependent diabetes mellitus in adult life. Of great concern inadult life is the increasing prevalence of obesity (as a risk factor for the development ofdiseases such as hypertension, heart problems, cancer, diabetes and strokes), mainlybecause of its ability to increase mortality rates by 50 per cent or more.
Van der Merwe (2000) records the following statistics reported during the first NationalWellness Conference in South Africa held at the University of Port Elizabeth: tobacco-related conditions killed 25 000 South Africans every year; the most prevalent diseasewas hypertension, with 20 per cent of men aged 20–50 years having it (interestingly,32 per cent of the people with hypertension did not realise they had the condition);25 per cent of the general population had heart disease. Major diseases that contributedto death were heart disease (54%), cancer (37%), strokes (55%), influenza/pneumonia(23%) and diabetes (34%).
Steyn (2001) reported that the burden of chronic disease in South Africa is high, withapproximately six million people having hypertension, four million having diabetes,seven million smoking and four million having hyperlipidaemia. About 56 per cent ofthe population has at least one of these diseases and about 20 per cent is at a high levelof risk for CDL. According to Steyn (2001), it is clear that lifestyle changes and medicalcare are required to reduce the projected burden of these diseases.
Statistics South Africa (StatsSA) undertook a study to investigate the causes of death inSouth Africa during the period 1997–2001, based on a 12 per cent stratified randomsample of deaths that occurred during the study period (StatsSA 2002). Cerebrovasculardiseases and heart disease featured prominently in the cause of death pattern among theadult population. Cerebrovascular disease was the leading cause of death for both malesand females in the age group 50 and above. It accounted for 8.9 per cent of male deathsand 12.7 per cent of female deaths. Ischaemic and other types of heart disease wereleading causes of death among males, while for females it was ischaemic and other formsof heart disease and diabetes mellitus.
Another study was conducted in Limpopo Province to investigate the mortality profileof the province for the period 1997–2001, using the sample of registered deaths obtainedfrom StatsSA. In terms of annual trends, it was noted in the findings that chronic diseases consistently ranked highest during the period for both sexes, and accounted for42 per cent of the recorded deaths. It was indicated that diabetes, strokes, hypertensiveheart diseases, ischaemic heart disease and ill-defined cardiovascular diseases featuredmore prominently in both males and females in the 45–59-year and over 60-year agegroups (Igumbor, Bradshaw & Laubscher 2003).
T H E D E V E L O P M E N T D E C A D E ? S O U T H A F R I C A , 1 9 9 4 – 2 0 0 4
330
Free
dow
nloa
d fr
om w
ww
.hsr
cpre
ss.a
c.za
Efforts to address chronic diseases
The WHO (2003) reported that chronic diseases are preventable to some extent; there-fore, the most cost-effective, affordable and sustainable course of action to cope with achronic diseases epidemic is through primary prevention. Thus, a major development inthe thinking behind an integrated health policy calls for the adoption of a common risk-factor approach to the prevention of chronic diseases. There is a clear suggestion fromcurrent data that comprehensive public-health strategies to improve the health of thenation should be strengthened.
According to the Department of Health (2001), opportunities exist for prevention andfor promoting healthy behaviour at every stage. ‘Health priorities for South Africa arebased on the promotion of a healthy lifestyle and on prevention, early detection of riskfactors and diseases, and cost-effective treatment with good patient compliance’ (Steyn1999: 1). Basically, this includes increasing equitable access to information, life skillsrelated to making informed choices concerning a healthy lifestyle, awareness of earlysigns and symptoms of priority chronic diseases, stress management and early atten-dance at health facilities, to mention a few.
Attempts have been made to direct intervention programmes at the whole populationvia the media, in the workplace and within the education system. Recommendationsinclude improved health care, promotion of health awareness and adoption of healthierlifestyles. According to Steyn (2001), an essential part of the prevention and manage-ment of all CDL is the promotion of a healthy lifestyle. This includes the promotion ofnon-smoking, healthy diet and physical activity.
An example of a large-scale intervention to address the increasing burden of chronic dis-eases is the ‘healthy schools’ initiative, which focuses on the prevention of obesity andnutrition-related chronic diseases. Another intervention is a television series called SoulCity. The programme targets low-income groups and includes health messages address-ing both under-nutrition and being overweight. For those without access to television,a related radio programme is broadcast (Doak 2002).
CDL have been identified as a health priority in South Africa and an effective healthpolicy for the prevention and management of chronic diseases has been introduced.The policy suggests a multifaceted health-promotion programme directed at the wholepopulation, and a health-service approach for the early diagnosis and cost-effectivemanagement of persons with chronic diseases.
To sum up, various measures have been taken to address CDL. Other illnesses and causesof death are also noted; sexually transmitted infections (including HIV), malaria, diar-rhoeal diseases, asthma and TB are among them. Although it is known that these diseasesclaim a lot of South African lives, it is not clear how people in communities manage theseillnesses. Health disparities in South Africa that existed prior to 1994 are still quite obvious.This chapter attempts to present people’s views on how they deal with cronic illnesses andwhen a death eventually occurs in the family, what they do to cope with the situation.
C O P I N G W I T H I L L N E S S E S A N D D E AT H S
331
Free
dow
nloa
d fr
om w
ww
.hsr
cpre
ss.a
c.za
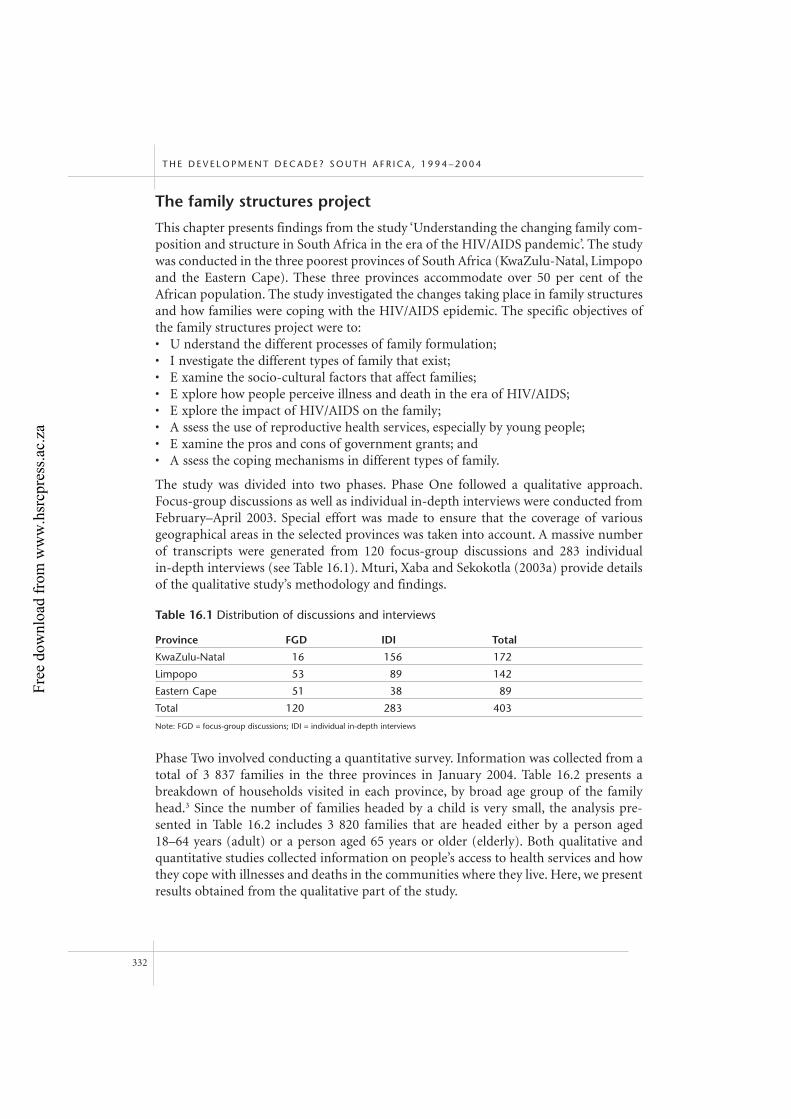
The family structures project
This chapter presents findings from the study ‘Understanding the changing family com-position and structure in South Africa in the era of the HIV/AIDS pandemic’. The studywas conducted in the three poorest provinces of South Africa (KwaZulu-Natal, Limpopoand the Eastern Cape). These three provinces accommodate over 50 per cent of theAfrican population. The study investigated the changes taking place in family structuresand how families were coping with the HIV/AIDS epidemic. The specific objectives ofthe family structures project were to:• U nderstand the different processes of family formulation;• I nvestigate the different types of family that exist;• E xamine the socio-cultural factors that affect families;• E xplore how people perceive illness and death in the era of HIV/AIDS;• E xplore the impact of HIV/AIDS on the family;• A ssess the use of reproductive health services, especially by young people;• E xamine the pros and cons of government grants; and• A ssess the coping mechanisms in different types of family.
The study was divided into two phases. Phase One followed a qualitative approach.Focus-group discussions as well as individual in-depth interviews were conducted fromFebruary–April 2003. Special effort was made to ensure that the coverage of various geographical areas in the selected provinces was taken into account. A massive numberof transcripts were generated from 120 focus-group discussions and 283 individual in-depth interviews (see Table 16.1). Mturi, Xaba and Sekokotla (2003a) provide detailsof the qualitative study’s methodology and findings.
Phase Two involved conducting a quantitative survey. Information was collected from atotal of 3 837 families in the three provinces in January 2004. Table 16.2 presents abreakdown of households visited in each province, by broad age group of the familyhead.3 Since the number of families headed by a child is very small, the analysis pre-sented in Table 16.2 includes 3 820 families that are headed either by a person aged18–64 years (adult) or a person aged 65 years or older (elderly). Both qualitative andquantitative studies collected information on people’s access to health services and howthey cope with illnesses and deaths in the communities where they live. Here, we presentresults obtained from the qualitative part of the study.
T H E D E V E L O P M E N T D E C A D E ? S O U T H A F R I C A , 1 9 9 4 – 2 0 0 4
332
Table 16.1 Distribution of discussions and interviews
Province FGD IDI Total
KwaZulu-Natal 16 156 172
Limpopo 53 89 142
Eastern Cape 51 38 89
Total 120 283 403
Note: FGD = focus-group discussions; IDI = individual in-depth interviews
Free
dow
nloa
d fr
om w
ww
.hsr
cpre
ss.a
c.za
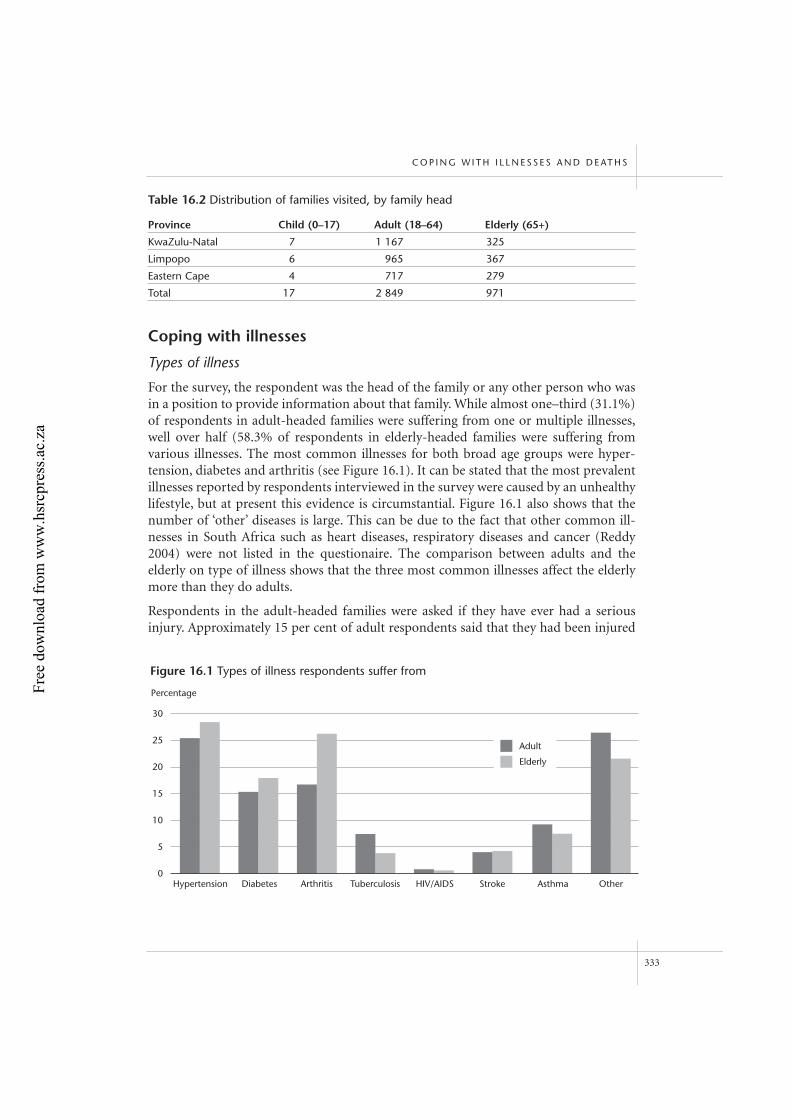
Coping with illnesses
Types of illness
For the survey, the respondent was the head of the family or any other person who wasin a position to provide information about that family. While almost one–third (31.1%)of respondents in adult-headed families were suffering from one or multiple illnesses,well over half (58.3% of respondents in elderly-headed families were suffering fromvarious illnesses. The most common illnesses for both broad age groups were hyper-tension, diabetes and arthritis (see Figure 16.1). It can be stated that the most prevalentillnesses reported by respondents interviewed in the survey were caused by an unhealthylifestyle, but at present this evidence is circumstantial. Figure 16.1 also shows that thenumber of ‘other’ diseases is large. This can be due to the fact that other common ill-nesses in South Africa such as heart diseases, respiratory diseases and cancer (Reddy2004) were not listed in the questionaire. The comparison between adults and theelderly on type of illness shows that the three most common illnesses affect the elderlymore than they do adults.
Respondents in the adult-headed families were asked if they have ever had a seriousinjury. Approximately 15 per cent of adult respondents said that they had been injured
C O P I N G W I T H I L L N E S S E S A N D D E AT H S
333
Table 16.2 Distribution of families visited, by family head
Province Child (0–17) Adult (18–64) Elderly (65+)
KwaZulu-Natal 7 1 167 325
Limpopo 6 965 367
Eastern Cape 4 717 279
Total 17 2 849 971
30
25
20
15
10
5
0
Figure 16.1 Types of illness respondents suffer from
Hypertension Diabetes Arthritis Tuberculosis HIV/AIDS Stroke Asthma Other
Percentage
Adult
Elderly
Free
dow
nloa
d fr
om w
ww
.hsr
cpre
ss.a
c.za
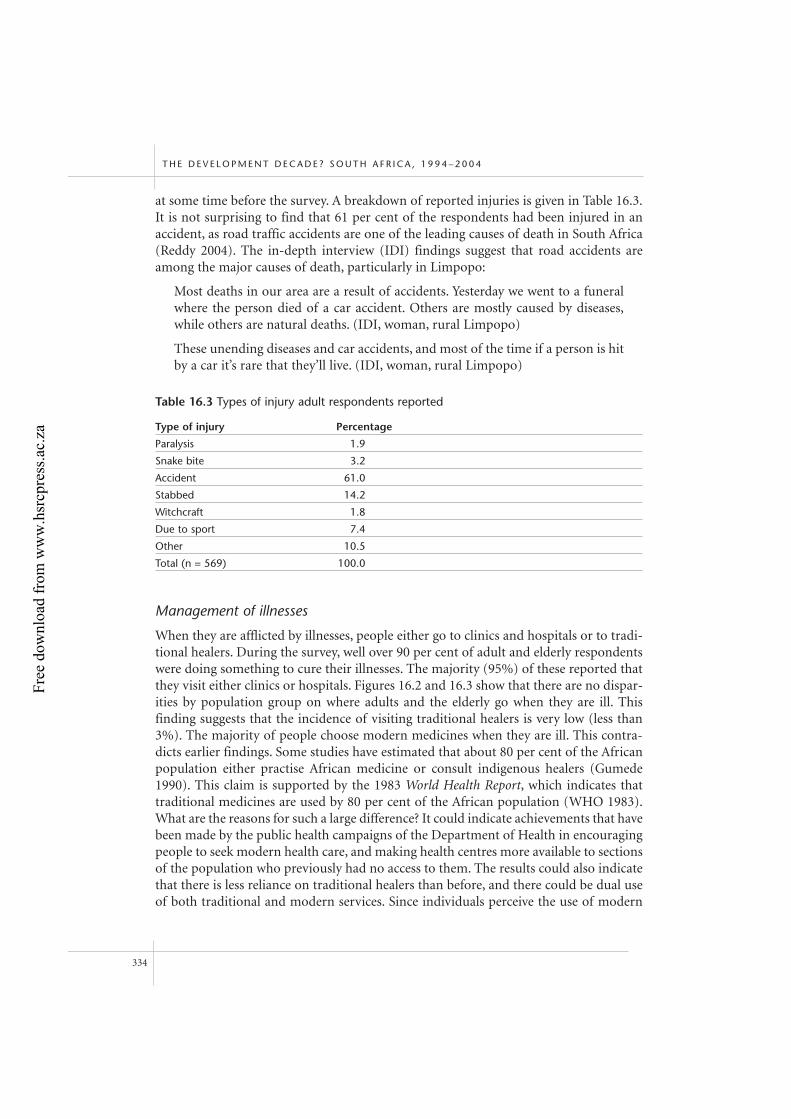
at some time before the survey. A breakdown of reported injuries is given in Table 16.3.It is not surprising to find that 61 per cent of the respondents had been injured in anaccident, as road traffic accidents are one of the leading causes of death in South Africa(Reddy 2004). The in-depth interview (IDI) findings suggest that road accidents areamong the major causes of death, particularly in Limpopo:
Most deaths in our area are a result of accidents. Yesterday we went to a funeralwhere the person died of a car accident. Others are mostly caused by diseases,while others are natural deaths. (IDI, woman, rural Limpopo)
These unending diseases and car accidents, and most of the time if a person is hitby a car it’s rare that they’ll live. (IDI, woman, rural Limpopo)
Management of illnesses
When they are afflicted by illnesses, people either go to clinics and hospitals or to tradi-tional healers. During the survey, well over 90 per cent of adult and elderly respondentswere doing something to cure their illnesses. The majority (95%) of these reported thatthey visit either clinics or hospitals. Figures 16.2 and 16.3 show that there are no dispar-ities by population group on where adults and the elderly go when they are ill. Thisfinding suggests that the incidence of visiting traditional healers is very low (less than3%). The majority of people choose modern medicines when they are ill. This contra-dicts earlier findings. Some studies have estimated that about 80 per cent of the Africanpopulation either practise African medicine or consult indigenous healers (Gumede1990). This claim is supported by the 1983 World Health Report, which indicates that traditional medicines are used by 80 per cent of the African population (WHO 1983).What are the reasons for such a large difference? It could indicate achievements that havebeen made by the public health campaigns of the Department of Health in encouragingpeople to seek modern health care, and making health centres more available to sectionsof the population who previously had no access to them. The results could also indicatethat there is less reliance on traditional healers than before, and there could be dual useof both traditional and modern services. Since individuals perceive the use of modern
T H E D E V E L O P M E N T D E C A D E ? S O U T H A F R I C A , 1 9 9 4 – 2 0 0 4
334
Table 16.3 Types of injury adult respondents reported
Type of injury Percentage
Paralysis 1.9
Snake bite 3.2
Accident 61.0
Stabbed 14.2
Witchcraft 1.8
Due to sport 7.4
Other 10.5
Total (n = 569) 100.0
Free
dow
nloa
d fr
om w
ww
.hsr
cpre
ss.a
c.za
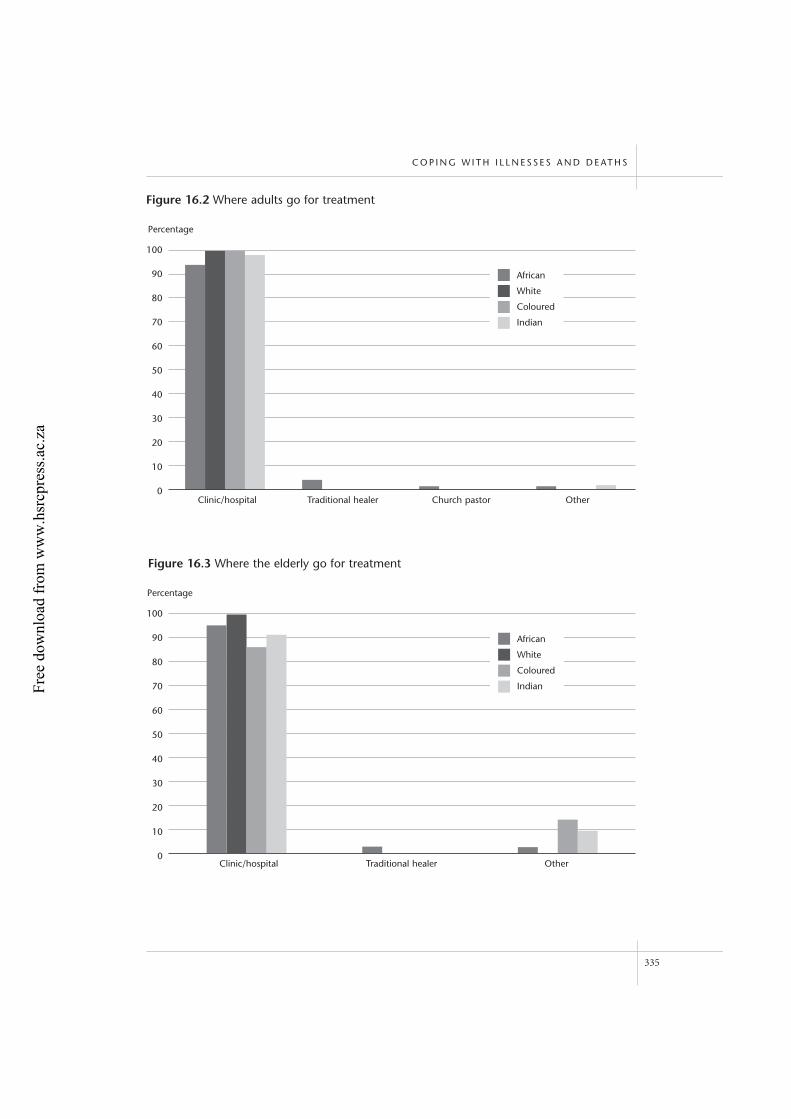
C O P I N G W I T H I L L N E S S E S A N D D E AT H S
335
100
90
80
70
60
50
40
30
20
10
0
Figure 16.2 Where adults go for treatment
Clinic/hospital Traditional healer Church pastor Other
Percentage
African
White
Coloured
Indian
100
90
80
70
60
50
40
30
20
10
0
Figure 16.3 Where the elderly go for treatment
Clinic/hospital Traditional healer Other
Percentage
African
White
Coloured
IndianFree
dow
nloa
d fr
om w
ww
.hsr
cpre
ss.a
c.za
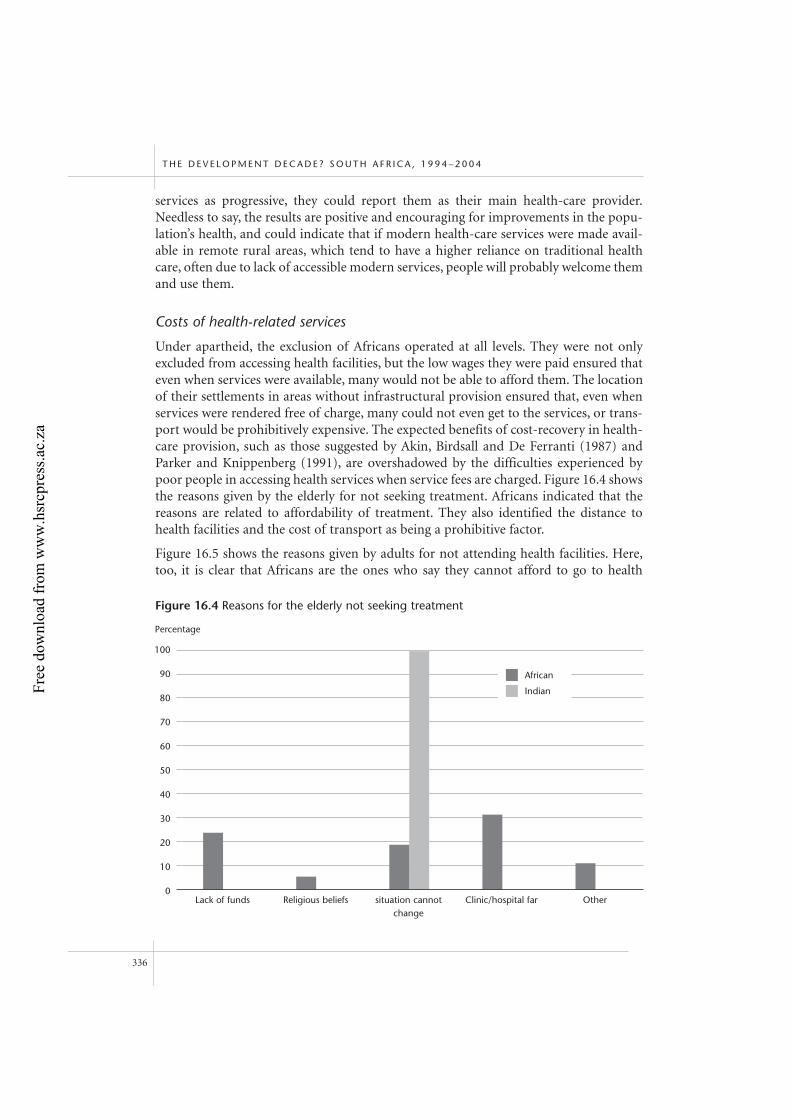
services as progressive, they could report them as their main health-care provider.Needless to say, the results are positive and encouraging for improvements in the popu-lation’s health, and could indicate that if modern health-care services were made avail-able in remote rural areas, which tend to have a higher reliance on traditional healthcare, often due to lack of accessible modern services, people will probably welcome themand use them.
Costs of health-related services
Under apartheid, the exclusion of Africans operated at all levels. They were not onlyexcluded from accessing health facilities, but the low wages they were paid ensured thateven when services were available, many would not be able to afford them. The locationof their settlements in areas without infrastructural provision ensured that, even whenservices were rendered free of charge, many could not even get to the services, or trans-port would be prohibitively expensive. The expected benefits of cost-recovery in health-care provision, such as those suggested by Akin, Birdsall and De Ferranti (1987) andParker and Knippenberg (1991), are overshadowed by the difficulties experienced bypoor people in accessing health services when service fees are charged. Figure 16.4 showsthe reasons given by the elderly for not seeking treatment. Africans indicated that thereasons are related to affordability of treatment. They also identified the distance tohealth facilities and the cost of transport as being a prohibitive factor.
Figure 16.5 shows the reasons given by adults for not attending health facilities. Here,too, it is clear that Africans are the ones who say they cannot afford to go to health
T H E D E V E L O P M E N T D E C A D E ? S O U T H A F R I C A , 1 9 9 4 – 2 0 0 4
336
100
90
80
70
60
50
40
30
20
10
0
Figure 16.4 Reasons for the elderly not seeking treatment
Lack of funds Religious beliefs situation cannotchange
Clinic/hospital far Other
Percentage
African
IndianFree
dow
nloa
d fr
om w
ww
.hsr
cpre
ss.a
c.za
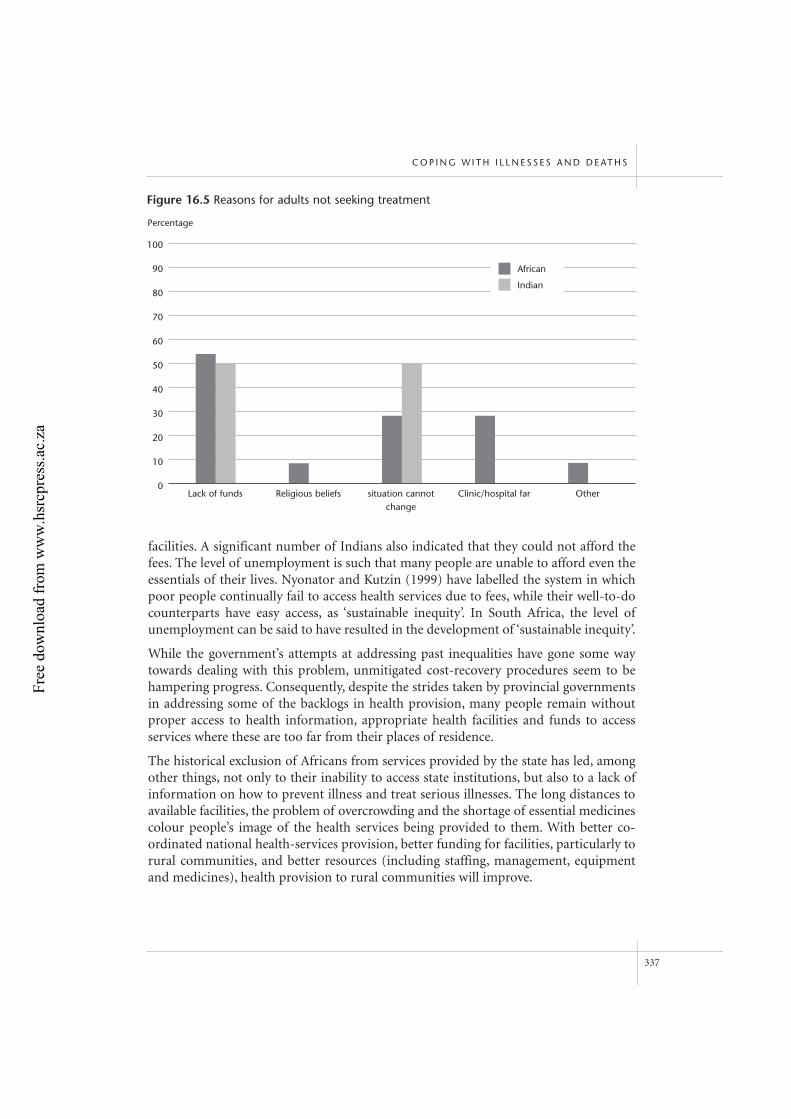
facilities. A significant number of Indians also indicated that they could not afford thefees. The level of unemployment is such that many people are unable to afford even theessentials of their lives. Nyonator and Kutzin (1999) have labelled the system in whichpoor people continually fail to access health services due to fees, while their well-to-docounterparts have easy access, as ‘sustainable inequity’. In South Africa, the level ofunemployment can be said to have resulted in the development of ‘sustainable inequity’.
While the government’s attempts at addressing past inequalities have gone some waytowards dealing with this problem, unmitigated cost-recovery procedures seem to behampering progress. Consequently, despite the strides taken by provincial governmentsin addressing some of the backlogs in health provision, many people remain withoutproper access to health information, appropriate health facilities and funds to accessservices where these are too far from their places of residence.
The historical exclusion of Africans from services provided by the state has led, amongother things, not only to their inability to access state institutions, but also to a lack ofinformation on how to prevent illness and treat serious illnesses. The long distances toavailable facilities, the problem of overcrowding and the shortage of essential medicinescolour people’s image of the health services being provided to them. With better co-ordinated national health-services provision, better funding for facilities, particularly torural communities, and better resources (including staffing, management, equipmentand medicines), health provision to rural communities will improve.
C O P I N G W I T H I L L N E S S E S A N D D E AT H S
337
100
90
80
70
60
50
40
30
20
10
0
Figure 16.5 Reasons for adults not seeking treatment
Lack of funds Religious beliefs situation cannotchange
Clinic/hospital far Other
Percentage
African
Indian
Free
dow
nloa
d fr
om w
ww
.hsr
cpre
ss.a
c.za
Conclusion
It is obvious from the findings that the majority of illnesses in the study areas werecaused by unhealthy lifestyles. Therefore, knowledge on how to lead a healthy life couldgo a long way towards reducing the burden of chronic diseases in South Africa.Individuals, especially heads of families need to be informed, about what to do if afamily member contracts a disease. Special attention needs to be paid to people who areill but not doing anything to treat their illnesses. Almost 8 per cent of adults and theelderly who were ill reported that they were not doing anything about the illness. Lackof funds and the clinic/hospital being far away are the main reasons given for people notseeking medical assistance. It should be noted also that the proportion of ill respondentswho said that they believe their situation cannot change or that their religious beliefs donot allow them to visit clinics or hospitals is not negligible. These explanations werereported in another recent study conducted in KwaZulu-Natal (Mturi et al. 2003b).
Coping with deaths
Overview
A discussion on how people cope with deaths needs to understood within the context ofhow, when death nears and finally arrives, these practices are informed by people’s cul-tures and religious beliefs. For most people, when a person is seriously ill, those aroundshow support for the sick person and provide comfort to the members of his or herfamily. While the community can and does provide emotional and other support, thesocio-economic conditions of many of these families are such that people cannotprovide the kind of financial support they would like to provide. When that happens, aswill be shown later, people appeal to various sources of support, including friends, rela-tives and the government.
Funeral ceremonies
Often, funerals are very expensive and not many families can afford, or raise sufficientfunds, to bury a deceased family member. The costs of burials are generally covered byburial societies, which have been established in many communities. The survey showsthat 54.2 per cent of families whose head is an adult, and 72.8 per cent of those whosehead is an elderly person, have joined a burial society providing cover for the family. Thebreakdown by population group is given in Figure 16.6. There are disparities by popu-lation group: while just over 50 per cent of adult Africans said that their family had someform of burial cover, this was so for 80 per cent of whites, over 60 per cent of colouredsand just below 50 per cent of Indians. It is clear from Figure 16.6 that the groups that aremore vulnerable to financial shock as a result of death are Africans and Indians.
Figure 16.7 indicates that the families of the elderly responded in a similar manner towhether or not they had burial cover. It is surprising to note that those families of whichthe head is an elderly African or coloured person are most likely to have cover (over
T H E D E V E L O P M E N T D E C A D E ? S O U T H A F R I C A , 1 9 9 4 – 2 0 0 4
338
Free
dow
nloa
d fr
om w
ww
.hsr
cpre
ss.a
c.za
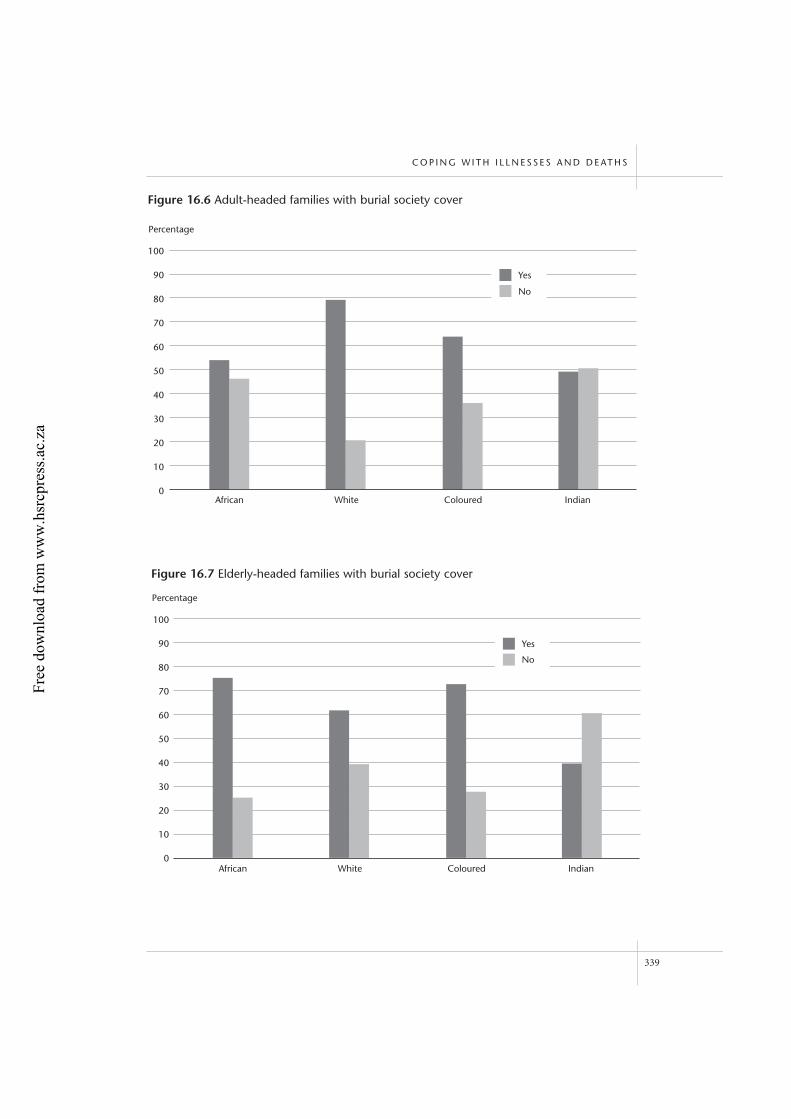
C O P I N G W I T H I L L N E S S E S A N D D E AT H S
339
100
90
80
70
60
50
40
30
20
10
0
Figure 16.6 Adult-headed families with burial society cover
African White Coloured Indian
Percentage
Yes
No
100
90
80
70
60
50
40
30
20
10
0
Figure 16.7 Elderly-headed families with burial society cover
African White Coloured Indian
Percentage
Yes
No
Free
dow
nloa
d fr
om w
ww
.hsr
cpre
ss.a
c.za
70%) and Indians are the least likely to have cover (less than 40%). The reasons for thedifferences in having burial cover between adult-headed and elderly-headed families arenot very clear, but it seems likely that Africans are more concerned about preparing fordeath at advanced stages of their lives. Many, respondents gave responses such as:
There is a burial society that collects money from people every month in this area.If you have joined it, it becomes easy to bear funeral expenses. (IDI, woman, ruralKwaZulu-Natal)
When asked how much their families have to contribute towards burial cover, theamounts varied widely. The lowest was R5 and the highest was R6 000. Disparitiesamong adult-headed and elderly-headed families were observed (see Tables 16.4 and16.5). While the median contribution was the same (R50) for the two types of family,the mean was R102.68 for adult-headed families and R86.50 for elderly-headed families,showing that the disparities are mostly among adult-headed families. Table 16.4 showsthat, on average, white families spend more on burial cover than all the other groups.They are followed by Indians, then coloureds and lastly Africans. When the informationin Table 16.4 is combined with information in Figure 16.6, it is clear that Africans con-tribute the least towards burial cover, and the numbers of those who do not contributeat all are among the highest among Africans. This could be an indication of their inability to afford the premiums. A woman from KwaZulu-Natal summed up the reasonsfor not having burial cover:
There are those people who do not have them [burial societies] because peopledo not have equal power. You cannot have a burial society if you are not working.(IDI, woman, rural KwaZulu-Natal)
A consequence of not having burial society cover is that one is buried in a manner thatbrings shame on the family. The following are examples:
If you do not have a burial society, you are out. You are folded with a mat or ablanket and buried. (IDI, woman, rural KwaZulu-Natal)
If I die now, people will try to get a car to take me to the mortuary and keep methere until the day of my funeral. If there is no money for doing that, I am buriedthe following morning. (IDI, woman, rural KwaZulu-Natal)
T H E D E V E L O P M E N T D E C A D E ? S O U T H A F R I C A , 1 9 9 4 – 2 0 0 4
340
Table 16.4 Amount paid by adult-headed families towards burial cover (R per month)
Mean Number Std. deviation Minimum Maximum Median
African 78.65 1 224 217.4 5 6 000 50
White 222.68 77 124.9 14 550 200
Coloured 139.61 44 152.5 26 900 100
Indian 209.28 174 484.8 15 5 600 105
Total 102.68 1 519 262.4 5 6 000 50
Free
dow
nloa
d fr
om w
ww
.hsr
cpre
ss.a
c.za
Table 16.5 shows that, on average, families headed by an elderly Indian person spendmuch more money per month on funeral benefits than all the elderly-headed families ofthe other groups. The next highest group are white families (R95), followed by colouredfamilies (R77). Those families headed by an elderly African are the lowest, with a meancontribution of R69. It should be noted, however, that only 20 Indians responded to thisquestion and a few of these were contributing high amounts which inflated the mean.
When the adult-headed families were asked whether they could afford death-cover premi-ums, 58.6 per cent said they could comfortably afford them, whereas 40 per cent said theycould afford them with difficulty. For the elderly-headed families, 46.4 per cent could affordthem comfortably, while 52.2 per cent could afford them with difficulty. A tiny number ofeach type of family said they could not afford the premiums. Figure 16.8 shows that over 20per cent of Africans indicated that they struggle to keep up with premium payments, andalmost the same proportion said they could afford them comfortably. The other populationgroups, particularly whites, are more comfortable with paying the monthly dues for burialcover. The pattern for the elderly-headed families is similar (see Figure 16.9).
As indicated earlier, in the event that people cannot afford to pay for the funeral of oneof their family members, various sources are approached to help with funding theburial. Figure 16.10 shows that when asked to mention the sources they approach forhelp, most adults of all groups indicated that they get assistance from relatives more thanfrom any other source. This source of funding is greater even than the community,which, in the literature, is normally treated as the best source of funds for destitutemembers.4 Figure 16.11 shows that, like families headed by adults, families headed by theelderly receive more assistance from their relatives than from any other source.
The need for assistance with burials is caused by the costs of funerals, which themselvesare a result of various pressures that families have to face. Some of the expenses thatAfricans in particular have to incur are the costs of keeping the body at the mortuaryuntil the weekend, (preferred for funerals so as to accommodate distant relatives andfriends), the cost of the coffin, buses to take mourners to and from the cemetery and the purchase of either a goat or a cow, which is slaughtered ceremonially to separate thedead from the living and to introduce him or her to the ancestors. While Africans gen-erally help, and would like to help, with funeral preparations, poverty makes it difficultfor some. Such conditions give rise to responses such as:
C O P I N G W I T H I L L N E S S E S A N D D E AT H S
341
Table 16.5 Amount paid by elderly-headed families towards burial cover (R per month)
Mean Number Std. deviation Minimum Maximum Median
African 69.04 645 283.6 5 5 000 50.0
White 95.21 14 54.0 30 200 84.5
Coloured 77.00 8 50.7 10 150 73.0
Indian 660.05 20 1 508.9 20 5 000 74.5
Total 86.50 697 382.7 5 5 000 50.0
Free
dow
nloa
d fr
om w
ww
.hsr
cpre
ss.a
c.za
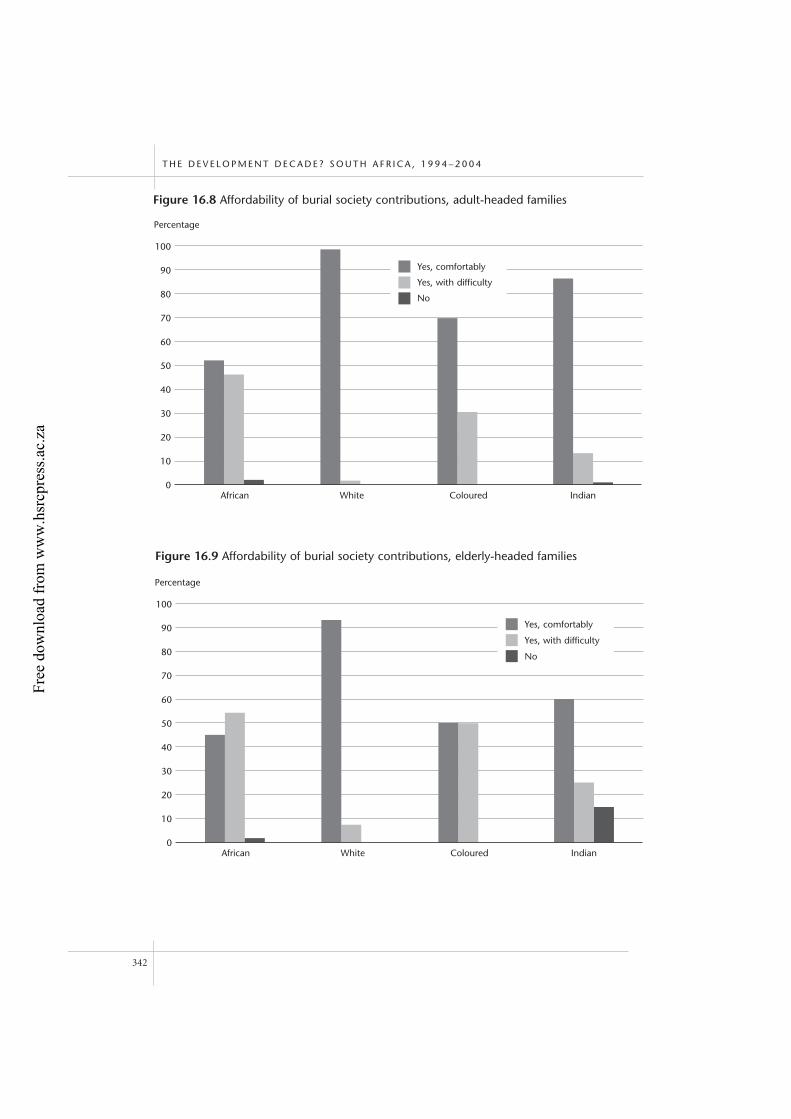
T H E D E V E L O P M E N T D E C A D E ? S O U T H A F R I C A , 1 9 9 4 – 2 0 0 4
342
100
90
80
70
60
50
40
30
20
10
0
Figure 16.8 Affordability of burial society contributions, adult-headed families
African White Coloured Indian
Percentage
Yes, comfortably
Yes, with difficulty
No
100
90
80
70
60
50
40
30
20
10
0
Figure 16.9 Affordability of burial society contributions, elderly-headed families
African White Coloured Indian
Percentage
Yes, comfortably
Yes, with difficulty
No
Free
dow
nloa
d fr
om w
ww
.hsr
cpre
ss.a
c.za
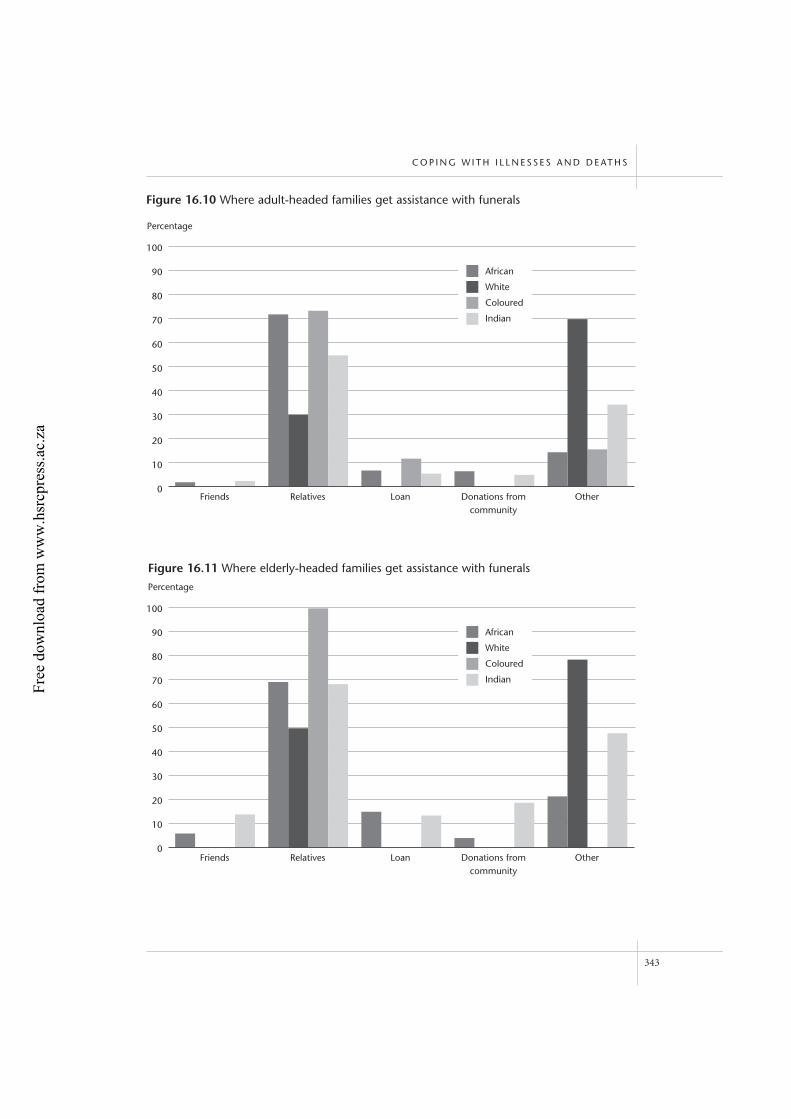
C O P I N G W I T H I L L N E S S E S A N D D E AT H S
343
100
90
80
70
60
50
40
30
20
10
0
Figure 16.10 Where adult-headed families get assistance with funerals
Friends Relatives Loan Donations fromcommunity
Other
Percentage
African
White
Coloured
Indian
100
90
80
70
60
50
40
30
20
10
0
Figure 16.11 Where elderly-headed families get assistance with funerals
Friends Relatives Loan Donations fromcommunity
Other
Percentage
African
White
Coloured
Indian
Free
dow
nloa
d fr
om w
ww
.hsr
cpre
ss.a
c.za
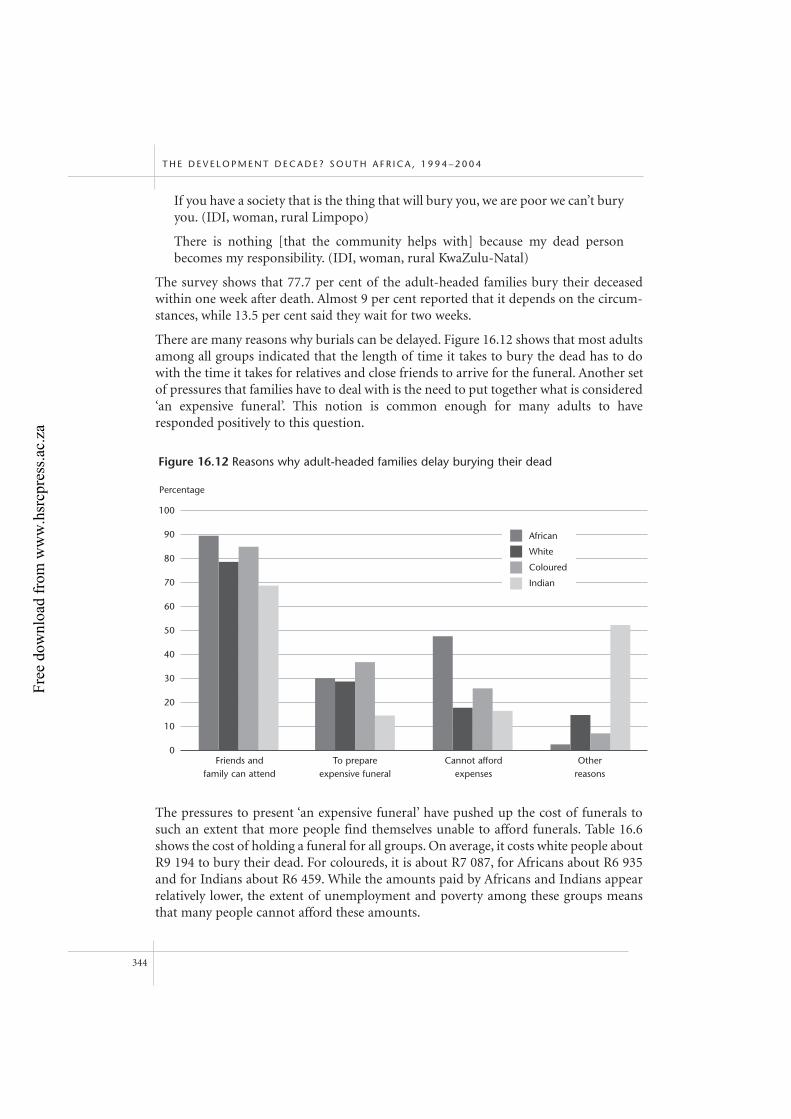
If you have a society that is the thing that will bury you, we are poor we can’t buryyou. (IDI, woman, rural Limpopo)
There is nothing [that the community helps with] because my dead personbecomes my responsibility. (IDI, woman, rural KwaZulu-Natal)
The survey shows that 77.7 per cent of the adult-headed families bury their deceasedwithin one week after death. Almost 9 per cent reported that it depends on the circum-stances, while 13.5 per cent said they wait for two weeks.
There are many reasons why burials can be delayed. Figure 16.12 shows that most adultsamong all groups indicated that the length of time it takes to bury the dead has to dowith the time it takes for relatives and close friends to arrive for the funeral. Another setof pressures that families have to deal with is the need to put together what is considered‘an expensive funeral’. This notion is common enough for many adults to haveresponded positively to this question.
The pressures to present ‘an expensive funeral’ have pushed up the cost of funerals tosuch an extent that more people find themselves unable to afford funerals. Table 16.6shows the cost of holding a funeral for all groups. On average, it costs white people aboutR9 194 to bury their dead. For coloureds, it is about R7 087, for Africans about R6 935and for Indians about R6 459. While the amounts paid by Africans and Indians appearrelatively lower, the extent of unemployment and poverty among these groups meansthat many people cannot afford these amounts.
T H E D E V E L O P M E N T D E C A D E ? S O U T H A F R I C A , 1 9 9 4 – 2 0 0 4
344
100
90
80
70
60
50
40
30
20
10
0
Figure 16.12 Reasons why adult-headed families delay burying their dead
Friends and family can attend
To prepareexpensive funeral
Cannot affordexpenses
Otherreasons
Percentage
African
White
Coloured
Indian
Free
dow
nloa
d fr
om w
ww
.hsr
cpre
ss.a
c.za
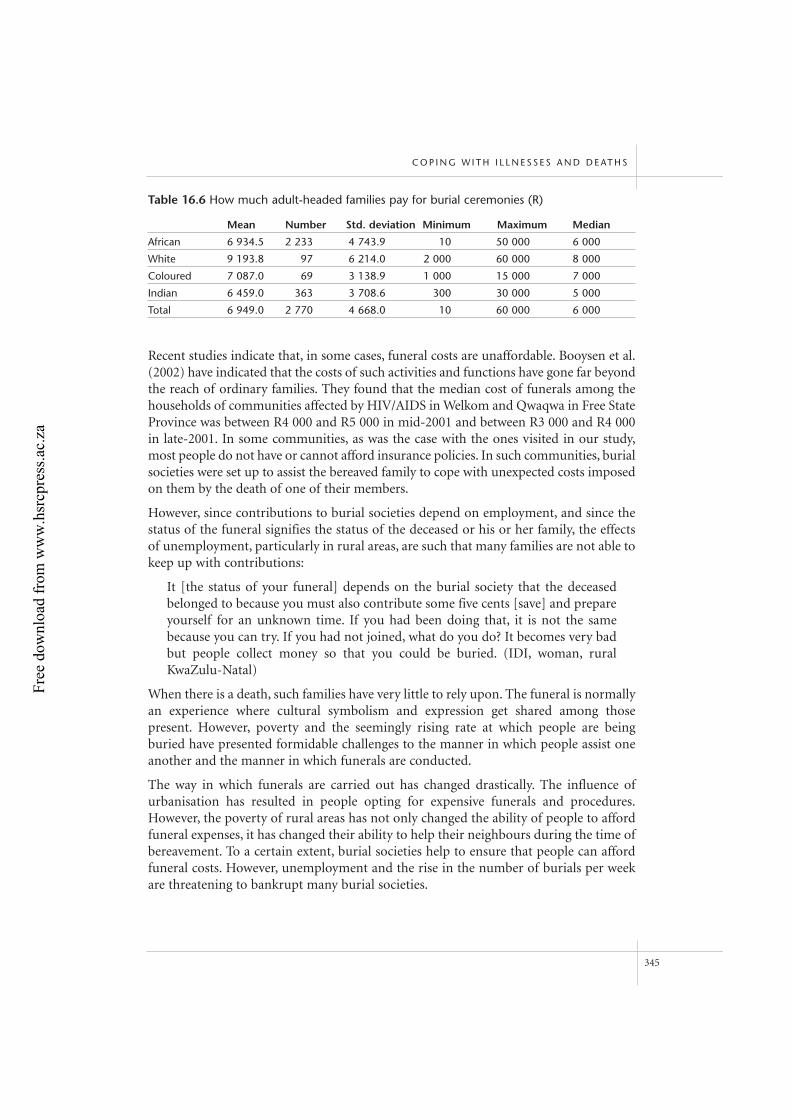
Recent studies indicate that, in some cases, funeral costs are unaffordable. Booysen et al.(2002) have indicated that the costs of such activities and functions have gone far beyondthe reach of ordinary families. They found that the median cost of funerals among thehouseholds of communities affected by HIV/AIDS in Welkom and Qwaqwa in Free StateProvince was between R4 000 and R5 000 in mid-2001 and between R3 000 and R4 000in late-2001. In some communities, as was the case with the ones visited in our study,most people do not have or cannot afford insurance policies. In such communities, burialsocieties were set up to assist the bereaved family to cope with unexpected costs imposedon them by the death of one of their members.
However, since contributions to burial societies depend on employment, and since thestatus of the funeral signifies the status of the deceased or his or her family, the effectsof unemployment, particularly in rural areas, are such that many families are not able tokeep up with contributions:
It [the status of your funeral] depends on the burial society that the deceasedbelonged to because you must also contribute some five cents [save] and prepareyourself for an unknown time. If you had been doing that, it is not the samebecause you can try. If you had not joined, what do you do? It becomes very badbut people collect money so that you could be buried. (IDI, woman, ruralKwaZulu-Natal)
When there is a death, such families have very little to rely upon. The funeral is normallyan experience where cultural symbolism and expression get shared among thosepresent. However, poverty and the seemingly rising rate at which people are beingburied have presented formidable challenges to the manner in which people assist oneanother and the manner in which funerals are conducted.
The way in which funerals are carried out has changed drastically. The influence ofurbanisation has resulted in people opting for expensive funerals and procedures.However, the poverty of rural areas has not only changed the ability of people to affordfuneral expenses, it has changed their ability to help their neighbours during the time ofbereavement. To a certain extent, burial societies help to ensure that people can affordfuneral costs. However, unemployment and the rise in the number of burials per weekare threatening to bankrupt many burial societies.
C O P I N G W I T H I L L N E S S E S A N D D E AT H S
345
Table 16.6 How much adult-headed families pay for burial ceremonies (R)
Mean Number Std. deviation Minimum Maximum Median
African 6 934.5 2 233 4 743.9 10 50 000 6 000
White 9 193.8 97 6 214.0 2 000 60 000 8 000
Coloured 7 087.0 69 3 138.9 1 000 15 000 7 000
Indian 6 459.0 363 3 708.6 300 30 000 5 000
Total 6 949.0 2 770 4 668.0 10 60 000 6 000
Free
dow
nloa
d fr
om w
ww
.hsr
cpre
ss.a
c.za
Conclusion
This chapter has examined how people cope with illnesses and deaths in KwaZulu-Natal,the Eastern Cape and Limpopo. It presents results obtained from a UN-funded projectstudying how family structure and composition have changed in South Africa and howfamilies cope with those changes. One of this study’s objectives is to explore how peopleperceive illness and death in the era of HIV/AIDS. This chapter is based on part of thatbroader study. It was noted that many major health problems in South Africa are a resultof a long period of exposure to unhealthy diets, lack of exercise and stress. The threeleading illnesses of respondents in this study are hypertension, diabetes and arthritis.The study has shown that the majority of the population, including Africans, visit clinicsand hospitals for medical assistance. These results contradict findings obtained else-where that show that Africans mainly visit traditional healers.
It is sad to note that 8 per cent of those who are ill are not able to visit clinics and hos-pitals because of various reasons. This is a group that needs to be targeted. The easiestsubgroup to address for change is that category of people who have financial difficultiesin paying for transport and medical services. Efforts should be made by the governmentto assist poor people who are ill but do not have enough funds to pay for medicalexpenses.
It is African tradition to have a proper ceremony to bury deceased loved ones. In orderto manage the costs involved, people have set up burial societies, but not everyone canafford to join. Perhaps it is time to assess various activities that take place during funeralceremonies. Is it really necessary for a poor family to keep the body for more than twoweeks, during which time relatives and visitors have to be fed and entertained? Is it nec-essary to hire vehicles, kill a cow, and so on, even if you cannot afford it? Costs could bereduced dramatically if families did things that they can comfortably afford, and ignoredthose activities that they cannot manage.
It would be interesting also to examine the differentials addressed in this research byplace of residence. It is likely that differentials by the three provinces under study and byrural/urban residence do exist.
Notes
1 This is part of a larger study on ‘Understanding the changing family composition and structure
in South Africa in the era of the HIV/AIDS pandemic’. This ‘family structures study’ is funded by
the African Social Research Programme of the United Nations Population Fund.
2 We are also aware of other types of disease (such as diarrhoeal diseases, TB, asthma, sexually
transmitted infections and malaria) that affect the South African population but are not
necessarily caused by lifestyles.
3 The qualitative study indicated that there were families visibly headed by children. The
distribution of households suggests that the coverage of child-headed households is very low.
T H E D E V E L O P M E N T D E C A D E ? S O U T H A F R I C A , 1 9 9 4 – 2 0 0 4
346
Free
dow
nloa
d fr
om w
ww
.hsr
cpre
ss.a
c.za
C O P I N G W I T H I L L N E S S E S A N D D E AT H S
347
It should be noted also that each household was investigated as to whether it was comprised of
one family or more than one. Information was collected for each family in the household.
4 Domingues (2002) found that burial societies and church organisations were two of the means
that poor people used to get out of poverty. This section looks at the role of these societies in
assisting people to carry the burden of funeral costs.
References
Akin J, Birdsall N & De Ferranti D (1987) Financing health services in developing countries: An agenda
for reform. Washington, DC: World Bank.
Badham F (2000) Relaunching an old product in new packaging: An introduction to food based dietary
guidelines. JB Consultancy. <http://www.saafost.org.za/jane-b1.html>
Baier E (1997) The impact of HIV/AIDS on rural households/communities and the need for
multisectoral prevention and mitigation strategies to combat the epidemic in rural areas.
Rome: FAO.
Becker G (1981) A treatise on the family. Cambridge: Harvard University Press.
Booysen F, Bachmann M, Van Rensburg H, Engelbrecht M, Steyn F & Meyer K (2002) The socio-
economic impact of HIV/AIDS on households in South Africa: Pilot study in Welkom and
Qwaqwa, Free State Province. Draft final report, Centre for Health Systems Research and
Development.
Bradshaw D, Bourne D, Schneider M & Sayed R (1999) Mortality patterns of chronic diseases of
lifestyle in South Africa, in Medical Research Council review of research and identification of
essential health research priorities, Technical report. Johannesburg: SAHealthInfo.
Bradshaw D, Schneider M, Laubscher R & Nojilana B (2002) Cause of death profile, South Africa 1996.
Burden of Disease Research Unit Report, South African Medical Research Council.
<http://www.mrc.ac.za/bod/profile.pdf>
Bradshaw D & Nannan N (2004) Health status, in P Ijumba, C Day & A Ntuli (eds.) South African
health review report 2003/2004. Durban: Health Systems Trust.
Department of Health, South Africa (2001) National guideline on primary prevention of chronic
diseases of lifestyle. Pretoria: Department of Health.
Doak C (2002) Large-scale interventions and programmes addressing nutrition-related chronic
diseases and obesity: Examples from 14 countries, Public Health Nutrition 5: 275–77.
Domingues Y (2002) Burial societies and church groups: Exploring the relationship between
organizations and poverty in KwaZulu-Natal. Masters Thesis, University of Natal, Durban.
Gumede M (1990) Traditional healers: A medical practitioner’s perspective. Johannesburg: Skotaville.
Igumbor E, Bradshaw D & Laubscher R (2003) Mortality profile from registered deaths for Limpopo
Province, South Africa 1997–2001. Cape Town: South African Medical Research Council and
University of Venda.
Mturi A, May J & Hunter N (2003b) Vital indicators of children in rural KwaZulu-Natal. Durban:
Department of Social Welfare and Population Development.
Free
dow
nloa
d fr
om w
ww
.hsr
cpre
ss.a
c.za
Mturi A, Xaba T & Sekokotla D (2003a) Assessment of circumstances facing contemporary families in
South Africa. Durban: School of Development Studies, University of Natal.
Nyonator F & Kutzin J (1999) Health for some? The effects of user fees in the Volta Region of Ghana,
Health Policy and Planning 14: 329–41.
Parker D & Knippenberg R (1991) Community cost-sharing and participation: A review of the issues.
Bamako Initiative, Technical Report Series No. New York: UNICEF.
Parsons T (1949) The social structure of the family, in R Anshen (ed.) The family: Its functions and
destiny. New York: Harper and Brothers.
Reddy P (2004) Chronic diseases, in P Ijumba, C Day & A Ntuli (eds.) South African health review
report 2003/2004. Durban: Health Systems Trust.
StatsSA (2002) Causes of death in South Africa 1997–2001: Advance release of recorded causes of death.
Pretoria: Statistics South Africa.
Steyn K (1999) A health service policy proposal for South Africa to address chronic diseases of
lifestyle, in Medical Research Council review of research and identification of essential health
research priorities, Technical Report. Johannesburg: SAHealthInfo.
Steyn K (2001) An overview of chronic diseases of lifestyle. Cape Town: South African Medical Research
Council, Chronic Diseases of Lifestyle Research Unit.
Van der Merwe A (2000) Health, stress and lifestyle management. <http://www.wellness
empowerment.com/questions/articles.htm>
WHO (1983) World health report 1983. Geneva: World Health Organisation.
WHO (2003) Joint WHO/FAO expert consultation on diet, nutrition and the prevention of chronic
diseases. WHO Technical Report Series 916. Geneva: World Health Organisation.
Yach D & Puska P (2002) Globalisation, diets and non-communicable diseases. Geneva: World Health
Organisation.
T H E D E V E L O P M E N T D E C A D E ? S O U T H A F R I C A , 1 9 9 4 – 2 0 0 4
348
Free
dow
nloa
d fr
om w
ww
.hsr
cpre
ss.a
c.za
17Are condoms infiltrating marital and cohabiting partnerships? Perspectives of couples in KwaZulu-Natal, South Africa
Pranitha Maharaj and John Cleland
Introduction
As the HIV pandemic continues to spread in many parts of the world, the focus offamily planning programmes has shifted from an emphasis on pregnancy preven-tion to include disease prevention. Motivated by demographic objectives, manyfamily planning programmes in the past promoted the use of longer-term, ‘moreeffective’ family planning methods such as injectables and sterilisation, with little orno attention to protection against sexually transmitted infections (STIs) (Awusabo-Asare 1995). However, with the advent of the HIV epidemic and the link betweenSTIs and HIV, there is a growing awareness of the need to protect sexually activeindividuals against the dual risks of unplanned pregnancy and STIs (includingHIV/AIDS).
More than 20 years into the pandemic, apart from abstinence and mutually monogamousrelationships between uninfected partners, the use of condoms remains the most effec-tive strategy for preventing the sexual transmission of HIV and other STIs. A recentNational Institute for Health report on condom effectiveness concluded that correct andconsistent use of male latex condoms effectively reduces the risk of HIV infection in menand women, although incorrect or inconsistent use, breakage and slippage inevitablyreduce effectiveness against HIV transmission (Cates 2001). The male condom is also theonly widely used device that offers dual protection against pregnancy and disease (WHO2000).
Over the years priorities have changed. Initially, in the absence of access to effective HIVtreatment, the emphasis has been largely on promoting condom use in high-risk sexualencounters, including premarital and extramarital sexual relationships. A fair degree ofsuccess has been achieved (Ezeh, Seroussi & Raggers 1996; Kamya, Mcfarland, Hudes,Ssali, Busuulwa & Hearst 1997). By comparison, the needs of married and cohabitingcouples have been neglected, despite the fact that in severe, generalised HIV epidemics,many infections occur within marital and cohabiting unions, either because of priorinfection by one partner or because of infidelity (Lindan, Allen & Caraël 1991; De Zoysa,Sweat & Denison 1996). Indeed, it is likely that many condom promotion campaigns, byreinforcing the association between condoms and illicit relationships, have stiffenedresistance to their use within marriage.
349
Free
dow
nloa
d fr
om w
ww
.hsr
cpre
ss.a
c.za
Recent surveys indicate that condom use is higher with casual than with regular part-ners (Preston-Whyte 1999; Adetunji 2000). Both men and women are resistant to the useof condoms in long-term, regular relationships (Worth 1989; Caldwell 1999). Thisresistance to condoms has been found to be strongly related to their negative associationwith promiscuity (Caldwell 1999). Both men and women say that asking a partner to usea condom is equivalent to admitting one’s own infidelity or accusing one’s partner ofbeing unfaithful. The subconscious message their presentation for use delivers is, ‘Youare not the only one with whom I am having sex’ (Worth 1989: 304). The desire forchildbearing may sometimes act as a barrier to condom use. Childbearing and mother-hood are viewed as an important component of women’s role, conferring on them asense of social identity and self-worth. As a result, condoms may be rejected becausethey interfere with the natural process of conception (Preston-Whyte 1999).
To date, however, limited data are available on condom use within marital and cohabit-ing relationships. Moreover, most studies consider the views and characteristics of onlyone partner, with little or no attention to the dynamics between the individuals. Thisapproach is seen as problematic, for women and men do not act as autonomous indi-viduals, operating independently of their partners (Campbell 1995). Increasingly, it isbecoming evident that the dynamics of reproductive processes can best be understoodwhen researchers collect information from both partners (Bankole 1995). Ezeh (1993:163) argues that ‘focusing on the couple offers a unique opportunity to explore how theseparate activities and experiences of husbands and wives are unified to produce anoutcome’. The purpose of this chapter is to assess the relative impact of men’s andwomen’s attitudes and perceptions on condom use, using survey data from married orcohabiting couples.
Context
South Africa has a population of approximately 45 million people (StatsSA 2002), andwas one of the first countries in sub-Saharan Africa to experience a national fertilitydecline (Nkau 1998). In South Africa, contraceptive use is high compared with the othersub-Saharan African countries. The findings from the 1998 South African Demographicand Health Survey show that more than 60 per cent of sexually active women were usingsome method of contraception (SADHS 1999). This contraceptive revolution is occur-ring in a context of very high levels of HIV infection. The results of antenatal surveysshow that HIV prevalence has risen from less than 1 per cent in 1990 to almost 24 percent in 2001 (Department of Health 2002).
The present study was conducted in an urban and in a rural site in KwaZulu-Natal, theprovince that has been most severely affected by the AIDS epidemic in South Africa. Boththe rural and urban sites are inhabited primarily by isiZulu-speaking people of low socio-economic status. The rural site is situated approximately 80 km south-west of the city ofDurban, and the urban site approximately 15 km from the city. Both areas were selectedbecause of high levels of HIV infection among antenatal clinic attendees. In 1998, the level
T H E D E V E L O P M E N T D E C A D E ? S O U T H A F R I C A , 1 9 9 4 – 2 0 0 4
350
Free
dow
nloa
d fr
om w
ww
.hsr
cpre
ss.a
c.za
of HIV infection for the rural area was estimated at between 25 per cent and 33 per centand for the urban area between 33 per cent and 42 per cent (Department of Health 1999).
Methods
Sample design and data collection
The data for the study were derived from a household survey. Within each urban andrural site, four sub-districts were identified and demarcated using cadastral maps. Inboth sites, five enumeration areas were identified within each designated sub-districtand 23 households in each area were randomly selected for the study. In each household,one index adult respondent was randomly selected using a Kish grid. The partners ofmarried or cohabiting respondents were also selected for interview. The survey ques-tionnaire was very similar for men and women. It comprised sets of questions on the following main topics: reproduction; contraception; HIV-related knowledge, attitudesand risk perceptions; attitudes to and use of condoms; and extramarital partnerships.Only a small subset of the available variables is used in this chapter.
A total of 238 couples were successfully interviewed. Of these couples, 60 per cent weremarried and 40 per cent were not married but cohabiting. In South Africa, marriage is along and complicated process, usually involving the payment of bride price. As a result,marriage is often preceded by long periods of cohabitation. The participation rates were70 per cent and 87 per cent for index men and women, respectively, and for partners were84 per cent and 94 per cent. There were few refusals, though two male respondentsrefused to complete the entire interview and, as a result, were excluded from the analysis.
At the beginning of each interview, respondents were briefed about the purpose of theinterview. Respondents were then asked if they would be willing to participate in thestudy. Respondents were also assured of confidentiality. In general, each interview lastedapproximately 45 minutes. All the interviews were conducted by field staff of the same sexas the respondent. Partners were interviewed separately and in some cases concurrently,but this was not always possible. Since the questionnaire was long and complex, highlycompetent and well-trained interviewers were needed. For this reason, interviewers withprior experience were recruited and trained. All the interviewers were African and couldcommunicate in the local language (isiZulu). Ethical clearance for the study was obtainedfrom the University of Natal. Though the sample was not designed to be representative ofKwaZulu-Natal, the survey data were weighted to take into account the over-sampling ofthe urban population. Data collection took place from August 1999 to January 2000.
Measures
During the survey, respondents were asked to identify all methods of family planningthat they had heard of; if the condom was not mentioned as a response, then a one-linedescription was provided and thereafter respondents were asked if they had heard of it.Respondents were considered to have heard of condoms if they said that they heard of
C O N D O M U S E I N M A R I TA L A N D C O H A B I T I N G PA R T N E R S H I P S
351
Free
dow
nloa
d fr
om w
ww
.hsr
cpre
ss.a
c.za
them spontaneously or after prompting. The outcome variable was derived from a ques-tion on frequency of use of condoms (male or female) with the named spouse or co-habiting partner, the response categories being ‘always’, ‘occasionally’, ‘at the start of therelationship’ or ‘never’. The explanatory or predictor variables were selected on the basisof a conceptual framework that drew upon social learning theory and the theory ofreasoned action (Bandura 1994; Fishbein, Middlestadt & Hitchcock 1994).
Some of the predictors are self-explanatory but the derivation of others requires expla-nation. Beliefs about the severity of AIDS might influence the extent to which individu-als are likely to engage in risk-avoidance behaviour. The perceived severity of AIDS wasdefined as ‘high’ if the respondent knew that AIDS was fatal. Knowing someone withAIDS is likely to make the disease more salient in one’s life and serves to promote pro-tective sexual practices (Mansergh, Marks, Appleby & Murphy 2000; Adetunji & Meekers2001). The salience of HIV/AIDS was defined as ‘high’ if the respondent either had expe-rienced a family member or friend who had suffered or died from AIDS or had attendedthe funeral of someone who had died of AIDS. Beliefs about condoms – both positiveand negative – are also likely to influence condom use. Attitude towards use of condomswithin marriage was derived from agreement with three statements: ‘It is acceptable fora married couple to use condoms’; ‘It is acceptable for a married woman to ask her husbandto use condoms’; and ‘To protect themselves against HIV and STIs, a married couple can usecondoms every time they have sex’. A summary scale was created from these responses andwas divided into three categories: favourable, neutral and unfavourable. To adopt meas-ures to reduce their risk, people must also believe that they have the ability to take actionto reduce their risk (Tanfer, Grady, Klepinger & Billy 1993). In order to determine anindividual’s self-efficacy to use condoms, respondents were asked to state their agree-ment with the following statements: ‘There is not much use in trying to prevent HIV; ifyou are going to get it, you will get it eventually no matter how much you try’ and ‘If awife/husband gets HIV or STIs from outside the marriage, there is nothing the husband/wifecan do to avoid getting infected him/herself’. Respondents who disagreed with both state-ments were defined as possessing high self-efficacy.
Data analysis
Differences between men and women in knowledge, attitudes and condom use weresummarised in tabular form, with application of chi-square tests to determine statisticalsignificance. The relationship between explanatory factors and condom use was assessedusing logistic regression. The data were analysed using the Statistical Package for theSocial Sciences.
Results
Prevention programmes have been successful at raising awareness of condoms.Knowledge of condoms was high among men and women, as shown in Table 17.1. Thevast majority of respondents who had heard of condoms could also identify a source of
T H E D E V E L O P M E N T D E C A D E ? S O U T H A F R I C A , 1 9 9 4 – 2 0 0 4
352
Free
dow
nloa
d fr
om w
ww
.hsr
cpre
ss.a
c.za
supply. More than 80 per cent of husbands and wives had heard of the method and knewa potential source of supply. However, knowledge of condoms and a source of supplywas lower among women with less than upper secondary education than among otherwomen. Condoms were widely recognised as a method of protection against HIV infec-tion. Women were more likely than men to hold a positive attitude to condom usewithin marriage. The stratum with higher levels of education was more likely to hold apositive attitude to condom use within marriage than the stratum with lower levels ofeducation. Among both men and women, condoms were seen as more acceptable innon-marital than in marital relationships. Communication on condom use was fairlylimited. Less than half of the respondents said that they had discussed condom use withtheir partners. In general, 68 per cent of couples gave consistent responses about theirdiscussions on condoms. In 19 per cent of couples, both partners said that they had discussed condoms while in 49 per cent both said that they had not.
The majority of men and women knew that AIDS was fatal. Overall, men displayedgreater confidence in their ability to protect themselves against the risk of HIV infectionthan women. In general, women were more likely than men to perceive themselves atrisk of HIV infection (57 per cent versus 22 per cent). This was because women were alsomore likely than men to perceive their partner as unfaithful. Not surprisingly, perceivedrisk of HIV infection was strongly associated with a wife’s belief in the infidelity of herspouse (result not shown). Also, men and women with higher levels of education weremore likely to report higher levels of self-efficacy (results not shown).
Almost 85 per cent of men and 82 per cent of women reported that they had neverused condoms with their partner or had used them only at the start of the relation-ship. Of the remainder, very few said that they were consistent condom users, thebulk defining themselves as occasional users. Although irregular use offers onlylimited protection against HIV infection, the low number of those reporting consis-tent use prompted the combining of the categories ‘always’ and ‘occasionally’. For theanalysis, consistent and occasional users were classified as condom users. Consistency
C O N D O M U S E I N M A R I TA L A N D C O H A B I T I N G PA R T N E R S H I P S
353
Table 17.1 Profile of condom use and related attitudinal factors
Both Husband only Wife only Neither
Knowledge of condoms and source of supply 84.0 11.0 4.6 0.4
Belief in condom efficacy 71.3 17.7 9.7 1.3
Favourable attitudes to condoms 20.8 11.6 27.1 40.6
Discussed condoms with partner 19.1 15.7 16.5 48.7
AIDS is fatal 75.7 12.8 9.8 1.70
HIV/AIDS is salient 19.1 21.6 22.9 36.4
Perceived risk of HIV infection from partner 13.6 8.5 43.0 34.9
High perceived self-efficacy 13.7 19.2 12.8 54.3
Consistent or occasional condom use 9.7 5.0 8.0 77.3
Free
dow
nloa
d fr
om w
ww
.hsr
cpre
ss.a
c.za
of reporting within matched couples was also relatively high (overall agreement = 87 per cent). In 77 per cent of couples, both partners said that they were not usingcondoms, while in 10 per cent, both said they were using condoms consistently oroccasionally. Condom use increases significantly with the level of education. Ingeneral, women were more likely than men to report consistent condom use. Therecan be no doubt that women use condoms for the primary purpose of disease pre-vention rather than for dual protection. A large majority (94 per cent) of womenreporting use of condoms were also practising another method of contraception,notably injectables. This suggests that the motive for using condoms was protectionagainst HIV and other sexually transmitted infections. Also, given the strongly heldbelief that family planning is the woman’s responsibility it is not surprising that themajority of women reported using a female-controlled method for preventing preg-nancy. Preliminary analysis shows major discrepancies in husbands’ reports ofcondom use. Of the 61 husbands who reported using the condom for family planningpurposes, only 53 per cent reported currently using the condom ‘always’ or ‘occa-sionally’. As a result, a wife’s report of condom use is seen as a more reliable accountof the behaviour of the couple, and the analysis that follows is largely limited to thewife’s reported condom use.
Predictors of consistent or occasional condom use, as reported by wives, are assessed inTable 17.2. In exploratory analysis, the belief that AIDS is fatal and the salience ofHIV/AIDS were found to be unrelated to use and were, therefore, dropped. Because ofthe extreme difficulty of causal interpretation of the strong associations betweencondom use and the wife’s own attitude to condoms and discussion of condoms withthe spouse, these factors were also excluded. However, the husband’s attitude tocondoms was retained because the aim was to ascertain the extent to which his opposi-tion deterred use of condoms. The unadjusted or bivariate results, presented in terms ofodds ratios, indicate that all factors except the wife’s age were significantly related to thewife’s report of condom use. The wife’s education, her perceived risk of HIV infectionand belief in condom efficacy were particularly strong predictors, as was the husband’sattitude to condoms.
In the multivariate model, the strengths of these associations were attenuated, althoughtheir directions remained the same. The adjusted results show that condom use washigher among the urban, more educated than among the rural, less educated. The oddsof condom use were also higher among wives with a high belief in condom efficacy, butthis relationship was no longer significant. The effect of the husband’s attitude tocondoms was severely reduced in the multivariate model and was no longer significant.Only one statistically significant effect remained. Women who felt themselves at risk ofHIV infection from their husband were more likely than other women to reportcondom use.
T H E D E V E L O P M E N T D E C A D E ? S O U T H A F R I C A , 1 9 9 4 – 2 0 0 4
354
Free
dow
nloa
d fr
om w
ww
.hsr
cpre
ss.a
c.za
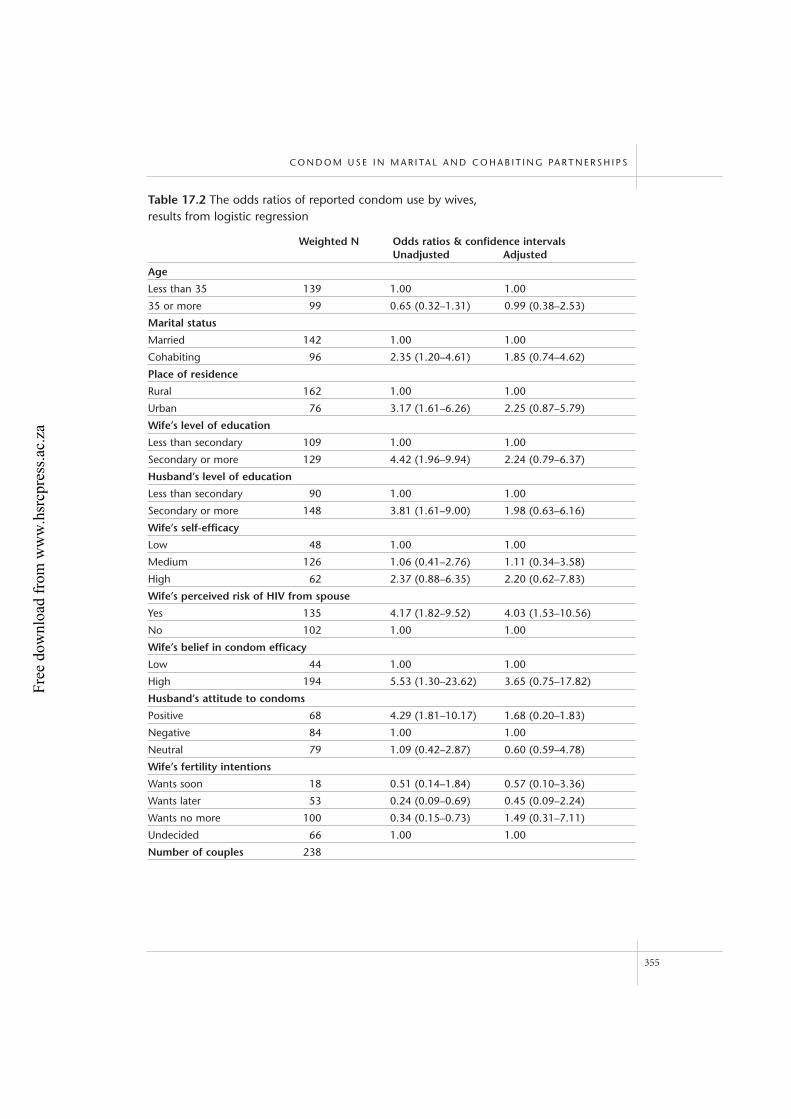
C O N D O M U S E I N M A R I TA L A N D C O H A B I T I N G PA R T N E R S H I P S
355
Table 17.2 The odds ratios of reported condom use by wives, results from logistic regression
Weighted N Odds ratios & confidence intervalsUnadjusted Adjusted
Age
Less than 35 139 1.00 1.00
35 or more 99 0.65 (0.32–1.31) 0.99 (0.38–2.53)
Marital status
Married 142 1.00 1.00
Cohabiting 96 2.35 (1.20–4.61) 1.85 (0.74–4.62)
Place of residence
Rural 162 1.00 1.00
Urban 76 3.17 (1.61–6.26) 2.25 (0.87–5.79)
Wife’s level of education
Less than secondary 109 1.00 1.00
Secondary or more 129 4.42 (1.96–9.94) 2.24 (0.79–6.37)
Husband’s level of education
Less than secondary 90 1.00 1.00
Secondary or more 148 3.81 (1.61–9.00) 1.98 (0.63–6.16)
Wife’s self-efficacy
Low 48 1.00 1.00
Medium 126 1.06 (0.41–2.76) 1.11 (0.34–3.58)
High 62 2.37 (0.88–6.35) 2.20 (0.62–7.83)
Wife’s perceived risk of HIV from spouse
Yes 135 4.17 (1.82–9.52) 4.03 (1.53–10.56)
No 102 1.00 1.00
Wife’s belief in condom efficacy
Low 44 1.00 1.00
High 194 5.53 (1.30–23.62) 3.65 (0.75–17.82)
Husband’s attitude to condoms
Positive 68 4.29 (1.81–10.17) 1.68 (0.20–1.83)
Negative 84 1.00 1.00
Neutral 79 1.09 (0.42–2.87) 0.60 (0.59–4.78)
Wife’s fertility intentions
Wants soon 18 0.51 (0.14–1.84) 0.57 (0.10–3.36)
Wants later 53 0.24 (0.09–0.69) 0.45 (0.09–2.24)
Wants no more 100 0.34 (0.15–0.73) 1.49 (0.31–7.11)
Undecided 66 1.00 1.00
Number of couples 238
Free
dow
nloa
d fr
om w
ww
.hsr
cpre
ss.a
c.za
Discussion
The discovery of antiretroviral (ARV) therapy has meant that tremendous progress hasbeen made in the treatment of AIDS over the last decade. The simultaneous expansionof both ARV therapy and prevention is critical in the long term. Some commentatorsargue that unless the incidence of HIV infections is dramatically reduced, HIV treat-ment will not be able to keep pace with all those who need therapy. For example, whilethe World Health Organization established its ‘3 by 5’ initiative, a project that aims tohave 3 million people on ARVs by the end of 2005, 5 million new infections occur eachyear (Global HIV Prevention Working Group 2004). A number of studies conducted insub-Saharan Africa report high levels of HIV infection in stable, ongoing sexual rela-tionships (Lindan et al. 1991; Caraël, Ali & Cleland 2001). Obviously, married andcohabiting relationships do not represent a safe haven from HIV infection, and a press-ing public health priority is to legitimate condom use within these relationships. Thepurpose of this chapter is to redress the imbalance by examining condom use withinmarital and cohabiting partnerships.
It is important to begin this discussion with a cautionary note with regard to the gener-alisation of the results. Though the two study areas were selected to be typical of low-income parts of KwaZulu-Natal, the sample was not designed to be statisticallyrepresentative. In addition, the number of couples interviewed for the study was rela-tively small. Furthermore, one limitation inherent in cross-sectional data is that they aresubject to ambiguities of causal interpretation. However, a particular strength of thestudy design is the collection of similar cognitive, attitudinal and behavioural data fromboth partners in primary sexual relationships.
In some regards, the results are consistent with those of many other studies in East andSouthern Africa. Prevention programmes have been very successful in raising awarenessof the methods of family planning. Condoms are widely recognised as a highly effectivemethod of HIV prevention. However, the nature of the sexual relationship does influ-ence condom use. Condoms are less acceptable in marital than in non-marital relation-ships. Men are more likely than women to express negative attitudes to condom usewithin marriage. Women feel a greater risk of HIV infection than men. However, thecentral message is more positive and challenges widely held views that resistance tocondoms within marriage is immutable. No direct estimate of trends in condom use ispossible, but the pattern of results suggests that the infiltration of condoms in marriedand cohabiting relationships in KwaZulu-Natal is occurring.
Almost 15 per cent of men and 18 per cent of women reported that they used condomsoccasionally or consistently. One would expect a high consistency of reporting amongcouples because of their daily associations and common living conditions (Miller, Zulu& Watkins 2001). Almost 77 per cent of partners reported that they did not use condomswhile 10 per cent said that they did use condoms either occasionally or consistently.There is a high level of agreement about condom use. The aggregate consistencybetween husband’s and wife’s reports is impressive and the nature of statistical associa-
T H E D E V E L O P M E N T D E C A D E ? S O U T H A F R I C A , 1 9 9 4 – 2 0 0 4
356
Free
dow
nloa
d fr
om w
ww
.hsr
cpre
ss.a
c.za
tions is coherent and convincing, a clear sign that condoms are used in marital andcohabiting relationships. One major limitation of the study is the vagueness of the term‘occasional’. Obviously, it implies inconsistent protection but the degree of protectionmight range from 10 per cent of coital acts to 90 per cent. Clearly, a priority for futurestudies is to obtain more precise measures of use. Nevertheless, ‘occasional’ use doeshave the positive connotation that use is continuing, albeit intermittently.
The bivariate analysis shows that condom use in marital and cohabiting relationshipscorresponds strongly with level of education and urban residence. It is possible, asargued by Lagarde et al. (2001: 1407), that ‘the association of condom use with educa-tion could reflect increased exposure to condom prevention campaigns or greater skillsin negotiating condom use’. The key finding, however, is more surprising and interest-ing. In the multivariate model, the wife’s perceived risk of infection from her husbandemerges as the dominant predictor of use. The husband’s attitude to condoms had nosignificant net effects on use. Most studies in sub-Saharan Africa have found that menare often the primary decision-makers about condoms and, as a result, women have dif-ficulty negotiating use (Chikamata, Chinganya, Jones & RamaRao 2002). For example,Kapiga, Lwihula, Shao & Hunter (1995) found that the majority of women in their studyreported not using condoms because of partner opposition. Even when women arehighly motivated to use condoms, they may not do so because of opposition from theirpartners (Kapiga et al. 1995). However, the multivariate analysis shows that the wife’sperceived risk of HIV infection overrides the husband’s resistance to condom use inmarital and cohabiting relationships. This suggests that women are able to translate theirconcern about HIV infection into protective behaviour, regardless of the views of thehusband.
Several studies have found that perception of risk is strongly related to the increase inself-protective behaviour (Lindan et al. 1991; Adih & Alexander 1999; Akwara, Diamond& Madise 2001). This is largely because the adoption of protective behaviour is unlikelyto occur unless the person is aware of the risk. Prevention programmes have an impor-tant role to play in creating greater awareness of the risk of HIV infection within maritaland cohabiting partnerships. Indeed, the advent of ARVs and the expansion and inte-gration of voluntary counselling and testing into health systems are also likely to lead toa more accurate assessment of risk of HIV infection.
As noted, the promotion of condoms within stable relationships has been a neglectedelement in HIV prevention strategies, largely because of a widely held belief that resist-ance is too strong to change. The results suggest that some couples are willing to usecondoms at least some of the time if they perceive themselves to be at risk of HIV infec-tion from their partners. By showing that modification of behaviour in response to HIVhas actually started in KwaZulu-Natal, we hope that prevention programmes will beencouraged to broaden their focus to more effectively meet the needs of married andcohabiting couples.
C O N D O M U S E I N M A R I TA L A N D C O H A B I T I N G PA R T N E R S H I P S
357
Free
dow
nloa
d fr
om w
ww
.hsr
cpre
ss.a
c.za
T H E D E V E L O P M E N T D E C A D E ? S O U T H A F R I C A , 1 9 9 4 – 2 0 0 4
358
Acknowledgement
This research was supported by the Strategic Programme Component on Social Science Research
on Reproductive Health, UNDP/UNFPA/WHO/World Bank Special Programme of Research,
Development and Research Training in Human Reproduction. Further financial assistance was
provided by the Mellon Foundation.
References
Adetunji J (2000) Condom use in marital and non-marital relationships in Zimbabwe, International
Family Planning Perspectives 26: 196–200.
Adetunji J & Meekers D (2001) Consistency of condom use in the context of AIDS in Zimbabwe,
Journal of Biosocial Science 33: 121–38.
Adih W & Alexander C (1999) Determinants of condom use to prevent HIV infection among youth
in Ghana, Journal of Adolescent Health 24: 63–72.
Akwara P, Diamond I & Madise N (2001) Perception of risk of HIV/AIDS and sexual behaviour. Is
there a causal link? Paper presented at the conference of the Population Association of America,
Washington, DC.
Awusabo-Asare K (1995) HIV infection and contraceptive use in sub-Saharan Africa: Challenges and
prospects. Ghana: Department of Geography, University of Cape Coast.
Bandura A (1994) Social cognitive theory and exercise of control over HIV infection, in
R DiClemente & J Peterson (eds.) Preventing AIDS: Theories and methods of behavioural
interventions. New York: Plenum Press.
Bankole A (1995) Desired fertility and fertility behaviour among the Yoruba of Nigeria: A study of
couple preferences and subsequent fertility, Population Studies 49: 317–28.
Caldwell J (1999) Reasons for limited sexual behavioural change in the sub-Saharan African AIDS
epidemic and possible future intervention strategies, in J Caldwell, P Caldwell & J Anarfi (eds.)
Resistance to behavioural change to reduce HIV/AIDS infection. Canberra: Health Transition
Centre.
Campbell C (1995) Male gender roles and sexuality: Implications for women’s AIDS risk and
prevention, Social Science and Medicine 41: 197–210.
Caraël M, Ali M & Cleland J (2001) Nuptiality and risk behaviour in Lusaka and Kampala, African
Journal of Reproductive Health 5: 83–9.
Cates W (2001) The NIH condom report: The glass is 90% full, Family Planning Perspectives 33(5):
231–3.
Chikamata D, Chinganya O, Jones H & RamaRao S (2002) Dual needs: Contraceptive and sexually
transmitted infection protection in Lusaka, Zambia, International Family Planning Perspectives
28: 96–104.
Department of Health (1999) National HIV and syphilis sero-prevalence survey of women attending
public antenatal clinics in South Africa. Pretoria: Department of Health.
Free
dow
nloa
d fr
om w
ww
.hsr
cpre
ss.a
c.za
C O N D O M U S E I N M A R I TA L A N D C O H A B I T I N G PA R T N E R S H I P S
359
Department of Health (2002) National HIV and syphilis sero-prevalence survey of women attending
public antenatal clinics in South Africa – 2001, Summary report. Pretoria: Department of
Health.
De Zoysa I, Sweat M & Denison J (1996) Faithful but fearful: Reducing HIV transmission in stable
relationships, AIDS 10: S197–203.
Ezeh A (1993) The influence of spouses over each others contraceptive attitudes in Ghana, Studies in
Family Planning 24: 163–74.
Ezeh A, Seroussi M & Raggers H (1996) Men’s fertility contraceptive use and reproductive preferences.
DHS Comparative Studies No. 18. Calverton, MD, Macro International Inc.
Fishbein M, Middlestadt S & Hitchcock P (1994) Using information to change sexually transmitted
diseases-related behaviours, in R DiClemente & J Peterson (eds.) Preventing AIDS: Theories and
methods of behavioural interventions. New York: Plenum Press.
Global HIV Prevention Working Group (2004) HIV prevention in the era of expanded treatment
access. <http://www.kff.org/hivaids/hiv061004pkg.cfm>
Kamya M, Mcfarland W, Hudes E, Ssali A, Busuulwa R & Hearst N (1997) Condom use with casual
partners by men in Kampala, Uganda, AIDS 11: S61–6.
Kapiga S, Lwihula G, Shao J & Hunter D (1995) Predictors of AIDS knowledge, condom use and high
risk sexual behaviour among women in Dar-es-Salaam, Tanzania, International Journal of STD
and AIDS 6: 175–83.
Lagarde E, Caraël M, Glynn J, Kanhonou L, Abega S, Kahindo M, Musonda R, Auvert B & Buve A
(2001) Educational level is associated with condom use within non-spousal partnerships in four
cities of sub-Saharan Africa, AIDS 15: 1399–1408.
Lindan C, Allen S & Caraël M (1991) Knowledge, attitudes and perceived risk of AIDS among
urban Rwandan women: Relationship to HIV infection and behavioural change, AIDS 5:
993–1002.
Mansergh G, Marks G, Appleby P & Murphy S (2000) Is ‘knowing people with HIV/AIDS’ associated
with safer sex in men who have sex with men? AIDS 14: 1845–1851.
Miller K, Zulu E & Watkins S (2001) Husband–wife survey response in Malawi, Studies in Family
Planning 32: 161–74.
Nkau D (1998) How fertility rates vary in different parts of South Africa: The use of GIS in
demography, In Focus Forum 5: 30–3.
Preston-Whyte E (1999) Reproductive health and the condom dilemma: Identifying situation
barriers to HIV protection in South Africa, in Caldwell J, Caldwell P & Anarfi J (eds.) Resistance
to behavioural change to reduce HIV/AIDS infection. Canberra: Health Transition Centre.
SADHS (South African Demographic and Health Survey) (1999) South African demographic and
health survey 1998: Full report. Pretoria/Calverton: South African Medical Research
Council/Macro International.
Free
dow
nloa
d fr
om w
ww
.hsr
cpre
ss.a
c.za
StatsSA (2002) Census in brief: The people of South Africa population census 1996. Pretoria: Statistics
South Africa.
Tanfer K, Grady W, Klepinger D & Billy J (1993) Condom use among US men, 1991, Family Planning
Perspectives 25: 61–6.
WHO (2000) Joint WHO/UNAIDS/UNFPA policy statement: Dual protection against unwanted
pregnancy and sexually transmitted infections, including HIV. Geneva: World Health
Organisation.
Worth D (1989) Sexual decision-making and AIDS: Why condom promotion is likely to fail,
Studies in Family Planning 20: 297–307.
T H E D E V E L O P M E N T D E C A D E ? S O U T H A F R I C A , 1 9 9 4 – 2 0 0 4
360
Free
dow
nloa
d fr
om w
ww
.hsr
cpre
ss.a
c.za
18Framing the South African AIDS epidemic: a social science perspective
Eleanor Preston-Whyte
Introduction
There is little doubt that in the years since it assumed power, it is in the AIDS arena thatthe record of the new South African government and its senior leadership has almostconsistently been, at best, ambiguous and, at worst, tragically wanting. Consequently, thegovernmental response to the AIDS epidemic has been controversial, divisive and, formany of its supporters, bewildering, inexplicable and deeply distressing. It is appropri-ate that ‘ten years on’ in both the South African epidemic and the history of the countryand the new government, South Africans reflect not only on past failures, but on how toaddress these as swiftly as possible. I argue here that an important part of the latterprocess must be to approach the epidemic from more than the usual, predominantlymedical perspective. In Chapter 19, Whiteside and Lee provide a devastating analysis ofthe effects the epidemic will have on the country’s economy. Here I draw attention to thebroader structural conditions that have accompanied and exacerbated the global spreadof the epidemic and from which this country and much of Africa is not immune. These,by implication, go a long way to account for the hold it has been able to establish on thecontinent. Important also, though often largely neglected, is a comprehensive under-standing of how ordinary people are reacting to the appearance of the frightening newcrisis that HIV/AIDS presents in their lives and how they seek to cope with its demands.I hope in a small way to allow their voices to be heard alongside those of the country’sleadership, the medical profession and the health-care providers responsible for thetreatment and care of those infected and affected by AIDS both now and in the future.
A new beginning?
As the horrifying and tragic statistics of death and morbidity in South Africa revealthemselves ever more fully (Barnett & Whiteside 2002; UNAIDS 2004; Abdool Karim &Abdool Karim 2005), and so justify the worst and most ridiculed prognoses of the earlyyears, it may yet be possible to make a new beginning in this country. There are clearsigns in many quarters of government both of an acceptance of the gravity of the situa-tion and of concerted and sincere efforts to provide adequate care and support for AIDSsufferers. This is supported by a wide range of NGOs, CBOs and by an increasing varietyof the organs of civil society. At the same time, although far from extensive in coverage,the slowly increasing availability of antiretroviral (ARV) treatment in both the public
361
Free
dow
nloa
d fr
om w
ww
.hsr
cpre
ss.a
c.za
and private sectors has provided hope to those who are infected and affected by HIV andAIDS. This has also raised the morale of the country as a whole, despite clear evidenceof ever-rising mortality and infection rates (Department of Health 2003) and the stilllargely unresolved presidential stance on the link between HIV and AIDS.
Given commitment from many senior national and regional health providers and fromlarge sections of civil society, the task that now faces the country is nothing less thanimagining, and then building, a new society. It also entails reorganising much of thehealth system to accommodate the continuing devastation of the AIDS epidemic amidthe competing demands of a multitude of other health problems. As such, the challengeis developmental in the broadest sense and, in the last resort, is a matter of political willand leadership at many levels, and particularly at those in which the allocation of thecountry’s human and financial resources are decided.
For a government committed to democratic values, HIV/AIDS presents a major chal-lenge to ensuring basic human rights and equity for all citizens in accessing AIDS careand treatment, and also in providing the knowledge and means for protection fromfuture infection. Whiteside and Lee’s chapter provides a level-headed and comprehen-sive assessment of the socio-economic challenges of HIV/AIDS that now face the gov-ernment and country as a whole. At the conference panel to which the original versionsof their chapter and this one were presented, the challenges of AIDS to medical scienceand to South African AIDS activists, both currently and in the recent past, wereaddressed by Professor Salim Abdool Karim and Dr Mark Heywood, both recognisedleaders in their respective fields. The gist of their contributions is available in numerousrecent publications (see Heywood 2005; Abdool Karim & Abdool Karim 2005). In thischapter, I argue the case for another kind of leadership and understanding – that which isdependent on inserting a broader social science perspective into what are predominantlymedical, activist and economic debates. When it comes to policy recommendations, it iscurrently largely medical models that are most influential. Sometimes, these have beenimported from outside the country, and are less than appropriate to local situations(Preston-Whyte 1999).
Some of the material presented in this chapter draws attention to the challenges ofdeveloping policies and interventions that are based on an understanding of the localcontext and of how ordinary people rather than medical scientists interpret and under-stand the disease and how it affects their daily lives. Universally, HIV and AIDS presentresearchers and policy-makers with major challenges because infection is directly relatedto areas of social, personal and sexual life that are regarded as private, and are usuallyhidden from public gaze. However, AIDS has spawned its own arena of secrecy stem-ming from the fear of openly admitting being infected, or having infected people in thehousehold. This is because infection and even the suspicion of infection evoke virulentstigma both here and globally (Parker & Aggleton 2003). I consider the interaction of thelocal manifestations of the epidemic with the observed international realities of AIDS.In doing so, I draw attention to what is being usefully characterised as the ‘pauperisa-tion’, ‘feminisation’ and ‘juvenilisation’ of the epidemic across the globe,1 and how this
T H E D E V E L O P M E N T D E C A D E ? S O U T H A F R I C A , 1 9 9 4 – 2 0 0 4
362
Free
dow
nloa
d fr
om w
ww
.hsr
cpre
ss.a
c.za
recognition is leading to the need for international as well as local advocacy aroundthese issues. I conclude by raising what is in South Africa a sensitive, but increasinglyheard, explanatory discourse around the apparent difficulty of introducing protectivebehaviour change in the face of the spreading epidemic in terms of the apparentintractability of what is referred to as local culture and tradition.
Although merely the tip of the iceberg, I believe these are some of the critical issues towhich the voice of social science has much to contribute.
The challenge to the social sciences in South Africa
In the early days of the global epidemic, the response from social scientists, with someexceptions, was not as rapid as it should have been, and this was, by and large, the casein South Africa. By the end of the 1990s, however, momentum had built up in thecountry to the extent that it was possible to hold a large conference at the University ofthe Witwatersrand, at which over 100 papers were delivered on the social, cultural andhistorical context of the epidemic in the country. These papers encapsulated the experi-ences of the last decade of academic researchers, activists and NGOs, and represented alandmark for social science in the country. The conference also provided a meetingground and opportunity for many people who had been working largely in isolation, tomeet and talk to others in the field. The discussions and the volume that emanated fromthe conference, and which, like the conference itself, was entitled Aids in Context (Delius& Walker 2002), set the tone for much of the social research and intervention in the following few years. It drew wide attention not only to the behavioural complexities ofthe epidemic, but also to the fact that HIV/AIDS requires a multidisciplinary and amulti-sectoral perspective if it is to be successfully understood and contained. The sameis proving true in the successful planning and execution of behavioural interventionstrategies at both the individual and community levels. The importance of gender andpower relations in increasing the risk of contracting HIV was highlighted, and issues ofthe silences around sexual behaviour and gender violence in relation to AIDS and AIDSstigma were aired in the country largely for the first time. In general, the conference alsoserved to alert journalists and to some extent the public and some potential funders tothe fact that AIDS presents as great a challenge to social science as to medical science. Italso foreshadowed the call to ‘break the silence’, which came to dominate a subsequentinternational AIDS conference and, later, a South African conference on ‘Sex andSecrecy’ (2004), in which secrecy and stigma around HIV/AIDS received considerableattention.
Hidden pleasures and increased vulnerabilities
For researchers and interventionists, exploring and ‘breaking the silence’ meant – andstill means – entering what were, and are still, largely unexplored, taboo and heavilypoliced terrains of human action, experience and thought. These include the highlycharged and traditionally ‘private’ arenas of sexuality and desire. Even the adjectives used
F R A M I N G T H E S O U T H A F R I C A N A I D S E P I D E M I C
363
Free
dow
nloa
d fr
om w
ww
.hsr
cpre
ss.a
c.za
in discussions of these arenas, both by laypeople and often, unfortunately, by unwaryacademics, flag negative attitudes to many of the behavioural nuances and manifestationsof sexuality revealed by early journalistic ‘fact finding’ and later by some researchers.Words like ‘unnatural’, ‘abusive’ and ‘irrational’ abound in the discourses. Moreover,words and phrases like ‘incest’ and, more recently, ‘virgin’ and ‘baby rape’, are loaded withmeaning and often implicit condemnation. Successful intervention must include under-standing, if not necessarily tolerance or acceptance.
Because a good deal of recent social research in HIV has revealed previously hidden and‘private’ behaviours and pleasures, even to obtain funding and to obtain permissionfrom protective and challenged gatekeepers to pursue such studies was, from the first,invariably problematic. The situation remains much the same in many quarters today.Thus, in the early days of the epidemic, the act of calling for sexuality education, letalone free distribution of condoms to adolescents, was greeted by a storm of protest and,on occasions, vilification. Even now in some quarters, advocating the use of condoms iscontroversial. In others, while countenanced, the emphasis is upon limiting the numberof sexual partners each person has, and delaying sexual debut as long as possible and,ideally, until after marriage. In South Africa, where marriage is delayed until well over 30years of age and many women bear children and rear them outside of marriage, this isnot always feasible or realistic. There is, however, a widespread call in many places for anew morality based on the realities of HIV/AIDS. Here the tenets of influential churchesand of long-standing – some would say traditional and outdated – moral standards thattoday are hard to achieve in practice vie with the pressing realities of many people’s lives.Women, and poor women in particular, are vulnerable due to lack of education, finan-cial support and the scarcity of opportunities for long-term, reasonably well-paidemployment. Fortunately, there is now general agreement that information on high-riskbehaviour should be universally available, and protection made accessible to all whowant and require it. The controversy now rages over what this protection should be and,indeed, AIDS activists and others are pointing out that some of the more conservativemeasures advocated may, themselves, have negative repercussions for hard-won genderequality, human rights and the status of minority groups (Scorgie 2002). The latterinclude stigmatised sections of the world and of regional communities. Paradoxically,protection against AIDS risk has opened the gates to the possibility of the marginalisa-tion and victimisation of vulnerable people. The ever-present human tendency to dividethe world into ‘us’ and ‘them’ has proliferated and entered the AIDS arena to create newdivisions and solidify existing ones.
Issues such as these are making the task of the social researcher ever more complex anddemanding, not only in terms of the development of new research methodologies thatare at once sensitive to the prevailing silences around sexuality and AIDS stigma, scien-tifically acceptable and productive. These must also meet the highest of ethical standardsand chart new ethical pathways through a multitude of ethical considerations thatHIV/AIDS research and its publication have brought in their wake. These are not issuesthat I have time to pursue here, but they are receiving a good deal of attention in many
T H E D E V E L O P M E N T D E C A D E ? S O U T H A F R I C A , 1 9 9 4 – 2 0 0 4
364
Free
dow
nloa
d fr
om w
ww
.hsr
cpre
ss.a
c.za
academic circles from both social and, more recently, medical scientists who have beenalerted to the possibility that ‘harm’ to research subjects may, in the case of HIV andAIDS infected and affected people, extend beyond what is normally covered by standardmedical expectations of ‘informed consent’ (Abdool Karim, Abdool Karim, Coovadia &Susser 1998; Abdool Karim 2000; Beyrer & Kass 2002; Benetar 2002; Simpson 2004).
The terrain of ethical behaviour for researchers should be interpreted to include aninjunction to make their findings known and accessible as widely as possible. Thismeans not only writing in academic journals with limited and specialist circulation, butrecognising the responsibility to discuss research findings with the widest possible layaudience. Of particular importance is making the effort and time available to reportfindings to research participants and to policy-makers and those who have the poten-tial influence to bring about policy change and alterations in lay and professional circlesdealing with the epidemic. This must be done in a balanced and non-judgementalmanner on public platforms and in the lay press and media. In some cases, such acourse of action will touch on aspects of human behaviour that are not normally talkedabout openly but which endanger life in the era of HIV/AIDS. This, in itself, may raisepublic opinion against the researcher concerned and possibly have negative repercus-sions for the research endeavour itself. In some cases, it may mean engaging activelywith public misconceptions about the epidemic and the social factors that exacerbateits spread. With these strictures and preliminary remarks on the work and potentialrole of social science in the epidemic, I turn to consider some of the major character-istics of the epidemic, at both the global and local levels, to which social scientists havedrawn attention.
Global versus local realities
A comparative reading of the ever-growing literature on HIV and AIDS across the worldindicates a number of striking commonalities. It is important to list these, but I do sowith the caveat that in each region or country they tend to be combined differently, andthey interact in different ways, both with each other and with local contextual factors.While it is useful for clarity of analysis to distinguish between the global and local levels,in practice, as the growing social science literature attests, it is often difficult to isolatethem completely. Trends and decisions made at the international level often have impor-tant implications for the manner in which issues play out within specific countries andregions, and international pressures as well as funding streams have major impacts onthe course of events at the local level. At some point, however, it is individuals and localcommunities who feel the impact of forces of which they may have relatively littleunderstanding. Perhaps the most striking example of this is that many of the scientificadvances in understanding the epidemic and in treatment and care derive from the workof internationally trained scientists in laboratories situated in the North. It is true thatmany of the drug trials are held in developing countries (a source of continuing con-troversy in itself), but this has not necessarily meant that the benefits of this researchhave been speedily felt in the developing world, including South Africa. This has led to
F R A M I N G T H E S O U T H A F R I C A N A I D S E P I D E M I C
365
Free
dow
nloa
d fr
om w
ww
.hsr
cpre
ss.a
c.za
massive inequities in access to care between North and South (Benetar 2002; Preston-Whyte & Bodasingh 2003). Pertinent currently is the fact that international funding forARV treatment saves lives without the local recipients in many developing countriesbeing fully aware of the source of this funding, or understanding clearly the reason forsudden shortages of treatment or drugs due to the withdrawing of, or changes in,funding streams globally. All these factors serve to increase the feelings of widespreadpersonal helplessness and vulnerability at the local level, to which I will draw attentionlater in the chapter. In a few instances, events at the local or regional level may haveinternational reverberations. This occurs when crises at the local level become widelyknown, often through the media but also through effective mobilisation and campaign-ing, and so prick the conscience of the international community, leading to some formof remedial action. Such events are, however, relatively infrequent and their effects maylast only as long as global attention remains on them.
To social scientists, global realities present themselves as what may be referred to asmacro-structural vulnerabilities that operate and are determined largely at the nationaland international levels. In the absence of mass mobilisation, these are outside thecontrol of the individual and, if they are recognised at all, are largely perceived as such.At the local level, the experiences and reactions to the epidemic may be similar in somerespects, but tend also to differ widely from situation to situation. Taken together,however, the two levels, global and local, at which HIV/AIDS operates contribute towhat is often referred to as an increasing trend toward a pauperisation, feminisation andjuvenilisation of the AIDS epidemic in both the developed and developing world.Currently, these three words are providing an easily accessible clarion call to interna-tional action and, it is hoped, to co-operation and collaboration toward this end. Theyprovide also an apt and appropriate slogan for international advocacy around treatmentand the maintenance of human rights. In what follows, they are used to frame andorganise a summary of the commonalities that a close reading of the growing interna-tional literature on HIV and AIDS suggests. I have attempted to summarise the majorpoints in Figure 18.1. As suggested already, none of the factors explored below operatesin isolation, either of each other, or of other regular cross-cutting influences such as thatof gender and often age and personal status. In this, the holistic perspective adopted bymany social sciences can and does add important insights to a full understanding of thespread of the epidemic.
Poverty, hunger and underdevelopment
Poverty and economic underdevelopment, the latter often exacerbated by global restruc-turing, appear repeatedly to accompany the rapid spread of HIV infection. Although therich and comfortably off are not immune to the disease, poverty and particularly the process of becoming poorer as an individual or a family or at a community level(pauperisation) force people, especially women and increasingly children, into high-riskbehaviour as the price to be paid for survival. This is predominantly economic survival,with sex (often without condoms) for cash as its coinage. It can also mean agreeing to
T H E D E V E L O P M E N T D E C A D E ? S O U T H A F R I C A , 1 9 9 4 – 2 0 0 4
366
Free
dow
nloa
d fr
om w
ww
.hsr
cpre
ss.a
c.za
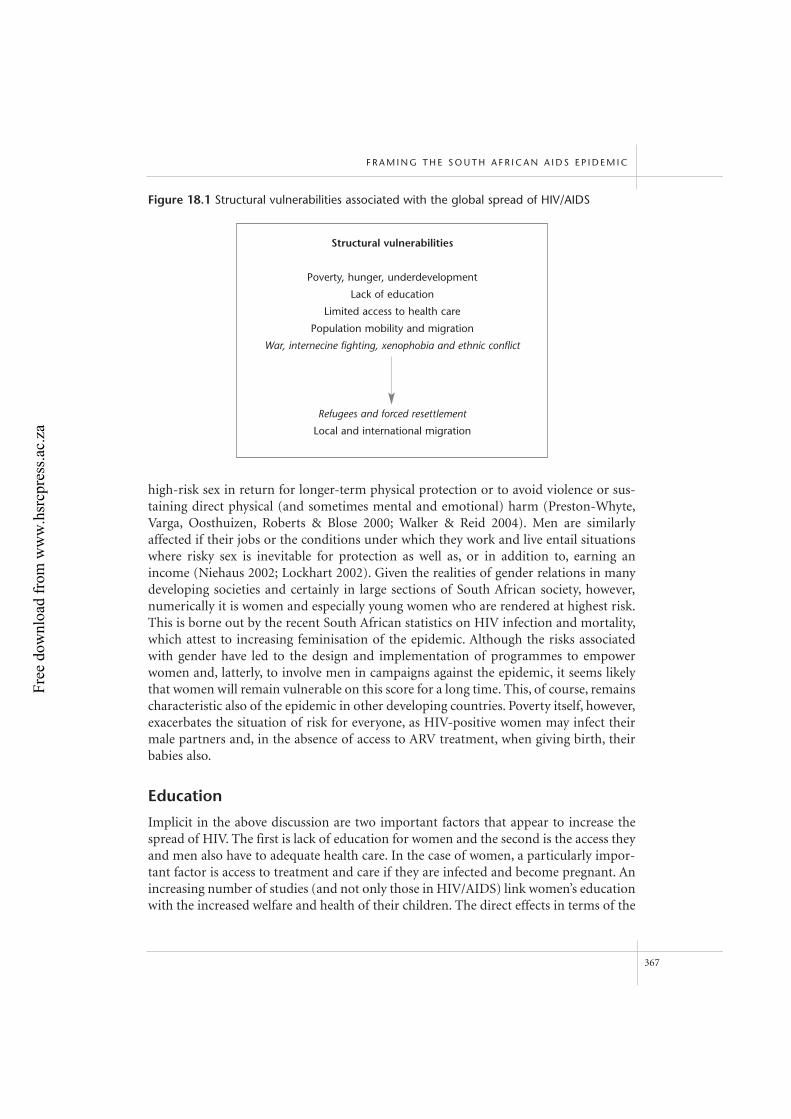
high-risk sex in return for longer-term physical protection or to avoid violence or sus-taining direct physical (and sometimes mental and emotional) harm (Preston-Whyte,Varga, Oosthuizen, Roberts & Blose 2000; Walker & Reid 2004). Men are similarlyaffected if their jobs or the conditions under which they work and live entail situationswhere risky sex is inevitable for protection as well as, or in addition to, earning anincome (Niehaus 2002; Lockhart 2002). Given the realities of gender relations in manydeveloping societies and certainly in large sections of South African society, however,numerically it is women and especially young women who are rendered at highest risk.This is borne out by the recent South African statistics on HIV infection and mortality,which attest to increasing feminisation of the epidemic. Although the risks associatedwith gender have led to the design and implementation of programmes to empowerwomen and, latterly, to involve men in campaigns against the epidemic, it seems likelythat women will remain vulnerable on this score for a long time. This, of course, remainscharacteristic also of the epidemic in other developing countries. Poverty itself, however,exacerbates the situation of risk for everyone, as HIV-positive women may infect theirmale partners and, in the absence of access to ARV treatment, when giving birth, theirbabies also.
Education
Implicit in the above discussion are two important factors that appear to increase thespread of HIV. The first is lack of education for women and the second is the access theyand men also have to adequate health care. In the case of women, a particularly impor-tant factor is access to treatment and care if they are infected and become pregnant. Anincreasing number of studies (and not only those in HIV/AIDS) link women’s educationwith the increased welfare and health of their children. The direct effects in terms of the
F R A M I N G T H E S O U T H A F R I C A N A I D S E P I D E M I C
367
Figure 18.1 Structural vulnerabilities associated with the global spread of HIV/AIDS
Structural vulnerabilities
Poverty, hunger, underdevelopment
Lack of education
Limited access to health care
Population mobility and migration
War, internecine fighting, xenophobia and ethnic conflict
Refugees and forced resettlement
Local and international migration
Free
dow
nloa
d fr
om w
ww
.hsr
cpre
ss.a
c.za
knowledge of a universal language, literacy and facility in speaking the language of mostdoctors and many senior nurses from outside Africa may be important here; so are thegeneral world view, which accompanies being part of a wider global system of informa-tion and communication, and the more difficult to pin down and quantify elements ofthe socialisation process that occur during schooling. In addition, women with no orlittle education find it difficult to compete for well-paid jobs, both with other womenwho have been to school and also with most men. This often has repercussions on themoney at their personal disposal for feeding and educating their children.
Schooling, in general, can bring financial independence from men, though it may notguarantee it. Neither has it been found to necessarily increase the ability of women toprotect themselves from infection through insisting on condom use in long-term per-sonal love and sexual relationships. All things considered, it may, at best, enable womento avoid being forced into sex for survival either for themselves or to support their fam-ilies and children. In some cases, education may increase perceived material needs (andthese may include further education for either themselves or their children). Overall,however, the consensus is that education is a factor in child health and survival, and thismay well be the case with protection against HIV infection. It is probably better to haveit than not.
Access to health care
In terms of access to health care, in general and in reference to HIV/AIDS specifically,we are dealing with both physical access in terms of hospital or clinic coverage and thequality of the care provided to patients. In South Africa, access to speedy care is notassured, though it is better in towns than in many far-flung rural areas. In both cases,patients may spend long hours and precious funds getting to the health facility wherethe queues and waiting time are long. Assessments of the quality of care in particularclinics and hospitals tend to rely on the numbers and degree of training of health-careworkers. Far more difficult to gauge is the extent of true communication possiblebetween patients and clinic staff, and the latter’s understanding of and sympathy forboth the patients’ own perspectives on their illness and the constraints that patientsexperience in accepting and adhering to the health messages, advice and treatmentreceived at the clinic. I give some examples below of the possible gaps in the beliefs ofpatients and the often Western scientific assumptions behind clinic-based messages.Some of the former draw directly on traditional explanations and remedies and theadvice of traditional healers who are widely consulted before and at the same time asWestern medical sources (Leclerc-Madlala 2002c; Xaba 2002). The latter are invariablyderived from and dominated by Western science and, as we will see, offer but littlecomfort in the face of queries deriving from alternative belief and explanatory systemsof health and well-being.
In practice, communication within any health facility is influenced by a host of factors,including a partial or even complete lack of understanding of what an HIV positive
T H E D E V E L O P M E N T D E C A D E ? S O U T H A F R I C A , 1 9 9 4 – 2 0 0 4
368
Free
dow
nloa
d fr
om w
ww
.hsr
cpre
ss.a
c.za
diagnosis means other than that it is deadly. In particular, the necessity of following ARVtreatment regimes closely is seldom fully appreciated. In some cases, it may be virtuallyimpossible for patients to comply with the instructions they have been given if they havenot disclosed their status to family, friends and possibly employers. The existence ofstigma is well known to most health providers, but they are often unsure and untrainedin how to deal with it. Few have the time during busy clinic hours to listen to and copewith the problems their patients experience, not only with stigma, but with the practi-calities of taking the prescribed medicines regularly and correctly. Here the stumblingblock may be as apparently simple as a patient not having anyone or even an alarm clockor watch to remind them of the times pills are due. In addition, it is often necessary forpills to be taken during times of travel or when privacy is impossible to achieve.
In South Africa, the dominant challenges stressed by most reviews of health services arelack of coverage, severely limited funding and a lack of well-trained staff to deliver theservices that are planned and reflected in policy documents. The ‘brain drain’, whichdraws an increasing number of locally trained health personnel out of the country, isalso of growing concern as it leaves the country with a scarcity of personnel to maintainthe routine functions of the hospitals and clinics let alone a cadre of staff who could bereleased for special training in the management of HIV and AIDS. Less easily quantifiedare the problems that revolve around the quality of the service offered in terms ofpatient/provider communication. These may not even be recognised fully in many casesand are, of course, among the most difficult challenges facing the health authorities.However, without what is regarded as reliable information on the beliefs and challengesfacing patients (and staff), senior health officials and policy-makers are not entirely toblame for the situation. Ideally, it should be the role and responsibility of appropriatesocial science research to provide this in an unbiased and sensitive manner. In manycases, it is very unlikely that brief survey techniques will be sufficient or successful in exploring what are often extremely complex issues with many ramifications.Furthermore, findings may challenge the establishment and the accepted order of doingthings in the existing health system. In some instances, the existing training of health-care providers may leave few openings for developing the kind of lateral or innovativethinking that administering or overseeing the complex treatments ARV regimensdemand. Outside qualitative research, which combines observation with interviewingboth patients and health-care personnel, may be more successful. This was, indeed, thecase in a recent qualitative study of the new health system in the Western Cape (Gibson2000). Although not focused on AIDS, it brought to light the blockages in the new deliv-ery system as well as faithfully chronicling the experiences of patients.
Population mobility and migration
The world is becoming increasingly aware of the potential of personal mobility to spreadHIV infection rapidly and extremely effectively. The AIDS epidemic has added a newand potentially deadly dimension to both internal and international migration and alsoto the occurrence of small and large population movements, whatever their cause. In
F R A M I N G T H E S O U T H A F R I C A N A I D S E P I D E M I C
369
Free
dow
nloa
d fr
om w
ww
.hsr
cpre
ss.a
c.za
particular, the role in spreading HIV infection played by war, internecine fighting, ethnicconflict and xenophobia in moving people and disease around the globe cannot be neglected and is now on the agenda of a number high-level international meetings.Solutions are by no means easy to find and, in themselves, may raise a multitude ofhuman rights and humanitarian considerations to add to those that already bedevil thearena. Refugees and refugee populations are at extremely high risk of infection (UNFPA2002; IOM-UNAIDS 2003), and may present risks to countries offering them asylum.The characteristic rape and sexual violence that accompany the subjugation of defeatedpopulations, as well as the need for women and sometimes men and children to bartersex for food and protection, tell their own story. Although there is a growing socialscience literature on, and an increasing humanitarian concern with, the general healthsituation of refugees, the association specifically with HIV and AIDS requires ongoingattention. Attempts or suggestions for intervention, other than the provision of care andtreatment, which are taxing enough, are hard to imagine. For the people concerned, day-to-day survival is likely to take precedence over concerns about HIV infection, even if itwere remotely within their power to protect themselves. Concerns about risk and theeffects of war on the spread of the epidemic lodge at the national and international levelsrather than with people on the ground who must strive merely to survive.
Turning to look at labour migration, within countries and regions as well as interna-tionally, we have a diverse and growing literature to call upon, which is both descrip-tively diverse and highly theorised (Massey, Goldring & Durand 1994; Massey, Arango,Portes 1997, 2000a, 2000b; Koucouci, Pelligrino & Taylor 1998). On the basis of this, itis possible to predict some of the likely impacts that HIV/AIDS will have on migrantpopulations, their countries of origin and return, and on the regions to which theymove. In general, migration, like HIV, is driven and exacerbated by poverty and under-development and specifically by a paucity of local employment and other money-making opportunities. Thus, regular and often large-scale mobility by the poor andaspiring in search of jobs and income is characteristic of developing countries andexpanding nations, and has been for many decades (indeed, centuries). In the case ofSouth Africa, what Wilson has referred to locally as ‘oscillating migration’ (Wilson 1972)was characteristic of the apartheid era when legislative barriers were in place to limit thenumber of black rural dwellers moving to the cities. Only those able to secure employ-ment were permitted to live in and around urban areas designated for whites. By andlarge, this labour force was made up of men whose families remained in the country toeke out a living from the land and proceeds of the migrants’ work in town. At the end oftheir long working careers, migrants retired to their rural homes. While labour migra-tion of much the same description occurred and still occurs elsewhere in the world, theSouth African situation was an extreme and heavily policed version. The inequitiesinvolved in the South African migrant labour system and its dangers to public healthwere well recognised as early as the 1940s and have been much discussed in communityhealth circles ever since. Kark (in Kark & Steuart 1962), for instance, warned of thespread of STDs from urban to rural areas in a classic paper that should have been takenas a warning in the mid-to-late 1980s when a new STD, HIV, began to spread rapidly
T H E D E V E L O P M E N T D E C A D E ? S O U T H A F R I C A , 1 9 9 4 – 2 0 0 4
370
Free
dow
nloa
d fr
om w
ww
.hsr
cpre
ss.a
c.za
across the country. He and other rural doctors also commented vociferously on the poorcoverage of public health facilities in rural areas and on the toll this was taking on thegeneral health and well-being of the rural population of the time. Despite attempts toreverse this situation after the end of apartheid, the coverage is still wanting and theexisting facilities and staff are totally unable to bear the demands of an epidemic of theproportions of HIV/AIDS.
Migration is, of course, by no means limited to the poor, and is increasingly characteris-tic of highly educated and specialised professionals, bureaucrats, technologists and tech-nocrats who move about and serve the interests of the global economy. In general,however, the long periods spent by migrants away from their families and domestic net-works are likely to increase their propensity to form short- and sometimes long-termsexual relationships in receiving areas. Just as in the case of STDs, generally, this increasesthe speed at which HIV infection spreads. With the advent of HIV and AIDS, the gov-ernments of receiving and sending countries are increasingly aware of the health issuesraised by migration, as are international organisations such as the InternationalOrganisation for Migration. For some years, southern African migration has been mon-itored by the Southern African Migration Project. This project recently focused attentionon the interface of migration and HIV/AIDS and has provided a useful review of the localliterature to date (IOM-UNAIDS 2003). While the overwhelming focus of recent researchand public concern has been on poverty and the search for employment, and opportuni-ties to earn in international currencies, as critical factors in the spread of the epidemic,mention is also made of the growing phenomenon of international tourism as a proba-ble factor in the spread of infection. In South Africa, as elsewhere in the world, tourismand service provision to tourists meet tragically in the person of the ubiquitous taxidriver and tour operator. In other parts of the world, the figure of the ‘prostitute’ or com-mercial sex worker, as well as international networks servicing commercial sex work andtrafficking in women, dominate fears about the spread of the epidemic. The example ofthe Thai government in apparently limiting the spread of HIV in its country through theearly control of brothels is often lauded, but is by no means easy is replicate given the verydifferent organisational structures of the commercial sex trade across the world. Somecountries seek to screen potential migrants and also immigrants and exclude those withHIV. Such policies are highly controversial, both internally and in the international arenaand are generally deemed to be largely ineffective due to the long latency period of thedisease and the clearly temporary nature of such provisions. In yet other cases, immigra-tion policy seeks to limit migration from the countries of high infection. This, too, is controversial as it threatens both local and international trade agreements and labourflows. In the long run it also removes the avenue to earning money that migrants nowexploit to the benefit of their families and the domestic economy.
As the AIDS epidemic has spread and worsened, its effects on migrants and migrationpatterns have been noted and commented upon, and the last five or so years have seenstudies developed specifically to map these effects. Early trends for migrants to return totheir homes to die, and for children and particularly girls to be taken out of school or
F R A M I N G T H E S O U T H A F R I C A N A I D S E P I D E M I C
371
Free
dow
nloa
d fr
om w
ww
.hsr
cpre
ss.a
c.za
paid employment in order to care for the dying and take over home care, were notedwith considerable concern. The loss in family income and well-being was also noted, andthe part played by multiple deaths in pushing households into poverty has becomeobvious (May, Maluccio & Haddad 2000). Working in rural Thailand, Knodel et al.provided the first clear indications of the burden that care of the ailing placed on theelderly (Knodel & Wassana 2004; Knodel, Chayovan, Mithranon, Amornsirisomboon &Arunraksombat 2005). Indeed, the world over, it is clear that as the young and middle-aged succumb to AIDS, it is the elders and children who bear the brunt of the epidemic.Comments about the juvenilisation of the global epidemic need to be expanded to takeinto account that currently much of the burden of care falls on the shoulders of theelderly and aging. This reverses the entrenched expectation in the Western world that theresponsibility for supporting and leading society lies in the hands of the young tomiddle-aged. There has been much talk about orphan families and how, with the assis-tance of kin and neighbours, the children of a family in which both parents die manageto survive as a unit. In many cases, of course, the household and family group dispersesand the children who do not and cannot join relatives may move away and survive asbest they can, often on the streets of towns and urban centres. This is a form of migra-tion, in itself, which may or may not result in permanent resettlement.
Interactions at the personal level
As distinct from the structural vulnerabilities that it often accompanies and feeds on,HIV/AIDS affects the way people interact with each other in personal, face-to-face situ-ations. These changes and the ambiguities they often reveal (or, more often, serve tohide) are characteristic largely of local-level interactions that, in turn, are guided bybroader and conventionally accepted ways of behaving. The latter are often conceptu-alised and described, by academics and by lay-people alike, as ‘culture’ or ‘tradition’.Listening to how people speak about both suggests that they are invariably assumed toprovide major stumbling blocks to behaviour change. In truth, many of these conven-tions are and have for a long time been changing, not only in the West, but in much ofthe developing world. In Africa, while manifestly apparent in some arenas, in otherschange has been slow to come. Unequal gender relations are a case in point, and havebeen the subject of a great deal of social research and painstaking analysis, as well asactive advocacy for more rapid change. So far, however, they have proved as intransigentto intervention as economic underdevelopment, poverty and, indeed, the AIDS epi-demic itself (Walker & Reid 2004).
To be more explicit, HIV/AIDS has affected the relationships between men and womenin ways that often confirm older and existing stereotypes and expectations of appropri-ate but unequal behaviour. Fear of the spread of HIV and, on the part of some men, fearfor personal safety have been documented as leading to blame being assigned to womenas the carriers of HIV infection (Leclerc-Madlala 2001). This has played into the handsof conservative male gender stereotypes, and calls for the greater control of women anda retreat from any relaxation of gendered male control over women and, particularly,
T H E D E V E L O P M E N T D E C A D E ? S O U T H A F R I C A , 1 9 9 4 – 2 0 0 4
372
Free
dow
nloa
d fr
om w
ww
.hsr
cpre
ss.a
c.za
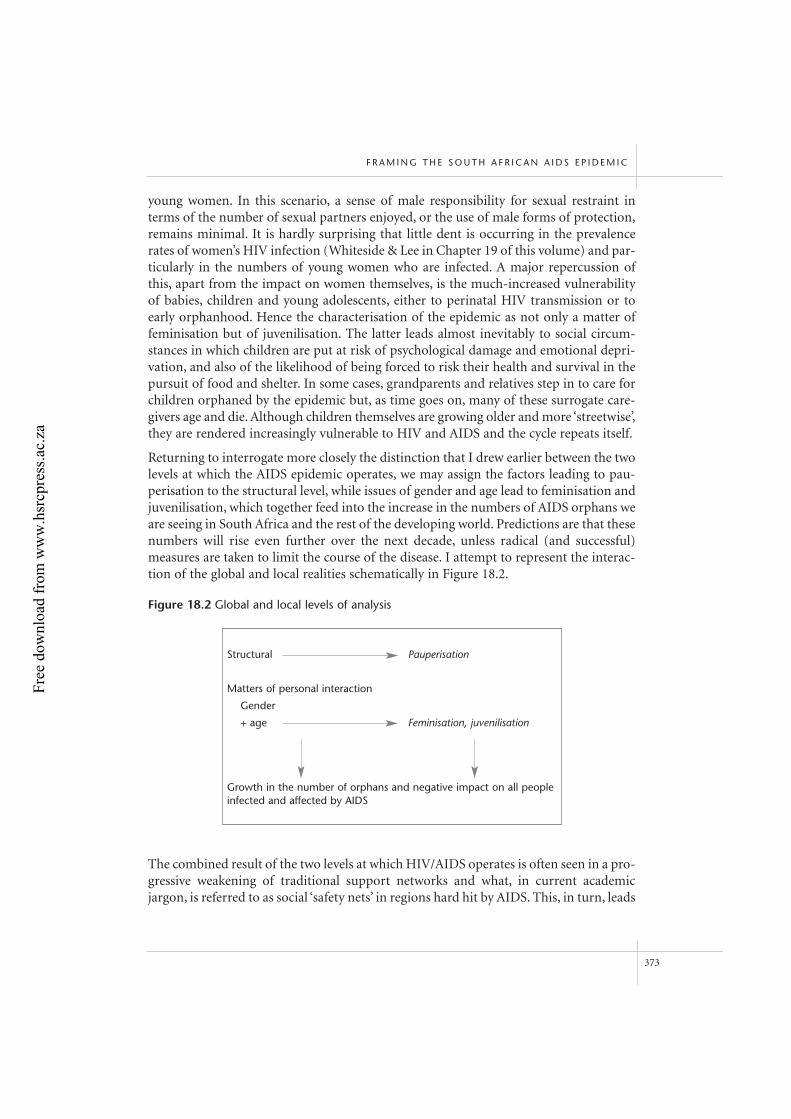
young women. In this scenario, a sense of male responsibility for sexual restraint interms of the number of sexual partners enjoyed, or the use of male forms of protection,remains minimal. It is hardly surprising that little dent is occurring in the prevalencerates of women’s HIV infection (Whiteside & Lee in Chapter 19 of this volume) and par-ticularly in the numbers of young women who are infected. A major repercussion ofthis, apart from the impact on women themselves, is the much-increased vulnerabilityof babies, children and young adolescents, either to perinatal HIV transmission or toearly orphanhood. Hence the characterisation of the epidemic as not only a matter offeminisation but of juvenilisation. The latter leads almost inevitably to social circum-stances in which children are put at risk of psychological damage and emotional depri-vation, and also of the likelihood of being forced to risk their health and survival in thepursuit of food and shelter. In some cases, grandparents and relatives step in to care forchildren orphaned by the epidemic but, as time goes on, many of these surrogate care-givers age and die. Although children themselves are growing older and more ‘streetwise’,they are rendered increasingly vulnerable to HIV and AIDS and the cycle repeats itself.
Returning to interrogate more closely the distinction that I drew earlier between the twolevels at which the AIDS epidemic operates, we may assign the factors leading to pau-perisation to the structural level, while issues of gender and age lead to feminisation andjuvenilisation, which together feed into the increase in the numbers of AIDS orphans weare seeing in South Africa and the rest of the developing world. Predictions are that thesenumbers will rise even further over the next decade, unless radical (and successful)measures are taken to limit the course of the disease. I attempt to represent the interac-tion of the global and local realities schematically in Figure 18.2.
The combined result of the two levels at which HIV/AIDS operates is often seen in a pro-gressive weakening of traditional support networks and what, in current academicjargon, is referred to as social ‘safety nets’ in regions hard hit by AIDS. This, in turn, leads
F R A M I N G T H E S O U T H A F R I C A N A I D S E P I D E M I C
373
Figure 18.2 Global and local levels of analysis
Structural Pauperisation
Matters of personal interaction
Gender
+ age Feminisation, juvenilisation
Growth in the number of orphans and negative impact on all peopleinfected and affected by AIDS
Free
dow
nloa
d fr
om w
ww
.hsr
cpre
ss.a
c.za
to an overall lessening of ‘social capital’ (Putnam 1993; Portes 1998; Schuller, Baron &Field 2000; Grix 2001) and less resilience to crisis within these communities and localgroups. Exacerbating this is a new set of factors added by the AIDS epidemic itself. Thefirst is the widespread stigma and social rejection that I have already noted to be char-acteristic of the AIDS epidemic and that further disrupts social relationships of care andsupport. The second flows from it – marginalisation, and sometimes the victimisation,of not only the individual but whole categories and groups of HIV-positive people(Parker & Aggleton 2003). This process is encapsulated diagrammatically in Figure 18.3,which ends this short discussion of the impact of the epidemic on individuals. I turnnow to consider some of the ways in which those most affected interpret and deal withthe disease at a practical level.
Voices from the epidemic
I have already indicated that I believe one of the objectives of social research in the field ofHIV/AIDS should be to gain a sympathetic understanding of what ordinary people arethinking about, and how they are responding to the epidemic. Here I engage briefly withone such explanation, and the actions to which it leads. The explanation is most often usedto account for apparent failures to take the advice of Western medical science in mattersof HIV protection and, sometimes, AIDS treatment. It centres largely on the supposedlyconservative influence on behaviour of culture and what is often referred to as ‘our tradi-tion’. The issue is not without its controversial aspects as outsiders and particularlyWestern-trained medical professionals react to and condemn such explanations as evi-dence either of intransigence on the part of patients or of their backwardness and crassstupidity. In striking contrast, ‘our culture’ or ‘African tradition’ carries increasingly posi-
T H E D E V E L O P M E N T D E C A D E ? S O U T H A F R I C A , 1 9 9 4 – 2 0 0 4
374
Figure 18.3 Pressure on established patterns of interaction at the local level
Local realities
Weakening of support networks and ‘safety nets’
Less ‘social capital’
HIV/AIDS adds stigma and social rejection, which further disrupts relationships of care and support
Marginalisation and victimisation
Free
dow
nloa
d fr
om w
ww
.hsr
cpre
ss.a
c.za
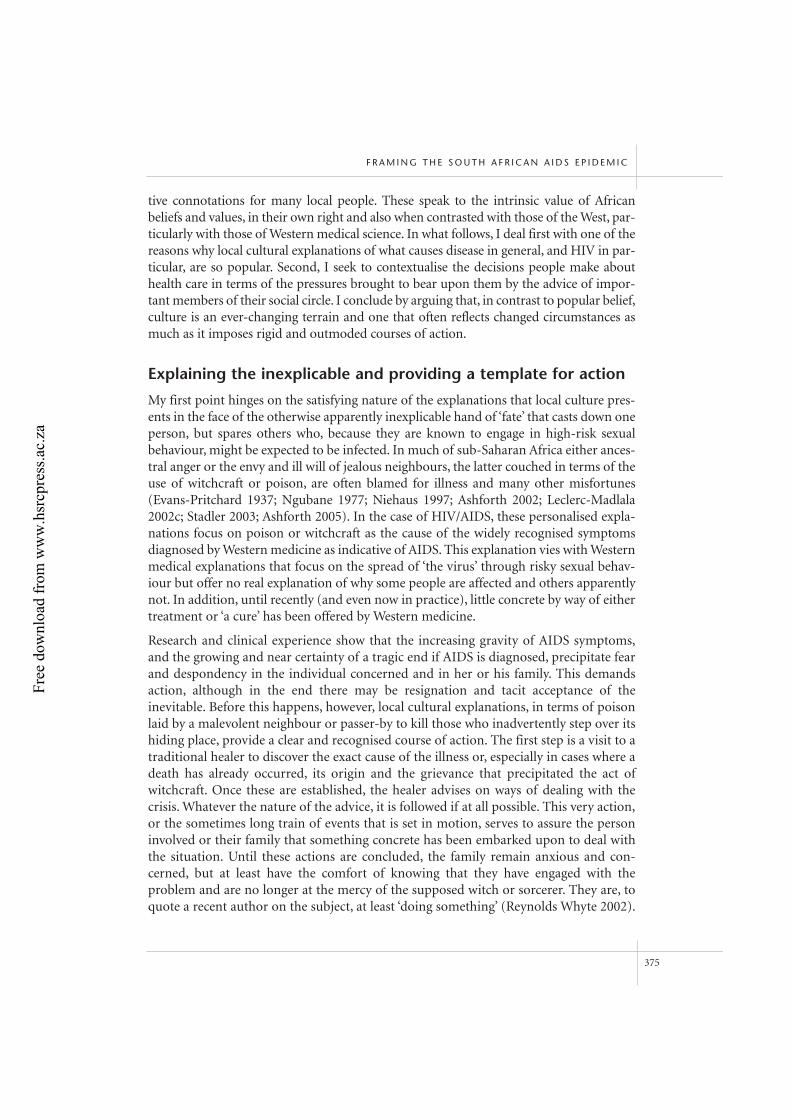
tive connotations for many local people. These speak to the intrinsic value of Africanbeliefs and values, in their own right and also when contrasted with those of the West, par-ticularly with those of Western medical science. In what follows, I deal first with one of thereasons why local cultural explanations of what causes disease in general, and HIV in par-ticular, are so popular. Second, I seek to contextualise the decisions people make abouthealth care in terms of the pressures brought to bear upon them by the advice of impor-tant members of their social circle. I conclude by arguing that, in contrast to popular belief,culture is an ever-changing terrain and one that often reflects changed circumstances asmuch as it imposes rigid and outmoded courses of action.
Explaining the inexplicable and providing a template for action
My first point hinges on the satisfying nature of the explanations that local culture pres-ents in the face of the otherwise apparently inexplicable hand of ‘fate’ that casts down oneperson, but spares others who, because they are known to engage in high-risk sexualbehaviour, might be expected to be infected. In much of sub-Saharan Africa either ances-tral anger or the envy and ill will of jealous neighbours, the latter couched in terms of theuse of witchcraft or poison, are often blamed for illness and many other misfortunes(Evans-Pritchard 1937; Ngubane 1977; Niehaus 1997; Ashforth 2002; Leclerc-Madlala2002c; Stadler 2003; Ashforth 2005). In the case of HIV/AIDS, these personalised expla-nations focus on poison or witchcraft as the cause of the widely recognised symptomsdiagnosed by Western medicine as indicative of AIDS. This explanation vies with Westernmedical explanations that focus on the spread of ‘the virus’ through risky sexual behav-iour but offer no real explanation of why some people are affected and others apparentlynot. In addition, until recently (and even now in practice), little concrete by way of eithertreatment or ‘a cure’ has been offered by Western medicine.
Research and clinical experience show that the increasing gravity of AIDS symptoms,and the growing and near certainty of a tragic end if AIDS is diagnosed, precipitate fearand despondency in the individual concerned and in her or his family. This demandsaction, although in the end there may be resignation and tacit acceptance of theinevitable. Before this happens, however, local cultural explanations, in terms of poisonlaid by a malevolent neighbour or passer-by to kill those who inadvertently step over itshiding place, provide a clear and recognised course of action. The first step is a visit to atraditional healer to discover the exact cause of the illness or, especially in cases where adeath has already occurred, its origin and the grievance that precipitated the act ofwitchcraft. Once these are established, the healer advises on ways of dealing with thecrisis. Whatever the nature of the advice, it is followed if at all possible. This very action,or the sometimes long train of events that is set in motion, serves to assure the personinvolved or their family that something concrete has been embarked upon to deal withthe situation. Until these actions are concluded, the family remain anxious and con-cerned, but at least have the comfort of knowing that they have engaged with theproblem and are no longer at the mercy of the supposed witch or sorcerer. They are, toquote a recent author on the subject, at least ‘doing something’ (Reynolds Whyte 2002).
F R A M I N G T H E S O U T H A F R I C A N A I D S E P I D E M I C
375
Free
dow
nloa
d fr
om w
ww
.hsr
cpre
ss.a
c.za
In many cases, consulting a traditional healer or coming to believe that the symptomsdiagnosed in the clinic as AIDS are, in fact, due to poison does not close the path to fol-lowing other advice offered with respect to treatment. In addition to the clinic or hos-pital, people invariably consult trusted neighbours and their kin, and all these avenuesproduce advice on alternative courses of action to regain health. These, too, may be fol-lowed, either simultaneously or serially, for it is judged wise to leave no stone unturnedin so critical a matter as persistent ill health, possibly untimely death and further malev-olent infection. Reynolds Whyte (2002) argues that all these courses of action help toreassure both the dying and the living that a cure is still possible. It is only when there isclearly no hope that the search is abandoned. Much the same is often the case withincreasing numbers of people across the world who nowadays move between Westernmedical science and alternative and ‘complementary’ medical paradigms. In the Africansituation, where effective treatment is unavailable for ‘the virus’ that Western-traineddoctors and health workers describe, their explanation of AIDS provides little hope andcomfort, nor does it prescribe a definite course of action that might lead to a cure. It isnot surprising that the ailing and their families seek alternative advice and spend theirmoney on what health workers castigate as ‘bogus cures’. In the absence of readily avail-able Western treatment, any authoritative voice may be listened to and the advice itcarries with it added to a growing curative repertoire.
Reynolds Whyte (2002), along with other social scientists, makes another arresting pointbased on research with families and households living in small and isolated rural com-munities – people seldom face illness alone. They do so in the company of their relativesand, unless AIDS stigma is very strong, with nearby friends. All of these people may havedifferent opinions and, particularly in the case of older people and local elders, definiteand persuasive advice to offer. To ignore this would be lacking in respect and in whatReynolds Whyte terms ‘civility’, which she defines as ‘a recognition of your involvementwith other social actors’ (Reynolds Whyte 2002: 182). It is important, and never more sothan in small resource-poor settings, to have (and keep) friends and influential support-ers who may assist one in times of need. The bottom line in all these examples is that themajority of people in South Africa and Africa, generally, live on the borderline of survivaland have few sustainable resources, other than their relationships with others, on whichto fall back in times of need. This potential support is not easily or knowingly jeopardisedand, indeed, is the essence of what is often referred to as social capital (Portes 1998;Schuller et al. 2000; Grix 2001) and of the marked differences between the ability of com-munities characterised by high degrees of social cohesiveness and reciprocity to survivecrises as compared to those in which such binding mechanisms are limited (Putnam1993). In speaking to people about what often seems an unwillingness not to take theadvice of senior family and community figures, resort is often made to ‘our culture’ in theguise of African tradition, which stresses respect for age and seniority.
I turn now to consider a final issue that is often neglected in discussions of the role oflocal culture in HIV/AIDS. This is its flexibility and creativity. An excellent example ofthis comes from the South African lowveld, where Stadler (2003) reports the develop-
T H E D E V E L O P M E N T D E C A D E ? S O U T H A F R I C A , 1 9 9 4 – 2 0 0 4
376
Free
dow
nloa
d fr
om w
ww
.hsr
cpre
ss.a
c.za
ment of what he calls local ‘moral scripts’ relevant to the fast encroaching AIDS epi-demic. Gender differences, in particular, are reflected in gossip and stereotyping, in thatmen and women are seen as open to risk of HIV infection for strikingly differentreasons. The former are portrayed as powerful because they have more access to paidemployment than women. They are, however, also branded as womanisers who prey onwomen needing cash. This brings its own punishment, however, in terms of HIV infec-tion. Women, in contrast, are portrayed as the prey of men, but they are seen also asusing their ‘beauty’ to ensnare and exploit them. In doing this, they, in turn, ‘buy theirown coffins’. The message that having many sexual partners is dangerous and should beavoided is clear. Stadler argues that in this way a new morality appropriate to the AIDSsituation is developing and is reinforced every time these gender stereotypes are usedand repeated. In this manner, new local cultural forms are developing that belie the con-ventional wisdom that men cannot be expected to change their sexual habits becausethese are deeply embedded in ‘African culture’. Much the same process of subtle culturalchange, although in this case one that has been carefully planned and executed, is to beseen in the Treatment Action Campaign’s (TAC) public stance that with the advent ofARV treatment AIDS no longer constitutes a death sentence (Friedman & Mottiar2004). Their current campaign, which is based on public messages transmitted directlyfrom people living successfully with AIDS, is an example of the sensitive and skilful useof the media to change attitudes and so influence behaviour. The TAC is, indeed, in thebusiness of actively changing local culture.
Cultural change is not always positive, however. Scrutinising the case of the new stereo-type of women that Stadler reports from the lowveld gives the proponents of genderequality some cause for concern. Although the message of reducing partners has a pos-itive effect in stemming the spread of the epidemic, it is made alongside a negative imageof women that brands them as avaricious to the point of cynically and uncaringly offer-ing sex to men for money. This echoes comments made by Leclerc-Madlala (2002a) tothe effect that women in KwaZulu-Natal are demonised as the carriers of HIV and,therefore, are seen as increasingly dangerous to men in the time of AIDS. These devel-oping stereotypes immediately sound a warning note. Deeply conservative culturalforms from the past may be reinforced as easily as progressive and adaptive ones aredeveloped and may, in fact, be consciously manipulated to serve particular and, in thiscase, conservative male interests (Scorgie 2002).
Culture and ‘tradition’ need to be treated with care by researchers, interventionists andleaders. Nonetheless, the bottom line illustrated by the examples above suggests thatculture, although often blamed by outsiders for the conservatism that they assumeimpedes the acceptance of Western medical science, may, in fact, be an important forceand tool in building and securing social capital and providing psychological support andthe comfort of alternative action that is vital in the absence of adequate supplies ofWestern-developed and controlled medications.
In concluding this chapter, I return to the call I made earlier to social scientists workingin the HIV/AIDS arena to make their professional knowledge and research findings
F R A M I N G T H E S O U T H A F R I C A N A I D S E P I D E M I C
377
Free
dow
nloa
d fr
om w
ww
.hsr
cpre
ss.a
c.za
available in the service of public debate and intervention. In the latter vein, Stadler(2003) recommends that local intervention messages should be built upon existing andcurrently apposite local images (developing ‘moral scripts’) of both men and womenwho do not indulge in risky unprotected sex. He points out, as many others in the fieldhave done, that men must be targeted in tandem with women in HIV/AIDS campaigns.In this manner, his work indicates that the study of local culture is not merely of arcaneinterest – the information it gleans has the potential to be put to practical ends to fightthe spread of the HIV epidemic.
Note
I am indebted to Richard Parker in one of whose lectures I first heard use being made of these terms.
Indeed, he and his colleagues are leaders in exploring these processes in a range of different social
and economic situations.
References
Abdool Karim S (2000) Globalisation ethics and AIDS vaccines (editorial), Science 288: 2129.
Abdool Karim Q, Abdool Karim S, Coovadia H & Susser M (1998) Informed consent for HIV testing
in a South African hospital: Is it truly informed and truly voluntary? American Journal of Public
Health 88: 637–40.
Abdool Karim S & Abdool Karim Q (eds.) (2005) HIV/AIDS in South Africa. Cambridge: Cambridge
University Press.
Ashforth A (2002) An epidemic of witchcraft: The implication of AIDS for the post-apartheid state,
African Studies 61: 121–43.
Ashforth A (2005) Witchcraft, violence, and democracy in South Africa. Chicago: University of
Chicago Press.
Barnett T & Whiteside A (2002) AIDS in the 21st century: Disease and globalisation. Basingstoke:
Palgrave.
Benetar S (2002) Reflections and recommendations on research ethics in developing countries,
Social Science and Medicine 54: 1131–41.
Beyrer C & Kass E (2002) Human rights, politics and reviews of research ethics, The Lancet 360:
246–51.
Delius P & Walker L (2002) AIDS in context, African Studies 61: 5–12.
Department of Health (2003) National HIV and syphilis antenatal seroprevalence survey in South
Africa, 2003. Pretoria: DOH.
Evans-Pritchard E (1937) Witchcraft, oracles and magic among the Azande. Oxford: Clarendon Press.
Friedman S & Mottiar S (2004) A rewarding engagement? The Treatment Action Campaign and the
politics of HIV/AIDS. Centre for Civil Society, University of Natal, Durban.
Gibson D (2000) Negotiating the new health systems in Cape Town, South Africa: Five case studies of
the chronically ill, Medical Anthropology Quarterly 15: 515–32.
T H E D E V E L O P M E N T D E C A D E ? S O U T H A F R I C A , 1 9 9 4 – 2 0 0 4
378
Free
dow
nloa
d fr
om w
ww
.hsr
cpre
ss.a
c.za
Grix J (2001) Social capital as a concept in the social sciences: The current state of the debate,
Democratization 8: 189–210.
Heywood M (2005) The price of denial. <http://www.tac.org.za> accessed 1 March 2005.
IOM-UNAIDS (2003) Refugees and internally displaced persons (IDPS), in Mobile population and
HIV/AIDS in the southern African region, desk review and bibliography in mobile populations.
<http://www.iom.org.za0>
Kark S & Steuart G (eds.) (1962) A practice of social medicine. A South African team’s experience in
different African communities. Edinburgh: E&S Livingstone.
Knodel J, Chayovan N, Mithranon P, Amornsirisomboon P & Arunraksombat S (2005) Thailand’s
older population: Social and economic support as assessed in 2002. PSC Research Report 05-471.
Population Studies Center, Institute for Social Research, University of Michigan.
Knodel J & Wassana I (2004) The economic consequences for parents of losing an adult child to
AIDS: Evidence from Thailand, Social Science & Medicine 29: 987–1001.
Leclerc-Madlala S (2001) Virginity testing: Managing sexuality in a maturing HIV/AIDS epidemic,
Medical Anthropology Quarterly 15: 533–52.
Leclerc-Madlala S (2002a) On the virgin cleansing myth: Gendered bodies, AIDS and ethnomedicine,
Journal of AIDS Research 1: 87–95.
Leclerc-Madlala S (2002b) Youth, HIV/AIDS and the importance of sexual culture and context, Social
Dynamics 28: 20–41.
Leclerc-Madlala S (2002c) Traditional healers and the fight against HIV/AIDS in South Africa, in
Bodies and politics: Healing rituals in the new South Africa, Les Cahiers de l’IFAS. Johannesburg:
IFAS.
Lockhart C (2002) Kunyenga, ‘real sex’, and survival: Assessing the risk of HIV infection among
urban street boys in Tanzania, Medical Anthropology Quarterly 16: 294–311.
Massey D, Arango J, Koucouci A, Pelligrino A & Taylor E (1998) Worlds in motion: Understanding at
the end of the millennium. Oxford: Oxford University Press.
Massey D, Goldring L & Durand J (1994) Continuities in transnational migration: An analysis of
19 Mexican communities, American Journal of Sociology 99: 1492–533.
May J, Maluccio J & Haddad L (2000) Social capital and development in South Africa, Journal of
Development Studies 36: 54–81.
Ngubane H (1977) Body and mind in Zulu medicine. London: London Academic Press.
Niehaus I (1997) Witches, mysteries, rumours, dreams and bones: Tensions in the subjective reality of
witchcraft in the Mpumalanga lowveld, South Africa. Johannesburg: University of the
Witwatersrand, Institute for Advanced Social Research.
Niehaus I (2002) Renegotiating masculinity in the South African lowveld: Narratives of male-to-male
sex in labour compounds and prisons, African Studies 61: 77–120.
Parker R & Aggleton P (2003) HIV and AIDS-related stigma and discrimination: A conceptual
framework and implications for action, Social Science and Medicine 57: 13–24.
Portes A (1997) Neoliberalism and the sociology of development: Emerging trends and unanticipated
facts, Population and Development Review 23: 229–59.
F R A M I N G T H E S O U T H A F R I C A N A I D S E P I D E M I C
379
Free
dow
nloa
d fr
om w
ww
.hsr
cpre
ss.a
c.za
T H E D E V E L O P M E N T D E C A D E ? S O U T H A F R I C A , 1 9 9 4 – 2 0 0 4
380
Portes A (1998) ‘Social Capital’: Its origins and applications in modern sociology, Annual Review of
Sociology 24: 1–24.
Portes A (2000a) Immigration and the metropolis: Reflections on urban history, Journal of
International Migration and Integration 1: 153–75.
Portes A (2000b) The two meanings of social capital, Sociological Forum 15: 1–12.
Preston-Whyte E (1999) Reproductive health and the condom dilemma: Identifying situational
barriers to HIV protection in South Africa, in J Caldwell, P Caldwell, J Anarfi, K Awusabo-Asare
& J Ntozi (eds.) Resistances to behavioural change to reduce HIV/AIDS infection in predominantly
heterosexual epidemics in Third World countries. Canberra: Health Transition Centre Books.
Preston-Whyte E & Bodasingh U (2003) HIV/AIDS research in South Africa: A new tyranny?
in B Simpson (ed.) Between macroethics and micro realities: Three papers presented at the
decennial meeting of the Association of Social Anthropologists of the Commonwealth. University of
Manchester, July 2003. <http://www.wellcome.ac.uk/assets/wtx022952.pdf>
Preston-Whyte E, Varga C, Oosthuizen H, Roberts R & Blose F (2000) Survival sex and HIV/AIDs
in an African city, in R Parker, R Barbosa & P Aggleton (eds.) Framing the sexual subject:
The politics of gender, sexuality and power. California: University of California Press.
Putnam R (1993) Making democracy work. Civic traditions in modern Italy. Princeton NJ: Princeton
University Press.
Reynolds Whyte S (2002) Subjectivity and subjunctivity: Hoping for health in eastern Uganda,
in R Werbner (ed.) Postcolonial subjectivity in Africa. London: Zed Books.
Schuller T, Baron S & Field J (2000) Social capital: A review and critique, in T Schuller, S Baron
& J Field (eds.) Social capital, critical perspectives. Oxford: Oxford University press.
Scorgie F (2002) Virginity testing and the politics of sexual responsibility: Implications for AIDS
intervention, African Studies 61: 55–75.
Simpson B (ed.) (2004) Between macroethics and micro realities: Three papers presented at the
decennial meeting of the Association of Social Anthropologists of the Commonwealth. University of
Manchester, July 2003. <http://www.wellcome.ac.uk/assets/wtx022952.pdf>
Stadler J (2003) The young, the rich, and the beautiful: Secrecy, suspicion and discourses of AIDS in
the South African lowveld, African Journal of AIDS Research 2: 127–40.
UNAIDS (2004) Report on the global AIDS epidemic. <http://www.unaids.org/ bangkok2004/
report.html>
UNFPA (2002) HIV/AIDS a time bomb for refugees and the internally displaced. <http://www.unfpa.
org/news/news.cfm?ID=110&Language=1>
Walker L & Reid G (2004) Waiting to happen: HIV/AIDS in South Africa. Cape Town: Double
Storey/Juta.
Wilson F (1972) Migrant labour in South Africa. Johannesburg: South African Council of Churches.
Xaba T (2002) The transformation of indigenous medical practices in South Africa (1985–2000),
in Bodies and politics: Healing rituals in the new South Africa, Les Cahiers de l’IFAS.
Johannesburg: IFAS.
Free
dow
nloa
d fr
om w
ww
.hsr
cpre
ss.a
c.za
19 Economic and development issues around HIV/AIDS
Alan Whiteside and Sabrina Lee
Introduction
In 1990 the African National Congress (ANC) was unbanned and so began the complexnegotiations that brought South Africa to its first democratic election in 1994. At thatpoint, the AIDS epidemic in the country was seven years old, the first cases having beenseen among gay white men in 1982. The epidemic was very limited: a number of surveysin KwaZulu-Natal and the then Transvaal had found virtually no HIV; indeed, a surveyof 17 000 mine workers identified only 0.01 per cent HIV prevalence, among migrantsprimarily from Malawi (Abdool Karim 1999).
However, the epidemic was looming and the rapid rate at which it has spread is trulyalarming. In 1990 the first national survey was carried out to estimate HIV prevalencein the South African population. This followed accepted international procedures andtested women attending antenatal clinics (ANCs). At this early stage of the epidemic,prevalence was 0.8 per cent.
National HIV sero-prevalence surveys are conducted annually, and the national preva-lence trend from 1990 to 2003 is shown in Figure 19.1. At the time of the first electionin 1994, HIV prevalence stood at 7.6 per cent. Large regional variations were identified.The highest prevalence was in KwaZulu-Natal where prevalence was estimated at 14.4per cent, compared to 0.2 per cent in the Western Cape. By 1999, and the second elec-tion, prevalence had risen to 22.4 per cent. In 2003, the latest year for which we havedata, the national prevalence was 27.9 per cent (Department of Health 2003).
It takes an average of eight years for people infected with HIV to develop AIDS; thus,while many people are infected, the full impact has yet to be felt. This chapter will showthat the scale of the epidemic is such that the consequences for the economy, society andfor development more generally will be bleak. However, the real tragedy is that the dev-astating impact of the HIV/AIDS epidemic could have been averted by concerted actionon the part of the government and other key players. This chapter will touch on theseissues by asking:• W hy has the development community totally failed to take cognisance of the HIV
epidemic and do more to prevent its spread, in South Africa and globally?• W hy has the South African government failed so dismally to make an appropriate
response to HIV?• W hat action can be taken?
381
Free
dow
nloa
d fr
om w
ww
.hsr
cpre
ss.a
c.za
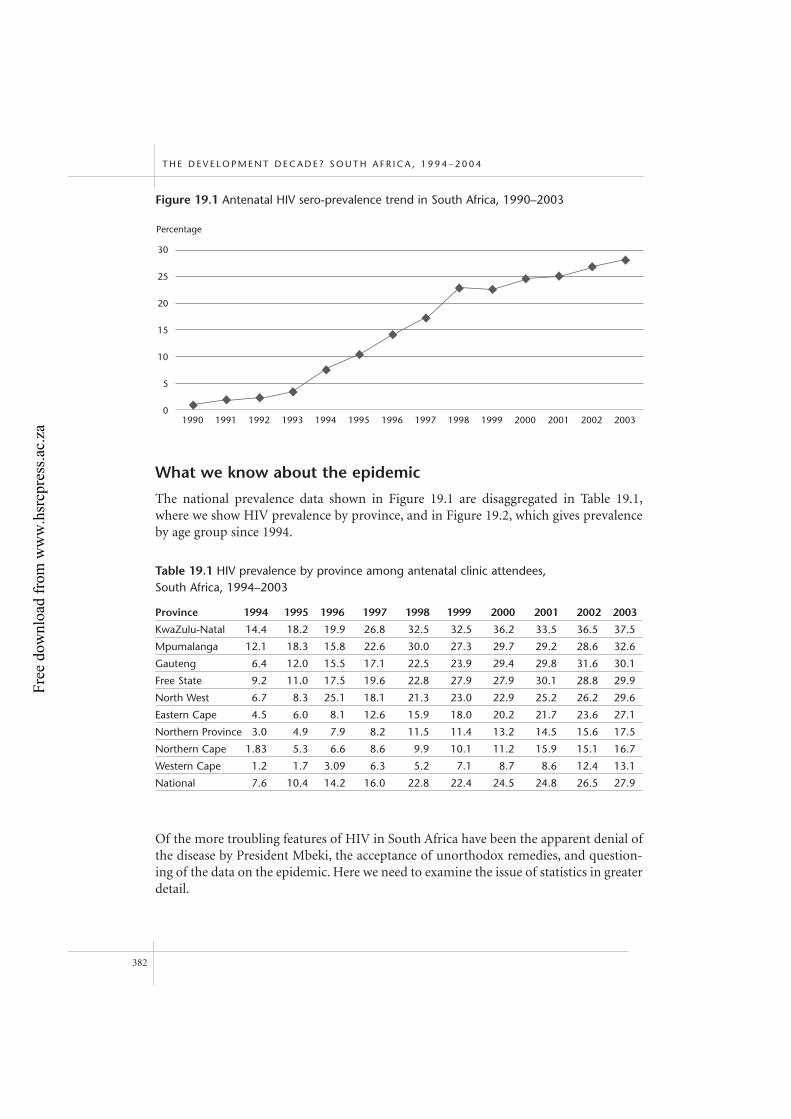
What we know about the epidemic
The national prevalence data shown in Figure 19.1 are disaggregated in Table 19.1,where we show HIV prevalence by province, and in Figure 19.2, which gives prevalenceby age group since 1994.
Of the more troubling features of HIV in South Africa have been the apparent denial ofthe disease by President Mbeki, the acceptance of unorthodox remedies, and question-ing of the data on the epidemic. Here we need to examine the issue of statistics in greaterdetail.
T H E D E V E L O P M E N T D E C A D E ? S O U T H A F R I C A , 1 9 9 4 – 2 0 0 4
382
30
25
20
15
10
5
0
Figure 19.1 Antenatal HIV sero-prevalence trend in South Africa, 1990–2003
1990 1991 1992 1993 1994 1995 1996 1997 1998 1999 2000 2001 2002 2003
Percentage
Table 19.1 HIV prevalence by province among antenatal clinic attendees, South Africa, 1994–2003
Province 1994 1995 1996 1997 1998 1999 2000 2001 2002 2003
KwaZulu-Natal 14.4 18.2 19.9 26.8 32.5 32.5 36.2 33.5 36.5 37.5
Mpumalanga 12.1 18.3 15.8 22.6 30.0 27.3 29.7 29.2 28.6 32.6
Gauteng 6.4 12.0 15.5 17.1 22.5 23.9 29.4 29.8 31.6 30.1
Free State 9.2 11.0 17.5 19.6 22.8 27.9 27.9 30.1 28.8 29.9
North West 6.7 8.3 25.1 18.1 21.3 23.0 22.9 25.2 26.2 29.6
Eastern Cape 4.5 6.0 8.1 12.6 15.9 18.0 20.2 21.7 23.6 27.1
Northern Province 3.0 4.9 7.9 8.2 11.5 11.4 13.2 14.5 15.6 17.5
Northern Cape 1.83 5.3 6.6 8.6 9.9 10.1 11.2 15.9 15.1 16.7
Western Cape 1.2 1.7 3.09 6.3 5.2 7.1 8.7 8.6 12.4 13.1
National 7.6 10.4 14.2 16.0 22.8 22.4 24.5 24.8 26.5 27.9
Free
dow
nloa
d fr
om w
ww
.hsr
cpre
ss.a
c.za
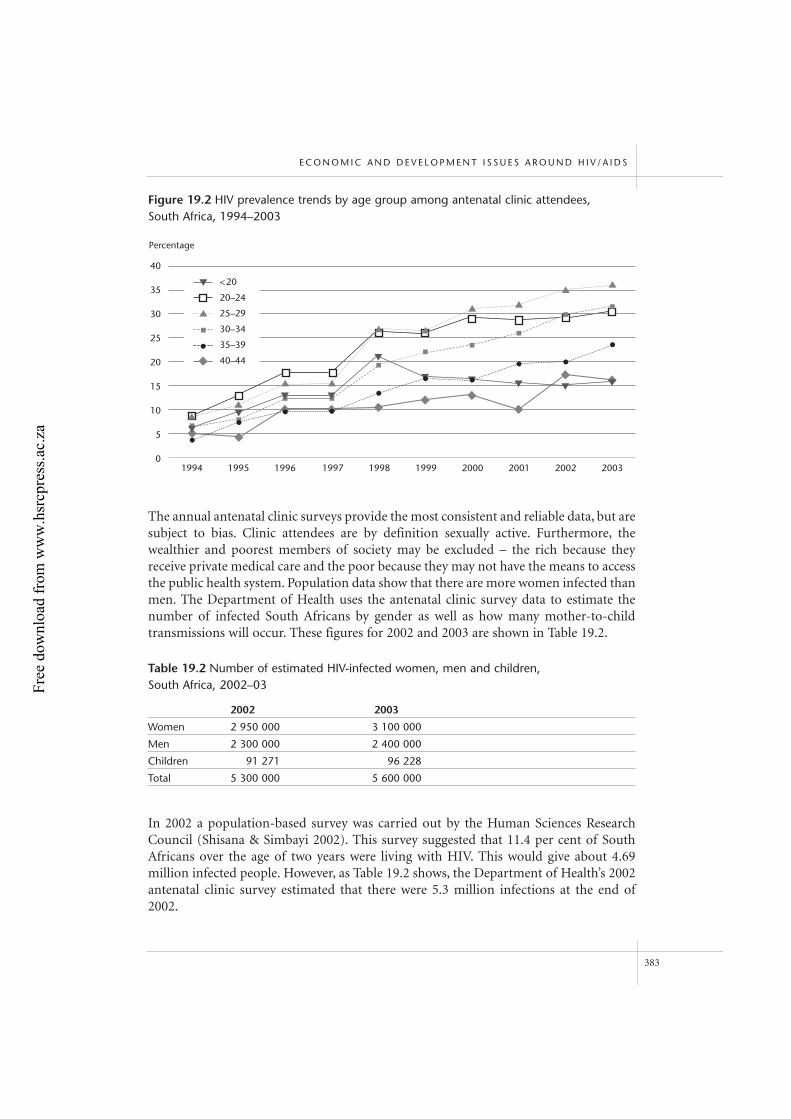
The annual antenatal clinic surveys provide the most consistent and reliable data, but aresubject to bias. Clinic attendees are by definition sexually active. Furthermore, thewealthier and poorest members of society may be excluded – the rich because theyreceive private medical care and the poor because they may not have the means to accessthe public health system. Population data show that there are more women infected thanmen. The Department of Health uses the antenatal clinic survey data to estimate thenumber of infected South Africans by gender as well as how many mother-to-childtransmissions will occur. These figures for 2002 and 2003 are shown in Table 19.2.
In 2002 a population-based survey was carried out by the Human Sciences ResearchCouncil (Shisana & Simbayi 2002). This survey suggested that 11.4 per cent of SouthAfricans over the age of two years were living with HIV. This would give about 4.69million infected people. However, as Table 19.2 shows, the Department of Health’s 2002antenatal clinic survey estimated that there were 5.3 million infections at the end of2002.
E C O N O M I C A N D D E V E L O P M E N T I S S U E S A R O U N D H I V / A I D S
383
40
35
30
25
20
15
10
5
0
Figure 19.2 HIV prevalence trends by age group among antenatal clinic attendees, South Africa, 1994–2003
1994 1995 1996 1997 1998 1999 2000 2001 2002 2003
Percentage
<20
20–24
25–29
30–34
35–39
40–44
Table 19.2 Number of estimated HIV-infected women, men and children, South Africa, 2002–03
2002 2003
Women 2 950 000 3 100 000
Men 2 300 000 2 400 000
Children 91 271 96 228
Total 5 300 000 5 600 000
Free
dow
nloa
d fr
om w
ww
.hsr
cpre
ss.a
c.za
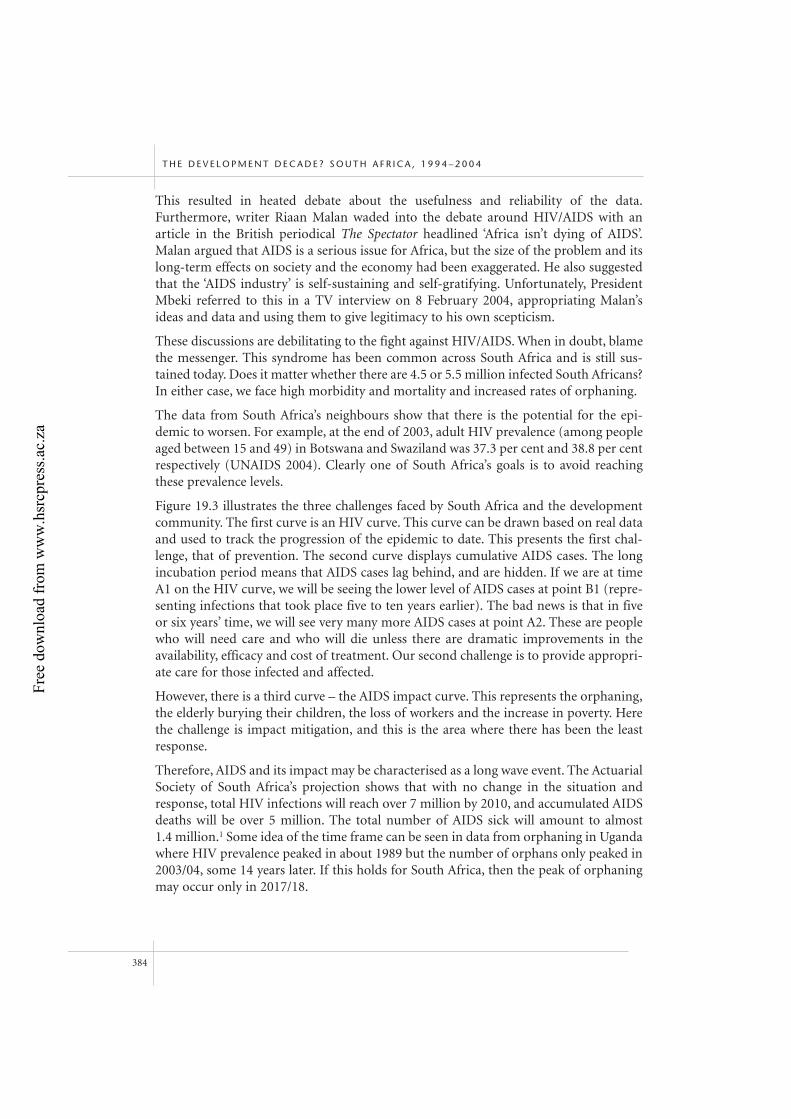
This resulted in heated debate about the usefulness and reliability of the data.Furthermore, writer Riaan Malan waded into the debate around HIV/AIDS with anarticle in the British periodical The Spectator headlined ‘Africa isn’t dying of AIDS’.Malan argued that AIDS is a serious issue for Africa, but the size of the problem and itslong-term effects on society and the economy had been exaggerated. He also suggestedthat the ‘AIDS industry’ is self-sustaining and self-gratifying. Unfortunately, PresidentMbeki referred to this in a TV interview on 8 February 2004, appropriating Malan’sideas and data and using them to give legitimacy to his own scepticism.
These discussions are debilitating to the fight against HIV/AIDS. When in doubt, blamethe messenger. This syndrome has been common across South Africa and is still sus-tained today. Does it matter whether there are 4.5 or 5.5 million infected South Africans?In either case, we face high morbidity and mortality and increased rates of orphaning.
The data from South Africa’s neighbours show that there is the potential for the epi-demic to worsen. For example, at the end of 2003, adult HIV prevalence (among peopleaged between 15 and 49) in Botswana and Swaziland was 37.3 per cent and 38.8 per centrespectively (UNAIDS 2004). Clearly one of South Africa’s goals is to avoid reachingthese prevalence levels.
Figure 19.3 illustrates the three challenges faced by South Africa and the developmentcommunity. The first curve is an HIV curve. This curve can be drawn based on real dataand used to track the progression of the epidemic to date. This presents the first chal-lenge, that of prevention. The second curve displays cumulative AIDS cases. The longincubation period means that AIDS cases lag behind, and are hidden. If we are at timeA1 on the HIV curve, we will be seeing the lower level of AIDS cases at point B1 (repre-senting infections that took place five to ten years earlier). The bad news is that in fiveor six years’ time, we will see very many more AIDS cases at point A2. These are peoplewho will need care and who will die unless there are dramatic improvements in theavailability, efficacy and cost of treatment. Our second challenge is to provide appropri-ate care for those infected and affected.
However, there is a third curve – the AIDS impact curve. This represents the orphaning,the elderly burying their children, the loss of workers and the increase in poverty. Herethe challenge is impact mitigation, and this is the area where there has been the leastresponse.
Therefore, AIDS and its impact may be characterised as a long wave event. The ActuarialSociety of South Africa’s projection shows that with no change in the situation andresponse, total HIV infections will reach over 7 million by 2010, and accumulated AIDSdeaths will be over 5 million. The total number of AIDS sick will amount to almost 1.4 million.1 Some idea of the time frame can be seen in data from orphaning in Ugandawhere HIV prevalence peaked in about 1989 but the number of orphans only peaked in2003/04, some 14 years later. If this holds for South Africa, then the peak of orphaningmay occur only in 2017/18.
T H E D E V E L O P M E N T D E C A D E ? S O U T H A F R I C A , 1 9 9 4 – 2 0 0 4
384
Free
dow
nloa
d fr
om w
ww
.hsr
cpre
ss.a
c.za
E C O N O M I C A N D D E V E L O P M E N T I S S U E S A R O U N D H I V / A I D S
385
The consequences of HIV/AIDS
AIDS is a development disaster. It has the potential to slow growth and undermine thegains made since 1994. In order to understand why this may be the case, we need to lookat the consequences of the disease.
Demographic impact
The demographic impact of AIDS is the most easily identified and measured conse-quence of the epidemic. There is an increase in the mortality rate of people mainly intheir 20s, 30s and 40s. There is also a rise in infant and child mortality for two reasons:firstly, infants infected by mother-to-child transmission have poor life chances (mostwill die before their third birthday) and, secondly, children who are orphans have highermortality than non-orphans.
There is solid evidence of this increased mortality in South Africa. The Medical ResearchCouncil released a study on adult mortality in 2001. It shows increased deaths in menand women by age. Increased mortality was more marked for women than for men.Figure 19.4 shows that a woman aged between 25 and 29 was three and a half times morelikely to die in 1999/2000 than she would have been in 1985 (Medical Research Council2001).
A1A2
T1 T2
B1
Time
Impact
AIDS –cumulative
HIV prevalence
Numbers
A
B
Figure 19.3 Epidemic curves, HIV, AIDS and impact
Free
dow
nloa
d fr
om w
ww
.hsr
cpre
ss.a
c.za
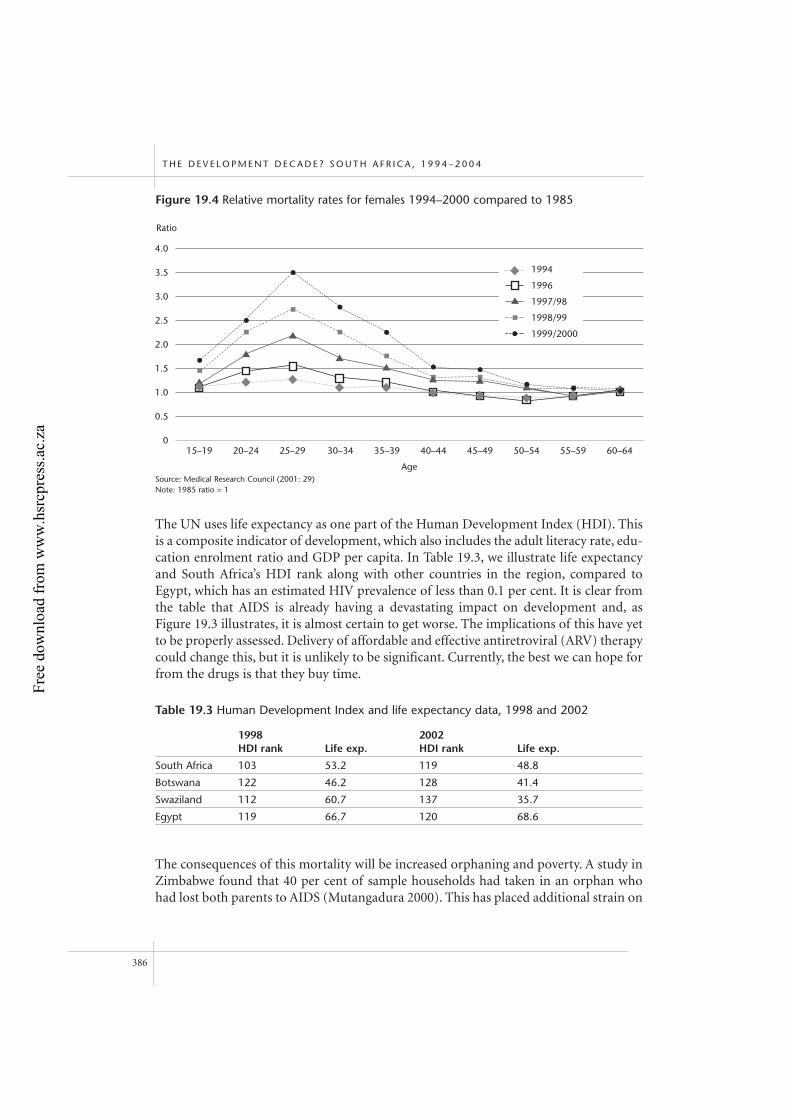
The UN uses life expectancy as one part of the Human Development Index (HDI). Thisis a composite indicator of development, which also includes the adult literacy rate, edu-cation enrolment ratio and GDP per capita. In Table 19.3, we illustrate life expectancyand South Africa’s HDI rank along with other countries in the region, compared toEgypt, which has an estimated HIV prevalence of less than 0.1 per cent. It is clear fromthe table that AIDS is already having a devastating impact on development and, asFigure 19.3 illustrates, it is almost certain to get worse. The implications of this have yetto be properly assessed. Delivery of affordable and effective antiretroviral (ARV) therapycould change this, but it is unlikely to be significant. Currently, the best we can hope forfrom the drugs is that they buy time.
The consequences of this mortality will be increased orphaning and poverty. A study inZimbabwe found that 40 per cent of sample households had taken in an orphan whohad lost both parents to AIDS (Mutangadura 2000). This has placed additional strain on
T H E D E V E L O P M E N T D E C A D E ? S O U T H A F R I C A , 1 9 9 4 – 2 0 0 4
386
4.0
3.5
3.0
2.5
2.0
1.5
1.0
0.5
0
Figure 19.4 Relative mortality rates for females 1994–2000 compared to 1985
15–19 20–24 25–29 30–34 35–39 40–44 45–49 50–54 55–59 60–64
Ratio
1994
1996
1997/98
1998/99
1999/2000
AgeSource: Medical Research Council (2001: 29)Note: 1985 ratio = 1
Table 19.3 Human Development Index and life expectancy data, 1998 and 2002
1998 2002HDI rank Life exp. HDI rank Life exp.
South Africa 103 53.2 119 48.8
Botswana 122 46.2 128 41.4
Swaziland 112 60.7 137 35.7
Egypt 119 66.7 120 68.6
Free
dow
nloa
d fr
om w
ww
.hsr
cpre
ss.a
c.za
household resources and extended family networks. Given the current trends, in 2010the highest proportion of orphaned children – more than one in five – will be in thesouthern African region. Eighty per cent of cases will be as a result of AIDS deaths(UNICEF 2003).
The responsibility for care of orphans and the sick has largely fallen to women, whomake up almost 70 per cent of caregivers according to a survey conducted in SouthAfrica. Women also bear the burden of the disease itself (Steinberg, Johnson, Schierhort& Ndegwa 2002). Women have higher infection rates than men: 56 per cent of HIV positive adults in South Africa are women and they are likely to die younger. The lowsocial and economic status of women in sub-Saharan Africa has rendered them vulner-able to the negative impacts of the epidemic. Women face greater impoverishment,girl children are more likely to be withdrawn from school, and the threat of violence anddiscrimination weighs more heavily on women than on men. AIDS will exacerbategender inequality and reverse many of the gains that have been made to elevate thestatus of women in society.
Demography measures events, but when we focus on deaths and their consequences,there is an important point to be made. Each death is preceded by illness, wretched,debilitating and distressing illness, which has also been impoverishing for many families.
Political consequences
Much has been written and postulated about the security and political consequences ofthis epidemic. It is the first disease to have a special session at the UN Security Council.Indeed, in 2003 the Commission on HIV/AIDS and Governance in Africa was appointedby Kofi Annan and was expected to publish its report at the end of 2005. The idea thatthe disease might threaten global security overstates its reach, but at the local level theimpact on governance will be considerable and it is an area that needs further research.
Recent work by the Institute for Democracy in South Africa (Idasa) has looked at thepolitical impact of the disease. In Zambia there has been a dramatic increase in by-elections since the first reported AIDS cases. Between 1985 and 2003, 102 by-electionstook place, 39 as a result of death – almost three times as many as during the previous20-year period. Idasa also analysed the 2004 election in South Africa. This analysis foundthat the higher the prevalence the less likely young women were to register as voters.AIDS stigma and discrimination were also found to be significant factors preventingpeople living with HIV/AIDS and caregivers from participating in elections (Strand &Chirambo 2004).
Economic impact
The economic impact of the disease can be assessed at various levels from the nationalor macro to the household.
E C O N O M I C A N D D E V E L O P M E N T I S S U E S A R O U N D H I V / A I D S
387
Free
dow
nloa
d fr
om w
ww
.hsr
cpre
ss.a
c.za
Macroeconomic effects
The key concern when looking at macroeconomic impacts is the rate of growth ofnational economies. Evidence of slower economic growth is often more compelling ingetting people to respond to threats posed by HIV/AIDS than confirmation of impact athousehold or firm level. Which government can ignore claims that it will face operatingon a smaller budget, higher levels of poverty and unemployment and decreased foreigninvestment?
From as early as 1992, there were predictions that AIDS would slow economic growth.The degree of impact depended on assumptions about who would be infected and theextent to which illness would be funded by savings. The conclusion was that economicgrowth rates would be between 0.56 per cent and 1.47 per cent lower (Over 1992). In2000, World Bank economist Rene Bonnel used cross-country regressions to assess theimpact of HIV/AIDS. He suggested that the rate of growth of Africa’s per capita GDPhad been reduced by 0.7 per cent per year in the period from 1990–97 (Bonnel 2000).This growth was lowered by a further 0.3 per cent per year in countries also affected bymalaria. Early predictions demonstrated relatively minor impacts on macroeconomicperformance, when compared to more recent models.
South Africa is probably the most studied country with regard to the macroeconomicimpact of HIV/AIDS. Table 19.4 summarises the studies done in 2000 and 2001. The ‘withAIDS’ scenario in each case assumed lower levels of production and a smaller labour force,direct and indirect costs to the business sector, higher government expenditure (particu-larly on health and social welfare) and additional household out-of-pocket spending.
However, a new generation of macroeconomic impact studies suggest that previousassumptions do not appreciate the complexity and full significance of the epidemic,particularly regarding the importance of human capital. The earlier comparisons of‘with AIDS’ and ‘without AIDS’ treated the disease as an ‘exogenous’ influence that was
T H E D E V E L O P M E N T D E C A D E ? S O U T H A F R I C A , 1 9 9 4 – 2 0 0 4
388
Table 19.4 Macroeconomic studies in South Africa, 2000/01
Study Results
ING Barings 2000 (Quattek 2000) Real GDP will be an average 3.1% lower in 2006–2010 and 4.7% lower in 2011–2015.Declines in average annual GDP growth: 0.4% (2006–2010); 0.3% (2011–2015).
Arndt & Lewis (2001) Real GDP will be 20% lower in 2010.GDP growth rates will decline from the late 1990s to 2008 (maximum difference in growth rate: 2.6% in 2008). GDP growth will rebound slightly in 2009/10.
Bureau for Economic Research (2000) Real GDP will be 1.5% lower by 2010 and 5.7% lower by 2015.Declines in average annual GDP growth: 0.1% (2002–2005); 0.3% (2006–2010); 0.9% (2011–2015).
Free
dow
nloa
d fr
om w
ww
.hsr
cpre
ss.a
c.za
added to models derived on the presumption that the workforce is HIV-free. Yet, inreality, HIV/AIDS is an ‘endogenous’ influence, requiring feedback loops to appreciateaccumulative impacts.
A recent World Bank paper suggests that the long-run economic costs of AIDS in SouthAfrica are almost certain to be much higher than predicted to date and could be devas-tating to the national economy (Bell, Devarajan & Gersbach 2003). This is becausehuman capital is transmitted across generations, making an ‘overlapping generations’model more appropriate in understanding how AIDS will impact upon people.According to the authors, AIDS will retard economic growth in the following ways:• b y destroying human capital, particularly of young adults;• b y weakening and breaking down mechanisms that generate human capital and
investment in people, through loss of income and the death of parents; and• b y giving rise to a new generation with little education and knowledge, and
therefore less able to raise their own children and invest in their education.2
‘Endogenous growth models’ are recognised as providing a more accurate assessment ofthe effects of epidemiological crises such as HIV/AIDS on developing countries(Drouhin, Touze & Ventelou 2003). Importantly, such models consider persisting effectson development. They identify productivity variables that act as catalysts to develop-ment, and further consider the impact of HIV/AIDS on these variables. Unfortunately,these are models and they have yet to be applied by politicians or policy-makers.
If macroeconomic growth is slowed or the economy contracts, there will be significantimplications for poverty, government revenue and spending on service delivery. Sectorssuch as health and social services will be hardest hit because not only do they face theimpact of the disease on their staff and other resources, but they are also required toprovide additional care and support.
Sector/firm-level impacts
While sector- or firm-level studies do not attract the same attention as those with amacroeconomic focus, they are important in the development context. The body of lit-erature on this level of impact is growing. However, there is still a dearth of informationon small companies and the informal sector, because of the challenges involved indesigning and carrying out relevant research.
At the firm/sector-level, AIDS is equivalent to an additional payroll cost; it increases thecost of doing business. The best firm studies are those by the Centre for InternationalHealth at Boston University’s School of Public Health. Initially, they looked at sixformal-sector enterprises in South Africa and Botswana (Rosen, Vincent, MacCleod &Fox 2004). The results of these studies showed that under a conservative set of assump-tions, HIV/AIDS among employees added between 0.4 and 5.9 per cent to the annualsalary and wage bill of the firms, the variation resulting largely from differences in end-of-service benefits.
E C O N O M I C A N D D E V E L O P M E N T I S S U E S A R O U N D H I V / A I D S
389
Free
dow
nloa
d fr
om w
ww
.hsr
cpre
ss.a
c.za
While decreases in productivity of those who are HIV-positive are understood to formpart of the cost to companies, this decrease typically evades measurement. Onecontext where measurement of changes in productivity is possible is where workersare paid according to their daily output. The first study looking at the impact of AIDSon productivity was conducted on a tea plantation in Kenya, where workers were paidper kilogram of tea picked (Fox, Rosen, MacCleod & Wasunna 2004). The tea planta-tion research reviewed records of outputs and absenteeism over a six-year period from January 1997 to December 2002. HIV-positive individuals picked on average 3.6 kg/day less tea two to three years prior to death, 5.1 kg/day less one year prior todeath and 9.3 kg/day less approaching death. In the three years leading up to death,HIV-positive individuals used between 3.4 and 11.0 more days sick leave, dependingon the stage of illness.
The impacts resulting from HIV/AIDS, including decreasing productivity, are oftenexacerbated in the public sector when compared to the private sector. Job security isoften seen as a substitute for salary, and the sector has a limited capacity to respond tochanges in its environment. The security of employment is often characterised by betterleave entitlements, superior pension benefits and a lack of systems to ensure high pro-ductivity. This means that public-sector employees would, in most cases, be able to takemore leave and be less productive when illness strikes, without the risk of losing theirjobs. The costs of such benefits are then borne by the government. Government sectors,notably health and social welfare, will have to contend with increased demand and areduced capacity to deliver in a context of HIV/AIDS.
Whether costed or not, it is clear that economic impacts on both the private and publicsectors will be significant. The burden of HIV/AIDS will be shifted to firms or sectorsthat rely heavily on less-dispensable skilled labour and offer more in the way of medicaland end-of-service benefits. Furthermore, firms or sectors that fail to consider theimpact of HIV/AIDS and incorporate this in their planning will encounter difficulties infinancing what could be considered an additional ‘tax’.
Family/household-level impacts
Some of the most devastating and immediate impacts of HIV/AIDS can be seen at thehousehold level. While macroeconomic impacts will unfold over generations, house-hold-level impacts are already evident in countries affected by the epidemic. Researchoften excludes the most seriously affected households, as they are likely to disintegratebefore surveys commence. Another limitation with household-level research is the focuson rural rather than urban or peri-urban households. In addition, it rarely captures thedynamics of household or intra-household allocations and relations that underliehousehold decision-making.
The overwhelming message concerns the close relationship between households affectedby HIV/AIDS and subsequent impoverishment. Not only are HIV-affected householdsgenerally poorer, but there are also changes in income, consumption and expenditure
T H E D E V E L O P M E N T D E C A D E ? S O U T H A F R I C A , 1 9 9 4 – 2 0 0 4
390
Free
dow
nloa
d fr
om w
ww
.hsr
cpre
ss.a
c.za
patterns. Most notably, many impact studies at this level demonstrate that in affectedhouseholds:• m edical and funeral expenses consume a much greater share of household
resources;• less money is spent on food; and • p roportionally fewer resources are given to education.
How do households cope with the economic impacts of HIV/AIDS? Work on this themefrom various countries was summarised and complemented with original research fromSouth Africa by Booysen (2002, 2003). Three coping strategies were regularly employed:borrowing, the sale of assets and the utilisation of savings. While it was found that socialassistance grants play an important role in mitigating poverty fuelled by HIV/AIDS, anadditional study noted that fewer than 16 per cent of AIDS-affected households in SouthAfrica received a government grant or home-based assistance from welfare services(Steinberg et al. 2002). However, AIDS-affected households in other African countriesare rarely able to access any such social assistance.
There are still large gaps in our knowledge of household-level impacts and there is littledirection given for mitigating these. While macroeconomic studies often take the lime-light, there is a need for greater focus on examining the effects of HIV/AIDS at thehousehold and firm level.
The failure of development studies, and ways ahead
The Copenhagen Consensus 2004 project demonstrates that we must consider AIDS as a serious development issue. For this project, a panel of eight economic experts setpriorities for confronting ten great global challenges by answering the question: ‘Whatwould be the best ways of advancing global welfare, and particularly the welfare of devel-oping countries, supposing that an additional $50 billion of resources were at govern-ment’s disposal?’ The highest priority was assigned to measures to prevent the spread ofHIV/AIDS, with the conclusion that costs, although substantial (an estimated $27billion), are small in relation to what stands to be gained by averting nearly 30 millionnew infections by 2010 (Copenhagen Consensus 2004).
The merits of a holistic approach towards tackling the HIV/AIDS epidemic have beenacknowledged and are likely to be most successful in reducing economic impacts in thelong term. Such an approach includes prevention, treatment and care, as well as impact-mitigation strategies. Jeffrey O’Malley, Executive Director of the InternationalHIV/AIDS Alliance from 1993–2003, reflected on ten years of the global response toAIDS by saying:
The struggle against the epidemic has been hampered by the curse of believing inand promoting single magic bullets … We have managed to learn that preven-tion, care, treatment and impact mitigation are all possible. But what works is acombination of strategies, alongside efforts to embed HIV/AIDS responses in the
E C O N O M I C A N D D E V E L O P M E N T I S S U E S A R O U N D H I V / A I D S
391
Free
dow
nloa
d fr
om w
ww
.hsr
cpre
ss.a
c.za
broader and longer-term work of strengthening public health, promoting devel-opment, and respecting and protecting human rights. (O’Malley 2003)
So why has there been this blind spot? It began with the first statistics. AIDS case datafrom 1982 (when the first two cases were seen) to 1991 showed the majority of thoseinfected were gay white men. It was concluded that this was a gay disease and the dataseemed to support this. When the new government came to power in 1994, it was con-fronted by many challenges, and AIDS did not seem to be a priority. An issue was thatmany of those advocating for its prioritisation were either from the old regime or werewhite liberals, and both groups lacked credibility.
Responses occur because of information, observation or instruction (Barnett &Whiteside 2002). Information provided in South Africa was not seen as credible and/orthe messengers were not believable. Observation was difficult because HIV spreadsinvisibly and AIDS follows years later. It is also hard to ascertain causality, and the con-sequences and impact of epidemics are not evident in the short term. It is not like theannual Christmas and Easter death tolls on the roads, immediate and tangible.Instruction could not work – leaders expect to give instructions, not take them.
It is also clear that, for South Africa, the international community has done us nofavours by appropriating the epidemic and seeing it as one it wishes to solve. It is easyfor leaders to say, ‘if you think it’s a problem, you solve it’. This has been made morecomplex by the nature of recent responses where it has been suggested that financial,technical and medical interventions will deal with the issue.
However, development practitioners have fewer excuses. Their short-sightedness hasbeen negligent. We must recognise that AIDS has developmental and economic impacts.It will reduce our working population, decrease our GDP and have a societal impact,which creates a major negative incentive for investors. It will impoverish large numbersof people, create orphans and worsen gender inequality. What needs to be done is notgoing to be easy. It will require conceptualising an uncertain future and thinking ‘outsideof the box’. However, there are certainties. We know how many people are infected, andwe can project mortality and orphaning and estimate morbidity. There is a growingbody of evidence on the devastating impact of this disease on household welfare,poverty and other development indicators.
We are seeing an increasing recognition of these factors in South Africa, and a greatercommitment to the fight against AIDS is evident. This year the government allocatedR4.3 billion from the National Treasury to fight HIV/AIDS over the next three years.These funds are being used to implement the 2003 Comprehensive National Plan onHIV and AIDS Care, Management and Treatment, which aims, among other things, toprovide antiretroviral treatment to 53 000 of the eligible 400 000 South African’s livingwith HIV as at 2005. The current figures fall far short of the target (only 18 500 peopleare receiving treatment to date), and there are gross regional disparities in treatmentaccess.3 Nevertheless, South Africa has the advantage of having a plethora of bilateralagencies, foundations and dedicated civil society organisations bringing additional
T H E D E V E L O P M E N T D E C A D E ? S O U T H A F R I C A , 1 9 9 4 – 2 0 0 4
392
Free
dow
nloa
d fr
om w
ww
.hsr
cpre
ss.a
c.za
resources to the national response. The National AIDS Council also provides a multi-sectoral forum that engages civil society and the private sector in developing and imple-menting effective policies and programme interventions.
AIDS in Africa has been identified by Kofi Annan as ‘the most formidable developmentchallenge of our time’. In many ways, South Africa is beginning, albeit slowly, to rise tothat challenge. There are encouraging signs that determined and collaborative action isbeing taken, and we hope that when South Africa reaches the twentieth anniversary ofmajority rule we will have come a long way towards beating the AIDS epidemic.
Notes
1 Results extracted from the ASSA 2000 AIDS model, downloaded from www.assa.org.za on
23 February 2005.
2 The developers of this economic model applied it to South Africa, because the country has an
advanced epidemic and comparatively good data.
3 AIDS Law Project (ALP). Treatment Action Campaign <www.tac.org.za>, July 2005.
References
Abdool Karim S (1999) Making AIDS a notifiable disease – is it an appropriate policy for South
Africa? South African Medical Journal 89: 609–11.
Arndt C & Lewis J (2001) The HIV/AIDS pandemic in South Africa: Sectoral impacts and
unemployment, Journal of International Development 13: 427–49.
Barnett T & Whiteside A (2002) AIDS in the twenty-first century: Disease and globalization.
Basingstoke: Palgrave.
Bell D, Devarajan S & Gersbach H (2003) The long-run economic costs of AIDS: Theory and an
application to South Africa. Washington: The World Bank.
Bonnel R (2000) HIV/AIDS and economic growth: A global perspective, The South African Journal of
Economics 68: 820–55.
Booysen F (2002) Financial responses of households in the Free State Province to HIV/AIDS related
morbidity and mortality, The South African Journal of Economics 70: 1193–215.
Booysen F (2003) The role of social grants in mitigating the socio-economic impact of HIV/AIDS:
Evidence from the Free State Province. Working Paper No. 56. Cape Town: Centre for Social
Science Research, University of Cape Town.
Bureau for Economic Research (2000) HIV/AIDS and the South African economy. Economic Research
Note No. 8. Stellenbosch: Bureau for Economic Research.
Copenhagen Consensus (2004) Copenhagen consensus: The results. <http://www.copenhagen
consensus.com/>
Department of Health (2003) National HIV and syphilis antenatal sero-prevalence survey in South
Africa. Pretoria: Department of Health.
E C O N O M I C A N D D E V E L O P M E N T I S S U E S A R O U N D H I V / A I D S
393
Free
dow
nloa
d fr
om w
ww
.hsr
cpre
ss.a
c.za
Drouhin N, Touze V & Ventelou B (2003) AIDS and economic growth in Africa: A critical assessment
of the ‘base-case scenario’ approach, in J Moatti, B Coriat, Y Souteyrand, T Barnett, J Dumoulin
& Y Flori (eds.) Economics of AIDS and access to HIV/AIDS care in developing countries. Issues
and challenges. Paris: Agence Nationale de Recherches sur le SIDA (ANRS).
Fox M, Rosen S, MacCleod W & Wasunna M (2004) The impact of HIV/AIDS on labour
productivity in Kenya, Tropical Medicine & International Health 9: 318–24.
Medical Research Council (2001) The impact of HIV/AIDS on adult mortality in South Africa.
Cape Town: Burden of Disease Research Unit, Medical Research Council.
Mutangadura G (2000) Household welfare impacts of adult females in Zimbabwe: Implications for
policy and program development. Paper presented at the AIDS and Economics Symposium,
International AIDS Economic Network (IAEN), Durban.
O’Malley J (2003) Ten years on – the global response to AIDS. News Update, Brighton, UK:
International HIV/AIDS Alliance.
Over M (1992) Macroeconomic impact of AIDS in sub-Saharan Africa. Technical Working Paper No. 3.
Washington DC: World Bank Africa Technical Department, Population, Health and Nutrition
Division.
Quattek K (2000) Economic impact of AIDS in South Africa: A dark cloud on the horizon.
Johannesburg: WEFA, commissioned by ING Barings.
Rosen S, Vincent J, MacCleod W & Fox M (2004) The cost of HIV/AIDS to businesses in Africa,
AIDS 18: 317–24.
Shisana O & Simbayi L (2002) South African national HIV prevalence, behavioural risks and mass
media household survey 2002. Cape Town: Human Sciences Research Council.
Steinberg M, Johnson S, Schierhort G & Ndegwa D (2002) Hitting home: How households cope with
the impact of the HIV/AIDS epidemic – A survey of households affected by HIV/AIDS in South
Africa. Johannesburg: Kaiser Family Foundation.
Strand P & Chirambo K (eds.) (2004) HIV/AIDS and democratic governance in South Africa:
Illustrating the impact on electoral processes. Cape Town: Institute for a Democratic South Africa.
UNAIDS (2004) Report on the global AIDS epidemic: 4th global report. Geneva: Joint United Nations
Programme on HIV/AIDS.
UNICEF (2003) Africa’s orphaned generations. New York: United Nations Children’s Fund.
T H E D E V E L O P M E N T D E C A D E ? S O U T H A F R I C A , 1 9 9 4 – 2 0 0 4
394
Free
dow
nloa
d fr
om w
ww
.hsr
cpre
ss.a
c.za
Section 8Social movements and democratic transition
395
Free
dow
nloa
d fr
om w
ww
.hsr
cpre
ss.a
c.za

Free
dow
nloa
d fr
om w
ww
.hsr
cpre
ss.a
c.za
20Social movements in South Africa: promoting crisis or creating stability?
Richard Ballard, Adam Habib and Imraan Valodia
Introduction
The first non-racial democratic elections on 27 April 1994 opened a new chapter inSouth African political history. One feature of this moment was that many of the leadersof South Africa’s anti-apartheid social movements entered the corridors of politicalpower. As has happened so often in newly liberated countries, the euphoria of the polit-ical transition led many to expect that the need for adversarial social struggle with thestate was over and for a while this expectation tended to inform much civic activity,stifling social struggles. This pattern was by no means uniform. Some social strugglesdid take place. Labour struggles, for example, exploded in the immediate aftermath of the first non-racial general elections. Spontaneous social eruptions also occurredaround the issues of crime and the demarcation of new municipal boundaries. However,in most cases these outbursts quickly dissipated and state–civic engagements came to belargely defined by collaboration.
This collaborative relationship between the state and those in the unions and civics1 waspartly facilitated by the new government’s attempts to create an enabling political andfiscal environment. Corporatist institutions like the National Economic Developmentand Labour Council (Nedlac) were established and non-governmental organisations(NGOs) and community-based organisations (CBOs) were provided representation in this forum through the establishment of a development chamber. Legislation waspromulgated that required the official registration of NGOs and CBOs. Public fundingagencies, like the National Development Agency (NDA), were established to directfinancial resources to the sector. Most of all, the government enabled the subcontractingof development services to a number of civic actors, thereby entrenching their servicedelivery function and the collegiate logic of state–civic relations during the immediatepost-apartheid phase.
However, this honeymoon did not last for very long and social struggles in South Africaemerged surprisingly quickly, coinciding with South Africa’s second democratic electionand the ascension to the presidency of Thabo Mbeki. Three related but distinct devel-opments prompted these struggles. First were those struggles directed against one orother policy of government. The exemplary case here is the Congress of South AfricanTrade Union’s (Cosatu) opposition to the Growth Employment and Redistribution(GEAR) strategy. Second were those struggles focused on the government’s partial
397
Free
dow
nloa
d fr
om w
ww
.hsr
cpre
ss.a
c.za
failure in relation to service delivery. The most noted examples here are the LandlessPeople’s Movement (LPM) and the Treatment Action Campaign (TAC) that are address-ing, respectively, the slow pace of land redistribution and the government’s failure toprovide an adequate response to the HIV/AIDS crisis. Lastly, some struggles emerged in response to the government’s repressive activities. The Soweto Electricity CrisisCommittee, the Concerned Citizens Forum and the Anti-Eviction Campaign were allattempts to organise poor and marginalised communities to resist attempts by local,provincial and national government to cut off electricity and water supplies, and to evictresidents. The sheer scale and diversity of these social struggles have raised concern inofficial circles and prompted a number of scholars to turn their attention to analysingthis emerging phenomenon (see, for example, Marais 1998; Bond 2000).
Our argument in this chapter is that these new social struggles, some of which areemerging out of so-called new social movements (see Melucci 1985; Tilley 1985; Tarrow1994; McAdam, Tarrow & Tilly 2001), are essential for democratic consolidation inSouth Africa.2 This argument goes against the grain of dominant discourse and thepolitical logic governing the transition in the country. According to this, political stabil-ity is of overriding importance, leading to a favouring of strategies and structures thatcontain conflict and contestation and promote political order. It is this logic, forexample, that informs the continuation of the tripartite alliance between the AfricanNational Congress (ANC), Cosatu and the South African Communist Party, the estab-lishment of corporatist structures like Nedlac and the entrenchment of the collegiateform of state–civic relations.
However, this logic also reinforces existing power relations that are decidedly against the interests of the poor and marginalised in our society. Economic transformationscharacterised by the rise of financial capital, the mobility of international capital, theintegration of production systems across the globe and the dominance of multinationalcorporations have fundamentally transformed the relations of power between differentconstituents within the societies of developing nations. The result of neo-liberal econ-omic policies and global economic transformation has been the increasing impoverish-ment of the majority of the citizenry of developing nations, and the rise of what somehave termed delegative or illiberal democracies (O’ Donnell 1994). South Africa is animportant exemplar of this pattern of events. The ANC, as the dominant party in the liberation movement, came to office with an overwhelming electoral mandate but itspolicy concessions over the last decade have been largely to foreign investors and domes-tic capital (both black and white). This is because it has been able to take the citizenry’svote for granted. As a result of some of the developments discussed above, and peculiarcontextual factors, such as the racialised or ethnic character of South Africa’s principalopposition parties – the Democratic Alliance, Inkatha Freedom Party and the NewNational Party – the ANC has not been seriously threatened at the polls. This lack ofsubstantive uncertainty has eroded the citizenry’s leverage vis-à-vis state elites. Policyconcessions in favour of capital are most graphically reflected in the abandonment ofthe Reconstruction and Development Programme (RDP) and the adoption of GEAR.
T H E D E V E L O P M E N T D E C A D E ? S O U T H A F R I C A , 1 9 9 4 – 2 0 0 4
398
Free
dow
nloa
d fr
om w
ww
.hsr
cpre
ss.a
c.za
The net effect has been a transition that has de-racialised the apex of the class structureand has economically favoured the upper echelons and strata of South African society(see Whiteford & Van Seventer 1999).
The antidote to this state of affairs, we believe, is the emergence of substantive uncertaintyin the political system. Political uncertainty is, of course, the essence of democracy. Ittakes one of two distinct forms – institutional and substantive. Institutional uncertainty– uncertainty about the rules of the game – implies the vulnerability of the democraticsystem to anti-democratic forces. Substantive uncertainty – uncertainty of the outcomesof the game – is about the perceptions of ruling political elites in a democratic system onwhether they will be returned to office. The former, institutional uncertainty, is bad fordemocracy as it raises the prospect of a return to authoritarianism. The latter, substantiveuncertainty, is good for democracy for it keeps politicians on their toes and makes themresponsive to their citizenry.
There has been much investigation into and reflection on institutional uncertainty(see O’Donnell & Schmitter 1986; Huntington 1991; O’Donnell 1993) but there isremarkably little work on substantive uncertainty. This should not be surprising giventhat researchers and activists concerned with democratisation have been preoccupiedwith the business of transcending authoritarian regimes and institutionalising democratic ones. Nevertheless, the lack of attention to substantive uncertainty has significant political costs. Indeed, the weakness of many contemporary democracieslies precisely in this arena. Despite the presence of institutional mechanisms that are intended to promote substantive uncertainty – legislative elections, separation ofpowers, civil liberties, opposition political parties, an independent press – this goalstill eludes many of what Huntington (1991) has called the ‘third wave’ democracies.One reason for this is the shift in power from the legislature to the executive ofgovernments across the globe in the last two decades. Another emanates from theinclination of democratisers and democratisation scholars to not rock the boat insocieties undergoing democratic transitions. Fearful of the very real danger of a rever-sion to authoritarianism, these actors have focused on procedural aspects of democ-ratisation and have made significant political and institutional concessions to the stateand economic elites of the authoritarian order. Lastly, it can be explained by the honeymoon phenomenon, where citizens are reluctant to vote against liberationparties who were responsible for co-ordinating the popular rebellions that broughtdown authoritarian regimes.
Nevertheless, we believe that the emergence of substantive political uncertainty is nec-essary if a more human-centred developmental project is to be realised in South Africaand, along with it, democratic consolidation. Our support for and reflections on thevalue of social movements must be understood in this analytical context. With this inmind, the chapter begins by providing an overview of developments in South Africancivil society in the post-apartheid phase. Thereafter, we undertake a review of contem-porary social struggles in the country, to explain why these movements have emerged,who their constituencies are and what influences their choice of strategies and tactics.
S O C I A L M O V E M E N T S I N S O U T H A F R I C A
399
Free
dow
nloa
d fr
om w
ww
.hsr
cpre
ss.a
c.za
We conclude by considering the implications of their emergence for the political andsocio-economic evolution of the society and our analysis of it.
Civil society in post-apartheid South Africa – an overview
Civil society can be defined as ‘the organized expression of various interests and valuesoperating in the triangular space between the family, state, and the market’ (Habib &Kotze 2002: 3; see also Keane 1988). This definition conceptualises civil society as anentity distinct from both the market and the state. While traditional Hegelian definitionsof the term include the market, Jean Cohen and Andrew Arrato’s (1992) comprehensiveand defining work on the subject makes a coherent case for why the market should beexcluded from the definition of civil society. For Cohen and Arrato, the actors of whatthey call ‘political’ and ‘economic’ society control and manage state power and economicproduction and this imparts to them a different strategic purpose and function fromcivil society actors. In their words, political and economic actors cannot ‘subordinate[their] strategic and instrumental criteria to the patterns of normative integration andopen-ended communication characteristic of civil society’ (Cohen & Arrato 1992: ix).This then makes it essential for civil society to be analytically distinguished from ‘botha political society of parties, political organizations, and political publics (in particular,parliaments) and an economic society composed of organizations of production anddistribution, usually firms, cooperatives, [and] partnerships’ (Cohen & Arrato 1992: ix).
Regime change, democratic or otherwise, can have significant impacts on civil society. Itis useful here to briefly consider changes introduced by the democratic government inorder to create an enabling environment for civil society in South Africa. Three initia-tives were undertaken in this regard. First, the security environment was reorganised insignificant ways. Repressive legislation was repealed and a political climate permittingpublic scrutiny and protest activity was established. This was in no way unqualified.Indeed, in the last eight years there have been occasions when security officials and evensome politicians have reacted to legitimate scrutiny and protest in ways reminiscent oftheir predecessors. This notwithstanding, any overall assessment would have to concludethat the security environment is far more enabling now than it has ever been in thecountry.
Second, the post-apartheid regime moved quickly to pass legislation and adopt practicesto reorganise the political environment. Thus, a Non-Profit Act was passed in 1997 thatofficially recognised civil society, created a system of voluntary registration for its constituents and provided benefits and allowances in exchange for NGOs and CBOsundertaking proper accounting and providing audited statements to the government.Shortly thereafter, a Directorate for Non-Profit Organisations was established in theDepartment of Social Welfare to co-ordinate the above processes. In addition, Nedlacwas established with four chambers, the last of which was to cater for representationfrom civil society. Most important in creating a new political environment, however, wasthe state’s willingness to partner with NGOs in the policy development and service-
T H E D E V E L O P M E N T D E C A D E ? S O U T H A F R I C A , 1 9 9 4 – 2 0 0 4
400
Free
dow
nloa
d fr
om w
ww
.hsr
cpre
ss.a
c.za
delivery arenas. This opened up a whole new avenue of operations for NGOs and fundamentally transformed their relations with the state.
Third, an enabling fiscal environment was created to facilitate the financial sustainabilityof this sector. This was in part forced onto the state very early on in the transition, asNGOs confronted a financial crunch when foreign donors redirected their funding awayfrom civil society organisations (CSOs) to the state. Again, legislation was passed andinstitutions were established to facilitate a flow of resources to the sector. The 1978Fundraising Act, which limited NGOs’ capacity to raise funds, was repealed. Institutionslike the NDA and the Lottery Commission were established in the late 1990s with amandate to fund legitimate non-profit activity. Further, a reform of the tax regulationswas promulgated in 2000/01 to grant registered CSOs tax-exemption status, and toencourage a philanthropic culture in the country.
The net effect of these legislative changes and the restructuring of the sector has beenthe establishment of a fiscal, legal and political environment that has facilitated thedevelopment of a collaborative relationship between the state and formal NGOs. NGOsare the first of three blocs that we wish to identify in post-apartheid civil society. NGOshave increasingly been contracted by the state, often encouraged by international donoragencies, to assist it in policy development, implementation and service delivery. Thepositive result of this is that it has facilitated the financial sustainability of a number ofthese organisations, but it has come at a cost. Commercialisation and professionalisationhave blurred the non-profit/profit divide and have led to questions around the lines ofaccountability of these organisations. As Habib and Taylor (1999: 79) have argued:
The existing literature on the non-profit sector is replete with suggestions thatNGOs are institutions that service the interests of the poor and marginalized. Butcan one really argue this when NGOs have become so commercially oriented anddependent on the resources of donors and the government? … Can one reallyassert that [they are] community driven or answerable to marginalized sectors ofSouth African society?
The second and third constituent blocs of contemporary civil society are different inthat they are membership organisations and, therefore, are more accountable thanNGOs, at least to their constituents. We characterise them as informal survivalist groupsand social movements, respectively. They need to be understood as products associatedwith economic and political globalisation and its particular manifestation in SouthAfrica. The increasing leverage of multinational corporations and the domestic businesscommunity has translated in South Africa into the ANC government’s adoption ofneo-liberal economic policies (Habib & Padayachee 2000; Padayachee & Valodia 2001).The social effects of this neo-liberalism – read as the liberalisation of the financial andtrade markets, the deregulation of the economy and the privatisation of state assets –have been largely negative. Even in its own terms, the government’s macroeconomicpolicies, in the form of GEAR, have not done very well. Foreign investment, the primaryrationale of GEAR, has not flowed into the country. Moreover, the prospects for
S O C I A L M O V E M E N T S I N S O U T H A F R I C A
401
Free
dow
nloa
d fr
om w
ww
.hsr
cpre
ss.a
c.za
increased flows are slim given the problems of crime, HIV/AIDS and the uncertaintyassociated with South Africa’s neighbour, Zimbabwe. The problem is aggravated by therelaxation of exchange controls, which have enabled South African companies and indi-viduals to export capital, resulting in substantial outflows from the country. Lastly, thestate’s privatisation programme has not registered much success in efficiency terms,although it has had the effect of ideologically polarising the country and the ruling partyand its alliance partners, the Congress of South African Trade Unions (Cosatu) and theSouth African Communist Party (SACP).
The net achievement of the GEAR programme has been the realisation of the state’sdeficit targets, but at the cost of unemployment, poverty and inequality. Massive joblosses have occurred in almost all sectors of the economy. Tighter fiscal constraints havecompromised the state’s poverty alleviation and development programmes. State officialsoften claim credit for having met the targets of the RDP, especially in the areas of water,sanitation, telephone and electricity connections. However, the most comprehensiveindependent study in this regard estimates that there have been approximately tenmillion cut-offs in water and electricity services because people have not paid their bills,and a further two million people have been victims of evictions for non-payment of ratesand rent (McDonald & Pape 2002). Moreover, other studies have shown that poverty andinequality have increased in real and measurable ways. For example, Carter and May(2001), in a study of approximately 1 200 black households in KwaZulu-Natal, demon-strated that poverty rates increased from 27 per cent to 43 per cent between 1993 and1998. Economic liberalisation has benefited the upper classes of all racial groups and, inparticular, the black political, economic and professional elites who are the primary ben-eficiaries of affirmative action policies and black economic empowerment deals (Adam,Slabbert & Moodley 1997), but GEAR has had a devastating effect on the lives of millionsof poor and low-income families. As Habib and Padayachee (2000: 24) have argued:
The ANC’s implementation of neo-liberal economic policies has meant disasterfor the vast majority of South Africa’s poor. Increasing unemployment and eco-nomic inequalities associated with neo-liberal policies have also pushed evenmore of South Africa’s population into the poverty trap.
CSOs have responded to this challenge. The second bloc we identify within civil society,after NGOs, are informal, survivalist CBOs, networks and associations. Through collec-tive action, poor and marginalised communities are better able to survive the dailyravages of neo-liberalism. According to the recently published study of the JohnsHopkins survey on the shape and size of civil society in South Africa, such associationscomprise 53 per cent of the 98 920 non-profit organisations reviewed and, as such, con-stitute the largest category of organisational formations within the sector (Russell &Swilling 2002). Care must be taken not to see these associations as spearheading theenergies and vibrancy of South African civil society. Rather, they should be recognisedfor what they are, the survivalist responses of poor and marginalised people who havehad no alternative in the face of unemployment and a retreating state that refuses tomeet its socio-economic obligations to its citizenry. Anecdotal evidence suggests that
T H E D E V E L O P M E N T D E C A D E ? S O U T H A F R I C A , 1 9 9 4 – 2 0 0 4
402
Free
dow
nloa
d fr
om w
ww
.hsr
cpre
ss.a
c.za
these ‘informal, community-based networks are on the rise, particularly in the struggleto deal with the ever-increasing repercussions of the government’s failure to address theHIV/AIDS and unemployment crises’ (Habib 2002: viii).
The third bloc that we identify as having emerged within civil society is a category oforganisations that have been described as social movements (Desai 2002). These organi-sations are diverse and some might better be described as proto-social movements. Someare national issue-based associations, like TAC, which focuses on challenging the state’sHIV/AIDS policy and enabling the provision of antiretroviral drugs to AIDS sufferers.Others are located at the local level and are more akin to the older urban social movementsengaged in action around issues of collective consumption identified by Castells (1983).These include, for example, the Soweto Electricity Crisis Committee and the ConcernedCitizens Forum, which respectively organise against electricity cut-offs in Soweto and ratesevictions and water terminations in Chatsworth and surrounding townships in Durban.When compared to the informal survivalist groups, both types of organisation are moreformally constituted community-based structures with a distinct leadership and member-ship, often supported by a middle-class activist base. Moreover, their mode of operation isfundamentally different, characterised by greater political intent. For the most part, theyhave been established with the explicit political aim of organising and mobilising the poorand marginalised to contest and/or engage the state and other social actors around theimplementation of neo-liberal social policies. As a result, they have implicitly launched afundamental challenge to the hegemonic political and socio-economic discourse thatdefines the prevailing status quo.
Hence, social movements as we have defined them here have an explicit relationshipwith the state, which, depending on the organisation and the issue area, hovers some-where between adversarialism and engagement, sometimes involving both (Bond 2001;Desai 2002). Even when engaging the state, however, the engagement is of a qualitativelydifferent kind to that of formal NGOs. For NGOs, the relationship with the state islargely defined by their service-delivery role, whereas for social movements it is moreadvocacy-based. Engaging the state means attempting to persuade it through lobbying,court action, demonstration and even outright resistance. Survivalist organisations, bycontrast, have no relationship with the state, receiving neither resources nor recognitionfrom government agencies. They are preoccupied with the task of simply surviving.Thus, it needs to be understood that the reconstitution of civil society in South Africa inresponse to globalisation and neo-liberalism has led to a proliferation of organisationalforms and the evolution of a plurality of relationships between civil society and the post-apartheid state.
Mapping the terrain of activism
Having situated South African social movements within the broader landscape of civilsociety, the remainder of this chapter considers the functioning and role of social move-ments across the wide diversity of their concerns: land equity, gender, sexuality, racism,
S O C I A L M O V E M E N T S I N S O U T H A F R I C A
403
Free
dow
nloa
d fr
om w
ww
.hsr
cpre
ss.a
c.za
environment, education, formal labour, informal labour, access to infrastructure,housing, eviction, HIV/AIDS treatment, crime and safety, and geo-politics. Many movements draw from class-based ideologies, with notable self-ascribed descriptionsbeing anti-neo-liberal, anti-capital, anti-GEAR, anti-globalisation, anti-market, pro-poor,pro-human rights, socialist and Trotskyist. The material improvement of poor people’slives is at the core of many of these movements but they are by no means limited todemands for delivery or indeed the concerns of the poor. Some also speak to legal rights,and social and environmental justice. Others speak against stigmatisation of and dis-crimination against certain categories of people.
These movements also vary in terms of the constituencies they represent. As a result of overlapping concerns, there may be, for example, some shared membership or at least similar kinds of constituencies across the Anti-Eviction Campaign, the Anti-Privatisation Forum, the Concerned Citizens Forum, the Homeless People’s Federationand the Soweto Electricity Crisis Committee. Similarly, these memberships are unlikelyto overlap with those of the Gay and Lesbian Equality Project and Earthlife Africa, as theconcerns of the latter speak to a different, potentially more middle-class constituency,which in turn may have issues in common. Further, some social movements, such as thePalestine Solidarity Committee and People Against Gangsterism and Drugs, draw largelyfrom particular religious constituencies.
In addition to issues and constituencies, social movements vary according to geographicscale. At one end of the continuum, the Concerned Citizens Forum is based primarily inthe Durban township of Chatsworth and focuses its work at the city level. On thenational scale, the TAC is strongly represented throughout the country, although it isundoubtedly more active in urban areas. At the other end of the continuum, JubileeSouth Africa is linked to a global movement concerned with international trade anddebt. Local initiatives often overcome the constraints of their geographic focus by affil-iating with movements elsewhere in the country or the world. This is most clearlydemonstrated by the Self-Employed Women’s Union, which, with 2 000 members basedin Durban, models itself on the Self-Employed Women’s Association in India, which has500 000 members, and with which it has an association. These and many similar insti-tutions are linked through the global organisation Streetnet, launched in Durban in2002, and which constitutes an international network of organised street traders. Alongwith variation in scale, movements also vary in size. According to Forrest (2003), theLPM in South Africa aimed in 2004 to have 100 000 members, while the NationalAssociation of People Living with HIV/AIDS claimed a membership of 200 000 to 300000. Other, perhaps more proto-social, movements have memberships of just a fewhundred, or membership numbers that are difficult to determine as a result of theirloose organisational form.
Organisational shape is another dimension of variation. In addition to the formationsdescribed, some membership organisations, such as the LPM, describe themselves asindependent NGOs while others, such as the Coalition of South Africans for the BasicIncome Grant, are loosely federated associations and networks of existing organisations.
T H E D E V E L O P M E N T D E C A D E ? S O U T H A F R I C A , 1 9 9 4 – 2 0 0 4
404
Free
dow
nloa
d fr
om w
ww
.hsr
cpre
ss.a
c.za
Lastly, some groups choose not to formalise their structure at all and prefer to remainunregistered and informally organised. As has been argued by Beall (2001a, 2001b), thiscan be a deliberate strategy to avoid elite or political capture.
Probably the most important factor giving rise to the emergence of contemporary socialmovements in South Africa is the high and growing level of poverty and inequality thatcharacterises our society. Although directly attributable to the apartheid policies of thepast, the policies pursued by the ANC government have exacerbated an already criticalsituation. While there have no doubt been winners from the government’s pursuit ofSouth Africa’s integration into the global economy, economic reform processes have haddeleterious effects on sections of the working class and the poor. These effects are moststarkly felt in the labour market, where unemployment has soared, with close to 40 percent of the workforce now without any prospect of employment for the foreseeablefuture. Labour-intensive industries, such as clothing, textiles and footwear, have shrunkdramatically as the domestic market has lost out to imports and as local industries strug-gle to find markets abroad. The mining industry, for many decades the bedrock of theSouth African economy, has undergone a pronounced restructuring process shiftingtoward more capital-intensive mining and thereby shedding over 200 000 jobs (StatsSA2002). Closer integration into the global economy has resulted in a shift away from man-ufacturing towards a services-based economy, and a consequent growth in part-timeand subcontracted labour processes. Where employment has grown, this has largelybeen in low-paid and insecure jobs in the informal economy, which is now estimated toconstitute some 25 per cent to 30 per cent of all employment in South Africa (Devey,Skinner & Valodia 2002). The effects of this restructuring process are reflected innational income data, which show higher levels of both poverty and inequality com-pared to those on the eve of the democratic transition in 1994.
These trends are catastrophic when combined with a cost-recovery model for the provi-sion of social services. The national government has devolved responsibility for thedelivery of many services to local government without offering significant increases intheir budgets. The only way local governments can provide these services, therefore, isto ensure that they ‘pay for themselves’. Yet, with the dramatic increases in unemploy-ment, residents find themselves simply unable to pay for water, electricity, rents, ratesand mortgages. Together, these forces amount to a ‘pincer movement’ on the poor, withthe state insisting that people pay for their services, housing and land while simultane-ously eroding livelihoods. Desai (2002) has argued that there is no longer a ‘culture ofnon-payment’ as there was in the 1980s intended to undermine the government,but rather an ‘economics of non-payment’ whereby individuals simply cannot affordservices as a result of their marginalisation from employment in the formal sector. Thegovernment responds as if this were a problem of discipline, cutting off services andevicting delinquent residents.
The membership of a number of social movements is affected by this pincer movementof falling employment and increasing cost-recovery for services, and a first set of socialmovements has responded directly to the issue of employment and the labour market.
S O C I A L M O V E M E N T S I N S O U T H A F R I C A
405
Free
dow
nloa
d fr
om w
ww
.hsr
cpre
ss.a
c.za
Cosatu, for example, represents to some extent a set of winners within the context of thetransition. Its members enjoy access to employment within the formal economy andunder increasingly progressive labour conditions. However, formal unions are all tooaware that theirs is a pyrrhic victory. Within the context of massive job losses, theirmembers are faced with supporting growing numbers of dependants. The recommen-dation of Cosatu and a variety of other organisations has been a universal Basic IncomeGrant, advocated and mobilised through a second social movement concerned withunemployment and a poorly performing labour market, the Coalition of South Africansfor the Basic Income Grant. The third labour market-related movement is the Self-Employed Women’s Union, which is lobbying for the recognition of the informal sector,as not only a site for pursuing legitimate livelihoods but also an important part of theeconomy.
These and other movements are responding, then, to one side of the squeeze on the poor – their ability to make a living. Responses to the other side – their right to shelter,services and other goods of collective consumption – emerge from the Anti-EvictionCampaign, the Anti-Privatisation Forum, the Concerned Citizens Forum, the HomelessPeople’s Federation, the Soweto Electricity Crisis Committee and others who opposecost-recovery for services. Through illegal reconnections, court injunctions and protest,they attempt to expose the contradiction whereby councils demand payment from resi-dents without sufficient incomes. Other social movements, such as the Education RightsProject and the TAC, address aspects of state delivery around schooling and health care.
Second, alongside these movements concerned primarily with the material conditions ofthe poor, are a number of social actions driven by what might be classified as positionsof marginality arising out of or defined by identity. In some cases, such as that of eco-nomic migrants and refugees, identity may coincide with material deprivation but alsogives rise to xenophobia and social and cultural exclusion resulting from not beingreadily accepted by host groups. The challenges facing this group are being addressed byorganisations such as the Co-ordinating Body of Refugee Communities in Gauteng.Other identity-based groups such as People Against Gangsterism and Drugs combinereligious concerns, in this case adherence to Islam, with a challenge to lawlessness andpoverty in society. A variety of groups deal with the long-standing marginalisation ofwomen who often bear the brunt of material deprivation and social exclusion. Identity-related concerns have also been taken up by groups such as the Gay and Lesbian EqualityProject, which has made shrewd use of the legal system in order to end institutionaliseddiscrimination against gays and lesbians.
Social movements, therefore, sometimes reflect the concerns of post-industrial middle-class groups for whom class is no longer a dominant basis of identity. Some forms ofenvironmentalism fall into this category, although it would be over-simplistic to applythis logic to groups such as Earthlife Africa, which link their concerns for the environ-ment with challenging socio-economic injustices. Identity is seen by the literature onnew social movements to be the basis of post-industrial popular mobilisation (seeMcAdam et al. 2001). It is possible to suggest that, in South Africa, certain sections of
T H E D E V E L O P M E N T D E C A D E ? S O U T H A F R I C A , 1 9 9 4 – 2 0 0 4
406
Free
dow
nloa
d fr
om w
ww
.hsr
cpre
ss.a
c.za
post-industrial society, including new black elites, are finding expression through theseforms. However, in the examples outlined above, we see that identity questions ofcitizenship, gender and sexuality often exacerbate material disadvantage and cannotalways easily be divorced from it. Hence, issues of identity are not simply the concern ofan indulgent ‘classless’ petit bourgeoisie. Indeed, there is a notable absence in SouthAfrica of new social movements of the kind described in literature pertaining to theindustrialised world, involving middle-class individuals concerned with their own privileged predicaments. Rather, it is the case that many social movements are as con-cerned with issues of social and economic justice and orientate their energies to poorsectors of society.
Third, social movements do not necessarily emerge spontaneously out of grassrootsuprisings among the poor. To be effective and have reach, they are dependent on mate-rial and human resources, solidarity networks and often the external interventions of prominent personalities operating from within well-resourced organisations. Forexample, the TAC benefits from its leader, Zackie Achmat, having direct access to andpublic support from Nelson Mandela. The Education Rights Project emerged from theCentre for Applied Legal Studies and the Education Policy Unit located at the Universityof the Witwatersrand. The Concerned Citizens Forum was formed and driven by FatimaMeer, a well-known retired professor from the University of Natal, and Ashwin Desai, anindependent writer. Leadership is sometimes shared between movements. For example,Trevor Ngwane is a high-profile leader associated with both the Anti-PrivatisationForum and the Soweto Electricity Crisis Committee. Such individuals are crucial to thevery existence of movements not only because they organise effective campaigns, butalso for their ability to leverage resources from donors who are increasingly allocatingmoney to support court cases and other actions undertaken by social movements.Furthermore, the histories of these individuals, frequently linked to a track record in theliberation movement, provide them with access to key players within government for thepurposes of accessing information and influencing policy. Solidarity among movementsgoes beyond shared leadership and, in South Africa, many are affiliated with one anotherand are mutually supportive. They have come together at particular global moments,such as the Durban Social Forum at the time of the United Nations Conference AgainstRacism (2001), the Social Movements Indaba at the time of the World Summit onSustainable Development (2002) and for various anti-war protests in 2003. These soli-darity actions may have the effect of building on local struggles and co-ordinatingactions on a wider scale.
Fourth, despite the fact that leaders of contemporary social movements often have historical links with anti-apartheid struggles of the past, they are products of the oppor-tunities and constraints generated by the post-1994 political environment. The newpolitical, economic and social order is underwritten by a Constitution that enshrinesfirst- and second-generation rights, a factor used by a number of social movementseither to defend themselves or advance their campaigns. For instance, the TAC’s successful court challenge against the government on the provision of antiretroviral
S O C I A L M O V E M E N T S I N S O U T H A F R I C A
407
Free
dow
nloa
d fr
om w
ww
.hsr
cpre
ss.a
c.za
drugs to HIV/AIDS sufferers was informed by a rights-based approach. It is undeniablethat there has been an opening up of the state since 1994 and more democratic engage-ment with various societal forums. Increasingly, instruments and spaces have becomeavailable for the state to engage with civil society and, indeed, for civil society to challenge the state. Nedlac, the media, the courts and the Constitution are all formalisedattempts to have public input into policies, and there is even support for mass demon-strations as mechanisms for influencing policy and challenging the government.
However, there are some negative features beginning to develop in the post-apartheidpolitical system, some of which point to undemocratic tendencies in the highest echelons of government, including a stigmatisation of the ‘ultra-left’ and a desire torepress protests (Bond 2000: 140; Desai 2002). Vally, writing in a newspaper article in 2003, expressed concern about a trend towards authoritarianism in the post-apartheidpolitical environment:
In addition to the apartheid-era laws such as the Regulation of Gatherings Act, asmorgasbord of Bills, which gave the security and intelligence agencies additionalpowers, are in the offing. These include the Interception and Monitoring Bill,Intelligence Services Bill, the Electronic Communications Security (Pty) Ltd Bill,the National Strategic Intelligence Amendment Bill and the Anti-Terrorism Bill.
The perception is emerging, therefore, that the political freedoms anticipated for post-apartheid South Africa might not always be realised in practice.
Fifth, the engagement by social movements with the state falls along a continuum fromin-system collaborative relations, at the one extreme, to out-of-system adversarial inter-actions, at the other. It is important to highlight immediately that there is a lack of con-sensus within social movements over the best strategic approach. Some fear cooption bythe government and, therefore, wish to avoid collaboration of any sort, while othersfavour reformism or constructive engagement. While some movements such as theNational Land Committee limit themselves to mass mobilisation, others choose to makeextensive use of a wider range of democratic spaces afforded by South Africa’s post-apartheid political system. One example of the latter approach is the celebrated‘Grootboom case’ of October 2002, in which the Human Rights Commission and theUniversity of the Western Cape’s Community Law Centre, acting on behalf of an infor-mal settlement, successfully took the government to the Constitutional Court in orderto assert the right to adequate housing and services.
Given the existence of institutionalised avenues of action, social movements recognisethat the most belligerent tactics may not be the most expedient way of achieving mate-rial goals, and it is often useful to apply both ‘friendly’ and ‘unfriendly’ pressure. Forexample, early successes by the TAC were achieved in the courts where they co-operatedwith the government in confronting global copyright laws around the use of genericdrugs. This was followed by a second phase of attempting to force the government,through the forum of Nedlac, to provide drugs. When the TAC believed the governmentwas becoming intransigent, it returned to the courts to force the Minister of Health, Dr
T H E D E V E L O P M E N T D E C A D E ? S O U T H A F R I C A , 1 9 9 4 – 2 0 0 4
408
Free
dow
nloa
d fr
om w
ww
.hsr
cpre
ss.a
c.za
Manto Tshabalala-Msimang, to provide drugs that would prevent mother-to-childtransmission. This was successful and was followed by a defiance campaign in anattempt to broaden provision. The campaign was then suspended in order to provide aface-saving way for the government to announce the provision of such drugs. Such calculations represent a constantly evolving relationship between the movement and thegovernment where, through an extensive repertoire of tactics, the TAC has demon-strated that power does not reside exclusively with political or economic elites. It hasshown that it is possible for even marginalised players to exert influence over policy andpractice through various tactics such as shaming, de-legitimisation and even the threatto vote for another party. The terms of engagement may be shaped from both sides andthe very presence of a social movement may influence a political order.
Nevertheless, it has to be asked whether the strategies and tactics adopted by the TAC arereplicable in other issue areas. After all, the AIDS struggle has some unique features,drawing support as it does from across racial, class and other social backgrounds.Moreover, resources, expertise and skills are often the primary variables in influencing amovement’s strategies and impact. Social movements representing and organising thedisadvantaged and marginalised are more likely to be prone to out-of-system outburstsof mass anger than those in more privileged circumstances, which have the luxury ofengaging in in-system collaborative interactions (see Guha 2000).
The last point we wish to make is that the systemic impact of contemporary social move-ments is likely to be facilitative of the consolidation of democracy in South Africa. Some,particularly in the government, see these social movements as a threat to stable democ-racy but our view is that this is an overreaction and represents over-sensitivity to political criticism. Social movements contribute to the plurality of civil society, which isindispensable to all mature democracies. Most of the contemporary social movementsare membership organisations accountable to their constituencies and operating withinthe parameters of the new status quo. They pose no immediate challenge to the legiti-macy of the government and there is still much loyalty to the Constitution. They are not,as yet, about overthrowing the existing order. Instead, they are about holding the government accountable for the delivery of promises made, and prising the political and socio-economic order open so that more constituencies can be included in its list ofbeneficiaries.
This systemic commitment of most social movements cannot be taken for granted. Ifsignificant sectors of society are consistently alienated from the political order and if arevolutionary party were to emerge, serving an alternative political pole around whichthe disaffected could coalesce, then social movements could become the building blocksfor a new systemic project. However, that would require extreme unresponsiveness fromthe political authorities, significant alienation on the part of society and ultimately theemergence of a political party committed to seriously challenging the existing order.None of this exists, or is likely to emerge in the immediate future, but South Africa’spolitical leaders should not become complacent. The surest route to realising such a stateof affairs is when political elites forget their social contract with their citizenry and
S O C I A L M O V E M E N T S I N S O U T H A F R I C A
409
Free
dow
nloa
d fr
om w
ww
.hsr
cpre
ss.a
c.za
engage in the primitive accumulation of wealth through the mindless plunder of thenation’s resources.
Conclusion
In sum then, our argument is that the emergence of social movements in South Africais good for democratic consolidation. Of course, some of these movements mightundermine the project of stability, but the assumption that all forms of stability and at all costs are necessarily good for democracy is a mantra that has to be challenged.Indeed, our argument suggests that stability within the prevailing status quo merelyreinforces existing power relations and works to the disadvantage of poor and margin-alised communities in South Africa. What is advocated, therefore, and what is beginningto be provided by established and emerging social movements, is the emergence of sub-stantive uncertainty in the political system so that the leverage of ordinary citizens – thevote – can be given more weight and be taken more seriously by decision-makers andstate elites. The vehicle for taking this agenda forward is to prioritise substantive uncer-tainty over political order in strategic organisation and in the country’s developing democratic culture. The overriding political concern in South Africa since 1994 bothwithin and outside the ruling party has been the realisation of political order and theinstitutionalisation of democracy. If the voices of those marginalised from the main-stream of the economy and from executive decision-making are to be heard, substantiveuncertainty will have to be prioritised.
Notes
1 Civics is the name given in South Africa to community-level or area-based organisations of civil
society.
2 Parts of this chapter are drived from Ballard et al. (2005) and Habib (2003 and 2005).
References
Adam H, Slabbert F & Moodley K (1997) Comrades in business. Tafelberg: Cape Town.
Ballard R, Habib A, Valodia & Zvern E (2005) Globalization, marginalization and contemporary
social movements in South Africa, African Affairs 104: 615–34.
Beall J (2001a) Valuing social resources or capitalising on them? The limits to pro-poor urban
governance in nine cities of the South, International Planning Studies 6: 357–75.
Beall J (2001b) From social networks to public action in urban governance: Where does benefit
accrue? Journal of International Development 13: 1015–21.
Bond P (2000) Elite transition: From apartheid to neoliberalism in South Africa. London: Pluto Press.
Bond P (2001) Against global apartheid. Cape Town: University of Cape Town Press.
Carter M & May J (2001) One kind of freedom: Poverty dynamics in post-apartheid South Africa,
World Development 29: 1987–2006.
T H E D E V E L O P M E N T D E C A D E ? S O U T H A F R I C A , 1 9 9 4 – 2 0 0 4
410
Free
dow
nloa
d fr
om w
ww
.hsr
cpre
ss.a
c.za
Castells M (1983) The city and the grassroots: A cross-cultural theory of urban social movements.
Berkeley: University of California Press.
Cohen J & Arrato A (1992) Civil society and political theory. Boston: MIT Press.
Desai A (2002) We are the poors: Post-apartheid struggles in South Africa. New York: Monthly
Review Press.
Devey R, Skinner C & Valodia I (2002) The informal economy: Who, where and how much.
Conference paper, Development Policy Research Unit Conference.
Forrest D (2003) Social movements: ‘Ultra-left’ or ‘global citizens’? Mail & Guardian, 31 February.
Guha R (2000) On some aspects of the historiography of colonial India, in V Chaturvedi (ed.)
Mapping subaltern studies and the postcolonial. London: Verso.
Habib A (2002) Editor’s introduction, in The size and scope of the non-profit sector in South Africa.
Johannesburg/Durban: University of the Witwatersrand School of Public and Development
Management/The Centre for Civil Society.
Habib A (2003) State-civil society relations in post-apartheid South Africa, in J Daniel, A Habib &
R Southall (eds.) State of the nation: South Africa 2003–2004. Cape Town: HSRC Press.
Habib A (2005) The politics of economic policy making: Substantive uncertainty, political leverage
and human development, in P Jones & K Stokke (eds.) Democratising development: The politics of
socio-economic rights in South Africa. Leiden: Martinus Nijhoff.
Habib A & Kotze H (2002) Civil society, governance and development in an era of globalisation.
Unpublished manuscript.
Habib A & Padayachee V (2000) Economic policy and power relations in South Africa’s transition to
democracy, World Development 28: 245–63.
Habib A & Taylor R (1999) South Africa: Anti-apartheid NGOs in transition, Voluntas 10: 73–82.
Harvey D (1989) The condition of postmodernity. Oxford: Blackwell.
Huntington S (1991) The Third Wave: Democratisation in the late twentieth century. USA: University
of Oklahoma Press.
Keane J (1988) Democracy and Civil Society. London: Verso.
Laclau E & Mouffe C (1985) Hegemony and socialist strategy: Towards a radical democratic politics.
London: Verso.
Marais H (1998) South Africa: Limits to change. The political economy of transformation. London:
Zed Books.
McAdam D, Tarrow S & Tilly C (2001) Dynamics of contention. New York: Cambridge University
Press.
McDonald D & Pape J (2002) Cost recovery and the crisis of service delivery in South Africa.
Pretoria/London: HSRC Publishers/Zed Books.
Melucci A (1985) The symbolic challenge of contemporary movements, Social Research 52: 789–816.
O’Donnell G (1993) On the state of democratization, and some conceptual problems: A Latin
American view with glances at some post-communist countries, World Development 21:
1355–69.
S O C I A L M O V E M E N T S I N S O U T H A F R I C A
411
Free
dow
nloa
d fr
om w
ww
.hsr
cpre
ss.a
c.za
O’Donnell G (1994) Delegative democracy, Journal of Democracy 5: 55–69.
O’Donnell G & Schmitter P (1986) Transitions from authoritarian rule: Tentative conclusions about
uncertain democracies. Baltimore: Johns Hopkins University Press.
Padayachee V & Valodia I (2001) Changing GEAR? The 2001 budget and economic policy in South
Africa, Transformation 46: 71–83.
Russell A & Swilling M (2002) The size and scope of the non-profit sector in South Africa.
Johannesburg/Durban: University of the Witwatersrand School of Public and Development
Management/The Centre for Civil Society.
StatsSA (2002) Labour Force Survey: September 2001. Pretoria: Statistics South Africa.
Tarrow S (1994) Power in movement: Social movements, collective action and politics. New York:
Cambridge University Press.
Tilly C (1985) Models and realities of popular action, Social Research 52: 717–47.
Vally S (2003) The iron fist and the velvet glove, Mail & Guardian, 20 December.
Whiteford A & Van Seventer D (1999) Winners and losers: South Africa’s changing income distribution
in the 1990s. Pretoria: WEFA Southern Africa.
T H E D E V E L O P M E N T D E C A D E ? S O U T H A F R I C A , 1 9 9 4 – 2 0 0 4
412
Free
dow
nloa
d fr
om w
ww
.hsr
cpre
ss.a
c.za
21Democracy and social movements in South Africa
Dale McKinley
The liberation struggle revisited
[I]t is of less importance to us whether capitalism is smashed or not. It is ofgreater importance to us that while capitalism exists, we must fight and struggleto get our full share and benefit from the system. (Dr AB Xuma, President-General of the ANC, 1945, in Fine & Davis 1990: 52)
For the better part of three decades (from the early 1960s to the early 1990s), the dom-inant theoretical basis for the African National Congress’ (ANC) liberation struggle hadbeen cast within the necessity for the revolutionary seizure of power. Whether appliedto the smashing of apartheid and the attainment of majority rule or as a springboard toa transition to socialism, the revolutionary seizure of power was presented as a necessaryprecondition for movement forward. Joe Slovo had put it this way:
Thus there is a distinction between the creation of the new state form and thebuilding of a new socialist economic formation. The former is made possible bya revolutionary seizure of power; the latter, through the exercise of that politicalpower by a class whose interests are unconditionally served by a socialist order.(Slovo 1976: 146–147)
Many liberal and neo-Marxist academics, as well as numerous ANC-aligned intellectu-als, have historically conceptualised arguments for a revolutionary seizure of power innarrowly statist terms. As a result, the (autonomous) state is given the status of thestruggle ‘throne’, leaving revolutionary (purposive) struggle cast in terms of a fight for aspecific form (structure) of power rather than its foundation/content. If such anapproach is adopted, either theoretically or practically, there emerges a false dichotomybetween the political and the socio-economic ‘sides’ of revolutionary struggle. Thus,political control of the state can be achieved with no corresponding transformation ofthe economic sphere; and we only have to take one quick glance at the contemporaryresults of most Third World political revolutions to see what kind of national liberationhas been delivered. In the historical context of the South African struggle, then, suchapproaches have provided the basis from which to lend both revolutionary credence topurely political change and ammunition for critics of any revolutionary struggle that isoutside the theoretical (read: strategic) and practical (read: institutional) boundariesdemanded by liberal bourgeois (capitalist) democracy.
413
Free
dow
nloa
d fr
om w
ww
.hsr
cpre
ss.a
c.za
However, there is nothing implicitly statist in any struggle for revolutionary change.What is implicit, though, is that there must be a fundamental attack on the entrenchedeconomic and political interests of capital (in whatever form) in order for there to bemeaningful liberation. As the ANC had put this quite clearly in the 1970s:
It is therefore a fundamental feature of our strategy that victory must embracemore than formal political democracy. To allow the existing economic forces toretain their interests intact is to feed the root of racial supremacy and does notrepresent even a shadow of liberation. (Slovo 1976: 111)
Yet, the cumulative effect of the strategic and tactical programme of the ANC’s libera-tion struggle, consummated in the period of a ‘negotiated transition’ in the early 1990s,was to demobilise gradually the only constituency capable of leading and carryingthrough such a revolutionary struggle – the broad working class made up of organisedworkers and the unemployed. The strategic primacy given to the achievement of a nar-rowly conceived national and liberal bourgeois democracy allowed for a fundamentalcontradiction to permeate South Africa’s ‘transition to democracy’, namely, that theANC’s own base constituency (the broad working class) has had to take a transitionalback seat to a whole host of powerful social and economic forces, both national andinternational, whose fundamental interests are inimical to revolutionary political andsocio-economic transformation.
The strategic statism of the ANC’s struggle for national liberation consistently underes-timated and seriously undermined the potential and actual struggles of the ANC’s ownworking-class constituency. More specifically, the political strategies of the liberationmovement led to a lack of recognition and incorporation of actual struggles on theground that were, themselves, grounded in a struggle for political and socio-economicliberation from apartheid capitalism. The false separation, both theoretically and prac-tically, between political and socio-economic change that emerged out of the negotiatedsettlement meant that processes such as democratisation took on a narrow bourgeois,nationalist and predominantly political meaning and context in which changes in socio-economic power relations were subordinated to changes in who controlled the seat ofpolitical power (that is, a privileging of the economic status quo – capitalism – and theinstitutions of bourgeois democracy essential to its maintenance).
The foundations of the post-1994 democratic divide
The device by which content is replaced by form and ideas by phrases has pro-duced a host of declamatory priests … whose last offshoots had of course to leadto democracy. (Marx & Engels 1977: 243)
When South Africa’s first ever one-person, one-vote elections in 1994 resulted in anoverwhelming victory for the ANC, the majority of South Africans understandably cel-ebrated the arrival of a new democracy. After all, the ANC and its liberation movementallies were now in political control of the state thanks to the votes of those who had,
T H E D E V E L O P M E N T D E C A D E ? S O U T H A F R I C A , 1 9 9 4 – 2 0 0 4
414
Free
dow
nloa
d fr
om w
ww
.hsr
cpre
ss.a
c.za
throughout South Africa’s modern history, been denied the right of institutionaliseddemocratic participation. Accompanying this, however, there still remained a broad-based (but ultimately mistaken) expectation amongst the black majority that the newANC state would immediately begin to pursue a more socialist – or at the least, radicallyredistributive – political economy.
Besides the contextual backdrop of militant, mass-based political and socio-economicstruggles that had been waged since the mid-1980s alongside the continued radical rhet-oric of the ANC itself, such an expectation was fuelled by the ANC’s adoption of theReconstruction and Development Programme (RDP) as the main policy platform onwhich it had based its electoral campaign. With its rhetorical centrepiece being the creation of a ‘people-centred society’, the RDP proposed to pursue growth and develop-ment through reconstruction and redistribution, sought a leading and enabling role forgovernment in guiding a mixed economy, prioritised the meeting of basic socio-economic needs for the poor majority and argued for a living wage as a prerequisite forachieving the required level of economic growth.1 The millions of organised workersand unemployed who had provided the ANC with both its political and organisationalpower looked to the RDP’s promises to create millions of jobs, provide massive increasesin infrastructure, meet basic social needs and redistribute large amounts of white-owned land.
It did not take long, however, for the new ANC state to make it known that the basisupon which the objectives outlined in the RDP were to be approached would be througha tightly controlled macroeconomic balance. Thus, at the same time that the RDP wasbeing seen by ANC supporters and most black South Africans as the framework for amore radical and substantive shift in the country’s political economy, the ANC govern-ment was stressing the need for fiscal discipline, export-oriented growth, privatisationand decreased levels of corporate taxation (Habib & Padayachee 2000).
Importantly then, the first two years of South Africa’s new democracy witnessed the ANC’s gradual, even if at times contested, political and ideological acceptance ofthe broad framework of a globally dominant, neo-liberal political and economic orthodoxy.2
In these early transitional years, the ANC cleverly sought to utilise the all-encompassing,legitimating argument of liberal bourgeois democracy, namely, that ‘its link to society isheld to be that it operates at the level of the general interest’ (Levin 1989: 140). Whencoupled to the more practical global offensive of internationalised corporate and financecapital (otherwise known as neo-liberalism), it then appears as though liberal bourgeoisdemocracy has taken on the mantle of a necessary and natural political product of anequally necessary and natural economic order. Under such a scenario, democracy itselfbecomes synonymous with the capitalist ‘free market’ and everything else is merelyabout degrees and emphases.
Crucially, the rightward ideological shift of the ANC was paralleled by the systematicdismemberment, or incorporation into the organisational framework of the ANC itself,
D E M O C R A C Y A N D S O C I A L M O V E M E N T S I N S O U T H A F R I C A
415
Free
dow
nloa
d fr
om w
ww
.hsr
cpre
ss.a
c.za
of almost all independent and allied community organisations in South Africa (whether‘civics’, women’s organisations or youth groupings). By the mid-1990s the vast majorityof those community organisations that had been so central to the radicalisation ofthe anti-apartheid struggle and that had sustained the hope of millions for an anti-capitalist transformation of South African society had been swallowed by the ANC and,to a lesser, extent by its tripartite-alliance partners, the Congress of South African TradeUnions (Cosatu) and the South African Communist Party (SACP).
As a result, the political and organisational terrain for active and militant resistance tothe ANC’s creeping neo-liberalism, elite deal-making and wholesale acceptance of theinstitutionalised framework of bourgeois democracy was effectively contained withinthe ANC and its Alliance partners. In turn, this ensured (in the short term, at least) thatthe possibilities for independent, mass-based and anti-neo-liberal organisation andstruggle were severely curtailed.
The ANC’s political decision to turn its back on previous commitments to its broadworking-class constituency to implement more radical socio-economic policies wasthen institutionally codified with the formal unveiling of the overtly neo-liberal Growth,Employment and Redistribution (GEAR) macroeconomic strategy in mid-1996. GEARcommitted the ANC state to: slashing government spending (as a means to reduce theBudget deficit); keeping inflation in single digits (through high real interest rates);providing tax holidays and other incentives for corporate capital; phasing out exchangecontrols; creating a more ‘flexible’ labour market; encouraging ‘wage restraint’; andspeeding up the privatisation of state assets.
Key to the future political role for, and economic impact on, the millions of workers andunemployed, though, was GEAR’s choice of socio-political ‘vehicles’ for carrying throughthe ‘transformation’ of South Africa’s political economy. GEAR proffered that a combi-nation of economic affirmative action (through land distribution to a new class of blackcommercial farmers and state assistance to emerging black industrial entrepreneurs) andnew black economic empowerment initiatives through ‘partnerships’ with corporatecapital, would best ‘deliver’ the desired outcomes of economic redistribution, equity andgrowth as well as job creation. Just as GEAR rubbished any latent applicability of the RDPas the vehicle for economic transformation, so too was the oft-stated ‘leading’ role of theANC’s historic mass base – the millions of workers and unemployed – rubbished as thevehicle for the socio-political transformation of post-apartheid South Africa.
By the mid-1990s, if not before, it should have been clear to anyone paying attention thatanti-capitalist class-based struggle, generated and led by organised workers and the poormajority, had been fundamentally rejected by the ANC as a strategy for political and socio-economic change. Rather, the ANC’s strategic path was now firmly located within its earlieracceptance of a negotiated solution that politically institutionalised bourgeois democracyand, economically, laid the foundation for a de-racialised South African capitalism.
Nowhere have the political and organisational consequences of such a strategy beenmore acutely realised than in relation to the political role of the ANC’s key alliance part-
T H E D E V E L O P M E N T D E C A D E ? S O U T H A F R I C A , 1 9 9 4 – 2 0 0 4
416
Free
dow
nloa
d fr
om w
ww
.hsr
cpre
ss.a
c.za
ners. Their acceptance of an unequal political relationship within an ANC-dominatedalliance3 has served to tie organised workers and large numbers of community activistsinto a false sense of ideological and strategic unity and to continuously weaken theability of the broader working class to fully engage in independent and anti-capitalistclass struggle. In turn, this surrendering of political, and thus organisational, independ-ence has facilitated the believability in the interlinked notions (energetically propagatedby the ANC and alliance leaders) that South Africans can ‘find’ a ‘national consensus’about the economic and social path upon which the country should travel, that classstruggle can be effectively ‘suspended’ and that the contradictions emerging can be suc-cessfully managed.4 Thus, at the same time that the ANC state moved full steam aheadwith the implementation of GEAR in the mid-to-late 1990s, the main organised forcescapable of leading a collective working-class struggle against the logic and practicaleffects of capitalist neo-liberalism succumbed to the exigencies of the ANC’s fullembrace of bourgeois politics.
Not surprisingly, such subjective choices could do very little to stem the effectual tide ofobjective realities that were being experienced by workers and poor communities acrossSouth Africa. Massive job losses were visited upon those members of the South Africanworking class who had been fortunate enough to be employed, the ‘experience’ beingaccompanied by all the attendant social and economic devastation to already poor families and communities. To make matters worse, the ANC state also implementedbasic-needs policies that effectively turned such needs/services into market commodi-ties, to be bought and sold on the ‘free market’ and framed by the pursuit of profit. Thiswas facilitated by a drastic decrease in national government grants/subsidies to localmunicipalities and city councils and support for the development of financial instru-ments for privatised delivery. In turn, this forced local government to turn towardscommercialisation and privatisation of basic services as a means of generating therevenue no longer provided by the national state (McDonald 2000).
The logical result of these developments was a huge escalation in the costs of basic serv-ices and a concomitant increase in the use of cost-recovery mechanisms such as waterand electricity cut-offs that necessarily hit poor people the most. So, between 1999 and2000, over 75 000 water cut-offs occurred in the Greater Cape Town area (McDonald &Smith 2002: 41). During 1999, close to 20 000 houses had their electricity supplies cutoff every month in Soweto, with Brian Johnson, the manager of Eskom, openly boastingthat, ‘the aim is to disconnect at least 75 per cent of Soweto residents’ (Mail & Guardian6–12 April 2000). By the turn of the century, millions more poor South Africans had alsoexperienced cut-offs and evictions as a result of the ANC’s neo-liberal orgy (seeMcDonald & Smith 2002; Cottle 2003). Similarly, the ANC state’s capitalist-friendly landpolicies, which ensured that apartheid land ownership patterns remained virtuallyintact, meant that South Africa’s long-suffering rural population continued to taste thebitter fruits of labour exploitation and landlessness.
It was the cumulative result of such experiences, combined with the failure of the maintraditional forces of the South African working class (e.g. Cosatu and the SACP) as well
D E M O C R A C Y A N D S O C I A L M O V E M E N T S I N S O U T H A F R I C A
417
Free
dow
nloa
d fr
om w
ww
.hsr
cpre
ss.a
c.za
as ‘civic’ structures like the South African National Civics Organisation (Sanco) to leadand sustain counter-mobilisations and active class resistance, that eventually saw the riseof new social movements.
The rise of the new social movements
We must understand that the new democracy cannot allow for hostile surveil-lance of the democratic process and the participants in this process. (Mbeki1994)5
At first in South Africa’s main urban centres, and then later in rural communities, a collection of social movements arose to challenge water and electricity cut-offs, housingevictions, forced removals and lack of land redistribution. As Ashwin Desai (2002) hasnoted:
The rise of these movements based in particular communities and evincing particular, mainly defensive demands, was not merely a natural result of povertyor marginality but a direct response to state policy. The state’s inability or unwill-ingness to be a provider of public services and the guarantor of the conditions ofcollective consumption has been a spark for a plethora of community movements[and] the general nature of the neo-liberal emergency concentrates and aimsthese demands towards the state … activity has been motivated by social actorsspawned by the new conditions of accumulation that lie outside of the ambit ofthe trade union movement and its style of organising. What distinguishes thesecommunity movements from political parties, pressure groups and NGOs is massmobilisation as the prime source of social sanction.
The rapid growth of social movements and their increasingly militant opposition to thepolicies of the ANC-run state from the late 1990s soon led to a rupture between thoseorganisations/movements opposed to the ANC state’s political trajectory and economicpolicies and those that chose continued (even if at times critical) loyalty to the ANC‘line’. This was best exemplified in the run-up to, and during, the August 2002 WorldSummit on Sustainable Development (WSSD), which saw a decisive split between thetwo ‘camps’ – the former gathering together under the rubric of the Social MovementsIndaba (SMI) and the latter collectively grouped under the Civil Society (People’s)Forum. The most visible result of this developing fault line were the dual Alex-to-Sandton marches on the WSSD, with the march by the SMI and allied formations suchas the Landless People’s Movement attracting 25 000 people onto the streets, and theANC-backed Forum march attracting fewer than 5 000 (SMI 2002).
This developing fault line represents nothing less than a clear ideological and organisa-tional divide amongst historically progressive forces in South Africa. The bulk of the newsocial movements represent those who still believe in principled internationalism andthe possibility of a non-capitalist future, who increasingly desire to push beyond theenforced barriers of institutionalised bourgeois democracy and who pursue an inde-
T H E D E V E L O P M E N T D E C A D E ? S O U T H A F R I C A , 1 9 9 4 – 2 0 0 4
418
Free
dow
nloa
d fr
om w
ww
.hsr
cpre
ss.a
c.za
pendent, mass-based mobilisation and struggle as the only meaningful and realisticoption for resisting global neo-liberalism and forging an ideological and organisationalalternative to the capitalist ANC.6
On the other side stand the ‘traditional’ progressive forces in South Africa, representedin the main by the various leaderships of Cosatu, the SACP, Sanco and the South AfricanNational NGO Coalition. While employing left (socialist) rhetoric and proclaimingorganisational independence, they have critically accepted the ANC state’s capitalistdevelopmentalism, lost what confidence they did have in the ‘leading role’ of the broadworking class (both domestically and internationally) and chosen institutionalised‘democratic’ privilege and access – all rationalised by reference to historic alliance loyal-ties, the necessities of the ‘national democratic revolution’ and the ‘realities’ of globalcapitalism.
The immediate response of the ANC state to the emergence and activities of the newsocial movements was to embark on a political propaganda campaign that sought toportray these movements and their activists as ‘criminals’ and ‘anarchists’. When thisseemed to have little effect on the activities and growth of the social movements, theANC leaders chose to use the state’s repressive apparatus to launch a co-ordinated ‘lawand order’ crackdown. This culminated in physical assaults on, and arrests and impris-onment of, hundreds of social movement activists and community members across thecountry before, during and after the WSSD.7
When Cosatu’s affiliated unions, energetically supported by several social movements,embarked on an anti-privatisation strike soon after the WSSD (despite the alliance lead-ership’s attempts to negotiate the strike away), a more systematic and high-level ANCpropaganda campaign kicked into gear. The ANC accused all those who were activelycritiquing and opposing its neo-liberal policies and the democratic content of its gover-nance as being an ‘ultra-left … waging a counter-revolutionary struggle against the ANCand our democratic government’, and of siding with the ‘bourgeoisie and its supporters’(ANC 2002). President Mbeki waded in by claiming publicly that ‘this ultra-left worksto implant itself within our ranks … it hopes to capture control of our movement andtransform it into an instrument for the realisation of its objectives’ (Mbeki 2002a).Mbeki went further: ‘They should also have known that the people know that, histori-cally, those who opposed and worked to destroy the ANC, and tried to mobilise theworkers to act against our movement, were the same people who sought to entrench andperpetuate their oppression’ (Mbeki 2002b).
Such shrill and high-level attacks on the new social movements (and that minority inCosatu, the SACP and other allied organisations who continue to actively resist ANCstate policies) have only served to widen the political and class fault lines that now soclearly divide South African society. Indeed, this appears to be precisely what the ANCdesires as the tactical means to pursue a strategy of ‘divide and rule’, specifically asapplied to those forces on its left. This was confirmed later in 2003 when ANC DeputySecretary General, Sankie Mthembi-Mahanyele, distinguished between ‘positive social
D E M O C R A C Y A N D S O C I A L M O V E M E N T S I N S O U T H A F R I C A
419
Free
dow
nloa
d fr
om w
ww
.hsr
cpre
ss.a
c.za
formations’ (that is, those who have responded positively to the state) and those withwhom ‘we have a bit of a problem’. She added: ‘We are a young democracy … we need aconsensus. So we cannot behave in a manner like societies [that have been] independentfor many years’ (Merten 2003).
What better and more convenient way to confirm the presence and evident threat of anenemy of the state, democracy and ‘the people’, while affirming the ANC and the state asthe guardians of that democracy and the handmaidens of those ‘people’, than to let loosethe vultures of insinuation, caricature and demagoguery? Worse still, to effectively proscribe anti-capitalist (and, thus, anti-state) dissent and struggle and to declare thepolitical, and indeed moral, inviolability of an enforced, institutionalised bourgeoisdemocracy. The script has been all too familiar – manufacture an ‘enemy’, construct itsself-fulfilling destructive character and purpose and then launch a sustained assaultagainst it under the guise of rationality, ‘law and order’, the nation’s political heritage andidentity, the preservation of democracy and, of course, in the name of the ‘people’.
Democracy and the state under capitalism
The political system of liberal democracy looks more and more like a mixture ofplebiscitary dictatorship and corporate oligarchy. (James Cornford, in Levin1989: 145).
The starting point for any meaningful understanding of, and practical engagementin/with, democracy is a theoretical base. Unfortunately, the dominant theoretical con-struct that has informed interrogations of, and approaches to, South Africa’s ‘democratictransition’ – that is, capitalist (bourgeois) liberalism – falsely separates democratic formand content/context. As such, democracy is conceptualised outside of its historical mate-rialist base as some sort of neutral principle floating somewhere outside material rela-tions. The result is that we are left with a single analytical starting point, namely, thatdemocracy is a function of institutional arrangements within capitalist society. In turn,this leads to the concept of class and the practice of class struggle being understoodsolely in relation to the dominant, contemporary institutional form of democracy undercapitalism (i.e. representative democracy).
The generalised failure to grasp the theoretical nettle of democracy under capitalismnecessarily leads to a focus on existing institutions of representation as the axle uponwhich any meaningful social and political activity turns. In relation to the character andcontent of the various struggles of South Africa’s new social movements, then, the mainargument, vigorously punted by ANC/alliance intellectuals, becomes one about thenecessity for social movements to accept, and participate in, the institutional ‘demo-cratic’ framework (‘institutionalised politics’) as a legitimate and acceptable means toimpact on, and potentially change, both state and society (Sachs 2003: 23–27).
The conceptual heart of this argument is fundamentally embedded within the preceptsof classic bourgeois liberalism, in other words, that institutionalised pluralism (a multi-
T H E D E V E L O P M E N T D E C A D E ? S O U T H A F R I C A , 1 9 9 4 – 2 0 0 4
420
Free
dow
nloa
d fr
om w
ww
.hsr
cpre
ss.a
c.za
plicity of organisational forms) is the essence of democracy, regardless of the dominantsocial relations within which such pluralism operates. The problem here is obvious –such an institutionalisation, under capitalist social relations, has always and everywhereled to an inevitable ‘democratic’ sterility. Pluralism simply becomes a catchword for arange of organisational and individual voices that are contained and limited within thenarrow institutional and political confines of liberal bourgeois democracy, which offersprecious little in the way of seriously contesting the parallel character and content of acapitalist state and the policies it implements.
There is no space here for fundamental (revolutionary) systemic challenges or for analternative politics that is not bounded by status quo institutionalism. The sterility thatinevitably derives from this approach has been more than evident over the last ten years,in relation to South Africa’s traditional political and social organisations/movements. Itis clear for all, except those still wearing their ‘transitional, national democratic revolu-tion’ blinkers, to see the devastating effects of this institutionalised sterility on the long-term capacity of working-class organisations and poor communities to effectivelychallenge the agenda of capital and the state institutions that now act, in the main, as the‘public’ arm of the private (capitalist) sector. Regardless of the institutionalised plural-ism that has accompanied processes of political democratisation since 1994, the SouthAfrican state remains a capitalist state (albeit a de-racialised one). Those social forcesthat remain oppressed and exploited under the ‘guidance’ of such a capitalist state thushave every reason to practise their politics predominately outside of its institutionalboundaries, and that can also include associated electoral processes.
While the state (both in general terms and as applied to South Africa) is a complex entitypossessing its own set of internal contradictions, it is not a neutral institution that cansomehow be enveloped and radically transformed through participation in its associatedinstitutional ‘network’ (including elections). States are, as Marx so cogently argued, theorganic repressive and ideological apparatuses of a class, and in South Africa’s immedi-ate future that class is capitalist. This is regardless of the hypocritical attempts by the newblack elite (both inside and outside the state) to present themselves as part of the broadworking class and somehow suspended above material relations and class realities.
Certainly, the South African state has played, and will continue to play, a role that is notnecessarily always in line with the highest expectations and demands of corporate andfinance capital; it will no doubt, for example, continue to play a part-time welfarist rolethat tries to smooth over class conflict and struggle. However, while capitalist relationsremain the driving force in society, the state will always imbibe and reflect those domi-nant relations in the most specific of ways. The kind of classless analysis of democracyand the South African state that presides over it, which passes for critical intellectualendeavour, leads directly to the kind of quiescent and sterile ‘institutional politics’ thatmost of South Africa’s new social movements want to avoid and transcend.8
If, as a sizeable section of South Africa’s new social movements do, we understand contemporary politics under capitalism as the continuing practice of class struggle, then
D E M O C R A C Y A N D S O C I A L M O V E M E N T S I N S O U T H A F R I C A
421
Free
dow
nloa
d fr
om w
ww
.hsr
cpre
ss.a
c.za
we can also understand why the existing state, its institutionalised politics (i.e. bourgeoisdemocracy) and its socio-economic policies are seen, and treated, as a central target ofthat practice. The democratic content of that practice cannot be manufactured and/orimposed. Those struggling to create new avenues of political expression and to freethemselves from the shackles of capitalism’s ‘democracy’ will create it.
Representation and social transformation
The analytical (contextual) focus on ‘representative democracy’ that has come to domi-nate notions of contemporary democratic content and practice has, in South Africa,come to represent the foil against which the organisational trajectory and practical activ-ities of the new social movements should be adjudged. It is not, however, representativedemocracy that has seen a ‘flowering’ of social movements. Rather, it has been the in-exorable push towards more inclusive and meaningful forms of direct and participatorydemocracy, which have little or nothing to do with the institutional forms of represen-tation within bourgeois ‘democratic’ society, that provides the contextual background tothe genesis and rise of social movements in South Africa.
One of the ANC’s up-and-coming young intellectuals, Michael Sachs, has argued thatthose social movements that position themselves in opposition to representative democ-racy will remain marginal to the process of social transformation (Sachs 2003). This rep-resents an approach that conflates the institutional forms of representative democracy,and the politics thus produced, with the democratic practice/activism that arises out ofclass struggle in a capitalist society. The ‘new’ social movements arose out of, and havebeen shaped by, direct opposition to specific state policies and actions, not representa-tive democracy itself. It is Sachs’ kind of self-constructed and uncritical acceptance ofthe political primacy of representational institutionalism that allows the ongoing strug-gle for democracy to be viewed as a simple exercise in finding the best way to fit into theexisting institutional (capitalist) order while mitigating its effects on the poor/workers.It is the same tired old mantra that has been discussed, and (to a lesser extent) pursued,for decades amongst so-called progressives/leftists who have occupied state power. And,what has been the result? More inequality, more oppression, less freedom, more povertyand certainly less democracy.
If the entire arena of class/political struggle under capitalism is pre-framed as one inwhich there are no strategic and tactical choices other than to work within the repre-sentational parameters of capitalist ‘democratic’ institutions, then any (proto) revolu-tionary class struggles against capitalism are being effectively proscribed. Here, there isabsolutely no room to view and practise ‘engagement’ with such institutions from a per-spective of independent and anti-capitalist class politics and struggle.
It is not that South Africa’s new social movements see all democratic institutions as ‘dan-gerous mechanisms for the co-option of the poor’ or view the vote (within the presentcapitalist framework) as ‘meaningless’ (Sachs 2003: 25–26). Rather, it is simply a matterof understanding that a reliance on formalised participation in such institutions, which
T H E D E V E L O P M E N T D E C A D E ? S O U T H A F R I C A , 1 9 9 4 – 2 0 0 4
422
Free
dow
nloa
d fr
om w
ww
.hsr
cpre
ss.a
c.za
includes participation in electoral politics, is inherently incapable of fundamentallytransforming social relations (that is, as long as capitalist property relations remain thebedrock of social relations). Most social movement activists have no illusions about therevolutionary efficacy of such institutions, whether or not the former liberation move-ment (which has now become the main political vehicle for the class interests of a newblack bourgeoisie) occupies a dominant position within them.
Indeed, South Africa has already entered into the terrain of a low-intensity and com-modified democracy. This is a terrain in which the mere existence and functioning ofrepresentative democratic institutions and processes increasingly mask the decline ofmeaningful popular democratic participation/control, where elections have become thepolitical playground of those with access to capitalist patronage and where electoralchoice is reduced to different shades of grey.
This has not meant, however, that various social movements have been unwilling toutilise the institutional mechanism of the vote as a tactical means/space to put forwardalternative ideas and positions, to expose the neo-liberal agenda of the ANC-run stateand, most importantly, to mobilise the poor outside of the institutional framework ofthe mechanisms of their own oppression. Democracy must not be conflated with theformal institutions that have been tailored, under capitalism, to channel expressions of‘popular democracy’.
While there is no doubt that some of the material and social interests of the poor majority can be partially realised through political representation in the institutions ofbourgeois democracy – something that has been the case since the introduction of theuniversal franchise in all ‘modern’ capitalist countries – the most crucial question ismost often not even posed: How can the poor majority realise (and where have theyrealised) a different, non-capitalist society by defining and ‘ring-fencing’ their struggleswithin the institutional framework of capitalist representative (democratic) institutions?
There is no necessary or inherent connection between participation in such an institu-tional framework (through utilising the vote, representation in state bodies, etc.) and the‘deepening of democracy’ in ways that can make a systemic difference in the lives of thebroad working class under capitalism. What is actually ‘deepened’, though, is the breadthof the institutional framework (the forms) but not the content of popular democracyitself. Fundamentally, then, institutionally-bound forms of ‘popular democracy’ canhave no real long-term meaning or effect as long as capitalist social and material relations remain politically and organisationally unchallenged.
Facing realities
Most of South Africa’s new social movements (and the poor who make up those move-ments) have, unsurprisingly, exhibited little desire to be part of the institutionalisedmainstream of South African politics. This is precisely because these movements havebeen born out of the very failures and betrayals of South Africa’s main political ‘currents’
D E M O C R A C Y A N D S O C I A L M O V E M E N T S I N S O U T H A F R I C A
423
Free
dow
nloa
d fr
om w
ww
.hsr
cpre
ss.a
c.za
and the institutional democratic framework that gives them contemporary, but lessen-ing, legitimacy.
The fact that the social movements are presently outside of the mainstream of SouthAfrica’s institutional politics is representative of a reality that the ANC and its alliancepartners appear wholly unwilling to face – that an increasing number of poor SouthAfricans no longer see active participation in the present institutional set-up of ‘repre-sentative democracy’ as being in their social and material interests. Empirical confirma-tion of this can be easily found in the rapidly declining numbers of poor who actuallyuse their vote (especially at the local level), and this only ten years after the ‘victory ofdemocracy’ for which they fought so long and hard.
The complementary fact that millions of South Africans have registered to vote does not,in any way, then mean that the present representational mechanisms of institutionaldemocracy are the answer to the democratic aspirations of the majority of SouthAfricans. What it does mean, though, is that the majority continue to look, either pas-sively or actively, to institutional representation precisely because there are, presently,few (in depth and breadth) alternative avenues for democratic expression. The socialmovements are just at the beginning of struggling for, and building, such alternativesand it is to be expected that their size, appeal and actions will (for some time) continueto be up against the inherited and accumulated ‘legitimacy’ of bourgeois representativedemocracy as practised, supported and institutionalised by the ANC. If that constitutesbeing on the margins instead of the mainstream in the short term, then that is exactlywhere the social movements should be and, mostly, want to be.
In many poor urban and rural communities, it is through the activities of the new socialmovements that an increasing number of people experience and practise meaningfuldemocracy. Indeed, it is no coincidence that the growing impact and popularity of thedaily ‘bread and butter’ issues and struggles taken up by the social movements aredirectly linked to the adverse effects of the ANC government’s neo-liberal policies on thepoor majority, which are most acutely experienced through the ‘offices’ of the variousinstitutional mechanisms of representative democracy.
If, in the coming years, the struggles of the social movements intensify, both qualitativelyand quantitatively, then it will be the equally intensifying failures of a capitalist state andits bourgeois (neo-liberal) politics that increasing numbers of the broad working classwill be struggling against. Real democracy cannot be achieved and/or measured by insti-tutional representation, processes and proclamation, but can by consistent and radicalpopular participation and mass struggle to ensure that the fundamentals of life are theproperty of the demos, not of a state, not of a political party and not of a capitalist elite.
T H E D E V E L O P M E N T D E C A D E ? S O U T H A F R I C A , 1 9 9 4 – 2 0 0 4
424
Free
dow
nloa
d fr
om w
ww
.hsr
cpre
ss.a
c.za
Notes
1 For a detailed exposition of the ‘fundamentals’ of the RDP, see NIEP 1996.
2 This was ameliorated, to some extent, by a period of intense legislative activity designed to
repeal apartheid-era discrimination and facilitate new social and economic opportunities for
‘historically disadvantaged’ sectors of the population.
3 This acceptance has not been without its vocal critics within both Cosatu and the SACP. For a
detailed treatment of debate and opposition within the alliance since 1994, see McKinley (2001).
4 For an overview (since 1994) of the varying contents and consequences flowing from this reality,
see McKinley (2003).
5 This document, which remained in the possession of a select few ANC-alliance hands until the
late 1990s, was penned when Mbeki was ANC Deputy General Secretary, and was circulated
amongst the alliance leadership prior to the ANC’s 49th National Conference in December 1994.
6 For a more detailed exposition of these positions, see Apollis (2002). Amongst the new social
movements, however, there have been (and continue to be) substantive organisational
differences and political/ideological debates. While the social movements do not represent some
kind of homogeneous entity, they have become inextricably bound together by the levelling
content and common forms of the neo-liberal onslaught (both nationally and, to a lesser extent,
internationally).
7 For an extended critical analysis of the WSSD and the role of the ANC state’s attempts to repress
opposition to it, see Bond (2002). Also see the excellent collection of essays in Kimani (ed.)
(2003).
8 Eric Hobsbawm’s (1973) argument that intellectuals who have been part and parcel of a
revolutionary party/liberation movement most often retreat into the ‘posture of the (liberal)
advocate’ once they have realised that the politics-ideology of that party/movement is not going
to deliver what was expected, rings true in the South African case.
References
ANC (African National Congress) (2002) Contribution to the NEC/NWC response to the Cronin
interviews on the issue of neo-liberalism. Internal ANC paper by the Political Education Unit
(September).
Apollis J (2002) The political significance of August 31st, Khanya 2: 5–9.
Bond P (2002) The World Summit on Sustainable Development: Critiques from the left. Paper
presented to the University of Pretoria Department of Sociology, 18 July.
Cottle E (2003) The failure of sanitation and water delivery and the cholera outbreak, Development
Update 4: 141–166.
Desai A (2002) Witnessing the transition. Article posted on the website of the Centre for Civil Society.
<http://www.nu.ac.za/ccs>
Fine R & Davis D (1990) Beyond apartheid: Labour and liberation in South Africa. Johannesburg:
Ravan Press.
D E M O C R A C Y A N D S O C I A L M O V E M E N T S I N S O U T H A F R I C A
425
Free
dow
nloa
d fr
om w
ww
.hsr
cpre
ss.a
c.za
Habib A & Padayachee V (2000) Economic policy and power relations in South Africa’s transition
to democracy. University of Natal–Durban/School of Development Studies Research Paper.
Hobsbawm E (1973) Revolutionaries. London: Phoenix Publishers.
Kimani S (ed.) (2003) The right to dissent. Johannesburg: Freedom of Expression Institute.
Levin M (1989) Marx, Engels and liberal democracy. New York: St. Martin’s Press.
Marx K & Engels F (1977) Collected works, Vol. 7. Moscow: Progress Publishers.
Mbeki T (1994) From resistance to reconstruction: Tasks of the ANC in the new epoch of the
democratic transformation – Unmandated reflections. Unpublished mimeo.
Mbeki T (2002a) Statement of the President of the ANC, Thabo Mbeki, at the ANC policy conference,
Kempton Park, 20 September. <http:///www.anc.org.za/docs>
Mbeki T (2002b) Letter from the President: The masses are not blind, ANC Today 2, 4–10 October.
McDonald D (2000) The bell tolls for thee: Cost recovery, cut offs, and the affordability of municipal
services in South Africa. Johannesburg: Municipal Services Project.
McDonald D & Smith L (2002) Privatizing Cape Town. Occasional Paper No 7. Johannesburg:
Municipal Services Project.
McKinley D (2001) Democracy, power and patronage: Debate and opposition within the ANC and
Tripartite Alliance since 1994, in R Southall (ed.) Opposition and democracy in South Africa.
London: Frank Cass Publishers.
McKinley D (2003) The Congress of South African Trade Unions and the Tripartite Alliance since
1994, in T Bramble & F Barchiesi (eds.) Rethinking the labour movement in the ‘new’ South
Africa. Aldershot: Ashgate Publishers.
Merten M (2003) The thrill of uhuru is over, Mail & Guardian 15–21 August.
NIEP (1996) From the RDP to GEAR. Research Paper Series, National Institute for Economic Policy,
Johannesburg.
Sachs M (2003) We don’t want the fucking vote: Social movements and demagogues in South Africa’s
young democracy, South African Labour Bulletin 27: 23–7.
Slovo J (1976) South Africa – No middle road, in B Davidson, D Wilkinson & J Slovo (eds.)
Southern Africa: The new politics of revolution. Harmondsworth: Penguin Books.
SMI (2002) Historic united social movements mass march to WSSD sends clear message: The people
will be heard. Social Movements Indaba, Press Release, 1 September. <http://www.apf.org.za>
T H E D E V E L O P M E N T D E C A D E ? S O U T H A F R I C A , 1 9 9 4 – 2 0 0 4
426
Free
dow
nloa
d fr
om w
ww
.hsr
cpre
ss.a
c.za
22 Post-apartheid livelihood struggles inWentworth, South Durban
Sharad Chari
Introduction
Wentworth and Merebank are two communities embedded in the mixedresidential–industrial landscape of South Durban in eThekwini Unicity.1 On oppositesides of Duranta Road, formerly racially defined ‘Indian’ Merebank and ‘coloured’Wentworth continue to live with the environmental and social costs of apartheid spatialplanning.2 With roughly similar populations, of 27 000 for Wentworth and 21 000 forMerebank in 2001, both have lived with similar indignities, such as breathing benzeneemissions from heavy industry all their lives. Although Merebank’s residents have onlyslightly higher household incomes, and slightly lower unemployment levels, Wentworthtoday is a hotbed of political activism while Merebank is comparatively quiescent.3
Wentworth has become more strongly ghettoised in the analytical sense proposed byWacquant (2004) as a process involving stigma, constraint, spatial confinement and insti-tutional containment.4 Although its residents have come from all over South Africa, orperhaps the world, this diverse product of the attempt to legislate against ‘miscegenation’is now largely mired in place. Across the road, Merebank’s quiescence emerges from a verydifferent history of space, through which a former village on the outskirts of Durban hasbeen pulled apart and has become part of the cultural, political and economic fortunesoffered by the new South Africa. This chapter is based on ongoing research on divergenthistories of space through which livelihoods and senses of belonging in what Marais(1998) has called the unfinished work of post-apartheid hegemony have been shrinkinginto a rebellious ghetto, on the one hand, and broadening into circuits of class, cultureand social citizenship, on the other.5
The focus here is on emergent livelihood struggles in Wentworth, which focus on entitle-ments of labour and environment, ten years after universal franchise. The pre-history tothese events in coloured Wentworth is a relatively recent past. An unexpectedly largenumber of coloureds were thrown out of backyard tenancies throughout the city ofDurban, along with the advancing expropriation of Indian-owned land, in the applicationof the Group Areas Act. This large population of coloured tenants from places likeMayville, Cato Manor and the city centre were relocated together with coloureds from theEastern Cape in former military housing in the neighbourhood of Austerville in Went-worth. The Group Areas Act was something of a blessing in that it offered improvedhousing to coloureds and, therefore, it would seem, drew them into a structural relation-ship of complicity with the planners of apartheid. However, this complicity was primarily
427
Free
dow
nloa
d fr
om w
ww
.hsr
cpre
ss.a
c.za

a presumption, and residents drawn from far and wide into cramped flats next to refineries found their lives shaped by new forms of violence and constraint.6 Wentworth’sresidents have acted in relation to violence and constraint in four key realms: gangs,sport, church and migrant labour. Wentworth’s residents have often claimed waves ofintense gang activity since the late 1960s as a direct consequence of the Group Areas Act,as portrayed at an exhibit on Wentworth’s gangs at the KwaMuhle Museum in 2001. Ofthese complex and intertwined histories, this chapter is confined to connections betweenthe primary labour regime that has used and discarded male industrial labour, and thecivic activism that has emerged in a time of rising unemployment.
Indeed, the most fortunate of Wentworth’s men have been shaped into the pre-eminentsemi-skilled industrial migrants of South Africa. They are the pipe-fitters, boilermakers,fitters and turners who have been at the centre of industrial construction work acrossSouth Africa’s refineries. It is, therefore, with painful irony that they return to live inunemployment at the footsteps of the oil refineries of South Durban. As these unem-ployed artisans have entered the sphere of labour and environmental activism, they havehad to confront the gendered fissures through the entire community, and the broaderchallenges of maintaining their livelihoods in the context of largely jobless growth in atoxic soup. Indeed, in the wake of possibly widespread industrial expansion in SouthDurban, both the city and the ruling alliance have held it important to seek the consentof representatives from Wentworth, and South Durban more generally, over their fate inthis changing residential–industrial geography. The question of who will play ‘commu-nity stakeholder’ in relation to eThekwini Metro and the ANC continued to be a fraughtpoint as of late 2004.
In the uncertain, unfinished process of social transformation, ‘civil society’ has emergedas a broad, polysemic terrain of debate, work, aspiration and control (Comaroff &Comaroff 1999). Variously considered, civil society condenses a wide variety of experi-ments over what politics in post-apartheid society means and how people sign up.Within these realms of experiment and engagement, some have suggested two broadpoles of opinion with respect to how civil society ought to act in relation to widerprocesses: on the one hand, as a voluntary sector or handmaiden to the democratic,developmental state, and, on the other hand, as a countervailing force that perpetuallychallenges state and corporate power, typically through ‘social movements’ (see, forexample, Greenstein 2003; Ballard, Habib, Valodia & Zuern 2004). Wentworth’s civicsinternalise this dichotomy in round after round of fierce debate about precisely thequestion of whom to negotiate with, how and to what extent. Participants in civic oractivist groupings manoeuvre between overtly technical-participatory and politicised-confrontational positions through the course of single campaigns, for reasons that gobeyond abstract commitments to resistance or collaboration. Indeed, what MichaelBurawoy (2003) calls ‘active society’, mobilised against commodification and in thedefence of livelihood, remains a hotly negotiated and not necessarily coherent process.7
How is this ‘active society’ mobilised, and what are its challenges? The civil and politicalin post-apartheid South Africa are constituted through enormously varied forms of
T H E D E V E L O P M E N T D E C A D E ? S O U T H A F R I C A , 1 9 9 4 – 2 0 0 4
428
Free
dow
nloa
d fr
om w
ww
.hsr
cpre
ss.a
c.za
praxis, far exceeding canonical genres of struggle narration. Research on post-apartheidsocial movements is only beginning to ask what alternate histories of mobilisation, andwhat new conceptions of ‘community’, activate political imaginations in relation toformer liberation leaders.8 With few exceptions, the activist intellectuals who write forand from today’s popular struggles against post-apartheid neo-liberalism, despite theirwealth of practical knowledge, are only beginning to represent these complex historieswith an attention to black cultural production and the related difficulties in building solidarity across different ways of understanding politics, community, struggle, work,desire, nature and life.9
My central concerns in this chapter are with tracking two important strands of activismin Wentworth, to chart some of their trials, limits and possibilities. First, I explore howa militant form of labour unionism, focused on certain marginal workers, has emergedin Wentworth, and how a section of this activism has been drawn into the challenge ofworker co-operatives. Second, I ask how environmental justice activism has emerged in the same milieu, to a different set of struggles with state, capital and community. Iconclude by turning to the strongly gendered and religious community, which is the siteof struggle and the terrain on which labour and environmental struggles are sustainedbetween high points of activism. This small but complex terrain of struggle reveals thecomplexity of post-apartheid livelihood struggles in microcosm, and some challenges inthe analysis of civic politics ten years after universal franchise.
Work in a time of unemployment
Census data show that at least a third of the population between the ages of 15 and 65is unemployed; a sizeable group is unable to work due to illness or disability; an equallysizeable group either chooses not to work or could not find work; and a significantgroup is comprised of currently unemployed seasonal workers. Of those who areemployed, a large share is in building trades and in metal or machine trades, as well asin health-associated professions. Census data by sex suggest a gender division of labourin which Wentworth men have been tracked into manufacturing and construction,while Wentworth women have worked in wholesale/retail, community/social/personalservices, and manufacturing. A large section of the local population are individuals andhouseholds with ‘no income’, for whom legal, waged work is ‘not applicable’, whichStatistics South Africa translates as ‘not economically active’. In contrast to neighbour-ing Merebank, the category for which legal, waged labour is ‘not applicable’ is similarlyhigh for both women and men in Wentworth.10
In the context of deepening unemployment with minimal self-provisioning, and wheremost if not all consumption goods are commodities, even informal or unwaged workmust be underwritten by income earned somewhere. At least some part of this incomein Wentworth is sought through theft, sex work and drugs, all of which eat away at indi-vidual and community resources, adding to the indignities and infirmities that comefrom living next to heavy industry. In the context of a dramatic decline in forms of legal
P O S T- A PA R T H E I D L I V E L I H O O D S T R U G G L E S I N W E N T W O R T H
429
Free
dow
nloa
d fr
om w
ww
.hsr
cpre
ss.a
c.za
waged work, families of various sorts rely on pensions, child support and disabilitygrants, some legal waged work and some illegal waged work, all cross-subsidised byunwaged care-work, primarily of women who take care of the young, infirm andinjured, and who share some resources through community welfare organisations. Thisis the landscape of work within which labour and environmental activism hasemerged.11
The labour that brings the strongest sense of both pride and forced commitment inWentworth is itinerant industrial work at the refineries. As a way into the history ofindustrial work undertaken by Wentworth men, I turn to the career of one industrialartisan, Lenny Samuels, whose life illustrates some important features about the trans-formation of work in a time of rising unemployment.12 Samuels speaks with great gustoabout the way in which he was forced, through a series of contingent events, out ofhigher education and a route to becoming a foreman, into the stereotypical colouredmale occupation of artisanal industrial labour. For most of his subsequent life, Lennyeither worked on limited duration contracts at the Engen refinery in the middle ofWentworth,13 or he travelled the length and breadth of South Africa to work at RichardsBay, Sasolberg and Saldhana.
Lenny also tells a complicated story about changing labour relations at the Engen refin-ery, in the middle of Wentworth, through the 1980s and 1990s. In his rendition, perma-nent labour had made a shift from being almost entirely white to more Indians andsome coloureds. Workers from Wentworth were primarily hired on limited-durationcontracts for maintenance work during the annual shutdown, reinforcing the stereotypethat artisanal industrial work is the coloured man’s natural lot. In the last decade, therefineries started using labour brokers, following major strikes in the 1980s.Outsourcing really took off in this period, and Engen stabilised its relations with locallabour in various parts of Wentworth by building ties with ex-gangsters. ‘Gang leadersactually became labour brokers. It was a mob thing. It’s not been broken,’ says Lenny. Asa contrast, Hector Andrews, a former shop steward at Engen, who was part of a series ofstrikes in the late 1990s said he did not see a strong link between gangs and labourrecruitment, except in the case of a firm actually called ‘The Mob’, which took over alarge share of labour contracting from Engen during the 1980s.14 The owner of this firmwas known to several people as the ‘Godfather of Wentworth’ in this period. Accordingto Lenny, ‘he would dictate rates. If you didn’t go to work he’d come to your house andkick you and make you go to work’.
Lenny’s account becomes more complicated in the 1990s. More recently, labour brokershave formed a consortium to attempt to monopolise local labour arrangements, and towork with representatives of organised labour to control recruitment. In turn, unionshave been criticised for leading strikes in the chemical industries sector and then bring-ing labour contracts to their own recruitment networks. The links between labour brokering and labour activism are undoubtedly complicated. Alan Martin, an ex-labourunionist, has clearly made a shift to becoming a labour broker, and he lives on the moreprosperous ridge in Wentworth called ‘Treasure Beach’, which rises above the oil refin-
T H E D E V E L O P M E N T D E C A D E ? S O U T H A F R I C A , 1 9 9 4 – 2 0 0 4
430
Free
dow
nloa
d fr
om w
ww
.hsr
cpre
ss.a
c.za
ery towards the sea.15 However, this kind of class mobility seems to have been the lot ofonly a minority of workers.
Others have been drawn to labour organising through the efforts of the fledglingChemical, Engineering and Industrial Workers’ Union (CEIWU), which has specialisedin organising limited-duration contract workers at the Engen oil refinery and beyondsince the late 1990s.16 Each year since 1998, CEIWU has struck during the annual shut-down at Engen, primarily for parity between the entitlements of limited-duration andpermanent workers. A manager at Engen, Gary Dent, admitted that as a consequence ofunrest, ‘we used to do the management job ourselves, but now we’ve farmed out the man-agement’.17 The management of contract labour for shutdowns has been outsourcedthrough labour contracting companies, more so since the enactment of the 1995 LabourRelations Act. While Dent perceived the number of people on site as staying the same, thenature of work has changed substantially for limited-duration contract workers. After amajor wildcat strike in 2001, Engen has shifted to a model of partial and ‘unscheduled’shutdowns, planned at short notice in order to lower the risk of strike activity. CEIWUalso claims that the refineries have been illegally blacklisting workers since the rise instrike activity after 2000. Lenny, who is sure he is on a blacklist, says, ‘I’ve lost my car, I’velost my wife, I’ve lost my house. I find myself in the situation where my lights are beingcut and I’m being evicted because I stand for justice for workers.’18
To try to screen its labour force through a certification process, Engen had used a localtraining programme housed in a building that was once a hotbed of black consciousnessactivism. Since 2002, Engen has combined forces with the Shell and BP joint venture, SouthAfrican Petroleum Refinery (Sapref) to shift the certification of contract workers to a loca-tion further south in Isipingo, which, in the words of Dent, means that ‘there are now fewerpeople who have jobs, but those fewer people will have more regular jobs’.19 More recently,the refineries have also shifted to getting work completed elsewhere, as far away as Gauteng.
2004 was an important year for CEIWU, as it won an important victory by turning a caseof unfair dismissal of 176 workers into a challenge against their limited-duration con-tracts. CEIWU used a combination of ongoing militancy at the swimming pool groundsacross the road from the main gate of the refinery, and patient legal activism with assis-tance from the Legal Resources Centre. The judgement they received ruled that theworkers’ contracts could not be considered ‘limited-duration’, as they made clear refer-ence to benefits, leave, overtime and other conditions of service. As a consequence, thestriking workers’ jobs could not be terminated either for insubordination or operationalrequirements without following due procedure. This judgement runs against the land-mark Fry Metals (Pvt) Ltd vs Numsa ruling from 2002, which upheld the right to dismissworkers on the basis of operational requirements while workers were on strike. Engencould have strengthened this verdict if it had won the case, on the grounds that the strikewas jeopardising the contracts necessary for the obligations of work. CEIWU’s victory hasquite fundamentally altered the terms of labour struggle for industrial artisans in thepetrochemical sector, and the judgement is a resource for the struggles of contractworkers across South Africa.
P O S T- A PA R T H E I D L I V E L I H O O D S T R U G G L E S I N W E N T W O R T H
431
Free
dow
nloa
d fr
om w
ww
.hsr
cpre
ss.a
c.za
CEIWU has since expanded to represent scaffolders, cleaners and the core maintenanceworkers who have been its mainstay within the Engen refinery. The maintenanceworkers who spearheaded the militancy in CEIWU have deepened unionisation drivesacross the refineries of South Durban. What about the community of Wentworth sur-rounding the refinery and its strikers? Karl Green, a union organiser at CEIWU, admits‘the community has a love-hate relationship with strikers at the refinery. They say “Eey,you’re going out on strike. Again! Other people haven’t got work. We’ll go down andwork down there!”’20 CEIWU has had problems with scab labour from the community,but says it has been able to convince them that, if they went in, they would face the sameproblems as the strikers in the future. Recently, CEIWU has been approached by call-centre workers from Pinetown, also on limited-duration contracts. Packing workersfrom a logistics centre in the retail sector have also approached CEIWU. Marginalworkers outside the provisions of the Labour Relations Act by virtue of their short-termcontracts have found CEIWU to be an effective voice. The union’s policy is to try to represent contract workers if they cannot find a bigger union to refer them to.
CEIWU’s labour organising is progressing on three fronts. First, CEIWU would like toconsolidate its base in the engineering sector in the South Basin, across refineries andsubcontracting companies. Second, CEIWU now represents workers who can poten-tially redefine the accountability of capital under the Labour Relations Act, to fightagainst contract work itself. This has expanded their focus on the chemical engineeringindustries to include workers on very short-term contracts in retail and services as well.Often, this expansion of focus has come through the activism of former refinery workerswho were blacklisted for militant labour unionism, and who have since shifted to workin call centres and other forms of short-term contract work. Finally, CEIWU has begunto see that it has built capacity in organising contract workers who are constantly in flux.Bigger unions presume that organisers can be sent to a site to unionise workers, whileCEIWU talks to people across work and home, individually and in groups, and in infor-mal locations. CEIWU has most recently been searching for ways to impart this activistexpertise to larger, more bureaucratised labour union federations.
A small group of unemployed industrial artisans who have participated in the militantunionism of CEIWU have over the past two years also begun experimenting withforming industrial co-operatives. Early on, the attempts to build worker co-ops have hadto contend with the fundamentally gendered fissures in the community. Lenny Samuelswas part of the initial phase of building worker co-ops, which he saw as an alternative tolong-distance migrant work in construction or meat processing. Lenny says he hasdecided to stay and fight for an alternative future without giving up his knowledge as askilled industrial worker. While selling his vision of an alternative future to the commu-nity, he spoke to me about how he saw co-operatives in a larger framework:21
We are looking into forming little co-operatives. I look at a co-operative as some-thing that will oppose multinational capitalism. This will unite our communityand also address our socio-economic needs … Giving a sense of dignity as youare owning something that belongs to you, not to some white guy that’s hidden,
T H E D E V E L O P M E N T D E C A D E ? S O U T H A F R I C A , 1 9 9 4 – 2 0 0 4
432
Free
dow
nloa
d fr
om w
ww
.hsr
cpre
ss.a
c.za
that you don’t even know … The government has encouraged this by a pro-gramme which they call GEAR: outsourcing. I’ve had my toilet fixed now; it wassupposed to be done by the department of housing, but they sent a private con-tractor to my house now. We’d rather all become contractors or co-ops. We wantto contract to the government to address our own needs. Why don’t we say we areco-operatives and do this work ourselves instead of allowing this outsourcing tobe done. There are no permanent jobs in the municipalities today; there are nopermanent jobs in the hospitals today; there are no permanent jobs in schoolstoday because of outsourcing through GEAR and the redistribution of wealth. Sowe’ve got our own ideas about the redistribution of wealth. If I belong to a co-opthat does metalworking, and my wife belongs to a co-op that does sewing forinstance, we could support one another, and then we could have another co-op,which would be a buying co-op, then maybe a gardening co-op. We’re looking atreversing things. We’ll barter.
This popular political economy is important to engage, both as a form of cultural pro-duction and as the organic analysis of someone living through the costs of post-apartheid neo-liberalism. Lenny is clearly wrestling with a notion of democratisingproduction and service work, but he knows that he cannot quite touch the dominantform of ‘redistribution of wealth’, so he suggests a kind of autonomist solution that hecalls ‘barter’.22 Lenny also knew as we spoke that this vision was already compromised bystrongly gendered tensions within the community over what co-operatives mean andwhat community development should be. What he does not question is this under-current of gender politics.
The metalworkers’ co-operative was formed by a small number of unemployed artisanallabour unionists from CEIWU, including Lenny and the late Skido Joseph.23 CEIWU’sinvolvement was at the inception, as part of the Wentworth Poverty AlleviationProgramme (WEPAP), which was to pitch a community-based co-operative initiative tothe poverty alleviation subsection of the local government’s economic developmentsection. WEPAP was based on the formation of two initial co-ops, which would thenspawn other co-ops engaged in other kinds of work. The men of CEIWU started a met-alworkers co-op, and a group of women, unemployed as a result of the massive retrench-ments in the clothing industry, were to start a sewing co-op. Conflict soon emerged,because it seemed that the sewing co-op was led by a mother and daughter from outsideWentworth who apparently saw this as an opportunity to harness a dependent contractgroup to their connections in the clothing industry. Lenny put it categorically: ‘They aretaking the co-operative and offering big businesses cheap labour; that’s exploitation.’
There are several things that can be said about this vision of co-operatives withoutexploitation, as a grassroots challenge to GEAR and as a proactive way of addressingpoverty. What is clear is that at least some of Wentworth’s working-class population areaware of the way in which their livelihoods are bound up with macroeconomic policy.What was blatant in practice is that community debates over co-operatives becamepolarised through the work of gender. Indeed, some of the unemployed women in the
P O S T- A PA R T H E I D L I V E L I H O O D S T R U G G L E S I N W E N T W O R T H
433
Free
dow
nloa
d fr
om w
ww
.hsr
cpre
ss.a
c.za
sewing co-operative did not conceptualise co-operatives in anything like the materialistidiom used by Lenny Samuels. For instance, in one of the heated meetings betweenmembers of the metalworkers’ co-op and the sewing co-op, Greta Jones rose up to controlthe negotiations and said, ‘I don’t know much about co-operatives, but I know that I’mhungry and my clothes are falling off my body.’ Pin-drop silence followed, and she seemedto use a command of Biblical oratory to steer very different factions into engagement.
When I asked her about it later, she smiled and said: ‘You saw what happened, didn’t you!He was there, the Holy Spirit speaks through me to show us the light.’24 Greta and herfriend Diane call themselves ‘intercessors’; they describe their primary work as inter-vening in oppressive marriages to show women the way to take control of their lives.They speak of the deep fissures that migrant work has driven into their possibilities ofhaving stable families, and they are proud to be single mothers.25 Stable marriage is notin actuality the norm, even if open divorce or separation is not either. In a context ofwhat several people from Wentworth see as endemic familial conflict, my conjecture isthat these and other women find in Pentacostalism a way of maintaining their politicalengagement in the name of ‘community’ without compromising their moral stature,knowing full well that their ideal of family has been deeply compromised.
Over the past year, the sewing co-operative has seen a revival after the departure of the‘outsiders’ and a turnaround of its membership. Janice Clayton left out of disgust withthe politics surrounding the co-operative, and a sense that more middle-class womenwere beginning to use the workers to bolster their images as champions of women in the community.26 Three sisters, Leanna, Georgina and Pearl are now running the co-operative. Two of them are unemployed machinists who returned to work once thisopportunity presented itself. When I met them, they had just been squeezed on apayment by someone in Wentworth for whom the co-operative was doing subcontractlabour. They admitted to me that it was still difficult not to act as a subcontract unitunder such circumstances.
The co-operative has rebuilt ties with the metalworkers’ co-operative, which has also hada significant turnaround over the past year, principally through the entry of LorraineLesley. Lorraine was a significant figure in the major Engen strike in 2000, when she wasa key activist in CEIWU. Subsequently, when I last interviewed her in 2002, she had leftthe chemical engineering sector to work at a call centre. It was her initial work organis-ing workers at the call centre that brought CEIWU into organising very limited-durationservice workers there and elsewhere. When she lost her job, Lorraine returned to being anindustrial artisan. Importantly, Lorraine flouts the conception that this work is colouredmen’s work, rather than the trade she is most attached to. When I spent time with themembers of the co-op in early 2004, they had just decided to draft a business plan and to pose as a small business, since it seemed they were not getting contracts because co-operatives cannot be held liable in the same ways that businesses can. It is ironic thatwhile they were once critics of the sewing co-op’s role as a subcontract unit, the metal-workers’ co-op might become a small business. This is not to say that its members are notidealistic or committed to co-operatives, but that larger forces call the shots.27
T H E D E V E L O P M E N T D E C A D E ? S O U T H A F R I C A , 1 9 9 4 – 2 0 0 4
434
Free
dow
nloa
d fr
om w
ww
.hsr
cpre
ss.a
c.za
Activism and the urban environment
In addition to the work of labour organisers and of the pioneers of co-operativisation,several people are involved in activity aimed at the transformation of the terms of work,life, environment, family and community. Although I began with the assertion thatWentworth has become more strongly ‘ghetto’, its residents refuse to move if they canhelp it because Wentworth is a vital neighbourhood with an unmistakeable vibe. Evenin the flats of Woodville Road, which housing activist, Jane Glover, calls ‘the ghettowithin the ghetto’, locals refuse to forget how cool it can be to sit at the front-door stepand see the whole world go by. Many residents have used their time and energy to engagein a variety of political, civic and social groups, on many fronts in the fight for social andenvironmental justice. Today’s struggles coalesce around a range of concerns, includinglimited-duration contract labour, which I have discussed, air pollution primarily fromthe refineries and the Mondi paper mill, sub-standard housing, and care for those livingwith HIV/AIDS.
Environmentalism would seem to have been the most efficacious form of struggle towork across race and class in shared mobilisation over the commons in South Durban.The origin of environmental organisation in South Durban is often attributed to theinterest with which Nelson Mandela listened to the concerns of protestors outside theEngen refinery in 1995, when he stopped to talk to them about their concerns. Aftersome fits and starts, the South Durban Community Environmental Alliance (SDCEA)was formally established in early 1997 as an alliance of organisations committed tolinking environmental justice struggles across the racial boundaries in Wentworth,Merebank, Bluff, Isipingo, Clairwood and Umlazi, in order to respond systematically topollution in the South Durban industrial basin. SDCEA is located in Wentworth, but ithas tried to maintain a sense that it represents all these communities.28 Joe Haynesargues that SDCEA had effectively challenged the Merebank Ratepayers’ Association’shegemony over the environmental debate in South Durban. The element of SDCEA rep-resenting Wentworth is the Wentworth Development Forum (WDF), a merger of threecivics in 1994 with unofficial sanction from the ANC. In its early stages, SDCEA receivedconsiderable support from the activism in the WDF as it built its reputation as a regionalalliance of civics. Over time, Haynes shifted the focus of his activism outward from thelocal, to later help found South Africa’s key environmental justice organisation,groundWork, in 1999.29 The mandate of groundWork has been to address three majorconcerns: oil and air pollution with regard to chemical industries, health-care waste andincineration, and hazardous waste.
A persisting strength of the SDCEA/WDF/groundWork alliance, from the perspective ofWentworth, is that it can wear many hats – militant and professionalised, grassroots andnetworked, confrontational and negotiable – and it can work across multiple scales:local, city, provincial, national and international. Joe Haynes and Mike Winters are per-ceived as very different types of activists: Haynes as more negotiable and Winters as arepresentative of the ‘ultra-left’. They speak of this perception openly, as if it is part oftheir tactical arsenal. Local and national levels of government have been their key points
P O S T- A PA R T H E I D L I V E L I H O O D S T R U G G L E S I N W E N T W O R T H
435
Free
dow
nloa
d fr
om w
ww
.hsr
cpre
ss.a
c.za
of pressure against the corporate–state alliance, particularly with the weakening ofprovincial government since the turn to decentralisation.30
Another key strength for the environmental movement is that the scientific knowledgeon pollution in South Durban is now clearer than ever. The important research atSettlers School, Merebank, conducted by a team of public health scholars from theUniversity of Michigan and the University of KwaZulu-Natal, shows a concentration of‘risk for air pollutant related health effect due to … geographical location amidst twomajor petroleum refineries, a paper mill and a wastewater treatment plant’ (Robins et al.2002: 3). What is striking in the wake of clear evidence that the residents of SouthDurban live in a toxic soup is that the lines of ‘friend’ and ‘enemy’ are by no meansclearly drawn. Many residents appeal to a pragmatism, arguing that the only way tomake the giants in their backyards pay for pollution is to extract from their ‘corporatesocial responsibility’ (CSR) programmes. SDCEA and groundWork are categoricallyagainst CSR as mere ‘greenwashing’. The groundWork campaign on corporate account-ability emerged out of this. Rather than CSR, groundWork’s position is that the under-lying problem is to make capital accountable across multiple spaces and scales. To thisend, groundWork facilitates links with communities across South Africa, but it contin-ues to use SDCEA as an index of the community-based environmental justice struggle.In other words, groundWork tries to use the history of environmental activism centredon Wentworth to create similar capacity elsewhere in South Africa where similar ‘fence-line’ issues – that is to say, issues specific to living on the boundary of polluting industry – can be politicised.
What must be said is that SDCEA does not command a steady mass base in SouthDurban, or even in Wentworth, through the WDF. As a consequence, SDCEA/WDF’swork within Wentworth has been multifaceted. There are three important points to benoted about SDCEA/WDF’s strategy. First, while both organisations are small and theirpresence in daily organising is weak, they can pull in a crowd for spectacular events bydrawing on a variety of other community organisations, even if they come to dissentwith SDCEA/WDF’s tactics or point of view. Second, SDCEA/groundWork have tried topursue a technocratic approach by claiming to empower residents in community mon-itoring of pollution levels, and community collection of research data to demonstrateongoing ill-health in the shadow of oil refineries. While this technocratic approach hasnot created an army of resident scientists monitoring pollution levels, it has won SDCEAimportant allies in international environmental justice research. Third, SDCEA has alsotaken recourse to legal activism, by pursuing Engen, Sapref and Mondi in the courts.This constitutional route, alongside periodic mass action, has been quite fruitful, par-ticularly in the recent victory against Mondi’s plan to build an incinerator/combustor.
The struggle around Mondi’s expansion has been very important for its multiple dimen-sions of activism. The expansion centred on what Mondi calls a combustor, and whichSDCEA/groundWork identify as an incinerator. Mondi first made the proposal in 1998to put in a new ‘fluidised boiler’, but the context is important. By November 1998, theyfound they had to extend their ash landfill site in neighbouring Merebank, but SDCEA
T H E D E V E L O P M E N T D E C A D E ? S O U T H A F R I C A , 1 9 9 4 – 2 0 0 4
436
Free
dow
nloa
d fr
om w
ww
.hsr
cpre
ss.a
c.za
opposed this and it was stopped. They then dumped the ash in the township of Umlazi,seven kilometres away, and there they were effective. SDCEA had managed to closedown the Umlazi dump for toxic waste in February 1997, an important moment atwhich the residents of this African township were mobilised into the regional environ-mental justice movement. As Joe Haynes laments, ‘every environmental justice struggleis bittersweet mate, you win here and you lose there’, and Umlazi was once more adumping ground. However, Mondi knew they were going to run out of space in Umlazi,and they did not want to transport their waste all the way to Shongweni, 35 kilometresaway, so they planned to re-burn it in a boiler on the plant, which is effectively what anincinerator does.31
Three points emerged through the case. First, definitions of the expansion were key tothe case. Was this a combustor to produce steam and power, as claimed by Mondi, or anincinerator to burn waste, as argued by SDCEA? Definitions are key to organising, as‘anti-incineration’ has been a key moral claim made by community residents. Second,the legal activists of the Legal Resources Centre caught the respondents on a technical-ity that exposed the development of informal ties between capital and the state. Thecompany that was contracted for the expansion claimed to have obtained exemptionsfrom conducting an environmental impact assessment and preparing a report, while nosuch exemptions had been granted through formal procedures. Third, the possibility ofa negotiated settlement exposed contradictions between legal counsel and communityactivists, as the latter would not give up their militancy even for important concessionsfrom the industrial giants. Ultimately, ‘anti-incineration’ works both as an emotiveorganising tool at the local level, and it brings international allies in the global ‘anti-incineration’ movement. These are two key constituencies for SDCEA/groundWork.
Joe Haynes concedes that SDCEA must decide its battles carefully and concentrate ener-gies on key cases. Given that SDCEA does not have a mass base but that it can bringtogether a strong crowd around issues like incineration and relocation, it has to deepenthe links between campaigning and episodic militancy. One of the challenges will be todraw a tighter link between organised labour, to bring together questions of environ-mental pollution and jobless growth in the expansion of the South Durban industrialbasin. Despite the fissures within the SDCEA/WDF/groundWork alliance, all of themsupported the militant labour union CEIWU during the important 2003 strike. AsHaynes warns, ‘the environmental movement is just beginning to challenge the eco-nomic system’.32
However, as I have already suggested, not everyone in Wentworth sees the environmen-tal movement as all that central. Jane Glover, housing activist, says, ‘I’m not worriedabout the environment; all I want is my piece of oxygen!’ It would be a mistake to seethis as just a competition between ideologies rather than one window into the profoundtensions between various domains of activism in Wentworth. Jane represents a muchmore contingent grouping of women who have found it necessary to organise them-selves rather than accept being represented by the WDF.
P O S T- A PA R T H E I D L I V E L I H O O D S T R U G G L E S I N W E N T W O R T H
437
Free
dow
nloa
d fr
om w
ww
.hsr
cpre
ss.a
c.za
Jane’s primary battle has been to take over a set of flats left vacant by the provincialhousing department. The gist of this struggle is that in early 2003, a group of womenfrom Woodville Road formed a small organisation to stage a putsch against the leader-ship of the WDF. The WDF’s position was that they were negotiating with the housingdepartment to employ local contractors for construction work. The women ofWoodville Road decided they could wait no longer. One night, they held hands andprayed, and they say that the Holy Spirit descended upon them and enabled them to act.By the next morning, they had taken over the new housing stock and could not be dis-lodged. The WDF then called a meeting with key external activists, and the women ofWoodville Road were chastised for defying the leadership. Jane Glover’s imprompturesponse, after a careful apology to the WDF leadership and the community, demon-strates the continuing centrality of gender in the everyday work of organising:33
I woke up one morning and I said to myself, ‘What is it that depresses me so muchabout living here?’ And when I looked around, I looked at the flat and I said ‘MyGod! It looks like the walls are closing in on me!’ So … that is what our commit-tee was all about. If we failed somewhere along the way, we are so sorry. You know,when we needed some men around, there were no men available. So we took itupon ourselves to get in there and take on the task.
In her public comments, Jane describes the difficulties of being intimate, of performing‘family obligations’, in overcrowded flats. The appeal to both Malthus and family valuesis bound to win points, but she also comes back with a stinging critique against thepolitical inactivity of men in securing basic means of survival. In private, Jane describesto me how a friend of hers, while buying used clothing, found that her ex-husband hadbeen selling her things off for a while. There are two intertwined dynamics at work inthe activism described by Jane Glover. On the one hand, she and her comrades claim areligious experience moved them to act in their interests, against the commands of theirmale leadership. On the other hand, her ideology is conservative in conceptions offamily and gender/sexuality that, in practice, have been transformed dramatically.
Conclusion
Within the profound subcontracting of the South African state and society in the newdispensation, as both capital and state have turned to forms of contracting to circum-vent labour law and organised labour, we are only just beginning to understand theraced and gendered ways in which communities pick up the pieces. Diane Elson (1991)argues that structural adjustment programmes (SAPs) have relied on ‘unlimited suppliesof female labour’, a play on Arthur Lewis’ classic argument on economic developmentwith unlimited supplies of agricultural labour. Elson’s argument is that cutbacks onwelfare and social security through SAPs require women in households to absorb muchof the shock, through increased unpaid care-work. This ‘Second Wave’ feminism carriesthe assumption of global sisterhood strongly critiqued by black and Third World femi-nists for not addressing the actual diversity of gender relations. The task for post-Second
T H E D E V E L O P M E N T D E C A D E ? S O U T H A F R I C A , 1 9 9 4 – 2 0 0 4
438
Free
dow
nloa
d fr
om w
ww
.hsr
cpre
ss.a
c.za
Wave feminism has been to see how sexuality and gender are understood differentially,and whether and how, in Elson’s problematic, ‘feminised’ labours do in fact pick up thepieces in the context of structural adjustment. What Wentworth demonstrates is thatone cannot assume that men and women do so passively.
Wentworth’s diverse struggles, which I have only touched on through the labour andenvironmental questions, continue into the present and do not converge in any clearway. A large number of people continue to participate in the everyday labours of organ-ising across a range of concerns that come from living in a community surrounding a refinery. Each form of activism confronts an aspect of the elements that makeWentworth, for the time being, a type of ghetto, characterised by particular forms ofstigma, constraint, spatial confinement and institutional containment. The rapid rise ofPentacostalism in Wentworth is significant for what people do with it, and what is rarefor Pentacostalism, given its conservatism, is for it to become a tool for women-led militancy. It remains to be understood precisely how Pentacostalism allows some peopleto claim their place as moral beings while also acting as agents of change outside thechurch and labour market, as heirs to the fruit of this world: to its housing, its basic services, its jobs, its medicine and its clean air.
Notes
1 I am grateful to the Michigan Society of Fellows and the University of Michigan for funding to
begin this research in 2002, and to the School of Development Studies (SODS), at the University
of KwaZulu-Natal, for support ever since. Versions of this paper were presented to the SODS
50th Anniversary Conference, Durban, 21–22 October 2004; the Anthropology of Work
Conference, San Francisco, 20 November 2004; and the African Studies Workshop at the
University of Chicago, 23 November 2004. I am grateful to several people from these audiences
for comments. With the usual disclaimers, in addition to my informants in the paper, I would
like particularly to thank John Comaroff, Ashwin Desai, Bernard Dubbeld, Grant Farred, Gillian
Hart, Jeremy Jones, Vishnu Padayachee, Raj Patel, Richard Pithouse and Stephen Sparks.
2 I do not systematically use quotes to indicate that ‘race’ is a fiction, but follow convention in
capitalising Indian and not coloured, without implying that one and not the other is a proper
noun. Census data in Chari (2005) shows that Indians and coloureds continue to numerically
dominate these townships, but that Wentworth coloureds are a much more significant share of
the coloured population of eThekwini city and KZN province, than are Merebank’s Indians to
the city or provincial Indian population. Wentworth has a distinctive character as such a
significant regional concentration of coloureds, while Merebank is far overshadowed by
townships like Chatsworth and Phoenix.
3 Individual monthly incomes for both communities are in the range of R1 600–R3 200, though
Austerville (a neighbourhood in Wentworth) has a substantially larger population of individuals
with no income. Household monthly incomes are stronger for Merebank. A comparison of
household annual incomes with the neighbouring, formerly African townships of Lamontville
and the much larger Umlazi, as well as formerly white Musgrave and Kloof, shows that
P O S T- A PA R T H E I D L I V E L I H O O D S T R U G G L E S I N W E N T W O R T H
439
Free
dow
nloa
d fr
om w
ww
.hsr
cpre
ss.a
c.za
Wentworth and Merebank sit similarly between former African and white areas in income terms,
with Merebank appearing slightly more advantaged but not tremendously so. What also stands
out is the much higher number of households with no income in African areas in contrast to
others. (See Chari 2005)
4 Wacquant (2004) derives a relational conception of the ghetto as a ‘social-organisational device’
directed, in his terms, at producing and forcibly confining a dispossessed and dishonoured
group. He argues that the ghetto ought to be seen in analogy with other forms of collective
violence like the reservation, the refugee camp and the prison. Each form links economic
exploitation and social ostracism differently. A coloured ghetto that breathes petrochemical
fumes, across town from the gentility of the leafy, and largely English, Berea, but not as far out
of the city as other black townships, carries specific social and spatial contradictions. Wacquant
suggests that ghetto residents create strong internal affinities to make the experience of stigma
bittersweet – a sentiment captured perfectly in Roy DeCarava and Langston Hughes’ (1955)
photo-poetic portrait of Harlem, The sweet flypaper of life. Unlike the ethnic neighbourhood,
which is what Merebank has become, the ghetto is less a springboard to assimilation in society
than a walled-in ‘dissimilation’, even if Wentworth’s ghettoisation draws on wider archetypes
from Pentacostalism or African American cultural production.
5 Histories of space presume what Henri Lefebvre (1974) calls a properly social theory of space
that refuses the dichotomy of physical/container space and mental/cognitive space, to apprehend
how spaces are fought for, made, devalued, destroyed, restored, irrevocably lost or nostalgically
remembered. Marais (1998) is an exemplary Gramscian analysis of the challenges of hegemony
and counter-hegemony.
6 Farred’s (2004) prescient critique of Sanders (2002) suggests the importance of careful research
on dialectics of resistance and complicity, in relation to changing forms of state-sanctioned
cultures of racism, to include both ‘black anti-black’ racism as well as moments of deeper
critique of black subjection. ‘The black intellectual’s work is never done,’ as Farred puts it,
because neither complicity nor resistance is guaranteed.
7 Michael Burawoy’s (2003) brilliant, contrapuntal reading of Karl Polanyi and Antonio Gramsci
is driven by the question of how counter-hegemony is forged, but he forgets his ethnographic
dictum by neglecting cultural production for the presumption that people act from necessity in
the wake of commodification. While new forms of ‘active society’ may indeed be produced to
defend life against the ravages of capitalism, Burawoy’s question (akin to the question he once
asked of workers at the point of production: Why do workers work?) ought to be: Why do
activists act?
8 See Watts (2004) on various mobilisations of ‘community’ in the wake of imperial oil politics
and the crisis of secular nationalist development in Nigeria. Jensen (2004) makes a parallel
argument on the polyvalence of ‘community’ on the Cape Flats.
9 The most broadly appreciated work remains Ashwin Desai’s (2002, 2003), where much is said
between the lines. Notable pieces are Lumsden & Loftus (2003), Greenstein (2003), Barchesi
(2004), Hart (2002, 2005), Mbali’s (2004) fascinating research on the Treatment Action
Campaign, and Pithouse (2004), for a challenging account of the importance of internal critique
in the oppositional movements of the present. By ‘cultural production’, I mean Paul Willis’
T H E D E V E L O P M E N T D E C A D E ? S O U T H A F R I C A , 1 9 9 4 – 2 0 0 4
440
Free
dow
nloa
d fr
om w
ww
.hsr
cpre
ss.a
c.za
(1981) sense of the broadest type of creative or meaning-making activity that we engage
in as humans, some of which becomes part of the ‘cultural reproduction’ necessary for the
maintenance of dominant ideologies, which then maintain capitalist hegemony, but which also
contain radical lines of flight necessary for the making of Burawoy’s ‘active society’.
10 For this data, please see Chari (2005).
11 My method thus far has primarily been through life histories collected in four periods of
residence in Durban, during which I have interviewed past and present activists, workers and
residents in, or from, Wentworth and Merebank. This is a preliminary report, focusing primarily
on Wentworth. All names of living people have been changed to protect people and their
intellectual positions.
12 Lenny Samuels, 26 November 2002.
13 Engen was initially the Standard Vacuum Oil Company of New Jersey at its inception in 1954.
The company subsequently changed its name to Mobil, which suddenly pulled out of South
Africa in 1989 and was bought over by a South African mining giant, Gencor. It has since
become Engen, which was listed on the Johannesburg Securities Exchange and bought out in
two major shares by the Malaysian state oil corporation, Petronas.
14 Hector Andrews, 13 July 2004.
15 Alan Martin, 26 November 2002.
16 I realise I am not attending to the history of the Boiler Makers’ Union here, as I do not have
enough source material on its emergence and relationship to CEIWU.
17 Gary Dent, 20 December 2002.
18 Lenny Samuels, 26 November 2002.
19 Gary Dent, 20 December 2002.
20 Karl Green, 21 April 2004.
21 Lenny Samuels, 26 November 2002.
22 See Gidwani & Chari (2004) on the limits of this kind of autonomism.
23 Skido Joseph passed away tragically in late 2003, after I had the opportunity to get to know him.
Although Skido was quite open about his faults and prejudices, he was articulate about his
feeling of post-revolutionary betrayal and commitment to continue the fight for social justice in
Wentworth, and he put in hours of unpaid labour to this end.
24 Greta Jones, 21 November 2002.
25 It is important to note that in today’s Wentworth, there are almost the same number of female
as male household heads; male household heads are significantly more likely to be employed
(female – 35 per cent, male – 53 per cent), and only slightly more likely to be unemployed
(female – 10 per cent, male – 14 per cent). Census data on ‘marital status’ show that 25 per cent
of the population of Austerville is married; 60 per cent have never married; 4 per cent live
together ‘like married partners’, and 5 per cent are separated or divorced (see appendix to
Chari 2005).
26 Janice Clayton, 14 September 2004.
P O S T- A PA R T H E I D L I V E L I H O O D S T R U G G L E S I N W E N T W O R T H
441
Free
dow
nloa
d fr
om w
ww
.hsr
cpre
ss.a
c.za
27 Lorraine Lesley, 13 September 2004.
28 Joe Haynes, one of its founders, comments on the difficulties in getting the Umlazi
Reconstruction and Development Forum onto the environmental justice platform, although he
had witnessed commitment to the issues in Umlazi through the difficult period of the ANC/IFP
tensions in 1995. Personal communication, 31 October 2004.
29 Joe Haynes, personal communication, 31 October 2004.
30 As an indication of this weakness, while the power to decline environmental impact assessments
(EIAs) lies at the provincial level, only one of the 64 EIAs concerning South Durban between
January 2002 and March 2003 was declined.
31 Andries Plaatje, 20 April 2004; Joe Haynes, 22 April 2004.
32 Joe Haynes, 22 April 2004.
33 Jane Glover, meeting in Wentworth on the Woodville/Wolraad/Tayne Residents Committee,
undated tape from early 2003. Interview with Jane Glover, Wentworth, 23 August 2003.
References
Ballard R, Habib A, Valodia I & Zuern E (2004) Globalisation, marginalisation and contemporary
social movements in South Africa. Paper presented at the School of Development Studies 50th
Anniversary Conference, Durban, 21–22 October.
Barchesi F (2004) Classes, multitudes and the politics of community movements in post-apartheid South
Africa. Centre for Civil Society Research Report 20, University of KwaZulu-Natal, Durban.
Burawoy M (2003) For a sociological Marxism: The complementary convergence of Antonio
Gramsci and Karl Polanyi, Politics and Society 31: 193–261.
Chari S (2005) Political work: The Holy Spirit and the labours of activism in the shadows of Durban’s
refineries. Research Report 30. Durban: Centre for Civil Society, University of KwaZulu-Natal.
Comaroff J & Comaroff J (1999) Occult economies and the violence of abstraction: Notes from the
South African postcolony, American Ethnologist 26: 279–303.
DeCarava R & Hughes L (1955) The sweet flypaper of life. New York: Hill and Wang.
Desai A (2002) We are the poors: Post-apartheid struggles in South Africa. New York: Monthly Review
Press.
Desai A (2003) Neoliberalism and resistance in South Africa, Monthly Review 54:16–28.
Elson D (1991) Male bias in the development process. Manchester: Manchester University Press.
Farred G (2004) The black intellectual’s work is never done: A critique of the discourse of
reconciliation in South Africa. Book review of Mark Sanders’ Complicities: The intellectual and
apartheid, Postcolonial Studies 7: 113–23.
Gidwani V & Chari S (2004) Geographies of work. Introduction to a special issue of Environment
and Planning: D, Society and Space 22: 475–84.
Gilmore R (2002) Fatal couplings of power and difference: Notes on racism and geography,
Professional Geographer 54: 15–24.
T H E D E V E L O P M E N T D E C A D E ? S O U T H A F R I C A , 1 9 9 4 – 2 0 0 4
442
Free
dow
nloa
d fr
om w
ww
.hsr
cpre
ss.a
c.za
Greenstein R (2003) State, civil society and the reconfiguration of power in post-apartheid South Africa.
Centre for Civil Society Research Report 8, University of KwaZulu-Natal, Durban.
Hart G (2002) Disabling globalisation: Places of power in post-apartheid South Africa. California:
University of California Press.
Hart G (2005) Denaturalising dispossession: Critical ethnography in the age of resurgent
imperialism. Research Report 27. From local processes to global forces: Research reports 2000,
Vol. 1. Durban: Centre for Civil Society, University of KwaZulu-Natal.
Jensen S (2001) Claiming community – Negotiating crime. State formation, neighbourhood and
gangs in a Capetonian township. PhD dissertation, International Development Studies,
Roskilde University.
Jensen S (2004) Claiming community: Local politics on the Cape Flats, South Africa, Critique of
Anthropology 24: 197–207.
Lefebvre H (1974) The production of space. Oxford: Blackwell.
Lumsden F & Loftus A (2003) Inanda’s struggle for water through pipes and tunnels: Exploring
state-civil society relations in a post-apartheid informal settlement. Centre for Civil Society
Research Report 6, University of KwaZulu-Natal, Durban.
Marais H (1998) South Africa, limits to change: The political economy of transformation. Cape Town:
University of Cape Town Press.
Mbali M (2004) TAC in the history of rights-based, patient-driven HIV/AIDS activism in South
Africa. Research Report 29. From local processes to global forces: Research reports 2000, Vol. 1.
Durban: Centre for Civil Society, University of KwaZulu-Natal.
Pithouse R (2004) Solidarity, co-optation and assimilation: The necessity, promises and pitfalls of
global linkages, Journal of Asian and African Studies, forthcoming. <http://www.nu.ac.za/
ccs/default.asp?10,24,10,1332>
Robins T et al. (2002) Air contaminant exposures, acute symptoms and disease aggravation among
students and teachers at the Settlers School in South Durban. Draft Final Report of 9 November.
Wacquant L (2004) Ghetto, in Smelsner N & Baltes P (eds.) International encyclopedia of the social
and behavioral sciences. London: Pergamon Press.
Watts M (2004) Antinomies of community: Some thoughts on geography, resources and empire,
Transactions of the Institute of British Geographers, 29: 195–216.
Willis P (1981) Cultural production is different from cultural reproduction is different from social
reproduction is different from reproduction, Interchange 12: 48–67.
P O S T- A PA R T H E I D L I V E L I H O O D S T R U G G L E S I N W E N T W O R T H
443
Free
dow
nloa
d fr
om w
ww
.hsr
cpre
ss.a
c.za
23Rural development in South Africa: tensionsbetween democracy and traditional authority
Lungisile Ntsebeza
Introduction
The post-1994 South African state has targeted local government as playing a pivotalrole in development in the whole of South Africa, including the rural areas in the formerbantustans. Historically, particularly during the apartheid period, these areas were underthe control of Tribal Authorities dominated by chiefs and headmen. These institutions,which were unaccountable and undemocratic, were imposed on unwilling rural resi-dents. In areas such as Pondoland (Mbeki 1984), Sekhukhuneland (Delius 1996) andXhalanga (Ntsebeza 2002), the imposition of these institutions led to often bloody con-flicts between apartheid state supporters and those in resistance. Since 1994, there havebeen various attempts to democratise the rural development process and governance. Inthis regard, local government is central.
Post-1994 local government is dubbed ‘developmental’. Local government is one of thethree spheres of government, the others being national and provincial. In terms ofSection 151 of the Constitution, it ‘consists of municipalities, which must be establishedfor the whole of the territory of the Republic’. This would include rural areas under thejurisdiction of Tribal Authorities, where municipalities next existed. In its ‘objects oflocal government’, the Constitution (Section 152) entrenches the democratic and devel-opmental aspects of local government and insists that local government must, inter alia,‘provide democratic and accountable government for local communities; … ensure theprovision of services in communities in a sustainable manner; … promote social andeconomic development’ and, crucially, ‘encourage the involvement of communities andcommunity organizations in the matters of local government’. Section 153(a) of theConstitution further prescribes that a municipality ‘must structure and manage itsadministration and budgeting and planning processes to give priority to the basic needsof the community, and to promote the social and economic development of the com-munity’.
This chapter deals with the vexed issue of rural development in the former bantustanssince the advent of democracy in 1994. More specifically, the chapter focuses on the roleof traditional authorities (chiefs of various ranks) in rural development in this period.To achieve this, I first consider the manner in which rural development has been con-ceptualised since 1994. I then consider how policies and laws on rural developmenthave been implemented. Against this background, the role of traditional authorities in
444
Free
dow
nloa
d fr
om w
ww
.hsr
cpre
ss.a
c.za
rural development is taken into account. The role of traditional authorities in rural development is considered against the backdrop of the constitutional requirement fordemocratic, community participation in development and governance broadly.
Rural dynamics in post-1994 South Africa
Conditions on the ground after 1994 in many rural areas under traditional authoritieshave often been characterised by tensions and conflicts between elected councillors andthe incumbents of apartheid-created Tribal Authorities (chiefs and headmen). Thesetensions, as will be demonstrated, can be attributed to the difficulty in reconciling rep-resentative democracy, based on elected leaders, and traditional authority, which ishereditary. Both the institutions of traditional leadership and representative democracyare entrenched in the Constitution. While the Constitution recognises the institution oftraditional leaders, there was no clarity about the role of traditional authorities. It is thislack of clarity that is at the heart of the confusion and tensions on the ground. These tensions were evident even before the advent of democracy in 1994. At the time, the tensions were between traditional authorities and groups in civil society, especially thoseorganised under the South African National Civic Organisation (Sanco). At the centreof these struggles was control over land, in particular, land allocation. In cases such asXhalanga in the Eastern Cape, residents’ associations took over the land allocation func-tions from traditional authorities (Ntsebeza 2002; see Manona 1997 for the Ciskei). By1994, there was a breakdown in land administration.
After the 1995/96 local government elections, these tensions manifested themselves asbetween elected rural councillors and Sanco, on the one hand, and traditional authori-ties, on the other. Elected councillors were introduced following the local governmentelections in 1995 and 1996 as part of the attempt to extend democracy to rural areas. Asalready noted, in terms of the Constitution, municipalities were to be introduced in allparts of the country, including areas falling under the jurisdiction of traditional author-ities. This meant that new structures based on elected councillors were introduced inthese areas, too. The majority of rural councillors were drawn from the ranks of Sancoactivists. Some of the functions of these democratically elected structures, such as thepromotion of state-led development in rural areas, used to be performed by traditionalauthorities. In the absence of clear-cut functions for traditional authorities, taking somefunctions from them was surely going to be a recipe for chaos and confusion.
Above all, it was confusion over the land allocation function that most of the tensionrevolved around. This was particularly true in the case where civic structures and tradi-tional authorities had more or less equal support. There are two levels at which thisdilemma could be understood and explained: the law and practice. Before the promul-gation of the Communal Land Rights Act, the laws governing the allocation of land inthe rural areas of the former bantustans had not been repealed. In this regard, the SouthAfrican Constitution is clear that existing laws will remain in force until such time asthey have been replaced by appropriate legislation. In terms of the then existing laws, an
R U R A L D E V E L O P M E N T I N S O U T H A F R I C A
445
Free
dow
nloa
d fr
om w
ww
.hsr
cpre
ss.a
c.za
application for land would only acquire legal recognition if it bore the stamp of the relevant Tribal Authority and was signed by the appropriate signatories.
Reality on the ground, though, was different. Many rural residents, rural councillorsand, indeed, South Africans assumed that the newly elected councillors would take overthe vital function of land allocation. After all, as the Xhalanga example shows, controlover land was the cardinal issue in rural struggles in the early-to-mid 1990s. When theintegrated development plan (IDP) for Xhalanga was developed in 1999, the issue ofwho would be responsible for land allocation cropped up.1 Although interviews and theminutes of meetings suggest that, on the whole, there were no tensions between electedrural councillors and the representative of traditional authorities, there were animateddiscussions when it came to the question of land administration. It appears that the rep-resentative of traditional authorities pointed out that Tribal Authorities were stillresponsible for land administration. This claim was strongly challenged by rural coun-cillors. The explanation of the representative of traditional authorities was simple andhighlighted the lack of clarity regarding land administration in the countryside:‘Nothing is clear. Government has indicated that land allocation will be the function ofthe TRCs [transitional rural councils]. However, at the moment this has not happened.Most areas still use the old method.’2 The IDP committee never resolved this issue. Oneof the committee members pointed out that one of the reasons why the matter was notdiscussed further was that ‘it was seen as divisive’.3 Of course, the committee could notresolve the issue, given, as will be seen below, the government’s ambivalence regardingthe role of traditional authorities.
However, residents and rural councillors, in particular, got a rude shock when it turnedout that the old apartheid laws were still in place. Above all, government officials stillused, with minor adjustments, the apartheid procedure and did not recognise electedcouncillors as having the powers to allocate land. The extent of this confusion, thedilemma of rural residents and the role of the officials of government, are best capturedin the following response by a resident who was sympathetic to Sanco on the questionof who was responsible for land allocation in areas falling under the jurisdiction oftraditional authorities:
This is the reason why we still use chiefs. Rural councillors run in circles. Thismakes us a laughing stock and divides us. People will tell you: ‘Go to your ruralcouncillor, you won’t succeed.’ You end up going to the chief, even if you did notwant to. At the magistrate’s offices they ask you about the stamp [of the TribalAuthority]. If you do not have the stamp they will say: ‘Don’t waste our time.’ Theland issue is complex. There is a struggle between TrepCs [transitional represen-tative councils which consist of elected rural councillors] and the headman. Theformer brought electricity and telephones, but land is in the hands of chiefs. Youare forced to be flexible (kufuneka ubemvoco) otherwise you won’t get your ben-efits. When we wanted land for pre-schools we were told to go to the headman,something that made the headman boastful. Sometimes you may have spokenbadly about the headman, and you end up bowing down to it, as it is often
T H E D E V E L O P M E N T D E C A D E ? S O U T H A F R I C A , 1 9 9 4 – 2 0 0 4
446
Free
dow
nloa
d fr
om w
ww
.hsr
cpre
ss.a
c.za
necessary that you get what you want. With chiefs and headmen it takes a fewdays to get what you want, whereas with rural councillors it takes months, andeven then you end up not succeeding.4
This reflects experiences in Sifonondile in Xhalanga, where inhabitants were dividedbetween supporters of the headman, on the one hand, and civic structures and ruralcouncillors, on the other. In this area, civic structures under the auspices of Sancodemarcated land and allocated plots to its supporters. Those who were allocated plots,however, were not granted permits to occupy (PTOs), as the government officials didnot recognise their process. It is partly this dilemma that the informant was referring to.
In the case of the Tshezi community in Mqanduli in the Eastern Cape, the issue of lackof clarity led to an abandonment of a rural development project. The Tshezi area, situ-ated near Coffee Bay and Hole-in-the-Wall in the Transkei region of the Eastern Cape,was one of four economic development nodes that were identified by the Departmentof Trade and Industry-led Spatial Development Initiative (SDI). One of the require-ments of the SDI for investment in ‘communal’ areas such as the Tshezi area was theneed to clarify the question of who owns land and who is responsible for the provisionof municipal services in these areas. In the end, this project was abandoned largelybecause traditional authorities in the Eastern Cape were not happy with the establish-ment of an alternative, democratic landholding entity, the Communal PropertyAssociation. They influenced the chief in the Tshezi area against the project.5 As will beseen, traditional authorities want to be the primary structure in rural areas, in prettymuch the same way as during the apartheid period, when Tribal Authorities had themonopoly of power.
In order to understand these tensions and how they have a bearing on rural devel-opment, I will consider the development of policies and legislation in the newdemocracy.
Rural development in South Africa’s democracy: policy analysis
It is important to note that the early conceptualisation of post-1994 local governmenthad a strong urban focus. For example, the 1993 Local Government Transition Act wassilent on the form local government would take in rural areas. Given the centrality oflocal government in the promotion of development as outlined earlier, the implicationof this omission was that the key instrument or vehicle for development in rural areaswas missing. The omission also cast doubt on the seriousness of the 1994 White Paperon Reconstruction and Development in its identification of local government as the keyvehicle for rural development.
However, the issue of the form of local government in rural areas could not be ignoredin the run-up to the first democratic local government elections in 1995/96. Local gov-ernment in post-1994 South Africa went through two phases: a transition phase between1995 and 2000, followed by the establishment of fully fledged municipalities in
R U R A L D E V E L O P M E N T I N S O U T H A F R I C A
447
Free
dow
nloa
d fr
om w
ww
.hsr
cpre
ss.a
c.za
December 2000. Amendments to the 1993 Local Government Transition Act in June1995 rectified the silence about the form local government would take in rural areas.These amendments focused specifically on local government in rural areas and providedfor a ‘district council’ model for rural areas, establishing a two-level structure, consistingof a district council at a sub-regional level, and a range of possible structures at local(primary) level. In rural areas, the primary structures, established at magisterial-districtlevel would either be transitional rural councils (TRCs), or transitional representativecouncils (TrepCs). These structures would be made up of elected representatives. Themain difference between TRCs and TrepCs was that the former were accorded thepowers of a fully fledged local authority, while TrepCs were seen as fulfilling representa-tive and brokering functions, and as bodies that would eventually evolve into effectiveand democratic local authorities.
Unlike in the urban areas, where the electoral system was based on a combination ofconstituencies and proportional representation, the system that was adopted for ruralareas was proportional representation. This meant that rural people voted only for polit-ical parties, rather than political parties and independent candidates. It is worth remark-ing that this form of election has grave implications for the downward accountability ofofficials to the constituency. In the proportional representation system, officials are oftenprone to be primarily accountable to their political parties or the leadership thereof,rather than their constituency, the voters.
At the same time as local government was being transformed, other policy initiativeswere put in place to address rural development. Following the introduction of the WhitePaper on Reconstruction and Development in 1994, a National Rural DevelopmentStrategy (NRDS) was unveiled in 1995. This was an attempt to integrate and align theobjectives of the Reconstruction and Development Programme (RDP) with those ofdevelopmental local government. Indeed, the RDP had also identified with the senti-ment that citizens should actively participate in development initiatives in their areas(ANC 1994). However, as Davids (2003) argues, the RDP objectives did not adequatelyaddress the rural economy and ignored issues of local governance, including traditionalleadership. In 1997, a Rural Development Framework (RDF) was introduced. It soughtto address some of the weaknesses of the NRDS, in particular those underlying the roleof rural local government in development and the alleviation of poverty in South Africa.This process was led by the office of the RDP. With the closure of the RDP office, though,the RDF was left in limbo.
By 1999, almost five years into South Africa’s democracy, there was no clear-cut policythat would guide development planning in rural areas under Tribal Authorities. On theground very little had happened. Land-based and rural-development NGOs andactivists, otherwise supportive of the African National Congress (ANC)-led govern-ment, were also disgruntled with the slow process in the improvement of the quality oflives of rural people. In the run-up to the 1999 elections, these NGOs and activists cametogether under the Rural Development Initiative (RDI) primarily to influence the election manifesto of the ANC ahead of the elections.
T H E D E V E L O P M E N T D E C A D E ? S O U T H A F R I C A , 1 9 9 4 – 2 0 0 4
448
Free
dow
nloa
d fr
om w
ww
.hsr
cpre
ss.a
c.za
In announcing plans under his presidency, the newly elected President Thabo Mbekimade known, soon after the 1999 election, his government’s intention to put in placeanother rural development programme. Whether this was in response to the RDI, asDavids (2003) seems to suggest, or not, is not clear. What is clear is that, in 2000, theIntegrated Sustainable Rural Development Strategy (ISRDS) was unfolded. This docu-ment was formulated in the Office of the Deputy President.
As with previous documents, the ISRDS emphasised the role of local government inpromoting rural development. The document makes it clear that ‘successful rural devel-opment must be implemented in a participatory and decentralized fashion in order torespond to articulated priorities and observed opportunities at the local level’ (Office ofthe Deputy President 2000: iv). It goes on to state:
The reform of municipal government places organs of local government in acentral role in integrating programmes to achieve synergistic rural development.Many will need assistance and guidance to develop capacity, but their role andresponsibilities are clearly established. They are required to clearly identify localdevelopment needs and opportunities and to plan to respond to these. They mustalign their budgets to achieve their planned objectives. (Office of the DeputyPresident 2000: iv)
It is critical to bear the broader context of local government in mind when reading theabove. The announcement of this programme took place at a time when new municipalboundaries were finalised in 2000. A model amalgamating several urban and ruralmunicipalities was adopted. This resulted in the creation of fewer and geographicallylarger municipalities. Between 1995 and 2000, the number of municipalities was drasti-cally reduced from 834 to 284. The number of councillors was also reduced, meaningthat fewer councillors would be responsible for larger municipalities. The electoralsystem combining constituency and proportional representation that applied to urbanareas was extended to all municipalities with wards.
In other words, we have here a situation where newly formed municipalities wereexpected to implement what the ISRDS itself admitted was a programme that was ‘ide-alistic in its vision’ though ‘practical in its focus on mechanisms of implementation’.While the programme sounded optimistic about the viability of rural development ingeographically larger municipalities with fewer councillors, there was a sense of realisa-tion that delivery would not be achieved in the short term. According to the document,the ‘approach outlined in the strategy … looks toward a horizon of 2010’ (Office of theDeputy President 2000: iv).
Central to developmental local government is the notion of integrated developmentplanning. Integrated development planning requires municipalities to co-ordinate alldevelopment activities within their area of jurisdiction. As indicated, it seeks not only todemocratise local government by introducing the notion of elected representatives evenin rural areas, but also to transform local governance with a new focus on improving thestandard of living and quality of life of previously disadvantaged sectors of the commu-
R U R A L D E V E L O P M E N T I N S O U T H A F R I C A
449
Free
dow
nloa
d fr
om w
ww
.hsr
cpre
ss.a
c.za
nity. In addition, developmental local government requires that citizens should activelyparticipate in development initiatives in their areas. All municipalities were initiallyrequired to produce IDPs and land development objectives (LDOs). However, thisprocess was streamlined with the adoption of the 1998 White Paper on LocalGovernment recommendation that the LDOs be part of the IDPs.
The role of traditional authorities in South Africa’s rural development policy
It seems quite clear from the above that post-1994 policy on rural development does notprovide for a prominent role for traditional authorities. As has been shown in this chapter,the leading actor in rural development is developmental local government. In this sphere,the role of traditional authorities is far from being clear. When the Local GovernmentTransition Act was amended in 1995, it empowered a Member of the Executive Council inthe various provinces to identify ‘interest groups’. In terms of the amendment, no interestgroup could have more than ten per cent of the seats. Traditional authorities were identi-fied as an interest group, along with women and farm workers.
The ISRDS also does not give traditional authorities a special role. They are classified assome of the many ‘stakeholders’ identified in the document. On the question of ‘humanresource development and capacity building’, the ISRDS does not even mention tradi-tional authorities, let alone privilege them. To quote from the document:
Critical to … participation by stakeholders will be capacity building at local gov-ernment and community levels. Programmes that will facilitate the developmentof community-based organizations and non-government organizations shouldbe encouraged. Existing CBOs and NGOs can also play meaningful roles in assist-ing with capacity-building efforts. (Office of the Deputy President 2000: 32)
Taken against the background of the monopoly and the concentration of power whichTribal Authorities enjoyed under the apartheid system, it is not surprising that the movesby the ANC-led government towards democratising rural local governance drew fiercecriticism and resistance from traditional authorities, including those who were membersof the Congress of Traditional Leaders of South Africa (Contralesa), an organisation thatis historically aligned to the ANC tradition. In the run-up to the first democratic localgovernment elections in South Africa in 1995/96, the Inkatha Freedom Party (IFP) andContralesa began to work together. This was despite their differences in the pre-1994period.6 Traditional authorities in both Contralesa and the IFP took the ANC-led government to the Constitutional Court, challenging the government over the issue ofestablishing municipalities throughout the country, including rural areas under theirjurisdiction. The president of Contralesa, Chief Patekile Holomisa, who is also an ANCMember of Parliament, took an increasingly militant stand towards the ANC, evencalling for a boycott of the first democratic local government elections. In other words,the post-1994 government policies and laws were closing the ideological gap betweenmembers of Contralesa and those traditional authorities who were sympathetic to theIFP (Ntsebeza 2002).
T H E D E V E L O P M E N T D E C A D E ? S O U T H A F R I C A , 1 9 9 4 – 2 0 0 4
450
Free
dow
nloa
d fr
om w
ww
.hsr
cpre
ss.a
c.za
While the initial collaboration was around local government, it is quite clear that themain issue that brings traditional authorities together is their opposition to the notionof introducing new democratic structures. They would be happy to be the only primarystructure in rural areas, and insist on preserving the concentration of functions theyenjoyed under apartheid, especially land administration. Not only are they opposed tothe idea of the separation of powers, they are also opposed to any attempt to introducealternative structures that would compete with them. For example, in the case of localgovernment, traditional authorities reject the introduction of municipalities in ‘their’areas. They argue that they should play a central role in rural development and, byimplication, they reject the democratic principles upon which post-1994 developmentallocal government is based. Traditional authorities adopted a similar stand with regard toland tenure reform. While they agree with the government that land in the rural areas ofthe former bantustans should not be the property of the state, they reject the notion thatwhere land is held on a group basis, the administration thereof should be transferred todemocratically constituted and accountable structures. Traditional authorities stronglyargue that the land should be transferred to Tribal Authorities that, as has been shown,are undemocratic and unaccountable. Transferring land to Tribal Authorities wouldlegally exclude ordinary rural residents from vital decision-making processes, includingland allocation.
Rural development in practice: the bottlenecks
Preliminary research and media accounts of the various imbizos that President Mbekiand other high-ranking ANC leaders have held with various South Africans, includingrural people, suggest that despite the efforts that have been made by the ANC-led government since 1994, the struggle against poverty has yet to be won. This is not onlyevidenced by the alarming rate of unemployment in South Africa, but also by the factthat in many areas, particularly in the countryside, South African citizens do not haveeasy access to basic services such as water, improved infrastructure such as good roads,and land. In the case of Xhalanga, in the newly created Sakhisizwe Municipality, theseservices have barely been addressed in the ten-year period since South Africa’s democ-racy.7 My contention is that provision of these basic, essential services is a necessary condition for a successful rural development exercise. This then raises the question as towhy very little has been achieved, especially given the fact that we seem to have some ofthe best policies and laws that are supposed to guide this process.
Given the dynamics in rural areas in the former bantustans, as highlighted at the begin-ning of this chapter, one would be tempted to come to the conclusion that the explana-tion lies in the lack of clarity as to the precise role of traditional authorities in rural localgovernance and, therefore, rural development. While this conclusion is justifiable, and Iwill address this issue below, I would argue that it is only a partial explanation. There areother explanations. The fact that lack of progress in improving the lives of rural peopleis found even in areas such as Xhalanga, where chiefs have historically been margin-alised, is a good example. Before dealing with the issue of traditional authorities in rural
R U R A L D E V E L O P M E N T I N S O U T H A F R I C A
451
Free
dow
nloa
d fr
om w
ww
.hsr
cpre
ss.a
c.za
development, I will briefly highlight the other obstacles to rural development, whichprovide an important context for dealing with the role of traditional authorities in ruraldevelopment.
Problems of implementation
A key problem facing rural development is that the main driver of this process, localgovernment, is often very weak and poorly equipped to deal with the challenges of adevelopmental local government. Most of the criticisms against rural councillors pointto their weakness and incapacity. This is a problem that almost all the policy documents,including the ISRDS, acknowledge. In the first five years of local government in SouthAfrica’s democracy, where, due to capacity problems, TrepCs were established in most ofthe rural areas in the former bantustans, the hope was that district councils woulddevelop TrepCs to a position where they could perform the functions of municipalities.However, the experience of the first five years of rural local government was that TrepCsnever graduated to performing municipal functions.8 Thus, district councils were facedwith the onerous task of preparing not only their own IDPs, but those of local munici-palities too. In cases such as Xhalanga and Mqanduli in the Eastern Cape, the local IDPswere often prepared by consultants, acting on instructions from the district council. Theperhaps unintended consequence of this, as Davids (2003) correctly points out, and thecase of Xhalanga clearly shows, was that local community participation in governancewas limited. In this way, ‘the central tenets of democratic decentralization and develop-mental local government, viz. transparent, accountable and participatory developmen-tal processes’, could run the risk of being undermined (Davids 2003: 44).
The fact that the demarcation process has vastly expanded the boundaries of munici-palities, while at the same time drastically reducing the number of councillors, meansthat the challenge for the new municipalities is even greater. Once again, the drafters ofthe ISRDS, which was published in 2000, the year the new municipalities kicked in, musthave been aware of these challenges when they indicated that they were looking ‘towarda horizon of 2010’. However, there are about five years left to 2010, and there seems tohave been very little done by way of practical steps to meet the ideals of the ISRDS.
Linked to the capacity problem outlined above is the question of financing the munici-palities. When the district council model was proposed in 1995, the rationale for thismodel was based on attempts to move towards equity and redistribution in terms ofwhich the wealthier urban councils would be amalgamated with poorer neighbouringcommunities, and so extend basic services to the latter. This argument, though, does notaddress the widespread problem in the former bantustans: here the towns that are sur-rounded by large poverty-stricken rural communities are themselves small and poorlyrun, and lack a strong revenue base.
The issue of funding rural local government is further complicated by the approach the government is taking on local government funding. This approach flows from the
T H E D E V E L O P M E N T D E C A D E ? S O U T H A F R I C A , 1 9 9 4 – 2 0 0 4
452
Free
dow
nloa
d fr
om w
ww
.hsr
cpre
ss.a
c.za
neo-liberal policies dictated by the government’s Growth, Employment andRedistribution programme. At least two aspects and implications of this programmeneed to be raised. First, local government is expected to meet at least 90 per cent of itsexpenditure needs, although it is entitled to an equitable share of national revenue,which can contribute up to 40 per cent of its revenue (see Davids 2003: 46–7 and foot-note 7). Second, and also typical of the principles of neo-liberalism, the managementapproach is geared towards minimising the role of the state in the delivery of services, inother words, the privatisation of services.
The expectation that municipalities should raise their own revenue does not seem totake into account that most of the citizens in the municipalities incorporating the ruralareas of the former bantustans are poor and would struggle to pay for these services. Inthe majority of cases, these citizens find it difficult to put food on the table. In reality,most of these municipalities would hardly survive without the national transfers(Davids 2003). Any attempt by municipalities to raise revenue from poor communitiesis likely to lead to disaster, as the outbreak of cholera in the Madlebe Tribal Authority inKwaZulu-Natal in August 2000 showed (Cottle 2003). With regard to privatising publicservices, the main problem here is that the democratic principles upon which develop-mental local government is premised would be seriously violated. Researchers andscholars such as Agrawal and Ribot (1999) argue that privatisation undermines demo-cratic decentralisation in the sense that private bodies are essentially accountable tothemselves and not downwardly accountable to citizens. In addition, they are oftenprofit-driven, rather than committed to the improvement of the socio-economic condi-tions of citizens.
Problems concerned with the unclear role of traditional authorities
As indicated, lack of clarity as to the precise role of traditional authorities in rural localgovernance is also a key factor in explaining problems with rural development. At onelevel, policy and laws seem to be quite clear about whose role and function it is topromote development in South Africa, including rural development. Both theConstitution and the various government policy documents apportion this task to localgovernment. Yet, at another level, the same Constitution and some policy documentsrecognise and assign some roles that have a bearing on rural development to the insti-tution of traditional leadership and its incumbents. The problem at this level can beformulated as being how to resolve the tension between institutions based on demo-cratic principles of elected representation and popular participation, on the one hand,and an institution of traditional leadership that is hereditary and, consequently, unde-mocratic in the sense that its leaders are not subjected to popular choice, for examplethrough elections, on the other.
For almost ten years, the ANC-led government was ambivalent about the precise role oftraditional authorities in rural local governance, particularly in local government andland administration. As we have seen, policy and legislation in the immediate post-1994
R U R A L D E V E L O P M E N T I N S O U T H A F R I C A
453
Free
dow
nloa
d fr
om w
ww
.hsr
cpre
ss.a
c.za
period seemed, on the whole, to have been driven by a commitment to extending participatory and representative notions of democracy to rural areas. An expression ofthis radicalism was the promulgation of the Regulation of Development in Rural AreasAct of 1997 by the Eastern Cape Legislature. This Act sought to divest traditional author-ities of all their development functions and transfer these to elected councillors. This, ofcourse, was in line with the new functions of local government. However, by the end of1997, the pendulum seemed to have swung in favour of traditional authorities (Ntsebeza2002; 2004). The White Paper on Local Government published in March 1998 madebroad and sweeping statements about the possible role that traditional authorities couldplay. Traditional ‘leadership’ was assigned ‘a role closest to the people’. On the issue ofdevelopment, a task that had been added to local government by the Constitution,the White Paper (1998: 77) boldly asserted: ‘There is no doubt that the important rolethat traditional leaders have played in the development of their communities should becontinued.’
The recommendation in the White Paper that ‘the institution of traditional leadership’should ‘play a role closest to the people’ flies in the face of the recommendation of the1994 ANC election manifesto, the RDP. The RDP was emphatic that democraticallyelected local government structures should play this role. The White Paper thus markeda major shift in government policy, and has grave consequences for the possibility ofdemocracy in rural areas. Moreover, the statement that traditional authorities played animportant role in development among their communities must be viewed with suspi-cion. No evidence is adduced to support this statement. Existing evidence shows thattraditional authorities were never directly involved in development projects. These proj-ects were implemented by government line-departments. Where traditional authoritiesacted as a link between government departments and their communities, research hasshown that they were often corrupt. An example is the illegal taxes traditional authori-ties imposed in the process of land allocation (see Ntsebeza 1999; 2004).
The issue of the role of traditional authorities was the subject of much discussion andnegotiation in the run-up to the second democratic local government election inDecember 2000. It was instrumental in causing the postponement of announcing thedate for the election. The position of the government was still ambivalent. After a seriesof meetings between the government and traditional authorities, the government madesome concessions. The first significant concession was the amendment of the MunicipalStructures Act that was successfully rushed through Parliament just before the local government elections. The amendment increased the representation of traditionalauthorities from 10 per cent to 20 per cent of the total number of councillors. Further,traditional authorities would not only be represented at a local government level, butalso at a district and, in the case of KwaZulu-Natal, metropolitan level. Traditionalauthorities, though, would not have the right to vote.
This concession seemed to encourage traditional authorities to ask for more. Theyrejected the increase to 20 per cent of councillors. They wanted nothing short of amend-ing the Constitution and legislation flowing from it regarding municipalities in rural
T H E D E V E L O P M E N T D E C A D E ? S O U T H A F R I C A , 1 9 9 4 – 2 0 0 4
454
Free
dow
nloa
d fr
om w
ww
.hsr
cpre
ss.a
c.za
areas in the former bantustans. They wanted municipalities to be scrapped in these areasin favour of apartheid-era Tribal Authorities as the primary local government structures.Traditional authorities have claimed that the President had promised them, in word andin writing, that their powers would not be tampered with. If anything, they would beincreased.9 On his part, the President has neither denied nor endorsed the traditionalauthorities’ claim.
The response of the government was, for the second time in as many months, to presenta Bill to Parliament to amend the Municipal Structures Act. The Bill did not address thecentral demand of traditional authorities, the scrapping of municipalities in rural areasin favour of Tribal Authorities. It merely sought to give local government the power todelegate certain powers and functions to traditional authorities. In addition, a range ofperipheral duties would be assigned to traditional authorities. Predictably, traditionalauthorities rejected the Bill and threatened to boycott the 2000 local government election. They also threatened that there would be violence in their areas if theirdemands were not met. The Bill was subsequently withdrawn on a technicality. It wouldseem that the President made some undertakings, given that traditional authoritieseventually participated in the election.
The manner in which this vexed issue of the role of traditional authorities in a post-1994democratic South Africa has been handled and negotiated is intriguing. In so far as localgovernment issues are concerned, traditional authorities fall under the Department ofProvincial and Local Government. In practice, though, traditional authorities did notseem to recognise this department. They preferred that the President and the DeputyPresident handle their matters. For example, traditional authorities have submittedalmost all their requests to the Office of the President. They seem to think that theMinister of Provincial and Local Government is not as favourably disposed towardsthem as the President. Alternatively, this might be a deliberate strategy to pit thePresident against the Minister. With regard to land administration and the Departmentof Land Affairs, similar shifts in favour of traditional authorities took place.
By August 2002, there was no clarity about how the issue of the role of traditional author-ities in local governance would be handled. One of the problems facing the governmentwas that despite the fact that an attempt was made to separate the various powers thatwere concentrated in Tribal Authorities and to allocate them to various departments, inthis case the Departments of Provincial and Local Government (for local government)and Land Affairs (for land administration), there was very little communication betweenthese departments. For example, interviews with some Land Affairs senior officialssuggest that the Department of Provincial and Local Government did not consult theseofficials when proposing the amendment to the Municipal Structures Act regardinggiving traditional authorities powers to allocate land. Yet, as already indicated, the task ofdeciding who should allocate land in rural areas is the competency of the Department ofLand Affairs. Under the circumstances, a trade-off of the nature proposed by theDepartment of Provincial and Local Government was not going to be easy to negotiate.
R U R A L D E V E L O P M E N T I N S O U T H A F R I C A
455
Free
dow
nloa
d fr
om w
ww
.hsr
cpre
ss.a
c.za
Resolving the issue of the role of traditional authorities in rural governance
After almost ten years of ambivalence, there seems to be some clarity about the role oftraditional authorities in rural governance. There are two pieces of legislation that areimportant in this regard: the Traditional Leadership and Governance Framework Actand the Communal Land Rights Act. Both went through Parliament in 2003. A signifi-cant feature of the 2003 legislative process involving the two departments is that onceco-operation took place, it was possible to clinch the trade-off.
An objective of the 2003 Framework Act that is pertinent here is the provision for theestablishment and recognition of traditional councils. A traditional council, accordingto Section 3(1), will be established in an area that has been recognised by the Premier asa traditional community. This would take place, in terms of the preamble, within thecontext of transforming ‘the institution of traditional leadership … in line with consti-tutional imperatives … so that democratic governance and the values of an open anddemocratic society may be promoted’. The Act provides for a role for traditional leader-ship, not only in the local government sphere, but in all three spheres of government. Itdoes not specify a role for traditional authorities in land administration. This is dealtwith in the Communal Land Rights Act of 2004.
With regard to the composition of traditional councils, the majority of its members areunelected, made up of traditional authorities and their appointees. Initially, there was arecommendation that a mere 25 per cent of members should be elected. After strongprotests from NGOs and other civil society organisations, this number was increased to40 per cent. This, however, still gives unelected traditional authorities and theirappointees a majority. Although there is provision for a minimum of 30 per cent repre-sentation of women in the councils, this does not subtract from the fact that the major-ity of the members are not popularly elected.
It seems clear from discussions in the Portfolio Committee on Provincial and LocalGovernment that establishing traditional councils dominated by traditional authoritiesand their appointees was a trade-off to persuade traditional authorities not to push fora constitutional amendment regarding the introduction of municipalities in rural areas.Members of the Portfolio Committee agreed that a constitutional amendment could bemade after the finalisation of the Framework Bill if there was ‘significant consensusbetween the traditional leaders, South African Local Government Association and otherkey stakeholders’.10 In the same report, the Committee suggested that ‘transformation inthe areas of custom and tradition have to be phased in appropriately’ and that ‘all stake-holders should be prepared to compromise in this phase’.
A last-minute amendment to the Communal Land Rights Bill by the Cabinet on 8October 2003, at more or less the same time that the Framework Bill was being consid-ered, seems to have resolved, at least for now, the thorny issue of the role of traditionalauthorities in rural governance. The Cabinet amendment provided that the traditional
T H E D E V E L O P M E N T D E C A D E ? S O U T H A F R I C A , 1 9 9 4 – 2 0 0 4
456
Free
dow
nloa
d fr
om w
ww
.hsr
cpre
ss.a
c.za
councils established in terms of the Framework Act, as described earlier, would haveland allocation and administration powers and functions in communal areas. Section21(2) of the Communal Land Rights Bill reads: ‘If a community has a recognised tradi-tional council, the powers and duties of the land administration committee may be exer-cised and performed by such council.’ This gives enormous and unprecedented powersto a structure with a majority of unelected members. This is particularly the case withregard to the allocation of land. Under the colonial and apartheid systems, the finalauthority in the form of issuing permits to occupy land in communal areas lay withmagistrates and, later, District Commissioners. The 2004 Communal Land Rights Actmakes traditional councils supreme structures when it comes to land allocation. Thismeans that they will be decentralised and, indeed, despotic in so far as they will be unac-countable.
The amended draft of the Communal Land Rights Bill drew criticism from a range ofcivil society organisations, and gender and land rights activists who were organisedunder the auspices of the University of the Western Cape’s Programme for Land andAgrarian Studies and the National Land Committee. It also received criticism from someANC MPs.11 The uproar was based on the view that traditional councils are ‘a retreatfrom democracy’ and an attempt to revive a defunct apartheid institution, which,amongst other things, was deeply discriminatory of women. Cousins and Claassens haveargued that under ‘customary law’ women will be dependent on men and vulnerable toloss of their land and other property on divorce or the death of their husbands (Mail &Guardian 31 October to 6 November 2003). Despite the protest, the controversial Billwas bulldozed through and passed unanimously by Parliament on 27 January 2004.
Traditional authorities have given their overwhelming support to the Communal LandRights Act. The chairperson of the National House of Traditional Authorities, ChiefMpiyezintombi Mzimela, supported the second draft of the Communal Land Rights Billwith these words: ‘The Communal Land Right Bill aims to restore to rural communitiesownership of the remnants that they occupy of land that the colonial and apartheid government took from them by force – giving the communities registered title, so thatit cannot happen again’ (Business Day 2 December 2003).
Mzimela gave an indication, though, that the push for a constitutional amendment maynot be over. According to him: ‘Our communities wish to govern their own areas andwant traditional communities to constitute the local government, not a fourth tier, butpart of the third tier.’ He averred that the institution of traditional leadership is the ‘onlyinstitution that does not have its powers and duties set out in the Constitution’, an ‘omis-sion’ he urged should be ‘rectified’. It is important to note that, in the past, traditionalauthorities insisted that there should be a constitutional amendment making them theprimary local government structure in rural areas. The Framework Act has avoided theconstitutional amendment and still recognises municipalities made up of elected coun-cillors as the primary form of local government in rural areas, but the establishment oftraditional councils has arguably given traditional authorities more powers than electedcouncillors.
R U R A L D E V E L O P M E N T I N S O U T H A F R I C A
457
Free
dow
nloa
d fr
om w
ww
.hsr
cpre
ss.a
c.za
The tension between democracy and traditional authority
A question that arises from this analysis is how to understand who leads the process ofrural development in South Africa. For most of the ten years of South Africa’s democ-racy, the indication from the Constitution and various policy documents and laws hasbeen that development, including rural development, was the prime responsibility oflocal government, operating through municipalities. However, I would argue that grant-ing land administration powers to traditional authorities, as the Communal Land RightsAct does, drastically shifts the power game in favour of traditional authorities. This alsomeans that elected councillors are robbed of one area where they could at least showsomething by way of delivery, especially given their poor performance in the provisionof municipal services, as discussed above.
The issue of rural development, and the role of traditional authorities in it, cannotignore the history of rural development, or lack thereof under the apartheid regime, inwhich Tribal Authorities, established in terms of the notorious Bantu Authorities Act of1951, played a leading role. These structures were dominated by traditional authoritiesand their appointees who were unaccountable and undemocratic precisely because theywere imposed on rural residents, and the latter were never given an opportunity toexpress their support or rejection of them. This then raises questions about the meaningof the democratic project for rural people. Insofar as the Constitution confers acommon citizenship on all South Africans, urban and rural, the assumption should bethat whatever rights are enjoyed by urban South Africans should be equally enjoyed bytheir rural counterparts. However, a crucial implication of the Communal Land RightsAct is that unaccountable institutions such as traditional councils are likely to play aninfluential function in rural development. This would clearly be at loggerheads with theprinciples underlying developmental local government, with its stress on accountabilityand community participation in governance and development.
This should not be interpreted to mean that traditional authorities do not have any role toplay in rural development. They are South African citizens and, as such, are protected bythe Constitution from exclusion in development planning and implementation. Wherethey stand out in their communities, and gain popular support, nothing should stop themfrom assuming leadership positions should they be elected. The issue that is raised in thischapter is the implication of providing a role in rural development for a structure that isunaccountable and undemocratic. I argue that giving traditional councils the powers ofland administration will have grave implications not only for democracy in the country-side, but for rural development more broadly. Whereas with elected representatives, com-munities can replace them if they are not satisfied with their performance, no similarmechanism is available as far as traditional authorities are concerned.
Conclusion
Control over land in rural areas is crucial to the development project in these areas. Therole of traditional authorities in rural development since the advent of South Africa’s
T H E D E V E L O P M E N T D E C A D E ? S O U T H A F R I C A , 1 9 9 4 – 2 0 0 4
458
Free
dow
nloa
d fr
om w
ww
.hsr
cpre
ss.a
c.za
democracy cannot be viewed in a vacuum. It has to be located within the historicalcontext of the role they played under the apartheid regime and attempts since 1994 toestablish a credible and democratic order in South Africa that extends democratic rightsto all its citizens, rural and urban. I have argued that a key aspect of apartheid-createdTribal Authorities was that they were unaccountable and undemocratic in the sense thatthe majority of their members were unelected, thus excluding the majority of rural residents from a say in who should administer their affairs. This poses a challenge for ademocratic South Africa in terms of how it extends democracy to the countryside.
This chapter has shown how the ANC-led government has embarked on this project,and the important steps it has taken to ensure that development is in the hands of struc-tures that are accountable and provide for community participation in the developmentprocess. However, I have argued that recognition in the South African Constitution ofthe institution of traditional leaders, coupled with the promulgation of the TraditionalLeadership and Governance Framework Act and the Communal Land Rights Act, runsthe risk of compromising this democratic project. As shown in the chapter, these lawsgive traditional authorities and their appointees unprecedented powers in land admin-istration. This means that rural development may well be controlled by unaccountablestructures, a disturbing departure from the democratic ideals enshrined in theConstitution.
Notes
1 IDPs will be explained later in the chapter.
2 Interview with Headman Zantsi, Manzimahle, 9 September 2000.
3 Interview with Mr Sipho Liwani, Cala, 11 September 2000.
4 Interview with Mr Jama, Cala, 9 September 2000.
5 For details of this case, see Ntsebeza (1999).
6 For details see Ntsebeza (2002) and Van Kessel (1995).
7 For the case of the Sakhisizwe municipal area in the Eastern Cape, see the reports of a local
NGO named the Cala University Students’ Association (Calusa) since 2000, and Ncapayi (2005).
For a historical background to this area, see Ntsebeza (2002).
8 See Ntsebeza (2004a) for the case of the Xhalanga TrepCs.
9 I have not been in a position to obtain a copy of this statement by the President.
10 Report on Traditional Leadership and Governance Framework Bill to the National Assembly,
28 October 2003.
11 This is based on my own observation and participation in some of the meetings.
R U R A L D E V E L O P M E N T I N S O U T H A F R I C A
459
Free
dow
nloa
d fr
om w
ww
.hsr
cpre
ss.a
c.za
References
Agrawal A & Ribot J (1999) Accountability in decentralization: A framework with South Asian and
West African cases, Journal of Developing Areas 33: 473–502.
ANC (1994) The Reconstruction and Development Programme: A policy framework. Johannesburg:
Umanyano Publications.
Calusa (2000–2003) Annual reports. Eastern Cape: Cala University Students’ Association.
Cottle E (2003) Meeting basic needs? The failure of sanitation and water delivery and the cholera
outbreak, Development Update 4: 141–66.
Davids I (2003) Developmental local government: The rural context and challenges, Development
Update 4: 31–53.
Delius P (1996) A lion amongst the cattle: Reconstruction and resistance in the Northern Transvaal.
Johannesburg: Ravan Press.
Department of Land Affairs (1997) White Paper on South African Land Policy. Pretoria.
Department of Provincial Affairs and Constitutional Development (1998) White Paper on Local
Government. Pretoria.
Manona C (1997) The collapse of the ‘Tribal Authority’ system and the rise of civic associations,
in C De Wet & M Whisson (eds.) From reserves to region: Apartheid and social change in the
Kieskamahoek district of (former) Ciskei, 1950–1960. Grahamstown: Institute of Social and
Economic Research, Rhodes University.
Mbeki G (1984) South Africa: The peasants’ revolt. London: International Defence and Aid Fund.
Ncapayi F (2005) Land need in South Africa: Who wants land, for what? Unpublished Masters thesis,
University of the Western Cape.
Ntsebeza L (1999) Land tenure reform, traditional authorities and rural local government in post-
apartheid South Africa: Case studies from the Eastern Cape. Research Report No. 3. Bellville:
Programme for Land and Agrarian Studies.
Ntsebeza L (2002) Structures and struggles of rural local government in South Africa: The case study
of traditional authorities in the Eastern Cape. Unpublished DPhil thesis, Rhodes University,
Grahamstown.
Ntsebeza L (2003) Democracy in South Africa’s countryside: Is there a role for traditional
authorities? Development Update 4: 55–84.
Ntsebeza L (2004) Democratic decentralisation and traditional authority: Dilemmas of land
administration in rural South Africa. European Journal of Development Research 16: 71–89.
Office of the Deputy President (South Africa) (2000) Integrated sustainable rural development
strategy. Pretoria.
Van Kessel I (1995) ‘Beyond our wildest dreams’: The United Democratic Front and the
transformation of South Africa. Unpublished PhD thesis, Leiden University.
T H E D E V E L O P M E N T D E C A D E ? S O U T H A F R I C A , 1 9 9 4 – 2 0 0 4
460
Free
dow
nloa
d fr
om w
ww
.hsr
cpre
ss.a
c.za
Contributors
Richard BallardResearch Fellow,Centre for Civil Society,School of Development Studies,University of KwaZulu-Natal
Justin BarnesCEO of Benchmarking andManufacturing Analysts, Durban
Haroon BhoratAssociate Professor,Department of Economics,University of Cape Town
Michael CarterProfessor,Department of Agricultural and Applied Economics,University of Wisconsin, Madison
Rashad CassimProfessor and Head of the Department of Economics,University of the Witwatersrand
Sharad ChariLecturer in Human Geography,London School of Economics andPolitical Science;Honorary Research Fellow,School of Development Studies,University of KwaZulu-Natal
461
John ClelandProfessor of Demography,Centre for Population Studies,London School of Hygiene and Tropical Medicine
Richard DeveyResearch Fellow,School of Development Studies,University of KwaZulu-Natal
Bill FreundSenior Professor of Economic History,University of KwaZulu-Natal
Adam HabibExecutive Director (Governance),Human Sciences Research Council
Gillian HartProfessor of Geography,University of California, Berkeley;Adjunct Professor,University of KwaZulu-Natal
Sabrina LeeResearcher,Health Economics and HIV/AIDSResearch Division,University of KwaZulu-Natal
Benoît Lootvoet Senior Researcher,Développement Localisé Urbain, Paris
Free
dow
nloa
d fr
om w
ww
.hsr
cpre
ss.a
c.za
Jo LorentzenChief Research Specialist,Research Programme on HumanResources Development,Human Sciences Research Council;Honorary Research Fellow,School of Development Studies,University of KwaZulu-Natal
Francie LundAssociate Professor,School of Development Studies,University of KwaZulu-Natal;Director, Social Protection, WIEGO
Pranitha MaharajResearch Fellow,School of Development Studies,University of KwaZulu-Natal
Julian MayAssociate Professor and Head of theSchool of Development Studies,University of KwaZulu-Natal
Dale McKinleyIndependent researcher,Occasional lecturer at the University ofJohannesburg and the University ofNorth Carolina-Chapel Hill
Jonathan Michie Professor of Management,University of Birmingham;Director and Head of BirminghamBusiness School
Mike MorrisSenior Professor,School of Development Studies,University of KwaZulu-Natal
Akim MturiAssociate Professor,School of Development Studies,University of KwaZulu-Natal
Dani Wadada NabudereExecutive Director,Afrika Study Center, Uganda
Kuben NaidooChief Director,National Treasury,South Africa
Lungisile NtsebezaAssociate Professor,Department of Sociology,University of Cape Town
Nompumelelo NzimandeResearcher,School of Development Studies,University of KwaZulu-Natal;PhD student,University of Wisconsin, Madison
Vishnu PadayacheeSenior Professor,School of Development Studies,University of KwaZulu-Natal
Eleanor Preston-WhyteHonorary Research Professor,School of Development Studies,University of KwaZulu-Natal
Glen RobbinsResearch Fellow,School of Development Studies,University of KwaZulu-Natal
T H E D E V E L O P M E N T D E C A D E ? S O U T H A F R I C A , 1 9 9 4 – 2 0 0 4
462
Free
dow
nloa
d fr
om w
ww
.hsr
cpre
ss.a
c.za
Christian M RogersonProfessor of Human Geography,School of Geography, Archaeology andEnvironmental Studies,University of the Witwatersrand
Dorothy SekokotlaResearcher,School of Development Studies,University of KwaZulu-Natal
Caroline SkinnerResearch Fellow,School of Development Studies,University of KwaZulu-Natal
Imraan ValodiaSenior Research Fellow,School of Development Studies,University of KwaZulu-Natal
Alan WhitesideProfessor and Director,Health Economics and HIV/AIDSResearch Division,University of KwaZulu-Natal
Thokozani XabaSenior Lecturer,School of Community Development and Adult Learning,University of KwaZulu-Natal
C O N T R I B U T O R S
463
Free
dow
nloa
d fr
om w
ww
.hsr
cpre
ss.a
c.za
Index
absenteeism 210, 390acts
Bantu Authorities Act of 1951 458Basic Conditions of Employment Act
x, 122, 293Communal Land Rights Act 445, 456–9Employment Equity Act 122, 300Fundraising Act 401Group Areas Act 427–8Labour Relations Act xi, 122, 293, 299–300
319, 431–2Leadership and Governance Framework Act
457, 459Local Government Municipal Systems Act of
1999 267Local Government Transition Act 447–8, 450Municipal Structures Act 455Municipal Systems Act 229Non-Profit Act 400Regulation of Development in Rural Areas
Act of 1997 454Regulation of Gatherings Act 408Skills Development Act 300Traditional Leadership and Governance
Framework Act 456–7, 459affirmative action 416African National Congress (ANC) 1, 3–4, 24,
26–6, 56, 75, 86, 110–11, 254, 256, 258,262, 381, 398, 402, 405, 414–20, 423–5,428, 435, 442, 448, 450–1, 453–4, 457, 459
ANC/IFP 442ANC–SACP–Cosatu Alliance 25
African Renaissance 48AIDS 4, 79, 154, 160, 163–4, 168, 171, 176, 328,
350, 352–4, 356, 361–6, 368, 370–7, 381,384–93, 409
epidemic 160, 163, 176, 350, 361–2, 366, 368,371, 373–4, 377, 381, 393
macroeconomic impacts 388, 390orphans 168, 171, 373
anthropology 6, 33, 47Anti-Eviction Campaign 398, 404, 406
Anti-Hijack Unit 267Anti-Privatisation Forum 404, 406–7antiretroviral(s) (ARV) 25, 256–7, 361, 366–8,
377, 386, 392, 407therapy 356, 386treatment 361, 366–8, 377, 392
Anti-Terrorism Bill 408apartheid 1, 3, 8, 13, 15, 26–7, 115, 120, 123, 144,
149, 155, 160, 163, 166, 171, 175–6, 208,233, 235–7, 239, 256–7, 260, 265, 268–9,336, 370–1, 405, 413–4, 427, 444, 446, 451,457–9
capitalism 414education system 120laws 446policy 8spatial planning 427
authoritarianism 399
Baker Plan 42Bantu Authorities Act of 1951 458bantustans 227, 444–5, 451–3, 455Basic Asset Grant (BAG) x, 127, 136Basic Conditions of Employment Act (BCEA)
x, 122, 293Basic Income Grant (BIG) x, 13, 26, 127, 136,
165, 406Basic Needs 13, 16–17black consciousness 17, 431black economic empowerment (BEE) x, 26, 62,
73, 125, 402, 416brain drain 37, 368Bretton Woods System 16–19, 28burial societies 338–40, 342, 345–6
contributions 342cover 339
business development services (BDS) x, 205, 217Business Improvement Districts 232Business Service Levy 264business–science relationships (BSRs) x, 184–8,
191–2, 196
464
Free
dow
nloa
d fr
om w
ww
.hsr
cpre
ss.a
c.za
capitalism 3, 5, 14–15, 17, 20–3, 41, 43, 413, 416,419–23, 432, 440
industrial 3, 14neo-liberal 20
Care Dependency Grant (CDG) 162–3, 170care economy 161–2, 176casualisation 294, 317Chemical, Engineering and Industrial Workers
Union (CEIWU) x, 431–4, 441Chicago Boys 19, 21child labour 148Child Support Grant (CSG) x, 80, 136, 147, 160,
162, 164–8, 171, 173, 176, 286, 288–300cholera 154, 453civil society organisations (CSOs) x, 401–2cluster(s) 201–10, 212–21, 230–1, 255
development 201, 204–5, 221initiatives 207, 216, 230processes 207–8, 218
Coalition of South Africans for the Basic IncomeGrant 404, 406
Coca-Cola culture 34Cold War 13–16, 38Colonial Pact 37colonialism 35, 37–8, 43, 160–1, 166commercialisation 401, 417Commission, Competition 71Communal Land Rights Act 445, 456–9Communal Land Rights Bill 456–8Communal Property Association 447communism 38, 40Community-based economic development 233community-based organisation(s) (CBOs)
x, 397, 400, 402, 450Community Water Supply and Sanitation
Scheme 147Competition Act of 1998 71, 92Competition Appeal Court 72Competition Commission 71Competition Tribunal 71–2Competitiveness Fund schemes 206Concerned Citizens Forum (CCF) x, 398, 404,
406–7Confederation of Employers of South Africa
(Cofesa) 319Congress of South African Trade Unions
(Cosatu) x, 1–2, 397–8, 402, 406, 416–7,419, 425
Congress of Traditional Leaders of South Africa(Contralesa) x, 450
Constitution 8, 261, 264, 407–9, 444–5, 453–4,457–9
convention tourism 232Co-ordinating Body of Refugee Communities in
Gauteng 406Copenhagen Declaration (2004) 143, 153, 391
Decade for Poverty Eradication 143–4decentralisation 208, 227democracy 3, 6–7, 9, 16, 27, 38–9, 44, 46, 57, 75,
110, 120, 160, 206, 237, 242, 399, 409–10,413–6, 418, 420–4, 444, 447, 451–2, 454,457–9
liberal 39political 414popular 423representative 9, 420, 422, 424
Democratic Alliance (DA) x, 398Democratic Party 25democratisation 38, 257–8, 399Department of Health 331, 334Department of Labour 318Department of Land Affairs 455Department of Provincial and Local
Government (DPLG) x, 229–30, 455Department of Provincial and Local
Government 455Department of Social Welfare 400Department of Trade and Industry (DTI)
x, 206–17, 219, 221, 230, 447despotism 33development 1–7, 14–16, 22–3, 25, 27, 33–5,
37–8, 40–1, 44, 47, 50, 62, 86, 100, 103–4,109–10, 121, 124, 144–6, 149, 151, 162,165, 184, 195, 201, 203–5, 208–9, 211–12,216, 221, 227–31, 233–8; 243, 256–7, 259,261–9, 329, 331, 258, 364, 381, 385–6, 389,391–3, 397, 399–402, 415, 433, 440, 444–5,447–54, 458–9
agriculture-led 240business 230chamber 397cluster 201, 204–5, 221community 233, 381discourse 5–7economic 195, 208, 227, 229, 238, 241, 243,
257, 262, 267–8, 433, 444, 447economics 1–2entrepreneurship 240
I N D E X
465
Free
dow
nloa
d fr
om w
ww
.hsr
cpre
ss.a
c.za
industrial 201, 203, 211, 231, 259initiatives 258, 448, 450planning 229, 237, 449policy 6, 103, 242, 400–1political 37, 44, 47post-modernist economic 40programmes 41, 44, 402rural 444–5, 447–53, 458Small Business Integrated 235small business 230, 235–6, 241spatial 231studies 3, 5–6sustainable 146technology 231theory 6, 33–4, 50tourism 238, 240
developmental state 109, 124developmentalism 13, 16, 39, 419Disability Grant (DG) x, 162–4, 174, 430disability pension 80disease(s), 346, 349,354, 362, 370, 382, 385, 387,
389, 392, 330–1, 333, 338chronic 330–1, 338heart 333prevention 349, 354respiratory 333
Dollar–Wall Street Regime 16, 19, 28Durban Auto Cluster (DAC) x, 212–6, 218–9Durban Social Forum 407
Earthlife Africa 404, 406econometric modelling techniques 149Economic Development Strategic Initiative 4economic development 195, 201, 208, 227, 229,
238,241, 243, 257, 262, 433, 444, 447economic globalisation 263economic liberalism 21economic redistribution 416economic reform(s) 7, 55–7, 62, 75, 79–83, 108,
125, 135–6, 153–4Economic Trends (ET) research group 2economically active population (EAP) x, 276economy, domestic 8, 275, 277, 280, 291, 299,economy 4–8, 15, 22, 24–7, 35, 37, 45, 55–9,
61–3, 65–70, 72, 74–5, 77–82, 87–9, 91–3,95–6, 98, 101–3, 108, 110–13, 115–16,119–20, 122, 125–7, 131, 133–5, 145–9,151, 154, 161–2, 176, 188, 195, 203, 211,217, 228, 231–5, 237–8, 242, 255, 258–61,
276–8, 291–2, 299, 302–8, 310–12, 316–7,319–20, 361, 371, 384, 389, 401–2, 405–6,410, 415, 433, 448
First 24formal 311,316–17, 406global 7–8, 231imperial 15informal 4, 8, 234–5, 242, 302–8, 310–12,
319–20labour-surplus 291metropolitan 261mixed 415political 5–6, 154, 255, 415, 433rural 448Second 24–7subsistence 147
education 57, 62, 80, 86, 100, 109–11, 121, 124,135, 143, 152–3, 161, 174, 183, 185, 189,194, 196, 201, 265, 283, 310, 331, 353–5,357, 364, 367–8, 386, 391, 404, 430
Education Rights Project 406–7electricity 259, 264, 286, 288–9, 398, 402, 405,
417–18, 446cut-offs 417–18
electrification 255–6Electronic Communications Security (Pty) Ltd
Bill 408employment 9, 55–7, 71, 73–4, 76, 80–1, 86–7,
92–5, 97–103, 108, 110–12, 114–17, 119,121–3, 125, 127, 133, 138, 147–9, 161–2,166, 171, 173–4, 186, 231, 233–6, 240, 260,263, 266, 268, 275–80, 282–4, 286, 290,292–5, 297–300, 302–3, 305–11, 314–15,317–20, 345, 364, 370–2, 377, 390, 405–6
formal 310informal 278, 302–3, 305–10, 320
Employment Equity Act 122, 300entrepreneurialism 236environmental degradation 148–9environmental justice activism 9environmentalism 435ethnic conflict 367, 370Eurocentricism 47European Patent Office 191European Union (EU) x, 65,evictions 402, 404Extended Public Works Programme (EPWP)
x, 26, 235externalisation 317–19
T H E D E V E L O P M E N T D E C A D E ? S O U T H A F R I C A , 1 9 9 4 – 2 0 0 4
466
Free
dow
nloa
d fr
om w
ww
.hsr
cpre
ss.a
c.za
family planning programmes 349Federation of South African Trade Unions
(Fosatu) x, 2feminisation 366–7, 373feminism 438–9First Economy 24First/Second Economy discourse 25–6flood protection 233forced resettlement 367foreign direct investment (FDI) x, 86, 98, 102formal economy 311, 316–17, 406formal employment 310Foster Care Grant (FCG) 162, 165free markets 41, 43free-trade regime 70Fundraising Act 401further education and training (FET) x, 121
Gay and Lesbian Equality Project 404, 406gender 363–4, 367, 372–3, 377, 383, 392, 403,
407, 429, 433, 438–9division of labour 429equality 364, 377inequality 392politics 433relations 367, 372, 438violence 363
Gini coefficient 4globalisation 2, 18–19, 34, 41–2, 45, 80, 126, 154,
187, 227–8, 263, 330, 237, 401, 403grants 156, 162–4, 172, 175,
state-provided 162Great Depression 111Greater Johannesburg Area (GJA) xGreen Revolution 17Gross Investment Expenditure 58Group Areas Act 427–8Growth and Development Summit (GDS) x, 86Growth, Employment and Redistribution
(GEAR) x, 1, 9, 13, 24, 112–14, 130,134, 147, 228, 256, 397–8, 401–2, 416–17,433, 453
health insurance 312–13, 321heart disease 329, 333High-commitment work systems 101–2higher education institutions 195highly indebted poor countries (HIPC) xi, 143
HIV/AIDS 8–9, 78, 145, 156, 168, 170, 234,327–9, 331–2, 345–6, 349–350, 352–5,361–8, 370–8, 381–4, 387–2, 398, 402–4,408, 435
campaigns 168epidemic 378, 328–9, 378, 381, 391infection 351, 356–7, 366–8, 370–3, 377pandemic 332, 349policy 403prevalence 384, 386treatment 349, 356, 404
homelands 176, 227Homeless People’s Federation 404, 406housing evictions 418human capital development 110, 233Human Development Index (HDI) 286human resources development 212Human Rights Commission 408human rights 362, 366, 370, 392
imperialism 13, 16, 18–19, 23, 33, 38, 43, 48import liberalisation 62income grants 136Income tax policy 256indigenous healers 334industrial capitalism 3, 14industrial decentralisation 227Industrial Development Corporation 98industrial development 201, 203, 211, 231, 259,
266industrial policy reform 67Industrial Strategy Project 206industrialisation 16, 40, 71, 79, 202, 211industry–science relations (ISRs) 188inflation 77, 87, 89, 90–7, 103–5, 117, 124, 146–7,
153informal economy 4, 8, 234–5, 242, 302–8,
310–12, 319–20informal employment 278, 302–3, 305–10, 320Inkatha Freedom Party (IFP) xi, 398, 450integrated development plan (IDP) xi, 229, 237,
263, 266, 446, 450, 452, 459Integrated Small Business Development 235Integrated Small Business Strategy 240Integrated Sustainable Rural Development
Strategy (ISRDS) xi, 235, 449–50, 452Intelligence Services Bill 408Interception and Monitoring Bill 408interest rates 86–8, 93, 95–6, 98, 102, 114, 116–17
I N D E X
467
Free
dow
nloa
d fr
om w
ww
.hsr
cpre
ss.a
c.za
International Bank for Reconstruction andDevelopment (IBRD) xi, 111
International Conference for Labour Statistics(ICLS) x
International Labour Organisation (ILO) xi, 234,310–12, 319
International Monetary Fund (IMF) xi, 16–19,21, 28, 41–2, 135, 152, 154
bread riots 28International Organisation for Migration 371internecine fighting 367, 370
Joint Service Councils 257juvenilisation 366, 372–3
Kwazulu-Natal (KZN) xiKZN Benchmarking Club 212
labouractivism 430brokers 318, 430exploitation 417law 438legislation 291, 293, 297, 299, 305, 309, 319market 8migration 370recruitment 430unionism 9, 429, 432
labour-market reforms 120, 122Labour Relations Act (LRA) xi, 122, 293,
299–300, 319, 431–2labour-surplus economy 291land
administration 458allocation 446, 451, 454development objectives (LDOs) 450distribution 416, 418equity 403redistribution 398reform 62, 80, 111, 136, 152, 156, 240restitution 240rights 457tenure reform 451
Landless People’s Movement (LPM) 398, 404,418
learning networks 202–4, 209, 215, 218liberalisation 45, 62–3, 66, 74, 78–80, 113, 134–5,
195, 261, 227, 401–2
import 62market 227of agricultural tariffs 63tariff 62trade 62, 79–80
local economic development (LED) xi, 8,227–43, 254–6, 258, 267–8
Fund 235planning 228, 232policy 238strategies 234
Local Government Municipal Systems Act of1999 267
Local Government Transition Act 450Lottery Commission 401
macroeconomic(s) xi, 1, 7, 69, 77, 82, 112–115124–127, 134, 147, 150, 152–3, 156, 228,391, 433
reform 7, 127stability 113–15, 125, 150, 153strategy 228structural reforms 147studies 391targets 126
Macroeconomic Research Group (MERG) xi, 1macroeconomy 110, 225malaria 154, 331malnutrition 329marginalisation 374market economy 136market liberalisation 227Marshall Plan 111Marxism 23maternity benefit 161, 174medical aid 312–313, 321Medium Term Expenditure Framework 100metropolitan economy 261microeconomic(s) 7, 109, 112, 115–6, 118, 120,
125–8, 133–4, 137, 156, 161, 231, 275, 280,299–300
analysis 156blockages 115constraints 275, 280, 299–300interventions 156policies 156, 161reform 7, 109, 112, 115–16, 118, 120, 125–8,
133–4, 137, 231
T H E D E V E L O P M E N T D E C A D E ? S O U T H A F R I C A , 1 9 9 4 – 2 0 0 4
468
Free
dow
nloa
d fr
om w
ww
.hsr
cpre
ss.a
c.za
migrant labour system 166, 171, 370, 428migration 367, 370–2
labour 370Millennium Development Goal (MDG) xi, 143modernisation 39, 41, 45monetarism 89–90most favoured nation (MFN) xi, 65Motor Industry Development Programme
(MIDP) xi, 70–1, 209, 216Multi-fibre Agreement (MFA) ximultilateral imperialism 38Municipal Structures Act 455Municipal Systems Act 229
National AIDS Council 393National Association of People Living with
HIV/AIDS 404national building 38National Development Agency (NDA) xi, 397,
401National Economic Development and Labour
Council (Nedlac) xi, 86, 93, 397–8, 400,408,
National Enterprise Survey (NES) xi, 291, 294–5,297
national innovation system (NIS) xi, 184, 191National Land Committee 408National Rural Development Strategy (NRDS)
xi, 448National Strategic Intelligence Amendment Bill
408nationalism 38, 43–5natural disasters 152neo-colonialism 43neo-liberal capitalism 20neo-liberalism 16, 21–23, 26, 401, 403, 415–17,
419, 429, 453networking 205, 207–8, 221New National Party 398newly industrialised country (NIC) xinon-accelerating inflation rate of unemployment
(NAIRU) xi, 90–3, 104non-governmental organisation(s) (NGOs) xi,
99, 397, 400–4, 418, 450Non-Profit Act 400
obesity 329–31,Old Age Pension (OAP) xi, 162–4, 166, 169,
170–1, 174, 176, 286, 288–9, 300
Organisation for Economic Co-operation andDevelopment (OECD) xi, 184–5, 188, 192–3
orientalism 33original equipment manufacturer (OEM) xi, 213
Palestine Solidarity Committee 404Participatory Appraisal of Competitive
Advantage approach 242patent(s) 187, 189–90pauperisation 366, 373pension 156, 161, 163, 165, 169–76, 313–15, 317,
321, 390, 430-day markets 172–3state 174–5
Pentacostalism 439–40People Against Gangsterism and Drugs 404, 406political democracy 414political development 37–8, 44, 47political economy 5, 6, 154, 255, 415, 433political mobilisation 38pollution 148, 435–7popular democracy 423post-modernist economic development 40poverty xi, 4, 7, 13, 17, 25–6, 55–7, 79–83,
108–10, 115, 124–8, 130–1, 133–4, 136–7,143–7, 149–52, 154–6, 160–1, 163, 165,175, 227, 229–30, 233–5, 237, 239, 256, 258,261, 329, 344–5, 347, 366, 367, 370–2, 384,386, 388–9, 391–2, 402, 405, 418, 422, 451
alleviation 13, 17, 126–8, 130, 160, 230,233–4, 237, 402
dynamics 130eradication 229-line unit (PLU) xireduction 156related illness 329-relief schemes 235trap(s) 127–30, 132, 287, 299, 402-trap equilibrium 131, 125
Poverty and Inequality Report 143Poverty Reduction Strategy Paper (PRSP) xi, 143primary caregivers (PCGs) 167, 173private maintenance system 168–9privatisation 44–5, 73–4, 80, 146, 156, 162, 175,
259, 401–2, 415–17, 453Project for Statistics on Living Standards and
Development (PSLSD) xi, 171–2, 175public transport 233public–private partnership (PPP) xi
I N D E X
469
Free
dow
nloa
d fr
om w
ww
.hsr
cpre
ss.a
c.za
racial capitalism 171racial discrimination 175racial supremacy 414racism 403, 440Reaganism 21recession 150Reconstruction and Development Programme
(RDP) xii, 1, 13, 86, 111, 256, 398, 415, 448reform(s) 55–8, 62–3, 67, 71, 75, 79–83, 109,
111–12, 116, 118, 120, 122, 125–8, 133–7,147, 152–4, 156, 165, 168–9, 451, 231
domestic 57economic 55–7, 75, 79–83, 108, 125, 135–6,
153–4financial market 156industrial policy 67industry 71labour-market 120, 122legal 169land tenure 451land 62, 80, 111, 152, 156macroeconomic structural 147microeconomic 109, 112, 116, 118, 120,
125–8, 133–4, 137, 231public sector 62social policy 156social 57trade 56–7, 62–3, 75
refugees 370, 406, 440Regulation of Development in Rural Areas Act of
1997 454Regulation of Gatherings Act 408representative democracy 9, 420, 422, 424, 445research and development (R&D) xi, 94–5, 99,
185–96, 201, 203–4Reserve Bank 96–8, 102retirement fund 314–15, 317, 321retrenchments 296–7, 300, 433Rural Development Framework (RDF) 448Rural Development Initiative (RDI) 112, 268,
402, 416, 425, 448–9, 454rural development 444–5, 447–53, 458rural economy 448rural local economic development 235
sanitation 233science and technology (S&T) xii, 192, 196,Second Economy 24–7Sector Partnership Fund (SPF) xii, 206–7, 209,
211–12
Self-Employed Women’s Association 404Self-Employed Women’s Union 406sex work 371, 429sexually transmitted infections (STIs) xii, 346,
349, 352, 354 Skills Development Act 300skills development 109small business development 230, 235, 236, 241small, medium and micro enterprises (SMMEs)
xii, 79, 81, 190, 230, 235social grants 300Social Movements Indaba 407social pension 80social policy reforms 156social security 111, 136, 156, 161–2, 165, 173–4,
176–7, 388, 390schemes 173system 80
social welfare 136, 388, 390socialism 34, 413South African Cities Network 232South African Communist Party (SACP) xii, 1–2,
398, 402, 416–17, 419, 425South African National Civics Organisation
(Sanco) xii, 418–19, 445, 447South African National NGO Coalition
(Sangoco) xii, 419South African Reserve Bank (SARB) xii, 87,
102–3, 110South Durban Community Environmental
Alliance (SDCEA) xii, 435, 437Southern African Development Community
(SADC) xii, 65Southern African Labour and Development
Research Unit (Saldru) xiiSoweto Electricity Crisis Committee 398, 403–4,
406–7Soweto uprising 17Spatial Development Initiative (SDI) xii, 67, 206,
258, 447spatial development 231stabilisation 137State Maintenance Grants (SMGs) 165State of the Nation address 13, 24, 137state-owned enterprises (SOE) xii, 73structural adjustment 41, 438subsistence economy 147sustainable development 8, 146
T H E D E V E L O P M E N T D E C A D E ? S O U T H A F R I C A , 1 9 9 4 – 2 0 0 4
470
Free
dow
nloa
d fr
om w
ww
.hsr
cpre
ss.a
c.za
tariff(s) 62, 65–66, 113, 115, 125, 208barriers 113, 115, 125liberalisation 62protection 66, 208schedule 65
tariffs, liberalisation of agricultural tax 62, 115, 117–18, 137, 146, 230, 390
concessions 137holidays 230rates 117reform 62, 118, 146system 115, 137
taxation 112, 305technical education 120technology development 231Ten Year Review 144Thatcherism 21, 28total-factor productivity (TFP) xii, 77tourism 62, 232, 234, 236, 238, 240–2, 266, 371
development 238, 240convention 232promotion 232, 241studies 236
trade 56–7, 59, 61–3, 66, 69, 71–2, 75, 77, 79–80,82, 87, 109, 125, 128, 137, 146, 153, 196, 201
agreements 63barriers 77liberalisation 62, 71, 79–80, 128, 137policy 82, 72, 109, 125policy liberalisation 201reform 56–7, 62–3, 75specialisation 61
trade union(s) x, 1–2, 9, 91, 103, 147, 397–8, 402,406, 416–7, 419, 425, 429, 431–4, 441, 450
Chemical, Engineering and IndustrialWorkers Union (CEIWU) x, 431–4, 441
Congress of South African Trade Unions(Cosatu) x, 1–2, 397–8, 402, 406, 416–7,419, 425
Federation of South African Trade Unions(Fosatu) x, 2
traditional healer(s) 346, 368, 375–6Traditional Leadership and Governance
Framework Act 456–7, 459Transitional Executive Council 1transitional representative council (TrepC)
xii, 448, 452transitional rural council (TRC) xii, 446, 448Treatment Action Campaign (TAC) xii, 377, 398,
403–4, 406–9
Tribal Authorities 444–51, 458,tuberculosis (TB) 154, 331, 329, 346
Ubuntu 50Umkhanyakude study 164, 166–7, 171Unemployment Insurance Fund (UIF) 161,
173, 320unemployment 4, 17, 25, 77, 80, 86–94, 99–100,
103–5, 121–4, 131, 133, 137–8, 147, 171–2,176, 227, 233–5, 261, 275–7, 282, 287–300,302, 337, 344–5, 388, 402–3, 405–6,427–30, 451
United Nations Industrial DevelopmentOrganisation (UNIDO) xii, 205
United Nations Programme on HIV/AIDS(UNAIDS) xii
urban cultivation 234Urban Renewal Programme 235urbanisation 111, 146, 148, 345US Patent and Trademark Office 191
Vietnam War 16Volcker shock 17
War on Terror 144War Veterans’ Pension 162Washington Consensus 13, 16, 22, 25, 27, 126–31,
134–5, 153, 201, 256welfare 82, 161–2, 171–2, 174, 256, 290, 392, 430
organisations 430services 161, 162, 174state 256
Wentworth Development Forum (WDF) xii,435, 437–8
Workplace Challenge 206World Bank Large Manufacturing Firm Survey
(WBLMS) xii, 291–5, 297World Bank 3, 13, 16–17, 19, 21, 41–6, 78, 149,
152, 154, 202, 204–5, 254, 291, 388–9World Conference Against Racism 25World Development Report 145World Health Organization (WHO) xii, 329,
331, 356World Summit for Social Development (1995)
xii, 25World Summit on Sustainable Development 232World Trade Organization (WTO) xii, 63–4
xenophobia 367, 370, 406
Yom Kippur wars 18
I N D E X
471
Free
dow
nloa
d fr
om w
ww
.hsr
cpre
ss.a
c.za

Free
dow
nloa
d fr
om w
ww
.hsr
cpre
ss.a
c.za
Related Documents