DEVELOPMENT OF URBAN INFRASTRUCTURES AND POPULATION CHANGE IN CHINA A Thesis submitted to the Faculty of the Graduate School of Arts and Sciences of Georgetown University in partial fulfillment of the requirements for the degree of Master of Public Policy in Public Policy By Yuhan Nan, LL.B. Washington, D.C. April 14, 2018

Welcome message from author
This document is posted to help you gain knowledge. Please leave a comment to let me know what you think about it! Share it to your friends and learn new things together.
Transcript
DEVELOPMENT OF URBAN INFRASTRUCTURES AND POPULATION CHANGE IN
CHINA
A Thesis
submitted to the Faculty of the
Graduate School of Arts and Sciences
of Georgetown University
in partial fulfillment of the requirements for the
degree of
Master of Public Policy
in Public Policy
By
Yuhan Nan, LL.B.
Washington, D.C.
April 14, 2018

ii
Copyright 2018 by Yuhan Nan
All Rights Reserved
iii
DEVELOPMENT OF URBAN INFRASTRUCTURES AND POPULATION CHANGE IN
CHINA
Yuhan Nan, LL.B.
Thesis Advisor: Andrews Kern, Ph.D.
ABSTRACT
The provision of urban infrastructure is crucial for the sustainable development of cities, and it
has been proven that the growth of urban infrastructure should be in line with the population
change in cities. However, evidences have shown that it is not the case in Chinese cities.
Furthermore, there are disparities in the development of urban infrastructures across sector, and
these disparities are also related the administrative level of a city. Using the data from China City
Statistical Yearbook, this paper mainly finds two conclusions: (1) compared to other sectors,
population condition (the size of household registered population) is more in line with the
development of urban infrastructures that can improve the attractiveness of the cities to businesses
and investments, and (2) population size and population density are more likely to be negatively
associated with the development of urban infrastructures in second level cities. The findings of
this paper suggest that local governments should emphasize the development of infrastructures of
a more diverse range, and that second level cities need more attention in further development.

iv
ACKNOWLEDGEMENTS
The research and writing of this thesis
is dedicated to everyone who helped along the way.
Many thanks,
Yuhan Nan

v
TABLE OF CONTENTS
INTRODUCTION ....................................................................................................................................... 1
1. BACKGROUD: URBANIZAITON OF CHINA ................................................................................. 4
2. LITERATURE REVIEW: URBAN INFRASTRUCTURE IN CHINA AND ITS
INTERACTION WITH POPULATION DYNAMICS ........................................................................ 7
2.1 CHALLENGES PUT FORWARD BY POPULATION GROWTH .............................................. 8
2.2 MISMATCH OF URBAN INFRASTRUCTURE AND DEMOGRAPHIC CONDITION ........... 9
2.3 CURRENT STUDIES ON URBAN INFRASTRUCTURE IN CHINA ...................................... 10
2.3.1 OUTCOME AND PERFORMANCE OF URBAN INFRASTRUCTURE ....................... 11
2.3.2 INTERACTION BETWEEN URBAN INFRASTRUCTURE AND URBANIZATION .. 12
3. HYPOTHESIS AND CONCEPTUAL FRAMEWORK .................................................................... 13
4. EMPIRICAL ANALYSIS .................................................................................................................. 16
4.1 EMPIRICAL MODEL ................................................................................................................. 17
4.2 DESCRIPTIVE STATISTICS ..................................................................................................... 18
4.3 REGRESSION RESULTS ........................................................................................................... 21
4.4 ROBUSTNESS OF EMPIRICAL RESULTS .............................................................................. 26
5. CONCLUSION AND DISCUSSION ................................................................................................ 28
5.1 POLICY IMPLICATIONS ........................................................................................................... 28
5.2 POTENTIAL LIMITATIONS ..................................................................................................... 29
APPENDIX ............................................................................................................................................... 31
BIBLIOGRAPHY ..................................................................................................................................... 34

1
INTRODUCTION
China has witnessed a rapid urbanization process since its economic reforms in the 1990s
(Yusuf, Nabeshima, 2008). This process has benefited from the national development policy that
took urbanization as a primary driver of economic growth and absorbing surplus rural labor (Su
and Zhao, 2017), among other factors such as industrialization, marketization, political reform,
and globalization. China’s urbanization is exceptional in terms of the expansion of urban lands,
the increase of urban population, the upgrade of industry, and its extraordinary speed.
Given the rapid urbanization rate, it is the time to consider the quality of urbanization,
especially the coordination between the three aspects of urbanization: landscape urbanization,
demographic urbanization, and industrial urbanization. Particularly, this paper focus on the
coordination between landscape and demographic urbanization, and takes the development of
urban infrastructure as a representative of the landscape urbanization because it is the foundation
of living and economic activities.
China’s urbanization features a threefold mismatch between urban construction and
population conditions: first, it is not uncommon that the rate of landscape urbanization out-speeds
urban population growth in many cities (Wang, Hui, Chonguill, Jia, 2015), rendering them not
dense enough to exploit the economies of scale and agglomeration (Henderson, 2009); second, the
distribution of urban infrastructures may not be in line with the distribution of population; and
third, China’s urbanization process features a property-led pro-growth model (Vytautas Snieskaa
and Ineta Zykieneb, 2015; Keith Head and John Ries, 1996), which incentivizes local government
to emphasize more on the development of infrastructures that can improve the attractiveness of
cities to businesses and investment, leading to a disparity across sectors of urban infrastructures.

2
These mismatches raise the necessity of further investigation into the relationship between the
physical development and the population change in the background of China’s urbanization.
Therefore, the objective of this paper is to figure out to the extent to which the population condition
is in line with the development of urban infrastructures across different sectors of infrastructure,
and the difference across administrative level of cities.
To achieve the objective stated, this paper will test three hypotheses. First, the development
of urban infrastructures is positively associated with the population conditions but not significantly
associated with the population density. The growth of urban population increases the demand for
urban infrastructures and raises the financial capacity of local government to provide more
infrastructures; therefore, it should have a positive influence on the development of urban
infrastructures. On the other hand, evidences suggest that the development of urban infrastructures
is not taking population density into sufficient consideration.
Second, considering that local government have more likely to build transportation
infrastructures to stimulate economic growth and increase government revenue from land leasing
(Li, 2017), I expect that there are disparities across different sectors of infrastructures. Particularly,
since literature shows that among other factors, the accessibility of the city, road infrastructure,
labor force would influence the choice of location of investment and businesses (Snieskaa and
Zykieneb, 2015), it is expected that infrastructures regarding transportation and education would
be more well development compared to other sectors.
Third, I expect that the effect of population condition on the development of urban
infrastructures tends to be different across city level. This reflects the different urbanization stages
of cities of different administrative level. First level cities are the most developed ones and at the
3
most advanced stage of urbanization, while cities of lower levels are still in the process of
developing and at an earlier stage of urbanization. Therefore, cities of different levels may have
disparate demands for infrastructures and capacity to provide them.
Using data from China City Statistical Yearbook, this paper will adopt a fixed effect model
to test the three hypotheses. This paper embraces a broader definition of urban infrastructure that
is the physical structure for societal operation (Cheng and Lu, 2017) and the provision of basic
services to industries and households (Li, 2017). Urban infrastructures are divided into four sectors:
education, transportation, sustaining system (that provides necessities for living and economic
activities), and cultural or social infrastructures. Population condition is captured by population
size, density, and growth rate, with a distinguish between permanent population and household
registered population. Control variables include economic condition, public finance, and city
specific factors.
The regression results indicate that all urban infrastructures except for sustaining system is
significantly associated with the size of household registered population, but not significantly
associated with population density and the size of permanent population. When the difference in
city levels is considered, population size is positively associated with all urban infrastructures
except for education infrastructures in first level cities, but is negatively associated with all urban
infrastructures except for education infrastructures in second and lower levels of cities. Particularly,
the strength of negative association is the largest in second level cities.
Based on the findings, this paper suggests local governments emphasize a more diverse range
of infrastructures, especially the social and cultural infrastructures, to make the cities more
4
livable. Also, the second level cities deserve more attention to develop a more balanced and
sustainable portfolio of urban infrastructures.
1. BACKGROUND: URBANIZATION OF CHINA
China has witnessed a rapid urbanization process since its economic reforms in the 1990s
(Yusuf, Nabeshima, 2008). China’s urbanization has benefited from the national development
policy that took urbanization as a primary driver of economic growth and absorbing surplus rural
labor (Su and Zhao, 2017), among other factors such as industrialization, marketization, political
reform, and globalization.
The definition of urbanization can be divided into three aspects: (1) landscape urbanization
that features the expansion of urban land and built-up areasa, (2) industrial urbanization meaning
the up-grade of industries from primary industries to secondary and tertiary industries, and (3)
demographic urbanization, namely the increase of urban population and the change in life style.
China’s urbanization is outstanding in all three aspects. As for landscape urbanization, up to 2010,
China expanded its urban lands at an average rate of 3.1% per year, and the absolute value of urban
land was 23,600 square kilometers, which took up two-thirds of the total urban land in East Asia
(World Bank, 2015). And the Pearl River Delta was honored as the largest single urban area in the
world, in terms of both population and area (World Bank, 2015). China’s urbanization is
incomparable also in terms of demographic urbanization. From 1978 to 2013, urban population
grew from 170 million to 730 million (Wang, Hui, Chonguill, Jia, 2015), and its proportion in total
population grew from 19% to 54% from 1980 to 2014 (Li, 2017). The rapid increase in urban land
a Bai, Chen, Shi (2012): “Land conversion is one of the key process that characterizes urbanization”.
5
and urban population makes cities in China a “growth pole” for economic development. The
process of urbanization is accompanied with an increase of productivity in secondary and service
industry. Employment in secondary industry grows from 70 million people to 225 million people
from 1978 to 2011; and the employment in service industry (tertiary industry) increases from 49
million people to 273 million people during the same period (World Bank, 2011).
China’s urbanization is also exceptional for its extraordinary speed. It is predicted that the
urbanization rate in China would exceed 60% in 2020, with the urban population increase by 200
million. This figure is high even compared to other countries under rapid urbanization in East Asia
(Yusuf, Nabeshima, 2008).
Given the rapid increase of urbanization rate, it is the time to start considering the quality of
urbanization. To achieve a sustainable urban development, the three aspects of urbanization should
be in line with each other, while it may not be the case in some Chinese cities. There are debates
over whether China’s urbanization is of the right speed compared to its industrialization, reflecting
the controversies on the relation between industrial and landscape urbanziation (Mingxing Chen,
Weidong Liu, Xiaoli Tao, 2012). The large number of immigrant workers and the urban-rural gap
also indicate the disparity between demographic change and the other two aspects of urbanization.
Particularly, this paper focuses on the delivery of urban infrastructure as representative of
landscape urbanization because it is the foundation of living and economic activities. This paper
embraces a broader definition of urban infrastructure that is the physical structure for societal
operation (Cheng and Lu, 2017) and the provision of basic services to industries and households
(Li, 2017). China’s urbanization features a threefold mismatch between their urban construction
and their population conditions. First, it is not uncommon that the rate of landscape urbanization
6
out-speeds urban population growth in many cities (Wang, Hui, Chonguill, Jia, 2015), rendering
them not dense enough to exploit the economies of scale and agglomeration (Henderson, 2009).
Many prefecture-level cities are only half of their efficient size (Henderson, 2009), but even in
mega-cities of higher density, they are criticized as “high-density sprawl”, because of failing to
capture the benefits (World Bank, 2015). This low-density expansion model increases the cost of
infrastructure and public services, induces energy inefficiency and environmental problem (Bhatta
B. 2010). Second, the distribution of urban infrastructures may not be in line with the distribution
of population. In this situation, though the number of infrastructures may be in line with the
population size, the infrastructures may underserve residents in some area in the city. Third,
China’s urbanization process features a property-led pro-growth model (Vytautas Snieskaa and
Ineta Zykieneb, 2015; Keith Head and John Ries, 1996), which incentivizes local government to
emphasize more on the development of infrastructures that can improve the attractiveness of cities
to businesses and investment, leading to a disparity across sectors of urban infrastructures. This
mismatch raises the necessity to further investigate the relationship between the physical
development and the population change in the background of China’s urbanization.
Urbanization puts forward requirements for urban infrastructure development to accommodate
the growth in population and economic activities (Su and Zhao, 2017). Sufficient and well-
designed infrastructure, in turn, benefits the urbanization process and ensures sustainable
economic growth in the long-run. The facilitating function of urban infrastructures for economic
growth comes from three mechanisms: first, urban infrastructure system, especially the
transportation system, reduces the transaction cost and optimizes the distribution of economic
activity (Li, 2017); second, the investment in and construction of infrastructure creates

7
employment (Tao Liu, Qi, Cao, Hui Liu, 2015); third, better urban infrastructures attract further
investment in industries (Bai, Chen, and Shi, 2012), and improve productivity in the private sector
(Li, 2017). Not only the economy, but also the well-being of urban residents is subject to the
provision of urban infrastructures. For example, as shown by Yusuf (2008), the livability of large
cities is subject to the development and design of the transport system. As for urbanization,
infrastructures and the related services attract more people into urban areas, thus promoting
demographic and landscape urbanization (Li, 2017). Acknowledging its importance in
urbanization, this paper focuses on urban infrastructure and its coordination with urban population.
2. LITERATURE REVIEW: URBAN INFRASTRUCTURE IN CHINA AND ITS INTERACTION WITH
POPULATION DYNAMICS
Theoretically speaking, the development of urban infrastructure should be in harmony with
both economic and population growth for the urbanization to be sustainable and efficient. However,
as shown in numerous literature, it’s not the case in Chinese cities, which causes challenges to
further urban development (Liu, 2017; Gao, 2015; World Bank, 2015). Particularly, this paper
focuses on the mismatch between urban infrastructure development and demographic urbanization,
focusing on the coordination between urban infrastructure development and the growth of urban
population.
8
2.1 CHALLENGES PUT FORWARD BY POPULATION GROWTH
Although the expansion of urban land and the reclassification of some “rural areas” as cities
played an important role in the early stages, urbanization in China is mainly driven by internal
migration, namely the migration from rural to urban areas.
Internal migration provides labor of lower cost for economic development (Hu, 2013) and
facilitates the poverty reduction in sending areas (Heikkila, 2007). However, one thing special
about the population dynamic of China is its hukou system (also known as household registration
system), which regulates the movement of people by assigning every person a specific locality
where they are supposed to live (Yusuf, Nabeshima, 2008). This system not only distinguishes
urban from rural residents, but also limits the number of people moving into certain cities (Yusuf,
Nabeshima, 2008). People who move from their registered locations to other places for better
economic or education opportunities become a “floating population”. They are employed by urban
industries but enjoy limited access to some of the infrastructures and public services. Up to 2014,
there are about 253 million floating populations in China, which also raises challenges for the
urban infrastructure development.b
Despite of the growth population size, the overall population density in Chinese cities is
decreasing. And in 2010, the population density in Chinese urban areas was 5,300 people per
square kilo meter, which is lower than the average of East Asia (World Bank, 2015). This is partly
because the urbanization in China takes a relatively expansive model, in which urbanization is
b National Health and Family Planning Commission.

9
featured by expanding the size of urban area rather than increase the density within already
constructed areas (Chen, Jia, Lau, 2008).
2.2 MISMATCH OF URBAN INFRASTRUCTURE AND DEMOGRAPHIC CONDITION
The sustainable development of urban areas requires urban infrastructure to increase in line
with its economic growth, landscape conversion, and population growth. However, Chinese
urbanization is facing a mismatch in urban infrastructure and demographic condition in terms of
population growth rate, population density, and distribution. This renders the supply side and the
demand side of urban infrastructure not well-coordinated with each other.
The provision of urban infrastructure in China is more supply-driven than demand-driven
after 2008, during which period the central government used urban infrastructure investment as a
tool to stabilize the economy (Li, 2017). In addition to that, since local governments take the
responsibility of both urban infrastructure delivery and economic development, the former one is
usually of lower priority (Liu, 2005). Even within the urban infrastructure development, there are
disparities across sectors. Local governments have more incentive to invest in real estate
development and constructions of physical infrastructure, because they are more profitable and
can stimulate short-term GDP growth (Li, 2017; Koppenjian and Enserink, 2009).
While insufficient provision of public services and infrastructures in large, affluent cities
leads to congestion and the deterioration of urban environment (Yusuf, Nabeshima, 2008), some
Chinese cities are over-supplying urban infrastructures compared to their population growth,
which further exacerbates the urban expansion. It is reported that 62% of urban areas in China with
10
populations over 100,000 are experiencing decreasing population density due to the expansion of
urban infrastructures; and about 50 smaller urban areas are constructing more roads and buildings
even though their population has declined (Gao, 2015; World Bank, 2015). The loss in population
density undermines the cost-efficiency of urban infrastructure development, and even creates
“ghost cities” where the infrastructures remain idle with no residents nor economic activities there
(Gao, 2015; World Bank, 2015).
Furthermore, the urbanization in China is project-oriented and scattered without an
integrated infrastructure system. This urbanization pattern prevents cities from achieving the
optimal density to take advantage of agglomeration and increases the construction cost of new
infrastructures (Chen, Jia, Lau, 2008).
The mismatching also occurs in the urban infrastructure investment. Although the
investment in urban infrastructure has been growing rapidly overtime, it remains relatively modest
compared to the average investment of developing countries, in terms of the share of total national
investment.c
2.3 CURRENT STUDIES ON URBAN INFRASTRUCTURE IN CHINA
Urban infrastructure in China has long been studied in literature, most of which focuses on
topics including finance system for urban infrastructure and the decentralization related to it,
evaluation of outcomes and performance of urban infrastructure investment, and the interaction
c According to a World Bank’s report in 1994, developing countries averagely spend 50% of local government investment, 20%
of total national investment, and 4% of GDP in urban infrastructure investment. Comparing to China, Shanghai spent 12.5% of
total investment or 5.9% of regional GDP to urban infrastructure over the period of Ninth Five-Year Plan; the number of Beijing
was 13.7% of total investment, and 6.3% of regional GDP.
11
between urban infrastructure with economic growth and urbanization. Although the
unresponsiveness of urban infrastructure development to population indicators has long been
noticed by researchers, the majority of them focus on the investment and finance, and consider
both population and urban infrastructure as a whole. This paper enriches the existing literatures by
trying to distinguish different sectors of urban infrastructure, especially the disparities between
conventional infrastructures and social infrastructure.
China has taken action to accelerate the development of urban infrastructure by increasing
investment. During the 12th Five-Year Plan (2011 to 2015), averagely 7 trillion yuan (1.03 trillion
US dollars) was invested in urban infrastructure (Song, 2013); and 2015 alone witnessed an
investment in urban infrastructure of more than 9 trillion CNY (Bai, Chen, Shi, 2012). Although
efforts have been taken, the development of urban infrastructure in China still faces the problem
of insufficient provision, disparities across regions and city levels, cost-inefficiency, financial
shortage, and lack of design (Song, 2013).
2.3.1 OUTCOME AND PERFORMANCE OF URBAN INFRASTRUCTURE
Assessment of the outcome and performance of urban infrastructure is another hot topic
related to urban infrastructure development. Researchers analyze the impact of urban infrastructure
development, and evaluate the efficiency of urban infrastructure investment.
There is mounting evidence that associates urban infrastructure development to economic
growth, with casualty flowing in both directions. The World Bank analyzes the function of urban
infrastructure by pointing out that improved road networks and public transit can lead to mixed
12
land use, which may contribute to the sustainability of urbanization (World Bank, 2015). Song
(2013) reinforces that urban infrastructure development is linked with “higher level of human
settlement” and can raise land value, which in turn increases the probability of landscape
urbanization (Song, 2013).
Researchers are also interested in the evaluation of investment efficiency of urban
infrastructure development. Chen and Lu (2017) assesses the investment efficiency at the national
level, drawing the conclusion that the technical efficiency of urban infrastructure investment
declines nationally, but the overall efficiency increased due to the improved management skills of
governments. Besides, due to the influence of changing economic conditions and national policies,
the performance of urban infrastructure investment is unstable overtime (Cheng and Lu, 2017).
Li (2017) compares the urban infrastructure growth with the urbanization rate in China and
assesses the efficiency of urban infrastructure investment. It concludes that the investment in roads
is less efficient compared to the US, and the inland regions are still facing under investment
problems (Li, 2017).
2.3.2 INTERACTION BETWEEN URBAN INFRASTRUCTURE AND URBANIZATION
There is abundant literature that focuses on the interaction between urban infrastructure
development and other aspects of urbanization, especially its interaction with demographic
conditions.
Although researchers have proven the positive influence of population density on the
availability and efficiency of urban infrastructure, the responsiveness of urban infrastructure

13
investment to population growth is not significant. Per capita investment in urban infrastructure is
actually decreasing with the increase of population density, indicating that urban infrastructure
development is determined by other factors like financial capacity or local development strategy
instead of the demand of population (Chen, Jia, Lau, 2008). Cheng and Lu (2017) conducts a factor
analysis (FA) and a STIRPAT (Stochastic Impacts by Regression on Population, Affluent and
Technology) analysis to figure out the critical influencing factors of urban infrastructure
development. They find that at the local level, urban infrastructure development is mainly
influenced by income, industrialization, and investment of local government; while at the national
level, urban infrastructure is mainly influenced by national public investment (Cheng and Lu,
2017). In either case, population indicators are not emphasized by local government when
determining the investment in and location of urban infrastructure.
3. HYPOTHESIS AND CONCEPTUAL FRAMEWORK
This paper will examine the coordination between urban infrastructure and demographic
conditions, especially the disparities across different sectors of urban infrastructures. It is also
expected that region and city’s level will exert an influence on the result.
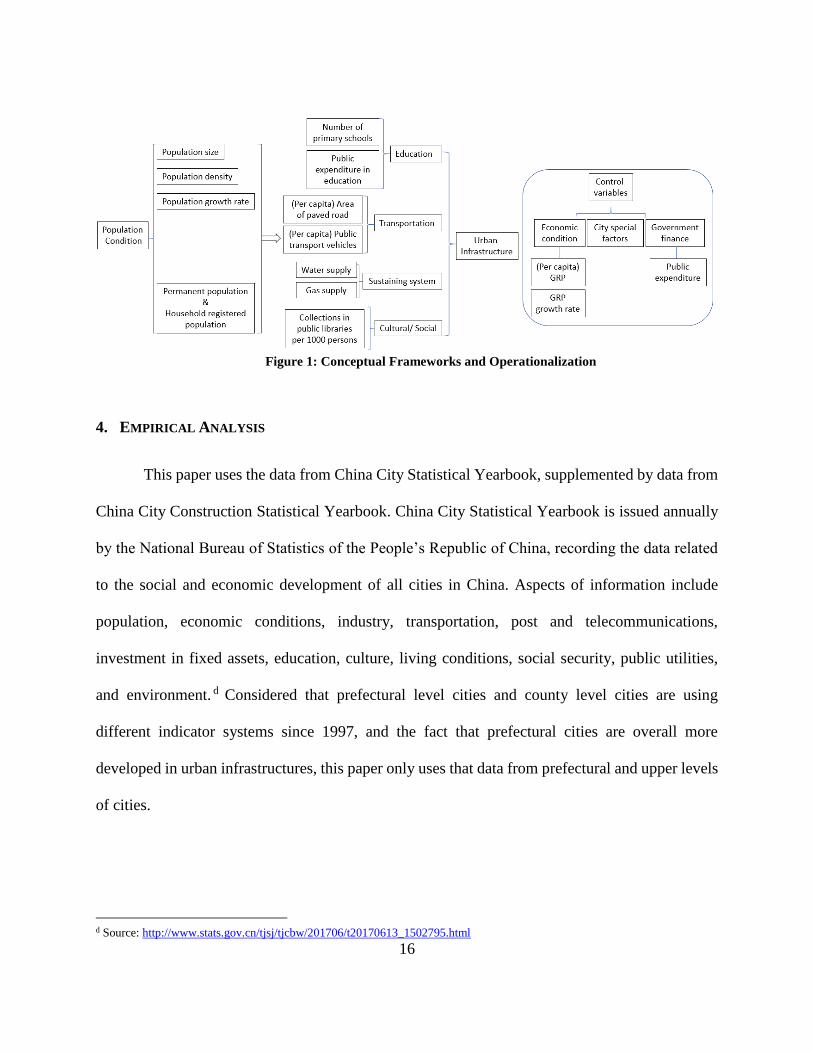
The interaction between urban population and urban infrastructure development is
presented in Figure 1, where the population is measured in three aspects: the total size of urban
population, population density, and population growth rate. On the other side, urban infrastructure
is measured by indicators provided in China City Statistical Yearbook. Population growth drives
the development of urban infrastructure by (1) increasing living and economic activities thus
increasing the demand for urban infrastructures, (2) enhancing cities’ capacity of developing urban
14
infrastructures through increased labor force and enlarged tax base, and (3) reducing the cost of
urban infrastructure per person due to higher density and economy of scale. Therefore, a positive
association between urban infrastructure and population growth is expected.
However, since the urban development in China is more supply-driven after 2008 (Li,
2017), I expect that the growth of urban infrastructure is not in line with the growth of urban
population, especially in terms of population density. Evidences suggest that the development of
urban infrastructures is not taking population density into sufficient consideration. Some cities are
constructing infrastructures ignoring their declining population density, giving raise to the
occurrence of “ghost cities” as mentioned before (Gao, 2015). Even some highly developed cities
share the problem. Taking Shanghai as an example, its urban area increased by 117% from 2000
to 2010, while the population grew only 73% (Gao, 2015). Although the expansion of urban land
cannot be equalized to the growth of urban infrastructure, this trend suggests the possibility of
higher urban infrastructures per capita compared to population growth rate. On the other hand,
some cities fail to provide sufficient infrastructures to accommodate their increasing population,
causing congestion problem. As pointed out by Liu (2005), the growth of urban population usually
exceeds the planned population target in some cities, making the demand for urban infrastructures
and public services increases faster than predicted and planned. These phenomena lead to
Hypothesis 1 that urban infrastructure indicators are not significantly associated with the
population density.
Related to the mismatch between urban infrastructures and population density comes
Hypothesis 2 that there are disparities across different sectors of infrastructures. Li’s (2017) report
shows that local government have more likely to build transportation infrastructures to stimulate

15
economic growth and increase government revenue from land leasing. This trend may result from
local governments’ emphasis on economic development, generating a property-led, pro-growth
urbanization model in Chinese cities. Literature shows that among other factors, the accessibility
of the city, road infrastructure, labor force would influence the choice of location of investment
and businesses (Snieskaa and Zykieneb, 2015). Therefore, it is expected that infrastructures
regarding transportation and education would be more responsive to population condition.
Hypothesis 3 is that the effect of population condition on the development of urban
infrastructures tends to be different across city level. As explained before, the economic return of
different types of urban infrastructures varies across region and city level. For example, research
has found out that infrastructures like telecommunications can promote local GDP in affluent
eastern cities, but not in cities in western region; while the investment in conventional
infrastructures like roads tends to gain better economic return in western regions (Li, 2017).
Acknowledging that the development of urban infrastructures would be determined by a
wide range of factors, this paper will take into account city specific factors that may influence the
development of urban infrastructure as control variables, including government finance indicators,
economic conditions, and the characteristics of cities.
16
Figure 1: Conceptual Frameworks and Operationalization
4. EMPIRICAL ANALYSIS
This paper uses the data from China City Statistical Yearbook, supplemented by data from
China City Construction Statistical Yearbook. China City Statistical Yearbook is issued annually
by the National Bureau of Statistics of the People’s Republic of China, recording the data related
to the social and economic development of all cities in China. Aspects of information include
population, economic conditions, industry, transportation, post and telecommunications,
investment in fixed assets, education, culture, living conditions, social security, public utilities,
and environment. d Considered that prefectural level cities and county level cities are using
different indicator systems since 1997, and the fact that prefectural cities are overall more
developed in urban infrastructures, this paper only uses that data from prefectural and upper levels
of cities.
d Source: http://www.stats.gov.cn/tjsj/tjcbw/201706/t20170613_1502795.html

17
This part is developed as following. First, this part introduces the fixed-effect model that
is adopted to analyze the data. Second, it presents the dependent and central independent variables
and their measurement. Third, the results of regression will be presented and interpreted. Finally,
the fourth part will be the robustness checks and the summary of findings.
4.1 EMPIRICAL MODEL
This paper will estimate a fixed effect model for the development of urban infrastructures
in each city. The equation is given as following:
𝑈𝐼𝑖𝑡 = 𝛽0 + 𝛽1𝑝𝑜𝑝𝑢𝑙𝑎𝑡𝑖𝑜𝑛𝑖𝑡 + 𝛽2𝐺𝑅𝑃𝑖𝑡 + 𝛽3𝐺𝑅𝑃 𝑝𝑒𝑟 𝑐𝑎𝑝𝑖𝑡𝑎𝑖𝑡 + 𝛽4𝐺𝑅𝑃 𝑔𝑟𝑜𝑤𝑡ℎ 𝑟𝑎𝑡𝑒𝑖𝑡
+ 𝛽5𝑝𝑢𝑏𝑙𝑖𝑐 𝑒𝑥𝑝𝑒𝑛𝑑𝑖𝑡𝑢𝑟𝑒𝑖𝑡 + 𝛽6𝑦𝑒𝑎𝑟𝑡 + 𝛽7𝑐𝑖𝑡𝑦 𝑙𝑒𝑣𝑒𝑙𝑖𝑡 + 𝛼𝑖 + 𝜇𝑖
Where 𝛼𝑖 is the unobserved characteristics for each city that does not change over time
(city fixed effect), and 𝜇𝑖 is the error term. Variable 𝑝𝑜𝑝𝑢𝑙𝑎𝑡𝑖𝑜𝑛𝑖𝑡 is the population condition of a
city in a given year, which is captured by either household registered population or permanent
population. 𝐺𝑅𝑃𝑖𝑡 is the Gross Regional Product of a city in a given year, representing the
economic condition of the city. 𝐺𝑅𝑃 𝑝𝑒𝑟 𝑐𝑎𝑝𝑖𝑡𝑎𝑖𝑡 and 𝐺𝑅𝑃 𝑔𝑟𝑜𝑤𝑡ℎ 𝑟𝑎𝑡𝑒𝑖𝑡 also capture the
economic condition of a city in a given year from the perspective of living condition and the stage
of development. Variable 𝑝𝑢𝑏𝑙𝑖𝑐 𝑒𝑥𝑝𝑒𝑛𝑑𝑖𝑡𝑢𝑟𝑒𝑖𝑡 is the public finance indicator that captures the
public expenditures of a city in a given year. Variable 𝑐𝑖𝑡𝑦 𝑙𝑒𝑣𝑒𝑙𝑖𝑡 indicated the level of cities,
containing five levels and reflecting the stage of development of cities.
18
4.2 DESCRIPTIVE STATISTICS
This paper uses data from China City Statistic Yearbook, from the year 2004 through 2015.
China’s city system at prefectural level experienced radical changes from 1997 to 2003, featured
by an increasing number of prefectural level cities at a rate of about 10 cities per year and
modifications of city level. e Taking account of this radical change, and the fact that the
measurement and scope of statistic indicators was not sufficiently stable until 2004, only data after
2004 is included in this paper to keep consistence of city numbers and variables.
Four categories of variables will be discussed in this part: population indicators including
population size, population growth rate, and population density; city economic indicators including
Gross Regional Product (GRP), GRP growth rate, and per capita GRP; public finance indicators
including public income and public expenditure; and indicators for infrastructures across section.
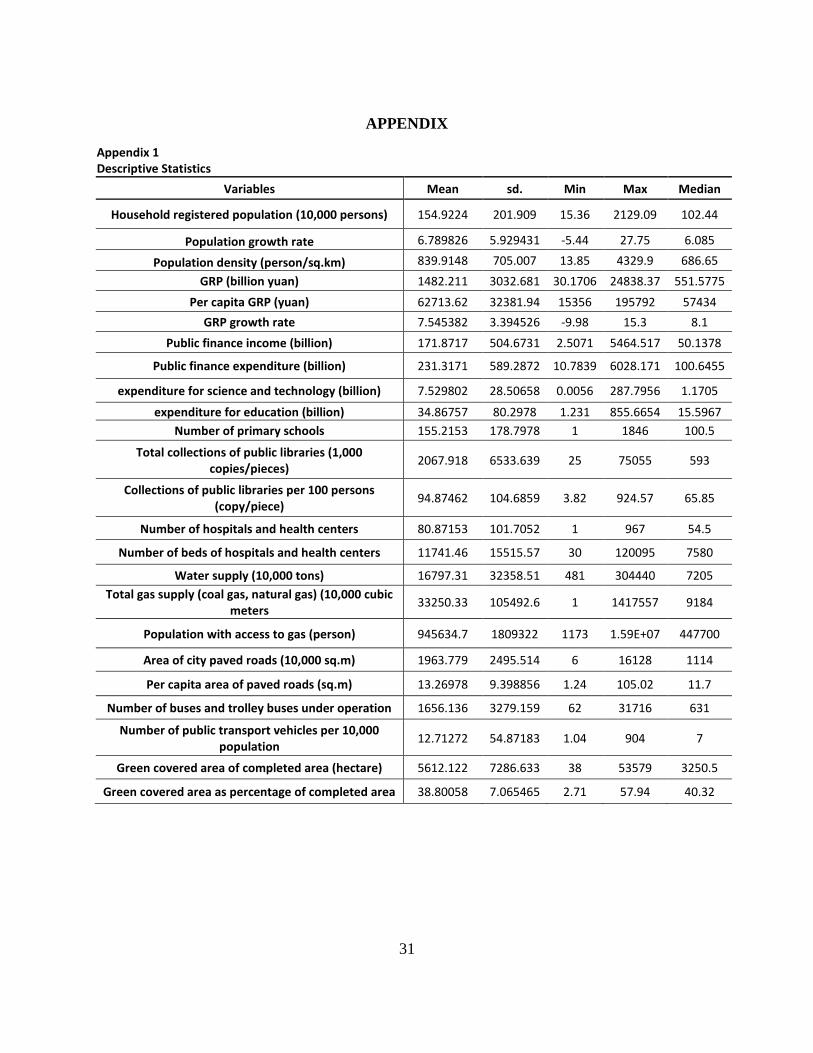
Detailed descriptive statistics are reported in Appendix 1.
This part highlights the distributions and characteristics of primary variables. Only data
from districts under cities are included in the discussion because of two reasons. First, considering
that the data regarding urban infrastructures and utilities only covers the district under cities, it
would be more consistent to discuss other variables in the same scope. Second, total city also
includes some counties under the jurisdiction of cities, which should be excluded from the
discussion of urban infrastructure because it is an administrative concept rather than the actual
urban areas. Also, cities of province Tibet are not included because there are large amounts of
e Policy Research Center, Ministry of Civil Affairs of the PRC:
http://www.mca.gov.cn/article/mxht/llyj/200801/20080100009424.shtml

19
missing data. The city of Sansha and Tibet province are also excluded because of the incomplete
data collection.
The average household registered population of districts under cities is about 1.55 million, but
the distribution of population is not even across cities, which is reflected by the large standard
deviation. Chongqing has the largest registered population, with a size of about 21.29 million;
while Lijiang has the smallest population size of 150,000 thousand inhabitants. The average
population natural growth rate of district under cities is 6.79%, and cities polarizes in this respect.
There are 38 cities with negative population growth rate, while the population growth rate of
Anshun has reached 27.75%.
Variation across cities also occurs in terms of population density. The average of
population density in total area of cities is about 840 persons per square kilometer. Heihe has the
lowest population density of 13.85 persons per square kilometer, while Xuchang owns the highest
population density of 2501.14 persons per square kilometer.
The gross regional production (GRP) indicates the economic condition of cities, while GRP
per capita reflects the standard of living. Chinese cities have an average GRP of 1482 billion yuan,
with a high standard deviation of 3032 billion yuan. The average per capita GRP is 62,713.62
yuan, and the disparity across cities is also large. The variation across cities is also reflected in the
growth rate of GRP. On average cities have a GRP growth rate of 7.54%, however, economic
growth does not happen in every city. Cities like Chaoyang experienced a negative growth rate of
-9.98, while the city of Anshun has a growth rate as high as 15.3%.
Public finance is the foundation of the development of urban infrastructures, which reflects
both the capacity and the willingness of cities to invest in urban infrastructures. In general, public
20
expenditures excesses public income in Chinese cities. The average public income of cities is
171.87 billion yuan, and the average public expenditure is 231.31 billion yuan. As part of the soft
power, cities’ average expenditure on technology and education is 7.53 billion yuan and 34.87
billion yuan respectively.
Cities have approximately 155 units of primary schools, and the standard deviation is about
178.8 units. The variation in number of schools can be attribute to either the difference in economic
condition and financial capacity, or the difference in demand. The total collection in public
libraries and the collections per 100 persons have huge standard deviations. On average, cities
have a total collection of approximately 2 million copies/pieces, but the standard deviation reaches
about 6.5 million copies. The average collections per 100 persons is 94.87 copies/pieces, with a
high standard deviation of 104.69 copies/pieces.
In summary, the large standard deviations show that there are huge disparities across cities
in the development of urban infrastructures. part of the variations can be explained by the
difference in demand for infrastructures, and the difference in economic and public financial
conditions of cities. While population living in cities is a main factor that generates the demand
for urban infrastructures, it is not always the most important determinant for the provision of
infrastructures in cities. Therefore, it would be beneficial to analyze that on what extent is the
development of urban infrastructures in line with the population conditions in cities, as well as the
disparity across city level.
21
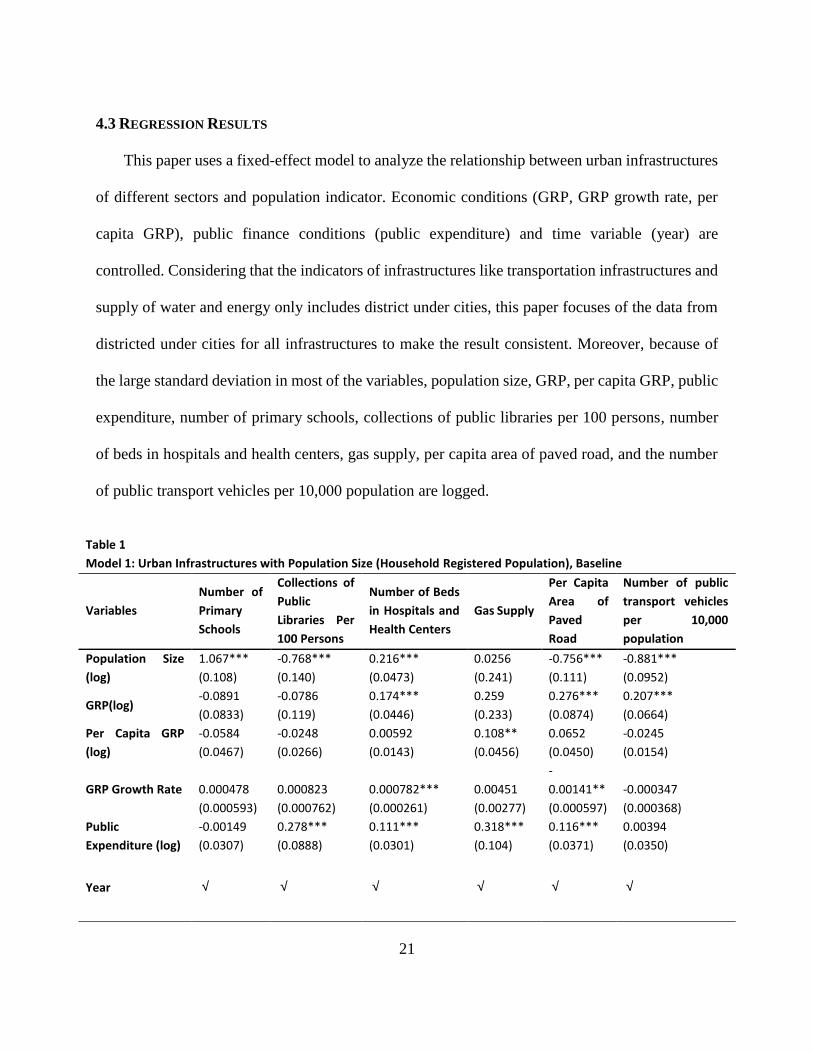
4.3 REGRESSION RESULTS
This paper uses a fixed-effect model to analyze the relationship between urban infrastructures
of different sectors and population indicator. Economic conditions (GRP, GRP growth rate, per
capita GRP), public finance conditions (public expenditure) and time variable (year) are
controlled. Considering that the indicators of infrastructures like transportation infrastructures and
supply of water and energy only includes district under cities, this paper focuses of the data from
districted under cities for all infrastructures to make the result consistent. Moreover, because of
the large standard deviation in most of the variables, population size, GRP, per capita GRP, public
expenditure, number of primary schools, collections of public libraries per 100 persons, number
of beds in hospitals and health centers, gas supply, per capita area of paved road, and the number
of public transport vehicles per 10,000 population are logged.
Table 1
Model 1: Urban Infrastructures with Population Size (Household Registered Population), Baseline
Variables
Number of
Primary
Schools
Collections of
Public
Libraries Per
100 Persons
Number of Beds
in Hospitals and
Health Centers
Gas Supply
Per Capita
Area of
Paved
Road
Number of public
transport vehicles
per 10,000
population
Population Size
(log)
1.067*** -0.768*** 0.216*** 0.0256 -0.756*** -0.881***
(0.108) (0.140) (0.0473) (0.241) (0.111) (0.0952)
GRP(log) -0.0891 -0.0786 0.174*** 0.259 0.276*** 0.207***
(0.0833) (0.119) (0.0446) (0.233) (0.0874) (0.0664)
Per Capita GRP
(log)
-0.0584 -0.0248 0.00592 0.108** 0.0652 -0.0245
(0.0467) (0.0266) (0.0143) (0.0456) (0.0450) (0.0154)
GRP Growth Rate 0.000478 0.000823 0.000782*** 0.00451
-
0.00141** -0.000347
(0.000593) (0.000762) (0.000261) (0.00277) (0.000597) (0.000368)
Public
Expenditure (log)
-0.00149 0.278*** 0.111*** 0.318*** 0.116*** 0.00394
(0.0307) (0.0888) (0.0301) (0.104) (0.0371) (0.0350)
Year √ √ √ √ √ √
22
Constant 2.157** 5.202*** 3.369*** -1.244 4.747*** 2.670***
(0.975) (1.641) (0.479) (2.931) (1.053) (0.793)
Observations 3,388 3,364 3,390 2,885 3,372 3,106
Number of city 303 302 303 298 302 301
R-squared 0.414 0.125 0.683 0.356 0.942 0.298
Standard errors in parentheses
*** p<0.01, ** p<0.05, * p<0.1
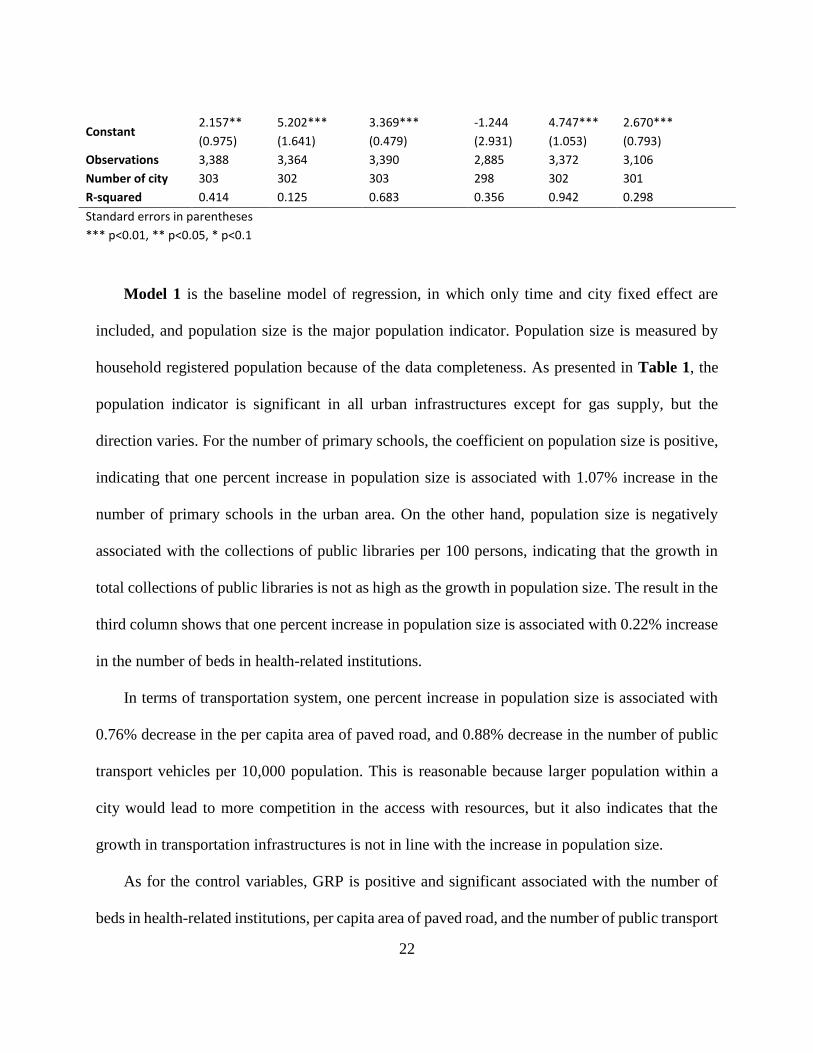
Model 1 is the baseline model of regression, in which only time and city fixed effect are
included, and population size is the major population indicator. Population size is measured by
household registered population because of the data completeness. As presented in Table 1, the
population indicator is significant in all urban infrastructures except for gas supply, but the
direction varies. For the number of primary schools, the coefficient on population size is positive,
indicating that one percent increase in population size is associated with 1.07% increase in the
number of primary schools in the urban area. On the other hand, population size is negatively
associated with the collections of public libraries per 100 persons, indicating that the growth in
total collections of public libraries is not as high as the growth in population size. The result in the
third column shows that one percent increase in population size is associated with 0.22% increase
in the number of beds in health-related institutions.
In terms of transportation system, one percent increase in population size is associated with
0.76% decrease in the per capita area of paved road, and 0.88% decrease in the number of public
transport vehicles per 10,000 population. This is reasonable because larger population within a
city would lead to more competition in the access with resources, but it also indicates that the
growth in transportation infrastructures is not in line with the increase in population size.
As for the control variables, GRP is positive and significant associated with the number of
beds in health-related institutions, per capita area of paved road, and the number of public transport
23
vehicles. The coefficient on per capita GRP, however, is significant at 95% confidence level only
with the gas supply. GRP growth rate has significant coefficients on the number of beds in health-
related institutions and the per capita area of paved road, but the absolute value is relatively small.
This result indicates that the economic conditions of cities is the foundation of urban
infrastructures because cities with higher GRP are more capable to invest in infrastructures. But
the development of urban infrastructures does not necessarily reflect the growth rate or the standard
of living.
It is not surprising that public expenditure has positive significant coefficients on most of the
dependent variables, except for number of primary schools and the number of public transport
vehicles per 10,000 population.
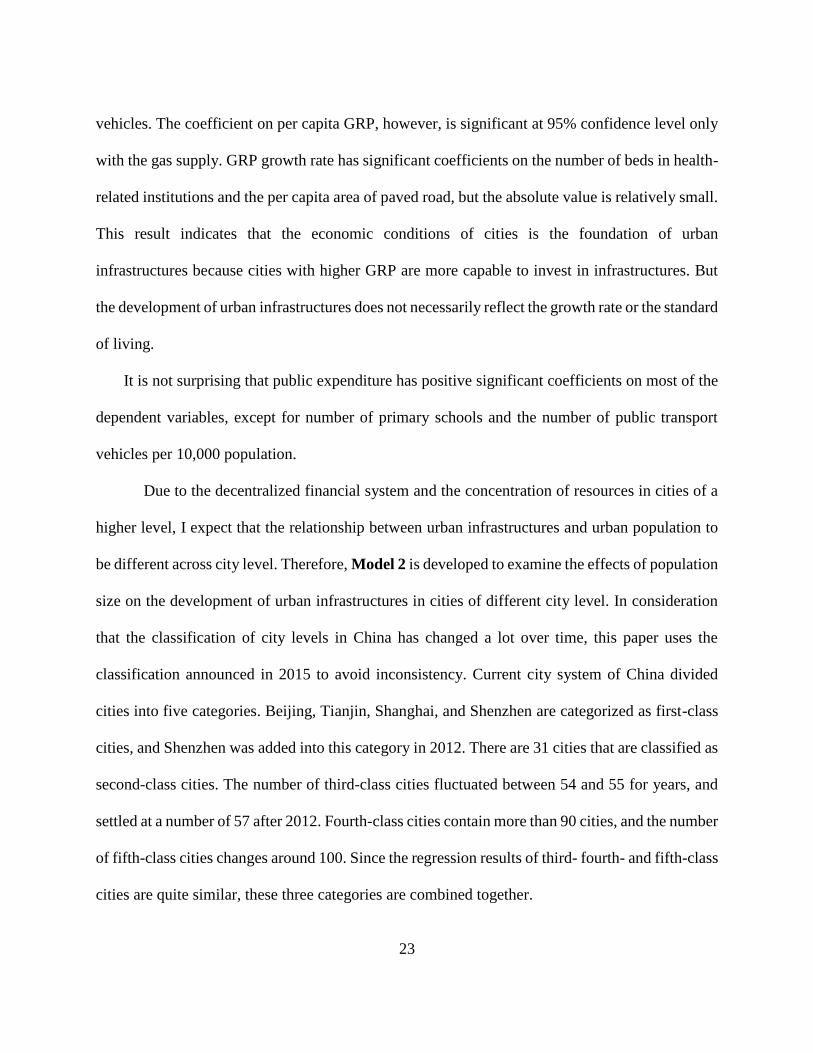
Due to the decentralized financial system and the concentration of resources in cities of a
higher level, I expect that the relationship between urban infrastructures and urban population to
be different across city level. Therefore, Model 2 is developed to examine the effects of population
size on the development of urban infrastructures in cities of different city level. In consideration
that the classification of city levels in China has changed a lot over time, this paper uses the
classification announced in 2015 to avoid inconsistency. Current city system of China divided
cities into five categories. Beijing, Tianjin, Shanghai, and Shenzhen are categorized as first-class
cities, and Shenzhen was added into this category in 2012. There are 31 cities that are classified as
second-class cities. The number of third-class cities fluctuated between 54 and 55 for years, and
settled at a number of 57 after 2012. Fourth-class cities contain more than 90 cities, and the number
of fifth-class cities changes around 100. Since the regression results of third- fourth- and fifth-class
cities are quite similar, these three categories are combined together.

24
When the difference across city levels is considered, as shown in Table 2, population size
is positive and significantly related to all urban infrastructures except for the number of primary
schools in first-class cities. It may indicate that the provision of infrastructures is more in line with
the population conditions in first-class cities. However, the coefficients on population size are
negative for second-, third-or-below class cities. Exceptions include the coefficient of population
size on number of primary schools for second-level cities is not significant, while its coefficient
for third- and below class cities is positive and significant. This result further confirms the disparity
across city levels in the provision of urban infrastructures.
25
Table 2
City Level L1 L2 L3 L1 L2 L3 L1 L2 L3 L1 L2 L3 L1 L2 L3
-0.0794 0.635* 1.124*** 1.663*** -1.028*** -0.768*** 0.661*** -0.0349 0.244*** 1.954** -0.930*** -0.700*** 0.194 -1.239*** -0.845***
(0.452) (0.325) (0.104) (0.294) (0.184) (0.155) (0.0550) (0.121) (0.0469) (0.617) (0.185) (0.110) (0.161) (0.188) (0.0982)
1.338 0.236 -0.131 0.578* -0.252 -0.0571 0.246*** 0.419*** 0.161*** 1.673 0.248 0.320*** 0.424 0.356* 0.200***
(0.833) (0.191) (0.0829) (0.226) (0.300) (0.126) (0.0401) (0.0922) (0.0464) (1.116) (0.209) (0.0823) (0.225) (0.182) (0.0689)
-0.478 -0.105 -0.0419 -0.142 -0.268 -0.0162 -0.115 -0.0791 0.0105 -0.627 -0.104 0.0381 0.0775 -0.275*** -0.0189
(0.388) (0.0871) (0.0383) (0.164) (0.190) (0.0221) (0.0747) (0.0528) (0.0128) (0.306) (0.112) (0.0304) (0.0787) (0.0814) (0.0123)
0.0376 -0.000384 0.000428 0.0140* -0.0184 0.000986 -0.00297 -7.69e-05 0.000769*** -0.00841 -0.0104 -0.00178*** -0.0178 -0.00243 -0.000391
(0.0186) (0.00359) (0.000593) (0.00626) (0.0145) (0.000825) (0.00634) (0.00239) (0.000270) (0.0226) (0.00624) (0.000582) (0.0238) (0.00472) (0.000375)
-0.288 0.0775 0.00912 -0.345 0.422 0.288*** -0.0533 -0.0818 0.118*** 0.127 0.0808 0.0656* 0.0496 0.0526 -0.00425
(0.255) (0.0840) (0.0316) (0.208) (0.317) (0.0935) (0.0665) (0.0742) (0.0318) (0.323) (0.141) (0.0336) (0.173) (0.0986) (0.0366)
Year √ √ √ √ √ √ √ √ √ √ √ √ √ √ √
-7.279 -1.459 2.241** -8.688** 11.88** 4.481*** 4.177*** 5.006** 3.230*** -26.71 10.21*** 4.502*** -7.147** 5.661** 2.443***
(15.99) (2.924) (0.994) (2.151) (4.614) (1.711) (0.103) (2.029) (0.486) (14.62) (2.731) (1.008) (1.901) (2.558) (0.814)
Observations 51 362 2,975 50 360 2,954 50 362 2,978 51 353 2,968 46 331 2,729
Number of city 5 31 267 5 31 266 5 31 267 5 31 266 5 31 265
R-squared 0.431 0.425 0.430 0.866 0.275 0.119 0.955 0.829 0.673 0.975 0.983 0.946 0.377 0.601 0.286
Per Cpita Area of Paved RoadNumber of Public Vehicles per 10,000
Population
Model 4: Urban Infrastructures with Population Size (Household Registered Population), Across City Levels
Constant
Number of Primary SchoolsCollections of Public libraries per 100
persons
Number of Beds in Hospitals and Health
Centers
Population Size
GRP (log)
Per Capita GRP
(log)
GRP Growth
Rate
Public
Expenditure

26
4.4 ROBUSTNESS OF EMPIRICAL RESULTS
The provision of urban infrastructure is subject to several additional factors; therefore, a
robustness check is necessary. Various models have been tested, and they generate similar results,
indicating the robustness of the empirical results is confirmed.
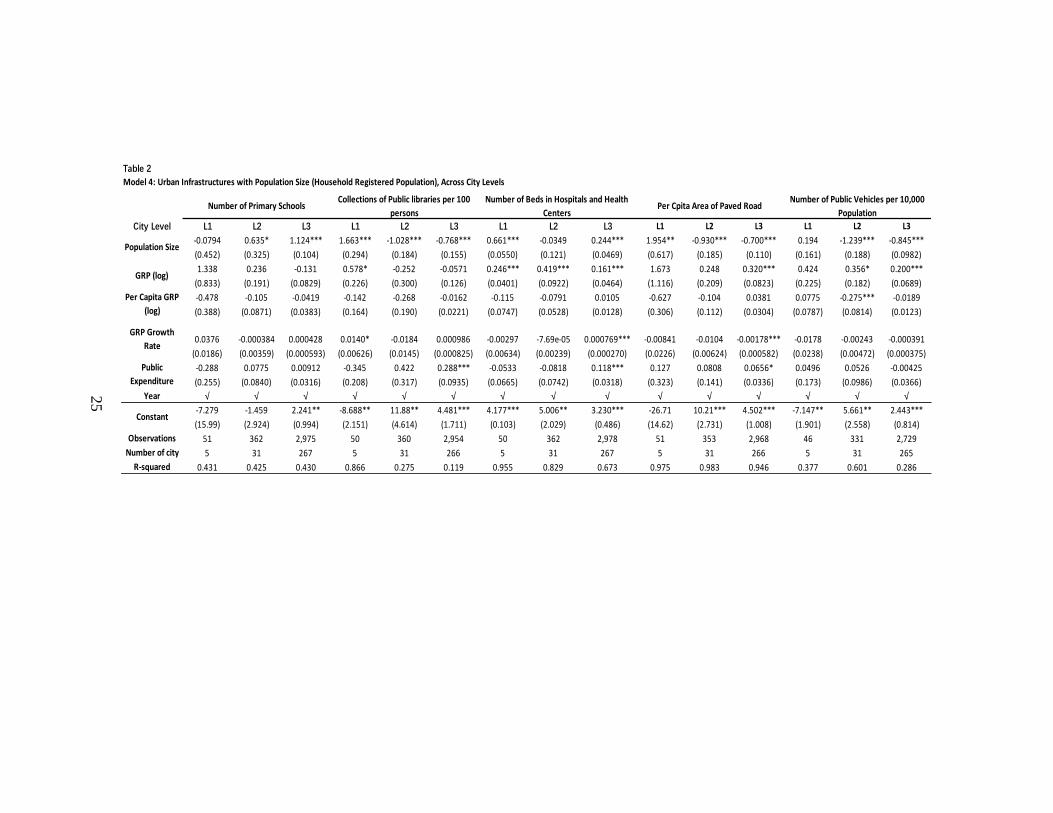
In this robustness check model, the independent variables are lagged in the consideration
that the current level of urban infrastructures is largely depend on their previous development. For
example, cities that have already got well developed paved roads are more likely to have more
paved roads in the following year.
Table 3 shows the regression results where all right-hand side variables are lagged. This
model generates similar results compared to Model 1, indicating that the baseline model is
sufficiently robust.
27
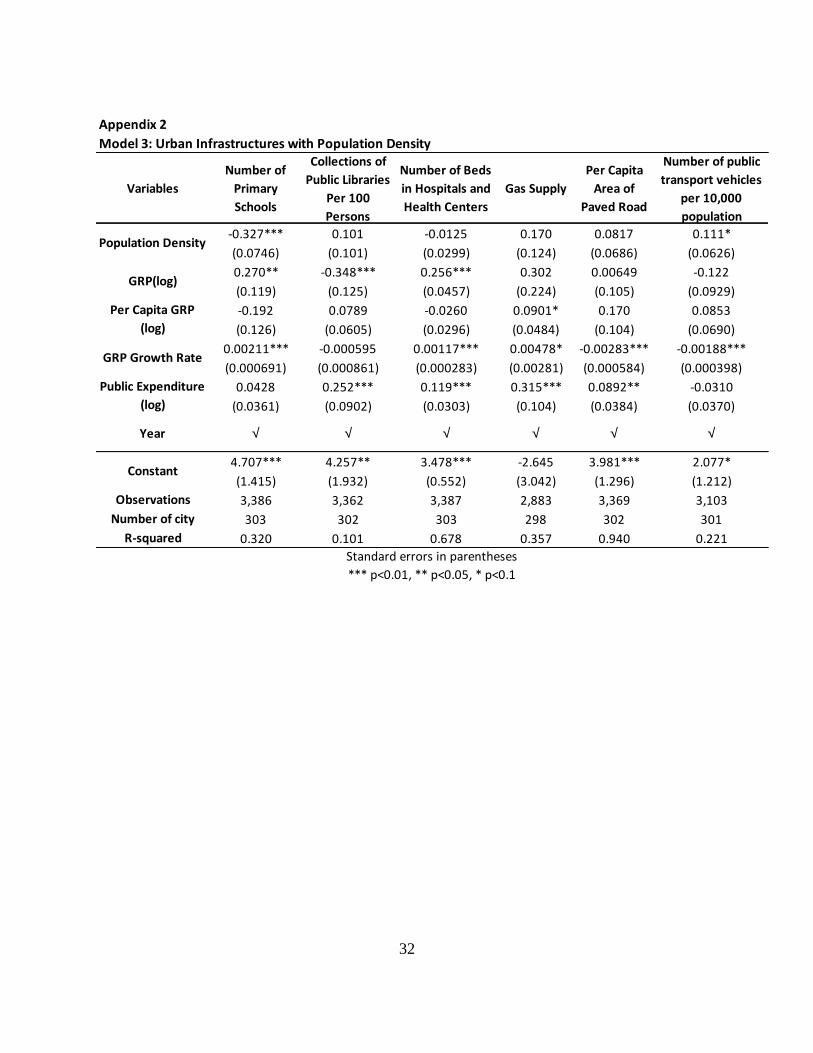
Acknowledging that the development of urban infrastructures is subject to complicated
factors, different models are estimated in this paper, and the results are presented in appendixes.
Model 3 uses population density as the major indicator of population condition, whose result is
reported in Appendix 2. The result shows that the coefficients of population density are not
significant on all urban infrastructures except for the number of primary schools, further
confirming that the development of urban infrastructures are not in line with the distribution of
urban population or the population density into consideration.
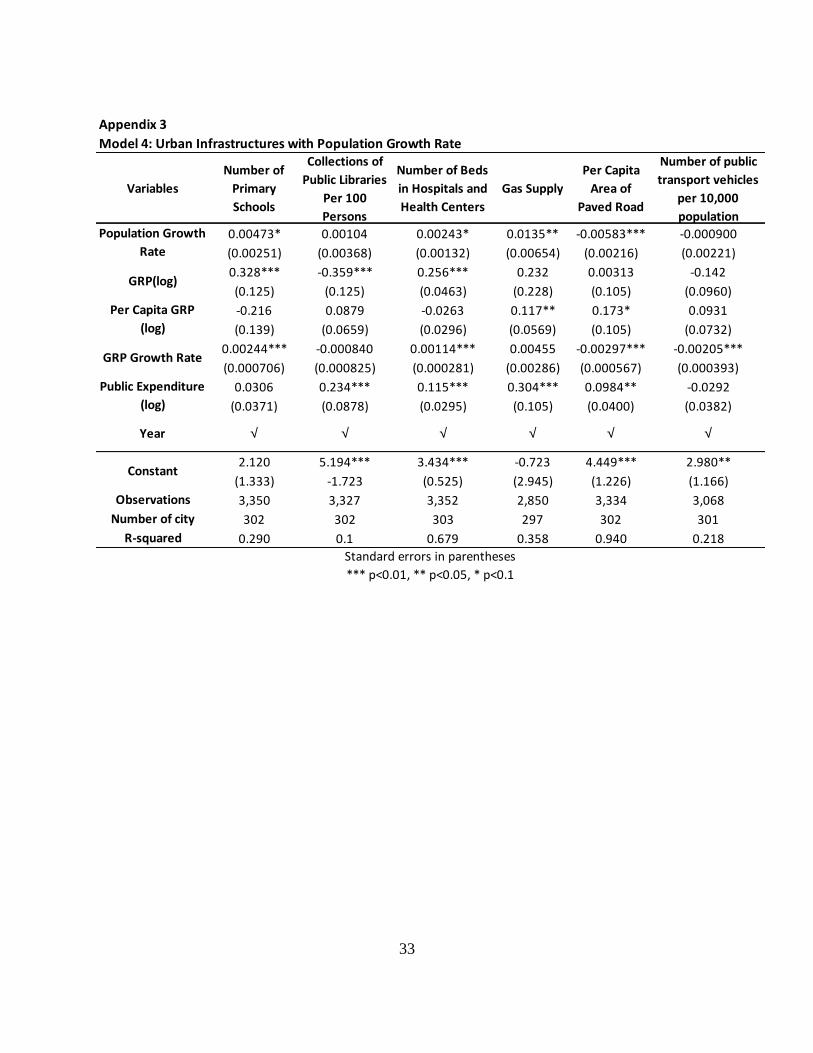
Model 4 uses the population growth rate as the major population indicator, and the result is
reported in Appendix 3. The coefficients of population growth rate are small in absolute value,
indicating that the effect of population growth is relatively small on the development of urban
infrastructures.
Table 3
VariablesNumber of
Primary Schools
Collections of
Public Libraries Per
100 Persons
Number of Beds in
Hospitals and
Health Centers
Gas SupplyPer Capita Area
of Paved Road
Number of public
transport vehicles
per 10,000
population
0.803*** -0.405*** 0.133*** -0.0817 -0.497*** -0.583***
-0.113 (0.143) (0.0500) (0.204) (0.106) (0.0953)
-0.102 -0.0934 0.157*** 0.354 0.221*** 0.189***
(0.0857) (0.135) (0.0412) (0.251) (0.0722) (0.0604)
-0.0558 0.00112 -0.0299*** 0.00836 0.0167 -0.0135
(0.0497) (0.0301) (0.00769) (0.0466) (0.0106) (0.0152)
0.000249 -0.000365 0.000824*** 0.00283 -0.00156** -0.000388
(0.000505) (0.000852) (0.000298) (0.00249) (0.000619) (0.000416)
0.0451 0.218*** 0.0698*** 0.183 0.0482 -0.00378
(0.0369) (0.0826) (0.0262) (0.114) (0.0294) (0.0379)
2.893*** 4.309** 4.881*** 0.464 0.272 1.597**
(1.080) (1.847) (0.515) (2.934) (1.010) (0.799)
Observations 3,089 3,067 3,091 2,691 3,076 3,089
Number of city 299 299 300 296 299 300
R-squared 0.290 0.090 0.647 0.345 0.388 0.236
*** p<0.01, ** p<0.05, * p<0.1
GRP Growth Rate
Public Expenditure
Year √ √ √ √ √ √
Constant
Standard errors in parentheses
Per Capita GRP (log)
Model 3: Urban Infrastructures with Population Size (Household Registered Population), Right-Hand Variabled Lagged
Population Size
GRP (log)
28
In consideration that the household registered population may not necessarily reflect the
actual population condition in China due to the large number of internal migrants, this paper also
uses permanent population in each city as the major independent variable in Model 5. The result
is reported in Appendix 4. The coefficients of permanent population are of the same direction
compared to the baseline model, but the absolute value is smaller. The result is not stable because
of the incomplete data on permanent population and the large number of missing values, therefore
it is not included in the baseline data.
5. CONCLUSION AND DISCUSSION
By analyzing the data on urban infrastructures and population conditions of Chinese cities
at prefectural level, this paper finds the disparity across different sectors of urban infrastructures.
Compared to other sectors, education and transportation related infrastructures are more in line
with the population size for they can improve the attractiveness of cities to businesses and
investments. The development of urban infrastructures does not take sufficient consideration of
population density, population growth rate, and permanent population. Furthermore, the second
level cities require more attention to develop a more balanced portfolio of urban infrastructures.
5.1 POLICY IMPLICATIONS
This study confirms the literature that local governments take effort in developing
infrastructures regarding transportation and education to increase the attractiveness of cities to
businesses or investment. Thus, my findings are in line with a property-led pro-growth
urbanization process of Chinese cities. While this model provides incentives to local governments
to improve the conditions of these infrastructures, it also incentivizes local government to
29
disproportionally focus on urban infrastructures that will attract businesses and investment.
Specialized to the relation between urban infrastructure and demographic condition, as shown in
the empirical results, infrastructures related to transportation and education are more in line with
the population growth compared to other sectors of infrastructure such as culture-related
infrastructures and infrastructures regarding to the water or energy supply to urban residents. For
governments that are willing to make the cities more livable and sustainable, it might be better to
emphasize a more diverse range of infrastructures.
Besides these findings, the results of my empirical analysis reveal that secondary level
cities deserve more attention. The development of urban infrastructures in secondary cities appears
to be less responsive to population growth in these cities. As secondary cities have less resources
to invest in infrastructures compared to first-class cities, the central government might consider
devoting more sources to the development of infrastructures in these cities. Therefore, more policy
support and funding can be expected to help secondary cities to develop a balanced and sustainable
portfolio of urban infrastructures.
5.2 POTENTIAL LIMITATIONS
In spite of the robustness check and the comparison of models, this research is not free
from limitations. First, the population condition is not differentiated. Due to the household
registered system in China, I expect that the influence of household registered population on the
provision of urban infrastructures would differ from the influence of internal migrants.
Furthermore, there are internal heterogeneity within immigrants. For example, cities specialized
in different industries may attract different subgroup of migrant populations, generating different
30
demand for infrastructures. This aspect is not addressed in this paper due to the limitation of data
on migrants. Therefore, the effect of subgroups of population requires further analysis in the future.
Second, the difference across sectors of infrastructures is difficult to capture, making it
hard to compare the development of infrastructures in different sectors. Public expenditures and
investment may be a method to address it, but this also influenced by funding channels of
infrastructures and the return rate of investment. For example, in some sectors of infrastructures
the government plays the major role financing it, while in other sectors private capitals are
common. In this case, public expenditure alone is not comparable. Public investment in urban
infrastructures by itself cannot solve the problem either, because the return rates vary drastically
across sectors. It may cost billions to construct roads or bridges, but it would be relatively easy to
increase the number of public transport vehicles. Therefore, it requires more consideration in
comparing infrastructures from different sectors.
31
APPENDIX
Appendix 1 Descriptive Statistics
Variables Mean sd. Min Max Median
Household registered population (10,000 persons) 154.9224 201.909 15.36 2129.09 102.44
Population growth rate 6.789826 5.929431 -5.44 27.75 6.085
Population density (person/sq.km) 839.9148 705.007 13.85 4329.9 686.65
GRP (billion yuan) 1482.211 3032.681 30.1706 24838.37 551.5775
Per capita GRP (yuan) 62713.62 32381.94 15356 195792 57434
GRP growth rate 7.545382 3.394526 -9.98 15.3 8.1
Public finance income (billion) 171.8717 504.6731 2.5071 5464.517 50.1378
Public finance expenditure (billion) 231.3171 589.2872 10.7839 6028.171 100.6455
expenditure for science and technology (billion) 7.529802 28.50658 0.0056 287.7956 1.1705
expenditure for education (billion) 34.86757 80.2978 1.231 855.6654 15.5967
Number of primary schools 155.2153 178.7978 1 1846 100.5
Total collections of public libraries (1,000 copies/pieces)
2067.918 6533.639 25 75055 593
Collections of public libraries per 100 persons (copy/piece)
94.87462 104.6859 3.82 924.57 65.85
Number of hospitals and health centers 80.87153 101.7052 1 967 54.5
Number of beds of hospitals and health centers 11741.46 15515.57 30 120095 7580
Water supply (10,000 tons) 16797.31 32358.51 481 304440 7205
Total gas supply (coal gas, natural gas) (10,000 cubic meters
33250.33 105492.6 1 1417557 9184
Population with access to gas (person) 945634.7 1809322 1173 1.59E+07 447700
Area of city paved roads (10,000 sq.m) 1963.779 2495.514 6 16128 1114
Per capita area of paved roads (sq.m) 13.26978 9.398856 1.24 105.02 11.7
Number of buses and trolley buses under operation 1656.136 3279.159 62 31716 631
Number of public transport vehicles per 10,000 population
12.71272 54.87183 1.04 904 7
Green covered area of completed area (hectare) 5612.122 7286.633 38 53579 3250.5
Green covered area as percentage of completed area 38.80058 7.065465 2.71 57.94 40.32
32
Appendix 2
Variables
Number of
Primary
Schools
Collections of
Public Libraries
Per 100
Persons
Number of Beds
in Hospitals and
Health Centers
Gas Supply
Per Capita
Area of
Paved Road
Number of public
transport vehicles
per 10,000
population
-0.327*** 0.101 -0.0125 0.170 0.0817 0.111*
(0.0746) (0.101) (0.0299) (0.124) (0.0686) (0.0626)
0.270** -0.348*** 0.256*** 0.302 0.00649 -0.122
(0.119) (0.125) (0.0457) (0.224) (0.105) (0.0929)
-0.192 0.0789 -0.0260 0.0901* 0.170 0.0853
(0.126) (0.0605) (0.0296) (0.0484) (0.104) (0.0690)
0.00211*** -0.000595 0.00117*** 0.00478* -0.00283*** -0.00188***
(0.000691) (0.000861) (0.000283) (0.00281) (0.000584) (0.000398)
0.0428 0.252*** 0.119*** 0.315*** 0.0892** -0.0310
(0.0361) (0.0902) (0.0303) (0.104) (0.0384) (0.0370)
4.707*** 4.257** 3.478*** -2.645 3.981*** 2.077*
(1.415) (1.932) (0.552) (3.042) (1.296) (1.212)
Observations 3,386 3,362 3,387 2,883 3,369 3,103
Number of city 303 302 303 298 302 301
R-squared 0.320 0.101 0.678 0.357 0.940 0.221
√
Constant
Standard errors in parentheses
*** p<0.01, ** p<0.05, * p<0.1
Year √ √ √ √ √
Model 3: Urban Infrastructures with Population Density
Population Density
GRP(log)
Per Capita GRP
(log)
GRP Growth Rate
Public Expenditure
(log)
33
Appendix 3
Variables
Number of
Primary
Schools
Collections of
Public Libraries
Per 100
Persons
Number of Beds
in Hospitals and
Health Centers
Gas Supply
Per Capita
Area of
Paved Road
Number of public
transport vehicles
per 10,000
population
0.00473* 0.00104 0.00243* 0.0135** -0.00583*** -0.000900
(0.00251) (0.00368) (0.00132) (0.00654) (0.00216) (0.00221)
0.328*** -0.359*** 0.256*** 0.232 0.00313 -0.142
(0.125) (0.125) (0.0463) (0.228) (0.105) (0.0960)
-0.216 0.0879 -0.0263 0.117** 0.173* 0.0931
(0.139) (0.0659) (0.0296) (0.0569) (0.105) (0.0732)
0.00244*** -0.000840 0.00114*** 0.00455 -0.00297*** -0.00205***
(0.000706) (0.000825) (0.000281) (0.00286) (0.000567) (0.000393)
0.0306 0.234*** 0.115*** 0.304*** 0.0984** -0.0292
(0.0371) (0.0878) (0.0295) (0.105) (0.0400) (0.0382)
2.120 5.194*** 3.434*** -0.723 4.449*** 2.980**
(1.333) -1.723 (0.525) (2.945) (1.226) (1.166)
Observations 3,350 3,327 3,352 2,850 3,334 3,068
Number of city 302 302 303 297 302 301
R-squared 0.290 0.1 0.679 0.358 0.940 0.218
√
Constant
Standard errors in parentheses
*** p<0.01, ** p<0.05, * p<0.1
Year √ √ √ √ √
Model 4: Urban Infrastructures with Population Growth Rate
Population Growth
Rate
GRP(log)
Per Capita GRP
(log)
GRP Growth Rate
Public Expenditure
(log)

34
Bibliography
[1] George Gao, 2015. Building Outpaces Population Growth in Many of China’s Urban Areas.
http://www.pewresearch.org/fact-tank/2015/11/19/building-outpaces-population-growth-in-many-of-chinas-urban-
areas/
[2] Shahid Yusuf, Kaoru Nabeshima. 2008. China Urbanizes: Consequences, Strategies, and Policies. Edited by
Shahid Yusuf and Tony Saich: The International Bank for Reconstruction and Development/ The World Bank.
[3] World Bank Group, 2015. East Asia’s Changing Urban Landscape.
[4] Su Ming, Zhao Quanhou. 2007. China: Fiscal Framework and Urban Infrastructure Finance. Edited by George
E. Peterson, Patricia Clarke Annez. Sage Publications India Pvt Ltd. P.74-107.
[5] Gao Guofu, 2007. Urban Infrastructure Investment and Financing in Shanghai. Edited by George E. Peterson,
Patricia Clarke Annez. Sage Publications India Pvt Ltd. P.218.
[6] Zhirong Jerry Zhao, Chengxin Cao. 2011. Funding China’s Urban Infrastructure: Revenue Structure and
Financing Approaches. Public Finance and Management. Vol11, No.3: p.284-305.
[7] Xiangzheng Deng, Jikun Huang, Scott Rozelle, Emi Uchida. 2008. Growth, Population and Industrialization, and
Urban Land Expansion of China. Journal of Urban Economics. Vol.63: p.96-115.
[8] Zhigang Li, 2017. Infrastructure and Urbanization in the People’s Republic of China. ADBI Working Paper
632. Tokyo: Asian Development Bank Institute. https://www.adb.org/publications/infrastructure-and-urbanization-
prc
[9] Yan Song, 2013. Infrastructure and Urban Development: Evidence from Chinese Cities. Infrastructure and Land
Policies. Edited by Gregory K. Ingram, Karin L. Brandt: p.21-60. Lincoln Institute of Land Policy:
http://www.lincolninst.edu/publications/conference-papers/infrastructure-urban-development
[10] Min Cheng, Yujie Lu. 2017. Investment Efficiency of Urban Infrastructure System: Empirical Measurement
and Implications for China. Habitat International. Vol.70: p.91-102.
[11] Yu Li, Ji Zheng, Fei Li, Xueting Jin, Chen Xu. 2017. Assessment of Municipal Infrastructure Development and
It’s Critical Influencing Factor in Urban China: A FA and STIRPAT Approach. PLoS ONE 12(8)
https://doi.org/10.1371/journal.pone.0181917
[12] Xuemei Bai, Jing Chen, Peijun Shi. 2012. Landscape Urbanization and Economic Growth in China: Positive
Feedbacks and Sustainability Dilemmas. Environmental Science & Technology. Vol. 46: p.132-139.
[13] Zhi Liu, 2005. Planning and Policy Coordination in China’s Infrastructure Development: A Background Paper
for the EAP Infrastructure Flagship Study.
[14] Yehua Dennis Wei, Wangming Li. 2002. Reforms, Globalization, and Urban Growth in China: The Case of
Hangzhou. Eurasian Geography and Economics. Vol.43: 6, p.459-475.
35
[15] Liu Tao, Qi Yuanjing, Cao Guangzhong, Liu Hui. 2015. Spatial Patterns, Driving Forces, and Urbanization
Effects of China’s Internal Migration: County-Level Analysis Based on the 2000 and 2010 Censuses. Journal of
Geographical Sciences. Vol.25, Issue 2: p.236-256.
[16] Haiyan Chen, Beisi Jia, S.S.Y. Lau. 2008. Sustainable Urban Form for Chinese Compact Cities: Challenges of
a Rapid Urbanized Economy. Habitat International. Vol.32: p.28-40.
[17] UNESCAP discussion paper
[18] J. Vernon Henderson. 2009. Urbanization in China: Policy Issues and Options.
[19] Bhatta B. 2010. Causes and Consequences of Urban Growth and Sprawl. In: Analysis of Urban Growth and
Sprawl from Remote Sensing Data. Advances in Geographic Information Science. Spring, Berlin, Heidelberg. p. 17-
36.
[20] Richard Hu, 2013. Drivers of China’s Urbanization and Property Development. Australasian Journal of
Regional Studies. Vol.19, No.2: p.156-180.
[21] Huang Ping, Zhan Shaohua. 2005. Internal Migration in China: Linking it to Development. In: Migration,
Development and Poverty Reduction in Asia. International Organization for Migration, p. 65-84.
[22] Erick J. Heikkila, 2007. Three Questions Regarding Urbanization in China. Journal of Planning Education and
Research. Vol 27: p.65-81.
[23] Joop F. M. Koppenjian, Bert Enserink. Public-Private Partnerships in Urban Infrastructures: Reconciling
Private Sector Participation and Sustainability. Public Administration Review. March| April 2009: p.284-296.
[24] Xinrui Wang, Eddie Chi-Man Hui, Charles Chonguill, Shenghua Jia. 2015. The New Urbanization Policy in
China: Which Way Forward? Habitat International. Vol.47: p.279-284.
[25] United Nations, 2014. World Urbanization Prospects.
[26] Vytautas Snieska and Ineta Zykiene. 2015. City Attractiveness for Investment: Characteristics and Underlying
Factors. Procedia – Social and Behavioral Sciences. 213(2015) p.48 – 54.
[27] Keith Head and John Ries. 1996. Inter-City Competition for Foreign Investment: Static and Dynamic Effects of
China’s Incentive Areas. Journal of Urban Economics. Vol.40, p.38 – 60.
Related Documents