2008 A P P L I E D A N D N A T U R A L S C I E N C E F O U N D A T I O N ANSF JANS Journal of Applied and Natural Science 9 (1): 466 - 475 (2017) Development of unique buttermilk by incorporation of Moringa Binjan K. Patel * , Sunil M. Patel and Suneeta V. Pinto Department of Dairy Engineering, SMC College of Dairy Science, Anand Agricultural University, Anand-388110 (Gujarat), INDIA *Corresponding author. E-mail: [email protected] Received: June 24, 2016; Revised received: December 28, 2016; Accepted: February 15, 2017 Abstract: The present investigation was aimed at formulating a fermented beverage with incorporation of Moringa Pod Powder (MPP) to develop therapeutic buttermilk. Dahi (prepared from standardized milk) mesophilic/ thermophilic dahi culture. Optimisation of the product formulation was done by using Response Surface Methodolo- gy (RSM) with central composite rotatable design (CCRD) with varying levels of MPP, total milk solids (TMS) in but- termilk and acidity of dahi. It was found that 5.60 % TMS, 0.90 % acidity of dahi and 1.92 % MPP gave the most acceptable product with a desirability of 0.917 which is very high. From amongst various stabilizers, it was found that a blend of 0.04 % pectin and 0.015 % carrageenan most suitable and addition of salt, sugar and spices blend @ 0.5 %, 4.0 %, 0.5% respectively were most acceptable. The proximate chemical composition of Moringa Pod Buttermilk (MPBM) was 11.77 % total solids, 1.51 % protein, 1.84 % fat and 0.89 % ash. One serving size (300 g) of MPBM could be an "excellent source of calcium" having 21 % Daily Value (DV). The product could be labelled as "a good source of Vitamin A, calcium and iron" providing 10, 18 and 11 % DV respectively. MPBM was found to have consid- erable amount of Potassium and Vitamin C and fiber (9.0, 9.0 and 6.5 % DV respectively). The shelf-life of the prod- uct was 20 days under refrigeration (7±2⁰C). The developed product is rich in fiber and iron, that is conventionally deficient in milk and hence makes the developed product complete food. Keywords: Buttermilk, Chhash, Drumstick Moringa, Moringa pod INTRODUCTION Buttermilk is traditionally known as "Chhash" (Gujarat and MP), "Mattha" (UP and Delhi), "Tak" (Maharastra), "Ghol" (Bengal). Chhash is also popular, as sour buttermilk, in several other parts of the world i.e. East Asia, Africa, Europe, etc. It has uniform thick consistency, smooth texture, mild pleas- ing flavour resulting from a blend of clean acid taste and delicate aromatic flavour and it should be free from off flavours (Rao, 2003). The colour of the cul- tured buttermilk varies from yellowish creamy white for cow milk to creamy white for buffalo milk (Chandan 2006). The milk fat and total solids in buttermilk vary between 0.5 to 1.5 % and 4.5 to 5.5 % respectively. Recently, the production of buttermilk on commercial scale has been taken up largely by some reputed dairy plants such as Amul, Nestle, Danone, Go and Mother Dairy. Most of the available products are flavoured with herbs, spices and condiments (Salem et al. 2013). Moringa is very impressive and amazing plant due to its tested, trusted and potential benefits from nutrition- al as well therapeutical points of view. The pods and leaves of drumstick are considered as one of the most nutritious foods to be found in the plant kingdom. Moringa leaves contain about 7 times the vitamin C found in orange, 4 times the calcium and 2 times the ISSN : 0974-9411 (Print), 2231-5209 (Online) All Rights Reserved © Applied and Natural Science Foundation www.jans.ansfoundation.org protein found in milk, and 43 times the vitamin A found in carrot and 3 times the potassium found in banana (Pandey, 2013). Drumstick pods are rich source of calcium, iron and fibre out of which 40 % is soluble dietary fibre. The nutrient value per 100 g raw drumstick pod is Carbohydrates: 8.53%, Proteins: 2.10 %, Total fat: 0.20 %, Cholesterol: 0 %, Dietary fibre: 3.2 %. (USDA National Nutrient Database). The pods of drumsticks are used as vegetables and have great nutritional and medicinal value. Nutritionally, drum- stick pods are of great value as sources of calcium, phosphorus and vitamin C. Edible portion of drumstick pods are rich in calcium (30 mg/100 g), phosphorus (110 mg/100 g), iron (5.3 mg/100 g) vitamin C (120 mg/100 g). Fresh pods and seeds are a good source of oleic acid. Dried Moringa seeds contain about 35 % of an oil rich in oleic acid. The oil has high oxidative stability resulting in part from its fatty acid composi- tion and from the presence of the flavones myricetin which is a powerful antioxidant (Fahey, 2005). There is a need to develop new value added dairy products to reflect consumer interest in health (e.g. utilizing vege- table source with phytochemicals) and naturalness. Moringa can be a good tool to combat not only vitamin A deficiency, but also other micronutrient deficiency at a global level. Incorporation of compact form of Moringa can be envisaged as an effective and efficient

Welcome message from author
This document is posted to help you gain knowledge. Please leave a comment to let me know what you think about it! Share it to your friends and learn new things together.
Transcript
2008
APP
LIE
D
AN
DN
ATURAL SCIENCEFO
UN
DA
TIO
NANSF
JANS Journal of Applied and Natural Science 9 (1): 466 - 475 (2017)
Development of unique buttermilk by incorporation of Moringa
Binjan K. Patel*, Sunil M. Patel and Suneeta V. Pinto
Department of Dairy Engineering, SMC College of Dairy Science, Anand Agricultural University, Anand-388110
(Gujarat), INDIA
*Corresponding author. E-mail: [email protected]
Received: June 24, 2016; Revised received: December 28, 2016; Accepted: February 15, 2017
Abstract: The present investigation was aimed at formulating a fermented beverage with incorporation of Moringa Pod Powder (MPP) to develop therapeutic buttermilk. Dahi (prepared from standardized milk) mesophilic/thermophilic dahi culture. Optimisation of the product formulation was done by using Response Surface Methodolo-gy (RSM) with central composite rotatable design (CCRD) with varying levels of MPP, total milk solids (TMS) in but-termilk and acidity of dahi. It was found that 5.60 % TMS, 0.90 % acidity of dahi and 1.92 % MPP gave the most acceptable product with a desirability of 0.917 which is very high. From amongst various stabilizers, it was found that a blend of 0.04 % pectin and 0.015 % carrageenan most suitable and addition of salt, sugar and spices blend @ 0.5 %, 4.0 %, 0.5% respectively were most acceptable. The proximate chemical composition of Moringa Pod Buttermilk (MPBM) was 11.77 % total solids, 1.51 % protein, 1.84 % fat and 0.89 % ash. One serving size (300 g) of MPBM could be an "excellent source of calcium" having 21 % Daily Value (DV). The product could be labelled as "a good source of Vitamin A, calcium and iron" providing 10, 18 and 11 % DV respectively. MPBM was found to have consid-erable amount of Potassium and Vitamin C and fiber (9.0, 9.0 and 6.5 % DV respectively). The shelf-life of the prod-
uct was 20 days under refrigeration (7±2⁰C). The developed product is rich in fiber and iron, that is conventionally deficient in milk and hence makes the developed product complete food.
Keywords: Buttermilk, Chhash, Drumstick Moringa, Moringa pod
INTRODUCTION
Buttermilk is traditionally known as "Chhash" (Gujarat
and MP), "Mattha" (UP and Delhi),
"Tak" (Maharastra), "Ghol" (Bengal). Chhash is also
popular, as sour buttermilk, in several other parts of
the world i.e. East Asia, Africa, Europe, etc. It has
uniform thick consistency, smooth texture, mild pleas-
ing flavour resulting from a blend of clean acid taste
and delicate aromatic flavour and it should be free
from off flavours (Rao, 2003). The colour of the cul-
tured buttermilk varies from yellowish creamy white
for cow milk to creamy white for buffalo milk
(Chandan 2006).
The milk fat and total solids in buttermilk vary
between 0.5 to 1.5 % and 4.5 to 5.5 % respectively.
Recently, the production of buttermilk on commercial
scale has been taken up largely by some reputed dairy
plants such as Amul, Nestle, Danone, Go and Mother
Dairy. Most of the available products are flavoured
with herbs, spices and condiments (Salem et al. 2013).
Moringa is very impressive and amazing plant due to
its tested, trusted and potential benefits from nutrition-
al as well therapeutical points of view. The pods and
leaves of drumstick are considered as one of the most
nutritious foods to be found in the plant kingdom.
Moringa leaves contain about 7 times the vitamin C
found in orange, 4 times the calcium and 2 times the
ISSN : 0974-9411 (Print), 2231-5209 (Online) All Rights Reserved © Applied and Natural Science Foundation www.jans.ansfoundation.org
protein found in milk, and 43 times the vitamin A
found in carrot and 3 times the potassium found in
banana (Pandey, 2013). Drumstick pods are rich
source of calcium, iron and fibre out of which 40 % is
soluble dietary fibre. The nutrient value per 100 g raw
drumstick pod is Carbohydrates: 8.53%, Proteins: 2.10
%, Total fat: 0.20 %, Cholesterol: 0 %, Dietary fibre:
3.2 %. (USDA National Nutrient Database). The pods
of drumsticks are used as vegetables and have great
nutritional and medicinal value. Nutritionally, drum-
stick pods are of great value as sources of calcium,
phosphorus and vitamin C. Edible portion of drumstick
pods are rich in calcium (30 mg/100 g), phosphorus
(110 mg/100 g), iron (5.3 mg/100 g) vitamin C (120
mg/100 g). Fresh pods and seeds are a good source of
oleic acid. Dried Moringa seeds contain about 35 % of
an oil rich in oleic acid. The oil has high oxidative
stability resulting in part from its fatty acid composi-
tion and from the presence of the flavones myricetin
which is a powerful antioxidant (Fahey, 2005). There
is a need to develop new value added dairy products to
reflect consumer interest in health (e.g. utilizing vege-
table source with phytochemicals) and naturalness.
Moringa can be a good tool to combat not only vitamin
A deficiency, but also other micronutrient deficiency at
a global level. Incorporation of compact form of
Moringa can be envisaged as an effective and efficient
467
tool to eradicate nutritional parity of the country,
which can be very well done by adding it to conven-
tional daily use products like buttermilk and other fer-
mented products in order to overcome its bitter taste
and hence its use as a potential nutrition booster.
Moreover, drumsticks are rich in dietary fibers and it
has been postulated that fibers can provide a multitude
of functional properties when they are incorporated in
food systems (Madukwe et al., 2013). Dehydrated
drumstick powder is an integral part of Indian cuisine
and is extensively used in many food and curry prepa-
rations since it gives a distinct palatable taste and is
rich source of glutamic acid (Ramachandran et al.,
1980).
Improving human health and wellness through food
nutrition and innovative products is one of the priori-
ties identified in the world. A range of innovative ap-
plications are known to enhance nutritional quality of
food including novel materials and nutrient delivery
mechanisms (Salem et al. 2013). Manufacturers are
finding new ways to incorporate natural and innovative
ingredients into dairy products for health benefits.
Moringa is one such plant product which not only has
an impressive range of medicinal uses with high nutri-
tional value but also could aid in alleviating micronu-
trient deficiency which is prevalent at global level. In
India, drumstick pod is known as munga, saragwa or
saragwe and is often referred to as Moringa in generic
name (Pandey, 2013). Moringa oleifera has numerous
medicinal uses, which have long been recognized in
the Ayurvedic and Unani systems of medicine
(Mughal et al.,1999). Therefore, it was envisaged that
incorporation of drumstick in buttermilk by elevating
its nutritional and functional value. Additionally, ow-
ing to the inherent virtues of drumsticks, manufacture
of a drum stick based buttermilk may exert functional
role improving the nutritional value of such products.
The objective of present study was to develop a unique
buttermilk by incorporation of drumstick that result in
elevating its nutritional and functional value by in-
creasing its iron, vitamin C, calcium, potassium and
fiber content, that is very less in conventional butter-
milk, optimizing the major parameters i.e. total solids,
acidity of dahi and Moringa powder and accessing the
shelf life of developed product.
MATERIALS AND METHODS
Standardized milk (4.6±0.2 / 8.6±0.05 %) was used as
the base material for preparation of buttermilk. The
starter culture used for preparation of dahi was ob-
tained from Christen Hansen Exact Dahi 2- Mat
no.706272 (Freeze-dried lactic culture for Direct Vat,
Denmark). This culture consists of Mesophilic/
Thermophilic culture. Moringa pod powder (MPP)
was procured from Pushpam foods, Kunjrao, Gujarat.
The composition of MPP was 2.2 % fat, 16.1 % pro-
tein, 7.6 ash, 29.5 % fibre and 1.1 % moisture. Cane
sugar (Madhur Brand, Shri Renuka Sugars Ltd., Kar-
nataka, non-sulphated, refined) of commercial grade
and Tata brand (iodized) common salt was used. Two
blend of spices consisting of mixture spices viz. Blend
A consisting of cumin, dry mango powder, ginger and
chilli powder and Blend B consisting of mint, black
pepper and chilli powder was used for flavouring in
Moringa pod buttermilk (MPBM), Low methoxy Pec-
Binjan K. Patel et al. / J. Appl. & Nat. Sci. 9 (1): 466 - 475 (2017)
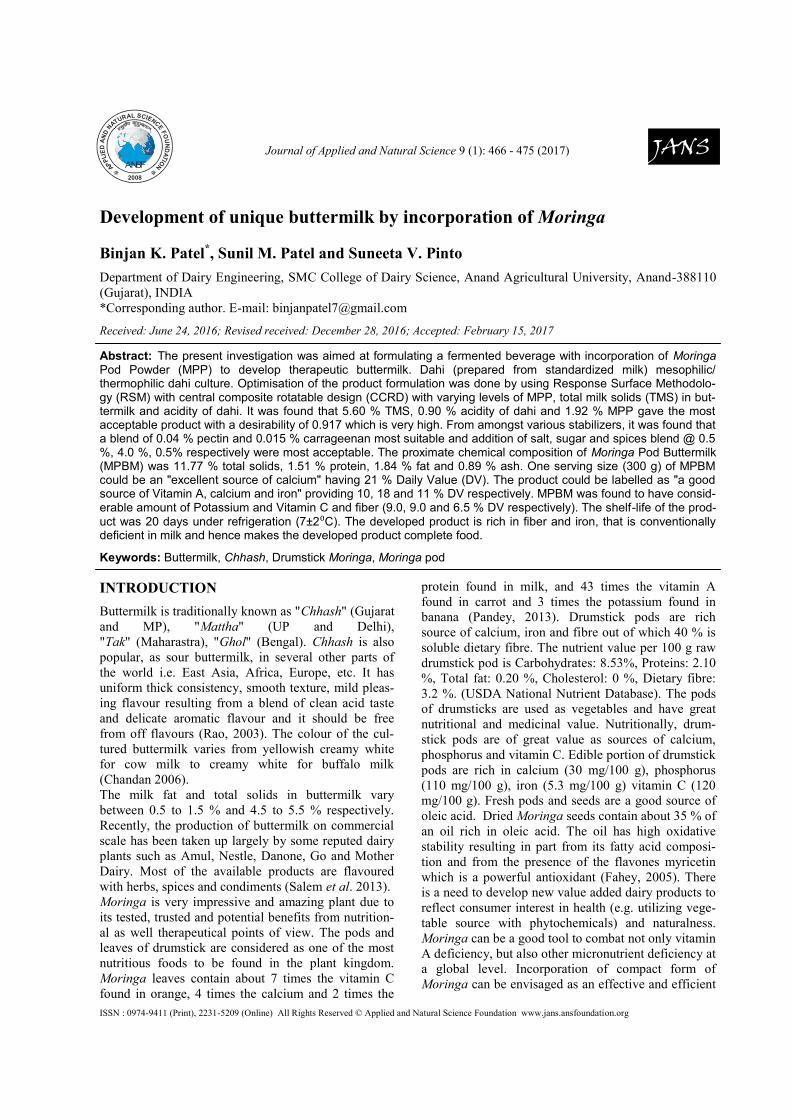
Fig. 1. Response surface of acidity (% LA) as influenced by
level of (A) Total Milk Solids (%) and (C) Moringa Pod
Powder (%).
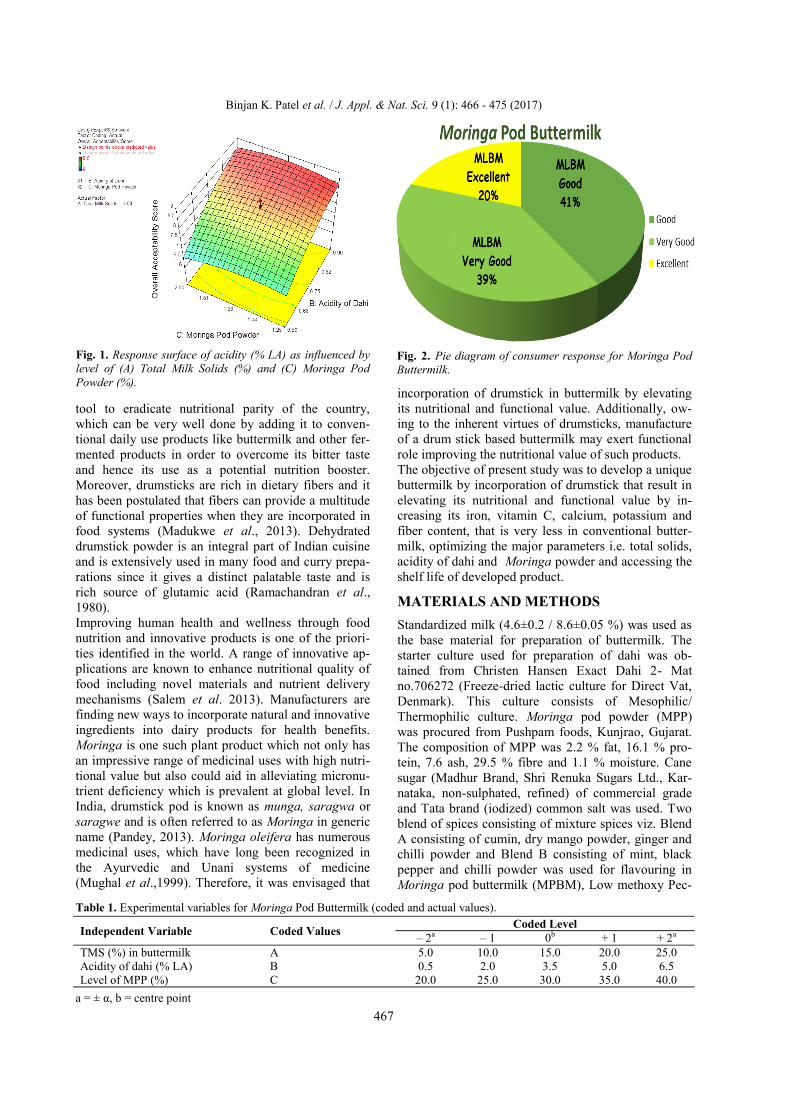
Fig. 2. Pie diagram of consumer response for Moringa Pod
Buttermilk.
Table 1. Experimental variables for Moringa Pod Buttermilk (coded and actual values).
Independent Variable Coded Values Coded Level
– 2a – 1 0b + 1 + 2a TMS (%) in buttermilk A 5.0 10.0 15.0 20.0 25.0 Acidity of dahi (% LA) B 0.5 2.0 3.5 5.0 6.5 Level of MPP (%) C 20.0 25.0 30.0 35.0 40.0
a = ± α, b = centre point
468
tin of Loba chemical, Mumbai and Iota carrageenan of
Himedia Laboratories Pvt. Ltd., Mumbai were used as
a stabilizer in buttermilk.
Preparation of Moringa pod buttermilk: The stand-
ardized milk was heated to 90 ⁰C for 5 min. The milk
was inoculated with starter culture added @ 7 g/100 kg
milk and incubated at 40±2 ⁰C till slightly less (0.05 %
LA) than desired acidity in the curd (0.7 to 1.0 % LA)
was obtained. Dahi was stirred using a blender and
immediately cooled to 7±2 ⁰C. The period spent for
stirring cooling i.e. 25 to 30 min. was enough to give
final desired acidity in the curd.
Moringa base was prepared using calculated quantity
of dry ingredients viz. stabilizer (pectin @ 0.04% and
carrageenan @ 0.015 % w/w, sugar @ 4 %, salt @ 0.5
%, MPP @ 1 to 2.0 %. All the dry ingredients mixed
and blended in potable water at 35-40 Cby stirring at
600 rpm (Yorko Micro Tissue Homogenizer, New
Delhi). The quantity of water was calculated on the
basis of required Total Milk Solids (TMS) in butter-
milk (i.e. between 4.00 to 6.00 %). Finally, the
Moringa base was blended with stirred dahi to prepare
MPBM. The product was subjected to thermization at
65 ⁰C for 5 min. and cooled immediately to 10±2 ⁰C
and filled in clean and sanitized PET bottles (250 ml)
screw capped and stored at refrigeration temperatures
(i.e. 7±2⁰C).
Physico-chemical analysis: The experimental samples
of buttermilks were analyzed for total solids (TS), pro-
tein, fat and ash as per methods advocated by Bureau
of Indian standards (BIS 1989). Soluble nitrogen con-
tent was estimated by the method outlined by
Kosikowaski (1982). Iron concentration of MPBM was
estimated by atomic absorption spectrophotometry
(Spectrophotometer – Perkin Elmer model 3110), l =
248.3 nm. The calcium content of product was meas-
ured according to the method given by BIS (SP: 18
(Part XI) 1989). Vitamin A was analyzed using the
standard procedure of AOAC (2004). Potassium con-
tent was analyzed by using the standard procedure of
AOAC (2004). Vitamin C estimation was carried out
by the procedure described as per BIS Hand Book
(1989). The crude fibre content of buttermilk was de-
termined by the method described in BIS Handbook
(1989) using 2 g sample.
Microbiological analysis: For microbiological analy-
sis (for lactobacilli, SPC, yeast and mold and coli-
forms) 11 g of sample was diluted in 99 ml phosphate
buffer according to the method described in IS: 1479
(1961). Further, serial dilutions were prepared in 9 ml
phosphate buffer. One ml each from two or three suita-
ble dilutions was poured with either acidified MRS
agar. The plates were allowed to solidify and then lay-
ered with 6-7 ml of the same agar. Number of colonies
developed were counted after incubating plates at 37 °
C for 48 h and expressed as colony forming units (cfu)
of lactobacilli/g. The methods of plating, incubation
and counting for the enumeration of Standard Plate
Count (SPC), yeasts and molds as well as coliforms
were followed as described by BIS (1989 (Part XI)).
Experimental design: The three factor Response Sur-
face Methodology (RSM) with Central Composite
Rotatable Design (CCRD) was used for designing the
experimental combinations. The experiment was de-
signed using software Design Expert version 10.0.2.
The variables used were TMS (% w/w of buttermilk),
acidity of dahi (% LA) and MPP (% w/w of butter-
milk) and level of these variables along with experi-
Binjan K. Patel et al. / J. Appl. & Nat. Sci. 9 (1): 466 - 475 (2017)
Table 2. Experimental design matrix and sensory scores of Moringa pod buttermilk.
Run
Order No.
Total Milk
Solids (%) (A)
Acidity of
Dahi (%LA) (B)
Moringa Pod
Powder (%) (C )
Flavour
Score B #Score
Acidity
Score C&A* Score
OA @Score
Acidity (% LA)
1 5.00 0.75 0.99 8.25 7.75 7.00 7.50 7.50 0.30 2 5.00 0.75 1.63 8.50 8.25 7.00 8.25 8.00 0.25 3 3.32 0.75 1.63 5.75 6.00 7.50 7.00 6.00 0.20 4 5.00 0.75 1.63 8.50 8.25 7.00 8.25 8.00 0.27 5 4.00 0.90 2.00 8.25 7.00 8.25 8.75 8.00 0.25 6 4.00 0.90 1.25 8.25 8.00 8.50 8.50 8.00 0.26 7 6.00 0.60 1.25 6.50 6.50 6.50 7.00 6.50 0.26 8 6.00 0.90 1.25 8.50 8.50 8.50 9.00 8.50 0.40 9 5.00 0.75 1.63 8.50 8.25 7.25 8.00 8.50 0.30 10 6.00 0.60 2.00 6.00 7.00 5.50 6.50 6.00 0.25 11 5.00 0.75 2.26 7.75 7.25 7.50 7.50 7.50 0.30 12 5.00 0.75 1.63 8.25 8.00 7.00 8.25 8.00 0.27 13 4.00 0.60 1.25 6.50 6.50 6.50 7.00 6.25 0.17 14 5.00 0.50 1.63 6.00 7.00 6.00 7.50 6.00 0.17 15 5.00 0.75 1.63 8.50 8.25 7.00 8.50 8.00 0.27 16 5.00 1.00 1.63 8.50 8.50 8.50 8.75 8.50 0.35 17 6.00 0.90 2.00 8.25 7.50 9.00 8.50 8.50 0.41 18 4.00 0.60 2.00 6.00 7.00 5.50 6.50 6.00 0.18 19 5.00 0.75 1.63 8.00 8.50 7.25 8.25 8.25 0.27 20 6.68 0.75 1.63 8.50 8.25 7.00 8.25 8.00 0.35
#Body(consistency); *Colour and Appearance; @Overall Acceptability, The sensory scores are based on 9 Point Hedonic Scale
469
mental plan consisting of three variables at five levels
and six replicates at center point. The variables were
standardized to simplify computation and to deduce
the relative effect of variables on response. The magni-
tude of the coefficients in second order polynomial
shows the effect of that variable on the response. The
factors (independent variables) and their levels, in
terms of coded and decoded forms are given in Table
1. The experimental plan consisted of a set of twenty
experiments.
Sensory evaluation: The Moringa buttermilk was
analyzed for sensory characteristics by a panel of ten
semi trained judges using 9-point hedonic scale. The
products were judged for flavour, body (consistency),
colour and appearance, acidity score and overall ac-
ceptability.
Statistical analysis: Statistical analysis of data was
carried out using Completely Randomized Design
(Steel and Torrie 1980) and RSM. The experiment was
designed and responses were analyzed using software
Design Expert version 10.0.2.
RESULTS AND DISCUSSION
In the present study, level of TMS ranging from 4 to 8
(%) was selected based on results of preliminary trials.
Similarly the level of acidity of dahi was selected
based on preliminary trials taken for MPBM, which
ranged from 0.60 to 0.90 (% LA) and MPP from 1.25
to 2.00 (%). In this investigation the level of TMS,
acidity of dahi and MPP were optimized using CCRD
and RSM consisting 20 experiments as shown in Table
2 were evaluated for sensory and physico-chemical
characteristics.
Effect of different levels of Moringa Pod Powder,
TMS and acidity of dahi on sensory properties and
physico-chemical attributes of Moringa Pod Butter-
milk: The flavour, body (consistency), acidity score,
color and appearance and overall acceptability score of
MPBM was observed in the range from 5.75-8.50, 6.00
Binjan K. Patel et al. / J. Appl. & Nat. Sci. 9 (1): 466 - 475 (2017)
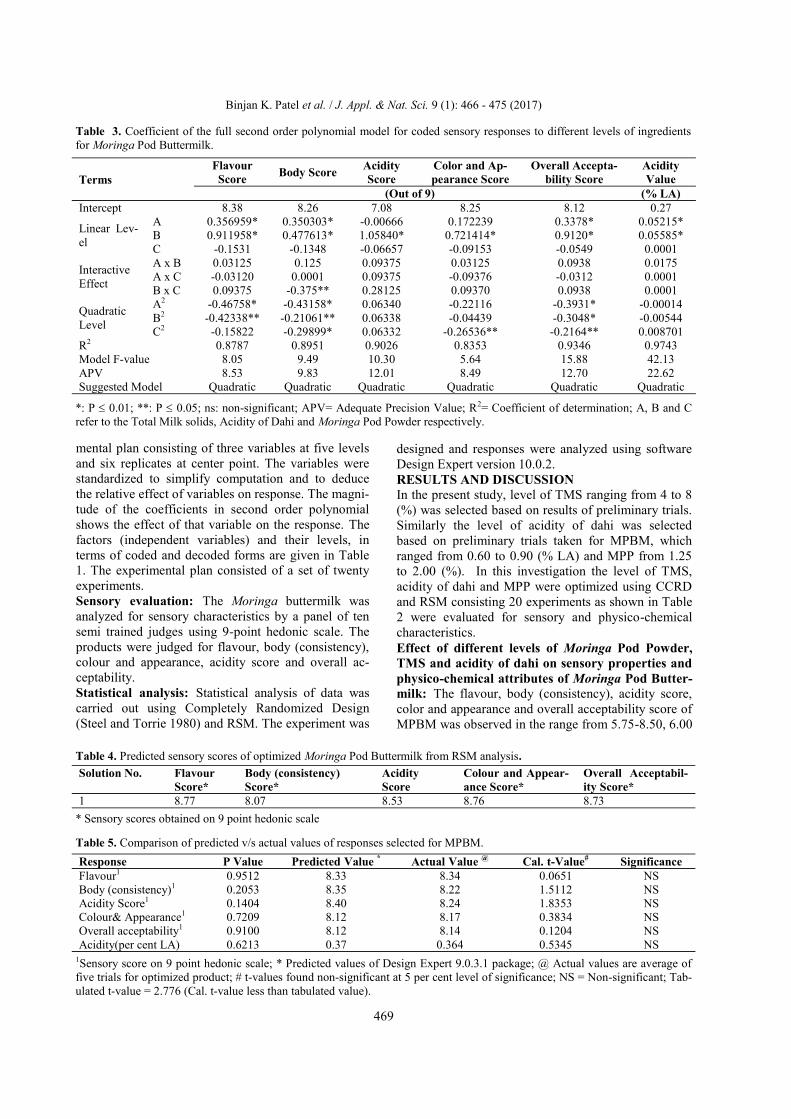
Table 3. Coefficient of the full second order polynomial model for coded sensory responses to different levels of ingredients
for Moringa Pod Buttermilk.
Terms Flavour
Score Body Score
Acidity
Score Color and Ap-
pearance Score Overall Accepta-
bility Score Acidity
Value (Out of 9) (% LA)
Intercept 8.38 8.26 7.08 8.25 8.12 0.27
Linear Lev-
el
A 0.356959* 0.350303* -0.00666 0.172239 0.3378* 0.05215* B 0.911958* 0.477613* 1.05840* 0.721414* 0.9120* 0.05585* C -0.1531 -0.1348 -0.06657 -0.09153 -0.0549 0.0001
Interactive
Effect
A x B 0.03125 0.125 0.09375 0.03125 0.0938 0.0175 A x C -0.03120 0.0001 0.09375 -0.09376 -0.0312 0.0001 B x C 0.09375 -0.375** 0.28125 0.09370 0.0938 0.0001
Quadratic
Level
A2 -0.46758* -0.43158* 0.06340 -0.22116 -0.3931* -0.00014 B2 -0.42338** -0.21061** 0.06338 -0.04439 -0.3048* -0.00544 C2 -0.15822 -0.29899* 0.06332 -0.26536** -0.2164** 0.008701
R2 0.8787 0.8951 0.9026 0.8353 0.9346 0.9743 Model F-value 8.05 9.49 10.30 5.64 15.88 42.13 APV 8.53 9.83 12.01 8.49 12.70 22.62 Suggested Model Quadratic Quadratic Quadratic Quadratic Quadratic Quadratic
*: P 0.01; **: P 0.05; ns: non-significant; APV= Adequate Precision Value; R2= Coefficient of determination; A, B and C
refer to the Total Milk solids, Acidity of Dahi and Moringa Pod Powder respectively.
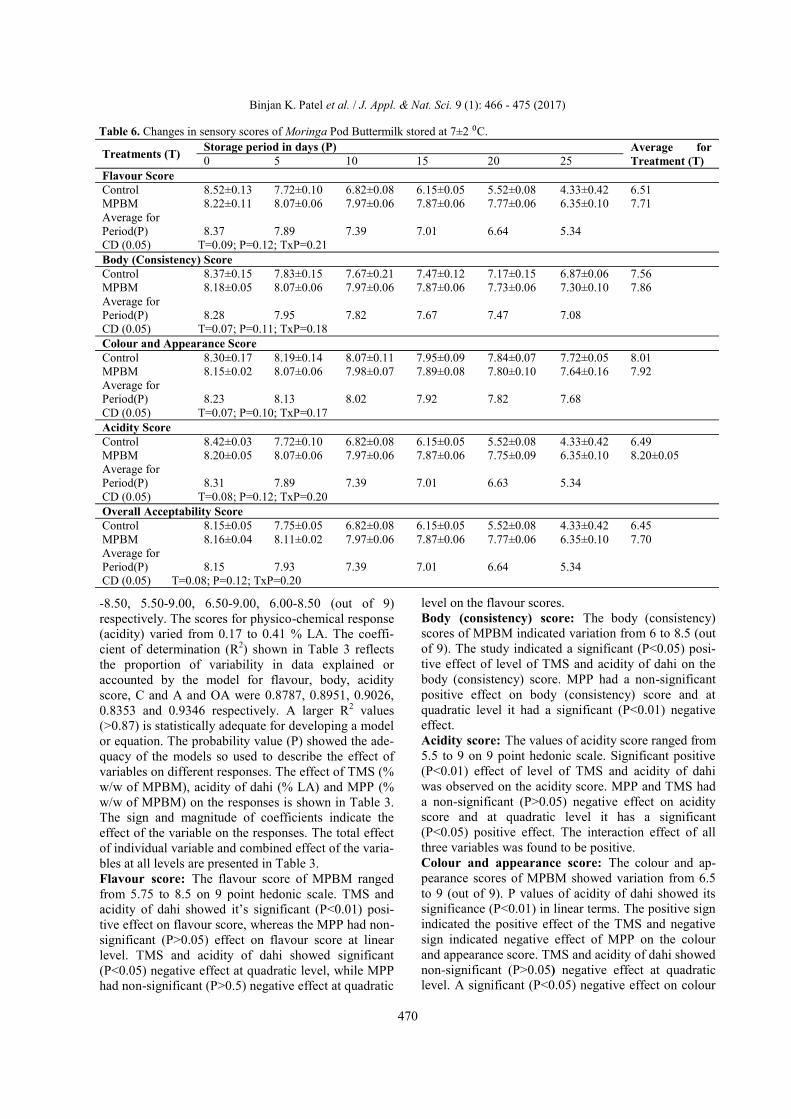
Table 4. Predicted sensory scores of optimized Moringa Pod Buttermilk from RSM analysis.
Solution No. Flavour
Score* Body (consistency) Score*
Acidity
Score Colour and Appear-
ance Score* Overall Acceptabil-
ity Score* 1 8.77 8.07 8.53 8.76 8.73
* Sensory scores obtained on 9 point hedonic scale
Table 5. Comparison of predicted v/s actual values of responses selected for MPBM.
Response P Value Predicted Value * Actual Value @ Cal. t-Value# Significance Flavour1 0.9512 8.33 8.34 0.0651 NS Body (consistency)1 0.2053 8.35 8.22 1.5112 NS Acidity Score1 0.1404 8.40 8.24 1.8353 NS Colour& Appearance1 0.7209 8.12 8.17 0.3834 NS Overall acceptability1 0.9100 8.12 8.14 0.1204 NS Acidity(per cent LA) 0.6213 0.37 0.364 0.5345 NS
1Sensory score on 9 point hedonic scale; * Predicted values of Design Expert 9.0.3.1 package; @ Actual values are average of
five trials for optimized product; # t-values found non-significant at 5 per cent level of significance; NS = Non-significant; Tab-
ulated t-value = 2.776 (Cal. t-value less than tabulated value).
470
-8.50, 5.50-9.00, 6.50-9.00, 6.00-8.50 (out of 9)
respectively. The scores for physico-chemical response
(acidity) varied from 0.17 to 0.41 % LA. The coeffi-
cient of determination (R2) shown in Table 3 reflects
the proportion of variability in data explained or
accounted by the model for flavour, body, acidity
score, C and A and OA were 0.8787, 0.8951, 0.9026,
0.8353 and 0.9346 respectively. A larger R2 values
(>0.87) is statistically adequate for developing a model
or equation. The probability value (P) showed the ade-
quacy of the models so used to describe the effect of
variables on different responses. The effect of TMS (%
w/w of MPBM), acidity of dahi (% LA) and MPP (%
w/w of MPBM) on the responses is shown in Table 3.
The sign and magnitude of coefficients indicate the
effect of the variable on the responses. The total effect
of individual variable and combined effect of the varia-
bles at all levels are presented in Table 3.
Flavour score: The flavour score of MPBM ranged
from 5.75 to 8.5 on 9 point hedonic scale. TMS and
acidity of dahi showed it‟s significant (P<0.01) posi-
tive effect on flavour score, whereas the MPP had non-
significant (P>0.05) effect on flavour score at linear
level. TMS and acidity of dahi showed significant
(P<0.05) negative effect at quadratic level, while MPP
had non-significant (P>0.5) negative effect at quadratic
level on the flavour scores.
Body (consistency) score: The body (consistency)
scores of MPBM indicated variation from 6 to 8.5 (out
of 9). The study indicated a significant (P<0.05) posi-
tive effect of level of TMS and acidity of dahi on the
body (consistency) score. MPP had a non-significant
positive effect on body (consistency) score and at
quadratic level it had a significant (P<0.01) negative
effect.
Acidity score: The values of acidity score ranged from
5.5 to 9 on 9 point hedonic scale. Significant positive
(P<0.01) effect of level of TMS and acidity of dahi
was observed on the acidity score. MPP and TMS had
a non-significant (P>0.05) negative effect on acidity
score and at quadratic level it has a significant
(P<0.05) positive effect. The interaction effect of all
three variables was found to be positive.
Colour and appearance score: The colour and ap-
pearance scores of MPBM showed variation from 6.5
to 9 (out of 9). P values of acidity of dahi showed its
significance (P<0.01) in linear terms. The positive sign
indicated the positive effect of the TMS and negative
sign indicated negative effect of MPP on the colour
and appearance score. TMS and acidity of dahi showed
non-significant (P>0.05) negative effect at quadratic
level. A significant (P<0.05) negative effect on colour
Binjan K. Patel et al. / J. Appl. & Nat. Sci. 9 (1): 466 - 475 (2017)
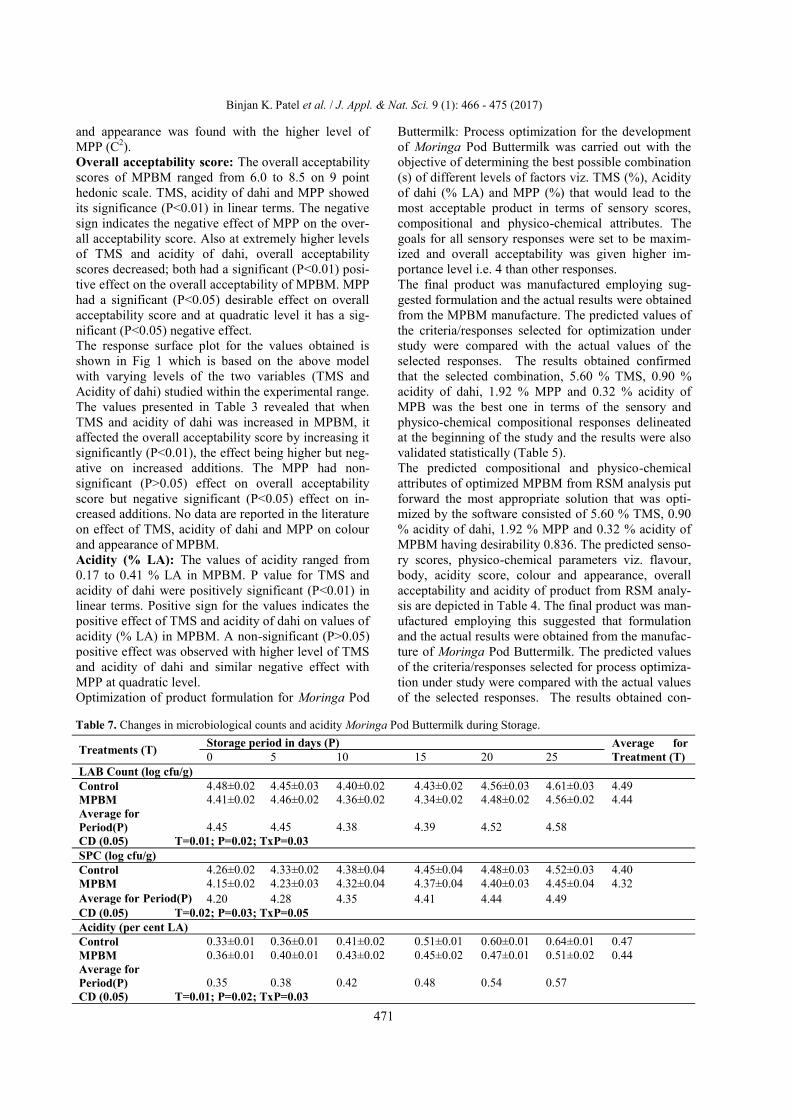
Treatments (T) Storage period in days (P) Average for
Treatment (T) 0 5 10 15 20 25 Flavour Score Control 8.52±0.13 7.72±0.10 6.82±0.08 6.15±0.05 5.52±0.08 4.33±0.42 6.51 MPBM 8.22±0.11 8.07±0.06 7.97±0.06 7.87±0.06 7.77±0.06 6.35±0.10 7.71 Average for Period(P) 8.37 7.89 7.39 7.01 6.64 5.34
CD (0.05) T=0.09; P=0.12; TxP=0.21 Body (Consistency) Score Control 8.37±0.15 7.83±0.15 7.67±0.21 7.47±0.12 7.17±0.15 6.87±0.06 7.56 MPBM 8.18±0.05 8.07±0.06 7.97±0.06 7.87±0.06 7.73±0.06 7.30±0.10 7.86 Average for Period(P) 8.28 7.95 7.82 7.67 7.47 7.08
CD (0.05) T=0.07; P=0.11; TxP=0.18 Colour and Appearance Score Control 8.30±0.17 8.19±0.14 8.07±0.11 7.95±0.09 7.84±0.07 7.72±0.05 8.01 MPBM 8.15±0.02 8.07±0.06 7.98±0.07 7.89±0.08 7.80±0.10 7.64±0.16 7.92 Average for Period(P) 8.23 8.13 8.02 7.92 7.82 7.68
CD (0.05) T=0.07; P=0.10; TxP=0.17 Acidity Score Control 8.42±0.03 7.72±0.10 6.82±0.08 6.15±0.05 5.52±0.08 4.33±0.42 6.49 MPBM 8.20±0.05 8.07±0.06 7.97±0.06 7.87±0.06 7.75±0.09 6.35±0.10 8.20±0.05 Average for Period(P) 8.31 7.89 7.39 7.01 6.63 5.34
CD (0.05) T=0.08; P=0.12; TxP=0.20 Overall Acceptability Score Control 8.15±0.05 7.75±0.05 6.82±0.08 6.15±0.05 5.52±0.08 4.33±0.42 6.45 MPBM 8.16±0.04 8.11±0.02 7.97±0.06 7.87±0.06 7.77±0.06 6.35±0.10 7.70 Average for Period(P) 8.15 7.93 7.39 7.01 6.64 5.34
CD (0.05) T=0.08; P=0.12; TxP=0.20
Table 6. Changes in sensory scores of Moringa Pod Buttermilk stored at 7±2 ⁰C.
471
and appearance was found with the higher level of
MPP (C2).
Overall acceptability score: The overall acceptability
scores of MPBM ranged from 6.0 to 8.5 on 9 point
hedonic scale. TMS, acidity of dahi and MPP showed
its significance (P<0.01) in linear terms. The negative
sign indicates the negative effect of MPP on the over-
all acceptability score. Also at extremely higher levels
of TMS and acidity of dahi, overall acceptability
scores decreased; both had a significant (P<0.01) posi-
tive effect on the overall acceptability of MPBM. MPP
had a significant (P<0.05) desirable effect on overall
acceptability score and at quadratic level it has a sig-
nificant (P<0.05) negative effect.
The response surface plot for the values obtained is
shown in Fig 1 which is based on the above model
with varying levels of the two variables (TMS and
Acidity of dahi) studied within the experimental range.
The values presented in Table 3 revealed that when
TMS and acidity of dahi was increased in MPBM, it
affected the overall acceptability score by increasing it
significantly (P<0.01), the effect being higher but neg-
ative on increased additions. The MPP had non-
significant (P>0.05) effect on overall acceptability
score but negative significant (P<0.05) effect on in-
creased additions. No data are reported in the literature
on effect of TMS, acidity of dahi and MPP on colour
and appearance of MPBM.
Acidity (% LA): The values of acidity ranged from
0.17 to 0.41 % LA in MPBM. P value for TMS and
acidity of dahi were positively significant (P<0.01) in
linear terms. Positive sign for the values indicates the
positive effect of TMS and acidity of dahi on values of
acidity (% LA) in MPBM. A non-significant (P>0.05)
positive effect was observed with higher level of TMS
and acidity of dahi and similar negative effect with
MPP at quadratic level.
Optimization of product formulation for Moringa Pod
Buttermilk: Process optimization for the development
of Moringa Pod Buttermilk was carried out with the
objective of determining the best possible combination
(s) of different levels of factors viz. TMS (%), Acidity
of dahi (% LA) and MPP (%) that would lead to the
most acceptable product in terms of sensory scores,
compositional and physico-chemical attributes. The
goals for all sensory responses were set to be maxim-
ized and overall acceptability was given higher im-
portance level i.e. 4 than other responses.
The final product was manufactured employing sug-
gested formulation and the actual results were obtained
from the MPBM manufacture. The predicted values of
the criteria/responses selected for optimization under
study were compared with the actual values of the
selected responses. The results obtained confirmed
that the selected combination, 5.60 % TMS, 0.90 %
acidity of dahi, 1.92 % MPP and 0.32 % acidity of
MPB was the best one in terms of the sensory and
physico-chemical compositional responses delineated
at the beginning of the study and the results were also
validated statistically (Table 5).
The predicted compositional and physico-chemical
attributes of optimized MPBM from RSM analysis put
forward the most appropriate solution that was opti-
mized by the software consisted of 5.60 % TMS, 0.90
% acidity of dahi, 1.92 % MPP and 0.32 % acidity of
MPBM having desirability 0.836. The predicted senso-
ry scores, physico-chemical parameters viz. flavour,
body, acidity score, colour and appearance, overall
acceptability and acidity of product from RSM analy-
sis are depicted in Table 4. The final product was man-
ufactured employing this suggested that formulation
and the actual results were obtained from the manufac-
ture of Moringa Pod Buttermilk. The predicted values
of the criteria/responses selected for process optimiza-
tion under study were compared with the actual values
of the selected responses. The results obtained con-
Binjan K. Patel et al. / J. Appl. & Nat. Sci. 9 (1): 466 - 475 (2017)
Table 7. Changes in microbiological counts and acidity Moringa Pod Buttermilk during Storage.
Treatments (T) Storage period in days (P) Average for
Treatment (T) 0 5 10 15 20 25 LAB Count (log cfu/g) Control 4.48±0.02 4.45±0.03 4.40±0.02 4.43±0.02 4.56±0.03 4.61±0.03 4.49 MPBM 4.41±0.02 4.46±0.02 4.36±0.02 4.34±0.02 4.48±0.02 4.56±0.02 4.44 Average for Period(P) 4.45 4.45 4.38 4.39 4.52 4.58
CD (0.05) T=0.01; P=0.02; TxP=0.03 SPC (log cfu/g) Control 4.26±0.02 4.33±0.02 4.38±0.04 4.45±0.04 4.48±0.03 4.52±0.03 4.40 MPBM 4.15±0.02 4.23±0.03 4.32±0.04 4.37±0.04 4.40±0.03 4.45±0.04 4.32 Average for Period(P) 4.20 4.28 4.35 4.41 4.44 4.49 CD (0.05) T=0.02; P=0.03; TxP=0.05 Acidity (per cent LA) Control 0.33±0.01 0.36±0.01 0.41±0.02 0.51±0.01 0.60±0.01 0.64±0.01 0.47 MPBM 0.36±0.01 0.40±0.01 0.43±0.02 0.45±0.02 0.47±0.01 0.51±0.02 0.44 Average for Period(P) 0.35 0.38 0.42 0.48 0.54 0.57
CD (0.05) T=0.01; P=0.02; TxP=0.03
472
firm that the selected combination is the best one in
terms of the sensory, compositional and textural re-
sponses delineated at the beginning of the study. The
results are also validated statistically by „t‟ test. The
values for „t‟ test being less than the table values, it is
inferred that there is no significant (P>0.05) difference
between the predicted and actual values of responses
are shown in Table 5.
Standardized method for manufacture of Moringa
pod buttermilk: The manufacture of MPBM by stand-
ardized method was done in two parts. In the first part,
Moringa pod base was prepared by weighing the re-
quired amount of dried ingredients viz. MPP @ 1.92
%, pectin @ 0.04 %, carrageenan @ 0.015 %, sugar @
4.0 %, salt @ 0.5 %, spice mixture @ 0.49 %. All the
dried ingredients were calculated on the basis of w/w
of buttermilk. Calculated amount of potable water (45
to 50 ⁰C) to lower down TMS of dahi from 13.0 % to
5.60 % was taken in a SS vessel. The dry ingredients
were added to the water and blended in high speed
blender for 2 min and heated to 90 ⁰C/ no hold fol-
lowed by immediate cooling to room temperature (35-
40 ⁰C). In the second part of the procedure SPM was
taken, then it was pre heated to 35-40 ⁰C, filtered,
heated to 90 ⁰C for 5 min, cooled to 40±2 ⁰C and incu-
bated with DVS lactic mesophilic/ thermophilic dahi
culture (@ 0.7g/10 kg milk) till an acidity of 0.85 %
LA) was attained. The curd was broken and cooled
immediately to 8±2 ⁰C. After cooling the curd attained
the desired final acidity of 0.90 % LA. The Moringa
pod base was added to the dahi and blended for 30-40
s in a mixer at low speed. Finally, for proper blending
product was heated to 60 ⁰C and subjected to low pres-
sure homogenization at 25 kg/cm2 followed by thermi-
zation at 65 ⁰C for 5 min and filling in pre sterilized
PET bottles and stored at 7±2 ⁰C.
Storage studies: Various physico-chemical changes
occurring in MPBM and Control were monitored at
predetermined time intervals (on every 5th day of stor-
age) till the product was rejected on sensory ground
(when the score reaches 6.0 or less on hedonic scale)
or till it became unacceptable. Control (C) was pre-
pared by addition of water at the rate of 30 % in dahi,
followed by mixing and addition of salt @ 0.5% and
roasted cumin @ 0.4% following the method of Mahe-
ta et al. 2014.
Changes in sensory scores during storage: The most
affected sensory attribute is flavour. The changes in
flavour score during storage of control and MPBM are
presented in Table 6. The initial flavour scores of the
two different type of buttermilk viz. Control and
MPBM were 8.52 and 8.22 respectively. In case of
Control, the flavour score decreased from the initial
value of 8.52±0.13 to 7.72±0.10 (on the 5th day) and
further decreased to 6.35±0.10 (on the 20th day) and on
which the judging panel rejected it. The pertinent sta-
tistical analysis revealed that type of buttermilk as well
as storage period had significant (P<0.05) effect on the
flavour scores of buttermilk. The interaction between
type of buttermilk (T) and storage period (P) was sta-
tistically significant (P<0.05) for changes in flavour
score of buttermilk over the storage period. Moreover,
the difference in flavour score of the butter milk pre-
pared with Moringa (MLBM) remained significantly
(P<0.05) higher compared to C. In case of buttermilks
containing Moringa, the flavour scores were found
acceptable even on the 25th day of storage. The sam-
ples were noticed to develop slight staleness and slight
ethereal smell on the 25th day of storage, hence the
study was discontinued. The changes in flavour score
of the buttermilk during storage revealed that the
MLBM was acceptable even on the 25th day of storage,
indicating its better stability compared to Control but-
termilk. The reason for sharp decrease in flavour score
of the Control buttermilk was attributed to lower inten-
sity of desirable flavour and higher acidity. However,
no research has been reported in the literature on the
changes in flavour scores in Moringa buttermilk dur-
ing storage for comparison.
There was significant (P<0.05) difference observed in
Binjan K. Patel et al. / J. Appl. & Nat. Sci. 9 (1): 466 - 475 (2017)
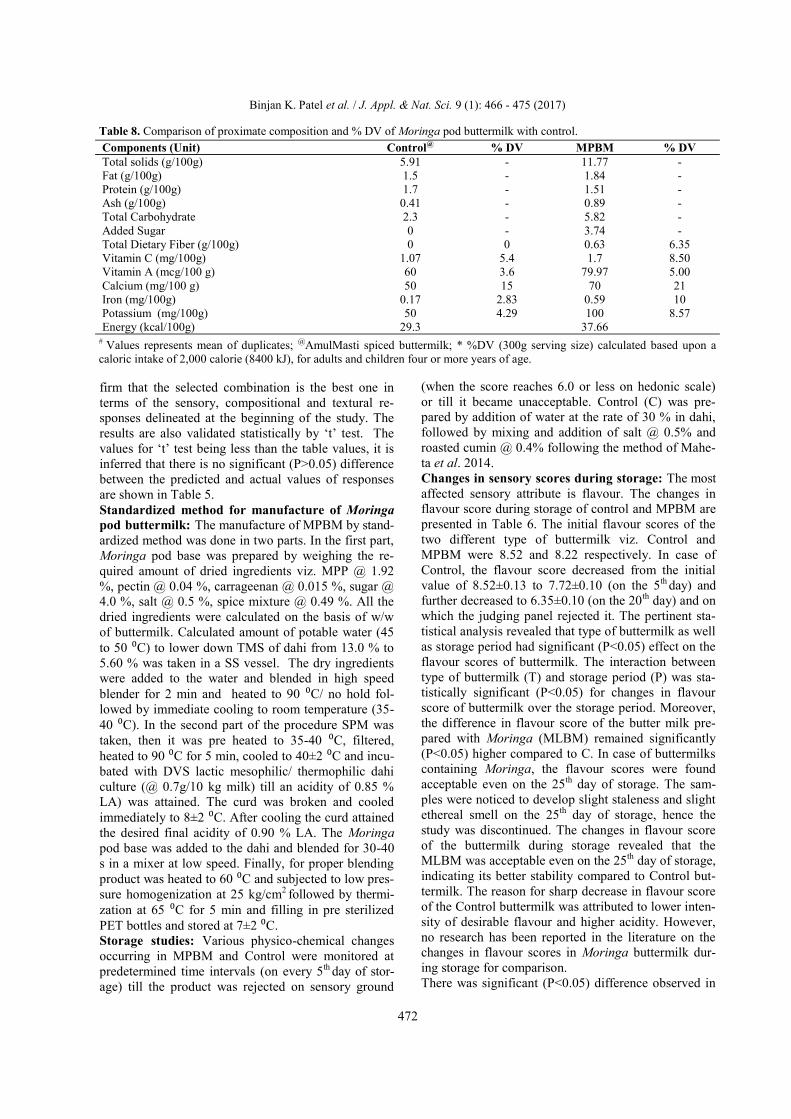
Table 8. Comparison of proximate composition and % DV of Moringa pod buttermilk with control.
Components (Unit) Control@ % DV MPBM % DV Total solids (g/100g) 5.91 - 11.77 - Fat (g/100g) 1.5 - 1.84 - Protein (g/100g) 1.7 - 1.51 - Ash (g/100g) 0.41 - 0.89 - Total Carbohydrate 2.3 - 5.82 - Added Sugar 0 - 3.74 - Total Dietary Fiber (g/100g) 0 0 0.63 6.35 Vitamin C (mg/100g) 1.07 5.4 1.7 8.50 Vitamin A (mcg/100 g) 60 3.6 79.97 5.00 Calcium (mg/100 g) 50 15 70 21 Iron (mg/100g) 0.17 2.83 0.59 10 Potassium (mg/100g) 50 4.29 100 8.57 Energy (kcal/100g) 29.3 37.66
# Values represents mean of duplicates; @AmulMasti spiced buttermilk; * %DV (300g serving size) calculated based upon a
caloric intake of 2,000 calorie (8400 kJ), for adults and children four or more years of age.
473
body scores of Control and MPBM. In Moringa butter-
milk with body and texture score was slightly lower
than Control throughout the storage period. The de-
crease in body and texture score of the buttermilks
might be attributed to physicochemical changes taking
place in the product during the storage. It is reported
that buttermilk typically has a thick, homogeneous
body. Some of the known culture-related defects will
eventually lead to body and texture defects. For exam-
ple, if the culture lacks adequate activity and if the
product is cooled at low acidity, the finished product
will not have optimum viscosity. Some contaminants
produce slime, which results in a highly viscous prod-
uct (Mistry 2001). Therefore, reduction in body score
of buttermilks may be attributed to such reasons as
discussed above. However, no research has been re-
ported in the literature on the changes in body scores
in Moringa buttermilk during storage for comparison.
Significant difference (P < 0.05) in colour and appear-
ance score in both the products was found during the
storage of 25th day. The score significantly (P<0.05)
decreased on 5th, 10th, 15th and 20th day of storage.
Thereafter, the decrease in colour and appearance
score was significant (P<0.05). The interaction effect
of the treatments with the period showed significant
(P<0.05) difference in the scores. The decrease in col-
our score may be due to the degradation of chlorophyll
during the storage. The decrease in colour and appear-
ance score of the buttermilk might be attributed to
associated physicochemical changes taking place in
product during storage. However, no research has been
reported in the literature on the changes in colour and
appearance scores in Moringa buttermilk during stor-
age for comparison.
In case of Control, the acidity score decreased from
the initial value of 8.42±0.13 to 7.72±0.10 (on the 5th
day) and further decreased to 5.52±0.08 (on the 20th
day) and on which the judging panel rejected it. The
changes in acidity score of the buttermilk during stor-
age revealed that the MPBM was acceptable even on
the 25th day of storage, indicating its better stability
compared to Control buttermilk (15th day). The reason
for sharp decrease in acidity score of the Control but-
termilk was attributed to progressive decrease in pH
and increase in acidity during storage. However, no
research has been reported in the literature on the
changes in acidity scores in Moringa buttermilk during
storage for comparison.
There was significant (P<0.05) decrease observed in
overall acceptability score during the storage. The 0 d
score decreased from 8.15 and 8.26 out of 9.00 for the
Control, MPBM, 8.16 to 7.77 respectively on the 20th
day of storage. The decrease in score was found to be
significant (P<0.05) for the products. The significant
difference in score obtained from 0 d to 10 day of stor-
age in control whereas non-significant for the Moringa
product. The interaction effect of the treatments with
the period also showed significant (P<0.05) changes.
The overall acceptability of MPBM was statistically
superior. Hence there was no such difference observed
in acceptability due to addition of type of Moringain
the fermented product. The main reason for sharp de-
crease in overall acceptability score of the buttermilks
with was attributed to deterioration of flavour. The
other reason was undesirable changes in body of the
product.
According to sensory profile, the Moringa product was
better or at par in terms of different attribute through-
out the storage period compared to control. Based on
the sensory attributes studied during storage, Moringa
buttermilk showed a slight improvement in terms of
acceptability compared to control during storage. It
can be concluded from this Section that C had a shelf
life of 15 days whereas MPBM had a shelf life of 25
days when stored in PET bottles, the improvement in
shelf life in Moringa buttermilk could be attributed to
the significant reduction in SPC count (Table 7) in
MPBM compared to control during the entire storage
period.
The increased shelf life in Moringa buttermilk could
also be attributed to the antioxidant and anti-bacterial
properties of Moringa. Nadeem et al. (2013) evaluated
the antioxidant potential of an extract of Moringa
oleifera for the stabilization of butter at refrigeration
temperature and suggested that LEMO at 600 ppm
may be used for reasonable storage stability of butter
at refrigeration temperature with acceptable sensory
characteristics. Vanajakshi et al. (2015) found that
fermented beverage containing Moringa had showed
antibacterial activity and also exhibited radical scav-
enging activity. Therefore, the results obtained in this
study are in accordance with those reported in litera-
ture as discussed above (Nadeem et al., 2013 and
Vanjakshi et al. (2015). However, no research has
been reported in the literature on the shelf life of
Moringa buttermilk during storage for comparison.
Changes intitratable acidity during storage: The
changes in titratable acidity (% LA) of control (C) and
MPBM stored at refrigerated temperature are present-
ed in Table 7. During refrigerated storage, titratable
acidity gradually increased from 0.33 to 0.64 % LA in
control whereas 0.36 to 0.51 % in MPBM. There was a
significant (P<0.05) increase in acidity during storage.
Comparing the treatment and period means, control
and Moringa buttermilk showed significant (P<0.05)
increase in titratable acidity till 25th day of storage.
However, significant (P<0.05) increase in acidity was
found up to 10th day against the fresh or 0 d. The inter-
action effect of the treatments with the period showed
statistically significant (P<0.05) changes.
The progressive increase in titratable acidity during
storage may be due to increase in number of organisms
and the use of sugar in the experimental samples. Ma-
heta et al. (2014) reported an increase in acidity in
Binjan K. Patel et al. / J. Appl. & Nat. Sci. 9 (1): 466 - 475 (2017)
474
buttermilk samples during storage at refrigeration tem-
peratures from an initial value of 0.60 % LA to 0.79 %
LA on 12th day of storage. Therefore, the results are in
line of this study that titratable acidity increase during
the refrigerated storage period. The differences in acid-
ity could be attributed to the differences in the initial
acidity of dahi as well as ingredients used in the prod-
ucts. However, no research has been reported in the
literature on the changes in acidity of Moringa butter-
milk during storage for comparison.
Changes in microbiological counts during storage:
The changes in Lactobacilli count of control (C) and
MPBM stored at refrigeration temperature are illustrat-
ed in Table 7. Lactobacilli count was significantly
higher (P<0.05) in MPBM (4.41 Log cfu/g) as com-
pared to control (4.48 log cfu/g) in the fresh product on
0 day. The viable count for control and MPBM were
4.61 and 4.56 log cfu/g at the end of refrigeration stor-
age. The LAB counts of buttermilk stored at 7±2⁰C
delineated in Table 7, indicates spasmodic changes in
count during storage of chhash. Statistically there was
significant (P<0.05) difference in LAB count through-
out the storage period. The interaction effect of the
treatments with the period also showed significant
(P<0.05) changes. However, the Lactobacilli count
4.41 log cfu/g vs 4.48 log cfu/g for control, was appre-
ciably lower in MPBM by the anti-bacterial effect of
Moringa till the end of 25 day storage.
In case of experimental samples, the count remained
almost stationary for some time (up to 10th day of stor-
age), which may be attributed to the damage caused by
the heat treatment given to experimental buttermilks.
The increase in LAB population during extended peri-
od of storage may be ascribed to repair of the damaged
cells and their subsequent growth or other lactic organ-
isms (other than culture organism) surviving the heat
shock given to buttermilk or may also be due to diaux-
ic growth phenomena (Stainier et al., 1985).
The SPC of buttermilk was significantly (P<0.05) in-
fluenced by storage period. During storage of butter-
milks at refrigerated temperature also, a significant
(P<0.05) increase in SPC was observed up to 25th day
of storage for Moringa buttermilk and 20th day for C
and thereafter, the product was found unacceptable due
to rejection by sensory panel. However, no research
has been reported in the literature on the changes in
SPC count of Moringa buttermilk during storage for
comparison.
Compositional analysis of Moringa pod buttermilk:
According to guidelines provided by FDA (2013) on
food labeling, the product label must include % daily
value (% DV), to designate both the daily reference
value (DRV) and recommended daily intake (RDI).
The DV (%) of control and MPBM (300 g serving
size) was calculated. The proximate composition of
DV % of the product for various nutrients is presented
in Table 8. In order to make a "good source of micro-
nutrient", the finished product must ideally contain 10
to 19 % of DV per serving. One serving size (300 g)
per day of MPBM could be an "excellent source of
calcium" having 21 per cent DV. MPBM had highest
levels of fibre, providing 6.35 per cent DV from
amongst both samples. Moreover, the product contains
considerable amount Vitamin C (9% DV) and protein
(8.5 %DV). Therefore, this study was successful to
formulate a composite fermented buttermilk which can
be labeled as "good source of iron, protein, potassium
and vitamin A" with considerable amount of vitamin C
and potassium.
Consumer response study: The commercial success
of any new product developed depends on the consum-
er response. Consumer response studies play a key role
in launching a newly developed product in the market.
Therefore, the MPBM manufactured using the recipe
formulated in the present study was evaluated through
a consumer survey conducted by selecting randomly
100 consumers representing different segments of the
society. For consumer acceptance trial in the present
project, the product was packed in 100 ml PET Bottles
and distributed to 100 probable consumers. The con-
sumers were asked to indicate whether they like the
product or not, and if yes, to what level i.e.
“Excellent”, “Very Good” or “Good”. None of the
consumers disliked the product.
In case of MPBM, none of the consumers disliked the
product. It can be seen from Fig. 2, out of 100 consum-
ers who judged the product 20 consumer rated it as
excellent, 39 consumers rated it as very good and 41
consumers per cent rated it as good. This indicates that
the products have a good potential for marketing. This
indicates that the product has a good potential for mar-
keting. The consumers, in general commented that
such a product if available in the market would enor-
mously benefit those who are health conscious, calorie
conscious and those suffering from lifestyle diseases.
Conclusion
A method was standardized for manufacture of butter-
milk containing Moringa pod powder as an ingredient.
Based upon the results, conclusively, the product may
be characterized as excellent source of calcium (21 %
DV) and good source of protein (8.5 %DV) and potas-
sium (8.57 %DV). Based on consumer response stud-
ies, the developed product has a good potential for
marketing. The shelf-life of the product was 20 days
when packaged in Polyethylene terephthalate (PET)
bottles and stored under refrigeration (7±2 ⁰C) com-
pared to 15 days for control buttermilk prepared with-
out Moringa pod powder.
REFERENCES
AOAC Official methods of analysis (2004). 13th edition;
Association of official analytical chemists, Washington
DC.
Binjan K. Patel et al. / J. Appl. & Nat. Sci. 9 (1): 466 - 475 (2017)
475
BIS Handbook of food analysis (1989). SP: 18 (Part XI –
Dairy Products). Bureau of Indian Standards, Manak
Bhavan, Bahadur Shah Zafar Marg, New Delhi, India.
Chandan, R. C. (2006). History and consumption trends. In
Manufacturing of yogurt and fermented milks. 1st Edn.
Blackwell Publishing Professional. Ames, Iowa Pp. 3-
17.
Fahey, J.W. (2005). Moringa oleifera: A review of the medi-
cal evidence for its nutritional, therapeutic, and prophy-
lactic properties. Trees Life J., 1:5-15
Indian Standards (1961). IS: 1479 (Part-II). Methods of test-
ing for dairy industry Part-II. Rapid examination of
milk. Indian Standards Institution, New Delhi.
Kosikowaski, F. (1982). Cheese and fermented milk prod-
ucts. Kosikowaski F. V. (Ed), Associates Publ., New
York Pp, 568
Madukwe, E.U., Ezeugwu, J.O. and Eme, P.E. (2013). Nutri-
ent composition and sensory evaluation of dry Moringa
oleifera aqueous extract. Int. J. Basic & Applied Sci., 13
(3):1303-1321
Maheta, R. G., Balakrishnan, S. and Aparnathi, K. D. (2014).
Standardization of the method for utilization of paneer
whey in cultured buttermilk. J. Food Sci. Technol., doi
10.1007/s13197-014-1301-1302
Mistry, V.V. (2001). Fermented milks and cream. In: Marth
E. H. and Steele J. L., Eds. Applied Dairy Microbiolo-
gy, Chapter 9, 2nd edition. Marcel Dekker, New York
Pp, 301-325.
Mughal, M. H., Ali, G., Srivasta, P.S. and Iqbal, M. (1999).
Improvement of drumstick (M. pterygosperma Gaertn)
– a unique source of food and medicine through tissue
culture. Harmdad Med., 42: 37-42
Nadeem, M. M., Abdullah, I., Hussain, S., Inayat, A., Javid,
A. and Zahoor, Y. (2013). Antioxidant potential
of Moringa oleifera leaf extract for the stabilisation of
butter at refrigeration temperature. Czech. J. Food Sci.,
31: 332-339
Pandey, A. K. (2013). Chapter 4 Composition and uses. In
Drumstick (Moringa oileiferaLamk) A miracle health
tree. Agrotech Publishing Academy, Udaipur Pp 60-95.
Ramachandran, C., Peter, K. V. and Gopalakrishnan, P. K.
(1980). Drumstick (Moringa oleifera): A multipurpose
Indian vegetable. Econ. Bot., 34(3):276-283
Rao, A.V. (2003). Selected technological parameters for
manufacture of chhash. M. Sc. Thesis submitted to
Anand Agricultural University, Anand.
Salem, A.S., Wafaa, M., Salama, A.M., Hassanein, Hanan,
M.A. and Ghandour, E.L. (2013). Enhancement of nu-
tritional and biological values of Labneh by adding dry
leaves of Moringa oleifera as innovative dairy products.
World Applied Sci. J., 22(11): 1594-1602
Stainier, R.Y., Adelberg, E.A. and Ingrahan, J.L. (1985). In:
General Microbiology 4th Ed. MacMillian Pub. Ltd.,
London Pp 256-258
Steel, R.G.D. and Torrie, J.H. (1980). Principles and Proce-
dures of Statistics. 2nd ed. New York: McGraw-Hill.
Vanajakshi, V., Vijayendra, S.V.N., Varadaraj, M. C., Ven-
kateswaran, G. and Agrawal, R. (2015). Optimization of
a probiotic beverage based on Moringa leaves and beet-
root. LWT - Food Sci. and Technol., 63(2): 1268-1273
Binjan K. Patel et al. / J. Appl. & Nat. Sci. 9 (1): 466 - 475 (2017)
Related Documents