Development of the Releasable Asbestos Field Sampler John R. Kominsky Environmental Quality Management, Inc., Cincinnati, OH Jonathan W. Thornburg Research Triangle Institute International, Research Triangle Park, NC Glenn M. Shaul and William M. Barrett National Risk Management Research Laboratory, U.S. Environmental Protection Agency, Cincinnati, OH Fred D. Hall Environmental Quality Management, Inc., Cincinnati, OH James J. Konz Office of Superfund Remediation and Technology Innovation, U.S. Environmental Protection Agency, Washington, DC ABSTRACT The releasable asbestos field sampler (RAFS) was devel- oped as an alternative to activity-based sampling (ABS; personal breathing zone sampling during a simulated ac- tivity). The RAFS utilizes a raking motion to provide the energy that releases particulate material from the soil and aerosolizes the asbestos fibers. A gentle airflow laterally transports the generated aerosol inside of a tunnel to one end where filter sampling cassettes or real-time instru- ments are used to measure asbestos and particulate re- lease. The RAFS was tested in a series of laboratory exper- iments to validate its performance and then was deployed for field trials in asbestos-contaminated soil at multiple geographical locations. Laboratory data showed the RAFS generated repeatable and representative aerosol particu- late concentrations. Field tests showed the RAFS aerosol- ized asbestos concentrations were statistically correlated with total particle concentrations. Field tests also showed the RAFS aerosolized asbestos concentrations were statis- tically correlated with asbestos concentrations measured by multiple ABS tests with different activities, different soil/environmental conditions, and at different geograph- ical locations. RAFS provides a direct measurement of asbestos emission from soil in situ without consideration of meteorology and personal activity on the asbestos transport to the breathing zone. INTRODUCTION Asbestos aerosolization (or releasability) is the potential for fibrous asbestos structures that are present in a mate- rial or on a solid surface to become airborne when the source is disturbed by human activities or natural forces such as wind erosion. The magnitude of asbestos released to air from disturbances of soil sources is likely to depend on several factors, including concentration of asbestos in the source material, source material matrix properties, nature of the disturbance activities, and other local envi- ronmental conditions. When the exposure pathway is asbestos released to the air from disturbance of contaminated soil during hu- man activities such as gardening or recreational activities, the primary concern is inhalation exposure. The U.S. En- vironmental Protection Agency (EPA) established the use of activity-based sampling (ABS) as the preferred approach for assessing asbestos exposure at Superfund and other sites with soil contaminated with asbestos-containing materials or naturally occurring asbestos. 1 This sampling approach recognizes that static (or fixed-station) area sampling would not adequately capture personal expo- sure. 1,2 Additionally, EPA 1 recognizes that ABS measure- ments provide a “snapshot” at a single point in time under one set of conditions. Currently available methods for determining asbestos aerosolization from soil are not suitable for field use. The qualitative 3 and quantitative 4 methods require removal and transport of the source matrix such as soil, thereby IMPLICATIONS A risk assessment for intermittent, low-level exposure to asbestos requires personal breathing concentration data. Currently, ABS is the preferred approach to measure a person’s inhalation exposure. It is an expensive, labor- intensive procedure that the U.S. Environmental Protection Agency indicates may not adequately capture personal exposure. RAFS was developed as an alternative method to reduce the time and expense necessary to obtain breath- ing zone concentration data. It provides repeatable and representative asbestos aerosolization data from soil in situ with less labor and at a lower cost than ABS. TECHNICAL PAPER ISSN:1047-3289 J. Air & Waste Manage. Assoc. 60:294 –301 DOI:10.3155/1047-3289.60.3.294 Copyright 2010 Air & Waste Management Association 294 Journal of the Air & Waste Management Association Volume 60 March 2010

Welcome message from author
This document is posted to help you gain knowledge. Please leave a comment to let me know what you think about it! Share it to your friends and learn new things together.
Transcript
Development of the Releasable Asbestos Field Sampler
John R. KominskyEnvironmental Quality Management, Inc., Cincinnati, OH
Jonathan W. ThornburgResearch Triangle Institute International, Research Triangle Park, NC
Glenn M. Shaul and William M. BarrettNational Risk Management Research Laboratory, U.S. Environmental Protection Agency,Cincinnati, OH
Fred D. HallEnvironmental Quality Management, Inc., Cincinnati, OH
James J. KonzOffice of Superfund Remediation and Technology Innovation, U.S. Environmental ProtectionAgency, Washington, DC
ABSTRACTThe releasable asbestos field sampler (RAFS) was devel-oped as an alternative to activity-based sampling (ABS;personal breathing zone sampling during a simulated ac-tivity). The RAFS utilizes a raking motion to provide theenergy that releases particulate material from the soil andaerosolizes the asbestos fibers. A gentle airflow laterallytransports the generated aerosol inside of a tunnel to oneend where filter sampling cassettes or real-time instru-ments are used to measure asbestos and particulate re-lease. The RAFS was tested in a series of laboratory exper-iments to validate its performance and then was deployedfor field trials in asbestos-contaminated soil at multiplegeographical locations. Laboratory data showed the RAFSgenerated repeatable and representative aerosol particu-late concentrations. Field tests showed the RAFS aerosol-ized asbestos concentrations were statistically correlatedwith total particle concentrations. Field tests also showedthe RAFS aerosolized asbestos concentrations were statis-tically correlated with asbestos concentrations measuredby multiple ABS tests with different activities, different
soil/environmental conditions, and at different geograph-ical locations. RAFS provides a direct measurement ofasbestos emission from soil in situ without considerationof meteorology and personal activity on the asbestostransport to the breathing zone.
INTRODUCTIONAsbestos aerosolization (or releasability) is the potentialfor fibrous asbestos structures that are present in a mate-rial or on a solid surface to become airborne when thesource is disturbed by human activities or natural forcessuch as wind erosion. The magnitude of asbestos releasedto air from disturbances of soil sources is likely to dependon several factors, including concentration of asbestos inthe source material, source material matrix properties,nature of the disturbance activities, and other local envi-ronmental conditions.
When the exposure pathway is asbestos released tothe air from disturbance of contaminated soil during hu-man activities such as gardening or recreational activities,the primary concern is inhalation exposure. The U.S. En-vironmental Protection Agency (EPA) established the useof activity-based sampling (ABS) as the preferred approachfor assessing asbestos exposure at Superfund and othersites with soil contaminated with asbestos-containingmaterials or naturally occurring asbestos.1 This samplingapproach recognizes that static (or fixed-station) areasampling would not adequately capture personal expo-sure.1,2 Additionally, EPA1 recognizes that ABS measure-ments provide a “snapshot” at a single point in timeunder one set of conditions.
Currently available methods for determining asbestosaerosolization from soil are not suitable for field use. Thequalitative3 and quantitative4 methods require removaland transport of the source matrix such as soil, thereby
IMPLICATIONSA risk assessment for intermittent, low-level exposure toasbestos requires personal breathing concentration data.Currently, ABS is the preferred approach to measure aperson’s inhalation exposure. It is an expensive, labor-intensive procedure that the U.S. Environmental ProtectionAgency indicates may not adequately capture personalexposure. RAFS was developed as an alternative methodto reduce the time and expense necessary to obtain breath-ing zone concentration data. It provides repeatable andrepresentative asbestos aerosolization data from soil in situwith less labor and at a lower cost than ABS.
TECHNICAL PAPER ISSN:1047-3289 J. Air & Waste Manage. Assoc. 60:294–301DOI:10.3155/1047-3289.60.3.294Copyright 2010 Air & Waste Management Association
294 Journal of the Air & Waste Management Association Volume 60 March 2010

potentially altering the physical characteristics of the ma-trix and subsequent aerosolization.
The releasable asbestos field sampler (RAFS) was de-signed to measure an accurate emission rate (asbestosstructures/sec) and concentration (asbestos structures/cm3 of air) from soil. The RAFS operates in situ underactual soil conditions with representative moisture con-tent and grain size. Thus, the possibility that soil condi-tions may change during handling, transport, and storageis eliminated.
As a related research project, Thornburg et al.5 devel-oped a probability-based breathing zone model that linksthe asbestos emission rate and concentration determinedby the RAFS with the asbestos concentration inhaledby an individual disturbing the asbestos-containing orasbestos-contaminated soil. The breathing zone modelaccounts for the variability in the exposure conditionsexpected in real-world situations when predicting thebreathing zone concentration distribution. The combina-tion of RAFS and the breathing zone model eventuallymay serve as an alternate for the need to perform ABS atSuperfund and other sites to predict airborne exposure(and associated health risk) to asbestos.
METHODSRAFS
The RAFS is a field instrument that provides an in situmeasurement of asbestos releasability from consistentand reproducible mechanical agitation of the source ma-terial soil (Figure 1). The RAFS consists of a variable-speedhigh-efficiency particulate air (HEPA)-filtered fan at-tached to a tunnel (6 � 6 � 24 in.) with an open bottomfor exposure to the test matrix soil. The fan discharges theair at the tunnel inlet through diffusers to evenly distrib-ute the airflow. A variable-speed motorized rake mecha-nism inside of the tunnel provides consistent and repro-ducible agitation of the top 1⁄2 in. of soil. The rake
mechanism has 10 tines that oscillate slightly as ittraverses the tunnel back and forth to agitate the soil toaerosolize the asbestos fibers. An attachment at the tunnelexit can support up to three 25-mm diameter mixed-cellulose ester (MCE) membrane filter cassettes with50-mm extension cowls for asbestos collection and anal-ysis using direct-transfer transmission electron micros-copy (TEM). This aspect of the RAFS design permits col-lection of concurrent samples for different samplingperiods with resultant varied air volumes to ensure that asample is obtained with an acceptable particulate loadingfor analysis using direct-transfer TEM. A typical samplingperiod ranges from 10 to 60 min, depending on the filterparticulate loading.
Each filter assembly is attached with flexible tubing toan electric-powered (110-V alternating current) 1/10-hpvacuum pump operating at an airflow rate of approxi-mately 13.5 L/min. Each pump is equipped with a flow-control regulator and individually calibrated rotameterthat maintains the initial flow rate of approximately 13.5L/min.
The RAFS collects anisokinetic samples in which thefreestream velocity is greater than the sample velocity.Anisokinetic sampling does not introduce a positive biasto the measured asbestos concentration because theStokes number for the aerosolized asbestos fibers is lessthan 0.01. Under these conditions, inertia effects are neg-ligible and the freestream-to-sample concentration ratio isunity.6
Laboratory Performance EvaluationThe laboratory performance evaluation included samplecharacterization tests and aerosolization tests.
Sample Collection Characterization. Sample collection char-acterization tests determined the homogeneity of aerosolgenerated by the rake mechanism within the RAFS tunnel.These tests determined the placement of the samplingcassettes to measure the maximum concentration of thegenerated aerosol. The optimum aerosol sample collec-tion location was determined by (1) measuring the airvelocity at the RAFS tunnel outlet at multiple fan speeds,and (2) measuring aerosol concentrations generated bythe RAFS at the tunnel outlet.
The air velocity and aerosol measurements weremade on a nine-point sampling grid at the tunnel outlet.Air velocities at each of the nine grid points were mea-sured at a fan speed of 340 ft/min using a calibratedDwyer series 471 digital thermal anemometer. Three mea-surements were collected at each grid point yielding atotal of 27 measurements. This arrangement was repli-cated once, yielding a total of 54 measurements. Student’st tests (� � 0.05) determined if a difference in air velocityexisted across the RAFS tunnel outlet.
Concentration uniformity was confirmed by collect-ing aerosol samples generated by the RAFS on soil. Testswere conducted with a fan speed of 340 ft/min and therake agitator operating at 100% power. Two MetOne GT-521 optical particle counters were used to measure theaerosol concentration. The MetOne measures the particlegeometric size in micrometers. The first MetOne was po-sitioned continuously at the center point (3 in., 3 in.) of
Figure 1. Schematic of RAFS with rake mechanism detail (U.S.Patent pending, 11/966,069, filed December 28, 2007).
Kominsky et al.
Volume 60 March 2010 Journal of the Air & Waste Management Association 295

the RAFS tunnel outlet. A second MetOne GT-521 opticalparticle counter collected simultaneous data at each ofthe remaining eight grid locations. Twelve replicate mea-surements were collected. Each measurement was 22 sec,corresponding to one traverse of the rake mechanism.Particle concentrations at each location were normalizedby the center point concentration to account for temporalfluctuations. Aerosol concentration data were collected intwo size fractions: less than 2.5 �m and more than 2.5�m. Aerosol data were collected for at least 60 sec (15sec/sample, 4 samples) at each of the eight locations, withthree random measurements per location. Student’s t tests(� � 0.05) on the aerosol concentrations at each locationdetermined concentration homogeneity.
Aerosolization Characterization. The aerosolization charac-terization tests assessed the aerosol particulate concentra-tion and size distribution created by the RAFS at opera-tional fan speed and rake power for various soilconditions. Aerosol concentration is the particle numberconcentration (i.e., the number of particles per unit vol-ume of air exiting the RAFS tunnel) expressed as numberper cubic centimeter. The aerosol size distribution wascharacterized as the count median diameter (CMD) andgeometric standard deviation (GSD). CMD is the diameterat which 50% of the particles are greater or less than thespecified size. GSD specifies the breadth of the size distri-bution. The aerosol size distribution and number concen-tration generated by the RAFS were measured at the tun-nel outlet using a TSI model 3321 aerodynamic particlesizer (APS). It should be noted that the aerosol concentra-tion measured by the APS is not a true representation ofthe real aerosol concentration; that is, the APS is not aparticle counter. Therefore, the APS reports a concentra-tion lower than the true concentration.7,8 However,counting efficiency correction factors applied to the APSdata allowed comparison of number concentration databetween experimental conditions.7
The three independent variables were (1) fan speed(velocity of air in the RAFS tunnel, ft/min), (2) rake power(speed at which the rake traverses the RAFS tunnel, sec/traverse), and (3) soil moisture content (%). Fan speed andrake power were adjustable via the RAFS control panel.Soil moisture content was controlled by performing allexperiments in an environmentally controlled chamberwhere the soil moisture was controlled via evaporation.The soil (generic topsoil) was loaded into a wooden framein a controlled environment (temperature and humidity)and monitored at three depths (0, 0.5, and 1 in.) and threelocations until the target moisture content (�3%) wasobtained at each of the locations. Soil moisture was mea-sured using a Dynamax ML2x soil moisture meter.
A 23 blocked factorial design with one replicate wasused to characterize RAFS performance.9 The three exper-imental variables were fan speed, rake power, and soilmoisture content. Moisture content was the blockingvariable. Analysis of the data from the first-order designdetermined the experimental conditions for the secondset of tests to complete a composite experimental design.These additional tests focused on changes in individualvariables or a combination of variables that yielded a
significant increase in the aerosolization rate or size dis-tribution. The second set of experiments focused on theinfluence of soil moisture content. Analysis of variance(ANOVA) statistics (� � 0.05) determined whether theaerosol size distribution or concentration produced by theRAFS varied between experimental conditions.
Field EvaluationThree locations were selected for the initial field evalua-tion that represented different soil characteristics (e.g.,moisture content) and type of asbestos. Two locations(Swift Creek10 and Clear Creek Management11) repre-sented naturally occurring asbestos, and the third loca-tion (Klamath Falls12) involved soil contaminated withasbestos-containing building materials (i.e., cementboard, floor tile, roofing paper, and pipe insulation). Thesoil at these three sites was contaminated with chrysotileand trace amounts of amphibole asbestos. Four additionallocations were selected for simultaneous comparison ofthe RAFS-generated asbestos concentrations and personalbreathing zone concentrations measured by multiple ABStests. Three locations (Coalinga,13 Sapphire,14 and Ver-mont15) represented naturally occurring asbestos. The soilat Coalinga and Vermont was contaminated with chryso-tile and trace amounts of amphibole asbestos, and the soilat Sapphire was contaminated with amphibole asbestos.The fourth location (Big Tex16) involved soil contami-nated with asbestos from a vermiculite exfoliation plant.
Air Sampling and Analysis. A critical parameter of the RAFSis the sample flow rate and resultant sample volume.Sample periods must be sufficiently long to collect anadequate amount of aerosol to achieve the specified ana-lytical detection limit but not overload the filter to pre-vent analysis using the direct-transfer TEM analysismethod. To ensure that at least one sample per test runwas acceptable for analysis using the direct-transfer TEM,a sample from each test run was examined on-site with aphase contrast microscope using National Institute forOccupational Safety and Heath (NIOSH) method 7400. Ifthe filter was overloaded with particulate, the sampleswere discarded, the sampling period was adjusted, and thesample collection was repeated to achieve samples withan acceptable particulate loading. The sampling durationwas 10–60 min depending primarily on moisture con-tent, as indicated by microscopic examination of onefilter at 10 min.
Three open-faced filter cassettes were concurrentlycollected during each test run. Two of the filters were0.8-�m pore size, 25-mm diameter MCE membrane witha 50-mm extension cowl; the other was a 5-�m pore size,25-mm diameter tared Teflon filter with a 50-mm exten-sion cowl.17 One MCE filter was prepared and analyzedusing the International Organization for Standardization(ISO) method 10312:1995.18 The target analytical sensi-tivity was 0.005 structure/cm3. The aspect ratio for anal-ysis was 3:1. All structures 0.5 �m or longer in length werequantified with the following breakdown according toranges by length: from 0.5 to 5 �m, between 5 and 10 �m,and larger than 10 �m. The second MCE filter was used foron-site screening by phase contrast microscopy to deter-mine whether the particulate loading was acceptable for
Kominsky et al.
296 Journal of the Air & Waste Management Association Volume 60 March 2010

direct-transfer TEM analysis or analyzed for asbestos as acolocated quality assurance sample. The tared 25-�m Te-flon filter was analyzed gravimetrically for total particu-late loading.
Soil Sampling and Analysis. At each test location, aftercollection of the RAFS air samples, a five-part compositesoil sample was collected in the vicinity of the RAFS. Onesubsample of the five-part composite sample was at thecenter of the RAFS and the other four subsamples were atthe four compass ordinal points. Each sample was col-lected using a clean scooping tool to acquire approxi-mately the top 1⁄2 in. of soil from a 6- by 6-in. area. In thefield, the composite sample was homogenized and splitinto equal portions. One portion of the homogenized soilwas analyzed for asbestos and the second portion wasanalyzed for soil characteristics such as moisture contentand grain size.
Before analysis of the soil for asbestos, the soil wasdried in the laboratory, further homogenized, andweighed. Any rocks and organic material larger than ap-proximately 3⁄8 in. were removed and the resultant soilfraction was weighed. The soil samples were prepared andanalyzed for asbestos content using polarized light mi-croscopy (PLM) and dispersion staining in accordancewith the revised EPA method 600/R-93/116 for analysis ofasbestos in bulk materials.19 The soil samples were ana-lyzed for asbestos using gravimetric reduction and subse-quent TEM analysis described in the aforementionedmethod.
Moisture content of the soil was determined in thefield using a type ML2x theta probe soil moisture sensorintegrated with a type HH2 moisture meter manufacturedby Delta-T-Devices, Ltd. The moisture content was mea-sured at the center of the RAFS and at the four compassordinal points located within 12 in. of the RAFS. Moisturecontent of the soil was also determined by laboratoryanalysis using American Society for Testing and MaterialsInternational (ASTM) method D 2216-05.20
RESULTS AND DISCUSSIONLaboratory Evaluation
Sample Collection Characterization. The sample collectioncharacterization was made to determine where to placethe aerosol sampler (i.e., 25-mm diameter sampling cas-settes). Determination of the ideal location for samplerplacement in the x, y, and z directions was necessary toensure representative aerosol samples were collected.
The first series of tests identified whether the gener-ated aerosol concentration varied as a function of height(y-direction) and lateral distance (x-direction) across thetunnel outlet. Aerosol concentrations generated with theRAFS operating at 340 ft/min and 100% rake agitatorpower were measured at nine sampling points over thetunnel outlet (Table 1). Concentrations are presented forparticles smaller than 2.5 �m and larger than 2.5 �m.Aerosol concentrations were greatest at 1.5 in. above thesurface and quickly decrease with height. The variabilityin aerosol concentration at each location was caused byvariations in aerosol generation that result from the rakeagitator movement and direction changes. The aerosol
concentration gradient as a function of height was statis-tically significant (P � 0.05) for particles larger than 2.5�m. Differences in aerosol concentrations laterally, whencontrolling for height, were not statistically significant.The tests determined that aerosol samplers should be lo-cated 1.5 in. (center line) above the surface and that threesamplers should be evenly spaced laterally at the specifiedheight.
The second series of tests identified the proper depthinside of the tunnel for sample collection. Options wereto locate the samplers between 2 in. inside of the tunneland at the face of the tunnel outlet (0 in.). It was imme-diately obvious that samplers placed at the tunnel outletwere influenced by ambient particles. Sampler placementat least 1 in. inside of the tunnel eliminated the samplingartifact caused by ambient particles. However, outdoorsampling showed that wind gusts directed at the tunneloutlet introduced ambient particles that created a positiveartifact to the measured aerosol concentration regardlessof sampler location inside of the tunnel (i.e., either 2 in.or 1 in. inside of the tunnel). Therefore, a wind shield wasused to eliminate the impact of ambient particles regard-less of wind direction (Figure 1). It was concluded thatsampler placement 2 in. inside of the tunnel (as measuredfrom the tunnel face) is necessary to maximize aerosolcollection and still avoid interferences with the rake agi-tator.
Aerosolization Characterization. The aerosol characteristicsgenerated by the RAFS are dependent on the soil condi-tions and RAFS operating conditions. The soil moisturecontent and RAFS fan speed significantly influenced the
Table 2. Statistical significance (� � 0.05) of experimental parametersthat influence aerosol size distribution and number concentration.
Soil PercentWater
FanSpeed
RakePower
CMD �0.001 �0.001 0.583GSD 0.015 0.019 0.768Number concentration �0.001 0.011 0.556
Table 1. Aerosol (�2.5 �m and �2.5 �m) concentration at RAFS outletnormalized by center point concentration to account for time variations.
Sampler Position(x,y)
Mean Aerosol Number Concentration(particles/L)
x � 1.5 in. x � 3 in. x � 4.5 in.
Aerosol �2.5 �my � 4.5 in. 1.0 1.4 0.4y � 3 in. 1.0 1.0 0.2y � 1.5 in. 3.2 2.7 3.0
Aerosol �2.5 �my � 4.5 in. 0.1 0.4 0.1y � 3 in. 0.6 1.0 0.1y � 1.5 in. 8.4 6.3 5.5
Notes: Fan speed � 340 ft/min and rake agitator mechanism operating at100% power.
Kominsky et al.
Volume 60 March 2010 Journal of the Air & Waste Management Association 297

CMD, GSD, and number concentration (Table 2). Agitatorrake power was not a statistically significant variable (P �0.05). These experiments determined that measurableparticle aerosolization above background levels by theRAFS did not occur when soil moisture content was 40%or greater (Figure 2). At these moisture contents, the soilparticles remained as agglomerates because the capillaryforce induced by the thin water layer between individualparticles exceeded the disturbance force induced by theRAFS.
A graphical representation of how the soil moisturecontent affected the generated aerosol properties is shownin Figure 3. The graphs show the best model fits whencontrolling for influence of the other independent param-eters. As described above, the aerosolized particle concen-tration increased as soil moisture content decreased be-cause the RAFS generated sufficient force to overcome thecapillary force holding the soil agglomerates together.The polynomial shape of the regression curve fitting theCMD as a function of soil moisture content is related tothe number of particles generated. The smaller CMD andGSD at low soil moisture content are directly related tothe total particle concentration available for aerosoliza-tion. Most of these particles were between 1 and 2 �m anda greater percentage was aerosolized at low soil moisturecontents, thereby causing the CMD and GSD of the aero-sol size distribution to decrease. As soil moisture content
increased, fewer of the smallest particles became aerosol-ized and the CMD and GSD increased. The decrease inCMD as the soil moisture approaches 35% is an artifact ofthe APS caused by poor counting statistics due to the lowaerosol concentration. Note that the GSD was essentiallyconstant for moisture contents greater than 20%.
A graphical presentation of fan speed influence onthe generated aerosol properties when controlling for theother independent parameters is shown in Figures 4 and5. The aerosolized particle concentration decreased as fanspeed increased because of the number of particles dis-persed in a larger air volume and because of the interac-tion between air velocity in the tunnel and the samplingparameters of the instrument. Operating the RAFS at ahigher fan speed allowed for the collection of a largersample air volume without overloading the sampling fil-ters with generic non-asbestos particles. The CMD andGSD are a function of the aerosol transport through theRAFS tunnel. The CMD of the generated aerosol increasedwith fan speed.
Field EvaluationSoil Characteristics. Table 3 presents descriptive statisticsof the asbestos analyses (PLM and TEM) of the soil ob-tained from the seven sites. The PLM results for the soilfraction from essentially all of the samples showed thequantitative presence of asbestos. The average asbestosconcentrations in the soil fractions ranged from less than
Figure 2. Relationship between soil moisture content and RAFS-generated aerosol number concentration.
Figure 3. Influence of moisture content on CMD and GSD ofaerosol generated by RAFS.
Figure 4. Relationship of fan speed and aerosol number concen-tration generated by RAFS.
Figure 5. Influence of fan speed on CMD and GSD of aerosolgenerated by RAFS.
Kominsky et al.
298 Journal of the Air & Waste Management Association Volume 60 March 2010

0.1 to 0.82% with a maximum concentration of approx-imately 1.2%. The concentration range excludes the sam-ples collected at the Vermont site, which all showed vis-ible asbestos. In these samples, naturally occurringasbestos was visible with the unaided eye; hence, theasbestos content was not quantified. Although the Na-tional Emission Standards for Hazardous Air Pollutants(NESHAP) definition of an asbestos-containing material(1%) is not directly applicable to soil, all of the concen-trations were below this concentration except for onesample collected at Swift Creek and all of the samplesfrom the Vermont Mine. The TEM asbestos concentra-tions (structures/g) are also contained in Table 3. With theincreased sensitivity of this method, asbestos was de-tected in each of the samples. Chrysotile asbestos waspresent at Swift Creek, Clear Creek Management Area,Coalinga, Big Tex, Vermont Mine, and Sapphire Mine;chrysotile (primarily) with some amosite was present atKlamath Falls.
Table 4 presents descriptive statistics of the moisturecontent of the soil as measured in the field for the sevensites. The average moisture content ranged from 2.8 to29.1% with a maximum moisture content of 43.8%. Al-though the average soil moisture content varied by afactor of approximately 10, the average soil moisture ateach of the sites was optimal for aerosol generation by theRAFS (Figure 2).
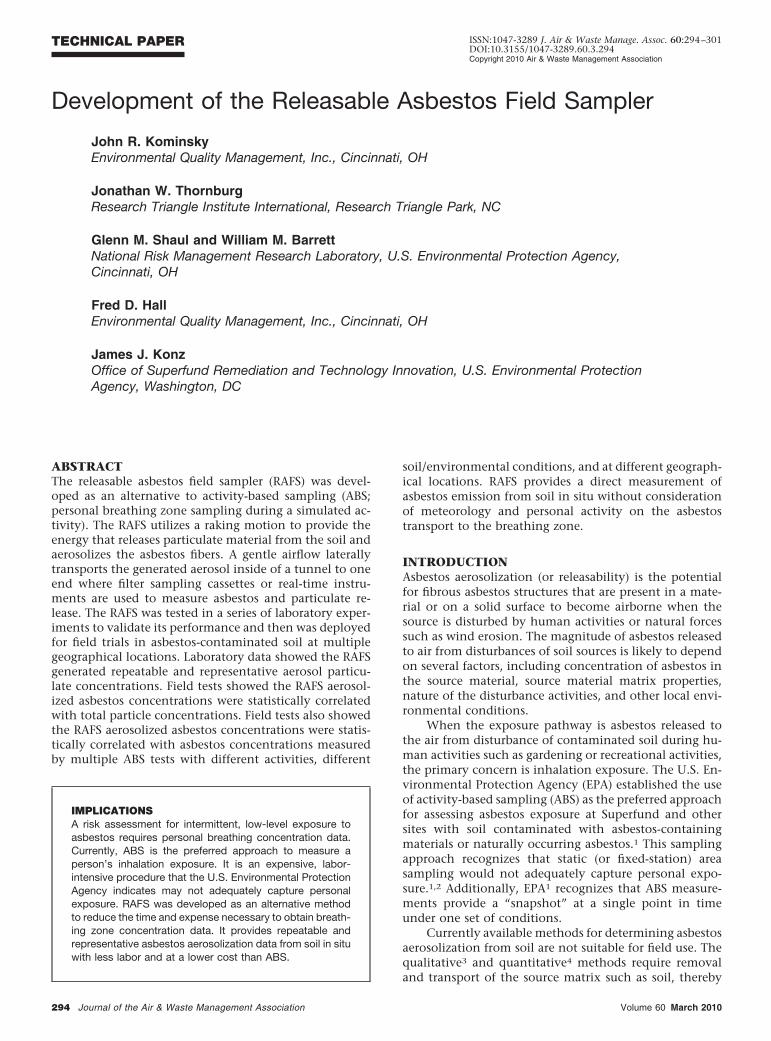
RAFS Asbestos Releasability Data. Particulate concentra-tion (Cp) and asbestos (Casb) concentration aerosolized bythe RAFS at three of the seven study locations were com-pared (Figure 6). The total asbestos concentration was
related to the 1- to 5-�m particulate concentration aero-solized by the RAFS as measured by the MetOne GT-521.Linear regression statistics for each location are statisti-cally significant. Differences in the regression slopes andintercepts are primarily a function of the different soilmoisture content and asbestos soil loading between thethree locations. The strongest correlation (0.90) wasshown for Swift Creek, which had the highest averageasbestos concentration (0.82%) in the soil and lowestaverage soil moisture content (5.1%). The highest air con-centrations of total asbestos structures were measured attwo sites with naturally occurring asbestos; this was mostlikely because of the more evenly dispersed asbestos inthe soil versus the soil contaminated with fragments ofasbestos-containing materials (e.g., pipe insulation orfloor tile).
A comparison of the RAFS-generated median asbestosconcentrations with the ABS-measured median asbestosconcentrations is shown in Figure 7. The average concen-trations generated by the RAFS are highly correlated (P �0.001) with the personal breathing zone concentrationsmeasured by multiple ABS tests with different simulatedactivities, different soil/environmental conditions, and atdifferent geographical locations. Although highly corre-lated, the RAFS concentrations can be significantly higherthan the ABS concentrations. In part, this is because of theRAFS in situ measurement of the releasability of asbestosat the source and is not affected by changing meteorolog-ical conditions such as wind speed and direction or sim-ulated activity. This may also be partly due to the largerparticles containing agglomerates of asbestos structures.
Table 3. Asbestos (PLM and TEM) in soil.a
Site
Mean Percent ofSample by
Weightb
PLM–Point Count Asbestos (%) TEM Asbestos (structures/g)
n/N b Mean Minimum Maximum n/N c Mean Minimum Maximum
Swift Creek 100 8/8 0.82 0.56 1.02 8/8 4.80 � 108 1.03 � 108 1.36 � 109
Clear Creek Management Area 96.5 4/4 0.44 0.33 0.59 4/4 6.21 � 109 1.17 � 109 1.83 � 1010
Klamath Falls 100 7/8 0.37 �0.1 0.65 8/8 2.54 � 107 1.83 � 106 8.61 � 107
Coalinga 100 10/10 0.10 �0.1 0.31 10/10 2.53 � 1010 9.28 � 108 6.74 � 1010
Big Tex 100 4/4 0.15 �0.1 0.31 4/4 2.96 � 1010 9.58 � 108 6.08 � 1010
Sapphire Mine 100 12/12 �0.1 �0.1 �0.1 12/12 5.98 � 106 2.18 � 104 3.81 � 107
Notes: aFor the Vermont Mine, visible asbestos was present in all samples; therefore, the asbestos content was not quantified. bRepresents the percentage ofthe soil sample by weight that was analyzed after rocks and organic debris larger than 3/8-in. (if present) were removed. cDenotes number of samples at or aboveanalytical sensitivity/total number of samples.
Table 4. Moisture content of soil.
Site Location of Measurement Number
% Moisture Content
Mean Minimum Maximum
Swift Creek In-Field 24 5.1 3.4 7.4Clear Creek Management Area In-Field 48 2.8 �0.5 6.6Klamath Falls In-Field 48 13.0 7.6 18.9Coalinga In-Field 46 4.9 2.9 7.2Big Tex In-Field 12 6.1 5.1 7.2Vermont Mine In-Field 59 4.3 2.6 6.9Sapphire Mine In-Field 33 29.1 17.4 43.8
Kominsky et al.
Volume 60 March 2010 Journal of the Air & Waste Management Association 299
These results demonstrate the RAFS is capable of con-sistently aerosolizing asbestos from soil containing lowconcentrations of asbestos (�1%) and at varied moistureconditions. The results also demonstrate that the RAFScan consistently generate samples with particulate load-ings that are suitable for analysis of asbestos using thedirect-transfer TEM technique, which is preferred by EPAfor performing exposure assessment at Superfund andother sites.1
CONCLUSIONSA laboratory and field performance evaluation of the RAFSwas conducted with a series of laboratory and field exper-iments. The RAFS was designed to aerosolize particlesfrom soil in situ. Current available methods for determin-ing asbestos aerosolization from soil are not suitable forfield use and require removal and transport of the sourcematrix, thereby potentially altering the physical charac-teristics of the matrix and subsequent aerosolization.
The aerosol concentration, CMD, and GSD generatedby the RAFS under laboratory conditions are stronglyinfluenced by soil moisture content, fan speed, and otherfactors. The rake agitator was not a statistically significantvariable because of the limited range of the variable speedmotor. Laminar airflow through the tunnel created a de-creasing concentration gradient with increasing heightfrom the surface. The only apparent limitation of theinstrument is its ability to generate an aerosol from soilwith moisture content greater than approximately 40%.
The RAFS successfully collected asbestos releasabilitydata under field conditions that are representative of thegeneral particulate aerosolized. The instrument per-formed well in all weather conditions—hot, dry, cold, orwet. The concentration (number of particles/cm3) of in-field soil aerosol generated by the RAFS was statisticallycorrelated with the corresponding asbestos fiber concen-tration (asbestos structures/cm3).
ACKNOWLEDGMENTSThis paper is dedicated to Glenn M. Shaul, who passedaway unexpectedly in 2008. He provided technical andadministrative guidance as well as assistance with fielddata collection. The authors wish to acknowledge LaurenDrees, EPA Office of Research and Development, for herinput and review of the project quality assurance plan;Julie Wroble, Jed Januch, Alan Goodman, and DeniseBaker, EPA Region 10, who coordinated access to the fieldsites; Jeremy Seagraves and Andrew Dart, RTI Interna-tional, for their assistance with collection of the field data;Jim Flores, Forensic Analytical Services, Inc., for conduct-ing the on-site phase contrast microscopy of the fieldsamples; and John Tisch and Fred Taphorne, Tisch Envi-ronmental, Inc., for constructing the prototype RAFS.
EPA, through its Office of Research and Develop-ment, funded and managed the research described hereunder contract no. 68-C-00-186, task order no. 0016, toEnvironmental Quality Management, Inc. This paper hasnot been subject to EPA review and therefore does notnecessarily reflect the views of the agency. No officialendorsement should be inferred.
REFERENCES1. Framework for Investigating Asbestos-Contaminated Superfund Sites; Direc-
tive No. 9200.0-68; Prepared by the Asbestos Committee of the Tech-nical Review Workgroup of the Office of Solid Waste and EmergencyResponse; U.S. Environmental Protection Agency: Washington, DC,2008.
2. Cherrie, J.W. The Effect of Room Size and General Ventilation on theRelationship between Near- and Far-Field Concentrations; Appl. Occup.Environ. Hyg. 1999, 14, 539-546.
3. Standard Operating Procedure for Sampling Airborne Asbestos Fibers in aLaboratory Enclosure—a Qualitative Procedure; U.S. Environmental Pro-tection Agency; Region 10: Seattle, WA, 2005.
4. Berman, D.W.; Kolk, A.J. Modified Vertical Elutriator Method for theDetermination of Asbestos in Soils and Bulk Materials; Draft Revision 1;Prepared for the U.S. Environmental Protection Agency, Region 8:Denver, CO, 2000.
5. Thornburg, J.; Kominsky, J.; Brown, G.G.; Frechtel, P.; Barrett, W.;Shaul, G. A Model to Predict the Breathing Zone Concentrations ofParticles Emitted from Surfaces; J. Environ. Monit. 2010; doi: 10.1039/6919385e.
6. Hinds, W.C. Aerosol Technology, 2nd ed.; John Wiley and Sons: NewYork, 1999.
7. Peters, T.M.; Leith, D. Concentration Measurement and CountingEfficiency of the Aerodynamic Particle Sizer 3321; J. Aerosol Sci. 2003,34, 627-634.
Figure 6. Relationship between particulate concentrations (1–5�m) and total asbestos concentrations measured at Swift Creek,Clear Creek Management Area, and Klamath Falls.
Figure 7. Relationship between RAFS-generated asbestos con-centrations and personal breathing zone concentrations measuredby multiple ABS tests.
Kominsky et al.
300 Journal of the Air & Waste Management Association Volume 60 March 2010

8. Thornburg, J.W.; Cooper, S.; Leith, D. Counting Efficiency of the APIAerosizer; J. Aerosol Sci. 1999, 30, 479-488.
9. Mason, R.L.; Gunst, R.F.; Hess, J.L. Statistical Design and Analysis ofExperiments; John Wiley & Sons: New York, 1989.
10. Sumas River, Swift Creek, Drainage Asbestos Fiber Source Investigation;Publication No. 77-E00.2-11-1977; Washington State Department ofEcology: Olympia, WA, 1977.
11. Suer, L. Asbestos Exposure and Human Health Risk Assessment, AsbestosAir Sampling, Conducted November 2–3, 2004, Clear Creek ManagementArea, California; Technical Memorandum; U.S. Environmental Projec-tion Agency; Region 10: Seattle, WA, 2005.
12. Wroble, J. Quality Assurance Project Plan for Activity-Based Sampling, SoilSampling, Indoor Air Sampling, and Indoor Dust Sampling; Revision 3.0;U.S. Environmental Protection Agency; Region 10: Seattle, WA, 2006.
13. Quality Assurance Project Plan (Field Sampling Plan), City of CoalingaOperable Unit 2 Asbestos Soil Sampling, Coalinga, California, Environmen-tal Response Team; U.S. Environmental Protection Agency: Las Vegas,NV, 2007.
14. Risk Evaluation for Sapphire Gem Mine Site Sapphire Valley, North Caro-lina; U.S. Environmental Protection Agency; Region 4: Atlanta, GA,2008.
15. Request for a Removal Action at the Vermont Asbestos Group Mine Site,Eden and Lowell, Orleans and Lamolie Counties; Action Memorandum;U.S. Environmental Protection Agency; Office of Remediation andRestoration: Washington, DC, 2007.
16. Quality Assurance Project Plan (Field Sampling Plan), Big Tex Grain Site,354 Blue Star Street, San Antonio, Texas; U.S. Environmental ProtectionAgency; Region 6: Dallas, TX, 2007.
17. Vallero, D.A.; Kominsky, J.R.; Beard, M.E.; Crankshaw, O.S. Efficiencyof Sampling and Analysis of Asbestos Fibers on Filter Media: Implica-tions for Exposure Assessment; J. Occup. Environ. Hyg. 2009, 6, 62-72.
18. Ambient Air Determination of Asbestos Fibres—Direct Transfer Transmis-sion Electron Microscopy; Method ISO 10312; International Organiza-tion for Standardization: Geneva, Switzerland, 1995.
19. Method for the Determination of Asbestos in Bulk Building Materials;EPA/600/R-93/116; U.S. Environmental Protection Agency: Washing-ton, DC, 1993.
20. Standard Test Method for Laboratory Determination of Water (Moisture)Content of Soil and Rock by Mass; Standard Method D 2216-5; AmericanSociety for Testing and Materials International: West Conshohocken,PA, 2005.
About the AuthorsJohn Kominsky is a project engineer at EnvironmentalQuality Management, Inc., in Cincinnati, OH. JonathanThornburg is an aerosol physicist at RTI International inResearch Triangle Park, NC. Glenn Shaul (deceased) was asenior research engineer at the National Risk ManagementResearch Laboratory of EPA in Cincinnati, OH. WilliamBarrett is a senior research engineer at the National RiskManagement Research Laboratory of EPA. Fred Hall is aproject engineer at Environmental Quality Management,Inc. Jim Konz is a senior research scientist at the Office ofSuperfund Remediation and Technology Innovation, EPA.Please address correspondence to: John R. Kominsky,Environmental Quality Management, Inc., 1800 CarillonBoulevard, Cincinnati, OH 45240; phone: �1-513-825-7500; fax: �1-513-825-7495; e-mail: [email protected].
Kominsky et al.
Volume 60 March 2010 Journal of the Air & Waste Management Association 301
Related Documents