NASA CONTRACTOR-~- REPORT DEVELOPMENT OF THE DRY TAPE BATTERY CONCEPT by Bernmd A. Grzlber, Joseph J. Byrne, Ralph Kafesjim, Kurt W. Klzcnder, Elixubeth A. McEZbiZZ, Wilson H. Power, Theodore J. WoZunski, and Louis I. Zirin Prepared under Contract No. NAS 3-4168 by Prepared under Contract No. NAS 3-4168 by MONSANTO RESEARCH CORPORATION MONSANTO RESEARCH CORPORATION Everett, Mass. Everett, Mass. for Lewis Research Center for Lewis Research Center NATIONAL AERONAUTICS AND SPACE ADMINISTRATION - WASHINGTON, D. C. - NATIONAL AERONAUTICS AND SPACE ADMINISTRATION - WASHINGTON, D. C. -

Welcome message from author
This document is posted to help you gain knowledge. Please leave a comment to let me know what you think about it! Share it to your friends and learn new things together.
Transcript

NASA CONTRACTOR-~-
REPORT
DEVELOPMENT OF THE DRY TAPE BATTERY CONCEPT
by Bernmd A. Grzlber, Joseph J. Byrne, Ralph Kafesjim,
Kurt W. Klzcnder, Elixubeth A. McEZbiZZ, Wilson H. Power,
Theodore J. WoZunski, and Louis I. Zirin
Prepared under Contract No. NAS 3-4168 by Prepared under Contract No. NAS 3-4168 by
MONSANTO RESEARCH CORPORATION MONSANTO RESEARCH CORPORATION Everett, Mass. Everett, Mass.
for Lewis Research Center for Lewis Research Center
NATIONAL AERONAUTICS AND SPACE ADMINISTRATION - WASHINGTON, D. C. - NATIONAL AERONAUTICS AND SPACE ADMINISTRATION - WASHINGTON, D. C. -

NASA CR-347
DEVELOPMENTOFTHEDRYTAPEBATTERYCONCEPT
By Bernard A. Gruber, Joseph J. Byrne, Ralph Kafesjian, Kurt W. Klunder, Elizabeth A. McElhill, Wilson H. Power,
Theodore J. Wolanski, and Louis I. Zirin
Distribution of this report is provided in the interest of information exchange. Responsibility for the contents resides in the author or organization that prepared it.
Prepared under Contract No. NAS 3-4168 by MONSANTO RESEARCH CORPORATION
Everett, Mass.
for Lewis Research Center
NATIONAL AERONAUTICS AND SPACE ADMINISTRATION
For sale by the Clearinghouse for Federal Scientific and Technical Information Springfield, Virginia 22151 - Price $6.00

. ---

FOREWORD
The research described herein was conducted at the Boston Laboratory of the Monsanto Research Corporation under contract to NASA and at the Southwest Research Institute under subcontract to Monsanto. This work was done under the technical management of William J. Nagle of the NASA Lewis Research Center.
iii

-

ABSTRACT _--____
Several new high energy couples were discharged efficiently at high voltages in a moving single-tape configuration. The constant potential and power output due to continuous supply of fresh reactants and removal of reaction products from the current collector zone were demonstrated.
Couples not suitable for conventional battery operation were discharged efficiently in the tape configuration. Magnesium was successfully discharged versus potassium periodate, organic nitro compounds (picric acid, m-dinitrobenzene) and organic N-chlorine compounds in both strong acid and neutral electro- lyte.
Macroincapsulation of electrolytes in Kel-F 81 tubing was achieved with payloads greater than 80%. Microincapsulation of both aqueous and organic electrolytes was achieved with lower payloads.
A lightweight demonstration conversion unit was designed and constructed.
V


TABLE OF CONTENTS ---- ------
SUMMARY............ . . . . . .
A. OBJECTIVES . . . . . . . . . . . .
B. STATUS . . . . . . . . . . . . . .
INTRODUCTION . . . . . . . . . . . . . . .
A. OBJECTIVES . . . . . . . . . . . .
B. DRY TAPE CONCEPT . . . . . . . . .
C. PREVIOUS WORK. . . . . . . . . . .
D. SCOPE OF THIS REPORT . . . . . . .
. .
. .
. .
. .
. .
. .
. .
. .
. .
. .
. .
. .
. .
. .
. .
. .
PHASE 1. SINGLE COMPONENT CONFIGURATION DEVELOPMENT
A. HIGH ENERGY ANODE DEVELOPMENT. . . . . . . .
1. Background . . . . . . . . . . . . . . . Method................. Results. . . . . . . . . . . . . . . . .
a. Electrode Configuration and Anode Material Selection . . . . . . .
b. Magnesium Anode Characterization . . . .
. .
. .
. .
. .
. .
. .
. .
. .
. .
. .
. .
. .
B. HIGH ENERGY CATHODE DEVELOPMENT. . .
1. Background ........... Method ............. Results. ............
a. Electrode Configuration. . .
1 Coating Technique . . . 2 Conductor Properties. .
z Binders . . . . . . . . Fibrous Fillers . . . .
b. Cathode Development. . . . .
Potassium Periodate . . Picric Acid . . . . . .
. .
. .
. .
. .
. .
. .
. .
. .
. .
. .
. .
. .
.
.
.
.
.
.
.
.
.
.
.
.
.
.
.
.
.
.
.
.
.
.
.
.
.
.
.
.
.
.
.
.
.
.
.
.
.
.
.
.
.
.
.
.
.
.
.
.
.
.
.
.
.
.
.
.
.
.
.
.
.
.
.
.
.
.
.
.
.
.
.
.
.
.
.
.
.
.
.
.
.
.
.
.
.
.
.
.
.
.
.
.
.
.
.
.
.
.
.
. . .
1
1
3
3
3
5
5
6
6
6 6 9
9 14
19
19 21 23
23
23 23 28 28
28
28 32
vii

C.
ia> c-d
(4
(d)
Effect of Picric Acid Loading on Performance. . . . . . . . . . . . Effect of Aluminum Chloride Electrolyte Concentration on Picric Acid Energy Output. . . . . Effect of the Composition of Magnesium Anode on Picric Acid Discharge . . . . . . . . . . Fibrous Carbon and Graphite as Cathode Conductors . . . . . . . .
(3) Dinitrobenzene and Other Nitro Compounds
i a> Electrolyte Screening. ......
(3 Particle Size of Depolarizer ... Catalysts. ............
(4) Trichlorotriazinetrione and Hexa- chloromelamine. ............
4. Conclusions. ..................
INCAPSULATION. ...................
1. Background ................... 2. Macroincapsulation ...............
ba: Design Considerations. ........... Incapsulating Materials. ..........
2 Capsule Fabrication. ............ Capsule Electrolyte Loss ..........
1 i i
Method. ................ 2 Test Results. .............
(a> Water Incapsulations ....... (b) Electrolyte Incapsulations and
Temperature Effects. ....... (c) Composition Analysis .......
e. Electrolyte Release Methods ........
3. Microincapsulation ...............
49
49 52 58
58
62
63
63 63
63 67 67 71
73 74
74
81 90
90
94
E: Background ................. 94 Summary of Microincapsulation Report .... 94
4. Discussion ................... 5. Conclusions. ..................
94 96
Page
32
38
44
44
viii

D. HIGH ENERGY COUPLES IN NONAQUEOUS ELECTROLYTE.
1. Background ............. 2. Experimental Method. ........
t : Type A Cell. .......... Type B Cell. ..........
3. Discharge of Lithium-Cupric Chloride 4. Discussion . . . . . . . . . . . 5. Conclusions. . . . . . . . . . .
PHASE 2. DRY TAPE DESIGN. . . . . . . . . .
A. TAPE MANUFACTURING METHODS . . . . .
1. Background . . . . . . . . . . . 2. Anodes . . . . . . . . . . . . .
;: Materials and Configuration. Block Anodes . . . . . . . .
C. Expanded and Punched Strips.
(1) Thin Sheet Material . . (2) Anode Configuration . .
3. Cathode Tapes. . . . . . . . . .
;: Background . . . . . . . . . Knife Casting. . . . . . . .
2 Power Spraying . . . . . . . Extrusion and Compression. .
4. Composite Tapes. . . . . . . . . 5. Conclusions. . . . . . . . . . .
. .
. .
. .
. .
. .
. .
. .
. .
. .
. .
. .
. .
. .
. .
. .
. .
. .
. .
B. JOINT ANODE-CATHODE ,:DYNAMIC) TESTING. .
1. Background .............
;: Equipment. ............. Dynamic Test Results ........
,": Anode. ............. Cathode. ............
urrcnt Collector . . . . . Electrolyte . . . . . . . .
C. Energy Densities . . . . . . . .
. . .
. . .
. . .
. . .
Cell. . .
.
.
.
.
.
.
.
.
.
.
.
.
.
.
.
.
.
.
.
.
.
.
.
.
.
.
.
.
.
.
.
.
.
.
.
.
.
.
.
.
.
.
.
.
.
.
.
.
.
.
.
.
.
.
.
.
.
.
.
.
.
.
.
.
.
.
.
.
.
.
.
.
.
.
.
.
.
.
.
.
.
.
.
.
.
.
.
.
.
.
.
.
.
.
.
.
.
.
.
.
.
.
.
.
.
.
.
.
.
.
.
.
.
.
.
.
.
.
.
.
.
.
.
.
.
.
. ,
.
.
.
.
.
.
.
.
.
.
.
.
.
.
.
.
.
.
.
.
.
.
.
.
.
.
.
.
.
.
.
.
.
.
.
.
.
.
.
.
.
.
.
.
.
Page -- 96
96 98
98 98
99 103 103
106
106
106 106
106 106 108
108 109
110
110 110 110 113
117 120
120
120 121 126
130 131
131 133
135
ix

PHASE 3. CONVERSION DEVICE DEVELOPMENT.
A. B.
C.
D.
BACKGROUND . TAPE DRIVE M&HAN&M : : : :
1. Tape Transport Device. .
i: Start Systems. . . . . . Speed Control. . . . . .
. Motors . . . . . . . . .
MATERIAL INVESTIGATION . . .
. .
. .
. .
. .
. .
. .
. .
. .
. .
. .
. .
. .
. .
. .
. .
1. Structural Metals and Plastics . 2. Corrosive Effect of Electrolytes 3. Protective Films . . . . .
TRANSPORT DEVICE DESIGN. . . .
1.
;:
;: 6. 7.
Chassis. . . . . . . . . . Current Collector Assembly Electrolyte Pump Assembly. Capstan Drive Assembly . . Motor. . . . . . . . . . . Electrolyte Storage Reel . Take-Up Reel . . . . . . .
REFERENCES . . . . . . . . . . . . . .
APPENDICES . . . . . . . . . . . . . .
A. EXPERIMENTAL DATA. . . . . . .
. .
. .
. .
. .
. .
. .
. .
. .
. .
. .
. .
. .
.
.
.
.
.
.
.
.
.
.
.
.
. .
. .
. .
. .
. .
. .
. .
. .
. .
. .
. .
. .
. .
. .
. .
. .
. .
. .
. .
. .
. .
. .
. .
. .
. .
. .
. . on Materials. .
.
.
.
.
.
.
.
.
.
.
. B. ENCAPSULATION OF ELECTROLYTES FOR FUEL
. .
. .
. .
. .
. .
. .
. .
. .
. .
. .
. .
. . CELLS, by
. .
. .
. .
. .
. .
. .
. .
. .
. .
. .
. .
. .
. .
. .
. .
. .
. .
. .
. .
. .
. .
. .
. .
. .
E. C. Martin and W. W. Harlowe, Southwest Research Institute. . . . . . . . . . . . . . . . . . . . .
.
.
.
.
.
.
.
.
.
.
.
.
.
.
.
.
.
.
.
.
.
.
.
137 137
137 137 138 138
138
138 143 143
143
143 148 148 148 151 151 151
153
155
155
181
x

SUMMARY
A. OBJECTIWS
The primary objective of this contract was to incorporate previously unused high energy electrochemical couples into a single tape configuration, deliver the available energy in an efficient and practical manner, and demonstrate those features of a dry tape battery system that distinguish it from conventional battery configurations.
B. STATUS
1. A magnesium-potassium periodate cell (Mg/2M A1C13, 1M HC1/KI04) was discharged at high rate (65-75s at 450 ma/in.2) and cell voltage (1.95 to 2.00-v) in a moving tape configuration. The moving tape consisted of anode, cathode and separator with electrolyte being fed from a continuous segmented tube to a point just ahead of the cathode current collectors. Power densities of 1 watt/in.2 of collector area were attained at slightly lower efficiencies.
2. Magnesium was successfully used as an anode material in strong acid electrolyte (e.g., 2M A1C13, 1M HCl). Anode corrosion was relatively light and gassing did not interfere with cell operation. Organic nitro compounds (picric acid, dinitrobenzene), which had not been previously discharged successfully at high current densities, were discharged (50-60$, 1.0-1.2 v vs. Mg) at current densities of 500 ma/in, using a combination of acid electrolyte and thin tape configuration.
3. The constant potential and power output due to continuous supply of fresh reactants and removal of reaction products from the current collector zone were demonstrated.
4. Of the couples investigated, potassium periodate was the most suitable depolarizer found for tape configuration studies. Energy densities, determined experimentally from dynamic tests, for the potassium periodate-magnesium couple in acid electrolyte were 50-75 watt-hours per pound of complete tape and. electrolyte weight. Single cell tests gave energy densities of 80-90 watt-hr/lb. Using the technology acquired here, the incorporation of more energetic couples has begun. Organic N-halogen compounds (trichlorotriazinetrione and hexachloro- melamine), which have energy capacities substantially higher than the periodate system, have been successfully discharged vs magnesium in aqueous electrolyte in a tape
1

configuration. In addition, work on a lithium tape anode has begun.
5. Methods for delivering dry tape energy in a weight optimized device were developed. A continuous manufacturing process for cathode tape preparation involving metering cathode mix onto nylon separator tape and compressing between steel rolls has been developed. Cathode tapes made with this equipment have suitable physical uniformity and adherence for use in the tape device. Rolled and perforated magnesium ribbon and macroincapsulated electrolyte were combined with the potassium periodate cathode tape and separator to make the complete dry tape battery.
6. A permanent magnet 4-vdc gear motor was selected for driving the 12- to 16-watt demonstration unit. The unit will drive four tapes connected in series to provide 8 v at a current of 1.5 to 2 amp using the magnesium- potassium periodate system. The device will provide speed variation from 0.1 to 0.25 in./min and will weigh about 2.4 lb with capacity for approximately 75 feet of tape. The power requirement for parasitic drive is approximately 0.3 watt or 2 to 3% of the power output.
7. Macroincapsulation of electrolytes in Kel-F 81 tubing was achieved with payloads greater than 80%. Measured loss rates were about 1% per year at ambient conditions. Permeability coefficients (2.4 x 10m4 g-mm/24 hr-m2-cm Hg) agree reasonably well with literature values. An activation energy of about 12 kcal/mole was found for the permeation process. This value allows estimation of loss rates over a temperature range.
8. Microincapeulation studies, subcontracted to the Southwest Research Institute, have shown that aqueous solutions can be contained in capsules about 1000 microns in diameter, but the loss rate of water is high (0.3 to h.O$/day), and initial payloads range from 40 to 75%. Two nonaqueous electrolyte solvents have also been incapsulated.

INTRODUCTION
A. OBJECTIVES
The particular objectives of this program were to develop (1) methods of utilizing high energy anodes and cathodes on tapes and to com- bine these couples onto a single tape, (2) methods of electrolyte incapsulation and tape activation, (3) a weight-optimized tape energy conversion device capable of unattended operation by start-stop parasitic power, and (4) methods of supplying multiple cell voltages from the dry tape system.
B. DRY TAPE CONCEPT
A "dry tape" battery uses a thin separator tape with dry anode and cathode coatings of the active components of a battery system and incapsulated electrolyte. This tape can be fed continuously or intermittently to a set of current collectors after releasing the electrolyte to wet the separator and electrodes. Electrolyte is released by crushing microcapsules between rolls or by slitting macrocapsules just prior to discharging a section of the tape.
In addition to having extended shelf life, a dry tape device can be designed to minimize some of the common limitations of conventional batteries such as reactant depletion and reaction product build-up during discharge as well as separator deterior- ation. Because of the continuous supply of fresh reactants and the removal of reaction products from the current collector area, a constant potential and power output should be maintained. Relatively heavy separators are required by conventional batteries to prevent shorting and intercontamination of oxidant and reductant. Such separators usually limit the battery to low-rate applications. By using a compact electrode spacing with minimum separator thickness, the dry tape can be designed for high-rate discharges of the small activated section.
Since the duration of discharge of a specific tape section is only a few minutes, long-term parasitic deterioration is not a problem. The tape can use electrolyte-reactant combinations that have high energy potential but that cannot be used in conventional batteries because of self discharge that would consume the reactants during extended contact of electrodes and electrolyte.
Since the tape moves between permanent current collectors, the conventional grid supports for active materials are not required and the weight can be eliminated.
A summary of the features of the dry tape battery is given in Figure 1.
I 3

Electrolyte Dispensing
Electrolyte7
Collector Heads
Design Attribute Beneficial Effect
Use of thin electrode structures
Minimized (electrolyte) concentration polari- zation
Continuous feed of anode and cathode
Elimination of metallic grid support Continuous removal of discharged products Continuous refreshment with unused active materials Both of above
Continuous electrolyte wet-out only as required
Adjustable motor drive speed
Unused electrode sec- tions remain dry
Use of incompatible couples Control over feed rate of reactants
Separation of active material from auxiliary components
Renewable tape reels for each unit
Resultant Advantage
Higher watt-hr/lb
LOVJ internal impedance maintained Constant potential maintained
Separator shoring, if occurring, is only temporary problem
Figure 1. Features of the Dry Tape Battery
4
Reserve capability !%,',n%E! :El8iK%~ Higher watt-hr/lb
rammed power or
Logistic storage and transport advantage

C. PREVIOUS WORK
During our previous NASA contract (ref. l), the feasibility of the dry tape battery concept was demonstrated using the silver peroxide/zinc system. Tapes coated with silver peroxide were discharged efficiently (85%) at high current density (1000 ma/in. ) against a zinc block anode. Tape speed, electro- lyte feed rate, and other operating parameters were investigated. Four spring-driven devices were constructed and used to demonstrate the dry tape concept. Discharge was accomplished by drawing the tape between current collectors, one of which also served as the zinc anode. Electrolyte was supplied by a second prewet tape that contacted the coated tape ahead of the current collectors. Current densities up to 850 ma/in.2 at tape speeds of 0.2 to 1.5 in./min and electrolyte feed rates of 0.15 to 0.3 ml/min were attained.
D. SCOPE OF THIS REPORT
A research program leading to the demonstration of a dry tape unit is described in this report. The fabrication and testing of anode and cathode materials, the effect of many electrolytes on current efficiencies, macro- and microincapsulation of electro- lytes, electrolyte loss rates during storage, and methods of electrolyte release during tape operation are discussed. A process for continuously manufacturing tape electrodes is given. The fabrication of dry tape, incapsulated electrolyte packets, and a weight-optimized energy conversion device for the complete dry tape demonstration unit are described. Results of a brief investigation of a nonaqueous system are discussed.

PHASE 1. SINGLE COiMPONENT CONFIGURATION DEVELOPMENT
A. HIGH ENERGY ANODE DEVELOPMENT
1. Background
The objective of the electrode component research portion of the overall dry tape battery program was the development of high energy density couples that could be discharged efficiently at high current drains (0.5 to 1.0 amp/in.') in a practical tape configuration. Magnesium (2.2 amp-hr/g), aluminum (2.98 amp-hr/g), and lithium (3.86 amp-hr/g) were the prime anode candidates because of their potentially high energy density. None of these has been used to any significant extent in conventional battery systems primarily because of compatibility problems leading to electrode corrosion and unsatisfactory shelf life. However, the dry tape electrodes, which are discharged soon after the initial electrode-electrolyte contact, are not dissipated by minor spontaneous reactions with the electrolyte.
To achieve the objective of a working electrode system within the contract period, work on the better characterized magnesium- and aluminum-aqueous electrolyte systemsrather than the less well known lithium-nonaqueous electrolyte systems was emphasized. Attention could be concentrated on electrode design and operating technique development; such technology was applicable to any future electrode system. The ability to use couples considered unsuitable for conventional batteries would be demonstrated. In addition, effort duplication with existing lithium anode research programs would be avoided.
Recent developments now make examination of lithium as a tape anode more desirable. A limited research program was initiated, Preliminary results are reported in Section II-D dealing solely with nonaqueous systems.
2. Method
Three anode configurations were studied: Cl> solid block or foil; (2) pressed porous powder; and (3) flame-sprayed films on tape backing. Commercial solid stock was used, and the flame sprayed tapewere made by a local vendor. The pressed porous powder electrodes were prepared using a die mold as illustrated in Figure 2.
Table 1 summarizes the various sheet forms of magnesium. For the preliminary configuration studies 20-mil primary and alloyed (AZ31B) magnesium and 1-mil aluminum foil were used. The flame- sprayed stock included magnesium, and aluminum on nylon, d nel fabric and polypropylene. The pressed powder (20-100 mesh B anodes
6

lr
; 8 IP
1. Guide Fin 2. Base 3. Bolt 4. Locknut
SECTION AA
Legend ----_--
5. Spring 6. Plate 7. Die 8. Bushing
Figure 2. Die Mold for Porous Powder Electrode Manufacture
7

Tabl
e 1
MAG
NES
IUM
STR
IP F
OR
MS
Form
an
d Th
ickn
ess
Allo
y Su
pplie
r Am
p-M
in/in
: g/
in:
10 m
il sh
eet
10 m
il ex
pand
ed
(clo
sed)
10
mil
shee
t 10
mil
expa
nded
(c
lose
d)
10
mil
expa
nded
(o
pen)
6
mil
shee
t es
t. 6
mil
expa
nded
a3
6
mil
expa
nded
4
mil
shee
t 4
mil
mac
hine
-pun
ched
2
mil
shee
t
Prim
ary
Mg
Prim
ary
Mg
AZ31
B AZ
31B
AZ31
B AZ
31B
AZ31
B AZ
31B
Prim
ary
Mg
Prim
ary
Mg
Prim
ary
Mg
Dow
Che
m.
Co.
0.
280
Exm
et
Cor
p.
0.21
0 D
ow C
hem
. C
o.
Exm
et
Cor
p.
: l :%
Pe
erle
ss
Rol
led
Leaf
0:
253
Peer
less
R
olle
d Le
af
0.13
3 Pe
erle
ss
Rol
led
Leaf
0.
151
&met
C
orp.
0.
115
H.
Cro
ss
Co.
0.
114
Tria
ngle
To
ol
and
Die
0.
105
MR
C-C
hem
ical
ly
mille
d 0.
052
36.9
27
.7
37.8
34
.5
:,'-; 19:9
15
.2
15.1
13
.9
6.9

contained 1.5 to 2.0 g/in.* with 30% to 40% void volume. The powders were pressed on 3.5-mil and 5.5 mil dyne1 fabric at 2 to 4 tons/in.*. For the more detailed work on the magnesium anode, 2-to lo-mil continuous, expanded and perforated sheet were used.
For initial configuration and anode selection testing, either the open or sandwich cell described schematically in Figure 3 was used. At the high current drains considered, electrolyte IR losses may be significant, so interelectrode distances are important. The interelectrode distance "d" in these tests was 100 mils.
The ultimate cell used for both anode and cathode studies is shown in detail in Figure 4. The interelectrode distance is controlled by separator thickness, and the plastic anode retainer is porous or slotted to allow unhindered venting of parasitically produced hydrogen.
3. Results
a. Electrode Configuration and Anode Material Selection
The continuous foil, pressed powder, and flame-sprayed anodes all showed substantial IR losses due to hydrogen blockage. The open cell was used to screen the foil forms for over twenty electro- lytesof various strengths. Selected results (Figure 5) indicate the losses encountered,particularly at high current drain. Magnesium, being more electronegative than aluminum, is affected more severely. Furthermore, with magnesium, the unusual "negative difference effect" (ref 2) occurs where parasitic hydrogen evolution actually increases as anodic current increases. In the relatively small interelectrode volume of the test cells, the gas produced blocks large areas of the electrode, resulting in extremely high electrolytic resistance in the blocked region and increased current density in the remaining accessible region.
This gas polarization is compounded in the closed sandwich cell where the hydrogen produced is virtually trapped. The shaded area in Figure 6 shows the poor results obtained with foil, pressed powder, and flame sprayed anodes in this test configuration. A significant improvement occurred when an expanded or perforated anode was used as indicated by curve 2 in Figure 6. Even in the closed sandwich cell, an appreciable amount of gas is vented through the back of the anode.
As illustrated in Figure 6, the discharge characteristics of the pressed powder anodes improve somewhat by going from the closed to open sandwich test configuration. The flame sprayed anodes discharged poorly, if at all, regardless of test configuration; hence, no detailed data are reported for them.
9

t-+-i d
d
Ope
n C
ell
1.
Elec
troly
te
Test
El
ectro
de
Cou
nter
Sl
ectrs
de
(-)(+
I
1 2 3 4 -- 5
Id'
4d+-
Sand
wic
h C
ell
Ope
n Sa
ndw
ich
Cel
l
L .
Luci
te
Ret
sJ.n
ers
(2)
2:
Ref
eren
ce
Elec
trode
Sp
acer
7 I
- C
ompr
esse
d Se
para
tor
Figu
re
';.
Sche
mat
ic
Rep
rese
ntat
ion
of
Test
M
etho
ds

A.
Poro
us
Luci
te
anod
e re
tain
er
B.
Anod
e (e
xpan
ded
Mg
show
n)
C.
Sepa
rato
r D
. C
atho
de
E.
Cat
hode
cu
rrent
co
llect
or
(Pt
foil
show
n)
F.
Solid
Lu
cite
ca
thod
e re
tain
er
Figu
re
4.
Impr
oved
Sa
ndw
ich
Cel
l fo
r El
ectro
de
Test
ing
(Dis
asse
mbl
ed)

0.6
0.4
0.2
0 0.
2 0.
4 0.
6 0.
e 1.
0 0
0.2
0.4
0.6
0.8
1.0
0.8
-
0.6
-
0.4
-
0.2-
Cur
rent
D
ensi
ty
(am
ps/in
.z)
Cur
rent
D
ensi
ty
(am
ps/in
.z)
i: ii;
t !!
3iig
(c
l.04
) *
2:
2 1 M
M
MgC
l;!
1.
Mg
Br2
0.5
1 M
N A
lC13
Al
Cl3
2:
2 2M
M M
g Br
2 M
gC12
+
HC
l 2
M M
gC12
2
M A
lCl3
7.
1
M H
Cl
? M
&c)
MdC
10.h
i:
AZ31
B Al
loy-
0.
1 M
HC
l .
0.5
M M
gBr2
2
M M
gC12
Figu
re
5.
Anod
ic
Pola
rizat
ion
of
Mag
nesi
um
and
Alum
inum
Fo
il (In
itial
Sc
reen
ing
Dat
a)

"Closed Sandwich" Cell
0
- - 7 I I I I 0 0.2 0.4 0.6 0.8 l.o
Current Density (amps/ina2)
1. Most Results for Foil, Powder, Flame Spraying 2. Expanded Magnesium in 2M MgC12
"Open Sandwich" Cell
1.0 - 01 2 Mg Pressed Powder 6! 0.8 -
c? i;::' 2 0.6
1
best data for several packing
I I I I I 0 0.2 0.4 0.6 0.8 1.0
Current Density (amps/in.*)
Figure 6. Comparison of "Closed Sandwich" Cell and "Open Sandwich" Cell Test Results.
13
_-- _____ ~~ -__ .-
: ,, _ .; -.,: II.

While gassing cannot be eliminated, polarization due to gassing can be eliminated in the foil configuration by providing for easy hydrogen venting. This is accomplished by using expanded or perforated foil. The pressed powder anodes have increased surface area in an equivalent volume. The resultant increased gassing apparently clogs the pores rapidly,nullifying the increased surface area feature. The sprayed metal is so intimately attached to, and imbedded in, the tape backing that gas evolved becomes trapped, making efficient discharge impossible.
The discharge characteristics of magnesium and aluminum are similar. The more severe gassing of magnesium can be offset by using an open anode structure. Aluminum has a slight coulombic capacity advantage (2.98 amp-hr/g compared with 2.20 amp-hr/g for magnesium). However, magnesium is 0.8 volt more electro- negative than aluminum [approximately -1.6 vto -1.8~ (SCE) compared with -0.8~ (SCE) open circuit]. Because of higher single cell voltage and potentially higher power output, magnesir in expanded or perforated form was chosen as the prime anode material.
b. Magnesium Anode Characterization
Quantitative information describing polarization and corrosion of pure magnesium and several magnesium-aluminum-zinc alloys in various electrolytes was obtained.
Polarization studies were carried out in 2M A1C13, 2M MgC&, 2M MgBr2 and 2M Mg(C10a)2. A 3 x 1 in. magnesium foil, 5 mils thick, was placed l/8 in. from a platinum foil electrode in the open cell. The plastic cell was submerged in a beaker of electrolyte. The spacing between electrodes was sufficient to eliminate gas polarization effects. The results of these studies are illustrated in Figure 7.
Both primary magnesium and its AZ61B and AZ31B alloys exhibited little polarization at current densities up to 1000 ma/in.2 As expected, half-cell voltages varied with the nature of electro- lyte. Primary magnesium operated at about -1.8 to -1.9 v vs SCE in the most acidic electrolyte, aluminum chloride. Successive 0.1 volt drops occurred with magnesium chloride, magnesium bromide, and magnesium perchlorate electrolyte. The alloys operated at approximately 0.15 v poorer than pure magnesium in each electro- lyte.
These results show that gassing was the major cause of polarization in the earlier screening studies. Providing for free escape of the hydrogen essentially eliminates gas polarization. Similar results, reported in Section III-B, were obtained using expanded or perforated magnesium in an actual tape configuration where the anode and cathode are separated only by a 3-5-mil separator tape.
14
.-- _~.. - -

-1.2
-2.0
i
Ano
de C
ompo
sitio
n
Prim
ary
Mg
Mg
Allo
y AZ
6lB
Mg
Allo
y AZ
3lB
Tem
pera
ture
: 25
%
Elec
troly
te
34
Mg (
ClO
e ).z
2M M
gBr2
2M M
gC12
2M A
lCl3
2M
AlC
13
2M A
lC13
I 100
I I
500
1000
20
00
Cur
rent
D
ensi
ty,
ma/
lne2
Figu
re
7.
Pur
e an
d Al
loye
d M
agne
sium
Ano
de P
olar
izat
ion
Cha
ract
eris
tics
in
Var
ious
El
ectro
lyte
s

The desirability of being able to use a strong acid electrolyte is illustrated here. In 2M AlC& (pH m 1), magnesium discharges at about -1.9 volts versus SCE. In corresponding magnesium perchlorate or magnesium bromide (pH a 6), the anode potential is approximately -1.5 versus SCE.
The chemical stability of magnesium in these electrolytes, particularly under high current load, is important. Table 2 lists corrosion data in aluminum chloride, magnesium chloride, and magnesium perchlorate.under load. Weight loss measurements with time were recorded for a 2 x 1 in. area of magnesium. Table 3 shows relative chemical corrosion occurring under open-circuit conditions. Under no-load conditions neither pure magnesium nor alloyed magnesium showed significant short-term weight loss in 2M MgC12, 2M MgBra, or 2M Mg(C104)2. Corrosion increased in 2M AlCle and was more severe for primary magnesium than for AZ31B and AZ61B alloys.
As expected, temperature severely affected primary magnesium corrosion in 2M AlCle as illustrated in Table 4.
Under electrical load, however, the alloys corrode faster than a corresponding sample of pure magnesium.
Per cent weight losses for 5-mil foil are reported for both load and no load conditions. This is the approximate thickness of the ultimate tape anode. In actual operation the discharge time of any section of anode will be close to ten minutes. The maximum weight loss due to chemical corrosion for a 5 mil magnesium anode operating in 2M AlCle at 500 ma/in.2 is about 40%. However, the actual discharge conditions in a tape configuration are much less severe than in the corrosion test described here. In the corrosion test, excess electrolyte is used and the pH does not change significantly. Under actual tape discharge conditions a minimum of electrolyte is used and the pH increases as acid is consumed by cathode discharge reactions. Qualitative observation of single cell and dynamic discharge of complete tape couples has shown that chemical corrosion and accompanying gas evolution was far less than predicted on the basis of the above data. \
Another significant observation was the relatively slow corrosion of magnesium in concentrated aluminum chloride electrolyte, Corrosion was far less than in f&ee hydrochloric acid solutions of identical pH. Attempts to discharge a m-dinitrobenzene/mag- nesium AZ31B alloy couple in 1M HCl acid and even 1M FeCle or 1M ZnC12 resulted in complete deterioration of the anode in less than ten minutes.
Both zinc and ferric ion can be displaced from solution by magnesium, resulting in increased corrosion. Magnesium does not displace aluminum in aqueous solution. Furthermore, we speculate that aluminum chloride in solution keeps the free hydronium ion
16
.- .-

Tabl
e 2
MAG
NES
IUM
CO
RR
OSI
ON
UN
DER
VAR
YIN
G C
UR
REN
T LO
ADS
Anod
e M
ater
ial
Prim
ary
Mg
Prim
ary
Mg
Prim
ary
Mg
Prim
ary
Mg
Prim
ary
Mg
Prim
ary
Mg
AZ31
B Al
loy
AZ31
B Al
loy
AZ31
B Al
loy
AZ31
B Al
loy
AZ31
B Al
loy
AZ31
B Al
loy
AZ61
B Al
loy
AZ61
B Al
loy
AZ61
B Al
loy
AZ61
B Al
loy
AZ61
B Al
loy
AZ61
B Al
loy
Thic
knes
s (m
il)
5 5 5 5 5 5 4-5
4-5
4-5
4-5
25
25
10
10
10
10
10
10
Elec
troly
te
2M A
lCl3
2M A
lCl3
2M M
&10&
2M M
g(C
lO&
2M M
gCla
2M M
gC13
2M A
lC13
2M A
lC13
2M
Mg(
C10
4)2
2M M
g(C
lO&
2M M
gCle
2M M
gCle
2M A
lCl3
2M A
lC13
24
Mg(
ClO
&
2M M
g(C
lO.&
2M M
gCle
2M M
gC13
Cur
rent
D
ensi
ty,
ma/
in."
250
500
250
500
250
500
250
500
250
500
250
500
250
500
250
500
250
500
Wei
ght
Lost
fro
m
2 x
1 in
. Ar
ea,
mg
(wt.
%)
1 m
inut
e 5
min
utes
10
min
utes
5.8(
2.0)
30
.6(1
0.7)
65
.5(2
2.8)
11
.4(4
.0
64.2
(22.
5)
123.
4(43
.3)
5.5(
1.9)
26
.6(
9.4)
51
.4(1
8.1)
8.6(
3.0)
46
.3(1
6.3)
93
431.
5)
1.3(
0.5)
16
.W
5.9)
33
.1(1
1.6)
1.6(
0.6)
21
.4(
7.5)
48
.8(1
6.5)
8.1(
2.8)
38
.1(1
3.4)
78
.5(2
7.6)
15.7
(5.5
) 64
.5(2
2.7)
12
4.8(
43.4
3.4(
1.2)
13
.2(
4.6)
27
.2(
9.6)
6.1(
2.1)
a’
& 9.
8)
63.7
(22.
4)
3.0
17.6
36
.5
6.3
38.3
83
.0
11.0
48
.6
95*
2
1995
84
.8
145.
0
0.8
10.5
27
.5
2.4
23.4
45
.3
2.2
14.3
36
,4
4.4
32.3
77
.6

Table 3
MAGNESIUM CHEMICAL CORROSION
Open-Circuit Conditions Temperature: 25 Oc
Anode Material Electrolyte Weight Loss, $ for 5 mil Foil
1 minute 10 minutes 30 minutes
Primary Mg 2M A1C13 2M MgC12 2M lQBr2 2M W0104)2
7 <l <l <l
AZ61B Alloy 2M AlC& 2 2M M&l2 <l 2M MgBr2 <l 2M Mg(ClO& <l
AZ31B Alloy 2M A1C13 2M MgClz 2M MgBr2 2M Mg(C%d2
3 <l <l <l
34 i
1
20 * 2 2
<l
25 -32
2 <l <l
Table 4
EFFECT OF TEMPERATURE ON CHEMICAL CORROSION OF PRIMARY MAGNESIUM IN 2M AlC&
Open-Circuit Conditions
Temperature, Weight Loss by 2 x 1 in. Area of 5 Mil Foil OC In 5 minutes,%
25 11
50 62 75 1()(y'
iF Complete solution
18
-.-__ -__.__ _._ __..

concentration at a tolerable level. One mole of aluminum chloride can form three moles of acid on hydrolysis
AlClz + ~HzO--,A~(OH)~ f 3HCl (1)
In solution, although three moles of acid are potentially available for reaction, there are not three moles of free acid existing at any one time. This is because of the stepwise hydrolysis of aluminum chloride.
HCl + H30+ -f cl- pkA 1 =hl- 7 (2)
+3 A1(H20)x + Hz0 e H30+ -I- A1(H20)x-10H+2 pkA, = 4.9 (3)
Three molar hydrochloric acid solution is a stronger acid than one molar aluminum chloride.
As joint anode-cathode testing progressed, it was found that an aluminum chloride-hydrochloric acid mixed electrolyte was less corrosive than a free hydrochloric acid electrolyte of the same concentration. Magnesium corrosion in a 2M A1C13'1M KC1 electrolyte was far less severe than that in 1M HCl. This indicates the possibility of some kind of association between aluminum chloride and hydrochloric acid similar to that encountered in organic solvents (S).
S + HCl + A1C13+ SH+AlCl,- (4)
H20 + HCl + AlCl,e H30+A1C14- (5)
The overall effect may be a decrease in hydrogen ion mobility. Discharge data for couples in mixed acid electrolyte are reported below and in the appendix (Tables A-l, A-2).
B. HIGH ENERGY CATHODE DEVELOPMENT ----~--
1. Background
Our previous work (ref.3 ) with organic nitro compound and positive halogen compound depolarizers in dry cell bobbin con- figurations served as a basis for choosing candidate cathode materials. When the feasibility of using strong acid electro- lytes was demonstrated, high energy inorganic cathodes, potassium periodate, for example, which require strongly acid electrolytes were added. Theoretical coulombic capacities and half-cell potentials are listed in Table 5. The organic nitro compounds have the highest theoretical coulombic capacities. However, the positive chlorine compounds and potassium periodate
19

Table 5
COULOMBIC CAPACITIES OF DEPOLARIZERS
Compound
2,4,5-Trinitrotoluene
Picric acid
.Experimental Theoretical Coulombic Open-Circuit
Efficiency Potential (amp-min/g) versus NHE
128 -to .25
125 +0.58
l-Carboxymethyl-3,3,5,5-tetra- nitropiperidine 120 +0.7
Ortho- and Meta- Dinitrobenzene 115 -to*4
2,5-Dinitrothiophene 111 +0.5
2,4-Dinitrothiophene
3,6-Dinitrophthalic acid
111 +0.5
76 40.47
2,4,6-Trichlorotriazinetrione
Hexachloromelamine
42 +1.2
58 +1.2
Potassium periodate 4g+ -f-l.3
-3 Based on reduction to iodine.
20

exhibit substantially higher half cell voltages, which make the resulting theoretical energy outputs comparable.
Estimates of couple energy densities are based on watt-hours per pound of total reactants. With periodate and organic nitro compounds, acid is consumed. Water is consumed during discharge of the positive chlorine compounds. Theoretical energy densities and reactions upon which they are based are listed in Table 6. During the course of the program, a more realistic estimate of attainable energy densities could be made using the actual measured operating cell voltages. The calculations in Table 6 are based on the highest operating voltages obtained to date.
Initially we assigned a coulombic capacity of 55 amp-min/g for potassium periodate in case some reduction to iodide occurred. Investigation has shown no significant reduction beyond iodine, so all previous efficiency data have been adjusted to the 49 amp- min/g basis.
The dry tape cathode configuration studies were made mainly with the organic nitro compounds since these were the best known of the candidates. Once the basic physical and mechanical parameters for satisfactory tape operation were determined, emphasis was shifted to the development and incorporation of more energetic cathodes. This is reflected in the progression from dinitrobenzene to picric acid to potassium periodate as the prime cathode. A complete characterization of picric acid and potassium periodate was carried out to meet the overall program objective of a practical working high energy couple on tape within the contract period. The active halogen compounds that are significantly more energetic are less well characterized and require further development to reach a stage of operation comparable to the periodate electrode. They are the prime candidates for the next generation tape cathode material.
A complete compilation of formulations and static discharge tests of potassium periodate cathodes is given in Table A-l of the Appendix. A similar compilation for organic nitro compound cathodes is given in Table A-2 of the Appendix, The data given in the following sections are selected from Tables A-l and A-2.
2. Method
Single cell or static discharge experiments were made using the improved sandwich cell shown in Figure 4. A 3 x 1 in. electrode was used and discharged against an expanded or perforated magnesium anode. Electrolyte was supplied by prewetting the separator tape or immersing the entire cell. As the program progressed, the latter technique was abandoned; using a prewet separator more closely approximated ultimate tape operation. A platinum foil or graphite sheet was used as the cathode current collector.
21

Tabl
e 6
Cou
ple
ENER
GY
DEN
SITY
ES
TIM
ATE
OF
CAN
DID
ATE
CO
UPL
ES
Cal
cula
ted
Ener
gy
Den
sity
, w
att-W
/lb.
Rea
ctan
ts
At
Stan
dard
R
ever
sibl
e C
ondi
tions
.,ilp
,nes
ium
-Pct
ar~i
uln
Perio
date
-
Acid
El
ectro
lyte
2!',I
O
6 -1
'(‘.I
G .
/. ]I.
"Cl
: I2
+
7MgC
lz
+ 12
HsC
57
5
Qgn
esiu
m-P
icric
Ac
id
- Ac
id
Elec
troly
te
?Jag
nesi
um-m
-Din
itrob
enze
ne
- Ac
id
Elec
troly
te
580
525
Mag
nesi
um-T
richl
orot
riazi
netri
one
- N
eutra
l El
ectro
lyte
0 0
Cl
II C
l H
H
1
,c,
i N
N
\
7,
/
2 ::
A
i~5r
~~gi
6h’2
0=
2 N
N
+
3 M
giln
+3
!~~g
(OH
)2
782
‘N’
‘1,
L ,h
0”
/’ N
A
0 0.
1
0 H
ho6
(2.0
v.
at
10
0 m
a/in
.2)
Mag
nesi
um-H
exac
hlor
omel
amin
e -
Neu
tral
Elec
troly
te
Cl2
H
Z N
N
C
c
N
N
+ 6
?dilg
+ 6
He0
=
N
‘N
+ 3
M@
lz
+yg(
oHj2
c
c c
,c
Cl;?
N
N
NC
12
NH
2 N
’ N
HB
960
500
(2.0
v.
at
10
0 m
a/in
.s)
At
Mea
sure
d C
ell
Volta
ge,
E
jl0
(2.1
v.
at
50
0 m
a/in
.')
254
(1.1
v.
at
50
0 m
a/in
.s)
230
(1.1
v.
at
50
0 m
a/in
.a)

The methods of tape preparation and description of materials are reported in the following section dealing with electrode configuration.
3. Results
a. Electrode Configuration
(1) Coating Technique
The most satisfactory cathode coated tapes are made by casting from an aqueous or organic slurry. For static cell work, aqueous slurrieswere usually used and the coating thickness was controlled by a Gardner Blade. Nylon, polypropylene, and acrylonitrile-vinyl chloride copolymer (dynel) were used as tape backing. The coated tapes were air dried at ambient temperatures. Some dry-pressed powder tapes were made, but this technique was abandoned early because of poor adhesion and flexibility.
Most cathode mixtures consisted of a 1:l volume ratio of depolarizer and Shawinlgan acetylene black (50% compressed) with approximately 5% binder and 5% fibrous reinforcing material. The dry materials were Waring blended or mixed with a mortar and pestle. The organic nitro compounds were normally mixed by hand, although these mixes showed no sensitivity to the standard Bureau of Mines impact test. An aqueous solution of binder was added to the dry components and the slurry was mixed until homogeneous.
(2) Conductor Properties _--- --- --
Shawinigan acetylene black (50% compressed) was found to be the most suitable conductor material. Table 7 shows the effect of various carbon substrateswith o-dinitrobenzene. The major factor favoring acetylene black appears to be its incompressible nature, which results in an open pore electrode structure. For organic nitro compound or potassium periodate cathodes, at least 65 to 75% voids are required to achieve reasonable efficiencies. Substitution of graphitic carbons or mechanical compression resulted in higher packing densities, which led to poorer operation. Initial results with trichlorotriazinetrione indicate that substantially higher packing densities can be tolerated. The active chlorine compounds are much more soluble than either the nitro compounds or potassium periodate and, therefore, can act as leachable pore builders during discharge.
Potassium periodate, picric acid, and dinitrobenzene exhibit Potassium periodate, picric acid, and dinitrobenzene exhibit best discharge characteristics with approximately a 1:l volume best discharge characteristics with approximately a 1:l volume ratio of acetylene black conductor. ratio of acetylene black conductor. Cathode efficiency data at Cathode efficiency data at various depolarizer/conductor ratios are shown in Ta.bles 8, 9 various depolarizer/conductor ratios are shown in Ta.bles 8, 9 and 10. and 10. Because of the higher density of potassium periodate, Because of the higher density of potassium periodate, substantially less weight of carbon black is required compared substantially less weight of carbon black is required compared with that needed for the nitro compounds. with that needed for the nitro compounds.
23 23

Tabl
e 7
CO
MPA
RIS
ON
OF
EFFE
CTI
VEN
ESS O
F VA
RIO
US
CAR
BON
S AS
SUBS
TRAT
ES FO
R D
INIT
RO
BEN
ZEN
E
Cel
l: M
g/2M
A1C
13 o
r 2M
Mg(
C10
4)2/
o-D
NB
and
Car
bon
Subs
trate
Car
bon:
o-
DN
B C
arbo
n Vo
l.Rat
io
S!ia
win
igan
, 50
% c
ompr
esse
d 1:
l
Shaw
inig
an,
50%
com
pres
sed
1:2
Nuc
har-C
N
1:2
Pure
C
arbo
n FC
-13
1:l
Col
umbi
an
Con
duct
ex-
SC
1:l
Asbu
ry
Gra
phite
~6
25
1:l
Cat
hode
Ef
ficie
ncy
to
0.8
v 2
Mg(
C10
4)2
100
ma/
in?
2M M
g(C
lO&
2M A
lCls
21-4
9 62
(a
t 20
0 m
a/in
.2
35
(at
300
ma/
in.2
1-5,
22
7 (3
00
ma/
in.2
) 22
, 24
(a
t 50
0 m
a/in
.')
(200
m
$inf
) 17
(a
t 30
0 m
a/in
.2)
Doe
s no
t ho
ld
9 (a
t 10
0 m
a/in
.2)
12
15
(at
500
ma/
in.')
1 5
(at
100
ma/
in.2
)

Table 8
EFFECT OF o-DINITROBENZENE--CARBON RATIO ON CATHODIC REDUCTION EFFICIENCY
Cell: Mg/2M Mg( Clod 2/o-Dm Current Density: 100 ma/in.2 Cathode Type: Basic (No Fiber) Carbon: Shawinigan Black, 50% compressed
Carbon: o-DNB
Volume Ratio
0.2:l
0.4:1
1:l
Coulombic Efficiency (%) to -0.88~ cutoff vs S.C.E.
8-g
15-22
40-50
25

Table 9
EFFECT OF PICRIC ACID--CARBON RATIO ON CATHODIC REDUCTION EFFICIENCY
Cell: ivg/2.8~ (sat Id) AlCla/Picric Acid Cathode Loading: 100 + 10 mg Picric Acid/in.2 Cathode Type : Dynei Fiber, l/4 in. (5%)
Carbon:
Acetylene Black/ Picric Acid
Volume Ratio
1:l
o.g:1
0.8:1
0.7: 1
0.6:1
0.5:1
PW Binder (5%) Shawinigan Acetylene Black, 50% compressed
Coulombic Efficiency ($) To-O.88 volt Cutoff vs SCE 500 ma/in.2 250 ma/in.2
54 60
52 53
49 47
43 46
39 40
34 37
26
111 I , , ,, II

Table 10
EFFECT OF POTASSIUM PERIODATE--CARBON RATIO ON CATHODIC REDUCTION EFFICIENCY
Cell: ~g/2.8~ (sat'd)AlCle/Potassium Periodate Cathode Type: Dyne1 Fiber, l/4 in. (5%)
PW Binder (5%) Carbon: Shawinigan Acetylene Black, 50% compressed
Carbon: KI04 Volume Ratio
1.7:1
1.3:1
1:l
0.5:1
Coulombic Efficiency (%) to -0.15 volt Cutoff vs SCE
65-70
60-70
60-70
40-45
27

(3) Binders
A number of water-soluble and non-water-soluble binders were screened. Suitable binding action is achieved with 2.0% to 5.0% polymer. At this concentration range neither type of binder appeared to interfere with the discharge characteristics of the cell (Table 11). Dynamic test results have shown that of all the binders studied water-soluble polyvinylpyrrolidone (PVP) and non-water-soluble polyvinylformal (PVF) impart the best mechanical properties to the cathode coat.
(4) Fibrous Fillers
Initial cathode coated tapes prepared for dynamic testing comprised 90-95s cathode material (1:l volume ratio depolarizer: carbon black) and 5-10s PVP binder. The cathode coat cracked on drying and sloughed off the tape when wet out. The incorporation of short (l/8 to l/4 in.) dyne1 or carbon fibers (approximately 5%) resulted in smooth, coherent coatings with good wet strength. No sloughing occurred during dynamic tests. An improvement in efficiency as well as reproducibility was noted upon addition of fibrous fillers. Results of experiments specifically designed to examine the effect of fibrous fillers on picric acid discharge are listed in Table 12.
The improved efficiency appears to be mainly due to mechanical improvements in the cathode. An improvement in electrolyte wet out is noted. There are also indications that the addition of carbon or graphite fibers may improve conduction through the cathode coat. This is discussed in more detail in the next section. Carbon fibers incorporated in the cathode mix result in a coating that is smoother and more coherent than the correspond- ing cathode coatings containing dyne1 fiber. For this reason, carbon fibers are currently used in all tape formulations.
b. Cathode Development
(1) Potassium Periodate
Potassium meta-periodate tape cathodescan be discharged at 60-80s coulombic efficiencies at 500 ma/in.2 versus magnesium in aluminum chloride or aluminum chloride-hydrochloric acid mixed electrolytes. Average operating cell potentials range from 1.9 to 2.1 v in single cell experiments. Cell cut-off voltage for efficiency calculations is 1.5 v.
Typical discharge curves are illustrated in Figure 8 for experiments in saturated aluminum chloride electrolyte. The operating potential is fairly flat until the end of the discharge where it drops sharply. The initial dip in potential is caused at least partially by slow wet out and reduced ion mobility due to the viscous saturated aluminum chloride electrolyte. The
28

Tabl
e 11
EFFE
CT
OF
BIN
DER
S O
N S
TATI
C C
ELL
OU
TPU
T
Test
C
atho
de
Syst
em:
50/5
0 VQ
l ra
tio
depo
lariz
er
acet
ylen
e bl
ack
Elec
troly
te:
2M A
lCle
Ba
se
Tape
: 3m
il dy
ne1
Cur
rent
D
ensi
ty:
100
ma/
in.2
Dep
olar
izer
Type
m
g/in
?
o-D
NB
80
o-D
NB
74
o-D
NB
o-D
NB
76;
o-D
NB
Picr
ic
Acid
Pi
cric
Ac
id
79
Picr
ic
Acid
68
Pi
cric
Ac
id
95
Bind
er
(5%
)
none
(p
ress
ed
pow
der)
poly
viny
lpyr
rolid
one,
PV
P N
P-K3
0 po
lyvi
nyla
lcoh
ol,
Gel
vato
l 20
-60
met
hylv
inyl
ethe
r-mal
eic
anhy
drid
e co
poly
mer
, G
antre
z AN
-139
hy
drox
ymet
hyl
cellu
lose
, M
etho
cel
HG
no
ne
(pre
ssed
po
wde
r) po
lyvi
nylp
yrro
lidon
e po
lyac
ryla
mid
e,
Cya
nam
er p
-26
poly
viny
lform
al,
PVF
15-9
53
Cou
lom
bic
Effic
ienc
y to
0.
8 vo
lt,
%
35-5
0

Table 12
EFFECT OF CATHODE FIBER CONTENT ON CATHODIC REDUCTION EFFICIENCIES OF PICRIC ACID
Cathode: Shawinigan Black:Picric Acid (1:l)
Anode: Magnesium
Electrolyte: 2M A1C13
Current Density: 500 ma/in.2
Cathode Mixture Cathode Coulombic Tnx Efficiency?, to 0.8v, $
No fiber 20-35
Dyne1 fiber 38-42
Graphite fiber 41-46
* At equivalent tape loadings
30

Sha
ded
Are
a C
orre
spon
ds
to
Dis
char
ge
Ran
ge o
f 25
Cel
ls
2.4
Addi
tives
-
5 w
t %
PVP
Xnd
er
and
5 w
t $
Cyr
iel
Fibe
r -
3 m
il 3j
me:
(1
00 m
g KI
OJi
n.
/-Bes
t S
ingl
e D
isch
arge
<75
mg
Car
bon/
in
I \,M
g Allo
y AZ
31B
Cut
of
f V
olta
ge
2
20
40
50
60
Cou
lom
bic
Effic
ienc
y,
$ 70
80
90
10
0
Figu
re
a.
Dis
char
ge
Cha
ract
eris
tics
zf
Pota
ssiu
m
Per
ioda
te
Cat
hode
in
Sat
urat
ed
A1C
13 a
t 50
0 m
a/in
.2
addition of free hydrochloric acid to form a mixed electrolyte with aluminum chloride eliminates this dip. A typical mixed electrolyte discharge curve is shown in Figure 9. A summary of all periodate tape cathode discharge experiments is contained in the Appendix. The best power density output obtained with a single cell potassium periodate cathode ranged from 80 to 90 watt-hr/lb total electrode weight plus electrolyte (see Table 10). Accurate minimum electrolyte requirement data were not taken during these static tests. The energy density figures are based on results of electrolyte requirement data reported in Section III-B.
No effort was made to minimize separator or anode weight in these tests. Electrolyte required is by far the largest weight contributor. The energy density is 236 watt-hr/lb total reactants. Addition of inert ingredients including conductor, tape, binder, etc., reduces the energy density to 122 watt-hr/lb. The reduction from 122 watt-hr/lb to 85 watt-hr/lb is due mainly to electrolyte required to wet out the electrode and electrolyte lost to anode corrosion. Cathodes such as periodate salts and organic nitro compounds that consume acid during discharge will be burdened with a high electrolyte weight penalty. Despite high coulombic efficiencies, it is estimated that a maximum of approximately 115 watt-hr/lb can be obtained with potassium periodate.
Potassium iodate (KI03) and sodium periodate (NaI04) were examined briefly. Both efficiencies and voltages were substantially lower than those of potassium periodate- magnesium cells. Since they offered no advantage over the potassium periodate electrode, their study was not pursued.
(2) Picric Acid
(a) Effect of Picric Acid Loading on Performance
Unlike potassium periodate cathodes, the performance of organic nitro compound cathodes becomes poorer at high loadings, apparently due to interference by reaction products. Table 14 lists the coulombic capacities and potentials of picric acid cathodes as a function of loading. Cells were immersed in a stationary pool of electrolyte contained in a beaker. The highest coulombic efficiencies (47-58s) were obtained with cathode loadings ranging from 20 to 100 mg picric acid/in? At higher loadings efficiencies became progressively lower. At the same time, operating potentials appear to improve with loading.
The effect on the complete cell is illustrated in Figure 10. The effect of circulating fresh electrolyte through the cell is shown by the data in Table 15. For this test series, the static cell holder was placed on its side and the electrolyte allowed to drain through continuously. The highly colored reaction products were continually removed from the electrode area.
32

cell
Com
posi
tion
2.7 26
60 w
t %
KI0
4 (1
00 m
g/in
.')
35 w
t $
Acet
ylen
e Bl
ack
2.5
wt
% P
olyv
inyl
form
al
(dic
hlor
oeth
ane
slur
ry)
2.5
wt
% D
yne1
Fib
er
4 m
il ny
lon
tape
Ano
de
Exp
ande
d P
rimar
y M
agne
sium
2.
1.6-
1.4-
C
ut
off
Vol
tage
0 10
20
30
40
50
60
70
80
90
10
0
Cou
lom
bic
Effic
ienc
y
Figu
re
9.
Dis
char
ge
Cha
ract
eris
tics
of
Pota
ssiu
m
Per
ioda
te
Cat
hode
In
2M A
lCls
*0.5
M
BZL
Ele
ctro
lyte
at
50
0 m
a/in
.2

Table 13
SINGLE CELL POWER DENSITY OF MAGNESIUM- POTASSIUM PERIODATE SYSTEM
Total cathode electrode weight - 0,66g(includes separator, con- ductor, binder, filler)
Total anode weight 0 l 3lg
Total electrolyte weight 1.5og
Total weight 2.47g
Cell area 3 in.2
Theoretical Capacity 0.274 amp-hr
Efficiency
Cell emf
83% (1.5 amp current)
2.0 v
Energy output
Energy density
2.0 x .274 x 0.83 = 0.46 watt-hr
&!!$$@k = 85 watt-hr/lb
34

Table 14
EFFECT OF PICRIC ACID LOADING ON COULOMBIC EFFICIENCY
(Static Cell Test)
Cathode Composition: Picric Acid (PA) Acetylene Black Dyne1 fiber, l/8 in. PVP Binder
Cathode Loading
mg PA/in?
30 -t 10
50 : 10
70 + 10
90 $ 10
120 f 10
150 f 10
200 + 10
Average Theoretical
Capacity, amp-min/in.2
3.5
6.3
8.7
11.3
14.7
18.8
25
Anode: Expanded Mg AZ31B alloy Electrolyte: Saturated (2.8M) A1C13 Temperature: 25Oc Cathode cutoff potential: -0.88 v
vs SCE
Coulombic Efficsency,
n
54 - 58
54 - 55
48 - 60 0.4 -0.50
47 - 58
37 - 45
25 - 33 0.4 -0.40
20 - 25 0.4 -0.35
it Open-Circuit Potential
35
Cathode Potential, volts vs SCE
Average ocp” Operating
Voltage
0.5 -0.65
0.4 -0.60
0.4 -0.48
0.4 -0.35

Picr
ic
Acid
, Th
eore
tical
Ta
pe
mg/
lne2
C
apac
ity,
min
utes
at
te
st
curre
nt
dens
ity
w
123
31.9
0
100
25.3
I I
I I
I 0
I I
10
I I
I 20
I
30
I 40
50
60
Pi
cric
Ac
id
Con
sum
ed, %
Fi
gure
10
. Ef
fect
of
Pi
csic
Ac
id
Load
ing
on S
tatic
D
isch
arge
of
Pi
cric
Ac
id
in
2M A
1C13
at
50
0 m
a/in
.

Table 15
E3FECT OF PRODUCT REMOVAL ON PICRIC ACID CATHODE OPERATION
Cathode Composition: Picric Acid (PA) Acetylene Black g 0
Dyne1 fiber, l/8 in. 5% PVP Binder 5%
Anode: Expanded MgAZ31B alloy Electrolyte: Saturated (2.8M) AlC13 Temperature: 25 “c Cathode cutoff potential: -0.88~
vs SCE
Cathode Loac&ing, mg PA/in.
200 2 10
150 2 10
100 !: 10
Coulombic Efficiency, $ Stationary Circulating Electrolyte Electrolyte
20 - 25 50 - 60
25 - 33 51 - 53
47 - 58 49 - 58
37
_- - --.
- - -rC’.-^’ .’

~~-- ---. --..- -~~~- ---_----~ _
Interference of reaction products appears to be negligible for picric acid-Mg cells of lo-minute discharge capacity or less at 500 ma/in. current density. Concentration polarization due to reaction products does appear where discharge times are longer than 10 minutes at this current density.
The better operating potential with increased cathode loading is presumably due to the higher effective surface area of the cath- ode, which in effect lowers the real current density.
A number of picric acid cathodes were discharged at current densities of 250 and 750 ma/in.2 in addition to the 500 ma/in.2 reported above. The results are tabulated in Table 16 and illustrated in Figures 11,12,and 13. Efficiencies did not improve under lower current drain (250 ma/in.2) except for very low loadings. The long discharge times associated with low current densities led to reaction product polarization and anode corrosion problems for the moderate and high loading cathode tapes.
The reduction of a nitro group is a complicated reaction involving several steps.
,'NOab '=NO.---j NHOH---+NH2 (6) In neutral or basic solution, the intermediate products can react to form azo- or azoxy- compoundswhich either do not reduce readily or reduce at a lower potential
:NO + :NHOH----+ ,‘N = N', + H20 (7) 4 0
The presence of acid hinders these coupling reactions by tying up the intermediate products as acid salts until they can be reduced. Electrolyte screening reported earlier for anode performance and below for dinitrobenzene discharge performance indicated aqueous aluminum chloride to be the most suitable acid electrolyte.
(b) Effect of Aluminum Chloride Electrolyte Concentration on Picric Acid Energy Output
Table 17 shows the results of a study of the effect of changing aluminum chloride concentration on the coulombic efficiency and operating potential of the picric acid cathode vs magnesium, From the discharge reaction,
OH + 9 Mg + 18 H+ ----jH2N
OH
0 m2 + g rdg++ + 613~0
NH2 (8)
38

Table 16
COULOMBIC EFFICIENCIES OF PICRIC ACID CATHODES AT SEVERAL CURRENT DENSITIES
Cathode Composition Anode: Expanded Mg AZ31B alloy Picric Acid (PA) Electrolyte: Saturated (2.8M) A1C13 Acetylene Black Temperature: 25'c Dyne1 fiber, l/8 in. Cathode cutoff potential: -0.88v PVP Binder 5% vs SCE
Coulombic Efficiency, % Cathode Loading,
mg PA/in.2 ( Average Op.g.ga.k_i_ng WLentLal~vs SW). _ 2~~-m~ZJ~~$ -~.- 500 ma/in? 750 ma/G.'
200 f 10 44-45 (-0.45) 50-60 (-0.35) 1~7-48 (-0.40)
i50 2 10 50-53 (-0.50) 51-53 (-0.40) 48-50 (-0.65)
100 -t 10 58-61 (-0.50) 49-58 (-0.48) 30-50 (-0.60)
30 -t 10 16 48-60 (-0.50) 25-28 (-0.72)
40 -t 10 66-68 (-0.55) 54-55 (-0.60) 0
$5 No data

Cur
rent
D
ensi
ty,
Dis
char
ge
Tim
e,
ma
in.2
m
in.
Q
250
9
0 l
500
4.3
750
2.0
Cat
hode
Fo
rmul
atio
n $
Picr
ic
Acid
45
Ac
etyl
ene
Blac
k 45
D
yne1
Fi
ber,l
/8
in.
5 PV
P B
inde
r 5
Cat
hode
Lo
adin
g
28
5 3
mg
Picr
ic
acid
/in.2
Ano
de:
Allo
y
0.8
40
50
60
Cou
lom
bic
Effic
ienc
y,
$
Figu
re
11.
Effe
ct
of
Cur
rent
D
ensi
ty
on P
icric
Ac
id
Dis
char
ge
Cha
ract
eris
tics
at
Low
Cat
hode
Lo
adin
gs

0.9
0.8
Cur
rc
Den
sity
, in
.2
Dis
char
ge
Tim
e,
n m
in
Q
250
35
0 50
0 13
.5
l 75
0 9
Cat
hode
Fo
rmul
atio
n $
Picr
ic
Acid
Ac
etyl
ene
Blac
k t";
D
yne1
Fib
er,l/
8 in
. PV
P B
inde
r
Cat
hode
100
k 10
mg
Picr
ic
acid
/in.'
Elec
troly
te:
Sat'd
(2
.8M
) Al
Cl.
Ano
de:
Ma
A'Z3
l.B A
lloy
0 10
20
30
40
50
00
Cou
lom
bic
Effic
ienc
y,
$
Figu
re
12.
Effe
ct
of
Cur
rent
D
ensi
ty
on P
icric
Ac
id
Dis
char
ge
Cha
ract
eris
tics
at
Mod
erat
e C
atho
de
Load
ings

Cur
rent
D
ensi
ty,
ma
in.2
D
isch
arge
Ti
me,
m
in
Q
250
44
0 50
0 29
0 75
0 15
Cat
hode
Fo
rmul
atio
n $ t;
Picr
ic
Acid
Ac
etyl
ene
Blac
k D
yne1
Fi
ber,l
/8
in.
PVP
Bin
der
Cat
hode
200
+ 10
mg
Picr
ic
ac
in.
2 id
/
Ano
de:
Mg
AZ31
B Al
loy
Elec
troly
te:
Sat'd
(2
.8M
)~l~
l~
I :. ‘J
I I
I iv
‘:
n fl
J.
”
Cou
lom
bic
Effic
ienc
y,
$ .\J
Figu
re
13.
Effe
ct
of
Cur
rent
D
ensi
ty
on P
icric
Ac
id
Dis
char
ge
Cha
ract
eris
tics
at
Hig
h C
atho
de
Load
ings

Table 17
EFFECT OF ALUMINUM CHLORIDE ELECTROLYTE CONCENTRATION ON PICRIC ACID CATHODE PERFORMANCE
(Static Cell Test)
Cathode Composition: Picric Acid Acetylene Black $f Dyne1 fiber, l/4 in. 5; PVP Binder 5%
Anode: Expanded Mg AZ31B alloy
Cathode Loading: 90 2 10 mg picric acid/in?
Temperature: 25oc
Cathode cutoff potential: -0.88 v vs SCE
Cathode Potential, volts vs SCE
A1C13 Coulombic Average Concentration, Efficiency, OCPS Operating
Molarity $ Voltage
1 1-5 - 25 0.42 -0.65
2 35 - 50 0.34 -0.53
2.8 (saturated)
50 - 58 0.45 -0.45
36 Open-Circuit Potential
43

it is apparent that ‘picric acid requires a high concentration of hydrogen ion to operate properly. This is reflected in the poor efficiencies in a limited amount of 1M AlCle. All discharges reported in Table 17 were carried out with equal, limited volumes of electrolyte. The average operating potential increased approx- imately 0.1 volt with each increase in concentration. These changes correspond closely with the measured pH changes among the electrolytes and can be ascribed to a simple pH effect.
Full-cell data are illustrated in Figure 14. As in the case of potassium periodate, the initial potential dip followed by a rise to the normal operating potential appears to be correlated with aluminum chloride concentration. Highly concentrated electrolyte is fairly viscous. This could account in part for low ion mobility, at least initially before appreciable amounts of magnesium ions are formed or temperature increase lowers viscosity. It could also explain slow cathode wet out action. Addition of free hydrochloric acid or small amounts of magnesium perchlorate appeared to reduce internal resistance. Under optimum conditions, t1 picric acid cathode may be discharged vs magnesium at 500 ma/in.2 wii a cell emf close to 1.2 v and efficiencies near 60%.
(c) Effect of the Composition of Magnesium Anode on Picric Acid Discharge
Extensive studies have shown that picric acid cathodes discharge at higher coulombic efficiencies with magnesium-aluminum-zinc alloys than with primary magnesium. This occurred despite the fact that, initially at least, cell voltages were at least 0.1 volt higher with primary magnesium. Table 18 shows some typical results using primary magnesium, AZ31B alloy, and AZ61B alloy. Coulombic efficiencies of picric acid were higher with both alloys. Half- cell data indicate that all magnesium anodes operated normally. The cathode half-cell performance was poorer against primary magnesium.
Figure 15 shows a difference in the shape of the discharge curves of picric acid run against pure and alloyed magnesium. Against pure magnesium the full- and cathode half-cell potentials fell off steadil Against the alloys, a plateau occurred and was maintained until near the end of the run. Attempts to isolate the cause of this phenomenor have been unsuccessful so far. An interaction between picric acid and zinc ion produced by alloy corrosion and dissolution is suggested but this is strictly conjecture at this point.
(d) Fibrous Carbon and Graphite as Cathode Conductors
Several screening experiments were performed incorporating l/q-in. carbon and graphite fibers in the cathode mix to improve conduc- tivity. The "as received" fiber bundles were fluffed with a Waring Blender prior to use. Polarization studies shown in Figure 16 indicate that a picric acid cathode containing 10% carbon
44

1.3
1.2
0.9
0.8
Elec
troly
te
1111
1111
111
Sat
urat
ed
(2.8
M)
AlC
13
:+:::
:: e:
.:.:.:
. :.:
.:.:.:
y:
::::::
. 2M
AlC
13
. . . .._
. f q 1M
A1C
13
Cat
hode
Lo
adin
q
80
f 10
mg
Picr
ic
acid
/in..2
Cat
hode
Fo
rmul
atio
n $
Picr
ic
Acid
Ac
etyl
ene
Blac
k t:
Dyn
e1 F
iber
,l/8
in.
PVP
Bin
der
z
Ano
de:
Mg
Allo
y AZ
31B
Cur
rent
D
ensi
ty:
500
ma/
in.2
I I
10
20
I 30
I
I I
40
50
60
Cou
lom
bic
Effic
ienc
y,
$
I 70
Figu
re
14.
Effe
ct
of
Alu
min
um
Chl
orid
e C
once
ntra
tion
on P
icric
Ac
id
Dis
char
ge
Cha
ract
eris
tics

Table 18
EFFECT OF PURE AND ALLOYED MAGNESIUM ON PICRIC ACID CATHODE EFFICIENCY
(Static Cell Test)
Cathode Composition: Picric Acid 45% Acetylene Black Carbon Fiber "2 PVP Binder 5;
Cathode Loading: 90 f 10 mg picric acid/in?
Electrolyte: 2M A1C13
Cutoff Potential: 0.8 v full cell -0.88 v vs SCE for alloys -1.05 v vs SCE for pure Mg
Anode
Cathode Coulombic Efficiency,
0
Primary Mg 28 - 38
AZ61B Alloy 42 - 43
AZ31B Alloy 40 - 48
46

1.2
rn
-I-, ;
1.1
>
0.8
Ano
de C
ompo
sitio
n
@
Mg
Allo
y AZ
31B
0 M
g Al
loy
AZ61
B l
Prim
ary
Mg
Ano
de T
hick
ness
: 5
mil
Elec
troly
te:
2M A
1C13
C
urre
nt
Den
sity
: 50
0 m
a/in
.2
Cat
hode
Fo
rmul
atio
n $
Picr
ic
Acid
Ac
etyl
ene
Blac
k t;
Dyn
e1 F
iber
,l/8
in.
PVP
Bin
der
Tem
pera
ture
: 25
'C
40
50
60
70
Cou
lom
bic
Effic
ienc
y,
$
Figu
re
15.
Dis
char
ge
Cha
ract
eris
tics
of
Picr
ic
Acid
C
atho
de
Agai
nst
'Pur
e an
d Al
loye
d M
agne
sium
A
node

I I
I I
I I
I I
Cat
hode
Lo
adin
g
2.1
- (o
cv)
80 m
g Pi
cric
Ac
id/in
.2
40
mg
Car
bon
Blac
k/in
.' 40
m
g C
arbo
n Fi
ber/i
n.2
PVP
Bind
er:
5% of
To
tal
Solid
s
Elec
troly
te:
2M A
lC13
An
ode:
M
g AZ
TlB
Allo
y Te
mpe
ratu
re:
25'C
100
I I
I I
1 I
I I
200
300
400
5oo
600
7oo
800
:
Cur
rent
D
ensi
ty,
ma/
in.'
) 100
Figu
re
16.
Pola
rizat
ion
of
Picr
ic
Acid
C
atho
de
Con
tain
ing
Car
bon
Fibe
r

fiber can maintain better than 1 volt vs magnesium at current drains up to 1000 ma/in.2 in 2M AlCle. Coulombic efficiencies of 18-20s were obtained from two discharge experiments at 1000 ma/in? using expanded magnesium AZ31B alloy as the anode in 2M AlCle.
(3) Dinitrobenzene and Other Nitro Compounds
(a) Electrolyte Screening
The data reported here for dinitrobenzene and certain other organic nitro compounds represent early work devoted primarily to initial tape configuration studies and electrolyte screening.
A tabulation of o-dinitrobenzene cathode efficiencies when dis- charged in various electrolytesis given in Table lg.
The best single neutral electrolyte found was 2M Mg(C104)2, and the best overall electrolyte was 2M A1C13. These electrolytes were therefore used in subsequent tests where other variables affecting discharge characteristics of the nitro compounds were studied.
The electrolyte studies were conducted with the basic (no fiber) type tape cathodes. Where only slight variations in cathode performance were observed, the order of effectiveness of the electrolytes is not defined clearly. However, the considerable advantage of 2M A1C13 over other electrolytes tested is evident. Its superiority as an electrolyte has also been confirmed in tests with picric acid on the improved (fiber type) tapes.
Two combinations of mixed electrolytes were tested with picric acid. A mixture of magnesium perchlorate with aluminum chloride was used to improve the ease of wetting of the electrodes. (Electrodes were wet more readily in 2M Mg(C104)2 than in 2M AlClo. ) The mixed electrolyte, 1.6M A1C13 and 0.4M Mg(C104)2 improved the reduction efficiency of o-DNB on tapes with high loadings as shown in Table 20. These tapes have extremely high loadings of depolarizer, and the effectiveness'of wetting the electrode is most critical.
A mixture of 2M A1C13 and 1M Li2Cr04 was tested as an electrolyte (Li2Cr04 is an inhibitor for magnesium attack). However, the chromate was reduced at more positive potentials than the nitro compounds, o-DNB and picric acid. In addition, either the chromate or its reduction products inhibited discharge of the nitro compounds even after the chromate adsorbed on the electrode was consumed, as shown by Table 21.
Organic acids were incorporated directly into the cathode coating to supply acid at the reaction site without causing corrosion of the magnesium anode. Initial attempts to improve discharge in neutral electrolytes of o-DNB by incorporation of oxalic acid in
49

EFFECT OF
DISCHARGE
Cell:
Electrolyte
Acid Salts
2M AlCls+
2M Th(NO&
Neutral Salts
2M J’kdC%d2
214 Mg( Cl%) 2
8~ NH&CN
4M NH*SCN
2M NH.&CN
3M NdC104!2
1M MgBr2
.5M NH4C104
1M MgBr2 saturated with Mg(OH)e
Table 19
ELECTROLYTE ON CATHODIC
EFFICIENCY AT 100 ma/in?
Mg/Electrolyte/o-DNB
Carbon:Depolarizer Ratio
50:50
50:50
Reduction Efficiency to 0.8 v
62 (at 200 ma/in?)
29
50:50 20-49
33:67 15,22 50:50 29
33:67 13920
33:67 13,18 50:50 19,15
50:50 17-25
50:50 18
50:50 9,12
::- FeClo, ZnC12 and AlCl 3 + NHbCl mixture proved too corrosive to the magnesium anode for use.
50

Table 20
EFFECT OF ELECTROLYTE ON CATHODIC DISCHARGE EFFICIENCY AT 200 ma/cm'
Cell: Mg/Electrolyte/o-DNB
Electrolyte
2M Mg(C104)2
o-DNB k7/in.2
0.125
Reduction fZf;c;e;cy
. , 0
26.4
1.6M A1C13; 0.4M Mg(ClO& 0.128 49.9 0.129 49.5
2M AlClo 0.111 33.0
Table 21
CELL DISCHARGES IN 2M A1C13 + 1M Li2Cr04
Efficiency Current of Reduction Amp-min Density Based on Cathode to 0.8 v
Cathode Material ma/in.2 Material only, % vs Mg
None 100 2.5
Picric Acid 500 203' 2.5
Picric Acid 100 54 3.2
o-Dinitrobenzene 500 20 2.5
* Normal efficiency in 2M AlClo is 40%
51

the tape were not successful. However, incorporation of solid acid (equal weights succinic acid with picric acid) in the new type fiber electrode gave increases in both discharge potential and reduction efficiency in 2M AlCl 3 as shown in Figure 17 for low current densities. At 500 ma/in?, (Figure 18) improvement in reduction efficiency was obtained in 2M A1C13. It is possible that an acid with higher water solubility might be more effective at higher current drains. This technique was not emphasized primarily because of weight penalty incurred compared with supplying acid directly in the electrolyte.
2,4,5-Trinitrotoluene (TNT) would not maintain 0.8 v vs magnesium at 500 ma/in.2 in 2M AlClo and was reduced at the lowest potentials of all the depolarizers in 2M Mg(C104)2 at 100 ma/in.2 as shown in Figure lg. The energy output of TNT may be improved by using a smaller particle size.
l-Carboxymethyl-3,3,5,5-tetranitropiperidine was almost completely inactive in the acid electrolyte, 2M A1C13. 2M Mg (C104)2 was flat,
Its discharge in but both reduction efficiency and discharge
potential were low, as shown in Figure 20.
2,5-Dinitrothiophene was discharged at higher potentials than the 2,4- isomer (see Figures 19 and 20) as would be expected from its structure (the nitro group in the 5- position is made more reactive to reduction by the electron withdrawing effect of the nitro group in the 2- position). Both isomers had flat discharges in 2’M Mg( Clod 2 at 100 ma/in.2, but efficiencies were low. The 2,5- isomer did not maintain 0.8 v vs magnesium in 2M AlClo at 500 ma/in.2 (See Figure 21).
2,5-Dinitrothiophene was checked on fiber-type electrode configura- tions. Efficiencies of reduction were the same on both type electrodes in 2M Mg(C104)2 at 100 ma/in.2 (13%) and in 2M AlCls at 100 ma/in.2 (38$), indicating that the depolarizer activity and not the limits of the electrode configurations were measured on both type electrodes.
3,6-Dinitrophthalic acid has the advantage of having two equivalents of acid in its mol, :ule. It is also very soluble in water. It had a high potential 100 ma/in.2
in the early part of the discharge at in 2M Mg(C104)2 (Figure 20) but did not maintain
higher current drains well. Its theoretical capacity is low compared with that of picric acid and it appears to offer no advantage to compensate for this.
(b) Particle Size of Depolarizer
The coulombic efficiency of the m-DNB/Mg couple in 2M MgC12 increased from 8 to 25% as the particle size of the m-DNB was reduced from 200 to 48 I-(, respectively.
52

1.3
0-i
0.6
Succ
inic
Ac
id
Picr
ic
Acid
m
g/in
.2
mg/
in.2
0 68
68
A 37
37
I I
1 I
I I
I
0 20
40
60
a0
1(
Picr
ic
Acid
C
onsu
med
, $
Figu
re
17.
Effe
ct
of
Succ
inic
Ac
id
on
Stat
ic
Dis
char
ge
Cha
ract
eris
tics
of
Picr
ic
Acid
in
2M
A1C
13 a
t 10
0 m
a/in
.2

1.4
* r-i
2 0.
8
0.6
Picr
ic
Acid
m
g/in
.2
0 60
A 47
Succ
inic
Ac
id
mg/
in.2
60
---
10
20
30
40
50
60
Picr
ic
Acid
C
onsu
med
, $
Figu
re
18.
Effe
ct
of
Succ
inic
Ac
id
Con
tent
on
St
atic
D
isch
arge
C
hara
cter
istic
s of
Pi
cric
Ac
id
in
2M A
lCls
at
50
0 m
a/in
.2

1 . 4
d1.0
2 0.
9
0.8
10
Dep
olar
izer
l 2,
5-D
initr
othi
ophe
ne
0 Pl
cric
Ac
id
0 o-
DN
B
cl
2,4,
5-Tr
initr
otol
uene
2u
30
Dep
olar
izer
C
onsu
med
, $
Figu
re
19.
Stat
ic
Dis
char
ges
of
Vario
us
Dep
olar
izer
s in
2M
Mg(
C10
4,)2
at
10
0 m
a/in
.*

0.8
Dep
olar
izer
3,6-
Din
itrop
htha
lic
Acid
l 2,
4-D
initr
othi
ophe
ne
B 1-
Car
boxy
lmet
hyl-3
,3,5
,5-
tetra
nitro
pipe
ridin
e
3,6-
Din
itrop
htha
lic
Acid
2,4-
Din
itrot
hiop
hene
l-Car
boxy
lmet
hyl-3
,3,5
,5-
tetra
nitro
pipe
ridin
e
Dep
olar
izer
C
onsu
med
, %
Figu
re
20.
Stat
ic
Dis
char
ge
of
Vario
us
Dep
olar
izer
s in
2M
Mg(
C10
4)*
at
100
ma/
in.2

0.6
0 2,
5-D
initr
othi
ophe
ne
A o-
DN
B
0 Pi
cric
Ac
id
3,6-
Din
itrop
htha
lic
Acid
I I
I I
I I
1 I
I
0 10
20
30
40
50
D
epol
ariz
er
Con
sum
ed,
%
Figu
re
21.
Stat
ic
Dis
char
ges
of
Vario
us
Dep
olar
izer
s in
2M
AlC
13
at
500
ma/
in.*

Reduction of particle size of o-DNB to 48 v, however, did not increase reduction efficiency. Particle sizes of other depolarizers (except TNT) were similar to that of o-DNB. The particle size of TNT was slightly larger. Since TNT has very low solubility in water, its cathodic discharge may be improved by particle size reduction. The relatively high solubility of potassium periodate and picric acid eliminates particlesize as a major discharge parameter.
(c) Catalysts
Palladium appeared to catalyze the discharge of o-DNB in 2M A1C13. The best test result gave an increase of 0.2 v in the discharge potential of o-DNE3 at 200 ma/in? (Figure 22) for a 1.2% loading of palladium+ Catalysis was evident in a duplicate tape at low current densities but was ineffective at 500 ma/in.'. This same cathode composition exhibited no catalytic effect in 2M Mg(C104)2. Another catalyst formulation, 2.5% palladium prepared by chemically reducing palladium on Shawinigan black by hydrazine, exhibited only a minor catalytic effect with o-DNB in 2M A1C13 (Figure 22). Similarly, small increases in discharge potential were obtained with picric acid as depolarizer. Palladium has been reported as a catalyst for m-DNB in sulfuric acid electrolyte (ref. 4).
(4) Trichlorotriazinetrione and Hexachloromelamine
The active halogen compounds trichlorotriazinetrione (also known as trichloroisocyanuric acid) and hexachloromelamine both have theoretical energy densities over750-watt-hr/lb cell when coupled with magnesium. Little work has been done with these materials in improved electrode configurations, but preliminary experiments with both pressed powder and slurry casttape electrodes in a variety of electrolytes have shown that they can be discharged successfully at practical current drains. Some representative data are contained in Table 22.
The operating voltages for both trichlorotriazinetrione (Figure 23) and hexachloromelamine are close to 2.0 volts. The hexachloromelamine data represents the best single run. Wet out difficulties were encountered due to the nature of the coating. Use of latest electrode manufacture technique should result in improved operation.
In addition to their significantly higher energy capacity compared with electrodes described above, these active chlorine compounds offer several other advantages. Since neutral electrolytes can
$t 5% palladium on carbon, Englehard Industries, Inc., Newark, New Jersey
58

1u
20
30
40
50
Dep
olar
izer
C
onsu
med
, $
Figu
re
22.
Effe
ct
of
Cat
alys
ts
on
Stat
ic
Dis
char
ge
of
o-D
initr
oben
zene
at
C
arbo
n C
atho
de
in
2M A
1C13
at
20
0 m
a/ir,
.*

Cat
hode
C
ondu
ctor
Tabl
e 22
DIS
CH
ARG
E C
HAR
ACTE
RIS
TIC
S O
F AC
TIVE
C
HLO
RIN
E C
ATH
OD
ES
ANO
DE-
-Q
AZ31
B AL
LOY
Cat
hode
C
atho
de:C
ondu
ctor
El
ectro
de
Cur
rent
Ef
ficie
ncy
Volu
me
Rat
io
Elec
troly
te
Tme
Den
sity
to
15
v
ma/
in?
k -
2,4,
6-Tr
ichl
orot
riazi
netri
one
2,4,
6-Tr
ichl
orot
riazi
netri
one
2,4,
6-Tr
ichl
orot
riazi
netri
one
g 2,
4,6-
Tric
hlor
otria
zine
trion
e
2,4,
6-Tr
ichl
orot
riazi
netri
one
2,4,
6-Tr
ichl
orot
riazi
netri
one
Hex
achl
orom
elam
ine
Gra
phite
A-
625
1:l
4M L
iBr
pres
sed
pow
der
100
60
Gra
phite
~-
625
1:l
2M
NaC
l pr
esse
d po
wde
r 10
0 55
Gra
phite
A-
625
and
1:l
2M M
g(C
104)
e pr
esse
d po
wde
r 10
0 50
Ac
etyl
ene
Blac
k M
ix.
Gra
phite
~-
625
1:l
2M A
lCls
pr
esse
d po
wde
r 10
0 50
Acet
ylen
e Bl
ack
1:l
2M M
g(C
104)
2 w
ater
sl
urry
10
0 49
Acet
ylen
e Bl
ack
1:l
2M M
g(C
104)
2 he
xane
sl
urry
10
0 50
Acet
ylen
e Bl
ack
1:l
2M M
g(C
104)
a w
ater
sl
urry
10
0 30

+1.2
+o.s
+0.4
0
-0.4
-0.8
-1.2
F Si
ze:
1 in
. x
3 in
. 5
0.01
0 bp
prox
) C
urre
nt
Den
sity
:100
m
a/in
.2
Cou
lom
bic
effic
ienc
ies
from
45
% to
73
%
:
2.e
2.4
2.0
1.6
1.2
0.2
0.4
0 0
3 6
9 12
15
18
21
24
Tim
e (M
inut
es)
Figu
re
23.
Typi
cal
Dis
char
ge
Cur
ves
of
trion
e ca
thod
e 2,
4,
6,
-Tric
hlor
otria
zine
-

. . . . -, . . . . . . . . . -- ,-... ,. .- . . . . . . . . . . ..., . . . . . . ---.- . . . . ..- ~
be used, anode corrosion can be reduced, and the severe weight penalty incurred by acid electrolyte can be reduced. Graphitgc conductors and higher packing densities (up to 60% compared with 20-30s for other cathodes studied) may be employed which will result in thinner and mechanically more stable tapes.
At the present time, these materials offer the most promise for achieving in an aqueous system an ltimate goal of 200 watt-hr/lb delivered in a final package.
4. Conclusions
High energy couples can be discharged efficiently at high current drains in the dry tape electrode configurations. Efficiencies of 80% at 500 ma/in.2 are obtained with potassium periodate and picric acid when discharged versus magnesium in an acid electro- lyte. The potassium periodate-magnesium cell operates at 1.9-2.1 volts while the picric acid-magnesium cell operates at 1.0-1.2 volts. Both periodate and organic nitro compound cathodes require large amounts of acid for satisfactory discharge. Electrolyte requirements for the periodate system comprise about 60% of total cell weight. The electrolyte weight burden makes ultimate power densities substantially higher than 100 watt- hr/lb unlikely for these systems.
Magnesium, in a tape configuration, can be discharged efficiently with no gassing polarization in acid aqueous electrolytes com- prised of aluminum chloride or mixed aluminum chloride-hydro- chloric acid.
Tape electrode configuration and operation capability appears to be applicable to high energy couples in general. Incorporation of more active components can now proceed with a minimum of electrode design work required. In preliminary studies, the active chlorine compounds, hexachloromelamine and trichloro- triazinetrione, were discharged versus magnesium in neutral electrolyte at 100 ma/in.2 with a 2.0 volt cell emf using a standard cathode tape configuration.
62

c. INCAPSULATION
1. Background
The operation of the tape battery requires the supply of a suf- ficient quantity of electrolyte to the discharge area for effi- cient discharge. The electrolyte must be storable and compat- ible withstop-start operation.
Three methods of meeting these requirements have been examined: (1) a bottle-pump system; (2) macroincapsulation; and (3) micro- incapsulation. With the latter two methods, the metering of electrolyte is inherent in the design; the first requires some means of metering, Microincapsulation (capsule size under 1000 cl) also offers the possibility of incorporating the electrolyte <T;Ithin the tape itself.
In considering the method for electrolyte supply, the amount and fraction of tape weight due to electrolyte must also be con- sidered. As discussed elsewhere in this report, the electro- lyte weight is a large portion of the total tape weight. There- fore, the method of supply must provide a high payload of elec- trolyte, both initially and after extended storage. In micro- or macroincapsulation, the capsule wall thickness must be min- imized to provide a high payload. The smaller the capsule size, the thinner the wall must be to maintain the same payload. Consequently, the wall material must be more impermeable to meet storage requirements. The bottle-type supply eliminates this problem. It is effectively a giant macrocapsule and provides high payloads irrespective of the wall thickness.
The present contract effort was concentrated on macroincapsula- tion of aqueous electrolytes. Some work on microincapsulation was subcontracted to the Southwest Research Institute. This work indicated that microincapsulation of aqueous electrolyte would fulfill requirements only under special conditions. Micro- incapsulation may be useful for nonaqueous electrolytes or, in certain cases, for cathode or anode materials. A bottle-type system was not investigated other than to estimate the weight involved for purposes of comparison.
2. Macroincapsulation
a. Design Considerations
An electrolyte feed rate of 200 mg/in.2 of tape was used as a basis for designing a macroincapsulation system. While this was considerably in excess of theoretical requirements for originally anticipated capacities of 1 amp-min/in.2, excess electrolyte will always be required to wet the active components and separa- tor. A supply method such as that in Figure 24 was considered for using a single string of packets to supply two tapes. This
63

Hea
t Se
als
Mac
roin
caps
ulat
ed
Figu
re
24.
A Pr
opos
ed
Con
figur
atio
n fo
r Ta
pe-E
lect
roly
te
Inca
psul
atio
n

arrangement offers the advantages that (1) the container mater- ial is not on the tape surface and will not interfere with the discharge, and (2)puncture of the capsule followed by passage through rollers will efficiently distribute electrolyte to the two tapes with little loss. The packet width would be varied to supply the desired quantity of electrolyte. A summary of pre- liminary payload calculations for th$s type of incapsulation is given in Table 23. The cylindrical cross-section shows not only a higher initial payload than the elliptical cross-sections but also lower loss on storage because of the lower surface- to-volume ratio.
Further work discussed below led to selection of tubing for in- capsulation since it provided higher payloads and greater re- liability than packets formed from film sealed on all sides. To supply the quantity of electrolyte requir.:d, the tubing must be sized to the tape dimensions, loading, and number of tapes. To cover the anticipated range of electrolyte requirements and to allow rapid estimation of payloads for design purposes, the volumetric capacity and payload of various tubing sizes should be known. The volumetric capacity of a tube is easily calculated from its dimensions. To allow for the reduction of this capa- city due to heat seals, payloads were determined experimentally on finished packets made from several sized of tubing. Using these datat a "squash factor" was calculated for each size tube where the 'squash factor", @, is the ratio of the experimentally determined volume to the calculated volume of the tube. As would be expected, B decreases as the tube size increases, as sh 0Nt-l
1.
0.
0.
0.
in Figure 25.
8-
6-
P = actual volume calculated volume
41 4- I I I I I I I I I I
0 0 0.1 0.1 0.2 0.2 0.3 0.3 0.4 0.4 0.5 0.5 Tube Diameter, in. Tube Diameter, in.
Figure 25. Figure 25. Reduction in Capacity of Kel-F 81 tubing Reduction in Capacity of Kel-F 81 tubing Due to Heat Seals Due to Heat Seals
65 65

Table 23
CALCULATED PAYLOAD AND SURFACE AREA-TO- VOLUME RATIO FOR CAPSULES OF ELLIPTICAL CROSS SECTION-x
Axis of Ellipse,
mils
Major Minor
300 10
150 10
150 20
130 130
Internal Volume
cc
0.20
0.10
0.15
0.20
-
Initial Payload wt-%
82
80
83
90
Surface Area per
Unit Volume cm-l
40
51
28
13
payload%% 3 Years wt-%
60
65
68
80
+ ' Capsule length - 1 in.; film density - 2.1 g/cc; film thickness - 1 mil; electrolyte density - 1 g/cc, includes allowance for heat seals
+++* Assuming 50% relative humidity difference at 25OC and film permeability of 0.002 g-mm/24 hr-sq m-cm Hg
66

-
The squash factor will also vary with wall thickness and type of material. The calculated payload and capacity for tubing cover- ing the estimated range of electrolyte requirements is shown in Figure 26. Experimental payloads are shown for comparison.
The effects of wall thickness and film density parameters on payload are readily apparent in Figure 26. Initial payloads and tubing sizes for a specified electrolyte requirement can readily be obtained by reference to Figures 25 and 26. Further varia- tion in liquid capacity can be achieved by changing the packet length. Other factors needed to complete the incapsulation specification are film permeabilities (i.e., loss rates) and electrolyte release efficiency. Experimental results on loss rates of electrolytes from capsules under various conditions are given in a later section. Work on electrolyte release indicates that at least 90% of the incapsulated electrolyte can be trans- ferred to the tape.
b. Incapsulating Materials
Since electrolyte weight will be a major portion of the total weight of a completed system, it is necessary to obtain a high payload of electrolyte. This requires use of the thinnest, least dense containing materials consistent with permeability require- ments. For the configuration illustrated in Figure 24, initial payloads greater than 80% are obtainable with film thicknesses of 1 to 2 mils (depending on film density) as the calculations summarized in Table 23 show. Payloads greater than 60% are obtained after three years if the film permeability is of the order of 0.002 g-mm/24 hr-sq m-cm Hg.
From these considerations and the general characteristics desired, thermoplastic films are the choice for capsule material. Thermo- plastics also offer the advantage of relatively simple capsule fabrication by conventional sealing methods, the seals generally being at least as impermeable as the film. Permeability and density data of the more impermeable thermoplastic materials available as thin films are summarized in Table 24. It is appar- ent that a film thickness greater than 2 mils is needed with most thermoplastics to obtain the low electrolyte loss level with aqueous electrolytes.
c. Capsule Fabrication
Of the numerous methods for sealing or joining thin thermoplas- tic films, thermal impulse and ultrasonic sealing have the widest applicability to the materials of interest in this work. A thermal impulse sealer, Sentinel Model 12-12AS, was used to pro- duce capsules of Aclar, ate), etc.,
Scotchpak 25A2O (a Mylar- aluminum lamin- and polyethylene films with satisfactory results.
Integral seals of good strength were obtained on all materials after the proper sealing conditions had been established. Both
67

l/a
Tubi
ng
I.D.,
in.
1 r-:
$:2
l/4
5/16
l/2
11
I,
1 I
I
1 m
il,
p=2
or
2 m
il p=
l W
Expe
rimen
tal
Res
ults
fo
r H
eat-
Seal
ed
Kel-F
81
Tubi
ng
(1 i
n.
Pack
et
Leng
th)
Film
I.D
. Th
ickn
ess
Liqu
id
wat
er
2M A
lCls
an
d 1M
HC
1 0
5/16
w
ater
&I
5/1
6 ::;
w
ater
is
'1%
z
wat
er
2M M
gC10
4 A
l/8
0 3/
64
:-'
wat
er
wat
er
I I
I ,
I I
L I
Figu
re
26.
0.6
0.9
1.2
1.5
1.8
2.1
2.4
2.7
3.0
3.3
Liqu
id
Cap
acity
, C
C/in
a2
Cal
cula
ted
Film
Th
ickn
ess-
Den
sity
-Pay
load
R
elat
ions
hip
for
Tubi
ng
With
out
Hea
t Se
als
and
Com
paris
on
with
Ac
tual
In
caps
ulat
ions

P
P
Mat
eria
l
Teflo
n FE
P Ty
pe
A
Teflo
n TF
E Ty
pe
HB
Acla
r Ty
pe
33C
Acla
r Ty
pe
33C
Kel-F
-81
(Tub
e)
Myl
ar-A
lum
inum
-Myl
ar
Poly
ethy
lene
Poly
prop
ylen
e 0.
9 0.
06
Sara
n 1.
2-1.
7 0.
01-0
.03
Myl
ar
1.4
0.05
-0.1
s
Thic
knes
s M
ils
2,
3
2 2 5
2,
2.5,
3.
5
1-0.
5-l
1,
2
Appr
ox.
Den
sity
g/
cc
2.15
2.1-
2.2
2.12
2.1-
2.2
1.1
0.9-
0.96
Tabl
e 24
PER
MEA
BILI
TY T
O G
AS A
ND
WAT
ER VA
POR
OF
INC
APSU
LATI
ON
FIL
MS
Wat
er
vapo
r1
Perm
eabi
lity
g-m
m/2
4 H
r. m
2-cm
Hg
at
25'C
0.00
2
0.01
53
0.00
34
0.02
-0.0
8
Gas
Per
mea
bilit
y1
cc(S
TP)-
mil/
lOO
in
.2-2
4 H
r-atm
at
75
°F
Poly
mer
Ty
pe
Cop
olym
er
TFE
and
HFP
con
- 16
02
- 7
CO
2 -
1000
02
-
350
CO
B -
5 0 2
-l
co2
- 25
0 2
-8
Poly
tetra
fluor
oeth
ylen
e
Poly
trich
loro
ethy
lene
Poly
trlch
loro
ethy
lene
Viny
liden
e ch
lorid
e Vi
nylc
hlor
ide
copo
lym
er
Poly
este
r
1 D
ata
from
re
f.12
for
wat
er
vapo
r tra
nsm
issi
on
and
ref.
5 fo
r ga
s pe
rmea
bilit
y
2 Es
timat
ed
from
va
lue
of
O.O
15g/
lOO
in
* -
24
hr.
for
2 m
il fil
m
at
lOO
OF
and
90%
rela
tive
hum
idity
(R
H),
ref.
5.
s Es
timat
ed
from
da
ta
of
Siva
djia
n an
d R
ibei
ro,
ref.
14
4 Es
timat
ed
from
va
lue
of
O.O
2g/lO
O
In2
- 24
hr
. at
lO
OoF
, re
f. 16
5 Es
timat
ed
from
va
lue
of
110
g-m
m/1
00in
.2-h
r. at
10
3°F
and
95%
FfH
, re
f.12
Supp
lier
E.
I. D
uPon
t W
ilmin
gton
, D
el.
Die
lect
rix
Cor
p.
Farm
ingd
ale,
L.
I.
New
Yor
k
Allie
d C
hem
ical
M
orris
tow
n,
N.
J.
Car
mer
In
dust
ries
Pars
ipin
ee,
N.
J.
Adam
Spe
nce
Cor
p.
Uni
on,
N.
J.
3-M
C
ompa
ny
St.
Paul
, M
inn.

tetrafluoroethylene-hexafluoropropylene copolymer (FEP) and tetrafluoroethylene (TFE) types of Teflon sheet have been sealed without undue problems. The TFE Teflon sheet-;t was supplied with one surface treated to make it heat bondable.
To form incapsulations from film material, the film was first sealed down two sides and at one end to make a tube of the desir- ed length. The tube was then filled with the required liquid and heat sealed at intervals from the closed end to form a string of packets. When tubing was used as the starting mater- ial, the tube was sealed at one end and filled, and seals were made at intervals, normally one inch apart.
A narrow heat seal is desirable to minimize reduction of capsule payload due to seals. The upper head of the heat sealing unit was redesigned to reduce the clamping width from one in. to 3/16-in. The seal width was also reduced by using l/16-in. wide heating ribbon rather than the l/8-in. ribbon originally supplied. Occasional failure of the thinner heating ribbon has been mini- mized by lowering the tension on the ribbon proportionately. A partial cross section of the modified sealing head is shown in Figure 27 with the heads in the open position.
8.9 mil Heating Ribbon
FULL SCALE
Removable Glass Teflon Shades e
Silicone Rubber Clamping Pads
Figure 27. Cross Section of Modified Heat Sealer Head
tc.
X- Dilectrix Corp., Farmingdale, L.I., N.Y.
70

The heat sealer* provides control of a wide range of sealing variables, allowing almost any thermoplastic film to be heat sealed. Jaw clamping pressure, clamping time, heat impulse time, and heater voltage can all be varied independently to determine the conditions required for a particular type of film.
Final incapsulation manufacture from the selected Kel-F 81 tubing was readily accomplished in the lengths required with our pre- sent equipment. Finished incapsulations were rapidly tested by short-term (2-3 days) measurement of weight loss in vacuum at 39” c. A defective incapsulation can be detected by this test. Some of the finished incapsulations are shown in Figure 28.
d. Capsule Electrolyte Loss
The transmission of a vapor or gas through a polymer film takes place primarily by a diffusion controlled mechanism, wherein the gas dissolved in one surface of the film, passes through by an activated diffusion process, and evaporates from the opposite surface. Under steady-state conditions, and assuming that the diffusion coefficient, D, is not concentration dependent, the rate of permeation through the film per unit area, q, can be expressed by
q = Dh-c21_ t (1)
where this film thickness, and cl and c2 are the concentrations at the high and low pressure surfaces, respectively. AppW.w Henry's law,
q - DS(PYP,) t (2)
where S is the solubility of the vapor in cc/cc of polymer at a pressure of 1 cm Hg with the volume corrected to S.T.P., and p is the vapor pressure. The permeability c nstant, P, may be defined as cc of gas at S.T.P. permeating per second through a film of 1 cm2 area and 1 mm thickness under a pressure differ- ence of 1 cm Hg and may be expressed as
P = DS = tq Pl'P2 (3)
For gases, P should be independent of thickness and pressure, while for vapors it may increase with pressure.
The temperature dependence of P may be expressed as an Arrhenius relationship:
P = P,exp(-~~/E3~) (4)
+ Sentinel Model 12-12AS, Packaging Industries, Montclair, N.J. 71

1.
Al-M
ylar
, 2.
5-m
il w
all
4.
Kel-F
81
, l/8
in
. x
2.5-
mil
wal
l 2.
FE
P Te
flon,
2-
mil
wal
l 5.
and6
. Ke
l-F
81,
l/2
in.
x 6-
mil
wal
l 3.
Ke
l-F
81,
5/16
-in.
x 3-
mil
wal
l 7.
sa
me,
2
in.
pack
et
leng
th
Figu
re
28.
Inca
psul
a,te
d El
ectro
lyte
C
onfig
urat
ions
Fo
rmed
by
H
eat
Seal
ing

where "p:
is the activation energy associated with the overall permeat on process, and PO is a constant. Since both the diffusion coefficient and the solubility depend on temperature, equation (4) will usually only approximate the temperature dependence of P. For pinhole-free films showing very low solubility for a vapor, the above relations should be quantitative and independ- ent of whether a liquid or its vapor contact the film. The results should also be independent of the level of the relative humidity difference.
(1) Method
Various methods (refs. 5 through 10) have been employed to mea- sure the permeability of thin films. employed by Barrer (ref.
A diffusion cell method, 5), depends on measurement of the pres-
sure rise with time in a previously evacuated chamber that is sealed by the test sample. A modification of the Patra method (ref. 7) involves weighing a dish, filled with desiccant, enclo- sed by the film and stored in a cabinet of constant temperature and humidity. A hydrophotographic method, depending on the sen- sitivity of a double silver and mercury salt to moisture, has been developed recently by Sivadjian (ref. 11). It should be noted that considerable variations in measured permeabilities have been found for different samples of the same material and for different measurement methods.
For our purposes, it was felt that tests on the completed in- capsulations would be desirable since the results would then include any effects tif heat seals, handling, etc. The gravi- metric method used involves storing of capsules under the desired conditions and weighing them at intervals of time depending on the loss rate expected. The permeabilities of the films used are so low that the time during which the capsules were re- moved from controlled conditions for weighing is negligible com- pared to the total storage time and should not have affected the test results.
Three test conditions were used in the evaluation of incapsula- tions-ambient storage (approximately 25OC and 50% R.H.), and storage under vacuum at 25'C and 39°C (0% R.H.). Capsules of various dimensions were sealed as described in Section II.C.2.C. Water, 34 Mg (Cl04 12, 2M AlC13, and 30% KOH have been incapsula- ted in the films selected for tests. Physical data on the types of capsules tested are given in Table A-3 (Appendix).
Composition analyses were also made for incapsulations of aque- ous potassium hydroxide to determine the relative effects of moisture loss and carbon dioxide up take through the capsule wall. In these tests, the composition of electrolyte was deter- mined by standard titration methods using capsules stored for various lengths of time.
73

(2) Test Results
(a) Water Incapsulations
Lnitial tests of finished packets were made with water in a number of candidate films at ambient conditions. Test data on these capsules formed by thermal impulse sealing are summarized in Table 25 and Figure 29. While the 1-mil polyethylene cap- sule shows a large weight loss, the film density is low and, consequently, the payload is high. However, extrapolation of the data obtained indicates that after 100 days, the polyethylene capsule payload would be below that of the Al-Mylar capsule and below that of the Aclar film in 150 days. Use of a thicker polyethylene film would lower the initial payload but improve the slope of the payload versus time curve. It is necessary that the payload be essentially constant so that the quantity of electrolyte supplied will show no variation with time.
For comparison of weight loss data on films, all capsules should have the same specific surface area, i.e., the same area per unit volume of liquid incapsulated. This is illustrated by the results shown in Figure 30 for Aclar capsules with different specific surface areas. Obviously, the higher the specific surface area, the greater the percentage weight loss shown. A better compar- ison of film materials is obtained when packet dimensions vary by using the weight loss per unit area as shown in Figure 31. Here, the same incapsulations indicated in the previous illus- tration show about the same weight loss per unit area. Com- parison of weight loss data for packets made from various films is shown in Figures 32, 33, 34 and 35.
The data are shown as weight loss per unit area of capsules, the area being estimated from the physical dimensions of the incap- sulation. The fluorohalocarbon materials (Figure 32) show the lowest vapor transmission, with consistent results being obtained except for incapsulation number 4. The jump shown here after 14 days is believed to be due to a loss of a small portion of the film in handling since the continuation of the tests shows the same loss rate as obtained in the initial portion of the test. The Al-Mylar incapsulations show a much wider range of vapor transmission rates (Figure 35), the lowest of these rates being comparable with those obtained on the fluorohalocarbons. The wide variation is believed due to the heat seals since the higher loss rates were usually from capsules with proportionately greater heat seal length. The vapor transmission rates of FEP and TFE types of Teflon (Figure 33) are consistently higher than those of the fluorohalocarbon materials tested, With the exception of capsule E20, which showed a rapid increase in transmission after 25 days, the results are consistent. The increase noted with E20 is believed due to a failure of a small portion of the seal. The polyethylene incapsulations showed high loss rates (Figure 34) as expected, and would be unsuitable for most applications even though the film density is low.
74

Tabl
e 25
TEST
DAT
A O
N T
KER
MAL
-IMPU
LSE S
EALE
D W
ATER
MAC
RO
CAP
SULE
S
Test
C
ondi
tions
: Am
bien
t Te
mpe
ratu
re
(25'
C),
atm
. pr
essu
re
40 t
o 50
% r
elat
ive
hum
idity
Film
Th
ick-
ne
ss
mils
Film
W
eigh
t g
Liqu
id
Load
ing
cc/in
.
Surfa
ce
Area
/Uni
t W
eigh
t in
.2/g
Initi
al
Payl
oad
Payl
oad
Afte
r w
t-$
wt-$
D
ays
Rem
arks
2.5
0.03
2 0.
33
1.56
83
.8
70
82.8
Si
ngle
pa
ck
No.
1
Mat
eria
l
Al-M
ylar
25
A20
;31
Poly
ethy
lene
Acla
r
Acla
r
FEP
Teflo
n
0.19
0 6.
9 0.
44
99.1
0.28
8 0.
5 1.
03
72.2
1.32
2 0.
91
1.40
75
.6
0.41
9 0.
088
5.7
43.3
70
90.2
50
72.1
21
75.3
Som
e ai
r in
ca
psul
es
6 7
0.31
1.
93
69.5
0.17
6.
5 78
.2
Acla
r
EL-F
81
Tubi
ng
2 3.5
0.55
2
0.33
5 11
78
.0
Proj
ecte
d
pay1
0ad6
: ;;"
;" J
Al-M
ylar
25
A20
8 2.
5 0.
223
0.21
4.
8 81
.9

2
Cap
sule
M
ater
ial
and
Spec
ific
Surfa
ce
No.
Th
ickn
ess:
M
I1
Area
,in.2
/cc
i
cl1
AI-M
ylar
, 2.
5
0 3'
Po
lyet
hyle
ne,
1 Ac
lar,
5
A 0
c&E8
Ac
lar,
2 ---
7
Kel-F
81
,3.5
0
8 Al
-Myl
ar,
2.5
1.5
0.4 1.0
1.9
6.5
4.8
/
0 /
/ /’
0 1
A
40
80
120
160
200
240
280
320
360
400
Stor
age
Tim
e,
(day
s)
Figu
re
29.
Wei
ght
Loss
of
W
ater
fro
m
Vario
us
Shap
e C
apsu
les
at
Ambi
ent
Con
ditio
ns

0 10
20
30
40
50
60
70
U
O
Tim
e,
days
Fi
gure
30
. C
ompa
rison
of
W
ater
In
caps
ulat
ions
in
Ac
lar
with
D
iffer
ent
Spec
ific
Surfa
ce
Area
s

4 W
El,
8,9-
Acla
r 2
mil
0.8
- 0 0
10
20
30
40
50
60
70
80
Tim
e,
days
Figu
re
31.
Wei
ght
Loss
D
ata
for
Wat
er
in
Acla
r at
Am
bien
t C
ondi
tions

3, Aclar 5 mil 4,6-Aclar 2 mil 7-Kel-F 81 3.5 mil
4
0 I 0 10 20 30 40 50 GO
Time, days
Figure 32. Weight Loss Data for Water Incapsulation in Fluorohalocarbon Films at Ambient Conditions
- 0
.’ 2 /
12-
/ - 5, E20-2 mil FEP A’ n ~21-3 mil FEP 9 ,-0’” E17, 18, 18, 22-2 // 16 mil/rFE 22,=
I
E20 / El&' //
0 10 20 30 40 50 60 Time, days
Figure 33. Weight Loss Data for Water Incapsulaticins in Teflon at Ambient Conditkns
79
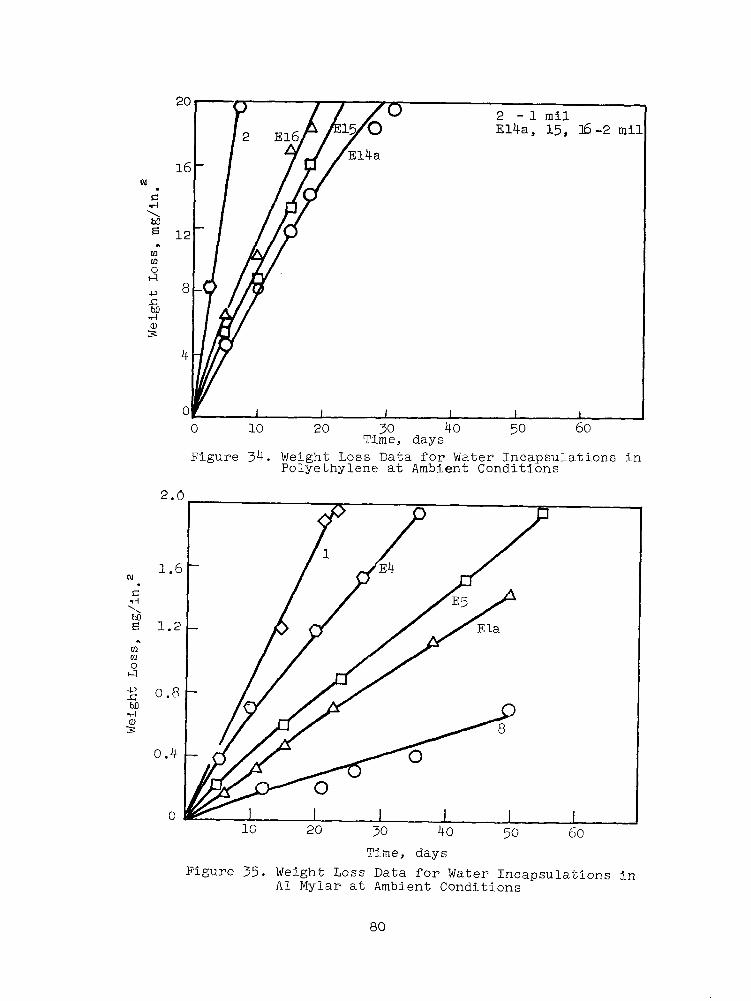
0 10 20 *I;: 40 50 b0 , days
Figure 34. Weight Loss Data for Water Incapsulations in Polyethylene at Ambient Conditions
Time, days Figure 35. Weight Loss Data for Water Incapsulations in
Al Mylar at Ambient Conditions
80

Permeability constants calculated from the vapor transmission rates are compared with values obtained from the literature in Table 26. Considerable disparity is evident in several cases, depending on the source of the values. Good agreement is evident for the fluorohalocarbon films except for reference 6 whose values are a factor of ten greater than ours. Both the Kel-F and Aclar films show very low permeability to moisture.
A comparison of materials from a per cent weight loss stand- point is shown in Figure 36 for incapsulations having approxi- mately the same surface area per unit weight of liquid. The superiority of the Aclar film is evident.
(b) Electrolyte Incapsulations and Temperature Effects
Work discussed in the previous sections indicated that incapsula- tions with the desired payloads and loss rates could be attained best by heat-sealing packets from Kel-F 81 tubing. Limitations on minimum wall thickness in custom extrusion of this material currently range from 2.5 mil for l/8-in. I.D. to 5.5 mils for l/2-in. I.D. A 2.5 mil wall tube in l/2-in. I.D. could also be obtained by forming a tube from film using ultrasonic sealing. However, the increase in payload with larger tube sizes tends to make the increase in wall thickness acceptable.
Weight losses were determined for incapsulations of water, 2M W (Cl04 > 2, 2M AlC13, and 30% KOH in Kel-F 81 tubing. These sol- utions can be contained satisfactorily in the heat-sealed pack- ets. Weight loss data at ambient conditions with and without vacuum and with vacuum at 39°C are shown in Figures 37 through 40, All incapsulations were in Kel-F 81 tubing of equal lengths and are therefore directly comparable. Physical data on these incapsulations are given in Table 27.
A reduction in loss rate due to the presence of electrolyte is evident when the loss rates are compared with those for pure water. The decrease in loss rate is of the order expected as a result of the lowering of the vapor pressure of water by the salts; the greater the molar concentration of salt, the lower the loss rate should be. It is evident that 30% KOH (about 5 molar) reduced the loss rate significantly more than 2M AlCls or 2M Mg(C104)s. The 2M AlCls was more effective in reducing the loss rate than 2M Mg(C104)z because the former hydrolyzes to pro- duce acid, which in effect increased the molar concentration of solute present.
These effects on loss rate show up more clearly in Table 28, in which the permeability constants calculated from the experimental results are listed. Under ambient conditions, the loss rate was so low that experimental errors masked the effect of the sol- ute. Also, under these conditions, the permeation of carbon dioxide into the capsule affected the loss rate measured for potassium hydroxide as discussed below. Under vacuum conditions the results fall into the order expected.
81

Table 26
COMPARISON OF PERMEABILITY CONSTANTS ESTIMATED FROM THIS WORK AND AVAILABLE LITERATURE
Material
Polytrifluoro- chloroethylene
KEL-F 81
Permeability Sample Constant Thickness Test Reported Estimated at 250~~ Literature Mlls Conditions Value - -- g-mm/24 hr-ma-cm Hg Reference -~
25Oc 0.015-0.180 g-m 0.015-0.180 12 24 hr-ma-cm= 0.00 13
6.1 25'c Liquid 0.0015 g-m m2-hr 0.015 14
KEL-F 81 Vapor
KEL-F 300 25T
KEL-F 300 peg 25Oc
Aclar 33C Aclar 33C
Aclar 33C Aclar
KXL-F 81
Teflon TFE
Teflon TFE
Teflon FEP
Teflon FEP
Teflon FEP
1 2
2 5
3.5
(Type HB) 2
25Oc
25Oc
1.77 25'? Liquid
Vapor
: {;r::;Rt[ >
0.0015 g-mm FiTFir
2.9 x 10~~~ CC-~ cm"-set-cm Hg
2 x 10-s cc-mm cm"-set-cm Hg
0.025 g/100 lna-24 hr 0.015 g/100 in2-24 hr
0.46 g-mi? 100 ii+-24 hr
0.0013 g:mm m'-hr
0.0007 g-mm m"-hr
0.015 14
0.0002 15
0.002 15
0.0022 (lOOoF) 0.0027 (100°F) 5
0.001-0.002 this 0.0075 Work
0.00024-0.0018 this 0.0006 (VW .25’c) work
0.0 12
0.025 this work
0.002 12
0.076 5
0.013 14
0.007 14
0.018-0.025 this 0.011 work
Al-Mylar 25~20 2.5 lOOOF 0.02 g/100 in=-24 hr 16 Al-Mylar 25A20 2.5 25Y
0.0083 (100°F) 0.0014-0.005 this work
Polyethylene (Low density) 2
1
0.04 - 0.08 12 0.06 this 0.10 work
Mylar 25OC 0.10 14
Saran 25Y 0.01-0.02 14
82

0.8
0.6
0.2
0
P El- 2 mil Aclar
0 10 20 30 40 50 60 Time, days
Figure 36. Comparison of Incapsulation of Water in Various Materials with a Specific Surface of 4 in.2/cc Liquid
83

3 2 2 2 2 2 1 1 1 0
. . 0 0 .8
.6
Cap
sule
N
c.
Star
age
Csn
ditiz
ns
E44
E46
E48
39°C
in
Va
cua
23'C
in
Va
cus
Ambl
ent
Kel-F
81
!4a
ll Th
ickn
ess:
3
mils
.4
.2
.O
.8
.6
.4
.2
.O
.8
.6
.4
.2
i40
Tim
e,
days
Figu
re
37.
Wei
ght
i~ss
of
M
acro
inca
psul
ated
'd
ater
In
Ke
l-3'
811
TLtb
lng
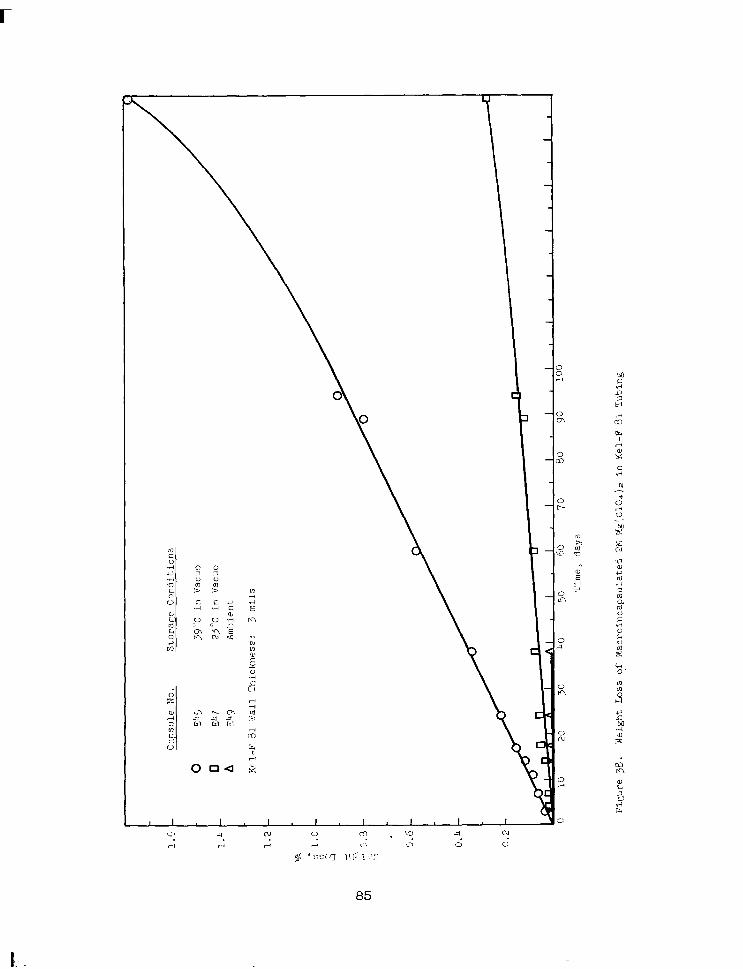
1
1.2
Cn!
-xT:
,le
X0. Storage
C
ondi
tions
0 EL
!?
39°C
in
Va
cua
0 G
7 23
°C
in
Vacu
a A
33
Ambi
ent
Krl-F
31
Ya
ll Th
ickn
ess:
7
mils
u I
I I
, I
I I
I I
I I
I I
II,
I I
I I
I I
I 0
10
20
3c
“0
5G
rSC
70
80
90
10
0
Tim
e,
days
Fipr
e 38
. ae
ight
LO
SS o
f M
acro
inca
psu:
ated
2M
Mg'
,C10
4)2
in
Kel-F
81
Tu
bing

Cap
sule
M
O.
Stor
age
Con
ditio
ns
A E5
0 Am
bien
t
0 E5
1 23
°C
in
Vacu
a
0 55
2 39
°C
in
Vacu
a
A
E53
39'C
in
Va
cua
&l-F
81
U
all
Thic
knes
s:
3 m
ils
0
a m
0
l *
I I
I I
I I
I ,
I I
I I
I ,I
I I
I I
I I
I I
I a
10
20
30
40
50
60
70
80
90
100
110
120
130
140
150
160
'Tim
e,
days
Figu
reSg
. W
eigh
t Lo
ss
of
Mac
roin
caps
ulat
ed
2M A
lCls
in
Ke
l-F
81
Tubi
ng

ai
E54,
E
55
E56
A E
57
0 E
60
II E
61
Cap
sule
N
o.
Sto
rage
C
ondi
tions
Ambi
ent
23°C
in
Vac
ua
23°C
in
Vac
ua
39°C
in
Vac
ua
39°C
in
V
acua
Kel
-F
81 W
all
Th ic
knes
s:
3 m
ils
Tim
e,
days
Figu
re
40.
Wei
ght
Loss
of
M
acro
inca
psul
ated
3%
KO
H in
K
el-F
81
Tub
ing

Cap
sule
N
umbe
r
E44
E45
~46
E47
~48
E'+
9
E5o
E E
51
E52
E53
E54
E55
E56
E57
358
E59
E60
E61
Cap
sule
I.D
.
Cap
sule
M
ater
ial
Kel-F
81
Kel-F
81
Kel-F
81
Kel-F
81
Kel-F
81
Kel-F
31
Kel-F
81
Kel-F
81
Kel-F
81
Kel-F
81
Kel-F
81
Kel-F
81
Kel-F
81
Kel-F
81
Kel-F
81
Kel-F
81
Kel-F
81
Kel-F
81
'Tab
le
27
PHYS
ICAL
D
ATA
ON
CAP
SULE
S PR
EPAR
ED F
OR
PER
MEA
BILI
TY
TEST
S
0.12
in
., Le
ngth
6.
0 in
., Su
rface
Ar
ea
2.36
in
.2,
Film
Th
ickn
ess
3 m
ils
Liqu
id
Wat
er
2M
Mg
(Cl%
) 2
Wat
er
214
Mg
(Cl0
4 ) 2
Wat
er
34
Mg
(Cl0
4 )
2
2M A
1C13
2M A
lC13
2M A
lCls
2M A
lCls
30%
KO
H
30%
KO
H
30%
KO
H
30%
KO
H
30%
KO
H
30%
KO
H
30%
KO
H
30%
KO
H
Con
di-
tions
+
C
C
B B A A A B C
C
A A B B C
C
C
C
Film
To
tal
Liqu
id
Wei
ght,
Wei
ght,
Wei
ght,
64
Pi
R
0.27
33
1.49
07
1.21
74
0.26
74
1.84
56
1.57
82
0.27
03
1.50
16
1.23
13
0.27
04
1.88
93
1.61
89
0.28
33
1.62
18
1.33
85
o. 2
696
1.85
40
1.58
44
o. 2
798
1.80
33
1.52
35
0.27
60
1.81
23
1.53
63
0.27
88
1.81
66
1.53
78
0.27
39
1.73
76
1.46
37
0.27
85
1.87
43
1. x
68
0.27
92
1.85
06
1.57
14
0.27
92
1.87
60
1.59
68
0.27
63
1.88
92
1.61
29
0.27
64
1.83
61
1.55
97
0.28
07
1.83
30
1.55
23
0.28
50
1.91
13
1.62
63
0.27
90
1.89
54
1.61
64
Initi
al
Payl
oad
!YLY
22
81.7
85.3
82.1
85.6
82.6
85.6
84.6
84.9
84.5
84.1
85.3
84.9
84.9
85.3
84.8
84.8
85.2
85.1
*A-
Ambi
ent
B -
25oc
, Va
cuum
C
-
39"C
, Va
cuum

Table 28
PERMEABILITY OF KEL-F 81 INCAPSULATIONS OF ELECTROLYTES UNDER VARI:OUS CONDITIONS
Incapsulations made by Heat Sealing Kel-F 81 Extruded Tubing, 3-mil wall thickness, l/8 in. I.D.
Incapsulated Liquid
Water
2M Ns (Cl04 > 2
2M A1C13
37% KOH
Permeability Cons-tan-t, 10'" g-mm/24 hr-m2-cm Hg at 25"c, at 25"c, at 39% 50% R.H. vacuum vacuum
2.4 7.0 17.5
2.4 6.5 14.1
1.5 5.4 13.0
1.5 4.6 12.5
Table 29
BASIC STRENGTH OF POTASSIUM HYDROXIDE INCAPSULATIONS IN KEL-F 81 TUBING
Conditions Basicity of Solution, meq/g 23 days 50 days 81 days
Ambient, 25OC 4.850 4.817 4.154
Vacuum, 25Oc 4.857 4.837 4.706
Vaccum, 39°C 4.852 4.869 4.718
89

It should be noted that the permeability constants are nearly an order of magnitude lower than our previously reported values on this film. This is the result of longer test periods, which yielded more precise values. Also, the previous results were an average of values obtained on several thicknesses.
Still lower permeabilities have been reported for certain Kel-F type films as shown in Figure 41. et al (ref. 15),
Here the results of Myers, are shown compared with our results on an
Arrhenius type plot. While the test methods differ somewhat, the results are in fair agreement for the temperature dependence of the permeability with an activation energy of about 12 kcal/mole for the permeation process. With this information, loss rates can be estimated for other temperatures below the glass transition temperature for this material (about 70°C). At this temperature the curve shows an inflection and the permeability increases more rapidly with further increases in temperature. It should be noted that the increase in transmission rate with temperature is not completely accounted for by the greater vapor pressure of the liquid. The remaining increase is presumably due to the effect of temperature on the film itself. No effect of these electrolytes on the stiffness or clarity of the film was evident.
(c) Composition Analysis
Incapsulations of approximately 30% KOH were analyzed by acid titration after storage for various times under the conditions previously used. A significant drop in the concentration of base was evident in the capsules stored at ambient conditions (see Table 29. This was undoubtedly due to permeation of car- bon dioxide into the capsule. The driving force was the par- tial pressure of carbon dioxide in air compared with its partial pressure in the capsule (essentially zero). A slight increase in basicity was observed initially during storage at 39°C under vacuum because of the more rapid loss of water than uptake of carbon dioxide. For long-term storage of potassium hydroxide at ambient conditions, a thicker capsule wall may be desirable.
e. Electrolyte Release Methods
The electrolyte must be released from the incapsulation and distributed to the dry tape prior to or during the movement of the tape through the collector area. The time required for adequate distribution and wet-out will vary with the nature of the tape and electrolyte. Tapes with good discharge character- istics have had wet-out times of less than one minute. In many cases electrolyte distribution is adequately achieved by the fibrous tape base material when the electrolyte is fed to the uncoated side of the cathode tape. Wet-out times have been reduced by addition of wetting agents to the electrolyte or tape coating mix.
90

lo-*
i lo- 4
iz &
-5 10
AKel-F 300 P25 Plasticized HomopolymerS C)Kel-F 300 Low Crystallinity Homopolyme VKel-F 81 Extruded, Ambient Conditions OKel-F 81 Extruded, In Vacua
1000/T, 'K-l
Figure 41. Effect of Temperature on Permeation of Water through Kel-F 81 Tubing
91
I\; ,

With these considerations in mind, release methods applicable to the incapsulation selection of Kel-F tubing have been investi- gated. A number of the methods incorporated in a collector head are illustrated in Figure 42. Earlier tests on one method, slitting by a stainless steel blade followed by squeeze-rolling, were carried out with a rather flat packet of 2-mil polyethylene film. The test results were encouraging, showing both a low pulling force required and over 90% transfer of the incapsulated liquid to a dummy tape.
With slight modification, the method was next tried on the custom- extruded Kel-F tubing 1/8-h. I.D. subsequently obtained. Two drawbacks were noted in the slitting of this size tubing, re- sulting both from the greater stiffness of the film and the rounder shape compared to that of the polyethylene incapsulation. First, a considerable increase in pulling force (rising from about 18 oz. to over 2 lb) was usually necessary when the blade encountered the heat seal. Second, the orientation of the slit packets at the rollers varied causing occasional increase in pulling force.
A second method of release appeared to present few difficulties and offersbetter reliability. This method employed sharp-toothed spro'ckt wheels of 3-mil thick stainless steel to puncture the capsules, a puncture being made about every l/16 to l/8 in. as the incapsulation is pulled over and against the wheel. The punctured capsules next move through a slot of controlled width to remove the electrolyte. This method has given a release efficiency of 95% but the slot width required for good efficiency resulted in excessive drag. Rollers were tried to reduce the drag but some electrolyte passed through the rollers lowering the efficiency, Simply pulling the punctured incapsulation around a roll provided good release and lowered the drag to about 10 oz.
The use of a single incapsulation for supplying four tapes with electrolyte in the tape conversion device was desirable to conserve weight. This required an increase in tubing size, which made the packets much flatter and thus made the slitting method feasible. The final incapsulation release device incor- porating slitting is discussed in section IV.
An initial attempt to obtain electrolyte conservation by passing a dummy tape (several layers of nonwoven'nylon) through pressure rolls was ineffective. At the low tape speeds used, the elec- trolyte wicks forward through the rolls to the drier area. Some feedback was obtained by pulling the tape through rapidly or exerting extreme pressure on the tape. The latter then requires high pulling force. Subsequently it was found that actual elec- trolyte consumption with the KIO 4-Mg system was large and left little opportunity for electrolyte conservation so this work was terminated.
92

Elec
troly
te
Dis
tribu
tion
Area
Inca
psul
atio
I \
Sprin
g Lo
ad
Dua
l R
azsr
Sl
ittin
g Ac
ticn
Sque
ezin
g R
cll
a.
Slitt
ing
cf
Flat
C
apsu
les
Fcllo
wed
by
Sq
ueez
e R
i-11s
L I
I
Slitt
ing
Plad
e b.
Sl
ittin
g M
etho
d In
ccrp
orat
ed
into
Ta
pe
Dis
char
ge
Hea
d fa
r tw
o Ta
pe
Cpe
ratio
n
ncap
sula
tiyn
Vario
us
Xeth
cds
of
Cap
sule
C
ompr
essi
on
3 m
il sh
im
stoc
k pu
nctu
ring
Dua
l C
apilla
ry
Ccl
lect
7rs
Com
pone
nts
of
TuC
ing
Punc
ture
N
etho
d fo
r *
Elec
troly
te
Rel
ease
Anod
e C
cile
ctor
s C
. Tu
bing
Ix
aps:
;latic
n Sl
ittin
g xi
th
Feed
??
roug
!-i
or
Ahea
d of
D
isch
arge
Ar
ea
Figu
re
42 .
:!!
e?hO
dS
of
Elec
trcly
te
Rel
ease

3. Microincapsulation
a. Background
MicrDincapsulation is one scheme for separating the dry anode and cathode materials from the electrolyte and, at the same time, to provide intimate contact of the electrodes with electrolyte on demand. Microcapsules of the liquid, approximately 500 p in diameter, would be imbedded in the dry tape and the liquid re- leased by applying pressure rollers immediately before the current collector.
The microincapsulation of electrolytes was undertaken by the Southwest Research Institute as a result of a subcontract with Monsanto Research Corporation. The complete final report of the Southwest Research Institute on this subject is reproduced in its entirety in the Appendix. We have prepared the following Summary and Recommendation sections to appraise the results of the microincapsulation program and to compare this scheme with other means of containing liquids during storage and releasing them for tape activation.
b. Summary of Microincapsulation Report
Both aqueous and nonaqueous electrolyte were incapsulated in microcapsules with diameters of from 500 to 1700 II. load of these capsules Panged from 40 to 72%.
The pay- The weight loss
of microcapsules of aqueous solutions, taken from the slope of the loss-time curves after the initially very high loss rate, was from 0.4 to several per cent per day for aqueous electrolytes and from 0.1 to 1% per day for nonaqueous solutions.
4. Discussion
A comparison of methods of supplying electrolyte is shown in Figure 43. In this comparison, electrolyte loss due to water vapor permeation through the-containing wall is not included. This will not significantly affect the values for macroincapsula- tion or the bottle and pump system since the loss rates in these cases are negligible. For microincapsulation, however, the very high loss rates obtained in the present work would require a steeper slope of the lines. This would present a further pro- blem in matching the feed rate to that required. That is, if the tape is put into operation after very short storage time, excess electrolyte would be present. The low electrolyte ay- loacbactually obt&ed in microincapsulation (less than 60% 'j and the high loss rates indicate that microincapsulation would only be advantageous in a special application.
A comparison of the bottle and pump system to the macroincapsul- ation and release system shows that the weights involved are not greatly different, with the former system offering a weight sav- ing for tape times longer than about 50 hours. A volume reduc- tion would also be obtained with the bottle and pump system.
94
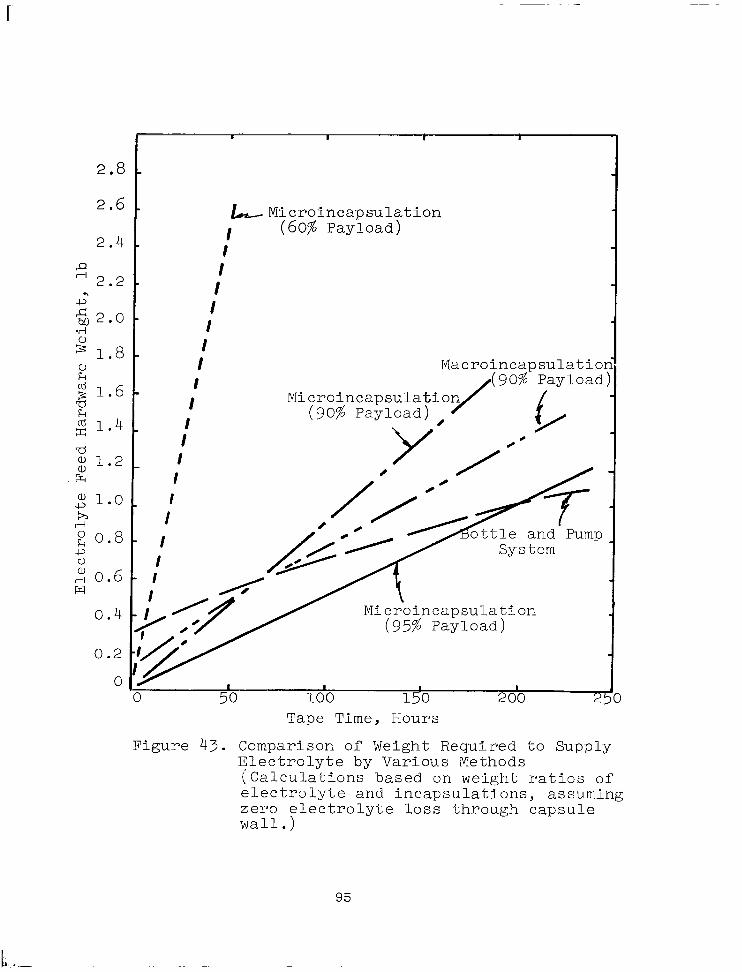
2.8
2.6
2.4
0.4
0.2
0
LMicroincapsulation I (60% Payload)
: I I I I I Macroincapsulation
ottle and Pump
1 I I I 50 100 150 200 250
Tape Time, Hours
Figure 43. Comparison of Weight Required to Supply Electrolyte by Various Methods (Calculations based on weight ratios of electrolyte and incapsulations, assuming zero electrolyte loss through capsule wall.)
95
IL-

5.
(1)
(2)
(3)
D.
1.
The
Conclusions
The best macroincapsulating material is Kel-F 81 plastic film, preferably in tubing form. The permeability constant for Kel-F 81 tubing is of the order of 0.0002 to 0.001 g HaO-mm/24 hr-m*-cm Hg for various aqueous solutions. Electrolyte contained in macrocapsules of the size used in this work loses about 1% of its water per year.
Other polytrifluorochloroethylenes and the Al-Mylar lamin- ate have very low permeability coefficients.
The very high loss rate of electrolytes from microincapsul- ations eliminates this electrolyte-containing scheme for use in dry tapes for all except unusual and special appli- cations. Apparently, no means of microincapsulating aqueous liquids with good load but with suitably low loss rate is known.
HIGH ENERGY COUPLES IN NONAQUEOUS ELECTROLYTES
Background
use of high energy couples that are not compatible with aqueous electrolytes in the tape configuration was explored. Metallic lithium with its very high coulombic capacity of 232 amp-min, was of particular interest as an anode candidate. For comparison, the capacities of cadmium, zinc and magnesium are 29,49, and 132 amp-min/g, respectively. In addition to its high coulombic capacity, lithium is also a very active metal with a high anodic potential (E" = 3.0~). Lithium reacts readily with water to evolve hydrogen and forms the oxide and nitride readily in the presence of moist air (ref. 17). Utilization of lithium as an anodic material, therefore, requires the use of a nonaqueous electrolyte and an inert atmosphere to prevent spontaneous oxidation or nitride formation.
The cell lithium-lithium perchlorate in butyrolactone-cupric chloride was reported by Meyers (ref. 18) to have an energ density of 106 watt-hr/lb at a current density of 13 ma/in.. The low discharge rate was required because of the high resistance of the nonaqueous electrolyte. The common aqueous battery electrolytes have specific conductances in the range of 10-l to 1 mho/cm, while the best nonaquegus electrolytes have specific conductances in the range of 10 to lo-= rnho/cm (see Figure 44). The use of active metal anodes in nonaqueous systems would be expected to produce high voltages and good energy densities at rather low current densities. Increasing current density may be possible if tapes can be designed to reduce IR voltage losses associated with high electrolyte resistances.
96

80~
60~
5oc
4oc E < :: s
3oc
200
lOO(
- x 1o-4
n Aqueous H2SO4 at 18”~ /
I
I Aqueous\
OH at 15°C , \
LiC104 in Acetone
LiClOd in Rutyrolactone
Concentration, % Figure 44. Specific Conductance of Aqueous and
Nonaqueous Electrolytes
97

2. Experimental Method
All cells were assembled and discharged in an argon dry box. For anodes, commercial lithium ribbon, l/l&in. thick, was degreased with ethylene trichloride and the tarnished surface removed by scraping with a knife. Cathodes were prepared by one of the methods described in the following paragraphs.
a. Type A Cell
Cathode Mix
CuCl=, analytical reagent $ O7 Shawinigan Black 20 Carbon Fibers, l/+-in. 3 Polyvinylpyrrolidone (PVP)
binder 10
The cupric chloride, carbon black, and carbon fibers were mixed in a Waring Blender. The PVP binder was dissolved in 13 times its weight of water, and the dry cathode mix was stirred into the solution. Cathode grids of 20 x 20 mesh Ni screen, 4 x l/2 in., were coated with the thick cathode paste and dried over- night at room temperature and then in a vacuum oven at 2OO'C. The cathodes were transferred to the argon dry box, saturated with an electrolyte of 1M LiC104 in butyrolactone, and assembled into a two-electrode cell with the lithium anode. A 6-mil thick polypropylene separator saturated with the electrolyte solution was placed between the electrodes, and the assembly was clamped between polyethylene blocks. A piece of freshly scrap.ed cadmium metal was clamped to a protruding section of the separator for use as a reference electrode.
b. Type B Cell
Cathode Mix
CuC12, analytical reagent Asbury ~-625 Carbon Paper Fiber, Whatman
Ashless Filter Disks
L ~Z .
3.6
The ingredients were dry-mixed in a Waring Blendor and then pressed onto wire screen grids with a hydraulic press. The cathodes were dried for 16 hours at 200°C in a vacuum.
A cell was assembled from one lithium anode, 8-rni.1 thick glass filter sheet (Whatman), a 7-mil anion exchange membrane (What- man AE-81), and one cupric chloride cathode. The separators and ion exchange membrane were saturated with 12% LiC104 in butyrolac-
98

tone. The cell assembly was clamped between horizontal blocks of polyethylene, and a cadmium reference electrode was inserted between the separators, which protruded one inch beyond the active plates.
Butyrolactone solvent was dried by storing over molecular sieves. Reagent-grade lithium perchlorate was dried in a vacuum at 200°C for 24 hours.
Constant current discharges were made at a current density of 13 ma/in.2 at 25°C. Cell voltages and cathode and anode pot- entials were continuously recorded until the cell voltages, initially 3.5 v, dropped to 2.5 v. Current-voltage relationships for freshly assembled cells were made by polarizing a cell at constant current for two minutes each at increasing current densities until voltage failure occurred.
3. Discharge of Lithiumlkpric Chloride Cell
A typical current-voltage relation for a freshly assembled lithium-cupric chloride cell is shown in Figure 45. The high open-c5rcuit voltage of. 3.6 v is characteristic of this system. The voltage remained above 3 volts at current densities lower than 19 ma/in. 2 but fell rapidly at higher current densities. The working voltage at low current densities also decreased as the cell discharged.
A typical constant current discharge is shown in Figure 46. The cathode rather than the anode failed for most discharges. How- ever, when the separators were replaced with new separators, freshly wet with electrolyte, another discharge, almost as long as the first discharge, could be obtained. After replacing the separators, the cathode and anode usually failed together. The originally bright lithium anode surface was tarnished with a black coating at the end of a discharge. The anodes gave a positive test for copper contamination. Apparently, cupric or cuprous chloride is somewhat soluble in the solvent and is re- duced at the lithium surEace after diffusingthrough the separ- ators. Potential readings with and without IR voltage loss, shown in Figure 46, indicate that the cell resistance is con- stantly increasing from a value of about 7 ohm-in.= at the start of a discharge to about 45 ohm-in.2 at the time of voltage failure.
Discharges of several cell types having different cathode load- ings, formulation pressures, and grid types are given in Table 30. Although all cathode efficiencies are low, those with high formulation pressure are least active. Apparently, highly compacted cathodes, while desirable for electrode rigidity, are less active than more porous cathodes.
99

0 l
Cel
l Ty
pe
A
5 10
50
10
0 C
urre
nt
Den
sity
, m
a/in
.'
Figu
re45
.
Dis
char
ge
Cha
ract
eris
tics
of
the
Li/L
iClO
s in
Bu
tyro
lact
one/
CuC
12
Cel
l

Cel
l Em
f (IR
-free
)
Cat
hode
Po
tent
ial
Anod
e Po
tent
ial
8 -3
-
Cel
l R
esis
tanc
e
I 0
10
20
30
40
50
60
70
80
90
100
110
Min
utes
Li
thiu
m
Cat
hode
: cu
c12
Elec
troly
te:1
2$
LiC
104
in
Buty
rola
cton
e Te
mpe
ratu
re
25°C
Figu
re
46.
Stat
ic
Dis
char
ge
Cha
ract
eris
tics
of
the
Li/L
iClO
h in
Bu
tyro
lact
one/
CuC
12
Cel
l

Tabl
e 30
CU
PRIC
CH
LOR
IDE-
LIT
HIU
M
CEL
L C
APAC
ITY
TEST
S
Dep
olar
izer
-
CuC
12
Cat
hode
M
ix
- B
Sepa
rato
rs
Dry
ina
Tim
e-
16
hrs
at
200°
C
in
vacu
a W
hatm
an A
nion
Exch
ange
M
embr
ane
AE-8
1,
7 m
ils
thic
k W
hatm
an G
lass
Fi
lter
Shee
t G
F-1,
8
mils
th
ick
Tem
peqa
ture
-
25'C
Cat
hode
Lo
adin
g C
atho
de
mg
CuC
lJin
.' G
rid
510
ss
520
ss
541
ss
560
Ni
570
Ni
620
Ni
630
Ni
670
Ni
720
Ni
740
Ni
780
Ni
860
Ni
Form
ula-
tio
n Pr
es-
sure
, ps
i
10,0
00
10,0
00
10,0
00
10,0
00
4,00
0
8,00
0
5,00
0
9,00
0
24,0
00
16,0
00
25,0
00
18,0
00
Min
utes
to
Ex
perim
enta
l 2.
5 v
at
13 m
a/in
.* C
apac
ity
amp-
min
/in.z
Theo
retic
al
Cat
hode
C
apac
ity
amp-
min
/in.2
Ef
ficie
ncy,
%
115
1.50
12
.3
12.2
110
1.43
12
.5
11.5
110
1.43
13
.0
11.0
74
o. 9
6 13
.4
7.2
105
1.37
13
.7
10.0
95
1.23
14
.9
8.3
103
1.34
15
.1
8.9
145
1.88
16
.1
11.7
8 0.
10
17.3
0.
6
50
0.65
17
.8
3.7
330
0.39
18
.7
2.1
82
1.07
20
.6
5.2

The effect of electrode loading on cathode efficiency is shown by the data presented in Table 31, and plotted in Figure 47. Efficiencies were better for low cathode loadings than for high loadings. This relation again indicated that only the cathode surface was active, and cupric chloride beneath the electrode surface was not in the right physical state to be electrochem- ically active.
4. Discussion
Although the lithium-cupric chloride system had very good volt- age characteristics on open circuit or at low current drains, the cell resistance of our configuration was much too high to allow a reasonable current density (100 ma/in.2) to be drawn without severe IR loss. A practical maximum for cell resis- tance is of the order of one ohm in.2, since with this resistiv- ity a practical current density of 100 ma/in.2 would result in an IR drop of 0.1 v. Nonaqueous electrolytes have characteris- tically high specific resistances (Figure 47), so approaches to devising tape configurations using nonaqueous systems should include reducing the cell resistance by the use of closer spac- ing and lower resistance separators as well as searching for nonaqueous electrolytes with higher specific conductances.
5. Conclusions
The lithium-lithium perchlorate in butyrolactone-cupric chloride cell had characteristically high voltages at low current rates (13 ma/in.2) and during the initial discharge period. Cathode efficiencies were low, and cell resistance increased during continuous discharge at 25°C.
103

Tabl
e 31
EFFE
CT
OF
CAT
HO
DE L
OAD
ING
ON
CAT
HO
DE C
OU
LOM
BIC
EFFI
CIE
NC
Y
Dep
olar
izer
C
uCls
C
atho
de
Mix
B
+ Fo
rmul
atio
n Pr
essu
re
10,0
00
lbs/
in.'
Dry
ing
Tim
e -
16 h
rs
at
200°
C
in
Vacu
a An
ode
l/16
in.
Li
Tem
pera
ture
25
'C
Cat
hode
Lo
adin
g M
inut
es
to
2 m
g C
uC1e
/in.2
4
v at
13
ma/
in.
240
75
346
95
437
55
541
63
614
110
660
120
860-
= 65
86
0%;:-
65
t
860+
3t
30+
j:-
-‘.:-
860
30t
880
105
95
125
~~ B
all
mille
d 24
hou
rs
Sepa
rato
rs
Wha
tmsn
Ani
on
Exch
ange
M
embr
ane
AE-8
1 7
mils
th
ick
Wha
tman
Gla
ss
Filte
r Sh
eet
GF-
1 8
mils
th
ick
Expe
rimen
tal
Theo
retic
al
Cap
acity
am
p-m
in/in
.2
0.98
1.24
0.72
0.82
1.43
1.56
0.85
1.70
2.09
2.48
1.36
1.62
Cap
acity
sm
p-m
in/in
.2
5.7
8.3
10.5
13.0
14.8
15.8
20.6
20.6
20.6
20.6
21.1
23.6
Cat
hodi
c Ef
ficie
ncy,
$
17.2
15.0
6.9
6.3
9.6
9.9
4.2
8.3
10.2
12.2
6.4
6.9
t Fr
esh
sepa
rato
rs
and
elec
troly
te
supp
lied
befo
re
seco
nd
disc
harg
e +
Addi
tiona
l el
ectro
lyte
on
ly
supp
lied
**
Sam
e C
ell
redi
scha
rged

\ \
-n
\
0 \
‘. \
0 \ 0.
0 \ \
1 I
I I
I I
0 20
0 40
0 60
0 80
0 10
00
1200
Cat
hode
Lo
adin
g,
mg
CuC
12/in
.2
Figu
re
47.
Effe
ct
of
Load
ing
on
Dis
char
ge
Effic
ienc
y of
C
uC12
Cat
hode

PHASE 2. DRY TAPE DESIGN
A. TAPE MANUFACTURING METHODS
1. Background
The ability to buy commercially, or to produce "in house", com- plete tape strips of reasonable lengths was recognized as a nec- essary adjunct to the testing program. Early in the work, the natural division of effort into cathode-tape composites and anode strips was made. This acknowledged the probability that the cathode materials would most likely be deposited on the tape substrate (separator) and later mated to the anode. The problems encountered in each area were widelydifferent. Availability was of primary concern when thin sheet stock of magnesium anode was needed; commercially available rolled stock was not manufactured thinner than 10 mils. For cathodes, elimination of cracking upon drying, continuous extrusion of uniform q,uantities of slurry, and maintenance of uniform loading and thickness tolerances were among the problems to solve.
2. Anodes
a. Materials and Configuration
For reasons stated earlier in this report, magnesium metal was selected as the anode material. However, magnesium reacts with the acid electrolytes needed for efficient cathode performance, evolving hydrogen. Difficulties arose not from the coulombic losses this represented but rather from the polarization and increased 12R heating suffered under excess gassing conditions. Accordingly, the provision of gas escape mechanisms was a neces- sary consideration in all anode configurations. With the pressed powder and other high surface area forms ruled out, attention was focused on "block" anodes and various types of thin strips.
b. Block Anodes
This concept concentrates the magnesium in a single location for each cell and exposes one face of the block to the cathode for reaction. Consistent with the gas evolution requirements, sev- eral designs were incorporated, ranging from solid to slotted to machined blocks with drilled holes (see Figure 48). With proper precautions, magnesium was readily machined, and no difficulty was encountered in obtaining the desired shapes. Initial tests were conducted with a slotted block in which both the bands and grooves were approximately l/8 in. wide. Excess electrolyte, however, tended to collect in the grooved sections.
106

Sl:f”
,ed
P,lc
ck
b!ith
C
pen
Ease
Slrf:
ed
Bloc
k Xi
th
incr
ease
d :#
:e
tio
Figu
re
48. S
olid
Zl
cck
:.!eg
nesi
um
Anod
e D
esig
n5

Accordingly, the unit was modified to eliminate the base of the grooves, leaving the area between the bands unfilled and remov- ing pockets in which liquid could collect. Nevertheless, max- imum tape performance could not be obtained with either design. The difficulty lay in the uneven forces pressing against the tape surface by an anode that was partly solid, and partly open space. Because of correspondingly uneven cathode collector con- tact, cathode current density was not uniform and outputs suffered.
Considerable improvement was obtained by the substitution of an anode with small holes drilled perpendicular to the exposed face and with the ratio of solid area to open area markedly increased. Similar performance was also noted with a slotted collector in which the void spaces were considerably reduced.
The block anode concept, while desirable from several standpoints, has a number of disadvantages when considered for use with start- stop tape devices. Since local electrolyte excesses may accumu- late, anode corrosion may be excessive. This could be particular- ly troublesome after each stop when additional unconsumed electro- lyte is present. Some accumulation of dark reaction products was noticed, even under dynamic conditions, although the extent of detrimental effects was not determined over extended periods of time (i.e. tens of hours). Certainly, this accumulation will present some difficulties for each restart. Consequently, it was decided to stop further efforts with block anodes and shift emphasis to the provision of magnesium in strip form along with the cathode tape.
c. Expanded and Punched Strips
The desire to incorporate the magnesium anode with the cathode tape in strip form placed special emphasis on the acquisition of magnesium in thin, continuous coils. Initial efforts in this area uncovered no readily available stock thinner than 10 mils. This provides a theoretical capacity of approximately 37 amp-min/in.2, far in excess of the 3 to 8 amp-min/in.e output range that appeared reasonable for the cathode loadings. Even with an assumed oxidation efficiency of 65$, thinner material was obviously required. A reference summary of many of the materials obtained later in the program and the corresponding theoretical capacities is shown in Table 1 (page 6).
(1) Thin Sheet Material
At the start,the configuration of magnesium was undetermined, but the need for the basic thin gage material was pressing. Two possibilities were foreseen to reduce the thickness to an estim- ated 3-5 mils. Roll milling (hot or cold) appeared likely if vendors with this type of experience could be located, and chem- ical milling (etching) was a likely process if cost was not prohibitive for our moderate quantities. Following visits to
108

Dow Chemical Company, Midland, Michigan and Chemical Micromilling co., Philadelphia, Pennyslvania, etching baths were set up in our laboratories. While accurate tolerances were not maintained, it was found that the process was sufficiently straight-forward for us to supply our own requirements until a more refined source was developed. With Chemical Micromilling Co., steps were taken to define the cost and time involved in establishing a small, pilot-size capability for producing continuous strips of magnes- ium in the 3-5 mil range. While capital cost was reasonable (less than $lOOO), set-up and prove-in time would run dangerously close to the end of the contract period and give us little bene- fit. In view of this, the commercial etching approach was aband- oned while we awaited results of the concurrent roll milling program discussed below. In the interim, preparations were made for doing the work in-house if required. are shown in Appendix A-4.
The process steps used
A great number of roll milling firms, particularly those special- izing in thin foil materials, were contacted to obtain thin gage magnesium. Most contacts were fruitless. Some extended lengths of 6-mil stock were obtained from Peerless Rolled Leaf Co., Union City, N. J., but this was the remaining shelf stock of earlier experimental work. The process (understood to be cold rolling of 16 mil) was later dropped due to economics and low demand. The Hi Cross Co., Wehauken, N. J., using a hot rolling process, agreed to roll some 4-mil samples from lo-mil stock supplied by us. These were evaluated and found to be satisfactory, and arrangements were made to obtain continuous lengths. This pro- cedure proved satisfactory for our present needs. The lo-mil coils are purchased from Dow Chemical Co., slit to proper width, and re-rolled by Hi Cross Co.
(2) Anode Configuration
With the base stock available, the proper design features for gas release could be incorporated. Early anode work had shown an open mesh expanded form to operate best, but this was later determined to be true only for excess electrolyte conditions such as are encountered in beaker cell static testing. In transla- ting to the limited electrolyte dynamic testing, a relatively flat, closed mesh was used. This design presented maximum sur- face for contact to the wetted separator and provided a uniform current density distribution with the positive electrode while still maintaining a slight three dimensional effect. The con- sumption of the magnesium during discharge, however, weakened the expanded metal joints and caused frequent rupturing of the strip. In addition, contact for current collection was more difficult.
Desia emphasis shifted to perforated strips where continuity was more assured and anode contact was simplified. Using chem- ically milled samples and manual perforating techniques, a var- iety of designs were evaluated. The final arrangement is shown
109

in Figure 49. A local tool and die shop manufactured the punches and die mountings for use with standard kick presses to produce the continuous lengths. The photograph in Figure 50 shows the punched strip along with one of the earlier flat expanded forms.
Performance of the anode under dynamic testing conditions has Performance of the anode under dynamic testing conditions has been very satisfactory. been very satisfactory. Both the limited electrolyte quantities Both the limited electrolyte quantities and the pressure effect of close contact with separators appear and the pressure effect of close contact with separators appear to have reduced the gassing problem from the rapid evolution to have reduced the gassing problem from the rapid evolution noted early in the contract period. noted early in the contract period.
3. Cathode Tapes
a. Background
This portion of the electrode processing work was concerned with the production of cathode tape composites of sufficient length to meet the requirements of the dynamic testing and demonstra- tion programs. Aside from the obvious demands of uniformity, flexibility, and physical strength, the process had to be adapt- able to a variety of depolarizer materials and cathode formula- tions. Since the coating materials were not similar to any known commercial coatings, a specific process had to be developed. At the same time, it was expected that good use could be made of the experience and methods employed by painting, laminating, and similar industries.
b. Knife Casting
With this method, a small quantity of slurry, is drawn over a stationary tape by a moving adjustable blade (Gardner Knife). It was used for all early cathode testing and was conveniently done on a small scale basis. Analysis for scale-up, however, pinpointed several detrimental features. The reservoir of slurry behind the knife edge is pulled over the entire length of tape and an impregnation rather than a surface coating tends to re- sult. Consequently, thicker base tapes are usually required to give adequate electrode separation. Unless subsequent treat- ments are applied, cracking upon drying is troublesome, partic- ularly when organic solvents are used to prepare the slurry. Temperature variations to speed up or slow down the drying had little effect. While thickness control was generally adequate, the metering control of slurry output was sensitive to lumps, density variations, and other inconsistencies in the slurry it- self. Accordingly, more sophisticated methods were sought.
c. Power Spraying
The DeVilbiss spray gun used for this work has two separate feed systems. The first employs adjustable air pressure over the slurry material to be sprayed, forcing it through the exit nozzles at a controlled rate.
110

All Holes l/16 in. in diameter
Material: 4 mil Magnesium
0 0 0 0 0 0
0 0 0 0 0 0
0 0 0
000 0 0 0
0 0 0 0 0 0
0 0 0
0 0 0 0 0 0
0 0 0 0 0 0
0 0 0 0 0 0
0 0 0 0 0 0
Figure 49. Punched Magnesium Strip Design
Figure 50. Comparison of Punched and "Flat Expanded" 4-mil Magnesium
111

The second system, equally controllable, supplies only the air stream (or air for atomization) on which the par- ticles from the solution reservoir are carried to the work. To permit effective use of the equipment, a rotating drum approximate- ly 15 in. in diameter was attached by pulley and drive belt to an adjustable-speed motor. Base tape material was attached to the circumference of the drum, allowing production of cathode tapes approximately 1 foot wide by 4 feet long. These were later slit to desired width.
Water and organic slurries were used. The water-based type, however, was eliminated immediately because of severe soaking and impregnation. The organic slurries, however, produced good quality tapes from the outset. The naturally rapid evaporation of these solvents plus their breakdown into a fine mist by the atomization air resulted in almost instant drying. Thus, the solvents served excellently as a carrier medium to the gun exit nozzle but the net effect from the point was virtually a spray- ing of solid matter. Barely sufficient moisture remained to promote adhesion to the tape material and the tapes were totally dry within l-3 seconds. These same factors permitted layer to be sprayed upon layer as the drum rotates, since over 95% of the evaporation takes place before the tape is coated. A secondary benefit is realized in that the added material is a true surface coating making possible the use of thinner base materials.
Tapes prepared by the spray method were more fragile than many of those cast with a Gardner knife, particularly those cast with dyne1 fibers. Nevertheless, flexibility was excellent and they did meet maximum standards of durability to allow winding on a reel, unwinding, discharge, and rewinding without visible mater- ial loss. Care was required when slitting to proper width. Surfaces were quite smooth, which promoted good collector con- tact. A major problem area was an occasional uneven slurry flow that caused thickness variations (I- 0.1 to + 0.2 mils). Some corrosion of the spray gun passageways was evident despite the use of stainless steel parts for all vital areas. To cor- rect both of these difficulties and to permit use of the gun with all of the cathode materials likely to be investigated, Teflon parts were substituted for all slurry-carrying passage- ways. This change eliminated the intermittant action of the gun and reduced clogging difficulties. Also, to prevent clogging, dyne1 or carbon fibers were eliminated from all spray formulas.
As the evaluation of the spray gun technique progressed, increas- ingly heavier cathode loadingwere being demanded by the other aspects of the dry tape program. To meet these requirements, a thorough analysis of the capabilities and limitations of the process was conducted. As the loadings increased, the coating became somewhat loose and fluffy. This was reflected in the low density of the sprayed coat, which dropped as low as 11% solids packing. While this in itself is not detrimental (even desirable),
112

it is characterized by poor adherance to the l+pe and flaking problems. A secondary operation was added to compress the sprayed tape between a set of steel rollers and, although improve- ments were noted, rippling sometimes resulted and physical quality was still minimal. This, coupled with the requirement for multiple passes over the tape surface, combined to diminish the value of the power spraying technique. A summary of the characteristics of sprayed tapes is shown in Table 32 where all the processes are compared. The numerical ranges listed do not necessarily reflect absolute limitations of the process; in some cases, attempts were not made to achieve a wider range.
d. Extrusion and Compression
Previous studies in the area of cathode cracking with drying brought to light the advantages of working the cast materials while still wet, to bring the moisture to the surface in the manner of cement troweling. Cracking was greatly reduced or even eliminated.
This principle had been adapted in a one-step process in the 1 x 3 in. compression molding die used for earlier cathode test- ing. Electrode ingredients were mixed with a minimum quantity of water or other solvent to form a semi-dry paste. A known volume of the paste was then dispensed into the die cavity. Upon compression, excess solvent was forced out through the die clearances resulting in a molded tape-cathode, almost completely dry, whose surface was uniformly smooth. Since the coatings were also quite rigid, the method was considered unsatisfactory for tape usage except possibly for a magazine dispenser where the tape is loaded in a zig-zag fashion,
The same principle was applied in the two-step metering and compression process. Using this approach, the cathode paste was first metered onto the tape in uniform quantities, and then the tape was passed between a set of steel rollers to squeeze out the liquid. The resulting tape was, as above, almost com- pletely dry and had a smooth surface. Since the process is inherently continuous, and since preliminary experiments showed it to be entirely feasible, full scale pilot equipment was de- signed and constructed. A photograph of the equipment layout is shown in Figure 51.
The two-step approach has been given considerable testing and has had several modifications. In summary, the compression rolls appeared to perform adequately as designed, but the metering step possessed some problems. Bridging of mix particles and fibers at the exit ports was troublesome as was tearing of the tape due to excess pressure by the edge guides and center runner (the process was designed for a double tape system). Several die designs were tried, the general progression of which is repre- sented schematically in Figure 52. The major improvements were
113

Table 32
SUMMARY OF PHYSICAL DATA FOR CATHODE TAPE PROCESSING METHODS
Knife Cast Power Spraying Compression Final
Coating Thick- ness, mils
8-40
As Made Rerolled Range Design
5-33 g-22 12-28 18
Tape loading, mg/in2
85-250 80-150 80-150 120-396 200
Theoretical capacity, amp-min/in.2 (various form- ulas)
4.5-14.4 3.0-9.0 3.0-9.0 3.5-15.5 6.7
Solids packing,% 18-23 11-18 17-20 21-38 23
114

Figu
re
51.
Cat
hode
Ta
pe
Man
ufac
turin
g Eq
uipm
ent

Original Head Modified Head
Area of Bridging
Redesigned Head Floating Runners Inc.
(Front View)
Figure 52. Schematic of Slurry Extrusion Dies
116

the elimination of the go-degree turn within the head, the elim- ination of the lead out angle (lead out compression zone), and the incorporation of floating runners for edge and center defin- ition. A photograph of the final die is shown in Figure 53. The latter, made of stainless steel for greater rigidity, per- formed satisfactorily from the start.
The electrical performance of machine-made tapes was initially below par (compared to comparable knife-cast tapes). Several factors were responsible. Solids packing tended to be consider- ably higher at first; reducing the density by adding fugitives or opening the compression roller gap did little to improve performance. The best results were obtained by adjusting the carbon black content which, due to its incompressible nature, produced an open pore structure and, apparently, a higher sur- face area with the same void volume. The binder content was also a factor since higher quantities of binder produced higher solids packings. This was in opposition to our efforts to pro- mote good adhesion to the tape surface.
The problem was resolved by pre-dissolving the binder in the slurry solvent prior to mixing, thereby assuring excellent dispersion and obtaining maximum utilization of the amount pre- sent. An additional benefit lay in the fact that during the slurry extrusion, the base tape became wetted with solvent that contained the binder. This helped strengthen the hinding link between the coating and the tape.
A general tabulation of many of the process trials is presented along with the mix formulas in Appendix Tables A-5 and A-6. The listing reflects our attempts to resolve the interrelating fac- tors of electrical performance, physical stability, cathode loadings, binder content, and collector sticking. An interest- ing note on the latter problem is the incorporation of a grooved pattern into the coating surface during cathode-tape manufacture, This is accomplished by inserting a nylon netting between the top blotting paper and the slurry coating prior to roller com- pression and removing it following the compression rolls. The pattern provides a multitude of interconnected channels that serve to distribute electrolyte more evenly, particularly on the collector contact surface (which should be kept moist to prevent sticking). Some benefit arises, also, in flexibility and stability due to the grooving. seen in Figure 54.
The cathode pattern can be
4. Composite Tapes
A large effort was not expended on techniques for mating the anode and cathode sections since only a minimum level was re- quired to satisfy our program requirements. Some comparisons were conducted, however, on the suitability of various adhesives and on the type of joint required. Satisfactory composite tapes were made using a PVP-chloroform solution (about the consistency
IL17

Topside showing slurry lead-in section
. ._ . .
Underside with floating runners removed
Figure 53. Final Extrusion Die
118

Figu
re
54.
Com
posi
te
Tape
As
sem
bly

of motor oil) and placing l/8 in. 3/4 in.
dots of the glue approximately apart on the solid portions of the magnesium strip. They
were wound with the cathode to the outside since there was suf- ficient stretch in the coating to allow for the larger diameter. The complete tape is shown in Figure 54.
5. Conclusions
With the background in tape fabrication obtained during the con- . tract period, we have the capability to manufacture cathode tapes from a wide variety of depolarizer materials and slurries. The two-step process is satisfactory from a tape quality stand- point and is adaptable to scale-up to pilot line or production operations. The product is uniform and electrochemically active although only minimal in adherance and ruggedness. It is felt that improvement in the latter areas can be accomplished without major change in the essential process steps.
Adequate sources of supply for thin magnesium coil were developed. Further treatment in the form of punching, expanding, etc. can be done without undue problems. With the AK&-HCl mixed ele& trolyte, a perforated magnesium pattern performs satisfactorily with respect to corrosion and gas escape. With our present experience, obtaining and handling other uncommon metallic anode configurations can be approached with confidence.
Mating of anode strips and cathode tapes into a Composite struc- ture was performed on a minimum basis only. No outstanding problem are foreseen in this area although some sophistication seems desireable.
B. JOINT ANODE-CATHODE (DYNAMIC) TESTING
1. Background
The dynamic testing phase of the dry tape program is concerned with the engineering aspects of discharging moving tapes. The objectives of this portion of the work were: (1) to develop a system capable of discharging tapes continuously with the close control of variables necessary to achieve steady-state conditions; and (2) subsequently to characterize tapes quantitatively using this system. The tapes used in the early portions of this work were based on a variety of cathode materials with magnesium anode and were made by the techniques described earlier. block, flame-sprayed, tested.
and milled magnesium strip Stationary
anodes were Initial tests were qualitative and were concerned with
tape integrity and other physical performance factors. These tests, discussed briefly in the following sections, led to various modifications in the tape formulation and makeup methods and in the dynamic test equipment itself. lengths of uniform tapes available,
In later work, with long various discharge parameters
were explored and their effects on discharge efficiency determined, 9 120
._-~-.._ _ - - - - - . . -
. - ;
.

This work was done with potassium periodate cathodes and provided data for the design of a demonstration unit.
2. Equipment
The dynamic tape test device is shown in Figure 55. The discharge head (1) is discussed in detail below with reference to Figure 56. The tape shawn is a double tape (2) pulled through the discharge head by the take up reel (3), which is driven by the motor (4) through two speed reducers. Most tests were conducted on single tapes, in which case only the front collector head was used. The large diameter reel was used to limit speed variation due to diameter changes as the tape has wrapped on the reel. Test times of over one hour required less than two wraps on the reel. Tape speed was set by the motor speed control and determined by reading the voltmeter, (6) which was connected to a tachometer generator on the motor shaft. This system provided close control and reproducibility of tape speeds from 0.05 to 0.50 in./min. Speed was maintained constant within 3% of the desired value for test durations of over an hour.
Electrolyte was fed to the tape through the discharge head from syringes (7), the rate being controlled by varying the available hydrostatic head. The feed rate was determined from the syringe readings taken at fixed time intervals. Tapes with good wetting characteristics were found to take up electrolyte over a wide range of head, the flow evidently being controlled primarily by the wicking properties of the cathode and separator materials. Tapes with poor wetting characteristics would not absorb sufficient electrolyte to wet the separator and magnesium surface well. In these cases, additional electrolyte was added through the punched magnesium from another syringe.
The tape was discharged through two parallel connected, 15-ohm variable resistors (8), one being used for coarse adjustment to the desired current, the other for fine control. The discharge circuit is shown in Figure 57. Depending on the discharge rate, the current was read on a 1.5-amp or 3-amp meter along with cell and reference voltages (9). Both cathode- and anode-to-reference voltages were measured using a silver-silver chloride reference (10). The reference electrode was made from fine silver strip that was anodized in 1M HCl at 25 ma/cm2 for 10 to 15 minutes. The strip was wrapped in a dyne1 separator that contacted the anode and cathode surfaces downstream from the discharge head.
The discharge head in its final form as used with the potassium per- iodate cathode is shown in Figure 56. The graphite cathode collector (1) is made from graphite block?, 3 x 1.5 x l/4 in. thick.
+t U. S. Graphite 443

1. Discharge head 6. Tape speed meter
2. Double tape extrusion-- 7. Electrolyte feed syringes KI04-Mg tape
3. Take-up reel 8. Load resistors
4. Drive motor and drive train
9. Output meters
5. Speed control 10. Ag-AgCl reference electrodes
Figure 55. Dynamic Tape Test Apparatus
122

LEGEND
1. Graphite cathode current collector
2. Spring-loaded anode current pick-up
3. Slotted Plexiglas anode pressure plate with weight
4. Electrolyte feed tube
5. Electrolyte dispensing ports
6. Light and mirror for viewing discharged cathode coating
7. Double tape extrusion--KI04 cathode-m anode
Figure 56. Detail of Discharge Head in Figure 55
123.

,, .-. . . ..---... . ..-.. . . . . . . . . . .._ -.-.. ._ .- . ..-_. ,.- .-_.. . .._. .--_. ..-- -.-- ----.- ..--
LEGEND L
t M-1,3 - 1.5-O-1.5 VDC
M-2,4,5&6 -0-3 VDC
M-6- 0 -3ADC
M-l- 0 -1.5 ADC
SW-I- M-7 SHORTING
SW-2 -WHEN CLOSED- SINGLE CELL
WHEN OPEN- SERIES CELLS
R-l,2 - LOAD RESISTORS
TERMINAL STRIP-/
REE CATH. AN. CATH. AN.
-- FRONT REAR CELL CELL
Figure 57. Pry Tape Discharge Circuit
124

The leading edge was chamfered for the first half inch and taped over to provide a smooth entrance for the cathode coating. The active cathode collector area was 3.75 in. with this discharge head. Anode current pickup was accomplished by a sharp-toothed copper-beryllium tab (2) with adjustable spring loading pressing it on the magnesium upstream of the wetted discharge area. Contact pressure at the discharge area was maintained by lead weights placed on a slotted (for gas release) Plexiglas plate (3).
Electrolyte was fed from the syringe through Teflon tubing (4) to a manifold in the graphite cathode collector and then through the dispensing parts and slots (5) to the cathode surface. The slots were found beneficial in providing uniform electrolyte distribution. A mirror and light arrangement (6) was also provided for convenient viewing of the discharged cathode surface.
Earlier test work was also done with 1 in. wide tapes on another discharge head. On this head, both platinum and graphite were tried as cathode collector materials, the graphite collector being somewhat less prone to sticking to the cathode coating. Slotted cathode collectors of several designs were also tried in this setup. The slotted collector designs varied from a single narrow slot across the collector to wide (1/8-h.) multiple slots. Electrolyte was fed both through the cathode collector and directly to the separator material. Feed through the cathode collector generally reduced the sticking problem, but certain tapes required additional electrolyte to the separator as mentioned previously. In one case, the slots were filled with Silastic insulating material, to provide intermittent nondischarge areas for redistribution of electrolyte for the elimination of sticking. This method did not substantially alleviate sticking with tapes that were prone to adhere to the collector surface. It was found that feed of a large excess of electrolyte at the cathode collector surface would effectively eliminate sticking. This reduced output, however, by "floating" the cathode surface off of the collector thus reducing the area of electronic contact. The best method found for eliminating sticking was to reduce the packing density of the cathode coating thereby allowing a greater quantity of electrolyte to be taken up in the coating. When the packing density was reduced sufficiently to provide take-up of electrolyte in accord with the discharge requirements as discussed below, sticking was generally alleviated.
In one case, a static discharge of a cell using a tape cathode and magnesium anode was run with mercury as the cathode collector to eliminate sticking possibilities. The discharge on mercury compared favorably with discharges on platinum and graphite collectors. However, indications of oxidized mercury were noted on the discharged cathode surface when the cell was opened
It was felt that any loss of mercury would not be tolerable %m a weight standpoint and this approach was not pursued further.
125

3. Dynamic Test Results
Dynamic tests were made on trichlorotriazinetrione, picric aciG, and potassium periodate cathode tapes with magnesium anodes. aarly test work was conuucteci on trichlorotridalnetrione and pic-ric acid cathodes. The later, more complete test results with potassium periodate as tabulated in Appendix Table A-7 reflect improvements in the test equipment as well as the tape itself. Representative data from the early tests are given in Table 33. The use of a block anode of primary magnesium was demonstrated in early tests with trichlorotriazinetrione cathode tapes. While continuous magnesium foil anodes were used in all later testing, the block magnesium anode appears feasible for use with neutral or acid electrolytes and may offer advantages in these cases.
The following test procedure was generally employed with potassium periodate. With the dry tape in position, the tape speed was set and electrolyte feed started. When complete wetout of the tape in the discharge head was accomplished, the open-circuit voltage was read and the circuit was then completed, the current being adjusted to the desired value by varying the load resistance. Under open-circuit conditions, chlorine evolution occurred, evidenced by the odor of chlorine gas. This was undoubtedly due to the oxidation of chloride ion present in the electrolyte by the periodate at the high open-circuit potentials developed. The rate of this oxidation was not rapid, however, since short times on wet stand did not appreciably affect static discharge efficiencies.
Upon initiation of discharge, the cell potential decreased from the high open-circuit value of about 2.9 v to about 2.3 v and continued to fall as steady-state conditions were approached. The load resistance was adjusted as necessary to maintain constant current and cell voltage. Other pertinent data were recorded at short time intervals, usually every 4 minutes. At the tape speed used most frequently, 0.25 in./min., 10 minutes were required for complete change of tape over the 2.5 in. collector length. Within this time, the cell voltage fell to an essentially constant value unless the discharge rate was greater than the tape could support, in which case the discharge rate was reduced. The run was continued for a sufficient time to effect discharge of a minimum of two collector lengths of tape before any change in conditions was made.
Sample discharge curves are shown in Figures 58 and 59 for several tapes. Small voltage deviations from a steady value during a run were caused by variations in wet-out or tape characteristics, but a continued decrease in voltage was caused by inability of the tape to support a particular drain rate or, as was often the case, the adhering of a portion of the cathode to the cathode collector. In some of the tabulated runs, steady- state conditions could not be attained for this reason. When a
126

Tape
N
o.
,L w
ei&m
t
TN- 4
TW
- 4
5276
4-w
-2
5276
5-1-
~-l
5276
6-2-
A 52
765-
2-A
5276
5-1-
B 52
765-
2-C
52
765-
2-C
52
76%
1-B
52
766-
l-B
5276
E-1-
B
s 52
771-
5
4
S-6-
A S-
6-B
+,/'/
G-2
-2
$jf7
6-i-2
52
776-
2-3
52’p
q5-2
-3
5277
6-2-
j
Deo
ular
izer
--
‘;‘,’ .
‘; 47
.5
'17.
5 47
.5
47.5
47
.5
4? .5
4'
1.5
47.5
‘I’
( . 5
47 .5
‘1
7 .5
Tabl
e 33
EAR
LY D
YNAM
IC T
EST
RES
ULT
S W
ITH
PIC
RIC
AC
ID,
TRIC
HLO
RO
TRIA
ZIN
ETR
ION
E AN
D P
OTA
SSIU
M PE
RIO
DAT
E C
ATH
OD
E DEP
OLA
RIZ
ERS
Anod
e Th
ickn
ess
Mat
eria
l m
ils
AZ31
B AZ
3lB
3
AZ61
B 2
z s
MS
AZ
61B
z FX
p.AZ
jlB
10
Exp.
AZ3l
B Ex
p.AZ
3lB
lgo
AZ31
B 0
AZ31
B 8
m-
3
Bloc
k
Cel
l C
urre
nt
ocv,
Vo
ltage
, El
ectro
lyte
vo
lts
volts
--
Ficr
ic
Acid
D
epol
arw
$ -
-. Sa
t Id
Al
Cls
Sa
tId
AlC
ls+0
,25M
H
Cl
Sat'd
Al
C13
2M
AlC
ls+0
.25M
H
Cl
Sat'd
Al
Cls
2M
AlC
ls+0
.25M
H
Cl
2M A
lCls
+0.2
5M
HC
l Sa
t'd
AlC
ls
2M A
lCls
+0.2
5M
HC
l Sa
t'd
AlC
ls
2M A
lCls
+O .
25fd
HC
l 2M
AlC
11+0
.25M
H
Cl
2M A
lCl&
j.25M
H
Cl
2.05
1.63
2.
05
2.15
2.
2
z5 ::0
9 11
8
Pota
ssiu
m
Perio
date
D
epol
arlz
er$f
t
AZ3l
B AZ
3lB
AZ3l
B AZ
3lB
AZ3l
B
SatId
Al
Cls
2.
4 2M
AlC
ls+0
.5M
H
Cl
SatId
Al
Cl
a:58
2M
Mg(
ClO
dya
(t Sa
t'd
NaC
l 1:
70
Typi
cal
Cat
hode
C
astin
g M
ix
Com
posi
tions
, '.J
t $:
*
Picr
ic
Acid
'1
7.5
Shaw
lnlg
an
Blac
k 38
.0
Car
bon
Fibe
r Po
lyvl
nylp
yrro
lldon
e
A:8
0.9 1.0
2:
1.0
1'::
Pi?
0:85
1.
0
2.0
1.5
1.5
::;
117
150
350
250
500
255 E 225
300
200
230
325
290 60
80
410-
470
210
220
280
Tape
Szk"
2;
0:17
0.
15
:*:;
0:25
0.15
0.
10
0.15
0.
15
32
0.15
0.15
0115
Cat
hode
C
oulo
mbl
c Ef
flc;e
ncy,
16
28
58-6
8
‘IO
f$
Tric
hlor
otria
zlne
trlon
e 45
**
* Po
tass
ium
Sh
awln
igan
Bl
ack
Opa
lon-
45
Pe
rioda
te
45
Shaw
lnlg
an
Blac
k 45
,
Sant
iciz
er-1
60
8 7
Dyn
e1 F
iber
s P
VP
Pl
astic
izer
3
(+
Cat
hode
sw
ells
an
d flo
ws

Cur
rent
D
ensi
ty
Spee
d C
atho
de
Run
No.
m
a/in
. in
./min
Ef
ficie
ncy,
%
%Y
;;:
0.25
0.
25
t; 20
0 0.
125
58
320
ma/
in.2
40
0 0.
25
83
1.8
to
425
ma/
in.2
1.6
Cur
rent
re
duce
d to
35
0 m
a/in
.2
I 10
I I
I I
I I
I 40
50
60
70
80
90
10
0 M
inut
es
Cur
rent
D
ensi
ty
Spee
d C
atho
de
Run
No.
m
a/in
.2
in./m
in
Effic
ienc
y,%
L%$
293
3oo
0.25
0.
25
83
85
5oo
0.25
37
5 0.
25
zl(H
and-
Cas
t)
n h
u 26
7 m
a/in
.2
Cur
rent
in
crea
sed
to
293
ma/
in.2
z
.z
2.0 1.8
1.6
0 10
20
up
, I‘,
.- I
I I
I I
I I
30
40
50
60
70
80
90
100
Min
utes
Fi
gure
58
. R
epre
sent
ativ
e D
ynam
ic
Test
R
esul
ts
for
Pota
ssiu
m
Perio
date
-Mag
nesi
um
Cou
ple
in
2M A
lCle
-1M
H
Cl
Elec
troly
te

4.0
3.8-
3.6-
4
Tota
l Vo
ltage
C
urre
nt
Den
sity
Sp
eed
Run
No.
m
a/in
.2
in./m
in.
350
0.30
40
0 0.
30
1.
1.
4.
3.
3.
t ‘y
&A
I 0
10
20
0,
'OM
inut
2:
50
60
70
80
Tota
l V-
"---
- -r\
8
(Cel
ls
n-.A
Cur
rent
2 .o
*
1.8-
1.6,
In
terc
hang
ed
1.4
yl;""
;:
I I
I I
I I
0 10
20
30
40
50
60
70
80
M
inut
es
Figu
re
59.
Dyn
amic
Te
st
Res
ults
fo
r Se
ries-
Con
nect
ed
Dou
ble
Tape
s U
sing
Po
tass
ium
Pe
rioda
te-M
agne
sium
C
oupl
e

run was terminated because of cathode sticking, an "S" follows the run time as given in Appendix Table A-7.
When double tapes were discharged, the procedure was identical to that above except that SW-~ in Figure 57 was opened to connect the cells in series, and the appropriate individual cell and reference voltages were recorded, The double tapes were extruded on a single separator and this separator provided an electrolyte path between the two cells. This path apparently affects the cell voltage as indicated in Figure 59. When the cell order was interchanged, the poorer cell improved while the better cell showed a drop in voltage. This effect was reduced by wet-proofing the portion of the separator between the two tapes but conclusive results on this effect have not been obtained.
a. Anode
The preferred anode material was primary magnesium. Magnesium AZ31B and AZ61B alloys offered no stability advantages with the electrolyte as used under the dynamic test conditions and resulted in lower cell voltages. The machine punched magnesium strip, 4 mils thick, operated with lower polarization than the strip without holes and provided more uniform contact than the perforated and expanded magnesium. The expanded magnesium was prone to break at the areas of reduced cross-section. For very low tape speed, less than 0.15 in./min or high delivered cathode capacity, greater than about 8 amp-min/in.2, a greater thickness of magnesium would be required. This was evident when operation at 0.1 in./min or a 2.5-in. long collector was attempted. With the acid electrolyte used, the 25-minute residence time beneath the collector head was sufficient to cause disconnuity of portions of the magnesium from the- upstream anode current collector. When residence time was shortened by decreasing the collector length, low speeds could be used without anode disconnecting. Anode coulombic efficiency was not maximized, but satisfactory operation was achieved with anode coulombic efficiencies of better than 50% in acid electrolytes.
Separate voltage probes showed that 20 to 30 mv was lost at the anode current pickup with a current of 1.5 amp when primary magnesium was used. Other methods of anode contact, such as rolling knife pickup, were less satisfactory. The surface con- dition of the magnesium also affected the contact voltage drop; dirty or highly oxidized surfaces gave losses as high as 150 mv. The magnesium AZ31B alloy showed lower contact losses than the primary magnesium, probably due to a thinner or less perfect surface oxide layer.
130
.--- - _..._ _

b. Cathode
(1) Current Collector
Selection of a suitable cathode collector material depends on the type of cathode depolarizer used, The only materials found suitable for discharge of potassium periodate were platinum and high conductivity, dense graphite (USG443). The graphite was preferred since its inherent flaking action reduced sticking. Lead wires to the collectors were coated with epoxy or Silastic resin to avoid possible contact with electrolyte and the resulting depression of cell voltage. A relatively smooth collector surface was found desirable for providing a low resistance contact with the cathode coating and keeping pulling force low. A chamfered, leading edge on the collector reduced scraping of the cathode coating. Rendering the lead-in chamber nonconducting by covering with tape provided time for the electro- lyte wet-out to occur before discharge. While the current- density profile on the collector was not measured, results of static constant voltage discharges indicated that the current density was high over the leading one-third of the collector with the maximum current density occuring at about one-third of the way through the collector.
Several constant voltage static discharge curves are shown in Figure 60. The abscissa, time, corresponds approximately to the distance through the collector and the ordinate, current, to local current density in a dynamic test. The cathode coulombic efficiencies in these tests approximated those obtained in dynamic tests of these tapes. It is evident that the major portion of the capacity (the area under the curve) is delivered in the early portion of the discharge corresponding to the forward portion of the collector in dynamic tests.
During the course of dynamic testing, considerable heat evolution was evident in\the collector area. It was thought that this might be a major factor in the cathode sticking Rroblem if temperatures high enough to melt the binder were attained. Accordingly, a thermocouple was placed in a cathode slot during one discharge test. Temperatures up to 50°C were measured. In another test, a traverse of the temperature was made with a thermocouple on the anode side. Temperatures ranged from 40°C at the inlet and outlet to a maximum of 63°C about one third of the way into the collector. It was tentatively concluded that the major position of the heat generated was a result of chemical action of the electrolyte on the magnesium since the measured IR losses were far too low to account for the temperatures measured, even if no heat losses to the surroundings were allowed. The heating was not a major contributor to the sticking problem since the binders used do not soften appreciably until temperatures near 94°C are reached,
131
1 _.~ .-_ ---
, . --- , . . : :., .‘.. ,I/,.. ,.;

2000
1800
1600
1400
2 12
00
-G
Li
co
~ 10
00
$ 2 80
0
600
400
200 0 0
100
200
3oo
400
5oo
600
70d
’ 11
00
1200
Ti
me,
se
t Fi
gure
60
. C
onst
ant
Volta
ge
(2.0
~)
Stat
ic
Dis
char
ge
of
Pota
ssiu
m
Perio
date
- Pr
imar
y M
agne
sium
C
oupl
e in
2M
AlC
ls-0
.5M
KC
1 El
ectro
lyte
Anod
e Ex
pand
ed
Mg,
C
ell
Volta
ge
= 2.
Ov,
Ar
ea
= 3.
0in.
wt
.KIO
c C
atho
de
mg/
in.2
Ef
f.,%
Te
st
No.
Ta
pe
No.
- 11
6 --
110
---
71

Some pressure must be applied to the current collector to insure good collector-to-cathode contact. In laboratory tests, pressure was applied by putting small lead weights on top of the upper current collector. The amount of weight required for good contact depended a great deal on the physical nature of the cathode coat surface. A smooth cathode coat required less current collector pressure for good contact than a rough cathode coat. The machine-extruded cathode coatings were much smoother and more uniform than those produced by hand casting. Compared with the hand-cast cathodes, machine-extruded cathode tape required only half the collector weight to insure good contact. In addition to surface property differences, the hand- cast cathode coats were much less dense than the machine- extruded coatings. Increased weight undoubtedly improved particle-to-particle contact as well as current collector contact.
(2) Electrolyte
A mixed electrolyte, 2M AlCls - 1M HCl was found to be most suitable for dynamic discharge of the potassium periodate- magnesium tapes. The hydrochloric acid imparts good conductivity and wetting properties to the electrolyte while the aluminum chloride reduces the rate of attack on the magnesium and provides additional acid (by hydrolysis) for consumption in the cathode discharge reactions. The periodate discharge reaction requires 7 gram equivalents of acid per gram-mole of potassium periodate. The weight requirements of electrolyte to provide this acid are shown in Figure 61. The 2M AlClo - effectively about 6.8N in acid,
1M HCl electrolyte is and about 0.54 g of this electro-
lyte is needed to wet out the separator as indicated by the dotted line in Figure 61 for the 4-mil nylon separator used in most tests. As indicated by the results of static discharge tests with limited electrolyte, the cathode efficiencies at the high voltages and current densities desired in this work appear to be electrolyte limited.
The results shown (shaded area) for dynamic discharge of potassium periodate tapes do not reach the electrolyte limiting level probably because larger quantities of electrolyte were fed to avoid sticking problems. As a result of the acid consumption by the discharge reaction, the pH of the electrolyte eventually increases sufficiently to cause considerable hydrolysis of aluminum chloride. The resulting aluminum hydroxide gel ties up the remaining water. The formation of this voluminous gel in the electrode is not desirable and probably contributes to the sticking problem. The feeding of excess electrolyte retards the pH change and attendant gel formation. Separate titration studies showed that aluminum chloride provided about 2.8 equivalents of acid per mole before reaching a pH of 4.5 but gel formation began at pH as low as 1.5.
On way to reduce the electrolyte weight required is to use a more concentrated acid electrolyte. This was, in fact, the
133

luw
Th
eore
tical
/-T
heor
etic
al
Usi
ng
2M A
lCls
-1M
H
Cl
Elec
troly
te
Req
uire
d to
w
etou
t se
para
tor
(Nyl
on
2506
K)
Stat
ic
test
s,
limite
d el
ectro
lyte
, cu
rrent
de
nsity
-500
m
a/in
.2
Ran
ge
of
dyna
mic
te
st
resu
lts
curre
nt
dens
ity=2
5048
0 m
aA.?
,/-q
Wou
ld
not
disc
harg
e ef
ficie
ntly
t
I I
I 0
0.1
0.2
0.3
0.4
0.5
O-6
0.7
0.
8 0.
9 1.
0 1.
1 1.
2 1.
3 G
ram
s El
ectro
lyte
pe
r 10
0 m
g KI
04
Figu
re
61.
Elec
troly
te
Usa
ge
Com
pare
d w
ith
Theo
retic
al
Acid
R
equi
rem
ents
fo
r Po
tass
ium
Pe
rioda
te
Dep
olar
izer

direction taken in arriving at the 2M AlC& - 1M HCl mixed electrolyte; that is, saturated aluminum chloride was first used and, subsequently, better performance was obtained as increasing concentrations of hydrochloric acid were used. However, use of hydrochloric acid concentrations over one molar resulted in excessive corrosion and gassing of the magnesium and deterioration of the nylon separator. It may be possible to overcome this and also to limit distribution of aluminum ion throughout the electrode by incorporating a dry aluminum chloride layer in the separator adjacent to the anode. Use of a straight hydrochloric acid electrolyte (say 10N) for wet out may then be possible since the aluminum chloride should provide a protective action at the anode. The more concentrated hydrochloric acid should also provide higher discharge voltage and cathode efficiency in addition to reducing the required electrolyte weight (see Figure 61). Electrolyte weight can also be reduced somewhat by reducing the separator thickness or changing the type of separator. The effects of these changes on the energy-densities obtained are discussed below.
C. Energy Densities
The energy densities calculated from dynamic test data ranged from 50 to 70 watt-hr/lb for the improved potassium periodate tapes. This figure includes electrolyte fed over and above that indicated as necessary for the discharge (Figure 61) and the actual weights of separator and magnesium used. Using the minimum electrolyte (2M A1C13 - 1M HCl) weight as indicated in Figure 61, a 2-mil rather than 4-mil nylon separator, and the minimum weight of magnesium successfully used in testing (about 50% coulombic anode efficiency) energy densities were raised to about 85 watt-hr/lb. It should be noted that electrolyte weight still accounted for about 60% of the total weight in this system. If a further reduction in electrolyte weight can be achieved (by use of 1ON HC1, for example), energy densities over 100 watt-hr/lb can be attained with the magnesium potassium periodate couple. Even with this reduction, the electrolyte weight isstill the largest contributor to the weight of the system. Table 34 indicates the weight distribution that would be realized from the use of 10N HCl as an electrolyte. Experimental weights were assigned to all components other than electrolyte for the compilation weight percentages.
135

Table 34
COMPONENT WEIGHTS OF DRY TAPE DEVICE USING 10N HCl AS ELECTROLYTE
Cathode Coating Separator Anode Electrolyte (10N HCl) Incapsulating Material Hardware
19.1
::; 42.;
22:o 100.0 (lo.9 lbs)
These percentages apply approximately to a four tape unit with capacity for 75 ft of tape.
136

II I
PHASE 3. CONVERSION DEVICE DEVELOPMENT --- --
A. BACKGROUND
The dry tape device must first contain the dry tape components on spools and then, on demand, move the tapes through an electrolyte release mechanism and through the current collectors, and finally roll the spent tape on an empty spool. The minimum weight consideration is important'to achieving a high watt-hr/lb output for the entire device (battery components plus mechanical hard- ware) . The pertinent design considerations were: (1) minimum weight, (2) auxiliary "start" system, (3) parasitic operation, (4) tape speed control (for regulating power output), and (5) reliability. An auxiliary energy system required to start the device foliowing a period-of inactivity when no parasitic power is available for driving the tape reel.
Parasitic operation of moving the tape with a the dry tape battery.
the driving motor is required for continually small fraction of the power generated by
Variable speed control of the tape permits matching tape electrical output to the external load for efficient tape discharge at either high or low current loads.
B. TAPE DRIVE MECHANISM
1. Tape Transport Device
Several of the more important design concepts of the tape device are similar to those of a commercial tape recorder. Two methods for the tape transport were analyzed: (1) fixed speed capstan drive, and (2) variable speed take-up-reel drive. Both systems are used in commercial recorders. Careful analysis of both designs, against the background of minimum weight and reliability requirements, indicated that a capstan drive design should be used for moving the dry tape.
2. Start Systems
Three methods of "start' systems were: (1) a primary battery (silver oxide) package with no recharging capability, (2) a secondary battery package (nickel-cadmium) with provisions for recharging, and (3) an all mechanical system with energy storage in a spiral power spring. Tests of these three devices showed that the mechanical system was the most reliable but also the heaviest.
137

3. Speed Control
Two methods for tape speed control were: (1) a manually operated rheostat control in series connection with a dc motor armature, and (2) an electronic control system that would automatically regulate tape linear speed to maintain a constant discharge voltage. The electronic control was not available for the trans- port device at the final assembly period. The "back-up" manual control was substituted and can be seen in the left-hand leg of Figure 62. The manual control can be adjusted so that the tape linear speed varies from 0.1 to 0.2 in./min.
4. Motors
Measurements during breadboard tests indicated that 150 oz/in. of motor torque was required to move the tape. Of the several light weight, low power input, commercial motors, a small dc permanent ma net gearmotor +* had the best torque for least power consumption 7 see Figure 62). This motor had adequate torque and speed in the low voltage range (2 to 4 v dc) to be of interest for dry tape application. Comparative data on the best motor candidates are given in Table 35.
C. MATERIAL INVESTIGATION
1. Structural Metals and Plastics
Early breadboard tests indicated that to move the tape reliably would require a rigid chassis structure to maintain the original alignments. Rigidity is a calculable function of geometric shape and Young's modulus of elasticity.
To a large degree the shape of the chassis was determined by the anode-cathode tape and electrolyte tape configurations. Analysis of the specific stiffness index of some of the more available structural metals and plastics indicated that magnesium alloy had an excellent specific stiffness characteristic surpassed only by that of natural mica. (See Table 36). The specific stiffness index permits a quick comparison of the stiffness per unit specific weight of the various construction materials under analysis. From the several materials listed in Table 36, magnesium AZ31B-H24 alloy was selected on the basis of ready availability and workability.
A further comparison of materials of construction on a basis of specific tensile strength (Table 37) provided a further criterion for the selection of structural materials.
--- 3c Globe Industries, Inc., Model 43A836
138

Figu
re
62.
Low
-Vol
tage
, Pe
rman
ent
Mag
net
Gea
rmoL
uL

Tabl
e 35
TAPE
DR
IVE
MO
TOR
S C
ram
er
Div
. of
G
lob
Indu
s-
Gia
nnin
i C
ontro
ls
tries
, In
c.
Cor
p.
Type
N
o.
220
Type
43
A836
d-c
Perm
anen
t M
ag-
d-c
P/M
ne
t G
ear
Mot
or
Gea
r M
otor
Sigm
a In
stru
- C
hara
cter
istic
s m
ents
In
c.
Tme
Sync
hron
ous
Step
ping
M
otor
d-c
Volts
4
4 4
4 4
Cur
rent
In
put,m
a 50
0
Pow
er
Inpu
t, M
W
2000
RPM
l/1
0
Torq
ue-o
z.in
. 40
M
ax.
Torq
ue
Allo
w-
300
ante
W
eigh
t-Gra
ms
280
$ Pa
rasi
tic
Pow
er
25
From
8
Wat
t Sy
stem
35
52
140
208
l/12
l-/19
33
40
3::
130
168
1.75
2.
6
Han
kscr
aft
Co.
(P
roto
- ty
pe)
d-c
P/M
G
ear
Mot
or
12
48
52
90 0.6
0.65
Hay
don
Div
. of
G
ener
al
Tim
e,
No.
MD
83-O
OO
K
d-c
P/M
Gea
r M
otor
13
l/10 38
40
180

TABLE 36
SPECIFIC STIFFNESS INDEX OF MATERIALS
Material_
Natural Mica
Magnesium AZ31B-H24 Alloy
Delrin
Steel
Aluminum
Phenolic Resin
Specific Stiffness: $?$+$
210 x 106
160 x lo6
115 x lo6
105 x lo6
100 x lo6
40 x lo6
+ Specific stiffness = F/A x 1 -q-c w
where
F = Tensile force within elastic limit (lbs)
L = Original length of specimen (in.)
A = Cross sectional area (in.')
e = Elongation within elastic limit (in.)
W = Specific weight of specimen (lb/in.3)
141

TABLE 37
SPECIFIC TENSILE STRENGTH OF MATERIALS
Material
Polyester-glass laminate
Steel
Aluminum
Magnesium AZ31B-H24 alloy
Phenolic Resin
Delrin
Specific Tensile Strength:
61 x lo4
60 x 10 4
59 x lo4
50 x lo4
48 x lo4
20 x lo4
* Specific Tensile Strength = $ x $
where
F = Ultimate force at time of rupture (lb)
W = Specific weight of specimen (lb/in.3)
A = Cross sectional area (in?)
142

2. Corrosive Effect of Electrolytes on Materials
The qualitative corrosive effects of electrolyte on candidate materials of construction are listed in Table 38.
3. Protective Films
Magnesium alloy without film protection is subject to rapid corrosive attack when exposed to the electrolyte solution, 2M AlC13, 0.25M HCl.
Suppliers of magnesium metal+* recommended one of the following surface treatments: (1) application of a clear vinyl film to the alloy surface; (2) application of a film of white titanium dioxide (primer paintt); (3) for maximum corrosion protection, anodizing with Dow No. 17 process to a thickness of 1 mil and then application of a titanium dioxide primer; or (4) electroless nickel plating. Step (3) was used to anodize magnesium parts during fabrication. Several of the magnesium components whose function did not permit the use of thick films were electroless nickel plated.
D. TRANSPORT DEVICE DESIGN
A complete, weight-optimized transport device is shown in Figure 63. The total weight of this device as shown is 2.4 lb. A breakdown of the major sub-assemblies of the device is given in Table 39.
1. Chassis
Two transport devices were assembled. The first used cast-in- place polyurethane foam as a means for imparting additional rigidity to the chassis, which was fabricated from l6-mil thick magnesium alloy AZ31B-H24 alloy. The second chassis was fabricated without foam but using epoxy adhesive+k+t between all lap joints and for filleting where required. This method resulted in a weight saving of 2 oz with no significant sacrifice of rigidity.
Figure 64 shows top and bottom views of the chassis showing the preferred foam-less construction. This construction resulted as a consequence of the transport design. With all components and sub-assemblies mounted beneath the chassis deck, very little volume was available for the use of sandwich construction. There- fore, the adhesive-rivetting technique was employed and with good results.
3C Dow Metal Products Co. t Sherwin Williams Co. je+c Minnesota Mining and Metallurgy Co., Epoxy Adhesive ~~-2216
143

TABLE 38
ELECTROLYTE CORROSION ACTION ON MATERIALS OF CONSTRUCTION
Materials
Phenolic, NEMA X
Delrin
Monel
Magnesium, AZ31B-H24
Viton-A Elastomer
Stainless type 304
Aluminum
Teflon film
No. 17 anodized magnesium alloy
No. 17 anodized magnesium with zinc chromate primer (film)
No. 17 anodized magnesium with titanium dioxide primer (film)
Electroless plated magnesium alloy
24-Hour Immersion in Electrolyte 2M A1C13 + 0.2M HCl
no effect
no effect
slight gassing
dissolved
no effect
blackened slightly
dissolved
no effect
slight attack
no attack
no attack
no attack
144

r
Table 39
WEIGHTS OF TRANSPORT SUB-ASSEMBLIES
Item _I_.
Chassis
Current Collector
Motor with Mounts
Tape Reels (2)
Electrolyte Reel
Capstan Drive
Hardware
Electrolyte Pump
Figure Number
64
65, 66, 67
62
63, 71
70
69
68
145
Weight, oz.
8.8
8.4
7.0
4.2
3.4
3.0
2.7
1.0

Figu
re
63.
Com
plet
e Ta
pe
Tran
spor
t D
evic
e

147

2. Current Collector Assembly
.The complete anode-cathode current collector assembly is shown in Figure 65. Additional details of the anode collector are shown in Figure 66, which shows the four saw-toothed contacts (for contact with magnesium tape), four electrical leads, and four perforated phenolic plastic pressure pads for squeezing the anode, separator, and cathode against the cathode collector. The cathode collector, Figure 67, is made of graphite+b.
3. Electrolyte Pump Assembly
The electrolyte pump, shown in Figure 68, is a positive displace- ment pump for supplying electrolyte to the cathode current collector (Figure 67). The incapsulated packets of electrolyte are drawn into the sealed chamber of the pump body by the spines of a capstan wheel. There the packets are slit, electrolyte is released, and the film is flattened and discharged.
The electrolyte is continuously discharged from the ends of the four Teflon tubes because of the displacement action of the progressively advancing packets. These displace the free liquid from the pump body, and the free liquid is forced into and out of the tubes as the sealed packets advance. The other ends of the tubes are fastened to the carbon cathode blocks shown in Figure 67. The electrolyte is distributed to the surface of the cathode tape either by appropriate grooves cut in the carbon or by its inherent porosity, depending on the grade of carbon-graphite selected. The entire tape system is wet out in the region between the current collectors and an electrochemical reaction produces current between the current collectors and an external load. The electro- lyte pump is fabricated from monel metal and Viton-A elastomer for corrosion protection.
4. Capstan Drive Assembly
The capstan drive assembly is shown in Figure 69. Two each of the smaller one-inch diameter wheels pull the tape through the current collectors. Small spines project l/32 in. beyond the one inch diameter, thus assuring a positive drive independent of friction.
The large center wheel of the capstan is two inches in diameter and pulls the flattened film of the electrolyte packet chain. The larger diameter is required to pull the electrolyte packets through at twice the linear rate of the electrode components.
l’r United States Graphite Company, No. 443 electrical brush grade carbon-graphite
148

Figure 65. Complete Anode-Cathode Current Collector Assembly
Figure 66. Anode Current Collector
Figure 67. Cathode Current Collector
149

Figure 69. Capstan Drive Assembly
150

I’
The capstan is, in turn, driven by a sprocket and roller chain which concludes at the mounted sprocket of the motor
~~~~,""{see Figure 62).
5. Motor
The low voltage dc permanent magnet gearmotor is shown in Figure 62. This motor will operate in the range of 2 to 4 v and develop 150 oz/in. of torque. The motor draws 0.3 watt at 4 volts dc.
6.
The was The
Electrolyte Storage Reel c-- -
electrolyte storage reel is shown in Figure 70. The reel fabricated from magnesium AZ31B-H24 alloy and epoxy adhesive. reel is mounted underneath the transport chassis inside the
"side bubble" feature seen in Figure 64. Thus, the electrolyte system is normally not seen and is completely protected. This design approach permitted efficient utilization of the envelope volume.
7. Take-Up Reel
The spent tapes and electrolyte film are wound up and stored on the reel shown in Figure 71. This reel is positively driven by a sprocket and roller chain and always keeps the tape under tension. The reel does not add significantly to the pull of the tape, although it is driven by the same raer chain as the capstan drive. The take-up reel shaft system contains a miniature slip clutch that is preset to a friction value that will always maintain tension on the tape without influencing the linear tape speed, which is controlled by the capstan drive only.
151

Figure 70. Electrolyte Storage Reel
Figure 71. Take-up Reel
152

REFERENCES
1. B. A. Gruber, et. al., "Feasibility Proof of Dry Tape", Contract NAS3-2777, Final Report, 31 March 1964, MRC Report No. MRB5001F.
2. J. L. Robinson and P. F. King, J. Electrochem. Sot., 108, 36-41(1g61).
.3* B. A. Gruber, et. al., "Research on Organic Depolarizers", Contract No. DA 36-o3g-SC-873360
4. G. Cohn and A. P. Handel, Engelhard Industries, Inc., Technical Bulletin 2, 54 (1961).
5. Allied Chemical Tech. Bulletin, Aclar Fluorohalocarbon Film, ADT 1263, p. 16, General Chem. Div., Bridgeport, Conn.
6. R. M. Barrer and G. Skirrow, J. Polymer Sci., 3, 549 (1948).
7. H. J. Lelie, Modern Packaging, 37, 145 (1964).
8. F. S. Symington and R. F. Burroughs, Fibre Containers, 28, 107 (1943) *
9. Tappi, T448m-49.
10. ASTM Eg6-53G.
11. J. Sivadjian and F. Corral, J. 561 (1962). Applied Polymer Sci., 5,
12. "Modern Plastics Encyclopedia Issue 1964", 41, No. lA, September 1963, Films Chart.
13. "Modern Plastics Encyclopedia" Issue 1964, Vol. 41, No. September 1962.
lA,
14. J. Sivadjian and 5. RiRibeiro, Applied Polymer Sci., 8, 1403 (1964) .
15. A. W. Myers, V. Tammela, V. Stannett, and M. Szwarc, Modern Plastics, 139 (1960).
16. Commercial Development Report 'Preservation and Protective Packaging in Scotchpak Films", 3M Company, Commercial Development Laboratory, St. Paul, Minnesota.
17. M. S. Chandrasekharaiah and J. L. Margrave, J. Electrochem. sot ., 108, 1008-1012 (1961).
-
18. W. F. Meyers, 'Development of High Energy Density Primary Batteries 200 Watt Hours per Pound Total Weight Minimum' Final Report, Contract NAS3-2775, Report No. NASA CR-54083.
153


APPENDIX A
EXPERIMENTAL DATA
-


.4;:1
-1”
.;:1-
11
.:;1-
12
.J;:)
l-!
x:-5
1-2
.,:;1
-, ..;
>z-1
; t;j
-1
4 .i:
‘.o-l
:I:
90-2
23
:,0-;
y,, c
l-!,
FOFX
JULT
ION
S AN
D S
T. T
IC
CEL
L D
ISC
HAC
E C
HJ.
CTE
RIS
TIC
S O
F M
ACN
ESI”,
&PO
T;.S
SIU
!I PE
RIO
D;.T
E TA
PE
CEL
LS
92.;
priln
ary
A&T
102.
3 ,I
132.
0 PZ
31B
105.
4 II
03.2
II
109.
G
II .1
2.?
II 16
3.j
II 19
9.3
II
- : :, ,x-J
7:
20 ; 64
Cl ;4’
:: 63
72
La
62
1.70
1.
73
I.70
1 L-
5 1
.70
1.50
l.U
O
1 .c
5 1.
78
1.70
1.
75
1.70
1
.a0
:z
1:90
2.
00
64
1.80
65
1.
80
>a
EiO
1.
85
J
II 2 J
16
39
2,’
1:;
1:75
27
1.70
1.
70
34
1.80
2,”
1.60
1.
55
t: 1.
66
1.50
5 1.
5
KIO
, gr
ound
to
-2
00
+3,0
m
esh
II II
1,
I! II
Low
“0
1tag
e du
e to
pa
ss1”
(?-
not
suPf
lcie
ntly
pe
rforn
ted
PeH
orat
ed
anod
e Pe
rfora
ted
anod
e ra
n po
orly
at
st
art
due
to
insu
ffici
ent
elec
troly
te
Pc,te
ntia
l di
d no
t ris
e ab
ove
1.2
-Diff
eren
t se
ctio
ns
of
ram
e ta
pe
Volta
ge
fell
fast
i-o
r a1
1 N
;lIO
* ce
lls
Pote
ntia
l dr
oppe
d be
low
1.
j im
med
iate
ly
- po
or
wet
ting
Shar
p in
itial
vo
ltage
di
ps
follo
ued
by
slow
ris
e to
m
ax.
emr.
indi
cate
s po
or
wet
ting
No
adde
d w
eigh
t D
id
not
run
with
0.
5 ps
i w
t. G
raph
ite
coat
ed
cath
ode

Tlbl
e A-
l (C
ont’d
)
FOR
MU
LATI
ON
S AN
D
STAT
IC
CEL
L D
ISC
HAR
GE
CH
ARAC
TER
ISTI
CS
OF
MAG
NES
IUM
-PO
TASS
ILW
PE
RIO
DAT
E TA
PE
CEL
LS
oper
atin
g m
lf “0
1 ts
1.60
:::i
com
men
ts
Ran
at
ap
prox
. 1.
40
volt.
5 C
raph
lte
pow
der
coat
ed
on
cath
ode
Gra
phite
co
ated
ca
thod
e G
raph
ite
coat
ed
cath
ode
RJ"
be
low
1.
5v-c
arbo
" cu
rrent
co
llect
or,
silic
one
treat
ed
to
fill
pore
s ""t
reat
ed
ca;b
on
co1j
;ect
or
II II 9,
II
II II
II
41
62
30
1.85
1.
93
::I?:
1.
60
Air
drie
d ta
pe
Ran
be
low
1.
5 KJ
1ts
1.80
1.
75
Ove
ndrle
d ta
pe
Pa”
*t 1.
30
volts
, ca
rbon
co
llect
or
Ran
at
1.
20
volts
ca
rbon
co
llect
or
Pt
colle
ctor
II
II
6436
0~;b
6’ 3
60-5
co
92.6
II
II
2:::
II II
105.
1 ex
p.
pi-l.
w&.
1;
ex
p.
AZ31
B
1.70
2.
00
2.00
2.
10
:+:
1:90
1.
95
2.05
2.
00
1.95
:g
1185
85.4
88
.2
73.1
93
.9
101.
5 11
0.3
104.
9 10
4.8
133.
5 11
3.1
1%
117
::2
1231
8 1;
,5.2
exp.
,,pr1
.,.lg
. ”
500
11
~MA~
C~L
,.O.~
MH
C~
,, Sa
t'd
AlC
la
II II 2M
AlC
+'0.
5MH
Cl
:I
No
initi
al
volta
ge
dip
25%
ox
alj;c
acid
in
ca
tjhod
e
Sepa
rato
r co
ated
w
ith
a&w
-aga
r C
atho
de
pres
sed
at
2000
ps
i N
ot
pres
sed
Ran
be
low
1.
5 vo
lts
6j.2
II
II II
114.
5 II
~MA~
C~Z
.O.~
HBF
I '
97.1
II
122.
1 II
1.5M
AIC
13.1
.5M
HC
L;;
2MA1
C13
'1N
HC
l lG
j.6
II 2M
AlC
lz,~
2MH
C1
'I 12
6.0
II PM
AIC
Iz.lI
WC
1 "
121.
3 II
124.
0 II
2MAI
Cls
~PM
HC
I "
124.
3 II
1.5M
A;C
l~.1
.5M
HC
l;;
148.
8 II
127.
1 II
2MAI
C+.
3MH
Cl
” II
Flat
pl
atea
u fo
llow
ed
by
rapi
d dr
op
Volta
ge
drop
s gr
adua
lly
II II
II
clp,
s1
yTy

Tabl
e A-
l (C
ont’d
)
FOP,
,.,XL
ATIO
NS
AND
STA
TIC
C
3.L
DIS
CH
ARG
E C
HAR
ACTE
RIS
TIC
S O
F M
AGN
ESIU
M-P
OTA
SSIIM
PE
RIO
DAT
E TA
PE
CEL
LS 1.35
1
.oo
2.00
2.
00
1 .‘i
;i 1.
49
1.35
1.
90
1.70
1.
95
1 .‘>
I 1.
95
2.04
2.
G5
1.75
2.
08
2.02
2.
05
2.08
2.
10
2.00
‘,:%
Anod
e ce
.“ere
ly
corro
ded
II II
II Et
hyle
ne
chlo
ride
n1ur
ry
:Xac
hine
m
ade
tape
s II
II I,
2.10
2.
05
2.08
2.
05
2.10
2.
05
2.05

5042
4
5052
4 '>
0623
.505
23
,jO61
9 50
519
Ccn
,‘uc’
;cr
Dep
olar
izer
“'c
te
1)
n t
vt
Picr
ic
Arid
!'~
;.3)
II I, II
9,
Blsn
k '?
!I)
Picf
ic
Acid
13
4.5)
'!1.3
41
.3
-11.
3
C
F.5
,5.5
J?
.5
z.5 '!'.5
!11.
5 35
.5
j'O.7
5 40
.75
"1.5
41
.5
"1.5
11
4 .5
4'1.
5
"5.5
45
.5
45.5
29.7
29
.7
Tabl
e A-
2
FOR
MU
LATI
ON
S AN
D S
TATI
C
CEL
L C
HAR
ACTE
RIS
TIC
S O
F O
RG
,\tIIC
?!IT
RO
CO
MPO
UN
D CAT
HO
DES
(A
ll ca
thod
es
disc
harg
ed
vs.
expa
nded
m
agne
sium
AZ
31B
unle
ss
othe
rwis
e no
ted)
Fibe
r C
ontP
nt
of
Cos
ting,
k
(Not
e 2)
;
Bind
er
cont
ent
of
Coa
ting-
:, %
(N
ote
3)
11.4
PV
P 11
.4
PVP
11.4
PV
P
11.4
PV
P
15
:: 29
11
11
11
11
11
11
PVP
PVP
PVP
PVP
PVP
PVP
PVP
PVP
PVP
PVP
PVP
PVP
PVP
PVP
PVP
Pvp
Fabr
ic
(Not
e 4,
.~
D
D
Dep
olar
izer
m
p,/in
.'
59.7
96
.5
D
53.1
D
D
90.0
D
78
.5
D
94.6
N-2
73
.1
N-2
58
.0
N-2
66
.8
D
118
D
96.1
D
38
.2
D
112
D
45.7
N
11
5
117
114 04.7
81.1
109 98.5
Elec
troly
te
2M A
lC13
2M A
lC13
2M
Mg(
ClO
.,)z
2M A
lCl.
2M M
g(C
lO.,)
z 2M
AlC
lz
NO
TCS:
1.
Sh
ariln
igan
ac
etyl
ene
blac
k,
5C$
com
pres
sion
un
less
ot
herw
ise
note
d.
2.
l/4
in.
j-den
ier
Dyn
e1
fiber
s un
less
ot
herw
ise
note
d.
3.
PVP
= Po
lyvi
nylp
yrro
lidon
e,
G =
Po
lyvi
nyla
ceta
te-p
olyv
inyl
al
coho
l.
4.
D =
Web
ril
n~nw
~ven
D
YNEL
No.
14
10,
N =
Pel
lon
Nyl
on
No.
25
05B,
N
-2
= 60
mil
Nyl
on
524.
CU
l-l=?
“t D
ensi
ty
E.3/
in.2
500
500
100
100
500
200
500
200
100
100
300
500
500
300
300
100
100
100
100
100
200
300
Cel
l Ef
ficie
ncy
c22
__
0.65
Y
com
men
ts
45.3
27
.0
54.3
-
(25
min
)(65
min
)
44.3
2:::
14.9
9 C
l 5.4
6.4
17.2
51.1
61
.2
35.9
70.0
71
.7
74.3
2;:;
4o:a
40
.8
Con
duct
ex
SC
(Col
umbi
an)
18.5
C
ondu
ctex
SC
(C
olum
bian
) FC
-13
Car
bon
6.5
Asbu
ry
Gra
ph-
ite
~625
As
bury
G
raph
- ite
~6
25
9.5
Nuc
har
CN
18
N
ucha
r C
N

Ccn
duct
or
':'cte
1)
::I
&
20.
/. 44
.5
a.9
a.9
Et;
4415
44
.5
44.5
15
:?
2 44
12
44.2
44
.2
44.2
44
.2
44.2
44
.2
41.5
2.;
41:5
41
.5
k:
41:5
zi
.5
24
24
24
Tabl
e A-
2 (c
ontin
ued)
FOR
MU
LATI
ON
S AN
D S
TATI
C
CEL
L C
HAR
ACTE
RIS
TIC
S O
F c5
cmIc
N
ITR
O c
O;.!
POU
ND
CAT
HO
DES
(A
ll ca
thod
es
disc
harg
ed
vs.
expa
nded
m
agne
sium
AZ
31B
unle
ss
othe
rwis
e no
ted)
Fibe
r Bi
nder
co
nten
t or
co
nten
t of
co
atin
g,
%
coat
ing,
k
(Not
e 2)
(N
ote
3)
:: FE
11
PV
F 11
PV
P 11
PV
P 11
PV
P 11
PV
F 11
PV
F 11
PV
P 11
PV
P 11
PV
P 11
.7
PW
11.7
PV
F 11
.7
PVP
11.7
PV
P 11
.7
PVP
11.7
PV
P 11
.7
PVP
11.7
PW
11
.1
PVP
11.1
PV
P 11
.1
PVP
11.1
PV
F 11
.1
PVF
11.1
PV
P 11
.1
PVP
11.1
PV
P 11
.1
PVF
11.1
PV
P 11
.1
PVP
11.1
PV
F 11
.1
PVP
CO
MM
ENTS
: A.
1:
l FC
-13:
Shaw
lnig
a"
blac
k
B.
lo@
C
ompr
esse
d ac
etyl
ene
blac
k
C.
Succ
lnlc
ac
ld:P
icrlc
ac
id
IS
1:l
D.
o-D
NB
unde
r 30
0 m
esh
Fabr
ic 4)
(N
ote I1
N
N
N
N N
N
N N
N
N
D D
D
D D
D
D
D D
D
D
II D
D
D
D
D
D
D D D
Dep
olar
izer
m
g/ln
.2
109 20
11.7
13
.0
83.6
12
0 11
2 61.7
47
.0
112 68
.6
146
147 5Y
.5
107
106 55
.7
21.6
la
.1
46.7
21
.5
141 79
.3
76.6
54
.5
61.5
59
.3
95.1
31
.8
25.3
Elec
troly
te
2M A
lCl;
iM
Mg(
ClO
a),
2M A
lC13
21
"1 Al
C13
2M
AlC
la
2M A
lC13
2M
AlC
l. 2M
AlC
l. 2M
AlC
ln
2M A
lCl;
2M A
lC13
2M
AlC
l. 2M
AlC
l. 2M
AlC
13
*M Mg
(C10
4)z
curre
nt
Den
slty
m
a/ln
.2
300
3oo
100
100 50
100
500
500
200
100
100
5oo
500
5oo
5oo 17
20
0 5O
C
200
500
500
5oo
3oo
%
100
5oo
5oo
5oo
5on
100
100
Cel
l Ef
ficie
ncy
-c-S
T 0.
8 0.
65
44.7
3i.2
19.7
20
.3
28.6
21.9
24
.7
E*Z
4314
33
.1
57.5
? 5.
2
4x*:
2614
40
.6
com
men
ts
A A A A A A A i
Sam
ple
pres
sed
lob,
by
w
t Pd
B B

Tabl
e A-
2 (c
ontin
ued)
FOR
YQIL
ATIO
MS
AND
STA
TIC
C
ELL
CH
ARAC
TER
ISTI
CS
OF
OR
GAN
IC M
ITR
O
CO
MPO
UN
D C
ATH
OD
ES
iAl1
ca
thod
es
disc
harg
ed
VS.
expa
nded
m
agne
sium
AZ
jlB
unle
ss
othe
rwls
e no
ted)
5543
3
rE,
6OG
44
6064
4 60
644
6064
5
i2::
P G
o652
E 2%
2
? 60
640
6064
1
:oo~
~:
~3
%z:
zs",:
63
125
6312
5 63
101
"6;::
: 52
298
5229
9 52
299
5223
0
Con
duct
or
01ot
r 1)
\it
;
1'5.
1 30
.1
2p.i
'Is.1
44
.2
44.2
44
.2
44.2
44
.2
44.2
44
.2
44.2
44
.2
44.2
41
.5
41.5
:; iz
2 44
:2
44.2
44
.2
;;*g
;g:;
44:2
44
.2
44.2
44
.2
44.2
44
.2
't4.2
cont
ent
of
Coa
ting,
%
(Not
e 2)
6.:
.5.
5
Bind
er
cont
ent
of
coat
ing,
%
(N
ote
3)
;.;
: ;:;
;
9.7
G
11.7
PV
P 11
.7
PVF
11.7
PV
P 11
.7
PVP
11.7
PV
P 11
.7
PVP
11.7
PV
P 11
.7
PVP
11.7
PV
P 11
.7
PVP
:; PV
P PV
P
:; K
z.,
x 11
.7
PVP
11.7
PV
P 11
.7
PVP
11.7
PV
P 11
.7
PVP
11.7
PV
P 11
.7
PVP
11.7
PV
P 11
.7
PVP
11.7
PV
P 11
.7
PVP
11.7
PV
P 11
.7
PVF
11.7
PV
P
Fabr
ic 4)
(N
ote N
N
N
N
Dep
olar
izer
m
g/in
.'
48.0
25
.2
38.4
50
.5
54.8
11
4 11
9 95.8
10
4 82.5
13
1 10
5 11
3 17
4 17
1 :;.;
57:a
11
2 10
5 71.5
11
6 13
9 64.2
62
.7
146 48
.0
59.0
44
.7
128 43
.8
curre
nt
Den
sity
El
ectro
lyte
m
a/in
.z
1M M
gBra
1M
MgB
rn
1M M
gBrn
1M
MgB
rn
satu
rate
d w
ith
Mg(
OH
)e
2M A
lC13
2M
AlC
13
2M A
lCl.
2M A
lClz
%
%:::
k PM
AlC
13
2M A
lCl.
2M A
lCll
2M A
lC13
2M
AlC
ll 2M
AlC
l; 2M
AlC
ll
2M A
lC13
2M
Mg(
ClO
a)z
2M A
lC13
2M
AlC
13
2M Q
C
lO.,
2 2M
Mg
Cl0
4 2
I I
2M f
ik
Cl0
4 2
2M A
lCl.
2M A
lClz
100
100
100
100
100
500
500
200
200
200
200
200
200
5oo
200
300
300
300
100
100
100
200
500
100
100
100
100
100
200
500
100
200
100
500
200
Cel
l Ef
ficie
ncy
%
to
0.8
v
21.6
2:;
12 a.
7 17
:8'
29
10
$:Z
20:7
2.
7 $2
=2
5 -1
0 23.6
g.,
41.3
4;:;
z.5
:F5 0 $2
14.5
0
29.5
to
0.65
"
47
22.2
29
17.5
21
40.8
::.s
s5.3
36
.4
27.2
g.;
2217
50
.7
:;.4
39.4
13
Y5.5
35.7
com
men
ts
1.2%
Pd
1.2%
Pd
1.2%
Pd
ii Pd
Pd

Con
duct
or
(Not
e 1.
) w
t$
Tabl
e A-
2 (c
ontin
ued)
FOR
MU
LATI
ON
S AN
D S
TATI
C
CEL
L C
HAR
ACTE
RIS
TIC
S O
F (A
ll ca
thod
es
disc
harg
ed
VS.
expa
nded
m
agne
sium
O
RG
ANIC
NIT
RO
CO
MPO
UN
D CAT
HO
DES
AZ
31B
unle
ss
othe
rwis
e no
ted)
Fibe
r El
r,der
co
nten
t or
co
nten
t 0r
C
oatin
g,
s C
oatin
g,
(Not
e 2)
s
(Not
e 3)
6”
6.6
Gra
phite
2 6.
6 G
raph
ite
2 E l2
11.1
Pv
F 11
.1
PVP
11.1
Pv
P 11
.1
PVP
11.1
Pv
P 11
.1
PW
11.1
Pv
P 11
.1
PvF
11.1
PV
F 11
.1
PvP
11.1
Pv
P 11
.1
PvP
11
PirP
::
Pvp
PVP
11
PW
11
PvP
:: PV
P PV
P 13
Pv
P 16
.5
PVP
:; PV
P PV
P 13
Pv
P
:: Pv
p Pv
P ::
PVP
PVP
13
PvP
13
PvP
:: PV
P Pv
P 13
PV
P 13
PV
P 13
Pv
P 13
Pv
P
9.7
G
9.7
G
Fabr
ic
(Not
e 41
D
D D
D D
D D
D
D D D
D
N N
N N
N
N
N
N N
N
N
N N
N
N
N N
N N N
N
N N
N
K
Dep
olar
izer
m
g/in
e2
59.5
f:?
3616
11
1
iL* E:
;
552;
40
.9
36.5
35
.0
43.8
:t:
34:e
;‘o+
39:6
61
.7
Elec
troly
te
34 M
g(C
lO.s
)z
2M A
lCll
2M A
lCl;
2M A
lCl.
2M A
U&
2M A
l&
2M A
lC13
2M
AlC
lx
2M A
lCl.
2M A
lCll
2M M
g (c
l04
1 2
2M M
g (C
lO.,
2 2M
AlC
ls
2M Mg
(ClO
a)z
2M N
H.,S
CN
4M
NH
dSC
N
2M N
H.,S
CN
2M M
g(C
iO*)
B
1M M
gBrz
1M
MgB
ra
curre
nt
Den
sity
m
a/in
.2
300
100
500
100
500
500
100
3oo
100
500
100
200
400
100
100
100
100
100
100
100
100
100
100
100
200
100
200
200
100
100
100 :: 200
300
100
100
100
Cel
l Ef
ficie
ncy
to
to
0.8
v 0.
65
v
32.4
?2*4
’ ;::
g
41:2
59
.3
32.8
85
.3
50.4
49
.4
38.6
12
14
.7
13.8
:z
23:3
19
.0
29.7
17
.8
;: 6
20:2
12
.5
44.8
21
.9
15.4
15
.3
19.7
29
.1
31
51.2
62
.2
::
40.4
68
.5
55.7
87
.5
26.9
if.62
36
:1
87.6
2;
5718
41:e
22
.8
$2
3e:o
35
.6
49.5
31
.7
g.7
27.5
38.8
g.29
74
15
52.5
26.6
31
.5
com
men
t.?
B C
C C
C
Oxa
lic
acid
In
ca
thod
e
E

Drr,
l ‘“‘
“I.
6315
6-4
" :I
" 52
753-
CF-
1 '
(47.
5)
6316
3-l
II m
(4
1.3)
2
4 .2
4
-.2
4. .
2 4
:.2
41.2
4i
.2
44.2
4'
k.2
4:: .
z 4'
. .2
42.2
4'
.2
41.3
41
.3
:;.i:
41:s
41
.3
:z
41:3
41.3
41
.3
41.3
41.3
41
.3
41.3
23
.7
41.3
FOR
&,L1
LAT‘
IC,,S
AND
STA
TIC
CC
LL C
HaL
RAC
TER
ISTI
CS C
F O
'G.::
'I(
::I'?
? C
C.:P
CU
ND
CAT
HO
DES
fA
l1
cath
ode:
di
scha
rged
vc
. en
ande
d m
agne
zlum
AZ
jlB
unle
ss
othe
rwis
e nc
ted)
1/4"
~yn
el(6
,;2)
!I VI
!I II
:: (5
,;6)
II ,I ::
(6,;2
) II II
;: (5
,;6)
II I'
(6.2
)
11.7
PV
P
:1.;
rvp
il.7
L'IP
11
.7
PVP
11.7
PV
P
11.7
PV
P 11
.7
PVP
11.7
PV
P 11
.7
PVP
11.7
PV
P 11
.7
PVP
11.7
PV
P 11
.7
PVF
Llec
troly
te
59.4
2M
M:(C
lO<,
z
E:P
3.3
ll&
.'M A
lC!a
-M
M!;(
ClO
a:z
2M M
~(C
104.
z 2M
RlC
lrJ
71.3
2::
21.0
19
.9
18.4
19
.2
23.5
2M A
lClq
2M
M
&(C
IO.,!
P 2M
M.:(
ClO
a,z
2M M
.;(C
lOs:
z 2M
Mg(
C10
4is
2M M
g(C
104:
a 2M
M~(
C10
4Is
2M M
~(C
104;
a
curre
nt
d
Den
sity
7
ma/
in.2
0.
3
100
gi!0
1o
c 10
0 10
0
100
100
100
100
100
100
100
100
LL
l?
1c
1: 4 IL
24.t
33.0
32
.<
56
.; 36
.2
37.c
11
12
10
189
2M A
lCl,
172
184
1.6M
AlC
1~.:.
4M
r@(a
Qk
?O
,, 19
0 21
1: Al
Cl,
,I 12
8 16
MAl
Cl,'
O.'I
M
Mg(
ClO
a)z
' 13
2 12
4 1M
AlC
l,.llJ
M
g(C
104)
z ::
104
II #I
81
.3
2M A
lCl.
200
119
II 30
0 85
.7
II 50
0
118
II 25
0 78
I!
500
62.3
II
II
Cel
l Ef
fiC
:ePC
C
ell
Emf
'.'OltS
C
oam
ents
0.86
59
°C
0.05
1.
00
24
1.00
20
16
1.
05
14
0.05
45
0.98
1.
20
20
30
36
40
39
:'6
38
0.94
1,
Ol
1.01
0.97
5
ml1
AZ
61-B
- pe
rfora
ted
24°C
24
°C
4OQ
C
42°C
53
°C
ran
belo
w
o.&
volts
20
nil
extru
ded
pri-
mar
-y I
"& a
nod,
sa
me
as
abov
e pr
imar
y IQ
-hol
es
punc
hed
in
anod
e el
ectro
lyte
sa
tura
ted
with
Sa
ntom
erse
Sa
me
as
abov
e 3
ml1
pr
imar
y M
g an
ode
sam
e as
ab
ove

Test
D
epO
l~il-
i‘er
No.
:rt
,.
6316
3-4
Picr
lc
Acid
(4
1.3)
5276
1-3
5276
1-2
6317
7-l
6317
7-2
6317
7-3
Tabl
e A-
2 (c
ontin
ued)
FO
RM
ULA
TIO
NS
AND
STA
TIC
C
ELL
CH
AHAC
TER
ISTI
CS
OF
OR
GAN
IC
NIT
RO
C
OM
POU
ND
CAT
HO
DES
(A
ll ca
thod
es
disc
harg
ed
vs.
expa
nded
m
agne
sium
AZ
3lB
unle
ss
othe
rwis
e no
ted)
Fibe
r Bi
nder
co
nten
t of
C
onte
nt
of
CO
nrlu
Cto
P (N
ote
1)
coat
ing,
C
oativ
.g,
wtF
s
5 2)
(N
ote
(Not
e 3)
41.3
23.7
23.7
45
45
45
45
Dep
olar
izer
m
g/ln
.'
63.7
60
58
70.8
82."
72.6
76.3
:;:
il 78
.1
2M
AlC
l,'lM
M
&l,
PM A
lCl.
g;
::
73.4
II
126
II 13
1 II
134
128
!I 12
0 II II II
Sat'd
Al
Cl,
2M
AlC
l, 81
.2
e6.6
Sa
t'd
AlC
l. II
78.7
II
88.8
1M
AlC
& 94
.9
Sat'd
Al
Cl.
87.2
2M
Al
Clz
.l/4M
H
Cl
112
alM
Mg[
ClQ
) Sa
tldw
AlC
l, "
99.7
'
2 6
O.IM
~~(;l
$;sa
tU II
3
AlC
l,
I, II UJ
.V
31.7
Sa
t'd
AlC
l. II
33.8
II
I,
Cel
l Ef
flCie
nC!i
%
to 0.8 47
31
31
34
E 42
48
43
28
$2
44
34
:: 2;
5:
2:
2:
$ 2,"
:'8
15
22
:i
Cel
l Em
f Vo
lts
1.05
1.00
1.00
0.9-
I
1.11
1.
05
1.01
:.;3
l:oo
1.15
1.
20
1.05
1.00
1.
00
:*:z
1:12
1.
16
1.14
1.
13
XT
1127
::::
1.16
1.
23
:z
1:15
1.
01
1.01
?o'Z
61-s
pe
rfora
ted
AZ
doub
le
thick
ness
hi
gh
open
ci
rcui
t 2.
45~
high
op
en
circ
uit
2.30
~ 5m
il pr
imar
y M
g-
perfo
rate
d 2.
35
OC
V sa
me
as
abov
e AZ
61-B
IQ
-per
fora
ted
2.17
oc
v sa
me
as a
bove
A!
Z61-
B M
g-do
uble
la
yer
AZ~~
-B f
@
prim
ary
MS
anod
e
prim
ary
MS
anod
e-AZ
31-B
pl
aced
in
so
lutio
n pr
lma~
y M
g an
ode
SAB
pret
reat
ed
with
H
NO
s ca
rbon
bl
ack
and
fiber
va
cuum
tre
ated
at
15
0°C
for
1 hc
$r II
HC
l ad
ded
to
mak
e pH
0.
01

Test
N
C3
- b4 j
O')-
36
r,Sj@
;-Y
( 6k
jl6-6
64
316-
7 64
316-
11
6431
6-12
64
316-
G
Ghj
lS-1
4 64
312-
61
6431
2-62
6430
:‘~SS
64
303-
41
: 64
325-
l
(53
64j2
5-2
bkj2
3-1
6432
3-2
6432
3-5
6432
3-b
6432
3-7
64 j23
-6
64 j2
3-)
6432
3-10
64
524-
13
6432
4.14
64
324-
15
6432
4-16
64
j24-
21
6432
'1-2
2 64
324-
19
6432
4-20
64
j27
-4
6432
7-6
Tabl
e A-
2 (c
ontin
rled)
IiO
Ri'lU
LATI
ON
S AN
D
STAT
IC
CEL
L C
HAR
ACTE
RIS
TIC
S O
F O
RG
ANIC
N
ITI+
@
CO
MPO
UN
D C
ATH
OD
ES
[All
cath
odes
di
scha
rged
VS
. ex
pand
ed
ma6
nesi\
am
AZ)lE
un
less
ot
herv
Ise
note
d)
127.
5)
47.5
II 47
.5
45
45
87 _
45
II II i!:7.
7)
t: 42.3
"2
.3
,! 42
.3
II 42
.3
(20.
4)
XL;
I>
39.6
II (24)
:6
9.b
87
:2
II 36
(5
6.7)
33
.3
II II Z:
’ 3
II (28.
5)
::::
31.5
II
91.5
II
31.5
Fibe
r co
nten
t of
C
oa~,
ln,,
(Not
e 2)
D
epO
lariZ
er
mg/
in.'-
- El
ectro
lyte
57.1
34
.j ua
11
5.5
163.
5 16
0 14
5 15
9.2
%."
Sat'd
Al
Cl,
II
93.8
II
I,
91.j
2M
AlC
13tO
.lii
ZnC
l. 50
0
ea.6
68.7
84
.2
82.6
PM
AXI, 3,
Sat'd
Al
C13
3,
250
500
250 ,I
5?@
7:0 ,I 25
0 II 500
300
I,
500
250 II
500 II 250 II 500
II 250 II
5P
250 I?
500 9,
250 II
Cel
l En
f VO
lLS
com
men
ts
- 1.16
1.
10
1.10
1.
15
1.15
l.l
j 1.
02
1.01
1.
10
1.10
1.10
1.24
1.25
1.
00
1.00
1.
04
0.97
1.
01
1.17
1.
10
1.05
1.
05
1.13
1.
15
1.05
1.
10
1.21
1.
21
1.10
1.
10
1.20
1.
20
1.00
:.2
1:14
sepa
;ato
r w
;t or
+
II II
I, II
II !I
!I II
II II
II I,
0,
II II
II II
11
II II
I, se
para
tor
wet
on
ly-
cell
ran
53
min
utes
se
para
tor
wet
O
nly
28%
to
-O.8
8 "S
SC
E pe
rfora
ted
zinc
an
ode
cath
ode
spra
yed
from
He
xane
sl
urry
?.
ame
as
abov
e
Car
bon
cath
ode
coIle
ctor
us
ed-c
ell
did
not
mai
n-
tain
0.
8~
carb
on
colle
ctor
ca
rbon
co
llect
or

Test
N
o.
6430
4-l?
64
304-
20
b&30
4-22
b!
ljo4-
23
;g$:
z 64
304-
26
6430
4-2:
b430
"-5
6430
"-25
2::::
::5
4 64
304.
16
6430
4-13
6430
4-18
6431
2-50
6431
2-58
64
312-
60
::::g
: 64
3X-3
Picr
ic
Acid
(/t5)
Tabl
e A-
2 (c
ontin
ued)
FO
R:!"
ULA
TIO
NS A
ND
STA
TIC
CEL
L C
HAR
ACTE
RIS
TIC
S OF
OR
GAN
IC N
ITR
O C
OM
POU
ND
CAT
HO
DES
(A
ll ca
thod
es
disc
harg
ed
vs.
expa
nded
m
agne
sium
AZ3
1B u
nles
s ot
herw
ise
note
d1
Fibe
r co
nten
t or
C
C.rl
'!"C
tC r
I:-,
te
1 )
coat
ing,
f
'-t
(Not
e 2)
D
epol
ariz
er
m&i
n .2
27.6
23
.8
2b.iJ
24
.5
40.4
?,":i
55
30.2
30.1
289
83.4
77
.5
69.7
103
106
106
104
115
111.
3 17
8.9
173
199.
4
210.
7
216.
8
2::: 39
.7
38.9
Cur
rent
D
enrlt
y m
a/in
. 250 I! 720
500 II 250
750
250 9,
500
750
250
To
750
500
750
250 I#
500 II 720 II 250 #,
Cel
l Er
rl;ie
ncy
Cel
l Em
r Vo
lts
75
O.E
64
51
;A
54
54
1.23
1.
22
0.92
c.
?8
1.10
1.
10
Anod
e co
nsum
ed a
t 51
s er
r. 1.
06
cell
volta
ge
Tape
did
no
t ho
ld
this
cu
rrent
An
ode
corro
ded
at
SOS:
er
r. an
d 1.
5 ce
ll Vo
lt-
age
(El m
inut
es)
Sam
e as
ab
ove
doub
le
thic
knes
s an
ode
used
'I ,:
Stop
ped
at
3!'::
(1
.60~
) du
e to
an
ode
fallu
re-
doub
le
anod
e St
oppe
d at
35
:; (1
.30~
) du
e to
an
ode
railu
re-
4 la
yer
anod
e
54
2:
42
37
19
;; 55
27'
1.26
1.
15
1.20
1.30
1.
35
i?%
1:
26
1.1-
f 1.
20
1.15
1.
15
1.00
0.95
1.
00
?!Z
1:10
Anod
e ra
iled-
10
min
ru
n -8
.5
mln
ru
n AZ
31B
-uer
fora
ted
shee
t st
ock
ahod
e El
ectro
lyte
ad
ded
to
sepa
rato
r on
ly
sepa
rato
r ue
t on
ly-c
ell
ran
26 m
inut
ea
sepa
rato
r w
et
only
se
para
tor
wet
on
ly
sepa
rato
r w
et
only
se
para
tor
wet
on
ly
sepa
rato
r w
et
only

:apc
ule
I-
536
E37
E39
EY,
90
E41
EL’
P d
ES3
y+1,
3:
Ebb
97
E43
E4g
E50
s51
E52
E53
E54
Cap
sule
M
3ter
i31
Kel-F
91
FCP-
TePl
on
Acl?
r
,c1s
r
Acle
?
Acla
r
fic1a
r
ACla
r
Kel-F
91
Kel-F
61
Kel-F
31
Kel-F
81
Kel-F
31
Kel-F
81
Kel-F
81
Kel-F
al
Kel-F
81
Kel-F
91
Kel-F
a1
Kel-F
31
Lit
.;i
2 M
AlC
ls
wat
er
2 M
M~:
ClO
a)z
? M
Ms(
ClO
,),
2 M
M~(
C10
a ,z
2 M
MS(
C10
a.z
2 M
M?(
ClO
qJz
2 M
M~(
C10
,!z
wat
er
2 M
Mg(
C10
4)z
wat
er
2 M
Mcz
(ClO
.,z
wat
er
2 M
Mz(
C10
4)z
2 M
AlC
13
2 M
AlC
ls
2 M
R
lClr,
2 M
AlC
l.
37%
KO
H
37%
KO
H
Tabl
e A-
3 (c
ontin
ued)
PHYS
ICAL
D
ATA
ON
CAP
SULE
S PR
EPAR
ED
FOR
PE
RM
EABI
LITY
TE
STS
Con
ditio
ns
. C
A C
C
B B A A C C
B B A A A B C
C A A
Flllll
Th
ickne
ss
(mlls
)
3.5
2 2 2 2 2 2 2 3 3 3 3 3 3 3 3 3 3 3 3
Film
W
eigh
t AL
L 0.26
76
0.76
35
0.74
79
0.77
50
0.71
52
0.77
30
0.70
18
0.27
33
0.26
74
0.27
03
0.27
04
0.28
33
0.26
96
0.27
98
0.27
60
0.27
88
0.27
39
0.27
85
0.27
92
Tota
l
"3 0.
6074
1.07
80
3.28
84
2.98
72
3.10
44
2.98
83
3.26
93
3.23
58
1.49
07
1.84
56
1.50
16
1.88
93
1.62
18
1 .a5
40
1.80
33
1.81
23
1.81
66
1 .-i-
376
1.87
43
1.85
06
Lic:
:iJ
FE 0.79
02
2.52
49
2.23
93
2.32
94
2.27
31
2.49
63
2.53
40
1.21
74
1.57
82
1.23
13
1.61
89
1.33
85
1.58
44
1.52
35
1.53
63
1.53
70
1.46
37
1.59
58
1.57
14
Flat
I.
D.
0.
D.
Wid
th
(in..(
In.!
(In.
0.12
0.36
0.56
0.56
0.56
0.56
0.56
0.56
0.12
0.12
0.12
0.12
0.12
0.12
0.12
0.12
0.12
0.12
0.12
0.12
Leng
th
(in. 2.
25
4.0
6.20
6.20
6.20
6.20
6.20
6.20
6.0
6.0 6.0
6.0
6.0
6.0
6.0
6.0
6.0 6.0
6.0
6.0
Appr
ox-
imat
e Th
ickne
ss
(lnch
esj
0.08
0.06
0.06
0.06
0.06
0.06
0.06
stm
-ace
Ar
ea
(in.2
)
0.08
3 7 7 7 7 7 7 2.36
2.36
2.36
2.36
2.36
2.36
2.36
2.36
2.36
2.36
2.36
2.36
initi
al
Paylo
ad
We$
yt
73.2
76.7
75.1
75.1
76.0
76.3
78.2
81.7
85.3
82.1
85.6
82.6
85.6
84.6
84.9
84.5
84.1
85.3
04.9

Cap
sule
C
apsu
le
Num
ber
Mat
eria
l
E5b
Kel-F
81
E57
Kel-F
81
E58
Kel-F
81
P
E59
Kel-F
81
EbO
Ke
l-F
81
~61
Kel-F
81
Tabl
e A-
3 (c
ontin
ued)
PHYS
ICAL
D
ATA
ON
CAP
SULE
S PR
EPAR
ED F
OR
PE
RM
EABI
LITY
TE
STS
Appr
ox-
Initi
al
Film
Fi
lm
Tota
l Li
quid
Fl
at
imat
e Su
rface
Pa
yload
C
ondi
tions
Th
ickne
ss
"eig
ht
Wei
ght
Liqu
id
l (m
ils)
Ad
ALL
37%
KO
H
B 3
0.27
92
1.87
60
1.59
68
0.12
6.
0 2.
36
84.9
37%
KO
H
B 3
0.27
63
1.88
92
1.61
29
0.12
6.
0 2.
36
85.3
37%
KO
H
C
3 0.
2764
1.
8361
1.
5597
0.
12
6.0
2.36
04
.0
37%
KO
H
C
3 0.
2807
1.
8330
1.
5523
0.
12
6.0
2.36
84
.8
37%
KO
H
C
3 0.
2850
1.
9113
1.
6263
0.
12
6.0
2.36
85
.2
37%
KO
H
C
3 0.
2790
1.
8954
1.
6164
0.
12
6.0
2.36
85
.1

Table A-4
LABORATORY PROCEDURE FOR CHEMICAL ETCHING OF MAGNESIUM
Degreasing Bath
20 grams Alconox/liter Hz0 (dist.)
OP
22.5 grams 15.0 grams
Etching Bath
~~~~03)/liter Hz0 (dist.)
60 ml cone. HN03 150 grams NaN03 >
/liter Hz0 (dist.)
Procedure (Batch Method)
1.
2.
3.
4.
5.
Clean magnesium in either of the degreasing baths for approximately 5 minutes, sponging or wiping as required. For heavy grease deposits, the Alconox bath is preferred but requires a longer following rinse.
Rinse thoroughly in tap water.
Etch for approximately 30 seconds to 1 minute for each 1 mil reduction in thickness, monitoring continuously with micrometer as desired thickness is approached. This can be done by removing and rinsing in Hz0 bath for a few seconds on each check.
Rinse well in tap water.
Dry with towelling.
172

Table A-5 FORMULAS USED FOR COMPRESSION AND EXTRUSION TRIALS
KI04 Acetylene Black Carbon Fiber Binder
KI04 Acetylene Black No. 6553 Graphite Carbon Fiber Binder
KI04 Acetylene Black Carbon Fiber Binder
KIOQ Acetylene Black Carbon Fiber Binder
KI04 Acetylene Black Carbon Fiber Binder
KI04 Acetylene BlaCk
$Weight $Volume Formula A
67.91 29.30 z:*;
2.37 0.G
3:o i.0
100.00 100.0 Formula C
67T-- 53.2
2.33 3.0 0.42 1.0
100.00 100.0 Formula E
68.21 This formula ad- 29.43 justs to formulas
2.36 A,B,G,or H when binder is added.
100.00 Used for mixing purposes.
Formula G 67.62 52.8 29.20 42.3
100.00 z26 3.0
100.0 1.9
Formula J 62.83 47.5 33.83 47.5
$Weight @Jolume Formula B
68.05 53.6 29.37 42.9
2.37 3.0 0.21 0.5
100.00 100.0 Formula D
67.46 23.25 ;z*g
Es;: 0:21
8:6 3.0 0.5
100.00 100.0 Formula F
60.0 44.5 36.5 50.3
2.5 3.0 1.0 2.2
100.0 100.0
Formula H 67.50 52.5 29.03 42.0
2.40 3.0 1.07 2.5
100.00 100.0 Formula K
63.12 46.9 \33.83 46.9
2.47 3.0 0.87 1.9
100.00 100.0 Formula L
60.66 45.25 35.95 49.75
(Dynel) 2.00 4.2 0.87 2.0
100.00 100.0 Formula M
61.21 This formula 36.27 adjusts to _ _ _
Fiber Binder
(Carbon)2.50 3.00 o .8g 2.00
100.00 100.00
2.52 formula L when binder is
100.00 added.Used for mixing purposes.
173

Tabl
e A-
6
SUM
MAR
Y OF
TAPE
PR
OC
ESS
RU
NS
- EX
TRU
SIO
N A
ND
CO
MPR
ESSI
ON
i'un
NO
.
r,2xs
j
Forn
wla
Bi
nder
it
A-
PVF
G24
65-1
c-
PV
F
6246
5-2
c-
PVF
W65
-3
c-
styr
ene
6246
5-4
B-
PVF
6246
5-5
B-
PVF
6246
6-l
2 P 62
466-
2
6246
6-3
A-
PVF
6246
6-4
6246
6-5
6246
6-6
6246
6-B
6246
7-l
6246
7-2
Solv
ent
+
Chl
orof
orm
Chl
orof
orm
w
/0.1
$ G
afac
Chl
orof
orm
Chl
orof
orm
II
Chl
orcf
orm
Chl
orof
orm
w
ith
5 g/
l Pv
F
Chl
orof
orm
w
ith
5 8/
l w
-e
Adhe
sive
+
Chl
orof
orm
w
ith
25
g/l
Pm
spra
yed
on
tape
NO
"EZ
Spra
yed
chlo
rofo
rm
with
un
know
n st
rer.g
th
PVF
Spra
yed
chlo
ro:o
rm
w/2
.5
g/1
PVF
Spra
yed
chlo
rofo
rn
w/2
.5
g/l
styr
ene
Spra
yed
Hz0
w
/1$
Gel
vat
Spra
yed
Hz0
w
/0.7
$ C
MC
Spra
yed
chlo
rofo
rm
w/2
.5
g/l
PVF
Spra
yed
chlo
rofo
rm
w/2
.5
g/i
styr
ene
Spra
yed
Hz0
w
ith
0.7%
C
MC
Non
e
NO
M
Adhe
slon
tt
Exce
l
Exce
l
Exce
l
Exce
l
P00r
Fair
Fair
Fail-
POW
?
Fair
F&i-
POO
P
POO
F
Goo
d
Fair-
Goo
d
Phys
ical
D
ata
0.01
6 in
. th
ick
0.26
4 g/
in?
,013
in
. th
ick
'.161
g/
in?
0.01
3 I".
th
ick
0.16
0 g/
in?
0.01
2 in
. th
ick
0.19
0 g/
in.2
0.01
5 0.
176
In.
;hic
k g/
in.
Rem
arks
El
ect.P
erfo
rman
ce**
_
Fair
(sev
ere
stlc
klng
)
Elec
trode
hy
drop
hobi
c
Elec
trode
s w
ere
of
insu
ffici
ent
stre
ngth
fo
r ge
nera
.1
use
Slig
htly
be
tter
than
ab
ove
Hz0
gl
ue
solu
tions
ca
used
w
avy
elec
trode
s on
dr
ying
0.01
5 in
. th
ick
0.21
0 g/
in.2
28
% s
olid
s
0.26
4 di
n.2
38%
Sol
ids
Elec
trode
hy
drop
hopl
c
Fair-
good
-sp
to
0.9
wat
t/'"?
(s
ever
e st
!ckl
ng)
Fair
(stic
king
)
Fair
LIP
to
0.35
w
att/i
".z
(stic
king
)
Very
go
od-s
usta
in
up
to
1 w
att/i
n2
(occ
asio
nal
stlc
klng
:
Goo
d--b
ut
less
th
an
abov
e
Fair-
good
-up
to
0.9
wat
t/in?
(s
ticki
ng)
Fair
(stic
king
)
Poor
(s
ticki
ng)
Fair-
good
-up
f" 0.
88
hth.
Wav
y or
rip
pled
min
tain
0.
85
dth.
2 St
icki
ng
to
colle
ctor
Esse
ntia
lly
wet
proo
fed
Sust
aine
d ve
ry
little
cu
rrent
See
note
s at
en
d of
ta
ble.

Tzbl
e A-
6 (C
ont’d
)
SUM
XAR
Y O
F TA
PE P
P.O
CES
S RU
NS
- EX
TRU
SIO
N A
ND
CO
E!PR
ESSI
ON
Run
Fo
r-?ul
a N
o.
Bind
er
*
5245
7-3
A
6246
7-k
E F
62:7
0-l
B-
I’VE
62::7
0-2
Phys
ical
Ad
hesi
ont+
D
ata
Goo
d -
1,
II A-
Pm
c-
PVI:
PVP
F-
PVl-
G-
PVI:
Solv
ent
*
Chl
orof
orm
vr
lth
5 g/
1 PV
F
Chl
orof
or,:.
w
ith
jp/l
PVB
Chl
orof
or”)
with
5
g/l
PVB
and
5 m
l/l
Gaf
ac
1120
with
5
r-/l
,,?th
ocel
Adhe
sive
f
Prew
et
with
rh
loro
-
Rem
arks
Shor
t se
ct’o
ns
Elec
t.Per
form
ance
**
Goo
d -
Shor
t se
ctio
ns
Fair-
Goo
d 0.
015
in.
t$‘c
k 0.
230
g/in
. ‘d
‘th
bind
er
‘n
solv
ent
form
,la
ad
;ust
s to
z
2fl
Vol
PVB
Cou
ld
not
man
llfac
ture
lIn
ti ny
lon
netti
ng
was
in
serte
d be
twee
n ca
thod
e su
rface
an
d bl
ottin
g pa
per
Adhe
sive
ad
ded
by
draw
ing
tape
th
ru
solu
tion
pr+o
r to
ex
trudi
ng
Sust
ain
up
to
0.“4
w
att,/
l”.2
Fair
Fa i
r-goo
d-,!p
to
0
. “5
wa t
1 /’
n ?
(sev
ere
st’c
k’ng
)
Chl
orof
orr
with
5
:::l/l
ca
rat
Spra
yed
chlo
rofo
rm
w/5
g/
l PV
F P0
0r
Fair
‘:p
to
0.‘5
w
att/l
”.=
(stic
k’ng
) Sp
raye
d ch
loro
form
W
/25
g/l
PVF
Fair
0.01
3 In
. &h
ick
0.19
0 g/
in:
Spra
yed
chlo
rofo
rm
w/5
g/
l Pm
/VA
Fair
-
6247
0-k
G2!
:70-
5
‘,2h/
O-6
<2!~
72-2
Spra
yed
chlo
rofo
rm
w/2
5 g/
l PV
P/vA
Sh
ort
- Se
ctIo
n-
did
not
dete
rmin
e
Fair-
good
0.
013
in.
thic
k 0.
185
g/in
.* 30
5 so
lids
Poor
-fair-
0.
210
g/in
.' so
me
good
Fair-
mai
ntai
n 0.
70
wat
t/t*2
Spra
yed
chlo
rofo
rm
w/2
5 g/
l PV
F (re
peat
)
Spra
yed
chlo
rofo
rm
w/2
5 g/
i Pw
/vA
(Rep
eat)
Pres
et
with
ch
loro
- fo
rm
Prew
rt ~v
ith
chlo
ro-
Non
e fo
rm
II
(2-3
m
g bi
nder
/i”?
on
tape
)
Chl
orof
orm
w
ith
5 m
l/l
Gaf
ac
Fair-
up
to
0.76
w
atth
?
Fair-
up
to
0.63
w
att/i
n.2
P00r
0.
017
in.
thic
k 0.
225
g/in
?
P00r
7
0.01
7 In
. th
ick
Poor
-fair
’ 0.
280
g/in
.2
Chl
orof
om
with
5
ml/l
G
afac
Chl
orof
orm
C
arbo
n bl
ack
and
KI04
w
ere
not
War
ing
Blen
ded
durin
g m
ixin
g
Hz0
w
ith
0.78
C
MC
ap
plie
d w
ith
pain
t br
ush
Mix
w
as
- ru
bber
y co
uld
not
extru
de
Chl
orof
orm
N
O”e
See
note
s at
en
d of
ta
ble.

Tabl
e A-
6 (C
ont'd
)
SUM
MAR
Y O
F TA
PE P
RO
CES
S R
UN
S -
EXTR
USI
ON
AN
D C
OM
PRES
SIO
N
Run
N
O
- 6247
j-l
Phys
ical
D
ata
0.01
3 in
. th
ick
0.18
1 g/
in.2
30
% s
olid
s
Form
ula
- Bi
nder
*
G-
PV?
Solv
ent
t
Chl
orof
orm
Adhe
sive
+
NO
"e
Adhe
sion
tt
Fair
Rem
arks
El
ect.P
erfo
rman
cerrl
r
This
an
d al
l fo
llow
ing
tape
s:
l.Adj
uste
d m
ixin
g pr
oced
ure
Goo
d-O
.80
wat
t/In?
su
stai
ned
(stu
ck
once
)
2.N
ylon
sc
reen
pa
ttern
on
su
rface
Fair-
O.5
9 w
att/l
": (s
usta
ined
ru
ns
with
out
stic
king
)
Goo
d-O
86
w
att/l
"?
(stic
king
)
6247
3-2
F-
PVF
6247
4-l
H-
PVF
Chl
orof
orm
N
O"e
Fa
ir-go
od
0.01
2 in
. th
ick
0.11
9 g/
in?
'2j$
so
lids
Chl
orof
orm
w
ith
Non
e 0.
12
g N
ekal
BX
-72
per
l?‘o
g
mix
Fair
0.01
8 in
. th
ick
0.31
0 g/
in?
25%
s01
lds
Mad
e w
ith
.030
in
. ex
trusi
on
open
ing
6247
4-2
" !I
0.33
5 g/
in?
28$
solid
s
0.02
5 in
. th
ick
0.28
0 g/
in?
25%
SO
lids
0.01
7 in
. th
ick
0.15
1 g/
in?
21$
solid
s
Mad
e w
ith
,040
in
. ex
trusi
on
open
ing
Mad
e w
ith
,040
in
. ex
trusi
on
opex
,ing
Goo
d--l.
1 w
att/i
n.2
6247
4-j
J-
PVF
Chl
orof
orm
Goo
d-O
.79
wat
t/l"?
Fa
ir-go
od
Mad
e w
ith
0.03
0 in
. ex
trusi
on
open
ing
6247
5-1
J-
PVF
6247
5-‘1
"
Chl
orof
orm
II
Prew
et
with
ch
loro
P0
0r
Inse
rt 5
mil
dyne
1 Fa
ir be
twee
n to
p bl
otte
r an
d ca
thod
e co
atin
g
Inse
rt Sa
ran
wra
p PO
W
as
abov
e
This
en
tire
serie
s ru
n to
te
st
vario
us
met
hods
of
ob
tain
ing
good
ad
hesi
on
to
tape
su
bstra
te
with
out
mas
king
KI
04
with
ex
cess
bi
nder
. Th
e in
serti
on
of
poor
ly
abso
rbin
g m
ater
ials
be
twee
n to
p bl
otte
r an
d co
atin
g w
as
Inte
nded
to
fo
rce
the
exce
ss
chlo
ro-
form
(w
ith
bind
er)
to
the
botto
m
blot
ter
durin
g co
mpr
essi
on.
6247
5-3
” II
6247
5-4
VI
II Pr
ewet
to
p bl
otte
r Fa
ir w
ith
chlo
rofo
rm
Fair-
o.69
w
att/i
n?
6247
5-5
!' II
Prew
et
taue
w
ith
Goo
d 0.
016
in.
thic
k 0.
177
g/in
.2
24%
so
lids
appr
ox
6 m
g PV
F pe
r in
2 ta
pe
chlo
rofo
rm
cont
ain-
in
g 50
g/
l PV
F
Fibe
rs
brid
ged
-- C
ould
no
t ex
trude
-
6247
7-l
K-
PVF
Chl
orof
orm
(D
yne1
Fi
bers
)
6247
7-2
K (D
yne1
Fi
bers
) C
hlor
ofor
m
with
re
quire
d PV
F pr
e-di
ssol
ved
See
note
s at
en
d of
ta
ble.

2.“”
For:
ula
- N
o b
Bind
er
*
G-.7
’/ -: J-
62.T
77-5
J
62$7
.?1
J
Solv
ent t
Ad
hesi
ve
*
Chl
orvi
’or,:
. ‘?
lt’h
re‘?
uire
d Pv
r pr
e-di
ssol
ved
NO
”, G
OO
d ?.
01:3
in
. th
ick
O.lS
O
E;/:“
P 22
,A s
olid
s
Chl
oroi
’or
v!lth
j
G/l
Pn,’
pre-
diss
olve
d
Chl
orof
orm
w
ith
3.5
6/l
id-
(Thi
s ad
just
s C
hlor
ol’o
rn
with
to
r’o
r,..u
la
It L”
2.4
g/l
Pv?
\:hen
Pv
1: s
trenc
th
is
incl
uded
)
T&l
3 :,-
,_
‘Cw
.‘d)
;lJi~
~~A.
3’ O
i, TA
PE P
’OC
ESS
RU
NS
- SI
:TXI
SIO
N
ANI)
CG
XPR
ESSI
GN
Phys
ical
D
ata
Aahe
sion
t+
Fern
arks
Goo
d O
.Sl,>
in
. lh
’ck
I).lx
g/
:n.=
26
: sa
lids
II NO
”e
Goo
d (B
ccte
r ii?
:.”
L;~D
.‘c)
Goo
d
Non
e G
ood
0.02
2 in
. th
ick
(Bet
ter
0.26
0 di
n.2
than
27
-282
so
lids
abov
e)
Non
e G
ood
0.01
7 in
. th
ick
5.2’
-0
g/:n
.=
24
5 so
lids
Base
ta
pe
prel
’l,:ff
ed
wit”
em
ery
c1ot
t:
Base
ta
pe
pref
lcffe
d w
ith
wire
br
wsh
Ease
ta
pe
l’luffe
d by
pa
ssin
g ur
.der
w
eigh
wd
emer
y
Hun
in
2
parts
w
ith
over
- ni
yhL
stan
d in
be
twee
n.
Both
se
ct
ions
go
od.
Base
ta
pe
hand
flu
ffed
with
w
ire
brus
h.
Han
d flu
ffed
with
w
ire
brus
h.
Con
tinuo
us
run
of
80
ft.
Elec
t .P
erfo
rllla
nce’
* ---
-
Gw
d-0:
57
wat
t /:n
?
Goo
d-G
.‘.‘.
wai
t/:
n.*
(som
e st
ick!
ng
at
high
er
outp
uts)
Goo
d-0.
7,5
wat
t/!“.’
(o
ccas
iona
l st
lck’
ng)
Goo
d-O
.79
wat
t/!“?
11
i,ur
,11c
:; Si
!Ui.”
‘”
J: i
ls
..-i,
, do
no
t sp
ecii’y
bi
naer
. ‘i’l
ose
chos
en
for
each
ru
n ar
e :n
dica
ted
:n
tn:o
co
lt,m
n.
1’01
’ ;):n
cers
!;h
use
apec
lfic
grxv
ity
1s
clos
e to
1.
2 (re
st
01’
thos
C
used
). W
here
no
bi
nder
is
:n
dica
ted,
Fo
rmul
a vo
lum
e pe
rcen
tage
s ho
ld
it ha
s be
e”
incl
uded
w
ith
the
slur
ry
solv
ent.
t Li
<!ui
d ed
ia
used
to
:.!
ake
slur
ry.
Som
etim
es
will
co
ntai
n bi
nder
’ or
w
ettin
g ag
ent.
+ Ad
ditio
nal
adhe
sive
el
ewnt
s,
adde
d to
ta
pe
prio
r to
ex
trusi
on
?t
Adhe
sion
ra
tlncs
as
lo
llous
: Po
or-e
xces
sive
fla
ke-o
ff of
co
atin
g;
Fair-
occa
sion
al
flake
-off
of
coat
ing,
ca
n be
di
scha
rged
dy
nam
ical
ly
if de
s’re
d;
Go&
-no
i’laI:i
ni:
but
care
sh
ould
be
ex
erci
sed
In
hand
ling;
Ex
celle
nt-re
ason
ably
ru
gged
. ad
here
nt
coat
ing
*+
Gen
eral
ra
ting
01’
dyw
ulic
di
scha
rge
char
acte
ristic
s ta
kes
into
ac
coun
t cu
rrent
ef
ficie
ncy,
vo
ltage
, cu
rrent
de
nsity
an
d ou
tput
m
aint
enan
ce
w’th
11
I?
. St
lcki
nC
to
curre
nt
cslle
ctor
no
ted
whe
re
appr
opria
te.
See
Tabl
e A-
‘( fo
r de
tails
.

Tabl
e A-
7
DYN
AMIC
TES
TS R
ESU
LTS
\JIT
H
TAPE
S U
SIN
G P
OTA
SSIU
M P
ERIO
DAT
E AS
CAT
HO
DE
DEP
OIA
RIZ
ER
P-
pmI
TC-
MO
- M
l-
Prim
ary
Mg,
no
ho
les
W-
2M A
K!13
+
0.5M
H
Cl
Perfo
rate
d Pr
imar
y M
g M
4-
2M A
lCl.
+ 0.
5M
HBF
4 Ex
pand
ed
Prim
ary
Mg
D -
D
yne1
3.
5 m
il M
achi
ned
Punc
hed
Prim
ary
Mg
Satu
rate
d Al
C13
(2
.8
M)
DS-
D
yne1
2.
5 m
il N
l- N
ylon
4
ml1
2M
AlC
& +
1M H
Cl
N2-
N
ylon
2.
5 ni
l
PP-
Poly
prop
yler
le
2.7
mil
Pt-
Plat
inum
G
-
U.S
. G
raph
ite
443
Gp-
G
raph
ite
pow
der
Gs-
Sl
otte
d G
raph
ite
GS-
Gra
phite
-Sila
stic
al
ter-
GM
- G
raph
ite
larg
e sl
ots
Gm
- M
ultip
le
Slot
ted
GW
- G
raph
ite
1.5
in.
S -
Cat
hode
st
uck
to
Gra
phite
w
ide
Col
lect
or
naiin
g sl
ots
Cat
hode
"^
..^^i
i..
ticAP
”LL
“y
b0I.L
i1
ectro
1yte
C
olle
ctor
Ta
p'
LILZ
El
ectro
lyte
AM
/in.2
Run
No
Tape
iik
:. A!
~ode
w
:ie
nrat
or'
w
A---
.,,,*l
n-l
,;2iir
53-F
,<
.,21R
2 ,,2
45j-F
,2
11)-j
62
453-
F tir
;220
;2
%53
-F
,,,22
1 52
779-
l
I) !I 0 P P P D
p D
? p Jz
P P B !I P p p P sx
s P P : P P P P P P P P P P P P
IrO
D
I42
D+D
14
0 D
+ I
i1
rt 22
0 0.
15
4 :;
2.55
Pt
22
0 0.
20
2s
- rt
180
0.20
6s
2.
6 G
P 18
0 0.
25
14s
2.57
G
30
0 0.
2'5
57
2.55
0.35
140
D +
Nl
M2
D
0.30
0.
5
180
180
180
189,
'20
jl8
4.8
1.60
1.
65
1.65
1.
55
47
1.95
L.' ,2
22
_ _ _ _
- _ _
"1
,223
-l 52
779-
l-2
.;;22
3-2
5277
3-l-2
~2
24
&225
52
773-
1-2
6245
3-F
m&2
27-1
52
773-
l-j
&227
-2
5277
9-1-
j 'u
G22
3-1
6245
3-F
1&22
9-2
;245
j-F
111:
231-
l i2
457-
w
&23l
-2 6
2457
-x
&123
1-3
&457
-X
>\>2
34-1
G
2457
-v
6623
4-2
6245
7-V
6623
5-F
6245
3-F
H2
PP
p.12
PI
1 M
2 11
2 M
2 D
1.
12
ill
I42
D +
PP
14
2 D
14
1 !I1
M
l Ii1
G
c c G
cs
GR
cs
C
S C
S cs
GS
cc
CS
GS
Pt
410
220
220
220
220
220
220 8:
ii aDE
E
0.1s
;;
2.57
0.
25
2.87
:*:S
5 24
24
- -
0:75
15
s 2.
85
0.25
13
2.
90
0.25
45
-
0.25
3
2.67
0.
30
0.25
0.
25
:; 2:
89
2.75
0.
25
20
- 0.
30
12
2.75
O
.jO
5 -
0.30
30
-
0.57
0.
54
0.51
0.
4 0.
5 0.
50
0.56
0.
co -c
$6
0::s
0.
5 0.
7
1.75
1.
75
1.75
:*;:
1:75
1.
75
1.75
1.
75
1.7:
2.
0 2.
c 2.
0 2.
0 1.
75
1.90
1.
30
1.83
:: : i
1.80
1.
70
1.90
1.
60
1.82
1.
95
xi 1:85
1.
85
<uG
Pj5-
R 6
2453
-F
&123
C-1
52
779-
l-4
uvPj
&2
5277
9-l-4
&j
237-
1 62
453-
:rA
6323
7-2
G24
53-i,
!n
GG
238-
1 62
453~
v!A
C;2
38-2
62
453-
UA
&239
52
779-
3-l
5624
0 i;6
241
6246
5-4
6624
3 ;$
;W&-
"
g;;;
6245
3-F
6245
3-F
6624
6 66
247
$246
5-1
6624
8 66
249
p8$;
6246
5-3
6246
4-A
i42
II +
N2
M2
D +
ii1
I"!
2 II
+ N
l M
l D
+ N
l M
l D
M
l D
+ N
l M
l D
+ N
l Kt
D
+ N
l M
l N
l
3s
CS
CS
ti.?
GS
cs
GS
GS
GS
cs
CS
GS
GS
GS GS
GS
GS
EZ
0.30
30
2.
75
0.25
13
2.
75
0.25
20
-
0.25
30
2.
25
0.25
15
0.
25
15
2175
0.
25
26
- 0.
25
jo
2.8
0.25
13
2.
92
0.25
28
s 2.
82
0.25
55
2.
75
0.25
35
0.
25
5S
?:8
0.25
2s
2:
;o
0.25
1s
0.
25
65
s.20
0.25
56
2:
9uo
0.54
0.
54
0.5
0.6
0.6
L.7
c.65
OYG
2.0
1.75
1.
75
2.0
1.75
2.
7 1.
75
3.4
2.0
;.;
;.;
316
2:0
2 2:
4:
o 2:
o 2.
0 2.
0 2.
0
1.85
1.
80
1.85
%
8 1.
80
59
:%
59
1:70
1.
90
1.95
A ma
com
men
ts
450
stuc
k 48
0 st
uck
480
~011
. ar
ea
480
~011
. ar
ea
560
elec
troly
te
fed
into
se
para
tor
Ez",
coat
ing
falls
of
f
;,:
600
slot
ted
colle
ctor
60
0 sl
otte
d co
llect
or
700
slot
ted
colle
ctor
75
0 sl
otte
d co
llect
or
950
slot
ted
colle
ctor
'9
2;
foam
du
e to
PV
P gl
ue
900
800
1000
70
0)
E!
serie
s co
nnec
ted
6625
2 66
253
Ml
Ml
Ml
Nl
Ml
Nl
Ml
Nl
MC
N
l M
l N
l M
l N
l M
l N
l
ii:
i:
0.5
0.62
P M
l N
l G
S 40
st
icks
repe
ated
ly,
Ir fre
e m
eas.
sh
ows
0.2~
dr
op
in
cell
at
1000
m
a.
174/
14
174/
14
174/
14
174/
14
148/
15
;;;p
238/
1 2
176/
15
231/
18
190/
13
264/
20
205/
15
2:;
2:;
4.77
5.
7 5.
7 7.8
5.7
6.6
4.0
2.0
2.0
2.0
2.0
2.0
2.0 2.0
61
1.85
2.
0
::;
800
500
650
850
850
700
900
1000
90
0 10
00
950
stuc
k af
ter
5 m
in.
900
stuc
k im
med
iate
ly
stuc
k im
med
iate
ly
stuc
k af
ter
6 m
in.
1000
70
0 st
icks
repe
ated
ly
thru
C
all
stic
k af
- te
r 2
to
5 m
in.
oper
atio
n 30
0 w
ill
not
wet
ou
t 70
0

X2-
PM A
lCl~
+
0.5N
H
Cl
w-
a1 A
lCl,
+ 0.
5M
t!BF<
PP
- Po
lypr
opyl
ene
2.7
nil
Pt-
Plar
inun
L)
-
Dyne
1 3.
5 m
il 0
- u.
s.
O
S-
Dyne
1 2.
5 rk
il G
raph
ite
44 j
Nl-
I’lyl
on
h m
il G
p-
Gra
phite
po
wde
r
r12-
N
ylon
2.
5 ni
l G
s-
Slot
ted
Gra
phite
G
S-
Grs
uhite
-Sila
stic
al
ter-
.‘,
rs,,
:, ‘k
’;‘C
-
6525
0 52
7.31
-7
m51
52
470-
5 66
263-
l 62
471-
P 66
263-
2 62
471-
l 66
264-
Z 62
472-
3 ;<
2j5
.q&c
, ;;;
;:I;
Gi2
:',7
6247
3-l
6’32
58
6247
3-2
6626
9 62
473-
2 G
6272
-1
6247
4-4
Gg'
g;
;;;
6627
4 66
276
6247
5-5
6247
7-3
5627
7 62
477-
4 66
279-
l 62
478-
2 6.
2279
-2
6247
9-2
ggg-
3 gf
~;
6628
1 62
479
6628
2-F
6247
9 G
6282
-R
6628
5-F
6247
9 62
479
6628
5a
6247
g
GM
- G
rapt
ite
1Pr;e
S!
Ot,Z
C
r!-
Mul
tplc
Sl
otte
d G
raph
ite
W-
irq!li
te
1.5
in.
nide
S
- C
atho
de
stuc
k to
co
llect
or
P :>
‘TC
TC
TC
TC
TC
TC
P TC
TC
TC
TC
TC
TC
TC
TC
TC
TC
TC
TC
TC
TC
TC
TC
TC
TC
TC
Ml
ill
r, ';
Ml
Nl
GK
Ml
Nl
GM
M
l N
l G
M
Ml.
Nl
GM
M
l N
l G
M
Ml
Nl
GM
I.1
1 N
l G
W
Ml
Nl
GM
M
l N
l G
w
Ml
Nl
ribI
Ml
Nl
Gw
M
l N
l G
W
Nl
ii N
l G
w
Gw
M
J.
Nl
Gw
N
l ii
Nl
Gw
G
W
W.
Nl
Gb!
N
l ii
Nl
GW
G
w
Ml
1~1
GW
M
l N
l G
w
Ml
Nl
GW
M
l N
l G
W
Ml
Nl
Gw
0 1,
,o
10.
180 60
E 40
140
160 t: 1;
c:
t: 40
E 20
20
20
20
20
20
0.25
LO
S 2.
Ll
0.25
24
s 2.
7 0.
25
71
2.55
0.
25
24
2.9
0.25
lo
o 0.
25
0.25
:z
x2
2:
93
0.25
45
2.
95
0.25
35
2.
89
o*25
:c
2.
95
0.25
2.
95
0.25
32
5 2.
93
0.25
64
2.
91
0.25
20
2.
90
0.25
20
2.
92
0.25
40
s 2.
92
0.12
5 44
0.
125
9 0.
125
;A"
2.92
0.
25
2.90
0.
25
76
2.85
0.
25
0.25
g
2. L
5
0.25
24
28
2
0. a
! 0.
5 0.
5 0.
65
0.5
0.45
0.8
0.67
0.
54
0.50
0.
77
0.55
0.
54
0.55
0.
67
1.0
1.0
0.58
0.
65
0.67
3
211/
'1
j 21
1/15
211/
15
l?O
/lj
l:'O
/l>
220/
S
:::;:s
22
5/17
227/
X 26
0/31
1a
o/13
11
9/12
11
9/12
15
1/12
:"lF$
:z
;;g
~~'7
~~:
227/
20
laam
:;;;::
17
5/17
x5 .:
6.;
6.5
6.0
g:E
6.6
'5.3
31
5 -3
5
4:5
8.5
10.1
5.
3 4.
6 5.
7
$H
517
4.0
5.1
:::
5.1
2.e
2.0
3 . .;
2.
0 2.
0
4.0
2:
4.8
3175
3.
2 2.
0 3.
0 3.
75
2.95
3.
75
E 4:6
?85
3:75
700
"00
6OC
10
00
900
'7%
10
00
7::
a00
a00
1000
Te
mp.
ca
thod
e 12
0'F
';&I",
Te
mp.
an
ode
145°
F
1120
11
00
1250
14
00
stick
s 14
50
at
1.5
amp
conn
ecte
d
corre
cted
‘late
: 'P
.",,
rurb
cr,”
in
52,C
OO
crrl
ee
wer
e !m
.nd
c3rt,
th
ese
In
62,0
00
rerle
r w
ere
wch
ine
Tade
. C
atho
de
coul
ombl
c ef
ficie
ncle
e w
ere
t,zi:~
d rn
,:i
C-.
n.lie
up
neip
,ht.
'2nd
3
theo
rrtlc
-z,
cepa
city
ur
49
PI-M
/g K
I04.
rc
r nr
r~.~
rr??
belo
x th
e a'
,ktx
p v-
ilue.
R
mly
rr:
cf
I(104
in
co
mpl
eted
ta
pe:
was
us
ually
s

Table A-8
STORAGE STABILITY TEST SUMMARY FOR KIO*-Mg SYSTEM
Weight Change in 30 Days
Conditions
Magnesium Ambient(25, C 50% RH) Vacuum (0% R.H.) 88% R.H.,25'C
Primary Mg No change No change +0.4$
AZ31B No change No change +0.08$
KI04-Mg Tape No change +40%
180

APPENDIX B
ENCAPSULATION OF ELECTROLYTES FOR FUEL CELLS
by E. C. Martin and W. W. Harlowe
Southwest Research Institute San Antonio, Texas
Prepared under Subcontract to Monsanto Research Corporation
Everett, Mass.


APPENDIX B
ENCAPSULATION OF ELECTROLYTES FOR FUEL CELLS
by E. C. Martin and W. W. Harlowe
Southwest Research Institute San Antonio, Texas
I. INTRODUCTION
Fuel cells or batteries that are being manufactured at the present time have a limited shelf-life and as a result are not applicable to space travel , since several years may pass before the cell is used for current production. In order to eliminate the limited storage life of the cell, it is necessary to keep the components of the cell separated. One approach under investigation is to have the dry elements of the cell in the form of a tape. As the tape is advanced for use, the electrolyte is introduced at the advanced section of the tape to moisten it.
The objective of this program is to investigate the feasibil.ity of encapsulating various electrolytes. The capsules can be imbedded in the tape. As the tape is advanced, the capsules will be crushed to re- lease the electrolyte and form an activated cell.
The electrolytes suggested for encapsulation were both aqueous and organic systems. One aqueous system was 2 M Lithium chloride. The organic systems were butyrolactone, butyronitrile, acetonitrile, dimethylformamide, dimethylsulfoxide, propylene carbonate, and dioxane.
For the purposes of this feasibility study, capsules having a size range of 500 to 1000 microns were considered acceptable; however, it is anticipated that the optimum capsule must be 500 microns or less.
183

II. EXPERIMENTATION
A. Equipment
The extrusion equipment for the encapsulation of liquids was used to prepare capsules during this program. This equipment consists of a steam jacketed encapsulation nozzle having concentric tubes. For the encapsulation of electrolytes using polymer solutions as the shell formu- lation, the inner tube had a 0. OlO-inch ID and a 0.018-inch OD. The outer orifice was 0. 045-inch in diameter.
When hot melts were used to encapsulate the electrolytes, the polymer rese.rvoir? pump assembly and the extrusion encapsulation equipment were placed in a constant temperature oil bath in order to keep the molten polymer and the filler at a uniform temperature. During the initial experiments, the inner tube had a 0.016-inch ID and a 0.028-,inch OD, .and the outer orifice was 0. 625-inch in diameter. This combination of orifices produced capsules in the range of 1000 microns. When the inner tube was decreased to 0.007-inch ID and 0. 014-inch OD and the outer orifice was decreased to 0.018-inch, the resulting capsules were less than 600 microns in diameter.
B. Encapsulation of Aqueous Electrolytes Using Polymer Solutions -- - -___-I_
The initial experiments were made using a polymer blend as the shell material. The polymers used were Elvax 250 (an ethylene-vinyl acet.ate copolymer manufactured by du Pont), Nevindene R-7 ( a coumarone indene resin produced by Neville Chemical Co. ), Par ton S- 10 (a chlorinated rubber produced by Hercules Powder Co. ), and Sunoco 4412 (a hydrocarbon wax manufactured by Sun Oil Company).
In run number l-3 as listed in Table 1, the shell material consisted of 34. 2 weight. percent Elvax 250, 29.0 weight percent Nevindene R-7, 22.2 weight percent Parlon S-10 and 14. 6 weight percent Sunoco 4412 wax. The solvent system for the shell materials was a 50:50 mixture of benzene and toluene, and the hardening bath was methanol containing 0. 01 weight percent Tween 80, a nonionic surfactant manufactured by Atlas Powder Company. Using a shell solution having a total solids CCL centration of 35 weight percent and water as the filler, capsilles were obtained having a diameter of 2000 microns. Analysis showed that the capsules had a payload of 60. 1 weight percent. The payload was deter- mined by crushing a weighed quantity of capsules, washing with methanol
184

and then drying the residual shells in a vacuum desiccator. The payload was readily determined after weighing the dried shell material.
A storage test was made on all of the capsules produced during this investigation. The test consisted of taking approximately 1. 0 gram of capsules and permitting them to air-dry for 24 hours. The capsules were then weighed and placed in a room maintained at 77°F and a relative humidity of 50 percent. Figure 1 shows the plot obtained using the cap- sules prepared in run number l-3. It can be noted that the capsules lost 12 weight percent water in the first twelve days. Since the stability test was started 24 hours after the capsules were prepared, this weight loss is probably high since there was some residual solvent in the shell.
In run number l-7, the Elvax and Nevindene concentrations were increased, and the Parlon and wax were decreased. The total solids in the shell solution was 30 weight percent, and the filler was water. This system produced capsules having a size range of 840 to 1000 microns. Analysis of the capsules showed them to contain 74.9 weight percent water D The storage test, as shown in Figure 1, revealed that the cap- sules lost 90 weight percent of the water in 20 days.
In run number l- 10, 0.01 weight percent Triton X-100, a nonionic surfactant manufactured by Rohm and Haas, was added to the water. The shell formulation was the same as was used in run number l-7. Figure 1 shows that these capsules also had a high weight loss during the storage tests. This high weight loss is probably due to the fact that the filler in. some of the capsules was off-center. This causes the capsules to have a thin film on one side and produces a higher permeation rate.
Initially, there was some interest in encapsulating an electrolyte that would function over a wide temperature range. In view of this, several runs were made in which the filler was 40 volume percent glycerol and 60 volume percent water. The composition of the shell material is listed in run number l- 14 in Table 1. These capsules had an average size range of 590 to 840 microns, and the payload was 47. 0 weight per.- cent. The results of the storage test for these capsules are presented in Figure 2. In 47 days, the capsules had lost only 20 weight percent of t.he filler. The high initial weight loss is probably caused by the residual solvent in the shell.
When the solids content of the polymer solution was increased to 35 weight percent (run number l-23), the resulting capsules had a pay.- load of 43. 9 weight percent. The size of these capsules were from 1000 to 1300 microns. Figure 2 shows that the capsules lost 15 weight percent of the filler when stored for 32 days at 77°F and 50 percent relative humidit).
185

In run number 1- 25, the polymer solution was the same as was used in run number l-23. The resulting capsules were slightly larger (1400 to 1600 microns); however, the storage test results were essen- tially the same as were obtained in run number l-23. This shows that the formulation is reproducible.
Another system of interest for encapsulation was a 2 M aqueous solution of lithium chloride. In run number l- 26 as listed in Table 1, the shell consisted of Elvax 250, Nevindene R-7, Parlon S-10 and Sunoco 4412 wax. With a total solids content of 35 weight percent in the shell solution, the resulting capsules had a payload of 44. 7 weight percent and a size range of 1000 to 1200 microns. The plot of the storage test (Figure 3) shows that the capsules lost 75 percent of the fill in 30 days.
In run number l-29, the feed rates were adjusted and increased in order to obtain smaller capsules with a higher payload. The dried capsules had a 72.2 weight percent payload and a size range of 700 to 900 microns. The storage test showed that the capsules lost 22 weight percent of the filler during the 32 day test. The plot also shows that the weight lost per day would be much lower if the test had been conducted over a longer period of time because the greatest loss occurs during the first few days of the test.
c. Encapsulation of Aqueous Electrolytes Using Hot Melts -
The second approach undertaken for the encapsulation of electrolytes was to melt the polymer blend and use the molten mixture in place of a solution. This technique has an advantage over the preceding technique in that no solvents are used.
In run number 1-33a as listed in Table 2, the polymer blend con- sisted of 15.0 weight percent Elvax 240 and 85 weight percent Sunoco wax 4412. The shell materials were held at 160°F while encapsulating water. The resulting capsules contained 56. 5 weight percent water and had a size range of 1190 to 1410 microns. These capsules, when stored for 25 days at 77°F and 50 percent relative humidity, lost 14. 0 weight percent of the water (Figure 4).
In an effort to increase the payload, the above run (run number 1-33a) was repeated. In this run (run number l-33b), the feed rate of water was increased. This experiment produced capsules having a
186

payload of 62.9 weight percent and a size range of 1410 to 1680 microns. Results of the storage test as plotted in Figure 4 show that the weight loss was the same as was obtained with the capsules made in run number 1-33a.
Several experiments were made in an effort to encapsulate a 2 M aqueous solution of lithium chloride. In run number l-33d, the shell consisted of 15 weight percent Elvax 240 and 85 weight percent Sunoco wax 4412. Tween 80 (0. 01 weight percent), a nonionic surfactant manu- factured by Atlas Powder Company, was added to the filler to aid in droplet formation. This system produced capsules having a 39. 3 weight percent payload and a size range of 1680 to 2380 microns. These cap- sules lost 11.0 weight percent of the water over 25 days storage. The rate of weight loss per day is shown in Figure 5.
A series of runs was also made using Elvax 210 in place of Elvax 240. The Elvax 210 is a lower molecular weight polymer and has im- proved barrier proper ties. In run number 1 - 39, a 2 M aqueous lithium chloride solution was encapsulated using a polymer blend consisting of 21.0 weight percent Elvax 210 and 79.0 weight percent Sunoco wax 4412 as the shell material. The capsules contained 52. 2 weight percent water and had a size range between 1200 and 1300 microns. Results of the storage test are shown in Figure 7. It can be noted that the test lasted only 17 days. During this time the capsules lost 8. 0 weight percent of the filler.
In run number 1-41, the Elvax 210 concentration was decreased to 15. 0 weight percent and the Sunoco wax 4412 concentration was in- creased to 85 weight percent. These capsules contained 40.4 weight percent 2 M aqueous lithium chloride. Over the 15 days storage test, the capsules lost 12 weight percent of the filler.
In run number l-43, a blend of Elvax 210 and candelilla wax was used to encapsulate the aqueous lithium chloride. These capsules had a payload of 38. 6 weight percent and a size range of 1300 to 1500 microns. Figure 6 indicates that 5. 0 weight percent of the filler was lost during the 14 day storage test. The plot indicates that if the storage test had continued, a lower average weight loss/day would be obtained.
Since smaller capsules were desired, the inner tube of the encap- sulation equipment was decreased to 0.014-inch OD, 0.007-inch ID, and the outer orifice was decreased from 0.625-inch to 0. 018-inch. A description of this equipment appeared in a previous section. In run number l-45, aqueous 2 M lithium chloride was encapsulated using
187

the above equipment. The shell material was again the Elvax 210-Sunoco wax 4412 blend. The capsules produced in this experiment were less than 595 microns in diameter and had a 68.4 weight .percent payload. Figure 7 shows that the capsules lost 17.0 weight percent of the filler in the 10 day storage test. The plot also shows that the loss in weight had started to level off. This indicates that a much lower average weight loss /day would be obtained had the storage test extended over a longer period of time.
D. Encapsulation of Organic Electrolytes Using Hot Melts
In addition to the aqueous electrolyte systems, attempts were made to encapsulate several organic electrolytes. The organic electrolytes under consideration were propylene carbonate, butyrolactone, and dioxane. The initial screening tests showed these compounds to be water-miscible and miscible with most organic solvents normally used to dissolve various polymers. In fact, these compounds are excellent solvents for many poly- mers. However, it was learned that these electrolytes are immiscible with a molten mixture consisting of 15.0 weight percent Elvax 210 and 85 weight percent Sunoco wax 4412.
In run number 2-2, the aforementioned polymer blend was used to encapsulate propylene carbonate. The resulting capsules had a payload of 57.4 weight percent. The size range of the capsules was from 595 to 1000 microns. The capsules were sieved, and the fraction between 840 and 1000 microns was used in the storage tests. A plot of the results of the storage test is shown in Figure 8. The total weight loss over the 9-day storage test was 4.0 weight percent. The plot shows that, had the test continued, a much lower loss rate would have been obtained.
In run number 2-7, the same polymer blend was used to encapsu- late butyrolactone. Figure 9 indicates that the butyrolactone was rapidly permeating the shell; however, the storage test was very short and as a consequence, no definite conclusions can be made.
In run number 2-9, the Elvax-wax blend was used to encapsulate dioxane o After 24 hours, it was noted that the capsule shells had col- lapsed. This is caused by the dioxane permeating through the shell faster than air can permeate into the capsule. The possibility exists that a different ratio of Elvax to wax, a different Elvax and wax, or a different polymer system is needed to satisfactorily contain the dioxane.
188

III. CONCLUSIONS
The results obtained during this program show that both aqueous and organic electrolytes can be successfully encapsulated. No attempt was made to optimize the shell formulation or the equipment since the major effort was directed toward encapsulating as many of the potential electrolytes as possible. Because of the short duration of the storage tests, many of the reported weight losses are exceptionally high. Ex,- amination of the plots indicates that, in many instances, the filler loss rate would be much lower if the tests had continued over an extended period of time.
It is believed that the high initial weight losses are caused by several factors. When polymer solutions are used to prepare the capsules s the residual solvents in the shell will produce high initial weight Losses by two mechanisms. One is the continued evaporation of the residual solvents. The second is that the residual solvents in the shell will cause a high diffusion rate of the filler. As the solvents evaporate, the wax content of the shell will crystallize, retarding the diffusion rate.
When hot melts are used to encapsulate the electrolytes, the shell is rapidly cooled. This causes the wax content of the shell to solidify in an amorphous form. This random molecular structure will permit the filler to have a high diffusion rate. With time, the wax molecules will orient themselves and form crystals. In this oriented form the wax has a very low diffusion rate. Various techniques can be employed to in- crease the crystallization rate of the wax. One technique is to warm the capsules in order to increase the molecular orientation process. Stow cooling will cause the wax to assume the crystalline form.
189

TABL
E 1
ENC
APSU
LATl
ON
O
F AQ
UEO
US
SYST
EMS
USI
NG
VA
RIO
US
POLY
MER
SO
LUTI
ON
S
Srllv
ent
Syst
em
50
50
Benz
ene
-Tol
uene
H
arde
ning
Ba
th
: M
etha
nol
cont
aini
ng
Twee
n 80
--~
__---
Sh
ell
Com
posi
tioni
W
t. Pe
rcen
t. To
tal
Cap
s&-
---__
_-
Run
El
vax
Nev
inde
ne
Pa r
lon
Suno
co
Solid
s N
o 25
0(l)
R-7
(2)
s-
lot3
1 44
12
Wax
(“)
Payl
oad
Size
, w
t %
Fi
ller
wt
%
Mic
rons
1-3
34.2
l-7
36.2
l-10
36.2
z 1-
14
35.0
0
1 -
23
15.0
29.
0
31.4
31.4
30.
0
22"
2
LO.
8
20.8
20.0
14.
6
11.
6
11.
6
15.
0
35
30
30
20
HO
H
60.
1 20
00
HO
H
74.9
84
0.-
1000
500-
700
40%
G
lyce
rol
47.
0 60
%
HO
H
590-
840
40%
G
lyce
rol
43.
9 60
%
HO
H
30.
0 20
.0
15.
0 35
10
00-1
300
40%
G
lyce
rol
43.8
60
%
HO
H
1 -
25
35.0
30
. 0
20.0
15
.0
35
1400
-160
0
1 -
26
35.0
30
. 0
20.0
15
. 0
35
2 M
Li
Cl
44‘7
in
H
OH
10
00-1
200
l-29
35.0
30
. 0
20.
0 15
.0
35
II 72
.2
700-
900
(1)
Elva
x 25
0.
A co
poly
mer
of
et
hyle
ne
and
viny
l ac
etat
e (d
u Po
nt)
(2)
Nev
inde
ne
R-7
. A
coum
aron
e-in
dene
re
sin
(Nev
ille
Che
mic
al
Co
) (3
) Pa
rlon
S-10
. A
chlo
rinat
ed
rubb
er
(Her
cule
s Po
.Gld
er
Co,
)
(41
Suno
i-.o
4412
W
ax
A hy
droc
arbo
n.
wax
(S
un
Oil
Co
) i5
) 0
01
wt
% T
riton
X-
100
(Rnh
m
& H
aas)
was
ad
ded
to
the
wat
er.

TABL
E 2
ENC
APSU
LATI
ON
O
F VA
RIO
US
ELEC
TRO
LYTE
S U
SIN
G
HO
T M
ELTS
Tem
pera
ture
of
Sy
stem
:
160°
F H
arde
ning
Ba
th
: M
etha
nol
cont
aini
ng
D 01
wt
% T
wee
n 80
Run
N
o.
Shel
l C
ompo
sitio
n C
apsu
le
Payl
oad
Size
, M
ater
ial
wt
%
Fille
r w
t %
M
icro
ns
l-33a
l-33b
F l-3
3c
l-33d
l-37
l-38
l-43
l-39
Elva
x 24
0 15
Su
noco
w
ax
44 1
2 85
H
OH
56
. 5
1190
-141
0
Elva
x 24
0 15
Su
noco
w
ax
4412
85
H
OH
62
. 9
1410
- 16
80
Elva
x 24
0 15
Su
noco
w
ax
4412
85
H
OH
59
.6
>168
0
Elva
x 24
0 15
2
M
aq.
LiC
l Su
noco
w
ax
44 1
2 85
.
01 w
t %
Tw
een
80
Elva
x 24
0 15
Su
noco
w
ax
4412
84
. 99
Tr
iton
X-
15
0. 0
1
HO
H
-- 0.
01
wt
% T
riton
X-
15
Elva
x 21
0 15
C
arna
uba
wax
N
o.
3 85
H
OH
--
Elva
x 21
0 15
C
ande
lilla
wax
85
2
M
aq.
LiC
l 38
. 6
1300
- 15
00
Elva
x 21
0 Su
noco
w
ax
44 1
2 21
79
2
M
aq.
LiC
l 52
. 2
1200
-130
0
39.3
16
80-
2380
No
caps
ules
w
ere
form
ed.
No
caps
ules
w
ere
form
ed.

TABL
E 2
(Con
t’d)
ENC
APSU
LATI
ON
O
F VA
RIO
US
ELEC
TRO
LYTE
S U
SIN
G
HO
T M
ELTS
Tem
pera
ture
of
Sy
stem
I
160°
F H
arde
ning
Ba
th
: M
etha
nol
cont
aini
ng
D 01
w
t “/o
Tw
een
80
Run
N
o.
Shel
l C
ompo
sitio
n
Mat
eria
l w
t %
Fi
ller
Payl
oad
wt
%
‘Cap
sule
Si
ze,
Mic
rons
1-41
El
vax
210
15
2 M
aq
. Li
Cl
40.4
12
00
z Su
noco
w
ax
4412
85
N
J
1-45
El
vax
210
15
2 M
aq
. Li
Cl
68.4
<5
95
Suno
co
wax
44
12
85
2-2
Elva
x 21
0 15
Pr
opyl
ene
57.4
59
5-
1000
Su
noco
w
ax
4412
85
C
arbo
nate
2-7
Elva
x 21
0 15
Bu
tyro
lact
one
58.
2 59
5-
1410
Su
noco
w
ax
44 1
2 85
2-9
Elva
x 21
0 15
D
ioxa
ne
-- C
apsu
les
colla
psed
Su
noco
w
ax
44 1
2 85
af
ter
24
hour
s.

80
60
40
20 0
Cod
e R
un
No.
0
1-3
0 1-
7 A
l-10
0 5
10
15
20
25
30
35
40
45
50
Day
s
FIG
UR
E 1
STO
RAG
E TE
STS
ON
EN
CAP
SULA
TED
W
ATER

80
60
40
20 0
1 I
I -
I I
I I
Cod
e R
un
No.
0 1-
14
u l-2
3 A
l-25
25
Day
s
FIG
UR
E 2
STO
RAG
E TE
STS
ON
EN
CAP
SULA
TED
G
L’YC
ERO
L-W
ATER
M
IXTU
RES
Fille
r: 40
Vo
lum
e Pe
rcen
t G
lyce
rol
60
Volu
me
Perc
ent
Wat
er

100
80
60
40
20
0
-I-.-~ -.-_~- --..1 ~_.I. _--___.-. -.----------- I- -i I 7” ”
. -..-- - -.-. _ __.. 1’ _--. ..-. .--...-
Code Run No. 0 1-26
a l-29
FIGURE 3 STORAGE TESTS ON ENCAPSULATED 2M AQUEOUS LiCl
195

8(
6C
4c
20
1 .
1 -
I -
I -
Code Run No.
0 1-33a
0 1-33b A 1-33c
100
I--’ I I I I
Days
FIGURE 4 STORAGE TESTS ON ENCAPSULATED WATER USING HOT MELTS
196

Run No. l-33d
15
Days
FIGURE 5 STORAGE TEST ON ENCAPSULATED AQUEOUS
2M LiCl-SURFACTANT MIXTURE USING HOT MELT
197

1oc
80
I 1 I
Run No.
1-43
Days
20
FIGURE 6 STORAGE TEST ON AN ENCAPSULATED AQUEOUS
2M LiCl SOLUTION USING HOT MELT
198
‘,
I I

100
80
60
I I I I
Code Run No. 0 l-39 cl 1-41 A l-45
I
10 15 20
Days
FIGURE 7 STORAGE TESTS ON ENCAPSULATED AQUEOUS
2M LiCl USING HOT MELTS
199

100
80
60
40
20
Run No. 2-2
I .-
/ -
0 5 10
Days
15 20
FIGURE 8 STORAGE TEST ON ENCAPSULATED PROPYLENE
CARBONATE USING HOT MELT
200

80
60
40
20
I I I I
Run No. 2-7
10 15
Days
FIGURE 9
20 25
STORAGE TEST ON ENCAPSULATED BUTYROLACTONE USING HOT MELT
NASA-Langley, 1965 201
Related Documents