Analytica Chimica Acta 783 (2013) 39–48 Contents lists available at SciVerse ScienceDirect Analytica Chimica Acta j ourna l ho mepage: www.elsevier.com/locate/aca Development of sensitive and rapid analytical methodology for food analysis of 18 mycotoxins included in a total diet study Eduardo Beltrán a , María Ibá ˜ nez a , Tania Portolés a , Cristina Ripollés a , Juan Vicente Sancho a , Vicent Yusà b , Silvia Marín b , Félix Hernández a,∗ a Research Institute for Pesticides and Water, University Jaume I, 12071 Castellón, Spain b Public Health Research Center of Valencia (CSISP), Avda Catalunya, 21, 46020 Valencia, Spain h i g h l i g h t s • Multiclass method for 18 mycotoxins in 24 different matrices. • UHPLC–MS/MS method has been applied to a total diet study. • Dilution of the extracts allowed mini- mizes matrix effects. • Acquisition of 3 SRM tranisitions allowed unequivocal confirmation. • The most detected compounds were DON, FB1 and OTA, mainly in cereals. g r a p h i c a l a b s t r a c t a r t i c l e i n f o Article history: Received 16 January 2013 Received in revised form 16 April 2013 Accepted 20 April 2013 Available online 1 May 2013 Keywords: Mycotoxins Ultra-high performance liquid chromatography Tandem mass spectrometry Food analysis Total diet study a b s t r a c t A rapid and sensitive method for the determination of 18 mycotoxins in 24 different food matrices has been developed and validated. With the exception of beverages and oil samples, a simple extraction with acetonitrile:water 80:20 (0.1% formic acid) was applied. Fruit juice, wine and beer samples were simply diluted with water containing 0.1% formic acid. Oil samples were partitioned with acetonitrile/hexane in order to remove fats. Analyses were made by ultra-high performance liquid chromatography (UHPLC) coupled to tandem mass spectrometry with triple quadrupole. Validation was carried out in all selected matrices using blank samples spiked at two analyte concentrations. Extraction recoveries between 70 and 120% and relative standard deviations lower than 20% were obtained for the wide majority of analyte–matrix combinations. Matrix-matched calibration was used for a correct quantification in order to compensate for matrix effects. Limits of quantification were lower than maximum permitted levels for every regulated mycotoxin–matrix combination. The acquisition of three SRM transitions per compound allowed the unequivocal confirmation of positive samples, supported by the accomplishment of ion inten- sity ratios and retention time when compared with reference standards. The developed methodology was applied to the analysis of 240 samples within a total diet study performed at Comunidad Valenciana (Spain). The most frequently found mycotoxins were deoxynivalenol, fumonisin B1, ochratoxin A and zearalenone at low g kg −1 levels, mainly in bread, breakfast cereals and beer. © 2013 Elsevier B.V. All rights reserved. 1. Introduction Mycotoxins are naturally occurring contaminants produced by filamentous fungi as secondary metabolites. All mycotoxins are ∗ Corresponding author. Tel.: +34 964 387366; fax: +34 964 387368. E-mail address: [email protected] (F. Hernández). low-molecular-weight natural products [1]. Food contaminated by mycotoxins can produce acute and chronic effects, especially hepatic, gastrointestinal, and carcinogenic diseases [2]. Regarding toxicity, aflatoxins have been classified as carcinogenic for humans whilst other mycotoxins as fumonisins and ochratoxin A have been classified as possibly carcinogenic [3]. Current regulations are based on scientific opinions of authori- tative organizations such as the FAO/WHO Joint Expert Committee 0003-2670/$ – see front matter © 2013 Elsevier B.V. All rights reserved. http://dx.doi.org/10.1016/j.aca.2013.04.043

Welcome message from author
This document is posted to help you gain knowledge. Please leave a comment to let me know what you think about it! Share it to your friends and learn new things together.
Transcript

Da
EJa
b
h
•
•
•
•
•
ARRAA
KMUcTFT
1
fi
0h
Analytica Chimica Acta 783 (2013) 39– 48
Contents lists available at SciVerse ScienceDirect
Analytica Chimica Acta
j ourna l ho mepage: www.elsev ier .com/ locate /aca
evelopment of sensitive and rapid analytical methodology for foodnalysis of 18 mycotoxins included in a total diet study
duardo Beltrána, María Ibáneza, Tania Portolésa, Cristina Ripollésa,uan Vicente Sanchoa, Vicent Yusàb, Silvia Marínb, Félix Hernándeza,∗
Research Institute for Pesticides and Water, University Jaume I, 12071 Castellón, SpainPublic Health Research Center of Valencia (CSISP), Avda Catalunya, 21, 46020 Valencia, Spain
i g h l i g h t s
Multiclass method for 18 mycotoxinsin 24 different matrices.UHPLC–MS/MS method has beenapplied to a total diet study.Dilution of the extracts allowed mini-mizes matrix effects.Acquisition of 3 SRM tranisitionsallowed unequivocal confirmation.The most detected compounds wereDON, FB1 and OTA, mainly in cereals.
g r a p h i c a l a b s t r a c t
a r t i c l e i n f o
rticle history:eceived 16 January 2013eceived in revised form 16 April 2013ccepted 20 April 2013vailable online 1 May 2013
eywords:ycotoxinsltra-high performance liquidhromatographyandem mass spectrometry
a b s t r a c t
A rapid and sensitive method for the determination of 18 mycotoxins in 24 different food matrices hasbeen developed and validated. With the exception of beverages and oil samples, a simple extraction withacetonitrile:water 80:20 (0.1% formic acid) was applied. Fruit juice, wine and beer samples were simplydiluted with water containing 0.1% formic acid. Oil samples were partitioned with acetonitrile/hexanein order to remove fats. Analyses were made by ultra-high performance liquid chromatography (UHPLC)coupled to tandem mass spectrometry with triple quadrupole. Validation was carried out in all selectedmatrices using blank samples spiked at two analyte concentrations. Extraction recoveries between 70and 120% and relative standard deviations lower than 20% were obtained for the wide majority ofanalyte–matrix combinations. Matrix-matched calibration was used for a correct quantification in orderto compensate for matrix effects. Limits of quantification were lower than maximum permitted levels for
ood analysisotal diet study
every regulated mycotoxin–matrix combination. The acquisition of three SRM transitions per compoundallowed the unequivocal confirmation of positive samples, supported by the accomplishment of ion inten-sity ratios and retention time when compared with reference standards. The developed methodologywas applied to the analysis of 240 samples within a total diet study performed at Comunidad Valenciana(Spain). The most frequently found mycotoxins were deoxynivalenol, fumonisin B1, ochratoxin A and
−1 lev
zearalenone at low �g kg. Introduction
Mycotoxins are naturally occurring contaminants produced bylamentous fungi as secondary metabolites. All mycotoxins are
∗ Corresponding author. Tel.: +34 964 387366; fax: +34 964 387368.E-mail address: [email protected] (F. Hernández).
003-2670/$ – see front matter © 2013 Elsevier B.V. All rights reserved.ttp://dx.doi.org/10.1016/j.aca.2013.04.043
els, mainly in bread, breakfast cereals and beer.© 2013 Elsevier B.V. All rights reserved.
low-molecular-weight natural products [1]. Food contaminatedby mycotoxins can produce acute and chronic effects, especiallyhepatic, gastrointestinal, and carcinogenic diseases [2]. Regardingtoxicity, aflatoxins have been classified as carcinogenic for humans
whilst other mycotoxins as fumonisins and ochratoxin A have beenclassified as possibly carcinogenic [3].Current regulations are based on scientific opinions of authori-tative organizations such as the FAO/WHO Joint Expert Committee

4 Chimi
oFls1fmmt
bmmhsemMctoica[
ttaialLmtatopwufm(I[aasm[gom
facFfSwpttm
0 E. Beltrán et al. / Analytica
n Food Additives of the United Nations (JECFA) or the Europeanood Safety Authority (EFSA) [4]. The European Union has estab-ished the maximum mycotoxin concentration levels allowed ineveral food commodities in the Commission Regulation (EC) No.881/2006 [5–7]. Limits as low as few ng g−1 have been establishedor some mycotoxin–matrix combinations. Therefore, the develop-
ent of sensitive, selective and reliable analytical methods is ofajor importance to have realistic data on the presence of myco-
oxins in foodstuffs.Liquid chromatography (LC) and gas chromatography (GC) have
een the most widely applied techniques for determination ofycotoxins [8–11]. In the last years, the number of LC–MS/MSethods reported for multiclass analysis of mycotoxins in food
as increased considerably due to the high selectivity and sen-itivity reached, and also because of the compatibility of samplextract’s and analyte’s physicochemical characteristics with theobile phases and ionization sources employed in LC–MS/MS [12].ore recently, the introduction of ultra-high performance liquid
hromatography (UHPLC) has provided additional advantages inhe determination of mycotoxins in foodstuffs [13–21]. The usef columns packed with sub-2 �m particles has allowed obtain-ng narrower peaks than those obtained with traditional HPLColumns. Faster separations and improved sensitivity have beenchieved maintaining similar or even better separation efficiency22].
One of the main objectives pursued in most laboratories ishe application of multi-analyte methods with minimum samplereatment. The so called “dilute and shoot” methods [14–16,23,24]re nowadays feasible thanks to the continuous improvementsn analytical instrumentation. However, although LC–MS/MS is
powerful technique and the workhorse for most organic pol-utants/residues in the food safety and environmental fields,C–MS/MS methods with little sample treatment are exposed toatrix effects which would lead to notable errors in quantifica-
ion if they are not properly corrected. Several strategies can bepplied to correct matrix effects [25,26]. One of them is to increasehe sample treatment with the aim of minimizing the presencef coeluting matrix interferences; however, this approach ham-ers the application of rapid multianalyte methods due to theide chemical diversity of toxins. Furthermore, extensive clean-p might be a handicap for application of the same methodologyor different matrices. Other common options to compensate for
atrix effects are the use of isotopically-labeled internal standardsILIS) or matrix-matched standard calibration. The use of analyteLIS seems the ideal approach to compensate for matrix effects14,17,21,27], however the elevated cost of the internal standardss well as their commercial availability for every analyte hinder itspplication in multi-residue methods. Matrix-matched calibrationeems to be the most feasible and realistic approach in multi-ycotoxin methods to ensure a correct and reliable quantification
15,16,24,28]. In addition, the excellent sensitivity of new-eneration of triple quadrupole instruments may allow the dilutionf sample extracts to an extent that matrix effects are notablyinimized [29].The aim of this work is to develop and validate a rapid method
or the simultaneous determination of 18 mycotoxins (includingll EU regulated mycotoxins) in a notable number of food matri-es at concentration levels lower than the maximum permitted.or this purpose, UHPLC–MS/MS has been selected as the pre-erred technique. Selected compounds have been determined inRM mode, using a state of the art triple quadrupole analyserith a rapid chromatographic separation of only 4.5 min. Sam-
le treatment has been minimized in order to decrease analysisime as well as solvent consumption, reducing undesired losseshat might occur along sample treatment. Finally, the developedethod has been applied to the analysis of around 240 samples
ca Acta 783 (2013) 39– 48
corresponding to 24 different matrices, susceptible of mycotox-ins contamination, collected for a total-diet study carried out atthe Valencian region. The selection of food matrices was madeto be representative of the diet at this Spanish area. Total DietStudies (TDSs) are used as a tool for estimating the level ofdietary exposure to chemical substances among the general popu-lation. It is recognized that the availability and detailed occurrencedata for chemicals in food are essential in order to perform riskassessment [30].
2. Experimental
2.1. Reagents
All mycotoxin standards (>99% purity) were supplied by SigmaAldrich (Madrid, Spain). Neosolaniol (100 �g L−1 in acetonitrile),T-2 triol (50 �g L−1 in acetonitrile) and fumonisin B1 and B2(50 �g L−1 in acetonitrile:water (50:50)) were purchased in solu-tion whilst the other mycotoxin reference standards were suppliedas powder. HPLC-grade water was obtained from water passedthrough a MilliQ water purification system (Millipore Ltd., Bedford,MA, USA). HPLC-grade methanol (MeOH), HPLC-grade acetonitrile(ACN), acetic acid (>99.8%) and ammonium acetate (NH4Ac) (>99%)were purchased from ScharLab (Barcelona, Spain). Formic acid(HCOOH) (>98%) was obtained from Fluka (Buchs, Switzerland).Individual stock solutions, at around 10 mg L−1, were prepared bydiluting the reference standards solutions of NEO, T-2 triol andfumonisins in acetonitrile (abbreviations used for mycotoxins arespecified in Table 1). For the rest of compounds, individual stocksolutions, at around 100 mg L−1, were prepared by dissolving about1, 5, 10 or 25 mg of solid reference standard in 10, 50, 100 or 250 mLof ACN, respectively. An intermediate mixed solution (MIX A) con-taining aflatoxins and OTA at a concentration of 0.1 mg L−1 wasobtained after mixing individual stock solutions and diluting withACN. A similar procedure was carried out with NEO, FB1, FB2, T-2triol, DIA, T-2 toxin, and ZEN, at a concentration of 1 mg L−1 (MIXB). In the same way, DON, 3AcDON, 15AcDON, HT-2, FUSX andNIV, were mixed in order to obtain a concentration of 10 mg L−1
(MIX C). The total mixed standard solution was prepared by adding1 mL of MIX A, 1 mL of MIX B, and 1 mL of MIX C, and diluting to10 mL with water. Working standard solutions for LC–MS/MS anal-ysis and for fortification of samples were prepared by dilution ofthe total mixed standard solution with water. Stock and interme-diate standard solutions were stored in a freezer at −20 ◦C, whereasworking solutions were stored in a fridge.
2.2. Instrumentation
An UPLCTM system (Acquity, Waters, Milford, MA, USA) wasinterfaced to a triple quadrupole mass spectrometer (TQ-S,Waters Micromass, Manchester, UK) using an orthogonal Z-spray-electrospray interface (ESI). The LC separation was performedusing an Acquity UPLC BEH C18 analytical column (1.7 �m parti-cle size, 2.1 mm × 50 mm; Waters), at a flow rate of 500 �L min−1.Mobile phase was a time programmed gradient using A (H2O0.1 mM NH4Ac, 0.01% HCOOH), and B (MeOH 0.1 mM NH4Ac, 0.01%HCOOH). The percentage of organic modifier (B) was changed lin-early as follows: 0 min, 10%; 0.5 min, 20%; 2.5 min, 20%; 4 min, 90%;4.5 min, 90%; 4.6 min, 10%; 6 min, 10% B. Injection volume was10 �L.
Drying as well as nebulizing gas was nitrogen (Praxair, Valen-
cia, Spain). The gas flow was set to 1200 L h−1 and the conegas to 250 L h−1. For operating in MS/MS mode, collision gaswas argon (99.995%; Praxair, Valencia, Spain) with a pressure ofapproximately 4 × 10⁻³ mbar in the collision cell (0.15 mL min−1).
E. Beltrán et al. / Analytica Chimica Acta 783 (2013) 39– 48 41
Table 1Experimental conditions of the optimized UHPLC–(ESI)-MS/MS method for the selected mycotoxins.
Compound Retention time(min)
Precursor ion Cone voltage(V)
Product ion Collision energy(eV)
Nivalenol (NIV) 0.70 [M+H]+ 313.1 10175.1 (Q) 20159.1 (q1) 20
91.0 (q2) 40
Deoxynivalenol (DON) 0.96 [M+H]+ 297.0 20249.1 (Q) 10231.1 (q1) 10203.1 (q2) 10
Fusarenon X (FUSX) 1.49 [M+H]+ 355.1 30175.1 (Q) 20229.1 (q1) 20247.1 (q2) 20
Neosolaniol (NEO) 1.90 [M+NH4]+ 400.2 20185.1 (Q) 20305.1 (q1) 10215.1 (q2) 10
3 Acetyl deoxynivalenol (3AcDON) 2.70 [M+H]+ 339.1 20231.1 (Q) 10213.1 (q1) 20279.1 (q2) 10
15 Acetyl deoxynivalenol(15AcDON) 2.78 [M+H]+ 339.1 20
137.0 (Q) 10261.1 (q1) 10297.1 (q2) 10
Aflatoxin G2 (AFG2) 3.42 [M+H]+ 331.1 30245.1 (Q) 30189.1 (q1) 40257.1 (q2) 30
Aflatoxin G1 (AFG1) 3.49 [M+H]+ 329.1 30243.1 (Q) 30200.1 (q1) 40215.1 (q2) 30
Aflatoxin B2 (AFB2) 3.56 [M+H]+ 315.1 30259.1 (Q) 30287.1 (q1) 30243.1 (q2) 30
Aflatoxin B1 (AFB1) 3.62 [M+H]+ 313.1 30285.1 (Q) 20269.1 (q1) 30241.1 (q2) 30
Diacetoxyscirpenol (DIA) 3.67 [M+NH4]+ 384.2 10307.1 (Q) 10247.1 (q1) 10349.2 (q2) 10
T-2 triol 3.72 [M+Na]+ 405.2 50303.1 (Q) 20273.1 (q1) 20405.2 (q2) 5
Fumonisin B1 (FB1) 3.85 [M+H]+ 722.2 30334.2 (Q) 40352.2 (q1) 30686.2 (q2) 30
HT-2 toxin (HT-2) 3.88 [M+NH4]+ 442.2 20263.1 (Q) 10215.1 (q1) 15197.0 (q2) 15
T-2 toxin (T-2) 3.99 [M+NH4]+ 484.2 20185.1 (Q) 20305.1 (q1) 10245.1 (q2) 10
Fumonisin B2 (FB2) 4.04 [M+H]+ 706.2 30336.2 (Q) 40318.2 (q1) 40354.2 (q2) 30
Zearalenon (ZEN) 4.07 [M−H]− 317.1 20175.1 (Q) 25273.1 (q1) 20131.1 (q2) 35
239.1 (Q) 30
Epotsp1
Ochratoxin A (OTA) 4.08 [M+H]+
xperiments were performed by continuous positive/negativeolarity switching (switching time of 0.02 s). Capillary voltagesf 3.0 kV (positive ionization mode) and 2.5 kV (negative ioniza-
ion mode) were applied. The desolvation gas temperature waset to 650 ◦C and the source temperature to 150 ◦C. Column tem-erature was set to 40 ◦C. Automatic dwell times between 3 and1 ms/transition were used. TargetLynx (MassLynx v. 4.1, Waters,404.2 30 221.1 (q1) 35102.0 (q2) 60
Manchester, UK) software was used to process the quantitative dataobtained from calibration standards and from samples.
A mechanical shaker (S.B.S. Instruments S.A, Barcelona, Spain)
was used for shaking the sample during extraction. A centrifuge(Consul centrifuge, Orto-Alresa, Madrid, Spain) was used. Nylonfilters (Iso-disc, Supelco, 0.22 �m) were used for filtering the finalextract before injection.
4 Chimi
2
d1cfwt
•
•
•
•
l(mss
2
c“td
2
wwH4fd
2
tsiuH
2
owtp
2
1hua2
2 E. Beltrán et al. / Analytica
.3. Samples
The 24 food matrices were classified in four different groupsepending on their characteristics: nine were dry matrices (group), nine were a variety of food matrices, commonly with high waterontent, and milk products (group 2), four were liquid matrices ofruit juice, wine and beer (group 3) and, finally, two were matricesith high fat content, concretely oils (group 4). These groups were
he following:
Group 1: wheat bread, sliced bread, cereals bread, pasta, rice,dried fruits, biscuits, processed baked goods, and breakfast cere-als;Group 2: olives and pickles, apple and pear, eggs, milk, yoghurt,milk shakes and custards, soya products, cheese, and grapes;Group 3: wine, beer, orange juice, and juices (pineapple, grapesand peaches);Group 4: olive oil, and sunflower oil.
In addition to the samples used for validation (that were ana-yzed to test the possible presence of mycotoxins), 240 samples10 samples per matrix) were analyzed following the developed
ethodology. Samples were provided by AINIA within a total-diettudy performed by the Valencian regional government (Con-ellería de Sanidad, Generalitat Valenciana).
.4. Analytical procedure
Sample extraction was based on a previous work [15], with somehanges applied when required, e.g. extraction of oils. The approachdilute and shoot” was tried for all mycotoxin–matrix combina-ions, trying to avoid sample manipulation and compound lossesuring sample preparation.
.4.1. Group 12.5 g triturated and homogenized samples were accurately
eighed and transferred to centrifuge tubes (50 mL). Samplesere extracted by shaking with 10 mL ACN/water (80:20) 0.1%COOH on a mechanical shaker for 90 min, and then centrifuged at000 rpm for 10 min. Afterwards, the supernatant extract was four-old diluted with HPLC-grade water, taking an aliquot of 2.5 mL andiluting to 10 mL (final extract contains 0.0625 g sample mL−1).
.4.2. Group 22.5 g of homogenized samples were accurately weighed and
ransferred to centrifuge tubes (50 mL). Samples were extracted byhaking with 10 mL ACN/water (80:20) 0.1% HCOOH on a mechan-cal shaker for 90 min. The whole extracting mixture was filteredsing a paper filter and the final volume was adjusted to 50 mL withPLC-grade water (final content 0.05 g sample mL−1).
.4.3. Group 3Fruit juice, wine and beer samples were treated as follows: 2.5 g
f homogenized samples were accurately weighed. Final volumeas adjusted to 25 mL with HPLC-grade water 0.1% HCOOH and
hen centrifuged at 4000 rpm for 15 min (final content 0.1 g sam-le mL−1).
.4.4. Group 4Olive and sunflower oil samples content were treated as follows:
0 mL of hexane were added to 5 g homogenized samples. Then, the
exane-diluted sample was extracted twice with 10 mL of ACN sat-rated in hexane. Afterwards, the acetonitrile layer was separatednd four-fold diluted with HPLC-grade water, taking an aliquot of.5 mL and diluting to 10 mL (final content 0.0625 g sample mL−1).ca Acta 783 (2013) 39– 48
In all cases, the final diluted extracts were filtered througha 0.22 �m nylon filter and 10 �L were directly injected into theUHPLC–(ESI)MS/MS system.
Samples of groups 1, 2 and 3, were spiked for recovery exper-iments by delivering 1 mL of the corresponding aqueous mixedstandard solution to 2.5 g homogenized blank. Fortification levelsof 0.4, 4, 40 or 400 �g kg−1 were obtained, depending on the sensi-tivity observed for each analyte. Oil samples (group 4) were spikedby adding 1 mL of the corresponding mixed standard solution pre-pared in acetone to 5 g of oil sample in order to yield the fortificationlevels above mentioned. Spiked samples were equilibrated 1 h priorto extraction.
Matrix-matched standard calibration was used for quantifica-tion purposes. Standards in matrix were prepared by adding 100 �Lfrom the corresponding standard solution to 900 �L of the four-folddiluted blank extract.
2.5. Validation study
Method validation was carried out for the 18 selected myco-toxins in all the 24 food matrices under investigation. Compoundswere divided into three different groups depending on their inten-sity response (i.e. sensitivity in the LC–MS/MS measurement):group A (high sensitivity; recovery experiments performed at 0.4and 4 �g kg−1), including aflatoxin B1, aflatoxin B2, aflatoxin G1,aflatoxin G2, Ocratoxin A; group B (medium sensitivity; recov-ery experiments carried out at 4 and 40 �g kg−1), which includesNeosolaniol, fumonisin B1, fumonisin B2, T-2 triol, T-2 toxin,Diacetoxyscirpenol, Zearalenone, and group C (low sensitivity;recovery experiments made at 40 and 400 �g kg−1), containingNivalenol, Deoxynivalenol, 3AcDON, 15AcDON, Fusarenon X, HT-2Toxin.
Linearity of the method was evaluated taking at least six matrix-matched standard solutions which were analyzed in duplicate inthe following ranges: 0.01–1 �g L−1 for the compounds of the groupA; 0.1–10 �g L−1 for group B; and 1–100 �g L−1 for group C. It wasconsidered satisfactory when correlation coefficients were higherthan 0.99 with residuals lower than 20%.
Recoveries and precision (repeatability, expressed as relativestandard deviation (RSD) in %) were determined within-day byanalyzing spiked blank samples in triplicate at the spiking levelsindicated above. Acceptable recoveries and RSDs were establishedaccording to Commission Regulation 401/2006/EC [31]. For thosecompounds with no specific criteria in the regulation, recoveriesbetween 70 and 120% with RSD lower than 20% were required [32].
Limits of quantification (LOQ) as well as limits of detection (LOD)were estimated for a signal-to-noise ratio (S/N) equal to 10 and 3,respectively, from the SRM chromatograms of samples spiked atthe lowest concentration level validated.
The specificity of the method was evaluated by analyzing a blankprocedure, a processed blank sample and a blank sample spiked atthe lowest concentration validated, considering satisfactory resultswhen the signal obtained from blank samples were lower than 30%of the signal at LOQ.
3. Results and discussion
3.1. Optimization of MS/MS conditions
MS/MS parameters were optimized by chromatography usingindividual standard solutions of each mycotoxin at concentrations
levels of 1, 10 or 100 ng mL−1 depending on the sensitivity of thecompound. Experiments were carried out in both positive andnegative ionization modes. Firstly, full-scan acquisitions were per-formed to select the precursor ion and optimum cone voltage.
Chimi
Ais
ppft
saa
[twi
3ppw
E. Beltrán et al. / Analytica
ll selected compounds presented higher sensitivity in positiveonization mode with the exception of ZEN, which showed moreatisfactory results in negative mode.
Most of the compounds ionized under ESI positive moderesented an abundant [M+H]+ ion. NEO, DIA, HT-2 and T-2 com-ounds, belonging to the group of thricothecenes A, showed theormation of ammonium adducts [M+NH4]+, in more abundancehan the protonated molecules.
For some mycotoxins, such as aflatoxins, the formation ofodium and potassium adducts was also observed. These undesir-ble adducts were minimized by the addition of small amounts ofmmonium acetate (0.1 mM) in the mobile phase.
In the case of T-2 triol, which only presented the formation of theM+Na]+ adduct, despite adding different concentrations of NH4Ac,he formation of the protonated molecule or ammonium adductas not observed. Therefore, [M+Na]+ was selected as precursor
on for T-2 triol.Mycotoxins of the group of thricothecenes B (NIV, DON,
AcDON, 15AcDON and FUSX) were ionized in both negative andositive modes. In negative ionization, the [M+HCOO]− adduct wasredominant, while in positive ionization mode, the [M+H]+ ionas the most abundant. Although some authors have reported
100 12 0 14 0 16 0 18 0 20 0 22 0 24 0 26 0 28 0 30 0 32 0 34 0
%
0
100
PROVA 193 587 ( 1.460 ) 1: Da ugh ters of 3339.1
231.2
213.2203.3 321.1279.1
100 12 0 14 0 16 0 18 0 20 0 22 0 24 0 26 0 28 0 30 0 32 0 34 0
%
0
100
PROVA 190 590 ( 1.468 ) 1: Da ugh ters of 3321.1
137.0
125.3
261.1
231.4
203.2 213.4249.3
279.0297.0
339.1
3AcDON
15AcDON
(a)
Fig. 1. (a) Product ion spectra of 3 AcDON and 15 AcDON protonated molecules at 1
ca Acta 783 (2013) 39– 48 43
negative ionization mode for determination of thricothecenes B[33], in this work positive ionization led to better sensitivity forthese compounds, and therefore it was selected for further exper-iments.
Once the precursor ion was selected, daughter scan acquisi-tions were performed at different collision energies in order toselect product ions and optimum collision energies. Three SRMtransitions were acquired for each compound to increase theconfidence in the compound identification process Product ionsresulting from non-specific losses (such as H2O or CO2 losses) wereavoided. The most abundant transition was commonly selectedfor quantification (Q) and the other two for confirmation pur-poses (qi). The acquisition of two transitions is normally sufficientfor a safe identification; however, the use of a third transi-tion can be beneficial when dealing with complex analyte/matrixcombinations, low analyte concentrations and/or non-specific tran-sitions [34]. Although sodium adducts are not the best optiondue to their poor fragmentation, for T-2 triol at least monitor-
ing of two product ions was possible. Pseudo-MS/MS transitionof the sodium adduct was selected as the additional confir-mative transitions (405 > 405) as other product ions were notavailable.Time2.20 2.40 2.60 2.80 3.00 3.20 3.40 3.60
%
0
100
2.20 2.40 2.60 2.80 3.00 3.20 3.40 3.60
%
0
100
2.20 2.40 2.60 2.80 3.00 3.20 3.40 3.60
%
0
100
2.20 2.40 2.60 2.80 3.00 3.20 3.40 3.60
%
0
100
2.20 2.40 2.60 2.80 3.00 3.20 3.40 3.60
%
0
100
2.20 2.40 2.60 2.80 3.00 3.20 3.40 3.60%
0
100
mico000 8 8: MRM of 3 Channel s ES+ 339.1 > 231 .1 ( 3 A cDON)
4.20e 6
2.71
mico0008 8: MRM of 3 Channels ES+ 339.1 > 213 .1 ( 3 A cDON)
1.62e 6
2.71
mico000 8 8: MRM of 3 Channel s ES+ 339.1 > 279 .1 ( 3 A cDON)
1.38e 6
2.71
2.85
mico0008 7: MRM of 3 Channels ES+ 339.1 > 297.1 (15 AcDON)
5.52e 5
2.70
2.85
mico000 8 7: MRM of 3 Channel s ES+ 339.1 > 261 .1 ( 15 A cDON)
1.60e 6
2.85
2.71
mico0008 7: MRM of 3 Channels ES+ 339.1 > 137 ( 15 A cDON)
1.70e 6
2.85
2.72
m/z
39ES+ 5.87e 7
m/z
39ES+ 3.16e 7
3AcDON 15 AcDON
(b)
0 eV collision energy and (b) SRM chromatograms for 3AcDON and 15AcDON.

4 Chimica Acta 783 (2013) 39– 48
ioIubtabbs
pi
3
ft(b1vbvtr
mabsaiauswc
aaUaotip
0o0iif
3
spuniw
0
20
40
60
80
100
120
DON FUSX 3AcDON AFB1 T-2 OTA
Soya products
0
20
40
60
80
100
120
DON FUSX 3AcDON AFB1 T-2 OTA
Dried fruits
0
20
40
60
80
100
120
DON FUSX 3AcDON AFB1 T-2 OTA
Breakfast cereals
cer. Desayuno x2 cer. Desayuno x4 cer. Desayuno x102-fold dilu�on 4-fold dilu�on 10 -fold dilu�on
Matr
ixef
fect
(%)
= (
are
a s
pik
edb
lan
kex
tract
/ a
rea
stan
dard
) x 1
00
Fig. 2. Dilution of sample extract as a way to reduce matrix effects.
4 E. Beltrán et al. / Analytica
The use of UHPLC requires fast analyzers, capable of work-ng with very short dwell times as well as inter channel times,btaining in this way enough points per chromatographic peak.n the new generation triple quadrupole instruments (as the onesed in this work), sensitivity and repeatability are not affectedy the dwell time used during acquisition. In this work, dwellimes as low as 3 ms were used without significant reproducibilitynd/or sensitivity losses. This value was automatically calculatedy the software depending on the peak width, the desired num-er of points per peak and the number of transitions acquiredimultaneously.
Table 1 shows optimized MS/MS parameters (precursor androduct ions, cone voltage and collision energy) for the mycotoxins
nvestigated in this work.
.2. LC optimization
In order to optimize the chromatographic separation, dif-erent organic mobile phases (methanol and acetonitrile) withwo additives (formic acid (HCOOH) and ammonium acetateNH4Ac), at various concentrations) were tested. A compromiseetween mobile phase composition and MS response for the8 mycotoxins studied was required. Regarding the organic sol-ent, no significant differences in sensitivity (S/N) were observedetween the use of methanol or acetonitrile as organic sol-ents. Finally, methanol was selected as a mobile phase dueo a slight improvement in peak shape for the most pola
compounds.For those compounds determined under positive ionization
ode, sensitivity improved when small amounts of NH4Ac weredded, in both water and methanol mobile phase solvents. Theest results were obtained with 0.1 mM, as ionization suppres-ion occurred at higher concentrations of this salt (≥0.25 mM). Theddition of HCOOH to the previous mobile phases was required tomprove the peak shape of some compounds, such as fumonisinsnd OTA. Aflatoxins also showed narrower peaks when HCOOH wassed. However the addition of acid produced a slight decrease in theensitivity of thricothecenes. Finally, the addition of 0.01% HCOOHas selected as a compromise for the determination of selected
ompounds.Chromatographic separation of the positional isomers 3 AcDON
nd 15 AcDON was critical as they present similar fragmentation,nd share the SRM transitions (Fig. 1). Two UHPLC Acquity BEHPLC C18 (1.7 �m) columns of different length (2.1 mm × 50 mmnd 2.1 mm × 100 mm) were tested to obtain an efficient separationf both isomers. After testing different gradients in both columns,he shortest column (50 mm) was selected, as the separation of thesomers was satisfactorily achieved, reducing analysis time com-ared with the longest one.
Different flow rates were also tested. When working at.3 mL min−1, no significant differences in sensitivity werebserved with respect to 0.5 mL min−1 flow. However, at.8 mL min−1, the sensitivity decreased surely due to a less efficient
onization process. Therefore, 0.5 mL min−1 was selected as work-ng flow rate as separations could be achieved in less time (4.5 minor all the 18 mycotoxins), without a loss of sensitivity.
.3. Matrix effects
Due to the complexity and composition-diversity of the foodamples under study, matrix effect was considered a criticalarameter for the correct quantification of mycotoxins. As the
se of isotopically-labeled standards for each compound couldot be afforded due to their high cost, the possibility of reduc-ng the quantity of matrix by simple dilution of the extractsas considered as a suitable approach [29]. However, this
solution requires the use of highly sensitive instrumentation,capable to detect the low concentration levels expected in thesamples.
In order to evaluate matrix effects, the peak area of the ref-erence standards was compared with the peak area of a blankextract (2-fold, 4-fold and 10-fold diluted) spiked at the corre-sponding concentration. Fig. 2 shows the matrix effects for someselected compounds in three different matrices (soya products,dried fruits and breakfast cereals). As expected, the higher dilu-tion factor, the lower matrix effect. However, the results for someanalyte/matrix combinations, indicated that 10-fold dilution wasnot enough to completely remove the matrix effect (see Figure S1,supplementary information (SI)). However, higher dilutions mightcompromise the analysis of some mycotoxins at low levels, near theregulated limits, specially for aflatoxins. As this further dilution wasdiscarded, matrix-matched calibration was selected as a solution
to compensate for matrix effects, but maintaining some dilutionto decrease matrix effects. Finally, a 4-fold dilution together with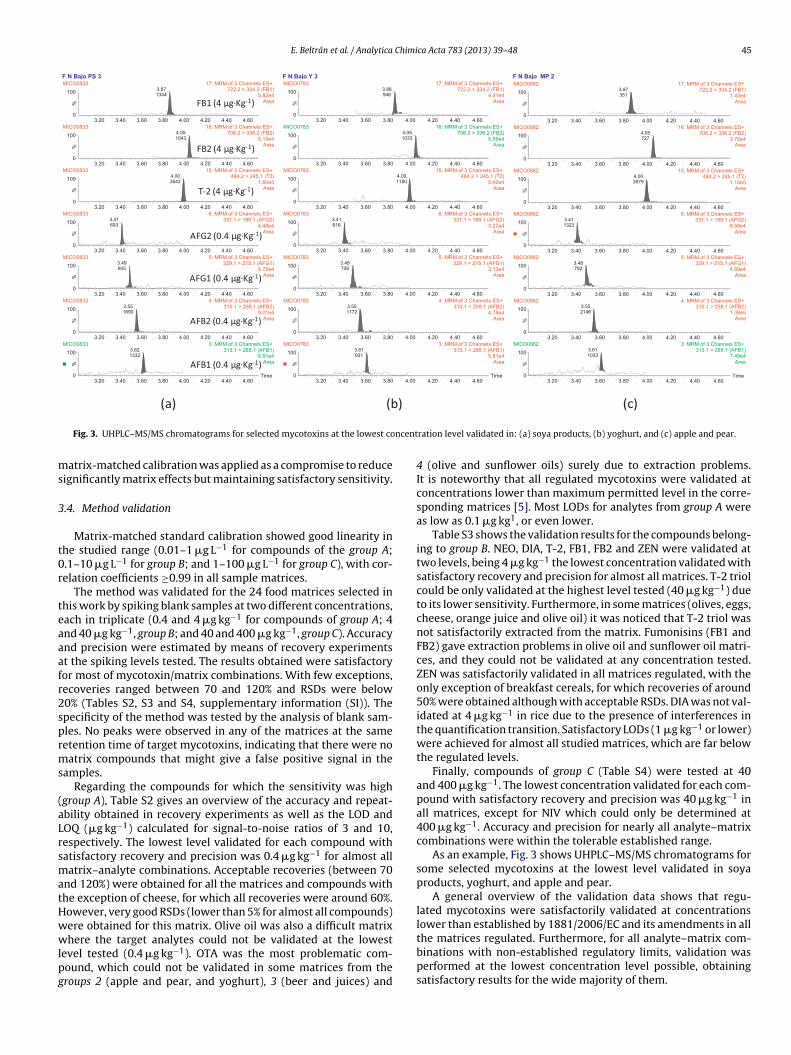
E. Beltrán et al. / Analytica Chimica Acta 783 (2013) 39– 48 45
ncent
ms
3
t0r
teaaafr2sprms
(aLrsmatHwwlpg
Fig. 3. UHPLC–MS/MS chromatograms for selected mycotoxins at the lowest co
atrix-matched calibration was applied as a compromise to reduceignificantly matrix effects but maintaining satisfactory sensitivity.
.4. Method validation
Matrix-matched standard calibration showed good linearity inhe studied range (0.01–1 �g L−1 for compounds of the group A;.1–10 �g L−1 for group B; and 1–100 �g L−1 for group C), with cor-elation coefficients ≥0.99 in all sample matrices.
The method was validated for the 24 food matrices selected inhis work by spiking blank samples at two different concentrations,ach in triplicate (0.4 and 4 �g kg−1 for compounds of group A; 4nd 40 �g kg−1, group B; and 40 and 400 �g kg−1, group C). Accuracynd precision were estimated by means of recovery experimentst the spiking levels tested. The results obtained were satisfactoryor most of mycotoxin/matrix combinations. With few exceptions,ecoveries ranged between 70 and 120% and RSDs were below0% (Tables S2, S3 and S4, supplementary information (SI)). Thepecificity of the method was tested by the analysis of blank sam-les. No peaks were observed in any of the matrices at the sameetention time of target mycotoxins, indicating that there were noatrix compounds that might give a false positive signal in the
amples.Regarding the compounds for which the sensitivity was high
group A), Table S2 gives an overview of the accuracy and repeat-bility obtained in recovery experiments as well as the LOD andOQ (�g kg−1) calculated for signal-to-noise ratios of 3 and 10,espectively. The lowest level validated for each compound withatisfactory recovery and precision was 0.4 �g kg−1 for almost allatrix–analyte combinations. Acceptable recoveries (between 70
nd 120%) were obtained for all the matrices and compounds withhe exception of cheese, for which all recoveries were around 60%.owever, very good RSDs (lower than 5% for almost all compounds)ere obtained for this matrix. Olive oil was also a difficult matrix
here the target analytes could not be validated at the lowestevel tested (0.4 �g kg−1). OTA was the most problematic com-ound, which could not be validated in some matrices from theroups 2 (apple and pear, and yoghurt), 3 (beer and juices) and
ration level validated in: (a) soya products, (b) yoghurt, and (c) apple and pear.
4 (olive and sunflower oils) surely due to extraction problems.It is noteworthy that all regulated mycotoxins were validated atconcentrations lower than maximum permitted level in the corre-sponding matrices [5]. Most LODs for analytes from group A wereas low as 0.1 �g kg1, or even lower.
Table S3 shows the validation results for the compounds belong-ing to group B. NEO, DIA, T-2, FB1, FB2 and ZEN were validated attwo levels, being 4 �g kg−1 the lowest concentration validated withsatisfactory recovery and precision for almost all matrices. T-2 triolcould be only validated at the highest level tested (40 �g kg−1) dueto its lower sensitivity. Furthermore, in some matrices (olives, eggs,cheese, orange juice and olive oil) it was noticed that T-2 triol wasnot satisfactorily extracted from the matrix. Fumonisins (FB1 andFB2) gave extraction problems in olive oil and sunflower oil matri-ces, and they could not be validated at any concentration tested.ZEN was satisfactorily validated in all matrices regulated, with theonly exception of breakfast cereals, for which recoveries of around50% were obtained although with acceptable RSDs. DIA was not val-idated at 4 �g kg−1 in rice due to the presence of interferences inthe quantification transition. Satisfactory LODs (1 �g kg−1 or lower)were achieved for almost all studied matrices, which are far belowthe regulated levels.
Finally, compounds of group C (Table S4) were tested at 40and 400 �g kg−1. The lowest concentration validated for each com-pound with satisfactory recovery and precision was 40 �g kg−1 inall matrices, except for NIV which could only be determined at400 �g kg−1. Accuracy and precision for nearly all analyte–matrixcombinations were within the tolerable established range.
As an example, Fig. 3 shows UHPLC–MS/MS chromatograms forsome selected mycotoxins at the lowest level validated in soyaproducts, yoghurt, and apple and pear.
A general overview of the validation data shows that regu-lated mycotoxins were satisfactorily validated at concentrationslower than established by 1881/2006/EC and its amendments in all
the matrices regulated. Furthermore, for all analyte–matrix com-binations with non-established regulatory limits, validation wasperformed at the lowest concentration level possible, obtainingsatisfactory results for the wide majority of them.
46 E. Beltrán et al. / Analytica Chimica Acta 783 (2013) 39– 48
PB 01
Time0.60 0.80 1.00 1.20 1.40
%
0
MICO2430 1: MRM of 3 Channels ES+ 297 > 249 .1 (D ON)
2.07e6Area
0.9645805
PB 01
Time3.80 4.00 4.20 4.40
%
0
100
MIC O243 0 18 : MRM of 3 Channel s ES- 317.1 > 175 .1 ( ZEN)
7.67e3Area
4.08176
PB 01
Time3.80 4.00 4.20 4.40
%
0
100
MIC O243 0 12 : MRM of 3 Channel s ES+ 404.1 > 239 .1 (O TA)
4.05e 4Area
4.09830
PI 01
Time0.60 0.80 1.00 1.20 1.40
%
1
MICO2441 1: MRM of 3 Channels ES+ 297 > 249 .1 (D ON)
1.12e6Area
0.9626204
PI 01
Time3.80 4.00 4.20 4.40
%
0
100
MIC O244 1 12 : MRM of 3 Channel s ES+ 404.1 > 239 .1 (O TA)
5.52e 4Area
4.091197
CD03
Time3.60 3.80 4.00 4.20 4.40
%
1
MIC O226 9 17 : MRM of 3 Channel s ES+ 722.2 > 334 .2 ( FB1)
8.09e 4Area
3.851875
CD03
Time3.80 4.00 4.20 4.40
%
1
MIC O226 9 12 : MRM of 3 Channel s ES+ 404.1 > 239 .1 (O TA)
1.26e 5Area
4.072387
CE 01
Time3.60 3.80 4.00 4.20 4.40
%
0
MIC O153 9 17 : MRM of 3 Channel s ES+ 722.2 > 334 .2 ( FB1)
3.31e 5Area
3.858719
3.92115
(b)
(d)(c)
(a)
FB18.8 μg·Kg-1
FB1< 3.5 μg·Kg-1
OTA0.61 μg·Kg-1
DON99 μg·Kg-1
OTA0.29 μg·Kg-1
DON200 μg·Kg-1
ZEN< 0.1 μg·Kg-1
OTA0.27 μg·Kg-1
n: (a)
3
spsasa
Fig. 4. UHPLC–MS/MS chromatograms for detected mycotoxins i
.5. Application to samples
The developed methodology was applied to the analysis of 240amples (10 per each validated matrix) within a total-diet studyerformed at the Valencian region of Spain. Two quality control
amples (QCs), i.e. “blank” samples (previously analyzed) fortifiedt the two validated levels were also analyzed together with theamples in every sequence of analysis. QC recoveries between 60nd 140% were required to consider the quantification of targetcereals bread, (b) white bread, (c) breakfast cereals, and (d) beer.
analytes in the samples as satisfactory in the line of EU guidelines[32].
In a notable number of food matrices, mycotoxins were notdetected. This occurred in rice, milk, olive oil, sunflower oil, cheese,yogurt, milk shakes and custard, orange juice, dried fruits, biscuits,
olives and pickles, grapes, apple and pear, eggs and soya prod-ucts. Among the positive samples, it is worth noting the presenceof DON in the group of food matrices based on cereals (wheatbread (detected in 10 of 10 samples analyzed), sliced bread (10/10),
E. Beltrán et al. / Analytica Chimica Acta 783 (2013) 39– 48 47
F g to:
( tion)/
cpfbtdLbtataa
m1
QEarobs
4
dcTfM
ig. 5. Positive sample confirmation. UHPLC–MS/MS chromatograms correspondinQ/q)s: Q (quantification)/q (confirmation) ratio in the sample. (Q/q)st: Q (quantifica
ereals bread (10/10), pasta (10/10), breakfast cereals (7/10) androcessed baked goods (10/10)). Estimated concentrations rangedrom LOQ to a maximum value of 203 �g kg−1 in a sample of whiteread. Fumonisin B1 was detected in all beer samples at concen-rations between LOQ and 13 �g kg−1. This mycotoxin was alsoetected in breakfast cereals (6/10) at concentration levels near theOQ (3.5 �g kg−1). OTA was found in breakfast cereals (3/10), wheatread (9/10) and cereal bread (10/10), at low concentrations, nearhe LOQ. ZEN was also detected in 6 of the wheat bread samplesnalyzed although at concentrations below the LOQ. Fig. 4 showshe chromatograms for detected mycotoxins in cereals bread (DONnd OTA), white bread (DON, ZEN and OTA), breakfast cereals (FB1nd OTA) and beer (FB1).
It is remarkable that in none of the samples the concentration ofycotoxins exceed the maximum levels established by Regulation
881/2006/EC and their subsequent amendments.All positive findings were confirmed by accomplishment of the
/q ratios, with deviations lower than the limits established by theuropean Commission Decision 657/2002/EC [35], as well as bygreement of retention time, with deviations lower than 2.5% withespect to a reference standard. Fig. 5 illustrates the confirmationf FB1 in breakfast cereals, DON in sliced bread and OTA in cerealsread. The Q/q ratios accomplishment between the obtained in theamples (Qs) and standards (Qst) can be seen in this figure.
. Conclusions
Highly sensitive, rapid and reliable methodology has beeneveloped in order to determine 18 mycotoxins in different food
ommodities as required by the European Commission regulations.he method has been validated in 24 different matrices with satis-actory results at two different concentrations for each compound.ycotoxins determination at very low concentrations has been
(a) FB1 in breakfast cereals, (b) DON in sliced bread, and (c) OTA in cereals bread.q (confirmation) ratio in the reference standard.
achieved without any kind of pre-concentration. On the contrary,the dilution of the sample extract was a simple solution to mini-mize matrix effects. This was feasible thanks to the high sensitivityof the modern instrumentation used. Matrix-matched calibrationhas been used to correct some minor matrix effects that still remainfor some analyte–matrix combination.
The validated methodology has been applied to the analysis of240 samples within a total-diet study. Positive findings of DON havebeen reported in cereals matrices (e.g. white bread, cereals bread,and breakfast cereals) whereas FB1 was found in breakfast cerealsand beer. Furthermore, other mycotoxins such as OTA and ZEN weredetected in a few matrices at concentrations near the LOQ of themethod. Confirmation of the compound identity was made by theaccomplishment of the ion ratios and retention times deviationswhen compared with reference standards.
Disclaimer
The findings and conclusions in this report are those of theauthors and do not necessarily represent the views of the General-itat Valenciana.
Acknowledgments
The authors acknowledge the financial support from theGeneralitat Valenciana, as research group of excellence PROME-TEO/2009/054. The authors are very grateful to Serveis Centralsd’Instrumentació Científica (SCIC) of University Jaume I for usingthe UPLC-TQS mass spectrometer. E.B. is grateful to University
Jaume I for his pre-doctoral grant. This work forms a part of thetotal-diet study performed at the Valencia region by GeneralitatValenciana. AINIA (Valencia) was the responsible of samples col-lection.
4 Chimi
A
t
R
[
[
[
[
[
[
[
[
[
[[
[
[
[
[
[[[
[[[
[
[
SANCO/12495/2011.
8 E. Beltrán et al. / Analytica
ppendix A. Supplementary data
Supplementary data associated with this article can be found, inhe online version, at http://dx.doi.org/10.1016/j.aca.2013.04.043.
eferences
[1] J.W. Bennett, M. Klich, Clin. Microbiol. Rev. 16 (2003) 497–516.[2] F. Fung, R.F. Clark, J. Toxicol. Clin. Toxicol. 42 (2004) 217–234.[3] IARC, IARC Monographs on the Evaluation of Carcinogens Risks to Humans, vol.
82, IARC, Lyon, 2002.[4] H.P. Van Egmond, R.C. Schothorst, M.A. Jonker, Anal. Bioanal. Chem. 389 (2007)
147–157.[5] Commission Regulation (EC) No. 1881/2006, Off. J. Eur. Commun. L364 (2006)
5–24.[6] Commission Regulation (EC) No. 1126/2007, Off. J. Eur. Commun. L255 (2007)
14–17.[7] Commission Regulation (EC) No. 105/2010, Off. J. Eur. Commun. L35 (2010) 7–8.[8] P. Zöllner, B. Mayer-Helm, J. Chromatogr. A 1136 (2006)
123–169.[9] R. Krska, P. Schubert-Ullrich, A. Molinelli, M. Sulyok, S. MacDonald, C. Crews,
Food Addit. Contam. 25 (2008) 152–163.10] P. Songsermsakul, E. Razzazi-Fazeli, J. Liq. Chromatogr. Relat. Technol. 31 (2008)
1641–1686.11] R. Köppen, M. Koch, D. Siegel, S. Merkel, R. Maul, I. Nehls, Appl. Microbiol.
Biotechnol. 86 (2010) 1595–1612.12] A.L. Capriotti, G. Caruso, C. Cavaliere, P. Foglia, R. Samperi, A. Laganà, Mass
Spectrom. Rev. 31 (2012) 466–503.13] Y. Ren, Y. Zhang, S. Shao, Z. Cai, L. Feng, H. Pan, Z. Wang, J. Chromatogr. A 1143
(2007) 48–64.14] E. Varga, T. Glauner, R. Köppen, K. Mayer, M. Sulyok, R. Schuhmacher, R. Krska,
F. Berthiller, Anal. Bioanal. Chem. 402 (2012) 2675–2686.15] E. Beltrán, M. Ibánez, J.V. Sancho, F. Hernández, Rapid Commun. Mass Spectrom.
23 (2009) 1801–1809.
[[
[
ca Acta 783 (2013) 39– 48
16] A.G. Frenich, J.L.M. Vidal, R. Romero-González, M.d.M. Aguilera-Luiz, FoodChem. 117 (2009) 705–712.
17] M. Zachariasova, O. Lacina, A. Malachova, M. Kostelanska, J. Poustka, M. Godula,J. Hajslova, Anal. Chim. Acta 662 (2010) 51–61.
18] H.G.J. Mol, P. Plaza-Bolanos, P. Zomer, T.C. De Rijk, A.A.M. Stolker, P.P.J. Mulder,Anal. Chem. 80 (2008) 9450–9459.
19] F. Soleimany, S. Jinap, A. Faridah, A. Khatib, Food Control 25 (2012) 647–653.20] E. Van Pamel, A. Verbeken, G. Vlaemynck, J. De Boever, E. Daeseleire, J. Agric.
Food Chem. 59 (2011) 9747–9755.21] L.C. Jackson, M.B. Kudupoje, A. Yiannikouris, Rapid Commun. Mass Spectrom.
26 (2012) 2697–2713.22] D. Guillarme, J. Schappler, S. Rudaz, J. Veuthey, TrAC – Trend Anal. Chem. 29
(2010) 15–27.23] M.C. Spanjer, P.M. Rensen, J.M. Scholten, Food Addit. Contam. A 25 (2008)
472–489.24] M. Sulyok, R. Krska, R. Schuhmacher, Anal. Bioanal. Chem. 389 (2007)
1505–1523.25] W.M.A. Niessen, P. Manini, R. Andreoli, Mass Spectrom. Rev. 25 (2006) 881–899.26] F. Hernández, J.V. Sancho, O.J. Pozo, Anal. Bioanal. Chem. 382 (2005) 934–946.27] V.M.T. Lattanzio, S.D. Gatta, M. Suman, A. Visconti, Rapid Commun. Mass Spec-
trom. 25 (2011) 1869–1880.28] J. Rubert, C. Soler, J. Manes, Food Chem. 133 (2012) 176–183.29] H. Stahnke, S. Kittlaus, G. Kempe, L. Alder, Anal. Chem. 84 (2012) 1474–1482.30] EFSA, FAO, WHO, State of the Art on Total Diet Studies Based on the Replies to
the EFSA/FAO/WHO Questionnaire on National Total Diet Study Approaches,vol. 206, Supporting Publications, 2011, pp. 1–13.
31] Commission Regulation (EC) No. 401/2006, Off. J. Eur. Commun. L70 (2006)12–34.
32] European Commission, Method Validation and Quality Control Proceduresfor Pesticide Residues Analysis in Food and Feed, 2011, Document No.
33] M.K. Kokkonen, M.N. Jestoi, Food Anal. Method 2 (2009) 128–140.34] O.J. Pozo, J.V. Sancho, M. Ibánez, F. Hernández, W.M.A. Niessen, TrAC – Trend
Anal. Chem. 25 (2006) 1030–1042.35] Commission Decision (EC) 2002/657/EC, Off. J. Eur. Commun. L221 (2002) 8–36.
Related Documents