DEVELOPMENT OF SELF-DIAGNOSTIC COMPOSITE STRUCTURES USING EMBEDDED FIBER-BRAGG GRATING SENSORS By Anthony Dellicolli A THESIS Submitted to Michigan State University in partial fulfillment of the requirements for a degree of MASTER OF SCIENCE ENGINEERING MECHANICS 2012

Welcome message from author
This document is posted to help you gain knowledge. Please leave a comment to let me know what you think about it! Share it to your friends and learn new things together.
Transcript

DEVELOPMENT OF SELF-DIAGNOSTIC COMPOSITE STRUCTURES
USING EMBEDDED FIBER-BRAGG GRATING SENSORS
By
Anthony Dellicolli
A THESIS
Submitted to
Michigan State University
in partial fulfillment of the requirements
for a degree of
MASTER OF SCIENCE
ENGINEERING MECHANICS
2012

ABSTRACT
DEVELOPMENT OF SELF-DIAGNOSTIC COMPOSITE STRUCTURES
USING EMBEDDED FIBER-BRAGG GRATING SENSORS
By
Anthony Dellicolli
The use of composite materials in large structures has grown rapidly over the past
decade. Consequently, the need to identify a technique for robust structural health monitoring of
these composite structures has arisen. Developing composite structures that are capable of
diagnosing their own structural health using embedded sensors would allow proper monitoring of
structural integrity and further increase the advantages of working with composites. Fiber-Bragg
Grating (FBG) sensors have been used to monitor the structural health of composite structures in
real-time and are well suited to the task due to their non-intrusive size and multiplexing
capability.
In this thesis, the durability of embedded FBG sensors is first explored through tension
and impact testing. The effect of non-uniform strain on the embedded FBG sensor is
investigated through the implementation of a numerical analysis that can predict a reflection
spectrum when given a non-uniform strain distribution. It will be shown that a new proposed
reflection spectrum interrogation method will improve crack detection capability. The new
interrogation method is validated by multiple experiments in which embedded FBG sensors are
used to monitor crack propagation in composite specimens using various geometries. Health
monitoring capabilities are extended to thick-section composite panels with multiple FBG
sensors to detect and monitor impact damage. The use of embedded FBG sensors is found to be
an effective method of structural health monitoring in multiple applications.

iii
This thesis is dedicated to my family for making this all possible and always being there for me.

iv
ACKNOWLEDGEMENTS
I would like to thank everyone who played a part in my schooling at Michigan State
University as I feel everything I have learned here has contributed to the completion of this
thesis. I would like to thank Dr. Soonsung Hong for believing in me and guiding me through all
the work and research to earn my Masters. Thank you to the U.S. Tank Army Research,
Development and Engineering Center (TARDEC) and the Composite Vehicle Research Center
for their funding and allowing me the opportunity to conduct research that I truly believe in.
Thank you to all my fellow research assistants and students that shared a laugh when we were
too tired to stare at computer screens any longer.

v
TABLE OF CONTENTS
LIST OF TABLES....................................................................................................................... viii
LIST OF FIGURES....................................................................................................................... ix
CHAPTER 1
INTRODUCTION......................................................................................................................... 1
Motivation.......................................................................................................................... 1
Objectives........................................................................................................................... 2
Scope.................................................................................................................................. 3
CHAPTER 2
STATE OF THE ART.................................................................................................................... 5
Structural Health Monitoring.............................................................................................. 5
Potential Sensors for Structural Health Monitoring............................................................ 5
Fiber-Bragg Grating Sensors.............................................................................................. 6
Principles of Fiber-Bragg Grating Sensors......................................................................... 7
Application of FBG Sensors to Structural Health Monitoring........................................... 8
FBG Sensor Durability and Survivability........................................................................... 9
The Effect of Delamination Damage on the Reflection Spectrum.................................... 11
The Transfer Matrix Method............................................................................................. 13
Design of a Smart Composite Panel.................................................................................. 14
CHAPTER 3
DURABILITY TESTING OF EMBEDDED FBG SENSORS.................................................... 17
Introduction....................................................................................................................... 17
FBG Sensor Strain Limit................................................................................................... 17
Previous Work................................................................................................................... 17
Objectives.......................................................................................................................... 18
Manufacturing of Composite Specimen............................................................................ 18
Uni-Axial Tension Test..................................................................................................... 19
Impact Damage Test.......................................................................................................... 21
Consequences of Exceeding the Strain Limit.................................................................... 23
Effect of Impact on the Reflection Spectrum.................................................................... 26
Findings............................................................................................................................. 30
CHAPTER 4
BASELINE TESTING OF COMPOSITE SPECIMENS............................................................. 32
Introduction....................................................................................................................... 32
Mode-I and Mode-II Fracture Toughness......................................................................... 33
Mode-I Bending Test........................................................................................................ 36
Mode-II Bending Test…………....................................................................................... 39
Measuring Mode-I Fracture Toughness............................................................................ 40
Measuring Mode-II Fracture Toughness........................................................................... 44

vi
Stabilization of Crack Propagation Subject to Mode-II Bending..................................... 45
Findings............................................................................................................................. 47
Setting Test Standards for Specimen with Embedded FBG Sensors................................ 47
CHAPTER 5
NUMERICAL ANALYSIS OF FBG RESPONSE TO NON-UNIFORM STRAIN................... 49
Introduction....................................................................................................................... 49
Objectives.......................................................................................................................... 49
Peak Wavelength Spectrum Monitoring Method.............................................................. 50
Peak Intensity Ratio Spectrum Monitoring Method.......................................................... 50
Transfer Matrix Method.................................................................................................... 51
Effect of Linear Strain Distribution on the Spectrum........................................................ 54
Effect of Quadratic Strain Distribution on the Spectrum.................................................. 56
Effect of Highly Non-Uniform Strain Distribution on the Spectrum................................ 57
Monitoring Peak Intensity Ratio vs. Spectrum Bandwidth.............................................. 59
Findings............................................................................................................................. 62
Application of Numerical Analysis to Testing of Embedded FBG Sensors..................... 62
CHAPTER 6
MONITORING INTERLAMINAR CRACK GROWTH IN COMPOSITE LAMINATES
USING EMBEDDED FBG SENSORS........................................................................................ 63
Introduction....................................................................................................................... 63
Previous Work................................................................................................................... 63
Objectives.......................................................................................................................... 64
Manufacturing of Composite Specimen............................................................................ 64
Mode-I Bending Interlaminar Fracture Test..................................................................... 65
Mixed-Mode Bending Interlaminar Fracture Test............................................................ 66
Mode-II Bending Interlaminar Fatigue Test..................................................................... 66
Validation Experiment 1 – Double Cantilever Beam Experiment.................................... 67
Validation Experiment 2 – Mixed-Mode Bending Experiment........................................ 71
Validation Experiment 3 – End-Notched Flexure Specimen Subject to Cyclic Loading. 74
Findings............................................................................................................................. 76
Specimen with Multiple Embedded FBG Sensors............................................................ 77
CHAPTER 7
DEVELOPMENT OF A SMART COMPOSITE PANEL........................................................... 78
Introduction....................................................................................................................... 78
Previous Work................................................................................................................... 78
Objectives.......................................................................................................................... 78
Manufacturing of the Smart Composite Panel.................................................................. 79
Proof Loading Test............................................................................................................ 82
Drop-Weight Impact Test.................................................................................................. 84
Detecting Damage by Monitoring Peak Wavelength Shift............................................... 86
Findings............................................................................................................................. 88
Future Work on Smart Composite Panels......................................................................... 88

vii
CHAPTER 8
CONCLUSIONS........................................................................................................................... 89
APPENDIX................................................................................................................................... 92
Distribution Statement....................................................................................................... 93
Derivation of Interlaminar Fracture Toughness Curve...................................................... 94
REFERENCES.............................................................................................................................. 95

viii
LIST OF TABLES
Table 1. Ply locations of the embedded sensors and specimen lay-up configuration................. 23
Table 2. Measured Mode-I interlaminar fracture toughness values............................................ 42
Table 3. Measured Mode-II fracture toughness values – Panel 1............................................... 45
Table 4. Measured Mode-II fracture toughness values – Panel 2............................................... 46

ix
LIST OF FIGURES
Figure 1. Typical reflection spectrum of an FBG sensor.............................................................. 7
Figure 2. A reflection spectrum of a FBG sensor subjected to non-uniform strain...................... 9
Figure 3. Peak wavelength, center wavelength, and -20 dB bandwidth of the reflection spectrum
identified for spectrum monitoring purposes................................................................................ 12
Figure 4. Glass-fiber epoxy specimen with embedded FBG sensor............................................ 19
Figure 5. The uni-axial tension test specimen with an embedded FBG sensor.......................... 19
Figure 6. Static uni-axial tension test experimental set-up.......................................................... 20
Figure 7. Time history of load applied to specimen.................................................................... 20
Figure 8. Uni-axial tension test specimen after failure................................................................ 21
Figure 9. Drop weight impact tower............................................................................................ 22
Figure 10. Impact locations and specimen configuration (not to scale) ...................................... 22
Figure 11. Time history of strain measured using the laser and clip extensometers during tensile
testing and FBG sensor ................................................................................................................ 23
Figure 12. Critical points during tensile testing........................................................................... 24
Figure 13. Reflection spectra of normalized intensity for the critical points marked in Figure
12.................................................................................................................................................. 25
Figure 14. Time history of peak wavelength, center wavelength, and spectral bandwidth during
tensile testing................................................................................................................................ 26
Figure 15. The reflection spectrum before any impact damage and the reflection spectrum after
the fifth and final impact for the specimen with an impact location at 10 mm from the center of
gauge length (impact location 1) .................................................................................................. 28
Figure 16. The reflection spectrum before any impact damage and the reflection spectrum after
the fifth and final impact for the specimen with an impact location at 5 mm from the center of
gauge length (impact location 2) .................................................................................................. 28
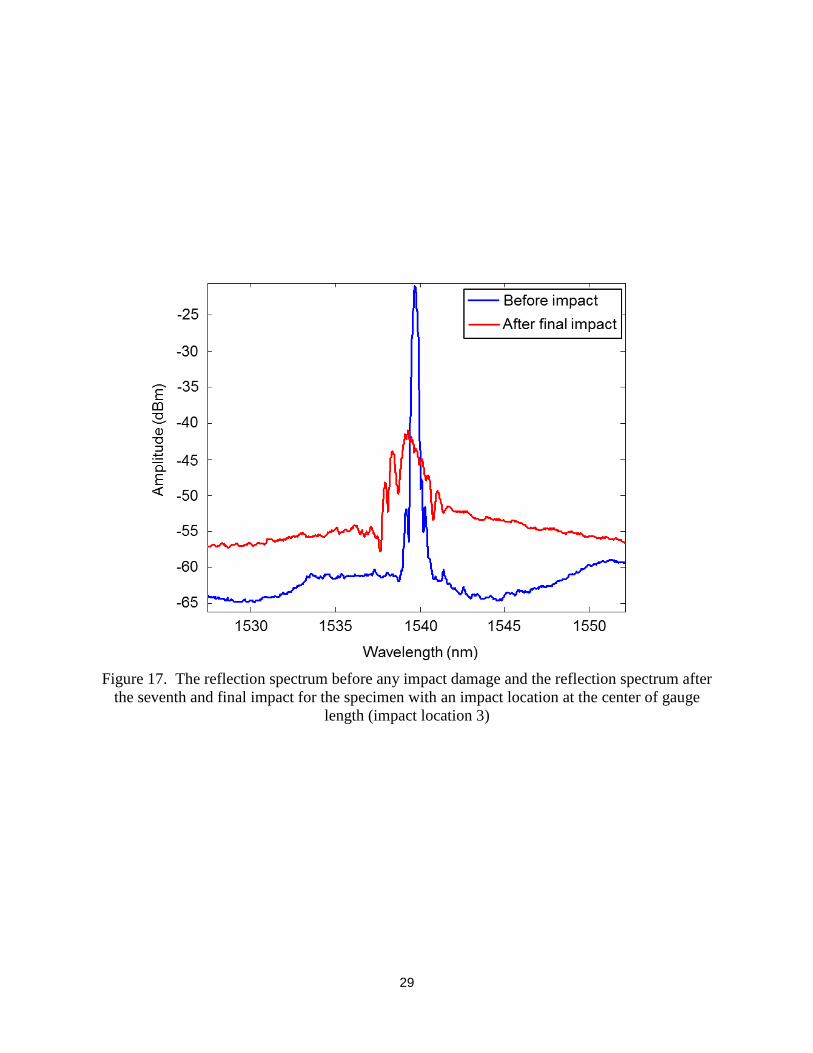
Figure 17. The reflection spectrum before any impact damage and the reflection spectrum after
the seventh and final impact for the specimen with an impact location at the center of gauge
length (impact location 3)............................................................................................................. 29

x
Figure 18. Reflection spectra at incremental number of impacts at the center of the FBG sensor’s
gauge length (impact location 3).................................................................................................. 30
Figure 19. DCB Specimen with attached hinges......................................................................... 36
Figure 20. Experimental setup of Mode-I bending experiment................................................... 37
Figure 21. DCB specimen marked at 10 mm intervals................................................................ 38
Figure 22. Sample image used to locate the crack tip................................................................. 39
Figure 23. Experimental setup of Mode-II bending experiment................................................. 40
Figure 24. ENF specimen geometry............................................................................................ 40
Figure 25. Interlaminar fracture toughness calculated by four different equations during
delamination................................................................................................................................. 41
Figure 26. Load versus displacement with curve fits based on beam theory
approximation............................................................................................................................... 42
Figure 27. Fiber bridging occurring in specimen during testing................................................. 44
Figure 28. Load versus displacement curves of Specimen 1-4.................................................... 45
Figure 29. Load versus displacement curves of Specimen 5-14.................................................. 46
Figure 30. T-matrix model for a uniform grating........................................................................ 51
Figure 31. Reflection spectra of a FBG sensor subjected to five different absolute strain values
and linear strain distributions........................................................................................................ 55
Figure 32. Relations between the strain gradient and the spectrum bandwidth determined by
different definitions of the spectral bandwidth............................................................................. 55
Figure 33. Reflection spectra of a FBG sensor subjected to quadratic strain distributions......... 56
Figure 34. Relation between the spectral bandwidth and the magnitude of quadratic strain
distribution.................................................................................................................................... 57
Figure 35. Reflection spectra of a FBG sensor subjected to five different absolute strain values
and discontinuous strain distributions.......................................................................................... 58
Figure 36. Relations between the strain gradient and the spectrum bandwidth determined by
different definitions of the spectral bandwidth............................................................................ 58
xi
Figure 37. Collection of discontinuous strain distributions used to simulate the propagation of a
crack along the FBG sensor’s gauge length.................................................................................. 59
Figure 38. Reflection spectrum generated at a crack tip position of -2 mm along the gauge
length............................................................................................................................................. 60
Figure 39. Peak intensity ratio (I1/I2) (a) and spectrum bandwidth (b) as crack propagates along
gauge length.................................................................................................................................. 61
Figure 40. Side view of specimen lay-up showing an embedded Teflon insert and potential
sensor locations............................................................................................................................. 65
Figure 41. Double Cantilever Beam (DCB) specimen for mode-I interlaminar fracture
test................................................................................................................................................. 65
Figure 42. Mixed-mode bending test setup for mixed-mode interlaminar fracture test.............. 66
Figure 43. Edge-notched-flexure test setup for interlaminar fatigue test.................................... 67
Figure 44. Time-history of the average strain during the mode-I interlaminar fracture test....... 67
Figure 45. The reflection spectra at the three different points indicated in Figure 44................. 68
Figure 46. Time-histories of the peak wavelength, center wavelength, and bandwidth during the
mode-I interlaminar fracture test with a +6 sensor embedding location...................................... 69
Figure 47. Time-histories of the peak wavelength, center wavelength, and bandwidth during the
mode-I interlaminar fracture test with a +2 sensor embedding location...................................... 70
Figure 48. Reflection spectra at the three points indicated in Figure 47..................................... 71
Figure 49. Time-histories of the peak wavelength, center wavelength, and bandwidth during the
mixed-mode interlaminar fracture test with a +6 sensor embedding location.............................. 72
Figure 50. Reflection spectra at the three points indicated in Figure 49..................................... 73
Figure 51. Time-histories of the peak wavelength, center wavelength, and bandwidth during the
mixed-mode interlaminar fracture test with a +2 sensor embedding location............................. 73
Figure 52. Reflection spectra at the three points indicated in Figure 51..................................... 74
Figure 53. Time-history of interlaminar fatigue crack growth in an edge-notched-flexure
specimen....................................................................................................................................... 75
Figure 54. Time-histories of the peak wavelength, center wavelength, and bandwidth during the
mode-II interlaminar fatigue test.................................................................................................. 76

xii
Figure 55. Lay-up of woven composite plies before VARTM.................................................... 79
Figure 56. Embedding position of FBG sensor in woven layer................................................... 80
Figure 57. Cross-sectional view of the embedding location of FBG sensors in the thickness of
the panel........................................................................................................................................ 80
Figure 58. Positioning of FBG sensors in woven composite panel and smart composite panel
dimensions................................................................................................................................... 81
Figure 59. Plate configuration during the VARTM process........................................................ 81
Figure 60. Smart composite panel with FBG sensor embedding locations................................. 82
Figure 61. Time histories of load and displacement during proof loading of the undamaged
SCP............................................................................................................................................... 83
Figure 62. Proof loading test set-up............................................................................................. 83
Figure 63. Impact location and damage area............................................................................... 84
Figure 64. The support fixture on which the SCP was placed for impact loading using the drop-
weight impact tower..................................................................................................................... 85
Figure 65. Time histories of load and displacement during proof loading of the damaged........ 85
Figure 66. Time history of peak wavelength shift of the embedded FBG sensors during the proof
loading test before impact damage on the SCP........................................................................... 87
Figure 67. Time history of peak wavelength shift of the embedded FBG sensors during the proof
loading test after impact damage on the SCP.............................................................................. 87

1
CHAPTER 1
INTRODUCTION
Motivation
The use of composite materials in large structures has become increasingly prevalent due
to the high stiffness-to-weight ratio of the materials. Inspection of large areas of composite
structures using the conventional non-destructive testing approach is a time-consuming process.
Consequently, the need to develop structural health monitoring (SHM) techniques for composite
structures has emerged. Developing smart composite structures that are capable of diagnosing
their own structural health using embedded sensors will allow real-time monitoring of defects
and damage in composites and enable condition-based maintenance of the composite structures.
Fiber-Bragg grating (FBG) sensors developed for strain sensing capability have been
extensively investigated to be used for structural health monitoring of composite structures. The
FBG sensors are well-suited for the SHM applications due to their non-intrusive size and
excellent multiplexing capability and can be easily embedded in composite structures during the
manufacturing process. The reflection spectrum obtained from the embedded FBG sensors
contains information on local deformation which can be related to the location and extent of
defects and damage.
However, the existing interrogation method developed for strain measurement by
monitoring the peak-wavelength shift of the reflection spectrum has several limitations to be
used for damage identification. The limitations include the lack of quantitative damage
monitoring capability and the ambiguity in differentiating normal structural response from the
abnormal response caused by damage. Therefore, a new interrogation method which will allow

2
early detection and quantitative monitoring of damage progression is required for the
development of a robust health monitoring system.
Another challenge comes from the concern that the failure of the embedded sensor will
result in a loss of structural health monitoring capabilities. Thus, the durability of embedded
FBG sensors subjected to static and dynamic loading conditions must be verified to ensure the
sensor’s ability to maintain its functionality. Once the sensor’s durability is confirmed, validation
experiments are required to demonstrate the improved damage monitoring capabilities of the new
interrogation method. The experiments should be designed to create stable and well-
characterized defects in composites, so that the quantitative monitoring capability could be
evaluated.
Finally, the structural health monitoring abilities of the FBG sensors must be extended to
large-scale structures to make further progress towards full-scale, realistic applications.
Structural health monitoring of a large-scale panel requires multiple embedded FBG sensors to
adequately monitor damage in large areas.
Objectives
In this thesis, the following objectives have been established for the development of self-
diagnostic composite structures using embedded FBG sensors.
Demonstrate the durability and survivability of FBG sensors embedded in composite
laminates when subjected to static and impact loading conditions.
Design interlaminar fracture tests that will be used to validate structural health
monitoring capability of embedded FBG sensors for crack detection and monitoring.
Develop a new interrogation method well-suited to quantify the FBG reflection spectrum
for damage monitoring by conducting numerical simulation of the spectral response of an
FBG sensor under non-uniform strain.

3
Demonstrate improved crack detection capability of the new interrogation method by
performing validation experiments including interlaminar fracture and fatigue tests of
composite laminates with embedded FBG sensors.
Extend damage monitoring capabilities to a large-scale, thick-section composite panel
with multiple embedded FBG sensors for detecting impact damage.
Scope
Chapter 3 presents durability testing of embedded FBG sensors in composite laminates
subjected to quasi-static tensile loading and drop-weight impact loading. The ability of an FBG
sensor to survive and maintain its functionality is demonstrated. These preliminary tests aim to
counter the perceived fragility of FBG sensors and provide a baseline for further development of
self-diagnostic composite structures.
Chapter 4 presents standard interlaminar fracture test procedures that are developed to
determine the Mode-I and Mode-II fracture toughness of unidirectional fiber-reinforced
composites. The specimen design and experimental procedures will be used in Chapter 6 to
demonstrate the structural health monitoring capability of embedded FBG sensors.
In Chapter 5, a new interrogation method is proposed to analyze the reflection spectrum
of FBG sensors for health monitoring purposes. Following a numerical analysis designed to
predict the effect of non-uniform strain on the FBG reflection spectrum, the spectral bandwidth
and center wavelength are identified as simple and robust indicators for tracking the growth of
defects in composite structures.
In Chapter 6, the effectiveness of the new interrogation method is demonstrated by
conducting validation experiments which include interlaminar fracture and fatigue testing of
composite specimens with an embedded FBG sensor. The crack-detection capability of the
4
proposed interrogation method is compared to that of the existing peak-wavelength monitoring
technique under quasi-static and cyclic loading conditions.
Chapter 7 presents an application of multiple embedded FBG sensors to impact damage
monitoring in a large-scale, thick-section composite panel. The method utilizes the sensors’
response to a simulated in-service loading experienced by the composite structure after
sustaining damage.

5
CHAPTER 2
STATE OF THE ART
Structural Health Monitoring
With the increased use of composite materials in military vehicles and commercial
airliners, developing a better understanding of the damage sustainability and failure behavior of
composite structures becomes a crucial aspect in safely utilizing them. The development of
structural health monitoring capabilities aims to improve passenger safety and increase the
reliability of composites.
Structural health monitoring is the practice of embedding sensors in a composite structure
to create real-time damage detection capabilities and allow the structure to diagnose its own
structural health. Such sensors are typically embedded in the composite structure during the
manufacturing process and have very little effect on the material properties. The sensors are
designed to provide structural integrity information to an operator to allow for repair or
replacement decisions based on damage size and severity. Some of the potential sensors that
have been identified for this purpose include ultrasonic-based sensors and fiber optic sensors.
A decision matrix based on meeting key requirements, technology readiness level,
existing limitations, mass, and cost produced piezoelectric, magnetostrictive, and fiber-Bragg
grating sensors as the top three options to serve this purpose.
Potential Sensors for Structural Health Monitoring
Piezoelectric sensors utilize lead zirconate titanate (PZT) transducers and ultrasonic
waves for structural health monitoring by relating changes in wave propagation to damage size
and location. Piezoelectric sensors have been used successfully to identify cracking and
delamination in composites [1-8]. They have also been used to effectively detect impact damage

6
in composite structures [9-13]. The film-based nature of the sensors allows them to be applied to
the surface of a composite or embedded within. The sensors are also well suited to use in
composites with curved surfaces [1]. However, the embedment of piezoelectric sensors is more
complicated than optical fiber sensors due to the presence of connecting wires [3]. Additionally,
piezoelectric sensors have not been proven effective for use in thick composites.
Magnetostrictive sensors relate changes in the magnetic state of a magnetostrictive
material to damage size and location using ultrasonic waves. These sensors can be embedded in
composites as a film layer and have been shown to be capable of delamination detection [15-18]
although no work could be found on impact damage detection.
Fiber-Bragg grating (FBG) sensors employ a refractive index embedded in a small length
of an optical fiber to reflect a narrow bandwidth of light that changes as the sensor experiences
strain. Their structural health monitoring capabilities have been employed in detecting both
delamination [19-34] and impact damage [21, 35-43] in composites and offer efficient methods
for quantitative characterization of defects and damages [27, 31-34]. FBG sensors have been
chosen as the optimal sensors for structural health monitoring due to their non-intrusive size,
multiplexing capabilities, and ease of imbedding.
Fiber-Bragg Grating Sensors
An FBG sensor is a short length of FBG contained in a polyimide coated optical fiber
meant for fiber optic strain sensing purposes. FBG sensors are extremely sensitive to strain and
can provide accurate axial strain measurements of a structure by monitoring the peak wavelength
shift of the returned signal due to the linearly-proportional relationship between the peak
wavelength shift and applied strain. They can be easily and quickly embedded in between plies
of composite panels during the hand lay-up process and require minimal training to operate and

7
obtain data without any calibration necessary. The multiplexing capability of FBG sensors
allows for up to 100 sensors to be embedded in a single optical fiber thus providing many
damage monitoring points in a structure without complicating the manufacturing process. The
optical fiber is small in diameter (~0.15 – 0.25 mm) and has no effect on the material properties
of the composite in which it is embedded. The sensor gauge length varies in size (~mm) to
accommodate multiple damage types and sizes. FBG sensors remain reliable for great lengths of
time due to their passive sensing ability and are suitable for applications in which the expected
service time of a structure is multiple decades.
Principles of Fiber-Bragg Grating Sensors
An FBG sensor is designed to reflect light with a narrow bandwidth while transmitting all
other wavelengths by using a sinusoidal variation in the refractive index of the fiber core. The
wavelength of the reflected light, called the Bragg wavelength, is determined by
(1)
where n is the average refractive index and is the grating period. A typical reflection spectrum
of an FBG sensor is shown in Figure 1.
Figure 1. Typical reflection spectrum of an FBG sensor
1537 1538 1539 1540 1541 1542-60
-50
-40
-30
-20
-10
Wavelength (nm)
Am
plit
ude (
dB
m)

8
When the FBG sensor is subjected to a uniform strain distribution, n and can be
expressed as [44]:
[
] (2)
(3)
where n0 is the initial average refractive index, 0 is the initial grating period at a strain-free
state, P11 = 0.17 and P12 = 0.36 are the Pockel’s constants of silica, 1 is an axial strain and 2
and 3 are transverse strains. An FBG sensor subjected to uniform strain along its gage length
will reflect light with a different peak wavelength. Therefore, the axial strain can be determined
by measuring the peak wavelength shift, B, with respect to the initial Bragg wavelength of the
FBG sensor, B, [2] by
[
{ }]
(4)
where neff is the effective index of refraction of the fundamental mode of the optical fiber, and
= 0.16 is the Poisson’s ratio of silica.
Application of FBG Sensors to Structural Health Monitoring
The use of FBG sensor for the structural health monitoring of composite structures has
become increasingly popular due to the low cost of introducing embedded FBG sensors relative
to the benefits of creating self-diagnostic composite structures. The use of embedded FBG
sensors could prevent the costly and time-intensive tear down inspection of structural
components by providing structural integrity information. The real-time structural health

9
monitoring ability increases the safety of composite vehicles by delivering information to
operators as soon as the structure becomes compromised. This allows the operator the
opportunity to immediately determine if the vehicle can continue service or if it must be repaired.
When an FBG sensor is subjected to a non-uniform strain distribution along the gage
length, the spectral response will change as a function of the non-uniform strain distribution, and
the linear relationship in (4) will no longer hold true. The reflection spectrum will become wider
and may contain multiple peaks as the non-uniform strain increases (Figure 2).
Figure 2. A reflection spectrum of a FBG sensor subjected to non-uniform strain
The spectrum broadening and multiple peaks due to the non-uniform strain fields can be used as
indicators of strain concentration caused by the defects and damage in composite structures.
FBG Sensor Durability and Survivability
The possibility that FBG sensors could be too fragile and fail before the composite
structures they are embedded in, resulting in a loss of structural health monitoring capabilities, is
a concern that must be addressed. Typically, FBG sensors are given a strain limit by the
manufacturer and exceeding this point potentially results in unreliable data and damage to the
sensor. While exceeding this point will not cause the sensor to lose its signal entirely, it could
1534 1536 1538 1540 1542-60
-50
-40
-30
-20
-10
Wavelength (nm)
Am
plit
ude (
dB
m)

10
result in residual damage and reduce the strength of the signal even if the strain being sustained
by the sensor is returned to a value below the limit. Ang et al. [45] found that above the
prescribed strain limit, the reflection spectrum of an uncoated, surface-mounted FBG sensor
progressively deteriorated until catastrophic failure of the optical fiber. The reflection spectrum
at the failure of the optical fiber showed significant broadening and multiple peaks. However, it
was noted that remaining below the endurance strain limit prevented damage to the FBG sensor
and its reflection spectrum regardless of the number of load cycles. Theoretically, the sensor
should be able to sustain millions of load cycles over many years without any residual damage or
signal deterioration.
Despite the fact that the strain limit of FBG sensors has been explored, it was tested for
an uncoated, surface-mounted sensor and is the opposite of the application of the FBG sensors
used in this thesis. Furthermore, the method of mechanically or chemically stripping the coating
from the FBG sensor results in cracking in the optical fiber and a reduction of its strength. In the
work to come, coated FBG sensors are embedded in composite specimens and it will be essential
to explore the strain limit of the sensors in this scenario.
Another scenario in which an FBG sensor could fail is when the composite in which it is
embedded in is subjected to impact damage. Repeated impacts near an embedded FBG sensor
have been shown to cause spectrum broadening [38], although this is not an absolute indicator of
when or if the sensor will eventually fail. It is likely that repeated impacts directly centered on
the optical fiber transmitting light to the sensor could cause a deformation or deterioration in the
signal or complete loss of signal due to splitting of the fiber. With the gauge length of the sensor
being the most fragile part of the embedded sensor, a single direct impact to it of sufficient
energy will cause both a loss of intensity and broadening of the reflection spectrum [46]. The

11
potential for sensor failure when subjected to repeated impacts designed to cause visible external
damage to the composite is worth investigating further.
The Effect of Delamination Damage on the Reflection Spectrum
One excellent use of embedded FBG sensors is in the detection of delamination damage
in composite laminates. Delamination damage is an often occurring failure mechanism in
composites because it can grow between plies or from an edge and is prevalent under many types
of loading including impact, fatigue, and various bending modes. To internally monitor for this
type of damage, FBG sensors are embedded in locations near which delamination is likely to
occur. In situations where the delamination results in stable crack propagation, the growth of the
crack tip will result in a non-uniform strain across the FBG sensor’s gauge length. Thus, the
broadening of the spectrum that occurs can be used as an indication of damage detection and as a
method to approximate delamination length.
As soon as a propagating crack exits the gauge length of the sensor, the reflection
spectrum returns to the narrow, single peak form with a slight shift in peak wavelength assuming
the now debonded region it is contained in is still under stress. Problems arise in scenarios in
which the crack propagation is not stable and travels across the gauge length of the sensor almost
instantaneously. Due to the low frequency of the full-spectrum interrogator, unstable crack
propagation is problematic because the spectrum does not remain broadened for the adequate
amount of time for detection. Even after the crack ‘jumps’ across the gauge length, the peak
wavelength shift acts as a poor indicator of damage detection because change in the peak
wavelength is not exclusively caused by non-uniform strain.
The challenge in analyzing the reflection spectrum under non-uniform strain lies in
properly quantifying it for monitoring purposes and identifying a parameter that can be related to

12
damage presence, type, and size. Okabe et al. [31] found that the broadening of the spectrum
increased as a function of transverse crack density and showed that the spectrum bandwidth at
half of its maximum intensity could be used to determine the transverse crack density in real
time. Takeda et al. [27, 32, 33] proposed a method of measuring the intensity ratio of the two
peaks that appear in the spectrum when subjected to non-uniform strain as a way to measure
delamination length. However, there are problems that can arise when using this method
including an intermittent signal presence. Using this method for real-time damage monitoring is
unreliable because it requires the presence of only two peaks in the reflection spectrum under
non-uniform strain. This is not always the case, as the spectrum can display either a single peak
or several peaks which would result in a faulty signal. The work in this thesis will focus on
taking a simpler approach to relating the reflection spectrum to damage presence by investigating
the peak wavelength, center wavelength, and bandwidth (Figure 3) as spectrum monitoring
methods.
Figure 3. Peak wavelength, center wavelength, and -20 dB bandwidth of the reflection spectrum
identified for spectrum monitoring purposes. For interpretation of the references to color in this
and all other figures, the reader is referred to the electronic version of this thesis.

13
An efficient method for further exploring how the reflection spectrum will react to non-
uniform strain is through the use of a numerical analysis of an FBG sensor by utilizing a transfer
matrix formulation.
The Transfer Matrix Method
It is possible to design a numerical analysis to predict the effect of non-uniform strain on
the reflection spectrum and investigate the ability to determine the actual strain distribution of a
specimen with embedded FBG sensors by using the Transfer Matrix Method (TMM).
Formulated by Yamada and Sakuda [47], it allows for the creation of a reflection spectrum based
on a user-input strain distribution. It is often used for verification purposes where experimental
reflection spectra obtained from an FBG sensor embedded in a composite specimen are
compared with simulated reflection spectra produced using the TMM [27, 48, 49]. The matching
of simulated and experimental spectral responses in this manner allows for the determination of
the associated strain distribution [50-52]. If the produced reflection spectra are similar, the strain
distribution used in the numerical analysis can be assumed to be the strain distribution in the
specimen.
An additional benefit of a numerical analysis of an FBG sensor subjected to non-uniform
strain is the ability to produce many reflection spectra for an investigation of spectrum
monitoring methods without wasting FBG sensors in physical experiments. An optimal
spectrum monitoring method can be determined through this method and experiments with FBG
sensors embedded in composite laminates will only be necessary for a validation of the chosen
method for monitoring damage.

14
Design of a Smart Composite Panel
While the TMM allows for a better understanding of the behavior of FBG sensors when
subjected to non-uniform strain, this knowledge can be extended to more complex experiments
in which large-scale panels that are more representative of realistic applications are tested.
The term ‘smart composite panel’ can be used to refer to any panel with at least one
embedded sensor that allows it to diagnose its own structural health by monitoring and detecting
damage. In this thesis, it will be used to specifically refer to large-scale, thick-section composite
panels with multiple embedded FBG sensors. The goal in creating a smart composite panel is to
utilize multiple FBG sensors throughout its area or surface that can guarantee the detection of
damage without the prior knowledge of where it will occur.
Large-scale self-diagnostic composite structures are highly desirable in applications
where impact damage is experienced. The occurrence of a dynamic impact event can cause
significant damage to a composite structure in a short amount of time and quick detection is
crucial in preventing catastrophic failure. Composite panels have even been designed to self-
heal by restoring compressive strength after detecting impact damage with a vascular network
carrying an epoxy resin system [53] and shape memory alloy wires [54]. Hence, a smart
composite panel’s ability to effectively self-diagnose becomes even more important.
A dynamic impact event can be instantaneously detected with an embedded FBG sensor
when a high frequency (>200 kHz) interrogator is used and is indicated by a jump in signal that
occurs within a matter of milliseconds before the signal returns to its initial value. A low
frequency (<200 kHz) interrogator may be used only if the composite specimen or structure is
repeatedly impacted at the same point in a manner that causes the edge of propagating damage to
slowly travel across the gauge length of the FBG sensor as the number of impacts increases. In

15
this case, the peak wavelength would shift and the spectrum would broaden allowing an increase
of the full width at half-maximum to serve as a damage indicator [38]. However, if the impact
were great enough that the damage encompassed the gauge length of the sensor after a single
impact, it would be tough to determine from the reflection spectrum if damage had been
sustained.
A low frequency interrogator (<100 Hz) presents a significant challenge in detecting
impact damage with FBG sensors. Low frequency interrogators are significantly less expensive
than high frequency units, although they are incapable of measuring a dynamic impact event
because of the speed at which it occurs. One potential method for solving this problem is
periodically introducing strain to the embedded FBG sensors through bending of the composite
structure based on the theory that the sensors will measure significantly higher strain values if
damage has occurred due to the resulting increased compliance. In one instance, compressive
loading was employed to detect impact damage in a large composite panel with embedded FBG
sensors long after it had occurred [46], although the panel was destroyed in the process. For
structural health monitoring purposes with realistic applications in mind, this method must be
tweaked to detect impact damage while remaining in the linear-elastic range of the panel.
Efforts have been made in determining the location of impact with time-of-flight
measurements by three surface-mounted FBG sensors of the Lamb waves that propagate through
a structure when impact occurs [54]. The impacts were located using an iterative algorithm
implemented in MATLAB based on work by Jeong and Jang [55]. However, the surface
mounting of the FBG sensors makes them vulnerable to impact damage. For structural health
monitoring applications in which impact could occur at any random location on the panel, it will
be necessary to explore alternatives. The work to come will find a solution in which impact

16
damage can be located using embedded FBG sensors so that the survival of the sensors is
assured.

17
CHAPTER 3
DURABILITY TESTING OF EMBEDDED FBG SENSORS
Introduction
The durability of embedded FBG sensors subject to impact and tensile loading is a
concern that must be addressed to ensure that the sensor’s ability to monitor structural health is
not lost during service. The failure of a sensor embedded in a composite structure would likely
result in a blind spot in a high-probability failure area without the ability to repair the sensor and
re-gain a signal. The significant drawback of embedded FBG sensors in composite structures is
that the sensors are contained within the structure itself rather than on the surface and become
immovable and unreachable after material curing. Although, this single negative aspect is of
little consequence compared to the potential benefits of self-diagnostic composites.
FBG Sensor Strain Limit
FBG sensors obtained from commercial manufacturers will typically come with a
prescribed strain limit. This prescribed strain limit is a value beyond which the manufacturer
deems data retrieved using the FBG sensor as unreliable. It is not explicitly stated that this strain
limit is the point at which the sensor will fail although it is recommended that it not be exceeded.
Previous Work
Extensive work has been done using FBG sensors to detect both crack propagation in
specimens subjected to multiple bending modes and damage in specimen subjected to dynamic
impact loading. However, little work has actually been done on pushing FBG sensors to their
limits in these applications to determine the extent of damage the sensors can withstand without
failing and the residual effects of loading beyond the sensor’s strain limit. Ang et al. [45]

18
examined similar situations by attaching an uncoated FBG sensor to the surface of a composite
subjected to four-point bending. Their work found that the sensor failed at approximately 6000
and had an apparent endurance strain limit above which the reflection spectrum deteriorated.
While the sensors used in these tests failed at 6000 , there is no information given on the value
of the manufacturer’s prescribed strain limit. Additionally, the methods used to strip the coating
of the sensor by mechanical and chemical means left scratches and cracks on the uncoated fiber
that reduced the durability of the sensor and initiated failure.
The FBG sensors investigated in this chapter have a protective polyimide coating and a
prescribed strain limit, specified as 5000 , and it is necessary to perform tests that further
explore the consequences of exceeding this point to determine if there is a strain at which the
embedded sensors fail before the composite material.
Objectives
This work aims to address sensor durability issues through two simple yet effective
experiments aimed at providing concrete information about the survivability of FBG sensors
embedded in a glass/epoxy composite specimen. The prescribed 5000 limit of the FBG
sensors will be investigated through a uni-axial tension test while the survivability of the sensors
will be scrutinized through a drop-weight impact test. The goal of these tests is to verify sensor
durability and their ability to maintain functionality after damage has occurred.
Manufacturing of Composite Specimen
A thin unidirectional glass/epoxy composite specimen of approximately 152.4 x 25.4 x
1.75 mm3 made using a hand lay-up process of pre-preg sheets (Cycom 1003) and cured in a hot
oven press was used in this experiment. During the hand lay-up process, an FBG sensor (Micron

19
Optics os1100) with a 10 mm gauge length was embedded between the fourth and fifth plies of
the 8-ply specimen. The positioning of the sensor is shown in Figure 4. The optical fiber was
embedded parallel to the fiber direction in the composite.
Figure 4. Glass-fiber epoxy specimen with embedded FBG sensor
Uni-Axial Tension Test
A static uni-axial tension test was performed on the specimen using a MTS 793 uni-axial
testing machine. Thick composite tabs covered with sandpaper were attached at the ends to
absorb the gripping force, prevent slipping between the specimen and the grip, and prevent
unwanted compression on the embedded optical fiber. The tabs also prevented failure of the
specimen near the gripped ends and allowed for catastrophic failure in the fiber direction. The
uni-axial tension test specimen with an embedded FBG sensor is shown in Figure 5.
Figure 5. The uni-axial tension test specimen with an embedded FBG sensor
A laser extensometer (Electronic Instrument Research Model LE-05) with a 10 mm
gauge length and clip extensometer (MTS Model 632.11B-20) with a one inch gauge length were

20
employed to measure the strain experienced by the embedded FBG sensor during loading and the
data was recorded using the MTS Station Manager software. An Optical Sensing Interrogator
(Micron Optics sm-125) and Micron Optics ENLIGHT software were used to record the
reflection spectrum of the FBG sensor. The experimental set-up is shown in Figure 6.
Figure 6. Static uni-axial tension test experimental set-up
The time history of load applied to the specimen is shown in Figure 7. The specimen was
subjected to two loading cycles to investigate the effect of exceeding the FBG sensor’s strain
limit on the reflection spectrum.
Figure 7. Time history of load applied to specimen
21
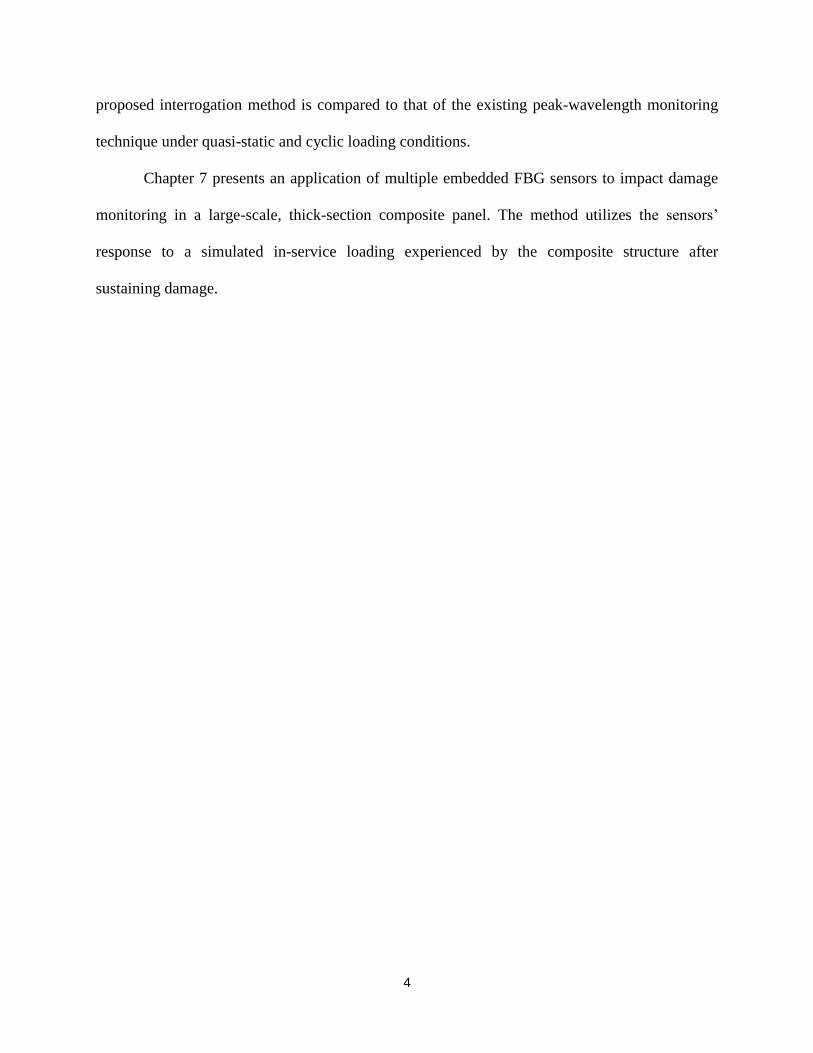
The slight notch at approximately 275 seconds marks the initial breakage along the fiber
direction of the specimen and breakage continued until failure. The specimen experienced
catastrophic failure at approximately 325 seconds. At this point, the composite split along the
fiber direction and the test was stopped. The specimen after failure with breakage along the fiber
direction is shown in Figure 8.
Figure 8. Uni-axial tension test specimen after failure
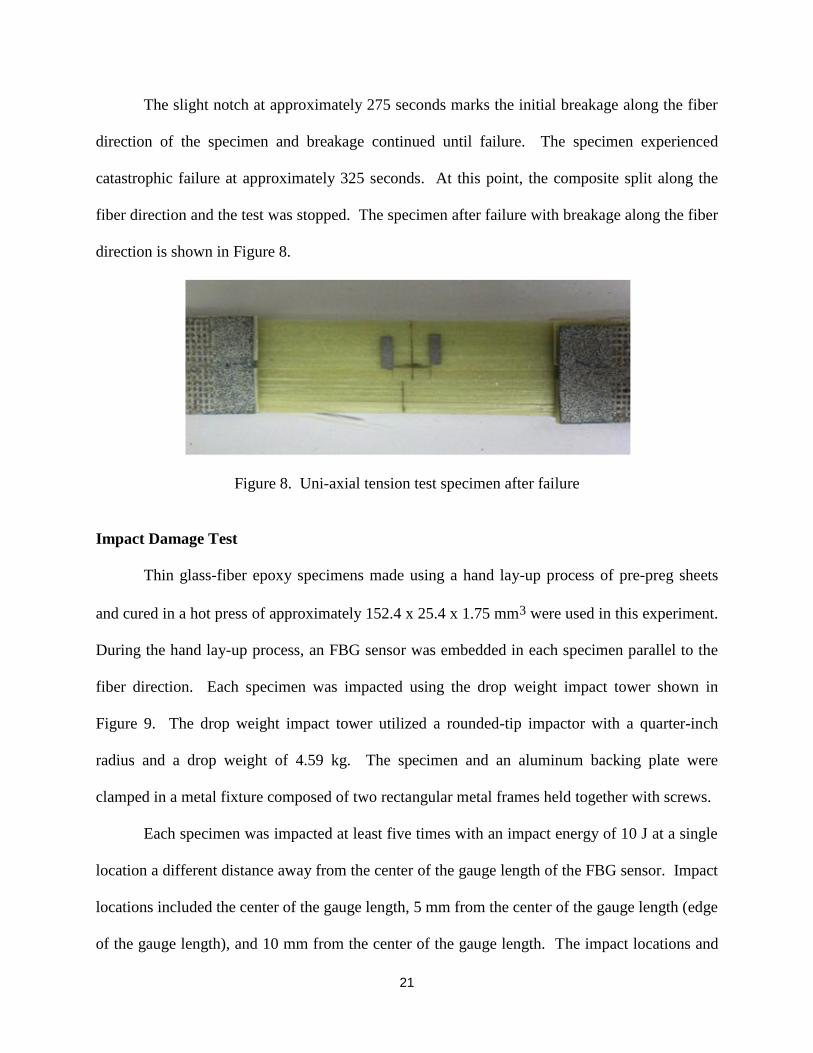
Impact Damage Test
Thin glass-fiber epoxy specimens made using a hand lay-up process of pre-preg sheets
and cured in a hot press of approximately 152.4 x 25.4 x 1.75 mm3 were used in this experiment.
During the hand lay-up process, an FBG sensor was embedded in each specimen parallel to the
fiber direction. Each specimen was impacted using the drop weight impact tower shown in
Figure 9. The drop weight impact tower utilized a rounded-tip impactor with a quarter-inch
radius and a drop weight of 4.59 kg. The specimen and an aluminum backing plate were
clamped in a metal fixture composed of two rectangular metal frames held together with screws.
Each specimen was impacted at least five times with an impact energy of 10 J at a single
location a different distance away from the center of the gauge length of the FBG sensor. Impact
locations included the center of the gauge length, 5 mm from the center of the gauge length (edge
of the gauge length), and 10 mm from the center of the gauge length. The impact locations and

22
specimen configuration are shown in Figure 10. The ply locations of the embedded sensors and
specimen lay-up are given in Table 1.
The reflection spectrum of the embedded FBG sensor was recorded prior to impact using
a Micron Optics Optical Sensing Interrogator (sm-125). During the impact event, the signal
voltage was measured using a Redondo Optics FBG-Transceiver (M600) capable of dynamic
strain measurement due to its 320 kHz scanning frequency. After each of the five impacts, the
reflection spectrum was again recorded using the Micron Optics interrogator.
Figure 9. Drop weight impact tower
Figure 10. Impact locations and specimen configuration (not to scale)

23
Table 1. Ply locations of the embedded sensors and specimen lay-up configuration
Impact location Layup (from bottom to top)
10 mm from center of gauge length (Impact location 1) [0°]6/[FBG]/ [0°]2
5 mm from center of gauge length (Impact location 2) [0°]2/[FBG]/ [0°]6
Center of gauge length (Impact location 3) [0°]6/[FBG]/ [0°]2
Consequences of Exceeding the Strain Limit
The time history of strain measured using the laser and clip extensometers during tensile
testing and FBG sensor strain limit are shown in Figure 11. The first loading cycle is designed to
load the specimen to 10,000 , or twice the prescribed strain limit. The specimen is then
unloaded to zero and pulled to composite failure.
Figure 11. Time history of strain measured using the laser and clip extensometers during tensile
testing and FBG sensor strain limit
Critical points must be identified in the time history of measured strain to investigate the
behavior of the FBG sensor beyond the strain limit. Five critical points have been identified in
Figure 12.

24
Figure 12. Critical points during tensile testing
Critical points 1 and 3 provide a comparison at zero strain before and after exceeding the
FBG sensor’s strain limit. Points 2 and 4 provide a comparison between the first and second
loading cycles at 10,000 . Point 5 provides a checkpoint to determine if the FBG sensor is
active just after catastrophic failure of the composite specimen.
The reflection spectra of normalized intensity for the critical points marked in Figure 12
are presented in Figure 13. The colors correspond to the color of the critical point marker and
the reflection spectra are further identified by the time at which they are obtained. Comparing
the reflection spectra obtained at points 1 and 3 shows there is a significant intensity reduction of
approximately 65%. This demonstrates that exceeding the FBG sensor’s strain limit will indeed
have an effect on the reflection spectrum. Comparing the reflection spectra obtained at points 2
and 4 shows an intensity reduction of approximately 10%. This demonstrates that multiple
passes above the strain limit cause a further reduction of spectrum intensity.

25
Figure 13. Reflection spectra of normalized intensity for the critical points marked in Figure 12
An investigation of the reflection spectrum at point 5 results in a signal with zero
intensity. At this point, the sensor has been damaged and is no longer capable of reporting data.
However, the sensor has been active up until this point, confirmed by the presence of a spectrum
at point 4, and has successfully remained active until catastrophic failure despite being strained
far beyond the strain limit.
The survivability of the sensor is further confirmed by monitoring the peak wavelength,
center wavelength, and spectral bandwidth during tensile testing as plotted in Figure 14. The
measurements of all spectrum quantification methods remain reliable until catastrophic failure of
the specimen occurs at a time of approximately 275 seconds and the signals become erratic.
While monitoring the peak and center wavelength will do little more than identify the
point at which the FBG sensor breaks, monitoring the spectral bandwidth during loading of the
specimen may serve an additional purpose. The small jump in width that occurs during high

26
strain and prior to failure can act as a rough indication of when the sensor has exceeded the strain
limit. The benefit of monitoring the spectral bandwidth is that the value remains constant during
loading and unloading of the specimen.
Figure 14. Time history of peak wavelength, center wavelength, and spectral bandwidth during
tensile testing
Effect of Impact on the Reflection Spectrum
The reflection spectrum before any impact damage and the reflection spectrum after the
fifth and final impact for the specimen at an impact location of 10 mm from the center of gauge
length are compared in Figure 15. Most importantly, the results demonstrate that the FBG sensor
survives all five impacts and remains capable of reporting a reflection spectrum. While the
reflection spectrum after the final impact has broadened and shows an increased amount of noise
near the peak, it remains sensitive to strain. The spectrum broadening is most likely directly
related to the proximity of the embedded FBG sensor to the specimen’s surface. The sensor’s
embedding position of a +6 ply location means that there are only two plies between it and the
impact surface. The FBG sensor is demonstrating the consequences of experiencing both

27
external damage from the impactor’s force on the specimen’s surface and internal damage
caused by absorbed impact energy.
The reflection spectrum before any impact damage and the reflection spectrum after the
fifth and final impact for the specimen at an impact location of 5 mm from the center of gauge
length are compared in Figure 16. Again, the results show that the sensor survives the impact
testing and continues to return a reflection spectrum that is nearly identical to the initial
reflection spectrum. The smaller change between these spectra and the spectra shown previously
in Figure 15 is due to the embedding position of the FBG sensors. The reflection spectra for the
previous specimen impacted 10 mm from the center of the gauge length had its FBG sensor
embedded at a +6 ply location while this specimen had its FBG sensor embedded at a +2 ply
location, meaning there are six plies between the FBG sensor and the impact surface. The
embedding location and the FBG sensor’s proximity to the impact surface appears to have more
effect on the broadening of the signal than the impact location relative to the center of the
sensor’s gauge length.
The reflection spectrum before any impact damage and the reflection spectrum after the
seventh and final impact for the specimen at an impact location at the center of the gauge length
are compared in Figure 17. This specimen was impacted an additional two times in an effort to
establish how many impacts the embedded FBG sensor could survive and still return a reliable
reflection spectrum. It was determined that after approximately six impacts, the reflection
spectrum broadened and its intensity deteriorated in a way that it was no longer effective in
measuring strain and was ruled catastrophically damaged. This scenario subjects the FBG sensor
to the most damage per impact based on the impact location and its embedding position and it is
for this reason that this case was tested to complete failure of the FBG sensor.

28
Figure 15. The reflection spectrum before any impact damage and the reflection spectrum after
the fifth and final impact for the specimen with an impact location at 10 mm from the center of
gauge length (impact location 1)
Figure 16. The reflection spectrum before any impact damage and the reflection spectrum after
the fifth and final impact for the specimen with an impact location at 5 mm from the center of
gauge length (impact location 2)
29
Figure 17. The reflection spectrum before any impact damage and the reflection spectrum after
the seventh and final impact for the specimen with an impact location at the center of gauge
length (impact location 3)

30
The reflection spectra at incremental number of impacts at the center of the FBG sensor’s
gauge length (impact location 3) are shown in Figure 18. The transition from a narrow, single-
peak reflection spectrum with high amplitude to a broad, multi-peak reflection spectrum with
low amplitude as the number of impacts increases is illustrated. As previously demonstrated, it
takes a significant number of impacts at the same location to wear down the signal strength of
the embedded FBG sensor.
Figure 18. Reflection spectra at incremental number of impacts at the center of the FBG sensor’s
gauge length (impact location 3)
Findings
It has been demonstrated that embedded FBG sensors are extremely reliable and capable
of withstanding amounts of strain exceeding the manufacturer’s prescribed limit without failing.
The embedded FBG sensor subjected to static loading remained intact and functional until the

31
composite failed. However, it was found that exceeding the strain limit resulted in a residual
effect on the sensor’s signal that caused the signal’s intensity to deteriorate upon reloading of the
specimen.
An FBG sensor embedded in a thin composite laminate has been shown to be resistant to
failure when subjected to impact near its embedding location. Impacts that occurred at the center
of the gauge length of the sensor caused the reflection spectrum to broaden and drop in intensity
at a rate much faster than other impact locations. However, it required at least seven impacts at
the most vulnerable location to produce this effect and the endurance of the sensor to this extent
is impressive.
Ultimately, the sensors have been proven capable of surviving for the entire life of a
specimen subjected to static loading or impact. Having established the great survivability of
embedded FBG sensors for structural health monitoring purposes, it is safe to further explore the
development of self-diagnostic composites using these sensors.

32
CHAPTER 4
BASELINE TESTING OF COMPOSITE SPECIMENS
Introduction
The experiments performed in this chapter will simulate delamination in a composite
structure by creating a propagating crack in a small composite specimen through Mode-I and
Mode-II bending. The experiments will be a trial run before testing specimens with embedded
FBG sensors to ensure that the tests are repeatable and that stable crack propagation can be
achieved. Stable crack propagation is required due to the low scanning frequency of the FBG
interrogator used to record the signal of an embedded FBG sensor. It will give the interrogator
ample time to record the change in the reflection spectrum as the crack slowly propagates along
the gauge length of the FBG sensor.
The use of dummy specimen in these experiments will reduce the number of FBG sensors
required to obtain sufficient results in later testing. Once stable crack propagation is achieved,
the tests will be repeated with an FBG sensor embedded in the specimen in Chapter 6 to validate
the structural health monitoring capabilities of FBG sensors.
The first experiment performed uses a double cantilever beam (DCB) specimen subjected
to Mode-I bending in which a slowly propagating crack is grown along the mid-plane of the
specimen. The procedure is based on ASTM D 5528 [60] and is modified to allow for the
tracking of crack propagation at approximately ten second intervals using a CCD camera. The
second experiment uses the same specimen and subjects it to Mode-II bending to facilitate shear
loading. Because there is no ASTM Standard for this type of bending, the ability to grow a
stable crack in this configuration is uncertain.
The experiments carried out also allowed for the calculation of the Mode-I and Mode-II
fracture toughness. These values are not provided by the composite’s manufacturer and will be

33
beneficial to add to the material properties list of the glass/epoxy unidirectional composite
(Cycom 1003) used in these tests.
Mode-I and Mode-II Fracture Toughness
Sanford [61] defines a measure of tracking the ability of a crack to grow in a geometry,
the strain energy release rate, G, as the spatial rate of change of stored strain energy under
system isolated conditions. It is defined numerically as,
A
UG
(5)
where U is the strain energy of the system, and the negative sign produces a positive quantity.
Under linear-elastic conditions, the strain energy of the system can be written as,
PU
2
1
(6)
and
CP (7)
where P is the applied load, d is the deflection, and C, the compliance, is the reciprocal of the
slope of the load-deflection line. By replacing the deflection in Eq. (6) with Eq. (7) and
differentiating with respect to A, it follows that
A
CPG
2
2
(8)
It is important to note that this equation derived for the strain energy release rate is
independent of specimen dimensions and can therefore be applied to any geometry through a
compliance calibration method. Sanford specifies that assuming the crack length, a, is short
compared to the overall length of the specimen, the undamaged portion of the specimen can be

34
treated as the rigid support for the double cantilever beams formed by the crack and from
elementary beam theory the deflection of the beams is given as,
EI
Pa
3
2 3
(9)
and
12
3BhI
(10)
where B is the width of the specimen and h is half the thickness of the specimen. Based on Eq.
(8), (9), and (10), the strain energy release rate of the DCB specimen can be written as,
BI
aP
A
CPG
222
2
(11)
The experiment used four different methods to calculate the fracture toughness of the
composite material as stipulated by ASTM D 5528. The first equation, known as the Modified
Beam Theory, is given as,
ba
PGI 2
3
(12)
where δ is the load point displacement, b is the specimen width, and a is the delamination length.
The ASTM Standard simplifies Eq. (11) to Eq. (12) for cases in which the load and deflection
can be measured at the point of delamination. To account for the rotation at the delamination
front caused by the piano hinges, a correction factor, Δ, is introduced. This factor can be
determined using a least squares plot of the cubed root of compliance, C1/3, versus delamination
length. The compliance is calculated as the ratio of load point displacement to applied load, δ/P.
The corrected equation, referred to as the Corrected Modified Beam Theory, is defined as,

35
)(2
3
ab
PGI
(13)
The Compliance Calibration (CC) Method, introduced as Eq. (14), calculates fracture
toughness using an alternative correction factor, n. The CC Method defines n as the slope of the
best least-squares fit of the curve generated by a least squares plot of log (δi/Pi) versus log (ai).
ba
nPGI 2
(14)
The Modified Compliance Calibration (MCC) Method uses the correction factor A1. A1
is defined as the slope of the best least-squares fit of the curve generated by a least squares plot
of (a/h) versus cubed root of compliance, C1/3, where h is the specimen thickness.
bhA
CPGI
1
3/22
2
3 (15)
To arrive at an equation to calculate the Mode-II fracture toughness, a method similar to
that used to derive Eq. (11) is used. Chatterjee [62] specifies the Mode II strain energy release
rate as,
32
11
22 )(
2
9
hbE
haPGII
(16)
where a in Eq. (11) has been replaced with (a + h) and
13
1113.0G
E
(17)
where G13 is the through thickness shear modulus and E11 is the axial Young’s Modulus.

36
Mode-I Bending Test
A panel of Cycom 1003, a unidirectional glass/epoxy composite (E = 39.3 GPa), was
manufactured using a hand lay-up technique and tetrahedral oven press for curing with an
approximate thickness of 3 mm. During lay-up, a thin sheet of Teflon was inserted in the mid-
plane of the composite approximately two inches deep from one end to initiate crack growth.
Individual specimens were cut using a diamond saw to be approximately 25.4 x 152.4 mm2.
The Mode-I bending experiment was done on an MTS uni-axial testing machine capable
of measuring extension and load. Load versus extension data was recorded using TestWorks 4
software and saved for later analysis. The specimen was modified so that it could be loaded in a
fashion similar to a double cantilever beam. Aluminum piano hinges were attached to the
specimen on the Teflon-inserted end using a high-strength epoxy so that the specimen could be
loaded into the testing machine and delaminated. The specimen was loaded at 5 mm/min as
specified in ASTM D 5528. The final specimen is shown in Figure 19 with the necessary
measurements prior to testing.
Figure 19. DCB Specimen with attached hinges
In order to track crack growth during testing, a mirror and camera were set up to record
images of the flat side of the specimen at 10 second intervals. By illuminating the specimen with

37
a lamp attached to the crosshead, the propagation of the crack could be tracked in the images.
The setup of the experiment is shown in Figure 20.
The mirror side of the DCB specimen was marked at 10 mm intervals starting at the
initial delamination length to aid in the tracking of crack growth as shown in Figure 21. The
images were captured using ImageCapture 2.0 and analyzed using MATLAB. MATLAB aided
in the location of the crack at 10 second intervals and this data was interpolated in Microsoft
Excel to approximate delamination length at roughly one second intervals that matched up to the
time recorded by TestWorks 4 corresponding to load and extension data.
Figure 20. Experimental setup of Mode-I bending experiment
Camera
Mirror
Lamp

38
Figure 21. DCB specimen marked at 10 mm intervals
The Mode-I bending experiment was conducted with slight variation from ASTM D 5528. The
ASTM Standard specified that an initial delamination length of 63.5 mm was optimal however
the specimen used were manufactured with an initial delamination length of approximately 50.8
mm. The ASTM Standard dictated that once the piano hinges were applied, the distance from
the initial delamination point to loading point, or pin of the piano hinges, should be
approximately 50.8 mm. Because of this, the piano hinges had to be applied to the specimen in
the opposite direction of how they are typically applied according to the ASTM Standard. This
allowed for the specified distance between initial delamination point and loading point to be
approximately 50.8 mm to comply with the ASTM Standard.
In addition to the modified piano hinges, the procedure in which the delamination length
was tracked throughout the experiment was modified from the ASTM Standard specification.
The ASTM Standard uses a procedure in which the delamination length is tracked with the naked
eye using tick marks on the side of the specimen during testing and loading is paused to observe
the corresponding load, displacement, and delamination length values. In order to make the
measurement of delamination length more precise and allow for a continuous experiment, the
mirror and digital camera were introduced to record images at ten second intervals during testing
so the delamination could be measured digitally through MATLAB. This modified procedure
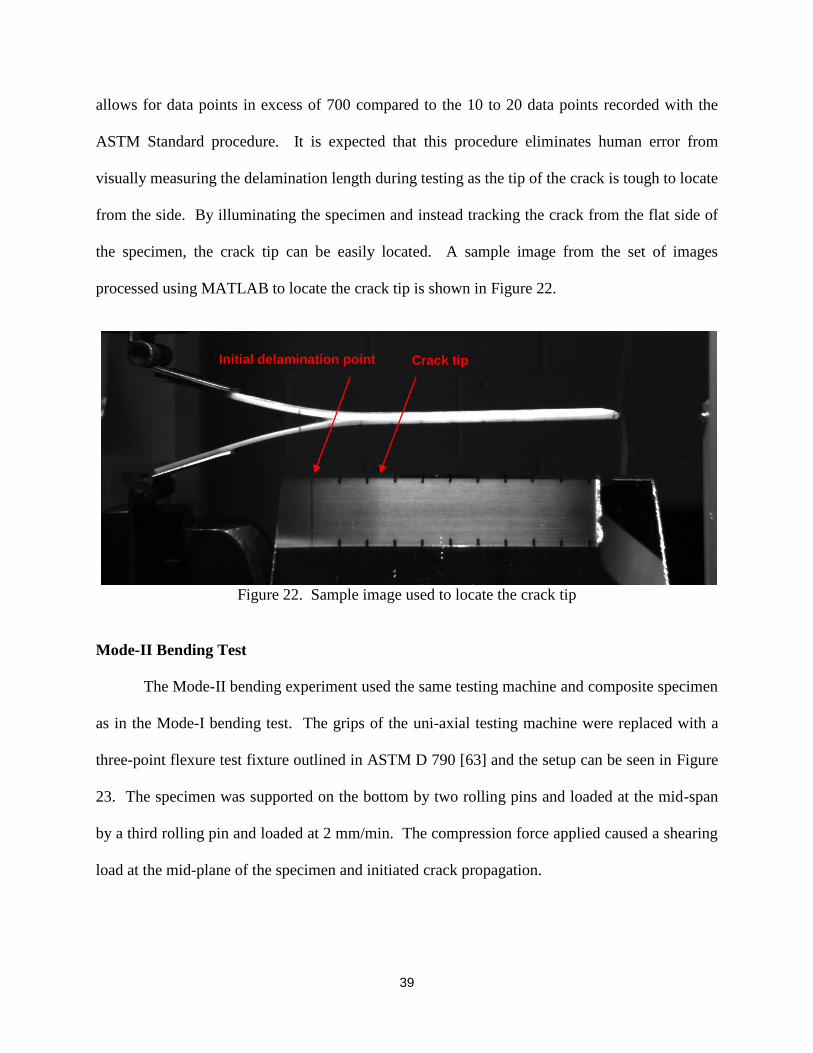
39
allows for data points in excess of 700 compared to the 10 to 20 data points recorded with the
ASTM Standard procedure. It is expected that this procedure eliminates human error from
visually measuring the delamination length during testing as the tip of the crack is tough to locate
from the side. By illuminating the specimen and instead tracking the crack from the flat side of
the specimen, the crack tip can be easily located. A sample image from the set of images
processed using MATLAB to locate the crack tip is shown in Figure 22.
Figure 22. Sample image used to locate the crack tip
Mode-II Bending Test
The Mode-II bending experiment used the same testing machine and composite specimen
as in the Mode-I bending test. The grips of the uni-axial testing machine were replaced with a
three-point flexure test fixture outlined in ASTM D 790 [63] and the setup can be seen in Figure
23. The specimen was supported on the bottom by two rolling pins and loaded at the mid-span
by a third rolling pin and loaded at 2 mm/min. The compression force applied caused a shearing
load at the mid-plane of the specimen and initiated crack propagation.
Initial delamination point Crack tip

40
Figure 23. Experimental setup of Mode-II bending experiment
The end notched flexure (ENF) specimen used and the critical dimensions are shown in
Figure 24. Initial specimens were manufactured with an a/L ratio of 0.5, however it became
necessary to manufacture additional specimens with an a/L ratio of 0.75 for reasons that will be
later explained. Overall dimensions of the specimens were approximately 25.4 x 152.4 mm2.
Figure 24. ENF specimen geometry
Measuring Mode-I Fracture Toughness
The interlaminar fracture toughness versus delamination length, also referred to as the
resistance curve or R-curve, of one of the tested specimen is shown in Figure 25. The four
Roller
Pre-crack
Insert
a
L L
Total length
OverhangOverhang
Total length
a
L L

41
different curves use slightly different equations to calculate the interlaminar fracture toughness at
each recorded data point. These equations are given by Eq. (12) through (15).
Figure 25. Interlaminar fracture toughness calculated by four different equations during
delamination
The ASTM Standard specifies that the Modified Beam Theory with Correction Factor
(MBTC) equation results in the most conservative calculation of interlaminar fracture toughness.
Therefore, the fracture toughness of four specimens has been obtained using the MBTC value.
The fracture toughness values are shown in Table 2 and were obtained at propagation points on
the curve after it reached steady state. The values obtained were the maximum fracture
toughness between 90 and 120 mm of delamination length. After 120 mm of delamination, it
became increasingly difficult to track the crack length in the captured images and likely led to
the slight drop-off in fracture toughness at this point. After this drop-off, the fracture toughness
values increased until catastrophic failure of the specimen. This is as expected according to
Hwang [64], and is likely caused by the increased angle of delamination and fiber bridging,
which will be discussed later.
Inte
rlam
inar
Fra
ctu
re T
ou
ghn
ess
(J/
m2)
Delamination Length (mm)
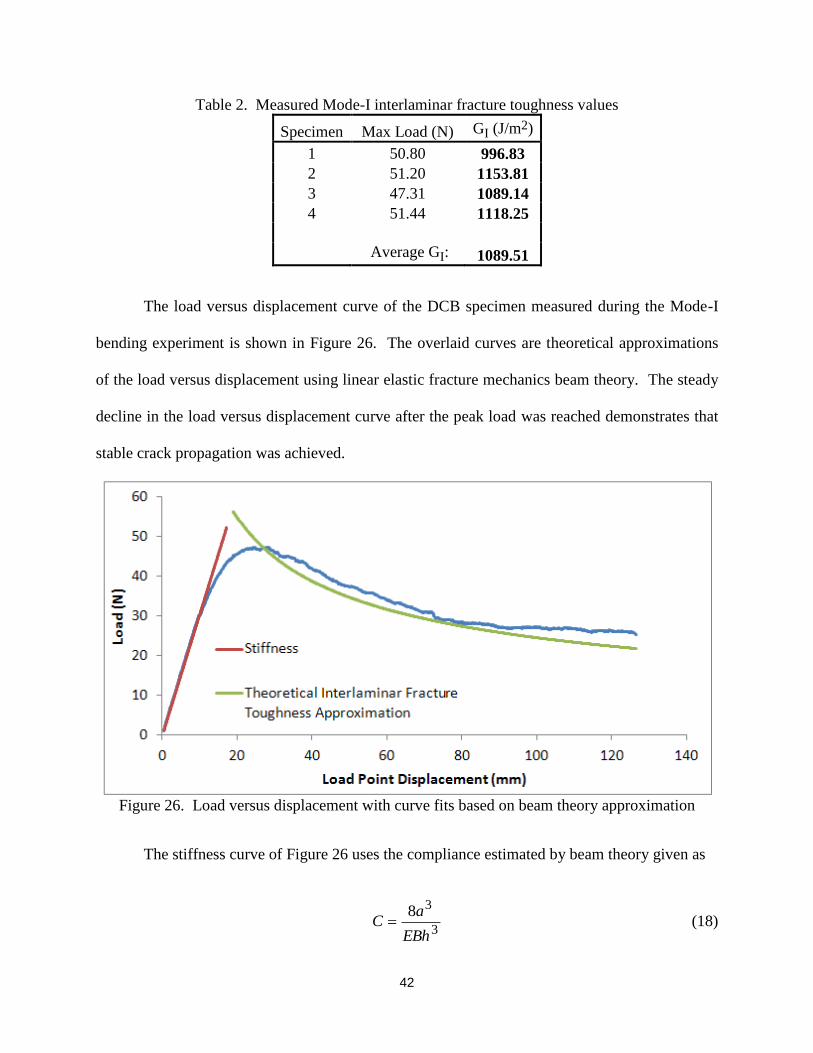
42
Table 2. Measured Mode-I interlaminar fracture toughness values
Specimen Max Load (N) GI (J/m2)
1 50.80 996.83
2 51.20 1153.81
3 47.31 1089.14
4 51.44 1118.25
Average GI: 1089.51
The load versus displacement curve of the DCB specimen measured during the Mode-I
bending experiment is shown in Figure 26. The overlaid curves are theoretical approximations
of the load versus displacement using linear elastic fracture mechanics beam theory. The steady
decline in the load versus displacement curve after the peak load was reached demonstrates that
stable crack propagation was achieved.
Figure 26. Load versus displacement with curve fits based on beam theory approximation
The stiffness curve of Figure 26 uses the compliance estimated by beam theory given as
3
38
EBh
aC
(18)

43
where B is the specimen width and h is half of the specimen thickness. The stiffness is then
calculated as the ratio of load point displacement against compliance, (Δ/C).
Figure 26 also uses a derivation of the beam theory approximation to theoretically predict
the load versus displacement curve after peak load given by
2/1
4/133
27
B
EhGF c
(19)
This equation approximates the load as a function of interlaminar fracture toughness and
displacement. The value for interlaminar fracture toughness remains constant throughout and is
based on a maximum value from the R-curve. A derivation of this equation can be found in the
Appendix.
It is seen in Figure 26 that the theoretical interlaminar fracture toughness approximation
underestimates the load versus displacement curve. This is due to a phenomenon that occurs
during delamination known as fiber bridging. Fiber bridging occurs when the fibers
perpendicular to the direction of crack propagation and across the width of a unidirectional
composite act to resist crack growth by “sticking” to one side of the specimen as it separates.
Although this is a desirable quality in unidirectional composites that acts to increase the fracture
toughness of the material, it is not accounted for in the theoretical approximation curve because
this curve is derived from elementary beam theory normally used for metal beams that do not
possess this quality. If it were possible to account for fiber bridging, it would be expected that
the theoretical curve would be increased and could better predict the load versus displacement
curve after peak load. Evidence of fiber bridging in one of the captured images during testing is
shown in Figure 27.

44
Figure 27. Fiber bridging occurring in specimen during testing
Measuring Mode-II Fracture Toughness
The results of the first set of specimen tested to calculate the Mode-II fracture toughness
of the unidirectional glass/epoxy composite are shown in Figure 28. It is seen that the curves
show a different trend than the Mode-I bending test in that the curve completely drops off after
reaching a peak load. This is the result of unstable crack propagation and indicates a sudden
crack jump in the specimen. This presents a problem because it is impossible to record fracture
toughness values during propagation and limits the calculation of fracture toughness values to
the point of onset of Mode-II fracture. Furthermore, it is a problem because stable crack
propagation in this configuration is required for later testing in which FBG sensors will be
embedded in the specimen. It will be necessary to investigate a way to solve this problem and
stabilize the crack propagation.
Table 3 shows the calculated Mode-II fracture toughness values corresponding to the
specimen shown in Figure 28. It is seen that there is a large variation in fracture toughness
values of the specimen as high as 28% off from the average fracture toughness of the four
specimens. Davies et al. [65] specify that a variation in fracture toughness of 15-20% deviation
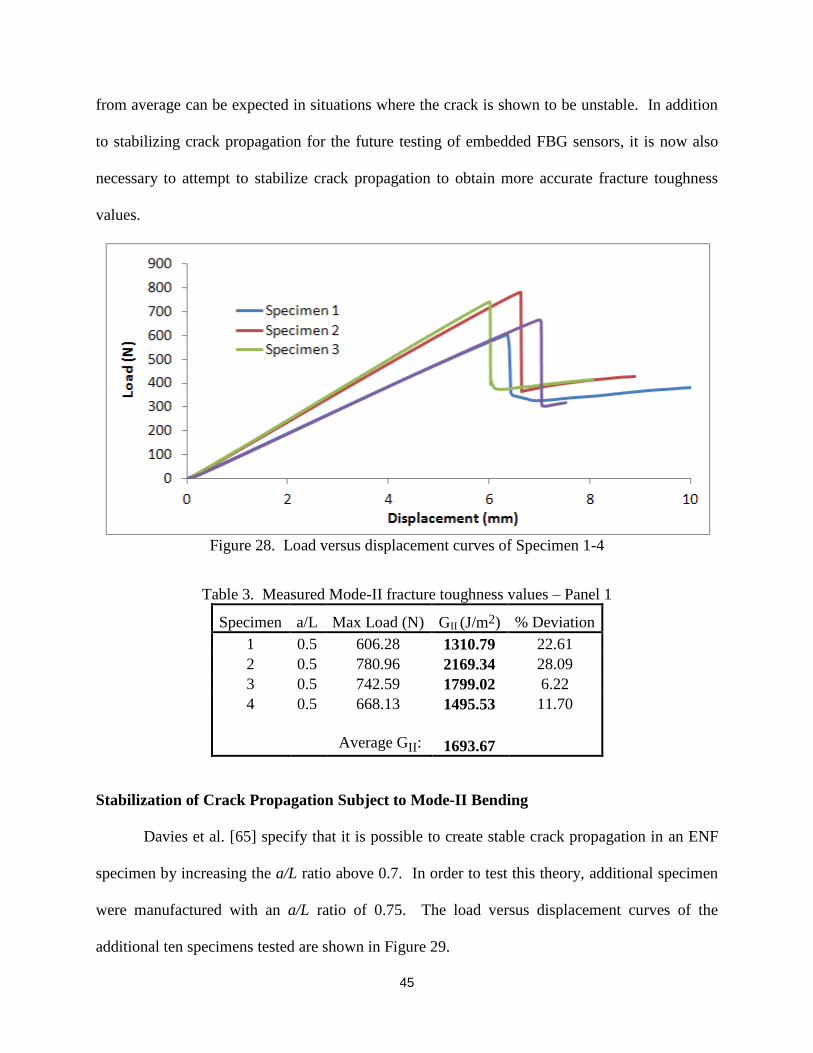
45
from average can be expected in situations where the crack is shown to be unstable. In addition
to stabilizing crack propagation for the future testing of embedded FBG sensors, it is now also
necessary to attempt to stabilize crack propagation to obtain more accurate fracture toughness
values.
Figure 28. Load versus displacement curves of Specimen 1-4
Table 3. Measured Mode-II fracture toughness values – Panel 1
Specimen a/L Max Load (N) GII (J/m2) % Deviation
1 0.5 606.28 1310.79 22.61
2 0.5 780.96 2169.34 28.09
3 0.5 742.59 1799.02 6.22
4 0.5 668.13 1495.53 11.70
Average GII: 1693.67
Stabilization of Crack Propagation Subject to Mode-II Bending
Davies et al. [65] specify that it is possible to create stable crack propagation in an ENF
specimen by increasing the a/L ratio above 0.7. In order to test this theory, additional specimen
were manufactured with an a/L ratio of 0.75. The load versus displacement curves of the
additional ten specimens tested are shown in Figure 29.

46
Although Specimen 8 shows signs of stable crack propagation as it does not completely
drop off vertically, the other nine specimens still show unstable crack propagation and thus an
increase in a/L ratio could potentially stabilize crack propagation albeit with very little
consistency. Table 4 shows the fracture toughness values corresponding to the specimens shown
in Figure 29. It is seen that these specimens have the same deviation range in fracture toughness
as the previous group.
Figure 29. Load versus displacement curves of Specimen 5-14
Table 4. Measured Mode-II fracture toughness values – Panel 2
Specimen a/L Max Load (N) GII (J/m2) % Deviation
5 0.75 822.51 2429.36 27.03
6 0.75 799.46 2076.31 8.57
7 0.75 852.07 2342.78 22.51
8 0.75 661.50 1463.44 23.47
9 0.75 795.05 2019.22 5.59
10 0.75 652.24 1742.03 8.91
11 0.75 637.87 1507.47 21.17
12 0.75 742.73 1967.37 2.88
13 0.75 707.48 1638.66 14.31
14 0.75 769.22 1937.00 1.29
Average GII: 1912.36

47
Based on these results, it is evident that further testing and investigation is needed on the
ability to stabilize crack propagation. Kageyama et al. [66] created and patented a device similar
to an extensometer that attaches to the delamination front of the specimen and allows for control
to a constant shear displacement and produces stable crack propagation. Although this method
requires the purchase of additional equipment, or the manufacturing of an extensometer-like
device, it is a proven method of stabilization.
Findings
A Mode-I bending test has been performed on multiple specimens to find an average
Mode-I fracture toughness value of 1090 J/m2. An improved method for locating the crack tip
and analyzing captured images of the propagating crack in MATLAB has been presented. A
Mode-II bending test was performed on two sets of specimens, first on a set with an a/L ratio of
0.5 and then on a set with an a/L ratio of 0.75 in an unsuccessful attempt to stabilize crack
propagation. Regardless, average Mode-II fracture toughness values of 1694 and 1912 J/m2
were found for the first and second set of specimen, respectively, albeit from a large variation of
data.
Setting Test Standards for Specimen with Embedded FBG Sensors
The Mode-I and Mode-II bending tests conducted will act as excellent baseline tests for
the experiments to come in Chapter 6. In Chapter 6, FBG sensors will be embedded in the same
type of specimens used in the above experiments and will be subjected to the same Mode-I and
Mode-II bending tests. While stable crack propagation could not be achieved in the Mode-II
bending test under monotonic loading, Chapter 6 will explore cyclic loading as a means of
solving this problem. The introduction of FBG sensors into the specimen will allow an

48
experimental validation of their damage detection capabilities and will support the results of a
numerical analysis of an FBG sensor’s response to non-uniform strain outlined in the next
chapter.

49
CHAPTER 5
NUMERICAL ANALYSIS OF FBG RESPONSE TO NON-UNIFORM STRAIN
Introduction
An FBG sensor subjected to constant strain along its gauge length will maintain a linear
relationship between peak wavelength and applied strain. However, when the sensor experiences
non-uniform strain along its gauge length caused by local damage, the spectral response will
change as a function of this non-uniform strain distribution and the linear relationship will no
longer hold true. Studying the spectrum response and inherent spectrum broadening through a
numerical analysis of an FBG subjected to non-uniform strain will improve structural health
monitoring capabilities and aid in damage analysis.
A numerical analysis of this type has previously been used by Yashiro et al. [48] and
Ling et al. [49] to build reflection spectra that verify those obtained experimentally with FBG
sensors embedded in composite specimens subjected to various loading scenarios. However, in
this work, the numerical analysis will be used to build hundreds of reflection spectra that can
then be used to identify a new quantification parameter. It will be used to study the relationship
between this quantification parameter and the strain gradient and test the established
relationship’s versatility. The numerical analysis will also be used to compare a new spectrum
monitoring method to an existing spectrum quantification method by using each to measure the
same simulated spectra.
Objectives
The objective of this work is to develop a numerical analysis method to predict a
reflection spectrum of a fiber-Bragg grating subjected to non-uniform strain using a transfer
matrix formulation. The effect of various non-uniform strain distributions on the reflection
50
spectrum of an FBG sensor will be investigated. During the investigation of these various non-
uniform strain distributions, an optimal parameter for quantifying the spectrum shape for
monitoring damage will be identified. The proposed optimal parameter will be shown to be a
better method of detecting a propagating crack than the peak intensity ratio method.
Peak Wavelength Spectrum Monitoring Method
FBG sensors are strain-based sensors that were originally developed for uniform strain
measurement purposes. The peak wavelength of the reflection spectrum produced by an FBG
sensor has a direct correlation with the average strain along its gauge length. However,
monitoring the peak wavelength lacks a quantitative damage monitoring capability due to the
resulting ambiguity in differentiating a change in signal due to a normal structural response from
an abnormal response caused by damage.
Peak Intensity Ratio Spectrum Monitoring Method
Takeda et al. [27, 32, 33] proposed the peak intensity ratio method as a way to measure
delamination length based on the reflection spectrum and created a quantitative damage
monitoring capability for FBG sensors. The peak intensity ratio measures the intensity ratio of
the two peaks that appear in the spectrum when an FBG sensor is subjected to non-uniform
strain. This monitoring method is flawed because it relies on the presence of two peaks in the
reflection spectrum and in some cases the spectrum is much more complex and displays several
peaks. A more robust structural health monitoring parameter must be identified through a
numerical analysis of the reflection spectrum.
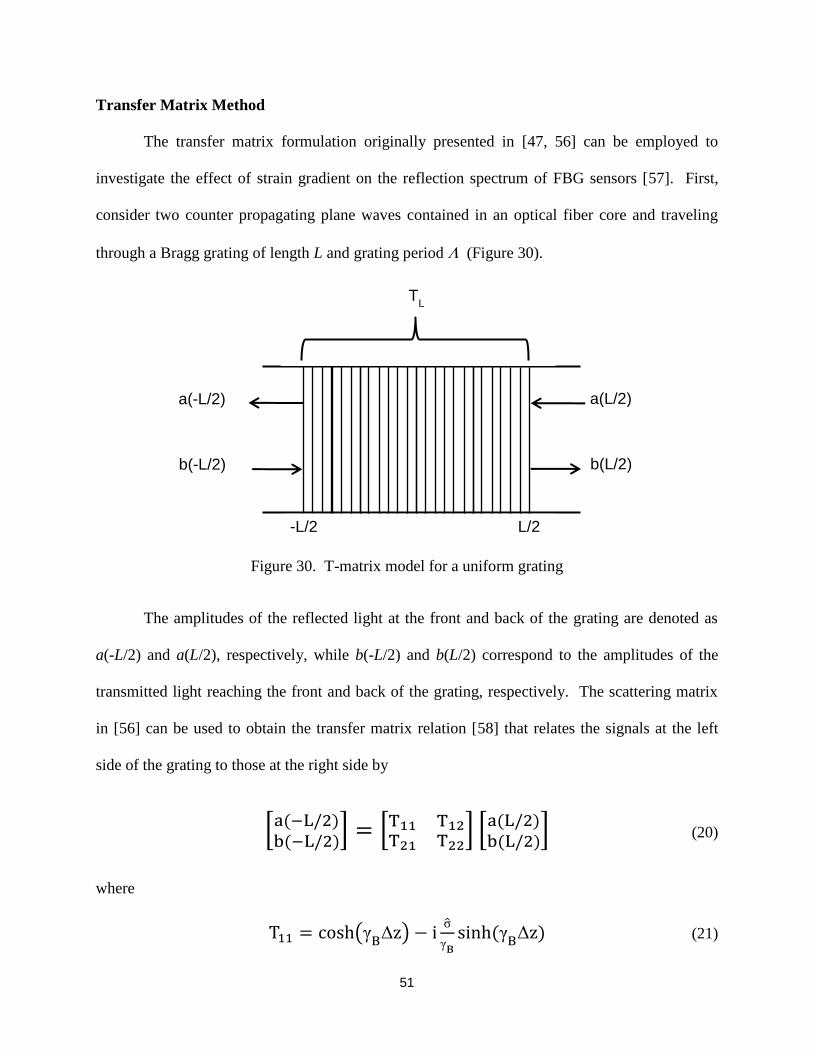
51
Transfer Matrix Method
The transfer matrix formulation originally presented in [47, 56] can be employed to
investigate the effect of strain gradient on the reflection spectrum of FBG sensors [57]. First,
consider two counter propagating plane waves contained in an optical fiber core and traveling
through a Bragg grating of length L and grating period (Figure 30).
Figure 30. T-matrix model for a uniform grating
The amplitudes of the reflected light at the front and back of the grating are denoted as
a(-L/2) and a(L/2), respectively, while b(-L/2) and b(L/2) correspond to the amplitudes of the
transmitted light reaching the front and back of the grating, respectively. The scattering matrix
in [56] can be used to obtain the transfer matrix relation [58] that relates the signals at the left
side of the grating to those at the right side by
[
] [
] [
] (20)
where
( )
(21)
a(-L/2)
b(-L/2)
a(L/2)
b(L/2)
TL
-L/2 L/2
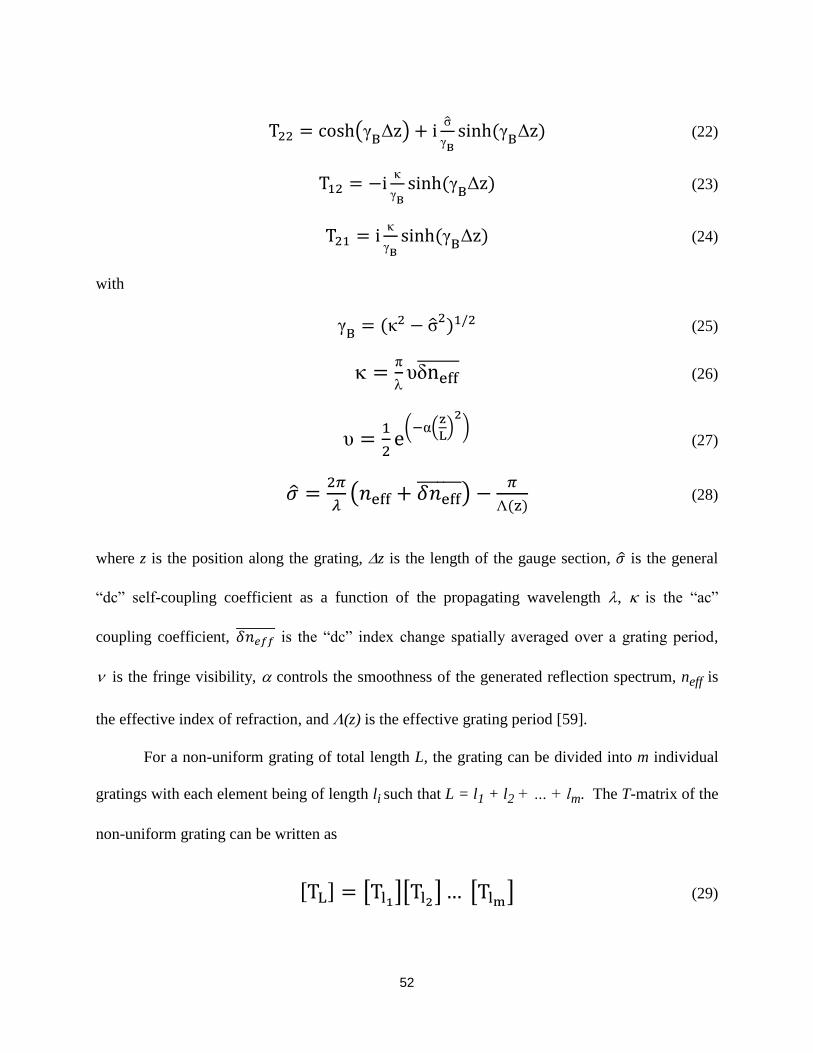
52
( )
(22)
(23)
(24)
with
(25)
δ (26)
( (
) )
(27)
(
)
(28)
where z is the position along the grating, z is the length of the gauge section, is the general
“dc” self-coupling coefficient as a function of the propagating wavelength , is the “ac”
coupling coefficient, is the “dc” index change spatially averaged over a grating period,
is the fringe visibility, controls the smoothness of the generated reflection spectrum, neff is
the effective index of refraction, and (z) is the effective grating period [59].
For a non-uniform grating of total length L, the grating can be divided into m individual
gratings with each element being of length li such that L = l1 + l2 + … + lm. The T-matrix of the
non-uniform grating can be written as
[ ] [ ][ ] [ ] (29)

53
where [TL] denotes the T-matrix for the whole grating and [Tli] denotes the T-matrix for the ith
grating segment. The individual gratings are assumed to be uniform but have different values of
, , and . The transfer matrix relation can then be written as
[
] [ ][ ] [ ] [ ] [
]. (30)
From the boundary conditions of a(-L/2) = 0 and b(L/2) = bL assuming no backward
input on the far end of the grating, the amplitudes of the reflected and transmitted lights, a(-L/2)
and b(-L/2), can be determined and used to calculate the spectral reflectivity of the grating by
[57]
| (
)
|
. (31)
For a non-uniform strain field, the effective grating period defined in [57] can be written
as
[ ] (32)
where 0 is the period of the grating in the reference configuration, the photoelastic constant pe
takes into account the change in effective refractive index of the optical fiber and(z) is the
axial strain distribution. However, it was recently pointed out that the effective grating period in
Eq. (32) is inaccurate [59], and a modified form of the effective grating period was given as
[ ’ ] (33)
where ’(z) is the strain gradient. The “dc” self-coupling coefficient in Eq. (28) must then be
modified as
( δ
)
(34)

54
Effect of Linear Strain Distribution on the Spectrum
The modified Transfer Matrix Method was used to construct the reflection spectra of an
FBG sensor subjected to linear strain distributions along its gauge length. The construction of
reflection spectra at various strain gradients allowed for an investigation of spectrum bandwidth
quantification methods. The grating modeled in this study has the following parameters: neff =
1.46, B = 1557 nm, L = 10 mm, = 3.4 x 10⁻⁴, pe = 0.26, and = 1. The linear strain
distribution is expressed as
(z) = b * (2z / L) (35)
where b is the absolute strain at the front and back tips of the sensor and z is the position along
the gauge length. The reflection spectra constructed with five different absolute strain values
and linear strain distributions are shown in Figure 31. As the strain gradient increases, the peak
intensity decreases and the spectrum bandwidth increases.
Several definitions can be used to quantify the spectrum bandwidth. The most commonly
used definition is the full width at half maximum (FWHM) which corresponds to a -3 dB
bandwidth in the logarithmic scale. In this investigation, different definitions of -6 dB, -10 dB,
and -20 dB bandwidth are also used. The relationship between the strain gradient and the
spectrum bandwidth are plotted in Figure 32. The relationships were found to be non-linear in
general. However, it was found that the trend can be well approximated with linear functions
especially when -10 dB and -20 dB bandwidth definitions are used. The optimal definition for
measuring spectral bandwidth was determined to be -10 dB or -20 dB depending on the signal-
to-noise ratio of the FBG sensor.
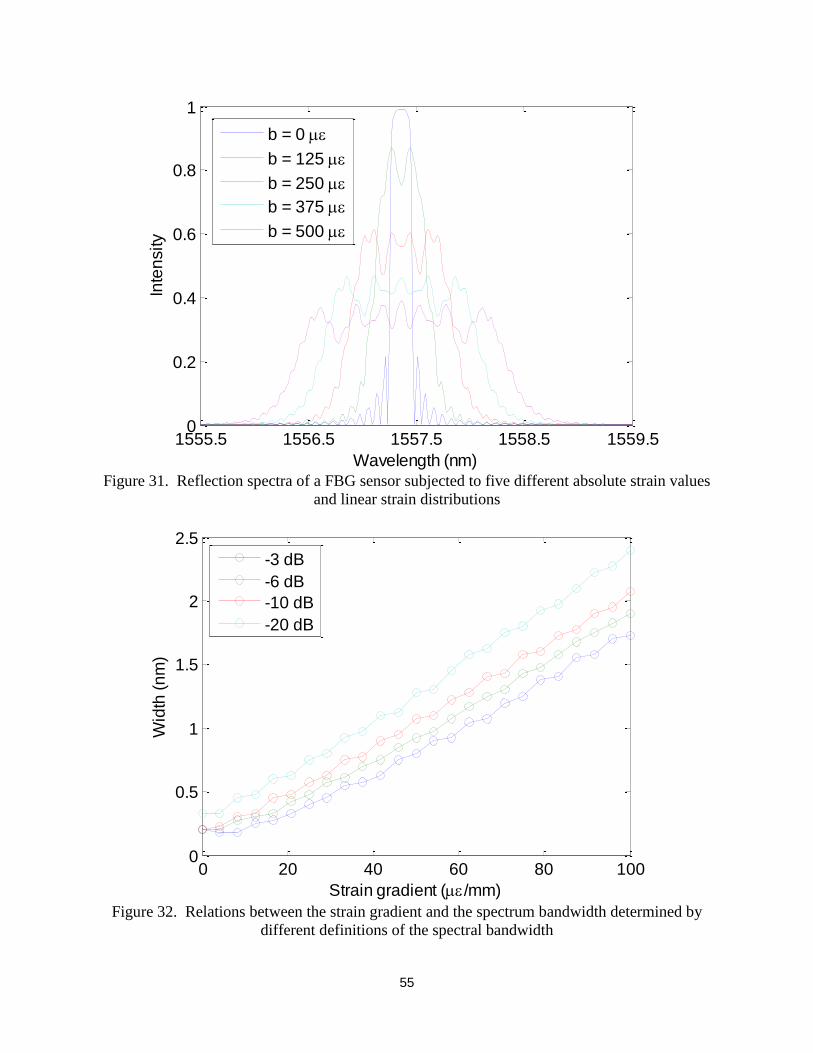
55
Figure 31. Reflection spectra of a FBG sensor subjected to five different absolute strain values
and linear strain distributions
Figure 32. Relations between the strain gradient and the spectrum bandwidth determined by
different definitions of the spectral bandwidth
1555.5 1556.5 1557.5 1558.5 1559.50
0.2
0.4
0.6
0.8
1
Wavelength (nm)
Inte
nsity
b = 0
b = 125
b = 250
b = 375
b = 500
0 20 40 60 80 1000
0.5
1
1.5
2
2.5
Strain gradient (/mm)
Wid
th (
nm
)
-3 dB
-6 dB
-10 dB
-20 dB

56
Effect of Quadratic Strain Distribution on the Spectrum
To investigate the effect of the higher order terms on the relationship between the
spectrum bandwidth and the strain gradient, the quadratic strain distributions are included in the
non-uniform strain distributions as
(
) (
). (37)
The changes in the spectrum shape due to the quadratic term are shown in Figure 33. As
the magnitude of the quadratic term increases, the resulting spectra become asymmetrical but did
not show any significant broadening.
Figure 33. Reflection spectra of a FBG sensor subjected to quadratic strain distributions.
The relations between the spectrum bandwidth and the magnitude of the second order
term are plotted in Figure 34. It is shown that the -20 dB bandwidth measurements remain
relatively constant as the second order term increases. Thus, the presence of a second order term
in the strain distribution will have little effect on the bandwidth measurement by -20 dB
1556 1556.5 1557 1557.5 1558 1558.5 15590
0.2
0.4
0.6
0.8
1
Wavelength (nm)
Inte
nsity
a = 0
a = 125
a = 250
a = 375
a = 500

57
bandwidth, and the linear relationship between the spectrum bandwidth and the strain gradient
will hold true.
Figure 34. Relation between the spectral bandwidth and the magnitude of quadratic strain
distribution
Effect of Highly Non-Uniform Strain Distribution on the Spectrum
The relationship between the strain gradient and the spectrum bandwidth was also
investigated for highly non-uniform strain distributions. The reflection spectra constructed with
five different absolute strain values and highly non-uniform strain distributions are shown in
Figure 35.
The relationship between the strain gradient and the spectrum bandwidth measured from
the reflection spectra shown in Figure 35 are plotted in Figure 36. The relationship remains best
approximated with linear functions with optimal definitions for measuring spectral bandwidth of
-10 dB or -20 dB. This confirms that the relationship holds true for a more complex strain
distribution and one that is most likely to be experienced by an embedded FBG sensor.

58
Figure 35. Reflection spectra of a FBG sensor subjected to five different absolute strain values
and discontinuous strain distributions
Figure 36. Relations between the strain gradient and the spectrum bandwidth determined by
different definitions of the spectral bandwidth
1556 1556.5 1557 1557.5 1558 1558.5 15590
0.1
0.2
0.3
0.4
0.5
0.6
0.7
0.8
0.9
1
Wavelength (nm)
Inte
nsity
b = 0
b = 125
b = 250
b = 375
b = 500
0 100 200 300 400 5000.2
0.4
0.6
0.8
1
1.2
1.4
1.6
One-third order term ()
Wid
th (
nm
)
-3 dB
-6 dB
-10 dB
-20 dB

59
Monitoring Peak Intensity Ratio vs. Spectrum Bandwidth
Currently, the peak intensity ratio method is being used to measure delamination length
and has been identified as the only method that provides the capability for quantitative damage
monitoring [27, 32, 33]. However, it is not always a simple task to identify two distinct peaks in
the reflection spectrum during crack propagation. In this section, the existing spectrum
quantification method (peak intensity ratio) will be compared with a new interrogation method
(spectrum bandwidth).
A numerical simulation was performed in which a crack propagated along the gauge
length of a FBG sensor for the purpose of comparing the peak intensity ratio and spectrum
bandwidth monitoring methods. The propagating crack was simulated by moving a
discontinuous strain distribution along the sensor’s gauge length at 1 mm intervals and obtaining
the reflection spectrum at each. The distribution of the strain is given by
(z) = b * [2(z + c) / L]1/3 (36)
where c is used to shift the curve from the zero position of the gauge length. The collection of
the ten discontinuous strain distributions is displayed in Figure 37.
Figure 37. Collection of discontinuous strain distributions used to simulate the propagation of a
crack along the FBG sensor’s gauge length

60
A sample reflection spectrum generated at a crack tip position of -2 mm along the gauge
length is shown in Figure 38. The intensities of the longer and shorter wavelength peaks are
identified as I1 and I2, respectively. The peak intensity ratio is measured as I1/I2.
Figure 38. Reflection spectrum generated at a crack tip position of -2 mm along the gauge length
A comparison of measuring the peak intensity ratio versus the spectrum bandwidth
during crack propagation is shown in Figure 39. Monitoring the peak intensity ratio (Figure 39a)
produces a steadily increasing curve as the crack tip position gets further along the gauge length.
However, points are only produced between -3 to 3 mm as there is only one identifiable peak in
the spectrum outside this region. Alternatively, the spectrum bandwidth (Figure 39b) is able to
produce measurements along the entire gauge length. All bandwidth curves show a significant
spike near the front edge indicating that the crack has entered the gauge length and show only a
slight change as the crack propagates through. The signals return to their initial value as the
crack leaves the gauge length.
For real-time damage monitoring purposes, the spectrum bandwidth is the optimal
monitoring method as it provides a continuous signal with a distinct indicator of crack detection.
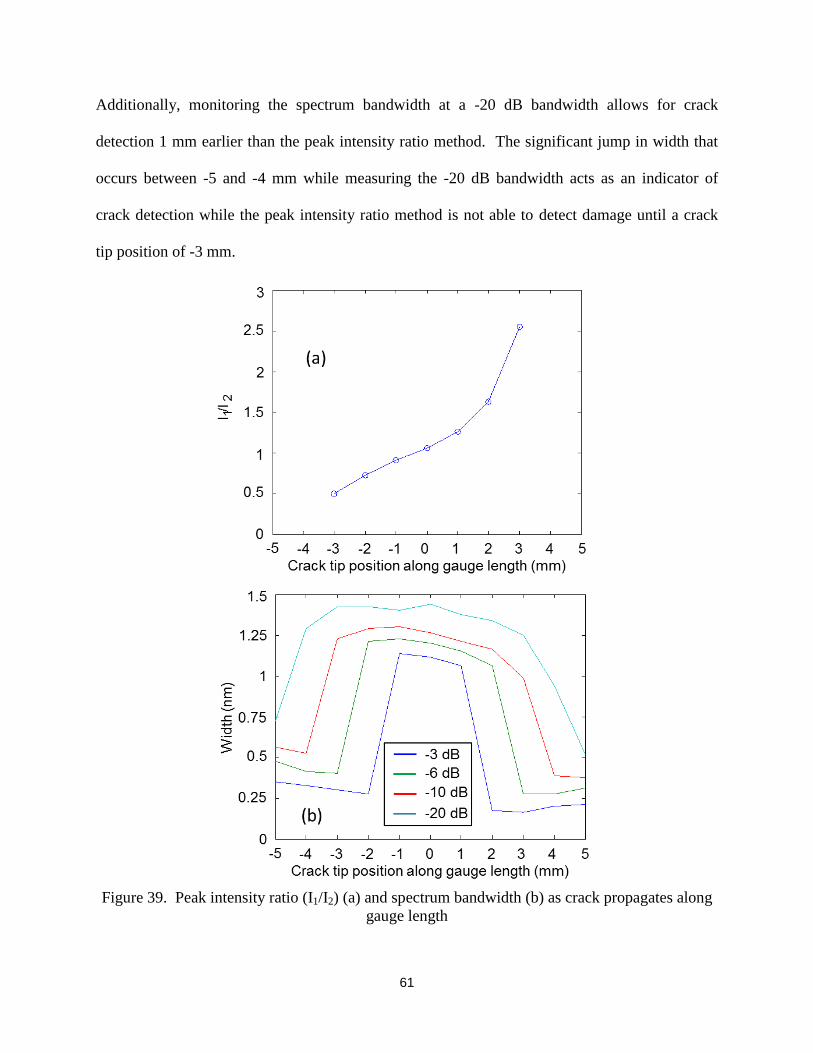
61
Additionally, monitoring the spectrum bandwidth at a -20 dB bandwidth allows for crack
detection 1 mm earlier than the peak intensity ratio method. The significant jump in width that
occurs between -5 and -4 mm while measuring the -20 dB bandwidth acts as an indicator of
crack detection while the peak intensity ratio method is not able to detect damage until a crack
tip position of -3 mm.
Figure 39. Peak intensity ratio (I1/I2) (a) and spectrum bandwidth (b) as crack propagates along
gauge length

62
Findings
This numerical analysis employed a transfer matrix formulation in order to produce a
reflection spectrum based on a user-input strain distribution. The numerical analysis was used to
generate many reflection spectra to identify a parameter for adequately quantifying the signal for
health monitoring purposes. The parameter, chosen as spectrum bandwidth, was compared to the
strain gradient of various linear strain distributions and it was found that their relationship was
close to linear. More complex strain distributions were then investigated to determine their
effect on this relationship. Introducing a second order term to create a quadratic strain
distribution resulted in little effect between the -20 dB bandwidth and strain gradient. Finally, a
highly non-uniform strain distribution was shown to maintain the same linear relationship
between bandwidth and strain gradient.
Application of Numerical Analysis to Testing of Embedded FBG Sensors
This numerical analysis has identified an optimal parameter for quantifying the reflection
spectrum of an FBG sensor. It is believed that monitoring the -20 dB bandwidth during crack
propagation could provide an improvement of structural health monitoring capabilities over
monitoring the peak wavelength. Additionally, it could provide an improvement over the peak
intensity ratio method because it is capable of providing a constant signal and an earlier crack
detection time. For these reasons, a new interrogation method based on -20 dB bandwidth and
center wavelength is proposed.
The benefits of spectrum bandwidth monitoring can be further investigated through
experimental testing of embedded FBG sensors for structural health monitoring purposes. In
Chapter 6, it will be physically demonstrated how utilizing the spectrum bandwidth monitoring
method is a significant improvement over the current peak wavelength monitoring method.

63
CHAPTER 6
MONITORING INTERLAMINAR CRACK GROWTH IN COMPOSITE LAMINATES
USING EMBEDDED FBG SENSORS
Introduction
In this work, embedded FBG sensors will be used to monitor the interlaminar crack
growth in composite specimens subjected to monotonic and cyclic loading through various
bending modes. The reflection spectra of the FBG sensor will be recorded as the crack
propagates along the mid-plane of the specimen and will be analyzed to demonstrate crack
detection capability. This work will be an experimental validation of the response of an FBG
sensor to non-uniform strain, previously investigated through a numerical analysis in the
previous chapter, with a focus on monitoring interlaminar crack growth using a new
interrogation method.
The test procedures for the following experiments have been previously established in
Chapter 4 in which baseline testing of the composite specimens was performed to set precise test
parameters for stable crack propagation. Although stable crack propagation was not previously
achieved under Mode-II bending, the following work will solve this problem using cyclic
loading. Each specimen from the baseline testing in Chapter 4 will now include an embedded
FBG sensor for structural health monitoring purposes.
Previous Work
Although many research groups have reported the presence of ‘spectrum broadening’
when the FBG sensor is subjected to non-uniform strain, a relatively small number of works have
been made to quantify the changes of the reflection spectrum for damage monitoring purposes.
Takeda et al. [27, 32, 33] used the ratio of the peak intensities in the reflection spectrum as an
indicator of damage growing in composite materials and Ling et al. [34] noted that the bandwidth

64
of the reflection spectrum increases as the non-uniformity of the strain distribution increases, but
did not quantify the trend beyond the peak intensity ratio method.
The newly proposed interrogation method will both improve upon the peak intensity ratio
method, as discussed in the previous chapter, and provide a robust spectrum quantification
capability.
Objectives
The following experiments will validate the optimal parameter for spectrum
quantification that was previously identified in Chapter 5 as the spectrum bandwidth. The
benefits of using either the spectrum bandwidth or center wavelength monitoring method in
place of the peak wavelength monitoring method will be clearly defined through these
experiments.
Manufacturing of Composite Specimen
Unidirectional glass/epoxy composite laminates to be used in the following experiments
were manufactured by a hand lay-up of 16 plies of pre-preg sheets (Cycom 1003) and cured in a
hot press. During the hand lay-up process, a Teflon film of approximate length 50 mm was
inserted in the mid-plane to act as an initial crack, and an FBG sensor was embedded at the +2 or
+6 ply location from the mid-plane for each laminate (Figure 40). The center of the FBG sensor
with a 10 mm gauge length was located approximately 12.5 mm away from the initial crack tip.
The specimens measured approximately 152.4 x 25.4 x 3 mm3.

65
Figure 40. Side view of specimen lay-up showing an embedded Teflon insert and potential
sensor locations
Mode-I Bending Interlaminar Fracture Test
A Mode-I interlaminar quasi-static fracture test was conducted as a validation experiment
following the ASTM Standard D5528--01 [60]. The Double Cantilever Beam (DCB) specimen
(Figure 41) with an FBG sensor embedded at the +6 ply location was pulled at 5 mm/min and the
sensor was monitored using an interrogator (Micron Optics, sm125) capable of recording the
reflection spectrum in the wavelength range of 1510 to 1590 nm with an accuracy of 2.5 pm and
a scan frequency of 5 Hz.
Figure 41. Double Cantilever Beam (DCB) specimen for mode-I interlaminar fracture test

66
Mixed-Mode Bending Interlaminar Fracture Test
A mixed-mode interlaminar fracture test was also conducted by using a mixed-mode
bending (MMB) test setup shown in Figure 42. A FBG sensor was embedded at the +6 ply
location. The test fixture used in this experiment is described in detail by ASTM D 6671-04
[67]. The fixture is designed to apply a specific ratio of Mode I to Mode II loading by varying
the position of the loading yoke. The ratio of Mode I to Mode II loading for this experiment was
3:1 and the specimen was loaded at 2 mm/min.
Figure 42. Mixed-mode bending test setup for mixed-mode interlaminar fracture test
Mode-II Bending Interlaminar Fracture Test
A Mode-II interlaminar fatigue fracture test was conducted by using an End Notched
Flexure (ENF) test geometry shown in Figure 43. A FBG sensor was embedded at the +2 ply
location. A cyclic load was applied at the mid-span at 1 Hz, and the peak load and the minimum
load were 300 N and 30 N, respectively. The reflection spectrum was recorded in the same
manner as the previous experiments.
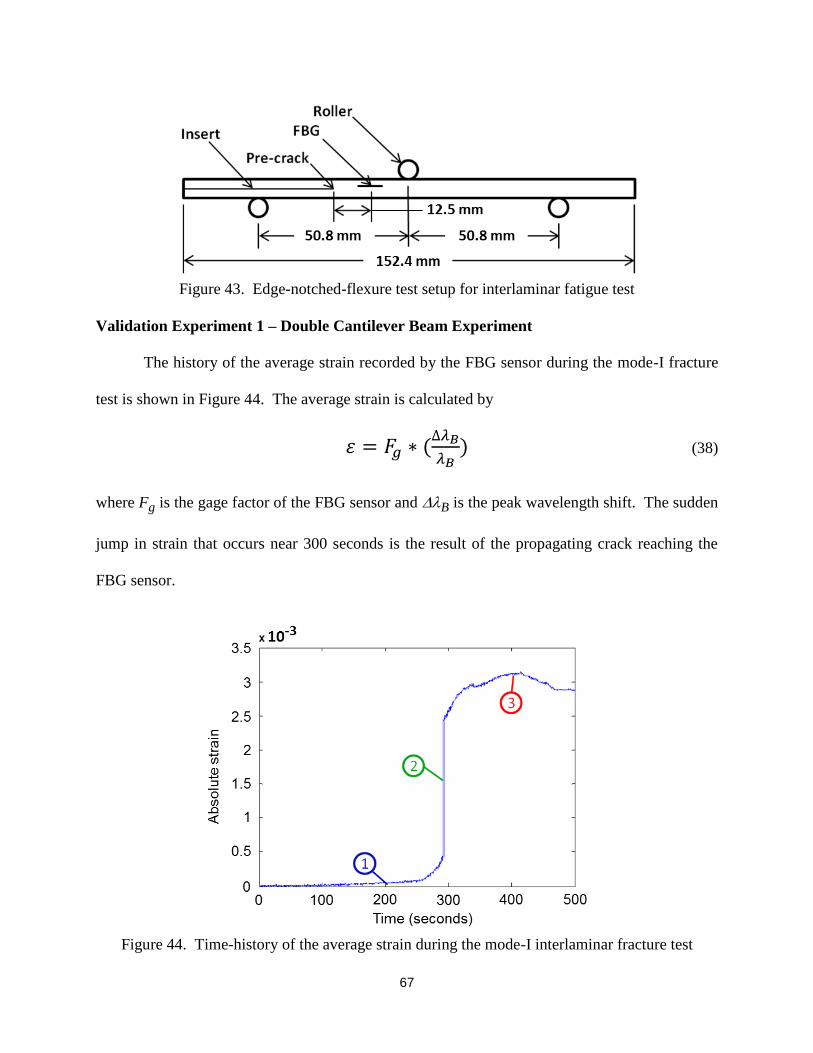
67
Figure 43. Edge-notched-flexure test setup for interlaminar fatigue test
Validation Experiment 1 – Double Cantilever Beam Experiment
The history of the average strain recorded by the FBG sensor during the mode-I fracture
test is shown in Figure 44. The average strain is calculated by
(38)
where Fg is the gage factor of the FBG sensor and B is the peak wavelength shift. The sudden
jump in strain that occurs near 300 seconds is the result of the propagating crack reaching the
FBG sensor.
Figure 44. Time-history of the average strain during the mode-I interlaminar fracture test
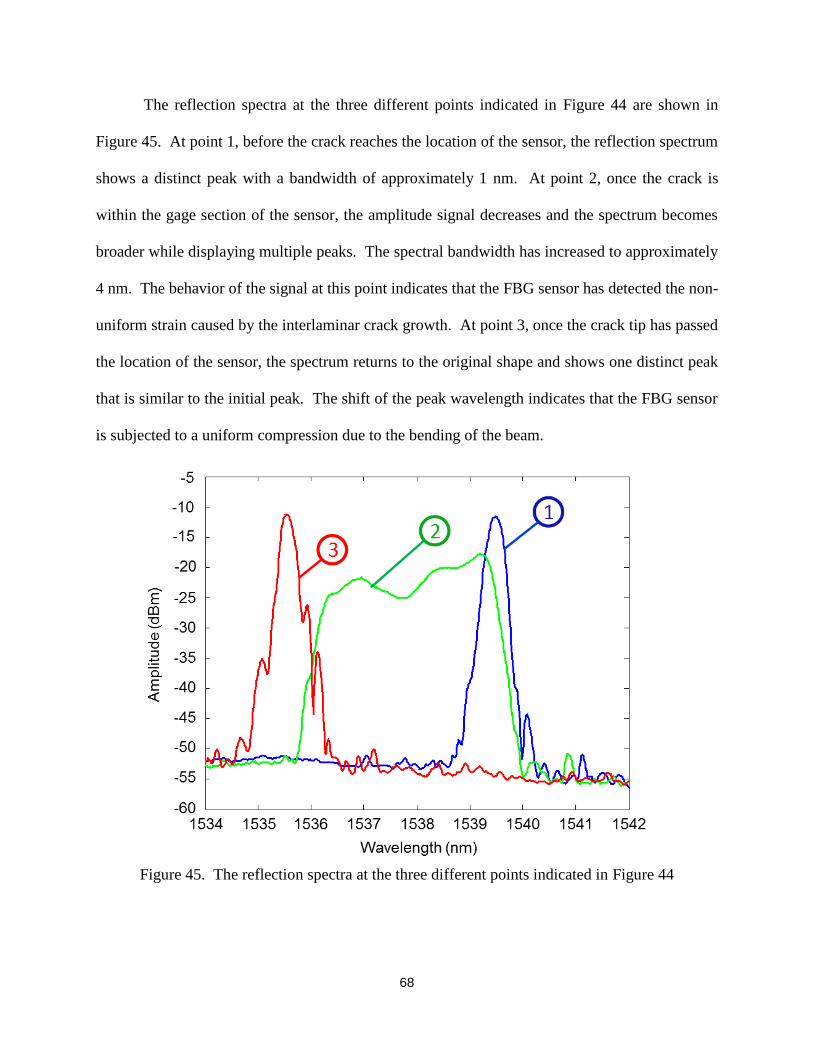
68
The reflection spectra at the three different points indicated in Figure 44 are shown in
Figure 45. At point 1, before the crack reaches the location of the sensor, the reflection spectrum
shows a distinct peak with a bandwidth of approximately 1 nm. At point 2, once the crack is
within the gage section of the sensor, the amplitude signal decreases and the spectrum becomes
broader while displaying multiple peaks. The spectral bandwidth has increased to approximately
4 nm. The behavior of the signal at this point indicates that the FBG sensor has detected the non-
uniform strain caused by the interlaminar crack growth. At point 3, once the crack tip has passed
the location of the sensor, the spectrum returns to the original shape and shows one distinct peak
that is similar to the initial peak. The shift of the peak wavelength indicates that the FBG sensor
is subjected to a uniform compression due to the bending of the beam.
Figure 45. The reflection spectra at the three different points indicated in Figure 44

69
The peak wavelength, center wavelength, and -20 dB bandwidth measured during the
Mode-I interlaminar fracture test on a DCB specimen with a +6 sensor embedding location are
shown in Figure 46. All signals remain constant until the crack reaches the vicinity of the FBG
sensor. As the crack reaches the sensor, the strain concentration near the crack tip causes the
shift and broadening of the reflection spectrum. The bandwidth signal increases as the crack
approaches, reaches a peak when the crack tip reaches the center of the gauge section, and
returns to nearly the initial bandwidth as the crack passes the sensor. As a result, the peak
wavelength changes rapidly while the center wavelength changes gradually. It is noted that
monitoring the spectral bandwidth allows early detection of crack propagation.
Figure 46. Time-histories of the peak wavelength, center wavelength, and bandwidth during the
mode-I interlaminar fracture test with a +6 sensor embedding location
The peak wavelength, center wavelength, and -20 dB bandwidth measured during the
Mode-I interlaminar fracture test on a DCB specimen with a +2 sensor embedding location are
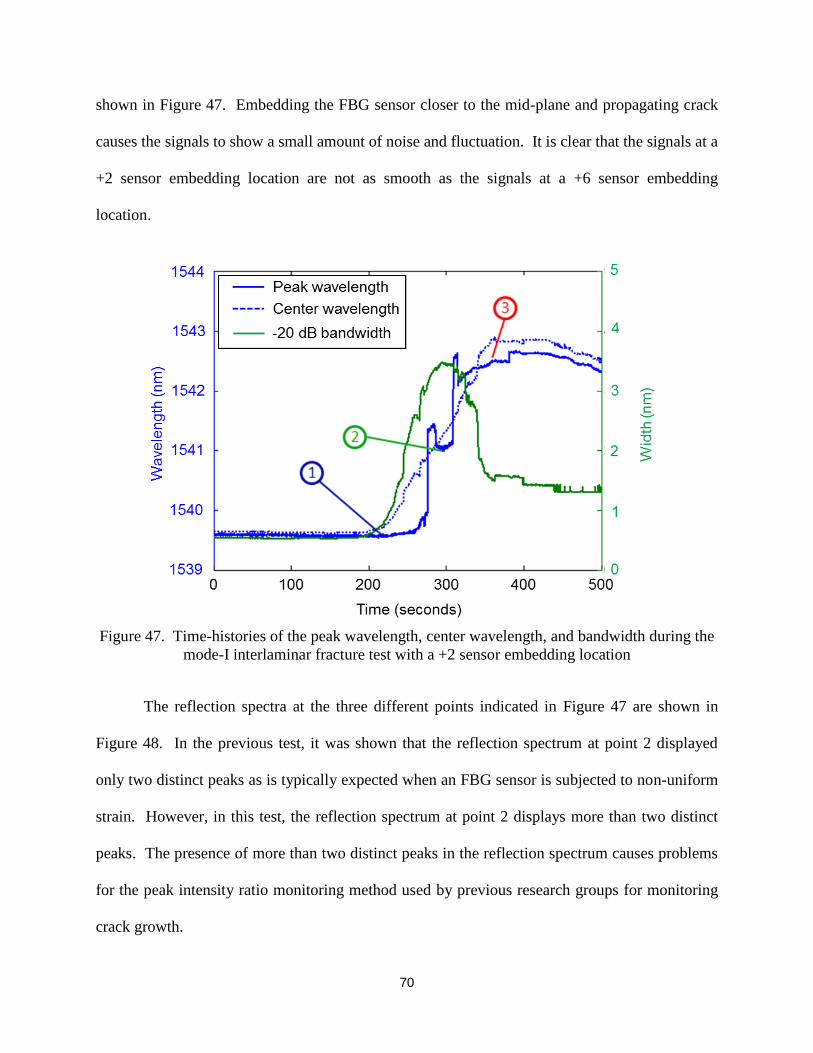
70
shown in Figure 47. Embedding the FBG sensor closer to the mid-plane and propagating crack
causes the signals to show a small amount of noise and fluctuation. It is clear that the signals at a
+2 sensor embedding location are not as smooth as the signals at a +6 sensor embedding
location.
Figure 47. Time-histories of the peak wavelength, center wavelength, and bandwidth during the
mode-I interlaminar fracture test with a +2 sensor embedding location
The reflection spectra at the three different points indicated in Figure 47 are shown in
Figure 48. In the previous test, it was shown that the reflection spectrum at point 2 displayed
only two distinct peaks as is typically expected when an FBG sensor is subjected to non-uniform
strain. However, in this test, the reflection spectrum at point 2 displays more than two distinct
peaks. The presence of more than two distinct peaks in the reflection spectrum causes problems
for the peak intensity ratio monitoring method used by previous research groups for monitoring
crack growth.
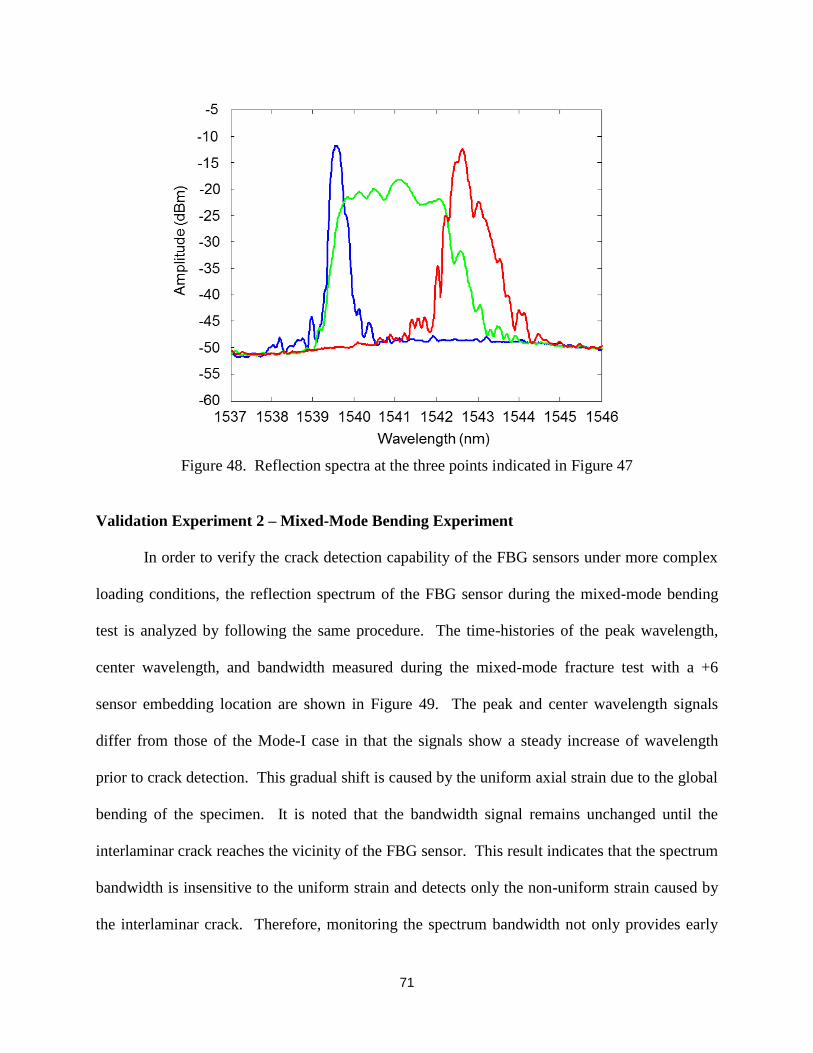
71
Figure 48. Reflection spectra at the three points indicated in Figure 47
Validation Experiment 2 – Mixed-Mode Bending Experiment
In order to verify the crack detection capability of the FBG sensors under more complex
loading conditions, the reflection spectrum of the FBG sensor during the mixed-mode bending
test is analyzed by following the same procedure. The time-histories of the peak wavelength,
center wavelength, and bandwidth measured during the mixed-mode fracture test with a +6
sensor embedding location are shown in Figure 49. The peak and center wavelength signals
differ from those of the Mode-I case in that the signals show a steady increase of wavelength
prior to crack detection. This gradual shift is caused by the uniform axial strain due to the global
bending of the specimen. It is noted that the bandwidth signal remains unchanged until the
interlaminar crack reaches the vicinity of the FBG sensor. This result indicates that the spectrum
bandwidth is insensitive to the uniform strain and detects only the non-uniform strain caused by
the interlaminar crack. Therefore, monitoring the spectrum bandwidth not only provides early

72
detection of crack propagation but also differentiates the normal structural responses from the
responses due to the localized defects.
Figure 49. Time-histories of the peak wavelength, center wavelength, and bandwidth during the
mixed-mode interlaminar fracture test with a +6 sensor embedding location
The reflection spectra at the three different points indicated in Figure 49 are shown in
Figure 50. The reflection spectrum at point 2 is nearly flat at the peak amplitude and just barely
displays two distinct peaks. A reflection spectrum of this type is very close to presenting a
significant problem to the peak intensity monitoring method because if the spectrum were to
remain flat at the peak amplitude, two distinct peaks would not be identified and damage would
not be detected.
The time-histories of the peak wavelength, center wavelength, and bandwidth measured
during the mixed-mode fracture test with a +2 sensor embedding location are shown in Figure
51. The smoothness of the signals shows little difference when compared to those at the +6
sensor embedding location.

73
Figure 50. Reflection spectra at the three points indicated in Figure 49
Figure 51. Time-histories of the peak wavelength, center wavelength, and bandwidth during the
mixed-mode interlaminar fracture test with a +2 sensor embedding location

74
The reflection spectra at the three different points indicated in Figure 51 are shown in Figure 52.
The presence of more than two distinct peaks in the reflection spectrum at point 2 could again
present problems for the peak intensity ratio monitoring method.
Figure 52. Reflection spectra at the three points indicated in Figure 51
Validation Experiment 3 – End-Notched Flexure Specimen Subject to Cyclic Loading
In order to demonstrate the applicability of the spectral-bandwidth monitoring to
interlaminar fatigue crack growth, the reflection spectrum obtained during the ENF fatigue test is
analyzed using the same procedure. The time-history of the interlaminar fatigue crack growth
under cyclic Mode-II loading is shown in Figure 53. The crack tip position was determined from
the compliance of the ENF specimen calibrated with various delamination lengths. It is shown
that the crack propagated along the FBG sensor in a slow and stable manner.

75
Figure 53. Time-history of interlaminar fatigue crack growth in an edge-notched-flexure
specimen
The time-histories of the peak wavelength, center wavelength, and bandwidth measured
during the fatigue test are shown in Figure 54. The initial Bragg wavelength of the sensor is
approximately 1540 nm. The peak wavelength signal oscillates in a way that mirrors the cyclic
loading applied to the specimen. The amplitude of the oscillation remains constant until the
fatigue crack reaches the location of the FBG sensor. During this period, the bandwidth signal
does not show any oscillation, which indicates that the sensor is subjected to uniform
compressive strain due to the bending of the beam. The changes in the amplitude and sign of the
wavelength shift shown at approximately 1400 seconds indicate that the crack tip has passed the
location of the sensor and the loading applied to the sensor has changed from compression to
tension. The amplitude of the bandwidth oscillation increases as the crack tip reaches the
location of the sensor and causes non-uniform strain within the gauge section. It is important to
note that the increase of the bandwidth amplitude is detected approximately 200 seconds earlier

76
than the changes in the peak wavelength signals. As the crack tip travels across the gauge
section, the amplitude of the bandwidth signal attains a maximum and decreases to zero. As
discussed earlier, monitoring the bandwidth signal provides the unique benefit of detecting
localized defects even in the presence of complex loading modes and fatigue spectrum.
Figure 54. Time-histories of the peak wavelength, center wavelength, and bandwidth during the
mode-II interlaminar fatigue test.
Findings
Multiple experiments were performed to monitor interlaminar crack growth in a
composite specimen with an embedded FBG sensor. The reflection spectrum was measured
during the experiments using three spectrum quantification parameters: peak wavelength, center

77
wavelength, and the optimal parameter identified with the numerical analysis in Chapter 5 –
bandwidth. In the Mode-I and Mixed-Mode fracture tests, it was found that the center
wavelength and bandwidth monitoring methods were able to detect damage prior to the peak
wavelength method. In the Mode-II fatigue test, it was also found that the center wavelength and
bandwidth monitoring methods were able to detect damage earlier. Additionally, measuring the
spectral response with the bandwidth method allowed the signal to remain constant despite the
fluctuation from cyclic loading experienced by the peak and center wavelength methods.
The spectral bandwidth monitoring method has been shown to be a more robust and
effective method than the previous monitoring method of peak wavelength and the peak intensity
ratio method previously employed by Takeda et al. [27, 32, 33] through multiple experiments
and various bending modes.
Specimen with Multiple Embedded FBG Sensors
After improving upon past methods of monitoring crack growth in small-scale composite
specimen with a single FBG sensor, it is of interest to transition to larger specimen with multiple
embedded FBG sensors. In the previous experiments, the crack propagation direction and
approximate position was known, however it is important to investigate scenarios where the
crack propagation direction is not known or the point at which damage will occur is not known.
Using multiple embedding locations and spacing out the positioning of the sensors will increase
the damage detection probability in such scenarios and cover a more sufficient area in large-scale
composite panels. The next chapter will focus on this task.

78
CHAPTER 7
DEVELOPMENT OF A SMART COMPOSITE PANEL
Introduction
A large-scale, thick-section woven composite panel with multiple embedded FBG
sensors was created using the Vacuum-Assisted Resign Transfer Molding (VARTM) process to
investigate its self-diagnostic ability after sustaining impact damage. A proof loading test, meant
to represent in-service loading of a large panel, was performed on the smart composite panel
both before and after impact damage to investigate the change in peak wavelength shift of the
sensors. The difference in behavior of the peak wavelength shift signal during proof loading
before and after the panel was impacted was used to detect impact damage.
Previous work
Previous work done by Takeda [46] et al. employed compression loading of a large
composite panel with multiple embedded FBG sensors to detect impact damage based on the
behavior of the reflection spectrum of the FBG sensors. The problem with this method is that the
research group only demonstrated the damage detection ability by further damaging the panel.
For structural health monitoring purposes, this is unacceptable because the method should be
capable of monitoring for defects without further increasing the damage. While this group also
demonstrated the ability to detect the dynamic impact event with a high frequency interrogator, it
is necessary to research alternative monitoring methods using low frequency interrogators
because high frequency interrogators are extremely expensive.
Objectives
A new method for monitoring and detecting damage caused by impact loading on a thick-
section woven composite panel using multiple embedded FBG sensors will be developed and
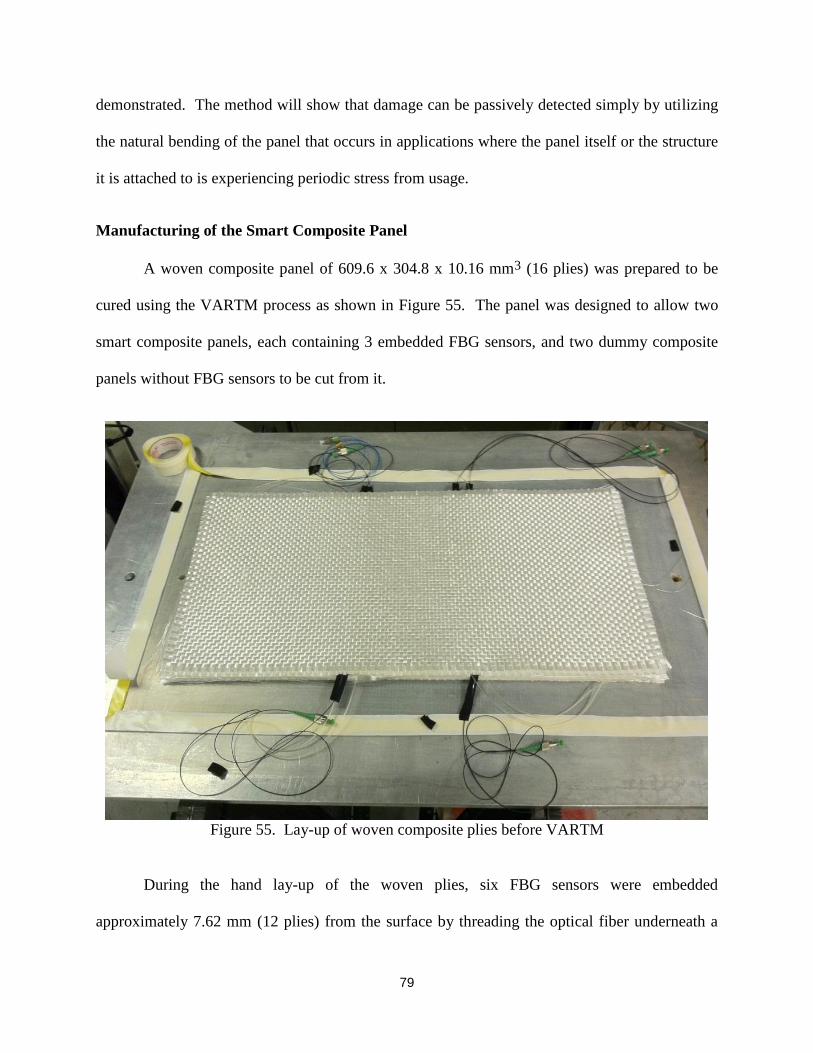
79
demonstrated. The method will show that damage can be passively detected simply by utilizing
the natural bending of the panel that occurs in applications where the panel itself or the structure
it is attached to is experiencing periodic stress from usage.
Manufacturing of the Smart Composite Panel
A woven composite panel of 609.6 x 304.8 x 10.16 mm3 (16 plies) was prepared to be
cured using the VARTM process as shown in Figure 55. The panel was designed to allow two
smart composite panels, each containing 3 embedded FBG sensors, and two dummy composite
panels without FBG sensors to be cut from it.
Figure 55. Lay-up of woven composite plies before VARTM
During the hand lay-up of the woven plies, six FBG sensors were embedded
approximately 7.62 mm (12 plies) from the surface by threading the optical fiber underneath a

80
single weave until the gauge length was positioned beneath it as seen in Figure 56. A cross-
sectional view of the embedding location of the FBG sensors in the thickness of the panel is
shown in Figure 57.
Figure 56. Embedding position of FBG sensor in woven layer
Figure 57. Cross-sectional view of the embedding location of FBG sensors in the thickness of
the panel
The positioning of the FBG sensors for the smart composite panels is shown in Figure 58.
The sensors were positioned so that they would all be within the loading span during the proof
loading test.
16 plies, 0.4” 12 plies, 0.3”
Optical fiber
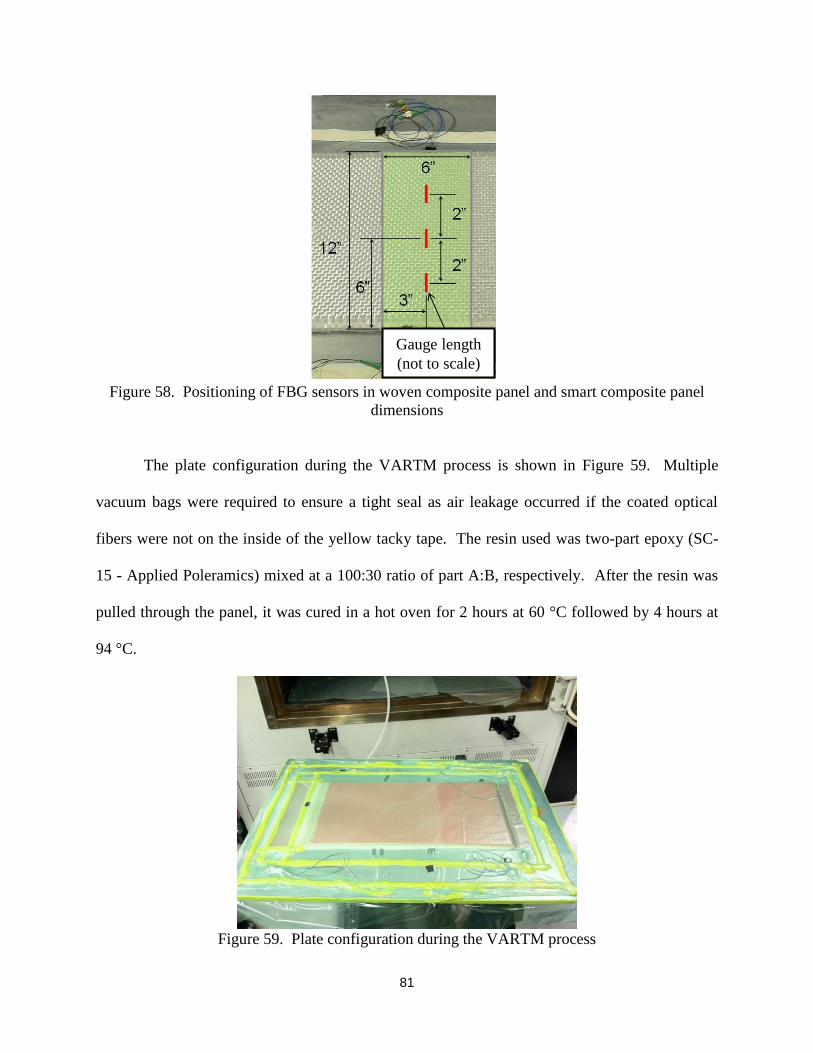
81
Figure 58. Positioning of FBG sensors in woven composite panel and smart composite panel
dimensions
The plate configuration during the VARTM process is shown in Figure 59. Multiple
vacuum bags were required to ensure a tight seal as air leakage occurred if the coated optical
fibers were not on the inside of the yellow tacky tape. The resin used was two-part epoxy (SC-
15 - Applied Poleramics) mixed at a 100:30 ratio of part A:B, respectively. After the resin was
pulled through the panel, it was cured in a hot oven for 2 hours at 60 °C followed by 4 hours at
94 °C.
Figure 59. Plate configuration during the VARTM process
Gauge length
(not to scale)

82
One of the final smart composite panels cut from the completed 304.8 x 609.6 mm2 plate
and the FBG sensor embedding locations is shown in Figure 60.
Figure 60. Smart composite panel with FBG sensor embedding locations
Proof Loading Test
A proof loading bending test was performed on the smart composite panel (SCP) prior to
impact damage. The SCP was centered in a 4-point bending fixture with a support span and
loading span of 203.2 mm and 152.4 mm, respectively. The FBG sensors were nearest to the
bottom of the SCP. The test set-up is shown in Figure 62. The SCP was twice loaded and
unloaded to a peak load of 35 kN at a constant displacement rate of 5 mm/min. The time
histories of the load and displacement during proof loading of the undamaged panel are shown in
Figure 61. The loading remained within the linear-elastic region of the material to prevent
unwanted damage prior to impact testing. It was critical that the SCP remained undamaged to
ensure all damage incurred was solely the result of impact damage. During loading, the
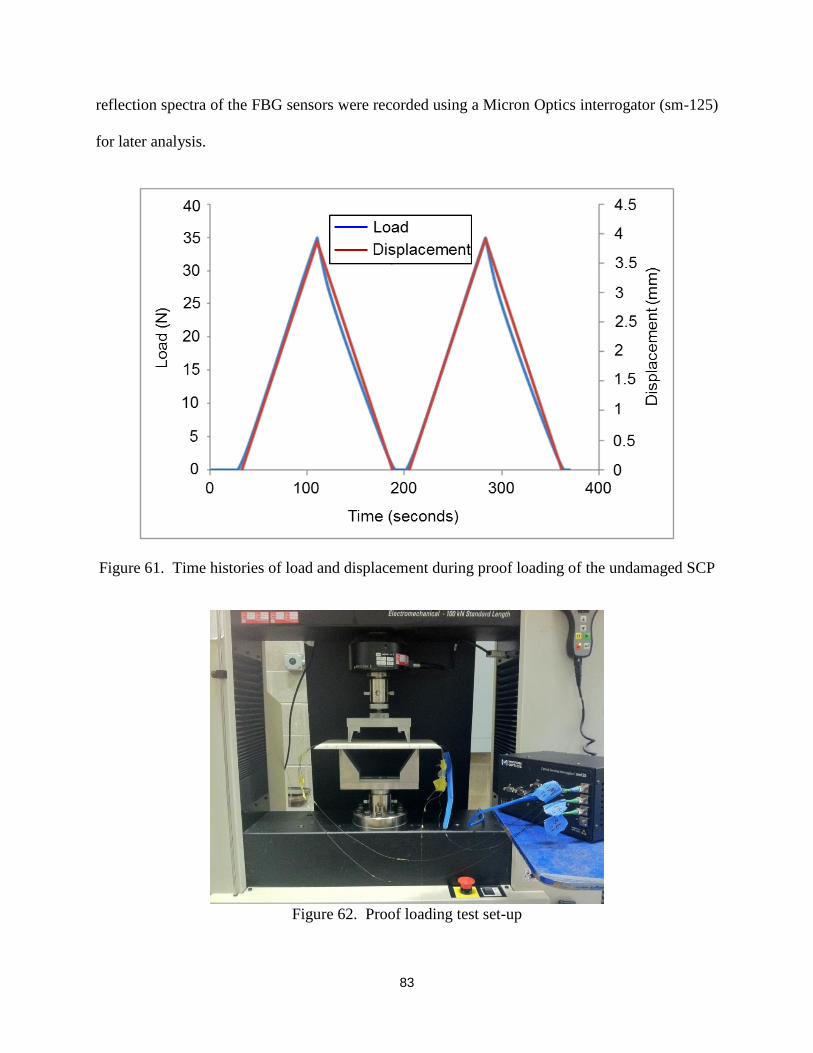
83
reflection spectra of the FBG sensors were recorded using a Micron Optics interrogator (sm-125)
for later analysis.
Figure 61. Time histories of load and displacement during proof loading of the undamaged SCP
Figure 62. Proof loading test set-up

84
Drop-Weight Impact Test
After proof loading of the undamaged SCP, damage was inflicted using an Instron drop-
weight impact tower. The SCP was subjected to 135 J of impact energy at the impact location
indicated in Figure 63. This particular amount of impact energy was chosen because it created a
damage area with an approximate two inch diameter. This allowed for the point of impact to be
a sufficient distance away from the middle sensor while still encompassing it in the damage area.
The impact location was chosen so that each sensor was a different distance away from impact.
The SCP was impacted on the rough side of the panel 12 plies (7.62 mm) away from the
embedded FBG sensors.
Figure 63. Impact location and damage area
The support fixture on which the SCP was placed for impact loading using the drop-
weight impact tower is shown in Figure 64. The SCP was secured to the support fixture at each
roller using a rubber band to prevent rebounding upon impact.
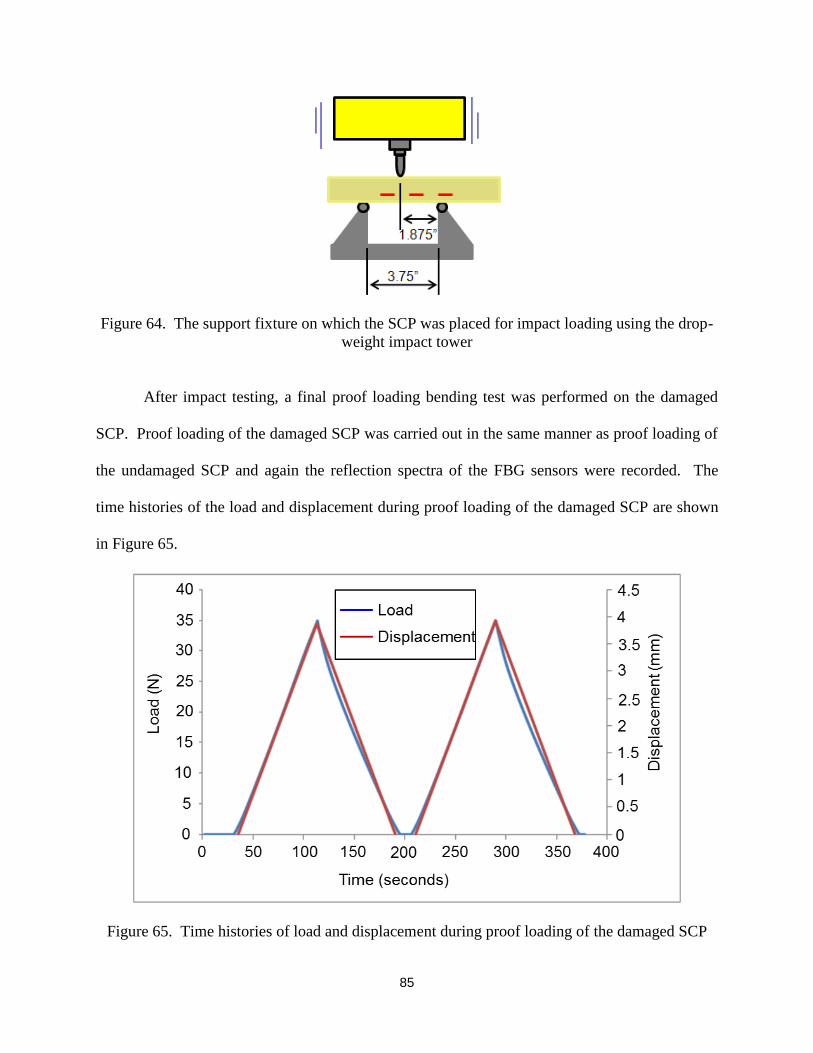
85
Figure 64. The support fixture on which the SCP was placed for impact loading using the drop-
weight impact tower
After impact testing, a final proof loading bending test was performed on the damaged
SCP. Proof loading of the damaged SCP was carried out in the same manner as proof loading of
the undamaged SCP and again the reflection spectra of the FBG sensors were recorded. The
time histories of the load and displacement during proof loading of the damaged SCP are shown
in Figure 65.
Figure 65. Time histories of load and displacement during proof loading of the damaged SCP

86
Detecting Damage by Monitoring Peak Wavelength Shift
The time histories of the peak wavelength shift of the embedded FBG sensors during the
proof loading test before and after impact damage on the SCP are shown in Figure 66 and Figure
67, respectively. The peak wavelength shift is measured as the difference between the current
peak wavelength at time t and the initial peak wavelength.
Prior to impact damage, the sensors are shown to be functioning properly as they all
follow the two loading cycles without any discrepancies. After impact damage, the middle
sensor, located within the damage zone, no longer follows the linear rise and fall of the loading
cycles and only reaches a third of the maximum peak wavelength shift reached during proof
loading before impact damage. This change in behavior is a clear indication that the impact
damage was detected by the middle sensor. It was predicted that the impact damage would cause
the panel to become more compliant and therefore the peak wavelength shift would increase in
magnitude rather than decrease. However, the embedding of the FBG sensor into the weave
rather than in between plies may have caused this discrepancy. The desensitization of the sensor
to strain after damage is believed to be caused by the separation of the sensor from the woven
threads due to impact thus limiting its ability to bend with the panel. It may have also been
caused by the less compliant, undamaged areas of the panel near the edges taking on the stress
during loading and absorbing a significant amount of strain away from the damaged area.
The left sensor, the second closest sensor to the damage zone, was also able to detect
damage albeit with a less significant change in peak wavelength shift during proof loading after
impact. The peak wavelength shift of the left sensor shows significant fluctuation during both
loading and unloading cycles and this indicates damage is nearby. Alternatively, the right
sensor, the furthest sensor from the damage zone, remains unchanged.

87
Figure 66. Time history of peak wavelength shift of the embedded FBG sensors during the proof
loading test before impact damage on the SCP
Figure 67. Time history of peak wavelength shift of the embedded FBG sensors during the proof
loading test after impact damage on the SCP

88
Findings
A new method that aims to utilize the passive loading and unloading of a composite
structure in service for impact detection purposes has been found to be effective. This new
method was tested on a large-scale, thick-section composite panel with three embedded FBG
sensors subjected to proof loading meant to simulate the passive stresses on a structure both
before and after impact damage to investigate the difference in spectral response. The sensors’
signals were monitored before and after impact during proof loading and the presence of impact
damage was detected by monitoring the peak wavelength shift of the sensors located within or
nearby the damage zone.
Future Work on Smart Composite Panels
Future work would include developing the capability to locate impact damage based on
the response of the embedded FBG sensors. This could be done by determining the FBG sensor
embedding locations that optimize impact damage detection capability relative to the impact
energy. Additionally, the size and thickness of the panel could be increased while implementing
additional FBG sensors to achieve a closer representation of a full-scale panel.

89
CHAPTER 8
CONCLUSIONS
The development of real-time structural health monitoring techniques for composite
structures using embedded FBG sensors was thoroughly detailed. A new sensor interrogation
method was introduced based on a numerical analysis of an FBG sensor subjected to non-
uniform strain. The current interrogation method for damage detection was improved upon using
the new sensor interrogation method that made earlier detection times possible in multiple
bending modes as demonstrated in various experiments. Small-scale health monitoring
capabilities were extended to thick-section composite panels with multiple FBG sensors to
investigate and transition to large-scale applications.
Durability testing of FBG sensors embedded in composite laminates was performed
through quasi-static tension testing and drop-weight impact testing. In quasi-static tension
testing, the embedded sensors survived until catastrophic failure of the specimen. It was found
that exceeding the prescribed sensor cut-off point incurred a residual effect on the reflection
spectrum causing it to lose intensity upon the reintroduction of strain to the sensor. The
embedded sensors subjected to impact loading survived multiple localized impacts and failed
only when complete splitting in the fiber direction of the specimen occurred. Impacts directly
centered on the center of an embedded sensor’s gauge length caused the reflection spectrum to
broaden and reduce in intensity as the number of impacts increased. It was found that embedded
FBG sensors remained intact and functional until failure of the composite. The survivability of
embedded FBG sensors was adequately established.
The Mode-I and Mode-II fracture toughness of Cycom 1003, a glass fiber/epoxy
composite, were measured and baseline testing parameters were set to achieve stable crack
propagation for future testing of DCB and ENF specimens with embedded FBG sensors. An

90
improved method for measuring the Mode-I fracture toughness for a translucent composite
material was presented. By slightly modifying the procedure outlined in ASTM D 5528, more
data points were produced and more accurate data was obtained. The Mode-II fracture
toughness was calculated albeit with a high percent of variation as expected when unstable crack
propagation is present. An attempt was made at stabilizing the crack by increasing the a/L ratio
in the specimen but testing showed an inconsistent ability to produce a stable crack propagation
in more than one specimen.
A numerical analysis utilizing a transfer matrix formulation was used to investigate the
effect of non-uniform strain on an FBG sensor’s response. A new interrogation method of the
reflection spectrum using bandwidth and center wavelength was introduced. A nearly linear
relationship between bandwidth and strain gradient was found when a -20 dB bandwidth was
used to quantify the reflection spectrum of a sensor subjected to linear strain. This relationship
held true for a highly non-uniform strain distribution and was unaffected by the introduction of a
second order term to create a quadratic strain distribution. The reflection spectrum resulting
from a simulated propagating crack was measured using the peak intensity ratio method and the
proposed bandwidth method. It was shown that the bandwidth method detected the propagating
crack before the peak intensity ratio method if the -10 or -20 dB bandwidth measurement was
used.
Three experiments were conducted to validate the findings of the numerical analysis.
First, damage was monitored using the newly proposed interrogation method by an FBG sensor
embedded in DCB and MMB composite specimens subjected to Mode-I and Mixed-mode
bending interlaminar fracture tests, respectively. Monitoring the reflection spectrum using the
newly proposed method allowed for earlier damage detection than the peak wavelength

91
monitoring method. An additional experiment was conducted in which damage was monitored
by an FBG sensor embedded in an ENF composite specimen subjected to a Mode-II bending
interlaminar fatigue test. Cyclic loading was used to create stable crack propagation in an ENF
specimen. The sensor survived the duration of fatigue loading and the new interrogation method
demonstrated the ability to detect damage earlier than the peak wavelength method.
A new method for monitoring and detecting damage caused by an impact event on a
large-scale, thick-section woven composite panel using multiple embedded FBG sensors was
developed. A proof loading test, meant to represent in-service loading of a large panel, was
performed on the smart composite panel both before and after impact damage to investigate the
change in peak wavelength shift of the sensors. It was found that irregular behavior of the peak
wavelength shift during proof loading of the damaged smart composite panel acted as a good
indicator that impact damage was detected. The FBG sensors embedded within and nearby the
damage zone detected the presence of damage.
This work hopes to provide the bridge between simple, single FBG sensor experiments to
complex, multiple FBG sensor large-scale applications that is necessary for the development of
full-scale smart panels in composite structures. The research conducted not only establishes the
excellent feasibility of FBG sensors for real-time structural health monitoring but also improves
upon past interrogation methods and develops a new damage monitoring method that will be
crucial to implementing thick-section smart composite panels.

92
APPENDIX

93
APPENDIX
Distribution Statement
UNCLASSIFIED: Distribution Statement A. Approved for public release.

94
Derivation of Interlaminar Fracture Toughness Curve
(
)
(
)
(
)
(
)
(
)
( )
(
)
(
)

95
REFERENCES

96
REFERENCES
1. M. Kobayashi, K.-T. Wu, L. Song, C.-K. Jen and N. Mrad, “Structural health monitoring of
composites using integrated flexible piezoelectric ultrasonic transducers,” Journal of
Intelligent Material Systems and Structures 20, (2009): 969-977.
2. L. Yin, X.-M. Wang and Y.-P. Shen, “Damage-monitoring in composite laminates by
piezoelectric films,” Computers & Structures 59, no. 4 (1996): 623-630.
3. C. Ramos, R. de Oliveira, A. T. Marques and O. Frazao, “Measurement of dynamic strain
using an optic fibre system in adaptive composite laminates with an integrated piezoelectric
sensor/actuator,” Optica Applicata 41, no. 1 (2011): 79-88.
4. H. T. Banks, D. J. Inman, D. J. Leo and Y. Wang, “An experimentally validated damage
detection theory in smart structures,” Journal of Sound and Vibration 191, no. 5 (1996): 859-
880.
5. S.G. Galea, W.K. Chiu and J. Paul, “Use of piezoelectric films in detecting and monitoring
damage in composites,” Journal of Intelligent Material Systems and Structures 4, (1993):
330-336.
6. P. Tan and L. Y. Tong, “Delamination detection of composite beams using piezoelectric
sensors with evenly distributed electrode strips,” Journal of Composite Materials 38, no. 4
(2004): 321-352.
7. P. Tan and L. Y. Tong, “Identification of delamination in a composite beam using integrated
piezoelectric sensor/actuator layer,” Composite Structures 66, no. 1-4 (2004): 391-398.
8. X. P. Qing, S. J. Beard, A. Kumar and T. K. Ooi, “Built-in sensor network for structural
health monitoring of composite structure,” Journal of Intelligent Material Systems and
Structures 18, (2007): 39-49.
9. I.-G. Kim, H.-Y. Lee and J.-W. Kim, “Impact damage detection in composite laminates using
PVDF and PZT sensor signals,” Journal of Intelligent Material Systems and Structures 16,
(2005): 1007-1013.
10. W.K. Chiu, S.C. Galea, H. Zhang, R. Jones, and Y.C. Lam, “The use of piezoelectric thin
film sensors for structural integrity monitoring,” Journal of Intelligent Material Systems and
Structures 5, (1994): 683-693.
11. I. Kim, H. T. Hahn and D. Weems, “Impact monitoring in smart composite structures using
piezoelectric sensors,” Proceedings of 6th
Japan-U.S. Conference on Composite Materials,
Technomics Pub Co., pp. 201-210.

97
12. C. Y. Park, I. Kim and Y. S. Lee, “Monitoring of low-velocity impact damage initiation of
gr/ep panel using piezoelectric thin film sensor,” Journal of the Korean Society for
Composite Materials 15, no. 2 (2002): 11-17.
13. J. Haywood, P. T. Coverley, W. J. Staszewski, and K. Worden, “An automatic impact
monitor for a composite panel employing smart sensor technology,” Smart Material
Structures 14, (2005): 265-271.
14. F. T. Calkins, A. B. Flatau and M. J. Dapino, “Overview of magnetostrictive sensor
technology,” Journal of Intelligent Material Systems and Structures 18, (2007): 1057-1066.
15. X. Chen and M. Anjanappa, “Health monitoring of composites embedded with
magnetostrictive thick film without disassembly,” Smart Material Structures 15, (2006): 20-
32.
16. H. Kwun and K. A. Bartels, “Magnetostrictive sensor technology and its applications,”
Ultrasonics 36, (1998): 171-178.
17. P. Tan and L. Y. Tong, “Multiple delamination detection of composite beam using
magnetostrictive patch,” AIAA Journal 44, no. 11 (2006): 2547-2551.
18. A. V. Krishnamurthy, M. Anjanappa, Z. Wang and X. Chen, “Sensing of delaminations in
composite laminates using embedded magnetostrictive particle layers,” Journal of Intelligent
Material Systems and Structures 10, (1999): 825-835.
19. R. Jones and S. Galea. “Health monitoring of composite repairs and joints using optical
fibres.” Composite Structures 58 (November 2002): 397-403.
20. H.-Y. Ling, K.-T. Lau, and L. Cheng. “Determination of dynamic strain profile and
delamination detection of composite structures using embedded multiplexed fibre-optic
sensors.” Composite Structures 66 (October 2004): 317-326.
21. S. Minakuchi, Y. Okabe, and N. Takeda. “Real-time detection of debonding between
honeycomb core and facesheet using a small-diameter FBG sensor embedded in adhesive
layer.” Journal of Sandwich Structures and Materials 9 (January 1, 2007): 9-33.
22. Y. Okabe, J. Kuwahara, K. Natori, N. Takeda, T. Ogisu, S. Kojima, and S. Komatsuzaki.
“Evaluation of debonding progress in composite bonded structures using ultrasonic waves
received in fiber Bragg grating sensors.” Smart Materials and Structures 16 (August 1,
2007): 1370-1378.
23. Y. Okabe, R. Tsuji, and N. Takeda. “Application of chirped fiber Bragg grating sensors for
identification of crack locations in composites.” Composites Part A: Applied Science and
Manufacturing 35 (January 2004): 59-65.

98
24. L. Sorensen, J. Botsis, T. Gmür, and J. Cugnoni. “Delamination detection and
characterisation of bridging tractions using long FBG optical sensors.” Composites Part A:
Applied Science and Manufacturing 38 (October 2007): 2087-2096.
25. N. Takeda, Y. Okabe, and T. Mizutani. “Damage detection in composites using optical fibre
sensors.” Proceedings of the Institution of Mechanical Engineers, Part G: Journal of
Aerospace Engineering 221 (January 1, 2007): 497-508.
26. N. Takeda, Y. Okabe, J. Kuwahara, S. Kojima, and T. Ogisu. “Development of smart
composite structures with small-diameter fiber Bragg grating sensors for damage detection:
Quantitative evaluation of delamination length in CFRP laminates using Lamb wave
sensing.” Composites Science and Technology 65 (December 2005): 2575-2587.
27. S. Takeda, Y. Okabe, and N. Takeda. “Delamination detection in CFRP laminates with
embedded small-diameter fiber Bragg grating sensors.” Composites Part A: Applied Science
and Manufacturing 33 (July 2002): 971-980.
28. S. Takeda, Y. Okabe, and N. Takeda. “Monitoring of Delamination Growth in CFRP
Laminates using Chirped FBG Sensors.” Journal of Intelligent Material Systems and
Structures 19 (May 10, 2007): 437-444.
29. S. Yashiro, T. Okabe, and N. Takeda. “Damage identification in a holed CFRP laminate
using a chirped fiber Bragg grating sensor.” Composites Science and Technology 67
(February 2007): 286-295.
30. G. Zhou, and L. M. Sim. “Damage detection and assessment in fibre-reinforced composite
structures with embedded fibre optic sensors-review.” Smart Materials and Structures 11
(December 1, 2002): 925-939.
31. Y. Okabe, S. Yashiro, T. Kosaka, and N. Takeda, “Detection of transverse cracks in CFRP composites using embedded fiber Bragg grating sensors,” Smart materials and structures 9
(2000): 832.
32. S. Takeda, Y. Okabe, T. Yamamoto, and N. Takeda, “Detection of edge delamination in
CFRP laminates under cyclic loading using small-diameter FBG sensors,” Composites
science and technology 63, no. 13 (2003): 1885–1894.
33. S. Takeda, T. Yamamoto, Y. Okabe, and N. Takeda, “Debonding monitoring of composite
repair patches using embedded small-diameter FBG sensors,” Smart materials and structures
16 (2007): 763.
34. H. Y. Ling, K. T. Kau, Z. Su, and E. T. T. Wong, “Monitoring mode II fracture behaviour of
composite laminates using embedded fiber-optic sensors,” Composites Part B: Engineering
38, no. 4 (2007): 488–497.

99
35. K. S. C. Kuang and W. J. Cantwell, “Detection of impact damage in thermoplastic-based
fiber-metal laminates using optical fiber sensors,” Journal of Materials Science Letters 21,
no. 17 (2002): 1351-1354.
36. A. Chambers, M. Mowlem, and L. Dokos. “Evaluating impact damage in CFRP using fibre
optic sensors.” Composites Science and Technology 67 (May 2007): 1235-1242.
37. C.-C. Chang, and J. S. Sirkis. “Design of fiber optic sensor systems for low velocity impact
detection.” Smart Materials and Structures 7 (April 1, 1998): 166-177.
38. C. Park, K. Peters, M. Zikry, Todd Haber, Stephen Schultz, and Richard Selfridge. “Peak
wavelength interrogation of fiber Bragg grating sensors during impact events.” Smart
Materials and Structures 19 (April 1, 2010): 045015.
39. H. Tsuda, N. Toyama, K. Urabe, and J. Takatsubo. “Impact damage detection in CFRP using
fiber Bragg gratings.” Smart Materials and Structures 13 (August 1, 2004): 719-724.
40. H. Tsutsui, A. Kawamata, J. Kimoto, A. Isoe, Y. Hirose, T. Sanda, and N. Takeda. “Impact
damage detection system using small-diameter optical-fiber sensors embedded in CFRP
laminate structures.” Advanced Composite Materials 13 (March 1, 2004): 43-55.
41. H. Tsutsui, A. Kawamata, T. Sanda, and N. Takeda. “Detection of impact damage of
stiffened composite panels using embedded small-diameter optical fibers.” Smart Materials
and Structures 13 (December 1, 2004): 1284-1290.
42. T. Vella, S. Chadderdon, R. Selfridge, S. Schultz, S. Webb, C. Park, K. Peters, and M. Zikry.
“Full-spectrum interrogation of fiber Bragg gratings at 100 kHz for detection of impact
loading.” Measurement Science and Technology 21 (September 1, 2010): 094009.
43. S. Takeda, S. Minakuchi, Y. Okabe, and N. Takeda. “Delamination monitoring of laminated
composites subjected to low-velocity impact using small-diameter FBG sensors.” Composites
Part A: Applied Science and Manufacturing 36 (July 2005): 903-908.
44. R. J. Van Steenkiste and G. S. Springer, Strain and Temperature Measurement with Fiber
Optic Sensors, Lancaster, PA: Technomic, 1997.
45. J. Ang, H.C.H. Li, I. Herszberg, M.K. Bannister, A.P. Mouritz, “Tensile fatigue properties of
fibre Bragg grating optical fibre sensors,” International Journal of Fatigue 32, no. 4 (2010):
762-768.
46. S-i. Takeda, Y. Aoki, Y. Nagao, Monitoring of CFRP stiffened panel under compressive
loading using FBG sensors, Composite Structures (2011),
doi:10.1016/j.compstruct.2011.02.020.
47. M. Yamada and K. Sakuda, “Analysis of almost-periodic distributed feedback slab
waveguide via a fundamental matrix approach,” Applied Optics 26, (1987): 2474-2478.
100
48. S. Yashiro, N. Takeda, T. Okabe, and H. Sekine. “A new approach to predicting multiple
damage states in composite laminates with embedded FBG sensors.” Composites science and
technology 65, no. 3-4 (2005): 659–667.
49. H. Ling, K. Lau, L. Cheng, and K. Chow, “Embedded fibre Bragg grating sensors for non-
uniform strain sensing in composite structures,” Meas Sci Technol 16, (2005) 2415–2424.
50. H.-y. Ling, K.-t. Lau, L. Cheng, and K.-w. Chow, “Embedded fiber Bragg grating sensors for
non-uniform strain sensing in composite structures,” Measurement Science and Technology
16 (2005): 2415-2424.
51. A. Gill, K. Peters, and M. Struder, “Genetic algorithm for the reconstruction of Bragg grating
sensor strain profiles,” Measurement Science and Technology 15 (2004): 1877-1884.
52. S. Huang, M. M. Ohn, R. M. Measures, “Phase-based Bragg intragrating distributed strain
sensor,” Applied Optics 35, no. 7 (1995): 1135-1142.
53. H. R. Williams, R. S. Trask, and I.P. Bond, “Self-healing sandwich panels: Restoration of
compressive strength after impact,” Composites Science and Technology 68 (2008): 3171-
3177.
54. E. Kirkby, R. de Oliveira, V. Michaud, and J. A. Manson, “Impact localization with FBG for
a self-healing carbon fibre composite structure,” Composite Structures 94 (2011): 8-14.
55. H. Jeong, and Y. S. Jang, “Wavelet analysis of plate wave propagation in composite
laminates,” Composite Structures 49 (2000): 443–50.
56. H. A. Haus, “Mirrors and interferometers,” in Waves and Fields in Optoelectronics, N.
Holonyak, ed. (Prentice-Hall, Englewood Cliffs, N.J., 1984), Chap. 3, p. 55-80.
57. S. Huang, M. LeBlanc, and M. M. Ohn, “Bragg intragrating structural sensing,” Applied
Optics 34, no. 22 (1995): 5003–5009.
58. T. Erdogan, “Fiber grating spectra,” J. Lightwave Technol., vol.15, pp. 1227-1294, Aug.
1997.
59. M. Prabhugoud and K. Peters, “Modified Transfer Matrix Formulation for Bragg Grating
Strain Sensors,” Journal of Lightwave Technology 22, no. 10 (10, 2004): 2302-2309.
60. ASTM D 5528-01 (Reapproved 2007), “Mode I Interlaminar Fracture Toughness of
Unidirectional Fiber-Reinforced Polymer Matrix Composites,” ASTM International, W.
Conshohocken, Pa. (first issued in 1994).
61. R. J. Sanford, Principles of Fracture Mechanics, Prentice Hall, Upper Saddle River, NJ,
2003.

101
62. S. N. Chatterjee, "Analysis of Test Specimens for Interlaminar Mode II Fracture Toughness,
Parts 1 and 2," J. Comp. Mater., Vol 25, 1991, pp. 470-493 and pp. 494-511.
63. ASTM D 790-10, “Standard Test Methods for Flexural Properties of Unreinforced and
Reinforced Plastics and Electrical Insulating Materials,” ASTM International, W.
Conshohocken, Pa.
64. W. Hwang and K.S. Han, “Interlaminar fracture behavior and fiber bridging of glass-epoxy
composite under mode I static and cyclic loadings,” J. Compos. Mater.,23, 396–430
(April,1989).
65. P. Davies, B. R. K. Blackman and A. J. Brunner, ‘Standard Test Methods for Delamination
Resistance of Composite Materials: Current Status’, Applied Composite Materials 5, 1998.
66. K. Kageyama, M. Kikuchi, and N. Yanagisawa, "Stabilized End Notched Flexure Test:
Characterization of Mode II Interlaminar Crack Growth," Composite Materials: Fatigue and
Fracture, Third Volume, ASTM STP 1110, 1991, pp. 210-225.
67. ASTM D 6671-04, “Standard Test Method for Mixed Mode I–Mode II Interlaminar Fracture
Toughness of Unidirectional Fiber Reinforced Polymer Matrix Composites,” ASTM
International, W. Conshohocken, Pa.
68. "Cytec Cyply 1002 Epoxy Fiberglass Composite, Unidirectional." Cytec Cyply 1002 Epoxy
Fiberglass Composite, Unidirectional. Web. 16 Mar. 2010.
<http://www.matweb.com/search/datasheet.aspx?matguid=3f2253a553404b13893830617250
b5d8&ckck=1>.
69. [25]. Department of Defense Handbook, Composite Materials Handbook, Volume 1.
Polymer Matrix Composites Guidelines for Characterization of Structural Materials, 2002.
Related Documents