i Development of Rationally Designed Polymer for Extraction and Purification of physiologically active components from Vegetable Oils Thesis submitted for the degree of Doctor of Philosophy at University of Leicester By Eman Mohammed Alghamdi Department of Chemistry Supervisors Dr Elena Piletska Prof Sergey Piletsky September 2018

Welcome message from author
This document is posted to help you gain knowledge. Please leave a comment to let me know what you think about it! Share it to your friends and learn new things together.
Transcript
i
Development of Rationally Designed Polymer for
Extraction and Purification of physiologically
active components from Vegetable Oils
Thesis submitted for the degree
of Doctor of Philosophy at University of Leicester
By
Eman Mohammed Alghamdi
Department of Chemistry
Supervisors
Dr Elena Piletska
Prof Sergey Piletsky
September 2018
ii
Development of Rationally Designed Polymer for Extraction and
Purification of physiologically active components from Vegetable Oils
Eman Alghamdi
Abstract
Vegetable oils are among the most common topics of many recent studies. This is
because they are important constituents of the human diet and a major source of edible
lipids. Moreover, vegetable oils such as soybean, sunflower and palm oils are typical raw
materials used for the production of biodiesel.
Chapter 1 presents an introduction to the physiologically-active compounds in some
vegetable oils in terms of their importance and their available extraction methods from
edible oils.
Chapter 2 displays a development of a rationally designed polymer (RDP) that had
an affinity towards a group of minor components. RDP has several advantages over
commercial sorbents that make it suitable for analytical and industrial applications. It has
a low cost, potential group-specificity towards the compounds that share some common
functionalities, and compatibility with mass-manufacturing and high stability.
Chapter 3 shows a study to develop the rationally designed polymer (RDP) for the
extraction and purification of a group of minor components including free fatty acids, -
tocopherol and some phytosterols, from a range of oils including sunflower oil, palm oil,
wheat germ oil, olive oil, sesame oil and soybean oil in a single step without any additional
pre-treatment with an environmentally-friendly process.
Chapter 4 includes a comparison of the developed RDP and several commercially
available resins in relation to the retention and recovery of the compounds of interest. The
comparison has shown the superiority of RDP to extract the group of minor components
from 20% sunflower oil in heptane with the minimum use of organic solvents.
Chapter 5 also includes a comparison between the RDP and tocopherol-specific
MIPs and magnetic molecularly imprinted nanoparticles (MIP NPs), in terms of the
advantages of each material for particular separation and purification. MIP and MIP NP
have shown an affinity towards -tocopherol; however, the RDP extracted not only -
tocopherol but also other minor compounds in a higher concentration under the mild
conditions of SPE.
iii
Acknowledgments
I would like to express my deepest gratitude to my supervisor, Dr Elena Piletska, for
her patience, valuable guidance and enthusiastic encouragement throughout my research
degree during the past four years. I also would like to thank my second supervisor Prof.
Sergey Piletsky for his inspiring guidance, knowledge, expertise and critical comments on
the thesis.
I would also like to extend my thanks to all the past and present members of the
Biotechnology Group at University of Leicester. Special thanks to Dr Michael Whitcombe,
Dr Kal Karim, Dr Antonio Guerreiro, Dr Francesco Canfarotta, Dr Katarzyna Smolinska-
Kempisty and Dr Joanna Czulak for their help, support and allowing me the opportunity
to work with them to learn more. I would also like to extend my thanks to the technician
Michael Lee for his help in the instrumental programs used for measurements in this thesis.
A sincerely thank to all friends in the Biotechnology Group and in the chemistry
department at University of Leicester for their continuous supporting.
I would like to express my heartfelt gratitude to my father, mother, mother in law,
sisters and brother for their emotional support and their constant encouragement and
motivation throughout my studies. My immeasurable appreciation and thanks is for my
family, my husband, my son and my daughters for encouragement and for being so proud
of my efforts. Your love and excitement have helped me believe in myself. Thank you
very much, I could not have done it without you.
Finally, thanks to King Abdul-Aziz University who has provided the opportunity
and the scholarship which has made this research possible.
iv
Contents
Abstract ............................................................................................................................................. ii
Acknowledgments........... .................................................................................................................. iii
Contents................................................................................................................................................ iv
List of Figures .................................................................................................................................... xi
List of Tables .................................................................................................................................... xv
List of Equations ............................................................................................................................... xv
Publications ................................................................................................................................... xviii
Abbreviations ................................................................................................................................. xix
Chapter One ...................................................................................................................................... 1
Literature review ................................................................................................................................ 2
1.1 Vegetable oils ............................................................................................................................... 2
1.2 Phytochemical composition of the vegetable oils ........................................................................... 3
1.2.1 Fatty acids ............................................................................................................................................. 4
1.2.2 Vitamin E ............................................................................................................................................... 6
1.2.3 Phytosterol .......................................................................................................................................... 12
1.3 Solid phase extraction (SPE) ........................................................................................................ 15
1.4 Commercial sorbents used for SPE of minor components from vegetable oils ............................... 17
1.5 Molecularly imprinted polymer MIP ............................................................................................ 19
1.5.1 Synthesis of Molecularly Imprinted Polymer ...................................................................................... 20
1.5.2 Types of molecular imprinting ............................................................................................................ 22
1.5.2.1 Covalent imprinting ......................................................................................................................... 22
1.5.2.2 Non-covalent imprinting .................................................................................................................. 22
1.5.2.3 Semi-covalent imprinting ................................................................................................................ 22
v
1.6 Applications of Molecularly Imprinting Polymers ......................................................................... 23
1.6.1 Molecularly Imprinted-Solid Phase Extraction (MISPE) ...................................................................... 23
1.6.2 Sensors ................................................................................................................................................ 25
1.6.3 Catalysis .............................................................................................................................................. 25
1.6.4 Drug delivery ....................................................................................................................................... 26
1.7 Computational design of MIPs ..................................................................................................... 27
1.8 Comparison of Molecularly Imprinted Polymer (MIP) and Non-Imprinted Polymer (NIP) ............... 28
1.9 Rationally-designed polymers RDPs ............................................................................................. 29
1.10 Aims and objectives .................................................................................................................. 31
References ....................................................................................................................................... 32
Chapter Two ................................................................................................................................... 44
Development of RDP resin and SPE protocol for extraction of α-tocopherol and other physiologically-
active components from sunflower oil ............................................................................................... 45
2.1 Introduction ............................................................................................................................... 45
2.1.1 Multi-target adsorbents ..................................................................................................................... 45
2.1.2 Sample clean-up using MIPs ............................................................................................................... 48
2.1.3 RDP versus MIP ................................................................................................................................. 488
2.2 Materials and methods ............................................................................................................... 49
2.2.1 Chemicals and reagents ...................................................................................................................... 49
2.2.2 Equipment and analysis techniques.................................................................................................... 49
2.2.3 Molecular modelling of the -tocopherol-specific polymers .............................................................. 50
2.2.4 Synthesis of RDP.................................................................................................................................51
2.2.5 Evaluation of the -tocopherol binding ability ................................................................................... 51
2.2.6 Choosing the cross-linker .................................................................................................................... 53
2.2.7 Polymer synthesis and optimisation of the monomer cross-linker ratio ............................................ 54
2.2.8 Quantification of -tocopherol ........................................................................................................... 55
2.2.9 Characterisation of RDP ...................................................................................................................... 56
vi
2.2.9.1 Measuring the surface area of RDPs ............................................................................................... 56
2.2.9.2 Calculation of the breakthrough volume ........................................................................................ 56
2.2.9.3 Calculation of the binding capacity ................................................................................................. 56
2.2.9.4 Calculation of the -tocopherol recovery ....................................................................................... 57
2.2.9.5 The reusability of the polymer ........................................................................................................ 57
2.2.10 Optimisation of SPE protocol for -tocopherol solution .................................................................. 57
2.2.11 Application of optimised conditions for the extraction of -tocopherol from sunflower oil............ 58
2.2.11.1 Development of the ratio between the oil and loading solvent ................................................... 58
2.3 Results and discussion ................................................................................................................ 59
2.3.1 Molecular modelling ................................................................................................................ 59
2.3.2 Composition of the RDP ...................................................................................................................... 62
2.3.2.1 The functional monomer ................................................................................................................. 63
2.3.2.2 The cross-linker ................................................................................................................................ 65
2.3.2.3 Choosing the optimal monomer: cross-linker ratio ........................................................................ 67
2.3.2.4 Characterisation of the developed polymers .................................................................................. 68
2.3.2.5 Measurement of the breakthrough volume and binding capacity .................................................. 68
2.3.2.6 Evaluation of reusability and measurement of the surface area .................................................... 70
2.3.3 Calibration curve of -tocopherol....................................................................................................... 70
2.3.4 Optimisation of the SPE protocol using the model solution of -tocopherol ..................................... 72
2.3.5 Application of the SPE conditions for the extraction of α-tocopherol and other minor compounds
from sunflower oil ........................................................................................................................................ 77
2.4 Conclusions ................................................................................................................................ 79
References ....................................................................................................................................... 80
Chapter Three .................................................................................................................................. 86
Applications of the optimised SPE protocols to extract selected physiologically-active compounds from
the vegetable oils ............................................................................................................................. 87
3.1 Introduction ............................................................................................................................. 87
3.2 Materials and methods ............................................................................................................ 90
3.2.1 Chemicals and reagents .................................................................................................................. 90
vii
3.2.2 Equipment and analysis techniques .............................................................................................. 90
3.2.3 Invistigation the affinity of RDP towards minor compontns ...................................................... 91
3.2.4 Applications of the optimised SPE protocol to the vegetable oils ............................................. 91
3.2.4.1 Preparation of oil sample ............................................................................................................ 91
3.2.4.2 The SPE protocol conditions ....................................................................................................... 92
3.2.4.3 Calibration curves ......................................................................................................................... 92
3.2.5 Saponification the fatty acids ......................................................................................................... 93
3.2.6 Method validation ........................................................................................................................... 93
3.3 Results and discussion ............................................................................................................. 94
3.3.1 Molecular modelling: ...................................................................................................................... 94
3.3.1.1 Study the molecular modelling of fatty acids ........................................................................... 96
3.3.1.2 Study the molecular modelling of phytosterols ..................................................................... 101
3.3.2 Quantification of the minor components in the vegetable oils................................................ 104
3.3.2.1 Calibration curves ....................................................................................................................... 104
3.3.3 Investigation the minor components .......................................................................................... 105
3.3.3.1 Extraction and analysis of palmitic acid (16:0) ....................................................................... 107
3.3.3.2 Extraction and analysis of oleic (18:1) and linoleic (18:2) acids ........................................... 112
3.3.3.3 Extraction and analysis of -tocopherol .............................................................................. 118
3.3.3.4 Extraction and study of phytosterols ....................................................................................... 121
Campesterol ............................................................................................................................................. 121
Stigmasterol ............................................................................................................................................. 123
β-sitosterol ............................................................................................................................................... 125
3.3.3.5 Further minor components extraction .................................................................................... 127
Sesamin. .................................................................................................................................................... 127
3.3.4 Method validation ......................................................................................................................... 129
3.5 Conclusions ............................................................................................................................ 131
References ................................................................................................................................... 132
Chapter Four .................................................................................................................................. 139
Comparison between the developed RDP and commercial SPE adsorbents for the extraction of minor
compounds from sunflower oil ........................................................................................................ 140
4.1 Introduction ........................................................................................................................... 140
viii
4.1.1 SPE definition .................................................................................................................................. 140
4.1.2 Main steps of SPE ........................................................................................................................... 143
4.1.2.1 Condition...................................................................................................................................... 143
4.1.2.2 Loading (retention)..................................................................................................................... 144
Mechanisms of retention on SPE stationary phases........................................................................... 144
4.1.2.3 Washing ....................................................................................................................................... 146
4.1.2.4 Elution .......................................................................................................................................... 147
4.2 Materials and methods .......................................................................................................... 148
4.2.1 Chemicals and reagents ................................................................................................................ 148
4.2.2 Equipment and analysis techniques ............................................................................................ 149
4.3 Results and discussion ........................................................................................................... 150
4.3.1 After loading ................................................................................................................................... 150
4.3.2 After washing ................................................................................................................................. 154
4.3.3 After elution ........................................................................................................................ 157
4.4 Conclusion: ............................................................................................................................. 160
References ................................................................................................................................... 161
Chapter Five ................................................................................................................................... 165
Comparison of the selectivity and capacity of the three different formats of molecularly imprinted
polymers ........................................................................................................................................ 166
5.1 Introduction ............................................................................................................................. 166
5.2 Materials and methods ............................................................................................................. 168
5.2.1 Chemicals and reagents .................................................................................................................... 168
5.2.2 Equipment and analysis techniques.................................................................................................. 168
5.2.3 Synthesis of the microparticles of bulk polymers RDPs and MIP ...................................................... 169
5.2.4 Preparation of the bulk MIP.............................................................................................................. 169
5.2.5 Characterisation of the MIP particles ............................................................................................... 170
Surface area ............................................................................................................................................... 170
5.2.6 Recognition of MIP towards -tocopherol ....................................................................................... 170
ix
5.2.7 Comparison between the microparticles MIP and RDP .................................................................... 170
5.2.8 Application of the optimised SPE protocol to sunflower oil solution to MIP .................................... 171
5.2.9 Exploration the Selectivity and capacity of MIP NPs ........................................................................ 171
Synthesis of MIP NPs ................................................................................................................................. 171
5.2.9.1 Functionalisation of the glass beads (GB) ..................................................................................... 171
5.2.9.2 Silanisation of the glass beads ....................................................................................................... 172
5.2.9.3 Immobilisation of -tocopherol on the surface of the glass beads .............................................. 173
5.2.9.4 Salinisation the iron oxide nanoparticles ...................................................................................... 174
5.2.9.5 Solid-phase synthesis of MIP NPs in organic solvent .................................................................... 174
5.2.9.6 The elution of MIP NPs .................................................................................................................. 175
5.2.10 Physical characterisation of magnetic nanoparticles ..................................................................... 175
5.2.10.1 Dynamic Light Scattering (DLS) size analysis ............................................................................... 175
5.2.10.2 Investigating the sorption property of MIP NPs .......................................................................... 176
5.3 Results and discussion .............................................................................................................. 177
5.3.1 Synthesis of microparticles MIP ........................................................................................................ 178
5.3.1.1 Characterisation of the MIP........................................................................................................... 178
5.3.1.2 Rebinding of -tocopherol towards the MIP ............................................................................... 178
5.3.2 MIP vs. RDP ....................................................................................................................................... 179
5.3.2.1 Physical characteristic of polymers ............................................................................................... 179
5.3.2.2 Loading capacity ............................................................................................................................ 180
5.3.2.3 Recovery of -tocopherol.............................................................................................................. 182
5.3.2.4 SPE from 20% sunflower using bulk MIP and RDP ........................................................................ 183
5.3.3 Synthesis of MIP NPs ......................................................................................................................... 185
5.3.4 The affinity properties of MIP NPs .................................................................................................... 195
5.4 Conclusion ................................................................................................................................ 198
References ..................................................................................................................................... 200
Chapter Six .................................................................................................................................... 204
Conclusions and future work ........................................................................................................... 205
6.1 Conclusions .............................................................................................................................. 205
6.2 Future work.............................................................................................................................. 207

x
Appendix 1 .................................................................................................................................... 208
Appendix 2 .................................................................................................................................... 212
Appendix 3 .................................................................................................................................... 213
xi
List of Figures
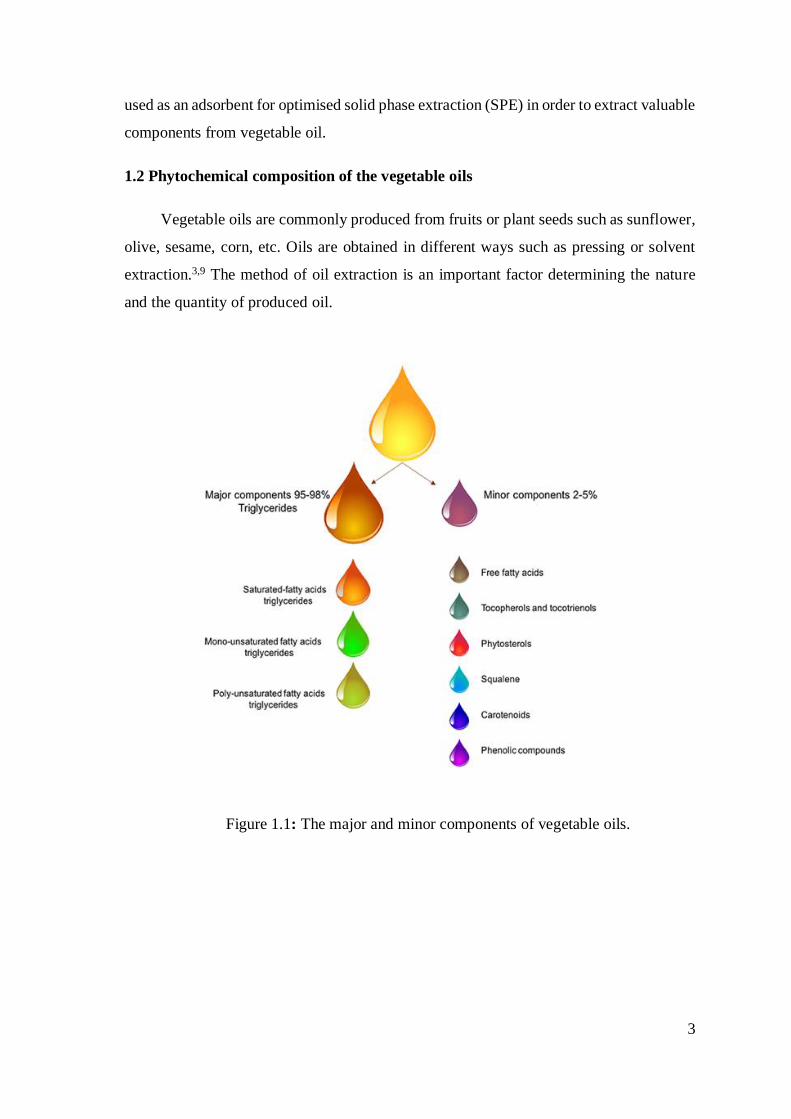
Figure 1.1: The major and minor components of vegetable oils. ....................................................................3
Figure 1.2: Structure of the eight forms of tocopherols and tocoterienols ......................................................7
Figure 1.3: Stereoisomers of α-tocopherol ....................................................................................................10
Figure 1.4: The most common phytosterols available in vegetable oils. ......................................................13
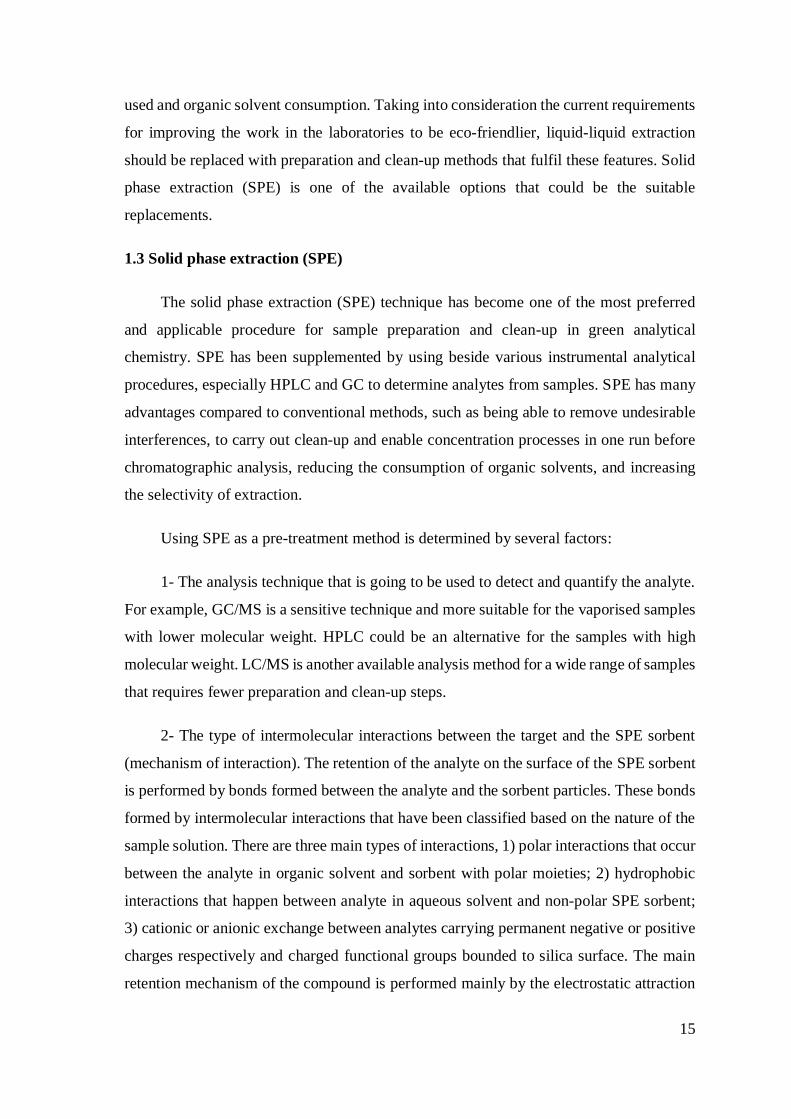
Figure 1.5: Main steps of SPE. ......................................................................................................................16
Figure 1.6: Typical SPE apparatus. ...............................................................................................................17
Figure 1.7: Molecular imprinting approach. .................................................................................................20
Figure 2.1: Chemical structures of some pharmaceuticals extracted using group-specificity MIP. .............47
Figure 2.2: The library of functional monomers used in LEAPFROG screening.........................................52
Figure 2.3: Solid phase extraction tools. .......................................................................................................53
Figure 2.4: The chiral centres in the 2D molecular structure (a), 3D molecular structure of α-tocopherol
minimised using the SYBYL software (b). ...................................................................................................60
Figure 2.5: Molecular complexes between α-tocopherol and the functional monomers: EGMP (1), MAA (-)
(2), UA (-), (3) AMPSA (4), IA (5) and EGDMA (as a cross-linker) (6), the hydrogen bonds are shown as
dotted lines.....................................................................................................................................................63
Figure 2.6: Regeneration cycles of the RDP loaded with -tocopherol in heptane standard solution. Standard
deviations were represented as error bars (n=5). ...........................................................................................70
Figure 2.7: The calibration curve of -tocopherol hexane using UV. ..........................................................71
Figure 2.8: The relationship between concentration and absorbance of -tocopherol solution in hexane. ..71
Figure 2.9: The calibration curve of -tocopherol using GC/MS .................................................................72
Figure 2.10: The optimised conditions for SPE of -tocopherol using RDP. ..............................................74
Figure 2.11: The statistical demonstration of cadidate solvents for the optimisation of SPE conditions. (1)
Condition and loading, (2) washing, (3) elution. ...........................................................................................75
Figure 2.12: The GC/MS chromatogram of a standard solution of -tocopherol.........................................76
xii
Figure 2.13: The similarity between the mass-spectrum of extracted -tocopherol (upper) and the spectrum
of -tocopherol from the spectral library (lower). .......................................................................................76
Figure 2.14: The GC/MS chromatogram for the eluted samples. .................................................................78
Figure 3.1: The equation of esterification (biofuel production). ............................................................88
Figure 3.2: The formation of soap during the esterification (undesirable interference by free fatty
acids in the reactants)..................................................................................................................................88
Figure 3.3: The relative binding energy of common functional monomers towards minor components.
.......................................................................................................................................................................96
Figure 3.4: The 3D structures of palmitic acid (1), the hydrogen bonds between palmitic acid and the
functional monomers: MAA (-) (2), EGDMA(cross-linker) (3), AMPSA (4), EGMP (-) (5), UA (-) (6) and
IA (-) (7). .......................................................................................................................................................98
Figure 3.5: The 3D structures of oleic acid (1), the hydrogen bonds between palmitic acid and the
functional monomers: MAA (-) (2), EGDMA(cross-linker) (3), EGMP (-) (4), AMPSA (5), IA (-) (6) and
UA (-) (7). ......................................................................................................................................................99
Figure 3.6: The 3D structures of linoleic acid (1), the hydrogen bonds between palmitic acid and the
functional monomers: MAA (-) (2), EGDMA(cross-linker) (3), EGMP (-) (4), AMPSA (5), IA (-) (6) and
UA (-) (7). ....................................................................................................................................................100
Figure 3.7: The 3D structures of campesterol (1) and the hydrogen bonds between campesterol and the
functional monomers: MAA (2), EGDMA(cross-linker) (3), EGMP (-) (4), AMPSA (5), IA (-) (6) and UA
(-) (7). ..........................................................................................................................................................102
Figure 3.8: The 3D structures of stigmasterol (1) and the hydrogen bonds between stigmasterol and the
functional monomers: MAA (2), EGDMA (cross-linker) (3), EGMP (-) (4), AMPSA (5), IA (-) (6) and UA
(-) (7). ..........................................................................................................................................................103
Figure 3.9: The 3D structures of -sitosterol (1) and the hydrogen bonds between -sitosterol and the
functional monomers: MAA (2), EGDMA(cross-linker) (3), EGMP (-) (4), AMPSA (5), IA (-) (6) and
UA (-) (7). ....................................................................................................................................................104
Figure 3.10: GC chromatograms of the eluted samples from the six different vegetable oils spiked
with the seven standards (this experiment was repeated three times). ........................................................106
Figure 3.11: GC chromatogram for (a) palmitic acid and (b) methyl palmate solutions in hexane. 108
xiii
Figure 3.12: Mass spectrum of (a) palmitic acid and (b) methyl palmate. ..........................................109
Figure 3.13: IR spectrum for (a) palmitic acid and (b) methyl palmate ..............................................110
Figure 3.14: The relative quantities of palmitic acid in different vegetable oils. ...............................111
Figure 3.15: GC chromatogram for (a) oleic acid and (b) methyl oleate solutions in hexane. .........113
Figure 3.16: GC chromatogram for (a) linoleic acid and (b) methyl linoleate solutions in hexane. 113
Figure 3.17: Mass spectrum of oleic acid (a) and methyl oleate (b). ...................................................114
Figure 3.18: IR spectrum for (a) oleic acid and (b) methyl oleate. ......................................................115
Figure 3.19: Mass spectrum of (a) linoleic acid and (b) methyl linoleate. ..........................................116
Figure 3.20: IR spectrum of linoleic acid (a) and methyl linoleate (b). ...............................................117
Figure 3.21: The relative quantities of oleic and linoleic acids together in different vegetable oils.
.....................................................................................................................................................................118
Figure 3.22: Mass spectrum of extracted α-tocopherol (upward) and NIST mass spectrum (down).
.....................................................................................................................................................................119
Figure 3.23: The relative quantities of α-tocopherol in different vegetable oils. ...............................120
Figure 3.24: The mass spectrum of campesterol. ...................................................................................122
Figure 3.25: The relative quantities of campesterol in different vegetable oils. .................................123
Figure 3.26: Mass spectrum of stigmasterol. ..........................................................................................124
Figure 3.27: The relevant concentrations of stigmasterol in different vegetable oil. .........................125
Figure 3.28: The mass spectrum of -sitosterol. ...................................................................................126
Figure 3.29 : The relative concentrations of β-sitosterol in different vegetable oils..........................127
Figure 3.30: The mass spectrum of sesamin. ..........................................................................................128
Figure 4.1: Illustration of the possible intermolecular interactions between the analyte and surface of
the stationary phase in SPE. .....................................................................................................................145
Figure 4.2: Binding energy of different types of intermolecular interactions. ...................................146
xiv
Figure 4.3: The relationships between the main elements of SPE. ......................................................148
Figure 4.4: Statistical demonstration of the concentration of the compounds which were not absorbed
during loading. ...........................................................................................................................................153
Figure 4.5: Statistical demonstration of the concentration of the compounds which were lost during
washing. ......................................................................................................................................................156
Figure 4.6: Statistical demonstration of the concentration of the eluted compounds. .......................159
Figure 5.1: The chemical structure of -tocopherol (a), the mechanism for breaking the epoxy ring under
basic conditions (b). .....................................................................................................................................172
Figure 5.2: Chemical structure of GOPTS used in the immobilisation. .....................................................173
Figure 5.3: The steps of solid phase synthesis (deoxygenate the polymerisation mixture by purging with a
stream of N2 (a), addition of the polymerisation mixture to the solid phase (b), UV polymerisation (c), cooled
washing (d), hot washing (e) and colour of glass beads after last hot wash (f). ..........................................174
Figure 5.4: GC/MS chromatograms with the integration of the peaks. ......................................................182
5.5: Statistical analysis of the concentrations of non-adsorption of the minor components to MIP and RDP
particles after the incubation with 20% sunflower oil in heptane. ..............................................................185
Figure 5.6: Salinisation with epoxy derivative for the activated glass beads..............................................187
Figure 5.7: The immobilisation of -tocopherol on the modified glass beads. ..........................................188
Figure 5.8: The polymerisation of magnet MIP NPs specific to -tocopherol. ..........................................189
Figure 5.9: The process of collection of MIP NPs. .....................................................................................191
Figure 5.10: The image of the eluted MIP NPs obtained in one synthesis cycle. .......................................192
Figure 5.11: The method of separating magnetic MIP NPs from solution using the magnet. ....................192
Figure 5.12: The DLS graphs for three different concentrations of MIP NPs solutions.............................194
Figure 5.13: The steps of the optimised protocol of separation of -tocopherol by incubation with MIP NPs.
.....................................................................................................................................................................196
Figure 5.14: The calibraion curve -tocopherol using UHPLC/DAD/MS. ................................................197
xv
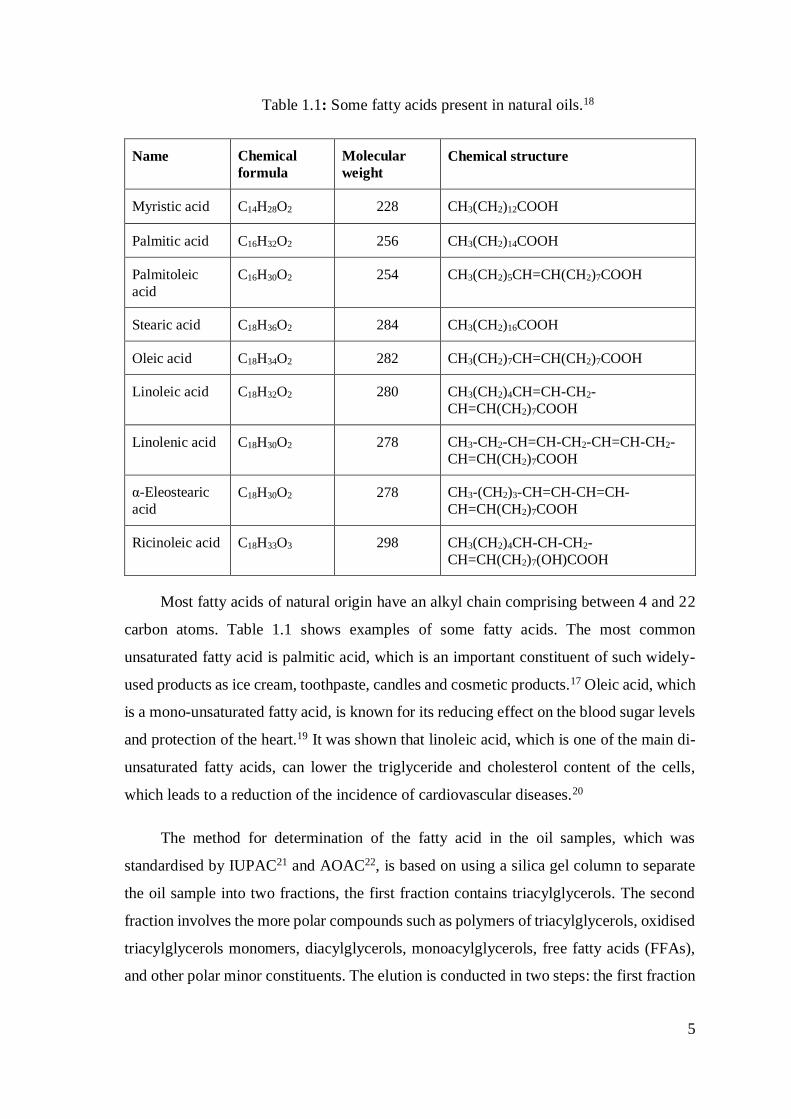
List of Tables Table 1.1: Some fatty acids present in natural oils..........................................................................................5
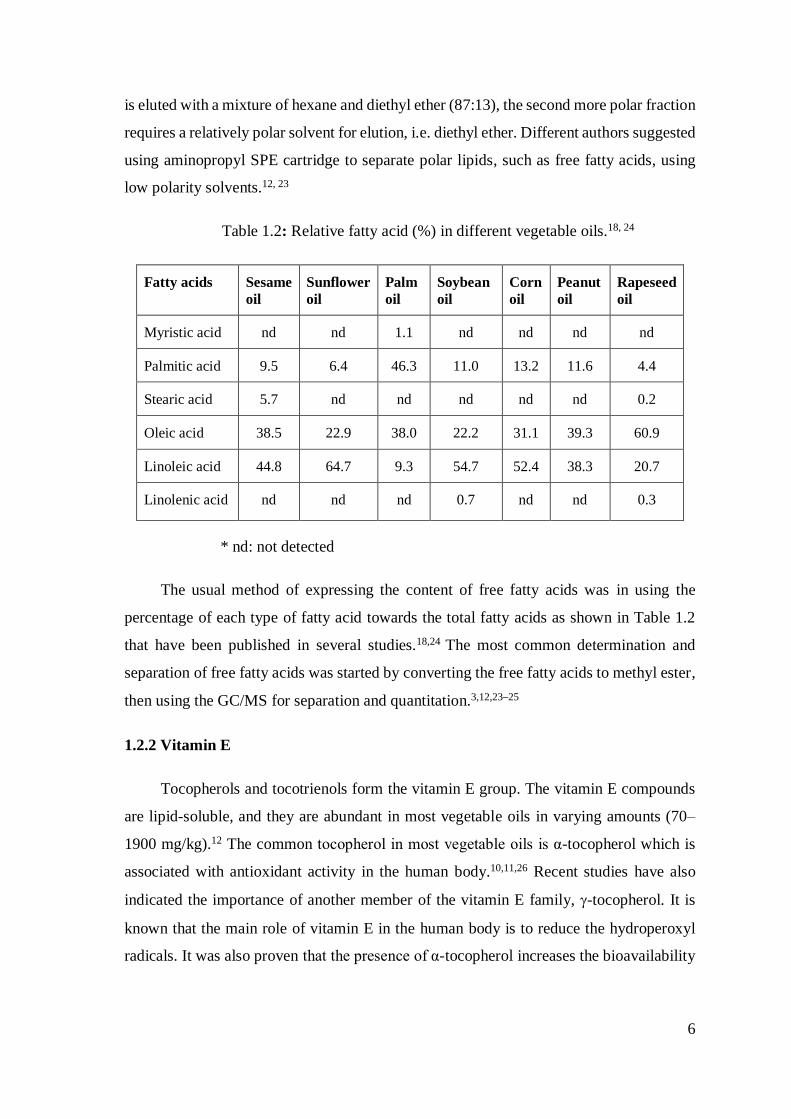
Table 1.2: Relative Fatty Acid (%) in different vegetable oils. ......................................................................6
Table 1.3: Tocopherol content in some vegetable oils (mg kg-1). ...................................................................7
Table 1.4: Relative biological activities of α-tocopherol derivatives and synthetic derivatives of α-tocopherol
acetate (determined by the foetal resorption-gestation test of rat) ..................................................................9
Table 1.5: The content of common phytosterols of some vegetable oils (mg kg-1) ......................................14
Table 1.6: Examples of commonly-used initiators, functional monomers and cross-linkers in MIP synthesis.
.......................................................................................................................................................................21
Table 2.1: The different polymers composition using different functional monomers. ...............................53
Table 2.2: The polymer composition (g) of two MAA-based polymers with different cross-linkers. .........54
Table 2.3: The polymer composition with different monomer: cross-linker ratio. .......................................55
Table 2.4: The candidate solvents used for optimisation SPE conditions. ...................................................58
Table 2.5: The list of functional monomers suggested by SYBYL software based on the template structure
(α-tocopherol). ...............................................................................................................................................61
Table 2.6: The percentage of recovery of the different polymers synthesised with different functional
monomers and EGDMA (cross-linker). ........................................................................................................65
Table 2.7: Percentage of recovery for two MAA-based polymers with two different cross-linkers. ...........66
Table 2.8: Different features of the different polymers with different monomer: cross-linker ratios. .........67
Table 2.9: The breakthrough volume of MD polymer. .................................................................................69
Table 2.10: Breakthrough volume of ME polymer. ......................................................................................69
Table 2.11: Quantities of minor components extracted from sunflower oil in heptane. ...............................77
Table 3.1: Summarised the calibration curve equations and R-squared values were produced from
calibration curves (Appendix 2) for all the minor compounds. ...........................................................105
Table 3.2: The concentrations of palmitic acid in different vegetable oils. ........................................107
xvi
Table 3.3: The concentrations of oleic and linoleic acid in different vegetable oils. ........................112
Table 3.4: The concentrations of -tocopherol in different vegetable oils. .......................................119
Table 3.5: The concentrations of campesterol in different vegetable oils. ..........................................122
Table 3.6: The concentrations of stigmasterol in different vegetable oils. .........................................124
Table 3.7: The concentrations of β-sitosterol in different vegetable oils. ...........................................126
Table 3.8: The matrix effects of spiking 1 mL heptane with standards solutions at known
concentrations. (percentage of recovery is average of triplicates SD). ...........................................130
Table 4.1: Characteristics of the main chromatographic separation approaches. .............................142
Table 4.2: Concentration of the minor components in the samples lost during loading (mg g-1). ...151
Table 4.3: Concentration of the minor components in the samples after washing (mg g -1). ............155
Table 4.4: Concentration of the minor components in the samples after elution (mg g-1). ...............158
Table 5.1: The percentage of adsorbed -tocopherol on MIP particles. .....................................................179
Table 5.2: The physical characteristics (surface area and pore size) of MIP and RDP particles. ...............180
Table 5.3: The loading capacity of MIP and RDP calculated from the recovery percentage of -tocopherol.
.....................................................................................................................................................................181
Table 5.4: The percentage of recovery standard deviation from RDP and MIP. .....................................183
Table 5.5: Concentration (mg mL-1) of the non-adsorption minor components to MIP and RDP after
incubating overnight with 20% sunflower oil in heptane. ...........................................................................184
Table 5.6: The physical characterisations of MIP NPs. ..............................................................................193
Table 5.7: The concentration and percentage of -tocopherol bound by the MIP NPs from different
concentration of standard solution. ..............................................................................................................197
Table 5.8: The concentration and percentage of eluted -tocopherol from the MIP NPs from different
concentration of standard solution. ..............................................................................................................198
xvii
List of Equations Equation 1.1: Gibbs free energy equation .................................................................................................... 28
Equation 2.1: The polymer capacity ............................................................................................................ 57
Equation 2.2: Beer-Lambert low. ................................................................................................................. 71
Equation 5.1: Stokes-Einstein equation. .................................................................................................... 176
xviii
Publications
Conference
1- Alghamdi Eman, Piletska Elena. Development of rationally-designed polymers
for α-tocopherol extraction and purification using solid phase extraction. The 9th
Saudi Students Conference, 13th-14th February, 2016, Birmingham, UK.
2- Alghamdi Eman, Piletska Elena. Development of rationally-designed polymers
for -tocopherol extraction and purification using solid phase extraction. The 5th
Global Chemistry Congress, 04-06 September, 2017, London, UK.
Papers
1- Alghamdi E.; Whitcombe M.; Piletsky S.; Piletska E. Solid phase extraction of α-
tocopherol and other physiologically active components from sunflower oil using
rationally designed polymers. Anal. Methods 2018, 10, 1–8.
2) Alghamdi E.; Piletsky S.; Piletska E. Application of the bespoke solid-phase
extraction protocol for extraction of physiologically-active compounds from
vegetable oils. Talanta 2018, 189, 157–165.
xix
Abbreviations
ACN
AIBN
AMPSA
AOAC
α-TTP
DIPEA
DLS
DMF
DVB
dh
DRD
EIPA
EGDMA
EtOH
FFAs
FID
IR
IUPAC
IA
GB
GC
GOPTS
H2SO4
HPLC
LDL
MAA
MIT
MIP
MS
NIP
NaCl
NaOH
NPs
NP
PDI
PBS
RDP
Acetonitrile
Azobisisobutyronitrile
Acrylamido-2-methyl-1-propanesulfonic acid
Association of Official Analytical Chemists
α-tocopherol transfer protein
Di-isopropylethylamine
Dynamic light scattering
Dimethylformamide
Divinylbenzene
Hydrodynamic diameter
Diode array detector
Ethyl-di-isopropylamine
Ethylene glycol methacrylate
Ethanol
Free fatty acids
Flame ionization detection
Infrared spectroscopy
International Union of Pure and Applied Chemistry
Itaconic acid
Glass beads
Gas chromatography
Glycidyloxypropyl trimetoxysilane
Sulfuric acid
High performance liquid chromatography
Low-density lipoprotein
Methacrylic acid
Molecularly imprinted technology
Molecularly imprinted polymers
Mass spectrometry
Non-imprinted polymers
Sodium chloride
Sodium hydroxide
Nanoparticles
Normal phase
Polydispersity index
Phosphate buffered saline
Rationally designed polymer
xx
RP
SD
SPE
TLC
TRIM
UA
UV
UHPLC
v/v
wt.
Reverse phase
Standard deviation
Solid phase extraction
Thin layer chromatography
Tri-methylolpropane tri-methacrylate
Urocanic acid
Ultra-violet spectrophotometry
Ultra-high performance liquid chromatography
Volume by volume
Weight

1
Chapter one
2
Literature review
1.1 Vegetable oils
Vegetable oil is an essential component of the human diet and a major source of
edible lipids, which supplies more than 75% of the total world consumption of the lipids.1
Vegetable oils provide an important medium used in cooking, a source for energy, to
protect body tissues, to maintain the normal body temperature, to carry the essential lipid-
soluble vitamins in the human body and many other vital functions. Moreover, vegetable
oils are the main source of many necessary nutrients such as the essential fatty acids,
vitamins and some phenolic compounds.2,3
Oils, in general, are an important renewable material for biofuel production.4 The
growth in population and development of industry around the world has caused an increase
in the demand for energy. This, in turn, has led to more attention being given to renewable
energy sources. Although 80% of world energy consumption is still derived from fossil
fuels, significant research has been conducted and great improvements have been made in
the use of biofuels derived from biomass.5,6 Biomass is defined as any matter of biologic
origin that can be converted into biofuel.7 When biofuel is produced from biomass that is
based on vegetable oil, corn or sugar, it is called ‘first-generation fuel’. If the biomass is
part of other parts of the plants, including the leaves, bark, fruit and seeds, it is named
‘second-generation fuel’.8
Vegetable oils are considered as an important resource for the first generation of
biofuel. These oils contain useful secondary metabolites such as tocopherols,
tocoterienols, sterols and other phenolic compounds which could be extracted prior or
through the biofuel production procedures. These valuable compounds, which have
various industrial and pharmaceutical applications can be extracted from the oil during
pre-treatment or other biofuel-producing processes and by doing that, it simplifies the
biomass to the its basic components of fermentation or esterification used to produce
ethanol or biodiesel.5,8 Therefore, some of the valuable components will be recovered and
will add extra value to the biofuel production, which will reduce the cost of the biofuel.
The goal of this study was to prepare efficient and cheap polymers that possess a high
affinity towards some physiologically-active compounds in the vegetable oils. These were
3
used as an adsorbent for optimised solid phase extraction (SPE) in order to extract valuable
components from vegetable oil.
1.2 Phytochemical composition of the vegetable oils
Vegetable oils are commonly produced from fruits or plant seeds such as sunflower,
olive, sesame, corn, etc. Oils are obtained in different ways such as pressing or solvent
extraction.3,9 The method of oil extraction is an important factor determining the nature
and the quantity of produced oil.
Figure 1.1: The major and minor components of vegetable oils.
4
Vegetable oils are considered as a non-polar and lipophilic matrixes that consist of
variable and complex components, depending on their origin, quality and extraction
methods.10 Triacylglycerols are the main components of the oils, making up to 95-98%.
Triglycerides consist of three fatty acid molecules ester-linked with the OH groups of
one glycerol molecule. The fatty acids that bound to the glycerol are determining the
characteristics of the oil. Triglycerides are generally classified according to the
saturation degree of fatty acids into saturated, mono- and poly-unsaturated fatty acids,
which may result in different physical and chemical properties.1,3 The remaining oil (2-
5%) (non-glyceridic fraction) comprises different compound groups such as hydrocarbons,
tocopherols and phytosterols, as demonstrated in Figure 1.1. The analyses of these
components indicated different information about the origin and the quality of vegetable
oils.3,11–13
1.2.1 Fatty acids
Free fatty acids are one of the minor components of the vegetable oils. Free fatty
acids are generally formed during the hydrolysis of triglycerides. They are undesirable in
the vegetable oils and should be eliminated during refining processes since they impact
negatively on edible oils. In addition, unfavourable features of edible oils such as the low
smoke point of oil and increasing the foam-making properties of the oil are caused by the
higher free fatty acids in the vegetable oil.14,13
In terms of producing biofuel from vegetable oils, removal of free fatty acids is
essential to make the biodiesel production more effective, which preventing the reverse
reaction with the alkali catalyst during transesterification reaction. This usually requires a
great amount of alcohol to maintain the equilibrium of the reaction and produce more
methyl esters.15,16 The negative impact of free fatty acids was observed through the
production of soap and water, thus hindering the separation and purification procedures of
the biodiesel production.16,17
5
Table 1.1: Some fatty acids present in natural oils.18
Name Chemical
formula
Molecular
weight
Chemical structure
Myristic acid C14H28O2 228 CH3(CH2)12COOH
Palmitic acid C16H32O2 256 CH3(CH2)14COOH
Palmitoleic
acid
C16H30O2 254 CH3(CH2)5CH=CH(CH2)7COOH
Stearic acid C18H36O2 284 CH3(CH2)16COOH
Oleic acid C18H34O2 282 CH3(CH2)7CH=CH(CH2)7COOH
Linoleic acid C18H32O2 280 CH3(CH2)4CH=CH-CH2-
CH=CH(CH2)7COOH
Linolenic acid C18H30O2 278 CH3-CH2-CH=CH-CH2-CH=CH-CH2-
CH=CH(CH2)7COOH
α-Eleostearic
acid
C18H30O2 278 CH3-(CH2)3-CH=CH-CH=CH-
CH=CH(CH2)7COOH
Ricinoleic acid C18H33O3 298 CH3(CH2)4CH-CH-CH2-
CH=CH(CH2)7(OH)COOH
Most fatty acids of natural origin have an alkyl chain comprising between 4 and 22
carbon atoms. Table 1.1 shows examples of some fatty acids. The most common
unsaturated fatty acid is palmitic acid, which is an important constituent of such widely-
used products as ice cream, toothpaste, candles and cosmetic products.17 Oleic acid, which
is a mono-unsaturated fatty acid, is known for its reducing effect on the blood sugar levels
and protection of the heart.19 It was shown that linoleic acid, which is one of the main di-
unsaturated fatty acids, can lower the triglyceride and cholesterol content of the cells,
which leads to a reduction of the incidence of cardiovascular diseases.20
The method for determination of the fatty acid in the oil samples, which was
standardised by IUPAC21 and AOAC22, is based on using a silica gel column to separate
the oil sample into two fractions, the first fraction contains triacylglycerols. The second
fraction involves the more polar compounds such as polymers of triacylglycerols, oxidised
triacylglycerols monomers, diacylglycerols, monoacylglycerols, free fatty acids (FFAs),
and other polar minor constituents. The elution is conducted in two steps: the first fraction
6
is eluted with a mixture of hexane and diethyl ether (87:13), the second more polar fraction
requires a relatively polar solvent for elution, i.e. diethyl ether. Different authors suggested
using aminopropyl SPE cartridge to separate polar lipids, such as free fatty acids, using
low polarity solvents.12, 23
Table 1.2: Relative fatty acid (%) in different vegetable oils.18, 24
Fatty acids Sesame
oil
Sunflower
oil
Palm
oil
Soybean
oil
Corn
oil
Peanut
oil
Rapeseed
oil
Myristic acid nd nd 1.1 nd nd nd nd
Palmitic acid 9.5 6.4 46.3 11.0 13.2 11.6 4.4
Stearic acid 5.7 nd nd nd nd nd 0.2
Oleic acid 38.5 22.9 38.0 22.2 31.1 39.3 60.9
Linoleic acid 44.8 64.7 9.3 54.7 52.4 38.3 20.7
Linolenic acid nd nd nd 0.7 nd nd 0.3
* nd: not detected
The usual method of expressing the content of free fatty acids was in using the
percentage of each type of fatty acid towards the total fatty acids as shown in Table 1.2
that have been published in several studies.18,24 The most common determination and
separation of free fatty acids was started by converting the free fatty acids to methyl ester,
then using the GC/MS for separation and quantitation.3,12,23–25
1.2.2 Vitamin E
Tocopherols and tocotrienols form the vitamin E group. The vitamin E compounds
are lipid-soluble, and they are abundant in most vegetable oils in varying amounts (70–
1900 mg/kg).12 The common tocopherol in most vegetable oils is α-tocopherol which is
associated with antioxidant activity in the human body.10,11,26 Recent studies have also
indicated the importance of another member of the vitamin E family, -tocopherol. It is
known that the main role of vitamin E in the human body is to reduce the hydroperoxyl
radicals. It was also proven that the presence of α-tocopherol increases the bioavailability
7
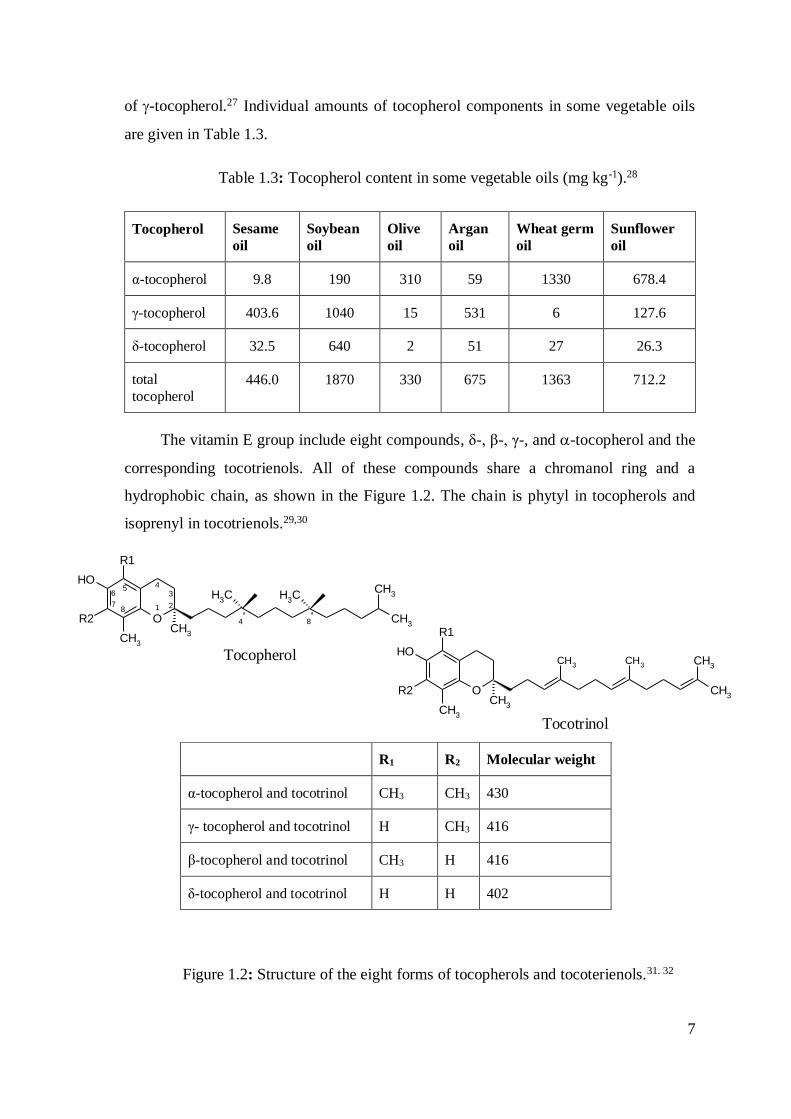
of -tocopherol.27 Individual amounts of tocopherol components in some vegetable oils
are given in Table 1.3.
Table 1.3: Tocopherol content in some vegetable oils (mg kg-1).28
Tocopherol Sesame
oil
Soybean
oil
Olive
oil
Argan
oil
Wheat germ
oil
Sunflower
oil
α-tocopherol 9.8 190 310 59 1330 678.4
γ-tocopherol 403.6 1040 15 531 6 127.6
δ-tocopherol 32.5 640 2 51 27 26.3
total
tocopherol
446.0 1870 330 675 1363 712.2
The vitamin E group include eight compounds, δ-, β-, γ-, and -tocopherol and the
corresponding tocotrienols. All of these compounds share a chromanol ring and a
hydrophobic chain, as shown in the Figure 1.2. The chain is phytyl in tocopherols and
isoprenyl in tocotrienols.29,30
Figure 1.2: Structure of the eight forms of tocopherols and tocoterienols.31. 32
R1 R2 Molecular weight
α-tocopherol and tocotrinol CH3 CH3 430
γ- tocopherol and tocotrinol H CH3 416
β-tocopherol and tocotrinol CH3 H 416
δ-tocopherol and tocotrinol H H 402
1 2
4
OCH
3
R1
OH
R2
CH3
CH3
CH3
CH3
CH3
56
78
3
4'
8'
Tocopherol
OCH
3
R1
OH
R2
CH3
CH3
CH3
CH3
CH3
Tocotrinol
8
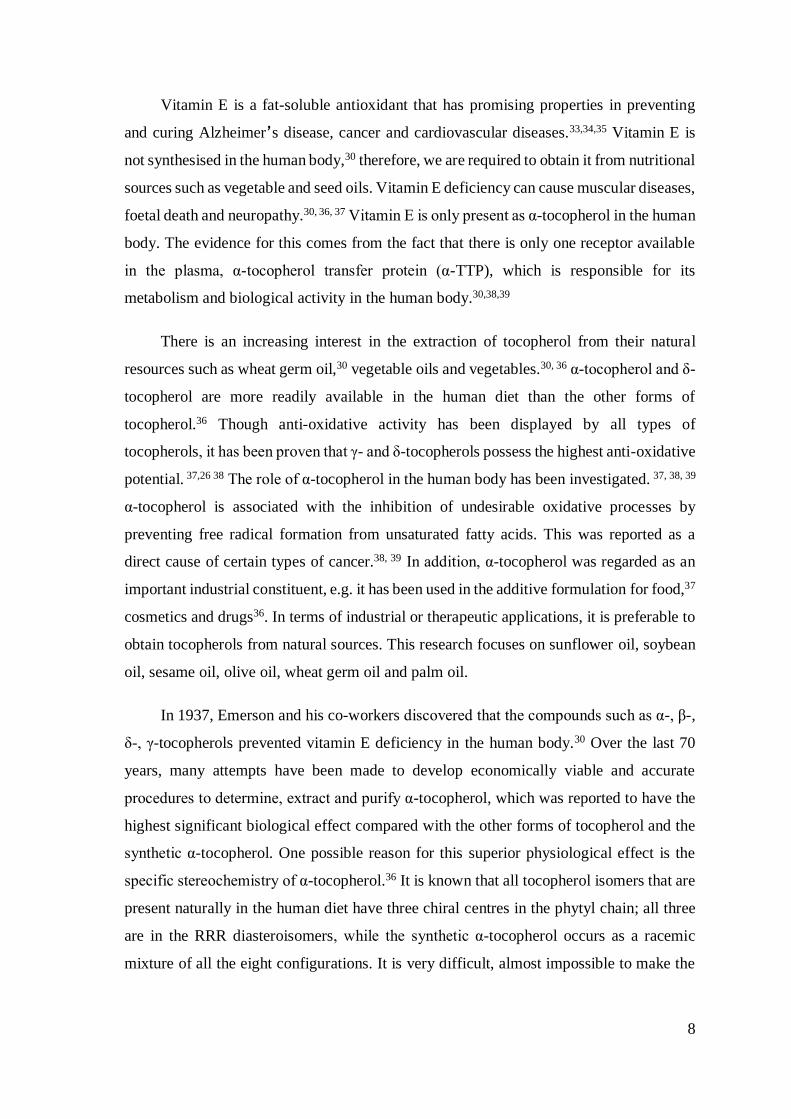
Vitamin E is a fat-soluble antioxidant that has promising properties in preventing
and curing Alzheimer’s disease, cancer and cardiovascular diseases.33,34,35 Vitamin E is
not synthesised in the human body,30 therefore, we are required to obtain it from nutritional
sources such as vegetable and seed oils. Vitamin E deficiency can cause muscular diseases,
foetal death and neuropathy.30, 36, 37 Vitamin E is only present as α-tocopherol in the human
body. The evidence for this comes from the fact that there is only one receptor available
in the plasma, α-tocopherol transfer protein (α-TTP), which is responsible for its
metabolism and biological activity in the human body.30,38,39
There is an increasing interest in the extraction of tocopherol from their natural
resources such as wheat germ oil,30 vegetable oils and vegetables.30, 36 α-tocopherol and δ-
tocopherol are more readily available in the human diet than the other forms of
tocopherol.36 Though anti-oxidative activity has been displayed by all types of
tocopherols, it has been proven that γ- and δ-tocopherols possess the highest anti-oxidative
potential. 37,26 38 The role of α-tocopherol in the human body has been investigated. 37, 38, 39
α-tocopherol is associated with the inhibition of undesirable oxidative processes by
preventing free radical formation from unsaturated fatty acids. This was reported as a
direct cause of certain types of cancer.38, 39 In addition, α-tocopherol was regarded as an
important industrial constituent, e.g. it has been used in the additive formulation for food,37
cosmetics and drugs36. In terms of industrial or therapeutic applications, it is preferable to
obtain tocopherols from natural sources. This research focuses on sunflower oil, soybean
oil, sesame oil, olive oil, wheat germ oil and palm oil.
In 1937, Emerson and his co-workers discovered that the compounds such as α-, β-,
δ-, γ-tocopherols prevented vitamin E deficiency in the human body.30 Over the last 70
years, many attempts have been made to develop economically viable and accurate
procedures to determine, extract and purify α-tocopherol, which was reported to have the
highest significant biological effect compared with the other forms of tocopherol and the
synthetic α-tocopherol. One possible reason for this superior physiological effect is the
specific stereochemistry of α-tocopherol.36 It is known that all tocopherol isomers that are
present naturally in the human diet have three chiral centres in the phytyl chain; all three
are in the RRR diasteroisomers, while the synthetic α-tocopherol occurs as a racemic
mixture of all the eight configurations. It is very difficult, almost impossible to make the
9
physiologically active molecule with such complex stereo configuration using organic
synthesis, therefore, the extraction from natural sources is the only option.
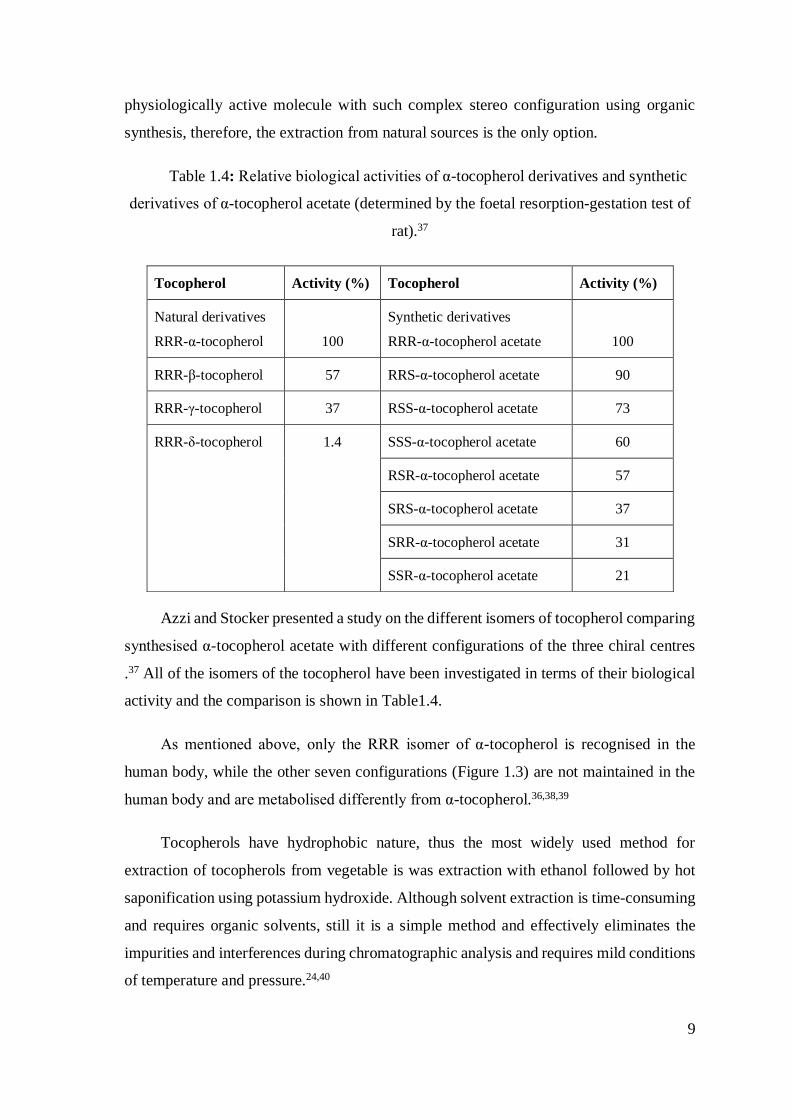
Table 1.4: Relative biological activities of α-tocopherol derivatives and synthetic
derivatives of α-tocopherol acetate (determined by the foetal resorption-gestation test of
rat).37
Azzi and Stocker presented a study on the different isomers of tocopherol comparing
synthesised α-tocopherol acetate with different configurations of the three chiral centres
.37 All of the isomers of the tocopherol have been investigated in terms of their biological
activity and the comparison is shown in Table1.4.
As mentioned above, only the RRR isomer of α-tocopherol is recognised in the
human body, while the other seven configurations (Figure 1.3) are not maintained in the
human body and are metabolised differently from α-tocopherol.36,38,39
Tocopherols have hydrophobic nature, thus the most widely used method for
extraction of tocopherols from vegetable is was extraction with ethanol followed by hot
saponification using potassium hydroxide. Although solvent extraction is time-consuming
and requires organic solvents, still it is a simple method and effectively eliminates the
impurities and interferences during chromatographic analysis and requires mild conditions
of temperature and pressure.24,40
Tocopherol Activity (%) Tocopherol Activity (%)
Natural derivatives
RRR-α-tocopherol
100
Synthetic derivatives
RRR-α-tocopherol acetate
100
RRR-β-tocopherol 57 RRS-α-tocopherol acetate 90
RRR-γ-tocopherol 37 RSS-α-tocopherol acetate 73
RRR-δ-tocopherol 1.4 SSS-α-tocopherol acetate 60
RSR-α-tocopherol acetate 57
SRS-α-tocopherol acetate 37
SRR-α-tocopherol acetate 31
SSR-α-tocopherol acetate 21
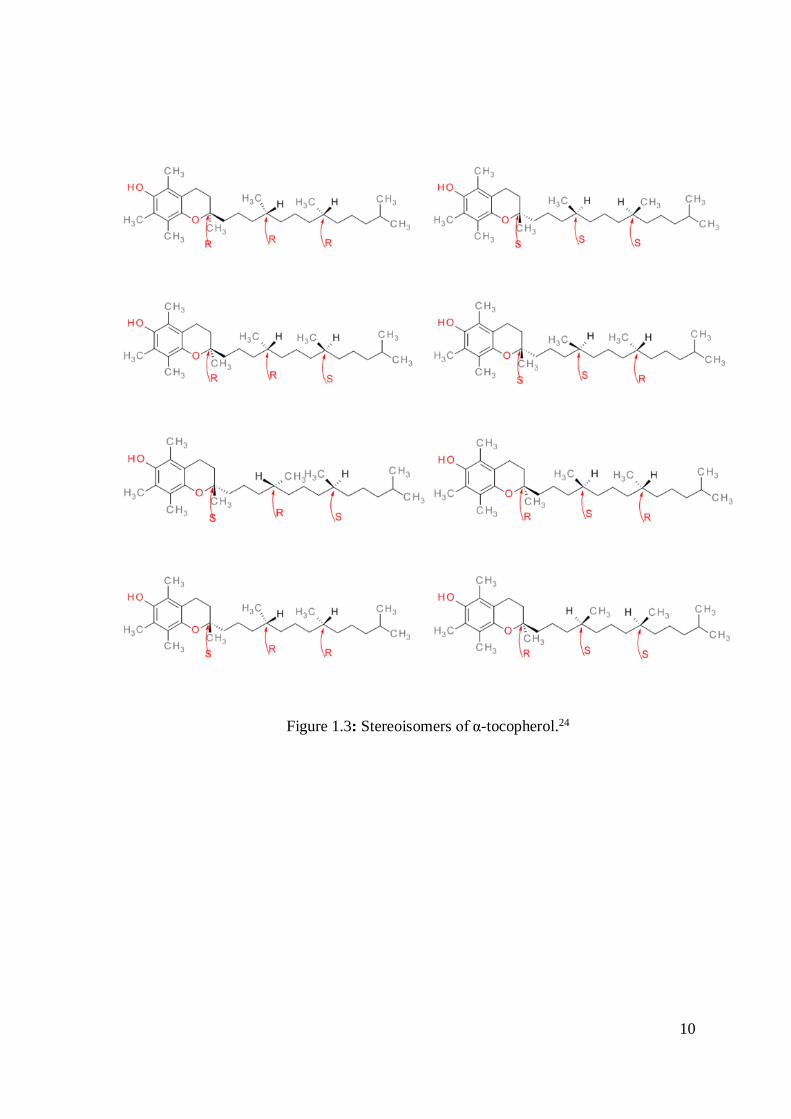
10
Figure 1.3: Stereoisomers of α-tocopherol.24
11
There is an extensive list of publications that reported the attempts to develop
efficient methods to extract tocopherol from different sources.1-3 For example, Ofori-
Boateng and Lee developed an ultrasonic-assisted extraction of α-tocopherol from palm
oil. The extraction efficiency was compared with the commonly used methods such as
Soxhlet extraction or saponification. The highest recovery of tocopherols was observed in
the case of ultrasonic-assisted extraction.41 The advantage of this method includes the
possibility to perform the extraction at a low temperature, which is useful in case of
extraction of tocopherol, as it is usually unstable at high temperatures and might
decompose. In addition, the ultrasound helped to improve penetration of the solvent into
the cell allowing development of an inexpensive, simple, fast, a low-sample and solvent-
required method which is an efficient alternative to conventional techniques. Nevertheless,
this method was criticised in terms of low experimental reproducibility because of a lack
of uniformity of the distribution of ultrasound energy and cooling of the sonication vessel
was required due to a large amount of heat generation.42
Super-critical fluid extraction is a method that shows promise due to the relatively
low consumption of time and organic solvents, accuracy and economic viability.43,44
Several studies were conducted on tocopherols using this method for extraction. However,
it is still generally unavailable for practical applications due to the high cost of the
equipment.11,45,46
Solid phase extraction (SPE) is one of the most effective and popular extraction
methods in terms of its relatively low cost and high resistance to environmental and other
physical and chemical conditions.40,47 It was used widely in industry as an effective clean-
up method for bio-recovery of natural compounds from various biomasses. Typically, SPE
is conducted using several types of stationary phases packed commercially in glass or
plastic columns. However, the most common criticisms levelled at these commercial
stationary phases are their poor stability, inadequate selectivity, limited reusability and
restricted binding capacity, especially for polar compounds.48,49 Bartosińska reported solid
phase extraction (SPE) as an effective extraction method for small-scale study purposes.47
In addition, among the most commonly used SPE sorbents were C18, silica gel and
aminopropyl-functionalised silica.12
12
Regarding the detection methods, there are different metods to detect tocopherol
after extraction from vegetable oils. The method standardised by IUPAC and AOAC is
based on direct injection into the HPLC system with UV or fluorescence detector.12,40
Reverse phase and normal phase HPLC were reported to separate tocopherols and different
methods such as TLC or using a silica gel column were stated to separate tocopherols from
sterols or triacylglycerols. GC/MS has been used effectively for the determination and
quantification studies of tocopherols, which was required for the derivatised tocopherol
with the saponification process.10,11,24,50
1.2.3 Phytosterol
Sterols are an important phytochemical group of compounds because they possess a
wide range of biological properties. Plant sterols, which are called phytosterols, are
important for health as antioxidative agents and decrease serum low-density lipoprotein
(LDL) cholesterol levels, thus protecting against cardiovascular diseases.42,51 Phytosterols
are applicable in the nutrition industries as steroidal intermediates and precursors to
produce hormone pharmaceuticals.52,53
Phytosterols are 28- or 29-carbon alcohols with a steroid nucleus, a 3-hydroxyl
group, and a 5, 6 double bond. Phytosterols vary by containing an extra methyl or ethyl
group, or double bond. Moreover, most phytosterol side chains contain 9–10 carbon atoms,
instead of the 8 carbon atom side chain in cholesterol.42 The most important natural sources
of phytosterols in human diets are oils and margarine. Phytosterols are found in vegetable
oils in either free form or as conjugates through esterification of the 3 -hydroxyl group
with a fatty acid or hydroxycinnamic acid.13,50 The esterified sterol content and free sterol
have different physiological effects and their composition of vegetable oils has been used
to measure adulteration of oil. Figure 1.4 show examples of the most common phytosterols
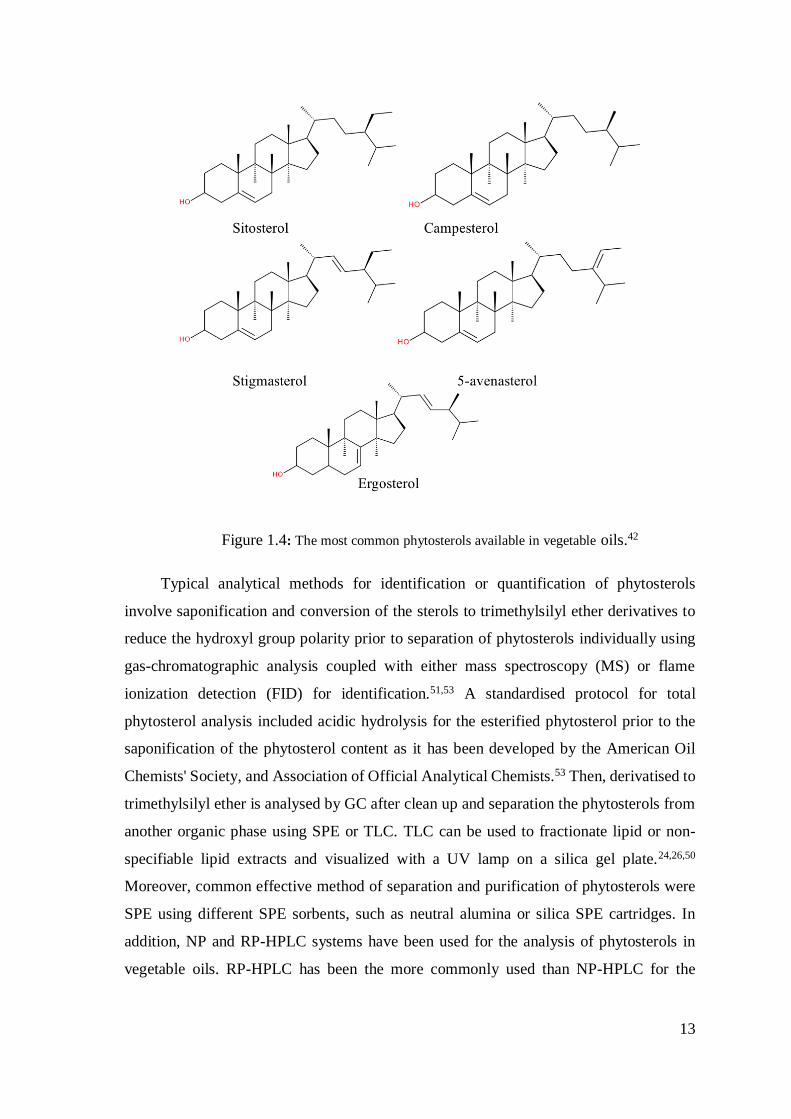
available in vegetable oils.
13
Figure 1.4: The most common phytosterols available in vegetable oils.42
Typical analytical methods for identification or quantification of phytosterols
involve saponification and conversion of the sterols to trimethylsilyl ether derivatives to
reduce the hydroxyl group polarity prior to separation of phytosterols individually using
gas-chromatographic analysis coupled with either mass spectroscopy (MS) or flame
ionization detection (FID) for identification.51,53 A standardised protocol for total
phytosterol analysis included acidic hydrolysis for the esterified phytosterol prior to the
saponification of the phytosterol content as it has been developed by the American Oil
Chemists' Society, and Association of Official Analytical Chemists.53 Then, derivatised to
trimethylsilyl ether is analysed by GC after clean up and separation the phytosterols from
another organic phase using SPE or TLC. TLC can be used to fractionate lipid or non-
specifiable lipid extracts and visualized with a UV lamp on a silica gel plate.24,26,50
Moreover, common effective method of separation and purification of phytosterols were
SPE using different SPE sorbents, such as neutral alumina or silica SPE cartridges. In
addition, NP and RP-HPLC systems have been used for the analysis of phytosterols in
vegetable oils. RP-HPLC has been the more commonly used than NP-HPLC for the
14
separation of individual sterols due to the possibility to use less volatile polar organic
solvents in water, and offers quick equilibration in a bonded silica stationary phase with
the mobile phase solvents.42,54
In the case of the separation of free phytosterols, the direct saponification methods
have been applied to the oil sample for the determination of free phytosterols. It was
reported that phytosterols represented the highest portion of the unsaponifiable fraction of
vegetable oils.51 Corn oil, rapeseed oil and wheat germ oil typically have the highest total
phytosterol contents of individual sterols and this does not include the esterified
phytosterols in the original oil. Table 1.5 shows examples of some vegetable oil content
of phytosterols.
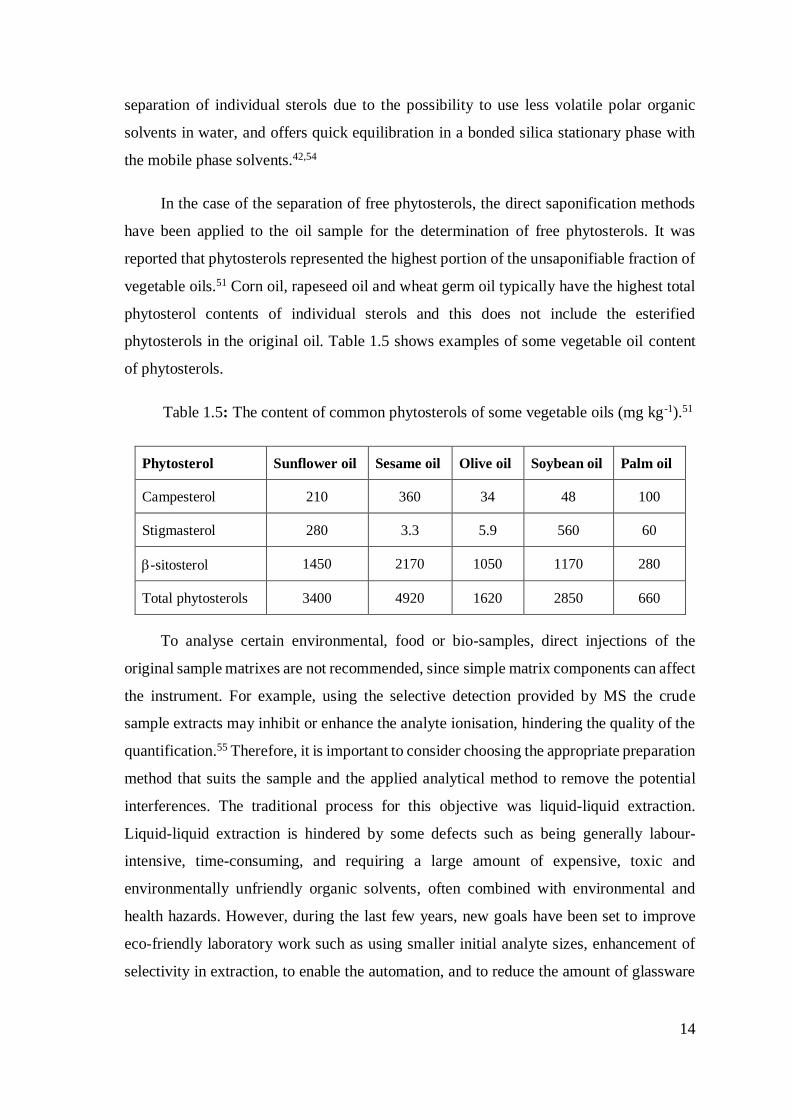
Table 1.5: The content of common phytosterols of some vegetable oils (mg kg-1).51
Phytosterol Sunflower oil Sesame oil Olive oil Soybean oil Palm oil
Campesterol 210 360 34 48 100
Stigmasterol 280 3.3 5.9 560 60
-sitosterol 1450 2170 1050 1170 280
Total phytosterols 3400 4920 1620 2850 660
To analyse certain environmental, food or bio-samples, direct injections of the
original sample matrixes are not recommended, since simple matrix components can affect
the instrument. For example, using the selective detection provided by MS the crude
sample extracts may inhibit or enhance the analyte ionisation, hindering the quality of the
quantification.55 Therefore, it is important to consider choosing the appropriate preparation
method that suits the sample and the applied analytical method to remove the potential
interferences. The traditional process for this objective was liquid-liquid extraction.
Liquid-liquid extraction is hindered by some defects such as being generally labour-
intensive, time-consuming, and requiring a large amount of expensive, toxic and
environmentally unfriendly organic solvents, often combined with environmental and
health hazards. However, during the last few years, new goals have been set to improve
eco-friendly laboratory work such as using smaller initial analyte sizes, enhancement of
selectivity in extraction, to enable the automation, and to reduce the amount of glassware
15
used and organic solvent consumption. Taking into consideration the current requirements
for improving the work in the laboratories to be eco-friendlier, liquid-liquid extraction
should be replaced with preparation and clean-up methods that fulfil these features. Solid
phase extraction (SPE) is one of the available options that could be the suitable
replacements.
1.3 Solid phase extraction (SPE)
The solid phase extraction (SPE) technique has become one of the most preferred
and applicable procedure for sample preparation and clean-up in green analytical
chemistry. SPE has been supplemented by using beside various instrumental analytical
procedures, especially HPLC and GC to determine analytes from samples. SPE has many
advantages compared to conventional methods, such as being able to remove undesirable
interferences, to carry out clean-up and enable concentration processes in one run before
chromatographic analysis, reducing the consumption of organic solvents, and increasing
the selectivity of extraction.
Using SPE as a pre-treatment method is determined by several factors:
1- The analysis technique that is going to be used to detect and quantify the analyte.
For example, GC/MS is a sensitive technique and more suitable for the vaporised samples
with lower molecular weight. HPLC could be an alternative for the samples with high
molecular weight. LC/MS is another available analysis method for a wide range of samples
that requires fewer preparation and clean-up steps.
2- The type of intermolecular interactions between the target and the SPE sorbent
(mechanism of interaction). The retention of the analyte on the surface of the SPE sorbent
is performed by bonds formed between the analyte and the sorbent particles. These bonds
formed by intermolecular interactions that have been classified based on the nature of the
sample solution. There are three main types of interactions, 1) polar interactions that occur
between the analyte in organic solvent and sorbent with polar moieties; 2) hydrophobic
interactions that happen between analyte in aqueous solvent and non-polar SPE sorbent;
3) cationic or anionic exchange between analytes carrying permanent negative or positive
charges respectively and charged functional groups bounded to silica surface. The main
retention mechanism of the compound is performed mainly by the electrostatic attraction
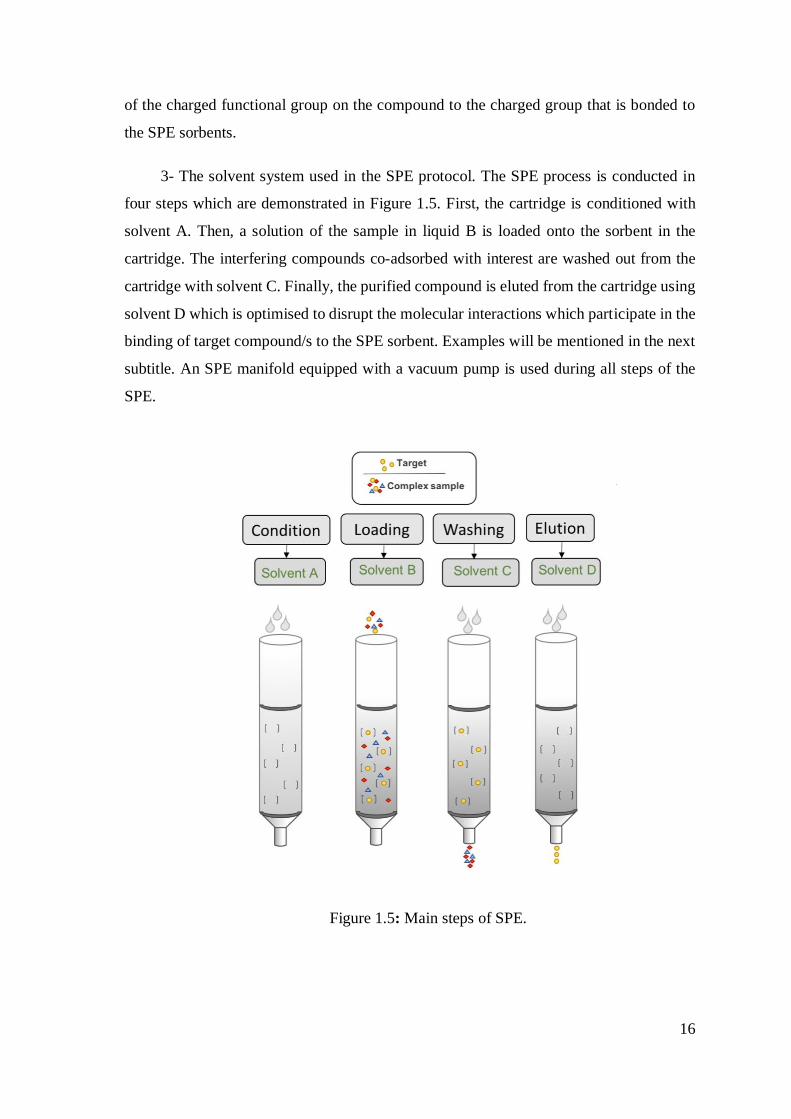
16
of the charged functional group on the compound to the charged group that is bonded to
the SPE sorbents.
3- The solvent system used in the SPE protocol. The SPE process is conducted in
four steps which are demonstrated in Figure 1.5. First, the cartridge is conditioned with
solvent A. Then, a solution of the sample in liquid B is loaded onto the sorbent in the
cartridge. The interfering compounds co-adsorbed with interest are washed out from the
cartridge with solvent C. Finally, the purified compound is eluted from the cartridge using
solvent D which is optimised to disrupt the molecular interactions which participate in the
binding of target compound/s to the SPE sorbent. Examples will be mentioned in the next
subtitle. An SPE manifold equipped with a vacuum pump is used during all steps of the
SPE.
Figure 1.5: Main steps of SPE.
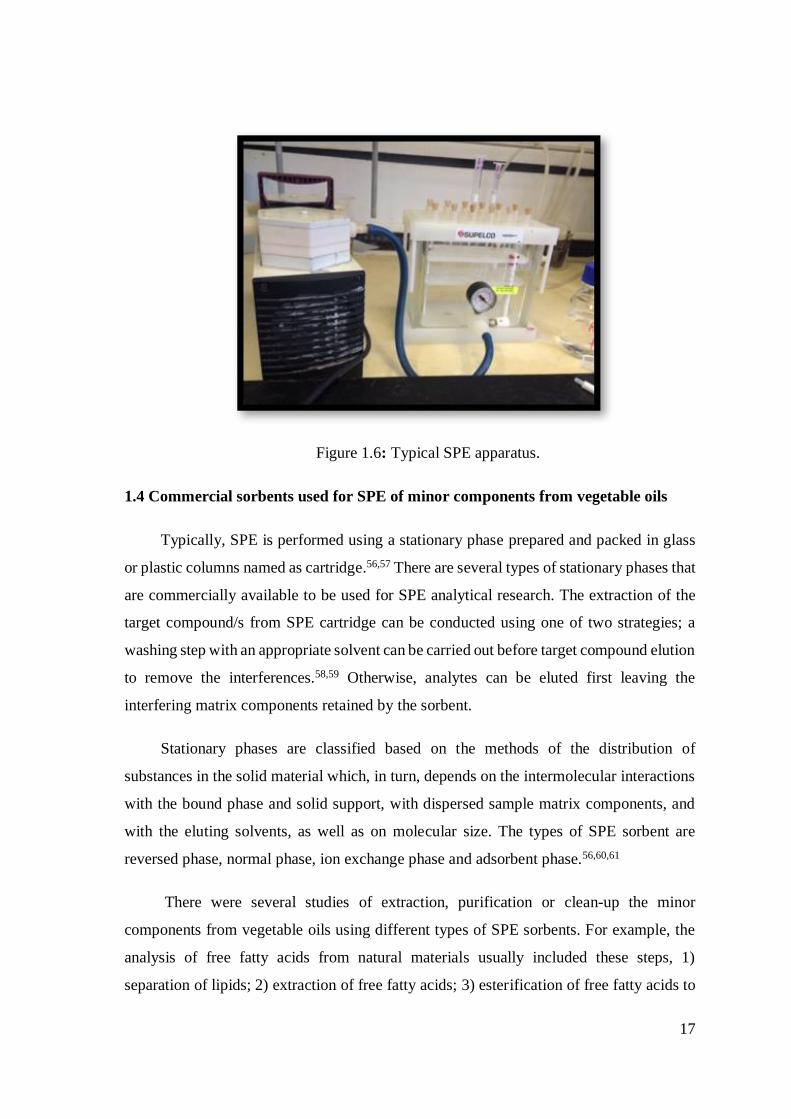
17
Figure 1.6: Typical SPE apparatus.
1.4 Commercial sorbents used for SPE of minor components from vegetable oils
Typically, SPE is performed using a stationary phase prepared and packed in glass
or plastic columns named as cartridge.56,57 There are several types of stationary phases that
are commercially available to be used for SPE analytical research. The extraction of the
target compound/s from SPE cartridge can be conducted using one of two strategies; a
washing step with an appropriate solvent can be carried out before target compound elution
to remove the interferences.58,59 Otherwise, analytes can be eluted first leaving the
interfering matrix components retained by the sorbent.
Stationary phases are classified based on the methods of the distribution of
substances in the solid material which, in turn, depends on the intermolecular interactions
with the bound phase and solid support, with dispersed sample matrix components, and
with the eluting solvents, as well as on molecular size. The types of SPE sorbent are
reversed phase, normal phase, ion exchange phase and adsorbent phase.56,60,61
There were several studies of extraction, purification or clean-up the minor
components from vegetable oils using different types of SPE sorbents. For example, the
analysis of free fatty acids from natural materials usually included these steps, 1)
separation of lipids; 2) extraction of free fatty acids; 3) esterification of free fatty acids to
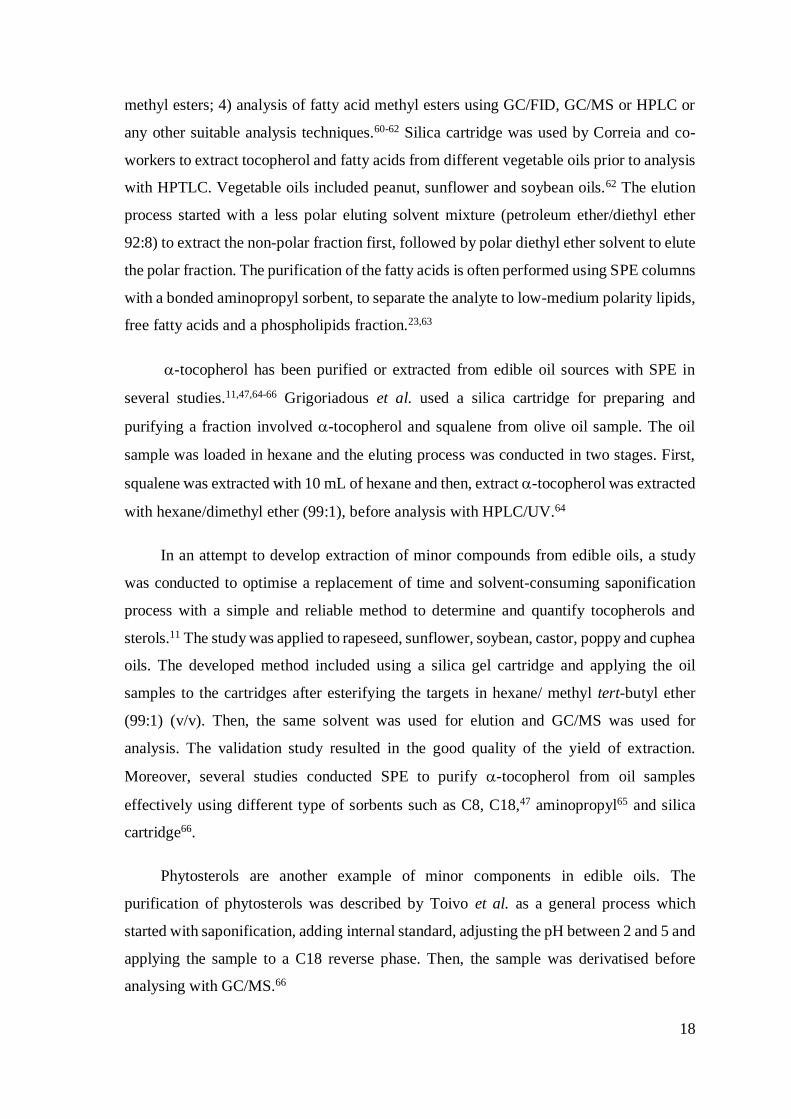
18
methyl esters; 4) analysis of fatty acid methyl esters using GC/FID, GC/MS or HPLC or
any other suitable analysis techniques.60-62 Silica cartridge was used by Correia and co-
workers to extract tocopherol and fatty acids from different vegetable oils prior to analysis
with HPTLC. Vegetable oils included peanut, sunflower and soybean oils.62 The elution
process started with a less polar eluting solvent mixture (petroleum ether/diethyl ether
92:8) to extract the non-polar fraction first, followed by polar diethyl ether solvent to elute
the polar fraction. The purification of the fatty acids is often performed using SPE columns
with a bonded aminopropyl sorbent, to separate the analyte to low-medium polarity lipids,
free fatty acids and a phospholipids fraction.23,63
-tocopherol has been purified or extracted from edible oil sources with SPE in
several studies.11,47,64-66 Grigoriadous et al. used a silica cartridge for preparing and
purifying a fraction involved -tocopherol and squalene from olive oil sample. The oil
sample was loaded in hexane and the eluting process was conducted in two stages. First,
squalene was extracted with 10 mL of hexane and then, extract -tocopherol was extracted
with hexane/dimethyl ether (99:1), before analysis with HPLC/UV.64
In an attempt to develop extraction of minor compounds from edible oils, a study
was conducted to optimise a replacement of time and solvent-consuming saponification
process with a simple and reliable method to determine and quantify tocopherols and
sterols.11 The study was applied to rapeseed, sunflower, soybean, castor, poppy and cuphea
oils. The developed method included using a silica gel cartridge and applying the oil
samples to the cartridges after esterifying the targets in hexane/ methyl tert-butyl ether
(99:1) (v/v). Then, the same solvent was used for elution and GC/MS was used for
analysis. The validation study resulted in the good quality of the yield of extraction.
Moreover, several studies conducted SPE to purify -tocopherol from oil samples
effectively using different type of sorbents such as C8, C18,47 aminopropyl65 and silica
cartridge66.
Phytosterols are another example of minor components in edible oils. The
purification of phytosterols was described by Toivo et al. as a general process which
started with saponification, adding internal standard, adjusting the pH between 2 and 5 and
applying the sample to a C18 reverse phase. Then, the sample was derivatised before
analysing with GC/MS.66
19
Neutral alumina cartridge for SPE was used for clean-up and purification of eight
free and esterified phytosterols from 31 samples of vegetable oils by Phillips and co-
workers. The extraction was conducted using hexane for conditioning, followed by loading
using 20:80 diethyl ether: hexane. Then, the esterified phytosterols were eluted with 20:80
diethyl ether/hexane, and free phytosterols with ethanol/ hexane/ diethyl ether (50:25:25).
The eluted samples were saponified with potassium hydroxide before separation and
analysed with GC/MS.51
According to Lagarade et al.,42 phytosterols have been separated successfully from
the non-saponified fraction of edible oils with several types of SPE sorbent such as reverse-
phase sorbent (C18)67, normal-phase (neutral alumina)51 and silica SPE cartridge and
eluted with hexane containing 20% tert-butyl methyl ether from olive oil.68–71
SPE showed simplicity, flexibility, relative selectivity and requirement of mild
extraction conditions which led to the diffusion of this method over many classical sample
preparation methods. Yet there is a demand for the development of the SPE sorbent to
improve their features. One of the most important developments is synthesis the
customised porous polymer with specific recognition to specific compounds called
molecularly imprinted polymer (MIP). MIPs have many applications in different
disciplines which will be presented in this chapter (subtitle1.6). In the next part of this
chapter, will focus only on the achieved applications of MIPs in purification and extraction
of the minor component in this study.
1.5 Molecularly imprinted polymers (MIPs)
MIPs are synthetic polymeric materials with specific binding sites to selectively
recognise target molecules during rebinding. Recently, there have been extensive reports
on the development of Molecularly Imprinted Polymer-based solid phase extraction
(MISPE) protocols for the applications in different areas including environmental, food
and pharmaceutical analyses.72
SPE is preferable as an extraction method compared to other extraction methods in
terms of its relatively low cost and high resistance to the environmental and harsh physical
and chemical conditions.73 Before exhibiting the successful application of MIPs in SPE
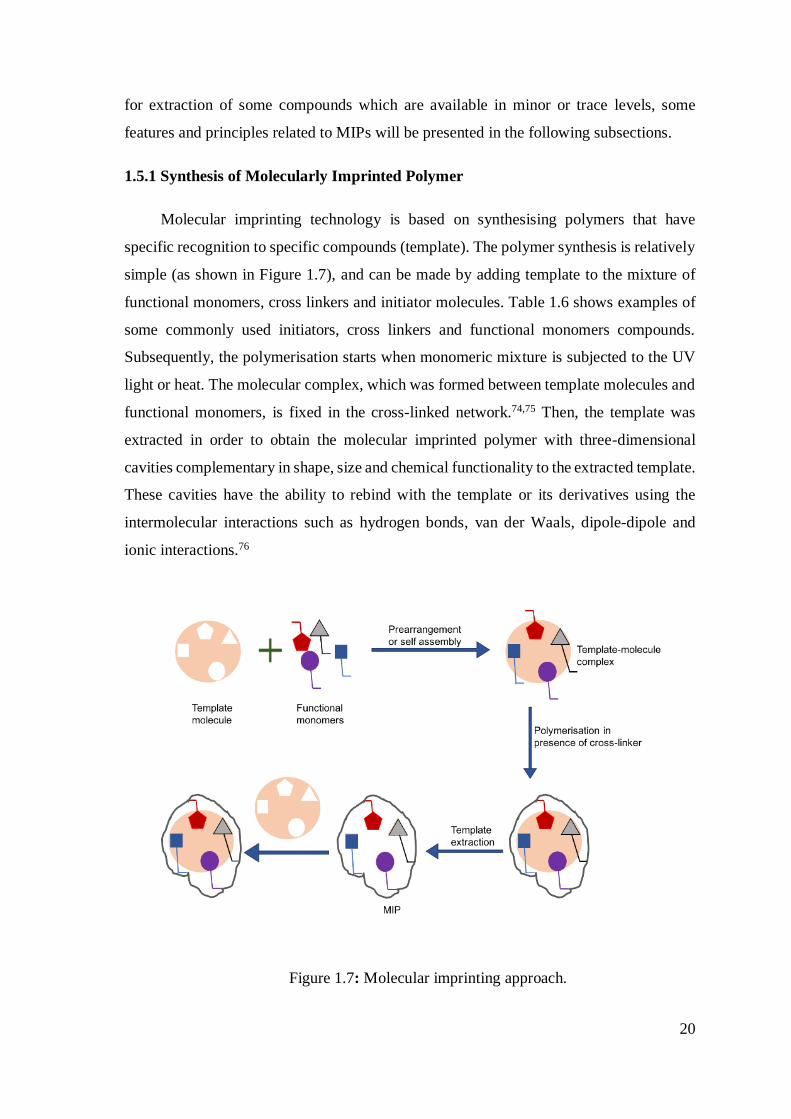
20
for extraction of some compounds which are available in minor or trace levels, some
features and principles related to MIPs will be presented in the following subsections.
1.5.1 Synthesis of Molecularly Imprinted Polymer
Molecular imprinting technology is based on synthesising polymers that have
specific recognition to specific compounds (template). The polymer synthesis is relatively
simple (as shown in Figure 1.7), and can be made by adding template to the mixture of
functional monomers, cross linkers and initiator molecules. Table 1.6 shows examples of
some commonly used initiators, cross linkers and functional monomers compounds.
Subsequently, the polymerisation starts when monomeric mixture is subjected to the UV
light or heat. The molecular complex, which was formed between template molecules and
functional monomers, is fixed in the cross-linked network.74,75 Then, the template was
extracted in order to obtain the molecular imprinted polymer with three-dimensional
cavities complementary in shape, size and chemical functionality to the extracted template.
These cavities have the ability to rebind with the template or its derivatives using the
intermolecular interactions such as hydrogen bonds, van der Waals, dipole-dipole and
ionic interactions.76
Figure 1.7: Molecular imprinting approach.
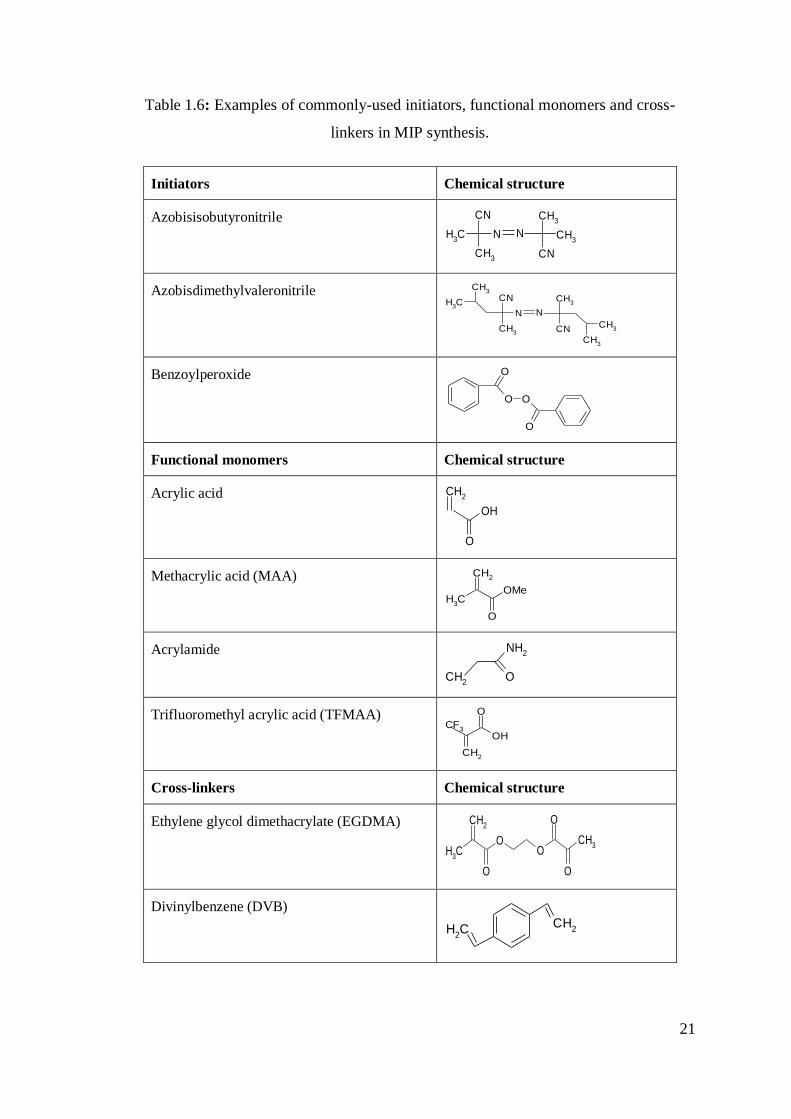
21
Table 1.6: Examples of commonly-used initiators, functional monomers and cross-
linkers in MIP synthesis.
Initiators Chemical structure
Azobisisobutyronitrile CH
3
CH3
N
CN
N
CH3
CH3
CN
Azobisdimethylvaleronitrile
CH3
N
CN
CH3
CH3
N
CH3
CNCH
3
CH3
Benzoylperoxide
O
OO
O
Functional monomers Chemical structure
Acrylic acid CH2
OH
O
Methacrylic acid (MAA)
CH3
O
CH2
OMe
Acrylamide
CH2
O
NH2
Trifluoromethyl acrylic acid (TFMAA)
CH2
OH
O
CF3
Cross-linkers Chemical structure
Ethylene glycol dimethacrylate (EGDMA)
CH3
O
OO
O
CH3
CH2
O
Divinylbenzene (DVB) CH
2CH2
22
1.5.2 Types of molecular imprinting
In the first step of MIP preparation, template and monomers form the complex
functional monomer and cross-linker by one of the three following binding approaches:
1.5.2.1 Covalent imprinting
This approach was first presented by Wullf and Sarhan in 1972.72 Reversible
covalent bonds were formed between the template and monomers prior to polymerisation.
The covalent bonds support more homogeneous binding sites on the polymer. This method
requires relatively mild conditions to allow cleavage of the formed covalent bonds
between template and MIP, which are going to rebind with the same compound or its
analogues but from an analyte. The important advantage of this method is the production
of stable and well-defined polymers due to the covalent bonds before the polymerisation.
Nevertheless, the acid hydrolysis for the cleavage of the reversible covalent interaction
that reformed by adding the analyte makes this approach less common than the
others.72,73,77
1.5.2.2 Non-covalent imprinting
This method was introduced by Mosbach and his co-workers in 1981.72,77 In this
method, the covalent bonds in the previous method were being replaced with rather weaker
intermolecular interactions such as hydrogen bonds, van der Waals and hydrophilic
reactions between the template and monomers in the first step of MIP preparation. This
approach is one of the most adopted in the literature due to its ease of use and the
availability of broad choices of suitable monomers. However, this method tends towards
polymer formation by adding an excess of free monomers that in turn cause non-selective
binding sites compared to the covalent method.72,73
1.5.2.3 Semi-covalent imprinting
This method combines elements of the two other methods. It depends on the
formation of covalent bonds in the first step of MIP formation. Then, the target binds with
the polymer by non-covalent interactions.72,73,77
23
1.6 Applications of Molecularly Imprinting Polymers
The synthesis of MIPs is based on the complex formation between the functional
monomer, templates and cross-linker molecules to form polymers with specific
recognition properties towards the template. The molecular recognition creates molecular
memory that makes complemented cavities in shape, size and chemical functionality,
therefore, selectively recognising the imprinted species.77 MIPs are able to mimic natural
antibodies and biological receptors, demonstrating specific molecular recognition
phenomena. Moreover, MIPs could be used to separate and analyse mixtures of
compounds. MIPs also have considerable robustness and stability under harsh conditions
in various environments. All these properties have made MIPs attractive for application in
research and analysis.72,74,78 There are four main areas of research that have been
developed using MIPs, including separation science and purification, sensors, catalysis
and drug delivery.
1.6.1 Molecularly Imprinted-Solid Phase Extraction (MISPE)
Since SPE has been used as an application of MIPs, it is now called molecularly
imprinted solid phase extraction MISPE. MIPs have been applied successfully to extract
several compounds from matrices or compounds available in certain samples at very low
concentrations.79 MIPs can be packed in HPLC columns for on-line analysis, or between
two frits in cartridges for off-line synthesis.72
As mentioned above in subtitle 1.4, although there has been huge development and
there exist variety in the commercially available SPE sorbents, there is still demand for
improving the sorbent selectivity. In this regard, many studies have been conducted to
develop the selectivity during extraction and/or purification of analytes.80 MIPs are stable
polymers with molecular recognition, provided by the presence of a template during their
synthesis. Therefore, MIPs are excellent materials providing selectivity to sample
preparation.
MIPs were applied successfully in many different types of analytical applications.
One of the earlier successful applications was purification of sameridine in biological
sample prior to detect with GC/MS. Clean chromatographic traces from plasma samples
24
were obtained in the sample eluted from synthesised MIP that was synthesised using a
sameridine analogue.81
Additionally, several studies described the purification of different analytes in
environmental samples in aqueous solutions. Generally, the loading step onto the MIP
cartridge is performed in a low-polarity solvent, in order to reduce the non-specific
interactions, and after the washing step and removal of adsorbed compounds by non-
specific bonds from the polymeric matrix, analytes are eluted with a solvent with a suitable
degree of polarity to disrupt the non-covalent interactions between the analyte and the
imprinted polymer.80 In order to develop water- compatible MIPs, it is useful to contain
hydrophilic surface properties to the polymer to reduce non-specific hydrophobic
interactions. This could be attained by using polar porogens,78 hydrophilic co-monomers
(e.g. 2-hydroxyethyl methacrylate, acrylamide) or cross-linkers (e.g.
pentaerythritoltriacrylate, methylenebis(acrylamide)),82 and/or designed monomers
capable of stoichiometrically interacting with the template functionalities.80 Many other
examples were demonstrated in the literature about the effective application of MIPs in
MISPE, such as extraction and purification of microcystin-LR83, cocaine, morphine,84
biotin,85 simazine,86 tarbaryl87 and triazines88.
Although the witnessed achievements were recorded using MIPs in sample
preparation, there is a continuous demand for the constant enhancement and for these
materials to be able emulate the current development of the scientific research. The
traditional polymerisation was the bulk polymerisation which is rapid, simple and does not
required a sophisticated or expensive instrumentation. However, MIPs which were
synthesised by bulk polymerization have been criticised due to the poor site accessibility
to the target molecules. In addition, the thick polymeric network and lower rebinding
capacity. Several strategies have been developed to overcome these drawbacks of bulk
polymerisation. The different polymerisation methods include suspension polymerisation,
emulsion polymerisation, precipitation polymerisation and the most recent method solid-
phase synthesis of molecularly imprinted polymer nanoparticles (MIP NPs).89–92
25
1.6.2 Sensors
Chemical sensors for clinical diagnostics, environmental and food analyses have
been improved using MIPs. MIP technology is applied in sensor research by synthesising
antibody-like materials with high selectivity and sensitivity, chemical inertness, long-
thermal stability and insolubility in water and most organic solvents.78,89 Many studies
have been reported for the detection and control of poisonous substances in adulterated
foods which are the major challenges in food safety in the world.93,94 MIP-based
immunoassay methods in food safety, and the developed biomimetic immunoassay could
be effective alternatives to antibodies which are relatively unstable and costly, resulting in
a limitation of their applications and developments.93 N-methylcarbamate insecticide
metolcarb was determined by Wang et al., who developed MIP film as the antibody
mimic.94 The established method was successful to be used in the determination of
metolcarb in spiked apple juice, cabbage, and cucumber, with recoveries ranging from
71.5 to 100%. The results suggested that the method was effective for the direct
determination of metolcarb in foods. Moreover, vancomycin (antibiotic) was used as a
template in molecularly imprinted nanoparticles (MIP NP) prepared by solid-phase
syntheses to development of a clinically relevant enzyme-linked assay. The sensitivity of
the assay was superior to a previously described enzyme-linked immunosorbent assay
based on antibodies.95
A sensor to determine atropine concentration in human serum and urine was
synthesised by preparing an aniline-o-phenylenediamine-atropine MIP layer onto a
piezoelectric quartz crystal.96 In addition, MIPs were successfully used as sensors for
enantiomeric separation of compounds like R and S-propranolol, D and L-tryptophan and
D and L-serine.78,97,98
1.6.3 Catalysis
MIPs have been given a lot of importance due to their high selectivity and stability
under the harsh conditions of high temperature and pressure, basic or acidic pHs. This
explains the interest in them as a replacement for enzymes or catalytic antibodies.99 For
example, Wulff used amidines as monomers to obtain phosphonate ester imprinted
polymers with the ability to bind to carboxylic acids and phosphonate esters with very high
26
affinity. The catalyst was used in the hydrolysis reaction of analogous carboxylate esters.
The reaction rate increased 100 times by using the imprinted matrices compared with the
un-catalysed reaction.98
The specific recognition and catalysis performance of MIP is a result of the
conformational complement of imprint-substrates. The shape of the imprint can partially
allow molecules that are identical to, or smaller than, the template to enter the interior.
Tong et al. presented thermodynamic and kinetic surveys on the specific recognition and
catalysis by p-nitrophenyl phosphate as templates and 1-allylimidazole as functional
monomers in MIP.100 The imprinted polymer catalyst showed a highly specific recognition
and catalysis toward the imprint species.
In addition, a catalytic and positively thermosensitive molecularly imprinted
polymer was synthesised.101 At higher temperatures (such as 40 °C), this polymer
exhibited significant catalytic activity resulting from the dissociation of the inter-polymer
complexes between 1‐vinylimidazole and 2‐trifluoromethylacrylic acid that facilitated
access to the active sites of the imprinted polymer and inflated them.
1.6.4 Drug delivery
MIPs have ability to bind strongly and selectively to bioactive molecules which
could be applied in drug delivery application. Due to the cross-linked nature and affinity
properties of MIPs, it was found that they are suitable to be used in the enhancement of
the pharmacological therapy by using MIPs to act as reservoirs that are capable to achieve
a controlled drug release.102,103 For example, theophylline-imprinted polymers performed
a controlled release of the drug, the obtained polymer showed a slow drug release for
several hours in the phosphate buffer, pH 7.0.104
MIPs offered some effective applications for improving some drugs, particularly
those drugs with a low therapeutic index, which might cause negative effects if their
concentration is not kept below a certain threshold value. In addition, MIPs offered
selective release of one of the enantiomers of racemic drugs, where the two enantiomers
have different activity levels or effects as shown with the template -adrenergic
antagonist.105,106
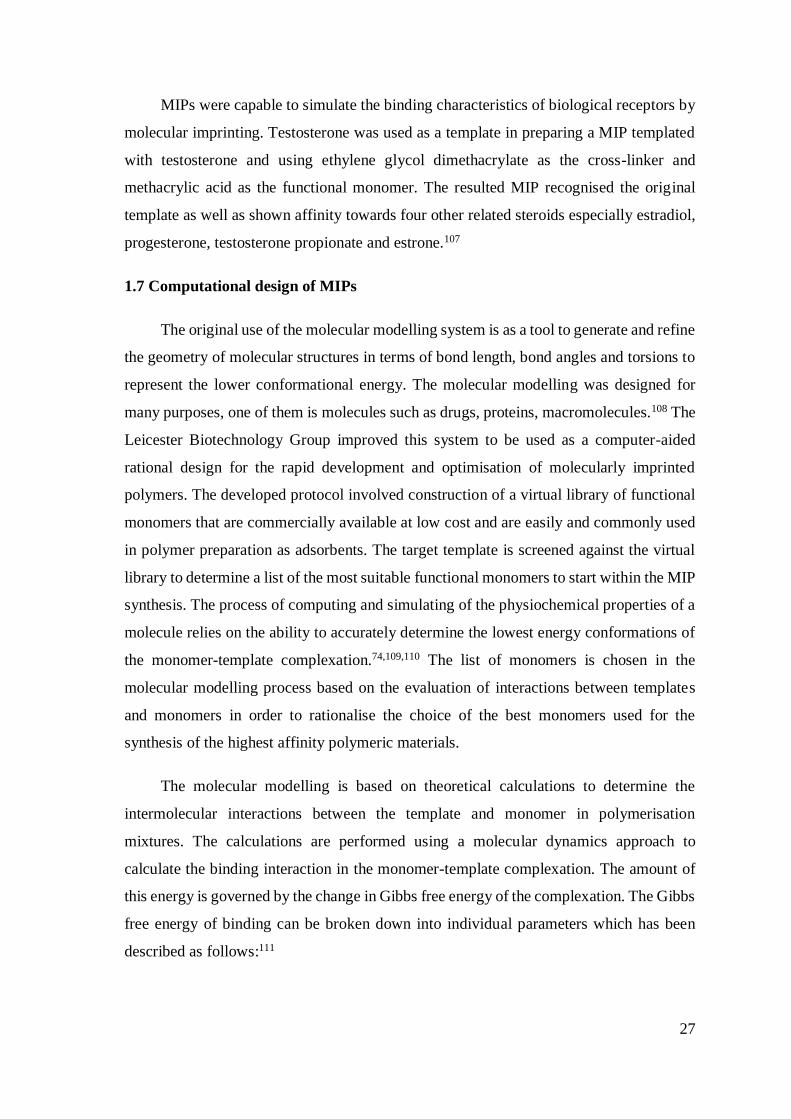
27
MIPs were capable to simulate the binding characteristics of biological receptors by
molecular imprinting. Testosterone was used as a template in preparing a MIP templated
with testosterone and using ethylene glycol dimethacrylate as the cross-linker and
methacrylic acid as the functional monomer. The resulted MIP recognised the original
template as well as shown affinity towards four other related steroids especially estradiol,
progesterone, testosterone propionate and estrone.107
1.7 Computational design of MIPs
The original use of the molecular modelling system is as a tool to generate and refine
the geometry of molecular structures in terms of bond length, bond angles and torsions to
represent the lower conformational energy. The molecular modelling was designed for
many purposes, one of them is molecules such as drugs, proteins, macromolecules.108 The
Leicester Biotechnology Group improved this system to be used as a computer-aided
rational design for the rapid development and optimisation of molecularly imprinted
polymers. The developed protocol involved construction of a virtual library of functional
monomers that are commercially available at low cost and are easily and commonly used
in polymer preparation as adsorbents. The target template is screened against the virtual
library to determine a list of the most suitable functional monomers to start within the MIP
synthesis. The process of computing and simulating of the physiochemical properties of a
molecule relies on the ability to accurately determine the lowest energy conformations of
the monomer-template complexation.74,109,110 The list of monomers is chosen in the
molecular modelling process based on the evaluation of interactions between templates
and monomers in order to rationalise the choice of the best monomers used for the
synthesis of the highest affinity polymeric materials.
The molecular modelling is based on theoretical calculations to determine the
intermolecular interactions between the template and monomer in polymerisation
mixtures. The calculations are performed using a molecular dynamics approach to
calculate the binding interaction in the monomer-template complexation. The amount of
this energy is governed by the change in Gibbs free energy of the complexation. The Gibbs
free energy of binding can be broken down into individual parameters which has been
described as follows:111
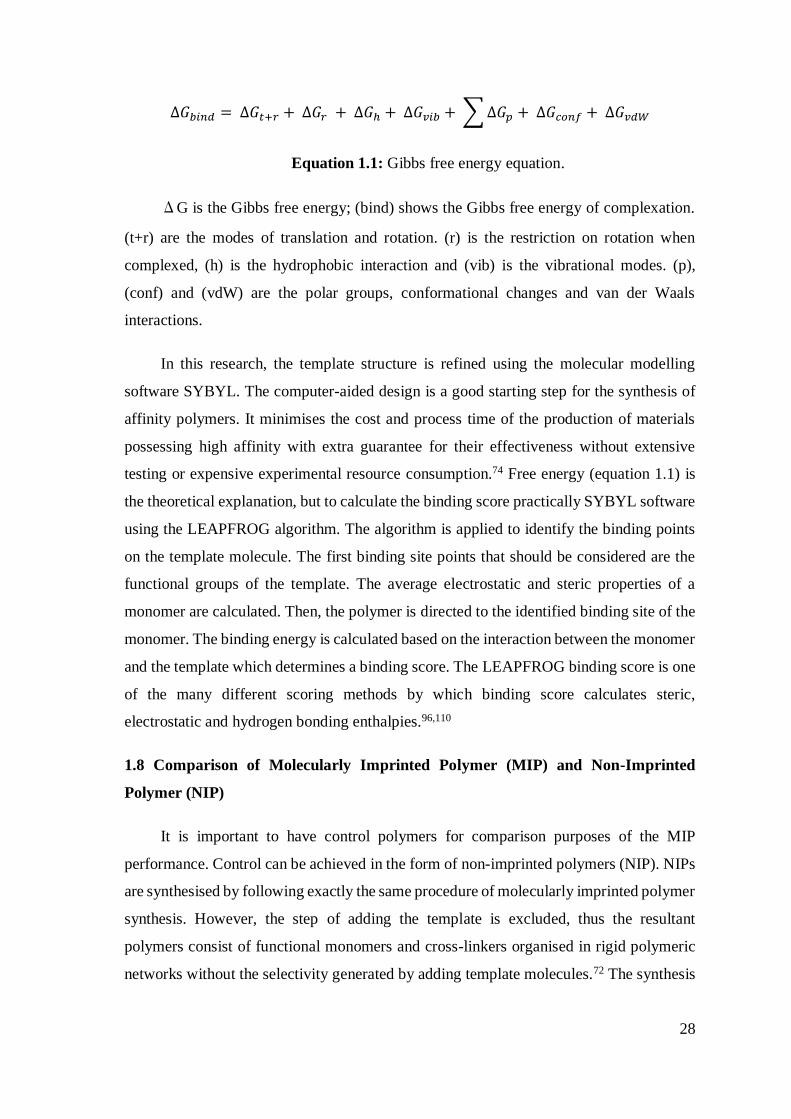
28
∆𝐺𝑏𝑖𝑛𝑑 = ∆𝐺𝑡+𝑟 + ∆𝐺𝑟 + ∆𝐺ℎ + ∆𝐺𝑣𝑖𝑏 + ∑ ∆𝐺𝑝 + ∆𝐺𝑐𝑜𝑛𝑓 + ∆𝐺𝑣𝑑𝑊
Equation 1.1: Gibbs free energy equation.
ΔG is the Gibbs free energy; (bind) shows the Gibbs free energy of complexation.
(t+r) are the modes of translation and rotation. (r) is the restriction on rotation when
complexed, (h) is the hydrophobic interaction and (vib) is the vibrational modes. (p),
(conf) and (vdW) are the polar groups, conformational changes and van der Waals
interactions.
In this research, the template structure is refined using the molecular modelling
software SYBYL. The computer-aided design is a good starting step for the synthesis of
affinity polymers. It minimises the cost and process time of the production of materials
possessing high affinity with extra guarantee for their effectiveness without extensive
testing or expensive experimental resource consumption.74 Free energy (equation 1.1) is
the theoretical explanation, but to calculate the binding score practically SYBYL software
using the LEAPFROG algorithm. The algorithm is applied to identify the binding points
on the template molecule. The first binding site points that should be considered are the
functional groups of the template. The average electrostatic and steric properties of a
monomer are calculated. Then, the polymer is directed to the identified binding site of the
monomer. The binding energy is calculated based on the interaction between the monomer
and the template which determines a binding score. The LEAPFROG binding score is one
of the many different scoring methods by which binding score calculates steric,
electrostatic and hydrogen bonding enthalpies.96,110
1.8 Comparison of Molecularly Imprinted Polymer (MIP) and Non-Imprinted
Polymer (NIP)
It is important to have control polymers for comparison purposes of the MIP
performance. Control can be achieved in the form of non-imprinted polymers (NIP). NIPs
are synthesised by following exactly the same procedure of molecularly imprinted polymer
synthesis. However, the step of adding the template is excluded, thus the resultant
polymers consist of functional monomers and cross-linkers organised in rigid polymeric
networks without the selectivity generated by adding template molecules.72 The synthesis
29
of NIPs accompanies MIP synthesis. The NIP should be subjected similarly to the
experiments to compare between them in terms of the selectivity that is absent in NIPs.
However, in some cases NIPs act as MIPs or close to them with a high recovery
percentage, for example, nonyphenol was extracted with 99% recovery similarly via MIP
and NIP.112 Another example of successful use of NIP is the effective extraction of
kukoamine from potato peel.76
The multiple successful examples of NIPs as adsorbents in SPE are a motivation
behind using the rationally-designed polymers (RDPs) in the current research. The
specificity of RDPs is based on the computational selection of monomers using the same
protocol as a design of the MIPs. Generally, the principles of the molecular imprinting are
realised in virtual sense (in silico) and allow the production of cost effective adsorbents,
at scale and possessing the required binding properties.74
1.9 Rationally-designed polymers RDPs
Over the years, a number of polymers were designed and applied successfully to
extract different compounds from different matrices with high affinity and specificity. In
addition, MIPs have demonstrated their superior chemical and thermal stability as
compared to traditional stationary phases. Nevertheless, MIPs remain mainly used for
analytical applications. However, MIPs are not suitable for the large-scale purification
processes due to their cost which is associated with the price of the template and relatively
low binding capacity.74,79
RDPs developed by Piletsky and co-workers could be an alternative to MIPs as
stationary phases in SPE. They were designed computationally using the SYBYL software
exactly as for the MIP synthesis. RDPs are synthesised using computationally-selected
functional monomers without adding the template to the monomeric mixture. The obtained
polymers consist of the rigid polymeric network which contains an excess of functional
groups on the polymer surface that are capable to interact with target compound and
provide a high binding sites suitable for its extraction and purification. It is possible to
highlight that the absence of the specific cavities in the RDP in comparison with MIPs is
compensated by the high amount of the functional groups which possess the natural
affinity towards the compound of interest.
30
MIPs, in general, are very selective towards the target, but the small number of
binding site could hinder the binding capacity of the polymers. In terms of the industrial
purification and extraction, it is necessary to take in consideration what is the maximum
amount of the target that could be extracted. In addition, it is preferable to improve the
stationary phase to be a multi-purpose SPE resin. It was observed that one of the
difficulties associated with MIP synthesis is to achieve complete removal of the template
which directly affects the efficiency of the recovery in the extraction step.74
In some cases, the difficulty of synthesis of MIPs is related to the fact that the target
that is expensive, unavailable in pure standards or unsuitable for use in the research
because of its toxic nature. In these cases, the development of the polymer consists of the
computational screening of the template against the library of functional monomers and
experimental screening of the computer-suggested monomers to make blank imprinted
polymers. The advantage of this method is that it increases the chance of success using the
virtual imprinting by executing the extraction process under the conditions (pH, solvent,
salinity, temperature, etc) which are required in the practical application.73
It was found that in some cases the performance of non-imprinted polymers (NIPs)
is not distinguished from the performance of MIPs. Consequently, it is apparent that the
computer-selected monomers should have an affinity to the corresponding template when
it is included into a random polymeric network. This knowledge has been exploited in
developing adsorbents (RDPs) which could have natural selectivity for specific target
molecules, have lower cost than MIPs, are less selective and can improve extraction from
the natural source of the target at the maximum level. High affinity of NIPs was observed
in the case of polymers that were computationally designed for nonyphenol with a
recovery percentage of 99%, which is similar to the performance of the MIPs made for the
same target.112
MIPs and the corresponding NIPs were computationally designed to purify the
phenolic polyamine kukoamine. The predicted molecular modelling was to match the
experimental performance of MIP and NIP with binding capacities of 54 and 45 mg g -1
respectively. This could suggest that rationally designed polymers broaden the efficiency
of extraction process. Further detailed studies could be conducted to extract pure
compounds from less complex crude samples.76
31
1.10 Aims and objectives
The main objective of this project is to develop an economical method to extract and
purify minor chemical compounds from the essential biomass (vegetable oils), which is
one of the common renewable resources used for the production of biofuel. To achieve the
aim of this project, a rationally-designed polymer was prepared based on the molecular
imprinting principles. It was used as an adsorbent in the optimised SPE protocol in order
to extract and purify the selected chemical compounds. In addition, the study aimed to
approve the effective performance of the synthesised polymer by comparing the yield of
SPE process using the optimised protocol to RDP as well as several commercially
available sorbents. Finally, the synthesis of RDP beside MIP from the same components
and at the closest conditions was presented to highlight the difference of RDP from the
traditional MIP. In addition, the MIP NPs with affinity towards -tocopherol was
synthesised and optimised the separation conditions.
32
References
1) Yang, R.; Zhang, L.; Li, P.; Yu, L.; Mao, J.; Wang, X.; Zhang, Q. A Review of
Chemical Composition and Nutritional Properties of Minor Vegetable Oils in China.
Trends Food Sci Technol. 2018, 74, 26–32.
2) Ballus, C. A.; Meinhart, A. D.; de Souza Campos, F. A.; da Silva, L. F.; de Oliveira, A.
F.; Godoy, H. T. A Quantitative Study on the Phenolic Compound, Tocopherol and Fatty
Acid Contents of Monovarietal Virgin Olive Oils Produced in the Southeast Region of
Brazil. Food Res. Int. 2014, 62, 74–83.
3) Li, C.; Yao, Y.; Zhao, G.; Chen, Y.; Liu, H.; liu, C.; Shi, Z.; Chen, Y.; Wang, S.
Comparison and Analysis of Fatty Acids, Sterols, and Tocopherols in Eight Vegetable Oils.
J. Agric. Food Chem. 2011, 59, 12493–12498.
4) Nigam, P. S.; Singh, A. Production of Liquid Biofuels from Renewable Resources.
Prog Energy Combust Sci. 2011, 37 (1), 52–68.
5) Gunnarsson, I. B.; Svensson, S. E.; Johansson, E.; Karakashev, D.; Angelidaki, I.
Potential of Jerusalem Artichoke (Helianthus Tuberosus L.) as a Biorefinery Crop. Ind
Crops Prod. 2014, 56, 231–240.
6) Chum, H. L.; Overend, R. P. Biomass and Renewable Fuels. Fuel Process. Technol.
2001, 71, 187–195.
7) Yang, Y.; Fang, J.; Ma, W.; Guo, D.; Mohammat, A. Large-Scale Pattern of Biomass
Partitioning across China’s Grasslands. J. Biogeogr. 2010, 19, 268–277.
8) Naureen R., Tariq M., Yuossoff I., Chowdhury A., A. M. Synthesis, Spectroscopic and
Chromatographic Studies of Sunflower Oil Biodiesel Using Optimizes Base Catalyzed
Methodlysis. Saudi J Biol Sci. 2014, 1–8.
9) Christodouleas, D.; Fotakis, C.; Papadopoulos, K.; Dimotikali, D.; Calokerinos, A. C.
Luminescent Methods in the Analysis of Untreated Edible Oils: A Review. Anal Lett. 2012,
5–6, 625–641.
33
10) Schwartz, H.; Ollilainen, V.; Piironen, V.; Lampi, A. M. Tocopherol, Tocotrienol and
Plant Sterol Contents of Vegetable Oils and Industrial Fats. J Food Compost Anal 2008,
21, 152–161.
11) Lechner, M.; Reiter, B.; Lorbeer, E. Determination of Tocopherols and Sterols in
Vegetable Oils by Solid-Phase Extraction and Subsequent Capillary Gas Chromatographic
Analysis. J Chromatogr A 1999, 857, 231–238.
12) Cert, A.; Moreda, W.; Pérez-Camino, M. Chromatographic Analysis of Minor
Constituents in Vegetable Oils. J Chromatogr A 2000, 881, 131–148.
13) Yara-Varón, E.; Li, Y.; Balcells, M.; Canela-Garayoa, R.; Fabiano-Tixier, A. S.;
Chemat, F. Vegetable Oils as Alternative Solvents for Green Oleo-Extraction, Purification
and Formulation of Food and Natural Products. Molecules 2017, 22, 1474.
14) Tan, C. H.; Ghazali, H. M.; Kuntom, A.; Tan, C. P.; Ariffin, A. Extraction and
Physicochemical Properties of Low Free Fatty Acid Crude Palm Oil. Food Chem. 2009,
113, 645–650.
15) Aransiola, E. F.; Ojumu, T. V.; Oyekola, O. O.; Madzimbamuto, T. F.; Ikhu-
Omoregbe, D. I. O. A Review of Current Technology for Biodiesel Production: State of the
Art. Biomass Bioenergy 2014, 61, 276–297.
16) Freedman, B.; Pryde, E. H.; Mounts, T. L. Variables Affecting the Yields of Fatty
Esters from Transesterified Vegetable Oils. J Am Oil Chem Soc. 1984, 61, 1638–1643.
17) Mancini, A.; Mancini, A.; Nigro, E.; Montagnese, C.; Daniele, A.; Orrù, S.; Buono,
P. Biological and Nutritional Properties of Palm Oil and Palmitic Acid: Effects on Health.
Molecules 2015, 20, 17339–17361.
18) Adekunle, K. F. A Review of Vegetable Oil-Based Polymers : Synthesis and
Applications. OJPChem. 2015, 5, 34–40.
19) Kris-Etherton, P. M.; Pearson, T. A.; Wan, Y.; Hargrove, R. L.; Moriarty, K.; Fishell,
V.; Etherton T. High Monounsaturated Fatty Acid Diets Lower Both Plasma Cholesterol
and Triacylglycerol Concentrations 1 – 3 Experimental Design. Am J Clin Nutr. 1999, 70,
1009–15.
34
20) Roman, O.; Heyd, B.; Broyart, B.; Castillo, R.; Maillard, M. N. Oxidative Reactivity
of Unsaturated Fatty Acids from Sunflower, High Oleic Sunflower and Rapeseed Oils
Subjected to Heat Treatment, under Controlled Conditions. Food Sci. Technol 2013, 52,
49–59.
21) Waltking, A. E.; Wessels, H. Chromatographic Separation of Polar and Nonpolar
Components of Frying Fats. J. Assoc. Off. Anal. Chem 1981, 64, 1329–1330.
22) AOAC, Official Methods of Analysis, Association of Analytical Chemists, Arlington,
VA, 14th Ed., 1984, Official Method 18.074.
23) Kim, H.; Salem, N. Extraction Thermospray LC-MS Analysis. J. Lipid Res. 1990, 31,
2285–2289.
24) Gharby, S.; Harhar, H.; Bouzoubaa, Z.; Asdadi, A.; El Yadini, A.; Charrouf, Z.
Chemical Characterization and Oxidative Stability of Seeds and Oil of Sesame Grown in
Morocco. J Saudi Soc. Agricul. S. 2017, 16, 105–111.
25) Koushki, M.; Nahidi, M.; Cheraghali, F. Physico-Chemical Properties, Fatty Acid
Profile and Nutrition in Palm Oil. J Paramed Sci. 2015, 6, 117–134.
26) Abidi, S. L.; Thiam, S.; Warner, I. M. Elution Behavior of Unsaponifiable Lipids with
Various Capillary Electrochromatographic Stationary Phases. J Chromatogr A 2002, 949,
195–207.
27) Moazzami, A. A.; Kamal-Eldin, A. Sesame Seed Is a Rich Source of Dietary Lignans.
JAOCS, J Am Oil Chem Soc. 2006, 83, 719–723.
28) Galae M., Horga C., C. M. Separation and Determination of Tocopherols in Vegetable
Oils by Solid Phase Extraction on Porous Polymers SPE Cartidges and Capillary Gas
Chromatography Analysis. Open Chem. 2010, 8, 1110–1116.
29) Monferrere, G. L.; Azcarate, S. M.; Cantarelli, M. Á.; Funes, I. G.; Camiña, J. M.;
Monfreere C., Azcarate S., Cantarelli M., Funes I., C. J. Chemometric Characterization of
Sunflower Seeds. Journal of food scince 2012, 77 (, 1018–1022.
35
30) Murphy P.; Subar F. Vitamin E Intakes and sources in the United States. Am. J. Clin.
Nutr. 1989, 52, 361–367.
31) Luo, Z.; Murray, B. S.; Ross, A.-L.; Povey, M. J. W.; Morgan, M. R. A.; Day, A. J.
Effects of PH on the Ability of Flavonoids to Act as Pickering Emulsion Stabilizers.
Colloids Surf B Biointerfaces. 2012, 92, 84–90.
32) Salgin, U.; Döker, O.; Çalimli, A. Extraction of Sunflower Oil with Supercritical
CO2: Experiments and Modeling. J Supercrit Fluids 2006, 38, 326–331.
33) Amakura, Y.; Yoshimura, M.; Yamakami, S.; Yoshida, T. Isolation of Phenolic
Constituents and Characterization of Antioxidant Markers from Sunflower (Helianthus
Annuus) Seed Extract. Phytochem Lett. 2013, 6, 302–305.
34) Pająk, P.; Socha, R.; Gałkowska, D.; Rożnowski, J.; Fortuna, T. Phenolic Profile and
Antioxidant Activity in Selected Seeds and Sprouts. Food Chem. 2014, 143, 300–306.
35) Puoci F., Cirillo G., Curcio M., Iemma F., Spizzirri U., P. N. Molecular Imprinted
SPE of Selective HPLC Determination of A-Tocopherol in Bay Leave. Anal. Chim. Acta.
2007, 593, 164–170.
36) Bramley, P. M.; Elmadfa, I.; Kafatos, a; Kelly, F. J.; Manios, Y.; Roxborough, H. E.;
Schuch, W.; Sheehy, P. J. a; Wagner, K. H. Vitamin E. J. Sci. Food Agric. 2000, 80, 913–
938.
37) Azzi A., S. A.; Azzi, A.; Stocker, A. Vitamin E: Non-Antioxidant Roles. Prog. Lipid
Res. 2000, 39, 321–255.
38) Lemaire-Ewing, S.; Desrumaux, C.; Néel, D.; Lagrost, L. Vitamin E Transport,
Membrane Incorporation and Cell Metabolism: Is Alpha-Tocopherol in Lipid Rafts an Oar
in the Lifeboat? Mol Nutr Food Res. 2010, 54, 631–640.
39) Atkinson, J.; Epand, R. F.; Epand, R. M. Tocopherols and Tocotrienols in
Membranes: A Critical Review. Free Radic. Biol. Med. 2008, 44, 739–764.
36
40) Saini, R. K.; Keum, Y. Tocopherols and Tocotrienols in Plants and Their Products: A
Review on Methods of Extraction, Chromatographic Separation, and Detection; Food Res
Int., 2016, 82, 59-70.
41) Ofori-Boateng, C.; Lee, K. Ultrasonic-Assisted Extraction of α-Tocopherol Anti-
Oxidants from the Fronds of Elaeis Guineensis Jacq.: Optimization, Kinetics, and Ther-
Modynamic Studies. Food Anal Methods 2013, 7, 257–267.
42) Lagarda, M. J.; García-Llatas, G.; Farré, R. Analysis of Phytosterols in Foods. J
Pharm Biomed Anal. 2006, 41, 1486–1496.
43) Wei, F.; Shen, B.; Chen, M.; Zhou, X.; Zhao, Y. Separation of -Tocopherol with a
Two-Feed Simulated Moving Bed. Chin. J. Chem. Eng. 2012, 20, 673–678.
44) Victor R.; Ronald R. The Encyclopedia of Vitamin E; CABI, 2007.
45) Monferrere, G. L.; Azcarate, S. M.; Cantarelli, M. Á.; Funes, I. G.; Camiña, J. M.;
Monfreere C., Azcarate S., Cantarelli M., Funes I., C. J. Chemometric Characterization of
Sunflower Seeds. J. Food Sci. 2012, 77, 1018 –1022.
46) Delgado-Zamarreño, M. M.; Fernández-Prieto, C.; Bustamante-Rangel, M.; Pérez-
Martín, L. Determination of Tocopherols and Sitosterols in Seeds and Nuts by QuEChERS-
Liquid Chromatography. Food Chem. 2016, 192, 825–830.
47) Bartosińska, E.; Buszewska-Forajta, M.; Siluk, D. GC–MS and LC–MS Approaches
for Determination of Tocopherols and Tocotrienols in Biological and Food Matrices. J
Pharm Biomed Anal 2016, 127, 156–169.
48) Galea M., Horga C., C. M. Separation and Determination of Tocopherols in Vegetable
Oil by SPE. Open Chem. 2010, 8, 110– 116.
49) Pyka, A.; Sliwiok, J. Chromatographic Separation of Tocopherols. J Chromatogr A
2001, 935, 71 – 76.
50) Ghafoor, K.; Ozcan, M. M.; Al-Juhaimi, F.; Babiker, E. E.; Sarker, Z. I.; Ahmed, I.
A. M.; Ahmed, M. A. Nutritional Composition, Extraction, and Utilization of Wheat Germ
Oil: A Review. Eur J Lipid Sci Technol. 2017, 118, 1–9.
37
51) Phillips, K. M.; Ruggio, D. M.; Toivo, J. I.; Molly, S.; Amy, S. Free and Esterified
Sterol Composition of Edible Oils and Fats. J Food Compost Anal. 2002, 15, 123–142.
52) Moreau, R. A.; Whitaker, B. D.; Hicks, K. B. Phytosterols, Phytostanols, and Their
Conjugates in Foods: Structural Diversity, Quantitative Analysis, and Health-Promoting
Uses. Prog. Lipid Res.2002, 41, 457–500.
53) Moreau, R. A.; Nyström, L.; Whitaker, B. D.; Winkler-Moser, J. K.; Baer, D. J.;
Gebauer, S. K.; Hicks, K. B. Phytosterols and Their Derivatives: Structural Diversity,
Distribution, Metabolism, Analysis, and Health-Promoting Uses. Prog. Lipid Res. 2018,
70, 35-61.
54) Villegas, L.; Benavente, F.; Sanz-Nebot, V.; Grases, J. M.; Barbosa, J. A Rapid and
Simple Method for the Analysis of Bioactive Compounds in Olive Oil Refining By-
Products by Liquid Chromatography with Ultraviolet and Mass Spectrometry Detection. J
Food Compost Anal. 2018, 69, 107–114.
55) Luthria D. Oil Extraction and Analysis, 2004, AOCS Press: Maryland, USA.
56) Andrade-Eiroa, A.; Canle, M.; Leroy-Cancellieri, V.; Cerdà, V. Solid-Phase
Extraction of Organic Compounds: A Critical Review. Part Ii. Trends Analyt Chem. 2016,
80, 655–667.
57) Andrade-Eiroa, A.; Shahla, R.; Romanías, M. N.; Dagaut, P. An Alternative to Trial
and Error Methodology in Solid Phase Extraction: An Original Automated Solid Phase
Extraction Procedure for Analysing PAHs and PAH-Derivatives in Soot. RSC Adv. 2014,
4, 33636–33644.
58) Buszewski, B.; Szultka, M. Past, Present, and Future of Solid Phase Extraction: A
Review. Crit Rev Anal Chem. 2012, 42, 198–213.
59) Ibrahim, W. A. W.; Ali, L. I. A.; Sulaiman, A.; Sanagi, M. M.; Aboul-Enein, H. Y.
Application of Solid-Phase Extraction for Trace Elements in Environmental and Biological
Samples: A Review. Crit Rev Anal Chem. 2014, 44, 233–254.
60) Christie W.; HAN X. Lipid Analysis. Isolation, Separation, Identification and
Lipidomic Analysis I; Woodhead Publishing Limited: Cambridge, 2012.
38
61) Augusto, F.; Hantao, L. W.; Mogollón, N. G. S.; Braga, S. C. New Materials and
Trends in Sorbents for Solid-Phase Extraction. Trends Analyt Chem. 2013, 43, 14–23.
62) Correia, A. C.; Dubreucq, E.; Ferreira‐Dias, S.; Lecomte, J. Rapid Quantification of
Polar Compounds in Thermo-Oxidized Oils by HPTLC-Densitometry. Eur J Lipid Sci
Technol. 2015, 117, 311–319.
63) Russell, J. M.; Werne, J. P. The Use of Solid Phase Extraction Columns in Fatty Acid
Purification. Org. Geochem. 2007, 38, 48–51.
64) Grigoriadou, D.; Androulaki, A.; Psomiadou, E.; Tsimidou, M. Z. Solid Phase
Extraction in the Analysis of Squalene and Tocopherols in Olive Oil. Food Chem. 2007,
105, 675–680.
65) Koštál, V.; Urban, T.; Řimnáčová, L.; Berková, P.; Šimek, P. Seasonal Changes in
Minor Membrane Phospholipid Classes, Sterols and Tocopherols in Overwintering Insect,
Pyrrhocoris Apterus. J. Insect Physiol. 2013, 59, 934–941.
66) Toivo, J.; Piironen, V.; Kalo, P.; Varo, P. Gas Chromatographic Determination of
Major Sterols in Edible Oils and Fats Using Solid-Phase Extraction in Sample Preparation.
Chromatographia 1998, 48, 745–750.
67) Piironen, V.; Toivo, J.; Lampi, A.-M. Natural Sources of Dietary Plant Sterols. J Food
Compost Anal. 2000, 13, 619–624.
68) Breinhölder, P.; Mosca, L.; Lindner, W. Concept of Sequential Analysis of Free and
Conjugated Phytosterols in Different Plant Matrices. J. Chromatogr. B Analyt. Technol.
Biomed. Life Sci. 2002, 777, 67–82.
69) Mathison, B.; Holstege, D. A Rapid Method To Determine Sterol, Erythrodiol, and
Uvaol Concentrations in Olive Oil. Journal of Agricultural and Food Chemistry 2013, 61
(19), 4506–4513.
(70) Gómez-Coca, R. B.; Pérez-Camino, M. del C.; Moreda, W. On the Glucoside
Analysis: Simultaneous Determination of Free and Esterified Steryl Glucosides in Olive
Oil. Detailed Analysis of Standards as Compulsory First Step. Food Chemistry 2013, 141
(2), 1273–1280.

39
71) Azadmard-Damirchi S.; Dutta P. Phytosterol Classes in Olive Oils and Their Analysis
by Common Chromatographic Methods. In Victor R.; and Ronald R., editor. Olives and
Olive Oil in Health and Disease Prevention; Elsevier Science & Technology, 2010; pp
249–257.
72) Vaspollo G., Sole R., Mergola L., Lazzoi M., Scorrano S., M. G. Molecularly
Imprinted Polymers: Present and Future Prospective. Int J Mol Sci 2011, 12, 5908 – 5945.
73) Qiao, F.; Sun, H.; Yan, H.; Row, K. H. Molecularly Imprinted Polymers for Solid
Phase Extraction. Chromatographia 2006, 64, 625–634.
74) Piletska E., Kumir J., Sergeyeva T., Rational Design and Development of Affinity
Adsorbents for Analytical and Biopharmacutical. JCAM 2013, 1, 229-244.
75) Płotka-Wasylka, J.; Szczepańska, N.; de la Guardia, M.; Namieśnik, J. Miniaturized
Solid-Phase Extraction Techniques. Trends Analyt Chem. 2015, 73, 19–38.
76) Piletska, E. V.; Burns, R.; Terry, L.; Piletsky, S. Application of a Molecularly
Imprinted Polymer for the Extraction of Kukoamine a from Potato Peels. J. Agric. Food
Chem. 2012, 60, 95–9.
77) McEvoy, J. Molecular Recognition Biotechnology, Chemical Engineering and
Material Applications, 2011, Nova Science Publisher: New York, USA.
(78) Yan, H.; Row, K. H. Characteristic and Synthetic Approach of Molecularly Imprinted
Polymer. Int J Mol Sci. 2006, 7, 155–178.
79) Sánchez-Barragán I., Karim K., Costa-Fernández J. M., Piletsky S. A., Molecularly
Imprinted Polymer for Carbaryl Determination in Watere. Sens. Actuators. 2006, 123, 798–
804.
80) Turiel, E.; Martín-Esteban, A. Molecularly Imprinted Polymers for Sample
Preparation: A Review. Anal. Chim. Acta. 2010, 668, 87–99.
81) Andersson, L. I.; Paprica, A.; Arvidsson, T. A Highly Selective Solid Phase
Extraction Sorbent for Pre-Concentration of Sameridine Made by Molecular Imprinting.
Chromatographia 1997, 46, 57–62.
40
82) Musile, G.; Cenci, L.; Piletska, E.; Gottardo, R.; Bossi, A. M.; Bortolotti, F.
Development of an In-House Mixed-Mode Solid-Phase Extraction for the Determination
of 16 Basic Drugs in Urine by High Performance Liquid Chromatography-Ion Trap Mass
Spectrometry. J Chromatogr A 2018, 1560, 10–18.
83) Chianella, I, Lotierzo M, Piletsky SA, Tothill I, Chen B, Karim K, Rational Design of
a Polymer Specific for Microcystin-LR Using a Computational Approach. Anal. Chem.
2002, 74, 1288–1293.
84) Piletska, E. V, Romero-Guerra M, Chianella I, Karim K, Turner A, Towards the
Development of Multisensore for Drugs of Abuse Based on Molecular Imprinted Polymers.
Anal. Chim. Acta. 2005, 542, 111–117.
85) Piletska E, Piletsky S, Karim K, Terpetschnig E, Introducing the Biotin-Specific
Synthetic Receptors Based on Molecular Imprinted Polymerisation by Photografting from
Water. Anal. Chim. Acta.2004, 504, 179–183.
86) Turner, N. W.; Piletska, E. V.; Karim, K.; Whitcombe, M.; Malecha, M.; Magan, N.;
Baggiani, C.; Piletsky, S. a. Effect of the Solvent on Recognition Properties of Molecularly
Imprinted Polymer Specific for Ochratoxin A. Biosens Bioelectron. 2004, 20, 1060–1067.
87) Brragan I, Karim K, Fernandez J, P. S. A Molecularly Imprinted Polymer for Carbayl
Determination in Water. Sens Actuators B Chem. 2007, 123, 798–804.
88) Breton F, Rouillon R, Piletska E, Karim K, Guerreiro A, Chianella I, P. S. Virtual
Imprinting as a Tool to Design Efficient MIPs for Photosynthesis-Inhibiting Herbicides.
Biosens Bioelectron 2005, 22, 1948–1954.
89) Song, X.; Xu, S.; Chen, L.; Wei, Y.; Xiong, H. Recent Advances in Molecularly
Imprinted Polymers in Food Analysis. J Appl Polym Sci 2014, 131, 1-18 .
90) Madikizela, L. M.; Tavengwa, N. T.; Chimuka, L. Applications of Molecularly
Imprinted Polymers for Solid-Phase Extraction of Non-Steroidal Anti-Inflammatory Drugs
and Analgesics from Environmental Waters and Biological Samples. J Pharm Biomed
Anal. 2018, 147, 624–633.
41
91) Ashleya, Jon; Ali Shahbazia, Mohammad; Kanta, Krishna; Aaydha, Vinayaka;
Chidambarab, Wolff, Aanders; , Dang Duong Bangb; Sun, Y. Molecularly Imprinted
Polymers for Sample Preparation and Biosensing in Food Analysis: Progress and
Perspectives. Biosens Bioelectron. 2017, 91, 606–615.
92) Gilart, N.; Borrull, F.; Fontanals, N.; Marcé, R. M. Selective Materials for Solid-Phase
Extraction in Environmental Analysis. TrEAC 2014, 1, e8–e18.
93) Lin, X. H.; Aik, S. X. L.; Angkasa, J.; Le, Q.; Chooi, K. S.; Li, S. F. Y. Selective and
Sensitive Sensors Based on Molecularly Imprinted Poly (Vinylidene Fluoride) for
Determination of Pesticides and Chemical Threat Agent Simulants. Sens Actuators B Chem
2018, 258, 228–237.
94) Wang, T.; Shannon, C. Electrochemical Sensors Based on Molecularly Imprinted
Polymers Grafted onto Gold Electrodes Using Click Chemistry. Anal. Chim. Acta. 2011,
708, 37–43.
95) Chianella, I.; Guerreiro, A.; Moczko, E.; Caygill, J. S.; Piletska, E. V.; De Vargas
Sansalvador, I. M. P.; Whitcombe, M. J.; Piletsky, S. A. Direct Replacement of Antibodies
with Molecularly Imprinted Polymer Nanoparticles in ELISA—Development of a Novel
Assay for Vancomycin. Anal. Chem. 2013, 85, 8462–8468.
96) Chianella, I.; Karim, K.; Piletska, E. V.; Preston, C.; Piletsky, S. a. Computational
Design and Synthesis of Molecularly Imprinted Polymers with High Binding Capacity for
Pharmaceutical Applications-Model Case: Adsorbent for Abacavir. Anal. Chim. Acta.
2006, 559, 73–78.
97) Fireman-Shoresh, S.; Avnir, D.; Marx, S. General Method for Chiral Imprinting of
Sol-Gel Thin Films Exhibiting Enantioselectivity. Chem. Mater. 2003, 15, 3607–3613.
98) Wulff, G. G. Fourty Years of Molecular Imprinting in Synthetic Polymers: Origin,
Features and Perspectives. Mikrochim Acta 2013, 180, 1359–1370.
99) Muratsugu S.; Tada M. A Molecular Imprinting polymer as Catalyst in Alvarez-
Lorenzo C.; Concheiro A., Editor., Handbook of Molecularly Imprinted Polymers. Smithers
Rapra Technology Ltd: 2013pp 259-308.
42
100) Tong, K.; Xiao, S.; Li, S.; Wang, J. Molecular Recognition and Catalysis by
Molecularly Imprinted Polymer Catalysts: Thermodynamic and Kinetic Surveys on the
Specific Behaviors. J Inorg Organomet Polym Mater 2008, 18, 426–433.
101) Li, S.; Gi, Y.; Turner, F. A Catalytic and Positively Thermosensitive Molecularly
Imprinted Polymer. Adv Funct Mater. 2011, 21, 1194–1200.
102) Cunliffe, D.; Kirby, A.; Alexander, C. Molecularly Imprinted Drug Delivery Systems.
Adv. Drug Deliv. Rev. 2005, 12, 1836-1853
103) Piletska, E. V.; Abd, B. H.; Krakowiak, A. S.; Parmar, A.; Pink, D. L.; Wall, K. S.;
Wharton, L.; Moczko, E.; Whitcombe, M. J.; Karim, K.; Piletsky, S. Magnetic High
Throughput Screening System for the Development of Nano-Sized Molecularly Imprinted
Polymers for Controlled Delivery of Curcumin. Analyst 2015, 140, 3113–3120.
104) Wu, L.; Li, Y. Study on the Recognition of Templates and Their Analogues on
Molecularly Imprinted Polymer Using Computational and Conformational Analysis
Approaches. J. Mol. Recognit. 2004, 17, 567–574.
105) Ostrowski, J.; Kjelsberg, M.; Caron, M.; Lefkowitz, R. Mutagenesis of the Bita-
Adrenergic Receptor: How Structure Elucidates Function. Annu. Rev. Pharmacal. Taxical.
1993, 32, 167–183.
106) Luliński, P. Molecularly Imprinted Polymers Based Drug Delivery Devices: A Way
to Application in Modern Pharmacotherapy. A Review. Mater Sci Eng C Mater Biol Appl.
2017, 76, 1344–1353.
107) Rathbone, D. Molecularly Imprinted Polymers in the Drug Discovery Process. Adv.
Drug Deliv. Rev. 2005, 57, 1854–1874.
108) Brantl V.; Picone D.; Amodeo P.; Temussi P. Solution Structure of Casokefamide.
Biochem. Biophys. Res. Commun. 1993, 191, 853–859.
109) Mohamed, R.; Mottier, P.; Treguier, L.; Richoz-Payot, J.; Yilmaz, E.; Tabet, J.-C.;
Guy, P. A. Use of Molecularly Imprinted Solid-Phase Extraction Sorbent for the
Determination of Four 5-Nitroimidazoles and Three of Their Metabolites from Egg-Based
43
Samples before Tandem LC−ESIMS/MS Analysis. J. Agric. Food Chem. 2008, 56, 3500–
3508.
110) Karim, K.; Breton, F.; Rouillon, R.; Piletska, E. V.; Guerreiro, A.; Chianella, I.;
Piletsky, S. a. How to Find Effective Functional Monomers for Effective Molecularly
Imprinted Polymers? Adv. Drug Deliv. Rev. 2005, 57, 1795–1808.
(111) Nicholls A.; Adbo K.; Andersson H.; Andersson O., Ankarloo J.; Hedin-Dahlström
J.; Jokela J. Karlsson G.; Olofsson L.; Rosengren J.P.; Shoravi S.; Can we rationally design
molecularly imprinted polymers? Anal. Chim. Acta. 2001, 435, 9-18.
(112) Guerreiro, A.; Soares, A.; Piletska, E.; Mattiasson, B.; Piletsky, S. Preliminary
Evaluation of New Polymer Matrix for Solid-Phase Extraction of Nonylphenol from Water
Samples. Anal. Chim. Acta. 2008, 612, 99–104.

44
Chapter two
45
Development of RDP resin and SPE protocol for extraction of
α-tocopherol and other physiologically-active components from
sunflower oil
2.1 Introduction
2.1.1 Multi-target adsorbents
In the last few years, particular attention has been given to the development of
detecting multiple targets simultaneously in various matrices, such as food and
environmental complexes or biological samples, that has encouraged the enhancement of
the analytical methodology.1-8 One of the early trials was reported by Lechner and co-
workers using silica gel in SPE cartridge and the eluted samples were analysed by
GC/FID.1 The proposed method performed determination of the quantities of -
tocopherol, -tocopherol, -tocopherol, -tocopherol, brassicasterol, stigmasterol,
campesterol, -sitosterol and 5-avenasterol simultaneously, in five types of vegetable
seed oils including rapeseed, sunflower, soybean, castor and cuphea.1 The recent studies
have shown several feasible protocols for group-specificity molecularly imprinted
polymers that demonstrated considerable recognition for a wide range of compounds
simultaneously.2–4 These MIPs have been developed based on chromatographic techniques
coupled to one of the standard detecting technologies such as the UV detector,
fluorescence, diode array detector or mass spectrometer. Madikizela and co-workers
introduced a MIP that has simultaneous selectivity towards three acidic pharmaceutical
compounds as templates.5 The polymer was synthesised using 2-vinyl pyridine as a
functional monomer with EGDMA as cross-linker in the presence of diclofenac (3),
ibuprofen (1) and naproxen (2) as templates (Figure 2.1). The synthesised polymer was
capable of recognising all the three compounds, even in the presence of competitor
compound gemfibrozil (4) (Figure 2.1).5
Furthermore, Lolic and co-workers optimised an SPE protocol using commercial
adsorbent (Strata-X) to extract a group of compounds from seawater at the same time.6
The eluted compounds from seawater include diclofenac, 1-hydroxyibuprofen (5),
carboxyibuprofen (6), acetaminophen (7), acetylsalicylic acid (8), naproxen (2),
46
nimesulide (9), ketoprofen (10) and ibuprofen (1) (Figure 2.1). These compounds were
extracted from several seawater samples collected from different places, some of the
seawater samples had all the compounds and were separated, while other samples had only
a few of these compounds. The analysis was performed by UHPLC with a C18 column.6
Another study on similar compounds (1, 2, 3, 4, 10 in Figure 2.1) was reported by
Lindqvist et al., using SPE via Oasis MCX commercial cartridge.7 The compounds were
separated from sewage water and were analysed using HPLC/MS. Regarding the
biological samples, Stolker and Brinkman reviewed the different types of SPE cartridges
which were used for separating various drugs from biological tissues including liver,
kidney and meat.8 The authors reported the most widely used polymeric sorbents including
the (poly)styrene-divinylbenzene co-polymers, Oasis-HLB, N-vinylpyrrolidone and
divinyl-benzenes.
On the other hand, non-imprinted polymers accompanying synthesis of the imprinted
polymer as a control have shown considerable group specificity to some compounds,
though it was less than what has demonstrated by MIP. Non-imprinted polymers are
synthetic material from functional monomers connected with excess cross-linkers. NIPs
have the same chemical characteristics except for the presence of the cavities with specific
recognition. However, functional monomers in NIPs serve as binding sites which lead to
exhibition of strong non-specific binding to the organic compounds in the analytes.9–13 For
example, Meischl and co-workers extracted acetylsalicylic and salicylic acid
simultaneously with the percentage recovery of 98.4% using a NIP synthesised,
acrylamide (functional monomer) and EGDMA (cross-linker).11 Moreover, it was possible
to extract 17-estradiol (harmful compound in water) using NIP at a high level of
efficiency (80%).9 In addition, NIP synthesised by Boulanouar and co-workers used MAA
as a functional monomer and EGDMA as a cross-linker. NIP demonstrated specific
recognition towards five compounds with the percentage recovery of 7513%. These five
compounds include: fenthion sulfoxide, malathion, diazinon, fenitrothion and fenthion. In
some cases, NIP outperformed MIP and C18 as a material for extraction and concentration
of nonylphenol from a water sample.13
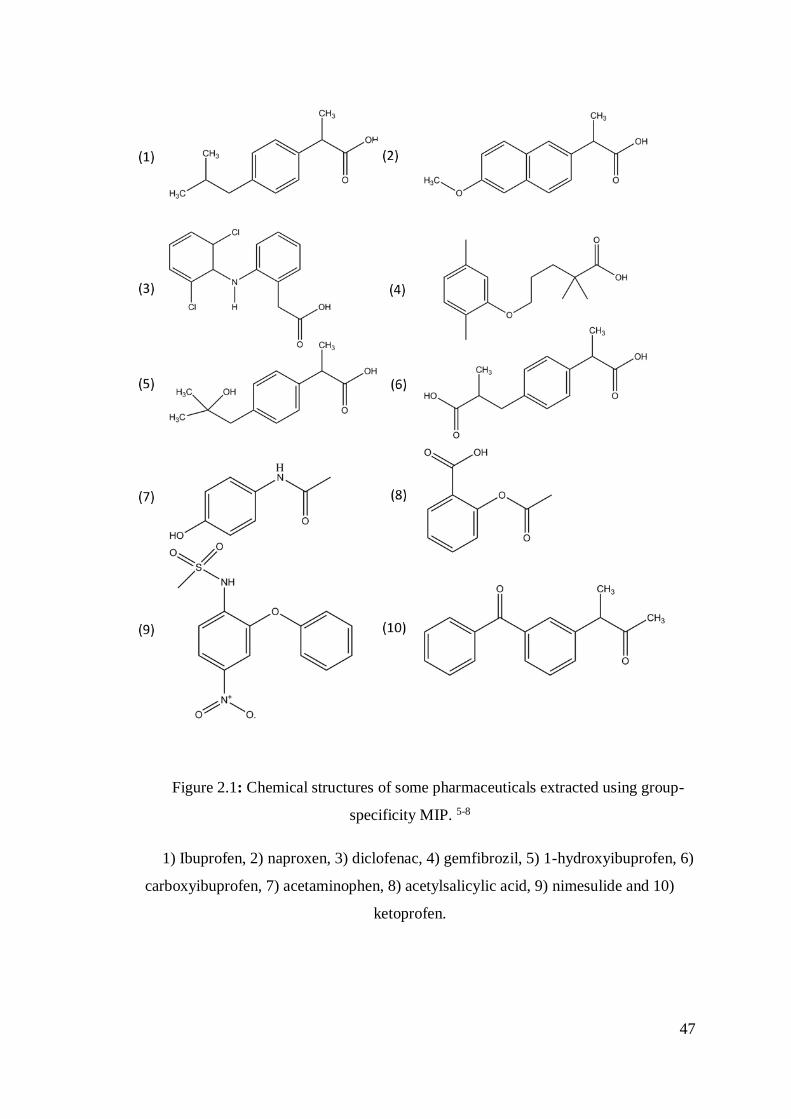
47
Figure 2.1: Chemical structures of some pharmaceuticals extracted using group-
specificity MIP. 5-8
1) Ibuprofen, 2) naproxen, 3) diclofenac, 4) gemfibrozil, 5) 1-hydroxyibuprofen, 6)
carboxyibuprofen, 7) acetaminophen, 8) acetylsalicylic acid, 9) nimesulide and 10)
ketoprofen.
48
2.1.2 RDP versus MIP
Regardless the immense attention that MIPs have gained as sorbents employed in
classical solid phase extraction for sample preparation, there are some limitations in this
methodology demanding more development to overcome such limitation. The most
common reported drawback of this technique was the bleeding which occurred in case of
incomplete removal of the template (target) molecules from the MIP after the
polymerisation. Bleeding leaded to false positive quantification which is defined as the
overestimation of the quantities in the real sample.3,4 One of the suggested solution was to
use the dummy template which was a structural analogue of the template molecule, that
was used as a template in synthesis the imprinted polymer. This helped to distinguish
between the dummy template and the main target in the real sample in case of leakage
from the MIP during the analysis.3,4,14
Typically, SPE is performed using stationary phase packed in glass or plastic
columns. However, the commercial stationary phases are often blamed for their poor
stability, which limits a selection of compatible solvents, for inadequate selectivity, limited
reusability and restricted binding capacity, especially for polar compounds.22,23 Therefore,
due to the absence of effective commercial resins for extraction of -tocopherol and other
secondary metabolites from oil matrices, there is a demand for economical, alternative
stationary phase that could be cost-effective and, potentially, be suitable for industrial
applications. This chapter includes the development of Rational Designed Polymer (RDP)
as a resin for the extraction and purification of a group of minor components including
free fatty acids, -tocopherol and some phytosterols from such complex and dense matrix
like sunflower oil. It is important to highlight that due to the complexity and high viscosity
of the oil matrix, the extraction of any compounds from natural oils is a very challenging
task. There are very scarce publications that report successful development of the
Molecularly Imprinted Polymers as resins for extraction of the oil-soluble pesticides.12,16-
18 Among the advantages of RDPs which could make them suitable for analytical and
industrial applications are their low cost, potential group-specificity towards the
compounds sharing some common functionalities, and compatibility with mass-
manufacturing and high stability.14,24,25 This chapter demonstrates the development of the
protocols and materials, which could effectively be applied for the extraction of minor
components of sunflower and other vegetable oils.
49
2.2 Materials and methods
2.2.1 Chemicals and reagents
Unrefined sunflower oil was purchased from Activecare through Amazon.com. The
vegetable oil-originated α-tocopherol, a mixture of phytosterols consisting of 46% -
sitosterol, 24% campesterol and 16% stigmasterol were obtained from Santa Cruz
Biotechnology (UK). Samples of free fatty acids containing palmitic, oleic and linoleic
acids were purchased from Aldrich (UK). Methanol, ethyl acetate, heptane, acetonitrile,
n-hexane, dichloromethane and acetic acid were obtained from Fisher Scientific (UK). All
solvents were of HPLC-quality grade and used without any purification. 1,1'-
azobis(cyclohexane carbonitrile), methacrylic acid (MAA) and ethylene glycol
dimethacrylate (EGDMA) were purchased from Aldrich (UK). Dimethylformamide
(DMF) was obtained from Acros Organics (UK).
2.2.2 Equipment and analysis techniques
The characterisation of the rationally designed polymer was performed using a
standard solution of -tocopherol (model solution) using UV-Vis spectrophotometer
(Shimadzu, UV1800, UK). In the current research, it was found that -tocopherol absorbs
UV light to give a peak at wavelength λmax 296 nm in direct proportion to its concentration
in the sample. Therefore, the UV absorption spectroscopy (λmax 296 nm) was the first
analytical technique applied here to quantify the bound -tocopherol in hexane and for the
evaluation of the binding capacity of the polymer. The optimisation process was applied
to SPE extraction from the model solution. One mL SPE columns were packed with 100
mg of the RDP and used in combination with a vacuum manifold (Supelco, UK). All SPE
experiments were repeated five times.
The second part of the experiment was applying the optimised protocol to the
sunflower oil. The quantification of the eluted -tocopherol and other minor components
was performed using the Gas Chromatography-Mass-spectrometry (GC/MS) set-up
(Perkin Elmer, TurboMass, UK) using a 30 m x 250 µm, 0.25 mm I.D., ZB-5 capillary
column (Phenomenex, UK). Helium gas was used as mobile phase to carry the sample at
a flow-rate of 1 mL min-1 at 200 °C. After injection of 10 L of the sample at 200 °C, the
temperature of the GC oven was raised by 10 °C min-1 to 350 °C and held for 3 min.
50
2.2.3 Molecular modelling of the -tocopherol-specific polymers
A computer-aided rational design was used for the optimisation of molecular
imprinting procedure. In the current research, molecular modelling was the first step to
design the polymer that is going to be the stationary phase in SPE. Molecular modelling
was performed using a workstation from Research Machines running the CentOS 5
GNU/Linux operating system. The workstation was configured with a 3.2GHz core 2 duo
processor, 4 GB memory and a 350 GB fixed drive. Molecular modelling was executed
via the software packages SYBYL 7.0 (Tripos Inc., St. Louis, Missouri, USA). The library
of functional monomers was chosen and developed in S. Piletsky group. The functional
monomers in this library are available and inexpensive to use rapidly and easily by
screening them using the LEAPFROG algorithm. The LEAPFROG algorithm works by
screening the library of commonly used functional monomers for their potential
interactions with the template (-tocopherol) that is either downloaded or drawn. The
calculated energies are a combination of (i) a typical monomer-template complexation and
(ii) a system of scoring the complementarities between monomer and template where the
template is defined by LEAPFROG as the receptor binding site (using additional site-point
matching scores, a system of scoring the receptor and ligand interactions).26
The monomers were ordered in terms of the strength of their possible interactions
with the template (-tocopherol). The monomers were ranked by the highest binding score
(kcal mol-1) as the best candidates for polymer preparation. The library consists of 22
functional monomers (Figure 2.2 showed some of them) that are commonly used in
molecular imprinting due to their ability to interact with a template through ionic and
hydrogen bonds, van der Waals’ and dipole-dipole interactions.27 The molecular energy
of each monomer from the library was minimised at a value of 0.01 kcal mol-1 and the
charges for each atom were calculated. The structures of the monomers were then refined
using molecular mechanical methods. The 2D structures of -tocopherol and monomers
were minimised, and Gasteiger-Hückel charges were applied to obtain the 3D molecular
structure.
51
2.2.4 Synthesis of RDP
The preparation of the polymer was done by weighing all the components of the
polymerisation mixture. Firstly, as shown in Table 2.1, 1 g (10%) of each monomer with
9 g (90%) of EGDMA were dissolved in the equal weight of dimethyl formamide (DMF)
10 g, then, 100 mg (1%) of the initiator 1,1'-azobis (cyclohexane carbonitrile) was added.
All the components were dissolved using an ultrasonic bath for 5 min. Subsequently, the
monomeric mixture was deoxygenated by purging with nitrogen for 10 min. The vial with
monomeric mixture was tightly closed using parafilm and thermo-polymerised at 80 °C
for 24 h. On the next day, the polymer was removed from the vial, and ground using
electrical mortar. The resulting particles were sieved and polymer fraction with a size
between 63 to 125 µm was collected. The prepared polymer fraction was washed overnight
using Soxhlet extraction with methanol. The polymer was dried in the oven at 70 °C.
Finally, 100 mg of polymer was packed in 1 mL SPE cartridge and used for extraction
experiments. 100 mg of each polymer was packed in 1 mL SPE cartridge to evaluate the
binding ability of -tocopherol to these polymers as a stationary phase in SPE. In this
experiment, 1 mL of 0.1 mg mL-1 -tocopherol in hexane was loaded in those cartridges
after conditioning them with hexane. The absorption of UV light at wavelength 296 nm
was measured for all the samples of -tocopherol before loading and after loading. By
using calibration curves, the concentrations of these samples were calculated.
2.2.5 Evaluation of the -tocopherol binding ability
The outcome of the modelling is a list of monomers ordered based on their binding
energy. In order to choose one of them, the top 6 monomers in the list were used to prepare
rationally-designed polymers (RDPs) with EGDMA (Table 2.2) as a very commonly used
cross-linker that gives the polymer the rigidity. In addition, EGDMA as a monomer has
been evaluated from the list to assess the potential interaction with the difference in the
concentration of -tocopherol before and after loading was used to evaluate the binding
ability of -tocopherol to the polymers then calculated the binding percentage for each
polymer as shown in Table 2.3. The evaluation of the polymers was performed using SPE
technique. All these steps were repeated three times for each polymer.
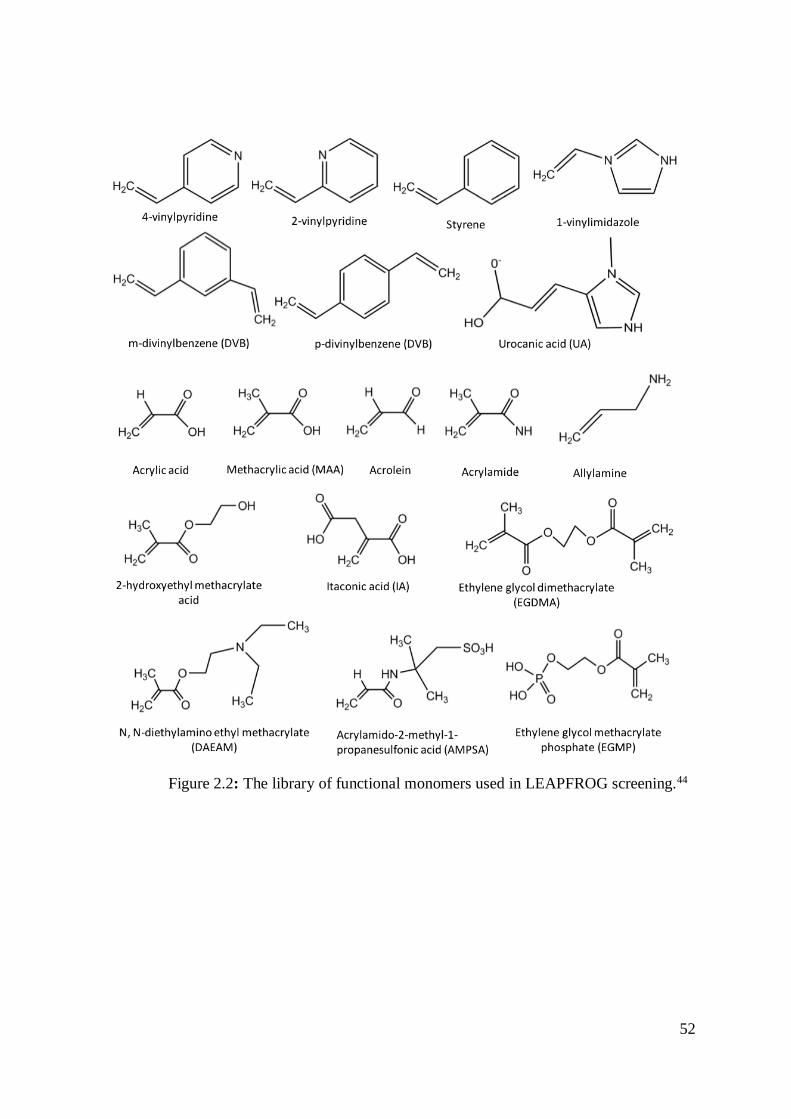
52
Figure 2.2: The library of functional monomers used in LEAPFROG screening.44
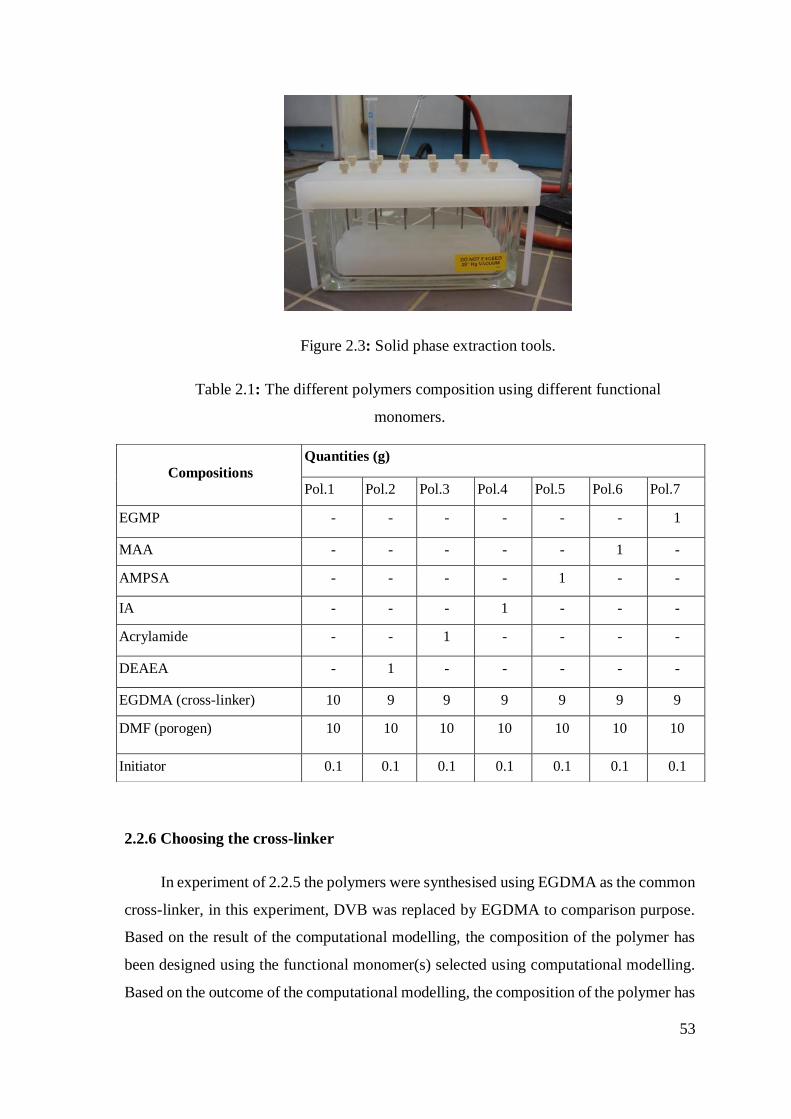
53
Figure 2.3: Solid phase extraction tools.
Table 2.1: The different polymers composition using different functional
monomers.
2.2.6 Choosing the cross-linker
In experiment of 2.2.5 the polymers were synthesised using EGDMA as the common
cross-linker, in this experiment, DVB was replaced by EGDMA to comparison purpose.
Based on the result of the computational modelling, the composition of the polymer has
been designed using the functional monomer(s) selected using computational modelling.
Based on the outcome of the computational modelling, the composition of the polymer has
Compositions
Quantities (g)
Pol.1 Pol.2 Pol.3 Pol.4 Pol.5 Pol.6 Pol.7
EGMP - - - - - - 1
MAA - - - - - 1 -
AMPSA - - - - 1 - -
IA - - - 1 - - -
Acrylamide - - 1 - - - -
DEAEA - 1 - - - - -
EGDMA (cross-linker) 10 9 9 9 9 9 9
DMF (porogen) 10 10 10 10 10 10 10
Initiator 0.1 0.1 0.1 0.1 0.1 0.1 0.1
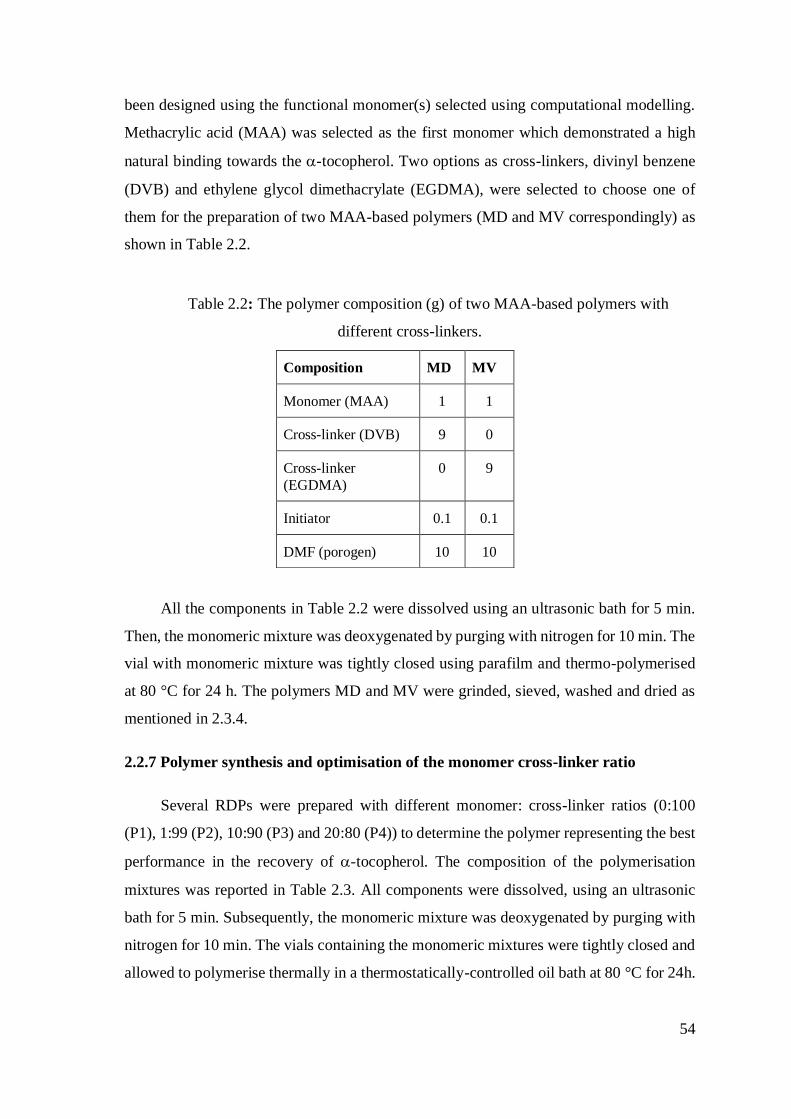
54
been designed using the functional monomer(s) selected using computational modelling.
Methacrylic acid (MAA) was selected as the first monomer which demonstrated a high
natural binding towards the -tocopherol. Two options as cross-linkers, divinyl benzene
(DVB) and ethylene glycol dimethacrylate (EGDMA), were selected to choose one of
them for the preparation of two MAA-based polymers (MD and MV correspondingly) as
shown in Table 2.2.
Table 2.2: The polymer composition (g) of two MAA-based polymers with
different cross-linkers.
All the components in Table 2.2 were dissolved using an ultrasonic bath for 5 min.
Then, the monomeric mixture was deoxygenated by purging with nitrogen for 10 min. The
vial with monomeric mixture was tightly closed using parafilm and thermo-polymerised
at 80 °C for 24 h. The polymers MD and MV were grinded, sieved, washed and dried as
mentioned in 2.3.4.
2.2.7 Polymer synthesis and optimisation of the monomer cross-linker ratio
Several RDPs were prepared with different monomer: cross-linker ratios (0:100
(P1), 1:99 (P2), 10:90 (P3) and 20:80 (P4)) to determine the polymer representing the best
performance in the recovery of -tocopherol. The composition of the polymerisation
mixtures was reported in Table 2.3. All components were dissolved, using an ultrasonic
bath for 5 min. Subsequently, the monomeric mixture was deoxygenated by purging with
nitrogen for 10 min. The vials containing the monomeric mixtures were tightly closed and
allowed to polymerise thermally in a thermostatically-controlled oil bath at 80 °C for 24h.
Composition MD MV
Monomer (MAA) 1 1
Cross-linker (DVB) 9 0
Cross-linker
(EGDMA)
0 9
Initiator 0.1 0.1
DMF (porogen) 10 10
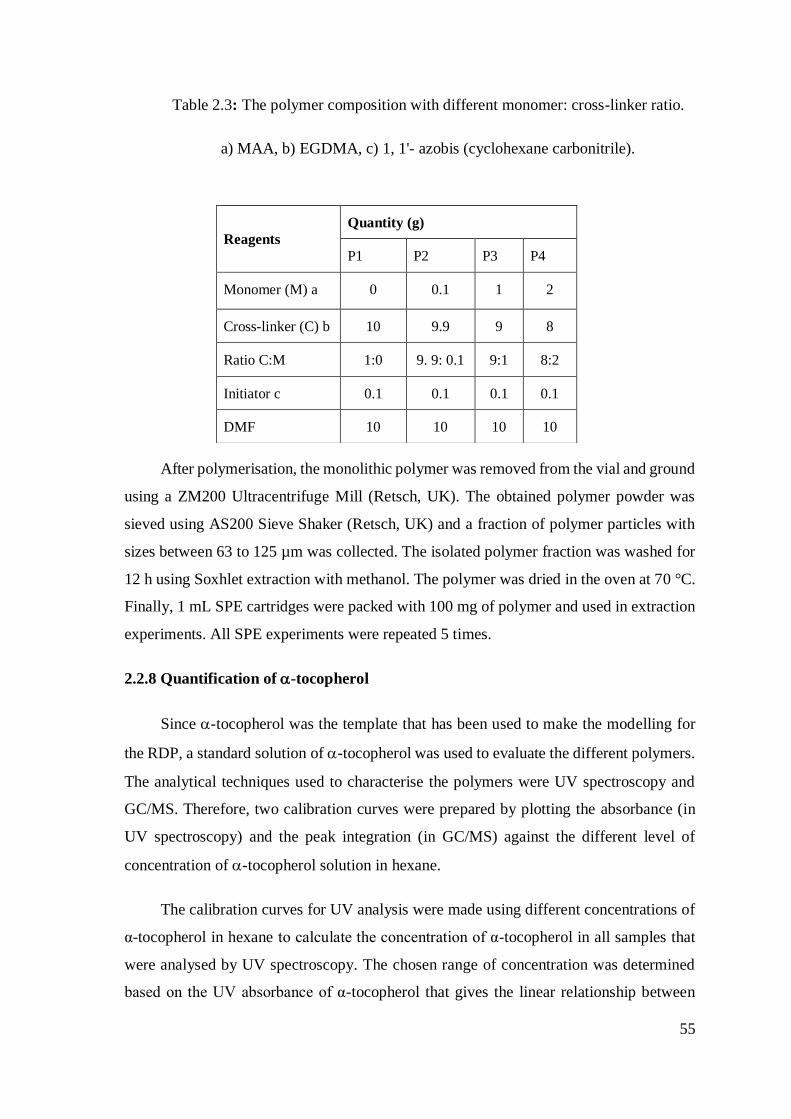
55
Table 2.3: The polymer composition with different monomer: cross-linker ratio.
a) MAA, b) EGDMA, c) 1, 1'- azobis (cyclohexane carbonitrile).
After polymerisation, the monolithic polymer was removed from the vial and ground
using a ZM200 Ultracentrifuge Mill (Retsch, UK). The obtained polymer powder was
sieved using AS200 Sieve Shaker (Retsch, UK) and a fraction of polymer particles with
sizes between 63 to 125 µm was collected. The isolated polymer fraction was washed for
12 h using Soxhlet extraction with methanol. The polymer was dried in the oven at 70 °C.
Finally, 1 mL SPE cartridges were packed with 100 mg of polymer and used in extraction
experiments. All SPE experiments were repeated 5 times.
2.2.8 Quantification of -tocopherol
Since -tocopherol was the template that has been used to make the modelling for
the RDP, a standard solution of -tocopherol was used to evaluate the different polymers.
The analytical techniques used to characterise the polymers were UV spectroscopy and
GC/MS. Therefore, two calibration curves were prepared by plotting the absorbance (in
UV spectroscopy) and the peak integration (in GC/MS) against the different level of
concentration of -tocopherol solution in hexane.
The calibration curves for UV analysis were made using different concentrations of
α-tocopherol in hexane to calculate the concentration of α-tocopherol in all samples that
were analysed by UV spectroscopy. The chosen range of concentration was determined
based on the UV absorbance of α-tocopherol that gives the linear relationship between
Reagents
Quantity (g)
P1 P2 P3 P4
Monomer (M) a 0 0.1 1 2
Cross-linker (C) b 10 9.9 9 8
Ratio C:M 1:0 9. 9: 0.1 9:1 8:2
Initiator c 0.1 0.1 0.1 0.1
DMF 10 10 10 10
56
concentration and UV absorbance. The final concentration of α-tocopherol was calculated
using the same calibration curve by evaporating the eluted solvent, and then, analyte was
dissolved in hexane before measuring its absorbance.
Since the integration values of the area under the peaks in the GC/MS
chromatograms are directly proportional to the concentration of the analysed sample, a
calibration curve of -tocopherol was made using the integration of the peaks to calculate
the concentration of -tocopherol in the different fractions of SPE protocol and to calculate
the concentration of -tocopherol with other minor components from oil samples.
2.2.9 Characterisation of RDP
2.2.9.1 Measuring the surface area of RDPs
The multi-point Brunauer, Emmett and Teller (BET) method was used to evaluate
the surface area of the developed RDPs using Surface Area and Pore Size Analyser
(Quantachrome, UK).28,29 The 45-points isotherm curve was used to evaluate the total pore
volume and average pore diameter.
2.2.9.2 Calculation of the breakthrough volume
In order to measure the ‘breakthrough’ volume of the developed polymer a model
solution of -tocopherol in heptane (0.1 mg mL-1) was prepared. SPE was carried out using
100 mg of the polymer backed in cartridge that attached to a vacuum manifold at a flow
rate 0.5 mL min-1. Sequential aliquots of these solutions were passed through the
cartridges, and the amount of free -tocopherol left in the filtrates was quantified using a
UV-Vis spectrophotometer 2100UVPC (Shimadzu, UK) at a wavelength of 296 nm. The
breakthrough volume was calculated as the amount of -tocopherol adsorbed from the
fractions that demonstrated ≤ 50% adsorption.26,30 All experiments were conducted in five
repeats.
2.2.9.3 Calculation of the binding capacity
The data of the breakthrough volume was used to calculate the binding capacity (B)
of the RDP. One millilitre of a model solution of -tocopherol in heptane (0.1 mg mL-1)
57
was filtered through 100 mg of polymer. The polymer capacity was calculated using the
equation 2.2:10,31
B = (Ci - Cf) V m-1
Equation 2.1: The polymer capacity11,28
Where Ci and Cf are the initial and final concentration (fraction correspond to 50%
adsorption by the polymer) of free analyte, V is the breakthrough volume and m is the
weight of the polymer.
2.2.9.4 Calculation of the -tocopherol recovery
This test was done by filtering 1 mL of heptane spiked with 0.1 mg of -tocopherol
(model solution) through 100 mg of the developed RDP. Then, 1 mL of methanol
containing 5% acetic acid was used to elute the bound -tocopherol from the RDP. A
comparison between the synthesised polymers and their selection was performed based on
the percentages of -tocopherol recovered from the polymers after the elution process.
2.2.9.5 The reusability of the polymer
To assess the possibility of reusing the cartridge for SPE used for a standard solution
of -tocopherol and 20% sunflower oil, this cartridge was washed with 3 mL of 10% acetic
acid-methanol, then 5 to 7 mL of acetonitrile. Then, after drying the polymer, SPE protocol
was applied again. The process was repeated 7 times.
2.2.10 Optimisation of SPE protocol for -tocopherol solution
The optimisation protocol involved choosing different solvents in each step of the
SPE process, such as loading, washing and eluting solvents. The primary selection of
solvents was based on literature data that described studies of SPE for -tocopherol, as
shown in Table 2.4. 14,34,26,33,34 In order to evaluate the extraction process, the highest
percentage of -tocopherol recovered was used as an indication of the optimal conditions.
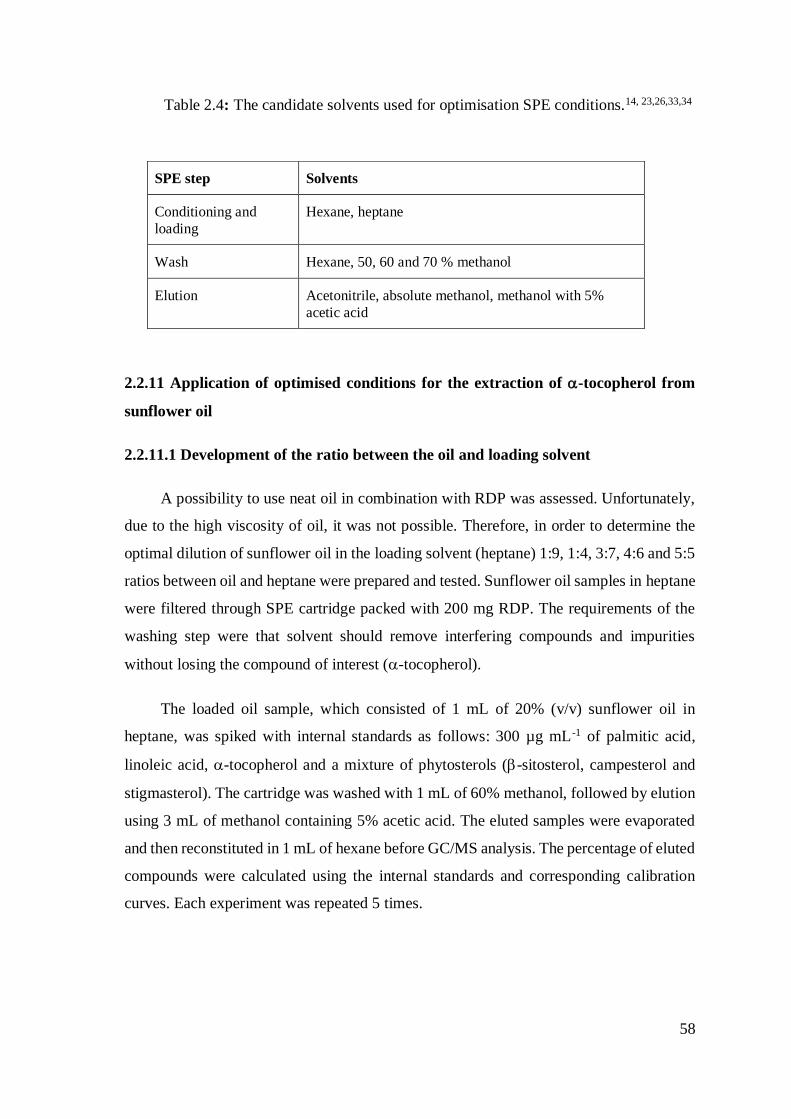
58
Table 2.4: The candidate solvents used for optimisation SPE conditions.14, 23,26,33,34
2.2.11 Application of optimised conditions for the extraction of -tocopherol from
sunflower oil
2.2.11.1 Development of the ratio between the oil and loading solvent
A possibility to use neat oil in combination with RDP was assessed. Unfortunately,
due to the high viscosity of oil, it was not possible. Therefore, in order to determine the
optimal dilution of sunflower oil in the loading solvent (heptane) 1:9, 1:4, 3:7, 4:6 and 5:5
ratios between oil and heptane were prepared and tested. Sunflower oil samples in heptane
were filtered through SPE cartridge packed with 200 mg RDP. The requirements of the
washing step were that solvent should remove interfering compounds and impurities
without losing the compound of interest (-tocopherol).
The loaded oil sample, which consisted of 1 mL of 20% (v/v) sunflower oil in
heptane, was spiked with internal standards as follows: 300 µg mL-1 of palmitic acid,
linoleic acid, -tocopherol and a mixture of phytosterols (-sitosterol, campesterol and
stigmasterol). The cartridge was washed with 1 mL of 60% methanol, followed by elution
using 3 mL of methanol containing 5% acetic acid. The eluted samples were evaporated
and then reconstituted in 1 mL of hexane before GC/MS analysis. The percentage of eluted
compounds were calculated using the internal standards and corresponding calibration
curves. Each experiment was repeated 5 times.
SPE step Solvents
Conditioning and
loading
Hexane, heptane
Wash Hexane, 50, 60 and 70 % methanol
Elution Acetonitrile, absolute methanol, methanol with 5%
acetic acid
59
2.3 Results and discussion
2.3.1 Molecular modelling
The design of imprinted polymers for a new template is a multi-step process. It is
time-consuming and demands a trial-and-error approach to optimise the polymer
components. Different parameters should be considered to design certain polymer such as
type and quantity of the functional polymer/s, cross-linker, template and temperature in
which the polymerisation performed in the case of using template temperature responsive
or temperature sensitive. Several methods have been suggested in the literature to design
MIPs instead of experimental methods, including chemometric, molecular modelling and
computational methods.2 Currently, molecular modelling has become an increasingly
popular approach that provides reliable data to speculate (computationally) on the strength
of the interactions between the target molecule and the functional monomer/s in the
synthesis. Madikizela and co-workers described molecular modelling as a trustworthy tool
that helps to calculate the binding energy (computationally) before practically evaluating
the affinity of the monomers towards specific target molecule.3 In general, the use of
computational chemistry to design the imprinted polymers has proved that it is useful in
terms of facilitating the development of synthesising the imprinted polymer with lower
consumption of the chemical reagents. Therefore, the aim of this part of the study was
production of a list of group of monomers that have affinity towards -tocopherol.
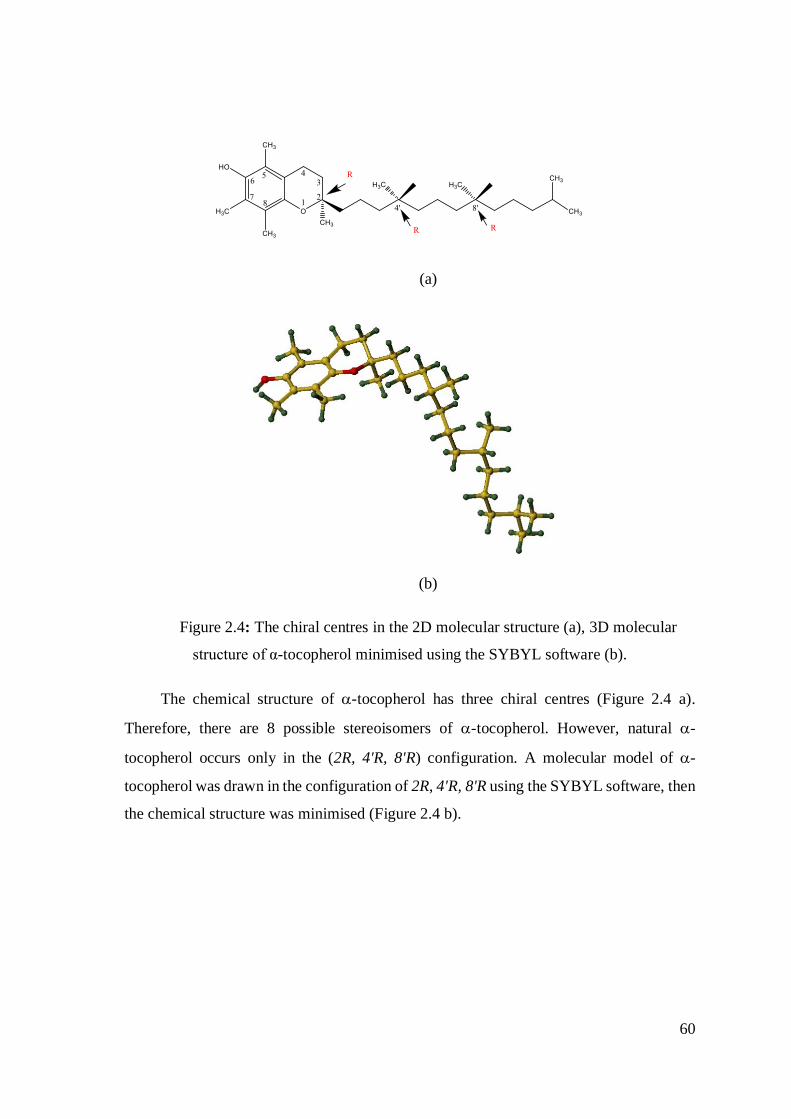
60
(a)
(b)
Figure 2.4: The chiral centres in the 2D molecular structure (a), 3D molecular
structure of α-tocopherol minimised using the SYBYL software (b).
The chemical structure of -tocopherol has three chiral centres (Figure 2.4 a).
Therefore, there are 8 possible stereoisomers of -tocopherol. However, natural -
tocopherol occurs only in the (2R, 4'R, 8'R) configuration. A molecular model of -
tocopherol was drawn in the configuration of 2R, 4'R, 8'R using the SYBYL software, then
the chemical structure was minimised (Figure 2.4 b).
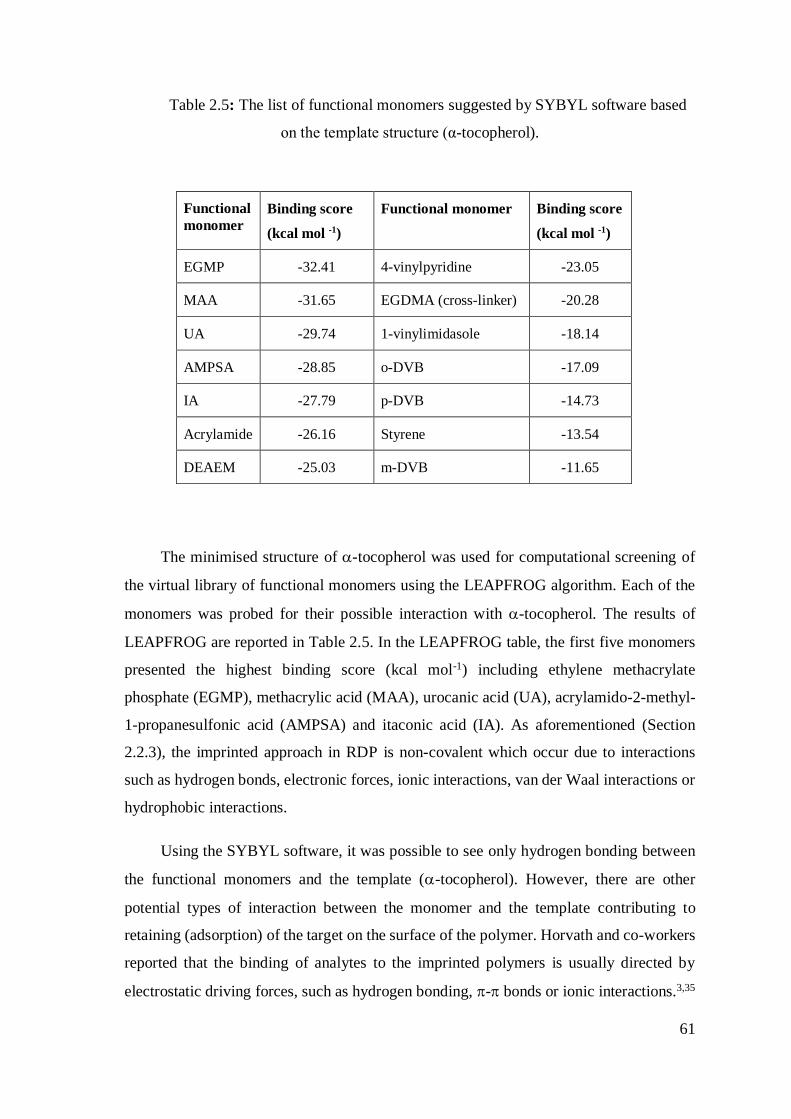
61
Table 2.5: The list of functional monomers suggested by SYBYL software based
on the template structure (α-tocopherol).
The minimised structure of -tocopherol was used for computational screening of
the virtual library of functional monomers using the LEAPFROG algorithm. Each of the
monomers was probed for their possible interaction with -tocopherol. The results of
LEAPFROG are reported in Table 2.5. In the LEAPFROG table, the first five monomers
presented the highest binding score (kcal mol-1) including ethylene methacrylate
phosphate (EGMP), methacrylic acid (MAA), urocanic acid (UA), acrylamido-2-methyl-
1-propanesulfonic acid (AMPSA) and itaconic acid (IA). As aforementioned (Section
2.2.3), the imprinted approach in RDP is non-covalent which occur due to interactions
such as hydrogen bonds, electronic forces, ionic interactions, van der Waal interactions or
hydrophobic interactions.
Using the SYBYL software, it was possible to see only hydrogen bonding between
the functional monomers and the template (-tocopherol). However, there are other
potential types of interaction between the monomer and the template contributing to
retaining (adsorption) of the target on the surface of the polymer. Horvath and co-workers
reported that the binding of analytes to the imprinted polymers is usually directed by
electrostatic driving forces, such as hydrogen bonding, - bonds or ionic interactions.3,35
Functional
monomer
Binding score
(kcal mol -1)
Functional monomer Binding score
(kcal mol -1)
EGMP -32.41 4-vinylpyridine -23.05
MAA -31.65 EGDMA (cross-linker) -20.28
UA -29.74 1-vinylimidasole -18.14
AMPSA -28.85 o-DVB -17.09
IA -27.79 p-DVB -14.73
Acrylamide -26.16 Styrene -13.54
DEAEM -25.03 m-DVB -11.65
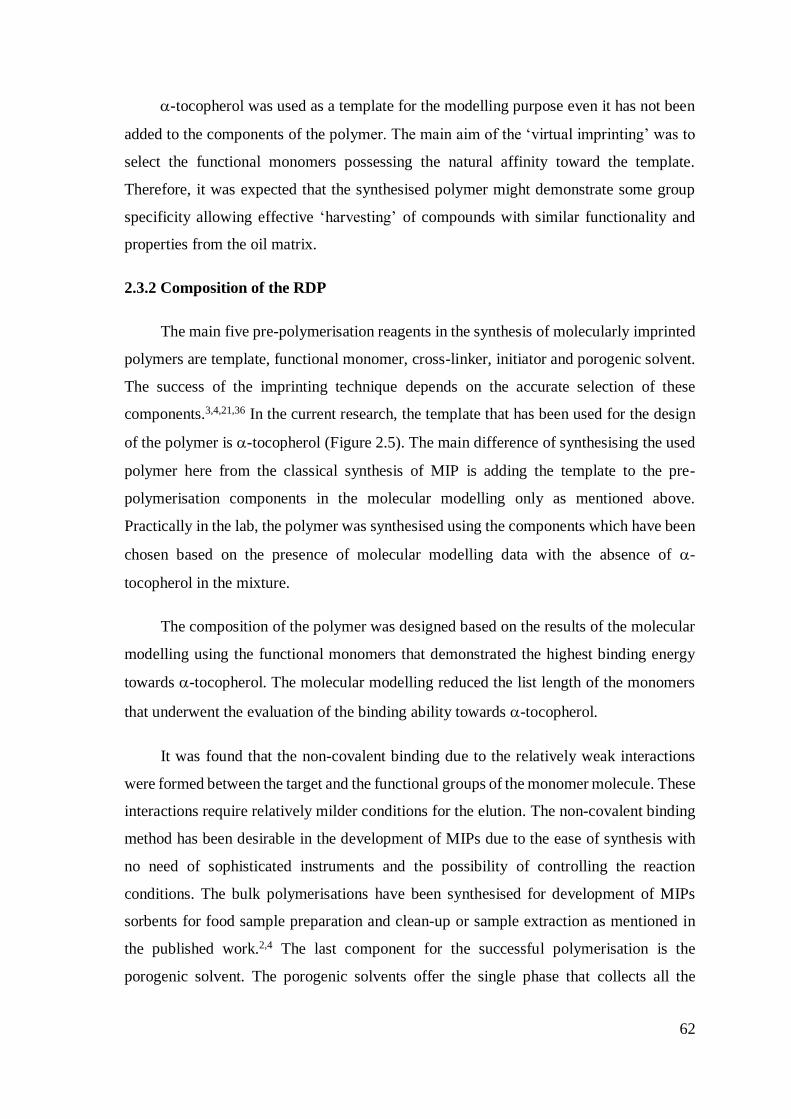
62
-tocopherol was used as a template for the modelling purpose even it has not been
added to the components of the polymer. The main aim of the ‘virtual imprinting’ was to
select the functional monomers possessing the natural affinity toward the template.
Therefore, it was expected that the synthesised polymer might demonstrate some group
specificity allowing effective ‘harvesting’ of compounds with similar functionality and
properties from the oil matrix.
2.3.2 Composition of the RDP
The main five pre-polymerisation reagents in the synthesis of molecularly imprinted
polymers are template, functional monomer, cross-linker, initiator and porogenic solvent.
The success of the imprinting technique depends on the accurate selection of these
components.3,4,21,36 In the current research, the template that has been used for the design
of the polymer is -tocopherol (Figure 2.5). The main difference of synthesising the used
polymer here from the classical synthesis of MIP is adding the template to the pre-
polymerisation components in the molecular modelling only as mentioned above.
Practically in the lab, the polymer was synthesised using the components which have been
chosen based on the presence of molecular modelling data with the absence of -
tocopherol in the mixture.
The composition of the polymer was designed based on the results of the molecular
modelling using the functional monomers that demonstrated the highest binding energy
towards -tocopherol. The molecular modelling reduced the list length of the monomers
that underwent the evaluation of the binding ability towards -tocopherol.
It was found that the non-covalent binding due to the relatively weak interactions
were formed between the target and the functional groups of the monomer molecule. These
interactions require relatively milder conditions for the elution. The non-covalent binding
method has been desirable in the development of MIPs due to the ease of synthesis with
no need of sophisticated instruments and the possibility of controlling the reaction
conditions. The bulk polymerisations have been synthesised for development of MIPs
sorbents for food sample preparation and clean-up or sample extraction as mentioned in
the published work.2,4 The last component for the successful polymerisation is the
porogenic solvent. The porogenic solvents offer the single phase that collects all the
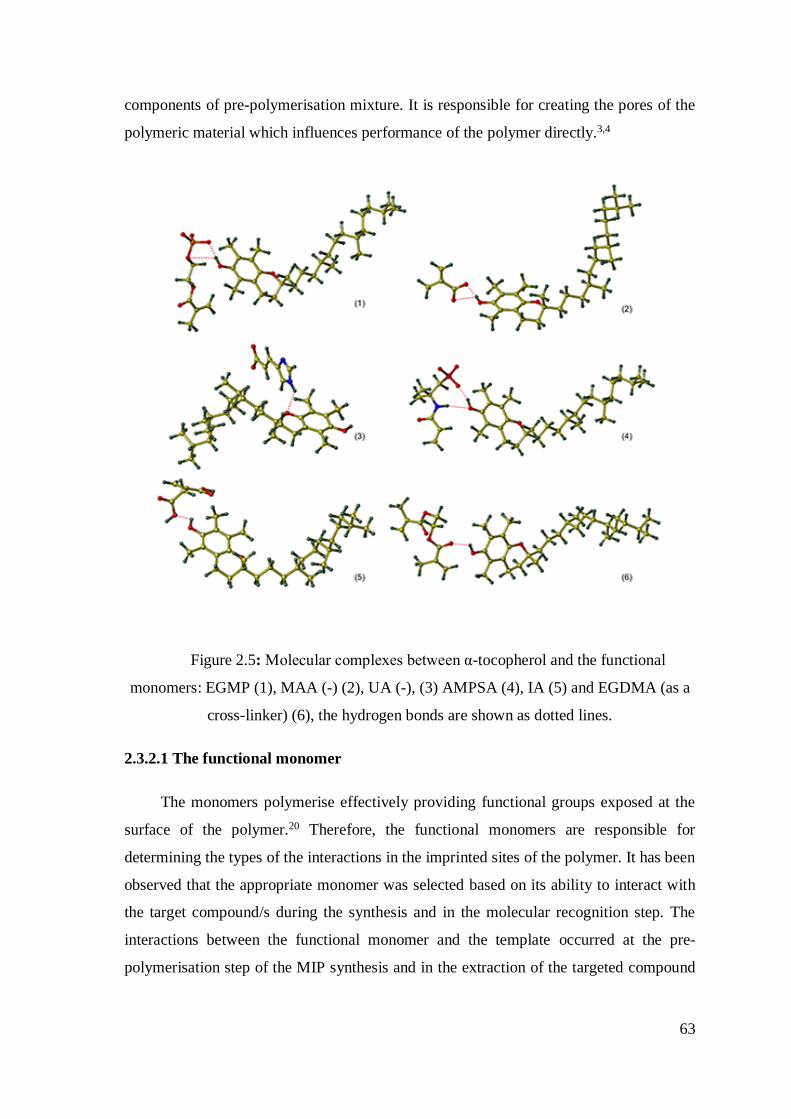
63
components of pre-polymerisation mixture. It is responsible for creating the pores of the
polymeric material which influences performance of the polymer directly.3,4
Figure 2.5: Molecular complexes between α-tocopherol and the functional
monomers: EGMP (1), MAA (-) (2), UA (-), (3) AMPSA (4), IA (5) and EGDMA (as a
cross-linker) (6), the hydrogen bonds are shown as dotted lines.
2.3.2.1 The functional monomer
The monomers polymerise effectively providing functional groups exposed at the
surface of the polymer.20 Therefore, the functional monomers are responsible for
determining the types of the interactions in the imprinted sites of the polymer. It has been
observed that the appropriate monomer was selected based on its ability to interact with
the target compound/s during the synthesis and in the molecular recognition step. The
interactions between the functional monomer and the template occurred at the pre-
polymerisation step of the MIP synthesis and in the extraction of the targeted compound
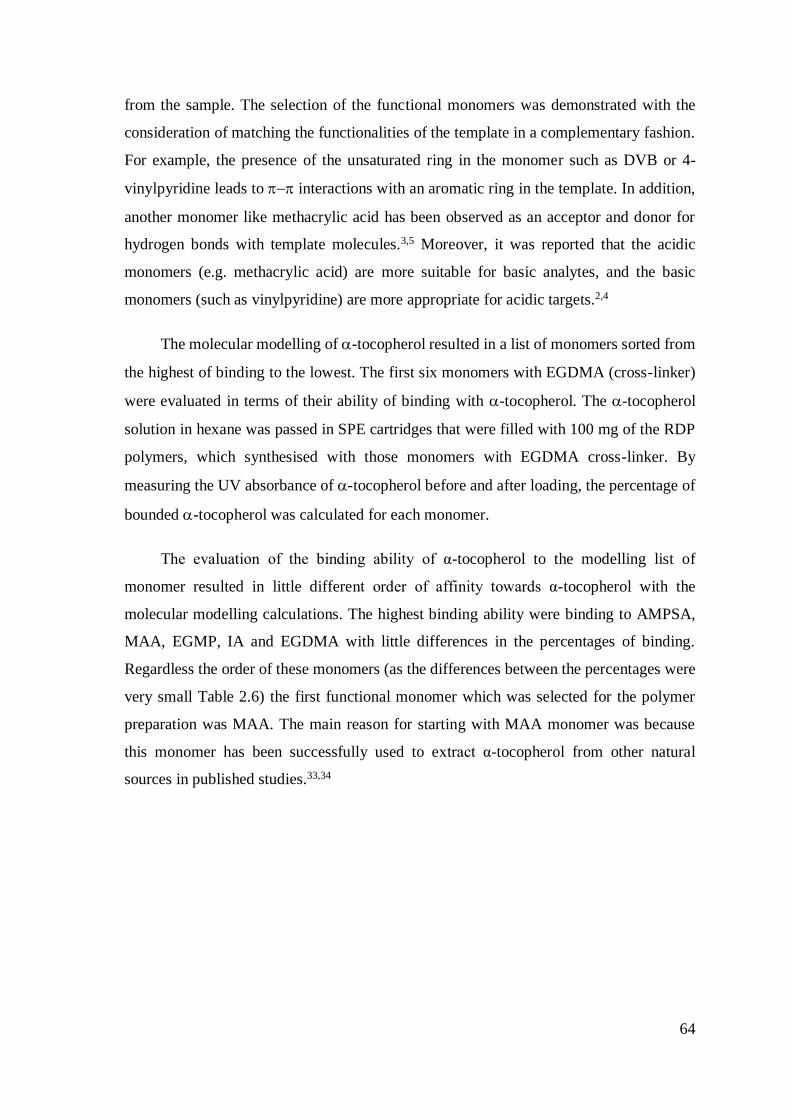
64
from the sample. The selection of the functional monomers was demonstrated with the
consideration of matching the functionalities of the template in a complementary fashion.
For example, the presence of the unsaturated ring in the monomer such as DVB or 4-
vinylpyridine leads to − interactions with an aromatic ring in the template. In addition,
another monomer like methacrylic acid has been observed as an acceptor and donor for
hydrogen bonds with template molecules.3,5 Moreover, it was reported that the acidic
monomers (e.g. methacrylic acid) are more suitable for basic analytes, and the basic
monomers (such as vinylpyridine) are more appropriate for acidic targets.2,4
The molecular modelling of -tocopherol resulted in a list of monomers sorted from
the highest of binding to the lowest. The first six monomers with EGDMA (cross-linker)
were evaluated in terms of their ability of binding with -tocopherol. The -tocopherol
solution in hexane was passed in SPE cartridges that were filled with 100 mg of the RDP
polymers, which synthesised with those monomers with EGDMA cross-linker. By
measuring the UV absorbance of -tocopherol before and after loading, the percentage of
bounded -tocopherol was calculated for each monomer.
The evaluation of the binding ability of α-tocopherol to the modelling list of
monomer resulted in little different order of affinity towards α-tocopherol with the
molecular modelling calculations. The highest binding ability were binding to AMPSA,
MAA, EGMP, IA and EGDMA with little differences in the percentages of binding.
Regardless the order of these monomers (as the differences between the percentages were
very small Table 2.6) the first functional monomer which was selected for the polymer
preparation was MAA. The main reason for starting with MAA monomer was because
this monomer has been successfully used to extract α-tocopherol from other natural
sources in published studies.33,34
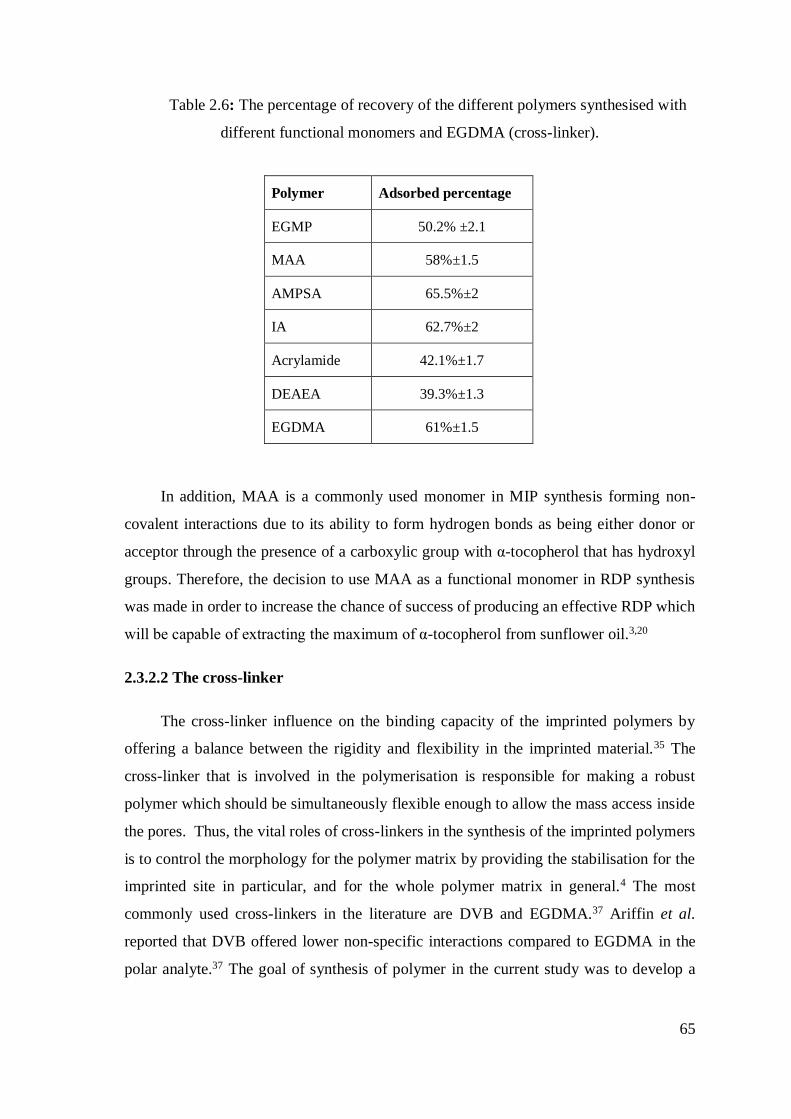
65
Table 2.6: The percentage of recovery of the different polymers synthesised with
different functional monomers and EGDMA (cross-linker).
In addition, MAA is a commonly used monomer in MIP synthesis forming non-
covalent interactions due to its ability to form hydrogen bonds as being either donor or
acceptor through the presence of a carboxylic group with α-tocopherol that has hydroxyl
groups. Therefore, the decision to use MAA as a functional monomer in RDP synthesis
was made in order to increase the chance of success of producing an effective RDP which
will be capable of extracting the maximum of α-tocopherol from sunflower oil.3,20
2.3.2.2 The cross-linker
The cross-linker influence on the binding capacity of the imprinted polymers by
offering a balance between the rigidity and flexibility in the imprinted material.35 The
cross-linker that is involved in the polymerisation is responsible for making a robust
polymer which should be simultaneously flexible enough to allow the mass access inside
the pores. Thus, the vital roles of cross-linkers in the synthesis of the imprinted polymers
is to control the morphology for the polymer matrix by providing the stabilisation for the
imprinted site in particular, and for the whole polymer matrix in general.4 The most
commonly used cross-linkers in the literature are DVB and EGDMA.37 Ariffin et al.
reported that DVB offered lower non-specific interactions compared to EGDMA in the
polar analyte.37 The goal of synthesis of polymer in the current study was to develop a
Polymer Adsorbed percentage
EGMP 50.2% ±2.1
MAA 58%±1.5
AMPSA 65.5%±2
IA 62.7%±2
Acrylamide 42.1%±1.7
DEAEA 39.3%±1.3
EGDMA 61%±1.5
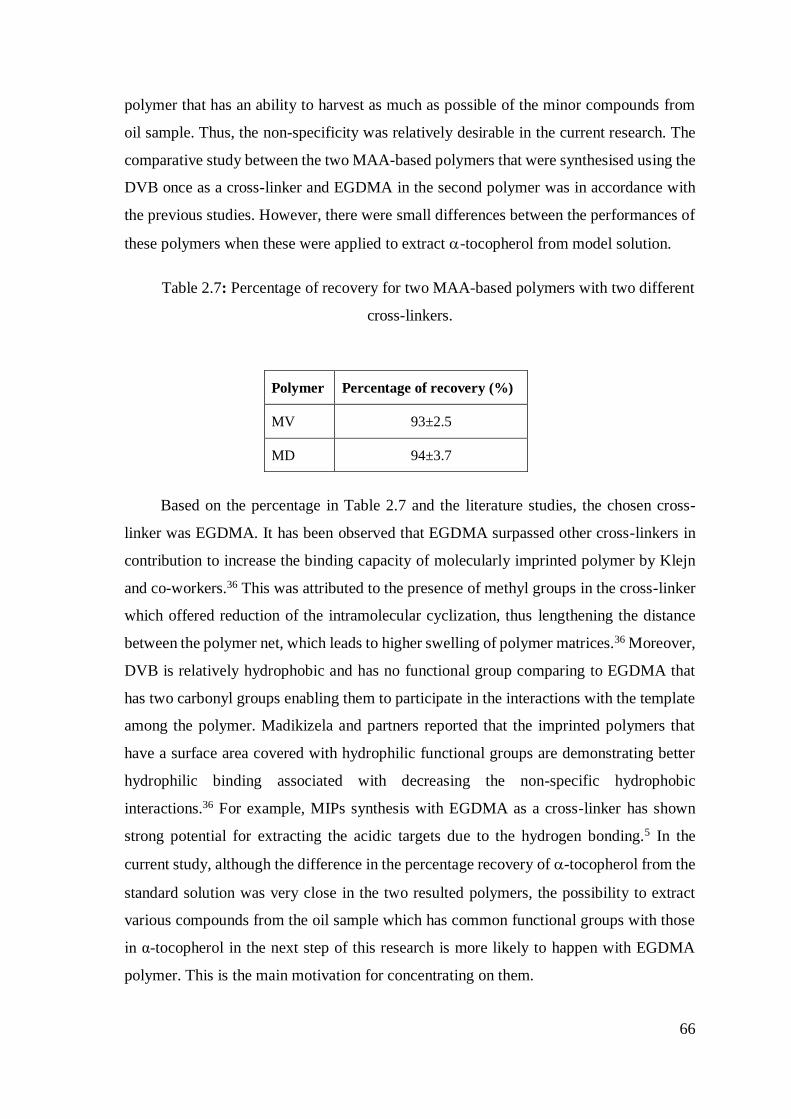
66
polymer that has an ability to harvest as much as possible of the minor compounds from
oil sample. Thus, the non-specificity was relatively desirable in the current research. The
comparative study between the two MAA-based polymers that were synthesised using the
DVB once as a cross-linker and EGDMA in the second polymer was in accordance with
the previous studies. However, there were small differences between the performances of
these polymers when these were applied to extract -tocopherol from model solution.
Table 2.7: Percentage of recovery for two MAA-based polymers with two different
cross-linkers.
Based on the percentage in Table 2.7 and the literature studies, the chosen cross-
linker was EGDMA. It has been observed that EGDMA surpassed other cross-linkers in
contribution to increase the binding capacity of molecularly imprinted polymer by Klejn
and co-workers.36 This was attributed to the presence of methyl groups in the cross-linker
which offered reduction of the intramolecular cyclization, thus lengthening the distance
between the polymer net, which leads to higher swelling of polymer matrices.36 Moreover,
DVB is relatively hydrophobic and has no functional group comparing to EGDMA that
has two carbonyl groups enabling them to participate in the interactions with the template
among the polymer. Madikizela and partners reported that the imprinted polymers that
have a surface area covered with hydrophilic functional groups are demonstrating better
hydrophilic binding associated with decreasing the non-specific hydrophobic
interactions.36 For example, MIPs synthesis with EGDMA as a cross-linker has shown
strong potential for extracting the acidic targets due to the hydrogen bonding.5 In the
current study, although the difference in the percentage recovery of -tocopherol from the
standard solution was very close in the two resulted polymers, the possibility to extract
various compounds from the oil sample which has common functional groups with those
in α-tocopherol in the next step of this research is more likely to happen with EGDMA
polymer. This is the main motivation for concentrating on them.
Polymer Percentage of recovery (%)
MV 93±2.5
MD 94±3.7
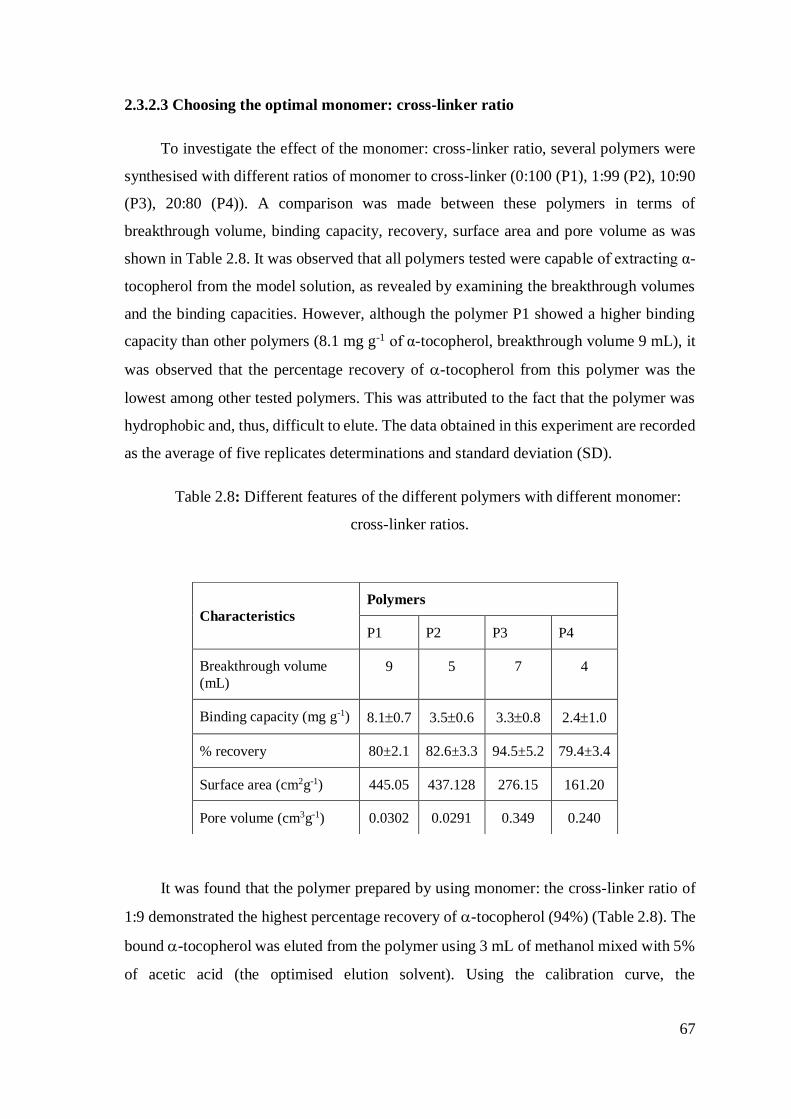
67
2.3.2.3 Choosing the optimal monomer: cross-linker ratio
To investigate the effect of the monomer: cross-linker ratio, several polymers were
synthesised with different ratios of monomer to cross-linker (0:100 (P1), 1:99 (P2), 10:90
(P3), 20:80 (P4)). A comparison was made between these polymers in terms of
breakthrough volume, binding capacity, recovery, surface area and pore volume as was
shown in Table 2.8. It was observed that all polymers tested were capable of extracting α-
tocopherol from the model solution, as revealed by examining the breakthrough volumes
and the binding capacities. However, although the polymer P1 showed a higher binding
capacity than other polymers (8.1 mg g-1 of α-tocopherol, breakthrough volume 9 mL), it
was observed that the percentage recovery of -tocopherol from this polymer was the
lowest among other tested polymers. This was attributed to the fact that the polymer was
hydrophobic and, thus, difficult to elute. The data obtained in this experiment are recorded
as the average of five replicates determinations and standard deviation (SD).
Table 2.8: Different features of the different polymers with different monomer:
cross-linker ratios.
It was found that the polymer prepared by using monomer: the cross-linker ratio of
1:9 demonstrated the highest percentage recovery of -tocopherol (94%) (Table 2.8). The
bound -tocopherol was eluted from the polymer using 3 mL of methanol mixed with 5%
of acetic acid (the optimised elution solvent). Using the calibration curve, the
Characteristics
Polymers
P1 P2 P3 P4
Breakthrough volume
(mL)
9 5 7 4
Binding capacity (mg g-1) 8.10.7 3.50.6 3.30.8 2.41.0
% recovery 80±2.1 82.6±3.3 94.5±5.2 79.4±3.4
Surface area (cm2g-1) 445.05 437.128 276.15 161.20
Pore volume (cm3g-1) 0.0302 0.0291 0.349 0.240
68
concentrations of -tocopherol after each step of SPE were calculated to compare the
percentage of -tocopherol recovery.
2.3.2.4 Characterisation of the developed polymers
The monomer MAA was chosen for polymer preparation, as it was one of the top
candidates from modelling screening and because this monomer has been successfully
used in Molecularly Imprinted Polymers (MIPs) employed to extract -tocopherol from
non-oil sources.23,33,38 As it was known from previous studies, MAA has the ability to form
hydrogen bonds with -tocopherol, demonstrated a strong specific binding and also non-
specific binding which attributed to long chain moiety and the hydroxyl group in -
tocopherol molecules.33 The presence of hydrogen-bonding between the functional
monomer and -tocopherol was suggested by SYBYL, as shown in Figure 2.5. We believe
that these two types of interactions (specific electrostatic and non-specific hydrophobic)
attribute to the high capacity and the ability of RDPs to adsorb not only -tocopherol but
also other minor components present in the sunflower oil.
2.3.2.5 Measurement of the breakthrough volume and binding capacity
In order to evaluate the binding capacity of the prepared polymers, breakthrough
volume has been measured. It allowed comparing the performance of different polymers
under required extraction conditions and selecting the polymer which possessed the
highest capacity. The data were collected using UV spectroscopy to measure the
absorbance of the samples after a pass through the SPE cartridge, then, using the
calibration curve to calculate the concentration of breakthrough volume of the two MAA-
based polymers with two different cross-linkers were shown in Tables 2.9 and 2.10. The
polymer ME has shown a higher capacity of 3.3 mg of α-tocopherol g-1 of polymer
(breakthrough volume is 7mL) than the polymer MD 0.51mg of α-tocopherol g-1 of
polymer (breakthrough volume is 2mL). The measurements were repeated 5 times.
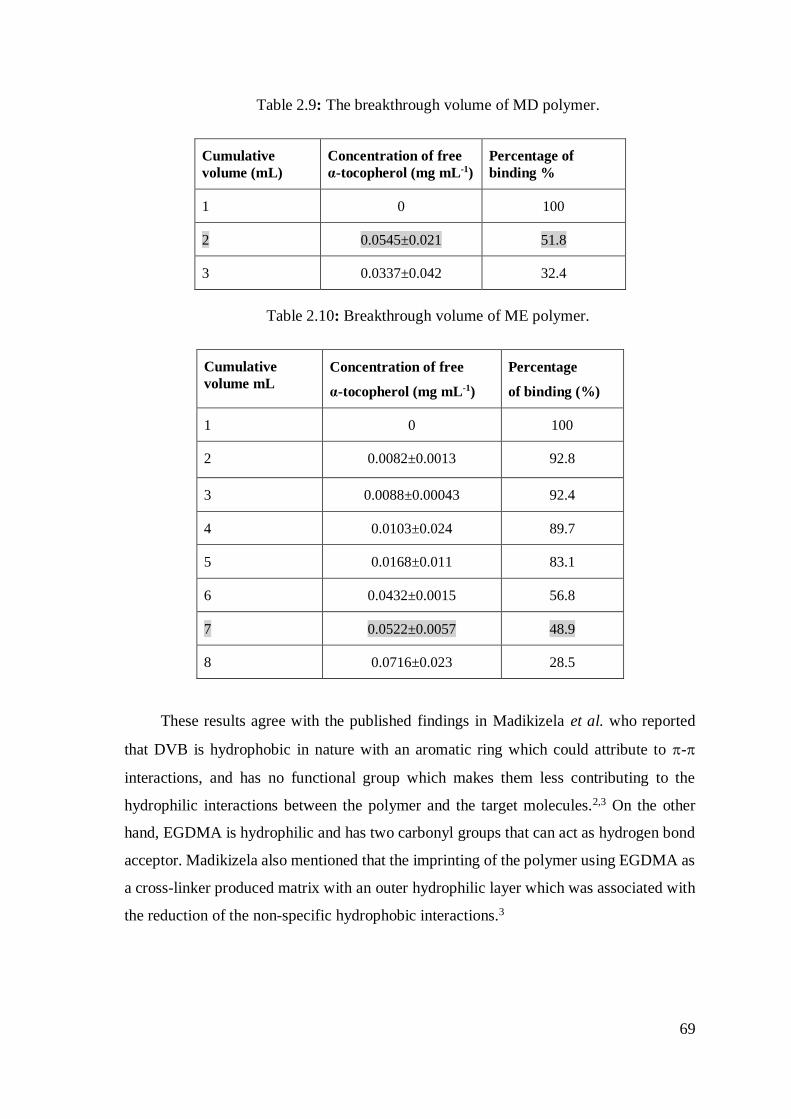
69
Table 2.9: The breakthrough volume of MD polymer.
Cumulative
volume (mL)
Concentration of free
α-tocopherol (mg mL-1)
Percentage of
binding %
1 0 100
2 0.0545±0.021 51.8
3 0.0337±0.042 32.4
Table 2.10: Breakthrough volume of ME polymer.
Cumulative
volume mL
Concentration of free
α-tocopherol (mg mL-1)
Percentage
of binding (%)
1 0 100
2 0.0082±0.0013 92.8
3 0.0088±0.00043 92.4
4 0.0103±0.024 89.7
5 0.0168±0.011 83.1
6 0.0432±0.0015 56.8
7 0.0522±0.0057 48.9
8 0.0716±0.023 28.5
These results agree with the published findings in Madikizela et al. who reported
that DVB is hydrophobic in nature with an aromatic ring which could attribute to -
interactions, and has no functional group which makes them less contributing to the
hydrophilic interactions between the polymer and the target molecules.2,3 On the other
hand, EGDMA is hydrophilic and has two carbonyl groups that can act as hydrogen bond
acceptor. Madikizela also mentioned that the imprinting of the polymer using EGDMA as
a cross-linker produced matrix with an outer hydrophilic layer which was associated with
the reduction of the non-specific hydrophobic interactions.3
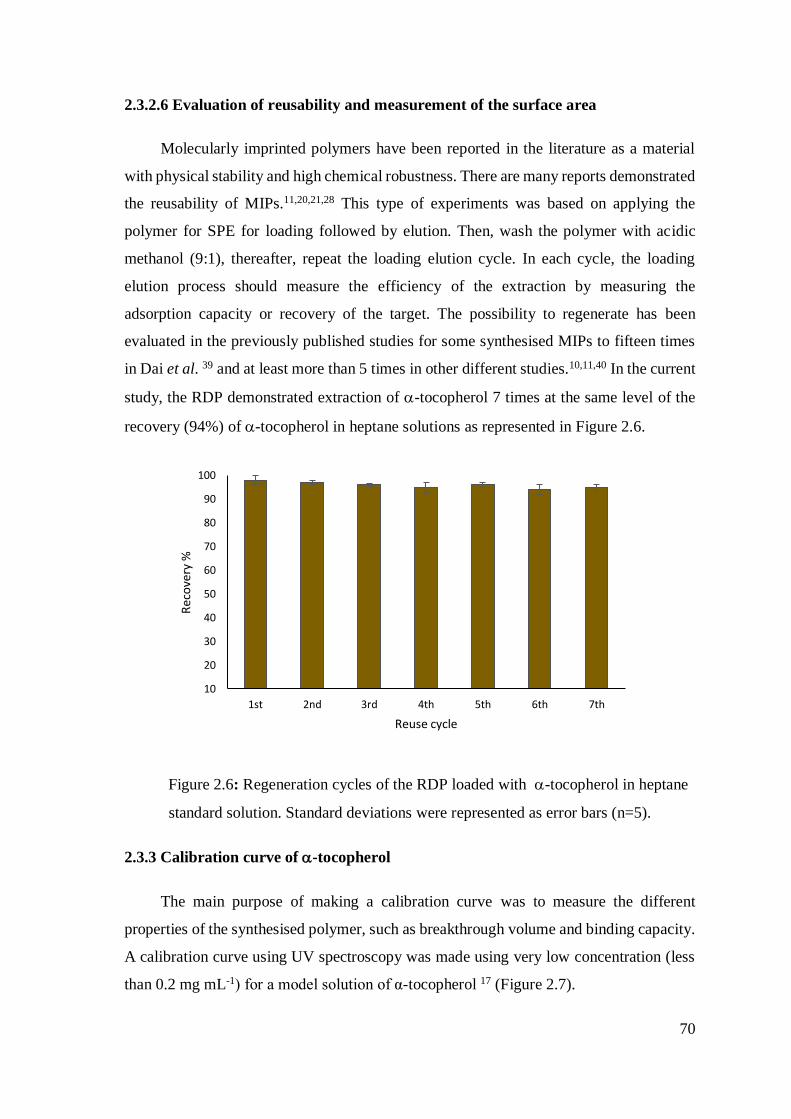
70
2.3.2.6 Evaluation of reusability and measurement of the surface area
Molecularly imprinted polymers have been reported in the literature as a material
with physical stability and high chemical robustness. There are many reports demonstrated
the reusability of MIPs.11,20,21,28 This type of experiments was based on applying the
polymer for SPE for loading followed by elution. Then, wash the polymer with acidic
methanol (9:1), thereafter, repeat the loading elution cycle. In each cycle, the loading
elution process should measure the efficiency of the extraction by measuring the
adsorption capacity or recovery of the target. The possibility to regenerate has been
evaluated in the previously published studies for some synthesised MIPs to fifteen times
in Dai et al. 39 and at least more than 5 times in other different studies.10,11,40 In the current
study, the RDP demonstrated extraction of -tocopherol 7 times at the same level of the
recovery (94%) of -tocopherol in heptane solutions as represented in Figure 2.6.
Figure 2.6: Regeneration cycles of the RDP loaded with -tocopherol in heptane
standard solution. Standard deviations were represented as error bars (n=5).
2.3.3 Calibration curve of -tocopherol
The main purpose of making a calibration curve was to measure the different
properties of the synthesised polymer, such as breakthrough volume and binding capacity.
A calibration curve using UV spectroscopy was made using very low concentration (less
than 0.2 mg mL-1) for a model solution of α-tocopherol 17 (Figure 2.7).
10
20
30
40
50
60
70
80
90
100
1st 2nd 3rd 4th 5th 6th 7th
Rec
ove
ry %
Reuse cycle
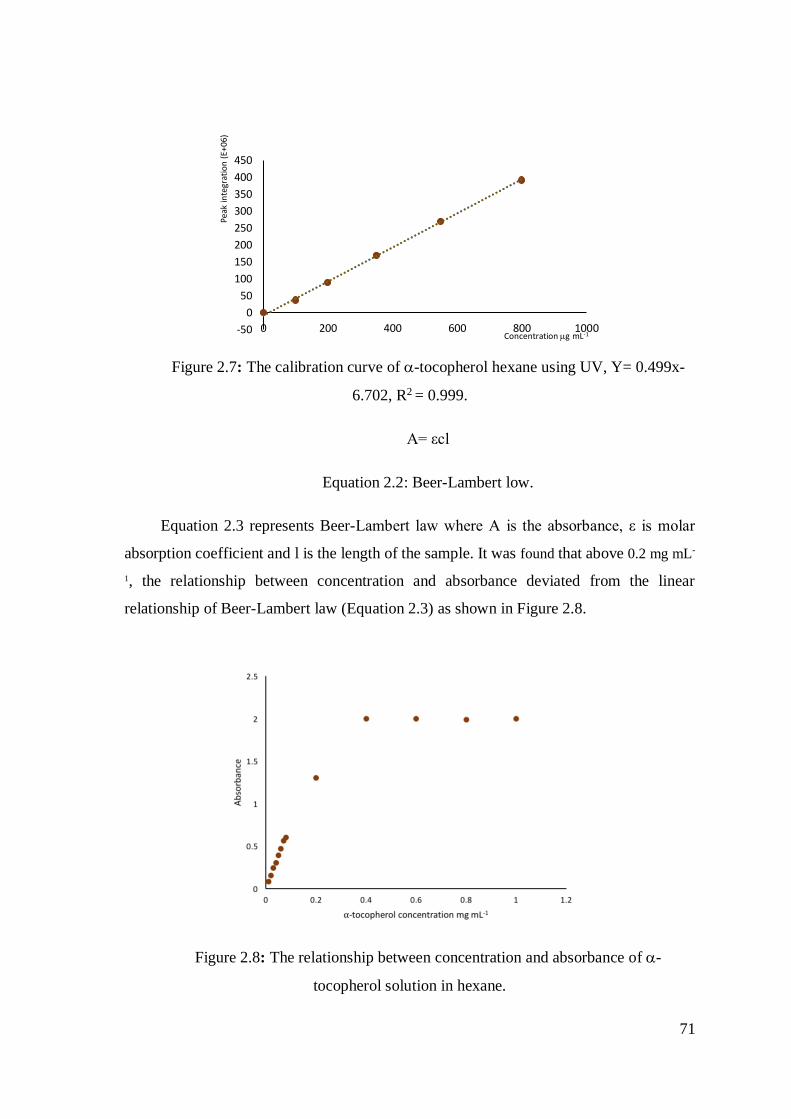
71
Figure 2.7: The calibration curve of -tocopherol hexane using UV, Y= 0.499x-
6.702, R2 = 0.999.
A= εcl
Equation 2.2: Beer-Lambert low.
Equation 2.3 represents Beer-Lambert law where A is the absorbance, ε is molar
absorption coefficient and l is the length of the sample. It was found that above 0.2 mg mL-
1, the relationship between concentration and absorbance deviated from the linear
relationship of Beer-Lambert law (Equation 2.3) as shown in Figure 2.8.
Figure 2.8: The relationship between concentration and absorbance of -
tocopherol solution in hexane.
-50
0
50
100
150
200
250
300
350
400
450
0 200 400 600 800 1000
Peak
inte
grat
ion
(E+
06)
Concentration g mL-1
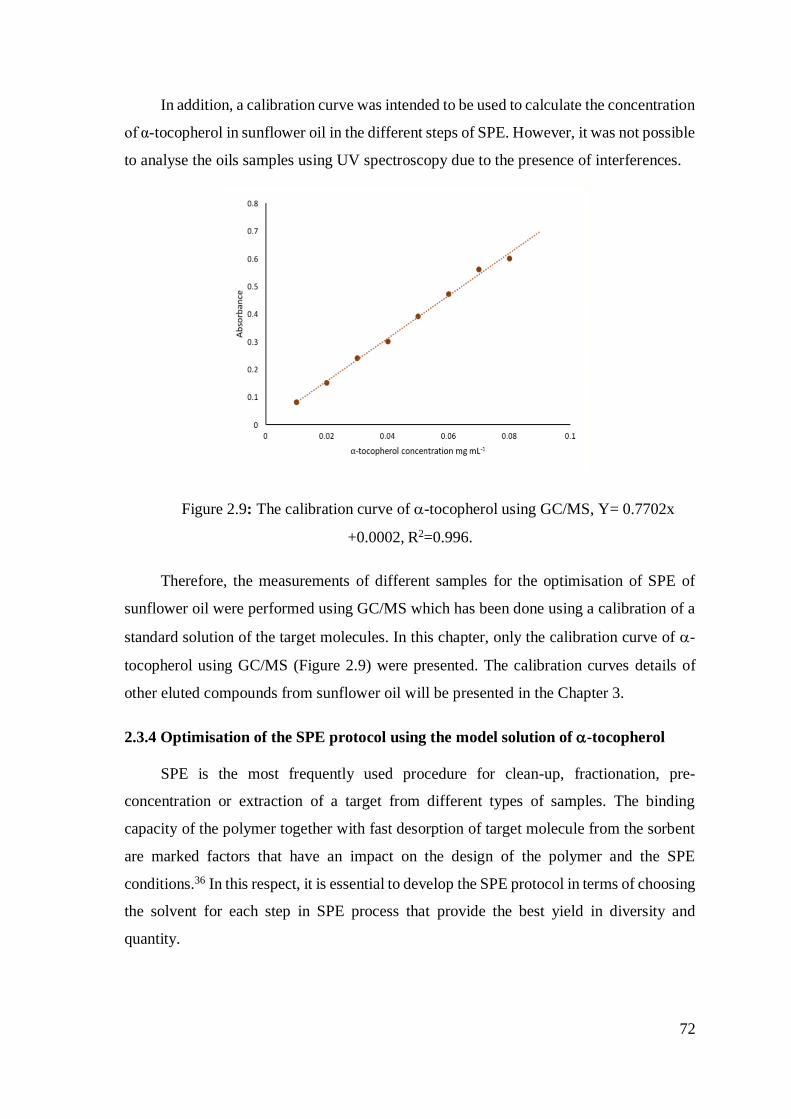
72
In addition, a calibration curve was intended to be used to calculate the concentration
of α-tocopherol in sunflower oil in the different steps of SPE. However, it was not possible
to analyse the oils samples using UV spectroscopy due to the presence of interferences.
Figure 2.9: The calibration curve of -tocopherol using GC/MS, Y= 0.7702x
+0.0002, R2=0.996.
Therefore, the measurements of different samples for the optimisation of SPE of
sunflower oil were performed using GC/MS which has been done using a calibration of a
standard solution of the target molecules. In this chapter, only the calibration curve of -
tocopherol using GC/MS (Figure 2.9) were presented. The calibration curves details of
other eluted compounds from sunflower oil will be presented in the Chapter 3.
2.3.4 Optimisation of the SPE protocol using the model solution of -tocopherol
SPE is the most frequently used procedure for clean-up, fractionation, pre-
concentration or extraction of a target from different types of samples. The binding
capacity of the polymer together with fast desorption of target molecule from the sorbent
are marked factors that have an impact on the design of the polymer and the SPE
conditions.36 In this respect, it is essential to develop the SPE protocol in terms of choosing
the solvent for each step in SPE process that provide the best yield in diversity and
quantity.
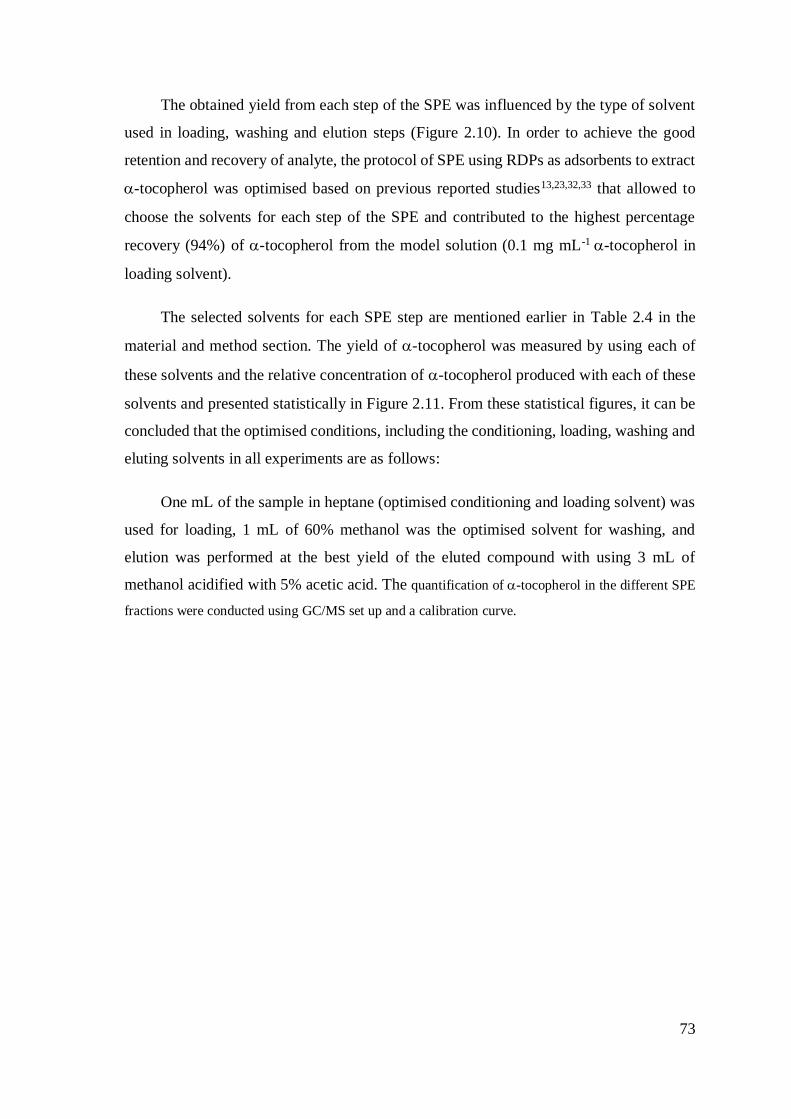
73
The obtained yield from each step of the SPE was influenced by the type of solvent
used in loading, washing and elution steps (Figure 2.10). In order to achieve the good
retention and recovery of analyte, the protocol of SPE using RDPs as adsorbents to extract
-tocopherol was optimised based on previous reported studies13,23,32,33 that allowed to
choose the solvents for each step of the SPE and contributed to the highest percentage
recovery (94%) of -tocopherol from the model solution (0.1 mg mL-1 -tocopherol in
loading solvent).
The selected solvents for each SPE step are mentioned earlier in Table 2.4 in the
material and method section. The yield of -tocopherol was measured by using each of
these solvents and the relative concentration of -tocopherol produced with each of these
solvents and presented statistically in Figure 2.11. From these statistical figures, it can be
concluded that the optimised conditions, including the conditioning, loading, washing and
eluting solvents in all experiments are as follows:
One mL of the sample in heptane (optimised conditioning and loading solvent) was
used for loading, 1 mL of 60% methanol was the optimised solvent for washing, and
elution was performed at the best yield of the eluted compound with using 3 mL of
methanol acidified with 5% acetic acid. The quantification of -tocopherol in the different SPE
fractions were conducted using GC/MS set up and a calibration curve.
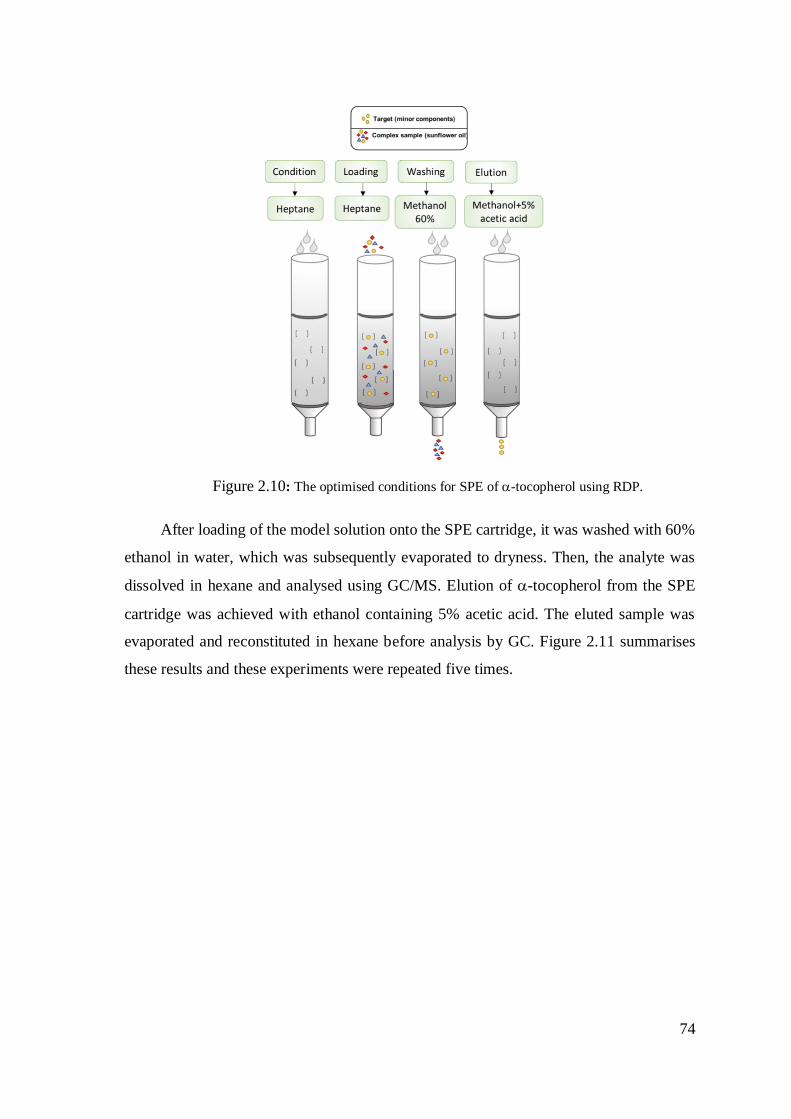
74
Figure 2.10: The optimised conditions for SPE of -tocopherol using RDP.
After loading of the model solution onto the SPE cartridge, it was washed with 60%
ethanol in water, which was subsequently evaporated to dryness. Then, the analyte was
dissolved in hexane and analysed using GC/MS. Elution of -tocopherol from the SPE
cartridge was achieved with ethanol containing 5% acetic acid. The eluted sample was
evaporated and reconstituted in hexane before analysis by GC. Figure 2.11 summarises
these results and these experiments were repeated five times.
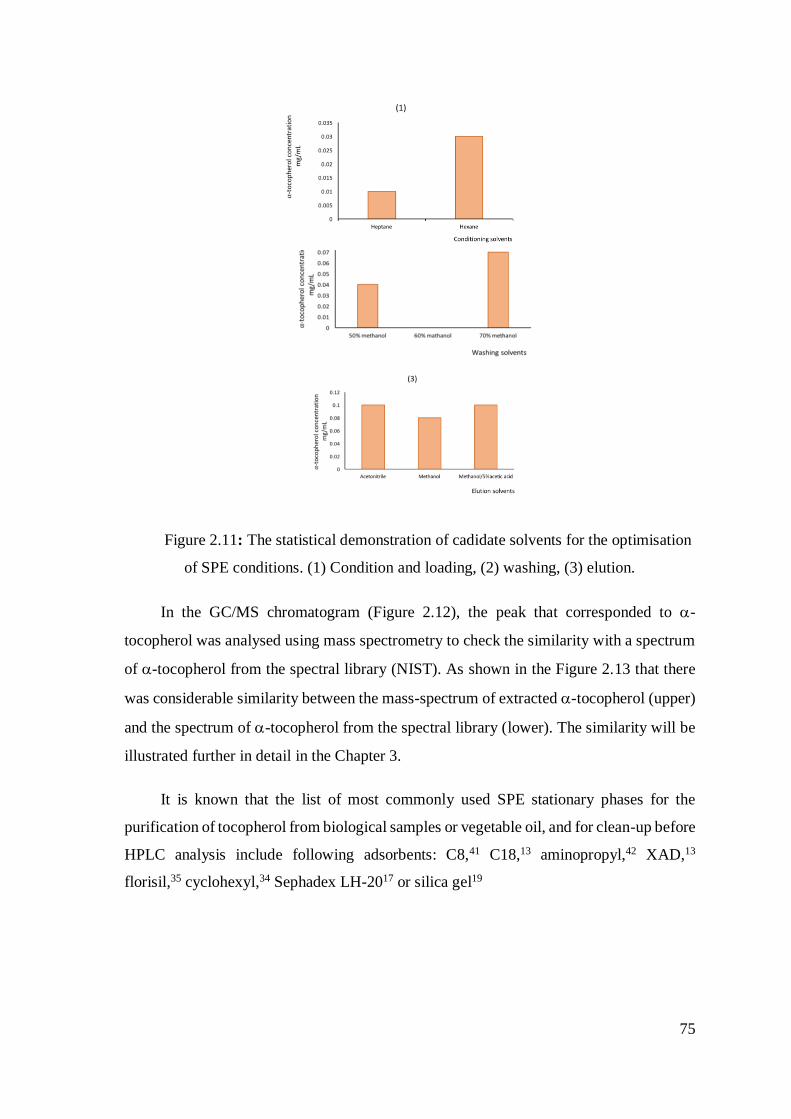
75
Figure 2.11: The statistical demonstration of cadidate solvents for the optimisation
of SPE conditions. (1) Condition and loading, (2) washing, (3) elution.
In the GC/MS chromatogram (Figure 2.12), the peak that corresponded to -
tocopherol was analysed using mass spectrometry to check the similarity with a spectrum
of -tocopherol from the spectral library (NIST). As shown in the Figure 2.13 that there
was considerable similarity between the mass-spectrum of extracted -tocopherol (upper)
and the spectrum of -tocopherol from the spectral library (lower). The similarity will be
illustrated further in detail in the Chapter 3.
It is known that the list of most commonly used SPE stationary phases for the
purification of tocopherol from biological samples or vegetable oil, and for clean-up before
HPLC analysis include following adsorbents: C8,41 C18,13 aminopropyl,42 XAD,13
florisil,35 cyclohexyl,34 Sephadex LH-2017 or silica gel19
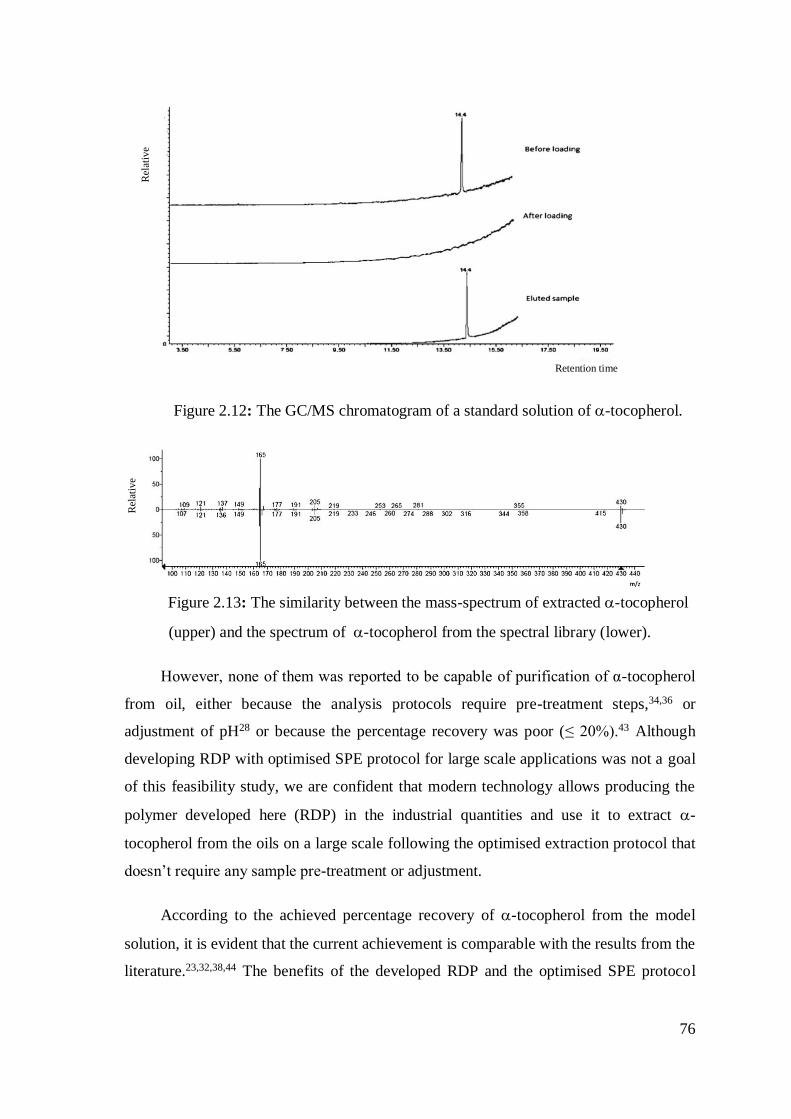
76
Figure 2.12: The GC/MS chromatogram of a standard solution of -tocopherol.
Figure 2.13: The similarity between the mass-spectrum of extracted -tocopherol
(upper) and the spectrum of -tocopherol from the spectral library (lower).
However, none of them was reported to be capable of purification of α-tocopherol
from oil, either because the analysis protocols require pre-treatment steps,34,36 or
adjustment of pH28 or because the percentage recovery was poor (≤ 20%).43 Although
developing RDP with optimised SPE protocol for large scale applications was not a goal
of this feasibility study, we are confident that modern technology allows producing the
polymer developed here (RDP) in the industrial quantities and use it to extract -
tocopherol from the oils on a large scale following the optimised extraction protocol that
doesn’t require any sample pre-treatment or adjustment.
According to the achieved percentage recovery of -tocopherol from the model
solution, it is evident that the current achievement is comparable with the results from the
literature.23,32,38,44 The benefits of the developed RDP and the optimised SPE protocol
Rel
ativ
e
Retention time
Rel
ativ
e
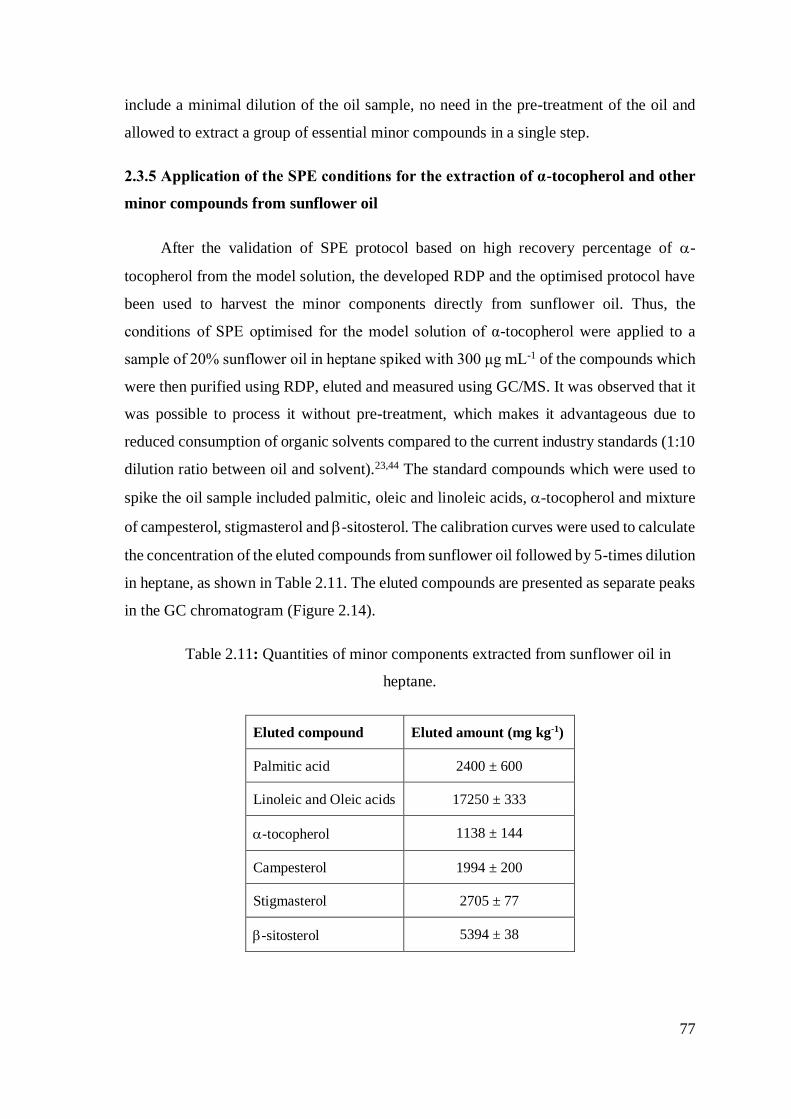
77
include a minimal dilution of the oil sample, no need in the pre-treatment of the oil and
allowed to extract a group of essential minor compounds in a single step.
2.3.5 Application of the SPE conditions for the extraction of α-tocopherol and other
minor compounds from sunflower oil
After the validation of SPE protocol based on high recovery percentage of -
tocopherol from the model solution, the developed RDP and the optimised protocol have
been used to harvest the minor components directly from sunflower oil. Thus, the
conditions of SPE optimised for the model solution of α-tocopherol were applied to a
sample of 20% sunflower oil in heptane spiked with 300 μg mL-1 of the compounds which
were then purified using RDP, eluted and measured using GC/MS. It was observed that it
was possible to process it without pre-treatment, which makes it advantageous due to
reduced consumption of organic solvents compared to the current industry standards (1:10
dilution ratio between oil and solvent).23,44 The standard compounds which were used to
spike the oil sample included palmitic, oleic and linoleic acids, -tocopherol and mixture
of campesterol, stigmasterol and -sitosterol. The calibration curves were used to calculate
the concentration of the eluted compounds from sunflower oil followed by 5-times dilution
in heptane, as shown in Table 2.11. The eluted compounds are presented as separate peaks
in the GC chromatogram (Figure 2.14).
Table 2.11: Quantities of minor components extracted from sunflower oil in
heptane.
Eluted compound Eluted amount (mg kg-1)
Palmitic acid 2400 ± 600
Linoleic and Oleic acids 17250 ± 333
-tocopherol 1138 ± 144
Campesterol 1994 ± 200
Stigmasterol 2705 ± 77
-sitosterol 5394 ± 38
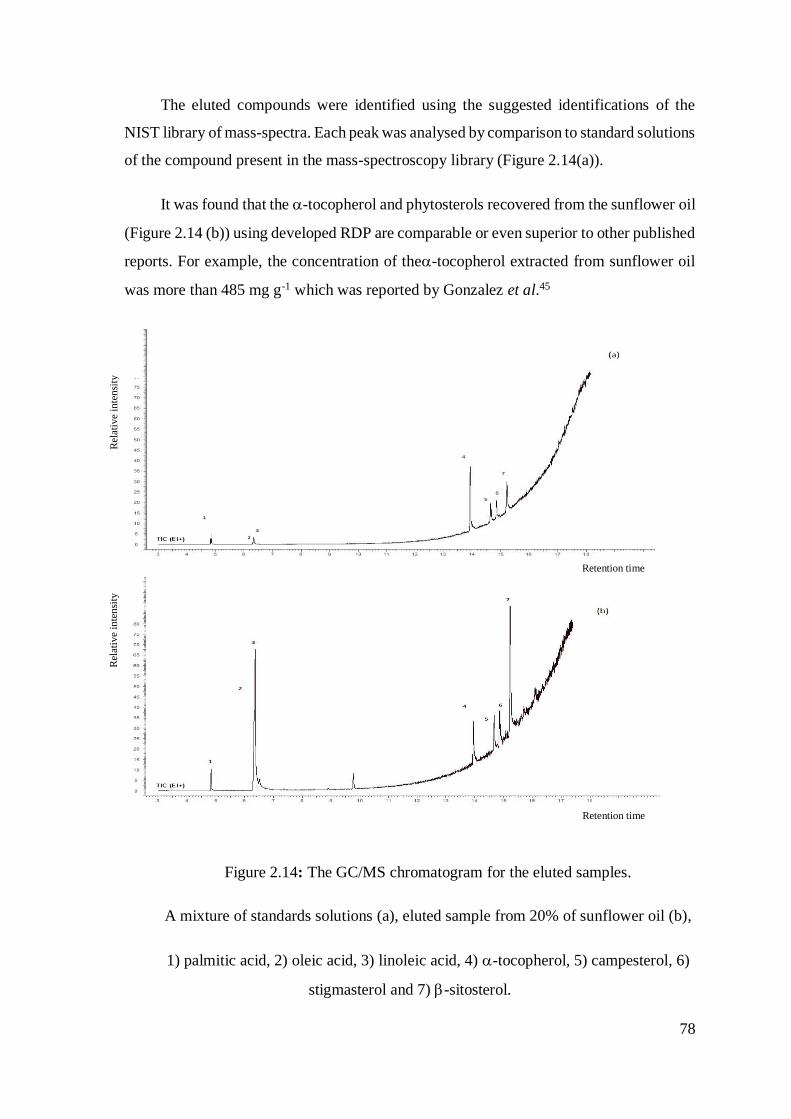
78
The eluted compounds were identified using the suggested identifications of the
NIST library of mass-spectra. Each peak was analysed by comparison to standard solutions
of the compound present in the mass-spectroscopy library (Figure 2.14(a)).
It was found that the -tocopherol and phytosterols recovered from the sunflower oil
(Figure 2.14 (b)) using developed RDP are comparable or even superior to other published
reports. For example, the concentration of the-tocopherol extracted from sunflower oil
was more than 485 mg g-1 which was reported by Gonzalez et al.45
Figure 2.14: The GC/MS chromatogram for the eluted samples.
A mixture of standards solutions (a), eluted sample from 20% of sunflower oil (b),
1) palmitic acid, 2) oleic acid, 3) linoleic acid, 4) -tocopherol, 5) campesterol, 6)
stigmasterol and 7) -sitosterol.
Retention time
Rel
ativ
e in
ten
sity
Retention time
Rel
ativ
e in
ten
sity
79
In addition, the content of -tocopherol in spiked unrefined sunflower oil was found
to be close to the published range measured in sunflower seeds by Galea et al. (416 mg
kg-1)23 and Ballesteros et al. (473 mg kg-1)46 indicating the efficiency of the developed
method. Similarly, the concentrations of phytosterols extracted were in good correlation
with the concentrations reported by Lechner et al. who has recovered 325 mg kg-1 of
campesterol, 198 mg kg-1 of stigmasterol and 1868 mg kg-1 of -sitosterol.47 The
phytosterols extracted from sunflower oil by Schwartz et al. were reported as campesterol
(68 mg kg-1), stigmasterol (280 mg kg-1) and -sitosterol (2060 mg kg-1).8
2.4 Conclusions
An effective protocol for the extraction and purification of -tocopherol beside other
minor components from sunflower oil, based on a bespoke RDP, has been developed. The
optimised SPE method resulted in the increased recovery of the valuable natural product,
-tocopherol from a complex matrix of the sunflower oil. Another important advantage of
using the developed polymer over traditional methods of extraction included a two-fold
reduction in the volume of solvent required. The protocol reported here for the extraction
of a group of components involved only 5 times dilution of the sunflower oil with heptane.
This dilution rate is twice improved by comparison with the 10-fold dilution applied in the
industrial protocol, representing a reduction in waste and saving in the resources and time.
It was also demonstrated that the combination of the optimised SPE protocol and
developed RDP allowed a quantitative extraction of minor components from sunflower oil
to be performed without any additional pre-treatment. It is important to highlight that the
optimised protocols and proposed strategy could be used as blueprints for the development
of extraction procedures for different groups of compounds from other natural oil-
containing biomasses.
The relatively high percentage recovery of the minor components from sunflower oil
has encouraged the research to be directed to evaluate the possibility of applying the
proposed protocol to other vegetable oils and report to what extent that is going to be
potential, which is going to be demonstrated in the next chapter.
80
References
1) Lechner M.; Reiter B.; Lorbeer E. Determination of tocopherols and sterols in vegetable
oils by solid-phase extraction and subsequent capillary gas chromatographic analysis. J
Chromat A. 1999, 857, 231-238.
2) Ashleya, J.; Shahbazia M.; Krishna K.; Aaydha V.; Wolff A.; Bangb D.; Sun Y.
Molecularly imprinted polymers for sample preparation and biosensing in food analysis:
Progress and perspectives. Biosens Bioelectron. 2017, 91,606–615.
3) Madikizelaa L.; Tawanda, N.; Chimuka L. Applications of molecularly imprinted
polymers for solid-phase extraction of non-steroidal anti-inflammatory drugs and
analgesics from environmental waters and biological samples. J Pharm Biomed Anal.
2018, 147, 624–633.
4) Regal P.; Barreiro R.; Cepeda A.; Fente C. Application of molecularly imprinted
polymers in food analysis: clean-up and chromatographic improvements. Cent Eur J
Chem. 2012, 3,766-784.
5) Madikizela L.; Mdluli P. Experimental and theoretical study of molecular interactions
between 2-vinyl pyridine and acidic pharmaceuticals used as multi-template molecules in
a molecularly imprinted polymer. React Funct Polym. 2016, 103, 33–43.
6) Lolić A.; Paíga P.; Santos L.; Ramos S.; Correia M.; Delerue-Matos C. Assessment of
non-steroidal anti-inflammatory and analgesic pharmaceuticals in seawaters of North of
Portugal: Occurrence and environmental risk. Sci Total Environ. 2015, 508,240-250.
7) Lindqvist N.; Tuhkanen T.; Kronberg L. Occurrence of acidic pharmaceuticals in raw
and treated sewages and in receiving waters. Water Res. 2005, 39, 2219-2228.
8) Stolker A.; Brinkman U.; Analytical strategies for residue analysis of veterinary drugs
and growth-promoting agents in food-producing animals - a review. J Chromatogr A,
2005, 1067,15-53.
9) Yiyan L.; Edward C.; Extraction of 17β-estradiol in water using non-imprinted polymer
submicron particles in membrane filters. J Environ Sci. 2010, 22,1820–1825.
81
10) Duan Y.; Dai C.; Zhang Y.; Ling C. Selective trace enrichment of acidic
pharmaceuticals in real water and sediment samples based on solid-phase extraction using
multi-templates molecularly imprinted polymers. Anal Chim Acta. 2013, 758, 93-100.
11) Meischl F.; Schemeth D.; Harder M.; Köpfle N.; Tessadri R.; Rainer M. Synthesis
and evaluation of a novel molecularly imprinted polymer for the selective isolation of
acetylsalicylic acid from aqueous solutions. J Environ Chem Eng. 2016, 4, 4083-4090.
12) Boulanouar S.; Combesa A.; Pichon S.; Mezzacheb V. Synthesis and application of
molecularly imprinted polymers for the selective extraction of organophosphorus
pesticides from vegetable oils. J Chromat A. 2017,1513, 59–68.
13) Guerreiro A.; Soares A.; Piletska E.; Mattiasson B.; Piletsky S. Preliminary evaluation
of new polymer matrix for solid-phase extraction of nonylphenol from water samples. Anal
Chim Acta. 2008, 612, 99-104.
14) Qiao F.; Sun H.; Yan H.; Row K. Molecularly Imprinted Polymers for Solid Phase
Extraction. Chromatographia. 2006, 64, 625-634.
15) Herrero-Latorre C.; Barciela-García J.; García-Martín S.; Crecente R. Graphene and
carbon nanotubes as solid phase extraction sorbents for the speciation of chromium : A
review. Anal Chim Acta J. 2017, 1002, 1-17.
16) Wackerlig J.; Schirhagl R. Applications of Molecularly Imprinted Polymer
Nanoparticles and Their Advances toward Industrial Use: A Review. Anal Chem. 2016,
88, 250-261.
17) Melchert H.; Pollok D.; Pabel E.; Rubach K.; Stan H. Determination of tocopherols,
tocopherolquinones and tocopherol hydroquinones by gas chromatography-mass
spectrometry and preseparation with lipophilic gel chromatography. J Chromatogr A.
2002, 976, 215-220.
18) Shakerian F.; Kim K., Kwon E.; Szulejko J.; Kumar P.; Dadfarnia As.; Mohammad
A. Advanced polymeric materials: Synthesis and analytical application of ion imprinted
polymers as selective sorbents for solid phase extraction of metal ions. Trends Anal Chem.
2016, 83, 55-69.
82
19) Bakas I.; Oujji N.; Moczko E,.; Georges I.; Piletsky S.; Piletska E.; Ait-Addi E.; Ait-
I.; Noguer T.; Rouillon R. Computational and experimental investigation of molecularly
imprinted polymers for selective extraction of dimethoate and its metabolite omethoate
from olive oil. J Chromatogr A. 2013, 1274, 13-18.
20) Piletsky S.; Karim K.; Piletska E.; Day C.; Freebairn K.; Leggeb C. Turner A.;
Piletsky S.; Recognition of ephedrine enantiomers by molecularly imprinted polymers
designed using a computational approach. Analyst. 2001, 126, 1826–1830.
21) Piletska E.; Kumir J.; Sergeyeva T. Rational design and development of affinity
adsorbents for analytical and biopharmaceutical. JCAM. 2013, 1, 229-244.
22) Pyka A.; Pyka a.; Sliwiok J. Chromatographic separation of tocopherols. J
Chromatogr A. 2001, 935,71-76.
23) Beldean-Galea M.; Horga C.; Coman M. Separation and determination of tocopherols
in vegetable oils by solid phase extraction on porous polymers SPE cartridges and capillary
gas chromatography analysis. Cent Eur J Chem. 2010, 8, 1110-1116.
24) Bramley P.; Elmadfa I.; Kafatos A.; Kelly F.; Manios Y.; Roxborough H.; Schuch
W.; Sheehy P.; Wagner K. Vitamin E. J Sci Food Agric. 1999, 80, 913-938.
25) Azzi A.; Stocker A. Vitamin E: non-antioxidant roles. Prog lipid research. 2000, 39,
321-255.
26) Chianella I.; Karim K.; Piletska E.; Preston C.; Piletsky S. Computational design and
synthesis of molecularly imprinted polymers with high binding capacity for
pharmaceutical applications-model case: Adsorbent for abacavir. Anal Chim Acta. 2006,
559, 73-78.
27) Luo M.; Ross A.; Morgan M.; Day A. Effects of pH on the ability of flavonoids to act
as Pickering emulsion stabilizers. Colloids Surf B Biointerfaces. 2012, 92, 84-90.
28) Piletsky S.; Piletska E.; Karim K.; Foster G.; Legge C.; Turner A. Custom synthesis
of molecular imprinted polymers for biotechnological application: Preparation of a
polymer selective for tylosin. Anal Chim Acta. 2004, 504, 123-130.
83
29) Mijangos I.; Navarro-Villoslada F.; Guerreiro A.; Piletska E.; Chianella I.; Karim K.;
Turner A.; Piletsky S. Influence of initiator and different polymerisation conditions on
performance of molecularly imprinted polymers. Biosens Bioelectron. 2006, 22, 381-387.
30) Muhammad T.; Nur Z.; Piletska E.; Piletsky S. Rational design of molecularly
imprinted polymer: the choice of cross-linker. Analyst. 2012, 137, 2623-2628.
31) Breton F.; Rouillon R.; Piletska E.; Karim K.; Guerreiro A.; Chianella I. Virtual
imprinting as a tool to design efficient MIPs for photosynthesis-inhibiting herbicides.
Biosens Bioelectron. 2005, 22, 1948-1954.
32) Gimeno E.; Castellote A.; Lamuela-Ravent R.; Torre M.; López-Sabater M. Rapid
determination of vitamin E in vegetable oils by reversed-phase high-performance liquid
chromatography. J Chromatogr A. 2000, 881, 251-254.
33) Piacham T.; Nantasenamat C.; Isarankura-Na-Ayudhya C.; Prachayasittikul V.
Synthesis and computational investigation of molecularly imprinted nanospheres for
selective recognition of alpha-tocopherol succinate. EXCLI J. 2013, ; 12, 701-718.
34) Garbaras A.; Masalaite A.; Garbariene I.; Ceburnis D.; Krugly E.; Remeikis V.; Puida
E.; Kvietkus K.; Martuzevicius D. Stable carbon fractionation in size-segregated aerosol
particles produced by controlled biomass burning. J Aerosol Sci. 2015, 79, 86-96.
35) Horváth C.; Wayne R. Theory of chromatography. In: J Chromat Library. 1983, 22,
A27-A135.
36) Klejn D.; Luliński P.; Maciejewska D.; Klejn D.; Luliński P.; Maciejewska D.
Desorption of 3,3′-diindolylmethane from imprinted particles: An impact of cross-linker
structure on binding capacity and selectivity. Mater Sci Eng. 2015, 56, 233-240.
37) Ariffin M. The application of novel extraction and analytical techniques in forensic
toxicology. PhD Thesis, University of Glasgow, 2006.
38) Puoci F.; Cirillo G.; Curcio M.; Iemma F.; Spizzirri U. Molecular imprinted SPE of
selective HPLC determination of -tocopherol in bay leave. Anal Chim Acta. 2007, 593,
164-170.
84
39) Dai C.; Zhang J.; Zhang Y.; Zhou X.; Duan Y.; Liu S. Selective removal of acidic
pharmaceuticals from contaminated lake water using multi-templates molecularly
imprinted polymer. Chem Eng J. 2012, 211, 302-309.
40) Dai C.; Zhou X.; Zhang Y.; Liu Z. Synthesis by precipitation polymerization of
molecularly imprinted polymer for the selective extraction of diclofenac from water
samples. J Hazard Mater. 2011, 198, 75-181.
41) Chatzimichalakis P.; Samanidou V.; Papadoyannis I. Development of a validated
liquid chromatography method for the simultaneous determination of eight fat-soluble
vitamins in biological fluids after solid-phase extraction. J Chromat B Anal Technol
Biomed Life Sci Appl. 2004, 805, 289-296.
42) Touchstone J. Thin-layer chromatographic procedures for lipid separation. J Chromat
B Biomed Sci Appl. 1995, 671, 169-195.
43) Fernández-Cuesta Á.; Aguirre-González M.; Ruiz-Méndez M.; Velasco L. Validation
of a method for the analysis of phytosterols in sunflower seeds. Eur J Lipid Sci Technol.
2012, 114, 325-331.
44) Feng S,.;Gao F.; Chen Z.; Grant E.; Kitts D.; Wang S.; Lu, X. Determination of α-
Tocopherol in Vegetable Oils Using a Molecularly Imprinted Polymers − Surface-
Enhanced Raman Spectroscopic Biosensor. J Agric Food Chem. 2013, 61, 10467-10475.
45) Gonzalez M.; Ballesteros E.; Gallego M.; Valcarcel M. Continuous-flow
determination of natural and synthetic antioxidants in foods by gas chromatography. Anal
Chim Acta. 1998, 359, 47-55.
46) Ballesteros E.; Gallego M.; Valcárcel M. Gas chromatographic determination of
cholesterol and tocopherols in edible oils and fats with automatic removal of interfering
triglycerides. J Chromat A. 1996, 719, 221-227.
47) Lenchner M.; Reiter B. Determination of tocopherols and sterols in vegetable oils by
SPE and subsequent capillary chromatographic. J Chromatogr A. 1999, 857, 231-238.
85
48) Schwartz H.; Ollilainen V.; Piironen V.; Lampi A. Tocopherol, tocotrienol and plant
sterol contents of vegetable oils and industrial fats. J Food Compos Anal. 2008, 21, 152-
161.

86
Chapter three
87
Applications of the optimised SPE protocols to extract selected
physiologically-active compounds from the vegetable oils
3.1 Introduction
Vegetable oils consist of 95 to 98% of triacylglycerol and 2 to 5% of different
groups of minor components such as hydrocarbons, tocopherols, phytosterols and
their esters.1-3. The typical raw materials for biodiesel production are vegetable oils,
such as rapeseed, canola, soybean, sunflower and palm oils. “The cost of biodiesel
can be lowered by increasing feedstock yields, developing novel technologies, and
increasing economic return”4 (p.S111), described by Demirbas (2009) to highlight
the importance of encouraging this industry to protect our planet. Triglycerides are
the target components of vegetable oils which are used as reactants with methanol
or ethanol in the transesterification reaction in the presence of the alkali catalyst to
produce biodiesel (Figure 3.1).1-7 Therefore, the minor components of vegetable
oils, most of which are physiologically active, are lost during the biodiesel
production process.
Free fatty acids are the main group of minor compounds in the vegetable oils
that are desirable to be separated or treated before biofuel production process. One
of the reactions used for producing the biofuel is transesterification.
Transesterification is the reaction of a fat or oil with an alcohol to yield esters and
glycerol. The reaction should be controlled by an alkali catalyst. This equilibrium
reaction requires a great amount of alcohol to keep the reaction equilibrium in the
forward direction and produce more methyl esters, not the opposite.1,2 It was
observed that the presence of free fatty acids has a negative effect on the biodiesel
production from vegetable oils due to their reaction with the alkali catalyst to form
soap and water, thus inhibiting the separation and purification processes of the
biodiesel as demonstrated in Figure 3.2.2,3 Hence, free fatty acids represent a
potential problem in biodiesel production. The most common fatty acids in
vegetable oils are palmitic, oleic and linoleic acids. Palmitic acid is the main
saturated fatty acid that has numerous food and industrial applications. According
to Mancini et al., palmitic acid is an important constituent in industrial products
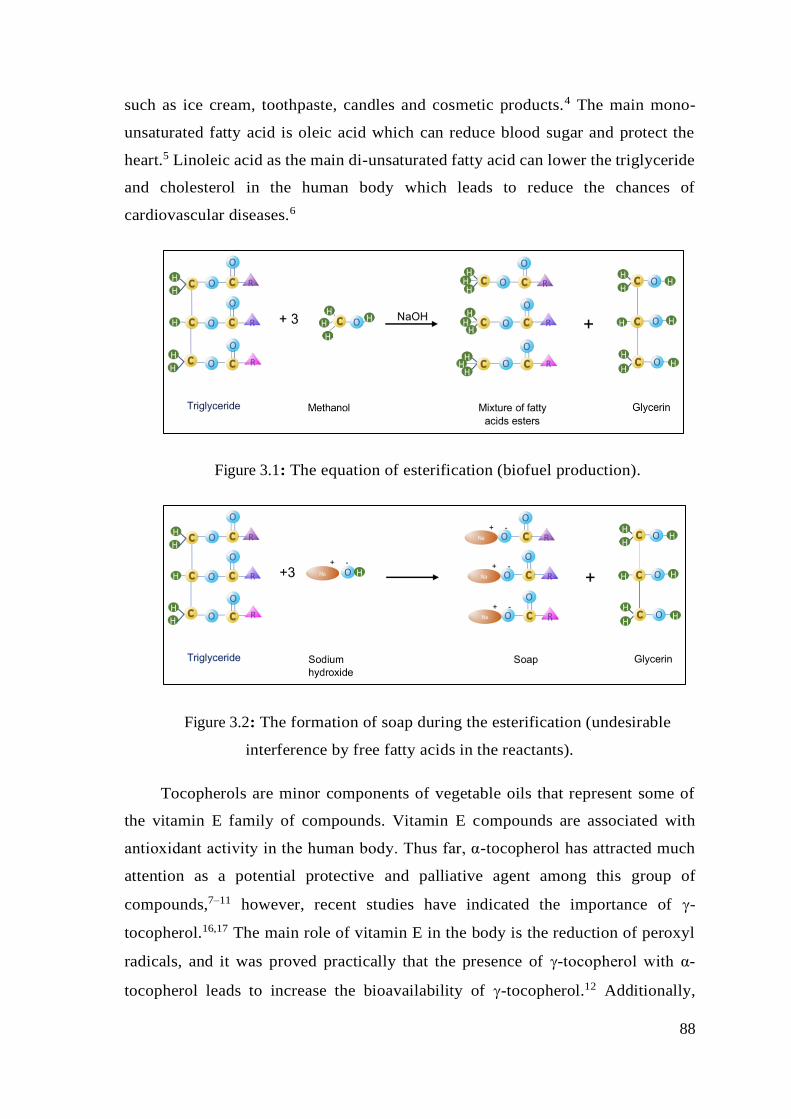
88
such as ice cream, toothpaste, candles and cosmetic products.4 The main mono-
unsaturated fatty acid is oleic acid which can reduce blood sugar and protect the
heart.5 Linoleic acid as the main di-unsaturated fatty acid can lower the triglyceride
and cholesterol in the human body which leads to reduce the chances of
cardiovascular diseases.6
Figure 3.1: The equation of esterification (biofuel production).
Figure 3.2: The formation of soap during the esterification (undesirable
interference by free fatty acids in the reactants).
Tocopherols are minor components of vegetable oils that represent some of
the vitamin E family of compounds. Vitamin E compounds are associated with
antioxidant activity in the human body. Thus far, α-tocopherol has attracted much
attention as a potential protective and palliative agent among this group of
compounds,7–11 however, recent studies have indicated the importance of -
tocopherol.16,17 The main role of vitamin E in the body is the reduction of peroxyl
radicals, and it was proved practically that the presence of -tocopherol with α-
tocopherol leads to increase the bioavailability of -tocopherol.12 Additionally,
89
vitamin E is widely used in industrial applications like medicine, cosmetics,
agriculture and the food industry.13,14,15
Other minor components of vegetable oils are comprised of phytosterols (plant
sterols) a type of triterpenes which have drawn the attention of many researchers
due to their bioactivity. They are available in plants in their free and conjugated
forms with fatty acids or glycosylated with hexose. It is known that phytosterols
have the potential to reduce total serum cholesterol as well as LDL-cholesterol in
the human body through the inhibition of the absorption of dietary cholesterol and
the reabsorption of excreted cholesterol in the bile in the enterohepatic cycle.16–18
Many published studies suggested several protocols to purify and extract the
minor components from vegetable oils separately or simultaneously.19,20 However,
all of these methods require either pre-treatment of the oil sample or consuming a
lot of chemical solvents to dilute the oil sample and using developed technologies
for separation such as HPLC and supercritical fluid extraction.21,22 Thus,
applications of these methods in the industry are limited.
In this study, the proposed protocol presented here was based on an optimised
method which allows to “harvest” some physiologically-active compounds in a
single step, from the vegetable oils with a minimum of organic solvents in an
environmentally-safe process using an earlier developed bespoke adsorbent.
90
3.2 Materials and methods
3.2.1 Chemicals and reagents
The unrefined and cold pressing oils including sunflower and sesame oil were
purchased from Activecare. Palm oil was obtained from KTC and olive oil,
wheatgerm and soybean oil were all bought from the Food Marketplace through
Amazon.com. Standards were originated from vegetable oil including -tocopherol
that was purchased from Santa Cruz Biotechnology (UK). In addition to the -
tocopherol, mixtures of phytosterols, containing 46% -sitosterol, 24% campesterol
and 16% stigmasterol, were also purchased from Santa Cruz Biotechnology (UK).
Ethylene glycol dimethacrylate (EGDMA), azobis (cyclohexane carbonitrile),
methacrylic acid (MAA) and free fatty acids including palmitic, oleic and linoleic
acids were purchased from Aldrich (UK). Methanol, ethyl acetate, heptane,
acetonitrile, n-hexane, dichloromethane and acetic acid were obtained from Fisher
Chemicals (UK). All solvents were used without any purification and they were all
HPLC-quality grade. 1, 1'-azobis (cyclohexane carbonitrile), methacrylic acid
(MAA) and ethylene glycol dimethacrylate (EGDMA) were purchased from
Aldrich (UK). Dimethylformamide (DMF) was obtained from Acros Organics
(UK).
3.2.2 Equipment and analysis techniques
1 mL SPE columns were packed with 200 mg of the RDP and used in SPE
supported with a vacuum manifold (Supelco, UK). Gas Chromatography-Mass
Spectrometry (Perkin Elmer, TurboMass, UK) was used for the analysis and
quantification of the extracted components in the eluted samples during SPE
protocol. Gas Chromatography was performed using a 30 m X 250 µm, 0.25 mm
I.D., ZB-5 capillary column (Phenomenex, UK). To carry the sample, helium gas
was used as a mobile phase with a flow-rate of 1 mL min-1 at 200 °C. The
temperature of the GC oven was raised after a sample injection by 10 °C min-1 to
350 °C and held for 3 min.
91
3.2.3 Invistigation the affinity of RDP towards minor compontns
In order to justify the potential of the synthesised RDP in the previous chapter,
modelling process has been applied again (though using different templates) to
demonstrate specific recognition to some minor components, such as fatty acids and
phytosterols in vegetable oils. The molecular modelling software capable to
illustrate the hydrogen bonds between each of these minor components with the
same functional monomers as presented in the previous chapter.
The main goal of doing the modelling for the extracted minor components was
to be able to predict the possible molecular interactions contributing to the
formation of the template: monomer interactions among the RDP. Molecular
modelling was performed using a workstation from Research Machines running the
CentOS 5 GNU/Linux operating system. The workstation was configured with a
3.2GHz core 2 duo processor, 4 GB memory and a 350 GB fixed drive. Molecular
modelling was conducted using the software packages SYBYL 7.0 (Tripos Inc., St.
Louis, Missouri, USA).23 The LEAPFROG screening of the library of functional
monomers for their potential interactions with the template resulted in tables of
functional monomers with the binding energy to each template. Each modelling
process was repeated for all the minor components as a template in this study
including palmitic, oleic, linoleic acids, campesterol, stigmasterol and -sitosterol.
3.2.4 Applications of the optimised SPE protocol to the vegetable oils
The optimised protocol that has been applied to all types of oil was based on
the optimised protocol in the previous chapter, which has been published24
(Appendix1), as follows:
3.2.4.1 Preparation of the samples
Dissolved the oils (20%) and the standards of each minor components in
heptane. Further, used these standards to spike 1 mL of each oil (sunflower, sesame,
soybean, olive, palm and wheat germ) solution in heptane with 0.3 mg of each
standard.
92
3.2.4.2 The SPE protocol conditions
The SPE cartridges were packed with 200 mg of synthesised RDP and
conditioned with 1 mL heptane. Further, two separate cartridges were loaded, one
with 1 mL of spiked oil sample and other with 1 mL of oil without spiking, for each
type of oils. After that, the cartridges were washed with 1 mL of 60% methanol,
subsequently, 3 mL of methanol with 5% acetic acid was used for the elution of the
adsorbed compounds from the cartridges. The eluted samples were evaporated and
reconstituted in hexane (1 mL) to be analysed with GC/MS. The quantitative
measurements were performed using the integration values of the area under peaks
in GC chromatogram which is directly proportional to the concentration of the
analysed samples. The concentration of compounds was calculated in mg g-1 of oil
using calibration curves of the pure standards. The mass spectra of each compound
were analysed to match the fragmentation pattern in the NIST library and the
literature with the obtained fragments. In addition, IR was used to distinguish
between fatty acids and their esters in the eluted samples.
3.2.4.3 Calibration curves
Calibration curves were made using the integration of the peaks corresponding
to the series of concentrations of the standards solution in hexane for the minor
components involved in this study, in GC/MS chromatogram. Hence integration
values of these peaks were directly proportional to the concentration of analysed
samples. The calibration curve was generated from ploting the relationship between
the integration of series of known concentration solutions and their concentration.
The straight line resulted follow the equation y=mx where x is the concentrations
and y is the corresponding integration. Then, simply replaced the integration (y) of
the unknown concentration into the equation, where the m is known from the
resulted equation produced from calibration curve, to calculate the unkown
concentration.
The calibration curves were made for each fatty acid: palmitic acid, oleic acid
and linoleic acid. Calibration curve for -tocopherol was presented in the previous
chapter. Phytosterols standard sample contained naturally 24% of campesterol and
93
16% of stigmasterol. Therefore, the calibration curve was made from a series of the
mixture to each sterol alone as shown in the results section.
3.2.5 Saponification the fatty acids
For comparison in GC/MS between the fatty acids and their esters, methyl
esters were synthesised from each fatty acid individually. The saponification was
carried out by following the method described by Fallon et al.25 Briefly, 0.7 mL of
10 N KOH in water was added to 40 µL of liquid fatty acid or 0.5 mg of solid fatty
acid in 125x16 mm screw-cap Pyrex tubes. Then, 5.3 mL of methanol was added
before heating at 55ºC for 1.5 hours with the mixture being shaken by hand every
20 minutes. The mixture was cooled to room temperature before adding 0.58 mL of
sulfuric acid (24 N) in water. The mixture was heated again at 55ºC with it being
shaken 3 min every 20 min. Next, the mixture was vortex shaken after cooling it to
room temperature and adding 3 mL of hexane. Finally, the mixture was centrifuged
for 5 min at 4000 rpm. The layer of hexane contained the ester of fatty acids, which
was separated and analysed using GC/MS.
3.2.6 Method validation
Method reliability and matrix effects were investigated using the published
method in Flakelar et al.1 mL of heptane was spiked with the mixed standards.26
1mL of the spiked solution was analysed with GC/MS with the same used
conditions of this study. Using the calibration curve and the integration of peaks, it
was possible to calculate the percentage of each standard compound in the spiked
sample as shown in Table 3.8 in results section. Further matrix effects were
examined by comparing the weight of the eluted sample from 20% sunflower oil in
heptane with weight of the eluted sample after subtracting the calculated weight of
the natural compounds quantified using GC/MS. The calculations of the
concentrations of eluted compounds were performed using the integration of peaks
and the calibration curve.
94
3.3 Results and discussion
The main objective of this chapter was to determine the possibility of applying
the optimised protocol to other vegetable oils. Before presenting the results of these
experiments, it is important to highlight the properties of the RDP that provided
specificity towards these minor components. In order to explain the common
molecular interaction between the minor compounds, which were extracted in the
current study, and the synthesised polymer, a molecular modelling has been
conducted using the SYBYL software as it was described in the previous chapter
for -tocopherol.
3.3.1 Molecular modelling:
The RDP has been synthesised based on -tocopherol as a template.
However, after applying the optimised method to the sunflower oil sample, it was
found that the polymer has demonstrated recognition to not only -tocopherol but
also to other minor compounds. The used polymer has been synthesised based on
the 3D chemical structure of -tocopherol, therefore, the investigation of the
modelling for other minor compounds was focused on the same functional
monomers in the top of the LEAPFROG list in terms of their binding energy with
each template. The functional monomers include MAA, EGDMA, AMPSA,
EGMP, IA and UA. The results of the modelling were presented initially together
in Figure 3.3 for the purpose of justification the affinity of these minor compounds
to the same functional monomers. In general, it was found that AMPSA showed the
highest binding energy then, EGMP with a little exception in some phytosterols,
then MAA and EGDMA (cross-linker) and, finally, IA and UA with some
exceptions. In the next part, each group of minor compounds was presented with
these functional monomers and was explained in more detail.
RDP was applied in this study as a resin or a stationary phase which retained
the analytes based on binding to the organic moieties of some available compounds
from the different groups of vegetable oil components. To explain the capacity of
RDP and the excellent efficiency of RDP towards the fatty acids in the vegetable
oils a comparison has been made between the different chromatographic separation
95
mechanisms to justify the common features that led to the separation of the group
of compounds in this study.
In the solid phase extraction, the retentive properties and the selectivity of
certain analytes are affected mainly by the stationary phase and the mobile phase.27
There are six different modes of stationary phases which were presented in details
in the fourth chapter. In this chapter, the stationary phases that have common
features with RDP have been demonstrated to understand the retention mechanism
of RDP. Firstly, in normal-phase separation, the analytes are separated according to
their polar moieties (e.g. the hydroxyl group, amine group or ester bonds).
Therefore, the retentive properties of silica gel as stationary phase are due to the
interactions between silanol groups, to which hydroxyl groups are linked, and the
polar moieties from analytes. Thus, the separation depends on the nature and the
number of the polar functional groups of the analytes.28
In the reversed-phase the stationary phase retains the compounds by attractive
dispersion interactions. Moreover, shape and size of moleculas have an effect on
the retintive properties.29 The third separation mode could be used in the explanation
of the RDP selectivity is the ion-exchange separation. Ion-exchange separation
modes are based on the competition between the analyte ion and counter ion comes
from the mobile phase in certain site with opposite charge on the sorbent. The
separation is performed by controlling the concentration of ion or pH of the elution
solvent (the mobile phase).28,29
RDP has some common features with the three above mentioned separation
modes. RDPs are particles contain functional groups such as carboxylic (come from
MAA), imidazole rings (come from urocanic acid) or phosphoric (come from
EGMP). These functional groups interact with polar intermolecular interactions
such as hydrogen bonds or non-polar intermolecular interactions such hydrophobic
interactions depending on the nature of the analytes and the functional groups on
the surface of the polymer particles. In the polymer particles, the orientation of
functional monomers was fixed using cross-linker (EGDMA), which contributed as
well to the retentive properties of the polymer particles via the electron-withdrawing
and electron-donor properties of alkoxy and carbonyl groups. Furthermore, the
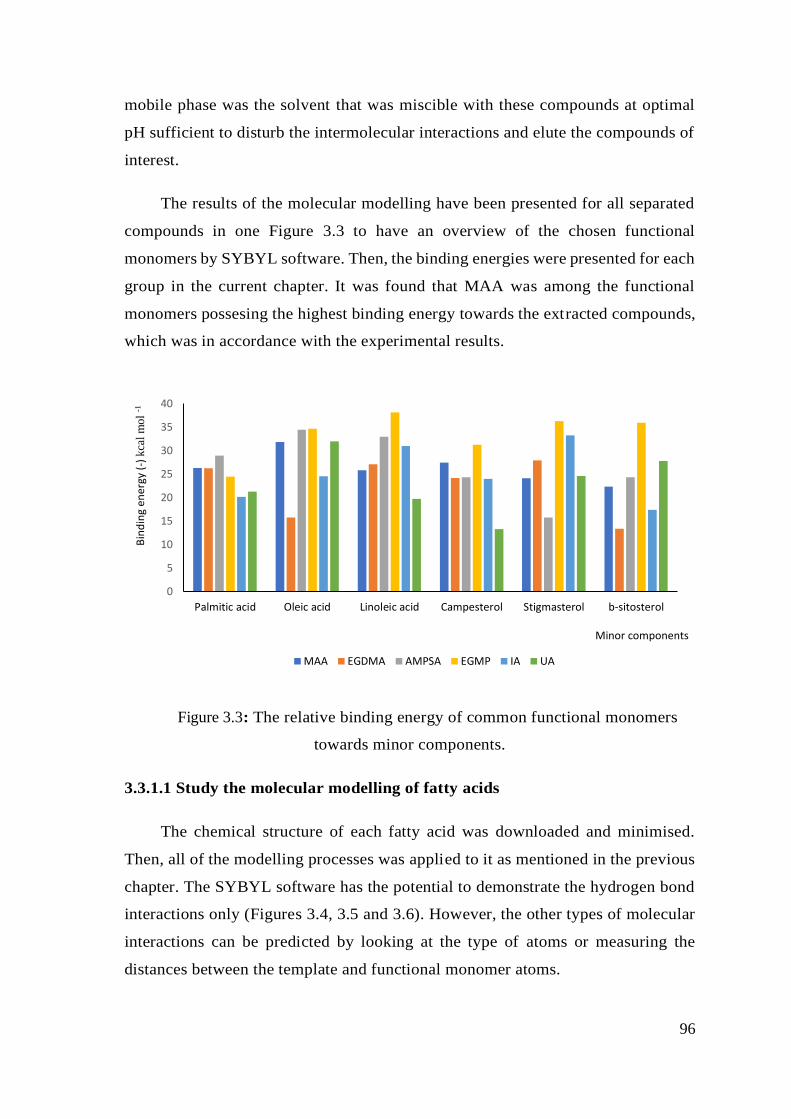
96
mobile phase was the solvent that was miscible with these compounds at optimal
pH sufficient to disturb the intermolecular interactions and elute the compounds of
interest.
The results of the molecular modelling have been presented for all separated
compounds in one Figure 3.3 to have an overview of the chosen functional
monomers by SYBYL software. Then, the binding energies were presented for each
group in the current chapter. It was found that MAA was among the functional
monomers possesing the highest binding energy towards the extracted compounds,
which was in accordance with the experimental results.
Figure 3.3: The relative binding energy of common functional monomers
towards minor components.
3.3.1.1 Study the molecular modelling of fatty acids
The chemical structure of each fatty acid was downloaded and minimised.
Then, all of the modelling processes was applied to it as mentioned in the previous
chapter. The SYBYL software has the potential to demonstrate the hydrogen bond
interactions only (Figures 3.4, 3.5 and 3.6). However, the other types of molecular
interactions can be predicted by looking at the type of atoms or measuring the
distances between the template and functional monomer atoms.
0
5
10
15
20
25
30
35
40
Palmitic acid Oleic acid Linoleic acid Campesterol Stigmasterol b-sitosterol
Bin
din
g en
ergy
(-)
kca
l m
ol
-1
Minor components
MAA EGDMA AMPSA EGMP IA UA
97
According to Christie, the fatty acids have several organic moieties, by which
fatty acids were separated using differet types of stationary phases.27 The lipid
compounds were separated in the normal-phase mode based on the chain-lengthe
moieties and the degree of saturation. In reversed-phase chromatography the alkyle
moieties, carboxyl moieties and the number and configuration of the fatty acids
were contributing to the separation process. The used mobile phase was methanol
with 5% acetic acid that disturbed the interactions between the fatty acids with the
functional monomers on the RDP surface. The potential moieties by which the
intermolecular interactions occurd include two double bonds in linoleic acid, a
carboxylic group and 18 carbon chain-length. In case of oleic acid, only one double
bond with the carboxylic group and 18 carbon chain-length participated in the
retentive properties. Palmitic acid has no double bond and the contributed moieties
to the retention on the stationary phase included the 16 carbon chain-length and
carboxyl group.
The fatty acids were interacting using London forces and Van der Wall with
the alkyl moiety or double bonds on fatty acid and methyl groups on the polymer
surface.27,29 Moreover, hydrogen bonds, polar dipole-induced dipole, dipole-dipole
and proton doner-proton acceptor interactions have also participated in the retention
process. Therefore, it was suggested that the difference in the preference of these
types of interactions could lead to the prefentional binding of the functional
monomers towards different fatty acids. For example, since AMPSA has carbonyl
group, nitrogen and sulpur atoms as proton acceptors and hydrogen linked to a
sulfuric group could act as a proton donor, it could provide an explination why this
functional monomer could prefer interacting through polar intermolecular
interactions with polar moieties. On the other hand, UA and IA have alkyl moieties
that could show more non-polar intermolecular interactions such as van der Waals
with the alkyl chain and double bonds. Moreover, EGMP was at the beginning of
oleic and linoleic acids and in the middle of the list in palmitic acid. This could be
explained through the preference of oleic and linoleic to interact with EGMP with
van der Waals scince it has methyl and methylene moieties.
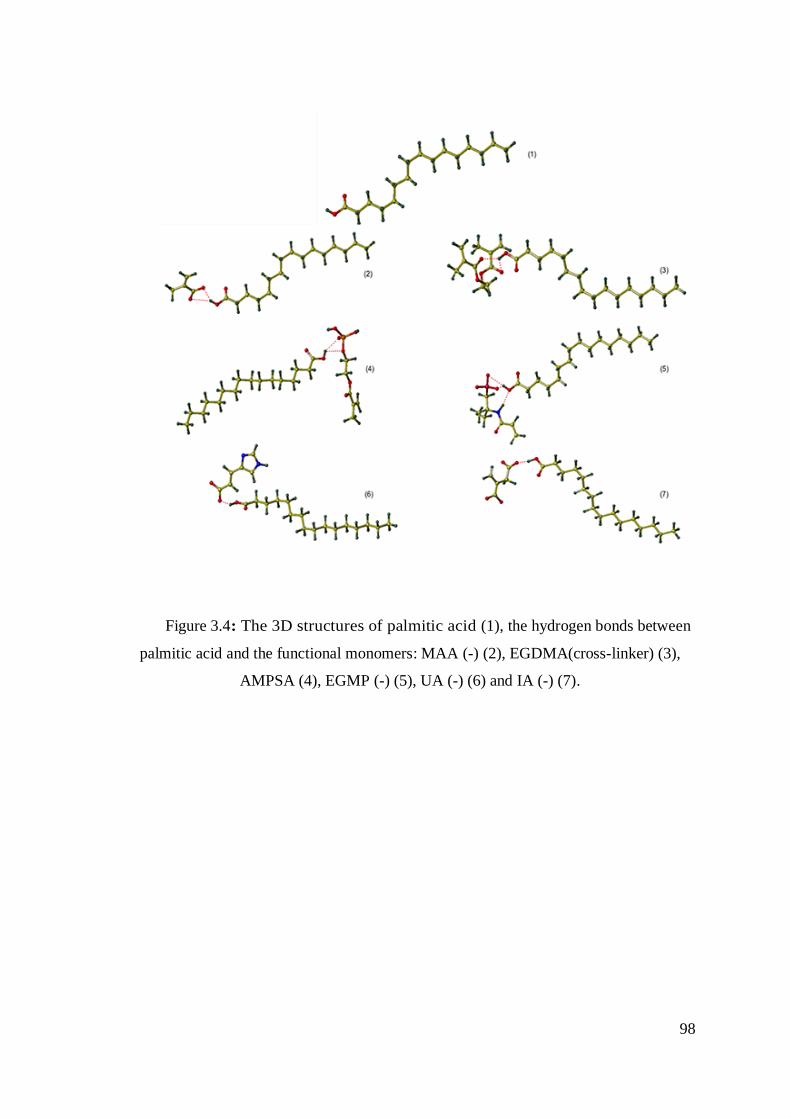
98
Figure 3.4: The 3D structures of palmitic acid (1), the hydrogen bonds between
palmitic acid and the functional monomers: MAA (-) (2), EGDMA(cross-linker) (3),
AMPSA (4), EGMP (-) (5), UA (-) (6) and IA (-) (7).
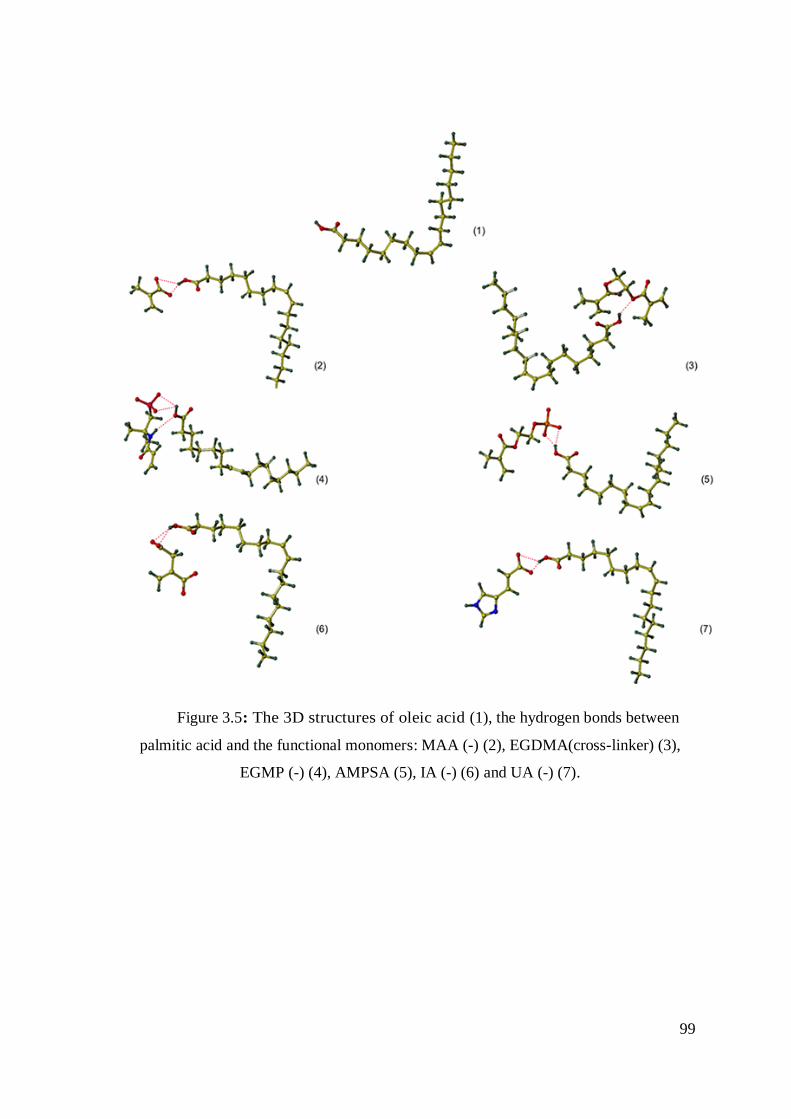
99
Figure 3.5: The 3D structures of oleic acid (1), the hydrogen bonds between
palmitic acid and the functional monomers: MAA (-) (2), EGDMA(cross-linker) (3),
EGMP (-) (4), AMPSA (5), IA (-) (6) and UA (-) (7).
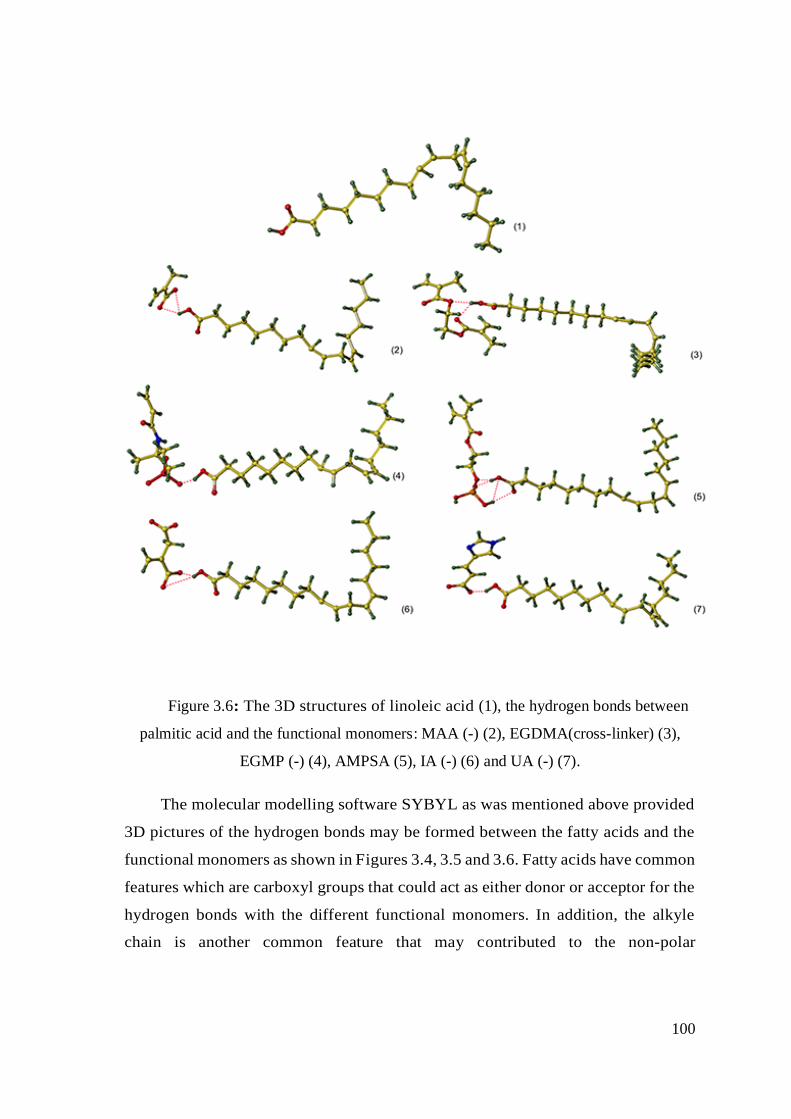
100
Figure 3.6: The 3D structures of linoleic acid (1), the hydrogen bonds between
palmitic acid and the functional monomers: MAA (-) (2), EGDMA(cross-linker) (3),
EGMP (-) (4), AMPSA (5), IA (-) (6) and UA (-) (7).
The molecular modelling software SYBYL as was mentioned above provided
3D pictures of the hydrogen bonds may be formed between the fatty acids and the
functional monomers as shown in Figures 3.4, 3.5 and 3.6. Fatty acids have common
features which are carboxyl groups that could act as either donor or acceptor for the
hydrogen bonds with the different functional monomers. In addition, the alkyle
chain is another common feature that may contributed to the non-polar
101
intermolecular interactions involving, for example, van der Waals and London
forces.28
3.3.1.2 Study the molecular modelling of phytosterols
Phytosterols molecules consist of four rings with standard carbon numbering.
The three are six carbon atoms in a non-linear arrangement and are attached to one
5-carbon atom ring. The different phytosterols extracted from plants vary in the
number of carbon atoms in the side chain and the position and number of double
bonds in the ring and side chain. The structure of phytosterols determines the
chromatographic properties of them. It has been demonstrated that phytosterols
interacted with the chromatographic surfaces with hydrophilic and hydrophobic
interactions due to the presence of polar and non-polar moieties in the same
molecule.30-32 According to Demel et al., phytosterols could participate in polar
intermolecular interactions via 3-hydroxy group in the meanwhile of making non-
polar interactions through the alkyl side chain.32
The binding energy of intermolecular interactions between the three types of
phytosterol in the current study (campesterol, stigmasterol and -sitosterol) and six
types of functional monomers that were calculated by SYBYL software.
The SYBYL software demonstrated the hydrogen bonds between the six types
of functional monomers and the three phytosterols only through the 3b-hydroxy
group as shown in Figures 3.7, 3.8 and 3.9.
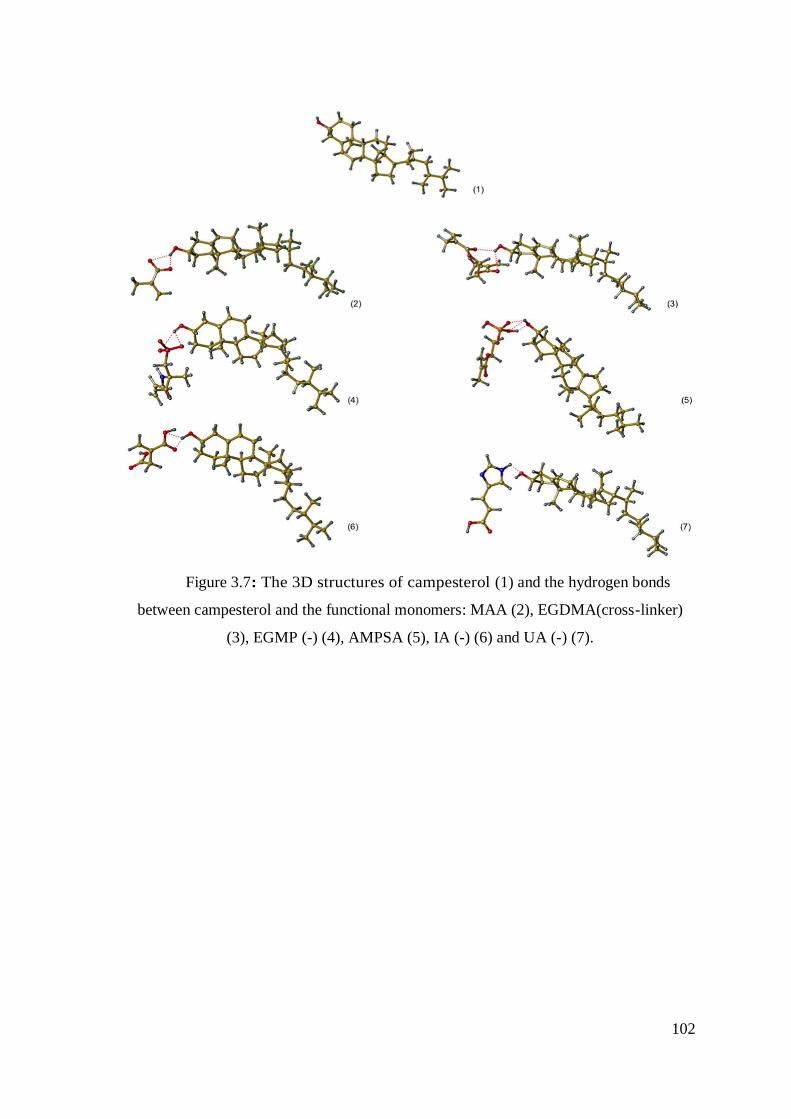
102
Figure 3.7: The 3D structures of campesterol (1) and the hydrogen bonds
between campesterol and the functional monomers: MAA (2), EGDMA(cross-linker)
(3), EGMP (-) (4), AMPSA (5), IA (-) (6) and UA (-) (7).
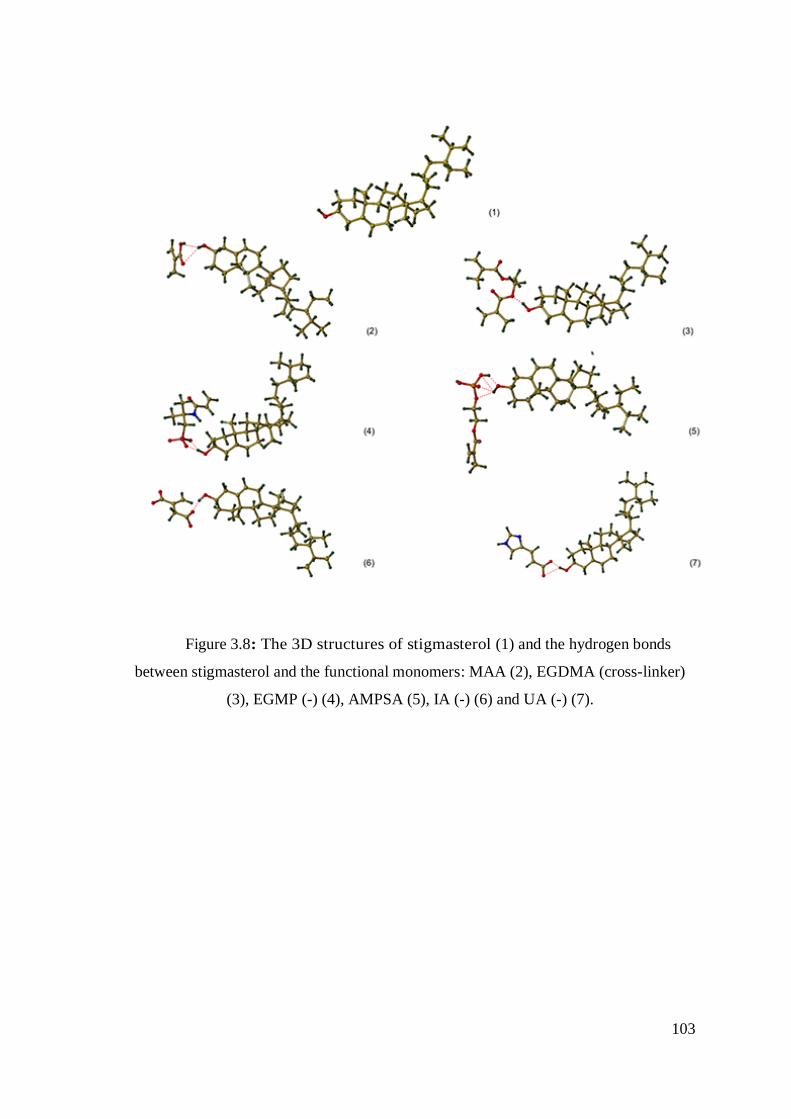
103
Figure 3.8: The 3D structures of stigmasterol (1) and the hydrogen bonds
between stigmasterol and the functional monomers: MAA (2), EGDMA (cross-linker)
(3), EGMP (-) (4), AMPSA (5), IA (-) (6) and UA (-) (7).

104
Figure 3.9: The 3D structures of -sitosterol (1) and the hydrogen bonds
between -sitosterol and the functional monomers: MAA (2), EGDMA(cross-linker)
(3), EGMP (-) (4), AMPSA (5), IA (-) (6) and UA (-) (7).
3.3.2 Quantification of the minor components in the vegetable oils
3.3.2.1 Calibration curves
Calibration curves of the minor components in the current study facilitated the
quantification of the components in all of these experiments (Table 3.1). The minor
components included palmitic, oleic, linoleic acids, campesterol, stigmasterol, -
sitosterol and sesamin (obseved in sesame oil only). It is important to highlight here
that -tocopherol was quantified along with these minor components in the
vegetable oils, but its calibration curve was showed in the previous chapter.
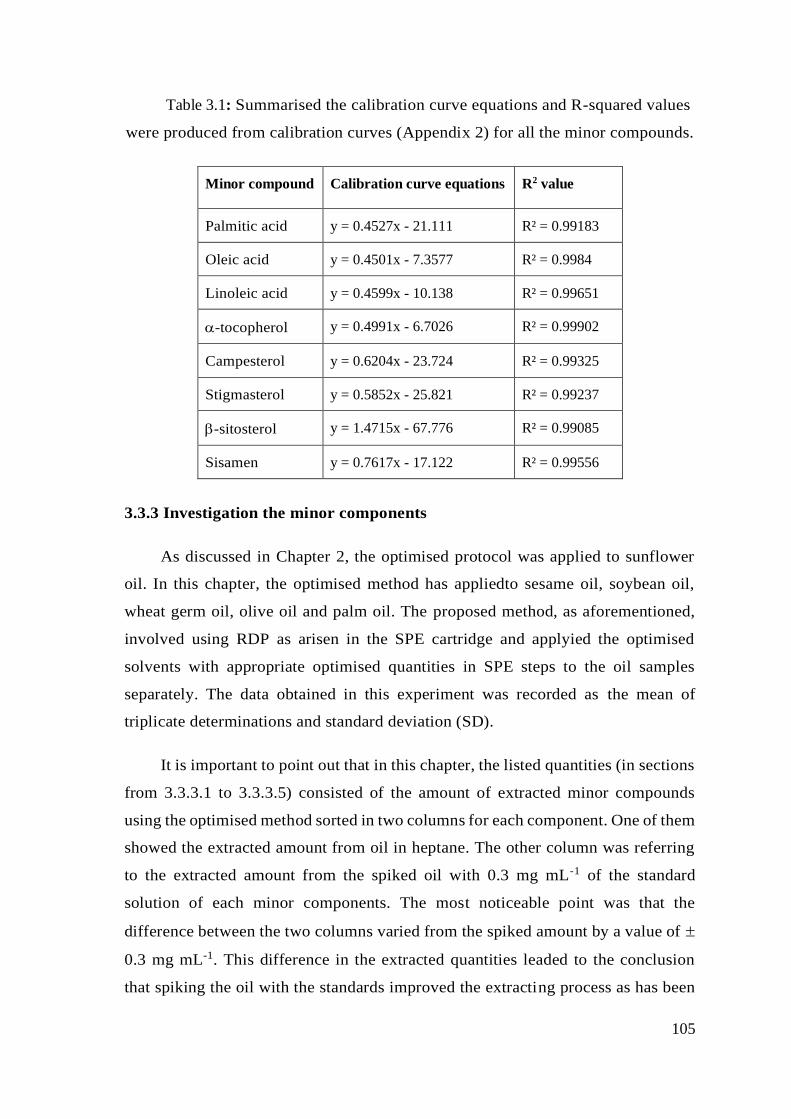
105
Table 3.1: Summarised the calibration curve equations and R-squared values
were produced from calibration curves (Appendix 2) for all the minor compounds.
Minor compound Calibration curve equations R2 value
Palmitic acid y = 0.4527x - 21.111 R² = 0.99183
Oleic acid y = 0.4501x - 7.3577 R² = 0.9984
Linoleic acid y = 0.4599x - 10.138 R² = 0.99651
-tocopherol y = 0.4991x - 6.7026 R² = 0.99902
Campesterol y = 0.6204x - 23.724 R² = 0.99325
Stigmasterol y = 0.5852x - 25.821 R² = 0.99237
-sitosterol y = 1.4715x - 67.776 R² = 0.99085
Sisamen y = 0.7617x - 17.122 R² = 0.99556
3.3.3 Investigation the minor components
As discussed in Chapter 2, the optimised protocol was applied to sunflower
oil. In this chapter, the optimised method has appliedto sesame oil, soybean oil,
wheat germ oil, olive oil and palm oil. The proposed method, as aforementioned,
involved using RDP as arisen in the SPE cartridge and applyied the optimised
solvents with appropriate optimised quantities in SPE steps to the oil samples
separately. The data obtained in this experiment was recorded as the mean of
triplicate determinations and standard deviation (SD).
It is important to point out that in this chapter, the listed quantities (in sections
from 3.3.3.1 to 3.3.3.5) consisted of the amount of extracted minor compounds
using the optimised method sorted in two columns for each component. One of them
showed the extracted amount from oil in heptane. The other column was referring
to the extracted amount from the spiked oil with 0.3 mg mL-1 of the standard
solution of each minor components. The most noticeable point was that the
difference between the two columns varied from the spiked amount by a value of
0.3 mg mL-1. This difference in the extracted quantities leaded to the conclusion
that spiking the oil with the standards improved the extracting process as has been
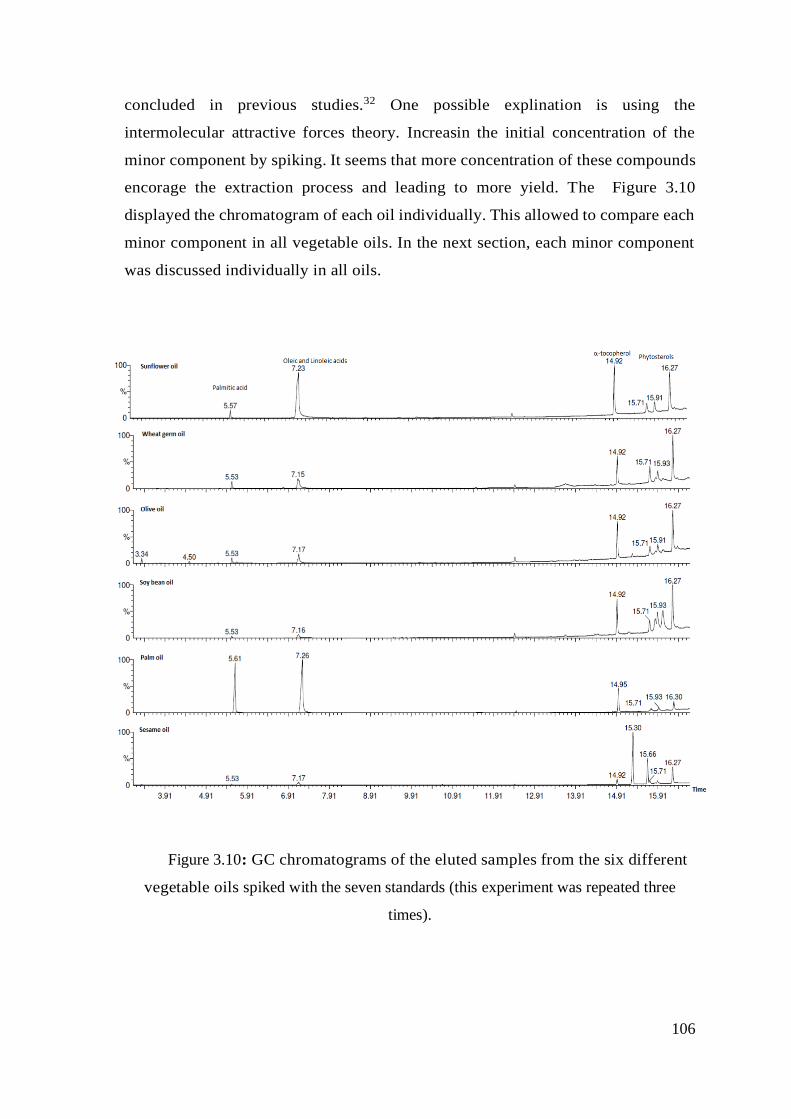
106
concluded in previous studies.32 One possible explination is using the
intermolecular attractive forces theory. Increasin the initial concentration of the
minor component by spiking. It seems that more concentration of these compounds
encorage the extraction process and leading to more yield. The Figure 3.10
displayed the chromatogram of each oil individually. This allowed to compare each
minor component in all vegetable oils. In the next section, each minor component
was discussed individually in all oils.
Figure 3.10: GC chromatograms of the eluted samples from the six different
vegetable oils spiked with the seven standards (this experiment was repeated three
times).
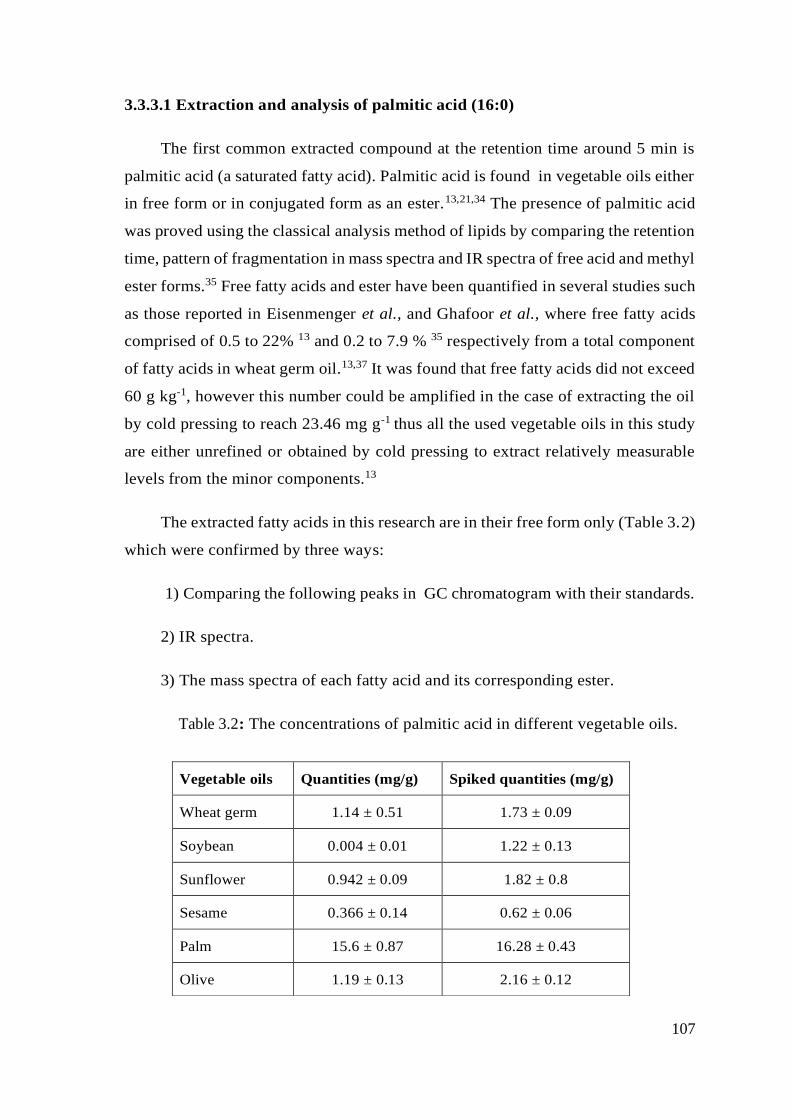
107
3.3.3.1 Extraction and analysis of palmitic acid (16:0)
The first common extracted compound at the retention time around 5 min is
palmitic acid (a saturated fatty acid). Palmitic acid is found in vegetable oils either
in free form or in conjugated form as an ester.13,21,34 The presence of palmitic acid
was proved using the classical analysis method of lipids by comparing the retention
time, pattern of fragmentation in mass spectra and IR spectra of free acid and methyl
ester forms.35 Free fatty acids and ester have been quantified in several studies such
as those reported in Eisenmenger et al., and Ghafoor et al., where free fatty acids
comprised of 0.5 to 22% 13 and 0.2 to 7.9 % 35 respectively from a total component
of fatty acids in wheat germ oil.13,37 It was found that free fatty acids did not exceed
60 g kg-1, however this number could be amplified in the case of extracting the oil
by cold pressing to reach 23.46 mg g-1 thus all the used vegetable oils in this study
are either unrefined or obtained by cold pressing to extract relatively measurable
levels from the minor components.13
The extracted fatty acids in this research are in their free form only (Table 3.2)
which were confirmed by three ways:
1) Comparing the following peaks in GC chromatogram with their standards.
2) IR spectra.
3) The mass spectra of each fatty acid and its corresponding ester.
Table 3.2: The concentrations of palmitic acid in different vegetable oils.
Vegetable oils Quantities (mg/g) Spiked quantities (mg/g)
Wheat germ 1.14 ± 0.51 1.73 ± 0.09
Soybean 0.004 ± 0.01 1.22 ± 0.13
Sunflower 0.942 ± 0.09 1.82 ± 0.8
Sesame 0.366 ± 0.14 0.62 ± 0.06
Palm 15.6 ± 0.87 16.28 ± 0.43
Olive 1.19 ± 0.13 2.16 ± 0.12
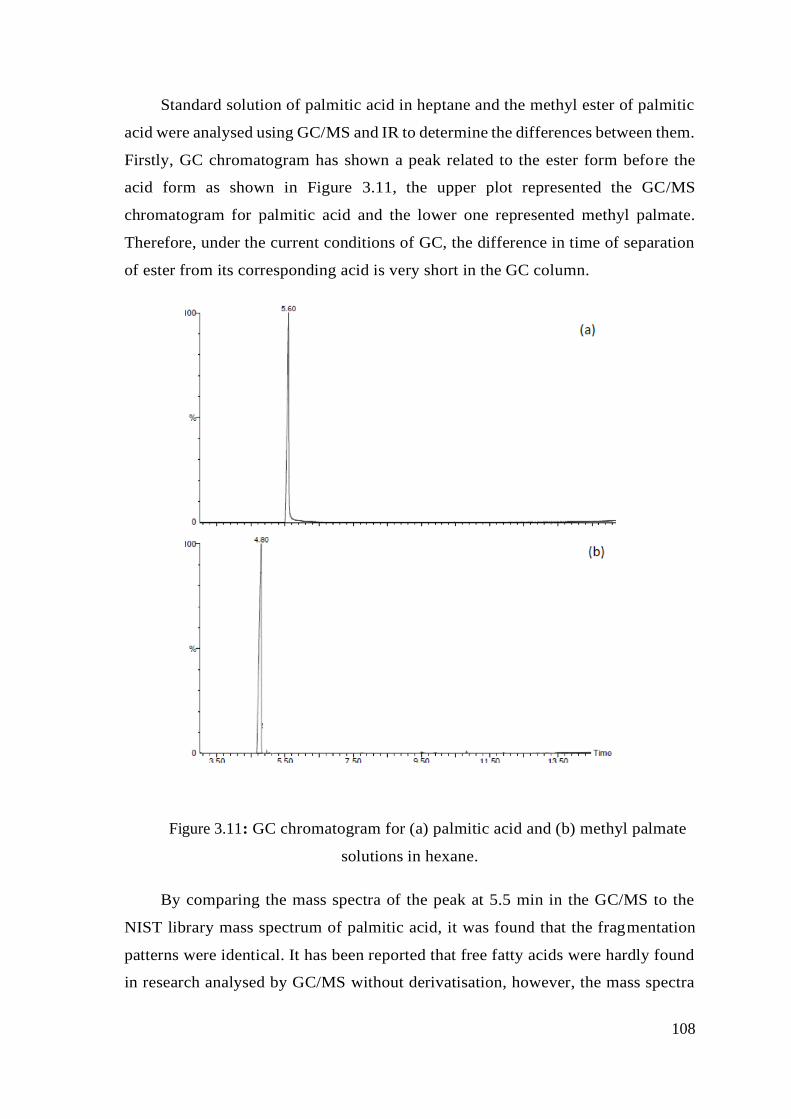
108
Standard solution of palmitic acid in heptane and the methyl ester of palmitic
acid were analysed using GC/MS and IR to determine the differences between them.
Firstly, GC chromatogram has shown a peak related to the ester form before the
acid form as shown in Figure 3.11, the upper plot represented the GC/MS
chromatogram for palmitic acid and the lower one represented methyl palmate.
Therefore, under the current conditions of GC, the difference in time of separation
of ester from its corresponding acid is very short in the GC column.
Figure 3.11: GC chromatogram for (a) palmitic acid and (b) methyl palmate
solutions in hexane.
By comparing the mass spectra of the peak at 5.5 min in the GC/MS to the
NIST library mass spectrum of palmitic acid, it was found that the fragmentation
patterns were identical. It has been reported that free fatty acids were hardly found
in research analysed by GC/MS without derivatisation, however, the mass spectra
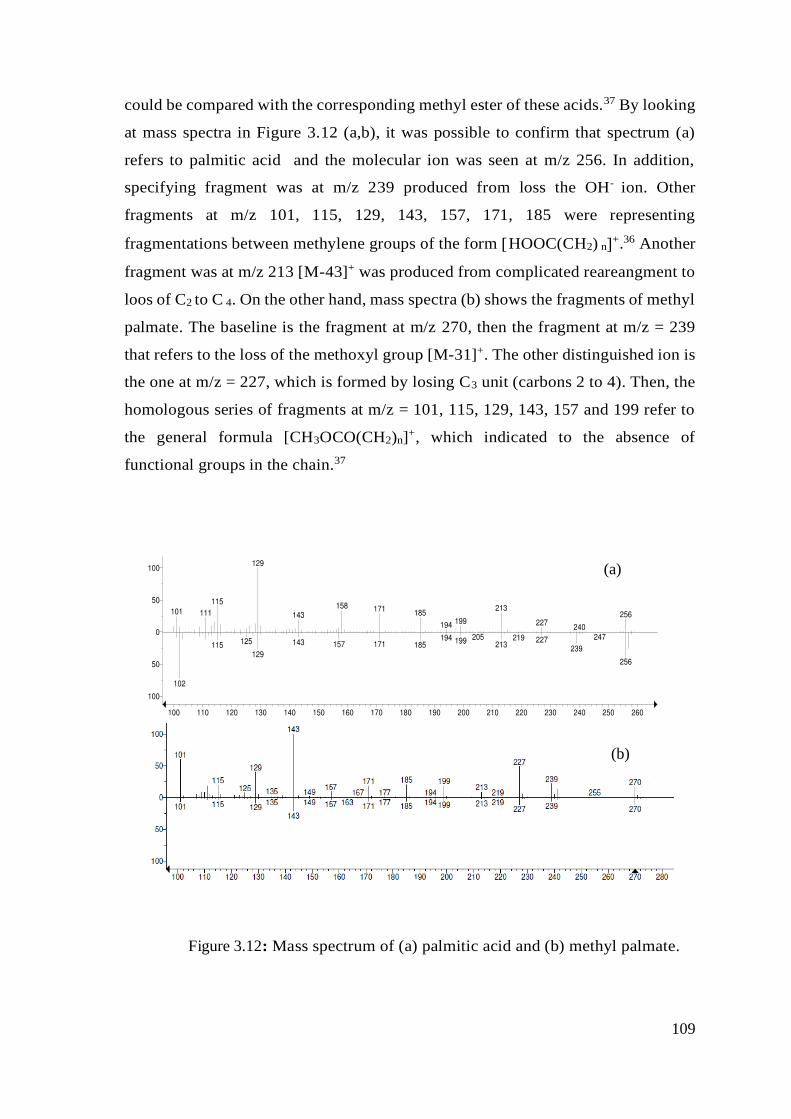
109
could be compared with the corresponding methyl ester of these acids.37 By looking
at mass spectra in Figure 3.12 (a,b), it was possible to confirm that spectrum (a)
refers to palmitic acid and the molecular ion was seen at m/z 256. In addition,
specifying fragment was at m/z 239 produced from loss the OH- ion. Other
fragments at m/z 101, 115, 129, 143, 157, 171, 185 were representing
fragmentations between methylene groups of the form HOOC(CH2) n+.36 Another
fragment was at m/z 213 [M-43]+ was produced from complicated reareangment to
loos of C2 to C 4. On the other hand, mass spectra (b) shows the fragments of methyl
palmate. The baseline is the fragment at m/z 270, then the fragment at m/z = 239
that refers to the loss of the methoxyl group [M-31]+. The other distinguished ion is
the one at m/z = 227, which is formed by losing C3 unit (carbons 2 to 4). Then, the
homologous series of fragments at m/z = 101, 115, 129, 143, 157 and 199 refer to
the general formula [CH3OCO(CH2)n]+, which indicated to the absence of
functional groups in the chain.37
Figure 3.12: Mass spectrum of (a) palmitic acid and (b) methyl palmate.
(b)
(a)
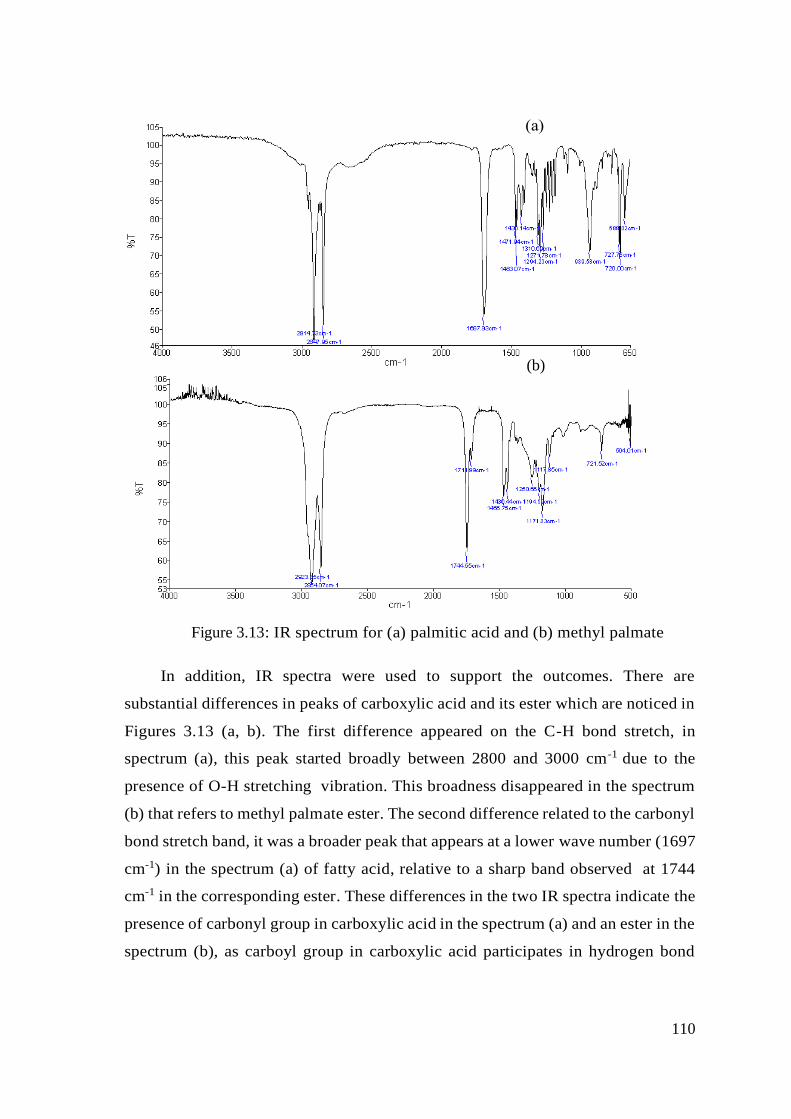
110
Figure 3.13: IR spectrum for (a) palmitic acid and (b) methyl palmate
In addition, IR spectra were used to support the outcomes. There are
substantial differences in peaks of carboxylic acid and its ester which are noticed in
Figures 3.13 (a, b). The first difference appeared on the C-H bond stretch, in
spectrum (a), this peak started broadly between 2800 and 3000 cm-1 due to the
presence of O-H stretching vibration. This broadness disappeared in the spectrum
(b) that refers to methyl palmate ester. The second difference related to the carbonyl
bond stretch band, it was a broader peak that appears at a lower wave number (1697
cm-1) in the spectrum (a) of fatty acid, relative to a sharp band observed at 1744
cm-1 in the corresponding ester. These differences in the two IR spectra indicate the
presence of carbonyl group in carboxylic acid in the spectrum (a) and an ester in the
spectrum (b), as carboyl group in carboxylic acid participates in hydrogen bond
(
(
b)
(b)
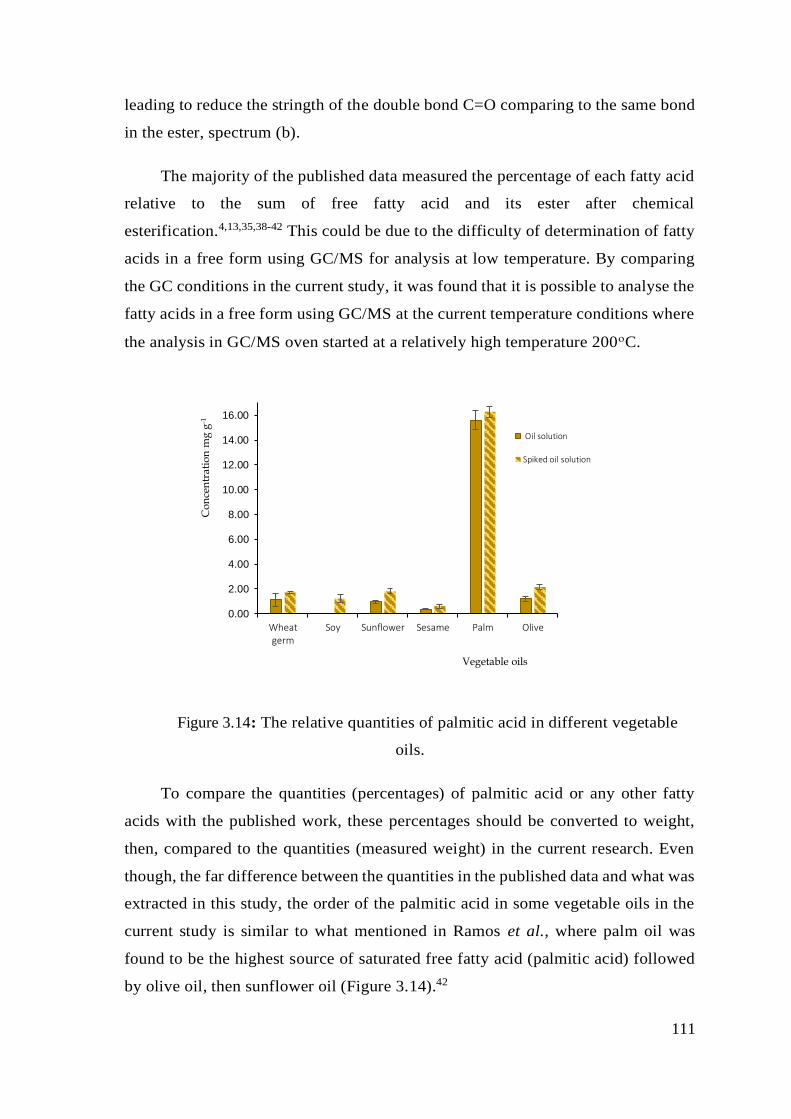
111
leading to reduce the stringth of the double bond C=O comparing to the same bond
in the ester, spectrum (b).
The majority of the published data measured the percentage of each fatty acid
relative to the sum of free fatty acid and its ester after chemical
esterification.4,13,35,38-42 This could be due to the difficulty of determination of fatty
acids in a free form using GC/MS for analysis at low temperature. By comparing
the GC conditions in the current study, it was found that it is possible to analyse the
fatty acids in a free form using GC/MS at the current temperature conditions where
the analysis in GC/MS oven started at a relatively high temperature 200C.
Figure 3.14: The relative quantities of palmitic acid in different vegetable
oils.
To compare the quantities (percentages) of palmitic acid or any other fatty
acids with the published work, these percentages should be converted to weight,
then, compared to the quantities (measured weight) in the current research. Even
though, the far difference between the quantities in the published data and what was
extracted in this study, the order of the palmitic acid in some vegetable oils in the
current study is similar to what mentioned in Ramos et al., where palm oil was
found to be the highest source of saturated free fatty acid (palmitic acid) followed
by olive oil, then sunflower oil (Figure 3.14).42
0.00
2.00
4.00
6.00
8.00
10.00
12.00
14.00
16.00
Wheatgerm
Soy Sunflower Sesame Palm Olive
Co
nce
ntr
atio
n m
g g
-1
Vegetable oils
Oil solution
Spiked oil solution
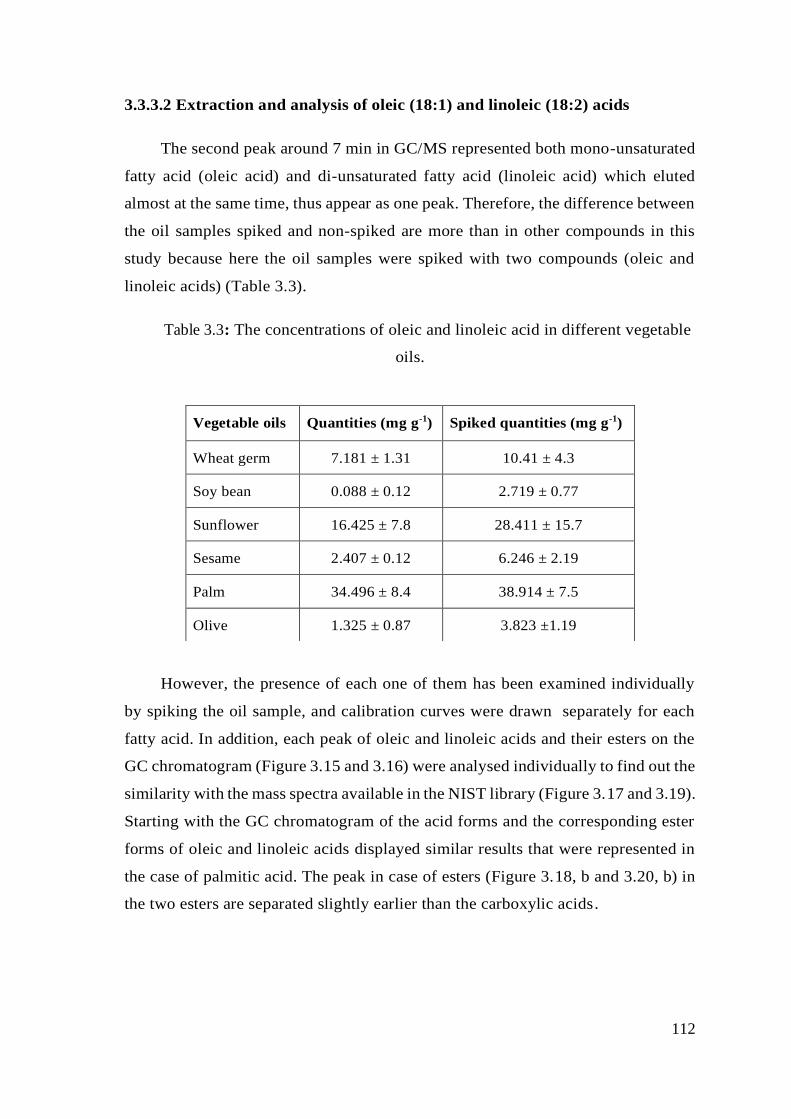
112
3.3.3.2 Extraction and analysis of oleic (18:1) and linoleic (18:2) acids
The second peak around 7 min in GC/MS represented both mono-unsaturated
fatty acid (oleic acid) and di-unsaturated fatty acid (linoleic acid) which eluted
almost at the same time, thus appear as one peak. Therefore, the difference between
the oil samples spiked and non-spiked are more than in other compounds in this
study because here the oil samples were spiked with two compounds (oleic and
linoleic acids) (Table 3.3).
Table 3.3: The concentrations of oleic and linoleic acid in different vegetable
oils.
However, the presence of each one of them has been examined individually
by spiking the oil sample, and calibration curves were drawn separately for each
fatty acid. In addition, each peak of oleic and linoleic acids and their esters on the
GC chromatogram (Figure 3.15 and 3.16) were analysed individually to find out the
similarity with the mass spectra available in the NIST library (Figure 3.17 and 3.19).
Starting with the GC chromatogram of the acid forms and the corresponding ester
forms of oleic and linoleic acids displayed similar results that were represented in
the case of palmitic acid. The peak in case of esters (Figure 3.18, b and 3.20, b) in
the two esters are separated slightly earlier than the carboxylic acids.
Vegetable oils Quantities (mg g-1) Spiked quantities (mg g-1)
Wheat germ 7.181 ± 1.31 10.41 ± 4.3
Soy bean 0.088 ± 0.12 2.719 ± 0.77
Sunflower 16.425 ± 7.8 28.411 ± 15.7
Sesame 2.407 ± 0.12 6.246 ± 2.19
Palm 34.496 ± 8.4 38.914 ± 7.5
Olive 1.325 ± 0.87 3.823 ±1.19
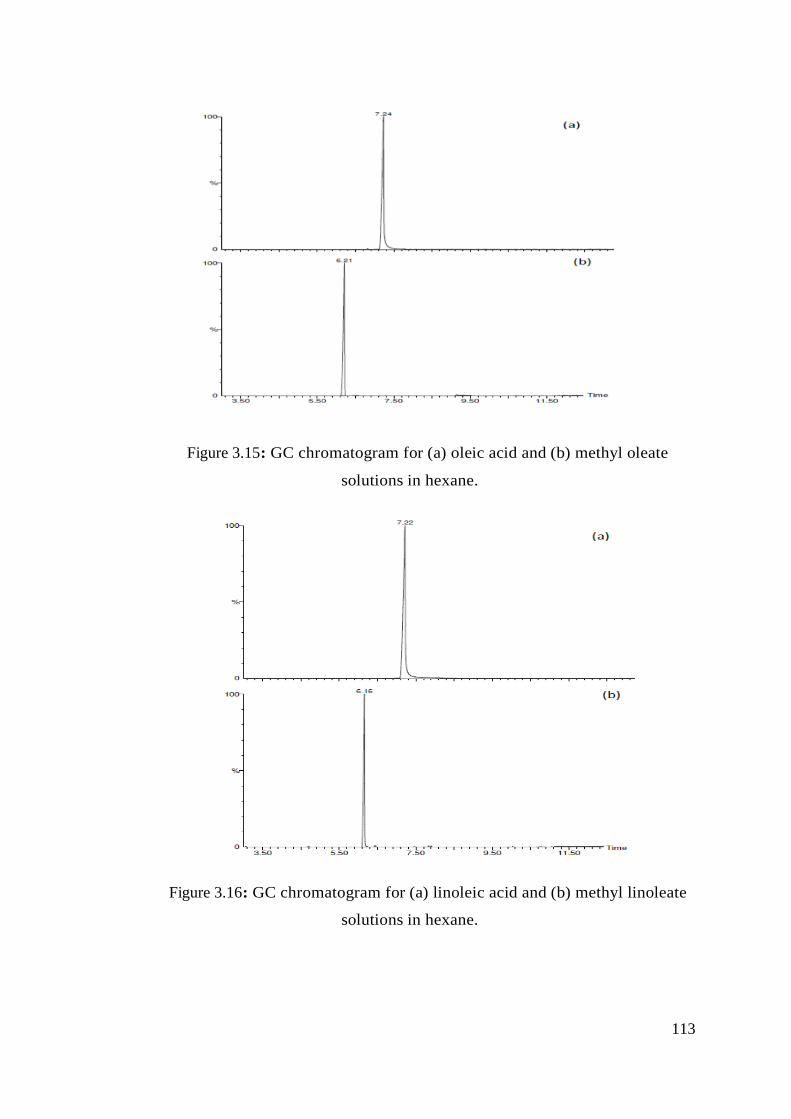
113
Figure 3.15: GC chromatogram for (a) oleic acid and (b) methyl oleate
solutions in hexane.
Figure 3.16: GC chromatogram for (a) linoleic acid and (b) methyl linoleate
solutions in hexane.
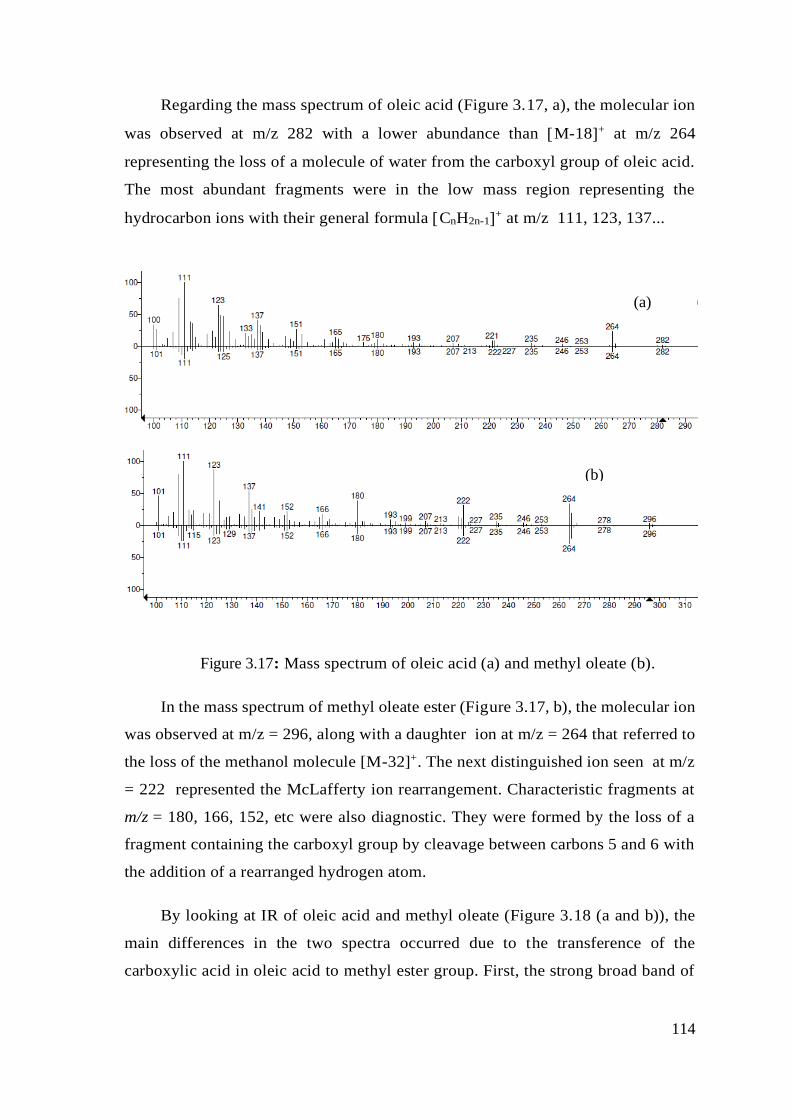
114
Regarding the mass spectrum of oleic acid (Figure 3.17, a), the molecular ion
was observed at m/z 282 with a lower abundance than M-18+ at m/z 264
representing the loss of a molecule of water from the carboxyl group of oleic acid.
The most abundant fragments were in the low mass region representing the
hydrocarbon ions with their general formula CnH2n-1+ at m/z 111, 123, 137...
Figure 3.17: Mass spectrum of oleic acid (a) and methyl oleate (b).
In the mass spectrum of methyl oleate ester (Figure 3.17, b), the molecular ion
was observed at m/z = 296, along with a daughter ion at m/z = 264 that referred to
the loss of the methanol molecule [M-32]+. The next distinguished ion seen at m/z
= 222 represented the McLafferty ion rearrangement. Characteristic fragments at
m/z = 180, 166, 152, etc were also diagnostic. They were formed by the loss of a
fragment containing the carboxyl group by cleavage between carbons 5 and 6 with
the addition of a rearranged hydrogen atom.
By looking at IR of oleic acid and methyl oleate (Figure 3.18 (a and b)), the
main differences in the two spectra occurred due to the transference of the
carboxylic acid in oleic acid to methyl ester group. First, the strong broad band of
(
(b)
(a)
(
b)
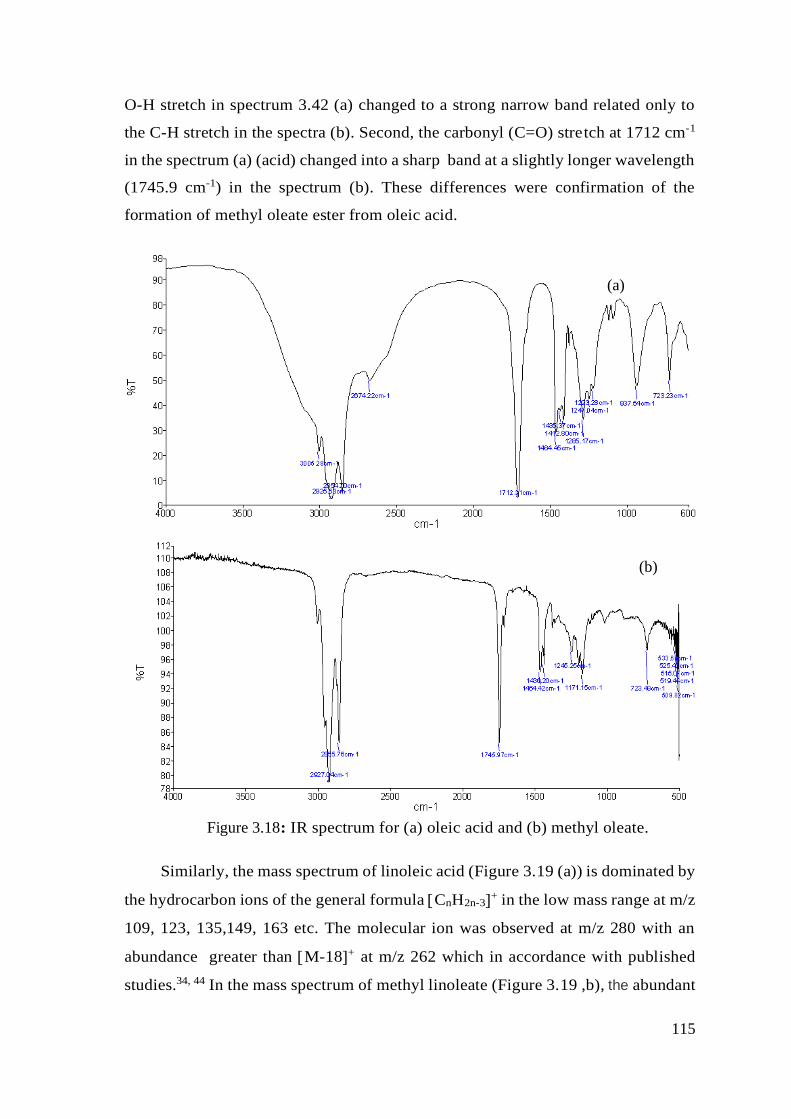
115
O-H stretch in spectrum 3.42 (a) changed to a strong narrow band related only to
the C-H stretch in the spectra (b). Second, the carbonyl (C=O) stretch at 1712 cm-1
in the spectrum (a) (acid) changed into a sharp band at a slightly longer wavelength
(1745.9 cm-1) in the spectrum (b). These differences were confirmation of the
formation of methyl oleate ester from oleic acid.
Figure 3.18: IR spectrum for (a) oleic acid and (b) methyl oleate.
Similarly, the mass spectrum of linoleic acid (Figure 3.19 (a)) is dominated by
the hydrocarbon ions of the general formula CnH2n-3+ in the low mass range at m/z
109, 123, 135,149, 163 etc. The molecular ion was observed at m/z 280 with an
abundance greater than M-18+ at m/z 262 which in accordance with published
studies.34, 44 In the mass spectrum of methyl linoleate (Figure 3.19 ,b), the abundant
(
(b)
((a)
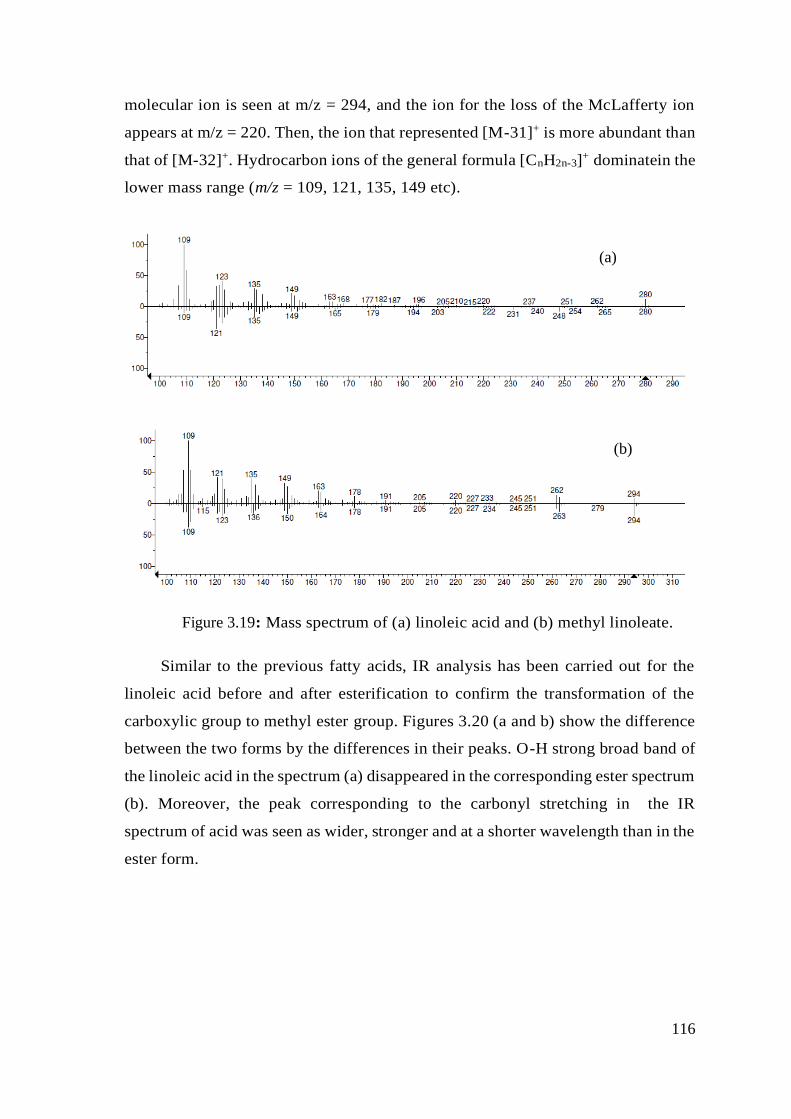
116
molecular ion is seen at m/z = 294, and the ion for the loss of the McLafferty ion
appears at m/z = 220. Then, the ion that represented [M-31]+ is more abundant than
that of [M-32]+. Hydrocarbon ions of the general formula [CnH2n-3]+ dominatein the
lower mass range (m/z = 109, 121, 135, 149 etc).
Figure 3.19: Mass spectrum of (a) linoleic acid and (b) methyl linoleate.
Similar to the previous fatty acids, IR analysis has been carried out for the
linoleic acid before and after esterification to confirm the transformation of the
carboxylic group to methyl ester group. Figures 3.20 (a and b) show the difference
between the two forms by the differences in their peaks. O-H strong broad band of
the linoleic acid in the spectrum (a) disappeared in the corresponding ester spectrum
(b). Moreover, the peak corresponding to the carbonyl stretching in the IR
spectrum of acid was seen as wider, stronger and at a shorter wavelength than in the
ester form.
(a)
(b)
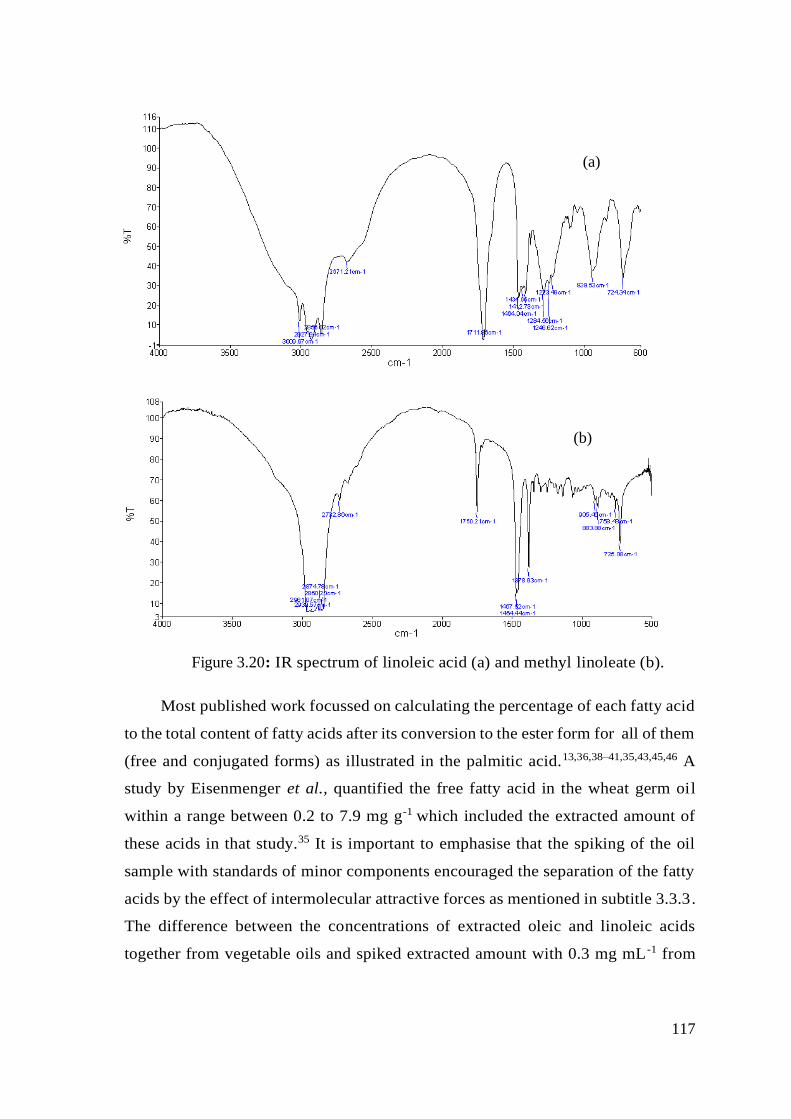
117
Figure 3.20: IR spectrum of linoleic acid (a) and methyl linoleate (b).
Most published work focussed on calculating the percentage of each fatty acid
to the total content of fatty acids after its conversion to the ester form for all of them
(free and conjugated forms) as illustrated in the palmitic acid.13,36,38–41,35,43,45,46 A
study by Eisenmenger et al., quantified the free fatty acid in the wheat germ oil
within a range between 0.2 to 7.9 mg g-1 which included the extracted amount of
these acids in that study.35 It is important to emphasise that the spiking of the oil
sample with standards of minor components encouraged the separation of the fatty
acids by the effect of intermolecular attractive forces as mentioned in subtitle 3.3.3.
The difference between the concentrations of extracted oleic and linoleic acids
together from vegetable oils and spiked extracted amount with 0.3 mg mL -1 from
((a)
(b)
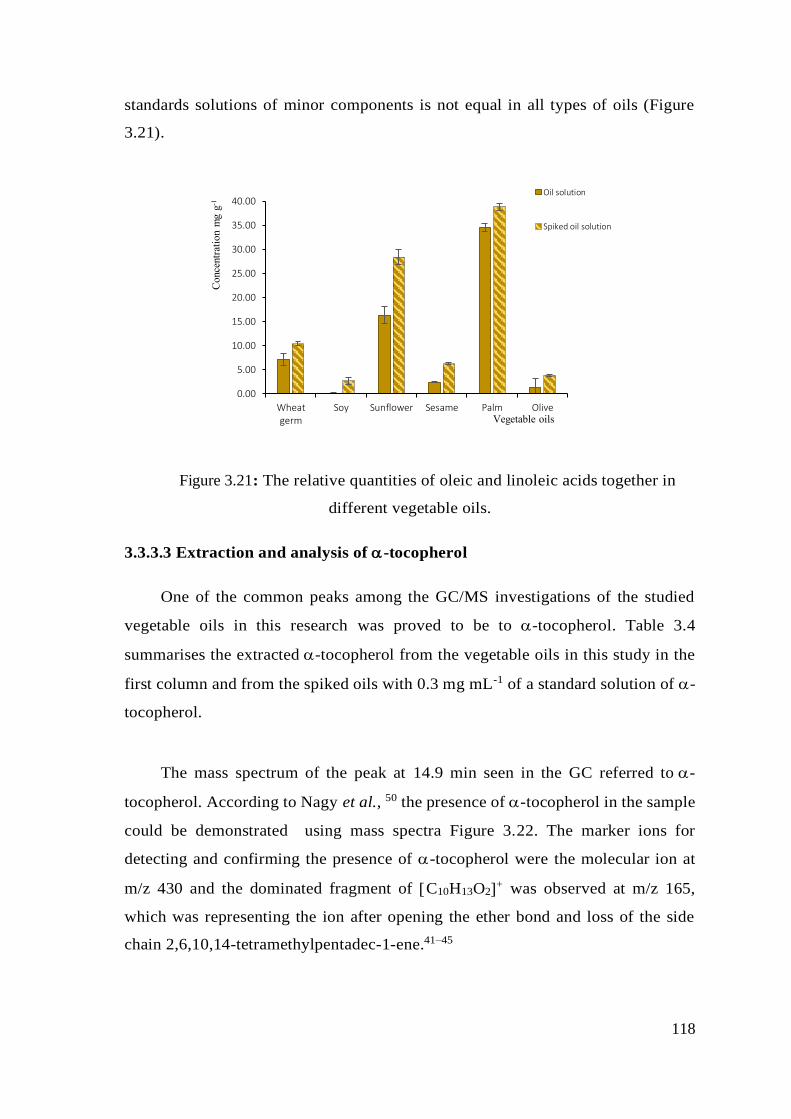
118
standards solutions of minor components is not equal in all types of oils (Figure
3.21).
Figure 3.21: The relative quantities of oleic and linoleic acids together in
different vegetable oils.
3.3.3.3 Extraction and analysis of -tocopherol
One of the common peaks among the GC/MS investigations of the studied
vegetable oils in this research was proved to be to -tocopherol. Table 3.4
summarises the extracted -tocopherol from the vegetable oils in this study in the
first column and from the spiked oils with 0.3 mg mL-1 of a standard solution of -
tocopherol.
The mass spectrum of the peak at 14.9 min seen in the GC referred to -
tocopherol. According to Nagy et al., 50 the presence of -tocopherol in the sample
could be demonstrated using mass spectra Figure 3.22. The marker ions for
detecting and confirming the presence of -tocopherol were the molecular ion at
m/z 430 and the dominated fragment of C10H13O2+ was observed at m/z 165,
which was representing the ion after opening the ether bond and loss of the side
chain 2,6,10,14-tetramethylpentadec-1-ene.41–45
0.00
5.00
10.00
15.00
20.00
25.00
30.00
35.00
40.00
Wheatgerm
Soy Sunflower Sesame Palm Olive
Conce
ntr
atio
n m
g g
-1
Vegetable oils
Oil solution
Spiked oil solution
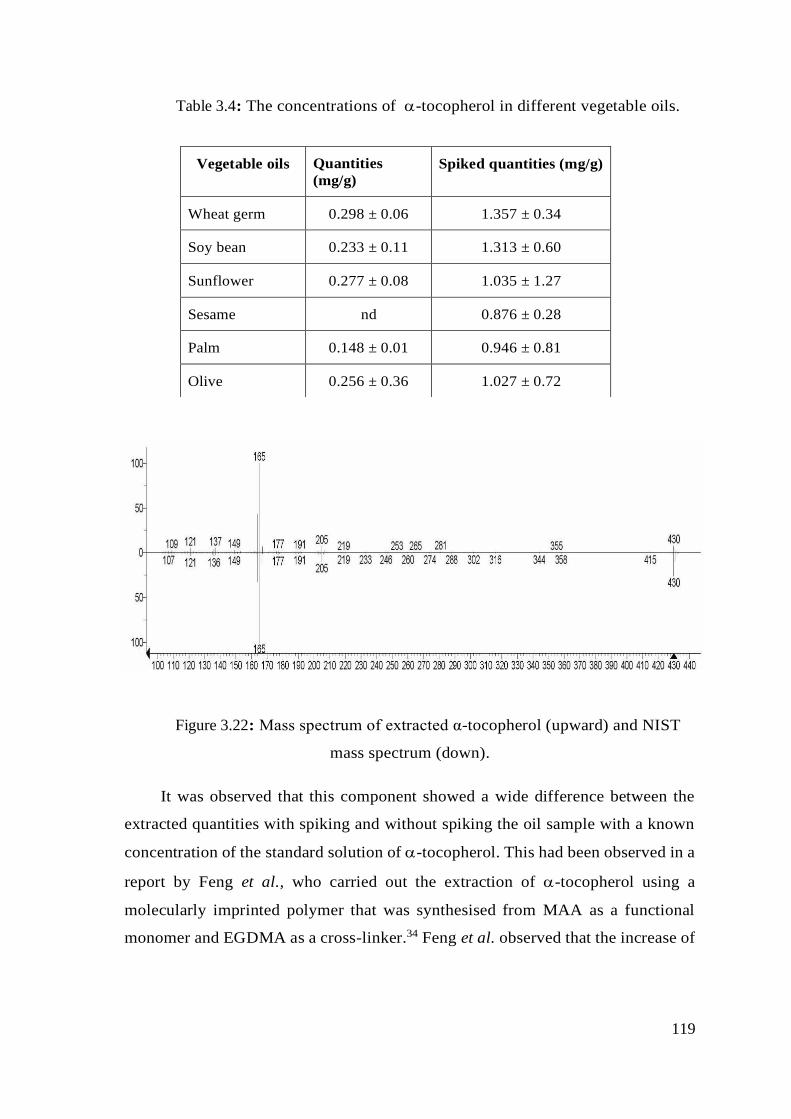
119
Table 3.4: The concentrations of -tocopherol in different vegetable oils.
Figure 3.22: Mass spectrum of extracted α-tocopherol (upward) and NIST
mass spectrum (down).
It was observed that this component showed a wide difference between the
extracted quantities with spiking and without spiking the oil sample with a known
concentration of the standard solution of -tocopherol. This had been observed in a
report by Feng et al., who carried out the extraction of -tocopherol using a
molecularly imprinted polymer that was synthesised from MAA as a functional
monomer and EGDMA as a cross-linker.34 Feng et al. observed that the increase of
Vegetable oils Quantities
(mg/g)
Spiked quantities (mg/g)
Wheat germ 0.298 ± 0.06 1.357 ± 0.34
Soy bean 0.233 ± 0.11 1.313 ± 0.60
Sunflower 0.277 ± 0.08 1.035 ± 1.27
Sesame nd 0.876 ± 0.28
Palm 0.148 ± 0.01 0.946 ± 0.81
Olive 0.256 ± 0.36 1.027 ± 0.72
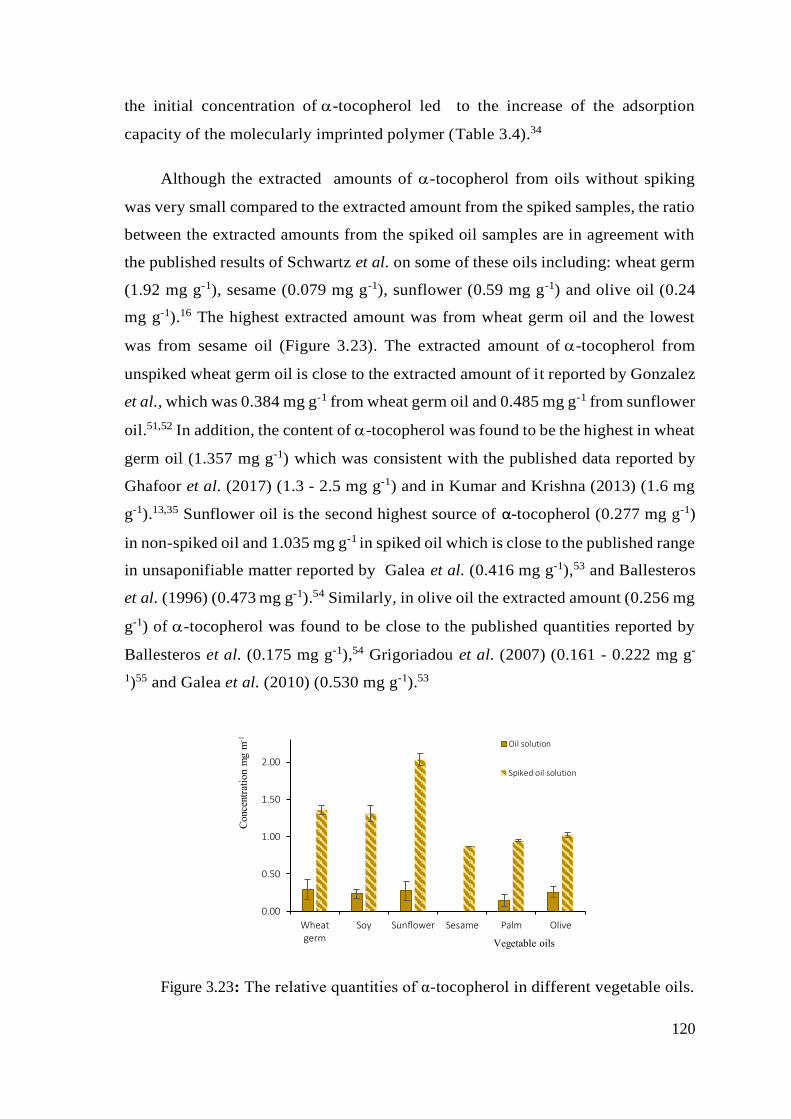
120
the initial concentration of -tocopherol led to the increase of the adsorption
capacity of the molecularly imprinted polymer (Table 3.4).34
Although the extracted amounts of -tocopherol from oils without spiking
was very small compared to the extracted amount from the spiked samples, the ratio
between the extracted amounts from the spiked oil samples are in agreement with
the published results of Schwartz et al. on some of these oils including: wheat germ
(1.92 mg g-1), sesame (0.079 mg g-1), sunflower (0.59 mg g-1) and olive oil (0.24
mg g-1).16 The highest extracted amount was from wheat germ oil and the lowest
was from sesame oil (Figure 3.23). The extracted amount of -tocopherol from
unspiked wheat germ oil is close to the extracted amount of it reported by Gonzalez
et al., which was 0.384 mg g-1 from wheat germ oil and 0.485 mg g-1 from sunflower
oil.51,52 In addition, the content of -tocopherol was found to be the highest in wheat
germ oil (1.357 mg g-1) which was consistent with the published data reported by
Ghafoor et al. (2017) (1.3 - 2.5 mg g-1) and in Kumar and Krishna (2013) (1.6 mg
g-1).13,35 Sunflower oil is the second highest source of α-tocopherol (0.277 mg g-1)
in non-spiked oil and 1.035 mg g-1 in spiked oil which is close to the published range
in unsaponifiable matter reported by Galea et al. (0.416 mg g-1),53 and Ballesteros
et al. (1996) (0.473 mg g-1).54 Similarly, in olive oil the extracted amount (0.256 mg
g-1) of -tocopherol was found to be close to the published quantities reported by
Ballesteros et al. (0.175 mg g-1),54 Grigoriadou et al. (2007) (0.161 - 0.222 mg g-
1)55 and Galea et al. (2010) (0.530 mg g-1).53
Figure 3.23: The relative quantities of α-tocopherol in different vegetable oils.
0.00
0.50
1.00
1.50
2.00
Wheatgerm
Soy Sunflower Sesame Palm Olive
Co
nce
ntr
atio
n m
g m
-1
Vegetable oils
Oil solution
Spiked oil solution
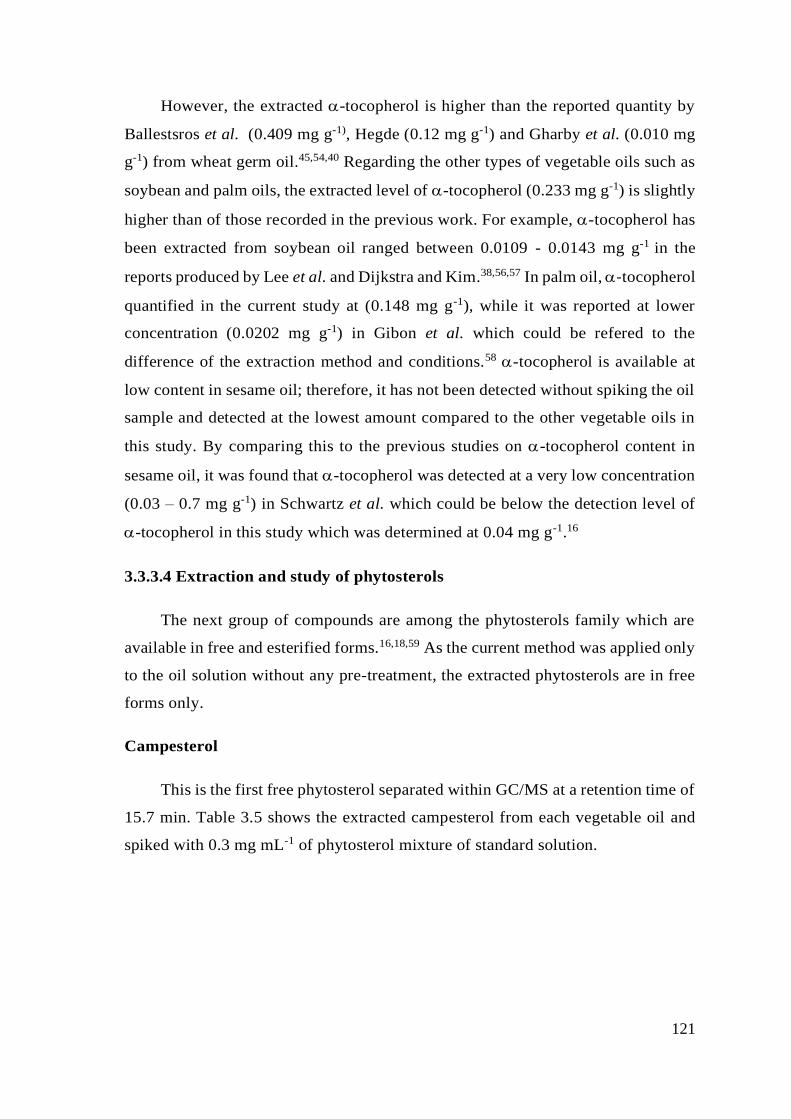
121
However, the extracted -tocopherol is higher than the reported quantity by
Ballestsros et al. (0.409 mg g-1), Hegde (0.12 mg g-1) and Gharby et al. (0.010 mg
g-1) from wheat germ oil.45,54,40 Regarding the other types of vegetable oils such as
soybean and palm oils, the extracted level of -tocopherol (0.233 mg g-1) is slightly
higher than of those recorded in the previous work. For example, -tocopherol has
been extracted from soybean oil ranged between 0.0109 - 0.0143 mg g-1 in the
reports produced by Lee et al. and Dijkstra and Kim.38,56,57 In palm oil, -tocopherol
quantified in the current study at (0.148 mg g-1), while it was reported at lower
concentration (0.0202 mg g-1) in Gibon et al. which could be refered to the
difference of the extraction method and conditions.58 -tocopherol is available at
low content in sesame oil; therefore, it has not been detected without spiking the oil
sample and detected at the lowest amount compared to the other vegetable oils in
this study. By comparing this to the previous studies on -tocopherol content in
sesame oil, it was found that -tocopherol was detected at a very low concentration
(0.03 – 0.7 mg g-1) in Schwartz et al. which could be below the detection level of
-tocopherol in this study which was determined at 0.04 mg g-1.16
3.3.3.4 Extraction and study of phytosterols
The next group of compounds are among the phytosterols family which are
available in free and esterified forms.16,18,59 As the current method was applied only
to the oil solution without any pre-treatment, the extracted phytosterols are in free
forms only.
Campesterol
This is the first free phytosterol separated within GC/MS at a retention time of
15.7 min. Table 3.5 shows the extracted campesterol from each vegetable oil and
spiked with 0.3 mg mL-1 of phytosterol mixture of standard solution.
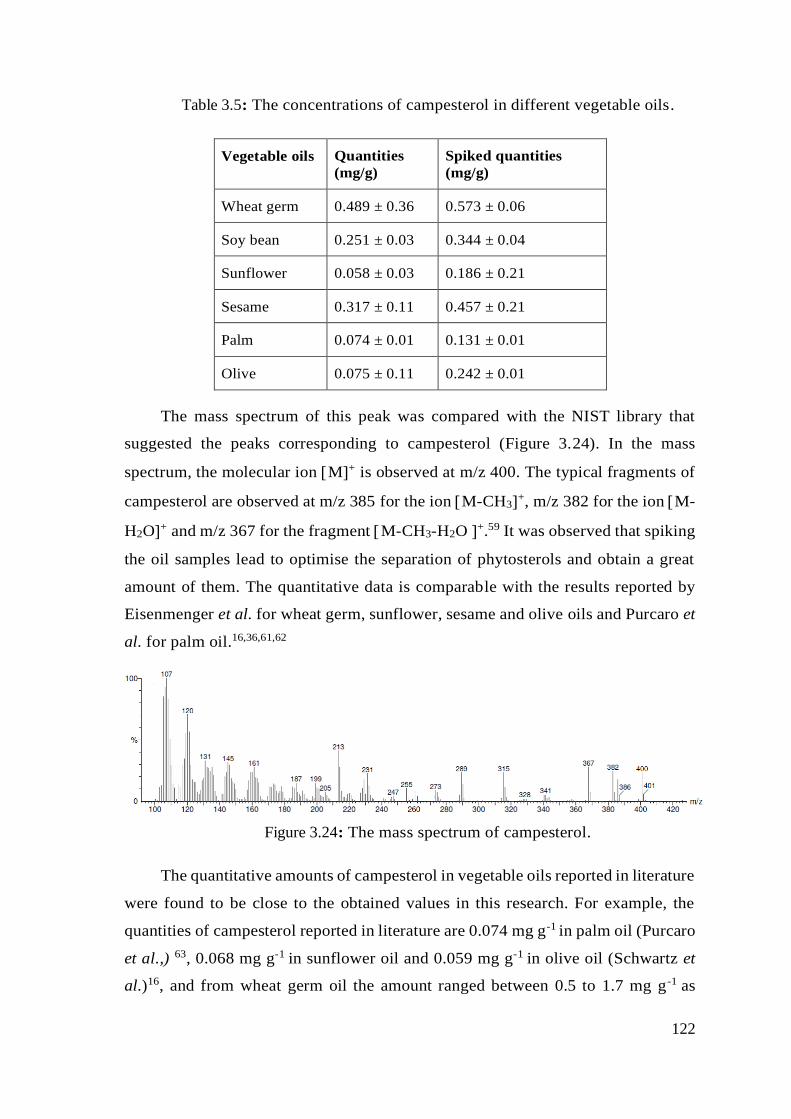
122
Table 3.5: The concentrations of campesterol in different vegetable oils.
Vegetable oils Quantities
(mg/g)
Spiked quantities
(mg/g)
Wheat germ 0.489 ± 0.36 0.573 ± 0.06
Soy bean 0.251 ± 0.03 0.344 ± 0.04
Sunflower 0.058 ± 0.03 0.186 ± 0.21
Sesame 0.317 ± 0.11 0.457 ± 0.21
Palm 0.074 ± 0.01 0.131 ± 0.01
Olive 0.075 ± 0.11 0.242 ± 0.01
The mass spectrum of this peak was compared with the NIST library that
suggested the peaks corresponding to campesterol (Figure 3.24). In the mass
spectrum, the molecular ion M+ is observed at m/z 400. The typical fragments of
campesterol are observed at m/z 385 for the ion M-CH3+, m/z 382 for the ion M-
H2O+ and m/z 367 for the fragment M-CH3-H2O +.59 It was observed that spiking
the oil samples lead to optimise the separation of phytosterols and obtain a great
amount of them. The quantitative data is comparable with the results reported by
Eisenmenger et al. for wheat germ, sunflower, sesame and olive oils and Purcaro et
al. for palm oil.16,36,61,62
Figure 3.24: The mass spectrum of campesterol.
The quantitative amounts of campesterol in vegetable oils reported in literature
were found to be close to the obtained values in this research. For example, the
quantities of campesterol reported in literature are 0.074 mg g-1 in palm oil (Purcaro
et al.,) 63, 0.068 mg g-1 in sunflower oil and 0.059 mg g-1 in olive oil (Schwartz et
al.)16, and from wheat germ oil the amount ranged between 0.5 to 1.7 mg g-1 as
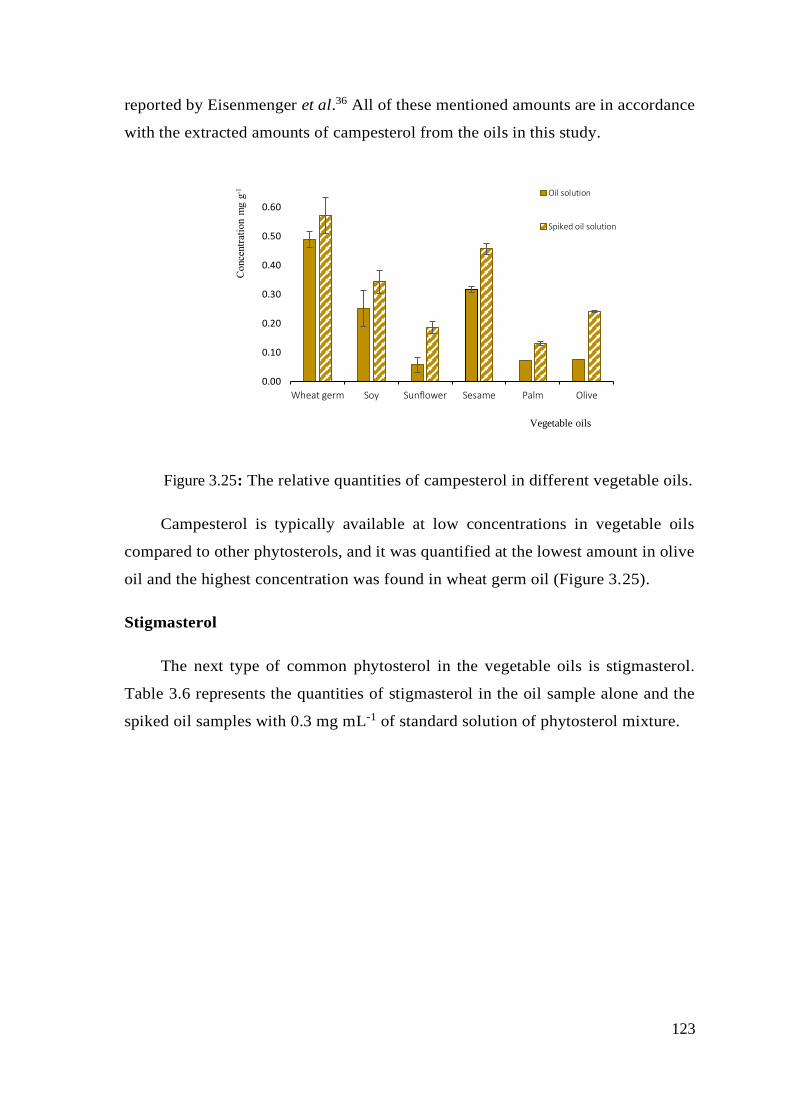
123
reported by Eisenmenger et al.36 All of these mentioned amounts are in accordance
with the extracted amounts of campesterol from the oils in this study.
Figure 3.25: The relative quantities of campesterol in different vegetable oils.
Campesterol is typically available at low concentrations in vegetable oils
compared to other phytosterols, and it was quantified at the lowest amount in olive
oil and the highest concentration was found in wheat germ oil (Figure 3.25).
Stigmasterol
The next type of common phytosterol in the vegetable oils is stigmasterol.
Table 3.6 represents the quantities of stigmasterol in the oil sample alone and the
spiked oil samples with 0.3 mg mL-1 of standard solution of phytosterol mixture.
0.00
0.10
0.20
0.30
0.40
0.50
0.60
Wheat germ Soy Sunflower Sesame Palm Olive
Conce
ntr
atio
n m
g g
-1
Vegetable oils
Oil solution
Spiked oil solution
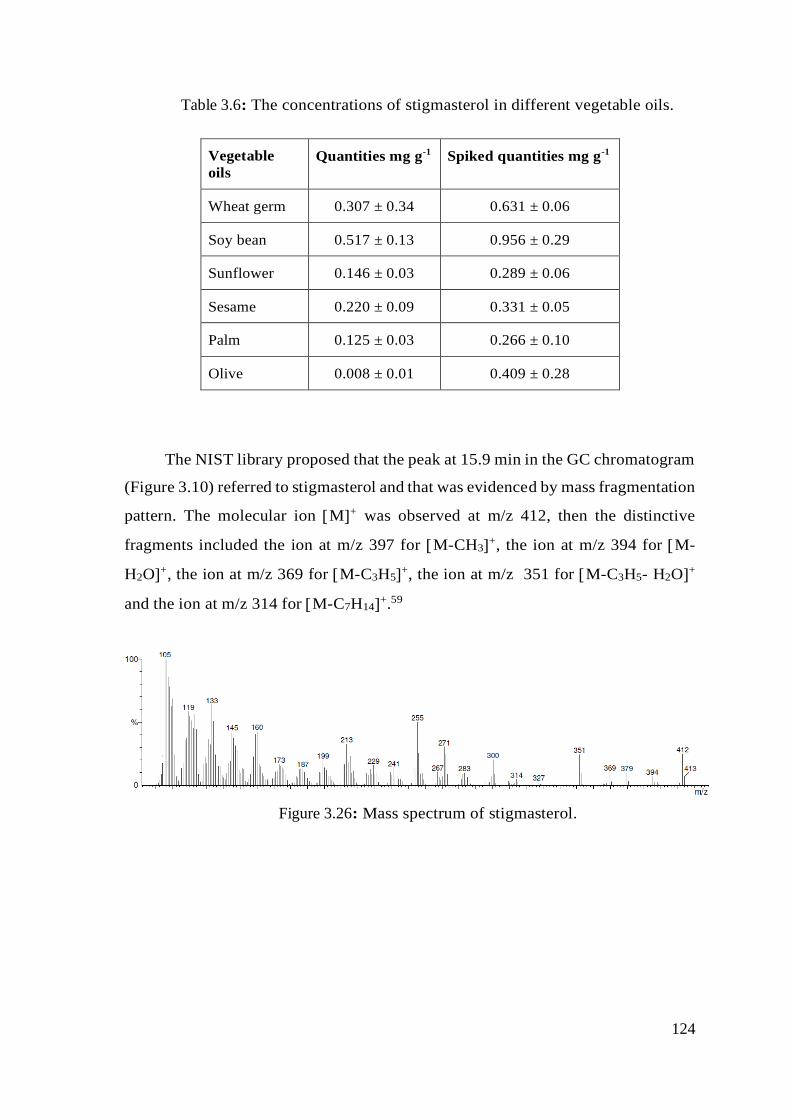
124
Table 3.6: The concentrations of stigmasterol in different vegetable oils.
Vegetable
oils
Quantities mg g-1 Spiked quantities mg g-1
Wheat germ 0.307 ± 0.34 0.631 ± 0.06
Soy bean 0.517 ± 0.13 0.956 ± 0.29
Sunflower 0.146 ± 0.03 0.289 ± 0.06
Sesame 0.220 ± 0.09 0.331 ± 0.05
Palm 0.125 ± 0.03 0.266 ± 0.10
Olive 0.008 ± 0.01 0.409 ± 0.28
The NIST library proposed that the peak at 15.9 min in the GC chromatogram
(Figure 3.10) referred to stigmasterol and that was evidenced by mass fragmentation
pattern. The molecular ion M+ was observed at m/z 412, then the distinctive
fragments included the ion at m/z 397 for M-CH3+, the ion at m/z 394 for M-
H2O+, the ion at m/z 369 for M-C3H5+, the ion at m/z 351 for M-C3H5- H2O+
and the ion at m/z 314 for M-C7H14+.59
Figure 3.26: Mass spectrum of stigmasterol.
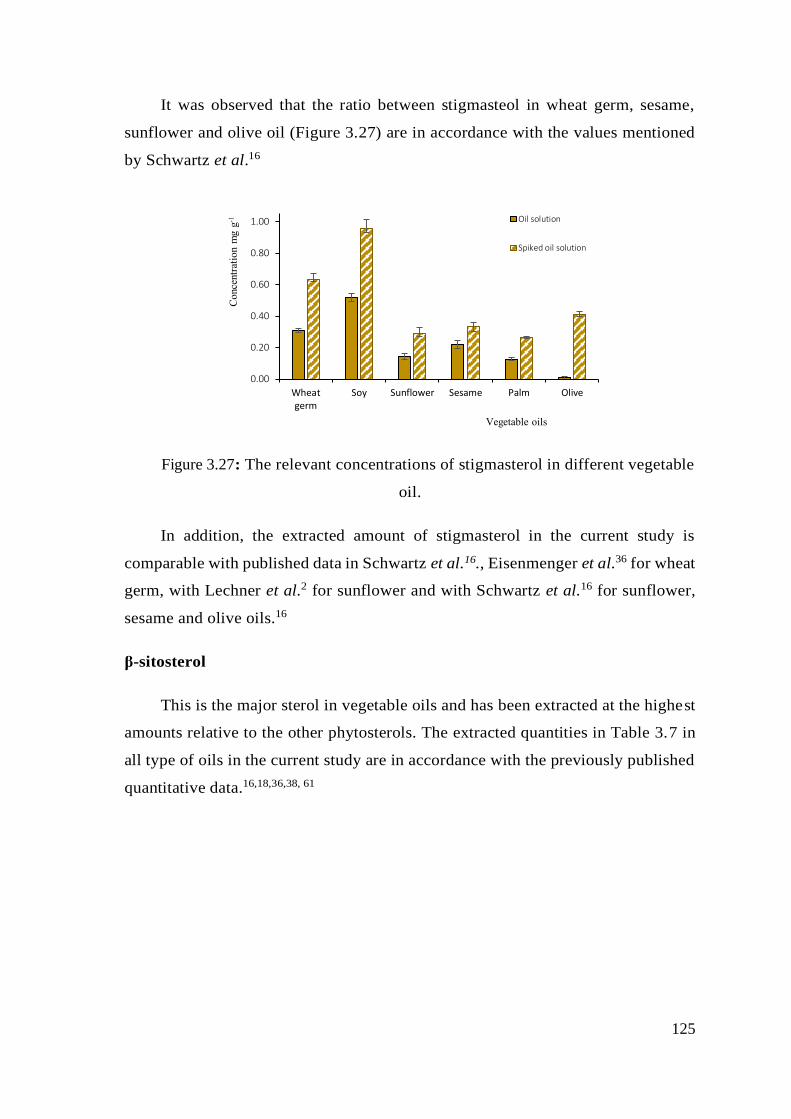
125
It was observed that the ratio between stigmasteol in wheat germ, sesame,
sunflower and olive oil (Figure 3.27) are in accordance with the values mentioned
by Schwartz et al.16
Figure 3.27: The relevant concentrations of stigmasterol in different vegetable
oil.
In addition, the extracted amount of stigmasterol in the current study is
comparable with published data in Schwartz et al.16., Eisenmenger et al.36 for wheat
germ, with Lechner et al.2 for sunflower and with Schwartz et al.16 for sunflower,
sesame and olive oils.16
β-sitosterol
This is the major sterol in vegetable oils and has been extracted at the highest
amounts relative to the other phytosterols. The extracted quantities in Table 3.7 in
all type of oils in the current study are in accordance with the previously published
quantitative data.16,18,36,38, 61
0.00
0.20
0.40
0.60
0.80
1.00
Wheatgerm
Soy Sunflower Sesame Palm Olive
Conce
ntr
atio
n m
g g
-1
Vegetable oils
Oil solution
Spiked oil solution
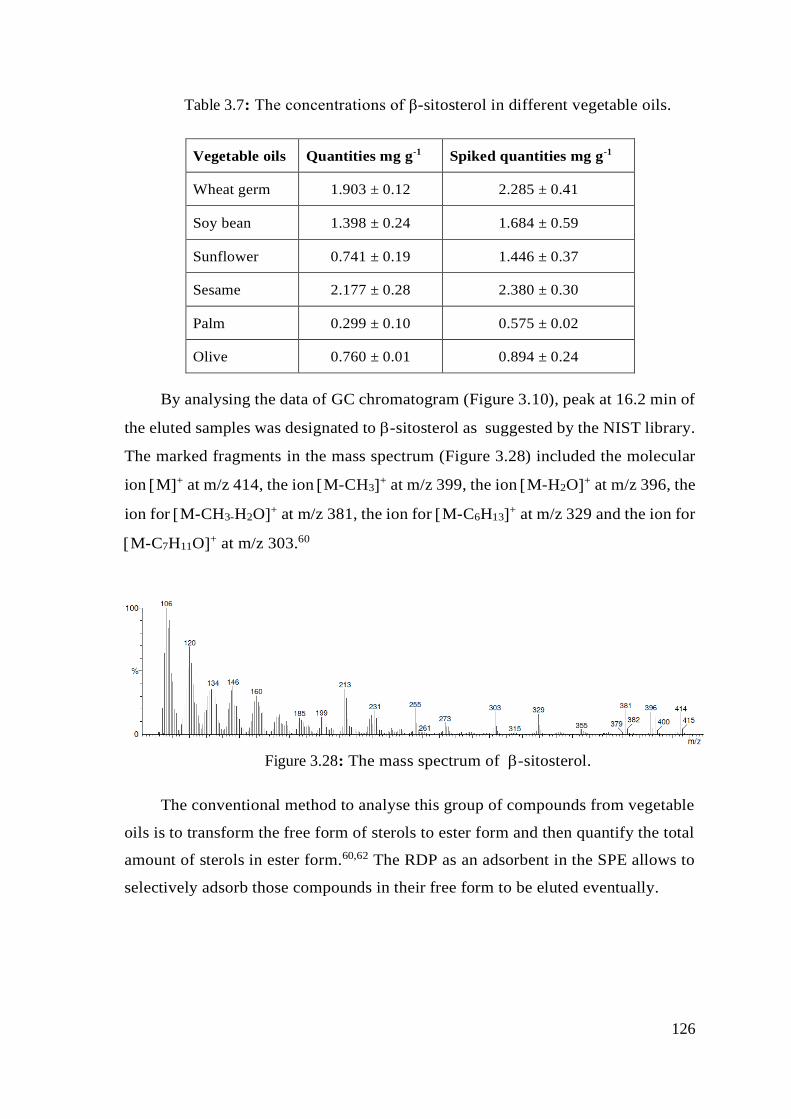
126
Table 3.7: The concentrations of β-sitosterol in different vegetable oils.
Vegetable oils Quantities mg g-1 Spiked quantities mg g-1
Wheat germ 1.903 ± 0.12 2.285 ± 0.41
Soy bean 1.398 ± 0.24 1.684 ± 0.59
Sunflower 0.741 ± 0.19 1.446 ± 0.37
Sesame 2.177 ± 0.28 2.380 ± 0.30
Palm 0.299 ± 0.10 0.575 ± 0.02
Olive 0.760 ± 0.01 0.894 ± 0.24
By analysing the data of GC chromatogram (Figure 3.10), peak at 16.2 min of
the eluted samples was designated to -sitosterol as suggested by the NIST library.
The marked fragments in the mass spectrum (Figure 3.28) included the molecular
ion M+ at m/z 414, the ion M-CH3+ at m/z 399, the ion M-H2O+ at m/z 396, the
ion for M-CH3-H2O+ at m/z 381, the ion for M-C6H13+ at m/z 329 and the ion for
M-C7H11O+ at m/z 303.60
Figure 3.28: The mass spectrum of -sitosterol.
The conventional method to analyse this group of compounds from vegetable
oils is to transform the free form of sterols to ester form and then quantify the total
amount of sterols in ester form.60,62 The RDP as an adsorbent in the SPE allows to
selectively adsorb those compounds in their free form to be eluted eventually.
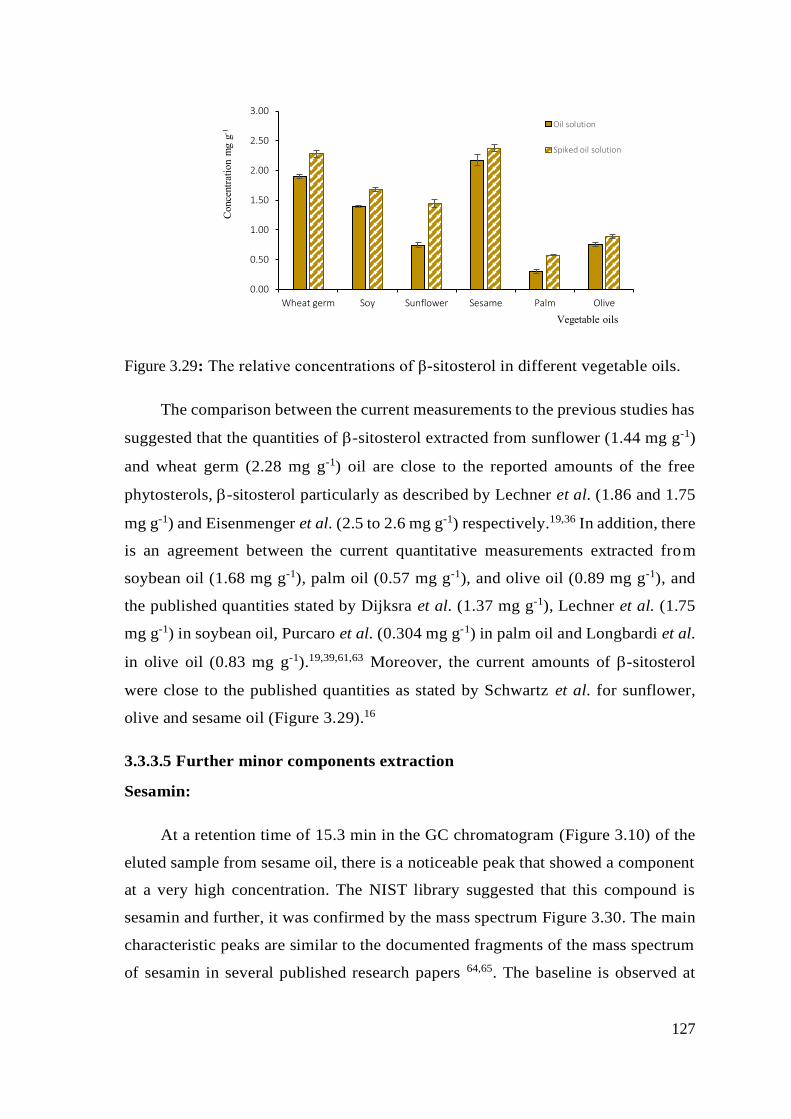
127
Figure 3.29: The relative concentrations of β-sitosterol in different vegetable oils.
The comparison between the current measurements to the previous studies has
suggested that the quantities of -sitosterol extracted from sunflower (1.44 mg g-1)
and wheat germ (2.28 mg g-1) oil are close to the reported amounts of the free
phytosterols, -sitosterol particularly as described by Lechner et al. (1.86 and 1.75
mg g-1) and Eisenmenger et al. (2.5 to 2.6 mg g-1) respectively.19,36 In addition, there
is an agreement between the current quantitative measurements extracted from
soybean oil (1.68 mg g-1), palm oil (0.57 mg g-1), and olive oil (0.89 mg g-1), and
the published quantities stated by Dijksra et al. (1.37 mg g-1), Lechner et al. (1.75
mg g-1) in soybean oil, Purcaro et al. (0.304 mg g-1) in palm oil and Longbardi et al.
in olive oil (0.83 mg g-1).19,39,61,63 Moreover, the current amounts of -sitosterol
were close to the published quantities as stated by Schwartz et al. for sunflower,
olive and sesame oil (Figure 3.29).16
3.3.3.5 Further minor components extraction
Sesamin:
At a retention time of 15.3 min in the GC chromatogram (Figure 3.10) of the
eluted sample from sesame oil, there is a noticeable peak that showed a component
at a very high concentration. The NIST library suggested that this compound is
sesamin and further, it was confirmed by the mass spectrum Figure 3.30. The main
characteristic peaks are similar to the documented fragments of the mass spectrum
of sesamin in several published research papers 64,65. The baseline is observed at
0.00
0.50
1.00
1.50
2.00
2.50
3.00
Wheat germ Soy Sunflower Sesame Palm Olive
Conce
ntr
atio
n m
g g
-1
Vegetable oils
Oil solution
Spiked oil solution
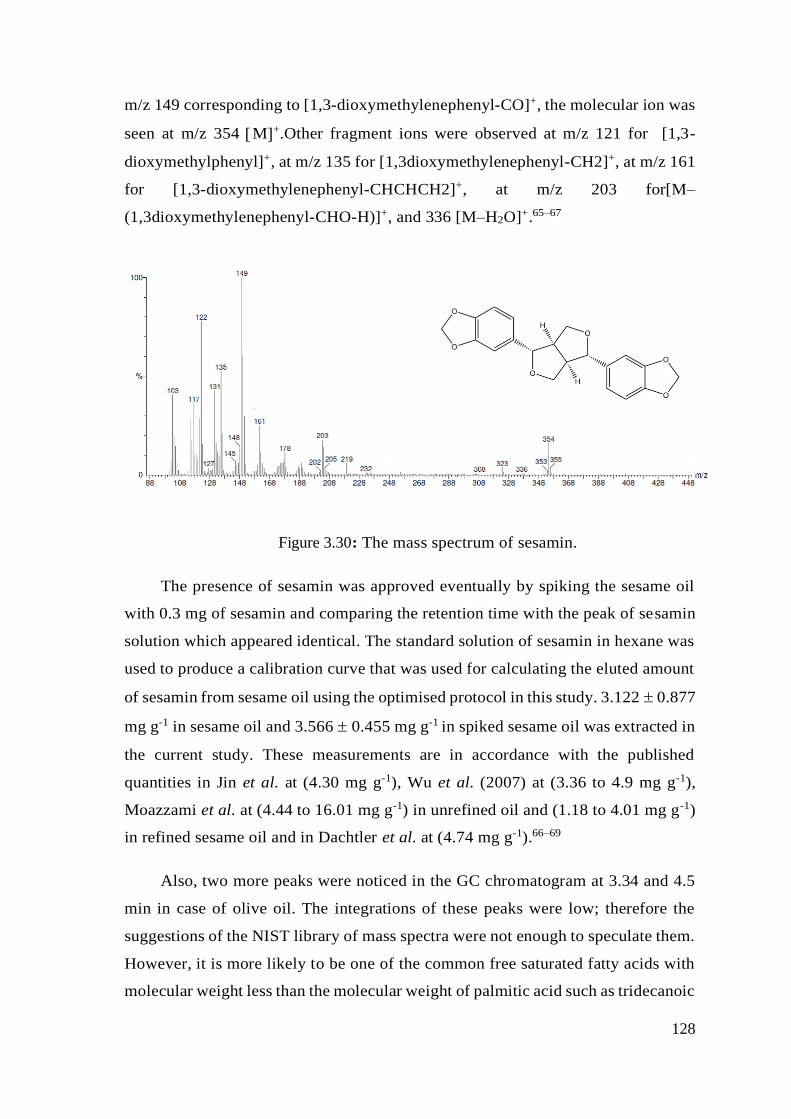
128
m/z 149 corresponding to [1,3-dioxymethylenephenyl-CO]+, the molecular ion was
seen at m/z 354 M+.Other fragment ions were observed at m/z 121 for [1,3-
dioxymethylphenyl]+, at m/z 135 for [1,3dioxymethylenephenyl-CH2]+, at m/z 161
for [1,3-dioxymethylenephenyl-CHCHCH2]+, at m/z 203 for[M–
(1,3dioxymethylenephenyl-CHO-H)]+, and 336 [M–H2O]+.65–67
Figure 3.30: The mass spectrum of sesamin.
The presence of sesamin was approved eventually by spiking the sesame oil
with 0.3 mg of sesamin and comparing the retention time with the peak of sesamin
solution which appeared identical. The standard solution of sesamin in hexane was
used to produce a calibration curve that was used for calculating the eluted amount
of sesamin from sesame oil using the optimised protocol in this study. 3.122 0.877
mg g-1 in sesame oil and 3.566 0.455 mg g-1 in spiked sesame oil was extracted in
the current study. These measurements are in accordance with the published
quantities in Jin et al. at (4.30 mg g-1), Wu et al. (2007) at (3.36 to 4.9 mg g-1),
Moazzami et al. at (4.44 to 16.01 mg g-1) in unrefined oil and (1.18 to 4.01 mg g-1)
in refined sesame oil and in Dachtler et al. at (4.74 mg g-1).66–69
Also, two more peaks were noticed in the GC chromatogram at 3.34 and 4.5
min in case of olive oil. The integrations of these peaks were low; therefore the
suggestions of the NIST library of mass spectra were not enough to speculate them.
However, it is more likely to be one of the common free saturated fatty acids with
molecular weight less than the molecular weight of palmitic acid such as tridecanoic
129
acid (13:0), myristic (14:0) or pentadecanoic acid (15:0) as published in previous
studies.70,71
3.3.4 Method validation
The proposed method to measure the determine matrix effects was performed
by examining the percentage of the spiking standards (palmitic, oleic, linoleic acids,
-tocopherol, campesterol, stigmasterol and -sitosterol. Satisfactory recoveries
were determined for these solutions, with values ranging from 94–99% as shown in
Table 3.8 The purification percentage was evaluated by comparing the dry weight
of the 20% oil sample before SPE (200 ± 5 mg) and a dry weight of the eluted
sample after SPE (21.45 ±4.8 mg). Considering that 18.52 ± 5.2 mg of the eluted
sample constitutes a weight of the natural compounds which were quantified using
GC/MS, only 2.93 mg of the matrix is remained which is equivalent of 1.4%.
Therefore, a very high level of purification of 98.6% was achieved.
Blank samples were run to check the possibility of memory effect from the
analysis of high concentration in the calibration curve. No signal has been given
that interfered with the peaks, confirming no memory effect in the chromatographic
run.
Analysis of minor fat-soluble compounds in vegetable oils can be challenging
due to the interference from the oily matrix.17, 72 The challenging is presenting in
the requirement of complex pre-treatment of the sample to make the hydrophobic
sample suitable for the reverse phase (RP) HPLC. Therefore, there is a demand to
develop new extraction methods to overcome these challenges and optimise simple
and efficient methods. Several published studies suggested simultaneous separation
and quantification protocols of some minor components from vegetable oils.73,74
Almost of these studies depended on optimised chromatographic separation with
appropriate detecting techniques to extract tocopherols and carotenoids from
different types of vegetable oils. However, all these methods required sample
preparation and did not include the phytosterols.
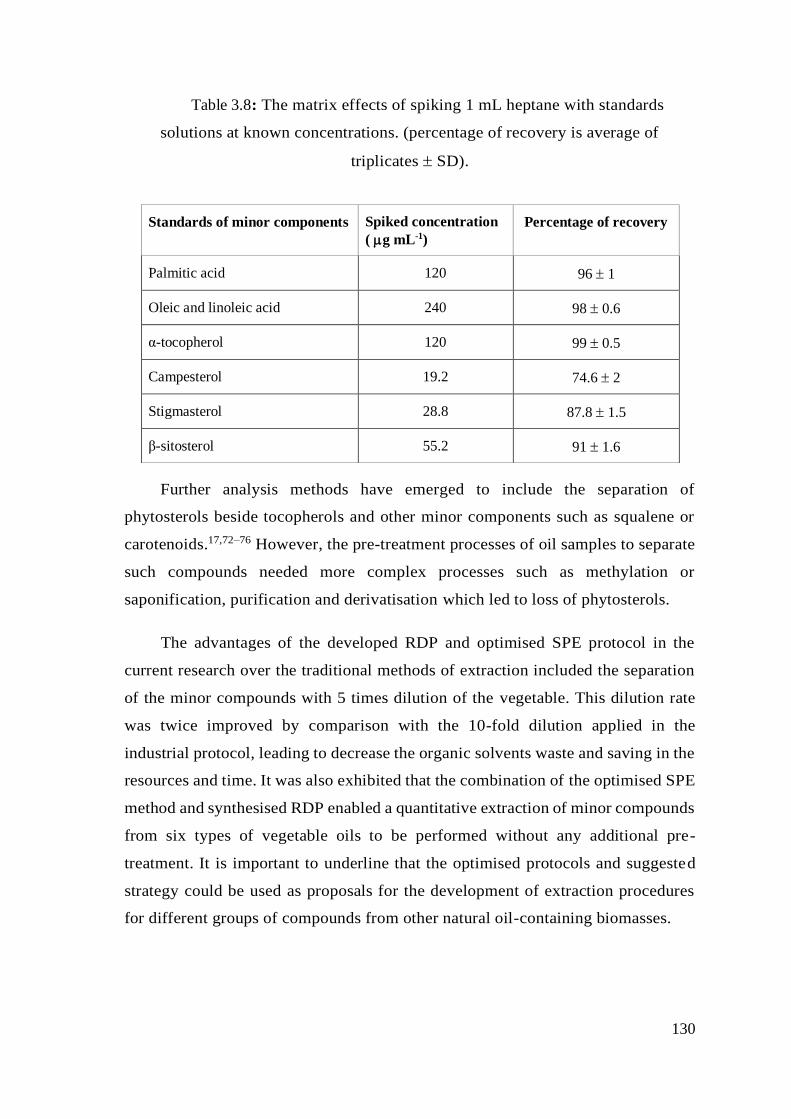
130
Table 3.8: The matrix effects of spiking 1 mL heptane with standards
solutions at known concentrations. (percentage of recovery is average of
triplicates SD).
Further analysis methods have emerged to include the separation of
phytosterols beside tocopherols and other minor components such as squalene or
carotenoids.17,72–76 However, the pre-treatment processes of oil samples to separate
such compounds needed more complex processes such as methylation or
saponification, purification and derivatisation which led to loss of phytosterols.
The advantages of the developed RDP and optimised SPE protocol in the
current research over the traditional methods of extraction included the separation
of the minor compounds with 5 times dilution of the vegetable. This dilution rate
was twice improved by comparison with the 10-fold dilution applied in the
industrial protocol, leading to decrease the organic solvents waste and saving in the
resources and time. It was also exhibited that the combination of the optimised SPE
method and synthesised RDP enabled a quantitative extraction of minor compounds
from six types of vegetable oils to be performed without any additional pre-
treatment. It is important to underline that the optimised protocols and suggested
strategy could be used as proposals for the development of extraction procedures
for different groups of compounds from other natural oil-containing biomasses.
Standards of minor components Spiked concentration
( g mL-1)
Percentage of recovery
Palmitic acid 120 96 1
Oleic and linoleic acid 240 98 0.6
α-tocopherol 120 99 0.5
Campesterol 19.2 74.6 2
Stigmasterol 28.8 87.8 1.5
β-sitosterol 55.2 91 1.6
131
3.5 Conclusions
An eco-friendly, economical and simple method has been developed to extract
a group of minor compounds from oil samples in heptane without any pre-treatment
of the oil sample. The proposed method has been optimised in the previous chapter
using sunflower oil, and in the current research this method was applied to five more
types of vegetable oils using spiked oil samples in heptane with the standard
solutions of the seven minor components expected to be extracted from the oil
samples. With the proposed protocol, it was possible to harvest those
physiologically-active components and then GC/MS was used for their
identification and quantification. The optimised method involved the RDP synthesis
which was used as an adsorbent in the optimised SPE protocol. The method has
successfully extracted a group of free fatty acids, -tocopherol and three free
phytosterols from six types of vegetable oils, despite of the variability of the content
of the minor components in each one of these oils. This happened due to the pre-
customised selectivity of the polymer which was designed on the basis of common
structural features of these compounds. The quantitative results of this study were
compared to the published results from different studies using variable methods and
techniques to extract these minor components from the same vegetable oils and it
was found they were in accordance.
It can be concluded that this protocol is useful to reduce the use of organic
solvents and save the cost and time compared to the previously published methods
because there is no need for any pre-treatment or derivatisation of the free fatty
acids, -tocopherol or free phytosterols before the extraction. Finally, the proposed
method opened a wide field for future work on the synthesis of the customised
polymer with wide selectivity options which could have great applications in
different fields.
132
References
1) Aransiola F, Ojumu V, Oyekola O, Madzimbamuto T, Ikhu-Omoregbe D. A
review of current technology for biodiesel production: State of the art. Biomass
Bioenergy. 2014,61, 276-297.
2) Freedman B.; Pryde E.; Mounts T. Variables affecting the yields of fatty esters
from transesterified vegetable oils. J Am Oil Chem Soc. 1984, 61, 1638-1643.
3) Van Gerpen J. Biodiesel processing and production. Fuel Process Technol.
2005, 86, 1097-1107.
4) Mancini A.; Mancini A.; Nigro E.; Montagnese C.; Daniele A.; Orrù S.; Buono
P. Biological and Nutritional Properties of Palm Oil and Palmitic Acid: Effects on
Health. Molecules 2015, 20, 17339–17361.
5) Kris-Etherton P.; Pearson T.; Wan Y.; Hargrove R.; Moriarty K.; Fishell V.;
Etherton T. High–Monounsaturated Fatty Acid Diets Lower Both Plasma
Cholesterol and Triacylglycerol Concentrations 1 – 3 Experimental Design. Am. J.
Clin. Nutr. 1999, 70, 1009–15.
6) Yi J.; WenXue Z.; HaiLe M. Optimization on ultrasonic-assisted extraction
technology of oil from Paeonia suffruticosa Andr. seeds with response surface
analysis. the Chinese Soc Agric Mach. 2009, 40, 103-110.
7) Pająk P.; Socha R.; Gałkowska D.; Rożnowski J.; Fortuna T. Phenolic profile
and antioxidant activity in selected seeds and sprouts. Food Chem. 2014, 143, 300-
306.
8) Luo Z.; Murray B.; Ross A.; Povey M.; Morgan M.; Day A. Effects of pH on the
ability of flavonoids to act as Pickering emulsion stabilizers. Colloids Surf B
Biointerfaces. 2012, 92, 84-90.
9) Puoci F.; Cirillo G.; Curcio M.; Iemma F.; Spizzirri U. Molecular imprinted SPE
of selective HPLC determination of -tocopherol in bay leave. Anal Chim Acta.
2007, 593, 164-170.
10) Azzi A.; Stocker A. Vitamin E: non-antioxidant roles. Prog lipid researc.
2000, 39, 321-255.
11) Lemaire-Ewing S.; Desrumaux C.; Néel D.; Lagrost L. Vitamin E transport,
membrane incorporation and cell metabolism: Is alpha-tocopherol in lipid rafts an
oar in the lifeboat? Mol Nutr Food Res. 2010, 54, 631-640.
133
12) Moazzami A.; Kamal-Eldin A. Sesame Seed Oil. Gourmet Heal Spec Oils.
2009, 267-282.
13) Ghafoor K.; Ozcan M.; Al-Juhaimi F.; Babiker E.; Sarker Z.; Ahmed I.
Nutritional Composition, Extraction, and Utilization of Wheat Germ Oil: A Review.
Eur. J. Lipid Sci. Technol. 2017, 1600160, 1–9.
14) Yang Y.; Fang J.; Ma W.; Guo D.; Mohammat A. Large-scale pattern of
biomass partitioning across China’s grasslands. Glob Ecol Biogeogr. 2010, 19, 268-
277.
15) Naureen R.; Tariq M.; Yuossoff I.; Chowdhury A. Synthesis, spectroscopic
and chromatographic studies of sunflower oil biodiesel using optimizes base
catalyzed methodlysis. Saudi J Biol Sci. 2015; 3, 1-8.
16) Schwartz H.; Ollilainen V.; Piironen V.; Lampi M. Tocopherol, tocotrienol and
plant sterol contents of vegetable oils and industrial fats. J Food Compos Anal.
2008, 21, 152-161.
17) Abidi S.; Thiam S.; Warner I. Elution behavior of unsaponifiable lipids with
various capillary electrochromatographic stationary phases. J Chromatogr A. 2002,
949, 195-207.
18) Reiter B.; Lechner M.; Lorbeer E.; Aichholz R. Isolation and characterization
of wax esters in fennel and caraway seed oils by SPE-GC. HRC J High Resolut
Chromatogr.1999, 22, 514-520.
19) Lechner M.; Reiter B.; Lorbeer E. Determination of tocopherols and sterols in
vegetable oils by solid-phase extraction and subsequent capillary gas
chromatographic analysis. J Chromat A. 1999, 857, 231-238.
20) Iqbal M. Trans fatty acids - A risk factor for cardiovascular disease. Food
Chem. 2014, 16, 194-197.
21) Cert A.; Moreda W.; Pérez-Camino M. Chromatographic analysis of minor
constituents in vegetable oils. J Chromatogr A. 2000, 88, 131-148.
22) Cocero M. Super critical fluid extraction of sunflower seed oil with CO2-
ethanol mixtures. JAOCS. 1996, 73, 1573-1578.
23) Piletska E.; Stavroulakis G.; Larcombe L.; Whitcombe M.; Sharma A.;
Primrose S.; Robinson G.; Piletsky S. Passive Control of Quorum Sensing:
Prevention of Pseudomonas Aeruginosa Biofilm Formation by Imprinted Polymers.
Biomacromolecules 2011, 12, 1067–1071.
134
24) Alghamdi E.; Whitcombe M.; Piletsky S.; Piletska E. Solid phase extraction of
α-tocopherol and other physiologically active components from sunflower oil using
rationally designed polymers. Anal Methods. 2018, 10, 1-8.
25) O’Fallon J.; Busboom J.; Nelson M.; Gaskins C. A direct method for fatty acid
methyl ester synthesis: Application to wet meat tissues, oils, and feedstuffs. J Anim
Sci. 2007, 85, 1511-1521.
26) Flakelar C.; Prenzler P.; Luckett D.; Howitt J.; Doran G. A rapid method for
the simultaneous quantification of the major tocopherols, carotenoids, free and
esterified sterols in canola (Brassica napus) oil using normal phase liquid
chromatography. Food Chem. 2017, 214, 147–55
27) Turowski M.; Morimoto T.; Kimata K.; Monde H.; Ikegami T.; Hosoya K.;
Tanaka N. Selectivity of Stationary Phases in Reversed-Phase Liquid
Chromatography Based on the Dispersion Interactions. J. Chromatogr. A 2001, 911,
177–190.
28) Christie, W. Lipid Analysis. Isolation, Separation, Identification and
Lipidomic Analysis I, 2012, Woodhead Publishing Limited: Cambridge, UK.
29) Andrade-Eiroa A. Reverse-High Performance Liquid Chromatography
Mechanism Explained by Polarization of Stationary Phase. CheM 2011, 1, 62–79.
30) Courtois C.; Allais C.; Constantieux T.; Rodriguez J.; Caldarelli S.; Delaurent
C. Cholesteric Bonded Stationary Phases for High-Performance Liquid
Chromatography: Synthesis, Physicochemical Characterization, and
Chromatographic Behavior of a Phospho–Cholesteric Bonded Support. A New Way
to Mimic Drug/Membrane Interactions? Anal. Bioanal. Chem. 2008, 392, 1345–
1354.
31) Simpso N. Solid Phase Extraction Principles, 2000, Techniques and
Applications; Marcel Dckker, Inc.:New York, USA.
32) Demel R.; Bruckdorfer K.; van Deenen L. Structural Requirements of Sterols
for the Interaction with Lecithin at the Air-Water Interface. Biochim. Biophys. Acta
BBA - Biomembr. 1972, 255, 311–320.
33) Feng S.; Gao F.; Chen Z.; Grant E.; Kitts D.; Wang S.; Lu X. Determination of
α‑Tocopherol in Vegetable Oils Using a Molecularly Imprinted Polymers−Surface-
Enhanced Raman Spectroscopic Biosensor. J. Agric. Food Chem. 2013, 61, 10467–
75.
135
34) Moreau R.; Whitaker B.; Hicks K. Phytosterols, phytostanols, and their
conjugates in foods: Structural diversity, quantitative analysis, and health-
promoting uses. Prog Lipid Res. 2002, 41, 457-500.
35) Kumar G.; Krishna A. Studies on the nutraceuticals composition of wheat
derived oils wheat bran oil and wheat germ oil. J Food Sci Technol. 2013, 52, 1145-
1151.
36) Eisenmenger M.; Dunford N. Bioactive components of commercial and
supercritical carbon dioxide processed wheat germ oil. JAOCS, J Am Oil Chem Soc.
2008, 85, 55-61.
37) Christie W. The Lipid Web http://www.lipidhome.co.uk/ms/others/ffa-
tms/index.htm (accessed Oct 1, 2017).
38) Nill K. Changes in the contents and profiles of selected phenolics,
soyasapogenols, tocopherols, and amino acids during soybean-rice mixture
cooking: Electric rice cooker vs electric pressure rice cooker. Encycl Food Heal.
2016, 100, 58-63.
39) Longobardi F.; Ventrella A.; Casiello G.; Sacco D.; Catucci L.; Agostiano A.;
Kontominas, M. Instrumental and Multivariate Statistical Analyses for the
Characterisation of the Geographical Origin of Apulian Virgin Olive Oils. Food
Chem. 2012, 133, 579–584.
40) Koushki M.; Nahidi M.; Cheraghali F. Physico-chemical properties, fatty acid
profile and nutrition in palm oil. J Paramed Sci Summer. 2015, 6, 2008-4978.
41) Xu B.; Han J.; Zhou S.; Wu Q.; Ding F. Quality Characteristics of Wheat Germ
Oil Obtained by Innovative Subcritical Butane Experimental Equipment. J Food
Process Eng. 2016, 39, 79-87.
42) Kan A. Chemical and elemental characterization of wheat germ oil (Triticum
spp. L.) cultivated in Turkey. African J Agric Reseearch. 2012, 7, 4979-4982.
43) Ramos M.; Fernandez C.; Casas A.; Rodriguez L.; Perez A. Influence of fatty
acid composition of raw materials on biodiesel properties. Bioresour Technol. 2009,
100, 261-268.
44) Guttman C M. Mass Spectrometry Principles and Applications. 2001. 3rd Edit.
(Edmond H, Vincent S, eds.). West Sussex: JohnWiley & Sons Ltd.
45) Hegde D. Sesame, in Peter K.V., Editor. Handbook of Herbs and Spices, 2012,
pp. 267-28239.
136
46) Gharby S.; Harhar H.; Bouzoubaa Z.; Asdadi A.; El Yadini A.; Charrouf Z.
Steam explosion technology based for oil extraction from sesame (Sesamum
indicum L.) seed. Food Chem. 2014, 7, 194-197.
47) Bartosińska E.; Buszewska-Forajta M.; Siluk D. GC–MS and LC–MS
approaches for determination of tocopherols and tocotrienols in biological and food
matrices. J Pharm Biomed Anal. 2016, 127, 156-169.
48) Fiorentino A.; Mastellone C.; D’Abrosca B.; Pacifico S.; Scognamiglio M.;
Cefarelli G.; Caputo R.; Monaco P. -Tocomonoenol: A New Vitamin E from Kiwi
(Actinidia Chinensis) Fruits. Food Chem. 2009, 115, 187–192.
49) Nair P.; Luna Z. Identification of α-tocopherol from tissues by combined gas-
liquid chromatography, mass spectrometry and infrared spectroscopy. Arch
Biochem Biophys. 1968, 127, 413-418.
50) Nagy K.; Courtet-Compondu M.; Holst B.; Kussmann M. Comprehensive
Analysis of Vitamin E Constituents in Human Plasma by Liquid
Chromatography−Mass Spectrometry. Anal Chem. 2007, 79, 7087-7096.
51) Zou L.; Akoh C. Identification of tocopherols, tocotrienols, and their fatty acid
esters in residues and distillates of structured lipids purified by short-path
distillation. J Agric Food Chem. 2013, 61, 238-246.
52) Gonzalez M.; Ballesteros E.; Gallego M.; Valcarcel M. Continuous-flow
determination of natural and synthetic antioxidants in foods by gas chromatography.
Anal Chim Acta. 1998, 359, 47-55.
53) Galea M.; Horga C. Separation and Determination of tocopherols in vegetable
oil by SPE. Cent Eur J Chem. 2010, 8, 110-116.
54) Ballesteros E.; Gallego M.; Valcárcel M. Gas chromatographic determination
of cholesterol and tocopherols in edible oils and fats with automatic removal of
interfering triglycerides. J Chromatogr A. 1996, 719, 221-227.
55) Grigoriadou D.; Androulaki A.; Psomiadou E.; Tsimidou M. Solid phase
extraction in the analysis of squalene and tocopherols in olive oil. Food Chem. 2007,
105, 675-680.
56) Lee Y.; Park H.; Lee C.; Kim S.; Hwang T. Comparing Extraction Methods for
the Determination of Tocopherols and Tocotrienols in Seeds and Germinating Seeds
of Soybean Transformed with OsHGGT. J. Food Compos. Anal. 2012, 27, 70–80.
137
57) Kim H.; Salem N. Extraction Thermospray LC-MS analysis. J Lipid Res. 1990,
31, 2285-2289.
58) Gibon V.; Dijckmans P.; Greyt W. Future prospects for palm oil refining and
modifications. Innov Technol. 2009, 16, 193-200.
59) Koistinen V. Hanhineva K. Mass spectrometry-based analysis of whole-grain
phytochemicals. Crit Rev Food Sci Nutr. 2017, 57, 1688-1709.
60) Suttiarporn P.; Chumpolsri W.; Mahatheeranont S.; Luangkamin S.;
Teepsawang S.; Leardkamolkarn V. Structures of phytosterols and triterpenoids
with potential anti-cancer activity in bran of black non-glutinous rice. Nutrients.
2015, 7, 1672-1687.
61) Purcaro G.; Barp L.; Beccaria M.; Conte L. Characterisation of minor
components in vegetable oil by comprehensive gas chromatography with dual
detection. Food Chem. 2016, 212, 730-738.
62) Dutta P. Phytosterols as Functional Food Components and Nutraceuticals.
2004 Marcel Dekker, INC New York, USA.
63) Dijkstra A J, Soybean Oil. in: B. Catallcro, P. Finglas, F. Toldra, Editor.
Encyclopedia of Food and Health, 2016, pp.58–63.
64) Yan G.; Li Q.; Huarong T.; Ge T. Electrospray ionization ion-trap time-of-
flight tandem mass spectrometry of two furofurans: sesamin and gmelinol. Rapid
Commun Mass Spectrom. 2007, 21, 3613-3620.
65) Lee J.; Choe E. Extraction of lignan compounds from roasted sesame oil and
their effects on the autoxidation of methyl linoleate. J Food Sci. 2006, 71, 430-436.
66) Dachtler M.; Van De P.; Stijn F.; Beindorff C.; Fritsche J. On-line LC-NMR-
MS characterization of sesame oil extracts and assessment of their antioxidant
activity. Eur J Lipid Sci Technol. 2003, 105, 488-496.
67) Kim J.; Seo W.; Lee S.; Lee Y.; Park C.; Ryu, H.; Lee J. Comparative
Assessment of Compositional Components, Antioxidant Effects, and Lignan
Extractions from Korean White and Black Sesame (Sesamum Indicum L.) Seeds
for Different Crop Years. J. Funct. Foods 2014, 7, 495–505
68) Wu W. The contents of lignans in commercial sesame oils of Taiwan and their
changes during heating. Food Chem. 2007, 104, 341-344.
69) Moazzami A.; Haese S.; Kamal-Eldin A. Lignan contents in sesame seeds and
products. Eur J Lipid Sci Technol. 2007, 109, 1022-1027.
138
70) Monfreda M.; Gobbi L.; Grippa A. Blends of olive oil and sunflower oil:
Characterisation and olive oil quantification using fatty acid composition and
chemometric tools. Food Chem. 2012, 134, 2283-2290.
71) Wabaidur S.; AlAmmari A.; Aqel A.; AL-Tamrah S.; Alothman Z.; Ahmed A.
Determination of free fatty acids in olive oils by UPHLC–MS. J Chromatogr B.
2016, 1031, 109-115.
72) Psomiadou E.; Tsimidou M. Simultaneous HPLC Determination of
Tocopherols, Carotenoids, and Chlorophylls for Monitoring Their Effect on Virgin
Olive Oil Oxidation. J. Agric. Food Chem. 1998, 46, 5132–8.
73) Carrasco-Pancorbo A.; Navas-Iglesias N.; Cuadros-Rodríguez L. From lipid
analysis towards lipidomics, a new challenge for the analytical chemistry of the 21st
century. Part I: Modern lipid analysis. Trends Analyt Chem. 2009, 28, 263–78.
74) Fromm M.; Bayha S.; Kammerer D.; Carle R. Identification and Quantitation
of Carotenoids and Tocopherols in Seed Oils Recovered from Different Rosaceae
Species. J Agric Food Chem. 2012, 60,10733–42.
75) Abdallah I.; Tlili N.; Martinez-Force E.; Rubio A.; Perez-Camino M.; Albouchi
A.; Boukhchina S. Content of carotenoids, tocopherols, sterols, triterpenic and
aliphatic alcohols, and volatile compounds in six walnuts (Juglans regia L.)
varieties. Food Chem. 2015, 15, 972–8.
76) Li C.; Yao Y.; Zhao G.; Chen Y.; Liu H.; liu C.; Shi Z.; Chen Y.; Wang S.
Comparison and analysis of fatty acids, sterols, and tocopherols in eight vegetable
oils. J Agric Food Chem. 2011, 59, 12493–8.

139
Chapter four
140
Comparison between the developed RDP and commercial SPE
adsorbents for the extraction of minor compounds from
sunflower oil
4.1 Introduction
The development of efficient analytical procedures is one of the most
important scientific objectives. SPE is a widely used analytical process to perform
analyte separation and improve the performance of analysis. SPE provides several
analysis processes such as clean-up, preconcentration and preparation of samples,
which are some of the most laborious steps during the analytical techniques,
consuming in average 61% of the total time required to execute analytical
procedures.1–5 SPE has been used for more than 20 years as an alternative to liquid-
liquid extraction for sample preparation in analysis of organic compounds in
industry, bioanalysis, food safety and nutrition and environmental applications.2–4
SPE usually cobined to other analytical technique or preparation method to provide
a selective, cheap, quick, and environmentally friendly separation.5
4.1.1 SPE definition
SPE is an analytical method applied for the preparation of a certain sample for
quantitative or qualitative detection.1,6 In the SPE process, the analyte is dissolved
in a suitable solvent and removed from the solution potentially containing many
interfering compounds. The main common goals to be achieved by SPE is either
one or more of these of four purposes:
1) Concentrating the compound of interest;
2) Removal of undesirable interferences from the sample (clean-up);
3) Transform the analytes into a group of fractions;
4) Alternative storage method for the compound unstable in liquid medium.
In the SPE process, the sample is applied to one of the common formats such
as cartridge devices or discs packed with SPE sorbents or magnetic nanoparticles.7
141
The different SPE sorbents are classified in terms of their separation mode, similarly
to the classification of the chromatographic stationary phases.2,8–10 There are several
reviews in the literature attempted to separate the SPE sorbents into groups
possessing common features, which represent a well-defined classification for the
SPE resin that help to enhance the analytes separation and preparations
processes.1,11,12,13 The main types of SPE sorbents are reversed-phase, normal
phase, ion exchange resins and customised resins based on functionalised
polymers.1,2,8 Table 4.28 summarised the main features of each approach.
There are some reviews in the literature which suggest adding another group
to the sorbents types listed in Table 4.1 is known as mixed mode phases (ion
exchange and reversed phase). These group of sorbents are applicable for wide
selections of analytes as they are involved the modified reverse-phase with anionic
or cationic functional groups such as the silica-based modified resin SDB or the
polymeric resin modified with carboxylic or sulfonic acid groups.1 Moreover, the
functionalised resins included a new group of the SPE resins based on molecularly
imprinted polymers (MIPs). MIPs offer selectivity, high capacity, regeneration
capability, relatively short time for preparation and low-cost extraction and
purification applications of different compounds in sustainable, natural/biological
matrices, especially if these compounds are present at trace levels.14–17
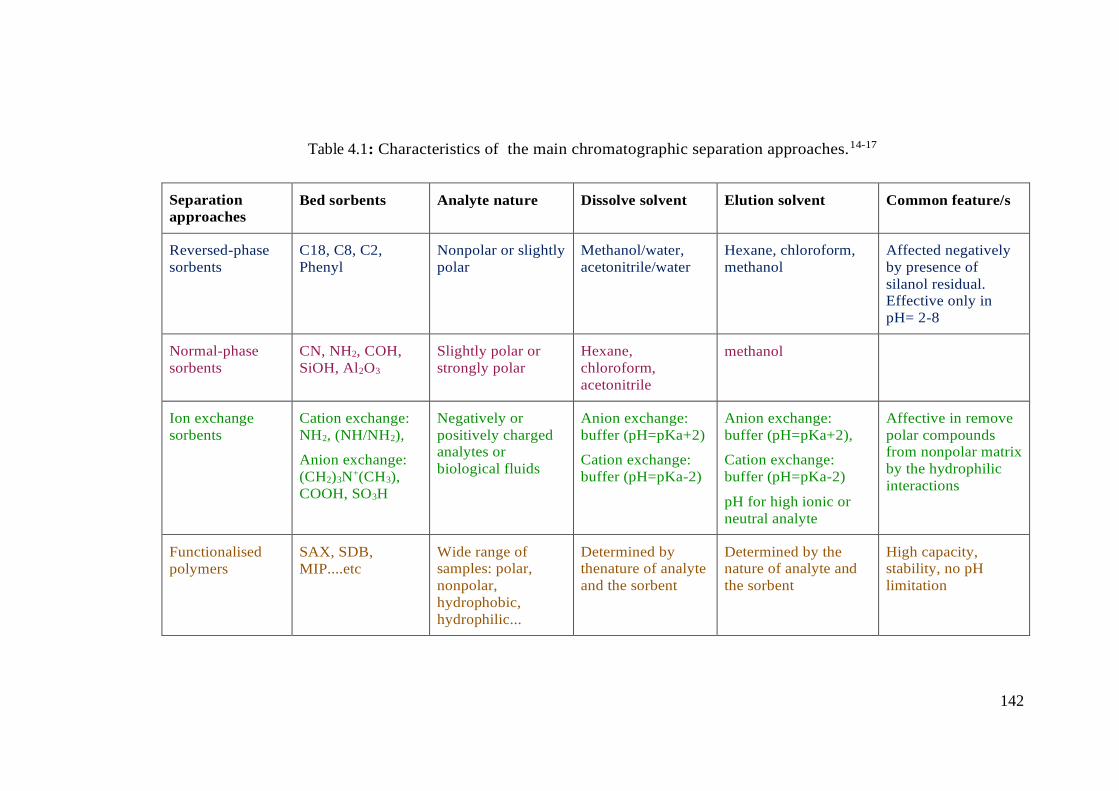
142
Table 4.1: Characteristics of the main chromatographic separation approaches.14-17
Separation
approaches
Bed sorbents Analyte nature Dissolve solvent Elution solvent Common feature/s
Reversed-phase
sorbents
C18, C8, C2,
Phenyl
Nonpolar or slightly
polar
Methanol/water,
acetonitrile/water
Hexane, chloroform,
methanol
Affected negatively
by presence of
silanol residual.
Effective only in
pH= 2-8
Normal-phase
sorbents
CN, NH2, COH,
SiOH, Al2O3
Slightly polar or
strongly polar
Hexane,
chloroform,
acetonitrile
methanol
Ion exchange
sorbents
Cation exchange:
NH2, (NH/NH2),
Anion exchange:
(CH2)3N+(CH3),
COOH, SO3H
Negatively or
positively charged
analytes or
biological fluids
Anion exchange:
buffer (pH=pKa+2)
Cation exchange:
buffer (pH=pKa-2)
Anion exchange:
buffer (pH=pKa+2),
Cation exchange:
buffer (pH=pKa-2)
pH for high ionic or
neutral analyte
Affective in remove
polar compounds
from nonpolar matrix
by the hydrophilic
interactions
Functionalised
polymers
SAX, SDB,
MIP....etc
Wide range of
samples: polar,
nonpolar,
hydrophobic,
hydrophilic...
Determined by
thenature of analyte
and the sorbent
Determined by the
nature of analyte and
the sorbent
High capacity,
stability, no pH
limitation
143
It is clear that the type of SPE sorbent has had a remarkable influence on the
separation process, however, Turowski and co-workers highlighted the importance
of other elements of the SPE process. For example, in case of the reversed-phase
mode, the analyte adsorbed on the sorbent was due to the hydrophobic interactions,
which are considered as weak interactions. However, the polar solvent are the
dominant effect on the interactions between the solute and the sorbent. This was
due to reduction of the surface area of the non-polar area in contact with polar sites
by the repulsion forces between the polar and non-polar molecules.18
Moreover, the nature of the compound of interest has an important effect on
the choice of SPE resins. Courtois et al. reported that the reversed-phase separation
is mainly affected by the size and the shape of the solute, while normal-phase
separation depends on the selectivity interactions of the polar functional groups of
solute with polar sorbent.19
During the SPE, the analyte of interest is partitioned between a solid phase and
a liquid matrix. The analyte/s that has/have higher affinity to the solid phase than
towards the sample matrix will be retained on the stationary phase. This process is
called retention or adsorption, which is opposite of the other process called elution
or desorption. In elution, the retained compound/s on the stationary phase will leave
the stationary phase to eluent if it/they has/have a higher affinity towards the eluting
solvent than towards the stationary phase.19,20
4.1.2 Main steps of SPE
The SPE process is performed in four steps, namely: condition, loading,
washing and elution.
4.1.2.1 Condition
This step involves the conditioning of the cartridge with a solvent to wet the
sorbent. An appropriate solvent is passed over the stationary phase that activates the
stationary phase particles. The importance of the conditioning process varies from
one to another type of SPE sorbents. For example, in reversed-phase separation
systems the stationary phase should be kept wet by the conditioning solvent,11
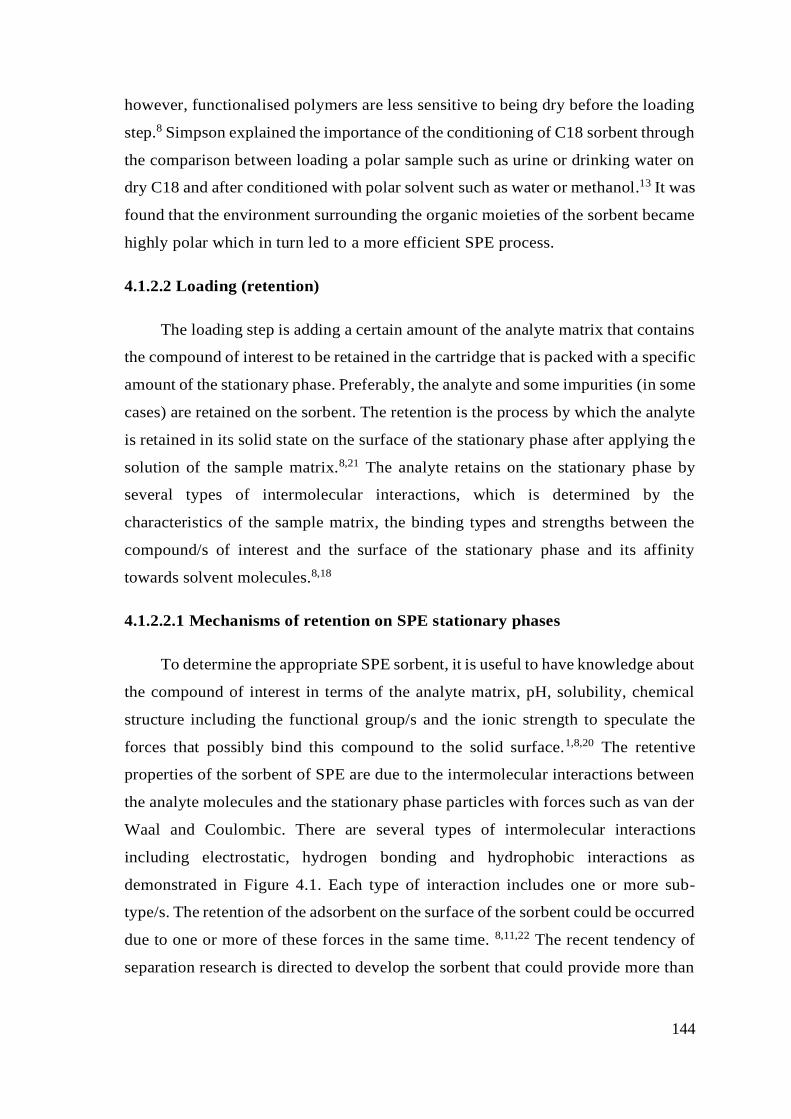
144
however, functionalised polymers are less sensitive to being dry before the loading
step.8 Simpson explained the importance of the conditioning of C18 sorbent through
the comparison between loading a polar sample such as urine or drinking water on
dry C18 and after conditioned with polar solvent such as water or methanol.13 It was
found that the environment surrounding the organic moieties of the sorbent became
highly polar which in turn led to a more efficient SPE process.
4.1.2.2 Loading (retention)
The loading step is adding a certain amount of the analyte matrix that contains
the compound of interest to be retained in the cartridge that is packed with a specific
amount of the stationary phase. Preferably, the analyte and some impurities (in some
cases) are retained on the sorbent. The retention is the process by which the analyte
is retained in its solid state on the surface of the stationary phase after applying the
solution of the sample matrix.8,21 The analyte retains on the stationary phase by
several types of intermolecular interactions, which is determined by the
characteristics of the sample matrix, the binding types and strengths between the
compound/s of interest and the surface of the stationary phase and its affinity
towards solvent molecules.8,18
4.1.2.2.1 Mechanisms of retention on SPE stationary phases
To determine the appropriate SPE sorbent, it is useful to have knowledge about
the compound of interest in terms of the analyte matrix, pH, solubility, chemical
structure including the functional group/s and the ionic strength to speculate the
forces that possibly bind this compound to the solid surface.1,8,20 The retentive
properties of the sorbent of SPE are due to the intermolecular interactions between
the analyte molecules and the stationary phase particles with forces such as van der
Waal and Coulombic. There are several types of intermolecular interactions
including electrostatic, hydrogen bonding and hydrophobic interactions as
demonstrated in Figure 4.1. Each type of interaction includes one or more sub-
type/s. The retention of the adsorbent on the surface of the sorbent could be occurred
due to one or more of these forces in the same time. 8,11,22 The recent tendency of
separation research is directed to develop the sorbent that could provide more than
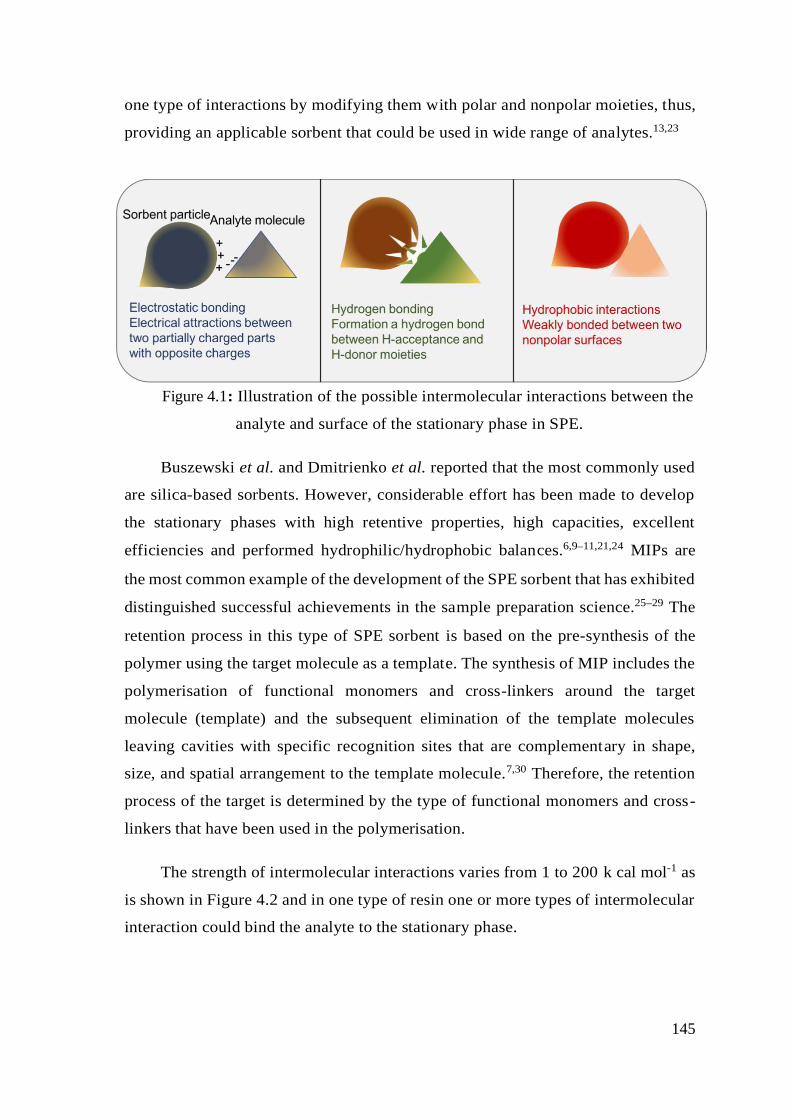
145
one type of interactions by modifying them with polar and nonpolar moieties, thus,
providing an applicable sorbent that could be used in wide range of analytes.13,23
Figure 4.1: Illustration of the possible intermolecular interactions between the
analyte and surface of the stationary phase in SPE.
Buszewski et al. and Dmitrienko et al. reported that the most commonly used
are silica-based sorbents. However, considerable effort has been made to develop
the stationary phases with high retentive properties, high capacities, excellent
efficiencies and performed hydrophilic/hydrophobic balances.6,9–11,21,24 MIPs are
the most common example of the development of the SPE sorbent that has exhibited
distinguished successful achievements in the sample preparation science.25–29 The
retention process in this type of SPE sorbent is based on the pre-synthesis of the
polymer using the target molecule as a template. The synthesis of MIP includes the
polymerisation of functional monomers and cross-linkers around the target
molecule (template) and the subsequent elimination of the template molecules
leaving cavities with specific recognition sites that are complementary in shape,
size, and spatial arrangement to the template molecule.7,30 Therefore, the retention
process of the target is determined by the type of functional monomers and cross-
linkers that have been used in the polymerisation.
The strength of intermolecular interactions varies from 1 to 200 k cal mol-1 as
is shown in Figure 4.2 and in one type of resin one or more types of intermolecular
interaction could bind the analyte to the stationary phase.
146
Figure 4.2: Binding energy of different types of intermolecular interactions.
There is a continuous development of the stationary phases for SPE that
exhibit sufficient capacity and excellent selectivity. The most commonly used SPE
sorbents are among the four types: silica-based types, oxides of metals, carbon-
based types or polymer-based sorbents. Qureshi et al. suggested that polymer based
sorbents have an advantage over silica-based and oxides of metal sorbents due to
being less sensitive to drying out after conditioning and have less impact of variation
of pH.21 These polymer based sorbents show enhanced retention of highly polar
analytes such as phenols. In addition, these sorbents with a high surface area exhibit
a high degree of hydrophobicity that leads to large capacity. On the other hand, the
silica active and oxides of metals have limitations by the condition of that the
sorbents must be wet with the condtioning solvent before applying the sample
(loading step), effective in the limited range of pH and the presence of highly active
sites that cause the secondary interaction leading to reduce the efficiency.
4.1.2.3 Washing
To reduce the interferences that may be adsorbed on the stationary phase at
the same time as the compound of interest is retained during loading step, it is
essential to wash the SPE cartridge with an appropriate solvent that has a greater
affinity for the co-retained compounds to desorb and leave the SPE cartridge.
Meanwhile, this solvent should not disrupt the interactions between the compound
of interest and the resin to allow it to be eluted in the next step.
147
4.1.2.4 Elution:
The step by which the extraction of the compound of interest is carried out
from a mixture using an appropriate solvent is called as elution, which makes the
componds more suitable for analysis. When a liquid mobile phase (eluent) provides
more affinity for the analyte than the solid stationary phase, then the compound of
interest leaves the solid surface to this liquid. Subsequently, the compound of
interest can be collected in the liquid as it exits the SPE device. Recent studies have
shown that silica based SPE sorbents, oxides of metals, carbon-based sorbents and
polymer-based sorbents are the most commonly used.1,2,4 In the literature, a range
of attempts and methods has been mentioned to develop the silica based stationary
phases to improve the quality of the separation and the variety of the purified
samples. It was done by modification of the silica surface by immobilising
functional groups to enable either hydrophobic or hydrophilic interactions between
the analyte and the solid surface. As an example, Qureshi et al. presented Oasis
HLB as a polymer-based sorbent that was produced by polymerisation of lipophilic
DVB and hydrophilic N-vinylpyrrolidone, making a hydrophilic–lipophilic
balance. The Oasis HLB sorbent has been applicable in SPE for many polar or
apolar analytes.21
The principles of the relationships between the main elements of the SPE
process are shown in the Figure 4.3. Silica-based sorbents have advantage of the
large surface area and versatility to be derivatised. However, they suffer from some
drawbacks, such as being unable to be used in pH outside the range 2-8, as silica
dissolves in high pH. Moreover, silanol groups are easily ionised causing highly
active sites on the silica particles.
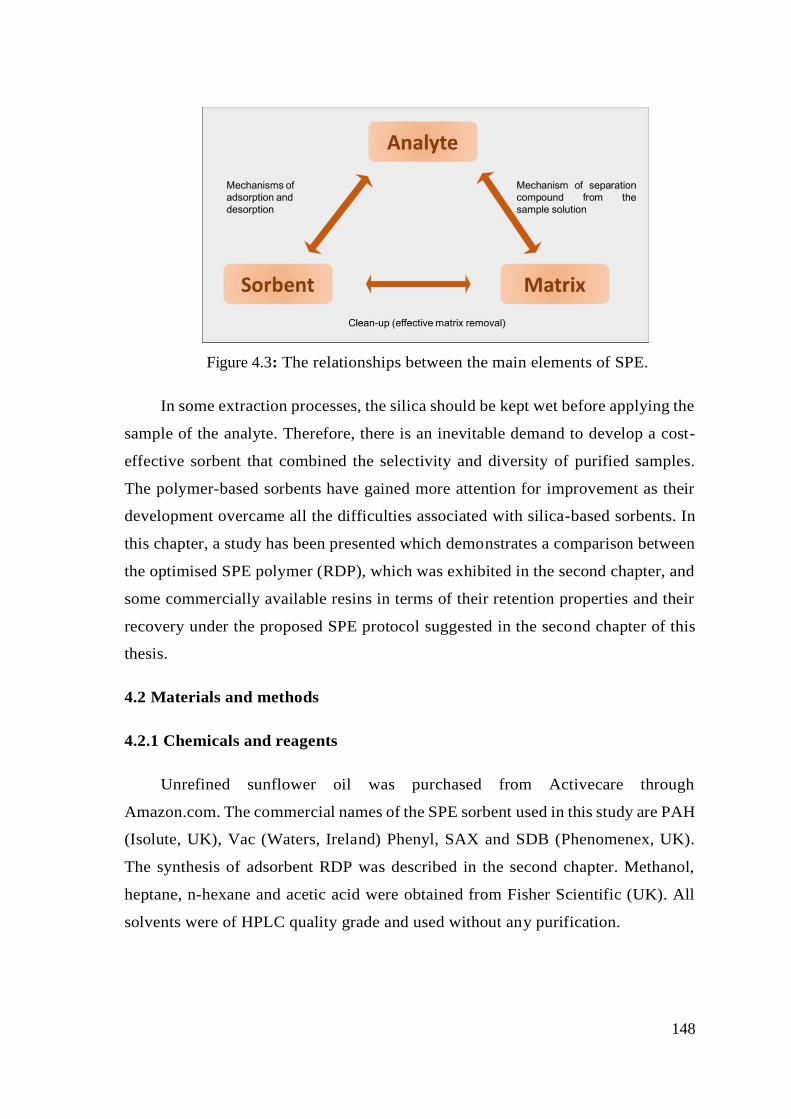
148
Figure 4.3: The relationships between the main elements of SPE.
In some extraction processes, the silica should be kept wet before applying the
sample of the analyte. Therefore, there is an inevitable demand to develop a cost-
effective sorbent that combined the selectivity and diversity of purified samples.
The polymer-based sorbents have gained more attention for improvement as their
development overcame all the difficulties associated with silica-based sorbents. In
this chapter, a study has been presented which demonstrates a comparison between
the optimised SPE polymer (RDP), which was exhibited in the second chapter, and
some commercially available resins in terms of their retention properties and their
recovery under the proposed SPE protocol suggested in the second chapter of this
thesis.
4.2 Materials and methods
4.2.1 Chemicals and reagents
Unrefined sunflower oil was purchased from Activecare through
Amazon.com. The commercial names of the SPE sorbent used in this study are PAH
(Isolute, UK), Vac (Waters, Ireland) Phenyl, SAX and SDB (Phenomenex, UK).
The synthesis of adsorbent RDP was described in the second chapter. Methanol,
heptane, n-hexane and acetic acid were obtained from Fisher Scientific (UK). All
solvents were of HPLC quality grade and used without any purification.
149
4.2.2 Equipment and analysis techniques
Three-mL SPE cartridges were each packed with 100 mg of all SPE sorbents
and used in combination with a vacuum manifold (Supelco, UK). All SPE
experiments were repeated three times. The quantification of the minor components
was performed using the Gas Chromatography-Mass-spectrometry (GC/MS) set-up
(Perkin Elmer, TurboMass, UK) using a 30 m x 250 µm, 0.25 mm I.D., ZB-5
capillary column (Phenomenex, UK). Helium gas was used as the mobile phase to
carry the sample at a flow-rate of 1 mL min-1 at 200 °C. After injection of 10 L of
the sample at 200 °C, the temperature of the GC oven was raised by 10 °C min -1 to
350 °C and held for 3 min.
To assess the performance of RDP, 100 mg of six different types of
commercially available sorbents were packed in SPE cartridge.25 The commercial
names of the SPE sorbent in this study are C18, PAH, Phenyl, SAX, SDB, Vac and
RDP. The optimised SPE protocol included following steps: a conditioning 100 mg
of adsorbent packed in a 3mL cartridge with 1 mL of hexane, loading of 1 mL of
20% sunflower oil in heptane, washing the cartridge with 1 mL of 60% methanol
and then, elution using 3 mL of methanol with 5% acetic acid. The collected eluent
from each cartridge was evaporated to dryness and reconstituted in 1 mL of hexane
to be analysed with GC/MS. Using calibration curves for each of the minor
components (Table 3.1 in the chapter 3 and Appendix 2), it was possible to calculate
the concentrations from the integration of each peak in GC/MS chromatogram
corresponding to each component. Subsequently, calcultion of the loading capacity
and percentage of recovery for each sorbent.
150
4.3 Results and discussion
The goal of the experiments described in this chapter was to compare the
performance of the synthesised RDP resin with a group of commercially-available
SPE cartridges. An examination of the optimised SPE protocol with different SPE
sorbents was carried out. The comparison was made by packing 100 mg of each
sorbent in 3-mL SPE cartridges and applying the optimised SPE process in the
second chapter. The samples, which were collected from each cartridge and after
the three steps of SPE namely: loading (unbounded sample), washing
(interferences) and elution (eluted sample), were evaporated and reconstituted in
hexane to be analysed with GC/MS. The integration of each peak was converted to
concentration using the calibration curves of the minor compounds of sunflower oil
and was presented in the second chapter. The results were presented for each step
to all sorbents as follows:
4.3.1 After loading
The loaded sample in each cartridge was 1 mL of 20% of sunflower oil in
heptane. It was passed through the cartridge under vacuum using the manifold
device. The concentration of the minor components in the collected samples
indicated the unabsorbed amount of these compounds. The concentrations of these
samples indicated the retentive properties of the sorbents in this study (Table 4.2,
Figure 4.4).
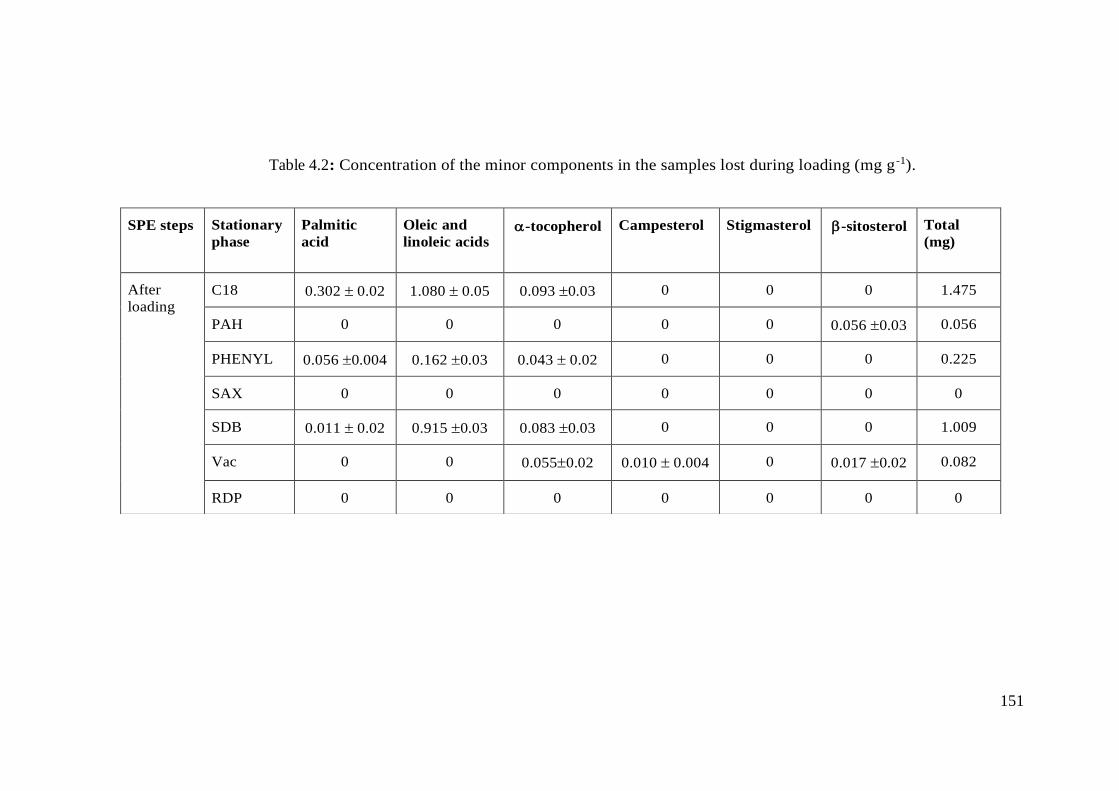
151
Table 4.2: Concentration of the minor components in the samples lost during loading (mg g-1).
SPE steps Stationary
phase
Palmitic
acid
Oleic and
linoleic acids -tocopherol Campesterol Stigmasterol -sitosterol Total
(mg)
After
loading
C18 0.302 0.02 1.080 0.05 0.093 0.03 0 0 0 1.475
PAH 0 0 0 0 0 0.056 0.03 0.056
PHENYL 0.056 0.004 0.162 0.03 0.043 0.02 0 0 0 0.225
SAX 0 0 0 0 0 0 0
SDB 0.011 0.02 0.915 0.03 0.083 0.03 0 0 0 1.009
Vac 0 0 0.0550.02 0.010 0.004 0 0.017 0.02 0.082
RDP 0 0 0 0 0 0 0
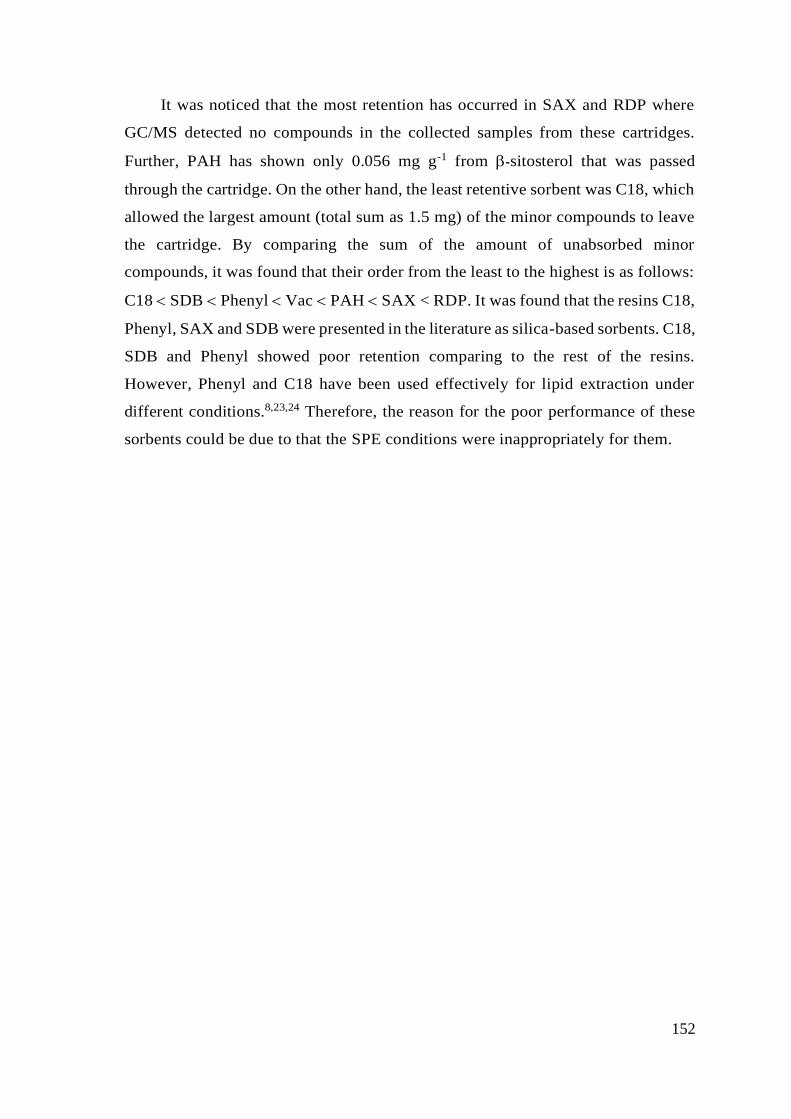
152
It was noticed that the most retention has occurred in SAX and RDP where
GC/MS detected no compounds in the collected samples from these cartridges.
Further, PAH has shown only 0.056 mg g-1 from -sitosterol that was passed
through the cartridge. On the other hand, the least retentive sorbent was C18, which
allowed the largest amount (total sum as 1.5 mg) of the minor compounds to leave
the cartridge. By comparing the sum of the amount of unabsorbed minor
compounds, it was found that their order from the least to the highest is as follows:
C18 SDB Phenyl Vac PAH SAX < RDP. It was found that the resins C18,
Phenyl, SAX and SDB were presented in the literature as silica-based sorbents. C18,
SDB and Phenyl showed poor retention comparing to the rest of the resins.
However, Phenyl and C18 have been used effectively for lipid extraction under
different conditions.8,23,24 Therefore, the reason for the poor performance of these
sorbents could be due to that the SPE conditions were inappropriately for them.
153
Figure 4.4: Statistical demonstration of the concentration of the compounds which were not absorbed during loading.
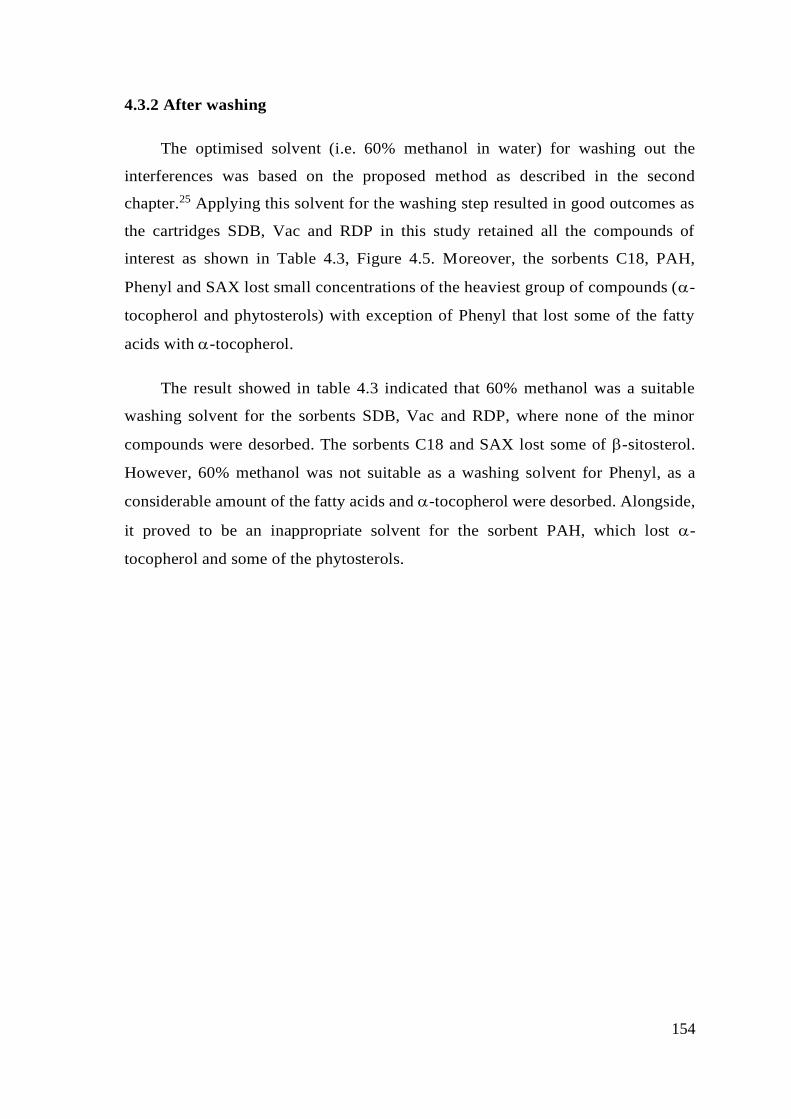
154
4.3.2 After washing
The optimised solvent (i.e. 60% methanol in water) for washing out the
interferences was based on the proposed method as described in the second
chapter.25 Applying this solvent for the washing step resulted in good outcomes as
the cartridges SDB, Vac and RDP in this study retained all the compounds of
interest as shown in Table 4.3, Figure 4.5. Moreover, the sorbents C18, PAH,
Phenyl and SAX lost small concentrations of the heaviest group of compounds (-
tocopherol and phytosterols) with exception of Phenyl that lost some of the fatty
acids with -tocopherol.
The result showed in table 4.3 indicated that 60% methanol was a suitable
washing solvent for the sorbents SDB, Vac and RDP, where none of the minor
compounds were desorbed. The sorbents C18 and SAX lost some of -sitosterol.
However, 60% methanol was not suitable as a washing solvent for Phenyl, as a
considerable amount of the fatty acids and -tocopherol were desorbed. Alongside,
it proved to be an inappropriate solvent for the sorbent PAH, which lost -
tocopherol and some of the phytosterols.
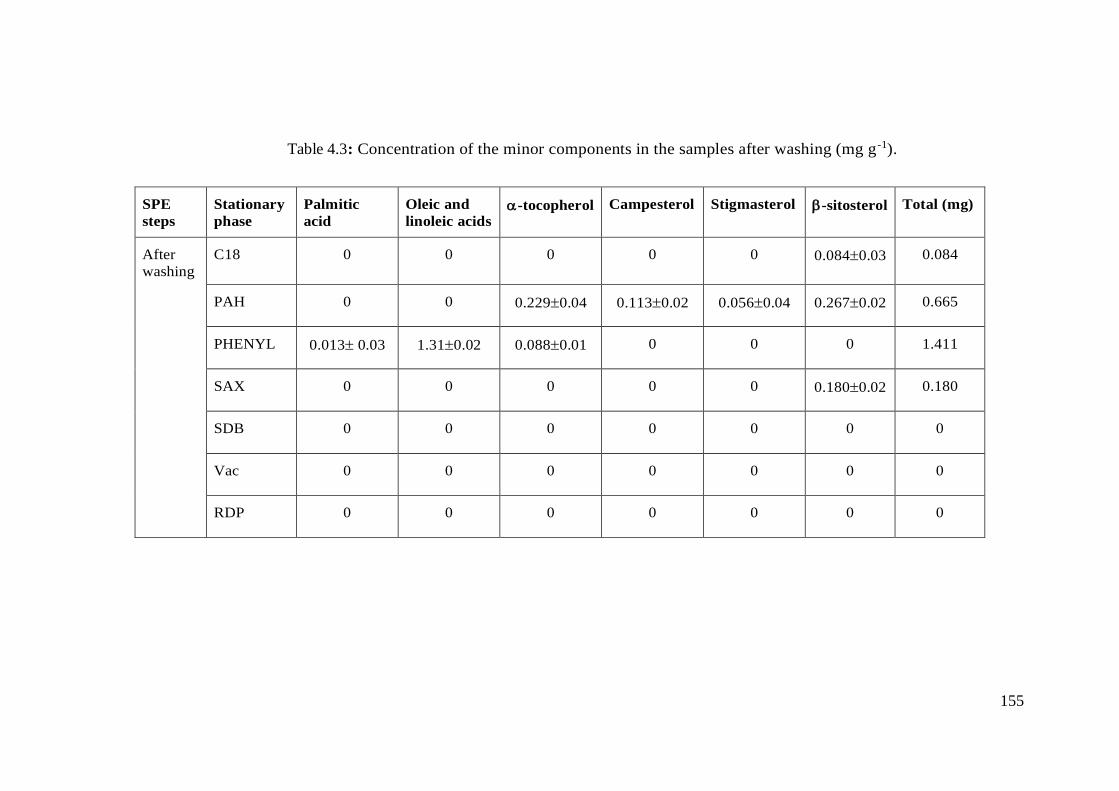
155
Table 4.3: Concentration of the minor components in the samples after washing (mg g-1).
SPE
steps
Stationary
phase
Palmitic
acid
Oleic and
linoleic acids -tocopherol Campesterol Stigmasterol -sitosterol Total (mg)
After
washing
C18 0 0 0 0 0 0.0840.03 0.084
PAH 0 0 0.2290.04 0.1130.02 0.0560.04 0.2670.02 0.665
PHENYL 0.013 0.03 1.310.02 0.0880.01 0 0 0 1.411
SAX 0 0 0 0 0 0.1800.02 0.180
SDB 0 0 0 0 0 0 0
Vac 0 0 0 0 0 0 0
RDP 0 0 0 0 0 0 0
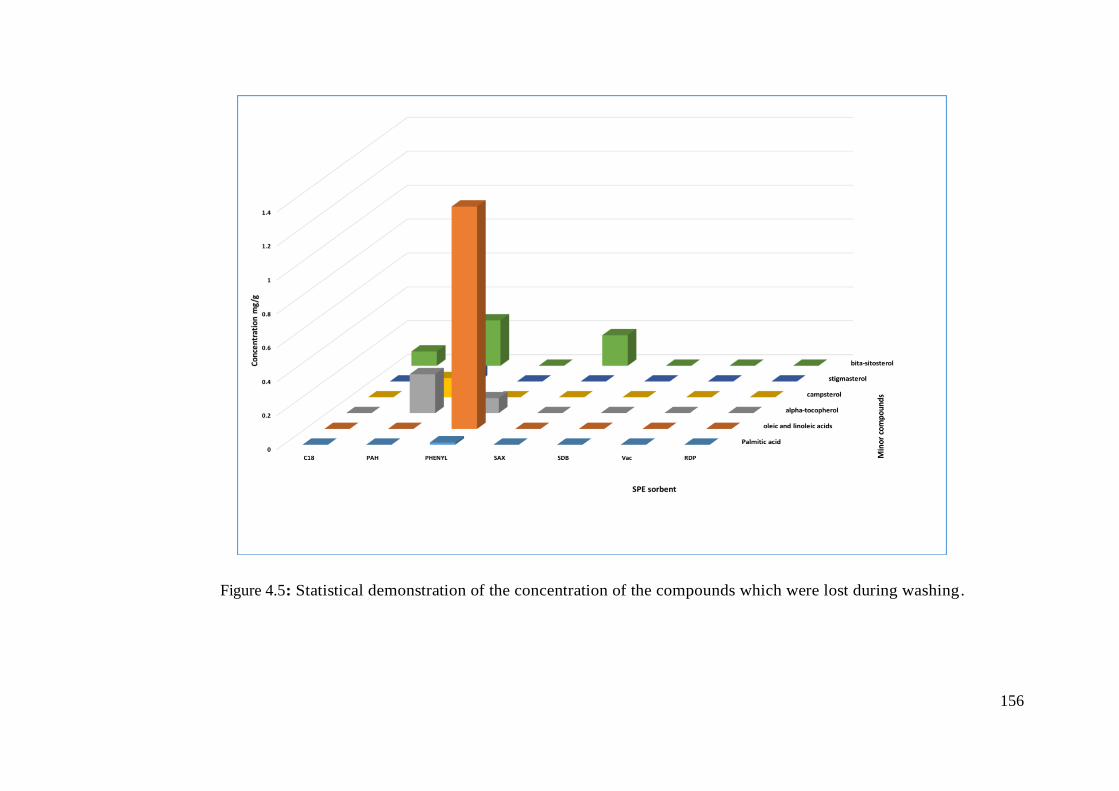
156
Figure 4.5: Statistical demonstration of the concentration of the compounds which were lost during washing.
157
4.3.3 After elution
The elution step was carried out by adding 3 mL of methanol with 5% acetic
acid to the SPE cartridges, then collectting the eluent after passing the sorbents.
Afterwards, the solvent was evaporated and the residues were reconstituted in
hexane to be analysed using GC/MS. It was possible to calculate the concentrations
using the integration of the peaks and the calibration curve for each compound
(Table 4.4, Figure 4.6).
To compare the recovery of SPE from the seven types of sorbents in the current
study, it was essential to consider the total amount of the separated compounds and
the types of eluted compounds in Table 4.4. Regarding the diversity and quantity of
the extracted minor compounds, RDP and PAH were far superior to other SPE
sorbents with 6.759 and 5.095 mg g-1, respectively of the separated minor
compounds from the sunflower oil solution. The purification using these adsorbnets
resulted in the largest number of the compounds under the study that were identified
using GC/MS. Moreover, Phenyl and Vac showed the various range of the extracted
compounds with less of the total compounds extracted. Purificaiton using SAX and
SDB resins allowed to purify fewer variety of the extracted compounds, in general
it was only the fatty acids and -tocopherol which were extracted in even lower
quantities that when other resins were used. C18 showed the least amount of
extraction including only fatty acids and -tocopherol and this is expected (in terms
of the quantity) as this adsorbent has shown the highest loss of unadsorbed
compounds after loading.
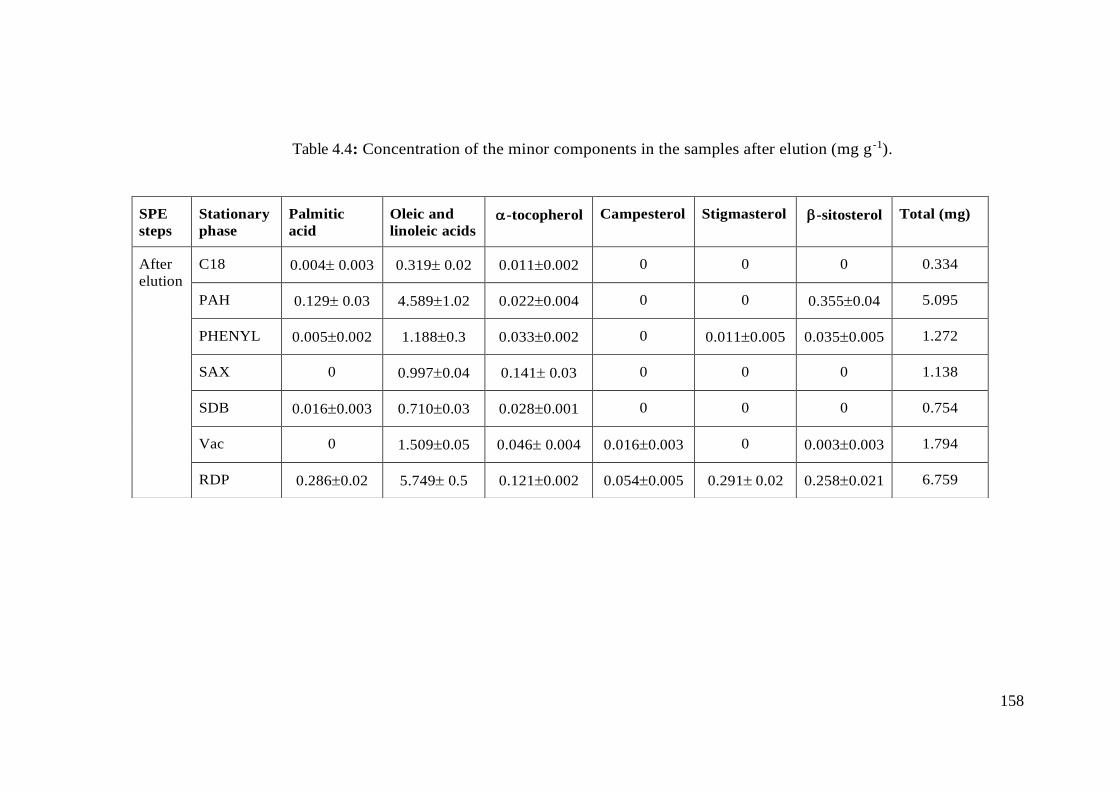
158
Table 4.4: Concentration of the minor components in the samples after elution (mg g-1).
SPE
steps
Stationary
phase
Palmitic
acid
Oleic and
linoleic acids -tocopherol Campesterol Stigmasterol -sitosterol Total (mg)
After
elution
C18 0.004 0.003 0.319 0.02 0.0110.002 0 0 0 0.334
PAH 0.129 0.03 4.5891.02 0.0220.004 0 0 0.3550.04 5.095
PHENYL 0.0050.002 1.1880.3 0.0330.002 0 0.0110.005 0.0350.005 1.272
SAX 0 0.9970.04 0.141 0.03 0 0 0 1.138
SDB 0.0160.003 0.7100.03 0.0280.001 0 0 0 0.754
Vac 0 1.5090.05 0.046 0.004 0.0160.003 0 0.0030.003 1.794
RDP 0.2860.02 5.749 0.5 0.1210.002 0.0540.005 0.291 0.02 0.2580.021 6.759
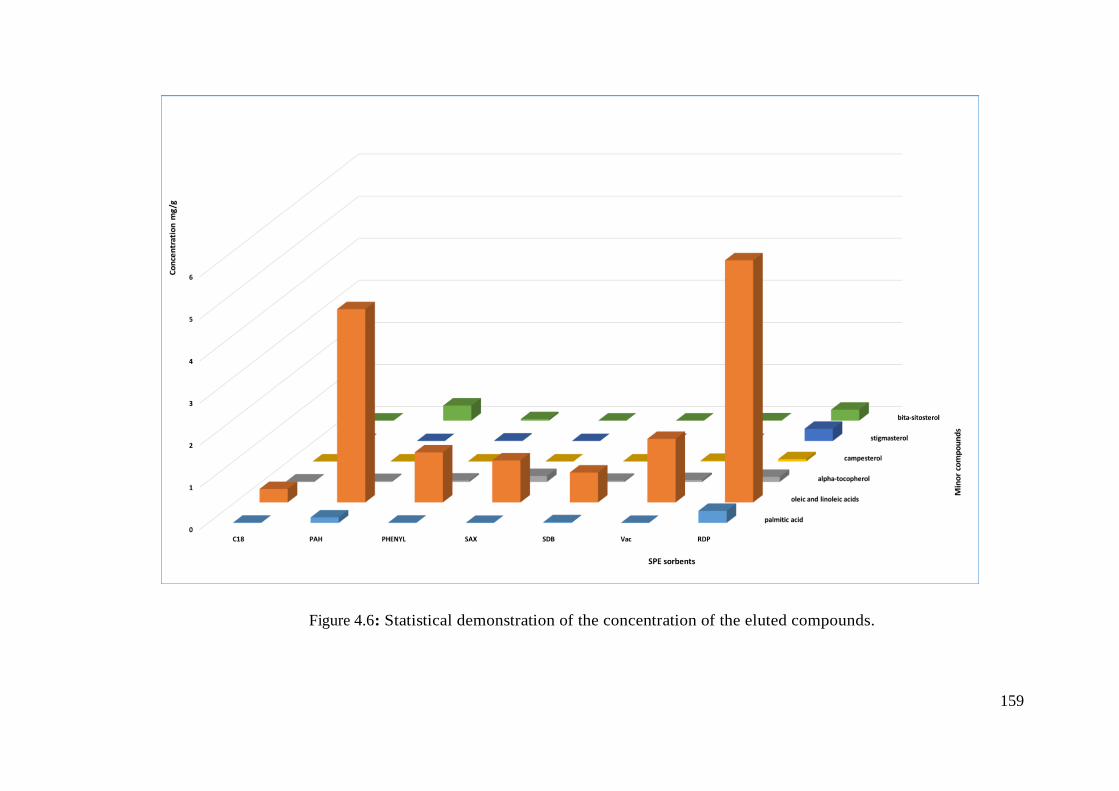
159
Figure 4.6: Statistical demonstration of the concentration of the eluted compounds.
160
4.4 Conclusion:
Based on the time of this research, limited comparison between RDP and some
commercially availble cartridges was made. Using optimised SPE protocol, the
comparison between six commercially available resins and RDP has shown
distinguished efficiency of RDP to extract the group of minor components from
20% sunflower oil in heptane with minimum of organic solvents. Moreover, the
optimised protocol has enabled to achieve an almost similar and good result with
carbon-based polymer PAH. Despite the possibility to extract some of the minor
component using the other sorbents they were not as effective as developed RDP.
161
References
1) Andrade-Eiroa A.; Canle M.; Leroy-Cancellieri V.; Cerdà V. Solid-phase
extraction of organic compounds: A critical review (Part I). Trends Anal. Chem.
2016, 80, 641–654.
2) Augusto F.; Hantao L.; Mogollón, N.; Braga, S. New materials and trends in
sorbents for solid-phase extraction. Trends Anal. Chem. 2013, 43, 14–23.
3) Płotka-Wasylka J.; Szczepańska N.; de la Guardia, M.; Namieśnik J.
Miniaturized solid-phase extraction techniques. Trends Anal. Chem. 2015, 73, 19–
38.
4) Gilart N.; Borrull F.; Fontanals N.; Marcé R. Selective materials for solid-phase
extraction in environmental analysis. Trends Environ. Anal. Chem. 2014, 1, e8–e18.
Trends Anal. Chem. 2016, 80, 12–29.
5) Xu C.; Chen G.; Xiong Z.; Fan Y.; Wang X.; Liu Y. Applications of solid-phase
microextraction in food analysis. Trends Anal. Chem. 2016, 80, 12–29.
6) Huck C.; Bonn G. Recent developments in polymer-based sorbents for solid-
phase extraction. J. Chromatogr. A 2000, 885, 51–72.
7) Song X., Xu S.; Chen L.; Wei Y.; Xiong H. Recent advances in molecularly
imprinted polymers in food analysis. J. Appl. Polym. Sci. 2014, 131, 1-18.
8) Buszewski B.; Szultka M. Past, Present, and Future of Solid Phase Extraction: A
Review. Crit. Rev. Anal. Chem. 2012, 42, 198–213.
9) Dmitrienko S.; Kochuk E.; Tolmacheva V.; Apyari V.; Zolotov Y. Comparison
of adsorbents for the preconcentration of sulfanilamides from aqueous solutions
prior to HPLC determination. J. Anal. Chem. 2013, 68, 871–879.
10) Kimata K.; Hirose T.; Moriuchi K.; Hosoya K.; Araki T.; Tanaka N. High-
Capacity Stationary Phases Containing Heavy Atoms for HPLC Separation of
Fullerenes. Anal. Chem. 1995, 67, 2556–2561.
162
11) Turowski M.; Morimoto T.; Kimata K.; Monde H.; Ikegami T.; Hosoya K.;
Tanaka N. Selectivity of stationary phases in reversed-phase liquid chromatography
based on the dispersion interactions. J. Chromatogr. A 2001, 911, 177–191.
12) Christie W. The Lipid Web http://www.lipidhome.co.uk/ms/others/ffa-
tms/index.htm (accessed Oct 1, 2017).
13) Simpson N. Solid phase extraction principle, techniques and applications.
2000, Marcel Dckker, Inc. New York, USA.
14) Piletsky S.; Karim K.; Piletska E.; Day C.; Freebairn K.;Leggeb C. Turner A.
Recognition of ephedrine enantiomers by molecularly imprinted polymers designed
using a computational approach. Analyst 2001, 126, 1826–1830.
15) Piletska E.; Burns R.; Terry L.; Piletsky S. Application of a molecularly
imprinted polymer for the extraction of kukoamine a from potato peels. J. Agric.
Food Chem. 2012, 60, 95–9.
16) Piletsky S.; Piletska E.; Karim K.; Foster G.; Legge C.; Turner A. Custom
synthesis of molecular imprinted polymers for biotechnological application:
Preparation of a polymer selective for tylosin. Anal. Chim. Acta 2004, 504, 123–
130.
17) Guerreiro A.; Soares A.; Piletska E.; Mattiasson B.; Piletsky S. Preliminary
evaluation of new polymer matrix for solid-phase extraction of nonylphenol from
water samples. Anal. Chim. Acta 2008, 612, 99–104.
18) Horváth C.; R.Melander W.; Molnar I. Solvophobic interactions in liquid
chromatography with nonpolar stationary phase. J. Chromatogr. 1976, 1269, 129–
156.
19) Courtois C.; Allais C.; Constantieux T.; Rodriguez J.; Caldarelli S.; Delaurent
C. Cholesteric bonded stationary phases for high-performance liquid
chromatography: synthesis, physicochemical characterization, and
chromatographic behavior of a phospho–cholesteric bonded support. A new way to
mimic drug/membrane interactions? Anal. Bioanal. Chem. 2008, 392, 1345–1354.
163
20) Ashley, J.; Shahbazi M.; Kant K.; Chidambara V.; Wolff A.; Bang D.; Sun Y.
Imprinted polymers for sample preparation and biosensing in food analysis:
Progress and perspectives. Biosens. Bioelectron. 2017, 91, 606–615.
21) Qureshi M.; Stecher G.; Huck C.; Bonn G. Preparation of polymer based
sorbents for solid phase extraction of polyphenolic compounds. Cent. Eur. J. Chem.
2011, 9, 206–212.
22) Andrade-Eiroa A.; Canle M.; Leroy-Cancellieri V.; Cerdà V. Solid-phase
extraction of organic compounds: A critical review. part ii. Trends Anal. Chem.
2016, 80, 655–667.
23) Christie, W. W. Advance in lipid methodology. 2013, Woodhead Publishing
Limited, Cambridge. UK.
24) Thomas J.; Donnelly C.; Lloyd E.; Mothershead R. Miller M. Development and
validation of a solid phase extraction sample cleanup procedure for the recovery of
trace levels of nitro-organic explosives in soil. Forensic Sci. Int. 2018, 284, 65–77.
25) Alghamdi E.; Whitcombe M.; Piletsky S.; Piletska E. Solid phase extraction of
α-tocopherol and other physiologically active components from sunflower oil using
rationally designed polymers. Anal. Methods 2018, 10, 1–8.
26) Alghamdi E.; Piletsky S.; Piletska E. Application of the bespoke solid-phase
extraction protocol for extraction of physiologically-active compounds from
vegetable oils. Talanta 2018, 189, 157–165.
27) Munawar H.; Smolinska-Kempisty K.; Cruz A.; Canfarotta F.; Piletska E.;
Karim K.; Piletsky S. A Molecularly imprinted polymer nanoparticle-based assay
(MINA): application for fumonisin B1 determination. The Analyst 2018, 143, 3481–
3488.
28) Smolinska-Kempisty K.; Ahmad, O.; Guerreiro A.; Karim K.; Piletska E.;
Piletsky S. New potentiometric sensor based on molecularly imprinted
nanoparticles for cocaine detection. Biose Bioelectronics, 2017, 96, 49-54.
29) Musile, G.; Cenci L.; Piletska E.; Gottardo R.; Bossi A.; Bortolotti F.
Development of an in-house mixed-mode solid-phase extraction for the
164
determination of 16 basic drugs in urine by High Performance Liquid
Chromatography-Ion Trap Mass Spectrometry. J. Chromatogr. A 2018, 1560, 10–
18.
30) Piletska E.; Kumir J.; Sergeyeva T.; Rational design and development of
affinity adsorbents for analytical and biopharmacutical. JCAM 2013, 1, 229-244.
31) Nabarlatz D.; de Celis J.; Bonelli P.; Cukierman A. Batch and dynamic sorption
of Ni(II) ions by activated carbon based on a native lignocellulosic precursor. J.
Environ. Manage. 2012, 97, 109–115.
32) Fu, M.; Xing H.; Chen X.; Zhao R.; Zhi C.; Wu C. Boron nitride nanotubes as
novel sorbent for solid-phase microextraction of polycyclic aromatic hydrocarbons
in environmental water samples. Anal. Bioanal. Chem. 2014, 406, 5751–5754.

165
Chapter five
166
Comparison of the selectivity and capacity of the three different
formats of molecularly imprinted polymers
5.1 Introduction
Molecular imprinting technology is a widely accepted synthetic approach to produce
pre-designed polymeric materials with memory to a specific template (or its analogues)
presented during polymer preparation.1,2 The main attractive feature of the molecularly
imprinted polymers that makes them applicable in separation studies is the selectivity.1,3
MIPs have been applied in different research fields based on the capability to recognise
the specific structure and three dimensional shape of the functional groups.
According to Koesdjojo et al., there are a number of successful examples of using
MIPs in separation science 4 and sample preparation or concentration before the analysis.
MIPs have been used as stationary phases for SPE.5,6 There are many successes examples
that have been reported in the pharmaceutical, cosmetic, and nutraceutical industries where
selective MIPs have been used to these compounds. For example, selective microparticles
MIPs have been reported to extract kukoamine from potato peel, the antibiotic tylosin
andephedrine.7–9
More than 40 years ago, many published studies attributed to the development of
molecularly imprinted technology under the same simple concept of using the molecular
template to create recognition sites. Although the great number of successful applications
of these materials, several reviews have suggested that bulk MIPs have some limitations
that require more research and improvements. One of the main drawbacks of MIP is an
irregular shape of the resultant bulk MIPs particles produced after grinding and
sieving.1,3,10,11 MIPs are highly stable materials and can withstand high pressure,
temperatures, organic solvents and different ranges of pH, which made them relevant for
the chromatographic applications.1,12,13 However, it is claimed that the physical
appearances (polydispersity) of MIPs have a significant impact on the efficiency of their
chromatographic performance.3,10,11 The irregular shape of the MIP microparticles,
obtained by grinding of the bulk polymer, hinders the complete removal of the template
molecules that are located in the interior area of the particles due to the high cross-linking
nature of the MIP particles. Therefore, the difficulties of removing the template molecules
from internal binding sites contribute to the reduction of the rebinding capacity and cause
167
poor site accessibility to target molecules.11 Therefore, there are many studies that have
introduced alternative synthetic processes such as those based on the surface imprinting
approaches to generate uniform polymer particles,4 for example, suspension,14
precipitation,15 emulsion16 and dispersion17 polymerisations.
MIP synthesis has been developed to overcome these limitations through the new
generation of the molecularly imprinted polymers. Synthesis MIP in nano-structured can
be one of the attempts to controlling the position of the templates to be only on the surface
of the particles, offering the thorough removal of template molecules. The original
initiative to enhance the MIPs nanostructure was to optimise the uniformity of the
polymeric materials by increasing the surface area-to-volume ratio, leading to better
separation performance and to minimise the variation of the produced polymer
particles.1,11 However, the synthesis of MIP nanoparticles does not have the same degree
of simplicity of preparing bulk MIPs that can be prepared in any moderately equipped
lab.18 Various approaches were developed for the synthesis of molecularly imprinted
polymer nanoparticles (MIP NPs) such as core-shell approaches, precipitation
polymerisation, emulsion polymerisation, and living radical polymerisation processes.3,19
The main goal of this chapter was to compare the main characteristics of the
microparticles RDP and MIP and magnetic nanoparticles (MIP NPs) and discuss their
advantages for particular separation and purification needs. In addition, to complete the
framework of this thesis, this chapter includes an optimised protocol of solid-phase
synthesis of molecularly imprinted polymer nanoparticles (MIP NPs) specific for α-
tocopherol based on the procedure recently developed by Leicester Biotechnology Group.
168
5.2 Materials and methods
5.2.1 Chemicals and reagents
Ethylene glycol dimethacrylate (EGDMA), 1,1'-azobis (cyclohexane carbonitrile),
methacrylic acid (MAA), tri-methylolpropane tri-methacrylate (TRIM) and methanol
were purchased from Sigma-Aldrich, UK. -tocopherol was purchased from Santa Cruz
Biotechnology (UK). Acetonitrile, iron (II, III) oxide, ethyl acetate, heptane, n-hexane, dry
toluene, 3-(trimethyloxysilyl) propyl methacrylate and acetic acid were obtained from
Fisher Scientific (UK). Dimethylformamide was obtained from Acros Organics (UK). All
solvents were of HPLC-quality grade and used without any purification. N, N-
diethyldithiocarbamic acid benzyl ester (iniferter) was synthesised in the lab by a member
of the group. Glass beads (diameter, 70 - 100 μm) (Potters, Spheriglass A-Glass cat. no.
2429, CP 00), Blagden Chemicals, UK. Phosphate buffered saline (PBS), N, N’-
diisopropylethylamine (DIPEA), (3-glycidyloxypropyl) trimetoxysilane) (GOPTS), N-
ethyldiisopropylamine (EIPA), Sodium hydroxide (NaOH) and sulfuric acid (H2SO4) were
purchased from Sigma-Aldrich, UK
5.2.2 Equipment and analysis techniques
The quantification of the -tocopherol in the different experiments was performed
using the Gas Chromatography-Mass-spectrometry (GC/MS) set-up (Perkin Elmer,
TurboMass, UK) using a 30 m x 250 µm, 0.25 mm I.D., ZB-5 capillary column
(Phenomenex, UK). Helium gas was used to carry the sample at a flow-rate of 1 mL min-
1 at 200 °C. After injection of 10 L of the sample at 200 °C, the temperature of the GC
oven was raised by 10 °C min-1 to 350 °C and held for 3 min.
Surface Area Analyser and Porosimeter (Quantachrome, UK) was used for the
measurement of the surface area of bulk microparticles (MIP and RDP). The size of the
nanoparticles was analysed using a Zetasizer Nano (Nano-S) from Malvern Instruments
Ltd (Malvern, UK) in a glass cuvette at 25 °C.
UHPLC/DAD/MS was used for analysing the samples of -tocopherol in the
experiment of incubation with MIP NPs. It consists of UHPLC (Waters Acquity UPLC),
UV detector (DAD) (Waters PDA e detector), MA (Waters Xevo G2XS QTof), (+ESI)
169
ionisation and C18 column, 1.7m, 2.1 mm 50 mm (Waters UPLC BEH) with solvent
system 100% acetonitrile for 2 min run and 1 L injection of the sample.
5.2.3 Synthesis of the microparticles of bulk polymer (RDPs and MIP)
The bulk polymers RDP and MIP were prepared using the same monomeric
composition that was mentioned in the second chapter for synthesis of the RDP. The
synthesis of the polymer has started with the molecular modelling that has been presented
in the second chapter as well. Then, synthesis of MIP involved adding -tocopherol as a
template in the polymerisation mixture, while it was not included in the synthesis RDP.
5.2.4 Preparation of the bulk MIP
The bulk MIP was prepared based on the optimised formulation that was mentioned
in the second chapter with some modification associated with the presence of the template
in the case of MIPs as follows:
MIP was prepared using the free radical polymerisation to produce the polymers in
a bulk form. The used ratio of monomer: cross-linker by mass was 1:9, then the addition
of the template was 5% of the monomer mixture, which was included in the amount of the
cross-linker as follows: the polymer was prepared by weighing all the components of
polymerisation mixture. Firstly, 1 g of MAA (10%) and 0.5 gm of -tocopherol with 8.5
g of EGDMA (90%) were dissolved in an equal weight of dimethylformamide (10 g), then,
0.1 g of the initiator 1,1' azobis (cyclohexane carbonitrile) was added. All the components
were dissolved using an ultrasonic bath for 5 min. Then, the monomeric mixture was
deoxygenated by purging it with the nitrogen for 10 min. The vial with the monomeric
mixture was tightly closed with cap, additionally secured using parafilm and thermo-
polymerised at 80 °C for 24 h. After 24 hours, the polymer was removed from the vial and
ground using electrical mortar. The resulting particles were sieved and the polymer
fraction with a size between 63 to 125 µm was collected. The prepared polymer fraction
was washed for 36 hours using Soxhlet extraction with methanol: acetic acid (9:1 v/v).
The MIP was further washed with methanol in order to remove the remaining acetic acid.
Then, the polymer was dried in the oven at 70 °C. To test the complete wash of MIP and
removal of -tocopherol from imprinted cavities, the polymer was packed in SPE
cartridges and eluted with the solvent (ethanol containing 5% acetic acid). No -
170
tocopherol was detected in the elution sample that was analysed using the UV-Vis
spectrophotometer. All experiments were repeated three times.
5.2.5 Characterisation of the MIP particles
Surface area
As it was done with RDP, the surface area of MIP was measured using the multi-
point Brunauer, Emmett and Teller (BET) method using the Surface Area and Pore
Volume Analyser (Quantachrome, UK).8,20 The total pore volume and average pore
diameter were evaluated using the 45-point isotherm curve.
5.2.6 Recognition of MIP towards -tocopherol
Three different amounts of MIP (50, 100, 500 mg) were incubated in 2 mL of 2 mg
mL-1 of -tocopherol in heptane for 4 hours. Then, -tocopherol analytes were filtered and
dried under nitrogen, then, dissolved in hexane before measuring the unbounded -
tocopherol. Then, the concentration of -tocopherol was measured by using UV
spectroscopy and compared to the calibration curve of -tocopherol in hexane to measure
to the concentration of adsorbed -tocopherol was calculate as follows:
[bound -tocopherol] = [Initial concentration of -tocopherol]- [unbound -
tocopherol] Adsorption % = ([bound -tocopherol]/ [Initial concentration of -
tocopherol])100
5.2.7 Comparison between the microparticles MIP and RDP
This comparison between the performance of the two polymers was made by
comparing the loading capacity and the recovery from each of them. The loading capacity
was measured by weighing 100 mg from each of RDP and MIP and transferring them to
3 different vials for each polymer including 1 mL of three different concentrations: 1, 2, 3
mg mL-1. After 4 hours, the polymers were filtered. The filtrates were dried under nitrogen
and dissolved in hexane to quantify the unbounded -tocopherol using GC/MS, then, the
loading capacity was calculated as follows:
171
Loading capacity= [bound template (mg)]/weight of the polymer (g)
After filtering from the incubation solution, recovery of -tocopherol was quantified
by filtering the solution and placing the polymer into 3mL of methanol containing 5%
acetic acid. The eluted solution was then filtered and evaporated to the dryness. The
obtained residues were solvated in hexane and analysed using GC/MS. The recovery of
the eluted -tocopherol was calculated as follows:
Recovery % = ([eluted analyte]/ [ bound template])100
5.2.8 Application of the optimised SPE protocol to sunflower oil solution to MIP
The same solvent system of the SPE process to extract the minor components from
vegetable oils which was described in the second chapters was applied here to examine
the difference in the performance of MIP and RDP towards 20% sunflower oil in heptane.
100 mg of MIP and RDP were incubated in 2 vials, each of them contained 1 mL of 20%
of sunflower oil in heptane. Then, each millilitre was filtered through the polymer and
filtrates were collected, evaporated and dissolved in hexane to be analysed with GC/MS.
The experiment was repeated three times.
5.2.9 Exploration the Selectivity and capacity of MIP NPs
Synthesis of MIP NPs
The synthesis of MIP NPs was performed based on the protocol developed by
Leicester Biotechnology Group.21 The protocol consisted of three parts: (1) the preparation
of the glass beads (GB) as a solid phase with an immobilised template (-tocopherol); (2)
the synthesis of molecularly imprinted polymer nanoparticles (MIP NPs); (3) the
purification and characterisation of the MIP NPs.
5.2.9.1 Functionalisation of the glass beads (GB)
Starting with the glass beads with diameters between 70 to 100 μm (Potters,
Spheriglass A glass) that were activated and modified to have an epoxy group on their
surface as a preamble to immobilise the template on them. 500 g of glass beads (75-100
µm) were placed in a flask with an aqueous of sodium hydroxide solution (4 M) and boiled
for 15 mins. Solution was kept 2 cm above the solids. Then, the glass beads were washed
with deionised water 3 times. After washing the glass beads, they were incubated in a
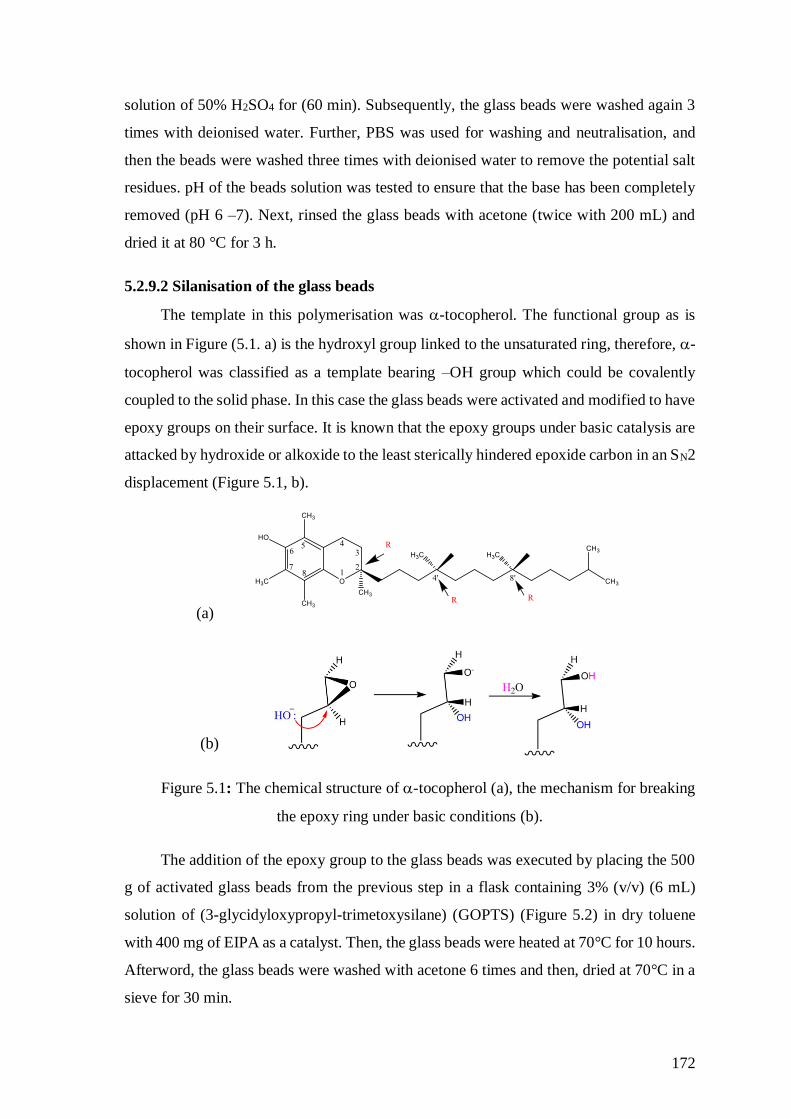
172
solution of 50% H2SO4 for (60 min). Subsequently, the glass beads were washed again 3
times with deionised water. Further, PBS was used for washing and neutralisation, and
then the beads were washed three times with deionised water to remove the potential salt
residues. pH of the beads solution was tested to ensure that the base has been completely
removed (pH 6 –7). Next, rinsed the glass beads with acetone (twice with 200 mL) and
dried it at 80 °C for 3 h.
5.2.9.2 Silanisation of the glass beads
The template in this polymerisation was -tocopherol. The functional group as is
shown in Figure (5.1. a) is the hydroxyl group linked to the unsaturated ring, therefore, -
tocopherol was classified as a template bearing –OH group which could be covalently
coupled to the solid phase. In this case the glass beads were activated and modified to have
epoxy groups on their surface. It is known that the epoxy groups under basic catalysis are
attacked by hydroxide or alkoxide to the least sterically hindered epoxide carbon in an SN2
displacement (Figure 5.1, b).
(a)
(b)
Figure 5.1: The chemical structure of -tocopherol (a), the mechanism for breaking
the epoxy ring under basic conditions (b).
The addition of the epoxy group to the glass beads was executed by placing the 500
g of activated glass beads from the previous step in a flask containing 3% (v/v) (6 mL)
solution of (3-glycidyloxypropyl-trimetoxysilane) (GOPTS) (Figure 5.2) in dry toluene
with 400 mg of EIPA as a catalyst. Then, the glass beads were heated at 70°C for 10 hours.
Afterword, the glass beads were washed with acetone 6 times and then, dried at 70°C in a
sieve for 30 min.
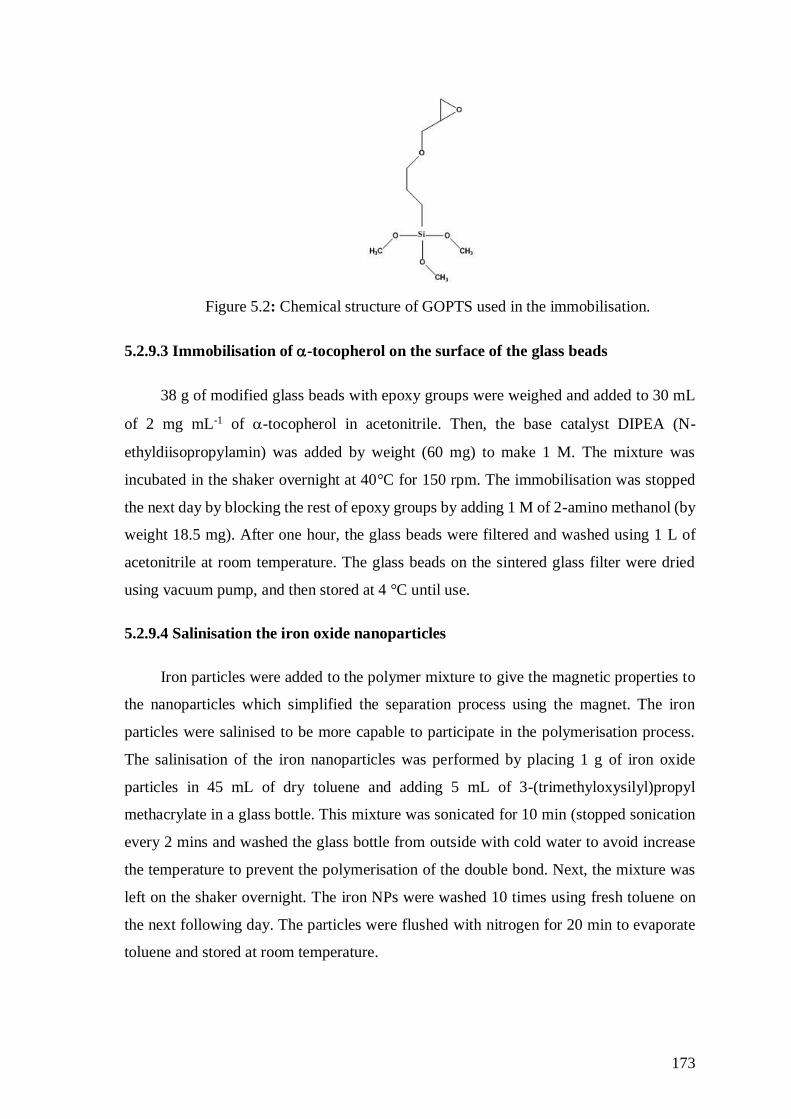
173
Figure 5.2: Chemical structure of GOPTS used in the immobilisation.
5.2.9.3 Immobilisation of -tocopherol on the surface of the glass beads
38 g of modified glass beads with epoxy groups were weighed and added to 30 mL
of 2 mg mL-1 of -tocopherol in acetonitrile. Then, the base catalyst DIPEA (N-
ethyldiisopropylamin) was added by weight (60 mg) to make 1 M. The mixture was
incubated in the shaker overnight at 40°C for 150 rpm. The immobilisation was stopped
the next day by blocking the rest of epoxy groups by adding 1 M of 2-amino methanol (by
weight 18.5 mg). After one hour, the glass beads were filtered and washed using 1 L of
acetonitrile at room temperature. The glass beads on the sintered glass filter were dried
using vacuum pump, and then stored at 4 °C until use.
5.2.9.4 Salinisation the iron oxide nanoparticles
Iron particles were added to the polymer mixture to give the magnetic properties to
the nanoparticles which simplified the separation process using the magnet. The iron
particles were salinised to be more capable to participate in the polymerisation process.
The salinisation of the iron nanoparticles was performed by placing 1 g of iron oxide
particles in 45 mL of dry toluene and adding 5 mL of 3-(trimethyloxysilyl)propyl
methacrylate in a glass bottle. This mixture was sonicated for 10 min (stopped sonication
every 2 mins and washed the glass bottle from outside with cold water to avoid increase
the temperature to prevent the polymerisation of the double bond. Next, the mixture was
left on the shaker overnight. The iron NPs were washed 10 times using fresh toluene on
the next following day. The particles were flushed with nitrogen for 20 min to evaporate
toluene and stored at room temperature.
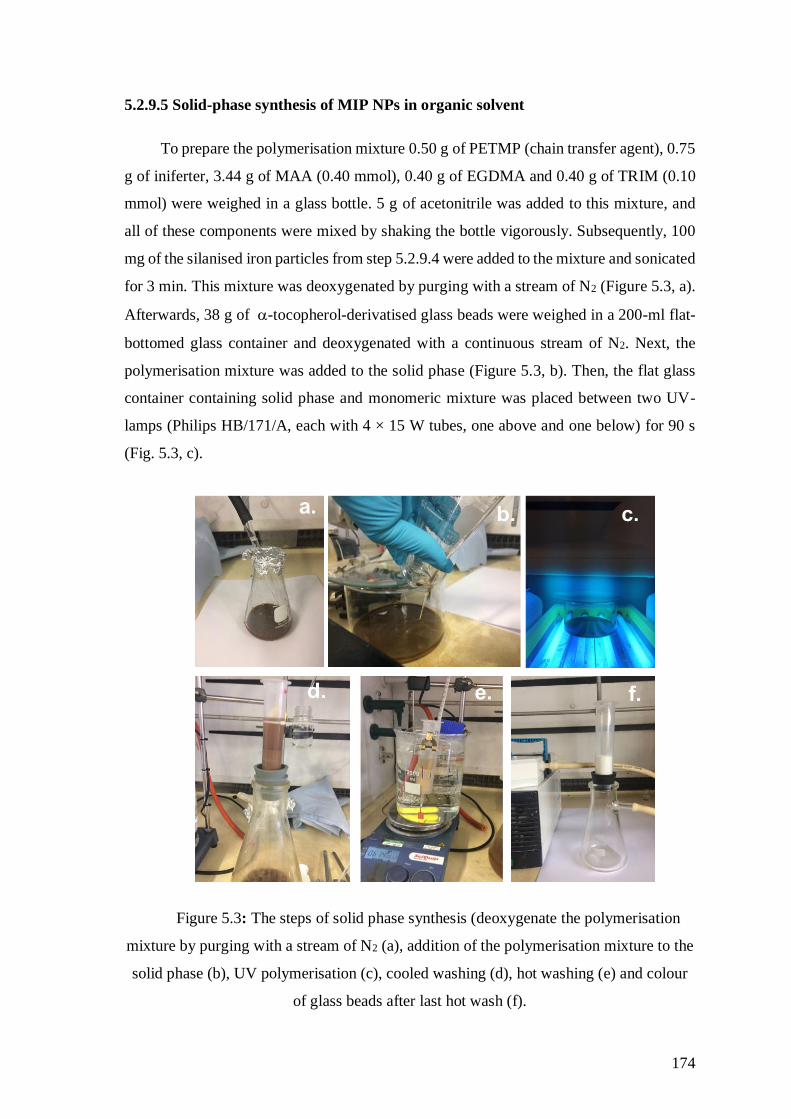
174
5.2.9.5 Solid-phase synthesis of MIP NPs in organic solvent
To prepare the polymerisation mixture 0.50 g of PETMP (chain transfer agent), 0.75
g of iniferter, 3.44 g of MAA (0.40 mmol), 0.40 g of EGDMA and 0.40 g of TRIM (0.10
mmol) were weighed in a glass bottle. 5 g of acetonitrile was added to this mixture, and
all of these components were mixed by shaking the bottle vigorously. Subsequently, 100
mg of the silanised iron particles from step 5.2.9.4 were added to the mixture and sonicated
for 3 min. This mixture was deoxygenated by purging with a stream of N2 (Figure 5.3, a).
Afterwards, 38 g of -tocopherol-derivatised glass beads were weighed in a 200-ml flat-
bottomed glass container and deoxygenated with a continuous stream of N2. Next, the
polymerisation mixture was added to the solid phase (Figure 5.3, b). Then, the flat glass
container containing solid phase and monomeric mixture was placed between two UV-
lamps (Philips HB/171/A, each with 4 × 15 W tubes, one above and one below) for 90 s
(Fig. 5.3, c).
Figure 5.3: The steps of solid phase synthesis (deoxygenate the polymerisation
mixture by purging with a stream of N2 (a), addition of the polymerisation mixture to the
solid phase (b), UV polymerisation (c), cooled washing (d), hot washing (e) and colour
of glass beads after last hot wash (f).
175
5.2.9.6 The elution of MIP NPs
To collect the MIP NPs the content of the flat glass container after UV
polymerisation was transferred into a 10 mL SPE cartridge blocked with polyethylene frit
(Figure 5.3, d). Then, the SPE cartridge was cooled in an ice bath at 0°C for 10 min. To
remove the un-react monomers and low-affinity MIP NPs, cold acetonitrile at 4 °C was
used for washing out the SPE content for 10 times. Next, the SPE cartridge was placed
into a water bath at 60 °C. To monitor and maintain the temperature at 60 °C, a
thermometer was placed inside the cartridge (Figure 5.3, e). To collect the nanoparticles,
the SPE content was washed with pre-warmed acetonitrile at 60 °C until the glass beads
turned white in colour (Figure 5.3, f). The acetonitrile from each wash was collected to
finish up with 100 mL of acetonitrile that enclosed the high affinity nanoparticles. The
solution was left at the room temperature to cool down and then, stored them in the fridge
at 4°C.
In order to determine the yield of the MIP NPs, the solution of nanoparticles was
reduced to 20 mL using magnet to collect the nanoparticles and remove the solvent. The
yield and total MIP NPs concentration in the stock solution was calculated by transferring
1 mL of nanoparticles solution to the pre-weighed small vial. The vial weight was also
measured after the complete evaporation of solvent and yield of MIP NPs was calculated
by subtracting original weight of the vial.
5.2.10 Physical characterisation of magnetic nanoparticles (MIP NPs)
5.2.10.1 Dynamic Light Scattering (DLS) size analysis
The characterisations of MIP NPs which have been done in the current study were
analysis of the nanoparticles by DLS to determine the average hydrodynamic diameter (dh)
and the PDI of the MIP NPs. To evaluate the size of the synthesised MIP nanoparticles,
Nano-S Zetasizer Particle Size Analyser (Malvern Instruments, UK) was used to measure
the particle size as an average of the hydrodynamic diameter and the polydispersity index
(PDI). These measurements were used as an indicator of the success of the synthesis.29
DLS measures are based on the interaction between a laser source and the particles to be
measured. The particles were in constant movements (Brownian motion) which was based
on their size. The Brownian motion change by exposing the particles to laser light that in
turn scattered by the nanoparticles. The result of this interaction is fluctuations in the
176
intensity of the scattered light. The DLS apparatus measures the timing of the fluctuations
to define the rate of Brownian motion that was related to the diffusion coefficient (D). dh
(hydrodynamic diameter) can be calculated using the Stokes-Einstein equation:
dh= kT / 3D
k = Boltzmann’s constant, = viscosity, T = absolute temperature.
Equation 5.1: Stokes-Einstein equation.
DLS measurements were done at 25 °C in a glass cuvette (1 cm path length) for MIP
NPs in acetonitrile. 1 mL of MIP NPs in acetonitrile was placed in a vial and sonicated for
2 min to remove any aggregations and the measurements under similar conditions were
taken again. Then, the same measurements were repeated for MIP NPs with a dilution of
10 and 20 times. Further, the MIP NPs were transferred to the glass cuvette and analysed
in the DLS. Six readings were averaged to obtain the measurements.
5.2.10.2 Investigating the sorption property of MIP NPs
In order to investigate the possibility of the produced MIP nanoparticles to rebind -
tocopherol molecules, known amounts of these particles were incubated overnight in the
different concentrations of -tocopherol solution. 0.5 mL of MIP NPs solution containing
1.3 mg of nanoparticles was placed in four different concentrations of a standard solution
of -tocopherol in acetonitrile (40, 60, 80, 100 g mL-1). Subsequently, the incubated
solutions were separated from MIP NPs using a magnet. Then, acetonitrile with 5% acetic
acid was added and sonicated to disturb the intermolecular binding between -tocopherol
and surface of the nanoparticles. After 30 mins, the eluting solution was collected using a
magnet. This solution was evaporated and then, the residues were reconstituted in
acetonitrile and analysed using UHPLC/MS/DRD. Each concentration was repeated two
times and each measurement was repeated five times to take the average.
A calibration curve was made based on the range of -tocopherol concentrations that
were used in the incubation. The concentrations of -tocopherol before and after
incubation with MIP NPs were calculated using the calibration curve equation.
Consequently, calculating the percentage of adsorbed -tocopherol.
177
5.3 Results and discussion
Vegetable oils are a rich source for valuable physiological-active compounds that
have many benefits in the health and pharmaceutical industry. However, there are several
obstacles make this type of research challenging.22,23 Most of the physiologically-active
compounds which are considered as minor components of oil (about 2%) belong to the
polar fraction of vegetable oils. Besides the health importance of this fraction, it has been
considered as an indicator of the quality of the oil measured by the international
regulations. Therefore, there is a demand for improving a reliable method to separate and
analyse the minor components from vegetable oils. -tocopherol is one of the minor
components in vegetable oils that has been drawing researchers’ attention. Several studies
have been reported that analysed -tocopherol directly from oil solution without
processing the oil through the chemical reactions such as saponification that reduced the
yield of separated -tocopherol. For example, using SPE based on a silica cartridge, it was
possible to extract 225 mg kg-l from olive oil.22 Similarly, another report by Lechner, et
al., highlights that -tocopherol was extracted directly from the olive oil solution using a
silica cartridge which yielded 200 mg kg-1.23 However, these studies were conducted using
relatively large amount of solvents or performing multistep pre-treatment of the oil sample
before the SPE using silica gel sorbents.
As has been shown in Chapters 2 and 3 of this thesis, -tocopherol was extracted
from vegetable oils using an optimised SPE protocol and a developed resin together with
several minor components. For example, from olive oil -tocopherol was extracted at level
265 mg kg-1 and this amount was maximised to 1.03 g kg-1 by spiking the oil sample with
(2710-5) mg kg-1. In the previous work in this thesis, GC/MS was applied to analyse the
samples, identify the extracted compounds and measure their quantities. Nevertheless, it
became more challenging to use GC/MS to analyse the samples after extracting using MIP
NPs. This directed the research to explore a more sensitive technique that was capable of
detecting much smaller amounts of -tocopherol in the several experiments in this work.
Fortunately, UHPLC/DAD/MA was available, and kindly the analysis of this part was
conducted by Michael Lee within the Department of Chemistry.
178
5.3.1 Synthesis of microparticles MIP
As mentioned above, MIP was synthesised using the optimised method in the second
chapter with one modification. 5% of -tocopherol was added as a template which
correspond the percentage of template optimised and the commonly used by imprinting
community. Therefore, it was expected that the resulted polymer will have the specificity
towards -tocopherol. Moreover, it was assumed that the quantity of -tocopherol
extracted will be equal to 0.5 mg (the added amount of the template) or less, in contrast to
RDP that extracted -tocopherol with other minor compounds with no restrictions to the
added amount of the template.
5.3.1.1 Characterisation of the MIP
MIPs are synthesised by copolymerisation of functional monomers and cross-linkers
in the presence of template molecules. The synthesis of the polymer underwent to grinding
and sieving, and then, Soxhlet was applied with methanol: acetic acid (9:1) for 36 hours
to wash the template molecule out of the polymer. After removal of the template
molecules, cavities with specific recognition to -tocopherol were formed in the highly
cross-linked polymer matrix. Therefore, the bulk polymer differed from the RDP in terms
of the addition of the template (-tocopherol) in the polymer mixture.
To ensure that the template was completely washed out from the MIP, 30 mg of the
polymer particles were placed in methanol with 5% acetic acid for 4 hours. Then, filtered
the eluting solution, evaporated and dissolved the residue in hexane to analysis with UV-
Vis spectrophotometer. No -tocopherol was detected as evidence for complete washing
out of the template from the polymer particles.
5.3.1.2 Rebinding of -tocopherol towards the MIP
The rebinding of -tocopherol towards the MIP was assessed by calculating the
percentage of adsorbed -tocopherol on the polymer particles from the standard solution
in heptane. In the beginning, 100 mg of MIP was packed in a 1 mL SPE cartridge to be
used as RDP in the current research. However, under the same SPE conditions mentioned
in the third chapter, MIP did not show sufficient binding of -tocopherol as it was
assessed using GC/MS. This could be because that 100 mg of MIP was insufficient to
extract -tocopherol that in the range of GC/MS detection range. Therefore, to keep the
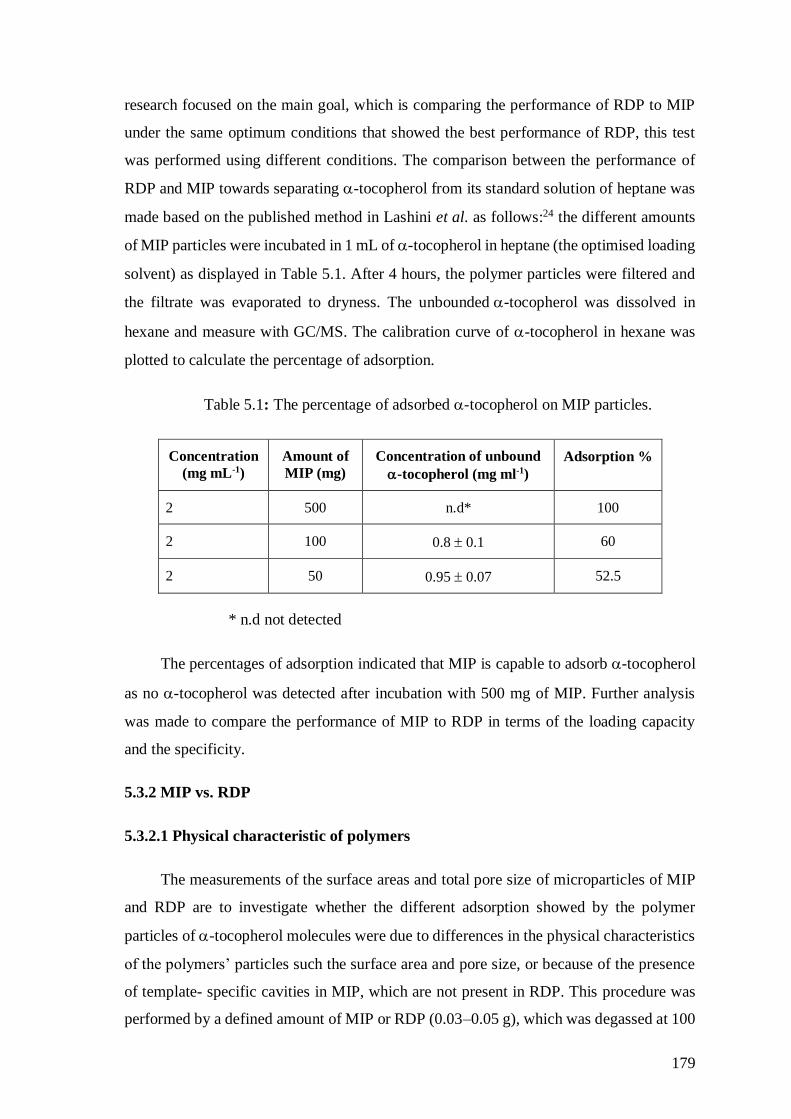
179
research focused on the main goal, which is comparing the performance of RDP to MIP
under the same optimum conditions that showed the best performance of RDP, this test
was performed using different conditions. The comparison between the performance of
RDP and MIP towards separating -tocopherol from its standard solution of heptane was
made based on the published method in Lashini et al. as follows:24 the different amounts
of MIP particles were incubated in 1 mL of -tocopherol in heptane (the optimised loading
solvent) as displayed in Table 5.1. After 4 hours, the polymer particles were filtered and
the filtrate was evaporated to dryness. The unbounded -tocopherol was dissolved in
hexane and measure with GC/MS. The calibration curve of -tocopherol in hexane was
plotted to calculate the percentage of adsorption.
Table 5.1: The percentage of adsorbed -tocopherol on MIP particles.
Concentration
(mg mL-1)
Amount of
MIP (mg)
Concentration of unbound
-tocopherol (mg ml-1)
Adsorption %
2 500 n.d* 100
2 100 0.8 0.1 60
2 50 0.95 0.07 52.5
* n.d not detected
The percentages of adsorption indicated that MIP is capable to adsorb -tocopherol
as no -tocopherol was detected after incubation with 500 mg of MIP. Further analysis
was made to compare the performance of MIP to RDP in terms of the loading capacity
and the specificity.
5.3.2 MIP vs. RDP
5.3.2.1 Physical characteristic of polymers
The measurements of the surface areas and total pore size of microparticles of MIP
and RDP are to investigate whether the different adsorption showed by the polymer
particles of -tocopherol molecules were due to differences in the physical characteristics
of the polymers’ particles such the surface area and pore size, or because of the presence
of template- specific cavities in MIP, which are not present in RDP. This procedure was
performed by a defined amount of MIP or RDP (0.03–0.05 g), which was degassed at 100
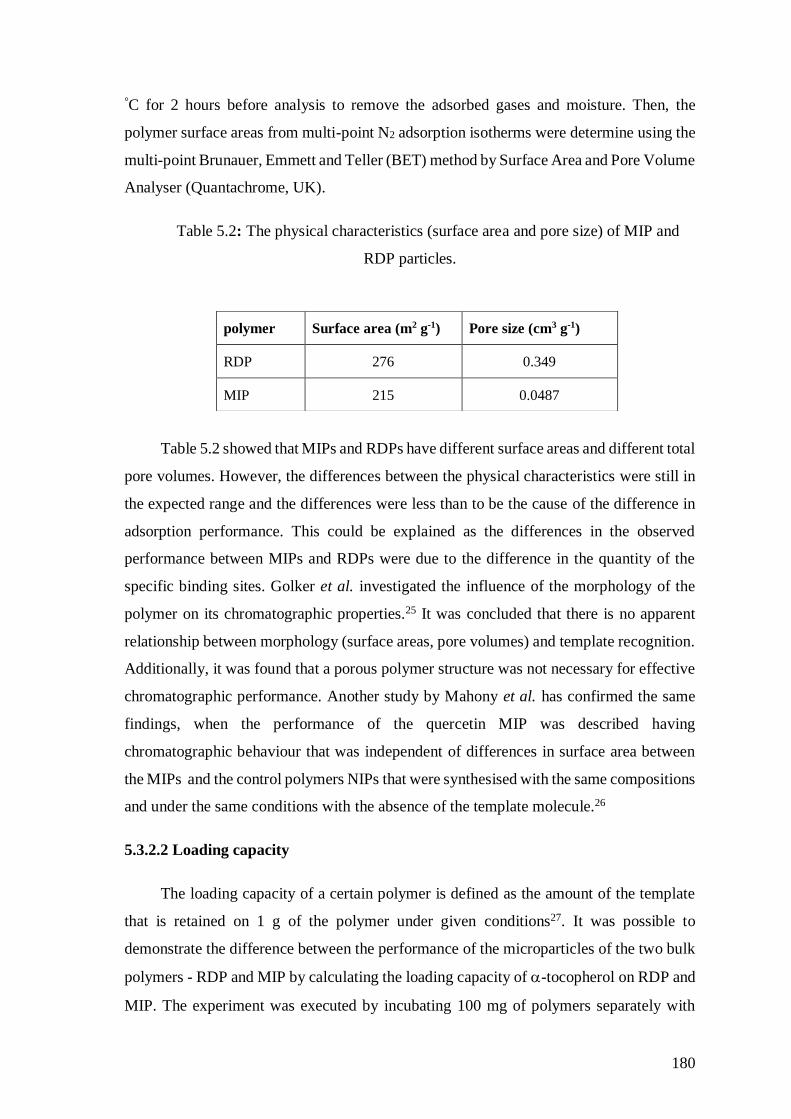
180
°C for 2 hours before analysis to remove the adsorbed gases and moisture. Then, the
polymer surface areas from multi-point N2 adsorption isotherms were determine using the
multi-point Brunauer, Emmett and Teller (BET) method by Surface Area and Pore Volume
Analyser (Quantachrome, UK).
Table 5.2: The physical characteristics (surface area and pore size) of MIP and
RDP particles.
Table 5.2 showed that MIPs and RDPs have different surface areas and different total
pore volumes. However, the differences between the physical characteristics were still in
the expected range and the differences were less than to be the cause of the difference in
adsorption performance. This could be explained as the differences in the observed
performance between MIPs and RDPs were due to the difference in the quantity of the
specific binding sites. Golker et al. investigated the influence of the morphology of the
polymer on its chromatographic properties.25 It was concluded that there is no apparent
relationship between morphology (surface areas, pore volumes) and template recognition.
Additionally, it was found that a porous polymer structure was not necessary for effective
chromatographic performance. Another study by Mahony et al. has confirmed the same
findings, when the performance of the quercetin MIP was described having
chromatographic behaviour that was independent of differences in surface area between
the MIPs and the control polymers NIPs that were synthesised with the same compositions
and under the same conditions with the absence of the template molecule.26
5.3.2.2 Loading capacity
The loading capacity of a certain polymer is defined as the amount of the template
that is retained on 1 g of the polymer under given conditions27. It was possible to
demonstrate the difference between the performance of the microparticles of the two bulk
polymers - RDP and MIP by calculating the loading capacity of -tocopherol on RDP and
MIP. The experiment was executed by incubating 100 mg of polymers separately with
polymer Surface area (m2 g-1) Pore size (cm3 g-1)
RDP 276 0.349
MIP 215 0.0487
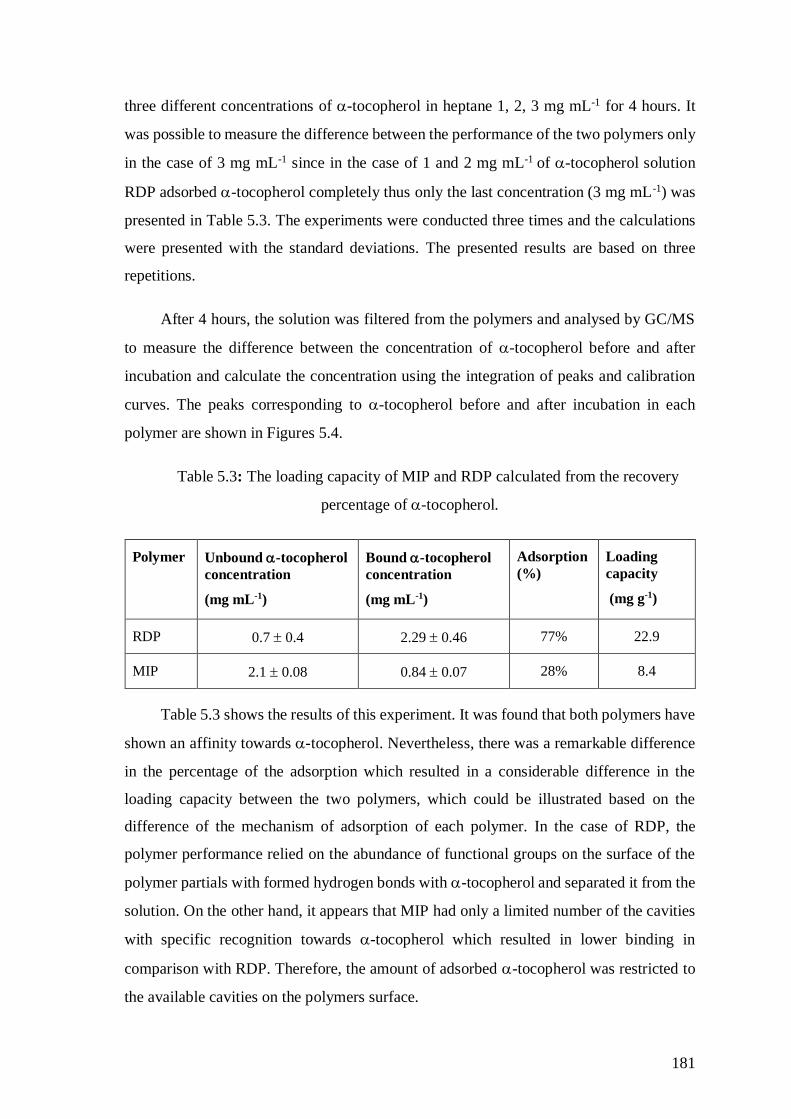
181
three different concentrations of -tocopherol in heptane 1, 2, 3 mg mL-1 for 4 hours. It
was possible to measure the difference between the performance of the two polymers only
in the case of 3 mg mL-1 since in the case of 1 and 2 mg mL-1 of -tocopherol solution
RDP adsorbed -tocopherol completely thus only the last concentration (3 mg mL-1) was
presented in Table 5.3. The experiments were conducted three times and the calculations
were presented with the standard deviations. The presented results are based on three
repetitions.
After 4 hours, the solution was filtered from the polymers and analysed by GC/MS
to measure the difference between the concentration of -tocopherol before and after
incubation and calculate the concentration using the integration of peaks and calibration
curves. The peaks corresponding to -tocopherol before and after incubation in each
polymer are shown in Figures 5.4.
Table 5.3: The loading capacity of MIP and RDP calculated from the recovery
percentage of -tocopherol.
Polymer Unbound -tocopherol
concentration
(mg mL-1)
Bound -tocopherol
concentration
(mg mL-1)
Adsorption
(%)
Loading
capacity
(mg g-1)
RDP 0.7 0.4 2.29 0.46 77% 22.9
MIP 2.1 0.08 0.84 0.07 28% 8.4
Table 5.3 shows the results of this experiment. It was found that both polymers have
shown an affinity towards -tocopherol. Nevertheless, there was a remarkable difference
in the percentage of the adsorption which resulted in a considerable difference in the
loading capacity between the two polymers, which could be illustrated based on the
difference of the mechanism of adsorption of each polymer. In the case of RDP, the
polymer performance relied on the abundance of functional groups on the surface of the
polymer partials with formed hydrogen bonds with -tocopherol and separated it from the
solution. On the other hand, it appears that MIP had only a limited number of the cavities
with specific recognition towards -tocopherol which resulted in lower binding in
comparison with RDP. Therefore, the amount of adsorbed -tocopherol was restricted to
the available cavities on the polymers surface.
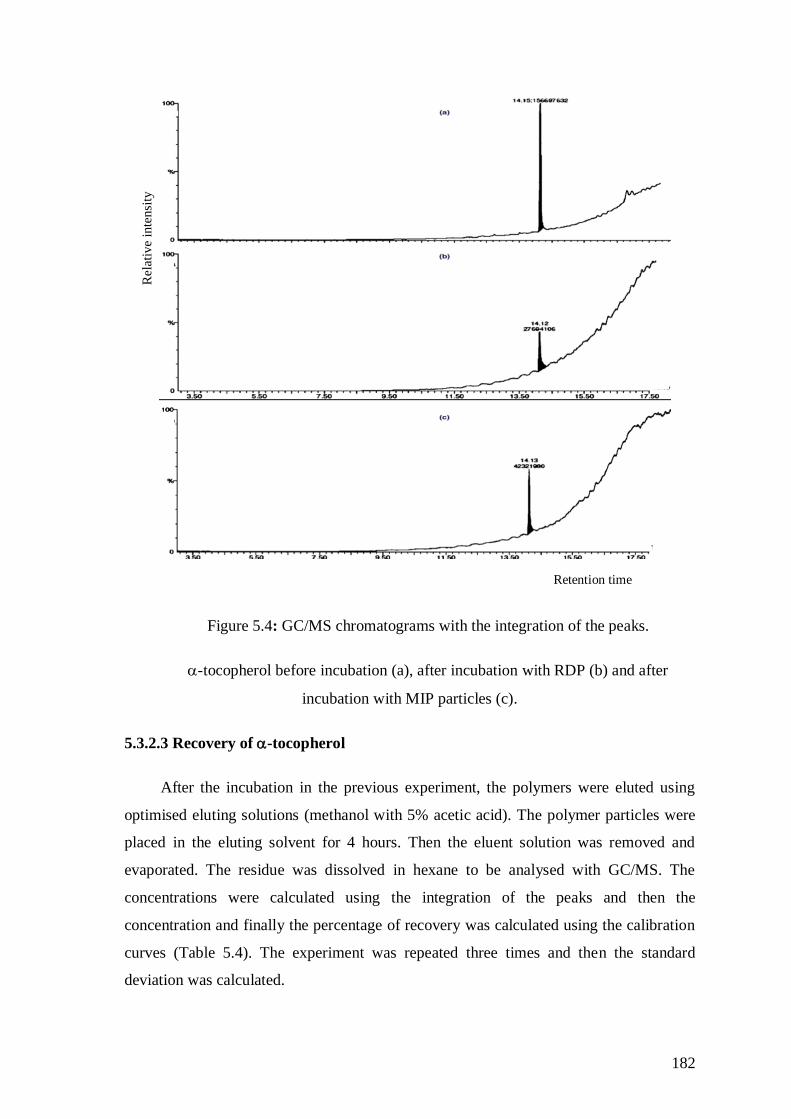
182
Figure 5.4: GC/MS chromatograms with the integration of the peaks.
-tocopherol before incubation (a), after incubation with RDP (b) and after
incubation with MIP particles (c).
5.3.2.3 Recovery of -tocopherol
After the incubation in the previous experiment, the polymers were eluted using
optimised eluting solutions (methanol with 5% acetic acid). The polymer particles were
placed in the eluting solvent for 4 hours. Then the eluent solution was removed and
evaporated. The residue was dissolved in hexane to be analysed with GC/MS. The
concentrations were calculated using the integration of the peaks and then the
concentration and finally the percentage of recovery was calculated using the calibration
curves (Table 5.4). The experiment was repeated three times and then the standard
deviation was calculated.
Rel
ativ
e in
tensi
ty
Retention time
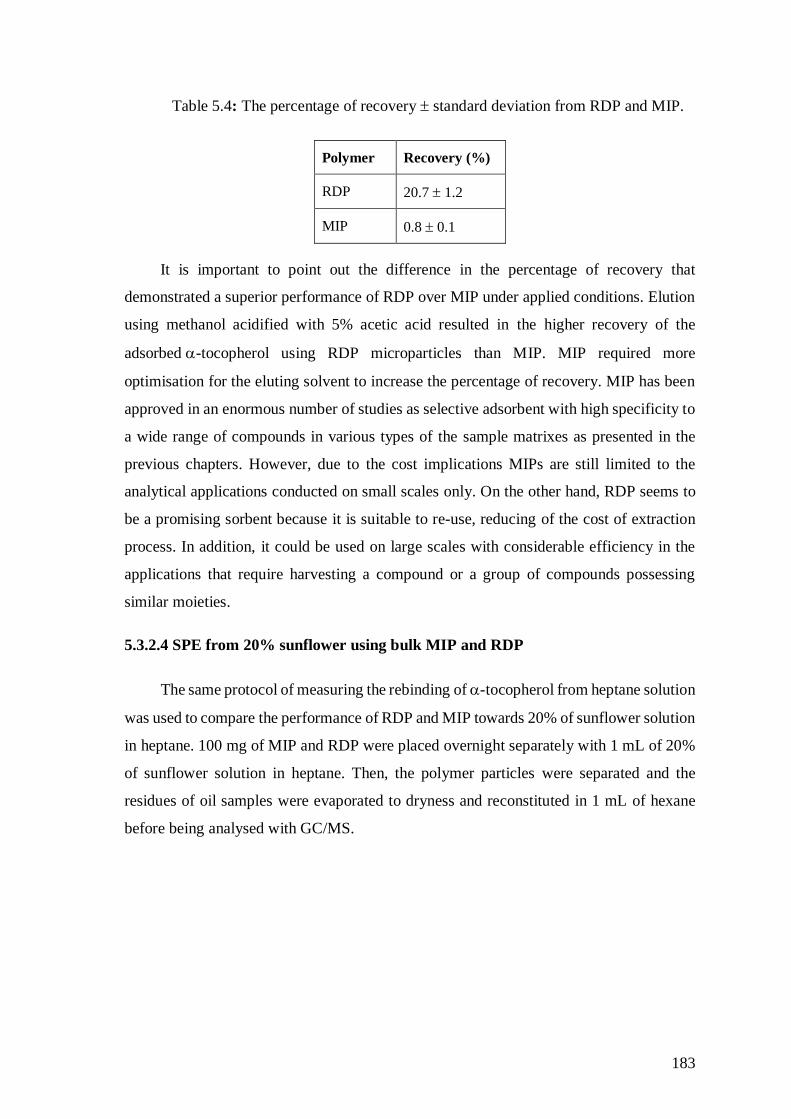
183
Table 5.4: The percentage of recovery standard deviation from RDP and MIP.
Polymer Recovery (%)
RDP 20.7 1.2
MIP 0.8 0.1
It is important to point out the difference in the percentage of recovery that
demonstrated a superior performance of RDP over MIP under applied conditions. Elution
using methanol acidified with 5% acetic acid resulted in the higher recovery of the
adsorbed -tocopherol using RDP microparticles than MIP. MIP required more
optimisation for the eluting solvent to increase the percentage of recovery. MIP has been
approved in an enormous number of studies as selective adsorbent with high specificity to
a wide range of compounds in various types of the sample matrixes as presented in the
previous chapters. However, due to the cost implications MIPs are still limited to the
analytical applications conducted on small scales only. On the other hand, RDP seems to
be a promising sorbent because it is suitable to re-use, reducing of the cost of extraction
process. In addition, it could be used on large scales with considerable efficiency in the
applications that require harvesting a compound or a group of compounds possessing
similar moieties.
5.3.2.4 SPE from 20% sunflower using bulk MIP and RDP
The same protocol of measuring the rebinding of -tocopherol from heptane solution
was used to compare the performance of RDP and MIP towards 20% of sunflower solution
in heptane. 100 mg of MIP and RDP were placed overnight separately with 1 mL of 20%
of sunflower solution in heptane. Then, the polymer particles were separated and the
residues of oil samples were evaporated to dryness and reconstituted in 1 mL of hexane
before being analysed with GC/MS.
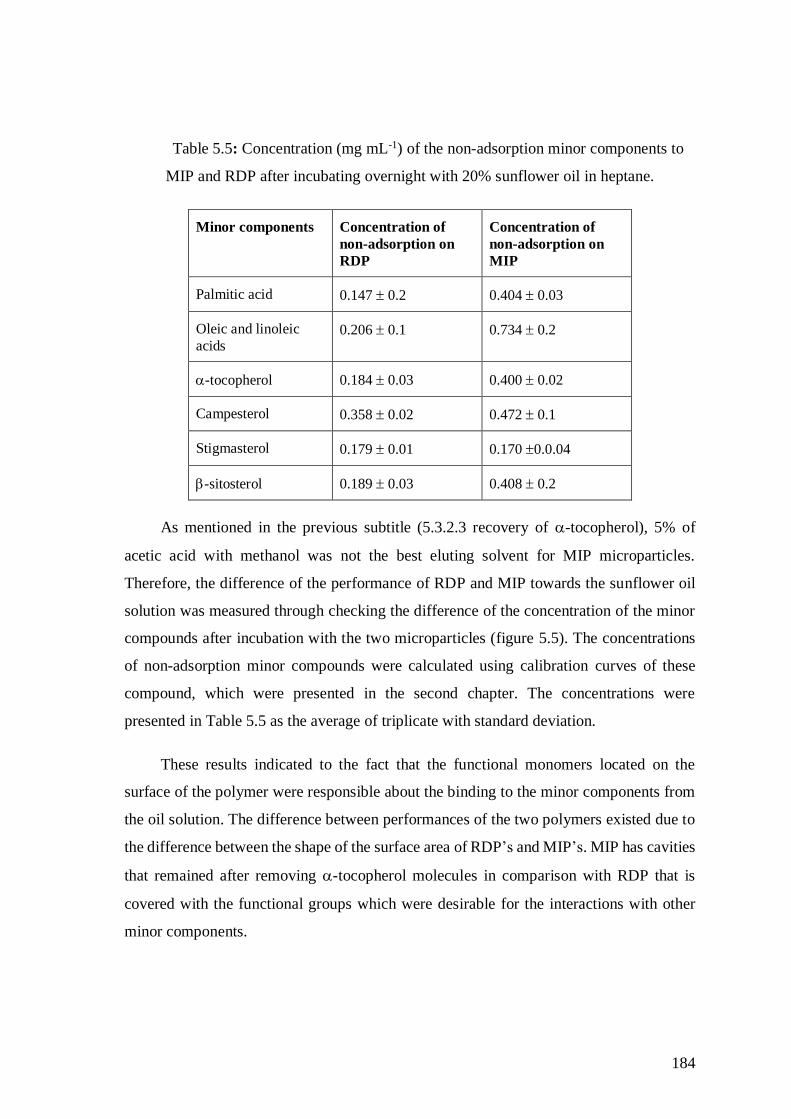
184
Table 5.5: Concentration (mg mL-1) of the non-adsorption minor components to
MIP and RDP after incubating overnight with 20% sunflower oil in heptane.
Minor components Concentration of
non-adsorption on
RDP
Concentration of
non-adsorption on
MIP
Palmitic acid 0.147 0.2 0.404 0.03
Oleic and linoleic
acids 0.206 0.1 0.734 0.2
-tocopherol 0.184 0.03 0.400 0.02
Campesterol 0.358 0.02 0.472 0.1
Stigmasterol 0.179 0.01 0.170 0.0.04
-sitosterol 0.189 0.03 0.408 0.2
As mentioned in the previous subtitle (5.3.2.3 recovery of -tocopherol), 5% of
acetic acid with methanol was not the best eluting solvent for MIP microparticles.
Therefore, the difference of the performance of RDP and MIP towards the sunflower oil
solution was measured through checking the difference of the concentration of the minor
compounds after incubation with the two microparticles (figure 5.5). The concentrations
of non-adsorption minor compounds were calculated using calibration curves of these
compound, which were presented in the second chapter. The concentrations were
presented in Table 5.5 as the average of triplicate with standard deviation.
These results indicated to the fact that the functional monomers located on the
surface of the polymer were responsible about the binding to the minor components from
the oil solution. The difference between performances of the two polymers existed due to
the difference between the shape of the surface area of RDP’s and MIP’s. MIP has cavities
that remained after removing -tocopherol molecules in comparison with RDP that is
covered with the functional groups which were desirable for the interactions with other
minor components.
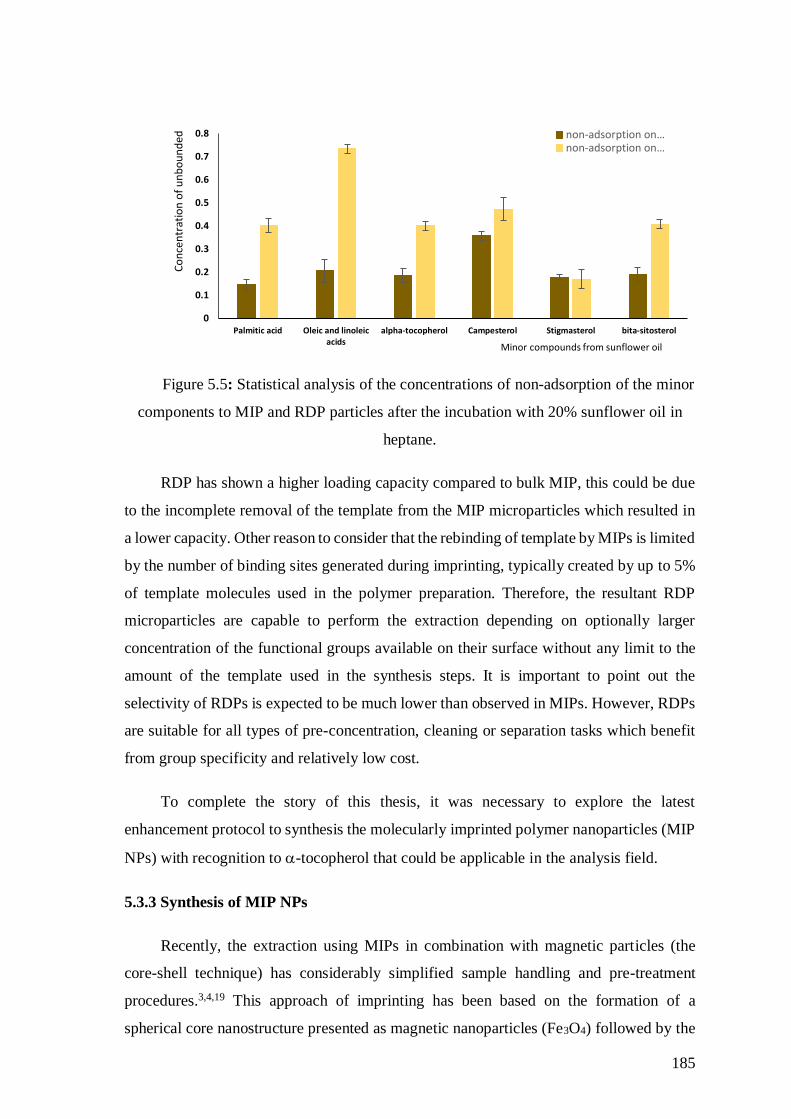
185
Figure 5.5: Statistical analysis of the concentrations of non-adsorption of the minor
components to MIP and RDP particles after the incubation with 20% sunflower oil in
heptane.
RDP has shown a higher loading capacity compared to bulk MIP, this could be due
to the incomplete removal of the template from the MIP microparticles which resulted in
a lower capacity. Other reason to consider that the rebinding of template by MIPs is limited
by the number of binding sites generated during imprinting, typically created by up to 5%
of template molecules used in the polymer preparation. Therefore, the resultant RDP
microparticles are capable to perform the extraction depending on optionally larger
concentration of the functional groups available on their surface without any limit to the
amount of the template used in the synthesis steps. It is important to point out the
selectivity of RDPs is expected to be much lower than observed in MIPs. However, RDPs
are suitable for all types of pre-concentration, cleaning or separation tasks which benefit
from group specificity and relatively low cost.
To complete the story of this thesis, it was necessary to explore the latest
enhancement protocol to synthesis the molecularly imprinted polymer nanoparticles (MIP
NPs) with recognition to -tocopherol that could be applicable in the analysis field.
5.3.3 Synthesis of MIP NPs
Recently, the extraction using MIPs in combination with magnetic particles (the
core-shell technique) has considerably simplified sample handling and pre-treatment
procedures.3,4,19 This approach of imprinting has been based on the formation of a
spherical core nanostructure presented as magnetic nanoparticles (Fe3O4) followed by the
0
0.1
0.2
0.3
0.4
0.5
0.6
0.7
0.8
Palmitic acid Oleic and linoleicacids
alpha-tocopherol Campesterol Stigmasterol bita-sitosterol
Co
nce
ntr
atio
n o
f u
nb
ou
nd
ed
Minor compounds from sunflower oil
non‐adsorption on…non‐adsorption on…
186
synthesis of MIP on these pre-formed nanostructures. The imprinting sites have situated
either on the surface of the cores or on the shells of nanoparticles.4,19
The synthesis protocol as reported in Canfarotta et al. and Poma et al. has been
started with the activation of the glass beads with diameters between 70 to 100 μm by
boiling with an aqueous 4 M of sodium hydroxide solution to allow the number of silanol
groups (Si-OH) be formed on the surface to increasing the reactivity.21,28 Subsequently,
the activated glass beads were silanised with an epoxy silane 3-
glycidoxypropyltrimethoxysilane (GOPTS) to link the glass beads to surfaces containing
hydroxide groups (Figure 5.6). The remaining epoxy group subsequently reacted with 2-
amino methanol.
Consequently, the template (-tocopherol) was covalently attached (immobilised) to
the modified solid phase (glass beads). The reaction of the epoxide with a hydroxyl group
of -tocopherol forms an ether bond linking between -tocopherol and the modified glass
beads as shown in Figure 5.7. The aim of the post-polymerisation modification of the glass
beads and the functionalisation process was to add an outer layer on the glass beads in
order to manipulate their properties such as solubility or surface reactivity without
affecting the binding sites of the polymerisation reactants.
The next stage was the formation of the polymer nanoparticles. The immobilised
template on the surface of the solid phase participated to the shape of the cavities that have
been formed during the polymerisation as follows: the polymerisation mixture including
the functional monomers (MAA), cross-linkers (TRIM and EGDMA), silanised iron
particles, iniferter and chain transfer agents were added to the glass beads that strongly
attached to -tocopherol (template). The polymers particles were formed by photo-
polymerisation (Figure 5.8).
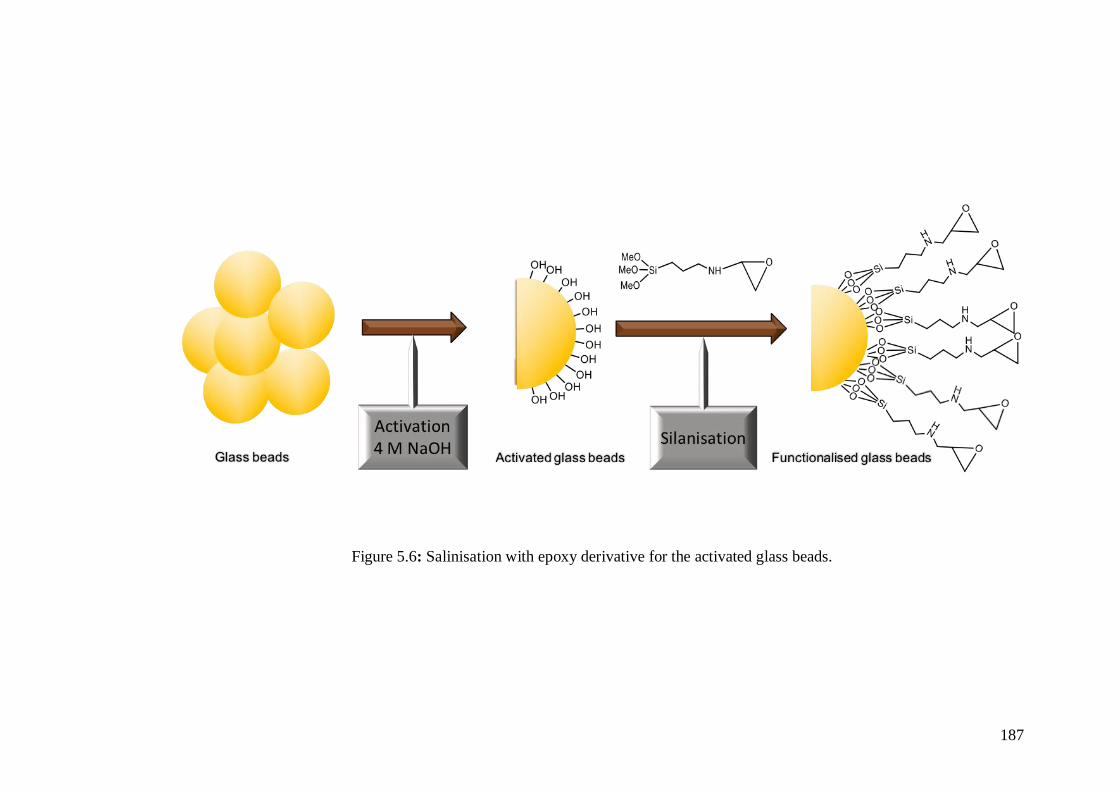
187
Figure 5.6: Salinisation with epoxy derivative for the activated glass beads.
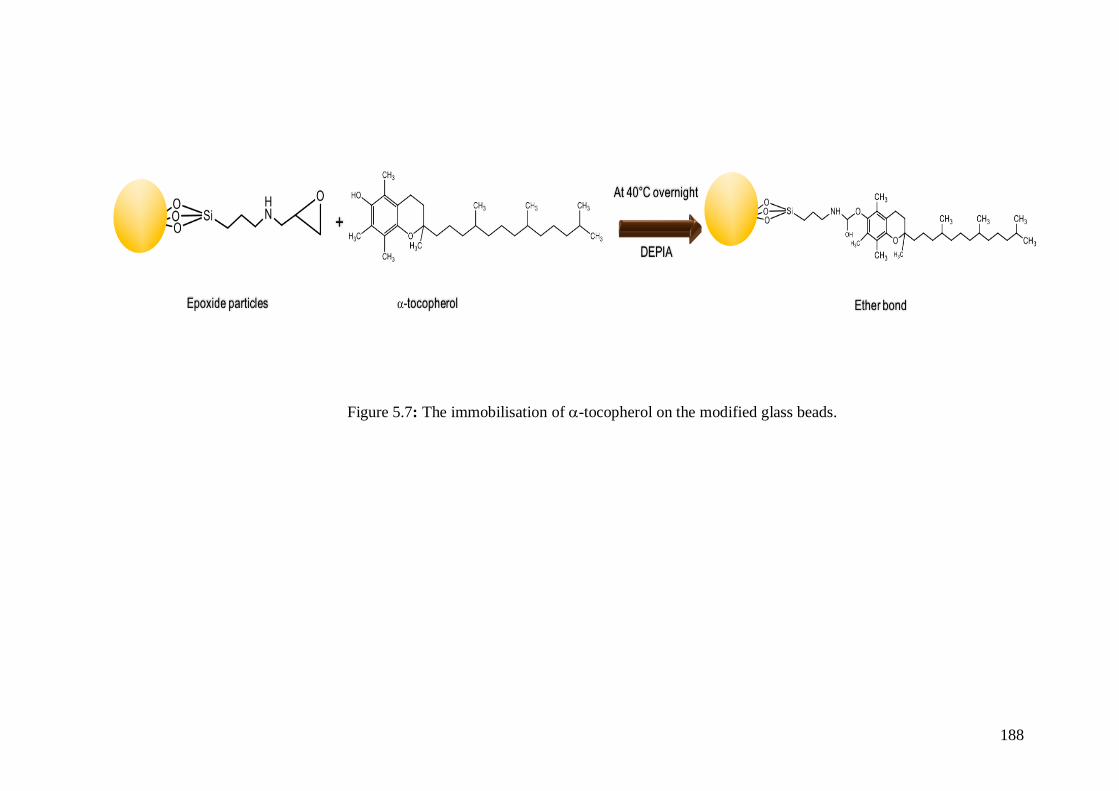
188
Figure 5.7: The immobilisation of -tocopherol on the modified glass beads.
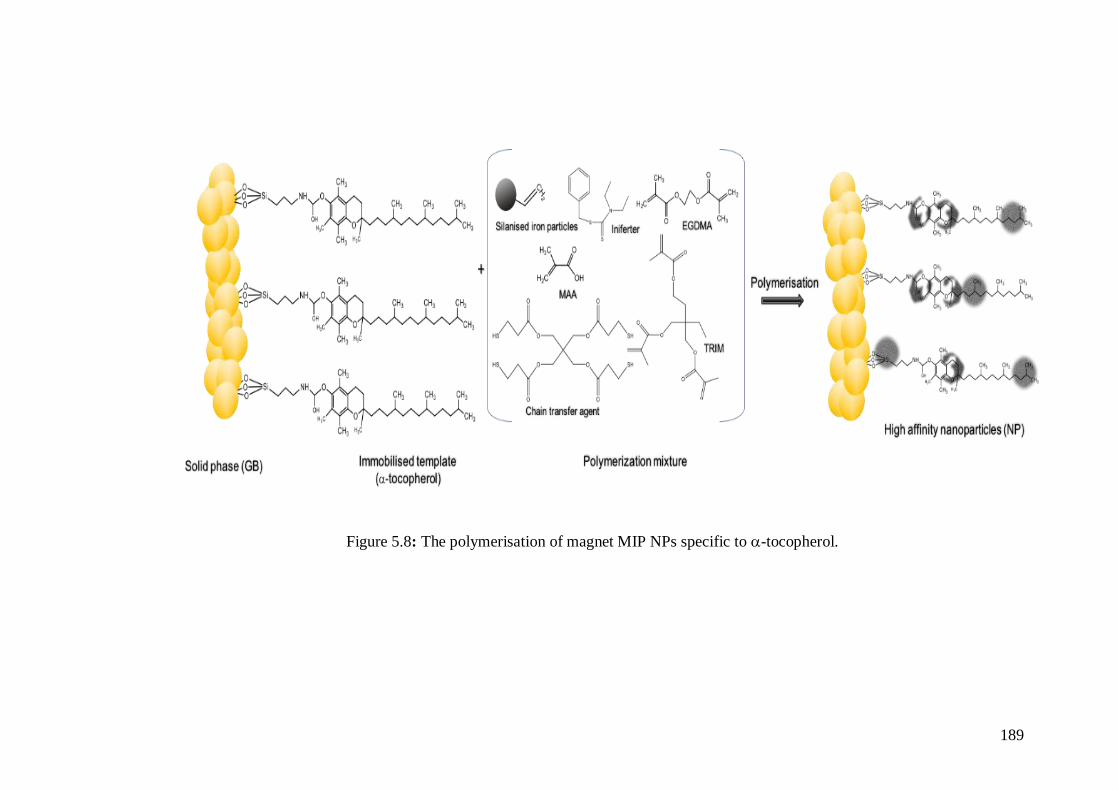
189
Figure 5.8: The polymerisation of magnet MIP NPs specific to -tocopherol.
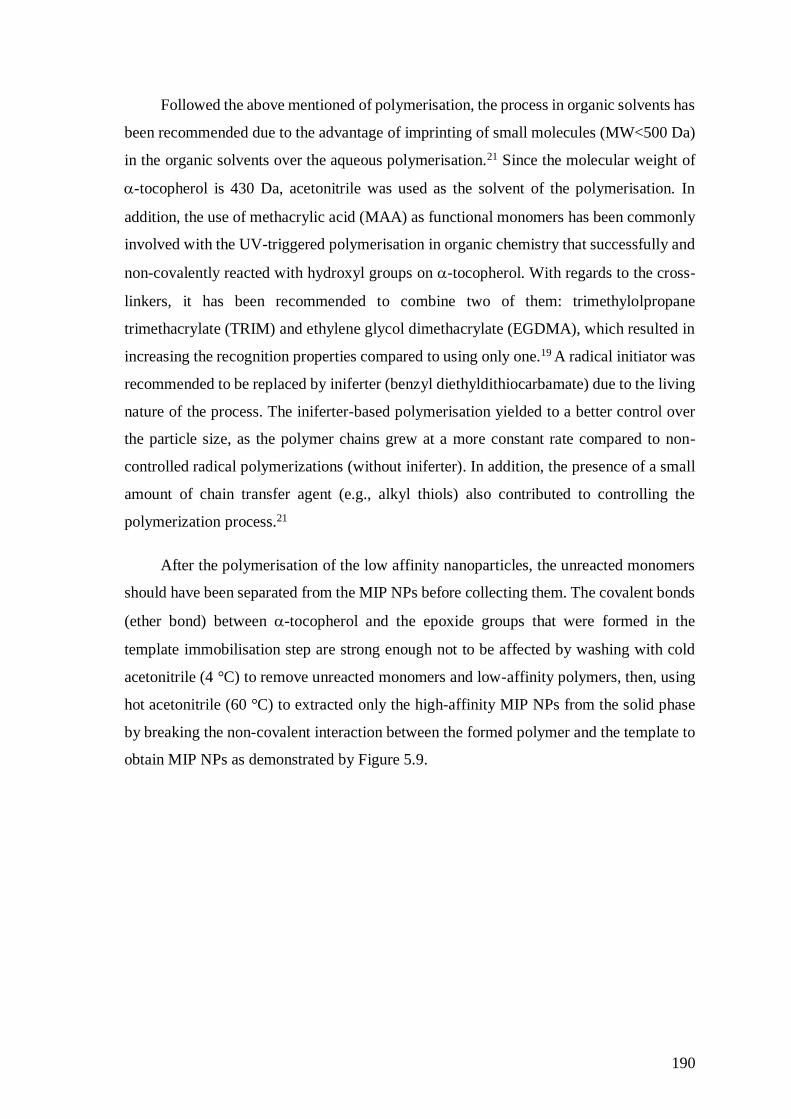
190
Followed the above mentioned of polymerisation, the process in organic solvents has
been recommended due to the advantage of imprinting of small molecules (MW<500 Da)
in the organic solvents over the aqueous polymerisation.21 Since the molecular weight of
-tocopherol is 430 Da, acetonitrile was used as the solvent of the polymerisation. In
addition, the use of methacrylic acid (MAA) as functional monomers has been commonly
involved with the UV-triggered polymerisation in organic chemistry that successfully and
non-covalently reacted with hydroxyl groups on -tocopherol. With regards to the cross-
linkers, it has been recommended to combine two of them: trimethylolpropane
trimethacrylate (TRIM) and ethylene glycol dimethacrylate (EGDMA), which resulted in
increasing the recognition properties compared to using only one.19 A radical initiator was
recommended to be replaced by iniferter (benzyl diethyldithiocarbamate) due to the living
nature of the process. The iniferter-based polymerisation yielded to a better control over
the particle size, as the polymer chains grew at a more constant rate compared to non-
controlled radical polymerizations (without iniferter). In addition, the presence of a small
amount of chain transfer agent (e.g., alkyl thiols) also contributed to controlling the
polymerization process.21
After the polymerisation of the low affinity nanoparticles, the unreacted monomers
should have been separated from the MIP NPs before collecting them. The covalent bonds
(ether bond) between -tocopherol and the epoxide groups that were formed in the
template immobilisation step are strong enough not to be affected by washing with cold
acetonitrile (4 °C) to remove unreacted monomers and low-affinity polymers, then, using
hot acetonitrile (60 °C) to extracted only the high-affinity MIP NPs from the solid phase
by breaking the non-covalent interaction between the formed polymer and the template to
obtain MIP NPs as demonstrated by Figure 5.9.
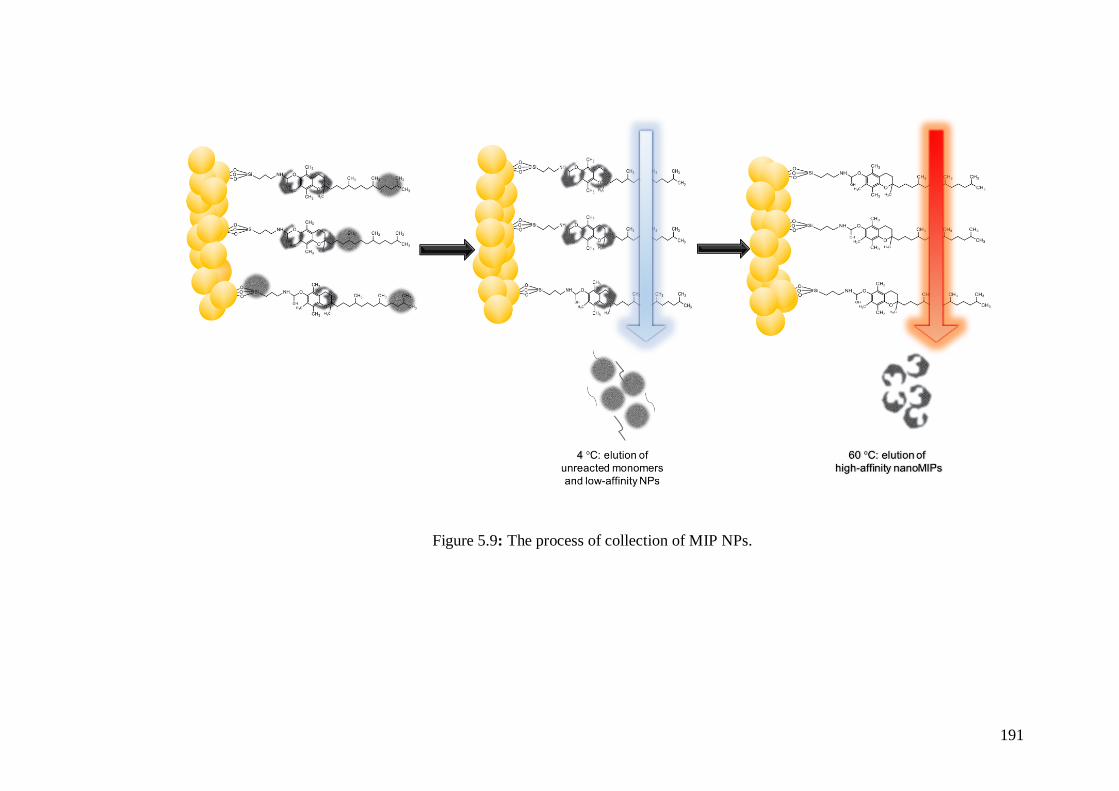
191
Figure 5.9: The process of collection of MIP NPs.
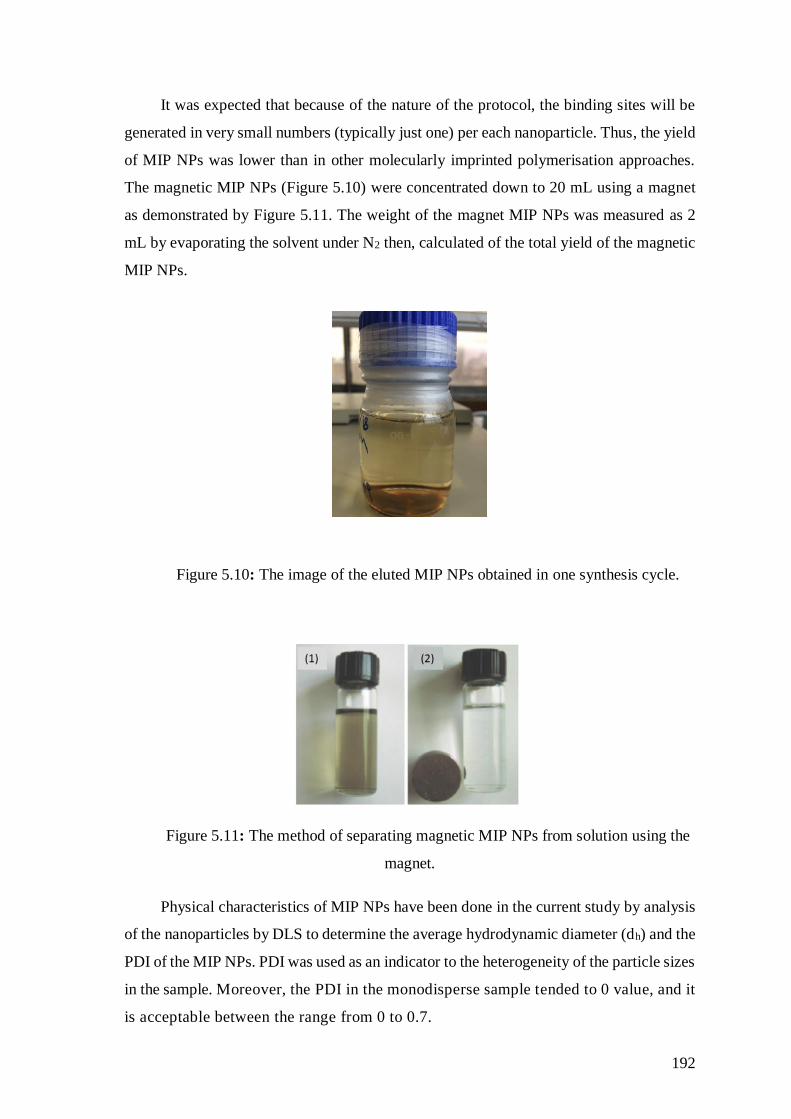
192
It was expected that because of the nature of the protocol, the binding sites will be
generated in very small numbers (typically just one) per each nanoparticle. Thus, the yield
of MIP NPs was lower than in other molecularly imprinted polymerisation approaches.
The magnetic MIP NPs (Figure 5.10) were concentrated down to 20 mL using a magnet
as demonstrated by Figure 5.11. The weight of the magnet MIP NPs was measured as 2
mL by evaporating the solvent under N2 then, calculated of the total yield of the magnetic
MIP NPs.
Figure 5.10: The image of the eluted MIP NPs obtained in one synthesis cycle.
Figure 5.11: The method of separating magnetic MIP NPs from solution using the
magnet.
Physical characteristics of MIP NPs have been done in the current study by analysis
of the nanoparticles by DLS to determine the average hydrodynamic diameter (dh) and the
PDI of the MIP NPs. PDI was used as an indicator to the heterogeneity of the particle sizes
in the sample. Moreover, the PDI in the monodisperse sample tended to 0 value, and it
is acceptable between the range from 0 to 0.7.
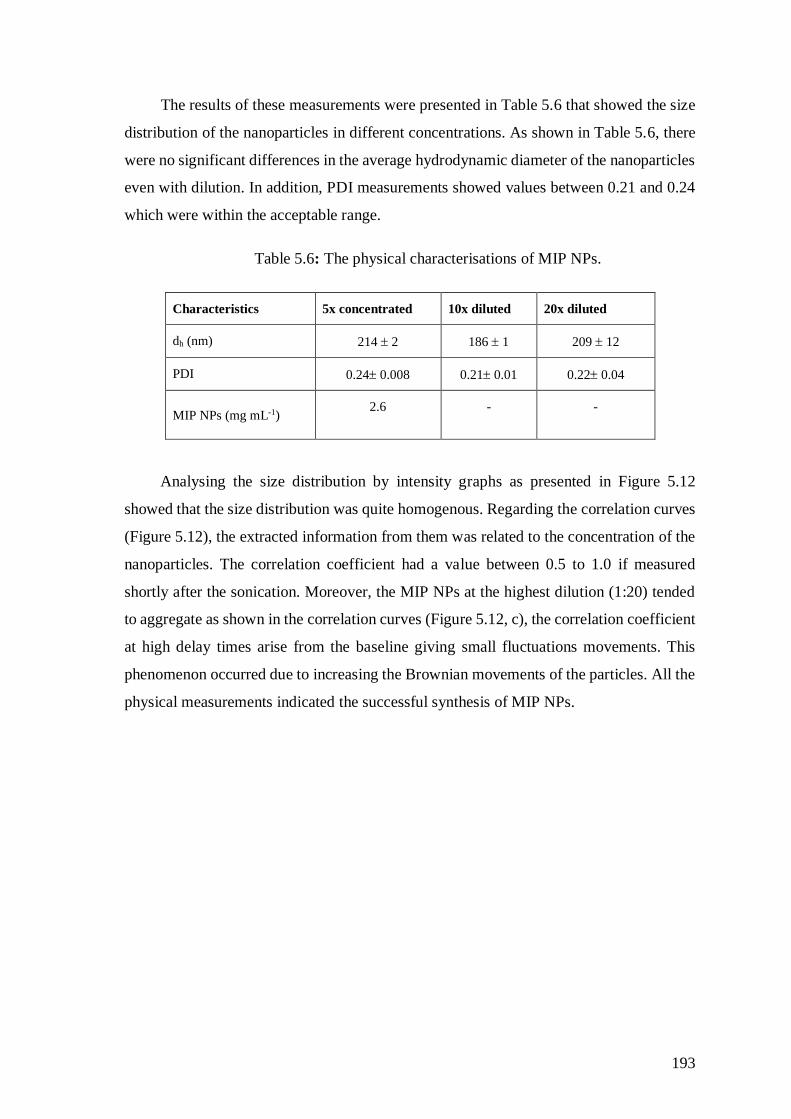
193
The results of these measurements were presented in Table 5.6 that showed the size
distribution of the nanoparticles in different concentrations. As shown in Table 5.6, there
were no significant differences in the average hydrodynamic diameter of the nanoparticles
even with dilution. In addition, PDI measurements showed values between 0.21 and 0.24
which were within the acceptable range.
Table 5.6: The physical characterisations of MIP NPs.
Characteristics 5x concentrated 10x diluted 20x diluted
dh (nm) 214 2 186 1 209 12
PDI 0.24 0.008 0.21 0.01 0.22 0.04
MIP NPs (mg mL-1) 2.6 - -
Analysing the size distribution by intensity graphs as presented in Figure 5.12
showed that the size distribution was quite homogenous. Regarding the correlation curves
(Figure 5.12), the extracted information from them was related to the concentration of the
nanoparticles. The correlation coefficient had a value between 0.5 to 1.0 if measured
shortly after the sonication. Moreover, the MIP NPs at the highest dilution (1:20) tended
to aggregate as shown in the correlation curves (Figure 5.12, c), the correlation coefficient
at high delay times arise from the baseline giving small fluctuations movements. This
phenomenon occurred due to increasing the Brownian movements of the particles. All the
physical measurements indicated the successful synthesis of MIP NPs.
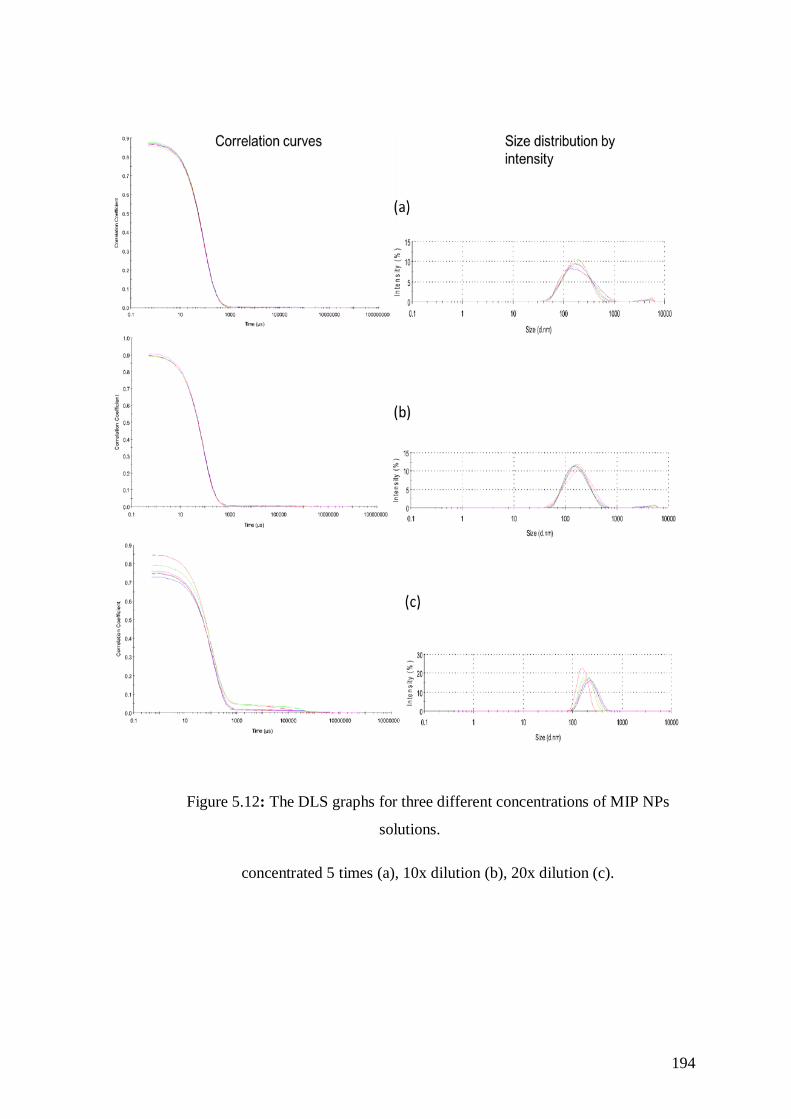
194
Figure 5.12: The DLS graphs for three different concentrations of MIP NPs
solutions.
concentrated 5 times (a), 10x dilution (b), 20x dilution (c).
195
5.3.4 The affinity properties of MIP NPs
To analyse -tocopherol binding and follow the change in its concentration in the
next part of this research, it was important to find sensitive analytical method compatible
with low concentrations of analysed samples and very small changes which happen after
its binding with the nanoparticles. From the literature review, it was found that -
tocopherol has been analysed with several sensitive techniques. According to Schwarts et
al. the usual analysis of -tocopherol was performed using GC/MS, GC/FID and NP-
HPLC.30 However, these techniques required pre-treatment of the sample before
conducting the analysis which differed depending on the nature of the sample. The
researcher added that in the case of vegetable oils, it was possible to analyse -tocopherol
from the low concentration of the vegetable oil directly because -tocopherol is presented
mainly in the unconjugated form in these oils.
Other suggestion has been presented by several studies that recommended the
reverse phase (RP) HPLC for analysis of -tocopherol, which is effective more than
normal phase (NP).31–35 By comparing the results of RP-HPLC and NP-HPLC, it was
noticed that RP did not distinguish between and -tocopherol which were not available
in the vegetable oils or available at a very low levels according to literature.34 This
contributed to minimising the error of the quantification process. In addition, RP-HPLC
has the advantage of short equilibrium and analysis time and high reproducibility of the
retention time. On the other hand, NP-HPLC presented better separation for all isomers of
-tocopherol, but during longer time and with more variable retention time.
The examination of the affinity of the synthesised nanoparticles towards -
tocopherol was performed by incubation the same amount of MIP NPs solution in three
different concentrations of the standard solution of -tocopherol in acetonitrile as
demonstrated in figure 5.13.
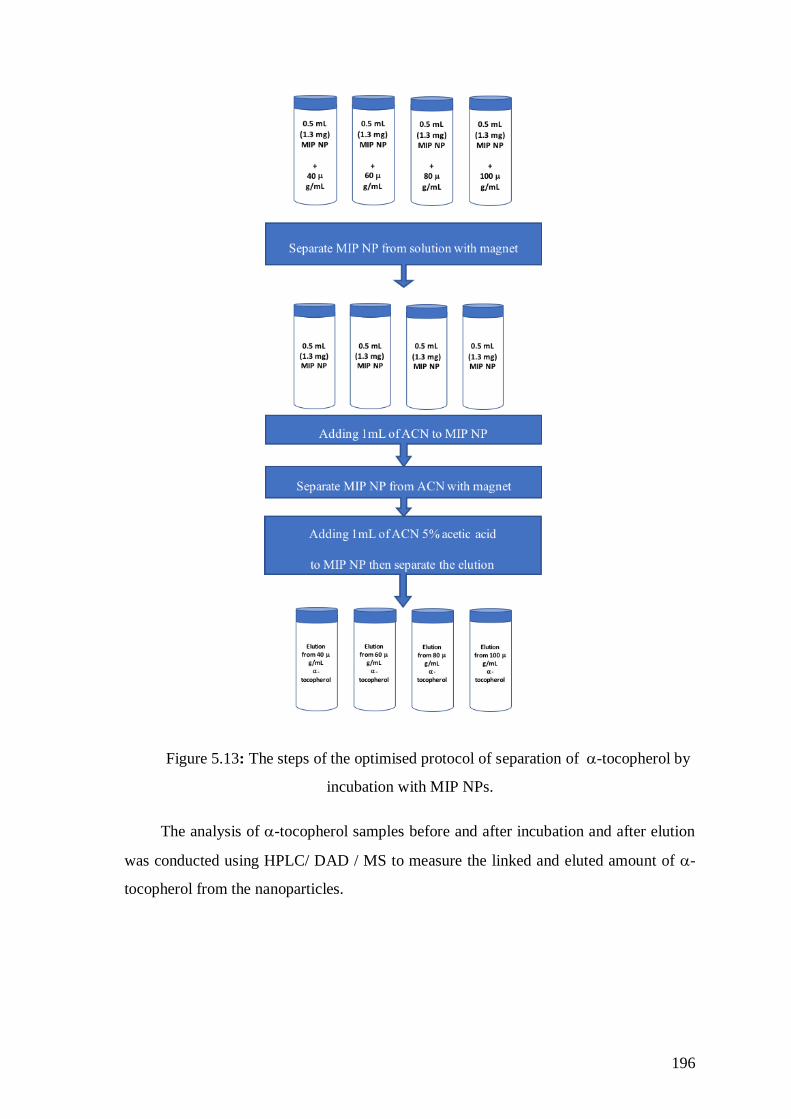
196
Figure 5.13: The steps of the optimised protocol of separation of -tocopherol by
incubation with MIP NPs.
The analysis of -tocopherol samples before and after incubation and after elution
was conducted using HPLC/ DAD / MS to measure the linked and eluted amount of -
tocopherol from the nanoparticles.
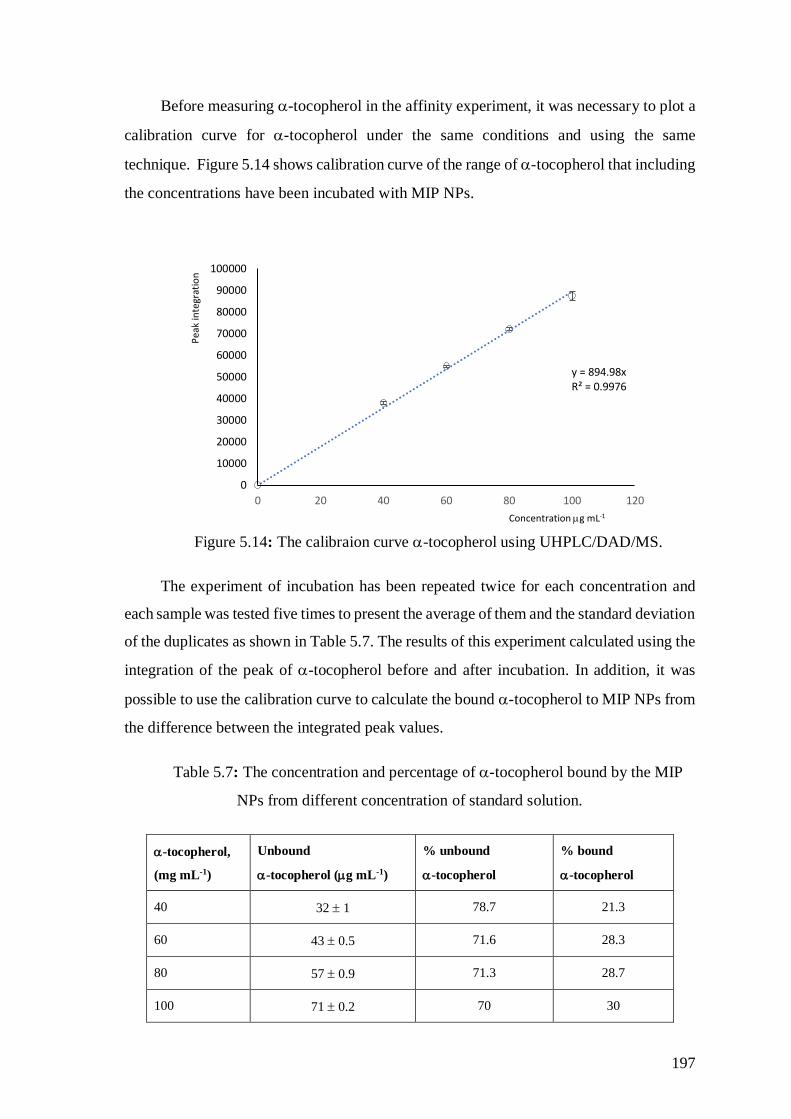
197
Before measuring -tocopherol in the affinity experiment, it was necessary to plot a
calibration curve for -tocopherol under the same conditions and using the same
technique. Figure 5.14 shows calibration curve of the range of -tocopherol that including
the concentrations have been incubated with MIP NPs.
Figure 5.14: The calibraion curve -tocopherol using UHPLC/DAD/MS.
The experiment of incubation has been repeated twice for each concentration and
each sample was tested five times to present the average of them and the standard deviation
of the duplicates as shown in Table 5.7. The results of this experiment calculated using the
integration of the peak of -tocopherol before and after incubation. In addition, it was
possible to use the calibration curve to calculate the bound -tocopherol to MIP NPs from
the difference between the integrated peak values.
Table 5.7: The concentration and percentage of -tocopherol bound by the MIP
NPs from different concentration of standard solution.
-tocopherol,
(mg mL-1)
Unbound
-tocopherol (g mL-1)
% unbound
-tocopherol
% bound
-tocopherol
40 32 1 78.7 21.3
60 43 0.5 71.6 28.3
80 57 0.9 71.3 28.7
100 71 0.2 70 30
y = 894.98xR² = 0.9976
0
10000
20000
30000
40000
50000
60000
70000
80000
90000
100000
0 20 40 60 80 100 120
Pea
k in
tegr
atio
n
Concentration g mL-1
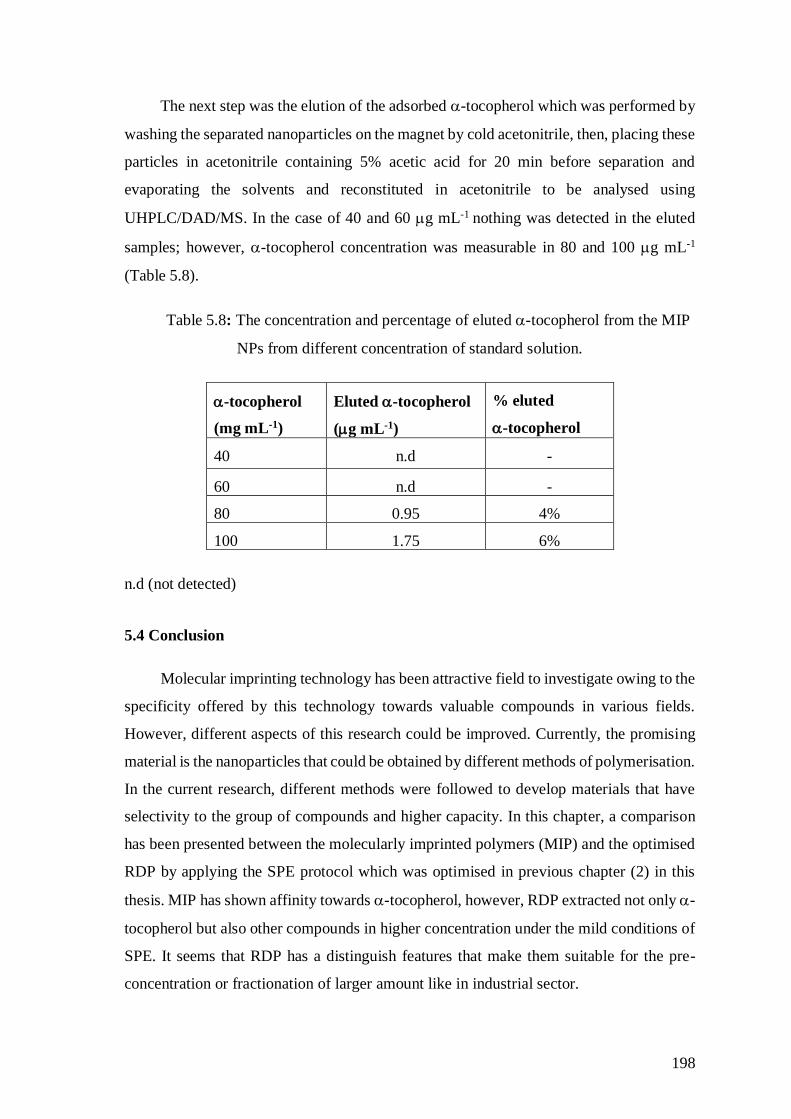
198
The next step was the elution of the adsorbed -tocopherol which was performed by
washing the separated nanoparticles on the magnet by cold acetonitrile, then, placing these
particles in acetonitrile containing 5% acetic acid for 20 min before separation and
evaporating the solvents and reconstituted in acetonitrile to be analysed using
UHPLC/DAD/MS. In the case of 40 and 60 g mL-1 nothing was detected in the eluted
samples; however, -tocopherol concentration was measurable in 80 and 100 g mL-1
(Table 5.8).
Table 5.8: The concentration and percentage of eluted -tocopherol from the MIP
NPs from different concentration of standard solution.
-tocopherol
(mg mL-1)
Eluted -tocopherol
(g mL-1)
% eluted
-tocopherol
40 n.d -
60 n.d -
80 0.95 4%
100 1.75 6%
n.d (not detected)
5.4 Conclusion
Molecular imprinting technology has been attractive field to investigate owing to the
specificity offered by this technology towards valuable compounds in various fields.
However, different aspects of this research could be improved. Currently, the promising
material is the nanoparticles that could be obtained by different methods of polymerisation.
In the current research, different methods were followed to develop materials that have
selectivity to the group of compounds and higher capacity. In this chapter, a comparison
has been presented between the molecularly imprinted polymers (MIP) and the optimised
RDP by applying the SPE protocol which was optimised in previous chapter (2) in this
thesis. MIP has shown affinity towards -tocopherol, however, RDP extracted not only -
tocopherol but also other compounds in higher concentration under the mild conditions of
SPE. It seems that RDP has a distinguish features that make them suitable for the pre-
concentration or fractionation of larger amount like in industrial sector.
199
On the other hand, this chapter describes the synthesis of magnetic MIP NPs
performed accordingly to the recently developed method of solid phase synthesis of MIP
NPs. The produced MIP NPs demonstrated affinity and specificity towards -tocopherol
which allowed to separate it specifically from the complex mixture of other compounds
purified using RDP developed in the frame of this project. However, due to the limited
time of this studentship no further investigation of the synthesis and application of
magnetic MIP NPs was made. In general, magnetic MIP NPs still need more development
before being considered for purification application. It is possible to state that in existing
state of development the magnetic MIP NPs, similarly to MIP microparticles, are more
appropriate for the analytical purposes. The feasibility study which has been done in this
research will open various investigations to be conducted in the future.
200
References
1) Huiqi Z. Application of Controlled “Living” Radical Polymerization Techniques in
Molecular Imprinting. In Molecular Imprinting Principles and Applications of Micro-and
Nanostructured Polymers; Ye, L., Editor. 2013; pp 105–160.
2) Alexander C.; Andersson S.; Andersson I.; Ansell J.; Kirsch N.; Nicholls A.; O’Mahony
J.; Whitcombe J. Molecular Imprinting Science and Technology: A Survey of the
Literature for the Years up to and Including 2003. J. Mol. Recognit. 2006, 19, 106–180.
3) Poma A.; Turner A.; Piletsky S. Advances in the Manufacture of MIP Nanoparticles.
Trends Biotechnol. 2010, 28, 626–639.
4) Koesdjojo Y.; Tennico V.; Remcho T. 18 Molecularly Imprinted Polymers as Sorbents
for Separations and Extraction/Separation Scince Technology. Sep. Sci. Technol. 2007, 8,
479–503.
5) Cheong, H.; McNiven S.; Rachkov A.; Levi R.; Yano K.; Karube I. Testosterone
Receptor Binding Mimic Constructed Using Molecular Imprinting. Macromolecules.
Macromolecules 1997, 30, 1317–1322.
6) Sajonz P.; Kele M.; Zhong G.; Sellergren B.; Guiochon G. Study of the
Thermodynamics and Mass Transfer Kinetics of Two Enantiomers on a Polymeric
Imprinted Stationary Phase. J. Chromatogr. A 1998, 810, 1–17.
7) Piletska E.; Burns R.; Terry L.; Piletsky S. Application of a Molecularly Imprinted
Polymer for the Extraction of Kukoamine A from Potato Peels. J. Agric. Food Chem. 2012,
60, 95–99.
8) Piletsky S.; Piletska E.; Karim K.; Foster G.; Legge C.; Turner A. Custom Synthesis of
Molecular Imprinted Polymers for Biotechnological Application: Preparation of a
Polymer Selective for Tylosin. Anal. Chim. Acta 2004, 504, 123–130.
9) Piletsky S.; Karim K.; Piletska E.; Day C.; Freebairn K.; Leggeb C.; Turner A.;
Recognition of Ephedrine Enantiomers by Molecularly Imprinted Polymers Designed
Using a Computational Approach. Analyst 2001, 126, 1826–1830.
201
10) Tokonami S.; Shiigi H.; Nagaoka T. Micro- and Nanosized Molecularly Imprinted
Polymers for High-Throughput Analytical Applications. Anal. Chim. Acta 2009, 641, 7–
13.
11) Gao D.; Zhang Z.; Wu M.; Xie C.; Guan G.; Wang D. A Surface Functional
Monomer-Directing Strategy for Highly Dense Imprinting of TNT at Surface of Silica
Nanoparticles. J Am. Chem. So.c 2007, 129, 7859–7866.
12) Kempe M.; Mosbach K. Direct Resolution of Naproxen on a Non-Covalently
Molecularly Imprinted Chiral Stationary Phase. J. Chromatogr. A 1994, 2, 276–279.
13) Remcho V.; Tan Z. MIPs as Chromatographic Stationary Phases for Molecular
Recognition. Anal. Chem. 1999, 71, 248A-255A.
14) Mayes A.; Mosbach K. Molecularly Imprinted Polymer Beads: Suspension
Polymerization Using a Liquid Perfluorocarbon as the Dispersing Phase. Anal. Chem.
1996, 68, 3769–3774.
15) Ye L.; Weiss R.; Mosbach K. Synthesis and Characterization of Molecularly
Imprinted Microspheres. Macromolecules 2000, 33, 8239–8245.
16) Masci G.; Aulenta F.; Crescenzi V. Uniform‐sized Clenbuterol Molecularly Imprinted
Polymers Prepared with Methacrylic Acid or Acrylamideas an Interacting Monomer. J.
Appl. Polym. Sci. 2002, 83, 2660–2668.
17) Sellergren B. Imprinted Dispersion Polymers: A New Class of Easily Accessible
Affinity Stationary Phases. J. Chromatogr. A 1994, 673, 133–141.
18) Sellergren B.; Hall A. Synthetic Chemistry in Molecular Imprinting. In Molecular
Imprinting Principles and Applications of Micro-and Nanostructured Polymers; 2013; pp
25–70.
19) Wackerlig J.; Schirhagl R. Applications of Molecularly Imprinted Polymer
Nanoparticles and Their Advances toward Industrial Use: A Review. Anal. Chem. 2016,
88, 250–261.
20) Mijangos I.; Navarro-Villoslada F.; Guerreiro A.; Piletska E.; Chianella I.; Karim K.;
Turner A.; Piletsky S. Influence of Initiator and Different Polymerisation Conditions on
202
Performance of Molecularly Imprinted Polymers. Biosens. Bioelectron. 2006, 22, 381–
387.
21) Canfarotta F.; Poma A.; Guerreiro A.; Piletsky S. Solid-Phase Synthesis of
Molecularly Imprinted Nanoparticles. Nat. Protoc. 2016, 11, 443–455.
22) Grigoriadou D.; Androulaki A.; Psomiadou E.; Tsimidou M. Solid Phase Extraction
in the Analysis of Squalene and Tocopherols in Olive Oil. Food Chem. 2007, 105, 675–
680.
23) Lechner M.; Reiter B.; Lorbeer E. Determination of Tocopherols and Sterols in
Vegetable Oils by Solid-Phase Extraction and Subsequent Capillary Gas Chromatographic
Analysis. J. Chromat A 1999, 857, 231–238.
24) Lahsini R.; Louhaichi M.; Adhoum N.; Monser L. Preparation and Application of a
Molecularly Imprinted Polymer for Determination of Glibenclamide Residues. Acta
Pharm. 2013, 63, 265–275.
25) Golker K.; Karlsson B.; Wiklander J.; Rosengren A.; Nicholls I. Hydrogen Bond
Diversity in the Pre-Polymerisation Stage Contributes to Morphology and MIP-Template
Recognition – MAA versus MMA. Eur. Polym. J. 2015, 66, 558–568.
26) O’Mahony J.; Molinelli A.; Nolan K.; Smyth M.; Mizaikoff B. Anatomy of a
Successful Imprint: Analysing the Recognition Mechanisms of a Molecularly Imprinted
Polymer for Quercetin. Biosens. Bioelectron. 2006, 21, 1383–1392.
27) Lahsini R.; Louhaichi M.; Adhoum N.; Monser L. Preparation and application of a
molecularly imprinted polymer for determination of glibenclamide residues. Acta Pharm.
2013, 63, 265-75.
28) Poma A.; Guerreiro A.; Whitcombe M.; Piletska E.; Turner A.; Piletsky S. Solid-
Phase Synthesis of Molecularly Imprinted Polymer Nanoparticles with a Reusable
Template–“Plastic Antibodies.” Adv. Funct. Mater. 2013, 23, 2821–2827.
29) Hansen S. DLSanalysis.Org: A Web Interface for Analysis of Dynamic Light
Scattering Data. Eur. Biophys. J. 2018, 47, 179–184.
203
30) Schwartz H.; Ollilainen V.; Piironen V.; Lampi A. Tocopherol, Tocotrienol and Plant
Sterol Contents of Vegetable Oils and Industrial Fats. J. Food Compos. Anal. 2008, 21,
152–161.
31) Cert A.; Moreda W.; Pérez-Camino M. Chromatographic Analysis of Minor
Constituents in Vegetable Oils. J. Chromatogr. A 2000, 881, 131–148.
32) Andersson, L.; Paprica A.; Arvidsson T. A Highly Selective Solid Phase Extraction
Sorbent for Pre-Concentration of Sameridine Made by Molecular Imprinting.
Chromatographia 1997, 46, 57–62.
33) Victor R.; Watson R. The Encyclopedia of Vitamin E; CABI, 2007, UK
34) Grilo E.; Costa P.; Santos C.; Gurgel S.; Fernanda A.; Beserra D.; Niéce F.; Almeida
D.; Dimenstein R. Alpha-Tocopherol and Gamma-Tocopherol Concentration in Vegetable
Oils. Food Sci. Technol. 2014, 34, 379–385.
35) Aturki Z.; D’Orazio G.; Fanali S. Rapid Assay of Vitamin E in Vegetable Oils by
Reversed-Phase Capillary Electrochromatography. Electrophoresis 2005, 26, 798–803.

204
Chapter six
205
Conclusions and future work
6.1 Conclusions
An effective protocol for the extraction and purification of seven minor compounds
(free fatty acids, α-tocopherol and three free phytosterols) from the six vegetable oils
(sunflower oil, soy bean oil, sesame oil, wheat germ oil, palm oil and olive oil) using
heptane without any pre-treatment for the oil samples was developed. It was shown that it
was possible to harvest those physiologically-active components in their free forms as it
was confirmed using GC/MS, despite the variability of the content of the minor
components in each of these oils. The optimised SPE protocol was performed using the
rationally designed polymer (RDP) which was capable of recognising -tocopherol and
other minor components in vegetable oils.
The quantitative results of this study were comparable with published data that used
various methods and techniques to extract these minor components from the vegetable
oils. Application of the developed polymer was advantageous over traditional methods of
extraction which included the possibility of a two-fold reduction in the volume of solvent
required and ability to extract the physiologically active free forms of the compounds
without saponification. The protocol of the extraction of a group of components involved
only 5 times dilution of the vegetable oils with heptane which was twice improved by
comparison with the 10-fold dilution applied in the industrial protocol, representing a
reduction of waste and a saving in resources and time. It is important to highlight that the
optimised protocols and proposed strategy could be used as blueprints for the development
of extraction procedures for different groups of compounds from other natural oil-
containing biomasses. Analysis of the matrix presence before and after purification using
developed SPE protocol and RDP, suggested that the 98.6%-pure α-tocopherol has been
extracted. Moreover, a direct correlation was found between the quantitative results of this
study and results published from different studies that employed various methods and
techniques commonly used to extract these minor components from the same vegetable
oils.
The optimised solid-phase extraction protocol was compared with the performance
of several commercial adsorbents, particularly in relation to the retention properties and
recovery of the minor components explored in this study. The comparison was performed
206
between six commercially available resins and RDP using optimised SPE protocol. It has
shown the distinguished efficiency of RDP to extract the group of minor components from
20% sunflower oil in heptane with the minimum of organic solvents. Despite the
possibility to extract some of the minor component using the other sorbents, they were not
as effective as developed RDP.
Subsequently, in the purpose of presenting the similarity and difference between the
traditional molecularly imprinted polymer (MIP) and the optimised RDP, the SPE protocol
was also applied to MIP that was synthesised using similar components and under similar
conditions as RDP. Even though developed MIP has shown affinity and specificity
towards -tocopherol, RDP extracted not only -tocopherol but also other compounds in
higher concentration under the mild conditions of SPE. The developed RDP has a superior
capacity towards α-tocopherol and other minor oil compounds including palmitic acid,
oleic acid, linoleic acid, campesterol, stigmasterol and -sitosterol, which make it capable
to pre-concentrate or fractionate of the larger quantities of the compounds making it
suitable for industrial application. 1140mg kg-1 of palmitic acid, 7181 mg kg-1 of oleic and
linoleic acids, 298 mg kg-1 -tocopherol 489 mg kg-1 of campesterol, 307 mg kg-1 of
stigmasterol and 1903 mg kg-1 of -sitosterol have been extracted from wheat germ oil, 4
mg kg-1 of palmitic acid, 88 mg kg-1 of oleic and linoleic acids, 233 mg kg-1 -tocopherol
251 mg kg-1 of campesterol, 517 mg kg-1 of stigmasterol and 1398 mg kg-1 of -sitosterol
have been extracted from soy bean oil, 942 mg kg-1 of palmitic acid, 16425 mg kg-1 of oleic
and linoleic acids, 277 mg kg-1 -tocopherol 58 mg kg-1 of campesterol, 146 mg kg-1 of
stigmasterol and 741 mg kg-1 of -sitosterol have been extracted from sunflower oil, 366
mg kg-1 of palmitic acid, 2407 mg kg-1 of oleic and linoleic acids, 3122 mg kg-1 sesamin
317 mg kg-1 of campesterol, 220 mg kg-1 of stigmasterol and 2741 mg kg-1 of -sitosterol
have been extracted from sesame oil, 15600 mg kg-1 of palmitic acid, 34496 mg kg-1 of
oleic and linoleic acids, 148 mg kg-1 -tocopherol 74 mg kg-1 of campesterol, 125 mg kg-
1 of stigmasterol and 299 mg kg-1 of -sitosterol have been extracted from palm oil and
1190 mg kg-1 of palmitic acid, 1325 mg kg-1 of oleic and linoleic acids, 256 mg kg-1 -
tocopherol 75 mg kg-1 of campesterol, 8 mg kg-1 of stigmasterol and 760 mg kg-1 of -
sitosterol have been extracted from olive oil.
207
The optimised SPE protocol in this study, in comparison to six commercially
available resins, has shown significant efficiency to extract the group of minor components
from 20% sunflower oil in heptane with minimum of organic solvents.
Moreover, to complete the framework of molecular imprinting theme of this project,
the synthesis of magnetic MIP NPs using the recently developed method was performed.
The MIP NPs have shown affinity towards -tocopherol which could be used to selectively
extract it from the complex mixture eluted using developed SPE protocol.
6.2 Future work
The work in this project has opened a wide field for future work on the synthesis of
the customised polymers with group selectivity towards natural physiologically-active
compounds present in vegetable oils which could have great applications in different
fields.
To broaden the potential interest of commercial and industrial partners for this
technology, it would be interesting to cover the following research topics in the future:
Application of the optimised extraction approach to explore the possibility to extract
the tocopherols, fatty acids or phytosterols from the extraction of other parts from biomass.
Development of a fractionation protocol based on magnetic MIP NPs which could
be applied to extract any particular compound from the complex mixture eluted using
optimised RDP-based SPE protocol.
It was demonstrated already in this thesis that MIP NPs have shown an affinity
towards -tocopherol, further investigation is needed to develop the extraction of -
tocopherol from other parts of biomass such as extraction of leaves, seeds ... etc.
The application of protocol optimised in this study resulted in extraction of a
significant amount from sesamin from sesame oil, which has a great biologically activity.
This could be a target for a new research as the literature has no studies related to sesamin
purification using MIPs.
208
Appendix 1
The published papers:
1- Alghamdi E.; Whitcombe M.; Piletsky S.; Piletska E. Solid phase extraction of α-
tocopherol and other physiologically active components from sunflower oil using
rationally designed polymers. Anal. Methods 2018, 10, 1–8.
2) Alghamdi E.; Piletsky S.; Piletska E. Application of the bespoke solid-phase
extraction protocol for extraction of physiologically-active compounds from vegetable
oils. Talanta 2018, 189, 157–165.
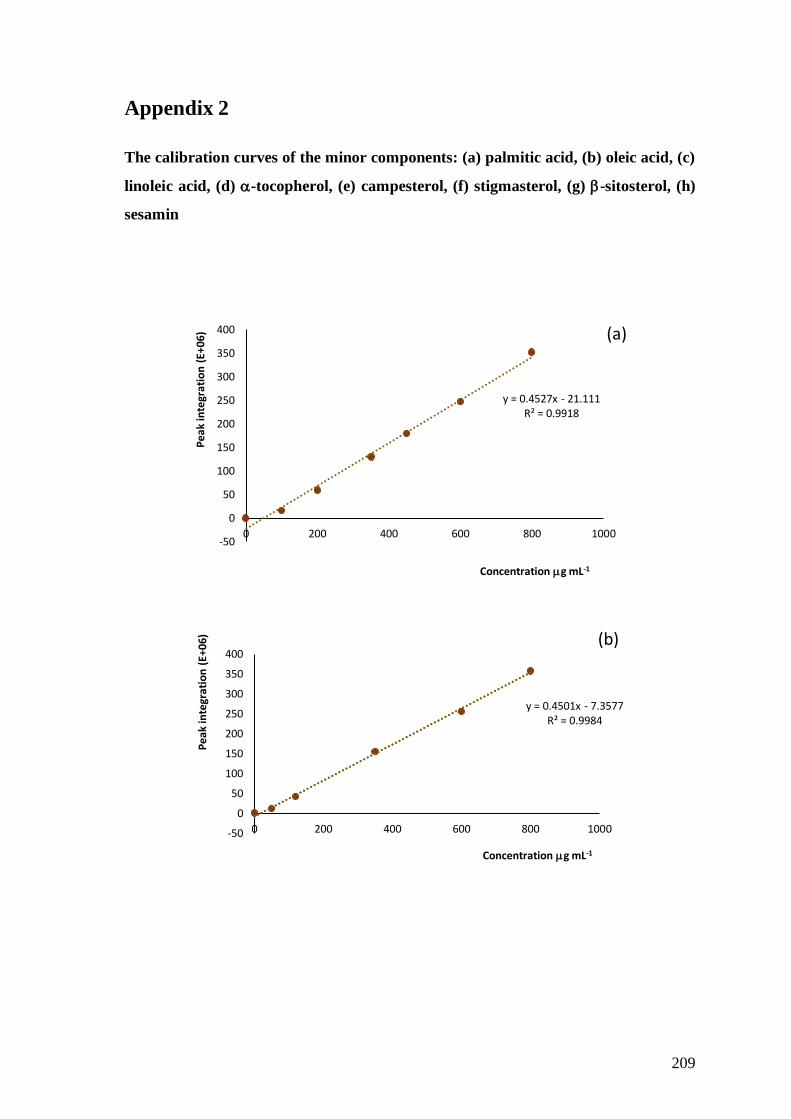
209
Appendix 2
The calibration curves of the minor components: (a) palmitic acid, (b) oleic acid, (c)
linoleic acid, (d) -tocopherol, (e) campesterol, (f) stigmasterol, (g) -sitosterol, (h)
sesamin
y = 0.4527x - 21.111R² = 0.9918
-50
0
50
100
150
200
250
300
350
400
0 200 400 600 800 1000
Pe
ak in
tegr
atio
n (
E+0
6)
Concentration g mL-1
(a)
y = 0.4501x - 7.3577R² = 0.9984
-50
0
50
100
150
200
250
300
350
400
0 200 400 600 800 1000
Pea
k in
tegr
atio
n (
E+0
6)
Concentration g mL-1
(b)
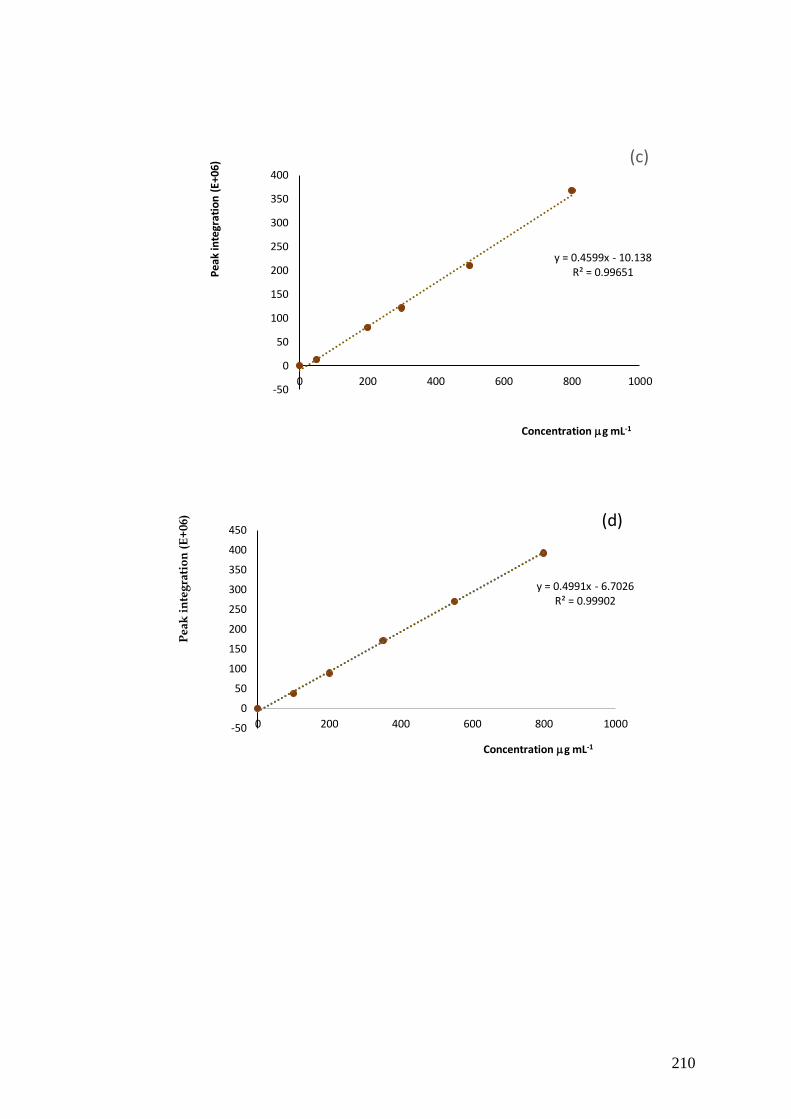
210
y = 0.4599x - 10.138R² = 0.99651
-50
0
50
100
150
200
250
300
350
400
0 200 400 600 800 1000
Pea
k in
tegr
atio
n (
E+06
)
Concentration g mL-1
(c)
y = 0.4991x - 6.7026R² = 0.99902
-50
0
50
100
150
200
250
300
350
400
450
0 200 400 600 800 1000
Pe
ak
in
teg
rati
on
(E
+0
6)
Concentration g mL-1
(d)
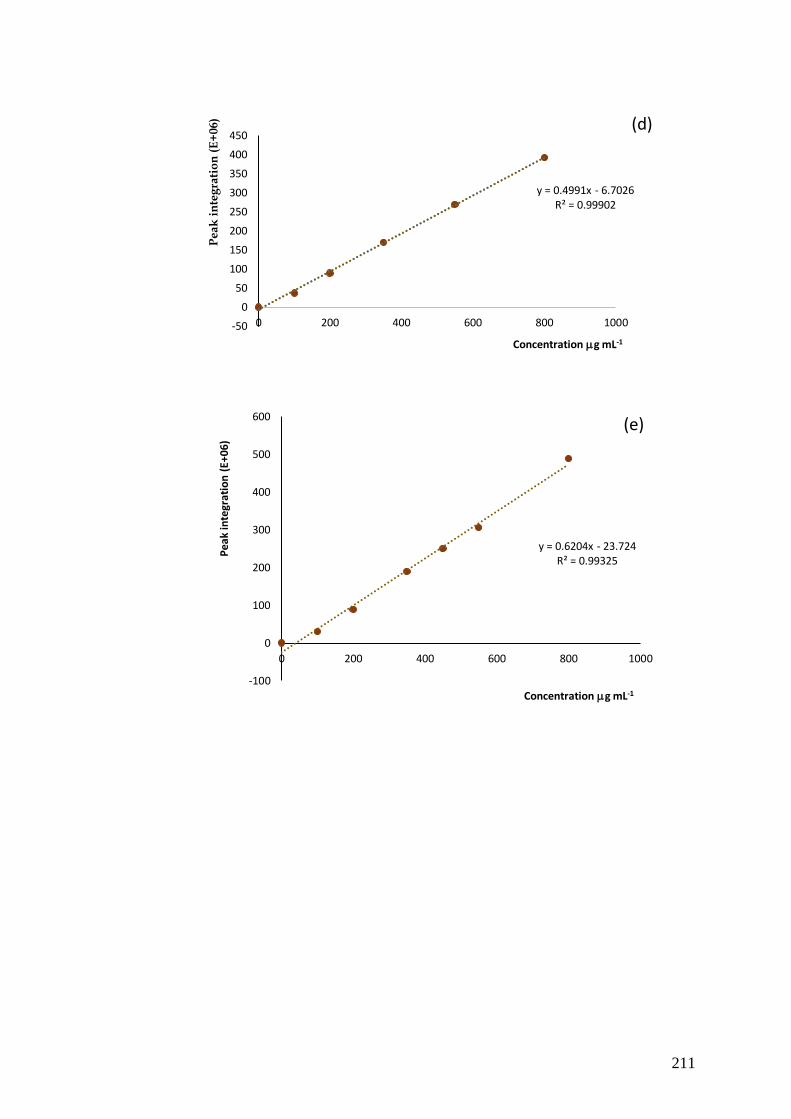
211
y = 0.4991x - 6.7026R² = 0.99902
-50
0
50
100
150
200
250
300
350
400
450
0 200 400 600 800 1000
Pe
ak
in
teg
rati
on
(E
+0
6)
Concentration g mL-1
(d)
y = 0.6204x - 23.724R² = 0.99325
-100
0
100
200
300
400
500
600
0 200 400 600 800 1000
Pea
k in
tegr
atio
n (
E+0
6)
Concentration g mL-1
(e)
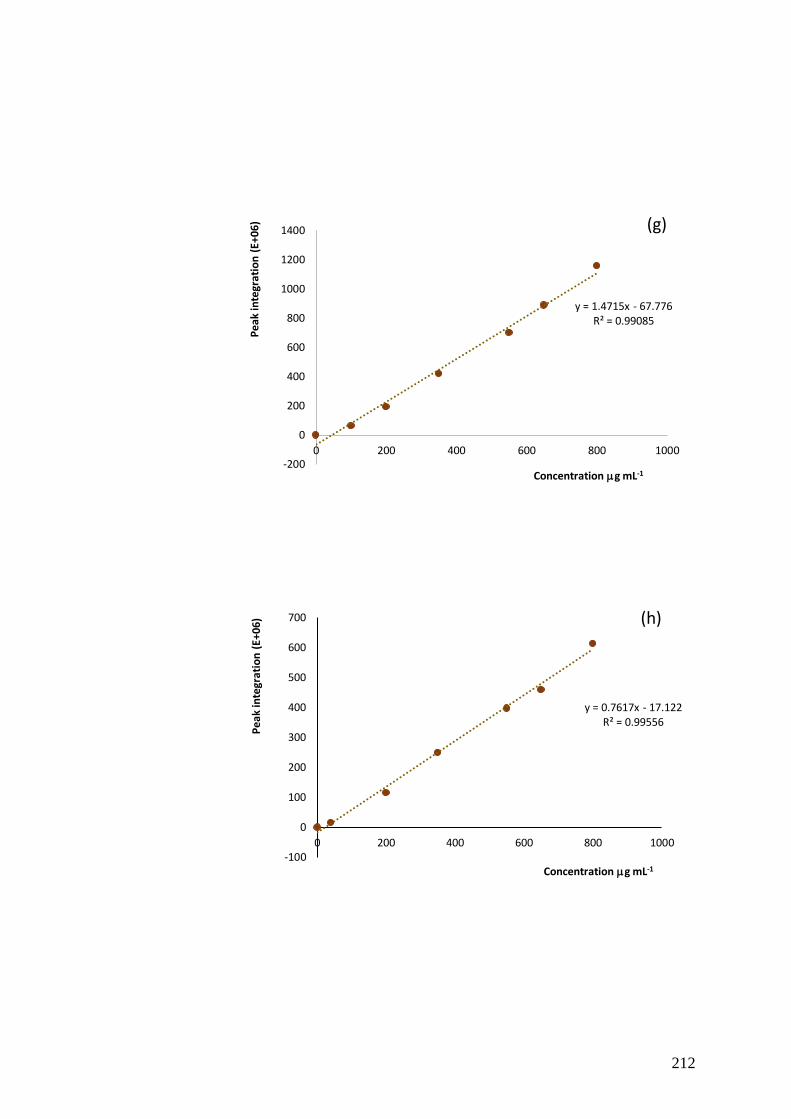
212
y = 1.4715x - 67.776R² = 0.99085
-200
0
200
400
600
800
1000
1200
1400
0 200 400 600 800 1000
Pea
k in
tegr
atio
n (
E+0
6)
Concentration g mL-1
(g)
y = 0.7617x - 17.122R² = 0.99556
-100
0
100
200
300
400
500
600
700
0 200 400 600 800 1000
Pea
k in
tegr
atio
n (
E+0
6)
Concentration g mL-1
(h)

213
Appendix 3
Surface area and total pore volume evaluated by BET theory
Related Documents


