1 REEEP 7 th funding cycle project 107070515 NAMIBIA ENERGY REGULATORY FRAMEWORK DEVELOPMENT OF PROCUREMENT MECHANISMS FOR RENEWABLE ENERGY RESOURCES IN NAMIBIA Draft 2 Authored by: Martin Meyer-Renschhausen 1 Kudakwashe Ndhlukula 2 Stephanus Nambili 3 Nico Snyders 4 . October, 2010 1 Hochschule Darmstadt, Universirty of Applied Sciences, Germany; 2 Renewable Energy & Energy Efficiency Institute, Polytechnic of Namibia, Namibia 3 Department of Legal Studies, Polytechnic of Namibia, Namibia 4 Renewable Energy Division, Ministry of Mines and Energy, Namibia

Welcome message from author
This document is posted to help you gain knowledge. Please leave a comment to let me know what you think about it! Share it to your friends and learn new things together.
Transcript

1
REEEP 7th funding cycle project 107070515
NAMIBIA ENERGY REGULATORY FRAMEWORK
DEVELOPMENT OF PROCUREMENT
MECHANISMS FOR RENEWABLE ENERGY
RESOURCES IN NAMIBIA
Draft 2
Authored by:
Martin Meyer-Renschhausen1
Kudakwashe Ndhlukula2
Stephanus Nambili3
Nico Snyders4.
October, 2010
1 Hochschule Darmstadt, Universirty of Applied Sciences, Germany;
2 Renewable Energy & Energy Efficiency Institute, Polytechnic of Namibia, Namibia
3 Department of Legal Studies, Polytechnic of Namibia, Namibia
4 Renewable Energy Division, Ministry of Mines and Energy, Namibia

2
This publication was prepared for the Electricity Control Board of Namibia by the
Renewable Energy & Energy Efficiency Institute of the Polytechnic of Namibia.

3
This project was funded by the Renewable Energy and Energy Efficiency Partnership (REEEP)
and international multi-stakeholder partnership, which aims to accelerate the market for
renewable energy and energy efficiency.”
i
Contents ACKNOWLEDGEMENTS .................................................................................................................... v
GLOSSARY OF TERMS AND ABBREVIATIONS................................................................................... vi
EXECUTIVE SUMMARY ..................................................................................................................... x
1. BACKGROUND AND INTRODUCTION ....................................................................................... 1
1.1 Background ......................................................................................................................... 1
1.2 The Namibian Electricity Supply Industry and its Institutions ........................................... 3
1.2.1 MME ................................................................................................................................ 3
1.2.2 ECB .............................................................................................................................. 3
1.2.3 NamPower .................................................................................................................... 4
1.2.4 REDs and Local Authorities ............................................................................................. 4
1.2.5 IPPs .............................................................................................................................. 4
1. 4 Namibia’s Power Market Model ........................................................................................ 7
1.5 Cabinet Retreat Recommendations ..................................................................................... 8
1.6 Tariff Cost Reflectivity........................................................................................................ 9
1.7 Challenges Faced by Renewable Energy Resources in Namibia ...................................... 10
2. COMPARATIVE ANALYSIS OF RENEWABLE ENERGY PROCUREMENT MECHANISMS ............ 12
2.1 Purpose .............................................................................................................................. 12
2.2 Introduction ....................................................................................................................... 12
2.3 Internalisation of External Costs ....................................................................................... 12
2.4 Renewable Energy Technologies as Meritorics ................................................................ 14
2.5 Renewable Energy Procurement Mechanisms .................................................................. 16
2.6 Summary of RETs procurement mechanisms ................................................................... 28
2.7 The cost of renewable energy electricity ........................................................................... 30
2.8 Risks and financing cost .................................................................................................... 32
2.9 Recommendations for RET procurement mechanisms in Namibia .................................. 37
2.10 Conclusions ..................................................................................................................... 40
3. ESTIMATING THE COSTS OF THE PROCURMENT MECHANISMS............................................ 41
3.1 Purpose .............................................................................................................................. 41
3.2 Introduction ....................................................................................................................... 41
3.3 Determining the Cost Elements and REFIT Calculator .................................................... 43
3.4 Program Cost Calculator ................................................................................................... 47
3.5 Conclusions ....................................................................................................................... 56
4. DESIGNING SUITABLE PROCUREMENT MECHANISMS FOR NAMIBIA ................................... 58
4.1 Summary of recommendations for RE procurement mechanisms .................................... 59
4.2 Best Practice Recommendations ....................................................................................... 59
4.3 Designing a Tendering Mechanism ................................................................................... 60
4.4 Designing a REFIT Mechanism ........................................................................................ 60
4.5 Designing a Net-metering Mechanism .............................................................................. 60
4.6 Monitoring, Reporting and Review ................................................................................... 61
4.7 Sustainability ..................................................................................................................... 62
4.8 Resolution of Disputes and Remedies ............................................................................... 62
5. CONCLUSION .......................................................................................................................... 63

ii
6. REFERENCES: .......................................................................................................................... 65
ANNEX 1: TERMS OF REFERENCE ................................................................................................... 68
ANNEX 2: REFIT CALCULATOR ....................................................................................................... 71

iii
LIST OF FIGURES
Figure 1.1: Namibia’s Peak Load Forecast Scenario ........................................................................ 6
Figure 1.2: Projected System Peak Demand at Economic Growth of 2% and 6% ............................. 6
Figure 1.3: Namibia Single Buyer Model ........................................................................................ 8
Figure 1.4: Generation and Transmission Projected Price Increases. ............................................ 10
Figure 2.1: Tendering ................................................................................................................. 19
Figure 2.2: Long Run Marginal Cost of different RET for power generation ................................... 30
Figure 2.3: Prices (in Euros) for Wind Energy in Countries with REFIT and Quota Schemes ............ 36
Figure 3.1: Estimated base tariffs for generating options ............................................................. 42
Figure 4.1: RE Procurement Structure and Process under REFIT ................................................... 61
iv
LIST OF TABLES
Table 1.1: Conditional Generation Licences Issued by ECB ............................................................. 5
Table 1.2: Planned and Status of Power Generation Projects ......................................................... 7
Table 2.1 Instruments for RE generation in selected countries. .................................................... 17
Table 2.2: Summary of Comparison of RETs Procurement Mechanism ......................................... 29
Table 2.3: Estimates of Global Energy Production Capacity Growth ............................................. 32
Table 2.4: Risks of RETs and Role of Policies ................................................................................ 34
Table 2.5: Risk Profile of Selected RET Projects ........................................................................... 35
Table 3.1: Estimated Generator Capacities and Step Sizes. .......................................................... 42
Table 3.2: Specific Costs of Selected RETs According to National and International Studies .......... 43
Table 3.3.1: Key parameters of WACC calculation ....................................................................... 45
Table 3.3.2: Key parameters for calculating the annual cost ........................................................ 45
Table 3.3.3: Calculation of annual cost and specific cost for the first year (Nam$) ........................ 46
Table 3.3.4: Calculation of future FIT considering escalation of running cost by rate of inflation ... 47
Table 3.4.1: Parameters for calculating the Program Cost ........................................................... 48
Table 3.5: Share of Electricity from RE in African Countries, existing in 2008 and Targets ............. 49
Table 3.4.2: Program Cost of Scenario I ....................................................................................... 51
Table 3.4.3: Program Cost and Change of Power Price for Final Customers in Scenario I ............... 52
Table 3.4.4: Program Cost of Scenario II ...................................................................................... 53
Table 3.4.5: Program Cost and Change of Power Price for Final Customers in Scenario II .............. 54
Table 3.4.6: Program Cost of Scenario III ..................................................................................... 55
Table 3.4.7: Program Cost and Change of Power Price for Final Customers in Scenario III ............. 56

v
ACKNOWLEDGEMENTS
We are thankful of the financial and technical support received from REEEP.
We are also grateful of the thoughtful counsel from the Electricity Control Board, and the following
individuals:
Dr. Xavier Lemaire and Dr. Gill Owen - Sustainable Energy Regulation Network (SERN).
Dr. Detlof von Oertzen- VO Consulting.
Finally, we are also thankful to all sustainable energy professionals across many organisations whose
technical and moral contributions helped shape this study.

vi
GLOSSARY OF TERMS AND ABBREVIATIONS
Avoided cost; the marginal cost of energy acquired by way of construction of plant, finance of a new
generation facility or purchase from an alternate supplier.
Debt Service Coverage Ratio (DSCR); describes the net operating income (revenues minus running
cost) divided by the debt service value. If the ratio equals one all net income
is required for repaying interest and amortisation.
Distributor; legal entity that owns and operates distribution assets, and distributes electricity
through such a distribution system. In Namibia, these entities include
Regional Electricity Distributors, local authorities, municipalities and private
distributors.
Distribution System; electricity network consisting mainly of medium and low voltage distribution
infrastructure that is used to deliver electricity to a consumer.
Electricity Act; refers to the Electricity Act of 2007 (Act No. 4, 2007).
Electricity Control Board; refers to the entity created under the Electricity Act to provide for the
requirements and conditions for obtaining licences for the provision of
electricity; to provide for the powers and obligations of licensees; and to
provide for incidental matters.
Electricity market; a market in which electricity is traded and which is established, operated and
administered in accordance with the established regulations, rules and
codes.
Electricity Trading; the wholesale or retail buying and selling of electricity.
Generator; an entity or unit that produces electricity.
Greenhouse gases; gases, primarily carbon dioxide, methane, sulphur hexafluoride and nitrous oxide
in the earth's lower atmosphere that trap heat, thus causing an increase in
the earth's temperature and leading towards the phenomenon of global
warming. Some greenhouse gases are of anthropogenic origin, e.g. from
coal-fired power stations.
vii
Independent Power Producer (IPP); typically limited-liability, investor-owned enterprises that
generate electricity either for bulk sale to a utility or for retail sale to
industrial or other customers.
Long run marginal cost (LMRC); the cost of providing an additional unit of electrical output over and
above any output currently being produced. LMRC includes capital and
operational costs.
Net-metering; a two-way flow of electricity between the distribution grid and customers with their
own generation. Usually the utility will not pay for excess electricity
generated by the customer but the customer pays for the net amount of
electricity used.
Offtaker; an entity in the form of distributor, local authority, utility or buyer of electricity from the
independent power producer.
Power Purchase Agreement (PPA); a legal contract between a generator of electricity and the buyer
of the electric energy. A PPA can be between an IPP and the incumbent
generator, system operator, buyer, distribution company or end user.
Quota mechanism; government or regulator mandates a minimum capacity, generation or
consumption of electricity to come from RETs. The mandate is on producers,
system operator, distributors or customers.
Regional Electricity Distributors (REDs); entities created by the Electricity Act of 2000, mandated to
distribute electricity to consumers.
Renewable Energy Sources (RET); sources of energy that are continuously replenished by natural
processes, such as solar, wind, biomass, hydro, tidal, wave, ocean current
and geothermal energy, and which can be converted into useful energy such
as electricity. RET include:
Biomass; living and recently dead bio-organic materials which can be used as fuel or for
industrial production. Biomass is found in liquid, solid and gaseous forms,
and include wood, ethanol, biodiesel, butanol, biogas, producer gas and
landfill gas. Only sustainably harvested biomass material is considered a
renewable energy source. A major source of renewable electricity derives
from agricultural and animal waste, either through direct combustion, or

viii
through the production of biogas (anaerobic digestion of agricultural or
animal wastes) to generate methane rich gas which, in turn, is combusted to
generate heat and electricity (cogeneration). Landfill gas is considered to be
a source of biomass.
Geothermal energy; generated from heat stored beneath the earth's surface. Hot rocks in
the earth’s crust give off heat when pumping water through the natural rock
fissures, which can then be used to produce steam for power generation.
Hydropower; derived from the movement of water under gravitational force to drive
turbines to generate electricity.
Solar energy; derived from the sun’s radiant energy or electromagnetic radiation. Solar
energy can be converted directly into electricity through photovoltaic semi-
conducting materials, or used in thermal energy applications to produce
steam and then generate electricity using steam turbines, or warm water in
solar water heaters.
Wave energy; derived through turbines from ocean waves that build up from the wind
blowing on the ocean surface; considered pre-commercial.
Tidal energy; derived through turbines from tidal motion generated from the gravitational
pull of the moon; considered pre-commercial.
Wind energy; derived from harvesting naturally occurring energy of the wind though
turbines or windmills to generate electricity.
Renewable Energy Feed-In Tariff (REFIT); RET generating plants are enabled access and to sell to the
grid at a fixed price or fixed premiums added to market tariffs.
Single Buyer Model; an electricity market where all power producers may only sell their electricity
through long-term power purchase agreements to a single entity, which is
also called the single buyer. The single buyer may also be a coordinating
intermediary between generation, transmission and supply entities.
Tendering; RE developers bid for access to funds and/ or power purchase agreements through a
competitive bidding process. The tenderer specifies the RE capacity or share
of total electricity to be achieved and the maximum price.

ix
Transmission; the conveyance of electricity by means of a transmission system which consists wholly
or mainly of high-voltage networks from an energy source or system to a
customer such as a distributing entity.
White Paper on Energy Policy; the 1998 policy document of the Ministry of Mines and Energy of the
Republic of Namibia.
x
EXECUTIVE SUMMARY
The paper is organized as follows: Chapter 1 provides background and introductory information on
Namibia’s Electricity Supply Industry covering the important players and applicable rules and
regulations. The Chapter provides an overview of such policies and regulations that apply to
renewable energy in Namibia including the important White Paper on Energy Policy of 1998, Cabinet
Retreat Paper of 2008 and finally the Electricity Act of 2007. It also outlines the challenges that
renewable energy technologies face in being mainstreamed into the grid.
Before analysing market interventions in favour of RETs (like REFIT, quotas or grants), Chapter 2
discusses ways and problems to internalise external cost. It provides the Theory of Meritorics where
the government has to provide those goods that meet public needs but which are not revealed by
individual preferences and willingness to pay. An evaluation is made of different renewable energy
support mechanisms based on the criteria of the instrument being capable to meet a politically
defined target (criterion of efficacy) and secondly, the instrument being in the position to meet a
target with minimum cost (criterion of efficiency). The four instruments or renewable energy
procurement mechanisms analysed include Tendering; Quota; Renewable Energy Feed-in- Tariff
(REFIT); Net Metering and Others such as subsidies, investments grants and tax credits.
Chapter 2 continues to review the four renewable energy procurement mechanisms on a theoretical
and a practical level and presents best practice approaches. The long Chapter illustrates the
relationship between risk and financing cost and discusses how the design of RE procurement can
reduce risk and thus reduce financing cost. Recommendations from the review and comparative
analysis of the instruments are that Namibia must adopt a regulatory framework consisting of 4
procurement mechanisms, namely; a REFIT for small (less than 500 kW) wind; solid biomass and land
fill gas -and small hydro (less than 10 MW); tendering for large concentrating solar power and
(greater than 500 kW) wind based technologies. Net Metering is recommended for photovoltaics
because of high specific costs. Its inclusion will enable investors who might expect extra services of
such plants like independence from the grid and increased supply reliability. Supporting measures
like subsidies, soft-loans, grants and tax credits can reduce equity requirements and thus lead to
reduced capital. More-so, the supporting measures might help to limit the cost of the REFIT and
tendering mechanisms. Instruments like subsidies and soft loans are also ideal to support rural and
off-grid electrification. Even if REFIT and tendering schemes can be considered as powerful
instruments to promote the deployment of renewable energy technologies, the design of the
instruments is crucial.

xi
Chapter 3 gives an overview over the specific costs of different renewable energy technologies
(RETs). The costs of the proposed procurement mechanisms are calculated and the impact on the
retail power price is analysed. A REFIT is built for small RETS to calculate the specific costs of
different RETs and thus the appropriate FIT. Based on a PROGRAM cost calculator (see ANNEX 2) the
impacts of different scenarios on the economy and the retail price for residential power consumers
are calculated. The scenarios describe different renewable electricity generation capacities (60MW
and 160 MW), but also include technologies proposed under tendering.
Namibia has a small consumer market, and as such any significant renewable energy installation
will have an impact on electricity tariffs. The impact of the tariff depends on several factors,
including the type of technology, e.g. CSP or wind; size of installed capacity and subsequent energy
generated; location (in cases of wind and solar whose speed and radiation levels respectively may
not be uniform) and the wholesale market price of electricity.
Chapter 4 reiterates the recommendations of Chapter 2 and Chapter 3 giving specific guidelines on
how Namibia may implement the recommended instruments by assigning responsibilities and
proposing the necessary institutional guidelines. The Chapter also discusses the monitoring,
reporting, review and dispute resolution mechanisms. Chapter 5 concludes the whole study.

1
1. BACKGROUND AND INTRODUCTION
1.1 Background
The Ministry of Mines and Energy of the Republic of Namibia is cognisant that the country’s energy
regulatory framework and associated energy laws and regulations are fragmented and outdated,
and has therefore embarked on a review. In the past 10 years there have been amendments to
various energy-related acts, such as the Electricity Act (2000 and 2007), the Petroleum Products and
Energy Amendment Acts (2000 and 2003) and the Petroleum (Taxation) Amendment Act (Act 3,
1991). There have also been various developments within the sector demanding that capacities of
existing institutions be enhanced to more comprehensively respond to new challenges in the sector,
such as the regulation of gas, nuclear energy and renewable energy technologies. These
developments may be well assessed through the policy objectives as stated in the White Paper on
Energy Policy of 1998 (IPPR, 2009). The Policy objectives are;
- effective governance
- security of supply
- social upliftment
- investment and growth
- economic competitiveness and efficiency, and
- sustainability
Further change of the regulatory framework conditions are anticipated: the Electricity Control Board
(ECB) is set to be transformed into an energy regulator; the South West Africa Water and Electricity
Corporation Act of 1980 which governs NamPower is likely to be revised completely, and the Act
governing the Regional Electricity Distributors (REDs) has been earmarked for review to specifically
address the challenges faced by the REDs.
Even though the promotion of renewable energy technologies (RETs) is not mentioned as a special
target of energy policies, the White Paper on Energy Policy (1998) points out the potential of RETs
contributing to meeting several targets like energy security and sustainability.
The Ministry started promoting the use of renewable energy resources in earnest in 1993 with the
launch of the project “Promotion of the Use of Renewable Energy Sources in Namibia”, with the
support of the Deutsche Gesellschaft für Technische Zusammenarbeit (GTZ) GmbH. A solar credit
scheme, the Home Power Project, was launched in 1996 with financial support of the United States
of America based development organisation, Renewable Energy for African Development (REFAD).
2
There have been subsequent projects and programmes launched to promote the diffusion of RETs.
The Government partnered the Global Environment Facility (GEF) and the United Nations
Development Programme (UNDP) to launch the Namibia Renewable Energy Programme (NAMREP)
in 2004 to reduce the barriers that prevented the wider adoption of the solar resource. NAMREP was
designed to remove technical, financial, social, institutional capacity, public awareness and social
acceptability barriers to solar energy use. The Renewable Energy and Energy Efficiency Capacity
Building Programme (REEECAP) was launched in 2005 with the objective “to increase the capacity of
the Namibian resource base in selected areas to enable it to contribute to the implementation of the
national policies for renewable energy and energy efficiency as stated in the White Paper on Energy
(1998) and the Second National Development Plan” [NDP2, covering 2001-2005]. The Renewable
Energy and Energy Efficiency Institute (REEEI) was re-launched at the Polytechnic of Namibia in 2006,
following a cooperation agreement between the Polytechnic and MME. The Institute was given the
mandate to facilitate and conduct research into renewable energy and energy efficiency and
develop materials and standards, reports and disseminate information and materials.
Energy efficiency has also been promoted by MME and implemented through the ECB, NamPower
and REEEI. For example, the Demand Side Management Study commissioned by the ECB in 2006
identified seven (7) measures with the potential to yield significant energy efficiency gains in the
country. The following demand side management (DSM) measures were adopted by the DSM
Steering Committee that includes MME, ECB, NamPower, the REDs, the Manufacturers Association
of Namibia and REEEI: compact fluorescent lights (CFL); solar water heaters; time of use tariffs;
demand market participation; ripple control of geysers; energy audits; and energy saving awareness
campaigns. The measures are at various stages of implementation.
Rural and off-grid electrification are two of the many programmes that MME is driving through the
Directorate of Electricity and Directorate of Renewable Energy. The Rural Electrification Distribution
Master Plan (REDMP) provides a framework for the planning of electrical distribution infrastructure,
network planning, area prioritisation, financing and implementation of grid electrification. With a
rural grid electrification penetration rate of only 27 %, Namibia also pursues the electrification of off-
grid areas using solar technologies in an initiative guided by the Off-grid Energisation Master Plan
(OGEMP). The barriers to rural electrification in Namibia arise from limited financial resources to
extend the grid, and low rural population densities that lead to high investment costs and generally
low returns on that investment. Although the policy frameworks covering rural electrification and
off-grid electrification exist, there is a regulatory vacuum for the latter. This absence of clear
3
regulatory guidelines is a disincentive to investment in and deployment of clean energy technologies
for rural Namibia.
It is concluded that Namibia has an inadequate regulatory framework to incentivise the introduction
of large-scale renewable energy technologies and energy efficiency. Such a framework would
facilitate the levelling of the playing field between conventional and renewable energy technologies,
set national generation targets for renewable energy technologies, ensure a fair market access and
regulated return on investment, specify the quality of supply and associated standards, and create a
framework of market support structures and incentives.
1.2 The Namibian Electricity Supply Industry and its Institutions
The Namibian electricity supply industry (ESI) encompasses the entire value chain from power
generation to retailing. In the context of this study, the ESI will include electricity generation,
transmission, trading and distribution as well as the relevant policy and regulatory institutions. The
Namibian ESI institutions include:
1.2.1 MME
MME is the custodian of Namibia’s energy and mineral resources. It sets and guides policies related
to the sector, including the electricity sector. MME’s Energy Directorate aims to ensure adequate,
affordable and sustainable energy supply leveraging on the country’s natural resources for the
nation's socio-economic development. The Directorate enforces the compliance of legal
requirements of energy legislation and regulations and researches new and renewable sources of
energy. According to its website, the Ministry conducts functions, amongst others, such as:
Petroleum product import and export control, pricing and price equalization including
upstream and downstream regulation -and the administration of the National Energy Fund
Rural electrification and the administration of the Solar Electrification Revolving Fund
1.2.2 ECB
The ECB is responsible for regulating the electricity industry, and is the statutory regulatory authority
established in terms of the Electricity Act, 2000 (Act 2 of 2000). The Act was subsequently repealed
by the Electricity Act, 4 of 2007 which expanded the ECB’s mandate and core responsibilities. The
core responsibility is to regulate electricity generation, transmission, distribution, supply, import and
export to/from Namibia, while its mandate includes developing electricity tariff methodologies as
well as independently reviewing and approving electricity tariffs. A significant development to power
4
sector reform is the development of the IPP Framework and development of transmission and
distribution grid codes and related operating standards for the market players.
1.2.3 NamPower
NamPower is a state-owned utility and is responsible for power generation, transmission, trading
and also has distribution functions in select areas. It was renamed NamPower in 1996, from the
previous name of South West Africa Water and Electricity Corporation (Pty) Ltd (SWAWEK) which
had been created by South Africa’s Industrial Development Corporation in 1964. NamPower is a
private limited company but wholly owned by Government and still operates under the SWAWEK
Act of 1980.
The company has long enjoyed a complete monopoly position within the electricity industry. Recent
ESI restructuring efforts have seen NamPower cede some of these responsibilities, such as the
distribution of electricity in areas now served by the REDs. NamPower remains the single buyer
through its electricity trading unit, and has the responsibility as Namibia’s electricity system
operator. On generation, the utility operates three power plants, i.e. the 249 MW Ruacana plant
(hydro), the 120 MW Van Eck coal-fired plant, and 24 MW heavy fuel-oil-powered Paratus plant.
1.2.4 REDs and Local Authorities
The creation of REDs is in line with the White on Energy Policy (1998), intentioned to restructure
Namibia’s electricity distribution industry to improve sector efficiency. The restructuring, which is
still on-going, will culminate in five licensed REDs companies from the 45 distributors that include
NamPower, local authorities and regional councils -and farmers’ cooperatives. Although five REDs
are envisaged, in 2010 only CENORED, ErongoRED and NORED are operational.
1.2.5 IPPs
The deregulation of the ESI was intended to create a platform for the entry of Independent Power
Producers. In 2010, there are eight (8) IPPs that have been conditionally licensed by ECB, intending
to generate power from coal, gas, heavy fuel oil, wind, hydro and biomass, refer to Table 1.1. The
licensees are at various stages of negotiating power purchase agreements (PPAs) with NamPower as
expected in the single buyer market model. As yet, only Bush Energy Namibia has established an
operational power plant (250kW fuelled by biomass, inaugurated in September 2010), while none of
the other licensees has put up any power generation infrastructure.
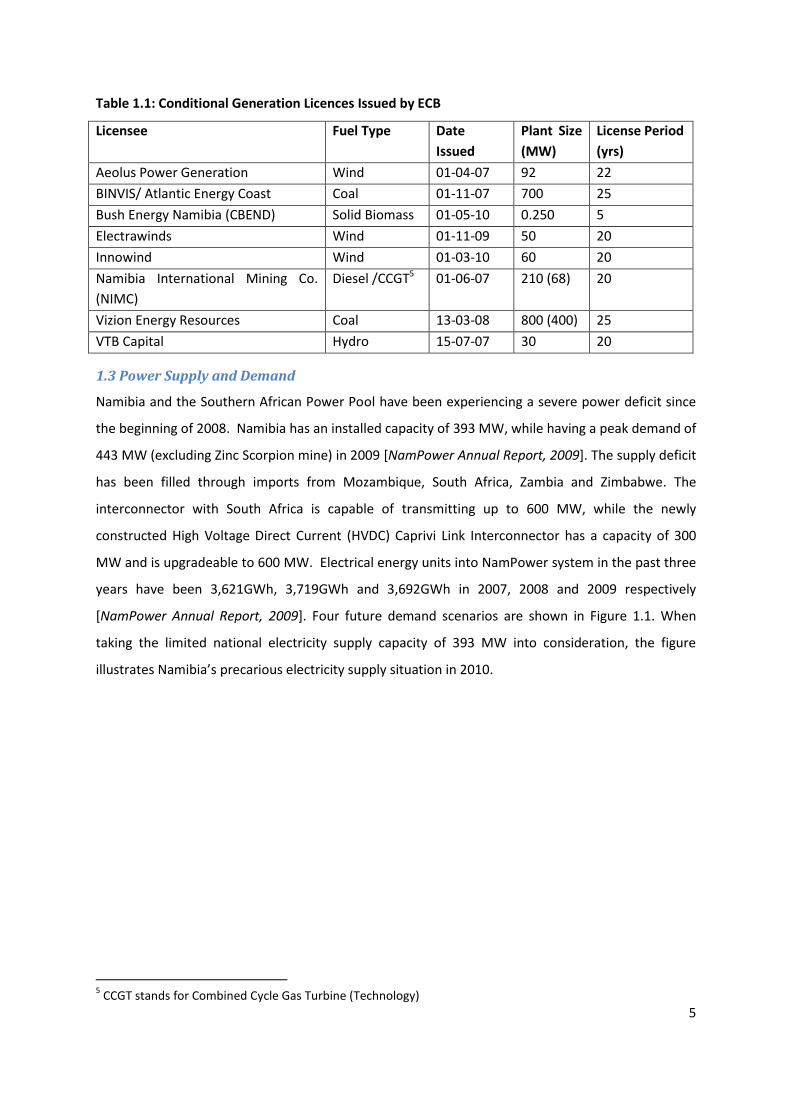
5
Table 1.1: Conditional Generation Licences Issued by ECB
Licensee Fuel Type Date
Issued
Plant Size
(MW)
License Period
(yrs)
Aeolus Power Generation Wind 01-04-07 92 22
BINVIS/ Atlantic Energy Coast Coal 01-11-07 700 25
Bush Energy Namibia (CBEND) Solid Biomass 01-05-10 0.250 5
Electrawinds Wind 01-11-09 50 20
Innowind Wind 01-03-10 60 20
Namibia International Mining Co.
(NIMC)
Diesel /CCGT5 01-06-07 210 (68) 20
Vizion Energy Resources Coal 13-03-08 800 (400) 25
VTB Capital Hydro 15-07-07 30 20
1.3 Power Supply and Demand
Namibia and the Southern African Power Pool have been experiencing a severe power deficit since
the beginning of 2008. Namibia has an installed capacity of 393 MW, while having a peak demand of
443 MW (excluding Zinc Scorpion mine) in 2009 [NamPower Annual Report, 2009]. The supply deficit
has been filled through imports from Mozambique, South Africa, Zambia and Zimbabwe. The
interconnector with South Africa is capable of transmitting up to 600 MW, while the newly
constructed High Voltage Direct Current (HVDC) Caprivi Link Interconnector has a capacity of 300
MW and is upgradeable to 600 MW. Electrical energy units into NamPower system in the past three
years have been 3,621GWh, 3,719GWh and 3,692GWh in 2007, 2008 and 2009 respectively
[NamPower Annual Report, 2009]. Four future demand scenarios are shown in Figure 1.1. When
taking the limited national electricity supply capacity of 393 MW into consideration, the figure
illustrates Namibia’s precarious electricity supply situation in 2010.
5 CCGT stands for Combined Cycle Gas Turbine (Technology)

6
Figure 1.1: Namibia’s Peak Load Forecast Scenario
Source: NamPower Presentation at Anixas Ground Breaking Ceremony, 2010.
The REEECAP study of 2008, “Electricity Supply and Demand Management Options for Namibia - A
Technical and Economic Evaluation” provides macro-economic scenarios based on different supply
and demand options. Figure 1.2 illustrates different demand scenarios for economic growth
scenarios with annual economic growth rates of 2% (low growth) and 6% (high growth) per annum
[REEECAP, 2008].
Figure 1.2: Projected System Peak Demand at Economic Growth of 2% and 6%
Source: REEECAP, 2008.
-
200
400
600
800
1 000
1 200
1 400
1 600
1 800
2 000
Demand Forecast Scenarios
Medium Forecast
High Growth
Low Growth
Vision 2030 scenario

7
Namibia is vulnerable to power supply disruptions since its foreign suppliers are also facing a power
deficits. Step loads, largely from increased mining activities, will continue to place pressure on
national supplies. In order to address the current shortfall, MME through NamPower is
contemplating a number of generation options as summarised in Table 1.2.
Table 1.2: Planned and Status of Power Generation Projects
Project Capacity
(MW)
Fuel
Type
Expected
Completion Date
Status
Anixas 22 Diesel 2011 Work has commenced
Ruacana 4th
Unit
92 Hydro 2012 Project funded from NamPower’s
balance sheet plus loan from KfW
Work has commenced
Lower Orange
river mini
hydro power
stations
30 - 120 Hydro 2013 Projects in feasibility stage
Likely development in collaboration
with IPPs
Kudu Gas to
Power Project
(CCGT)
400-800 Gas 2014 Various options including compressed
natural gas are being considered
Payment modalities for gas uncertain
Identification of power off-taker
required
Walvis Bay
Base Load
200- 500 Coal 2014 Environmental Impact Assessment
(EIA) Study completed
Environmental clearance outstanding
IPP required to build and operate the
plant
Baines Hydro
Power
360-500
Hydro
2017
Techno-economic study and EIA
started
Project to be built jointly with Angola
Power output to be shared with
Angola
1. 4 Namibia’s Power Market Model
The current electricity market structure is that of a vertically integrated single buyer whereby
NamPower’s Electricity Trading Unit buys electricity from suppliers through long-term PPAs. Figure
1.3 illustrates the prevailing market structure in Namibia. The single buyer model in Namibia’s open
market system compromises NamPower’s partiality in negotiating PPAs with IPPs since the Power
Trading and Transmission Divisions are an integral part of NamPower.

8
Figure 1.3: Namibia Single Buyer Model
Source: ECB Annual Report, 2009
Namibia’s power market can best be summarised by Lovei (2000) who states that “...the lack of a
unified wholesale market price means that the electricity price for small consumers depends on the
power purchase contracts signed by their distributors”. Lovei goes on to suggest that in order to
protect the interests of these consumers, the regulator needs to spell out procurement rules or
other criteria that distributors must meet before they can pass through electricity purchase costs to
captive consumers.
Presently, the ECB contemplates the creation of a modified single buyer market structure. The
model will be similar to a wholesale market where there are multiple buyers and sellers of
electricity. REDs and other distributors will be able to buy power directly from the IPPs.
NamPower’s role in a modified single buyer model remains critically important, especially to
maintain system balance in real time, and NamPower will also remain the supplier of last resort.
1.5 Cabinet Retreat Recommendations
Of relevance to the Namibian ESI, the Namibian Cabinet Retreat Paper of 2008 makes a series of
recommendations with the following observations:
1. The Central RED and Southern RED need to be created. CENORED and Erongo RED have been
requested to assist in management of electricity distribution in the outstanding REDs.
2. In 2005 Cabinet took a decision that electricity tariffs must reach cost reflectivity by the year
2010/11. Cost reflectivity means that the utility is allowed by the regulator to recover all costs of
9
supplying electricity which include all operational, administrative and customer care costs.
Cabinet reiterated this position in 2009. However, based on tariff increases in 2009 and 2010, it is
most likely that the 2010/2011 target will not be met. Tariff cost –reflectivity is essential to
attract investments in the electricity sector.
3. The role of private sector investments in the electricity sector is recognized as a complement to
NamPower. IPPs are being invited to take up projects such as the Walvis Bay Thermal Power
Plant and the small hydros.
4. The definition of rural electrification is broadened to include low-income, informal and peri-
urban settlements. These areas have been neglected since they are in undesignated areas and
are being considered under the Off-grid Energisation Master Plan.
5. Fuel is to be levied for infrastructure to help other energy sector entities like NamPower, REDs
and Namcor. The Petroleum Products and Energy Amendment Act, No. 16 of 2003, provides for
levies of petroleum products for contribution towards the Energy Fund. The Act empowers the
Minister responsible to impose a levy for the benefit of the Fund on any energy source including
electricity, nuclear and renewable energy. The Fund may be used for any project or activity in
connection with energy as may be prescribed by regulation.
6. ECB to be transformed into an energy regulator, in line with regional trends and to avoid the
unnecessary expense of creating too many new entities with similar functions.
7. The Namibian Government is to engage the government of the Republic of South Africa for
support in building small hydro-power plants along the Orange River.
8. Recognition is given to the importance of subsidies to encourage the mainstreaming of
renewable energy technologies to the energy supply chain. The Solar Revolving Fund under
OGEMP is designed to subsidise RET.
1.6 Tariff Cost Reflectivity
It is stated in the Cabinet Directive that electricity tariffs must be cost reflective by 2011/12. The
ECB has been granting NamPower tariff increments (e.g. 18% for 2010/2011) to set it on a path to
meet that target. For 2010/11 NamPower had requested an increase of 35.16%. REDs and Local
authorities are granted varying increases according to the revenue requirements they submit to the
ECB. The ECB argues that its pricing methodology takes into consideration the “recovery of cost of
supply plus regulated rate of return while keeping prices affordable to consumers” (ECB Press
Statement, 2010).
Figure 1.4 illustrates a projection of generation and transmission price increases. It is noted that the
actual wholesale price of electricity to re-distributors is 45.62c/kWh (in Namibian currency) for
2010/2011, while the 2008/09 projection proposed a tariff which is almost double that.

10
Figure 1.4: Generation and Transmission Projected Price Increases.
Source: ECB, 2010
1.7 Challenges Faced by Renewable Energy Resources in Namibia
Namibia is well-endowed with energy resources. Non-renewable energy resources include gas and
uranium; however both have their challenges to develop to provide power to the country. The
renewable energy resources are in the form of good wind resources, excellent solar radiation, and
biomass [Von Oertzen, 2009].
However, despite the abundance of various renewable energy sources (RET) in the country, only
solar technologies have gained some market access, although their use is limited to off-grid
energisation and for domestic water heating. This is despite several licence applications being
approved by ECB for wind power development.
The optimum utilisation of RET requires a combination of appropriate policies and a favourable
investment framework for the would-be investor. One of the major bottlenecks to the large-scale
development of renewable energy projects is with the pricing mechanism for these resources.
Countries that have witnessed the large scale development of RETs, such as Germany, Spain, Sri
Lanka and China, have introduced procurement mechanisms such as renewable energy feed-in-
tariffs (REFITs), often in addition to other procurement mechanisms. South Africa introduced REFITs
in March 2009, but their impact is yet to be felt. Kenya is implementing feed-in-tariffs for wind,
small hydro-power and biomass resource to generate electricity.

11
The development of procurement mechanisms for the development of renewable energy resources
in Namibia is therefore necessary. The present study assesses the following renewable energy
technologies: wind, solar, solid biomass including landfill gas and small hydro-power. These
resources have received considerable interest from investors, and their development given the right
framework conditions seems promising.
Observation:
Namibia’s lack of grid based renewable electricity is due to an absence of a specific renewable
energy policy and an enabling regulatory framework despite a good overall energy policy. Countries
with large scale development of RETs, such as Germany, Spain, Sri Lanka and China, have introduced
procurement mechanisms such as REFITs, premiums and other support mechanisms.
12
2. COMPARATIVE ANALYSIS OF RENEWABLE ENERGY
PROCUREMENT MECHANISMS
2.1 Purpose
The section provides a comprehensive comparative analysis of different instruments used to procure
RETs globally and their applicability for use in Namibia. The instruments considered in this study are
Renewable Energy Feed-in-Tariff (REFIT), Quota, Tendering, Net Metering and others grouped as Tax
Incentives or Rebates, Grants and Capital Subsidies. These instruments are used to promote the use
RETs and deliver renewable electricity to the grid. The theoretical analysis is used to make proposal
for the design of RE procurement mechanisms for Namibia. Besides theoretical evaluation practical
experiences with different procurement mechanisms made abroad are considered, too.
2.2 Introduction
Namibia’s White Paper on Energy Policy emphasises the need of increasing the share of indigenous
resources by levelling the playing field between conventional and renewable energy technologies.
Creating a level playing field for RETs includes abolishing market and policy failures (such as price
ceilings, subsidies for grid-based electrification) [Ministry of Mines and Energy (2005)]. Presently, the
most prominent market failure of the Namibian power market is the externalisation of certain costs
of fossil fuel power plants operating within the country or abroad. As long as this market failure
persists, RETs are systematically discriminated against. Appropriate institutional support is needed
to overcome this barrier.
Economic literature suggests two different approaches to overcome market failures and to improve
the competitiveness of RETs (Musgrave & Musgrave 1984):
a) internalisation of external cost of fossil fuels based power generation;
b) introduction of special instruments to ensure a greater share of RET in the electricity
supply (like quotas, REFIT and others).
Since economists prefer to leave the choice of technologies to the market, they normally
recommend that the first approach is used.
2.3 Internalisation of External Costs
RETs face several impediments like high investment costs, lack of information by consumers and
generators, institutional barriers, and others. Utilities are hesitant to invest in RETs other than
conventional hydro-power. The main reason for the dominance of fossil fuels in the power sector is

13
the fact that their specific upfront costs are lower than those of RETs like wind power plants,
concentrating power plants (CSP) or PV plants.
One important reason for such a cost advantage of fossil fuel power generation is that the market
price of electricity generated by fossil fuels does not reflect all the costs related to its generation.
Power plants using coal or fuel oils do not have to pay for disposing all pollutants, such as particulate
matter and greenhouse gases into the atmosphere. Since the capacity of the atmosphere to absorb
and neutralise pollutants is limited, there are harmful feed-backs to all other economic entities,
including governments, companies and households.
The disposal of pollutants to the atmosphere indicates the existence of “external costs” and is the
“free disposal assumption” held by traditional economic models. The market system on its own does
not provide information to the generators about the magnitude of such external costs. And, even if
such information was available, no incentive exists to apply it or to consider incorporating external
costs in the calculation of power prices.
Since the polluters only pay for the internal costs such as capital costs and fuel costs but not for the
external costs, they enjoy cost advantages when compared to other power generators using low
emitting technologies like RETs. This is an indication that the conventional fossil fuel based power
market is distorted and the government has to intervene and to correct relevant market failures, at
least according to welfare economics. Only if all suppliers on the market bear all cost of their
activities, the market mechanism can ensure that a given demand (for power) is met by minimum
social costs, including internal and external cost.
A correction of the market failure can be achieved by calculating or estimating the external costs,
and then attributing these to the polluters. In theory, this can be done by imposing a production tax,
such as the so-called Pigouvian tax or emissions tax, where a proper taxation rate is determined by
the level of external cost6. In this way, conventional fossil fuel power generation become more
expensive. As a consequence, economic theory predicts that the demand for such polluting power
would decrease, and producers would have incentives to look for cleaner and environmentally
cheaper alternatives including the introduction of RETs. Thus, a production tax helps to overcome
the market failure and the existing discrimination of RETs.
Unfortunately, an exact calculation of a proper tax rate faces considerable informational barriers
that are hard to overcome. Exact information on the quantitative impacts of given pollutants is not
6 The optimum rate of a Pigouvian tax is determined by the marginal external cost at the optimum output
level.

14
available and are also difficult to express in monetary terms since it is not known whether
consumer’s would be willing to pay for better air quality, and by implication, less global warming.
A specific challenge exists in countries such as Namibia where coal-generated power is not
generated locally but imported from neighbouring countries. Here, a Pigouvian or emissions tax
cannot be introduced by the state. One option to circumvent this issue is by introducing import
tariffs on electricity generated from coal, or introduce specific instruments to increase the share of
RET in the local power sector.
2.4 Renewable Energy Technologies as Meritorics
Increasing the share of renewable energy technologies can be done by using a variety of
procurement mechanisms or policy instruments, including:
offering renewable energy feed-in-tariffs
implementing renewable energy tendering schemes
introducing a quota system for renewable energy technologies, and
creating investment grants, tax credits, rebates, etc.
All these strategies are based on the assumption that RETs encompass a bundle of advantages, such
as making positive contributions to energy security, technological development and economic
growth and reducing greenhouse gas and particulate emissions. Whereas a strategy to internalise
external costs is based on welfare economics, the above-mentioned RET procurement mechanisms
are not, and are rather based on the Theory of Meritorics founded by Musgrave.
According to the Theory, the government has to provide those goods that meet public needs but
which are not revealed by individual preferences and willingness to pay. Since individuals do not
fully recognise the benefits of RETs, they are not willing to pay premium prices. Thus, government
would have to ensure a proper level of supply. The question, however, is what the appropriate
quantity of supply would be. However, it is difficult to define the optimum level of consumption of
such goods, and defining the quantity of RET (e.g. in GWh or share of electricity production) remains
subject to political decision making.
Therefore, decision criterion is needed to evaluate different RE procurement mechanisms. In
economics, government policy instruments should be chosen in a way that political targets are met
with minimum social costs. This proposition includes at least two criteria: firstly, the instrument
must be capable to meet a politically defined target. Secondly, the instrument must be effective

15
(criterion of efficacy). Gipe defines that efficacy of procurement mechanisms for renewable
generation of electricity “...must, at a minimum, include for:
access to the grid (interconnection), and
a price for the electricity produced that contributes to profitability or at least the prospects
of profitability” (Gipe, 2006, p. 8)
Since RET are exploiting indigenous resources they contribute to energy security. Thus it can be said
that an effective procurement mechanism can be considered as one of improving energy security.
The contribution to the target of energy security (although difficult to quantify) must not, therefore,
be discussed separately.
The chosen instrument must ensure that the target has minimum costs. The instrument must be
efficient (criterion of efficiency). Since efficient solutions (maximization of social welfare) might
include different distributional impacts, another criterion is added, which is avoidance of negative
distributional impacts. This criterion is met if the consumer surplus is maximised. In practical terms
this implies that the instrument should be selected in a way that extra-ordinary profits by producers
are avoided (OPTRES 2007, p.50).
Finally, RET procurement mechanisms should contribute to the provision job opportunities. It is well-
known that applying RETs promotes employment in several ways: during manufacturing,
construction and the procurement of renewable fuels. Namibia’s unemployment rates currently
stand around 50% with the majority of the unemployed being unskilled and young people.
Thus, theoretical evaluation of the procurement mechanisms is based on the following three criteria:
1. efficacy: does the instrument meet the target
2. efficiency: is the total cost to meet the RET-target minimised
3. avoidance of negative distributional impacts: is consumer surplus maximised as well as
creating additional social benefits such as employment creation.
With respect to efficiency two issues have to be addressed:
First, the criteria of cost minimisation or economic efficiency can be interpreted as static or
dynamic. Static efficiency is given if the government target is met by minimum cost of using
given technologies. Dynamic efficiency implies the capability of an instrument to provide
incentives to lower the costs which is a precondition for future ambitious targets. Static and
dynamic efficiencies have to be considered in evaluating the different procurement
mechanisms.
16
Secondly, if a country has not formulated quantitative targets for RET (or targets for specific
renewable energy types) such as Namibia, but only general energy policy targets like energy
security, the evaluation becomes more difficult.
Since meeting policy targets in an efficient way and avoiding unnecessary extra costs for the public
is of general economic importance to Namibia, the study will concentrate on these criteria.
The evaluation of RET procurement instruments will use a three-step process:
1. the different RET procurement approaches are presented assuming an ideal type7 and ideal
market conditions (competition) and these are evaluated with respect to the mentioned
criteria of efficiency and efficacy.
2. flaws in the design of the procurement mechanisms that can be observed in practice are
discussed.
3. some best practice recommendations are then presented.
Observation:
Market failures are addressed by internalising external costs of fossil fuel based generation or by
introducing special instruments like REFITs to ensure a greater share of RET in the electricity supply.
Internalising of external costs is almost impossible in Namibia. The special instruments introduced
under the Theory of Meritorics must be such that they are efficient, effective and maximise
consumer surplus, e.g. job creation.
The nascent renewable energy industry which is still largely confined to solar energy for off-grid
electrification and solar warm water preparation employs around 85 people8 on fulltime basis.
2.5 Renewable Energy Procurement Mechanisms
Introducing renewable energy procurement mechanisms in a market economy like Namibia needs
careful legitimating because the market as a decision making process is replaced by a state planning.
Since government decision can be based on poor information and lobbying, replacing the market
should be based on sound arguments such as the problem of internalising external cost and the
Theory of Meritorics. The instruments or procurement mechanisms used to promote the use of
RETs and deliver renewable electricity to the grid in different countries include REFIT, quota,
tendering, net metering and others grouped as tax incentives or rebates, grants and capital subsidies
7 The ideal type as introduced by Max Weber in this context is describing the typical composition of a support
mechanism and should not be mixed with a best practice mechanism. 8 Based on annual surveys conducted by REEEI

17
(Table 2.1). The utility is obliged to purchase the renewable electricity under the REFIT, quota and
tendering. The following sections will describe these instruments in detail evaluating their
advantages and disadvantages -and their implementation and delivery experiences.
Table 2.1 Instruments for RE generation in selected countries.
Co
un
try
REF
IT
Qu
ota
Cap
ital
su
bsi
die
s,
gran
ts, r
ebat
es
Inve
stm
en
t
exci
se,
oth
er
tax
cred
its
Sale
s ta
x,
ener
gy
tax,
V
AT
red
uct
ion
En
ergy
pro
du
ctio
n
pay
me
nts
, ta
x
cred
its
Net
me
teri
ng
Pu
blic
inve
stm
en
t,
loan
s, f
inan
cin
g P
ub
lic
com
pet
itiv
e
bid
din
g/te
nd
erin
g
Algeria
Argentina
Brazil
China
Guatemala
India
Indonesia
Kenya
Mexico
Mauritius
South Africa
Sri Lanka
Thailand
Notes: = applied in some states
Source: adapted from Ljung, 2007
2.5.1 Tendering
The national government pursues a quantitative target for RET that should be realized by one or
several auction with RET developers being invited to apply to bid for an RE contract. The tendering
approach is used by both industrialized (United Kingdom and France) and developing countries (by
Peru9, Argentina10, Honduras11, Brazil12 and Bangladesh13).
9 http://www.minerandina.com/index.php?option=com_k2&view=item&id=85:arranca-mercado-de-
energias-renovables-en-el-peru&Itemid=2&lang=en
18
Typical features of a tendering system are:
- Eligible technologies are defined by the government, but no specific targets for selected
technologies;
- All necessary technical information concerning wind-speed, radiation etc. are provided by
the government;
- The least cost bidder or the least cost bidders whose capacity is needed to meet the RE
target are awarded a contract;
- For defined number of years (15-20 years) the successful bidders will receive a fixed price
that is in accordance to their bid;
- A penalty has to be paid in case of withdrawal from the contract or in case of lacking RE
generation.
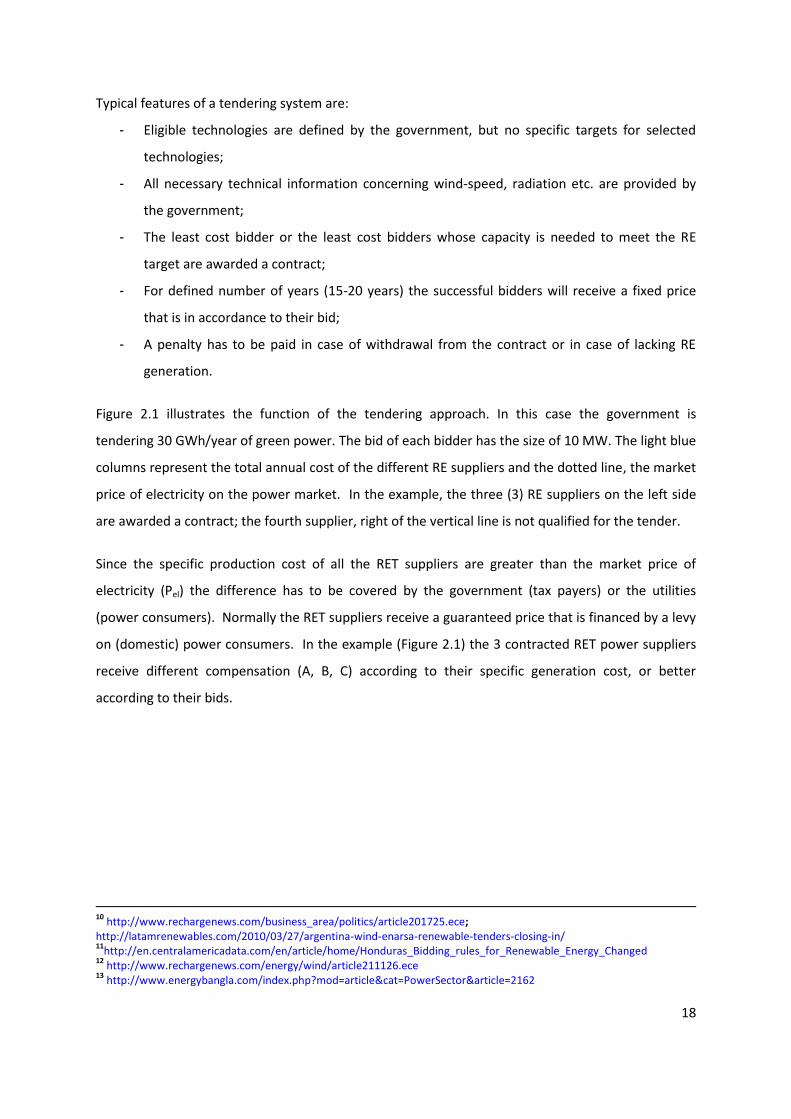
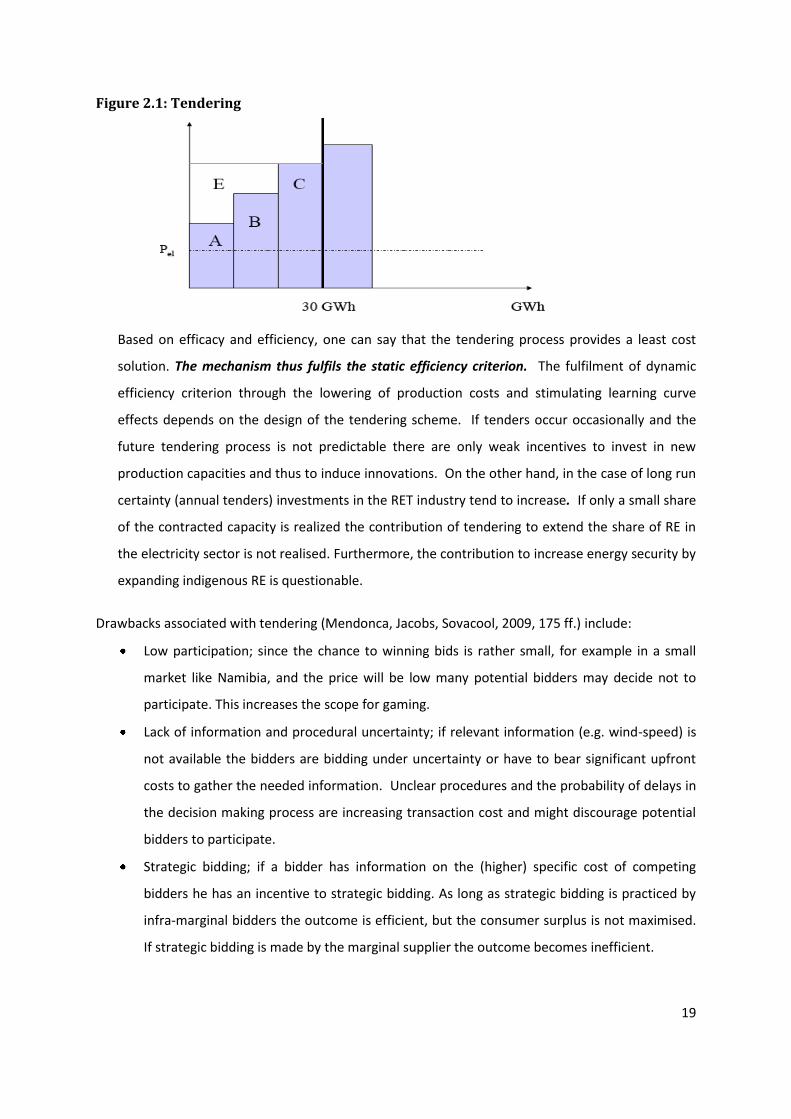
Figure 2.1 illustrates the function of the tendering approach. In this case the government is
tendering 30 GWh/year of green power. The bid of each bidder has the size of 10 MW. The light blue
columns represent the total annual cost of the different RE suppliers and the dotted line, the market
price of electricity on the power market. In the example, the three (3) RE suppliers on the left side
are awarded a contract; the fourth supplier, right of the vertical line is not qualified for the tender.
Since the specific production cost of all the RET suppliers are greater than the market price of
electricity (Pel) the difference has to be covered by the government (tax payers) or the utilities
(power consumers). Normally the RET suppliers receive a guaranteed price that is financed by a levy
on (domestic) power consumers. In the example (Figure 2.1) the 3 contracted RET power suppliers
receive different compensation (A, B, C) according to their specific generation cost, or better
according to their bids.
10
http://www.rechargenews.com/business_area/politics/article201725.ece; http://latamrenewables.com/2010/03/27/argentina-wind-enarsa-renewable-tenders-closing-in/ 11
http://en.centralamericadata.com/en/article/home/Honduras_Bidding_rules_for_Renewable_Energy_Changed 12
http://www.rechargenews.com/energy/wind/article211126.ece 13
http://www.energybangla.com/index.php?mod=article&cat=PowerSector&article=2162
19
Figure 2.1: Tendering
Based on efficacy and efficiency, one can say that the tendering process provides a least cost
solution. The mechanism thus fulfils the static efficiency criterion. The fulfilment of dynamic
efficiency criterion through the lowering of production costs and stimulating learning curve
effects depends on the design of the tendering scheme. If tenders occur occasionally and the
future tendering process is not predictable there are only weak incentives to invest in new
production capacities and thus to induce innovations. On the other hand, in the case of long run
certainty (annual tenders) investments in the RET industry tend to increase. If only a small share
of the contracted capacity is realized the contribution of tendering to extend the share of RE in
the electricity sector is not realised. Furthermore, the contribution to increase energy security by
expanding indigenous RE is questionable.
Drawbacks associated with tendering (Mendonca, Jacobs, Sovacool, 2009, 175 ff.) include:
Low participation; since the chance to winning bids is rather small, for example in a small
market like Namibia, and the price will be low many potential bidders may decide not to
participate. This increases the scope for gaming.
Lack of information and procedural uncertainty; if relevant information (e.g. wind-speed) is
not available the bidders are bidding under uncertainty or have to bear significant upfront
costs to gather the needed information. Unclear procedures and the probability of delays in
the decision making process are increasing transaction cost and might discourage potential
bidders to participate.
Strategic bidding; if a bidder has information on the (higher) specific cost of competing
bidders he has an incentive to strategic bidding. As long as strategic bidding is practiced by
infra-marginal bidders the outcome is efficient, but the consumer surplus is not maximised.
If strategic bidding is made by the marginal supplier the outcome becomes inefficient.
20
Cancellations; cost overruns result in cancellations. In UK less than 30% of the contracted
capacity was installed and the same is true for France.
Tendering does not allow a continuous growth of RE industry; rather a Stop- and-Go
development. Since the timing of the next round of tendering is unclear there are no
incentives to build production capacities with developers more likely to use imported
technology.
Concentration on least cost technologies may contribute to economic competitiveness and
efficiency, but may not fulfil other targets of economic and social policy.
Definition of sub-categories for different types of technologies (wind, solar) or for different
types of bidders (small, large) does not allow the concentration on least cost RETs.
To avoid these flaws best practice recommendations (Ecofys, 2008, p. 40) may include:
Penalties for non-compliance to help avoid unreasonable low bids;
Corrections for inflation and prices for key commodities;
Continuity of calls increasing the predictability of the tendering process and thus avoiding a
stop-and-go development;
Streamlining interacting policies (like special planning) “...to ensure the tendered capacities
can actually be realised” (p. 40).
2.5.2 Quota Systems
Quota schemes, sometimes called Renewable Portfolio Standards (RPS) are applied in many
industrialized countries like UK, Australia, Canada, Japan and Italy but also in several developing
countries like China and India (see Mendonca, Jacobs, Sovacool, 2009, p. 150 ff). In the USA RPS are
applied in more than 30 states like Iowa, Minnesota and California. In the case of a quota system,
the government mandates a minimum share of power coming from RET which is similar to
tendering. The mandate can be placed on generators, distributors or consumers. In the following
case it is assumed that the mandate is placed on distributors (utilities). Typical features of a quota
system are:
- Eligible technologies are defined by the government, but no specific targets for selected
technologies;
- The target increases over time; but there is a final target (MWh) and an end-date;
- The utility decides how to comply, by type of technology and by choosing appropriate
developers to deal with;
- Government is allocating Green Certificates for each MWh of RET;

21
- At the end-date the utility has to prove meeting the obligation. This can be done by bundled
certificate or unbundled certificates. Bundled certificates are considered if physical
electricity and the certificate are transferred together (this is the case in California). If green
power and certificates are traded on different market then the certificates are unbundled.
In this case a utility facing relative high cost of RE power production can meet its RE quota by
buying certificates on the certificate market;
- A penalty has to be paid in case a utility is lacking certificates.
Discussing the outcomes of a quota system a system of unbundled certificates is considered, where
power and certificates are traded on different markets. In this case utilities are free to develop own
RET projects like wind farms or CSP plants or to buy the certificates from third parties, like
independent green power producers. A RET producer receives two types of income: revenues from
selling the green power on the general power market and revenues from selling the certificates on
the certificate market.
The green power producers will extend the RET power production as the sum of power price and
certificate price are greater or equal to the long-run marginal cost (LRMC) of RET projects. In reality
both, the future power price and the future price of green certificates are very difficult to project.
The price on the certificate market is determined by LRMC of the last MW of RE capacity that is
necessary to meet the quota, more precisely the sum of all green obligations of all utilities. The “law
of one price” holds for both the power market certificate market. RET producers with relatively low
cost of supplying green power, so called infra-marginal producers, earn extra profits.
Evaluating the results of a quota system with tradable green certificates the following can be said:
- On a competitive power market each utility will choose the least cost option to meet the
obligation. Faced with own low cost RE resources a utility will develop the RET projects and
the associate certificates on its own, otherwise, it would buy the green certificates from the
certificate market. Thus, the outcome is efficient. Efficiency is given if the marginal cost of
producing green power over all utilities is equal;
- Due to the fact that there is one price for each MWh of green power, infra-marginal RET
producers enjoy extra profits thus failing the consumer surplus maximisation criterion.
The ability of the Quota Scheme to meet the criterion of dynamic efficiency or provide incentives to
lower production cost and to induce learning curve effects depends on the design of the quota
system. If the persistence of the quota system is uncertain there are no strong incentives to invest
22
in new production capacities incorporating innovative solutions. On the other hand, in the case of
long run certainty investments in the industry, the rate of technical progress will increase.
Similar to tendering systems outcomes of quota schemes often differ from the `ideal type´ as
describe above (see Mendonca, 2007, p.68 ff.) with the main reasons being market or policy failures.
The most relevant market imperfection is missing information on future certificate and power prices.
Thus, an investment in RETs today is associated with a high degree of uncertainty concerning future
revenues. As a consequence, financing RET project becomes more expensive.
Research on RE procurement mechanisms focussing on the design and the results of quota schemes
make the following best practice recommendations (OPTRES, 2007, p. 129 ff.);
targets for RE in the electricity sector: political targets to increase the share of RE in the
power sector will increase security for investors,
avoiding maximum prices for RE certificates,
introducing minimum limits for RE certificates prices,
introducing generic quotas and no technology-specific quotas,
issuing of green certificates only to new capacities,
allowing for banking and borrowing.
Comparing tendering and the quota system, it can be said that in both cases the least cost RETs will
be chosen; thus, the outcome is efficient. But one important difference in the case of the quota
system is the market price of certificates which is determined by the marginal producer. In
conclusion, from the theoretic consideration one can say that both alternatives are equal from the
perspective of economic welfare. In both cases the sum of producer and consumer surplus is
maximised. But considering the distribution impacts both options are different. The tendering
process implies a higher consumer surplus and lower power prices (including the levy or green
certificate component).
2.5.3 Renewable Energy Feed-in-Tariffs (REFITs)
REFIT systems are applied in many industrialized countries as well as few of developing countries
(see Table 2.1). The main feature of REFIT systems is the provision of cost covering prices for
electricity produced by RE plants and fed into the grid. Since the costs of different RETs are
different, the guarantee prices are of different levels. Additional to cost covering prices the grid
operators face a purchase obligation to buy up all RE power produced. Normally, a REFIT system is
23
not combined with a quantitative target for the RE development. Among developing countries some
apply REFIT system to just one or two types of RETs.
Very similar to REFIT schemes are premium prices for RET electricity that are provided in several
countries like the Netherlands, Norway, Denmark, and Spain and in the Canadian province of Ontario
(ECOFY, 2009, p.34). In this case the RET power generator receives two types of revenues: the
market price of electricity and a fixed premium per kWh. Compared to a REFIT scheme the premium
system offers an opportunity of a higher return in case of increasing prices on the power market. On
the other hand the premium system involves higher risks, since the power price might drop.
Furthermore, a combination of REFIT system and premium prices is possible. In Spain the RE
producers can choose every year what support system they like to use. In the following section we
concentrate on REFIT systems.
2.5.3.1 Typical Design and effects of REFIT Systems
In practice REFIT systems are designed in manifold ways. The features of the `ideal type´ are:
1. The REFIT is designed as a cost covering tariff that is provided for a sufficient duration of the
system, say 15-20 years.
2. Since the cost of different technologies differs, technology specific tariffs are offered. Thus,
high producer surplus can be avoided.
3. Since the cost of RETs differ by size, location and fuel type the technology specific tariffs are
often stepped in accordance to
a) local conditions (wind, hydro, PV)
b) size (PV, hydro, biogas plants)
c) fuel (solid bio-waste, biogas, energy crops)
4. Degression: Since the costs of RETs are often decreasing by time, the tariff for new plants is
revised periodically (e.g. 5% per annum)
5. Since the cost and revenues of RE plants cannot be anticipated correctly in advance, it can
be prudent to start with a “generous tariff” that will be revised after some years, say 3 years.
6. Inflation-Indexation: Inflation reduces the real value of revenues. If running costs and capital
costs are increasing with the rate of inflation the economic performance of RE projects

24
might become endangered. Existing plants become uneconomic, new plants will face
serious financing problems since loans are often inflation-indexed.
7. Purchase obligation: Besides cost covering tariffs the purchase obligation of the grid owner
is the “second most important ingredient for all FIT schemes” (Mendonca, Jacobs, Savacool,
2009, p.29). It obliges the nearest grid company to buy all renewable electricity independent
of power demand.
Since the tariff is strictly oriented to the specific cost of the respective technology (including an
acceptable return to equity), there is an incentive to invest, but no extra profits will occur.
Different tariffs exist for different local conditions (e.g. wind-speed or radiation) or types of
technology which prevents windfall profits.
Since the FIT is offered for a defined period, long enough to recover all cost, the investment is
almost riskless for the investor. Thus, a strong demand can be expected. As a consequence, the
political target to increase the share of RE in the power sector will be met. The mechanism is
effective.
On the other hand, if cost covering FITs are provided for all types of RETs the outcome will be
inefficient. Static inefficiency is given, if the expansion of RE is not concentrating on the least
cost RETs but includes high cost options too. In such a case electricity consumers (or tax payers)
will face a serious burden. This holds especially for developing countries where the people spend
a relatively high share of their income on electricity.
Evaluating the dynamic efficiency of the REFIT scheme shows different picture. Once a FIT is
defined for several years the RET suppliers have strong incentives to lower the cost and to
improve the quality to increase profits and to extend the market share. The REFIT scheme will
give permanent incentives to promote technical progress to induce learning curve effects.
Similar to tendering and quota the dynamic efficiency depends on the design of the scheme. If
the duration of the REFIT were uncertain there would be no incentives to invest in new
production capacities and innovative solutions.
Some elements of “bad design” (Mendonca, Jacobs, Savacool, 2009, p. 57 ff) for REFIT are:
Low tariff level, leading to lacking incentives for investments in RETs;
Unnecessarily high tariff level, leading to windfall profits and unnecessary high burden to
electricity customers or tax payers;

25
Flat rate level: If one tariff for all types of RETs is provided only a few RETs will be supported
(if the tariff is low) or significant windfall profit will be realized by producers applying low
cost RETs;
Lack of clear rules on who has to bear the cost of grid connection and grid reinforcement
(the producer of RE or the grid company);
Exemptions from purchase obligation;
Bad financing mechanism: The extra cost of RE is not financed by a top-up on electricity bill,
but by the general budget or a by special funds. In such a case the stability of the REFIT
system will depend on tax incomes and becomes subject to political debates;
Bad tariff calculation schemes like ‘avoided costs’ (which may be interpreted differently)
from conventional power production or ‘avoided external cost’. In the first case the tariff will
be too low to provide a significant incentive, in the second case the outcome depends on
many assumptions and political considerations. While ‘avoided costs’ of conventional
energy generation in a given market can still be calculated relatively objectively, the
estimate of the ‘avoided external costs’ is based on a large number of assumptions.
Capacity caps: They tend to limit the expansion of RE in the electricity sector. Furthermore,
they lead to ‘stop-and-go’ cycles with strong demand before the cap is reached and
collapsing demand when the cap is reached. In general it can be observed that ‘stop-and-go’
dynamics are not suitable to promote a RET industry.
Legal status: The REFIT system is not established by law but by ministerial orders.
Formulating some best practice recommendations one can say an effective REFIT system should;
provide technology specific tariffs covering the cost of the respective RET (including the cost
of grid connection),
provide size specific tariffs to avoid over subsidization,
grant the FIT for a duration of 15 – 20 years,
include a compensation for inflation,
include a clearly defined purchase obligations of the Offtaker without exemptions,
26
have an effective administrative structure (limited number of involved authorities),
have clearly defined rules concerning the allocation of grid connection and grid
reinforcement cost,
be backed-up by a national grid reinforcement plan.
2.5.4 Net Metering
The mechanism allows a consumer to connect small RETs to the grid through bi-directional or smart
meters. The consumer is offsetting electric energy provided by the utility by own generation. The
RET power plant is usually designed to prioritise on-site electricity demand. Excess energy may be
sold at the retail rate. In periods of excess demand electricity is bought from the utility. “In this way,
the consumer uses the utility as a battery. The utility stores the energy until producer needs it. This
is the essence of net metering” (Gipe, 2009, p. 97). “Net” in this context means, that the consumers
pay for the amount of energy consumed after deducting the amount of kWh generated by the own
plant.
Net Metering schemes are applied in USA, Canada, Australia and Denmark. In the USA all states
have net metering schemes with special rules (see Wikipedia, keyword “Net Metering”).
Elements of an ‘ideal’ Net Metering Scheme:
Definition of eligible facilities;
The interconnection of facilities is limited to the consumers property to offset his
consumption;
Utilities buy up all excess demand at retail rate;
The amount of electric energy fed into the grid and compensated by the retail rate is
restricted to the annual electricity consumption. If more energy is generated than used
within a billing period (year) it is billed zero.
Net Metering is effective where small scale RETs are available with specific generation cost smaller
than the retail rate. The mechanism is undesirable in cases with RETs with specific cost higher than
the retail price.
The procurement mechanism is inefficient, since the plant size is limited by the on-site consumption.
Thus, RET generators cannot make use of economies of scale. Furthermore, since interconnection is

27
limited on the consumer’s property, low cost opportunities of green power generation (e.g. remote
areas with high wind speed) cannot be used.
In practice the efficacy of Net Metering programmes is reduced by several restrictions (Gipe, 2009,
p. 99 ff.):
Monthly balance of account (instead of annual balance);
Price of RE fed into the grid often is considerably lower than the retail price (no price
symmetry);
Not all utilities (public, private) are obliged to provide Net Metering services;
The size of the single facility is limited normally to own demand;
The size of the total programme is limited (total amount of generating capacity or
percentage of utility’s total load);
In conclusion, it can be said that Net Metering can provide some incentives to apply low cost RETs
but it cannot be considered as a policy for a rapid deployment of a significant amount of RET. This
holds especially if the retail prices are artificially low (lacking internalization of external cost,
subsidization of retail prices).
2.5.5 Subsidies, investment grants and tax credits
Another approach to increase the share of RET in the electricity sector is providing investment
grants, low-interest loans or tax credits to investors (see ECOFYS, p. 40 ff.). These instruments are
applied in many countries (see Table 2.1). In some countries investment grants are provided as main
support instrument (Finland), but in most countries as secondary instrument supporting other
instruments like REFIT or quota systems.
Subsidies, soft-loans and tax exemptions (like accelerated depreciation schemes or tax credits) play
an important role to reduce the capital cost of RETs. As mentioned earlier, the criterion of efficacy
can only be met, if the instrument includes measures for a) the access to the grid and b) a price for
the electricity produced that contributes to profitability. Since subsidies and soft-loans are not
intended to fully bridge the gap between the power price and the specific cost of RETs, they are
incapable to meet the criterion of efficacy. If they are not designed to meet a defined target they
cannot be directly compared to the other instruments mentioned before and may be applied
differently from country to country.
28
2.6 Summary of RETs procurement mechanisms
It can be concluded that each of the RET procurement mechanism considered so far has its specific
strengths and drawbacks drawn from its design characteristics and intended purpose. Tendering
schemes and quota systems are suitable to meet politically defined targets for RET. Furthermore,
both support schemes tend to provide efficient solutions: they give incentives to investors to apply
least cost RETs. In the case of quota systems the efficient outcome is depending on a competitive
market for RET certificates.
REFIT systems on the other hand typically support a broad range of RETs with different specific cost.
By setting minimum prices REFIT schemes provide investors with incentives to demand for RETs, but
they are not designed to meet specific targets. REFITs are instruments of “industry policy” rather
than instruments of “energy policy”. As instruments of industry policy are not aiming at quantitative
objectives, its effectiveness has to be judged against other criteria like deployment and diffusion of
new technologies and development of a new industry. It also provides an opportunity for
committed citizens to participate in the energy production.
Since REFIT systems are designed to promote different types of RETs they do not focus on least cost
solutions. Since the outcome is not meeting the criterion of static efficiency, the burden for the
power consumers tends to be higher than in the case of tendering and quota systems.

29
Table 2.2: Summary of Comparison of RETs Procurement Mechanism
Mechanism Contract Compensation Other aspects Efficacy & Energy security
Static efficiency
Dynamic efficiency
Impact of electricity cost to customers
Impact on employment
Tendering Least cost RET supplier sells to utility; gets long-term contract
Price as bid; fixed in contract
Penalty in case of withdrawal
Very positive
Very positive
Negative Very positive Positive
Quota system with green certificates
Least cost RET suppliers sell to power market; No long-term contracts
Variable Pool power price and variable price of green certificates.
Level of risk for RE producers is very high
Very positive
Positive Negative Positive Positive
REFIT All RE-producers feed power into grid with no long term contract
Cost covering tariff; Tariff is technology specific; Usually fixed by law/regulation
Purchase obligation; priority rule given to utility
Depends on tariff
Negative Very positive
Negative Positive
Premium Prices (e.g. Spain)
All RE producers feed power into grid with no long –term contract
Power pool price and premium
Purchase obligation; priority rule given to utility
Depends on tariff
Negative Very positive
Negative Positive
Subsidies, investment grants & tax reductions
Very variable Grants or rebates which are usually not usually cost covering
Depends on the design and application
Negative Negative Positive Negative Positive
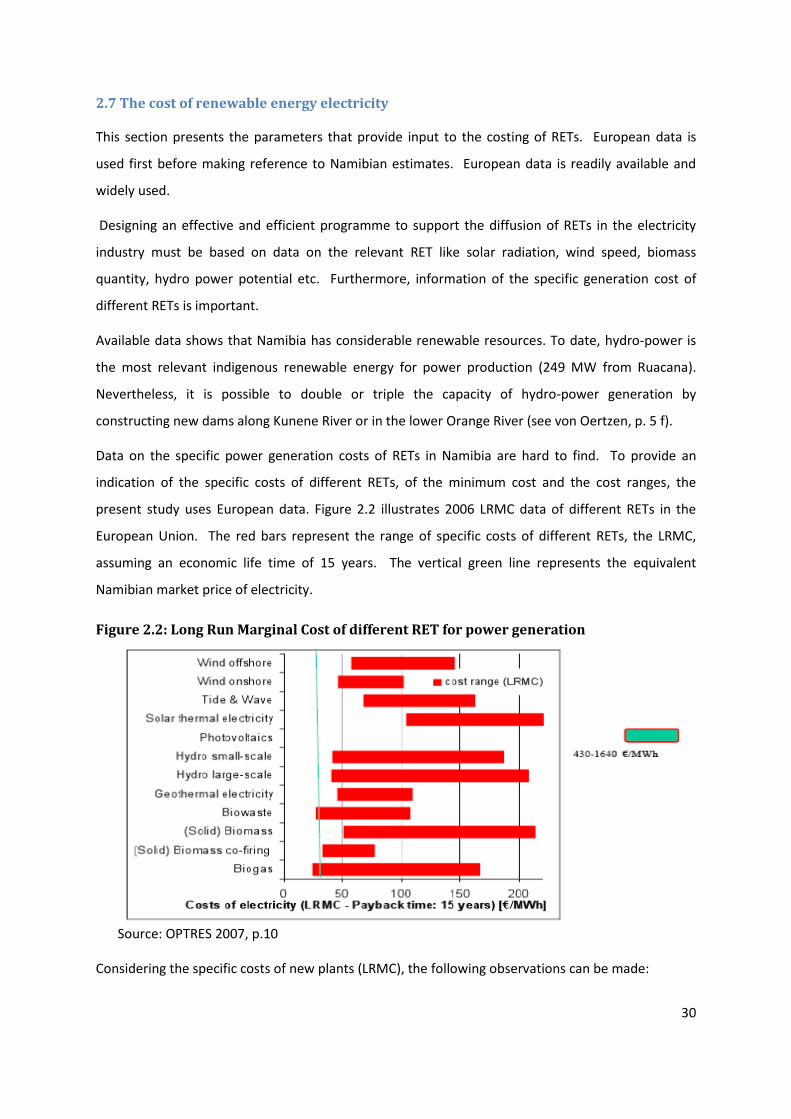
30
2.7 The cost of renewable energy electricity
This section presents the parameters that provide input to the costing of RETs. European data is
used first before making reference to Namibian estimates. European data is readily available and
widely used.
Designing an effective and efficient programme to support the diffusion of RETs in the electricity
industry must be based on data on the relevant RET like solar radiation, wind speed, biomass
quantity, hydro power potential etc. Furthermore, information of the specific generation cost of
different RETs is important.
Available data shows that Namibia has considerable renewable resources. To date, hydro-power is
the most relevant indigenous renewable energy for power production (249 MW from Ruacana).
Nevertheless, it is possible to double or triple the capacity of hydro-power generation by
constructing new dams along Kunene River or in the lower Orange River (see von Oertzen, p. 5 f).
Data on the specific power generation costs of RETs in Namibia are hard to find. To provide an
indication of the specific costs of different RETs, of the minimum cost and the cost ranges, the
present study uses European data. Figure 2.2 illustrates 2006 LRMC data of different RETs in the
European Union. The red bars represent the range of specific costs of different RETs, the LRMC,
assuming an economic life time of 15 years. The vertical green line represents the equivalent
Namibian market price of electricity.
Figure 2.2: Long Run Marginal Cost of different RET for power generation
Source: OPTRES 2007, p.10
Considering the specific costs of new plants (LRMC), the following observations can be made:
31
- Specific costs (€/MWh) are very different between RETs (some are close to the market price
of electricity such as biomass and biogas whilst others such as solar thermal and
photovoltaics are significantly higher);
- The cost of given RETs varies in a broad range. Major reasons for the cost variations are the
plant size, the variation of wind-speed and radiation, fuel cost (in the case of biomass etc.).
Other aspects like financing cost are equally relevant;
- Using wastes (from forest industry, agriculture or landfill gas) is the least cost option,
followed by hydro and onshore wind;
- RETs based on solar energy show the highest specific cost, especially photovoltaics (PV).
(But, in the long run the relative prices of different RETs can change. In the past the strong
promotion of RET technologies in industrialized countries has reduced cost significantly, in
industrialized and developing countries.)
Even if the European cost data many not be entirely representative for developing countries like
Namibia, they however, indicate that a least cost strategy should be based on landfill gas,
agricultural wastes, hydro and wind power. In any case Namibia has a limited manufacturing base,
meaning that all RETs will still be imported from Europe and other developed countries.
Specific costs of new plants in developing countries are often higher than in industrialized countries,
mainly due to higher transport costs, taxes, missing infrastructure and higher (administrative) risks.
Also, country-specific risk levels are affecting financing cost (UNEP, 2004). Section 2.8 discusses how
the financing cost can be reduced by an intelligent design of RE procurement.
Research conducted on the costs of RETs largely focuses on the cost dynamics (experience curve
effect), and the associated experience-curve effects that can be observed (Neij, 2008; NEEDS 2006).
The most impressive learning rate exists in the case of PV (see Table 2.3). Here, a doubling of
capacity induces a decrease of specific investment cost by 20%. Evaluating US figures, Wiser et al.
observe a decline in specific investment cost ($/KWp), mainly caused by a drop of module prices14,
and observe that the decline was more evident for smaller system sizes (Wiser et. al. 2009, p. 12 ff.).
In the case of wind energy the costs were decreasing significantly until 2003 and then rising
significantly (Wiser, Bolinger 2009). Similar observation of increasing specific cost for wind power
14
About 50% of investment cost are non-module cost (installation, inverter, grid-connection)
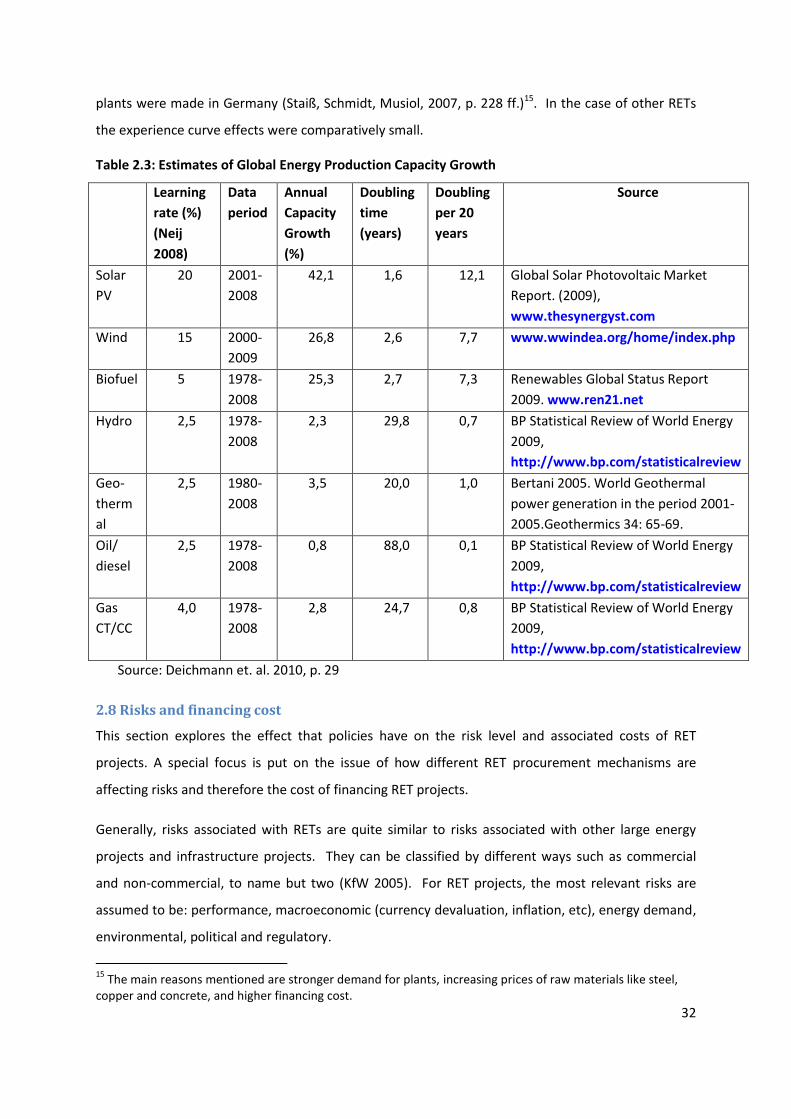
32
plants were made in Germany (Staiß, Schmidt, Musiol, 2007, p. 228 ff.)15. In the case of other RETs
the experience curve effects were comparatively small.
Table 2.3: Estimates of Global Energy Production Capacity Growth
Learning
rate (%)
(Neij
2008)
Data
period
Annual
Capacity
Growth
(%)
Doubling
time
(years)
Doubling
per 20
years
Source
Solar
PV
20 2001-
2008
42,1 1,6 12,1 Global Solar Photovoltaic Market
Report. (2009),
www.thesynergyst.com
Wind 15 2000-
2009
26,8 2,6 7,7 www.wwindea.org/home/index.php
Biofuel 5 1978-
2008
25,3 2,7 7,3 Renewables Global Status Report
2009. www.ren21.net
Hydro 2,5 1978-
2008
2,3 29,8 0,7 BP Statistical Review of World Energy
2009,
http://www.bp.com/statisticalreview
Geo-
therm
al
2,5 1980-
2008
3,5 20,0 1,0 Bertani 2005. World Geothermal
power generation in the period 2001-
2005.Geothermics 34: 65-69.
Oil/
diesel
2,5 1978-
2008
0,8 88,0 0,1 BP Statistical Review of World Energy
2009,
http://www.bp.com/statisticalreview
Gas
CT/CC
4,0 1978-
2008
2,8 24,7 0,8 BP Statistical Review of World Energy
2009,
http://www.bp.com/statisticalreview
Source: Deichmann et. al. 2010, p. 29
2.8 Risks and financing cost
This section explores the effect that policies have on the risk level and associated costs of RET
projects. A special focus is put on the issue of how different RET procurement mechanisms are
affecting risks and therefore the cost of financing RET projects.
Generally, risks associated with RETs are quite similar to risks associated with other large energy
projects and infrastructure projects. They can be classified by different ways such as commercial
and non-commercial, to name but two (KfW 2005). For RET projects, the most relevant risks are
assumed to be: performance, macroeconomic (currency devaluation, inflation, etc), energy demand,
environmental, political and regulatory.
15
The main reasons mentioned are stronger demand for plants, increasing prices of raw materials like steel, copper and concrete, and higher financing cost.

33
Boettcher (2009) distinguishes endogenous (project-specific, such as project management, technical
performance) and exogenous risks (such as regulatory, macro-economic environment, resource,
etc). Whereas endogenous risks can be managed by the project company using financial risk
instruments (insurances, weather derivates etc.), the exogenous risks cannot. The latter are not
insurable since they are not accurately quantified according to likelihood and severity of losses
(UNEP, SEFI (2004, p.15)). The UNEP study emphasizes the differences between large scale projects
and small scale projects with respect to the availability of financial risk management instruments.
Since lenders are risk averse, high risk levels will be translated in financial parameters like;
- debt term (share of equity, duration of loan),
- interest rate,
- and debt service coverage rate (DSCR)16,
Therefore, the higher the risk level, the higher the share of equity, the shorter the duration of
loans, the higher the interest rate and the DSCR.
Another approach to classify the risks of RET projects is to consider the different stages of the
project cycle. Risks occur on all stages of the project cycle, starting from project development,
construction, along operation until decommissioning.
Policies can play an important role to reduce the risk level and thus capital cost. This is true for all
stages of the RET project cycle (see ECOFYS, 2008, p. 10 ff; Boettcher, 2009, p.73 ff.).
16
The Debt Service Coverage Ratio (DSCR) describes the net operating income (revenues minus running cost) divided by the debt service value. If the ratio equals one all net income is required for repaying interest and amortization.
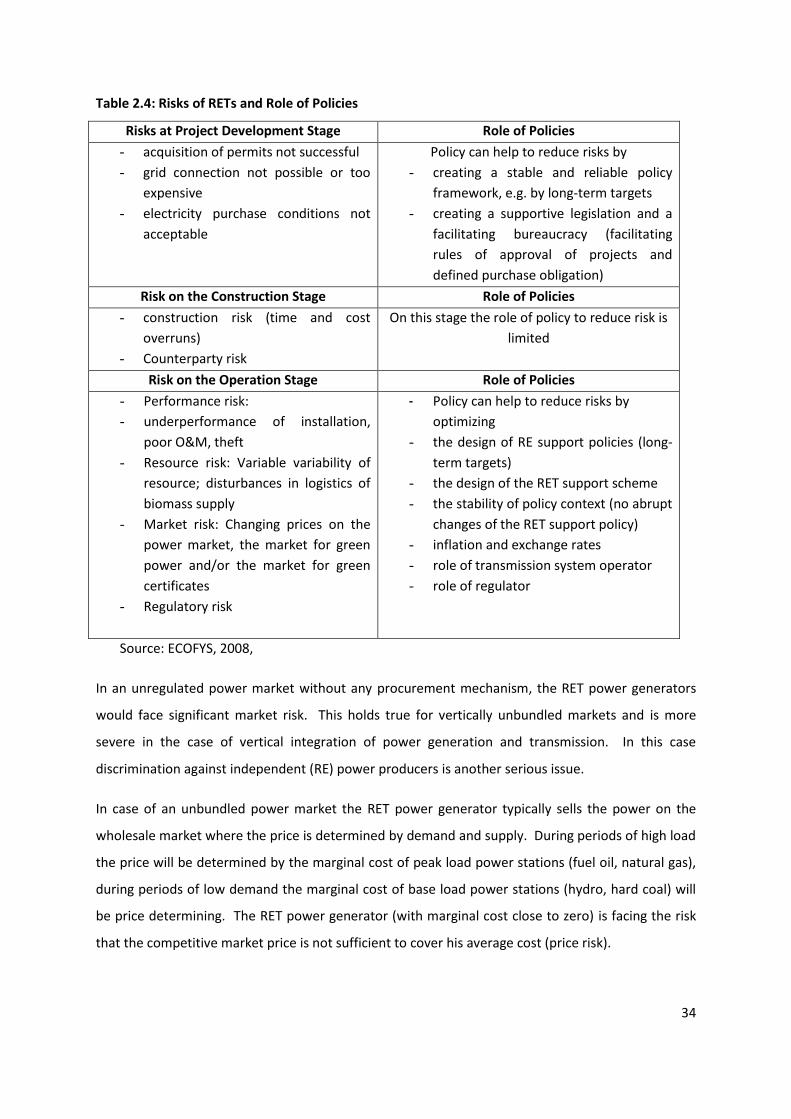
34
Table 2.4: Risks of RETs and Role of Policies
Risks at Project Development Stage Role of Policies
- acquisition of permits not successful
- grid connection not possible or too
expensive
- electricity purchase conditions not
acceptable
Policy can help to reduce risks by
- creating a stable and reliable policy
framework, e.g. by long-term targets
- creating a supportive legislation and a
facilitating bureaucracy (facilitating
rules of approval of projects and
defined purchase obligation)
Risk on the Construction Stage Role of Policies
- construction risk (time and cost
overruns)
- Counterparty risk
On this stage the role of policy to reduce risk is
limited
Risk on the Operation Stage Role of Policies
- Performance risk:
- underperformance of installation,
poor O&M, theft
- Resource risk: Variable variability of
resource; disturbances in logistics of
biomass supply
- Market risk: Changing prices on the
power market, the market for green
power and/or the market for green
certificates
- Regulatory risk
- Policy can help to reduce risks by
optimizing
- the design of RE support policies (long-
term targets)
- the design of the RET support scheme
- the stability of policy context (no abrupt
changes of the RET support policy)
- inflation and exchange rates
- role of transmission system operator
- role of regulator
Source: ECOFYS, 2008,
In an unregulated power market without any procurement mechanism, the RET power generators
would face significant market risk. This holds true for vertically unbundled markets and is more
severe in the case of vertical integration of power generation and transmission. In this case
discrimination against independent (RE) power producers is another serious issue.
In case of an unbundled power market the RET power generator typically sells the power on the
wholesale market where the price is determined by demand and supply. During periods of high load
the price will be determined by the marginal cost of peak load power stations (fuel oil, natural gas),
during periods of low demand the marginal cost of base load power stations (hydro, hard coal) will
be price determining. The RET power generator (with marginal cost close to zero) is facing the risk
that the competitive market price is not sufficient to cover his average cost (price risk).

35
In the case of physical bottlenecks in transmission another risk occurs. RET power generation is
separated by a bottleneck from power consumption and cannot be sold. Furthermore, in case of
vertically integrated structure the incumbent power generator has incentives to discriminate against
the RET power generators to ensure a high usage of own generation capacities.
RET procurement mechanisms are designed to reduce some of these risks. Thus, they help to reduce
capital cost. Table 2.5 shows which risks are affected by the different support schemes. The REFIT
scheme combined with a tough purchase obligation completely eliminates the price risk. The grid
company has to buy up all RET power supplied at the cost covering price.
In case of a premium price the RET power supplier receives a premium on top of the market price of
power. In case of dropping power market prices the sum of market price and premium might be
insufficient to cover the specific cost and to cover the dept. Thus, some price risk exists.
In case of a quota system with unbundled certificates the revenues of RET power supplier consist of
the market price of electricity plus the price of green certificates. In the event of abundant
conventional and green power production the market price of electricity and the price of certificates
will drop. Thus, the RET power production faces a double risk.
In the case of tendering the successful bidder is awarded a contract guaranteeing a cost covering
price. Thus, the price risk is eliminated.
Table 2.5: Risk Profile of Selected RET Projects
Support mechanism Power price risk Green certificate price risk
REFIT combined with
purchase obligation
None None
Premium Yes None
Quota System Yes Yes
Tender None none
Source: ECOFYS, 2008, p. 35; own assessment
Summing up the theoretical considerations one can say that REFIT and tendering schemes are most
appropriate to reduce price risks and hence to reduce financing cost.

36
Figure 2.3: Prices (in Euros) for Wind Energy in Countries with REFIT and Quota Schemes
Source: BWE, 2005
Butler and Neuhoff emphasize that switching from tendering (Non-Fossil Fuel Obligation, NFFO) to a
quota system (Renewable Obligation Certificates, ROC) in the UK has increased uncertainty and
financing problems: “by contrast, obtaining finance is perceived to be more difficult under the ROC
where payments are not guaranteed. Although the price paid under the latter is currently higher
than under the NFFO, there is concern amongst investors that the policy will not be continued over
the long term” (Butler, Neuhoff 2004, p. 22.).
The ECOFYS study (p.130) which conducts a comparative assessment of all support instruments for
different countries from a project financing perspective concludes that the “15 to 20 year support
provided or negotiable in Germany, France, California and Quebec sets the standard favourably for
the applied economic lifetime of a project, whereas the 10 year premium support in the Netherlands
and the inherent uncertainties in the UK obligation scheme result in lower applied economic
lifetimes (e.g. 15 year) and higher liveliest cost of electricity” (ECOFYS, 2008, p. 104 f).
In conclusion it can be argued, regardless of the fact that there is no riskless procurement
mechanism, the choice of procurement mechanism plays an important role to reduce the risk and
capital cost of RET projects. As discussed earlier, each procurement mechanism consists of different
measures and can be designed in various ways. The working of a REFIT system for example depends
on numerous design elements (like duration of support and compensation for inflation) and other
supporting measures like purchase obligation and grid connection rules. Furthermore, risks occur on

37
all stages of the project cycle. The best design of a REFIT system does not take into account, if there
are serious obstacles on the development stage, e.g. if it is difficult to obtain a planning permission
or during construction (RET support policy is not linked with spatial planning).
In the same way a quota scheme, showing a higher level of risk can be improved by supporting
measures like soft-loans, stand-by guarantees, minimum prices for certificates etc.
Discussion:
Tendering, Quota, REFIT, Premiums, Net metering and subsidies are instruments used to promote
the use RETs and deliver renewable electricity to the grid. Different countries use different
instruments to achieve specific objectives. The instruments will depend on a number of factors,
namely local resource base, financial and economic resources, RE target, the prevailing and adopted
power sector and market model.
2.9 Recommendations for RET procurement mechanisms in Namibia
In the White Paper on energy policies (1998) the Government of Namibia has defined its energy
policy targets, including improving security of supply, sustainability, social upliftment, investment
and growth, economic competitiveness and efficiency.
RET can contribute to meet these targets, especially the target of security of supplies. Several
barriers, however, have to be overcome (see Nexant 2010, p. 16 ff.). Currently, the power price
does not reflect the scarcity of resources. To provide a level playing field and to make use of the
advantages that RETs offer, effective and efficient procurement mechanisms have to be introduced.
Section 2.4 has introduced several procurement mechanisms, including tendering, quota schemes
and REFIT systems. It was shown that these mechanisms are suitable to meet defined targets, but
that differences exist with respect to static and dynamic efficiency. Efficiency is important, since all
procurement mechanisms will increase the actual price that consumers will have to pay, or the tax
portion allocated by government to pay subsidies.
To discuss the suitability of these procurement mechanisms for Namibia, aspects such as the
simplicity and transparency of implementing such mechanisms, the size of the power market with
regards to administrative challenges, and national developmental objectives as set in national
developmental plans (Vision 2030 and National Development III) will have to be taken into account.
It is recommended that REFITs are applied to small (less than 500kW) wind; solid biomass and land
fill gas -and small hydro (less than 10MW). Tendering is proposed for large (greater than 500kW)
38
CSP and wind based technologies. Any installation above these specified capacities is considered
large. The rational for these thresholds is purely regulatory and administrative since the Electricity
Act (Act No. 4 of 2007) sets 500kW as the threshold for generators not needing to be licensed if used
for imbedded generation.
2.9.1 Tendering for CSP and Large Wind
It is an effective approach to provide a defined amount of RET power. It is efficient since the price
of RET power is revealed in a competitive process. Furthermore, designed as pay-as bid auction it
minimizes the burden for power consumers or tax payers. Tendering is already a widespread
procurement process in the electricity industry of Namibia. It is recommended for RET with capacity
above 500 kW except for small hydro power plants that have to be above 5 MW. CSP is exclusively
recommended for tendering. The mechanism must be administered by the National Tender Board
with technical input from MME and ECB.
Rationale: Large wind power plants and large CSP projects typically feed power into the transmission
grid. Tendering is an effective approach to provide a defined amount of RET power at defined
location. Tendering can help “to prepare for the integration of additional renewable resources
commensurate with the expansion of Namibia’s system” (Nexant, 2010, p.19). In this sense the
tendering approach or Request for Proposal (RFP) is superior to a REFIT scheme where the location
of feed-in is determined by decentralized RET power producers. “Given the relatively small size of
Namibia’s system, and the importance of ensuring that the renewable generation resources brought
into the system have adequate balancing resources for integration, the RFP approach gives the
country more control over the process than would be the case with a Feed-In Tariff”. (Nexant, 2010,
p.19)
The tendering process is efficient since the price of RET power is revealed in a competitive process.
Designed as pay-as bid auction, it minimizes the burden for power consumers or tax payers.
2.9.2 REFIT for Small RETs
A REFIT system significantly reduces the market risks (price risk) and thus provides incentives for
investors to look for opportunities. It is an ideal instrument to mobilize small and decentralized
resources. A REFIT can provide an opportunity for building economic opportunities in rural areas
and ensure sustainability. The REFIT is recommended for small hydro (less than 5 MW) and solid
biomass and landfill gas (both less than 500 kW). The ECB will administer the REFIT which will be
applied at distribution level and implemented by REDs and local government authorities since
electricity from small installations is expected to be fed into the grid at distribution level.

39
The REFIT scheme should include a purchase obligation for Regional Electricity Distributors (RED) and
any other electricity distributor in Namibia -and a priority rule.
Rationale: A simple and transparent REFIT scheme provides a permanent incentive for decentralized
economic units (households, firms, eventually REDs) to look for opportunities of applying RETs.
Concentrating on small scale plants the electricity will be fed into the distribution grid. The location
of feed-in will be determined by the decentralized power generators. For the sake of simplicity and
transparency the RET generator should bear the cost of grid connection, but not the cost of grid
reinforcement. Furthermore, the provision of a permanent incentive to apply small scale RETs will
promote the deployment of an indigenous RET industry. Small-scale producers cannot compete
against bigger developers in a tendering process.
2.9.3 Net metering for PV
Installed capacities for PV are not expected to be large and are all assumed to be roof top
installations at this moment. The rationale for the exclusion of PV facilities from the REFIT scheme is
the high costs of this RET (factor 3 – 4 compared to other RETs- see Chapter 3 for cost indications). It
is therefore recommended to introduce Net Metering for PV
Rationale: Net metering typically provides incentives for electricity consumers to apply RETs with
specific cost lower than the retail price (about 1$). For RETs with high specific cost like PV plants (2 –
3 Nam$) the incentive for investing in PV is small. But investors might expect extra services of PV
plants like independence from the grid and increased supply reliability.
2.9.4 Other support measures like soft loans, grants, tax breaks, etc.:
Some of these measures have been applied in Namibia for off-grid electrification and have spurred
growth in solar home systems. The measures are recommended to be combined with others like
tendering, REFIT and net metering. Namibia is still struggling with low electrification rates and RETs
are viewed as appropriate and alternative energy resources to provide energy in off-grid and rural
communities in line with OGEMP. Soft loans and grants have been used to support RETs under the
ongoing MME’s Solar Revolving Fund and the just concluded Namibia Renewable Energy Programme
(September 2010).
Rationale: Supporting measures like soft-loans, grants and stand-by guarantees can reduce equity
requirements. Leading to reduced capital costs supporting measures might help to limit the cost of
the REFIT scheme and tendering. The instruments are also ideal to support rural and off-grid
electrification.

40
2.10 Conclusions
Renewable energy sources can play an important role to meet Namibia’s energy policy targets. Since
market penetration of RET is hampered by many barriers, effective and efficient procurement
mechanisms are necessary to stimulate their increased uptake. After evaluating the pros and cons
of different procurement mechanisms, a scheme consisting of 4 procurement mechanism
instruments is recommended, namely a REFIT scheme and a tendering process are suggested as
“main” instruments, Net Metering for PV, and soft loans as supporting instruments which must
continue to reinforced to support rural and off-grid electrification. REFITs are proposed for small
(less than 500kW) wind; solid biomass and land fill gas -and small hydro (less than 10MW).
Tendering is proposed for large (greater than 500kW) CSP and wind based technologies. Even if
REFIT and tendering schemes can be considered as powerful instruments to promote the
deployment of RET, the design of the instruments is crucial.
As discussed earlier, each procurement mechanism consists of different measures and can be
designed in various ways. The design of the specific procurement mechanisms recommended in this
section is discussed in a Chapter 4.
Discussion:
Namibia has a small electricity market but is endowed with abundant renewable energy resources.
Affordability of electricity services must be considered. RETs benefits must be maximised to address
challenges such as employment creation, rural upliftment, industrial competitiveness, energy
security, and sustainable development. RET procurement mechanisms adopted must be catalysts to
address these challenges.
41
3. ESTIMATING THE COSTS OF THE PROCURMENT MECHANISMS
3.1 Purpose
The purpose of this chapter is to calculate the costs of the proposed procurement mechanisms and
the impact on the retail power price. A REFIT is calculated for small RETS which are then applied to
different RET generation capacities. The overall impact on different mixes and levels of RET is
calculated.
3.2 Introduction
The costs and benefits of different power supply scenarios, including different forms of renewable
energies, have been recently analysed by REEECAP (2008). The outcome of the study was that a
balanced power generation strategy including a measured share of RETs will show the highest
benefit-cost-ratio (BCR).
In principle, the REEECAP study includes a significant proportion of the data needed to evaluate a RE
procurement programme. The reason, why the present study cannot simply refer to the REEECAP
study is fourfold:
- the study is based on the assumption of a drastic increase of power demand of Namibia
leading to a huge demand of additional supply- which might still hold true based on rapid
mining growth largely in the Erongo Region
- the expansion of RETs is based on comparatively large units (e.g. 1 MW in the case of PV),
- some relevant RETs are not considered (landfill gas, biogas, small hydro), and
- the assumed specific costs of some RETs seem low taking current price developments into
account.
Thus a careful consideration of all available cost data of RETs is required. This is presented in Section
3.2.1. To include more recent data and local conditions, a tariff calculator is developed in Section
3.3. To estimate the cost of the renewable energy procurement mechanisms a reference case
including a given mix of RETs is defined.
3.2.1 Availability of RET Cost Data
The Terms of Reference specify that the present study is to focus on procurement mechanisms
including for the following RETs: wind, CSP, landfill gas, small hydro, PV and solid biomass.
Detailed cost data for generation of electricity by wind, CSP, PV and solid biomass in Namibia have
been presented by REEECAP and are shown in Figure 3.1 below.
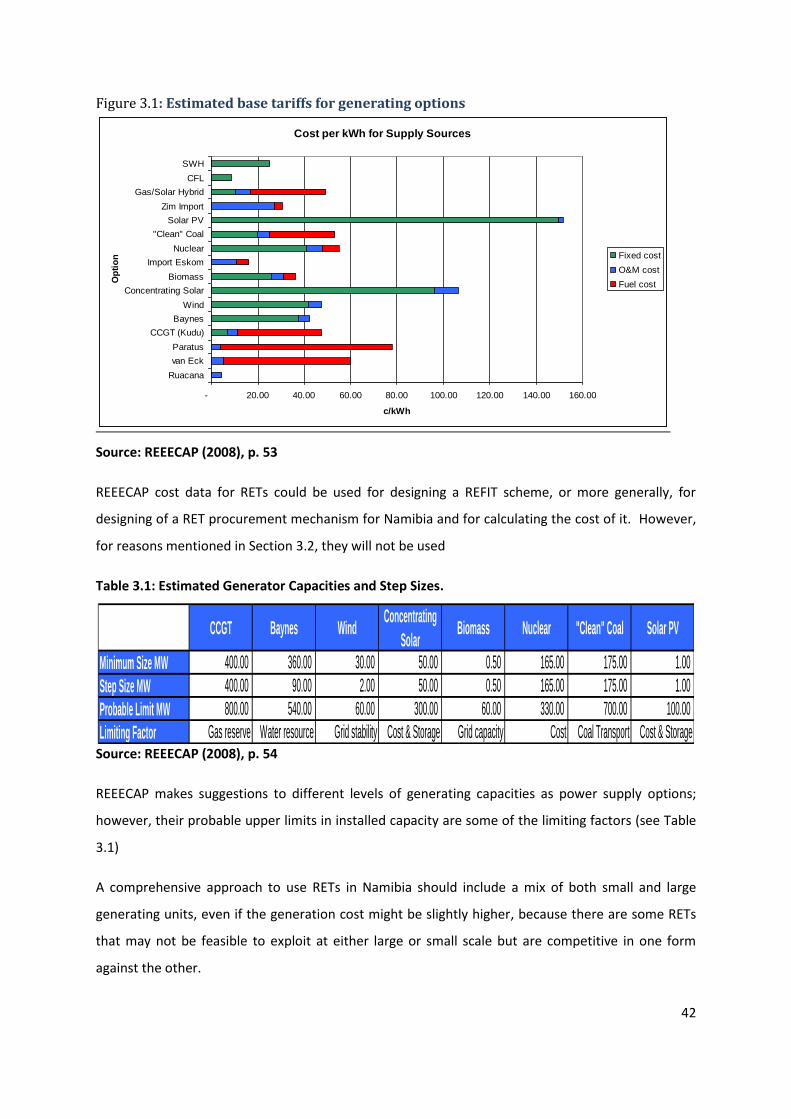
42
Figure 3.1: Estimated base tariffs for generating options
Source: REEECAP (2008), p. 53
REEECAP cost data for RETs could be used for designing a REFIT scheme, or more generally, for
designing of a RET procurement mechanism for Namibia and for calculating the cost of it. However,
for reasons mentioned in Section 3.2, they will not be used
Table 3.1: Estimated Generator Capacities and Step Sizes.
Source: REEECAP (2008), p. 54
REEECAP makes suggestions to different levels of generating capacities as power supply options;
however, their probable upper limits in installed capacity are some of the limiting factors (see Table
3.1)
A comprehensive approach to use RETs in Namibia should include a mix of both small and large
generating units, even if the generation cost might be slightly higher, because there are some RETs
that may not be feasible to exploit at either large or small scale but are competitive in one form
against the other.
Cost per kWh for Supply Sources
- 20.00 40.00 60.00 80.00 100.00 120.00 140.00 160.00
Ruacana
van Eck
Paratus
CCGT (Kudu)
Baynes
Wind
Concentrating Solar
Biomass
Import Eskom
Nuclear
"Clean" Coal
Solar PV
Zim Import
Gas/Solar Hybrid
CFL
SWH
Op
tio
n
c/kWh
Fixed cost
O&M cost
Fuel cost
CCGT Baynes WindConcentrating
SolarBiomass Nuclear "Clean" Coal Solar PV
Minimum Size MW 400.00 360.00 30.00 50.00 0.50 165.00 175.00 1.00
Step Size MW 400.00 90.00 2.00 50.00 0.50 165.00 175.00 1.00
Probable Limit MW 800.00 540.00 60.00 300.00 60.00 330.00 700.00 100.00
Limiting Factor Gas reserve Water resource Grid stability Cost & Storage Grid capacity Cost Coal Transport Cost & Storage

43
Table 3.2: Specific Costs of Selected RETs According to National and International Studies
REEECAP
(2008)
Germany
(BMU)
(2007)
EU (2008)
2007 data
EU (2008)
Projection
2010
NERSA
(2010)
Tariff
Calculator
(preliminary)
Wind 0.44 0.7 – 0.852) 0.55 – 1.10 0.50 – 0.90 1.25 1.655
Solar PV 1.5 4.80 – 5.50 5.20 – 8.80 2,70 – 4.60 3.94 3.941
CSP 1.0 - 1.70 – 2.50 1.10 - 1.60 3.14 4.241.
Small
Hydro
- 0.97 (<500 kW)
0.67 (<5000 kW)
0.60 – 1.85 0.55 – 1.60 0.94 3.365.
Solid
Biomass
0.38 1.4 – 2.201) 0.80 – 1.95 0.85 - 2.00 1.18 1.669.
Landfill - 0.64 (2 MW) –
1.50 (0.25 MW)
- - 0.90 0.762.
Notes: 1) Smaller Plants (< 10MW) with cogeneration of heat
2) Wind speed of 6.5 m/sec
Table 3.2 presents international cost data. Costs expressed in EUR/kWh were converted to
Nam$/kWh, assuming an exchange rate of EUR/Nam$ of 1:10. The national and international cost
data on RETs for power generation show a wide range. REEECAP data are the most optimistic while
the NERSA cost figures are the highest from the comparison illustrate in Table 3.2. The preliminary
cost data of the REFIT calculator for Namibia, included in the last column, are explained below.
3.3 Determining the Cost Elements and REFIT Calculator
To get a realistic picture of the cost of RETs in Namibia local data of investment cost and financing
cost have to be considered. On the other hand, since the data (capital cost, inflation rates, interest
rates etc.) change regularly a flexible cost calculator is desirable. It should include all relevant cost
elements.
The FIT calculator presented is quite simple, but it includes all relevant data. It is interconnected to
the PROGRAM-cost-calculator that is outlined in section 3.4. The PROGRAM-cost calculator provides
information on the additional cost the economy and the power consumers have to bear if RETs are
used instead of expanding the traditional power mix. The section below explains the working and
the outcome of the FIT calculator.
The FIT calculator consists of 4 parts in tabular form. In the first part the weighted average capital
cost (WACC) is calculated (using specific ECB definitions). The second table includes cells for the
relevant investment parameters (specific investment cost, hours of full load, economic lifetime etc.)
that may be completed by ECB to calculate the specific cost for the first year of operation. The
44
running costs have to be expressed as percentage of the investment cost. Fuel cost – relevant in the
case of solid biomass and landfill gas – has to be inserted as cost per MWh electricity.
In the second part all costs are expressed as annual costs. In the bottom line the total annual costs
are divided by the annual amount of kWh. As a result specific costs (Nam/kWh) are obtained. A FIT,
typically designed as a cost covering tariff, has to be oriented to the specific cost17.
The third section develops the specific costs (the FIT) where the running costs are increasing with a
given rate. This inflation rate can be filled in the cell between Part 2 and 3. Escalating the running
cost by an assumed constant rate indicates the future development of the FIT. This figure is needed
to calculate the future Program Cost in the PROGRAM calculator.
Since the rate of inflation is varying from year to year, the FIT provided to the investors has to
consider the metered or expected inflation rate of a given year. The idea of adapting the FIT is that
in a country with a significant rate of inflation, the FIT cannot be determined once and then left
unchanged for the economic lifetime of the project. The risk would be too great for both, the
investor and the electricity consumer.
3.3.1 FIT Calculator for Namibia
The following tables show the construction and the working of the FIT calculator. The relevant
assumptions have to be filled in the yellow boxes. The figures should be replaced by the actual
figures. T he outcome in terms of specific cost (Nam$/kWh) or cost covering tariffs is included in the
light red boxes.
The yellow boxes include preliminary figures of
relevant parameters that can be changed
The light brown boxes show intermediate figures
resulting from assumptions above
The red boxes show the cost covering feed-in tariff for
future years (adapted to inflation)
Table 3.3.1 shows how the weighted cost of capital (WACC) is calculated. In general it is based on
the ECB methodology for calculation the WACC for investments in generation. In accordance to the
current ECB guidelines for generators we assume post tax cost of equity of 19.62 % (equal to a pre
tax cost of equity of 30.19 %).
17
According to economic theory competition ensures that the market price is oriented to the cost. Thus, a FIT should be oriented to the specific cost. In case of new investments the specific cost are calculated by dividing the annual cost by the energy output (kWh). The annual costs imply a sector specific return on equity. In a competitive environment the net present value (NPV) is zero.

45
Table 3.3.1: Key parameters of WACC calculation
Key Parameters for WACC calculation
Parameters Solar PV Wind CSP Small
Hydro
Solid
Biomass
Landfill
Gas
Weight of Dept 70.00% 70.00% 70.00% 70.00% 70.00% 70.00%
Weight of Equity 30.00% 30.00% 30.00% 30.00% 30.00% 30.00%
Corporate Tax Rate 35.00% 35.00% 35.00% 35.00% 35.00% 35.00%
Risk free rate of
investment 9.05% 9.05% 9.05% 9.05% 9.05% 9.05%
Dept premium 2.30% 2.30% 2.30% 2.30% 2.30% 2.30%
Equity beta 1.762 1.762 1.762 1.762 1.762 1.762
Equity risk premium 6.00% 6.00% 6.00% 6.00% 6.00% 6.00%
Cost of dept 11.35% 11.35% 11.35% 11.35% 11.35% 11.35%
Cost of equity -
after tax 19.62% 19.62% 19.62% 19.62% 19.62% 19.62%
Cost of equity -
nominal before tax 30.19% 30.19% 30.19% 30.19% 30.19% 30.19%
Table 3.3.2: Key parameters for calculating the annual cost
Investment parameters Solar PV Wind CSP Small
Hydro
Solid
Biomass
Landfill
Gas
WACC according to table above - cost of
equity before tax
17.00% 17.00% 17.00% 17.00% 17.00% 17.00%
Economic Lifetime/years of operation (n) 20 20 20 40 20 20
Specific Investment Cost (Nam$/kWp) 35,000 15,000 60,000 80,00018 30,000 20,000
Power (kW) typical size 35 1,500 10,000 5,000 500 500
Annual Electricity production (kWh/KW) 1,800 2,200 4,000 5,000 7,000 7,000
Annual Insurance Cost as % of initial
investment cost
0.50% 0.50% 0.50% 0.50% 0.50% 0.50%
Annual Administration & Management costs %
of initial investment cost
1.00% 3.00% 3.00% 3.00% 4.00% 3.00%
Annual O&M of Investment Cost as % of initial
investment cost
1.00% 3.00% 7.00% 0.50% 5.00% 4.00%
Fuel Cost (Nam$/MWh) 0 0 0 0 500 40
18
Specific costs for small hydros are relatively high because of the sound environmental measures that have to be adopted in the ecologically sensitive basin of the Lower Orange river.
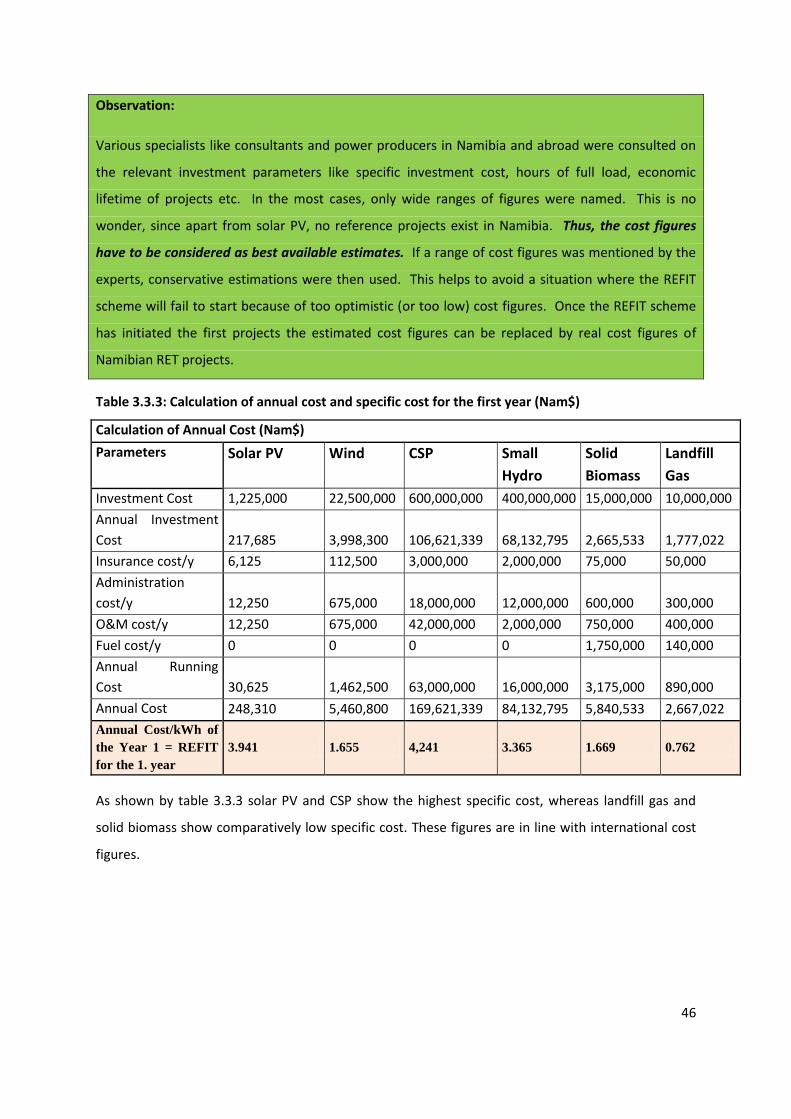
46
Observation:
Various specialists like consultants and power producers in Namibia and abroad were consulted on
the relevant investment parameters like specific investment cost, hours of full load, economic
lifetime of projects etc. In the most cases, only wide ranges of figures were named. This is no
wonder, since apart from solar PV, no reference projects exist in Namibia. Thus, the cost figures
have to be considered as best available estimates. If a range of cost figures was mentioned by the
experts, conservative estimations were then used. This helps to avoid a situation where the REFIT
scheme will fail to start because of too optimistic (or too low) cost figures. Once the REFIT scheme
has initiated the first projects the estimated cost figures can be replaced by real cost figures of
Namibian RET projects.
Table 3.3.3: Calculation of annual cost and specific cost for the first year (Nam$)
Calculation of Annual Cost (Nam$)
Parameters Solar PV Wind CSP Small
Hydro
Solid
Biomass
Landfill
Gas
Investment Cost 1,225,000 22,500,000 600,000,000 400,000,000 15,000,000 10,000,000
Annual Investment
Cost 217,685 3,998,300 106,621,339 68,132,795 2,665,533 1,777,022
Insurance cost/y 6,125 112,500 3,000,000 2,000,000 75,000 50,000
Administration
cost/y 12,250 675,000 18,000,000 12,000,000 600,000 300,000
O&M cost/y 12,250 675,000 42,000,000 2,000,000 750,000 400,000
Fuel cost/y 0 0 0 0 1,750,000 140,000
Annual Running
Cost 30,625 1,462,500 63,000,000 16,000,000 3,175,000 890,000
Annual Cost 248,310 5,460,800 169,621,339 84,132,795 5,840,533 2,667,022
Annual Cost/kWh of
the Year 1 = REFIT
for the 1. year
3.941 1.655 4,241 3.365 1.669 0.762
As shown by table 3.3.3 solar PV and CSP show the highest specific cost, whereas landfill gas and
solid biomass show comparatively low specific cost. These figures are in line with international cost
figures.

47
Table 3.3.4: Calculation of future FIT considering escalation of running cost by rate of inflation
Inflation-Rate 6.29% (Rate to escalate the running cost)
Development of the FIT with compensation of inflation (Nam$/kWh)
Year Solar PV Wind CSP Small
Hydro
Solid
Biomass
Landfill
Gas
1 3.941 1.655 4.241 3.365 1.669 0.762
2 3.972 1.683 4.340 3.406 1.726 0.778
3 4.005 1.712 4.445 3.448 1.786 0.795
4 4.039 1.744 4.557 3.494 1.851 0.813
5 4.076 1.777 4.676 3.542 1.919 0.832
6 4.115 1.813 4.802 3.594 1.992 0.853
7 4.156 1.851 4.937 3.648 2.070 0.874
8 4.200 1.891 5.079 3.706 2.152 0.897
9 4.247 1.934 5.231 3.768 2.239 0.922
10 4.297 1.979 5.393 3.833 2.332 0.948
11 4.350 2.027 5.564 3.903 2.431 0.976
12 4.406 2.079 5.747 3.977 2.536 1.005
13 4.466 2.133 5.940 4.056 2.648 1.036
14 4.530 2.191 6.146 4.140 2.766 1.070
15 4,597 2,253 6.365 4.229 2.893 1.105
16 4.669 2.318 6.598 4.323 3.027 1.143
17 4.745 2.388 6.845 4.424 3.169 1.183
18 4.827 2.462 7.108 4.531 3.320 1.225
19 4.913 2.540 7.388 4.644 3.481 1.270
20 5.004 2.624 7.685 4.765 3.652 1.318
Table 3.3.4 shows that the specific cost will increase as the running cost are increasing by the
expected rate of inflation. To provide a cost covering FIT the tariff has to be adapted year by year.
In Table 3.3.4 a constant inflation rate is assumed. In reality the inflation rate will vary from one
year to the other. Thus, Table 3.3.4 rather serves for illustrative purposes than working as a tool to
calculate future tariff levels.
3.4 Program Cost Calculator
In this section the construction and the working of the Program Cost calculator are presented. The
Program Cost calculator takes the power customers’ point of view. Thus, the Program Costs are
defined as the additional cost to the power consumers if RETs instead of a traditional power mix is
used19. The power consumers’ point of view is different from the economic point of view. From the
economic point of view the additional costs have to be balanced by the additional benefits like
19
It is assumed that all RET program cost are born by the final electricity customers.

48
improved job opportunities and less pollution. Dividing the Program Costs by the power
consumption (kWh) information on the additional cost per kWh is obtained. As a rough
approximation one can say that the wholesale power price and also the price for final customers will
increase by this amount. In reality, the increase to final power prices will be higher since local
surcharges are charged on top of the wholesale prices (including the REFIT supplement).
Calculating the Program Costs requires a lot of additional information. Besides information on the
specific cost of the single RETs information on the quantities that are produced by each RET is
needed. This is on top of information on the total power consumption and the wholesale price.
These data values have to be filled into the upper section of the Program Cost calculator.
Table 3.4.1: Parameters for calculating the Program Cost
NamPower Wholesale price 2010 (Nam$/MWh) 456
National Power Consumption (MWh) 3,600,000
Final Consumer Price 2010 (Nam$/kWh) 1.15
Expected Increase of Annual Power consumption (%) 5.00%
Expected Increase of Power Price for Final Customers (%) 8.00%
In general, one can say that the greater the amount of renewable electricity the higher the Program
Cost. Some support mechanisms like tendering are capping the capacity or amount of renewable
electricity while others do not. Thus, the amount of renewable electricity depends on design of the
support scheme. The following conditions are considered;
Tendering: the additional capacity or the amount of electricity generated in the Namibian
system is defined.
REFIT with cap: additional capacity or the amount of electricity is defined
REFIT without cap: If a FIT without a cap is provided the renewable electricity suppliers are
behaving as price takers extending the supply until the marginal cost are identical to the true
FIT. If precise information on the marginal cost of renewable electricity production is lacking
the amount of renewable electricity generation can only be estimated20.
20
Germany provides a good example for this case. Due to decreasing prices of PV modules, in 2009 and 2010 the amount of additional PV capacity was much higher than expected. As a consequence a new provision was introduced: The FIT will be extraordinarily decreased if the expansion of the capacity is surmounting defined thresholds (e.g. 1500 MW/year).

49
The Program Costs include the cost of RETs that are supported by REFIT, but even indicates the cost
for RETs that go under tendering. In the case on net metering no additional cost for the power
consumers is assumed. Concerning the calculation of the REFIT and tendering Program Cost we have
to emphasise one important difference: In the REFIT case the price is decreed by government,
whereas in the case of tendering the price is determined by competition. If the government
succeeds to define the FIT in an “as-if-competition manner” 21and if the tendering process is working
properly, theoretically the outcome of both processes can be identical. In reality neither the
government has perfect information on the cost of the RETs nor is the tendering process working
perfectly (incomplete information on site specific cost drivers, market power, strategic behaviour).
Being aware of these issues the cost calculated by the REFIT calculator can be taken as an
approximation to the cost of the tendering process.
Unlike in other African countries (see Table 3.6), the Government of the Republic of Namibia has not
yet defined a quantitative target for the expansion of RETs in the electricity sector (neither capacity
targets nor output targets).
Table 3.5: Share of Electricity from RE in African Countries, existing in 2008 and Targets
Country Existing Share Future target
Algeria 9.9% 10% by 2010
Cameroon - 50% by 2015 & 80% by 2020
Cape Verde - 50% by 2020
Egypt - 20% by 2020
Ghana - 10% by 2020
Libya - 10% by 2020 & 30% by 2030
Madagascar - 75% by 2020
Mauritius 37% 65% by 2028
Morocco - 20% by 2012
Niger - 10% by 2020
Nigeria - 7% by 2025
Rwanda - 90% by 2012
South Africa <1% 4% by 2013 & 13% by 2020
Source: REN 21; Renewables 2010, global Status Report, 2010, p. 59
Thus, estimating the Program Cost for Namibia requires reasonable assumptions on the quantities
supplied. This includes assumptions on
- the total RET capacity (or electricity output)
21
To adapt the FIT to perfectly the cost of different RETs of different sizes and at different locations a great number of different tariffs have to be offered.
50
- the contribution of single RET to meet the target
These capacity assumptions have to be filled into the first row of the second part of the PROGRAM
calculator. For the sake of simplicity, Program Costs of 3 scenarios are considered:
1. consisting of 60 MW assuming 10 MW for each of the 6 suggested RETs (wind, CSP, solid
biomass, small hydro, land fill gas and PV). All supported by a REFIT scheme. It is assumed
that no other support instrument exists22.
2. consisting of 60 MW assuming 3 technologies suggested for a REFIT scheme (5 MW of
landfill gas, 15 MW of solid biomass, 40 MW of small hydro).
3. consisting of Program 2 and additional 100 MW of wind and CSP power plants (50 MW each)
To calculate the Program Cost of the scenarios, the amount of electrical energy (MWh) produced by
each of the technologies included is considered. This amount is calculated by multiplying the
capacity (MW) by the average hours of full (h).
Empirical evidence shows that the hours of full load per annum differ significantly among the
technologies in question, ranging from 1800 hours in the case of PV up to 7700 hours in the case of
landfill gas and solid biomass.
The third part of the Program Cost calculator shows how the Program Costs and the power price of
final customers will develop if the FIT is increasing and in the same time the power consumption and
the wholesale power market price are increasing.
In the following paragraph we shortly describe the 3 scenarios
- the total Program Cost and it’s dynamics
- the relevance of the different RETs with respect to the Program Cost
- the dynamics of power price to the final customers
Scenario 1:
In Scenario I, assuming 10 MW of each RET, the Program Cost is about Nam$ 400 million in the first
year increasing to more than Nam$ 900 million in the 20th year. Scenario I helps to see what
technology is driving the Program Cost. The most important contributions to the Program Cost
result from CSP and small hydro. The lowest contributions stem from landfill gas and wind power.
22
Theoretically the additional cost of a REFIT scheme and tendering can be identical, provided the government has perfect information on the market price of RETs when designing the REFIT scheme.
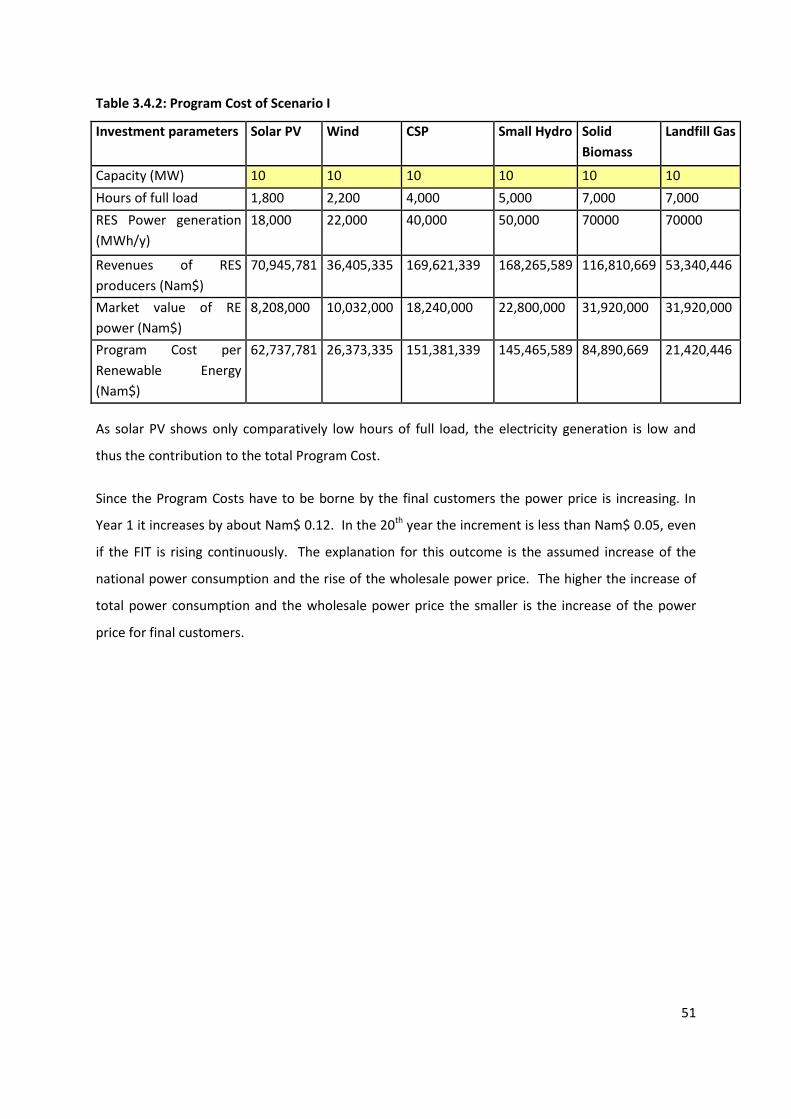
51
Table 3.4.2: Program Cost of Scenario I
Investment parameters Solar PV Wind CSP Small Hydro Solid
Biomass
Landfill Gas
Capacity (MW) 10 10 10 10 10 10
Hours of full load 1,800 2,200 4,000 5,000 7,000 7,000
RES Power generation
(MWh/y)
18,000 22,000 40,000 50,000 70000 70000
Revenues of RES
producers (Nam$)
70,945,781 36,405,335 169,621,339 168,265,589 116,810,669 53,340,446
Market value of RE
power (Nam$)
8,208,000 10,032,000 18,240,000 22,800,000 31,920,000 31,920,000
Program Cost per
Renewable Energy
(Nam$)
62,737,781 26,373,335 151,381,339 145,465,589 84,890,669 21,420,446
As solar PV shows only comparatively low hours of full load, the electricity generation is low and
thus the contribution to the total Program Cost.
Since the Program Costs have to be borne by the final customers the power price is increasing. In
Year 1 it increases by about Nam$ 0.12. In the 20th year the increment is less than Nam$ 0.05, even
if the FIT is rising continuously. The explanation for this outcome is the assumed increase of the
national power consumption and the rise of the wholesale power price. The higher the increase of
total power consumption and the wholesale power price the smaller is the increase of the power
price for final customers.

52
Table 3.4.3: Program Cost and Change of Power Price for Final Customers in Scenario I
Program Cost
(Nam$)/year
Increase of Final Consumer Price
(Nam$/kWh)
Increase of Final Consumer Price
(%)
492,269,159 0.1189 10.34%
498,366,079 0.1115 9.69%
504,925,908 0.1046 9.09%
511,981,732 0.0982 8.54%
519,568,921 0.0922 8.02%
527,725,273 0.0868 7.54%
536,491,187 0.0817 7.10%
545,909,828 0.0769 6.69%
556,027,323 0.0726 6.31%
566,892,949 0.0685 5.96%
578,559,351 0.0647 5.63%
591,082,765 0.0612 5.32%
604,523,256 0.0580 5.04%
618,944,976 0.0550 4.78%
634,416,435 0.0522 4.54%
651,010,793 0.0496 4.31%
668,806,168 0.0472 4.10%
687,885,964 0.0449 3.90%
708,339,226 0.0428 3.72%
730,261,014 0.0409 3.55%
Scenario I allows to study the impacts of net metering for solar PV. If we assume that PV is not
going under REFIT (0 capacity) but under net metering (10 MW) the Program Cost are reduced by
about Nam$ 50 million in the first year and the increase of the power price for final customers is
Nam$ 0.104 instead of Nam$ 0.119 (in the first year).
Scenario II
In Scenario II the program consists of 60MW (small hydro, biomass, landfill gas), supported by REFIT.
Here, the Program Cost are about Nam$ 550 million in the first year increasing to more than Nam$ 1
billion in the 20th year. Thus, the costs are higher than in Scenario I. The reasons for that are
twofold. One reason is the high share of small hydro that is characterized by high specific
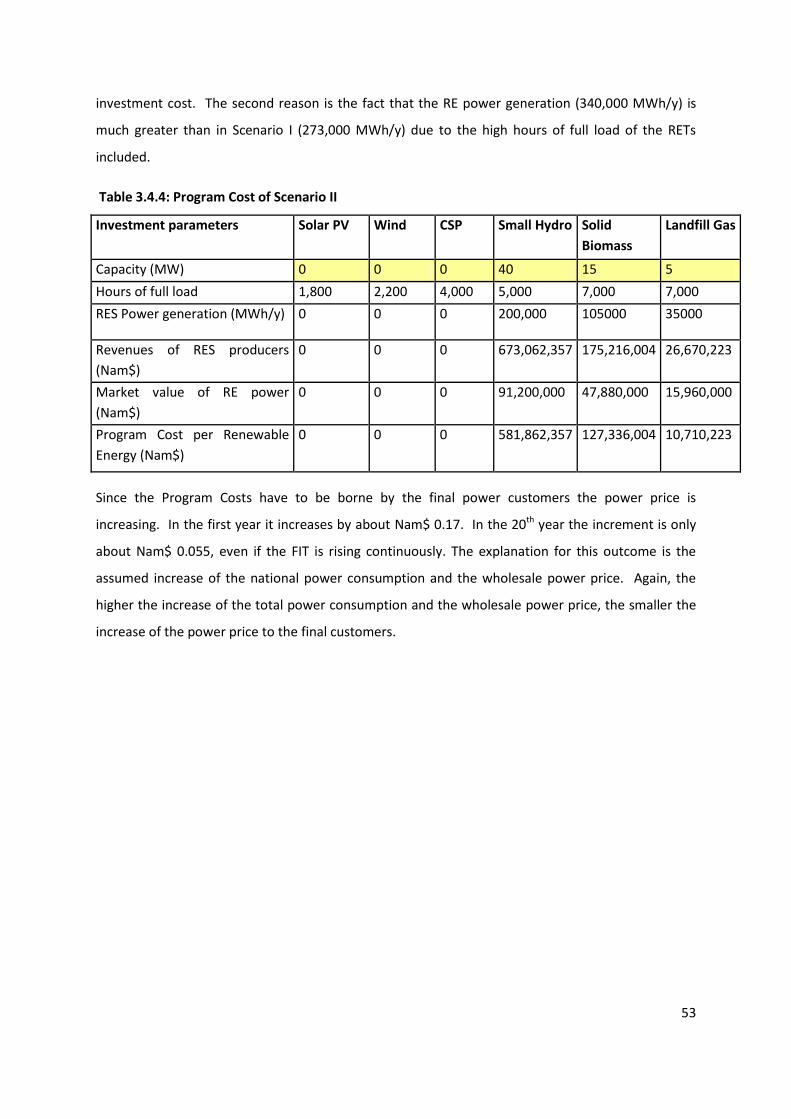
53
investment cost. The second reason is the fact that the RE power generation (340,000 MWh/y) is
much greater than in Scenario I (273,000 MWh/y) due to the high hours of full load of the RETs
included.
Table 3.4.4: Program Cost of Scenario II
Investment parameters Solar PV Wind CSP Small Hydro Solid
Biomass
Landfill Gas
Capacity (MW) 0 0 0 40 15 5
Hours of full load 1,800 2,200 4,000 5,000 7,000 7,000
RES Power generation (MWh/y) 0 0 0 200,000 105000 35000
Revenues of RES producers
(Nam$)
0 0 0 673,062,357 175,216,004 26,670,223
Market value of RE power
(Nam$)
0 0 0 91,200,000 47,880,000 15,960,000
Program Cost per Renewable
Energy (Nam$)
0 0 0 581,862,357 127,336,004 10,710,223
Since the Program Costs have to be borne by the final power customers the power price is
increasing. In the first year it increases by about Nam$ 0.17. In the 20th year the increment is only
about Nam$ 0.055, even if the FIT is rising continuously. The explanation for this outcome is the
assumed increase of the national power consumption and the wholesale power price. Again, the
higher the increase of the total power consumption and the wholesale power price, the smaller the
increase of the power price to the final customers.
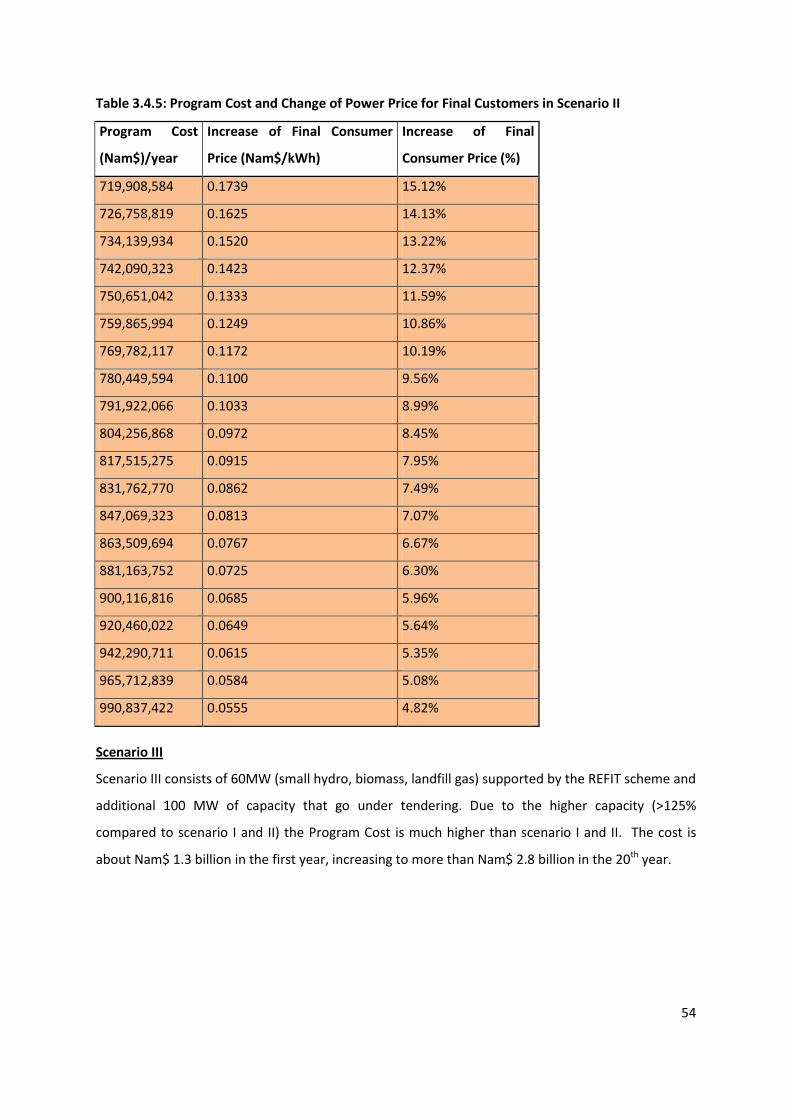
54
Table 3.4.5: Program Cost and Change of Power Price for Final Customers in Scenario II
Program Cost
(Nam$)/year
Increase of Final Consumer
Price (Nam$/kWh)
Increase of Final
Consumer Price (%)
719,908,584 0.1739 15.12%
726,758,819 0.1625 14.13%
734,139,934 0.1520 13.22%
742,090,323 0.1423 12.37%
750,651,042 0.1333 11.59%
759,865,994 0.1249 10.86%
769,782,117 0.1172 10.19%
780,449,594 0.1100 9.56%
791,922,066 0.1033 8.99%
804,256,868 0.0972 8.45%
817,515,275 0.0915 7.95%
831,762,770 0.0862 7.49%
847,069,323 0.0813 7.07%
863,509,694 0.0767 6.67%
881,163,752 0.0725 6.30%
900,116,816 0.0685 5.96%
920,460,022 0.0649 5.64%
942,290,711 0.0615 5.35%
965,712,839 0.0584 5.08%
990,837,422 0.0555 4.82%
Scenario III
Scenario III consists of 60MW (small hydro, biomass, landfill gas) supported by the REFIT scheme and
additional 100 MW of capacity that go under tendering. Due to the higher capacity (>125%
compared to scenario I and II) the Program Cost is much higher than scenario I and II. The cost is
about Nam$ 1.3 billion in the first year, increasing to more than Nam$ 2.8 billion in the 20th year.
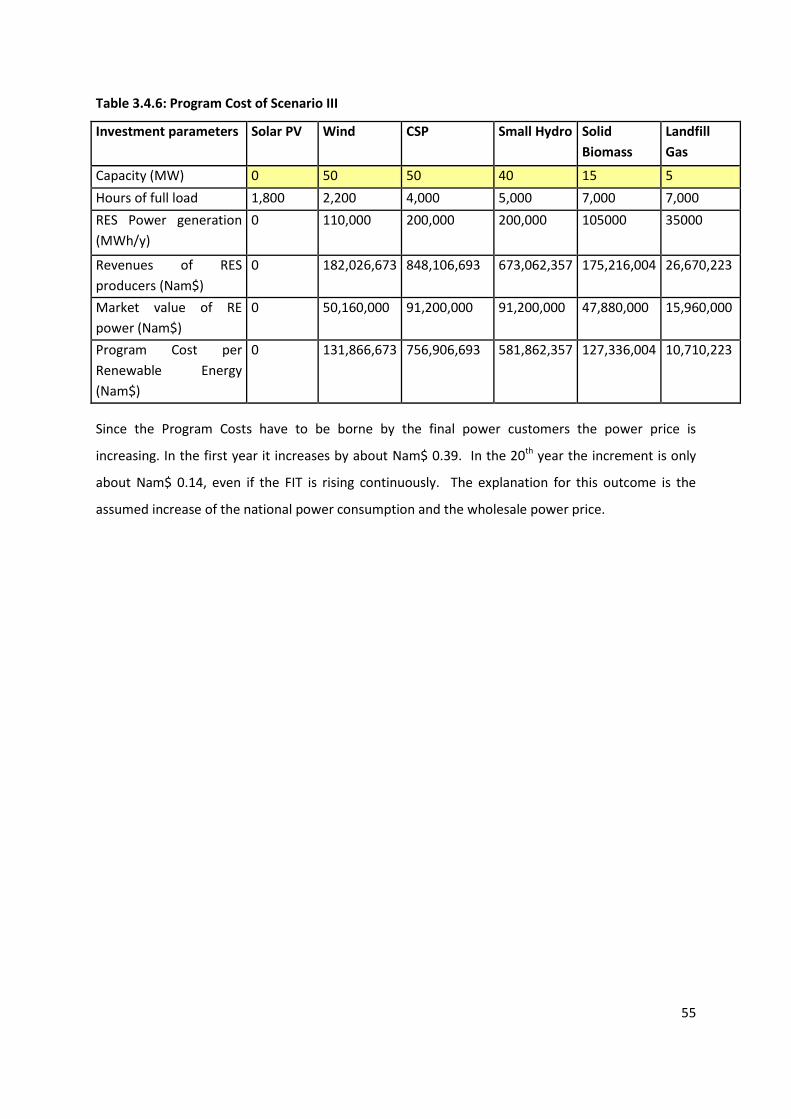
55
Table 3.4.6: Program Cost of Scenario III
Investment parameters Solar PV Wind CSP Small Hydro Solid
Biomass
Landfill
Gas
Capacity (MW) 0 50 50 40 15 5
Hours of full load 1,800 2,200 4,000 5,000 7,000 7,000
RES Power generation
(MWh/y)
0 110,000 200,000 200,000 105000 35000
Revenues of RES
producers (Nam$)
0 182,026,673 848,106,693 673,062,357 175,216,004 26,670,223
Market value of RE
power (Nam$)
0 50,160,000 91,200,000 91,200,000 47,880,000 15,960,000
Program Cost per
Renewable Energy
(Nam$)
0 131,866,673 756,906,693 581,862,357 127,336,004 10,710,223
Since the Program Costs have to be borne by the final power customers the power price is
increasing. In the first year it increases by about Nam$ 0.39. In the 20th year the increment is only
about Nam$ 0.14, even if the FIT is rising continuously. The explanation for this outcome is the
assumed increase of the national power consumption and the wholesale power price.

56
Table 3.4.7: Program Cost and Change of Power Price for Final Customers in Scenario III
Program Cost
(Nam$)/year
Increase of Final Consumer
Price (Nam$/kWh)
Increase of Final Consumer
Price (%)
1,608,681,950 0.3886 33.79%
1,631,344,060 0.3649 31.73%
1,655,622,795 0.3429 29.81%
1,681,629,399 0.3224 28.04%
1,709,482,592 0.3035 26.39%
1,739,309,064 0.2859 24.86%
1,771,243,998 0.2696 23.44%
1,805,431,637 0.2545 22.13%
1,842,025,875 0.2404 20.90%
1,881,190,898 0.2273 19.77%
1,923,101,857 0.2152 18.71%
1,967,945,596 0.2039 17.73%
2,015,921,414 0.1934 16.81%
2,067,241,891 0.1836 15.97%
2,122,133,754 0.1745 15.18%
2,180,838,809 0.1661 14.44%
2,243,614,932 0.1582 13.76%
2,310,737,119 0.1509 13.12%
2,382,498,608 0.1440 12.52%
2,459,212,079 0.1376 11.97%
3.5 Conclusions
In conclusion one can say that different program designs result in different impacts on the power
price for final consumers. The smallest price impact is shown by scenario I that is comprised of all 6
RETs. The price impact can be lowered if solar PV is taken out of the REFIT program and goes under
net metering.
In the case of Scenario II the impact on the power price for final customers is slightly higher than in
Scenario I. This is resulting from the high share of small hydro with comparatively high specific cost,
but also from the higher electricity generation (>25 % compared to Scenario I). The RE power mix of
Scenario II has some other positive impacts. First, the RETs included in Scenario II are base load

57
power stations. The need for back up capacities for balancing a fluctuating supply, are lower than in
case of Scenario I and III. Moreover, RETs based on solid biomass and landfill gas are based on less
sophisticated technologies that can be easier to manufacture in Namibia. Thus, the impact on
economic growth and labour opportunities will be higher.
Scenario III shows the strongest impacts on the price for final power consumers. This impact is fairly
independent of whether CSP and wind are going under REFIT or tendering. The main reason for the
stronger price impact is the significant higher RET capacity and RE power generation.
All calculations are based on very rough cost estimations. More solid national cost figures will be
available once investments in the RETs have been done. Thus, starting the program helps to develop
the market for RETs and thus to improve the data base and to better fine-tune the instruments. Solid
national RET cost data will only be available if the market for RETs becomes more mature.
A comprehensive approach to use RETs in Namibia should include a mix of both small and large
generating units, even if the generation cost might be slightly higher, because there are some RETs
that may not be feasible to exploit at either large or small scale but are competitive in one form
against the other

58
4. DESIGNING SUITABLE PROCUREMENT MECHANISMS FOR
NAMIBIA
The procurement mechanisms recommended in this study have been elaborated in consultation
with key ESI stakeholders. Namibia has a small consumer market, and as such any significant
renewable energy installation will have an impact on electricity tariffs. The impact of the tariff
depends on several factors, including the type of technology, e.g. CSP or wind; size of installed
capacity and subsequent energy generated; location (in cases of wind and solar whose speed and
radiation levels respectively may not be uniform) and the wholesale market price of electricity. The
retail electricity tariff is also subjected to surcharges by the local authorities.
The study recommends that a combination of 4 procurement mechanisms, namely; tendering, REFIT
and net-metering be implemented to procure renewable electricity in Namibia as outlined in
Chapter 2 and 3. The mechanisms must be subject to review for improvement after 3 years of
implementation. It is expected that Namibia a few projects that would have been initiated will
provide Namibian cost figures.
The Electricity Act of 2007 does not explicitly provide for the recommended mechanism or any
support for renewable electricity generation, save for Section 43 which states that the Minister
responsible for energy may make regulations in relation to “instalment and implementation of
renewable energy technologies, the use thereof (including the placing of obligations on persons with
regard thereto) and the provision of electricity therefrom”. Although this regulation is not the best
and ideal regulation to facilitate the wide diffusion of RET, it is however advisable to ride on this Act
to lay the foundation for the future of grid in feed RETs.
It is therefore recommended that the proposed RET procurement mechanisms be implemented as a
regulation as provided for by Section 43 of the Electricity Act (2007) as this will not delay the
process. The ECB must facilitate the development and promulgation of the requisite regulations for
the procurement of RETs. Although a law is ideal and necessary if the procurement instruments are
to be effective, this route has long time scales since wider consultation and consensus has to be
reached in the legislature. Necessary regulations must be adopted while the legislative route is
being pursued.
The rest of this Chapter will outline the specific guidelines on how Namibia may implement the
recommended instruments by assigning responsibilities and proposing institutional guidelines.
59
4.1 Summary of recommendations for RE procurement mechanisms
The recommended mechanisms and the applicable technologies are:
1. Tendering to be applied for solar (CSP) and large wind based generation systems, i.e. for CSP
and wind greater than 500kW in installed capacity;
2. REFIT for small wind, small hydro and biomass including landfill gas;
3. Net-metering for photovoltaics; and
4. Other support measures like soft loans, grants, tax breaks, etc to support all the above
instruments and continue promoting rural and off-grid electrification.
The reasons for these recommendations are given Section 2.9 while the REFIT tariffs are
summarised in Table 3.5.
4.2 Best Practice Recommendations
The failure of renewable energy programmes may not only be attributed to the lack of appropriate
policies and low tariffs, but are often due to poorly designed procedures and process that govern
their implementation. The following will outline some of the simple design recommendations based
the analysis of different literature as discussed in Chapter 2 and practices elsewhere. These best
practices facilitate fair market access and return on investment for renewable energy.
MME, through the Minister must proclaim regulations to govern the RET procurement and
the regulations are administered by the ECB.
The regulatory framework must absolve ECB from licensing generators of small power
plants. Such generators must however seek generation permits from the respective power
offtaker.
The regulatory framework must be simple, comprehensible and transparent but fulfilling all
applicable regulations.
Interconnection of the recommended RETs to the grid must be provided for in the respective
Transmission and Distribution Grid Codes.
In the case of REFIT, the framework must provide a platform for power producers to sell
while obligating the regional electricity distributors, local authorities and NamPower to buy
on a priority basis all RETs generated electricity at a pre-determined fixed tariff for the given
period of time.
The framework must differentiate the amount paid to producers by technology.
Technologies that Namibia wants to develop further because of other socio-economic
benefits get relatively higher payment to encourage wide installations and innovation.
60
Compensation to producers varies by geographic location and system size. This is done to
encourage decentralised development and encourage smaller-scale projects.
Compensation for inflation must incorporated
All projects implemented under each procurement mechanism must comply with all other
relevant technical, legal and regulatory requirements of the Republic of Namibia.
4.3 Designing a Tendering Mechanism
The tendering mechanism must be administered by MME with technical support from a committee
comprising the ECB and other ESI members. MME is in a neutral position to administer the tender
process for large scale RETS. Tendering has the advantage that cost competitive RETs will be
deployed. The mechanism also gives the administrator control over the whole process.
Tendering should be implemented on condition that the Government has knowledge of the
availability of the resources i.e. solar and wind. The Government must invest in resource
assessments to possess that knowledge base.
4.4 Designing a REFIT Mechanism
The REFIT must basically fulfil two main objectives of price and access.
The offtaker, i.e. RED, local authority or NamPower is obligated to purchase renewable
electricity. They are obliged to connect renewable energy generated electricity from eligible
technology to their grid network.
The renewable energy electricity price is set at a level and for a period long enough to
guarantee a fair return on investment.
The offtaker will grant a generation permit to the RE generator. The permit must be a
“standard contract” to ensure a fast and non bureaucratic start of RE generation.
The offtaker must ensure that the authorised power plant meets safety and technical quality
standards as prescribed by the appropriate Grid Code.
The RE developer must bear the cost of grid connection.
The offtaker must bear the cost of grid enhancement.
4.5 Designing a Net-metering Mechanism
Net-metering is one of the simplest means of promoting direct consumer investment in renewable
energy. Consumers will have to install bi-directional or advance metering equipment as guided by
standards set by ECB’s Distribution Grid Code.
The net-metering model proposed will include the following provisions:
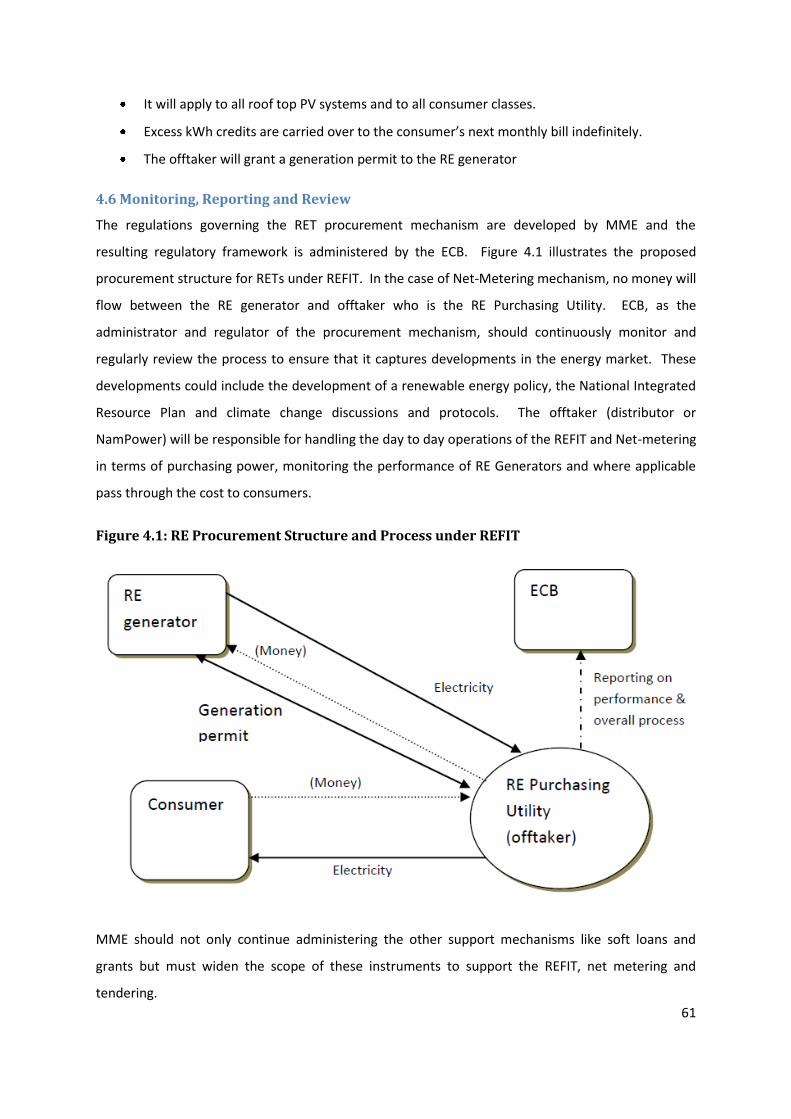
61
It will apply to all roof top PV systems and to all consumer classes.
Excess kWh credits are carried over to the consumer’s next monthly bill indefinitely.
The offtaker will grant a generation permit to the RE generator
4.6 Monitoring, Reporting and Review
The regulations governing the RET procurement mechanism are developed by MME and the
resulting regulatory framework is administered by the ECB. Figure 4.1 illustrates the proposed
procurement structure for RETs under REFIT. In the case of Net-Metering mechanism, no money will
flow between the RE generator and offtaker who is the RE Purchasing Utility. ECB, as the
administrator and regulator of the procurement mechanism, should continuously monitor and
regularly review the process to ensure that it captures developments in the energy market. These
developments could include the development of a renewable energy policy, the National Integrated
Resource Plan and climate change discussions and protocols. The offtaker (distributor or
NamPower) will be responsible for handling the day to day operations of the REFIT and Net-metering
in terms of purchasing power, monitoring the performance of RE Generators and where applicable
pass through the cost to consumers.
Figure 4.1: RE Procurement Structure and Process under REFIT
MME should not only continue administering the other support mechanisms like soft loans and
grants but must widen the scope of these instruments to support the REFIT, net metering and
tendering.

62
4.7 Sustainability
As the market evolves the Government is encouraged to devise mechanisms of financing the
procurement of RETs sustainably. This may mean transforming the National Energy Fund to cover
RETs rather than petroleum industry alone. The Petroleum Products and Energy Amendment Act,
No. 16 of 2003 which governs the Energy Fund already empowers the “Minister responsible to
impose a levy for the benefit of the fund on any energy source including electricity, nuclear and
renewable energy”. A regulation may need to be passed to allow RE financing benefiting from the
Fund. This will cushion the offtaker and the consumer from direct tariff hikes but at the same time
spurring the growth of the RE industry.
MME must explore and encourage the use carbon financing as a top up financing and generate
additional revenues that can be used to cover the additional cost of RE.
4.8 Resolution of Disputes and Remedies
The resolution of disputes, resolution and remedies are defined as per the Electricity Act 2007.
Minister of Mines and Energy is recommended to promulgate regulations that provide for
the four RET procurement mechanisms.
Renewable electricity generators feeding into the distribution network will not need to be
licensed by the ECB but must get a permit to develop and supply electricity to the respective
offtaker at distribution level
Renewable electricity generator feeding into the transmission network must be licensed by
the ECB
A regulation may need to be passed to allow RE financing benefiting from the National
Energy Fund. This will cushion the offtaker and the consumer from direct tariff hikes.
Carbon financing must be explored to top up financing and generate additional income

63
5. CONCLUSION
Namibia’s lack of grid based renewable electricity is largely due to an absence of a specific
renewable energy policy and an enabling regulatory framework to address market failures despite a
good overall energy policy. Countries with large scale development of RETs, such as Germany, Spain,
Sri Lanka and China, have introduced procurement mechanisms such REFTs, premiums and other
support mechanism.
Market failures are addressed by internalising external costs of fossil fuel based generation or by
introducing special instruments like REFITs to ensure a greater share of RET in the electricity supply.
Internalising external costs is almost impossible in Namibia because part of the fossil fuel based
electricity is imported and also the fact that the country is under no obligation to reduce and/or
avoid carbon emissions. The special instruments introduced under the Theory of Meritorics must be
such that they are efficient, effective and maximise consumer surplus, e.g. job creation.
Tendering, Quota, REFIT, Premiums, Net metering and subsidies are instruments used to promote
the use RETs and deliver renewable electricity to the grid. Different countries use different
instruments to achieve specific objectives. The instruments will depend on a number of factors,
namely local resource base, financial and economic resources, RE target, the prevailing and adopted
power sector and market model.
Namibia has a small electricity market but is endowed with abundant renewable energy resources.
Affordability of electricity services must be considered. RETs benefits must be maximised to address
challenges such as employment creation, rural upliftment, industrial competitiveness, energy
security, and sustainable development. RET procurement mechanisms adopted must be catalysts to
address these challenges. The nascent renewable energy industry which is still largely confined to
solar energy for off-grid electrification and solar warm water preparation currently employs around
85 people on fulltime basis.
In order to come up with appropriate figures for calculating the costs of introducing different
procurement instruments, various specialists like consultants and power producers in Namibia and
abroad were consulted on the relevant investment parameters like specific investment cost, hours of
full load, economic lifetime of projects etc. In most cases, only wide ranges of figures were
provided. This is no wonder, since apart from solar PV, no reference projects exist in Namibia.
Conservative estimations were then used. This helps to avoid a situation where the REFIT scheme
will fail to start because of too optimistic (or too low) cost figures. Once the REFIT scheme has
64
initiated the first projects the estimated cost figures can be replaced by real cost figures of Namibian
RET projects.
The study concludes by suggesting the following RET procurement mechanisms:
1. Tendering to be applied for solar (CSP) and large wind based generation systems, i.e. for CSP
and wind greater than 500kW in installed capacity;
2. REFIT for small wind, small hydro and biomass including landfill gas;
3. Net-metering for photovoltaics; and
4. Other support measures like soft loans, grants, tax breaks, etc to support all the above
instruments and continue promoting rural and off-grid electrification.
A comprehensive approach to use RETs in Namibia should include a mix of both small and large
generating units.
Minister of Mines and Energy is therefore recommended to promulgate regulations that provide for
the four RET procurement mechanisms. Under the new regulatory framework, renewable electricity
generators feeding into the distribution network will not need to be licensed by the ECB but must
get a permit to develop and supply electricity to the respective offtaker at distribution level.
Renewable electricity generator feeding into the transmission network, however, must be licensed
by the ECB.
In order to cushion the offtaker and the consumer from direct tariff hikes but at the same time
spurring the growth of the RE industry, a regulation may need to be passed to allow RE financing
benefiting from the National Energy Fund. MME is encouraged to explore and support the use
carbon financing as a top up financing and generate additional revenues that can be used to cover
the additional cost of RETs.
65
6. REFERENCES:
Bannon John. 2007. NamPower: Ten years and Beyond. United Kingdom
Baumol, W.; Oates, W. (1998): The Theory of Environmental Policy. Second Edition. Cambridge
University Press
Boettcher, J. (2009): Finanzierung von Erneuerbaren Energien-Vorhaben. München
Butler, L, Neuhoff, K. (2004): Comparison of Feed in Tariffs, Quota and Auction Mechanisms to
support Wind Power Development
Commission of the European Communities. (2008): Energy Sources, Production Costs and
Performance of Technologies for Power Generation, Heating and Transport. Commission Staff
Working Document. Brussels
Deichmann, U.; Meisner, C.; Siobhan, M.; Wheeler, D. (2010): The Economics of Renewable Energy
Expansion in Rural Sub-Saharan Africa. The World Bank. Policy Research Working Paper 5193
Ecofys (2008): Policy instruments to reduce financing cost in RE technology projects. David de Jager
and Max Rathmann, Utrecht 2008
German Wind Energy Association (BWE) (2005): Minimum price system compared to the quota
model – which system is more efficient? http://www.wind-
works.org/FeedLaws/Germany/BWE%20Minimum%20price%20system%20compared%20with%20
the%20Background_Systeme_eng.pdf
Gipe, P. (2006): Renewable Energy Policy Mechanisms. http://www.wind-
works.org/FeedLaws/RenewableEnergyPolicyMechanismsbyPaulGipe.pdf
Gipe, P. (2009): Wind Energy Basics. A Guide to Home and Community Scale Wind Energy Systems.
2nd edition
International Energy Agency: The Electricity Access Database
http://www.iea.org/weo/database_electricity/electricity_access_database.htm
Kreditanstalt für Wiederaufbau (KFW) (2005): Financing Renewable Energy. Instruments, Strategies,
Practice Approaches.

66
Lovei Laszlo. 2000. The Single Buyer Model. World Bank Group. Note Number 225. Washington, DC
20433.
Ljung P. (2007). Energy sector reform: strategies for growth, equity and sustainability. Sida Studies
No. 20. Stockholm.
Mendonca, M. (2007): Feed-in Tariffs. Accelerating the Deployment of Renewable Energy. London
(Earthscan)
Mendonca, M. Jacobs, D., B. Sovacool (2009): Powering the Green Economy. London (Earthscan)
Ministry of Mines and Energy (1998): White Paper on the Energy Policy of Namibia
Ministry of Mines and Energy (2004): Hydropower Master Plan. .
http://www.mme.gov.na/energy/hydro-power-masterplan.htm
Ministry of Mines and Energy (2005): Barrier Removal to Namibian Renewable Energy Programme
(NAMREP) http://www.mme.gov.na/energy/pdf/SWH%20Study%20Report%20FINAL.pdf
Musgrave, R.A.; Musgrave, P. (1984): Public finance in theory and practice. McGraw Hill
NEEDS (2006): Cost development – an analysis based on experience curves. http://www.needs-
project.org/docs/results/RS1a/Deliverable%20D%203%203%20-%20RS%201a%20%283%29.pdf
Neij, L. (2008). Cost development of future technologies for power generation – A study based on
experience curves and complementary bottom-up assessment. Energy Policy, 36 (6), p. 2200-2211
Nexant (2010): Synthesis Paper. Policy Options for Developing Wind and other Renewable Energy
Resources in Namibia, Prepared by Edward Hoyt, Charles Zimmermann and Bernard Speckman,
Nexant, Inc., Draft
OPTRES (2007): Assessment and optimization of renewable energy support schemes in the European
electricity market. Final Report.
REEECAP (2008b), Electricity Supply and Demand Management Options for Namibia - A Technical
and Economic Evaluation, Emcon Consulting Group, as part of the REEECAP Project, The Renewable
Energy and Energy Efficiency Institute
67
Staiß, F.; Schmidt, M.; Musiol, F. (2007): Vorbereitung und Begleitung der Erstellung des
Erfahrungsberichtes gemäß §20 EEG. Forschungsbericht im Auftrag des BMU
UNEP, SEFI (2004): Financial Risk Management Instruments for Renewable energy Projects.
Summary document
UNEP, SEFI (2007): Renewable Power, Policy, and the Cost of Capital. Improving Capital Market
Efficiency to Support Renewable Power Generation Projects.
UNEP, GEF (2008): Financial Risk Management Instruments for Renewable energy Projects. Project
Status Note, March 2008
von Oertzen, D. (2008): Namibian National Issues Report on the Key Sector of Energy with focus on
Mitigation.
http://www.undp.org/climatechange/docs/Namibia/Namibian%20national%20issues%20report%
20on%20key%20sector%20of%20energy.pdf
von Oertzen, D. (2009), Green Energy in Namibia, Electricity Control Board of Namibia, May 2009
Wiser, R.; Bolinger, M. (2009): 2008 Wind Technologies Market Report. Berkeley
Wiser, R. et. al. (2009): Tracking the Sun II. The Installed Cost of Photovoltaics in the U.S. from 1998 –
2008. Berkeley
Websites
Electricity Control Board, http://www.ecb.org.na
Ministry of Mines and Energy, http://www.mme.gov.na/directe.htm
World Future Council http://www.futurepolicy.org/2573.html
68
ANNEX 1: TERMS OF REFERENCE
TERMS OF REFERENCE
DEVELOP A PROCUREMENT MECHANISM FOR RENEWABLE ENERGY RESOURCES IN NAMIBIA
1 Introduction
The Namibian Electricity Supply Industry (ESI) is undergoing fundamental changes in terms of its
institutional, regulatory and commercial framework. The Electricity Act (Act 4 of 2007) recognises
the existence of the Electricity Control Board (ECB) as an independent regulatory authority created
to control, regulate and promote the Namibian ESI. The Electricity Control Board has the sole
mandate to approve electricity tariffs in Namibia and in this regard has developed tariff
methodologies for generation, transmission and distribution.
Namibia’s economic growth and the reduction of poverty in the country depend on the expansion of
the country’s electricity supplies. Load growth in recent years has been robust, almost 10 percent
for 2006-2007, and while there was a slowdown in growth in 2009, it is expected that the steady
recovery of the global economy will lead to accelerating consumption and demand growth over the
next several years. Meanwhile, Namibia’s ability to secure supplies in South Africa and elsewhere is
diminishing because of the region’s rapid growth and perennial shortages. This means that Namibia
must bring new capacity on line quickly and continue to add to installed capacity in the medium- to
long-term. The ECB has recently embarked on several studies that focus on the use of different
energy sources to ensure sufficient generation capacity and energy for the future.
All recently completed studies, have recommended that Namibia should make use of competitive
contracting system to ensure the most competitive tariff. However, this is not the practice and as
new investors and developers approach the ECB the need for a tariff methodology for renewable
energy resources is becoming imminent.
The ECB has therefore decided to engage a consultant/s to develop a framework and tariff
methodology to ensure that sustainable, transparent and fair tariff methodology be developed for
renewable energy resources in Namibia.
2 Objectives
To obtain the services of a consultant/s, with appropriate and relevant financial & economic,
business, renewable energy and tariff expertise, who shall develop a framework and tariff

69
methodology to ensure that the renewable energy resources to be developed in Namibia will be
paid a fair, transparent and sustainable tariff that adheres to the overall national objectives as
outlined in the Energy White Paper of 1998.
3 Scope of Services
3.1 The consultant shall develop a comparative analysis of the different renewable
energy procurement mechanisms and methodologies available highlighting the
advantages and disadvantages and make a recommendation to the ECB
management on the appropriate and preferred methodology.
3.2 Using the methodology as recommended in 3.1 the consultant shall develop a model
to calculate the tariff for the following renewable energies in Namibia:
Solar (Concentrated and PV)
Wind
Biomass including land fill gas.
Small Hydro
3.3 At least one national workshop shall be held to discuss the results with the industry
and other stakeholders and another workshop with selected key stakeholders to
discuss the preliminary results of the study.
3.4 The consultant shall be responsible for all recordings of all proceedings and minutes
of meetings.
3.5 The consultant shall make available a final report to the ECB as well as an Excell
Spread sheet with the tariff calculations.
4 Background information
Contracted consultant/s to consider the following in carrying out its services:
4.1 Electricity Act 4, 2007
4.2 National Tariff Study 2001
4.3 The Energy White Paper, 1998
4.4 The IPP Framework, 2007
4.5 The Draft Synthesis Paper on Renewable Energy Policy, 2010
5. Reporting
5.1 The ECB will appoint a representative to co-ordinate the project with the consultant.
5.2 The ECB or consultant may request additional ad-hoc meetings on specific issues if required.

70
5.3 The consultant shall be responsible for record keeping of all proceedings and minutes of
meetings. All documents should be submitted to the ECB for approval before going out to
other stakeholders.
5.4 All reports, minutes, presentations, models (including calculations & source codes and
studies conducted shall be made available to the ECB in full electronic media. PDF or any
other encoded files will not be accepted.
5.5 Copyright of all reports, minutes, presentations, models and studies shall vest in the ECB.
6 Duration
The project is envisaged to last three (3) month from once the order/contract has been placed.
7 Proposals to be submitted
Proposals provided should at least contain:
7.1 The proposed key human resources (project team), qualifications and experience.
7.2 The proposed work plan (including time frames) to be implemented to cover the scope of
services.
7.3 Contract price quoted in Namibian Dollar (N$) or South African Rand (R)
7.4 Inclusive of all taxes.
7.5 Inclusive of professional fees, transportation cost, accommodation and subsistence cost and
administration fees (including logistical arrangements for meetings/ workshops, venues and
catering)
7.6 A written undertaking not to engage in collusive tendering or other restrictive practice.
8 General
8.1 The ECB reserves the right to reduce the scope of this project and to increase the scope
subject to negotiations with the successful tenderer.
8.2 Enquiries should be directed to Mrs Helene Vosloo at [email protected] or telephone
number (061) 374 313 or fax number (061) 374 305

71
ANNEX 2: REFIT CALCULATOR
Related Documents