Development of Pd-Catalysed C–H Bond Functionalisation Methodologies for the Accession of Molecular Complexity Alan James Reay PhD University of York Chemistry April 2016

Welcome message from author
This document is posted to help you gain knowledge. Please leave a comment to let me know what you think about it! Share it to your friends and learn new things together.
Transcript

Development of Pd-Catalysed C–H Bond
Functionalisation Methodologies for the
Accession of Molecular Complexity
Alan James Reay
PhD
University of York
Chemistry
April 2016

Abstract
2
Abstract
This thesis describes the development of novel Pd-catalysed C–H bond functionalisation
methodologies, with a view towards their application in sustainable chemical synthesis. The
basis of this project focuses on the need for more efficient utilisation of precious metal
catalysts, such as Pd, achieved by mechanistic understanding of the role of heterogeneous Pd
nanoparticles (PdNPs) in such chemistry. An overview of observations from Pd-catalysed
cross-coupling and C–H bond functionalisation chemistry is given initially, focusing on the
mechanistic dichotomy between observed homogeneous and heterogeneous catalytic
manifolds in these fields. The generation of potentially harmful stoichiometric byproducts in
direct arylation methodologies is also examined for two classes of commonly-used
electrophilic arylating agents, aryliodonium and aryldiazonium salts (Chapter 1).
The synthetic utility of C–H bond functionalisation chemistry has been exemplified through
the development of complementary conditions for the direct arylation of the amino acid
tryptophan (I) to form highly fluorescent 2-aryltryptophans (II), all of which have been
evaluated using several key mass-based green metrics (Chapter 2). These conditions have
also been shown to be effective for the functionalisation of tryptophan-containing peptides.
Initial rates kinetic analysis of the activity of several homogeneous and heterogeneous Pd
catalysts in other direct arylation chemistry has highlighted remarkable similarities between
apparently distinct catalysts, which suggests the formation of a comparable active catalyst
phase. Heterogeneous Pd sources have also been successfully applied to the selective
functionalisation of several biomolecules (Chapter 3).
The final part of this thesis describes fundamental studies on the nature of the ubiquitous Pd0
catalyst Pd2(dba)3. The major and minor isomers of this catalyst were characterised both in
solution and in the solid state, which revealed that dynamic exchange between these species
and free ligand varies significantly as a function of temperature. Crucially, this catalyst has
also been shown by NMR and MS studies to be a source of catalytically competent PdNPs
under commonly-found experimental conditions (Chapter 4).

List of Contents
3
List of Contents
Abstract ..................................................................................... 2
List of Contents ......................................................................... 3
List of Figures ........................................................................... 7
List of Schemes ...................................................................... 23
List of Tables ........................................................................... 28
Acknowledgements ................................................................ 30
Author’s Declaration ............................................................... 31
Chapter 1: Introduction .......................................................... 32
1.1 Pd-Catalysed C–X Bond Functionalisation ....................................... 32
1.1.1 Background ...........................................................................................32
1.1.2 Mizoroki–Heck and Sonogashira Cross-Couplings ................................36
1.1.3 Suzuki–Miyaura Cross-Couplings .........................................................39
1.2 Pd-Catalysed C–H Bond Functionalisation ....................................... 42
1.2.1 Background ...........................................................................................42
1.2.2 Mechanistic Interpretations of C–H Bond Functionalisation ...................45
1.3 Arylating Agents for C–H Bond Functionalisations at Pd .................. 46
1.3.1 Aryliodonium and Diaryliodonium Salts .................................................46
1.3.2 Aryldiazonium Salts...............................................................................54
1.4 Project Aim & Objectives................................................................... 59
1.4.1 Aims ......................................................................................................59
1.4.2 Objectives .............................................................................................59
Chapter 2: Direct C–H Bond Functionalisation of Tryptophans
and Peptides ........................................................................... 60
2.1 Literature Syntheses of Arylated Tryptophans .................................. 60
2.1.1 Cross-Couplings ...................................................................................60

List of Contents
4
2.1.2 Direct C–H Bond Functionalisations ......................................................62
2.2 Development of Diaryliodonium Salt Conditions ............................... 68
2.2.1 Method Development ............................................................................68
2.2.2 Application to Peptides ..........................................................................74
2.3 Development of Aryldiazonium Salt Conditions ................................ 80
2.3.1 Method Development and Scope ..........................................................80
2.4 Product Characterisation................................................................... 86
2.5 Green Metrics ................................................................................... 89
2.6 Conclusion ........................................................................................ 90
Chapter 3: Direct Arylation Reactions Using Heterogeneous
Catalysis .................................................................................. 91
3.1 Background ....................................................................................... 91
3.2 Direct Arylations Using Aryldiazonium Salts ..................................... 95
3.3 Direct Arylations Using Diaryliodonium Salts .................................. 100
3.3.1 Simple Nitrogen-Containing Heterocycles ........................................... 100
3.3.2 Biologically Relevant Heterocycles ...................................................... 103
3.4 Kinetic Studies ................................................................................ 109
3.5 Conclusion ...................................................................................... 119
Chapter 4: Analysis of Pd2(dba)3 Complexes ...................... 120
4.1 Introduction ..................................................................................... 120
4.2 Synthesis and Characterisation ...................................................... 122
4.3 Activation/Degradation to Form Pd Clusters ................................... 126
4.4 Conclusion ...................................................................................... 136
Chapter 5: Conclusions and Future Work ........................... 137
5.1 Conclusions .................................................................................... 137
5.2 Future Work .................................................................................... 141
5.2.1 Mechanism of Tryptophan Functionalisation ....................................... 141

List of Contents
5
5.2.2 Further Tryptophan Derivatives ........................................................... 142
5.2.3 Direct Arylations Using Aryldiazonium Salts ........................................ 143
5.2.4 Direct C–H Bond Functionalisations Using Pd Nanocatalysts ............. 144
Chapter 6: Experimental ....................................................... 146
6.1 General Experimental Details ......................................................... 146
6.2 General Procedures ........................................................................ 149
6.3 Synthetic Procedures and Compound Data .................................... 150
Appendix 1: Published Papers ............................................. 222
Appendix 2: X-Ray Diffraction Data ..................................... 269
Crystallographic data for compound 75 ................................................ 269
Crystallographic data for compound 142 .............................................. 271
Crystallographic data for compound 210 .............................................. 273
Crystallographic data for compound 238 .............................................. 275
Crystallographic data for compound 249 .............................................. 277
Crystallographic data for compound 250 .............................................. 279
Appendix 3: UV–Visible Spectroscopic Data ...................... 281
Appendix 4: HPLC Data ........................................................ 292
Arylation Products of 136 ...................................................................... 292
Method A ..................................................................................................... 292
Method B ..................................................................................................... 294
Method C ..................................................................................................... 297
Arylation Products of 138 ...................................................................... 299
Method A ..................................................................................................... 299
Method B ..................................................................................................... 300
Method C ..................................................................................................... 303
Appendix 5: GC Data ............................................................ 304
Calculations .......................................................................................... 304

List of Contents
6
Mesitylene Reference Solution..................................................................... 304
Calibration Solutions .................................................................................... 304
Calculation of Conversion from Peak Area ................................................... 305
Calculation of Error ...................................................................................... 305
Calibrations ........................................................................................... 306
Line Fitting ............................................................................................ 310
Appendix 6: ESI–MS Data for Pdx(dba)y Clusters ............... 317
Appendix 7: NMR Spectra .................................................... 327
Abbreviations ........................................................................ 427
References ............................................................................ 432

List of Figures
7
List of Figures
Figure 1 Selected examples of typical Pd-catalysed cross-coupling reactions. .................. 33
Figure 2 Schematic representation for the role of aggregated Pd in catalysis. Reproduced by
permission of The Royal Society of Chemistry.20 ............................................................... 36
Figure 3 Inverse relationship between catalyst activity and concentration in a Mizoroki–
Heck cross-coupling. Adapted with permission from Org. Lett. 2003, 5, 3285–3288. ....... 36
Figure 4 Inverse relationship between Pd loading and TOF in a Sonogashira cross-coupling.
Figure prepared by Prof. I. J. S. Fairlamb. ........................................................................... 38
Figure 5 Monomer unit of (poly)vinylpyrrolidone (PVP) 12. ............................................ 40
Figure 6 Relationship between TOF and particle size normalised to either total surface Pd
atoms (●) or defect surface Pd atoms (○) in a Suzuki–Miyaura cross-coupling. Reproduced
by permission of The Royal Society of Chemistry.33 .......................................................... 40
Figure 7 XAS spectra of PdNP coordination environment in a Suzuki–Miyaura cross-
coupling. Reproduced with permission from Angew. Chem. Int. Ed. 2010, 49, 1820–1824.
Copyright 2010 WILEY-VCH Verlag GmbH & Co. .......................................................... 41
Figure 8 Ratio of defect sites to terrace sites in truncated cuboctahedral PdNPs. Adapted
with permission from Langmuir 1999, 15, 7621–7625. Copyright 1999 American Chemical
Society. ................................................................................................................................ 42
Figure 9 Stable closed-shell structures of metal nanoparticles. .......................................... 42
Figure 10 Overview of Pd-catalysed processes for the formation of new carbon–carbon
bonds. ................................................................................................................................... 43
Figure 11 Structures of common hypervalent iodine(III) reagents. .................................... 47
Figure 12 1H NMR spectrum of 74 (400 MHz, CDCl3). ..................................................... 69
Figure 13 Crystal structure of (ʟ-tryptophyl-glycinato) copper(II). Reprinted from Inorg.
Chim. Acta 2001, 312, 133–138. Copyright 2001, with permission from Elsevier. ............ 71
Figure 14 Tryptophan-containing Sansalvamide A derivative 147. ................................... 75

List of Figures
8
Figure 15 Cyclometallated Pd–OTs complexes reported by (a) Brown et al. and (b) Bedford
et al. ..................................................................................................................................... 84
Figure 16 1H NMR spectrum of 75 (400 MHz, CDCl3). ..................................................... 86
Figure 17 Single crystal X-ray diffraction structure of 75. Thermal ellipsoids shown with
50% probability and hydrogen atoms removed for clarity. Selected bond lengths (Å): C(3)–
C(4): 1.500(3), C(4)–C(11): 1.375(3), N(2)–C(11): 1.388(2), C(11)–C(12): 1.475(3).
Selected bond angles (°): C(4)–C(11)–C(12): 131.75(18), N(2)–C(11)–C(12): 118.71(17).
............................................................................................................................................. 87
Figure 18 Single crystal X-ray diffraction structure of 142. Thermal ellipsoids shown with
50% probability and hydrogen atoms removed for clarity. Selected bond lengths (Å): C(7)–
C(9): 1.506(3), C(7)–C(8): 1.378(3), N(1)–C(8): 1.378(3), C(8)–C(12): 1.484(3). Selected
bond angles (°): C(7)–C(8)–C(12): 128.9(2), N(1)–C(8)–C(12): 121.8(2). ........................ 88
Figure 19 Single crystal X-ray diffraction structure of 210. Thermal ellipsoids shown with
50% probability and absolute stereochemistry established by anomalous dispersion. Selected
bond lengths (Å): C(7)–C(15): 1.500(2), C(7)–C(8): 1.369(3), N(1)–C(8): 1.382(3), C(8)–
C(9): 1.475(3), C(12)–Cl(1): 1.743(2). Selected bond angles (°): C(7)–C(8)–C(9):
131.44(17), N(1)–C(8)–C(9): 119.04(16). ........................................................................... 88
Figure 20 Cartoon schematic of PdNP encapsulation in PVP–Pd 13. .............................. 103
Figure 21 TEM image and particle size analysis for PVP–Pd 13. .................................... 104
Figure 22 PVP–Pd 13 after approximately 30 months (left) and freshly-synthesised (right).
........................................................................................................................................... 105
Figure 23 Synthesis of DMF–PdNPs 236. ........................................................................ 106
Figure 24 Direct arylation of N-methylindole 33 at 60 °C over 2 h. Fitting to an exponential
decay equation is shown where appropriate. × = starting concentration of substrate at t = 0.
Reactions performed by L. Neumann. ............................................................................... 110
Figure 25 Direct arylation of N-methylindole 33 at 50 °C over 24 h. Fitting to an exponential
decay equation is shown where appropriate. Detailed analysis over the initial 7 hours shown,

List of Figures
9
final conversions by GC after 24 h; Pd/C: 83%, PVP–Pd 13: 100%, Pd(OAc)2, 66%,
Pd2(dba)3 238: 88%. Reactions performed by L. Neumann. ............................................. 111
Figure 26 Direct arylation of N-methylindole 33 using freshly synthesised and 30-month old
PVP–Pd 13. × = starting concentration of substrate at t = 0. Reactions performed by L.
Neumann. ........................................................................................................................... 112
Figure 27 Direct arylation of benzofuran 239 over 24 h. Fitting to an exponential decay
equation is shown where appropriate. Detailed analysis over the initial 7 hours shown, final
conversions by GC after 24 h; Pd/C: 88%, PVP–Pd 13: 91%, Pd(OAc)2, 31%, Pd2(dba)3 238:
31%. × = starting concentration of substrate at t = 0. Reactions performed by L. Neumann.
........................................................................................................................................... 113
Figure 28 Direct arylation of butylthiophene 241 over 24 h. Fitting to an exponential decay
equation is shown where appropriate. Final conversions by GC after 24 h; Pd/C: 66%, PVP–
Pd 13: 86%, Pd(OAc)2, 75%, Pd2(dba)3 238: 42%. Reactions performed by L. Neumann.
........................................................................................................................................... 114
Figure 29 Direct arylation of butylfuran 243 over 24 h. Fitting to an exponential decay
equation is shown where appropriate. Final conversions by GC after 24 h; Pd/C: 100%, PVP–
Pd 13: 95%, Pd(OAc)2, 62%, Pd2(dba)3 238: 65%. × = starting concentration of substrate at t
= 0. Reactions performed by L. Neumann. ........................................................................ 116
Figure 30 Direct arylation of butylfuran 243 over 10 h at 70 °C. Fitting to an exponential
decay (substrate 243) or logarithmic growth (product 246) equation is shown where
appropriate. × = starting concentration of substrate at t = 0. Reactions performed by L.
Neumann. ........................................................................................................................... 117
Figure 31 Partial 1H NMR spectrum of Pd2(dba)3·CHCl3 in CDCl3 at 600 MHz: alkene
signals corresponding to the major (blue) and minor (green) isomers of complex 238, along
with free ligand 247 (red). Integral regions used for calculation of purity are highlighted as
I1–I3. Reprinted with permission from Organometallics 2012, 31, 2302–2309. Copyright
2012 American Chemical Society. .................................................................................... 121
Figure 32 Possible conformational alignment of dba ligand 247. ..................................... 122

List of Figures
10
Figure 33 Single crystal X-ray diffraction structure of 238 (major isomer). Thermal
ellipsoids shown with 50% probability, hydrogen atoms and solvating chloroform removed
for clarity. Selected bond lengths (Å): Pd(1)–C(7): 2.303(3), Pd(1)–C(8): 2.248(3), C(7)–
C(8): 1.358(4), Pd(1)–C(24): 2.279(4), Pd(1)–C(25): 2.251(4), C(24)–C(25): 1.364(6),
Pd(1)–C(41): 2.202(3), Pd(1)–C(42): 2.220(3), C(41)–C(42): 1.393(5), Pd(2)–C(10):
2.222(3), Pd(2)–C(11): 2.244(3), C(10)–C(11): 1.395(4), Pd(2)–C(27): 2.244(4), Pd(2)–
C(28): 2.241(4), C(27)–C(28): 1.392(6), Pd(2)–C(44): 2.244(3), Pd(2)–C(45): 2.280(3),
C(44)–C(45): 1.359(5). Pd(1)–Pd(2) bond distance: 3.244 Å. .......................................... 123
Figure 34 Single crystal X-ray diffraction structure of 238 (minor isomer). Thermal
ellipsoids shown with 50% probability, hydrogen atoms and solvating chloroform removed
for clarity. Selected bond lengths (Å): Pd(1)–C(7A): 2.275(11), Pd(1)–C(8A): 2.297(11),
C(7A)–C(8A): 1.368(19), Pd(1)–C(24A): 2.243(6), Pd(1)–C(25A): 2.254(6), C(24A)–
C(25A): 1.390(9), Pd(1)–C(41A): 2.211(7), Pd(1)–C(42A): 2.207(7), C(41A)–C(42A):
1.339(10), Pd(2)–C(10A): 2.192(11), Pd(2)–C(11A): 2.272(10), C(10A)–C(11A): 1.332(9),
Pd(2)–C(27A): 2.274(6), Pd(2)–C(28A): 2.242(6), C(27A)–C(28A): 1.352(9), Pd(2)–
C(44A): 2.267(7), Pd(2)–C(45A): 2.311(7), C(44A)–C(45A): 1.394(10). Pd(1)–Pd(2) bond
distance: 3.244 Å. .............................................................................................................. 123
Figure 35 Representative alkene binding from dba ligand 247 to palladium. .................. 124
Figure 36 1H NMR spectra of 238 in CDCl3 at a) 298 K b) 238 K; major isomer signal used
by Ananikov et al. (■), major isomer signal (●) and minor isomer signal (○) used in this
study. .................................................................................................................................. 125
Figure 37 Intensity of key integrals for complex 238 as a function of temperature. ........ 126
Figure 38 Behaviour of complex 238 in CDCl3, monitored by 1H NMR spectroscopic
analysis. .............................................................................................................................. 128
Figure 39 Behaviour of complex 238 in CDCl3 when treated with acid, monitored by 1H
NMR spectroscopic analysis. ............................................................................................. 129
Figure 40 FT–ICR–MS spectrum showing [Pdxdba2H]+ cluster species formed from complex
238. .................................................................................................................................... 130

List of Figures
11
Figure 41 DFT-calculated possible structures for the species [Pd4(dba)2H]+ in the gas phase:
(a) linear, (b) Y-shaped, (c) rhombic, (d) tetrahedral. ........................................................ 130
Figure 42 ESI–MS spectrum showing [PdxdbayH/Na]+ cluster species formed from complex
238. .................................................................................................................................... 131
Figure 43 Measured vs. simulated mass values for [Pd4(dba)2H]+ cluster detected by ESI–
MS. ..................................................................................................................................... 131
Figure 44 ESI–MS–MS spectra of [Pd4dbayH]+ cluster species. ...................................... 132
Figure 45 Relative abundance of [Pd4dbayH]+ cluster species as a function of secondary
collision energy. ................................................................................................................. 133
Figure 46 Key molecules obtained through the direct arylation of peptides..................... 138
Figure 47 Degradation behaviour of 238 as observed by 1H NMR and ESI–MS analysis.
........................................................................................................................................... 140
Figure 48 (a) UV–visible spectra showing formation of 75 at 304 nm (5 min intervals) at 37
°C. (b) Plot showing evolution of 75 over time. ............................................................... 141
Figure 49 Alternative N-terminus protected tryptophan substrates. ................................. 142
Figure 50 Potential heterocyclic substrates for novel direct arylation methodologies. ..... 143
Figure 51 Single crystal X-ray diffraction structure of 75. Thermal ellipsoids shown with
50% probability and hydrogen atoms removed for clarity. Selected bond lengths (Å): C(3)–
C(4): 1.500(3), C(4)–C(11): 1.375(3), N(2)–C(11): 1.388(2), C(11)–C(12): 1.475(3).
Selected bond angles (°): C(4)–C(11)–C(12): 131.75(18), N(2)–C(11)–C(12): 118.71(17).
........................................................................................................................................... 269
Figure 52 Single crystal X-ray diffraction structure of 142. Thermal ellipsoids shown with
50% probability and hydrogen atoms removed for clarity. Selected bond lengths (Å): C(7)–
C(9): 1.506(3), C(7)–C(8): 1.378(3), N(1)–C(8): 1.378(3), C(8)–C(12): 1.484(3). Selected
bond angles (°): C(7)–C(8)–C(12): 128.9(2), N(1)–C(8)–C(12): 121.8(2). ...................... 271
Figure 53 Single crystal X-ray diffraction structure of 210. Thermal ellipsoids shown with
50% probability and absolute stereochemistry established by anomalous dispersion. Selected
bond lengths (Å): C(7)–C(15): 1.500(2), C(7)–C(8): 1.369(3), N(1)–C(8): 1.382(3), C(8)–

List of Figures
12
C(9): 1.475(3), C(12)–Cl(1): 1.743(2). Selected bond angles (°): C(7)–C(8)–C(9):
131.44(17), N(1)–C(8)–C(9): 119.04(16). ......................................................................... 273
Figure 54 Single crystal X-ray diffraction structure of complex 238 (major isomer). Thermal
ellipsoids shown with 50% probability, hydrogen atoms and solvating chloroform removed
for clarity. Selected bond lengths (Å): Pd(1)–C(7): 2.303(3), Pd(1)–C(8): 2.248(3), C(7)–
C(8): 1.358(4), Pd(1)–C(24): 2.279(4), Pd(1)–C(25): 2.251(4), C(24)–C(25): 1.364(6),
Pd(1)–C(41): 2.202(3), Pd(1)–C(42): 2.220(3), C(41)–C(42): 1.393(5), Pd(2)–C(10):
2.222(3), Pd(2)–C(11): 2.244(3), C(10)–C(11): 1.395(4), Pd(2)–C(27): 2.244(4), Pd(2)–
C(28): 2.241(4), C(27)–C(28): 1.392(6), Pd(2)–C(44): 2.244(3), Pd(2)–C(45): 2.280(3),
C(44)–C(45): 1.359(5). Pd(1)–Pd(2) bond distance: 3.244 Å. .......................................... 275
Figure 55 Single crystal X-ray diffraction structure of complex 238 (minor isomer). Thermal
ellipsoids shown with 50% probability, hydrogen atoms and solvating chloroform removed
for clarity. Selected bond lengths (Å): Pd(1)–C(7A): 2.275(11), Pd(1)–C(8A): 2.297(11),
C(7A)–C(8A): 1.368(19), Pd(1)–C(24A): 2.243(6), Pd(1)–C(25A): 2.254(6), C(24A)–
C(25A): 1.390(9), Pd(1)–C(41A): 2.211(7), Pd(1)–C(42A): 2.207(7), C(41A)–C(42A):
1.339(10), Pd(2)–C(10A): 2.192(11), Pd(2)–C(11A): 2.272(10), C(10A)–C(11A): 1.332(9),
Pd(2)–C(27A): 2.274(6), Pd(2)–C(28A): 2.242(6), C(27A)–C(28A): 1.352(9), Pd(2)–
C(44A): 2.267(7), Pd(2)–C(45A): 2.311(7), C(44A)–C(45A): 1.394(10). Pd(1)–Pd(2) bond
distance: 3.244 Å. .............................................................................................................. 275
Figure 56 Single crystal X-ray diffraction structure of complex 249 (major isomer). Thermal
ellipsoids shown with 50% probability, hydrogen atoms and solvating methylene chloride
removed for clarity. ............................................................................................................ 277
Figure 57 Single crystal X-ray diffraction structure of complex 250 (major isomer). Thermal
ellipsoids shown with 50% probability, hydrogen atoms and solvating benzene removed for
clarity. ................................................................................................................................ 279
Figure 58 UV–visible spectroscopic analysis for compound 142. .................................... 281
Figure 59 UV–visible spectroscopic analysis for compound 160. .................................... 282
Figure 60 UV–visible spectroscopic analysis for compound 167. .................................... 283

List of Figures
13
Figure 61 UV–visible spectroscopic analysis for compound 170. .................................... 284
Figure 62 UV–visible spectroscopic analysis for compound 172. .................................... 285
Figure 63 UV–visible spectroscopic analysis for compound 173. .................................... 286
Figure 64 UV–visible spectroscopic analysis for compound 174. .................................... 287
Figure 65 UV–visible spectroscopic analysis for compound 175. .................................... 288
Figure 66 UV–visible spectroscopic analysis for compound 176. .................................... 289
Figure 67 UV–visible spectroscopic analysis for compound 209. .................................... 290
Figure 68 UV–visible spectroscopic analysis for compound 211. .................................... 291
Figure 69 HPLC–ESI–MS chromatogram (BPC) of the crude reaction material (arylated
tryptophan donated Trp*, diarylated tryptophans donated Trp**, dihydroxylated byproducts
donated Trp‡). .................................................................................................................... 292
Figure 70 ESI–MS of dihydroxylated side products from arylation of 136. ..................... 292
Figure 71 ESI–MS of arylation product 137. .................................................................... 293
Figure 72 ESI–MS of diarylated side products from arylation of 136. ............................. 293
Figure 73 HPLC–ESI–MS chromatogram (BPC) of the crude reaction material (arylated
tryptophan donated Trp*, starting material donated Trp). .................................................. 294
Figure 74 ESI–MS of starting material 136. ..................................................................... 294
Figure 75 ESI–MS of arylation product 137. .................................................................... 295
Figure 76 ESI–MS of starting material 140. ..................................................................... 296
Figure 77 HPLC–ESI–MS chromatogram (BPC) of the crude reaction material. ............ 297
Figure 78 ESI–MS of arylation product 137. .................................................................... 297
Figure 79 ESI–MS of iPr-ester formed during workup from arylation product 137. ........ 298
Figure 80 HPLC–ESI–MS chromatogram (BPC) of the crude reaction material (arylated
tryptophan donated Trp*, dihydroxylated byproducts donated Trp‡). ................................ 299
Figure 81 ESI–MS of dihydroxylated side products from arylation of 138. ..................... 299
Figure 82 ESI–MS of arylation product 139. .................................................................... 299
Figure 83 HPLC–ESI–MS chromatogram (BPC) of the crude reaction material (arylated
tryptophan donated Trp*, starting material donated Trp). .................................................. 300

List of Figures
14
Figure 84 ESI–MS of starting material 138. ..................................................................... 300
Figure 85 ESI–MS of arylation product 139. .................................................................... 301
Figure 86 ESI–MS of starting material 140. ..................................................................... 302
Figure 87 HPLC–ESI–MS chromatogram (BPC) of the crude reaction material. ............ 303
Figure 88 ESI–MS of arylation product 139. .................................................................... 303
Figure 89 Calibration plot to determine RRF for 1-methylindole 33. .............................. 306
Figure 90 Calibration plot to determine RRF for benzofuran 239. ................................... 307
Figure 91 Calibration plot to determine RRF for butylthiophene 241. ............................. 308
Figure 92 Calibration plot to determine RRF for butylfuran 243. .................................... 309
Figure 93 1st order exponential decay for arylation of 1-methylindole 33 with Pd/C. ...... 310
Figure 94 1st order exponential decay for arylation of 1-methylindole 33 with PVP–Pd 13.
........................................................................................................................................... 310
Figure 95 1st order exponential decay for arylation of 1-methylindole 33 with Pd(OAc)2.
........................................................................................................................................... 311
Figure 96 1st order exponential decay for arylation of benzofuran 239 with Pd/C. .......... 311
Figure 97 1st order exponential decay for arylation of benzofuran 239 with PVP–Pd 13. 312
Figure 98 1st order exponential decay for arylation of butylthiophene 241 with Pd/C. .... 312
Figure 99 1st order exponential decay for arylation of butylthiophene 241 with PVP–Pd 13.
........................................................................................................................................... 313
Figure 100 1st order exponential decay for arylation of butylthiophene 241 with Pd(OAc)2.
........................................................................................................................................... 313
Figure 101 1st order exponential decay for arylation of butylthiophene 241 with Pd2(dba)3
238. .................................................................................................................................... 314
Figure 102 1st order exponential decay for arylation of butylfuran 243 with Pd/C. ......... 314
Figure 103 1st order exponential decay for arylation of butylfuran 243 with PVP–Pd 13. 315
Figure 104 1st order exponential decay for arylation of butylfuran 243 with Pd2(dba)3 238.
........................................................................................................................................... 315

List of Figures
15
Figure 105 1st order exponential decay for arylation of butylfuran 243 with Pd/C at 70 °C.
........................................................................................................................................... 316
Figure 106 1st order logarithmic growth for 2-phenylbutylfuran 246 from reaction of
butylfuran with Pd/C at 70 °C. ........................................................................................... 316
Figure 107 Measured vs. simulated mass values for [Pd2(dba)2H]+ cluster. ..................... 317
Figure 108 Measured vs. simulated mass values for [Pd2(dba)2Na]+ cluster. ................... 317
Figure 109 Measured vs. simulated mass values for [Pd4(dba)2H]+ cluster. ..................... 318
Figure 110 Measured vs. simulated mass values for [Pd4(dba)2Na]+ cluster. ................... 318
Figure 111 Measured vs. simulated mass values for [Pd5(dba)2H]+ cluster. ..................... 319
Figure 112 Measured vs. simulated mass values for [Pd6(dba)2H]+ cluster. ..................... 319
Figure 113 Measured vs. simulated mass values for [Pd4(dba)3H]+ cluster. ..................... 320
Figure 114 Measured vs. simulated mass values for [Pd4(dba)3Na]+ cluster. ................... 320
Figure 115 Measured vs. simulated mass values for [Pd5(dba)3H]+ cluster. ..................... 321
Figure 116 Measured vs. simulated mass values for [Pd6(dba)3H]+ cluster. ..................... 321
Figure 117 Measured vs. simulated mass values for [Pd4(dba)4Na]+ cluster. ................... 322
Figure 118 Measured vs. simulated mass values for [Pd4(dba)5H]+ cluster. ..................... 322
Figure 119 Measured vs. simulated mass values for [Pd5(dba)5H]+ cluster. ..................... 323
Figure 120 Measured vs. simulated mass values for [Pd6(dba)5H]+ cluster. ..................... 323
Figure 121 Measured vs. simulated mass values for [Pd6(dba)6Na]+ cluster. ................... 324
Figure 122 Measured vs. simulated mass values for [Pd6(dba)7Na]+ cluster. ................... 324
Figure 123 Measured vs. simulated mass values for [Pd7(dba)8H]+ cluster. ..................... 325
Figure 124 Measured vs. simulated mass values for [Pd8(dba)8H]+ cluster. ..................... 325
Figure 125 Measured vs. simulated mass values for [Pd8(dba)9Na]+ cluster. ................... 326
Figure 126 Measured vs. simulated mass values for [Pd8(dba)11Na]+ cluster. .................. 326
Figure 127 1H NMR spectrum of 135 (400 MHz, CD3OD). ............................................. 327
Figure 128 13C NMR spectrum of 135 (101 MHz, CD3OD). ............................................ 327
Figure 129 1H NMR spectrum of 74 (400 MHz, CDCl3). ................................................. 328
Figure 130 13C NMR spectrum of 74 (101 MHz, CDCl3). ................................................ 328

List of Figures
16
Figure 131 1H NMR spectrum of 75 (400 MHz, CDCl3). ................................................. 329
Figure 132 13C NMR spectrum of 75 (101 MHz, CDCl3). ................................................ 329
Figure 133 1H NMR spectrum of 140 (400 MHz, CDCl3). ............................................... 330
Figure 134 13C NMR spectrum of 140 (101 MHz, CDCl3). .............................................. 330
Figure 135 19F NMR spectrum of 140 (376 MHz, CDCl3). .............................................. 331
Figure 136 1H NMR spectrum of 142 (400 MHz, CDCl3). ............................................... 332
Figure 137 13C NMR spectrum of 142 (101 MHz, CDCl3). .............................................. 332
Figure 138 1H NMR spectrum of 143 (400 MHz, CDCl3). ............................................... 333
Figure 139 13C NMR spectrum of 143 (101 MHz, CDCl3). .............................................. 333
Figure 140 1H NMR spectrum of 144 (400 MHz, CDCl3). ............................................... 334
Figure 141 13C NMR spectrum of 144 (101 MHz, CDCl3). .............................................. 334
Figure 142 11B NMR spectrum of 144 (128 MHz, CDCl3). .............................................. 335
Figure 143 19F NMR spectrum of 144 (376 MHz, CDCl3). .............................................. 335
Figure 144 1H NMR spectrum of 145 (400 MHz, (CD3)2SO). ......................................... 336
Figure 145 13C NMR spectrum of 145 (101 MHz, (CD3)2SO). ........................................ 336
Figure 146 19F NMR spectrum of 145 (376 MHz, (CD3)2SO). ......................................... 337
Figure 147 31P NMR spectrum of 145 (162 MHz, (CD3)2SO). ......................................... 337
Figure 148 1H NMR spectrum of 146 (400 MHz, (CD3)2SO). ......................................... 338
Figure 149 13C NMR spectrum of 146 (101 MHz, (CD3)2SO). ........................................ 338
Figure 150 19F NMR spectrum of 146 (376 MHz, (CD3)2SO). ......................................... 339
Figure 151 1H NMR spectrum of 132 (400 MHz, (CD3)2SO). ......................................... 340
Figure 152 13C NMR spectrum of 132 (101 MHz, (CD3)2SO). ........................................ 340
Figure 153 1H NMR spectrum of 149 (400 MHz, CDCl3). ............................................... 341
Figure 154 13C NMR spectrum of 149 (101 MHz, CDCl3). .............................................. 341
Figure 155 1H NMR spectrum of 152 (400 MHz, CDCl3). ............................................... 342
Figure 156 13C NMR spectrum of 152 (101 MHz, CDCl3). .............................................. 342
Figure 157 1H NMR spectrum of 155 (400 MHz, CD3OD). ............................................. 343
Figure 158 13C NMR spectrum of 155 (101 MHz, CD3OD). ............................................ 343
List of Figures
17
Figure 159 1H NMR spectrum of 156 (400 MHz, CDCl3). ............................................... 344
Figure 160 13C NMR spectrum of 156 (101 MHz, CDCl3). .............................................. 344
Figure 161 1H NMR spectrum of 158 (400 MHz, CDCl3). ............................................... 345
Figure 162 13C NMR spectrum of 158 (101 MHz, CDCl3). .............................................. 345
Figure 163 1H NMR spectrum of 160 (400 MHz, CDCl3). ............................................... 346
Figure 164 13C NMR spectrum of 160 (101 MHz, CDCl3). .............................................. 346
Figure 165 1H NMR spectrum of 161 (400 MHz, CDCl3). ............................................... 347
Figure 166 13C NMR spectrum of 161 (101 MHz, CDCl3). .............................................. 347
Figure 167 1H NMR spectrum of 163 (400 MHz, CD3OD). ............................................. 348
Figure 168 13C NMR spectrum of 163 (101 MHz, CD3OD). ............................................ 348
Figure 169 1H NMR spectrum of 92 (400 MHz, CDCl3). ................................................. 349
Figure 170 13C NMR spectrum of 92 (101 MHz, CDCl3). ................................................ 349
Figure 171 19F NMR spectrum of 92 (376 MHz, CDCl3). ................................................ 350
Figure 172 1H NMR spectrum of 166 (400 MHz, CDCl3). ............................................... 351
Figure 173 13C NMR spectrum of 166 (101 MHz, CDCl3). .............................................. 351
Figure 174 19F NMR spectrum of 166 (376 MHz, CDCl3). .............................................. 352
Figure 175 1H NMR spectrum of 167 (400 MHz, CDCl3). ............................................... 353
Figure 176 13C NMR spectrum of 167 (101 MHz, CDCl3). .............................................. 353
Figure 177 19F NMR spectrum of 167 (376 MHz, CDCl3). .............................................. 354
Figure 178 1H NMR spectrum of 169 (400 MHz, CD3OD). ............................................. 355
Figure 179 13C NMR spectrum of 169 (101 MHz, CD3OD). ............................................ 355
Figure 180 19F NMR spectrum of 169 (376 MHz, CDCl3). .............................................. 356
Figure 181 1H NMR spectrum of 170 (400 MHz, CDCl3). ............................................... 357
Figure 182 13C NMR spectrum of 170 (101 MHz, CDCl3). .............................................. 357
Figure 183 19F NMR spectrum of 170 (376 MHz, CDCl3). .............................................. 358
Figure 184 1H NMR spectrum of 171 (400 MHz, CDCl3). ............................................... 359
Figure 185 13C NMR spectrum of 171 (101 MHz, CDCl3). .............................................. 359
Figure 186 19F NMR spectrum of 171 (376 MHz, CDCl3). .............................................. 360

List of Figures
18
Figure 187 1H NMR spectrum of 172 (400 MHz, CDCl3). ............................................... 361
Figure 188 13C NMR spectrum of 172 (101 MHz, CDCl3). .............................................. 361
Figure 189 19F NMR spectrum of 172 (376 MHz, CDCl3). .............................................. 362
Figure 190 1H NMR spectrum of 173 (400 MHz, CDCl3). ............................................... 363
Figure 191 13C NMR spectrum of 173 (101 MHz, CDCl3). .............................................. 363
Figure 192 19F NMR spectrum of 173 (376 MHz, CDCl3). .............................................. 364
Figure 193 1H NMR spectrum of 174 (400 MHz, CDCl3). ............................................... 365
Figure 194 13C NMR spectrum of 174 (101 MHz, CDCl3). .............................................. 365
Figure 195 19F NMR spectrum of 174 (376 MHz, CDCl3). .............................................. 366
Figure 196 1H NMR spectrum of 175 (400 MHz, CDCl3). ............................................... 367
Figure 197 13C NMR spectrum of 175 (101 MHz, CDCl3). .............................................. 367
Figure 198 19F NMR spectrum of 175 (376 MHz, CDCl3). .............................................. 368
Figure 199 1H NMR spectrum of 176 (400 MHz, CDCl3). ............................................... 369
Figure 200 13C NMR spectrum of 176 (101 MHz, CDCl3). .............................................. 369
Figure 201 19F NMR spectrum of 176 (376 MHz, CDCl3). .............................................. 370
Figure 202 1H NMR spectrum of 48 (400 MHz, (CD3)2SO). ........................................... 371
Figure 203 13C NMR spectrum of 48 (101 MHz, (CD3)2SO). .......................................... 371
Figure 204 11B NMR spectrum of 48 (128 MHz, (CD3)2SO). .......................................... 372
Figure 205 19F NMR spectrum of 48 (376 MHz, (CD3)2SO). ........................................... 372
Figure 206 1H NMR spectrum of 192 (400 MHz, (CD3)2SO). ......................................... 373
Figure 207 13C NMR spectrum of 192 (101 MHz, (CD3)2SO). ........................................ 373
Figure 208 11B NMR spectrum of 192 (128 MHz, (CD3)2SO). ........................................ 374
Figure 209 19F NMR spectrum of 192 (376 MHz, (CD3)2SO). ......................................... 374
Figure 210 1H NMR spectrum of 193 (400 MHz, (CD3)2SO). ......................................... 375
Figure 211 13C NMR spectrum of 193 (101 MHz, (CD3)2SO). ........................................ 375
Figure 212 11B NMR spectrum of 193 (128 MHz, (CD3)2SO). ........................................ 376
Figure 213 19F NMR spectrum of 193 (376 MHz, (CD3)2SO). ......................................... 376
Figure 214 1H NMR spectrum of 194 (400 MHz, (CD3)2SO). ......................................... 377

List of Figures
19
Figure 215 13C NMR spectrum of 194 (101 MHz, (CD3)2SO). ........................................ 377
Figure 216 1H NMR spectrum of 195 (400 MHz, (CD3)2SO). ......................................... 378
Figure 217 13C NMR spectrum of 195 (101 MHz, (CD3)2SO). ........................................ 378
Figure 218 11B NMR spectrum of 195 (128 MHz, (CD3)2SO). ........................................ 379
Figure 219 19F NMR spectrum of 195 (376 MHz, (CD3)2SO). ......................................... 379
Figure 220 1H NMR spectrum of 196 (400 MHz, (CD3)2SO). ......................................... 380
Figure 221 13C NMR spectrum of 196 (101 MHz, (CD3)2SO). ........................................ 380
Figure 222 11B NMR spectrum of 196 (128 MHz, (CD3)2SO). ........................................ 381
Figure 223 19F NMR spectrum of 196 (376 MHz, (CD3)2SO). ......................................... 381
Figure 224 1H NMR spectrum of 197 (400 MHz, (CD3)2SO). ......................................... 382
Figure 225 13C NMR spectrum of 197 (101 MHz, (CD3)2SO). ........................................ 382
Figure 226 11B NMR spectrum of 197 (128 MHz, (CD3)2SO). ........................................ 383
Figure 227 19F NMR spectrum of 197 (376 MHz, (CD3)2SO). ......................................... 383
Figure 228 1H NMR spectrum of 198 (400 MHz, (CD3)2SO). ......................................... 384
Figure 229 13C NMR spectrum of 198 (101 MHz, (CD3)2SO). ........................................ 384
Figure 230 11B NMR spectrum of 198 (128 MHz, (CD3)2SO). ........................................ 385
Figure 231 19F NMR spectrum of 198 (376 MHz, (CD3)2SO). ......................................... 385
Figure 232 1H NMR spectrum of 199 (400 MHz, (CD3)2SO). ......................................... 386
Figure 233 13C NMR spectrum of 199 (101 MHz, (CD3)2SO). ........................................ 386
Figure 234 11B NMR spectrum of 199 (128 MHz, (CD3)2SO). ........................................ 387
Figure 235 19F NMR spectrum of 199 (376 MHz, (CD3)2SO). ......................................... 387
Figure 236 1H NMR spectrum of 200 (400 MHz, (CD3)2SO). ......................................... 388
Figure 237 13C NMR spectrum of 200 (101 MHz, (CD3)2SO). ........................................ 388
Figure 238 11B NMR spectrum of 200 (128 MHz, (CD3)2SO). ........................................ 389
Figure 239 19F NMR spectrum of 200 (376 MHz, (CD3)2SO). ......................................... 389
Figure 240 1H NMR spectrum of 201 (400 MHz, (CD3)2SO). ......................................... 390
Figure 241 13C NMR spectrum of 201 (101 MHz, (CD3)2SO). ........................................ 390
Figure 242 11B NMR spectrum of 201 (128 MHz, (CD3)2SO). ........................................ 391

List of Figures
20
Figure 243 19F NMR spectrum of 201 (376 MHz, (CD3)2SO). ......................................... 391
Figure 244 1H NMR spectrum of 202 (400 MHz, (CD3)2SO). ......................................... 392
Figure 245 13C NMR spectrum of 202 (101 MHz, (CD3)2SO). ........................................ 392
Figure 246 11B NMR spectrum of 202 (128 MHz, (CD3)2SO). ........................................ 393
Figure 247 19F NMR spectrum of 202 (376 MHz, (CD3)2SO). ......................................... 393
Figure 248 1H NMR spectrum of 203 (400 MHz, (CD3)2SO). ......................................... 394
Figure 249 13C NMR spectrum of 203 (101 MHz, (CD3)2SO). ........................................ 394
Figure 250 11B NMR spectrum of 203 (128 MHz, (CD3)2SO). ........................................ 395
Figure 251 19F NMR spectrum of 203 (376 MHz, (CD3)2SO). ......................................... 395
Figure 252 1H NMR spectrum of 54 (400 MHz, (CD3)2SO). ........................................... 396
Figure 253 13C NMR spectrum of 54 (101 MHz, (CD3)2SO). .......................................... 396
Figure 254 11B NMR spectrum of 54 (128 MHz, (CD3)2SO). .......................................... 397
Figure 255 19F NMR spectrum of 54 (376 MHz, (CD3)2SO). ........................................... 397
Figure 256 1H NMR spectrum of 204 (400 MHz, (CD3)2SO). ......................................... 398
Figure 257 13C NMR spectrum of 204 (101 MHz, (CD3)2SO). ........................................ 398
Figure 258 1H NMR spectrum of 76 (400 MHz, CDCl3). ................................................. 399
Figure 259 13C NMR spectrum of 76 (101 MHz, CDCl3). ................................................ 399
Figure 260 1H NMR spectrum of 205 (400 MHz, CDCl3). ............................................... 400
Figure 261 13C NMR spectrum of 205 (101 MHz, CDCl3). .............................................. 400
Figure 262 1H NMR spectrum of 206 (400 MHz, CDCl3). ............................................... 401
Figure 263 13C NMR spectrum of 206 (101 MHz, CDCl3). .............................................. 401
Figure 264 1H NMR spectrum of 207 (400 MHz, CDCl3). ............................................... 402
Figure 265 13C NMR spectrum of 207 (101 MHz, CDCl3). .............................................. 402
Figure 266 1H NMR spectrum of 77 (400 MHz, CDCl3). ................................................. 403
Figure 267 13C NMR spectrum of 77 (101 MHz, CDCl3). ................................................ 403
Figure 268 1H NMR spectrum of 208 (400 MHz, CDCl3). ............................................... 404
Figure 269 13C NMR spectrum of 208 (101 MHz, CDCl3). .............................................. 404
Figure 270 1H NMR spectrum of 120 (400 MHz, CDCl3). ............................................... 405

List of Figures
21
Figure 271 13C NMR spectrum of 120 (101 MHz, CDCl3). .............................................. 405
Figure 272 19F NMR spectrum of 120 (376 MHz, CDCl3). .............................................. 406
Figure 273 1H NMR spectrum of 79 (400 MHz, CDCl3). ................................................. 407
Figure 274 13C NMR spectrum of 79 (101 MHz, CDCl3). ................................................ 407
Figure 275 1H NMR spectrum of 209 (400 MHz, CDCl3). ............................................... 408
Figure 276 13C NMR spectrum of 209 (101 MHz, CDCl3). .............................................. 408
Figure 277 1H NMR spectrum of 210 (400 MHz, CDCl3). ............................................... 409
Figure 278 13C NMR spectrum of 210 (101 MHz, CDCl3). .............................................. 409
Figure 279 1H NMR spectrum of 211 (400 MHz, CDCl3). ............................................... 410
Figure 280 13C NMR spectrum of 211 (101 MHz, CDCl3). .............................................. 410
Figure 281 1H NMR spectrum of 215 (400 MHz, CD3OD). ............................................. 411
Figure 282 13C NMR spectrum of 215 (125 MHz, CD3OD). ............................................ 411
Figure 283 1H NMR spectrum of 224 (400 MHz, CDCl3). ............................................... 412
Figure 284 13C NMR spectrum of 224 (101 MHz, CDCl3). .............................................. 412
Figure 285 1H NMR spectrum of 231 (400 MHz, CDCl3). ............................................... 413
Figure 286 13C NMR spectrum of 231 (101 MHz, CDCl3). .............................................. 413
Figure 287 1H NMR spectrum of 232 (400 MHz, CDCl3). ............................................... 414
Figure 288 13C NMR spectrum of 232 (101 MHz, CDCl3). .............................................. 414
Figure 289 1H NMR spectrum of 233 (400 MHz, (CD3)2SO). ......................................... 415
Figure 290 13C NMR spectrum of 233 (101 MHz, CDCl3). .............................................. 415
Figure 291 1H NMR spectrum of 234 (400 MHz, CDCl3). ............................................... 416
Figure 292 13C NMR spectrum of 234 (101 MHz, CDCl3). .............................................. 416
Figure 293 1H NMR spectrum of 38 (400 MHz, (CD3)2SO). ........................................... 417
Figure 294 13C NMR spectrum of 38 (101 MHz, (CD3)2SO). .......................................... 417
Figure 295 19F NMR spectrum of 38 (376 MHz, (CD3)2SO). ........................................... 418
Figure 296 1H NMR spectrum of 34 (400 MHz, CDCl3). ................................................. 419
Figure 297 13C NMR spectrum of 34 (101 MHz, CDCl3). ................................................ 419
Figure 298 1H NMR spectrum of 240 (400 MHz, CDCl3). ............................................... 420

List of Figures
22
Figure 299 13C NMR spectrum of 240 (101 MHz, CDCl3). .............................................. 420
Figure 300 1H NMR spectrum of 242 (400 MHz, CDCl3). ............................................... 421
Figure 301 13C NMR spectrum of 242 (101 MHz, CDCl3). .............................................. 421
Figure 302 1H NMR spectrum of 246 (400 MHz, CDCl3). .............................................. 422
Figure 303 13C NMR spectrum of 246 (101 MHz, CDCl3). .............................................. 422
Figure 304 1H NMR spectrum of 247 (400 MHz, CDCl3). ............................................... 423
Figure 305 13C NMR spectrum of 247 (101 MHz, CDCl3). .............................................. 423
Figure 306 1H NMR spectrum of 238 (500 MHz, CDCl3). ............................................... 424
Figure 307 1H NMR spectrum of 252 (400 MHz, CD2Cl2). ............................................. 425
Figure 308 13C NMR spectrum of 252 (101 MHz, CD2Cl2). ............................................ 425
Figure 309 11B NMR spectrum of 252 (128 MHz, CD2Cl2). ............................................ 426
Figure 310 11B NMR spectrum of 252 (376 MHz, CD2Cl2). ............................................ 426

List of Schemes
23
List of Schemes
Scheme 1 Pd-catalysed formation of (E)–stilbene 3 from iodobenzene 1 and styrene 2. ... 32
Scheme 2 Key Mizoroki–Heck cross-coupling used in Danishefsky’s total synthesis of Taxol
4. .......................................................................................................................................... 34
Scheme 3 Key Mizoroki–Heck and Suzuki–Miyaura cross-couplings used in Stolz’s total
synthesis of (+)–Dragmacidin F 5. ....................................................................................... 34
Scheme 4 Simplified mechanism for Pd-catalysed cross-coupling. .................................... 35
Scheme 5 A unified Mizoroki–Heck mechanism. ............................................................... 37
Scheme 6 Mizoroki–Heck cross-coupling mediated by Pd/Al2O3. ..................................... 39
Scheme 7 Synthesis of Rebeccamycin Aglycone 17. .......................................................... 44
Scheme 8 Baudoin’s synthesis of Coralydine 19. ............................................................... 44
Scheme 9 CMD or AMLA-6 mechanism for direct C–H bond functionalisation. .............. 45
Scheme 10 Direct arylation of 2ʹ-deoxyadenosine 20 catalysed by DMF–PdNPs. ............. 46
Scheme 11 Site-selective acetoxylation of arenes using iodine(III) reagents. .................... 48
Scheme 12 Orthogonal arylation/acetoxylation using hypervalent iodine(III) reagents. .... 48
Scheme 13 Effect of acetate anion on direct arylation with iodoarenes. ............................. 49
Scheme 14 Selective asparagine cleavage mediated by hypervalent iodine(III) reagent. ... 49
Scheme 15 Suzuki-Miyaura cross-coupling of diaryliodonium salts. ................................. 50
Scheme 16 Nitrogen-directed arylation using diaryliodonium salts. ................................... 51
Scheme 17 Sanford’s proposed high oxidation state bimetallic Pd intermediate. ............... 51
Scheme 18 Room temperature arylation of N-methylindole. .............................................. 52
Scheme 19 Anilide-directed ortho-arylation using diaryliodonium salts. ........................... 52
Scheme 20 Direct arylation of phenol esters using diaryliodonium salts. ........................... 53
Scheme 21 Direct arylation of p-xylene 41 mediated by the Hermann–Beller palladacycle
42. ........................................................................................................................................ 53
Scheme 22 Tandem C–H and N–H arylation of indoles. .................................................... 54
Scheme 23 Heck–Matsuda reaction in the synthesis of (E)-stilbene 3. ............................... 55

List of Schemes
24
Scheme 24 One-pot combination of the Suzuki–Miyaura and Heck–Matsuda cross-
couplings. ............................................................................................................................. 55
Scheme 25 Suzuki–Miyaura reaction of aryldiazonium salts catalysed by nanoparticulate Pd.
............................................................................................................................................. 55
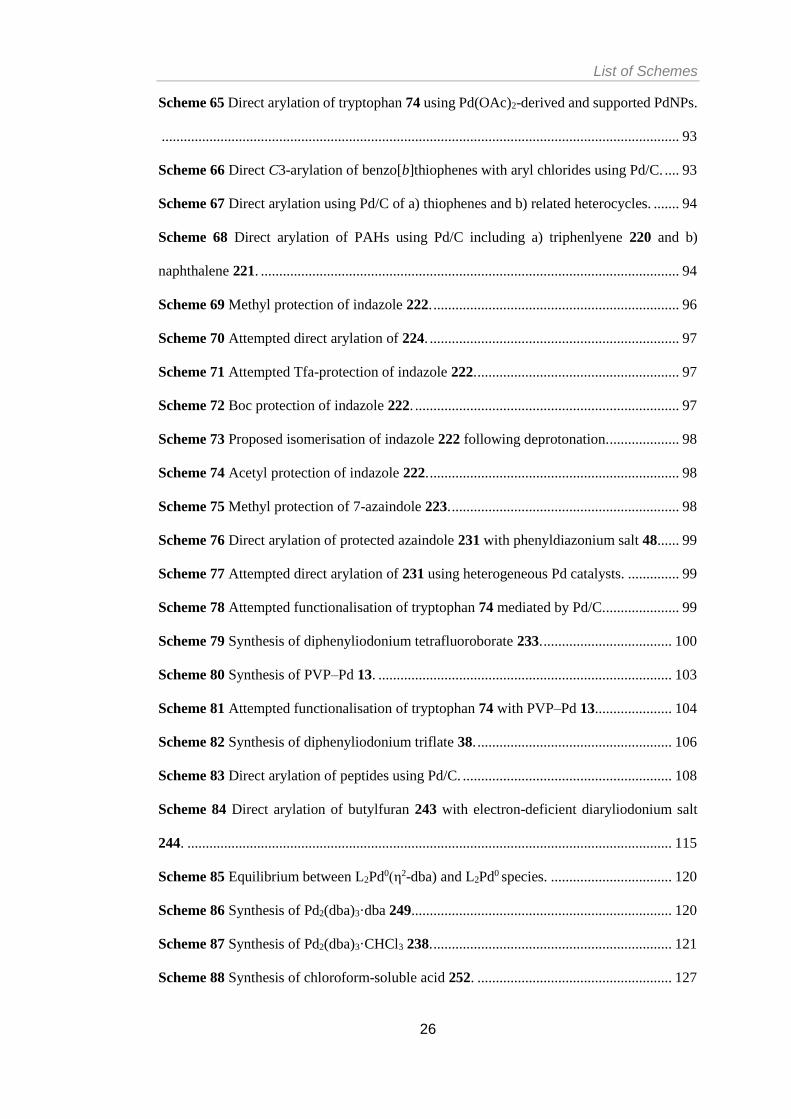
Scheme 26 Heck–Matsuda reaction of aryldiazonium salts catalysed by nanoparticulate Pd.
............................................................................................................................................. 56
Scheme 27 Stille reaction of aryldiazonium salts catalysed by nanoparticulate Pd. ........... 56
Scheme 28 Nitrogen-directed arylation using aryldiazonium salts. .................................... 57
Scheme 29 Direct arylation using aryldiazonium salts of a) N-methylindole 33, b) benzofuran
52 and c) benzothiophene 53. .............................................................................................. 57
Scheme 30 Direct arylation of protected indole using electron-deficient aryldiazonium salt.
............................................................................................................................................. 58
Scheme 31 Suzuki–Miyaura coupling to produce C2-tryptophan derivative 59. ................ 60
Scheme 32 Preparation of arylated apicidin analogues via a Suzuki–Miyaura coupling. ... 61
Scheme 33 Suzuki–Miyaura coupling of unprotected bromotryptophans in water. ............ 61
Scheme 34 Direct arylation of tryptophan 74 using a catalytic Pd/stoichiometric Ag system.
............................................................................................................................................. 62
Scheme 35 Selective arylation of tryptophan-containing peptides. ..................................... 63
Scheme 36 Direct arylation of Fmoc-protected tryptophan 93 using a Pd/TFA system. .... 63
Scheme 37 Direct arylation of brevianamide using a Pd/Ag system. .................................. 64
Scheme 38 Stapled bond formation of peptides through intramolecular C2-arylation of
tryptophan. ........................................................................................................................... 64
Scheme 39 Peptidic macrocyclisation utilising an intramolecular C2-arylation of tryptophan.
............................................................................................................................................. 65
Scheme 40 Direct C2-arylation of tryptophan with 14 and 22. ........................................... 65
Scheme 41 Direct C2-arylation of tryptophan using a Pd/Cu catalytic system. .................. 66
Scheme 42 Direct arylation of di- and hexapeptides using a Pd/Cu catalytic system. ........ 66

List of Schemes
25
Scheme 43 Direct arylation of a tryptophan-containing tripeptide using a diaryliodonium salt.
............................................................................................................................................. 67
Scheme 44 Selective metal-free arylation of a synthetic C3-substituted indole. ................. 67
Scheme 45 Synthesis of N-Ac, O-Me tryptophan 74. ......................................................... 68
Scheme 46 Deuterium-labelling experiment in the direct arylation of tryptophan. ............ 69
Scheme 47 Side product formation in peptides susceptible to aromatic oxidation. ............ 70
Scheme 48 Synthesis of [PhMesI]OTf salt 140. .................................................................. 71
Scheme 49 Synthesis of free-amine tripeptide precursor 153. ............................................ 75
Scheme 50 Synthesis of free-acid dipeptide precursor 157. ................................................ 76
Scheme 51 Amide coupling to generate linear pentapeptide 158. ....................................... 76
Scheme 52 Direct arylation of linear pentapeptide 158. ..................................................... 76
Scheme 53 Direct arylation of Boc-dipeptide 149 using CuII co-catalysis. ......................... 77
Scheme 54 Synthesis and attempted direct arylation of N–Boc tryptophan 161. ................ 77
Scheme 55 Synthesis of N–Ac Leu–Trp dipeptide 164. ...................................................... 77
Scheme 56 Synthesis of: a) N–Tfa tryptophan 92, b) Tfa Leu–Trp 167, c) Tfa Gly–Trp 170.
............................................................................................................................................. 78
Scheme 57 Arylation of a) N–Tfa tryptophan 92, b) Tfa Leu–Trp 167, c) Tfa Gly–Trp 170.
............................................................................................................................................. 79
Scheme 58 Arylation of peptides susceptible to dihydroxylation using a diaryliodonium salt.
............................................................................................................................................. 79
Scheme 59 Selective functionalisation of peptides using aryldiazonium salts. ................... 83
Scheme 60 Synthesis of Pd(OTs)2(MeCN)2 215. ................................................................ 84
Scheme 61 Direct arylation of tryptophan 74 at 1 mol% Pd loading. ................................. 84
Scheme 62 Effect of MeCN on direct arylation of tryptophan 74 using aryldiazonium salts.
............................................................................................................................................. 84
Scheme 63 Direct arylation using Pd(OAc)2 and PVP–Pd of a) benzoxazole 216 and b)
benzothiazole 218. ............................................................................................................... 91
Scheme 64 Direct arylation of N-methylindole using Pd(OAc)2 and PVP–Pd 13............... 92
List of Schemes
26
Scheme 65 Direct arylation of tryptophan 74 using Pd(OAc)2-derived and supported PdNPs.
............................................................................................................................................. 93
Scheme 66 Direct C3-arylation of benzo[b]thiophenes with aryl chlorides using Pd/C. .... 93
Scheme 67 Direct arylation using Pd/C of a) thiophenes and b) related heterocycles. ....... 94
Scheme 68 Direct arylation of PAHs using Pd/C including a) triphenlyene 220 and b)
naphthalene 221. .................................................................................................................. 94
Scheme 69 Methyl protection of indazole 222. ................................................................... 96
Scheme 70 Attempted direct arylation of 224. .................................................................... 97
Scheme 71 Attempted Tfa-protection of indazole 222. ....................................................... 97
Scheme 72 Boc protection of indazole 222. ........................................................................ 97
Scheme 73 Proposed isomerisation of indazole 222 following deprotonation. ................... 98
Scheme 74 Acetyl protection of indazole 222. .................................................................... 98
Scheme 75 Methyl protection of 7-azaindole 223. .............................................................. 98
Scheme 76 Direct arylation of protected azaindole 231 with phenyldiazonium salt 48...... 99
Scheme 77 Attempted direct arylation of 231 using heterogeneous Pd catalysts. .............. 99
Scheme 78 Attempted functionalisation of tryptophan 74 mediated by Pd/C. .................... 99
Scheme 79 Synthesis of diphenyliodonium tetrafluoroborate 233. ................................... 100
Scheme 80 Synthesis of PVP–Pd 13. ................................................................................ 103
Scheme 81 Attempted functionalisation of tryptophan 74 with PVP–Pd 13. .................... 104
Scheme 82 Synthesis of diphenyliodonium triflate 38. ..................................................... 106
Scheme 83 Direct arylation of peptides using Pd/C. ......................................................... 108
Scheme 84 Direct arylation of butylfuran 243 with electron-deficient diaryliodonium salt
244. .................................................................................................................................... 115
Scheme 85 Equilibrium between L2Pd0(η2-dba) and L2Pd0 species. ................................. 120
Scheme 86 Synthesis of Pd2(dba)3·dba 249. ...................................................................... 120
Scheme 87 Synthesis of Pd2(dba)3·CHCl3 238. ................................................................. 121
Scheme 88 Synthesis of chloroform-soluble acid 252. ..................................................... 127

List of Schemes
27
Scheme 89 Reaction conditions for the direct arylation of tryptophan 74 developed in this
project. ............................................................................................................................... 137
Scheme 90 Direct arylations of 231 highlighting differences in Pd/C catalysts. .............. 139
Scheme 91 Pre-catalyst activation and proposed tryptophan intermediate. ...................... 141
Scheme 92 Orthogonal borylation/arylation conditions for tryptophan 74. ...................... 142
Scheme 93 Sequential arylation/cross-coupling for tryptophan 74. .................................. 142

List of Tables
28
List of Tables
Table 1 Fluorescence spectroscopic properties for aryltryptophans.a ................................. 62
Table 2 Optimisation of direct arylation of tryptophan using [PhMesI]OTf 140.a ............. 72
Table 3 Counter-ion screen for asymmetric [PhMesI]X salts in the direct arylation of
tryptophan 74.a ..................................................................................................................... 73
Table 4 Evaluation of Ackermann conditions125 in the direct arylation of tryptophan.a ..... 74
Table 5 Synthesis of aryldiazonium tetrafluoroborates. ...................................................... 81
Table 6 Scope of aryldiazonium tetrafluoroborate salts for the direct arylation of tryptophan
74.a ....................................................................................................................................... 82
Table 7 Scope of aryldiazonium tetrafluoroborate salts for the direct arylation of tryptophan
74 using a Pd–OTs catalytic system.a .................................................................................. 85
Table 8 Comparison of mass-based metrics for several direct arylation conditions.a ......... 89
Table 9 Nitrogen heterocycle screening for direct arylation with phenyldiazonium salt 48.a
............................................................................................................................................. 96
Table 10 Nitrogen heterocycle screening for direct arylation with diaryliodonium salt 233.a
........................................................................................................................................... 101
Table 11 Catalyst screen for direct arylation of azaindole 231.a ....................................... 102
Table 12 Reaction screening for direct arylation of tryptophan 74 with heterogeneous Pd
sources.a ............................................................................................................................. 107
Table 13 Approximate observed rate constants (kobs) for direct arylation reactions.a ....... 118
Table 14 Pdxdbay clusters formed from 238 as a function of time.a .................................. 134
Table 15 Nanoparticle shapes obtained through variation of synthetic conditions. .......... 145
Table 16 Crystal data and structure refinement for ijsf1413 (compound 75). .................. 270
Table 17 Crystal data and structure refinement for ijsf1488 (compound 142). ................ 272
Table 18 Crystal data and structure refinement for ijsf1487 (compound 210). ................ 274
Table 19 Crystal data and structure refinement for ijsf1227 (compound 238). ................ 276
Table 20 Crystal data and structure refinement for ijsf1232 (compound 249). ................ 278

List of Tables
29
Table 21 Crystal data and structure refinement for ijsf1302 (compound 250). ................ 280

Acknowledgements
30
Acknowledgements
I would like to extend my gratitude to my supervisor Ian Fairlamb, for giving me the
wonderful opportunity to work within his group. I can honestly say that the last few years
have been immensely enjoyable, and I really can’t thank him enough for all the help, training
and support he has offered through my studies. Under his guidance I have learned a great
many new things, and I feel that it would be difficult to have gotten any more out of this
project than I have. For this I am eternally grateful.
I have had the good fortune of working with several talented researchers, whose dedication
and hard work are clearly demonstrated in their contributions to this thesis. Anders, Tom and
Lydia have not only made significant contributions to this project, but are also all lovely
people. Working with them has been a genuine pleasure. I also wish to thank Tom W for his
research, which has provided inspiration for me through my project.
Now that I am at the end of my time in York, it seems appropriate to reflect on the people
that I have worked with in the last few years within the Fairlamb group. All of these people
have contributed in some way to my time here, and for that I wish to thank them. There are
far too many to list them all here, but I do wish to specifically acknowledge the help and
support of those people with whom I have spent a significant amount of time: Tom R (who
really taught me a lot about everything), Josh (who I have known for many years now, and
is as funny and kind now as he was in 2008), Lyndsay (for spending an awful lot of time
hungover in various European hotels), George (for always being willing to see the latest
superhero movie), Ben (one of the nicest people I have ever met) and Kate (who shares my
love of the northeast coastline). Special thanks should also go to Ryan, Tim, Don and Chris
W, friends who have all now moved onto pastures new. I also wish to thank Will and the rest
of the Organics team; playing with you guys really was the highlight of each week.
The quality of technical support in York is unbelievably good, so I wish to acknowledge
Heather Fish (NMR), Karl Heaton and Ed Bergstrom (MS), Adrian Whitwood (XRD),
Graeme McAllister (CHN) and Meg Stark (TEM) for their invaluable assistance.
Finally, I want to thank my family for everything. During the course of this project I lost both
my father and grandfather; I feel sure that they both knew how I felt about them, and how
much they meant to me. Mum and Hannah are still providing their love and support.
Beck has been my best friend for 7 years now, I am sure she knows just how much she means
to me. I think it’s true to say that pretty much everything good I do is down to her.

Author’s Declaration
31
Author’s Declaration
The work presented in this thesis is my own except where referenced or clearly indicated in
the body of the text. The work was carried out at the University of York between October
2012 and April 2016, and has not previously been presented for an award at this or any other
university.
Parts of this work have been reproduced in published papers, copies of which can be found
in Appendix 1:
Kapdi, A. R.; Whitwood, A. C.; Williamson, D. C.; Lynam, J. M.; Burns, M. J.; Williams, T.
J.; Reay, A. J.; Holmes, J.; Fairlamb, I. J. S.; The elusive structure of Pd2(dba)3. Examination
by isotopic labeling, NMR spectroscopy, and X-ray diffraction analysis: synthesis and
characterization of Pd2(dba-Z)3 complexes, J. Am. Chem. Soc. 2013, 135, 8388–8399.
Williams, T. J.; Reay, A. J.; Whitwood, A. C.; Fairlamb, I. J. S.; A mild and selective Pd-
mediated methodology for the synthesis of highly fluorescent 2-arylated tryptophans and
tryptophan-containing peptides: a catalytic role for Pd0 nanoparticles?, Chem. Commun.
2014, 50, 3052–3054.
Reay, A. J.; Williams, T. J.; Fairlamb, I. J. S.; Unified mild reaction conditions for C2-
selective Pd-catalysed tryptophan arylation, including tryptophan-containing peptides, Org.
Biomol. Chem. 2015, 13, 8298–8309.
Alan James Reay
April 2016

Chapter 1: Introduction
32
Chapter 1: Introduction
1.1 Pd-Catalysed C–X Bond Functionalisation
1.1.1 Background
Metal-catalysed cross-coupling reactions have increased in significance since their discovery
to the point where these methods now underpin modern synthetic chemistry. A variety of
transformations can be effected through the reaction of activated organohalides with
organometallics including tin, silicon, zinc, boron and magnesium in the presence of
transition metal catalysts such as palladium, ruthenium, nickel and copper.1
The use of palladium in particular has increased enormously in scope and synthetic
applicability over the last fifty years so that it is now readily applied to many complex
synthetic organic routes.2 The importance of palladium in synthetic methodology has been
further highlighted by the awarding of the 2010 Nobel Prize in Chemistry to Heck, Negishi
and Suzuki for their pioneering work in this field.3 Heck and co-workers are credited with
developing aryl, benzyl or vinyl halide couplings to terminal alkenes using palladium(II)
throughout the 1960s and 1970s, such as the coupling of iodobenzene 1 and styrene 2 in the
presence of catalytic amounts of palladium to produce (E)-stilbene 3.4 This approach was
also developed independently by Mizoroki and co-workers, who used palladium(II) chloride
in an analogous system and found that the use of potassium acetate and higher temperatures
(120 °C) allowed the yield to be increased to 90% (Scheme 1).5 Importantly, the nature of
the base used in these two systems appears to directly affect the efficiency of the reaction;
with Mizoroki’s use of an inorganic acetate base providing a higher yield (albeit at increased
temperature) than Heck’s use of an organic amine base.
Scheme 1 Pd-catalysed formation of (E)–stilbene 3 from iodobenzene 1 and styrene 2.
Since this pioneering work, many different approaches for the palladium-catalysed formation
of new C–C bonds with a variety of coupling partners have been established. Notable

Chapter 1: Introduction
33
examples using halides or pseudohalides include, but are not limited to; the Stille (organotin
reagents),6-8 Suzuki–Miyaura (organoboronic acids),9,10 Sonogashira (terminal alkynes),11
Kumada–Corriu (Grignard reagents),12,13 Hiyama (organosilanes),14 and Negishi (organozinc
reagents)15 reactions (Figure 1). Note that some of these reactions require base whereas
others require activating species such as fluoride.
Figure 1 Selected examples of typical Pd-catalysed cross-coupling reactions.
These reactions offer a huge variety of chemoselective transformations that can be applied to
the synthesis of complex natural products, such as the use of an intramolecular Mizoroki–
Heck cyclisation in Danishefsky’s total synthesis of the important anticancer compound
Taxol 4 (Scheme 2).16 Danishefsky’s synthesis demonstrates that upon choice of a suitable
base and palladium source (stoichiometric in this case), selective cross-coupling reactions
can be performed in the presence of multiple functional groups. These types of reactions can
also be used in a combinatorial fashion, exemplified by Stoltz’s total synthesis of (+)–
Dragmacidin F 5 (Scheme 3).17

Chapter 1: Introduction
34
Scheme 2 Key Mizoroki–Heck cross-coupling used in Danishefsky’s total synthesis of Taxol 4.
Scheme 3 Key Mizoroki–Heck and Suzuki–Miyaura cross-couplings used in Stolz’s total synthesis
of (+)–Dragmacidin F 5.

Chapter 1: Introduction
35
Many mechanisms have been published in the area of palladium-catalysed C–X bond cross-
coupling processes, particularly when concerning well-established and versatile reactions
such as those highlighted above. Often these are homogeneous in nature, and revolve around
the reaction of mononuclear Pd0 precursors with alkyl halides to generate the oxidative
addition products. The typical picture of palladium cross-coupling found in the literature is
summarised in Scheme 4; a Pd0 precursor undergoes oxidative addition across a C–X bond,
followed by transmetallation with a second pre-functionalised substrate (e.g. boronic acid,
organostanne etc.) and subsequent reductive elimination to provide the new C–C bond and
regenerate the Pd0 catalyst.
Scheme 4 Simplified mechanism for Pd-catalysed cross-coupling.
There is however a significant body of evidence to suggest that many cross-coupling
processes could involve both homogeneous and heterogeneous Pd species. Common
‘homogeneous’ Pd precursors, such as Pd(OAc)2, have been conclusively shown to aggregate
to form higher-order Pd species. The likelihood is that such species can play an active role in
catalysis instead of, or alongside, more typical homogeneous manifolds. Such aggregates
could also act as a reservoir for catalytically active Pd, providing a measure of control over
the quantity of catalyst active in any given cycle. Additionally, commercially obtained Pd
catalysts like Pd(OAc)2 can contain significant quantities of catalytically active impurities
such as Pd3(OAc)5(NO2) and polymeric [Pd(OAc)2]n.18,19 This holistic approach to the
question of homogeneous versus heterogeneous catalysis can be represented as shown in
Figure 2.

Chapter 1: Introduction
36
Figure 2 Schematic representation for the role of aggregated Pd in catalysis. Reproduced by
permission of The Royal Society of Chemistry.20
1.1.2 Mizoroki–Heck and Sonogashira Cross-Couplings
Some of the first evidence for the existence of Pd reservoirs in cross-coupling chemistry was
published by de Vries and co-workers, who discovered that the Mizoroki–Heck reaction of
bromobenzene 6 with n-butylacrylate 7 in the presence of Pd(OAc)2 to produce 8 exhibited
an inverse relationship of catalyst activity, with respect to catalyst concentration (Figure 3).21
Figure 3 Inverse relationship between catalyst activity and concentration in a Mizoroki–Heck cross-
coupling. Adapted with permission from Org. Lett. 2003, 5, 3285–3288.
De Vries observations with Heck couplings
Pd mol% (ppm)
0.00125 (0.6 ppm)
0.02 (9.7 ppm)
0.08 (39 ppm)
1.28 (621 ppm)
Yie
ld. / %
0
20
40
60
80
100

Chapter 1: Introduction
37
For this reaction, the optimal catalyst loading was found to be 0.08 mol% (39 ppm), with
higher or lower catalyst loadings resulting in decreased yields. This observation is
attributable to the formation of Pd aggregates at higher catalyst loadings, often associated
with the precipitation of Pd black. There is however a point at which the catalyst loading
becomes so low that the reaction cannot effectively proceed. This inverse relationship
provides evidence for catalytically relevant Pd colloids, but the structure of the catalyst in
this reaction is unclear; ESI–MS data did however highlight the presence of PdBr3− under
working reaction conditions. These observations led both de Vries and Reetz to propose a
unified mechanism for the Mizoroki–Heck reaction, which accounts for both homogeneous
and heterogeneous manifolds (Scheme 5).22 In this mechanism Pd0 exists as both lower-order
monomeric or dimeric catalytic species, as well as higher-order palladium species such as
multinuclear colloids, all of which are capable of interconverting and performing the desired
coupling transformation. Importantly however the shapes of these particles are poorly
defined, size instead being relied upon to indicate the nature, and by extension activity, of
these higher-order species.
Scheme 5 A unified Mizoroki–Heck mechanism.
A similar inverse relationship was also observed in work conducted by the Fairlamb group,
who studied the Sonogashira cross-coupling of 4-bromoacetophenone 9 with
phenylacetylene 10 to produce 11. In this reaction several palladacylic precatalysts proposed
to act as Pd reservoirs were applied and their turnover frequencies (TOFs) studied as a
function of catalyst loading, at either 0.1 mol% (orange), 0.01 mol% (purple) or 0.001 mol%
(blue). In this reaction, 0.001 mol% (92 ppm) provided optimal TOFs (Figure 4).

Chapter 1: Introduction
38
Figure 4 Inverse relationship between Pd loading and TOF in a Sonogashira cross-coupling. Figure
prepared by Prof. I. J. S. Fairlamb.
[Pd] mol%
Tu
rno
ve
r F
req
ue
nc
y /
TO
F (
se
c-1
)

Chapter 1: Introduction
39
As can be inferred from Figure 2 and Scheme 5, in many cases these higher-order Pd
aggregates are proposed to act as sources of mononuclear Pd, meaning that the active
catalytic turnover of substrate can be considered homogeneous. Evidence for the leaching of
catalytically active Pd from supported catalysts such as Pd/C, Pd/SiO2 and Pd/γ–Al2O3 has
been reported.23,24 The mechanism of such leaching has been studied by Dupont and co-
workers, who demonstrated that quaternary ammonium salts can stabilise higher order Pd
species, facilitating the release of oxidised PdII species into solution (Jeffery conditions).25
Rothenberg et al. utilised a reactor containing a membrane which could select for particles
<5 nm in size in their efforts to demonstrate the leaching of Pd from larger Pd species (ca.
15 nm) under Mizoroki–Heck reaction conditions.26 Later work from the same group also
demonstrated the formation and subsequent growth of Pd clusters from several PdII
precursors using UV–visible spectroscopy, which allowed for modelling of the reduction,
including cluster growth and aggregation of such species.27 Baiker and co-workers have also
used in situ extended X-ray absorption fine structure (EXAFS) to analyse the Mizoroki–Heck
reaction of bromobenzene 6 with styrene 2, mediated by Pd/Al2O3 (Scheme 6).
Scheme 6 Mizoroki–Heck cross-coupling mediated by Pd/Al2O3.
Baiker’s study demonstrated the formation of higher-order Pd complexes in situ, assigned as
Pd0 colloids approximately 2 nm in diameter, which shortly preceded the formation of
product. These complexes were observed throughout the reaction with very little change until
complete conversion of the substrate at which point significant variations in the EXAFS data
were seen. It was also proposed that the rate-determining step of this reaction was
dissociation of mononuclear Pd0 from these multinuclear Pd0 colloids; hence these observed
colloids are directly involved in the catalytic cycle and do not serve purely as a reservoir for
mononuclear Pd species.28
1.1.3 Suzuki–Miyaura Cross-Couplings
Similar observations regarding the catalytic competence of higher-order Pd species have also
been made in the Suzuki–Miyaura reaction. Fairlamb and co-workers tested well-defined
PdNPs supported on a (poly)vinylpyrrolidone (PVP) polymer 12 (Figure 5), which is known
to stabilise PdNPs and prevent their thermodynamically favourable agglomeration.29-31

Chapter 1: Introduction
40
Figure 5 Monomer unit of (poly)vinylpyrrolidone (PVP) 12.
A seeding method was used to synthesise PVP–Pd 13 with NPs of four different diameters,
between 1.8 and 4.0 nm, which were then applied to the cross-coupling of phenylboronic acid
14 and iodoanisole 15 in methanol to produce 16. The activity of each of these catalysts was
then compared as a function of the TOF against the total number of surface Pd atoms, which
demonstrated an inverse relationship i.e. higher activity for the smaller particles. If the TOF
was normalised against only those Pd atoms contained within defect sites on the truncated
cuboctahedral particles however, no difference was observed (Figure 6).32,33 This strongly
suggests that it is the abundance of surface defect sites which determines the activity of these
particles; simply put, the more defect sites per particle, the more active the catalyst.
Figure 6 Relationship between TOF and particle size normalised to either total surface Pd atoms (●)
or defect surface Pd atoms (○) in a Suzuki–Miyaura cross-coupling. Reproduced by permission of
The Royal Society of Chemistry.33
This trend could however be observed if low-coordinate Pd species demonstrated preferential
solubility, so in operando X-ray absorption spectroscopy was used to monitor the
coordination environment of the PdNPs, to determine the heterogeneity of the reaction under
normal working conditions (Figure 7).

Chapter 1: Introduction
41
These measurements indicated no sintering or leaching of the particles during the reaction, a
result confirmed by EXAFS, X-ray photoelectron spectroscopy (XPS) and transmission
electron microscopy (TEM) studies. Importantly no induction period was seen, which is
consistent with the observation that nanoparticulate Pd is not simply acting as a pre-catalyst
or Pd reservoir.
Figure 7 XAS spectra of PdNP coordination environment in a Suzuki–Miyaura cross-coupling.
Reproduced with permission from Angew. Chem. Int. Ed. 2010, 49, 1820–1824. Copyright 2010
WILEY-VCH Verlag GmbH & Co.
Elemental mercury was administered to the reaction after a brief induction period (8 min)
under normal working conditions, as mercury has been shown to inhibit surface reactions
through poisoning of the catalyst; believed to occur as a result of surface amalgamation of
the mercury with any heterogeneous particles present in the reaction mixture.34,35 This
poisoning test caused immediate cessation of catalytic activity and the resultant Pd core/Hg
shell particles were successfully characterised by XPS, showing a 1:1 correlation between
the surface Pd and Hg atoms. This emphatically demonstrated the lack of any Pd leaching in
this system, confirming its heterogeneous nature. These results also provide strong evidence
that the Suzuki–Miyaura reaction can also operate in a dual-phase catalytic system for
common Pd0 catalysts, e.g. Pd(PPh3)4 or Pd2(dba)3.
The relevance of surface defect sites to the catalytic activity of PdNPs was also discussed by
Blackmond and co-workers during their study on a Mizoroki–Heck reaction. They correlated
the ratio of defect sites to terrace sites in nanoparticles of varying sizes, obtained by the
reduction of Pd2(dba)3·dba with hydrogen in the presence of PVP 12 (Figure 8).30

Chapter 1: Introduction
42
Figure 8 Ratio of defect sites to terrace sites in truncated cuboctahedral PdNPs. Adapted with
permission from Langmuir 1999, 15, 7621–7625. Copyright 1999 American Chemical Society.
This builds upon work performed by Knight et al. which explored the number of atoms
contained within the stable shell structures of sodium nanoparticles (Figure 9).36
Figure 9 Stable closed-shell structures of metal nanoparticles.
The examples highlighted above serve to demonstrate the ability of nominally homogeneous
Pd (pre)catalysts to serve as a source of heterogeneous Pd, either as a result of propagation
to form catalytically competent PdNPs, or as a reservoir of Pd colloids which are slowly
released into solution. There are also instances of supported Pd nanocatalysts which are
prepared, purified and characterised independently, before being used in a range of Pd-
mediated cross-coupling reactions.37-40
1.2 Pd-Catalysed C–H Bond Functionalisation
1.2.1 Background
While useful from a synthetic viewpoint, a significant drawback to C–X bond cross-coupling
reactions is the need to pre-functionalise the substrate with activated functional groups such
as boronic acids or organostannes, among others. This not only adds unwanted complexity
and the potential for unwanted byproducts to the reaction but also increases the economic
and environmental cost of syntheses employing such transformations. Removing substrate
pre-functionalisation potentially allows for the minimisation of downstream chemical waste;

Chapter 1: Introduction
43
moreover, it eliminates the need for prior mandatory reaction steps that enable the installation
of chemical functionality which is ultimately lost in the final and desired chemical
transformation. Recent advances in direct C–H bond functionalisation have attempted to
address this issue, as mild and selective methods can now be used to cleave and generate C–
H bonds directly without the need for pre-functionalised starting materials, expanding the
toolkit of the synthetic chemist.41 These processes can include direct, oxidative or
decarboxylative couplings, in addition to the classical cross-coupling of organometallic
reagents highlighted above (Figure 10).
Figure 10 Overview of Pd-catalysed processes for the formation of new carbon–carbon bonds.
It is important at this point to note the difference in nomenclature as regards C–H bond
activation and C–H bond functionalisation; C–H bond activation specifically refers to the
activation of a C–H σ–bond by a metal centre while C–H bond functionalisation refers to the
overall process by which a C–H fragment is coupled to another C–H or C–X fragment to
generate a new C–C bond.

Chapter 1: Introduction
44
Despite its relative infancy, C–H bond functionalisation has gained a large amount of
research interest, with an ever-increasing number of publications in this area. The ability to
directly couple two fragments together without the need for pre-functionalisation is a
particularly attractive prospect for the synthesis of natural products or pharmaceuticals.42 One
such example used on an industrial scale by Bristol-Myers Squibb is the synthesis of the
potent antitumor agent Rebeccamycin Aglycone 17 (Scheme 7).43
Scheme 7 Synthesis of Rebeccamycin Aglycone 17.
The synthetic applicability of this type of methodology is demonstrated by examples of
C(sp3)–H bond functionalisations, which can be used to construct otherwise challenging
motifs, such as the isolable aryl-cyclobutane intermediate 18 in the total synthesis of
Coralydine 19 (Scheme 8).44,45
Scheme 8 Baudoin’s synthesis of Coralydine 19.

Chapter 1: Introduction
45
1.2.2 Mechanistic Interpretations of C–H Bond Functionalisation
Reported mechanistic investigations of C–H bond functionalisation processes typically focus
on the concept of mononuclear Pd species mediating the catalytic cycle. Often these centre
around variations on the key mechanism in this class of reactions, the concerted metalation–
deprotonation (CMD) or ambiphilic metal–ligand activation (AMLA) process (Scheme 9),
proposed independently by Fagnou (CMD)46 and Davies/Macgregor (AMLA)47 and co-
workers.
Scheme 9 CMD or AMLA-6 mechanism for direct C–H bond functionalisation.
Given the significant body of evidence within cross-coupling catalysis however, it should be
expected that C–H bond functionalisations possess a capacity for complex, multistep reaction
processes involving higher-order Pd species. It is important to recognise that common Pd
(pre)catalysts can often act as Pd reservoirs for the subsequent generation of Pd0 particles, or
indeed as PdNP sources in their own right in this type of chemistry. Research conducted by
Fairlamb and co-workers on the direct C8-arylation of adenosine mediated by Pd(OAc)2
demonstrated the rapid formation of Pd agglomerates under the reaction conditions, with
substrate turnover occurring concomitantly with the observation of Pd/Cu-containing
nanoparticles.48 Optimisation of this protocol for the functionalisation of the more sensitive
2ʹ-deoxyadenosine 20 to form 21 demonstrated that these nanoparticles were critical to
precatalyst activation, with the (pre)catalyst trans-Pd(OAc)2(piperidine)2 used in this reaction
shown to degrade rapidly to form well-defined 1.7 nm PdNPs, via a Pd(DMF)2(piperidine)2
intermediate (Scheme 10).49 Polar aprotic solvents such as DMF have been shown by Hii et
al. to effect a rapid dissociation of Pd(OAc)2, leading to speciation of PdNPs from this
ubiquitous Pd precursor catalyst.50

Chapter 1: Introduction
46
Scheme 10 Direct arylation of 2ʹ-deoxyadenosine 20 catalysed by DMF–PdNPs.
While many examples exist of this type of speciation from common Pd precursors,51-56 it is
important to note that the multinuclear colloids proposed as sources of heterogeneous Pd0 are
often poorly defined, ranging from a few palladium atoms up to particles in the 5 nm range
consisting of many thousands of palladium atoms. Importantly, this creates a significant
physical difference between the surface, terrace site and bulk palladium atoms in the context
of their catalytic activity. This, in addition to their specific morphology and other surface
effects, must be kept in mind when attempting to demonstrate the heterogeneous nature of a
given reaction. Such considerations regarding the activation of Pd(OAc)2 and other related
precursors to form well-defined PdNPs can be extended to many C–H bond functionalisation
protocols, allowing for the activity of pre-synthesised PdNP catalysts to be independently
tested and compared in these reactions.57-64 The use of pre-supported PdNP catalysts such as
PVP–Pd 13 allows for a greater degree of control over potentially complex catalytic
manifolds, where a multi-ensemble of higher order Pd species often play a key role.65,66
The relevance of higher-order Pd species in C–H bond functionalisation processes and the
activity of pre-synthesised supported PdNPs in this chemistry has recently been reviewed in
detail (see Appendix 1).20
1.3 Arylating Agents for C–H Bond Functionalisations at Pd
1.3.1 Aryliodonium and Diaryliodonium Salts
One of the key features of many C–H bond functionalisation processes is the need for
organohalides or organopseudohalides to act as the coupling partner for the desired C–H
fragment (Figure 10). Choosing the appropriate coupling partner for a given methodology is
far from trivial however, as several drawbacks exist. Iodoarenes for example are often
employed preferentially due to the relatively weak C–I bond (ca. 240 kJ mol-1), as compared
to either bromoarenes (ca. 276 kJ mol-1) or chloroarenes (ca. 339 kJ mol-1). This is despite

Chapter 1: Introduction
47
the toxicity of iodine-containing waste streams, the decreased mass intensity of these reagents
or their relatively higher cost. Furthermore, external oxidants can often be required either for
regeneration of the active catalyst following substrate turnover, or transformation of the
substrate into the desired target molecule (in an oxidative process, Figure 10). These
considerations have led to significant developments in the use of hypervalent iodine(III)
reagents as coupling partners for many C–H bond functionalisation processes, as they are
both strong electrophiles and powerful oxidants.67-70 Moreover, employing iodobenzene 1 as
a leaving group (as opposed to I− for example), means these species are typically more
reactive than aryl halides.71
The reactivity of λ3-iodanes has recently been explored in a computational study, which
provides extensive detail on the impact of differing structural motifs on the reaction
mechanisms which may be observed.72 Unsurprisingly, it is the hypervalent nature of these
compounds which gives rise to the wide range of synthetic applications in which they have
been found to be effective (vide infra). Perhaps most interestingly, the authors report that the
unique electronic nature of λ3-iodanes allows these species to isomerise through a pseudo
Jahn-Teller effect. The iodine(III) acetates 22 and 23 for example are typically applied as
terminal oxidants for catalytic processes, with their labile acetate groups allowing for facile
metal binding and/or electron transfer (Figure 11).
Figure 11 Structures of common hypervalent iodine(III) reagents.
The strongly oxidative nature of λ3-iodanes can result in their acting in a non-innocent
fashion, as studies on the ligand-directed, site-selective acetoxylation of arenes by Sanford
et al. have shown (Scheme 11).73 The steric demands of the iodine(III) oxidant used (22 or
23) in this case are proposed to be the source of the observed regioselectivity. It was also
suggested that the acetate group donated to the substrate 24 is derived directly from these
oxidants, although this claim is unsubstantiated by mechanistic evidence. It is equally likely
that the acetate group is derived from the acetic acid/acetic anhydride solvent mixture used.

Chapter 1: Introduction
48
Scheme 11 Site-selective acetoxylation of arenes using iodine(III) reagents.
Qin and co-workers have also shown that 22 can be used facilitate the functionalisation of
C(sp3)–H bonds, with the reactivity of this species towards acetoxylation or arylation
regulated simply by addition of carbonate base (Scheme 11).74 In this system, the innate lack
of reactivity in the C–H bond to be functionalised is overcome by decorating amide 25 with
a proximal 8-aminoquinoline directing group, which also serves to provide the desired
regioselectivity.
Scheme 12 Orthogonal arylation/acetoxylation using hypervalent iodine(III) reagents.
Exploratory mechanistic studies using (p-CO2Me)PhI(OAc)2 28 indicated that decomposition
of the iodine(III) species to form (p-CO2Me)PhI 29 preceded product formation under the
direct arylation conditions, suggesting that iodoarenes were the true arylating agents in this
system. When 29 was used as the arylation agent in place of 28 however only 13% of the
desired product was obtained, corresponding to approximately one catalyst turnover,
signifying that the acetate anions generated from decomposition of 28 play a key role in this
system (Scheme 13a). Replacement of Cs2CO3 with CsOAc under otherwise identical

Chapter 1: Introduction
49
conditions provided 87% of the desired product, proving that these acetate anions (or related
complexes thereof) were effectively promoting the catalysis (Scheme 13b).
Scheme 13 Effect of acetate anion on direct arylation with iodoarenes.
These highly electrophilic species have even been demonstrated to selectively cleave the
peptide bonds of asparagine residues in neutral aqueous media, via an elegantly designed
Hofmann rearrangement.75
Scheme 14 Selective asparagine cleavage mediated by hypervalent iodine(III) reagent.

Chapter 1: Introduction
50
In addition to iodine(III) diacetates, diaryliodonium salts are the other prominent type of
iodine(III) reagent primarily used in catalysis. These are notable because they are able to
provide a synthetically broad range of coupling partners, typically synthesised in one-pot
processes from the corresponding iodoarene. They are often employed in cross-coupling
reactions such as the Suzuki–Miyaura, the first example of which was published by Bumagin
and co-workers, who generated biaryls through the direct coupling of symmetric
diaryliodonium salts with sodium tetraphenylborate 31 in the presence of PdCl2 in water
(Scheme 15).76 These conditions are especially notable as up to four equivalents (w.r.t.
iodonium salt) of product are obtained, representing a near-perfect incorporation of the
aromatic groups.
Scheme 15 Suzuki-Miyaura cross-coupling of diaryliodonium salts.
More recently, diaryliodonium salts have been applied to the emerging field of catalytic C–
H bond functionalisation mediated by palladium. One of the key challenges of such chemistry
is the need to direct the desired transformation to one C–H bond, in the presence of many
other potentially competing C–H bonds. Often this is accomplished by using either
introduced regioselectivity (e.g. directing group strategies) or taking advantage of innate
regioselectivity, by targeting the most acidic or most electronically activated position in a
given molecule. Sanford and co-workers used a range of 2-phenylpyridines, quinolines and
other directing substrates to direct selectivity in their system, which describes a direct C(sp2)–
H arylation using symmetric and asymmetric diaryliodonium salts, mediated by Pd(OAc)2 in
AcOH (Scheme 16).77 The key feature in all of their chosen substrates is the use of proximal
nitrogen directing groups at either the 1,3 or 1,4 position, with respect to the C–H bond being
functionalised.

Chapter 1: Introduction
51
Scheme 16 Nitrogen-directed arylation using diaryliodonium salts.
Subsequent mechanistic investigation of this reaction led the authors to propose a key
turnover-limiting step, involving oxidation of the PdII dimer 32 by the strongly oxidising
[Ar2I]BF4 (Scheme 17).78 The resulting species could be considered a mixed PdII/PdIV or a
PdIII/PdIII dimer.79 In later work, it was shown that similar transformations could be effected
via a radical-based mechanism, with a tandem PdII–IrIII–visible light catalytic manifold.80
Scheme 17 Sanford’s proposed high oxidation state bimetallic Pd intermediate.
In later work, the same group applied similar conditions to substrates with innate electronic
reactivity, N-methylindoles, as opposed to the directing group approach used in Scheme 16.
This proved extremely effective, as synthetically useful yields of the desired 2-arylindoles
could be obtained from reactions conducted at room temperature, as opposed to the elevated
temperature previously required (Scheme 16). Furthermore, when using N-methylindole 33,
Pd(OAc)2 provided the desired arylation product 34 in 49% yield within 5 minutes; upon
changing the catalyst to the carbene-ligated 35, the desired product was obtained in 86%, but
after a much longer reaction time (Scheme 18, 18 h).81 The authors use this example to
propose evidence of electrophilic palladation in the mechanism, in support of a proposed
PdII/PdIV catalytic pathway (as for their previous work, Scheme 17).78 It can however be
argued that Pd(OAc)2 and 35 are intrinsically different catalysts, therefore they do not
necessarily operate via the same catalytic manifold. That said, conditions such as these are
extremely likely to produce speciation to form higher-order Pd species in situ, thus the
difference in rates and final yields obtained may result from Pd(OAc)2 and 35 displaying
varying tendencies towards this process.20 Moreover, the authors of this work obtain similar

Chapter 1: Introduction
52
results by pre-mixing a solution of 22 and 14 prior to substrate addition, which they use as
evidence for the in situ formation of diaryliodonium species (vide infra).
Scheme 18 Room temperature arylation of N-methylindole.
Daugulis and Zaitsev demonstrated that anilides were an effective directing group in the
ortho-arylation of the simple arene 36 to produce 37 using diphenyliodonium salts, mediated
by catalytic Pd(OAc)2 in acetic acid (Scheme 19).82 In an interesting parallel to the work by
Qin and co-workers (Scheme 12 and Scheme 13), they discovered that simple iodoarenes
could be used in place of diaryliodonium salts if stoichiometric AgOAc was added, citing
lack of commercial availability of the diaryliodonium salts as their reasons for this switch.
No mention was made of the necessity of the silver cation in this reaction, hence it could be
the case that the acetate anion is promoting the catalysis, as Qin et al. found many years
later.74
Scheme 19 Anilide-directed ortho-arylation using diaryliodonium salts.
Liu and co-workers published the first reported stable complex of acyloxy-directed Pd-
insertion into a C–H bond, allowing them to postulate that triflic acid (TfOH) might be a
useful additive to tune the elecrophilicity of PdII in C–H bond functionalisation reactions,
allowing for modification of previously unreactive motifs. They demonstrated that a
combination of Pd(OAc)2, catalytic TfOH and [Ph2I]OTf 38 could effectively arylate a range
of phenol esters such as 39 to produce 40, in synthetically useful yields at low temperatures
(Scheme 20). Interestingly, they also found that addition of Ac2O to the reaction removed
any sensitivity to moisture. Replacement of Pd(OAc)2 and Ac2O with Pd(OPiv)2 and Piv2O
(Piv = pivaloyl), respectively, was found to increase the yields obtained for several
examples.83

Chapter 1: Introduction
53
Scheme 20 Direct arylation of phenol esters using diaryliodonium salts.
Greaney and co-workers applied symmetric diaryliodonium salts to their work on the direct
arylation of simple, unactivated arenes, in order to generate biaryls of value to the chemical
industry. Lack of directing groups in their substrates (such as p-xylene, 41) led to a
corresponding problematic lack of selectivity in the C–H bond functionalised and product
subsequently obtained. After extensive screening, they discovered that use of the Hermann–
Beller palladacyle 42 was effective in directing arylation of 41 to a single site to produce 43
(Scheme 21). Furthermore, using trifluoroacetic acid (TFA) to tune the elecrophilicity of PdII
improved the yields observed (as with the addition of TfOH in Liu’s work, vide supra).84
Scheme 21 Direct arylation of p-xylene 41 mediated by the Hermann–Beller palladacycle 42.
In the examples utilising diaryliodonium salts highlighted above, a significant drawback lies
in the fact that typically one or more equivalents of iodoarene are lost as waste, for each
equivalent of substrate turned over. In terms of atom economy, sustainability and simple
economics, this significantly reduces the appeal and versatility of transformations using these
reagents. Bumagin’s example (Scheme 15) is a rare instance of these reagents being used in
an atom-efficient manner, yet even this requires a privileged substrate (tetraphenylborate 31).
Greaney and co-workers have attempted to address this issue by applying tandem Cu
catalysis to functionalised indoles, where the “byproducts” of the initial C–H arylation
(iodoarenes) are then captured by a second Cu centre and used to effect N–H arylation on the

Chapter 1: Introduction
54
same substrate. This overall transformation can be conducted in a single reaction vessel
(“one-pot”), although this approach is so far limited to using the phenyldimethyluracil
iodonium salt 44, in order to provided differentiation between the two aromatic groups for
each catalytic step (Scheme 22). Nevertheless, this example represents a current “best-in-
class” approach to removing the stoichiometric iodoarene byproducts of such reactions.85
Scheme 22 Tandem C–H and N–H arylation of indoles.
Other approaches for the atom-efficient utilisation of diaryliodonium salts include supporting
these reagents on ionic liquids,86 polymers87 or other solid supports,88 allowing for their
subsequent recovery and re-use.
1.3.2 Aryldiazonium Salts
These approaches go some way toward mitigating the disadvantages of diaryliodonium salts,
but the fundamental limitation of these reagents is the presence of two aromatic groups. There
is thus a need to seek alternative electrophilic reagents for Pd-catalysed direct arylation
reactions, which can combine the generality of iodine(III) salts with more atom-efficient
byproduct generation. Aryldiazonium salts present just such an alternative, as they bear some
useful similarities to diaryliodonium salts in terms of their structure and reactivity, but
importantly produce dinitrogen instead of iodoarenes as a major byproduct. It is however the
case that despite the wide-ranging applications of iodine(III) species, investigations of their
diazonium counterparts have largely been limited to certain Pd-catalysed cross-coupling
reactions;89 primarily they have been applied as a replacement for aryl halides in
Sonogashira,90 Suzuki–Miyaura91 or Heck–Matsuda reactions.92-94 This latter reaction was
first reported by Matsuda in 1977 and combines Mizoroki–Heck palladium catalysis with
aryldiazonium salts to generate the corresponding substituted alkenes. The reaction of
phenyldiazonium chloride 47 with styrene 2 is shown in Scheme 23.95 The use of LiPdCl3 as
a precatalyst is unusual and the likelihood is that the authors used a 1:1 mixture of PdCl2 and
Li2PdCl4 as their source of catalytic palladium.

Chapter 1: Introduction
55
Scheme 23 Heck–Matsuda reaction in the synthesis of (E)-stilbene 3.
Sigman and co-workers have demonstrated that a one-pot combination of the Suzuki–
Miyaura and Heck–Matsuda cross-coupling reactions can be used to generate highly
functionalised molecules in an elegant three-component synthesis, such as the reaction
between phenyldiazonium 48, alkene 49 and arylboronic acid 50 in the presence of a Pd0
(pre)catalyst (Scheme 24).96
Scheme 24 One-pot combination of the Suzuki–Miyaura and Heck–Matsuda cross-couplings.
Wei and co-workers have demonstrated the efficacy of aryldiazonium salts in several cross-
coupling reactions catalysed by the nanoparticulate Pd catalyst, Pd/Al(OH)3, which consists
of PdNPs approximately 2–3 nm in diameter. A Suzuki–Miyaura reaction between
arylboronic acids and aryldiazonium salts in the presence of this catalyst was shown to
proceed effectively at room temperature in methanol without any additional base or
phosphine (note that the counter-ion of the aryldiazonium salt could act as a base), affording
many derivatives in synthetically useful yields (Scheme 25).97 A brief recycling experiment
demonstrated that this catalyst rapidly decreased in efficiency over 2 recovery/re-use cycles,
implying that leaching or at the very least sintering/agglomeration of the PdNPs was
occurring under the reaction conditions.
Scheme 25 Suzuki–Miyaura reaction of aryldiazonium salts catalysed by nanoparticulate Pd.
This catalyst was subsequently applied to a Heck–Matsuda reaction between aryldiazonium
salts and terminal alkenes in ethanol; once again good to excellent yields of the desired cross-
coupling products were obtained without the need for additional base or ligand (Scheme
26).98
Chapter 1: Introduction
56
Scheme 26 Heck–Matsuda reaction of aryldiazonium salts catalysed by nanoparticulate Pd.
An analogous recycling experiment was performed and under these conditions the
Pd/Al(OH)3 catalyst demonstrated slightly better efficiency after 2 recovery/re-use cycles,
although its performance rapidly deteriorated after this. For their recycling experiments
however, the authors of this work used progressively increasing reaction times for each
subsequent re-use in order to obtain similar yields, which strongly suggests that the catalyst
is losing its catalytic efficiency and this fact is masked by the pursuit of isolated yield of
product over actual comparison of catalytic activity. Structural studies on the recycled
catalyst demonstrated that the Al(OH)3 support displayed little change in either its surface
area or pore size after several uses. Conversely, TEM images of the PdNPs displayed
significant desorption and agglomeration had occurred under the reaction conditions.
Inductively coupled plasma atomic emission spectroscopy (ICP–AES) demonstrated that
substantial leaching of the Pd catalyst occurred, leading to the observed decrease in catalytic
activity. This is certainly also occurring under the Suzuki–Miyaura reaction conditions
detailed above (Scheme 25). The same group have also recently demonstrated the effective
combination of aryldiazonium salts with this catalyst in a Stille cross-coupling of substituted
tributylarylstannanes under mild conditions (Scheme 27).99
Scheme 27 Stille reaction of aryldiazonium salts catalysed by nanoparticulate Pd.
Despite the many examples of their useful application in Pd-catalysed cross-couplings,
aryldiazonium salts are as yet vastly underexplored for direct C–H bond functionalisations.
One notable exception combines the ruthenium-mediated visible-light photoredox catalysis
pioneered by Macmillan et al.100 with a Pd-mediated room temperature direct C–H arylation.
As with this group’s earlier work on Pd-mediated C–H bond functionalisations using
diaryliodonium salts (Scheme 16),77 a directing group strategy employing proximal nitrogen
directing groups at either the 1,3 or 1,4 position was combined with electrophilic
aryldiazonium salts to generate a range of arylated products in methanol at 25 °C (Scheme
28).101 This process was proposed to proceed through an aryl radical intermediate, formed by
one-electron reduction of the aryldiazonium salt by a photoexcited Ru(bpy)32+* transient
species.

Chapter 1: Introduction
57
Scheme 28 Nitrogen-directed arylation using aryldiazonium salts.
Correia et al. have also shown that aryldiazonium salts can be used for the direct arylation of
N-methylindole 33, benzofuran 52 and benzothiophene 53 under mild conditions with
typically short reaction times (Scheme 29).102
Scheme 29 Direct arylation using aryldiazonium salts of a) N-methylindole 33, b) benzofuran 52 and
c) benzothiophene 53.
During the screening for this reaction, the authors originally found that when acetic acid was
used as a solvent, moderate conversion of N-methylindole 33 was observed. They
subsequently deduced that the major side product in this reaction was a diazo species, formed
by nucleophilic attack of the arylindole formed under the reaction conditions on unreacted
aryldiazonium salt starting material. To combat this issue, the reaction solvent was changed
to a biphasic mixture in an attempt to separate the remaining aryldiazonium salt from the
product; the use of a 2:1 H2O/di-iso-propyl ether (IPE) solvent mixture allowed for good
yields of the desired products to be obtained. When attempting this reaction with the electron-
deficient 4-trifluoromethylbenzene diazonium salt 54, no reaction was seen. It required N-
Boc protection of the indole (55), an increase in catalyst loading, a change of solvent to tert-

Chapter 1: Introduction
58
butanol and a much increased reaction time in order to observe the desired arylation product
56 in good conversion (Scheme 30). It is evident that for these authors, room temperature
must be at least 25 °C in order for the tBuOH solvent to exist as a liquid. The observation
that the nucleophilicity of the substrates appeared to correlate with their reactivity led the
authors to suggest that the mechanism for this process involves a nucleophilic attack on the
palladium centre from the heteroaromatic substrates, as proposed by Zhao,103 instead of the
radical-based mechanism proposed by Sanford and co-workers (vide supra).
Scheme 30 Direct arylation of protected indole using electron-deficient aryldiazonium salt.
The stability of aryldiazonium reagents is one possible reason why these species have not yet
found wider application in the important field of Pd-catalysed C–H bond functionalisation.
They are often perceived to be highly explosive, although this particular risk can be mitigated
through the use of flow technology, particularly in large scale reactions.104,105 Additionally,
the counter ion used has a large impact in this regard, with tetrafluoroborate and tosylate salts
demonstrating greatly increased stability over halide anions.93 Their safe use in many varied
applications has been demonstrated extensively,106 with in situ formation from the
corresponding aniline a common approach used to limit handling of the crystalline salts of
these species.107,108

Chapter 1: Introduction
59
1.4 Project Aim & Objectives
1.4.1 Aims
I. Develop new synthetic methodology based on the application of catalytic C–H bond
functionalisation chemistry to access molecular complexity.
II. Investigate the role of higher-order Pd species in catalytic C–H bond
functionalisation reactions through the comparison of pre-synthesised heterogeneous
nanocatalysts with those forming in situ.
III. Study the propagation of palladium nanoparticles and clusters from commonly used
Pd (pre)catalysts.
1.4.2 Objectives
I. To explore the use of electrophilic arylating agents such as diaryliodonium and
aryldiazonium salts with a view to developing mild and sustainable C–H bond
functionalisation processes, in order to allow the selective functionalisation of
tryptophan and related biomolecules (Chapter 2).
II. To demonstrate and compare the activity of heterogeneous and homogeneous Pd
catalysts in the direct arylation of heterocycles in order to elucidate mechanistic
information about these processes, including the application of heterogeneous
catalysis to the selective functionalisation of biomolecules (Chapter 3).
III. To characterise the Pd0 precursor complex Pd2(dba)3 and related solvated compounds
in solution and in the solid state, in particular studying its behaviour in dynamic
systems and thus its potential for the formation of palladium nanoparticles and
clusters (Chapter 4).

Chapter 2: Direct C–H Bond Functionalisation of Tryptophans and Peptides
60
Chapter 2: Direct C–H Bond Functionalisation of
Tryptophans and Peptides
2.1 Literature Syntheses of Arylated Tryptophans
2.1.1 Cross-Couplings
Tryptophan is a hydrophobic, indole-containing amino acid present in approximately 90% of
proteins, which is known to alter the structure of proteins as well as providing a natural
fluorescent marker.109 These intrinsic photophysical properties can also be enhanced by
extension of the aromatic π-system, such as that obtained by generation of aryl-substituted
tryptophans via direct metal-mediated catalysis. Miller and co-workers have demonstrated
that a Suzuki–Miyaura reaction between the commercially available borylated tryptophan
derivative 57 and bromoindole 58 provides the desired C2-arylation product 59 in good yield,
although the high temperature required potentially limit the applicability of this method for
more complex substrates (Scheme 31).110
Scheme 31 Suzuki–Miyaura coupling to produce C2-tryptophan derivative 59.
A similar approach by Meinke et al. utilised a Suzuki–Miyaura coupling to prepare several
C2-functionalised derivatives of the tryptophan-containing natural product apicidin 60,
obtained by reaction of brominated precursor 61 with the appropriate arylboronic acid
(Scheme 32).111 The authors state that this reaction “provided good yields of the desired 2-
arylindoles”, although only an approximate yield of 65% was provided for all five analogues
prepared (62–66).

Chapter 2: Direct C–H Bond Functionalisation of Tryptophans and Peptides
61
Scheme 32 Preparation of arylated apicidin analogues via a Suzuki–Miyaura coupling.
Winn and co-workers also selected the Suzuki–Miyaura reaction to selectively functionalise
several unprotected 5- and 7-bromotryptophans in water (Scheme 33).112
Scheme 33 Suzuki–Miyaura coupling of unprotected bromotryptophans in water.
The fluorescence properties of the arylated products obtained were evaluated and shown to
provide stronger emission signals than that of the parent tryptophan compound 73 (Table 1,
Entry 1). Importantly, the position and nature of the aromatic substituent used gave rise to
varying emission signals and Stokes shifts; an electron-withdrawing carboxy group attached
to the phenyl ring (70) produced the largest Stokes shift of those examples tested (Table 1,
Entry 4), while 5-phenyltryptophan 67 (Table 1, Entry 2) was seen to be much more strongly
fluorescent than its 7-phenyl regioisomer 72 (Table 1, Entry 5).

Chapter 2: Direct C–H Bond Functionalisation of Tryptophans and Peptides
62
Table 1 Fluorescence spectroscopic properties for aryltryptophans.a
Entry Compound λex / nm λem / nm Stokes shift / cm-1
1 73 280 348 6978
2 67 254 370 12343
3 69 254 353 11041
4 70 254 411 15039
5 72 254 384 12703
a All spectra recorded in methanol.
2.1.2 Direct C–H Bond Functionalisations
While these approaches provide several facile routes to access aryltryptophans, they all suffer
from the disadvantage of having to prepare pre-functionalised halogenated or borylated
starting materials, as is usually the case for traditional cross-coupling processes. More recent
developments in the field of metal-mediated C–H bond functionalisations provide a way to
obviate this potential limitation, as the desired product(s) can be obtained from the direct
reaction of an intrinsically reactive C–H bond within the indole moiety, thus increasing the
atom economy and mass efficiency for the overall transformation required. Lavilla and co-
workers adapted the Pd-mediated arylation conditions of Larossa et al.113 to produce a range
of C2-aryltryptophans directly from protected tryptophan derivative 74 in synthetically
useful yields under microwave irradiation for 5 minutes. The arylating agents in this protocol
are iodoarenes, with AgBF4 and 2-nitrobenzoic acid used as stoichiometric additives
(Scheme 34).114
Scheme 34 Direct arylation of tryptophan 74 using a catalytic Pd/stoichiometric Ag system.
This methodology was also adapted to allow the selective modification of several tryptophan-
containing peptides, where in phosphate buffer at pH 6.0 the temperature could be lowered
to 80 °C while still allowing for high conversions to the desired products (Scheme 35). A

Chapter 2: Direct C–H Bond Functionalisation of Tryptophans and Peptides
63
tenfold excess of aryl iodide was however required in these cases. Furthermore, those
peptides with sulphur-containing amino acids in their sequence (90) proved unsuitable
arylation substrates, due to selective hydrolysis of the peptide bond presumably caused by in
situ palladium complex formation. The specific position of tryptophan within the peptide had
no effect on the efficacy of this protocol.
Scheme 35 Selective arylation of tryptophan-containing peptides.
One issue observed with the protocol developed on single tryptophan residues (Scheme 34)
was that the nitrogen protecting group was critical in providing the desired products in
synthetically useful yields. The acetyl protecting group used in this case has poor utility for
masking amino functionality in peptide syntheses; to address this drawback later work from
the same group explored the effect of acid additives on several tryptophan derivatives, as
well as unprotected tryptophan itself.115 Interestingly it was found that addition of
stoichiometric TFA to the reaction allowed for quantitative conversion (at 90 °C in DMF) of
unprotected tryptophan, in addition to N-Tfa (92) and N-Fmoc (93) tryptophans. As the Fmoc
protecting group is readily compatible with solid-phase peptide synthesis it was selected to
exemplify these new reaction conditions for a range of aryl iodides (Scheme 36).
Scheme 36 Direct arylation of Fmoc-protected tryptophan 93 using a Pd/TFA system.

Chapter 2: Direct C–H Bond Functionalisation of Tryptophans and Peptides
64
The aqueous conditions developed for short-chain peptides (Scheme 35) were also
subsequently adapted in the post-synthetic modification of the natural product brevianamide
102, which contains a masked tryptophan functionality (Scheme 37). This protocol was used
to synthesise a range of novel C2-arylated analogues which displayed antitumoral activity
distinct from that of the parent compound 102.116
Scheme 37 Direct arylation of brevianamide using a Pd/Ag system.
The arylating conditions developed by this group shown in Scheme 34 and Scheme 36 were
subsequently adapted to allow preparation of stapled tryptophan–tyrosine/phenylalanine
peptides through an elegant C2-activation, allowing rapid access to complex macrocyclic
peptide architectures.117 One such product obtained from the intramolecular reaction of a
tryptophan residue with a phenylalanine residue to produce a peptide containing the tumour-
homing signalling sequence Asn-Gly-Arg is shown in Scheme 38.
Scheme 38 Stapled bond formation of peptides through intramolecular C2-arylation of tryptophan.

Chapter 2: Direct C–H Bond Functionalisation of Tryptophans and Peptides
65
The protocols described by Lavilla et al. were also adapted by James and co-workers in a
sophisticated Pd-mediated peptidic macrocyclisation using an intramolecular C2-arylation of
a derivatised tryptophan residue (Scheme 39).118
Scheme 39 Peptidic macrocyclisation utilising an intramolecular C2-arylation of tryptophan.
The major drawback in the application of direct C–H bond functionalisation to the
modification of tryptophan derivatives in the examples highlighted above is the need for high
temperatures and microwave irradiation. To address this issue, studies conducted in the
Fairlamb group adapted Sanford’s work on the room temperature direct arylation of indoles81
to demonstrate the effective C2-arylation of tryptophan 74 under much milder conditions
than had been previously achieved. This was accomplished through mixing of phenylboronic
acid 14 and aryliodonium salt 22 in the presence of catalytic palladium and glacial acetic acid
(Scheme 40).119 Under these conditions it was proposed that 14 and 22 form a symmetric
diphenyliodonium salt in situ.
Scheme 40 Direct C2-arylation of tryptophan with 14 and 22.
Replacing aryliodonium salt 22 with catalytic quantities of Cu(OAc)2 allowed for moderate
to high yields of the desired arylated products to be obtained when using a range of
arylboronic acids (Scheme 41), while maintaining a mild reaction temperature. In this
protocol atmospheric oxygen functions as the terminal oxidant for the copper(II) salt.

Chapter 2: Direct C–H Bond Functionalisation of Tryptophans and Peptides
66
Scheme 41 Direct C2-arylation of tryptophan using a Pd/Cu catalytic system.
This latter methodology was also exemplified on two tryptophan-containing peptides,
dipeptide 121 and hexapeptide 123, affording excellent conversion to the desired arylation
products under similarly mild conditions (Scheme 42).
Scheme 42 Direct arylation of di- and hexapeptides using a Pd/Cu catalytic system.
More recently, Ackermann and co-workers have demonstrated the room temperature direct
arylation of a protected Ala-Trp-Gly tripeptide 125 using a range of symmetric
diaryliodonium salts, drawing comparisons with the in situ formation of such species in the
methodology shown in Scheme 40. Application of catalytic Pd(OAc)2 in glacial acetic acid
facilitated generation of a series of functionalised tripeptides in moderate to high yields
(Scheme 43). This protocol was exemplified with tryptophan-containing peptides to
selectively install a phenyl group at the C2 position of the tryptophan residue. Interestingly
the methodology described in Scheme 43 was also shown to proceed effectively in water,
albeit with reduced yields of the desired products, with a slightly extended reaction time (to
24 h).120

Chapter 2: Direct C–H Bond Functionalisation of Tryptophans and Peptides
67
Scheme 43 Direct arylation of a tryptophan-containing tripeptide using a diaryliodonium salt.
Earlier work from the Ackermann group had demonstrated that the symmetric
diaryliodonium salt 132 can function as an effective metal-free arylating reagent for
engineered C3-substituted indoles incorporated within non-natural peptidic scaffolds. In
DMF at 100 °C, C2-arylation of the synthetic indole proceeded with remarkably high
selectivity in the presence of a tryptophan residue; this was ascribed to the relative proximity
of the pivotal amide functionalities, i.e. the length of the carbon chain linker adjacent to the
indole moiety. An example of this bioorthogonality was exemplified using hexapeptide 133
as outlined in Scheme 44.
Scheme 44 Selective metal-free arylation of a synthetic C3-substituted indole.

Chapter 2: Direct C–H Bond Functionalisation of Tryptophans and Peptides
68
2.2 Development of Diaryliodonium Salt Conditions
2.2.1 Method Development
The two sets of reaction conditions previously developed within the Fairlamb group119 were
the first demonstration of low temperature (40 °C) direct arylations of tryptophan, however
despite the mild conditions and synthetically useful yields obtained, some potential
drawbacks can be identified. Addition of multiple equivalents of boron- and iodine-
containing arylating reagents severely impacts the atom economy and mass intensity of the
process in Scheme 40 (this can be quantified using green metrics, vide infra). Addition of a
second transition metal (copper) in the conditions shown in Scheme 41 is similarly
undesirable. With these factors in mind, a focus was placed on investigating the role of the
proposed oxidant in these systems, with the primary aim of identifying efficient and
sustainable synthetic protocols. Protected tryptophan 74 was accessed in two high-yielding
steps from commercially available ʟ-tryptophan 73 using the method of Taylor and co-
workers (Scheme 45).121
Scheme 45 Synthesis of N-Ac, O-Me tryptophan 74.
1H NMR spectroscopic analysis of 74 in CDCl3 confirmed the presence of the C-terminus
methyl ester at δ 3.70 ppm and N-terminus amide doublet at δ 6.03 ppm (3JH–H = 8.0 Hz) and
singlet at δ 1.95 ppm. Retention of the indole NH is seen as a broad singlet due to exchange
on the NMR timescale at δ 8.27 ppm. The C-2 proton at δ 6.97 ppm is observed as a doublet
3JH–H = 2.5 Hz coupling to the indole NH; likely this coupling is not observed on the indole
NH due to the aforementioned signal broadening. A doublet of triplets at δ 4.96 ppm can be
assigned as the enantiomeric proton, which demonstrates 3JH–H = 8.0 Hz coupling to the amide
NH and 3JH–H = 5.0 Hz coupling to the adjacent CH2 group. These protons are inequivalent
in their coupling to the enantiomeric proton however and so give rise to two diastereotopic
signals, which overlap to give the misleading appearance of a complex multiplet, even more
so due to the significant roofing observed. Correct assignment however shows a doublet of
doublets at δ 3.35 ppm and another doublet of doublets at δ 3.30 ppm, each with 3J H–H = 5.0
Hz and 2J H–H = 15.0 Hz (Figure 12).

Chapter 2: Direct C–H Bond Functionalisation of Tryptophans and Peptides
69
Figure 12 1H NMR spectrum of 74 (400 MHz, CDCl3).
With 74 in hand, an analogous experiment to that shown in Scheme 40 was performed using
d5-PhB(OH)2 (d5-14) to evaluate the nature of the arylating agent in this system i.e. whether
this species was derived from PhB(OH)2 14, PhI(OAc)2 22 or both. ESI–HRMS analysis of
this reaction indicated an approximately 1:1 mixture of H- and D-labelled products were
formed, providing convincing evidence for the formation of the proposed81 symmetrical
[Ph2I]+ species in situ (Scheme 46). Importantly this demonstrates the non-innocent role of
PhI(OAc)2 22, often proposed to act as a simple oxidant, in this system.
Scheme 46 Deuterium-labelling experiment in the direct arylation of tryptophan.
This non-selective donation presents an issue for the introduction of substituted aromatic
groups, so an alternative arylation strategy was sought. Replacing 22 with Cu(OAc)2
(Scheme 41)119 circumvented this issue, but during attempts to functionalise peptides 136
and 138 significant quantities of aromatic oxidation were noted in this Pd/Cu catalytic
system. HPLC–MS analysis of the reaction of tripeptide 136 under these conditions
a, b c
d
e
f
NH NH
g–j

Chapter 2: Direct C–H Bond Functionalisation of Tryptophans and Peptides
70
demonstrated complete loss of starting material, but also revealed the formation of
dihydroxylated and diarylated side products, in addition to the desired arylation product 137.
When these conditions were applied to tetrapeptide 138, similar dihydroxylation side
products were observed in addition to the desired arylation product 139 (Scheme 47). Copies
of the HPLC–MS chromatograms are provided in Appendix 4.
Scheme 47 Side product formation in peptides susceptible to aromatic oxidation.
Given the efficacy of this protocol for the selective functionalisation of other peptides
(Scheme 42),119 a terminal alanine residue neighbouring tryptophan was proposed to be
crucial in affecting the selectivity of the reaction in Scheme 47, in conjunction with the use
of copper(II).

Chapter 2: Direct C–H Bond Functionalisation of Tryptophans and Peptides
71
Free C-terminus alanines have been shown to form stable complexes with copper (II),122
while Delboni and co-workers have published the single crystal structure of a tryptophan-
glycine copper(II) complex (Figure 13), which demonstrates the ability of free C-termini
adjacent to tryptophan residues to coordinate copper(II).123 It is proposed therefore that such
species are responsible for the observed hydroxylation of the arylation products in Scheme
47.
Figure 13 Crystal structure of (ʟ-tryptophyl-glycinato) copper(II). Reprinted from Inorg. Chim. Acta
2001, 312, 133–138. Copyright 2001, with permission from Elsevier.
This over-oxidation confirms that while addition of copper(II) as a co-catalyst facilitates high
conversion to the desired aryltryptophans, it has limitations when applied to more challenging
substrates. It was hypothesised that the ability to utilise a single arylating agent without
requiring additional transition metal co-catalysts would provide a suitable solution to the
drawbacks outlined above. The observation that in situ [Ph2I]+ species can prove effective in
this type of transformation (Scheme 40) led to examination of pre-synthesised asymmetric
diaryliodonium salts, where a non-transferable ‘dummy group’ could be used to generate
arene selectivity in the products (vide supra). The simple [PhMesI]OTf salt 140 was therefore
synthesised in a high-yielding one-pot process from mesitylene 140 and 22 using the method
reported by Gaunt and co-workers (Scheme 48).124
Scheme 48 Synthesis of [PhMesI]OTf salt 140.
When 140 was applied to the arylation conditions shown in Scheme 40, in place of 14 and
22 the desired arylation product 75 was obtained with a yield of 65%. Optimisation of the
reaction conditions demonstrated that full conversion of starting material 74 could be
achieved after 16 h at 25 °C in ethyl acetate (Table 5, Entry 5). Other solvents demonstrated

Chapter 2: Direct C–H Bond Functionalisation of Tryptophans and Peptides
72
to be incompatible with this chemistry were; acetonitrile, acetone, DCM, DMF, DMSO, 1,4-
dioxane and water, all which provided no conversion to the desired product 75 (see Chapter
6 for details).
Table 2 Optimisation of direct arylation of tryptophan using [PhMesI]OTf 140.a
Entry Solvent Conv. to 75b (yield)c / % Conv. to 142b (yield)c / %
1 AcOHd 70 (65) 0
2 MeOH 12 0
3 EtOH 15 0
4 iPrOH 47 3
5 EtOAc 91 (85) 9 (3)
6 EtOAce, f 50 10
a All reactions conducted with 74 (50 mg, 0.192 mmol, 1 eq.), 140 (181 mg, 0.384 mmol, 2 eq.),
Pd(OAc)2 (2 mg, 9.6 µmol, 5 mol%) and solvent (5 mL), unless otherwise specified. b As determined
by 1H NMR spectroscopic analysis of the crude reaction mixture following an aqueous workup. c
Following purification by silica gel flash column chromatography. d Reaction conducted at 40 °C. e
Using 143 (0.384 mmol, 2 eq.) in place of 140. f 40% remaining starting material.
Removal of the acidic conditions previously required, in addition to complete substrate
conversion at 25 °C, meant that this protocol (Table 2, Entry 5) provided distinct benefits
over the previous methodologies for generation of 2-phenyltryptophan 75. In addition to the
desired phenylated product 75 however, a small quantity of mesityled product 142 was
formed from partial addition of the sterically-hindered mesityl component of iodonium salt
140. Attempts to improve upon this through use of the more sterically-demanding tri-iso-
propylphenyl (TRIP) dummy group (143) failed however, as this substrate lowered both the
reactivity of the system and selectivity for the desired product 75 (Table 2, Entry 6). A small
counter-ion screen was also performed which confirmed the efficacy of the triflate counter-
ion used above (Table 3).

Chapter 2: Direct C–H Bond Functionalisation of Tryptophans and Peptides
73
Table 3 Counter-ion screen for asymmetric [PhMesI]X salts in the direct arylation of tryptophan 74.a
Entry Counter-ion (X) Conv. to 75b / % Conv. to 142b / %
1 −OTf (140) 91 9
2 −BF4 (144) Trace Trace
3 −PF6 (145) 65 13
4 −SbF6 (146) 64 10
a All reactions conducted with 74 (50 mg, 0.192 mmol, 1 eq.), [PhMesI]X (0.384 mmol, 2 eq.),
Pd(OAc)2 (2 mg, 9.6 µmol, 5 mol%) and EtOAc (5 mL). b As determined by 1H NMR spectroscopic
analysis of the crude reaction mixture following an aqueous workup.
It was during development of these conditions that the selective metal-free arylation protocol
of non-natural indoles in the presence of tryptophan residues using [Ar2I]+ salts (Scheme 44)
was published by Ackermann and co-workers.125 Several experiments were performed to
evaluate these conditions when applied to tryptophan 74, in the presence and absence of Pd
and/or air (Table 4). These tests established that no reaction is observed without addition of
Pd(OAc)2 (5 mol%) and that air has no appreciable effect on this reaction, which correlates
with the observations of Ackermann et al.

Chapter 2: Direct C–H Bond Functionalisation of Tryptophans and Peptides
74
Table 4 Evaluation of Ackermann conditions125 in the direct arylation of tryptophan.a
Entry Pd(OAc)2 / mol% Air Conv.b / %
1 0 No 0
2 0 Yes 0
3 5 No 93
4 5 Yes 93
a All reactions conducted with 74 (65 mg, 0.25 mmol, 1 eq.), 132 (170 mg, 0.375 mmol, 1.5 eq.) and
DMF (2 mL). Where indicated, Pd(OAc)2 (2 mg, 9.6 µmol, 5 mol%) was added. b As determined by 1H NMR spectroscopic analysis of the crude reaction mixture following an aqueous workup.
2.2.2 Application to Peptides
With these optimised arylation conditions (Table 2, Entry 12) in hand, more complex,
biologically or medicinally relevant substrates were investigated in order to demonstrate the
applicability of this methodology. Second-generation derivatives of the potent anti-cancer
compound Sansalvamide A were thus identified, as this macrocyclic pentapeptide has unique
reactivity against several different forms of cancer. It also displays interesting configurational
requirements for biological activity, as modification of the side chains and optical
configurations of the amino acid residues in this compound allows for targeting of specific
chemotherapeutic benefits, for different mutagenic cell lines.126 Following the method of
McAlpine and co-workers, a simple N-Boc protection/deprotection strategy was employed
to synthesise the linear tryptophan-containing pentapeptide Boc-LeuLeuValLeuTrp-OMe
158, itself a precursor to the macrocyclic final product 147 shown in Figure 14. This was
accomplished by first preparing the free-amine tripeptide H2N-ValLeuTrp-OMe 153
(Scheme 49) and free-acid dipeptide Boc-LeuLeu-OH 157 (Scheme 50), before a final
coupling reaction to generate 158 in synthetically useful yields (Scheme 51).

Chapter 2: Direct C–H Bond Functionalisation of Tryptophans and Peptides
75
Figure 14 Tryptophan-containing Sansalvamide A derivative 147.
Scheme 49 Synthesis of free-amine tripeptide precursor 153.

Chapter 2: Direct C–H Bond Functionalisation of Tryptophans and Peptides
76
Scheme 50 Synthesis of free-acid dipeptide precursor 157.
Scheme 51 Amide coupling to generate linear pentapeptide 158.
The optimised arylation conditions shown in Table 2, Entry 12 were then applied to 158 in
an attempt to generate the arylated pentapeptide product 159 (Scheme 52). Note that for this
complex peptide the Pd catalyst loading was increased to 30 mol%.
Scheme 52 Direct arylation of linear pentapeptide 158.
TLC analysis of the crude mixture from this reaction indicated some conversion, attempts at
purification were however unsuccessful, although ESI–HRMS analysis of the crude mixture
did confirm approximately 20% conversion to the desired arylation product 159 ([M+Na]+
855.4980). Due to the purification difficulties of this complex peptide, it was decided to first
apply the arylation methodology to more modest peptide targets as a proof of principle. With
this in mind the intermediate dipeptide 149 was subjected to the previously optimised CuII

Chapter 2: Direct C–H Bond Functionalisation of Tryptophans and Peptides
77
co-catalysed conditions shown in Scheme 41, which had been proven to work effectively on
other peptides (Scheme 53).
Scheme 53 Direct arylation of Boc-dipeptide 149 using CuII co-catalysis.
Surprisingly, only 31% of the desired arylation product 160 could be obtained, contrasting
with the complete conversion seen when using 74 as a substrate. It was hypothesised that the
change in protecting group (N–Boc for N–Ac) may have been the cause of this discrepancy,
so the analogous N–Boc, O–Me protected tryptophan 161 was synthesised, before being
tested under the optimised conditions shown in Table 2, Entry 12 (Scheme 54).
Scheme 54 Synthesis and attempted direct arylation of N–Boc tryptophan 161.
As Scheme 54 shows, under these conditions only a trace of the desired arylation product
162 could be observed by TLC or ESI–HRMS and this could not be isolated, effectively
demonstrating the pronounced effect of the change in protecting group on the efficiency of
the arylation protocol; it is likely that this is rooted in steric effects due to the increased size
of N–Boc over N–Ac. The synthesis of the N–Ac analogue of dipeptide 149 was thus
attempted from 154 and 135 (Scheme 55).
Scheme 55 Synthesis of N–Ac Leu–Trp dipeptide 164.

Chapter 2: Direct C–H Bond Functionalisation of Tryptophans and Peptides
78
While the initial N–Ac protection of ʟ–Leucine 154 proceeded in good yield, attempts at
coupling this to 135 resulted in an inseparable mixture of 135 and 164. While significant
effort was expended to resolve this issue, unfortunately the desired dipeptide 164 could not
be purified. It was therefore decided to switch the protecting group from N–Ac to N–Tfa,
which satisfies the steric requirements, provides a useful 19F NMR handle and is easily
removed by aqueous sodium hydroxide.127 This switch to N–Tfa produced none of the
synthetic difficulties found with the N–Ac protecting group and three substrates were
protected according to literature procedures (Scheme 56).128
Scheme 56 Synthesis of: a) N–Tfa tryptophan 92, b) Tfa Leu–Trp 167, c) Tfa Gly–Trp 170.
The substrates shown in Scheme 56 were then subjected to the arylation conditions outlined
in Table 2, Entry 12. This provided the desired arylation products in moderate to good yields,
thus demonstrating the utility of this protocol when applied to small tryptophan-containing
peptides (Scheme 57). These conditions were also successfully applied to peptides 136 and
138, which had proven problematic with the Cu-containing conditions shown in Scheme 41,
affording the desired arylation products 137 and 139 in useful conversions (Scheme 58).
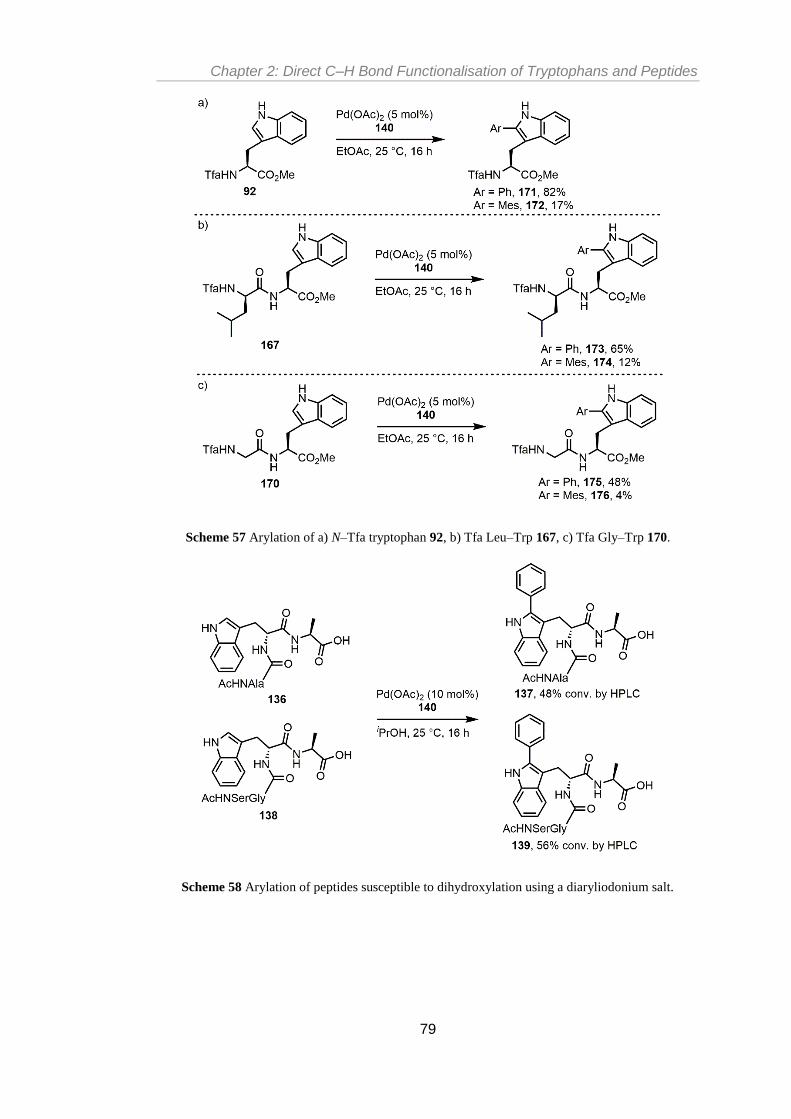
Chapter 2: Direct C–H Bond Functionalisation of Tryptophans and Peptides
79
Scheme 57 Arylation of a) N–Tfa tryptophan 92, b) Tfa Leu–Trp 167, c) Tfa Gly–Trp 170.
Scheme 58 Arylation of peptides susceptible to dihydroxylation using a diaryliodonium salt.

Chapter 2: Direct C–H Bond Functionalisation of Tryptophans and Peptides
80
2.3 Development of Aryldiazonium Salt Conditions
2.3.1 Method Development and Scope
Despite the general applicability of these methods for the generation of 2-aryltryptophans,
the limitations highlighted above meant that efforts were redirected towards identifying
alternative arylating conditions. Furthermore, the generation of stoichiometric byproducts
such as iodoarenes complicates product purification, hugely limits the efficiency and
increases the mass intensity of any given process. With these factors in mind, it was
hypothesised that a substrate containing a single aryl group, which can be readily
functionalised with a range of chemical moieties, would provide an ideal coupling partner.
The use of aryldiazonium salts was therefore investigated as these bear some useful
similarities to diaryliodonium salts, in terms of both their structure and reactivity (see Chapter
1).91 To begin these studies, several aryldiazonium tetrafluoroborate salts were readily
synthesised in an oxidative process from the corresponding commercially available
anilines,129 accessing the desired products in low to moderate yields (Table 5a). Following a
subsequent review of the literature, an improved synthesis of these salts published by
Goossen and co-workers was found, which provided access to the same salts in excellent
yields (Table 5b).130
SAFETY NOTE: Aryldiazonium salts can display both thermal and shock sensitivity which
can result in violent explosion, driven by the entropically favourable loss of dinitrogen.
Extreme care must therefore be taken when considering syntheses either generating or
employing such reagents. The nature of the counter anion used is critical to the stability of
these species; halide anions which are often found in the literature should be avoided at all
costs as these display very poor stability. Tetrafluoroborate and tosylate anions such as those
used in the entirety of this project display vastly increased thermal and shock sensitivity.93
All of the aryldiazonium salts used in this project and others131,132 were stored at −18 °C over
a period of many months and no decomposition was ever observed. The safe use of
aryldiazonium salts has been demonstrated extensively,106 with in situ formation from the
corresponding anilines,107,108 often coupled with flow technology,104,105 a common approach
used to limit handling of the crystalline salts of these species.

Chapter 2: Direct C–H Bond Functionalisation of Tryptophans and Peptides
81
Table 5 Synthesis of aryldiazonium tetrafluoroborates.
a Reaction performed by A. Hammarback. b Reaction not performed. c Reaction performed by T.
Sheridan.
When tryptophan 74 was treated with one equivalent of benzenediazonium salt 48, in the
presence of catalytic Pd(OAc)2 in ethyl acetate, the desired arylation product 75 was obtained
in quantitative yield after 16 h at room temperature (typically 20 °C). These conditions were
then extended across the range of diazonium salts shown in Table 5, to generate several
functionalised 2-aryltryptophans, the results of which are shown in Table 6.

Chapter 2: Direct C–H Bond Functionalisation of Tryptophans and Peptides
82
Table 6 Scope of aryldiazonium tetrafluoroborate salts for the direct arylation of tryptophan 74.a
a All reactions conducted with 74 (50 mg, 0.192 mmol, 1 eq.), aryldiazonium salt (0.192 mmol, 1 eq.),
Pd(OAc)2 (2.2 mg, 9.6 μmol, 5 mol%) and EtOAc (5 mL) at RT (ca. 16–23 °C). b Reaction time
extended to 24 h.
Alkylated, electron-donating and halide-containing examples provided good to excellent
yields, while the sterically encumbered 1-napthyl and 2,4,6-trimethylphenyl salts also proved

Chapter 2: Direct C–H Bond Functionalisation of Tryptophans and Peptides
83
effective (giving 206 and 142, respectively). The quantitative synthesis of the biphenyl-
substituted product 207 provided access to a product exhibiting fluorescence at long-wave
UV light (excitation at 365 nm), markedly distinct from that of the single arene-containing
examples or the parent compound 74. Additionally, the tolerance of the synthetic protocol
towards halogenated arenes provides a useful orthogonality to further functionalisation to
produce, for example, other biaryl derivatives. It is important to note that aryldiazonium salts
containing strongly electron-withdrawing substituents (54 and 204) were not tolerated by this
arylation protocol, an observation also made by Correia and co-workers102 who describe the
formation of a diazo side product generated by the nucleophilic attack of a C2-arylated indole
on electron-deficient aryldiazonium salts.
Peptides 136 and 138 which had previously demonstrated oxidative sensitivity to the CuII-
mediated reaction conditions (Scheme 47) were also subjected to the optimised
aryldiazonium salts conditions, affording the desired arylation products 137 and 139 in
excellent conversion, with no evidence of the undesired aromatic dihydroxylation (Scheme
59). The solvent was switched to iso-propanol and the catalyst loading increased to ensure
quantitative conversion of these challenging polar substrates.
Scheme 59 Selective functionalisation of peptides using aryldiazonium salts.
During investigation of the mechanism for this reaction in a related project,131 it was found
that addition of catalytic quantities of acid had a profound impact, removing the observed
induction period and thus accelerating conversion to product. When using 5 mol% of p-
toluenesulfonic acid (TsOH), the reaction reached completion within ca. one hour at 37 °C,
compared to two hours without acid (at 37 °C). As catalytically active cyclometallated Pd–

Chapter 2: Direct C–H Bond Functionalisation of Tryptophans and Peptides
84
OTs complexes have been reported by both Brown133 and Bedford134 et al. (Figure 15),
complex 215 was prepared according to literature procedures (Scheme 60).
Figure 15 Cyclometallated Pd–OTs complexes reported by (a) Brown et al. and (b) Bedford et al.
Scheme 60 Synthesis of Pd(OTs)2(MeCN)2 215.
Complex 215 was then tested in the arylation protocol detailed above in place of Pd(OAc)2
(Table 6), where it was found that the catalyst loading could be decreased to 1 mol%, and
still provide the desired arylation product 75 in quantitative yield after 16 h at room
temperature (Scheme 61).
Scheme 61 Direct arylation of tryptophan 74 at 1 mol% Pd loading.
An experiment was also performed to demonstrate that sub-stoichiometric quantities of
MeCN were not inhibiting the reaction (Scheme 62).
Scheme 62 Effect of MeCN on direct arylation of tryptophan 74 using aryldiazonium salts.
The scope of the arylation protocol using this catalytic system was also explored (Table 7).
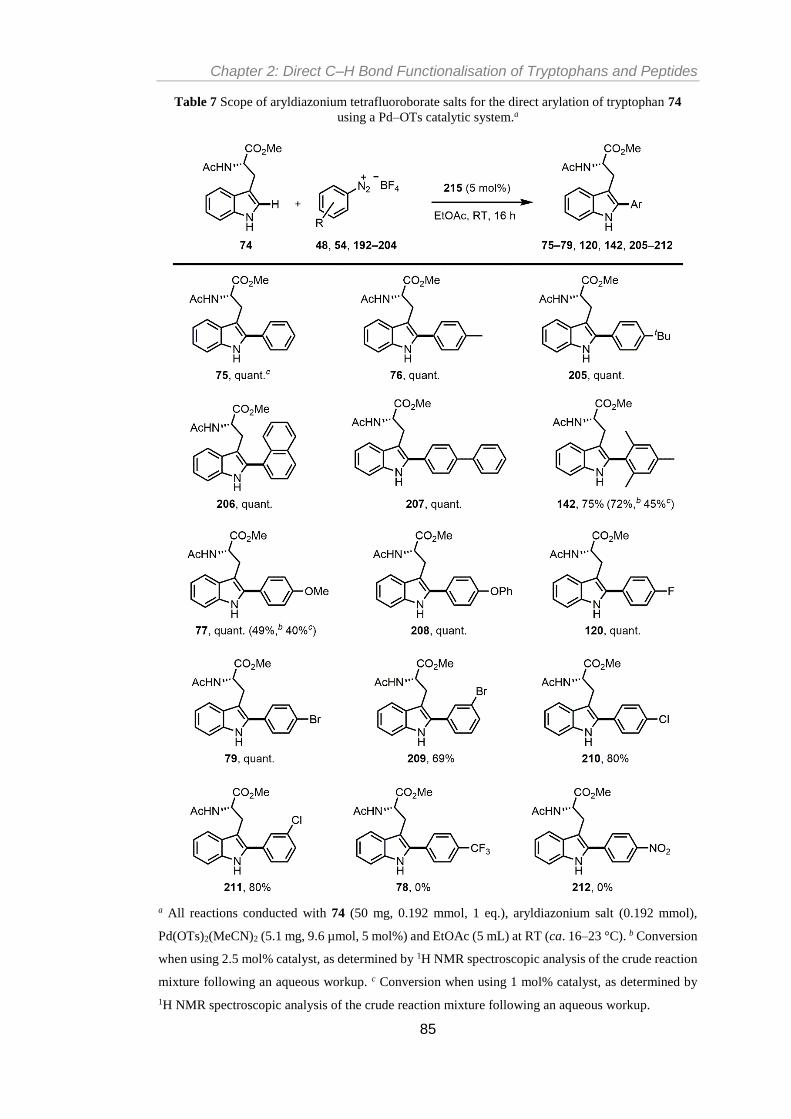
Chapter 2: Direct C–H Bond Functionalisation of Tryptophans and Peptides
85
Table 7 Scope of aryldiazonium tetrafluoroborate salts for the direct arylation of tryptophan 74
using a Pd–OTs catalytic system.a
a All reactions conducted with 74 (50 mg, 0.192 mmol, 1 eq.), aryldiazonium salt (0.192 mmol),
Pd(OTs)2(MeCN)2 (5.1 mg, 9.6 µmol, 5 mol%) and EtOAc (5 mL) at RT (ca. 16–23 °C). b Conversion
when using 2.5 mol% catalyst, as determined by 1H NMR spectroscopic analysis of the crude reaction
mixture following an aqueous workup. c Conversion when using 1 mol% catalyst, as determined by
1H NMR spectroscopic analysis of the crude reaction mixture following an aqueous workup.

Chapter 2: Direct C–H Bond Functionalisation of Tryptophans and Peptides
86
The scope of the arylation protocol using the catalytic system in Scheme 61 was explored
initially (1 mol% Pd), however several analogues displayed decreased activity at catalyst
loadings below 5 mol%, so 5 mol% Pd and a reaction time of 16 hours was used for the
majority of substrates tested (Table 7). This provided the desired products in isolated yields
comparable to those obtained using the previous reaction conditions (Table 6).
2.4 Product Characterisation
1H NMR spectroscopic analysis of 75 in CDCl3 confirmed the loss of the diagnostic C-2
proton from δ 6.97 ppm, with retention of the indole NH as a broad singlet at δ 8.20 ppm.
The additional aromatic signals are observed as several unresolvable multiplets between δ
7.60–7.34 ppm. The C-terminus methyl ester has undergone an upfield shift from δ 3.70 ppm
to δ 3.29 ppm, as has the N-terminus amide doublet at δ 5.79 ppm (3JH–H = 8.0 Hz) and singlet
at δ 1.66 ppm. A similar upfield shift of the enantiomeric proton at δ 4.84 ppm (dt, 3JH–H =
8.0, 5.0 Hz) can also be observed. Conversely, the two diastereotopic protons have undergone
a downfield shift, to δ 3.55 ppm and δ 3.52 ppm. These signals are even more misleading
than before due to a substantial roofing effect, resulting from a small difference in chemical
shift (δa−δb = 0.03 ppm), rendering the 2J H–H = 15.0 Hz coupling almost impossible to observe
(Figure 16).
Figure 16 1H NMR spectrum of 75 (400 MHz, CDCl3).
NH
a, b
d
e
c NH
g–j

Chapter 2: Direct C–H Bond Functionalisation of Tryptophans and Peptides
87
Single crystal X-ray diffraction structures of 75, 142 and 210 were obtained (Figure 17–
Figure 19); the absolute stereochemistry of 210 was determined and the product confirmed
as S (identical stereochemistry to the ʟ-tryptophan starting material 74). These structures all
demonstrate that the installed aromatic group lies orthogonal to the indole ring in the solid
state, which is presumably the ground-state configuration given that the single crystals grown
to provide these structures were obtained by simple evaporation under ambient conditions.
Presumably the aromaticity of these compounds is lessened as a result of the out-of-plane
configuration across their conjugated ring systems.
Figure 17 Single crystal X-ray diffraction structure of 75. Thermal ellipsoids shown with 50%
probability and hydrogen atoms removed for clarity. Selected bond lengths (Å): C(3)–C(4): 1.500(3),
C(4)–C(11): 1.375(3), N(2)–C(11): 1.388(2), C(11)–C(12): 1.475(3). Selected bond angles (°): C(4)–
C(11)–C(12): 131.75(18), N(2)–C(11)–C(12): 118.71(17).

Chapter 2: Direct C–H Bond Functionalisation of Tryptophans and Peptides
88
Figure 18 Single crystal X-ray diffraction structure of 142. Thermal ellipsoids shown with 50%
probability and hydrogen atoms removed for clarity. Selected bond lengths (Å): C(7)–C(9): 1.506(3),
C(7)–C(8): 1.378(3), N(1)–C(8): 1.378(3), C(8)–C(12): 1.484(3). Selected bond angles (°): C(7)–
C(8)–C(12): 128.9(2), N(1)–C(8)–C(12): 121.8(2).
Figure 19 Single crystal X-ray diffraction structure of 210. Thermal ellipsoids shown with 50%
probability and absolute stereochemistry established by anomalous dispersion. Selected bond lengths
(Å): C(7)–C(15): 1.500(2), C(7)–C(8): 1.369(3), N(1)–C(8): 1.382(3), C(8)–C(9): 1.475(3), C(12)–
Cl(1): 1.743(2). Selected bond angles (°): C(7)–C(8)–C(9): 131.44(17), N(1)–C(8)–C(9): 119.04(16).

Chapter 2: Direct C–H Bond Functionalisation of Tryptophans and Peptides
89
2.5 Green Metrics
For the tryptophan analogues where complete substrate conversion was recorded the desired
arylation product could be isolated without the need for silica gel flash column
chromatography, which provided a distinct practical benefit over the equivalent
diaryliodonium salt methodologies, in addition to the selective formation of one arylation
product. This advantage is reflected through calculation of some simple green metrics,
comparing the two novel protocols detailed in this chapter with the Fairlamb group’s
previously developed conditions, which were produced using the Chem21 unified metrics
toolkit for the simple phenyl derivative 75 (Table 8).135
Table 8 Comparison of mass-based metrics for several direct arylation conditions.a
Entry 1 2 3 4
Additives PhI(OAc)2 /
PhB(OH)2
PhB(OH)2 /
Cu(OAc)2 [PhMesI]OTf [PhN2]BF4
Yield / % 56 93 85 100
Temp. / °C 40 40 25 RT
Solvent AcOH AcOH EtOAc EtOAc
AE 48 88 46 74
RME 16 62 24 74
OE 33 70 52 100
MI 6902 4139 4504 602
a Calculated using the Chem21 unified metrics toolkit.135 AE = atom economy, RME = reaction mass
efficiency, OE = optimum efficiency, MI = (total) mass intensity.
In addition to an increase in yield and decrease in reaction temperature from our initial set of
conditions, several key mass-based metrics have been improved upon. Those conditions
which utilise hypervalent iodine reagents (Table 8, Entries 1 and 3) have noticeably lower
values for atom economy (AE), the theoretical maximum efficiency for a transformation.
While the CuII co-catalysed conditions (Table 8, Entry 2) do not suffer from this, they do
however require the undesirable addition of a second transition metal (in addition to the
drawbacks with certain peptides highlighted above). These trends are also observed for the
reaction mass efficiency (RME), which incorporates both yield and stoichiometry to the

Chapter 2: Direct C–H Bond Functionalisation of Tryptophans and Peptides
90
simpler AE calculation, thus giving a measure of the observed reaction efficiency as
compared to the theoretical value provided by AE. This can be rationalised through use of
the optimum efficiency metric, which directly correlates these two factors, highlighting the
aryldiazonium salt methodology (Table 8, Entry 4) as the most atom- and mass-efficient
overall.
The most striking improvement can be seen in the mass intensity (MI) value, which is an
order of magnitude lower for the aryldiazonium salt conditions (Table 8, Entry 4) as
compared to the initial conditions (Table 8, Entry 1). The primary reason for this dramatic
increase is the removal of purification by flash column chromatography, with other secondary
effects including the number of equivalents of arylating agent used for each set of conditions.
Finally, switching the reaction solvent from neat acetic acid to the more benign ethyl acetate
has a demonstrable health impact, as acetic acid has been ranked as a ‘problematic’ reaction
solvent by the recently-published Chem21 solvent selection guide136 (while ethyl acetate is
ranked as ‘recommended’).
2.6 Conclusion
Several different and complementary protocols for the direct Pd-mediated C2-arylation of
tryptophan 74 have been developed and shown to proceed under mild conditions. In order to
address issues involving undesirable peptidic dihydroxylation in a Pd/Cu co-catalytic system,
protocols applying electrophilic diaryliodonium salts have been demonstrated to afford high
conversions when applied to both single tryptophan residues and tryptophan-containing
peptides. Asymmetric variants of these salts have shown good selectivity, albeit with a small
amount of undesirable donation of the dummy aromatic component. To address this issue,
aryldiazonium salts have been successfully applied to this transformation to afford several
aryltryptophan analogues in excellent yield, in addition to the selective functionalisation of
two peptides shown to be incompatible with previous reaction conditions. Calculation of
several key green metrics has shown that these latter conditions also offer a significant
improvement over previously reported methods in terms of optimum efficiency, mass
intensity, synthetic utility and selectivity. Use of a Pd–OTs catalytic system has also been
shown to allow for a significant decrease in catalyst loading in some cases.
Part of the work described in this chapter has been included in several recent publications
(see Appendix 1).119,137

Chapter 3: Direct Arylation Reactions Using Heterogeneous Catalysis
91
Chapter 3: Direct Arylation Reactions Using
Heterogeneous Catalysis
3.1 Background
The importance of Pd-mediated reactions in organic synthesis is without question, as the
ability to selectively form carbon–carbon bonds in the presence of other molecular
functionality is unparalleled in its utility (see Chapter 1). The issue that remains however is
the elemental sustainability of this rare and precious metal, which increasingly leads to
prohibitive costs and issues surrounding the criticality of supply chains.138 One solution to
this problem is to research the potential of mediating selective C–C bond formation by using
cheaper and more elementally-sustainable first-row transition metals, such as Mn,139,140
Fe141,142 or Co.143-145 An alternative approach is to determine whether current Pd catalysts can
be used more effectively, by recycling the precious metal from each reaction and preventing
it from entering waste streams.37-40 Central to this latter approach is to understand that many
ubiquitous Pd (pre)catalysts often display heterogeneous-type catalytic behaviour, typically
through speciation to form higher-order Pd colloids or nanoparticles under commonly-found
experimental conditions. This is evident in both Pd-mediated cross-coupling and more
recently in C–H bond functionalisation reactions; the activity of pre-formed PdNP catalysts
can therefore be evaluated and compared to their in situ counterparts in such reactions.57
Studies by the Fairlamb group on the direct arylation of benzoxazole 216 and benzothiazole
218 under Pd/Cu-catalysed reaction conditions demonstrated a significant deleterious air
effect when Pd(OAc)2 was used as a catalyst (Scheme 63).57
Scheme 63 Direct arylation using Pd(OAc)2 and PVP–Pd of a) benzoxazole 216 and b)
benzothiazole 218.

Chapter 3: Direct Arylation Reactions Using Heterogeneous Catalysis
92
TEM analysis of the reaction mixtures demonstrated that the nanoparticles generated from
Pd(OAc)2 were larger and more varied in size under Schlenk conditions, suggesting that these
larger particles were more active under the reaction conditions. If the pre-synthesised
nanoparticle catalyst PVP–Pd 13 was applied in place of Pd(OAc)2 however, rigorous
exclusion of air (under typical Schlenk conditions) was found to be no longer necessary to
achieve equivalent conversion to product. The PdNPs obtained from this catalyst are however
much smaller (ca. 2 nm) than those formed from Pd(OAc)2 under air-free conditions (ca. 6
nm), suggesting that the PVP polymer may have prevented oxidative leaching in this
example. A long-term study on the stability of PVP–Pd catalysts by McGlacken et al.
concludes that low-index particles display preferential susceptibility to oxidation on their
high-energy facets, such as the (110) facets found on nanocubes. Correspondingly, octahedral
particles display greater stability as they contain mostly lower-energy (111) facets.
Conversely particles containing high-index surfaces, such as concave nanocubes, displayer
superior stability due to stronger chemisorption to the PVP polymer.146
Sanford’s reaction conditions for the direct arylation of indoles with Pd(OAc)2, using a
mixture of 14 and 22 in acetic acid,81 were also observed by Fairlamb and co-workers to
produce visible PdNPs within seconds of substrate addition. This discernible formation of
Pd0 contrasts with the PdII/IV catalytic manifold proposed to operate in this system, although
such precipitates could simply exist as a catalyst deactivation pathway. If the nominally
heterogeneous catalyst PVP–Pd 13 was applied in place of Pd(OAc)2 however, a significant
quantity of the desired arylation product 34 was formed (Scheme 64), providing evidence for
Pd0/II catalysis.57
Scheme 64 Direct arylation of N-methylindole using Pd(OAc)2 and PVP–Pd 13.
When analogous examination was applied to the direct arylation of tryptophan 74 using
similar conditions, rapid propagation of PdNPs was again observed to occur within minutes,
presumably concomitant with substrate turnover. Importantly, an aliquot taken from this
reaction and analysed by TEM demonstrated the presence of PdNPs of ca. 2 nm in size. When
the nanoparticulate catalyst PVP–Pd 13 was again used in place of Pd(OAc)2 under otherwise
identical conditions, an equivalent yield of isolated product 75 was obtained, demonstrating
the utility of nominally heterogeneous Pd catalysts in this manifold (Scheme 65).

Chapter 3: Direct Arylation Reactions Using Heterogeneous Catalysis
93
Scheme 65 Direct arylation of tryptophan 74 using Pd(OAc)2-derived and supported PdNPs.
While the PVP–Pd catalyst 13 used in the examples above demonstrates excellent versatility
and reproducibility in terms of its nanoparticle size and morphology, it could be argued that
bespoke catalysts such as this will always have an intrinsically lower utility than those with
widespread commercially availability, particularly within time-critical industries such as
drug discovery. This leads to the conclusion that research efforts should be directed towards
the re-appropriation of more commonly available heterogeneous Pd catalysts for direct C–H
bond functionalisation chemistry. Palladium supported on activated carbon (Pd/C), widely
used as a heterogeneous hydrogenation catalyst for many years, has also attention for its
utility in the formation of carbon–carbon bonds in cross-coupling catalysis.37-40 Glorius and
co-workers have recently described the use of this catalyst for the direct arylation of
benzo[b]thiophenes with aryl chlorides, to afford a range of C3-arylated products with
excellent regioselectivity (Scheme 66).147
Scheme 66 Direct C3-arylation of benzo[b]thiophenes with aryl chlorides using Pd/C.
Several tests for heterogeneous catalysis20 were performed and no active homogeneous Pd
species could be detected under the reaction conditions; rapid stirring was also found to be
critical to ensure good conversion to product, which is often suggestive of heterogeneous
catalysis. Several nominally homogeneous Pd sources such as Pd(OAc)2 proved able to
catalyse this reaction, although fascinatingly these demonstrated a complete switch in
regioselectivity to form exclusively the C2-arylated products. Subsequent development by
the same group on the arylation of thiophenes, benzo[b]thiophenes and other related
heterocycles demonstrated that a switch from aryl chlorides to diaryliodonium salts allowed
for much milder conditions to be applied (Scheme 67).148

Chapter 3: Direct Arylation Reactions Using Heterogeneous Catalysis
94
Scheme 67 Direct arylation using Pd/C of a) thiophenes and b) related heterocycles.
The same heterogeneity tests as in their previous work were performed and again these
demonstrated evidence of heterogeneous catalysis, although poor catalyst recyclability was
also observed which suggested that Pd leaching likely occurred under these oxidising
conditions. Pd leaching is also suggested as the source of catalytically active palladium in
later work from the same group, which detailed the direct arylation of triphenylene 220,
naphthalene 221 and other polyaromatic hydrocarbons (PAHs) using Pd/C. In many of these
examples, functionalisation of the most hindered C–H bond typically occurred, giving
generally high α:β selectivity in the products obtained (Scheme 68).149
Scheme 68 Direct arylation of PAHs using Pd/C including a) triphenlyene 220 and b) naphthalene
221.
The relevance of higher-order Pd species in C–H bond functionalisation processes and the
activity of pre-synthesised PdNPs encapsulated by a wide variety of supports (including
Pd/C) in this chemistry has recently been reviewed in detail (see Appendix 1).20

Chapter 3: Direct Arylation Reactions Using Heterogeneous Catalysis
95
3.2 Direct Arylations Using Aryldiazonium Salts
The mild and atom efficient conditions for the direct arylation of tryptophan 74 using
aryldiazonium salts previously developed in this project (see Chapter 2) represent a
synthetically useful method of performing direct arylation reactions, without the
stoichiometric iodoarene waste usually generated from their electrophilic iodine(III)
counterparts, diaryliodonium salts. It was hypothesised that combination of these atom
efficient coupling partners with recyclable heterogeneous Pd catalysis would represent a
significant improvement in the sustainability of direct arylation processes, as well as
generating valuable novel methodology. Thus far, the combination of heterogeneous PdNPs
with aryldiazonium salts has been limited to applications in the Suzuki–Miyaura,97 Heck–
Matsuda98,104 and Stille99 cross-couplings. Initial efforts at developing a general direct
arylation methodology focused on the attempted reaction of several simple yet medicinally
relevant nitrogen heterocycles.150 Reaction of indole 45 or N-methylindole 33 with
phenyldiazonium salt 48 and Pd(OAc)2 at 60 °C afforded a complex mixture of products due
to violent reaction with 48, so were abandoned as substrates (Table 9, Entries 1 and 2).
Indazole 222 was unreactive under these conditions, purification of this reaction mixture by
silica gel column chromatography afforded complete recovery of starting material (Table 9,
Entry 3). 7-azaindole 223 was unstable under these conditions, so two further reactions were
performed at reduced temperatures (40 °C and room temperature), which prevented
decomposition but afforded no conversion of starting material (Table 9, Entry 4).

Chapter 3: Direct Arylation Reactions Using Heterogeneous Catalysis
96
Table 9 Nitrogen heterocycle screening for direct arylation with phenyldiazonium salt 48.a
Entry Substrate Reaction outcome
1
Complex mixture obtained
2
Complex mixture obtained
3
No reaction
4
Decomposition of starting materialb
a All reactions conducted with substrate (0.30 mmol, 1 eq.), 48 (58 mg, 0.30 mmol, 1 eq.), Pd(OAc)2
(3.4 mg, 0.015 mmol, 5 mol%) and EtOAc (3 mL) at 60 °C for 22 h. b Analogous reactions of this
substrate at 40 °C and RT showed no conversion of starting material.
In an attempt to address the lack of reactivity of indazole 222, the free NH group was
protected according to literature conditions151,152 using methyl iodide and base, providing the
desired methyl indazole 224 in good yield (Scheme 69).
Scheme 69 Methyl protection of indazole 222.
224 was then subjected to the conditions described in Table 9, Entry 3, but no conversion of
starting material was observed (Scheme 70).

Chapter 3: Direct Arylation Reactions Using Heterogeneous Catalysis
97
Scheme 70 Attempted direct arylation of 224.
Carbonyl-containing protecting groups were proposed as an alternative to methyl protection,
as these could potentially aid coordination of the Pd catalyst, facilitating C–H bond
functionalisation. Reaction of 222 with ethyl trifluoroacetate 165 under basic conditions in
either THF or acetonitrile however afforded no conversion to the desired N-Tfa protected
indazole 226 (Scheme 71).
Scheme 71 Attempted Tfa-protection of indazole 222.
Reaction of 222 with Boc2O under basic conditions153 however proceeded smoothly to
provide a single product by TLC analysis of the reaction mixture. Following purification by
silica gel column chromatography a clear oil was obtained in a yield of 98%, 1H NMR
spectroscopic analysis of which subsequently revealed an equal mixture of two species
(Scheme 72).
Scheme 72 Boc protection of indazole 222.
One of these two species was confirmed as the desired N-Boc indazole 227 through
comparison of the 1H NMR signals with literature values, while the other is putatively
assigned as 228, obtained through isomerisation of the indazole 222 anion following
deprotonation (Scheme 73).

Chapter 3: Direct Arylation Reactions Using Heterogeneous Catalysis
98
Scheme 73 Proposed isomerisation of indazole 222 following deprotonation.
Reaction of indazole 222 with Ac2O under basic conditions also proceeded smoothly to give
a single product by TLC analysis of the reaction mixture. Once again however, following
purification a clear oil was obtained (in a yield of 79%) which 1H NMR spectroscopic
analysis demonstrated to be a mixture of two products, analogous to those formed in the
attempted Boc protection (Scheme 74).
Scheme 74 Acetyl protection of indazole 222.
Following this lack of success with indazole 222, efforts were turned to the remaining
nitrogen-containing heterocycle, 7-azaindole 223. Reaction of 223 with methyl iodide154
afforded the methyl protected azaindole 231 in high yield (Scheme 75).
Scheme 75 Methyl protection of 7-azaindole 223.
The attempted reaction of 231 with phenyldiazonium salt 48 in the presence of Pd(OAc)2 at
40 °C in ethyl acetate afforded no conversion after 24 h. A switch of solvent to ethanol
however provided the desired C2-arylation product in 39% conversion, as determined by 1H
NMR spectroscopic analysis (Scheme 76).

Chapter 3: Direct Arylation Reactions Using Heterogeneous Catalysis
99
Scheme 76 Direct arylation of protected azaindole 231 with phenyldiazonium salt 48.
Application of palladium on activated charcoal or PVP–Pd to this reaction afforded no
conversion of starting material, even after 40 h at 60 °C (Scheme 77).
Scheme 77 Attempted direct arylation of 231 using heterogeneous Pd catalysts.
With all attempts at developing a general C–H bond functionalisation methodology to
combine aryldiazonium salts with heterogeneous Pd catalysts stymied, the specific reaction
between tryptophan 74 and phenyldiazonium salt 48 (Chapter 2) was examined. When
palladium supported on activated carbon (Pd/C) was applied in place of the previously used
Pd(OAc)2 however, no reaction was seen in either ethyl acetate or ethanol at 60 °C (Scheme
78).
Scheme 78 Attempted functionalisation of tryptophan 74 mediated by Pd/C.

Chapter 3: Direct Arylation Reactions Using Heterogeneous Catalysis
100
3.3 Direct Arylations Using Diaryliodonium Salts
3.3.1 Simple Nitrogen-Containing Heterocycles
Due to the lack of success in combining heterogeneous Pd catalysis with atom efficient
aryldiazonium salt coupling partners, a return to the use of diaryliodonium salts was
proposed, as there is a greater body of evidence in the literature to suggest that these species
can be mediated by heterogeneous Pd0 catalysis (vide supra). To begin, the symmetric
diphenyliodonium tetrafluoroborate salt 233 was synthesised in a one-pot process from
iodobenzene 1 using the method of Olofsson and co-workers (Scheme 79).155
Scheme 79 Synthesis of diphenyliodonium tetrafluoroborate 233.
The mild conditions published by Glorius et al. (Scheme 67)148 utilising this species were
then initially applied to a substrate screen of the same medicinally relevant nitrogen
heterocycles as used previously,150 the results of which are summarised in Table 10. Note
that Pd(OAc)2 was used in place of Pd/C for this initial screening. Under these conditions,
indole 45 was successfully reacted to form the C2-arylated product 234 in moderate yield
(Table 10, Entry 1). The heterocycles indazole 222 or 7-azaindole 223 were however
unreactive under these conditions (Table 10, Entries 2 and 3). Pyridazine 235 and
methylindazole 224 were similarly unreactive, an observation also made when these
reactions were conducted over 4 days, or in ethyl acetate (Table 10, Entries 4 and 5). The
methyl-protected azaindole 231 was however cleanly converted to give the C2-arylation
product 232 in good yield (Table 10, Entry 6).

Chapter 3: Direct Arylation Reactions Using Heterogeneous Catalysis
101
Table 10 Nitrogen heterocycle screening for direct arylation with diaryliodonium salt 233.a
Entry Substrate Reaction outcomeb
1
2
No reaction
3
No reaction
4
No reactionc
5
No reactionc
6
a All reactions conducted with substrate (0.30 mmol, 1 eq.), 233 (155 mg, 0.42 mmol, 1.4 eq.),
Pd(OAc)2 (3.4 mg, 0.015 mmol, 5 mol%) and EtOH (1.5 mL) at 60 °C for 22 h. b Where applicable,
isolated yield following purification by silica gel flash column chromatography is provided. c
Extension of the reaction time to 4 days showed no conversion of starting material, while analogous
reactions of these substrates in EtOAc also demonstrated no conversion of starting material.
Following successful transformation of azaindole 231 mediated by Pd(OAc)2, this substrate
was then screened against a range of heterogeneous palladium sources to test their efficacy
in this protocol (Table 11).

Chapter 3: Direct Arylation Reactions Using Heterogeneous Catalysis
102
Table 11 Catalyst screen for direct arylation of azaindole 231.a
Entry Pd catalyst Conv. / %b
1 Pd/C (5 wt% Pd) 19
2 Pd/C (10 wt% Pd) 0
3 Pd/charcoal 100
4 Pd ‘black’ 0
5 Pd/CaCO3/Pb (Lindlar catalyst) 3
6 Pd(OH)2/C (Pearlman’s catalyst) 0
7 PdO 0
a All reactions conducted with 231 (40 mg, 0.30 mmol, 1 eq.), 233 (155 mg, 0.42 mmol, 1.4 eq.), Pd
catalyst (0.015 mmol, 5 mol%) and EtOH (1.5 mL) at 60 °C for 22 h. b As determined by 1H NMR
spectroscopic analysis of the crude reaction mixture following an aqueous workup.
Two different forms of palladium supported on activated carbon were tested, each containing
a different Pd loading. In the first example, a catalyst containing 5% by weight palladium
supported on activated carbon (Sigma Aldrich, catalogue number 205680) provided modest
conversion to the desired product 232 (Table 11, Entry 1). Surprisingly, when the analogous
catalyst containing 10% by weight palladium (Sigma Aldrich, catalogue number 205699)
was tested, no activity was observed (Table 11, Entry 2). Even more surprisingly, when a
catalyst containing 5% by weight palladium supported on activated charcoal (Sigma Aldrich,
catalogue number 75992) was used, complete conversion to the desired product 232 was
noted (Table 11, Entry 3). The heterogeneous Pd0 catalysts Pd ‘black’ and the Lindlar
catalyst provided no activity in this reaction (Table 11, Entries 4 and 5), while the
heterogeneous PdII catalysts Pd(OH)2/C and PdO were similarly unreactive (Table 11,
Entries 6 and 7). These observations agree with those made by Glorius and co-workers, who
noted severe incongruities in the activities and yields obtained thereof when utilising Pd/C
from different commercial sources in this chemistry.148 It is clear that differing manufacturing
methods and even variances between batches of supposedly identical catalysts have to be

Chapter 3: Direct Arylation Reactions Using Heterogeneous Catalysis
103
seriously considered in these reactions, as they will undoubtedly significantly impact on the
size and morphology of the resultant Pd particles.
3.3.2 Biologically Relevant Heterocycles
With the proof that simple nitrogen heterocycles could be functionalised directly under
relatively mild conditions, using a combination of heterogeneous palladium and
diaryliodonium salts, the amino acid tryptophan was examined in order to provide an
exemplification of this approach for more complex substrates. While commercially available
Pd catalysts such as Pd/C present many practical advantages, the lack of control over particle
size and morphology adds a significant element of irreproducibility to syntheses employing
such catalysts. It was decided therefore that the PdNP catalyst PVP–Pd 13 would be tested
alongside Pd/C, as its synthesis provides well-controlled, regular nanoparticles typically
between 2–5 nm in diameter (vide supra).32,33 Simple reduction of PdCl2 with aqueous acid
in the presence of a (poly)vinylpyrrolidone polymer 12 provides quantitative amounts of a
well-dispersed nanoparticle catalyst (Scheme 80).
Scheme 80 Synthesis of PVP–Pd 13.
The nanoparticles are prevented from thermodynamically favourable agglomeration through
interaction with the amide functionality in the polymer 12, creating a stabilising
encapsulation effect (Figure 20).
Figure 20 Cartoon schematic of PdNP encapsulation in PVP–Pd 13.

Chapter 3: Direct Arylation Reactions Using Heterogeneous Catalysis
104
Analysis of these polymer-supported particles (8 wt% Pd) was performed by TEM, with
several images recorded in order to ensure that data representative of the population as a
whole was used for subsequent analysis. A typical image is shown in Figure 21, which
indicates that well-defined PdNPs of approximately 3 nm in diameter are encapsulated by the
PVP, remaining stable in the solid-state after evaporation of the reaction solvent. The images
obtained all correlate well and have over 68% of the particles lying within the normal
Gaussian distribution range (mean ± std. dev.).
n = 100, mean = 2.98 nm, std. dev. 0.80, median = 3.00, mode = 3.30
Figure 21 TEM image and particle size analysis for PVP–Pd 13.
Protected tryptophan derivative 74 was subjected to the previously optimised conditions for
direct C–H bond functionalisation using the asymmetric diaryliodonium salt [PhMesI]OTf
140 (see Chapter 2), with PVP–Pd 13 used in place of Pd(OAc)2; no conversion of starting
material was observed under these conditions however (Scheme 81).
Scheme 81 Attempted functionalisation of tryptophan 74 with PVP–Pd 13.
When performing this reaction, it was noted that the PVP–Pd 13 catalysed used had changed
significantly in both colour and composition since its synthesis, approximately 30 months
previously. Freshly synthesised this catalyst is a black crystalline solid; the sample used for
the reaction in Scheme 81 was a greyish powder containing large metallic particles,
presumably of agglomerated Pd. This implies that this catalyst slowly decreases in stability
over time when stored at ambient temperature under air, losing its coordination from the PVP
polymer 12 and forming large unreactive Pd agglomerates, in an oxidative process as

Chapter 3: Direct Arylation Reactions Using Heterogeneous Catalysis
105
suggested by McGlacken and co-workers.146 PVP–Pd 13 was thus freshly synthesised and
simple visual inspection highlighted the significant changes that had occurred over time
(Figure 22). This catalyst was used for all of the experiments subsequently detailed in this
chapter, except where specifically indicated otherwise.
Figure 22 PVP–Pd 13 after approximately 30 months (left) and freshly-synthesised (right).
While these investigations were ongoing, a preparation of surfactant-free, DMF-stabilised
PdNPs of approximately 1–1.5 nm in diameter was noted in the literature.59 Recalling the
high activity of DMF–PdNPs formed in situ in previous work from the Fairlamb group,48,49,57
it was decided to investigate the potential of this catalyst. Following several attempted
syntheses, it was found that modifications to the original procedure had to be made in order
to prepare the DMF–PdNPs 236. Specifically, the reaction had to be carried out in the
presence of air, performing the reaction under an inert atmosphere led only to the formation
of visible Pd black; a large reaction headspace was also found to be beneficial, as were low
levels of amine impurities in the DMF used. DMF–PdNPs 236 were applied to a low
temperature Stille cross-coupling and were demonstrated to have activity equivalent to that
of a succinimide-based Pd catalyst in DMF, consistent with the proposal that DMF-stabilised
particles were forming in situ in this system.156 The synthetic reliability of this catalyst was
a source of concern however, so two reactions were performed side-by-side under identical
conditions, using the same glassware and starting materials. These demonstrated
substantially different outcomes; one reaction produced the intended clear yellow solution of
DMF–PdNPs 236, while the other resulted in a black particulate suspension (Figure 23).
These experiments provided a stark indication of the capricious nature of the synthesis of this
catalyst, so plans to use it for the direct arylation reactions in this chapter were abandoned.

Chapter 3: Direct Arylation Reactions Using Heterogeneous Catalysis
106
Figure 23 Synthesis of DMF–PdNPs 236.
Returning to the direct arylation of tryptophan, it was decided to use a symmetric
diaryliodonium salt rather than the asymmetric 140, in order to reduce the number of potential
products from this reaction; unselective donation of the mesityl ‘dummy’ group having been
previously noted (see Chapter 2). Diphenyliodonium triflate 38 was therefore synthesised in
a high-yielding one-pot process from iodobenzene diacetate 22 and benzene 237 (Scheme
82),124 in addition to the tetrafluoroborate salt 233 already synthesised (Scheme 79).
Scheme 82 Synthesis of diphenyliodonium triflate 38.
A screening of various conditions was then undertaken against tryptophan 74 using
heterogeneous Pd sources PVP–Pd 13, Pd/C (Sigma Aldrich, catalogue number 205680) and
Pd/charcoal (Sigma Aldrich, catalogue number 75992), in combination with diaryliodonium
salts (Table 12).

Chapter 3: Direct Arylation Reactions Using Heterogeneous Catalysis
107
Table 12 Reaction screening for direct arylation of tryptophan 74 with heterogeneous Pd sources.a
Entry Solvent Temp. / °C Pd. catalyst X Conv.b (yield)c / %
1 EtOAc 37 PVP–Pd 13 −OTf 0
2 EtOAc 60 PVP–Pd 13 −OTf 0
3 EtOAc 60 PVP–Pd 13 −BF4 0
4 AcOH 37 PVP–Pd 13 −OTf 8
5 AcOH 60 PVP–Pd 13 −OTf 80
6 AcOH 60 PVP–Pd 13 −BF4 80
7 AcOH 80 PVP–Pd 13 −OTf 91
8 AcOH 37 Pd/C −BF4 0
9 AcOH 60 Pd/C −BF4 100
10 EtOH 60 Pd/C −BF4 84
11 EtOH 60 Pd/C −BF4 100 (85)d
12 EtOH 60 Pd/charcoal −BF4 100 (98)d
a All reactions conducted with 74 (52 mg, 0.20 mmol, 1 eq.), 38 (172 mg, 0.40 mmol, 2 eq.) or 233
(147 mg, 0.40 mmol, 2 eq.), Pd catalyst (0.01 mmol, 5 mol%) and solvent (2 mL) at 60 °C for 16 h. b
As determined by 1H NMR spectroscopic analysis of the crude reaction mixture following filtration
through a silica gel pad using EtOAc. c After purification by silica gel column chromatography. d
Reaction time extended to 22 h.
This screening demonstrated that this protocol has a strong temperature dependence, with no
conversion observed at 37 °C, the temperature at which complete conversion was observed
when using Pd(OAc)2 (Table 12, Entries 1, 4 and 8). Additionally, no conversion was seen
in EtOAc, even at elevated temperatures (Table 12 Entries 1–3). No counter-ion effect was
observed in those examples tested (Table 12, Entries 2–3 and 5–6). The sudden change in

Chapter 3: Direct Arylation Reactions Using Heterogeneous Catalysis
108
reactivity when the protic solvents AcOH or EtOH were applied hints at leaching behaviour
to generate the active catalytic species, as evidenced by previous studies within the Fairlamb
group48,49 and others,25 although evidence to contradict this is presented by Glorius and co-
workers.148 All three catalysts tested displayed good reactivity in this transformation,
although PVP–Pd 13 was arguably less active than Pd/C, providing slightly lower conversion
after 16 h under otherwise comparable reaction conditions (Table 12, Entries 6 and 9). A
successful switch from AcOH to the less harmful EtOH was facilitated by an increase in
reaction time from 16 h to 22 h (Table 12, Entries 9–11). When purification was performed,
it was noted that in order to obtain isolated yields comparable to the conversion seen by 1H
NMR spectroscopic analysis of the crude reaction mixture (Table 12, Entries 11–12), care
had to be taken during workup and purification. The ideal method was found to be filtration
through a silica gel pad using EtOAc, followed by evaporation of the solvent and direct
purification by dry-loaded silica gel column chromatography. This effect is believed to result
from the relatively high quantities of activated carbon in these reaction mixtures potentially
sequestering some organic reaction products during other workup protocols e.g. filtration
through Celite™ and/or aqueous washing.
The acidic conditions shown in Table 12, Entry 6 were also exemplified on two peptides,
previously functionalised using analogous conditions with Pd(OAc)2 (see chapter 2). High
conversions to the desired arylation products were seen when using Pd/C, albeit at higher
temperatures than when using Pd(OAc)2 (Scheme 83).
Scheme 83 Direct arylation of peptides using Pd/C.

Chapter 3: Direct Arylation Reactions Using Heterogeneous Catalysis
109
3.4 Kinetic Studies
It is clear that when evaluating heterogeneous-like behaviour in Pd catalysis, significant
differences can be observed not only between different catalysts (vide supra) but also
between supposedly uniform catalysts, obtained from different suppliers (see work by
Glorius et al. using Pd/C).147,148 This difference in activity is usually observed in the literature
merely as a function of isolated yield or more commonly, conversion by GC–MS, used
primarily as a tool to identify the most effective method of improving conversion under
otherwise fixed conditions. This manner of evaluating catalytic behaviour however conceals
a multitude of sins, as the most efficient catalysts may not always be identified in this fashion.
For example, imagine a direct arylation reaction conducted using Pd catalysis in DMF at 140
°C. Single variable solvent and temperature screening for this reaction has indicated that
when using Pd(OAc)2, these conditions provide the desired product in 20% conversion after
8 hours and 40% conversion after 24 hours. The experimentalists therefore conclude that a
reaction time of 24 hours is ‘optimal’, and begin their heterogeneous catalyst screening. At
this point one can propose two potential scenarios for two different Pd catalysts. In the first,
catalyst A cleanly converts the substrate of choice in 80% conversion within 1 hour, but is
then deactivated by some other process (such as the elevated temperature causing
nanoparticle agglomeration and thus loss of activity). No further conversion occurs, so
measurement of crude reaction conversion by GC analysis after 24 hours indicates that
catalyst A gives a product conversion of 80%. Meanwhile, catalyst B only reaches 10%
conversion after 1 hour, but is not deactivated by the reaction conditions so continues to react
with the substrate at the same rate. After 24 hours therefore, 100% conversion to product is
observed by GC analysis, catalyst B is declared the most active catalyst and all subsequent
investigations are performed using this catalyst. From these scenarios, one can infer that
catalyst A has superior activity in this reaction (in terms of TOF), yet this would have gone
unnoticed by the experimentalists merely examining the outcome of their reactions by crude
GC conversion. It may even be the case that catalyst A would have tolerated lower reaction
temperatures while maintaining its activity.
Kinetic analysis of novel reactions is therefore of paramount importance in this field,66
particularly where non-linear kinetic effects often associated with heterogeneous catalysis
are likely to occur.34,35,157-159 These principles were applied to studying the direct arylation of
some simple heterocycles using diaryliodonium salts and Pd catalysis using the conditions of
Glorius and co-workers (vide supra).148 Four Pd catalyst sources were identified which
provide a useful test of two ubiquitous precatalysts, a supported catalyst and well-defined Pd
nanoparticulate catalyst, namely: Pd(OAc)2 (>99% purity, Precious Metals Online),

Chapter 3: Direct Arylation Reactions Using Heterogeneous Catalysis
110
Pd2(dba)3·CHCl3 238 (91% purity, based on Ananikov’s method, see Chapters 4 and 6),11
Pd/C (5 wt%, Sigma Aldrich, catalogue number 205680, lot number 06230AJ-298) and PVP–
Pd 13. These four catalysts were initially applied to the direct arylation of N-methylindole 33
and the reaction followed by ex situ GC analysis (details provided in Appendix 5) as shown
in Figure 24.
Figure 24 Direct arylation of N-methylindole 33 at 60 °C over 2 h. Fitting to an exponential decay
equation is shown where appropriate. × = starting concentration of substrate at t = 0. Reactions
performed by L. Neumann.
N-methylindole 33 demonstrated high reactivity with all four catalysts tested, especially so
when using either 13 or 238 as a catalyst; within 5 minutes 72% and 81% conversion of
starting material was observed, respectively. Line fitting to an exponential decay equation
for the other catalysts (Pd(OAc)2 and Pd/C) suggests that these reactions are 1st order with
respect to substrate, although more detailed studies would be required to validate this
approximation (details provided in Appendix 5). The above kinetic studies were repeated at
a lower temperature (50°C), in order to provide greater discrimination between the activity
of these catalysts (Figure 25).

Chapter 3: Direct Arylation Reactions Using Heterogeneous Catalysis
111
Figure 25 Direct arylation of N-methylindole 33 at 50 °C over 24 h. Fitting to an exponential decay
equation is shown where appropriate. Detailed analysis over the initial 7 hours shown, final
conversions by GC after 24 h; Pd/C: 83%, PVP–Pd 13: 100%, Pd(OAc)2, 66%, Pd2(dba)3 238: 88%.
Reactions performed by L. Neumann.
Once again, 13 and 238 proved to be the most active catalysts for this transformation. It is
interesting to note that these two catalysts produced similar reaction profiles, which implies
similarly between the active catalytic species in these examples (see Chapter 4 for other
evidence of PdNP propagation from Pd2(dba)3·CHCl3 238). Conversely, Pd/C and Pd(OAc)2
produced wholly different reaction profiles, which were however akin to one another. These
results suggest that the nanoparticles produced from Pd(OAc)2 and Pd/C are similar, yet
distinct from the nanoparticles produced by 13 and 238. It may be that PdNPs are not actively
catalysing this reaction, the active species instead consisting of leached mononuclear/lower-
order Pd species. If this is the case, then perhaps the parallels between catalysts manifests as
a result of similar leaching rates. It is also interesting to note that of the catalysts tested, only
PVP–Pd 13 led to complete starting material consumption after 24 h. Despite its relatively
slow initial rate, Pd/C eventually provides conversion akin to that using 238, which is much
more active in the early stages of the reaction. Pd(OAc)2 however does not however achieve
these levels of conversion; the activity of this catalyst eventually drops off, despite matching

Chapter 3: Direct Arylation Reactions Using Heterogeneous Catalysis
112
that of Pd/C initially. This type of behaviour can be rationalised if the deactivating
agglomeration of PdNPs is more facile in the absence of a supporting matrix such as activated
carbon, even if the PdNPs originally formed from Pd(OAc)2 and Pd/C are similar.
Conversely, little difference is seen in the reaction profiles when using either 13 or 238 as
the catalyst.
A quantitative comparison was also made between the old and new batches of 13, which were
qualitatively compared above (Figure 22). Monitoring of the activity of these two catalysts
for the direct arylation of N-methylindole 33 demonstrated significant differences in activity
(Figure 26). A comparison of freshly synthesised PVP–Pd catalysts with their artificially
time- and heat-aged counterparts found that the nanoparticle size in this catalyst had a strong
heat dependence, but no discernible time-dependence (when stored at ambient
temperature).160 This investigation was however carried out over a few months, as opposed
to the 30-month period of time covered by the PVP–Pd 13 shown in Figure 22.
Figure 26 Direct arylation of N-methylindole 33 using freshly synthesised and 30-month old PVP–
Pd 13. × = starting concentration of substrate at t = 0. Reactions performed by L. Neumann.

Chapter 3: Direct Arylation Reactions Using Heterogeneous Catalysis
113
The four catalysts shown above were also studied in the reaction of benzofuran 239 at 60 °C,
the kinetic profiles from which are shown in Figure 27.
Figure 27 Direct arylation of benzofuran 239 over 24 h. Fitting to an exponential decay equation is
shown where appropriate. Detailed analysis over the initial 7 hours shown, final conversions by GC
after 24 h; Pd/C: 88%, PVP–Pd 13: 91%, Pd(OAc)2, 31%, Pd2(dba)3 238: 31%. × = starting
concentration of substrate at t = 0. Reactions performed by L. Neumann.
Overall, this substrate demonstrated lower activity towards the desired transformation than
methylindole 33. PVP–Pd 13 was again the most active catalyst, providing ca. 29%
conversion within 5 minutes, and >90% after 24 hours. Interestingly, Pd/C performed very
similarly to 13, in stark contrast to its poor performance when using 33 as a substrate.
Pd(OAc)2 and 238 however displayed poor activity for this transformation. These results
demonstrated a clear substrate dependence on the catalytic activity for this transformation;
whether this is due to variation in PdNP formation or behaviour, or a difference in leaching
rates is unclear. The major product was confirmed by 1H NMR spectroscopic analysis as the
C2-arylated regioisomer, after isolation using silica gel column chromatography in a yield of
31%, from a separate reaction catalysed by Pd(OAc)2. Butylthiophene 241 was also examined
under these conditions, the kinetic profiles from which are shown in Figure 28.

Chapter 3: Direct Arylation Reactions Using Heterogeneous Catalysis
114
Figure 28 Direct arylation of butylthiophene 241 over 24 h. Fitting to an exponential decay equation
is shown where appropriate. Final conversions by GC after 24 h; Pd/C: 66%, PVP–Pd 13: 86%,
Pd(OAc)2, 75%, Pd2(dba)3 238: 42%. Reactions performed by L. Neumann.
This substrate demonstrated activity lower than that of either 33 or 239, as expected, but did
reach 86% conversion after 24 hours when using 13 as a catalyst (which was again the most
reactive catalysts of those tested). Little difference between catalysts was observed in the
initial period of reactivity, which provided such a clear discrimination between catalysts
when using either 33 or 239 as substrates. The final conversion obtained however varied
between the worst-performing catalyst 238 (42%) and the best-performing catalyst 13 (86%).
The major product was confirmed by 1H NMR spectroscopic analysis as the C3-arylated
regioisomer, after isolation using silica gel column chromatography from two separate
reactions catalysed by Pd(OAc)2 (49%) and PVP–Pd 13 (69%).

Chapter 3: Direct Arylation Reactions Using Heterogeneous Catalysis
115
The substrates tested thus far were all reported by Glorius et al. to be active under their
conditions, when using Pd/C as a catalyst.148 It was hypothesised that 2-n-butylfuran 243
should also prove effective in this protocol, but the original publication148 states that reaction
of this substrate with 233 using Pd/C leads to degradation of the starting materials.
Conversion to the desired arylated product 245 is however reported when the strongly
electron-deficient diaryliodonium salt 244 is used (Scheme 84).
Scheme 84 Direct arylation of butylfuran 243 with electron-deficient diaryliodonium salt 244.
No other details on this degradation were provided, so some initial studies were performed
to evaluate the reaction of this substrate (Figure 29). Surprisingly, reaction of 243 under the
standard conditions using the same four catalysts as used previously provided good
conversion of starting material. Reactivity not dissimilar to that of benzofuran 239 was
realised, with 13 and Pd/C proving the most effective catalysts with complete conversion
after 24 hours seen. Pd(OAc)2 and 238 were less effective, with ca. 70–75% conversion
observed after 24 hours. The activity of these four Pd catalysts is similar over the first hour
of the reaction, but the distinction between the different catalysts tested becomes apparent
after this point.

Chapter 3: Direct Arylation Reactions Using Heterogeneous Catalysis
116
Figure 29 Direct arylation of butylfuran 243 over 24 h. Fitting to an exponential decay equation is
shown where appropriate. Final conversions by GC after 24 h; Pd/C: 100%, PVP–Pd 13: 95%,
Pd(OAc)2, 62%, Pd2(dba)3 238: 65%. × = starting concentration of substrate at t = 0. Reactions
performed by L. Neumann.
In order to gain a complete picture of the reactivity of this substrate under conditions
catalysed by Pd/C, this reaction was repeated at a higher temperature (70 °C) and samples
taken at regular intervals until reaction completion after ca. ten hours. This demonstrated loss
of starting material 243 concomitant with product 246 formation, with no evidence of side-
products as a result of degradation behaviour observed (Figure 30).

Chapter 3: Direct Arylation Reactions Using Heterogeneous Catalysis
117
Figure 30 Direct arylation of butylfuran 243 over 10 h at 70 °C. Fitting to an exponential decay
(substrate 243) or logarithmic growth (product 246) equation is shown where appropriate. × =
starting concentration of substrate at t = 0. Reactions performed by L. Neumann.
It is not clear at this point why this substrate provides excellent reactivity in this system, in
contrast to that reported. It may be that the different sources of Pd/C used provide
fundamentally different forms of catalytically active Pd, alternatively an impurity such as
those reported for other commercially available Pd catalysts may be present,18 which
manifests itself when using this substrate. It was noted during these investigations that
purification of the 2-arylated product 246 from the Pd/C-catalysed reactions was challenging,
as was the case when using tryptophan 74 as a substrate (vide supra). Attempted purification
of several reactions catalysed by Pd/C afforded inseparable mixtures of the desired product
and biphenyl, as confirmed by TLC, EI–GC–MS and 1H NMR spectroscopic analysis.
Iodobenzene is also present as a major byproduct (b.p. 188 °C), which complicates matter
further due to the relatively low boiling point of the desired product (95 °C).161 Purification
by silica gel column chromatography of a separate reaction catalysed by PVP–Pd 13 afforded
the desired product in a yield of 45%, which was confirmed as the C2-arylated regioisomer
by 1H NMR spectroscopic analysis.

Chapter 3: Direct Arylation Reactions Using Heterogeneous Catalysis
118
Analysis of the initial stages of reaction using these substrates allowed fitting of simple
exponential decay equations, as shown in the appropriate figures. Good fits were obtained in
the majority of cases; where line fitting could not be performed this is suspected to be the
result of rapid initial reactivity followed by loss of catalytic activity, for example the reaction
of benzofuran with Pd(OAc)2 as catalyst (Figure 27). These analyses allowed for a rough
approximation of the initial rate of reaction (kobs) for the majority of substrate and catalyst
combinations; these are shown in Table 13.
Table 13 Approximate observed rate constants (kobs) for direct arylation reactions.a
Entry Substrate Pd/C PVP–Pd 13 Pd(OAc)2 Pd2(dba)3 238
1
(9.2 ± 0.5)
× 10-6
(1.3 ± 0.1)
× 10-5
(9.7 ± 0.4)
× 10-6 -
2
(6.3 ± 0.8)
× 10-6 - - -
3
(6.1 ± 0.6)
× 10-6 - -
(2.6 ± 0.3)
× 10-6
4
(7.1 ± 0.6)
× 10-6
(4.8 ± 0.5)
× 10-6
(1.6 ± 0.1)
× 10-6
(3.3 ± 0.5)
× 10-6
5
(9.3 ± 0.9)
× 10-6 N/A N/A N/A
6b
(9.4 ± 1.6)
× 10-6 N/A N/A N/A
a Rate constants calculated from initial rates using a fitted exponential decay equation, using at least 5
recorded data points with ≥90% correlation. All rates shown in s-1. In many cases, extremely rapid
conversion occurs within ca. 5 mins (the first recorded data point), which has not been considered in
these data. Hyphens indicate those reactions which cannot be fitted to this exponential decay equation.
b Rate constant for product 246 formation calculated from initial rates using a fitted logarithmic growth.

Chapter 3: Direct Arylation Reactions Using Heterogeneous Catalysis
119
It should be noted that these cannot be considered as empirically accurate values due to the
rough approximation present in the exponential decay line fitting. They are intended simply
as a guide to the approximate activity of each of the catalysts tested. Errors in these values
are calculated from the standard deviation of a linear regression of the initial reaction rates,
obtained by the ‘least squares’ method. These rate constants are broadly similar to one
another, lying between ca. 1 × 10⁻⁶ and 1 × 10⁻⁵ s-1 for all the catalyst/substrate combinations
tested. By comparison, a pseudo first-order rate of constant of 3.5(2) × 10-4 s-1 for the
arylation of 2-methylthiophene has been previously reported, although this was measured
when using the bespoke dimeric catalyst [PdAr(µ-OAc)(PPh3)]2.162
3.5 Conclusion
Several attempts have been made to develop a generic protocol for the arylation of nitrogen-
containing heterocycles using aryldiazonium salts, building on the methodology successfully
applied to the amino acid tryptophan 74 (see Chapter 2). These have met with limited success;
of those examples tested, only 7-azaindole 231 could be functionalised in the desired manner.
Attempted application of heterogeneous Pd sources to this class of reactions have been
similarly unsuccessful, the scarcity of such examples in the literature perhaps indicates the
significant challenge this poses.
The direct arylation of several simple heterocycles, in addition to the amino acid tryptophan
74 and tryptophan-containing peptides, has however been achieved using a combination of
diaryliodonium salts and heterogeneous Pd sources. Significant discrepancies in reaction
conversions when using several variations of palladium supported on activated carbon have
been noted. The pre-synthesised nanoparticle catalyst PVP–Pd 13 has also been demonstrated
as an effective catalyst in this chemistry; 13 has however been shown both qualitatively and
quantitatively to degrade over many months under air at ambient temperature, with a
concomitant loss of activity in the direct arylation of methylindole 33. Reaction profile
analysis has shown a substrate effect on catalyst activity in these transformations, in addition
to the observation of similar activity between apparently distinct catalysts (e.g. Pd(OAc)2 and
Pd/C), which suggests Pd speciation and higher-order Pd catalyst effects. Butylfuran 243
which was reported to be unstable under these reaction conditions has in fact been shown to
react effectively to provide the desired direct arylation product in quantitative conversion.

Chapter 4: Analysis of Pd2(dba)3 Complexes
120
Chapter 4: Analysis of Pd2(dba)3 Complexes
4.1 Introduction
The widely-used Pd0 precursor complex, Pd2(dba)3 (dba = E, E′-dibenzylideneacetone 247),
is ubiquitous in synthetic chemistry.163 It has been extensively studied within the Fairlamb
group, where work has shown that modifying the core structure with a variety of ligands to
generate ‘L2Pd0(η2-dba)’ complexes, can provide profound variations in catalytic
behaviour.164 The reasons for this are simple; the dba ligand plays a non-innocent role in the
catalytic activity of ‘LnPd0’ complexes, generated in situ prior to oxidative addition reactions
with aryl halides. This was first reported by Jutand and co-workers, who studied the
equilibrium behaviour of solvated ‘L2Pd0’ and ‘L2Pd0(η2-dba)’ species, using phosphine
ligands.165 The concentration of the active oxidative addition species ‘L2Pd0’ was found to be
dependent on its equilibrium position with unreactive ‘L2Pd0(η2-dba)’ species; an increase in
the number of equivalents of phosphine used therefore shifts the equilibrium towards the
active ‘L2Pd0’ species, increasing activity (Scheme 85).
Scheme 85 Equilibrium between L2Pd0(η2-dba) and L2Pd0 species.
This key complex is typically synthesised by reduction of sodium tetrachloropalladate(II) in
MeOH in the presence of the free ligand 247 (Scheme 86). Initially this complex was
incorrectly characterised as Pd(dba)2 based on IR and elemental analysis data;166 it was later
proposed to consist of three dba ligands asymmetrically coordinated around two palladium
centres, with a fourth loosely coordinated or ‘solvating’ dba ligand, giving complex
Pd2(dba)3·dba 248.167-169
Scheme 86 Synthesis of Pd2(dba)3·dba 249.
More recently, preparation of this complex from the readily available precursor palladium(II)
acetate has been published in a procedure purporting to afford both high yields and purities
(Scheme 87).170 This is achieved via recrystallisation from chloroform, affording the adduct

Chapter 4: Analysis of Pd2(dba)3 Complexes
121
complex Pd2(dba)3·CHCl3 238, while allowing removal of excess free dba ligand 247 and
elemental Pd (i.e. nanoparticulate Pd0). It is important to note that Pd2(dba)3 has been reported
to react with CHCl3 under certain conditions to form cluster complexes.171
Scheme 87 Synthesis of Pd2(dba)3·CHCl3 238.
This synthesis is proposed to avoid the pitfalls resulting from poor characterisation of
commercially available ‘Pd2(dba)3’, as high levels of variation were found, with up to 40%
of Pd nanoparticles (PdNPs) present in many samples. These PdNPs were found in a range
of sizes, from 10–200 nm, along with free ligand 247 and the desired complex 248.
Recrystallisation such as that in Scheme 87 allows for the ‘purity’ of the catalyst to be
determined prior to its use, as diffusion-ordered spectroscopy (DOSY) was utilised to
delineate the typically complex 1H NMR of complex 238, allowing for characterisation of
the major and minor isomers, in addition to free ligand 247 (Figure 31).
Figure 31 Partial 1H NMR spectrum of Pd2(dba)3·CHCl3 in CDCl3 at 600 MHz: alkene signals
corresponding to the major (blue) and minor (green) isomers of complex 238, along with free ligand
247 (red). Integral regions used for calculation of purity are highlighted as I1–I3. Reprinted with
permission from Organometallics 2012, 31, 2302–2309. Copyright 2012 American Chemical
Society.
The ‘purity’ (i.e. the amount of complexed ligand 238 versus free ligand 247) can thus be
evaluated simply by comparing the 1H NMR ratios of the appropriate signals (Equation 1).

Chapter 4: Analysis of Pd2(dba)3 Complexes
122
Purity = [major isomer + minor isomer]
[(major isomer + minor isomer + (free ligand
2⁄ )]
=[I2 + I3]
[I2 + I3 + (I1
2⁄ ) × 100%
× 100%
Equation 1 Purity determination of complex 238 from 1H NMR integrals.
In this work the solution-phase structure of complex 238 was also discussed, with high-field
1H NMR spectroscopic data being used to assert that the dba ligands were coordinated in a
symmetric s-cis, s-cis fashion around the palladium centres. This contradicted an earlier study
by Kawazura et al., who found that the dba ligands coordinated in an asymmetric s-cis, s-
trans fashion (Figure 32).172 These latter observations were subsequently supported by
detailed 1H and 13C NMR studies, in addition to DFT calculations, performed within the
Fairlamb group.173
Figure 32 Possible conformational alignment of dba ligand 247.
The facile propagation of PdNPs from this complex was proposed in the Ananikov study as
a potentially useful source of catalytically competent, heterogeneous Pd nanocatalysts. In a
subsequent publication from the same group, activated carbon was shown to exhibit an
efficient capture mechanism of these particles, obtained by degradation of complex 238 in
chloroform at 40 °C. These reactive Pd markers were used to demonstrate >2000 reactive Pd
centres per 1 µm2 of carbon surface area.174
The ambiguity surrounding the true coordination environment of this complex in solution
and in the solid state, in addition to its ability to form PdNPs under very mild conditions,
provided ample opportunity for further study of this important Pd0 (pre)catalyst.
4.2 Synthesis and Characterisation
To complete characterisation of the complex of interest (238), preparation of the chloroform
adduct via the protocol in Scheme 87 was performed. Recrystallisation in several solvents
was successful and single crystal X-ray structures obtained for three analogues;
Pd2(dba)3·CHCl3 238, Pd2(dba)3·CH2Cl2 249 and Pd2(dba)3·C6H6 250. The high quality
structures obtained for the chloroform adduct is shown in Figure 33 and Figure 34, with all
structures included in Appendix 2.

Chapter 4: Analysis of Pd2(dba)3 Complexes
123
Figure 33 Single crystal X-ray diffraction structure of 238 (major isomer). Thermal ellipsoids shown
with 50% probability, hydrogen atoms and solvating chloroform removed for clarity. Selected bond
lengths (Å): Pd(1)–C(7): 2.303(3), Pd(1)–C(8): 2.248(3), C(7)–C(8): 1.358(4), Pd(1)–C(24):
2.279(4), Pd(1)–C(25): 2.251(4), C(24)–C(25): 1.364(6), Pd(1)–C(41): 2.202(3), Pd(1)–C(42):
2.220(3), C(41)–C(42): 1.393(5), Pd(2)–C(10): 2.222(3), Pd(2)–C(11): 2.244(3), C(10)–C(11):
1.395(4), Pd(2)–C(27): 2.244(4), Pd(2)–C(28): 2.241(4), C(27)–C(28): 1.392(6), Pd(2)–C(44):
2.244(3), Pd(2)–C(45): 2.280(3), C(44)–C(45): 1.359(5). Pd(1)–Pd(2) bond distance: 3.244 Å.
Figure 34 Single crystal X-ray diffraction structure of 238 (minor isomer). Thermal ellipsoids
shown with 50% probability, hydrogen atoms and solvating chloroform removed for clarity. Selected
bond lengths (Å): Pd(1)–C(7A): 2.275(11), Pd(1)–C(8A): 2.297(11), C(7A)–C(8A): 1.368(19),
Pd(1)–C(24A): 2.243(6), Pd(1)–C(25A): 2.254(6), C(24A)–C(25A): 1.390(9), Pd(1)–C(41A):
2.211(7), Pd(1)–C(42A): 2.207(7), C(41A)–C(42A): 1.339(10), Pd(2)–C(10A): 2.192(11), Pd(2)–
C(11A): 2.272(10), C(10A)–C(11A): 1.332(9), Pd(2)–C(27A): 2.274(6), Pd(2)–C(28A): 2.242(6),
C(27A)–C(28A): 1.352(9), Pd(2)–C(44A): 2.267(7), Pd(2)–C(45A): 2.311(7), C(44A)–C(45A):
1.394(10). Pd(1)–Pd(2) bond distance: 3.244 Å.

Chapter 4: Analysis of Pd2(dba)3 Complexes
124
In these structures, each of the three dba ligands are disordered over two positions, with the
major isomer depicted in Figure 33 and the minor isomer depicted in Figure 34 (ratio
major:minor is 79:21). These isomers result from the asymmetric environment of the
coordinating alkenes, as they can occupy either an s-cis (green) or s-trans (orange) orientation
with respect to the carbonyl group of the ligand. The average C=C bond distances are 1.3603
Å for the s-cis alkenes and 1.3930 Å for the s-trans alkenes, indicating a weaker s-trans
alkene bond. Additionally, the C–Pd distances for the s-cis alkenes are Cα–Pd = 2.247 Å and
Cβ–Pd = 2.287 Å, and Cα–Pd = 2.228 Å and Cβ–Pd = 2.229 Å for the s-trans alkenes,
indicating a higher level of asymmetry in the s-cis bonds than in the s-trans bonds. These
two observations taken together appear to demonstrate a higher level of π-backbonding (and
thus more sp3, cyclometallopropane-like character) in the s-trans alkenes (Figure 35).
Figure 35 Representative alkene binding from dba ligand 247 to palladium.
When complex 238 was analysed by 1H NMR spectroscopy and the integrals applied to
Equation 1, the purity was found to be 91%, contrasting with the reported value of 98%
immediately post-synthesis.170 This value is the maximum obtained during the course of this
project, representing ca. ten syntheses of complex 238 (and was in fact obtained under
rigorously air-free conditions, using dry distilled solvent, which was not specified in the
published procedure).170 Representative purities lie in the region of 80–89%. The exchange
rates of the different isomers of complex 238 in solution was proposed as a source of this
discrepancy, so a variable temperature NMR (VT–NMR) study was performed to evaluate
the effect of temperature on the rate of exchange. The hypothesis in this instance was that
cryogenic temperatures could slow down the exchange process sufficiently to allow the
delineation of this effect on the NMR timescale. When a 1H NMR spectrum of complex 238
was recorded at −35 °C (238 K), it became apparent that a small quantity of an as-yet
unidentified species overlapped with the signal typically used to calculate the quantity of the
major isomer (ca. 5.29 ppm, ■). Another suitable region was thus identified (ca. 6.12 ppm,
●) and used as a measure of the concentration of the major isomer in solution (Figure 36).
The signal used to calculate the quantity of minor isomer remained unchanged from that
shown in Figure 31 (ca. 5.60 ppm, ○). The integrals recorded (and thus the derived purity)
differed slightly as a function of temperature (in this experiment, 89% at 298 K and 83% at
238 K), giving credence to the explanation that complex exchange in solution introduces

Chapter 4: Analysis of Pd2(dba)3 Complexes
125
variability in the purity measurement. The measurements made by Ananikov et al. were
recorded on a different spectrometer, at 600 MHz,170 so these factors alone could easily have
introduced the ca. 10% error observed in this calculation of purity.
Figure 36 1H NMR spectra of 238 in CDCl3 at a) 298 K b) 238 K; major isomer signal used by
Ananikov et al. (■), major isomer signal (●) and minor isomer signal (○) used in this study.
To further evaluate the exchange process of both isomers of complex 238, as well as the free
ligand 247, 1H NMR spectra of complex 238 (at 500 MHz using 64 scans, in CDCl3) were
recorded at several temperatures between 238–298 K. The full-width at half-maximum
(FWHM) of each of the key integral signals used in the purity determination (with the
exception of the signal at ca. 5.29 ppm, vide supra) was then measured and compared. This

Chapter 4: Analysis of Pd2(dba)3 Complexes
126
gave an indication of the relative exchange rates of these species, as signal broadening is an
effect typically associated with exchange on the NMR timescale i.e. the larger the measured
FWHM, the greater the degree of exchange. The results from this experiment are provided in
Figure 37.
Figure 37 Intensity of key integrals for complex 238 as a function of temperature.
Interestingly, this experiment demonstrated that the exchange rates of the species involved
differ significantly at non-cryogenic temperatures. This means that the two isomers of
complex 238 display different intra- and intermolecular exchange rates, introducing error into
the integral signals used in the purity determination proposed by Ananikov et al., 170
supporting the same conclusion drawn through comparison of the integrals at different
temperatures (Figure 36).
4.3 Activation/Degradation to Form Pd Clusters
The facile propagation of PdNPs from this complex, as detailed by Ananikov et al.,170 was
proposed to occur through initial dissociation of the dba ligand 247 followed by rapid
agglomeration of the resulting thermodynamically unstable Pd0 atoms. A putative model for
this process could centre around protonation of the keto moiety of the dba ligand 247,
reducing the electron density of the alkene and resulting in dissociation from the metal centre.
If this were the case, degradation of complex 238 should be initiated either by water or acid;
indeed, in their work Ananikov and co-workers note that degradation could result “by
reaction with acid traces and other impurities in the [NMR] solvent”.
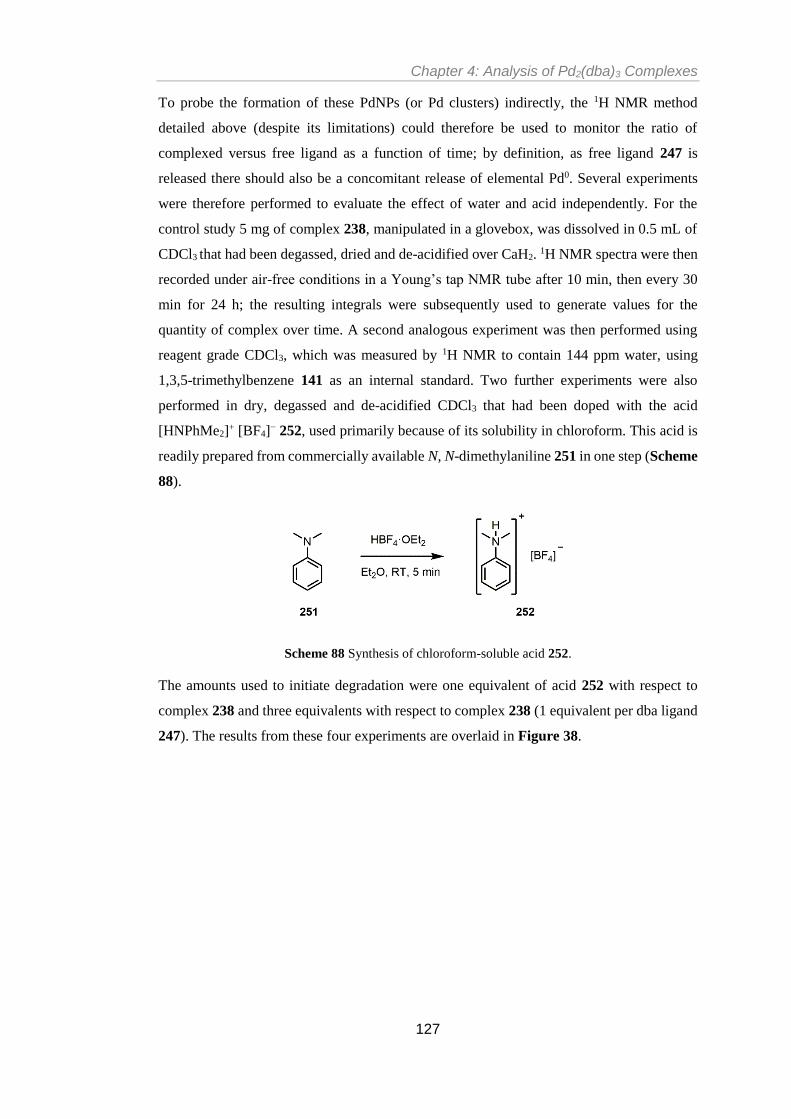
Chapter 4: Analysis of Pd2(dba)3 Complexes
127
To probe the formation of these PdNPs (or Pd clusters) indirectly, the 1H NMR method
detailed above (despite its limitations) could therefore be used to monitor the ratio of
complexed versus free ligand as a function of time; by definition, as free ligand 247 is
released there should also be a concomitant release of elemental Pd0. Several experiments
were therefore performed to evaluate the effect of water and acid independently. For the
control study 5 mg of complex 238, manipulated in a glovebox, was dissolved in 0.5 mL of
CDCl3 that had been degassed, dried and de-acidified over CaH2. 1H NMR spectra were then
recorded under air-free conditions in a Young’s tap NMR tube after 10 min, then every 30
min for 24 h; the resulting integrals were subsequently used to generate values for the
quantity of complex over time. A second analogous experiment was then performed using
reagent grade CDCl3, which was measured by 1H NMR to contain 144 ppm water, using
1,3,5-trimethylbenzene 141 as an internal standard. Two further experiments were also
performed in dry, degassed and de-acidified CDCl3 that had been doped with the acid
[HNPhMe2]+ [BF4]− 252, used primarily because of its solubility in chloroform. This acid is
readily prepared from commercially available N, N-dimethylaniline 251 in one step (Scheme
88).
Scheme 88 Synthesis of chloroform-soluble acid 252.
The amounts used to initiate degradation were one equivalent of acid 252 with respect to
complex 238 and three equivalents with respect to complex 238 (1 equivalent per dba ligand
247). The results from these four experiments are overlaid in Figure 38.

Chapter 4: Analysis of Pd2(dba)3 Complexes
128
Figure 38 Behaviour of complex 238 in CDCl3, monitored by 1H NMR spectroscopic analysis.
Figure 38 clearly shows that the relative concentration of complex 238 decreases over time,
with respect to free ligand 247 concentration, in the presence of both water and acid.
Conversely, it displays relatively higher stability in solution under anhydrous, air-free
conditions (eventually reaching complete decomposition after 11 days in solution). When
treated with one equivalent of acid 252, complete degradation of complex 238 occurs in less
than 11 hours, with the resultant 1H NMR spectrum matching that of free ligand 247 and
visible Pd ‘mirroring’ on the sides of the NMR tube qualitatively indicating elemental Pd0
formation. The profile for the acid-catalysed degradation appears to demonstrate two distinct
phases; a slow first step occurring between 0–6 hours after dissolution where the relative
concentration of complex 238 decreases by 8%, followed by a rapid second step between 6–
11 hours after dissolution where the relative concentration decreases by 70%. This behaviour
is difficult to rationalise by the simple model proposed above, but could be explained by
autocatalytic Pd complex formation; the [BF4]− counter-ion of acid 252 is known to stabilise
PdNPs in other systems.175 While not identical, this broad trend is also seen when using three
equivalents of acid 252. Notably, during the initial period degradation of the complex is more
rapid, possibly due to an increased rate of initial ligand protonation.
To delineate any potential counter-ion effect, complex 238 was treated with two other organic
soluble acids, acetic acid (AcOH) and trifluoroacetic acid (TFA). Treatment with AcOH (10
eq. or 359 eq. w.r.t 238, 100 µL in 5 mL CDCl3) had no effect on complex 238, with no
degradation seen by 1H NMR after several days. Ten equivalents of TFA did however initiate
degradation, the profile for which is shown in Figure 39, with the data from acid 252 overlaid

Chapter 4: Analysis of Pd2(dba)3 Complexes
129
for comparison. When 298 equivalents of TFA were used (100 µL in 5 mL CDCl3),
decomposition to free ligand 247 and elemental Pd occurred within seconds. This also
occurred when complex 238 was treated with HBF4·OEt2 (1 eq. w.r.t 238).
Figure 39 Behaviour of complex 238 in CDCl3 when treated with acid, monitored by 1H NMR
spectroscopic analysis.
Comparison of the experiments shown in Figure 39 indicates that using TFA to initiate
decomposition of complex 238 produces a simpler kinetic profile, which lacks the two-phase
behaviour seen when using acid 252. As highlighted above this may result from the ability
of [BF4]− to stabilise PdNPs in the latter case, producing unusual degradation profiles due to
involvement by higher-order Pd species, such as [Pd0xdbay] clusters. To probe this more
directly (as opposed to the indirect observations provided by 1H NMR signals of ligand 247),
Fourier-transform ion cyclotron resonance mass spectrometry (FT–ICR–MS) was performed
on a methanol/DCM solution of complex 238 and demonstrated the presence of Pd clusters
containing between three and eight Pd atoms, all with two dba ligands. (Figure 40).

Chapter 4: Analysis of Pd2(dba)3 Complexes
130
Figure 40 FT–ICR–MS spectrum showing [Pdxdba2H]+ cluster species formed from complex 238.
The most abundant ion detected via this method was [Pd4(dba)2H]+, so density functional
theory (DFT) calculations were performed by a collaborating group in Birmingham176 to
determine the relative energies of several possible conformations for this specific cluster in
the gas phase (Figure 41). Perhaps surprisingly, the conformation of calculated lowest
energy was the linear conformer of four Pd atoms, positioned in-between the two dba ligands
(Figure 41a).
Figure 41 DFT-calculated possible structures for the species [Pd4(dba)2H]+ in the gas phase: (a)
linear, (b) Y-shaped, (c) rhombic, (d) tetrahedral.
This cluster formation would result in a small increase in the concentration of free dba by 1H
NMR initially, as complex 238 degrades to elemental Pd0 and free dba ligand (Figure 38 and
Figure 39). The free dba liberated would then be sequestered by multinuclear elemental Pd0,
forming [Pd0xdbay] clusters. As these clusters grow, eventually they would reach a point
where they were no longer soluble and would precipitate out, liberating a large quantity of

Chapter 4: Analysis of Pd2(dba)3 Complexes
131
free dba ligand into solution. This would cause a large increase in the observed concentration
of free dba by 1H NMR, leading to the observed rapid decomposition several hours after
dissolution of complex 238 (Figure 38 and Figure 39). In an analogous experiment,
electrospray ionisation mass spectrometry (ESI–MS) was used to demonstrate that clusters
containing varying numbers of both Pd atoms and dba ligands could also be observed (Figure
42).
Figure 42 ESI–MS spectrum showing [PdxdbayH/Na]+ cluster species formed from complex 238.
Once again, the most abundant ion detected in solution was [Pd4(dba)2H]+, the detected
masses for which are shown in Figure 43. A full comparison of the observed isotope patterns
against their calculated values is provided in Appendix 6.
Figure 43 Measured vs. simulated mass values for [Pd4(dba)2H]+ cluster detected by ESI–MS.

Chapter 4: Analysis of Pd2(dba)3 Complexes
132
During this experiment, the ion corresponding to the [Pd4dba5H]+ cluster was isolated and
subjected to secondary ionisation (ESI–MS–MS), producing the smaller clusters [Pd4dba3H]+
and [Pd4dba2H]+. Interestingly, the relative intensity of these ions increased as a function of
collision energy (0–65 V); in other words, the greater the secondary collision energy, the
greater the relative concentration of clusters with fewer dba ligands (Figure 44).
Figure 44 ESI–MS–MS spectra of [Pd4dbayH]+ cluster species.
The evidence from Figure 44 implies that the larger Pd04dbay species form from the smaller
ones i.e. there is rapid addition of dba ligands to the initially forming, stable [Pd4dba2H]+ ion.
This is highlighted by the fractional bar chart presented in Figure 45, which compares the
relative abundance of the observed ions as a function of secondary collision energy.

Chapter 4: Analysis of Pd2(dba)3 Complexes
133
Figure 45 Relative abundance of [Pd4dbayH]+ cluster species as a function of secondary collision
energy.
As ESI–MS proved a suitable method by which to study the dynamic, cluster-forming
behaviour of complex 238 in solution, two similar experiments were devised to attempt to
extrapolate structural and kinetic data. These would ideally provide direct evidence of Pd
cluster formation from complex 238 as a function of time, complementary to the 1H NMR
experiments shown in Figure 38 and Figure 39 which provided indirect evidence of this
process.
In the first experiment, a solution of acid 252 in anhydrous chloroform was added to a
solution of complex 238 in anhydrous chloroform under nitrogen. This mixture was then
stirred at room temperature for eight hours, with a sample taken every 30 minutes and
analysed by ESI–MS. The Pd4(dba)2 species was again the major Pd cluster signal seen in all
spectra, so the peak height for this cluster (ion [Pd2(dba)4Na]+) was normalised to 100% and
the peak heights for all other species were monitored relative to this value. While similar ions
were observed as in the previous study (Figure 42), no appreciable change in the relative
intensities of these ions was observed as a function of time. Specifically, no increase in the
relative concentration of larger Pd clusters, as compared to smaller Pd clusters, was observed.
An analogous experiment was thus performed, with samples taken every two minutes for a
half hour period, which were subsequently analysed by ESI–MS, in order to monitor any
rapid changes that might occur in the early stages of the reaction (Table 14).

Chapter 4: Analysis of Pd2(dba)3 Complexes
134
Table 14 Pdxdbay clusters formed from 238 as a function of time.a
Time / min 0 2 4 6 8 10 30
Ion Detected Relative Intensity / %b
[Pd2(dba)2H]+ 0 22.1 21.3 22.6 24.5 20.1 25.1
[Pd2(dba)4H]+ 91.2 0 0 0 0 0 0
[Pd2(dba)4Na]+ 65.1 14.3 15.6 14.3 13 19.2 9.1
[Pd2(dba)5Na]+ 34.3 4.4 4.4 4.1 3.8 5.5 2.8
[Pd4(dba)2H]+ 0 0 0 0 0 0 0
[Pd4(dba)2Na]+ 100 100 100 100 100 100 100
[Pd4(dba)3H]+ 0 0 0 2 2.1 0 2.5
[Pd4(dba)4Na]+ 0 0 0 0 0 0 0
[Pd4(dba)5H]+ 8.4 19.8 18.3 25.9 23.6 24.1 19.9
[Pd4(dba)7Na]+ 15.5 7.6 9 7.7 7.5 10.4 5
[Pd4(dba)8Na]+ 11 4.4 4.5 3.9 3.7 5.3 2.6
[Pd6(dba)5Na]+ 15.9 41.4 40.8 55 58 55.1 44.4
[Pd6(dba)8H]+ 1.4 8.3 6.6 15.8 16.5 10.6 9
[Pd6(dba)9Na]+ 7.5 8.2 8.2 7.7 6.9 8 1.7
[Pd6(dba)10Na]+ 0 1.3 0 0 0 0 0
a Reaction conducted with 238 (100 mg, 0.09 mmol, 1 eq.) and 252 (18 mg, 0.09 mmol, 1 eq.) in dry
CHCl3 (10 mL) under N2. b Intensities normalised to the [Pd4(dba)2H]+ ion at 100%.

Chapter 4: Analysis of Pd2(dba)3 Complexes
135
The only significant change in ion distribution was observed before and after addition of the
acid, this distribution did not however change further as a function of time. The intensity of
two clusters containing two Pd atoms, Pd2(dba)4 and Pd2(dba)5, is markedly reduced after
addition of acid. The relative intensity of the Pd2(dba)2 cluster is increased however, possibly
due to greater stability of this species versus those Pd clusters with two Pd atoms and a greater
number of dba ligands. Conversely, the quantity of Pd4(dba)5 and Pd6(dba)5 clusters
significantly increases upon addition of acid 252, which may indicate a growth of Pd clusters
upon addition of acid, as suggested above.
These studies provide some structural information about the degradation observed by 1H
NMR (Figure 38 and Figure 39). Direct evidence for the growth of Pd0x(dba)y clusters has
been found, with at least two pathways observed. The first appears spontaneous; in solution
dissociation of dba ligand 247 releases Pd0 from complex 238, which agglomerates to form a
relatively stable Pd04(dba)2 cluster. Rapid addition of free ligand 238 in solution then occurs
to give secondary Pd04(dba)2+x clusters. Upon addition of acid 252, a decrease in the
concentration of smaller clusters is concurrent with an increase in the concentration of larger
clusters, importantly these secondary clusters contain not just additional ligand 247 but
consist of greater number of Pd atoms. This behaviour is suggestive of increased
concentrations of free ligand 247 and elemental Pd0 in solution, as a result of acid-promoted
ligand dissociation from complex 238. The expected increase in the concentration of larger
Pd clusters as a function of time was not observed, it may be however that the ions observed
are on the limit of solubility. Large species are therefore not observable under these
conditions due to rapid growth and subsequent insolubility. These observations would agree
with the unusual two-phase degradation behaviour seen through observation of the ligand
signals by 1H NMR (Figure 38 and Figure 39). Finally, it is important to note that when
stored at 5 °C in the dark, complex 238 shows long-term stability in the solid state,
ascertained by both 1H NMR spectroscopic analysis and elemental (CHN) analysis.
Atmospheric air has no appreciable deleterious effect on the stability of this complex in the
solid state.

Chapter 4: Analysis of Pd2(dba)3 Complexes
136
4.4 Conclusion
The important Pd0 precursor complex Pd2(dba)3 has been prepared and recrystallized in
several solvents. Several high-quality single-crystal X-ray diffraction structures have been
obtained, allowing for the complex asymmetric alkene binding of the dba ligands to be
characterised in both the major and minor isomers of the complex. The exchange rates of
these two isomers in solution were shown to differ from one another and free ligand 247
through the use of VT–NMR. The stability of the chloroform adduct of this complex (238)
when exposed to both water and acid has been probed by NMR and MS studies; direct and
indirect evidence of Pd0x(dba)y cluster formation under these conditions has been obtained.
These observations taken together appear to demonstrate that complex 238 is a viable source
of catalytically active PdNPs under commonly found experimental conditions.
Part of the work described in this chapter has been included in a recent publication (see
Appendix 1).173
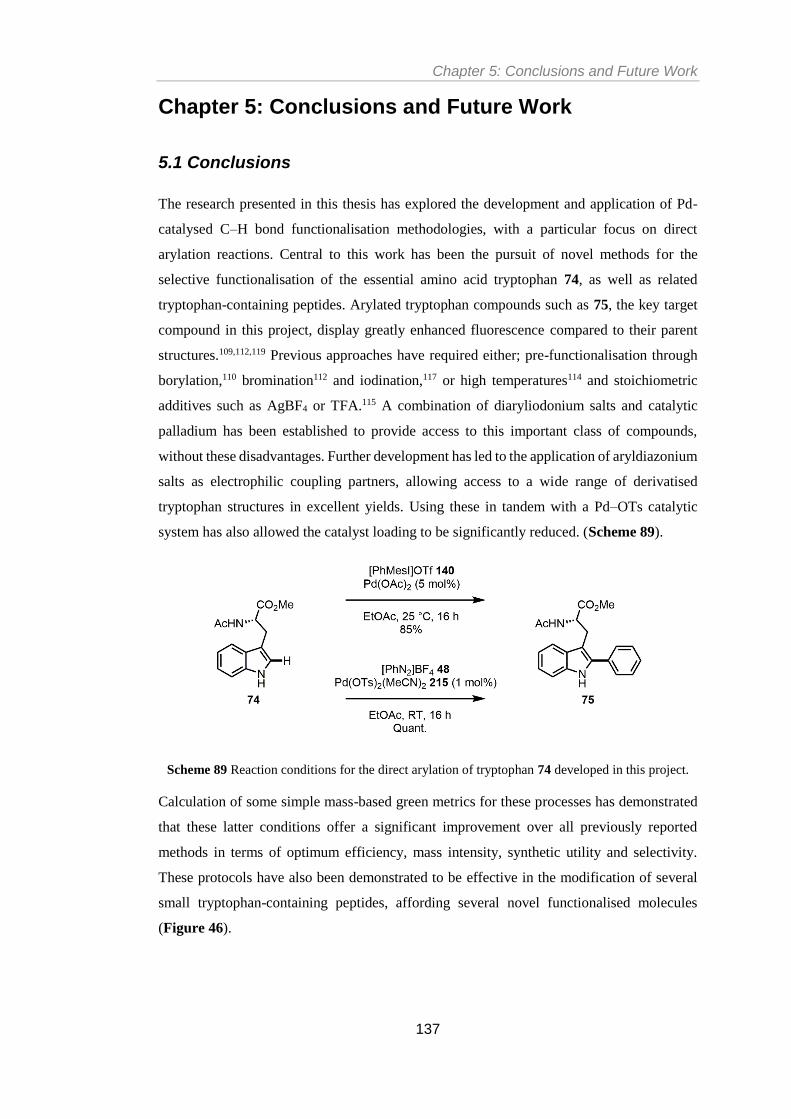
Chapter 5: Conclusions and Future Work
137
Chapter 5: Conclusions and Future Work
5.1 Conclusions
The research presented in this thesis has explored the development and application of Pd-
catalysed C–H bond functionalisation methodologies, with a particular focus on direct
arylation reactions. Central to this work has been the pursuit of novel methods for the
selective functionalisation of the essential amino acid tryptophan 74, as well as related
tryptophan-containing peptides. Arylated tryptophan compounds such as 75, the key target
compound in this project, display greatly enhanced fluorescence compared to their parent
structures.109,112,119 Previous approaches have required either; pre-functionalisation through
borylation,110 bromination112 and iodination,117 or high temperatures114 and stoichiometric
additives such as AgBF4 or TFA.115 A combination of diaryliodonium salts and catalytic
palladium has been established to provide access to this important class of compounds,
without these disadvantages. Further development has led to the application of aryldiazonium
salts as electrophilic coupling partners, allowing access to a wide range of derivatised
tryptophan structures in excellent yields. Using these in tandem with a Pd–OTs catalytic
system has also allowed the catalyst loading to be significantly reduced. (Scheme 89).
Scheme 89 Reaction conditions for the direct arylation of tryptophan 74 developed in this project.
Calculation of some simple mass-based green metrics for these processes has demonstrated
that these latter conditions offer a significant improvement over all previously reported
methods in terms of optimum efficiency, mass intensity, synthetic utility and selectivity.
These protocols have also been demonstrated to be effective in the modification of several
small tryptophan-containing peptides, affording several novel functionalised molecules
(Figure 46).

Chapter 5: Conclusions and Future Work
138
Figure 46 Key molecules obtained through the direct arylation of peptides.
The reaction conditions using aryldiazonium salts shown in Scheme 89 were subsequently
explored as a more general direct arylation methodology, with a view to combining these
atom-efficient coupling partners with heterogeneous Pd catalysis. Efforts to apply this
chemistry to the functionalisation of several medicinally relevant nitrogen heterocycles met
with limited success; of the substrates and conditions screened only 7-azaindole 231
demonstrated any reactivity when using Pd(OAc)2 as a catalyst, and this protocol
demonstrated no activity when using heterogeneous Pd catalysts. This observation was also
made when returning to tryptophan 74 as a substrate, indicating that direct arylation reactions
combining aryldiazonium salts and heterogeneous Pd catalysis is a significant challenge, a
deduction supported by the scarcity of examples in the literature.
Following recently published work by Glorius and co-workers,148 the combination of
diaryliodonium salts and heterogeneous Pd catalysts has been shown able to produce high
reactivity in several direct arylation reactions. The direct arylation of the amino acid
tryptophan 74 and tryptophan-containing peptides 167 and 170 has for example been
achieved under these conditions. The pre-synthesised nanoparticle catalyst PVP–Pd 13 was
also demonstrated as an effective catalyst in this chemistry; 13 has however been shown both
qualitatively and quantitatively to degrade over many months under air at ambient
temperature, with a concomitant loss of activity. An interesting dichotomy in activity
between several apparently similar forms of Pd supported on activated carbon has been noted
in this chemistry, suggestive of distinct sizes and/or morphologies of the Pd particles present
in these ubiquitous catalysts. The activity of these catalysts for the direct arylation of 7-
azindole 231 is shown as an example (Scheme 90).

Chapter 5: Conclusions and Future Work
139
Scheme 90 Direct arylations of 231 highlighting differences in Pd/C catalysts.
Reaction profile analysis using ex situ GC sampling has been used to evaluate the activity of
four Pd catalysts, Pd(OAc)2, Pd2(dba)3·CHCl3 238, Pd/C and PVP–Pd 13, in the direct
arylation of several simple heterocycles. This demonstrated remarkable similarities in
catalytic behaviour between apparently distinct catalysts, implying that dissimilar catalysts
can function as precatalysts for the formation of a single comparable active catalyst phase;
speciation to form PdNPs or clusters is proposed as one possible mechanism in this process.
A pronounced substrate effect has also been noted in these studies, which goes some way
towards suggesting that reaction conditions including model substrate choice may in some
cases be more important than the particular Pd (pre)catalyst used. These studies highlighted
the importance of kinetic analysis in reactions mediated by Pd catalysis, as opposed to
evaluating catalyst performance merely as a function of yield.
The structure and degradation behaviour of the important Pd0 pre-catalyst Pd2(dba)3·CHCl3
238 has also been studied, with a view to its potential as a source of catalytically active
PdNPs. Analysis of the X-ray diffraction structures of several solvent adducts of this complex
has allowed the asymmetric binding of the dba ligands to the metal centres to be
characterised, in both the major and minor isomers of this complex (ratio major:minor is
79:21). Solution-phase analysis of 238 by 1H NMR spectroscopy has also demonstrated that
the exchange rates of the two isomers and free dba ligand differ from one another; they also
vary significantly as a function of temperature. This means that reported170 methods of
determining the absolute amount of complex as compared to free ligand by 1H NMR cannot
be viewed as an empirically accurate measure. Finally, the stability of 238 when exposed to
water and acid has been probed by both 1H NMR and MS studies; direct and indirect evidence
of speciation to form Pd0x(dba)y clusters has been observed, which are proposed as a
precursor to larger PdNPs (Figure 47). These observations demonstrate that 238 is a viable
source of catalytically active PdNPs under commonly found experimental conditions, such
as those observed in the direct arylation methodologies detailed above.

Chapter 5: Conclusions and Future Work
140
Figure 47 Degradation behaviour of 238 as observed by 1H NMR and ESI–MS analysis.

Chapter 5: Conclusions and Future Work
141
5.2 Future Work
5.2.1 Mechanism of Tryptophan Functionalisation
The synthetic work performed during this project has produced several protocols for the
direct C–H bond functionalisation of tryptophan and tryptophan-containing peptides
(Scheme 89). The methodology utilising aryldiazonium salts is particularly novel, further
investigation into the mechanism of this transformation therefore has significant value. The
C2-arylated product 75 possesses a Stokes shift of 62 nm relative to starting material 74,
enabling the kinetic profile of the arylation reaction to be examined by UV–visible
spectroscopic analysis. Initial studies performed within the Fairlamb group have shown that
the product evolution curve from a reaction catalysed by Pd(OAc)2 exhibits an unusual
sigmoidal kinetic trace (Figure 48),131 which certainly merits further investigation.
Figure 48 (a) UV–visible spectra showing formation of 75 at 304 nm (5 min intervals) at 37 °C. (b)
Plot showing evolution of 75 over time.
As highlighted in Chapter 2, significant rate enhancements were observed with the addition
of catalytic TsOH due to removal of the observed induction period;131,132 this effect was also
seen when using pre-catalyst Pd(OTs)2(MeCN)2 215, which is known to form the
catalytically relevant species 253.133,134 It is therefore possible that the arylation proceeds via
a key tryptophan coordination complex such as 254 (Scheme 91).
Scheme 91 Pre-catalyst activation and proposed tryptophan intermediate.

Chapter 5: Conclusions and Future Work
142
If species 254 is indeed a key intermediate, it implies a non-innocent role for the amine
protecting group used. Mono-protected amino acids are well established as useful ligands for
the acceleration of catalytic processes,177 tailoring of these protecting groups could therefore
provide significant mechanistic information. Investigation of the initial rates of reaction for
the cross-section of substrates shown in Figure 49 would provide a useful platform to probe
this hypothesis.
Figure 49 Alternative N-terminus protected tryptophan substrates.
5.2.2 Further Tryptophan Derivatives
A recent publication has detailed the selective C7-borylation of tryptophans using Ir
catalysis,178 providing a facile method of generating valuable tryptophan structures to test in
the novel arylation conditions developed in this project (Scheme 92).
Scheme 92 Orthogonal borylation/arylation conditions for tryptophan 74.
Along similar lines, those tryptophan derivatives containing C2-aryl halide motifs already
synthesised (Chapter 2) could be subjected to standard cross coupling conditions in order to
generate products with modified fluorescence properties (Scheme 93).
Scheme 93 Sequential arylation/cross-coupling for tryptophan 74.

Chapter 5: Conclusions and Future Work
143
5.2.3 Direct Arylations Using Aryldiazonium Salts
Examples of direct arylation reactions using aryldiazonium salts as the arene coupling partner
are rare in the literature.101,102 The work performed on tryptophan 74 within this project
provides a stark indication of their potential utility, if suitable reaction conditions can be
found. Attempts in this direction have met with limited success in this project; some
encouraging signs, such as the successful arylation of 7-azaindole 231, have however been
seen (Chapter 3). While there is great interest in the arylation of indoles both in the literature
and in this report, recent developments in medicinal chemistry have highlighted the need for
research to focus on more unusual scaffolds, based on both the statistical trends seen in the
hit-rate of potential drug candidates and the need for novel structures to ensure intellectual
property rights.179 With this in mind, a focus on the direct arylation of non-typical
heterocycles would provide an interesting avenue of research, particularly if this could be
coupled with the heterogeneous palladium catalysis detailed above. A recent paper by Groom
et al. highlights a range of such heterocycles180 and some potential candidates that might be
suitable for direct arylations are shown in Figure 50.
Figure 50 Potential heterocyclic substrates for novel direct arylation methodologies.
To paraphrase a recent review, “a significant increase in the number of new ring systems
would not necessarily lead to an associated increase in success rates for drug discovery
projects. A suggested alternative strategy is to focus first on the assembly of existing drug
ring systems in novel configurations”.150 Development of a versatile direct arylation
methodology with good green metrics such as that shown in Scheme 89 would provide a
suitable platform to explore novel drug space in this fashion. Several of the potential
substrates shown in Figure 50 have more than one site which could be functionalised by
direct arylation, so there is a possibility that a site-selective arylation methodology could be
developed to functionalise at more than one position on the heteroaromatic. Glorius and co-
workers have shown that appropriate choice of Pd catalyst can provide such regioselectivity
in similar protocols.147 This is an area where research efforts could be focused in an attempt
Chapter 5: Conclusions and Future Work
144
to not only produce selective arylation procedures for medicinally-useful compounds, but
also to provide a link to the development of a range of rationally-designed palladium catalysts
which can be used to perform differing, selective transformations.
5.2.4 Direct C–H Bond Functionalisations Using Pd Nanocatalysts
Despite its widespread use as a heterogeneous hydrogenation catalyst, Pd/C has only recently
been explored for other Pd-mediated catalysis in any detail, usually in cross-coupling
reactions.37-40 Glorius and co-workers are particularly notable for their continuing
development of C–H bond functionalisation reactions using this catalyst.147-149 The direct
arylation of several common heterocycles such as (benzo)thiophene, indole and (benzo)furan
have been demonstrated to be effectively catalysed by this cheap, readily available Pd source.
One drawback of these protocols however lies in the poor degree of characterisation of such
catalysts; Glorius and co-workers have in fact noted severe incongruities in the activities and
yields obtained thereof when utilising Pd/C from different commercial sources. To date, no
specific analysis of how the catalyst structure/morphology relates to its activity in these
reactions has been performed. In this project (Chapter 3) similarities in catalytic behaviour
between apparently distinct Pd catalysts have been demonstrated, suggesting formation of a
comparable active catalytic phase, such as PdNPs, in these reactions. It may be that PdNPs
are not actively catalysing these reactions, the active species instead consisting of leached
mononuclear/lower-order Pd species. If this is the case, then perhaps the parallels between
catalyst type manifests as a result of similar leaching rates.
Conversely many well-defined Pd nanocatalysts have been synthesised and their catalytic
activities (often in hydrogenation reactions) correlated to specific features of their size and/or
shape.181-183 Effectively controlling the morphology of these nanocatalysts, usually through
appropriate choice of stabilising and surface-capping agents along with carefully-tailored
reduction rates, is far from a routine operation however. Such specific syntheses are typically
capricious, with centrifugation often applied to produce the desired nanocatalysts in very low
yields, thus reducing the synthetic appeal of these processes.184-187 These species can also
demonstrate significant deterioration from their original size or shape over time.146
In light of this dichotomy, between the development of operational ease in elegant C–H bond
functionalisation protocols using Pd nanocatalysts and the judicious structure/activity
relationships explored in other heterogeneous catalytic processes, there is significant scope
for an exploration of how these two concepts can be effectively combined. Typical conditions
for the synthesis Pd nanocatalysts begin with reduction of the Pd precursor Na2PdCl4 by
ascorbic acid, in the presence of PVP 12 as a stabiliser and KBr as a surface capping agent.

Chapter 5: Conclusions and Future Work
145
By using varying ratios of these reagents, as well of modification of the temperature and
duration of the synthesis, a number of structurally varied catalysts can be prepared (some
examples are highlighted in Table 15).188
Table 15 Nanoparticle shapes obtained through variation of synthetic conditions.
Entry Reducing agent Capping agent Temp. / °C Particle shape
1 Ascorbic acid - 100 Truncated octahedron
2 - - 100 Hexagonal/triangular plate
3 Ascorbic acid KBr 100 Rod
4 Ascorbic acid KBr 80 Cube
The nanocatalysts could be supported on activated carbon to generate supported particles,189
in order to mimic the operational ease found with commercially available Pd/C, as well as
preventing distortions of the size or morphology of the desired catalyst. With these well-
defined Pd catalysts in hand, a screen of various heterocyclic compounds against the direct
arylation protocols developed in this project could be performed. There is also potential for
site selectivity to be affected in those heterocycles with multiple activated C–H bonds. It
would be remarkable if this site selectivity could be achieved through perceptive choice of
nanocatalyst morphology, providing an important link to the development of rationally-
designed heterogeneous palladium nanocatalysts which can be used to perform differing,
selective transformations.
Finally, the evidence that Pd2(dba)3·CHCl3 238 serves as a competent source of PdNPs raises
the possibility that the activity of these particles can be evaluated (Chapter 4). Aging studies
on 238 could be used to provide PdNPs of different sizes and/or morphologies, the activity
of which could be tested and compared in a model catalytic reaction, in order to gain
important mechanistic insight. Crucially, this would extend the reported equilibrium between
‘L2Pd0’ and ‘L2Pd0(η2-dba)’ to include multinuclear Pd colloids with varying ratios of dba
247 ligand (Figure 47).

Chapter 6: Experimental
146
Chapter 6: Experimental
6.1 General Experimental Details
Solvents and Reagents
Commercially sourced solvents and reagents were purchased from Acros Organics, Alfa
Aesar, Fisher Scientific, Fluorochem, Sigma-Aldrich or VWR and used as received unless
otherwise noted. Petrol refers to the fraction of petroleum ether boiling in the range of 40–60
°C. Dry acetonitrile, dichloromethane, THF and toluene were obtained from a Pure Solv MD-
7 solvent machine and stored under nitrogen. The acetonitrile, dichloromethane and THF
were also degassed by bubbling nitrogen gas through the solvent with sonication. Dry
methanol was obtained by storing over activated 3 Å molecular sieves under nitrogen. Dry
chloroform was obtained by stirring with K2CO3 overnight, then distilling over P2O5 under
N2. Dry acetone was obtained by distilling over K2CO3 under N2. Dry Et3N and DIPEA were
obtained by distillation over potassium hydroxide and stored under nitrogen. Dry DMSO was
purchased from Acros Organics and used as received. Dry, degassed CDCl3 was obtained by
stirring over anhydrous CaH2 for 24 h then using the freeze-pump-thaw method (3 cycles).
This was then distilled at high vacuum (0.03 mm Hg) and stored in a Braun Unilab dry glove
box. Dry, degassed DMSO-d6 was obtained by stirring over activated molecular sieves for 4
days then using the freeze-pump-thaw method (3 cycles). This was then distilled at high
vacuum (0.03 mm Hg) under heating and stored in a Braun Unilab dry glove box.
Typical Conditions
Room temperature (RT) refers to reactions where no thermostatic control was applied and
was recorded as 16–23 °C. Reactions requiring anhydrous or air-free conditions were
performed in dry solvent under an argon or nitrogen atmosphere using oven- or flame-dried
glassware. Nitrogen gas was oxygen-free and dried immediately prior to use by passing
through a column of potassium hydroxide pellets and silica. Where indicated, a Braun Unilab
dry glove box was used (<0.5 ppm O2).
Flash Chromatography
Thin layer chromatography (TLC) analysis was performed using Merck 5554 aluminium
backed silica plates. Spots were visualised by the quenching of ultraviolet light (λmax = 254
nm) then stained and heated with one of p-anisaldehyde or potassium permanganate as
appropriate. Retention factors (Rf) are quoted to two decimal places and reported along with
the solvent system used in parentheses. All flash column chromatography was performed

Chapter 6: Experimental
147
using either Merck 60 or Fluorochem 60 Å silica gel (particle size 40–63 µm) and the solvent
system used is reported in parentheses.
Optical Rotations
Optical rotations were recorded using a digital polarimeter at 20 °C (using the sodium D line,
259 nm) with a path length of 100 mm, with the solvent and concentration used indicated in
the text. The appropriate solvent was used as a background with ten readings taken for each
sample and the average [α]ᴅ values in units of 10−1 deg cm3 g−1 quoted to one decimal place.
Melting Points
Melting points were recorded using a Stuart digital SMP3 machine using a temperature ramp
of 3 °C min-1 and are quoted to the nearest whole number. Where applicable, decomposition
(dec.) is noted.
Nuclear Magnetic Resonance Spectroscopy
All NMR spectra were recorded on either a Jeol ECS400, Jeol ECX400 or Bruker AV500
spectrometer at 298 K, unless otherwise specified. Chemical shifts are reported in parts per
million (ppm) of tetramethylsilane. Coupling constants (J) are reported in Hz and quoted to
±0.5 Hz. Multiplicities are described as singlet (s), doublet (d), triplet (t), quartet (q), quintet
(quin), sextet, (sext), heptet (hept), multiplet (m), apparent (app) and broad (br). Spectra were
processed using MestReNova. Copies of NMR spectra for all compounds are provided in
Appendix 7.
Proton (1H) spectra were typically recorded at 400 MHz. Alternatively and where specified,
spectra were recorded on a Bruker AV500 spectrometer at 500 MHz. Chemical shifts are
internally referenced to residual undeuterated solvent (CHCl3 δH = 7.26 ppm) and given to
two decimal places.
Carbon-13 (13C) spectra were recorded at 101 MHz. Chemical shifts are internally referenced
to residual solvent (CDCl3 δC = 77.16 ppm) and given to one decimal place.
Boron-11 (11B) spectra were recorded at 128 MHz and obtained with 1H decoupling.
Chemical shifts are externally referenced to BF3·OEt2 and given to one decimal place.
Fluorine-19 (19F) spectra were recorded at 376 MHz and obtained with 1H decoupling.
Chemical shifts are externally referenced to CFCl3 and given to one decimal place.
Phosphorus-31 (31P) spectra were recorded at 162 MHz and obtained with 1H decoupling.
Chemical shifts are externally referenced to H3PO4 and given to one decimal place.
Chapter 6: Experimental
148
Mass Spectrometry
Electrospray ionisation (ESI) mass spectrometry was performed using a Bruker Daltronics
micrOTOF spectrometer. Liquid induction field desorption ionisation (LIFDI) mass
spectrometry was performed using a Waters GCT Premier mass spectrometer. Mass to charge
ratios (m/z) are reported in Daltons with percentage abundance in parentheses along with the
corresponding fragment ion, where known. Where complex isotope patterns were observed,
the most abundant ion is reported. High resolution mass spectra (HRMS) are reported with
less than 5 ppm error.
Infrared Spectroscopy
Infrared spectra were recorded using a Bruker Alpha FT-IR spectrometer and were carried
out as ATR. Absorption maxima (νmax) are reported in wavenumbers (cm-1) to the nearest
whole number and described as weak (w), medium (m), strong (s) or broad (br).
UV-Visible Spectroscopy
UV-visible spectroscopy was performed on a Jasco V-560 spectrometer, with a background
taken in the appropriate solvent prior to recording spectra, using a quartz cell with a path
length of 1 cm. The wavelength of maximum absorption (λmax) is reported in nm along with
the extinction coefficient (ε) in mol dm-3 cm-1. Copies of the appropriate absorption spectra
and Beer–Lambert plots are given in Appendix 3.
Gas Chromatography
Gas chromatographic analysis was carried out using a Varian GC-430 gas chromatogram.
Statistical analyses were performed using Microsoft Excel and Origin. Method details and
copies of the appropriate calibration plots are provided in Appendix 5.
Elemental Analysis
Elemental (CHN) analysis was carried out using an Exeter Analytical CE-440 Elemental
Analyser. All values are given as percentages to two decimal places.
X-Ray Crystallography
Diffraction data were collected at 110 K on an Agilent SuperNova diffractometer MoKα
radiation (λ = 0.71073 Å). Data collection, unit cell determination and frame integration were
carried out with CrysalisPro. Absorption coefficients were applied using face indexing and
the ABSPACK absorption correction software within CrysalisPro. Structures were solved
and refined using Olex2190 implementing SHELX algorithms and the Superflip191-193 structure

Chapter 6: Experimental
149
solution program. Structures were solved by charge flipping, Patterson or direct methods and
refined with the ShelXL194 package using full-matrix least squares minimisation. All non-
hydrogen atoms were refined anisotropically. Where applicable, absolute configurations
were established by anomalous dispersion. Resolved structures, crystal data and structural
refinement are provided in Appendix 2.
Transmission Electron Microscopy
Transmission electron microscopy was performed at the Department of Biology Technology
Facility, University of York, using an FEI Technai 12 G2 BioTWIN microscope operating at
120 kV, and images were captured using an SIS Megaview III camera. Samples were
prepared by suspending ca. 1 mg of material in reagent grade ethanol with vigorous shaking,
applying a small amount to a TEM grid, and allowing the solvent to evaporate. The grids
used were 200 mesh copper grids with a Formvar/carbon support film. The resulting images
were enlarged and particle sizes measured manually. Statistical analyses were performed and
histograms drawn using Microsoft Excel 2010 with the Data Analysis ToolPak.
6.2 General Procedures
General Procedure A: Synthesis of aryldiazonium tetrafluoroborates in water129
The appropriate aniline (1 eq.) was dissolved in deionised water and HBF4 (50 wt% in H2O,
2 eq.) before being cooled to 0 °C with stirring. A solution of NaNO2 (1 eq.) in deionised
water was then added dropwise and the mixture was stirred vigorously for 30 min during
which time a precipitate formed. After 30 min this was collected by filtration through a glass
sinter and the solid dissolved in a minimum amount of acetone. Et2O was then added to
precipitate the aryldiazonium tetrafluoroborate which was collected by filtration through a
glass sinter and washed with further Et2O until the filtrate ran clear, then dried in vacuo to
afford the desired compound, which was subsequently stored at −18 °C.
General Procedure B: Synthesis of aryldiazonium tetrafluoroborates in ethanol130
The appropriate aniline (1 eq.) was dissolved in ethanol and HBF4 (50 wt% in H2O, 2 eq.)
before being cooled to 0 °C with stirring. A 90% solution of tert-butylnitrite (2 eq.) was then
added dropwise and the mixture was allowed to warm to room temperature with stirring for
1 h. After 1 h Et2O was added to precipitate the aryldiazonium tetrafluoroborate which was
collected by filtration through a glass sinter and washed with further Et2O until the filtrate
ran clear, then dried in vacuo to afford the desired compound, which was subsequently stored
at −18 °C.

Chapter 6: Experimental
150
General Procedure C: Direct arylation of tryptophan with aryldiazonium salts
To a microwave tube was added tryptophan 74 (50 mg, 0.192 mmol, 1 eq.), the appropriate
aryldiazonium salt (0.192 mmol, 1 eq.), Pd(OAc)2 (2.2 mg, 9.6 μmol, 5 mol%) and EtOAc
(5 mL). The reaction mixture was stirred at RT for 16 h. After 16 h the resulting brown
reaction mixture was filtered through Celite then washed with sat. aq. NaHCO3. The organic
layer was collected and dried over MgSO4, filtered and evaporated to give a brown solid.
When purification was required, it was performed using dry-loaded flash column
chromatography with a SiO2 stationary phase and the solvent system specified for each
compound.
General Procedure D: Kinetic study of the direct arylation of heterocycles
To a microwave vial fitted with magnetic stirrer bar was added diaryliodonium salt 233 (309
mg, 0.84 mmol, 1.4 eq.), Pd catalyst (5 mol%) and EtOH (3 mL). To initiate the reaction,
substrate (0.6 mmol, 1 eq.) was added, the vial sealed with a septum and the reaction stirred
at 60 °C for 24 h in a pre-heated solid heating block. The progress of the reaction was
monitored by GC, using an external standard solution of mesitylene (139 µL in 100 mL
EtOH, 9.975 × 10⁻³ mol dm-3). Sampling was performed by taking 80 µL aliquots, adding
these to an Eppendorf tube containing Celite and centrifuging for 10 min. After 10 min 30
µL of the supernatant layer was removed and diluted with mesitylene standard (0.6 mL). This
sample was then analysed by GC, using an initial temperature of 60 °C (1 min), followed by
a ramp of 30 °C min-1 to 250 °C, giving a total run time of 9.33 min. Three injections were
performed for each data point.
6.3 Synthetic Procedures and Compound Data
Throughout this section, laboratory notebook references are given for the experiment from
which the synthetic procedure is quoted. For experiment references for specific data, see the
relevant NMR spectra in Appendix 7. Known compounds prepared using literature
procedures are indicated with a literature reference next to the compound name. Known
compounds prepared using novel procedures are compared to literature analytical data and
referenced accordingly.

Chapter 6: Experimental
151
Methyl (2S)-2-amino-3-(1H-indol-3-yl)propanoate hydrochloride (135)121
To a round-bottomed flask was added MeOH (50 mL) which was cooled to −15 °C, before
addition of thionyl chloride (4.3 mL, 7.02 g, 59 mmol, 2.4 eq.) dropwise at −15 °C. After
complete addition, ʟ-Tryptophan 73 (5 g, 24.5 mmol, 1 eq.) was added in three portions,
resulting in a white suspension. The mixture was then warmed to RT and stirred for 24 h,
during which time a clear orange solution was formed. Deionised water (5 mL) was added to
the reaction mixture and the solvent evaporated to afford the title compound as an off-white
solid (6.24 g, quant.).
M.P. 205–206 °C dec. (lit.195 214 °C dec.); 1H NMR (400 MHz, CD3OD, δ): 10.61 (br s, 1H),
7.54 (dt, J = 8.0, 1.0 Hz, 1H), 7.40 (dt, J = 8.0, 1.0 Hz, 1H), 7.22 (s, 1H), 7.14 (ddd, J = 8.0,
7.0, 1.0 Hz, 1H), 7.07 (ddd, J = 8.0, 7.0, 1.0 Hz, 1H), 4.33 (dd, J = 7.5, 5.5 Hz, 1H), 3.79 (s,
3H), 3.46 (dd, J = 15.0, 5.5 Hz, 1H), 3.37 (dd, J = 15.0, 7.5 Hz, 1H); 13C NMR (101 MHz,
CD3OD, δ): 170.8, 138.3, 128.2, 125.6, 122.9, 120.3, 118.8, 112.7, 107.4, 54.6, 53.6, 27.5;
ESI–MS m/z (ion, rel. %): 219 ([C12H15N2O2]+, 100); ESI–HRMS m/z: 219.1130
[C12H15N2O2]+ (C12H15N2O2 requires 219.1128); IR (solid-state ATR, cm-1): 3259 (w), 2856
(w, br), 1747 (s), 1501 (m), 1436 (m), 1351 (m), 1210 (m), 1108 (m), 730 (s); Elemental
anal.: C 56.44, H 5.85, N 10.87 (C12H15ClN2O2 requires C 56.58, H 5.94, N 11.00).
Lab book reference number: AJR-8-710
Methyl (2S)-2-acetamido-3-(1H-indol-3-yl)propanoate (74)121
To a two-necked round-bottomed flask fitted with a reflux condenser was added tryptophan
135 (3 g, 13.7 mmol, 1 eq.), Et3N (2 mL, 1.45 g, 14.3 mmol, 1.05 eq.) and THF (150 mL).
The mixture was stirred to give a white suspension before being cooled to 0 °C, then acetic
anhydride (1.4 mL, 1.5 g, 15.1 mmol, 1.1 eq.) was added in one portion. The reaction was
then stirred for 2 h at reflux to give a white suspension. After 2 h this was added to deionised

Chapter 6: Experimental
152
water (150 mL) and extracted into EtOAc (3 × 150 mL). The organic layers were combined
and washed sequentially with 1 M aq. HCl (100 mL), sat. aq. NaHCO3 (100 mL) and brine
(100 mL). The organic layer was collected, dried over MgSO4, filtered and evaporated to
afford the title compound as an off-white solid (2.69 g, 75%).
Rf 0.08 (petrol/EtOAc, 1:1.5, v/v); [α]ᴅ = +41.5 (c 0.10, CHCl3); M.P. 154–155 °C (lit.195
155–156 °C); 1H NMR (400 MHz, CDCl3, δ): 8.27 (s, 1H), 7.53 (dd, J = 8.0, 1.0 Hz, 1H),
7.39–7.33 (m, 1H), 7.19 (ddd, 8.0, 7.0, 1.0 Hz, 1H), 7.12 (ddd, J = 8.0, 7.0, 1.0 Hz, 1H), 6.97
(d, J = 8.0 Hz, 1H), 6.03 (d, J = 8.0 Hz, 1H), 4.96 (dt, J = 8.0, 5.0 Hz, 1H), 3.70 (s, 3H), 3.35
(dd, J = 15.0, 5.0 Hz, 1H), 3.30 (dd, J = 15.0, 5.0 Hz, 1H), 1.95 (s, 3H); 13C NMR (101 MHz,
CDCl3, δ): 172.6, 169.4, 136.1, 127.1, 123.7, 120.1, 118.4, 118.0, 111.5, 109.6, 53.2, 51.8,
27.1, 22.3; ESI–MS m/z (ion, %): 261 ([M+H]+, 5), 283 ([M+Na]+, 100); ESI–HRMS m/z:
283.1053 [M+Na]+ (C14H16N2O3Na requires 283.1053); IR (solid-state, ATR, cm-1): 3405
(w), 3315 (m), 1732 (s), 1661 (s), 1520 (s), 1434 (m), 1220 (s), 1123 (m), 746 (s), 665 (m),
613 (m), 519 (s), 427 (s); Elemental anal.: C 64.34, H 6.23, N 10.47 (C14H16N2O3 requires C
64.60, H 6.20, N 10.76).
Lab book reference number: AJR-8-711
Methyl (2S)-2-acetamido-3-(2-phenyl-1H-indol-3-yl)propanoate (75)
Method A: To a microwave tube was added phenylboronic acid 14 (47 mg, 0.384 mmol, 2
eq.), aryliodonium salt 22 (123 mg, 0.384 mmol, 2 eq.), Pd(OAc)2 (2 mg, 9.6 μmol, 5 mol%)
and AcOH (5 mL). The reaction mixture was stirred at 40 °C for 10 min. To the resulting
orange-brown solution was added tryptophan 74 (50 mg, 0.192 mmol, 1 eq.). The reaction
was stirred at 40°C for 16 h. After 16 h the resulting black reaction mixture was filtered
through Celite and evaporated to give a brown solid. This was dissolved in EtOAc (10 mL)
then washed with sat. aq. NaHCO3. The organic layer was collected, dried over MgSO4,
filtered and evaporated to give a brown solid. Purification by dry-loaded flash column
chromatography (SiO2, petrol/EtOAc, 1:1.5, v/v) afforded the title compound as an off-white
solid (36 mg, 56%).
Method B: To a microwave tube was added tryptophan 74 (50 mg, 0.192 mmol, 1 eq.),
diaryliodonium salt 140 (181 mg, 0.384 mmol, 2 eq.), Pd(OAc)2 (2 mg, 9.6 μmol, 5 mol%)

Chapter 6: Experimental
153
and EtOAc (5 mL). The reaction mixture was stirred at 25 °C for 16 h. After 16 h the resulting
black reaction mixture was filtered through Celite then washed with sat. aq. NaHCO3. The
organic layer was collected and dried over MgSO4, filtered and evaporated to give a brown
solid. Purification by dry-loaded flash column chromatography (SiO2, petrol/EtOAc, 1:1.5,
v/v) afforded the title compound as an off-white solid (55 mg, 85%).
Method C: Synthesised using general procedure C with aryldiazonium salt 48 (37 mg, 0.192
mmol, 1 eq.) to afford the title compound as an off-white solid (65 mg, quant.).
Method D: Synthesised as in method C using Pd(OTs)2(MeCN)2 215 (5.1 mg, 9.6 µmol, 5
mol%) in place of Pd(OAc)2 and a reaction time of 6 h to afford the title compound as an off-
white solid (65 mg, quant.).
Method E: Synthesised as in method D using Pd(OTs)2(MeCN)2 215 (1 mg, 1.92 µmol, 1
mol%) and a reaction time of 16 h to afford the title compound as an off-white solid (65 mg,
quant.).
Method F: To a microwave tube was added tryptophan 74 (52 mg, 0.20 mmol, 1 eq.),
diaryliodonium salt 233 (147 mg, 0.40 mmol, 2 eq.), Pd/C (5 wt%, 21 mg, 10 μmol, 5 mol%)
and EtOH (2 mL). The reaction mixture was stirred at 60 °C for 22 h. After 22 h the reaction
mixture was allowed to cool to RT, then filtered through a silica pad with EtOAc. The solvent
was evaporated and the crude mixture purified by dry-loaded flash column chromatography
(SiO2, petrol/EtOAc, 1:1.5, v/v) afforded the title compound as an off-white solid (57 mg,
85%).
Method G: Synthesised as in method F using Pd/charcoal (5 wt%, 21 mg, 10 μmol, 5 mol%)
in place of Pd/C. Purification by dry-loaded flash column chromatography afforded the title
compound as an off-white solid (66 mg, 98%).
Rf 0.27 (petrol/EtOAc, 1:1.5, v/v); [α]ᴅ = +47.3 (c 0.10, CHCl3); M.P. 83–84 °C (lit.196 85–86
°C); 1H NMR (400 MHz, CDCl3, δ): 8.20 (s, 1H), 7.60–7.54 (m, 3H), 7.51–7.45 (m, 2H),
7.42–7.34 (m, 2H), 7.21 (ddd, J = 8.0, 7.0, 1.0 Hz, 1H), 7.14 (ddd, J = 8.0, 7.0, 1.0 Hz, 1H),
5.79 (d, J = 8.0 Hz, 1H), 4.84 (dt, J = 8.0, 5.0 Hz, 1H), 3.55 (dd, J = 15.0, 5.0 Hz, 1H), 3.52
(dd, J = 15.0, 5.0 Hz, 1H), 3.29 (s, 3H), 1.66 (s, 3H); 13C NMR (101 MHz, (CDCl3, δ): 172.3,
169.8, 136.1, 135.8, 133.3, 129.6, 129.3, 128.9, 128.4, 128.2, 127.4, 122.7, 120.2, 119.0,
111.1, 106.9, 52.9, 52.2, 26.7, 23.0; ESI–MS m/z (ion, %): 337 ([M+H]+, 40), 359 ([M+Na]+,
100); ESI–HRMS m/z: 337.1546 [M+H]+ (C20H21N2O3 requires 337.1547); IR (solid-state
ATR, cm-1): 3272 (w, br), 1735 (m), 1651 (m), 1519 (m), 1436 (m), 1373 (m), 1215 (m), 739
(s), 696 (s), 496 (m); UV–vis (EtOAc, nm): λmax 304 (ε = 17626 mol dm-3 cm-1).

Chapter 6: Experimental
154
Crystals suitable for X-ray diffraction were grown by slow diffusion from a solution of
hexane/Et2O (1:3, v/v).
The analytical data obtained was in accordance with the literature.196
Lab book reference number (method A): AJR-1-82
Lab book reference number (method B): AJR-3-252
Lab book reference number (method C): AJR-4-365
Lab book reference number (method D): AJR-6-596
Lab book reference number (method E): AJR-7-605
Lab book reference number (method F): AJR-8-741
Lab book reference number (method E): AJR-8-759
Deuterium-labelling experiment in the direct arylation of tryptophan (75/d5-75)
To a microwave tube was added d5-phenylboronic acid d5-14 (49 mg, 0.384 mmol, 2 eq.),
aryliodonium salt 22 (123 mg, 0.384 mmol, 2 eq.), Pd(OAc)2 (2 mg, 9.6 μmol, 5 mol%) and
AcOH (5 mL). The reaction mixture was stirred at 40 °C for 10 min. To the resulting orange-
brown solution was added tryptophan 74 (50 mg, 0.192 mmol, 1 eq.). The reaction was stirred
at 40 °C for 16 h. After 16 h the resulting black reaction mixture was filtered through Celite
and evaporated to give a brown solid. This was dissolved in EtOAc (10 mL) then washed
with sat. aq. NaHCO3. The organic layer was collected, dried over MgSO4, filtered and
evaporated to give a brown solid. Purification by dry-loaded flash column chromatography
(SiO2, petrol/EtOAc, 1:1.5, v/v) afforded the two title compounds as inseparable off-white
solids (24 mg, 37%).
Rf 0.27 (petrol/EtOAc, 1:1.5, v/v); ESI–MS m/z (ion, %): 337 ([M+H]+, 8), 342 ([d5-M+H]+,
10), 359 ([M+Na]+, 90), 364 ([d5-M+Na]+, 100); ESI–HRMS m/z: 359.1369 [M+Na]+
(C20H20N2NaO3 requires 359.1366), 364.1681 [d5-M+Na]+ (C20H15D5N2NaO3 requires
364.1680).

Chapter 6: Experimental
155
Lab book reference number: AJR-2-93
(2S)-2-[(2R)-2-[(2S)-2-acetamidopropanamido]-3-(2-phenyl-1H-indol-3-yl)
propanamido]propanoic acid (137)
Method A: To a microwave tube was added peptide 136 (10 mg, 0.026 mmol, 1 eq.),
phenylboronic acid 14 (16 mg, 0.13 mmol, 5 eq.), Cu(OAc)2 (2.8 mg, 0.0156 mmol, 60
mol%), Pd(OAc)2 (1.8 mg, 7.8 µmol, 30 mol%) and AcOH (1 mL). The reaction mixture was
stirred at 40 °C for 16 h. The solvent was removed under reduced pressure to give a brown
residue, which was analysed by HPLC–ESI–MS.
Method B: To a microwave tube was added peptide 136 (10 mg, 0.026 mmol, 1 eq.),
diaryliodonium salt 140 (25 mg, 0.052 mmol, 2 eq.), Pd(OAc)2 (0.6 mg, 2.6 µmol, 10 mol%)
and iPrOH (1 mL). The reaction mixture was stirred at 25 °C for 16 h. The resulting brown
reaction mixture was filtered through Celite with MeOH (5 mL) and the solvent removed
under reduced pressure to give a brown residue, which was analysed by HPLC–ESI–MS.
Method C: To a microwave tube was added peptide 136 (10 mg, 0.026 mmol, 1 eq.),
aryldiazonium salt 48 (10 mg, 0.052 mmol, 2 eq.), Pd(OAc)2 (1.2 mg, 5.2 µmol, 20 mol%)
and iPrOH (1 mL). The reaction mixture was stirred at RT for 16 h. The resulting brown
reaction mixture was filtered through Celite with MeOH (5 mL) and the solvent removed
under reduced pressure to give a brown residue, which was analysed by HPLC–ESI–MS.
ESI–MS m/z (ion, %): 465 ([M+H]+, 100).
Lab book reference number (method A): TJW/7/53/597 (reaction conducted by T. Williams)
Lab book reference number (method B): AJR-6-543
Lab book reference number (method C): AJR-6-539

Chapter 6: Experimental
156
(2S)-2-[(2R)-2-{2-[(2R)-2-acetamido-3-hydroxypropanamido]acetamido}-3-(2-phenyl-
1H-indol-3-yl)propanamido]propanoic acid (139)
Method A: To a microwave tube was added peptide 138 (10 mg, 0.022 mmol, 1 eq.),
phenylboronic acid 14 (13 mg, 0.11 mmol, 5 eq.), Cu(OAc)2 (2.4 mg, 0.0132 mmol, 60
mol%), Pd(OAc)2 (1.5 mg, 0.0066 mmol, 30 mol%) and AcOH (1 mL). The reaction mixture
was stirred at 40 °C for 16 h. The solvent was removed under reduced pressure to give a
brown residue, which was analysed by HPLC–ESI–MS.
Method B: To a microwave tube was added peptide 138 (10 mg, 0.022 mmol, 1 eq.),
diaryliodonium salt 140 (21 mg, 0.044 mmol, 2 eq.), Pd(OAc)2 (0.5 mg, 0.0022 mmol, 10
mol%) and iPrOH (1 mL). The reaction mixture was stirred at 25 °C for 16 h. The resulting
brown reaction mixture was filtered through Celite with MeOH (5 mL) and the solvent
removed under reduced pressure to give a brown residue, which was analysed by HPLC–
ESI–MS.
Method C: To a microwave tube was added peptide 138 (10 mg, 0.022 mmol, 1 eq.),
aryldiazonium salt 48 (8.4 mg, 0.044 mmol, 2 eq.), Pd(OAc)2 (1.0 mg, 4.4 µmol, 20 mol%)
and iPrOH (1 mL). The reaction mixture was stirred at RT for 16 h. The resulting brown
reaction mixture was filtered through Celite with MeOH (5 mL) and the solvent removed
under reduced pressure to give a brown residue, which was analysed by HPLC–ESI–MS.
ESI–MS m/z (ion, %): 538 ([M+H]+, 100).
Lab book reference number (method A): TJW/7/55/598 (reaction conducted by T. Williams)
Lab book reference number (method B): AJR-6-544
Lab book reference number (method C): AJR-6-540

Chapter 6: Experimental
157
Phenyl(2,4,6-trimethylphenyl)iodonium trifluoromethanesulfonate (140)124
Aryliodonium salt 22 (3.22 g, 10 mmol, 1 eq.) and 1,3,5-trimethylbenzene 141 (1.54 mL,
1.32 g, 11 mmol, 1.1 eq.) were added to a round-bottomed flask and dissolved in CH2Cl2 (20
mL) with stirring. The mixture was cooled to 0 °C then trifluoromethanesulfonic acid (0.96
mL, 1.65 g, 11 mmol, 1.1 eq.) was added dropwise with stirring. After complete addition the
reaction was stirred for 2 h over which time it was allowed to warm to RT. After 2 h the
mixture was evaporated to give an orange-white residue to which Et2O was added to
precipitate a white solid. This was filtered through a glass sinter and washed on the filter with
further Et2O until the filtrate ran clear. This was then dried in vacuo at 100 °C to afford the
title compound as a white solid (4.49 g, 95%).
M.P. 149–150 °C (lit.197 147–148 °C); 1H NMR (400 MHz, CDCl3, δ): 7.69 (d, J = 7.5 Hz,
2H), 7.51 (t, J = 7.5 Hz, 1H), 7.39 (t, J = 7.5 Hz, 2H), 7.09 (s, 2H), 2.61 (s, 6H), 2.34 (s, 3H);
13C NMR (101 MHz, CDCl3, δ): 144.5, 142.6, 133.1, 132.4, 131.9, 130.5, 120.5, 111.8, 27.2,
21.2; 19F NMR (376 MHz, CDCl3, δ): −78.2; ESI–MS m/z (ion, %): 323 ([M−OTf]+, 100);
ESI–HRMS m/z: 323.0303 [M−OTf]+ (C15H16I requires 323.0291); IR (solid-state, ATR, cm-
1): 3060 (w), 2919 (w), 1445 (m), 1247 (s), 1222 (s), 1158 (s), 1025 (s), 985 (m), 945 (w),
857 (m), 741 (s), 683 (m), 632 (s), 574 (m), 515 (s), 454 (m); Elemental anal.: C 40.43, H
3.24 (C16H16F3IO3S requires C 40.69, H 3.41).
Lab book reference number: AJR-4-318
Optimisation of the direct arylation of tryptophan
To a microwave tube was added tryptophan 74 (50 mg, 0.192 mmol, 1 eq.), diaryliodonium
salt 140 (181 mg, 0.384 mmol, 2 eq.), Pd(OAc)2 (2 mg, 9.6 μmol, 5 mol%) and solvent (5
mL). The reaction mixture was stirred at 25 °C for 16 h. After 16 h the resulting reaction
mixture was filtered through Celite then washed with sat. aq. NaHCO3. The organic layer
was collected and dried over MgSO4, filtered and evaporated to give a brown solid, which
was subsequently analysed by 1H NMR spectroscopy.

Chapter 6: Experimental
158
Lab book reference number (AcOH): AJR-3-212 (conducted at 40 °C)
Lab book reference number (MeCN): AJR-3-247
Lab book reference number (Acetone): AJR-3-249
Lab book reference number (DCM): AJR-3-248
Lab book reference number (DMF): AJR-4-285
Lab book reference number (DMSO): AJR-3-251
Lab book reference number (1,4-dioxane): AJR-3-260
Lab book reference number (H2O): AJR-3-258
Lab book reference number (MeOH): AJR-3-255
Lab book reference number (EtOH): AJR-3-256
Lab book reference number (iPrOH): AJR-3-261
Methyl (2S)-2-acetamido-3-[2-(2,4,6-trimethylphenyl)-1H-indol-3-yl]propanoate (142)
Method A: Title compound was isolated as an off-white solid side product from the synthesis
of 75 by method B (2 mg, 3%).
Method B: Synthesised using general procedure C (with a reaction time of 24 h) with
aryldiazonium salt 48 (45 mg, 0.192 mmol, 1 eq.). Purification by dry-loaded flash column
chromatography (SiO2, petrol/EtOAc, 1:1, v/v) afforded the title compound as an off-white
solid (60 mg, 83%).
Method C: Synthesised as in method B using Pd(OTs)2(MeCN)2 215 (5.1 mg, 9.6 µmol, 5
mol%) in place of Pd(OAc)2. Purification by dry-loaded flash column chromatography (SiO2,
petrol/EtOAc, 1:1, v/v) afforded the title compound as an off-white solid (55 mg, 75%).
Method D: Reaction conducted as in method C using Pd(OTs)2(MeCN)2 215 (2.5 mg, 4.8
µmol, 2.5 mol%) to afford a crude brown solid. 1H NMR spectroscopic analysis indicated
72% conversion to the title compound, which was not purified.

Chapter 6: Experimental
159
Method E: Reaction conducted as in method C using Pd(OTs)2(MeCN)2 215 (1 mg, 1.92
µmol, 1 mol%) to afford a crude brown solid. 1H NMR spectroscopic analysis indicated 45%
conversion to the title compound, which was not purified.
Rf 0.31 (petrol/EtOAc, 1:1, v/v); [α]ᴅ = +35.2 (c 0.10, CHCl3); M.P. 158–159 °C; 1H NMR
(400 MHz, CDCl3, δ): 7.89 (br s, 1H), 7.61 (m, 1H), 7.37–7.33 (m, 1H), 7.20 (ddd, J = 8.0,
7.0, 1.5 Hz, 1H), 7.14 (ddd, J = 8.0, 7.0, 1.5 Hz, 1H), 6.99 (s, 1H), 6.97 (s, 1H), 5.64 (d, J =
7.5 Hz, 1H), 4.72 (dt, J = 7.5, 5.0 Hz, 1H), 3.47 (s, 3H), 3.17 (dd, J = 15.0, 5.0 Hz, 1H), 3.02
(dd, J = 15.0, 5.0 Hz, 1H), 2.35 (s, 3H), 2.11 (s, 3H), 2.10 (s, 3H), 1.75 (s, 3H); 13C NMR
(101 MHz, (CDCl3, δ): 172.5, 169.9, 138.9, 138.3, 138.2, 135.9, 134.7, 128.8, 122.1, 119.9,
118.8, 110.9, 108.0, 100.1, 53.1, 52.3, 27.2, 23.1, 21.3, 20.4, 20.3; ESI–MS m/z (ion, %): 379
([M+H]+, 40), 401 ([M+Na]+, 100); ESI–HRMS m/z: 379.2015 [M+H]+ (C23H27N2O3 requires
379.2016); IR (solid-state, ATR, cm-1): 3402 (w), 3289 (w, br), 2953 (w), 2919 (w), 2852
(w), 1741 (s), 1646 (s), 1515 (m), 1458 (m), 1435 (s), 1373 (m), 1304 (w), 1293 (w), 1260
(w), 1239 (w), 1218 (s), 1129 (m), 1031 (m), 1012 (m), 987 (w), 854 (m), 798 (m), 744 (s),
591 (m), 505 (s), 445 (m); UV–vis (DMSO, nm): λmax 288 (ε = 15092 mol dm-3 cm-1).
Crystals suitable for X-ray diffraction were grown by overnight diffusion from a solution of
CH2Cl2.
Lab book reference number (method A): AJR-3-252
Lab book reference number (method B): AJR-5-402
Lab book reference number (method C): AJR-7-654
Lab book reference number (method D): AJR-7-647
Lab book reference number (method E): AJR-7-631
Phenyl(2,4,6-tri-iso-propylphenyl)iodonium trifluoromethanesulfonate (143)124
Aryliodonium salt 22 (805 mg, 2.5 mmol, 1 eq.) and 1,3,5-tri-iso-propylbenzene (665 µL,
562 mg, 2.75 mmol, 1.1 eq.) were added to a round-bottomed flask and dissolved in CH2Cl2
(5 mL) with stirring. The mixture was cooled to 0 °C then trifluoromethanesulfonic acid (241
µL, 413 mg, 2.75 mmol, 1.1 eq.) was added dropwise with stirring. After complete addition
the reaction was stirred for 2 h over which time it was allowed to warm to RT. After 2 h the

Chapter 6: Experimental
160
mixture was evaporated to give an orange-white residue to which Et2O was added to
precipitate a white solid. This was filtered through a glass sinter and washed on the filter with
further Et2O until the filtrate ran clear. This was then dried in vacuo at 100 °C to afford the
title compound as a white solid (1.19 g, 86%).
M.P. 177–179 °C (lit.124 169–179 °C); 1H NMR (400 MHz, CDCl3, δ): 7.70–7.65 (m, 2H),
7.58–7.52 (m, 1H), 7.47–7.40 (m, 2H), 7.19 (s, 2H), 3.25 (quin, J = 6.5 Hz, 2H), 2.96 (hept,
J = 7.0 Hz, 1H), 1.26 (dd, J = 15.0, 7.0 Hz, 18H); 13C NMR (101 MHz, CDCl3, δ): 155.9,
152.6, 132.7, 132.1, 125.5, 120.4, 113.0, 39.7, 34.4, 24.4, 23.8; ESI–MS m/z (ion, %): 407
([M−OTf]+, 100); ESI–HRMS m/z: 407.1247 [M−OTf]+ (C21H28I requires 407.1230);
Elemental anal.: C 47.26, H 4.93 (C22H28F3IO3S requires C 47.49, H 5.07).
Lab book reference number: AJR-2-165
Phenyl(2,4,6-trimethylphenyl)iodonium tetrafluoroborate (144)124
Phenylboronic acid 14 (305 mg, 2.5 mmol, 1 eq.) was added to a round-bottomed flask,
dissolved in CH2Cl2 (50 mL) and cooled to 0 °C. BF3·OEt2 (0.3 mL, 390 mg, 2.75 mmol, 1.1
eq.) was added dropwise and the solution stirred for 10 min before addition of a solution of
aryliodonium salt 23 (910 mg, 2.5 mmol, 1 eq.) in CH2Cl2 (10 mL) dropwise over 10 min.
After complete addition the reaction was stirred for 2 h over which time it was allowed to
warm to RT. After 2 h a sat. aq. sodium tetrafluoroborate solution (50 mL) was added and
the solution stirred vigorously for 30 min. After this time the phases were separated and the
aqueous layer extracted twice with CH2Cl2 (2 × 50 mL). The organic layers were combined,
dried over MgSO4, filtered and evaporated to give an off-white solid. The product was
precipitated from a hot CH2Cl2 solution of the crude residue by addition of cold Et2O. This
solid was filtered through a glass sinter and washed with Et2O before being dried in vacuo to
afford the title compound as a white solid (728 mg, 71%).
1H NMR (400 MHz, CDCl3, δ): 7.75–7.65 (m, 2H), 7.62–7.52 (m, 1H), 7.44 (ddt, J = 8.5,
8.0 Hz, 2H), 7.13 (dd, J = 1.5, 1.0 Hz, 2H), 2.63 (s, 6H), 2.37 (s, 3H); 13C NMR (101 MHz,
CDCl3, δ): 145.1, 143.1, 133.0, 132.8, 132.2, 130.8, 118.9, 110.7, 101.0, 27.4, 21.3; 11B NMR
(128 MHz, CDCl3, δ): −2.0; 19F NMR (376 MHz, CDCl3, δ): −147.3 (m, 1JF–10B
, 4F), −147.3
(m, 1JF–11B
, 4F); ESI–MS m/z (ion, %): 323 ([M−BF4]+, 100); ESI–HRMS m/z: 323.0306

Chapter 6: Experimental
161
[M−BF4]+ (C15H16I requires 323.0291); Elemental anal.: C 44.04, H 3.83 (C15H16BF4I
requires C 43.94, H 3.93).
Lab book reference number: AJR-2-158
Phenyl(2,4,6-trimethylphenyl)iodonium hexafluorophosphate (145)124
Phenylboronic acid 14 (305 mg, 2.5 mmol, 1 eq.) was added to a round-bottomed flask,
dissolved in CH2Cl2 (50 mL) and cooled to 0 °C. BF3·OEt2 (0.3 mL, 390 mg, 2.75 mmol, 1.1
eq.) was added dropwise and the solution stirred for 10 min before addition of a solution of
aryliodonium salt 23 (910 mg, 2.5 mmol, 1 eq.) in CH2Cl2 (10 mL) dropwise over 10 min.
After complete addition the reaction was stirred for 2 h over which time it was allowed to
warm to RT. After 2 h a sat. aq. sodium hexafluorophosphate solution (50 mL) was added
and the solution stirred vigorously for 30 min. After this time the phases were separated and
the aqueous layer extracted twice with CH2Cl2 (2 × 50 mL). The organic layers were
combined, dried over MgSO4, filtered and evaporated to give an off-white solid. The product
was precipitated from a hot CH2Cl2 solution of the crude residue by addition of cold Et2O.
This solid was filtered through a glass sinter and washed with Et2O before being dried in
vacuo to afford the title compound as a white solid (443 mg, 38%).
M.P. 182–183 °C ; 1H NMR (400 MHz, (CD3)2SO, δ): 8.03–7.92 (m, 2H), 7.68–7.58 (m, 1H),
7.55–7.45 (m, 2H), 7.22 (s, 2H), 2.60 (s, 6H), 2.29 (s, 3H); 13C NMR (101 MHz, (CD3)2SO,
δ): 143.1, 141.6, 134.5, 131.9, 129.8, 122.6, 114.5, 26.3, 20.5; 19F (376 MHz, (CD3)2SO, δ):
−70.0 (d, 1JF–P = 711.5 Hz); 31P NMR (162 MHz, (CD3)2SO, δ): −143.6 (hept, 1JP–F = 711.5
Hz); ESI–MS m/z (ion, %): 323 ([M−PF6]+, 100); ESI–HRMS m/z: 323.0303 [M−PF6]+
(C15H16I requires 323.0291); IR (solid-state, ATR, cm-1): 1584 (w), 1564 (w), 1470 (w), 1444
(w), 1383 (w), 1302 (w), 982 (w), 825 (s), 732 (m), 677 (w), 648 (w), 556 (s), 448 (w);
Elemental anal.: C 38.70, H 3.28 (C15H16F6IP requires C 38.48, H 3.44).
Lab book reference number: AJR-2-163

Chapter 6: Experimental
162
Phenyl(2,4,6-trimethylphenyl)iodonium hexafluorostibate (146)198
Diaryliodonium trifluoromethanesulfonate salt 140 (945 mg, 2.0 mmol, 1 eq.) was added to
a round-bottomed flask equipped with a magnetic stirrer, dissolved in MeCN (3 mL) and
stirred at RT for 5 min. To this was added a solution of NaSbF6 (1.55 g, 6.0 mmol, 3 eq.) in
deionised water (20 mL) and the resultant mixture stirred vigorously for 30 min at RT. After
30 min CH2Cl2 was added and the phases separated. The aqueous layer was then extracted
three times with CH2Cl2 (3 × 50 mL). The organic layers were combined, dried over MgSO4,
filtered and Et2O added to precipitate a white solid. This solid was filtered through a glass
sinter and washed with Et2O before being dried in vacuo to afford the title compound as a
white solid (1.05 g, 94%).
M.P. 172–173 °C; 1H NMR (400 MHz, (CD3)2SO, δ): 8.02–7.94 (m, 2H), 7.67–7.59 (m, 1H),
7.50 (ddd, J = 8.5, 7.5, 1.5 Hz, 2H), 7.26–7.18 (m, 2H), 2.60 (s, 6H), 2.29 (s, 3H); 13C NMR
(101 MHz, (CD3)2SO, δ): 143.2, 141.6, 134.5, 131.9, 129.8, 122.6, 114.5, 26.3, 20.5; 19F (376
MHz, (CD3)2SO, δ): −77.7; ESI–MS m/z (ion, %): 323 ([M−SbF6]+, 100); ESI–HRMS m/z:
323.0294 [M−SbF6]+ (C15H16I requires 323.0291).
Lab book reference number: AJR-4-338
Counter-ion screen for the direct arylation of tryptophan
To a microwave tube was added tryptophan 74 (50 mg, 0.192 mmol, 1 eq.), the appropriate
diaryliodonium salt (0.384 mmol, 2 eq.), Pd(OAc)2 (2 mg, 9.6 μmol, 5 mol%) and EtOAc (5
mL). The reaction mixture was stirred at 25 °C for 16 h. After 16 h the resulting reaction
mixture was filtered through Celite then washed with sat. aq. NaHCO3. The organic layer
was collected and dried over MgSO4, filtered and evaporated to give a brown solid, which
was subsequently analysed by 1H NMR spectroscopy.
Lab book reference number (−OTf): AJR-3-252
Lab book reference number (−BF4): AJR-3-263

Chapter 6: Experimental
163
Lab book reference number (−PF6): AJR-3-264
Lab book reference number (−SbF6): AJR-4-340
Diphenyliodonium tosylate (132)199
Diphenyliodonium tetrafluoroborate 233 (2.02 g, 5.49 mmol, 1 eq.) was added to a round-
bottomed flask equipped with a magnetic stirrer and dissolved in CH2Cl2 (25 mL). To this
was added a solution of NaOTs (10.7 g, 55 mmol, 10 eq.) in deionised water (50 mL) and the
resultant mixture stirred vigorously for 30 min at RT. After 30 min the phases were separated
and the aqueous layer extracted three times with CH2Cl2. The organic layers were combined
and evaporated, before being redissolved in CH2Cl2 (25 mL). To this was added a solution of
NaOTs (10.7 g, 55 mmol, 10 eq.) in deionised water (50 mL) and the resultant mixture stirred
vigorously for 30 min at RT. After 30 min the phases were separated and the aqueous layer
extracted three times with CH2Cl2. The organic layers were combined and evaporated, then
Et2O was added and the mixture kept at −18 °C overnight. The resultant precipitate was
filtered through a glass sinter and washed with Et2O before being dried in vacuo to afford the
title compound as an off-white solid (1.26 g, 51%).
M.P. 152–155 °C (lit.200 160–161 °C); 1H NMR (400 MHz, (CD3)2SO, δ): 7.93 (d, J = 8.0
Hz, 4H), 7.46 (t, J = 7.5 Hz, 2H), 7.41 (d, J = 8.0 Hz, 2H), 7.30 (t, J = 7.5 Hz, 4H), 6.97 (d,
J = 8.0 Hz, 2H), 2.27 (s, 3H); 13C NMR (101 MHz, (CD3)2SO, δ): 142.7, 139.4, 135.4, 131.6,
131.6, 128.6, 126.0, 115.7, 21.4; ESI–MS m/z (ion, %): 281 ([M−OTs]+, 100); ESI–HRMS
m/z: 280.9827 [M−OTs]+ (C12H10I requires 280.9822).
Lab book reference number: AJR-5-433
Evaluation of Ackermann conditions in the direct arylation of tryptophan
To an oven-dried Schlenk tube equipped with a magnetic stirrer bar was added tryptophan
74 (65 mg, 0.25 mmol, 1 eq.) and diphenyliodonium salt 132 (170 mg, 0.375 mmol, 1.5 eq.).
For entries 3 and 4, Pd(OAc)2 (2.8 mg, 12.5 μmol, 5 mol%) was also added at this stage. The

Chapter 6: Experimental
164
Schlenk tube was then evacuated and backfilled with N2 (3 cycles) for entries 1 and 3; for
entries 2 and 4 it was left open to air. Dry DMF (2 mL) was added and the reaction stirred at
100 °C for 17 h. After 17 h the reaction was allowed to cool to RT, then those reactions
containing Pd(OAc)2 (entries 3 and 4) were filtered through Celite with EtOAc. Deionised
water (5 mL) was added and extracted into EtOAc (2 × 20 mL). The organic layers were then
combined and dried over MgSO4, filtered and evaporated to give a brown solid, which was
subsequently analysed by 1H NMR spectroscopy.
Lab book reference number (entry 1): AJR-5-436
Lab book reference number (entry 2): AJR-5-438
Lab book reference number (entry 3): AJR-5-437
Lab book reference number (entry 4): AJR-5-439
Methyl (2S)-2-[(2S)-2-{[(tert-butoxy)carbonyl]amino}-4-methylpentanamido]-3-(1H-
indol-3-yl)propanoate (149)126
Acid 148 (463 mg, 2 mmol, 1 eq.), amine 135 (560 mg, 2.2 mmol, 1.1 eq.) and DEPBT (718
mg, 2.4 mmol, 1.2 eq.) were added to a round-bottomed flask which was fitted with a septum
and flushed with argon from a balloon for 20 min. After 20 min dry, distilled DIPEA (1.4
mL, 1.03 g, 8 mmol, 4 eq.) and dry CH2Cl2 (20 mL) were added via syringe to give a yellow
solution and the reaction stirred at RT for 2 h. After 2 h the reaction mixture was washed
with sat. aq. NH4Cl and extracted three times with CH2Cl2. The organic layers were
combined, dried over MgSO4, filtered and evaporated to give a crude yellow residue.
Purification by dry-loaded flash column chromatography (SiO2, petrol/EtOAc, 1:1, v/v)
afforded the title compound as an off-white solid (473 mg, 55%).
Rf 0.42 (petrol/EtOAc, 1:1, v/v); 1H NMR (400 MHz, CDCl3, δ): 8.26 (br s, 1H), 7.52 (d, J =
8.0 Hz, 1H), 7.33 (d, J = 8.0 Hz, 1H), 7.17 (td, J = 8.0, 7.5, 1.0 Hz, 1H), 7.10 (td, J = 7.5,
7.1, 1.0 Hz, 1H), 7.05–6.98 (m, 1H), 6.59 (d, J = 8.0 Hz, 1H), 4.95–4.79 (m, 2H), 4.11 (br s,
1H), 3.65 (s, 3H), 3.31 (d, J = 5.0 Hz, 2H), 1.68–1.53 (m, 2H), 1.41 (s, 9H), 0.94–0.80 (m,
5H); 13C NMR (101 MHz, CDCl3, δ): 172.4, 172.2, 155.7, 136.2, 127.7, 123.2, 122.3, 119.7,

Chapter 6: Experimental
165
118.7, 111.4, 109.9, 80.1, 53.3, 53.0, 52.5, 41.5, 28.4, 27.7, 24.8, 23.0, 22.0; ESI–MS m/z
(ion, %): 432 ([M+H]+, 100), 454 ([M+Na]+, 100); ESI–HRMS m/z: 432.2494 [M+H]+
(C23H34N3O5 requires 432.2493).
Lab book reference number: AJR-4-312
Methyl (2S)-2-[(2R)-2-amino-4-methylpentanamido]-3-(1H-indol-3-yl)propanoate
(150)126
To a round-bottomed flask equipped with a magnetic stirrer bar was added N-Boc dipeptide
149 (440 mg, 1.02 mmol, 1 eq.), which was then dissolved in a mixture of CH2Cl2 (8 mL)
and trifluoroacetic acid (2 mL). Anisole (220 µL, 221 mg, 2.04 mmol, 2 eq.) was then added
and the reaction stirred at RT for 2 h, during which time the solution turned dark red. After 2
h the solvent was evaporated to afford a brown solid (338 mg, quant.) which was used in the
next step without further purification or characterisation.
Lab book reference number: AJR-4-316
Methyl (2S)-2-[(2R)-2-[(2S)-2-amino-3-methylbutanamido]-4-methylpentanamido]-3-
(1H-indol-3-yl)propanoate (152)126
Acid 151 (202 mg, 0.93 mmol, 1 eq.), amine 150 (338 mg, 1.02 mmol, 1.1 eq.) and DEPBT
(335 mg, 1.12 mmol, 1.2 eq.) were added to a round-bottomed flask which was fitted with a
septum and flushed with argon from a balloon for 20 min. After 20 min dry, distilled DIPEA
(0.65 mL, 481 mg, 3.72 mmol, 4 eq.) and dry CH2Cl2 (9.3 mL) were added via syringe to
give a yellow solution and the reaction stirred at RT for 2 h. After 2 h the reaction mixture
was washed with sat. aq. NH4Cl and extracted three times with CH2Cl2. The organic layers
were combined, dried over MgSO4, filtered and evaporated to give a crude yellow residue.

Chapter 6: Experimental
166
Purification by dry-loaded flash column chromatography (SiO2, petrol/EtOAc, 1:1, v/v)
afforded the title compound as an off-white solid (266 mg, 54%).
Rf 0.22 (petrol/EtOAc, 1:1, v/v); 1H NMR (400 MHz, CDCl3, δ): 8.44 (br s, 1H), 7.49 (dd, J
= 8.0, 1.0 Hz, 1H), 7.33 (dt, J = 8.0, 1.0 Hz, 1H), 7.16 (ddd, J = 8.0, 7.0, 1.0 Hz, 1H), 7.09
(ddd, J = 8.0, 7.0, 1.0 Hz, 1H), 7.01–6.95 (m, 1H), 6.64 (d, J = 8.0 Hz, 1H), 6.34 (d, J = 8.5
Hz, 1H), 4.98 (d, J = 9.0 Hz, 1H), 4.86 (dt, J = 8.0, 5.5 Hz 1H), 4.46 (td, J = 9.0, 5.5 Hz, 1H),
3.90 (t, J = 7.5 Hz, 1H), 3.65 (s, 3H), 3.29 (dd, J = 5.5, 3.0 Hz, 2H), 2.14–2.01 (m, 1H), 1.69–
1.53 (m, 2H), 1.44 (s, 9H), 0.94–0.76 (m, 11H); 13C NMR (101 MHz, CDCl3, δ): 172.1,
171.8, 171.3, 136.2, 127.6, 123.4, 122.2, 119.7, 118.6, 111.5, 109.6, 80.5, 60.2, 52.8, 52.5,
51.6, 40.8, 30.6, 28.4, 27.6, 24.7, 23.0, 22.0, 19.3, 17.5; ESI–MS m/z (ion, %): 531 ([M+H]+,
60), 553 ([M+Na]+, 100); ESI–HRMS m/z: 553.3010 [M+Na]+ (C28H42N4NaO6 requires
553.2997).
Lab book reference number: AJR-4-317
Methyl (2S)-2-[(2R)-2-[(2S)-2-amino-3-methylbutanamido]-4-methylpentanamido]-3-
(1H-indol-3-yl)propanoate (153)126
To a round-bottomed flask equipped with a magnetic stirrer bar was added N-Boc tripeptide
152 (240 mg, 0.45 mmol, 1 eq.), which was then dissolved in a mixture of CH2Cl2 (3.6 mL)
and trifluoroacetic acid (0.9 mL). Anisole (100 µL, 97 mg, 0.90 mmol, 2 eq.) was then added
and the reaction stirred at RT for 1 h. After 1 h the solvent was evaporated to afford a red
solid (194 mg, quant.) which was used in the next step without further purification or
characterisation.
Lab book reference number: AJR-4-321

Chapter 6: Experimental
167
Methyl (2R)-2-amino-4-methylpentanoate hydrochloride (155)
Thionyl chloride (3.04 mL, 4.98 g, 41.9 mmol, 1.1 eq.) was added dropwise at 0 °C to a
round-bottomed flask containing MeOH (30 mL). ʟ-Leucine 154 (5 g, 38.1 mmol, 1 eq.) was
then added in three portions, resulting in a white suspension. The reaction mixture was
warmed to 40 °C and stirred for 16 h. During this time a clear solution was formed. Water (5
mL) was added to the reaction mixture and the solvent removed under reduced pressure to
afford the title compound as an off-white solid (6.72 g, 97%).
1H NMR (400 MHz, CD3OD, δ): 4.04 (t, J = 6.5 Hz, 1H), 3.84 (s, 3H), 1.87–1.65 (m, 3H),
0.99 (dd, J = 6.0, 4.0 Hz, 6H); 13C NMR (101 MHz, CD3OD, δ): 171.5, 53.8, 52.5, 40.6, 25.5,
22.5, 22.4; ESI–MS m/z (ion, %): 146 ([C7H16NO2]+, 100); ESI–HRMS m/z: 146.1176
[C7H16NO2]+ (C7H16NO2 requires 146.1176).
The analytical data obtained was in accordance with the literature.201
Lab book reference number: AJR-4-320
Methyl (2R)-2-[(2S)-2-{[(tert-butoxy)carbonyl]amino}-4-methylpentanamido]-4-
methylpentanoate (156)126
Acid 148 (1 g, 4.32 mmol, 1 eq.), amine 155 (863 mg, 4.75 mmol, 1.1 eq.) and TBTU (1.66
g, 5.18 mmol, 1.2 eq.) were added to a round-bottomed flask which was fitted with a septum
and flushed with argon from a balloon for 20 min. After 20 min dry, distilled DIPEA (3 mL,
2.2 g, 17.28 mmol, 4 eq.) and dry CH3CN (43 mL) were added via syringe to give a yellow
solution and the reaction stirred at RT for 2 h. After 2 h the reaction mixture was washed
with sat. aq. NH4Cl and extracted three times with CH2Cl2. The organic layers were
combined, dried over MgSO4, filtered and evaporated to give a crude yellow residue.
Purification by dry-loaded flash column chromatography (SiO2, petrol/EtOAc, 1:1, v/v)
afforded the title compound as a white solid (1.37 g, 88%).

Chapter 6: Experimental
168
Rf 0.58 (petrol/EtOAc, 1:1, v/v); 1H NMR (400 MHz, CDCl3, δ): 6.43 (d, J = 8.5 Hz, 1H),
4.93–4.79 (m, 1H), 4.61 (td, J = 8.5, 4.5 Hz, 1H), 4.16–4.02 (m, 1H), 3.72 (s, 3H), 1.73–1.60
(m, 6H), 1.44 (s, 9H), 0.98–0.87 (m, 12H); 13C NMR (101 MHz, CDCl3, δ): 173.3, 173.3,
172.3, 100.1, 52.4, 50.7, 28.4, 24.9, 24.8, 23.0, 21.9; ESI–MS m/z (ion, %): 359 ([M+H]+,
50), 381 ([M+Na]+, 100); ESI–HRMS m/z: 359.2539 [M+H]+ (C18H35N2O5 requires
359.2540).
Lab book reference number: AJR-4-322
(2R)-2-[(2S)-2-[(methoxycarbonyl)amino]-4-methylpentanamido]-4-methylpentanoic
acid (157)126
To a round-bottomed flask equipped with a magnetic stirrer bar was added O-Me dipeptide
156 (800 mg, 2.23 mmol, 1 eq.) and LiOH·H2O (374 mg, 8.92 mmol, 4 eq.). MeOH (22 mL)
was then added and the solution stirred at RT for 16 h. After 16 h the solution was acidified
to pH 1 using 1M HCl, then extracted into CH2Cl2 three times. The organic layers were
combined, dried over MgSO4, filtered and evaporated to afford a white solid (744 mg, 97%),
which was used in the next step without further purification or characterisation.
Lab book reference number: AJR-4-325
Methyl (2S)-2-[(2R)-2-[(2S)-2-[(2R)-2-[(2S)-2-{[(tert-butoxy)carbonyl]amino}-4-
methylpentanamido]-4-methylpentanamido]-3-methylbutanamido]-4-
methylpentanamido]-3-(1H-indol-3-yl)propanoate (158)126
Acid 157 (141 mg, 0.41 mmol, 1 eq.), amine 153 (194 mg, 0.45 mmol, 1.1 eq.) and DEPBT
(147 mg, 0.49 mmol, 1.2 eq.) were added to a round-bottomed flask which was fitted with a
septum and flushed with argon from a balloon for 20 min. After 20 min dry, distilled DIPEA
(0.29 mL, 212 mg, 1.64 mmol, 4 eq.) and dry CH3CN (4.1 mL) were added via syringe to

Chapter 6: Experimental
169
give a yellow solution and the reaction stirred at RT for 2 h. After 2 h the reaction mixture
was washed with sat. aq. NH4Cl and extracted three times with CH2Cl2. The organic layers
were combined, dried over MgSO4, filtered and evaporated to give a crude yellow residue.
Purification by dry-loaded flash column chromatography (SiO2, petrol/EtOAc, 1:3, v/v)
afforded the title compound as a brown solid (209 mg, 67%).
Rf 0.50 (petrol/EtOAc, 1:3, v/v); 1H NMR (400 MHz, CD3OD, δ): 7.50 (dt, J = 8.0, 1.0 Hz,
1H), 7.32 (dt, J = 8.0, 1.0 Hz, 1H), 7.11–7.05 (m, 2H), 7.00 (ddd, J = 8.0, 7.0, 1.0 Hz, 1H),
4.70 (dd, J = 7.5, 6.0 Hz, 1H), 4.45 (ddt, J = 9.0, 6.0, 2.5 Hz, 2H), 4.13–4.04 (m, 2H), 3.63
(s, 2H), 3.28–3.17 (m, 2H), 2.04–1.93 (m, 1H), 1.70–1.50 (m, 9H), 1.46–1.41 (m, 9H), 0.98–
0.79 (m, 24H); 13C NMR (101 MHz, CD3OD, δ): 175.6, 174.5, 174.4, 173.7, 173.3, 157.8,
138.0, 128.7, 124.5, 122.4, 119.8, 119.1, 112.3, 110.4, 80.5, 60.1, 54.8, 54.7, 54.5, 53.2, 52.9,
52.6, 52.6, 42.1, 42.0, 32.1, 30.1, 28.7, 28.5, 25.9, 25.8, 25.7, 23.5, 23.5, 23.4, 22.3, 22.1,
19.8, 19.7, 18.9; ESI–MS m/z (ion, %): 757 ([M+H]+, 7), 775 ([M+NH4]+, 60), 779 ([M+Na]+,
100); ESI–HRMS m/z: 779.4692 [M+Na]+ (C40H64N6NaO8 requires 779.4678).
Lab book reference number: AJR-4-326
Methyl (2S)-2-[(2R)-2-[(2S)-2-[(2R)-2-[(2S)-2-{[(tert-butoxy)carbonyl]amino}-4-
methylpentanamido]-4-methylpentanamido]-3-methylbutanamido]-4-
methylpentanamido]-3-(2-phenyl-1H-indol-3-yl)propanoate (159)
To a microwave tube was added peptide 158 (145 mg, 0.192 mmol, 1 eq.), aryliodonium salt
140 (181 mg, 0.384 mmol, 2 eq.), Pd(OAc)2 (13 mg, 0.058 mmol, 30 mol%) and EtOAc (5
mL). The reaction mixture was stirred at 25 °C for 16 h. After 16 h the resulting black reaction
mixture was filtered through Celite then washed with sat. aq. NaHCO3. The organic layer
was collected and dried over MgSO4, filtered and evaporated to give a brown solid.
The title compound could not be isolated from starting material 158.
ESI–MS m/z (ion, %): 855 ([M+Na]+, 20); ESI–HRMS m/z: 855.4980 [M+Na]+
(C46H68N6NaO8 requires 855.4996).
Lab book reference number: AJR-4-341

Chapter 6: Experimental
170
Methyl (2S)-2-[(2R)-2-{[(tert-butoxy)carbonyl]amino}-4-methylpentanamido]-3-(2-
phenyl-1H-indol-3-yl)propanoate (160)
To a microwave tube was added dipeptide 149 (83 mg, 0.192 mmol, 1 eq.), phenylboronic
acid 14 (47 mg, 0.384 mmol, 2 eq.), Cu(OAc)2 (3.5 mg, 0.0192 mmol, 10 mol%), Pd(OAc)2
(2 mg, 9.6 μmol, 5 mol%) and AcOH (5 mL). The reaction mixture was stirred at 40 °C for
16 h. After 16 h the resulting black reaction mixture was filtered through Celite and the
solvent removed under reduced pressure to give a brown solid. This was dissolved in EtOAc
(10 mL) then washed with sat. aq. NaHCO3. The organic layer was collected, dried over
MgSO4, filtered and evaporated to give a brown solid. Purification by dry-loaded flash
column chromatography (SiO2, petrol/EtOAc, 1.5:1, v/v) afforded the title compound as an
off-white solid (30 mg, 31%).
Rf 0.37 (petrol/EtOAc, 1.5:1, v/v); M.P. 55–58 °C; 1H NMR (400 MHz, CDCl3, δ): 8.24 (br
s, 1H), 7.63–7.54 (m, 3H), 7.51–7.45 (m, 2H), 7.41–7.33 (m, 2H), 7.20 (ddd, J = 8.0, 7.0, 1.0
Hz, 1H), 7.15 (ddd, J = 8.0, 7.0, 1.0 Hz, 1H), 6.35 (d, J = 7.5 Hz, 1H), 4.81 (d, J = 7.5 Hz,
1H), 4.56–4.43 (m, 1H), 3.92 (s, 1H), 3.50 (d, J = 6.0 Hz, 2H), 3.30 (s, 3H), 1.57–1.47 (m,
3H), 1.41 (s, 9H), 0.84 (dd, J = 6.5, 2.5 Hz, 6H); 13C NMR (101 MHz, CDCl3, δ): 172.2,
172.0, 136.0, 135.8, 133.2, 129.7, 129.5, 129.3, 128.4, 128.3, 122.8, 120.2, 119.2, 115.5,
111.1, 52.2, 41.6, 28.4, 27.2, 24.7, 23.2; ESI–MS m/z (ion, %): 508 ([M+H]+, 30), 530
([M+Na]+, 100); ESI–HRMS m/z: 508.2814 [M+H]+ (C29H38N3O5 requires 508.2806); IR
(solid-state, ATR, cm-1): 3395 (m, br), 3312 (m, br), 2956 (m), 2929 (m), 2870 (m), 2028
(w), 1885 (w), 1696 (s), 1659 (s), 1604 (w), 1594 (w), 1501 (s), 1455 (s), 1367 (s), 1248 (m),
1217 (m), 1164 (s), 1047 (w), 1021 (w), 910 (w), 741 (s), 698 (m); UV–vis (DMSO, nm):
λmax 308 (ε = 12870 mol dm-3 cm-1).
Lab book reference number: AJR-4-308

Chapter 6: Experimental
171
Methyl (2S)-2-{[(tert-butoxy)carbonyl]amino}-3-(1H-indol-3-yl)propanoate (161)202
To a round-bottomed flask containing a solution of tryptophan 135 (1 g, 3.9 mmol, 1 eq.) and
K2CO3 (539 mg, 3.9 mmol, 1 eq.) in deionised water (10 mL) was added a solution of di-tert-
butyl dicarbonate (851 mg, 3.9 mmol, 1 eq.) in acetone (10 mL) at 0 °C with stirring. The
solution was stirred for 2 h during which time it was allowed to warm to RT. After 2 h the
acetone was removed under reduced pressure and deionised water added. This was extracted
into EtOAc three times, dried over MgSO4, filtered and evaporated to afford the title
compound as an off-white solid (1.06 g, 85%).
[α]ᴅ = +43.1 (c 0.10, CHCl3); Mp 146–148 °C (lit.203 145–146 °C); 1H NMR (400 MHz,
CDCl3, δ): 8.20 (br s, 1H), 7.55 (d, J = 8.0 Hz, 1H), 7.35 (dt, J = 8.0, 1.0 Hz, 1H), 7.19 (ddd,
J = 8.0, 7.0, 1.0 Hz, 1H), 7.12 (ddd, J = 8.0, 7.0, 1.0 Hz, 1H), 6.99 (d, J = 8.0 Hz, 1H), 5.09
(d, J = 8.0 Hz, 1H), 4.64 (dt, J = 8.0, 5.0 Hz, 1H), 3.68 (s, 3H), 3.31 (dd, J = 15.0, 5.0 Hz,
1H), 3.29 (dd, J = 15.0, 5.0 Hz, 1H), 1.43 (s, 9H); 13C NMR (101 MHz, CDCl3, δ): 172.9,
155.4, 136.3, 127.6, 123.0, 122.1, 119.5, 118.6, 111.4, 109.8, 80.0, 54.3, 52.3, 28.4, 28.0;
ESI–MS m/z (ion, %): 319 ([M+H]+, 14), 341 ([M+Na]+, 100); ESI–HRMS m/z: 341.1465
[M+Na]+ (C17H22N2NaO4 requires 341.1472).
Lab book reference number: AJR-4-337
Methyl (2S)-2-{[(tert-butoxy)carbonyl]amino}-3-(2-phenyl-1H-indol-3-yl)propanoate
(162)
To a microwave tube was added tryptophan 161 (61 mg, 0.192 mmol, 1 eq.), diaryliodonium
salt 140 (181 mg, 0.384 mmol, 2 eq.), Pd(OAc)2 (2 mg, 9.6 μmol, 5 mol%) and EtOAc (5
mL). The reaction mixture was stirred at 25 °C for 16 h. After 16 h the resulting reaction
mixture was filtered through Celite then washed with sat. aq. NaHCO3. The organic layer
was collected and dried over MgSO4, filtered and evaporated to give a brown solid.

Chapter 6: Experimental
172
Attempted purification by dry-loaded flash column chromatography (SiO2, petrol/EtOAc,
1:1, v/v) could not afford the title compound.
Lab book reference number: AJR-4-315
(2S)-2-Acetamido-4-methylpentanoic acid (163)204
To a round-bottomed flask containing ʟ-Leucine 154 (1 g, 7.6 mmol, 1 eq.) was added a
mixture of 1,4-dioxane and deionised water (26 mL, 1:1, v/v) to form a white suspension,
then NaHCO3 (1.28 g, 15.2 mmol, 2 eq.) was added with stirring. Acetic anhydride (0.72 mL,
776 mg, 7.6 mmol, 1 eq.) was added dropwise over 10 min then the reaction was heated to
60 °C to form a clear solution. The solution was stirred at 60 °C for 16 h then evaporated.
The resulting residue was redissolved in deionised water and acidified to pH 1.5 with 1M
HCl. This was extracted into EtOAc three times, dried over MgSO4, filtered and evaporated
to afford the title compound as a white solid (1.11 g, 84%).
1H NMR (400 MHz, CD3OD, δ): 4.48–4.34 (m, 1H), 1.98 (s, 3H), 1.78–1.64 (m, 1H), 1.64–
1.54 (m, 2H), 0.97 (d, J = 6.5 Hz, 3H), 0.93 (d, J = 6.5 Hz, 3H); 13C NMR (101 MHz, CD3OD,
δ): 176.1, 173.4, 52.1, 41.6, 26.1, 23.4, 22.3, 21.8; ESI–MS m/z (ion, %): 174 ([M+H]+, 10),
196 ([M+Na]+, 100); ESI–HRMS m/z: 174.1124 [M+H]+ (C8H16NO3 requires 174.1125);
Elemental anal.: C 55.69, H 8.72, N 8.05 (C8H15NO3 requires C 55.47, H 8.73, N 8.09).
Lab book reference number: AJR-4-309
Methyl (2S)-2-[(2R)-2-acetamido-4-methylpentanamido]-3-(1H-indol-3-yl)propanoate
(164)
Acid 163 (200 mg, 1.15 mmol, 1 eq.), amine 135 (323 mg, 1.27 mmol, 1.1 eq.) and DEPBT
(413 mg, 1.38 mmol, 1.2 eq.) were added to a round-bottomed flask which was fitted with a
septum and flushed with argon from a balloon for 20 min. After 20 min dry, distilled DIPEA

Chapter 6: Experimental
173
(802 µL, 595 mg, 4.60 mmol, 4 eq.) and dry CH2Cl2 (12 mL) were added via syringe to give
a yellow solution and the reaction stirred at RT for 2 h. After 2 h the reaction mixture was
washed with sat. aq. NH4Cl and extracted three times with CH2Cl2. The organic layers were
combined, dried over MgSO4, filtered and evaporated to give a crude yellow residue.
Attempted purification by dry-loaded flash column chromatography (SiO2, EtOAc/MeOH,
98:2, v/v) could not afford the title compound.
Lab book reference number: AJR-4-311
Methyl (2S)-3-(1H-indol-3-yl)-2-(trifluoroacetamido)propanoate (92)
To a round-bottomed flask containing tryptophan 135 (1.27 g, 5 mmol, 1 eq.) was added
triethylamine (0.75 mL, 0.54 g, 5 mmol, 1 eq.) and MeOH (2.5 mL) and the resulting
suspension stirred for 5 min. After 5 min ethyl trifluoroacetate 165 (0.85 mL, 1.01 g, 6.35
mmol, 1.27 eq.) was added and the mixture stirred at RT for 16 h, during which time a clear
solution formed. After 16 h the solvent was evaporated and the resulting residue acidified
with 2M HCl, before being extracted into EtOAc three times. The organic layers were
combined then washed with brine, dried over MgSO4, filtered and evaporated to afford the
title compound as an off-white solid (1.35 g, 90%).
Rf 0.16 (petrol/EtOAc, 3:1, v/v); [α]ᴅ = +50.7 (c 0.10, CHCl3); M.P. 108–109 °C (lit.205 107–
109 °C); 1H NMR (400 MHz, CDCl3, δ): 8.25 (br s, 1H), 7.54–7.47 (m, 1H), 7.36 (dt, J =
8.0, 1.0 Hz, 1H), 7.22 (ddd, J = 8.0, 7.0, 1.0 Hz, 1H), 7.15 (ddd, J = 8.0, 7.0, 1.0 Hz, 1H),
6.96 (d, J = 8.0 Hz, 1H), 6.95 (s, 1H), 4.94 (dt, J = 8.0, 5.0 Hz, 1H), 3.73 (s, 3H), 3.42 (m,
2H); 13C NMR (101 MHz, CDCl3, δ): 170.8, 156.9 (q, 2JC–F = 37.5), 136.2, 127.4, 123.1,
122.6, 120.0, 118.3, 116.3 (q, 1JC–F = 287.0), 111.6, 108.8, 53.5, 53.0, 27.2; 19F NMR (376
MHz, CDCl3, δ): −75.8; ESI–MS m/z (ion, %): 315 ([M+H]+, 50), 332 ([M+NH4]+, 40), 337
([M+Na]+, 100), 353 ([M+K]+, 10); ESI–HRMS m/z: 315.0950 [M+H]+ (C14H14F3N2O3
requires 315.0951).
The analytical data obtained was in accordance with the literature.206
Lab book reference number: AJR-4-343

Chapter 6: Experimental
174
(2R)-4-Methyl-2-(trifluoroacetamido)pentanoic acid (166)
To a round-bottomed flask containing ʟ-Leucine 154 (1 g, 7.6 mmol, 1 eq.) was added
triethylamine (1.06 mL, 769 mg, 7.6 mmol, 1 eq.) and MeOH (7.6 mL) and the resulting
suspension stirred for 5 min. After 5 min ethyl trifluoroacetate 165 (1.13 mL, 1.35 g, 9.5
mmol, 1.25 eq.) was added and the mixture stirred at RT for 16 h, during which time a clear
solution formed. After 16 h the solvent was evaporated and the resulting residue acidified
with 2M HCl, before being extracted into EtOAc three times. The organic layers were
combined then washed with brine, dried over MgSO4, filtered and evaporated to afford the
title compound as an off-white solid (1.67 g, 97%).
[α]ᴅ = +31.6 (c 0.10, CHCl3); M.P. 75–77 °C (lit.207 76–77 °C dec.); 1H NMR (400 MHz,
CD3OD, δ): 4.48 (dd, J = 10.0, 5.0 Hz, 1H), 1.81–1.60 (m, 3H), 0.97 (d, J = 6.0 Hz, 3H), 0.94
(d, J = 6.0 Hz, 3H); 13C NMR (101 MHz, CD3OD, δ):174.4, 158.9 (q, 2JC–F = 38.0 Hz), 117.5
(q, 1JC–F = 287.0 Hz), 52.4, 40.7, 26.1, 23.3, 21.5; 19F NMR (376 MHz, CD3OD, δ): −77.0;
ESI–MS m/z (ion, %): 250 ([M+Na]+, 100); ESI–HRMS m/z: 250.0665 [M+Na]+
(C8H12F3NNaO3 requires 250.0661).
The analytical data obtained was in accordance with the literature.208
Lab book reference number: AJR-4-334
Methyl (2S)-3-(1H-indol-3-yl)-2-[(2R)-4-methyl-2-trifluoroacetamido)pentanamido]
propanoate (167)
Acid 166 (500 mg, 2.2 mmol, 1 eq.), amine 135 (616 mg, 2.42 mmol, 1.1 eq.) and DEPBT
(790 mg, 2.64 mmol, 1.2 eq.) were added to a round-bottomed flask which was fitted with a
septum and flushed with argon from a balloon for 20 min. After 20 min dry, distilled DIPEA
(1.5 mL, 1.14 g, 8.8 mmol, 4 eq.) and dry CH2Cl2 (22 mL) were added via syringe to give a
yellow solution and the reaction stirred at RT for 2 h. After 2 h the reaction mixture was

Chapter 6: Experimental
175
washed with sat. aq. NH4Cl and extracted three times with CH2Cl2. The organic layers were
combined, dried over MgSO4, filtered and evaporated to give a crude yellow residue.
Purification by dry-loaded flash column chromatography (SiO2, petrol/EtOAc, 1:1, v/v)
afforded the title compound as an off-white solid (568 mg, 60%).
Rf 0.48 (petrol/EtOAc, 1:1, v/v); [α]ᴅ = +33.9 (c 0.10, CHCl3); M.P. 129–131 °C; 1H NMR
(400 MHz, CDCl3, δ): 8.19 (br s, 1H), 7.48 (d, J = 8.0 Hz, 1H), 7.36–7.33 (m, 1H), 7.23–
7.08 (m, 2H), 6.98 (d, J = 2.0 Hz, 1H), 6.45 (d, J = 8.0 Hz, 1H), 4.97–4.84 (m, 1H), 4.51–
4.36 (m, 1H), 3.70 (s, 3H), 3.38–3.25 (m, 2H), 1.68 (s, 1H), 1.62–1.41 (m, 3H), 1.29–1.18
(m, 3H), 0.89–0.75 (m, 6H); 19F NMR (376 MHz, CDCl3, δ): −75.6; 13C NMR (101 MHz,
CDCl3, δ): 172.0, 170.4, 157.1 (q, 2JC–F = 37.5 Hz), 136.2, 127.5, 123.3, 122.5, 120.0, 118.4,
116.6 (q, 1JC–F = 288.0 Hz), 111.5, 109.3, 53.2, 52.7, 52.2, 41.5, 27.6, 24.7, 22.7, 22.1; ESI–
MS m/z (ion, %): 428 ([M+H]+, 75), 450 ([M+Na]+, 100); ESI–HRMS m/z: 450.1612
[M+Na]+ (C20H24F3N3NaO4 requires 450.1611); IR (solid-state, ATR, cm-1): 3277 (w, br),
3084 (w), 2959 (w), 2933 (w), 2873 (w), 1714 (s), 1652 (s), 1551 (m), 1439 (m), 1341 (m),
1209 (s), 1184 (s), 1156 (s), 1094 (w), 1010 (w), 988 (w), 742 (s), 719 (m), 652 (m), 632 (m),
521 (m); UV–vis (DMSO, nm): λmax 282 (ε = 5734 mol dm-3 cm-1).
Lab book reference number: AJR-4-344
2-(Trifluoroacetamido)acetic acid (169)
To a round-bottomed flask containing glycine 168 (826 mg, 11 mmol, 1 eq.) was added
triethylamine (1.5 mL, 1.11 g, 11 mmol, 1 eq.) and MeOH (5.5 mL) and the resulting
suspension stirred for 5 min. After 5 min ethyl trifluoroacetate 165 (1.7 mL, 1.99 g, 14 mmol,
1.27 eq.) was added and the mixture stirred at RT for 16 h, during which time a clear solution
formed. After 16 h the solvent was evaporated and the resulting residue acidified with 2M
HCl, before being extracted into EtOAc three times. The organic layers were combined then
washed with brine, dried over MgSO4, filtered and evaporated to afford the title compound
as a white solid (1.68 g, 89%).
M.P. 119–121 °C (lit.209 118–119 °C dec.); 1H NMR (400 MHz, CD3OD, δ): 4.00 (s, 2H);
13C NMR (101 MHz, CD3OD, δ): 171.5, 159.4 (q, 2JC–F = 37.5 Hz), 117.4 (q, 1JC–F = 286.0
Hz), 41.7; 19F NMR (376 MHz, CD3OD, δ): −77.3; ESI–MS m/z (ion, %): 194 ([M+Na]+,
100); ESI–HRMS m/z: 194.0033 [M+Na]+ (C4H4F3NNaO3 requires 194.0035).

Chapter 6: Experimental
176
The analytical data obtained was in accordance with the literature.210
Lab book reference number: AJR-4-342
Methyl (2S)-3-(1H-indol-3-yl)-2-[2-(trifluoroacetamido)acetamido]propanoate (170)
Acid 169 (100 mg, 0.58 mmol, 1 eq.), amine 135 (163 mg, 0.64 mmol, 1.1 eq.) and TBTU
(225 mg, 0.70 mmol, 1.2 eq.) were added to a round-bottomed flask which was fitted with a
septum and flushed with argon from a balloon for 20 min. After 20 min dry, distilled DIPEA
(0.4 mL, 300 mg, 2.32 mmol, 4 eq.) and dry CH3CN (5.8 mL) were added via syringe to give
a yellow solution and the reaction stirred at RT for 2 h. After 2 h the reaction mixture was
washed with sat. aq. NH4Cl and extracted three times with CH2Cl2. The organic layers were
combined, dried over MgSO4, filtered and evaporated to give a crude yellow residue.
Purification by dry-loaded flash column chromatography (SiO2, petrol/EtOAc, 1:3, v/v)
afforded the title compound as an off-white solid (201 mg, 93%).
Rf 0.52 (petrol/EtOAc, 1:3, v/v); [α]ᴅ = +40.7 (c 0.10, CHCl3); M.P. 53–55 °C; 1H NMR (400
MHz, CDCl3, δ): 8.28–8.18 (br s, 1H), 7.50–7.44 (m, 1H), 7.38 (t, J = 5.0 Hz, 1H), 7.30 (dt,
J = 8.0, 1.0 Hz, 1H), 7.18 (ddd, J = 8.0, 7.0, 1.2 Hz, 1H), 7.11 (ddd, J = 8.0, 7.0, 1.0 Hz, 1H),
6.94 (d, J = 2.5 Hz, 1H), 6.57 (d, J = 8.0 Hz, 1H), 4.93 (dt, J = 8.0, 5.5 Hz, 1H), 3.85–3.74
(m, 2H), 3.73 (s, 3H), 3.37–3.24 (m, 2H); 13C NMR (101 MHz, CDCl3, δ): 172.3, 166.8,
157.3 (q, 2JC–F = 38.0 Hz), 136.2, 127.4, 123.2, 122.5, 120.0, 118.3, 116.6 (q, 1JC–F = 287.0
Hz), 111.6, 109.4, 53.2, 52.8, 42.5, 27.5; 19F NMR (376 MHz, CDCl3, δ): −75.6; ESI–MS
m/z (ion, %): 372 ([M+H]+, 10), 394 ([M+Na]+, 100); ESI–HRMS m/z: 394.0988 [M+Na]+
(C16H16F3N3NaO4 requires 394.0985); IR (solid-state, ATR, cm-1): 3391 (m), 3341 (m), 1729
(m), 1704 (s), 1654 (m), 1560 (m), 1532 (m), 1445 (m), 1351 (m), 1215 (s), 1184 (s), 1150
(s), 1005 (m), 968 (m), 742 (s), 608 (s), 536 (s), 428 (s); UV–vis (DMSO, nm): λmax 284 (ε =
10138 mol dm-3 cm-1).
Lab book reference number: AJR-4-345

Chapter 6: Experimental
177
Methyl (2S)-3-(2-phenyl-1H-indol-3-yl)-2-(trifluoroacetamido)propanoate (171)
To a microwave tube was added tryptophan 92 (58 mg, 0.192 mmol, 1 eq.), aryliodonium
salt 140 (181 mg, 0.384 mmol, 2 eq.), Pd(OAc)2 (2 mg, 9.6 µmol, 5 mol%) and EtOAc (5
mL). The reaction mixture was stirred at 25 °C for 16 h. After 16 h the resulting black reaction
mixture was filtered through Celite then washed with sat. aq. NaHCO3. The organic layer
was collected and dried over MgSO4, filtered and evaporated to give a brown solid.
Purification by dry-loaded flash column chromatography (SiO2, petrol/EtOAc, 3:1, v/v)
afforded the title compound as an off-white solid (59 mg, 82%).
Rf 0.32 (petrol/EtOAc, 3:1, v/v); [α]ᴅ = +42.4 (c 0.10, CHCl3); M.P. 155–156 °C; 1H NMR
(400 MHz, CDCl3, δ): 8.15 (br s, 1H), 7.58–7.52 (m, 3H), 7.50 (dd, J = 8.0, 7.0 Hz, 2H),
7.44–7.36 (m, 2H), 7.23 (ddd, J = 8.0, 7.0, 1.0 Hz, 1H), 7.19–7.14 (m, 1H), 6.64 (d, J = 8.0
Hz, 1H), 4.83 (dt, J = 8.0, 5.5 Hz, 1H), 3.61 (dd, J = 5.5, 1.0 Hz, 2H), 3.35 (s, 3H); 13C NMR
(101 MHz, CDCl3, δ): 170.7, 156.7 (q, 2JC–F = 37.5), 136.5, 135.8, 132.6, 129.3, 129.1, 128.5,
128.4, 122.9, 120.4, 118.7, 114.9 (q, 1JC–F = 288.0 Hz), 111.2, 105.6, 53.4, 52.6, 26.5; 19F
NMR (376 MHz, CDCl3, δ): −75.9; ESI–MS m/z (ion, %): 391 ([M+H]+, 10), 408
([M+NH4]+, 35), 413 ([M+Na]+, 100), 429 ([M+K]+, 10); ESI–HRMS m/z: 413.1074
[M+Na]+ (C20H17F3N2NaO3 requires 413.1083).
The analytical data obtained was in accordance with the literature.211
Lab book reference number: AJR-4-346
Methyl (2S)-2-(trifluoroacetamido)-3-[2-(2,4,6-trimethylphenyl)-1H-indol-3-yl]
propanoate (172)
Method A: Title compound was isolated as an off-white solid side product from the synthesis
of 171 (14 mg, 17%).

Chapter 6: Experimental
178
Method B: To a microwave tube was added tryptophan 92 (60 mg, 0.192 mmol, 1 eq.),
aryldiazonium salt 196 (45 mg, 0.192 mmol, 1 eq.), Pd(OAc)2 (2 mg, 9.6 μmol, 5 mol%) and
EtOAc (5 mL). The reaction mixture was stirred at RT for 16 h. After 16 h the resulting
brown reaction mixture was filtered through Celite then washed with sat. aq. NaHCO3. The
organic layer was collected and dried over MgSO4, filtered and evaporated to give a brown
solid. Purification by dry-loaded flash column chromatography (SiO2, petrol/EtOAc, 3:1, v/v)
afforded the title compound as an off-white solid (54 mg, 65%).
Rf 0.42 (petrol/EtOAc, 3:1, v/v); [α]ᴅ = +34.4 (c 0.10, CHCl3); M.P. 58–60 °C; 1H NMR (400
MHz, CDCl3, δ): 8.00 (br s, 1H), 7.59 (dd, J = 8.0, 1.0 Hz, 1H), 7.39–7.34 (m, 1H), 7.22
(ddd, J = 8.0, 7.0, 1.0 Hz, 1H), 7.17 (ddd, J = 8.0, 7.0, 1.0 Hz, 1H), 6.99 (d, J = 2.5 Hz, 2H),
6.58 (d, J = 7.5 Hz, 1H), 4.76 (td, J = 7.0, 5.5 Hz, 1H), 3.50 (s, 3H), 3.26 (dd, J = 15.0, 5.5
Hz, 1H), 3.13 (dd, J = 15.0, 7.0 Hz, 1H), 2.36 (s, 3H), 2.10 (s, 3H), 2.09 (s, 3H); 13C NMR
(101 MHz, CDCl3, δ): 170.8, 157.0 (q, 2JC–F = 38.0 Hz), 139.0, 138.1, 135.9, 135.2, 128.7,
128.3, 128.0, 122.2, 120.0, 118.4 (q, 1JC–F = 288.0 Hz), 111.1, 106.7, 53.5, 52.7, 27.0, 21.2,
20.1; 19F NMR (376 MHz, CDCl3, δ): −75.7; ESI–MS m/z (ion, %): 433 ([M+H]+, 5), 450
([M+NH4]+, 40), 455 ([M+Na]+, 100), 471 ([M+K]+, 5); ESI–HRMS m/z: 455.1547 [M+Na]+
(C23H23F3N2NaO3 requires 455.1553); IR (solid-state, ATR, cm-1): 3391 (w, br), 2955 (w),
2919 (w), 2851 (w), 1712 (s), 1614 (w), 1543 (w), 1458 (m), 1439 (m), 1378 (w), 1344 (w),
1292 (m), 1206 (s), 1163 (s), 1011 (w), 909 (m), 853 (w), 731 (s), 510 (m); UV–vis (DMSO,
nm): λmax 288 (ε = 9725 mol dm-3 cm-1).
Lab book reference number (method A): AJR-4-346
Lab book reference number (method B): AJR-5-427
Methyl (2S)-2-[(2R)-4-methyl-2-(trifluoroacetamido)pentanamido]-3-(2-phenyl-1H-
indol-3-yl)propanoate (173)
Method A: To a microwave tube was added dipeptide 167 (82 mg, 0.192 mmol, 1 eq.),
diaryliodonium salt 140 (181 mg, 0.384 mmol, 2 eq.), Pd(OAc)2 (2 mg, 9.6 µmol, 5 mol%)
and EtOAc (5 mL). The reaction mixture was stirred at 25 °C for 16 h. After 16 h the resulting
black reaction mixture was filtered through Celite then washed with sat. aq. NaHCO3. The
organic layer was collected and dried over MgSO4, filtered and evaporated to give a brown

Chapter 6: Experimental
179
solid. Purification by dry-loaded flash column chromatography (SiO2, petrol/EtOAc, 3:1, v/v)
afforded the title compound as a yellow solid (63 mg, 65%).
Method B: To a microwave tube equipped with magnetic stirrer bar was added dipeptide 167
(43 mg, 0.10 mmol, 1 eq.), diaryliodonium salt 233 (74 mg, 0.20 mmol, 2 eq.), Pd/C (5 wt%,
11 mg, 5 mol%) and AcOH (1 mL). The vial was sealed with a septum and the reaction stirred
at 60 °C for 16 h. After 16 h the reaction mixture was allowed to cool to RT, filtered through
a silica pad with EtOAc and evaporated to give a brown residue, which was subsequently
analysed by 1H NMR spectroscopy.
Rf 0.19 (petrol/EtOAc, 3:1, v/v); [α]ᴅ = +43.8 (c 0.10, CHCl3); M.P. 83–85 °C dec; 1H NMR
(400 MHz, CDCl3, δ): 8.18 (br s, 1H), 7.57–7.53 (m, 3H), 7.49 (ddt, J = 8.0, 6.5, 1.0 Hz, 2H),
7.42–7.35 (m, 2H), 7.25–7.19 (m, 1H), 7.15 (ddd, J = 8.0, 7.0, 1.0 Hz, 1H), 6.91–6.84 (m,
1H), 5.93–5.83 (m, 1H), 4.79 (dq, J = 7.5, 5.5, 5.0 Hz, 1H), 3.96 (td, J = 8.0, 5.0 Hz, 1H),
3.65–3.48 (m, 2H), 3.38 (s, 3H), 1.54–1.34 (m, 3H), 0.82–0.75 (m, 6H); 13C NMR (101 MHz,
CDCl3, δ): 171.7, 170.1, 156.6 (q, 2JC–F = 37.5 Hz), 136.2, 135.8, 132.9, 129.3, 129.2, 129.1,
128.4, 128.3, 128.2, 122.8, 120.2, 118.6 (q, 1JC–F = 287.5 Hz), 111.2, 106.2, 53.3, 52.3, 51.8,
42.0, 26.6, 24.6, 22.7, 22.1; 19F NMR (376 MHz, CDCl3, δ): −72.4; ESI–MS m/z (ion, %):
504 ([M+H]+, 5), 521 ([M+NH4]+, 15), 526 ([M+Na]+, 100), 542 ([M+K]+, 5); ESI–HRMS
m/z: 526.1925 [M+Na]+ (C26H28F3N3NaO4 requires 526.1924); IR (solid-state, ATR, cm-1):
3337 (w, br), 3061 (w), 2958 (w), 2930 (w), 2873 (w), 1715 (m), 1658 (s), 1530 (m), 1448
(m), 1209 (s), 1155 (s), 742 (s), 698 (s); UV–vis (DMSO, nm): λmax 308 (ε = 20467 mol dm-
3 cm-1).
Lab book reference number (method A): AJR-4-348
Lab book reference number (method b): AJR-8-737
Methyl (2S)-2-[(2R)-4-methyl-2-(trifluoroacetamido)pentanamido]-3-[2-(2,4,6-
trimethylphenyl)-1H-indol-3-yl]propanoate (174)
Title compound was isolated as a yellow solid side product from the synthesis of 173 (13 mg,
12%).

Chapter 6: Experimental
180
Rf 0.29 (petrol/EtOAc, 3:1, v/v); [α]ᴅ = +31.1 (c 0.10, CHCl3); 1H NMR (400 MHz, CDCl3,
δ): 7.87 (br s, 1H), 7.61–7.56 (m, 1H), 7.39–7.34 (m, 1H), 7.22 (td, J = 8.0, 7.5, 1.0 Hz, 1H),
7.17 (td, J = 7.5, 1.0 Hz, 1H), 7.03 (d, J = 3.5 Hz, 2H), 6.91–6.85 (m, 1H), 5.67 (d, J = 7.0
Hz, 1H), 4.69 (td, J = 7.5, 4.5 Hz, 1H), 4.19–4.08 (m, 1H), 3.54 (s, 3H), 3.23 (dd, J = 15.0,
5.0 Hz, 1H), 3.01 (dd, J = 15.0, 7.5 Hz, 1H), 2.35 (s, 3H), 2.12 (s, 3H), 2.08 (s, 3H), 1.54–
1.41 (m, 3H), 0.96–0.64 (m, 6H); 13C NMR (101 MHz, CDCl3, δ): 171.8, 170.3, 156.7 (q,
2JC–F = 37.5 Hz), 139.4, 138.3, 137.9, 135.8, 134.7, 129.00, 128.9, 128.4, 128.0, 122.4, 120.1,
118.4, 116.5 (q, 1JC–F = 288.0 Hz), 111.1, 107.6, 53.5, 52.5, 51.8, 42.6, 29.6, 27.1, 24.6, 22.8,
22.3, 21.2, 20.3; 19F NMR (376 MHz, CDCl3, δ): −75.8; ESI–MS m/z (ion, %): 546 ([M+H]+,
2), 563 ([M+NH4]+, 15), 568 ([M+Na]+, 100), 584 ([M+K]+, 2); ESI–HRMS m/z: 568.2384
[M+Na]+ (C29H34F3N3NaO4 requires 568.2394); IR (solid-state, ATR, cm-1): 3391 (w), 3341
(w, br), 2957 (w), 2927 (w), 1710 (m), 1661 (s), 1529 (m), 1458 (m), 1439 (m), 1353 (w),
1210 (s), 1155 (s), 1008 (s), 909 (w), 853 (w), 731 (s); UV–vis (DMSO, nm): λmax 290 (ε =
8712 mol dm-3 cm-1).
Lab book reference number: AJR-4-348
Methyl (2S)-3-(2-phenyl-1H-indol-3-yl)-2-[2-(trifluoroacetamido)acetamido]
propanoate (175)
Method A: To a microwave tube was added dipeptide 170 (71 mg, 0.192 mmol, 1 eq.),
diaryliodonium salt 140 (181 mg, 0.384 mmol, 2 eq.), Pd(OAc)2 (2 mg, 9.6 µmol, 5 mol%)
and EtOAc (5 mL). The reaction mixture was stirred at 25 °C for 16 h. After 16 h the resulting
black reaction mixture was filtered through Celite then washed with sat. aq. NaHCO3. The
organic layer was collected and dried over MgSO4, filtered and evaporated to give a brown
solid. Purification by dry-loaded flash column chromatography (SiO2, petrol/EtOAc, 1.5:1,
v/v) afforded the title compound as an off-white solid (41 mg, 48%).
Method B: To a microwave tube equipped with magnetic stirrer bar was added dipeptide 170
(74 mg, 0.20 mmol, 1 eq.), diaryliodonium salt 233 (147 mg, 0.40 mmol, 2 eq.), Pd/C (5
wt%, 21 mg, 5 mol%) and AcOH (2 mL). The vial was sealed with a septum and the reaction
stirred at 60 °C for 16 h. After 16 h the reaction mixture was allowed to cool to RT, filtered
through a silica pad with EtOAc and evaporated to give a brown residue, which was
subsequently analysed by 1H NMR spectroscopy.

Chapter 6: Experimental
181
Rf 0.28 (petrol/EtOAc, 1.5:1, v/v); [α]ᴅ = +51.0 (c 0.10, CHCl3); M.P. 82–84 °C; 1H NMR
(400 MHz, CDCl3, δ): 8.22 (br s, 1H), 7.55–7.49 (m, 3H), 7.46 (dd, J = 8.0, 7.0 Hz, 2H),
7.40–7.33 (m, 2H), 7.22 (ddd, J = 8.0, 7.0, 1.0 Hz, 1H), 7.12 (ddd, J = 8.0, 7.0, 1.0 Hz, 1H),
6.93 (br s, 1H), 6.00 (d, J = 7.5 Hz, 1H), 4.83 (dt, J = 7.5, 5.0, 1H), 3.70–3.60 (m, 2H), 3.42
(s, 3H), 3.30–3.20 (m, 2H); 13C NMR (101 MHz, CDCl3, δ): 171.6, 166.1, 156.7 (q, 2JC–F =
37.5 Hz), 141.9, 136.3, 135.8, 133.2, 129.4, 129.2, 128.3, 128.3, 128.1, 122.9, 120.3, 118.7,
114.9 (q, 1JC–F = 287.0 Hz), 111.2, 106.2, 53.3, 52.6, 42.0, 26.3; 19F NMR (376 MHz, CDCl3,
δ): −75.7; ESI–MS m/z (ion, %): 470 ([M+Na]+, 100); ESI–HRMS m/z: 470.1292 [M+Na]+
(C22H20F3N3NaO4 requires 470.1298); IR (solid-state, ATR, cm-1): 3340 (w, br), 3061 (w),
2954 (w), 2930 (w), 1722 (m), 1666 (m), 1528 (m), 1441 (m), 1351 (m), 1211 (s), 1153 (s),
1074 (w), 1004 (m), 908 (m), 730 (m), 698 (s), 515 (s); UV–vis (DMSO, nm): λmax 308 (ε =
20684 mol dm-3 cm-1).
Lab book reference number (method A): AJR-4-349
Lab book reference number (method B): AJR-8-736
Methyl (2S)-2-[2-(trifluoroacetamido)acetamido]-3-[2-(2,4,6-trimethylphenyl)-1H-
indol-3-yl]propanoate (176)
Method A: Title compound was isolated as an off-white solid side product from the synthesis
of 175 (4 mg, 4%).
Method B: To a microwave tube was added dipeptide 170 (71 mg, 0.192 mmol, 1 eq.),
aryldiazonium salt 196 (45 mg, 0.192 mmol, 1 eq.), Pd(OAc)2 (2 mg, 9.6 μmol, 5 mol%) and
EtOAc (5 mL). The reaction mixture was stirred at RT for 24 h. After 24 h the resulting
brown reaction mixture was filtered through Celite then washed with sat. aq. NaHCO3. The
organic layer was collected and dried over MgSO4, filtered and evaporated to give a brown
solid. Purification by dry-loaded flash column chromatography (SiO2, petrol/EtOAc, 1:1, v/v)
afforded the title compound as an off-white solid (43 mg, 46%).
Rf 0.57 (petrol/EtOAc, 1:1, v/v); [α]ᴅ = +33.3 (c 0.10, CHCl3); M.P. 90–92 °C; 1H NMR (400
MHz, CDCl3, δ): 7.87 (br s, 1H), 7.56 (dd, J = 8.0, 1.0 Hz, 1H), 7.36 (dt, J = 8.0, 1.0 Hz, 1H),
7.22 (ddd, J = 8.0, 7.0, 1.0 Hz, 1H), 7.16 (ddd, J = 8.0, 7.0, 1.0 Hz, 1H), 7.05–7.00 (m, 2H),
6.89 (d, J = 1.0 Hz, 1H), 5.74 (d, J = 7.5 Hz, 1H), 4.76 (dt, J = 7.5, 5.5 Hz, 1H), 3.74 (dd, J

Chapter 6: Experimental
182
= 17.0, 4.5 Hz, 1H), 3.57 (dd, J = 17.0, 4.5 Hz, 1H), 3.50 (s, 3H), 3.18 (d, J = 5.5 Hz, 2H),
2.36 (s, 3H), 2.14 (s, 3H), 2.10 (s, 3H); 13C NMR (101 MHz, CDCl3, δ): 171.7, 166.2, 156.0
(q, 2JC–F = 37.5 Hz), 139.3, 138.2, 138.1, 135.8, 134.7, 128.9, 128.8, 128.6, 128.6, 122.3,
120.0, 118.4, 115.7 (q, 1JC–F = 287.0 Hz), 111.1, 107.4, 53.5, 52.5, 42.1, 27.0, 21.2, 20.3, 20.2;
19F NMR (376 MHz, CDCl3, δ): −75.7; ESI–MS m/z (ion, %): 512 ([M+Na]+, 100); ESI–
HRMS m/z: 512.1773 [M+Na]+ (C25H26F3N3NaO4 requires 512.1768); IR (solid-state, ATR,
cm-1): 3339 (w, br), 2959 (w), 2919 (w), 2850 (w), 1718 (m), 1670 (m), 1523 (m), 1458 (m),
1437 (m), 1260 (s), 1157 (s), 1006 (m), 853 (m), 800 (m), 744 (s), 517 (m); UV–vis (DMSO,
nm): λmax 288 (ε = 12188 mol dm-3 cm-1).
Lab book reference number (method A): AJR-4-349
Lab book reference number (method B): AJR-5-429
Benzenediazonium tetrafluoroborate (48)
Method A: Synthesised using general procedure A from phenylamine 177 (0.91 mL, 931 mg,
10 mmol, 1 eq.) in deionised water (5.5 mL) to afford the title compound as a white solid
(1.25 g, 65%).
Method B: Synthesised using general procedure B from phenylamine 177 (0.91 mL, 931 mg,
10 mmol, 1 eq.) in EtOH (3 mL) to afford the title compound as a white solid (1.92 g, quant.).
M.P. 103–105 °C (lit.212 101 °C dec.); 1H NMR (400 MHz, (CD3)2SO, δ): 8.67 (dd, J = 8.5,
1.0 Hz, 2H), 8.26 (tt, J = 7.5, 1.0 Hz, 1H), 7.98 (ddt, J = 8.5, 7.5, 1.0 Hz, 2H); 13C NMR (101
MHz, (CD3)2SO, δ): 140.8, 132.7, 131.2, 116.1; 11B NMR (128 MHz, (CD3)2SO, δ): −2.3;
19F NMR (376 MHz, (CD3)2SO, δ): −148.1 (m, 1JF–10B
, 4F), −148.1 (m, 1JF–11B
, 4F); ESI–MS
m/z (ion, %): 105 ([M−BF4]+, 100); ESI–HRMS m/z: 105.0480 [M−BF4]+ (C6H5N2 requires
105.0447).
The analytical data obtained was in accordance with the literature.212
Lab book reference number (Method A): AJR-4-360
Lab book reference number (Method B): LAH-1-78 (reaction conducted by A. Hammarback)

Chapter 6: Experimental
183
4-Methylbenzene-1-diazonium tetrafluoroborate (192)
Synthesised using general procedure B from 4-amino-1-methylbenzene 178 (1.07 g, 10
mmol, 1 eq.) in EtOH (3 mL) to afford the title compound as a white solid (1.78 g, 86%).
M.P. 106–107 °C (lit.213 101–102 °C); 1H NMR (400 MHz, (CD3)2SO, δ): 8.58–8.51 (m, 2H),
7.83–7.75 (m, 2H), 2.57 (s, 3H); 13C NMR (101 MHz, (CD3)2SO, δ): 153.94, 132.7, 131.8,
112.0, 22.4; 11B NMR (128 MHz, (CD3)2SO, δ): −2.3; 19F NMR (376 MHz, (CD3)2SO, δ):
−148.0 (m, 1JF–10B, 4F), −148.1 (m, 1JF–11B, 4F); ESI–MS m/z (ion, %): 119 ([M−BF4]+, 100);
ESI–HRMS m/z: 119.0603 [M−BF4]+ (C7H7N2 requires 119.0604).
The analytical data obtained was in accordance with the literature.213
Lab book reference number: THS-1-3 (reaction conducted by T. Sheridan)
4-tert-butylbenzene-1-diazonium tetrafluoroborate (193)
Synthesised using general procedure B from 4-tert-butylaniline 179 (0.8 mL, 746 mg, 5
mmol, 1 eq.) in EtOH (1.5 mL) to afford the title compound as a white solid (963 mg, 78%).
M.P. 93–94 °C (lit.214 91 °C); 1H NMR (400 MHz, (CD3)2SO, δ): 8.62–8.56 (m, 2H), 8.06–
8.00 (m, 2H), 1.35 (s, 9H); 13C NMR (101 MHz, (CD3)2SO, δ): 165.5, 132.8, 128.5, 112.2,
36.5, 30.2; 11B NMR (128 MHz, (CD3)2SO, δ): −2.3; 19F NMR (376 MHz, (CD3)2SO, δ):
−148.1 (m, 1JF–10B, 4F), −148.1 (m, 1JF–11B, 4F); ESI–MS m/z (ion, %): 161 ([M−BF4]+, 100);
ESI–HRMS m/z: 161.1070 [M−BF4]+ (C10H13N2 requires 161.1073).
The analytical data obtained was in accordance with the literature.214
Lab book reference number: AJR-8-716

Chapter 6: Experimental
184
1-Naphthalene-1-diazonium tetrafluoroborate (194)
Synthesised using general procedure B from 1-naphthylamine 180 (0.48 g, 3.33 mmol, 1 eq.)
in EtOH (1.7 mL) to afford the title compound as a brown solid (0.75 g, 93%).
M.P. 104–106 °C (lit.215 105–107 °C); 1H NMR (400 MHz, (CD3)2SO, δ): 9.20 (dd, J = 8.0,
1.0 Hz, 1H), 8.94 (dt, J = 8.5, 1.0 Hz, 1H), 8.51 (dq, J = 8.5, 1.0 Hz, 1H), 8.43 (ddd, J = 8.0,
1.0, 0.5 Hz, 1H), 8.12 (ddd, J = 8.5, 7.0, 1.5 Hz, 1H), 8.06 (t, J = 8.0 Hz, 1H), 7.97 (ddd, J =
8.0, 7.0, 1.0 Hz, 1H); 13C NMR (101 MHz, (CD3)2SO, δ): 142.6, 137.2, 132.6, 132.2, 130.3,
129.9, 127.1, 126.4, 122.4, 111.1; 11B NMR (128 MHz, (CD3)2SO, δ): −2.3; 19F NMR (376
MHz, (CD3)2SO, δ): −148.1 (m, 1JF–10B, 4F), −148.1 (m, 1JF–11B, 4F); ESI–MS m/z (ion, %):
155 ([M−BF4]+, 100); ESI–HRMS m/z: 155.0607 [M−BF4]+ (C10H7N2 requires 155.0604).
The analytical data obtained was in accordance with the literature.216
Lab book reference number: LAH-1-39 (reaction conducted by A. Hammarback)
4-Phenylbenzene-1-diazonium tetrafluoroborate (195)
Synthesised using general procedure B from 4-phenylaniline 181 (846 mg, 5 mmol, 1 eq.) in
EtOH (1.5 mL) to afford the title compound as a brown solid (870 mg, 65%).
M.P. 118–119 °C (lit.217 111–112 °C); 1H NMR (400 MHz, (CD3)2SO, δ): 8.76–8.70 (m, 2H),
8.36–8.29 (m, 2H), 7.95–7.88 (m, 2H), 7.65–7.56 (m, 3H); 13C NMR (101 MHz, (CD3)2SO,
δ): 151.5, 136.4, 133.5, 130.8, 129.6, 129.0, 128.0, 113.3; 11B NMR (128 MHz, (CD3)2SO,
δ): −2.3; 19F NMR (376 MHz, (CD3)2SO, δ): −148.1 (m, 1JF–10B, 4F), −148.1 (m, 1JF–11B, 4F);
EI–MS m/z (ion, %): 154 ([M−BF4−N2]+, 100); EI–HRMS m/z: 154.0782 [M−BF4−N2]+
(C12H10 requires 154.0783).
The analytical data obtained was in accordance with the literature.218
Lab book reference number: AJR-8-717

Chapter 6: Experimental
185
2,4,6-Trimethylbenzene-1-diazonium tetrafluoroborate (196)
Method A: Synthesised using general procedure A from 2,4,6-trimethylphenylamine 182 (1.4
mL, 1.35 g, 10 mmol, 1 eq.) in deionised water (5.5 mL) to afford the title compound as a
white solid (1.09 g, 47%).
Method B: Synthesised using general procedure B from 2,4,6-trimethylphenylamine 182 (1.4
mL, 1.35 g, 10 mmol, 1 eq.) in EtOH (3 mL) to afford the title compound as a white solid
(2.34 g, quant.).
M.P. 84–85 °C; 1H NMR (400 MHz, (CD3)2SO, δ): 7.40 (s, 2H), 2.57 (s, 6H), 2.39 (s, 3H);
13C NMR (101 MHz, (CD3)2SO, δ): 153.4, 143.7, 130.7, 112.0, 22.1, 18.1; 11B NMR (128
MHz, (CD3)2SO, δ): −2.3; 19F NMR (376 MHz, (CD3)2SO, δ): −148.1 (m, 1JF–10B
, 4F), −148.2
(m, 1JF–11B
, 4F); ESI–MS m/z (ion, %): 147 ([M−BF4]+, 100); ESI–HRMS m/z: 147.0916
[M−BF4]+ (C9H11N2 requires 147.0917).
The analytical data obtained was in accordance with the literature.219
Lab book reference number (Method A): AJR-5-376
Lab book reference number (Method B): LAH-1-38 (reaction conducted by A. Hammarback)
4-Methoxybenzene-1-diazonium tetrafluoroborate (197)
Method A: Synthesised using general procedure A from 4-methoxyaniline 183 (1.23 g, 10
mmol, 1 eq.) in deionised water (5.5mL) to afford the title compound as a white solid (182
mg, 8%).
Method B: Synthesised using general procedure B from 4-methoxyaniline 183 (1.23 g, 10
mmol, 1 eq.) in EtOH (3 mL) to afford the title compound as a white solid (2.16 g, 98%).
M.P. 145–147 °C (lit.220 143 °C); 1H NMR (400 MHz, (CD3)2SO, δ): 8.64–8.58 (m, 2H),
7.51–7.45 (m, 2H), 4.04 (s, 3H); 13C NMR (101 MHz, (CD3)2SO, δ): 168.8, 136.2, 117.3,
103.4, 57.5; 11B NMR (128 MHz, (CD3)2SO, δ): −2.3; 19F NMR (376 MHz, (CD3)2SO, δ):

Chapter 6: Experimental
186
−148.1 (m, 1JF–10B
, 4F), −148.1 (m, 1JF–11B
, 4F); ESI–MS m/z (ion, %): 135 ([M−BF4]+, 100);
ESI–HRMS m/z: 135.0548 [M−BF4]+ (C7H7N2O requires 135.0553).
The analytical data obtained was in accordance with the literature.212
Lab book reference number (Method A): AJR-5-406
Lab book reference number (Method B): LAH-1-34 (reaction conducted by A. Hammarback)
4-Phenoxybenzene-1-diazonium tetrafluoroborate (198)
Synthesised using general procedure B from 4-phenoxyaniline 184 (1.85 g, 10 mmol, 1 eq.)
in EtOH (3 mL) to afford the title compound as an off-white solid (2.71 g, 95%).
M.P. 167–170 °C (lit.213 177–178 °C); 1H NMR (400 MHz, (CD3)2SO, δ): 8.67–8.60 (m, 2H),
7.61–7.54 (m, 2H), 7.45–7.37 (m, 3H), 7.33–7.27 (m, 2H); 13C NMR (101 MHz, (CD3)2SO,
δ): 167.1, 152.7, 136.6, 131.0, 126.9, 121.0, 118.7, 106.0; 11B NMR (128 MHz, (CD3)2SO,
δ): −2.3; 19F NMR (376 MHz, (CD3)2SO, δ): −148.1 (m, 1JF–10B, 4F), −148.1 (m, 1JF–11B, 4F);
ESI–MS m/z (ion, %): 197 ([M−BF4]+, 100); ESI–HRMS m/z: 197.0706 [M−BF4]+
(C12H9N2O requires 197.0709).
The analytical data obtained was in accordance with the literature.213
Lab book reference number: AJR-8-722
4-Fluorobenzene-1-diazonium tetrafluoroborate (199)
Method A: Synthesised using general procedure A from 4-aminofluorobenzene 185 (0.95 mL,
1.11 g, 10 mmol, 1 eq.) in deionised water (5.5 mL) to afford the title compound as a white
solid (1.10 g, 52%).
Method B: Synthesised using general procedure B from 4-aminofluorobenzene 185 (0.95 mL,
1.11 g, 10 mmol, 1 eq.) to afford the title compound as a white solid (2.05 g, 98%).
M.P. 164–165 °C (lit.212 161–162 °C); 1H NMR (400 MHz, (CD3)2SO, δ): 8.83–8.77 (m, 2H),
7.93–7.85 (m, 2H); 13C NMR (101 MHz, (CD3)2SO, δ): 168.4 (d, J = 267.0 Hz), 137.0 (d, J

Chapter 6: Experimental
187
= 12.0 Hz), 119.4 (d, J = 25 .0 Hz), 111.9 (d, J = 3.0 Hz); 11B NMR (128 MHz, (CD3)2SO,
δ): −2.3; 19F NMR (376 MHz, (CD3)2SO, δ): −87.1, −148.0 (m, 1JF–10B
, 4F), −148.1 (m, 1JF–
11B, 4F); ESI–MS m/z (ion, %): 123 ([M−BF4]+, 100); ESI–HRMS m/z: 123.0353 [M−BF4]+
(C6H4FN2 requires 123.0353).
The analytical data obtained was in accordance with the literature.212
Lab book reference number (Method A): AJR-5-415
Lab book reference number (Method B): LAH-1-25 (reaction conducted by A. Hammarback)
4-Bromobenzene-1-diazonium tetrafluoroborate (200)
Method A: Synthesised using general procedure A from 4-aminobromobenzene 186 (1.72 g,
10 mmol, 1 eq.) in deionised water (5.5 mL) to afford the title compound as a white solid
(887 mg, 33%).
Method B: Synthesised using general procedure B from 4-aminobromobenzene 186 (1.72 g,
10 mmol, 1 eq.) in EtOH (3 mL) to afford the title compound as a white solid (2.52 g, 93%).
M.P. 138–140 °C (lit.213 138 °C dec.); 1H NMR (400 MHz, (CD3)2SO, δ): 8.60–8.55 (m, 2H),
8.29–8.24 (m, 2H); 13C NMR (101 MHz, (CD3)2SO, δ): 136.6, 134.5, 134.0, 115.2; 11B NMR
(128 MHz, (CD3)2SO, δ): −2.3; 19F NMR (376 MHz, (CD3)2SO, δ): −148.1 (m, 1JF–10B
, 4F),
−148.2 (m, 1JF–11B
, 4F); ESI–MS m/z (ion, %): 183 ([M−BF4]+, 100); ESI–HRMS m/z:
182.9556 [M−BF4]+ (C6H4BrN2 requires 182.9552).
The analytical data obtained was in accordance with the literature.212
Lab book reference number (Method A): AJR-5-373
Lab book reference number (Method B): LAH-1-23 (reaction conducted by A. Hammarback)

Chapter 6: Experimental
188
3-Bromobenzene-1-diazonium tetrafluoroborate (201)
Method A: Synthesised using general procedure A from 3-aminobromobenzene 187 (1.09
mL, 1.72 g, 10 mmol, 1 eq.) in deionised water (5.5 mL) to afford the title compound as a
white solid (1.18 g, 44%).
Method B: Synthesised using general procedure B from 3-aminobromobenzene 187 (1.09
mL, 1.72 g, 10 mmol, 1 eq.) in EtOH (3 mL) to afford the title compound as a white solid
(2.71 g, quant.).
M.P. 140–142 °C (lit.213 145 °C); 1H NMR (400 MHz, (CD3)2SO, δ): 8.96 (dd, J = 2.0, 2.0
Hz, 1H), 8.69 (ddd, J = 8.5, 2.0, 1.0 Hz, 1H), 8.49 (ddd, J = 8.5, 2.0, 1.0 Hz, 1H), 7.92 (dd,
J = 8.5, 8.5 Hz, 1H); 13C NMR (101 MHz, (CD3)2SO, δ): 143.8, 134.3, 132.8, 131.9, 122.3,
117.8; 11B NMR (128 MHz, (CD3)2SO, δ): −2.3; 19F NMR (376 MHz, (CD3)2SO, δ): −148.0
(m, 1JF–10B
, 4F), −148.0 (m, 1JF–11B
, 4F); ESI–MS m/z (ion, %): 183 ([M−BF4]+, 100); ESI–
HRMS m/z: 182.9548 [M−BF4]+ (C6H4BrN2 requires 182.9552).
The analytical data obtained was in accordance with the literature.213
Lab book reference number (Method A): AJR-5-390
Lab book reference number (Method B): LAH-1-31 (reaction conducted by A. Hammarback)
4-Chlorobenzene-1-diazonium tetrafluoroborate (202)
Method A: Synthesised using general procedure A from 4-aminochlorobenzene 188 (1.28 g,
10 mmol, 1 eq.) in deionised water (5.5 mL) to afford the title compound as a white solid
(556 mg, 25%).
Method B: Synthesised using general procedure B from 4-aminochlorobenzene 188 (1.28 g,
10 mmol, 1 eq.) in EtOH (3 mL) to afford the title compound as a white solid (2.15 g, 95%).
M.P. 138–139 °C (lit.212 134 °C dec.); 1H NMR (400 MHz, (CD3)2SO, δ): 8.73–8.64 (m, 2H),
8.15–8.07 (m, 2H); 13C NMR (101 MHz, (CD3)2SO, δ): 146.5, 134.4, 131.6, 114.8; 11B NMR
(128 MHz, (CD3)2SO, δ): −2.3; 19F NMR (376 MHz, (CD3)2SO, δ): −148.0 (m, 1JF–10B, 4F),
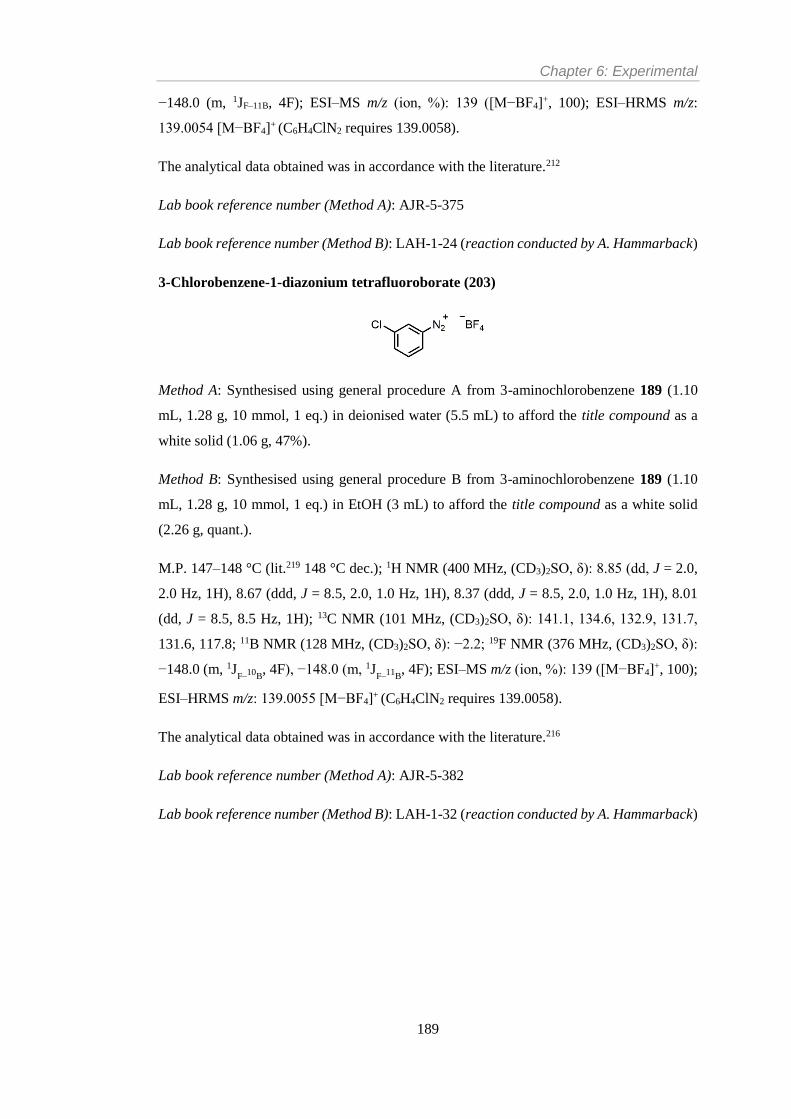
Chapter 6: Experimental
189
−148.0 (m, 1JF–11B, 4F); ESI–MS m/z (ion, %): 139 ([M−BF4]+, 100); ESI–HRMS m/z:
139.0054 [M−BF4]+ (C6H4ClN2 requires 139.0058).
The analytical data obtained was in accordance with the literature.212
Lab book reference number (Method A): AJR-5-375
Lab book reference number (Method B): LAH-1-24 (reaction conducted by A. Hammarback)
3-Chlorobenzene-1-diazonium tetrafluoroborate (203)
Method A: Synthesised using general procedure A from 3-aminochlorobenzene 189 (1.10
mL, 1.28 g, 10 mmol, 1 eq.) in deionised water (5.5 mL) to afford the title compound as a
white solid (1.06 g, 47%).
Method B: Synthesised using general procedure B from 3-aminochlorobenzene 189 (1.10
mL, 1.28 g, 10 mmol, 1 eq.) in EtOH (3 mL) to afford the title compound as a white solid
(2.26 g, quant.).
M.P. 147–148 °C (lit.219 148 °C dec.); 1H NMR (400 MHz, (CD3)2SO, δ): 8.85 (dd, J = 2.0,
2.0 Hz, 1H), 8.67 (ddd, J = 8.5, 2.0, 1.0 Hz, 1H), 8.37 (ddd, J = 8.5, 2.0, 1.0 Hz, 1H), 8.01
(dd, J = 8.5, 8.5 Hz, 1H); 13C NMR (101 MHz, (CD3)2SO, δ): 141.1, 134.6, 132.9, 131.7,
131.6, 117.8; 11B NMR (128 MHz, (CD3)2SO, δ): −2.2; 19F NMR (376 MHz, (CD3)2SO, δ):
−148.0 (m, 1JF–10B
, 4F), −148.0 (m, 1JF–11B
, 4F); ESI–MS m/z (ion, %): 139 ([M−BF4]+, 100);
ESI–HRMS m/z: 139.0055 [M−BF4]+ (C6H4ClN2 requires 139.0058).
The analytical data obtained was in accordance with the literature.216
Lab book reference number (Method A): AJR-5-382
Lab book reference number (Method B): LAH-1-32 (reaction conducted by A. Hammarback)

Chapter 6: Experimental
190
4-(Trifluoromethyl)benzene-1-diazonium tetrafluoroborate (54)
Method A: Synthesised using general procedure A from 4-aminobenzotrifluoride 190 (0.63
mL, 805 mg, 5 mmol, 1 eq.) in deionised water (2.75 mL) to afford the title compound as a
white solid (416 mg, 32%).
Method B: Synthesised using general procedure A from 4-aminobenzotrifluoride 190 (1.26
mL, 1.61 mg, 10 mmol, 1 eq.) in EtOH (3 mL) to afford the title compound as a white solid
(2.38 g, 92%).
M.P. 118–119 °C (lit.221 105–106 °C); 1H NMR (400 MHz, (CD3)2SO, δ): 8.91 (d, J = 8.5
Hz, 2H), 8.42 (d, J = 8.5 Hz, 2H); 13C NMR (101 MHz, (CD3)2SO, δ): 113.8, 128.3, 122.3
(q, J = 274.0 Hz), 121.3, 110.5; 11B NMR (128 MHz, (CD3)2SO, δ): −2.3; 19F NMR (376
MHz, (CD3)2SO, δ): −62.5, −148.0 (m, 1JF–10B
, 4F), −148.1 (m, 1JF–11B
, 4F); ESI–MS m/z (ion,
%): 173 ([M−BF4]+, 100); ESI–HRMS m/z: 173.0325 [M−BF4]+ (C7H4F3N2 requires
173.0321).
The analytical data obtained was in accordance with the literature.221
Lab book reference number (Method A): AJR-4-368
Lab book reference number (Method B): LAH-1-44 (reaction conducted by A. Hammarback)
4-Nitrobenzene-1-diazonium tetrafluoroborate (204)
Synthesised using general procedure A from 4-nitroaniline 191 (1.38 g, 10 mmol, 1 eq.) in
EtOH (3 mL) to afford the title compound as a white solid (2.24 g, 95%).
M.P. 148–151 °C (lit.212 155 °C dec.); 1H NMR (400 MHz, (CD3)2SO, δ): 8.95–8.90 (m, 2H),
8.75–8.69 (m, 2H); 13C NMR (101 MHz, (CD3)2SO, δ): 153.3, 134.6, 126.1, 121.9; 11B NMR
(128 MHz, (CD3)2SO, δ): −2.3; 19F NMR (376 MHz, (CD3)2SO, δ): −148.1 (m, 1JF–10B, 4F),
−148.1 (m, 1JF–11B, 4F); ESI–MS m/z (ion, %): 150 ([M−BF4]+, 100); ESI–HRMS m/z:
150.0304 [M−BF4]+ (C6H4N3O2 requires 150.0298).
The analytical data obtained was in accordance with the literature.212

Chapter 6: Experimental
191
Lab book reference number: LAH-1-41 (reaction conducted by A. Hammarback)
Methyl (2S)-3-[2-(4-methylphenyl)-1H-indol-3-yl]-2-acetamidopropanoate (76)
Method A: Synthesised using general procedure C with aryldiazonium salt 192 (40 mg, 0.192
mmol, 1 eq.) to afford the title compound as a brown solid (67 mg, quant.).
Method B: Synthesised as in method A using Pd(OTs)2(MeCN)2 215 (5.1 mg, 9.6 µmol, 5
mol%) in place of Pd(OAc)2 to afford the title compound as a brown solid (67 mg, quant.).
Rf 0.32 (petrol/EtOAc, 1:1, v/v); [α]ᴅ = +51.9 (c 0.10, CHCl3); M.P. 97–99 °C; 1H NMR (400
MHz, CDCl3, δ): 8.14 (br s, 1H), 7.56 (d, J = 8.0 Hz, 1H), 7.49–7.43 (m, 2H), 7.38–7.33 (m,
1H), 7.31–7.27 (m, 2H), 7.20 (ddd, J = 8.0, 7.0, 1.0 Hz, 1H), 7.13 (ddd, J = 8.0, 7.0, 1.0 Hz,
1H), 5.77 (d, J = 8.0 Hz, 1H), 4.82 (dt, J = 8.0, 5.5 Hz, 1H), 3.54 (dd, J = 15.0, 5.5 Hz, 1H),
3.52 (dd, J = 15.0, 5.5 Hz, 1H), 3.33 (s, 3H), 2.41 (s, 3H), 1.66 (s, 3H); 13C NMR (101 MHz,
(CDCl3, δ): 172.4, 169.7, 138.2, 136.2, 135.7, 130.3, 130.0, 129.6, 128.3, 122.5, 120.1, 118.9,
111.0, 106.6, 52.9, 52.2, 26.8, 23.0, 21.4; ESI–MS m/z (ion, %): 351 ([M+H]+, 10), 373
([M+Na]+, 100); ESI–HRMS m/z: 373.1524 [M+Na]+ (C21H22N2NaO3 requires 373.1523).
The analytical data obtained was in accordance with the literature.114
Lab book reference number (method A): AJR-8-715
Lab book reference number (method B): THS-1-64 (reaction conducted by T. Sheridan)
Methyl (2S)-3-[2-(4-tert-butylphenyl)-1H-indol-3-yl]-2-acetamidopropanoate (205)
Method A: Synthesised using general procedure C with aryldiazonium salt 193 (48 mg, 0.192
mmol, 1 eq.) to afford the title compound as a brown solid (75 mg, quant.).
Method B: Synthesised as in method A using Pd(OTs)2(MeCN)2 215 (5.1 mg, 9.6 µmol, 5
mol%) in place of Pd(OAc)2 to afford the title compound as a brown solid (75 mg, quant.).

Chapter 6: Experimental
192
Rf 0.30 (petrol/EtOAc, 1:1.5, v/v); [α]ᴅ = +68.6 (c 0.10, CHCl3); M.P. 153–155 °C; 1H NMR
(400 MHz, CDCl3, δ): 8.14 (br s, 1H), 7.56 (d, J = 8.0 Hz, 1H), 7.50 (s, 4H), 7.36 (d, J = 8.0
Hz, 1H), 7.19 (ddd, J = 8.0, 7.0, 1.0 Hz, 1H), 7.13 (ddd, J = 8.0, 7.0, 1.0 Hz, 1H), 5.77 (d, J
= 8.0 Hz, 1H), 4.84 (dt, J = 8.0, 5.5 Hz, 1H), 3.56 (app d, J = 5.5 Hz, 2H), 3.28 (s, 3H), 1.64
(s, 3H), 1.36 (s, 9H); 13C NMR (101 MHz, (CDCl3, δ): 172.3, 169.7, 151.3, 136.1, 135.7,
130.4, 129.6, 128.1, 126.2, 122.5, 120.1, 118.9, 111.0, 106.5, 52.9, 52.1, 34.9, 31.4, 26.6,
23.0; ESI–MS m/z (ion, %): 393 ([M+H]+, 10), 415 ([M+Na]+, 100); ESI–HRMS m/z:
393.2169 [M+Na]+ (C24H29N2O3 requires 393.2173); IR (solid-state ATR, cm-1): 3282 (w,
br), 2960 (m), 1738 (m), 1660 (m), 1518 (m), 1436 (m), 1372 (m), 1260 (m), 1214 (m), 1013
(m), 837 (m), 799 (m), 741 (s), 588 (m).
Lab book reference number (method A): AJR-8-718
Lab book reference number (method B): THS-1-65 (reaction conducted by T. Sheridan)
Methyl (2S)-2-acetamido-3-[2-(1-naphthylphenyl)-1H-indol-3-yl]propanoate (206)
Method A: Synthesised using general procedure C with aryldiazonium salt 194 (50 mg, 0.192
mmol, 1 eq.) to afford the title compound as a brown solid (74 mg, quant.).
Method B: Synthesised as in method A using Pd(OTs)2(MeCN)2 215 (5.1 mg, 9.6 µmol, 5
mol%) in place of Pd(OAc)2 to afford the title compound as a brown solid (74 mg, quant.).
Rf 0.15 (petrol/EtOAc, 1:1, v/v); M.P. 78–79 °C dec.; 1H NMR (400 MHz, CDCl3, δ): 8.45
(br s, 1H), 7.94 (d, J = 8.0 Hz, 2H), 7.80 (d, J = 8.0 Hz, 1H), 7.64 (d, J = 8.0 Hz, 1H), 7.58–
7.45 (m, 4H), 7.37 (d, J = 8.0 Hz, 1H), 7.24 (ddd, J = 7.5, 1.0 Hz, 1H), 7.19 (ddd, J = 7.5,
1.0 Hz, 1H), 5.58 (d, J = 8.0 Hz, 1H), 4.68 (dt, J = 8.0, 5.0 Hz, 1H), 3.50–2.98 (m, 5H), 1.26
(br s, 3H); 13C NMR (101 MHz, (CDCl3, δ): 172.2, 169.6, 136.0, 134.8, 134.0, 132.4, 130.3,
129.2, 128.8, 128.7, 128.7, 127.2, 126.5, 125.7, 125.6, 122.6, 120.1, 119.0, 111.1, 108.8,
52.9, 52.0, 26.8, 22.6; ESI–MS m/z (ion, %): 387 ([M+H]+, 20), 409 ([M+Na]+, 100); ESI–
HRMS m/z: 387.1695 [M+H]+ (C24H23N2O3 requires 387.1703); IR (solid-state, ATR, cm-1):
3254 (w, br), 1734 (m), 1653 (s), 1506 (m), 1435 (m), 1371 (s), 1214 (s), 1011 (s), 908 (m),
804 (m), 779 (m), 727 (m), 494 (w).

Chapter 6: Experimental
193
Lab book reference number (method A): LAH-2-110 (reaction conducted by A.
Hammarback)
Lab book reference number (method B): AJR-7-679
Methyl (2S)-2-acetamido-3-[2-(4-phenylphenyl)-1H-indol-3-yl]propanoate (207)
Method A: Synthesised using general procedure C with aryldiazonium salt 195 (52 mg, 0.192
mmol, 1 eq.) to afford the title compound as a brown solid (79 mg, quant.).
Method B: Synthesised as in method A using Pd(OTs)2(MeCN)2 215 (5.1 mg, 9.6 µmol, 5
mol%) in place of Pd(OAc)2 to afford the title compound as a brown solid (79 mg, quant.).
Rf 0.27 (petrol/EtOAc, 1:1.5, v/v); [α]ᴅ = +94.8 (c 0.10, CHCl3); M.P. 205–206 °C; 1H NMR
(400 MHz, CDCl3, δ): 8.32 (br s, 1H), 7.74–7.67 (m, 2H), 7.66–7.61 (m, 4H), 7.60–7.56 (m,
1H), 7.52–7.44 (m, 2H), 7.43–7.35 (m, 2H), 7.21 (ddd, J = 8.0, 7.0, 1.0 Hz, 1H), 7.15 (ddd,
J = 8.0, 7.0, 1.0 Hz, 1H), 5.84 (d, J = 8.0 Hz, 1H), 4.87 (dt, J = 8.0, 5.5 Hz, 1H), 3.62 (dd, J
= 15.0, 5.5 Hz, 1H), 3.59 (dd, J = 15.0, 5.5 Hz, 1H), 3.32 (s, 3H), 1.66 (s, 3H); 13C NMR
(101 MHz, (CDCl3, δ): 172.3, 169.7, 140.9, 140.3, 135.9, 135.7, 132.2, 129.7, 129.1, 128.7,
127.9, 127.1, 122.8, 120.2, 119.0, 111.1, 107.2, 100.1, 53.0, 52.2, 26.8, 23.0; ESI–MS m/z
(ion, %): 413 ([M+H]+, 10), 435 ([M+Na]+, 100); ESI–HRMS m/z: 413.1871 [M+H]+
(C26H25N2O3 requires 413.1860); IR (solid-state, ATR, cm-1): 3406 (w), 3378 (w), 1746 (m),
1655 (s), 1460 (m), 1449 (m), 1374 (m), 1314 (m), 1184 (m), 1008 (w), 982 (w), 842 (w),
767 (m), 743 (s), 734 (m), 697 (m), 535 (s), 512 (m).
Lab book reference number (method A): AJR-8-719
Lab book reference number (method B): THS-1-66 (reaction conducted by T. Sheridan)

Chapter 6: Experimental
194
Methyl (2S)-2-acetamido-3-[2-(4-methoxyphenyl)-1H-indol-3-yl]propanoate (77)
Method A: Synthesised using general procedure C (with a reaction time of 24 h) with
aryldiazonium salt 197 (43 mg, 0.192 mmol, 1 eq.) to afford the title compound as a brown
solid (70 mg, quant.).
Method B: Synthesised as in method A using Pd(OTs)2(MeCN)2 215 (5.1 mg, 9.6 µmol, 5
mol%) in place of Pd(OAc)2 to afford the title compound as a brown solid (70 mg, quant.).
Method C: Reaction conducted as in method B using Pd(OTs)2(MeCN)2 215 (2.5 mg, 4.8
µmol, 2.5 mol%) to afford a crude brown solid. 1H NMR spectroscopic analysis indicated
49% conversion to the title compound, which was not purified.
Method D: Reaction conducted as in method B using Pd(OTs)2(MeCN)2 215 (1 mg, 1.92
µmol, 1 mol%) to afford a crude brown solid. 1H NMR spectroscopic analysis indicated 40%
conversion to the title compound, which was not purified.
Rf 0.15 (petrol/EtOAc, 1:1, v/v); [α]ᴅ = +34.9 (c 0.10, CHCl3); M.P. 202–205 °C; 1H NMR
(400 MHz, CDCl3, δ): 8.56 (br s, 1H), 7.54 (d, J = 8.0 Hz, 1H), 7.49–7.44 (m, 2H), 7.33 (d,
J = 8.0 Hz, 1H), 7.17 (ddd, J = 8.0, 7.0, 1.5 Hz, 1H), 7.12 (ddd, J = 8.0, 7.0, 1.5 Hz, 1H),
6.95–6.90 (m, 2H), 5.85 (d, J = 8.0 Hz, 1H), 4.81 (dt, J = 8.0, 5.5 Hz, 1H), 3.81 (s, 3H), 3.52
(dd, J = 15.0, 5.5 Hz, 1H), 3.48 (dd, J = 15.0, 5.5 Hz, 1H), 3.34 (s, 3H), 1.66 (s, 3H); 13C
NMR (101 MHz, (CDCl3, δ): 172.4, 169.8, 159.5, 136.1, 135.7, 129.6, 129.5, 125.6, 122.2,
119.9, 118.6, 114.6, 111.1, 105.9, 55.5, 53.0, 52.2, 26.7, 23.0; ESI–MS m/z (ion, %): 367
([M+H]+, 50), 389 ([M+Na]+, 100); ESI–HRMS m/z: 389.1458 [M+Na]+ (C21H22N2NaO4
requires 389.1472).
The analytical data obtained was in accordance with the literature.114
Lab book reference number (method A): AJR-5-410
Lab book reference number (method B): AJR-7-653
Lab book reference number (method C): AJR-7-638
Lab book reference number (method D): AJR-7-627

Chapter 6: Experimental
195
Methyl (2S)-2-acetamido-3-[2-(4-phenoxyphenyl)-1H-indol-3-yl]propanoate (208)
Method A: Synthesised using general procedure C with aryldiazonium salt 198 (55 mg, 0.192
mmol, 1 eq.) to afford the title compound as a brown solid (82 mg, quant.).
Method B: Synthesised as in method A using Pd(OTs)2(MeCN)2 215 (5.1 mg, 9.6 µmol, 5
mol%) in place of Pd(OAc)2 to afford the title compound as a brown solid (82 mg, quant.).
Rf 0.29 (petrol/EtOAc, 1:1.5, v/v); [α]ᴅ = +85.3 (c 0.10, CHCl3); M.P. 72–74 °C; 1H NMR
(400 MHz, CDCl3, δ): 8.32 (br s, 1H), 7.56 (d, J = 8.0 Hz, 1H), 7.52–7.47 (m, 2H), 7.42–
7.36 (m, 2H), 7.35–7.32 (m, 1H), 7.22–7.16 (m, 2H), 7.15–7.11 (m, 1H), 7.10–7.04 (m, 4H),
5.85 (d, J = 8.0 Hz, 1H), 4.84 (dt, J = 8.0, 5.5 Hz, 1H), 3.52 (dd, J = 15.0, 5.5 Hz, 1H), 3.49
(dd, J = 15.0, 5.5 Hz, 1H), 3.38 (s, 3H), 1.72 (s, 3H); 13C NMR (101 MHz, (CDCl3, δ): 172.4,
169.7, 157.6, 156.5, 135.8, 135.7, 130.1, 129.8, 129.5, 127.9, 124.1, 122.6, 120.1, 119.6,
119.0, 118.9, 111.1, 106.6, 53.0, 52.2, 26.8, 23.1; ESI–MS m/z (ion, %): 429 ([M+H]+, 20),
451 ([M+Na]+, 100); ESI–HRMS m/z: 451.1622 [M+Na]+ (C26H24N2NaO4 requires
451.1628); IR (solid-state, ATR, cm-1): 3266 (w, br), 2961 (w), 1736 (m), 1654 (m), 1588
(w), 1487 (s), 1458 (m), 1436 (m), 1372 (w), 1229 (s), 1012 (m), 869 (m), 840 (m), 795 (m),
743 (s), 692 (m), 486 (w).
Lab book reference number: AJR-8-723
Lab book reference number (method B): THS-1-67 (reaction conducted by T. Sheridan)
Methyl (2S)-3-[2-(4-fluorophenyl)-1H-indol-3-yl]-2-acetamidopropanoate (120)
Method A: Synthesised using general procedure C with aryldiazonium salt 199 (40 mg, 0.192
mmol, 1 eq.) to afford the title compound as a brown solid (68 mg, quant.).
Method B: Synthesised as in method A using Pd(OTs)2(MeCN)2 215 (5.1 mg, 9.6 µmol, 5
mol%) in place of Pd(OAc)2 to afford the title compound as a brown solid (68 mg, quant.).

Chapter 6: Experimental
196
Rf 0.23 (petrol/EtOAc, 1:1, v/v); [α]ᴅ = +54.4 (c 0.10, CHCl3); M.P. 213–216 °C dec.; 1H
NMR (400 MHz, CDCl3, δ): 8.18 (br s, 1H), 7.56 (ddt, J = 8.0, 1.5, 1.0 Hz, 1H), 7.54–7.48
(m, 2H), 7.34 (dt, J = 8.0, 1.0 Hz, 1H), 7.20 (ddd, J = 8.0, 7.0, 1.0 Hz, 1H), 7.17–7.12 (m,
3H), 5.84 (d, J = 8.0 Hz, 1H), 4.83 (dt, J = 8.0, 5.5 Hz, 1H), 3.51 (dd, J = 15.0, 5.5 Hz, 1H),
3.46 (dd, J = 15.0, 5.5 Hz, 1H), 3.33 (s, 3H), 1.70 (s, 3H); 13C NMR (101 MHz, (CDCl3, δ):
172.3, 169.7, 162.9 (q, 1JC–F = 249.0 Hz), 135.8, 135.1, 130.3 (d, 3JC–F = 8.0 Hz), 129.5, 129.4
(d, 4JC–F = 3.5 Hz), 122.8, 120.3, 119.0, 116.3 (d, 2JC–F = 21.5 Hz), 111.1, 107.0, 52.9, 52.2,
26.8, 23.1; 19F NMR (376 MHz, CDCl3, δ): −112.8–−112.9 (m); ESI–MS m/z (ion, %): 355
([M+H]+, 60), 377 ([M+Na]+, 100); ESI–HRMS m/z: 355.1442 [M+H]+ (C20H20FN2O3
requires 355.1452).
The analytical data obtained was in accordance with the literature.211
Lab book reference number (method A): AJR-5-417
Lab book reference number (method B): AJR-7-655
Methyl (2S)-3-[2-(4-bromophenyl)-1H-indol-3-yl]-2-acetamidopropanoate (79)
Method A: Synthesised using general procedure C with aryldiazonium salt 200 (52 mg, 0.192
mmol, 1 eq.) to afford the title compound as a brown solid (80 mg, quant.).
Method B: Synthesised as in method A using Pd(OTs)2(MeCN)2 215 (5.1 mg, 9.6 µmol, 5
mol%) in place of Pd(OAc)2 to afford the title compound as a brown solid (80 mg, quant.).
Rf 0.31 (petrol/EtOAc, 1:1, v/v); [α]ᴅ = +44.0 (c 0.10, CHCl3); M.P. 74–75 °C dec.; 1H NMR
(400 MHz, CDCl3, δ): 8.36 (br s, 1H), 7.60–7.54 (m, 3H), 7.44–7.39 (m, 2H), 7.34 (dt, J =
8.0, 1.0 Hz, 1H), 7.21 (ddd, J = 8.0, 7.0, 1.0 Hz, 1H), 7.14 (ddd, J = 8.0, 7.0, 1.0 Hz, 1H),
5.85 (d, J = 8.0 Hz, 1H), 4.83 (dt, J = 8.0, 5.5 Hz, 1H), 3.52 (dd, J = 15.0, 5.5 Hz, 1H), 3.47
(dd, J = 15.0, 5.5 Hz, 1H), 3.33 (s, 3H), 1.70 (s, 3H); 13C NMR (101 MHz, (CDCl3, δ): 172.3,
169.8, 135.9, 134.8, 132.4, 132.2, 129.9, 129.5, 123.0, 122.2, 120.3, 119.1, 111.2, 107.4,
53.0, 52.2, 26.9, 23.1; ESI–MS m/z (ion, %): 415 ([M+H]+, 30), 437 ([M+Na]+, 100); ESI–
HRMS m/z: 437.0474 [M+Na]+ (C20H19BrN2NaO3 requires 437.0471).
The analytical data obtained was in accordance with the literature.114

Chapter 6: Experimental
197
Lab book reference number (method A): AJR-5-401
Lab book reference number (method B): AJR-7-656
Methyl (2S)-3-[2-(3-bromophenyl)-1H-indol-3-yl]-2-acetamidopropanoate (209)
Method A: Synthesised using general procedure C with aryldiazonium salt 201 (43 mg, 0.192
mmol, 1 eq.) to afford the title compound as a brown solid (80 mg, quant.).
Method B: Synthesised as in method A using Pd(OTs)2(MeCN)2 215 (5.1 mg, 9.6 µmol, 5
mol%) in place of Pd(OAc)2. Purification by dry-loaded flash column chromatography (SiO2,
petrol/EtOAc, 1:1, v/v) afforded the title compound as a brown solid (55 mg, 69%).
Rf 0.28 (petrol/EtOAc, 1:1, v/v); [α]ᴅ = +50.5 (c 0.10, CHCl3); M.P. 82–84 °C dec.; 1H NMR
(400 MHz, CDCl3, δ): 8.27 (br s, 1H), 7.71 (t, J = 1.5 Hz, 1H), 7.58 (ddt, J = 8.0, 1.5, 1.0 Hz,
1H), 7.53–7.48 (m, 2H), 7.38–7.32 (m, 2H), 7.22 (ddd, J = 8.0, 7.0, 1.0 Hz, 1H), 7.15 (ddd,
J = 8.0, 7.0, 1.0 Hz, 1H), 5.84 (d, J = 8.0 Hz, 1H), 4.85 (dt, J = 8.0, 5.5 Hz, 1H), 3.53 (dd, J
= 15.0, 5.5 Hz, 1H), 3.48 (dd, J = 15.0, 5.5 Hz, 1H), 3.34 (s, 3H), 1.72 (s, 3H); 13C NMR
(101 MHz, CDCl3, δ): 172.3, 169.7, 135.9, 135.3, 134.4, 131.2, 131.1, 130.8, 129.4, 127.1,
123.2, 123.1, 120.4, 119.2, 111.2, 107.9, 52.9, 52.2, 26.8, 23.1; ESI–MS m/z (ion, %): 415
([M+H]+, 50), 437 ([M+Na]+, 100); ESI–HRMS m/z: 415.0658 [M+H]+ (C20H20BrN2O3
requires 415.0652); IR (solid-state, ATR, cm-1): 3264 (w, br), 3057 (w), 2951 (w), 2924 (w),
2850 (w), 1732 (m), 1651 (s), 1596 (m), 1518 (m), 1435 (s), 1372 (m), 1261 (m), 1214 (s),
1010 (m), 787 (m), 741 (s), 687 (s), 594 (m), 507 (m), 437 (m); UV–vis (DMSO, nm): λmax
312 (ε = 19398 mol dm-3 cm-1).
Lab book reference number (method A): AJR-5-407
Lab book reference number (method B): AJR-7-666

Chapter 6: Experimental
198
Methyl (2S)-3-[2-(4-chlorophenyl)-1H-indol-3-yl]-2-acetamidopropanoate (210)
Method A: Synthesised using general procedure C with aryldiazonium salt 202 (43 mg, 0.192
mmol, 1 eq.). Purification by dry-loaded flash column chromatography (SiO2, petrol/EtOAc,
1:1, v/v) afforded the title compound as a brown solid (52 mg, 73%).
Method B: Synthesised as in method A using Pd(OTs)2(MeCN)2 215 (5.1 mg, 9.6 µmol, 5
mol%) in place of Pd(OAc)2. Purification by dry-loaded flash column chromatography (SiO2,
petrol/EtOAc, 1:1, v/v) afforded the title compound as a brown solid (57 mg, 80%).
Rf 0.39 (petrol/EtOAc, 1:1, v/v); [α]ᴅ = +45.6 (c 0.10, CHCl3); M.P. 202 °C dec.; 1H NMR
(400 MHz, CDCl3, δ): 8.19 (br s, 1H), 7.57 (dt, J = 8.0, 1.0, 1.0 Hz, 1H), 7.53–7.48 (m, 2H),
7.47–7.43 (m, 2H), 7.38–7.33 (m, 1H), 7.22 (ddd, J = 8.0, 7.0, 1.0 Hz, 1H), 7.15 (ddd, J =
8.0, 7.0, 1.0 Hz, 1H), 5.82 (d, J = 8.0 Hz, 1H), 4.84 (dt, J = 8.0, 5.5 Hz, 1H), 3.51 (dd, J =
15.0, 5.5 Hz, 1H), 3.46 (dd, J = 15.0, 5.5 Hz, 1H), 3.33 (s, 3H), 1.71 (s, 3H); 13C NMR (101
MHz, (CDCl3, δ): 172.3, 169.7, 135.9, 134.8, 134.2, 131.7, 129.6, 129.5, 129.5, 123.0, 120.4,
119.1, 111.2, 107.5, 53.0, 52.2, 26.9, 23.1; ESI–MS m/z (ion, %): 371 ([M+H]+, 30), 393
([M+Na]+, 100); ESI–HRMS m/z: 371.1166 [M+H]+ (C20H20ClN2O3 requires 371.1157).
Crystals suitable for X-ray diffraction were grown by slow diffusion from a solution of
CH2Cl2.
The analytical data obtained was in accordance with the literature.211
Lab book reference number (method A): AJR-5-405
Lab book reference number (method B): AJR-7-667

Chapter 6: Experimental
199
Methyl (2S)-3-[2-(3-chlorophenyl)-1H-indol-3-yl]-2-acetamidopropanoate (211)
Method A: Synthesised using general procedure C with aryldiazonium salt 203 (43 mg, 0.192
mmol, 1 eq.). Purification by dry-loaded flash column chromatography (SiO2, petrol/EtOAc,
1:1, v/v) afforded the title compound as a brown solid (45 mg, 63%).
Method B: Synthesised as in method A using Pd(OTs)2(MeCN)2 215 (5.1 mg, 9.6 µmol, 5
mol%) in place of Pd(OAc)2. Purification by dry-loaded flash column chromatography (SiO2,
petrol/EtOAc, 1:1, v/v) afforded the title compound as a brown solid (57 mg, 80%).
Rf 0.26 (petrol/EtOAc, 1:1, v/v); [α]ᴅ = +54.4 (c 0.10, CHCl3); M.P. 78–79 °C dec.; 1H NMR
(400 MHz, CDCl3, δ): 8.19 (br s, 1H), 7.61–7.54 (m, 2H), 7.47 (dt, J = 7.5, 1.5 Hz, 1H),
7.45–7.39 (m, 1H), 7.36 (ddd, J = 7.5, 2.5, 1.5 Hz, 2H), 7.22 (ddd, J = 8.0, 7.0, 1.0 Hz, 1H),
7.15 (ddd, J = 8.0, 7.0, 1.0 Hz, 1H), 5.83 (d, J = 8.0 Hz, 1H), 4.85 (dt, J = 8.0, 5.5 Hz, 1H),
3.54 (dd, J = 15.0, 5.5 Hz, 1H), 3.51 (dd, J = 15.0, 5.5 Hz, 1H), 3.34 (s, 3H), 1.72 (s, 3H);
13C NMR (101 MHz, (CDCl3, δ): 172.3, 169.7, 135.9, 135.2, 135.1, 134.5, 130.6, 129.5,
128.3, 128.2, 126.6, 123.2, 120.4, 119.3, 111.2, 107.9, 52.9, 52.2, 26.9, 23.1; ESI–MS m/z
(ion, %): 371 ([M+H]+, 90), 393 ([M+Na]+, 100); ESI–HRMS m/z: 393.0963 [M+Na]+
(C20H19ClN2NaO3 requires 393.0976); IR (solid-state, ATR, cm-1): 3271 (w, br), 3059 (w),
2952 (w), 2852 (w), 1733 (m), 1651 (s), 1597 (m), 1520 (m), 1436 (m), 1372 (s), 1214 (s),
788 (s), 737 (s), 688 (m); UV–Vis (DMSO, nm): λmax 312 (ε = 15639 mol dm-3 cm-1).
Lab book reference number (method A): AJR-5-408
Lab book reference number (method B): AJR-7-667
Bis(acetonitrile)palladium ditosylate (215)222
Pd(OAc)2 (500 mg, 2.23 mmol, 1 eq.) was added to a Schlenk tube equipped with a magnetic
stirrer which was then sealed, evacuated and purged with N2 three times. Dry MeCN (45 mL)
was added with stirring to give an orange–brown solution. To this was added a solution of
para-toluenesulfonic acid (2.07 g, 12.04 mmol, 5.4 eq.) in dry MeCN (30 mL) via cannula,

Chapter 6: Experimental
200
which resulted in a yellow solution. Dry Et2O (50 mL) was then added to precipitate a yellow
solid and the mixture left to stand for 20 min with no stirring. After 20 min the excess Et2O
was removed by filter cannula and the resulting solid washed with dry Et2O (20 mL), which
was then removed by filter cannula. The resulting solid was dried briefly under vacuum to
afford the title compound as a cream solid (944 mg, 80%).
Note: Dissociation of MeCN ligands is facile in solution, the ratio of complexed p-
TsOH:complexed MeCN:free MeCN by 1H NMR was measured as 1:0.6:1.3.
Mp 130–135 °C dec; 1H NMR (400 MHz, CD3OD, δ): 7.72 (d, J = 8.0 Hz, 4H), 7.25 (d, J =
8.0 Hz, 4H), 2.56 (s, complexed MeCN, 2H), 2.38 (s, 6H), 2.03 (s, free MeCN, 4H); 13C
NMR (125 MHz, CD3OD, δ): 142.6, 137.6, 130.0, 127.0, 21.3; IR (solid-state, ATR, cm-1):
3007, 2992, 2929, 2337, 1595, 1491, 1398, 1348, 1283, 1177, 1142, 1097, 1028, 1015, 947,
814, 712, 675, 642, 629, 554, 507, 438.
Lab book reference number (method A): AJR-6-532
Effect of MeCN on direct arylation of tryptophan
To a microwave tube was added tryptophan 74 (50 mg, 0.192 mmol, 1 eq.), aryldiazonium
salt 48 (37 mg, 0.192 mmol, 1 eq.), Pd(OAc)2 (2 mg, 9.6 μmol, 5 mol%), MeCN (1 µL, 789
µg, 19.2 μmol, 10 mol%) and EtOAc (5 mL). The reaction mixture was stirred at RT for 16
h. After 16 h the resulting brown reaction mixture was filtered through Celite then washed
with sat. aq. NaHCO3. The organic layer was collected and dried over MgSO4, filtered and
evaporated to afford the title compound as an off-white solid (64 mg, quant.).
Lab book reference number: AJR-7-681
Attempted direct arylation of indole
To a microwave tube was added phenyldiazonium salt 48 (58 mg, 0.30 mmol, 1 eq.) and
Pd(OAc)2 (3.4 mg, 15 μmol, 5 mol%). Indole 45 (35 mg, 0.30 mmol, 1 eq.) was then added.
Upon addition phenyldiazonium salt 48 visibly darkened to red, followed by black. This

Chapter 6: Experimental
201
heated up rapidly and began visibly smoking, which subsided after 2 min. EtOAc (3 mL) was
added to give a dark red solution which was stirred at 60 °C for 16 h. After 16 h TLC analysis
of the reaction mixture indicated a large number of species, so the reaction was abandoned.
Lab book reference number: AJR-5-453
Attempted direct arylation of methylindole
To a microwave tube was added 1-methylindole 33 (37 µL, 39 mg, 0.30 mmol, 1 eq.),
phenyldiazonium salt 48 (58 mg, 0.30 mmol, 1 eq.), Pd(OAc)2 (3.4 mg, 15 μmol, 5 mol%)
and EtOAc (3 mL). The mixture was then stirred at 60 °C for 16 h. After 16 h TLC (SiO2,
petrol/EtOAc, 4:1, v/v) analysis of the reaction mixture indicated a large number of species.
The resulting dark red reaction mixture was filtered through Celite then washed with sat. aq.
NaHCO3. The organic layer was collected and dried over MgSO4, filtered and evaporated to
give a brown residue. Analysis by 1H NMR spectroscopic analysis indicated a large number
of species, so the reaction was abandoned.
Lab book reference number: AJR-5-454
Attempted direct arylation of indazole
To a microwave tube was added indazole 222 (35 mg, 0.30 mmol, 1 eq.), phenyldiazonium
salt 48 (58 mg, 0.30 mmol, 1 eq.), Pd(OAc)2 (3.4 mg, 15 μmol, 5 mol%) and EtOAc (3 mL).
The mixture was then stirred at 60 °C for 16 h. After 16 h the reaction mixture was filtered
through Celite then washed with sat. aq. NaHCO3. The organic layer was collected and dried
over MgSO4, filtered and evaporated to give a brown residue. Analysis by 1H NMR
spectroscopic analysis indicated only starting material. Purification by dry-loaded flash
column chromatography (SiO2, petrol/EtOAc, 1:1, v/v) afforded the starting material as an
off-white solid (35 mg, quant.).
Lab book reference number: AJR-6-468

Chapter 6: Experimental
202
Attempted direct arylation of 7-azaindole at 60 °C
To a microwave tube was added 7-azaindole 223 (35 mg, 0.30 mmol, 1 eq.),
phenyldiazonium salt 48 (58 mg, 0.30 mmol, 1 eq.), Pd(OAc)2 (3.4 mg, 15 μmol, 5 mol%)
and EtOAc (3 mL). The mixture was then stirred at 60 °C for 16 h. After 16 h TLC (SiO2,
petrol/EtOAc, 1:1, v/v) analysis of the reaction mixture indicated a large number of species.
The reaction mixture was filtered through Celite then washed with sat. aq. NaHCO3. The
organic layer was collected and dried over MgSO4, filtered and evaporated to give a brown
residue. Analysis by 1H NMR spectroscopic analysis indicated a large number of species, so
the reaction was abandoned.
Lab book reference number: AJR-6-469
Attempted direct arylation of 7-azaindole at 40 °C
To a microwave tube was added 7-azaindole 223 (35 mg, 0.30 mmol, 1 eq.),
phenyldiazonium salt 48 (58 mg, 0.30 mmol, 1 eq.), Pd(OAc)2 (3.4 mg, 15 μmol, 5 mol%)
and EtOAc (3 mL). The mixture was then stirred at 40 °C for 16 h. After 16 h TLC (SiO2,
petrol/EtOAc, 1:1, v/v) analysis of the reaction mixture indicated no conversion of starting
material, so the reaction was abandoned.
Lab book reference number: AJR-6-477
Attempted direct arylation of 7-azaindole at RT
To a microwave tube was added 7-azaindole 223 (35 mg, 0.30 mmol, 1 eq.),
phenyldiazonium salt 48 (58 mg, 0.30 mmol, 1 eq.), Pd(OAc)2 (3.4 mg, 15 μmol, 5 mol%)
and EtOAc (3 mL). The mixture was then stirred at RT for 16 h. After 16 h TLC (SiO2,
petrol/EtOAc, 1:1, v/v) analysis of the reaction mixture indicated no conversion of starting
material, so the reaction was abandoned.
Lab book reference number: AJR-6-473

Chapter 6: Experimental
203
1-Methylindazole (224)152
To a round-bottomed flask equipped with a magnetic stirrer bar was added indazole 222 (1
g, 8.46 mmol, 1 eq.). This was dissolved in acetone (10 mL) with stirring, before being cooled
to 0 °C. KOH (1.42 g, 25.4 mmol, 3 eq.) was then added, the flask was sealed with a septum
and flushed with N2 from a balloon. The reaction mixture was then stirred at 0 °C for 1 h,
then MeI (0.8 mL, 1.8 g, 12.7 mmol, 1.5 eq.) was added dropwise at 0 °C. After complete
addition the reaction was allowed to warm to RT with stirring for 1 h. After 1 h the KOH was
filtered off using a glass sinter and the solvent evaporated. Purification by wet-loaded flash
column chromatography (SiO2, petrol/EtOAc, 4:1, v/v) afforded the title compound as a white
solid (810 mg, 72%).
Rf 0.55 (petrol/EtOAc, 4:1, v/v); M.P. 60–61 °C (lit.152 58–59 °C); 1H NMR (400 MHz,
CDCl3, δ): 7.99 (s, 1H), 7.73 (dt, J = 8.0, 1.0 Hz, 1H), 7.41–7.38 (m, 2H), 7.18–7.12 (m, 1H),
4.08 (s, 3H); 13C NMR (101 MHz, CDCl3, δ): 140.0, 132.8, 126.3, 124.1, 121.2, 120.5, 109.0,
35.6; EI–GC–MS m/z (ion): 132 [C8H8N2]+; EI–HRMS m/z: 132.0688 [C8H8N2]+ (C8H8N2
requires 132.0687).
Lab book reference number: AJR-6-498
Attempted direct arylation of 1-methylindazole (225)
To a microwave tube was added 1-methylindazole 224 (40 mg, 0.30 mmol, 1 eq.),
phenyldiazonium salt 48 (58 mg, 0.30 mmol, 1 eq.), Pd(OAc)2 (3.4 mg, 15 μmol, 5 mol%)
and EtOAc (3 mL). The mixture was then stirred at 60 °C for 16 h. After 16 h TLC (SiO2,
petrol/EtOAc, 1:1, v/v) analysis of the reaction mixture indicated no conversion of starting
material, so the reaction was abandoned.
Lab book reference number: AJR-8-758

Chapter 6: Experimental
204
Attempted Tfa-protection of 1-methylindazole (226)
To a round-bottomed flask equipped with magnetic stirrer bar was added indazole 222 (100
mg, 0.85 mmol, 1 eq.). The flask was sealed with a septum and flushed with nitrogen from a
balloon for 10 mins, then Et3N (131 µL, 95 mg, 0.94 mmol, 1.1 eq.) and solvent (0.85 mL)
were added via syringe. The mixture was cooled to 0 °C, then ethyl trifluoroacetate 165 (112
µL, 134 mg, 0.94 mmol, 1.1 eq.) was added dropwise. After complete addition the reaction
was allowed to warm to RT and stirred for 20 h. No conversion of starting material was
observed.
Lab book reference number (MeCN): AJR-6-495
Lab book reference number (THF): AJR-6-501
Boc-protection of 1-methylindazole (227)153
To a round-bottomed flask equipped with magnetic stirrer bar was added indazole 222 (591
mg, 5 mmol, 1 eq.) and DMAP (12 mg, 0.1 mmol, 2 mol%). The flask was sealed with a
septum and flushed with nitrogen from a balloon for 10 mins, then dry MeCN (7 mL) was
added via syringe. To this mixture was added a solution of Boc2O (1.31 g, 6 mmol, 1.2 eq.)
in dry MeCN (3 mL) to give a clear solution. This was stirred at RT for 3 h. After 3 h the
solvent was evaporated and the residue redissolved in Et2O. Deionised water was added and
the mixture extracted into Et2O three times. The organic layers were collected and dried over
MgSO4, filtered and evaporated to give an orange oil. Purification by wet-loaded flash
column chromatography (SiO2, petrol/Et2O, 2:1, v/v) afforded an inseparable mixture of the
title compound and 228 as a clear oil (1.0 g, 98%).
Lab book reference number: AJR-6-487

Chapter 6: Experimental
205
Attempted Ac-protection of 1-methylindazole (229)
To a round-bottomed flask equipped with magnetic stirrer bar was added indazole 222 (100
mg, 0.85 mmol, 1 eq.). The flask was sealed with a septum and flushed with nitrogen from a
balloon for 10 mins, then Et3N (131 µL, 95 mg, 0.94 mmol, 1.1eq.) and MeCN (0.85 mL)
were added via syringe. The mixture was cooled to 0 °C, then Ac2O (89 µL, 96 mg, 0.94
mmol, 1.1 eq.) was added dropwise. After complete addition the reaction was allowed to
warm to RT and stirred for 20 h. After 3 h deionised water was added and the mixture
extracted into EtOAc three times. The organic layers were collected and washed with 1M
HCl and brine, then dried over MgSO4, filtered and evaporated to give a clear oil. Purification
by wet-loaded flash column chromatography (SiO2, petrol/EtOAc, 4:1, v/v) afforded an
inseparable mixture of the title compound and 230 as a white solid (107 mg, 79%).
Lab book reference number: AJR-6-494
1-Methyl-7-azaindole (231)154
To a round-bottomed flask equipped with a magnetic stirrer bar was added 7-azaindole 223
(1 g, 8.46 mmol, 1 eq.). This was dissolved in DMF (5 mL) with stirring, before being cooled
to 0 °C. The flask was sealed with a septum and flushed with N2 from a balloon for 10 mins,
then NaH (244 mg, 10.15 mmol, 1.2 eq.) was added and the reaction stirred at 0 °C for 1 h.
After 1 h MeI (0.58 mL, 1.32 g, 9.31 mmol, 1.1 eq.) was added dropwise at 0 °C. After
complete addition the reaction was allowed to warm to RT with stirring for 1 h. After 1 h ice-
cold deionised water was added to quench the reaction, which was then extracted into EtOAc
three times. The organic layers were combined and washed five times with deionised water,
then washed with brine, dried over MgSO4, filtered and evaporated to give an orange oil.
This was purified directly by filtration through a silica plug (SiO2, EtOAc) to afford the title
compound as a yellow oil (0.98 g, 88%).
1H NMR (400 MHz, CDCl3, δ): 8.34 (dd, J = 5.0, 1.0 Hz, 1H), 7.91 (dt, J = 8.0, 1.0 Hz, 1H),
7.18 (d, J = 3.5 Hz, 1H), 7.05 (ddd, J = 8.0, 5.0, 1.0 Hz, 1H), 6.45 (dd, J = 3.5, 1.0 Hz, 1H),
3.90 (d, J = 1.0 Hz, 3H); 13C NMR (101 MHz, CDCl3, δ): 147.9, 142.9, 129.2, 128.9, 120.7,

Chapter 6: Experimental
206
115.6, 99.4, 31.4; ESI–MS m/z (ion, %): 133 ([M+H]+, 100); ESI–HRMS m/z: 133.0763
[M+H]+ (C8H9N2 requires 133.0760).
Lab book reference number: AJR-6-480
1-methyl-2-phenyl-7-azaindole (232)
Method A: To a microwave tube equipped with magnetic stirrer bar was added 1-methyl-7-
azaindole 231 (40 mg, 0.30 mmol, 1 eq.), aryldiazonium salt 48 (58 mg, 0.30 mmol, 1 eq.),
Pd(OAc)2 (3.4 mg, 15 μmol, 5 mol%) and EtOH (3 mL). The reaction mixture was stirred at
40 °C for 22 h. After 22 h the reaction mixture was filtered through Celite with EtOAc then
washed with sat. aq. NaHCO3. The organic layer was collected and dried over MgSO4,
filtered and evaporated to give a brown solid, which was subsequently analysed by 1H NMR
spectroscopy.
Method B: To a microwave tube equipped with magnetic stirrer bar was added 1-methyl-7-
azaindole 231 (100 mg, 0.76 mmol, 1 eq.), diaryliodonium salt 233 (390 mg, 1.06 mmol, 1.4
eq.), Pd(OAc)2 (8.4 mg, 37.5 μmol, 5 mol%) and EtOH (3.8 mL). The vial was sealed with a
septum and the reaction stirred at 60 °C for 22 h. After 22 h the reaction mixture was allowed
to cool to RT, then filtered through Celite with EtOAc, washed with sat. aq. NaHCO3, dried
over MgSO4, filtered and evaporated to give a brown residue. Purification by dry-loaded flash
column chromatography (SiO2, petrol/Et2O, 1:1, v/v) to afford the title compound as a yellow
oil (125 mg, 79%).
Rf 0.26 (petrol/Et2O, 1:1, v/v); 1H NMR (400 MHz, CDCl3, δ): 8.36 (dd, J = 5.0, 1.5 Hz, 1H),
7.91 (dd, J = 8.0, 1.5 Hz, 1H), 7.58–7.54 (m, 2H), 7.52–7.47 (m, 2H), 7.46–7.41 (m, 1H),
7.09 (dd, J = 8.0, 5.0 Hz, 1H), 6.52 (s, 1H), 3.89 (s, 3H); 13C NMR (101 MHz, CDCl3, δ):
149.4, 142.8, 142.0, 132.5, 129.3, 128.8, 128.4, 128.3, 120.8, 116.2, 99.5, 30.0; ESI–MS m/z
(ion, %): 209 ([M+H]+, 100); ESI–HRMS m/z: 209.1074 [M+H]+ (C14H13N2 requires
209.1073).
Lab book reference number (method A): AJR-6-520
Lab book reference number (method B): AJR-6-489

Chapter 6: Experimental
207
Diphenyliodonium tetrafluoroborate (233)155
To a round-bottomed flask equipped with a magnetic stirrer bar was added mCPBA (≤77%,
7.39 g, 33 mmol, 1.1 eq.), which was then dissolved in CH2Cl2 (100 mL). Iodobenzene 1 (3.4
mL, 6.12 g, 30 mmol, 1 eq.) was added to this solution, then BF3·OEt2 (9.2 mL, 10.6 g, 75
mmol, 2.5 eq.) was added dropwise. The resultant solution was stirred at RT for 30 min, then
cooled to 0 °C. PhB(OH)2 14 (4.02 g, 33 mmol, 1.1 eq.) was then added at 0 °C. After
complete addition, the reaction was allowed to warm to RT with stirring over 15 min. After
15 min the crude reaction mixture was filtered through a silica pad, first eluting with CH2Cl2,
then CH2Cl2/MeOH (20:1, v/v). The second fraction was collected and concentrated in vacuo.
Et2O was added to precipitate an off-white solid, which was filtered through a glass sinter
and washed with further Et2O, before being dried in vacuo to afford the title compound as an
off-white solid (7.82 g, 71%).
M.P. 136–138 °C (lit.223 136–138 °C); 1H NMR (400 MHz, (CD3)2SO, δ): 8.25 (dd, J = 8.0,
1.0 Hz, 4H), 7.73–7.62 (m, 2H), 7.57–7.51 (m, 4H); 13C NMR (101 MHz, (CD3)2SO, δ):
135.2, 132.1, 131.8, 116.5; ESI-MS m/z (ion, rel. %): 281 ([C12H10I]+, 100); ESI-HRMS m/z:
280.9824 [C12H10I]+ (C12H10I requires 280.9822).
Lab book reference number: AJR-8-727
2-Phenylindole (234)
To a microwave tube equipped with magnetic stirrer bar was added indole 45 (35 mg, 0.30
mmol, 1 eq.), diaryliodonium salt 233 (155 mg, 0.42 mmol, 1.4 eq.), Pd(OAc)2 (3.4 mg, 15
μmol, 5 mol%) and EtOH (1.5 mL). The vial was sealed with a septum and the reaction stirred
at 60 °C for 22 h. After 22 h the reaction mixture was allowed to cool to RT and purified
directly by wet-loaded flash column chromatography (SiO2, pentane/EtOAc, 9:1, v/v) to
afford the title compound as a white solid (32 mg, 55%).
Rf 0.46 (pentane/EtOAc, 9:1, v/v); 1H NMR (400 MHz, CDCl3, δ): 8.33 (br s, 1H), 7.70–7.64
(m, 3H), 7.49–7.40 (m, 3H), 7.38–7.31 (m, 1H), 7.22 (m, 1H), 7.15 (m, 1H), 6.85 (s, 1H);
13C NMR (101 MHz, CDCl3, δ): 138.0, 136.9, 132.5, 129.4, 129.2, 127.9, 125.3, 122.5, 120.8,

Chapter 6: Experimental
208
120.4, 111.0, 100.1; ESI–MS m/z (ion, %): 194 ([M+H]+, 100); ESI–HRMS m/z: 194.0968
[M+H]+ (C14H12N requires 194.0964).
Lab book reference number: AJR-7-641
Attempted direct arylation of indazole
To a microwave tube equipped with magnetic stirrer bar was added indazole 222 (35 mg,
0.30 mmol, 1 eq.), diaryliodonium salt 233 (155 mg, 0.42 mmol, 1.4 eq.), Pd(OAc)2 (3.4 mg,
15 μmol, 5 mol%) and EtOH (1.5 mL). The vial was sealed with a septum and the reaction
stirred at 60 °C for 22 h. After 22 h analysis of the crude reaction mixture by TLC (SiO2,
petrol/EtOAc, 1:1:, v/v) indicated no conversion of starting material, so the reaction was
abandoned.
Lab book reference number: AJR-6-470
Attempted direct arylation of 7-azaindole
To a microwave tube equipped with magnetic stirrer bar was added 7-azaindole 223 (35 mg,
0.30 mmol, 1 eq.), diaryliodonium salt 233 (155 mg, 0.42 mmol, 1.4 eq.), Pd(OAc)2 (3.4 mg,
15 μmol, 5 mol%) and EtOH (1.5 mL). The vial was sealed with a septum and the reaction
stirred at 60 °C for 22 h. After 22 h analysis of the crude reaction mixture by TLC (SiO2,
petrol/EtOAc, 1:1, v/v) indicated no conversion of starting material, so the reaction was
abandoned.
Lab book reference number: AJR-6-471
Attempted direct arylation of pyridazine
To a microwave tube equipped with magnetic stirrer bar was added pyridazine 235 (36 mg,
0.30 mmol, 1 eq.), diaryliodonium salt 233 (155 mg, 0.42 mmol, 1.4 eq.), Pd(OAc)2 (3.4 mg,
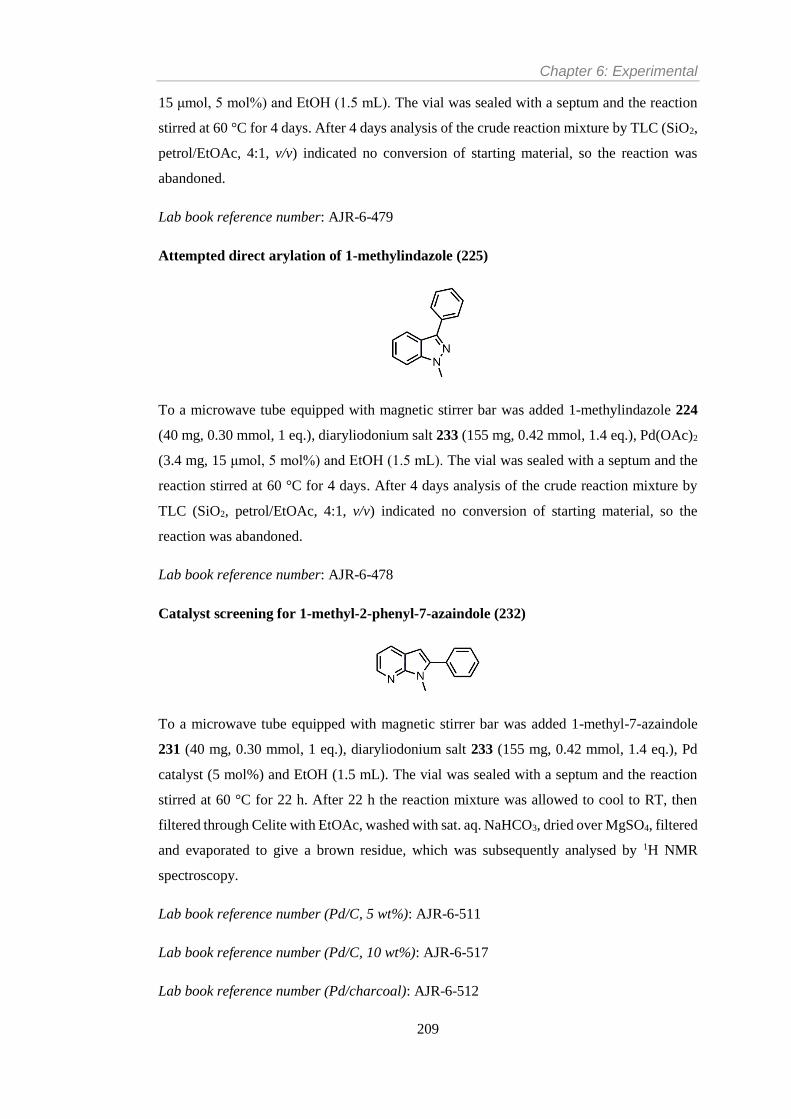
Chapter 6: Experimental
209
15 μmol, 5 mol%) and EtOH (1.5 mL). The vial was sealed with a septum and the reaction
stirred at 60 °C for 4 days. After 4 days analysis of the crude reaction mixture by TLC (SiO2,
petrol/EtOAc, 4:1, v/v) indicated no conversion of starting material, so the reaction was
abandoned.
Lab book reference number: AJR-6-479
Attempted direct arylation of 1-methylindazole (225)
To a microwave tube equipped with magnetic stirrer bar was added 1-methylindazole 224
(40 mg, 0.30 mmol, 1 eq.), diaryliodonium salt 233 (155 mg, 0.42 mmol, 1.4 eq.), Pd(OAc)2
(3.4 mg, 15 μmol, 5 mol%) and EtOH (1.5 mL). The vial was sealed with a septum and the
reaction stirred at 60 °C for 4 days. After 4 days analysis of the crude reaction mixture by
TLC (SiO2, petrol/EtOAc, 4:1, v/v) indicated no conversion of starting material, so the
reaction was abandoned.
Lab book reference number: AJR-6-478
Catalyst screening for 1-methyl-2-phenyl-7-azaindole (232)
To a microwave tube equipped with magnetic stirrer bar was added 1-methyl-7-azaindole
231 (40 mg, 0.30 mmol, 1 eq.), diaryliodonium salt 233 (155 mg, 0.42 mmol, 1.4 eq.), Pd
catalyst (5 mol%) and EtOH (1.5 mL). The vial was sealed with a septum and the reaction
stirred at 60 °C for 22 h. After 22 h the reaction mixture was allowed to cool to RT, then
filtered through Celite with EtOAc, washed with sat. aq. NaHCO3, dried over MgSO4, filtered
and evaporated to give a brown residue, which was subsequently analysed by 1H NMR
spectroscopy.
Lab book reference number (Pd/C, 5 wt%): AJR-6-511
Lab book reference number (Pd/C, 10 wt%): AJR-6-517
Lab book reference number (Pd/charcoal): AJR-6-512

Chapter 6: Experimental
210
Lab book reference number (Pd black): AJR-6-516
Lab book reference number (Lindlar): AJR-6-515
Lab book reference number (Pearlman’s): AJR-6-513
Lab book reference number (PdO): AJR-6-514
PVP–Pd (13)
To a three-necked round-bottomed flask fitted with a mechanical stirrer and reflux condenser
was added PdCl2 (255 mg, 1.44 mmol, 1 eq.), HCl (0.2 M, 14.4 mL) and deionised water
(706 mL). The reaction mixture was stirred for 1 h to give an orange solution. PVP 12 (3.2
g, 28.3 mmol, 14 eq.), deionised water (672 mL) and EtOH (1000 mL) were added and the
reaction heated to reflux with stirring for 4.5 h. The mixture was cooled to ambient
temperature and the solvent removed under reduced pressure to give a brittle, glassy black
solid. This was crushed with a pestle and mortar then dried in vacuo to give the product as a
black crystalline solid (3.40 g).
IR (solid-state ATR, cm-1): 2953 (w, br), 1640 (s), 1421 (s), 1288 (s).
Lab book reference number: AJR-1-33, AJR-8-709
DMF-stabilised PdNPs (236)
To a 250 mL two-necked round-bottomed flask equipped with a magnetic stirrer bar and
reflux condenser was added DMF (15 ml). This was heated to 140 °C before a suspension of
PdCl2 (2.6 mg, 15 µmol) in deionised water (150 µL) was added. The resulting solution was
heated at 140 °C for 6 h to yield the product as a clear yellow solution. Often the product
could not be obtained, and a black particulate solution was seen instead.
Lab book reference number: AJR-5-463, AJR-5-464
Diphenyliodonium trifluoromethanesulfonate (38)124
Aryliodonium salt 22 (1 g, 3.1 mmol, 1 eq.) and benzene 237 (303 µL, 266 mg, 3.41 mmol,
1.1 eq.) were added to a round-bottomed flask and dissolved in CH2Cl2 (6 mL) with stirring.
The mixture was cooled to 0 °C then trifluoromethanesulfonic acid (301 µL, 512 mg, 3.41
mmol, 1.1 eq.) was added dropwise with stirring. After complete addition the reaction was

Chapter 6: Experimental
211
stirred for 2 h over which time it was allowed to warm to RT. After 2 h the mixture was
evaporated to give an orange-white residue to which Et2O was added to precipitate a white
solid. This was filtered through a glass sinter and washed on the filter with further Et2O until
the filtrate ran clear. This was then dried in vacuo at 100 °C to afford the title compound as
an off-white solid (1.02 g, 76%).
M.P. 174–176 °C (lit.224 175–177 °C); 1H NMR (400 MHz, (CD3)2SO, δ):8.28–8.22 (m, 4H),
7.70–7.64 (m, 2H), 7.57–7.50 (m, 4H); 13C NMR (101 MHz, (CD3)2SO, δ): 135.2, 132.1,
131.8, 116.5; 19F NMR (376 MHz, CDCl3, δ): −77.7; ESI–MS m/z (ion, %): 280 ([M−OTf]+,
100); ESI–HRMS m/z: 280.9830 [M−OTf]+ (C12H10I requires 280.9822).
Lab book reference number: AJR-8-726
Screening for the direct arylation of tryptophan (75)
To a microwave tube equipped with magnetic stirrer bar was added tryptophan 74 (52 mg,
0.20 mmol, 1 eq.), diaryliodonium triflate salt 38 (172 mg, 0.40 mmol, 2 eq.) or
diaryliodonium tetrafluoroborate salt 233 (147 mg, 0.40 mmol, 2 eq.), Pd catalyst (5 mol%)
and solvent (2 mL). The vial was sealed with a septum and the reaction stirred at 60 °C for
16 h. After 16 h the reaction mixture was allowed to cool to RT, filtered through a silica pad
with EtOAc and evaporated to give a brown residue, which was subsequently analysed by 1H
NMR spectroscopy.
Lab book reference number (entry 1): AJR-8-712
Lab book reference number (entry 2): AJR-8-729
Lab book reference number (entry 3): AJR-8-730
Lab book reference number (entry 4): AJR-8-720
Lab book reference number (entry 5): AJR-8-714
Lab book reference number (entry 6): AJR-8-728
Lab book reference number (entry 7): AJR-8-725

Chapter 6: Experimental
212
Lab book reference number (entry 8): AJR-8-735
Lab book reference number (entry 9): AJR-8-733
Lab book reference number (entry 10): AJR-8-734
1-Methyl-2-phenylindole (34)
Method A: The initial kinetics for formation of the title compound were recorded using
general procedure D (temperature decreased to 50 °C) with Pd/C (64 mg), PVP–Pd 13 (40
mg), Pd(OAc)2 (6.7 mg) or Pd2(dba)3 238 (15.5 mg).
Method B: The initial kinetics for formation of the title compound were recorded using
general procedure D with Pd/C (64 mg), PVP–Pd 13 (40 mg), Pd(OAc)2 (6.7 mg) or Pd2(dba)3
238 (15.5 mg).
1H NMR (400 MHz, CDCl3, δ): 7.64 (d, J = 8.0 Hz, 1H), 7.56–7.46 (m, 4H), 7.45–7.36 (m,
2H), 7.28–7.23 (m, 1H), 7.18–7.12 (m, 1H), 6.57 (s, 1H), 3.76 (s, 3H); 13C NMR (101 MHz,
CDCl3, δ): 141.7, 138.5, 133.0, 129.5, 128.6, 128.1, 128.0, 121.8, 120.6, 120.0, 109.7, 101.8,
31.3.
Lab book reference number (method A, Pd/C): ln_1a_07 (reaction conducted by L. Neumann)
Lab book reference number (method A, PVP–Pd): ln_1c_04 (reaction conducted by L.
Neumann)
Lab book reference number (method A, Pd(OAc)2): ln_1f_05 (reaction conducted by L.
Neumann)
Lab book reference number (method A, Pd2(dba)3): ln_1g_05 (reaction conducted by L.
Neumann)
Lab book reference number (method B, Pd/C): ln_1a_06 (reaction conducted by L. Neumann)
Lab book reference number (method B, PVP–Pd): ln_1c_02_new (reaction conducted by L.
Neumann)
Lab book reference number (method B, Pd(OAc)2): ln_1f_03 (reaction conducted by L.
Neumann)

Chapter 6: Experimental
213
Lab book reference number (method B, Pd2(dba)3): ln_1g_02 (reaction conducted by L.
Neumann)
Comparison of PVP–Pd batches using 1-Methyl-2-phenylindole
The initial kinetics for formation of the title compound were recorded using general
procedure D with PVP–Pd 13 (40 mg).
Lab book reference number: ln_1c_02_old (reaction conducted by L. Neumann)
Lab book reference number: ln_1c_02_new (reaction conducted by L. Neumann)
2-phenylbenzofuran (240)
The initial kinetics for formation of the title compound were recorded using general
procedure D with Pd/C (64 mg), PVP–Pd 13 (40 mg), Pd(OAc)2 (6.7 mg) or Pd2(dba)3 238
(15.5 mg).
To a microwave tube equipped with magnetic stirrer bar was added benzofuran 239 (33 µL,
35 mg, 0.30 mmol, 1 eq.), diaryliodonium salt 233 (155 mg, 0.42 mmol, 1.4 eq.), Pd(OAc)2
(3.4 mg, 0.015 mmol, 5 mol%) and EtOH (1.5 mL). The vial was sealed with a septum and
the reaction stirred at 60 °C for 22 h. After 22 h the reaction mixture was allowed to cool to
RT, filtered through a silica pad with EtOAc and evaporated to give a brown residue, which
was purified directly by wet-loaded flash column chromatography (SiO2, petrol) to afford the
title compound as a white solid (18 mg, 31%).
1H NMR (400 MHz, CDCl3, δ): 7.92–7.87 (m, 2H), 7.63–7.59 (m, 1H), 7.57–7.53 (m, 1H),
7.50–7.44 (m, 2H), 7.40–7.35 (m, 1H), 7.31 (ddd, J = 8.0, 7.0, 1.5 Hz, 1H), 7.26 (ddd, J =
8.0, 7.0, 1.5 Hz, 1H), 7.05 (d, J = 1.0 Hz, 1H); 13C NMR (101 MHz, CDCl3, δ): 156.0, 155.0,
130.6, 129.3, 128.9, 128.7, 125.1, 124.4, 123.1, 121.0, 111.3, 101.4; EI–GC–MS m/z (ion):
194 [C14H10O]+; EI–HRMS m/z: 194.0720 [C14H10O]+ (C14H10O requires 194.0732).
Lab book reference number (Pd/C): ln_3a (reaction conducted by L. Neumann)
Lab book reference number (PVP–Pd): ln_3c (reaction conducted by L. Neumann)
Lab book reference number (Pd(OAc)2): ln_3f (reaction conducted by L. Neumann)
Lab book reference number (Pd2(dba)3): ln_3g (reaction conducted by L. Neumann)

Chapter 6: Experimental
214
Lab book reference number: AJR-7-642
4-n-butyl-2-phenylthiophene (242)
The initial kinetics for formation of the title compound were recorded using general
procedure D with Pd/C (64 mg), PVP–Pd 13 (40 mg), Pd(OAc)2 (6.7 mg) or Pd2(dba)3 238
(15.5 mg).
Method A: To a microwave tube equipped with magnetic stirrer bar was added 2-n-
butylthiophene 241 (42 mg, 0.30 mmol, 1 eq.), diaryliodonium salt 233 (155 mg, 0.42 mmol,
1.4 eq.), Pd(OAc)2 (3.4 mg, 0.015 mmol, 5 mol%) and EtOH (1.5 mL). The vial was sealed
with a septum and the reaction stirred at 60 °C for 22 h. After 22 h the reaction mixture was
allowed to cool to RT, filtered through a silica pad with EtOAc and evaporated to give a
brown residue, which was purified directly by wet-loaded flash column chromatography
(SiO2, petrol) to afford the title compound as a clear oil (32 mg, 49%).
Method B: Synthesised as in method A using PVP–Pd 13 (20 mg, 0.015 mmol, 5 mol%) in
place of Pd(OAc)2. Purification by wet-loaded flash column chromatography (SiO2, petrol)
afforded the title compound as a clear oil (45 mg, 69%).
1H NMR (400 MHz, CDCl3, δ): 7.61–7.56 (m, 2H), 7.42–7.36 (m, 2H), 7.31–7.25 (m, 1H),
7.24 (d, J = 1.5 Hz, 1H), 7.09 (dt, J = 1.5, 1.0 Hz, 1H), 2.87 (t, J = 7.5 Hz, 2H), 1.77–1.67
(m, 2H), 1.50–1.38 (m, 2H), 0.97 (t, J = 7.5 Hz, 3H); 13C NMR (101 MHz, CDCl3, δ): 146.8,
141.9, 136.4, 128.8, 127.0, 126.4, 123.5, 117.9, 33.9, 30.0, 22.4, 14.0; ESI–MS m/z (ion):
217 [C14H17S]+; ESI–HRMS m/z: 217.1024 [C14H17S]+ (C14H17S requires 217.1045).
Lab book reference number (Pd/C): ln_5a (reaction conducted by L. Neumann)
Lab book reference number (PVP–Pd): ln_5c (reaction conducted by L. Neumann)
Lab book reference number (Pd(OAc)2): ln_5f (reaction conducted by L. Neumann)
Lab book reference number (Pd2(dba)3): ln_5g (reaction conducted by L. Neumann)
Lab book reference number (method A): AJR-7-643
Lab book reference number (method B): AJR-7-731

Chapter 6: Experimental
215
5-n-butyl-2-phenylfuran (246)
The initial kinetics for formation of the title compound were recorded using general
procedure D with Pd/C (64 mg), PVP–Pd 13 (40 mg), Pd(OAc)2 (6.7 mg) or Pd2(dba)3 238
(15.5 mg).
The initial kinetics were also studied using procedure D, with the temperature increased to
70 °C over 10 h, using Pd/C (64 mg).
Method A: To a microwave tube equipped with magnetic stirrer bar was added 2-n-butylfuran
243 (42 µL, 37 mg, 0.30 mmol, 1 eq.), diaryliodonium salt 233 (155 mg, 0.42 mmol, 1.4 eq.),
PVP–Pd 13 (20 mg, 0.015 mmol, 5 mol%) and EtOH (1.5 mL). The vial was sealed with a
septum and the reaction stirred at 60 °C for 22 h. After 22 h the reaction mixture was allowed
to cool to RT, filtered through a silica pad with EtOAc and evaporated to give a brown
residue, which was purified directly by dry-loaded flash column chromatography (SiO2,
petrol) to afford the title compound as a clear oil (27 mg, 45%).
Method B: Synthesised as in method B using Pd/C (32 mg, 0.015 mmol, 5 mol%) in place of
PVP–Pd 13. Purification by dry-loaded flash column chromatography (SiO2, petrol) to afford
an inseparable mixture of the title compound and biphenyl as a clear oil (45 mg).
1H NMR (400 MHz, CDCl3, δ): 7.68–7.63 (m, 2H), 7.40–7.34 (m, 2H), 7.23 (tt, J = 7.5, 1.0
Hz, 1H), 6.56 (d, J = 3.0 Hz, 1H), 6.08 (dt, J = 3.0, 1.0 Hz, 1H), 2.70 (app t, J = 7.5 Hz, 2H),
1.70 (tt, J = 7.5, 6.5 Hz, 2H), 1.44 (app sext, J = 7.5 Hz, 2H), 0.97 (t, J = 7.5 Hz, 3H); 13C
NMR (101 MHz, CDCl3, δ): 156.6, 152.2, 131.4, 128.7, 126.8, 123.4, 107.0, 105.8, 30.4,
28.0, 22.4, 14.0; EI–GC–MS m/z (ion): 200 [C14H16O]+; EI–HRMS m/z: 200.1202 [C14H16O]+
(C14H16O requires 200.1201).
Lab book reference number (Pd/C): ln_6a (reaction conducted by L. Neumann)
Lab book reference number (PVP–Pd): ln_6c (reaction conducted by L. Neumann)
Lab book reference number (Pd(OAc)2): ln_6f (reaction conducted by L. Neumann)
Lab book reference number (Pd2(dba)3): ln_6g (reaction conducted by L. Neumann)
Lab book reference number: AJR-8-743
Lab book reference number (method A): AJR-8-732

Chapter 6: Experimental
216
Lab book reference number (method B): AJR-8-739, AJR-8-740, AJR-8-742
(1E,4E)-1,5-diphenylpenta-1,4-dien-3-one (247)
To a round-bottomed flask equipped with a magnetic stirrer was added NaOH (4.7 g, 117
mmol, 2.5 eq.), deionised water (91 mL) and EtOH (66 mL), before being cooled to 0 °C.
Acetone (3.45 mL, 2.73 g, 47 mmol, 1 eq.) and benzaldehyde (9.60 mL, 9.98 g, 94 mmol, 1
eq.) were then added dropwise with stirring over 15 min. After complete addition the reaction
was allowed to warm to RT over 40 min with stirring, during which time a yellow precipitate
formed. After 40 min this was filtered through a glass sinter and washed with deionised water
(3 × 25 mL). The resultant solid was dissolved in a minimum amount of hot (70 °C) ethyl
acetate and then rapidly cooled to 0°C using an ice bath to produce yellow crystals. These
were dried in vacuo to afford the title compound as a yellow crystalline solid (6.86 g, 62%).
M.P. 111–112 °C (lit.225 110–112 °C); 1H NMR (400 MHz, CDCl3, δ): 7.75 (d, J = 16.0 Hz,
2H), 7.65–7.58 (m, 4H), 7.45–7.38 (m, 6H), 7.09 (d, J = 16.0 Hz, 2H); 13C NMR (101 MHz,
CDCl3, δ): 189.3, 143.7, 135.2, 130.9, 129.4, 128.8, 125.8; ESI–MS m/z (ion, %): 235
([M+H]+, 100), 257 ([M+Na]+, 40); ESI–HRMS m/z: 235.1110 [M+H]+ (C17H15O requires
235.1117); IR (solid-state ATR, cm-1): 1649 (m), 1588 (m), 1446 (m), 979 (s), 753 (s), 691
(s); Elemental anal.: C 87.20, H 6.04 (C17H14O requires C 87.15, H 6.02).
Lab book reference number: AJR-1-3
Tris((1E,4E)-1,5-diphenylpenta-1,4-dien-3-one)dipalladium(0)·CHCl3 (238)170
Method A: To a round-bottomed flask equipped with a magnetic stirrer was added Pd(OAc)2
(100 mg, 0.45 mol, 1 eq.), dba 247 (209 mg, 0.89 mmol, 2 eq.), NaOAc (365 mg, 4.45 mol,

Chapter 6: Experimental
217
10 eq.) and MeOH (10 mL). The reaction was stirred at 40 °C for 3 h. After 3 h the resultant
dark precipitate was filtered through a glass sinter and washed with MeOH (2 × 5 mL),
deionised water (3 × 5 mL) then MeOH (2 × 5 mL). The dark purple residue was rinsed
through the sinter with dry, freshly distilled CHCl3 (30 mL) and the solvent removed to yield
a purple residue. This was redissolved in a minimum amount of dry, freshly distilled CHCl3
(7 mL), then dry, freshly distilled acetone (20 mL) was added and the solution kept at −18
°C for 18 h. After 18 h the dark purple precipitate formed was filtered through a glass sinter
and washed with cold (5 °C) dry, freshly distilled acetone (2 × 5 mL) then dried in vacuo at
40 °C for 30 min to afford the title compound as a purple crystalline solid (188 mg, 82%).
The purity was subsequently measured by 1H NMR spectroscopic analysis as 84%.
Method B: To a Schlenk tube equipped with a magnetic stirrer bar was added Pd(OAc)2 (100
mg, 0.45 mol, 1 eq.), dba 247 (209 mg, 0.89 mmol, 2 eq.) and NaOAc (365 mg, 4.45 mol, 10
eq.). The Schlenk tube was placed under vacuum and refilled with nitrogen three times, then
dry MeOH (10 mL) was added and the mixture stirred at 40 °C for 3 h. After 3 h the solvent
was removed by filter cannula and the residue washed with dry MeOH (2 × 5 mL). The
resulting residue was then redissolved in dry CHCl3 (20 mL) and the solution transferred to
a clean Schlenk tube under N2 via filter cannula. The reaction Schlenk tube was then rinsed
with dry CHCl3 (10 mL) and this was transferred under N2 via filter cannula to the CHCl3
solution. This solvent was then removed to give a dark purple residue, which was redissolved
in dry CHCl3 (20 mL). Dry acetone (80 mL) was then added and the solution kept at −18 °C
for 16 h. After 16 h the solvent was removed via filter cannula and the dark purple precipitate
washed with cold (5 °C) dry acetone (2 × 5 mL) then dried in vacuo to afford the title
compound as a purple crystalline solid (128 mg, 55%). The purity was subsequently
measured by 1H NMR spectroscopic analysis as 91%.
Note: the integrals for multiplets in the 1H NMR data have not been reported due to the
coincidence of multiple environments from both isomers and dissociated free ligand
rendering such assignment extraneous. Signals corresponding to the minor isomer have been
denoted with an asterisk.
M.P. 120–122 °C dec. (lit.168 120–122 °C dec.); 1H NMR (500 MHz, CDCl3, δ): 7.75 (d, J =
16.0 Hz, 1H,), 7.65–7.60* (m), 7.45–6.92* (m), 6.83–6.31* (m), 6.15 (d, J = 13.0 Hz, 1H),
6.03* (d, J = 12.5 Hz, 1H), 6.00–5.90* (m, 3H), 5.87 (d, J = 12.5 Hz, 1H), 5.65* (d, J = 14.0
Hz, 1H), 5.33 (d, J = 12.5 Hz, 1H), 5.13 (d, J = 13.0 Hz, 1H), 5.03* (d, J = 13.0 Hz, 1H),
4.96 (app t, J = 13.0 Hz, 2 H), 4.90–4.80* (m, 3 H); LIFDI–MS m/z (ion, %): 235 ([C17H15O]+,
100), 915 ([M+H]+, 10); IR (solid-state ATR, cm-1): 1609 (m), 1574 (m), 1539 (m), 1484

Chapter 6: Experimental
218
(m), 1442 (m), 1332 (m), 1184 (m), 974 (w), 757 (s), 696 (s), 557 (m); Elemental anal.: C
60.25, H 4.30 (Pd2C52H43O3Cl3 requires C 60.34, H 4.19).
Crystals suitable for X-ray diffraction were grown by layering of a saturated CHCl3 solution
with n-hexane to afford the Pd2(dba)3·CHCl3 adduct 238. Crystals of the Pd2(dba)3·CH2Cl2
249 and Pd2(dba)3·C6H6 250 adducts were grown by slow evaporation from saturated
solutions of CH2Cl2 and benzene, respectively.
Lab book reference number (Method A): AJR-8, pp. 91–92
Lab book reference number (Method B): AJR-4-335
N, N-dimethylanilinium tetrafluoroborate (252)
To Schlenk tube fitted with a magnetic stirrer was added aniline 251 (1 mL, 1 g, 8.25 mmol,
1 eq.). The Schlenk tube was then evacuated and backfilled with N2 three times, before dry
Et2O (5 mL) was added with stirring. HBF4·OEt2 (1.2 mL, 1.42 g, 9.08 mmol, 1.1 eq.) was
then added dropwise and after complete addition a biphasic mixture was formed, consisting
of a cloudy upper Et2O layer and a lower brown oil layer. The Et2O layer was removed via
cannula and the brown oil evaporated to form an off-white solid. This was redissolved in dry
CH2Cl2 (5 mL), then dry Et2O (5 mL) was added with stirring which formed the same brown
oil as before. The Et2O layer was removed via cannula and the brown oil evaporated to form
an off-white solid. This was redissolved in dry CH2Cl2 (5 mL), then dry Et2O (5 mL) was
added with stirring, which caused an off-white solid to precipitate. The Et2O was removed
via cannula, then the solid with washed with fresh dry Et2O (5 mL). This was removed via
cannula then the solid was dried in vacuo to afford the title compound as an off-white solid
(1.54 g, 89%).
M.P. 48–51 °C; 1H NMR (400 MHz, CD2Cl2, δ): 9.51 (br s, 1H), 7.65–7.50 (m, 5H), 3.33 (d,
J = 5.0 Hz, 6H); 13C NMR (101 MHz, (CD2Cl2, δ): 142.3, 131.5, 120.6, 85.3, 48.6; 11B NMR
(128 MHz, CD2Cl2, δ): −1.9; 19F NMR (376 MHz, CD2Cl2, δ): −151.1 (m, 1JF–10B, 4F), −151.1
(m, 1JF–11B, 4F); ESI–MS m/z (ion, %): 122 ([M−BF4]+, 100); ESI–HRMS m/z: 122.0965
[M−BF4]+ (C8H12N requires 122.0964).
Lab book reference number: AJR-7-680

Chapter 6: Experimental
219
Behaviour of 238 in dry, degassed CDCl3 under anhydrous conditions
To a Young’s NMR tube handled in a dry glove box was added complex 238 (5 mg, 4.4
µmol, 1 eq.) dissolved in dry, degassed CDCl3 (0.5 mL). 1H NMR spectra were then recorded
at 500 MHz 10 min after dissolution, then every 30 min for 24 h.
Lab book reference number: AJR-2-132
Behaviour of 238 in reagent grade CDCl3
To an NMR tube was added complex 238 (5 mg, 4.4 µmol, 1 eq.) dissolved in CDCl3 (0.5
mL). 1H NMR spectra were then recorded at 500 MHz 10 min after dissolution, then every
30 min for 24 h.
Lab book reference number: AJR-2-128
Behaviour of 238 under anhydrous conditions with 1 eq. acid 252
In a dry glove box, acid 252 (0.92 mg, 4.4 µmol, 1 eq.) was dissolved in dry, degassed CDCl3
(0.5 mL). This solution was then added to complex 238 (5 mg, 4.4 µmol, 1 eq.) and the
resultant solution transferred to a Young’s NMR tube. 1H NMR spectra were then recorded
at 500 MHz 10 min after dissolution, then every 30 min for 24 h.
Lab book reference number: AJR-2-138
Behaviour of 238 under anhydrous conditions with 3 eq. acid 252
In a dry glove box, acid 252 (2.8 mg, 13.2 µmol, 1 eq.) was dissolved in dry, degassed CDCl3
(0.5 mL). This solution was then added to complex 238 (5 mg, 4.4 µmol, 1 eq.) and the
resultant solution transferred to a Young’s NMR tube. 1H NMR spectra were then recorded
at 500 MHz 10 min after dissolution, then every 30 min for 24 h.
Lab book reference number: AJR-2-141
Behaviour of 238 under anhydrous conditions with 10 eq. AcOH
To a Young’s NMR tube handled in a dry glove box was added complex 238 (5 mg, 4.4
µmol, 1 eq.) dissolved in dry, degassed CDCl3 (0.5 mL). This was removed from the glove
box and AcOH (2.5 µL, 2.6 mg, 44 µmol, 10 eq.) was added under a flow of nitrogen. 1H
NMR spectra were then recorded at 500 MHz 10 min after dissolution, then every 30 min for
16 h. No degradation of the complex was observed during this period.
Lab book reference number: AJR-7-639

Chapter 6: Experimental
220
Behaviour of 238 under anhydrous conditions with 359 eq. AcOH
To a Young’s NMR tube handled in a dry glove box was added complex 238 (5 mg, 4.4
µmol, 1 eq.) dissolved in dry, degassed CDCl3 (0.5 mL). This was removed from the glove
box and AcOH (100 µL, 95 mg, 1.58 mmol, 359 eq.) was added under a flow of nitrogen. 1H
NMR spectra were then recorded at 500 MHz 10 min after dissolution, then every 30 min for
16 h. No degradation of the complex was observed during this period.
Lab book reference number: AJR-7-677
Behaviour of 238 under anhydrous conditions with 10 eq. TFA
To a Young’s NMR tube handled in a dry glove box was added complex 238 (5 mg, 4.4
µmol, 1 eq.) dissolved in dry, degassed CDCl3 (0.5 mL). This was removed from the glove
box and TFA (3.4 µL, 5 mg, 44 µmol, 10 eq.) was added under a flow of nitrogen. 1H NMR
spectra were then recorded at 500 MHz 10 min after dissolution, then every 30 min for 16 h.
Lab book reference number: AJR-7-670
Behaviour of 238 under anhydrous conditions with 298 eq. TFA
To a Young’s NMR tube handled in a dry glove box was added complex 238 (5 mg, 4.4
µmol, 1 eq.) dissolved in dry, degassed CDCl3 (0.5 mL). This was removed from the glove
box and TFA (100 µL, 149 mg, 1.31 mmol, 298 eq.) was added under a flow of nitrogen.
Visible decomposition to Pd black was observed within seconds. A 1H NMR spectra was
recorded at 500 MHz 10 min after dissolution, which matched that of the free ligand 247.
Lab book reference number: AJR-7-675
Behaviour of 238 under anhydrous conditions with HBF4·OEt2
To a Young’s NMR tube handled in a dry glove box was added complex 238 (5 mg, 4.4
µmol, 1 eq.) dissolved in dry, degassed CDCl3 (0.5 mL). This was removed from the
glovebox and HBF4·OEt2 (0.6 µL, 0.7 mg, 4.4 µmol, 1 eq.) was added under a flow of
nitrogen. Visible decomposition to Pd black was observed within seconds. A 1H NMR spectra
was recorded at 500 MHz 10 min after dissolution, which matched that of the free ligand 247.
Lab book reference number: AJR-7-637

Chapter 6: Experimental
221
ESI–MS study of complex 238
To a microwave tube equipped with a magnetic stirrer was added complex 238 (10 mg, 8.8
µmol, 1 eq.) and CHCl3 (0.5 mL). In a separate microwave vial, acid 252 (1.8 mg, 8.8 µmol,
1 eq.) was dissolved in CHCl3 (0.5 mL). The latter solution was then added to the solution
containing complex 238, the microwave vial was sealed and the reaction stirred at RT for 5
h. After 5 h an aliquot (4 µL) was removed and diluted 100-fold with a solution of
CH2Cl2:MeOH (400 µL, 2:1, v/v). This was then analysed by ESI–MS with a carrier gas flow
rate of 1200 µL h-1.
Lab book reference number: AJR-7-688
ESI–MS study of complex 238 over eight hours
In a glove (dry) box, complex 238 (100 mg, 0.09 mmol, 1 eq.) was dissolved in dry, degassed
CHCl3 (5 mL) in a microwave vial equipped with magnetic stirrer. In a separate microwave
vial, acid 252 (18 mg, 0.09 mmol, 1 eq.) was dissolved in dry, degassed CHCl3 (5 mL). The
latter solution was then added to the solution containing complex 238, the microwave vial
was sealed and the reaction stirred at RT for 5 min. After 5 min an aliquot (10 µL) was
removed, then 4 µL of this solution was diluted 100-fold with a solution of CH2Cl2:MeOH
(400 µL, 2:1, v/v). This was then analysed by ESI–MS with a carrier gas flow rate of 1200
µL h-1. This sampling process was repeated every 30 min for 8 h.
Lab book reference number: AJR-8-705
ESI–MS study of complex 238 over 30 minutes
In a glove (dry) box, complex 238 (100 mg, 0.09 mmol, 1 eq.) was dissolved in dry, degassed
CHCl3 (5 mL) in a microwave vial equipped with magnetic stirrer. After complete
dissolution, an aliquot (10 µL) was removed, then 4 µL of this solution was diluted 100-fold
with a solution of CH2Cl2:MeOH (400 µL, 2:1, v/v). This was then analysed by ESI–MS with
a carrier gas flow rate of 1200 µL h-1. In a separate microwave vial, acid 252 (18 mg, 0.09
mmol, 1 eq.) was dissolved in dry, degassed CHCl3 (5 mL). This solution was then added to
the solution containing complex 238, the microwave vial was sealed and the reaction stirred
at RT for 2 min. After 2 min an aliquot (10 µL) was removed, then 4 µL of this solution was
diluted 100-fold with a solution of CH2Cl2:MeOH (400 µL, 2:1, v/v). This was then analysed
by ESI–MS with a carrier gas flow rate of 1200 µL h-1. This sampling process was repeated
every 2 min for 30 min.
Lab book reference number: AJR-8-707

Appendix 1: Published Papers
222
Appendix 1: Published Papers
The following section contains, in chronological order, reproductions of papers which have
been published with the contributions of the author in connection with the work described in
this thesis.
1. Kapdi, A. R.; Whitwood, A. C.; Williamson, D. C.; Lynam, J. M.; Burns, M. J.;
Williams, T. J.; Reay, A. J.; Holmes, J.; Fairlamb, I. J. S.; The elusive structure of
Pd2(dba)3. Examination by isotopic labeling, NMR spectroscopy, and X-ray
diffraction analysis: synthesis and characterization of Pd2(dba-Z)3 complexes, J. Am.
Chem. Soc. 2013, 135, 8388–8399.
2. Williams, T. J.; Reay, A. J.; Whitwood, A. C.; Fairlamb, I. J. S.; A mild and selective
Pd-mediated methodology for the synthesis of highly fluorescent 2-arylated
tryptophans and tryptophan-containing peptides: a catalytic role for
Pd0 nanoparticles?, Chem. Commun. 2014, 50, 3052–3054.
3. Reay, A. J.; Williams, T. J.; Fairlamb, I. J. S.; Unified mild reaction conditions for
C2-selective Pd-catalysed tryptophan arylation, including tryptophan-containing
peptides, Org. Biomol. Chem. 2015, 13, 8298–8309.
4. Reay, A. J.; Fairlamb, I. J. S.; Catalytic C–H bond functionalisation chemistry: the
case for quasi-heterogeneous catalysis, Chem. Commun., 2015, 51, 16289–16307.

Appendix 1: Published Papers
223

Appendix 1: Published Papers
224

Appendix 1: Published Papers
225

Appendix 1: Published Papers
226

Appendix 1: Published Papers
227

Appendix 1: Published Papers
228

Appendix 1: Published Papers
229

Appendix 1: Published Papers
230

Appendix 1: Published Papers
231

Appendix 1: Published Papers
232

Appendix 1: Published Papers
233

Appendix 1: Published Papers
234

Appendix 1: Published Papers
235
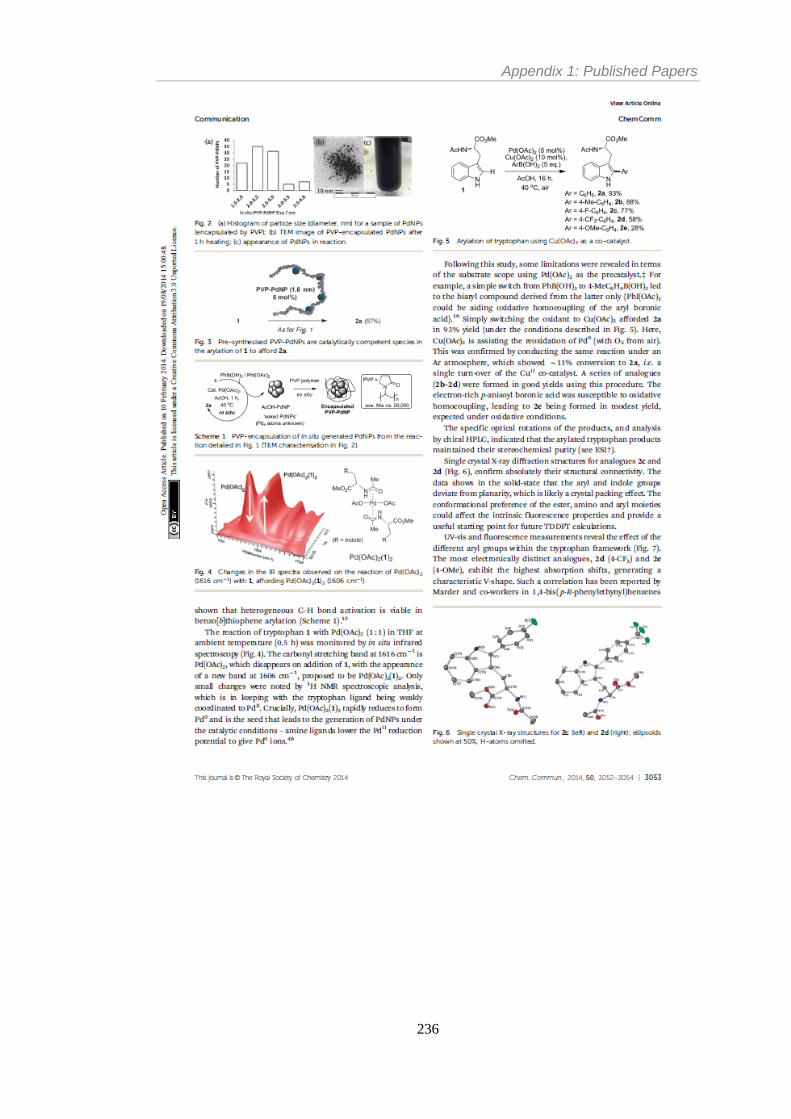
Appendix 1: Published Papers
236

Appendix 1: Published Papers
237

Appendix 1: Published Papers
238

Appendix 1: Published Papers
239

Appendix 1: Published Papers
240

Appendix 1: Published Papers
241

Appendix 1: Published Papers
242
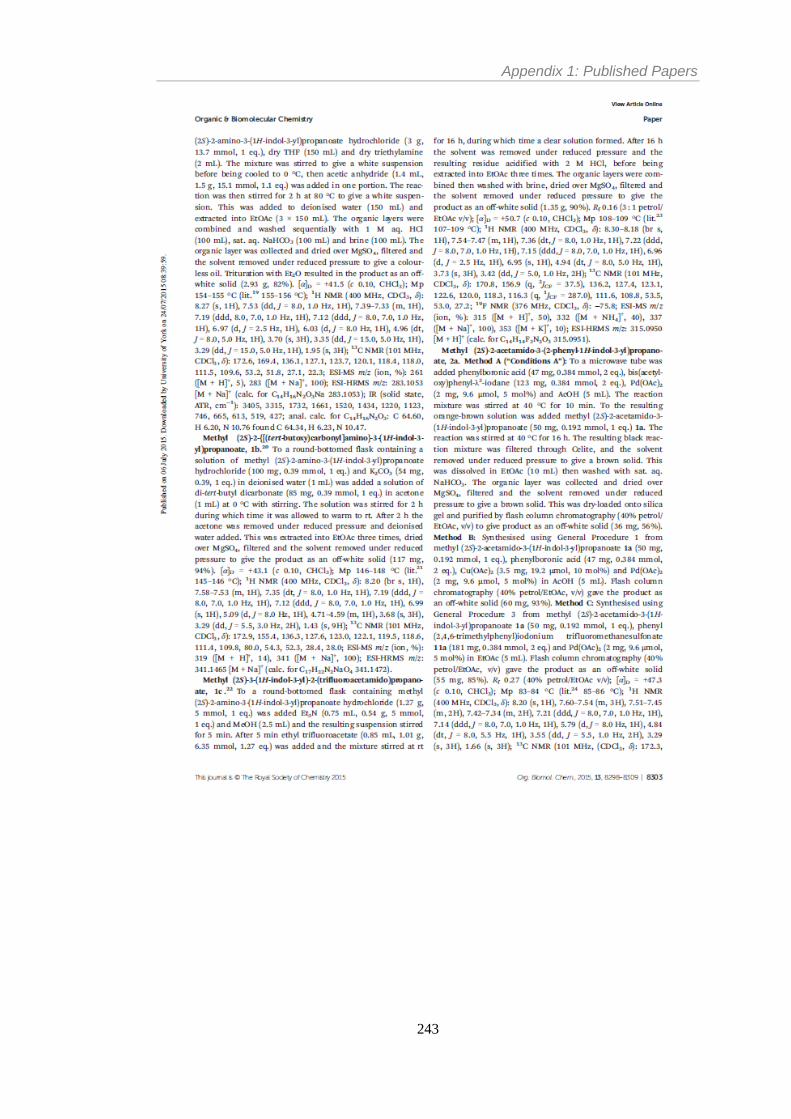
Appendix 1: Published Papers
243

Appendix 1: Published Papers
244

Appendix 1: Published Papers
245

Appendix 1: Published Papers
246

Appendix 1: Published Papers
247

Appendix 1: Published Papers
248

Appendix 1: Published Papers
249

Appendix 1: Published Papers
250

Appendix 1: Published Papers
251

Appendix 1: Published Papers
252

Appendix 1: Published Papers
253

Appendix 1: Published Papers
254

Appendix 1: Published Papers
255

Appendix 1: Published Papers
256

Appendix 1: Published Papers
257

Appendix 1: Published Papers
258

Appendix 1: Published Papers
259

Appendix 1: Published Papers
260

Appendix 1: Published Papers
261

Appendix 1: Published Papers
262

Appendix 1: Published Papers
263

Appendix 1: Published Papers
264

Appendix 1: Published Papers
265

Appendix 1: Published Papers
266
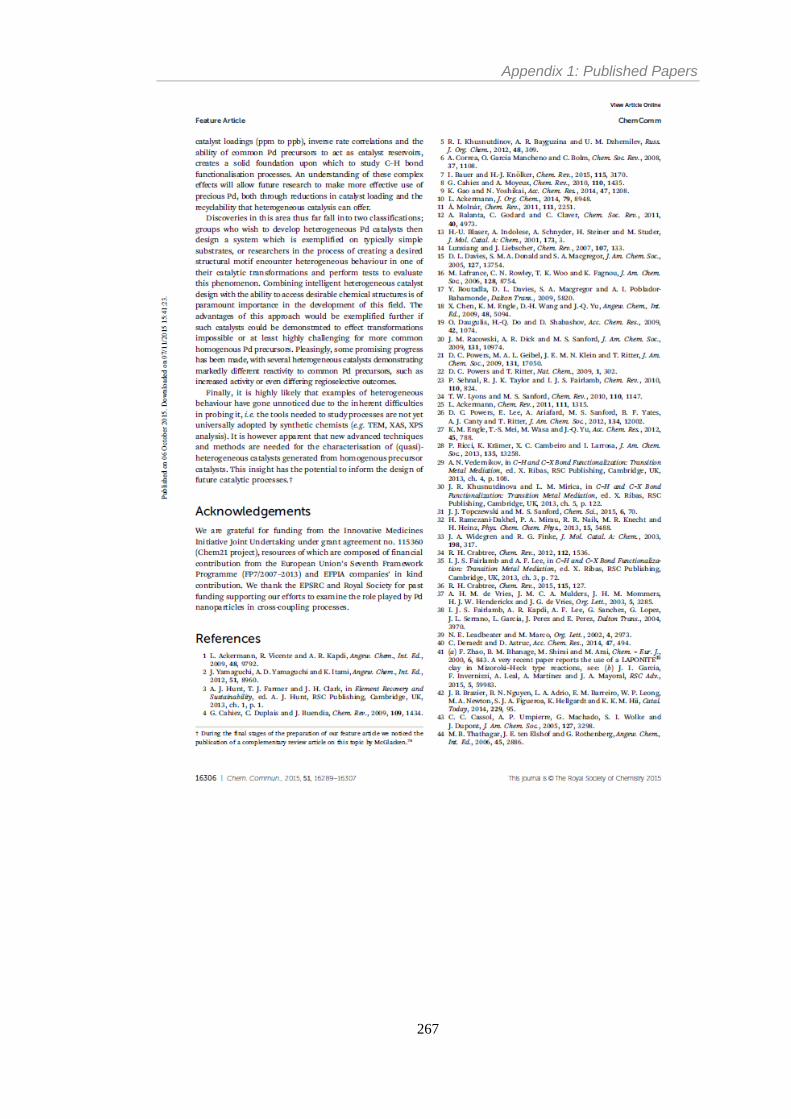
Appendix 1: Published Papers
267

Appendix 1: Published Papers
268

Appendix 2: X-Ray Diffraction Data
269
Appendix 2: X-Ray Diffraction Data
Crystallographic data for compound 75
Figure 51 Single crystal X-ray diffraction structure of 75. Thermal ellipsoids shown with 50%
probability and hydrogen atoms removed for clarity. Selected bond lengths (Å): C(3)–C(4): 1.500(3),
C(4)–C(11): 1.375(3), N(2)–C(11): 1.388(2), C(11)–C(12): 1.475(3). Selected bond angles (°): C(4)–
C(11)–C(12): 131.75(18), N(2)–C(11)–C(12): 118.71(17).

Appendix 2: X-Ray Diffraction Data
270
Table 16 Crystal data and structure refinement for ijsf1413 (compound 75).
Identification code
Empirical formula
Formula weight
Temperature / K
Crystal system
Space group
a / Å
b / Å
c / Å
α / Å
β / Å
γ / Å
Volume / Å3
No. of formula units per unit cell, Z
ρcalc mg / mm3
m / mm-1
F(000)
Crystal size / mm3
Radiation
2Θ range for data collection / °
Index ranges
Reflections collected
Independent reflections
Data/restraints/parameters
Goodness-of-fit on F2
Final R indexes [I>=2σ (I)]
Final R indexes [all data]
Largest diff. peak/hole / e Å-3
ijsf1413
C20H20N2O3
336.38
110.05(10)
trigonal
R3
21.2602(5)
21.2602(5)
10.1814(3)
90
90
120
3985.4(2)
9
1.261
0.086
1602.0
0.2757 × 0.1814 × 0.1572
MoKα (λ = 0.71073)
5.966 to 64.01
−23 ≤ h ≤ 31, −26 ≤ k ≤ 25, −15 ≤ l ≤ 13
6369
4199 [Rint = 0.0191]
4199/1/236
1.049
R1 = 0.0363, wR2 = 0.0863
R1 = 0.0404, wR2 = 0.0901
0.28/-0.22
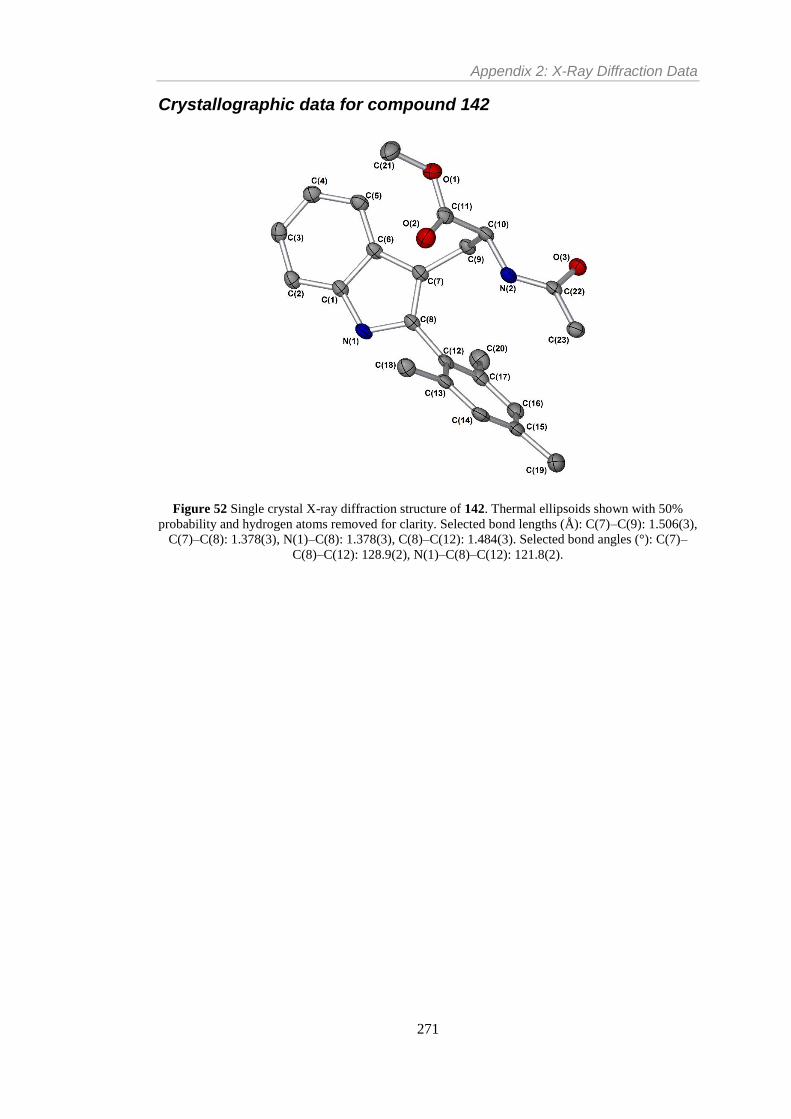
Appendix 2: X-Ray Diffraction Data
271
Crystallographic data for compound 142
Figure 52 Single crystal X-ray diffraction structure of 142. Thermal ellipsoids shown with 50%
probability and hydrogen atoms removed for clarity. Selected bond lengths (Å): C(7)–C(9): 1.506(3),
C(7)–C(8): 1.378(3), N(1)–C(8): 1.378(3), C(8)–C(12): 1.484(3). Selected bond angles (°): C(7)–
C(8)–C(12): 128.9(2), N(1)–C(8)–C(12): 121.8(2).

Appendix 2: X-Ray Diffraction Data
272
Table 17 Crystal data and structure refinement for ijsf1488 (compound 142).
Identification code
Empirical formula
Formula weight
Temperature / K
Crystal system
Space group
a / Å
b / Å
c / Å
α / Å
β / Å
γ / Å
Volume / Å3
No. of formula units per unit cell, Z
ρcalc mg / mm3
µ / mm-1
F(000)
Crystal size / mm3
Radiation
2Θ range for data collection / °
Index ranges
Reflections collected
Independent reflections
Data/restraints/parameters
Goodness-of-fit on F2
Final R indexes [I>=2σ (I)]
Final R indexes [all data]
Largest diff. peak/hole / e Å-3
ijsf1488
C23H26N2O3
378.46
110.05(10)
monoclinic
P21
8.7152(3)
13.5902(4)
8.7625(3)
90
100.507(3)
90
1020.44(6)
2
1.232
0.655
404.0
0.2485 × 0.1431 × 0.0656
CuKα (λ = 1.54184)
10.268 to 134.116
−9 ≤ h ≤ 10, −16 ≤ k ≤ 16, −10 ≤ l ≤ 10
6691
3634 [Rint = 0.0256, Rsigma = 0.0341]
3634/1/357
1.029
R1 = 0.0334, wR2 = 0.0865
R1 = 0.0350, wR2 = 0.0882
0.21/−0.18

Appendix 2: X-Ray Diffraction Data
273
Crystallographic data for compound 210
Figure 53 Single crystal X-ray diffraction structure of 210. Thermal ellipsoids shown with 50%
probability and absolute stereochemistry established by anomalous dispersion. Selected bond lengths
(Å): C(7)–C(15): 1.500(2), C(7)–C(8): 1.369(3), N(1)–C(8): 1.382(3), C(8)–C(9): 1.475(3), C(12)–
Cl(1): 1.743(2). Selected bond angles (°): C(7)–C(8)–C(9): 131.44(17), N(1)–C(8)–C(9): 119.04(16).

Appendix 2: X-Ray Diffraction Data
274
Table 18 Crystal data and structure refinement for ijsf1487 (compound 210).
Identification code
Empirical formula
Formula weight
Temperature / K
Crystal system
Space group
a / Å
b / Å
c / Å
α / Å
β / Å
γ / Å
Volume / Å3
No. of formula units per unit cell, Z
ρcalc mg / mm3
µ / mm-1
F(000)
Crystal size / mm3
Radiation
2Θ range for data collection / °
Index ranges
Reflections collected
Independent reflections
Data/restraints/parameters
Goodness-of-fit on F2
Final R indexes [I>=2σ (I)]
Final R indexes [all data]
Largest diff. peak/hole / e Å-3
ijsf1487
C20H19ClN2O3
370.82
110.05(10)
trigonal
R3
20.7806(2)
20.7806(2)
11.18107(13)
90
90
120
4181.48(10)
9
1.325
2.004
1746.0
0.183 × 0.1321 × 0.0705
CuKα (λ = 1.54184)
8.51 to 134.026
−24 ≤ h ≤ 24, −24 ≤ k ≤ 24, −13 ≤ l ≤ 13
19066
3300 [Rint = 0.0214, Rsigma = 0.0128]
3300/1/245
1.051
R1 = 0.0217, wR2 = 0.0550
R1 = 0.0219, wR2 = 0.0552
0.16/−0.23

Appendix 2: X-Ray Diffraction Data
275
Crystallographic data for compound 238
Figure 54 Single crystal X-ray diffraction structure of complex 238 (major isomer). Thermal
ellipsoids shown with 50% probability, hydrogen atoms and solvating chloroform removed for
clarity. Selected bond lengths (Å): Pd(1)–C(7): 2.303(3), Pd(1)–C(8): 2.248(3), C(7)–C(8): 1.358(4),
Pd(1)–C(24): 2.279(4), Pd(1)–C(25): 2.251(4), C(24)–C(25): 1.364(6), Pd(1)–C(41): 2.202(3),
Pd(1)–C(42): 2.220(3), C(41)–C(42): 1.393(5), Pd(2)–C(10): 2.222(3), Pd(2)–C(11): 2.244(3),
C(10)–C(11): 1.395(4), Pd(2)–C(27): 2.244(4), Pd(2)–C(28): 2.241(4), C(27)–C(28): 1.392(6),
Pd(2)–C(44): 2.244(3), Pd(2)–C(45): 2.280(3), C(44)–C(45): 1.359(5). Pd(1)–Pd(2) bond distance:
3.244 Å.
Figure 55 Single crystal X-ray diffraction structure of complex 238 (minor isomer). Thermal
ellipsoids shown with 50% probability, hydrogen atoms and solvating chloroform removed for
clarity. Selected bond lengths (Å): Pd(1)–C(7A): 2.275(11), Pd(1)–C(8A): 2.297(11), C(7A)–C(8A):
1.368(19), Pd(1)–C(24A): 2.243(6), Pd(1)–C(25A): 2.254(6), C(24A)–C(25A): 1.390(9), Pd(1)–
C(41A): 2.211(7), Pd(1)–C(42A): 2.207(7), C(41A)–C(42A): 1.339(10), Pd(2)–C(10A): 2.192(11),
Pd(2)–C(11A): 2.272(10), C(10A)–C(11A): 1.332(9), Pd(2)–C(27A): 2.274(6), Pd(2)–C(28A):
2.242(6), C(27A)–C(28A): 1.352(9), Pd(2)–C(44A): 2.267(7), Pd(2)–C(45A): 2.311(7), C(44A)–
C(45A): 1.394(10). Pd(1)–Pd(2) bond distance: 3.244 Å.

Appendix 2: X-Ray Diffraction Data
276
Table 19 Crystal data and structure refinement for ijsf1227 (compound 238).
Identification code
Empirical formula
Formula weight
Temperature / K
Crystal system
Space group
a / Å
b / Å
c / Å
α / Å
β / Å
γ / Å
Volume / Å3
No. of formula units per unit cell, Z
ρcalc mg / mm3
m / mm-1
F(000)
Crystal size / mm3
2Θ range for data collection / °
Index ranges
Reflections collected
Independent reflections
Data/restraints/parameters
Goodness-of-fit on F2
Final R indexes [I>=2σ (I)]
Final R indexes [all data]
Largest diff. peak/hole / e Å-3
ijsf1227
C52H43Cl3O3Pd2
1035.01
110.00(10)
monoclinic
P21/n
13.3506(2)
13.27319(12)
24.3667(3)
90
101.3288(14)
90
4233.77(9)
4
1.624
1.084
2088.0
0.1342 × 0.1177 × 0.1018
5.9 to 60.16
−9 ≤ h ≤ 18, −16 ≤ k ≤ 18, −34 ≤ l ≤ 28
25517
12430 [Rint = 0.0250]
12430/26/631
1.073
R1 = 0.0333, wR2 = 0.0720
R1 = 0.0464, wR2 = 0.0796
0.84/−0.61

Appendix 2: X-Ray Diffraction Data
277
Crystallographic data for compound 249
Figure 56 Single crystal X-ray diffraction structure of complex 249 (major isomer). Thermal
ellipsoids shown with 50% probability, hydrogen atoms and solvating methylene chloride removed
for clarity.

Appendix 2: X-Ray Diffraction Data
278
Table 20 Crystal data and structure refinement for ijsf1232 (compound 249).
Identification code
Empirical formula
Formula weight
Temperature / K
Crystal system
Space group
a / Å
b / Å
c / Å
α / Å
β / Å
γ / Å
Volume / Å3
No. of formula units per unit cell, Z
ρcalc mg / mm3
m / mm-1
F(000)
Crystal size / mm3
2Θ range for data collection / °
Index ranges
Reflections collected
Independent reflections
Data/restraints/parameters
Goodness-of-fit on F2
Final R indexes [I>=2σ (I)]
Final R indexes [all data]
Largest diff. peak/hole / e Å-3
ijsf1232
C52H44Cl2O3Pd2
1000.57
110.00(10)
triclinic
P-1
12.2214(4)
12.8052(3)
15.0153(3)
114.651(2)
96.795(2)
95.356(2)
2094.03(9)
2
1.587
1.031
1012.0
0.3172 × 0.1571 × 0.0798
5.94 to 64.28
−17 ≤ h ≤ 18, −18 ≤ k ≤ 18, −21 ≤ l ≤ 22
37706
13493 [Rint = 0.0487]
13493/21/635
1.086
R1 = 0.0395, wR2 = 0.0907
R1 = 0.0531, wR2 = 0.1009
1.06/−1.34

Appendix 2: X-Ray Diffraction Data
279
Crystallographic data for compound 250
Figure 57 Single crystal X-ray diffraction structure of complex 250 (major isomer). Thermal
ellipsoids shown with 50% probability, hydrogen atoms and solvating benzene removed for clarity.

Appendix 2: X-Ray Diffraction Data
280
Table 21 Crystal data and structure refinement for ijsf1302 (compound 250).
Identification code
Empirical formula
Formula weight
Temperature / K
Crystal system
Space group
a / Å
b / Å
c / Å
α / Å
β / Å
γ / Å
Volume / Å3
No. of formula units per unit cell, Z
ρcalc mg / mm3
m / mm-1
F(000)
Crystal size / mm3
2Θ range for data collection / °
Index ranges
Reflections collected
Independent reflections
Data/restraints/parameters
Goodness-of-fit on F2
Final R indexes [I>=2σ (I)]
Final R indexes [all data]
Largest diff. peak/hole / e Å-3
ijsf1302
C57H48O3Pd2
993.75
109.95(10)
monoclinic
P21/c
13.6130(3)
23.3621(5)
15.2236(4)
90
114.397(3)
90
4409.22(17)
4
1.497
0.862
2024.0
0.0881 × 0.0626 × 0.0492
5.7 to 50.7
−15 ≤ h ≤ 16, −24 ≤ k ≤ 28, −18 ≤ l ≤ 12
17380
8075 [Rint = 0.0377]
8075/15/662
1.062
R1 = 0.0440, wR2 = 0.0953
R1 = 0.0613, wR2 = 0.1038
0.71/−0.87

Appendix 3: UV–Visible Spectroscopic Data
281
Appendix 3: UV–Visible Spectroscopic Data
Figure 58 UV–visible spectroscopic analysis for compound 142.

Appendix 3: UV–Visible Spectroscopic Data
282
Figure 59 UV–visible spectroscopic analysis for compound 160.

Appendix 3: UV–Visible Spectroscopic Data
283
Figure 60 UV–visible spectroscopic analysis for compound 167.

Appendix 3: UV–Visible Spectroscopic Data
284
Figure 61 UV–visible spectroscopic analysis for compound 170.

Appendix 3: UV–Visible Spectroscopic Data
285
Figure 62 UV–visible spectroscopic analysis for compound 172.

Appendix 3: UV–Visible Spectroscopic Data
286
Figure 63 UV–visible spectroscopic analysis for compound 173.

Appendix 3: UV–Visible Spectroscopic Data
287
Figure 64 UV–visible spectroscopic analysis for compound 174.

Appendix 3: UV–Visible Spectroscopic Data
288
Figure 65 UV–visible spectroscopic analysis for compound 175.

Appendix 3: UV–Visible Spectroscopic Data
289
Figure 66 UV–visible spectroscopic analysis for compound 176.

Appendix 3: UV–Visible Spectroscopic Data
290
Figure 67 UV–visible spectroscopic analysis for compound 209.

Appendix 3: UV–Visible Spectroscopic Data
291
Figure 68 UV–visible spectroscopic analysis for compound 211.

Appendix 4: HPLC Data
292
Appendix 4: HPLC Data
Arylation Products of 136
Method A
Figure 69 HPLC–ESI–MS chromatogram (BPC) of the crude reaction material (arylated tryptophan
donated Trp*, diarylated tryptophans donated Trp**, dihydroxylated byproducts donated Trp‡).
Figure 70 ESI–MS of dihydroxylated side products from arylation of 136.
Ac-AlaTrp*Ala-OH, m/z 465, 54% Ac-AlaTrp‡Ala-OH, m/z 497, 37%
Ac-AlaTrp**Ala-OH,
m/z 541, 8%

Appendix 4: HPLC Data
293
Figure 71 ESI–MS of arylation product 137.
Figure 72 ESI–MS of diarylated side products from arylation of 136.

Appendix 4: HPLC Data
294
Method B
Figure 73 HPLC–ESI–MS chromatogram (BPC) of the crude reaction material (arylated tryptophan
donated Trp*, starting material donated Trp).
Figure 74 ESI–MS of starting material 136.
Ac-AlaTrpAla-OH,
m/z 465, 52%
Ac-AlaTrp*Ala-OH, m/z 465, 48%
[PhMesI]+, m/z 323

Appendix 4: HPLC Data
295
Figure 75 ESI–MS of arylation product 137.

Appendix 4: HPLC Data
296
Figure 76 ESI–MS of starting material 140.

Appendix 4: HPLC Data
297
Method C
Figure 77 HPLC–ESI–MS chromatogram (BPC) of the crude reaction material.
Figure 78 ESI–MS of arylation product 137.
Ac-AlaTrp(Ph)Ala-OH,
m/z 465, 69%
Ac-AlaTrp(Ph)Ala-OiPr,
m/z 507, 31%

Appendix 4: HPLC Data
298
Figure 79 ESI–MS of iPr-ester formed during workup from arylation product 137.

Appendix 4: HPLC Data
299
Arylation Products of 138
Method A
Figure 80 HPLC–ESI–MS chromatogram (BPC) of the crude reaction material (arylated tryptophan
donated Trp*, dihydroxylated byproducts donated Trp‡).
Figure 81 ESI–MS of dihydroxylated side products from arylation of 138.
Figure 82 ESI–MS of arylation product 139.
Ac-SerGlyTrp‡Ala-OH,
m/z 570, 57% Ac-SerGlyTrp*Ala-OH, m/z 560, 42%

Appendix 4: HPLC Data
300
Method B
Figure 83 HPLC–ESI–MS chromatogram (BPC) of the crude reaction material (arylated tryptophan
donated Trp*, starting material donated Trp).
Figure 84 ESI–MS of starting material 138.
Ac-SerGlyTrpAla-OH,
m/z 560, 44%
Ac-SerGlyTrp*Ala-OH, m/z 560, 56%
[PhMesI]+, m/z 323

Appendix 4: HPLC Data
301
Figure 85 ESI–MS of arylation product 139.

Appendix 4: HPLC Data
302
Figure 86 ESI–MS of starting material 140.

Appendix 4: HPLC Data
303
Method C
Figure 87 HPLC–ESI–MS chromatogram (BPC) of the crude reaction material.
Figure 88 ESI–MS of arylation product 139.
Ac-SerGlyTrp(Ph)Ala-OH,
m/z 538, 100%

Appendix 5: GC Data
304
Appendix 5: GC Data
Calculations
Mesitylene Reference Solution
Maximum concentration of substrate in the reaction:
𝑐𝑚𝑎𝑥 (𝑟𝑒𝑎𝑐𝑡𝑖𝑜𝑛) = 0.6 𝑚𝑚𝑜𝑙
3 𝑚𝐿= 0.2 𝑚𝑚𝑜𝑙 𝑚𝐿−1
For sampling a 30 uL aliquot is taken and diluted with 0.6 mL mesitylene standard. This
gives a maximum substrate concentration in the GC sample of 0.0095 mmol mL-1:
𝑐𝑚𝑎𝑥 (𝐺𝐶 𝑠𝑎𝑚𝑝𝑙𝑒) = 𝑐𝑚𝑎𝑥 (𝑟𝑒𝑎𝑐𝑡𝑖𝑜𝑛) ∙ 𝑉 (𝑎𝑙𝑖𝑞𝑢𝑜𝑡)
𝑉𝑡𝑜𝑡𝑎𝑙 (𝐺𝐶 𝑠𝑎𝑚𝑝𝑙𝑒)
= 0.2 𝑚𝑚𝑜𝑙 𝑚𝐿−1 ∙ 0.03 𝑚𝐿
0.63 𝑚𝐿= 0.0096 𝑚𝑚𝑜𝑙 𝑚𝐿−1
0.6 mL of mesitylene reference solution should have the maximum substrate concentration:
𝑛𝐺𝐶 𝑠𝑎𝑚𝑝𝑙𝑒(𝑚𝑒𝑠𝑖𝑡𝑦𝑙𝑒𝑛𝑒) = 𝑐𝑚𝑎𝑥(𝐺𝐶 𝑠𝑎𝑚𝑝𝑙𝑒) ∙ 𝑉𝑡𝑜𝑡𝑎𝑙(𝐺𝐶 𝑠𝑎𝑚𝑝𝑙𝑒)
= 0.0095 𝑚𝑚𝑜𝑙 𝑚𝐿−1 ∙ 0.63 𝑚𝐿 = 0.006 𝑚𝑚𝑜𝑙
𝑉𝐺𝐶 𝑠𝑎𝑚𝑝𝑙𝑒(𝑚𝑒𝑠𝑖𝑡𝑦𝑙𝑒𝑛𝑒) = 𝑀(𝑚𝑒𝑠𝑖𝑡𝑦𝑙𝑒𝑛𝑒)
𝜌 (𝑚𝑒𝑠𝑖𝑡𝑦𝑙𝑒𝑛𝑒) ∙ 𝑛(𝑚𝑒𝑠𝑖𝑡𝑦𝑙𝑒𝑛𝑒)
= 120.19 𝑔 𝑚𝑜𝑙−1
0.8637 𝑔 𝑚𝐿−1 ∙ 0.006 𝑚𝑚𝑜𝑙 = 0.835 µ𝐿
𝑉𝑟𝑒𝑓𝑒𝑟𝑒𝑛𝑐𝑒(𝑚𝑒𝑠𝑖𝑡𝑦𝑙𝑒𝑛𝑒) = 𝑉𝐺𝐶 𝑠𝑎𝑚𝑝𝑙𝑒(𝑚𝑒𝑠𝑖𝑡𝑦𝑙𝑒𝑛𝑒)
𝑉𝑚𝑒𝑠𝑖𝑡𝑦𝑙𝑒𝑛𝑒(𝐺𝐶 𝑠𝑎𝑚𝑝𝑙𝑒) ∙ 𝑉(𝑟𝑒𝑓𝑒𝑟𝑒𝑛𝑐𝑒)
= 0.835 µ𝐿
0.6 𝑚𝐿 ∙ 100 𝑚𝐿 = 139 µ𝐿
Calibration Solutions
Five solutions used at 100%, 80%, 60%, 40% and 20% concentrations of cmax(substrate). All
solutions contain c(mesitylene) = 100% cmax(substrate), with Vtotal = 1 mL

Appendix 5: GC Data
305
Calculation of Conversion from Peak Area
To calculate the substrate concentration in the GC sample:
𝒄(𝒔𝒖𝒃𝒔𝒕𝒓𝒂𝒕𝒆) = 𝒂𝒗. 𝒑𝒆𝒂𝒌 𝒂𝒓𝒆𝒂 (𝒔𝒖𝒃𝒔𝒕𝒓𝒂𝒕𝒆)
𝒂𝒗.𝒑𝒆𝒂𝒌 𝒂𝒓𝒆 (𝒔𝒕𝒂𝒏𝒅𝒂𝒓𝒅)⁄
𝑹𝑹𝑭 (𝒔𝒖𝒃𝒔𝒕𝒓𝒂𝒕𝒆) ∙ 𝒄(𝒎𝒆𝒔𝒊𝒕𝒚𝒍𝒆𝒏𝒆)
To calculate the substrate concentration in the reaction solution:
𝑐(𝑠𝑢𝑏𝑠𝑡𝑟𝑎𝑡𝑒) = 𝑐𝐺𝐶 𝑠𝑎𝑚𝑝𝑙𝑒(𝑠𝑢𝑏𝑠𝑡𝑟𝑎𝑡𝑒)
∙ 𝑉𝑡𝑜𝑡𝑎𝑙 (𝐺𝐶 𝑠𝑎𝑚𝑝𝑙𝑒) ∙
𝑉𝑡𝑜𝑡𝑎𝑙 (𝑟𝑒𝑎𝑐𝑡𝑖𝑜𝑛)𝑉𝐺𝐶 𝑠𝑎𝑚𝑝𝑙𝑒 (𝑠𝑢𝑏𝑠𝑡𝑟𝑎𝑡𝑒)⁄
𝑉𝑡𝑜𝑡𝑎𝑙(𝑟𝑒𝑎𝑐𝑡𝑖𝑜𝑛)
To convert substrate concentration into conversion:
𝑛(𝑠𝑢𝑏𝑠𝑡𝑟𝑎𝑡𝑒)% = 𝑐𝑟𝑒𝑎𝑐𝑡𝑖𝑜𝑛 (𝑠𝑢𝑏𝑠𝑡𝑟𝑎𝑡𝑒)
𝑐𝑚𝑎𝑥 (𝑟𝑒𝑎𝑐𝑡𝑖𝑜𝑛)
Calculation of Error
The maximum possible error is always accounted for. This is based on the maximum ratio of
peak areas for three injections, as well as the standard error of the slope from the calibration
curve:
𝑐𝐺𝐶 𝑠𝑎𝑚𝑝𝑙𝑒(𝑠𝑢𝑏𝑠𝑡𝑟𝑎𝑡𝑒)𝑚𝑎𝑥
= max (
𝑝𝑒𝑎𝑘 𝑎𝑟𝑒𝑎 (𝑠𝑢𝑏𝑠𝑡𝑟𝑎𝑡𝑒)𝑝𝑒𝑎𝑘 𝑎𝑟𝑒𝑎 (𝑠𝑡𝑎𝑛𝑑𝑎𝑟𝑑)⁄ )
𝑠𝑙𝑜𝑝𝑒 (𝑅𝑅𝐹) ∙ (1 − 𝑠𝑡𝑎𝑛𝑑𝑎𝑟𝑑 𝑒𝑟𝑟𝑜𝑟)
∙ 𝑐𝐺𝐶 𝑠𝑎𝑚𝑝𝑙𝑒(𝑠𝑢𝑏𝑠𝑡𝑟𝑎𝑡𝑒)

Appendix 5: GC Data
306
Calibrations
Figure 89 Calibration plot to determine RRF for 1-methylindole 33.
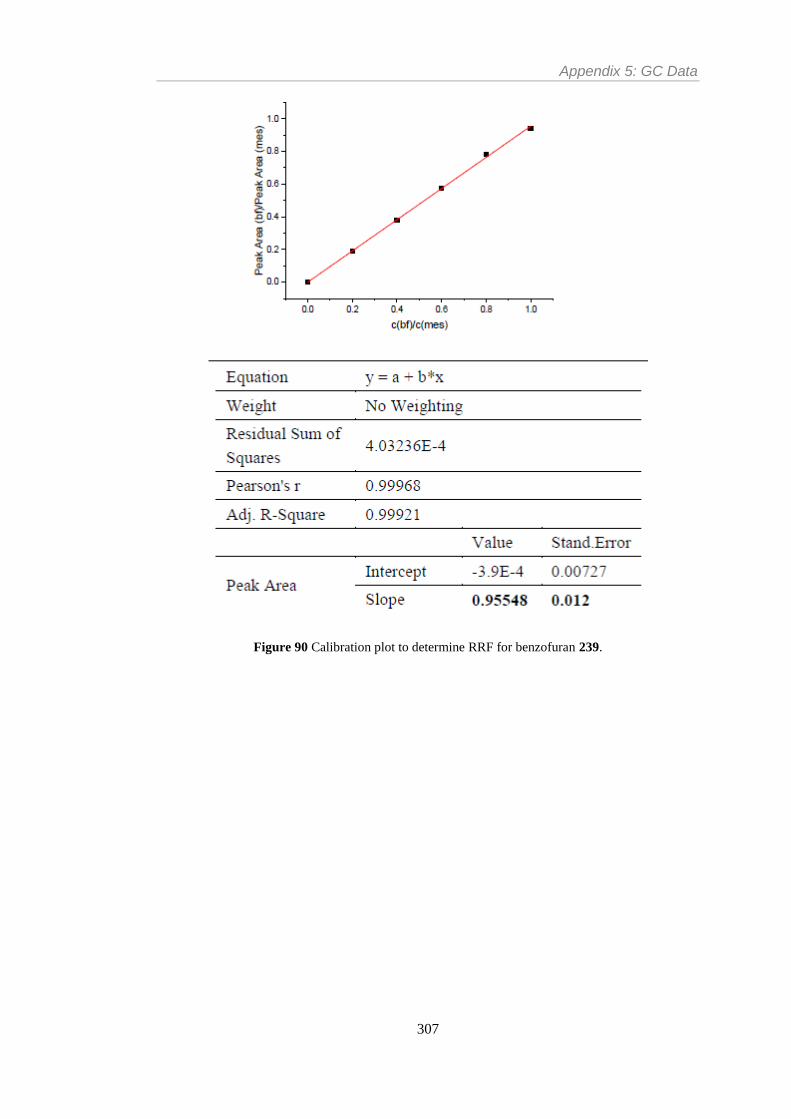
Appendix 5: GC Data
307
Figure 90 Calibration plot to determine RRF for benzofuran 239.

Appendix 5: GC Data
308
Figure 91 Calibration plot to determine RRF for butylthiophene 241.

Appendix 5: GC Data
309
Figure 92 Calibration plot to determine RRF for butylfuran 243.

Appendix 5: GC Data
310
Line Fitting
Figure 93 1st order exponential decay for arylation of 1-methylindole 33 with Pd/C.
Figure 94 1st order exponential decay for arylation of 1-methylindole 33 with PVP–Pd 13.

Appendix 5: GC Data
311
Figure 95 1st order exponential decay for arylation of 1-methylindole 33 with Pd(OAc)2.
Figure 96 1st order exponential decay for arylation of benzofuran 239 with Pd/C.

Appendix 5: GC Data
312
Figure 97 Exponential decay suggesting non-1st order kinetic profile for arylation of benzofuran 239
with PVP–Pd 13.
Figure 98 1st order exponential decay for arylation of butylthiophene 241 with Pd/C.

Appendix 5: GC Data
313
Figure 99 Exponential decay suggesting non-1st order kinetic profile for arylation of butylthiophene
241 with PVP–Pd 13.
Figure 100 Exponential decay suggesting non-1st order kinetic profile for arylation of
butylthiophene 241 with Pd(OAc)2.

Appendix 5: GC Data
314
Figure 101 1st order exponential decay for arylation of butylthiophene 241 with Pd2(dba)3 238.
Figure 102 1st order exponential decay for arylation of butylfuran 243 with Pd/C.

Appendix 5: GC Data
315
Figure 103 1st order exponential decay for arylation of butylfuran 243 with PVP–Pd 13.
Figure 104 1st order exponential decay for arylation of butylfuran 243 with Pd2(dba)3 238.

Appendix 5: GC Data
316
Figure 105 1st order exponential decay for arylation of butylfuran 243 with Pd/C at 70 °C.
Figure 106 1st order logarithmic growth for 2-phenylbutylfuran 246 from reaction of butylfuran with
Pd/C at 70 °C.

Appendix 6: ESI–MS Data for Pdx(dba)y Clusters
317
Appendix 6: ESI–MS Data for Pdx(dba)y Clusters
Figure 107 Measured vs. simulated mass values for [Pd2(dba)2H]+ cluster.
Figure 108 Measured vs. simulated mass values for [Pd2(dba)2Na]+ cluster.

Appendix 6: ESI–MS Data for Pdx(dba)y Clusters
318
Figure 109 Measured vs. simulated mass values for [Pd4(dba)2H]+ cluster.
Figure 110 Measured vs. simulated mass values for [Pd4(dba)2Na]+ cluster.

Appendix 6: ESI–MS Data for Pdx(dba)y Clusters
319
Figure 111 Measured vs. simulated mass values for [Pd5(dba)2H]+ cluster.
Figure 112 Measured vs. simulated mass values for [Pd6(dba)2H]+ cluster.

Appendix 6: ESI–MS Data for Pdx(dba)y Clusters
320
Figure 113 Measured vs. simulated mass values for [Pd4(dba)3H]+ cluster.
Figure 114 Measured vs. simulated mass values for [Pd4(dba)3Na]+ cluster.

Appendix 6: ESI–MS Data for Pdx(dba)y Clusters
321
Figure 115 Measured vs. simulated mass values for [Pd5(dba)3H]+ cluster.
Figure 116 Measured vs. simulated mass values for [Pd6(dba)3H]+ cluster.

Appendix 6: ESI–MS Data for Pdx(dba)y Clusters
322
Figure 117 Measured vs. simulated mass values for [Pd4(dba)4Na]+ cluster.
Figure 118 Measured vs. simulated mass values for [Pd4(dba)5H]+ cluster.

Appendix 6: ESI–MS Data for Pdx(dba)y Clusters
323
Figure 119 Measured vs. simulated mass values for [Pd5(dba)5H]+ cluster.
Figure 120 Measured vs. simulated mass values for [Pd6(dba)5H]+ cluster.

Appendix 6: ESI–MS Data for Pdx(dba)y Clusters
324
Figure 121 Measured vs. simulated mass values for [Pd6(dba)6Na]+ cluster.
Figure 122 Measured vs. simulated mass values for [Pd6(dba)7Na]+ cluster.

Appendix 6: ESI–MS Data for Pdx(dba)y Clusters
325
Figure 123 Measured vs. simulated mass values for [Pd7(dba)8H]+ cluster.
Figure 124 Measured vs. simulated mass values for [Pd8(dba)8H]+ cluster.

Appendix 6: ESI–MS Data for Pdx(dba)y Clusters
326
Figure 125 Measured vs. simulated mass values for [Pd8(dba)9Na]+ cluster.
Figure 126 Measured vs. simulated mass values for [Pd8(dba)11Na]+ cluster.

Appendix 7: NMR Spectra
327
Appendix 7: NMR Spectra
Figure 127 1H NMR spectrum of 135 (400 MHz, CD3OD).
Figure 128 13C NMR spectrum of 135 (101 MHz, CD3OD).

Appendix 7: NMR Spectra
328
Figure 129 1H NMR spectrum of 74 (400 MHz, CDCl3).
Figure 130 13C NMR spectrum of 74 (101 MHz, CDCl3).

Appendix 7: NMR Spectra
329
Figure 131 1H NMR spectrum of 75 (400 MHz, CDCl3).
Figure 132 13C NMR spectrum of 75 (101 MHz, CDCl3).

Appendix 7: NMR Spectra
330
Figure 133 1H NMR spectrum of 140 (400 MHz, CDCl3).
Figure 134 13C NMR spectrum of 140 (101 MHz, CDCl3).

Appendix 7: NMR Spectra
331
Figure 135 19F NMR spectrum of 140 (376 MHz, CDCl3).
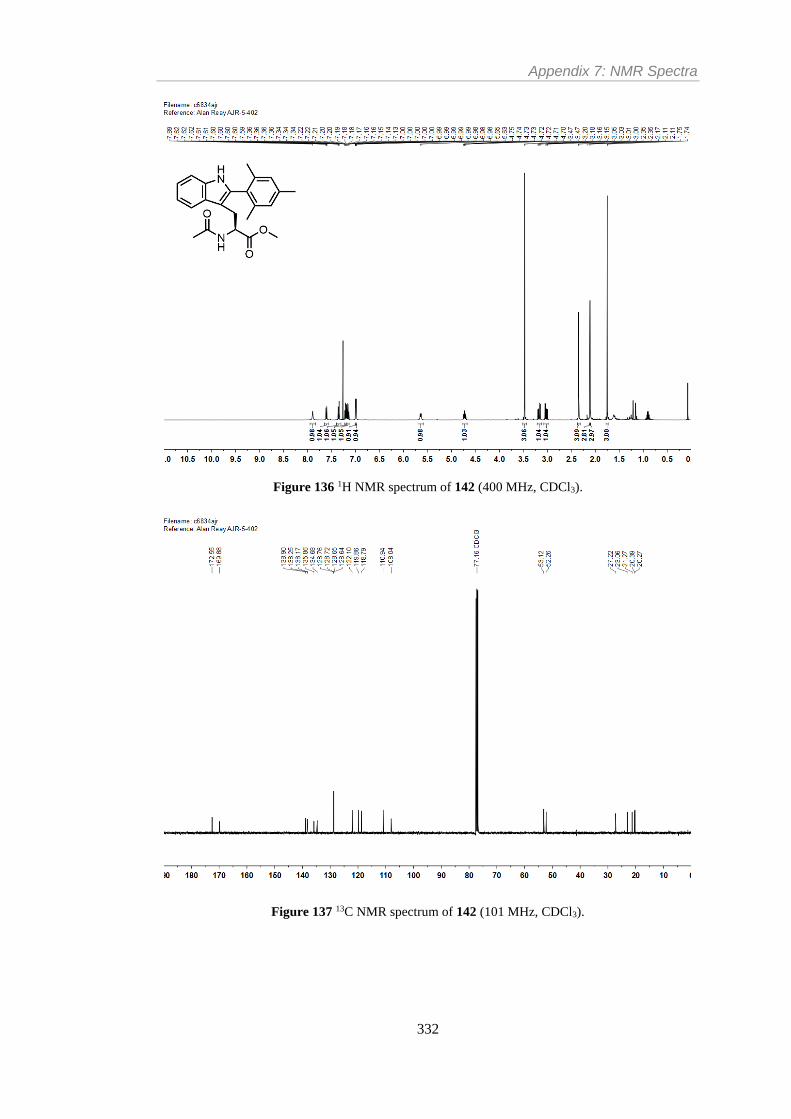
Appendix 7: NMR Spectra
332
Figure 136 1H NMR spectrum of 142 (400 MHz, CDCl3).
Figure 137 13C NMR spectrum of 142 (101 MHz, CDCl3).

Appendix 7: NMR Spectra
333
Figure 138 1H NMR spectrum of 143 (400 MHz, CDCl3).
Figure 139 13C NMR spectrum of 143 (101 MHz, CDCl3).

Appendix 7: NMR Spectra
334
Figure 140 1H NMR spectrum of 144 (400 MHz, CDCl3).
Figure 141 13C NMR spectrum of 144 (101 MHz, CDCl3).

Appendix 7: NMR Spectra
335
Figure 142 11B NMR spectrum of 144 (128 MHz, CDCl3).
Figure 143 19F NMR spectrum of 144 (376 MHz, CDCl3).

Appendix 7: NMR Spectra
336
Figure 144 1H NMR spectrum of 145 (400 MHz, (CD3)2SO).
Figure 145 13C NMR spectrum of 145 (101 MHz, (CD3)2SO).

Appendix 7: NMR Spectra
337
Figure 146 19F NMR spectrum of 145 (376 MHz, (CD3)2SO).
Figure 147 31P NMR spectrum of 145 (162 MHz, (CD3)2SO).

Appendix 7: NMR Spectra
338
Figure 148 1H NMR spectrum of 146 (400 MHz, (CD3)2SO).
Figure 149 13C NMR spectrum of 146 (101 MHz, (CD3)2SO).

Appendix 7: NMR Spectra
339
Figure 150 19F NMR spectrum of 146 (376 MHz, (CD3)2SO).

Appendix 7: NMR Spectra
340
Figure 151 1H NMR spectrum of 132 (400 MHz, (CD3)2SO).
Figure 152 13C NMR spectrum of 132 (101 MHz, (CD3)2SO).

Appendix 7: NMR Spectra
341
Figure 153 1H NMR spectrum of 149 (400 MHz, CDCl3).
Figure 154 13C NMR spectrum of 149 (101 MHz, CDCl3).

Appendix 7: NMR Spectra
342
Figure 155 1H NMR spectrum of 152 (400 MHz, CDCl3).
Figure 156 13C NMR spectrum of 152 (101 MHz, CDCl3).

Appendix 7: NMR Spectra
343
Figure 157 1H NMR spectrum of 155 (400 MHz, CD3OD).
Figure 158 13C NMR spectrum of 155 (101 MHz, CD3OD).

Appendix 7: NMR Spectra
344
Figure 159 1H NMR spectrum of 156 (400 MHz, CDCl3).
Figure 160 13C NMR spectrum of 156 (101 MHz, CDCl3).

Appendix 7: NMR Spectra
345
Figure 161 1H NMR spectrum of 158 (400 MHz, CDCl3).
Figure 162 13C NMR spectrum of 158 (101 MHz, CDCl3).

Appendix 7: NMR Spectra
346
Figure 163 1H NMR spectrum of 160 (400 MHz, CDCl3).
Figure 164 13C NMR spectrum of 160 (101 MHz, CDCl3).

Appendix 7: NMR Spectra
347
Figure 165 1H NMR spectrum of 161 (400 MHz, CDCl3).
Figure 166 13C NMR spectrum of 161 (101 MHz, CDCl3).

Appendix 7: NMR Spectra
348
Figure 167 1H NMR spectrum of 163 (400 MHz, CD3OD).
Figure 168 13C NMR spectrum of 163 (101 MHz, CD3OD).

Appendix 7: NMR Spectra
349
Figure 169 1H NMR spectrum of 92 (400 MHz, CDCl3).
Figure 170 13C NMR spectrum of 92 (101 MHz, CDCl3).

Appendix 7: NMR Spectra
350
Figure 171 19F NMR spectrum of 92 (376 MHz, CDCl3).

Appendix 7: NMR Spectra
351
Figure 172 1H NMR spectrum of 166 (400 MHz, CDCl3).
Figure 173 13C NMR spectrum of 166 (101 MHz, CDCl3).

Appendix 7: NMR Spectra
352
Figure 174 19F NMR spectrum of 166 (376 MHz, CDCl3).

Appendix 7: NMR Spectra
353
Figure 175 1H NMR spectrum of 167 (400 MHz, CDCl3).
Figure 176 13C NMR spectrum of 167 (101 MHz, CDCl3).

Appendix 7: NMR Spectra
354
Figure 177 19F NMR spectrum of 167 (376 MHz, CDCl3).

Appendix 7: NMR Spectra
355
Figure 178 1H NMR spectrum of 169 (400 MHz, CD3OD).
Figure 179 13C NMR spectrum of 169 (101 MHz, CD3OD).

Appendix 7: NMR Spectra
356
Figure 180 19F NMR spectrum of 169 (376 MHz, CDCl3).

Appendix 7: NMR Spectra
357
Figure 181 1H NMR spectrum of 170 (400 MHz, CDCl3).
Figure 182 13C NMR spectrum of 170 (101 MHz, CDCl3).

Appendix 7: NMR Spectra
358
Figure 183 19F NMR spectrum of 170 (376 MHz, CDCl3).

Appendix 7: NMR Spectra
359
Figure 184 1H NMR spectrum of 171 (400 MHz, CDCl3).
Figure 185 13C NMR spectrum of 171 (101 MHz, CDCl3).

Appendix 7: NMR Spectra
360
Figure 186 19F NMR spectrum of 171 (376 MHz, CDCl3).

Appendix 7: NMR Spectra
361
Figure 187 1H NMR spectrum of 172 (400 MHz, CDCl3).
Figure 188 13C NMR spectrum of 172 (101 MHz, CDCl3).

Appendix 7: NMR Spectra
362
Figure 189 19F NMR spectrum of 172 (376 MHz, CDCl3).

Appendix 7: NMR Spectra
363
Figure 190 1H NMR spectrum of 173 (400 MHz, CDCl3).
Figure 191 13C NMR spectrum of 173 (101 MHz, CDCl3).

Appendix 7: NMR Spectra
364
Figure 192 19F NMR spectrum of 173 (376 MHz, CDCl3).

Appendix 7: NMR Spectra
365
Figure 193 1H NMR spectrum of 174 (400 MHz, CDCl3).
Figure 194 13C NMR spectrum of 174 (101 MHz, CDCl3).
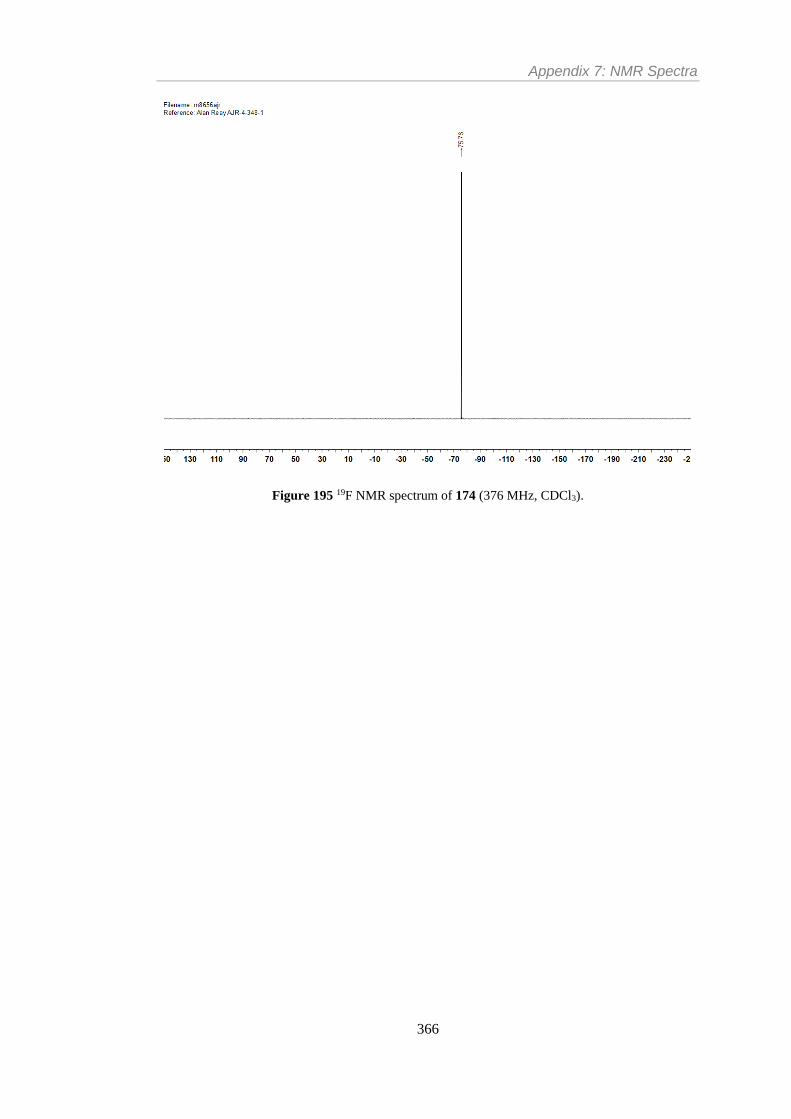
Appendix 7: NMR Spectra
366
Figure 195 19F NMR spectrum of 174 (376 MHz, CDCl3).

Appendix 7: NMR Spectra
367
Figure 196 1H NMR spectrum of 175 (400 MHz, CDCl3).
Figure 197 13C NMR spectrum of 175 (101 MHz, CDCl3).

Appendix 7: NMR Spectra
368
Figure 198 19F NMR spectrum of 175 (376 MHz, CDCl3).

Appendix 7: NMR Spectra
369
Figure 199 1H NMR spectrum of 176 (400 MHz, CDCl3).
Figure 200 13C NMR spectrum of 176 (101 MHz, CDCl3).

Appendix 7: NMR Spectra
370
Figure 201 19F NMR spectrum of 176 (376 MHz, CDCl3).

Appendix 7: NMR Spectra
371
Figure 202 1H NMR spectrum of 48 (400 MHz, (CD3)2SO).
Figure 203 13C NMR spectrum of 48 (101 MHz, (CD3)2SO).

Appendix 7: NMR Spectra
372
Figure 204 11B NMR spectrum of 48 (128 MHz, (CD3)2SO).
Figure 205 19F NMR spectrum of 48 (376 MHz, (CD3)2SO).

Appendix 7: NMR Spectra
373
Figure 206 1H NMR spectrum of 192 (400 MHz, (CD3)2SO).
Figure 207 13C NMR spectrum of 192 (101 MHz, (CD3)2SO).

Appendix 7: NMR Spectra
374
Figure 208 11B NMR spectrum of 192 (128 MHz, (CD3)2SO).
Figure 209 19F NMR spectrum of 192 (376 MHz, (CD3)2SO).

Appendix 7: NMR Spectra
375
Figure 210 1H NMR spectrum of 193 (400 MHz, (CD3)2SO).
Figure 211 13C NMR spectrum of 193 (101 MHz, (CD3)2SO).

Appendix 7: NMR Spectra
376
Figure 212 11B NMR spectrum of 193 (128 MHz, (CD3)2SO).
Figure 213 19F NMR spectrum of 193 (376 MHz, (CD3)2SO).

Appendix 7: NMR Spectra
377
Figure 214 1H NMR spectrum of 194 (400 MHz, (CD3)2SO).
Figure 215 13C NMR spectrum of 194 (101 MHz, (CD3)2SO).

Appendix 7: NMR Spectra
378
Figure 216 1H NMR spectrum of 195 (400 MHz, (CD3)2SO).
Figure 217 13C NMR spectrum of 195 (101 MHz, (CD3)2SO).

Appendix 7: NMR Spectra
379
Figure 218 11B NMR spectrum of 195 (128 MHz, (CD3)2SO).
Figure 219 19F NMR spectrum of 195 (376 MHz, (CD3)2SO).

Appendix 7: NMR Spectra
380
Figure 220 1H NMR spectrum of 196 (400 MHz, (CD3)2SO).
Figure 221 13C NMR spectrum of 196 (101 MHz, (CD3)2SO).

Appendix 7: NMR Spectra
381
Figure 222 11B NMR spectrum of 196 (128 MHz, (CD3)2SO).
Figure 223 19F NMR spectrum of 196 (376 MHz, (CD3)2SO).

Appendix 7: NMR Spectra
382
Figure 224 1H NMR spectrum of 197 (400 MHz, (CD3)2SO).
Figure 225 13C NMR spectrum of 197 (101 MHz, (CD3)2SO).

Appendix 7: NMR Spectra
383
Figure 226 11B NMR spectrum of 197 (128 MHz, (CD3)2SO).
Figure 227 19F NMR spectrum of 197 (376 MHz, (CD3)2SO).

Appendix 7: NMR Spectra
384
Figure 228 1H NMR spectrum of 198 (400 MHz, (CD3)2SO).
Figure 229 13C NMR spectrum of 198 (101 MHz, (CD3)2SO).

Appendix 7: NMR Spectra
385
Figure 230 11B NMR spectrum of 198 (128 MHz, (CD3)2SO).
Figure 231 19F NMR spectrum of 198 (376 MHz, (CD3)2SO).

Appendix 7: NMR Spectra
386
Figure 232 1H NMR spectrum of 199 (400 MHz, (CD3)2SO).
Figure 233 13C NMR spectrum of 199 (101 MHz, (CD3)2SO).

Appendix 7: NMR Spectra
387
Figure 234 11B NMR spectrum of 199 (128 MHz, (CD3)2SO).
Figure 235 19F NMR spectrum of 199 (376 MHz, (CD3)2SO).

Appendix 7: NMR Spectra
388
Figure 236 1H NMR spectrum of 200 (400 MHz, (CD3)2SO).
Figure 237 13C NMR spectrum of 200 (101 MHz, (CD3)2SO).
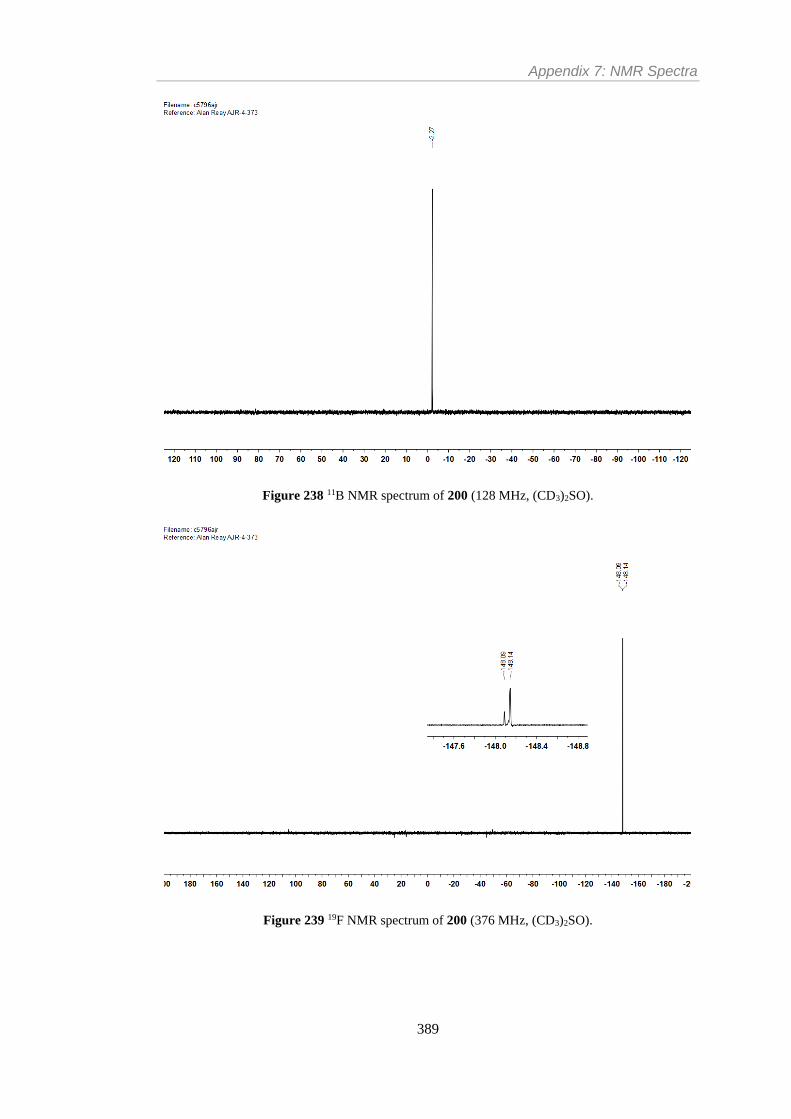
Appendix 7: NMR Spectra
389
Figure 238 11B NMR spectrum of 200 (128 MHz, (CD3)2SO).
Figure 239 19F NMR spectrum of 200 (376 MHz, (CD3)2SO).

Appendix 7: NMR Spectra
390
Figure 240 1H NMR spectrum of 201 (400 MHz, (CD3)2SO).
Figure 241 13C NMR spectrum of 201 (101 MHz, (CD3)2SO).

Appendix 7: NMR Spectra
391
Figure 242 11B NMR spectrum of 201 (128 MHz, (CD3)2SO).
Figure 243 19F NMR spectrum of 201 (376 MHz, (CD3)2SO).

Appendix 7: NMR Spectra
392
Figure 244 1H NMR spectrum of 202 (400 MHz, (CD3)2SO).
Figure 245 13C NMR spectrum of 202 (101 MHz, (CD3)2SO).

Appendix 7: NMR Spectra
393
Figure 246 11B NMR spectrum of 202 (128 MHz, (CD3)2SO).
Figure 247 19F NMR spectrum of 202 (376 MHz, (CD3)2SO).

Appendix 7: NMR Spectra
394
Figure 248 1H NMR spectrum of 203 (400 MHz, (CD3)2SO).
Figure 249 13C NMR spectrum of 203 (101 MHz, (CD3)2SO).

Appendix 7: NMR Spectra
395
Figure 250 11B NMR spectrum of 203 (128 MHz, (CD3)2SO).
Figure 251 19F NMR spectrum of 203 (376 MHz, (CD3)2SO).

Appendix 7: NMR Spectra
396
Figure 252 1H NMR spectrum of 54 (400 MHz, (CD3)2SO).
Figure 253 13C NMR spectrum of 54 (101 MHz, (CD3)2SO).

Appendix 7: NMR Spectra
397
Figure 254 11B NMR spectrum of 54 (128 MHz, (CD3)2SO).
Figure 255 19F NMR spectrum of 54 (376 MHz, (CD3)2SO).

Appendix 7: NMR Spectra
398
Figure 256 1H NMR spectrum of 204 (400 MHz, (CD3)2SO).
Figure 257 13C NMR spectrum of 204 (101 MHz, (CD3)2SO).

Appendix 7: NMR Spectra
399
Figure 258 1H NMR spectrum of 76 (400 MHz, CDCl3).
Figure 259 13C NMR spectrum of 76 (101 MHz, CDCl3).

Appendix 7: NMR Spectra
400
Figure 260 1H NMR spectrum of 205 (400 MHz, CDCl3).
Figure 261 13C NMR spectrum of 205 (101 MHz, CDCl3).
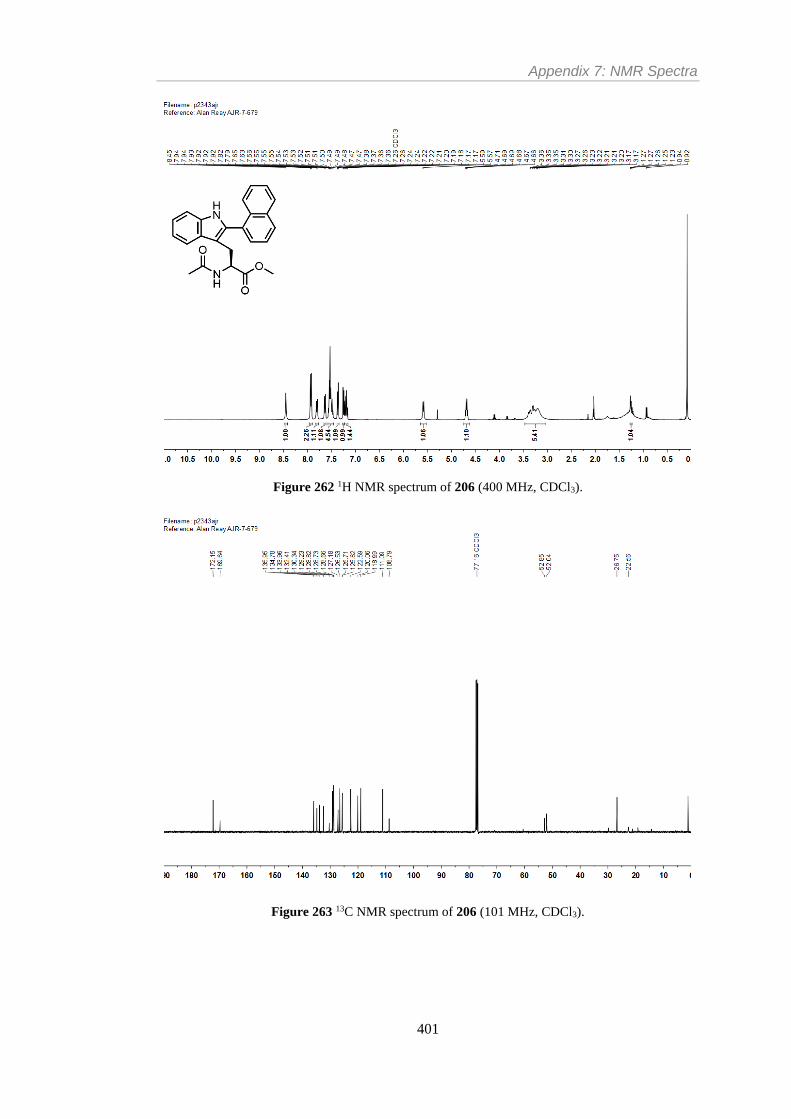
Appendix 7: NMR Spectra
401
Figure 262 1H NMR spectrum of 206 (400 MHz, CDCl3).
Figure 263 13C NMR spectrum of 206 (101 MHz, CDCl3).
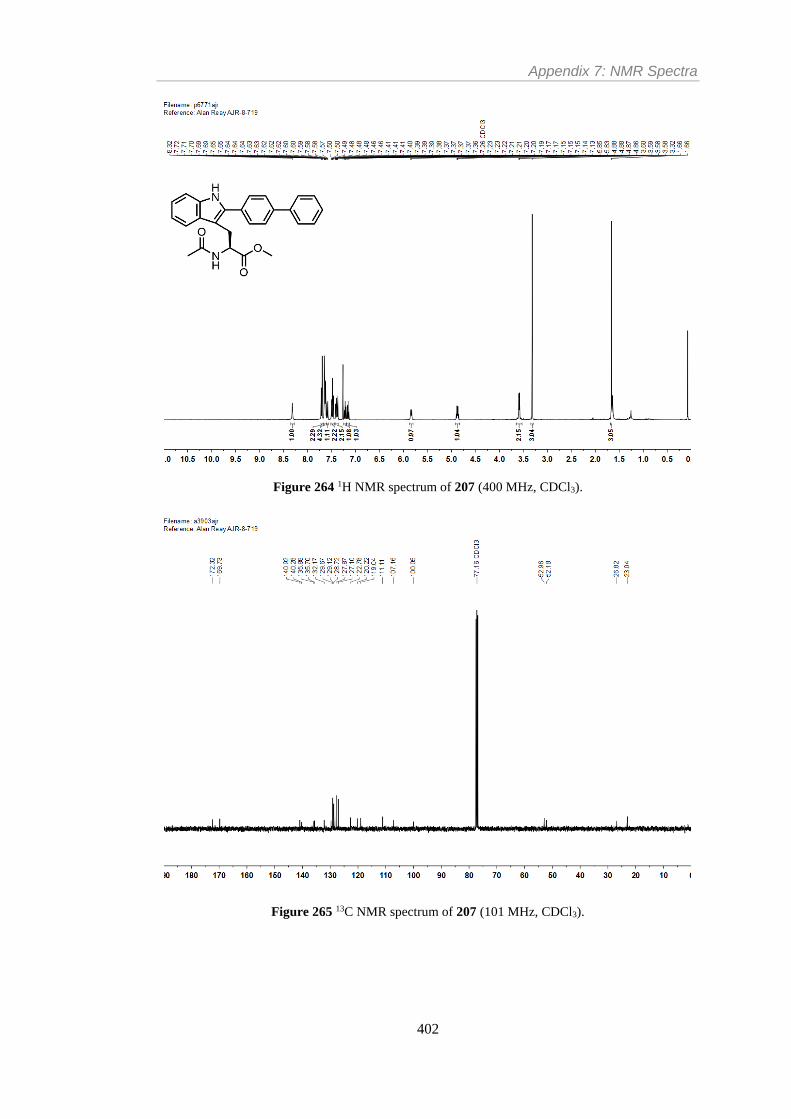
Appendix 7: NMR Spectra
402
Figure 264 1H NMR spectrum of 207 (400 MHz, CDCl3).
Figure 265 13C NMR spectrum of 207 (101 MHz, CDCl3).

Appendix 7: NMR Spectra
403
Figure 266 1H NMR spectrum of 77 (400 MHz, CDCl3).
Figure 267 13C NMR spectrum of 77 (101 MHz, CDCl3).

Appendix 7: NMR Spectra
404
Figure 268 1H NMR spectrum of 208 (400 MHz, CDCl3).
Figure 269 13C NMR spectrum of 208 (101 MHz, CDCl3).

Appendix 7: NMR Spectra
405
Figure 270 1H NMR spectrum of 120 (400 MHz, CDCl3).
Figure 271 13C NMR spectrum of 120 (101 MHz, CDCl3).

Appendix 7: NMR Spectra
406
Figure 272 19F NMR spectrum of 120 (376 MHz, CDCl3).

Appendix 7: NMR Spectra
407
Figure 273 1H NMR spectrum of 79 (400 MHz, CDCl3).
Figure 274 13C NMR spectrum of 79 (101 MHz, CDCl3).

Appendix 7: NMR Spectra
408
Figure 275 1H NMR spectrum of 209 (400 MHz, CDCl3).
Figure 276 13C NMR spectrum of 209 (101 MHz, CDCl3).

Appendix 7: NMR Spectra
409
Figure 277 1H NMR spectrum of 210 (400 MHz, CDCl3).
Figure 278 13C NMR spectrum of 210 (101 MHz, CDCl3).

Appendix 7: NMR Spectra
410
Figure 279 1H NMR spectrum of 211 (400 MHz, CDCl3).
Figure 280 13C NMR spectrum of 211 (101 MHz, CDCl3).

Appendix 7: NMR Spectra
411
Figure 281 1H NMR spectrum of 215 (400 MHz, CD3OD).
Figure 282 13C NMR spectrum of 215 (125 MHz, CD3OD).

Appendix 7: NMR Spectra
412
Figure 283 1H NMR spectrum of 224 (400 MHz, CDCl3).
Figure 284 13C NMR spectrum of 224 (101 MHz, CDCl3).

Appendix 7: NMR Spectra
413
Figure 285 1H NMR spectrum of 231 (400 MHz, CDCl3).
Figure 286 13C NMR spectrum of 231 (101 MHz, CDCl3).

Appendix 7: NMR Spectra
414
Figure 287 1H NMR spectrum of 232 (400 MHz, CDCl3).
Figure 288 13C NMR spectrum of 232 (101 MHz, CDCl3).

Appendix 7: NMR Spectra
415
Figure 289 1H NMR spectrum of 233 (400 MHz, (CD3)2SO).
Figure 290 13C NMR spectrum of 233 (101 MHz, CDCl3).

Appendix 7: NMR Spectra
416
Figure 291 1H NMR spectrum of 234 (400 MHz, CDCl3).
Figure 292 13C NMR spectrum of 234 (101 MHz, CDCl3).

Appendix 7: NMR Spectra
417
Figure 293 1H NMR spectrum of 38 (400 MHz, (CD3)2SO).
Figure 294 13C NMR spectrum of 38 (101 MHz, (CD3)2SO).

Appendix 7: NMR Spectra
418
Figure 295 19F NMR spectrum of 38 (376 MHz, (CD3)2SO).

Appendix 7: NMR Spectra
419
Figure 296 1H NMR spectrum of 34 (400 MHz, CDCl3).
Figure 297 13C NMR spectrum of 34 (101 MHz, CDCl3).

Appendix 7: NMR Spectra
420
Figure 298 1H NMR spectrum of 240 (400 MHz, CDCl3).
Figure 299 13C NMR spectrum of 240 (101 MHz, CDCl3).

Appendix 7: NMR Spectra
421
Figure 300 1H NMR spectrum of 242 (400 MHz, CDCl3).
Figure 301 13C NMR spectrum of 242 (101 MHz, CDCl3).

Appendix 7: NMR Spectra
422
Figure 302 1H NMR spectrum of 246 (400 MHz, CDCl3).
Figure 303 13C NMR spectrum of 246 (101 MHz, CDCl3).

Appendix 7: NMR Spectra
423
Figure 304 1H NMR spectrum of 247 (400 MHz, CDCl3).
Figure 305 13C NMR spectrum of 247 (101 MHz, CDCl3).

Appendix 7: NMR Spectra
424
Figure 306 1H NMR spectrum of 238 (500 MHz, CDCl3).
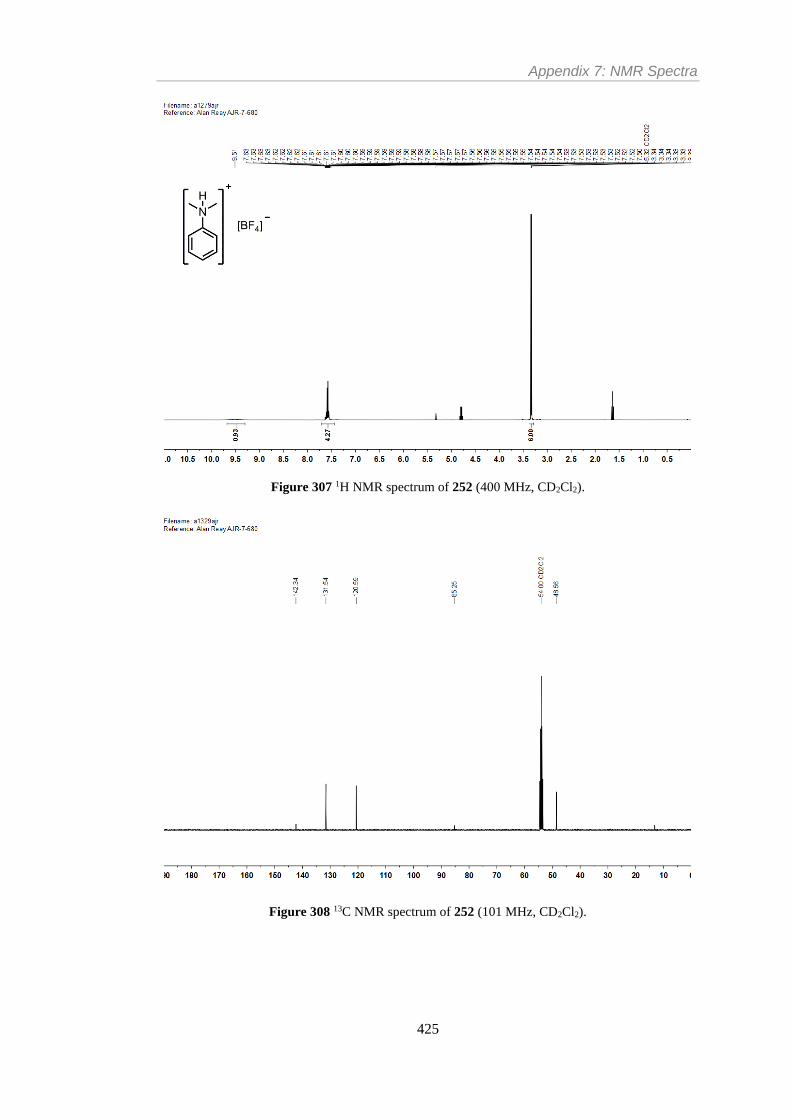
Appendix 7: NMR Spectra
425
Figure 307 1H NMR spectrum of 252 (400 MHz, CD2Cl2).
Figure 308 13C NMR spectrum of 252 (101 MHz, CD2Cl2).

Appendix 7: NMR Spectra
426
Figure 309 11B NMR spectrum of 252 (128 MHz, CD2Cl2).
Figure 310 11B NMR spectrum of 252 (376 MHz, CD2Cl2).

Abbreviations
427
Abbreviations
Ac acetyl
AE atom economy
AMLA ambiphilic metal–ligand activation
aq. aqueous
Ar arene
ATR attenuated total reflectance
Bn benzyl
Boc tert-butoxycarbonyl
B.P. boiling point
bpy 2,2′-bipyridine
Bu butyl
Bz benzoyl
C, c. concentration
cat. catalyst, catalytic
CMD concerted metalation deprotonation
conv. Conversion
CPBA chloroperbenzoicacid
Cy cyclohexyl
dba dibenzylideneacetone
DCE 1,2-dichloroethane
DCM dichloromethane
dec. decomposition
DEPBT 3-(Diethoxyphosphoryloxy)-1,2,3-benzotriazin-4-(3H)-one

Abbreviations
428
DFT density functional theory
DIPEA N, N-di-iso-propylethylamine
DME dimethyl ether
DMEDA N,N′-dimethylethylenediamine
DMF dimethylformamide
DMSO dimethylsulfoxide
DOSY diffusion-ordered NMR spectroscopy
dtbpy 2,6-di-tert-butylpyridine
EI electron ionisation
eq. equivalents
ESI electrospray ionisation
Et ethyl
EXAFS extended X-ray absorption fine structure spectroscopy
FMoc fluorenylmethyloxycarbonyl
FT Fourier transform
FWHM full-width at half-maximum
GC gas chromatography
HPLC high performance liquid chromatography
HR high resolution
Hz hertz
i- iso-
ICR ion cyclotron resonance
IPE di-iso-propylether
IR infrared

Abbreviations
429
L ligand
LIFDI liquid introduced field desorption ionisation
lit. literature
m- meta-
M mol dm-3
Me methyl
Mes mesityl, 1,3,5-trimethylphenyl
MHz megahertz
MI mass intensity
M.P. melting point
Ms methanesulfonic, methanesulfonyl
MS mass spectrometry
Mw molecular weight
NBS N-bromosuccinamide
NMP N-methyl-2-pyrrolidone
NMR nuclear magnetic resonance
OE optimum efficiency
p- para-
PdNPs palladium nanoparticles
Ph phenyl
pin pinacol ester
Piv pivaloyl
ppm parts per million
Pr propyl

Abbreviations
430
PVP (poly)vinylpyrrolidone
pyr. pyridine
quant. quantitative yield
Rf retention factor
RME reaction mass efficiency
RT at ambient temperature
SEM 2-trimethylsilylethoxymethyl
t- tertiary
TBS tert-butyldimethylsilyl
TBTU O-(Benzotriazol-1-yl)-N,N,N′,N′-tetramethyluronium
tetrafluoroborate
TEM transmission electron microscopy
Tf triflic, trifluoromethanesulfonic
Tfa trifluoroacetyl
TFA trifluoroacetic acid
THF tetrahydrofuran
TLC thin layer chromatography
TOF turnover frequency
Tol tolyl, p-methylphenyl
TPPTS 3,3′,3′′-phosphanetriyltris(benzenesulfonic acid) trisodium
Ts tosyl
UV ultraviolet
V volts
VT variable temperature

Abbreviations
431
W watts
w.r.t. with respect to
X leaving group
XAS X-ray absorption spectroscopy
XPhos 2-dicyclohexylphosphino-2′,4′,6′-tri-iso-propylbiphenyl
XPS X-ray photoelectron spectroscopy

References
432
References
(1) Kambe, N.; Iwasaki, T.; Terao, J. Chem. Soc. Rev. 2011, 40, 4937-4947.
(2) Nicolaou, K. C.; Bulger, P. G.; Sarlah, D. Angew. Chem. Int. Ed. 2005, 44, 4442-
4489.
(3) Johansson Seechurn, C. C. C.; Kitching, M. O.; Colacot, T. J.; Snieckus, V. Angew.
Chem. Int. Ed. 2012, 51, 5062-5085.
(4) Heck, R. F.; Nolley, J. P. J. Org. Chem. 1972, 37, 2320-2322.
(5) Mizoroki, T.; Mori, K.; Ozaki, A. Bull. Chem. Soc. Jpn. 1971, 44, 581-581.
(6) Milstein, D.; Stille, J. K. J. Am. Chem. Soc. 1978, 100, 3636-3638.
(7) Milstein, D.; Stille, J. K. J. Am. Chem. Soc. 1979, 101, 4992-4998.
(8) Stille, J. K. Angew. Chem. Int. Ed. 1986, 25, 508-524.
(9) Miyaura, N.; Suzuki, A. J. Chem. Soc., Chem. Commun. 1979, 866-867.
(10) Miyaura, N.; Yamada, K.; Suzuki, A. Tetrahedron Lett. 1979, 20, 3437-3440.
(11) Sonogashira, K.; Tohda, Y.; Hagihara, N. Tetrahedron Lett. 1975, 16, 4467-4470.
(12) Tamao, K.; Sumitani, K.; Kumada, M. J. Am. Chem. Soc. 1972, 94, 4374-4376.
(13) Corriu, R. J. P.; Masse, J. P. J. Chem. Soc., Chem. Commun. 1972, 144a-144a.
(14) Hiyama, T.; Obayashi, M.; Mori, I.; Nozaki, H. J. Org. Chem. 1983, 48, 912-914.
(15) Negishi, E.; King, A. O.; Okukado, N. J. Org. Chem. 1977, 42, 1821-1823.
(16) Danishefsky, S. J.; Masters, J. J.; Young, W. B.; Link, J. T.; Snyder, L. B.; Magee,
T. V.; Jung, D. K.; Isaacs, R. C. A.; Bornmann, W. G.; Alaimo, C. A.; Coburn, C.
A.; Di Grandi, M. J. J. Am. Chem. Soc. 1996, 118, 2843-2859.
(17) Garg, N. K.; Caspi, D. D.; Stoltz, B. M. J. Am. Chem. Soc. 2004, 126, 9552-9553.

References
433
(18) Bajwa, S. E.; Storr, T. E.; Hatcher, L. E.; Williams, T. J.; Baumann, C. G.;
Whitwood, A. C.; Allan, D. R.; Teat, S. J.; Raithby, P. R.; Fairlamb, I. J. S. Chem.
Sci. 2012, 3, 1656-1661.
(19) Carole, W. A.; Bradley, J.; Sarwar, M.; Colacot, T. J. Org. Lett. 2015, 17, 5472-5475.
(20) Reay, A. J.; Fairlamb, I. J. S. Chem. Commun. 2015, 51, 16289-16307.
(21) de Vries, A. H. M.; Mulders, J. M. C. A.; Mommers, J. H. M.; Henderickx, H. J. W.;
de Vries, J. G. Org. Lett. 2003, 5, 3285-3288.
(22) Reetz, M. T.; de Vries, J. G. Chem. Commun. 2004, 1559-1563.
(23) Zhao, F.; Bhanage, B. M.; Shirai, M.; Arai, M. Chem. Eur. J. 2000, 6, 843-848.
(24) Brazier, J. B.; Nguyen, B. N.; Adrio, L. A.; Barreiro, E. M.; Leong, W. P.; Newton,
M. A.; Figueroa, S. J. A.; Hellgardt, K.; Hii, K. K. M. Catal. Today 2014, 229, 95-
103.
(25) Cassol, C. C.; Umpierre, A. P.; Machado, G.; Wolke, S. I.; Dupont, J. J. Am. Chem.
Soc. 2005, 127, 3298-3299.
(26) Thathagar, M. B.; ten Elshof, J. E.; Rothenberg, G. Angew. Chem. Int. Ed. 2006, 45,
2886-2890.
(27) Gaikwad, A. V.; Rothenberg, G. Phys. Chem. Chem. Phys. 2006, 8, 3669-3675.
(28) Reimann, S.; Stötzel, J.; Frahm, R.; Kleist, W.; Grunwaldt, J.-D.; Baiker, A. J. Am.
Chem. Soc. 2011, 133, 3921-3930.
(29) Teranishi, T.; Miyake, M. Chem. Mater. 1998, 10, 594-600.
(30) Le Bars, J.; Specht, U.; Bradley, J. S.; Blackmond, D. G. Langmuir 1999, 15, 7621-
7625.
(31) Koczkur, K. M.; Mourdikoudis, S.; Polavarapu, L.; Skrabalak, S. E. Dalton Trans.
2015, 44, 17883-17905.
(32) Ellis, P. J.; Fairlamb, I. J. S.; Hackett, S. F. J.; Wilson, K.; Lee, A. F. Angew. Chem.
Int. Ed. 2010, 49, 1820-1824.
(33) Lee, A. F.; Ellis, P. J.; Fairlamb, I. J. S.; Wilson, K. Dalton Trans. 2010, 39, 10473-
10482.

References
434
(34) Widegren, J. A.; Bennett, M. A.; Finke, R. G. J. Am. Chem. Soc. 2003, 125, 10301-
10310.
(35) Widegren, J. A.; Finke, R. G. J. Mol. Catal. A: Chem. 2003, 198, 317-341.
(36) Knight, W. D.; Clemenger, K.; de Heer, W. A.; Saunders, W. A.; Chou, M. Y.;
Cohen, M. L. Phys. Rev. Lett. 1984, 52, 2141-2143.
(37) Blaser, H.-U.; Indolese, A.; Schnyder, A.; Steiner, H.; Studer, M. J. Mol. Catal. A:
Chem. 2001, 173, 3-18.
(38) Yin, L.; Liebscher, J. Chem. Rev. 2007, 107, 133-173.
(39) Molnár, Á. Chem. Rev. 2011, 111, 2251-2320.
(40) Balanta, A.; Godard, C.; Claver, C. Chem. Soc. Rev. 2011, 40, 4973-4985.
(41) Ackermann, L.; Vicente, R.; Kapdi, A. R. Angew. Chem. Int. Ed. 2009, 48, 9792-
9826.
(42) Yamaguchi, J.; Yamaguchi, A. D.; Itami, K. Angew. Chem. Int. Ed. 2012, 51, 8960-
9009.
(43) Wang, J.; Rosingana, M.; Watson, D. J.; Dowdy, E. D.; Discordia, R. P.;
Soundarajan, N.; Li, W.-S. Tetrahedron Lett. 2001, 42, 8935-8937.
(44) Chaumontet, M.; Piccardi, R.; Audic, N.; Hitce, J.; Peglion, J.-L.; Clot, E.; Baudoin,
O. J. Am. Chem. Soc. 2008, 130, 15157-15166.
(45) Chaumontet, M.; Piccardi, R.; Baudoin, O. Angew. Chem. Int. Ed. 2009, 48, 179-
182.
(46) Lafrance, M.; Rowley, C. N.; Woo, T. K.; Fagnou, K. J. Am. Chem. Soc. 2006, 128,
8754-8756.
(47) Davies, D. L.; Donald, S. M. A.; Macgregor, S. A. J. Am. Chem. Soc. 2005, 127,
13754-13755.
(48) Storr, T. E.; Firth, A. G.; Wilson, K.; Darley, K.; Baumann, C. G.; Fairlamb, I. J. S.
Tetrahedron 2008, 64, 6125-6137.

References
435
(49) Storr, T. E.; Baumann, C. G.; Thatcher, R. J.; De Ornellas, S.; Whitwood, A. C.;
Fairlamb, I. J. S. J. Org. Chem. 2009, 74, 5810-5821.
(50) Adrio, L. A.; Nguyen, B. N.; Guilera, G.; Livingston, A. G.; Hii, K. K. Catal. Sci.
Tech. 2012, 2, 316-323.
(51) Djakovitch, L.; Wagner, M.; Hartung, C. G.; Beller, M.; Koehler, K. J. Mol. Catal.
A: Chem. 2004, 219, 121-130.
(52) Raluy, E.; Favier, I.; Lopez-Vinasco, A. M.; Pradel, C.; Martin, E.; Madec, D.;
Teuma, E.; Gómez, M. Phys. Chem. Chem. Phys. 2011, 13, 13579-13584.
(53) Adak, L.; Bhadra, S.; Ranu, B. C. Tetrahedron Lett. 2010, 51, 3811-3814.
(54) Saha, D.; Adak, L.; Ranu, B. C. Tetrahedron Lett. 2010, 51, 5624-5627.
(55) Ehlers, P.; Petrosyan, A.; Baumgard, J.; Jopp, S.; Steinfeld, N.; Ghochikyan, T. V.;
Saghyan, A. S.; Fischer, C.; Langer, P. ChemCatChem 2013, 5, 2504-2511.
(56) Nassar-Hardy, L.; Deraedt, C.; Fouquet, E.; Felpin, F.-X. Eur. J. Org. Chem. 2011,
2011, 4616-4622.
(57) Baumann, C. G.; De Ornellas, S.; Reeds, J. P.; Storr, T. E.; Williams, T. J.; Fairlamb,
I. J. S. Tetrahedron 2014, 70, 6174-6187.
(58) Williams, T. J.; Fairlamb, I. J. S. Tetrahedron Lett. 2013, 54, 2906-2908.
(59) Hyotanishi, M.; Isomura, Y.; Yamamoto, H.; Kawasaki, H.; Obora, Y. Chem.
Commun. 2011, 47, 5750-5752.
(60) Yano, H.; Nakajima, Y.; Obora, Y. J. Organomet. Chem. 2013, 745–746, 258-261.
(61) Chiba, M.; Thanh, M. N.; Hasegawa, Y.; Obora, Y.; Kawasaki, H.; Yonezawa, T. J.
Mater. Chem. C 2015, 3, 514-520.
(62) Sahnoun, S.; Messaoudi, S.; Peyrat, J.-F.; Brion, J.-D.; Alami, M. Tetrahedron Lett.
2008, 49, 7279-7283.
(63) Sahnoun, S.; Messaoudi, S.; Brion, J.-D.; Alami, M. Org. Biomol. Chem. 2009, 7,
4271-4278.
(64) Parisien, M.; Valette, D.; Fagnou, K. J. Org. Chem. 2005, 70, 7578-7584.

References
436
(65) Djakovitch, L.; Felpin, F.-X. ChemCatChem 2014, 6, 2175-2187.
(66) Cano, R.; Schmidt, A. F.; McGlacken, G. P. Chem. Sci. 2015, 6, 5338-5346.
(67) Deprez, N. R.; Sanford, M. S. Inorg. Chem. 2007, 46, 1924-1935.
(68) Zhdankin, V. V.; Stang, P. J. Chem. Rev. 2008, 108, 5299-5358.
(69) Merritt, E. A.; Olofsson, B. Angew. Chem. Int. Ed. 2009, 48, 9052-9070.
(70) Yoshimura, A.; Zhdankin, V. V. Chem. Rev. 2016.
(71) Lancer, K. M.; Wiegand, G. H. J. Org. Chem. 1976, 41, 3360-3364.
(72) Pinto de Magalhães, H.; Lüthi, H. P.; Togni, A. J. Org. Chem. 2014, 79, 8374-8382.
(73) Cook, A. K.; Emmert, M. H.; Sanford, M. S. Org. Lett. 2013, 15, 5428-5431.
(74) Gou, Q.; Zhang, Z.-F.; Liu, Z.-C.; Qin, J. J. Org. Chem. 2015, 80, 3176-3186.
(75) Tanabe, K.; Taniguchi, A.; Matsumoto, T.; Oisaki, K.; Sohma, Y.; Kanai, M. Chem.
Sci. 2014, 5, 2747-2753.
(76) Bumagin, N. A.; Luzikova, E. V.; Sukhomlinova, L. I.; Tolstoya, T. P.; Beletskaya,
I. P. Russ. Chem. Bull. 1995, 44, 385-386.
(77) Kalyani, D.; Deprez, N. R.; Desai, L. V.; Sanford, M. S. J. Am. Chem. Soc. 2005,
127, 7330-7331.
(78) Deprez, N. R.; Sanford, M. S. J. Am. Chem. Soc. 2009, 131, 11234-11241.
(79) Powers, D. C.; Lee, E.; Ariafard, A.; Sanford, M. S.; Yates, B. F.; Canty, A. J.; Ritter,
T. J. Am. Chem. Soc. 2012, 134, 12002-12009.
(80) Neufeldt, S. R.; Sanford, M. S. Adv. Synth. Catal. 2012, 354, 3517-3522.
(81) Deprez, N. R.; Kalyani, D.; Krause, A.; Sanford, M. S. J. Am. Chem. Soc. 2006, 128,
4972-4973.
(82) Daugulis, O.; Zaitsev, V. G. Angew. Chem. Int. Ed. 2005, 44, 4046-4048.

References
437
(83) Xiao, B.; Fu, Y.; Xu, J.; Gong, T.-J.; Dai, J.-J.; Yi, J.; Liu, L. J. Am. Chem. Soc.
2010, 132, 468-469.
(84) Storr, T. E.; Greaney, M. F. Org. Lett. 2013, 15, 1410-1413.
(85) Modha, S. G.; Greaney, M. F. J. Am. Chem. Soc. 2015, 137, 1416-1419.
(86) Kumar Muthyala, M.; Choudhary, S.; Pandey, K.; Shelke, G. M.; Jha, M.; Kumar,
A. Eur. J. Org. Chem. 2014, 2014, 2365-2370.
(87) Huang, X.; Zhu, Q.; Xu, Y. Synth. Commun. 2001, 31, 2823-2828.
(88) Edwards, R.; de Vries, W.; Westwell, A. D.; Daniels, S.; Wirth, T. Eur. J. Org. Chem.
2015, 2015, 6909-6916.
(89) Mo, F.; Dong, G.; Zhang, Y.; Wang, J. Org. Biomol. Chem. 2013, 11, 1582-1593.
(90) Wu, X.-F.; Neumann, H.; Beller, M. Chem. Commun. 2011, 47, 7959-7961.
(91) Bonin, H.; Fouquet, E.; Felpin, F.-X. Adv. Synth. Catal. 2011, 353, 3063-3084.
(92) Felpin, F.-X.; Miqueu, K.; Sotiropoulos, J.-M.; Fouquet, E.; Ibarguren, O.; Laudien,
J. Chem. Eur. J. 2010, 16, 5191-5204.
(93) Taylor, J. G.; Moro, A. V.; Correia, C. R. D. Eur. J. Org. Chem. 2011, 2011, 1403-
1428.
(94) Kutonova, K. V.; Trusova, M. E.; Stankevich, A. V.; Postnikov, P. S.; Filimonov, V.
D. Beilstein J. Org. Chem. 2015, 11, 358-362.
(95) Kikukawa, K.; Matsuda, T. Chem. Lett. 1977, 6, 159-162.
(96) Saini, V.; Liao, L.; Wang, Q.; Jana, R.; Sigman, M. S. Org. Lett. 2013, 15, 5008-
5011.
(97) Li, X.; Yan, X.-Y.; Chang, H.-H.; Wang, L.-C.; Zhang, Y.; Chen, W.-W.; Li, Y.-W.;
Wei, W.-L. Org. Biomol. Chem. 2012, 10, 495-497.
(98) Li, X.; Wang, L.-C.; Chang, H.-H.; Zhang, C.-X.; Wei, W.-L. Appl. Catal., A 2013,
462–463, 15-22.

References
438
(99) Li, X.; Zhu, T.; Shao, Z.; Li, Y.; Chang, H.; Gao, W.; Zhang, Y.; Wei, W.
Tetrahedron 2016, 72, 69-75.
(100) Nicewicz, D. A.; MacMillan, D. W. C. Science 2008, 322, 77-80.
(101) Kalyani, D.; McMurtrey, K. B.; Neufeldt, S. R.; Sanford, M. S. J. Am. Chem. Soc.
2011, 133, 18566-18569.
(102) Biajoli, A. F. P.; da Penha, E. T.; Correia, C. R. D. RSC Adv. 2012, 2, 11930-11935.
(103) Zhao, J.; Zhang, Y.; Cheng, K. J. Org. Chem. 2008, 73, 7428-7431.
(104) Oger, N.; Le Grognec, E.; Felpin, F.-X. J. Org. Chem. 2014, 79, 8255-8262.
(105) Deadman, B. J.; Collins, S. G.; Maguire, A. R. Chem. Eur. J. 2015, 21, 2298-2308.
(106) Oger, N.; d’Halluin, M.; Le Grognec, E.; Felpin, F.-X. Org. Process Res. Dev. 2014,
18, 1786-1801.
(107) Joncour, R.; Susperregui, N.; Pinaud, N.; Miqueu, K.; Fouquet, E.; Sotiropoulos, J.-
M.; Felpin, F.-X. Chem. Eur. J. 2013, 19, 9291-9296.
(108) Oger, N.; Le Callonnec, F.; Jacquemin, D.; Fouquet, E.; Le Grognec, E.; Felpin, F.-
X. Adv. Synth. Catal. 2014, 356, 1065-1071.
(109) Vivian, J. T.; Callis, P. R. Biophys. J. 2001, 80, 2093-2109.
(110) Kolundzic, F.; Noshi, M. N.; Tjandra, M.; Movassaghi, M.; Miller, S. J. J. Am. Chem.
Soc. 2011, 133, 9104-9111.
(111) Colletti, S. L.; Li, C.; Fisher, M. H.; Wyvratt, M. J.; Meinke, P. T. Tetrahedron Lett.
2000, 41, 7825-7829.
(112) Roy, A. D.; Goss, R. J. M.; Wagner, G. K.; Winn, M. Chem. Commun. 2008, 4831-
4833.
(113) Lebrasseur, N.; Larrosa, I. J. Am. Chem. Soc. 2008, 130, 2926-2927.
(114) Ruiz-Rodríguez, J.; Albericio, F.; Lavilla, R. Chem. Eur. J. 2010, 16, 1124-1127.
(115) Preciado, S.; Mendive-Tapia, L.; Albericio, F.; Lavilla, R. J. Org. Chem. 2013, 78,
8129-8135.

References
439
(116) Preciado, S.; Mendive-Tapia, L.; Torres-Garcia, C.; Zamudio-Vazquez, R.; Soto-
Cerrato, V.; Perez-Tomas, R.; Albericio, F.; Nicolas, E.; Lavilla, R. Med. Chem.
Comm. 2013, 4, 1171-1174.
(117) Mendive-Tapia, L.; Preciado, S.; Garcia, J.; Ramon, R.; Kielland, N.; Albericio, F.;
Lavilla, R. Nat. Commun. 2015, 6, 1-9.
(118) Dong, H.; Limberakis, C.; Liras, S.; Price, D.; James, K. Chem. Commun. 2012, 48,
11644-11646.
(119) Williams, T. J.; Reay, A. J.; Whitwood, A. C.; Fairlamb, I. J. S. Chem. Commun.
2014, 50, 3052-3054.
(120) Zhu, Y.; Bauer, M.; Ackermann, L. Chem. Eur. J. 2015, 21, 9980-9983.
(121) Evans, E. F.; Lewis, N. J.; Kapfer, I.; Macdonald, G.; Taylor, R. J. K. Synth.
Commun. 1997, 27, 1819-1825.
(122) Borsook, H.; Thimann, K. V. J. Biol. Chem. 1932, 98, 671–705.
(123) Nascimento, O. R.; Costa-Filho, A. J.; De Morais, D. I.; Ellena, J.; Delboni, L. F.
Inorg. Chim. Acta 2001, 312, 133-138.
(124) Phipps, R. J.; Grimster, N. P.; Gaunt, M. J. J. Am. Chem. Soc. 2008, 130, 8172-8174.
(125) Zhu, Y.; Bauer, M.; Ploog, J.; Ackermann, L. Chem. Eur. J. 2014, 20, 13099-13102.
(126) Rodriguez, R. A.; Pan, P.-S.; Pan, C.-M.; Ravula, S.; Lapera, S.; Singh, E. K.; Styers,
T. J.; Brown, J. D.; Cajica, J.; Parry, E.; Otrubova, K.; McAlpine, S. R. J. Org. Chem.
2007, 72, 1980-2002.
(127) Sorokina, Y. M.; Sladkova, A. A.; Popova, L. A.; Shadyro, O. I.; Knizhnikov, V. A.
Russ. J. Org. Chem. 2012, 48, 1297-1301.
(128) Notte, G. T.; Sammakia, T. J. Am. Chem. Soc. 2006, 128, 4230-4231.
(129) Xia, Z.; Zhu, Q. Org. Lett. 2013, 15, 4110-4113.
(130) Matheis, C.; Jouvin, K.; Goossen, L. J. Org. Lett. 2014, 16, 5984-5987.
(131) Hammarback, L. A. M.Chem. Research Report, University of York, United
Kingdom, 2015.

References
440
(132) Sheridan, T. H. M.Chem. Research Report, University of York, United Kingdom,
2016.
(133) Rauf, W.; Thompson, A. L.; Brown, J. M. Dalton Trans. 2010, 39, 10414-10421.
(134) Bedford, R. B.; Haddow, M. F.; Mitchell, C. J.; Webster, R. L. Angew. Chem. Int.
Ed. 2011, 50, 5524-5527.
(135) McElroy, C. R.; Constantinou, A.; Jones, L. C.; Summerton, L.; Clark, J. H. Green.
Chem. 2015, 17, 3111-3121.
(136) Prat, D.; Wells, A.; Hayler, J.; Sneddon, H.; McElroy, C. R.; Abou-Shehada, S.;
Dunn, P. J. Green. Chem. 2016, 18, 288-296.
(137) Reay, A. J.; Williams, T. J.; Fairlamb, I. J. S. Org. Biomol. Chem. 2015, 13, 8298-
8309.
(138) Hunt, A. J.; Farmer, T. J.; Clark, J. H. In Element Recovery and Sustainability; Hunt,
A. J., Ed.; RSC Publishing: Cambridge, UK, 2013, pp 1–28.
(139) Cahiez, G.; Duplais, C.; Buendia, J. Chem. Rev. 2009, 109, 1434-1476.
(140) Khusnutdinov, R. I.; Bayguzina, A. R.; Dzhemilev, U. M. Russ. J. Org. Chem. 2012,
48, 309-348.
(141) Correa, A.; Garcia Mancheno, O.; Bolm, C. Chem. Soc. Rev. 2008, 37, 1108-1117.
(142) Bauer, I.; Knölker, H.-J. Chem. Rev. 2015, 115, 3170-3387.
(143) Cahiez, G.; Moyeux, A. Chem. Rev. 2010, 110, 1435-1462.
(144) Gao, K.; Yoshikai, N. Acc. Chem. Res. 2014, 47, 1208-1219.
(145) Ackermann, L. J. Org. Chem. 2014, 79, 8948-8954.
(146) Collins, G.; Schmidt, M.; McGlacken, G. P.; O’Dwyer, C.; Holmes, J. D. J. Phys.
Chem. C 2014, 118, 6522-6530.
(147) Tang, D.-T. D.; Collins, K. D.; Glorius, F. J. Am. Chem. Soc. 2013, 135, 7450-7453.

References
441
(148) Tang, D.-T. D.; Collins, K. D.; Ernst, J. B.; Glorius, F. Angew. Chem. Int. Ed. 2014,
53, 1809-1813.
(149) Collins, K. D.; Honeker, R.; Vasquez-Cespedes, S.; Tang, D.-T. D.; Glorius, F.
Chem. Sci. 2015, 6, 1816-1824.
(150) Taylor, R. D.; MacCoss, M.; Lawson, A. D. G. J. Med. Chem. 2014, 57, 5845-5859.
(151) Ben-Yahia, A.; Naas, M.; El Kazzouli, S.; Essassi, E. M.; Guillaumet, G. Eur. J. Org.
Chem. 2012, 2012, 7075-7081.
(152) Naas, M.; El Kazzouli, S. d.; Essassi, E. M.; Bousmina, M.; Guillaumet, G. J. Org.
Chem. 2014, 79, 7286-7293.
(153) Unsinn, A.; Knochel, P. Chem. Commun. 2012, 48, 2680-2682.
(154) Kannaboina, P.; Anilkumar, K.; Aravinda, S.; Vishwakarma, R. A.; Das, P. Org. Lett.
2013, 15, 5718-5721.
(155) Bielawski, M.; Aili, D.; Olofsson, B. J. Org. Chem. 2008, 73, 4602-4607.
(156) Ronson, T. O., Ph.D. Thesis, University of York, United Kingdom, 2015.
(157) Crabtree, R. H. Chem. Rev. 2012, 112, 1536-1554.
(158) Crabtree, R. H. Chem. Rev. 2015, 115, 127-150.
(159) Mower, M. P.; Blackmond, D. G. J. Am. Chem. Soc. 2015, 137, 2386-2391.
(160) Herbert, T. A. M.Chem. Research Report, University of York, United Kingdom,
2012.
(161) Pridgen, L. N.; Jones, S. S. J. Org. Chem. 1982, 47, 1590-1592.
(162) Wakioka, M.; Nakamura, Y.; Wang, Q.; Ozawa, F. Organometallics 2012, 31, 4810-
4816.
(163) Fairlamb, I. J. S. Org. Biomol. Chem. 2008, 6, 3645-3656.
(164) Macé, Y.; Kapdi, A. R.; Fairlamb, I. J. S.; Jutand, A. Organometallics 2006, 25,
1795-1800.

References
442
(165) Amatore, C.; Jutand, A.; Khalil, F.; M'Barki, M. A.; Mottier, L. Organometallics
1993, 12, 3168-3178.
(166) Takahashi, Y.; Ito, T.; Sakai, S.; Ishii, Y. J. Chem. Soc. D 1970, 1065-1066.
(167) Mazza, M. C.; Pierpont, C. G. Inorg. Chem. 1973, 12, 2955-2959.
(168) Ukai, T.; Kawazura, H.; Ishii, Y.; Bonnet, J. J.; Ibers, J. A. J. Organomet. Chem.
1974, 65, 253-266.
(169) Tanaka, H.; Kawazura, H. Bull. Chem. Soc. Jpn. 1980, 53, 1743-1744.
(170) Zalesskiy, S. S.; Ananikov, V. P. Organometallics 2012, 31, 2302-2309.
(171) Burrows, A. D.; Mingos, D. M. P.; Menzer, S.; Vilar, R.; Williams, D. J. J. Chem.
Soc., Dalton Trans. 1995, 2107-2108.
(172) Kawazura, H.; Tanaka, H.; Yamada, K.-i.; Takahashi, T.; Ishii, Y. Bull. Chem. Soc.
Jpn. 1978, 51, 3466-3470.
(173) Kapdi, A. R.; Whitwood, A. C.; Williamson, D. C.; Lynam, J. M.; Burns, M. J.;
Williams, T. J.; Reay, A. J.; Holmes, J.; Fairlamb, I. J. S. J. Am. Chem. Soc. 2013,
135, 8388-8399.
(174) Pentsak, E. O.; Kashin, A. S.; Polynski, M. V.; Kvashnina, K. O.; Glatzel, P.;
Ananikov, V. P. Chem. Sci. 2015, 6, 3302-3313.
(175) Yuan, X.; Yan, N.; Katsyuba, S. A.; Zvereva, E. E.; Kou, Y.; Dyson, P. J. Phys.
Chem. Chem. Phys. 2012, 14, 6026-6033.
(176) Heard, C. J., Ph.D. Thesis, University of Birmingham, United Kingdom, 2014.
(177) Musaev, D. G.; Figg, T. M.; Kaledin, A. L. Chem. Soc. Rev. 2014.
(178) Loach, R. P.; Fenton, O. S.; Amaike, K.; Siegel, D. S.; Ozkal, E.; Movassaghi, M. J.
Org. Chem. 2014, 79, 11254-11263.
(179) Marson, C. M. Chem. Soc. Rev. 2011, 40, 5514-5533.
(180) Pitt, W. R.; Parry, D. M.; Perry, B. G.; Groom, C. R. J. Med. Chem. 2009, 52, 2952-
2963.

References
443
(181) Crespo-Quesada, M.; Yarulin, A.; Jin, M.; Xia, Y.; Kiwi-Minsker, L. J. Am. Chem.
Soc. 2011, 133, 12787-12794.
(182) Zang, W.; Li, G.; Wang, L.; Zhang, X. Catal. Sci. Tech. 2015, 5, 2532-2553.
(183) Long, R.; Rao, Z.; Mao, K.; Li, Y.; Zhang, C.; Liu, Q.; Wang, C.; Li, Z.-Y.; Wu, X.;
Xiong, Y. Angew. Chem. Int. Ed. 2015, 54, 2425-2430.
(184) Tao, A. R.; Habas, S.; Yang, P. Small 2008, 4, 310-325.
(185) Xia, Y.; Xiong, Y.; Lim, B.; Skrabalak, S. E. Angew. Chem. Int. Ed. 2009, 48, 60-
103.
(186) Jia, C.-J.; Schuth, F. Phys. Chem. Chem. Phys. 2011, 13, 2457-2487.
(187) Xia, Y.; Xia, X.; Peng, H.-C. J. Am. Chem. Soc. 2015, 137, 7947-7966.
(188) Lim, B.; Jiang, M.; Tao, J.; Camargo, P. H. C.; Zhu, Y.; Xia, Y. Adv. Funct. Mater.
2009, 19, 189-200.
(189) Collins, G.; Schmidt, M.; O'Dwyer, C.; Holmes, J. D.; McGlacken, G. P. Angew.
Chem. Int. Ed. 2014, 53, 4142-4145.
(190) Dolomanov, O. V.; Bourhis, L. J.; Gildea, R. J.; Howard, J. A. K.; Puschmann, H. J.
Appl. Crystallogr. 2009, 42, 339-341.
(191) Palatinus, L.; Chapuis, G. J. Appl. Crystallogr. 2007, 40, 786-790.
(192) Palatinus, L.; van der Lee, A. J. Appl. Crystallogr. 2008, 41, 975-984.
(193) Palatinus, L.; Prathapa, S. J.; van Smaalen, S. J. Appl. Crystallogr. 2012, 45, 575-
580.
(194) Sheldrick, G. Acta Crystallogr., Sect. A 2008, 64, 112-122.
(195) Appleton, D. R.; Babcock, R. C.; Copp, B. R. Tetrahedron 2001, 57, 10181-10189.
(196) Angelini, E.; Balsamini, C.; Bartoccini, F.; Lucarini, S.; Piersanti, G. J. Org. Chem.
2008, 73, 5654-5657.
(197) Kitamura, T.; Matsuyuki, J.-i.; Taniguchi, H. Synthesis 1994, 1994, 147-148.

References
444
(198) Zhu, S.; MacMillan, D. W. C. J. Am. Chem. Soc. 2012, 134, 10815-10818.
(199) Petersen, T. B.; Khan, R.; Olofsson, B. Org. Lett. 2011, 13, 3462-3465.
(200) Kakinuma, Y.; Moriyama, K.; Togo, H. Synthesis 2013, 45, 183-188.
(201) Jeong, Y.-C.; Moloney, M. G. Synlett 2009, 2009, 2487-2491.
(202) Cardillo, G.; Gentilucci, L.; Tomasini, C.; Tomasoni, L. Tetrahedron: Asymmetry
1995, 6, 1947-1955.
(203) Sato, K.; Kozikowski, A. P. Tetrahedron Lett. 1989, 30, 4073-4076.
(204) Calmes, M.; Daunis, J.; Jacquier, R.; Verducci, J. Tetrahedron 1987, 43, 2285-2292.
(205) Stadler, P. A. Helv. Chim. Acta 1978, 61, 1675-1681.
(206) Gellerman, G.; Rudi, A.; Kashman, Y. Tetrahedron 1994, 50, 12959-12972.
(207) Otani, T. T.; Briley, M. R. J. Pharm. Sci. 1979, 68, 496-499.
(208) Turner, R. A.; Hauksson, N. E.; Gipe, J. H.; Lokey, R. S. Org. Lett. 2013, 15, 5012-
5015.
(209) Steglich, W.; Hinze, S. Synthesis 1976, 1976, 399-401.
(210) Naturale, G.; Lamblin, M.; Commandeur, C.; Felpin, F.-X.; Dessolin, J. Eur. J. Org.
Chem. 2012, 2012, 5774-5788.
(211) Kieffer, M. E.; Repka, L. M.; Reisman, S. E. J. Am. Chem. Soc. 2012, 134, 5131-
5137.
(212) Erb, W.; Hellal, A.; Albini, M.; Rouden, J.; Blanchet, J. Chem. Eur. J. 2014, 20,
6608-6612.
(213) Hanson, P.; Jones, J. R.; Taylor, A. B.; Walton, P. H.; Timms, A. W. J. Chem. Soc.,
Perkin Trans. 2 2002, 1135-1150.
(214) Bahr, J. L.; Yang, J.; Kosynkin, D. V.; Bronikowski, M. J.; Smalley, R. E.; Tour, J.
M. J. Am. Chem. Soc. 2001, 123, 6536-6542.

References
445
(215) Becker, B. C.; Adams, R. J. Am. Chem. Soc. 1932, 54, 2973-2982.
(216) Tang, Z. Y.; Zhang, Y.; Wang, T.; Wang, W. Synlett 2010, 2010, 804-808.
(217) Southam, R. M.; Whiting, M. C. J. Chem. Soc., Perkin Trans. 2 1982, 597-603.
(218) Shu, X.-z.; Zhang, M.; He, Y.; Frei, H.; Toste, F. D. J. Am. Chem. Soc. 2014, 136,
5844-5847.
(219) Chaudhuri, A.; Loughlin, J. A.; Romsted, L. S.; Yao, J. J. Am. Chem. Soc. 1993, 115,
8351-8361.
(220) Kuokkanen, T.; Palokangas, J.; Talvensaari, M. J. Phys. Org. Chem. 2000, 13, 452-
460.
(221) Yang, H.-H.; McCreery, R. L. Anal. Chem. 1999, 71, 4081-4087.
(222) Drent, E.; Van Broekhoven, J. A. M.; Doyle, M. J. J. Organomet. Chem. 1991, 417,
235-251.
(223) Ren, K.; Malpert, J. H.; Gu, H.; Li, H.; Neckers, D. C. Tetrahedron 2002, 58, 5267-
5273.
(224) Stang, P. J.; Zhdankin, V. V.; Tykwinski, R.; Zefirov, N. S. Tetrahedron Lett. 1991,
32, 7497-7498.
(225) Prasad, B.; Sreenivas, B. Y.; Krishna, G. R.; Kapavarapu, R.; Pal, M. Chem.
Commun. 2013, 49, 6716-6718.
Related Documents

![Supporting Information carboxylic acids with Aryl bromides ... · S1 Supporting Information Ligand-free Pd-catalysed decarboxylative arylation of Imidazo[1,2-a]pyridine-3-carboxylic](https://static.cupdf.com/doc/110x72/5fd3a6a8ff554d65dd3d9522/supporting-information-carboxylic-acids-with-aryl-bromides-s1-supporting-information.jpg)