BioMed Central Page 1 of 14 (page number not for citation purposes) BMC Plant Biology Open Access Research article Development of microsatellite markers from an enriched genomic library for genetic analysis of melon (Cucumis melo L.) Patricia Silva Ritschel 1,3 , Tulio Cesar de Lima Lins 2 , Rodrigo Lourenço Tristan 2 , Gláucia Salles Cortopassi Buso 2 , José Amauri Buso 4 and Márcio Elias Ferreira* 2,5 Address: 1 Cellular Biology Department, IB – University of Brasília (UnB) – Campus Universitário, Asa Norte, CEP 70.910-900, Brasilia, DF, Brazil, 2 Embrapa Genetic Resources and Biotechnology, CP 02372, CEP 70.879-970, Brasilia, DF, Brazil, 3 Embrapa Vegetable Crops, CP 218, CEP 70.359- 970 Brasilia, DF, Brazil, 4 Embrapa International Cooperation Coordination, Estação Parque Rural, Av. W-3 Norte (Final), CEP 70.770-901, Brasilia, DF, Brazil and 5 Catholic University of Brasília, CAMPUS II – SGAN Quadra 916, Módulo B, Av. W5 Norte – Brasília, DF, CEP: 70790-160, Brazil Email: Patricia Silva Ritschel - [email protected]; Tulio Cesar de Lima Lins - [email protected]; Rodrigo Lourenço Tristan - [email protected]; Gláucia Salles Cortopassi Buso - [email protected]; José Amauri Buso - [email protected]; Márcio Elias Ferreira* - [email protected] * Corresponding author Abstract Background: Despite the great advances in genomic technology observed in several crop species, the availability of molecular tools such as microsatellite markers has been limited in melon (Cucumis melo L.) and cucurbit species. The development of microsatellite markers will have a major impact on genetic analysis and breeding of melon, especially on the generation of marker saturated genetic maps and implementation of marker assisted breeding programs. Genomic microsatellite enriched libraries can be an efficient alternative for marker development in such species. Results: Seven hundred clones containing microsatellite sequences from a Tsp-AG/TC microsatellite enriched library were identified and one-hundred and forty-four primer pairs designed and synthesized. When 67 microsatellite markers were tested on a panel of melon and other cucurbit accessions, 65 revealed DNA polymorphisms among the melon accessions. For some cucurbit species, such as Cucumis sativus, up to 50% of the melon microsatellite markers could be readily used for DNA polymophism assessment, representing a significant reduction of marker development costs. A random sample of 25 microsatellite markers was extracted from the new microsatellite marker set and characterized on 40 accessions of melon, generating an allelic frequency database for the species. The average expected heterozygosity was 0.52, varying from 0.45 to 0.70, indicating that a small set of selected markers should be sufficient to solve questions regarding genotype identity and variety protection. Genetic distances based on microsatellite polymorphism were congruent with data obtained from RAPD marker analysis. Mapping analysis was initiated with 55 newly developed markers and most primers showed segregation according to Mendelian expectations. Linkage analysis detected linkage between 56% of the markers, distributed in nine linkage groups. Conclusions: Genomic library microsatellite enrichment is an efficient procedure for marker development in melon. One-hundred and forty-four new markers were developed from Tsp-AG/TC genomic library. This is the first reported attempt of successfully using enriched library for microsatellite marker development in the species. A sample of the microsatellite markers tested proved efficient for genetic analysis of melon, including genetic distance estimates and identity tests. Linkage analysis indicated that the markers developed are dispersed throughout the genome and should be very useful for genetic analysis of melon. Published: 18 May 2004 BMC Plant Biology 2004, 4:9 Received: 16 January 2004 Accepted: 18 May 2004 This article is available from: http://www.biomedcentral.com/1471-2229/4/9 © 2004 Ritschel et al; licensee BioMed Central Ltd. This is an Open Access article: verbatim copying and redistribution of this article are permitted in all media for any purpose, provided this notice is preserved along with the article's original URL.

Welcome message from author
This document is posted to help you gain knowledge. Please leave a comment to let me know what you think about it! Share it to your friends and learn new things together.
Transcript
BioMed CentralBMC Plant Biology
ss
Open AcceResearch articleDevelopment of microsatellite markers from an enriched genomic library for genetic analysis of melon (Cucumis melo L.)Patricia Silva Ritschel1,3, Tulio Cesar de Lima Lins2, Rodrigo Lourenço Tristan2, Gláucia Salles Cortopassi Buso2, José Amauri Buso4 and Márcio Elias Ferreira*2,5Address: 1Cellular Biology Department, IB – University of Brasília (UnB) – Campus Universitário, Asa Norte, CEP 70.910-900, Brasilia, DF, Brazil, 2Embrapa Genetic Resources and Biotechnology, CP 02372, CEP 70.879-970, Brasilia, DF, Brazil, 3Embrapa Vegetable Crops, CP 218, CEP 70.359-970 Brasilia, DF, Brazil, 4Embrapa International Cooperation Coordination, Estação Parque Rural, Av. W-3 Norte (Final), CEP 70.770-901, Brasilia, DF, Brazil and 5Catholic University of Brasília, CAMPUS II – SGAN Quadra 916, Módulo B, Av. W5 Norte – Brasília, DF, CEP: 70790-160, Brazil
Email: Patricia Silva Ritschel - [email protected]; Tulio Cesar de Lima Lins - [email protected]; Rodrigo Lourenço Tristan - [email protected]; Gláucia Salles Cortopassi Buso - [email protected]; José Amauri Buso - [email protected]; Márcio Elias Ferreira* - [email protected]
* Corresponding author
AbstractBackground: Despite the great advances in genomic technology observed in several crop species, the availability ofmolecular tools such as microsatellite markers has been limited in melon (Cucumis melo L.) and cucurbit species. Thedevelopment of microsatellite markers will have a major impact on genetic analysis and breeding of melon, especially onthe generation of marker saturated genetic maps and implementation of marker assisted breeding programs. Genomicmicrosatellite enriched libraries can be an efficient alternative for marker development in such species.
Results: Seven hundred clones containing microsatellite sequences from a Tsp-AG/TC microsatellite enriched librarywere identified and one-hundred and forty-four primer pairs designed and synthesized. When 67 microsatellite markerswere tested on a panel of melon and other cucurbit accessions, 65 revealed DNA polymorphisms among the melonaccessions. For some cucurbit species, such as Cucumis sativus, up to 50% of the melon microsatellite markers could bereadily used for DNA polymophism assessment, representing a significant reduction of marker development costs. Arandom sample of 25 microsatellite markers was extracted from the new microsatellite marker set and characterized on40 accessions of melon, generating an allelic frequency database for the species. The average expected heterozygositywas 0.52, varying from 0.45 to 0.70, indicating that a small set of selected markers should be sufficient to solve questionsregarding genotype identity and variety protection. Genetic distances based on microsatellite polymorphism werecongruent with data obtained from RAPD marker analysis. Mapping analysis was initiated with 55 newly developedmarkers and most primers showed segregation according to Mendelian expectations. Linkage analysis detected linkagebetween 56% of the markers, distributed in nine linkage groups.
Conclusions: Genomic library microsatellite enrichment is an efficient procedure for marker development in melon.One-hundred and forty-four new markers were developed from Tsp-AG/TC genomic library. This is the first reportedattempt of successfully using enriched library for microsatellite marker development in the species. A sample of themicrosatellite markers tested proved efficient for genetic analysis of melon, including genetic distance estimates andidentity tests. Linkage analysis indicated that the markers developed are dispersed throughout the genome and shouldbe very useful for genetic analysis of melon.
Published: 18 May 2004
BMC Plant Biology 2004, 4:9
Received: 16 January 2004Accepted: 18 May 2004
This article is available from: http://www.biomedcentral.com/1471-2229/4/9
© 2004 Ritschel et al; licensee BioMed Central Ltd. This is an Open Access article: verbatim copying and redistribution of this article are permitted in all media for any purpose, provided this notice is preserved along with the article's original URL.
Page 1 of 14(page number not for citation purposes)
BMC Plant Biology 2004, 4 http://www.biomedcentral.com/1471-2229/4/9
BackgroundThe Cucurbitaceae family includes several species of culti-vated plants of great economic importance, such as water-melon (Citrullus lanatus L.), squash (Cucurbita maxima L.),melon (Cucumis melo L.) and cucumber (Cucumis sativusL.). The morphological variation observed in germplasmaccessions of melon and other cucurbit species is enor-mous. Gene flow between cultigenes is facilitated by theallogamous habit of the species [1]. Difficulties concern-ing intraspecific botanical classification in C. melo, basedmainly on morphological characters, have been addressedin the last 40 years [2-4]. Cultivated melon morphotypesare usually classified in three major groups: reticulatus,cantaloupensis and inodorus [3,4]. More recently, the reticu-latus group has been suggested to be part of the canta-loupensis group [1]. Wild type melons are classified in theflexuosus, momordica, conomon, dudaim and chito groups[4].
Melon varieties that belong to the cantaloupensis or reticu-latus groups are the most cultivated in the United States,usually called "muskmelon" or "cantaloupe", producingaromatic fruits with a netted or ribbed coat and a sweetorange flesh. However, the yellow melons of "Valen-ciano" type are the most important in the Brazilian [5]and other markets. In European countries it is the secondmost commercialized type of melon [6]. Valenciano mel-ons are classified in the inodorus group, showing non-smelling fruits with a smooth or wrinkled rind and whiteor green sweet flesh. Fresh melon production is importantfor internal market consumption in Brazil, but a signifi-cant percentage of the production is exported to othercountries [7-9]. Melon is actually one of the most impor-tant agronomic products of Northeastern Brazil, wheresoil and climate conditions are suitable for commercialproduction. Fruit quality, especially flavor, is among themost valued commercial traits demanding furtherimprovement [8]. The development of Valenciano melonvarieties with improved fruit quality could be acceleratedwith the use of genomic technology. This would include,for example, molecular mapping of genomic regions asso-ciated with fruit quality control and, eventually, markerassisted selection.
Molecular markers have been widely used in genetic anal-ysis and breeding of plant species, with a multitude ofapplications [10]. Among the various types of molecularmarkers available, microsatellites have received greaterattention recently, especially for breeding purposes. Mic-rosatellite markers, also known as simple sequencerepeats or SSRs [11,12], are clusters of short (usually 2 to6) tandemly repeated nucleotide bases distributedthroughout the genome. Microsatellite markers distin-guish themselves as co-dominant, multiallelic, highly pol-ymorphic genetic markers, requiring small amounts of
DNA for straightforward PCR and gel electrophoresisanalysis. Its main disadvantage is the high cost of the ini-tial investment necessary for marker development [13].The development of microsatellite markers can be basedon DNA sequence information deposited in databases, orit could be based on the screening of genomic DNA librar-ies specifically constructed for the discovery of repeatedsequences in the genome. The use of genomic librariesenriched for microsatellite sequences is a strategy devisedto decrease the cost of marker development while increas-ing the opportunity for marker discovery [14].
The actual use of microsatellite markers in melon geneticanalysis has been very limited. Only about 70 microsatel-lite markers have been described in the literature so far[15,16] and just a few used in linkage analysis. Thesemarkers were integrated in genetic maps built with mor-phological, isoenzimatic and other molecular markerssuch as RFLP (Restriction Fragment Length Polymor-phisms), AFLP (Amplified Fragment Length Polymor-phisms) and RAPD (Random Amplified PolymorphicDNA [16-28]. There is, therefore, great need to discoverand develop more microsatellite markers for genetic andlinkage analysis of melon.
The main objectives of this work were to develop newmicrosatellite markers for melon based on a genomicDNA library enriched for microsatellite sequences and testtheir usefulness: (a) in genetic linkage analysis; (b) todetermine genetic distances between varieties of Valen-ciano melons and (c) as molecular markers in other cucur-bit species.
Results and DiscussionGenomic library enriched for microsatellite sequencesA Tsp-AG/TC genomic library was constructed and a totalof 700 positive colonies were identified as a result of thehybridization of 1600 clones with (AG/TC)13 probes,most of them containing microsatellite repeat sequences.Anchored-PCR reactions confirmed microsatellite pres-ence in 450 of the 700 clones and allowed theidentification of the size, orientation and position of mic-rosatellite sequences in these clones. This information wasimportant for selecting the clones to be sequenced, reduc-ing costs and time. Knowledge of the DNA sequencesflanking the microsatellite region allowed for primerdesign and synthesis. A set of 237 primer pairs was ini-tially developed based on information generated by theanchored-PCR approach and one hundred and forty-fourprimer pairs were synthesized (additional file 1). Fifty-nine of these markers had perfect AG or TC repeats (41%),68 had complex repeats (47%) and 17 had compoundrepeats (12%) (additional file 1). A greater amount of per-fect repeats was detected in this sample compared to whatwas observed for the 40 melon microsatellite markers
Page 2 of 14(page number not for citation purposes)
BMC Plant Biology 2004, 4 http://www.biomedcentral.com/1471-2229/4/9
already published, which reported 34% of perfect repeats,24% of compound repeats and 42% of complex repeats[16]. The number of repeat units observed in the new mic-rosatellite markers varied from 3 to 40 (additional file 1),while in the markers already published the observed rangewas 7–15 (dinucleotides) and 5–10 (trinucleotides)[15,16].
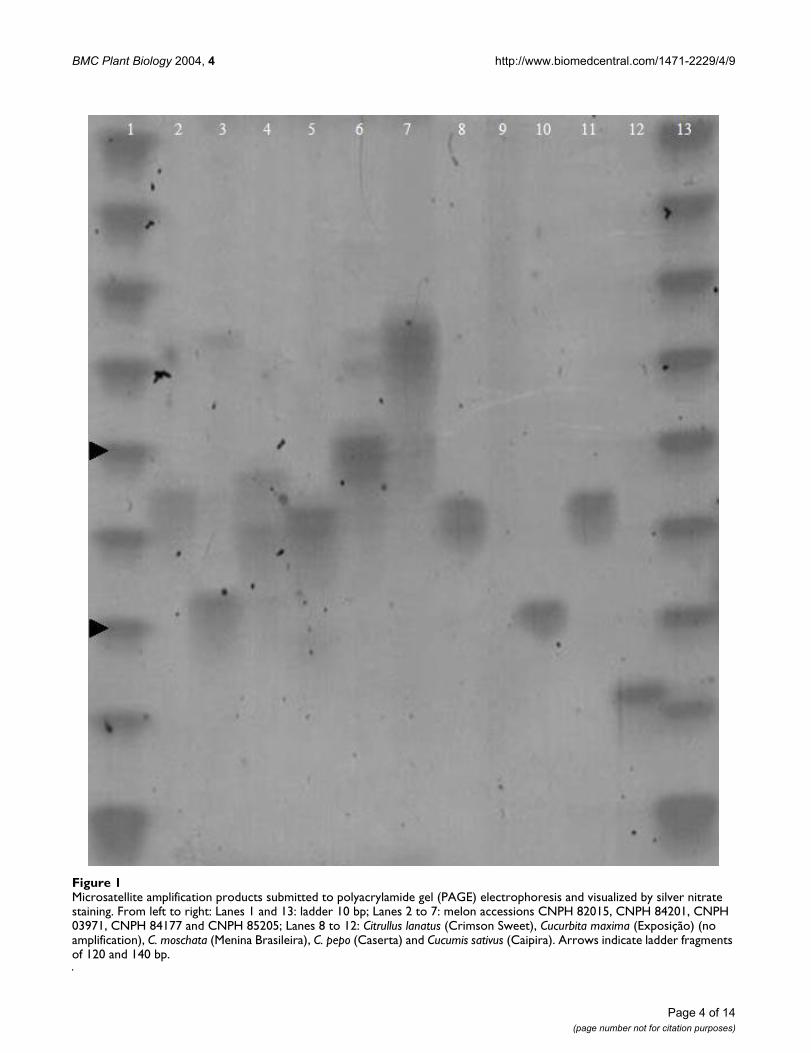
Sixty-seven out of 144 primer pairs were immediatelyselected for genetic tests since their PCR conditions didnot require further adjustments. The sixty-seven markerswere tested on a panel of 11 varieties of six cucurbit spe-cies (C. melo, Citrullus lanatus, Cucurbita maxima, C. mos-chata, C. pepo and Cucumis sativus). Sixty-five markersdetected DNA polymorphism between the five melonaccessions analyzed (Figure 1).
Marker transferability to other cucurbit speciesThirty-three of the 67 new melon microsatellite markerstested on the cucurbit panel generated PCR products withsample DNA from cucumber (Cucumis sativus), 16 withwatermelon DNA (Citrullus lanatus), 11 with Cucurbitamoschata DNA and a smaller amount (8 primer pairs) withC. maxima and Cucurbita pepo DNA. Previously reportedestimates of microsatellite marker transferability frommelon to cucumber were similar to these results [16]. Itseems, therefore, that the level of microsatellite markertransferability in the genus Cucumis resembles what isobserved in other intragenus comparisons, such as Gly-cine, where up to 65% of the microsatellite markers devel-oped for G. max could be transferred to other Glycinespecies [29]. This, of course, results in a rapid dissemina-tion of marker use and facilitates studies on mapping andcomparative genetics. Likewise, the use of melon micros-atellite markers for DNA polymorphism assessment incucurbit species represents a significant reduction ofmarker development costs and a shortcut to in-depthgenetic analysis of these species.
Six markers (CMBR18, CMBR22, CMBR23, CMBR48,CMBR56, CMBR82) produced PCR products with sampleDNA from all seven species. These sequences were com-pared with DNA sequences deposited at Genbank [30]and marker CMBR48 showed very significant homologywith chloroplastic 16S ribosomal RNA gene sequences.This could explain the high level of transferability of thismarker and, as expected, DNA polymorphism was notdetected at this marker locus on melon accessions andother cucurbit species. On the other hand, three of themicrosatellite markers detected in all six cucurbit species(CMBR18, CMBR56 and CMBR23) showed polymor-phism between Cucumis melo accessions. The nature ofthese marker loci is not known at this point. The data indi-cates, however, that a larger and more diverse sample of
each cucurbit species should be considered for microsatel-lite polymorphism analysis and marker transferability.
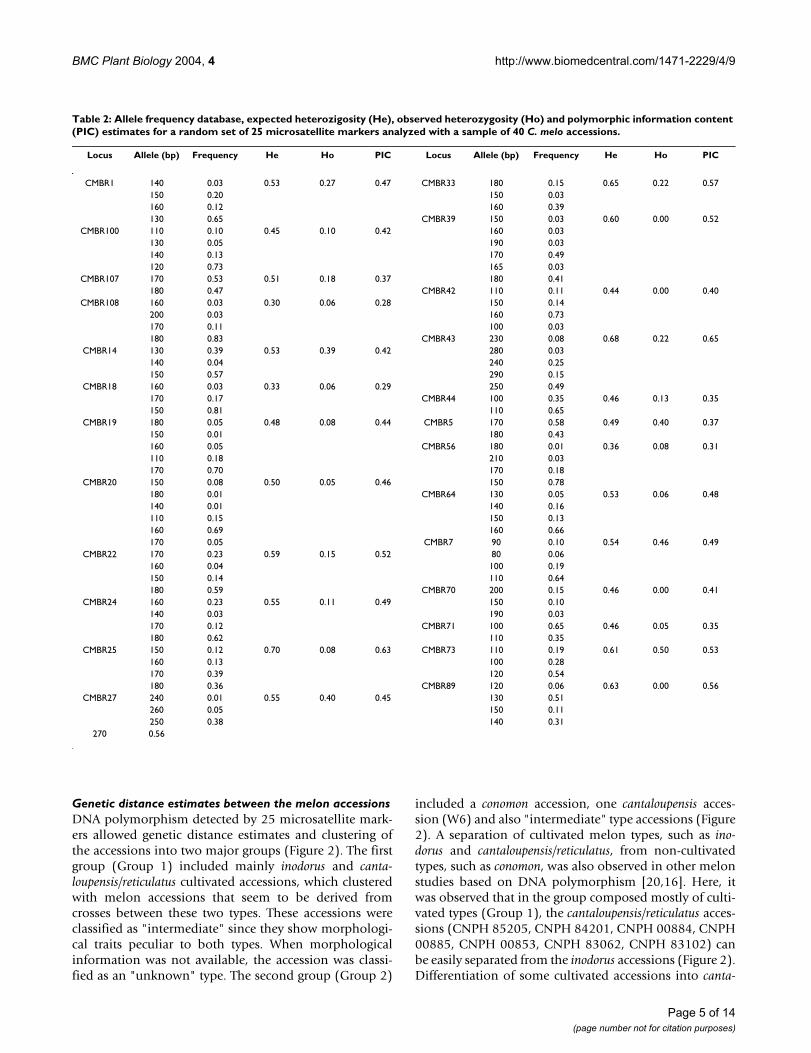
Genetic diversity analysis with microsatellite markersA set of 25 microsatellite markers (Table 2) was selected atrandom to perform a diversity study of 40 accessions ofmelon. Without exception, the PCR products for the newmarkers had the expected fragment size when tested onDNA from accession AF 686. Allele number per locus var-ied from two (CMBR107, CMBR44, CMBR5, CMBR71) tosix (CMBR20 and CMBR39). Expected heterozygosity var-ied from 0.45 (CMBR100) to 0.70 (CMBR25) (Table 2).The mean expected heterozygosity for these selected mic-rosatellite markers was 0.52. Observations with six micro-satellite markers [15] reported the number of alleles perlocus varying from 3–5 and observed heterozygosity rang-ing from 0.49 to 0.75 (mean 0.61). Another study with 38microsatellite markers detected 2–6 alleles per locus andobserved heterozygosity ranging from 0.26–0.79 [16].The number of alleles and observed heterozygosity esti-mated here are smaller than expected for an allogamousspecies such as melon. This is obviously related to thegenetic relationships of the melon samples chosen for thestudy. Rather than selecting a very diverse germplasm forthe analysis, a sample composed mostly of Valencianoaccessions collected throughout Brazil, representing thecommercial varieties planted in the country, predomi-nated in the study. This sample represents, therefore, asmall subset of the melon genetic pool, which could cer-tainly explain the relatively lower than expected heterozy-gosity estimates. It should also be noted that endogamydepression is not significant in the cucurbit family [1,31-33]. Populations in cucurbits are generally derived fromseeds obtained from one or few fruits in small popula-tions, not only at farms but also in the wild, favoringendogamy [34].
Polymorphism Information Content (PIC) was estimatedfor the 25 markers (Table 2), with values ranging from0.28 (CMBR100) to 0.65 (CMBR43). A group of thesemarkers could certainly be selected for DNA fingerprint-ing purposes, including applications such as for identitytests, analysis of seed contamination in commercial seedproduction and variety protection. Based on the estimatesof PIC and He (expected heterozygosity), ten of suchmarkers were chosen and studied on 40 melon accessions(markers CMBR7, CMBR22, CMBR24, CMBR25,CMBR27, CMBR33, CMBR39, CMBR43, CMBR73,CMBR89). The probability of identical genotypes was esti-mated as 2.0 × 10⁻⁷, based on the allelic frequency data-base constructed (Table 2). This suggests that DNAprofiles based on a panel of selected microsatellite mark-ers could be efficiently used to differentiate melon indi-viduals and accessions.
Page 3 of 14(page number not for citation purposes)
BMC Plant Biology 2004, 4 http://www.biomedcentral.com/1471-2229/4/9
Microsatellite amplification products submitted to polyacrylamide gel (PAGE) electrophoresis and visualized by silver nitrate stainingFigure 1Microsatellite amplification products submitted to polyacrylamide gel (PAGE) electrophoresis and visualized by silver nitrate staining. From left to right: Lanes 1 and 13: ladder 10 bp; Lanes 2 to 7: melon accessions CNPH 82015, CNPH 84201, CNPH 03971, CNPH 84177 and CNPH 85205; Lanes 8 to 12: Citrullus lanatus (Crimson Sweet), Cucurbita maxima (Exposição) (no amplification), C. moschata (Menina Brasileira), C. pepo (Caserta) and Cucumis sativus (Caipira). Arrows indicate ladder fragments of 120 and 140 bp.
Page 4 of 14(page number not for citation purposes)
BMC Plant Biology 2004, 4 http://www.biomedcentral.com/1471-2229/4/9
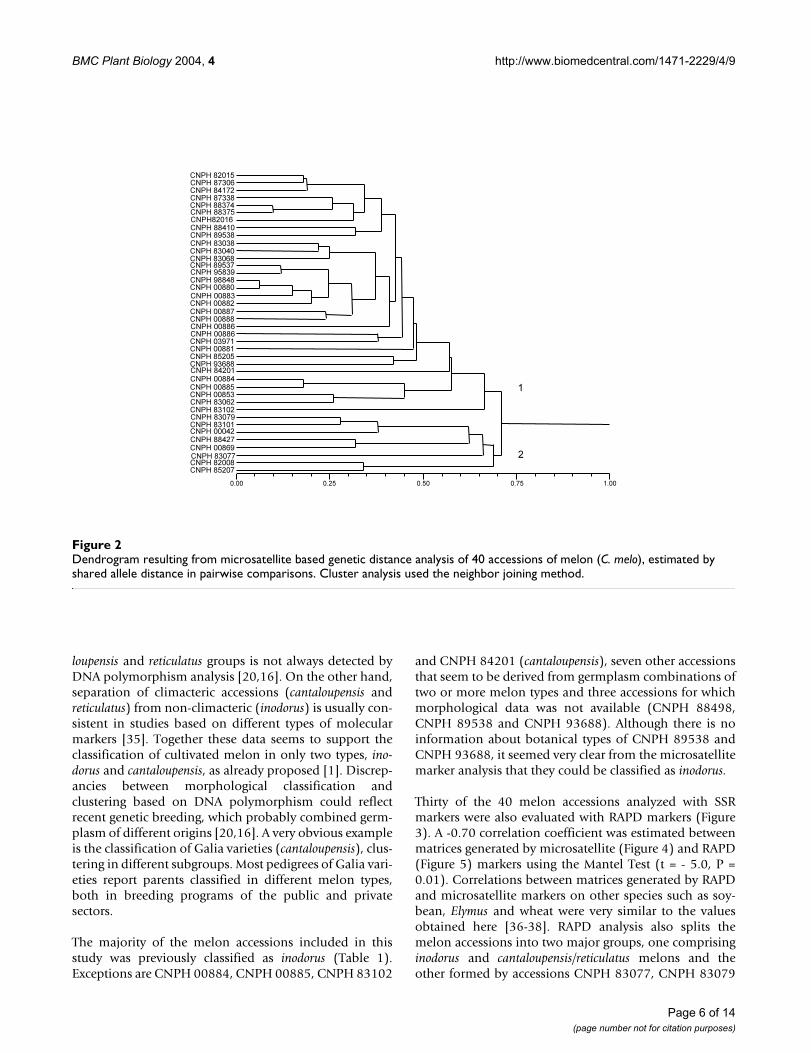
Genetic distance estimates between the melon accessionsDNA polymorphism detected by 25 microsatellite mark-ers allowed genetic distance estimates and clustering ofthe accessions into two major groups (Figure 2). The firstgroup (Group 1) included mainly inodorus and canta-loupensis/reticulatus cultivated accessions, which clusteredwith melon accessions that seem to be derived fromcrosses between these two types. These accessions wereclassified as "intermediate" since they show morphologi-cal traits peculiar to both types. When morphologicalinformation was not available, the accession was classi-fied as an "unknown" type. The second group (Group 2)
included a conomon accession, one cantaloupensis acces-sion (W6) and also "intermediate" type accessions (Figure2). A separation of cultivated melon types, such as ino-dorus and cantaloupensis/reticulatus, from non-cultivatedtypes, such as conomon, was also observed in other melonstudies based on DNA polymorphism [20,16]. Here, itwas observed that in the group composed mostly of culti-vated types (Group 1), the cantaloupensis/reticulatus acces-sions (CNPH 85205, CNPH 84201, CNPH 00884, CNPH00885, CNPH 00853, CNPH 83062, CNPH 83102) canbe easily separated from the inodorus accessions (Figure 2).Differentiation of some cultivated accessions into canta-
Table 2: Allele frequency database, expected heterozigosity (He), observed heterozygosity (Ho) and polymorphic information content (PIC) estimates for a random set of 25 microsatellite markers analyzed with a sample of 40 C. melo accessions.
Locus Allele (bp) Frequency He Ho PIC Locus Allele (bp) Frequency He Ho PIC
CMBR1 140 0.03 0.53 0.27 0.47 CMBR33 180 0.15 0.65 0.22 0.57150 0.20 150 0.03160 0.12 160 0.39130 0.65 CMBR39 150 0.03 0.60 0.00 0.52
CMBR100 110 0.10 0.45 0.10 0.42 160 0.03130 0.05 190 0.03140 0.13 170 0.49120 0.73 165 0.03
CMBR107 170 0.53 0.51 0.18 0.37 180 0.41180 0.47 CMBR42 110 0.11 0.44 0.00 0.40
CMBR108 160 0.03 0.30 0.06 0.28 150 0.14200 0.03 160 0.73170 0.11 100 0.03180 0.83 CMBR43 230 0.08 0.68 0.22 0.65
CMBR14 130 0.39 0.53 0.39 0.42 280 0.03140 0.04 240 0.25150 0.57 290 0.15
CMBR18 160 0.03 0.33 0.06 0.29 250 0.49170 0.17 CMBR44 100 0.35 0.46 0.13 0.35150 0.81 110 0.65
CMBR19 180 0.05 0.48 0.08 0.44 CMBR5 170 0.58 0.49 0.40 0.37150 0.01 180 0.43160 0.05 CMBR56 180 0.01 0.36 0.08 0.31110 0.18 210 0.03170 0.70 170 0.18
CMBR20 150 0.08 0.50 0.05 0.46 150 0.78180 0.01 CMBR64 130 0.05 0.53 0.06 0.48140 0.01 140 0.16110 0.15 150 0.13160 0.69 160 0.66170 0.05 CMBR7 90 0.10 0.54 0.46 0.49
CMBR22 170 0.23 0.59 0.15 0.52 80 0.06160 0.04 100 0.19150 0.14 110 0.64180 0.59 CMBR70 200 0.15 0.46 0.00 0.41
CMBR24 160 0.23 0.55 0.11 0.49 150 0.10140 0.03 190 0.03170 0.12 CMBR71 100 0.65 0.46 0.05 0.35180 0.62 110 0.35
CMBR25 150 0.12 0.70 0.08 0.63 CMBR73 110 0.19 0.61 0.50 0.53160 0.13 100 0.28170 0.39 120 0.54180 0.36 CMBR89 120 0.06 0.63 0.00 0.56
CMBR27 240 0.01 0.55 0.40 0.45 130 0.51260 0.05 150 0.11250 0.38 140 0.31
270 0.56
Page 5 of 14(page number not for citation purposes)
BMC Plant Biology 2004, 4 http://www.biomedcentral.com/1471-2229/4/9
loupensis and reticulatus groups is not always detected byDNA polymorphism analysis [20,16]. On the other hand,separation of climacteric accessions (cantaloupensis andreticulatus) from non-climacteric (inodorus) is usually con-sistent in studies based on different types of molecularmarkers [35]. Together these data seems to support theclassification of cultivated melon in only two types, ino-dorus and cantaloupensis, as already proposed [1]. Discrep-ancies between morphological classification andclustering based on DNA polymorphism could reflectrecent genetic breeding, which probably combined germ-plasm of different origins [20,16]. A very obvious exampleis the classification of Galia varieties (cantaloupensis), clus-tering in different subgroups. Most pedigrees of Galia vari-eties report parents classified in different melon types,both in breeding programs of the public and privatesectors.
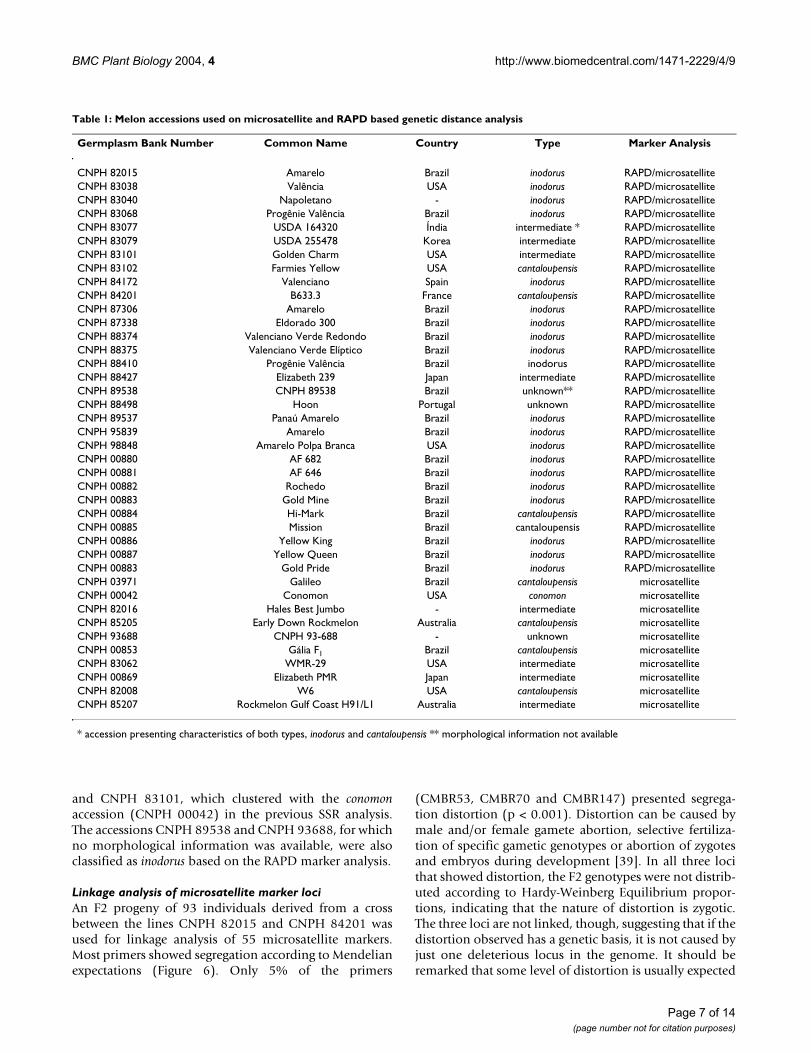
The majority of the melon accessions included in thisstudy was previously classified as inodorus (Table 1).Exceptions are CNPH 00884, CNPH 00885, CNPH 83102
and CNPH 84201 (cantaloupensis), seven other accessionsthat seem to be derived from germplasm combinations oftwo or more melon types and three accessions for whichmorphological data was not available (CNPH 88498,CNPH 89538 and CNPH 93688). Although there is noinformation about botanical types of CNPH 89538 andCNPH 93688, it seemed very clear from the microsatellitemarker analysis that they could be classified as inodorus.
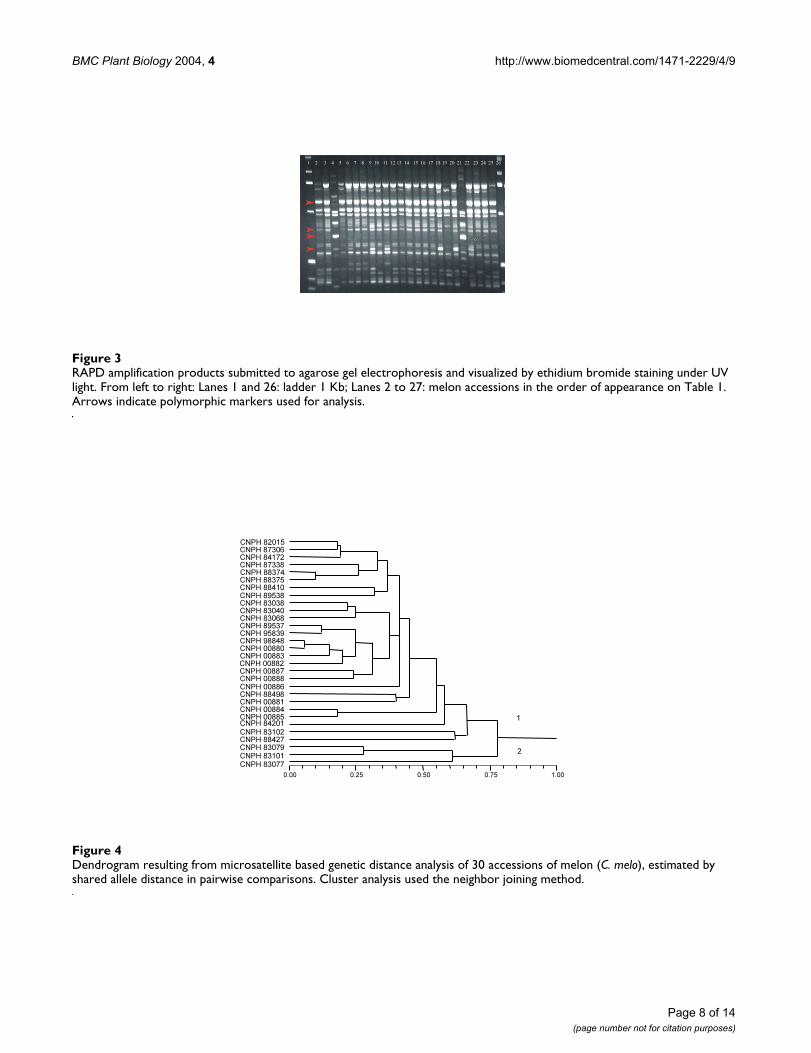
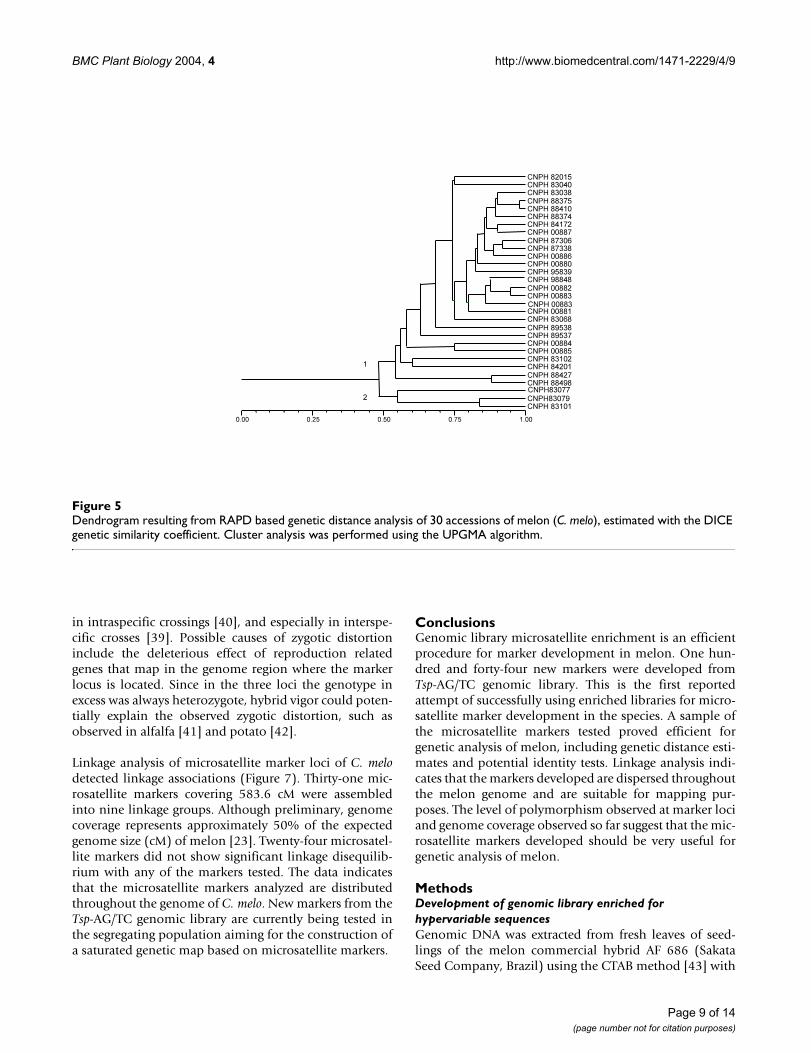
Thirty of the 40 melon accessions analyzed with SSRmarkers were also evaluated with RAPD markers (Figure3). A -0.70 correlation coefficient was estimated betweenmatrices generated by microsatellite (Figure 4) and RAPD(Figure 5) markers using the Mantel Test (t = - 5.0, P =0.01). Correlations between matrices generated by RAPDand microsatellite markers on other species such as soy-bean, Elymus and wheat were very similar to the valuesobtained here [36-38]. RAPD analysis also splits themelon accessions into two major groups, one comprisinginodorus and cantaloupensis/reticulatus melons and theother formed by accessions CNPH 83077, CNPH 83079
Dendrogram resulting from microsatellite based genetic distance analysis of 40 accessions of melon (C. melo), estimated by shared allele distance in pairwise comparisonsFigure 2Dendrogram resulting from microsatellite based genetic distance analysis of 40 accessions of melon (C. melo), estimated by shared allele distance in pairwise comparisons. Cluster analysis used the neighbor joining method.
0.00 0.25 0.50 0.75 1.00
CNPH 82015
CNPH 87306
CNPH 84172
CNPH 87338
CNPH 88374CNPH 88375
CNPH82016
CNPH 88410
CNPH 89538
CNPH 83038
CNPH 83040
CNPH 83068CNPH 89537CNPH 95839
CNPH 98848
CNPH 00880
CNPH 00883
CNPH 00882
CNPH 00887
CNPH 00888
CNPH 00886
CNPH 00886
CNPH 03971
CNPH 00881
CNPH 85205
CNPH 93688CNPH 84201
CNPH 00884
CNPH 00885
CNPH 00853
CNPH 83062
CNPH 83102
CNPH 83079
CNPH 83101CNPH 00042
CNPH 88427
CNPH 00869
CNPH 83077CNPH 82008
CNPH 85207
1
2
Page 6 of 14(page number not for citation purposes)
BMC Plant Biology 2004, 4 http://www.biomedcentral.com/1471-2229/4/9
and CNPH 83101, which clustered with the conomonaccession (CNPH 00042) in the previous SSR analysis.The accessions CNPH 89538 and CNPH 93688, for whichno morphological information was available, were alsoclassified as inodorus based on the RAPD marker analysis.
Linkage analysis of microsatellite marker lociAn F2 progeny of 93 individuals derived from a crossbetween the lines CNPH 82015 and CNPH 84201 wasused for linkage analysis of 55 microsatellite markers.Most primers showed segregation according to Mendelianexpectations (Figure 6). Only 5% of the primers
(CMBR53, CMBR70 and CMBR147) presented segrega-tion distortion (p < 0.001). Distortion can be caused bymale and/or female gamete abortion, selective fertiliza-tion of specific gametic genotypes or abortion of zygotesand embryos during development [39]. In all three locithat showed distortion, the F2 genotypes were not distrib-uted according to Hardy-Weinberg Equilibrium propor-tions, indicating that the nature of distortion is zygotic.The three loci are not linked, though, suggesting that if thedistortion observed has a genetic basis, it is not caused byjust one deleterious locus in the genome. It should beremarked that some level of distortion is usually expected
Table 1: Melon accessions used on microsatellite and RAPD based genetic distance analysis
Germplasm Bank Number Common Name Country Type Marker Analysis
CNPH 82015 Amarelo Brazil inodorus RAPD/microsatelliteCNPH 83038 Valência USA inodorus RAPD/microsatelliteCNPH 83040 Napoletano - inodorus RAPD/microsatelliteCNPH 83068 Progênie Valência Brazil inodorus RAPD/microsatelliteCNPH 83077 USDA 164320 Índia intermediate * RAPD/microsatelliteCNPH 83079 USDA 255478 Korea intermediate RAPD/microsatelliteCNPH 83101 Golden Charm USA intermediate RAPD/microsatelliteCNPH 83102 Farmies Yellow USA cantaloupensis RAPD/microsatelliteCNPH 84172 Valenciano Spain inodorus RAPD/microsatelliteCNPH 84201 B633.3 France cantaloupensis RAPD/microsatelliteCNPH 87306 Amarelo Brazil inodorus RAPD/microsatelliteCNPH 87338 Eldorado 300 Brazil inodorus RAPD/microsatelliteCNPH 88374 Valenciano Verde Redondo Brazil inodorus RAPD/microsatelliteCNPH 88375 Valenciano Verde Elíptico Brazil inodorus RAPD/microsatelliteCNPH 88410 Progênie Valência Brazil inodorus RAPD/microsatelliteCNPH 88427 Elizabeth 239 Japan intermediate RAPD/microsatelliteCNPH 89538 CNPH 89538 Brazil unknown** RAPD/microsatelliteCNPH 88498 Hoon Portugal unknown RAPD/microsatelliteCNPH 89537 Panaú Amarelo Brazil inodorus RAPD/microsatelliteCNPH 95839 Amarelo Brazil inodorus RAPD/microsatelliteCNPH 98848 Amarelo Polpa Branca USA inodorus RAPD/microsatelliteCNPH 00880 AF 682 Brazil inodorus RAPD/microsatelliteCNPH 00881 AF 646 Brazil inodorus RAPD/microsatelliteCNPH 00882 Rochedo Brazil inodorus RAPD/microsatelliteCNPH 00883 Gold Mine Brazil inodorus RAPD/microsatelliteCNPH 00884 Hi-Mark Brazil cantaloupensis RAPD/microsatelliteCNPH 00885 Mission Brazil cantaloupensis RAPD/microsatelliteCNPH 00886 Yellow King Brazil inodorus RAPD/microsatelliteCNPH 00887 Yellow Queen Brazil inodorus RAPD/microsatelliteCNPH 00883 Gold Pride Brazil inodorus RAPD/microsatelliteCNPH 03971 Galileo Brazil cantaloupensis microsatelliteCNPH 00042 Conomon USA conomon microsatelliteCNPH 82016 Hales Best Jumbo - intermediate microsatelliteCNPH 85205 Early Down Rockmelon Australia cantaloupensis microsatelliteCNPH 93688 CNPH 93-688 - unknown microsatelliteCNPH 00853 Gália F1 Brazil cantaloupensis microsatelliteCNPH 83062 WMR-29 USA intermediate microsatelliteCNPH 00869 Elizabeth PMR Japan intermediate microsatelliteCNPH 82008 W6 USA cantaloupensis microsatelliteCNPH 85207 Rockmelon Gulf Coast H91/L1 Australia intermediate microsatellite
* accession presenting characteristics of both types, inodorus and cantaloupensis ** morphological information not available
Page 7 of 14(page number not for citation purposes)
BMC Plant Biology 2004, 4 http://www.biomedcentral.com/1471-2229/4/9
RAPD amplification products submitted to agarose gel electrophoresis and visualized by ethidium bromide staining under UV lightFigure 3RAPD amplification products submitted to agarose gel electrophoresis and visualized by ethidium bromide staining under UV light. From left to right: Lanes 1 and 26: ladder 1 Kb; Lanes 2 to 27: melon accessions in the order of appearance on Table 1. Arrows indicate polymorphic markers used for analysis.
Dendrogram resulting from microsatellite based genetic distance analysis of 30 accessions of melon (C. melo), estimated by shared allele distance in pairwise comparisonsFigure 4Dendrogram resulting from microsatellite based genetic distance analysis of 30 accessions of melon (C. melo), estimated by shared allele distance in pairwise comparisons. Cluster analysis used the neighbor joining method.
1 2 3 4 5 6 7 8 9 10 11 12 13 14 15 16 17 18 19 20 21 22 23 24 25 26
CNPH 82015
CNPH 87306
CNPH 84172
CNPH 87338
CNPH 88374
CNPH 88375
CNPH 88410
CNPH 89538
CNPH 83038
CNPH 83040
CNPH 83068
CNPH 89537
CNPH 95839
CNPH 98848
CNPH 00880
CNPH 00883
CNPH 00882
CNPH 00887
CNPH 00888
CNPH 00886
CNPH 88498
CNPH 00881
CNPH 00884
CNPH 00885
CNPH 83077
CNPH 83102
CNPH 88427
CNPH 83079
CNPH 83101
CNPH 84201
0.00 0.25 0.50 0.75 1.00
1
2
Page 8 of 14(page number not for citation purposes)
BMC Plant Biology 2004, 4 http://www.biomedcentral.com/1471-2229/4/9
in intraspecific crossings [40], and especially in interspe-cific crosses [39]. Possible causes of zygotic distortioninclude the deleterious effect of reproduction relatedgenes that map in the genome region where the markerlocus is located. Since in the three loci the genotype inexcess was always heterozygote, hybrid vigor could poten-tially explain the observed zygotic distortion, such asobserved in alfalfa [41] and potato [42].
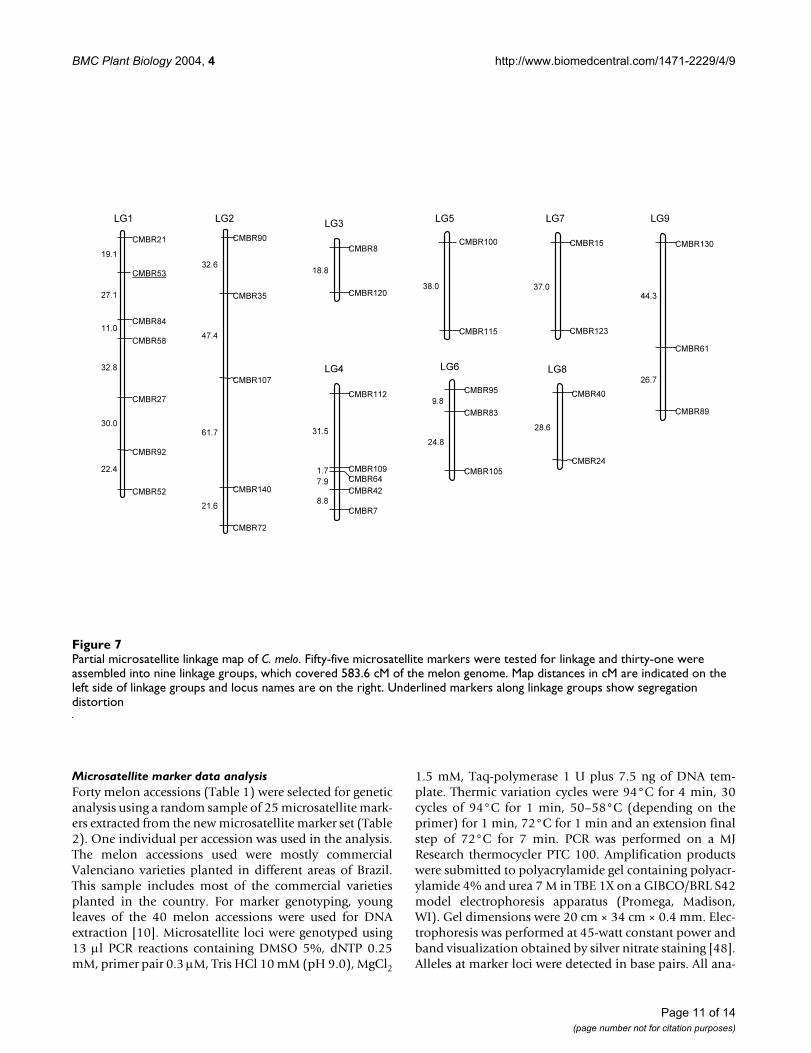
Linkage analysis of microsatellite marker loci of C. melodetected linkage associations (Figure 7). Thirty-one mic-rosatellite markers covering 583.6 cM were assembledinto nine linkage groups. Although preliminary, genomecoverage represents approximately 50% of the expectedgenome size (cM) of melon [23]. Twenty-four microsatel-lite markers did not show significant linkage disequilib-rium with any of the markers tested. The data indicatesthat the microsatellite markers analyzed are distributedthroughout the genome of C. melo. New markers from theTsp-AG/TC genomic library are currently being tested inthe segregating population aiming for the construction ofa saturated genetic map based on microsatellite markers.
ConclusionsGenomic library microsatellite enrichment is an efficientprocedure for marker development in melon. One hun-dred and forty-four new markers were developed fromTsp-AG/TC genomic library. This is the first reportedattempt of successfully using enriched libraries for micro-satellite marker development in the species. A sample ofthe microsatellite markers tested proved efficient forgenetic analysis of melon, including genetic distance esti-mates and potential identity tests. Linkage analysis indi-cates that the markers developed are dispersed throughoutthe melon genome and are suitable for mapping pur-poses. The level of polymorphism observed at marker lociand genome coverage observed so far suggest that the mic-rosatellite markers developed should be very useful forgenetic analysis of melon.
MethodsDevelopment of genomic library enriched for hypervariable sequencesGenomic DNA was extracted from fresh leaves of seed-lings of the melon commercial hybrid AF 686 (SakataSeed Company, Brazil) using the CTAB method [43] with
Dendrogram resulting from RAPD based genetic distance analysis of 30 accessions of melon (C. melo), estimated with the DICE genetic similarity coefficientFigure 5Dendrogram resulting from RAPD based genetic distance analysis of 30 accessions of melon (C. melo), estimated with the DICE genetic similarity coefficient. Cluster analysis was performed using the UPGMA algorithm.
0.00 0.25 0.50 0.75 1.00
CNPH 82015
CNPH 83040
CNPH 83038
CNPH 88375
CNPH 88410
CNPH 88374
CNPH 84172
CNPH 00887
CNPH 87306
CNPH 87338
CNPH 00886
CNPH 00880
CNPH 95839
CNPH 98848
CNPH 00882
CNPH 00883
CNPH 00883
CNPH 00881
CNPH 83068
CNPH 89538
CNPH 89537
CNPH 00884
CNPH 00885
CNPH 83102
CNPH 84201
CNPH 88427
CNPH 88498CNPH83077
CNPH83079
CNPH 83101
1
2
Page 9 of 14(page number not for citation purposes)
BMC Plant Biology 2004, 4 http://www.biomedcentral.com/1471-2229/4/9
some modifications [10]. Enzymatic DNA digestions withTsp 509 I, Sau III and Mse I were performed in order toselect the enzyme yielding the greatest amount of frag-ments in the range of 300 to 800 bp. The Tsp 509 I andMse I fragment profiles were selected and the digestionproducts separated in 3.5% agarose gel [44,45]. Fragmentsbetween 300 and 800 bp were recovered in DEAE-cellu-lose NA-45 membrane [13]. These selected fragmentswere precipitated in saline solution and linked to adaptorscontaining complementary sequences to the enzymerestriction site. The enrichment of the library with micro-satellite sequences was performed through ligation offragments to biotinilated oligonucleotides. Thebiotinilated fragments were then hybrized with (AG)13probes to develop the genomic library based on Tsp 509 Iderived fragments selected with probes (AG)13. Fragmentspotentially containing microsatellite sequences wererecovered with magnetic beads [13]. Enrichment controlwas performed through PCR using primers complemen-tary to the target site of the restriction enzyme. SouthernBlot confirmed preferential recovery of fragments contain-ing microsatellite regions. Fragments containing microsat-ellite sequences were cloned on pGEMT™ plasmids andused to transform XL1Blue E. coli cells (Promega, Madi-son, WI) through thermic shock [45], resulting in melongenomic library Tsp-AG/TC.
Selection and identification of positive clonesClones of the genomic library containing microsatelliteinsertions were identified by Southern hybridization [46].Positive clones were selected by orientation, size and posi-tion inside the plasmid insert using the anchored-PCRapproach [13]. Plasmid DNA of selected clones wasextracted and prepared for sequencing.
DNA sequencing and primer designSequencing reactions were performed with "Dye-Termi-nator" and "Big-Dye" kits (Applied Biosystems, FosterCity, CA) using an Applied Biosystems 377 DNAsequencer. Specific primer pairs, unique and complemen-tary to microsatellite flanking regions, were designedusing the software PRIMER v.3.0 [46]. Primer designingconsidered restrictive parameters for primer auto-anneal-ing, G+C content of ~50% and annealing temperature forPCR reactions in the 55–60°C range.
Characterization and transferability of newly developed microsatellite markersPrimer pairs were synthesized and tested on three melonaccessions (CNPH 82015, CNPH 84201 and CNPH83102). The expected size of fragments resulting fromamplification was observed on 3.5% agarose gel and,whenever necessary, adjustments on annealing tempera-ture were performed. Sixty-seven out of 144 primer pairswere immediately selected for genetic tests since their PCRconditions did not require further adjustments. The sixty-seven markers were tested on a panel of 11 varieties of sixcucurbit species (C. melo, Citrullus lanatus, Cucurbitamaxima, C. moschata, C. pepo and Cucumis sativus), whichincluded five accessions of melon. Sixty-five markersdetected DNA polymorphism between the five melonaccessions analyzed (Figure 1). The experiment was alsorepeated in polyacrylamide gel electrophoresis (PAGE)followed by silver nitrate staining, confirming the agaroseresults. PCR and electrophoresis conditions were the sameas described below.
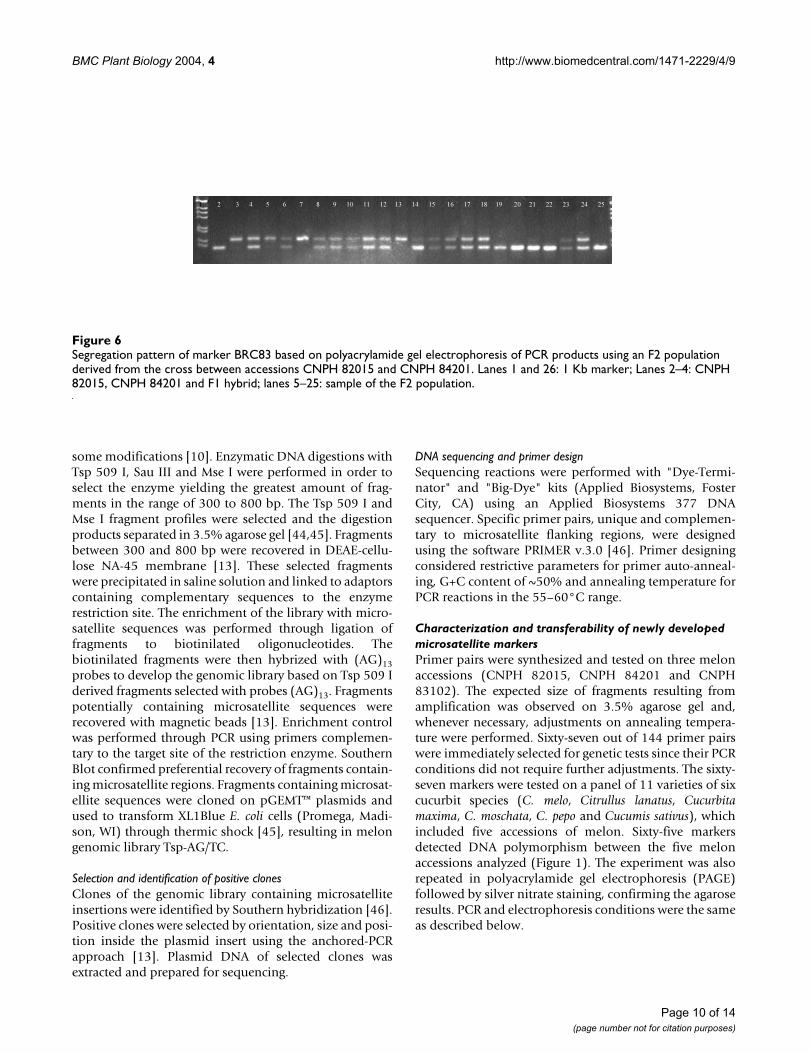
Segregation pattern of marker BRC83 based on polyacrylamide gel electrophoresis of PCR products using an F2 population derived from the cross between accessions CNPH 82015 and CNPH 84201Figure 6Segregation pattern of marker BRC83 based on polyacrylamide gel electrophoresis of PCR products using an F2 population derived from the cross between accessions CNPH 82015 and CNPH 84201. Lanes 1 and 26: 1 Kb marker; Lanes 2–4: CNPH 82015, CNPH 84201 and F1 hybrid; lanes 5–25: sample of the F2 population.
1 2 3 4 5 6 7 8 9 10 11 12 13 14 15 16 17 18 19 20 21 22 23 24 25 2
Page 10 of 14(page number not for citation purposes)
BMC Plant Biology 2004, 4 http://www.biomedcentral.com/1471-2229/4/9
Microsatellite marker data analysisForty melon accessions (Table 1) were selected for geneticanalysis using a random sample of 25 microsatellite mark-ers extracted from the new microsatellite marker set (Table2). One individual per accession was used in the analysis.The melon accessions used were mostly commercialValenciano varieties planted in different areas of Brazil.This sample includes most of the commercial varietiesplanted in the country. For marker genotyping, youngleaves of the 40 melon accessions were used for DNAextraction [10]. Microsatellite loci were genotyped using13 µl PCR reactions containing DMSO 5%, dNTP 0.25mM, primer pair 0.3 µM, Tris HCl 10 mM (pH 9.0), MgCl2
1.5 mM, Taq-polymerase 1 U plus 7.5 ng of DNA tem-plate. Thermic variation cycles were 94°C for 4 min, 30cycles of 94°C for 1 min, 50–58°C (depending on theprimer) for 1 min, 72°C for 1 min and an extension finalstep of 72°C for 7 min. PCR was performed on a MJResearch thermocycler PTC 100. Amplification productswere submitted to polyacrylamide gel containing polyacr-ylamide 4% and urea 7 M in TBE 1X on a GIBCO/BRL S42model electrophoresis apparatus (Promega, Madison,WI). Gel dimensions were 20 cm × 34 cm × 0.4 mm. Elec-trophoresis was performed at 45-watt constant power andband visualization obtained by silver nitrate staining [48].Alleles at marker loci were detected in base pairs. All ana-
Partial microsatellite linkage map of C. meloFigure 7Partial microsatellite linkage map of C. melo. Fifty-five microsatellite markers were tested for linkage and thirty-one were assembled into nine linkage groups, which covered 583.6 cM of the melon genome. Map distances in cM are indicated on the left side of linkage groups and locus names are on the right. Underlined markers along linkage groups show segregation distortion
LG2
CMBR95
9.8
CMBR83
24.8
CMBR105
LG6
LG5
CMBR8
18.8
CMBR120
LG3
CMBR130
44.3
26.7
LG9
CMBR40
28.6
CMBR24
LG8
CMBR15
37.0
CMBR123
LG7
LG4
CMBR112
31.5
CMBR1091.7
CMBR647.9
CMBR42
8.8
CMBR7
CMBR21
19.1
CMBR53
27.1
CMBR8411.0
CMBR58
32.8
CMBR27
30.0
CMBR92
22.4
CMBR52
LG1
CMBR90
32.6
CMBR35
47.4
CMBR107
61.7
CMBR140
21.6
CMBR72
CMBR100
38.0
CMBR115
CMBR61
CMBR89
Page 11 of 14(page number not for citation purposes)
BMC Plant Biology 2004, 4 http://www.biomedcentral.com/1471-2229/4/9
lyzed microsatellite loci contained dinucleotide repetitivesequences. In addition to the ladder of known fragmentsizes used to size alleles, the most frequent allele of a locuswas used as a reference to adjust fragment size of the otheralleles in the same locus.
Allele frequencies across loci were estimated using thesoftware GDA-Genetic Data Analysis [49]. An allelefrequency database for the 25 microsatellite loci geno-typed on 40 varieties of melon was then constructed.Observed (Ho) and expected (He) heterozygosities as wellas genetic parameters such as the size range and numberof alleles per locus were estimated for each microsatellitelocus (additional file 1) using the GDA software [49]. Thepercentage of observed heterozygosity was calculated asthe ratio between heterozygote individual genotypes andthe total number of analyzed genotypes for each locus.Expected heterozygosity was estimated based on the prob-ability that two individuals taken at random from a givensample would have different alleles at a locus [50]. Thearithmetic mean of the expected heterozygosity of multi-ple loci is defined as Hav = Hn / n where n is the totalnumber of loci. The Polymorphism Information Content(PIC) was also estimated as the probability that an indi-vidual is informative with respect to the segregation of itsinherited alleles [51].
A set of 10 new microsatellite loci (CMBR7, CMBR22,CMBR24, CMBR25, CMBR27, CMBR33, CMBR39,CMBR43, CMBR73, CMBR89) was selected to estimatethe potential of these markers for line identification andvariety protection in melon. The probability of identicalgenotypes [52], defined as PI = ∑ pi4 + ∑(2pipj)2 was esti-mated for the selected loci individually, and later, for all10 loci as a whole.
Genetic distance analysis with microsatellite markersGenetic distance estimates between the 40 melon acces-sions were performed with microsatellite and RAPDmarkers. One individual per accession was used on geno-typing experiments. Microsatellite genotyping followedthe procedures described above. RAPD genotyping wasbased on data from an initial screening of eighty oligonu-cleotide primers (Operon Technologies, USA) tested onthree melon accessions (CNPH 82015, CNPH 83038,CNPH 83040). Thirty-five oligonucleotide primers wereselected. Primer sequences are available upon request.DNA amplifications were performed by PCR in 13 µl reac-tion volume containing 1.04 µg/µl purified BSA, 0.20 mMeach dNTP, 0.5 µM primer, 10 mM Tris HCl (pH 9,0), 1.5mM MgCl2, 50 mM KCl, 1 U Taq-polymerase and 7.5 ngof extracted melon DNA [10]. Amplification conditionswere 40 cycles of 94°C for 1 min, 35°C for 1 min, 35°Cfor 1 min, 72°C for 2 min and an extension final step of72°C for 5 min. Amplification products were separated
on horizontal 1.5% agarose gel stained with ethidiumbromide. Electrophoresis was performed at 100 volts con-stant power during 4–5 hours [10].
Genetic distances among melon accessions based on mic-rosatellite marker polymorphism were estimated byshared allele distance in pairwise comparisons. The esti-mates are based on the sum of the proportion of commonalleles between two melon accessions examined acrossloci (PS) divided by twice the number of tested loci[53,54]. Genetic distances were obtained by the parameter[-ln (PS)] using the Genetic Distance Calculator [55]. Thediagonal matrix was then submitted to cluster analysisusing the neighbor joining method and a genetic distancedendrogram built using the software NTSYS 2.02 g [56].RAPD marker polymorphism was used to calculate pair-wise distances among melon accessions with the DICEgenetic similarity coefficient [57]. Cluster analysis wasperformed using the UPGMA method (NTSYS software)[56,58]. The correspondence between distance and simi-larity matrices based on microsatellite and RAPD markerswas evaluated through the correlation coefficient esti-mated by the MXCOMP procedure of NTSYS software[56]. The program plots one matrix against the other, ele-ment by element, ignoring diagonal values and estimatingthe product moment correlation (r) between two matri-ces. Statistical significance was declared based on a t-test,comparing the observed Z value with its permutationaldistribution [56,59].
Linkage mapping analysisAn F2 progeny of 93 individuals derived from a crossbetween the lines CNPH 82015 and CNPH 84201 wasused for linkage analysis of 55 microsatellite markersreported here (additional file 1). Deviations from theexpected Mendelian segregation ratios were calculatedbased on chi-square contingency tables. Marker loci even-tually showing segregation distortion were further ana-lyzed for the nature of distortion, if gametic or zygotic,based on two additional chi-square conditional [39]: (a)one testing the hypothesis p=q by the formula Chi-square(GL = 1) = [(2np - n)2 + (2nq - n)2]/n [where p (A) = (AA+ AB/2)/n and q (B) = (BB + AB/2)/n and n = total numberof individuals] and (b) a second testing if genotypes aredistributed as expected frequencies by Hardy-Weinbergequilibrium: Chi-square = + [(AB - 2npq)2]/ 2npq + [(BB- nq2)2]/ nq2. The relationships of these two tests allowsfor the classification of distortion as gametic or zygotic[39]. Linkage analysis was performed using the programMapmaker v 2.0 [60]. Only markers with 81 or morescored F2 individuals were considered for analysis. A min-imum LOD score of 4.0 and a maximum recombinationfrequency of 0.35 were used to group the microsatellitemarkers into potential linkage groups. Three-point andmultipoint analyses were performed to find the most
Page 12 of 14(page number not for citation purposes)
BMC Plant Biology 2004, 4 http://www.biomedcentral.com/1471-2229/4/9
probable locus order within eventual linkage groupsobserved. The final locus order of each linkage group wastested by removing one locus at a time and checking forinconsistencies. Double crossover events were examined,and the original scores re-checked before a final linkagegroup order was assigned. Recombination frequencieswere corrected based on Haldane's map distance functionas executed by Mapmaker.
Authors' contributionsPSR developed the microsatellite markers, the segregationpopulation, carried out microsatellite analysis and draftedthe manuscript. TCLL and RLT carried out the RAPD studyand GSCB participated in RAPD data analysis and devel-opment of microsatellite markers. JAB helped on interpre-tation of RAPD and SSR diversity analysis data. MEFconceived the study, participated in its design and coordi-nation, checked the data and reviewed the manuscript. Allauthors read and approved the final manuscript.
Additional material
AcknowledgementsThis research is part of PhD thesis of Patricia Silva Ritschel and was partially supported by Avança Brasil and Prodetab (number 030-02/01) projects.
References1. Robinson RW, Decker-Walters DS: Cucurbits New York: CAB
International; 1997. 2. Whitaker TW, Davis GN: Cucurbits: botany, cultivation and utilization
New York: Interscience Publications; 1962. 3. Munger HM, Robinson RW: Nomenclature of Cucumis melo L.
Cucurbit Genetics Cooperation Reports 1991, 14:43-44.4. Pitrat M, Hanelt K, Hammer K: Some comments on intraspecific
classification of cultivars of melon. Acta Horticulturae 2000,510:29-36.
5. Pedrosa JF: Fitotecnia da cultura do melão Petrolina-PE: Embrapa-Semi-Árido, Brazil; 1999.
6. Araújo JLP: Mercado de melão na Europa. [http://www.cpatsa.embrapa.Br/artigos/melaonaeuropa.html].
7. PROFRUTAS: Ações Básicas para o Desenvolvimento da Agricultura Irri-gada no Rio Grande do Norte Mossoró-RN, Brazil; 1996.
8. Dias R, de CS: A Cadeia Produtiva do Melão na Região Nordeste Petro-lina-PE: Embrapa Semi-Árido, Brazil; 1997.
9. Gomes RS: Unexpected Growth and Unintended Spillover: The Making ofthe Melon Industry in Mossoró-Assú, Northeast Brazil Massachusetts:Massachusetts Institute of Technology, USA; 1999.
10. Ferreira ME, Grattapaglia D: Introdução ao uso de marcadores molecu-lares em análise genética Brasília-DF: Embrapa Recursos Genéticos eBiotecnologia, Brazil; 1998.
11. Litt M, Luty JA: A hypervariable microsatellite revealed by invitro amplification of a dinucleotide repeat within the cardiacmuscle actin gene. Am J Hum Genet 1989, 44:397-401.
12. Weber JL, May P: Abundant class of human DNA polymor-phisms which can be typed using the polymerase chainreaction. Am J Hum Gene 1989, 44:388-396.
13. Rafalski JA, Vogel JM, Morgante M, Powell W, Andre C, Tingey SV:Generating and using DNA markers in plants. In Nonmamma-lian Genomic Analysis: A practical guide 1st edition. Edited by: New York:Academic Press Inc. Birren B, Lai E; 1996:73-134.
14. Kandpal RP, Kandpal G, Weissman SM: Construction of librariesenriched for sequence repeats and jumping clones andhybridization selection for region-specific markers. Proc NatlAcad Sci USA 1994, 91:88-92.
15. Katzir N, Danin-Poleg Y, Tzuri G, Karchi Z, Lavi U, Cregan PB:Length polymorphism and homologies of microsatellites inseveral Cucurbitaceae species. Theor Appl Genet 1996,93:1282-1290.
16. Danin-Poleg Y, Reis N, Tzuri G, Katzir N: Development and char-acterization of microsatellite markers in Cucumis. Theor ApplGenet 2001, 102:61-72.
17. Neuhausen SL: Evaluation of restriction fragment length poly-morphism in Cucumis melo. Theor Appl Genet 1992, 83:379-384.
18. Garcia E, Jamilena M, Alvarez JI., Arnedo T, Oliver JL, Lozano R:Genetic relationships among melon breeding lines revealedby DNA markers and agronomic traits. Theor Appl Genet 1998,96:878-885.
19. Staub JE, Danin-Poleg Y, Fazio G, Horejsi T, Reis N, Katzir N: Com-parative analysis of cultivated melon groups (Cucumis meloL.) using random amplified polymorphic DNA and simplesequence repeat markers. Euphytica 2000, 115:225-241.
20. Staub JE, Meglic V, McCreight JD: Inheritance and linkage rela-tionships of melon (Cucumis melo L.) isoenzymes. J Am Soc Hor-tic Sci 1998, 123:264-272.
21. Baudracco-Arnas S, Pitrat M: A genetic map of melon (Cucumismelo L.) with RFLP, RAPD, isozyme, disease resistance andmorphological markers. Theor Appl Genet 1996, 93:57-64.
22. Wang YH, Thomas CE, Dean RA: A genetic map of melon (Cucu-mis melo L) based on amplified fragment length polymor-phism (AFLP) markers. Theor Appl Genet 1997, 95:791-797.
23. Oliver M, Garcia-Mas J, Cardús M, Pueyo N, López-Sesé AI, ArroyoM, Gómez-Paniagua H, Arús P, de Vicente MC: Construction of areference linkage map of melon. Genome 2001, 44:836-845.
24. Périn C, Hagen LS, Giovinazzo N, Besombess D, Dogimont C, PitratM: Genetic control of fruit shape acts prior to anthesis inmelon (Cucumis melo L). Molecular Genetics and Genomics 2002,266:933-941.
25. Danin-Poleg Y, Reis N, Baudracco-Arnas S, Pitrat M, Staub JE, OliverM, Arus P, deVicente CM, Katzir N: Simple Sequence repeats inCucumis mapping and map merging. Genome 2000, 43:963-974.
26. Danin-Poleg Y, Tadmor Y, Tzuri G, Reis N, Hirschberg J, Katzir N:Construction of a genetic map of melon with molecularmarkers and horticultural traits, and localization of genesassociated with ZYMV resistance. Euphytica 2002, 125:373-384.
27. Périn C, Hagen LS, De Conto V, Katzir N, Danin-Poleg Y, Portnoy V,Baudracco-Arnas S, Chadoeuf J, Dogimont C, Pitrat M: A referencemap of Cucumis melo based on two recombinant inbred linepopulations. Theor Appl Genet 2002, 104:1017-1034.
28. Silberstein L, Kovalski I, Brotman Y, Perin C, Dogimont C, Pitrat M,Klingler J, Thompson G, Portnoy V, Katzir N, Perl-Treves R: Linkagemap of Cucumis melo including phenotypic traits andsequence-characterized genes. Genome 2003, 46:761-73.
29. Peakall R, Gilmore S, Keys W, Morgante M, Rafalski A: Cross-spe-cies amplification of soybean (Glycine max) simple sequencerepeats (SSRs) within the genus and other legume genera:implications for the transferability of SSRs. Plants Mol Biol Evol1998, 15:1275-87.
30. National Center for Biotechnology Information [http://www.ncbi.nlm.nih.gov]
31. Tatlioglu TP: Cucumber. In Genetic Improvement of Vegetable Crops1st edition. Edited by: Kaloo G, Bergh BO. New York: PergamonPress; 1992:197-234.
32. McCreight JD, Nerson H, Grumet R: Melon. In Genetic Improvementof Vegetable Crops 1st edition. Edited by: Kaloo G, Bergh BO. NewYork: Pergamon Press; 1992:267-294.
Additional File 1Repeat number and type, primer sequence, annealing temperature and expected fragment size of 144 new melon microsatellite markers. This table describes the repeat number and type, primer sequence, annealing temperature and expected fragment size of 144 new microsatellite markers developed from a Tsp AG/TC enriched genomic library.Click here for file[http://www.biomedcentral.com/content/supplementary/1471-2229-4-9-S1.xls]
Page 13 of 14(page number not for citation purposes)
http://www.ncbi.nlm.nih.gov/entrez/query.fcgi?cmd=Retrieve&db=PubMed&dopt=Abstract&list_uids=2563634
http://www.ncbi.nlm.nih.gov/entrez/query.fcgi?cmd=Retrieve&db=PubMed&dopt=Abstract&list_uids=2563634
http://www.ncbi.nlm.nih.gov/entrez/query.fcgi?cmd=Retrieve&db=PubMed&dopt=Abstract&list_uids=8278412
http://www.ncbi.nlm.nih.gov/entrez/query.fcgi?cmd=Retrieve&db=PubMed&dopt=Abstract&list_uids=8278412
BMC Plant Biology 2004, 4 http://www.biomedcentral.com/1471-2229/4/9
Publish with BioMed Central and every scientist can read your work free of charge
"BioMed Central will be the most significant development for disseminating the results of biomedical research in our lifetime."
Sir Paul Nurse, Cancer Research UK
Your research papers will be:
available free of charge to the entire biomedical community
peer reviewed and published immediately upon acceptance
cited in PubMed and archived on PubMed Central
yours — you keep the copyright
Submit your manuscript here:http://www.biomedcentral.com/info/publishing_adv.asp
BioMedcentral
33. Fehét T: Watermelon. In Genetic Improvement of Vegetable Crops 1stedition. Edited by: Kaloo G, Bergh BO. New York: Pergamon Press;1992:295-314.
34. Allard RW: Princípios do melhoramento genético de plantas.Rio de Janeiro-RJ: USAID 1971.
35. Zheng XY, Wolff DW: Ethylene production, shelf-life and evi-dence of RFLP polymorphisms linked to ethylene genes inmelon (Cucumis melo L.). Theor Appl Genet 2000, 101:613-624.
36. Powell W, Morgante M, André C, Hanafey M, Vogel J, Tingey S, Rafal-ski A: The comparison of RFLP, RAPD, AFLP and SSR (mic-rosatellite) markers for germplasm analysis. Molecular Breeding1996, 2:225-228.
37. Sun GL, Salomon B, von Bothmer R: Analysis of tetraploid Elymusspecies using wheat microsatellite markers and RAPDmarkers. Genome 1997, 40:806-841.
38. Guadagnuolo R, Bianchi DS, Felber F: Specific genetic markers forwheat, spelt, and tour wild relatives: comparisons of iso-zymes, RAPDs, and wheat microsatellites. Genome 2001,44:610-621.
39. Lorieux M, Perrier X, Goffinet B, Lanaud C, González de León D:Maximum-likelihood models for mapping genetic markersshowing segregation distortion. 2. F2 populations. Theor ApplGenet 1995, 90:81-89.
40. Jenczewski E, Gherardi M, Bonnin I, Prosperi JM, Olivieri I, Huguet T:Insight on segregation distortions in two intraspecíficcrosses between annual species of Medicago (Leguminosae).Theor Appl Genet 1997, 94:682-691.
41. Diwan N, Bouton JH, Kochert G, Cregan PB: Mapping of simplesequence repeat (SSR) DNA markers in diploid and tetra-ploid alfafa. Theor Appl Genet 2000, 101:165-172.
42. Bonierbale MW, Plaisted RL, Tanksley SD: RFLP maps based oncommon set of clones reveal modes of chromosomal evolu-tions in potato and tomato. Genetics 1988, 120:1095-1103.
43. Murray M, Thompson WF: Rapid isolation of high-molecularweight plant DNA. Nucleic Acid Research 1980, 8:4321-4325.
44. Ritschel PS, Buso GSC, Buso JA, Ferreira ME: Development ofhypervariable molecular markers for the melon genome[abstract]. Congresso Nacional de Genética 2001:47.
45. Ritschel PS, Buso GSC, Buso JA, Ferreira ME: Towards the devel-opment of microssatellite marker based genetic map ofmelon (Cucumis melo) [abstract]. International Conference on theStatus of Animal and microbe genomes 2002, 10:129.
46. Sambrook J, Fritsch EF, Maniatis T: Molecular Cloning: a Labora-tory Manual. New York: Cold spring Habor 1989.
47. PRIMER v.3.0 [http://http\\www.genome.wi.mit.edu]48. Bassam BJ, Caetano-Anollés G, Gressholf PM: Fast and sensitive
silver staining in polyacrylamide gels. Analytical biochemistry1991, 196:80-83.
49. Lewis PO, Zaykin D: Genetic Data Analysis: Computer pro-gram for the analysis of allelic data. Version 1.0 (d16c). [http://lewis.eeb.uconn.edu/lewishome/software.htm].
50. Nei M: Molecular Evolutionary Genetics. New York: ColumbiaUniv Press 1987.
51. Botstein D, White RL, Skolnick M, Davis RW: Construction of agenetic linkage map in man using restriction fragmentpolymorphisms. Am J Hum Genet 1980, 32:314-331.
52. Sefc KM, Regner F, Turetschek E, Glössl J, Steinkellner H: Identifica-tion of microsatellite sequences in Vitis riparia and theirapplicability for genotyping of different Vitis species. Genome1999, 42:367-373.
53. Bowcock AM, Ruiz-Linhares A, Tomfohrde J, Minch E, Kidd JR, Cav-alli-Sforza LL: High resolution of human evolutionary treeswith polymorphic microsatellites. Nature 1994, 368:455-457.
54. Goldstein DB, Ruiz Linares A, Cavalli-Sforza LL, Feldman MW:Genetic absolute dating based on microsatellite and the ori-gin of modern humans. Proc Natl Acad Sci USA 1995, 92:6723-6727.
55. Genetic Distance Calculator [http://www2.biology.ualberta.ca/jbrzusto/sharedst.php]
56. Rohlf FJ: NTSYS-PC: numerical taxonomy and multivariateanalysis system – version 1.7. New York: Exeter Software 1992.
57. Dice LR: Measures of the amount of ecologic associationbetween species. Ecology 1945, 26:297-302.
58. Sneath PHA, Sokal RP: Numerical taxonomy. San Francisco: WHFreeman and Company 1973.
59. Manly FJ: Multivariate Statistical Methods. London : Chapman &Hall 1994.
60. Lander EP, Green P, Abrahanson J, Barlow A, Daly MJ, Lincoln SE,Newburg L: MAPMAKER: An interative computer packagefor constructing primary genetic linkage maps with experi-mental and natural populations. Genomics 1987, 1:174-181.
Page 14 of 14(page number not for citation purposes)
http://www.ncbi.nlm.nih.gov/entrez/query.fcgi?cmd=Retrieve&db=PubMed&dopt=Abstract&list_uids=1716076
http://www.ncbi.nlm.nih.gov/entrez/query.fcgi?cmd=Retrieve&db=PubMed&dopt=Abstract&list_uids=1716076
http://www.ncbi.nlm.nih.gov/entrez/query.fcgi?cmd=Retrieve&db=PubMed&dopt=Abstract&list_uids=6247908
http://www.ncbi.nlm.nih.gov/entrez/query.fcgi?cmd=Retrieve&db=PubMed&dopt=Abstract&list_uids=6247908
http://www.ncbi.nlm.nih.gov/entrez/query.fcgi?cmd=Retrieve&db=PubMed&dopt=Abstract&list_uids=6247908
http://www.ncbi.nlm.nih.gov/entrez/query.fcgi?cmd=Retrieve&db=PubMed&dopt=Abstract&list_uids=7510853
http://www.ncbi.nlm.nih.gov/entrez/query.fcgi?cmd=Retrieve&db=PubMed&dopt=Abstract&list_uids=7624310
http://www.ncbi.nlm.nih.gov/entrez/query.fcgi?cmd=Retrieve&db=PubMed&dopt=Abstract&list_uids=7624310
http://www.ncbi.nlm.nih.gov/entrez/query.fcgi?cmd=Retrieve&db=PubMed&dopt=Abstract&list_uids=7624310
http://www.ncbi.nlm.nih.gov/entrez/query.fcgi?cmd=Retrieve&db=PubMed&dopt=Abstract&list_uids=3692487
http://www.ncbi.nlm.nih.gov/entrez/query.fcgi?cmd=Retrieve&db=PubMed&dopt=Abstract&list_uids=3692487
Related Documents