Development of Lean Maturity Model for Operational Level Planning Mohammad Ali Maasouman A Thesis in the Department of Mechanical and Industrial Engineering Presented in Partial Fulfillment of the Requirements for the Degree of Master of Applied Science in Industrial Engineering at Concordia University Montreal, Quebec, Canada December 2014 © Mohammad Ali Maasouman, 2014

Welcome message from author
This document is posted to help you gain knowledge. Please leave a comment to let me know what you think about it! Share it to your friends and learn new things together.
Transcript
Development of Lean Maturity Model for Operational Level Planning
Mohammad Ali Maasouman
A Thesis
in
the Department
of
Mechanical and Industrial Engineering
Presented in Partial Fulfillment of the Requirements
for the Degree of Master of Applied Science in Industrial Engineering at
Concordia University
Montreal, Quebec, Canada
December 2014
© Mohammad Ali Maasouman, 2014
iii
ABSTRACT
Development of Lean Maturity Model for Operational Level Planning
Mohammad Ali Maasouman
The purpose of this thesis is to develop a visual, data-driven operational lean maturity
model (LMM). The model intends to assess the level of lean maturity and the lean effectiveness
in different axes of production cells (PCs).
Lean is a transformation journey, in which, change management and organizational
culture are critical elements of successful implementation. Diverse maturity and assessment
models have been developed to evaluate and lead the organizational transformation toward
leanness. The main goal of lean is to create more value for the customers by removing wastes.
Despite the important role of PCs in creating value, the transformation principles in the
operational level have not been considered as deserved. Moreover, the research on lean
assessments has used either inputs (tools and processes) or outputs (performance) to evaluate
leanness. However, to evaluate the effectiveness of lean practices, both groups of indicators
should be measured separately but analyzed together.
Considering the mentioned gaps, the findings of a thorough literature review on lean
principles, tools, metrics and assessment models were synthesized to develop LMM for PCs
through four stages: defining maturity levels; defining lean axes; suggesting main control items
and performance measures; and suggesting enablers. A case study is carried out for gathering
data of analysis and explanatory study of results. The qualitative and quantitative data on lean
capability and performance results of two PCs was collected through direct observation and
audit. To quantify the qualitative indicators of leanness, a scoring system is used based on the
major and minor non-conformances. Minimum of fuzzy membership value is selected to
calculate the overall performance of each lean axis. Then, the results of leanness are compared
with the performance of PCs to find the gaps between requirements of leanness and results of
their practices, and to fill that gap by focusing on the areas of strength and those needing
improvement.
Results of the case study show that the developed model can be successfully used to
measure both leanness and lean effectiveness through assessment of lean-performance. The
model can be applied by practitioners as a framework to design and develop a company-specific
LMM.

iv
ACKNOWLEDGMENT
I am extremely grateful for the support I received from my advisor, Dr. Kudret Demirli who
has been a constant source of knowledge and support throughout my research. Without his excellent
guidance on lean and fuzzy systems, the work in this form would not be possible. I am also very
thankful for the support of individuals who take part in my research during data collection, checklist
preparation, audit and discussion meetings including RPS team, workshop managers and
supervisors of two manufacturing cells of case study and Engineering Director of ABC Company. I
would also like to thank my colleagues in industrial engineering lab for their time to read my thesis
and provide me with constructive feedbacks.
This thesis is dedicated to:
My beloved wife for her support throughout my time at graduate school, I appreciate her
patience during some of the more stressful times, as well as her time to take care of my dearest
Sepanta.
My beloved parents for their never fading support and love, and my younger brother, who
takes care of my father with his health issues when I was far away from home during graduate
study.

v
Table of Contents
Development of Lean Maturity Model for Operational Level Planning ......................... iii
ABSTRACT ..................................................................................................................... iii
ACKNOWLEDGMENT.................................................................................................. iv
Table of Contents .............................................................................................................. v
LIST OF TABLES ......................................................................................................... viii
LIST OF FIGURES ......................................................................................................... ix
CHAPTER 1: INTRODUCTION ..................................................................................... 1
1.1 Introduction ......................................................................................................... 1
1.2 Statement of Research Problem .......................................................................... 2
1.3 Research Objectives ............................................................................................ 5
1.4 Research Questions ............................................................................................. 6
1.5 Research Overview ............................................................................................. 6
1.6 Definition of Terms ............................................................................................. 8
2 CHAPTER 2: LITERATURE REVIEW .................................................................. 11
2.1 The Theoretical Framework .............................................................................. 11
2.2 Review of Lean History .................................................................................... 11
2.2.1 TPS and Lean .............................................................................................. 12
2.2.2 XPS.............................................................................................................. 13
2.3 Lean in Strategy Level, Lean in Functional Level ............................................ 14
2.4 Lean Principles, Tools and Metrics ................................................................... 17
2.4.1 Lean Principles ............................................................................................ 17
2.4.2 Lean Tools ................................................................................................... 21
2.4.3 Lean - Performance Metrics ........................................................................ 25

vi
2.5 Lean Maturity and Assessment Models ............................................................ 31
2.5.1 Qualitative Assessment ............................................................................... 32
2.5.2 Quantitative Assessment ............................................................................. 38
2.6 Critical Analysis of Literature ........................................................................... 39
3 CHAPTER 3: METHODOLOGY ............................................................................ 42
3.1 Overview of Research Procedure ...................................................................... 42
3.2 Design Phase ..................................................................................................... 44
3.3 Measurement Phase ........................................................................................... 46
3.4 Analysis Phase................................................................................................... 49
3.5 Verification Phase ............................................................................................. 52
4 Chapter 4: DEVELOPMENT OF CONCEPTUAL FRAMEWORK ...................... 54
4.1 First Step: Maturity Levels ................................................................................ 54
4.1.1 Understanding (Training, Standardization, Stability) ................................. 56
4.1.2 Implementation (Effectiveness) .................................................................. 57
4.1.3 Improvement (Efficiency) ........................................................................... 58
4.1.4 Sustainability (Autonomy) .......................................................................... 58
4.1.5 Maturity Levels - Conclusion ...................................................................... 59
4.2 Second Step: Maturity Axis .............................................................................. 60
4.2.1 People .......................................................................................................... 64
4.2.2 Facilities Management ................................................................................ 67
4.2.3 Working Condition ...................................................................................... 68
4.2.4 Production Processes ................................................................................... 70
4.2.5 Quality ......................................................................................................... 71
4.2.6 Just In Time (JIT) ........................................................................................ 72
4.2.7 Leadership ................................................................................................... 73

vii
4.3 Third Step: Lean and Performance Objectives ................................................. 74
4.4 Fourth Step: Enablers ........................................................................................ 78
5 Chapter 5: DATA COLLECTION AND ANALYSIS ............................................. 81
5.1 Definition of Leanness Indicators: .................................................................... 82
5.2 Development of Checklists for Measurement of Leanness Indicators: ............. 84
5.3 Definition of Performance Indicators:............................................................... 85
5.4 Collecting the Data of Leanness and Performance ........................................... 86
5.5 Data Analysis Plan and Implementation ........................................................... 90
5.6 Overall Leanness ............................................................................................... 91
5.7 Overall Performance ......................................................................................... 98
6 Chapter 6: RESULTS AND DISCUSSION ........................................................... 108
6.1.1 Leanness Indicators vs. Performance Measures ........................................ 108
6.1.2 Application of Model ................................................................................ 115
7 Chapter 7: CONCLUSION ..................................................................................... 117
7.1 Overall Summary of Findings ......................................................................... 117
7.2 Conclusion ....................................................................................................... 117
7.3 Limitations and Delimitations ......................................................................... 118
7.4 Recommendation and Future Research ........................................................... 121
BIBLIOGRAPHY ......................................................................................................... 122
APPENDICES .............................................................................................................. 129
Appendix A: .............................................................................................................. 130
Appendix B: .............................................................................................................. 132
Appendix C: .............................................................................................................. 135
viii
LIST OF TABLES
Table 1: Four Approach of lean production ...................................................................... 16
Table 2: Lean principles.................................................................................................... 20
Table 3 : lean tools and techniques ................................................................................... 24
Table 4: lean criteria for each lean objective .................................................................... 28
Table 5 : lean metrics ........................................................................................................ 29
Table 6: Summary of lean Maturity Levels ...................................................................... 38
Table 7: Four levels of lean maturity model in production cells ...................................... 60
Table 8: Suggested performance metrics in each axis of LMM ....................................... 77
Table 9: Lean techniques-maturity level matrix ............................................................... 79
Table 10 : Leanness indicators of axis Facilities .............................................................. 83
Table 11: sample of questions used for measurement of leanness indicators ................... 85
Table 12: Coding of leanness indicators and performance measures ............................... 87
Table 13: Leanness indicators – production cell 1............................................................ 89
Table 14: Leanness indicators – production cell 2............................................................ 90
Table 15: leanness indicators of each axis ........................................................................ 92
Table 16: leanness indicators of each axis ........................................................................ 97
Table 17: Performance measures of production cells 1 and 2 .......................................... 99
Table 18: Data collection results on performance measures .......................................... 101
Table 19: Overall performance based on minimum fuzzy membership function .......... 106
Table 20: Lean-Performance Benchmarking criterion – Production cells 1 and 2 ......... 114
ix
LIST OF FIGURES
Figure 1 : Most widely methodologies of process improvement ........................................ 2
Figure 2: Porter value chain ................................................................................................ 3
Figure 3 : Toyota Production System “House” ................................................................... 4
Figure 4: Two level of lean Management ......................................................................... 15
Figure 5: Renault Production System model .................................................................... 23
Figure 6: Two generation of lean implementation ............................................................ 31
Figure 7: RPS Roadmap.................................................................................................... 33
Figure 8: lean Enterprise model developed by LAI .......................................................... 34
Figure 9: Shingo principles of operational excellence ...................................................... 37
Figure 10 : Shingo Transformational Process ................................................................... 37
Figure 11: Framework of the research approach .............................................................. 43
Figure 12: Gradual development of new culture .............................................................. 56
Figure 13: IPO Model ....................................................................................................... 62
Figure 14 : Inputs of a typical manufacturing process ...................................................... 63
Figure 15 : lean Maturity model - Axes ............................................................................ 64
Figure 16: Performance indicators in LMM ..................................................................... 76
Figure 17: Progression of lean in each level ..................................................................... 93
Figure 18: leanness results – Production Cell 1 ................................................................ 94
Figure 19: leanness results – Production Cell 2 ................................................................ 94
Figure 20: Fuzzy membership function of P11, P23, P31, P32, P51, and P52 ............ 103
Figure 21: Fuzzy membership function of P21, P22, P41, P42, P53, and P62 ............. 105
Figure 22: Overall performance ...................................................................................... 107
Figure 23: leanness and performance assessment – Production cell 1 ........................... 108
Figure 24: leanness and performance assessment – Production cell 2 ........................... 109
Figure 25: Level of target achievement – Production Cell 1 .......................................... 111
Figure 26: Level of target achievement – Production Cell 2 .......................................... 112
Figure 27: lean – Performance Benchmarking Criterion – Production Cells 1 and 2 .... 114
Figure 28: Improvement through lean practice ............................................................... 118

x
LIST OF ABBRIVIATIONS
AHP Analytic hierarchy process
EDI Electronic data interchange
FMEA Failure Mode and Effects Analysis
FIFO First In, First Out
JIT Just In Time
KPI Key Performance Indicator
LMM Lean Maturity Model
MTBF Mean time between failures
MTTR Mean Time To Repair
OEE Overall equipment effectiveness
PDCA Plan, Do, Check, Act
TPS Toyota Production System
TQM Total Quality Management
TPM Total Productive Maintenance
VA Value added
VSM Value stream mapping
WIP Work in process
1
CHAPTER 1: INTRODUCTION
1.1 Introduction
Over the last three decades, there has been a growing focus in both manufacturing
and service organizations on implementation and development of improvement
techniques to reduce costs and increase benefits. Cost reduction strategies have become
one of the main objectives of many companies in order to remain in the global
competition market and to increase profits. As a result of this approach, several
management techniques such as Six Sigma, Total Quality Management (TQM), Total
Productive Maintenance (TPM), lean Manufacturing and Business Process Management
have been created and have become more popular in the recent years. Most of
organizations have applied a combination of different management tools, methods and
procedures in order to reduce non-value added activities, to eliminate variations in the
processes, to solve their problems and to improve the quality of their products and
services.
Lean manufacturing based on the Toyota Production System (TPS) is a set of
principles, tools and Methods that form a management philosophy in the organization in
which value is defined from the customer’s perspective as anything that customer is
willing to pay for (Womack, et al., 1991). The main focus of lean, according to this
paradigm is to provide a systematic way of identification and elimination of waste, to
reduce cost, and to empower employees (Ohno, 1988).
Many organizations have improved their market leadership, profitability and
productivity through application of lean principles and techniques. Based on a survey
conducted by Process Excellence Network (PEX) on over 874 process professionals in
2013 (see Figure 1), lean, Six Sigma and Business Process Management remain the most
widely methodologies of process improvement (Davis, 2013). Lean manufacturing is now
a part of management philosophy in different sectors from automotive and aerospace
industries to IT and Healthcare services.

2
Figure 1 : Most widely methodologies of process improvement (Davis, 2013)
1.2 Statement of Research Problem
Lean is a management philosophy and a transformation journey, in which, time,
evolution and organizational culture are critical elements of implementation. Diverse
maturity models and assessment tools have been developed to guide lean practitioners
through the process of lean evolution (LAI-MIT, 2001). Most of the maturity models
provide a general direction and a company-wide roadmap to improve organizational
performance in the level of enterprise. Developing a roadmap in the enterprise level,
linked to organization’s objectives and strategies, is crucial to transform the organization
to a sustainable leanness status. This is the reason of huge investments on developing and
applying generic and specific models of lean transformation.
Although many companies have tried to implement lean to reduce cost and
increase productivity, most of them have been unsuccessful in creating a set of goals and
a clear roadmap in the level of operations so that employees on the frontline can follow a
step by step, daily plan of refinement, problem solving and continuous improvement. As
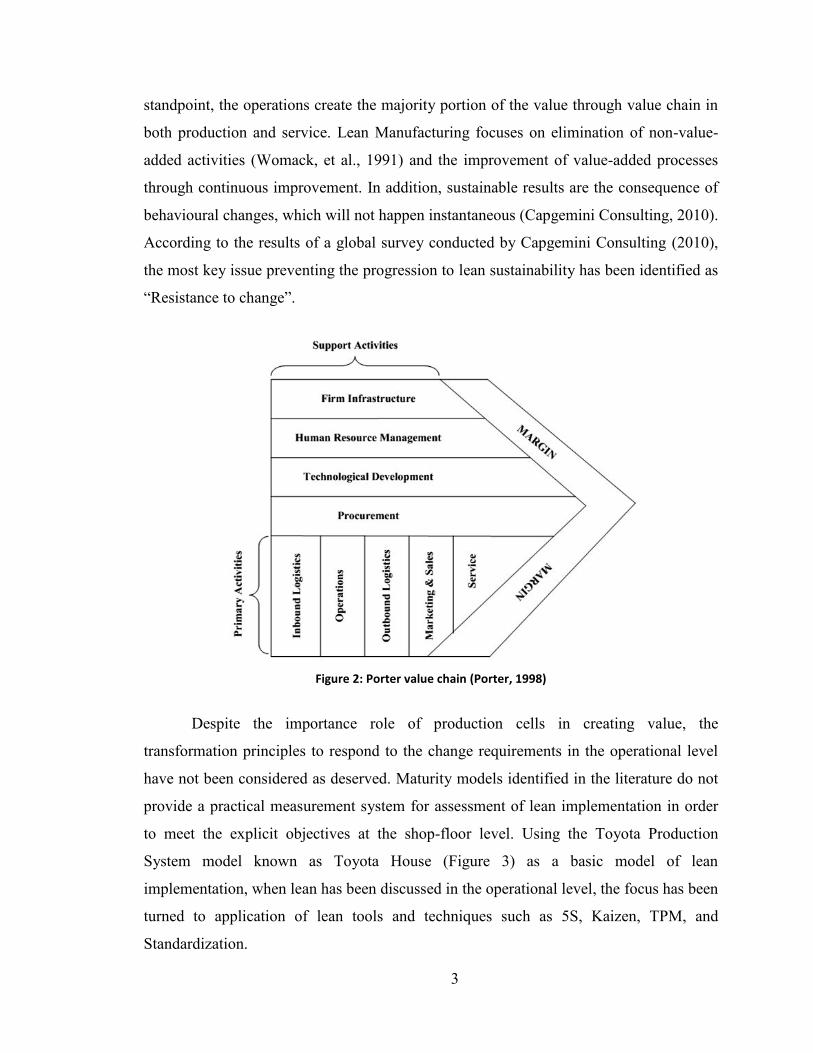
stated by Michael E. Porter (1988), Organizational processes are divided into two main
groups: primary activities and support activities (Figure 2). From a value-adding
3
standpoint, the operations create the majority portion of the value through value chain in
both production and service. Lean Manufacturing focuses on elimination of non-value-
added activities (Womack, et al., 1991) and the improvement of value-added processes
through continuous improvement. In addition, sustainable results are the consequence of
behavioural changes, which will not happen instantaneous (Capgemini Consulting, 2010).
According to the results of a global survey conducted by Capgemini Consulting (2010),
the most key issue preventing the progression to lean sustainability has been identified as
“Resistance to change”.
Figure 2: Porter value chain (Porter, 1998)
Despite the importance role of production cells in creating value, the
transformation principles to respond to the change requirements in the operational level
have not been considered as deserved. Maturity models identified in the literature do not
provide a practical measurement system for assessment of lean implementation in order
to meet the explicit objectives at the shop-floor level. Using the Toyota Production
System model known as Toyota House (Figure 3) as a basic model of lean
implementation, when lean has been discussed in the operational level, the focus has been
turned to application of lean tools and techniques such as 5S, Kaizen, TPM, and
Standardization.

4
Figure 3 : Toyota Production System “House” (LEI, 2008)
Considering the relationship between maturity models and assessment systems, a
gap exists in the literature about the lean manufacturing assessment tools similar to what
was stated about maturity models. While some studies have given a lot of attention to
assessment of organization’s leanness (Amin & Karim, 2012; Chauhan & Singh, 2012;
LAI-MIT, 2001; Pakdil & Moustafa Leonard, 2014), some others have concentrated on
performance measurement as a result of lean initiatives (Anvari, et al., 2012;
Seyedhosseini, et al., 2011; Tupa, 2013). However, each study has either focused on the
lean tools and techniques or lean performance measures in the level of enterprise.
Existing lean assessment models did not consider the leanness measures in the Production
cells, nor did they examine the relationship between the daily activities related to lean
implementation in the production cells and production cell’s performance.
Furthermore, most of the proposed models on developing and evaluating lean
have been conducted from an assessment viewpoint, as would be conducted by the lean
practitioner or the third parties. These assessment models are comprehensive, but can be
incompetent due to their either generality or unrelated elements to the certain
organization’s characteristics. They are mostly used for the assessment of lean
implementation based on general requirements and provide general guidelines. In each

5
organization, it is necessary to develop a self-assessment model in order to assess and
lead the lean efforts.
1.3 Research Objectives
A comprehensive, dynamic, multi-dimensional lean Maturity Model (LMM) is
developed in this study to assess the leanness and lean effectiveness in seven axes of
production cells, namely: People, Working Conditions, Facilities, Production Processes,
Quality, JIT and Leadership. The performance criteria are categorized into the axes of the
model. The lean assessment criteria are also developed in each axis and in four levels of
lean maturity which are: Understanding, Implementation, Improvement and
Sustainability. The data of leanness and performance of a case study then compared
together to evaluate the effectiveness of lean practices.
By developing a customized LMM for production cells, this study intended to fill
the gap mentioned earlier about the lack of tailored maturity models at operational level.
The proposed model can be applied by practitioners as a framework to design and
develop a company-specific LMM. Concluding that there is no one-best-way recipe for
lean implementation (Netland, 2013), this study is not intended to provide a detailed
prescription for production cells to develop and assess lean implementation; rather it
proposes a framework to assess lean maturity based on grounded lean principles. It also
suggests a dynamic process to adopt designed framework according to firm’s strategies
and company’s priorities.
Also, by measuring the performance of production cells from different
perspectives and then comparing them with the results of lean assessment in each
dimension, as suggested in this study, the model can be used to evaluate the effectiveness
of lean initiatives. The visual format of lean LMM can be applied to find the gaps
between requirements of leanness and results of their practices, and to fill that gap by
focusing on the areas of strength and those needing improvement.
The model can be used as an assessment tool to evaluate the leanness of
production cells from different perspectives. Furthermore, it can also be used to assess
the effectiveness of lean efforts on organizational performance. Thus, it creates insight

6
into the relationship between lean indicators and production’s performance measures. It
can also be used as a guideline for selecting the appropriate tools of process improvement
and for benchmarking the weaknesses and strengths of each production cell from the
different perspectives.
1.4 Research Questions
Considering the mentioned important void within the body of knowledge and
practical initiatives, by providing a conceptual model of lean maturity in operational
level, this research seeks to address the following fundamental questions:
RQ1: How can an organization measure the overall leanness and lean maturity level of a
production cell? Which quantitative and qualitative metrics should be used?
RQ2: How can an organization measure the overall performance of a production cell?
RQ3: How can an organization evaluate effectiveness of its lean practices in production
cells? How can a multi-dimensional maturity model support an organization to assess its
overall lean performance?
1.5 Research Overview
This study examines the existing literature on lean concept in general, as well as
on lean maturity models and lean assessment tools in particular. To do so, firstly, an
extensive literature review on lean principles, tools, and objectives is conducted; and the
fundamental principles of lean manufacturing and corresponding tools, methodologies
and techniques (as they relate to the shop-floor activities) are identified, analyzed,
classified and described. Then, a conceptual model is developed for assessment of lean
maturity in production cells. The best practice of lean maturity and lean assessment
models are investigated and the principles and the design concepts behind them are
analyzed. As a result of data gathering and analysis on maturity models and according to
transformation rules and general design principles of maturity models, axes and levels of
maturity as they relate to the shop floor activities are suggested. Next, a methodology to
define organization’s leanness and performance objectives is proposed. As a result, a
simple visual maturity model is proposed as a communication tool to show the leanness

7
status and the weaknesses and the strengths of lean initiative. The model proposed a link
between the leanness and the performance of production cells in order to evaluate both
lean efficiency and lean effectiveness. Then, to test the applicability of model, data of for
both leanness and performance measures is collected within a case study. Using a
proposed simple fuzzy logic concept, the performance results associated with each
dimension of lean are summarized into a single benchmarking number and determined
leanness level is compared to performance result of production cell. Finally, the study is
concluded by presenting the main limitations of the proposed framework and action
needed for its customization, as well as potential future research in this area.
8
1.6 Definition of Terms
Cell: “The location of processing steps for a product immediately adjacent to each other
so that parts, documents, etc., can be processed in very nearly continuous flow, either one
at a time or in small batch sizes that are maintained through the complete sequence of
processing steps” (LEI, 2008)
Downtime: Loss of production efficiency because of planned or unplanned stoppage
(LEI, 2008)
Effectiveness: Capability of meeting exact customer requirements
Efficiency: “Meeting exact customer requirements with the minimum amount of
resources” (LEI, 2008)
Gemba: The Japanese term for “actual place,” often used for the shop-floor or any place
where value-creating work actually occurs (LEI, 2008).
Heijunka: Or load-levelling box is a tool used to help levelling both the mix and volume
of production (Rother & Shook, 2003)
Jidoka: Providing machines and operators the ability in detecting when an abnormal
condition has occurred, and instantly stopping work (LEI, 2008)
Just In Time: “A system for producing and delivery of the right items at the right time
in the right amounts” (Womack & Jones, 1996)
Kaizen: Incremental improvement to a process or a product within a manufacturing
context (Rother & Shook, 2003)
Kanban: A request signal to produce or withdraw upstream materials in a production
process (Rother & Shook, 2003)
Lean manufacturing: An approach to production based on the philosophy of eliminating
all waste from operations. In lean manufacturing, production only occurs when there is a
demand from a downstream process (Rother & Shook, 2003)
9
Lean principles: The fundamental lean practicing concept on which transforming and
sustaining lean is based. The principles guide organizational initiatives into leanness.
Lead time: The time elapsed between the order of a product or service to the time of
delivery (Jones & Womack, 2003)
Level of leanness: The level of implementation lean manufacturing principles and
practices in order to achieve organizational objectives through continuous improvement
activities (Soriano-Meier & Forrester, 2002)
Mistake proofing (Poka Yoke): Providing the capability of alerting or preventing
passing or producing of non-conformity products or services in the process by avoiding
or alerting mistakes in the work
Non value-added work: Work done by a supplier that for whom customer is not willing
to pay (Rother & Shook, 2003)
Pull: One of the basic principles of lean manufacturing system. Producing only the type
and the quantity of product which are asked by internal following process based on the
customer order
Supermarket: “The location where a predetermined standard inventory is kept to supply
downstream processes” (LEI, 2008)
True North: “An organization’s strategic and philosophical vision or purpose” (LEI,
2008)
Takt time: Derived from the German word Taktzeit which means beat. Takt in lean
lexicon is a reference number which set the production pace of industrial manufacturing
lines based on the rate of the customer demand (Rother & Harris, 2001)
Visual Management: Application of visual signals, charts and graphs instead of
numbers, texts and written instructions in order to clarify and facilitate communication
between all levels of organization

10
Waste Reduction: There are three types of waste, with the Japanese terms Muda, Mura,
and Muri
Muda indicate the diverse wastes occurring in production and quality
processes in the shop-floor activities. Waste in the context of lean means any
activity that uses resources but not creating any value for the customer. Seven
basic types of waste include: Overproduction, Overprocessing, Waiting,
Inventory, Defects, Transportation, and Motion (Ohno, 1988).
Mura refers to “unevenness in operations. For example, a gyrating schedule
not caused by end-consumer’s demand but rather by the production system, or an
uneven work pace in an operation causing operators to hurry and then wait” (LEI,
2008)
Muri refers to “Overburdening equipment or operators by requiring them to
run at a higher or harder pace with more force and effort for a longer period of
time than equipment designs and appropriate workforce management allow” (LEI,
2008)
XPS: A company specific production system which is the same as Toyota Production
system (TPS) in basis and principles
11
2 CHAPTER 2: LITERATURE REVIEW
2.1 The Theoretical Framework
In order to answer the research questions, lean manufacturing in its institutional
and academic context is investigated in this section by collecting the information and data
on the following subjects:
- A review of the lean history
- A review of the lean manufacturing principles, tools and objectives
- A review of the content and the design principles of maturity models
- A review of the lean maturity/assessment models
Then, an inductive approach is used to develop a conceptual model and a
framework for leanness assessment in the operational level. The proposed methodology
for assessing lean implementation is built based on the data and the fact collected from
the most applicable and addressed model of maturity and leanness. Since the study
focuses on implementation of lean in the operational level with consideration of lean
requirements at the strategic level, the models have been chosen to analyze the both
perspectives. In addition, based on the nine years of the author’s experience in Renault
Production System, this model has been considered as a part of the research in
operational level.
2.2 Review of Lean History
Considering the difficulties caused by the economic crisis after the Second World
War, Japan emerged defeated and had to fight difficulties such as high cost of raw
material and low internal demand (Chiarini, 2013). In order to struggle with the crisis,
Japanese companies started to develop some strategies and techniques to improve the
quality of products and decrease the cost of production. In 1947, Dr. Deming came to
know and developed a respect from the Japanese after engagement to advise on sampling
techniques for a major census and once again, after when he received an invitation from
The Union of Japanese Scientists and Engineers (JUSE) in March of 1950 to return to
12
Japan and to teach the application of statistics to quality improvement as a part of Japan
program to improve quality (Robert B. Austenfeld, 2001).
Drucker suggested managers in the West pay close attention and study the
Japanese industry as an important competitor as well as an industry teacher (Drucker,
1971). He discussed some important Japanese management characteristics such as
decision by consensus, willingness to change, continuous training and continuous
improvement as the key elements of Japanese success. After the oil crisis of 1974 and by
the end of the 1970s, Japan was the nation to follow for its industrial and economic
structure (Chiarini, 2013).
2.2.1 TPS and Lean
Of all attentions to Japanese management system, the Toyota Production Way
drew widest consideration (Chiarini, 2013) as a result of Toyota dramatic spurt in the
sales and its 6th
place in the ranking by sales table of market share in 1970 (Watanabe,
2007). In 1978, Ohno published “Toyota Production System” in Japanese and credited
FPS and American supermarkets behind his just-in-time thinking (Shah & Ward, 2007).
He suggested a sale-based scheduling system instead of schedule-based forecast. In 1988,
Ohno’s book was published in English. In 1989 Shingo and Dillon (1989) described the
principles and mechanics of Toyota Production System such as Just In time, elimination
of wastes, SMED and Kanban in detail. Toyota’s way of shop floor management was
later called lean by John Krafcik in 1988 (Womack, et al., 1991).
Turning industry’s attention to the Japanese way of management and specifically
Toyota Production System entered to a new phase after publishing Womack et al.’s book,
The Machine That Changed the World; the book in which the word “lean Production”
was used to explain the production system created by the founder of Toyota, Sakichi
Toyoda and Toyota engineer Taiichi Ohno (Womack, et al., 1991). Womack et al (1991)
investigated Japanese production system on behalf of International Motor Vehicle
Program. Stone (2012) termed these two periods as “Discovery” and “Dissemination”
phases of lean, which started in 1970 and finished in 1996.
13
At the end of “Dissemination” phase, when most of the companies had spent
enough time to apply lean tools and techniques and had not achieved the same benefits as
Toyota, more attention turned to lean principles and Toyota culture underlying lean rather
than simply imitation of applying lean tools and methods. Based on the series of research
started by Spear and Bowen (1999), followed widely by other researchers, more attention
has been turned to rules and principles of lean, the nature of working they called “DNA
of TPS”. The book “lean thinking” by Womack and Jones which was published in 1994
was another response to the question in mind of organizations looking for the results of
their lean Practices. Stone (2012) also determined another three phases of lean literature
as “Implementation”, “Enterprise” and “Performance” phases. Stone’s systematic
literature review shows a growing attention on different perspectives of lean philosophy
from 1997 to 2009.
The concept of lean has been evaluated and expanded significantly beyond its
origins in the automotive industry (Hines, et al., 2004). Today, lean has being applied in
all sectors of manufacturing, banking, healthcare, retail, IT, government and even non-
profit organizations. It is employed by small, medium and large enterprises as a popular
change and transformation framework (Taggart & Kienhöfer, 2013). Its application also
has expanded from door to door manufacturing to whole supply chain.
2.2.2 XPS
While many companies have attempted to implement Toyota Production System
or lean manufacturing as the best practice of manufacturing system, after development of
system over time, or even in some cases, during the introduction of system to the
facilities, they realized that imitating the TPS model is not a perfect prescription for their
companies.
First, the internal and external regulations, organization’s priorities,
organizational culture, nature of industry, organizational environment, economical factors
and company’s processes made some TPS’s tools and principles more effective in some
organization, while not important or even applicable in others. Different manufacturing
systems have specific characteristics which distinguish their way toward excellence.
14
Second, in most cases, access to the TPS knowledge was limited to the observed
elements which were tools and visual procedures. As a result, companies started to create
and implement a company specific model as own best-way of continuous improvement
programmes (XPS) (Netland, 2013). Mercedes-Benz Production System, Hyundai
Production System, Renault Production System and Chrysler Operating System are some
samples of these approaches. The movement has not been limited to the automotive
companies, once the concept of lean was developed by other industries; they started to
initiate their own best way as well. Honeywell operating system (HOS), Nestlé
continuous improvement programme, Siemens Production System, Bombardier
Achieving Excellence System (AES) and Boeing lean+ are some examples of efforts
made in the other industries.
A general model of lean consists of the tools and concepts applied by the firm in
the form of a graphical model or a sort of procedures and instructions which guide
employees to use those tools and methods. However, regardless of design and visual form
of model, it represents a piece of TPS puzzle. The approach of focusing on the tools and
techniques and the approach which grew naturally in Toyota over decades are so often
counter-cultural that they have made successful implementation of lean a major
challenge.
2.3 Lean in Strategy Level, Lean in Functional Level
Creating a lean culture in the organization always requires behavioural changes in
all organizational level. There is an explicit need for leveraging supportive tools and
trainings to apply change. On one hand, being lean is often part of the core business
strategy and should be considered in any important and strategic decision made by the
company. On the other hand, equipping employees with appropriate techniques and
methods and empowering them to use a suitable set of those techniques for any
difficulties or improvement events can make an indicative impact on an organization’s
performance.
The practical and academic research which have been tried to drive lean to a more
efficient and effective concept can be divided into two main categories. First, lean
15
concept from a strategic standpoint which focuses more on philosophical perspective of
lean as a management philosophy and a way of thinking (Womack & Jones, 1996; Spear
& Bowen, 1999). Second, lean concept as an improvement technique in operational level
which focuses more on practical perspective of lean as a set of management techniques
and tools for improvement (Shah & Ward, 2003).
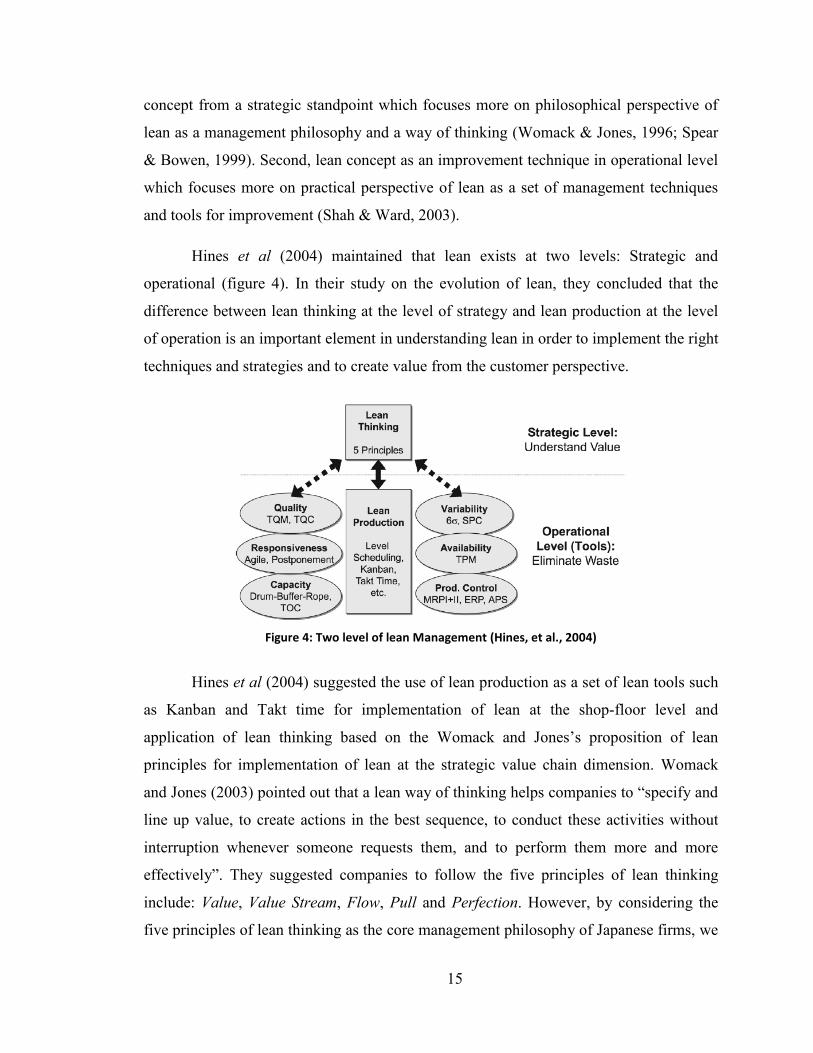
Hines et al (2004) maintained that lean exists at two levels: Strategic and
operational (figure 4). In their study on the evolution of lean, they concluded that the
difference between lean thinking at the level of strategy and lean production at the level
of operation is an important element in understanding lean in order to implement the right
techniques and strategies and to create value from the customer perspective.
Figure 4: Two level of lean Management (Hines, et al., 2004)
Hines et al (2004) suggested the use of lean production as a set of lean tools such
as Kanban and Takt time for implementation of lean at the shop-floor level and
application of lean thinking based on the Womack and Jones’s proposition of lean
principles for implementation of lean at the strategic value chain dimension. Womack
and Jones (2003) pointed out that a lean way of thinking helps companies to “specify and
line up value, to create actions in the best sequence, to conduct these activities without
interruption whenever someone requests them, and to perform them more and more
effectively”. They suggested companies to follow the five principles of lean thinking
include: Value, Value Stream, Flow, Pull and Perfection. However, by considering the
five principles of lean thinking as the core management philosophy of Japanese firms, we
16
could not separate them from application of lean at operational level. What is known as a
principle should be applied through all elements of a system in all levels. For example,
pursue perfection is a generally accepted convention through all levels of organization in
both operational and non-operational sections.
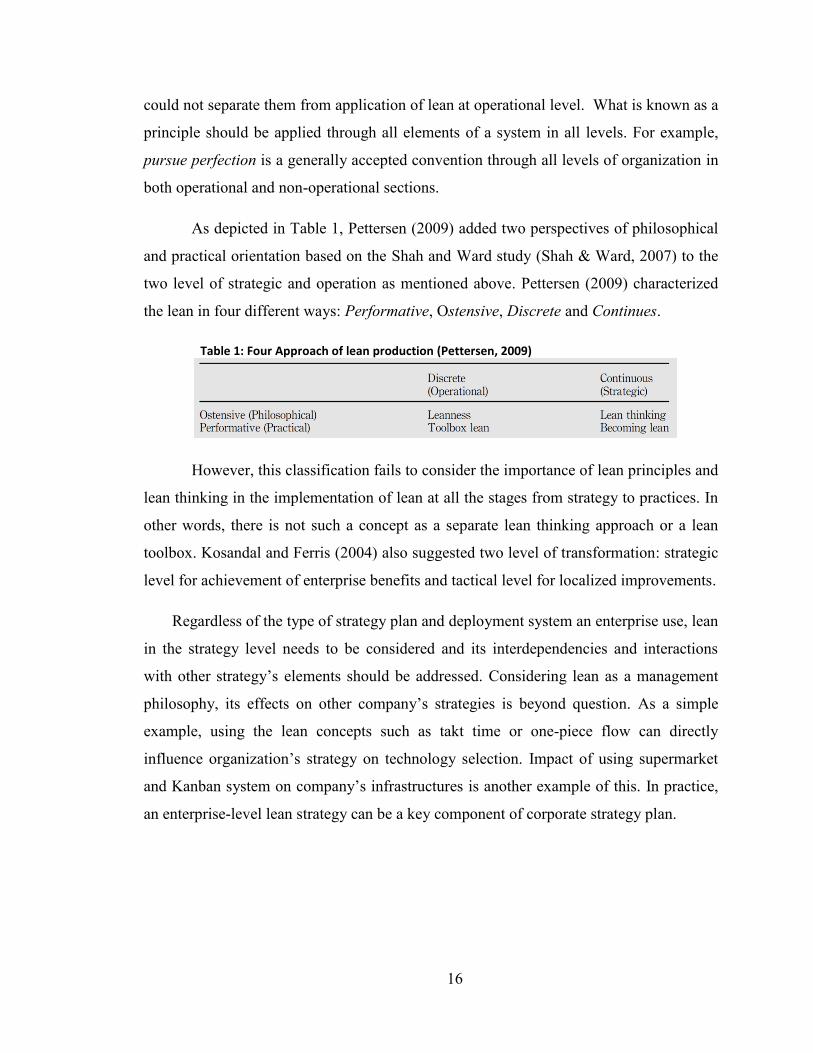
As depicted in Table 1, Pettersen (2009) added two perspectives of philosophical
and practical orientation based on the Shah and Ward study (Shah & Ward, 2007) to the
two level of strategic and operation as mentioned above. Pettersen (2009) characterized
the lean in four different ways: Performative, Ostensive, Discrete and Continues.
Table 1: Four Approach of lean production (Pettersen, 2009)
However, this classification fails to consider the importance of lean principles and
lean thinking in the implementation of lean at all the stages from strategy to practices. In
other words, there is not such a concept as a separate lean thinking approach or a lean
toolbox. Kosandal and Ferris (2004) also suggested two level of transformation: strategic
level for achievement of enterprise benefits and tactical level for localized improvements.
Regardless of the type of strategy plan and deployment system an enterprise use, lean
in the strategy level needs to be considered and its interdependencies and interactions
with other strategy’s elements should be addressed. Considering lean as a management
philosophy, its effects on other company’s strategies is beyond question. As a simple
example, using the lean concepts such as takt time or one-piece flow can directly
influence organization’s strategy on technology selection. Impact of using supermarket
and Kanban system on company’s infrastructures is another example of this. In practice,
an enterprise-level lean strategy can be a key component of corporate strategy plan.

17
2.4 Lean Principles, Tools and Metrics
A wide range of management concepts have been introduced and analyzed due to
the broad volume of lean literature and vast lean practices (Wang & Huzzard, 2006).
Design and implementation of LMM required identifying and gathering comprehensive
information from the literature about principles and practices related to lean
manufacturing, and thereafter applying those when developing the model. To achieve an
overall perspective, in this section, the literature has been studied from three main
perspectives: lean principles, lean tools and lean metrics.
2.4.1 Lean Principles
According to Stephan Covey’s definition, Principles are indispensable facts and
common laws which are timeless, incontestable and self-evident (Covey, 1999).
Principals are derived from a company’s strategy and are used as the guidelines to
operate in accordance with the overall strategy (Netland, 2013). Successful
implementation of lean depends ultimately on its underlying principles. Lean principles
in terms of lean thinking first were considered by Womack and Jones (1996) in the book
Lean Thinking: Banish Waste and Create Wealth in Your Corporation. In their book,
they suggested organizations to follow five lean principles as a framework of
implementing lean. Womack and Jones’ five principles are (Womack & Jones, 1996):
- Value: identify the value from customers perspective
- Value Stream: Identify “specific activities required to design, order, and
provide a specific product, from concept to launch, order to delivery, and
raw materials into the hands of the customer”
- Flow: “Progressive achievement of tasks along the value stream so that a
product proceeds from design to launch, order to delivery and raw
materials into the hands of the customer with no stoppages, scrap or
backflows”
- Pull: Only make what is pulled by the customer signal of need
- Perfection: By continually removing successive waste from value stream
In a guide developed at the Massachusetts Institute of Technology (MIT) under
the auspices of the lean Aerospace Initiative (LAI), six core strategic concepts of the lean

18
paradigm have been proposed as the overarching strategic concepts of lean. Four
principles of lean introduced by Womack and Jones are summarized in tow principles of
value and value stream and flow and pull by MIT team. They also suggested four other
principles as: Waste minimization and continuous improvement, near perfect product
quality (almost the same as perfection in Womack and Jones), Horizontal Organizational
Focus and Relationships Based on Mutual Trust and Commitment (Mize, et al., 2000).
Based on the series of research started by Spear and Bowen (1999), more
attention has been turned to rules and principles, the nature of working the so-called
“DNA of TPS”. They discussed four underlying principles of lean in the terms of TPS
rules. The first rule discussed the way people work at Toyota. The high level of detailed
work standards in all aspect of organization’s processes in Toyota is the result of their
first underlying principle. The second rule discussed the way customers, employees and
suppliers interact with each other in Toyota. Simple and direct pathway of product or
services and scientific and common method of improvement and problem solving under
the guidance of a sensei are the third and fourth principles of Toyota based on the
observations of Spear and Bowen in Toyota manufacturing sites (Spear & Bowen, 1999).
Liker (2004) in his book The Toyota Way: fourteen Management Principles from
the World's Greatest Manufacturer provided a synopsis of the fourteen principles as the
foundation of Toyota Way. These fourteen principles are organized in four categories:
long-term philosophy, the right results from right process, adding value to the
organization by developing people, and creating a learning organization by continuously
solving root problems (Liker, 2004).
Among all the models of lean implementation/assessment, the principles have
been considered most in the Shingo model. The model has been built based on the
operational excellence principles and represents the guiding principles and the related
supporting concepts in the graphical form of Shingo house in four categories: cultural
enablers, continuous process improvement, enterprise alignment and results (Miller,
2012). The model is intended to assess the culture of operational excellence in an
organisation by questioning the principle-based behaviour of its leaders, managers and
associates.

19
Many other researchers have also attempted to classify lean manufacturing
principles. For example, Pettersen (2009) listed lean principles in terms of most
frequently mentioned characteristics of lean based on a literature review. Shah and Ward
(2003) used sixteen key references and listed twenty-one lean practices which include
both principles and techniques. Some of shah and ward’s lean practices can be
considered as lean objectives or tools. For example maintenance optimization, planning
and scheduling strategies, preventive maintenance, process capability measurements,
quality management programs, quick changeover techniques, safety improvement
programs and total quality management. Netland (2013) ranked main principles of lean
based on the study of thirty company-specific production systems. His list include the
general management principles such as “Clear Communication” and “Innovation” which
is not necessarily related to lean initiative, as well as lean specific principles and
techniques like “Heijunka” and “Jidoka”.
In Table 2, the lean principles are summarized based on the common definitions
of subject in the key references. Since the distinction between lean tools, principles and
metrics is very important when designing a LMM, only principles are categorized in
Table 2. Lean tools and metrics have been studied in separate sections.

20
Table 2: Lean principles
Lean Principles Source/s
Defining value precisely from the perspective of end
customer.
Customer value and value stream
Create value for the customer
(Womack & Jones, 1996)
(Mize, et al., 2000)
Shingo Model
Identifying the entire value stream for each product
or product family
Focus on Value Stream
(Womack & Jones, 1996)
Shingo Model
Establish Flow
Create continuous process flow to bring problems to
the surface
Bottleneck removal (Production Smoothing)
JIT/Continuous Flow Production
Simple and direct production pathway
(Womack & Jones, 1996)
Shingo Model
(Liker, 2004) principle 2
(Mize, et al., 2000)
(Shah & Ward, 2003)
(Spear & Bowen, 1999)
Provide what the customer want only when the
customer want It
Use "Pull" systems to avoid overproduction
Pull System/Kanban
(Womack & Jones, 1996)
(Liker, 2004) principle 3
(Mize, et al., 2000)
(Shah & Ward, 2003)
Shingo Model
Pursue Perfection
Waste Minimization and Continuous Improvement
Near Perfect Product Quality
Continuous Improvement Programs
Improvement at the lowest level and under a
teacher’s guidance
(Womack & Jones, 1996)
Shingo Model
(Mize, et al., 2000)
(Shah & Ward, 2003)
(Spear & Bowen, 1999)
Base your management decisions on a long-term
philosophy, even at the expense of short-term
Financial Goals.
Strategic Alignment
(Liker, 2004) principle 1
(Capgemini Consulting, 2010)
Level out the workload (Heijunka) (Liker, 2004) principle 4
Build a culture of stopping to fix problems, to get
quality right the first time
Assure quality at the source
(Liker, 2004) principle 5
Shingo Model
Standardized tasks are the foundation for
continuous improvement and employee
empowerment
All work shall be highly specified as to content,
sequence, timing and outcome
Standardize processes
(Liker, 2004) principle 6
(Spear & Bowen, 1999)
Shingo Model
Use visual control so no problems are hidden (Liker, 2004) principle 7
Use only reliable, thoroughly tested technology
that serves your people and processes
(Liker, 2004) principle 8
Grow leaders who thoroughly understand the
work, live the philosophy, and teach it to others
Manager should coach, not fix
Lead with humility
(Liker, 2004) principle 9
(Spear, 2004)
(Miller, 2012)

21
Table 2: Lean principles - continued.
lean Principles Source/s
Develop exceptional people and teams who follow
your company's philosophy
Cross-functional work force
Self-directed work teams
(Liker, 2004) principle 10
(Shah & Ward, 2003)
Respect your extended network of partners and
suppliers by challenging them and helping them
improve
Respect every individual
(Liker, 2004) principle 11
Shingo Model
Go and see yourself to thoroughly understand the
situation (Genchi Genbutsu)
Direct observation
(Liker, 2004) principle 12
(Spear, 2004)
Shingo Model
Make decisions slowly by consensus, thoroughly
considering all options; implement decisions
rapidly
(Liker, 2004) principle 13
Become a learning organization through relentless
reflection (Hansei) and continuous improvement
(kaizen)
(Liker, 2004) principle 14
Horizontal organizational focus
(Mize, et al., 2000)
Relationships based on mutual trust and
commitment
(Mize, et al., 2000)
Cellular Manufacturing
Cellular design
(Shah & Ward, 2003)
Shingo Model
Competitive Benchmarking
(Shah & Ward, 2003)
Focused factory production
Focus on process
(Shah & Ward, 2003)
Shingo Model
Direct and unambiguous customer-supplier
relation
(Spear & Bowen, 1999)
Embrace scientific thinking Shingo Model
Think systematically Shingo Model
Create constancy of purpose Shingo Model
2.4.2 Lean Tools
There is a wide range of lean techniques and methods which can be used to
improve the organizational effectiveness and efficiency. The number and diversity of the
management tools attributed to the lean production have been increased with the spread
of this concept in industry. Ohno (1988) introduced the main TPS concepts and
techniques in the book “Toyota Production System: Beyond Large-Scale Production”.
Toyota Production System model, known as TPS House, represents a set of main tools
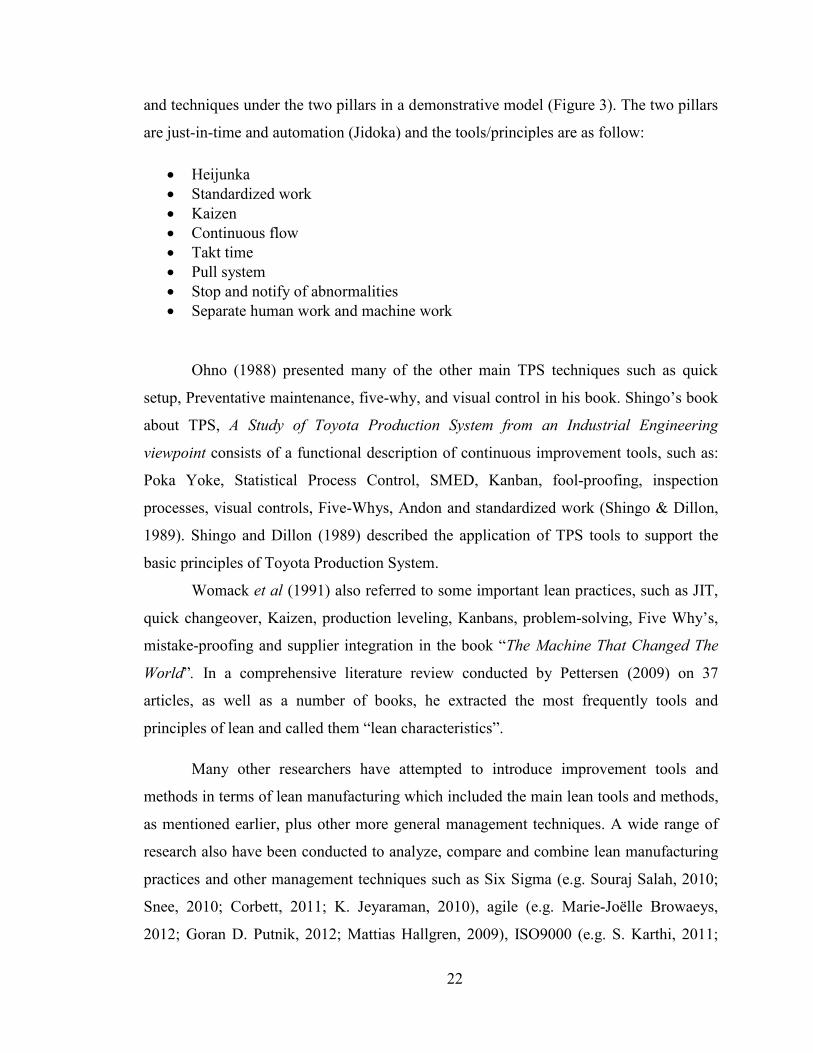
22
and techniques under the two pillars in a demonstrative model (Figure 3). The two pillars
are just-in-time and automation (Jidoka) and the tools/principles are as follow:
Heijunka
Standardized work
Kaizen
Continuous flow
Takt time
Pull system
Stop and notify of abnormalities
Separate human work and machine work
Ohno (1988) presented many of the other main TPS techniques such as quick
setup, Preventative maintenance, five-why, and visual control in his book. Shingo’s book
about TPS, A Study of Toyota Production System from an Industrial Engineering
viewpoint consists of a functional description of continuous improvement tools, such as:
Poka Yoke, Statistical Process Control, SMED, Kanban, fool-proofing, inspection
processes, visual controls, Five-Whys, Andon and standardized work (Shingo & Dillon,
1989). Shingo and Dillon (1989) described the application of TPS tools to support the
basic principles of Toyota Production System.
Womack et al (1991) also referred to some important lean practices, such as JIT,
quick changeover, Kaizen, production leveling, Kanbans, problem-solving, Five Why’s,
mistake-proofing and supplier integration in the book “The Machine That Changed The
World”. In a comprehensive literature review conducted by Pettersen (2009) on 37
articles, as well as a number of books, he extracted the most frequently tools and
principles of lean and called them “lean characteristics”.
Many other researchers have attempted to introduce improvement tools and
methods in terms of lean manufacturing which included the main lean tools and methods,
as mentioned earlier, plus other more general management techniques. A wide range of
research also have been conducted to analyze, compare and combine lean manufacturing
practices and other management techniques such as Six Sigma (e.g. Souraj Salah, 2010;
Snee, 2010; Corbett, 2011; K. Jeyaraman, 2010), agile (e.g. Marie-Joëlle Browaeys,
2012; Goran D. Putnik, 2012; Mattias Hallgren, 2009), ISO9000 (e.g. S. Karthi, 2011;
23
Chiarini, 2011) and Green (e.g. Susana Duarte, 2013; Helena Carvalho, 2011) A list of
the widely acknowledged tools and techniques based on the reviewed literature is
provided in Table 3, which can be used further in the development of LMM.
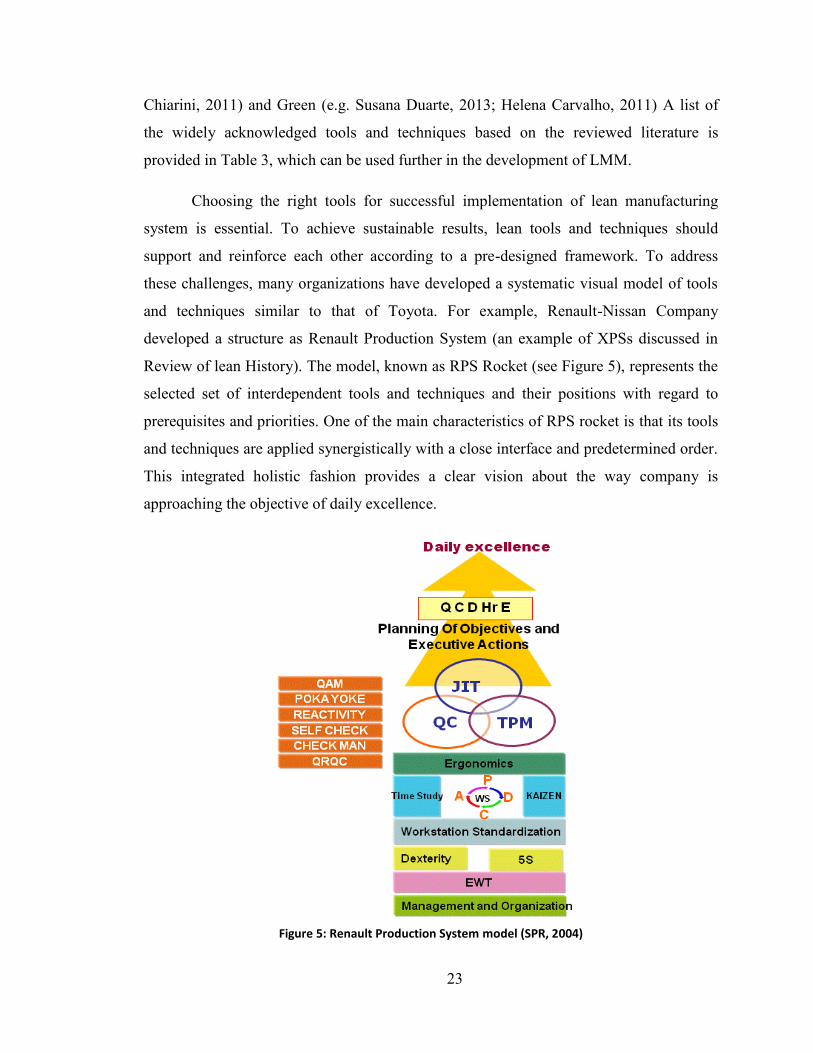
Choosing the right tools for successful implementation of lean manufacturing
system is essential. To achieve sustainable results, lean tools and techniques should
support and reinforce each other according to a pre-designed framework. To address
these challenges, many organizations have developed a systematic visual model of tools
and techniques similar to that of Toyota. For example, Renault-Nissan Company
developed a structure as Renault Production System (an example of XPSs discussed in
Review of lean History). The model, known as RPS Rocket (see Figure 5), represents the
selected set of interdependent tools and techniques and their positions with regard to
prerequisites and priorities. One of the main characteristics of RPS rocket is that its tools
and techniques are applied synergistically with a close interface and predetermined order.
This integrated holistic fashion provides a clear vision about the way company is
approaching the objective of daily excellence.
Figure 5: Renault Production System model (SPR, 2004)

24
Table 3 : lean tools and techniques (LEI, 2008; Shah & Ward, 2007; Liker, 2004; Netland, 2013; Pettersen, 2009; Vinodh & Chintha, 2011; SPR, 2004; Miller, 2012; Taggart & Kienhöfer, 2013)
General PDCA
Kaizen
Goal alignment/Policy deployment/Hushin kanri
Benchmarking
Total Quality Management Root cause analysis (5Whys)
Statistical Process Control (SPC)
Basic quality tools (Pareto chart, cause and effect diagram,
decision making matrix, etc )
Problem solving methodology(A3, DMAIC, QC Story)
Gemba (Genchi Genbustu)
Poka Yoke
Reactivity
Self control
Check man workstation
Voice of Customer
FMEA
Process Improvement Setup time reduction (SMED)
Standardized work (SOPs, routing, travel paths)
Value Stream Mapping (VSM)
Kaizen/ Continuous improvement
Stability study (Cpk, Cp)
Flexibility
Work force Employee involvement
Ergonomics analysis
Cross functional teams
Suggestion system
On-the-job training (on-line)
Basic skill training (off-line)
Multi-skill personnel
Visual management and Workplace
organization
process control boards
Andon system
QCD board
5S
Point of use storage
Inventory reduction
Production planning and Material
flow
Kanban/Pull system
Production leveling/Heijunka
EDI (Electronic data interchange)
Just-In-Time
Takt Time
FIFO
Cellular manufacturing
Time/work study
Cross-Docking
Infrastructures Elementary Working Teams
Total Productive Maintenance (TPM)
Supplier involvement/development
Customer involvement
Jidoka/Autonomation

25
Reviewing the lean manufacturing literature demonstrate that there is no common
and sharp boundary in definition and classification of lean principles and techniques. For
example, Netland (2013) and liker (2004) maintained standardised work as a principle
whereas it has been considered by Ugochukwu et al (2013) as a improvement tool. In
such cases, it is important to delineate the boundries of lean principles and lean tools. As
it has been mentioned before, principles are timeless, incontestable and long-term
consistent rules. Thus, they hardly change due to the daily problems in mid-term. On the
contrary, the lean tools are selected based on the problem or improvment programs. They
may be applicable in some areas while innapropriate for some other intentions.
Standardization as a principle, for example, refer to an approach in which all
organizaional activitiies are highly specified as to the inputs, the process content, time
and sequence and the outputs (Spear & Bowen, 1999). Whereas, standardization, as a
tool, is assiciated with some standard formats, such as: Process Operation Sheet (POS),
Flowchart and Process Map which are used for different purposes.
2.4.3 Lean - Performance Metrics
The goal of implementing improvement tools and methods is to increase
productivity of current processes. Lean practices have strong positive effects on
organizational performance (Agus & Hajinoor, 2012). Lean metrics helps organizations
to evaluate effectiveness and efficiency of lean initiatives during transformation into the
lean enterprise. Chiarini (2013) maintained that lean indicators help better control of
process improvement and achievement of results. It increase awareness of lean and
importance of continuous improvement throughout all levels, and improve analysis skills
at shop-floor level.
At the enterprise level, lean metrics are related to the key performance indicators,
such as: customer satisfaction, ROI and market share; whereas at the shop floor level,
they include progression of lean program and implementation of lean elements: such as
5s score, number of suggestions, and results of ergonomic assessment, as well as
intermediate indicators such as average downtime, set up time and work in progress.
Organizations that ignore strategic aspect of lean and concentrate on point optimization
26
of “island metrics” failed to drive the lean initiatives to achievement of the organizational
objectives (Hines, et al., 2004).
According to Womack (1991), in order to assess the leanness of an organization,
three groups of lean activities must be examined: business goals, processes and human
resource. However, Allen et al (2001) classified lean metrics into four groups:
productivity, quality, cost and safety. Krichbaum (2007) divided manufacturing
performance measurements into five categories: safety, people, quality, responsiveness
and financial performance. Al-Aomar (2011) suggested three groups of lean measures to
evaluate the leanness of production system: productivity, cycle time and work-in-process
inventory. Tupa (2013) divided the lean performance key indicators into the three main
groups: time-related, cost-related and quality-related key performance indicators. Chiarini
(2013) has divided lean metrics into three groups based on their purposes: improving
cell/process performance, improving processes and the product/service value stream as
well as improving strategic goals
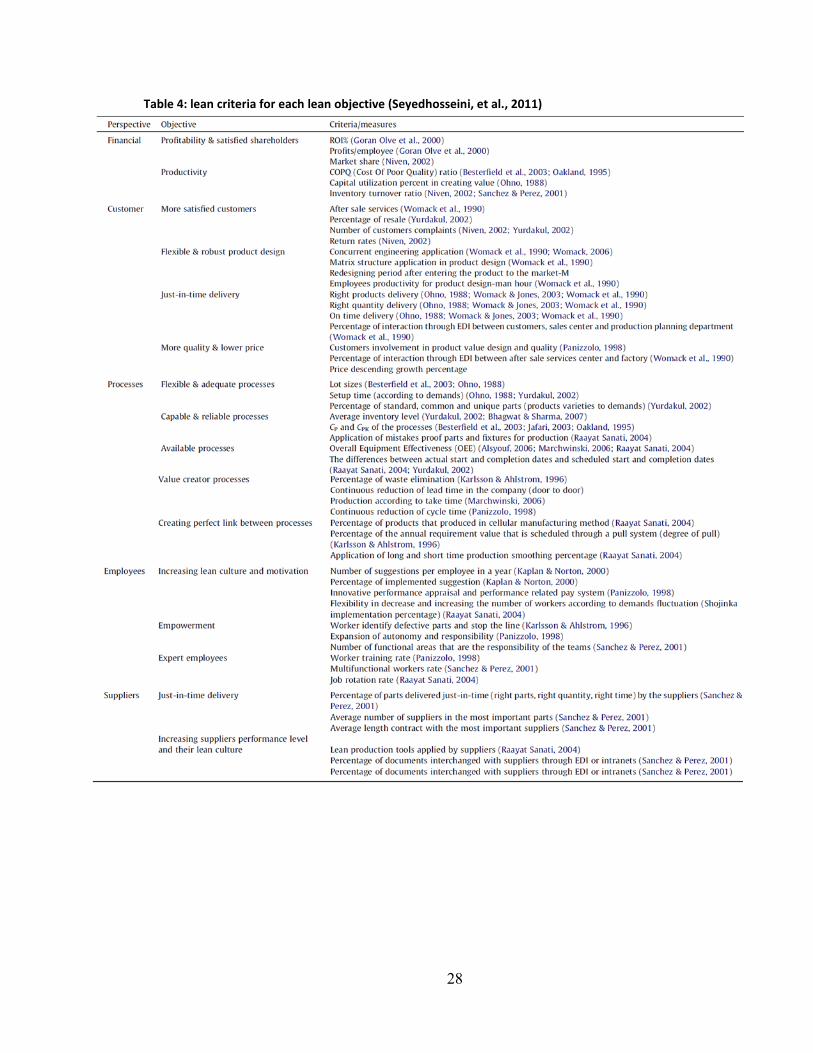
Seyedhosseini et al (2011) proposed five perspectives for defining lean
measurement criteria based on the Balance Scorecard concept. They used four
prospective of BSC in addition to the measures related to suppliers as an indicative
element of lean implementation (Seyedhosseini, et al., 2011). They also recommended a
set of different objectives and criteria for each perspective, as depicted in Table 4. Similar
to this approach, Bhasin (2008) suggested five following perspectives adapting Balance
Scorecard approaches to dynamic multi-dimensional performance:
- Financial
- Customer/market measures
- Process
- People
- Future
The future dimension puts emphasis on the ability of organizations in setting the
targets based on the new needs and organizational future prospects by considering
competitors and customers.
27
On the other hand, some researchers have investigated the financial effects of lean
programs (e.g. Fullerton & McWattersb, 2001; Jayaram, et al. 2008; Boyd, et al. 2006).
Many publications discuss the “lean Accounting” as a solution to the problem of large,
complex and wasteful traditional accounting systems (e.g. Maskell, et al. 2011; Stenzel,
2008). Chiarini (2013) also discussed the activity-based costing (ABC) as a simplified
analysis of the benefits obtained from continuous improvement activities and lean
accounting as an evolution of ABC. The impact of lean implementation on organizational
financial performance is determined by various intermediate performance objectives,
such as: delivery, cycle times, and manpower productivity (Fullerton, et al., 2003). Thus,
most focuses were carried out on the mediators, such as: inventory leanness and its
effects on financial performance.
28
Table 4: lean criteria for each lean objective (Seyedhosseini, et al., 2011)
29
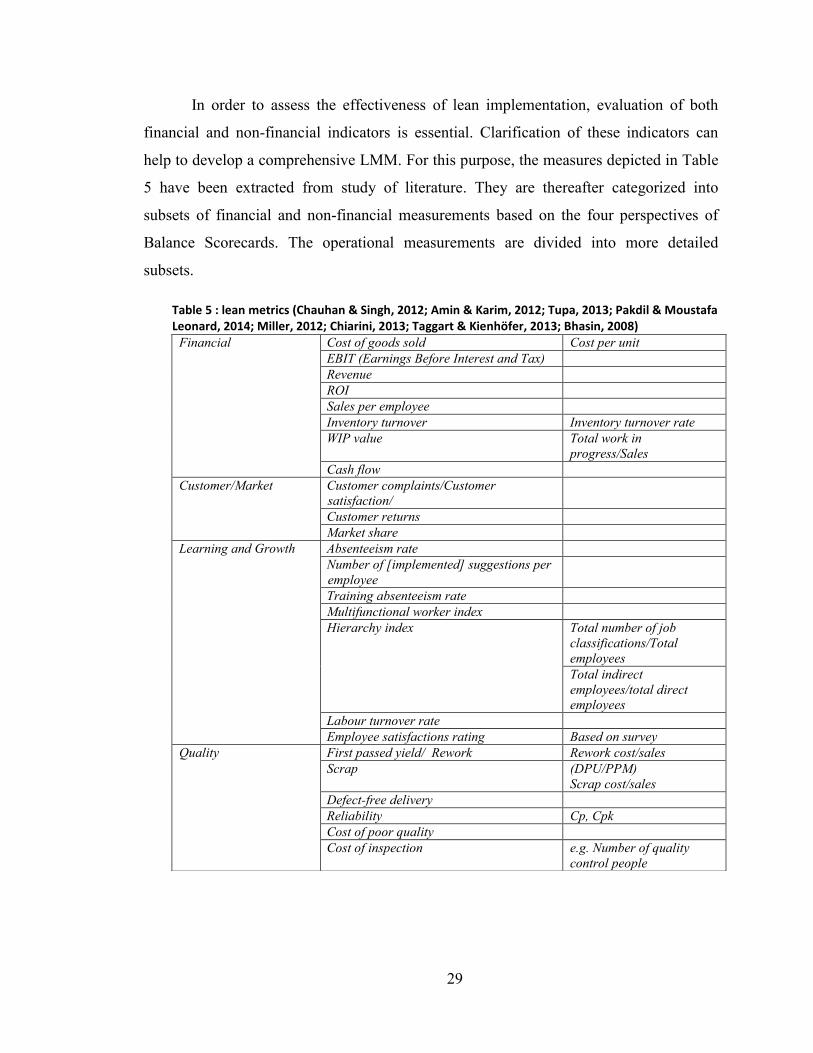
In order to assess the effectiveness of lean implementation, evaluation of both
financial and non-financial indicators is essential. Clarification of these indicators can
help to develop a comprehensive LMM. For this purpose, the measures depicted in Table
5 have been extracted from study of literature. They are thereafter categorized into
subsets of financial and non-financial measurements based on the four perspectives of
Balance Scorecards. The operational measurements are divided into more detailed
subsets.
Table 5 : lean metrics (Chauhan & Singh, 2012; Amin & Karim, 2012; Tupa, 2013; Pakdil & Moustafa Leonard, 2014; Miller, 2012; Chiarini, 2013; Taggart & Kienhöfer, 2013; Bhasin, 2008)
Financial Cost of goods sold Cost per unit
EBIT (Earnings Before Interest and Tax)
Revenue
ROI
Sales per employee
Inventory turnover Inventory turnover rate
WIP value Total work in
progress/Sales
Cash flow
Customer/Market Customer complaints/Customer
satisfaction/
Customer returns
Market share
Learning and Growth Absenteeism rate
Number of [implemented] suggestions per
employee
Training absenteeism rate
Multifunctional worker index
Hierarchy index Total number of job
classifications/Total
employees
Total indirect
employees/total direct
employees
Labour turnover rate
Employee satisfactions rating Based on survey
Quality First passed yield/ Rework Rework cost/sales
Scrap (DPU/PPM)
Scrap cost/sales
Defect-free delivery
Reliability Cp, Cpk
Cost of poor quality
Cost of inspection e.g. Number of quality
control people

30
Table 5: lean metrics (Chauhan & Singh, 2012; Amin & Karim, 2012; Tupa, 2013; Pakdil & Moustafa Leonard, 2014; Miller, 2012; Chiarini, 2013; Taggart & Kienhöfer, 2013; Bhasin, 2008) - continued.
Obviously, most of the metrics are not limited solely to the lean and operational
excellence efforts, the other company’s management dimensions effect results of some
measures (such as ROI, cost of inspection and job classifications). Reviewing the
literature shows a lack of boundaries between lean metrics and performance measures.
Considering the effects of multiple factors on each key performance indicators on one
hand and the correlation of different factors on the other hand, make finding the direct
impact of individual improvement initiatives on key performance indicators one of the
most difficult parts of management practices.
Cost Overall equipment efficiency (OEE)
Value added processing time (%)
Warranty cost Total cost of warranty/Sales
Transportation cost Cost of transportation/Total
sales
Capacity Utilization Idle capacity/total capacity
Work In Process turnover (days)
Finished goods inventory
Raw material inventory
Labour productivity Labour hours per unit
Manufacturing space required
Product transportation length
Safety Injuries index
Ergonomics metrics
Safety risk factor
Days worked without a lost time
accident
Delivery/
Reliability
Lead time Average lead time per unit
Changeover/set up time Average set-up time per unite
On-time delivery
Right quantity delivery
Processing time Order processing time/Total
orders
Material handling time
Down time Total down time/Total
machine time
Cycle time
Waiting time for sharing tools
Waiting time for materials
Product stock outs No. of stock out/No. Of orders
Reorder rate
31
2.5 Lean Maturity and Assessment Models
Recent literature shows an increasing practical and academic interest in maturity
models (Becker, et al., 2010). Maturity models have been formed on theory of evolution
and change and have been defined as the sequences of stages that articulate an anticipated
path of maturity (Gottschalk, 2009). Using a maturity model to define directions,
prioritising improvement opportunities, and guide cultural changes is a helpful way of
managing the major transformation changes (Nesensohn, et al., 2014).
Application of a maturity model is necessary to lead the project towards right
direction, whether a company want to implement lean or to shift its established lean
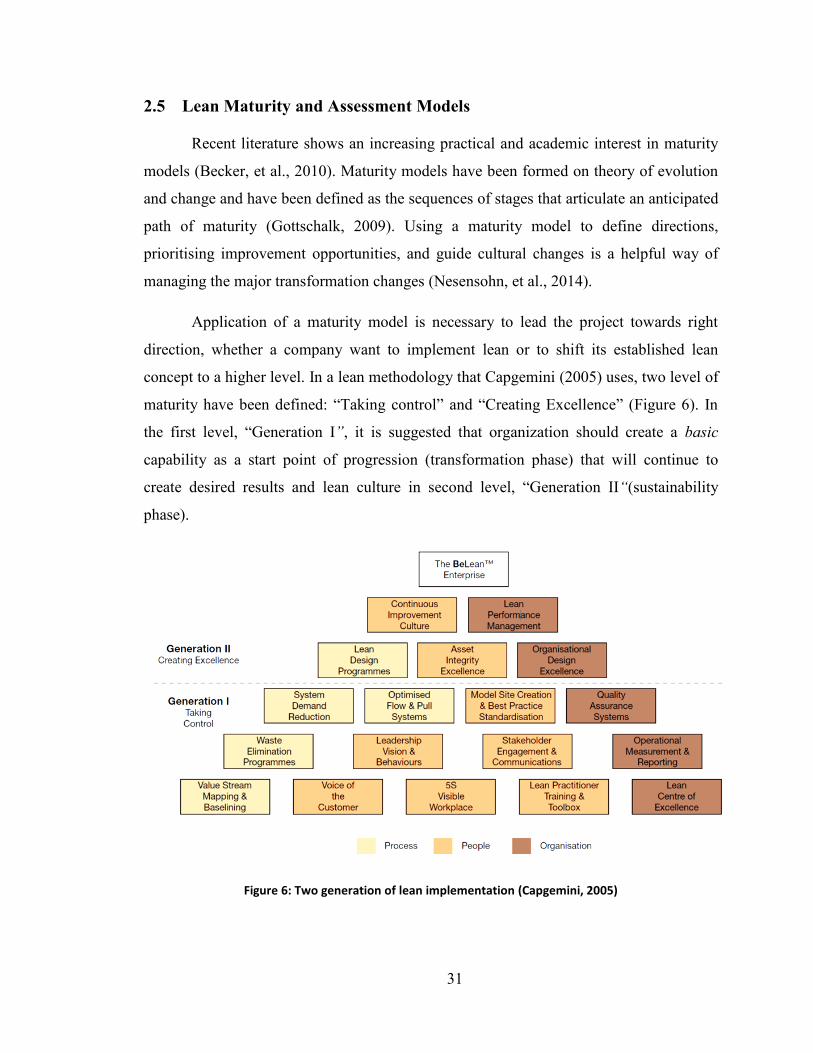
concept to a higher level. In a lean methodology that Capgemini (2005) uses, two level of
maturity have been defined: “Taking control” and “Creating Excellence” (Figure 6). In
the first level, “Generation I”, it is suggested that organization should create a basic
capability as a start point of progression (transformation phase) that will continue to
create desired results and lean culture in second level, “Generation II“(sustainability
phase).
Figure 6: Two generation of lean implementation (Capgemini, 2005)

32
Lean manufacturing is a gradual process of deep-rooted change in the
organizational culture and its people. Therefore, a maturity model and an assessment
model to follow a step by step evolution of lean culture are crucial for achieving a
sustainable lean status. The approaches were used to measure the leanness of
organizations can be divided into two main groups (Behrouzi & Wong, 2013): measuring
the level of implementing the lean principles and techniques qualitatively and measuring
quantitative results of lean implementation based on the performance outputs.
2.5.1 Qualitative Assessment
Various qualitative assessment tools for the evaluation and development of lean
concept have been developed in recent years.
In the operational level, for example, the “Renault Production System (RPS)” was
developed by Renault Company based on the Nissan Production way. To increase
customer satisfaction, four strategic targets have been set in RPS (SPR, 2004):
- Achievement of desired quality
- Reduction of overall production costs
- Right time and right quantity production
- Personal accountability and mutual respect
RPS rules, procedures and techniques are applied to increase industrial
performance in four main manufacturing functions namely Product and Process design,
Inbound Supplying, Outbound Logistics and Manufacturing (SPR, 2004). However, the
primary focus of RPS is in the elementary working teams at the production workstations.
The visual model of RPS (Figure 5) shows the set of tools and procedures that Renault
used in its production system. A daily excellence roadmap is also developed in RPS
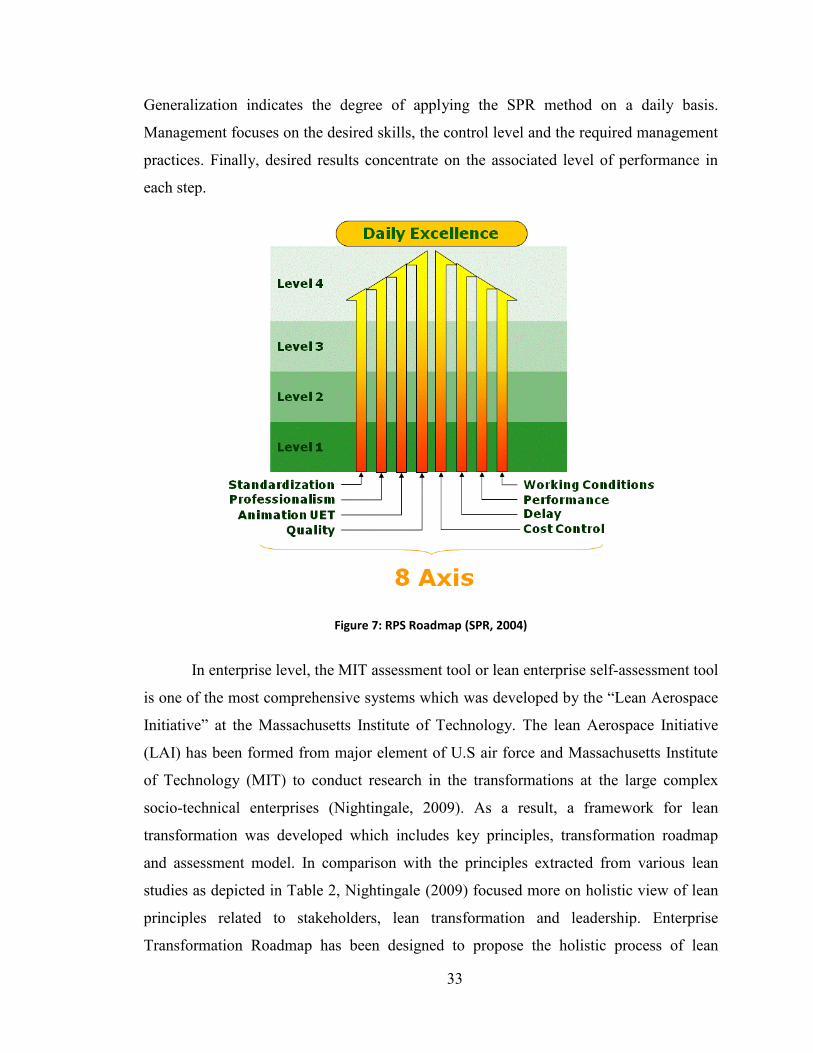
which provides the way in which the RPS is deployed and assessed. The RPS roadmap
also provides the coherence between all the improvement initiatives and their direction
toward RPS strategy (Figure 7). The roadmap is supported by a assessment system which
includes the general checklists related to requirements of system at each level of
excellence in the eight pillars of the system. In each pillar, system is measured based on
the “desired level of generalization”, “management” and “desired results” (SPR, 2004).
33
Generalization indicates the degree of applying the SPR method on a daily basis.
Management focuses on the desired skills, the control level and the required management
practices. Finally, desired results concentrate on the associated level of performance in
each step.
Figure 7: RPS Roadmap (SPR, 2004)
In enterprise level, the MIT assessment tool or lean enterprise self-assessment tool
is one of the most comprehensive systems which was developed by the “Lean Aerospace
Initiative” at the Massachusetts Institute of Technology. The lean Aerospace Initiative
(LAI) has been formed from major element of U.S air force and Massachusetts Institute
of Technology (MIT) to conduct research in the transformations at the large complex
socio-technical enterprises (Nightingale, 2009). As a result, a framework for lean
transformation was developed which includes key principles, transformation roadmap
and assessment model. In comparison with the principles extracted from various lean
studies as depicted in Table 2, Nightingale (2009) focused more on holistic view of lean
principles related to stakeholders, lean transformation and leadership. Enterprise
Transformation Roadmap has been designed to propose the holistic process of lean

34
implementation. It consists three main cycles of activities for lean transformation:
Strategic cycle, Planning cycle, and Execution cycle (Figure 8).
Figure 8: lean Enterprise model developed by LAI (Nightingale & Srinivasan, 2011)
To complete the model, LAI proposed a lean evaluation framework, lean
Enterprise Self Assessment Tool (LESAT). LESAT is a powerful guideline which helps
organization to assess their readiness for transformation as well as their level of maturity.
LAI determined following five level of capability maturity in supply chain management:
Traditional, Adopter, Performer, Reformer and Transformer (Bozdogan, 2004). Main
characteristics of each level has described as follow (LESAT, 2001):
Level 1: “Some awareness of this practice; sporadic improvement
activities may be underway in a few areas”.
Level 2: “General awareness; informal approach deployed in a few
areas with varying degrees of effectiveness and sustainment”.
Level 3: “A systematic approach/methodology deployed in varying
stages across most areas; facilitated with metrics; good
sustainment”.

35
Level 4: “On-going refinement and continuous improvement across
the enterprise; improvement gains are sustained”.
Level 5: “Exceptional, well-defined, innovative approach is fully
deployed across the extended enterprise (across internal and
external value streams); recognized as best practice”.
Among all the developed models of lean management, LAI provided one the most
comprehensive models described the primary activities and major tasks as well as
supportive enablers and tools. According to Hallam’s analysis (2003) of information
obtained from thirty-one enterprises in the US and UK aerospace industry that were
utilizing the LAI lean Enterprise Self-Assessment Tool (LESAT), going through the
assessment process is a valuable way of understanding the current state of lean. It
increase communication and common vocabulary around subject and clarify the current
and next level of lean maturity. Although LAI’s framework is one of the most
comprehensive models of lean transition, like many other recent lean models, it
concentrates on internal and external relations and strategic issues from the enterprise
perspective. Implementation path (LEM) is clear with the support of LESAT and
principles’ guide, but practitioners need help with the details of implementations.
The Shingo Prize, as another widely used lean assessment models was created in
1988 at the Jon M. Huntsman School of Business at Utah State University. Shingo model
maintains systematic lean assessment by considering the organization culture as a key
driver of lean implementation. The Shingo Model highlighted that improvement will not
be achieved only when tools and techniques (‘know how’) are used. Although the tools
and techniques are the building foundations of lean transformation, for deeper and
sustainable lean transformation, understanding and integrating the underlying Principles
(‘know why’) is necessary. To support the assessment model, a visual model of
operational excellence had been introduced by Shingo Academy. The Shingo house
consists of four dimensions: “Cultural enablers”, “Continuous Process Improvement”,
“Enterprise Alignment” and “Result” (Miller, 2012).
Shingo assessment model evaluates organizational performance in terms of
organizational behaviours and the operational excellence results. The behaviours are
assessed through first three dimensions in three organizational hierarchy levels: senior
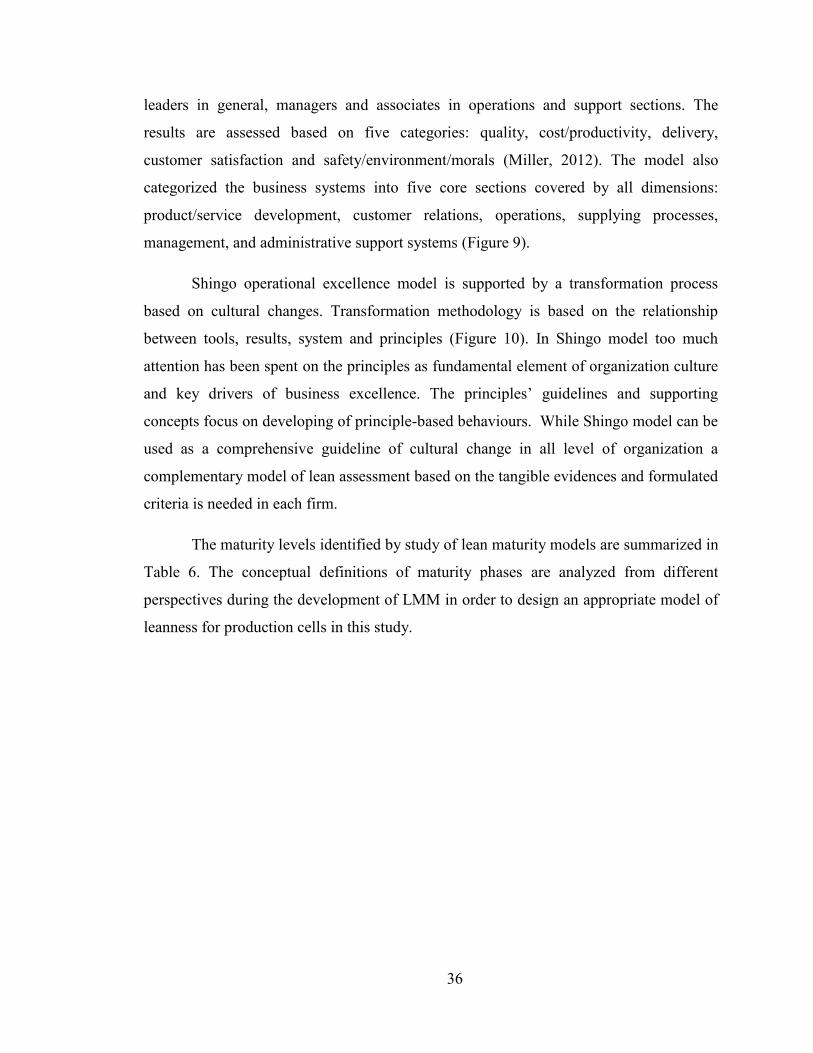
36
leaders in general, managers and associates in operations and support sections. The
results are assessed based on five categories: quality, cost/productivity, delivery,
customer satisfaction and safety/environment/morals (Miller, 2012). The model also
categorized the business systems into five core sections covered by all dimensions:
product/service development, customer relations, operations, supplying processes,
management, and administrative support systems (Figure 9).
Shingo operational excellence model is supported by a transformation process
based on cultural changes. Transformation methodology is based on the relationship
between tools, results, system and principles (Figure 10). In Shingo model too much
attention has been spent on the principles as fundamental element of organization culture
and key drivers of business excellence. The principles’ guidelines and supporting
concepts focus on developing of principle-based behaviours. While Shingo model can be
used as a comprehensive guideline of cultural change in all level of organization a
complementary model of lean assessment based on the tangible evidences and formulated
criteria is needed in each firm.
The maturity levels identified by study of lean maturity models are summarized in
Table 6. The conceptual definitions of maturity phases are analyzed from different
perspectives during the development of LMM in order to design an appropriate model of
leanness for production cells in this study.
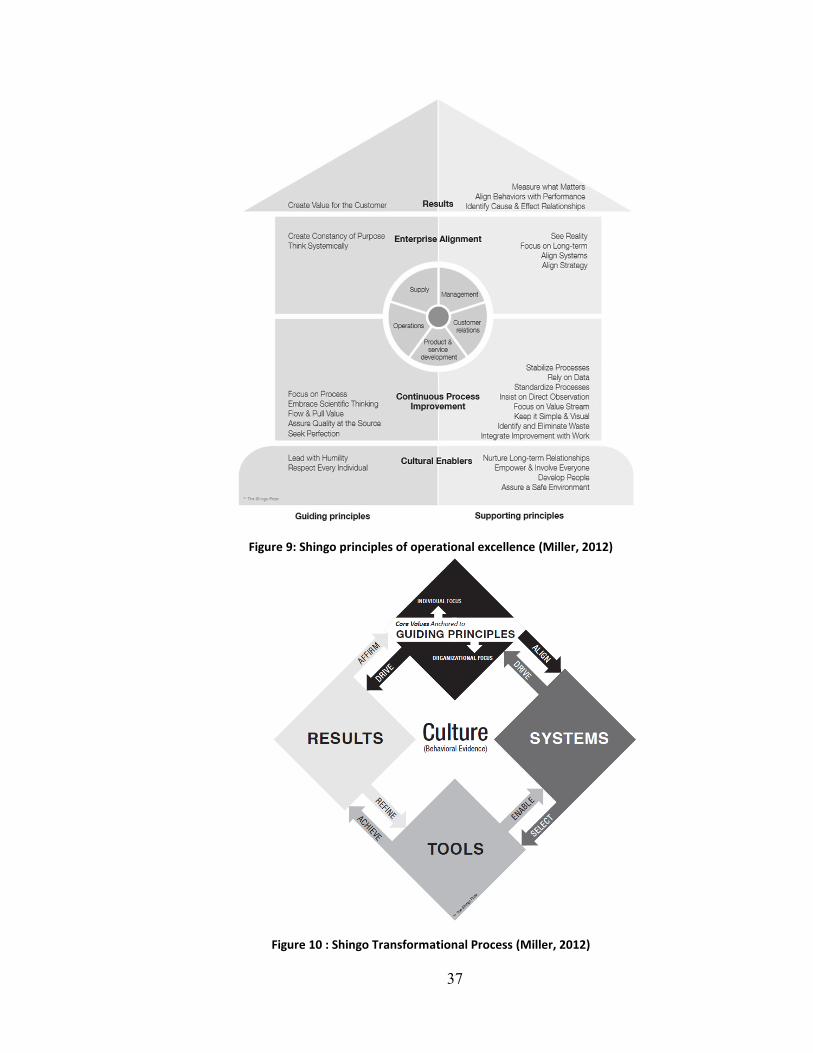
37
Figure 9: Shingo principles of operational excellence (Miller, 2012)
Figure 10 : Shingo Transformational Process (Miller, 2012)
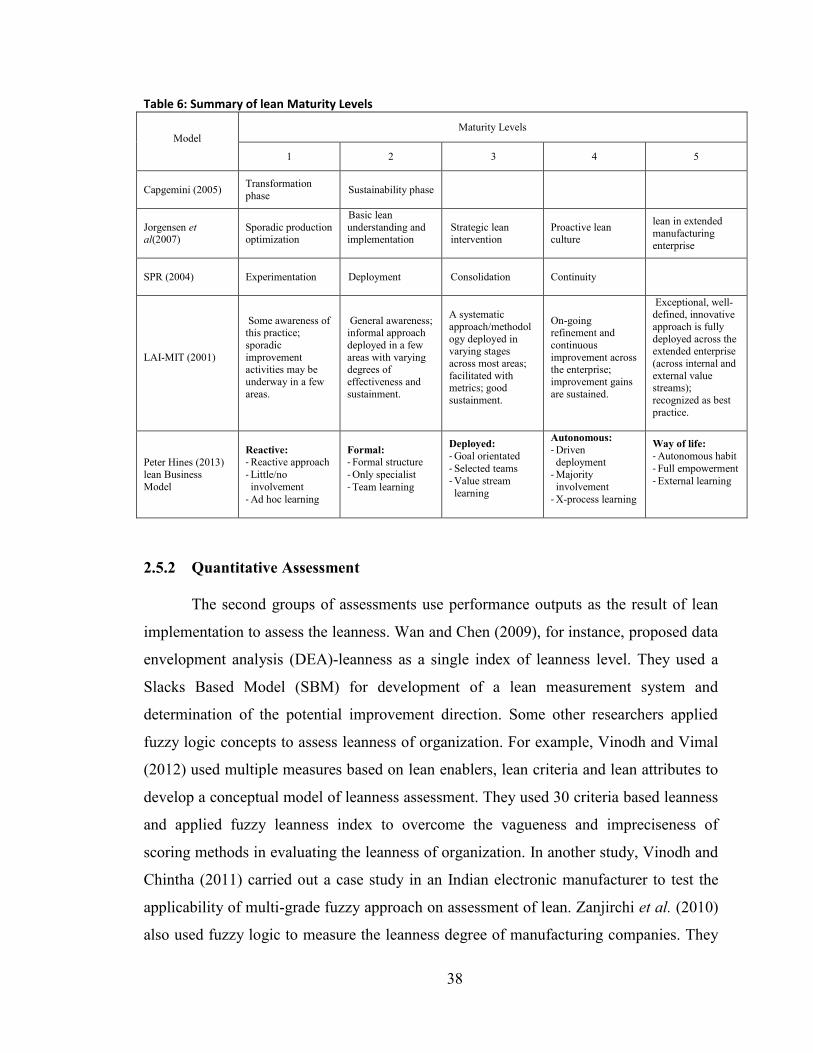
38
Table 6: Summary of lean Maturity Levels
Model
Maturity Levels
1 2 3 4 5
Capgemini (2005) Transformation
phase Sustainability phase
Jorgensen et al(2007)
Sporadic production optimization
Basic lean
understanding and implementation
Strategic lean intervention
Proactive lean culture
lean in extended
manufacturing
enterprise
SPR (2004) Experimentation Deployment Consolidation Continuity
LAI-MIT (2001)
Some awareness of this practice;
sporadic
improvement activities may be
underway in a few
areas.
General awareness; informal approach
deployed in a few
areas with varying degrees of
effectiveness and
sustainment.
A systematic
approach/methodol
ogy deployed in
varying stages
across most areas;
facilitated with metrics; good
sustainment.
On-going refinement and
continuous
improvement across the enterprise;
improvement gains
are sustained.
Exceptional, well-defined, innovative
approach is fully
deployed across the
extended enterprise
(across internal and
external value streams);
recognized as best
practice.
Peter Hines (2013)
lean Business
Model
Reactive:
- Reactive approach
- Little/no
involvement
- Ad hoc learning
Formal:
- Formal structure
- Only specialist
- Team learning
Deployed:
- Goal orientated
- Selected teams
- Value stream
learning
Autonomous:
- Driven
deployment
- Majority
involvement
- X-process learning
Way of life:
- Autonomous habit
- Full empowerment
- External learning
2.5.2 Quantitative Assessment
The second groups of assessments use performance outputs as the result of lean
implementation to assess the leanness. Wan and Chen (2009), for instance, proposed data
envelopment analysis (DEA)-leanness as a single index of leanness level. They used a
Slacks Based Model (SBM) for development of a lean measurement system and
determination of the potential improvement direction. Some other researchers applied
fuzzy logic concepts to assess leanness of organization. For example, Vinodh and Vimal
(2012) used multiple measures based on lean enablers, lean criteria and lean attributes to
develop a conceptual model of leanness assessment. They used 30 criteria based leanness
and applied fuzzy leanness index to overcome the vagueness and impreciseness of
scoring methods in evaluating the leanness of organization. In another study, Vinodh and
Chintha (2011) carried out a case study in an Indian electronic manufacturer to test the
applicability of multi-grade fuzzy approach on assessment of lean. Zanjirchi et al. (2010)
also used fuzzy logic to measure the leanness degree of manufacturing companies. They

39
developed a methodology based on the linguistic variables and fuzzy numbers to measure
the organization’s leanness. Singh et al. (Singh, et al., 2010) proposed an assessment
method according to the judgment of leanness measurement team to evaluate the leanness
through measurement of lean parameters such as supplier and customers' issues,
investment priorities and waste elimination. They suggested fuzzy set theory to eliminate
the individual’s perception bias. In another model, Behrouzi and Wong (2013) used an
integrated stochastic-fuzzy modeling approach to evaluate leanness of supply chain. They
used expert’s judgment to extract the 28 lean supply chain performance measures from an
initial list and to score them using data gathered from a survey. Anvari et al (Anvari, et
al., 2012) provided an innovative approach based on the fuzzy membership function to
measure the impacts of lean attributes on organizational performance.
Some research use both quantitative and qualitative measures for a comprehensive
evaluation of lean implementation. Amin and Karim (2012) proposed simultaneous
application of value stream mapping (VSM), performance metrics and maturity level to
measure the manufacturing performance in root cause analysis and lean strategy
selection. In another study, Pakdil and Leonard (2014) developed Leanness Assessment
Tool (LAT) for comprehensive evaluation of overall leanness based on the quantitative
objectives and qualitative individual’s perceptions.
2.6 Critical Analysis of Literature
Based on reviewing the literature, the studies and research on lean assessment
models have divided into two main categories.
On one hand, several attempts had been made to codify and shape the lean
practices into a synchronized set of tools and techniques specifically in the operational
level. These efforts included the description of tools and methods, and in the best cases,
focus on integration and synchronization of tools and methods and their relations to the
organizational objectives. These studies failed to consider transformation principles and
infrastructural requirements of lean as a management philosophy.
On the other hand, numerous studies have attempted to explain lean as a holistic
approach in the enterprise level. The principles and infrastructural requirements in the
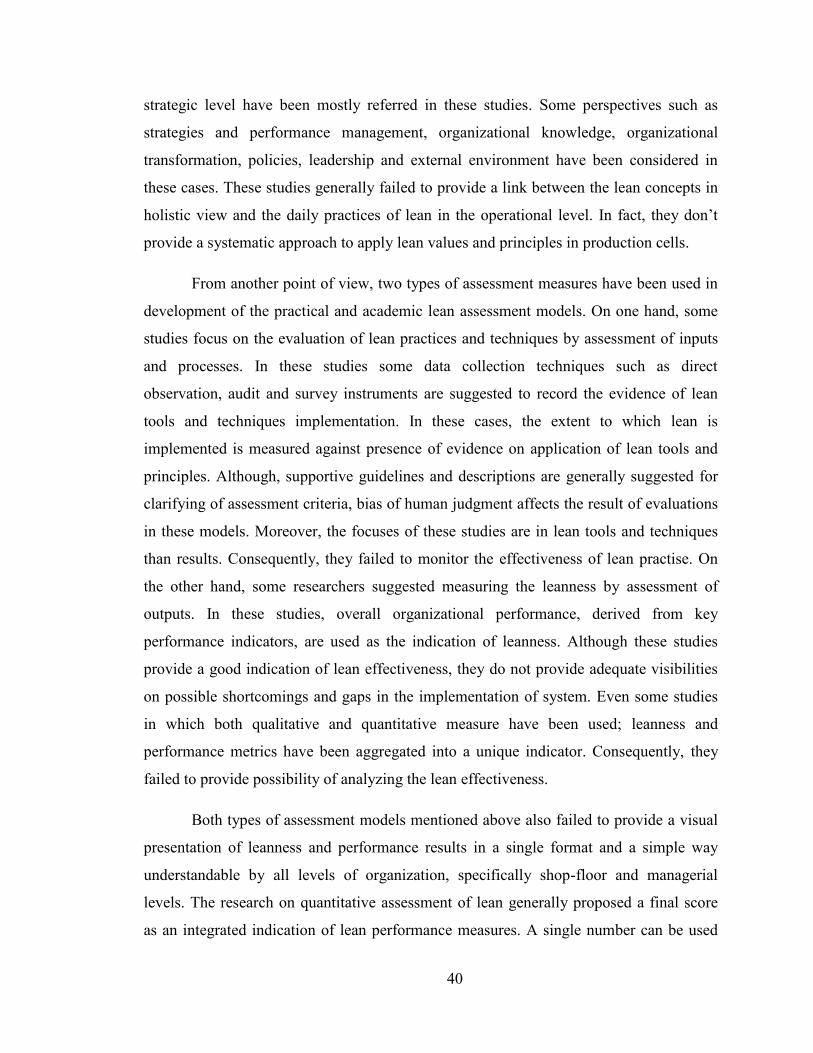
40
strategic level have been mostly referred in these studies. Some perspectives such as
strategies and performance management, organizational knowledge, organizational
transformation, policies, leadership and external environment have been considered in
these cases. These studies generally failed to provide a link between the lean concepts in
holistic view and the daily practices of lean in the operational level. In fact, they don’t
provide a systematic approach to apply lean values and principles in production cells.
From another point of view, two types of assessment measures have been used in
development of the practical and academic lean assessment models. On one hand, some
studies focus on the evaluation of lean practices and techniques by assessment of inputs
and processes. In these studies some data collection techniques such as direct
observation, audit and survey instruments are suggested to record the evidence of lean
tools and techniques implementation. In these cases, the extent to which lean is
implemented is measured against presence of evidence on application of lean tools and
principles. Although, supportive guidelines and descriptions are generally suggested for
clarifying of assessment criteria, bias of human judgment affects the result of evaluations
in these models. Moreover, the focuses of these studies are in lean tools and techniques
than results. Consequently, they failed to monitor the effectiveness of lean practise. On
the other hand, some researchers suggested measuring the leanness by assessment of
outputs. In these studies, overall organizational performance, derived from key
performance indicators, are used as the indication of leanness. Although these studies
provide a good indication of lean effectiveness, they do not provide adequate visibilities
on possible shortcomings and gaps in the implementation of system. Even some studies
in which both qualitative and quantitative measure have been used; leanness and
performance metrics have been aggregated into a unique indicator. Consequently, they
failed to provide possibility of analyzing the lean effectiveness.
Both types of assessment models mentioned above also failed to provide a visual
presentation of leanness and performance results in a single format and a simple way
understandable by all levels of organization, specifically shop-floor and managerial
levels. The research on quantitative assessment of lean generally proposed a final score
as an integrated indication of lean performance measures. A single number can be used
41
for benchmarking purpose, but it does not provide any insight into different aspects of
lean implementation and strengths and areas of improvements in each dimension.
Based on the mentioned gaps in current lean assessment approaches, in this study,
a visual multidimensional lean maturity model in shop floor level is proposed. Providing
a condition in the level of shop-floor to assess and lead the implementation of lean is as
important as the lean program in the level of enterprise. It should be at the center of
attention in all the steps of lean implementation from introduction and training through
practicing and applying of tools and principles. Behavioral changes will be achieved
during the training, executing, coaching and monitoring steps and through the
constructive communication between leaders, lean practitioners and executive teams.
While leanness indicators represent the extent to which lean principles and
practices are applied correctly in each dimension of a production cells, related
performance results demonstrate the effect of that practices in achievement of production
cells’ targets, and as a consequence, achievement of organizational objectives. The
leanness indicators represent the correct execution of lean practices according to a
customized way defined by organization. Thus, they are not appropriate subjects of
benchmarking between different companies. Whereas, performance measures are
common used indicators and can be benchmarked by best practices in each industry.
Lean maturity model suggested in this study provide the possibility of self-benchmarking
the best lean practices between the production cells of an organization and also suggest
external benchmarking of performance targets between different companies in an
industry.
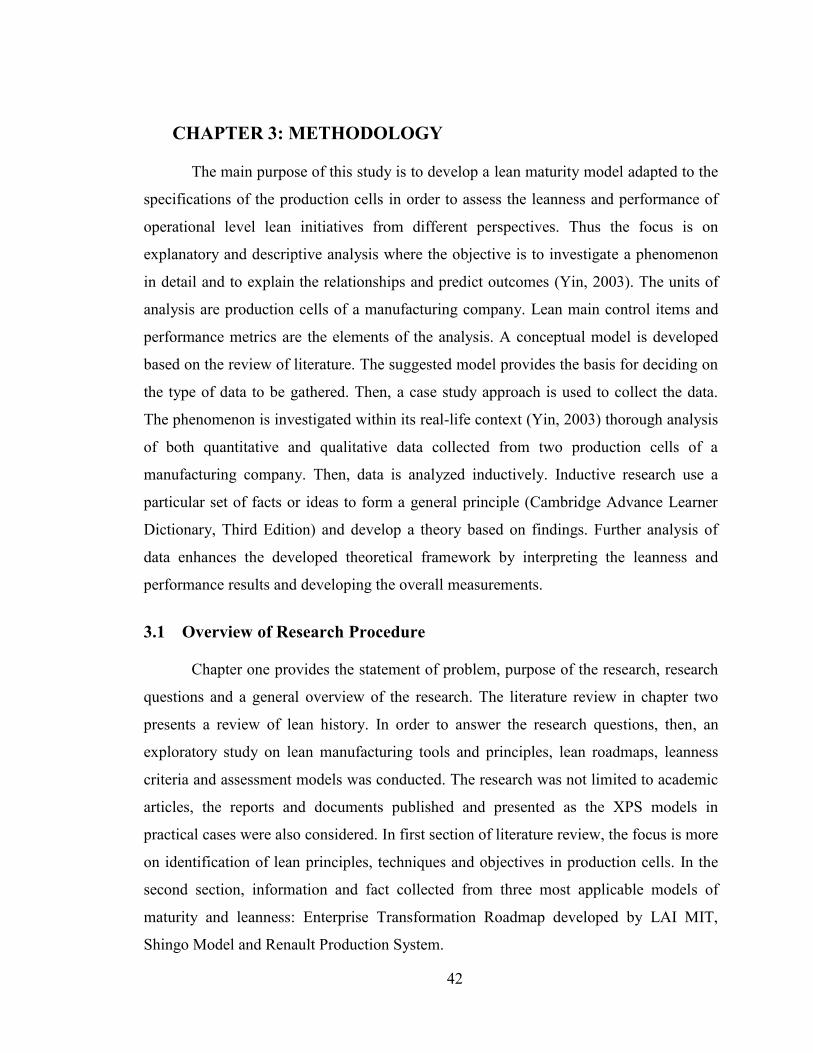
42
3 CHAPTER 3: METHODOLOGY
The main purpose of this study is to develop a lean maturity model adapted to the
specifications of the production cells in order to assess the leanness and performance of
operational level lean initiatives from different perspectives. Thus the focus is on
explanatory and descriptive analysis where the objective is to investigate a phenomenon
in detail and to explain the relationships and predict outcomes (Yin, 2003). The units of
analysis are production cells of a manufacturing company. Lean main control items and
performance metrics are the elements of the analysis. A conceptual model is developed
based on the review of literature. The suggested model provides the basis for deciding on
the type of data to be gathered. Then, a case study approach is used to collect the data.
The phenomenon is investigated within its real-life context (Yin, 2003) thorough analysis
of both quantitative and qualitative data collected from two production cells of a
manufacturing company. Then, data is analyzed inductively. Inductive research use a
particular set of facts or ideas to form a general principle (Cambridge Advance Learner
Dictionary, Third Edition) and develop a theory based on findings. Further analysis of
data enhances the developed theoretical framework by interpreting the leanness and
performance results and developing the overall measurements.
3.1 Overview of Research Procedure
Chapter one provides the statement of problem, purpose of the research, research
questions and a general overview of the research. The literature review in chapter two
presents a review of lean history. In order to answer the research questions, then, an
exploratory study on lean manufacturing tools and principles, lean roadmaps, leanness
criteria and assessment models was conducted. The research was not limited to academic
articles, the reports and documents published and presented as the XPS models in
practical cases were also considered. In first section of literature review, the focus is more
on identification of lean principles, techniques and objectives in production cells. In the
second section, information and fact collected from three most applicable models of
maturity and leanness: Enterprise Transformation Roadmap developed by LAI MIT,
Shingo Model and Renault Production System.

43
This chapter discusses the research methodology employed for this study along
with the data collection procedure and data analysis methods. The chapter begins by
establishing the overall approach and focus of the research. Then, the main stages of
developing LMM are defined. The data collection plan and the way both quantitative and
qualitative indicators are collected in a case study is then described. Finally, analysis of
results is followed by discussion and explanation of research validity and reliability.
Based on the review of literature and experience of author, a conceptual
framework is developed in chapter four, which provides a structure of LMM in the level
of operation and particularly in production cells. The applicability of model then will be
tested through an empirical study and analysis of leanness and performance results in
chapter five and six. Finally, the contributions of research, its limitations and
delimitations along with the recommendations are presented in chapter seven. Figure 11
shows the general framework of the research methodology.
Figure 11: Framework of the research approach
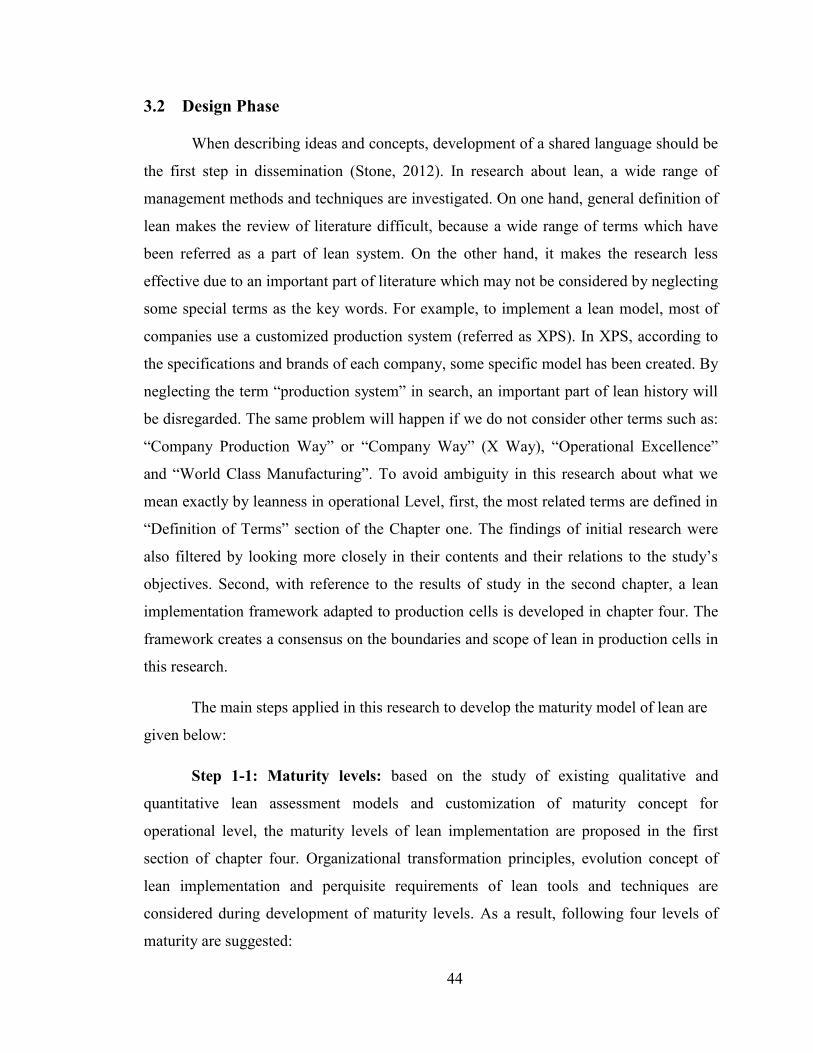
44
3.2 Design Phase
When describing ideas and concepts, development of a shared language should be
the first step in dissemination (Stone, 2012). In research about lean, a wide range of
management methods and techniques are investigated. On one hand, general definition of
lean makes the review of literature difficult, because a wide range of terms which have
been referred as a part of lean system. On the other hand, it makes the research less
effective due to an important part of literature which may not be considered by neglecting
some special terms as the key words. For example, to implement a lean model, most of
companies use a customized production system (referred as XPS). In XPS, according to
the specifications and brands of each company, some specific model has been created. By
neglecting the term “production system” in search, an important part of lean history will
be disregarded. The same problem will happen if we do not consider other terms such as:
“Company Production Way” or “Company Way” (X Way), “Operational Excellence”
and “World Class Manufacturing”. To avoid ambiguity in this research about what we
mean exactly by leanness in operational Level, first, the most related terms are defined in
“Definition of Terms” section of the Chapter one. The findings of initial research were
also filtered by looking more closely in their contents and their relations to the study’s
objectives. Second, with reference to the results of study in the second chapter, a lean
implementation framework adapted to production cells is developed in chapter four. The
framework creates a consensus on the boundaries and scope of lean in production cells in
this research.
The main steps applied in this research to develop the maturity model of lean are
given below:
Step 1-1: Maturity levels: based on the study of existing qualitative and
quantitative lean assessment models and customization of maturity concept for
operational level, the maturity levels of lean implementation are proposed in the first
section of chapter four. Organizational transformation principles, evolution concept of
lean implementation and perquisite requirements of lean tools and techniques are
considered during development of maturity levels. As a result, following four levels of
maturity are suggested:

45
- Level 1: Understanding
- Level 2: Implementation
- Level 3: Improvement
- Level 4: sustainability
The characteristics of each level and expected level of implementation and result are
described in detail in Chapter four.
Step 1-2: Maturity axes: in second step, lean axes are defined based on the
requirements of lean implementation in production cells. Balanced development of lean
concept in all axes during implementation of lean in shop-floor is very important.
Consequently, it is necessary to evaluate the progression of lean program in each pillar to
ensure that progression is made in a balanced condition. Based on the explanatory
analysis of information obtained from review of lean concept in the literature, following
seven axes are defined in the second step of conceptual model development. The axes are
specifically defined for implementation of lean in production cells in manufacturing
environment. They can be adapted to other industries based on the same logic as used in
Chapter four.
- Axis 1: People
- Axis 2: Facilities
- Axis 3: Working Condition
- Axis 4: Production Processes
- Axis 5: Quality
- Axis 6: Just in Time
- Axis 7: Leadership
Step 1-3: Leanness and performance indicators: in third step, the focus is on
definition of leanness objectives and organizational performance indicators in each axis
of maturity model. Leanness objectives should be defined particularly based on the way
of implementing lean in each organization. The general concepts and principles to be
considered in a production cell in each axis of LMM have been discussed in third step of
model development. But, to develop and examine a comprehensive LMM, leanness and
performance objectives should be defined in a real scenario. Thus, a case study is used in
Chapter five in order to customize the proposed general model.

46
Step 1-4: Lean enablers: in last section of Chapter four, lean tools and methods
are proposed to support development of lean principles through maturity levels. Lean
tools and techniques are extracted from the review of the literature and classified based
on the requirements of each axes. The classification provides a general guideline for
selection of appropriate lean tools and techniques in each axis of LMM to define the
action plans needed for filling the gaps discovered during the lean assessment.
Four steps of LMM development, as is described in detail in Chapter four, can be
used as a general framework to development a customized lean maturity model for each
organization. Four levels of maturity can be used in any organization to implement lean
philosophy gradually in different organizational levels. Lean axes may be changed
slightly based on the structure of cells in other sections out of manufacturing industry.
Lean and performance objectives and enablers in step 1-3 and 1-4 should be tailored
based on the organizational strategy and the way the firm is applying lean tools and
techniques in each company.
3.3 Measurement Phase
Defining and measuring of leanness indicators and performance measures is a part
of developing LMM which will not happen unless the model adapted to a real case. Thus,
a case study is needed to adjust the general proposed framework to a detailed and
customized lean assessment model. Furthermore, data is needed to examine the capability
of the model in evaluation of lean effectiveness.
A case-study approach was selected because it is a recognizable form of
validation in research when detailed “How” and “why” questions are posed about a
current set of events (Yin, 2003). A case study is chosen to conduct LMM as an
evaluation tool for assessing the leanness of two production cells in different workshops
of an automotive company where lean has been practiced for more than seven years. Both
quantitative and qualitative methods can be applied for collecting data in academic
research. In order to define and collect the data required for assessment of leanness as
well as measurement of performance, following steps have been pursued. It is suggested
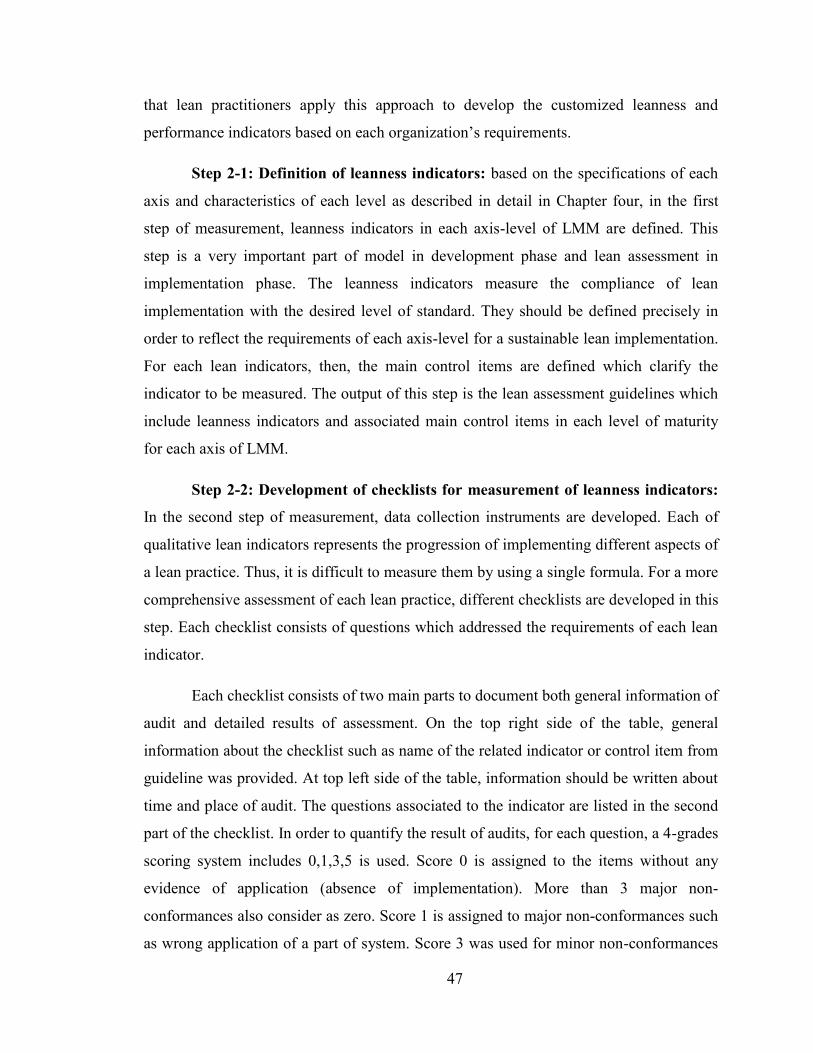
47
that lean practitioners apply this approach to develop the customized leanness and
performance indicators based on each organization’s requirements.
Step 2-1: Definition of leanness indicators: based on the specifications of each
axis and characteristics of each level as described in detail in Chapter four, in the first
step of measurement, leanness indicators in each axis-level of LMM are defined. This
step is a very important part of model in development phase and lean assessment in
implementation phase. The leanness indicators measure the compliance of lean
implementation with the desired level of standard. They should be defined precisely in
order to reflect the requirements of each axis-level for a sustainable lean implementation.
For each lean indicators, then, the main control items are defined which clarify the
indicator to be measured. The output of this step is the lean assessment guidelines which
include leanness indicators and associated main control items in each level of maturity
for each axis of LMM.
Step 2-2: Development of checklists for measurement of leanness indicators:
In the second step of measurement, data collection instruments are developed. Each of
qualitative lean indicators represents the progression of implementing different aspects of
a lean practice. Thus, it is difficult to measure them by using a single formula. For a more
comprehensive assessment of each lean practice, different checklists are developed in this
step. Each checklist consists of questions which addressed the requirements of each lean
indicator.
Each checklist consists of two main parts to document both general information of
audit and detailed results of assessment. On the top right side of the table, general
information about the checklist such as name of the related indicator or control item from
guideline was provided. At top left side of the table, information should be written about
time and place of audit. The questions associated to the indicator are listed in the second
part of the checklist. In order to quantify the result of audits, for each question, a 4-grades
scoring system includes 0,1,3,5 is used. Score 0 is assigned to the items without any
evidence of application (absence of implementation). More than 3 major non-
conformances also consider as zero. Score 1 is assigned to major non-conformances such
as wrong application of a part of system. Score 3 was used for minor non-conformances

48
which represents single observed lapse in some parts of system. More than 5 minor non-
compliances also consider as major. Finally, score 5 was given to a complete
accomplishment of an item’s requirements. Depends on the importance of each question
in the checklist, the value of the questions may be weighted based on an evaluation
weighting system. In the case of using such a system to assess the progress, a weighted
sum of audit results should be regarded as the final indication of progress. Appendix A
shows a sample checklist format used to collect the qualitative information of all leanness
indicators.
Step 2-3: Definition of performance indicators: The main purpose of lean
initiative is to achieve the organization’s main objectives. Measuring the performance of
production cells related to lean practices is important in order to show the effectiveness of
lean implementation. However, performance results are influenced by numerous factors.
Thus, creating a one-to-one link between leanness indicators and performance measures
is almost impossible. Some performance indicators such as OEE (Overall Equipment
Efficiency) are even related to more than one dimension of lean. On the other hand,
focusing on the fewer but most important and most relevant performance measures helps
the team to focus on achievement of organization’s objectives. The proposed LMM
provides the possibility of measuring the effectiveness of lean practices in each
dimension of lean model. Further analysis then can be applied to address the principal
causes of ineffectiveness.
The performance measures used in each axis of LMM may vary from firm to
firm. They can also change to more relevant and more precise indicators when
organization becomes more mature. In the third step of data collection, performance
measures are defined for each axis of LMM in each production cell of case study. Same
as leanness indicators, performance measures are specifically defined in each
organization based on their priorities and objectives. In the case study, performance
measures are selected based on availability of data and relation of indicators to lean
practices. The detail information on performance measures selected in each axis of LMM
is described in Chapter five.

49
Step 2-4: Data collection: in any empirical research, data collection is an
important and time consuming phase. Accuracy of data plays a decisive role in the results
of research. Several methods of data collection such as direct and indirect observations,
audits, interviews, historical analysis and questionnaire can be used for this purpose. The
main objective of data gathering is to gather as accurate information as possible related to
each indicator of lean implementation in deferent levels-axis of maturity model. In this
case study, a structured data gathering approach through observation is used.
To assess the proposed qualitative indicators of lean implementation, direct
observation and data gathering through audits are used. Audit is a systematic way to
check the evidences and to evaluate them in order to measure the extent to which
predefined criteria are met (Chiesa, et al., 1996). Audit also provides the opportunity to
address the gaps and coach the involved people to fill them. Audits are conducted for
each leanness indicator of developed guidelines by certified lean senior instructors using
the checklists developed in the step 2 of measurement phase. In each axis of LMM, audits
are conducted first for leanness indicators in maturity level one. Based on the average
leanness of each level, then, further audits are conducted for upper levels of each axis. As
a generally accepted rule, when the average result of all indicators in a level was equal or
less than 70%, the evaluation of production cells stopped in that axis-level.
For collection of data on the quantitative measures of lean and performance,
historical data was gathered from case study’s production cells and database of Balance
Scorecard.
3.4 Analysis Phase
In most of the studies related to the lean assessment, performance measures are
used as the indicator of leanness (e.g. Bhasin, 2008; Pakdil & Moustafa Leonard, 2014;
Behrouzi & Wong, 2013). Although considering performance indicators is necessary to
evaluate the effectiveness of lean implementation, understanding, evaluating and
improving the system in which performance is created is also crucial. Understanding the
difference and interaction between these two sets of indicators are necessary for
assessment of overall lean success. While lean metrics focus on level of lean maturity,
performance indicators show how much lean efforts help organization to attain its key

50
objectives. Thus, in this study, the leanness and performance indicators are calculated
separately and then compared together in each axis of LMM in order to analyze the
effectiveness of lean practices. In order to analyze the results of lean assessment more
effectively, the groups of structured data obtained from case study is analyzed
descriptively in following steps:
Step 3-1: Calculation of overall leanness: first, data of audits is used to calculate
the result of each leanness indicators in two production cells of case study. Based on the
number of non-conformances observed during the audits, one of the 0, 1, 3 and 5 scores
is given to each question of the checklist. Evidence-based scoring system is used to
minimize the perception bias of different auditors. Finally, based on the results of audit
which are summarized in the checklists, leanness of each lean indicator is calculated in
the scale of 0 to 1. The minimum of the averages leanness indicators in each level is used
to calculate the overall leanness of each LMM level. The overall leanness of each axis is
also calculated based on the sum of leanness scores up to the first uncompleted level of
each axis. Finally, overall leanness of each production cells is suggested as the minimum
of overall leanness between seven axes of LMM. Calculations are described in detail in
Chapter five.
Step 3-2: Calculation of overall performance in each axis of LMM: Different
sets of performance measures with different scales are proposed to measure the
performance of each manufacturing cells. Due to the complexity of manufacturing
systems, measuring the impact of each practice on performance is very difficult.
However, both the results and the practices can be categorized in 7 dimensions of
production cells. Performance measurement is a multidimensional concept (Bhasin,
2008). Therefore, a method is needed to synthesize their various dimensions with
different scales into a unified index. Referring back to the review of literature on lean
assessment models, a fuzzy synthetic index as a composite indicator (Zani, et al., 2013)
can be used to calculate the overall performance of each lean dimension.
Fuzzy logic is a form of many-valued logic in which everything is a matter of
degree (Zadeh, 1965). Behrouzi and Wong (2013) suggested using fuzzy membership
functions to quantify the lean performance of manufacturing systems. They proposed
51
comparing the current performance of the system to the benchmarks determined by
historical data. This method is also applicable and useful for measurement of
manufacturing cell’s performance related to the lean initiatives in each axis of proposed
LMM. The following basic definitions of fuzzy logic are used to calculate the overall
performance of production cells:
Definition 1 (Kaufmann & Gupta, 1991): A fuzzy set in a universe of
discourse X is characterized by a membership function ( ) which associates with each
element in X a real number in the interval 0, 1]. The function value ( ) is termed the
grade of membership of in .
Definition 2 (Klir & Yuan, 1995): Membership function in a Trapezoidal-shape
fuzzy set is defined as (x; a,b,c,d):
(x;a,b,c,d):
Definition 3 (Klir & Yuan, 1995): In an R-shape Trapezoidal fuzzy set
and in an L-shape Trapezoidal fuzzy set
To apply the fuzzy logic in calculation of performance, expected value of target
and worst case value of each performance measure are required. In the case study, the
target and worst case values are defined based on the historical and benchmarking data as
desired and minimum expected value of each indicator. Both the targets and worst cases
are assigned to two boundaries of lean maturity levels. Accordingly, worst cases reflects
the initial situation of production cell in level 0 of maturity (a non-lean production cell)
and targets are selected based on the expectation of team from a production cell in level 4

52
of lean maturity (a lean production cell). The targets and worst case values were used as
the threshold of each indicator.
Different performance measures may be used in each axis of LMM. Each
represents one aspect of production cell and can be used to fulfill one of the
organization’s KPIs. Thus, a composite indicator based on the fuzzy membership
function is used to condense all the performance measures into a scale of 0 to 1.
Composite indicators used to aggregate the multidimensional concepts (Zani, et al.,
2013). Then, Intersection of fuzzy membership indicator is selected to calculate the
overall performance of each lean dimension. In a comprehensive lean system, all of each
level’s objectives should be met simultaneously. Therefore, minimum of fuzzy
membership values among all the performance measures of each axis shows the overall
performance of production cells in that axis. This allows to focus on the gaps in each
level of maturity and to fulfill the requirements of each level before going further to the
higher levels. It makes the foundation of the system stable enough for sustainable
improvements when organization becomes more mature.
Step 3-3: Analysis of lean effectiveness
Finally, the overall leanness indicator in each axis of LMM is compared to the
result of overall performance of that axis in order to evaluate the effectiveness of lean
practices on the achievement of production cell’s objectives. Results of analysis are
discussed in detail in Chapter six.
3.5 Verification Phase
Any conceptual model can be validated at many different levels from short-term
validation such as analysis of individual professional’s feedbacks to a longer term
applications in a real case. Considering both the validity of results and time factor, the
theoretical development of model initially is examined by comparing its elements with
general design principles of maturity models (Pöppelbuß & Röglinger, 2011). The
theoretical development phase is completed at the academic level by collecting the
information through a comprehensive review of the existing literature and applying them
according to the design principles. Pöppelbuß and Röglinger (2011) proposed a pragmatic

53
checklist as a guideline to design maturity models. The guideline consists of three groups
of principles: “Basic Design Principles”, “Design Principles for Descriptive Purpose of
Use” and “Design Principles for Prescriptive Purpose of Use”. During the development
of conceptual model and forming the structure of LMM, these principles are used as the
guidelines to develop and to justify the model.
Along with the verification of model requirements in theory, the model is also
validated practically in an industry scenario as it is discussed in Chapter five. The case
study has been conducted to examine the applicability of proposed model in a real case.
Two production cells of the case study are selected based on the different times they had
started to implement lean. Considering the factor of time, being in different stages of lean
implementation provides variant sources of data for validation and generalizability of
model in two samples.
Finally, findings of research are summarized along with its applicability from
descriptive, perspective and comparative perspectives. Also, research limitations and
recommendations are presented and potential opportunities for further research are
discussed in last chapter.

54
4 Chapter 4: DEVELOPMENT OF CONCEPTUAL FRAMEWORK
This chapter describes the main steps of developing a maturity model of leanness
in manufacturing cells. The model is developed according to the requirements of lean
implementation in workstations at the operational level, which is based on the analysis of
the RPS information from literature review. Moreover, the following important findings
which are borrowed from analysis of LAI and Shingo models, makes the proposed LMM
a comprehensive approach for a sustainable lean implementation:
- Necessity of customizing the model to production cells specifications
- Priority of lean principles and objectives over lean tools and techniques
- Consideration of organizational culture, empowerment and involvement of
operators and change management as the fundamental principles of lean
implementation in production cells
- Importance of clear link between leanness indicators and performance objectives
- Importance of distinguish between short term and long term objectives in
evaluation of leanness
- Consideration of design principles of maturity models in development of LMM
4.1 First Step: Maturity Levels
In the first major part of maturity model development, we focus on determining
the levels of lean maturity in production cells. Maturity levels in the proposed model are
sequential steps needed to be followed in production cells in order to achieve the leanness
and performance objectives. Production cells are like small dependent organizations with
their own structure and objectives. So they can be assessed based on the characteristics of
lean maturity levels.
Developing the generic definitions and the main characteristics of each maturity
level are important for assessment (LAI-MIT, 2001). In order to define the levels of
maturity, the characteristics of maturation on both sides of the maturity border is
required. Typically, in an immature organization, policies and goals are not clearly
defined or employees are unaware of them. Moreover, work is done better by individuals

55
than teams. Processes are not standardized. Thus, work is done by different people in
different ways. Solving the problems in an immature organization usually is done by
focus on fire-fighting rather than prevention and without any referring to previous
experiments. There is a little understanding of the action’s effects on the final results.
Customer dissatisfaction and poor quality despite high level of cost are expected results
in such organizations.
On the other hand, in a mature organization, organization’s objectives and
customers’ value are clearly defined and understood by all level of organization. Tasks
are done based on standardized and best practice methods and through team working by
either existing or newly-assigned staff. Problems are solved based on the analysis of real
data and fact and by referring to the existing problem solving knowledge. Consequently,
organization is achieving its objectives in the terms of quality, cost and delivery.
Nearly half of the participants of a survey conducted by Capgemini (2010) have
listed “Resistance to change” and “Organizational culture” as the key barriers in their
lean journeys. Undoubtedly, the behavioural changes toward lean are not easy to achieve
and require considerable time and energy. In organizational language, culture can be
defined as the sum of individuals’ work habits (Mann, 2005). Emily Lawson and Price
(2003) pointed out changes in the mind-set and behaviour of employees as a deepest and
most difficult level of change. They suggested four conditions for changing mind-set
namely “A purpose to believe in”, “Reinforcement systems”, “The skills required for
change”, and “Consistent role models”. John Kotter (Kotter, 1966) also proposed a model
for leading the major change. His model includes the following eight steps:
1. Establishing a Sense of Urgency
2. Creating the Guiding Coalition
3. Developing a Vision and a Strategy
4. Communicating the Change Vision
5. Empowering Broad-Based Action
6. Generating Short-term Wins
7. Never Letting Up
8. Incorporating Changes into the Culture
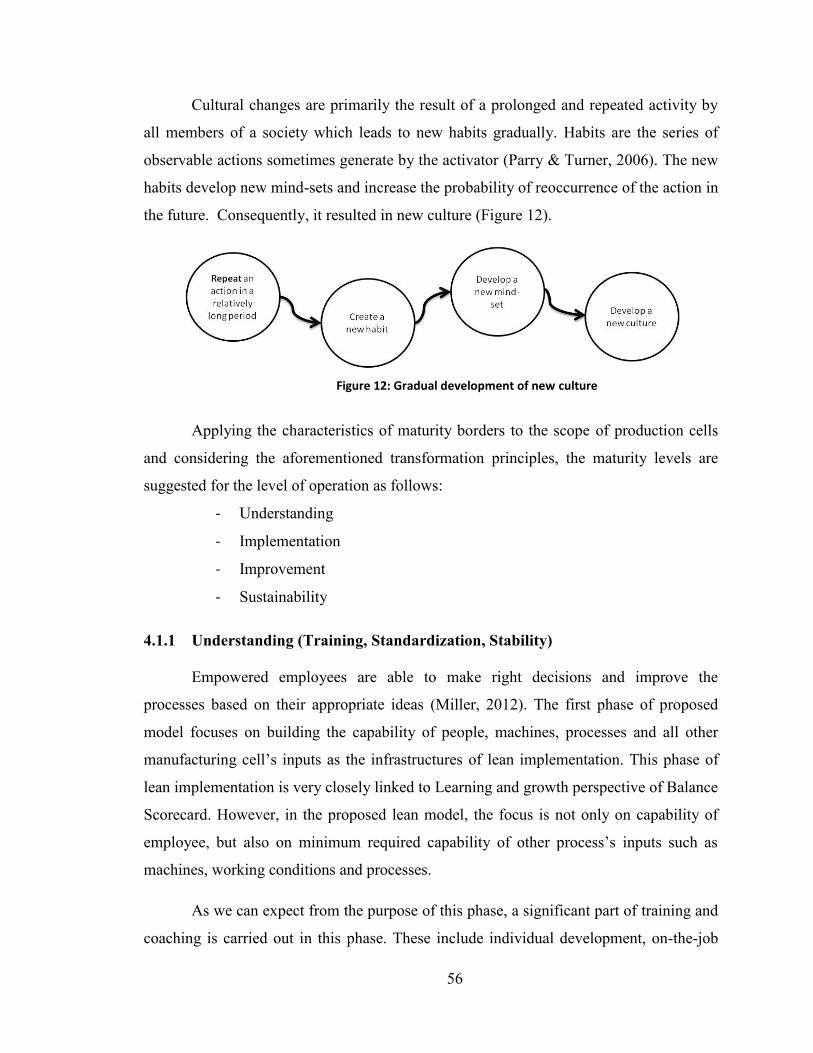
56
Cultural changes are primarily the result of a prolonged and repeated activity by
all members of a society which leads to new habits gradually. Habits are the series of
observable actions sometimes generate by the activator (Parry & Turner, 2006). The new
habits develop new mind-sets and increase the probability of reoccurrence of the action in
the future. Consequently, it resulted in new culture (Figure 12).
Figure 12: Gradual development of new culture
Applying the characteristics of maturity borders to the scope of production cells
and considering the aforementioned transformation principles, the maturity levels are
suggested for the level of operation as follows:
- Understanding
- Implementation
- Improvement
- Sustainability
4.1.1 Understanding (Training, Standardization, Stability)
Empowered employees are able to make right decisions and improve the
processes based on their appropriate ideas (Miller, 2012). The first phase of proposed
model focuses on building the capability of people, machines, processes and all other
manufacturing cell’s inputs as the infrastructures of lean implementation. This phase of
lean implementation is very closely linked to Learning and growth perspective of Balance
Scorecard. However, in the proposed lean model, the focus is not only on capability of
employee, but also on minimum required capability of other process’s inputs such as
machines, working conditions and processes.
As we can expect from the purpose of this phase, a significant part of training and
coaching is carried out in this phase. These include individual development, on-the-job
57
training, leadership development and training on lean tools and concepts. By
concentrating on development of lean capabilities, team members become continuously
better in lean practices while creating a learning environment that foster a lean culture
(Jørgensen, et al., 2007).
Standardization of activities is another aspect of this level. Standardization is one
of the most important principles of lean implementation. Capability of production cell
depends strongly on precision of local standards such as workstation procedures,
autonomous maintenance processes, control plans and inspection processes. Considering
this key element of change management, to measure the progression of standardization in
the production cells, two consecutive but overlapped stages is recommended in this
research: quantitative and qualitative progression.
At the first level, it is recommended to evaluate the progression of
standardization. For example, in the axis Production Processes, percentage of
standardized tasks written in Standard Operating Procedure (SOP) can be considered as
an initial subject of monitoring, regardless of how precise and correct the workstation
standards are. Coaching and monitoring the precision of SOPs, however, start before one-
hundred percent progression of first step. For all the axes of LMM, evaluating the
qualitative progression of lean standardization should be start in the middle of assessing
the quantitative progression. To measure the qualitative progression of standardization in
each axis, a precise assessment system should be designed and developed as a part of
overall lean evaluation system. To do so, the coaching and monitoring checklists may be
developed. Referring to our previous example about SOPs, correctness and precision of
SOPs are assessed and improved in this stage.
4.1.2 Implementation (Effectiveness)
Although a significant time has been spent on training of team leaders and
members in the first phase of LMM, deep understanding of the system is created through
putting in practice all those theories and principles in daily activities at shop-floor.
Effectiveness of the trainings depends on the immediate implementation of the concepts
in a real situation. While the focus of the first level is on standardizing and stabilizing of
58
processes and increasing the capability of people, the second phase is time to benefit
from the created capability to apply the established standards. Several checklists can be
developed to measure the implementation of lean principles in each axis.
Since the implementation of lean practices is the main focus of this level, in
addition to the leanness measurement, effectiveness of lean initiatives is also measured.
Considering the purpose of LMM in this study, effectiveness of lean initiatives is
measured based on the desired level of achievement in internal objectives, mainly quality,
safety, cost, and delivery. To keep all levels of organization encouraged, performance
measures are not suitable indicators for short term evaluation of the program. In turn, we
have to assess progression of lean implementation step by step through shop-floor audits.
Generating short term wins is one of the guiding points of organizational change (Kotter,
1996). Short-term objectives are required to assess the progression of project and at the
same time to encourage the team members to go further in implementation.
4.1.3 Improvement (Efficiency)
Achievement of the production cells’ objectives is the main goal of second level
of proposed LMM. When lean practices and application of lean tools and procedures
become routine of team and part of their daily activities, it is time to focus on efficiency
of results. In definition, effectiveness is an indicator of doing the right work (Drucker,
1987) which means the extent to which organizational objectives are met. Efficiency is a
measure of doing the work right (Drucker, 1987) which means how economically the
resource are utilized to achieve organizational objectives. Nottingham (2009) suggested
giving the priority to effectiveness over efficiency as a principle of enterprise thinking
during organizational transformation. Obviously, the organization should first focus on
selecting the correct way and performing the right activities before improving the set of
inputs to achieve best set of outputs during the lean implementation.
4.1.4 Sustainability (Autonomy)
Although lean approach is rapidly spreading in all sectors, many companies face
difficulties to sustain their existing lean status. As a result of a survey done by Capgemini
in 2010, sustainability of lean over long term has been suggested as the top challenge of

59
lean implementation (Capgemini Consulting, 2010). Considering the difficulties of major
transformational changes, many maturity models have been developed. However, their
focus is more on measuring the capability to implement change and to become mature. In
this study, our focus, in the last level of maturity, is on sustainability of lean program in
production cells. While organizations can use the project-based maturity model as a
roadmap toward leanness, their lean practices will not finish in the last level of maturity,
but in turn, they will start to work in a leanness lifestyle which is not project-based. The
last level of maturity in this study has been proposed as a transition stage to this way of
life.
While the first step of proposed maturity model focus on the capability and the
second and third level concentrate on the performance result both in terms of
effectiveness and efficiency, in the last level, the high level of autonomy and self-
regulation in production cells is at the center of attention. Autonomy refers to the right
and capability given to a group of people to organize its own activities (Cambridge
advance learner dictionary, third edition). In a lean organization, solving the problems
and improvement of working condition can happen closer to the source by giving more
responsibility and autonomy to the working teams (Fernando & Cadavid, 2007). In the
last level of maturity according to the LAI model as an example, it is expected that
employees get involved actively in setting the goals and planning the required actions for
their own production cells (Mize, et al., 2000).
Flexibility of manufacturing cells is another important capability in this level.
Integration of processes, lean practices, and information in the production cells in order
to increase their responsiveness to internal and external changes is one of the main goals
of lean implementation. Multi-skilled operators, flexible manufacturing technology,
flexible production plan and availability of multiple work- machine arrangements for
different set of products are some elements of a mature flexible production cell.
4.1.5 Maturity Levels - Conclusion
In summary, the proposed levels of maturity are designed based on the principles
of lean manufacturing and change management and adapted to the characteristics of
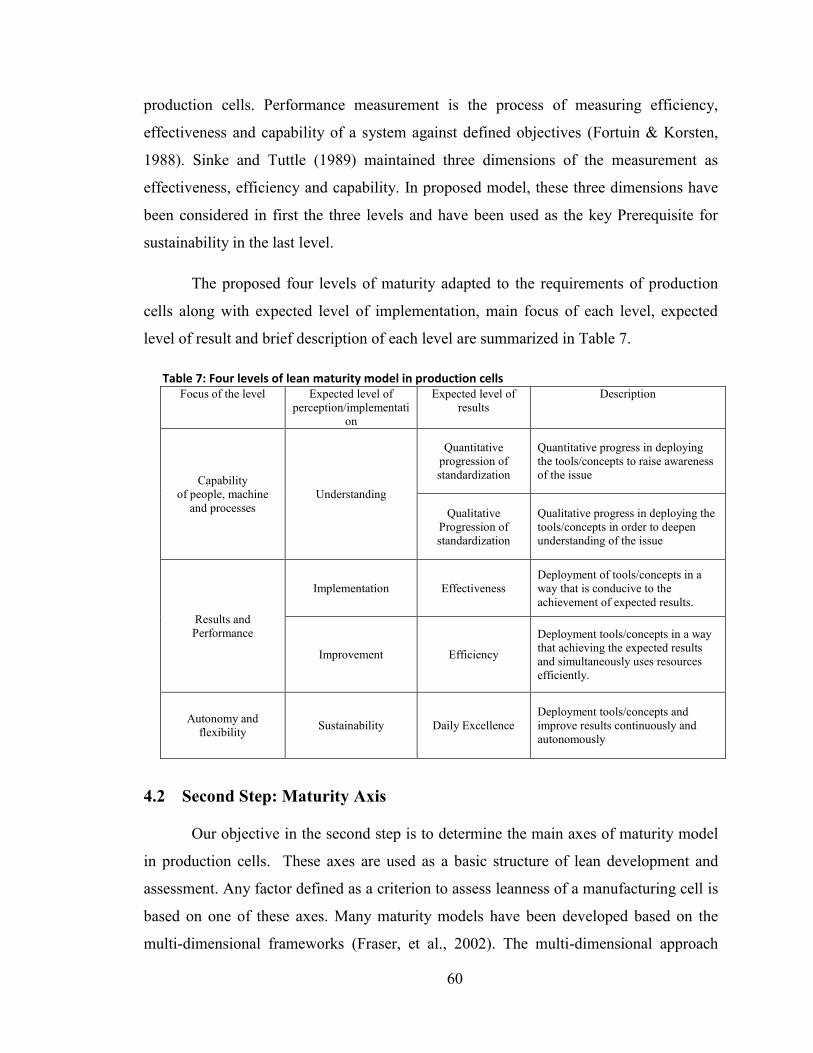
60
production cells. Performance measurement is the process of measuring efficiency,
effectiveness and capability of a system against defined objectives (Fortuin & Korsten,
1988). Sinke and Tuttle (1989) maintained three dimensions of the measurement as
effectiveness, efficiency and capability. In proposed model, these three dimensions have
been considered in first the three levels and have been used as the key Prerequisite for
sustainability in the last level.
The proposed four levels of maturity adapted to the requirements of production
cells along with expected level of implementation, main focus of each level, expected
level of result and brief description of each level are summarized in Table 7.
Table 7: Four levels of lean maturity model in production cells Focus of the level Expected level of
perception/implementati
on
Expected level of
results
Description
Capability
of people, machine
and processes
Understanding
Quantitative
progression of
standardization
Quantitative progress in deploying
the tools/concepts to raise awareness
of the issue
Qualitative
Progression of
standardization
Qualitative progress in deploying the
tools/concepts in order to deepen
understanding of the issue
Results and
Performance
Implementation Effectiveness
Deployment of tools/concepts in a
way that is conducive to the
achievement of expected results.
Improvement Efficiency
Deployment tools/concepts in a way
that achieving the expected results
and simultaneously uses resources
efficiently.
Autonomy and
flexibility Sustainability Daily Excellence
Deployment tools/concepts and
improve results continuously and
autonomously
4.2 Second Step: Maturity Axis
Our objective in the second step is to determine the main axes of maturity model
in production cells. These axes are used as a basic structure of lean development and
assessment. Any factor defined as a criterion to assess leanness of a manufacturing cell is
based on one of these axes. Many maturity models have been developed based on the
multi-dimensional frameworks (Fraser, et al., 2002). The multi-dimensional approach
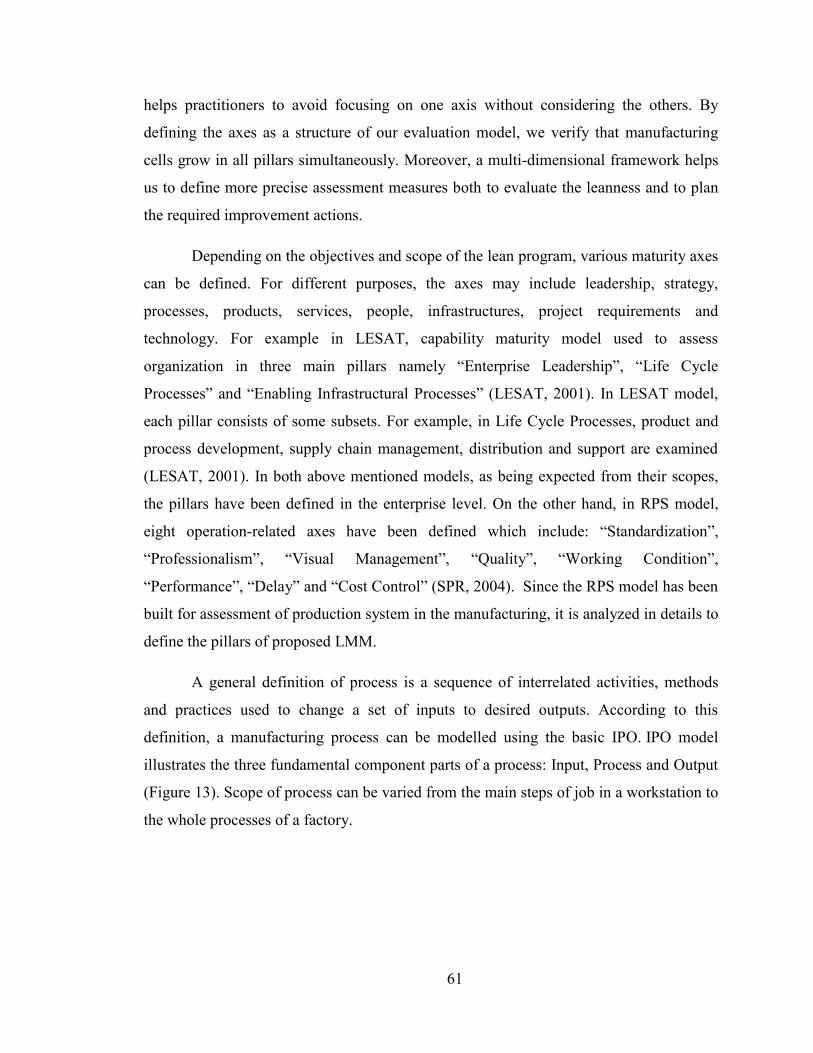
61
helps practitioners to avoid focusing on one axis without considering the others. By
defining the axes as a structure of our evaluation model, we verify that manufacturing
cells grow in all pillars simultaneously. Moreover, a multi-dimensional framework helps
us to define more precise assessment measures both to evaluate the leanness and to plan
the required improvement actions.
Depending on the objectives and scope of the lean program, various maturity axes
can be defined. For different purposes, the axes may include leadership, strategy,
processes, products, services, people, infrastructures, project requirements and
technology. For example in LESAT, capability maturity model used to assess
organization in three main pillars namely “Enterprise Leadership”, “Life Cycle
Processes” and “Enabling Infrastructural Processes” (LESAT, 2001). In LESAT model,
each pillar consists of some subsets. For example, in Life Cycle Processes, product and
process development, supply chain management, distribution and support are examined
(LESAT, 2001). In both above mentioned models, as being expected from their scopes,
the pillars have been defined in the enterprise level. On the other hand, in RPS model,
eight operation-related axes have been defined which include: “Standardization”,
“Professionalism”, “Visual Management”, “Quality”, “Working Condition”,
“Performance”, “Delay” and “Cost Control” (SPR, 2004). Since the RPS model has been
built for assessment of production system in the manufacturing, it is analyzed in details to
define the pillars of proposed LMM.
A general definition of process is a sequence of interrelated activities, methods
and practices used to change a set of inputs to desired outputs. According to this
definition, a manufacturing process can be modelled using the basic IPO. IPO model
illustrates the three fundamental component parts of a process: Input, Process and Output
(Figure 13). Scope of process can be varied from the main steps of job in a workstation to
the whole processes of a factory.
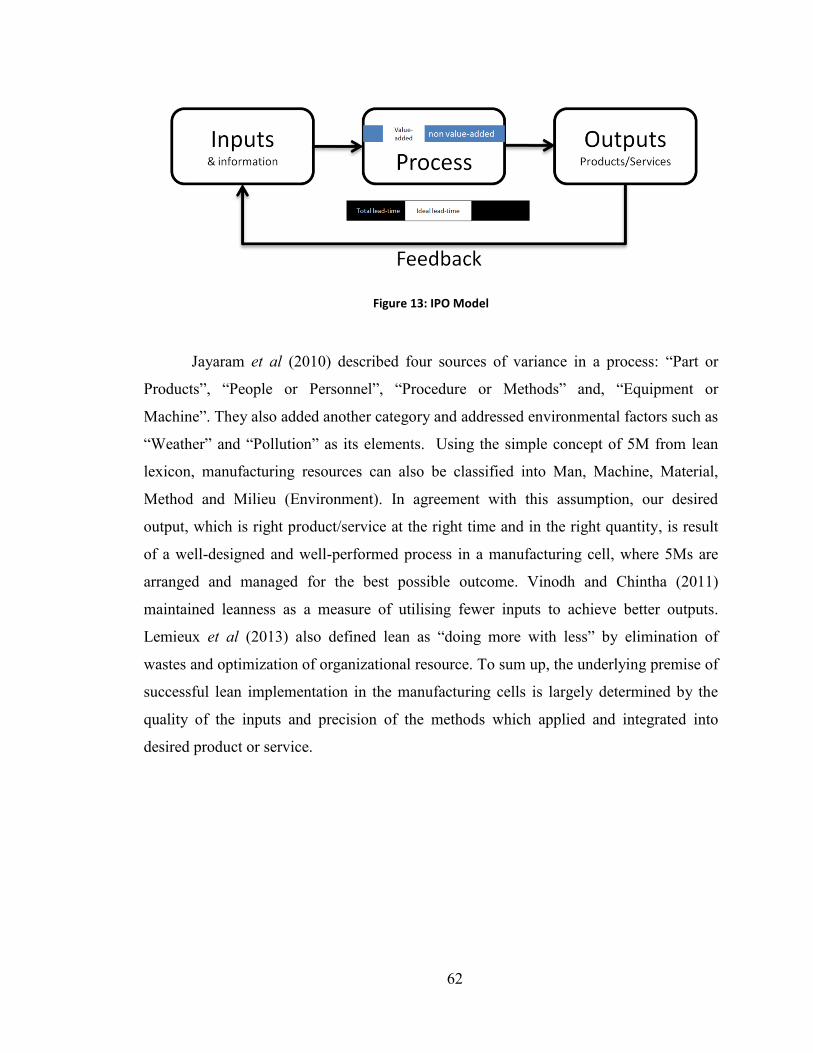
62
Figure 13: IPO Model
Jayaram et al (2010) described four sources of variance in a process: “Part or
Products”, “People or Personnel”, “Procedure or Methods” and, “Equipment or
Machine”. They also added another category and addressed environmental factors such as
“Weather” and “Pollution” as its elements. Using the simple concept of 5M from lean
lexicon, manufacturing resources can also be classified into Man, Machine, Material,
Method and Milieu (Environment). In agreement with this assumption, our desired
output, which is right product/service at the right time and in the right quantity, is result
of a well-designed and well-performed process in a manufacturing cell, where 5Ms are
arranged and managed for the best possible outcome. Vinodh and Chintha (2011)
maintained leanness as a measure of utilising fewer inputs to achieve better outputs.
Lemieux et al (2013) also defined lean as “doing more with less” by elimination of
wastes and optimization of organizational resource. To sum up, the underlying premise of
successful lean implementation in the manufacturing cells is largely determined by the
quality of the inputs and precision of the methods which applied and integrated into
desired product or service.
63
Figure 14 : Inputs of a typical manufacturing process
Analysis of the RPS shows the application of approximately same approach in
development of RPS roadmap. In RPS model, Professionalism is related to the
development of team within the manufacturing cells. Therefore, it is associated with
“Man” in Figure 14. Quality axis in the RPS model is related to the necessary activities
for controlling the quality of the material, work in progress and finished goods. Working
condition is the same as Milieu in the Fishbone diagram. Axis of Performance indicates
the sort of activities necessary to increase the availability and reliability of facilities. Axis
of standardization demonstrates the requirements of standardization in production
procedures. However, the term standardization is not a good indication of method since it
is one of the main inputs of production cells. As it can be seen from the terminology of
lean, principles are timeless and incontestable rules which apply to all activities of the
organization. Standardization, as it was discussed, is one the lean principles and therefore
should be applied in all axis of model. The same logic can be used for two other axis of
the RPS model: visualisation (animation in Figure 8) and cost control. Visualisation and
Cost control as the principles of lean are applicable for the all axes.
Looking at the lean concept from resource perspective and considering the axes of
RPS operational excellence model, we can customize and define the axes of the LMM to
the scope of manufacturing cells. As a result, seven pillars have been suggested: People
(Man, Management), Facilities (Machine), Working Condition (milieu), Production
Processes (methods), Quality (material), JIT, and Leadership. The first view of proposed
LMM model is illustrated in Figure 15. What follows is a description of each axis’s
elements.

64
Figure 15 : lean Maturity model - Axes
4.2.1 People
Basic production teams are one of the most important aspects of lean at shop-
floor. It includes direct production and quality operators, supervisor and other supportive
members of manufacturing cell for quality, maintenance, logistics, etc. Production cells
can be varied in the terms of size, responsibilities, and authority depends on the function
of the team, organizational chart, and scope of the activities. However, to lead a team
effectively and efficiently, it has been suggested to arrange the teams of 12 to 20
members for any production cell (SPR, 2004).
Successful implementation of lean in manufacturing cells depends on the
commitment of workstation’s members. The evidences emphasize on the importance of
employee’s involvement and their motivation for sustainable organizational change and
particularly successful lean implementation (Beale, 2004). According to Jayaram et al
(2010), fatigue, improper training and lack of motivation are the three main causes of
variation in the system performance. For successful implementation of lean, involvement
of all organizational level is necessary. Pettersen (2009) indicated “Employee
People Facilities Working
conditionsProduction
ProcessesQuality JIT Leadership
65
Involvement” as one of the most frequently mentioned characteristics of lean production.
To do the right job, team leader should ensure that team members are completely trained,
motivated and empowered to make suitable changes (Capgemini, 2005). From the review
of the literature, the main elements of the people axis in LMM are empowerment,
involvement, motivation and team work.
Empowerment
Team members in the manufacturing calls should be equipped with required
skills, knowledge, and attitude to involve with daily practices of lean. Training,
undoubtedly, provides the required capabilities. It is linked to enhancement of
organizational commitment (Bartlett, 2001). Although a considerable training is required,
it should not be considered as the only way of empowerment. In fact, learning is deeper
than classroom training. Successful transition to lean requires a deep understanding of
lean principles and practices. The focus of learning efforts must be on changing mental
models, beliefs, behaviors, and attitudes of team members.
Members of each production cell should be competent in both technical skills of
their specific roles and general and social skills such as team working and problem
solving. Technical skills development, however, should not be limited to a single role. A
multi-skilled development plan is needed for each cell. This element enhances
development of other Human Resource aspects s such as motivation, career path
planning, and employee involvement. Moreover, working in internal supplier and
customer stations within the production line, and even beyond, broaden the knowledge of
the operators on source of problems and customer requirements.
In Japanese manufacturing system, as Spear and Bowen (1999) pointed out in
Decoding the DNA of the TPS, performance improvement must be made under the
guidance of a teacher. The term “Sensei” is used in lean lexicon to refer to this role. The
term “guidance” in description of this role means not only be a teacher in cooperation
training, but also to help and guide people during the daily activities in the shop-floor. In
LEM (LAI) this position is referred as “Change Agent”, and defined as an individual who
possesses the knowledge and interpersonal skills required to facilitate transformation and
66
change during lean implementation (Mize, et al., 2000). In RPS, this role is called
“Senior Instructor”.
Involvement
Macduffie (1995) identified three primary roles for workers in lean production
systems: physical labour or "doing" work, cognitive input or "thinking" work and
member of a social entity or "team" work. More involvement of team members is
demanded in lean practices. Consequently, Cognitive and social role of team members is
more highlighted through lean activities such as kaizen, 5s and problem solving.
Involvement is accelerated through application of suggestion system, regular meeting in
manufacturing cell such as pre-shift meetings, participative decision making, problem
solving, and improvement practices such as Kaizen and 5s. Evidences show that the
numbers of problem-solving suggestions and their implementation rate per employee are
higher in lean production environment (Macduffie, 1995).
Motivation
There is a close, yet fragile link between the motivation and other factors of lean
implementation such as training and involvement. Based on the results of a research
conducted by Beale (2004), motivation for lean is directly affected by employee attitudes,
their perceived ability and social pressures. Reward system is one of most frequently used
approach for increasing the motivation. It can motivate employees for short term
objectives. However, long term programs such as lean implementation requires more
sophisticated methods. In facts, by providing the opportunity of learning through training,
experience and participation, sense of choice will be increased. Furthermore, supporting
the team to achieve the desired targets, they will feel more competent, thus become
willing for further improvements. The encouragement by participation and respect
establish a corporate culture that benefit from employee`s individual potential as well as
the strength of collaboration. Application of some techniques such as annual performance
appraisal can help to officially determine and document the team’s and individual’s
targets.

67
Team work
In RPS system, forming of elementary working teams is perquisite of
implementing the production system. Consequently, the system is built on team working.
The procedures and interactions are organized and objectives are then set to support the
elementary working team. Lean practices also should be designed such that promotes
team working. Daily meetings at the beginning of each shift, Kaizen events in
collaboration with operators, giving more weight to the suggestions proposed by teams
than individual and common targets are some example of these activities. In the book
Toyota Culture, the Heart and Soul of the Toyota Way, Liker and Hoseus (2007)
described the importance of the team working:
“At Toyota there are small rewards at the team level and the potential of
more significant bonuses shared by everyone if the plant and company perform
well. Delving deeper into the values and assumptions of the Toyota culture, we
can see this approach reflects the value placed on teamwork. More broadly,
Toyota wants its team members to develop the highest level of accountability and
ownership and as such to understand that their fate is tied to the company.” (p. 8-
9)
4.2.2 Facilities Management
Most important objectives of lean implementation are directly affected by
performance of operation’s facilities. Facilities management includes all the tools,
methods, procedures and activities designed to maintaining the production facilities and
optimizing overall performance of enterprise’s installations. These sorts of activities are
generally organized in the framework of TPM (Total Productive Maintenance) in
organization. The idea of Total Productive Maintenance was introduced by Seiichi
Nakajima In 1969 as a fundamental part of Toyota Production System (McBride, 2004).
By increasing interest of lean manufacturing in the world, more attention has been turned
to TPM.
Nakajima (1988) introduced Overall Equipment Effectiveness (OEE) as a key
performance indicator of TPM. OEE represents a unique indicator as combined effects of

68
equipment availability, performance and quality. OEE is suggested by Gibbons and
Burgess (2010) as an indicator of lean six sigma capability. Based on a study of
similarities and differences between lean and TPM, Arashpour et al (2010) revealed that
OEE improvement serves lean principles like Flow and Perfection.
Involvement of all organization’s level from top management to workers on the
shop floor is demanded in TPM. Operators in production cells play a critical role in
implementation of TPM. In fact, moving from reactive centralized maintenance to a
preventive, predictive and proactive maintenance by participation of all organization’s
level is one of the main objectives of TPM. Activities suggested below can help the
achievement of this objective:
- Developing the knowledge and skills of team members to identify and
signal the anomalies, analyze and eliminate the root causes, and propose
and implement daily maintenance tasks
- Promoting active participation of team members in elimination of
equipment’s waste and anomalies
- Standardization of daily maintenance activities designed for operators,
such as machine clean up, lubricating, general inspection and basic
maintenance
- Collaboration between maintenance support team and operation’s team to
improve TPM activities. For example: training of operators by
maintenance staff
- Preparing off-line facilities in which operators have the possibility of
practice
- Documenting the knowledge of problem solving associated with machines
in the production cells
4.2.3 Working Condition
Working condition of manufacturing cell from the lean point of view can be
discussed in two perspectives: First, improvement of operators’ working condition due to
the application of lean principles and techniques such as ergonomics analysis and safety
69
assessment; Second, assessment and improvement of working conditions from the
environmental perspective. Since the proposed maturity model in this study is subjected
to production cells, both perspectives are addressed by focusing on the role and condition
of production teams on the issues.
Safety and Ergonomics
Employees’ productivity is one of the main objectives of lean manufacturing.
Employee’s health is the main objective of safety and ergonomics programs in
organization. By comparison, none of these two objectives can be achieved in the
absence of other one. Ergonomics involve the design, evaluation and improvement of
activities, work load, working environments, devices and methods that fit the human
body and its cognitive abilities to optimize human safety and health (Helander, 2013). On
the other hands, based on the lean principle of waste elimination, any source of safety
risk and ergonomics problems leads to waiting and cost, therefore, should be eliminated.
“Respect every individual” is another principle of lean manufacturing. There is no greater
evidence for respect humility than creating a healthy and safe work environment (Miller,
2012). As a result, effective ergonomics is a necessary part of sustainable and correct lean
transformation (Walder, et al., 2007). To apply ergonomics programs and safety risk
analysis as a key component of lean process, one should consider them, as waste
reduction and value creation, as the core values of lean implementation.
Lean manufacturing tools and principles such as visual management and
standardization help to create a visibility on potential ergonomics challenges (Walder, et
al., 2007). Technical ergonomic analysis should be performed by an ergonomist.
However, similar to the other lean principles, participation of production team is
necessary. Some practices to encourage the engagement of production teams suggested as
follows:
- Ergonomics metrics should be a part of lean measures
- Improvements should be evaluated against their affects on safety risk factors and
ergonomic problems
- Basic ergonomics and safety rules should be included in training programs

70
- Basic ergonomics and safety analysis should be performed by supervisor of
manufacturing cell
- Employees should be educated about the potential risks and hazards in their
activities
- Safety requirements should be considered as the initial and crucial requirements
of operations
- 5S, visual management and Poka Yoke are the powerful tools of safety risk
reduction
- Safety and ergonomics improvement should be placed at the top of the kaizen list
Environmental Conditions
Increasing demand of sustainable, durable, and recyclable products and growing
need to use renewable energy sources has been considered as the top challenges of future
value chains (Forum, 2013). The recent increasing interest in environmental issue
together with the grounded interest of enterprises in lean principles have introduced a
new perspective of study which consider lean and green (Environmental Management
Systems) as a two side of the same coin. Studies show a strong coherence between lean
and green manufacturing activities (Bergmiller, 2006).
Elementary working teams of production as a core of manufacturing performance
play an importance role in environmental initiatives. The strong emphasis of lean
manufacturing on waste elimination incorporates environmental impacts (Herrmann, et
al., 2008). However, some specific actions can be designed and implemented to enhance
improvement of environmental issues. As an example, some specific kaizen events might
be carried out in order to reduce the negative environmental effects of wastes in
manufacturing cells. To promote the production team attention to the environmental
issue, the suggestions can be also assessed based on their impacts on the environmental
issue.
4.2.4 Production Processes
In their famous Harvard article, Decoding the DNA of Toyota Production System,
Spears and Bowen (1999), explained four rules as DNA of TPST. Their first rule is
71
“standardization of content, sequence, timing and outcome of all organization’s
activities”. The workstations are the adding value stage of supply chain. Hence,
standardization of production process in production cells should be at the top of the list of
major activities of lean. Most of the remaining lean activities require standardized
procedures in manufacturing cells. For instance, assessment of safety risk and
ergonomics problems in an inconsistent process or improvement of a process which is
done differently by different operators seems ineffective. Also, without using
standardized processes, on-the-job training and continuous improvement is not possible.
In addition to standardization as a powerful tool to increase the capability of
production process, other source of variations should be analyzed and reduced. Statistical
analysis of process capability and analysis of process and product variation are generally
the parts of Six Sigma program. Six Sigma is a set of analytical tools and techniques for
elimination of variation problem solving (Fursule, et al., 2012). While the focus of lean is
on elimination of waste to serve the value based on the customer requirements, Six
Sigma, on the other hand, provides an analytical framework for problem solving and
analysis of the variations. Many practitioners have benefited from the integration
framework of lean Six Sigma. Same as the other lean practices, high involvement of
manufacturing team leader and team members is recommended in analysis of variations.
4.2.5 Quality
Getting quality right at the first time is one of the main principles of lean
manufacturing (Liker, 2004). Application of Six Sigma in lean manufacturing as a
powerful technique of quality analysis has been discussed before. However, in production
cells, Six Sigma is not a simple, quick technique to solve daily quality problems. In RPS
system, for example, quality control has been defined as a part of the lean implementation
which consists of simple and basic quality tools and problem solving techniques tailored
for application in production cells (SPR, 2004).
Quality management in manufacturing cells is divided into two main categories:
quality control and reactivity system. Quality control manages and monitors key process
and product quality parameters. It includes the standardization, implementation and
72
improvement of quality control activities which are done either by production operators
in the form of self-control or by quality operators who work under the supervision of
team leader. It is recommended to create quality at the source by concentrating on
preventive quality activities such as Statistical Process Control (SPC), Failure Mode and
Effects Analysis (FMEA) and Poka Yoke. Reactivity system is about problem solving
with focus on root cause and non-conformity management. Same as the TPM, all the
members of operation and supportive teams are encouraged to use standardization,
statistical tools and basic quality techniques to solve the quality problems. Management
of non-conform products/parts is a part of reactivity system as well.
4.2.6 Just In Time (JIT)
JIT was designed by Toyota to eliminate keeping of large inventory between
processes (Womack & Jones, 2003). JIT is one of the two main pillars of Toyota
Production System (Figure 3). It includes a major part of the lean manufacturing tools
and concept such as establishing flow, pull system and level out the workload. In RPS,
JIT is one of the three elements of RPS rocket (Figure 5). Some elements of JIT such as
Value Stream Map (Womack & Jones, 2003) should be followed in the framework of
lean transformation at the enterprise level. The structure of production cells are affected
largely by JIT at the enterprise level. Consequently, some other JIT practices should be
carried out directly within production cells. In the proposed LMM, the second group of
JIT activities is considered.
Reduction of inventory is the main objective of JIT process. Depends on the scope
of JIT, inventory can be eliminated from supplier chain, door to door manufacturing
facilities as well as production cells. Inventory in production cells can be reduced or
eliminated by application of continuous flow principles and techniques such as Kanban
and heijunka box. By reducing the level of inventory and minimizing the non-value
added activities in the workstations, production team can contribute to achievement of
JIT objectives. Supervisor should facilitate and monitor the correct application of JIT
techniques and synchronization of activities according to planned cycle time in the
production cell.
73
4.2.7 Leadership
Successful implementation of lean depends strongly on management commitment
and engagement (Hines & Taylor, 2000). The role of leadership in implementation of
lean can be discussed in two stages: The role of leadership in lean transformation in
enterprise level and as it is related to this study, the leadership’s role in level of operation.
The role of leaders to foster the change in the organization culture has been described in
detail in other comprehensive research such as in Shingo model (Miller, 2012).
Considering the purpose of the LMM in this study, we examine the daily role of
leadership in successful implementation of lean in manufacturing cells. In a successful
lean project, leaders and top managers are involved in lean daily activities. Their role is
not limited to setting long-term goals and strategies and monitoring of progression.
Rather, they participate in training and review meetings, they work as a role model and
coach, and they are engaged directly in daily lean practices.
In development of lean principles at shop floor level, role of production
supervisor is very important. In mass production environment, supervisors focus on daily
activities within supervisory area. However, in lean environment, their role is to change
the culture of production cell. In this term, their activities are not limited to the daily
supervision of workstation, in turn; a great amount of time should be spent for analyzing
of past data and planning for future. Concerning their importance role to lead the
transformation, they should be competent in both technical and management skills. From
the technical perspective, they should know about the details of all of the processes in the
production cell. From the management perspective, they should be aware of company’s
policies, strategies and general rules and transfer them to team members. Furthermore,
they should be knowledgeable in lean practices. From the leadership point of view, they
need to be equipped with necessary skills to communicate effectively, to train the team
members, to lead working teams and projects, and to support the change process.

74
4.3 Third Step: Lean and Performance Objectives
Setting and planning overall targets of lean implementation and their consistency
to organization’s objectives and business strategy is necessary for successful
implementation of lean. Strategic business objectives, along with lean implementation
metrics, are conveyed to all levels of the organization (Mize, et al., 2000). Production
cells as the core of the industrial performance are not exception to this rule. A practical
maturity model describes current and future maturity levels as well as respective
improvement measures (Pöppelbuß & Röglinger, 2011). In the first two steps of model
development, the maturity axes and maturation levels of lean have been suggested as a
structure of the model which is applicable for all type of production cells. The third step
is dealing with the leanness objectives and key performance indicators (KPIs) relevant to
lean initiatives which may be customized in each firm.
The lean objectives such as setup time reduction, pull system and shorter lead
time have strong positive contribution toward performance (Tupa, 2013). But when it
comes to measurements, they don’t provide enough information about root causes of
problems. Thus, establishing leading targets align with overall objectives of project is
essential. While most of the articles published in recent years paid more attention to
performance of lean management systems (Stone, 2012), it is difficult to find a study in
which midterm targets and their relations to different maturity levels were investigated.
Most of the main and as expected, long term objectives of lean such as financial targets
are not precise in short term measurements. Therefore, the link between financial and
non-financial measures is not easy to perceive. Without considering the leading and as
expected midterm indicators, we hardly are able to find our position in the long journey
of lean.
Furthermore, if the success of the project is measured by achievement of final
objectives at the early stages, the motivation among employees will be faded. Definition
of inappropriate metrics can mislead the improvement initiatives and encourage the
wrong type of behavior (Bhasin, 2008). As suggested in previous section, in the early
stages of lean implementation, targets should be more related to learning and growth, in
other words, the capability of people and processes. As we go further through the levels
75
of maturity, the objectives should be more focused on the performance results in
production cell, namely: safety, quality, cost and delivery.
Performance indicators are selected based on organizations’ strategy. Thus, the
KPIs may be different from organization to organization and even from production cell to
production cell in each organization. Accordingly, associated leanness objectives also are
different. This is what makes the LMM and related production systems (XPS) a unique
roadmap for each organization despite the common approach as it is suggested in this
study. However, as a common way of measurement, gathering the historical data on
performance indicators and application of checklist through monitoring to assess the way
production cells applied the lean tools and principles is suggested in this study.
Development of coaching and assessment checklists is part of design and
customization of lean development model for each organization. Number of checklists,
their content, type of questions, weighting and scoring methods and assessment schedule
should be customized accordingly. Regardless of the format and content of each
checklist, quantifying the qualitative progression of multiple lean factors in each
dimension is essential for evaluation of production cell leanness. A wide range of scoring
methodologies such as simple Yes/No or Likert scale can be used to conclude to a unique
score for any indicator of proposed LMM. To put the proposed LMM into practice, a case
study is conducted and the customized leanness measure and performance indicators are
defined in the next chapter.
To evaluate performance of production cell, different targets can be set for each
performance indicators at various stages of lean implementation. Demonstrating the
leanness status and performance position of production cell in each axis of LMM provide
visibility on how effectively lean implementation leads to achieve organization’s
objectives in each lean dimension. By adding the performance indicators to lean maturity
matrix, following visual framework (Figure 16) is suggested to use as a production cell’s
management dashboard of both leanness and performance indicators.
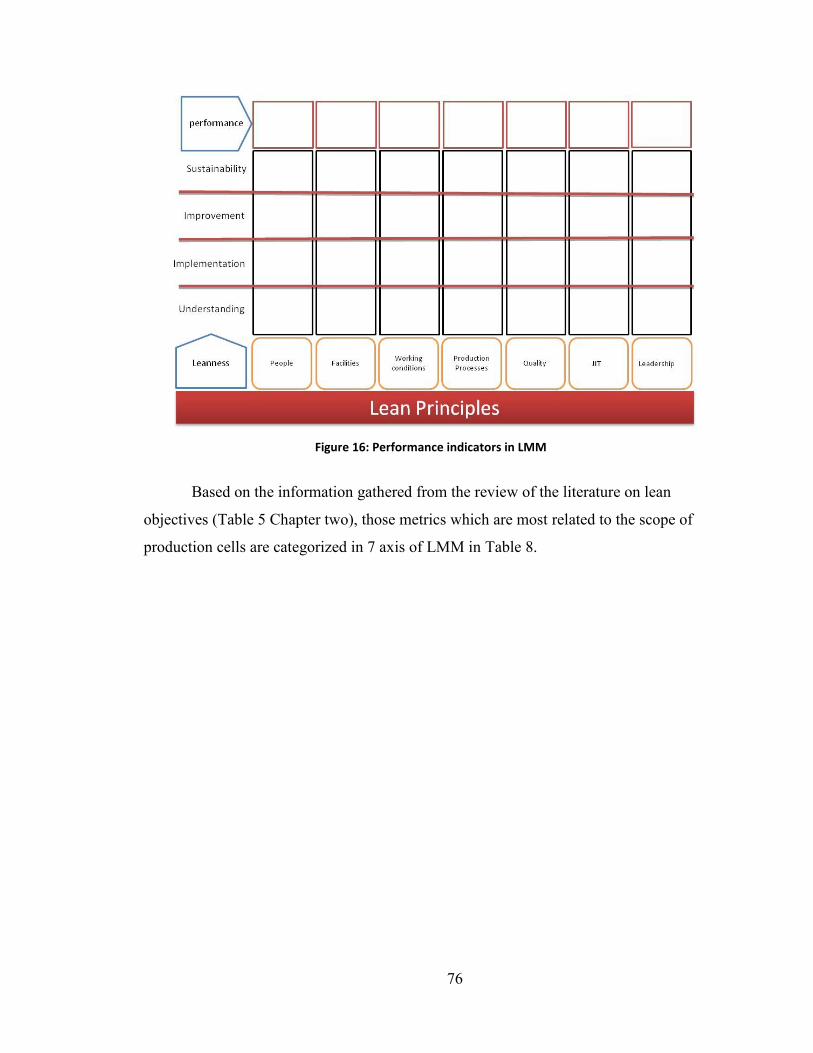
76
Figure 16: Performance indicators in LMM
Based on the information gathered from the review of the literature on lean
objectives (Table 5 Chapter two), those metrics which are most related to the scope of
production cells are categorized in 7 axis of LMM in Table 8.

77
Table 8: Suggested performance metrics in each axis of LMM
People
Absenteeism rate
Saving benefits of suggestions
Multifunctional operators indicator
Employees satisfaction rate
Facilities
MTTR (mean time to repair)
MTBF (mean time between failures)
OEE (overall equipment efficiency) Availability × Efficiency ×
Quality
Maintenance cost / net asset value
Total maintenance cost / unit produced
Down time (can be categorized based on down time causes)/
working time
Working Conditions
Safety metrics (e.g. average safety risk factor, Percent of job
conditions with medium or high safety risk)
Ergonomics metrics (e.g. Percent of job conditions with medium
or high ergonomic risk, ergonomics severity index)
Workers compensation costs
Injuries rate / incident rate
Percentage of lost workdays
% energy use reduction /unit of product
Production Process
Value-added rate (Value added time / Total leadtime)
Workers hours per unit produced
Non-value-added hours per unit produced
Waiting time / Total leadtime
Balance efficiency (Processing time / Number of operators *
cycle time)
Quality
PPM (of the manufacturing cell’s product )
Cost of Quality
Customer return for non-conformities with the root causes in
manufacturing cell (internal and external customers)
First passed yield
Rework time / total working time
Scrap rate
Just In Time
Inventory turnover
WIP value
On-time delivery
Right quantity delivery
Waiting time for sharing tools
Waiting time for materials
Product stock outs
Leadership All the KPIs’ indicators of manufacturing cell
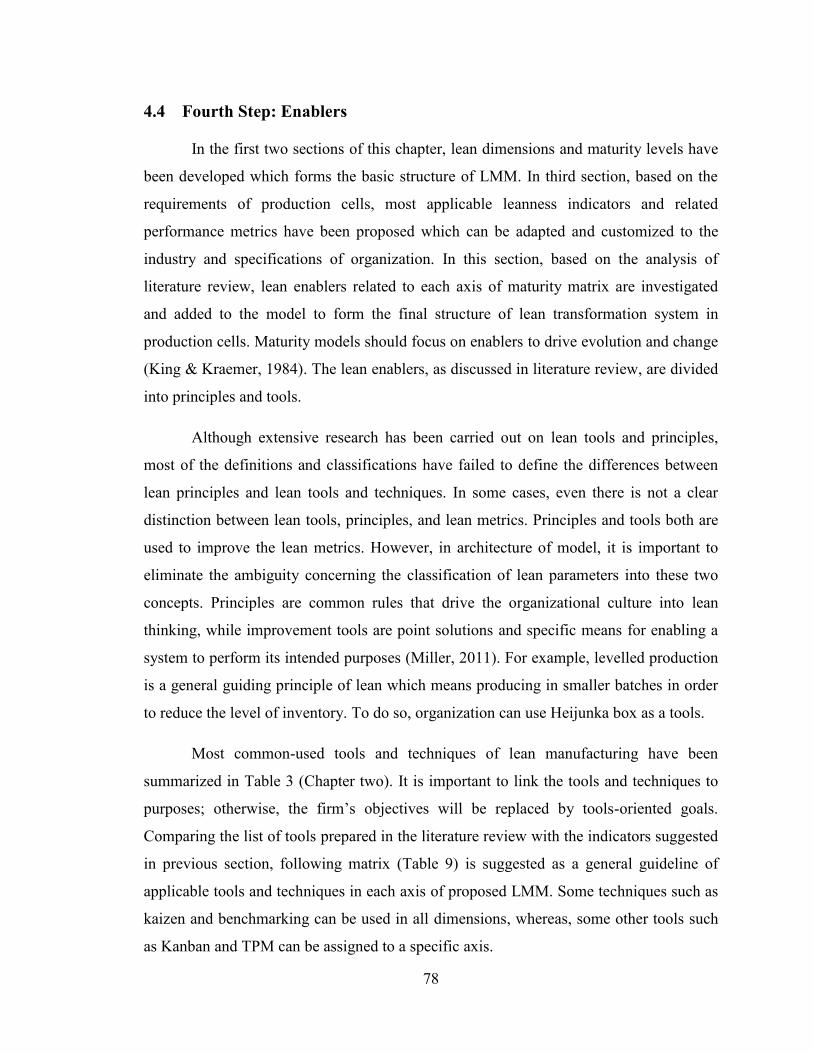
78
4.4 Fourth Step: Enablers
In the first two sections of this chapter, lean dimensions and maturity levels have
been developed which forms the basic structure of LMM. In third section, based on the
requirements of production cells, most applicable leanness indicators and related
performance metrics have been proposed which can be adapted and customized to the
industry and specifications of organization. In this section, based on the analysis of
literature review, lean enablers related to each axis of maturity matrix are investigated
and added to the model to form the final structure of lean transformation system in
production cells. Maturity models should focus on enablers to drive evolution and change
(King & Kraemer, 1984). The lean enablers, as discussed in literature review, are divided
into principles and tools.
Although extensive research has been carried out on lean tools and principles,
most of the definitions and classifications have failed to define the differences between
lean principles and lean tools and techniques. In some cases, even there is not a clear
distinction between lean tools, principles, and lean metrics. Principles and tools both are
used to improve the lean metrics. However, in architecture of model, it is important to
eliminate the ambiguity concerning the classification of lean parameters into these two
concepts. Principles are common rules that drive the organizational culture into lean
thinking, while improvement tools are point solutions and specific means for enabling a
system to perform its intended purposes (Miller, 2011). For example, levelled production
is a general guiding principle of lean which means producing in smaller batches in order
to reduce the level of inventory. To do so, organization can use Heijunka box as a tools.
Most common-used tools and techniques of lean manufacturing have been
summarized in Table 3 (Chapter two). It is important to link the tools and techniques to
purposes; otherwise, the firm’s objectives will be replaced by tools-oriented goals.
Comparing the list of tools prepared in the literature review with the indicators suggested
in previous section, following matrix (Table 9) is suggested as a general guideline of
applicable tools and techniques in each axis of proposed LMM. Some techniques such as
kaizen and benchmarking can be used in all dimensions, whereas, some other tools such
as Kanban and TPM can be assigned to a specific axis.
79
Table 9: Lean techniques-maturity level matrix
List of techniques
Peo
ple
Fac
ilit
ies
Qu
alit
y
Pro
du
ctio
n
pro
cess
es
Wo
rkin
g
con
dit
ion
JIT
Lea
der
ship
PDCA
Kaizen
Goal alignment/Policy deployment/Hushin kanri
Daily review meetings Benchmarking Root cause analysis (5Whys) Statistical Process Control (SPC) Basic quality tools (Pareto chart, cause and effect diagram, decision making matrix, etc )
Problem solving methodology(A3, DMAIC, QC Story)
Poka Yoke
Reactivity and non-conformity control Self control Check man workstation Voice of Customer FMEA Control plan Setup time reduction (SMED) Standardized work (SOPs, routing, travel paths)
Value Stream Mapping (VSM) Stability study (Cpk, Cp)
Cross functional teams Ergonomics analysis/audit Employee surveys Safety analysis/audit Environmental analysis/audit Suggestion system
Workstation audit
Individual development plan
On-the-job training (on-line) Basic skill training (off-line) Multi-skill personnel process control boards
Andon system
QCD board/visual board
Cost-benefit analysis
5S

80
Table 9- Lean techniques-maturity level matrix, continued.
List of techniques
Peo
ple
Fac
ilit
ies
Qu
alit
y
Pro
du
ctio
n
pro
cess
es
Wo
rkin
g
con
dit
ion
JIT
Lea
der
ship
Point of use storage
Inventory control (Supermarket, line side organization, ...)
Operator balance chart / analysis Kanban/Pull system Production leveling/Heijunka
EDI Just-In-Time
Takt Time
FIFO
Cellular manufacturing
Time/work study Cross-Docking
Elementary Working Teams
Total Productive Maintenance (Autonomous maintenance, losses analysis, preventive maintenance, OEE analysis, …)
Supplier involvement/development (work’s unit supplier)
Customer involvement (work’s unit customers)
Jidoka / Automation
Lean tools and techniques can be assigned to each axis of LMM based on the
proposed leanness indicators. However, lean principles are common guiding rules.
Understanding the relationship between principles and tools is important. Some lean
principles are applicable when implementing lean in enterprise level, for example
“Identifying the entire value stream for each product or product family”, whereas, some
others such as “Pursue perfection” can be applied in all level as well as in production
cells.
81
5 Chapter 5: DATA COLLECTION AND ANALYSIS
Development of LMM, as discussed in Chapter four, is a part of designing a
customized lean transformation system for each company. The leanness measures for
each axis-level of LMM should be defined based on the way company satisfy the
requirements of each maturity level. Therefore, a case study is conducted within a large
automotive manufacturing organization where lean principles have been applied for more
than 7 years (hereafter referred to as ABC). The ABC Company is selected based on the
company’s background in implementation of RPS. RPS is one of the main three lean
models which are reviewed in this study. Considering the organization’s background in
implementation of manufacturing systems, most of the information required for gathering
the data on lean main control items and performance measures was available. Therefore,
the focus was on organizing data and collecting them through direct observation and
audit. This potential capacity of selected sample was important to collect the accurate
data in the minimum amount of time. Otherwise, lots of time was needed to generate the
required data.
Two production cells are selected to conduct a series of observations, audits and
data collection. The focus is to assess the production cells thoroughly in all dimensions of
LMM. The advantage of focusing on a limited number of production cells is to invest
more time on considering all perspectives of production cells while at the same time to
overcome the limitations of typical case studies such as time and budget. However, it
may create some problems with its generalizability. To overcome this drawback, two
production cells are selected from two production lines in different stages of lean
implementation (time from the beginning of lean manufacturing project is selected as a
factor of progression). One manufacturing cell is selected from assembly shop where lean
has been implemented for more than six years and another manufacturing cell is selected
from paint shop where lean has been applied for less than three years. Each of the
production cells are assessed based on the seven lean axes.
As discussed in Chapter three, in step 3 and 4 of Design Phase, lean maturity
model in production cells should be customized based on the organizational objective and
82
priorities. The general framework discussed in this study can be used during the
development and customization of LMM. Since the lean maturity levels and lean axis
(step 1 and 2 of design phase) can be used generally as the framework of all production
cells in manufacturing industry, the case study start with step 3 of design phase which is
definition of leanness indicators and performance measures.
5.1 Definition of Leanness Indicators:
Definition of leanness indicators is part of development of LMM (phase 3 of
design phase). The result of measuring the leanness indicators shows how likely the
company follows the defined path of lean implementation and how correctly they apply
lean tools and techniques as they are standardized in company’s production system.
Therefore, leanness indicators cannot be defined precisely unless a real case is
considered. In the first step of data collection in the case study, leanness indicators are
defined based on the specifications of each axis-level of LMM. Therefore, leanness
indicators in level 1 reflect the understanding and standardizing of lean practices in each
axis of LMM. Consequently, indicators of level 2 focus on implementation of tools and
techniques required in each axis of LMM and in level 3, improvement of those practices
is considered. Finally, leanness indicators of level 4 emphasize on autonomy and
flexibility of production teams in application of lean tools and methods which leads to
sustainability of results.
Leanness indicators are defined for each axis of LMM in the form of guidelines.
For each leanness indicator, main control items are added in the guideline which helps
better understanding of the indicators and indicates the items which should be
investigated during the audit. Table 10, for example, shows the guideline of axis
Facilities which is developed for the ABC Company. The guidelines for all axis of LMM
are presented in Appendix B.
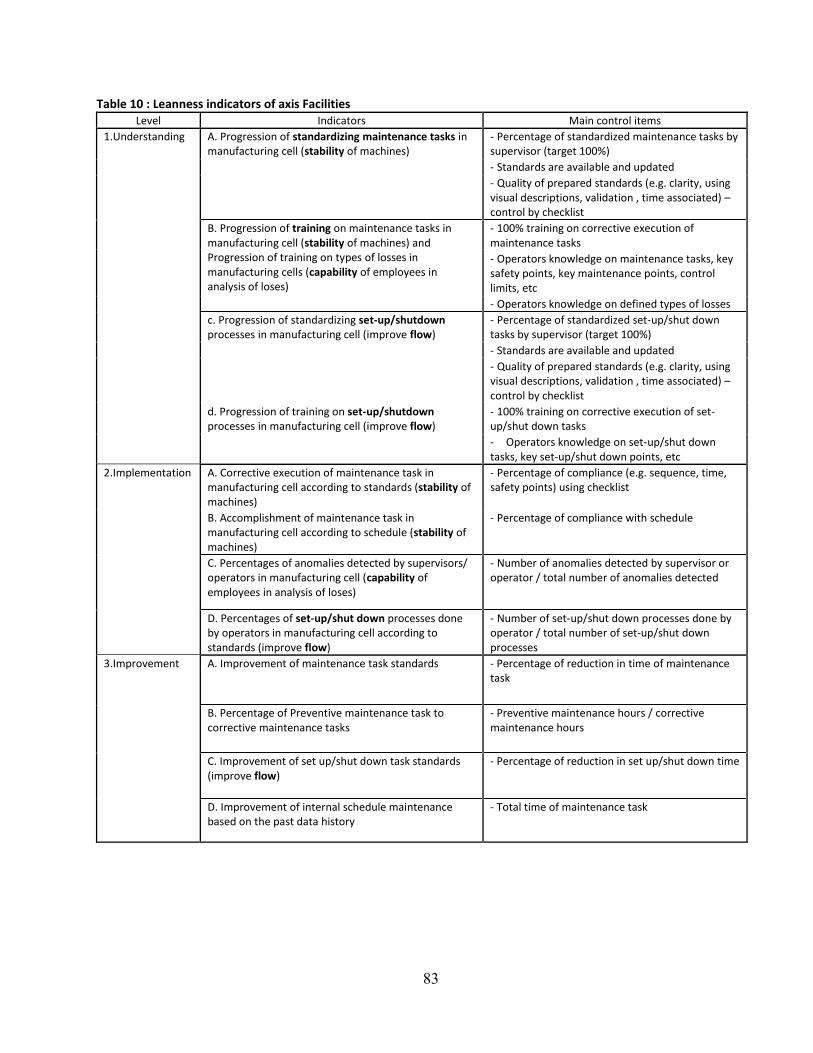
83
Table 10 : Leanness indicators of axis Facilities Level Indicators Main control items
1.Understanding A. Progression of standardizing maintenance tasks in manufacturing cell (stability of machines)
- Percentage of standardized maintenance tasks by supervisor (target 100%)
- Standards are available and updated
- Quality of prepared standards (e.g. clarity, using visual descriptions, validation , time associated) – control by checklist
B. Progression of training on maintenance tasks in manufacturing cell (stability of machines) and Progression of training on types of losses in manufacturing cells (capability of employees in analysis of loses)
- 100% training on corrective execution of maintenance tasks
- Operators knowledge on maintenance tasks, key safety points, key maintenance points, control limits, etc
- Operators knowledge on defined types of losses
c. Progression of standardizing set-up/shutdown processes in manufacturing cell (improve flow)
- Percentage of standardized set-up/shut down tasks by supervisor (target 100%)
- Standards are available and updated
- Quality of prepared standards (e.g. clarity, using visual descriptions, validation , time associated) – control by checklist
d. Progression of training on set-up/shutdown processes in manufacturing cell (improve flow)
- 100% training on corrective execution of set-up/shut down tasks
- Operators knowledge on set-up/shut down tasks, key set-up/shut down points, etc
2.Implementation A. Corrective execution of maintenance task in manufacturing cell according to standards (stability of machines)
- Percentage of compliance (e.g. sequence, time, safety points) using checklist
B. Accomplishment of maintenance task in manufacturing cell according to schedule (stability of machines)
- Percentage of compliance with schedule
C. Percentages of anomalies detected by supervisors/ operators in manufacturing cell (capability of employees in analysis of loses)
- Number of anomalies detected by supervisor or operator / total number of anomalies detected
D. Percentages of set-up/shut down processes done by operators in manufacturing cell according to standards (improve flow)
- Number of set-up/shut down processes done by operator / total number of set-up/shut down processes
3.Improvement A. Improvement of maintenance task standards - Percentage of reduction in time of maintenance task
B. Percentage of Preventive maintenance task to corrective maintenance tasks
- Preventive maintenance hours / corrective maintenance hours
C. Improvement of set up/shut down task standards (improve flow)
- Percentage of reduction in set up/shut down time
D. Improvement of internal schedule maintenance based on the past data history
- Total time of maintenance task
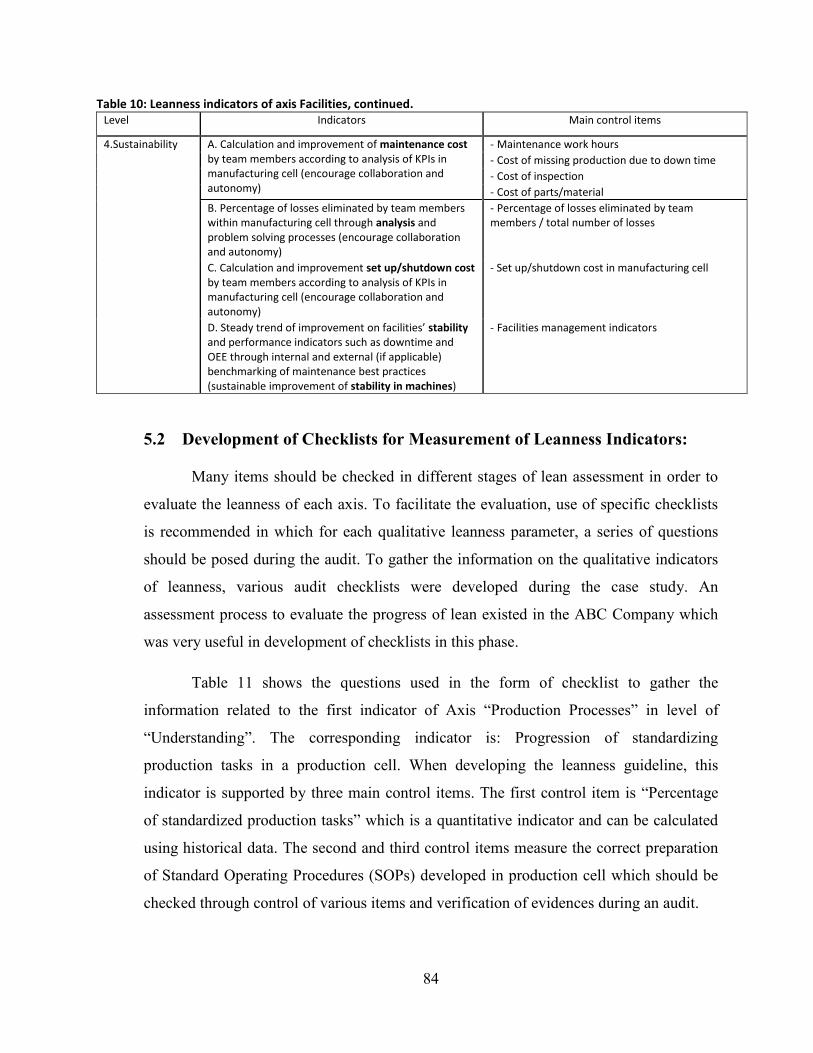
84
Table 10: Leanness indicators of axis Facilities, continued. Level Indicators Main control items
4.Sustainability A. Calculation and improvement of maintenance cost by team members according to analysis of KPIs in manufacturing cell (encourage collaboration and autonomy)
- Maintenance work hours
- Cost of missing production due to down time
- Cost of inspection
- Cost of parts/material
B. Percentage of losses eliminated by team members within manufacturing cell through analysis and problem solving processes (encourage collaboration and autonomy)
- Percentage of losses eliminated by team members / total number of losses
C. Calculation and improvement set up/shutdown cost by team members according to analysis of KPIs in manufacturing cell (encourage collaboration and autonomy)
- Set up/shutdown cost in manufacturing cell
D. Steady trend of improvement on facilities’ stability and performance indicators such as downtime and OEE through internal and external (if applicable) benchmarking of maintenance best practices (sustainable improvement of stability in machines)
- Facilities management indicators
5.2 Development of Checklists for Measurement of Leanness Indicators:
Many items should be checked in different stages of lean assessment in order to
evaluate the leanness of each axis. To facilitate the evaluation, use of specific checklists
is recommended in which for each qualitative leanness parameter, a series of questions
should be posed during the audit. To gather the information on the qualitative indicators
of leanness, various audit checklists were developed during the case study. An
assessment process to evaluate the progress of lean existed in the ABC Company which
was very useful in development of checklists in this phase.
Table 11 shows the questions used in the form of checklist to gather the
information related to the first indicator of Axis “Production Processes” in level of
“Understanding”. The corresponding indicator is: Progression of standardizing
production tasks in a production cell. When developing the leanness guideline, this
indicator is supported by three main control items. The first control item is “Percentage
of standardized production tasks” which is a quantitative indicator and can be calculated
using historical data. The second and third control items measure the correct preparation
of Standard Operating Procedures (SOPs) developed in production cell which should be
checked through control of various items and verification of evidences during an audit.
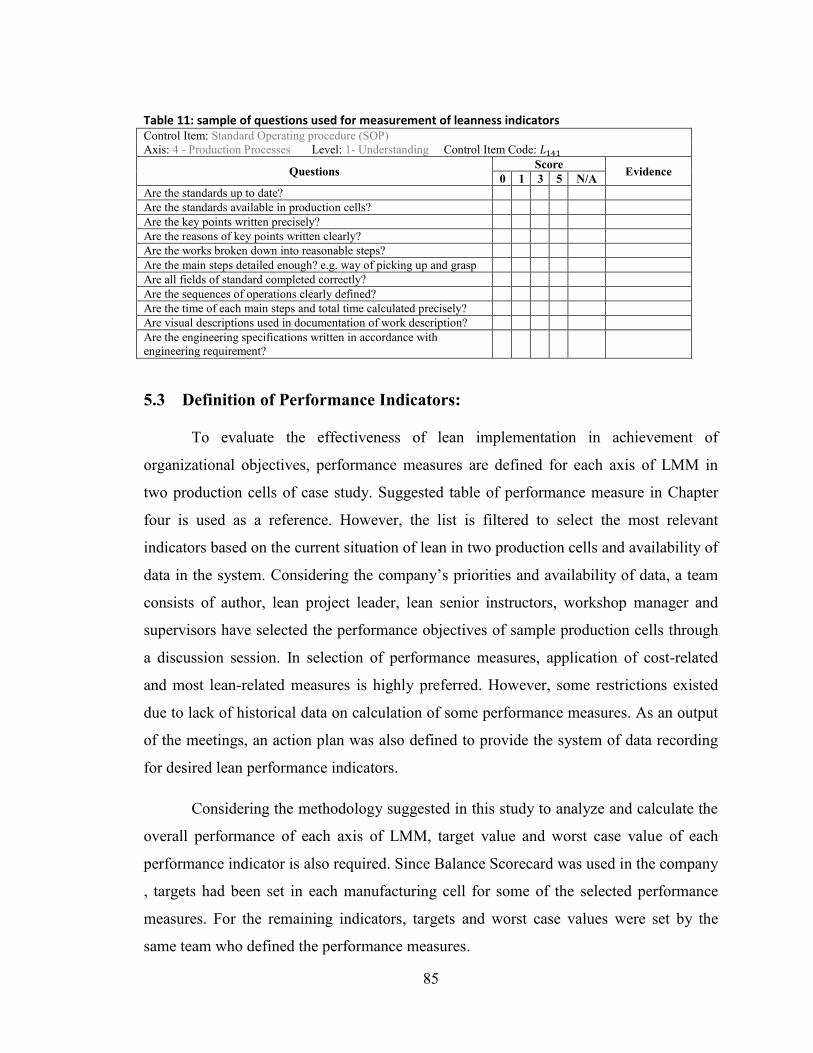
85
Table 11: sample of questions used for measurement of leanness indicators Control Item: Standard Operating procedure (SOP)
Axis: 4 - Production Processes Level: 1- Understanding Control Item Code:
Questions Score
Evidence 0 1 3 5 N/A
Are the standards up to date?
Are the standards available in production cells?
Are the key points written precisely?
Are the reasons of key points written clearly?
Are the works broken down into reasonable steps?
Are the main steps detailed enough? e.g. way of picking up and grasp
Are all fields of standard completed correctly?
Are the sequences of operations clearly defined?
Are the time of each main steps and total time calculated precisely?
Are visual descriptions used in documentation of work description?
Are the engineering specifications written in accordance with
engineering requirement?
5.3 Definition of Performance Indicators:
To evaluate the effectiveness of lean implementation in achievement of
organizational objectives, performance measures are defined for each axis of LMM in
two production cells of case study. Suggested table of performance measure in Chapter
four is used as a reference. However, the list is filtered to select the most relevant
indicators based on the current situation of lean in two production cells and availability of
data in the system. Considering the company’s priorities and availability of data, a team
consists of author, lean project leader, lean senior instructors, workshop manager and
supervisors have selected the performance objectives of sample production cells through
a discussion session. In selection of performance measures, application of cost-related
and most lean-related measures is highly preferred. However, some restrictions existed
due to lack of historical data on calculation of some performance measures. As an output
of the meetings, an action plan was also defined to provide the system of data recording
for desired lean performance indicators.
Considering the methodology suggested in this study to analyze and calculate the
overall performance of each axis of LMM, target value and worst case value of each
performance indicator is also required. Since Balance Scorecard was used in the company
, targets had been set in each manufacturing cell for some of the selected performance
measures. For the remaining indicators, targets and worst case values were set by the
same team who defined the performance measures.

86
5.4 Collecting the Data of Leanness and Performance
In this case study, two methods of data gathering were used to assess the leanness
and performance of selected production cells: audit using checklists (CL) for qualitative
indicators, and historical data (HD) for quantitative measures.
For gathering the data of qualitative measures a comprehensive series of audits
were conducted for all axes of maturity model namely People, Facilities, Quality,
Production Processes, Working Condition, JIT and Leadership. The audits were
principally conducted by five senior instructors of a team who was responsible for lean
implementation in the company. Production line managers, production cell’s supervisors
and operators were engaged as required. For leanness indicators, main control items were
used as a guideline for auditors to look for required information and related evidences in
production cells. In collaboration between the lean assessment team and author, all
ambiguities were resolved before the data gathering.
Different leanness indicators are used in each axis-level of LMM to evaluate
different perspectives of lean progression. Also, various performance measures are used
to show the degree of effectiveness in each proposed axis of lean implementation. To
facilitate the process of data collection and analysis, a coding system is used in this study
in which for each leanness indicator and performance measure, a unique code is assigned.
Table 12 with the help of visualisation shows the main parameters used in calculation of
leanness and lean effectiveness. Following notations describe each parameter.
87
Table 12: Coding of leanness indicators and performance measures
Performance
Sustainability
Improvement
Implementation
Understanding
Lean
Maturity
Levels ( )
People
Facilities
Working
Conditions
Production
Processes
Quality
JIT
Leadership
Notations: Level of maturity Axis of LMM leanness indicator of level axis
Leanness of level axis
Overall leanness of axis
Overall leanness of level Overall leanness of a production cell Overall performance of axis
performance indicator of axis
Number of performance indicators in axis
Number of leanness indicators in level axis
Target value of performance indicator
Worst case value of performance indicator
Real value of performance indicator
In order to help normalize the result of observations, all the leanness indicators
are converted to the scale of 0 to 100. During a review meeting in collaboration with
senior instructors (auditors), lean leader, production line managers and manufacturing
cell’s supervisors, targets were revised or, if necessary, were defined. For qualitative
indicators, equation (1) was used to quantify the results of each audit in a scale of 1 to
100. Based on the results of the audits, the number of items in each checklist with major
non-conformances, minor non-conformances and without non-conformances
88
( respectively) were counted. Then, according to equation (1) the score of
each main control item was calculated. Whenever a question was not applicable in a
production cell, it was not used in calculation.
(1)
Whenever the historical data was available in the system regarding a leanness
indicator or a performance measure, it was used in data collection process. Data was used
from either two manufacturing cells’ management dashboards or workshops’ database of
Balance Scorecard reports. Historical data is also used for quantitative main control
items. For example, to gather data related to “Percentage of standardized rework tasks”
which is one of the main control items of level “Understanding” in axis “Quality” (see
Appendix B), the list of rework tasks was compared with the standards accomplished for
rework tasks. So, the related control item was simply calculated using the following
equation:
A unique code in the format of is formed by using the indices as shown
above. For example, and forms the code L351 which correspond to the
first indicator of axis 5 (Axis Quality) in level 3. Results of leanness indicators obtained
through audits and direct observation of two production cells are summarized in Tables
13 and 14.
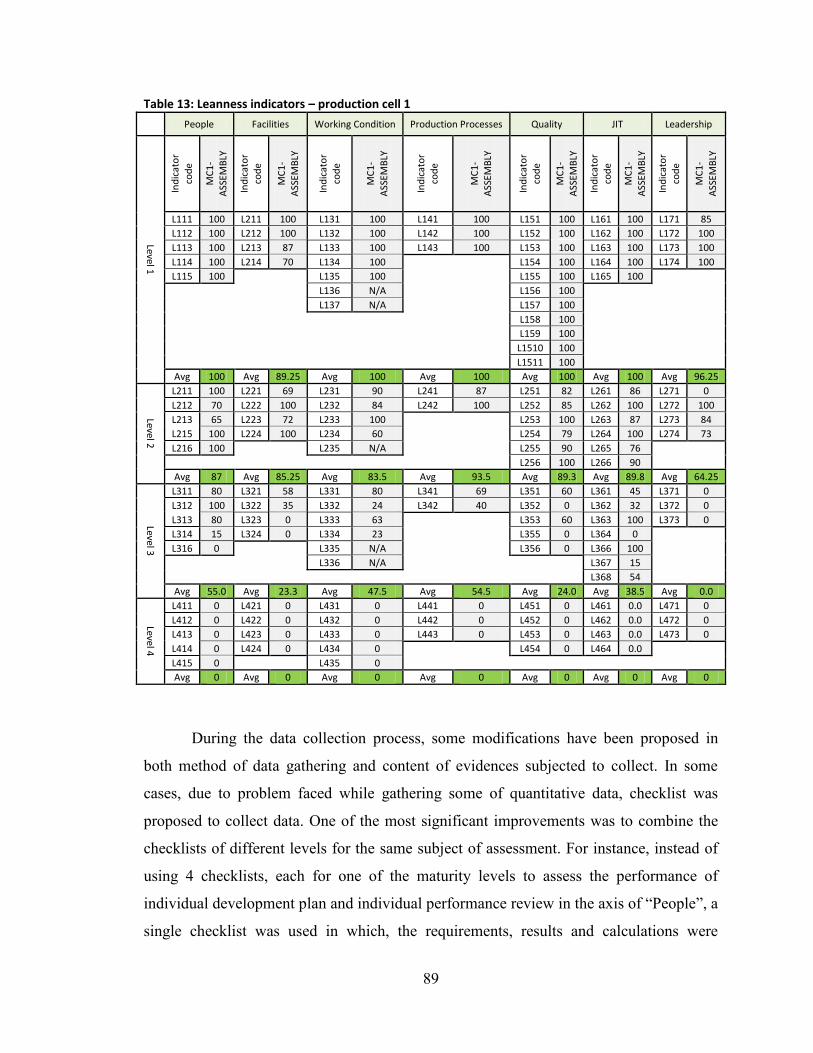
89
Table 13: Leanness indicators – production cell 1
People Facilities Working Condition Production Processes Quality JIT Leadership
Level 1
Ind
icat
or
cod
e
MC
1-
ASS
EMB
LY
Ind
icat
or
cod
e
MC
1-
ASS
EMB
LY
Ind
icat
or
cod
e
MC
1-
ASS
EMB
LY
Ind
icat
or
cod
e
MC
1-
ASS
EMB
LY
Ind
icat
or
cod
e
MC
1-
ASS
EMB
LY
Ind
icat
or
cod
e
MC
1-
ASS
EMB
LY
Ind
icat
or
cod
e
MC
1-
ASS
EMB
LY
L111 100 L211 100 L131 100 L141 100 L151 100 L161 100 L171 85
L112 100 L212 100 L132 100 L142 100 L152 100 L162 100 L172 100
L113 100 L213 87 L133 100 L143 100 L153 100 L163 100 L173 100
L114 100 L214 70 L134 100
L154 100 L164 100 L174 100
L115 100
L135 100
L155 100 L165 100
L136 N/A
L156 100
L137 N/A
L157 100
L158 100
L159 100
L1510 100
L1511 100
Avg 100 Avg 89.25 Avg 100 Avg 100 Avg 100 Avg 100 Avg 96.25
Level 2
L211 100 L221 69 L231 90 L241 87 L251 82 L261 86 L271 0
L212 70 L222 100 L232 84 L242 100 L252 85 L262 100 L272 100
L213 65 L223 72 L233 100
L253 100 L263 87 L273 84
L215 100 L224 100 L234 60
L254 79 L264 100 L274 73
L216 100
L235 N/A
L255 90 L265 76
L256 100 L266 90
Avg 87 Avg 85.25 Avg 83.5 Avg 93.5 Avg 89.3 Avg 89.8 Avg 64.25
Level 3
L311 80 L321 58 L331 80 L341 69 L351 60 L361 45 L371 0
L312 100 L322 35 L332 24 L342 40 L352 0 L362 32 L372 0
L313 80 L323 0 L333 63
L353 60 L363 100 L373 0
L314 15 L324 0 L334 23
L355 0 L364 0
L316 0
L335 N/A
L356 0 L366 100
L336 N/A
L367 15
L368 54
Avg 55.0 Avg 23.3 Avg 47.5 Avg 54.5 Avg 24.0 Avg 38.5 Avg 0.0
Level 4
L411 0 L421 0 L431 0 L441 0 L451 0 L461 0.0 L471 0
L412 0 L422 0 L432 0 L442 0 L452 0 L462 0.0 L472 0
L413 0 L423 0 L433 0 L443 0 L453 0 L463 0.0 L473 0
L414 0 L424 0 L434 0
L454 0 L464 0.0
L415 0
L435 0
Avg 0 Avg 0 Avg 0 Avg 0 Avg 0 Avg 0 Avg 0
During the data collection process, some modifications have been proposed in
both method of data gathering and content of evidences subjected to collect. In some
cases, due to problem faced while gathering some of quantitative data, checklist was
proposed to collect data. One of the most significant improvements was to combine the
checklists of different levels for the same subject of assessment. For instance, instead of
using 4 checklists, each for one of the maturity levels to assess the performance of
individual development plan and individual performance review in the axis of “People”, a
single checklist was used in which, the requirements, results and calculations were
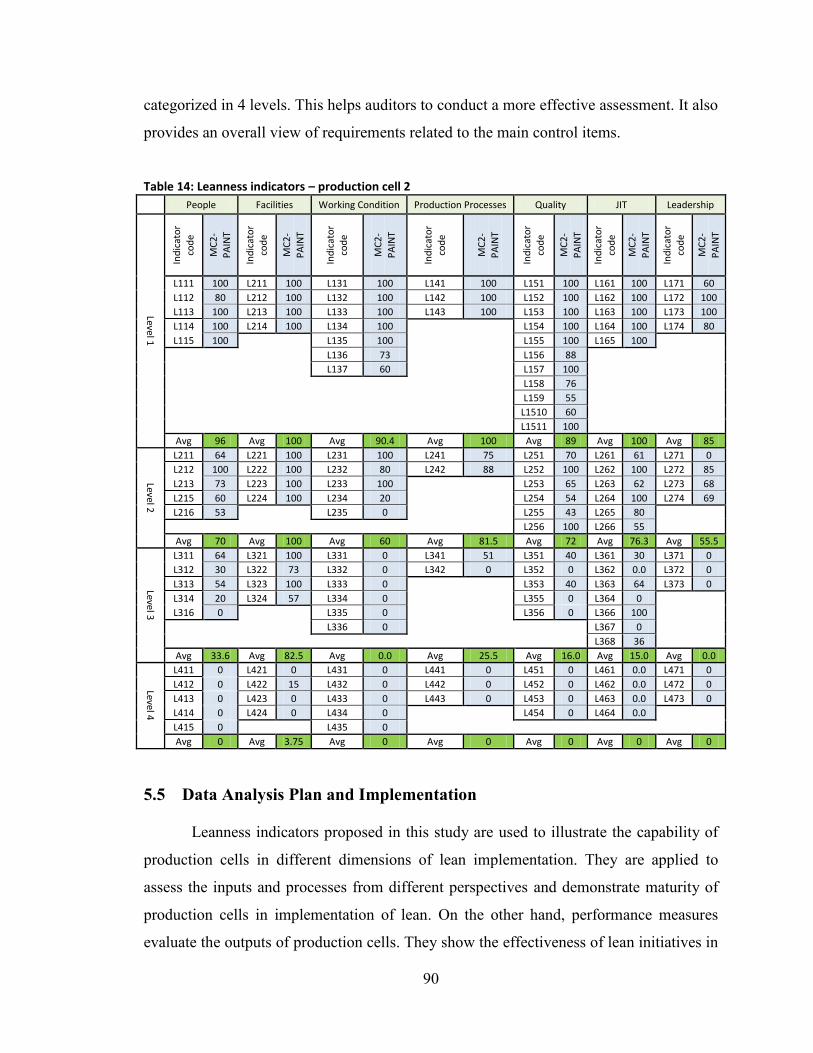
90
categorized in 4 levels. This helps auditors to conduct a more effective assessment. It also
provides an overall view of requirements related to the main control items.
Table 14: Leanness indicators – production cell 2
People Facilities Working Condition Production Processes Quality JIT Leadership
Level 1
Ind
icat
or
cod
e
MC
2-
PA
INT
Ind
icat
or
cod
e
MC
2-
PA
INT
Ind
icat
or
cod
e
MC
2-
PA
INT
Ind
icat
or
cod
e
MC
2-
PA
INT
Ind
icat
or
cod
e
MC
2-
PA
INT
Ind
icat
or
cod
e
MC
2-
PA
INT
Ind
icat
or
cod
e
MC
2-
PA
INT
L111 100 L211 100 L131 100 L141 100 L151 100 L161 100 L171 60
L112 80 L212 100 L132 100 L142 100 L152 100 L162 100 L172 100
L113 100 L213 100 L133 100 L143 100 L153 100 L163 100 L173 100
L114 100 L214 100 L134 100
L154 100 L164 100 L174 80
L115 100
L135 100
L155 100 L165 100
L136 73
L156 88
L137 60
L157 100
L158 76
L159 55
L1510 60
L1511 100
Avg 96 Avg 100 Avg 90.4 Avg 100 Avg 89 Avg 100 Avg 85
Level 2
L211 64 L221 100 L231 100 L241 75 L251 70 L261 61 L271 0
L212 100 L222 100 L232 80 L242 88 L252 100 L262 100 L272 85
L213 73 L223 100 L233 100
L253 65 L263 62 L273 68
L215 60 L224 100 L234 20
L254 54 L264 100 L274 69
L216 53
L235 0
L255 43 L265 80
L256 100 L266 55
Avg 70 Avg 100 Avg 60 Avg 81.5 Avg 72 Avg 76.3 Avg 55.5
Level 3
L311 64 L321 100 L331 0 L341 51 L351 40 L361 30 L371 0
L312 30 L322 73 L332 0 L342 0 L352 0 L362 0.0 L372 0
L313 54 L323 100 L333 0
L353 40 L363 64 L373 0
L314 20 L324 57 L334 0
L355 0 L364 0
L316 0
L335 0
L356 0 L366 100
L336 0
L367 0
L368 36
Avg 33.6 Avg 82.5 Avg 0.0 Avg 25.5 Avg 16.0 Avg 15.0 Avg 0.0 Level 4
L411 0 L421 0 L431 0 L441 0 L451 0 L461 0.0 L471 0
L412 0 L422 15 L432 0 L442 0 L452 0 L462 0.0 L472 0
L413 0 L423 0 L433 0 L443 0 L453 0 L463 0.0 L473 0
L414 0 L424 0 L434 0
L454 0 L464 0.0
L415 0
L435 0
Avg 0 Avg 3.75 Avg 0 Avg 0 Avg 0 Avg 0 Avg 0
5.5 Data Analysis Plan and Implementation
Leanness indicators proposed in this study are used to illustrate the capability of
production cells in different dimensions of lean implementation. They are applied to
assess the inputs and processes from different perspectives and demonstrate maturity of
production cells in implementation of lean. On the other hand, performance measures
evaluate the outputs of production cells. They show the effectiveness of lean initiatives in

91
achievement of organization’s objective. Analyzing these two groups of indicators helps
us to assess the overall lean success.
Despite multiple factors both in leanness and performance of each axis of LMM,
in order to assess the leanness and lean effectiveness of each production cell, it is
suggested to end up with a single indicator of progression. This will provide a general
view on the status of production cell on lean transformation journey and shows the
roadblocks in each level of maturity. Following two sections describe the methods which
are used in this study to calculate the overall leanness and overall performance of each
production cell.
5.6 Overall Leanness
The ultimate objective is to calculate the overall leanness of each PC, but first we
start calculating the leanness of each axis at each level. There is more than one way of
doing this calculation. One can use the minimum value of the indicators hence using the
weakest indicator to characterize the leanness of an axis at a certain level. Alternatively,
one can calculate the average of leanness indicators and interpret the results accordingly.
On one hand, using the weakest indicator while assessing the capability of
production cells from the beginning could be discouraging for the team of production
cells who initiate lean implementation. To facilitate the change, team members have to be
encouraged by highlighting the results and quick wins (Schaffer & Thomson, 1992). For
example, in the axis of Leadership in level 2, the averages of leanness indicators are
64.25 and 55.5 in PC1 and PC2, respectively. Using the minimum value of leanness
indicators, the leanness of this axis at the level 2 of both PCs will be zero (L271) which
shows neither the progress of each PC, nor the difference between them. On the other
hand, the average approach does not show the extreme values, which means the
indicators with less progress will remain hidden by the indicators with higher value of
progress in the same axis-level. Getting back to the example axis Leadership at level 2,
the average does not unravel the zero progress at L271 in PC1 and PC2.
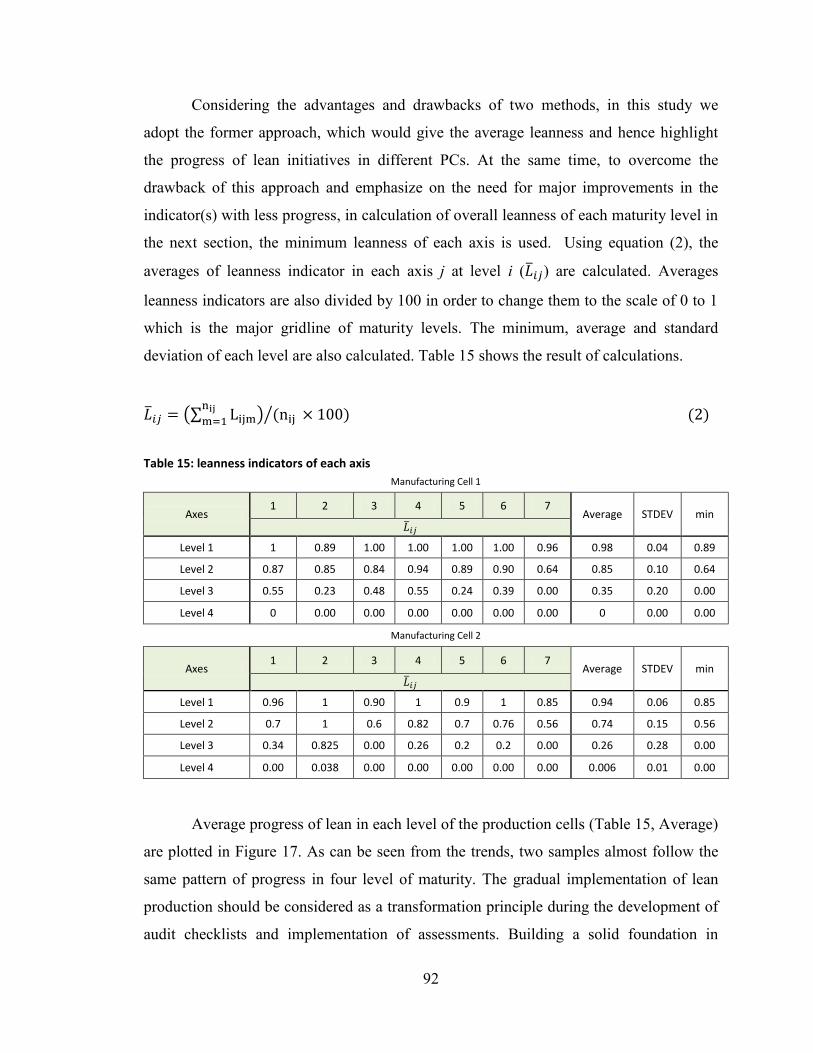
92
Considering the advantages and drawbacks of two methods, in this study we
adopt the former approach, which would give the average leanness and hence highlight
the progress of lean initiatives in different PCs. At the same time, to overcome the
drawback of this approach and emphasize on the need for major improvements in the
indicator(s) with less progress, in calculation of overall leanness of each maturity level in
the next section, the minimum leanness of each axis is used. Using equation (2), the
averages of leanness indicator in each axis j at level i ( ) are calculated. Averages
leanness indicators are also divided by 100 in order to change them to the scale of 0 to 1
which is the major gridline of maturity levels. The minimum, average and standard
deviation of each level are also calculated. Table 15 shows the result of calculations.
(2)
Table 15: leanness indicators of each axis
Manufacturing Cell 1
Axes 1 2 3 4 5 6 7
Average STDEV min
Level 1 1 0.89 1.00 1.00 1.00 1.00 0.96 0.98 0.04 0.89
Level 2 0.87 0.85 0.84 0.94 0.89 0.90 0.64 0.85 0.10 0.64
Level 3 0.55 0.23 0.48 0.55 0.24 0.39 0.00 0.35 0.20 0.00
Level 4 0 0.00 0.00 0.00 0.00 0.00 0.00 0 0.00 0.00
Manufacturing Cell 2
Axes 1 2 3 4 5 6 7
Average STDEV min
Level 1 0.96 1 0.90 1 0.9 1 0.85 0.94 0.06 0.85
Level 2 0.7 1 0.6 0.82 0.7 0.76 0.56 0.74 0.15 0.56
Level 3 0.34 0.825 0.00 0.26 0.2 0.2 0.00 0.26 0.28 0.00
Level 4 0.00 0.038 0.00 0.00 0.00 0.00 0.00 0.006 0.01 0.00
Average progress of lean in each level of the production cells (Table 15, Average)
are plotted in Figure 17. As can be seen from the trends, two samples almost follow the
same pattern of progress in four level of maturity. The gradual implementation of lean
production should be considered as a transformation principle during the development of
audit checklists and implementation of assessments. Building a solid foundation in
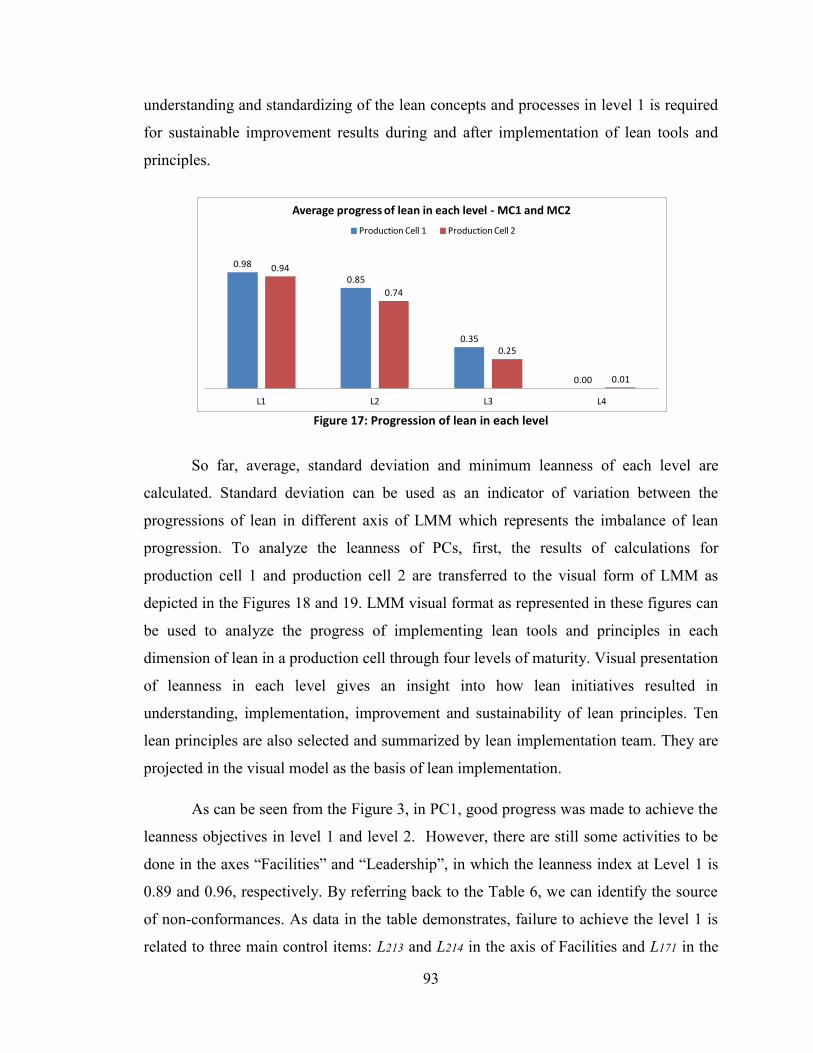
93
understanding and standardizing of the lean concepts and processes in level 1 is required
for sustainable improvement results during and after implementation of lean tools and
principles.
Figure 17: Progression of lean in each level
So far, average, standard deviation and minimum leanness of each level are
calculated. Standard deviation can be used as an indicator of variation between the
progressions of lean in different axis of LMM which represents the imbalance of lean
progression. To analyze the leanness of PCs, first, the results of calculations for
production cell 1 and production cell 2 are transferred to the visual form of LMM as
depicted in the Figures 18 and 19. LMM visual format as represented in these figures can
be used to analyze the progress of implementing lean tools and principles in each
dimension of lean in a production cell through four levels of maturity. Visual presentation
of leanness in each level gives an insight into how lean initiatives resulted in
understanding, implementation, improvement and sustainability of lean principles. Ten
lean principles are also selected and summarized by lean implementation team. They are
projected in the visual model as the basis of lean implementation.
As can be seen from the Figure 3, in PC1, good progress was made to achieve the
leanness objectives in level 1 and level 2. However, there are still some activities to be
done in the axes “Facilities” and “Leadership”, in which the leanness index at Level 1 is
0.89 and 0.96, respectively. By referring back to the Table 6, we can identify the source
of non-conformances. As data in the table demonstrates, failure to achieve the level 1 is
related to three main control items: L213 and L214 in the axis of Facilities and L171 in the
0.98
0.85
0.35
0.00
0.94
0.74
0.25
0.01
L1 L2 L3 L4
Average progress of lean in each level - MC1 and MC2
Production Cell 1 Production Cell 2

94
axis of leadership. By further analysis of these indicators and revision of audit results,
appropriate actions can be defined and implemented to fill up the gaps.
Figure 18: leanness results – Production Cell 1
Figure 19: leanness results – Production Cell 2
95
Figure 19 illustrates the results of assessment in production cell 2. The bar chart
shows less progression in level1, 2 and 3 in comparison with production cell 1 in Figure
17. These results are expected due to the difference between the times when lean had
been applied in paint shop and assembly shop. Despite the fact that assembly shop had
started to apply lean principles almost three years sooner than paint shop, difference
between progresses of lean between two samples is not noticeable. Two main reasons are
identified after further investigation and discussion of subject with lean implementation
team: First, leveraging the knowledge and skills acquired from lean practices in assembly
shop to implement lean in pain shop, and second, assigning some paint shop supervisory
positions to people who worked as supervisor in assembly shop before. Despite the
further overall progress of lean in assembly shop, bar chart shows more progress in axis
of Facilities in paint shop. Focus of TPM implementation in machine-dominated lines of
paint shop is indicated as the main reason of this difference.
Overall Leanness of Each Maturity Level :
One of the main objectives of developing a multi-dimensional lean maturity
model is to make progress simultaneously in all dimensions of lean. This balance
between the lean dimensions is very important to achieve the organization’s objectives.
For example, control of inventory level has to be done in the axis of JIT. However,
without high machine reliability, which is controlled in axis of Facilities, we won’t be
able to reduce the level of inventory. Lots of machine breakdowns will force us to keep
more inventories in order to avoid stockout. Turning back to the production cell 1, as an
example, most of the requirements for level 1 have been met, but there are still small gaps
in axes 2 and axes 7. Therefore, production cell 1 cannot be considered as level 1 of
maturity.
Considering balanced progress of lean as a basic principle of implementation,
minimum score between all axes of LMM is suggested as an overall leanness of each
level. Thus, according to equation (3), s are considered as overall indicator of PC’s
leanness in each level. This approach encourages the associated team of PC to focus on
the dimensions which lack progress in a certain level and resolve the existing
shortcomings before going forward in other dimensions where progress is more. In the
96
case of PC1, if the small current non-conformances in the axes Facilities and Leadership
eliminated, overall leanness will change from 0.89 (which is the minimum of the leanness
indicators in level 1) to 1 which shows the completion of level 1.
For each level i: (3)
As expected, when we go to the upper levels of maturity, overall score of leanness
becomes less. This is due to the characteristics assigned to each level of maturity which is
based on the transformation principles and maturation concept in business process
improvement (see Chapter Four, first section: Maturity Levels).
Overall Leanness of Each Maturity Axis :
Leanness indicators as are defined in the design phase, provide the possibility of
assessing the implementation of lean in each axis of LMM step by step from
understanding to implementation and improvement and finally, to sustainability of lean as
a way of life. During the implementation of lean in production cells, various activities
may be done simultaneously which belong to different levels of maturity. Some member
of production team, for example, can be assigned to work on autonomous maintenance
activities following their training, while the training is still in progress for other members
of the team. Also, some part of improvements may be happened from the commencement
of implementation. The result of assessments in case study shows a similar situation.
Despite some gaps in level 1, some progress has been made in level 2 and level 3. One of
the important roles of lean assessment is to highlight the gaps in each level of maturity.
Consequently, action plans can be defined and prioritized in order to fill the gaps and
create a synchronized and balanced continuous progress.
In order to focus on the mentioned gaps, completion of each level’s activities is
considered in calculation of overall leanness of each axis. For instance, in production cell
1, the average leanness of level 1 and 2 in the axis Quality is 1 and 0.89 respectively
(Figure 18). Thus, the overall leanness of axis Quality is equal to 1.89 (1+0.89). Since the
level 2 is not yet completed, the score of 0.24 in the level 3 is not added in calculation of
overall leanness in the axis Quality. In another example, according to the results of
assessment in production cell 2 in the axis of Facilities, requirements of level 1 and 2 are
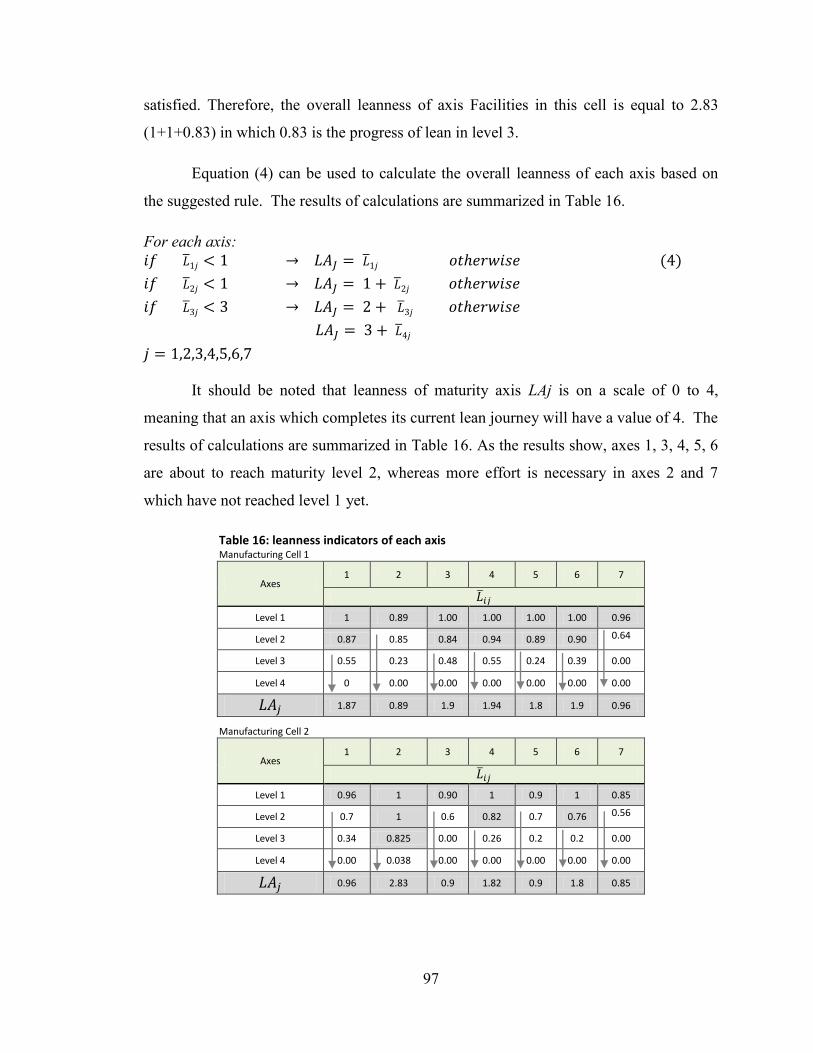
97
satisfied. Therefore, the overall leanness of axis Facilities in this cell is equal to 2.83
(1+1+0.83) in which 0.83 is the progress of lean in level 3.
Equation (4) can be used to calculate the overall leanness of each axis based on
the suggested rule. The results of calculations are summarized in Table 16.
For each axis:
(4)
It should be noted that leanness of maturity axis LAj is on a scale of 0 to 4,
meaning that an axis which completes its current lean journey will have a value of 4. The
results of calculations are summarized in Table 16. As the results show, axes 1, 3, 4, 5, 6
are about to reach maturity level 2, whereas more effort is necessary in axes 2 and 7
which have not reached level 1 yet.
Table 16: leanness indicators of each axis Manufacturing Cell 1
Axes 1 2 3 4 5 6 7
Level 1 1 0.89 1.00 1.00 1.00 1.00 0.96
Level 2 0.87 0.85 0.84 0.94 0.89 0.90 0.64
Level 3 0.55 0.23 0.48 0.55 0.24 0.39 0.00
Level 4 0 0.00 0.00 0.00 0.00 0.00 0.00
1.87 0.89 1.9 1.94 1.8 1.9 0.96
Manufacturing Cell 2
Axes 1 2 3 4 5 6 7
Level 1 0.96 1 0.90 1 0.9 1 0.85
Level 2 0.7 1 0.6 0.82 0.7 0.76 0.56
Level 3 0.34 0.825 0.00 0.26 0.2 0.2 0.00
Level 4 0.00 0.038 0.00 0.00 0.00 0.00 0.00
0.96 2.83 0.9 1.82 0.9 1.8 0.85
98
Overall Leanness of Production Cell :
In order to emphasize on balanced progress of lean in all axis of LMM and focus
the effort on the axes with less progression, minimum of leanness
between all axes (minimum of is suggested as the indication of overall leanness in a
production cell. Referring back to the results of leanness indicators in each axis of LMM
in Table 16, according to equation 5, the overall leanness of production cells 1 and 2 are
0.89 and 0.85, respectively. However, it should also be noted that overall leanness
measure L is on a scale of 0 to 4.
} (5)
5.7 Overall Performance
A comprehensive study has been carried out in literature review on performance
measures related to lean implementation. The results are summarized in Table 5 Chapter
two (See Literature Review: lean Principles, Tools and Metrics). As it can be seen from
the table, a wide range of performance measures can be considered as lean metrics. This
is not unexpected due to holistic nature of lean concept as the management philosophy of
organization. During the development of lean maturity framework in Chapter four, the
performance measures were categorized into proposed seven lean axes. Finally, using the
list of performance measures as a reference, performance measures of the case study are
defined prior to data collection process. Table 17, depicts the performance indicators of
seven axes of LMM along with their targets and worst case values determined for the
production cells of case study. Symbols ↑ and ↓ in the table shows the desired direction
in which the value of performance is expected to change.

99
Table 17: Performance measures of production cells 1 and 2
Production Cell 1
Axis Performance Measure performance
code ( ) Equation
Desired
trend
Target
value
Worst case
value
People
Absenteeism Rate P11 Total number of mandays lost due to absenteeism in last 12
months / Total number of working mandays available in last 12 months
↓ 0.03 0.07
Multifunctionality of Operators P12
Total number of operators with skill level 3 in more than 3 workstations in production cell, skill level 3 in 1 workstation in
supplier’s production cell and 1 workstation in customer’s production cell / total number of operators in production cell
↑ 1 0
Facilities
Uptime P21
(Total number of working hours in last 12 months – total downtime hours with the cause inside production cell in last 12
months)/ Total number of working hours in last 12 months – planned maintenance in last 12 months
↑ 0.97 0.85
MTBF P22 Total up time in last 12 months / Tootal number of breakdowns ↑ 170 100
MTTR P23 Total downtime hours for maintenance in last 12 months / Total number of breakdowns in last 12 months
↓ 0.5 2
Working Conditions Safety Risk Factor P31 3* Number of high risk WS + Number of medium risk WS / Total number of WS
↓ 0 0.3
Ergonomics Risk Factor P32 3* Number of high risk WS + Number of medium risk WS / Total number of WS
↓ 0 0.6
Production Processes
Value-added Rate P41 Value-added time / Total processing time ↑ 0.9 0.65 Balance Efficiency P42 Processing time / Number of operators * cycle time ↑ 0.9 0.7
Quality
Scrap Rate P51 Total number of parts scraped in last 12 months / Total number of parts produced or used
↓ 0 0.03
Rework P52 Total rework hours in last 12 months / Total working hours ↓ 0.02 0.08
FPY P53 units of products completed in production cell with no rework in last 12 months / total units of products entering production cell
in last 12 months ↑ 0.97 0.85
JIT
On-time Delivery P61 (3*Sum absolute value of tardiness in hours + Sum absolute value of earliness) / Total deliveries in last 12 months
↓ 0 1
Inventory Turnover Ratio P62 Cost of goods sold in last 12 months/ Average inventory in last 12 months (calculated just for
parts group A in production cell)* ↑ 195 160
Leadership Average Performance P71 average percentages of meet target value of each performance measure ↑
0.25 0 0.5 0.26
0.75 0.51 1 0.76
* Inventory Turnover ration was calculated based on the group A parts in production cell. As a result the value is bigger than what is usually calculating for a company
WS: Work Station
MTBF: Mean time between failures
MTTR: Mean Time To Repair
FPY: First pass yield
99
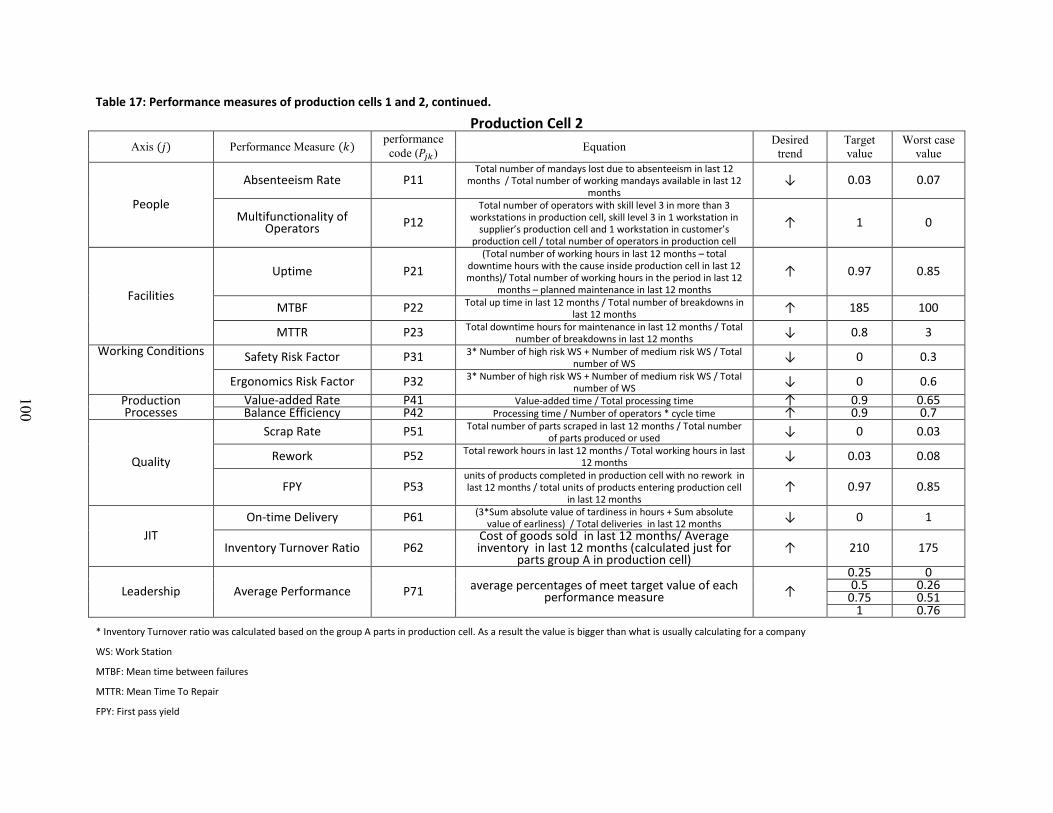
100
Table 17: Performance measures of production cells 1 and 2, continued.
Production Cell 2
Axis Performance Measure performance
code ( ) Equation
Desired
trend
Target
value
Worst case
value
People
Absenteeism Rate P11 Total number of mandays lost due to absenteeism in last 12
months / Total number of working mandays available in last 12 months
↓ 0.03 0.07
Multifunctionality of Operators P12
Total number of operators with skill level 3 in more than 3 workstations in production cell, skill level 3 in 1 workstation in
supplier’s production cell and 1 workstation in customer’s production cell / total number of operators in production cell
↑ 1 0
Facilities
Uptime P21
(Total number of working hours in last 12 months – total downtime hours with the cause inside production cell in last 12 months)/ Total number of working hours in the period in last 12
months – planned maintenance in last 12 months
↑ 0.97 0.85
MTBF P22 Total up time in last 12 months / Total number of breakdowns in last 12 months
↑ 185 100
MTTR P23 Total downtime hours for maintenance in last 12 months / Total number of breakdowns in last 12 months
↓ 0.8 3
Working Conditions Safety Risk Factor P31 3* Number of high risk WS + Number of medium risk WS / Total number of WS
↓ 0 0.3
Ergonomics Risk Factor P32 3* Number of high risk WS + Number of medium risk WS / Total number of WS
↓ 0 0.6
Production Processes
Value-added Rate P41 Value-added time / Total processing time ↑ 0.9 0.65 Balance Efficiency P42 Processing time / Number of operators * cycle time ↑ 0.9 0.7
Quality
Scrap Rate P51 Total number of parts scraped in last 12 months / Total number of parts produced or used
↓ 0 0.03
Rework P52 Total rework hours in last 12 months / Total working hours in last 12 months
↓ 0.03 0.08
FPY P53 units of products completed in production cell with no rework in last 12 months / total units of products entering production cell
in last 12 months ↑ 0.97 0.85
JIT
On-time Delivery P61 (3*Sum absolute value of tardiness in hours + Sum absolute value of earliness) / Total deliveries in last 12 months
↓ 0 1
Inventory Turnover Ratio P62 Cost of goods sold in last 12 months/ Average inventory in last 12 months (calculated just for
parts group A in production cell) ↑ 210 175
Leadership Average Performance P71 average percentages of meet target value of each performance measure ↑
0.25 0 0.5 0.26
0.75 0.51 1 0.76
* Inventory Turnover ratio was calculated based on the group A parts in production cell. As a result the value is bigger than what is usually calculating for a company
WS: Work Station
MTBF: Mean time between failures
MTTR: Mean Time To Repair
FPY: First pass yield
100
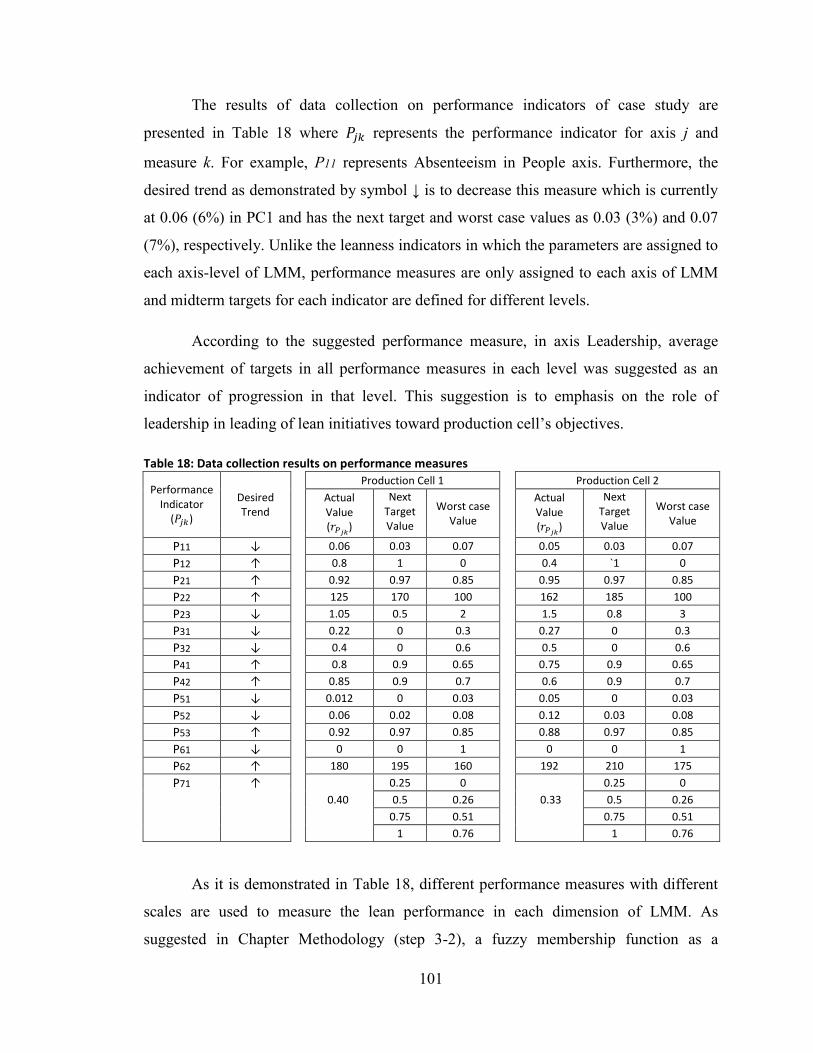
101
The results of data collection on performance indicators of case study are
presented in Table 18 where represents the performance indicator for axis j and
measure k. For example, P11 represents Absenteeism in People axis. Furthermore, the
desired trend as demonstrated by symbol ↓ is to decrease this measure which is currently
at 0.06 (6%) in PC1 and has the next target and worst case values as 0.03 (3%) and 0.07
(7%), respectively. Unlike the leanness indicators in which the parameters are assigned to
each axis-level of LMM, performance measures are only assigned to each axis of LMM
and midterm targets for each indicator are defined for different levels.
According to the suggested performance measure, in axis Leadership, average
achievement of targets in all performance measures in each level was suggested as an
indicator of progression in that level. This suggestion is to emphasis on the role of
leadership in leading of lean initiatives toward production cell’s objectives.
Table 18: Data collection results on performance measures
Performance Indicator
( )
Desired Trend
Production Cell 1
Production Cell 2
Actual Value (
)
Next Target Value
Worst case Value
Actual Value (
)
Next Target Value
Worst case Value
P11 ↓
0.06 0.03 0.07
0.05 0.03 0.07
P12 ↑
0.8 1 0
0.4 `1 0
P21 ↑
0.92 0.97 0.85
0.95 0.97 0.85
P22 ↑
125 170 100
162 185 100
P23 ↓
1.05 0.5 2
1.5 0.8 3
P31 ↓
0.22 0 0.3
0.27 0 0.3
P32 ↓
0.4 0 0.6
0.5 0 0.6
P41 ↑
0.8 0.9 0.65
0.75 0.9 0.65
P42 ↑
0.85 0.9 0.7
0.6 0.9 0.7
P51 ↓
0.012 0 0.03
0.05 0 0.03
P52 ↓
0.06 0.02 0.08
0.12 0.03 0.08
P53 ↑
0.92 0.97 0.85
0.88 0.97 0.85
P61 ↓
0 0 1
0 0 1
P62 ↑
180 195 160
192 210 175
P71 ↑
0.25 0
0.25 0
0.40 0.5 0.26
0.33 0.5 0.26
0.75 0.51
0.75 0.51
1 0.76
1 0.76
As it is demonstrated in Table 18, different performance measures with different
scales are used to measure the lean performance in each dimension of LMM. As
suggested in Chapter Methodology (step 3-2), a fuzzy membership function as a

102
composite indicator is used in this research to synthesize the different scales of
performance measures into a unified index. To calculate the fuzzy membership function,
expected target value and worst case value of each performance measure as described in
measurement phase are defined which are indicated in Table 18. As explained in Chapter
Methodology, target and worst case values are defined based on the available historical
and benchmarking data for level 0 and level 4 of maturity. For instance, the worst case
value of absenteeism rate (P11) is 7%. Any absenteeism rate equal or more than 7% also
consider as the worst case. Therefore, 0.07 is used as the worst case of absenteeism rate.
Since absenteeism has a negative effect on overall performance, 0.07 is considered as the
upper acceptable limit of fuzzy membership function. Zero absenteeism is the best value
which can be assigned to this indicator. However, 3% is set as the achievable target for
level 4 of maturity model. Consequently, 0.03 is set as the lower limit of fuzzy
membership function. In some performance measures, the value of target and/or worst
case is set differently in two production cells. For example, target value of P22 which is
performance indicators of MTBF is larger in production cell 2. This is due to importance
role of machine failures in final result of paint shop process in comparison with assembly
shop.
Based on the definitions of fuzzy membership functions presented in the Chapter
Methodology, two types of fuzzy functions should be applied in order to fuzzify the
performance indicators ( ) of the case study:
For the performance measures P11, P23, P31, P32, P51, P52 and P61 in which the
worst cases are the upper acceptable limit of performance measure, a Trapezoidal R-
function is used. The target level is defined as and the lower threshold is defined
as . Equation (6) is used to calculate the fuzzy membership values of these
performance measures. The defined target of P32 is 0 and its worst case is 0.6, which
means the fuzzy membership value of the actual value of P32 (which is 0.4) is µ(0.4)
=(0.6-0.4/0.6)= 0.33. For the performance measures the results of calculations related to
PC1 is shown in Figure 20.
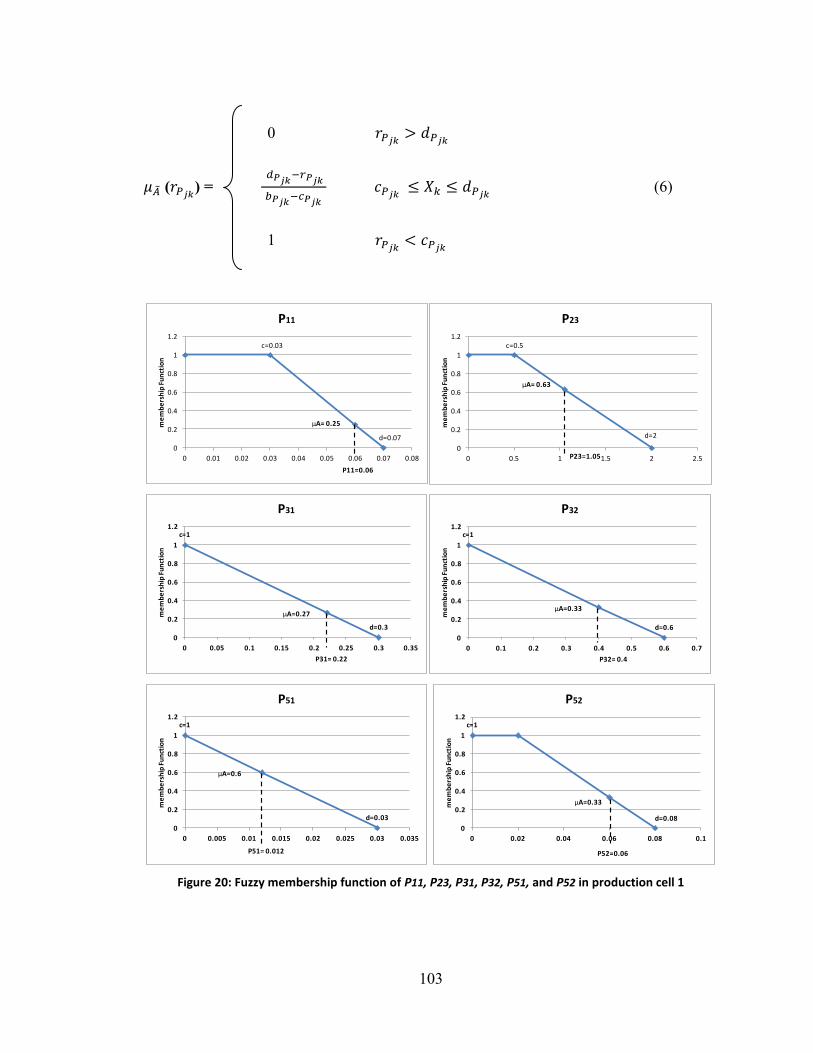
103
0
( ) =
(6)
1
Figure 20: Fuzzy membership function of P11, P23, P31, P32, P51, and P52 in production cell 1
c=0.03
d=0.07
µA= 0.25
0
0.2
0.4
0.6
0.8
1
1.2
0 0.01 0.02 0.03 0.04 0.05 0.06 0.07 0.08
me
mb
ers
hip
Fu
nct
ion
P11=0.06
P11
c=0.5
d=2
µA= 0.63
0
0.2
0.4
0.6
0.8
1
1.2
0 0.5 1 1.5 2 2.5
me
mb
ers
hip
Fu
nct
ion
P23=1.05
P23
c=1
µA=0.27
d=0.3
0
0.2
0.4
0.6
0.8
1
1.2
0 0.05 0.1 0.15 0.2 0.25 0.3 0.35
me
mb
ers
hip
Fu
nct
ion
P31= 0.22
P31
c=1
µA=0.33
d=0.6
0
0.2
0.4
0.6
0.8
1
1.2
0 0.1 0.2 0.3 0.4 0.5 0.6 0.7
me
mb
ers
hip
Fu
nct
ion
P32= 0.4
P32
c=1
µA=0.6
d=0.03
0
0.2
0.4
0.6
0.8
1
1.2
0 0.005 0.01 0.015 0.02 0.025 0.03 0.035
me
mb
ers
hip
Fu
nct
ion
P51= 0.012
P51
c=1
µA=0.33
d=0.08
0
0.2
0.4
0.6
0.8
1
1.2
0 0.02 0.04 0.06 0.08 0.1
me
mb
ers
hip
Fu
nct
ion
P52=0.06
P52
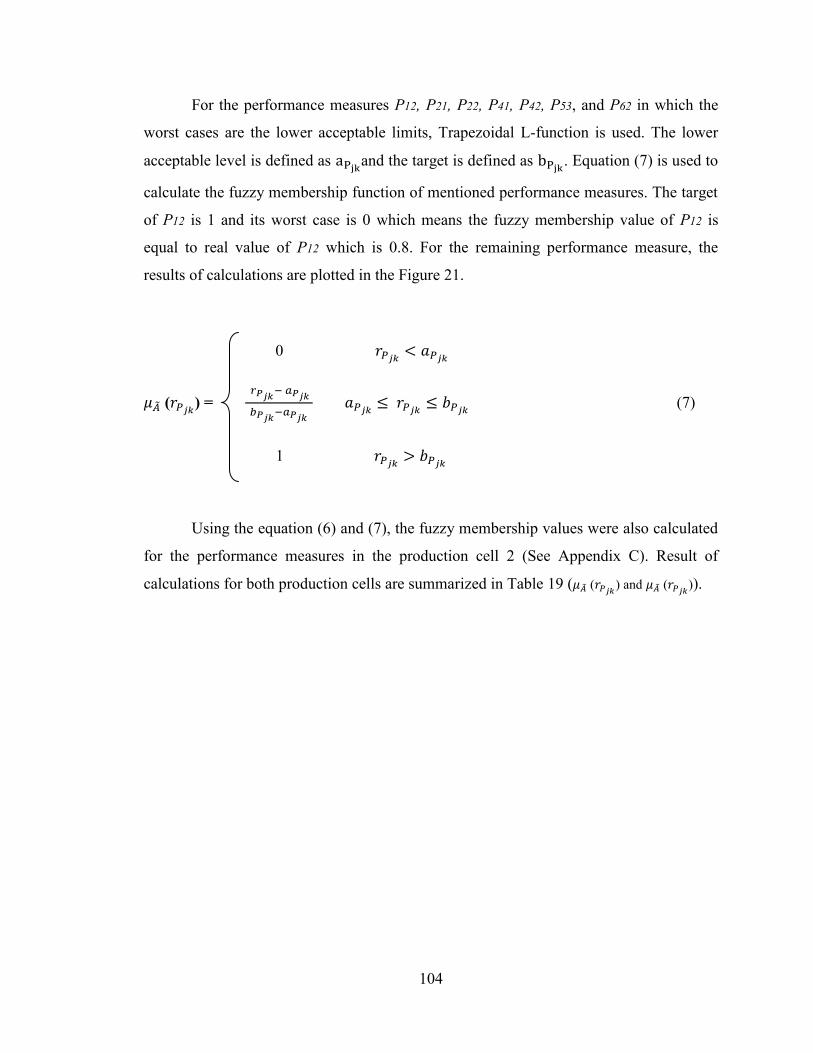
104
For the performance measures P12, P21, P22, P41, P42, P53, and P62 in which the
worst cases are the lower acceptable limits, Trapezoidal L-function is used. The lower
acceptable level is defined as and the target is defined as
. Equation (7) is used to
calculate the fuzzy membership function of mentioned performance measures. The target
of P12 is 1 and its worst case is 0 which means the fuzzy membership value of P12 is
equal to real value of P12 which is 0.8. For the remaining performance measure, the
results of calculations are plotted in the Figure 21.
0
( ) =
(7)
1
Using the equation (6) and (7), the fuzzy membership values were also calculated
for the performance measures in the production cell 2 (See Appendix C). Result of
calculations for both production cells are summarized in Table 19 ( ( ) and (
)).
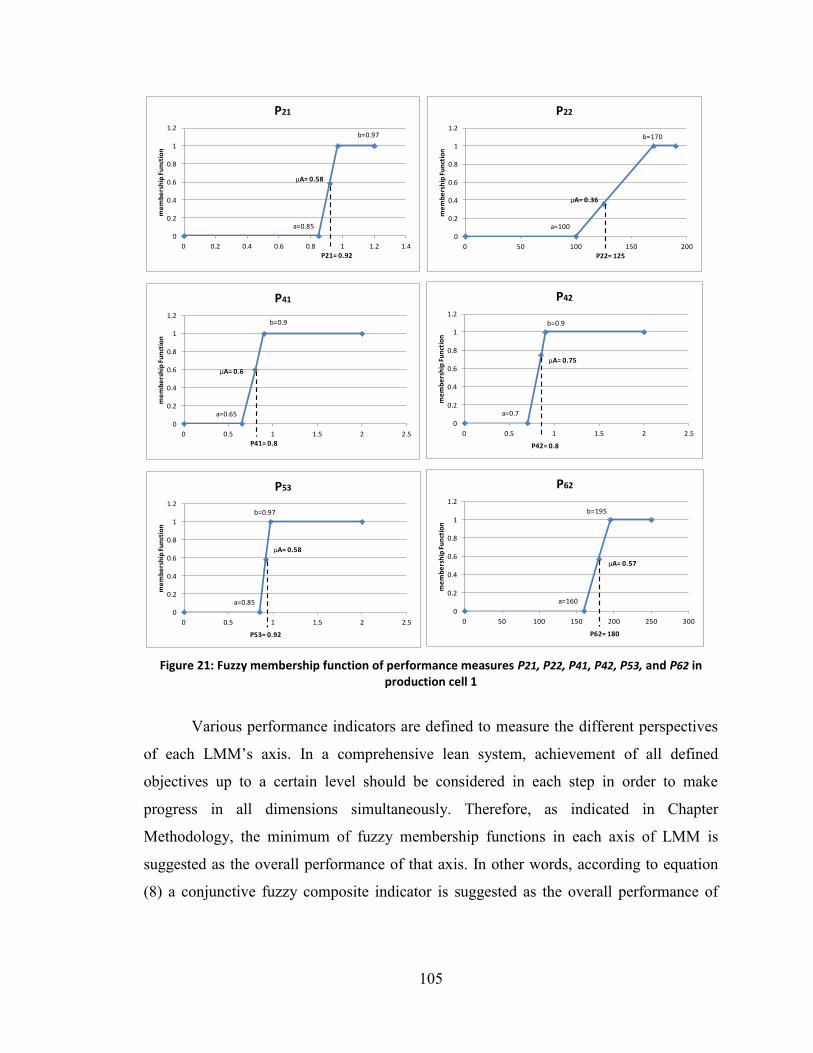
105
Figure 21: Fuzzy membership function of performance measures P21, P22, P41, P42, P53, and P62 in production cell 1
Various performance indicators are defined to measure the different perspectives
of each LMM’s axis. In a comprehensive lean system, achievement of all defined
objectives up to a certain level should be considered in each step in order to make
progress in all dimensions simultaneously. Therefore, as indicated in Chapter
Methodology, the minimum of fuzzy membership functions in each axis of LMM is
suggested as the overall performance of that axis. In other words, according to equation
(8) a conjunctive fuzzy composite indicator is suggested as the overall performance of
a=0.85
b=0.97
µA= 0.58
0
0.2
0.4
0.6
0.8
1
1.2
0 0.2 0.4 0.6 0.8 1 1.2 1.4
me
mb
ers
hip
Fu
nct
ion
P21= 0.92
P21
a=100
b=170
µA= 0.36
0
0.2
0.4
0.6
0.8
1
1.2
0 50 100 150 200
me
mb
ers
hip
Fu
nct
ion
P22= 125
P22
a=0.65
b=0.9
µA= 0.6
0
0.2
0.4
0.6
0.8
1
1.2
0 0.5 1 1.5 2 2.5
me
mb
ers
hip
Fu
nct
ion
P41= 0.8
P41
a=0.7
b=0.9
µA= 0.75
0
0.2
0.4
0.6
0.8
1
1.2
0 0.5 1 1.5 2 2.5m
em
be
rsh
ip F
un
ctio
nP42= 0.8
P42
a=0.85
b=0.97
µA= 0.58
0
0.2
0.4
0.6
0.8
1
1.2
0 0.5 1 1.5 2 2.5
me
mb
ers
hip
Fu
nct
ion
P53= 0.92
P53
a=160
b=195
µA= 0.57
0
0.2
0.4
0.6
0.8
1
1.2
0 50 100 150 200 250 300
me
mb
ers
hip
Fu
nct
ion
P62= 180
P62
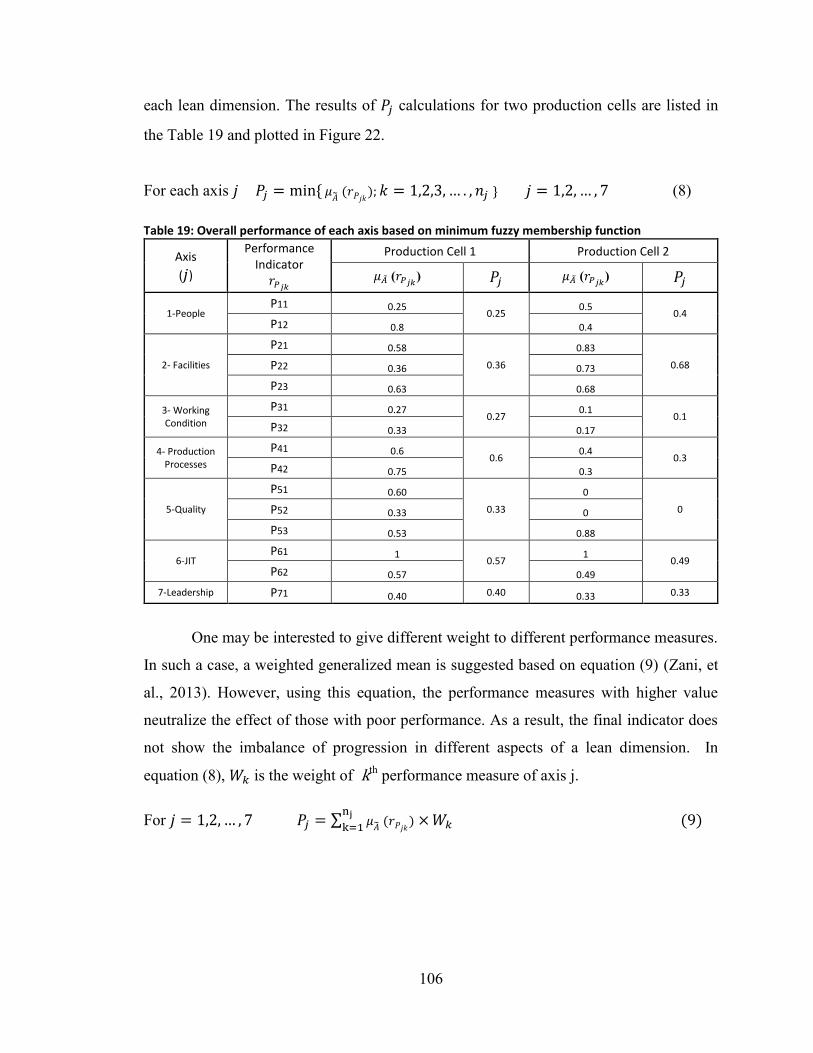
106
each lean dimension. The results of calculations for two production cells are listed in
the Table 19 and plotted in Figure 22.
For each axis
(8)
Table 19: Overall performance of each axis based on minimum fuzzy membership function
Axis
( )
Performance Indicator
Production Cell 1 Production Cell 2
( ) (
)
1-People P11 0.25
0.25 0.5
0.4 P12 0.8 0.4
2- Facilities
P21 0.58
0.36
0.83
0.68 P22 0.36 0.73
P23 0.63 0.68
3- Working Condition
P31 0.27 0.27
0.1 0.1
P32 0.33 0.17
4- Production Processes
P41 0.6 0.6
0.4 0.3
P42 0.75 0.3
5-Quality
P51 0.60
0.33
0
0 P52 0.33 0
P53 0.53 0.88
6-JIT P61 1
0.57 1
0.49 P62 0.57 0.49
7-Leadership P71 0.40 0.40 0.33 0.33
One may be interested to give different weight to different performance measures.
In such a case, a weighted generalized mean is suggested based on equation (9) (Zani, et
al., 2013). However, using this equation, the performance measures with higher value
neutralize the effect of those with poor performance. As a result, the final indicator does
not show the imbalance of progression in different aspects of a lean dimension. In
equation (8), is the weight of kth performance measure of axis j.
For
(9)
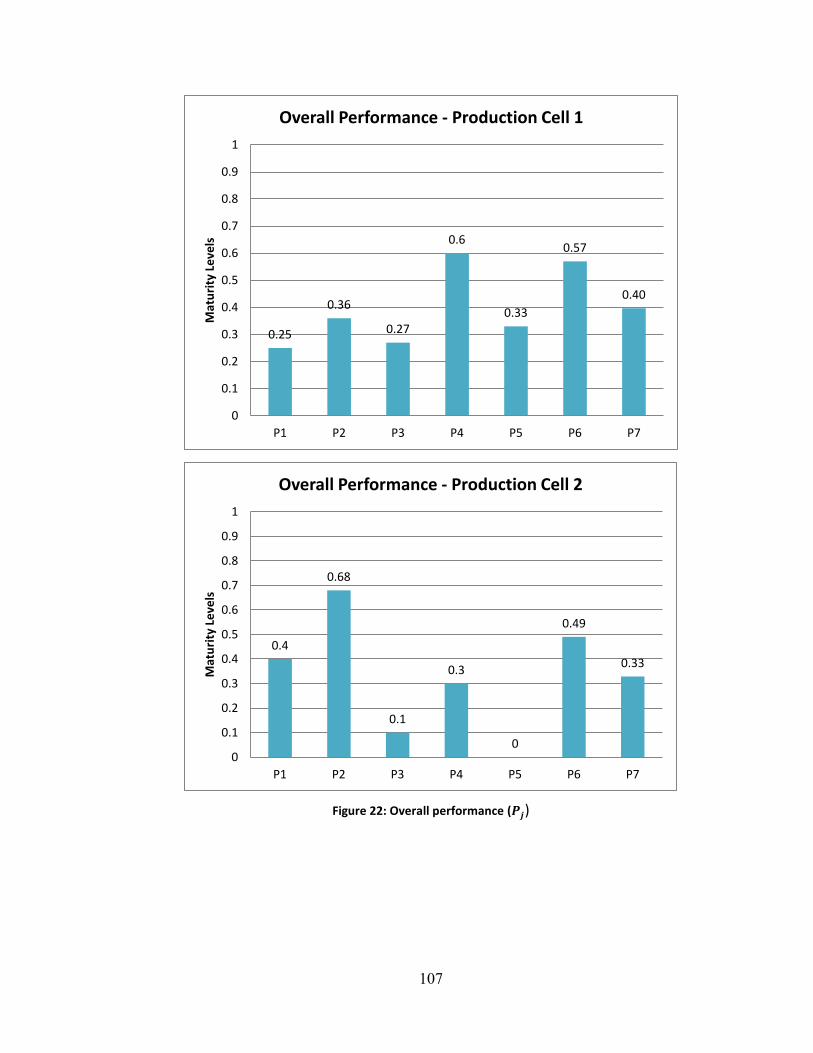
107
Figure 22: Overall performance ( )
0.25
0.36
0.27
0.6
0.33
0.57
0.40
0
0.1
0.2
0.3
0.4
0.5
0.6
0.7
0.8
0.9
1
P1 P2 P3 P4 P5 P6 P7
Mat
uri
ty L
eve
ls
Overall Performance - Production Cell 1
0.4
0.68
0.1
0.3
0
0.49
0.33
0
0.1
0.2
0.3
0.4
0.5
0.6
0.7
0.8
0.9
1
P1 P2 P3 P4 P5 P6 P7
Mat
uri
ty L
eve
ls
Overall Performance - Production Cell 2
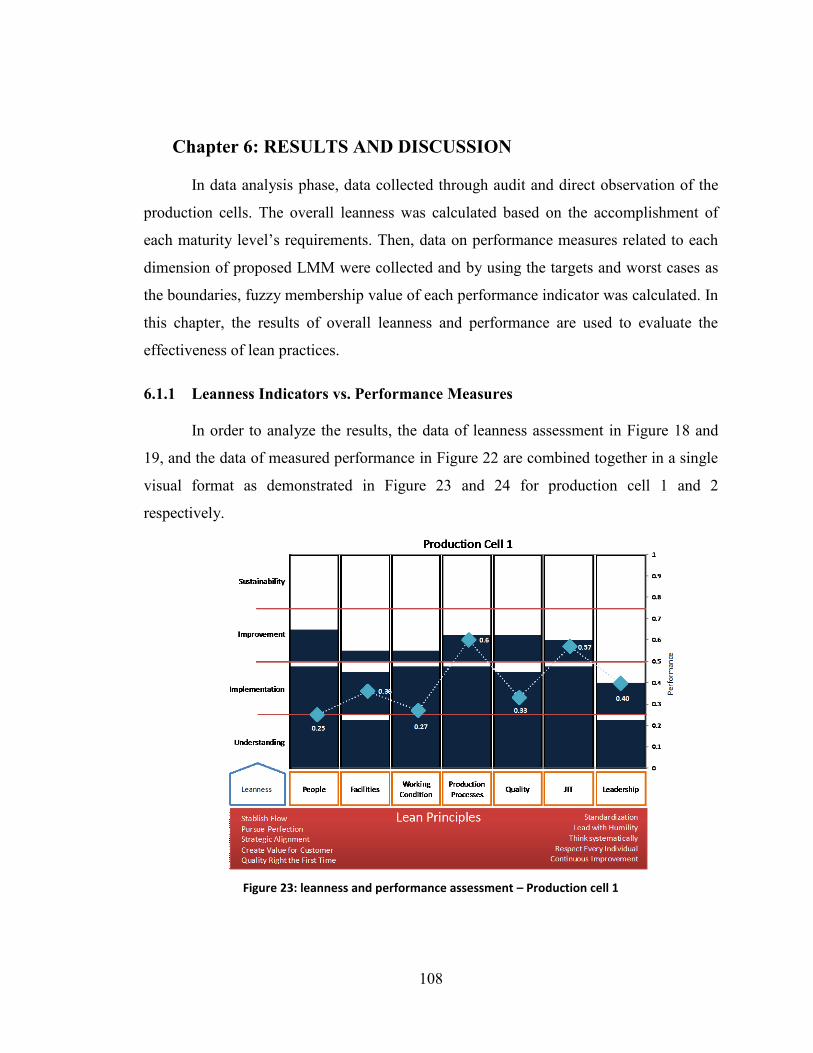
108
6 Chapter 6: RESULTS AND DISCUSSION
In data analysis phase, data collected through audit and direct observation of the
production cells. The overall leanness was calculated based on the accomplishment of
each maturity level’s requirements. Then, data on performance measures related to each
dimension of proposed LMM were collected and by using the targets and worst cases as
the boundaries, fuzzy membership value of each performance indicator was calculated. In
this chapter, the results of overall leanness and performance are used to evaluate the
effectiveness of lean practices.
6.1.1 Leanness Indicators vs. Performance Measures
In order to analyze the results, the data of leanness assessment in Figure 18 and
19, and the data of measured performance in Figure 22 are combined together in a single
visual format as demonstrated in Figure 23 and 24 for production cell 1 and 2
respectively.
Figure 23: leanness and performance assessment – Production cell 1

109
Figure 24: leanness and performance assessment – Production cell 2
Comparing the result of leanness and performance in each axis visually gives us
an overall idea on effectiveness of lean initiatives in that axis. With a quick overview of
graph in Figure 23 we realized that lean practices in axes Facilities, Production Processes,
JIT and Leadership resulted in a desired level of performance in production cell 1. On the
other hand, in axis People, Working Condition and Quality, there is a gap between the
two types of results. To analyze the gap between the leanness and performance, one can
refer back to the records of performance and leanness.
Going backward in details, it can be seen that the low performance in the axis of
“Working Condition”, for example, is related to the performance measures P31 and P32,
which are safety and ergonomics risk indices. Analysing the result of leanness indicators
in the same axis, also shows that 10% gap between the leanness indicators and the target
of level 2 in the axis of Working Condition is mostly related to the main control items
L232 (84 of 100) and L234 (60 of 100). L232 is the control item of leanness in level 2 which
is related to the safety audit and L234 is the control item of basic ergonomics analysis.
Comparing the results in this example shows that by corrective execution of safety audit
and ergonomic analysis in production cell 1, we can reach the leanness level of 2 (2.2,
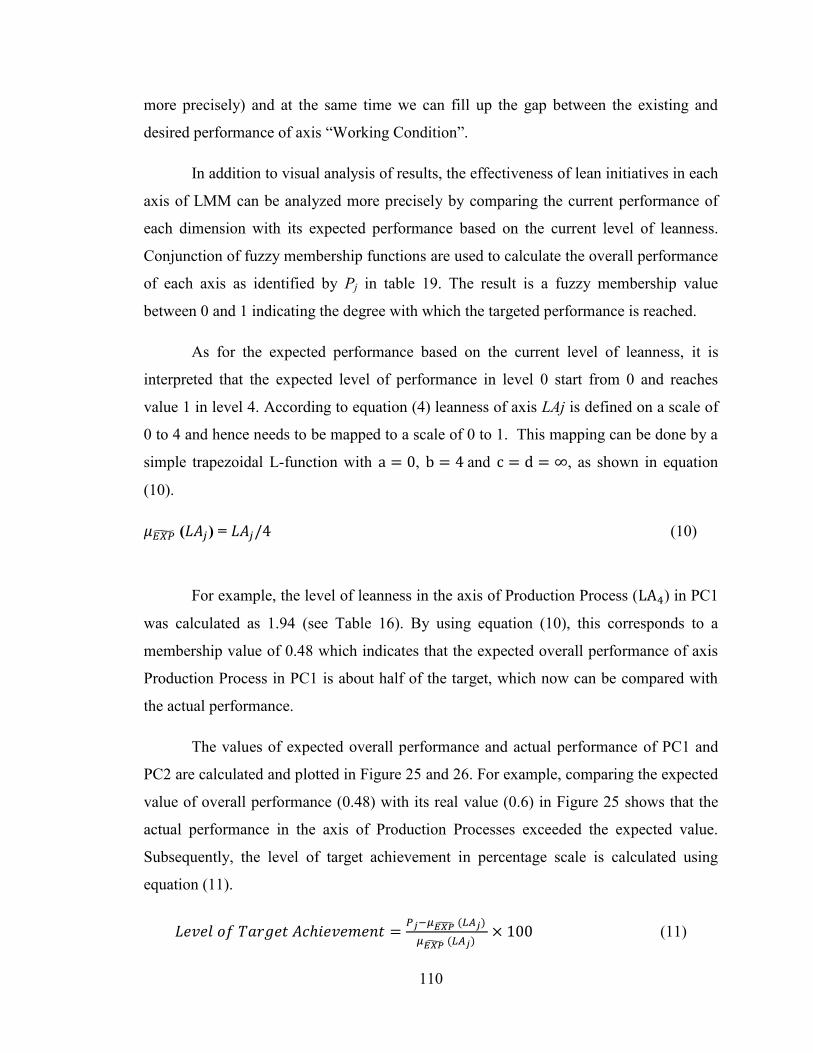
110
more precisely) and at the same time we can fill up the gap between the existing and
desired performance of axis “Working Condition”.
In addition to visual analysis of results, the effectiveness of lean initiatives in each
axis of LMM can be analyzed more precisely by comparing the current performance of
each dimension with its expected performance based on the current level of leanness.
Conjunction of fuzzy membership functions are used to calculate the overall performance
of each axis as identified by Pj in table 19. The result is a fuzzy membership value
between 0 and 1 indicating the degree with which the targeted performance is reached.
As for the expected performance based on the current level of leanness, it is
interpreted that the expected level of performance in level 0 start from 0 and reaches
value 1 in level 4. According to equation (4) leanness of axis LAj is defined on a scale of
0 to 4 and hence needs to be mapped to a scale of 0 to 1. This mapping can be done by a
simple trapezoidal L-function with , and , as shown in equation
(10).
( ) = (10)
For example, the level of leanness in the axis of Production Process ( ) in PC1
was calculated as 1.94 (see Table 16). By using equation (10), this corresponds to a
membership value of 0.48 which indicates that the expected overall performance of axis
Production Process in PC1 is about half of the target, which now can be compared with
the actual performance.
The values of expected overall performance and actual performance of PC1 and
PC2 are calculated and plotted in Figure 25 and 26. For example, comparing the expected
value of overall performance (0.48) with its real value (0.6) in Figure 25 shows that the
actual performance in the axis of Production Processes exceeded the expected value.
Subsequently, the level of target achievement in percentage scale is calculated using
equation (11).
(11)
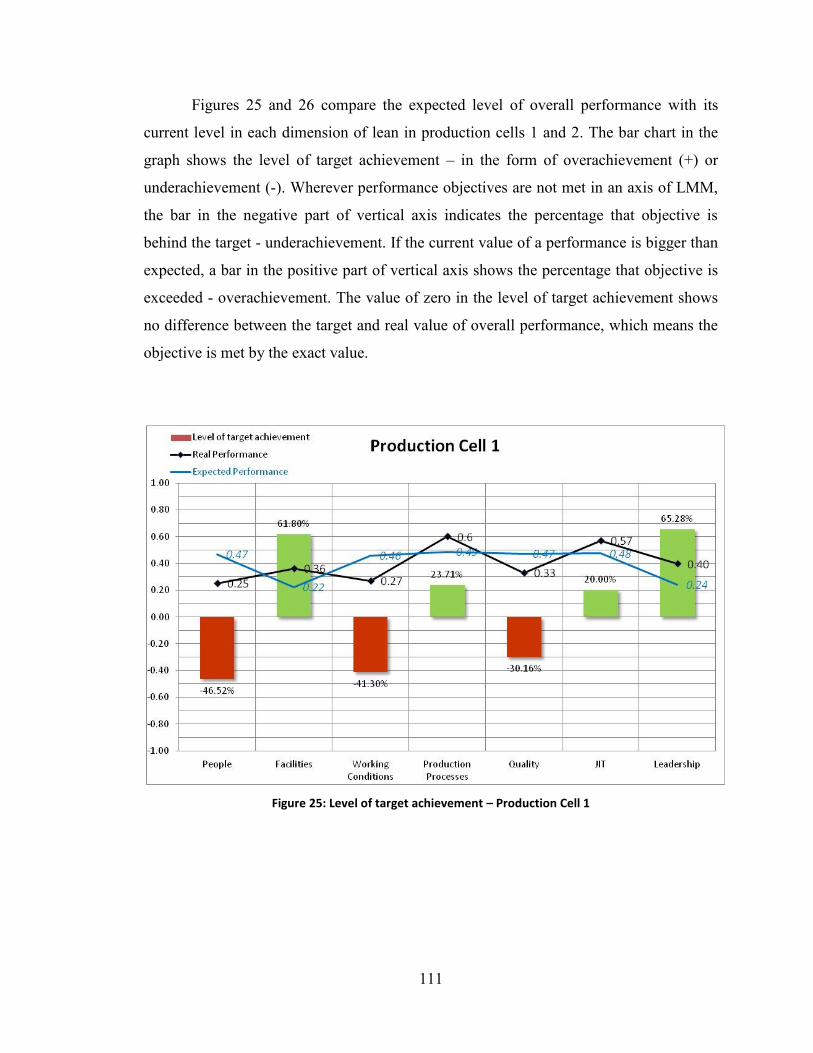
111
Figures 25 and 26 compare the expected level of overall performance with its
current level in each dimension of lean in production cells 1 and 2. The bar chart in the
graph shows the level of target achievement – in the form of overachievement (+) or
underachievement (-). Wherever performance objectives are not met in an axis of LMM,
the bar in the negative part of vertical axis indicates the percentage that objective is
behind the target - underachievement. If the current value of a performance is bigger than
expected, a bar in the positive part of vertical axis shows the percentage that objective is
exceeded - overachievement. The value of zero in the level of target achievement shows
no difference between the target and real value of overall performance, which means the
objective is met by the exact value.
Figure 25: Level of target achievement – Production Cell 1

112
Figure 26: Level of target achievement – Production Cell 2
Referring back to the research questions, analysis of the data provided in the
graphs helps organization to evaluate and improve the effectiveness of lean practices in
achievement of each PCs’ performance measures. Differentiating between the axes where
the targets have been achieved with those where lean has not resulted in the desired
objectives, leads the PC team to focus on the major gaps. In this regard, defining and
implementing of the action plans to resolve the problems in the axes with the higher
value of underachievement will resulted in the better achievements in shorter period of
time. As the diagrams depicted, in the order of importance, the axes People, Working
Condition and Quality should be addressed in PC1. However, in PC2, Quality is the most
the important issue, and then Working Condition, Production Processes and Facilities
should be analyzed respectively.
In production cell 1, as discussed, the focus should be more on the axis of people.
Despite the overall leanness (LAj) of this axis is 1.87, it has the highest value of
underachievement in PC1 (46.52%). Two indicators have been used to measure the
leanness of axis people, P11 and P12 which represent the absenteeism rate and
113
multifunctionality of operators, respectively. According to Equation 8, P11 has been
selected as overall performance ( of this axis in PC1. The expected performance value
based on the overall leanness is 0.47 while the real fuzzy membership value of
absenteeism rate is equal to 0.25. The gap between the actual and expected performance
shows that the lean initiatives was not successful as it is related to the improvement of
absenteeism rate. Referring back to the list of leanness indicators (Appendix B), two
indicators are directly linked to the absenteeism rate in PC1: L114 and L115 which
corresponds to 1- progress of standardizing the production cell’s rules (and absenteeism
rule as one of them) and 2- progress of training on manufacturing cell’s rules. Other
leanness indicators such as Satisfaction (L218) may also affect absenteeism rate.
Consequently, a problem solving approach is recommended to consider all the possible
causes and to focus on those with higher impact on the final results.
The poor performance results in the axis of Quality in PC2 (Figure 26), as another
example, shows the need of immediate analysis and appropriate action plans in this axis.
Comparing the quality performances data in PC2 shows that the good result (0.88 of 1) of
First Pass Yield (P53) has been achieved at the cost of high scrap rate and rework inside
the production cell. The overall performance value of zero in this axis is derived from the
value of zero of performance indicators Scrap rate (P51) and Rework (P52). By analyzing
the data of quality in details and using statistical analysis and problem solving methods,
members of PC1 can find and eliminate the root causes of high rate of scraps and rework
hours in workstations.
The result of overall leanness and overall performance can be also presented in
the form of Radar chart for benchmarking purpose. Radar chart is a powerful visual
reporting technique for graphing multivariate data. For a production cell to be
benchmarked as a best practice in each axis of lean, it is important to excel both in
leanness and performance. Therefore, Multiplication of two indicators was proposed as
the overall indicator of lean-performance for benchmarking purpose. The data of overall
leanness of each axis in Table 10 and the data of overall performance based on the fuzzy
membership functions in Table 13 are used to calculate the overall lean-performance
benchmarking criteria using equation (12). Results of calculations for production cells 1

114
and 2 is summarized in Table 20 and plotted in Figure 27. As graph shows, by
considering only the two production cells, JIT and Production Processes in production
cell 1 and Facility Management in production cell 2 are the best practices of the case
study.
For Lean-Performance Benchmarking criterion = (12)
Table 20: Lean-Performance Benchmarking criterion – Production cells 1 and 2
Production Cell 1 People Quality Facilities Production Processes
Working Conditions
JIT Leadership
1.87 0.89 1.89 1.94 1.84 1.9 0.96
0.25 0.36 0.33 0.6 0.27 0.57 0.4
0.47 0.62 0.32 1.164 0.50 1.08 0.38
Production Cell 2 People Quality Facilities Production Processes
Working Conditions
JIT Leadership
0.96 2.83 0.9 1.82 0.9 1.76 0.85
0.4 0.68 0 0.3 0.1 0.49 0.33
0.38 0 1.92 0.55 0.09 0.86 0.28
Figure 27: lean – Performance Benchmarking Criterion – Production Cells 1 and 2
115
6.1.2 Application of Model
The major accomplishment of this research is the development of a visual, data-
driven lean maturity model in production cells by considering both the qualitative
leanness metrics and the quantitative performance measures. Pöppelbuß & Röglinger
(2011) suggested three groups of design principles for development of maturity models:
“Basic principles”, “Principles for descriptive purpose” and “Principles for prescriptive
purpose”. In development of lean maturity model in this research, these principles have
been used as a guideline. The contributions of this research to develop and implement
lean principles in functional level are listed below.
Descriptive Application of Model
A set of assessment criteria is required for each level of maturity in a model
intended to use for descriptive purpose (Gottschalk, 2009). Proposed LMM provides
detailed assessment criteria both for leanness and performance of production cells. The
criteria are divided into 7 dimensions of lean implementation which are extracted from
review of lean literature and can be applied as a general framework of lean
implementation in operation. Each axis criteria is also categorized in four levels of
maturity which are characterized by review of literature on maturity models and
organizational transformation. Four levels of maturity are used in general framework of
lean implementation in operational level. Finally, based on the review of RPS model and
author’s experience, lean indicators and main control items related to each axis-level of
model are suggested. Main control items can be customized to the specifications of each
organization who intended to use the proposed LMM as a general framework of lean
transformation. As-is assessment of two production cells in a case study provided data to
test applicability of model through analysis of audit’s evidence and historical data in
explanation of current leanness and lean effectiveness.
Prescriptive Application of Model
The proposed lean maturity model provides a step by step guideline on
implementation of lean principles in production cells. Although extensive research has
116
been carried out on lean assessment, no study exists which adequately covers the
necessary elements of lean principles in production cells. Visual presentation of leanness
in each dimension provides a guideline on improvement measures. The generic
progression scales provide a clear insight of current situation and clearly indicates
potential opportunity of improvement in each axes. Furthermore, using a single checklist
for assessment of each main control item in all four levels of maturity assists production
cell’s supervisor to work on accomplishment of the higher levels’ requirements, while
improving the current status. Comparing the result of the leanness and the performance
also provides data to analyze the effectiveness of current lean practices. It also helps lean
practitioner to evaluate and improve the effectiveness of lean assessment system.
Comparative Application of Model
Since different organizations have been using different methods to assess the
leanness, the result of assessment is not comparable and therefore not appropriate to
benchmark. On the other hand, external best practices exists for some common used lean
performance measure such as OEE, value-added time ratio and on-time delivery.
Proposed lean maturity model provide both the possibility of self-benchmarking of
leanness and external benchmarking of performance. Calculation of proposed lean-
performance benchmarking indicator provides a criterion of best practices in each axis of
lean maturity model for the purpose of self-benchmarking. On the other hand, targets and
worst cases to calculate the fuzzy membership function of each performance measure can
be defined based on the historical data as well as external best practices of frequently
used performance measure.
117
7 Chapter 7: CONCLUSION
7.1 Overall Summary of Findings
For more than three decades now, lean manufacturing has been used widely as a
popular management system in both manufacturing and service industries. Recently,
considerable attention has been paid to assessment of organization leanness. However, in
most studies assessment has been carried out in enterprise level and by measurement of
organizational performance indicators. Although, performance metrics can be used to
assess the effectiveness of lean practices, evaluation and improvement of system’s inputs
and processes is crucial for lean success. Moreover, the elements of lean in functional
level are different from those in level of enterprise. Same as overall lean program, a
roadmap and a model of lean implementation adapted to overall lean program and
customized to their specific environment is needed in production cells.
The main objective of this research is to develop a multidimensional lean maturity
model for production cells. This research provides a framework to implement gradually
and to evaluate systematically lean practices in all dimensions of production cells in
proposed four level of lean maturity. A case study is carried out to validate the model.
Data collected from lean assessment and performance evaluation of two production cells
as samples is analyzed to assess the overall leanness and performance in each axis of
LMM. The proposed visual LMM provides a simple visual answer to two questions:
“how lean the production cell is?” and “how effective the lean is to achieve production
cell’s objectives?” The visual, data-driven format of maturity model helps lean
practitioners, production supervisors and production cell’s team to find easily and quickly
the gaps between requirements of leanness and results of their practices, and to fill that
gap by focusing on the areas of strength and those needing improvement.
7.2 Conclusion
Neely et al (2005) proposed a periodic re-evaluation of the established
performance measures to continuously improve the organization’s situation in the
competitive environment. In a learning organization, the knowledge of employees
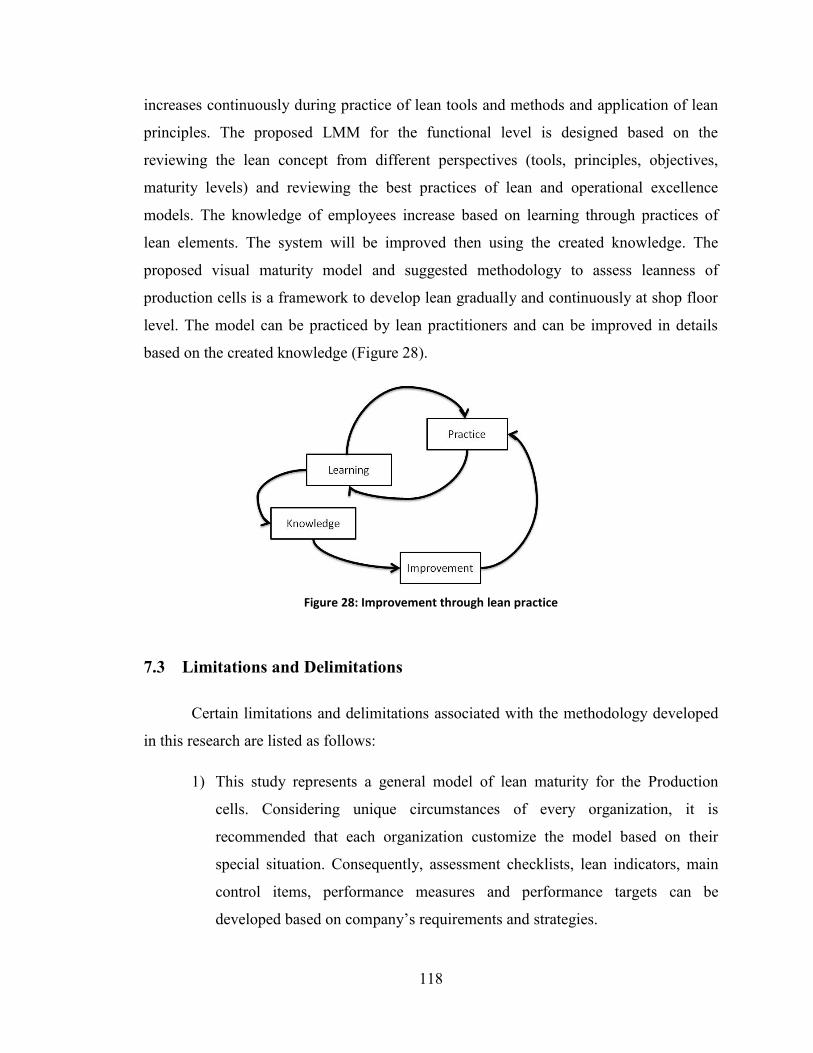
118
increases continuously during practice of lean tools and methods and application of lean
principles. The proposed LMM for the functional level is designed based on the
reviewing the lean concept from different perspectives (tools, principles, objectives,
maturity levels) and reviewing the best practices of lean and operational excellence
models. The knowledge of employees increase based on learning through practices of
lean elements. The system will be improved then using the created knowledge. The
proposed visual maturity model and suggested methodology to assess leanness of
production cells is a framework to develop lean gradually and continuously at shop floor
level. The model can be practiced by lean practitioners and can be improved in details
based on the created knowledge (Figure 28).
Figure 28: Improvement through lean practice
7.3 Limitations and Delimitations
Certain limitations and delimitations associated with the methodology developed
in this research are listed as follows:
1) This study represents a general model of lean maturity for the Production
cells. Considering unique circumstances of every organization, it is
recommended that each organization customize the model based on their
special situation. Consequently, assessment checklists, lean indicators, main
control items, performance measures and performance targets can be
developed based on company’s requirements and strategies.
119
2) In order to implement lean as a management philosophy in an organization,
several steps must be taken to set directions and policies and engage all
stakeholders. The LMM presented in this study focuses on the necessary
activities needed in the level of operations as a most important part of a value
stream. As an important prerequisite of the proposed model, organization must
provide an overall enterprise lean transformation plan (one such LESAT-
LAI).
3) During the case study, the process of evaluating leanness of each axis in each
production cell stopped at a point where a score of less than 70% was
obtained. Initial efforts to assess the main control items of level 3 and 4 shows
zero score in most axes. Therefore, there was not the opportunity to evaluate
all main control items, especially those of level 3 and level 4. Considering the
assessment system as a dynamic process, this limitation would not affect the
result of analysis on applicability of the model. Assessment system can be
modified and improved during the lean implementation.
4) Some main control items of lean can only be evaluated qualitatively. The
checklists were used to evaluate some qualitative items such as corrective
execution of lean practices through a series of audits. Although audits
conducted by certified senior lean instructors, bias of judgments may
sometimes affect the results of leanness. However, in practice, comparing the
result of leanness with the overall performance of production cells in each
axis, the process of audit can be verified if necessary.
5) Although the scope of this study is limited to production cells, by applying
some modifications, the framework, methodology, and the results can be used
for the operation cells in service industries. The maturity levels proposed in
this study are general in both manufacturing and services industries. The axis
of “Production Processes” should be replaced by “Operation Processes” and
Information Technology requirements should be highlighted in the “Facilities

120
Management” axis. To determine the lean control items, performance metrics
and lean enablers, the model should be customized for each case.
6) One can discuss about the contradiction of lean as a continuous improvement
method and a never-ending evolution with LMM which is limited to a number
of maturity levels and definite targets. Lean is a long-term journey, not a short
term project (Drew, et al., 2004). In order to resolve the possible ambiguity in
this area, we have to differentiate between establishing of a lean culture in the
organization as a project as we discuss in this study (development phase of
lean) and taking advantages of created potential of lean to improve
performance of organization continuously (deployment phase of lean).
7) Analyzing the results obtained from assessment of lean using detailed
checklists and comparing them with the corresponding performance measures
help lean practitioners to evaluate and improve the system of lean assessment.
Inconsistency between leanness results and performance outputs shows the
problems of lean assessment system. Any of the following reason may create
such kinds of inconsistencies:
- Error in the calculations
- Inaccuracy in performing audit
- Inaccuracy of checklists
- Lack of standardization after improvements
- Auditors are not calibrated
Although, leanness assessment checklists are developed through development of
lean program, a dynamic assessment system is suggested in which the evaluation system
and its related checklists can be continuously improved by using the feedbacks of the
previous assessments and by analyzing of leanness results in comparison with
performance of production cells.

121
7.4 Recommendation and Future Research
The goal of this research is to develop a multi-dimensional lean maturity model
for functional level and production cells in particular. By assessment of both leanness and
performance of production cells, lean practitioners can assess the effectiveness of lean
initiatives. In the future, the methodology can be further enhanced in the following areas.
- Testing of leanness control items in a longer term empirical study:
leanness indicators and main control items proposed in this study is based
on the background of ABC company and experience of author. Test the
variability of main control items needs longer term implementation of
assessment method in practice. Suggested main control items can be used
as an initial guideline. A dynamic assessment methodology is proposed in
which the assessment elements will be improved continuously through
analysis of leanness results and production cells’ performance.
- Including Cost-related performance: In definition of performance
measures in this study, a maximum effort was made to select the most
lean-related and cost-based performance measures. However, when
production cells are the subject of assessment, type of goals may vary and
data related to cost may not be available. When applying the model as an
assessment framework, it is suggested to provide the potential to record
and collect data related to the cost, quality and delivery in production cells
at the early stages of lean project.
- Applying LMM on Other Environments: The proposed leanness
maturity model is developed for production cells in manufacturing
environment. Since the lean principles are almost same in other
environment, the same model with small modifications can be applied to
other circumstance such as service sector. Customization of model and
definition of leanness elements related to each industry can be a subject of
further research.
122
BIBLIOGRAPHY
Agus, A. & Hajinoor, M. S., 2012. Lean production supply chain management as driver towards enhancing
product quality and business performance: Case study of manufacturing companies in Malaysia.
International Journal of Quality & Reliability Management, 29(1), pp. 92 - 121.
Alaa M. Ghalayini, J. S. N., 1996. The changing basis of performance measurement. International Journal
of Operations & Production Management, 16(8), pp. 63 - 80.
Al-Aomar, R., 2011. Handling multi-lean measures with simulation and simulated annealing. Journal of the
Franklin Institute, 348(7), p. 1506–1522.
Amin, M. & Karim, M., 2012. A Systematic Approach to Evaluate the Process Improvement in Lean
Manufacturing Organizations. In: G. Seliger, ed. Sustainable Manufacturing. s.l.:Springer Berlin
Heidelberg, pp. 65-70.
Anvari, A., Zulkifli, N. & Mohd Yusuff, R., 2012. A dynamic modeling to measure lean performance
within lean attributes. The International Journal of Advanced Manufacturing Technology, 66(5-8), pp. 663-
677.
Arashpour, M. R., Enaghani, M. R. & Andersson, R., 2010. The Rationale of Lean and TPM. Dhaka,
Bangladesh, s.n., pp. 393-398.
Bartlett, K. R., 2001. The relationship between training and organizational. Human Resource Development,
Volume Quarterly 12.4, pp. 335-352.
Beale, J., 2004. Employee Motivation to Adopt Lean Behaviours: Individual-level Antecedents. Dallas,
Texas, s.n.
Becker, J., Niehaves, B., Pöppelbuß, J. & Alexander, S., 2010. Maturity Models in IS ResearcH. Pretoria.,
s.n.
Behrouzi, F. & Wong, K. Y., 2013. An integrated stochastic-fuzzy modeling approach for supply chain
leanness evaluation. international journal of advanced manufacturing technology, 68(5-8), p. 1677–1696.
Bergmiller, G. G., 2006. Lean manufacturers transcendence to green manufacturing: Correlating the
diffusion of leanand green manufacturing systems, s.l.: Graduate School Theses and Dissertations.
Bhasin, S., 2008. Lean and performance measurement. Journal of Manufacturing Technology Management,
19(5), pp. 670 - 684.
Boyd, D. T., Kronk, L. A. & Boyd, S. C., 2006. Measuring the Effects of Lean Manufacturing Systems on
Financial Accounting Metrics Using Data Envolvment Analysis. Investment Management and Financial
Innovations, 3(4), pp. 40-54.
Bozdogan, K., 2004. Supplier Management Self Assessment Tool. Cambridge: Massachusette Institute of
Technology.
Bruin, T. D., Freeze, R., Kaulkarni, U. & Rosemann, M., 2005. Understanding the Main Phases of
Developing a Maturity Assessment Model. Sydney, Australasian Chapter of the Association for Information
Systems, pp. 8-19.
Capgemini Consulting, 2010. Lean for the Long-Haul: Why behavior is key for sustaining success. [Online]
Available at: http://www.capgemini.com/resources/lean-for-the-longhaul-why-behavior-is-key-for-
sustaining-success
123
Capgemini, 2005. How to implement Lean successfully and deliver results that last. [Online]
Available at: http://www.capgemini.com
[Accessed 25 September 2013].
Carvalho, H., Duarte, S. & Machado, V. C., 2011. Lean, agile, resilient and green: divergencies and
synergies. International Journal of Lean Six Sigma, 2(2), pp. 151 - 179.
Chauhan, G. & Singh, T., 2012. Measuring parameter of lean manufacturing realization. Measuring
Business Excellence, 3(16), pp. 57-71.
Chiarini, A., 2011. Integrating lean thinking into ISO 9001: a first guideline. International Journal of Lean
Six Sigma, 2(2).
Chiarini, A., 2013. Lean Organization: from the Tools of the Toyota Production System to Lean Office.
s.l.:Springer Milan.
Chiesa, V., Coughlan, P. & Voss, C., 1996. Development of a technical innovation audit. Journal of
Product Innovation Management, 13(2), pp. 105-136.
Clymer, F., 1955. Henry's wonderful Model T, 1908-1927. s.l.: Bonanza Books.
Corbett, L. M., 2011. Lean Six Sigma: the contribution to business excellence. International Journal of
Lean Six Sigma, 2(2).
Covey, S. R., 1999. Principle-centred leadership. s.l.:Simon & Schuster.
Davis, D., 2013. Trends and Success Factors in Business Process Excellence, s.l.: PEX. Process Excellence
Network.
Drew, J., McCallum, B. & Roggenhofer, S., 2004. Journey to Lean: Making Operational Change Stick.
s.l.:Palgrave Macmillan.
Drucker, P. F., 1971. What We Can Learn from Japanese Management. s.l.:Harvard Business Review.
Drucker, P. F., 1987. Managing for Business Effectiveness. Harvard Business Review.
Fernando, M. D. D. & Cadavid, L. R., 2007. Lean manufacturing measurement: the relationship between
lean activities and lean metrics. Estudios Gerenciales, 23(105), p. 69–83.
Fortuin, L. & Korsten, A. T. M., 1988. Quantitative methods in the field: Two case studies. European
Journal of Operational Research, 37(2), pp. 187-193.
Forum, C. -. C. G., 2013. FUTURE VALUE CHAIN: Industry Initiatives Address Challenges of the Digital
World and the Fight for Resources, s.l.: Capgemini.
Fraser, P., Moultrie, J. & Gregory, M., 2002. The use of maturity models/grids as a tool in assessing
product development capability. s.l., IEMC '02. 2002 IEEE International, pp. 244-249.
Fullerton, R., McWatters, C. & Fawson, C., 2003. An examination of the relationships between JIT and
financial performance. Journal of Operations Management, 24(1), p. 383–404.
Fullerton, R. R. & McWattersb, C. S., 2001. The production performance benefits from JIT
implementation. Journal of Operations Management, 19(1), p. 81–96.
Fursule, N. V., Bansod, S. V. & Fur, S. N., 2012. Understanding the Benefits and Limitations of Six Sigma
Methodology. International Journal of Scientific and Research Publication, 2(1).
124
Gibbons, P. M. & Burgess, S. C., 2010. Introducing OEE as a measure of lean Six Sigma capability.
International Journal of Lean Six Sigma, 1(2), pp. 134 - 156.
Goran D. Putnik, Z. P., 2012. Lean vs agile in the context of complexity management in organizations.
Learning Organization, 19(3), pp. 248 - 266.
Gottschalk, P., 2009. Maturity levels for interoperability in digital government. Government Information
Quarterly, pp. 75-81.
Hallam, C. R. A., 2003. Lean enterprise self-assessment as a leading indicator for accelerating
transformation in the aerospace industry. s.l.:Massachusetts Institute of Technology.
Helander, M., 2013. A Guide to Human Factors and Ergonomics, Second Edition. s.l.:CRC Press.
Herrmann, C., Thiede, S., Stehr, J. & Bergmann, L., 2008. An environmental perspective on Lean
Production. Tokyo, Japan, Springer London, pp. 83-88.
Hines, P., Holweg, M. & Rich, N., 2004. Learning to Evolve - A review of contemporary lean thinking.
International Journal of Operations and Production Management, 24(10), pp. 994-1011.
Hines, P. & Taylor, D., 2000. Going lean. s.l.:Lean Enterprise Research Centre.
Hofer, C., Eroglu, C. & Hofer, A. R., 2012. The effect of lean production on financial performance: The
mediating role of inventory leanness. International Journal of Production Economics, 138(2), p. 242–253.
Infor, 2013. Three Secrets to Bridging the Lean Performance Gap, s.l.: The Infor Blog.
Jayaram, J., Das, A. & Nicolae, M., 2010. Looking beyond the obvious: Unraveling the Toyota production
syste. International Journal of Production Economics, 7.pp. 280-291.
Jayaram, J., Vickery, S. & Droge, C., 2008. Relationship building, lean strategy and firm performance: an
exploratory study in the automotive supplier industry. International Journal of Production Research,
46(20), p. 5633–5649.
Jeffrey, L. & Michael, H., 2007. Toyota Culture: The Heart and Soul of the Toyota Way. s.l.:McGraw-Hill.
Jeyaraman, K. & Teo, L. K., 2010. A conceptual framework for critical success factors of lean Six Sigma:
Implementation on the performance of electronic manufacturing service industry. International Journal of
Lean Six Sigma, 1(3), pp. 191 - 215.
Jones, D. & Womack, J., 2003. Seeing the whole: Mapping the Extended Value Stream. s.l.:The Lean
Enterprise Institute.
Jørgensen, F., Matthiesen, R. & Nielsen, J., 2007. Lean Maturity, Lean Sustainability. Advances in
Production Management Systems, Volume 246, pp. 371-378.
Kaplan, R. S., 2010. Conceptual Foundations of the Balanced Scorecard. Harvard Business School
Accounting & Management Unit Working Paper, pp. Paper No. 10-074.
Kaplan, R. S. & Norton, D. P., 1996. The Balanced Scorecard: Translating Strategy into Action.
s.l.:Harvard Business Press.
Karthi, S., Devadasan, S. & Murugesh, R., 2011. Integration of Lean Six-Sigma with ISO 9001:2008
standard. International Journal of Lean Six Sigma, 2(4), pp. 309 - 331.
Kaufmann, A. & Gupta, M. M., 1991. Introduction to Fuzzy Arithmetic: Theory and Application. 3rd ed.
s.l.:Van Nostrand Reinhold.
125
King, J. L. & Kraemer, K. L., 1984. Evolution and organizational information systems: an assessment of
Nolan's stage model. Communications of the ACM, 27(5), pp. 466-475.
Klimko, G., 2001. Knowledge management and maturity models: Building common understanding. s.l.,
Budapest University of Economic Sciences and Public Administration.
Klir, G. & Yuan, B., 1995. Fuzzy sets and fuzzy logic. s.l.:New Jersey: Prentice Hall..
Kosandal, P. & Farris, J., 2004. The strategic role of the kaizen event in driving and sustaining
organizational change. Alexandria, s.n., pp. 517-526.
Kotter, J. P., 1966. Leading Change. Cambridge, MA: Harvard Business School Press.
Kotter, J. P., 1996. Leading Change. s.l.:Harvard Business Press.
Krichbaum, B. D., 2007. Establishing Lean Metrics - Using the Four Panel Approach as a Foundation for
a Lean Scorecard. [Online]
Available at: http://www.processcoachinginc.com/images/Leanmetrics1sample.pdf
LAI-MIT, 2001. Lean Enterprise Self Assessment Tool - Facilitator's Guide. s.l.:Massachusetts Institute of
Technology.
Lawson, E. & Price, C., 2003. The psychology of change management. McKinsey Quarterly.
LEI, 2008. Lean Lexicon. 4 ed. Cambridge(MA): Lean Enterprise Institute, Inc..
Lemieux, A.-A., Pellerin, R. & Lamouri, S., 2013. A Mixed Performance and Adoption Alignment
Framework for Guiding Leanness and Agility Improvement Initiatives in Product Development. Journal of
Enterprise Transformation, 3(3), pp. 161-186.
LESAT, 2001. Lean Enterprise Seplf Assessment Tool - Facilitator’s Guide. s.l.:Lean Aerospace Initiative -
Massachusetts Institute of Technology.
Liker, J., 2004. The Toyota Way: 14 Management Principles from the World's Greatest Manufacturer. New
York : McGraw-Hill.
Macduffie, J. P., 1995. Workers' Roles in Lean Production: The Implications for Worker Representation.
In: S. Babson, ed. Lean Work - Empowerment and Exploitation in the Auto Industry. s.l.:Wayne State
University Press, pp. 54-69.
Mann, D. W., 2005. Creating a lean culture : tools to sustain lean conversion. New York: Productivity
Press.
Marie-Joëlle Browaeys, S. F., 2012. Lean and agile: an epistemological reflection. Learning Organization,
19(3), pp. 207 - 218.
Maskell, B. H., Baggaley, B. & Grasso, L., 2011. Practical Lean Accounting: A Proven System for
Measuring and Managing the Lean Enterprise, Second Edition. s.l.:Productivity Press.
Mattias Hallgren, J. O., 2009. Lean and agile manufacturing: external and internal drivers and performance
outcomes. International Journal of Operations & Production Management, 29(10).
Melnyk, S., Stewart, D. & Swink, M., 2004. Metrics and performance measurement in operations
management: dealing with the metrics maze. Journal of Operations Management, 22(3), p. 209–217.
Miller, R., 2011. A Continuing Lean Journey: The Shingo Prize- Discovering the power of principles in
culture change. [Online]
126
Available at: http://www.lean.org/common/display/?o=2257
[Accessed 22 January 2014].
Miller, R., 2012. The Shingo Principles of Operational Excellence - Model & Application Guidelines.
s.l.:Jon M. Huntsman School of Business - Utah State University.
Mize, J., Nightingale, D., Taneja, A. & Tonaszuck, D., 2000. Transitioning to a Lean Enterprise:A Guide
for Leaders - Executive Overview. s.l.:Massachusetts Institute of Technology.
Nakajima, S., 1988. Introduction to TPM : Total Productive Maintenance by Seiichi Nakajima.
s.l.:Productivity Pr; Eleventh Printing edition.
Neely, A., 1999. The performance measurement revolution: why now and what next?. International
Journal of Operations & Production Management, 19(2), pp. 205 - 228.
Neely, A., Gregory, M. & Platts, K., 2005. Performance measurement system design: A literature review
and research agenda. International Journal of Operations & Production Management, 25(12), pp. 1228-
1263.
Nesensohn, C., Bryde, D., Ochieng, E. & Fearon, D., 2014. Maturity and Maturity Models in Lean
Construction. Australasian Journal of Construction, 14(1), pp. 45-59.
Netland, T., 2013. Exploring the phenomenon of company-specific production systems: one-best-way or
own-best-way?. International Journal of Production Research, 15 February, 51(4), pp. 1084-1097.
Nightingale, D., 2009. Principles of Enterprise Systems. Cambridge, Massachusetts, MIT ESD.
Nightingale, D. J. & Srinivasan, J., 2011. Beyond the Lean Revolution: Achieving Successful and
Sustainable Enterprise Transformation. s.l.: AMACOM .
Norton, D. P. & Kaplan, R. S., 2000. The Strategy-Focused Organization: How Balanced Scorecard
Companies Thrive in the New Business Environment. s.l.:Harvard Business School Press.
Ohno, T., 1988. Toyota Production System: Beyond Large-Scale Production. s.l.:Productivity Press.
Pakdil, F. & Moustafa Leonard, K., 2014. Criteria for a lean organisation: development of a lean
assessment tool. nternational Journal of Production Research, 52(15), pp. 4587-4607.
Parry, G. C. & Turner, C. E., 2006. Application of lean visual process management tools. Production
Planning & Control: The Management of, 17(1), pp. 77-86.
Pettersen, J., 2009. Defining lean production: some conceptual and practical issues. The TQM Journal,
21(2), pp. 127 - 142.
Pöppelbuß, J. & Röglinger, M., 2011. What Makes a Useful Maturity Model? A framework of general
design principles for maturity models and its demonstration in business process. s.l., ECIS 2011
Proceedings..
Porter, M. E., 1998. Competitive Advantage: Creating and Sustaining Superior Performance. s.l.:Free
Press; 1 edition.
Rigby, D. & Bilodeau, B., 2013. Management tools and trends 2013, s.l.: Brain and Company.
Robert B. Austenfeld, J., 2001. W. Edwards Deming: The Story of a Truly Remarkable Person. In: Papers
of the Research Society of Commerce and Economics. s.l.:Hiroshima Shudo University.
Rother, M. & Harris, R., 2001. Creating Continuous Flow. Cambridge: Lean Enterprise Institue.
127
Rother, M. & Shook, J., 2003. Learning to See: Value Stream Mapping to Add Value and Eliminate
MUDA. s.l.:The Lean Enterprise Institute.
Rousseau, D. M., 2006. Is there such a thimg as “Evidence-based Management”?. Academy of Management
Review, 31(2), pp. 256-269.
Salah, S., Rahim, A. & Carretero, J. A., 2010. The integration of Six Sigma and lean management.
International Journal of Lean Six Sigma, 1(3), pp. 249 - 274.
Saurin, T. A., Marodin, G. A. & Ribeiro, J. L. D., 2011. A framework for assessing the use of lean
production practices in manufacturing cells. International Journal of Production Research, 49(11), pp.
3211-3230(20).
Seyedhosseini, S., Ebrahimi Taleghani, A., Bakhsha, A. & Partovi, S., 2011. Extracting leanness criteria by
employing the concept of Balanced Scorecard. Expert Systems with Applications: An International Journal,
38(8), pp. 10454-10461.
Schaffer, R.H. & Thomson, H.A., 1992. Successful Change Programs Begin with Results. Harvard
Business Review, pp.80-89.
Shah, R. & Ward, P., 2003. Lean manufacturing: context, practice bundles, and performance. Journal of
Operations Management, 21(2), pp. 129-149(21).
Shah, R. & Ward, P., 2007. Defning and developing measures of lean production. Journal of Operations
Management, 25(4), pp. 785-805.
Shingo, S. & Dillon, A. P., 1989. A Study of the Toyota Production System: From an Industrial
Engineering Viewpoin. s.l.:Productivity Press.
Singh, B., Garg, S. & Sharma, S., 2010. Development of index for measuring leanness: study of an Indian
auto component industry. Measuring Business Excellence, 14(2), pp. 46 - 53.
Sink, D. S. & Tuttle, T. C., 1989. Planning and Measurement in Your Organization of the Future.
illustrated edition ed. s.l.:Inst of Industrial Engineers.
Snee, R. D., 2010. Lean Six Sigma – Getting better all the time. International Journal of Lean Six Sigma,
1(1), pp. pp.9 - 29.
Soriano-Meier, H. & Forrester, P. L., 2002. A model for evaluating the degree of leanness of manufacturing
firms. Integrated Manufacturing Systems, 13(2), pp. 104 - 109.
Spear, S. & Bowen, H., 1999. Decoding the DNA of Toyota Production System, s.l.: Harward Business
Review.
Spear, S. J., 2004. Learning to Lead at Toyota. Harvard Business Review, pp. 78-87.
SPR, 2004. SPR Management Book. Paris: SPR Steering Committee.
Stenzel, J., 2008. Lean Accounting: Best Practices for Sustainable Integration. s.l.:John Wiley & Sons.
Stewart, D., Robinson, C. & Allen, J., 2001. Lean Manufacturing: A Plant Floor Guide. s.l.:Society of
Manufacturing Engineers.
Stone, K. B., 2012. Four Decade of Lean: a systematic litrature review. International Journal of Lean Six
Sigma, 3(2), pp. 112-132.
Susana Duarte, V. C.-M., 2013. Modelling lean and green: a review from business models. International
Journal of Lean Six Sigma, 4(3), pp. 228 - 250.
128
Taggart, P. & Kienhöfer, F., 2013. The effectiveness of lean manufacturing audits in measuring operational
performance improvements. South African Journal of Industrial Engineering, 24(2), pp. 140-154.
Taylor, F. W., 1899. Shop Management, The Principles of Scientific Management and Testimony Before
the Special House Committee. 1911: Harper & Row.
Tupa, J., 2013. Performance Measurement for Efficient Lean Management. In: A. Azevedo, ed. Advances
in Sustainable and Competitive Manufacturing Systems. s.l.:Springer International Publishing, pp. 1375-
1384.
Ugochukwu, P., Engström, J. & Langstrand, J., 2013. Lean in the Supply Chain: A Literature Review.
Management and Production Engineering Review, 3(4), p. 87–96.
Vinodh, S. & Chintha, S. K., 2011. Leanness assessment using multi-grade fuzzy approach. International
Journal of Production Research, 1, 49(2), pp. 431-445.
Vinodh, S. & Vimal, K. E. K., 2012. Thirty criteria based leanness assessment using fuzzy. international
journal of advanced manufacturing technology, 60(9-12), p. 1185–1195.
Walder, J., Karlin, J. & Kerk, C., 2007. Integrated Lean Thinking & Ergonomics: Utilizing Material
Handling Assist DeviceSolutions for a Productive Workplace, s.l.: Industrial Engineering - South Dakota
School of Mines.
Wang, Y. & Huzzard, T., 2006. THE IMPACT OF LEAN THINKING ON ORGANIZATIONAL. s.l., Hull
University Business School..
Wan, H.-d. & Chen, F. F., 2009. Decision support for lean practitioners: A web-based adaptive assessment
approach. Computers in Industry, 60(4), p. 277–283.
Watanabe, K., 2007. Lessons from Toyota’s Long Drive [Interview] (July 2007).
Womack, J. P. & Jones, D. T., 1996. Beyond Toyota: how to root out waste and pursue perfection..
Harvard business review, pp. 140-158.
Womack, J. P. & Jones, D. T., 2003. Lean Thinking: Banish Waste and Create Wealth in Your
Corporation. s.l.:Productivity Press.
Womack, J. P., Jones, . D. T. & Roos, D., 1991. The Machine That Changed the World. s.l.:Harper
Perennial.
Wong, W. P., Ignatius, J. & Soh, K. L., 2012. What is the leanness level of your organisation in lean
transformation implementation? An integrated lean index using ANP approach. Production Planning &
Control: The Management of Operations, 25(4), pp. 273-287.
Yin, R. k., 2003. Case Study Research. s.l.:Sage Publications.
Zadeh, L. A., 1965. Fuzzy Sets. Information and Control, 8(3), pp. 338-353.
Zani, S., Milioli, M. A. & Morlini, I., 2013. Fuzzy Composite Indicators: An Application for Measuring
Customer Satisfaction. Advances in Theoretical and Applied Statistics, pp. 243-253.
Zanjirchi, S. M., Tooranlo, H. S. & Nejad, L. Z., 2010. Measuring Organizational Leanness Using Fuzzy
approach. Dhaka, International Conference on Industrial Engineering and Operations Management.

129
APPENDICES

130
Appendix A:
Sample of Data Collection Instrument
for audit of production cells

131
lean Maturity Assessment
Control Item: Date:
Axis: Shift:
Level: Department;
Control Item Code: Production cell:
Question: 0 1 3 5 N/A Evidence Action Plan Due
Date Pilot
Maximum score:
Sum:
a1 a2 a3 Audit Score: Audit Score: / 100
0 -
1 - 3 -
5 -
Not Conform
Major Non-conformance Minor Non-conformance
Conform
Supervisor:
Auditor:
131

132
Appendix B:
Sample of Guidelines for lean Assessment
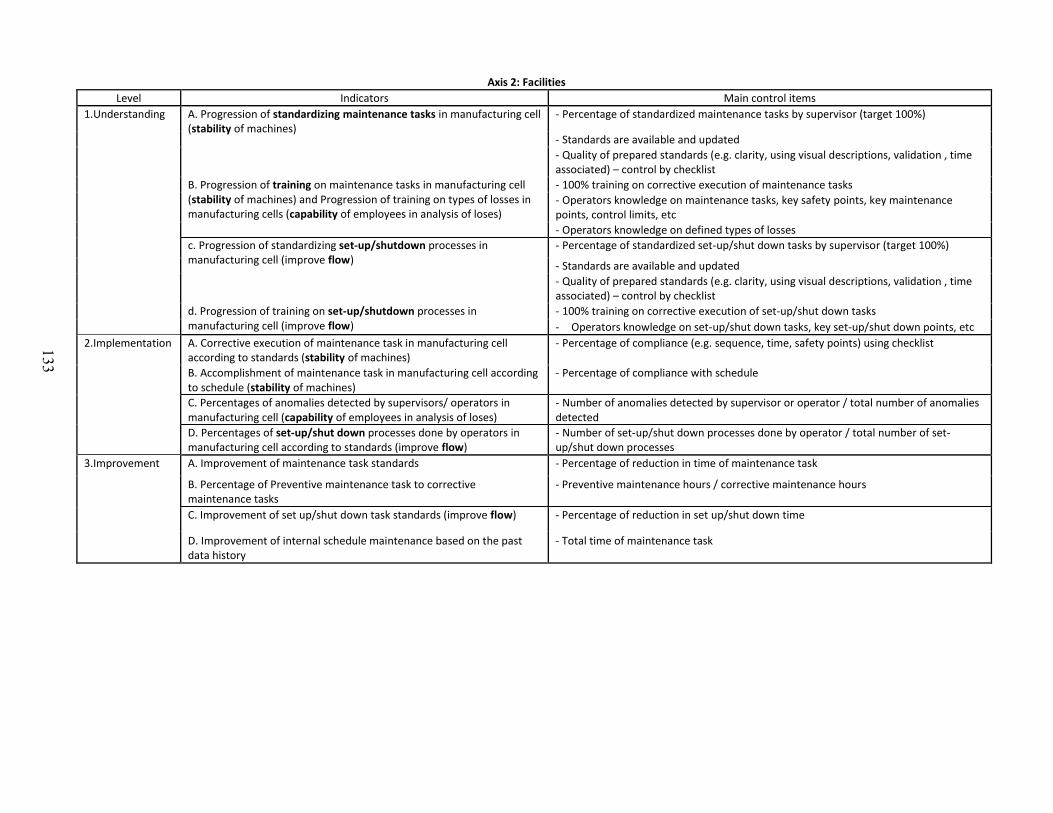
133
Axis 2: Facilities
Level Indicators Main control items
1.Understanding A. Progression of standardizing maintenance tasks in manufacturing cell (stability of machines)
- Percentage of standardized maintenance tasks by supervisor (target 100%)
- Standards are available and updated
- Quality of prepared standards (e.g. clarity, using visual descriptions, validation , time associated) – control by checklist
B. Progression of training on maintenance tasks in manufacturing cell (stability of machines) and Progression of training on types of losses in manufacturing cells (capability of employees in analysis of loses)
- 100% training on corrective execution of maintenance tasks
- Operators knowledge on maintenance tasks, key safety points, key maintenance points, control limits, etc
- Operators knowledge on defined types of losses
c. Progression of standardizing set-up/shutdown processes in manufacturing cell (improve flow)
- Percentage of standardized set-up/shut down tasks by supervisor (target 100%)
- Standards are available and updated
- Quality of prepared standards (e.g. clarity, using visual descriptions, validation , time associated) – control by checklist
d. Progression of training on set-up/shutdown processes in manufacturing cell (improve flow)
- 100% training on corrective execution of set-up/shut down tasks
- Operators knowledge on set-up/shut down tasks, key set-up/shut down points, etc
2.Implementation A. Corrective execution of maintenance task in manufacturing cell according to standards (stability of machines)
- Percentage of compliance (e.g. sequence, time, safety points) using checklist
B. Accomplishment of maintenance task in manufacturing cell according to schedule (stability of machines)
- Percentage of compliance with schedule
C. Percentages of anomalies detected by supervisors/ operators in manufacturing cell (capability of employees in analysis of loses)
- Number of anomalies detected by supervisor or operator / total number of anomalies detected
D. Percentages of set-up/shut down processes done by operators in manufacturing cell according to standards (improve flow)
- Number of set-up/shut down processes done by operator / total number of set-up/shut down processes
3.Improvement A. Improvement of maintenance task standards - Percentage of reduction in time of maintenance task
B. Percentage of Preventive maintenance task to corrective maintenance tasks
- Preventive maintenance hours / corrective maintenance hours
C. Improvement of set up/shut down task standards (improve flow) - Percentage of reduction in set up/shut down time
D. Improvement of internal schedule maintenance based on the past data history
- Total time of maintenance task
135
133
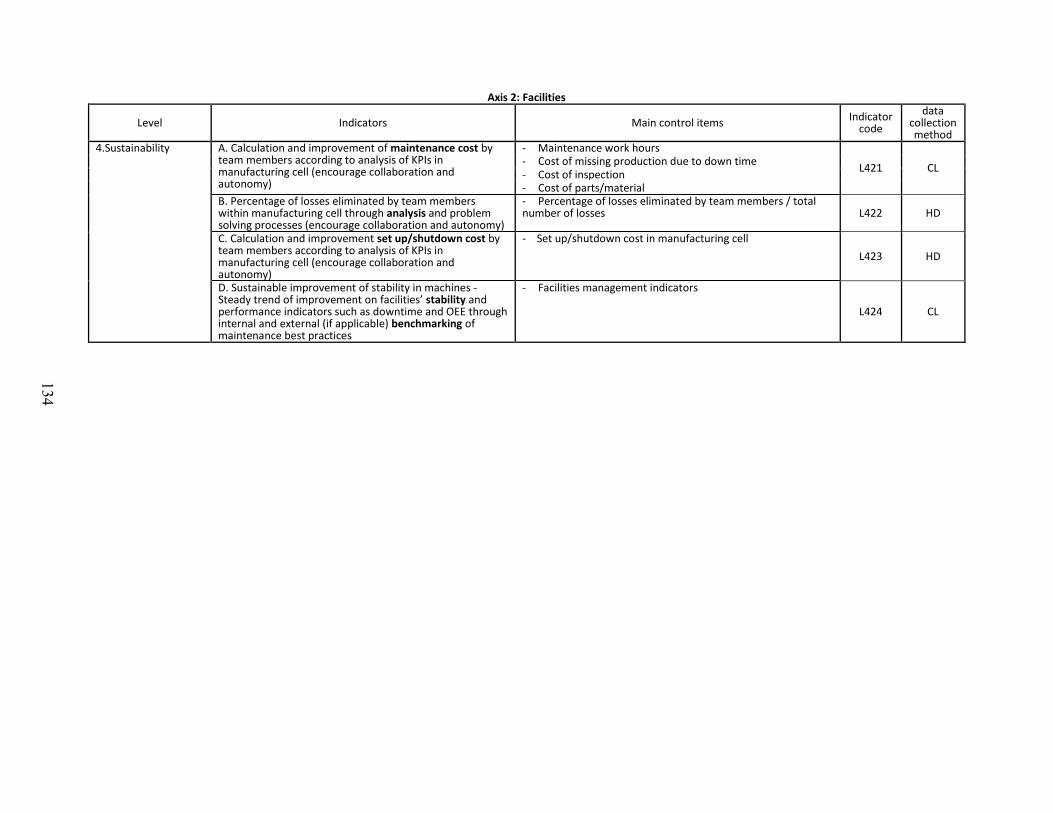
134
Axis 2: Facilities
Level Indicators Main control items Indicator
code
data collection method
4.Sustainability A. Calculation and improvement of maintenance cost by team members according to analysis of KPIs in manufacturing cell (encourage collaboration and autonomy)
- Maintenance work hours
L421 CL - Cost of missing production due to down time - Cost of inspection - Cost of parts/material
B. Percentage of losses eliminated by team members within manufacturing cell through analysis and problem solving processes (encourage collaboration and autonomy)
- Percentage of losses eliminated by team members / total number of losses L422 HD
C. Calculation and improvement set up/shutdown cost by team members according to analysis of KPIs in manufacturing cell (encourage collaboration and autonomy)
- Set up/shutdown cost in manufacturing cell
L423 HD
D. Sustainable improvement of stability in machines - Steady trend of improvement on facilities’ stability and performance indicators such as downtime and OEE through internal and external (if applicable) benchmarking of maintenance best practices
- Facilities management indicators
L424 CL
134

135
Appendix C:
Fuzzy Membership Function of Performance Measures in
production Cell 2
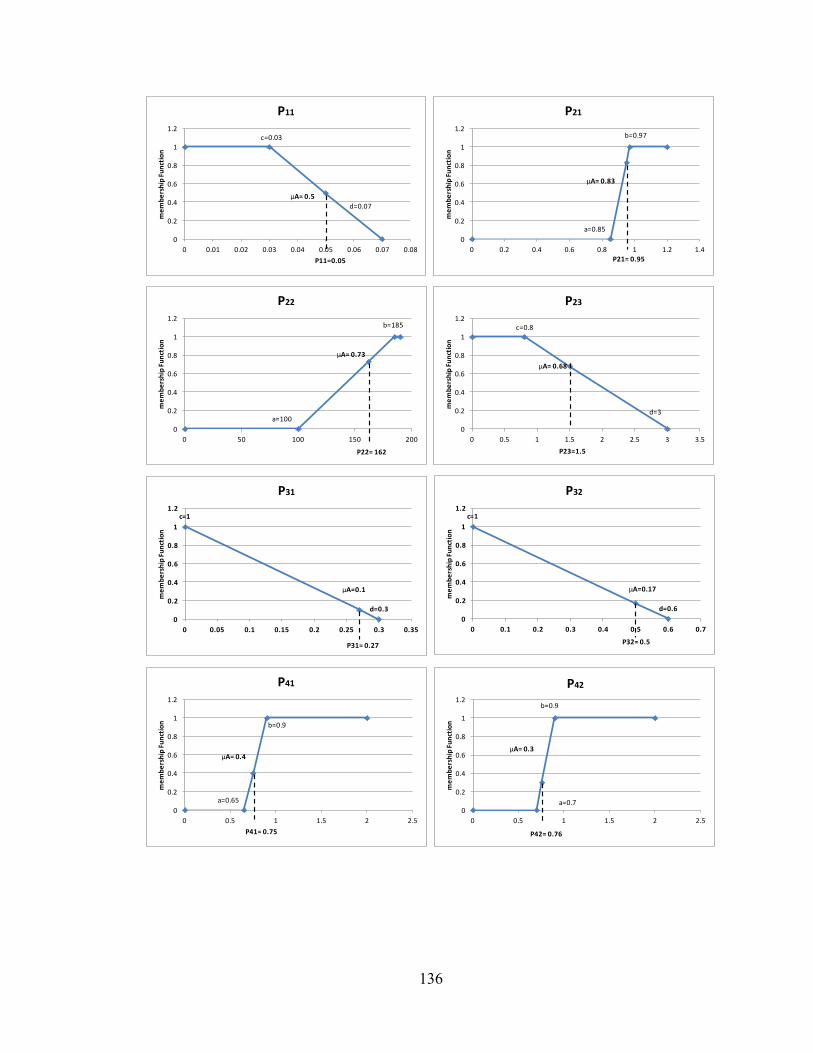
136
c=0.03
d=0.07
µA= 0.5
0
0.2
0.4
0.6
0.8
1
1.2
0 0.01 0.02 0.03 0.04 0.05 0.06 0.07 0.08
me
mb
ers
hip
Fu
nct
ion
P11=0.05
P11
a=0.85
b=0.97
µA= 0.83
0
0.2
0.4
0.6
0.8
1
1.2
0 0.2 0.4 0.6 0.8 1 1.2 1.4
me
mb
ers
hip
Fu
nct
ion
P21= 0.95
P21
a=100
b=185
µA= 0.73
0
0.2
0.4
0.6
0.8
1
1.2
0 50 100 150 200
me
mb
ers
hip
Fu
nct
ion
P22= 162
P22
c=0.8
d=3
µA= 0.68
0
0.2
0.4
0.6
0.8
1
1.2
0 0.5 1 1.5 2 2.5 3 3.5m
em
be
rsh
ip F
un
ctio
nP23=1.5
P23
c=1
µA=0.1
d=0.3
0
0.2
0.4
0.6
0.8
1
1.2
0 0.05 0.1 0.15 0.2 0.25 0.3 0.35
me
mb
ers
hip
Fu
nct
ion
P31= 0.27
P31
c=1
µA=0.17
d=0.6
0
0.2
0.4
0.6
0.8
1
1.2
0 0.1 0.2 0.3 0.4 0.5 0.6 0.7
me
mb
ers
hip
Fu
nct
ion
P32= 0.5
P32
a=0.65
b=0.9
µA= 0.4
0
0.2
0.4
0.6
0.8
1
1.2
0 0.5 1 1.5 2 2.5
me
mb
ers
hip
Fu
nct
ion
P41= 0.75
P41
a=0.7
b=0.9
µA= 0.3
0
0.2
0.4
0.6
0.8
1
1.2
0 0.5 1 1.5 2 2.5
me
mb
ers
hip
Fu
nct
ion
P42= 0.76
P42
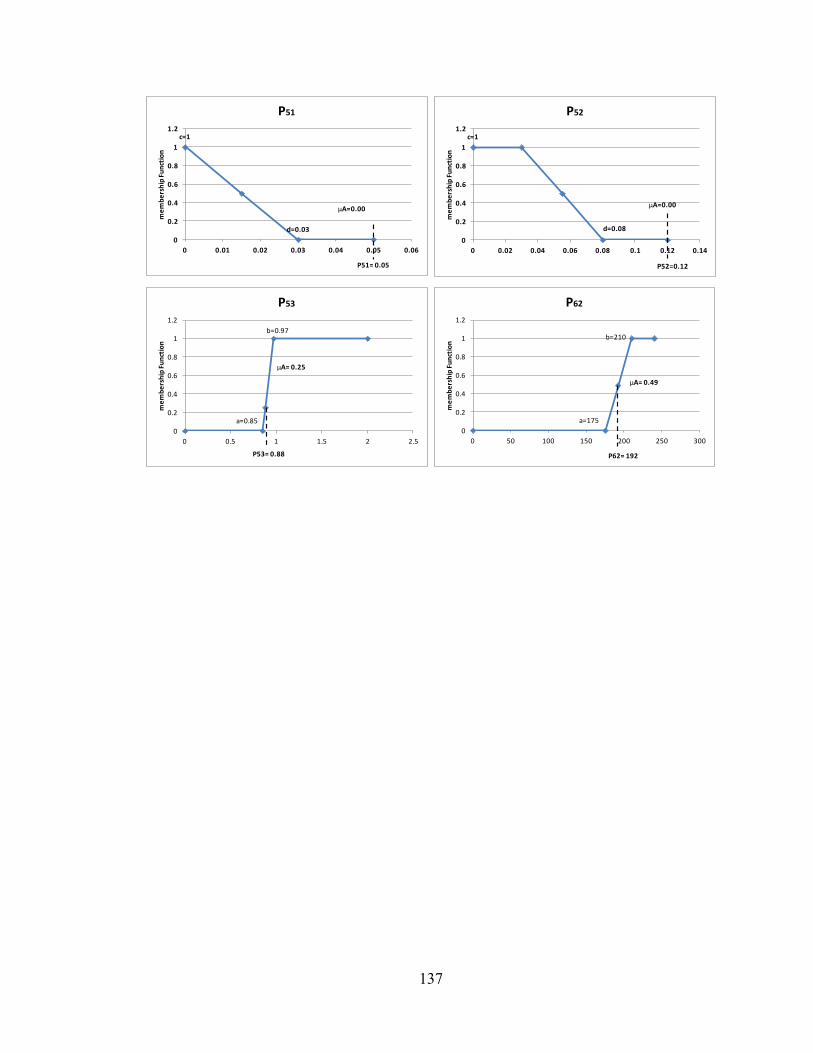
137
c=1
µA=0.00
d=0.03
0
0.2
0.4
0.6
0.8
1
1.2
0 0.01 0.02 0.03 0.04 0.05 0.06
me
mb
ers
hip
Fu
nct
ion
P51= 0.05
P51
c=1
µA=0.00
d=0.08
0
0.2
0.4
0.6
0.8
1
1.2
0 0.02 0.04 0.06 0.08 0.1 0.12 0.14
me
mb
ers
hip
Fu
nct
ion
P52=0.12
P52
a=0.85
b=0.97
µA= 0.25
0
0.2
0.4
0.6
0.8
1
1.2
0 0.5 1 1.5 2 2.5
me
mb
ers
hip
Fu
nct
ion
P53= 0.88
P53
a=175
b=210
µA= 0.49
0
0.2
0.4
0.6
0.8
1
1.2
0 50 100 150 200 250 300m
em
be
rsh
ip F
un
ctio
nP62= 192
P62
Related Documents