1 Development of KPIs for assessing the internal logistics of UNIVEG’s Warehouse Ana Patrícia Novo Trigo Department of Engineering and Management, Instituto Superior Técnico, 2015 Abstract In the current world, competition between companies in food industry is a frequent challenge. In food industry’s supply chain, is known that customer’s demand is always changing and it is necessary to change and readapt constantly the strategy of the companies. The companies’ logistic activity it’s a critical point that allows this capability of each company to readapt more efficiently its competition. Due to that, it is necessary analyze the UNIVEG Logistics Portugal’s warehouse and its operation, because this is a company that works in food industry and cold chains, and it is necessary to evaluate the performance of the different internal logistics’ areas insi de the company. In this way, it is intended to verify if the current key performance indicators (KPIs) that company applied are appropriate to each area analyzed and if they are applicability. In the end of this paper, it should have a development of new global performance indicators and suggestions to improve the oldest KPIs. In the end, is developed three global indicators associated to the activities in the warehouse, like the reception of goods, picking and shipping, through Swing Weighting method. Finally is created a dashboard that will allow a quick view of the indicators associated to the Operations Management. Keywords: Warehouses, Key Performance Indicators, Internal Logistics, Supply Chains, Perishable Products, Multicriteria Analysis, Swing Weighting, Dashboards 1. Introduction At the present, logistics activity of the companies is a key factor for their development and ability to reach their costumers faster and more efficiently than their competitors. If they are more efficient, they will have more costumers. It’s known that demand of the end costumer have a lot of uncertain, and due to that, companies have to readapt quickly to changes in demand and reconfigure their strategy (Beske, Land & Seuring, 2013). UNIVEG is the second largest distributor of fruits at the business world. Their second biggest activity is the Transportation and Logistics, and their operations are mainly focus on food products. The company is located at the center of Portugal, in Riachos. Their focus is to provide an excellent operational service, with quality and always focused on long relationships between UNIVEG and costumers. UNIVEG is always concerned about their clients, so it has been committed in the control of the internal logistics performance. This paper intends to focus on this constraint identified by the company. In that way, the present work will help the UNIVEG Logistics Portugal to improve its measurement activities, and therefore it will be proposed three global

Welcome message from author
This document is posted to help you gain knowledge. Please leave a comment to let me know what you think about it! Share it to your friends and learn new things together.
Transcript
1
Development of KPIs for assessing the internal logistics of
UNIVEG’s Warehouse
Ana Patrícia Novo Trigo
Department of Engineering and Management, Instituto Superior Técnico, 2015
Abstract
In the current world, competition between companies in food industry is a frequent challenge. In
food industry’s supply chain, is known that customer’s demand is always changing and it is necessary
to change and readapt constantly the strategy of the companies. The companies’ logistic activity it’s a
critical point that allows this capability of each company to readapt more efficiently its competition.
Due to that, it is necessary analyze the UNIVEG Logistics Portugal’s warehouse and its
operation, because this is a company that works in food industry and cold chains, and it is necessary
to evaluate the performance of the different internal logistics’ areas inside the company. In this way, it
is intended to verify if the current key performance indicators (KPIs) that company applied are
appropriate to each area analyzed and if they are applicability. In the end of this paper, it should have
a development of new global performance indicators and suggestions to improve the oldest KPIs.
In the end, is developed three global indicators associated to the activities in the warehouse, like
the reception of goods, picking and shipping, through Swing Weighting method.
Finally is created a dashboard that will allow a quick view of the indicators associated to the
Operations Management.
Keywords: Warehouses, Key Performance Indicators, Internal Logistics, Supply Chains,
Perishable Products, Multicriteria Analysis, Swing Weighting, Dashboards
1. Introduction
At the present, logistics activity of the
companies is a key factor for their
development and ability to reach their
costumers faster and more efficiently than their
competitors. If they are more efficient, they will
have more costumers. It’s known that demand
of the end costumer have a lot of uncertain,
and due to that, companies have to readapt
quickly to changes in demand and reconfigure
their strategy (Beske, Land & Seuring, 2013).
UNIVEG is the second largest distributor of
fruits at the business world. Their second
biggest activity is the Transportation and
Logistics, and their operations are mainly focus
on food products. The company is located at
the center of Portugal, in Riachos. Their focus
is to provide an excellent operational service,
with quality and always focused on long
relationships between UNIVEG and costumers.
UNIVEG is always concerned about their
clients, so it has been committed in the control
of the internal logistics performance. This
paper intends to focus on this constraint
identified by the company. In that way, the
present work will help the UNIVEG Logistics
Portugal to improve its measurement activities,
and therefore it will be proposed three global
2
KPIs linked to their warehouse activity:
reception, picking and shipping of goods. It will
be also created a dashboard that includes the
global indicators and the operational
management indicators.
This present paper is divided in seven
sections: Section 2 presents the literature
review; in Section 3 the problem that origins
this paper; Section 4 the methodology applied
in this work, the KPIs analysis and proposals;
in Section 5 the multicriteria analysis that
allowed to create the three global indicators is
presented; in Section 6 the dashboard created
is described and finally in Section 7 some
conclusions are taken.
2. Literature Review
2.1. Key Performance Indicators (KPIs)
KPIs are a set of measures which their focus
are the performance of critical processes or
activities that influences the success of the
company (Parmenter, 2007) and allow to
recognize which activities are more weak in
terms of performance (Illies et al., 2009).
With KPIs, companies have more
consolidated information and the decisions are
taken more easily (Meier et al., 2013).
2.2. Food Supply Chains
A supply chain is considered an essential part
of any business and it requires a concentration
of companies’ resources for the chain works
effectively and efficiently. This is important
because the objective ist that the product
arrives faster to the final consumer (Kurien &
Qureshi, 2011). In this global market with
constant changes, the ability to put the right
products at the right times and places, it’s as
important as achieving lower costs (Bogataj et
al., 2004). A supply chain is characterized as a
complex system, where suppliers, producers,
distributors and retailers work together to
satisfied the final consumer (Costantino et al.,
2013).
In recent years, the concern about food
supply chains has been increased. The food
industry faces constant challenges due to the
increased complexity of operations involved in
this industry (Aung & Chang, 2013).
Food chain stands out from the others because
is extremely dynamic and have a demand
variability very strong. The demand of final
consume is uncertain and due to that,
companies have to readapt quickly to the
changes in demand and reconfigure their
strategy (Beske et al., 2013). This type of chain
have a lot of costs, with labor, maintenance
and electricity (Tassou et al., 2011)
The workers in this type of industry should be
qualified and in constant training, because they
need to use a lot of equipment in the
warehouse and in transportation. Also the
interpretation of the temperatures’ sensors
requires prevention and education of workers
(Stragas & Zeimpekis, 2014).
2.2.1. Cold Supply Chains
There are different types of stores, like
warehouses of perishable products and they
can store food, fresh flowers, vaccines and
other products that require refrigeration. Jol et
al. (2006) consider perishable food like
products with a high risk of developing microbe
and they should be in an appropriate
refrigeration storage conditions, controlled
carefully. These warehouses are very different
from other types of warehouses, because the
products are typically stored for short periods
of time, and space is efficiently used due to the
cooling that has a high cost (Bartholdi &
Hackman, 2005).
One of the challenges of these warehouses is
avoiding contamination of the products,
because they are very fragile and susceptible
to these situations. Another challenge is the
inventory management due to the policies First
In, First Out (FIFO) or First Expire, First Out
(FEFO) that must be applied depending on the
types of products (Bartholdi & Hackman,
2005).
In addition, warehouses are not only a local
storage of goods: have activities like reception,
storage, picking and shipping of goods.
2.3. Swing Weighting Method
The multicriteria analysis is based on solving
decision problems involving the evaluation of
various options on multiple criteria. There are
weighting methods for determining which
weights are associated with each criteria in
analysis.
For swing weighting method is chosen one or
more decision makers, who will present their
preferences regarding the criterias, with
comparative processes. Through these
weights, it’s possible to understand the
importance of each criteria for the decision
maker. The method starts its weighting
3
process putting all criteria in a worst scenario,
creating a baseline as worst case scenario.
Thus, the decision maker is asked to choose
which criteria has more relevance to change
the worst scenario to the best scenario, and
that criteria will have 100 points, and then it’s
eliminated from the choices. Consecutively, the
decision maker is requested to choose again
another criteria that represents great
importance to change the worst scenario for
the better, comparative to the first criteria
choosen, having this second a value less than
100 points, which is determined by the
decision maker. This second criteria is
removed from the process and so on. At the
end, it is obtained in descending order of
relevance the set of criteria selected by the
decision maker. To complete the process, it is
necessary to determine the weights of the
criteria that will have to belong to a range
where total of the sum is the unit (Goodwin &
Wright, 2004).
3. Case Study
UNIVEG Logistics Portugal started their
activity in Riachos at 1999. It’s a worldwide
supply chain, which starts a the suppliers,
being the current company responsible to do
the transportation service and store the
products at the warehouse in Riachos. Then,
they shipped in their truck fleet to the final
costumers.
The most important client is Makro, the larger
wholesaler that company has as a client. In
their products performs the crossdocking,
which is a good advantage for UNIVEG. The
company make all the transport of Makro
requests to their stores all over the country.
UNIVEG works with other companies like Lidl,
Intermarché and other companies with
smallest dimension.
UNIVEG Logistics Portugal have, actually,
three services for their costumers:
Tranportation, Ad-Value Services and
Logistics’ Storage Services.
With 17.000m2 warehouse at Riachos,
UNIVEG can storage 14.000 pallets, in multi-
temperature environment.
Their three fundamental activities at
warehouse are reception, picking (Picking-by-
Line or Picking-by-Store) and shipping, which
will be the focus of this paper, at Section 5.
The actual KPIs implemented on UNIVEG
Logistics Portugal are a very large list and
don’t focus on the essencial aspects that
company wants to measure. So, the main
problem that company faces is that actual KPIs
don’t suffer a lot of changes since they were
created, so it’s necessary a big revision of that
list, and analyse all the aspects related to that
KPIs, like objectives, the way that they were
formulated and analyse its historic. Another
aspect are the fact that company needs KPIs
that allow lower costs, so it’s necessary to
create indicators that allow the company to
understand which activities can reduce costs.
4. Methodology
To do this work, the methodology implemented
was the following:
i. Initially, it was requested historical data of
the company of all the KPIs already
implemented. It has been only possible to
collect data for four consecutive years since
2011, was the year that KPIs were
implemented;
ii. The annual objectives of each KPI were
also asked, analyzing each of them and if
the goals have been achieved annually;
iii. Through the data collected, graphs for each
indicator were generated, that allowed to
understand what is the trend over time and
the feasibility of them;
iv. After this analysis, it has been suggested
some changes in KPIs already
implemented, as well the creation of new
ones that prove to be useful in the future for
the company;
4.1. Classification of KPIs implemented
UNIVEG implemented several KPIs. The next
list presents all the indicators analysed on this
work:
- Evaluation of Suppliers;
- Number of Picking Boxes;
- Number of In Pallets;
- Number of Stock Pallets;
- Number of Out Pallets;
- Number of CrossDocking Pallets;
- Productivity of Fresh Picking;
- Productivity of Frozen Picking;
- Productivity of Reception;
- Compliance with Daily Deliveries in Stores;
- Clients & UNIVEG Breaks;
- Volume of Extra Hours;
- Costs of Extra Hours;
4
- Level of Absenteeism;
- Compliance with Training Plan;
- Number of Work Accidents;
- Service Level;
- Compliance with Maintenance Actions;
- Number of Failures face of Shipped Pallets;
- Number of Projects Developed;
- Number of Interventions Performed;
- Reduction of Energy Consumption;
- Number of Non-Conformities at Warehouse;
- Number of Customer Complaints;
- Effectiveness of Picking Control.
It is possible to understand that there are two
groups of indicators: strategic indicators and
operational indicators. In this way, strategic
indicators are all the indicators associated with
the financial perspective (Clients & UNIVEG
Breaks, Costs of Extra Hours and Reduction of
Energy Consumption). These indicators help
the company to understand its operation
regarding costs while trying to minimize costs
by optimizing its performance. On the other
hand, the group of operational indicators (all
other that is related to the non-financial
indicators) are the ones are used to control
activities or company’s operations.
The classification used for these indicators
was based on SCOR model that presents six
phases, such as Planning, Supply, Production,
Distribution, Return and Transversals
(Rodrigues et al., 2006). Other perspectives
have been attached, with Balanced ScoreCard.
This perspectives are based on financial
perspective, clients, innovation and internal
processes (Kaplan, 2010).
With these models, it was possible to
understand that most of the indicators
implemented have their focus on the
production phase. It is considered the most
important activity, and the focus of concern by
the company;
The financial indicators classified in this
perspective have been well classified and
according to current literature, like Costs with
Extra Hours, Reduction of Energy
Consumption and Clients & UNIVEG Breaks
(with the products of their clients);
The indicators classified as Transversals are
presented as embodied indicators across all
the supply chain, such as Maintenance
Actions, Projects Developed, Clients’
Complaints;
Most of the indicators implemented on
UNIVEG are classified as internal processes.
However, according to the literature review, it
can be classified through more than one
perspective, like indicators associated with
continuous improvement, which are presented
in the category of Transversals, as Number of
Non-Conformities at Warehouse, Number of
Customer Complaints at warehouse and
Effectiveness of Picking Control which can be
encompassed (in addiction to Internal
Processes), as well as from the perspective of
innovation / learning since they are used to
improve the company's service and to innovate
all their business.
4.2. KPIs Analysis
In this work all KPIs were analysed, but in
this paper it will only be presented the most
relevant KPIs which should be deeply
analysed.
- Number of Interventions Performed
This indicator refers to interventions
performed with workers’ requests. This
indicator differs from the Maintenance Actions
because the maintenance indicator reffers to
preventive actions and these are corrective
actions. These actions may occur in
company's facilities, not necessarily just inside
the warehouse but it might also include
maintenance work in the offices, bar, among
others.
Historical data have values that exceed the
100% compliance in several months of 2013
and 2014. This means that there were more
interventions performed than requested in the
beginning of the month. Peaks are
concentrated in the months of more work,
during the summer period, when the work is
intense and more damages occur, requiring
maintenance interventions. Since the objective
of complying with this indicator is the 85%
threshold or higher, it is suggested that the
goal is increased to a value close to 100%.
Implementing TPM (Total Productive
Maintenance) makes workers more versatile,
there is no need to wait for the maintenance
team to solve certain situations in which
resolution is simple.
- Number of Work Accidents
This indicator presents a high volatility every
quarter. Achieving only one accident per
quarter is a goal not reached in most of the

5
registers. To improve this indicator, it is
proposed the following suggestions:
• Check if the current training given to workers
at safety level is appropriate;
• Meetings, set and spread safety standards;
• Check if the working conditions in the
warehouse are favorable to workers;
• Kaizen improvement: this philosophy implies
the practice of activities that continuously
improve all functions, and involve all
employees. Thus, it is possible to improve the
activities and processes to eliminate the
"waste", which is, the work poorly performed.
- Operations Management
When the indicators related to the Operations
Management area were analysed, some
problems with the way that indicators were
defined emerged. The indicators Number of
Picking Boxes, Number of In Pallets, Number
of Stock Pallets, Number of Out Pallets and
Number of CrossDocking Pallets, were all
evaluated on a monthly basis, but only reflect
the number of boxes or number of pallets
corresponding to the situation which they
describe. Although the literature on KPIs
allows indicators being defined with absolute
values, the company perspective on these
indicators relates to a strategic level, and thus
the information that UNIVEG wants to absorve
of these KPIs, indicates that they are defined in
a wrong way. Due to this, new ways to
evaluate these indicators have been suggested
in a way to keep their real importantance. The
suggested is registered in the following
equation (1):
𝑃𝑖𝑐𝑘𝑖𝑛𝑔 𝐵𝑜𝑥𝑒𝑠 =𝐶𝑝𝑛
𝐶𝑝𝑛−1∗ 100 (1)
Where:
𝐶𝑝𝑛 represents the month under consideration
reflected in the number of cases in the current
year n;
𝐶𝑝𝑛−1 represents the month under
consideration reflected in the number of cases
in the previous year.
To define its goal, current data was
considered. Thus, the current 2015 objectives
have been compared the corresponding 2014
ones. Applying Equation (1), it was found that
the average for the year 2015 is 145%. This
means that in addition to performing the same
number of Picking Boxes of the previous year
(it means 100%), the company wants to
overcome these values by 45%. The most
satisfactory situation for the company would be
to achieve 20% more than expected, which
means, to reach 165%.
For the other mentioned indicators, they were
reformulated in the same way, presented in
next equations (2), (3), (4) and (5):
𝑃𝑎𝑙𝑙𝑒𝑡𝑠 𝐼𝑛 =𝑃𝐼𝑛
𝑃𝐼𝑛−1∗ 100 (2)
𝑃𝑎𝑙𝑙𝑒𝑡𝑠 𝑆𝑡𝑜𝑐𝑘 =𝑃𝑆𝑛
𝑃𝑆𝑛−1∗ 100 (3)
𝑃𝑎𝑙𝑙𝑒𝑡𝑠 𝑂𝑢𝑡 =𝑃𝑂𝑛
𝑃𝑂𝑛−1∗ 100 (4)
𝑃𝑎𝑙𝑙𝑒𝑡𝑠 𝐶𝑟𝑜𝑠𝑠𝐷𝑜𝑐𝑘𝑖𝑛𝑔 =𝑃𝐶𝐷𝑛
𝑃𝐶𝐷𝑛−1∗ 100 (5)
Where:
𝑃𝐼𝑛, 𝑃𝑆𝑛, 𝑃𝑂𝑛, 𝑃𝐶𝐷𝑛 represents the month under
consideration reflected in the number of pallets
in the current year n;
𝑃𝐼𝑛−1, 𝑃𝑆𝑛−1, 𝑃𝑂𝑛−1, 𝑃𝐶𝐷𝑛−1 represents the month
under consideration reflected in the number of
pallets in the previous year.
The goals for each indicator have been
defined with the same logic as the goal for
Picking Boxes indicator and the results are
present in Table 1.
Table 1 – Goals for new indicators
KPI Goal Best Situation
Pallets In 145% 185%
Pallets Stock 130% <130%
Pallets Out 152% 172%
Pallets
CrossDocking 140% 160%
5. Global indicators
Since the Reception, the Picking and
Shipping are the core activities of a perishable
products’ warehouse, it became necessary to
establish a way to measure the performance of
these activities, on a monthly basis. The
purpose of its creation is to provide to UNIVEG
a tool that allows them to quickly understand if
these activities are carried out in accordance
with its objectives.
In order to develop these indicators, it was
necessary to choose two decision makers from
the company. For the creation of global
indicators, it was used the multi-criteria
analysis since their creation involve multiple
criteria. The methodology used was the
following:
i. Function value: the creation of this function
can transform value in performance,
through bisection method. This technique is
introduced as a way to identify the most
preferred and least preferred scenarios,

6
and an intermediate point that is equidistant
between the borders;
ii. Weighting Methodology: with Swing
Weighting method, it is possible to obtain
weights for each of the attributes involved;
iii. Additive Aggregation Model: through this
model it will be obtained a final formulation
for the desired indicators;
iv. Sensitivity Analysis: This will evaluate the
sensitivity of each indicator compared to the
variations of the obtained weighting
coefficients.
5.1. Value Functions
For the creation of this global indicator, the
currently used KPIs related to this activity were
selected.
For Reception Global Indicator it was used:
KPI1 = Pallets In;
KPI2 = Reception Productivity.
For Picking Global Indicator was used:
KPI3 = Picking Boxes;
KPI4 = Fresh Picking Productivity;
KPI5 = Frozen Picking Productivity;
KPI6 = Effectiveness of Picking Control.
For Shipping Global Indicator it was used:
KPI7 = Pallets Out;
KPI8 = Shipping Productivity.
The Bisection Method was used where
decision makers have identified what is the
best and worst case scenario in KPIs in
analysis, as well as an intermediate point that
is equidistant to the extreme scenarios. This
method is presented as a simple way of turning
performance of the KPIs in a range equal
between of them, in order to be used in the
final indicator. This value function becomes
valuable because it would not include
indicators with different measures. Decision
makers decide the values for the best and
worst level scenarios, between 100 points and
0 points, for each of the represented indicators.
The intermediate point has 50 points,
representing the neutral scenario.
The decisions made by decision makers are
represented at Table 2.
Tabela 2 – Values of each indicator in analysis
Value (Points)
KPI5 (Boxes)
KPI6
(%) KPI7
(%) KPI8
(Pallets)
100 190 30 172 32
75 180 25 164 29
50 155 20 152 24
0 130 15 100 18
5.2. Swing Weighting Method
This method has three steps:
Ordering criteria by their importance for
decision maker;
Quantification of weighting coefficients;
Coefficients’ normalization, so the total sum
is unit.
Ordering Criteria
For Reception Global Indicator: it was
questioned to decision makers which of the
criteria (points of view) the "swing" from the
worst to the best scenario would result in the
greatest improvement in overall attractiveness,
representing in what criteria the improvement
is more significant for them. The answer was
KPI1, so it means that the weight of this
indicator (𝑝1) is higher than the weight of KPI2,
𝑝2. It means that 𝑝1 > 𝑝2.
For Picking Global Indicator the result was
𝑝4 > 𝑝5 > 𝑝3 > 𝑝6 and for Shipping Global
Indicator the result was 𝑝7 > 𝑝8.
Quantification of Weighting Coefficients
In this step, it was asked to decision makers for Reception Global Indicator: “How much you classified the change from the worst in KPI2, for the same change in the worst case scenario to the best scenario KPI1?”
Decision makers answer if that change
happens in KPI2, it will have a value of 40
compared to KPI1. So, it was possible to obtain
the weight of 𝑝2 non-normalized, 𝑝2 = (40
100)𝑝1.
For Picking Global Indicator:
“How much you classified the change from the worst in KPI3, KPI5, KPI6, for the same change in the worst case scenario to the best scenario KPI4?”
Through their answers, it was obtained
𝑝3 = (70
100) 𝑃4 ; 𝑝5 = (
58
100) 𝑃4 ; 𝑝6 = (
20
100) 𝑃4 ;
For Shipping Global Indicator:
“How do you classified the change from the worst in KPI8, for the same change in the worst case scenario to the best scenario KPI7?”
The answer revealed that 𝑝8 = (60
100)𝑃7.
Value (Points)
KPI1 (%)
KPI2 (Pallets)
KPI3 (%)
KPI4 (Boxes)
100 185 40 165 200 75 170 35 155 190 50 145 30 145 180 0 100 10 100 175

7
Coefficients’ Normalization
In this final step, it was necessary to
normalize the coefficients, in a way that their
total sum be 1. So, through the equation (6):
𝑃𝑖 =𝑝𝑖
∑ 𝑝𝑖𝑛𝑖=1
, ∀ 𝑖 = 1,2, … , 𝑛 (6)
Finally, it was obtained that: 𝑃1 =100
140= 0.71;
𝑃2 =40
140= 0.29, 𝑃3 =
70
248= 0.28, 𝑃4 =
100
248=
0.40, 𝑃5 =58
248= 0.24, 𝑃6 =
20
248= 0.08, 𝑃7 =
100
160= 0.62 and 𝑃8 =
60
160= 0.38.
5.3. Additive Aggregation Model
The Additive Aggregation Model allows the
desired global indicator, in which it was
possible to apply all the results obtained in
previous steps. The equation (7) represents
this model and it will be applied to obtain the
three final global equations desired.
𝑉(𝐺𝐼) = ∑ 𝑃𝑖𝑣𝑖(𝐺𝐼)𝑛𝑖=1 (7)
Where:
𝑉(𝐺𝐼) represents the value of the desired
global indicator (GI);
𝑣𝑖(𝐼𝐺) represents the parcial value of GI of
point of view i
where 𝑣𝑖 (besti) = 100 e 𝑣𝑖 (worsti) = 0;
𝑃𝑖 represents the weighting coefficients of
point of view i
where ∑ 𝑃𝑖 = 1 𝑛𝑖=1 and 𝑃𝑖 > 0 ( i=1,2,…,n).
Through equation (7), it was possible to obtain
the three global indicators desired:
Reception Global Indicator
𝑉(𝑅𝐺𝐼) = 0.71 ∗ 𝑣1 + 0.29
𝑉(𝑃𝐺𝐼) = 0.28 ∗ 𝑣3 + 0.40 ∗ 𝑣4 + 0.24 ∗ 𝑣5 + 0.08 ∗ 𝑣6
Shipping Global Indicator
𝑉(𝑆𝐺𝐼) = 0.62 ∗ 𝑣7 + 0.38 ∗ 𝑣8
5.4. Sensitivity Analysis
In all of the next sensitivity analysis, it was
considered three scenarios for each KPI:
- Worst Scenario, where weight of KPI in
analysis is lower than other KPIs;
- Neutral Scenario, where KPIs’ weights
- Best Scenario, where weight of KPI in
analysis is higher than other KPIs.
Reception Global Indicator
To run this analysis, it was used as input 𝑣1=
60 and 𝑣2= 40. These values are random,
derivated from confidentiality agreement. The
values was obtained from the tranformation by
value function created at Section 4.1. The
sensitivity analysis is presented in Figure 1.
Figure 1 – Weight variation of KPI1
Through weight variation of KPI1, it’s possible
see that by increasing the value of 𝑃1, value of
𝑃2 decreases, progressing to the worst for a
better case scenario. If the range of values
between criteria weights is bigger, global
performance tends to assume the values
associated with the criteria with the highest
weight. On the order hand, if the interval
between the weights of the two criteria is
minimal, the overall performance tends to
intermediate values between the criteria
values. This happens because the weights are
negligible, meaning that they are similar and
therefore they do not affect the end value
performance in a large scale. It is also
important to note that these weighting values
only influence clearly Global Performance if the
input values 𝑣1 and 𝑣2 are more dissimilar,
which in this scenario is not what happens,
since the values used are similar.
Picking Global Indicator
For this analysis, input values are:𝑣3 = 60, 𝑣4 =
64.5, 𝑣5 = 60 and 𝑣6 = 81. Again, these values
were get by random values, because the
confidentiality agreement. Sensitivity analysis
was represented in Figure 2.
Figure 2 - Weight variations of all KPIs
Since the values of 𝑣3= 𝑣5= 60, they were
grouped, as it can be seen in the Figure 2
39
44
49
54
59
0 0,2 0,4 0,6 0,8 1
Glo
bal
Pe
rfo
rman
ce
Weight variation of KPI1
WorstScenario
NeutralScenario
BestScenario
63
64
65
66
67
68
69
70
0,1 0,25 0,4
Glo
bal
Pe
rfo
rman
ce
Weight variation of KPI3
Worst KPI3,KPI5Worst KPI4
Worst KPI6
Neutral KPI3,KPI4, KPI5, KPI6Best KPI3, KPI5
Best KPI4
Best KPI6
8
subtitle, in line of Best and Worst scenarios of
both KPI3 and KPI5. It is possible to verify by
the graph that in the column of the weight 0.1
all bad scenarios of four indicators are shown.
In the column of the the weight 0.25 only one
point is showed, which is related to all neutral
scenarios (as having the same weight, its
performance is equal). Finally, in the column of
the weight 0.4, it is demonstrated the best
scenarios for each indicator. It is possible to
note that the KPI6 influences more the result of
overall performance, because of the higher of
input values. If it has a weight lower or higher
compared to others, this would influence
negatively or positively more than the other
indicators. In conclusion, KPI6 is more robust,
dominating the final overall performance of the
picking activity.
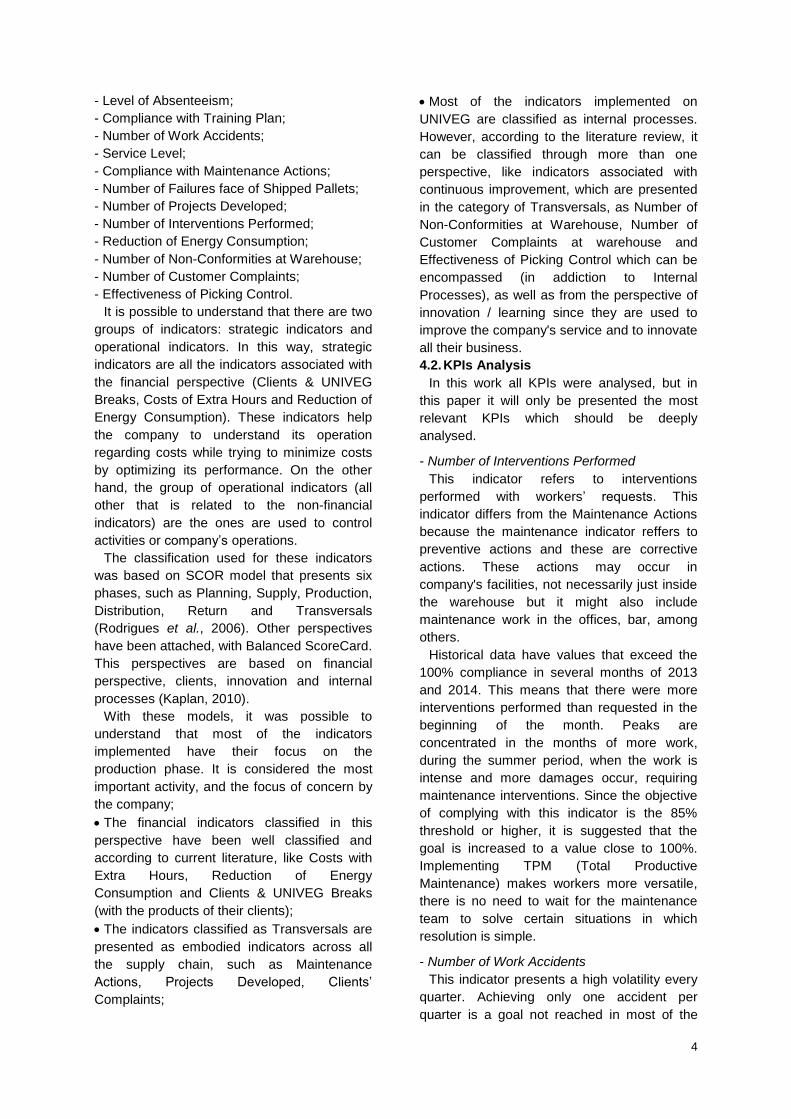
Shipping Global Indicator
In this analysis, it was used as input 𝑣7= 52
and 𝑣8= 65. Again, these values are random
and result from confidentiality with company.
Figure 3 - Weight variation of KPI7
Again, through Figure 3, can be conclude
that the variation of 𝑃7 influences proportionally
the variation of 𝑃8. In this situation, as the input
of 𝑣7 is higher than 𝑣8 and this analysis
focuses on the variation of the 𝑃7, then the
performance tends to become worse
depending on the positive variation of that
weight. If the determined weights were more
diverse, it would be advisable to reassess the
importance of KPI7 relative to KPI8. Since the
current weights are similar, it is not necessity
to do that review.
6. Dashboard
This dashboard was created to facilitate the
results’ view of KPIs included on Operations
Management of the company. The dashboard
was created on Excel program, aiming to
facilitate its use by UNIVEG workers.
The methodology applied was:
i. Data collection of Operations Management
indicators, like Picking Boxes, Pallets In,
Pallets Stock, Pallets Out, Pallets
CrossDocking, Productivity of Fresh Picking,
Productivity of Frozen Picking and Productivity
of Reception;
ii. Conversion of real data of the indicators
throught value scales defined in Section 4.1,
so they can be used in the Global Indicators
created;
iii. Creation of dashboard design, based on the
colors of the company;
iv. Creation of five pages on dashboard, titled
with Reception Global Indicator (“IGR”),
Picking Global Indicator (“IGP”), Shipping
Global Indicator (“IGE”), “KPIs Paletes_Caixas”
and “KPIs Produtividades”;
v. Each page needs to match the indicators
whose name describes.
6.1. Visual Dashboard
Each page of this visual tool is an indicator or
a set of indicators important for the company,
and due to that, they deserve more attention
than the remaining indicators implemented on
UNIVEG Logistics Portugal. This set of
indicators reflects the logistics company, more
specifically, the entire operations management
of their warehouse. Thus, it is important to
monitor all these data in order to understand if
the objectives are being achieved or not, on a
monthly and annual basis.
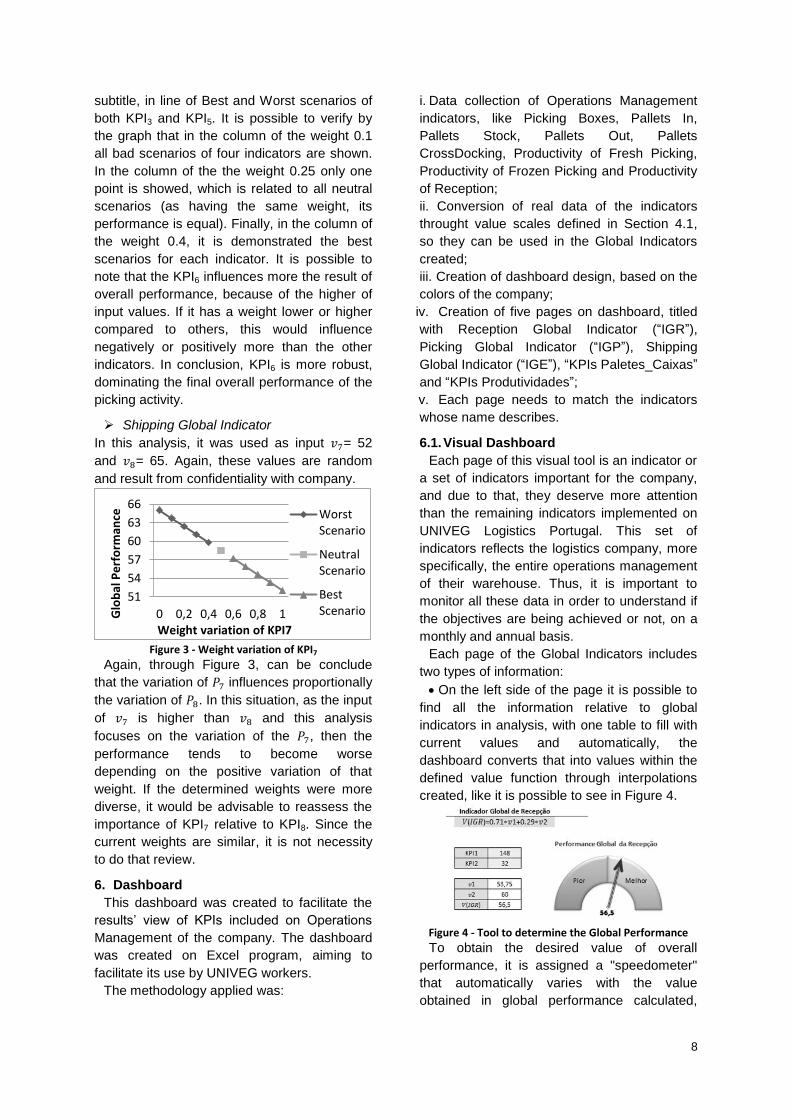
Each page of the Global Indicators includes
two types of information:
On the left side of the page it is possible to
find all the information relative to global
indicators in analysis, with one table to fill with
current values and automatically, the
dashboard converts that into values within the
defined value function through interpolations
created, like it is possible to see in Figure 4.
Figure 4 - Tool to determine the Global Performance
To obtain the desired value of overall
performance, it is assigned a "speedometer"
that automatically varies with the value
obtained in global performance calculated,
51
54
57
60
63
66
0 0,2 0,4 0,6 0,8 1Glo
bal
Pe
rfo
rman
ce
Weight variation of KPI7
WorstScenario
NeutralScenario
BestScenario

9
which indicates if this is within the desired
range (between the neutral and optimal values,
designated "Melhor" area) or if that is not in the
desired range (between the worst and neutral
scenario, called "Pior" area).
On the right side of the page it’s possible to
find a tool that is illustrated in Figure 5, where
all Global Performances of every month in
2014 were determined. As this indicator did not
exist before this work, it was necessary to
calculate all Global Performance values to be
able to check their trend. With this new
information, it is possible to see what was the
trend on last year of each global indicator.
Figure 5 – Tool to see the evolution of Global Indicators
In the other hand, each page of KPIs
Caixas_Picking or KPIs_Produtividades has
two types of information:
On the left side, a table that it is possible to
select the year to see all the values obtained in
each month of this year, and returns those
results in a graph, presented on Figure 6.
Figure 6 – Table of the trend each year
On the right side, a chart that allows the
user to perform a comparison between the
same month values across different years, as it
can be seen in Figure 7. By selecting the
desired month, the chart returns the values
obtained in each year of the selected month.
Note that exists a value 0 that is associated to
the year of 2015, because database has not
those values yet. This tool is useful to see, in a
quick view, which year was more productive in
month under review.
Figure 7 – Chart to compare same month in diferent years
Thus, it is the goal of this dashboard to
become useful, a quick view and easy
understanding for the company, if they need to
change or not the methodologies applied in the
activity under review by the company.
7. Conclusions
In this paper there were developed tools that
will help UNIVEG Logistics Portugal in their
control of activities that are their core business.
All indicators used in the company were
analysed in a way to improve their results and
suggesting what can be modified.
New ways to measure operational
management area were created with the goal
of transforming their operational indicators in
strategic, since that is their view of them.
Finally, global indicators for the most
important activities related to UNIVEG’s
warehouse have been created. These global
indicators related to reception, picking and
shipping of goods will help company to
understand if their efforts have been used
correctly and if it needs to change something
to performed better.
In the end of this work, it has been developed
a dashboard that reveals as a visual tool and
useful, allowing UNIVEG to undestand if they
are matching their goals.
In the future, to contribute for this work, it can
be developed a complete dashboard that links
all the database of the company to the all
database of the dashboard.
8. References
Aung, M. M., & Chang, Y. S. (2013). Temperature management for the quality assurance of a perishable food supply chain. Food Control, 40(1), 198–207. http://doi.org/10.1016/j.foodcont.2013.11.016
10
Bartholdi, J. J., & Hackman, S. T. (2005). WAREHOUSE & DISTRIBUTION SCIENCE Release 0.40. Science.
Beske, P., Land, A., & Seuring, S. (2013). Sustainable supply chain management practices and dynamic capabilities in the food industry: A critical analysis of the literature. International Journal of Production Economics, 152, 131–143. http://doi.org/10.1016/j.ijpe.2013.12.026
Bogataj, M., Bogataj, L., & Vodopivec, R. (2004). Stability of perishable goods in cold logistic chains, 94, 345–356. http://doi.org/10.1016/j.ijpe.2004.06.032
Costantino, F., Di Gravio, G., Shaban, a, & Tronci, M. (2013). Information sharing policies based on tokens to improve supply chain performances. International Journal of Logistics Systems and Management, 14(2), 133–160. http://doi.org/10.1504/IJLSM.2013.051336
Goodwin, P., & Wright, G. (2004). Decision Analysis for Management Judgment (3rd Editio).
Illies, L., Turdean, A.-M., & Crisan, E. (2009). WAREHOUSE PERFORMANCE MEASUREMENT – A CASE STUDY, 58–60.
Kaplan, R. S. (2010). Conceptual Foundations of the Balanced Scorecard Conceptual Foundations of the Balanced Scorecard 1. Management Accounting Research.
Kurien, G. P., & Qureshi, M. N. (2011). Study of performance measurement practices in supply chain management. International Business, Management and Social Sciences, 2(4), 19–34.
Meier, H., Lagemann, H., Morlock, F., & Rathmann, C. (2013). Key performance indicators for assessing the planning and delivery of industrial services. Procedia CIRP, 11, 99–104. http://doi.org/10.1016/j.procir.2013.07.056
Parmenter, D. (2007). Key Performance Indicators (KPI): Developing, Implementing, and Using Winning KPIs. http://doi.org/978-0470545157
Rodrigues, C., Donadel, C., Lorandi, J., & Kieckbusch, R. (2006). O modelo de referência das operações na cadeia de suprimentos -, 1–8.
Stragas, N., & Zeimpekis, V. (2014). Basic principles for effective warehousing and distribution of perishable goods in urban environment : Current status , advanced technologies and future trends, 1–49.
Tassou, S. A., Ge, Y., Hadawey, A., & Marriott, D. (2011). Energy consumption and conservation in food retailing, 31, 147–156. http://doi.org/10.1016/j.applthermaleng.2010.08.023
Jol, S., Kassianenko, A.,Wszol, K., & Oggel, J. (2006). Process control issues in time and temperature abuse of refrigerated foods. Food Safety Magazine. Dec ’05/Jan ’06
Related Documents