University of Kentucky University of Kentucky UKnowledge UKnowledge Theses and Dissertations--Civil Engineering Civil Engineering 2014 DEVELOPMENT OF INDIRECT RING TENSION TEST FOR DEVELOPMENT OF INDIRECT RING TENSION TEST FOR FRACTURE CHARACTERIZATION OF ASPHALT MIXTURES FRACTURE CHARACTERIZATION OF ASPHALT MIXTURES Alireza Zeinali Siavashani University of Kentucky, [email protected] Right click to open a feedback form in a new tab to let us know how this document benefits you. Right click to open a feedback form in a new tab to let us know how this document benefits you. Recommended Citation Recommended Citation Zeinali Siavashani, Alireza, "DEVELOPMENT OF INDIRECT RING TENSION TEST FOR FRACTURE CHARACTERIZATION OF ASPHALT MIXTURES" (2014). Theses and Dissertations--Civil Engineering. 22. https://uknowledge.uky.edu/ce_etds/22 This Doctoral Dissertation is brought to you for free and open access by the Civil Engineering at UKnowledge. It has been accepted for inclusion in Theses and Dissertations--Civil Engineering by an authorized administrator of UKnowledge. For more information, please contact [email protected].

Welcome message from author
This document is posted to help you gain knowledge. Please leave a comment to let me know what you think about it! Share it to your friends and learn new things together.
Transcript

University of Kentucky University of Kentucky
UKnowledge UKnowledge
Theses and Dissertations--Civil Engineering Civil Engineering
2014
DEVELOPMENT OF INDIRECT RING TENSION TEST FOR DEVELOPMENT OF INDIRECT RING TENSION TEST FOR
FRACTURE CHARACTERIZATION OF ASPHALT MIXTURES FRACTURE CHARACTERIZATION OF ASPHALT MIXTURES
Alireza Zeinali Siavashani University of Kentucky, [email protected]
Right click to open a feedback form in a new tab to let us know how this document benefits you. Right click to open a feedback form in a new tab to let us know how this document benefits you.
Recommended Citation Recommended Citation Zeinali Siavashani, Alireza, "DEVELOPMENT OF INDIRECT RING TENSION TEST FOR FRACTURE CHARACTERIZATION OF ASPHALT MIXTURES" (2014). Theses and Dissertations--Civil Engineering. 22. https://uknowledge.uky.edu/ce_etds/22
This Doctoral Dissertation is brought to you for free and open access by the Civil Engineering at UKnowledge. It has been accepted for inclusion in Theses and Dissertations--Civil Engineering by an authorized administrator of UKnowledge. For more information, please contact [email protected].

STUDENT AGREEMENT: STUDENT AGREEMENT:
I represent that my thesis or dissertation and abstract are my original work. Proper attribution
has been given to all outside sources. I understand that I am solely responsible for obtaining
any needed copyright permissions. I have obtained needed written permission statement(s)
from the owner(s) of each third-party copyrighted matter to be included in my work, allowing
electronic distribution (if such use is not permitted by the fair use doctrine) which will be
submitted to UKnowledge as Additional File.
I hereby grant to The University of Kentucky and its agents the irrevocable, non-exclusive, and
royalty-free license to archive and make accessible my work in whole or in part in all forms of
media, now or hereafter known. I agree that the document mentioned above may be made
available immediately for worldwide access unless an embargo applies.
I retain all other ownership rights to the copyright of my work. I also retain the right to use in
future works (such as articles or books) all or part of my work. I understand that I am free to
register the copyright to my work.
REVIEW, APPROVAL AND ACCEPTANCE REVIEW, APPROVAL AND ACCEPTANCE
The document mentioned above has been reviewed and accepted by the student’s advisor, on
behalf of the advisory committee, and by the Director of Graduate Studies (DGS), on behalf of
the program; we verify that this is the final, approved version of the student’s thesis including all
changes required by the advisory committee. The undersigned agree to abide by the statements
above.
Alireza Zeinali Siavashani, Student
Dr. Kamyar C. Mahboub, Major Professor
Dr. Y. T. (Ed) Wang, Director of Graduate Studies

DEVELOPMENT OF INDIRECT RING TENSION TEST FOR FRACTURE CHARACTERIZATION OF ASPHALT MIXTURES
DISSERTATION
A dissertation submitted in partial fulfillment of the requirements for the degree of Doctor of Philosophy in the
College of Engineering at the University of Kentucky
By Alireza Zeinali Siavashani
Lexington, Kentucky
Director: Dr. Kamyar C. Mahboub, Professor of Civil Engineering
Lexington, Kentucky
2014
Copyright© Alireza Zeinali Siavashani 2014
ABSTRACT OF DISSERTATION
DEVELOPMENT OF INDIRECT RING TENSION TEST FOR FRACTURE CHARACTERIZATION OF ASPHALT MIXTURES
Low temperature cracking is a major distress in asphalt pavements. Several test
configurations have been introduced to characterize the fracture properties of hot mix (HMA); however, most are considered to be research tools due to the complexity of the test methods or equipment. This dissertation describes the development of the indirect ring tension (IRT) fracture test for HMA, which was designed to be an effective and user-friendly test that could be deployed at the Department of Transportation level. The primary advantages of this innovative and yet practical test include: relatively large fracture surface test zone, simplicity of the specimen geometry, widespread availability of the required test equipment, and ability to test laboratory compacted specimens as well as field cores.
Numerical modeling was utilized to calibrate the stress intensity factor formula of
the IRT fracture test for various specimen dimensions. The results of this extensive analysis were encapsulated in a single equation. To develop the test procedure, a laboratory study was conducted to determine the optimal test parameters for HMA material. An experimental plan was then developed to evaluate the capability of the test in capturing the variations in the mix properties, asphalt pavement density, asphalt material aging, and test temperature.
Five plant-produced HMA mixtures were used in this extensive study, and the
results revealed that the IRT fracture test is highly repeatable, and capable of capturing the variations in the fracture properties of HMA. Furthermore, an analytical model was developed based on the viscoelastic properties of HMA to estimate the maximum allowable crack size for the pavements in the experimental study. This analysis indicated that the low-temperature cracking potential of the asphalt mixtures is highly sensitive to the fracture toughness and brittleness of the HMA material. Additionally, the IRT fracture test data seemed to correlate well with the data from the distress survey which was conducted on the pavements after five years of service. The maximum allowable crack size analysis revealed that a significant improvement could be realized in terms of the pavements performance if the HMA were to be compacted to a higher density. Finally, the IRT fracture test data were compared to the results of the disk-shaped
compact [DC(t)] test. The results of the two tests showed a strong correlation; however, the IRT test seemed to be more repeatable.
KEYWORDS: Asphalt Pavement, Low-Temperature Cracking,
Fracture Mechanics, Material Characterization, Laboratory Testing
Alireza Zeinali Siavashani Signature
7/30/14 Date
DEVELOPMENT OF INDIRECT RING TENSION TEST FOR FRACTURE CHARACTERIZATION OF ASPHALT MIXTURES
By
Alireza Zeinali Siavashani
Dr. Kamyar C. Mahboub
Director of Dissertation
Dr. Y. T. (Ed) Wang
Director of Graduate Studies
Date: 7/30/2014
DEDICATION
I dedicate this dissertation to my brilliant and outrageously loving wife, Shirin Abyazi,
whose unconditional support has always urged me to achieve my goals.
ACKNOWLEDGEMENTS
I would like to express the deepest appreciation to my dissertation chair, Professor
Kamyar C. Mahboub, who exemplifies the high quality scholarship to which I aspire. His
gift for conceptualization, his enduring encouragement, and his practical advice have
been an inestimable source of support for me during my doctoral work. I would also like
to thank my committee members, Professor George E. Blandford, Professor Issam E.
Harik, Professor Richard Charnigo, and Dr. Matthew J. Beck for their time, invaluable
suggestions, and interactions.
The materials and equipment used for the experimental studies in this dissertation
were provided by Asphalt Institute. I am deeply grateful to Mr. Phillip B. Blankenship,
Mr. R. Michael Anderson, and Mr. Peter T. Grass at Asphalt Institute for their generous
support of my research studies. Finally, I would like to express my sincere gratitude to
my wife, Shirin Abyazi, for her help with computer programs in this dissertation, and her
unwavering support and love.
iii
TABLE OF CONTENTS ACKNOWLEDGEMENTS ............................................................................................... iii
LIST OF TABLES ............................................................................................................ vii
LIST OF FIGURES ........................................................................................................... ix
CHAPTER 1 INTRODUCTION ........................................................................................ 1
1.1 HMA Fracture Test Configurations .......................................................................... 2
1.1.1 Single-Edge Notched Beam Test ..................................................................................... 2
1.1.2 Semi-Circular Bend Test ................................................................................................. 4
1.1.3 Disk-Shaped Compact Tension Test ............................................................................... 7
1.1.4 Indirect Tension Test ....................................................................................................... 9
1.2 Introduction of IRT Fracture Test ........................................................................... 13
CHAPTER 2 STRESS INTENSITY FACTOR CALIBRATION ................................... 17
2.1 Fracture Mechanics ................................................................................................. 17
2.2 Stress Intensity Factor ............................................................................................. 19
2.3 Finite Element Modeling ......................................................................................... 24
2.3.1 Crack Tip Element ........................................................................................................ 25
2.3.2 Symmetry and Plane-Strain State of the Model ............................................................ 29
2.3.3 Finite Element Model .................................................................................................... 31
2.3.4 Calculation of the Stress Intensity Factor ..................................................................... 34
2.3.5 Verification of the Finite Element Model ...................................................................... 36
2.4. IRT Stress Intensity Factor Formula ...................................................................... 38
CHAPTER 3 DEVELOPMENT OF IRT TEST PROCEDURES .................................... 42
3.1 Specimen Dimensions ............................................................................................. 42
3.2 HMA Materials ....................................................................................................... 44
3.3 Specimen Preparation .............................................................................................. 46
3.4 Test Procedure ......................................................................................................... 50
3.5 Fatigue Pre-Cracking............................................................................................... 53
3.6 Fracture Calculations............................................................................................... 54
iv
3.6.1 Calculation of Fracture Toughness .............................................................................. 54
3.6.2 Calculation of Fracture Energy .................................................................................... 56
3.7 Effects of Loading Rate........................................................................................... 57
3.9 Effects of Test Temperature .................................................................................... 61
CHAPTER 4 CRACKING SUSCEPTIBILITY ANALYSIS .......................................... 67
4.1 Linear Viscoelastic Model ...................................................................................... 68
4.2 Creep Compliance Testing of the Mixtures ............................................................ 74
4.2.1 Materials and Specimen Preparation ........................................................................... 75
4.2.2 Creep Compliance Test Data ........................................................................................ 76
4.3 Analysis of Critical Crack Sizes.............................................................................. 78
4.3.1 Thermal Stress Calculations ......................................................................................... 78
4.3.2 Analysis of Allowable Crack Size.................................................................................. 78
4.3.3 Comparison to the Tensile Strength Analysis ............................................................... 82
CHAPTER 5 EFFECT OF DENSITY ON THERMAL CRACKING ............................. 86
5.1 Material and Testing Plan ....................................................................................... 87
5.1.1 In-Place Densities ......................................................................................................... 87
5.1.2 Experimental Plan ........................................................................................................ 88
5.1.3 Specimen Preparation and Testing ............................................................................... 88
5.2 IRT Fracture Test Results ....................................................................................... 89
5.2.1 Fracture Toughness ...................................................................................................... 89
5.2.2 Normalized Fracture Energy ........................................................................................ 96
5.3. Comparison to DC(t) Test Data ........................................................................... 101
CHAPTER 6 SENSITIVITY OF IRT FRACTURE TEST TO ASPHALT AGING ..... 105
6.1 Materials and Test Matrix ..................................................................................... 106
6.2 IRT Fracture Test Data .......................................................................................... 107
6.2.1 Fracture Toughness Results ....................................................................................... 107
6.2.2 Fracture Energy Data ................................................................................................ 109
FUTURE RESEARCH SUGGESTIONS ....................................................................... 113
SYNOPSIS AND CONCLUSIONS ............................................................................... 114
APPENDIX A CREEP COMPLIANCE TEST DATA .................................................. 119
v

APPENDIX B IRT FRACTURE TEST DATA FOR DENSITY STUDY .................... 123
APPENDIX C IRT FRACTURE TEST DATA FOR AGING STUDY ........................ 128
BIBLIOGRAPHY ........................................................................................................... 136
VITA ............................................................................................................................... 143
vi
LIST OF TABLES
Table 1.1. Comparison of Different Geometries for HMA Fracture Testing ................... 15
Table 2.1. Range of the Geometric Parameters in the FE Model ..................................... 39
Table 3.1. Mixture Properties ........................................................................................... 45
Table 3.2. Calculated Fracture Toughness of the Specimens with Various Loading ....... 59
Table 3.3. Calculated Fracture Energy for Specimens with Various Loading Rates ....... 59
Table 3.4. Fracture Toughness of the Mixtures for Various Testing Temperatures ......... 64
Table 3.5. Normalized Fracture Energy of the Mixtures at Various Temperatures ......... 66
Table 4.1. Mixture Properties (road projects in various Kentucky counties) ................... 76
Table 4.2. Master Curve and Shift Factor Function Coefficients ..................................... 77
Table 4.3. Average IRT Fracture Test Results at -22°C ................................................... 80
Table 4.4. Maximum Allowable Crack Sizes at Various Temperatures ........................... 82
Table 4.5. IDT Tensile Strength Results and Critical Rupture Temperatures .................. 83
Table 5.1. In-Place Density of the Pavements .................................................................. 88
Table 5.2. Fracture Toughness of KY55 Mix at -22°C and Various Densities ................ 90
Table 5.3. Fracture Toughness of KY85 Mix at -22°C and Various Densities ................ 90
Table 5.4. Fracture Toughness of KY98 Mix at -22°C and Various Densities ................ 91
Table 5.5. Fracture Toughness of US42 Mix at -22°C and Various Densities ................. 91
Table 5.6. Fracture Toughness of US60 Mix at -22°C and Various Densities ................. 92
Table 5.7. Regression Analysis Results on KIC at Various Densities ............................... 94
Table 5.8. Normalized Fracture Energy of KY55 Mix from IRT Test ............................. 96
Table 5.9. Normalized Fracture Energy of KY85 Mix from IRT Test ............................. 97
Table 5.10. Normalized Fracture Energy of KY98 Mix from IRT Test ........................... 97
Table 5.11. Normalized Fracture Energy of US42 Mix from IRT Test ........................... 98
Table 5.12. Normalized Fracture Energy of US60 Mix from IRT Test ........................... 98
Table 5.13. Regression Analysis Results on Normalized Fracture Energy Data at Various
Densities .......................................................................................................................... 100
Table 5.14. Regression Analysis Results on DC(t) Data at Various Densities............... 104
Table 6.1. P-Values from t-Tests on the KIC Data with Two Different Conditioning
Durations ......................................................................................................................... 109
vii

Table 6.2. P-Values from t-Tests on the Fracture Energy Data with Two Different
Conditioning Durations ................................................................................................... 109
Table 6.3. Results of Multiple Linear Regression Analysis on Fracture Energy Data ... 111
viii

LIST OF FIGURES
Figure 1.1. Single-Edge Notched Beam Test Geometry ..................................................... 3
Figure 1.2. Semi-Circular Bend Specimen Geometry ........................................................ 5
Figure 1.3. Disk-shaped Compact Tension Specimen Geometry ....................................... 7
Figure 1.4. Imperfections in the Failure of DC(t) Specimens ............................................. 8
Figure 1.5. Disk under the Action of Two Diametrically Opposite Concentrated Loads 10
Figure 1.6. Stress Distribution along the Horizontal Diameter of IDT Specimen ............ 12
Figure 1.7. Stress Distribution along the Loading Diameter of IDT Specimen ............... 12
Figure 1.8. Indirect Ring Tension Fracture Test Geometry .............................................. 14
Figure 2.1. Basic Modes of Loading Involving Different Crack Surface Displacements 18
Figure 2.2. SE(B) Test Configuration: a) Mode-I Fracture, b) Mixed Mode-I & Mode-II
Fracture ............................................................................................................................. 19
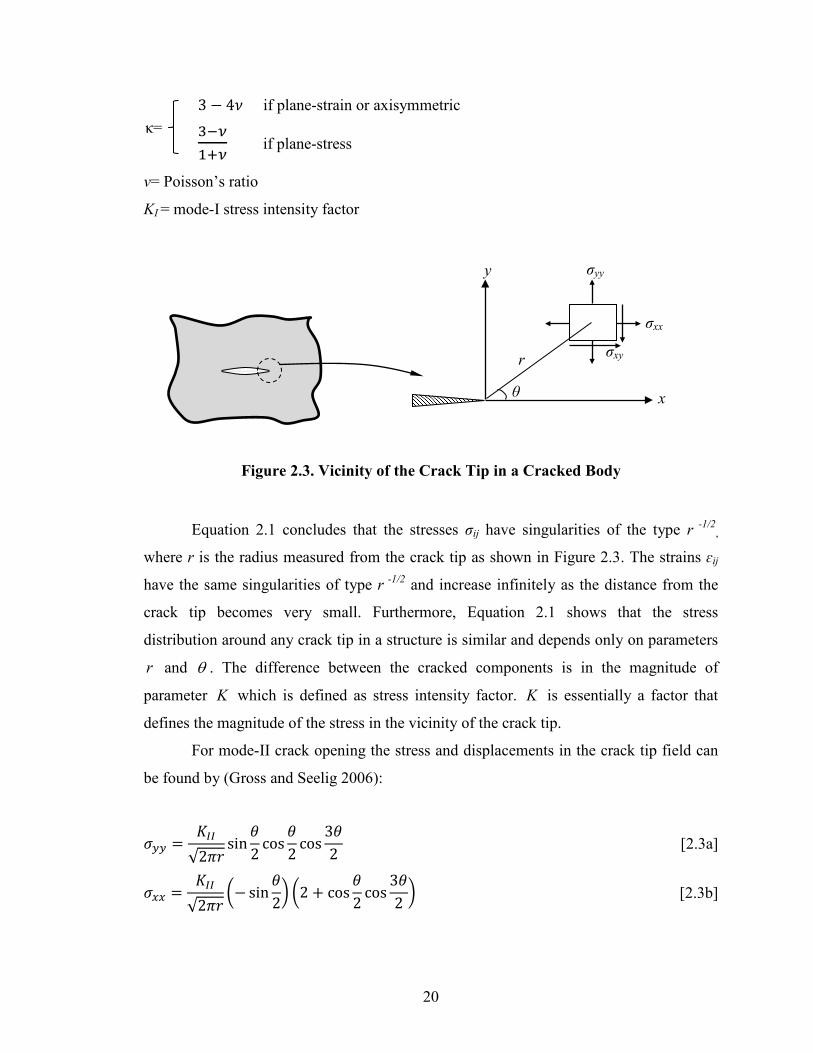
Figure 2.3. Vicinity of the Crack Tip in a Cracked Body ................................................. 20
Figure 2.4. Variation in Fracture Toughness with Respect to Plate Thickness ................ 23
Figure 2.5. 2-D Rectangular Elements with Mid-side Node at the Quarter Points .......... 26
Figure 2.6. 2-D Triangular Element with Mid-side Nodes at the Quarter Points ............. 28
Figure 2.7. Biaxial Symmetry of the Finite Element Model ............................................. 30
Figure 2.8. a) Finite Element Model, b) Singular Triangle Elements at the Crack Tip ... 32
Figure 2.9. Original and Deformed Boundaries of the Finite Element Model ................. 34
Figure 2.10. Contour Plot of the σx Values from One of the FE Models .......................... 35
Figure 2.11. Calculation of Stress Intensity Factor from Crack Tip Displacement .......... 36
Figure 2.12. Verification of the FE model with analytical solutions for the centrally
cracked IDT Specimen Geometry ..................................................................................... 37
Figure 2.13. KI Variation for IRT Specimens with Various Geometric Parameters......... 40
Figure 3.1. Fitting of the KI Calibration Formula on the FE Data for IRT Specimens with
R=75 mm and r=13 mm .................................................................................................... 44
Figure 3.2. a) Sample Divider, b) Superpave Gyratory Compactor ................................. 47
Figure 3.3. Fabrication of IRT Specimens: a) Gyratory Compacted Sample, b) Cutting the
Disk-Shaped Specimens, c) Prepared IRT Specimen ....................................................... 48
Figure 3.4. a) CoreDry™ Device, b) CoreLok™ Device ................................................. 49
ix

Figure 3.5. Equipment Used for Sample Preparation: a) Circular Saw, b) Core Drill, c)
Jigsaw ................................................................................................................................ 49
Figure 3.6. Fabricated IRT Specimen ............................................................................... 50
Figure 3.7. a) Universal Test Frame, b) IRT Specimen Placed in the Test Machine ....... 51
Figure 3.8. a) Fractured IRT Specimen, b) Measurement of the Initial Notch Length .... 52
Figure 3.9. Three Fracture Types for Linear Elastic Materials (ASTM E399 2012) ....... 54
Figure 3.10. Typical IRT Fracture Test Data for HMA .................................................... 55
Figure 3.11. Calculation of the Normalized Fracture Energy ........................................... 56
Figure 3.12. IRT Fracture Test Data at various Loading Rates: a) 12.5 mm/min, b) 1.0
mm/min, c) 0.1 mm/min ................................................................................................... 60
Figure 3.13. IRT Test Data at various Temperatures: a) -2°C, b) -12°C, c) -22°C .......... 62
Figure 3.14. Variation of the Plane-Strain Fracture Toughness versus Test Temperature 64
Figure 3.15. Variation of the Normalized Fracture Energy with Test Temperature ......... 66
Figure 4.1. a) Prepared IDT Creep Compliance Specimen, b) IDT Creep Specimen in the
Testing Device .................................................................................................................. 75
Figure 4.2. Creep Compliance Master Curves at -30°C ................................................... 77
Figure 4.3. Thermal Stresses as Calculated by the Viscoelastic Model ........................... 79
Figure 4.4. Maximum Allowable Transverse Crack Size in Asphalt Pavements ............. 81
Figure 4.5. Determination of 2aC ...................................................................................... 84
Figure 5.1. Fracture Toughness of the HMA Mixtures at Various Densities ................... 93
Figure 5.2. Maximum Allowable Crack Size for the HMA Mixtures at -12°C and Various
Densities ............................................................................................................................ 95
Figure 5.3. Normalized Fracture Energy of the HMA Mixtures at Various Densities ..... 99
Figure 5.4. DC(t) Test Apparatus ................................................................................... 102
Figure 5.5. DC(t) Fracture Energy for the HMA Mixes at Various Densities ................ 103
Figure 6.1. Fracture Toughness of the HMA Mixtures after Short-Term and Long-Term
Aging............................................................................................................................... 108
Figure 6.2. Fracture Energy of the HMA Mixtures after Short-Term and Long Term
Aging............................................................................................................................... 110
x

CHAPTER 1 INTRODUCTION
Hot mix asphalt (HMA) is the most expensive part of the asphalt pavements. HMA
pavements provide relatively high strength and durability, smooth and quiet ride, and are
yet constructed fairly easily at a relatively low cost. The life span, rideability, and need
for costly maintenance treatments of asphalt pavements are significantly affected by type,
extent, and rate of fracture that occurs in the surface layers of these pavements. The
Superpave mix design, which resulted from the Strategic Highway Research Program
(SHRP), addresses three major types of distress in asphalt pavements: rutting permanent
deformation, fatigue cracking, and low-temperature cracking (Asphalt Institute 2001).
Nonetheless, more forms of fracture are commonly observed in HMA pavements such as
longitudinal surface or top-down cracking, reflective cracking of asphalt overlays placed
on existing jointed or cracked pavements, and block cracking (Huang 1993).
Accurate characterization of HMA material is a necessity for design and
maintenance of asphalt pavements which represent a major investment in the
transportation infrastructure. To protect this investment and reduce the life-cycle cost of
asphalt pavements, the pavement managers require the proper tools to quantify the
performance of the pavements under specific traffic and climatic conditions. In recent
years a great deal of effort has been directed toward the development of testing and
evaluation methods that can be used for crack initiation and propagation mechanism
analyses.
In cold climates, the failure mode of asphalt pavements is primarily induced by
climatic conditions. As the pavement temperature decreases, the asphalt binder becomes
more brittle due to its viscoelastic properties. As the result of temperature drop and
thermal contraction of the asphalt pavement, thermal stresses accumulate in the HMA
layer which is restrained by the lower pavement layers. In current designs practices, a
mechanistic-empirical approach is used to predict the fracture resistance of asphalt
concrete as governed by engineering material parameters, such as modulus and tensile
strength (Huang 1993).
1
The thermal stresses caused by the temperature drop combined with the
embrittlement of asphalt binder make the HMA pavements more susceptible to cracking
(Asphalt Institute 2007). The capability of an asphalt binder to relax the thermal stresses
and its resistance against low-temperature cracking can be evaluated through binder
testing. However, once a binder is mixed with aggregates to produce the HMA, the
adhesion and interactions between the components of the resulted mix can also influence
the thermal cracking potential of the pavement. The effect of these interactions, such as
absorption of asphalt, air void content, and the aggregate-binder bonding, cannot be
predicted by binder testing alone, and instead the tests should be conducted on specimens
of the asphalt mixture.
Mixture testing, which is also referred to as performance testing, is performed on
HMA material at the structural scale to simulate the actual service conditions of an
asphalt pavement. Additionally, the study of fracture mechanics reveals that formation of
cracks and flaws during construction or service life of a pavement can significantly
reduce the resistance of the pavement to cracking. Since the asphalt mixtures respond as a
brittle material at low temperatures, understanding the fracture properties of HMA at
such temperatures is arguably an indispensable step towards efficient design and
maintenance of asphalt pavements in cold climates.
1.1 HMA Fracture Test Configurations
1.1.1 Single-Edge Notched Beam Test
Utilization of fracture mechanics theory for asphalt binders and mixtures started in late
1960s (Bahgat and Herrin 1968; Majidzade et al. 1971). These tests were primarily
conducted on single-edge notched beam [SE(B)] specimens in which a simply-supported
pre-notched beam is subjected to bending. Single-edge notched beam specimen geometry
has been used extensively in measuring fracture toughness of metallic materials, and is
standardized in ASTM E399 specification (2012). Majidzade et al. (1971) successfully
employed single-edge notched beam [SE(B)] geometry in fracture testing of HMA
specimens. SE(B) is a beam sample of HMA that is notched by a sharp cutting tool and is
subjected to a compressive load under three-point bend test configuration. Fracture
2
toughness testing and mode-I loading configurations require that the compressive load in
the three-point bend test to be applied on the beam surface and exactly along the notch
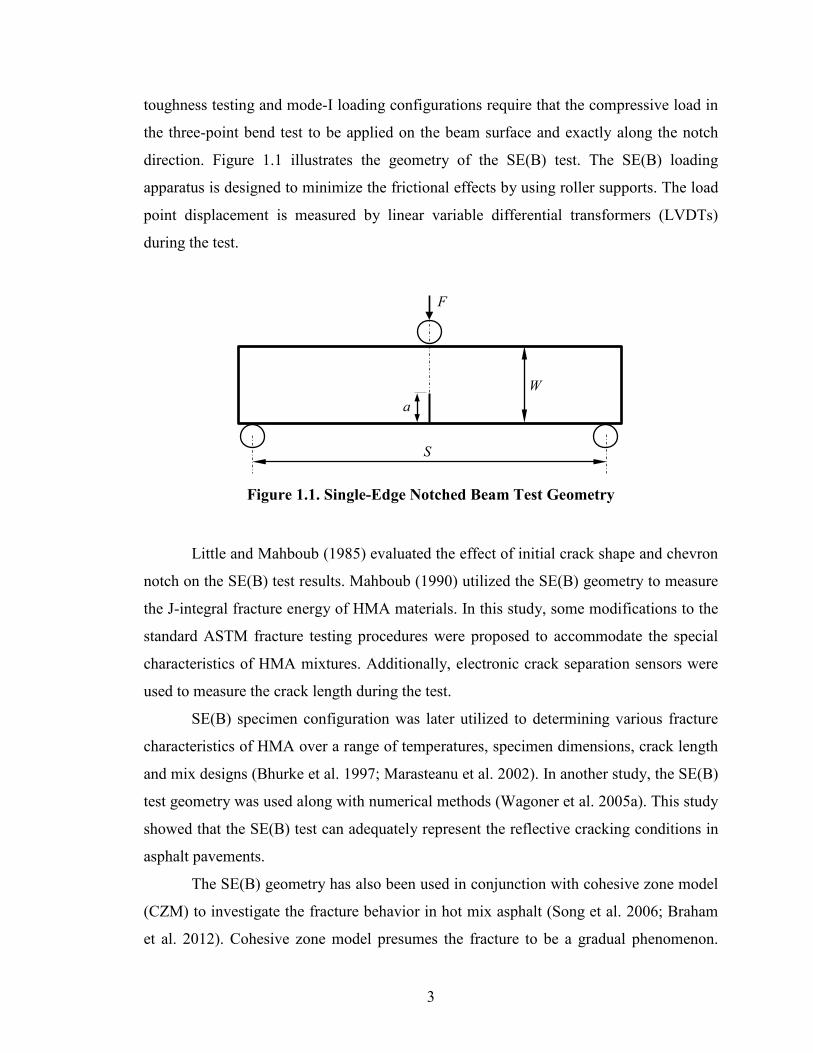
direction. Figure 1.1 illustrates the geometry of the SE(B) test. The SE(B) loading
apparatus is designed to minimize the frictional effects by using roller supports. The load
point displacement is measured by linear variable differential transformers (LVDTs)
during the test.
Figure 1.1. Single-Edge Notched Beam Test Geometry
Little and Mahboub (1985) evaluated the effect of initial crack shape and chevron
notch on the SE(B) test results. Mahboub (1990) utilized the SE(B) geometry to measure
the J-integral fracture energy of HMA materials. In this study, some modifications to the
standard ASTM fracture testing procedures were proposed to accommodate the special
characteristics of HMA mixtures. Additionally, electronic crack separation sensors were
used to measure the crack length during the test.
SE(B) specimen configuration was later utilized to determining various fracture
characteristics of HMA over a range of temperatures, specimen dimensions, crack length
and mix designs (Bhurke et al. 1997; Marasteanu et al. 2002). In another study, the SE(B)
test geometry was used along with numerical methods (Wagoner et al. 2005a). This study
showed that the SE(B) test can adequately represent the reflective cracking conditions in
asphalt pavements.
The SE(B) geometry has also been used in conjunction with cohesive zone model
(CZM) to investigate the fracture behavior in hot mix asphalt (Song et al. 2006; Braham
et al. 2012). Cohesive zone model presumes the fracture to be a gradual phenomenon.
F
W
S
a
3
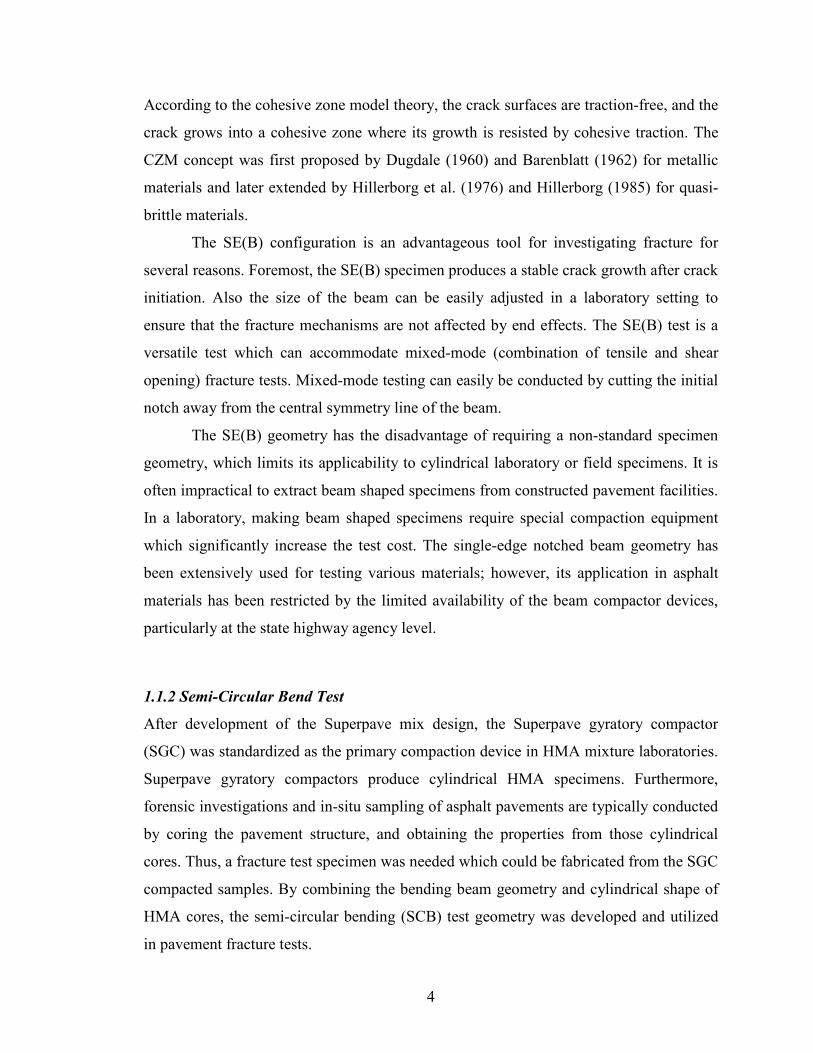
According to the cohesive zone model theory, the crack surfaces are traction-free, and the
crack grows into a cohesive zone where its growth is resisted by cohesive traction. The
CZM concept was first proposed by Dugdale (1960) and Barenblatt (1962) for metallic
materials and later extended by Hillerborg et al. (1976) and Hillerborg (1985) for quasi-
brittle materials.
The SE(B) configuration is an advantageous tool for investigating fracture for
several reasons. Foremost, the SE(B) specimen produces a stable crack growth after crack
initiation. Also the size of the beam can be easily adjusted in a laboratory setting to
ensure that the fracture mechanisms are not affected by end effects. The SE(B) test is a
versatile test which can accommodate mixed-mode (combination of tensile and shear
opening) fracture tests. Mixed-mode testing can easily be conducted by cutting the initial
notch away from the central symmetry line of the beam.
The SE(B) geometry has the disadvantage of requiring a non-standard specimen
geometry, which limits its applicability to cylindrical laboratory or field specimens. It is
often impractical to extract beam shaped specimens from constructed pavement facilities.
In a laboratory, making beam shaped specimens require special compaction equipment
which significantly increase the test cost. The single-edge notched beam geometry has
been extensively used for testing various materials; however, its application in asphalt
materials has been restricted by the limited availability of the beam compactor devices,
particularly at the state highway agency level.
1.1.2 Semi-Circular Bend Test
After development of the Superpave mix design, the Superpave gyratory compactor
(SGC) was standardized as the primary compaction device in HMA mixture laboratories.
Superpave gyratory compactors produce cylindrical HMA specimens. Furthermore,
forensic investigations and in-situ sampling of asphalt pavements are typically conducted
by coring the pavement structure, and obtaining the properties from those cylindrical
cores. Thus, a fracture test specimen was needed which could be fabricated from the SGC
compacted samples. By combining the bending beam geometry and cylindrical shape of
HMA cores, the semi-circular bending (SCB) test geometry was developed and utilized
in pavement fracture tests.
4

SCB specimen, as depicted in Figure 1.2, is comprised of a half disk of
compacted asphalt mixture with an initial notch that initiates at the center of the circle.
The specimen is supported symmetrically by two rollers and the load is applied on the top
of the specimen. Load point displacement can be measured using an LVDT and a metal
button on the specimen during the test procedure in order to calculate the fracture energy
of the specimen. The crack mouth opening displacement (CMOD) can also be measured
as a feedback signal by two metal buttons and an extensometer or by a single clip-on
gage. This geometry was first proposed by Chong and Kurrupu (1984) for fracture testing
of rocks. The SCB specimen geometry has also been used for fracture testing of rock
materials with fatigue pre-cracking to introduce a sharp crack tip (Lim et al. 1994).
Figure 1.2. Semi-Circular Bend Specimen Geometry
Molenaar et al. (2000) utilized the SCB geometry to evaluate the fracture
properties of HMA mixtures. In this study, seven standard types of asphalt mixtures were
tested using three different specimen sizes, four test temperatures (25°C, 15°C, 0°C, and
–10°C) and three loading rates (0.005, 0.05, and 0.5 mm/s). The results indicated that
possible excessive plastic deformation may occur at the vicinity of crack tip at higher
temperatures. Furthermore, it was observed that for a deformation rate of 0.05 mm/s,
most specimens did not show significant non-linear deformation before peak load.
F
r
2s
a
Clip Gage
a = crack length
r = radius of specimen
2s = support span
5
Additionally, the data showed that the fracture parameters obtained from the SCB
specimens were not independent of the specimen dimensions, which indicates that the
fundamental properties were not being measured without any interactions from the other
factors. Nonetheless, the comparison of the test to the indirect tensile strength test
showed that the SCB test is more sensitive to the mix properties.
The SCB test with a crack mouth opening (CMOD) rate of 0.0005 mm/s was
employed in a study on three mixtures used at MnROAD facility (Mull et al. 2002; Li et
al. 2005). The results showed that the fracture energy and fracture toughness as measured
by the SCB test could differentiate asphalt mixtures with respect to low-temperature
performance. The fracture energy seemed to be a better indicator due to its less
dependence on the conditions of linear elasticity and homogeneity of the tested materials.
However, both parameters were dependent upon the specimen size and temperature,
which indicate that they were not measured as fundamental properties.
The semi-circular bend geometry was later utilized to determine the critical
J-integral of HMA mixtures (Wu et al. 2005) using the elasto-plastic fracture mechanics
concepts. However, the test procedure proposed in this work deviates significantly from
the standard methods of determining the J-integral fracture energy. The SCB specimen
has been utilized in different research studies for fracture characterization of HMA
materials (Kim et al. 2012; Mogawer et al. 2013). In an experimental study, Mohammad
et al. (2013) used the SCB test to measure the critical J-integral of the asphalt mixtures
containing bio-binders. According to the test results, the mixtures that contained
bio-binder exhibited less intermediate temperature fracture resistance than the
conventional mixtures.
The semi-circular bend test specimens may also be taken form pavement field
cores. One of the advantages of the SCB test is its potential in obtaining two test
specimens from each field core, which can reduce the number of required cores.
However, this division of the core into two parts causes a constraint on crack length and
reduces the potential fracture surface area of the specimen. It should be noted that for
testing non-homogenous materials such as HMA, a minimum specimen size is always
required to account for the effect of non-homogeneity, and represent the actual properties
of the material. Moreover, a high compressive zone is created in the top rounded part of
6
the specimen in bending tests, which prevents the crack from propagating in this zone.
Consequently, the variation in the SCB test result is relatively high which undermines the
applicability of the test for distinguishing the difference between HMA mixtures.
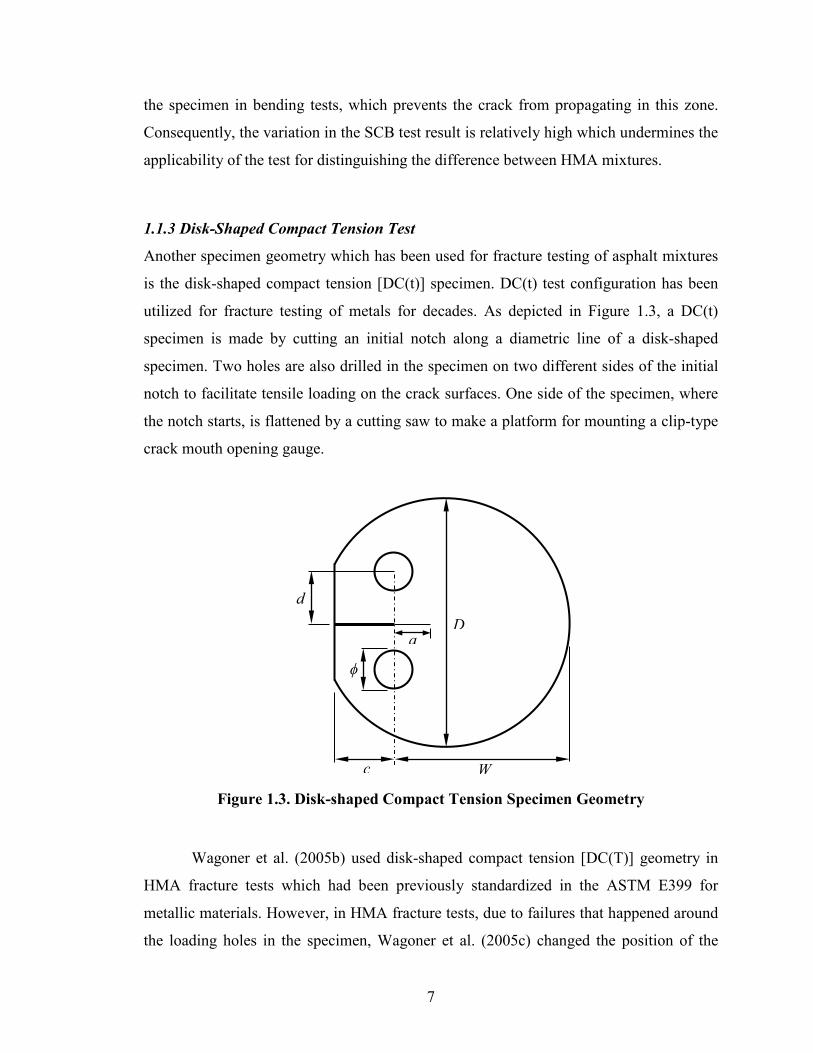
1.1.3 Disk-Shaped Compact Tension Test
Another specimen geometry which has been used for fracture testing of asphalt mixtures
is the disk-shaped compact tension [DC(t)] specimen. DC(t) test configuration has been
utilized for fracture testing of metals for decades. As depicted in Figure 1.3, a DC(t)
specimen is made by cutting an initial notch along a diametric line of a disk-shaped
specimen. Two holes are also drilled in the specimen on two different sides of the initial
notch to facilitate tensile loading on the crack surfaces. One side of the specimen, where
the notch starts, is flattened by a cutting saw to make a platform for mounting a clip-type
crack mouth opening gauge.
Figure 1.3. Disk-shaped Compact Tension Specimen Geometry
Wagoner et al. (2005b) used disk-shaped compact tension [DC(T)] geometry in
HMA fracture tests which had been previously standardized in the ASTM E399 for
metallic materials. However, in HMA fracture tests, due to failures that happened around
the loading holes in the specimen, Wagoner et al. (2005c) changed the position of the
d
c W
a D
ϕ
7
loading holes and proposed a new geometry for using DC(T) in HMA fracture tests.
Additionally, the initial notch length of the DC(t) specimens was increased to the center
of the specimen to make it more suitable for HMA materials and prevent failures around
the loading holes.
DC(T) specimens can be obtained from standard cylindrical field cores as well as
the laboratory-produced samples. However, the complexity of the DC(t) test equipment
has somewhat limited its widespread use, and it is often viewed as a research tool by
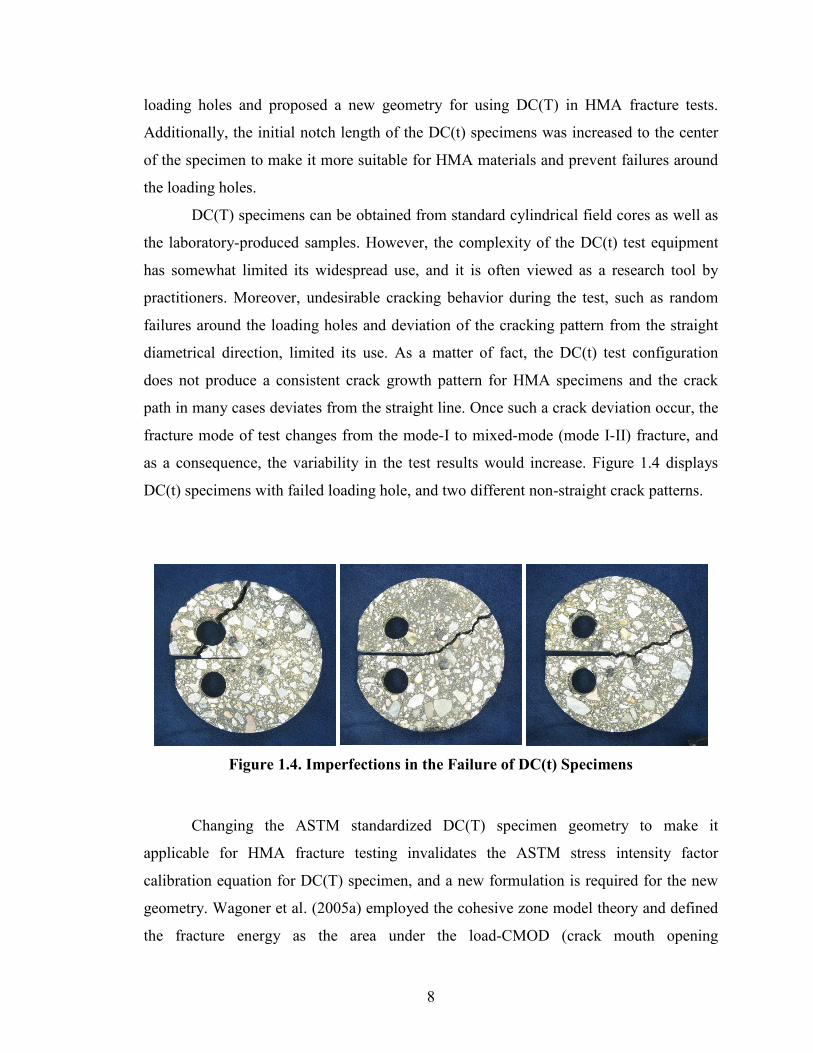
practitioners. Moreover, undesirable cracking behavior during the test, such as random
failures around the loading holes and deviation of the cracking pattern from the straight
diametrical direction, limited its use. As a matter of fact, the DC(t) test configuration
does not produce a consistent crack growth pattern for HMA specimens and the crack
path in many cases deviates from the straight line. Once such a crack deviation occur, the
fracture mode of test changes from the mode-I to mixed-mode (mode I-II) fracture, and
as a consequence, the variability in the test results would increase. Figure 1.4 displays
DC(t) specimens with failed loading hole, and two different non-straight crack patterns.
Figure 1.4. Imperfections in the Failure of DC(t) Specimens
Changing the ASTM standardized DC(T) specimen geometry to make it
applicable for HMA fracture testing invalidates the ASTM stress intensity factor
calibration equation for DC(T) specimen, and a new formulation is required for the new
geometry. Wagoner et al. (2005a) employed the cohesive zone model theory and defined
the fracture energy as the area under the load-CMOD (crack mouth opening
8
displacement) curve normalized by the area of fracture surface (initial ligament length
times the specimen thickness). This parameter indicates the amount of work that is done
to pull the crack faces apart. Although, this normalized fracture energy does not represent
a true material property, it is useful as fracture potential ranking tool.
1.1.4 Indirect Tension Test
Indirect tensile strength test (IDT) has been extensively used by different highway
agencies to measure the tensile strength of asphalt mixtures. By applying the elasticity
theory concepts, it can be shown that when a disk-shaped sample of a homogenous,
isotropic and linear elastic material is subjected to a pair of equal and diagonal loads (F),
the internal stress magnitude along the loaded diameter would be a constant in the
direction perpendicular to the loading line. Based upon this theory, indirect tension test
configuration has been designed that is advantageous in several aspects such as:
• IDT test uses compressive loading apparatus for determining the tensile strength
of materials which is more convenient than direct tensile loading configuration for
lab tests.
• The deformation of the indirect test specimen can be easily measured in one, two,
or three directions using either one or two LVDTs in each direction.
• The apparatus can be used under any existing loading frame (e.g. Marshall,
hydraulic system, unconfined, triaxial).
• According to the symmetric geometry of the specimen in two directions,
implementation of the test is more convenient than other similar methods.
• The apparatus is available in most HMA testing laboratories.
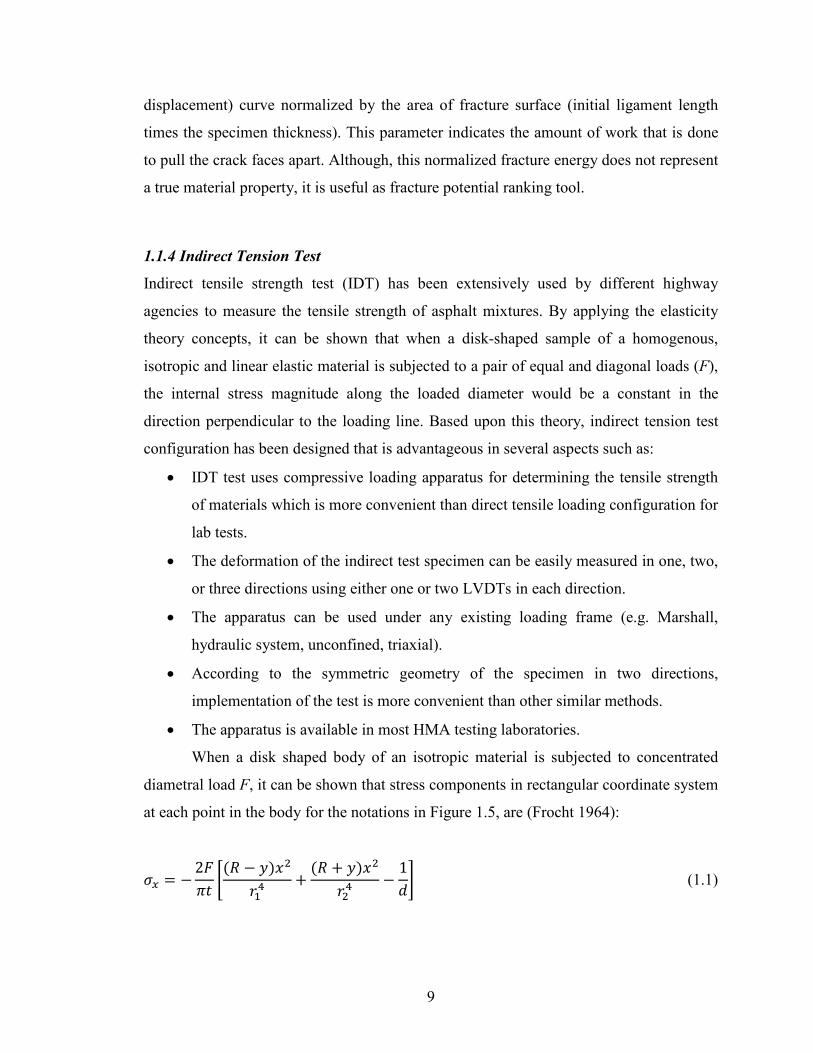
When a disk shaped body of an isotropic material is subjected to concentrated
diametral load F, it can be shown that stress components in rectangular coordinate system
at each point in the body for the notations in Figure 1.5, are (Frocht 1964):
𝜎𝑥 = −2𝐹𝜋𝑡
�(𝑅 − 𝑦)𝑥2
𝑟14+
(𝑅 + 𝑦)𝑥2
𝑟24−
1𝑑� (1.1)
9
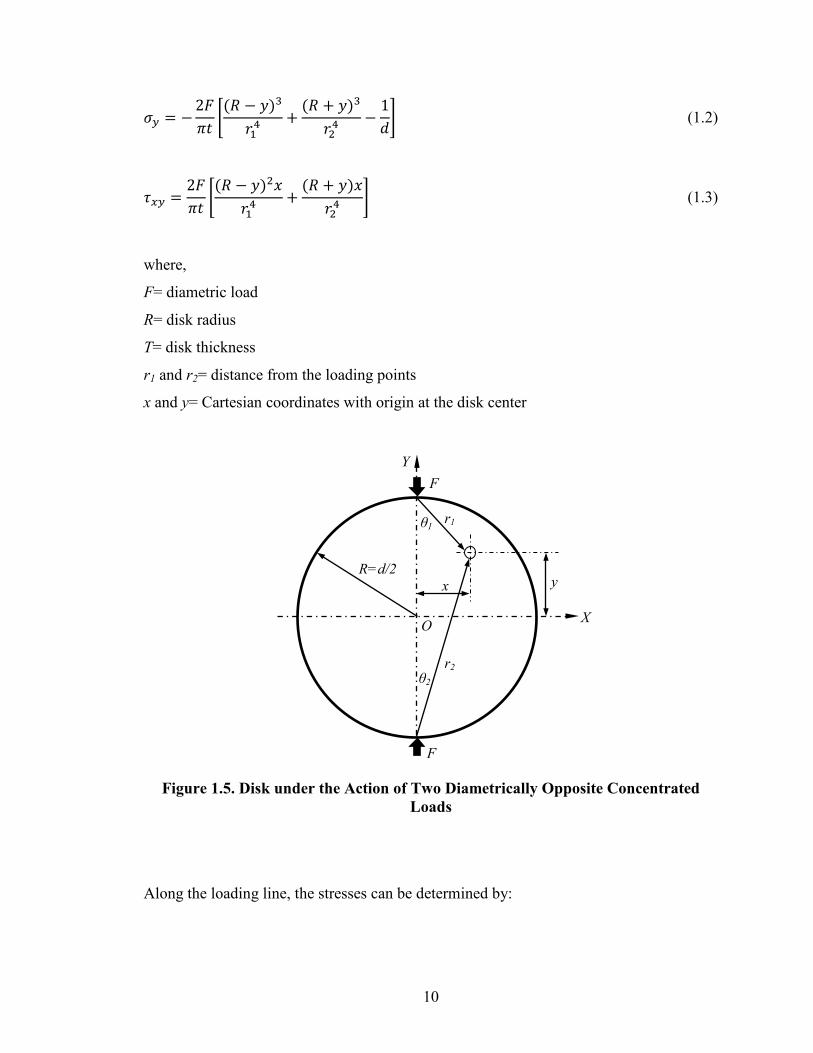
𝜎𝑦 = −2𝐹𝜋𝑡
�(𝑅 − 𝑦)3
𝑟14+
(𝑅 + 𝑦)3
𝑟24−
1𝑑� (1.2)
𝜏𝑥𝑦 =2𝐹𝜋𝑡
�(𝑅 − 𝑦)2𝑥
𝑟14+
(𝑅 + 𝑦)𝑥𝑟24
� (1.3)
where,
F= diametric load
R= disk radius
T= disk thickness
r1 and r2= distance from the loading points
x and y= Cartesian coordinates with origin at the disk center
Figure 1.5. Disk under the Action of Two Diametrically Opposite Concentrated
Loads
Along the loading line, the stresses can be determined by:
F
F
r2
r1
y x R=d/2
X
Y
O
θ1
θ2
10

𝜎𝑥 =2𝐹𝜋𝑡𝑑
(1.4)
𝜎𝑦 = −2𝐹𝜋𝑡
�2
𝑑 − 2𝑦+
2𝑑 + 2𝑦
−1𝑑� (1.5)
𝜏𝑥𝑦 = 0 (1.6)
Thus, it is seen that across the vertical central section, i.e. along the loading line, the
horizontal tension is constant and the vertical compression is theoretically infinite when
r1=0 or when r2=0. The minimum numerical value of the vertical compression is 6F/(πdt)
at the center of the disk. The distribution of the stresses across the X and Y axes are
shown in Figures 1.6 and 1.7.
The simplicity and widespread availability of the IDT test equipment persuaded
the researchers to develop other HMA tests with similar configurations such as resilient
modulus, IDT creep compliance, and IDT repeated load fatigue tests. It has also been
shown that the triaxial shear strength of HMA can be correlated to its strength by
applying the time-temperature superposition principles and the results can be used to
estimate the mixture cohesion (Pellinen et al. 2005). In another research, the results from
IDT strength test, IDT resilient modulus test, and IDT creep compliance tests were used
together to estimate the dissipated creep strain energy of HMA, and use it as an indicator
for top-down cracking potential of asphalt pavements (Zhang et al. 2001; Birgisson et al.
2002)
In theory, an IDT specimen with a central notch along the loading line could be
used for Mode-I fracture testing of HMA. The stress distribution of the IDT specimen
would induce a tensile stress on the crack faces without any shear stress. Furthermore, by
changing the inclination angle of the central notch with respect to the loading direction,
the mode of the fracture test can vary from mode-I to mixed-mode (Jia et al. 1996).
Nevertheless, cutting such a narrow notch at the center of an HMA specimen is not
practicable with the regular tools in typical asphalt laboratories.
11
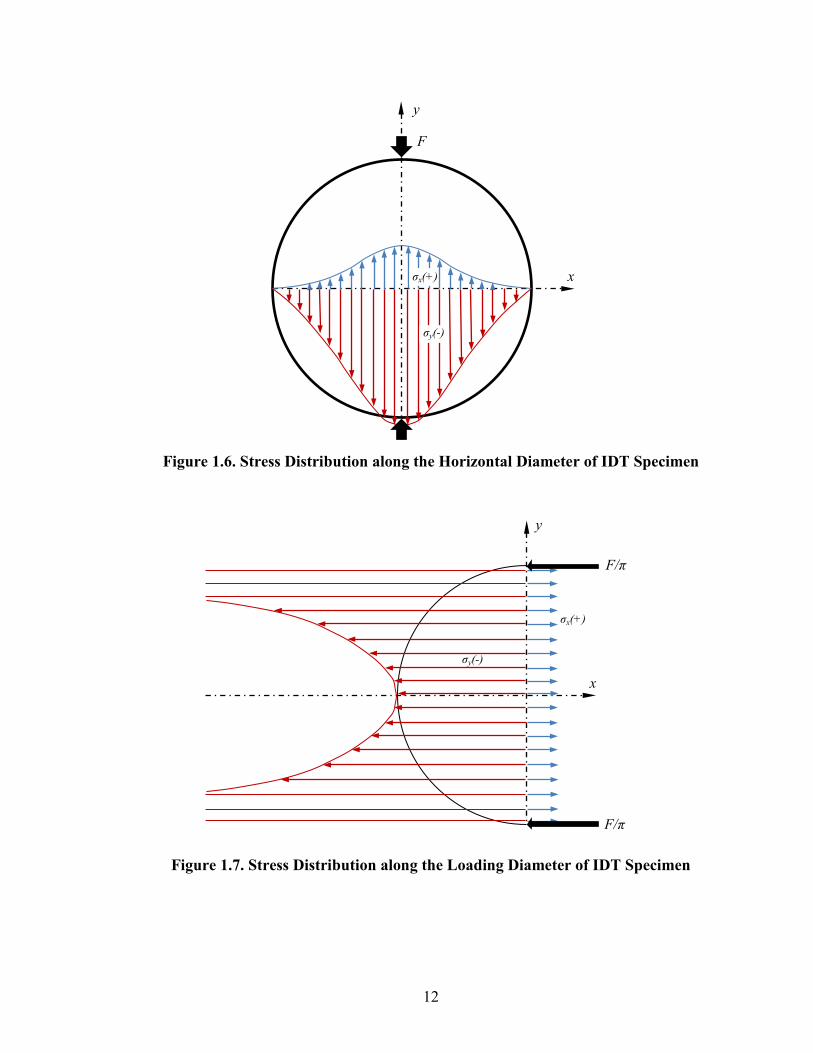
Figure 1.6. Stress Distribution along the Horizontal Diameter of IDT Specimen
Figure 1.7. Stress Distribution along the Loading Diameter of IDT Specimen
F
y
x σx(+)
σy(-)
F/π
y
x
σx(+)
σy(-)
F/π
12

Hiltunen and Roque (1994) used a centrally notched disk-shaped sample with a
small hole at the center to measure the parameters related to the fatigue crack growth in
HMA. The central hole was drilled at the center of the specimen so that the cutting device
would have room to create the initial notch. However, in the absence of the stress
intensity factor formula for this geometry, the test results were interpreted using the
equations for an infinitely large cracked body subjected to a uniform tensile stress. In a
research on compacted soils, Harison et al. (1994) calculated the stress intensity factor of
a somewhat similar ring specimen, but with a larger central hole, for a specific set of
dimensions through numerical modeling. In another study, Yang et al. (1997) used a
similar geometry to measure fracture parameters of portland cement concrete. In a
theoretical study, Fischer et al. (1996) conducted finite element analysis to calculate the
stress intensity factor of a somewhat similar specimen with a specific set of dimensions
and flatten loading areas.
1.2 Introduction of IRT Fracture Test
The indirect ring tension (IRT) fracture test was developed in this study such that it
could produce repeatable data, and would be implementable with the existing equipment
in the asphalt testing laboratories. The purpose of this research was to develop a user-
friendly HMA fracture test that was effective, based upon fundamental concepts, and yet
simple enough that it could be used at the Department of Transportation (DOT) level.
The approach was to do the hard work for the user, and deliver a set of protocols which
could be easily implemented by the practitioners.
The configuration of the indirect ring tension (IRT) fracture test is depicted in
Figure 1.8. To fabricate an IRT specimen of HMA, a hole is cored out from the central
part of a disk-shaped laboratory specimen or a field core specimen. Then, two notches
with equal lengths are cut along the diametrical line of the disk. This fracture test is
performed in a compression test frame, which is the most basic mechanical testing device
available in most asphalt laboratories. Furthermore, a mixed-mode fracture test could be
conducted by simply changing the inclination angle of the specimen prior to applying the
load. When compared to other HMA fracture test geometries, the IRT specimen can
13

better produce the stress distribution condition of a pavement under thermally-induced
loads. As the pavement temperature drops, the entire depth of the asphalt layer is
subjected to tensile stress, which is similar to the stress distribution along the crack
propagation line in the IRT fracture test. This stress distribution enables the crack to grow
rapidly into the fracture ligament when the material enters its quasi-brittle phase.
Furthermore, the stress distribution of IRT specimen prevents the potential for ductility
interfering with fracture, which sometimes occurs in bending-mode HMA fracture test
due to the relatively low stiffness of the asphalt mixtures.
Figure 1.8. Indirect Ring Tension Fracture Test Geometry
The primary advantages of the IRT fracture test configuration include:
• Simulating the stress distribution of an HMA layer under low-temperature tensile
loads,
• Ease of potential implementation,
• Generating a mode-I fracture on a relatively consistent basis,
• High repeatability,
F
r
a W
R
Test Specimen
Loading Platen
14
• Ability to accommodate field cores as well as laboratory-compacted samples,
• Relatively high fracture surface area, and
• Relatively low cost.
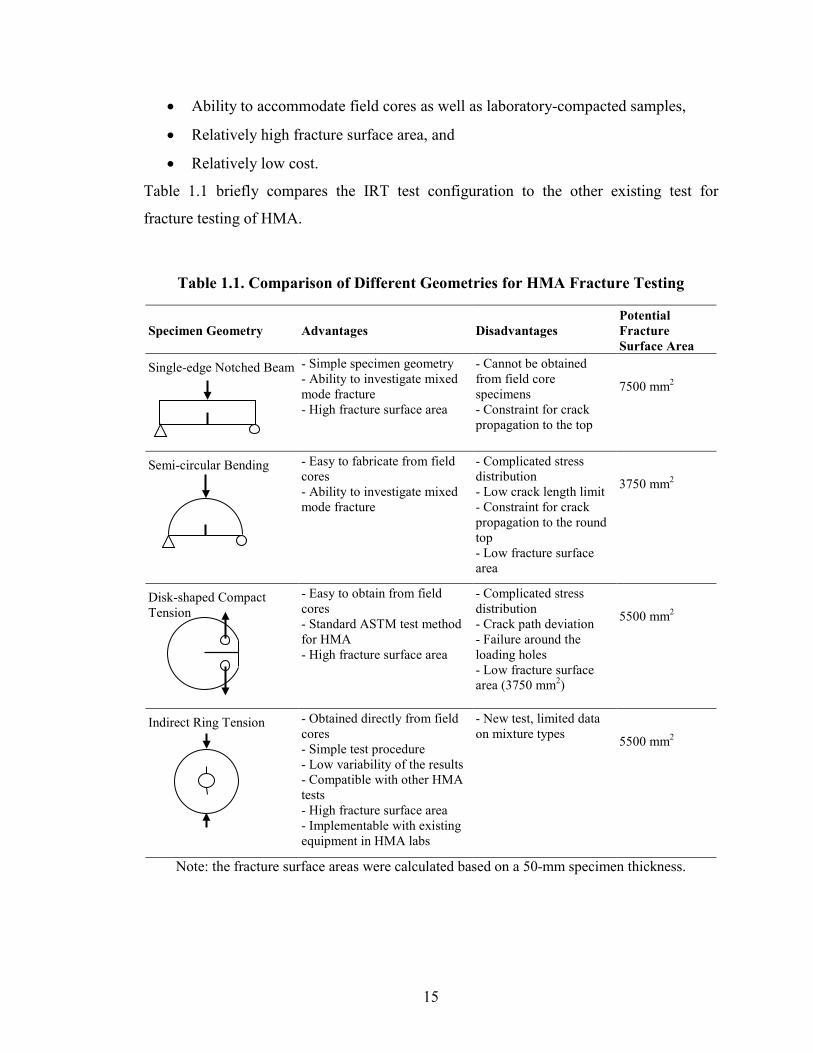
Table 1.1 briefly compares the IRT test configuration to the other existing test for
fracture testing of HMA.
Table 1.1. Comparison of Different Geometries for HMA Fracture Testing
Specimen Geometry Advantages Disadvantages Potential Fracture Surface Area
Single-edge Notched Beam
- Simple specimen geometry - Ability to investigate mixed mode fracture - High fracture surface area
- Cannot be obtained from field core specimens - Constraint for crack propagation to the top
7500 mm2
Semi-circular Bending
- Easy to fabricate from field cores - Ability to investigate mixed mode fracture
- Complicated stress distribution - Low crack length limit - Constraint for crack propagation to the round top - Low fracture surface area
3750 mm2
Disk-shaped Compact Tension
- Easy to obtain from field cores - Standard ASTM test method for HMA - High fracture surface area
- Complicated stress distribution - Crack path deviation - Failure around the loading holes - Low fracture surface area (3750 mm2)
5500 mm2
Indirect Ring Tension - Obtained directly from field cores - Simple test procedure - Low variability of the results - Compatible with other HMA tests - High fracture surface area - Implementable with existing equipment in HMA labs
- New test, limited data on mixture types
5500 mm2
Note: the fracture surface areas were calculated based on a 50-mm specimen thickness.
15
It is noteworthy to mention that various modeling methods, such as continuum
damage model (Hou et al. 2010), cohesive zone model (Hyunwook et al. 2008), and
dissipated strain energy (Sangpetngam et al. 2003) have been utilized to evaluate the
cracking phenomena and cumulative damage in asphalt mixtures. Such theories and
models can also be employed along with the IRT specimen geometry to study the internal
state of the HMA cracking at lower temperatures. However, the objective of this research
was to utilize the IRT specimen geometry to characterize the fundamental fracture
properties of HMA and use such properties to rank the mixtures performance and
estimate the low-temperature performance of asphalt pavements.
To develop a fracture-mechanics-based test, the stress intensity factor of the IRT
fracture specimen was calibrated through finite element modeling. Next, the developed
stress intensity factor equation was used to develop the IRT fracture test procedure and
optimize it for the HMA material. Then, an experimental study was conducted on
plant-produced HMA samples to examine the capability of the IRT test in discerning the
difference between the potential cracking susceptibility of the HMA mixtures.
Additionally, a viscoelastic model was used in conjunction with the IRT fracture test data
to evaluate the cracking performance of the pavements in the field based on a
hypothetical cooling scenario. Moreover, two experimental studies were executed by the
IRT fracture test to evaluate the effect of pavements density and aging on their thermal
cracking potential.
16

CHAPTER 2 STRESS INTENSITY FACTOR CALIBRATION
2.1 Fracture Mechanics
The field of fracture mechanics focuses on failure mechanism of flawed or cracked
materials. Analytical solutions and experimental methods are used in fracture mechanics
to explain the behavior of materials in the presence of a crack. At the microscopic scale, a
crack is considered as a cut in a body inducing a stress singularity. Crack surfaces are the
opposite boundaries of the crack which are traction-free, and the crack ends at the crack
tip. In linear fracture mechanics, the cracked body is presumably made of linear isotropic
elastic material in the whole domain. In such materials, any possible inelastic process in
the vicinity of the crack tip is restricted to a small region that is negligible at macro scale.
In the analysis of low-temperature cracking of asphalt pavements, the thermally-
induced loads are traditionally compared with the tensile strength of the material as the
failure criteria. However, the study of fracture mechanics reveals that tensile strength can
be very misleading as a fracture resistance indicator, and high strength materials can be
very susceptible to fracture in the presence of cracks and flaws. In fact, the fracture
strength of a cracked material can be far more representative of the actual field
performance than its laboratory-measured tensile strength. Since it cannot be guaranteed
that a pavement material will remain flaw-free during its construction and service life, the
fracture mechanics approach seems to provide more reliable information about the actual
resistance of the pavements to thermal cracking.
Generally, three types of crack opening can be defined with regard to deformation
of crack and the body. Figure 2.1 schematically illustrates the crack opening modes
which are denoted as mode-I, mode-II, and mode-III fracture. In mode-I, the crack
opening is symmetric with respect to x-z plane and occurs in most of actual engineering
situations related to cracked components, including low temperature cracking of asphalt
pavements. Mode-II or in-plane shear mode occurs when the crack surfaces slide over
each other in a direction normal to the crack front. Mode-III, also called tearing mode, is
characterized by movement of crack surfaces in a tangential direction to the crack front.
17
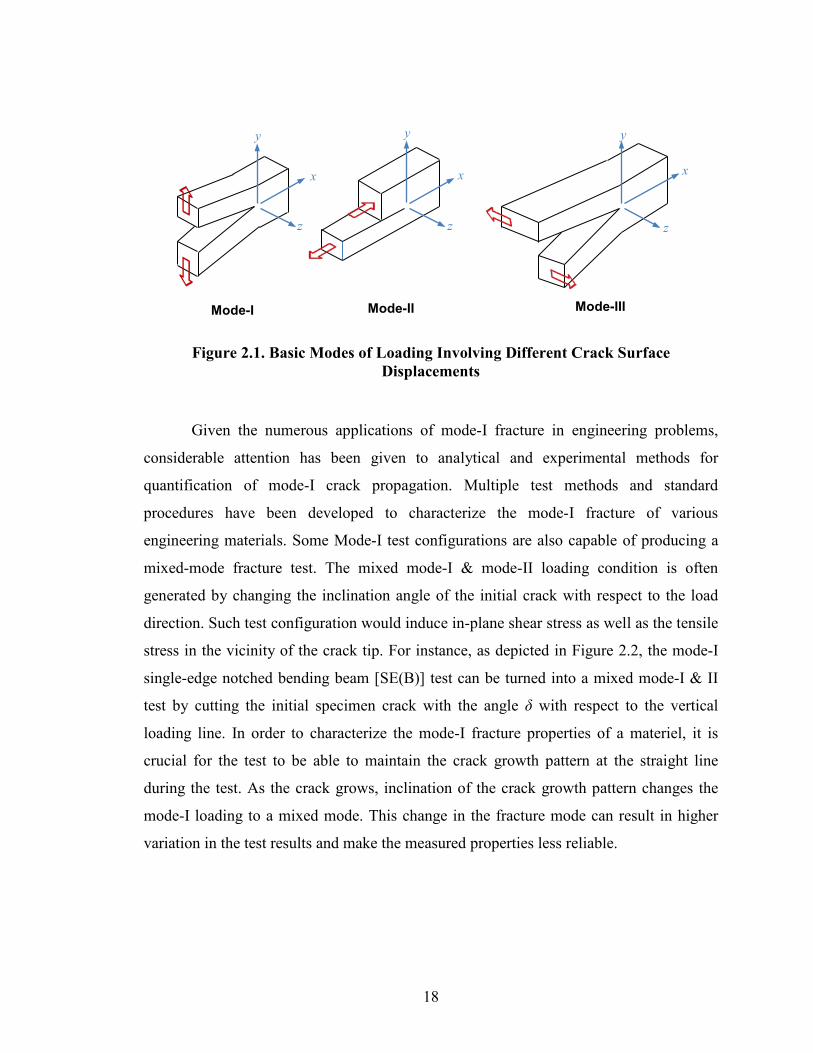
Figure 2.1. Basic Modes of Loading Involving Different Crack Surface Displacements
Given the numerous applications of mode-I fracture in engineering problems,
considerable attention has been given to analytical and experimental methods for
quantification of mode-I crack propagation. Multiple test methods and standard
procedures have been developed to characterize the mode-I fracture of various
engineering materials. Some Mode-I test configurations are also capable of producing a
mixed-mode fracture test. The mixed mode-I & mode-II loading condition is often
generated by changing the inclination angle of the initial crack with respect to the load
direction. Such test configuration would induce in-plane shear stress as well as the tensile
stress in the vicinity of the crack tip. For instance, as depicted in Figure 2.2, the mode-I
single-edge notched bending beam [SE(B)] test can be turned into a mixed mode-I & II
test by cutting the initial specimen crack with the angle δ with respect to the vertical
loading line. In order to characterize the mode-I fracture properties of a materiel, it is
crucial for the test to be able to maintain the crack growth pattern at the straight line
during the test. As the crack grows, inclination of the crack growth pattern changes the
mode-I loading to a mixed mode. This change in the fracture mode can result in higher
variation in the test results and make the measured properties less reliable.
y
x
z
y
x
z
y
x
z
Mode-I Mode-II Mode-III
18
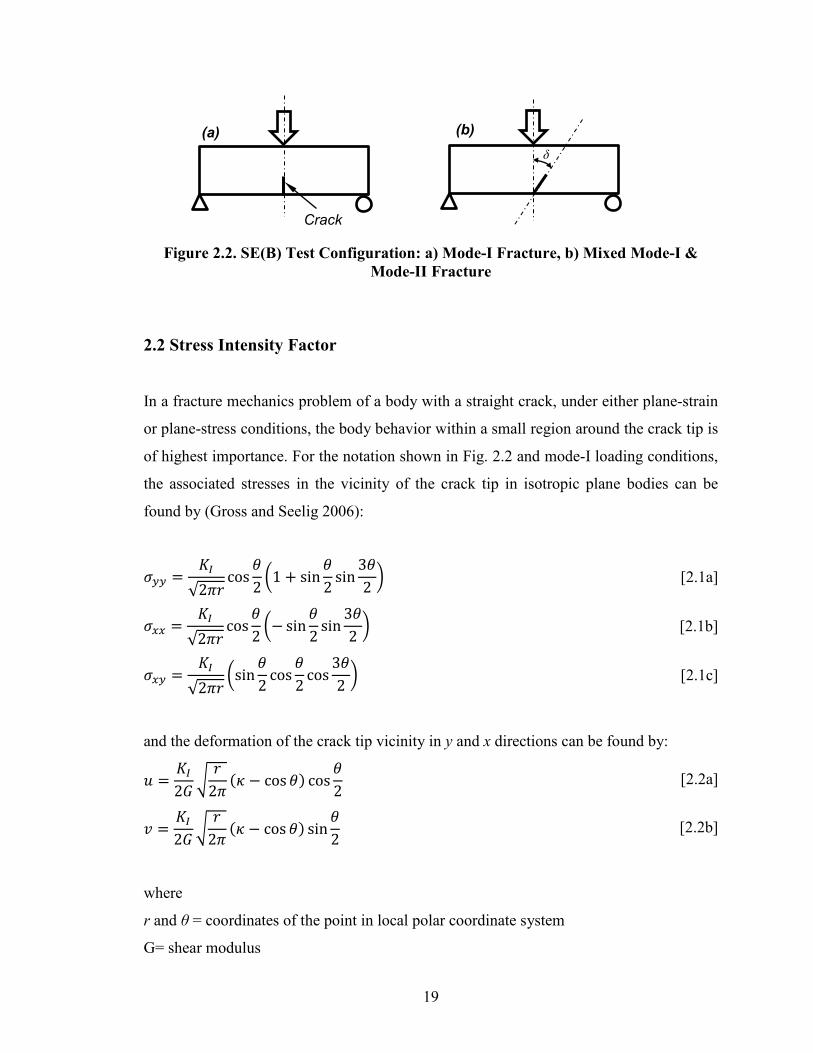
Figure 2.2. SE(B) Test Configuration: a) Mode-I Fracture, b) Mixed Mode-I &
Mode-II Fracture
2.2 Stress Intensity Factor
In a fracture mechanics problem of a body with a straight crack, under either plane-strain
or plane-stress conditions, the body behavior within a small region around the crack tip is
of highest importance. For the notation shown in Fig. 2.2 and mode-I loading conditions,
the associated stresses in the vicinity of the crack tip in isotropic plane bodies can be
found by (Gross and Seelig 2006):
𝜎𝑦𝑦 =𝐾𝐼
√2𝜋𝑟cos
𝜃2�1 + sin
𝜃2
sin3𝜃2� [2.1a]
𝜎𝑥𝑥 =𝐾𝐼
√2𝜋𝑟cos
𝜃2�− sin
𝜃2
sin3𝜃2� [2.1b]
𝜎𝑥𝑦 =𝐾𝐼
√2𝜋𝑟�sin
𝜃2
cos𝜃2
cos3𝜃2� [2.1c]
and the deformation of the crack tip vicinity in y and x directions can be found by:
𝑢 =𝐾𝐼2𝐺
�𝑟
2𝜋(𝜅 − cos𝜃) cos
𝜃2
[2.2a]
𝑣 =𝐾𝐼2𝐺
�𝑟
2𝜋(𝜅 − cos 𝜃) sin
𝜃2
[2.2b]
where
r and θ = coordinates of the point in local polar coordinate system
G= shear modulus
δ
Crack
(a) (b)
19
3 − 4𝜈 if plane-strain or axisymmetric 3−𝜈1+𝜈
if plane-stress
ν= Poisson’s ratio
KI = mode-I stress intensity factor
Figure 2.3. Vicinity of the Crack Tip in a Cracked Body
Equation 2.1 concludes that the stresses σij have singularities of the type r -1/2,
where r is the radius measured from the crack tip as shown in Figure 2.3. The strains ɛij
have the same singularities of type r -1/2 and increase infinitely as the distance from the
crack tip becomes very small. Furthermore, Equation 2.1 shows that the stress
distribution around any crack tip in a structure is similar and depends only on parameters
r and θ . The difference between the cracked components is in the magnitude of
parameter K which is defined as stress intensity factor. K is essentially a factor that
defines the magnitude of the stress in the vicinity of the crack tip.
For mode-II crack opening the stress and displacements in the crack tip field can
be found by (Gross and Seelig 2006):
𝜎𝑦𝑦 =𝐾𝐼𝐼√2𝜋𝑟
sin𝜃2
cos𝜃2
cos3𝜃2
[2.3a]
𝜎𝑥𝑥 =𝐾𝐼𝐼√2𝜋𝑟
�− sin𝜃2� �2 + cos
𝜃2
cos3𝜃2� [2.3b]
x
y
r
θ
σxx
σyy
σxy
κ=
20
𝜎𝑥𝑦 =𝐾𝐼𝐼√2𝜋𝑟
𝑐𝑜𝑠𝜃2�1 − sin
𝜃2
sin3𝜃2� [2.3c]
and
𝑢 =𝐾𝐼𝐼2𝐺
�𝑟
2𝜋(𝜅 + 2 + cos 𝜃) sin
𝜃2
[2.4a]
𝑣 =𝐾𝐼2𝐺
�𝑟
2𝜋(𝜅 − 2 + cos 𝜃) cos
𝜃2
[2.4b]
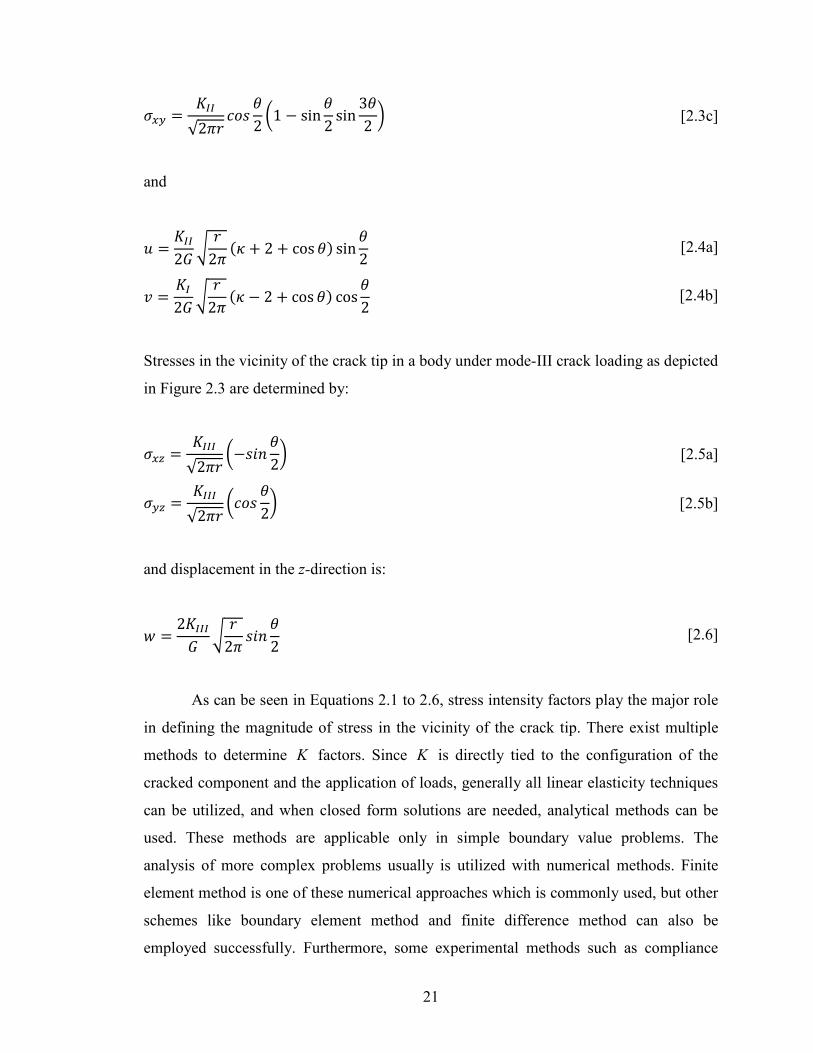
Stresses in the vicinity of the crack tip in a body under mode-III crack loading as depicted
in Figure 2.3 are determined by:
𝜎𝑥𝑧 =𝐾𝐼𝐼𝐼√2𝜋𝑟
�−𝑠𝑖𝑛𝜃2� [2.5a]
𝜎𝑦𝑧 =𝐾𝐼𝐼𝐼√2𝜋𝑟
�𝑐𝑜𝑠𝜃2� [2.5b]
and displacement in the z-direction is:
𝑤 =2𝐾𝐼𝐼𝐼𝐺
�𝑟
2𝜋𝑠𝑖𝑛
𝜃2
[2.6]
As can be seen in Equations 2.1 to 2.6, stress intensity factors play the major role
in defining the magnitude of stress in the vicinity of the crack tip. There exist multiple
methods to determine K factors. Since K is directly tied to the configuration of the
cracked component and the application of loads, generally all linear elasticity techniques
can be utilized, and when closed form solutions are needed, analytical methods can be
used. These methods are applicable only in simple boundary value problems. The
analysis of more complex problems usually is utilized with numerical methods. Finite
element method is one of these numerical approaches which is commonly used, but other
schemes like boundary element method and finite difference method can also be
employed successfully. Furthermore, some experimental methods such as compliance
21
method (Bonesteel et al. 1978; Newman 1981), strain measurements in the crack tip
vicinity by using high sensitivity measurement tools (Dally and Sanford 1987), and
photoelasticity (Hyde and Warrior 1990; Voitovich et al. 2011) have been utilized to
determine the K factors for complex configurations.
Generally, the stress intensity factor depends on the configuration of the crack
component as well as the manner in which the load is applied. It has been shown that
(Hertzberg 1996):
K= f(σ,a) [2.7]
where a is the crack length, and the crack is assumed to be sharp with a very small crack
tip radius. By increasing the mode-I traction in a crack field in a plane-strain condition,
the KI magnitude escalates to a maximum value at which point the crack starts growing.
This maximum KI value is known as the plane-strain fracture toughness (KIC), which is a
material specific property, and can be directly related to the fracture performance of the
material.
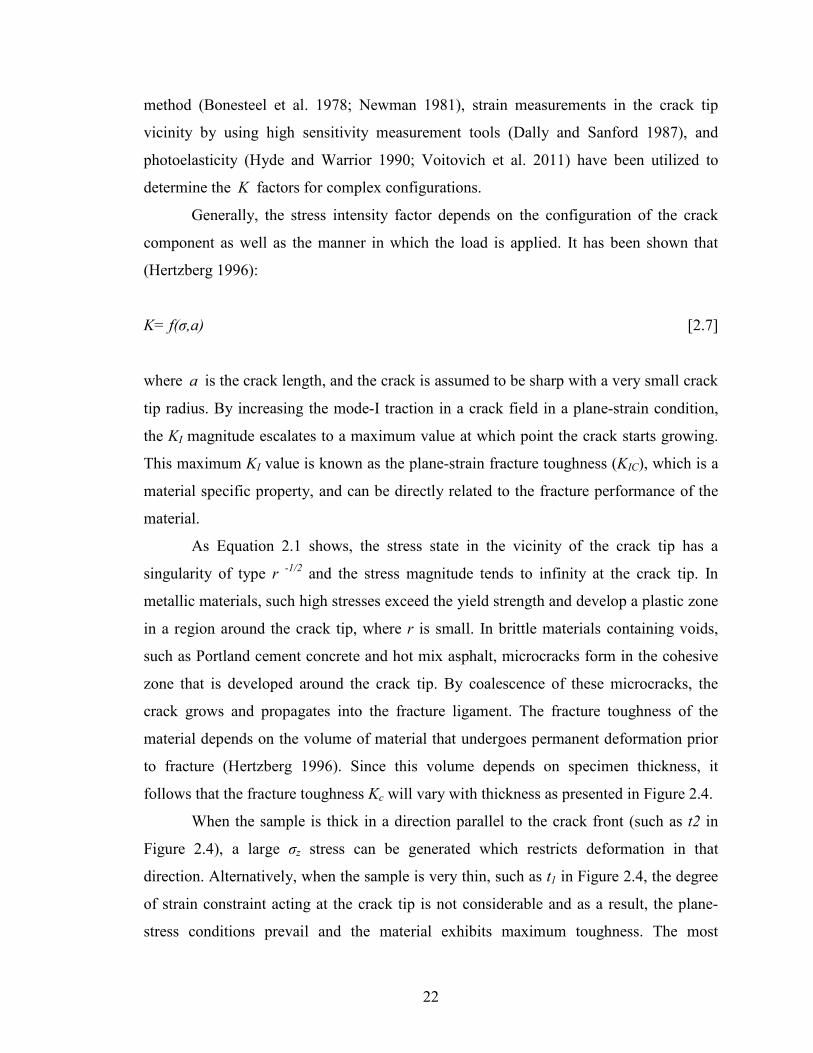
As Equation 2.1 shows, the stress state in the vicinity of the crack tip has a
singularity of type r -1/2 and the stress magnitude tends to infinity at the crack tip. In
metallic materials, such high stresses exceed the yield strength and develop a plastic zone
in a region around the crack tip, where r is small. In brittle materials containing voids,
such as Portland cement concrete and hot mix asphalt, microcracks form in the cohesive
zone that is developed around the crack tip. By coalescence of these microcracks, the
crack grows and propagates into the fracture ligament. The fracture toughness of the
material depends on the volume of material that undergoes permanent deformation prior
to fracture (Hertzberg 1996). Since this volume depends on specimen thickness, it
follows that the fracture toughness Kc will vary with thickness as presented in Figure 2.4.
When the sample is thick in a direction parallel to the crack front (such as t2 in
Figure 2.4), a large σz stress can be generated which restricts deformation in that
direction. Alternatively, when the sample is very thin, such as t1 in Figure 2.4, the degree
of strain constraint acting at the crack tip is not considerable and as a result, the plane-
stress conditions prevail and the material exhibits maximum toughness. The most
22

important aspect of plane-strain fracture toughness (KIC) of a material is that for any
testing conditions and specimen geometry, it remains a constant and does not decrease
with increasing sample thickness. Basically, the plane-stress fracture toughness depends
on the specimen geometry in addition to the natural properties of the material, while the
plane-strain fracture toughness depends only on the material properties. In other words,
thickness effects can be avoided by comparing the plane-strain fracture toughness values
of different materials. As the result, plane-strain fracture toughness has become the
material’s conservative lower limit of toughness in engineering application.
Figure 2.4. Variation in Fracture Toughness with Respect to Plate Thickness
Any specimen size and geometry that represents plane strain condition can be
used in determination of fracture toughness of a material. The test specimen must have a
starter crack which is sometimes produced by applying an oscillating load to an initially
notched specimen. Fracture toughness of a material can also be determined by specimens
taken from naturally cracked components with geometries whose stress intensity formula
is already known. Basically fracture toughness is one of the most commonly used
material properties in engineering design. For a certain material, knowing the fracture
toughness enables determining the critical flaw size or the stress that can be tolerated
before fracture.
Brown and Srawley (1966) after examining the fracture toughness of several
alloys with different specimen geometries and testing conditions, proposed the following
Kc
KIC
1/t t1 t2
23
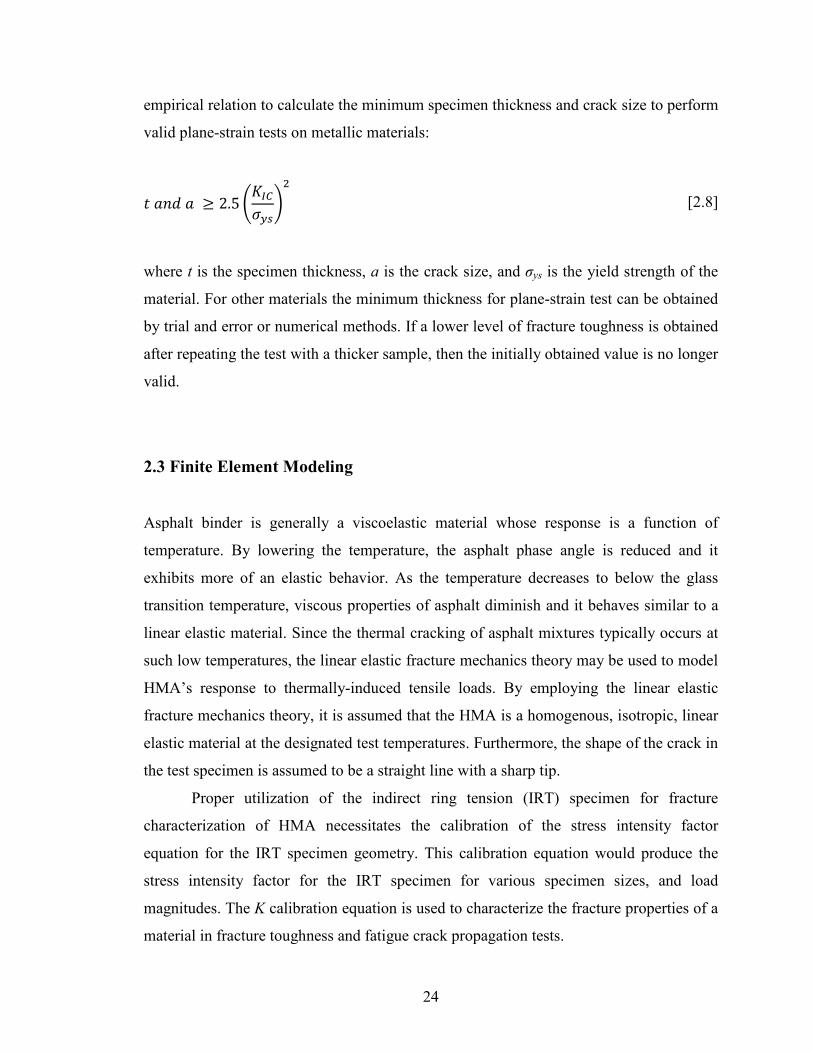
empirical relation to calculate the minimum specimen thickness and crack size to perform
valid plane-strain tests on metallic materials:
𝑡 𝑎𝑛𝑑 𝑎 ≥ 2.5�𝐾𝐼𝐶𝜎𝑦𝑠
�2
[2.8]
where t is the specimen thickness, a is the crack size, and σys is the yield strength of the
material. For other materials the minimum thickness for plane-strain test can be obtained
by trial and error or numerical methods. If a lower level of fracture toughness is obtained
after repeating the test with a thicker sample, then the initially obtained value is no longer
valid.
2.3 Finite Element Modeling
Asphalt binder is generally a viscoelastic material whose response is a function of
temperature. By lowering the temperature, the asphalt phase angle is reduced and it
exhibits more of an elastic behavior. As the temperature decreases to below the glass
transition temperature, viscous properties of asphalt diminish and it behaves similar to a
linear elastic material. Since the thermal cracking of asphalt mixtures typically occurs at
such low temperatures, the linear elastic fracture mechanics theory may be used to model
HMA’s response to thermally-induced tensile loads. By employing the linear elastic
fracture mechanics theory, it is assumed that the HMA is a homogenous, isotropic, linear
elastic material at the designated test temperatures. Furthermore, the shape of the crack in
the test specimen is assumed to be a straight line with a sharp tip.
Proper utilization of the indirect ring tension (IRT) specimen for fracture
characterization of HMA necessitates the calibration of the stress intensity factor
equation for the IRT specimen geometry. This calibration equation would produce the
stress intensity factor for the IRT specimen for various specimen sizes, and load
magnitudes. The K calibration equation is used to characterize the fracture properties of a
material in fracture toughness and fatigue crack propagation tests.
24
In order to calibrate the stress intensity factor equation for the IRT specimen
configuration, finite element (FE) modeling was utilized to calculate the K values for
various geometries. An individual FE model was made for every combination of the
IRT’s geometric parameters using the ANSYS® Academic Research, Release 12.0
software (ANSYS, Inc., 2009a).
2.3.1 Crack Tip Element
In the study of fracture mechanics, most interest is often focused on the singularity point
where stress becomes (mathematically but not physically) infinite. Near such singularities
polynomial-based finite element approximations perform poorly and attempts have
frequently been made to include special functions within an element that can model the
analytically known singular function. An element of this kind, shown in Figure 2.4 was
introduced by Henshell and Shaw (1975), and Barsoum (1976), almost simultaneously.
This element is made from quadratic, isoparametric quadrilateral or triangular elements
by shifting the mid-side node to the quarter point.
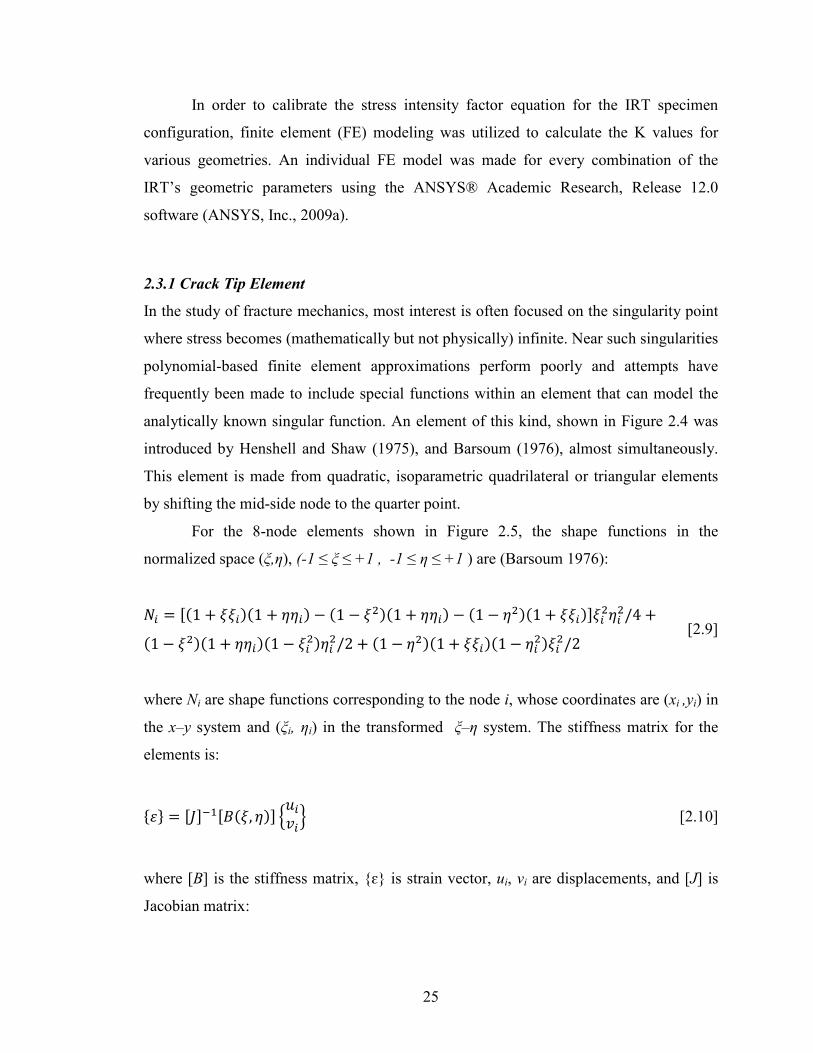
For the 8-node elements shown in Figure 2.5, the shape functions in the
normalized space (ξ,η), (-1 ≤ ξ ≤ +1 , -1 ≤ η ≤ +1 ) are (Barsoum 1976):
𝑁𝑖 = [(1 + 𝜉𝜉𝑖)(1 + 𝜂𝜂𝑖) − (1 − 𝜉2)(1 + 𝜂𝜂𝑖) − (1 − 𝜂2)(1 + 𝜉𝜉𝑖)]𝜉𝑖2𝜂𝑖2/4 +
(1 − 𝜉2)(1 + 𝜂𝜂𝑖)(1 − 𝜉𝑖2)𝜂𝑖2/2 + (1 − 𝜂2)(1 + 𝜉𝜉𝑖)(1− 𝜂𝑖2)𝜉𝑖2/2 [2.9]
where Ni are shape functions corresponding to the node i, whose coordinates are (xi ,yi) in
the x–y system and (ξi, ηi) in the transformed ξ–η system. The stiffness matrix for the
elements is:
{𝜀} = [𝐽]−1[𝐵(𝜉, 𝜂)] �𝑢𝑖𝑣𝑖� [2.10]
where [B] is the stiffness matrix, {ɛ} is strain vector, ui, vi are displacements, and [J] is
Jacobian matrix:
25

[𝐽] =
⎣⎢⎢⎢⎡𝜕𝑥𝜕𝜉
𝜕𝑦𝜕𝜉
𝜕𝑥𝜕𝜂
𝜕𝑦𝜕𝜂⎦⎥⎥⎥⎤
=
⎣⎢⎢⎢⎡…
𝜕𝑁𝑖𝜕𝜉
…
…𝜕𝑁𝑖𝜕𝜂
…⎦⎥⎥⎥⎤�
: :𝑥𝑖 𝑦𝑖: :
� [2.11]
The stresses are given by:
{𝜎} = [𝐷]{𝜀} [2.12]
where [D] is the stress-strain matrix. The element stiffness [K] is then:
[𝐾] = � � [𝐵]𝑇[𝐷][𝐵]. det|𝐽|𝑑𝜉 𝑑𝜂1
−1
1
−1 [2.13]
In order to obtain a singular element to be used to at the crack tip, the strain in
Equation 2.10 and stress in Equation 2.12 must be singular. This singularity can be
achieved by placing the mid-side node at the quarter points of the sides, and requiring
that the Jacobian [J] be singular at the crack tip. In other words, the determinant of the
Jacobian (det |J|) should vanish at the crack tip.
Figure 2.5. 2-D Rectangular Elements with Mid-side Node at the Quarter Points
1 2
3 4
6
7
8
l2
5
3l2/4
η
ξ
Crack Tip 3l1/4 l1/4
l1
l2/4 1 2
3
4
6
7
8
5
3l2/4
η
ξ
Crack Tip 3l1/4 l1/4
l2/4
26

For the 8-node quadrilateral element with mid-side nodes of two sides at the
quarter points (Figure 2.5), the displacement along the line 1–2 is:
𝑥 = −12𝜉(1 − 𝜉)𝑥1 +
12𝜉(1 + 𝜉)𝑥2 + (1 − 𝜉2)𝑥5 [2.14]
By choosing x1=0, x2=L, and x5=L/4, the displacement function will be:
𝑥 =12𝜉(1 + 𝜉)𝐿 + (1 − 𝜉2)
𝐿4
[2.15]
therefore,
𝜉 = �−1 + 2�𝑥𝐿� [2.16]
The term ∂x/∂ξ in the Jacobian is given by:
𝜕𝑥𝜕𝜉
=𝐿2
(1 + 𝜉) = √𝑥𝐿 [2.17]
which makes the Jacobian singular at (x=0, ξ=-1). Consequently, the resulting stress at
the crack tip will be singular as well. Similarly, displacement u along the line 1-2 is:
𝑢 = −12𝜉(1 − 𝜉)𝑢1 +
12𝜉(1 + 𝜉)𝑢2 + (1 − 𝜉2)𝑢5 [2.18]
And writing it in terms of x yields:
27
𝑢 = −12�−1 + 2�
𝑥𝐿��2 − 2�
𝑥𝐿� 𝑢1 +
12�−1 + 2�
𝑥𝐿��2�
𝑥𝐿�𝑢2
+ �4�𝑥𝐿− 4
𝑥𝐿�𝑢5
[2.19]
The strain in the x-direction is then:
𝜀𝑥 =𝜕𝑢𝜕𝑥
= 𝐽−1𝜕𝑢𝜕𝜉
= −12�
3√𝑥𝐿
−4𝐿� 𝑢1 +
12�−1√𝑥𝐿
+4𝐿� 𝑢2 + �
2√𝑥𝐿
−4𝐿� 𝑢5 [2.20]
The strain singularity along the line 1–2 is therefore, 1/√r, which is the required
singularity for elastic analysis.
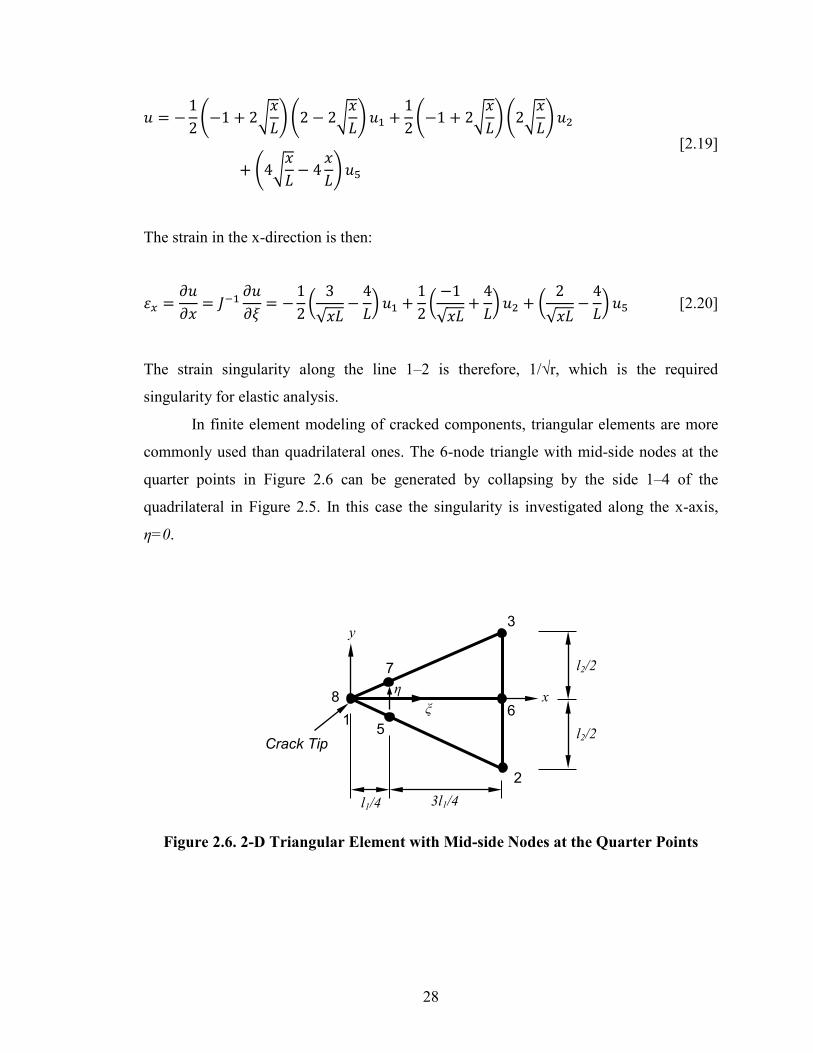
In finite element modeling of cracked components, triangular elements are more
commonly used than quadrilateral ones. The 6-node triangle with mid-side nodes at the
quarter points in Figure 2.6 can be generated by collapsing by the side 1–4 of the
quadrilateral in Figure 2.5. In this case the singularity is investigated along the x-axis,
η=0.
Figure 2.6. 2-D Triangular Element with Mid-side Nodes at the Quarter Points
1
2
3
6
7
8
5 Crack Tip
3l1/4 l1/4
x
y
l2/2
l2/2
ξ η
28
𝑥 = −14
(1 + 𝜉)(1 − 𝜉)𝑙1 +12
(1 − 𝜉2)𝑙14
+12
(1 + 𝜉)𝑙1 [2.21]
therefore,
𝜉 = �−1 + 2�𝑥𝑙1� [2.22]
Similar to Equation 2.16, the Equation 2.22 can satisfy the singularity condition of stress
and strain at the crack tip.
Generally, the triangular quarter point elements give excellent results for elastic
and perfectly-plastic analysis of small scale yielding problems. These elements are easy
to use and exist in most advanced finite element programs. Basically quadrilateral
elements can only provide singularity along sides containing the quarter-point nodes
whereas the triangular elements provide the singularity through the interior when
measuring the distance from the crack tip.
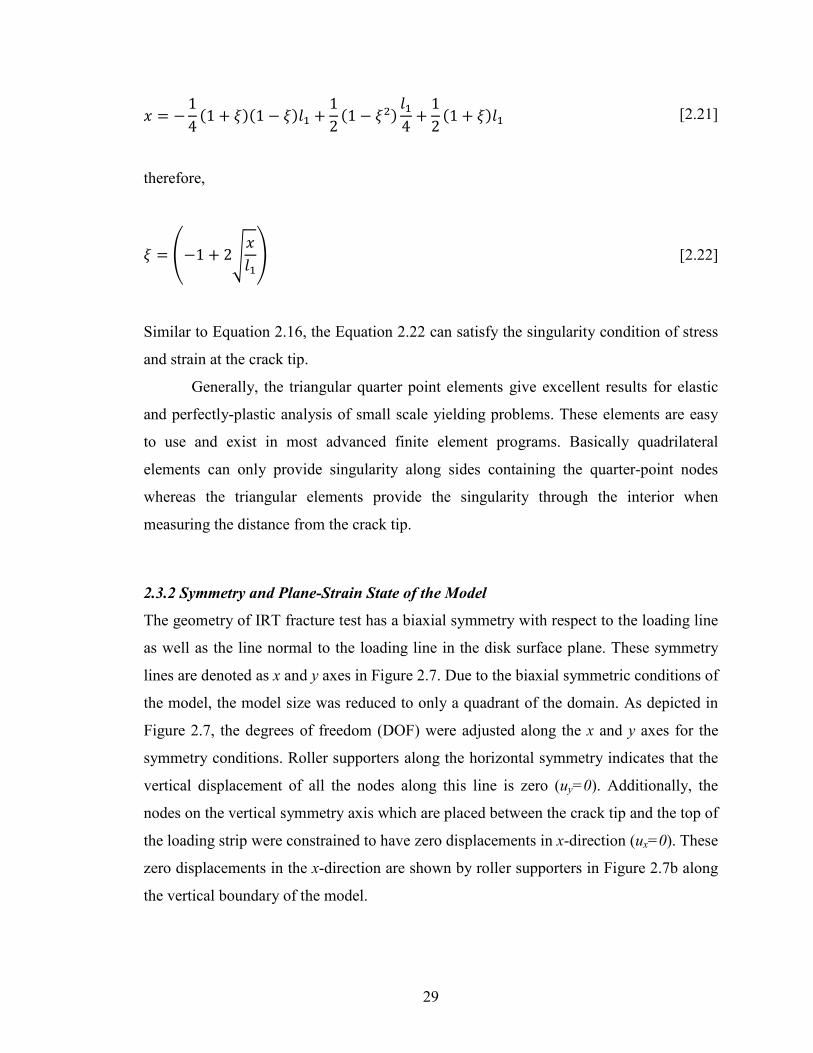
2.3.2 Symmetry and Plane-Strain State of the Model
The geometry of IRT fracture test has a biaxial symmetry with respect to the loading line
as well as the line normal to the loading line in the disk surface plane. These symmetry
lines are denoted as x and y axes in Figure 2.7. Due to the biaxial symmetric conditions of
the model, the model size was reduced to only a quadrant of the domain. As depicted in
Figure 2.7, the degrees of freedom (DOF) were adjusted along the x and y axes for the
symmetry conditions. Roller supporters along the horizontal symmetry indicates that the
vertical displacement of all the nodes along this line is zero (uy=0). Additionally, the
nodes on the vertical symmetry axis which are placed between the crack tip and the top of
the loading strip were constrained to have zero displacements in x-direction (ux=0). These
zero displacements in the x-direction are shown by roller supporters in Figure 2.7b along
the vertical boundary of the model.
29
Figure 2.7. Biaxial Symmetry of the Finite Element Model
The IRT fracture test for HMA has been developed to be conducted on specimens
at plane-strain state. To develop a finite element model that maintains the plane-strain
conditions, the displacement field should satisfy the following relations (Reddy 2006):
𝑢𝑥 = 𝑢𝑥(𝑥,𝑦) ; 𝑢𝑦 = 𝑢𝑦(𝑥,𝑦) ; 𝑢𝑧 = 0 [2.23]
where (ux ,uy ,uz ) are the components of the displacement vector in the (x, y, z) coordinate
system. This displacement field results in the following strain field:
𝜀𝑥𝑧 = 𝜀𝑦𝑧 = 𝜀𝑧𝑧 = 0 [2.24]
and
𝜀𝑥𝑥 =𝜕𝑢𝑥𝜕𝑥
; 2𝜀𝑥𝑦 =𝜕𝑢𝑥𝜕𝑦
+𝜕𝑢𝑦𝜕𝑥
; 𝜀𝑦𝑦 =𝜕𝑢𝑦𝜕𝑦
[2.25]
y
x
(a) (b)
Crack Face
R
a
a
r
Loading Platen
Quadrant of the IRT Specimen
30
The stress components for an isotropic material in a state of plane strain are given by:
𝜎𝑥𝑧 = 𝜎𝑦𝑧 = 0 ; 𝜎𝑧𝑧 = 𝜐�𝜎𝑥𝑥 + 𝜎𝑦𝑦� [2.26]
where ν is the Poisson’s ratio. By combining the Equations 2.23 and 2.26, the stress-
strain relationship for the finite element model reduces to:
�𝜎𝑥𝑥𝜎𝑦𝑦𝜎𝑥𝑦
� =𝐸
(1 + 𝜈)(1− 2𝜈)�1 − 𝜈 𝜈 0𝜈 1 − 𝜈 00 0 1 − 2𝜈
� �𝜀𝑥𝑥𝜀𝑦𝑦
2𝜀𝑥𝑦� [2.27]
As it shown in Equation 2.27, a finite element model in plane-strain condition can only
be generated by satisfying the continuity and stress-strain relations in the x–y plane. By
using this method, the finite element model for the IRT fracture test was reduced to a
two-dimensional model. This decreased the solution time and size of the model
significantly without any negative impact on the results.
2.3.3 Finite Element Model
The finite element model of the IRT fracture test involved curved boundaries and stress
concentration around the loading area. In order to accurately model these irregularities,
the element PLANE82 from the ANSYS Element Library (ANSYS 2009b) was utilized
with a fine mesh to discretize the domain (Figure 2.8a). PLANE82 includes 8-node
quadrilateral, and 6-node triangular, quadratic elements provides high accuracy in results
for mixed (quadrilateral-triangular) meshes and can tolerate irregular shapes without a
significant loss in accuracy (Zienkiewicz 1977). Moreover, the quadratic elements have a
better ability to model the stresses in the vicinity of the loading platens, where the stress
magnitude changes rapidly as the distance from the loading platen increases. The loading
platens were also modeled using the quadrilateral PLANE82 quadratic elements, and the
material properties were adjusted for steel.
31

Given the special attention to the stress singularity at the crack tip in fracture
mechanics problems, singular elements described in Section 2.3.1, were used in the
vicinity of the crack tip as illustrated in Figure 2.8b. Additionally, the loading platen was
modeled as a separate object with contact to the surface of the test specimen. The contact
between the two surfaces was modeled through a series of contact and target finite
elements. TARGE169 is a two dimensional target segment in ANSYS element library
(ANSYS 2009b) and it is used to represent and discretize various 2-D target surfaces for
the associated contact elements. The contact elements themselves overlay the solid
elements describing the boundary of a deformable body and are potentially in contact
with target surface, defined by TARGE169. The contact and target surfaces are
associated with a shared real constant. Any translational or rotational displacement,
forces and moments, temperature, voltage, and magnetic potential can be imposed on the
target segment elements.
Figure 2.8. a) Finite Element Model, b) Singular Triangle Elements at the Crack Tip
CONTA172 is a two dimensional, 3-node, surface-to-surface contact element and
is used to represent contact and sliding between the target surface and a deformable
surface (ANSYS 2009b). This element was used on the curved surface of the test
Crack tip
Crack Surface
Crack tip
(a) (b)
32
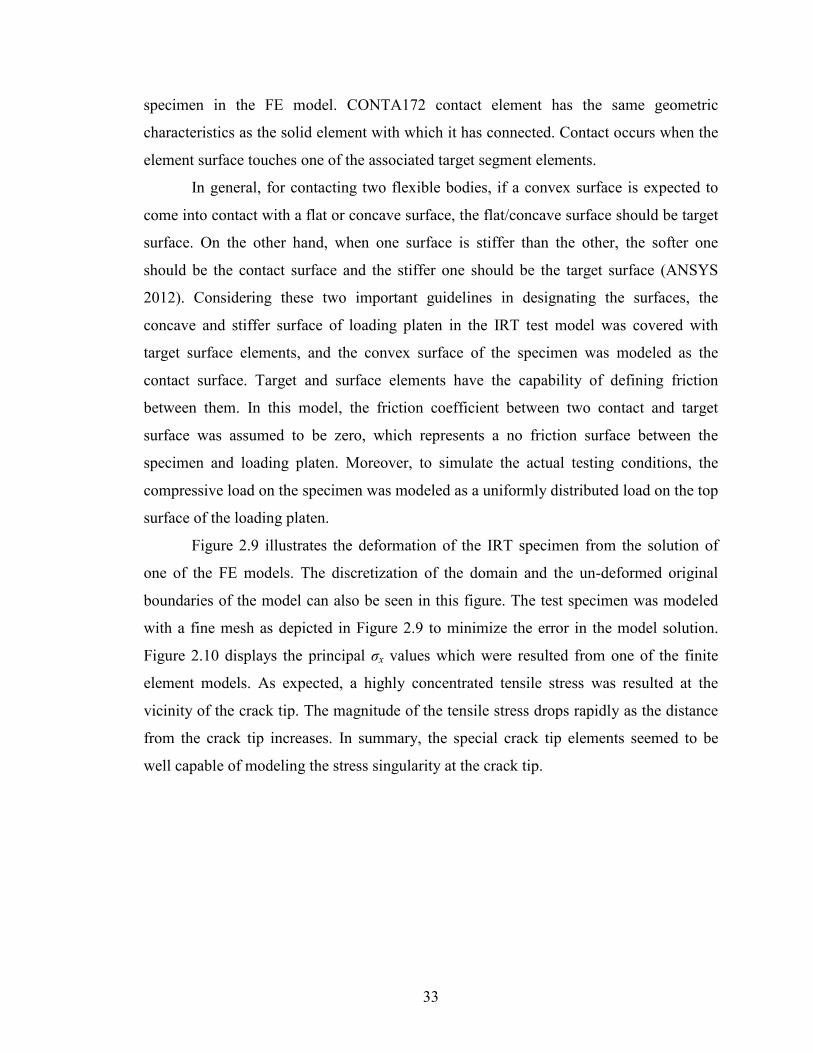
specimen in the FE model. CONTA172 contact element has the same geometric
characteristics as the solid element with which it has connected. Contact occurs when the
element surface touches one of the associated target segment elements.
In general, for contacting two flexible bodies, if a convex surface is expected to
come into contact with a flat or concave surface, the flat/concave surface should be target
surface. On the other hand, when one surface is stiffer than the other, the softer one
should be the contact surface and the stiffer one should be the target surface (ANSYS
2012). Considering these two important guidelines in designating the surfaces, the
concave and stiffer surface of loading platen in the IRT test model was covered with
target surface elements, and the convex surface of the specimen was modeled as the
contact surface. Target and surface elements have the capability of defining friction
between them. In this model, the friction coefficient between two contact and target
surface was assumed to be zero, which represents a no friction surface between the
specimen and loading platen. Moreover, to simulate the actual testing conditions, the
compressive load on the specimen was modeled as a uniformly distributed load on the top
surface of the loading platen.
Figure 2.9 illustrates the deformation of the IRT specimen from the solution of
one of the FE models. The discretization of the domain and the un-deformed original
boundaries of the model can also be seen in this figure. The test specimen was modeled
with a fine mesh as depicted in Figure 2.9 to minimize the error in the model solution.
Figure 2.10 displays the principal σx values which were resulted from one of the finite
element models. As expected, a highly concentrated tensile stress was resulted at the
vicinity of the crack tip. The magnitude of the tensile stress drops rapidly as the distance
from the crack tip increases. In summary, the special crack tip elements seemed to be
well capable of modeling the stress singularity at the crack tip.
33

Figure 2.9. Original and Deformed Boundaries of the Finite Element Model
Note: The deformations are magnified in this figure to make it distinguishable from the original boundaries
2.3.4 Calculation of the Stress Intensity Factor
After solving each finite element model, the stress intensity factor of the specimen was
calculated using the nodal displacement results. For plane-strain mode-I fracture, the
displacement of the nodes along the crack surface (θ=0) can be determined by Equation
2.4. For the notation shown in Figure 2.11, the displacement of the crack in the direction
normal to its crack surface can be determined by:
𝑢 =2𝐾𝐼𝐺
�𝑟
2𝜋(1 − 𝜈) [2.28]
where u = displacement in the direction normal to the crack face
KI = mode-I stress intensity factor
G = shear modulus
r = distance from the origin of the local cylindrical system
ν = Poisson’s ratio
Original Boundary
Deformed Boundary
Crack Tip
Loading Platen
34
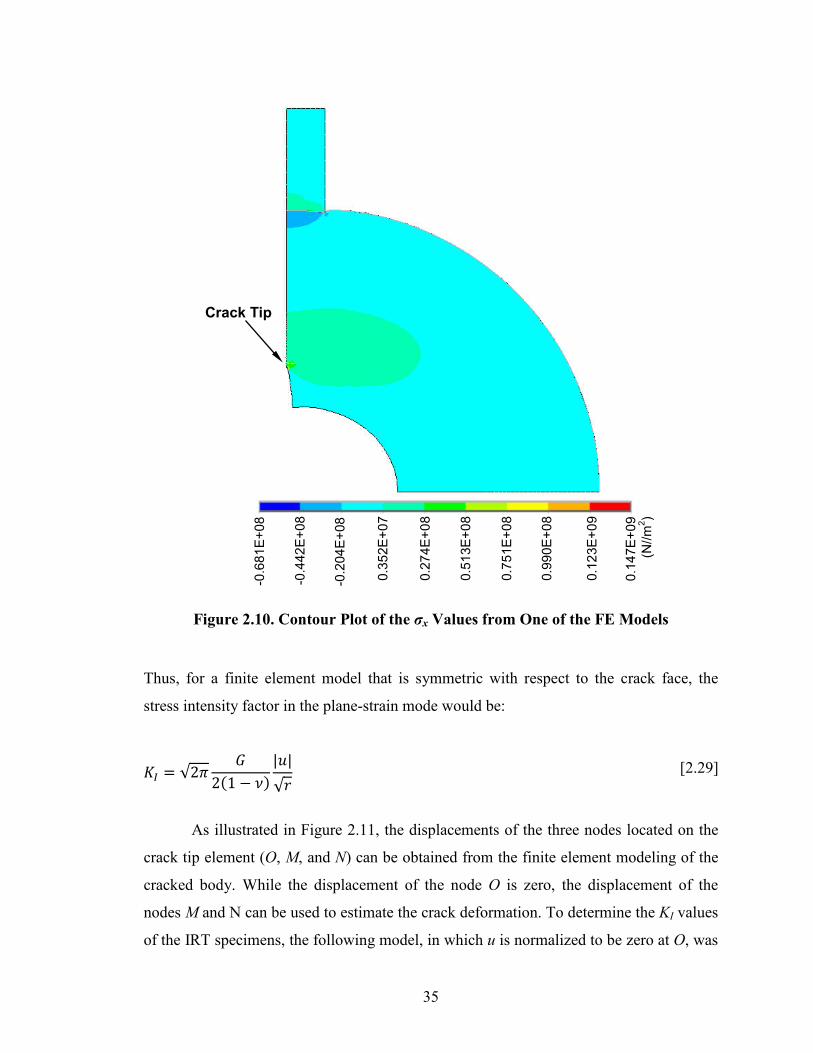
Figure 2.10. Contour Plot of the σx Values from One of the FE Models
Thus, for a finite element model that is symmetric with respect to the crack face, the
stress intensity factor in the plane-strain mode would be:
𝐾𝐼 = √2𝜋𝐺
2(1 − 𝜈)|𝑢|√𝑟
[2.29]
As illustrated in Figure 2.11, the displacements of the three nodes located on the
crack tip element (O, M, and N) can be obtained from the finite element modeling of the
cracked body. While the displacement of the node O is zero, the displacement of the
nodes M and N can be used to estimate the crack deformation. To determine the KI values
of the IRT specimens, the following model, in which u is normalized to be zero at O, was
-0.6
81E+
08
0.27
4E+0
8
0.51
3E+0
8
0.75
1E+0
8
0.99
0E+0
8
0.12
3E+0
9
0.14
7E+0
9 (N
//m2 )
-0.4
42E+
08
-0.2
04E+
08
0.35
2E+0
7
Crack Tip
35

fitted to the displacement data in the post-computation process of the ANSYS program
(ANSYS, 2009b):
|𝑢|√𝑟
= 𝐴 + 𝐵. 𝑟 [2.30]
This fitted model accommodates the proportionality of u with respect to the
squared root of r. By substituting the displacement of the M and N nodes (Figure 2.11),
the A and B coefficients can be determined for each model. For the crack tip (node O), as
the r value approaches zero, the |𝑢| √𝑟⁄ will approach A. Consequently, the KI for the
model can be determined by:
𝐾𝐼 = √2𝜋𝐺𝐴
2(1 − 𝜈) [2.31]
where A is already known from fitting the Equation 2.30 to the displacements of the
nodes on the crack face.
Figure 2.11. Calculation of Stress Intensity Factor from Crack Tip Displacement
2.3.5 Verification of the Finite Element Model
To assure the accuracy of the KI values from finite element modeling of the IRT fracture
test, an analytical solution was needed to be used as the check point. Such an analytical
solution has not been developed for the IRT specimen due to the complexities in
calculation of the stress distribution. Nonetheless, a centrally cracked indirect tension
x
y,u
r
θ O
N M u(r)
Deformed Crack Face
Original Crack Face Location
Symmetry Plane
36

(IDT) test specimen can be considered as a special case of the IRT geometry. That is, if
the inner radius of an IRT specimen is zero (practically no central hole), it turns into an
IDT specimen with a vertical crack at the center of the circle. For such a simplified
geometry, some analytical solutions have been published in the literature. Fett (2001) and
Dong et al. (2004) used weight functions in two separate studies to solve the differential
equations for the stress distribution of a centrally cracked IDT specimen. As
demonstrated in Figure 2.12, these two methods produced very similar KI. These
analytical solutions for the centrally cracked IDT geometry were used to cross check the
validity of the results obtained from FE modeling of the IRT fracture test.
For the purpose of this verification, a finite element model was developed for the
centrally cracked IDT by removing the central hole from the IRT specimen model (r=0).
This model was developed with the same details of the IRT test model, and for a
specimen with a diameter of 150 mm. The model was solved for various crack lengths
and the stress intensity factors were calculated. The same specimen dimensions were then
used to determine the stress intensity factors by the Fett’s and Dong’s analytical methods.
Figure 2.12. Verification of the FE model with analytical solutions for the centrally
cracked IDT Specimen Geometry Note: FE model properties: R=75 mm, B=100 mm, F=60 kN
0 0.2 0.4 0.6 0.8
0
10
20
30
40
50
60
70
80
90
100
0 10 20 30 40 50 60 70
a/R
KI (
MPa
√mm
)
a (mm) FE Model Fett Equation Dong Equation
37

Figure 2.12 compares the KI values obtained from the FE model and the analytical
solutions. This comparison showed a closed agreement between the stress intensity factor
values from the three methods. It is noteworthy to mention that some approximations
were used in the Fett’s and Dong’s solutions such as neglecting the higher order
derivative terms. In addition, the effect of the loading platens on the specimen
deformation was neglected in their solutions and the load was applied at a single point.
By contrast, more realistic testing condition was modeled for the IRT fracture test in
which the load was distributed on the loading platens with a set of dimensions which are
standardized in the AASHTO T 322 (2007) test method for determining the tensile
strength of HMA.
Applying the load through the loading platens distributes the load on an area on
the specimen circumference. Consequently, by neglecting the loading platens, the small
triangular-shape compressive zones at the contact points of the specimen and loading
plates were not considered in the analytical solutions. The width of these loading areas
induces small triangular-shape compressive zones in the specimen where it is in contact
with the loading platens. This difference between the FE model and analytical methods
could be the reason for the slight differences between the resulted stress intensity factors
particularly for the larger crack sizes, when the crack tips are closer to the top and bottom
triangular-shape compressive zones. For crack lengths (2a) of 50 mm or lower, when the
crack tip is not influenced by the compressive zone, the agreement between the three
methods is remarkably close.
2.4. IRT Stress Intensity Factor Formula
After successful verification of the finite element model with the analytical solutions, the
model was regenerated for a range of various geometric parameters of the IRT test
specimen. More than 3600 scenarios were modeled, and each model was solved for
various load magnitudes. Table 2.1 presents the specimen dimension ranges for which the
FE models were developed.
A small portion of the calculated KI values from the finite element modeling is
presented in Figure 2.13 to illustrate the relationship between KI and specimen geometry.
38

The data in Figure 2.13 were obtained from the FE models for IRT specimens with 100,
150, and 200 mm outer diameter with various inner diameters and crack sizes. As
expected, the obtained KI results showed a linear relationship to the applied compressive
load. Therefore, the KI/p (stress intensity factor divided by the applied load) ratio was
used in data analysis to eliminate one of the variables in the final model.
To facilitate the use of IRT stress intensity factor data, all the data obtained from
the finite element modeling was encapsulated in the form of a single formula. Several
evaluations were conducted on the data to establish the effect of various specimen
geometries on the KI values. Typically, the KI for a specimen of linear elastic materials is
linearly related to load magnitude and √a. Plane-strain KI also has an inverse linear
relationship to the specimen thickness (B). Moreover, the KI formula involves a
non-dimensionalized function that calibrates the KI equation for the specific specimen
geometry. The evaluations on the FE modeling data revealed that KI of the IRT specimen
is directly related to the specimen’s r/R (inner diameter to outer diameter) ratio. That is,
for two IRT specimens with different sizes but similar r/R values, the stress intensity
factor formula would be similar. This trend had also been found in the KI calibration
formula of the arc-shaped specimen geometry (Anderson 1995).
Table 2.1. Range of the Geometric Parameters in the FE Model
Dimension Range
Outer Radius (R) 50, 75, 100, 125, 150, 175, 200 mm
Inner Radius (r) 2 mm < r < 0.8R
Crack Length (a) 1 mm < a < 0.8R-r
39

Figure 2.13. KI Variation for IRT Specimens with Various Geometric Parameters Note: p= pressure over the loading platens
0.0
0.5
1.0
1.5
2.0
2.5
0 10 20 30 40 50
KI /
p, √
mm
Inner Radius (r), mm
r=2 mmr=5 mmr=10 mmr=15 mm
0
0.5
1
1.5
2
2.5
0 10 20 30 40 50 60
KI/p
, √m
m
Inner Radius (r), mm
r=4 mmr=7 mmr=10 mmr=14 mmr=20 mm
0.0
0.5
1.0
1.5
2.0
2.5
0 20 40 60 80
KI /
p, √
mm
Inner Radius (r), mm
r=5 mmr=10 mmr=15 mmr=20 mmr=24 mm
R= 50 mm
R= 75 mm
R= 100 mm
40

After fitting numerous forms of equations to the FE data, Equation 2.32 was
found to formulate the KI data with a coefficient of determination (R²) of 0.9956. It
should be noted that Equation 2.32 can only be used to calculate the stress intensity factor
of the IRT fracture specimen in the range of dimensions that were shown in Table 2.1.
𝐾𝐼 =𝐹√𝑎𝑊𝐵
�0.8772 − 11.2524 �𝑎.𝑊4
𝑅5� + 5.6104
𝑟𝑊− 10.4315 �
𝑎𝑊
.𝑟𝑅�1.1549
�
× �0.3 + ��0.65 −𝑎𝑊��1.5 −
𝑟𝑅��2� × 𝑓 �
𝑎𝑊�
and
𝑓 �𝑎𝑊� = 1.3883 − 2.1476 �
𝑎𝑊� + 20.1316 �
𝑎𝑊�2− 29.5564 �
𝑎𝑊�3
+ 20.2896 �𝑎𝑊�4
[2.32]
where
F = load on the IRT specimen
a = crack length
B = specimen thickness
R = outer radius
r = inner radius
W = R-r = maximum fracture ligament
41

CHAPTER 3 DEVELOPMENT OF IRT TEST PROCEDURES
The ASTM E399 (2012) standard describes the test method for determination of the
fracture toughness of metallic materials. This standard provides the K calibration
formulae for several specimen geometries along with the test procedure and sample size
requirements for each of those geometries. Similar to the specimen geometries specified
in the ASTM E399, the K formula for the indirect ring tension (IRT) specimen, as shown
in Equation 2-32, can be utilized to obtain the fracture properties in the linear elastic
range. However, to use the IRT specimen geometry for fracture testing of HMA, a test
procedure must be developed based upon the properties of HMA as well as the special
characteristics of the test. Since asphalt materials also behave similar to linear elastic
materials at low temperatures, the ASTM E399 standard was used as a baseline for
developing the IRT fracture test for HMA mixtures.
In order to develop the proper test procedures and factors for the IRT HMA
fracture test, a series of statistically-based laboratory experiments were conducted. The
experiments demonstrated the capability of IRT HMA fracture test in discerning the
properties of asphalt mixtures at low temperatures. The results obtained from the
experimental plan were then used to recommend the optimum set of parameters and
procedures for the IRT HMA fracture test.
3.1 Specimen Dimensions
One of the main advantages of the IRT fracture test is its practicality and ease of potential
implementation with the existing equipment in most of the typical asphalt testing
laboratories. In order to offer the test users a high level of flexibility, the KI calibration
formula for the IRT specimen was developed in such a way that it would cover a wide
range of specimen dimensions. Nonetheless, to conduct a consistent set of tests and
eliminate the specimen size effect, a set of dimensions was selected to be used for all of
the test specimens in this study. The outer diameter of the IRT specimens was chosen to
be 150 mm. This is the diameter of the standard Superpave gyratory compacted
42

specimens when fabricated in molds with a 150-mm diameter. Furthermore, asphalt field
cores are often taken using core drills with 150-mm diameter; therefore this size of
specimen is the best representative of the field and laboratory specimen geometry
conditions. Additionally, most standard tests on disk-shaped HMA specimens use the
150-mm diameter samples, such as the indirect tensile strength (AASHTO T 322, 2007),
and DC(t) fracture test (ASTM D7313 2013).
As for the inner radius of the IRT, a hole with a 26-mm diameter was found to be
practical and satisfy the requirements of the fracture test. A 26-mm inner diameter can be
conveniently cut using a 1-inch (25.4 mm) core drill (the final diameter of the hole would
be 26 mm). Such an inner diameter in the ring would provide adequate space for a cutting
device to generate the crack starter notches without damaging the circumference of the
inner circular hole of the IRT specimen. Damage to the central hole during the cutting of
the specimen notches should be avoided, as the presence of random damaged points in
the central area of the specimen could cause stress concentrations beyond the notch
zones, which would compromise the test results.
To simplify the fracture toughness calculations for the specimens in this
experiment, the finite element modeling data were used to develop a simpler K equation
for a specific set of specimen dimensions. For an IRT specimen with an outer diameter of
150 mm and an inner diameter of 26 mm, the stress intensity factor can be determined by:
𝐾𝐼 =𝐹√𝑎𝑊𝐵
𝑓 �𝑎𝑊�
where
𝑓 �𝑎𝑊� = 3.03 − 24.00 �
𝑎𝑊� + 109.25 �
𝑎𝑊�2− 261.88 �
𝑎𝑊�3
+ 311.28 �𝑎𝑊�4− 142.09 �
𝑎𝑊�5
[3.1]
where
F = load on the IRT specimen
a = crack length
B = specimen thickness
43
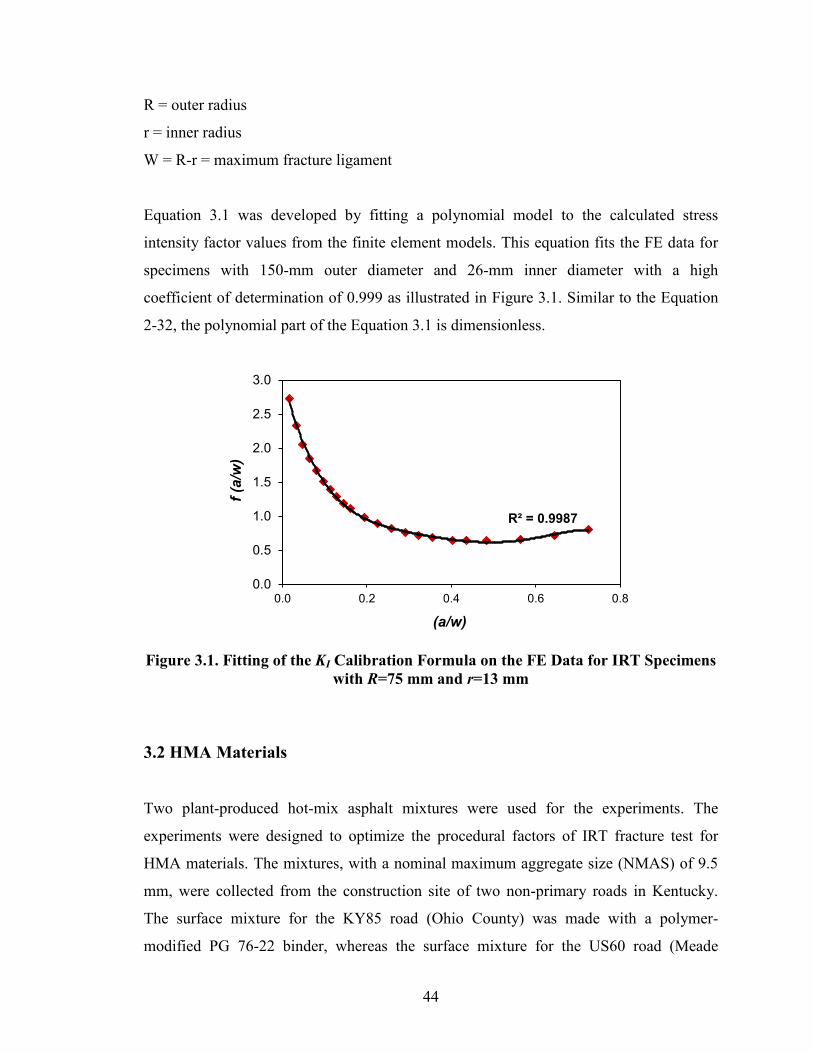
R = outer radius
r = inner radius
W = R-r = maximum fracture ligament
Equation 3.1 was developed by fitting a polynomial model to the calculated stress
intensity factor values from the finite element models. This equation fits the FE data for
specimens with 150-mm outer diameter and 26-mm inner diameter with a high
coefficient of determination of 0.999 as illustrated in Figure 3.1. Similar to the Equation
2-32, the polynomial part of the Equation 3.1 is dimensionless.
Figure 3.1. Fitting of the KI Calibration Formula on the FE Data for IRT Specimens with R=75 mm and r=13 mm
3.2 HMA Materials
Two plant-produced hot-mix asphalt mixtures were used for the experiments. The
experiments were designed to optimize the procedural factors of IRT fracture test for
HMA materials. The mixtures, with a nominal maximum aggregate size (NMAS) of 9.5
mm, were collected from the construction site of two non-primary roads in Kentucky.
The surface mixture for the KY85 road (Ohio County) was made with a polymer-
modified PG 76-22 binder, whereas the surface mixture for the US60 road (Meade
R² = 0.9987
0.0
0.5
1.0
1.5
2.0
2.5
3.0
0.0 0.2 0.4 0.6 0.8
f (a/
w)
(a/w)
44
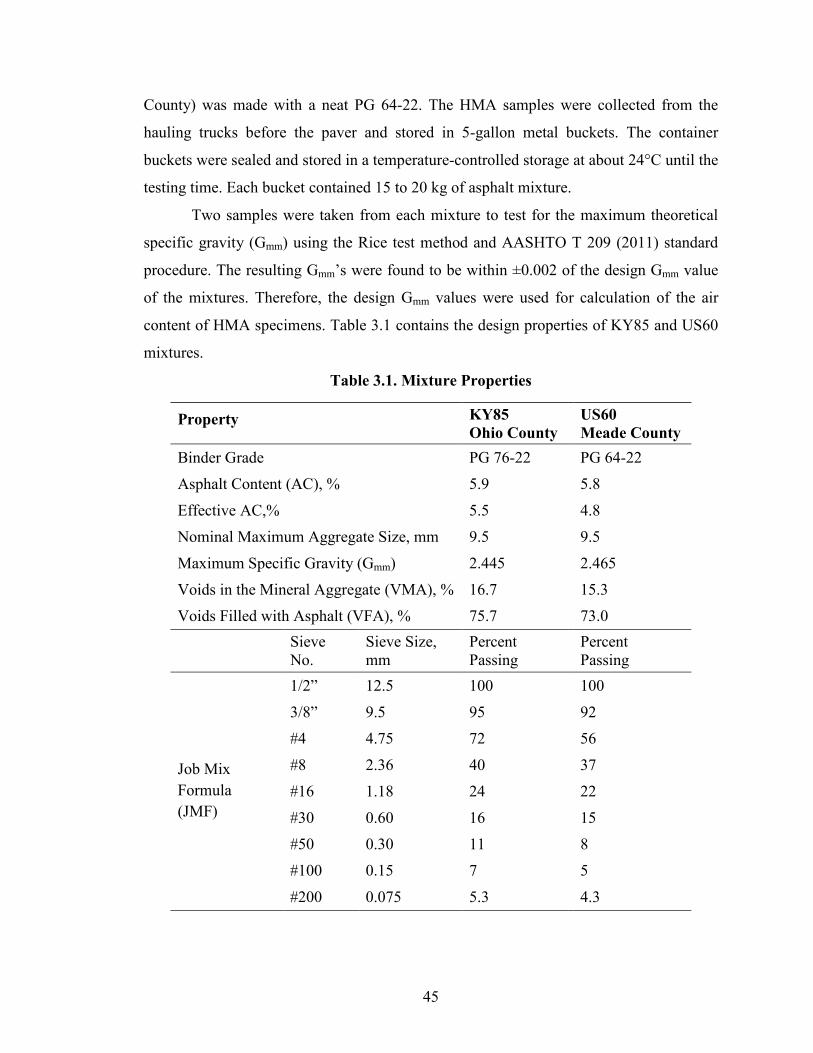
County) was made with a neat PG 64-22. The HMA samples were collected from the
hauling trucks before the paver and stored in 5-gallon metal buckets. The container
buckets were sealed and stored in a temperature-controlled storage at about 24°C until the
testing time. Each bucket contained 15 to 20 kg of asphalt mixture.
Two samples were taken from each mixture to test for the maximum theoretical
specific gravity (Gmm) using the Rice test method and AASHTO T 209 (2011) standard
procedure. The resulting Gmm’s were found to be within ±0.002 of the design Gmm value
of the mixtures. Therefore, the design Gmm values were used for calculation of the air
content of HMA specimens. Table 3.1 contains the design properties of KY85 and US60
mixtures.
Table 3.1. Mixture Properties
Property KY85 Ohio County
US60 Meade County
Binder Grade PG 76-22 PG 64-22
Asphalt Content (AC), % 5.9 5.8
Effective AC,% 5.5 4.8
Nominal Maximum Aggregate Size, mm 9.5 9.5
Maximum Specific Gravity (Gmm) 2.445 2.465
Voids in the Mineral Aggregate (VMA), % 16.7 15.3
Voids Filled with Asphalt (VFA), % 75.7 73.0
Sieve No.
Sieve Size, mm
Percent Passing
Percent Passing
Job Mix Formula (JMF)
1/2” 12.5 100 100
3/8” 9.5 95 92
#4 4.75 72 56
#8 2.36 40 37
#16 1.18 24 22
#30 0.60 16 15
#50 0.30 11 8
#100 0.15 7 5
#200 0.075 5.3 4.3
45
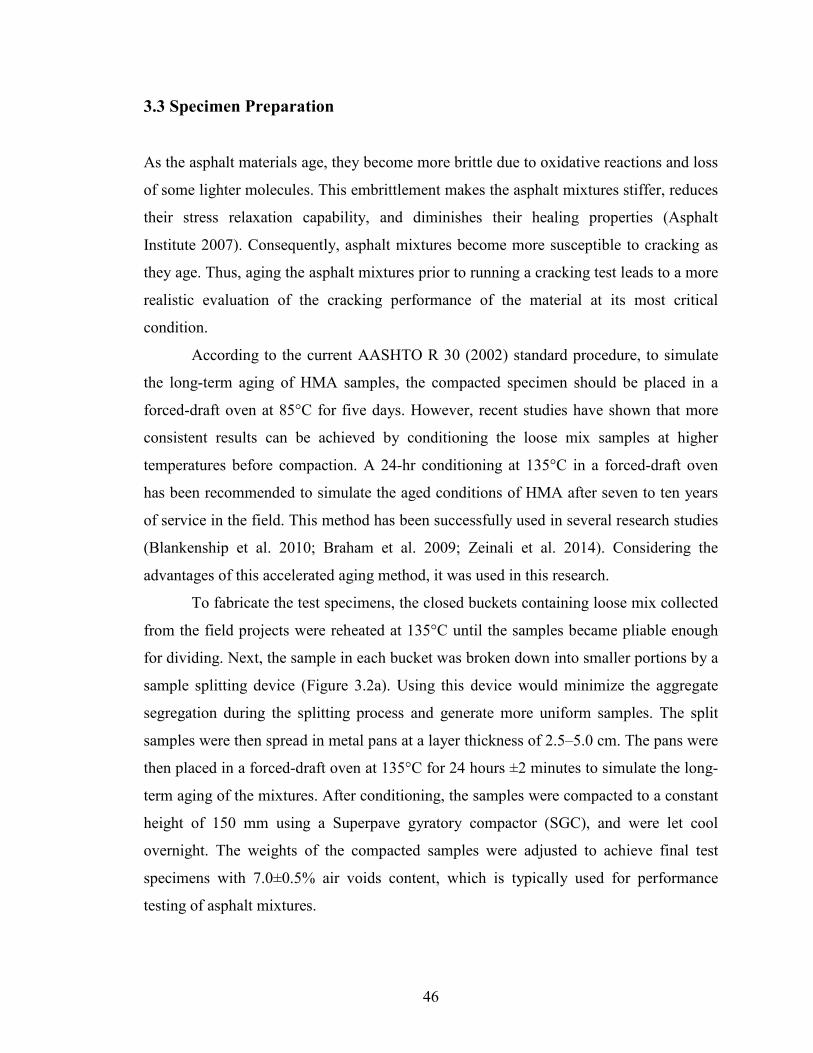
3.3 Specimen Preparation
As the asphalt materials age, they become more brittle due to oxidative reactions and loss
of some lighter molecules. This embrittlement makes the asphalt mixtures stiffer, reduces
their stress relaxation capability, and diminishes their healing properties (Asphalt
Institute 2007). Consequently, asphalt mixtures become more susceptible to cracking as
they age. Thus, aging the asphalt mixtures prior to running a cracking test leads to a more
realistic evaluation of the cracking performance of the material at its most critical
condition.
According to the current AASHTO R 30 (2002) standard procedure, to simulate
the long-term aging of HMA samples, the compacted specimen should be placed in a
forced-draft oven at 85°C for five days. However, recent studies have shown that more
consistent results can be achieved by conditioning the loose mix samples at higher
temperatures before compaction. A 24-hr conditioning at 135°C in a forced-draft oven
has been recommended to simulate the aged conditions of HMA after seven to ten years
of service in the field. This method has been successfully used in several research studies
(Blankenship et al. 2010; Braham et al. 2009; Zeinali et al. 2014). Considering the
advantages of this accelerated aging method, it was used in this research.
To fabricate the test specimens, the closed buckets containing loose mix collected
from the field projects were reheated at 135°C until the samples became pliable enough
for dividing. Next, the sample in each bucket was broken down into smaller portions by a
sample splitting device (Figure 3.2a). Using this device would minimize the aggregate
segregation during the splitting process and generate more uniform samples. The split
samples were then spread in metal pans at a layer thickness of 2.5–5.0 cm. The pans were
then placed in a forced-draft oven at 135°C for 24 hours ±2 minutes to simulate the long-
term aging of the mixtures. After conditioning, the samples were compacted to a constant
height of 150 mm using a Superpave gyratory compactor (SGC), and were let cool
overnight. The weights of the compacted samples were adjusted to achieve final test
specimens with 7.0±0.5% air voids content, which is typically used for performance
testing of asphalt mixtures.
46

Finite element modeling and laboratory testing have shown that the plane-strain
conditions can be assumed to be present in HMA specimens with a 50-mm thickness (Li
and Marasteanu 2004). As Figure 3.3 illustrates, to fabricate IRT specimens, two 50-mm
thick disk-shaped samples were cut from the mid-section of each gyratory sample. The
top and bottom portion of the gyratory samples were discarded (Figure 3.2b) to avoid the
density gradient caused by the loading plates in gyratory machines. These discarded
portions typically have a higher density than the mid-section of the cylindrical sample.
The disk-shaped specimens were cut using an automatic circular saw with digital
measurement systems and high-speed diamond tip blade to produce a uniform set of
specimens. Figure 3.3 schematically illustrates the fabrication of an IRT specimen from a
gyratory compacted sample.
After cutting the disk-shaped specimens they were tested for bulk specific gravity
using a CoreLokTM machine and vacuum bags. As compared to the conventional bulk
specific gravity test method in a water bath, sealing the specimen by a CoreLok™
method generates more accurate results, particularly for the specimens with higher air
voids content. Based upon the measured bulked specific gravity and the design Gmm of
the mixtures, the air voids content was determined for each disk-shaped specimen. In this
study, an acceptable tolerance of ±0.5% from the target air voids content value was
employed for all the specimens.
Figure 3.2. a) Sample Divider, b) Superpave Gyratory Compactor
(b) (a)
47
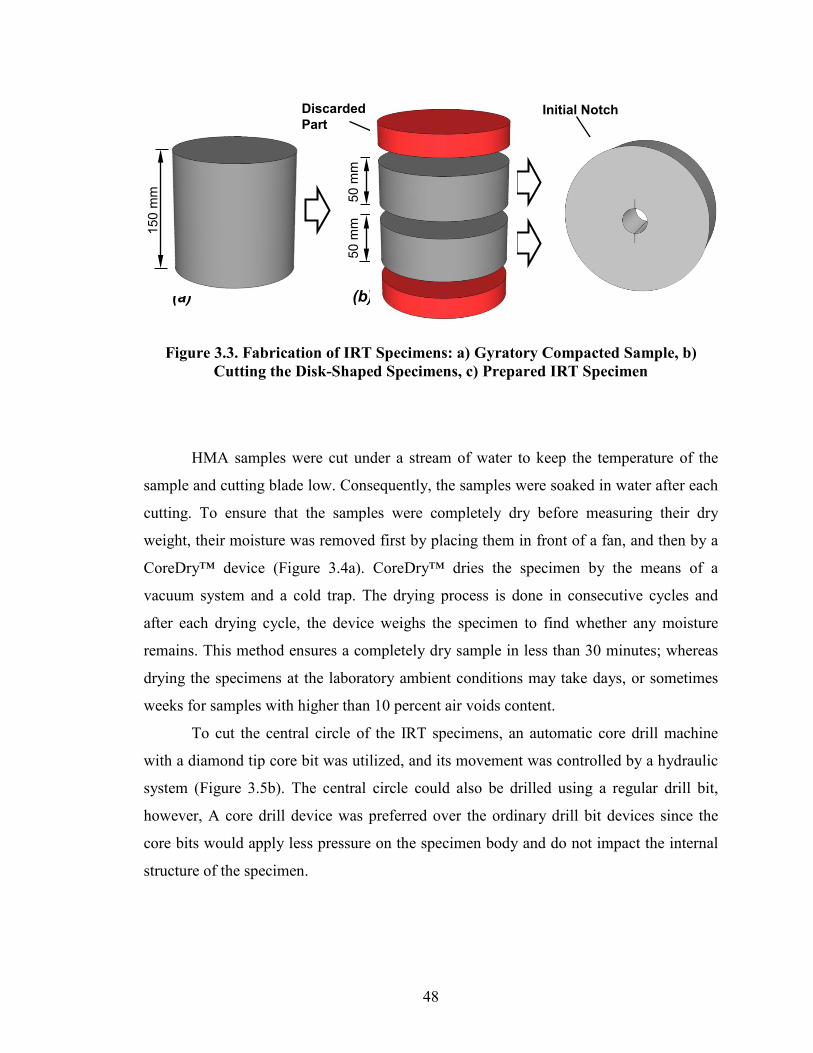
Figure 3.3. Fabrication of IRT Specimens: a) Gyratory Compacted Sample, b) Cutting the Disk-Shaped Specimens, c) Prepared IRT Specimen
HMA samples were cut under a stream of water to keep the temperature of the
sample and cutting blade low. Consequently, the samples were soaked in water after each
cutting. To ensure that the samples were completely dry before measuring their dry
weight, their moisture was removed first by placing them in front of a fan, and then by a
CoreDry™ device (Figure 3.4a). CoreDry™ dries the specimen by the means of a
vacuum system and a cold trap. The drying process is done in consecutive cycles and
after each drying cycle, the device weighs the specimen to find whether any moisture
remains. This method ensures a completely dry sample in less than 30 minutes; whereas
drying the specimens at the laboratory ambient conditions may take days, or sometimes
weeks for samples with higher than 10 percent air voids content.
To cut the central circle of the IRT specimens, an automatic core drill machine
with a diamond tip core bit was utilized, and its movement was controlled by a hydraulic
system (Figure 3.5b). The central circle could also be drilled using a regular drill bit,
however, A core drill device was preferred over the ordinary drill bit devices since the
core bits would apply less pressure on the specimen body and do not impact the internal
structure of the specimen.
150
mm
50 m
m
50 m
m
Initial Notch Discarded Part
(a) (b) (c)
48
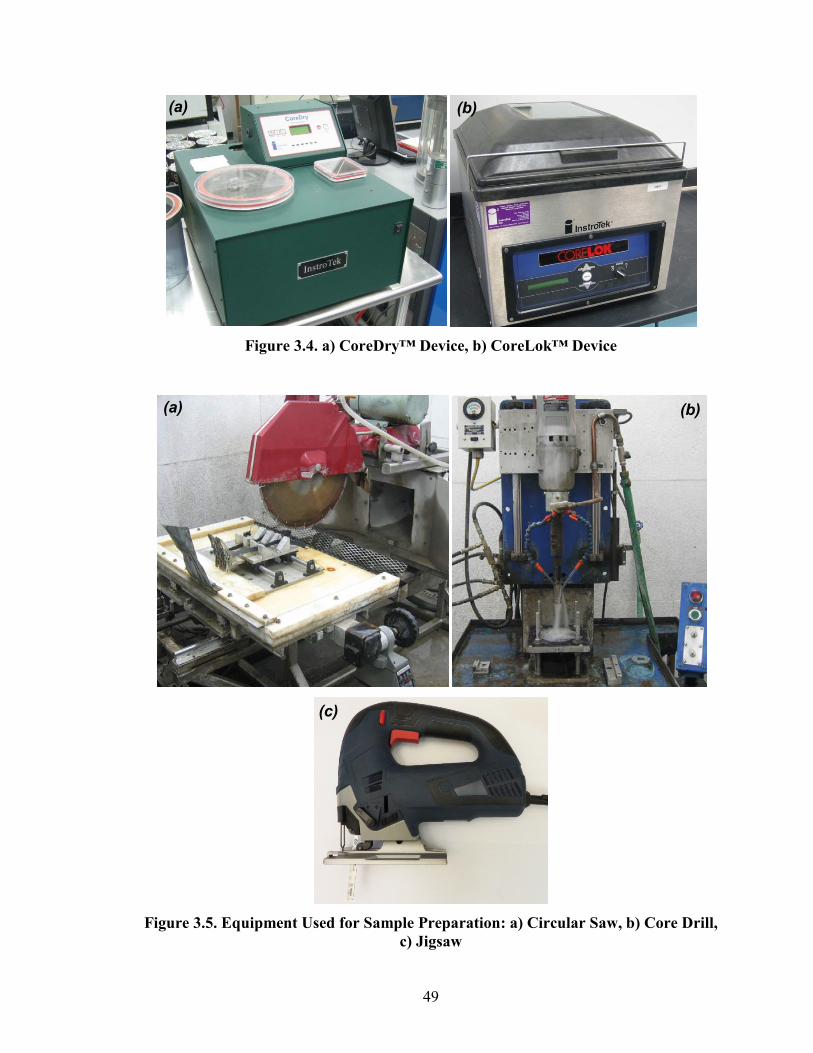
Figure 3.4. a) CoreDry™ Device, b) CoreLok™ Device
Figure 3.5. Equipment Used for Sample Preparation: a) Circular Saw, b) Core Drill,
c) Jigsaw
(a) (b)
(c)
(a) (b)
49
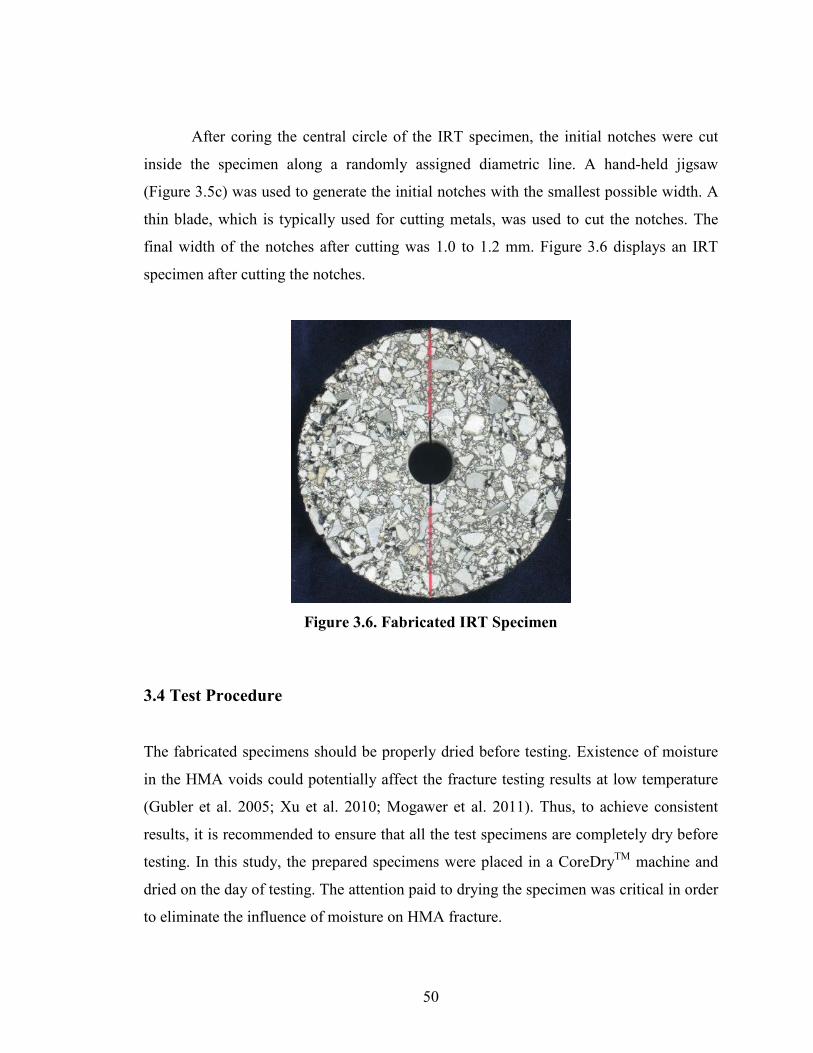
After coring the central circle of the IRT specimen, the initial notches were cut
inside the specimen along a randomly assigned diametric line. A hand-held jigsaw
(Figure 3.5c) was used to generate the initial notches with the smallest possible width. A
thin blade, which is typically used for cutting metals, was used to cut the notches. The
final width of the notches after cutting was 1.0 to 1.2 mm. Figure 3.6 displays an IRT
specimen after cutting the notches.
Figure 3.6. Fabricated IRT Specimen
3.4 Test Procedure
The fabricated specimens should be properly dried before testing. Existence of moisture
in the HMA voids could potentially affect the fracture testing results at low temperature
(Gubler et al. 2005; Xu et al. 2010; Mogawer et al. 2011). Thus, to achieve consistent
results, it is recommended to ensure that all the test specimens are completely dry before
testing. In this study, the prepared specimens were placed in a CoreDryTM machine and
dried on the day of testing. The attention paid to drying the specimen was critical in order
to eliminate the influence of moisture on HMA fracture.
50

After drying, the specimens were conditioned in an environmental chamber for at
least 3 hours so that the entire mass of the specimens reach the test temperature
uniformly. The temperature of the specimens during the conditioning process was
monitored using a dummy sample which was made with the similar geometry and
materials as the test specimens. The dummy sample was instrumented with two
thermocouples: one on the surface, and another one embedded at the center. The
temperature readings from these thermocouples were monitored until both the surface
and the core of the dummy specimen reached the designated test temperature. This
method would ensure a uniform temperature distribution throughout the test specimens.
After temperature conditioning, the test specimen was placed in between the
loading platens as displayed in Figure 3.7. A diametric line on the specimen, which was
drawn for the proper placement of notches, was used to align the specimen direction with
the loading line. The position of the specimen between the loading platens was stabilized
by applying an initial load of about 100 N. Then, the test was started at the designated
constant loading rate (e.g., in this study: 0.1, 1.0, and 10.0 mm/min). The loading
continued until the complete splitting of the test specimen. During the test, the applied
load and the load-point displacement data were recorded at 0.05-second intervals.
Figure 3.7. a) Universal Test Frame, b) IRT Specimen Placed in the Test Machine
(a) (b)
51

Theoretically, the two notches on each specimen should be cut with exactly equal
lengths through the pre-marked locations on two sides of the inner circle of the specimen.
However, from a practical point of view, the final notch lengths may not be exactly the
same. To account for this variation, the exact notch lengths were measured by a digital
caliper after the fracture test was completed. As Figure 3.8b illustrates, the initial notch
surface can be easily distinguished from the fracture surface after the test. To make an
accurate measurement, one of the caliper tips was put against the notch tip without any
movement and the other tip was aligned with the mouth of the notch in the internal
circular hole. Three readings were made on each notch, and the average of 6 readings was
used to represent the two notches in the calculations after the test. The measurements
which were made by this method had a repeatability of about ±0.05 mm. In order to
minimize the potential for adverse effects on fracture energy measurements due to
specimen size effects, the notch length for all of the specimens was limited to a range
between 8 and 12 millimeters in this study. Figure 3.8a shows an IRT specimen and the
cracking pattern after the test.
Figure 3.8. a) Fractured IRT Specimen, b) Measurement of the Initial Notch Length
(a)
(b)
d)
(a)
52
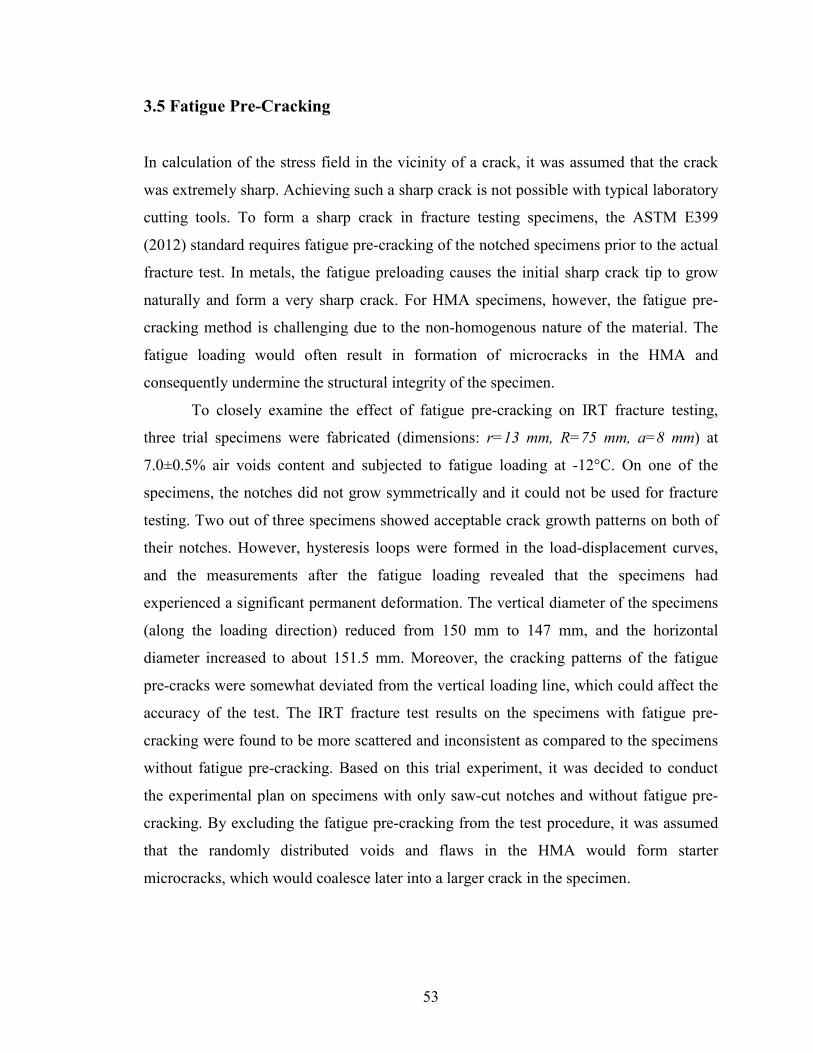
3.5 Fatigue Pre-Cracking
In calculation of the stress field in the vicinity of a crack, it was assumed that the crack
was extremely sharp. Achieving such a sharp crack is not possible with typical laboratory
cutting tools. To form a sharp crack in fracture testing specimens, the ASTM E399
(2012) standard requires fatigue pre-cracking of the notched specimens prior to the actual
fracture test. In metals, the fatigue preloading causes the initial sharp crack tip to grow
naturally and form a very sharp crack. For HMA specimens, however, the fatigue pre-
cracking method is challenging due to the non-homogenous nature of the material. The
fatigue loading would often result in formation of microcracks in the HMA and
consequently undermine the structural integrity of the specimen.
To closely examine the effect of fatigue pre-cracking on IRT fracture testing,
three trial specimens were fabricated (dimensions: r=13 mm, R=75 mm, a=8 mm) at
7.0±0.5% air voids content and subjected to fatigue loading at -12°C. On one of the
specimens, the notches did not grow symmetrically and it could not be used for fracture
testing. Two out of three specimens showed acceptable crack growth patterns on both of
their notches. However, hysteresis loops were formed in the load-displacement curves,
and the measurements after the fatigue loading revealed that the specimens had
experienced a significant permanent deformation. The vertical diameter of the specimens
(along the loading direction) reduced from 150 mm to 147 mm, and the horizontal
diameter increased to about 151.5 mm. Moreover, the cracking patterns of the fatigue
pre-cracks were somewhat deviated from the vertical loading line, which could affect the
accuracy of the test. The IRT fracture test results on the specimens with fatigue pre-
cracking were found to be more scattered and inconsistent as compared to the specimens
without fatigue pre-cracking. Based on this trial experiment, it was decided to conduct
the experimental plan on specimens with only saw-cut notches and without fatigue pre-
cracking. By excluding the fatigue pre-cracking from the test procedure, it was assumed
that the randomly distributed voids and flaws in the HMA would form starter
microcracks, which would coalesce later into a larger crack in the specimen.
53

3.6 Fracture Calculations
3.6.1 Calculation of Fracture Toughness
The data from the test was utilized to plot the load versus load-point displacement during
the test. ASTM E399 standard explains three types of load-displacement curve for linear
elastic materials as presented in Figure 3.9. Based upon the type of fracture and load-
displacement curve, the onset of crack propagation is determined, and the associated load
is used for calculation of the material’s fracture toughness. The numerous tests that were
conducted for the present research revealed that the resulted curve from IRT fracture
testing of HMA specimens at low temperatures matches the type-II fracture curve in the
ASTM E399 standard.
Figure 3.9. Three Fracture Types for Linear Elastic Materials (ASTM E399 2012)
A typical load-displacement curve from an IRT fracture test data trace at the
asphalt binder’s lower PG temperature is shown in Figure 3.10. As illustrated in this
figure, an initial hardening phase was observed at the beginning of all the test data. Such
hardening phase typically occurs at the beginning of the IDT strength test as well. During
this phase, the compliance of the specimen decreases by increasing the load. According
to the ASTM E399 standard, it is normal to observe some levels on nonlinearity at the
beginning of the test. This nonlinearity also depends on the test geometry and loading
configuration. The initial nonlinearity can be removed from the data by preloading the
54
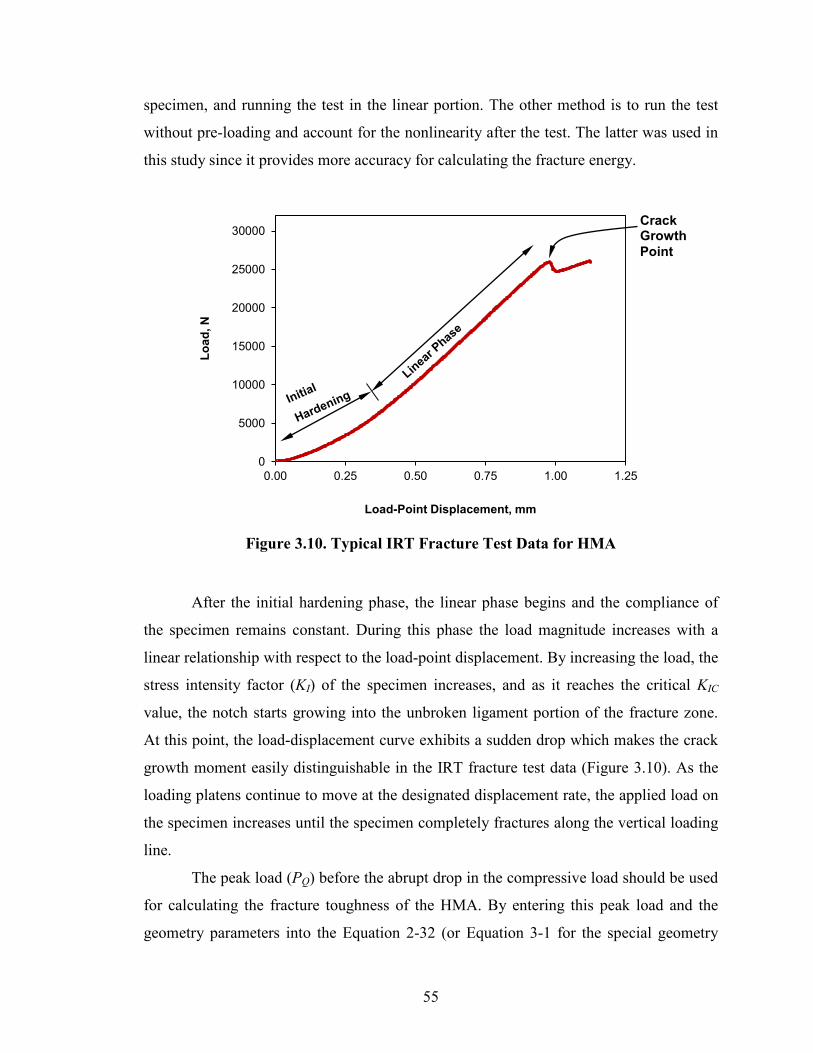
specimen, and running the test in the linear portion. The other method is to run the test
without pre-loading and account for the nonlinearity after the test. The latter was used in
this study since it provides more accuracy for calculating the fracture energy.
Figure 3.10. Typical IRT Fracture Test Data for HMA
After the initial hardening phase, the linear phase begins and the compliance of
the specimen remains constant. During this phase the load magnitude increases with a
linear relationship with respect to the load-point displacement. By increasing the load, the
stress intensity factor (KI) of the specimen increases, and as it reaches the critical KIC
value, the notch starts growing into the unbroken ligament portion of the fracture zone.
At this point, the load-displacement curve exhibits a sudden drop which makes the crack
growth moment easily distinguishable in the IRT fracture test data (Figure 3.10). As the
loading platens continue to move at the designated displacement rate, the applied load on
the specimen increases until the specimen completely fractures along the vertical loading
line.
The peak load (PQ) before the abrupt drop in the compressive load should be used
for calculating the fracture toughness of the HMA. By entering this peak load and the
geometry parameters into the Equation 2-32 (or Equation 3-1 for the special geometry
0
5000
10000
15000
20000
25000
30000
0.00 0.25 0.50 0.75 1.00 1.25
Load
, N
Load-Point Displacement, mm
Crack Growth Point
55

used in this experimental study), the plane-strain fracture toughness is determined. To
have a valid linear elastic fracture, ASTM E399 requires that for the Pmax/PQ ratio should
not exceed 1.10. The data collected from the IRT fracture test on HMA samples revealed
that this ASTM E399 requirement was met. As illustrated in Figure 3.8a, the IRT fracture
test produces a relatively straight crack pattern on a consistent basis. This straight crack
pattern generates a mode-I fracture throughout the test, and prevents mixed-mode crack
propagation.
3.6.2 Calculation of Fracture Energy
In addition to the fracture toughness, the normalized fracture energy from the load-point
displacement can also be determined from the IRT fracture test. In order to do so, the
consumed energy during the test is determined by calculating the area under the load
versus load-point displacement curve as depicted in Figure 3.11. Then, the fracture
energy is normalized by dividing the calculated fracture energy by the fracture ligament
area of the specimen, which is equal to 2B(W-a). Normalization of the fracture energy
helps decrease the effect of specimen size and initial notch length.
Figure 3.11. Calculation of the Normalized Fracture Energy
0
5000
10000
15000
20000
25000
30000
0.00 0.25 0.50 0.75 1.00 1.25
Load
, N
Load-Point Displacement, mm
Area under load-displacement curve
Fracture Surface Area
Initial Notch Surface
Cen
tral H
ole
56

The fracture energy calculated by this method is not considered as a broad
property of the material, and it is sensitive to the changes in mixture stiffness. However,
research studies on field performance of asphalt pavements have shown that the energy
obtained from the fracture tests on HMA can correlate well with the field cracking
performance (Wagoner et al. 2006; Zou et al. 2013). Correlation of the fracture energy
test data to the cracking performance of the pavement is typically conducted by running
the test on core samples obtained from the pavement, and correlating the test results to
the field cracking survey data.
3.7 Effects of Loading Rate
The response of HMA material to loading is highly dependent on the speed of applying
the load (Asphalt Institute 2001; Witczak et al. 2002). To correctly characterize the
material properties with a performance test, the loading rate of the test should represent
realistic field conditions. Furthermore, the test duration and consistency of the results are
among the factors which are taken into consideration when the optimal loading rate of a
test is evaluated.
In this study, an experimental approach was used to optimize the optimal loading
rate for the IRT fracture test. This experimental procedure involved conducting the IRT
fracture test on nine HMA specimens from the KY85 mixture (Table 3.1) at three loading
rates: 12.5 mm/min, 1.0 mm/min, and 0.1 mm/min. The 12.5 mm/min is considered as a
relatively fast loading rate for high strain testing, which is used for the indirect tensile
strength test (IDT) of HMA, and has been standardized under AASHTO T 322 (2007)
and ASTM D6931 (2012). The IDT strength test has been extensively used to determine
the tensile strength of Superpave mixtures at low and intermediate temperatures. The 1.0
mm/min is a moderate loading rate recommended by the ASTM D7313 (2013) for DC(t)
fracture testing of HMA. The DC(t) test is conducted in the tension-bending mode and its
configuration is essentially different from the IRT test; however, the 1.0 mm/min could
be considered as an intermediate loading rate for the IRT test. Finally, the 0.1 mm/min
rate was tested to evaluate the material’s behavior at a very slow loading rate. The tests
for loading rate evaluation were conducted at -12°C (10°C higher than the low PG
57
temperature of the binder). The data from tests for loading rate evaluations are depicted
in Figure 3.12. The calculated values for the IRT fracture toughness and fracture energy
of the specimens are presented in Table 3.2 and Table 3.3, respectively.
All of the specimens that were tested for various loading rates (Figure 3.12)
exhibited a sudden failure at the end of the test. The Tukey Honestly Significant
Difference (HSD) method was used to perform statistical pairwise comparisons on the
fracture toughness data with various loading rates. Tukey’s method compares all possible
pairs of means in the data while it corrects the results for the experiment-wise error rate,
which occurs as the consequence of running multiple comparisons on the data. The
pairwise comparisons revealed that the resulted KIC values at the 12.5 mm/min and 1.0
mm/min were not significantly different. However, as the loading rate decreased to 0.1
mm/min, the measured fracture toughness value decreased significantly.
At the 12.5 mm/min loading rate, one out of the three tested specimens failed
immediately after the crack growth initiation. This specimen is identified as S2 in Figure
3.12a. On the other hand, the other two specimens exhibited failure loads higher than the
load at the crack growth initiation point (Figure 3.12a). This non-uniformity in the failure
of the specimens resulted in a higher variation in the calculated normalized fracture
energy as can be seen in Table 3.3. By applying the loading rate of 1.0 mm/min, the
failure mode seemed to be more repeatable, and more uniform data was obtained.
Furthermore, the obtained fracture toughness and fracture energy at 1.0 mm/min, as
presented in Tables 3.2 and 3.3, had the lowest coefficient of variation. The IRT tests at
the 1.0 mm/min loading rate typically took 1 to 1.5 minutes to run.
Further decreasing the loading to 0.1 mm/min extended the test duration to more
than 12 minutes. At this slow loading rate, the response of the specimens seemed to be
affected by the HMA creep, and more variation was observed in the resulting fracture
toughness values. Generally, when a test is developed to characterize a certain property
of the material, the test procedure is developed in such a way to restrain the variations in
the test data to the level of interest, and isolate all the other interfering variables. During
this experimental study none of the IRT fracture tests at 0.1 mm/min would confound the
variations in the fracture factors with the variability caused by the HMA creep and time-
dependent loading.
58

Table 3.2. Calculated Fracture Toughness of the Specimens with Various Loading
Load Rate (mm/min)
Sample ID
Notch Length (mm)
Air Voids (%)
Max Load (N)
f(a/W) KIC (MPa√mm)
Test Value Average CV
12.5 S1 12.04 6.7 26458 0.970815 28.75
29.42 3.5% S2 10.76 6.7 27746 1.042351 30.60 S3 10.34 7.1 26054 1.069644 28.91
1.0 S4 10.00 7.0 26591 1.096197 29.68
29.55 2.3% S5 9.22 6.9 26690 1.153500 30.16 S6 10.36 7.1 25975 1.068296 28.81
0.1 S7 10.29 6.7 23469 1.073033 26.06
25.73 4.8% S8 10.02 7.1 21857 1.091881 24.37 S9 10.05 6.6 24002 1.089741 26.75
Note: Mix ID: KY85, test temperature= -12°C, R=75 mm, r=13 mm, B=50 mm
Table 3.3. Calculated Fracture Energy for Specimens with Various Loading Rates
Load Rate (mm/min)
Sample ID
Notch Length, (mm)
Air Voids (%)
Fracture Surface Area (mm2)
Area under the Curve (N.mm)
Normalized Fracture Energy (J/m2)
Test Value Average CV
12.5 S1 12.04 6.7 4996 14199 2842 S2 10.76 6.7 5124 11646 2273 2759 16% S3 10.34 7.1 5166 16340 3163
1.0 S4 10.0 7.0 5204 16284 3129 S5 9.22 6.9 5278 14522 2751 2894 7% S6 10.36 7.1 5164 14469 2802
0.1 S7 10.29 6.7 5171 14298 2765 S8 10.02 7.1 5198 13339 2566 2778 8% S9 10.05 6.6 5195 15600 3003
Note: Mix ID: KY85, test temperature= -12°C, R=75 mm, r=13 mm, B=50 mm
59
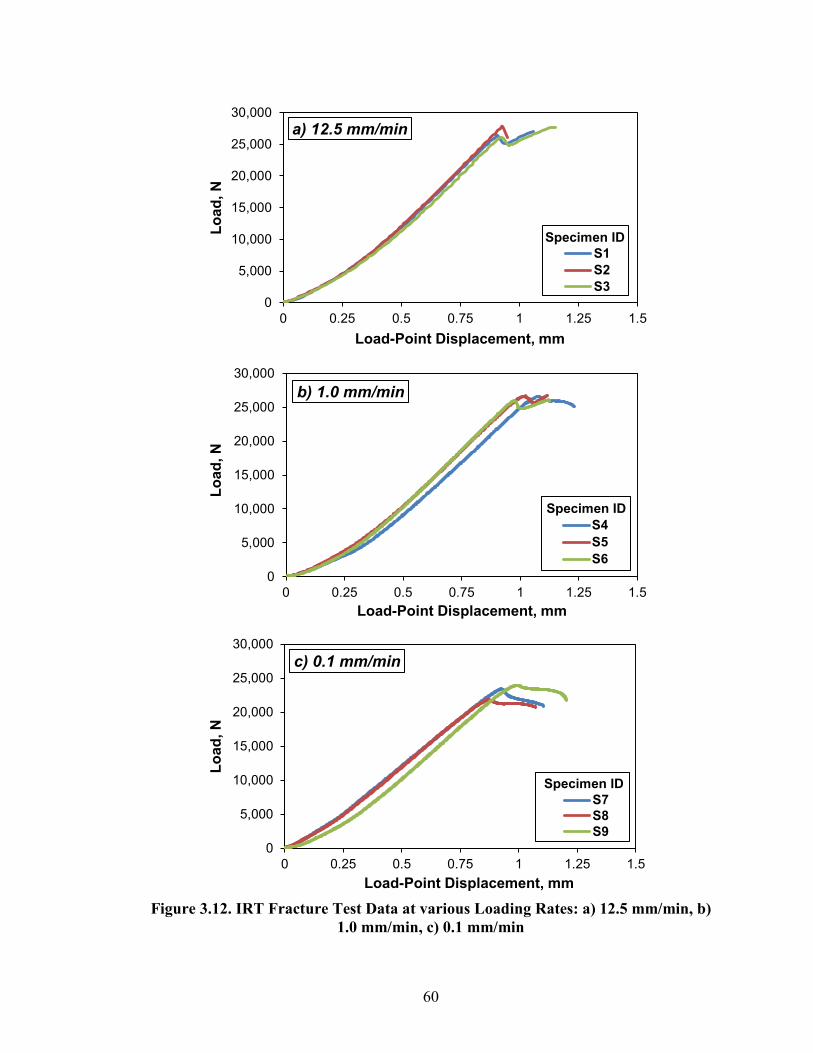
Figure 3.12. IRT Fracture Test Data at various Loading Rates: a) 12.5 mm/min, b)
1.0 mm/min, c) 0.1 mm/min
0
5,000
10,000
15,000
20,000
25,000
30,000
0 0.25 0.5 0.75 1 1.25 1.5
Load
, N
Load-Point Displacement, mm
a) 12.5 mm/min
S1S2S3
0
5,000
10,000
15,000
20,000
25,000
30,000
0 0.25 0.5 0.75 1 1.25 1.5
Load
, N
Load-Point Displacement, mm
b) 1.0 mm/min
S4S5S6
0
5,000
10,000
15,000
20,000
25,000
30,000
0 0.25 0.5 0.75 1 1.25 1.5
Load
, N
Load-Point Displacement, mm
c) 0.1 mm/min
S7S8S9
Specimen ID
Specimen ID
Specimen ID
60
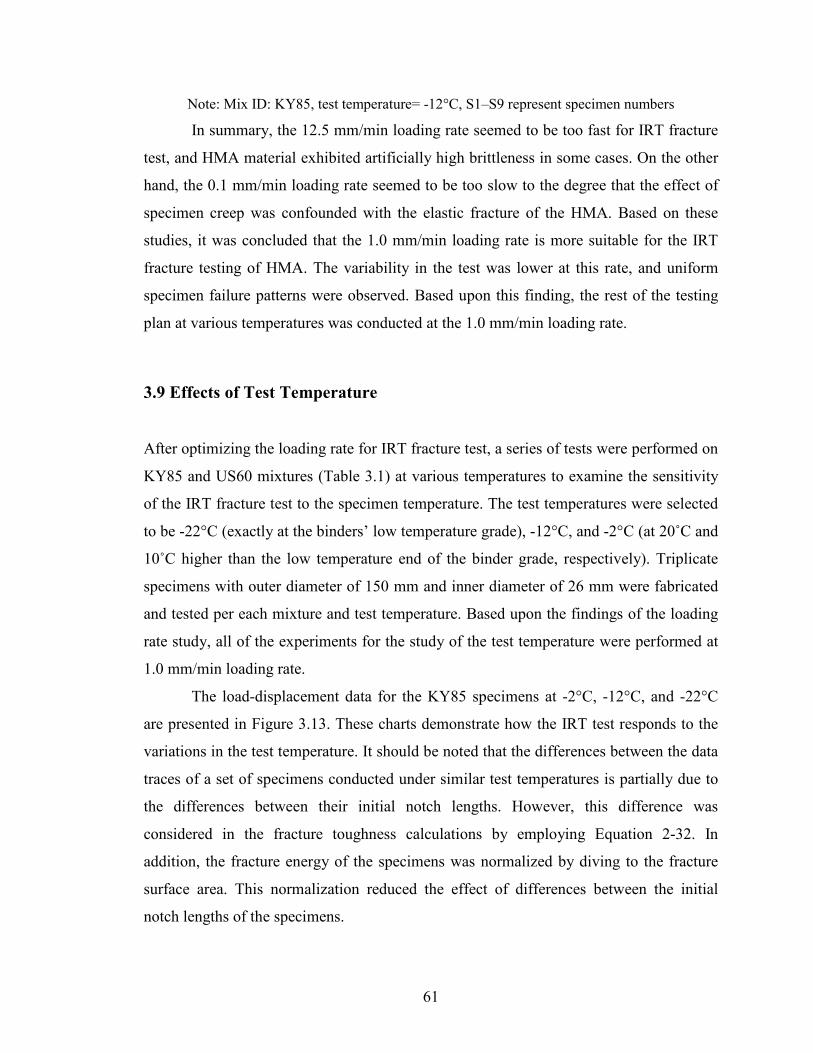
Note: Mix ID: KY85, test temperature= -12°C, S1–S9 represent specimen numbers
In summary, the 12.5 mm/min loading rate seemed to be too fast for IRT fracture
test, and HMA material exhibited artificially high brittleness in some cases. On the other
hand, the 0.1 mm/min loading rate seemed to be too slow to the degree that the effect of
specimen creep was confounded with the elastic fracture of the HMA. Based on these
studies, it was concluded that the 1.0 mm/min loading rate is more suitable for the IRT
fracture testing of HMA. The variability in the test was lower at this rate, and uniform
specimen failure patterns were observed. Based upon this finding, the rest of the testing
plan at various temperatures was conducted at the 1.0 mm/min loading rate.
3.9 Effects of Test Temperature
After optimizing the loading rate for IRT fracture test, a series of tests were performed on
KY85 and US60 mixtures (Table 3.1) at various temperatures to examine the sensitivity
of the IRT fracture test to the specimen temperature. The test temperatures were selected
to be -22°C (exactly at the binders’ low temperature grade), -12°C, and -2°C (at 20˚C and
10˚C higher than the low temperature end of the binder grade, respectively). Triplicate
specimens with outer diameter of 150 mm and inner diameter of 26 mm were fabricated
and tested per each mixture and test temperature. Based upon the findings of the loading
rate study, all of the experiments for the study of the test temperature were performed at
1.0 mm/min loading rate.
The load-displacement data for the KY85 specimens at -2°C, -12°C, and -22°C
are presented in Figure 3.13. These charts demonstrate how the IRT test responds to the
variations in the test temperature. It should be noted that the differences between the data
traces of a set of specimens conducted under similar test temperatures is partially due to
the differences between their initial notch lengths. However, this difference was
considered in the fracture toughness calculations by employing Equation 2-32. In
addition, the fracture energy of the specimens was normalized by diving to the fracture
surface area. This normalization reduced the effect of differences between the initial
notch lengths of the specimens.
61
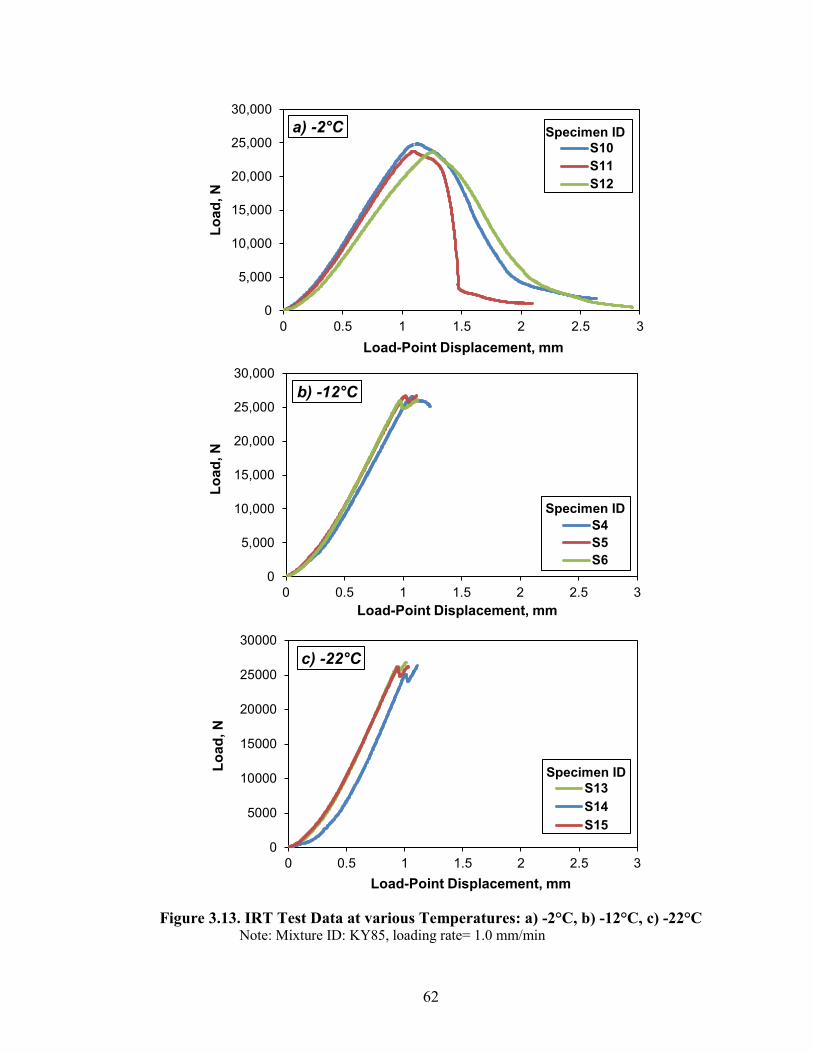
Figure 3.13. IRT Test Data at various Temperatures: a) -2°C, b) -12°C, c) -22°C Note: Mixture ID: KY85, loading rate= 1.0 mm/min
0
5,000
10,000
15,000
20,000
25,000
30,000
0 0.5 1 1.5 2 2.5 3
Load
, N
Load-Point Displacement, mm
a) -2°C S10S11S12
0
5,000
10,000
15,000
20,000
25,000
30,000
0 0.5 1 1.5 2 2.5 3
Load
, N
Load-Point Displacement, mm
b) -12°C
S4S5S6
0
5000
10000
15000
20000
25000
30000
0 0.5 1 1.5 2 2.5 3
Load
, N
Load-Point Displacement, mm
c) -22°C
S13S14S15
` Specimen ID
Specimen ID
Specimen ID
62
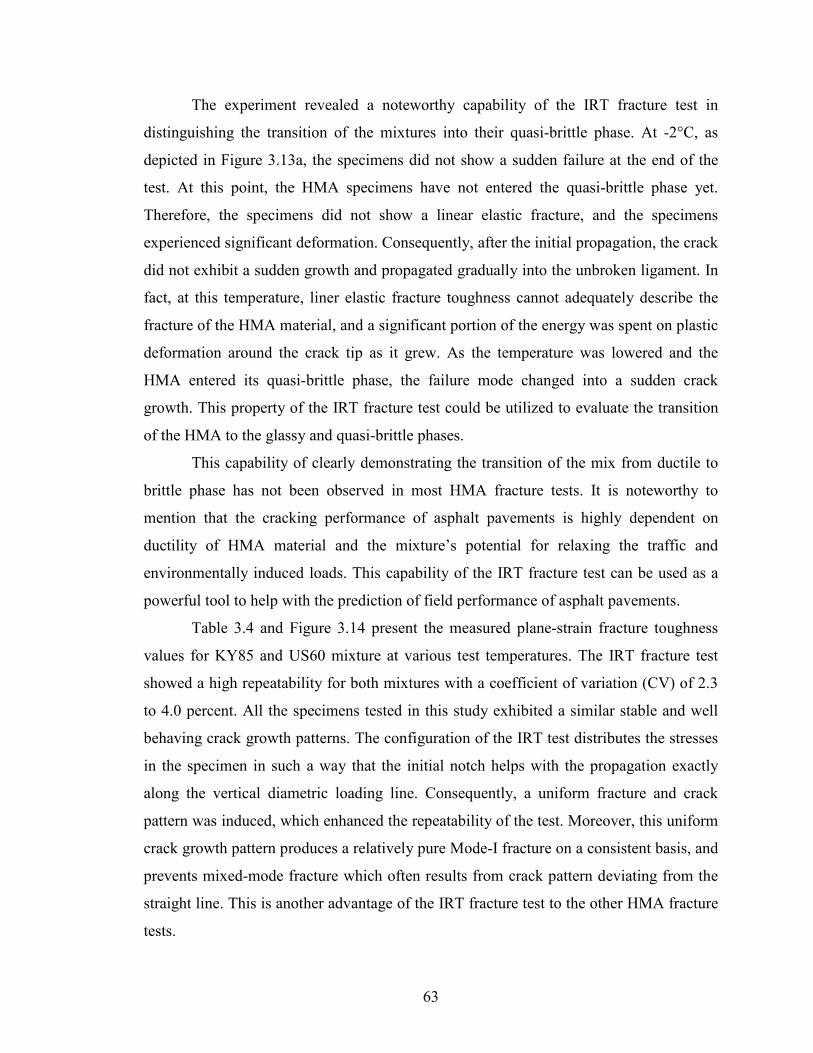
The experiment revealed a noteworthy capability of the IRT fracture test in
distinguishing the transition of the mixtures into their quasi-brittle phase. At -2°C, as
depicted in Figure 3.13a, the specimens did not show a sudden failure at the end of the
test. At this point, the HMA specimens have not entered the quasi-brittle phase yet.
Therefore, the specimens did not show a linear elastic fracture, and the specimens
experienced significant deformation. Consequently, after the initial propagation, the crack
did not exhibit a sudden growth and propagated gradually into the unbroken ligament. In
fact, at this temperature, liner elastic fracture toughness cannot adequately describe the
fracture of the HMA material, and a significant portion of the energy was spent on plastic
deformation around the crack tip as it grew. As the temperature was lowered and the
HMA entered its quasi-brittle phase, the failure mode changed into a sudden crack
growth. This property of the IRT fracture test could be utilized to evaluate the transition
of the HMA to the glassy and quasi-brittle phases.
This capability of clearly demonstrating the transition of the mix from ductile to
brittle phase has not been observed in most HMA fracture tests. It is noteworthy to
mention that the cracking performance of asphalt pavements is highly dependent on
ductility of HMA material and the mixture’s potential for relaxing the traffic and
environmentally induced loads. This capability of the IRT fracture test can be used as a
powerful tool to help with the prediction of field performance of asphalt pavements.
Table 3.4 and Figure 3.14 present the measured plane-strain fracture toughness
values for KY85 and US60 mixture at various test temperatures. The IRT fracture test
showed a high repeatability for both mixtures with a coefficient of variation (CV) of 2.3
to 4.0 percent. All the specimens tested in this study exhibited a similar stable and well
behaving crack growth patterns. The configuration of the IRT test distributes the stresses
in the specimen in such a way that the initial notch helps with the propagation exactly
along the vertical diametric loading line. Consequently, a uniform fracture and crack
pattern was induced, which enhanced the repeatability of the test. Moreover, this uniform
crack growth pattern produces a relatively pure Mode-I fracture on a consistent basis, and
prevents mixed-mode fracture which often results from crack pattern deviating from the
straight line. This is another advantage of the IRT fracture test to the other HMA fracture
tests.
63
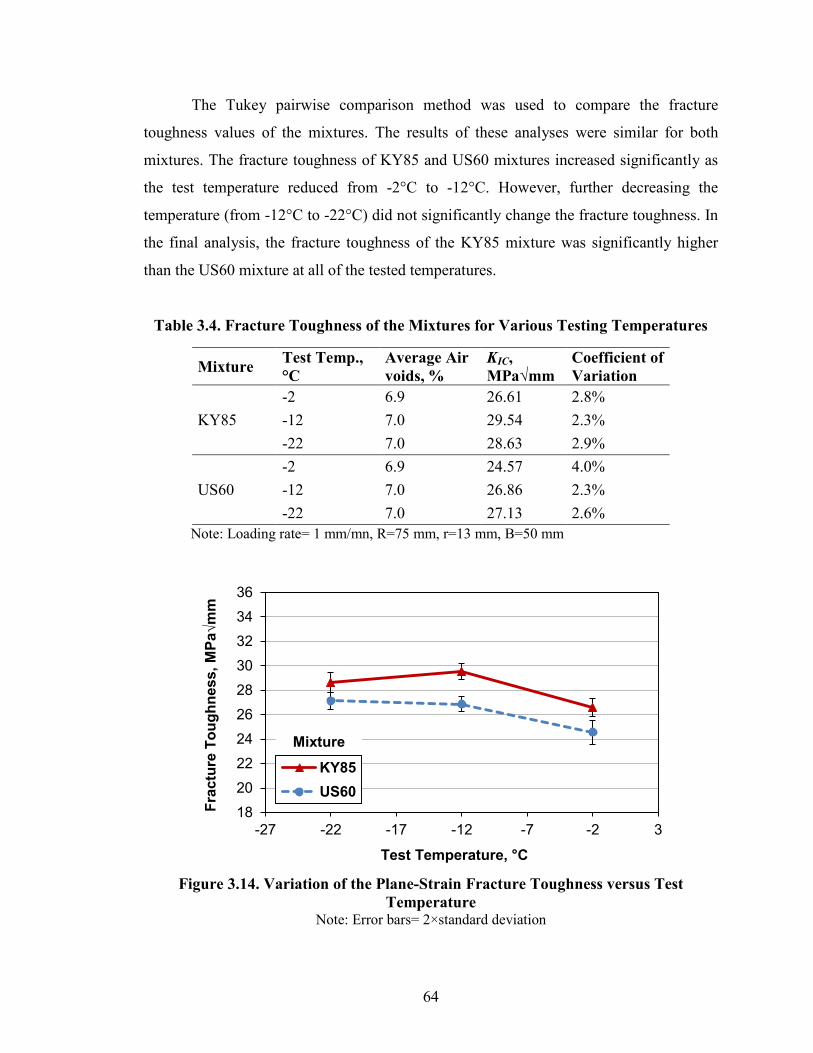
The Tukey pairwise comparison method was used to compare the fracture
toughness values of the mixtures. The results of these analyses were similar for both
mixtures. The fracture toughness of KY85 and US60 mixtures increased significantly as
the test temperature reduced from -2°C to -12°C. However, further decreasing the
temperature (from -12°C to -22°C) did not significantly change the fracture toughness. In
the final analysis, the fracture toughness of the KY85 mixture was significantly higher
than the US60 mixture at all of the tested temperatures.
Table 3.4. Fracture Toughness of the Mixtures for Various Testing Temperatures
Mixture Test Temp., °C
Average Air voids, %
KIC, MPa√mm
Coefficient of Variation
KY85 -2 6.9 26.61 2.8% -12 7.0 29.54 2.3% -22 7.0 28.63 2.9%
US60 -2 6.9 24.57 4.0% -12 7.0 26.86 2.3% -22 7.0 27.13 2.6%
Note: Loading rate= 1 mm/mn, R=75 mm, r=13 mm, B=50 mm
Figure 3.14. Variation of the Plane-Strain Fracture Toughness versus Test
Temperature Note: Error bars= 2×standard deviation
18
20
22
24
26
28
30
32
34
36
-27 -22 -17 -12 -7 -2 3
Frac
ture
Tou
ghne
ss, M
Pa√m
m
Test Temperature, °C
KY85US60
Mixture
64

The fracture energy from the load-point displacement was also calculated for this
set of specimens. As presented in Table 3.5, a low variation was observed in the fracture
energy data at -12°C and -22°C as well (a coefficient of variation of 3 to 7 percent).
However, the resulted fracture energy showed a higher variation at -2°C testing
temperature. This is due to the different fracture mode at -2°C and the variations in the
tail portion of the data trace. In general, the coefficient of variation for the IRT fracture
test was lower than the values determined by other currently in use HMA fracture tests,
which can often range as 3–27 percent for SE(B) test as reported by Mobasher et al.
(1997); 15–34 percent for SCB test as reported by Li and Marasteanu (2004); and 5–25
percent as shown in the research by Wagoner et al. (2005b) and Clements et al. (2012).
As Figure 3.15 displays, the fracture energy of the mixtures decreased by lowering the
test temperature. The linear regressions analysis indicated that for every 1°C decrease in
the test temperature, the IRT fracture energy of the KY85 and US60 mixtures decreased
on average by 135 and 95 J/m2, respectively.
Overall, mixture KY85 exhibited a better laboratory performance at low
temperatures. According to the IRT fracture test results, KY85 mixture is expected to
show a higher ductility, better resistance to crack growth, and an overall higher
performance at low temperatures. It should be noted that both mixtures were made with
PG XX-22 binders. The results of asphalt binder testing would suggest a similar
performance for both of them at low temperatures. However, the IRT fracture test
captured the slight difference between the fracture properties of the mixtures which could
stem from the other mix properties such as aggregate-binder bond, aggregate strength,
percentage of fine materials, and aggregate shape to name a few. Obviously, field studies
would be required to verify such cracking performance predictions.
65
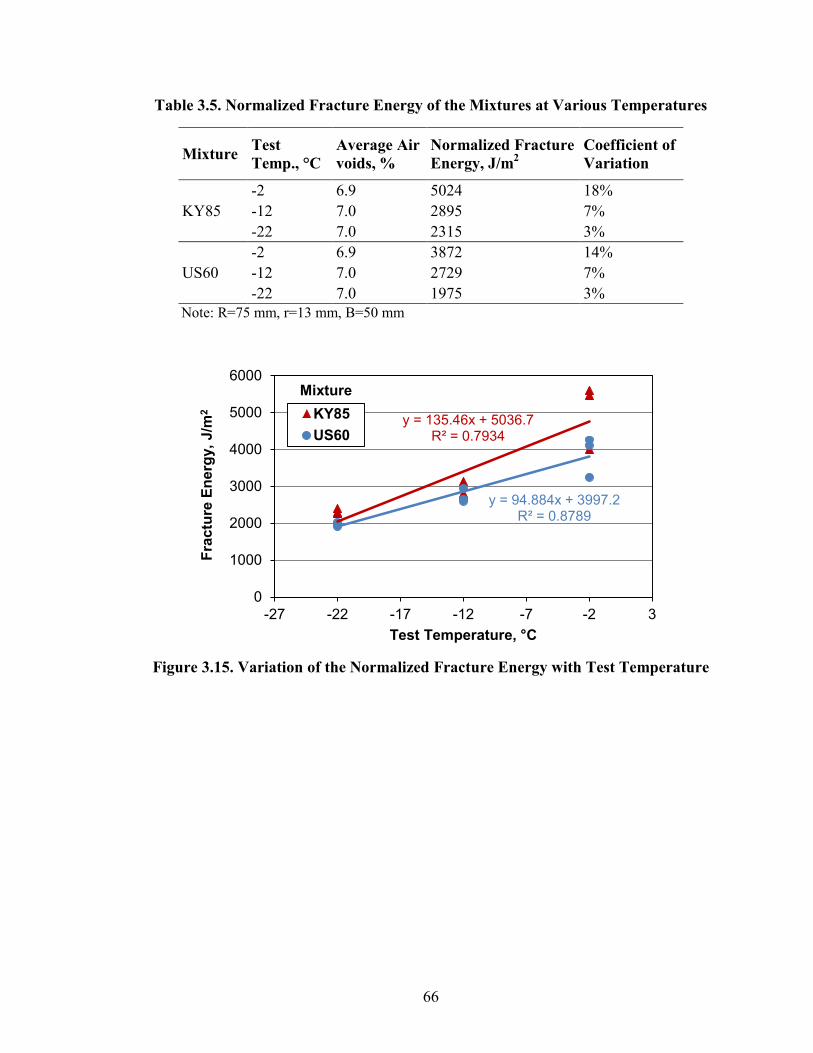
Table 3.5. Normalized Fracture Energy of the Mixtures at Various Temperatures
Mixture Test Temp., °C
Average Air voids, %
Normalized Fracture Energy, J/m2
Coefficient of Variation
KY85 -2 6.9 5024 18% -12 7.0 2895 7% -22 7.0 2315 3%
US60 -2 6.9 3872 14% -12 7.0 2729 7% -22 7.0 1975 3%
Note: R=75 mm, r=13 mm, B=50 mm
Figure 3.15. Variation of the Normalized Fracture Energy with Test Temperature
y = 135.46x + 5036.7 R² = 0.7934
y = 94.884x + 3997.2 R² = 0.8789
0
1000
2000
3000
4000
5000
6000
-27 -22 -17 -12 -7 -2 3
Frac
ture
Ene
rgy,
J/m
2
Test Temperature, °C
KY85US60
Mixture
66
CHAPTER 4 CRACKING SUSCEPTIBILITY ANALYSIS
The indirect ring tension (IRT) fracture test showed a strong capability in discerning the
difference between the HMA mixtures at low temperatures. However, the HMA materials
in the field are not always exposed to a constant low temperature. Typically, cooling of
an asphalt pavement starts at mid-temperatures, and as the pavement temperature
decreases, the HMA layer on top of the pavement contracts. On the other hand, the HMA
layer is physically restrained by its friction forces mobilized between the pavement and
its base as well as the adjacent asphalt layer in the longitudinal direction. Consequently,
the temperature drop causes a tensile stress in the HMA layer which is the main cause
behind the low-temperature cracking of asphalt pavements.
The pavement temperature does not necessarily change at the same rate as the
ambient temperature. Additionally, the temperature of a point within an HMA layer
depends on the pavement temperature gradient as a function of depth. Nonetheless, the
temperature drop is most rapid at the pavement surface. Consequently, the highest
thermal stresses are typically formed near the pavement surface, and that is where the
thermal cracks grow first. A comprehensive climatic model was developed during the
SHARP program (Lytton et al. 1990), which estimated the temperature profile, moisture
content, and freeze/thaw depth throughout the entire pavement layers. This model was
later enhanced (Larson and Dempsey 1997) and incorporated into the Mechanistic
Empirical Pavement Design Guide (MEPDG) (Zapata and Houston 2008). This model
can be used to estimate the temperature drop at various depths of the HMA layer and
estimate the cracking susceptibility as a function of depth.
As a viscoelastic material, asphalt’s response to loading is a function of its
temperature and loading time. When the temperature is higher or the loading rate is
slower, HMA is better capable of relaxing the stresses. Conversely, at lower temperatures
or faster loading rates (faster temperature drop), the HMA relaxes less and it may crack.
In summary, not only the low-temperature performance of an asphalt pavement is a
function of its fracture resistance, but also heavily related to its stress relaxation
properties.
67
To better correlate the IRT fracture test data to the actual low-temperature
performance of the HMA mixtures, an analytical method was developed in this part of
the study. First, a viscoelastic model was developed to estimate the thermally induced
tensile stresses at the surface of the asphalt pavements. Next, the creep compliance of the
mixtures at low temperatures was measured through laboratory testing. Then, by
incorporating the creep test data into the viscoelastic model, the thermally-induced tensile
stresses were estimated for the pavements in the study. Finally, the IRT test data was
utilized in conjunction with the thermal stress data to determine the cracking
susceptibility of asphalt pavements in this study.
4.1 Linear Viscoelastic Model
Hot mix asphalt (HMA) has traditionally been assumed to have linear viscoelastic
behavior at low temperatures (Roque and Buttlar 1992; Christensen 1998; Dave et al.
2010). HMA, as a viscoelastic material, is capable of relaxing some of its internal stresses
if the load is applied at a slow rate. Therefore, neglecting the relaxation properties of
HMA in stress analysis results in estimation of stresses that may be unrealistically too
high. The relaxation modulus is expressed by the following equation:
𝐸𝑟𝑒𝑙(𝑡) =𝜎(𝑡)𝜖0
(4.1)
where:
Erel (t)= stress relaxation modulus function
t = loading time
σ(t)= stress function
є0= initial test strain
To determine the relaxation modulus of a material, it is subjected to a constant
strain and the resulting stress is measured over time. This test method is cumbersome for
HMA material, and instead, the creep compliance of HMA is determined through a creep
test. The creep compliance is given by:
68
𝐶𝑐𝑟𝑝(𝑡) =𝜖(𝑡)𝜎0
(4.2)
where:
Ccrp (t)= creep compliance function
t = loading time
є(t)= strain function
σ0= initial test stress
In the creep test, a constant load is applied to a specimen and the strain is measured by
recording the specimen deformation over time. In fact compliance is a convenient way of
characterizing the stiffness of a material.
Since the response of a viscoelastic material is related to both time and
temperature, the creep compliance test of HMA must be conducted at various
temperatures and long loading times in order to provide a comprehensive understanding
of the stiffness behavior at different conditions. To do this, the creep test is typically
conducted at different temperatures, and the time-temperature superposition principle of
the viscoelastic materials is applied to build a creep master curve (Christensen 1968). By
using this principle, several creep-versus-time curves for a single material in log-log scale
can be shifted relative to loading time and construct a single master curve. This master
curve can then be used in conjunction with the proper shift factors to characterize the
creep compliance properties at various temperatures and loading durations.
In this study, a power law model was fitted to the final creep compliance master
curve data in the following form:
𝐶𝑐𝑟𝑝(𝑡) = 𝐷0 + 𝐷1𝑡𝑚 (4.3)
where:
Ccrp (t)= creep compliance at time t
D0, D1, m = constants in the power law model
69

Furthermore, an Arrhenius type function in the following form was employed to describe
the variation of shift factors with respect to temperature:
𝑙𝑜𝑔(𝑎𝑇) = 𝑎0 + 𝑎1 �1𝑇−
1𝑇𝑟𝑒𝑓
� (4.4)
where:
aT = shift factor at temperature T
a0, a1 = Arrhenius function constants
T= test temperature in degrees Kelvin (°K)
Tref = reference temperature at which the master curve is constructed (in °K)
A time-temperature shift factor aT(T) is defined as the horizontal shift that must be
applied to the response curve of Ccrp (t), which is measured at an arbitrary temperature T
in order to move it to the curve measured at the reference temperature Tref. This can be
formulated as:
log𝑎𝑇 = log 𝑡(𝑇) − log 𝑡(𝑇𝑟𝑒𝑓) (4.5)
where:
aT = shift factor at temperature T
t(T) = loading time at temperature T
t(Tref) = loading time at temperature Tref
While the Williams-Landel-Ferry (WLF) equation has been used for viscoelastic
modeling of HMA in some studies (Christensen and Anderson 1992; Christensen 1998),
an Arrhenius type function was used in this research since it has shown better
performance for viscoelastic modeling of HMA at low temperatures (Rowe et al. 2001;
Rowe and Sharrock 2001). When the temperature is constant, Equation 4.5 can be used to
easily determine the effective time. However, in the case of a temperature drop in an
asphalt pavement, the temperature varies as a function of time, therefore aT becomes an
implicit function of time:
70
𝑇 = 𝑇(𝑡) (4.6)
In this case, the effective time for continuous functions can be written as:
𝑡′ = �𝑑𝜉
𝑎𝑇(𝜉)
𝑡
0 (4.7)
where ξ is a dummy time variable. It should be noted that this approach only accounts for
the variation of temperature as a function of time. Other factors such as damage due to
applied stress, or environmental exposure can accelerate or retard the rate of given
response and should be applied into the model separately. By using the Equation 4.4 as
the shift factor function, the effective time in Equation 4.7 yields:
𝑡′ = 10� 𝑎1𝑇𝑟𝑒𝑓
−𝑎0� �𝑑𝜉
10�𝑎1𝑇𝑖+𝑟𝜉�
𝑡
0 (4.8)
where:
t’ = effective time
t = time from the beginning of cooling
Ti = the initial temperature from which the cooling starts
r = cooling rate (°C/hr)
ξ = dummy time variable
Equation 4.8 is based upon the assumption of a pavement cooling scenario as follows:
𝑇 = 𝑇𝑖 − 𝑟. 𝑡 (4.9)
By combining the effective time from Equation 4.8 and the stress relaxation
modulus of the HMA, the internal stress can be calculated at any time after the cooling
starts. However, the HMA stress relaxation modulus is not known at this point and it
should be derived from the creep compliance equation. It should be noted that the inverse
of the creep compliance modulus only gives the creep stiffness of the material which is
71

very different from the relaxation modulus. Formally, the stress relaxation modulus and
creep compliance can be related through their Laplace transforms and the following
equation:
𝐶�̅�𝑟𝑝(𝑠)𝐸�𝑟𝑒𝑙(𝑠) = 1𝑠2
(4.10)
where 𝐶�̅�𝑟𝑝(𝑠) and 𝐸�𝑟𝑒𝑙(𝑠) are Laplace transforms of the creep compliance and stress
relaxation modulus, respectively. The Laplace transforms of a known function is
mathematically determined as follows:
ℒ𝐹(𝑠) = 𝐹(𝑠) = � 𝑒−𝑠𝑡𝐹(𝑡)𝑑𝑡∞
0 (4.11)
where s is the transform variable. Essentially, the Laplace transformation reduces
differential equations to algebraic ones, and thus it is very convenient tool in many
viscoelastic problems. For the power law function (Equation 4.3) as it is fitted to the
creep compliance data, the Laplace transform would be (Spiegel 1992):
𝐶�̅�𝑟𝑝(𝑠) =𝐷0𝑠
+ 𝐷1Γ(𝑚 + 1)𝑠𝑚+1 (4.12)
where,
D0, D1, m = constants in the power law model
When n>0, the gamma function is defined by:
Γ(𝑛) = � 𝑢𝑛−1𝑒−𝑢∞
0𝑑𝑢 (4.13)
From Equations 4.10 and 4.12, the Laplace transform of the stress relaxation modulus can
be found as:
72
𝐸�𝑟𝑒𝑙(𝑠) =1
𝑠𝐷0 + 𝐷1Γ(𝑚 + 1)𝑡(1−𝑚) (4.14)
To obtain the stress relaxation function, the inverse Laplace transformation must be
performed on the Equation 4.14. However, a closed form solution is not available for this
function. An approximate method was developed by Christensen (1986) based on theory
which produces satisfactory results when the function changes slowly with respect to its
primary variable. Based upon this method, the stress relaxation modulus is determined as
follows:
𝐸𝑟𝑒𝑙(𝑡) ≅1
𝐷0 + 𝐷1Γ(𝑚 + 1)(1.73𝑡)𝑚 (4.15)
Christensen (1998) evaluated this method for typical HMA creep compliance values and
concluded that it could over-estimate the actual value by five to ten percent, and generate
more conservative results.
When a pavement temperature drops, the asphalt layer contracts and the
magnitude of the thermally-induced stresses are governed by the tensile strains which
result from material contraction. For the asphalt layer, by assuming a linear contraction
coefficient, the thermal strain is determined by:
𝜖𝑇 = 𝛼.∆𝑇 (4.16)
where,
єT = thermal strain
α = coefficient of thermal contraction
Once the stress relaxation modulus function of a linear viscoelastic material is
known, the stress at time t can be obtained by the Boltzman superposition integral:
𝜎(𝑡′) = 𝐸𝑟𝑒𝑙(𝑡′)𝜖0 = � 𝐸𝑟𝑒𝑙(𝑡′ − 𝜉) 𝑑𝜖(𝜉)𝑑𝜉
𝑑𝜉𝑡′
0 (4.17)
73
By inserting Equation 4.16 into Equation 4.17, the one-dimensional stress function for
the pavement surface is defined by:
𝜎(𝑡′) = 𝐸𝑟𝑒𝑙(𝑡′)𝜖0 = � 𝐸𝑟𝑒𝑙(𝑡′ − 𝜉) 𝛼𝑑𝑇𝑑𝜉
𝑑𝜉𝑡′
0 (4.18)
To solve the integral in Equation 4.8, the slice method (Charpa and Canale 2009) was
utilized. This method solves the constitutive equation through a stepwise numerical
approach as follows:
𝜎(𝑇𝑛) = 𝛼 Δ𝑇 �𝐸𝑟𝑒𝑙[𝑡′(𝑇𝑖 + 𝑛Δ𝑇) − 𝑡′(𝑇1 + 𝑗Δ𝑇 − Δ𝑇/2)]𝑛
𝑗=1
(4.19)
This method is advantageous over the trapezoidal method since it does not involve
calculation of the stress relaxation modulus at time zero. Mathematically, Erel(0) is a very
large number and including it in the model results in over-estimation of the thermal
stresses.
4.2 Creep Compliance Testing of the Mixtures
The indirect tensile mode was utilized in this study to measure the creep compliance of
the HMA samples at low temperatures. In this test, a compressive load is applied along
the diametric line of a disk-shaped specimen of HMA. As the compressive load remains
constant, the horizontal and vertical deformations are measured using four extensometers
which are mounted at the center of the specimen, both on the front and back. The creep
compliance of the HMA sample is then calculated by analyzing the deformation data.
Using the indirect tension mode eliminates the need for loading grips or gluing the
sample to the test fixture as needed in a direct tension creep test. Figure 4.1 illustrates a
prepared IDT creep specimen with the extensometers installed on its both faces.
74

Figure 4.1. a) Prepared IDT Creep Compliance Specimen, b) IDT Creep Specimen
in the Testing Device
4.2.1 Materials and Specimen Preparation
Five plant-produced HMA mixtures were tested for creep compliance at low
temperatures. Two of these mixtures were previously used in the initial test development
experiments. Table 4.1 presents the design properties of the mixtures as well as their job
mix formulae (JMF). All mixtures properties reported in Table 1 are from the as-built
information provided by Kentucky Transportation Cabinet (KYTC) except for the binder
contents. The binder contents of the samples were checked through chemical extraction
of asphalt in the laboratory. Since these vary significantly from the as-built information,
the extracted binder data were reported. Additionally, the aggregate gradations were
determined through sieve analysis and cross-checked with the design JMF.
As recommended in the test procedure, the HMA samples were subjected to loose
mix aging prior to testing. This process would simulate the aged condition of the
mixtures (7-10 years aging in the field), when they are more susceptible to cracking.
After aging, the creep compliance samples were compacted and fabricated according to
the same procedure used for IRT disk-shaped samples. All the specimens were
compacted to 7.0±0.5 percent air voids, and individually tested for bulk specific gravity
to ensure that their air void content is within the acceptable range.
75
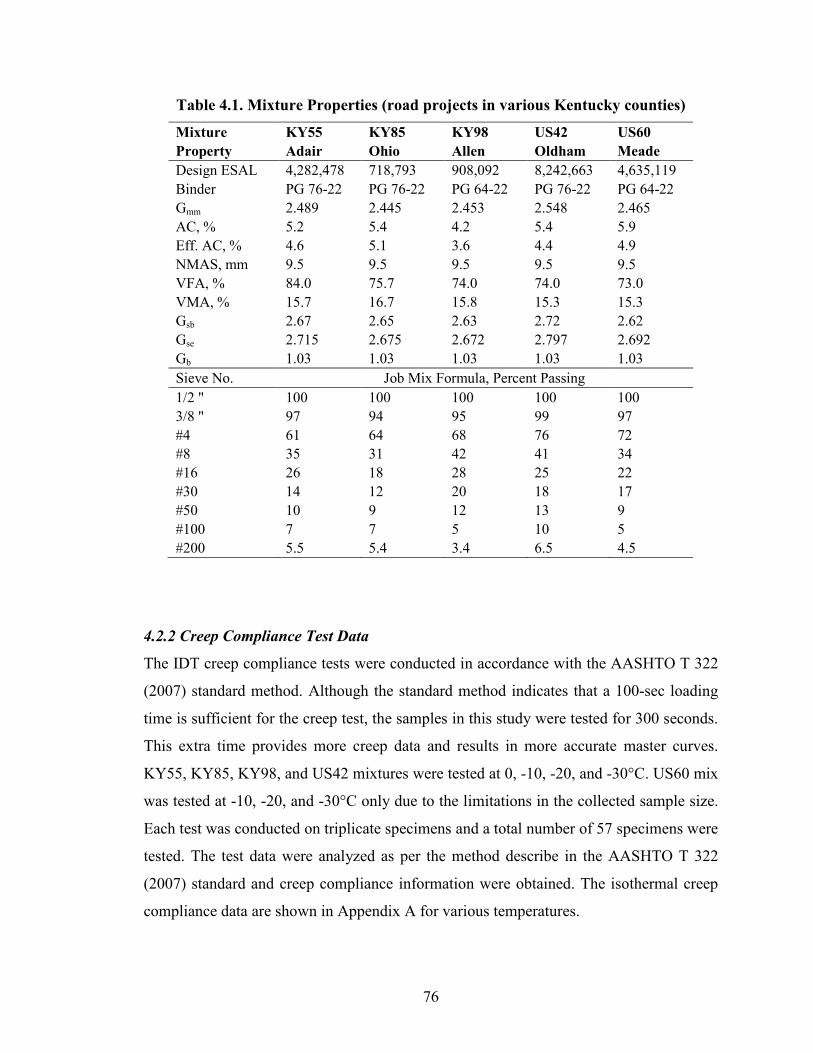
Table 4.1. Mixture Properties (road projects in various Kentucky counties)
Mixture KY55 KY85 KY98 US42 US60 Property Adair Ohio Allen Oldham Meade Design ESAL 4,282,478 718,793 908,092 8,242,663 4,635,119 Binder PG 76-22 PG 76-22 PG 64-22 PG 76-22 PG 64-22 Gmm 2.489 2.445 2.453 2.548 2.465 AC, % 5.2 5.4 4.2 5.4 5.9 Eff. AC, % 4.6 5.1 3.6 4.4 4.9 NMAS, mm 9.5 9.5 9.5 9.5 9.5 VFA, % 84.0 75.7 74.0 74.0 73.0 VMA, % 15.7 16.7 15.8 15.3 15.3 Gsb 2.67 2.65 2.63 2.72 2.62 Gse 2.715 2.675 2.672 2.797 2.692 Gb 1.03 1.03 1.03 1.03 1.03 Sieve No. Job Mix Formula, Percent Passing 1/2 " 100 100 100 100 100 3/8 " 97 94 95 99 97 #4 61 64 68 76 72 #8 35 31 42 41 34 #16 26 18 28 25 22 #30 14 12 20 18 17 #50 10 9 12 13 9 #100 7 7 5 10 5 #200 5.5 5.4 3.4 6.5 4.5
4.2.2 Creep Compliance Test Data
The IDT creep compliance tests were conducted in accordance with the AASHTO T 322
(2007) standard method. Although the standard method indicates that a 100-sec loading
time is sufficient for the creep test, the samples in this study were tested for 300 seconds.
This extra time provides more creep data and results in more accurate master curves.
KY55, KY85, KY98, and US42 mixtures were tested at 0, -10, -20, and -30°C. US60 mix
was tested at -10, -20, and -30°C only due to the limitations in the collected sample size.
Each test was conducted on triplicate specimens and a total number of 57 specimens were
tested. The test data were analyzed as per the method describe in the AASHTO T 322
(2007) standard and creep compliance information were obtained. The isothermal creep
compliance data are shown in Appendix A for various temperatures.
76
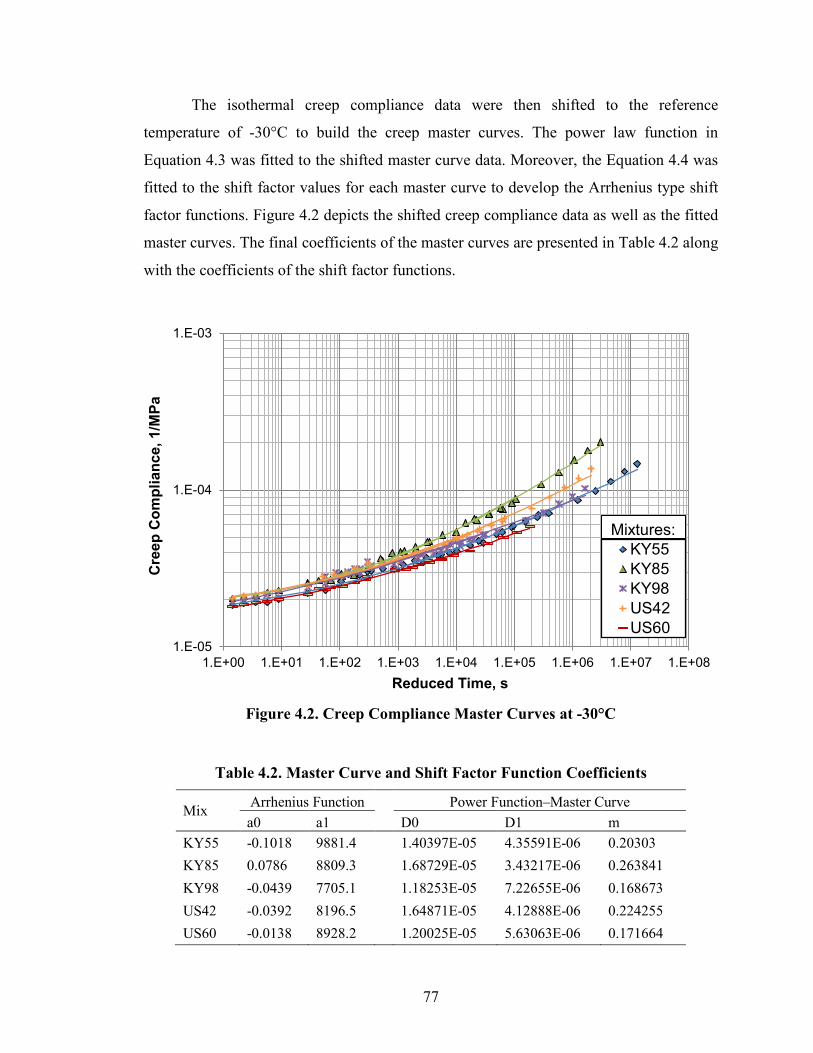
The isothermal creep compliance data were then shifted to the reference
temperature of -30°C to build the creep master curves. The power law function in
Equation 4.3 was fitted to the shifted master curve data. Moreover, the Equation 4.4 was
fitted to the shift factor values for each master curve to develop the Arrhenius type shift
factor functions. Figure 4.2 depicts the shifted creep compliance data as well as the fitted
master curves. The final coefficients of the master curves are presented in Table 4.2 along
with the coefficients of the shift factor functions.
Figure 4.2. Creep Compliance Master Curves at -30°C
Table 4.2. Master Curve and Shift Factor Function Coefficients
Mix Arrhenius Function Power Function–Master Curve a0 a1 D0 D1 m
KY55 -0.1018 9881.4 1.40397E-05 4.35591E-06 0.20303 KY85 0.0786 8809.3 1.68729E-05 3.43217E-06 0.263841 KY98 -0.0439 7705.1 1.18253E-05 7.22655E-06 0.168673 US42 -0.0392 8196.5 1.64871E-05 4.12888E-06 0.224255 US60 -0.0138 8928.2 1.20025E-05 5.63063E-06 0.171664
1.E-05
1.E-04
1.E-03
1.E+00 1.E+01 1.E+02 1.E+03 1.E+04 1.E+05 1.E+06 1.E+07 1.E+08
Cre
ep C
ompl
ianc
e, 1
/MPa
Reduced Time, s
KY55KY85KY98US42US60
Mixtures:
77
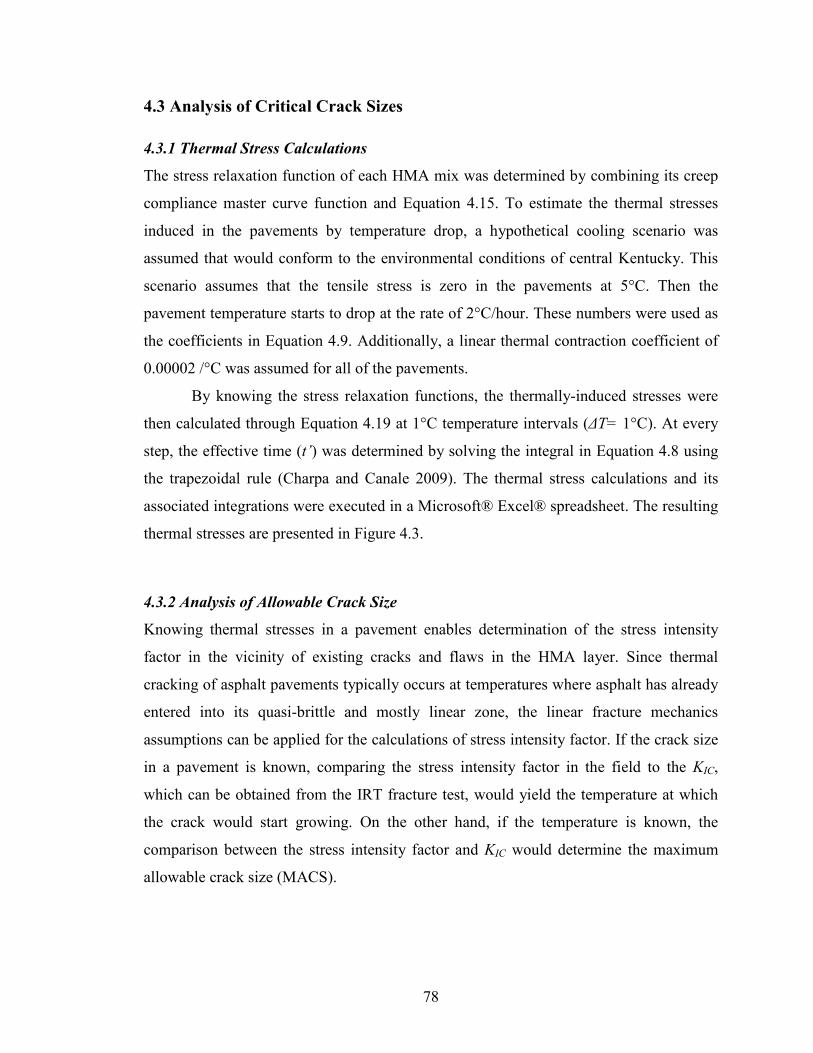
4.3 Analysis of Critical Crack Sizes
4.3.1 Thermal Stress Calculations
The stress relaxation function of each HMA mix was determined by combining its creep
compliance master curve function and Equation 4.15. To estimate the thermal stresses
induced in the pavements by temperature drop, a hypothetical cooling scenario was
assumed that would conform to the environmental conditions of central Kentucky. This
scenario assumes that the tensile stress is zero in the pavements at 5°C. Then the
pavement temperature starts to drop at the rate of 2°C/hour. These numbers were used as
the coefficients in Equation 4.9. Additionally, a linear thermal contraction coefficient of
0.00002 /°C was assumed for all of the pavements.
By knowing the stress relaxation functions, the thermally-induced stresses were
then calculated through Equation 4.19 at 1°C temperature intervals (ΔT= 1°C). At every
step, the effective time (t’) was determined by solving the integral in Equation 4.8 using
the trapezoidal rule (Charpa and Canale 2009). The thermal stress calculations and its
associated integrations were executed in a Microsoft® Excel® spreadsheet. The resulting
thermal stresses are presented in Figure 4.3.
4.3.2 Analysis of Allowable Crack Size
Knowing thermal stresses in a pavement enables determination of the stress intensity
factor in the vicinity of existing cracks and flaws in the HMA layer. Since thermal
cracking of asphalt pavements typically occurs at temperatures where asphalt has already
entered into its quasi-brittle and mostly linear zone, the linear fracture mechanics
assumptions can be applied for the calculations of stress intensity factor. If the crack size
in a pavement is known, comparing the stress intensity factor in the field to the KIC,
which can be obtained from the IRT fracture test, would yield the temperature at which
the crack would start growing. On the other hand, if the temperature is known, the
comparison between the stress intensity factor and KIC would determine the maximum
allowable crack size (MACS).
78
Figure 4.3. Thermal Stresses as Calculated by the Viscoelastic Model
Note: initial temperature = 5°C, cooling rate = -2°C/hr, temperature increment = 1°C, linear contraction coefficient= 0.00002 /°C
A set of IRT fracture tests were executed on the HMA mixtures in this part of the
study to measure the fracture properties of the mixtures at low temperatures. All five
mixtures were made with PG xx-22 binders; therefore, the IRT tests were conducted
at -22°C to ensure that mixes are in the quasi-brittle phase. The loose-mix samples were
conditioned for 24 hours at 135°C to simulate the long-term aged conditions of the
pavements. IRT test specimens were produced at 7.0±0.5 percent air voids content, which
is typical for mechanical testing of HMA. Table 4.3 contains the average fracture
toughness and normalized fracture toughness of the mixtures along with their coefficient
of variation based upon three replicate samples.
Several formulae have been developed for calculating the stress intensity factor in
plates with various forms of flaws and crack locations (Hertzberg 1996; Anderson 1995).
For instance, in an infinitely large body subjected to pure tension in the direction normal
to the crack face, the stress intensity factor can be determined by:
0
2
4
6
8
10
12
14
16
18
-50 -40 -30 -20 -10 0 10
Ther
mal
Str
ess,
MPa
Pavement Temperature, °C
KY55KY85KY98US42US60
Mixtures:
79

𝐾𝐼 = 𝜎√𝜋𝑎 (4.20)
where σ is the tensile stress and a is the one-half crack length. According to the linear
fracture mechanics theory, an existing crack in an infinitely large and thick plate (plane-
strain condition) starts growing when KI from Equation 4.20 reaches the critical value of
plane-strain fracture toughness (KIC) of the material.
Table 4.3. Average IRT Fracture Test Results at -22°C
Mix KIC, MPa√mm COV Fracture
Energy, J/m COV
KY55 30.18 3.5% 2346 9.4% KY85 28.63 2.9% 2315 2.9% KY98 26.30 3.2% 1996 5.3% US42 28.40 4.3% 2357 3.6% US60 27.13 2.6% 1975 3.0%
Note: Specimens were compacted to 7.0±0.5 percent air voids after 24 hours of loose mix aging at 135°C
The geometric conditions of Equation 4.20 are similar to those in an asphalt
pavement with a transverse crack, which is far from the pavement edge. By substituting
the KIC values obtained from the IRT fracture testing of the five HMA mixtures (Table
4.3) and thermally induced stresses based upon the hypothetical cooling scenario which
was described earlier (Figure 4.3), the maximum allowable crack sizes in the asphalt
surface were estimated as depicted in Figure 4.4. This figure demonstrates how the
existing transverse cracks and flaws in the pavements would react to the temperature
cooling. For example, as the pavement’s surface temperature drops to -12°C at the
assumed rate, the transverse cracks with an approximate length of 49 mm or longer
would start growing on the US60 pavement. For similar cooling conditions, KY85
mixture is estimated to exhibit a better performance and cracks shorter than 315 mm
would not start growing (Figure 4.4). Generally, the MACS parameter has an inverse
relationship to the cracking potential of the pavement, and the mixtures with higher
80

MACS would be expected to show a better performance at low temperatures. It should be
noted that this analysis was only performed to estimate the cracking potential of a single
thermal event. Other factors, such as cyclic thermal loading, crack initiation, and crack
healing could also contribute to the overall low-temperature cracking performance.
The cracking susceptibility analysis indicates that the maximum allowable crack
size in an asphalt pavement is highly sensitive to the HMA fracture toughness.
Additionally, as the temperature drops to below freezing point, the pavement
susceptibility to thermal cracking grows rapidly. In other word, this analysis shows that
small changes in the HMA fracture toughness could translate into significant changes in
terms of the asphalt pavement thermal cracking performance.
Figure 4.4. Maximum Allowable Transverse Crack Size in Asphalt Pavements
Table 4.4 presents the maximum allowable crack size (MACS) values for the
mixtures at various temperatures. This data implies that although all the HMA mixtures
were made with PG xx-22 asphalt binders, they could show very different performances
1
10
100
1000
10000
-45 -35 -25 -15 -5 5
Max
imum
Allo
wab
le C
rack
Siz
e (2
a), m
m
Pavement Temperature, °C
KY55KY85KY98US42US60
Mixtures:
2a
81
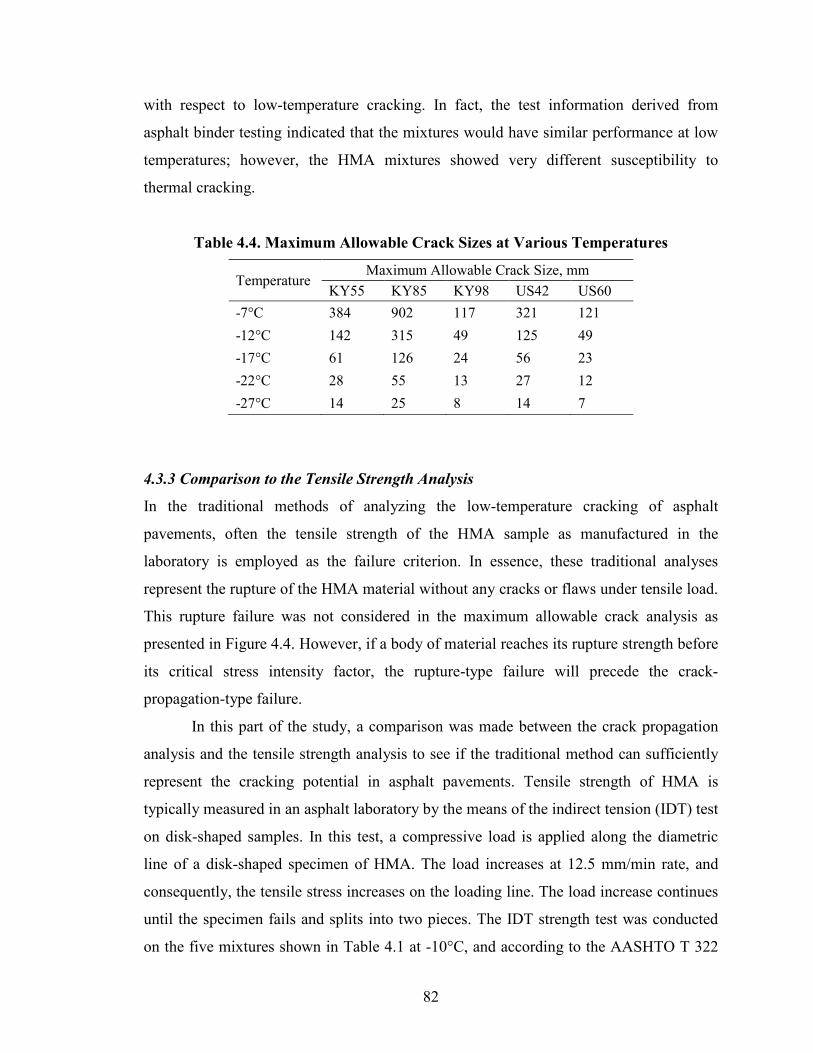
with respect to low-temperature cracking. In fact, the test information derived from
asphalt binder testing indicated that the mixtures would have similar performance at low
temperatures; however, the HMA mixtures showed very different susceptibility to
thermal cracking.
Table 4.4. Maximum Allowable Crack Sizes at Various Temperatures
Temperature Maximum Allowable Crack Size, mm KY55 KY85 KY98 US42 US60
-7°C 384 902 117 321 121 -12°C 142 315 49 125 49 -17°C 61 126 24 56 23 -22°C 28 55 13 27 12 -27°C 14 25 8 14 7
4.3.3 Comparison to the Tensile Strength Analysis
In the traditional methods of analyzing the low-temperature cracking of asphalt
pavements, often the tensile strength of the HMA sample as manufactured in the
laboratory is employed as the failure criterion. In essence, these traditional analyses
represent the rupture of the HMA material without any cracks or flaws under tensile load.
This rupture failure was not considered in the maximum allowable crack analysis as
presented in Figure 4.4. However, if a body of material reaches its rupture strength before
its critical stress intensity factor, the rupture-type failure will precede the crack-
propagation-type failure.
In this part of the study, a comparison was made between the crack propagation
analysis and the tensile strength analysis to see if the traditional method can sufficiently
represent the cracking potential in asphalt pavements. Tensile strength of HMA is
typically measured in an asphalt laboratory by the means of the indirect tension (IDT) test
on disk-shaped samples. In this test, a compressive load is applied along the diametric
line of a disk-shaped specimen of HMA. The load increases at 12.5 mm/min rate, and
consequently, the tensile stress increases on the loading line. The load increase continues
until the specimen fails and splits into two pieces. The IDT strength test was conducted
on the five mixtures shown in Table 4.1 at -10°C, and according to the AASHTO T 322
82
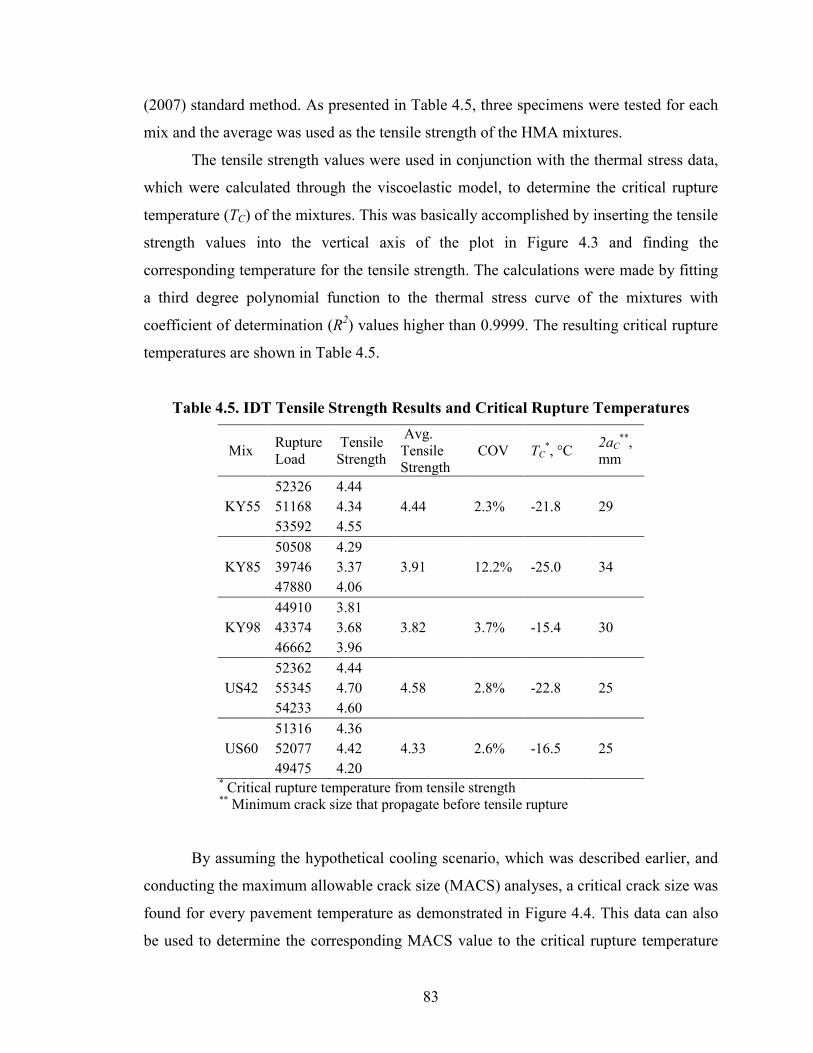
(2007) standard method. As presented in Table 4.5, three specimens were tested for each
mix and the average was used as the tensile strength of the HMA mixtures.
The tensile strength values were used in conjunction with the thermal stress data,
which were calculated through the viscoelastic model, to determine the critical rupture
temperature (TC) of the mixtures. This was basically accomplished by inserting the tensile
strength values into the vertical axis of the plot in Figure 4.3 and finding the
corresponding temperature for the tensile strength. The calculations were made by fitting
a third degree polynomial function to the thermal stress curve of the mixtures with
coefficient of determination (R2) values higher than 0.9999. The resulting critical rupture
temperatures are shown in Table 4.5.
Table 4.5. IDT Tensile Strength Results and Critical Rupture Temperatures
Mix Rupture Load
Tensile Strength
Avg. Tensile Strength
COV TC*, °C 2aC
**, mm
52326 4.44 KY55 51168 4.34 4.44 2.3% -21.8 29 53592 4.55 50508 4.29 KY85 39746 3.37 3.91 12.2% -25.0 34 47880 4.06 44910 3.81 KY98 43374 3.68 3.82 3.7% -15.4 30 46662 3.96 52362 4.44 US42 55345 4.70 4.58 2.8% -22.8 25 54233 4.60 51316 4.36 US60 52077 4.42 4.33 2.6% -16.5 25 49475 4.20 * Critical rupture temperature from tensile strength
** Minimum crack size that propagate before tensile rupture
By assuming the hypothetical cooling scenario, which was described earlier, and
conducting the maximum allowable crack size (MACS) analyses, a critical crack size was
found for every pavement temperature as demonstrated in Figure 4.4. This data can also
be used to determine the corresponding MACS value to the critical rupture temperature
83
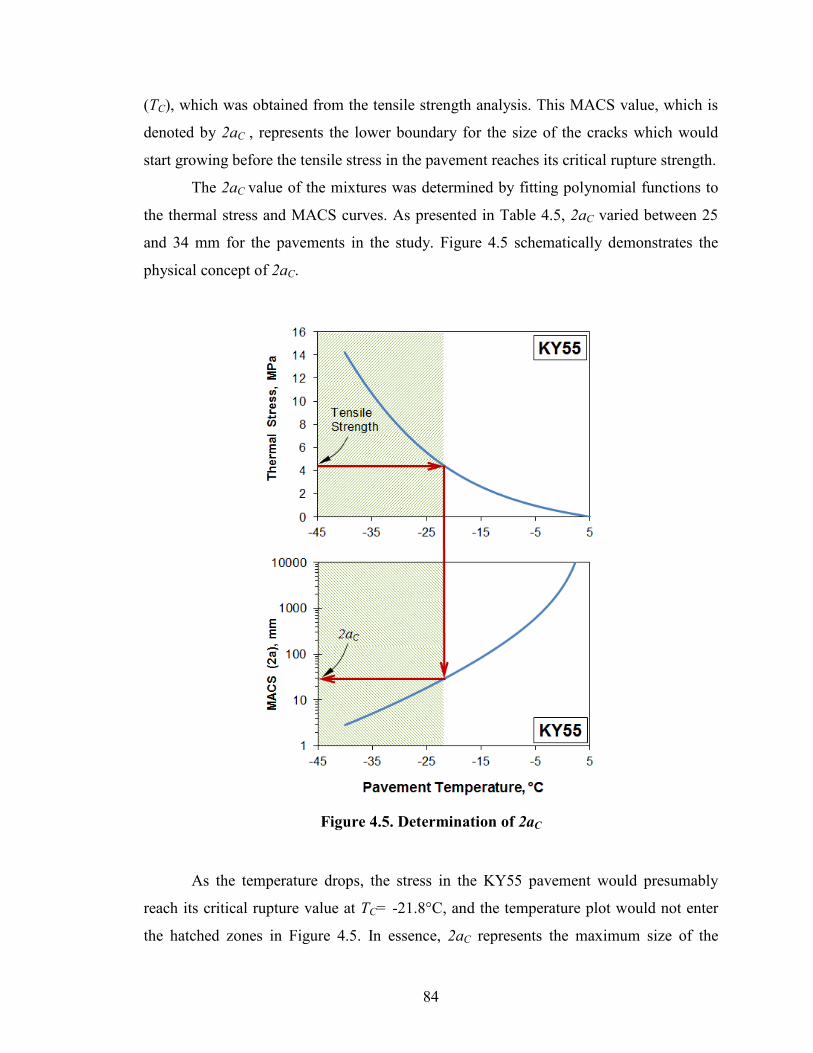
(TC), which was obtained from the tensile strength analysis. This MACS value, which is
denoted by 2aC , represents the lower boundary for the size of the cracks which would
start growing before the tensile stress in the pavement reaches its critical rupture strength.
The 2aC value of the mixtures was determined by fitting polynomial functions to
the thermal stress and MACS curves. As presented in Table 4.5, 2aC varied between 25
and 34 mm for the pavements in the study. Figure 4.5 schematically demonstrates the
physical concept of 2aC.
Figure 4.5. Determination of 2aC
As the temperature drops, the stress in the KY55 pavement would presumably
reach its critical rupture value at TC= -21.8°C, and the temperature plot would not enter
the hatched zones in Figure 4.5. In essence, 2aC represents the maximum size of the
84
cracks that are considered in the traditional tensile strength analysis. In other words, by
using the tensile rupture strength as the failure criterion, the effect of any cracks larger
than 29-mm was neglected. Therefore, by designing the pavement of KY55 for any
MACS larger than 20-mm, the tensile strength method produces a less conservative
design and imposes higher risk of thermal cracking. The 2aC values for the other
pavements are presented in Table 4.5. All the pavements showed relatively small 2aC
values. Considering the current practices of design and construction of asphalt
pavements, much larger cracks may form in the pavements, particularly when they age
and undergo a high number of traffic loads.
85
CHAPTER 5 EFFECT OF DENSITY ON THERMAL CRACKING The in-place density of the hot-mix asphalt (HMA) is one of the most important factors
that would influence the performance of an asphalt pavement (Asphalt Institute 2007).
The desired level of construction density in HMA layers in the field is achieved by the
means of roller compaction. The aggregate particles in an HMA layer tend to interlock as
the result of the compaction process and ideally would form a stone-on-stone type of
structure. An asphalt layer after compaction is a denser layer with lower air voids, and a
smooth and uniform surface.
The achieved in-place density of an asphalt pavement results from a combination
of different activities involved in proper design, production, placement, compaction, and
quality control of the mixture (Asphalt Institute 2007). The density of an asphalt mixture
is normally expressed as a percent of its theoretical maximum specific gravity (Gmm). An
HMA mixture behind a paver typically has a density of 75 to 85 percent of its Gmm. The
goal of compaction is often to increase the in-place density to a target level of 92 to 93
percent of Gmm, which translates to 7 to 8 percent air voids, for typical pavements.
Some research studies have been conducted to evaluate the effect of density on
rutting and fatigue performance of HMA (Akhtarhusein et al. 1994; Harvey and Tsai
1996; Kim et al. 2008). However, the effect of density on low-temperature fracture
properties of HMA has not been investigated thoroughly. In general, density has a high
impact on the performance of HMA material, and it is has been used as the primary
quality control factor for asphalt pavement construction for many years.
The Kentucky Transportation Cabinet (KYTC) launched a research project in
2007 to better understand the effect of density on durability of asphalt pavements. The
first phase of this study involved conducting a series of performance tests to see if
increasing the initial in-place density from 92 to 93 percent of Gmm would cause a
significant improvement in the asphalt pavements performance (Blankenship and
Anderson 2010). The results showed that for a 1.5 percent increase in the initial density,
the fatigue life of the tested specimens increased by up to 10 percent. Furthermore, the
flow number increased by 34 percent for a similar increase in the mixture’s density.
86

For the second phase of the KYTC density project, HMA samples were collected
from five pavement construction projects in central Kentucky. The in-situ measurements
on the pavements after construction revealed that the actual densities of the pavements
were considerably lower than the desired 92 percent of Gmm. Although the measured
in-place densities were lower than their target values, the results were not outside of the
KYTC’s expectations based on the requirements (rolling pattern only) for lower traffic
pavements placed at a 25-mm lift thickness. It should be noted that if these were higher-
type facilities, the lower densities would have been addressed by the KYTC.
The KYTC density project provided a unique opportunity to utilize the indirect
ring tension (IRT) fracture test and evaluate the effect of in-place density on low-
temperature fracture properties of the field mixtures. Furthermore, the IRT fracture data
could be compared to the DC(t) test, which is another fracture test geometry for HMA
material.
5.1 Material and Testing Plan
5.1.1 In-Place Densities
The mix samples were collected from several sections of five non-primary pavements
with traffics lower than 10 million equivalent single axle loads (ESALs). Design
properties of the mixtures are presented in Table 4.1. At each sampling location, the
in-place density profile of the pavement was determined using a non-nuclear density
gauge. The density was measured at the centerline, as well as at 15, 45, and 152 cm
distances on each side of the centerline for a total of seven measurements. It should be
noted that the in-place density readings were taken before any traffic was allowed on the
new pavements. Moreover, all of the highway projects were 25-mm (1-in) lift resurfacing
projects with little or no milling.
Results from the field measurements indicated that the density of the middle
portion of the pavement was consistently lower than the density of the pavement farther
from the centerline. For each section, the trimmed average density was calculated by
omitting the highest and lowest measured densities as outliers. Then, for each individual
87

project, the average in-place density was determined by taking the average density of the
sampling sections (Table 5.1).
Table 5.1. In-Place Density of the Pavements
Property KY55 KY85 KY98 US42 US60 Adair Ohio Allen Oldham Meade
Avg. In-Place Air Voids (%) 11.5 10.7 13.2 11.6 12.9
Avg. In-Place Density (%) 88.5 89.3 86.8 88.4 87.1
5.1.2 Experimental Plan
An experimental laboratory plan was developed to evaluate the potential low-temperature
performance of the HMA mixtures at various densities. The IRT fracture test specimens
were produced and tested at four density levels for each mixture:
- 4 percent air voids, which represents the standard for the laboratory compaction.
- 7 percent air voids, which is the typical value for laboratory mechanical testing.
- 8 percent air voids, the desirable level after compaction in the field.
- Average in-place density of each pavement as measured in the field (Table 5.1).
This experimental plan was basically developed to determine whether or not the
deficiencies in the in-place density would affect the performance of the pavements at low
temperatures. Additionally, testing at various density levels would help quantify the
effect of changes in the air voids content on thermal cracking potential of the HMA
mixtures.
5.1.3 Specimen Preparation and Testing
Three IRT replicate specimens were produced per each density level for each HMA mix.
The desired density levels were achieved in the lab by adjusting the weight of the loose-
mix samples that were placed in each gyratory compactor mold. All the IRT specimens
were fabricated with the geometry parameters that were recommended in Chapter 3, with
88

R= 75 mm, r= 13 mm, and 9 mm< a < 11 mm. Prior to compaction, the loose-mix
samples were conditioned for 24 hours in a forced-draft oven at 135°C to simulate the
long-term aging.
All the specimens were individually tested for bulk specific gravity. An air void
content tolerance of ±0.5% was employed for all the samples, and those outside of the
acceptable range were discarded. The preliminary measurements showed that the water
could become trapped in the specimens with 10.7 to 13.2 percent air voids, and the
specimens were not completely dry even after several days of storage at room
temperature. This water entrapment range is also seen in pavements where water
becomes trapped.
To overcome this problem, a CoreDry® device (Figure 3.4) was used to make
sure that all the water in the specimens from trimming was removed. The CoreLok®
bulking procedure (vacuum sealed bag) was used to achieve a consistent and accurate
method for determining the air voids of all the specimens. After sample preparation and
temperature conditioning, the IRT fracture tests were conducted at -22°C, which is the
temperature that represents the lower PG grade of the asphalt binders in the study.
5.2 IRT Fracture Test Results
5.2.1 Fracture Toughness
The IRT fracture tests were conducted in accordance with the procedures recommended
in Chapter 3. The raw test data for this group of specimens is presented in Appendix B.
After testing the samples and measuring their initial notch length, the Equation 3.1 was
employed to determine the plane-strain fracture toughness (KIC) of the mixtures. The
calculated KIC values are presented in Tables 5.2 to 5.6 for the five mixtures in the study.
As seen in these tables, the IRT fracture test produced consistent KIC values for the HMA
mixtures with a relatively high repeatability. The coefficient of variation for the obtained
KIC values from this set of specimens ranged from 1.8 to 6.2 percent.
In general, the specimens which were fabricated at the in-place air voids content
(10.7 to 13.2 percent) demonstrated slightly less repeatable results. Furthermore, the
specimens with high air voids showed more diverse failure patterns toward the end of the
89
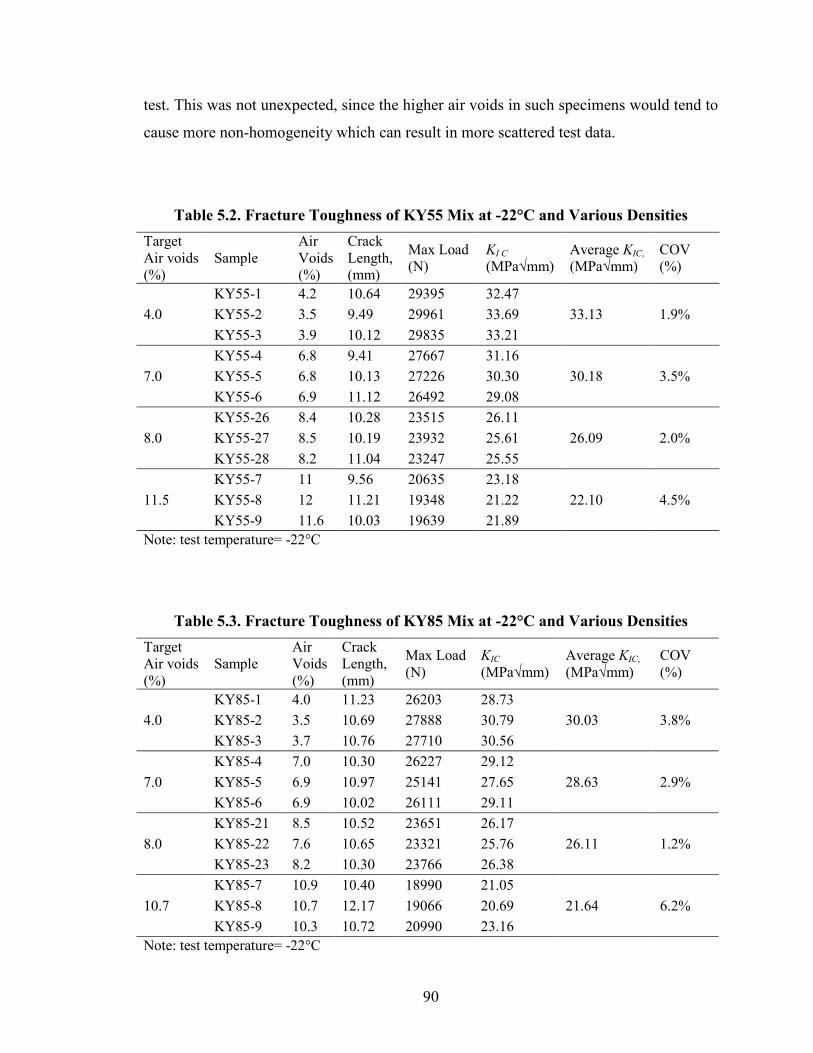
test. This was not unexpected, since the higher air voids in such specimens would tend to
cause more non-homogeneity which can result in more scattered test data.
Table 5.2. Fracture Toughness of KY55 Mix at -22°C and Various Densities Target Air voids (%)
Sample Air Voids (%)
Crack Length, (mm)
Max Load (N)
KI C (MPa√mm)
Average KIC, (MPa√mm)
COV (%)
4.0 KY55-1 4.2 10.64 29395 32.47
33.13 1.9% KY55-2 3.5 9.49 29961 33.69 KY55-3 3.9 10.12 29835 33.21
7.0 KY55-4 6.8 9.41 27667 31.16
30.18 3.5% KY55-5 6.8 10.13 27226 30.30 KY55-6 6.9 11.12 26492 29.08
8.0 KY55-26 8.4 10.28 23515 26.11
26.09 2.0% KY55-27 8.5 10.19 23932 25.61 KY55-28 8.2 11.04 23247 25.55
11.5 KY55-7 11 9.56 20635 23.18
22.10 4.5% KY55-8 12 11.21 19348 21.22 KY55-9 11.6 10.03 19639 21.89
Note: test temperature= -22°C
Table 5.3. Fracture Toughness of KY85 Mix at -22°C and Various Densities Target Air voids (%)
Sample Air Voids (%)
Crack Length, (mm)
Max Load (N)
KIC (MPa√mm)
Average KIC, (MPa√mm)
COV (%)
4.0 KY85-1 4.0 11.23 26203 28.73
30.03 3.8% KY85-2 3.5 10.69 27888 30.79 KY85-3 3.7 10.76 27710 30.56
7.0 KY85-4 7.0 10.30 26227 29.12
28.63 2.9% KY85-5 6.9 10.97 25141 27.65 KY85-6 6.9 10.02 26111 29.11
8.0 KY85-21 8.5 10.52 23651 26.17
26.11 1.2% KY85-22 7.6 10.65 23321 25.76 KY85-23 8.2 10.30 23766 26.38
10.7 KY85-7 10.9 10.40 18990 21.05
21.64 6.2% KY85-8 10.7 12.17 19066 20.69 KY85-9 10.3 10.72 20990 23.16
Note: test temperature= -22°C
90

Table 5.4. Fracture Toughness of KY98 Mix at -22°C and Various Densities Target Air voids (%)
Sample Air Voids (%)
Crack Length, (mm)
Max Load (N)
KI C (MPa√mm)
Average KIC, (MPa√mm)
COV (%)
4.0 KY98-1 4.4 9.37 28266 31.85
30.60 3.7% KY98-2 4.2 9.47 26395 29.69 KY98-3 3.6 10.18 27211 30.26
7.0 KY98-4 7.0 10.10 22774 25.36
26.30 3.2% KY98-5 6.9 10.04 23823 26.55 KY98-6 7.0 9.59 24025 26.97
8.0 KY98-23 8.5 8.77 22059 25.13
24.62 1.8% KY98-24 7.9 8.85 21493 24.45 KY98-25 8.0 9.00 21403 24.28
13.2 KY98-7 12.6 9.90 15021 16.78
17.77 5.2% KY98-8 13.0 9.98 16070 17.93 KY98-9 13.1 9.58 16570 18.61
Note: test temperature= -22°C
Table 5.5. Fracture Toughness of US42 Mix at -22°C and Various Densities Target Air voids (%)
Sample Air Voids (%)
Crack Length, (mm)
Max Load (N)
KI C (MPa√mm)
Average KIC, (MPa√mm)
COV (%)
4.0 US42-1 4.5 10.15 27125 30.18
31.20 2.9% US42-2 3.9 9.68 28505 31.96 US42-3 3.9 10.37 28368 31.46
7.0 US42-4 7.2 10.34 26852 29.79
28.40 4.3% US42-5 7.2 10.24 25177 27.98 US42-6 6.8 11.96 25227 27.43
8.0 US42-11 8.1 10.32 25965 28.82
27.40 5.1% US42-12 8.2 10.94 24866 27.36 US42-26 8.1 10.24 23416 26.02
11.6 US42-7 12 10.83 19407 21.38
22.73 5.2% US42-8 11.6 9.74 21096 23.63 US42-9 11.7 9.85 20721 23.16
Note: test temperature= -22°C
91

Table 5.6. Fracture Toughness of US60 Mix at -22°C and Various Densities
Target Air voids (%)
Sample Air Voids (%)
Crack Length, (mm)
Max Load (N)
KIC (MPa√mm)
Average KIC, (MPa√mm)
COV (%)
4.0 US60-1 3.8 10.13 27077 30.14
30.81 2.6% US60-2 3.7 10.59 27697 30.62 US60-3 3.6 9.96 28384 31.68
7.0 US60-4 7.0 9.49 23587 26.53
27.13 2.6% US60-5 7.1 9.53 23985 26.96 US60-6 6.8 9.64 24873 27.90
8.0 US60-31 8.1 11.70 22880 24.95
24.38 3.5% US60-32 7.7 10.80 21235 23.41 US60-33 8.3 10.73 22469 24.79
10.7 US60-7 12.8 10.20 18176 20.21
21.01 4.6% US60-8 11.6 9.98 19798 22.09 US60-9 11.7 10.51 18734 20.73
Note: test temperature= -22°C
Figure 5.1 displays the relationship between the specimens’ density and their
fracture toughness (KIC) as determined by the IRT fracture test. Statistical linear
regression was performed to analyze the effect of air voids content on KIC. The General
Linear Model procedure in the SAS/STAT® program was utilized to conduct the analysis.
The resulted regression lines are presented in Figure 5.1 along with their coefficient of
determination (R2) values. The regression analysis indicated that the effect of air voids
content on specimen KIC was highly significant. All the resulting P-values for the
regression lines slope, as presented in Table 5.7, concluded that increasing the air voids
content of the specimens significantly lowered the fracture toughness of the specimens.
In other words, the IRT test data implied that pavements with higher air voids content
could be more susceptible to thermal cracking.
In general, the IRT test seemed to be an effective tool for examining the effect of
density on low-temperature properties of the HMA mixtures. The test produced relatively
repeatable results and generated adequate information to discern the differences between
the cracking potential of various asphalt mixtures.
92

Figure 5.1. Fracture Toughness of the HMA Mixtures at Various Densities Note: test temperature= -22°C
y = -1.4892x + 39.266 R² = 0.9592
10
15
20
25
30
35
40
2 4 6 8 10 12 14
KIC
, MPa
√mm
Air Voids (%)
KY55
y = -1.2171x + 35.545 R² = 0.8496
10
15
20
25
30
35
40
2 4 6 8 10 12 14
KIC
, MPa
√mm
Air Voids (%)
KY85
y = -1.4325x + 36.306 R² = 0.9584
10
15
20
25
30
35
40
2 4 6 8 10 12 14
KIC
, MPa
√mm
Air Voids, %
KY98
y = -1.1111x + 36.060 R² = 0.9075
10
15
20
25
30
35
40
2 4 6 8 10 12 14
KIC
, MPa
√mm
Air Voids, %
US42
y = -1.1877x + 34.959 R² = 0.9411
10
15
20
25
30
35
40
2 4 6 8 10 12 14
KIC
, MPa
√mm
Air Voids, %
US60
93

Table 5.7. Regression Analysis Results on KIC at Various Densities
Mix DF Parameter Estimate
Standard Error t statistic P-value
KY55 Intercept 1 39.26612 0.79036 49.68 < .0001 Slope 1 -1.48919 0.09712 -15.33 < .0001
KY85 Intercept 1 35.62844 1.28357 27.75737 < .0001 Slope 1 -1.20897 0.16539 -7.30996 < .0001
KY98 Intercept 1 36.30573 0.81421 44.59 < .0001 Slope 1 -1.43254 0.09435 -15.18 < .0001
US42 Intercept 1 36.06041 0.92424 39.02 < .0001 Slope 1 -1.11105 0.11218 -9.90 < .0001
US60 Intercept 1 34.95850 0.77477 45.12 < .0001 Slope 1 -1.18767 0.09397 -12.64 < .0001
By calculating the maximum allowable crack size (MACS) for each IRT test data,
more information can be procured about the cracking susceptibility of the mixtures and
their differences. By employing the creep compliance data and the thermal stresses that
were estimated in Chapter 4, the MACS values were calculated individually for each test
specimen based upon its facture toughness (Tables 5.2 to 5.6). By assuming the same
cooling scenario as described in Chapter 4 (cooling starts at 5°C, and pavement
temperatures drops at the rate of 2°C/hr), the MACS values were determined for the
pavements with the final temperatures of -12°C. This is the temperature at which
mixtures have entered their quasi-brittle phase and have become more susceptible to
thermal cracking. The final MACS information was achieved by inputting the KIC data
from the IRT test into the curves in Figure 4.4.
Figure 5.2 illustrates the variation of the calculated maximum allowable crack
size of the pavements with respect to their in-place air voids content. Calculation of
MACS involves consideration of the relaxation properties of the mixtures in addition to
their fracture susceptibility. Therefore, by converting the fracture toughness data into
MACS, the difference between the mixtures cracking susceptibility became clearer. A
comparison between the regression lines in Figure 5.2 would reveal that there is a
substantial difference between the cracking susceptibility of the mixtures even though
they were all designed to have similar critical cracking temperature of -22°C.
94
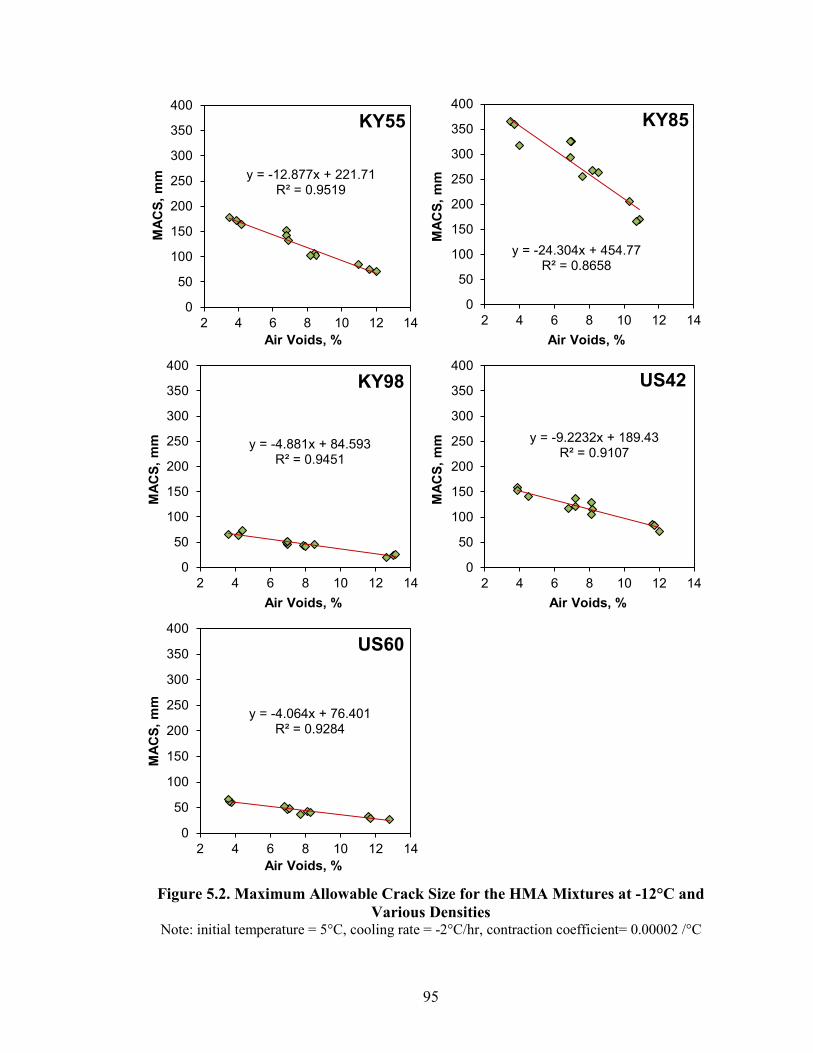
Figure 5.2. Maximum Allowable Crack Size for the HMA Mixtures at -12°C and
Various Densities Note: initial temperature = 5°C, cooling rate = -2°C/hr, contraction coefficient= 0.00002 /°C
y = -12.877x + 221.71 R² = 0.9519
0
50
100
150
200
250
300
350
400
2 4 6 8 10 12 14
MAC
S, m
m
Air Voids, %
KY55
y = -24.304x + 454.77 R² = 0.8658
0
50
100
150
200
250
300
350
400
2 4 6 8 10 12 14
MAC
S, m
m
Air Voids, %
KY85
y = -4.881x + 84.593 R² = 0.9451
0
50
100
150
200
250
300
350
400
2 4 6 8 10 12 14
MAC
S, m
m
Air Voids, %
KY98
y = -9.2232x + 189.43 R² = 0.9107
0
50
100
150
200
250
300
350
400
2 4 6 8 10 12 14
MAC
S, m
m
Air Voids, %
US42
y = -4.064x + 76.401 R² = 0.9284
0
50
100
150
200
250
300
350
400
2 4 6 8 10 12 14
MAC
S, m
m
Air Voids, %
US60
95
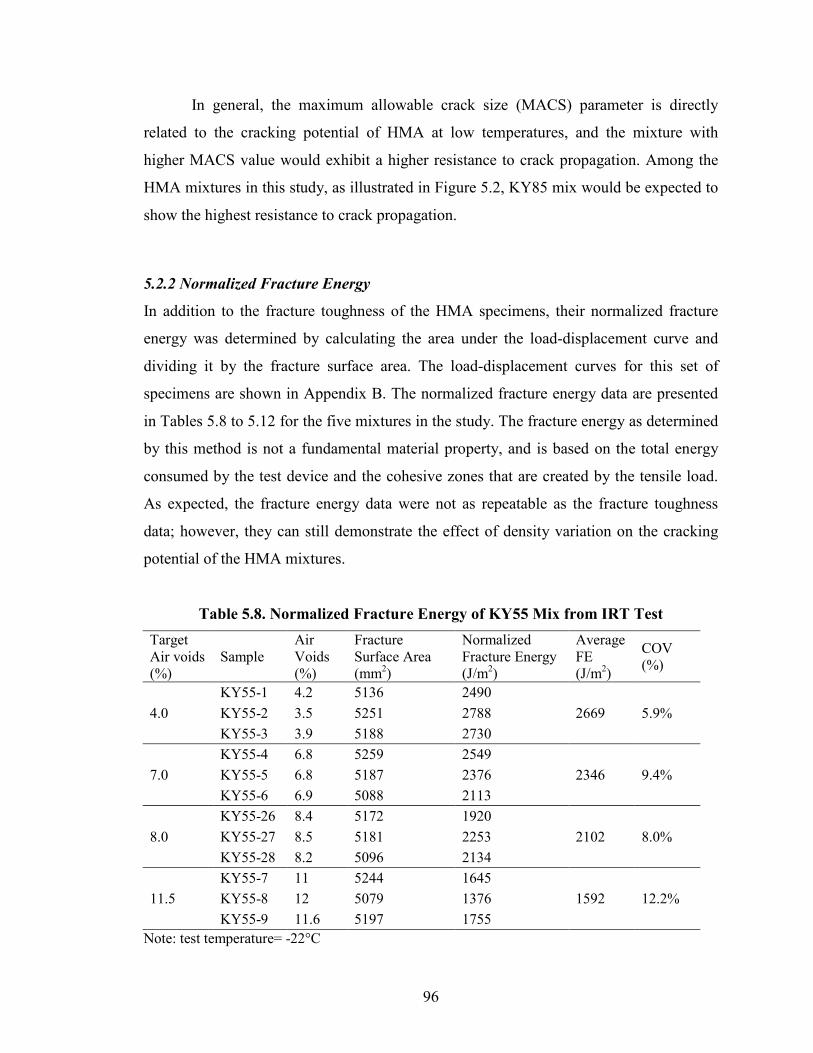
In general, the maximum allowable crack size (MACS) parameter is directly
related to the cracking potential of HMA at low temperatures, and the mixture with
higher MACS value would exhibit a higher resistance to crack propagation. Among the
HMA mixtures in this study, as illustrated in Figure 5.2, KY85 mix would be expected to
show the highest resistance to crack propagation.
5.2.2 Normalized Fracture Energy
In addition to the fracture toughness of the HMA specimens, their normalized fracture
energy was determined by calculating the area under the load-displacement curve and
dividing it by the fracture surface area. The load-displacement curves for this set of
specimens are shown in Appendix B. The normalized fracture energy data are presented
in Tables 5.8 to 5.12 for the five mixtures in the study. The fracture energy as determined
by this method is not a fundamental material property, and is based on the total energy
consumed by the test device and the cohesive zones that are created by the tensile load.
As expected, the fracture energy data were not as repeatable as the fracture toughness
data; however, they can still demonstrate the effect of density variation on the cracking
potential of the HMA mixtures.
Table 5.8. Normalized Fracture Energy of KY55 Mix from IRT Test Target Air voids (%)
Sample Air Voids (%)
Fracture Surface Area (mm2)
Normalized Fracture Energy (J/m2)
Average FE (J/m2)
COV (%)
4.0 KY55-1 4.2 5136 2490
2669 5.9% KY55-2 3.5 5251 2788 KY55-3 3.9 5188 2730
7.0 KY55-4 6.8 5259 2549
2346 9.4% KY55-5 6.8 5187 2376 KY55-6 6.9 5088 2113
8.0 KY55-26 8.4 5172 1920
2102 8.0% KY55-27 8.5 5181 2253 KY55-28 8.2 5096 2134
11.5 KY55-7 11 5244 1645
1592 12.2% KY55-8 12 5079 1376 KY55-9 11.6 5197 1755
Note: test temperature= -22°C
96
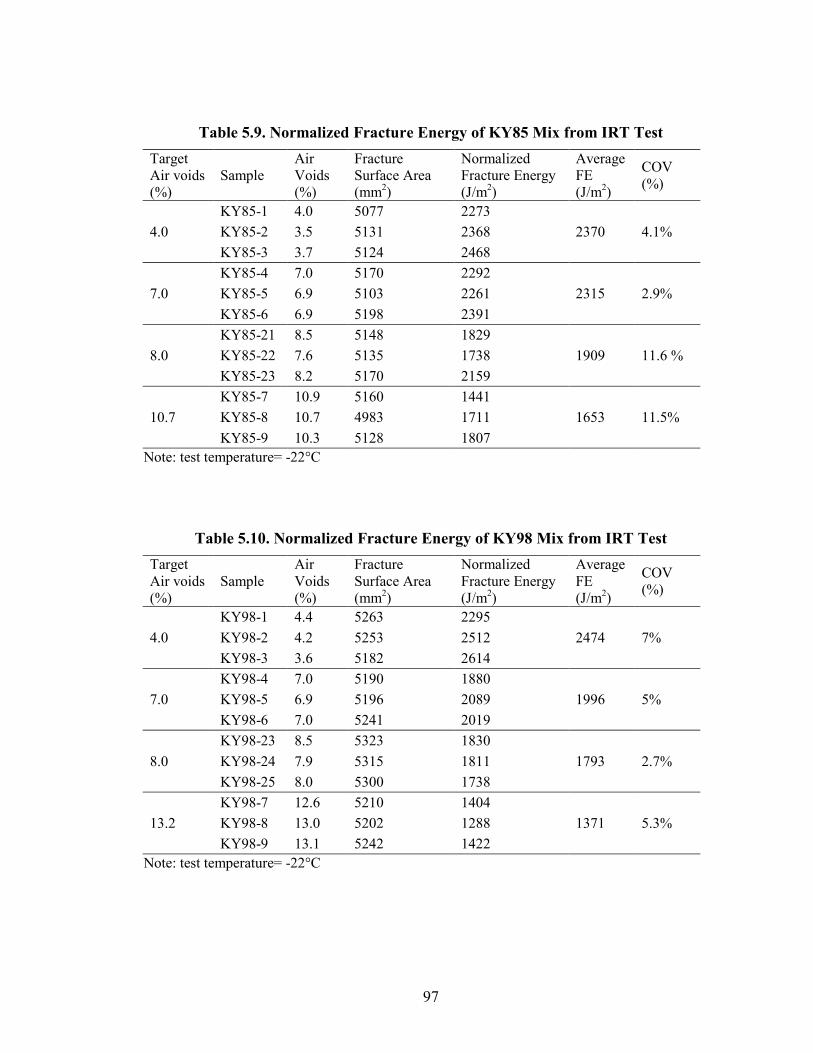
Table 5.9. Normalized Fracture Energy of KY85 Mix from IRT Test Target Air voids (%)
Sample Air Voids (%)
Fracture Surface Area (mm2)
Normalized Fracture Energy (J/m2)
Average FE (J/m2)
COV (%)
4.0 KY85-1 4.0 5077 2273
2370 4.1% KY85-2 3.5 5131 2368 KY85-3 3.7 5124 2468
7.0 KY85-4 7.0 5170 2292
2315 2.9% KY85-5 6.9 5103 2261 KY85-6 6.9 5198 2391
8.0 KY85-21 8.5 5148 1829
1909 11.6 % KY85-22 7.6 5135 1738 KY85-23 8.2 5170 2159
10.7 KY85-7 10.9 5160 1441
1653 11.5% KY85-8 10.7 4983 1711 KY85-9 10.3 5128 1807
Note: test temperature= -22°C
Table 5.10. Normalized Fracture Energy of KY98 Mix from IRT Test Target Air voids (%)
Sample Air Voids (%)
Fracture Surface Area (mm2)
Normalized Fracture Energy (J/m2)
Average FE (J/m2)
COV (%)
4.0 KY98-1 4.4 5263 2295
2474 7% KY98-2 4.2 5253 2512 KY98-3 3.6 5182 2614
7.0 KY98-4 7.0 5190 1880
1996 5% KY98-5 6.9 5196 2089 KY98-6 7.0 5241 2019
8.0 KY98-23 8.5 5323 1830
1793 2.7% KY98-24 7.9 5315 1811 KY98-25 8.0 5300 1738
13.2 KY98-7 12.6 5210 1404
1371 5.3% KY98-8 13.0 5202 1288 KY98-9 13.1 5242 1422
Note: test temperature= -22°C
97
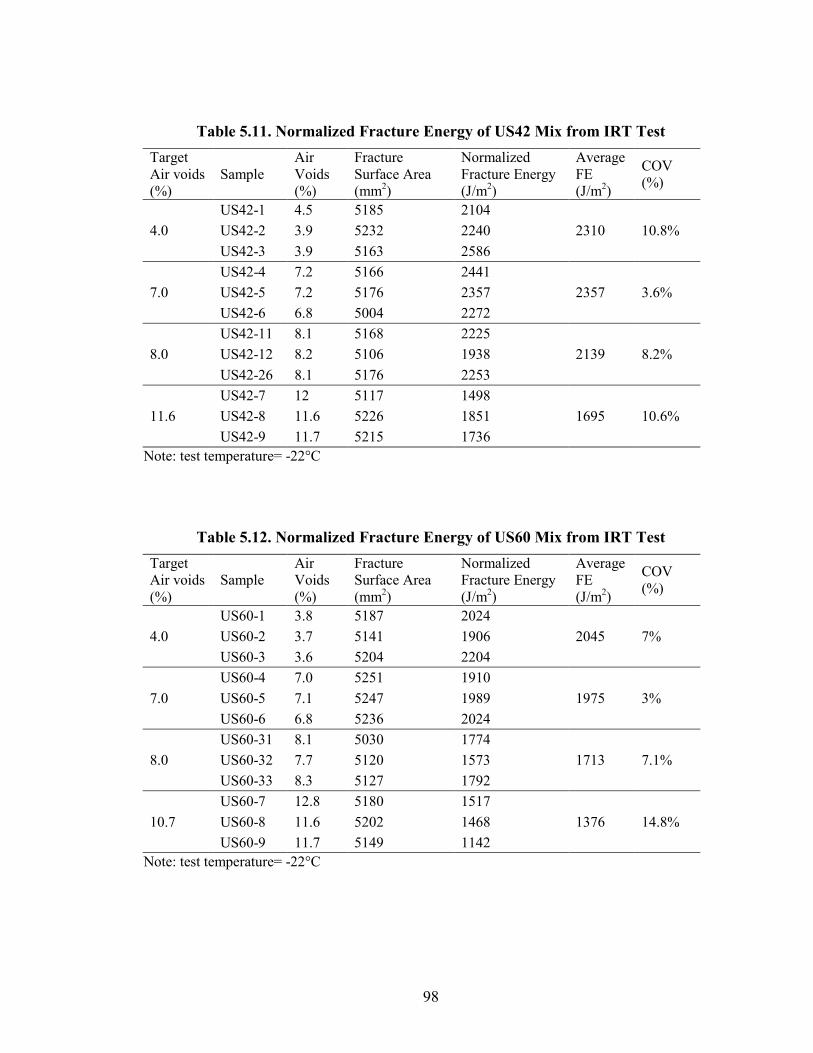
Table 5.11. Normalized Fracture Energy of US42 Mix from IRT Test
Target Air voids (%)
Sample Air Voids (%)
Fracture Surface Area (mm2)
Normalized Fracture Energy (J/m2)
Average FE (J/m2)
COV (%)
4.0 US42-1 4.5 5185 2104
2310 10.8% US42-2 3.9 5232 2240 US42-3 3.9 5163 2586
7.0 US42-4 7.2 5166 2441
2357 3.6% US42-5 7.2 5176 2357 US42-6 6.8 5004 2272
8.0 US42-11 8.1 5168 2225
2139 8.2% US42-12 8.2 5106 1938 US42-26 8.1 5176 2253
11.6 US42-7 12 5117 1498
1695 10.6% US42-8 11.6 5226 1851 US42-9 11.7 5215 1736
Note: test temperature= -22°C
Table 5.12. Normalized Fracture Energy of US60 Mix from IRT Test Target Air voids (%)
Sample Air Voids (%)
Fracture Surface Area (mm2)
Normalized Fracture Energy (J/m2)
Average FE (J/m2)
COV (%)
4.0 US60-1 3.8 5187 2024
2045 7% US60-2 3.7 5141 1906 US60-3 3.6 5204 2204
7.0 US60-4 7.0 5251 1910
1975 3% US60-5 7.1 5247 1989 US60-6 6.8 5236 2024
8.0 US60-31 8.1 5030 1774
1713 7.1% US60-32 7.7 5120 1573 US60-33 8.3 5127 1792
10.7 US60-7 12.8 5180 1517
1376 14.8% US60-8 11.6 5202 1468 US60-9 11.7 5149 1142
Note: test temperature= -22°C
98

Figure 5.3. Normalized Fracture Energy of the HMA Mixtures at Various Densities Note: test temperature= -22°C
y = -142.73x + 3269.2 R² = 0.8833
0
500
1000
1500
2000
2500
3000
2 4 6 8 10 12 14
Nor
mal
ized
FE,
J/m
2
Air Voids (%)
KY55
y = -108.46x + 2858.7 R² = 0.7037
0
500
1000
1500
2000
2500
3000
2 4 6 8 10 12 14
Nor
mal
ized
FE,
J/m
2
Air Voids (%)
KY85
y = -122.58x + 2891.2 R² = 0.9298
0
500
1000
1500
2000
2500
3000
2 4 6 8 10 12 14
Nor
mal
ized
FE,
J/m
2
Air Voids, %
KY98
y = -86.616x + 2797.8 R² = 0.628
0
500
1000
1500
2000
2500
3000
2 4 6 8 10 12 14
Nor
mal
ized
FE,
J/m
2
Air Voids, %
US42
y = -81.323x + 2401.9 R² = 0.7162
0
500
1000
1500
2000
2500
3000
2 4 6 8 10 12 14
Nor
mal
ized
FE,
J/m
2
Air Voids, %
US60
99
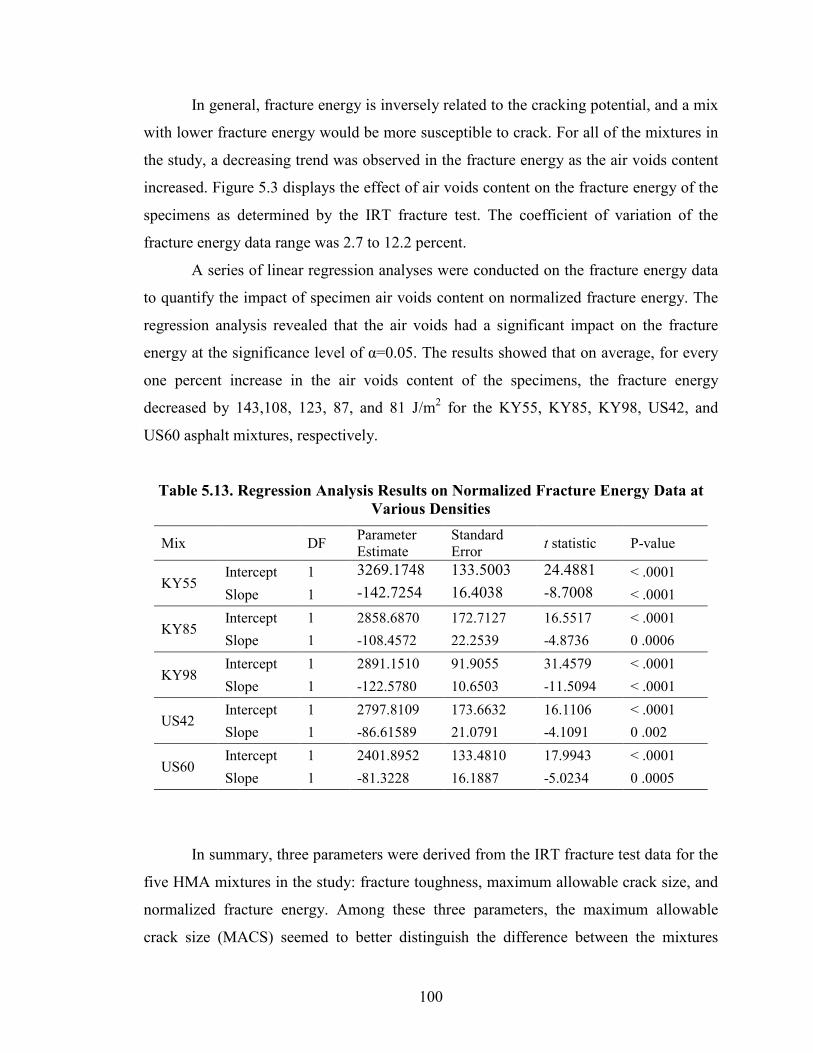
In general, fracture energy is inversely related to the cracking potential, and a mix
with lower fracture energy would be more susceptible to crack. For all of the mixtures in
the study, a decreasing trend was observed in the fracture energy as the air voids content
increased. Figure 5.3 displays the effect of air voids content on the fracture energy of the
specimens as determined by the IRT fracture test. The coefficient of variation of the
fracture energy data range was 2.7 to 12.2 percent.
A series of linear regression analyses were conducted on the fracture energy data
to quantify the impact of specimen air voids content on normalized fracture energy. The
regression analysis revealed that the air voids had a significant impact on the fracture
energy at the significance level of α=0.05. The results showed that on average, for every
one percent increase in the air voids content of the specimens, the fracture energy
decreased by 143,108, 123, 87, and 81 J/m2 for the KY55, KY85, KY98, US42, and
US60 asphalt mixtures, respectively.
Table 5.13. Regression Analysis Results on Normalized Fracture Energy Data at Various Densities
Mix DF Parameter Estimate
Standard Error t statistic P-value
KY55 Intercept 1 3269.1748 133.5003 24.4881 < .0001 Slope 1 -142.7254 16.4038 -8.7008 < .0001
KY85 Intercept 1 2858.6870 172.7127 16.5517 < .0001 Slope 1 -108.4572 22.2539 -4.8736 0 .0006
KY98 Intercept 1 2891.1510 91.9055 31.4579 < .0001 Slope 1 -122.5780 10.6503 -11.5094 < .0001
US42 Intercept 1 2797.8109 173.6632 16.1106 < .0001 Slope 1 -86.61589 21.0791 -4.1091 0 .002
US60 Intercept 1 2401.8952 133.4810 17.9943 < .0001 Slope 1 -81.3228 16.1887 -5.0234 0 .0005
In summary, three parameters were derived from the IRT fracture test data for the
five HMA mixtures in the study: fracture toughness, maximum allowable crack size, and
normalized fracture energy. Among these three parameters, the maximum allowable
crack size (MACS) seemed to better distinguish the difference between the mixtures
100
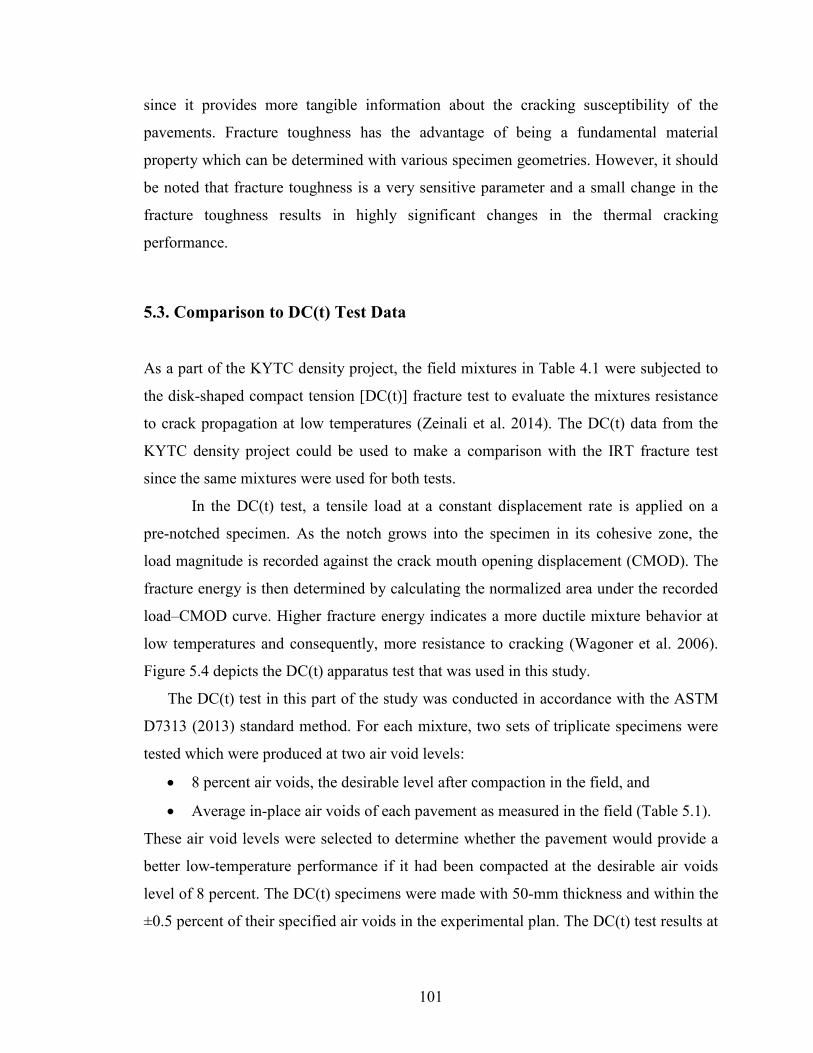
since it provides more tangible information about the cracking susceptibility of the
pavements. Fracture toughness has the advantage of being a fundamental material
property which can be determined with various specimen geometries. However, it should
be noted that fracture toughness is a very sensitive parameter and a small change in the
fracture toughness results in highly significant changes in the thermal cracking
performance.
5.3. Comparison to DC(t) Test Data
As a part of the KYTC density project, the field mixtures in Table 4.1 were subjected to
the disk-shaped compact tension [DC(t)] fracture test to evaluate the mixtures resistance
to crack propagation at low temperatures (Zeinali et al. 2014). The DC(t) data from the
KYTC density project could be used to make a comparison with the IRT fracture test
since the same mixtures were used for both tests.
In the DC(t) test, a tensile load at a constant displacement rate is applied on a
pre-notched specimen. As the notch grows into the specimen in its cohesive zone, the
load magnitude is recorded against the crack mouth opening displacement (CMOD). The
fracture energy is then determined by calculating the normalized area under the recorded
load–CMOD curve. Higher fracture energy indicates a more ductile mixture behavior at
low temperatures and consequently, more resistance to cracking (Wagoner et al. 2006).
Figure 5.4 depicts the DC(t) apparatus test that was used in this study.
The DC(t) test in this part of the study was conducted in accordance with the ASTM
D7313 (2013) standard method. For each mixture, two sets of triplicate specimens were
tested which were produced at two air void levels:
• 8 percent air voids, the desirable level after compaction in the field, and
• Average in-place air voids of each pavement as measured in the field (Table 5.1).
These air void levels were selected to determine whether the pavement would provide a
better low-temperature performance if it had been compacted at the desirable air voids
level of 8 percent. The DC(t) specimens were made with 50-mm thickness and within the
±0.5 percent of their specified air voids in the experimental plan. The DC(t) test results at
101
-22°C are illustrated in Figure 5.5. Each diagram in this figure shows the fracture energy
of a mixture at two density levels as well as the linear regression line for each dataset.
Figure 5.4. DC(t) Test Apparatus
The difference between the capability of the IRT and DC(t) tests in capturing the
variations in the material properties can be evaluated by comparing the data in Figure 5.5
to those in Figures 5.1, 5.2, and 5.3. This comparison reveals that the variability in the
DC(t) fracture energy data is higher than all three parameters measured form the IRT
fracture tests: plane-strain fracture toughness, maximum allowable crack size, and IRT
normalized fracture energy. A series of linear regression analyses was performed on the
DC(t) fracture energy data, which was similar to the analysis on the IRT fracture test
data. These regression analyses, as presented in Table 5.14, did not conclude that
specimen density has a significant effect on reducing the fracture energy. In other words,
the DC(t) test could not effectively discern the impact of air voids content on cracking
susceptibility.
It is noteworthy to mention that DC(t) fracture energy is highly influenced by the
specimen geometry, its stiffness, and both elastic and permanent deformations of the test
specimen during the test. Consequently, the resulting fracture energy as normalized on
cohesive zone can be different from one test to another. However, the data could be used
to rank the potential cracking performance of various asphalt mixtures.
102
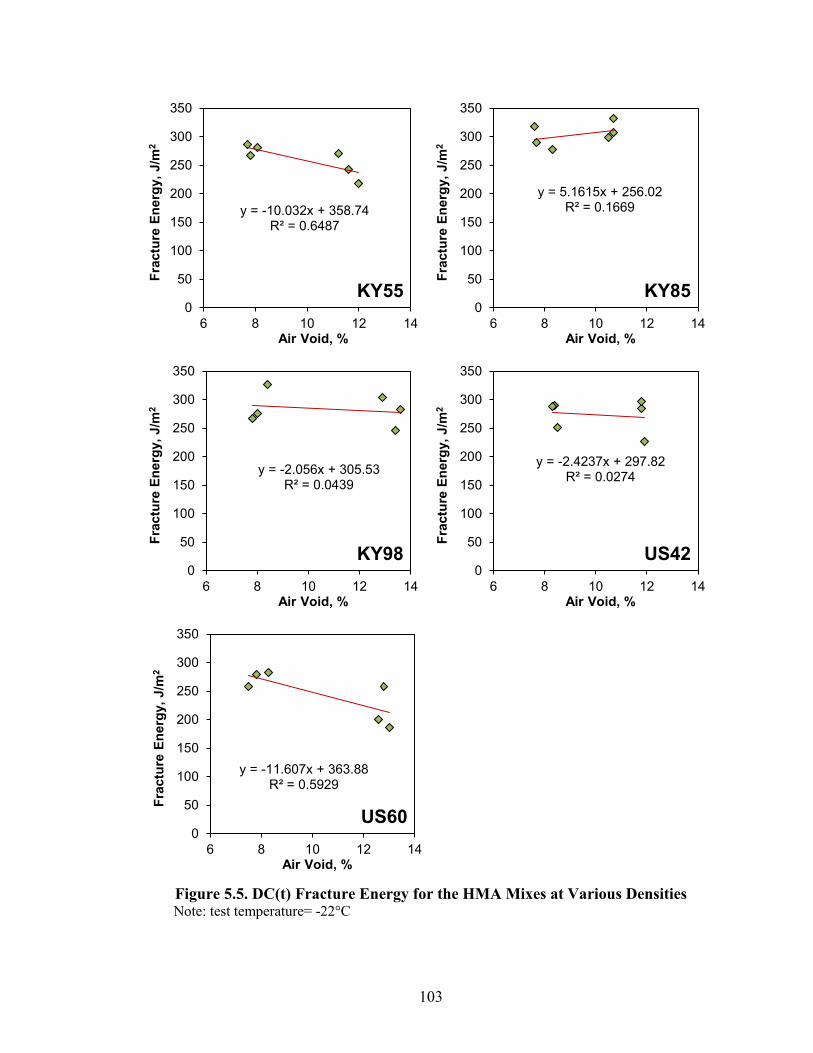
Figure 5.5. DC(t) Fracture Energy for the HMA Mixes at Various Densities Note: test temperature= -22°C
y = -10.032x + 358.74 R² = 0.6487
0
50
100
150
200
250
300
350
6 8 10 12 14
Frac
ture
Ene
rgy,
J/m
2
Air Void, %
KY55
y = 5.1615x + 256.02 R² = 0.1669
0
50
100
150
200
250
300
350
6 8 10 12 14
Frac
ture
Ene
rgy,
J/m
2
Air Void, %
KY85
y = -2.056x + 305.53 R² = 0.0439
0
50
100
150
200
250
300
350
6 8 10 12 14
Frac
ture
Ene
rgy,
J/m
2
Air Void, %
KY98
y = -2.4237x + 297.82 R² = 0.0274
0
50
100
150
200
250
300
350
6 8 10 12 14
Frac
ture
Ene
rgy,
J/m
2
Air Void, %
US42
y = -11.607x + 363.88 R² = 0.5929
0
50
100
150
200
250
300
350
6 8 10 12 14
Frac
ture
Ene
rgy,
J/m
2
Air Void, %
US60
103
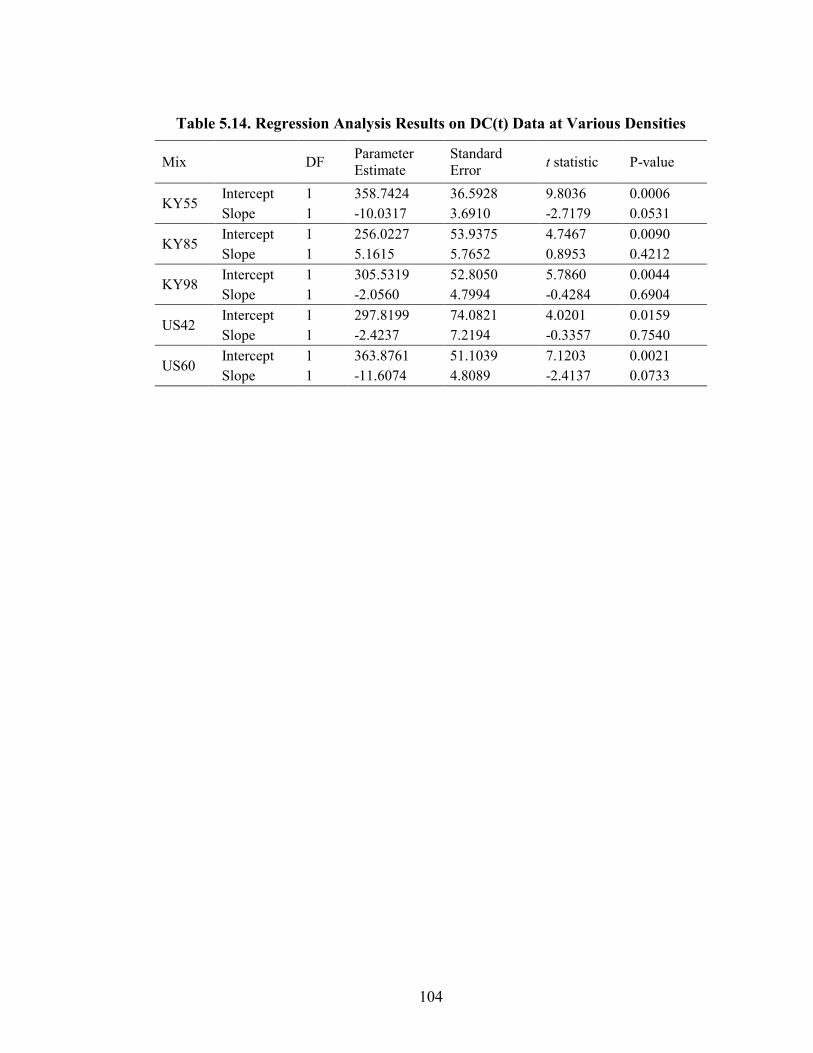
Table 5.14. Regression Analysis Results on DC(t) Data at Various Densities
Mix DF Parameter Estimate
Standard Error t statistic P-value
KY55 Intercept 1 358.7424 36.5928 9.8036 0.0006 Slope 1 -10.0317 3.6910 -2.7179 0.0531
KY85 Intercept 1 256.0227 53.9375 4.7467 0.0090 Slope 1 5.1615 5.7652 0.8953 0.4212
KY98 Intercept 1 305.5319 52.8050 5.7860 0.0044 Slope 1 -2.0560 4.7994 -0.4284 0.6904
US42 Intercept 1 297.8199 74.0821 4.0201 0.0159 Slope 1 -2.4237 7.2194 -0.3357 0.7540
US60 Intercept 1 363.8761 51.1039 7.1203 0.0021 Slope 1 -11.6074 4.8089 -2.4137 0.0733
104
CHAPTER 6 SENSITIVITY OF IRT FRACTURE TEST TO ASPHALT AGING
Hot-mix asphalt (HMA) is an engineering material which is composed of asphalt binder
and mineral aggregates. The brittleness of an HMA mix is highly dependent upon the
stiffness of the binder that is incorporated into the aggregate. Asphalt binder is only one
of the many products that are refined from crude oil, and it undergoes an oxidative
reaction with air continuously during its production and in service (Asphalt Institute
2008). Oxidation of the asphalt molecules takes place over years; however, this gradual
reaction can translate into substantial changes in the mechanical properties of asphalt
after a few years.
In the most prominent form, oxidative aging of asphalt binders manifests itself in
the form of a non-reversible stiffening and hardening of asphalt. The degree of stiffening
and hardening of binder is also a function of its crude source and chemical composition
(Branthaver et al. 1993). Moreover, the oxidative reaction of asphalt molecules makes the
asphalt material more brittle and undermines its stress relaxation capabilities. Thus, HMA
pavements become more susceptible to cracking as they age. At the pavement surface,
where the asphalt is exposed to the traffic and environmental factors, the rate of aging is
faster than in deeper layers. As the result, aging creates a gradient in the material
properties due to variation in the amount of aging across the depth of pavement.
Two primary stages are typically defined for oxidative aging of asphalt (Mirza
and Witczak 1996):
• Short-term aging, which occurs during the production, hauling, placement, and
compaction of the HMA pavement.
• Long-term aging, which takes place in the field and during the service life of the
pavement.
Due to the higher temperatures of asphalt during the construction process, the short-term
oxidative reaction takes place at a faster rate. This process in a laboratory is typically
simulated by conditioning the HMA samples in a forced-draft oven.
105

To simulate the short-term aging, 4 hours of loose-mix conditioning at 135°C was
recommended for HMA at the end of the Strategic Highway Research Program (Bell et
al. 1994) for both volumetric design and mechanical testing. To expedite the mixture
design process and reduce the number of ovens required for mixture design, the FHWA
Mixtures and Aggregates Expert Task Group (ETG) recommended that the short-term
oven conditioning time for mixture design be changed to two hours at the compaction
temperature. These recommendations were later standardized under AASHTO R 30
(2002) practice.
According to AASHTO R 30, to simulate long-term aging, compacted specimens
must be conditioned at 85°C for five days in a forced-draft oven. Nonetheless, this
method has not shown to be practical in aging the HMA specimens (Braham et al. 2009;
Azari and Mohseni 2013). Instead, a modified loose-mix conditioning has been
developed by researchers which recommends for the loose HMA samples to be
conditioned at 135°C for 24 hours (Zeinali et al. 2014; Blankenship et al. 2010; Braham
et al. 2009). For this type of conditioning, the loose-mix samples are spread in metal pans
at 25 to 50 millimeters depth.
The modified long-term oven aging was used in this part of the study to execute
an experimental study to investigate the effect of aging via the IRT fracture testing. This
experimental study would reveal whether the IRT fracture test is capable of
distinguishing the changes that occur in the HMA material properties as a result of long-
term oven aging. This study would also provide more information about the changes that
may occur in the low-temperature performance of the asphalt pavements as they age and
become more brittle.
6.1 Materials and Test Matrix
Four out of five HMA mixtures from the KYTC Density project (Table 4.1) were used in
the experimental study on HMA aging: KY55 (Adair County), KY85 (Ohio County),
KY98 (Allen County), US42 (Oldham County). Before compaction, two different
conditioning methods were performed on the loose-mix samples:
106

1- 0-hr conditioning: loose- mix samples were reheated in metal pans until they
reached the compaction temperature. Since the samples had been collected from
hauling trucks, they had already undergone the short-term aging in the field.
Therefore, the metal pans were covered with aluminum foil during the laboratory
heating to minimize aging during this period of time.
2- 24-hr conditioning: loose-mix samples were conditioned at 135°C for 24 hours.
The samples were spread in a single metal pan at the depth of 40 millimeters
during the 24-hr conditioning.
After conditioning, all the samples were compacted to 8.0±0.5 percent air
voids. This air voids level was selected to make the data comparable to those of the
KYTC Density project. The IRT fracture test specimens were produced according to
the procedures developed in Chapter 3. For each mix, the IRT fracture test was
conducted at three temperatures and two conditioning types. Triplicate specimens
were tested for each combination and 72 specimens were tested in total for this
experimental study.
6.2 IRT Fracture Test Data
6.2.1 Fracture Toughness Results
The IRT fracture test was conducted at -2, -12, and -22°C for each HMA type. The
original load-displacement plots for these tests are shown in Appendix C. The test data
were then used in conjunction with Equation 3.1 to calculate the fracture toughness of the
mixtures at various temperatures and aging durations. Figure 6.1 displays the variation of
the fracture toughness of the mixtures at various temperatures and conditioning durations.
The variation of fracture toughness with respect to test temperature in these plots follows
the same pattern that was observed in the test development procedure (Figure 3.14). The
Tukey’s HSD pairwise comparison that was conducted on the data showed that by
decreasing the temperature from -2°C to -12°C, the fracture toughness of all mixtures
increased significantly. Nonetheless, no significant change in fracture toughness was
observed by further decreasing the temperature to -22°C.
107
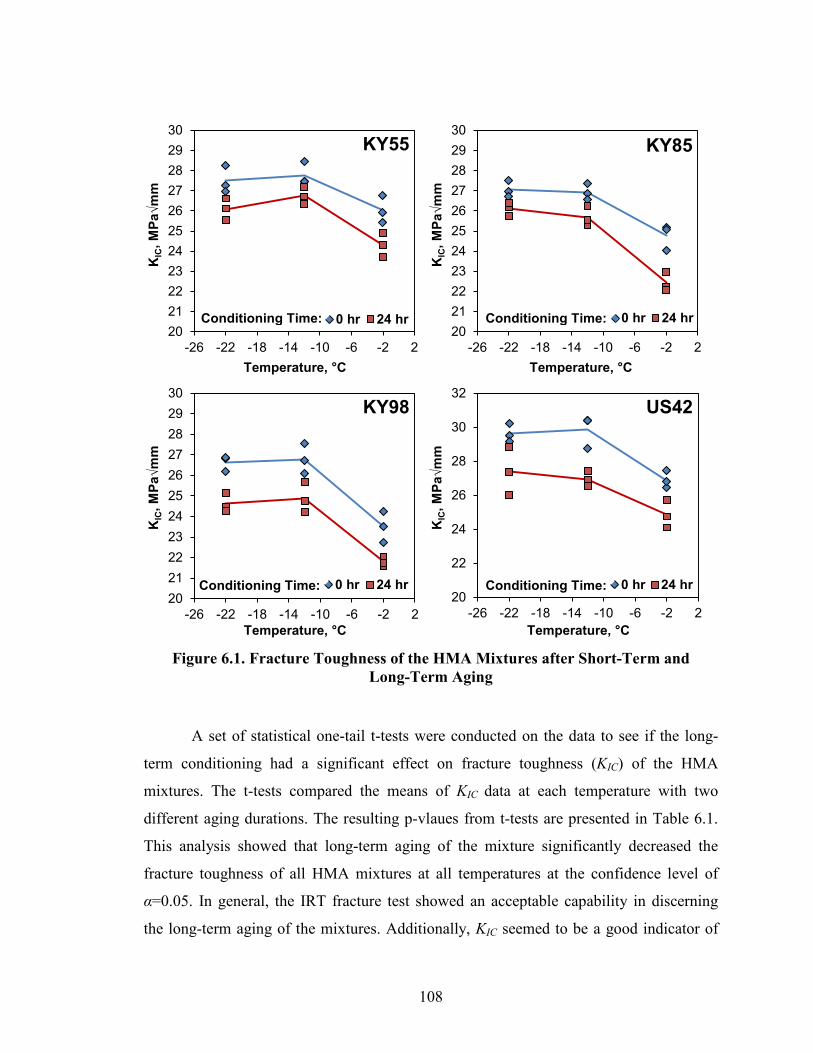
Figure 6.1. Fracture Toughness of the HMA Mixtures after Short-Term and
Long-Term Aging
A set of statistical one-tail t-tests were conducted on the data to see if the long-
term conditioning had a significant effect on fracture toughness (KIC) of the HMA
mixtures. The t-tests compared the means of KIC data at each temperature with two
different aging durations. The resulting p-vlaues from t-tests are presented in Table 6.1.
This analysis showed that long-term aging of the mixture significantly decreased the
fracture toughness of all HMA mixtures at all temperatures at the confidence level of
α=0.05. In general, the IRT fracture test showed an acceptable capability in discerning
the long-term aging of the mixtures. Additionally, KIC seemed to be a good indicator of
2021222324252627282930
-26 -22 -18 -14 -10 -6 -2 2
KIC
, MPa
√mm
Temperature, °C
KY55
0 hr 24 hr2021222324252627282930
-26 -22 -18 -14 -10 -6 -2 2
KIC
, MPa
√mm
Temperature, °C
KY85
0 hr 24 hr
2021222324252627282930
-26 -22 -18 -14 -10 -6 -2 2
KIC
, MPa
√mm
Temperature, °C
KY98
0 hr 24 hr20
22
24
26
28
30
32
-26 -22 -18 -14 -10 -6 -2 2
KIC
, MPa
√mm
Temperature, °C
US42
0 hr 24 hr
Conditioning Time: Conditioning Time:
Conditioning Time: Conditioning Time:
108
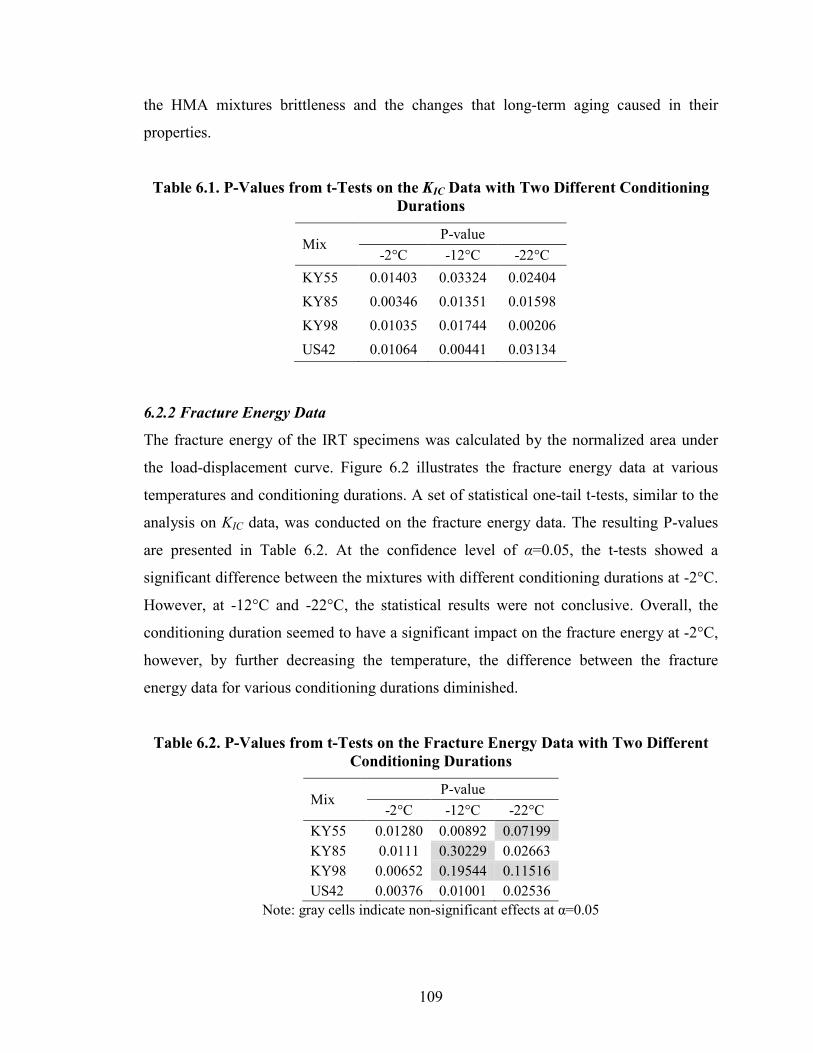
the HMA mixtures brittleness and the changes that long-term aging caused in their
properties.
Table 6.1. P-Values from t-Tests on the KIC Data with Two Different Conditioning Durations
Mix P-value
-2°C -12°C -22°C KY55 0.01403 0.03324 0.02404 KY85 0.00346 0.01351 0.01598 KY98 0.01035 0.01744 0.00206 US42 0.01064 0.00441 0.03134
6.2.2 Fracture Energy Data
The fracture energy of the IRT specimens was calculated by the normalized area under
the load-displacement curve. Figure 6.2 illustrates the fracture energy data at various
temperatures and conditioning durations. A set of statistical one-tail t-tests, similar to the
analysis on KIC data, was conducted on the fracture energy data. The resulting P-values
are presented in Table 6.2. At the confidence level of α=0.05, the t-tests showed a
significant difference between the mixtures with different conditioning durations at -2°C.
However, at -12°C and -22°C, the statistical results were not conclusive. Overall, the
conditioning duration seemed to have a significant impact on the fracture energy at -2°C,
however, by further decreasing the temperature, the difference between the fracture
energy data for various conditioning durations diminished.
Table 6.2. P-Values from t-Tests on the Fracture Energy Data with Two Different Conditioning Durations
Mix P-value
-2°C -12°C -22°C KY55 0.01280 0.00892 0.07199 KY85 0.0111 0.30229 0.02663 KY98 0.00652 0.19544 0.11516 US42 0.00376 0.01001 0.02536
Note: gray cells indicate non-significant effects at α=0.05
109
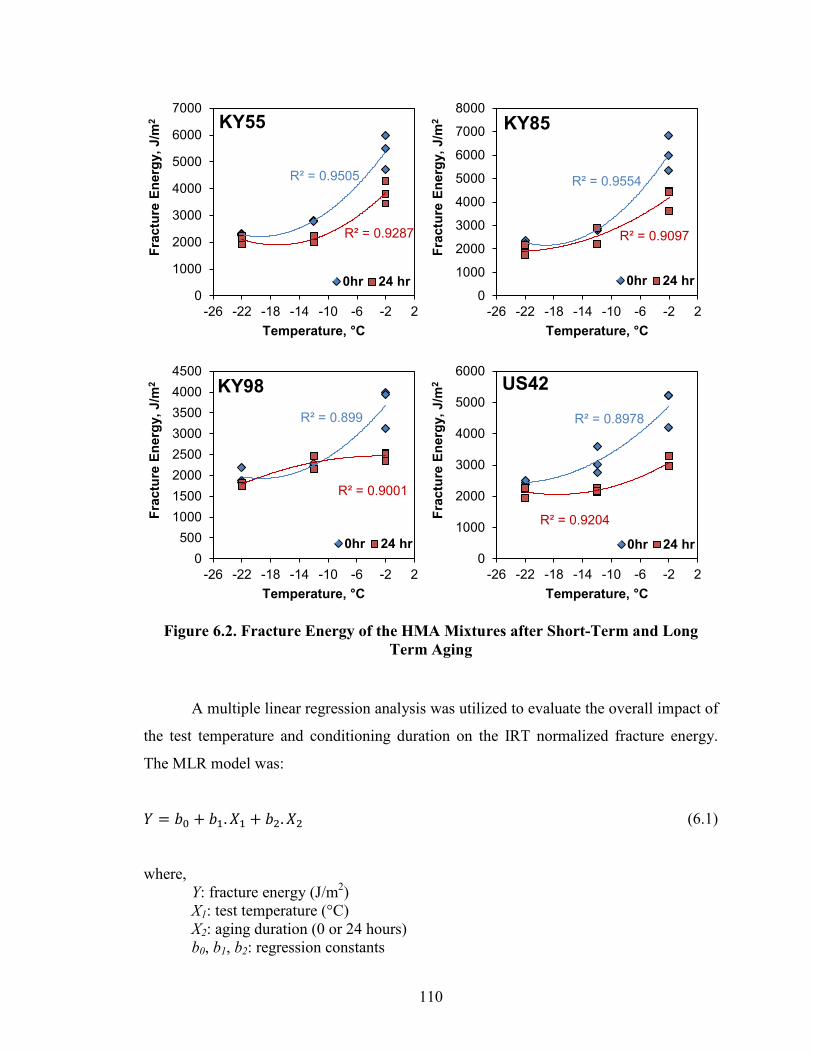
Figure 6.2. Fracture Energy of the HMA Mixtures after Short-Term and Long
Term Aging
A multiple linear regression analysis was utilized to evaluate the overall impact of
the test temperature and conditioning duration on the IRT normalized fracture energy.
The MLR model was:
𝑌 = 𝑏0 + 𝑏1.𝑋1 + 𝑏2.𝑋2 (6.1)
where, Y: fracture energy (J/m2) X1: test temperature (°C) X2: aging duration (0 or 24 hours) b0, b1, b2: regression constants
R² = 0.9505
R² = 0.9287
0
1000
2000
3000
4000
5000
6000
7000
-26 -22 -18 -14 -10 -6 -2 2
Frac
ture
Ene
rgy,
J/m
2
Temperature, °C
KY55
0hr 24 hr
R² = 0.9554
R² = 0.9097
0
1000
2000
3000
4000
5000
6000
7000
8000
-26 -22 -18 -14 -10 -6 -2 2
Frac
ture
Ene
rgy,
J/m
2
Temperature, °C
KY85
0hr 24 hr
R² = 0.899
R² = 0.9001
0500
10001500200025003000350040004500
-26 -22 -18 -14 -10 -6 -2 2
Frac
ture
Ene
rgy,
J/m
2
Temperature, °C
KY98
0hr 24 hr
R² = 0.8978
R² = 0.9204
0
1000
2000
3000
4000
5000
6000
-26 -22 -18 -14 -10 -6 -2 2
Frac
ture
Ene
rgy,
J/m
2
Temperature, °C
US42
0hr 24 hr
110
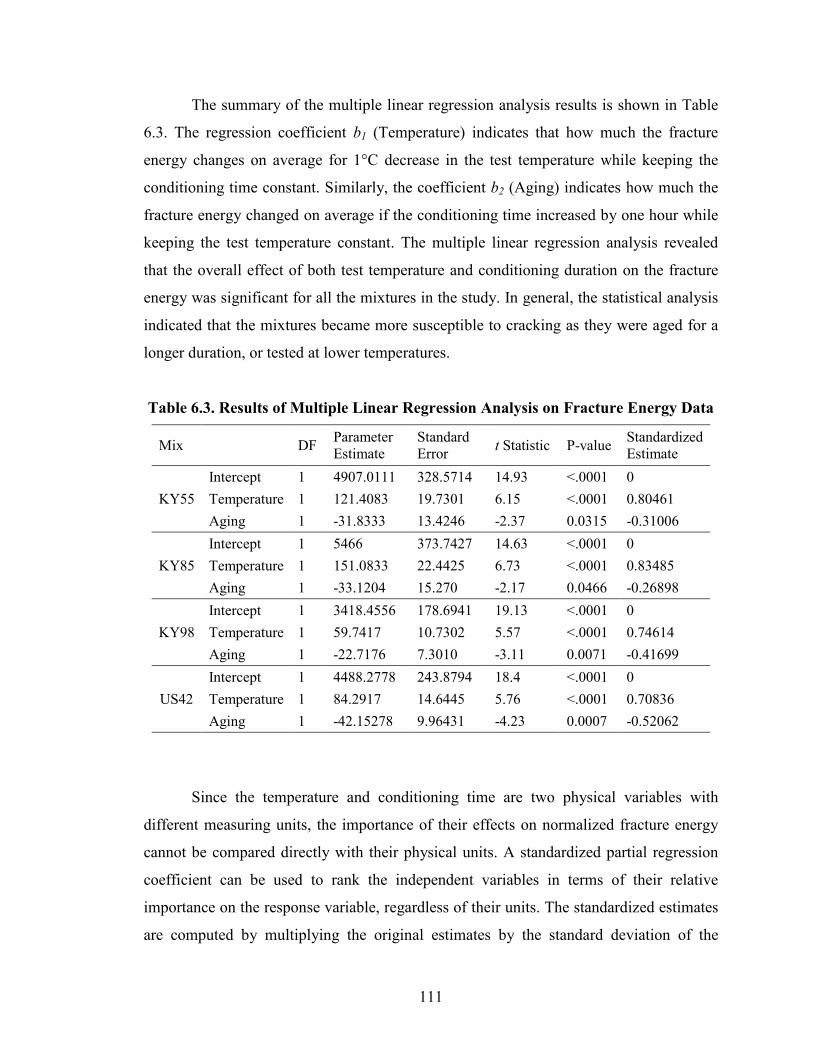
The summary of the multiple linear regression analysis results is shown in Table
6.3. The regression coefficient b1 (Temperature) indicates that how much the fracture
energy changes on average for 1°C decrease in the test temperature while keeping the
conditioning time constant. Similarly, the coefficient b2 (Aging) indicates how much the
fracture energy changed on average if the conditioning time increased by one hour while
keeping the test temperature constant. The multiple linear regression analysis revealed
that the overall effect of both test temperature and conditioning duration on the fracture
energy was significant for all the mixtures in the study. In general, the statistical analysis
indicated that the mixtures became more susceptible to cracking as they were aged for a
longer duration, or tested at lower temperatures.
Table 6.3. Results of Multiple Linear Regression Analysis on Fracture Energy Data
Mix
DF Parameter Estimate
Standard Error t Statistic P-value Standardized
Estimate
KY55 Intercept 1 4907.0111 328.5714 14.93 <.0001 0 Temperature 1 121.4083 19.7301 6.15 <.0001 0.80461 Aging 1 -31.8333 13.4246 -2.37 0.0315 -0.31006
KY85 Intercept 1 5466 373.7427 14.63 <.0001 0 Temperature 1 151.0833 22.4425 6.73 <.0001 0.83485 Aging 1 -33.1204 15.270 -2.17 0.0466 -0.26898
KY98 Intercept 1 3418.4556 178.6941 19.13 <.0001 0 Temperature 1 59.7417 10.7302 5.57 <.0001 0.74614 Aging 1 -22.7176 7.3010 -3.11 0.0071 -0.41699
US42 Intercept 1 4488.2778 243.8794 18.4 <.0001 0 Temperature 1 84.2917 14.6445 5.76 <.0001 0.70836 Aging 1 -42.15278 9.96431 -4.23 0.0007 -0.52062
Since the temperature and conditioning time are two physical variables with
different measuring units, the importance of their effects on normalized fracture energy
cannot be compared directly with their physical units. A standardized partial regression
coefficient can be used to rank the independent variables in terms of their relative
importance on the response variable, regardless of their units. The standardized estimates
are computed by multiplying the original estimates by the standard deviation of the
111
regressor (independent) variable and then dividing by the standard deviation of the
dependent variable.
The standardized partial regression coefficients were generated for the IRT
fracture test data, and presented in the Table 6.3. A comparison between the standardized
estimated values for Temperature and Aging coefficients showed that the test temperature
was slightly more impactful on fracture energy than aging duration in the analyzed range.
It should be noted that using a linear regression model does not necessarily signify that
there is a causal relationship between the fracture energy and aging time or test
temperature.
In summary, fracture energy seemed to be sensitive to aging duration at -2°C.
However, at -12°C and -22°C, fracture energy did not distinguish the change in material
properties. The reason behind this could be the sensitivity of the fracture energy to the
specimen stiffness. By reducing the temperature, the rate of change in the specimen
stiffness slows down and consequently, the fracture energy becomes less sensitive to the
changes in material property.
112
FUTURE RESEARCH SUGGESTIONS
The primary focus of this research was to develop an implementable and repeatable test
for characterizing the fracture properties of HMA. The background on development of
the test and measuring the elastic fracture properties of the HMA was also covered in the
research. Although the test results showed a brittle fracture at below glass transition
temperatures, further research is required to determine whether a significant portion of
the fracture energy has been consumed in plastic deformation of the material in the
vicinity of the notch tip. The results of such research would assist in refining a fracture-
based model to analyze low-temperature cracking in asphalt pavements. Such an analysis
should also account for the effect of repeated environmental and traffic loading on
changing the fracture properties of HMA.
In order to standardize the IRT fracture test by American Society for Testing and
Materials (ASTM), more experiments re required on the possible factors that may
influence the test results. Such experimental studies may include testing at different
temperatures with small intervals, various sample sizes, and different binder types. The
minimum specimen thickness to satisfy the plane-strain conditions can also be
determined more accurately from such studies.
The experimental studies which were conducted during this research revealed that
the IRT test has a good capability in discerning the variations in asphalt mixtures. An
analysis method was also developed to correlate the test results to field performance. To
examine the accuracy of this analysis and find a better correlation to pavements
performance, the analysis results should be compared and calibrated to the thermal
cracking data of the pavements which can be collected by field cracking surveys.
Moreover, implementing the test at the DOT level requires a full understanding of the
variables that may affect the test results as well as the test’s response to a wide range of
various mixture properties.
113
SYNOPSIS AND CONCLUSIONS
The Indirect Ring Tension (IRT) fracture test, which is also known as Kentucky Fracture
Test (KFT), was developed as a user-friendly tool for fracture characterization of hot-mix
asphalt. An IRT fracture specimen is basically made from a cylindrical sample of HMA.
To make an IRT fracture specimen, first, a disk-shaped specimen of HMA is cut from a
gyratory compacted sample or a field core. Then, a small cylinder is cored out from the
center of the disk-shaped sample to form a ring-shaped specimen. Then, a cutting device
is passed through the central hole to cut two notches with equal lengths along the
diametrical loading line, on two sides of the central circle.
The IRT test proved to be very effective in measuring the fundamental fracture
properties of hot-mix asphalt (HMA) while maintaining its practicality and user-
friendliness. In general, the IRT test seemed to be advantageous over all other existing
test configurations for low-temperature fracture characterization of HMA. The simplicity
of the IRT test configuration combined with the widespread availability of its test device
enables preforming the test at the state highway agency level. The main advantages of the
IRT fracture test include:
• Potential for low-cost implementation at the highway agencies level
• Capability of testing both field cores and laboratory-compacted samples
• Execution with the existing equipment in most HMA laboratories
• Simulating the stress distribution of an HMA layer under low-temperature tensile
loads
• Clearly distinguishing the transition of HMA from ductile to quasi-brittle phase
• Producing a straight crack growth pattern and mode-I fracture on a relatively
consistent basis
• Higher repeatability than other fracture tests currently in use for HMA
• Relatively large fracture surface zone
To develop a fracture-mechanics-based test, the stress intensity factor formula for
the IRT geometry was calibrated by a numerical solution method. Finite element (FE)
modeling was used to calculate the stress distribution and displacement of IRT test, and
obtain the mode-I stress intensity factor based upon the solution results. In order to
114
develop a comprehensive numerical solution, numerous FE models were generated with
various geometric parameters (inner radius, outer radius, and notch length) and under
different loads. Crack tip elements were used in the FE models to account for the
singularity of the stress at the crack tip and produce accurate displacement data.
Moreover, the loading platens were included in the model to account for the effect of load
distribution on the specimen surface.
The finite element model was verified by simplifying it to the centrally cracked
IDT specimen and comparing its FE results to the closed-form solutions in the literature.
After satisfactory verification of the model, the results of more than 3600 FE model runs
were consolidated in the form of a single equation, which allows for fracture toughness
(KIC) and fatigue fracture testing of linear elastic materials using the IRT specimen with a
range of dimensions. This equation provides the user with the versatility to fabricate the
IRT specimen with the existing equipment in the laboratory and desirable dimensions.
An experimental plan was designed to develop a procedure for running the IRT
fracture test at low temperatures. The goal of this part of the study was to determine the
optimal loading rate and testing temperature for the IRT fracture test to capture the linear
elastic fracture properties of HMA with high repeatability. This optimization was
performed by testing two plant-produced mixtures which were collected for a Kentucky
Transportation Cabinet research project. One of the HMA mixtures was produced with a
neat PG 64-22 and another was produced with a polymer-modified PG 76-22 binder. All
the tests in this research study were conducted at the Asphalt Institute’s laboratory using
fully calibrated equipment.
To find the optimal loading rate for the IRT fracture test, a set of specimens were
tested at three different monotonic loading rates: 12.5, 1.0 and 0.1 mm/min. Then, the
plane-strain fracture toughness (KIC) of each specimen was calculated by the newly
developed KI calibration equation. Additionally, the normalized fracture energy of the
specimens was determined by calculating the area under the load-displacement curve and
normalizing it over the fracture surface area. Based upon the statistical analysis on the
data, an optimal loading rate of 1.0 mm/min was recommended for the test. The IRT test
exhibited a strong capability in detecting the differences in fracture potential between the
field-produced mixes. Both mixtures were made with PG XX-22 binders, which means
115
based upon binder test data alone their low temperature cracking potential would be
expected to be identical. However, the IRT fracture test captured a significant difference
between these HMA mixes in terms of their cracking susceptibility at low temperatures.
To determine proper IRT test protocols, and to examine the effect of test
temperature on the fracture properties of the mixtures, triplicate samples from both field
mixtures were tested at 2°C, -12°C, and -22°C. At -2°C, when the asphalt had not entered
the brittle phase yet, the HMA specimens exhibited gradual and ductile crack propagation
after the initial crack growth. However, at -12°C and -22°C, when the asphalt was in
brittle phase, a sudden and brittle fracture was observed after the initial crack growth. In
fact, the test showed a noteworthy capability in capturing the ductile-to-brittle transition
of HMA. Further analysis revealed that decreasing the temperature from -12°C to -22°C
did not cause a significant change in the KIC value. At these temperatures, the test data
passed the requirements of the ASTM E399 test for linear elastic fracture test. However,
at -2°C, the specimen experienced a significant amount of permanent deformation and the
linear elastic conditions did not exist. Therefore, the plane-strain fracture toughness of
these mixtures could not account for all the energy that was consumed in the specimen
fracture.
In addition to the fundamental fracture properties, the relaxation properties of
HMA have an important impact on its cracking susceptibility. An analysis method was
developed to generate a cracking susceptibility indicator for HMA material based on both
fracture and relaxation properties. To perform this analysis, a set of creep compliance
tests was conducted at various temperatures on five plant-produced mixtures which were
collected from highway project in central Kentucky area. The creep compliance master
curve data for each mixture were then converted to stress relaxation modulus through
numerical methods. A viscoelastic model was developed to calculate the thermally-
induced tensile stress in the pavements for a hypothetical cooling scenario.
By employing the linear fracture mechanics theory, IRT fracture test data, and
using the thermal stress analysis, the maximum allowable crack sizes (MACS) were
calculated for a range of various temperatures. MACS at each temperature represents the
smallest crack size in the pavement that would start growing as the pavement temperature
drops to the designated temperature according to the hypothetical cooling scenario (the
116
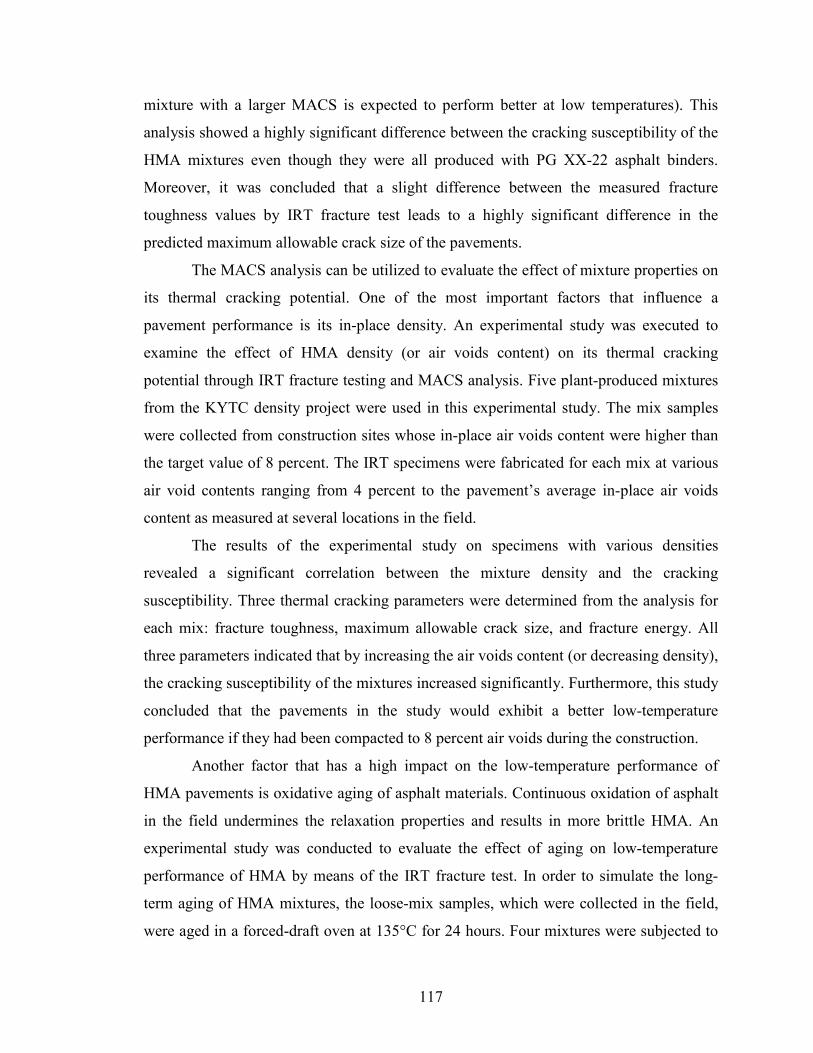
mixture with a larger MACS is expected to perform better at low temperatures). This
analysis showed a highly significant difference between the cracking susceptibility of the
HMA mixtures even though they were all produced with PG XX-22 asphalt binders.
Moreover, it was concluded that a slight difference between the measured fracture
toughness values by IRT fracture test leads to a highly significant difference in the
predicted maximum allowable crack size of the pavements.
The MACS analysis can be utilized to evaluate the effect of mixture properties on
its thermal cracking potential. One of the most important factors that influence a
pavement performance is its in-place density. An experimental study was executed to
examine the effect of HMA density (or air voids content) on its thermal cracking
potential through IRT fracture testing and MACS analysis. Five plant-produced mixtures
from the KYTC density project were used in this experimental study. The mix samples
were collected from construction sites whose in-place air voids content were higher than
the target value of 8 percent. The IRT specimens were fabricated for each mix at various
air void contents ranging from 4 percent to the pavement’s average in-place air voids
content as measured at several locations in the field.
The results of the experimental study on specimens with various densities
revealed a significant correlation between the mixture density and the cracking
susceptibility. Three thermal cracking parameters were determined from the analysis for
each mix: fracture toughness, maximum allowable crack size, and fracture energy. All
three parameters indicated that by increasing the air voids content (or decreasing density),
the cracking susceptibility of the mixtures increased significantly. Furthermore, this study
concluded that the pavements in the study would exhibit a better low-temperature
performance if they had been compacted to 8 percent air voids during the construction.
Another factor that has a high impact on the low-temperature performance of
HMA pavements is oxidative aging of asphalt materials. Continuous oxidation of asphalt
in the field undermines the relaxation properties and results in more brittle HMA. An
experimental study was conducted to evaluate the effect of aging on low-temperature
performance of HMA by means of the IRT fracture test. In order to simulate the long-
term aging of HMA mixtures, the loose-mix samples, which were collected in the field,
were aged in a forced-draft oven at 135°C for 24 hours. Four mixtures were subjected to
117

long-term laboratory aging and compacted. As the control point, a set of samples were
only reheated with no extra aging and compacted to make the IRT specimens.
For this experimental study, the HMA mixtures were tested for IRT fracture
toughness and fracture energy at three temperatures (-2, -12, -22°C) and two aging
durations (0-hr and 24-hr aging durations). The data analysis concluded that long-term
laboratory aging significantly lowered the fracture toughness of all four mixtures at all
tested temperatures. Additionally, the overall relationship between the obtained KIC data
and the temperature was similar for all mixtures. The normalized fracture energy data
showed that the long-term aging had a high impact on the mixtures stiffness and resulted
in increased cracking potential for the mixtures. The fracture energy seemed to vary more
quickly with respect to temperature at -2°C. By lowering the test temperature, the
sensitivity of fracture energy data to test temperature decreased. This could be due to the
dependency of normalized fracture energy on the mix stiffness. The statistical analysis
showed that the test temperature was slightly more influential on fracture energy than
aging duration in the analyzed range.
In summary, the IRT test proved to be a useful tool for evaluating the HMA
material performance at low temperatures. The test showed to be capable of discerning
the differences between the mixtures and can be utilized to rank HMA mixtures based on
their thermal cracking potential. Considering the findings and observations of this
research, it is recommended that this test be slated for trial implementation at the state
highway agency level.
118
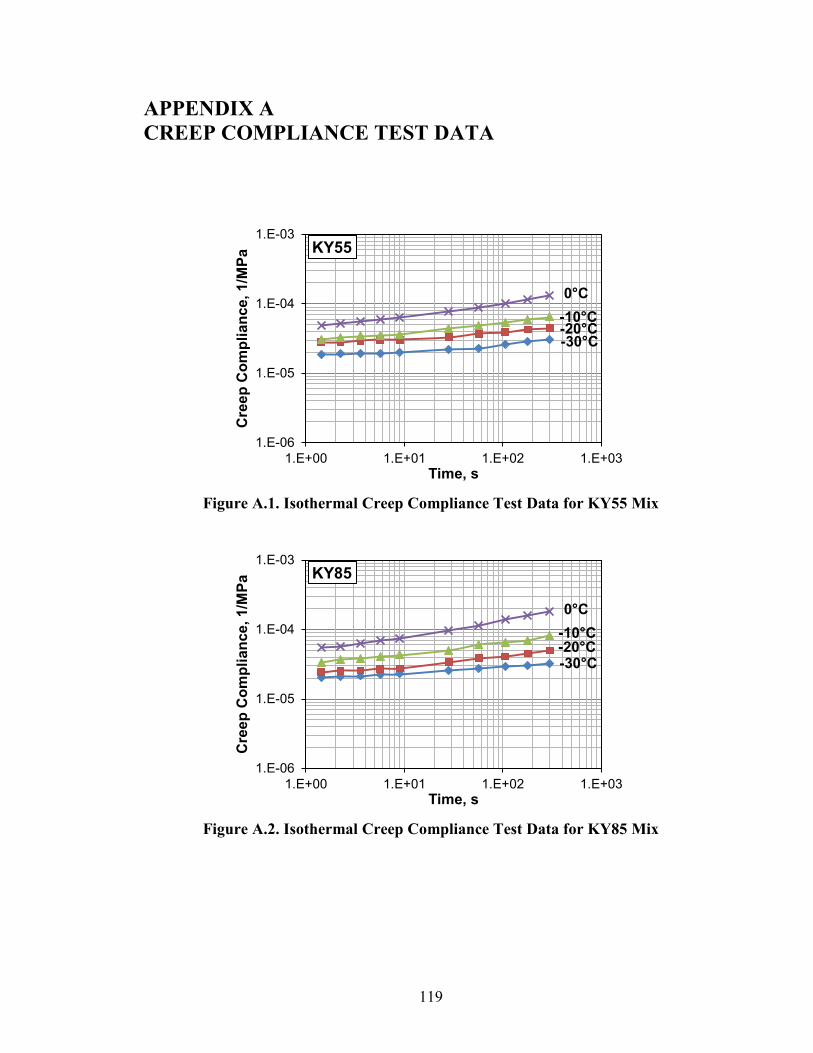
APPENDIX A CREEP COMPLIANCE TEST DATA
Figure A.1. Isothermal Creep Compliance Test Data for KY55 Mix
Figure A.2. Isothermal Creep Compliance Test Data for KY85 Mix
1.E-06
1.E-05
1.E-04
1.E-03
1.E+00 1.E+01 1.E+02 1.E+03
Cre
ep C
ompl
ianc
e, 1
/MPa
Time, s
KY55
0°C
-30°C -20°C -10°C
1.E-06
1.E-05
1.E-04
1.E-03
1.E+00 1.E+01 1.E+02 1.E+03
Cre
ep C
ompl
ianc
e, 1
/MPa
Time, s
KY85
0°C
-30°C -20°C -10°C
119

Figure A.3. Isothermal Creep Compliance Test Data for KY98 Mix
Figure A.4. Isothermal Creep Compliance Test Data for US42 Mix
Figure A.5. Isothermal Creep Compliance Test Data for US60 Mix
1.E-06
1.E-05
1.E-04
1.E-03
1.E+00 1.E+01 1.E+02 1.E+03
Cre
ep C
ompl
ianc
e, 1
/MPa
Time, s
KY98
0°C
-30°C -20°C -10°C
1.E-06
1.E-05
1.E-04
1.E-03
1.E+00 1.E+01 1.E+02 1.E+03
Cre
ep C
ompl
ianc
e, 1
/MPa
Time, s
US42
0°C
-30°C -20°C -10°C
1.E-06
1.E-05
1.E-04
1.E-03
1.E+00 1.E+01 1.E+02 1.E+03
Cre
ep C
ompl
ianc
e, 1
/MPa
Time, s
US60
-30°C -20°C -10°C
120

Figure A.6. Shift Factors and Arrhenius Function for KY55 Mix
Figure A.7. Shift Factors and Arrhenius Function for KY85 Mix
Figure A.8. Shift Factors and Arrhenius Function for KY98 Mix
y = 9881.4x - 0.1018 R² = 0.9858
-6
-5
-4
-3
-2
-1
0
1
-0.0006 -0.0004 -0.0002 0
log
(aT)
(1/T-1/Tref), 1/°Kelvin
KY55
y = 8809.3x + 0.0786 R² = 0.9958
-6
-5
-4
-3
-2
-1
0
1
-0.0006 -0.0004 -0.0002 -1E-18
log
(aT)
(1/T-1/Tref), 1/°Kelvin
KY85
y = 7705.1x - 0.0439 R² = 0.9491
-6
-5
-4
-3
-2
-1
0
1
-0.0006 -0.0004 -0.0002 0
log
(aT)
(1/T-1/Tref), 1/°Kelvin
KY98
121
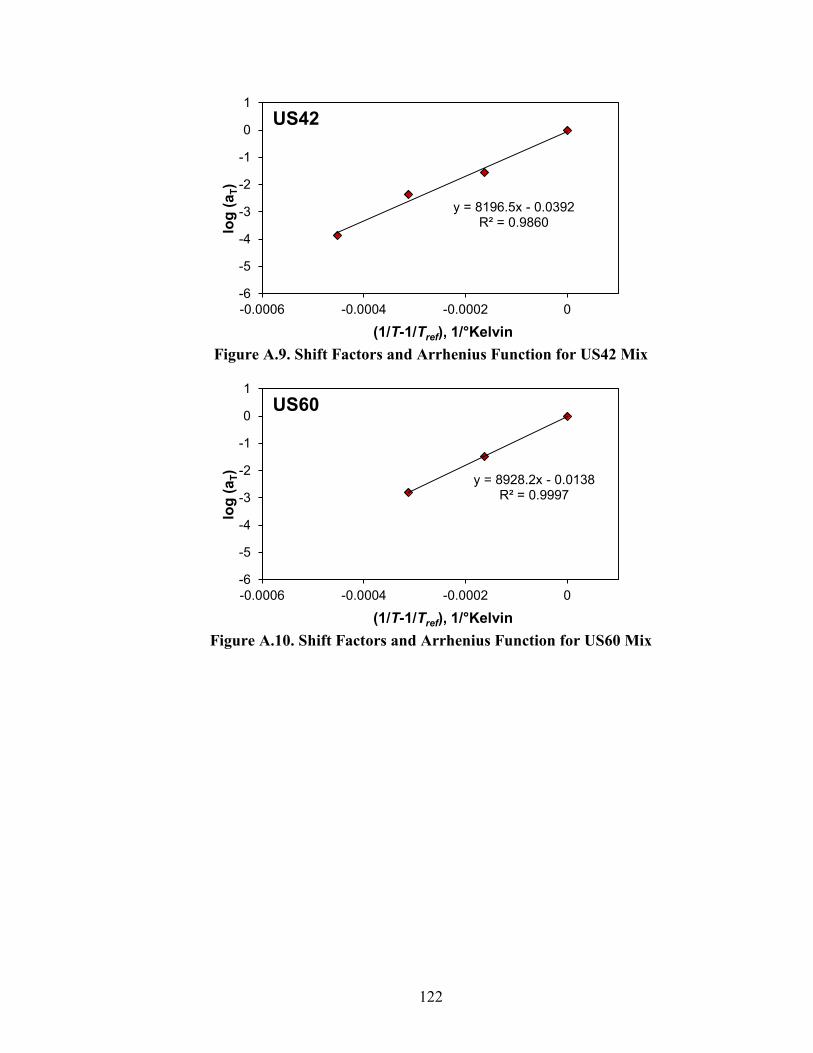
Figure A.9. Shift Factors and Arrhenius Function for US42 Mix
Figure A.10. Shift Factors and Arrhenius Function for US60 Mix
y = 8196.5x - 0.0392 R² = 0.9860
-6
-5
-4
-3
-2
-1
0
1
-0.0006 -0.0004 -0.0002 0
log
(aT)
(1/T-1/Tref), 1/°Kelvin
US42
y = 8928.2x - 0.0138 R² = 0.9997
-6
-5
-4
-3
-2
-1
0
1
-0.0006 -0.0004 -0.0002 0
log
(aT)
(1/T-1/Tref), 1/°Kelvin
US60
122

APPENDIX B IRT FRACTURE TEST DATA FOR DENSITY STUDY
Figure B.1. IRT Fracture Test Data for KY55 Mix with 4.0% Air Voids
Figure B.2. IRT Fracture Test Data for KY55 Mix with 7.0% Air Voids
Figure B.3. IRT Fracture Test Data for KY55 Mix with 11.5% Air Voids
0
5000
10000
15000
20000
25000
30000
35000
0 0.2 0.4 0.6 0.8 1 1.2
Load
, N
Load-Point Displacement, mm
KY55-1KY55-2KY55-3
Air Voids: 4.0±0.5% Temperature: -22°C Aging: 24 hr at 135°C
Specimen ID:
0
5000
10000
15000
20000
25000
30000
35000
0 0.2 0.4 0.6 0.8 1 1.2
Load
, N
Load-Point Displacement, mm
KY55-4KY55-5KY55-6
Air Voids: 7.0±0.5% Temperature: -22°C Aging: 24 hr at 135°C
Specimen ID:
0
5000
10000
15000
20000
25000
30000
35000
0 0.2 0.4 0.6 0.8 1
Load
, N
Load-Point Displacement, mm
KY55-7KY55-8KY55-9
Air Voids: 11.5±0.5% Temperature: -22°C Aging: 24 hr at 135°C
Specimen ID:
123
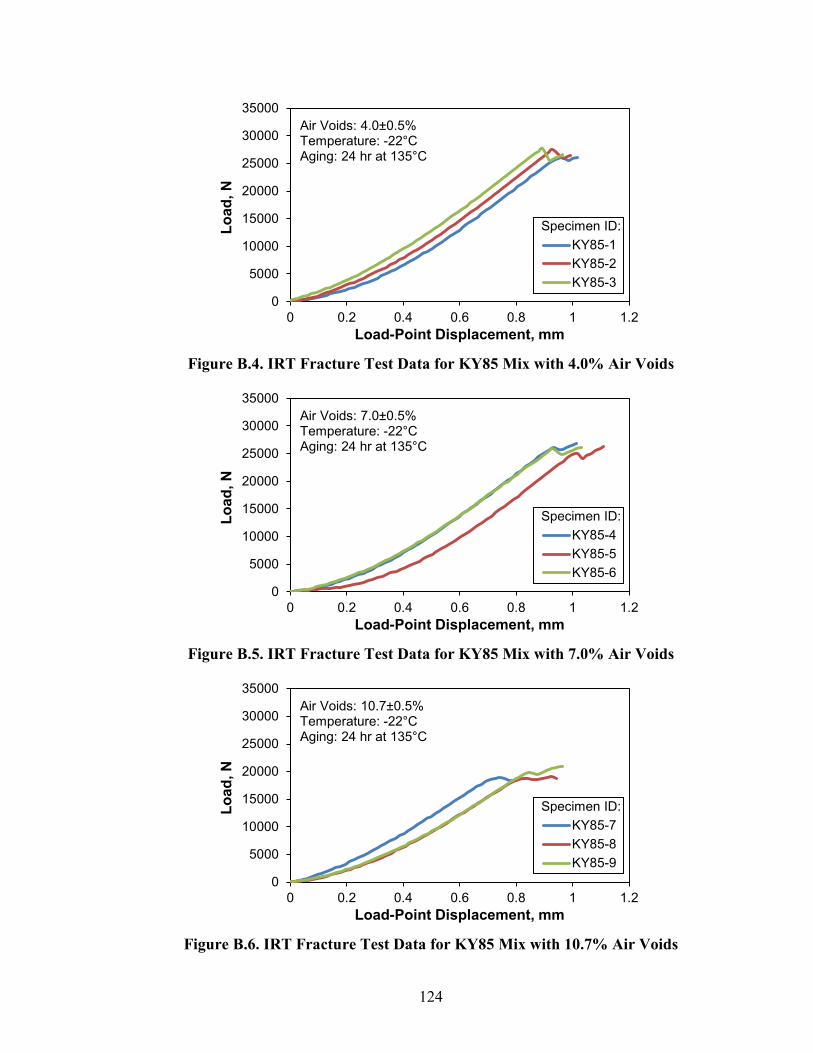
Figure B.4. IRT Fracture Test Data for KY85 Mix with 4.0% Air Voids
Figure B.5. IRT Fracture Test Data for KY85 Mix with 7.0% Air Voids
Figure B.6. IRT Fracture Test Data for KY85 Mix with 10.7% Air Voids
0
5000
10000
15000
20000
25000
30000
35000
0 0.2 0.4 0.6 0.8 1 1.2
Load
, N
Load-Point Displacement, mm
KY85-1KY85-2KY85-3
Air Voids: 4.0±0.5% Temperature: -22°C Aging: 24 hr at 135°C
Specimen ID:
0
5000
10000
15000
20000
25000
30000
35000
0 0.2 0.4 0.6 0.8 1 1.2
Load
, N
Load-Point Displacement, mm
KY85-4KY85-5KY85-6
Air Voids: 7.0±0.5% Temperature: -22°C Aging: 24 hr at 135°C
Specimen ID:
0
5000
10000
15000
20000
25000
30000
35000
0 0.2 0.4 0.6 0.8 1 1.2
Load
, N
Load-Point Displacement, mm
KY85-7KY85-8KY85-9
Air Voids: 10.7±0.5% Temperature: -22°C Aging: 24 hr at 135°C
Specimen ID:
124
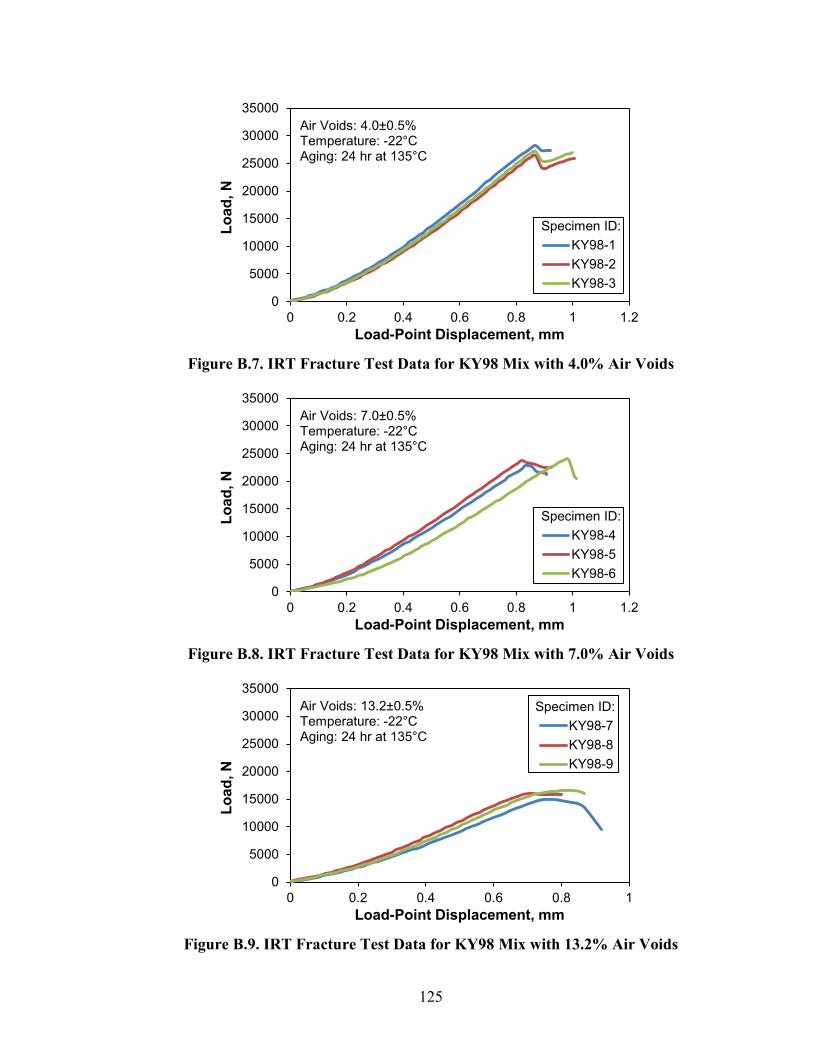
Figure B.7. IRT Fracture Test Data for KY98 Mix with 4.0% Air Voids
Figure B.8. IRT Fracture Test Data for KY98 Mix with 7.0% Air Voids
Figure B.9. IRT Fracture Test Data for KY98 Mix with 13.2% Air Voids
0
5000
10000
15000
20000
25000
30000
35000
0 0.2 0.4 0.6 0.8 1 1.2
Load
, N
Load-Point Displacement, mm
KY98-1KY98-2KY98-3
Air Voids: 4.0±0.5% Temperature: -22°C Aging: 24 hr at 135°C
Specimen ID:
0
5000
10000
15000
20000
25000
30000
35000
0 0.2 0.4 0.6 0.8 1 1.2
Load
, N
Load-Point Displacement, mm
KY98-4KY98-5KY98-6
Air Voids: 7.0±0.5% Temperature: -22°C Aging: 24 hr at 135°C
Specimen ID:
0
5000
10000
15000
20000
25000
30000
35000
0 0.2 0.4 0.6 0.8 1
Load
, N
Load-Point Displacement, mm
KY98-7KY98-8KY98-9
Air Voids: 13.2±0.5% Temperature: -22°C Aging: 24 hr at 135°C
Specimen ID:
125

Figure B.10. IRT Fracture Test Data for US42 Mix with 4.0% Air Voids
Figure B.11. IRT Fracture Test Data for US42 Mix with 7.0% Air Voids
Figure B.12. IRT Fracture Test Data for US42 Mix with 11.6% Air Voids
0
5000
10000
15000
20000
25000
30000
35000
0 0.2 0.4 0.6 0.8 1 1.2
Load
, N
Load-Point Displacement, mm
US42-1US42-2US42-3
Air Voids: 4.0±0.5% Temperature: -22°C Aging: 24 hr at 135°C
Specimen ID:
0
5000
10000
15000
20000
25000
30000
35000
0 0.2 0.4 0.6 0.8 1 1.2
Load
, N
Load-Point Displacement, mm
US42-4US42-5US42-6
Air Voids: 7.0±0.5% Temperature: -22°C Aging: 24 hr at 135°C
Specimen ID:
0
5000
10000
15000
20000
25000
30000
35000
0 0.2 0.4 0.6 0.8 1
Load
, N
Load-Point Displacement, mm
US42-7US42-8US42-9
Air Voids: 11.6±0.5% Temperature: -22°C Aging: 24 hr at 135°C
Specimen ID:
126

Figure B.13. IRT Fracture Test Data for US60 Mix with 4.0% Air Voids
Figure B.14. IRT Fracture Test Data for US60 Mix with 7.0% Air Voids
Figure B.15. IRT Fracture Test Data for US60 Mix with 10.7% Air Voids
0
5000
10000
15000
20000
25000
30000
35000
0 0.2 0.4 0.6 0.8 1 1.2
Load
, N
Load-Point Displacement, mm
US60-1US60-2US60-3
Air Voids: 4.0±0.5% Temperature: -22°C Aging: 24 hr at 135°C
Specimen ID:
0
5000
10000
15000
20000
25000
30000
35000
0 0.2 0.4 0.6 0.8 1
Load
, N
Load-Point Displacement, mm
US60-4US60-5US60-6
Air Voids: 7.0±0.5% Temperature: -22°C Aging: 24 hr at 135°C
Specimen ID:
0
5000
10000
15000
20000
25000
30000
35000
0 0.2 0.4 0.6 0.8 1
Load
, N
Load-Point Displacement, mm
US60-7US60-8US60-9
Air Voids: 10.7±0.5% Temperature: -22°C Aging: 24 hr at 135°C
Specimen ID:
127
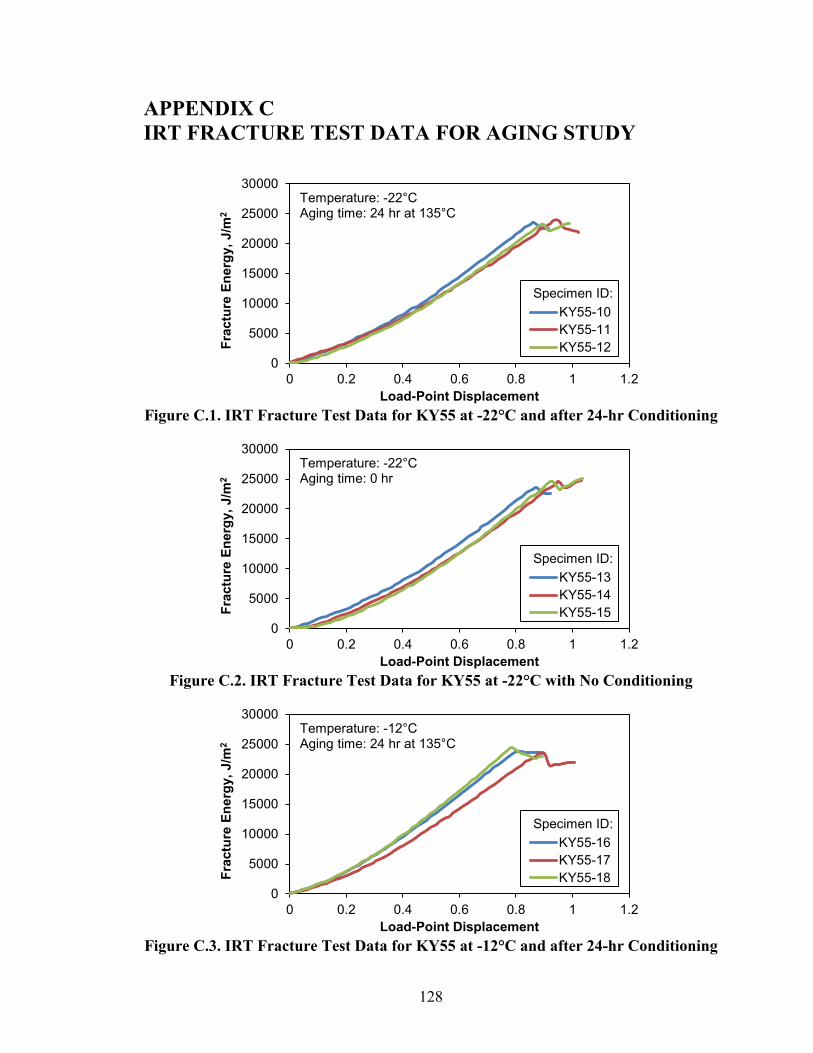
APPENDIX C IRT FRACTURE TEST DATA FOR AGING STUDY
Figure C.1. IRT Fracture Test Data for KY55 at -22°C and after 24-hr Conditioning
Figure C.2. IRT Fracture Test Data for KY55 at -22°C with No Conditioning
Figure C.3. IRT Fracture Test Data for KY55 at -12°C and after 24-hr Conditioning
0
5000
10000
15000
20000
25000
30000
0 0.2 0.4 0.6 0.8 1 1.2
Frac
ture
Ene
rgy,
J/m
2
Load-Point Displacement
KY55-10KY55-11KY55-12
Temperature: -22°C Aging time: 24 hr at 135°C
Specimen ID:
0
5000
10000
15000
20000
25000
30000
0 0.2 0.4 0.6 0.8 1 1.2
Frac
ture
Ene
rgy,
J/m
2
Load-Point Displacement
KY55-13KY55-14KY55-15
Temperature: -22°C Aging time: 0 hr
Specimen ID:
0
5000
10000
15000
20000
25000
30000
0 0.2 0.4 0.6 0.8 1 1.2
Frac
ture
Ene
rgy,
J/m
2
Load-Point Displacement
KY55-16KY55-17KY55-18
Temperature: -12°C Aging time: 24 hr at 135°C
Specimen ID:
128
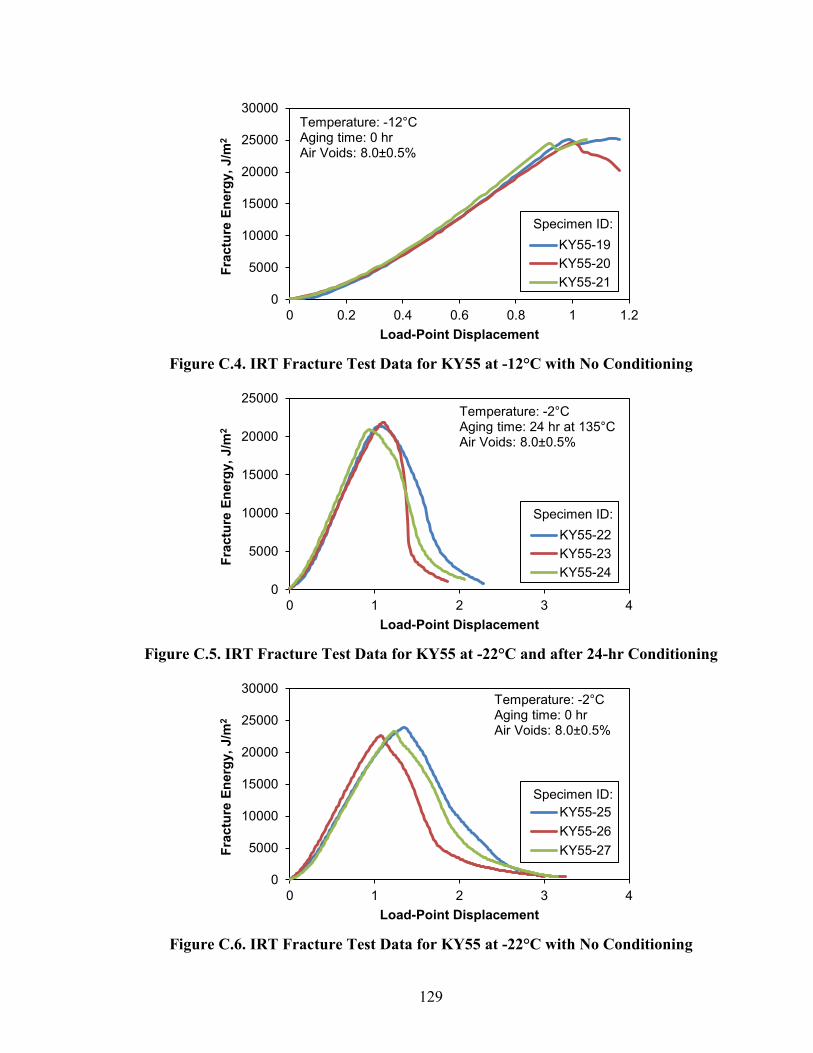
Figure C.4. IRT Fracture Test Data for KY55 at -12°C with No Conditioning
Figure C.5. IRT Fracture Test Data for KY55 at -22°C and after 24-hr Conditioning
Figure C.6. IRT Fracture Test Data for KY55 at -22°C with No Conditioning
0
5000
10000
15000
20000
25000
30000
0 0.2 0.4 0.6 0.8 1 1.2
Frac
ture
Ene
rgy,
J/m
2
Load-Point Displacement
KY55-19KY55-20KY55-21
Temperature: -12°C Aging time: 0 hr Air Voids: 8.0±0.5%
Specimen ID:
0
5000
10000
15000
20000
25000
0 1 2 3 4
Frac
ture
Ene
rgy,
J/m
2
Load-Point Displacement
KY55-22KY55-23KY55-24
Temperature: -2°C Aging time: 24 hr at 135°C Air Voids: 8.0±0.5%
Specimen ID:
0
5000
10000
15000
20000
25000
30000
0 1 2 3 4
Frac
ture
Ene
rgy,
J/m
2
Load-Point Displacement
KY55-25KY55-26KY55-27
Temperature: -2°C Aging time: 0 hr Air Voids: 8.0±0.5%
Specimen ID:
129
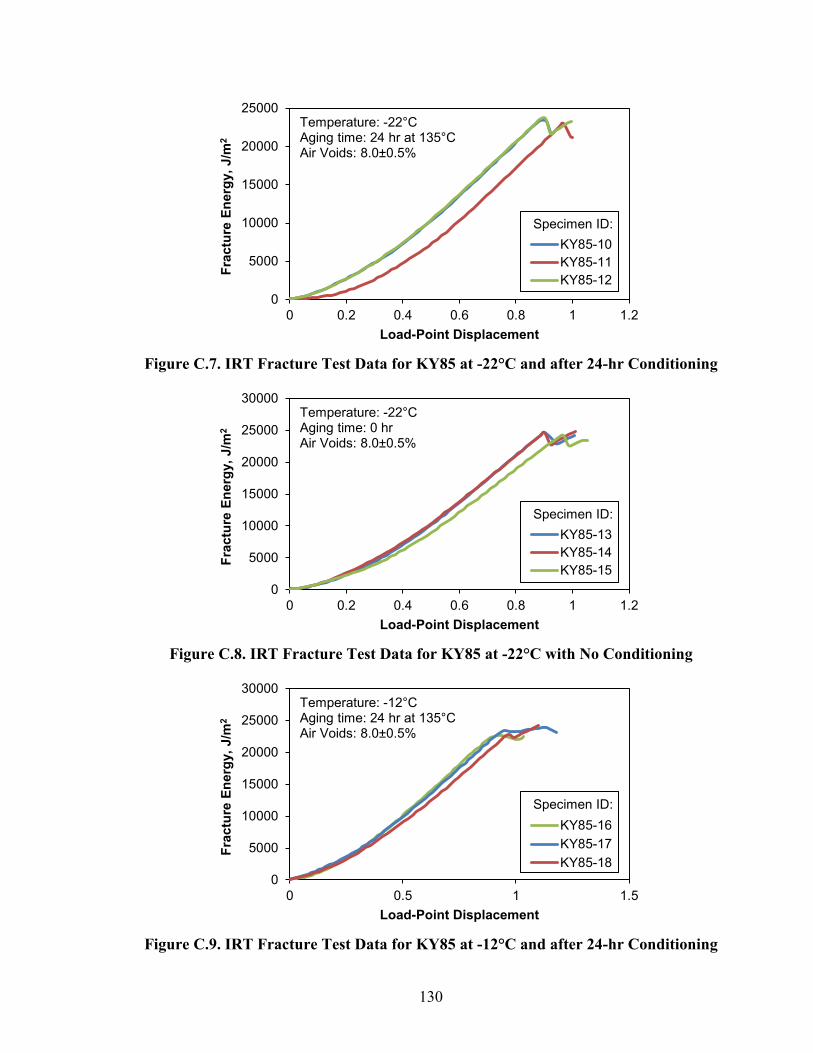
Figure C.7. IRT Fracture Test Data for KY85 at -22°C and after 24-hr Conditioning
Figure C.8. IRT Fracture Test Data for KY85 at -22°C with No Conditioning
Figure C.9. IRT Fracture Test Data for KY85 at -12°C and after 24-hr Conditioning
0
5000
10000
15000
20000
25000
0 0.2 0.4 0.6 0.8 1 1.2
Frac
ture
Ene
rgy,
J/m
2
Load-Point Displacement
KY85-10KY85-11KY85-12
Temperature: -22°C Aging time: 24 hr at 135°C Air Voids: 8.0±0.5%
Specimen ID:
0
5000
10000
15000
20000
25000
30000
0 0.2 0.4 0.6 0.8 1 1.2
Frac
ture
Ene
rgy,
J/m
2
Load-Point Displacement
KY85-13KY85-14KY85-15
Temperature: -22°C Aging time: 0 hr Air Voids: 8.0±0.5%
Specimen ID:
0
5000
10000
15000
20000
25000
30000
0 0.5 1 1.5
Frac
ture
Ene
rgy,
J/m
2
Load-Point Displacement
KY85-16KY85-17KY85-18
Temperature: -12°C Aging time: 24 hr at 135°C Air Voids: 8.0±0.5%
Specimen ID:
130

Figure C.10. IRT Fracture Test Data for KY85 at -12°C with No Conditioning
Figure C.11. IRT Fracture Test Data for KY85 at -2°C and after 24-hr Conditioning
Figure C.12. IRT Fracture Test Data for KY85 at -2°C with No Conditioning
0
5000
10000
15000
20000
25000
30000
0 0.2 0.4 0.6 0.8 1 1.2
Frac
ture
Ene
rgy,
J/m
2
Load-Point Displacement
KY85-19KY85-20KY85-21
Temperature: -12°C Aging time: 0 hr Air Voids: 8.0±0.5%
Specimen ID:
0
5000
10000
15000
20000
25000
0 1 2 3 4 5
Frac
ture
Ene
rgy,
J/m
2
Load-Point Displacement
KY85-22KY85-23KY85-24
Temperature: -2°C Aging time: 24 hr at 135°C Air Voids: 8.0±0.5%
Specimen ID:
0
5000
10000
15000
20000
25000
0 1 2 3 4 5
Frac
ture
Ene
rgy,
J/m
2
Load-Point Displacement
KY85-25KY85-26KY85-27
Temperature: -2°C Aging time: 0hr Air Voids: 8.0±0.5%
Specimen ID:
131

Figure C.13. IRT Fracture Test Data for KY98 at -22°C after 24-hr Conditioning
Figure C.14. IRT Fracture Test Data for KY98 at -22°C with No Conditioning
Figure C.15. IRT Fracture Test Data for KY98 at -12°C after 24-hr Conditioning
0
5000
10000
15000
20000
25000
0 0.2 0.4 0.6 0.8 1 1.2
Frac
ture
Ene
rgy,
J/m
2
Load-Point Displacement
KY98-10KY98-11KY98-12
Temperature: -22°C Aging time: 24 hr at 135°C Air Voids: 8.0±0.5%
Specimen ID:
0
5000
10000
15000
20000
25000
30000
0 0.2 0.4 0.6 0.8 1
Frac
ture
Ene
rgy,
J/m
2
Load-Point Displacement
KY98-13KY98-14KY98-15
Temperature: -22°C Aging time: 0 hr Air Voids: 8.0±0.5%
Specimen ID:
0
5000
10000
15000
20000
25000
0 0.5 1 1.5
Frac
ture
Ene
rgy,
J/m
2
Load-Point Displacement
KY98-16KY98-17KY98-18
Temperature: -12°C Aging time: 24 hr at 135°C Air Voids: 8.0±0.5%
Specimen ID:
132
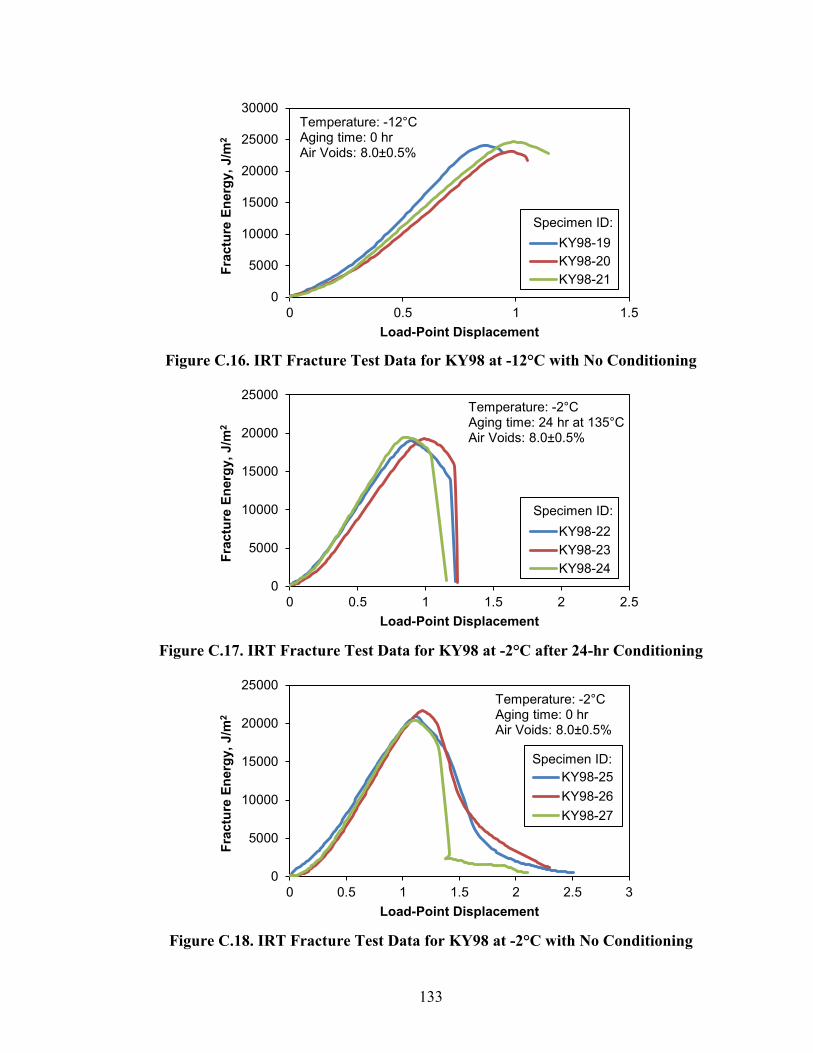
Figure C.16. IRT Fracture Test Data for KY98 at -12°C with No Conditioning
Figure C.17. IRT Fracture Test Data for KY98 at -2°C after 24-hr Conditioning
Figure C.18. IRT Fracture Test Data for KY98 at -2°C with No Conditioning
0
5000
10000
15000
20000
25000
30000
0 0.5 1 1.5
Frac
ture
Ene
rgy,
J/m
2
Load-Point Displacement
KY98-19KY98-20KY98-21
Temperature: -12°C Aging time: 0 hr Air Voids: 8.0±0.5%
Specimen ID:
0
5000
10000
15000
20000
25000
0 0.5 1 1.5 2 2.5
Frac
ture
Ene
rgy,
J/m
2
Load-Point Displacement
KY98-22KY98-23KY98-24
Temperature: -2°C Aging time: 24 hr at 135°C Air Voids: 8.0±0.5%
Specimen ID:
0
5000
10000
15000
20000
25000
0 0.5 1 1.5 2 2.5 3
Frac
ture
Ene
rgy,
J/m
2
Load-Point Displacement
KY98-25KY98-26KY98-27
Temperature: -2°C Aging time: 0 hr Air Voids: 8.0±0.5%
Specimen ID:
133
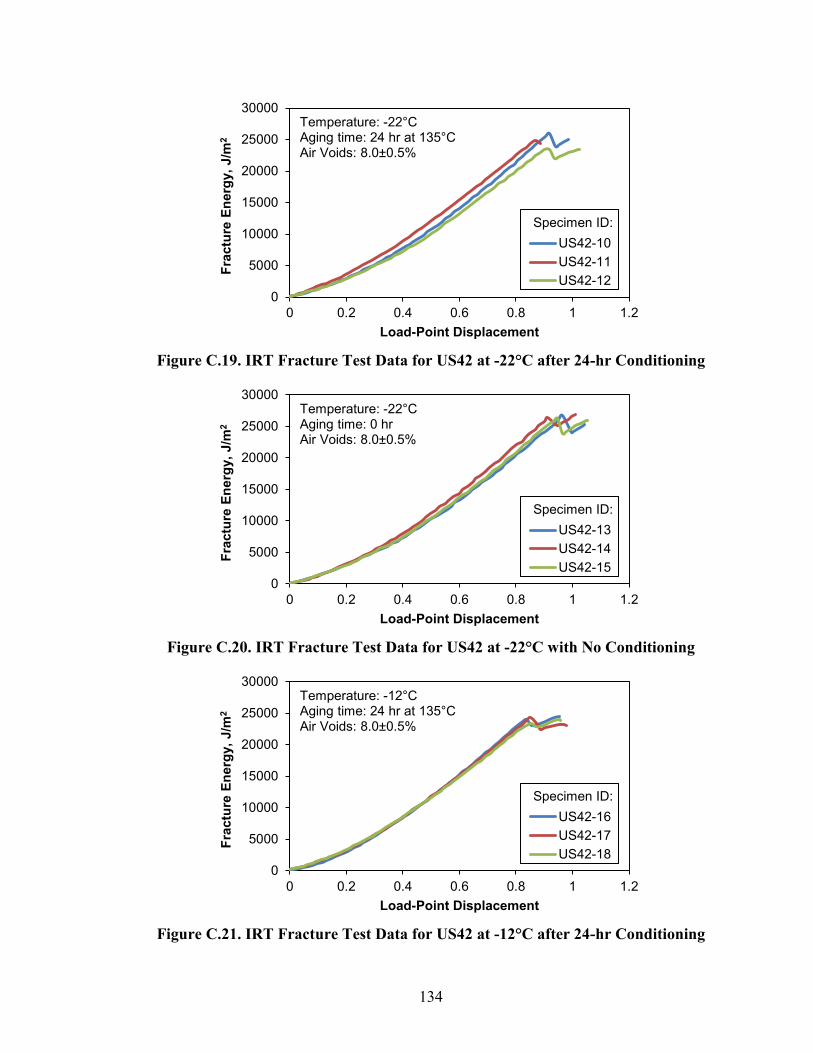
Figure C.19. IRT Fracture Test Data for US42 at -22°C after 24-hr Conditioning
Figure C.20. IRT Fracture Test Data for US42 at -22°C with No Conditioning
Figure C.21. IRT Fracture Test Data for US42 at -12°C after 24-hr Conditioning
0
5000
10000
15000
20000
25000
30000
0 0.2 0.4 0.6 0.8 1 1.2
Frac
ture
Ene
rgy,
J/m
2
Load-Point Displacement
US42-10US42-11US42-12
Temperature: -22°C Aging time: 24 hr at 135°C Air Voids: 8.0±0.5%
Specimen ID:
0
5000
10000
15000
20000
25000
30000
0 0.2 0.4 0.6 0.8 1 1.2
Frac
ture
Ene
rgy,
J/m
2
Load-Point Displacement
US42-13US42-14US42-15
Temperature: -22°C Aging time: 0 hr Air Voids: 8.0±0.5%
Specimen ID:
0
5000
10000
15000
20000
25000
30000
0 0.2 0.4 0.6 0.8 1 1.2
Frac
ture
Ene
rgy,
J/m
2
Load-Point Displacement
US42-16US42-17US42-18
Temperature: -12°C Aging time: 24 hr at 135°C Air Voids: 8.0±0.5%
Specimen ID:
134
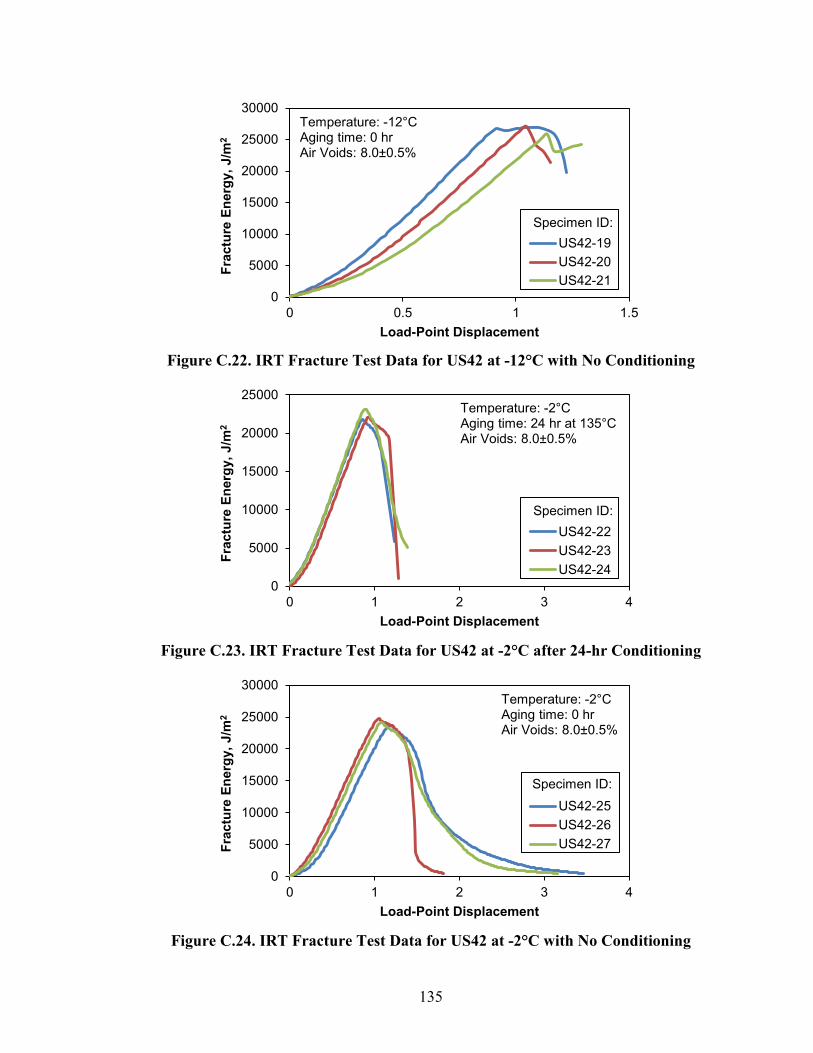
Figure C.22. IRT Fracture Test Data for US42 at -12°C with No Conditioning
Figure C.23. IRT Fracture Test Data for US42 at -2°C after 24-hr Conditioning
Figure C.24. IRT Fracture Test Data for US42 at -2°C with No Conditioning
0
5000
10000
15000
20000
25000
30000
0 0.5 1 1.5
Frac
ture
Ene
rgy,
J/m
2
Load-Point Displacement
US42-19US42-20US42-21
Temperature: -12°C Aging time: 0 hr Air Voids: 8.0±0.5%
Specimen ID:
0
5000
10000
15000
20000
25000
0 1 2 3 4
Frac
ture
Ene
rgy,
J/m
2
Load-Point Displacement
US42-22US42-23US42-24
Temperature: -2°C Aging time: 24 hr at 135°C Air Voids: 8.0±0.5%
Specimen ID:
0
5000
10000
15000
20000
25000
30000
0 1 2 3 4
Frac
ture
Ene
rgy,
J/m
2
Load-Point Displacement
US42-25US42-26US42-27
Temperature: -2°C Aging time: 0 hr Air Voids: 8.0±0.5%
Specimen ID:
135
BIBLIOGRAPHY
AASHTO R 30 (2002). “Standard practice for mixture conditioning of hot-mix asphalt (HMA).” American Association of State Highway and Transportation Officials, Washington, DC.
AASHTO T 209 (2011). “Standard method of test for theoretical maximum specific gravity and density of hot-mix asphalt (HMA).” American Association of State Highway and Transportation Officials, Washington, DC.
AASHTO T 322 (2007). “Standard method of test for determining the creep compliance and strength of hot-mix asphalt (HMA) using the indirect tensile test device.” American Association of State Highway and Transportation Officials, Washington, DC.
Akhtarhusein, T. T., Deacon, J. A., Coplantz, J. S., Harevy, J. T., Monosmith, C. L., and Finn, F. (1994). Fatigue Response of Asphalt-Aggregate Mixes. Publication SHRP-A-404. Strategic Highway Research Program, National Research Council, Washington, D.C.
Anderson, T. L. (1995). Fracture Mechanics, Fundamentals and Applications, 2nd Edition. CRC Press, Boca Raton, NY.
ANSYS, Inc. (2009a), LS-DYNA User’s Guide, Release 12.0. ANSYS, Inc., Canonsburg, PA.
ANSYS, Inc. (2009b), Element Reference, Release 12.1. ANSYS, Inc., Canonsburg, PA.
ANSYS, Inc. (2012), ANSYS Mechanical APDL Contact Technology Guide. ANSYS, Inc., Canonsburg, PA.
Asphalt Institute (2001). SuperPave Mix Design, SuperPave Series No.2 (SP-2), 3rd Edition, Lexington, KY.
Asphalt Institute (2003). Performance Graded Asphalt Binder Specification and Testing, SuperPave Series No.1 (SP-1), 3rd Edition, Lexington, KY.
Asphalt Institute (2007). The Asphalt Handbook, 7th Edition, Lexington, KY.
Asphalt Institute (2008). Asphalt Binder Testing, MS-25, 2nd Edition, Lexington, KY.
ASTM E399 (2012). “Standard test method for linear-elastic plane-strain fracture toughness KIC of metallic materials.” American Society for Testing and Materials, ASTM Book of Standards, Vol. 03.01, Philadelphia, PA.
ASTM D6931 (2012). “Standard test method for indirect tensile (IDT) strength of bituminous mixtures.” American Society for Testing and Materials, ASTM Book of Standards, Vol. 04.03, Philadelphia, PA.
ASTM D7313 (2013). “Standard test method for determining fracture energy of asphalt-aggregate mixtures using the disk-shaped compact tension geometry.” American Society for Testing and Materials, ASTM Book of Standards, Vol. 04.03, Philadelphia, PA.
136
Azari, H., and Mohseni, A. (2013). “Effect of short-term conditioning and long-term aging on permanent deformation characteristics of asphalt mixtures.” Journal of the Association of Asphalt Paving Technologists, 82, 127-149.
Bahgat, A. G., and Herrin, M. (1968). “Brittle fracture of asphalt mixtures.” Journal of the Association of Asphalt Paving Technologists, 37, 32-50.
Barenblatt G. I. (1962). “The Mathematical theory of equilibrium of cracks in brittle fracture.” Advanced Applied Mechanics, 7, 55-129.
Barsoum, R. S. (1976). “On the use of isoparametric finite elements in linear fracture mechanics.” International Journal for Numerical Methods in Engineering, 10(1), 25-37.
Bell, C. A., AbWahab, Y., Cristi, M. E., and Sosnovske, D. (1994). Selection of Laboratory Aging Procedures for Asphalt-Aggregate Mixtures. Publication (SHRP-A-383), Strategic Highway Research Program, Washington, D.C.
Bhurke, A. S., Shin, E. E., and Drzal, L. T. (1997). "Fracture morphology and fracture toughness measurement of polymer-modified asphalt concrete", Transportation Research Record, 1590, 23-33.
Birgisson, B., Roque, R., Sangpetngam, B., and Zhang, Z. (2002). “Hot mix asphalt fracture mechanics: a fundamental crack growth law for asphalt mixtures.” Journal of the Association of Asphalt Paving Technologists, 71, 816-827.
Blankenship, P., and Anderson, R. M. (2010). “Laboratory investigation of HMA modulus, flow number and flexural fatigue on samples of varying density.” Journal of the Association of Asphalt Paving Technologists, 79, 497-515.
Blankenship, P., Anderson, R. M., King, G. N., and Hanson, D. I. (2010). “A laboratory and field investigation to develop test procedures for predicting non-load associated cracking of airfield HMA pavements.” AAPTP Project 06-01 Report, Airfield Asphalt Pavement Technology Program.
Bonesteel, R. M., Piper, D. E., and Davinroy, A. T. (1978). “Compliance and KI calibration of double cantilever beams (DCB) specimens.” Engineering Fracture Mechanics, 10(2), 425-428.
Braham, A. F., Buttlar, W. G., Clyne, T. R., Marasteanu, M. O., and Turos, M. I. (2009). “The effect of long-term laboratory aging on asphalt concrete fracture energy.” Journal of the Association of Asphalt Paving Technologists, 78, 417-454.
Braham, A., Zofka, A., and Li, X. (2012). “Exploring the reduction of laboratory testing for the cohesive zone model for asphalt concrete.” International Journal of Pavement Engineering, 13(4), 350-359.y
Branthaver, J. F., Peterson, J. C., Robertson, R. E., Duvall, J. J., Kim, S. S., Harnsberger, P. M., Mill, T., Ensley, E. K., Barbour, F. A., and Schabron, J. F. (1993). Binder Characterization and Evaluation, Volume 2: Chemistry. SHRP-A-368, Strategic Highway Research Program, Washington, D.C.
Brown, W. F. and Srawly, J. E. (1966). K Calibration of Specimens. ASTM STP 410, American Society for Testing and Materials, Philadelphia, PA.
137

Clements, T. M., Blankenship, P. B., and Mahboub, K. C. (2012). “The effect of loose mix aging on the performance of warm mix asphalt.” Journal of the Association of Asphalt Paving Technologists, 81, 541-566.
Charpa, S. C., and Canale, R. P. (2009). Numerical Methods for Engineers, 6th Edition. McGraw Hill Science, New York, NY.
Chong, K. P., and Kuruppu, M. D. (1984). "New specimen for fracture toughness determination for rock and other materials." International Journal of Fracture, 26, 59-62.
Christensen, R. M. (1986). Theory of Viscoelasticiy: An Introduction. Academic Press Inc., New York, NY.
Christensen, D. W., and Anderson, D. (1992). “Interpretation of dynamic mechanical test data for paving grade asphalt cements.” Journal of the Association of Asphalt Paving Technologists, 61, 67-98.
Christensen, D. (1998). “Analysis of creep data from indirect tension test on asphalt concrete.” Journal of the Association of Asphalt Paving Technologists, 66, 458-489.
Dally, J. W., and Sanford R. J. (1987). “Strain gauge methods for measuring the opening mode stress intensity factor.” Experimental Mechanics, 27, 381-388.
Dave, E. V., Paulino, G. H., and Buttlar, W. G. (2010). “Asphalt pavement aging and temperature dependent properties through a functionally graded viscoelastic model, Part-I: Development, implementation and verification.” Materials Science Forum, 631, 47-52.
Dong S., Wang Y., and Xia Y. (2004). “Stress intensity factors for central cracked circular disk subjected to compression.” Engineering Fracture Mechanics, 71, 1135-1148.
Dugdale D.S. (1960) “Yielding of steel sheets containing slits.” Journal of Mechanics and Physics of Solids, 8, 100-108.
Fett T. (2001). “Stress intensity factors and T-stress for internally cracked circular disks under various boundary conditions.” Engineering Fracture Mechanics, 68, 1119-1136.
Fischer, M. P., Elsworth, D., Alley, R. B., and Engelder, T. (1996). “Finite element analysis of the modified ring test for determining mode I fracture toughness.” International Journal of Rock Mechanics, Mining Science, and Geomechanics, 33(1), 1-15.
Frocht, M. M. (1964). Photoelasticity. John Wiley & Sons, New York, NY.
Gross, D., and Seelig, T. (2006). Fracture Mechanics with an Introduction to Micromechanics. Springer, New York City, NY.
Gubler, R., Partl, M. N., Canestrari, F., and Grilli, A. (2005). “Influence of water and temperature on mechanical properties of selected asphalt pavements.” Materials and Structures, 38(279), 523-532.
138
Harison, J. A., Hardin, B. O., and Mahboub, K. (1994). “Fracture toughness of compacted cohesive soils using the ring test.”, ASCE Journal of Geotechnical Engineering, 120(5), 872-891.
Harvey, J. T., and Tsai B. W. (1996). “Effect of asphalt content and air void content on mix fatigue and stiffness.” Transportation Research Record, 1543, 38-45.
Henshell, R. D., and Shaw, K. G. (1975). “Crack tip finite elements are unnecessary.” International Journal for Numerical Methods in Engineering, 9(3), 495-507.
Hertzberg, R. W. (1996). Deformation and Fracture Mechanics of Engineering Materials, 4th Edition. John Wiley and Sons, Inc., New York, NY.
Hillerborg A. (1985). “The theoretical basis of a method to determine the fracture energy GF of concrete”, Material and Structures, 18(4), 291-296.
Hillerborg, A., Modeer, M., and Peterson, P. E. (1976). “Analysis of crack formation and crack growth in concrete by means of fracture mechanics and finite element.” Cement and Concrete Research, 6, 773-782.
Hiltunen, D. R., and Roque, R. (1996). “Mechanics-based prediction model for thermal cracking of asphalt concrete pavements.” Journal of the Association of Asphalt Paving Technologists, 63, 81-106.
Hou, T., Underwood, B. S., and Kim, Y. R. (2010). “Fatigue performance prediction of north Carolina mixtures using the simplified viscoelastic continuum damage model.” Journal of the Association of the Asphalt Paving Technologists, 79, 35-73.
Huang, Y. H. (2004). Pavement Analysis and Design, 2nd Edition, Pearson Prentice Hall, Upper Saddle River, NJ.
Hyde, T. H., and Warrior, N. A. (1990). “Improved method for determination of photoelastic stress intensity factors using the Westergaard stress function.” International Journal of Mechanical Sciences, 32(3), 265-273.
Hyunwook, K., Wagoner, M. P., and Buttlar, W. G. (2008). “Simulation of fracture behavior in asphalt concrete using a heterogeneous cohesive zone discrete element model.” Journal of Materials in Civil Engineering, 20(8), 552-563.
Jia, Z., Castro-Montero, A., and Shah, S. P. (1996). “Observation of mixed mode fracture with center notched disk specimen.” Cement and Concrete Research, 26(1), 125-137.
Kim, M., Mohammad, L., and Elseifi, M. (2012). “Characterization of fracture properties of asphalt mixtures as measured by semicircular bend test and indirect tension test.” Transportation Research Record, 2296, 115-124.
Kim, Y. R., Lee, S. J., Seo, Y., and El-Haggan, O. (2008). “Determination of price reduction factors for density-deficient asphalt pavements.” Journal of Testing and Evaluation, 36(4), 335-344.
Larson G., and Dempsey B. J. (1997). Enhanced Integrated Climatic Model: Version 2.0, DTFA MN/DOT Report No. 72114, Minnesota Road Research Project and Federal Highway Administration, Minneapolis, MN.
139

Li, X. and Marasteanu, M. (2004). “Evaluation of the low temperature fracture resistance of asphalt mixtures using the semi-circular bend test.” Journal of the Association of Asphalt Paving Technologists, 73, 401-426.
Li, X., Marasteanu, M. O., Dai, S., and Lukanen, E. (2005). "Prediction of low temperature crack spacing in asphalt pavements", Proceedings of the 7th International Conference on the Bearing Capacity of Roads, Railways and Airfields, Trondheim, Norway.
Lim, I. L., Johnston, I. W., Choi, S. K., and Boland, J. N. (1994). "Fracture testing of a soft rock with semi-circular specimens under three point bending. part1-mode I." International Journal of Rock Mechanics, Mining Science 31, 199-212.
Little D. N., and Mahboub K. (1985). “Engineering properties of first generation plasticized sulfur binders and low temperature fracture evaluation of plasticized sulfur paving mixtures.” Transportation Research Record, 1034, 103-111.
Lytton, R. L., Pufhal, D. E., Michalak, C. H., Liang, H. S., and Dempsey, B. J. (1990). An Integrated Model of the Climatic Effects on Pavements. FHWA Report No. RD-90-033, Federal Highway Administration, Washingont, D.C.
Mahboub, K. (1990). “Elasto-plastic fracture characterization of paving materials at low temperatures.” Journal of Testing and Evaluation, 18(3), 210-218.
Majidzadeh, K., Kauffmann, E. M., and Ramsamooj, D. V. (1971). “Application of fracture mechanics in the analysis of pavement fatigue.” Journal of the Association of Asphalt Paving Technologists, 40, 227-246.
Marasteanu, M. O., Labuz, J. E., Dai, S., and Li, X. (2002). "Determining the low-temperature fracture toughness of asphalt mixtures", Transportation Research Record, 1789, 191-199.
Mirza, M. W., and Witczak, W. M. (1996). “Development of a global aging system for short term and long term aging of asphalt cements.” Journal of the Association of Asphalt Paving Technologists, 64, 393-430.
Mobasher, B. M., Mamlouk, M. S., and Lin, H. M. (1997). “Evaluation of crack propagation properties of asphalt mixtures.” Journal of Transportation Engineering, 123(5), 405-413.
Mogawer, W. S., Austerman, A. J., Kaseem, E., and Masad, E. (2011). “Moisture damage characteristics of warm mix asphalt mixtures.” Journal of the Association of Asphalt Paving Technologists, 80, 491-524.
Mogawer, W. S., Austerman, A. J., Mohammad, L., and Emin, K. M. (2013). “Evaluation of high RAP-WMA asphalt rubber mixtures.” Journal of the Association of Asphalt Paving Technologists, 82, 253-287.
Mohammad, L., Elseifi, M., Cooper, S., Challa, H., and Naidoo, P. (2013). “Laboratory evaluation of asphalt mixtures that contain biobinder technologies.” Transportation Research Record, 2371, 58-65.
140

Molenaar, J. M. M., and Molenaar, A. A. A. (2000). “Fracture toughness of asphalt in the semi-circular bend test.” Proceedings of 2nd Eurasphalt and Eurobitume Congress, Barcelona, Spain, 509-517.
Mull, M. A., Stuart, K., and Yehia, A. (2002). “Fracture resistance characterization of chemically modified crumb rubber asphalt pavement.” Journal of Materials Science, 37, 557-566
Newman Jr., J. C. (1981). “Stress intensity factor and crack opening displacements for round compact specimens.” International Journal of Fracture, 17(6), 567-578.
Paris P. C., and Sih G. C. (1965). “Stress analysis of cracks.” Fracture Toughness Testing and its Application, ASTM STP 381, American Society for Testing and Materials, Philadelphia, PA.
Pellinen T. K., Xiao S., Carpenter S., Eyad M., Di Benedetto H., and Roque, R. (2005). “Relationship between triaxial shear strength and indirect tensile strength of hot mix asphalt”, Journal of the Association of the Asphalt Paving Technologists, 74, 347-379.
Reddy, J.N. (2006). An Introduction to the Finite Element Method. McGraw-Hill, New York.
Roque, R., and Buttlar, W. G. (1992). “The development of a measurement and analysis system to accurately determine asphalt concrete properties using the indirect tensile mode.” Journal of the Association of Asphalt Paving Technologists, 61, 304-328.
Rowe, G. M., Sharrock, M. J., Bouldin, M. G., and Dongre, R. N. (2001). “Advanced techniques to develop asphalt master curves from the bending beam rheometer.” Petroleum and Coal, 43(1), 54-59.
Rowe, G. M., and Sharrock, M. J. (2011). “Alternate shift factor relationship for describing temperature dependency of viscoelastic behavior of asphalt materials.” Transportation Research Record, 2207, 125-135.
Sangpetngam, B., Bjorn, B., and Roque, R. (2003). “Development of efficient crack growth simulator based on hot-mix asphalt fracture mechanics.” Transportation Research Record, 1832, 115-112.
Song, S. H., Paulino, G. H., and Buttlar, W. G. (2006). “A bilinear cohesive zone model tailored for fracture of asphalt concrete considering viscoelastic bulk material.” Engineering Fracture Mechanics, 73(18), 2829-2848.
Spiegel, M. R. (1992). Schaum’s Outline of Theory and Problems of Laplace Transforms, McGraw Hill, Inc., New York, NY.
Voitovich, L. V., Malezhik, M. P., and Chernyshenko, I. S. (2011). “Stress state around cracks on the boundary of a hole in a photoelastic orthotropic plate under creep.” International Applied Mechanics, 46(11), 1268-1274.
Wagoner, M. P., Buttlar, W. G., Paulino, G. H. (2005a). “Development of a single-edge notched beam test for asphalt concrete mixtures.” Journal of Testing and Evaluation, 33(6), 452-460.
141

Wagoner, M. P., Buttlar, W. G., and Paulino, G. H. (2005b). “Disk-shaped compact tension test for asphalt concrete fracture.” Experimental Mechanics, 45(3), 270-277.
Wagoner, M. P., Buttlar, W. G., Paulino, G. H., and Blankenship, P. (2005c). “Investigation of the fracture resistance of hot-mix asphalt concrete using a disk-shaped compact tension test.” Transportation Research Record, 1929, 183-192.
Wagoner, M. P., Buttlar, W. G., Paulino, G. H., Blankenship, P., Roque, R., Rongzong, W., De Bondt, A., Molenaar, A., Scarpas, T., Birgisson, B., Smith, L., and Gibson, N. (2006). “Laboratory testing suite for characterization of asphalt concrete mixtures obtained from field cores.” Journal of the Association of Asphalt Paving Technologists, 75, 815-852.
Witczak, M. W., Kaloush, K., Pellinen, T., El-Basyouny, M., and Van Quintus, H. (2002). Simple Performance Test for Superpave Mix Design, NCHRP Report 465, National Cooperative Highway Research Program, Washington, D.C.
Wu, Z., Mohammad, L. N., Wang, L. B., and Mull, M. A. (2005). “Fracture resistance characterization of Superpave mixtures using the semi-circular bending test.” Journal of ASTM International, 2(3), 1-15.
Xu, Q., Chen, H., and Prozzi, J. A. (2010). “Performance of fiber reinforced asphalt concrete under environmental temperature and water effects.” Construction and Building Materials, 24(10), 2003-2010.
Yang, S., Tang, T., Zollinger, D. G., and Gurjar, A., (1997). “Splitting tension tests to determine concrete fracture parameters by peak-load method.” Advanced Cement Based Materials, 5(1), 18-28.
Zapata, C. E., and Houston, W. N. (2008). Calibration and Validation of the Enhanced Integrated Climatic Model for Pavement Design. NCHRP Report 602, Transportation Research Board of the National Academies, Washington, D.C.
Zeinali, A., Blankenship, P. B., and Mahboub, K. C. (2014). “Evaluation of the effect of density on asphalt pavement durability through performance testing.” Presented at the 93rd annual meeting of the Transportation Research Board of the National Academies, Washington, DC.
Zhang, Z., Roque, R., Birgisson, B., and Sangpetngam, B. (2001). “Identification and verification of a suitable crack growth law.” Journal of the Association of Asphalt Paving Technologists, 70, 206–241.
Zienkiewicz, O.C. (1977). The Finite Element Method, McGraw-Hill, London.
Zou, J., Roque, R., Chun, S., and Lopp, G. (2013). “Long-term field evaluation and analysis of top-down cracking for Superpave projects.” Road Materials and Pavement Design, 14(4), 831-846
142
VITA
Author Alireza Zeinali
Education 2008-2011 University of Kentucky Lexington, KY Graduate Certificate in Applied Statistics 2012 Asphalt Institute Academy Lexington, KY Professional Certificate for Hot Mix Asphalt Mix Design Technology 2002-2005 University of Tehran Tehran, Iran M.Sc. Highway and Transportation Engineering 1997-2002 University of Tehran Tehran, Iran B.Sc. Civil Engineering
Professional Experience
2014 InstroTek, Inc. Raleigh, NC Director of Field Services 2011-2014 Asphalt Institute Lexington, KY Graduate Research Engineer
2008- 2014 University of Kentucky Lexington, KY Research Associate
2010 Lexington, KY Engineer in Training Certificate (State of Kentucky) 2009- 2014 University of Kentucky Lexington, KY Teaching Assistant 2004-2005 Soil Mechanics Lab Tehran, Iran Academic Research Associate
Patent Southgate H. F., Mahboub K. C., Zeinali A., Load Transfer Assembly (A New Load Transfer System for the Concrete Pavement Joints), U.S. Patent 08206059 Cl. 404-60, Filed September 14, 2011, and issued June 26, 2012.
143
Honors David R. Jones, IV, PhD Scholarship Award, Association of Modified Asphalt Producers (AMAP): 2013
Layman T. Johnson Fellowship Award: 2012
Ellis G. Williams Award for Asphalt Research: 2012
Kentucky Opportunity Fellowship: 2010 and 2011
College of Engineering Scholarship: 2008- 2014
Chi Epsilon (The Civil Engineering Honor Society)
Society Memberships
Chi Epsilon, University of Kentucky Chapter: Treasurer 2009-2013
Student Member of the American Society of Civil Engineers (ASCE)
Transportation Research Board (TRB) Student Affiliate
Peer-Reviewed Journal Publications
Zeinali A., Mahboub K. C., Blankenship P. B., “Development of the Indirect Ring Tension Fracture Test for Hot Mix Asphalt.” Accepted for publication in the AAPT Journal, Association of Asphalt Paving Technologists, V. 83, 2014, jointly to be published with the Road Materials and Pavement Deign (RMPD) Journal, 2014.
Zeinali A., Blankenship P. B., Mahboub K. C., “Effect of Long-Term Ambient Storage of Compacted Asphalt Mixtures on Laboratory-Measured Dynamic Modulus and Flow Number.” Accepted for publication in Transportation Research Record: Journal of the Transportation Research Board (TRB), 2014.
Zeinali A., Blankenship P. B., Mahboub K. C., “Effect of Laboratory Mixing and Compaction Temperatures on Asphalt Mixture Volumetrics and Dynamic Modulus.” Accepted for publication in Transportation Research Record: Journal of the Transportation Research Board (TRB), 2014.
Zeinali A., Blankenship P. B., Anderson R. M., Mahboub K. C., “Laboratory Investigation of Asphalt Pavements with Low Density and Recommendations to Prevent Density Deficiency.” Advanced Materials Research, Vol. 723, 2013, pp. 128-135.
Zeinali A., Mahboub K. C., Southgate H. F., “Effects of Hinged Dowel System on Performance of Concrete Pavement Joints.” International Journal of Pavement Research and Technology, Vol. 6, No. 4, 2013, pp. 243-249.
Zeinali A., M.Sc. Thesis: Measurement of Track Reaction During Train Passage on Railway Curves, University of Tehran, 2005.
144
Peer-Reviewed Conferences and Invited Presentations
Zeinali A., Blankenship P. B., Mahboub K. C., “Evaluation of the Effect of Density on Asphalt Pavement Durability through Performance Testing.” Presented at the 93rd Annual Meeting of the Transportation Research Board (TRB), Washington, D.C., 2014.
Zeinali A., Blankenship P. B., Mahboub K. C., “Effect of Long-Term Ambient Storage of Compacted Asphalt Mixtures on Laboratory-Measured Dynamic Modulus and Flow Number.” Presented at the 93rd Annual Meeting of the Transportation Research Board (TRB), Washington, D.C., 2014.
Zeinali A., Blankenship P. B., Mahboub K. C., “Effect of Laboratory Mixing and Compaction Temperatures on Asphalt Mixture Volumetrics and Dynamic Modulus.” Presented at the 93rd Annual Meeting of the Transportation Research Board (TRB), Washington, D.C., 2014.
Zeinali A., Blankenship P. B. (presenter), “Temperature Evaluation of the Forced-Draft Ovens for Conditioning of Loose Asphalt Mix Samples.” Committee Presentation at the 93rd Annual Meeting of the Transportation Research Board (TRB), AFK50 Committee, Washington, D.C., 2014.
Zeinali A., Mahboub K. C., Blankenship P. B., “Development of the Indirect Ring Tension Fracture Test for Hot Mix Asphalt.” Presented at the 89th AAPT Annual Meeting, Association of Asphalt Paving Technologists, Atlanta, GA, 2014.
Zeinali A., Blankenship P. B., Mahboub K. C., “Comparison of Performance Properties of Terminal Blend Tire Rubber and Polymer Modified Asphalt Mixtures.” Presented and published in the proceedings of 2nd Transportation and Development Institute (T&DI) Congress, American Society of Civil Engineers, Orlando, Florida, 2014.
Zeinali A., Mahboub K. C., Blankenship P. B., “Fracture Characterization of Hot-Mix Asphalt by Indirect Ring Tension Test.” Presented and published in the proceedings of the 3rd International Conference on Transportation Infrastructure (ICTI), Pisa, Italy, 2014.
Zeinali A., Blankenship P. B., Mahboub K. C., “Quantifying the Pavement Preservation Value of Chip Seals.” Presented and published in the proceedings of the 12th International Society for Asphalt Pavements (ISAP) Conference, Raleigh, North Carolina, 2014.
Zeinali A., Blankenship P. B., Mahboub K. C., “Laboratory Performance Evaluation of RAP/RAS Mixtures Designed with Virgin and Blended Binders.” Presented and published in the proceedings of the 12th International Society for Asphalt Pavements (ISAP) Conference, Raleigh, North Carolina, 2014.
145
Zeinali A., Mahboub K. C., Southgate H. F., “Application of the Hinged Dowel System for Increasing the Durability of Concrete Pavement Joints.” Presented and published in the proceedings of The Airfield and Highway Pavement Conference, The Transportation and Development Institute (T&DI) of the American Society of Civil Engineers (ASCE), Los Angeles, CA, 2013.
Zeinali A., Blankenship P. B., Anderson R. M., Mahboub K. C., “Investigating the Current Practice of Employing the Reclaimed Asphalt Pavement and Shingles in New Pavements.” Committee Presentation at the 92nd Annual Meeting of the Transportation Research Board (TRB), AFK30 Committee, Washington, D.C., 2013.
Zeinali A., Mahboub K. C., Southgate H. F., “A New Load Transfer Assembly for the Jointed Concrete Pavements.” Presented at the 92nd Annual Meeting of the Transportation Research Board (TRB), Washington, D.C., 2013.
Zeinali A., Blankenship P. B., Anderson R. M., Mahboub K. C., “Laboratory Investigation of Asphalt Pavements with Low Density and Recommendations to Prevent Density Deficiency.” Presented and published in the proceedings of the8th International Conference on Road and Airfield Pavement Technology (8th ICPT), Taipei, Taiwan, 2013.
Zeinali A., Mahboub K. C., Southgate H. F., “Effects of Hinged Dowel System on Performance of Concrete Pavement Joints.” Presented and published in the proceedings of the 8th International Conference on Road and Airfield Pavement Technology (8th ICPT), Taipei, Taiwan, 2013.
146
Related Documents