Wayne State University Wayne State University eses 1-1-2017 Development Of Hybrid Supervisory Controller And Energy Management Strategy For P2 Phev Guilin Zhu Zhu Wayne State University, Follow this and additional works at: hps://digitalcommons.wayne.edu/oa_theses Part of the Mechanical Engineering Commons is Open Access esis is brought to you for free and open access by DigitalCommons@WayneState. It has been accepted for inclusion in Wayne State University eses by an authorized administrator of DigitalCommons@WayneState. Recommended Citation Zhu, Guilin Zhu, "Development Of Hybrid Supervisory Controller And Energy Management Strategy For P2 Phev" (2017). Wayne State University eses. 601. hps://digitalcommons.wayne.edu/oa_theses/601

Welcome message from author
This document is posted to help you gain knowledge. Please leave a comment to let me know what you think about it! Share it to your friends and learn new things together.
Transcript
Wayne State University
Wayne State University Theses
1-1-2017
Development Of Hybrid Supervisory ControllerAnd Energy Management Strategy For P2 PhevGuilin Zhu ZhuWayne State University,
Follow this and additional works at: https://digitalcommons.wayne.edu/oa_theses
Part of the Mechanical Engineering Commons
This Open Access Thesis is brought to you for free and open access by DigitalCommons@WayneState. It has been accepted for inclusion in WayneState University Theses by an authorized administrator of DigitalCommons@WayneState.
Recommended CitationZhu, Guilin Zhu, "Development Of Hybrid Supervisory Controller And Energy Management Strategy For P2 Phev" (2017). WayneState University Theses. 601.https://digitalcommons.wayne.edu/oa_theses/601

DEVELOPMENT OF HYBRID SUPERVISORY CONTROLLER AND
ENERGY MANAGEMENT STRATEGY FOR P2 PHEV
by
Guilin Zhu
THESIS
Submitted to the Graduate School
of Wayne State University,
Detroit, Michigan
in partial fulfillment of the requirements
for the degree of
MASTER OF SCIENCE
2017
MAJOR: MECHANICAL ENGINEERING
Approved By:
_______________________________________
Advisor Date

ii
ACKNOWLEDGEMENT
I would like to express the deepest appreciation to my thesis advisor Dr. Jerry Ku for his understanding,
generous guidance and support which make it possible for me to finish my work.
Next I would like to thank my committee members, Dr. Chin-An Tan and Dr. Hao Ying for serving as my
committee members and comments and suggestions. I would also like to thank EcoCAR 3 team and all
team members of Wayne State University that I have worked with during EcoCAR 3 Year 3. Without
system and modeling foundation from past team members contribution, I would not have finished my
thesis successfully. Thanks again. WSU EcoCAR 3 team gave me the opportunity to learn and further
cultivate my technical skills in automotive field, especially for hybrid electric vehicle. Lastly, I would
also like to thank my family for always supporting and believing in me, and continuous encouragement
throughout my years of study and my life.

iii
TABLE OF CONTENTS
Acknowledgement ...................................................................................................................................... ii
TABLE OF CONTENTS ........................................................................................................................... iii
LIST OF FIGURES .................................................................................................................................. vii
List of Tables .............................................................................................................................................. x
1 Introduction......................................................................................................................................... 1
1.1 The EcoCAR3 Competition ........................................................................................................ 1
1.2 Wayne State University EcoCAR 3 Architecture ........................................................................ 2
1.3 Outline of Thesis ......................................................................................................................... 3
2 Background and Literature Review ..................................................................................................... 5
2.1 Introduction ................................................................................................................................. 5
2.2 Parallel Hybrid Electric Vehicle Architecture ............................................................................. 5
2.3 Control System Design for PHEV ............................................................................................... 7
2.3.1 Component control level ..................................................................................................... 8
2.3.2 Hybrid supervisory control level ......................................................................................... 9
2.4 Energy management strategy for PHEV ..................................................................................... 9
2.4.1 Rule-based Energy Management Strategy ......................................................................... 10
2.4.2 Optimization-based Energy Management Strategy ........................................................... 11
2.4.2.1 Dynamic Programming ................................................................................................. 11
2.4.2.2 Equivalent consumption minimization strategies (ECMS) ............................................ 12
2.5 Literature Review ...................................................................................................................... 13

iv
3 Controls Requirements for Hybrid Supervisory Controller ............................................................... 16
3.1 Software Development Process ................................................................................................. 16
3.2 Controls Requirements .............................................................................................................. 17
3.2.1 Controls Requirements for HSC ........................................................................................ 18
4 Development of Hybrid Supervisory Controller ............................................................................... 21
4.1 Introduction ............................................................................................................................... 21
4.2 Hybrid Supervisory Controller Software Structure ................................................................... 21
4.3 Diagnostic Development ........................................................................................................... 22
4.3.1 Fault Detection Strategy .................................................................................................... 23
4.3.2 Fault Mitigation Strategy................................................................................................... 24
4.3.3 Critical Fault Validated on the MIL/SIL ........................................................................... 26
4.3.3.1 Fault-Scenario Description ............................................................................................ 26
4.3.3.2 Fault Diagnostic Strategy .............................................................................................. 28
4.3.3.3 Diagnostic Strategy Validation in MIL/SIL .................................................................. 29
4.3.4 Test case Development ...................................................................................................... 32
4.4 Mode Selection and Torque Split .............................................................................................. 34
4.4.1 Mode Selection ................................................................................................................. 35
4.4.2 Blended Charge Depleting Strategy .................................................................................. 35
4.4.2.1 Torque Distribution Strategy ......................................................................................... 36
4.4.2.2 Simulation Setup ........................................................................................................... 39
4.4.3 Charge Sustaining Strategy ............................................................................................... 41

v
4.4.3.1 Torque Distribution Strategy ......................................................................................... 42
4.4.3.2 Simulation Setup ........................................................................................................... 44
4.4.4 Regenerative Braking Mode .............................................................................................. 45
4.5 Torque Request Subsystem ....................................................................................................... 47
4.6 Energy Analysis ........................................................................................................................ 48
4.6.1 Performance for E&EC Drive Cycle ................................................................................. 49
4.6.2 Energy Consumption ......................................................................................................... 50
5 Optimization-based Energy Management Strategy ........................................................................... 52
5.1 Introduction ............................................................................................................................... 52
5.2 Instantaneous Equivalent Fuel Consumption Analysis .............................................................. 53
5.3 Torque Distribution Strategy ..................................................................................................... 56
5.3.1 Motor torque candidate and engine torque candidate ........................................................ 58
5.3.2 Torque Split Optimization ................................................................................................. 59
5.3.3 Torque Request Subsystem ............................................................................................... 59
5.4 SOC Correction ......................................................................................................................... 60
5.5 Simulation Results .................................................................................................................... 62
5.6 Energy Consumption Comparison ............................................................................................ 65
5.6.1 505 Drive Cycle ................................................................................................................ 66
5.6.2 US06Highway ................................................................................................................... 66
5.6.3 US06 City.......................................................................................................................... 67
5.6.4 HWFET Drive Cycle ......................................................................................................... 68

vi
5.6.5 Energy Consumption Comparison in E&EC event............................................................ 68
6 Conclusion and Future Work ............................................................................................................ 72
6.1 Conclusion ................................................................................................................................ 72
6.2 Discussion and Future Work ..................................................................................................... 73
6.2.1 Validation .......................................................................................................................... 73
6.2.2 Future Work ...................................................................................................................... 74
Appendix A............................................................................................................................................... 75
A.1 List of Abbreviations...................................................................................................................... 75
A.2 DFMEA ......................................................................................................................................... 76
A.3 Test cases Documents for safety critical algorithms ....................................................................... 79
Appendix B ............................................................................................................................................... 88
B.1 ECMS Algorithm in MATLAB ...................................................................................................... 88
Reference .................................................................................................................................................. 91
Abstract..................................................................................................................................................... 94
vii
LIST OF FIGURES
Figure 1 Powertrain Configuration of Clutch-less P2 PHEV ...................................................................... 2
Figure 2 Control System Architecture ........................................................................................................ 3
Figure 3General Configuration of a Parallel Hybrid Drivetrain [1] ............................................................ 6
Figure 4Configurations of Parallel HEV [4] ............................................................................................... 7
Figure 5 Parallel Control System ................................................................................................................ 8
Figure 6 Energy path during discharge and charge for Parallel PHEV [15] .............................................. 13
Figure 7 Software Development Process: V-Model .................................................................................. 16
Figure 8 Hybrid Supervisory Controller Development Process ................................................................ 17
Figure 9 Requirements on signal diagnostics ............................................................................................ 19
Figure 10 Hybrid Supervisory Controller Software Structure ................................................................... 22
Figure 11 Fault Detection Strategy ........................................................................................................... 23
Figure 12 The engine crankshaft and coupler ........................................................................................... 26
Figure 13 Broken bolt ............................................................................................................................... 27
Figure 14 Engine and motor speed and feedback torque during fatal incident .......................................... 28
Figure 15 DFMEA for the specific fault scenario ..................................................................................... 28
Figure 16 Fault Insertion and Fault Detection ........................................................................................... 30
Figure 17 a) Engine and motor torque request; b) Battery SOC under fault scenario ............................... 30
Figure 18 Fault Insertion, Detection, system level status .......................................................................... 31
Figure 19 Engine torque and motor torque, speed trace ............................................................................ 32
Figure 20 Mode selection in torque distribution ....................................................................................... 35
Figure 21 Energy flows in Blended CD mode .......................................................................................... 36
Figure 22 Various engine operating lines.................................................................................................. 38
Figure 23 Battery SOC with various scale factors .................................................................................... 39
Figure 24 Speed trace and battery SOC .................................................................................................... 40
Figure 25 Driver Torque Request, Motor torque and Engine torque ......................................................... 40

viii
Figure 26 E&EC Drive Cycle Engine operation ....................................................................................... 41
Figure 27 Engine Charge mode in CS mode ............................................................................................. 42
Figure 28 Motor Assist mode in CS mode ................................................................................................ 42
Figure 29 Charge Sustaining Mode ........................................................................................................... 44
Figure 30 Speed Trace and SOC under CS mode ..................................................................................... 44
Figure 31 All torque request for City and Highway drive cycle ................................................................ 45
Figure 32 Engine Operating Points under CS mode .................................................................................. 45
Figure 33 Energy path for Regenerative Braking ...................................................................................... 46
Figure 34 Speed Trace and Battery SOC with/without Regen .................................................................. 46
Figure 35 Motor output torque .................................................................................................................. 47
Figure 36 Engine and motor torque control .............................................................................................. 47
Figure 37 Engine and electric motor torque request .................................................................................. 48
Figure 38 E&EC Full drive cycle and battery SOC depletes..................................................................... 50
Figure 39 Motor torque and engine torque request ................................................................................... 50
Figure 40 Energy Management Strategy in HEVs .................................................................................... 52
Figure 41 ECMS torque control strategy flow chart ................................................................................. 53
Figure 42 Engine Fuel Flow Rate Map ..................................................................................................... 54
Figure 43 Energy path in discharge phase ................................................................................................. 55
Figure 44 Energy path in charge case ....................................................................................................... 56
Figure 45 ECMS Control Algorithm ......................................................................................................... 58
Figure 46 Torque control system and actuators constraints....................................................................... 59
Figure 47 Engine torque and Motor torque request subsystem ................................................................. 60
Figure 48 Penalty function for SOC correction ......................................................................................... 61
Figure 49 Vehicle Speed trace and battery SOC with or without correction ............................................. 62
Figure 50 505 Speed Trace and Battery SOC in CS mode ........................................................................ 63
Figure 51 All torque requests using optimization based control strategy .................................................. 63

ix
Figure 52 Transmission Estimated Gear ................................................................................................... 64
Figure 53 a) Engine Operating Points of 505 drive cycle for ECMS, b) Engine Operating Points for rule-
based control strategy ............................................................................................................................... 64
Figure 54 505 Drive Cycle and SOC profile ............................................................................................. 66
Figure 55 US06 Highway drive cycle and SOC profile ............................................................................ 67
Figure 56 US06 City drive cycle and SOC profile .................................................................................... 67
Figure 57 HWFET drive cycle and SOC profile ....................................................................................... 68
Figure 58 Three drive cycles speed trace and SOC profile ....................................................................... 69
Figure 59 Engine fuel consumption .......................................................................................................... 70
Figure 60Engine Operating Points with ECMS Figure 61Engine Operating Points with Rule based
Control ...................................................................................................................................................... 70

x
List of Tables
Table 1 Test Requirements for Vehicle Startup operation ........................................................................ 20
Table 2 Critical Safety Requirements for HSC ......................................................................................... 23
Table 3 Diagnostic checks and remedial actions for safety critical functions ........................................... 24
Table 4 Fault Mitigation Strategy Overview ............................................................................................. 29
Table 5 Safety Critical Function Testing Summary .................................................................................. 33
Table 6 Torque request equations for Blended CD mode control strategy ................................................ 37
Table 7 Scale factor for engine operating line ........................................................................................... 37
Table 8 Vehicle Energy Consumption with different scale factors ........................................................... 39
Table 9 Torque Control strategy in CS mode ............................................................................................ 43
Table 10 E&EC drive cycle profile ........................................................................................................... 49
Table 11 Vehicle Energy Consumption for E&EC drive cycle ................................................................. 50
Table 12 Energy Consumption Comparison for 505 drive cycle............................................................... 66
Table 13 Energy Consumption Comparison for US06 Highway drive cycle ............................................ 67
Table 14 Energy Consumption Comparison for US06 City drive cycle .................................................... 67
Table 15 Energy Consumption Comparison for HWFET drive cycle ....................................................... 68
Table 16 Comparison of vehicle energy consumption for optimized and rule-based control strategies .... 71
1
1 Introduction
The powertrain of a parallel hybrid electric vehicle (PHEV) is a hybrid system with engine and electric
motor powertrain systems, which provides an opportunity for energy management. Compared to the
conventional vehicle, hybrid electric vehicles with high voltage battery and internal combustion engine
have more complicated powertrain systems and ECUs, therefore, control system also becomes more
complex. Under a hybrid supervisory controller (HSC), the power requested by driver is strategically
distributed between engine and electric motor, and the distribution of driver requested power is supervised
by energy management system which is the key technologies of PHEV.
This thesis discusses the development and implementation of hybrid supervisory controller for Wayne State
University EcoCAR 3 clutch-less pre-transmission (P2) parallel PHEV, and an optimization based control
strategy was proposed to reduce the energy consumption of PHEV.
1.1 The EcoCAR3 Competition
The EcoCAR 3 project is a four-year competition sponsored by General Motors and the U.S. Department
of Energy challenging 16 universities teams to reengineer a 2016 Chevrolet Camaro to be a performance
plug-in hybrid electric vehicle. A pre-transmission (P2) without clutch parallel architecture was chosen by
Wayne State University EcoCAR3 team in Year 3.
The final objectives of this competition are to reduce energy consumption, greenhouse gas (GHG)
emissions, criteria (regulated) emissions, and petroleum energy use (PEU), while to maintain the safety,
drivability, performance and acceptability. In Year 3 of EcoCAR 3, WSU EcoCAR 3 controls team
developed the supervisory control system based on our architecture and validated control strategies
implemented on HSC under Model in the Loop (MIL), Software in the Loop (SIL) and Hardware in the
Loop (HIL) by using dSPACE, and ultimately validate control strategies in the vehicle.
2
1.2 Wayne State University EcoCAR 3 Architecture
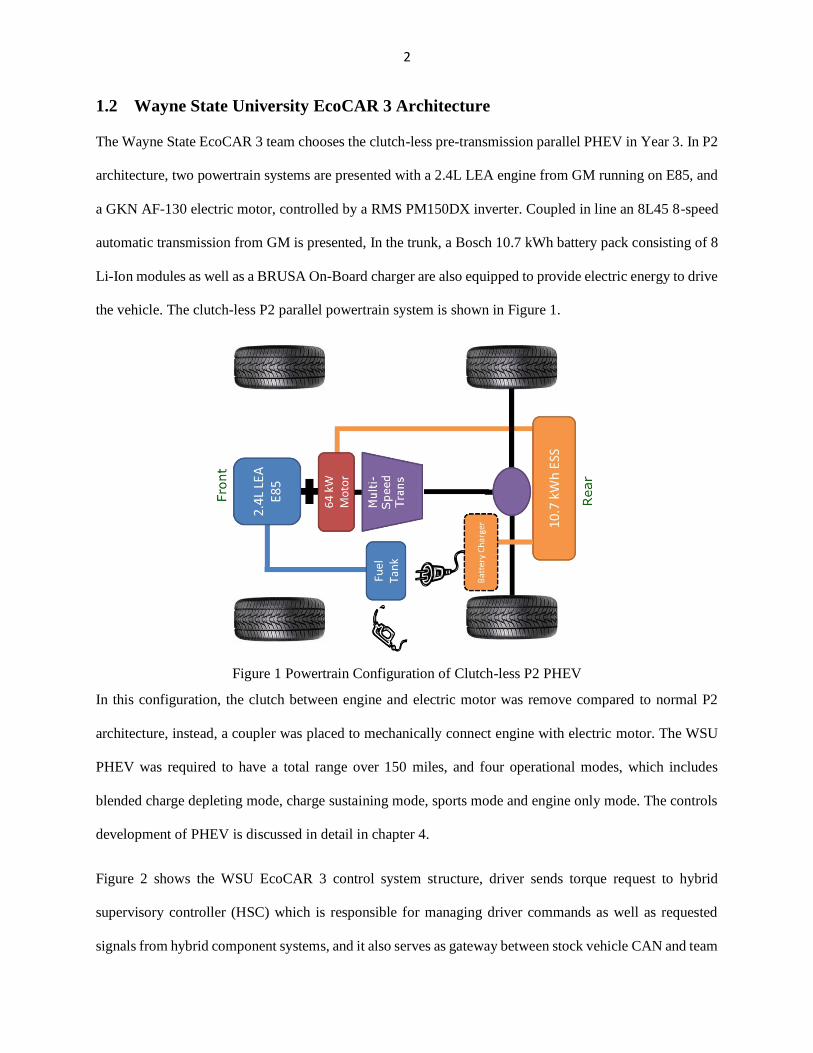
The Wayne State EcoCAR 3 team chooses the clutch-less pre-transmission parallel PHEV in Year 3. In P2
architecture, two powertrain systems are presented with a 2.4L LEA engine from GM running on E85, and
a GKN AF-130 electric motor, controlled by a RMS PM150DX inverter. Coupled in line an 8L45 8-speed
automatic transmission from GM is presented, In the trunk, a Bosch 10.7 kWh battery pack consisting of 8
Li-Ion modules as well as a BRUSA On-Board charger are also equipped to provide electric energy to drive
the vehicle. The clutch-less P2 parallel powertrain system is shown in Figure 1.
Figure 1 Powertrain Configuration of Clutch-less P2 PHEV
In this configuration, the clutch between engine and electric motor was remove compared to normal P2
architecture, instead, a coupler was placed to mechanically connect engine with electric motor. The WSU
PHEV was required to have a total range over 150 miles, and four operational modes, which includes
blended charge depleting mode, charge sustaining mode, sports mode and engine only mode. The controls
development of PHEV is discussed in detail in chapter 4.
Figure 2 shows the WSU EcoCAR 3 control system structure, driver sends torque request to hybrid
supervisory controller (HSC) which is responsible for managing driver commands as well as requested
signals from hybrid component systems, and it also serves as gateway between stock vehicle CAN and team

3
added CAN networks. The HSC then optimally distributed the torque request between engine and electric
motor and sent command signals to individual controller modules, as shown in figure 2.
Figure 2 Control System Architecture
1.3 Outline of Thesis
In Year3, the hybrid powertrain system was fully integrated into the vehicle, and component controls and
testing were also conducted to meet the requirements of competition. In addition, the hybrid vehicle model
including engine, motor, battery, etc. was also developed by controls team in Simulink/Stateflow to test the
algorithms needed to control the hybrid electric vehicle. This thesis aims to detail the development of a
hybrid supervisory controller for WSU PHEV, including controls requirements, system diagnostics,
operational modes and torque distribution strategies. Those controls algorithms are discussed in detail in
chapter 4.
The thesis work mainly focus on two aspects of development of hybrid supervisory controller: torque
distribution strategies and validation, fault detection and mitigation development. Chapter 2 discusses the
literature review which includes the methods and strategies for developing hybrid supervisory controller as

4
well as energy management strategies developed and implemented in current PHEV. Chapter 3 details the
controls requirements and WSU EcoCAR 3 team HSC software structure. Chapter 4 details the
development of hybrid supervisory controller, including fault detection and mitigation strategies
implemented on HSC, torque control strategies within each operational mode and validation for control
strategies under Model in the Loop (MIL) as well as Software in the Loop (SIL).
Another goal of this thesis is to propose a new energy management strategy which supervisors two
powertrain systems and distributes power between engine and electric motor more efficiently. In chapter 5,
a more detailed energy management strategy is discussed, and energy consumption is also conducted based
on new control strategy as well as validation results. Chapter 6 discusses the conclusion and future work
needs to be done for WSU EcoCAR 3 team.

5
2 Background and Literature Review
2.1 Introduction
This chapter provides background information for the hybrid electric vehicle architecture and the
development of hybrid supervisory controller as well as energy management strategies for PHEV.
2.2 Parallel Hybrid Electric Vehicle Architecture
The Hybrid electric vehicles have two types of energy sources, electricity and fuel. Fuel represents that a
fuel tank is required for internal combustion engine (ICE) to produce mechanical power, and electricity
represents that a high voltage battery system is required to store the energy, and a traction motor will be
used to produce mechanical power as well.
The parallel hybrid electric vehicles allow both engine and electric motor to deliver torque to drive the
wheels, and traction power may be produced by ICE only, by electric motor only or by both ICE and motor.
Since both engine and electric motor are coupled to the driveline of the wheels by clutch, and electric motor
can function as generator to charge the high voltage battery by regenerative braking or taking the power
from engine when its output power is greater than driver requested power. Figure 3 shows the configuration
of general parallel hybrid powertrain system.

6
Figure 3 General Configuration of a Parallel Hybrid Drivetrain [1]
In parallel hybrid powertrain, there are two kinds of mechanical coupling: torque coupling and speed
coupling. Torque coupling can add the torque of engine and electric motor together and deliver the total
torque to the wheels. The advantages of torque coupling are that the engine and motor can be controlled
independently but the speed of engine and motor cannot be controlled independently due to the fixed
relationship between them. In speed coupling, the speed of engine and electric motor can be added together
and torques are linked together [2].
More specifically, hybrid powertrain has different implementation of parallel architectures, depending on
the placement of motor, there are five different architectures which are corresponding to the placement of
the motor in the system [3], as illustrated in figure 4, including P0, P1, P2, P3, P4.

7
Figure 4Configurations of Parallel HEV [4]
As shown in the figure 4 above, P0 configuration represents that motor is located at the input to the engine,
and P1 represents motor is located at the output of the engine, in which engine and motor can be isolated
from the transmission by a clutch C0, P2 represents motor is located between the engine and transmission,
P3 represents motor is located at the transmission and P4 represents that motor is mounted on axle. C0 and
C1 are clutches.
2.3 Control System Design for PHEV
In hybrid electric vehicles, there are multiple torque sources (engine and electric motors) to generate
mechanical energy required to drive the vehicle. Compared to conventional vehicles with single torque
source and simple control systems, hybrid electric vehicles have more complicated control systems, which
is properly manage the energy of two torque sources. The key function of control system in HEVs is energy
management, the strategy of energy management is to optimally distribute the power between engine and
electric motor to meet the driver requested power while to reduce energy consumption and emissions. There
are two levels of control system in HEVs, supervisory control and component level control, the main
functions of supervisory controller are to distribute torque to different torque sources and determine status
of each component controller and subsystem/component (detect faults and failures). While component
controllers, which contain main functionalities of physical components, receive command signals from

8
supervisory controller as well as generate command signals to control actuators. Figure 5 shows the
interconnecting scheme along with supervisory controller and ECUs.
Figure 5 Parallel Control System
2.3.1 Component control level
In HEVs, the number of electronic control units (ECUs) need to control various aspects of vehicle and a
typical car on the road today have from 40 to 100 microcontrollers [5], those controllers are used to control
powertrain components, chassis, etc.
Component controllers consist of engine control module (ECM), motor control module (MCU), battery
management system (BMS), transmission control module (TCM) and other regular controller modules in
conventional vehicles. Component controllers interact with other control modules via Control Area
Network (CAN), and receive command signals from supervisory controllers or other component controllers
to meet the driver requirements [2]. Therefore, for each individual component controller, they are also
responsible for controlling their corresponding actuators, like battery and engine, etc. and request responses
are reported to supervisory controller which in turn makes the control decision.

9
2.3.2 Hybrid supervisory control level
The supervisory controller is considered to be the key part of the HEV control system, which provides high
level management among all other controllers. HSC takes and processes all important signals from the other
lower level controllers including Motor Control Module (MCU), Battery Management system (BMS), etc.
and it also receives driver intended signals like accelerator pedal position (APP), key position and brake
pedal position (BPP), as shown in figure 5, to make decisions for final execution [6].
The supervisory controller is to include the following functions: determine the status of each controller and
subsystem/component, interpret driver inputs and determine how and to what degree requests can be
fulfilled and oversee the startup and shutdown of the vehicle.
Improving energy efficiency is also a goal of supervisory controller, this is accomplished through
optimizing the control strategy of distributing torque between engine and electric motors, energy
management strategy maintains the vehicle at its highest efficient operating point and coordinates the status
of engine, motor, battery, like State of Charge (SoC), temperature, etc. For instance, multiple operation
modes in HEV like charge sustaining mode, regenerative braking mode are able to reduce fuel consumption
as well as emissions.
2.4 Energy management strategy for PHEV
In the conventional vehicles, there is no need for energy management system, since only one torque source
is presented in the vehicle and driver can deliver the power instantly by accelerator pedal position and brake
pedal position. However, in hybrid electric vehicles, energy management system is necessary to be taken
since vehicle doesn’t have idea that how much torque can be delivered by electric motor or engine. Due to
the complicated structure of PHEVs, the design of control strategies is a challenging task. A lot of research
has been carried out in this field. The main objective energy management strategy in hybrid electric vehicles
is to minimize the energy consumption over a defined drive cycle and satisfy driver’s power demand with
10
optimum vehicle performance. However, fuel economy and emission minimization are conflicting
problems, a smart energy management strategy is used to satisfy trade-off between them [7].
Various control strategies are proposed to manage the energy between multiple energy sources, many
researchers [8-11] have devoted their attention to the design and implementation of energy management
strategy in HEVs. The energy management strategy can be mainly categorized in two types [12]: ruled-
based strategy and optimization -based strategies. Rule-based control strategy is fundamental and robust
control scheme that depends on the mode of operation [7], while in optimization based control strategies,
the goal of this strategy is to minimize the cost function to find local or global optimization.
2.4.1 Rule-based Energy Management Strategy
The rule-based control strategies are fundamental and robust scheme that depends on the operation modes
of vehicle, this control strategy can be easily implemented in real time to manage the power flow in hybrid
electric powertrain, and rules are mostly defined by intuition, mathematical model or heuristic and generally
without prior knowledge of drive cycle. Although these control strategies are robust and computationally
efficient which can provide significant energy economy, they cannot guarantee the optimal performance of
the vehicle in all situations and do not involve explicit minimization. Rule-based control strategy can be
further divided into deterministic rule-based and fuzzy rule-based [13-14].
In deterministic rule-based control, it includes power follower control, state machine based control and
on/off control. The deterministic rule-based control strategies are designed with the aid of engine operating
maps, power flows within the powertrain and driving experience [7].
In the state machine based control, the transition between states is usually based on driver torque demand,
vehicle speed, and status of hybrid powertrain systems as well as battery SOC, this part of control strategy
is discussed in detail in chapter 4. However, this control strategy is unable to find the optimal torque
distribution between engine and electric motor and require a lot of calibration.

11
2.4.2 Optimization-based Energy Management Strategy
As mentioned previously, the energy management strategy aims to determine the optimal power split
between the engine and electric motor. In optimization based energy management strategy, the strategies
tend to minimize the cost function, the cost function includes minimization of energy consumption,
emission, etc.
There are two types of optimization based energy management strategy: global optimization and real time
optimization [15]. Global optimization is also numerical optimization method, like dynamics programming
[16], genetic algorithms [17], simulated annealing [18], the global optimal solution is calculated
numerically by minimization of a cost function over a fixed drive cycle.
The real-time optimization, on the other hand, uses analytical method to find local optimization which is
closed to globally optimal solution. The Equivalent Consumption Minimization strategy (ECMS) [19,20]
provides a real-time energy management of HEVs which consists in minimization at each time step of the
optimization of a defined instantaneous cost function. This strategy is reviewed in detail in the next section.
2.4.2.1 Dynamic Programming
Dynamic Programming is a numerical method for solving multistage decision making problems [16]. The
implementation of dynamic programming is capable of providing an optimal solution to the power split
between engine and electric motor while maintaining the battery OSC in certain threshold, however, this
control strategy is only implementable in simulation environment, since it requires the prior knowledge of
drive cycle, like road condition, grade, driver style, etc. but dynamic programming can be used to formulate
and tune actual controllers and develop rule based controls [7].
Since the main drawbacks of the DP are computationally intensive and not implementable in real time, a
ruled-based control combined with DP is presented [21], researchers derived rules from DP solutions to
obtain near-optimal solution, this strategy not only makes it possible to calibrate the rule-based controller
but also gives the near optimal solution in the real driving situation.

12
2.4.2.2 Equivalent consumption minimization strategies (ECMS)
Equivalent consumption minimization strategy is real time optimization method, which provides an
effective solution for energy management problems in HEVs. ECMS calculates the instantaneous fuel
consumption at each time step in the drive cycle, and it does not require prior knowledge of drive cycle
[19].
In charge sustaining hybrid vehicles, high voltage battery is used as energy buffer since the state of charge
of the battery in this mode maintains under a certain threshold, this means all electric energy comes from
fuel and battery can be seen as reversible tank. Any electric energy used in discharge of the battery will be
replenished from fuel in the future or from regenerative braking.
The core principle of ECMS is the equivalent cost vale that is assigned to the electric energy, this value
represents the use of electrical energy used is equivalent to using a certain amount of fuel [15]. As shown
in figure 6.
Figure X shows the energy path during the discharge and charge phase in parallel PHEV. In discharge phase,
the electric motor provides the mechanical energy and the energy used in this phase will be replenished
from the fuel tank. In charge phase, the electric motor acts as generator to charge the battery by engine, the
dotted line shows that the energy charged by the engine will provide mechanical energy to save the fuel
[15].

13
Figure 6 Energy path during discharge and charge for Parallel PHEV [15]
2.5 Literature Review
The paper written by Yatsko [22] presents the development and validation of control system for hybrid
electric vehicle, the paper discusses the hybrid supervisory control development and validation, fault
detection and mitigation, as well as energy management strategy. The hybrid supervisory control strategy
developed in this paper is divided into three parts: vehicle mode selection, torque distribution or energy
management, tactical control logic which includes regenerative braking, transmission shifting. A more
detailed fault detection and mitigation strategy is presented to prevent critical failures occurring during the
normal vehicle operation, the overall mitigation strategy mainly includes four operation modes: normal
operation, power limiting, disable operating modes and shutdown vehicle, which are used to maintain safe
vehicle operation.
Crain [23] emphasis the control system development and validation process to meet the vehicle technical
requirements (VTS), this paper presents the overall software structure for supervisory controller, which
contains inputs conversion, diagnostics, mode selection, component control and output conversions. The
control strategy is also discussed by outlining CD and CS modes as well as additional modes in mode
selection block. In addition to supervisory controller, the paper also presents electrical powertrain hardware

14
and ICE powertrain hardware. With control system implemented in the vehicle, some performance tests
and validation are conducted under SIL and HIL.
Harries and Brian Neal [24] demonstrates the development and validation for supervisory controller and
power management control algorithm is also discussed to control the vehicle during charge sustaining
operation. The paper first implemented a simplified bang-bang controller to operate at global minimum
BSFC for engine and then a power tracking controller is proposed to reduce the energy consumption on
simulated drive cycle. Two control strategies proposed in the paper are tested and compared under SIL and
power tracking controller achieved almost % reduction in fuel losses during EPA drive cycle.
Manning [25] detail the control strategy for charge sustaining mode and development of the controls for
diagnostics for series-parallel PHEV. The charge sustaining control strategy proposed in the thesis accounts
for a variety of system operating points and penalizes or rewards certain operating points for some vehicle
status conditions, like battery SOC. The control strategies are tested under SIL and HIL to validate the
effectiveness of control system in real vehicle.
Karmustaji [26] proposed a real-time optimization based power flow controller for energy consumption and
emissions reduction for parallel PHEV, in this thesis, a basic power flow controller is presented as a baseline
controller, and then two optimization based power flow controllers using shift schedule and shift logic are
presented to find the appropriate power split between the ICE and EM to reduce the energy consumption
as well as emissions, to compare the effectiveness of optimization based controller, the real time energy
and emission minimization controllers are tested under city and highway drive cycles when compared to
the basic power flow controller, and optimization based controllers effectively reduced the energy
consumption.
In Bovee’s [27] work, a new version of supervisory controller algorithm was presented and tested under
SIL environment, dynamic control algorithms are developed for charge depleting and charge sustaining
mode based on Equivalent Consumption Minimization Strategy (ECMS). The charge depleting strategy

15
includes a simplified version of ECMS that was able to select the most efficient torque split between front
and rear electric machines, while charge sustaining strategy contains a full version of ECMS with multiple
maps that were optimized offline to split the torque between engine, front EM, and rear EM. The ECMS
algorithm adapted in this paper is implemented offline so it doesn’t require large computation time and new
version of supervisory controller strategy increase the al electric range and reduce UF weighted fuel
consumption over the baseline control strategy.
The previous work greatly benefits the development of this study, in this study, a supervisory controller
was developed to control the interaction between powertrain components for WSU EcoCAR3. A rule-based
control and fault detection and mitigation strategy were also incorporated into the supervisory controller
and validated under model in the loop environment. The development of fault detection and mitigation is
included in the thesis scope,
To minimize the energy consumption, a real-time optimization based control strategy, which is different
from offline optimization strategy in Bovee’s work, was developed to control the engine and electric motor.
The idea of ECMS algorithm was highly adapted from the research of Tammer Basar, Antonio Bicchi [15].
However, a combination of rule-based control strategy based on ECMS is also proposed in the thesis.
16
3 Controls Requirements for Hybrid Supervisory Controller
3.1 Software Development Process
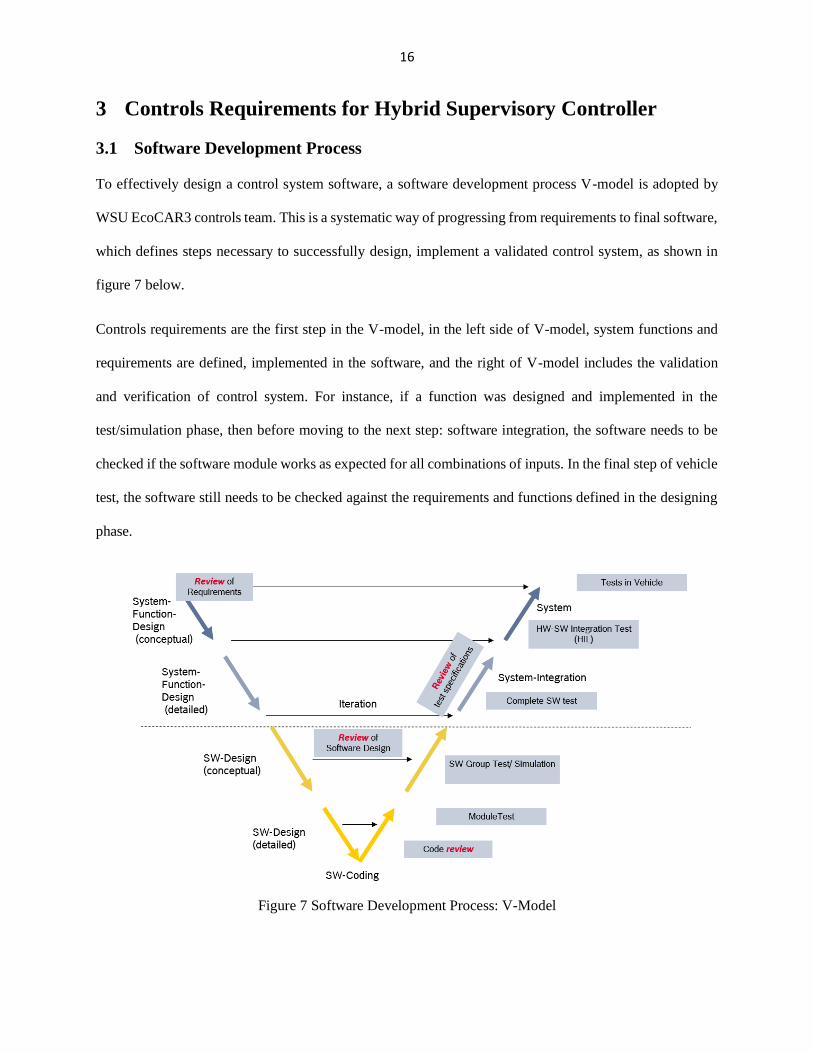
To effectively design a control system software, a software development process V-model is adopted by
WSU EcoCAR3 controls team. This is a systematic way of progressing from requirements to final software,
which defines steps necessary to successfully design, implement a validated control system, as shown in
figure 7 below.
Controls requirements are the first step in the V-model, in the left side of V-model, system functions and
requirements are defined, implemented in the software, and the right of V-model includes the validation
and verification of control system. For instance, if a function was designed and implemented in the
test/simulation phase, then before moving to the next step: software integration, the software needs to be
checked if the software module works as expected for all combinations of inputs. In the final step of vehicle
test, the software still needs to be checked against the requirements and functions defined in the designing
phase.
Figure 7 Software Development Process: V-Model

17
The V model is the key process in the development of hybrid supervisory controller. Figure 8 shows a
detailed example of HSC development process.
In the function designing phase, the main function of hybrid supervisory controller can be divided into
several sub-functions, including driver torque request, torque distribution, vehicle startup/shutdown,
controller handshaking, etc. and then each sub-function is developed and implemented based on previous
conceptual software design phase, finally the functions implemented in the module are tested under
software in the loop (SIL), hardware in the loop (HIL) and vehicle in the loop (VIL) which is vehicle test.
Figure 8 Hybrid Supervisory Controller Development Process
3.2 Controls Requirements
As mentioned in previous section, control requirements are the first step in the V-model. Following the
development of control requirements, the control algorithms must be developed to satisfy the goal of initial
design and VTS. The controls requirements can be derived from competition rules, hybrid powertrain
functionality, vehicle technical specifications, etc.

18
There are different types of requirements, including requirements on controller input/output, functional
requirements, diagnostic requirement as well as testing requirements. Control requirements can keep track
of algorithms implemented in the code. Therefore, this requirement analysis can give the team a whole idea
of what functionalities vehicle would need in the designing phase.
3.2.1 Controls Requirements for HSC
In Year 3, team needs to develop controller requirements that drive the development of activities in software.
The control requirements can be divided into four levels: requirements on controller input/output, functional
requirements, diagnostic requirement as well as testing requirements.
Requirements on HSC input/output include interfaces existed between the HSC and ECUs, like signals sent
and received by HSC, and data type as well as name conversion are defined in the requirements.
The functional requirements for hybrid supervisory controller are to define how vehicle behaves and what
functions vehicle needs to accomplish safe hybrid vehicle operation, including vehicle startup/shutdown,
vehicle powertrain enabling, mode selection, torque distribution within each mode, thermal control system
as well as regenerative braking behavior, etc. Each subsystem above involves lower level and detailed
control requirements, for instance, requirements for thermal system control includes input/output to the
thermal system, and functional requirements based on thermal system layout and goals of design.
Diagnostic requirements include three different level of diagnostic, component signal diagnostics,
component functionality assessment, system level functionality assessments, figure 9 shows an example of
requirements on signal diagnostic.

19
Figure 9 Requirements on signal diagnostics
Testing requirements include all critical functions implemented in the HSC that need to be tested, for
instance, vehicle startup operation, PRNDL, etc. Table 1 list a sample of vehicle startup/enabling procedure
requirements.
3.1 PRNDL
3.1.1 Park
The powertrain does not transmit any
torque to the wheels or allow the
vehicle to roll when PRNDL is in P
Vehicle
speed=0
SIL/HIL/In
vehicle
1. Start vehicle by turning key state
to crank
2. Set PRNDL position to P
3. Set APP > 10%
4. Set BPP = 0%
3.1.2 Reverse
The powertrain transmits only torque
to the wheels that propel the vehicle
in reverse when the PRNDL is in R
Vehicle
speed<0
SIL/HIL/In
vehicle
1. Start vehicle by turning key state
to crank
2. Set PRNDL position to R
3. Set APP > 10%
4. Set BPP = 0%
3.1.3 Neutral
The powertrain does not transmit any
torque to the wheels when the
PRNDL is in N
Vehicle
speed=0
SIL/HIL/In
vehicle
1. Start vehicle by turning key state
to crank
2. Set PRNDL position to N
3. Set APP > 10%
4. Set BPP = 0%
3.1.3 Drive
The powertrain transmits torque to
the wheels to propel the vehicle
forward when the PRNDL is in D
Vehicle
speed>0
SIL/HIL/In
vehicle
1. Start vehicle by turning key state
to crank
2. Set PRNDL position to D
3. Set APP > 10%
4. Set BPP = 0%
3.2 Startup/Enabling Procedure
3.2.1 Vehicle in Park
The vehicle will not start if the
PRNDL is not in P
Vehicle
does not
start
(signal
TBD)
SIL/HIL
1. Set PRNDL to D, R or N
2. Set APP=0%
3. Set BPP =100%
4. Turn key to crank
System/Requirement Req Number Requirement Date modifed Modifier
DIAG_S_001 When APP% (signalValue) is >-2 AND < 102 signal is in range (SignalInRange) and signalFault=0 9/20/2016 MDR
DIAG_S_002 If signalValue (APP %) is > 102 APP should go to Signal High state and the flag is set (signalFault=1). Any time the signal value <= 100 APP should return to Signal In Range state9/20/2016 MDR
DIAG_S_003 If signalValue (APP %) is < -2 signal APP should go to the Signal Low state and the flag is set (signalFault=1). Anytime the signal value >0 APP should return the Signal In Range state.9/20/2016 MDR
APP Mismatch Detection DIAG_S_004 If the difference of APP1 and APP2 is less than 0.01, tolerance is in normal range and Drv_APP_Agree is set to 1, or 2/18/2017 SW
DIAG_S_005 When the BPP% is > 100 OR < 0 then set BPP_valid to 0 9/20/2016 MDR
DIAG_S_006 When the BPP% is >0 OR BPP%==0 AND BPP% <0 OR BPP%== 100 set BPP_valid to 1 9/20/2016 MDR
Brake Failure Detection DIAG_S_007 When APP AND BPP AND VehSpeed>5mph for more than 1 second, set Brakefail to 1; 2/18/2017 SW
DIAG_S_009 When the keyPos is > 3 OR keyPos < 0, set KeyPos_valid to 0 9/20/2016 MDR
DIAG_S_010 When the keyPos is > 0 OR keyPos= 0 AND keyPos < 0 OR keyPos= 3, set KeyPos_valid to 1 9/20/2016 MDR
DIAG_S_011 When the PRNDL is > 4 OR PRNDL < 0, set PRNDL_valid to 0 2/18/2017 SW
DIAG_S_012 When the PRNDL is > 4 OR PRNDL < 0, set PRNDL_valid to 1 2/18/2017 SW
1.Driver Signal Diagnostic
Key Position Validity Detection
PRNDL Position Validity Detection
APP Validity Detection
BPP Validity Detection

20
3.2.2 Brake Pedal Depressed
The vehicle will not start if the brake
pedal is not depressed a minimum of
10%
Vehicle
does not
start
(signal
TBD)
SIL/HIL
1. Set PRNDL to P
2. Set APP=0%
3. Set BPP =7%
4. Turn key to crank
3.2.3 Accelerator Pedal Not
Depressed
The vehicle will not start if the
accelerator pedal is depressed more
than 3%
Vehicle
does not
start
(signal
TBD)
SIL/HIL
1. Set PRNDL to P
2. Set APP=5%
3. Set BPP =100%
4. Turn key to crank
Table 1 Test Requirements for Vehicle Startup operation

21
4 Development of Hybrid Supervisory Controller
4.1 Introduction
The hybrid supervisory control is a high – level controller that interprets driver demand and controls
interaction between powertrain components by their respective control units, it typically sends out analog,
digital and CAN signals to sub-controllers to fulfill torque or speed request from engine or motor, and
determine the appropriate torque split between two components as well as correct operating mode for hybrid
electric vehicle. In addition, the key functions of HSC include energy management strategy and fault
detection and mitigation which assess the status of hybrid powertrain components. The HSC mainly
interacts with different components control modules including engine control module, transmission control
module, battery management system, body control module, motor control module.
The HSC is primarily divided into four parts, the first part is driver requested torque, usually this part
calculates the torque required at the wheels based on accelerator pedal position or brake pedal position and
vehicle speed, which is the key input to the torque distribution. The second part is mode selection and torque
distribution, the propulsive torque split strategies will be explored in next section, the last part is fault
diagnostics which assess the status of signals, powertrain as well as system level, it’s derived from team’s
DFMEA (Appendix A.1)
4.2 Hybrid Supervisory Controller Software Structure
The hybrid supervisory controller takes different kinds of signals including analog, digital and CAN signals,
which are transmitted through team added high speed GM CAN networks. The signals coming from lower
level component controllers are then fed into main HSC functions which is illustrated in figure 10. The
output signals from hybrid supervisory controller are mostly control signals to component control module,
such as engine torque demand, motor torque demand, etc. Those signals which are required by vehicle will
be separated into messages needed by individual controllers. It also includes signals required by stock
vehicle.

22
Figure 10 Hybrid Supervisory Controller Software Structure
As mentioned previously, the signals coming from lower level controllers will be fed into fault detection
block which consists of three diagnostics levels including component signals diagnostics, component
functionality assessment and system level diagnostics, the details in different level of diagnostics will be
explored in the next sections. Signals from fault detection are then sent to driver demand block to determine
drive requested torque based on APP or BPP as well as other signals such as vehicle speed, transmission
ratio and vehicle mode, etc. Fault mitigation and mode selection block will take signals from fault detection
to determine the available vehicle operating mode, and then torque distribution block will calculate
command torque for engine and motor. There are also other functions in the HSC, such as regenerative
braking behavior, vehicle startup and shutdown.
4.3 Diagnostic Development
Fault Diagnosis algorithm contains fault detection and mitigation strategies for safety critical systems which
is derived from the team performed DFMEA (Appendix A.1). Fault detection algorithm identifies and
detects possible failures and faults of powertrain components, which is accomplished by receiving signals
from component controllers, and fault mitigation algorithm takes actions that would need to mitigate faults
for safety concern. DFMEA documentation defines each item or function in the vehicle that should be
examined for any potential failures, potential failures are discussed to estimate how often the fault occurs
and the severity level of failure as well as the possibility of detection. The DFMEA also documents the
detection and mitigation strategies to verity and validate that failure can be managed under safe operation.
The failures with high RPN numbers are discussed in the next section and safety requirements of HSC are

23
derived from DFMEA based on RPN numbers in Appendix. Table 2 below shows the safety requirements
for critical functions in the HSC.
Table 2 Critical Safety Requirements for HSC
Control Unit Safety Functions
Vehicle
Hybrid
Supervisory
Controller
(HSC)
The HSC should monitor the actual accelerate pedal position and brake pedal position
The HSC should monitor the actual torque of EM against the request torque
The HSC should monitor the actual torque of engine against the request torque
The HSC should monitor the transmission rotation direction against the gear position
The HSC should monitor 12V power supply
The HSC should monitor the actual gear position
The HSC should monitor the engine speed against electric motor speed.
The HSC should monitor High voltage battery limit
The HSC should monitor engine temperature and motor temperature against their
maximum and minimum.
The HSC should monitor the CAN communication for each controller
4.3.1 Fault Detection Strategy
Fault detection strategy only detects the faults or failures for each powertrain components as well as system
level. The fault detection strategy is organized by three different levels, including signal diagnostics,
component diagnostic and system level diagnostics. Each part provides different level functionality
assessments. For instance, Signal diagnostics is mainly to assess signals coming from each powertrain
controller module to check validity of data or whether signals are out of safe range, and the results of signal
diagnostics will be assessed to determine each component’s current level of functionality in the component
diagnostics, eventually previous results will go to system diagnostics to determine the overall functionality
of entire powertrain. The fault detection algorithm structure is presented in figure 11.
Figure 11 Fault Detection Strategy
There are several different techniques for detecting faults, the fault detection strategies implemented by
EcoCAR3 team are mainly threshold techniques, which are easiest fault diagnosis to implement. The
threshold technique is to set certain limit or threshold for signals that need to be monitored, if one of these
24
signal values go outside the threshold which means something is wrong. This technique is widely used for
monitoring component temperature, speed or high voltage and current. The validation in SIL environment
for fault detection strategy will be explored explicitly in the next section.
4.3.2 Fault Mitigation Strategy
Fault mitigation strategy is directly related to fault detection and the function of fault mitigation is to
maintain the safe operation of vehicle and try to avoid large deviation from driver’s demand. Different
faults would result in various mitigation strategies. Some faults will require vehicle operation to be stopped,
some will change to limo mode, while some will simply result in the display of an indicator light on the
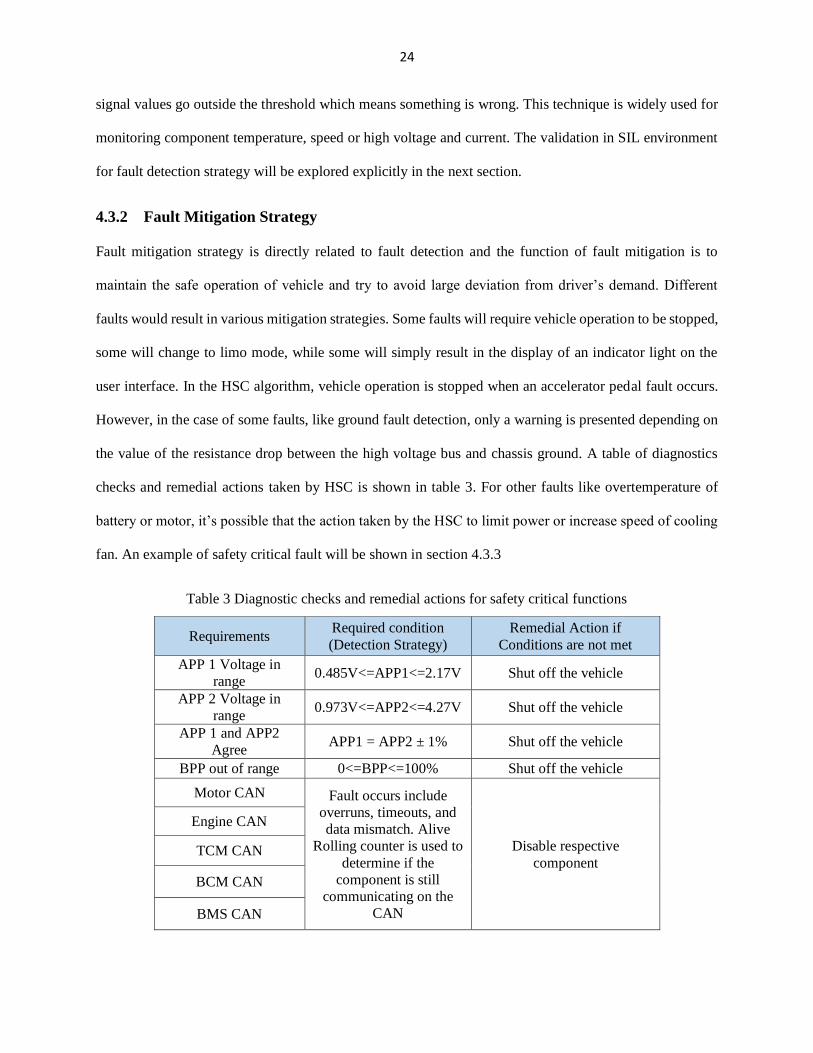
user interface. In the HSC algorithm, vehicle operation is stopped when an accelerator pedal fault occurs.
However, in the case of some faults, like ground fault detection, only a warning is presented depending on
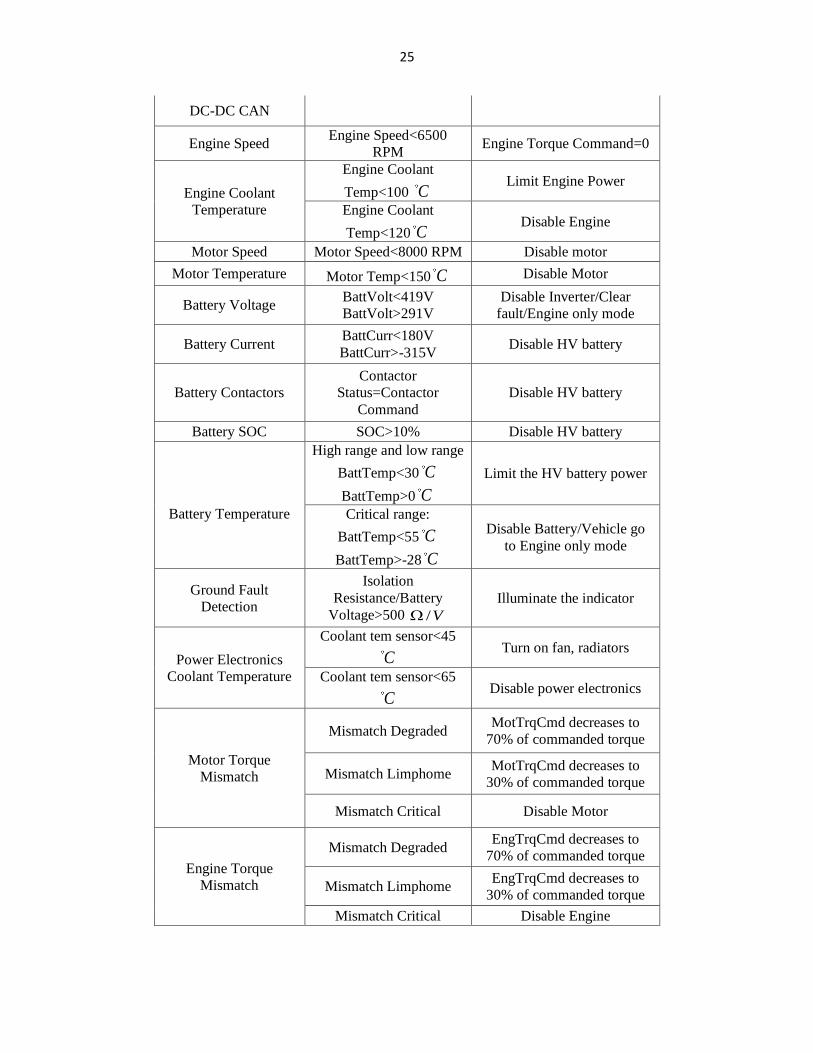
the value of the resistance drop between the high voltage bus and chassis ground. A table of diagnostics
checks and remedial actions taken by HSC is shown in table 3. For other faults like overtemperature of
battery or motor, it’s possible that the action taken by the HSC to limit power or increase speed of cooling
fan. An example of safety critical fault will be shown in section 4.3.3
Table 3 Diagnostic checks and remedial actions for safety critical functions
Requirements Required condition
(Detection Strategy)
Remedial Action if
Conditions are not met
APP 1 Voltage in
range 0.485V<=APP1<=2.17V Shut off the vehicle
APP 2 Voltage in
range 0.973V<=APP2<=4.27V Shut off the vehicle
APP 1 and APP2
Agree APP1 = APP2 ± 1% Shut off the vehicle
BPP out of range 0<=BPP<=100% Shut off the vehicle
Motor CAN Fault occurs include
overruns, timeouts, and
data mismatch. Alive
Rolling counter is used to
determine if the
component is still
communicating on the
CAN
Disable respective
component
Engine CAN
TCM CAN
BCM CAN
BMS CAN
25
DC-DC CAN
Engine Speed Engine Speed<6500
RPM Engine Torque Command=0
Engine Coolant
Temperature
Engine Coolant
Temp<100 C Limit Engine Power
Engine Coolant
Temp<120 C Disable Engine
Motor Speed Motor Speed<8000 RPM Disable motor
Motor Temperature Motor Temp<150 C Disable Motor
Battery Voltage BattVolt<419V
BattVolt>291V
Disable Inverter/Clear
fault/Engine only mode
Battery Current BattCurr<180V
BattCurr>-315V Disable HV battery
Battery Contactors
Contactor
Status=Contactor
Command
Disable HV battery
Battery SOC SOC>10% Disable HV battery
Battery Temperature
High range and low range
BattTemp<30 C
BattTemp>0 C
Limit the HV battery power
Critical range:
BattTemp<55 C
BattTemp>-28 C
Disable Battery/Vehicle go
to Engine only mode
Ground Fault
Detection
Isolation
Resistance/Battery
Voltage>500 /V
Illuminate the indicator
Power Electronics
Coolant Temperature
Coolant tem sensor<45
C Turn on fan, radiators
Coolant tem sensor<65
C Disable power electronics
Motor Torque
Mismatch
Mismatch Degraded MotTrqCmd decreases to
70% of commanded torque
Mismatch Limphome MotTrqCmd decreases to
30% of commanded torque
Mismatch Critical Disable Motor
Engine Torque
Mismatch
Mismatch Degraded EngTrqCmd decreases to
70% of commanded torque
Mismatch Limphome EngTrqCmd decreases to
30% of commanded torque
Mismatch Critical Disable Engine

26
4.3.3 Critical Fault Validated on the MIL/SIL
In this section, a full control system development for the specific fault scenario in WSU EcoCAR3 team is
discussed, the process first starts by identifying safety requirement derived from DFMEA documentation
for this specific fault, and then detection strategy and mitigation strategy are verified and validated for this
fault under MIL/SIL.
4.3.3.1 Fault-Scenario Description
During the Year3 vehicle testing, a mechanical failure related to coupler occurred and the bolts connected
the engine crankshaft with electric motor were broken for the first time, as shown in figure 12, figure 13
shows that all six bolts are sheared by the large torque requested from engine and electric motor, and they
have the same intersecting surface, as shown in figure 13.
Figure 12 The engine crankshaft and coupler

27
Figure 13 Broken bolt
This fatal fault has been analyzed for several reasons, improper bolt specification is the main issue for this
fault, however, based on the CAN log data which is derived from vehicle testing CAN messages, as shown
in figure 14, it’s clear that this fault actually occurred at the time when vehicle transitioned from CD mode
to CS mode, which means that vehicle request too much torque at the beginning of engine charging mode
since negative torque requested from motor increases the stress of mechanical connection between engine
and electric motor.

28
Figure 14 Engine and motor speed and feedback torque during fatal incident
4.3.3.2 Fault Diagnostic Strategy
In order to avoid this fatal fault in the future testing activity, the safety analysis is conducted for this specific
fault scenario. The first step of safety analysis is to derive the safety requirement, which is the beginning
of control system development process. The safety requirement can be derived from DFMEA, as shown in
the following figures. Due to the limitation of clutch-less P2 parallel architecture, this fault can be specific
scenario since mechanical failure to coupler between engine and electric motor can lead to undesired
acceleration/deceleration, over speed of the engine or even the damage to the electric motor. Therefore, a
robust fault detection and mitigation strategy for this fault can greatly decrease the occurrence of this fault
and let vehicle operate in a safe mode when fault happens.
Figure 15 DFMEA for the specific fault scenario
Fault Detection
The fault can be detected based on the comparison of engine speed and electric motor speed, as shown in
CAN log data from vehicle testing, when fault happens, the difference of engine speed and motor speed
can be over 1000 rpm, which indicates that the fault already occurred, therefore, a fault mitigation is taken
in HSC to operate vehicle in a safe mode. The fault detection strategy can be divided into two levels:
Degraded and Critical level.
Fault Mitigation

29
The goal of fault mitigation strategy is to maintain the safe vehicle functionality, if the speed mismatch
fault is triggered, then the vehicle will shut down completely to avoid further damage to the motor or engine.
In degraded level, the engine torque and electric motor commanded torque are limited during engine
charging or regenerative braking mode.
Table 4 Fault Mitigation Strategy Overview
Requirements Condition Preventing actions
Normal Operation Speed Mismatch< 50 rpm No action taken
Limited Operation 50 rpm<Speed
Mismatch<100 rpm
Reduce motor negative torque
and engine torque by 50%;
Critical Operation Speed Mismatch> 100 rpm Shut down the vehicle;
4.3.3.3 Diagnostic Strategy Validation in MIL/SIL
Fault detection and mitigation strategy are implemented in the team’s HSC to validate the effectiveness of
the strategy under MIL/SIL environment by using Simulink. In WSU EcoCAR3 team’s vehicle simulator,
the fault is inserted in the engine plant model, and vehicle simulator is running under 505 drive cycle.
1) Degraded Level
In this level, once the difference of engine speed and electric motor speed is over 50 rpm, the engine
torque and electric motor requested torque will be reduced by 50%, the fault insertion and fault
detection are shown in figure 16.

30
Figure 16 Fault Insertion and Fault Detection
Figure 17 a) Engine and motor torque request; b) Battery SOC under fault scenario
Figure 17 above shows that at time of 200s, the fault was inserted to the system, the fault detection in the
HSC detected the fault quickly and mitigation action is taken to limit the engine torque and electric motor

31
torque in the HSC. Battery SOC wen down at the moment when the fault was detected and mitigated, since
during the engine charging mode, the negative requested motor torque was limited, as shown in black
rectangle in the figure 17. once there is no fault detected in the HSC, the vehicle goes to normal CS operation
to keep sustain the SOC.
2) Critical Level
In the critical fault level, when the speed mismatch is over critical threshold, the vehicle will shut down
completely to avoid further damage the engine or electric motor which may be caused by major failure.
Figure 18 Fault Insertion, Detection, system level status

32
Figure 19 Engine torque and motor torque, speed trace
Figure 18 above shows that this critical fault is inserted at about 200s, and system level functionality
status goes to offline when the fault is detected in the HSC. The results of fault detection are then passed
to the torque distribution; the remedial action would be taken by HSC to determine the available modes
of operation based on diagnostics. The plot figure 19 above shows that when fault occurs the vehicle
will shut down and motor torque output will go to 0, since motor dynamics is not implemented in the
plant model, the torque would be 0 immediately when fault occurs.
4.3.4 Test case Development
Test case is important document in the process of requirements and testing development, it documented
procedure for performing verification and validation of supervisory controller. Test cases were executed
for safety critical functions in the SIL/HIL environment and eventually in the vehicle, and the results of test
executed by the control code will be compared to the expected results, and how supervisory controller
respond to the fault scenarios and what remedial actions are taken would be defined in the document as
well.

33
Test cases are detailed and step by step procedures to be followed to execute a specific test, for instance,
during the development of diagnostics, test cases need to cover all safety-critical functions and fault
scenarios, as explained in section 4.3.3, an engine and motor speed mismatch fault scenario needs to be
considered and detected by fault detection algorithm in the supervisory controller.
Table 5 provides a summary of the safety critical tests to date. The tests developed in Year3 cover the faults
which make ECUs or component unable to meet the driver demand, the results of tests executed by the
control code will be compared to the expected results. Step-by-step procedures for test cases that have been
developed for modeling and simulation provided in the Appendix.
Table 5 Safety Critical Function Testing Summary
Name and Description Pass/Fail Criteria
Primary
Testing
Environment
3.1 Accelerator Pedal
3.1.1 Accelerator Pedal Signal Range
If any of the two accelerator pedal signal is out of range the
vehicle receives only idle torque (limphome)
APP > APPmax
APP Status = High
Vehicle mode = Limphome
mode
SIL/HIL
APP <APPmin
APP Status = Low
Vehicle mode = Limphome
mode
SIL/HIL
3.1.2 Accelerator Pedal Mismatch
If the istantaneous value of the APP1 does not equal the
value of APP2 within a +/- 1% the vehicle receives idle
torque
APP Agree =0
Vehicle mode= Limphome
mode
SIL/HIL
3.1.3 Brake Pedal Signal Range
If the brake pedal signal is out of range vehicle shuts down
BPP Status = Out of range
Vehicle mode = Shutdown SIL/HIL
3.1.4 Brake Pedal Signal Fault
BPP depressed at a certain vaule but vehicle does not
decelerate at expected rate
BPP Status = Signal Fault
Vehicle mode = Shutdown SIL/HIL
3.2 PRNDL
3.2.1 Park
The powertrain does not transmit any torque to the wheels
or allow the vehicle to roll when PRNDL is in P
Vehicle speed=0 SIL/HIL/In
vehicle
3.1.2 Reverse
The powertrain transmits only torque to the wheels that
propel the vehicle in reverse when the PRNDL is in R
Vehicle speed<0 SIL/HIL/In
vehicle
34
3.2.3 Neutral
The powertrain does not transmit any torque to the wheels
when the PRNDL is in N
Vehicle speed=0 SIL/HIL/In
vehicle
3.2.3 Drive
The powertrain transmits torque to the wheels to propel the
vehicle forward when the PRNDL is in D
Vehicle speed>0 SIL/HIL/In
vehicle
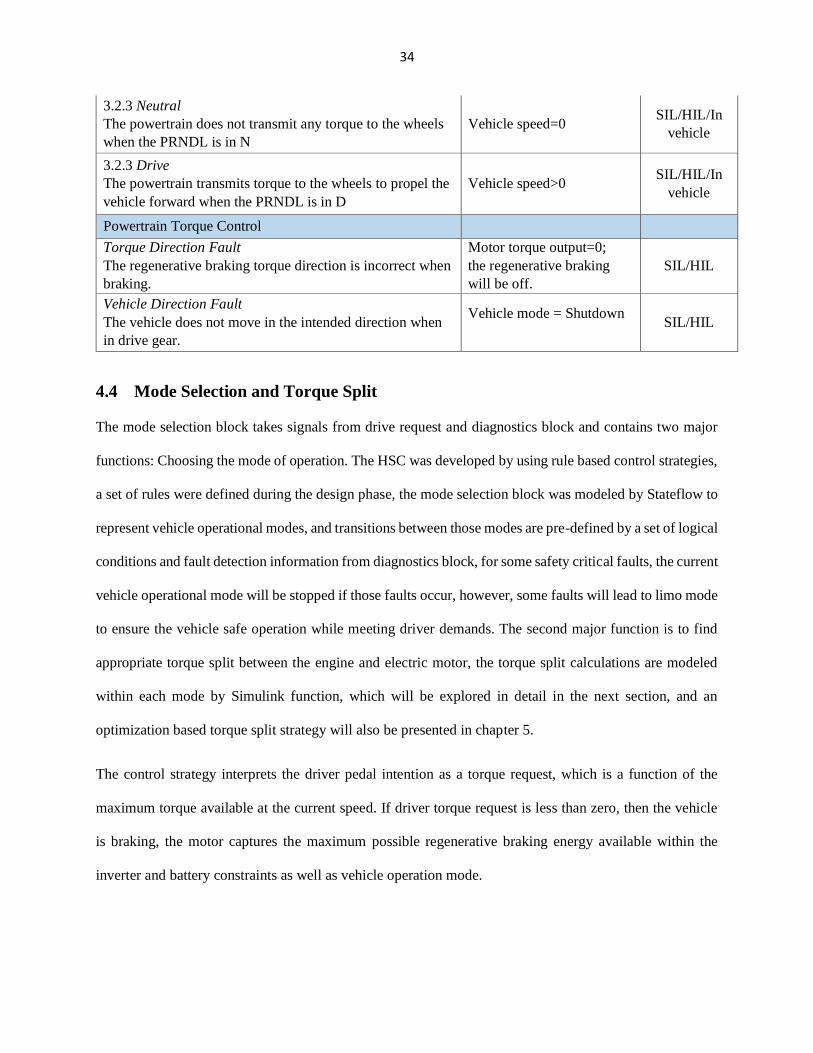
Powertrain Torque Control
Torque Direction Fault
The regenerative braking torque direction is incorrect when
braking.
Motor torque output=0;
the regenerative braking
will be off.
SIL/HIL
Vehicle Direction Fault
The vehicle does not move in the intended direction when
in drive gear.
Vehicle mode = Shutdown
SIL/HIL
4.4 Mode Selection and Torque Split
The mode selection block takes signals from drive request and diagnostics block and contains two major
functions: Choosing the mode of operation. The HSC was developed by using rule based control strategies,
a set of rules were defined during the design phase, the mode selection block was modeled by Stateflow to
represent vehicle operational modes, and transitions between those modes are pre-defined by a set of logical
conditions and fault detection information from diagnostics block, for some safety critical faults, the current
vehicle operational mode will be stopped if those faults occur, however, some faults will lead to limo mode
to ensure the vehicle safe operation while meeting driver demands. The second major function is to find
appropriate torque split between the engine and electric motor, the torque split calculations are modeled
within each mode by Simulink function, which will be explored in detail in the next section, and an
optimization based torque split strategy will also be presented in chapter 5.
The control strategy interprets the driver pedal intention as a torque request, which is a function of the
maximum torque available at the current speed. If driver torque request is less than zero, then the vehicle
is braking, the motor captures the maximum possible regenerative braking energy available within the
inverter and battery constraints as well as vehicle operation mode.

35
4.4.1 Mode Selection
The criteria used in Simulink is to select the proper hybrid operation mode for all conceivable situations
that may be encountered, fault modes were developed that can be used in the case of limited functionality
of any or all powertrains. Four modes were developed in the stateflow environment with Simulink, the logic
determines the criteria for transitioning between mode, which is shown in figure 20. First, the vehicle will
go to default mode which is blended CD mode with high initial SOC when vehicle is enabled and ready,
some diagnostic signals from fault detection block are highest priority checks, since vehicle will be forced
into fault mode, like engine only mode when those diagnostics signals are active. Second, CS mode will
start when high voltage battery SOC < CS_SOC_MIN which is minimum SOC threshold (18%) or CS
switch on is triggered by the driver. Engine only mode will be entered only if normal vehicle operational
modes are offline which means critical faults occur in the electric powertrain system. In sports mode, this
mode can be triggered by the driver’s switch, and improve performance of vehicle.
Figure 20 Mode selection in torque distribution
4.4.2 Blended Charge Depleting Strategy
A deterministic rule-based control strategy is developed to perform torque distribution between engine and
electric mode within blended CD mode, to meet the torque requirements at the wheels, since there was no
clutch between engine and electric motor, the engine output shaft will be always coupled to the motor,
therefore, a motor dominant blended CD control strategy was developed to split the torque to meet the
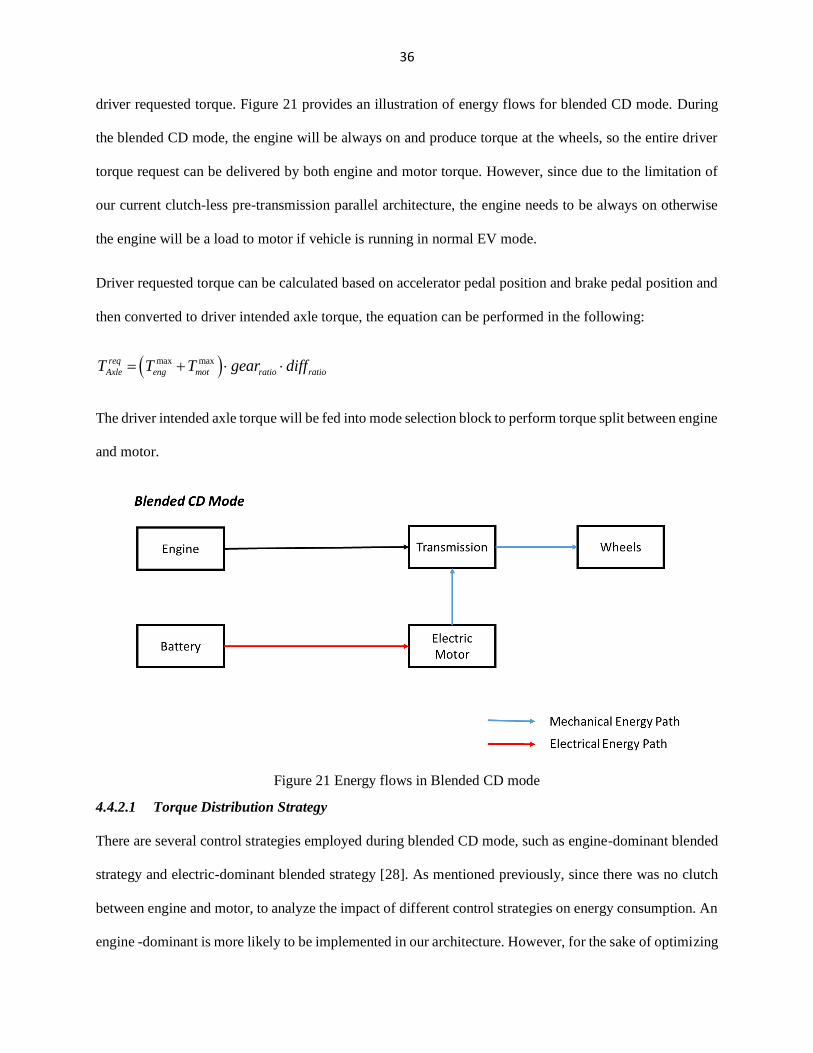
36
driver requested torque. Figure 21 provides an illustration of energy flows for blended CD mode. During
the blended CD mode, the engine will be always on and produce torque at the wheels, so the entire driver
torque request can be delivered by both engine and motor torque. However, since due to the limitation of
our current clutch-less pre-transmission parallel architecture, the engine needs to be always on otherwise
the engine will be a load to motor if vehicle is running in normal EV mode.
Driver requested torque can be calculated based on accelerator pedal position and brake pedal position and
then converted to driver intended axle torque, the equation can be performed in the following:
max maxreq
Axle eng mot ratio ratioT T T gear diff
The driver intended axle torque will be fed into mode selection block to perform torque split between engine
and motor.
Figure 21 Energy flows in Blended CD mode
4.4.2.1 Torque Distribution Strategy
There are several control strategies employed during blended CD mode, such as engine-dominant blended
strategy and electric-dominant blended strategy [28]. As mentioned previously, since there was no clutch
between engine and motor, to analyze the impact of different control strategies on energy consumption. An
engine -dominant is more likely to be implemented in our architecture. However, for the sake of optimizing

37
the energy consumption in E&EC event, which is the longest and most resource intensive driving event in
the competition [29]. Therefore, a new blended strategy was presented in this section:
Mode Torque Request Threshold Torque Distribution Strategy
Blended CD
Mode
,small ,maxreq eng motT T T
,
, max 0,
eng cmd small
mot cmd req small
T T
T T T
,small ,maxreq eng motT T T , ,opt ,max
, ,max
min ,eng cmd eng req mot
mot cmd mot
T T T T
T T
Table 6 Torque request equations for Blended CD mode control strategy
Table 6 shows that torque distribution strategies involve two different sub-modes of operation associated
with driver requested torque, and control strategies are discussed in detail in above table. when driver
requested torque is less than the addition of maximum torque of electric motor and limited engine torque,
the electric motor will produce majority of torque, while engine still needs to produce a small amount of
torque, due to our clutch-less P2 architecture, this small amount of torque is discussed in later section. When
driver requested torque is very large and requires power that is greater than maximum motor power, the
electric motor will produce maximum power under high voltage battery limited power and inverter limited
power, while the engine compensates the gap between motor command torque and driver requested torque
but the torque commanded by engine is limited under optimal engine operating line.
In order to determine how much torque that engine can produce during CD mode for the sake of reducing
UF-weighted total energy consumption, a set pf pre-defined engine operating line are determined to
evaluate how much total energy are consumed during the E&EC event. Figure 22 shows various engine
operating lines are defined according to the amount of percentage of max engine torque at current engine
speed available. The optimal engine operating line was scaled down to different levels, as listed in table 7.
The engine available torque based on current engine speed is limited by those lines.
Scale
Factor
20% 30% 40% 50% 60% 80% 100%
Table 7 Scale factor for engine operating line

38
Figure 23 shows that with different scale factors, battery SOC depletes at different speed due to engine
producing torque. It shows that the speed of SOC depleting increases when the scale factor decreases, which
means that the contribution of engine also decreases.
Table 8 presents the UF-weighted energy consumption for different engine torque level. One can see that
vehicle has the lowest fuel consumption which is only 4.07 gallon when the scale factor is 0.6. however,
the UF-weighted energy consumption increases when the scale factor increases, in order to find a tradeoff
between energy consumption and CD range, 0.3 of scale factor is selected to limit the engine torque during
CD mode.
Figure 22 Various engine operating lines

39
Figure 23 Battery SOC with various scale factors
Scalin
g
factor
UF CD
Range
(mile)
Fuel
Consumption
(Gal)
Vehicle Energy Consumption (Wh/km) PEU WTW
(Wh PE/km) CD Energy
Consumption
(Wh/km)
Equivalent
CS Fuel
Consumption
(Wh/km)
UF-Weighted
Energy
Consumption
(Wh/km)
0.2 0.4425 23.32 4.1748 486.43 689.84 599.82 143.65
0.3 0.4813 26.39 4.1773 506.65 691.16 602.36 145.18
0.4 0.5858 36.36 4.1491 561.26 685.27 612.63 150.30
0.5 0.7406 59.43 4.1015 590.29 700.33 618.84 156.14
0.6 0.7750 67.28 4.0747 611.97 675.99 626.37 159.41
0.8 0.8366 86.79 4.0963 625.47 690.60 636.11 165.95
1 0.8703 102.92 4.1644 646.29
Table 8 Vehicle Energy Consumption with different scale factors
4.4.2.2 Simulation Setup
To perform the blended control strategy analysis for PHEV, the E&EC city and highway drive cycle was
chosen to run the simulation with initial 89% of SOC. The following section shows the results obtained in
SIL for blended CD mode during a specified drive cycle as mentioned previously. Figure 24 shows the
drive cycle in detail with average speed of 39 mph, and maximum speed of 55.3 mph, and Figure 25 shows
the change of battery SOC, it’s clear that engine torque is limited to certain level when the it’s in CD mode
so that vehicle has longer CD range.

40
Figure 24 Speed trace and battery SOC
Figure 25 Driver Torque Request, Motor torque and Engine torque
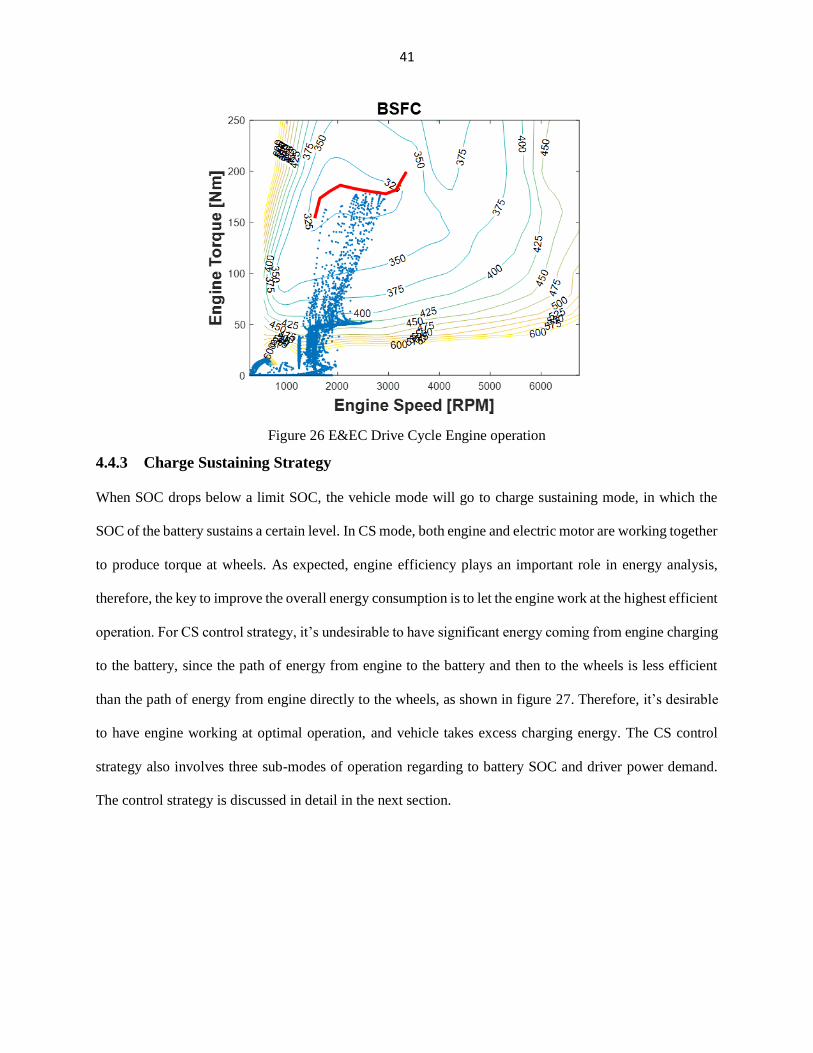
41
Figure 26 E&EC Drive Cycle Engine operation
4.4.3 Charge Sustaining Strategy
When SOC drops below a limit SOC, the vehicle mode will go to charge sustaining mode, in which the
SOC of the battery sustains a certain level. In CS mode, both engine and electric motor are working together
to produce torque at wheels. As expected, engine efficiency plays an important role in energy analysis,
therefore, the key to improve the overall energy consumption is to let the engine work at the highest efficient
operation. For CS control strategy, it’s undesirable to have significant energy coming from engine charging
to the battery, since the path of energy from engine to the battery and then to the wheels is less efficient
than the path of energy from engine directly to the wheels, as shown in figure 27. Therefore, it’s desirable
to have engine working at optimal operation, and vehicle takes excess charging energy. The CS control
strategy also involves three sub-modes of operation regarding to battery SOC and driver power demand.
The control strategy is discussed in detail in the next section.

42
Figure 27 Engine Charge mode in CS mode
Figure 28 Motor Assist mode in CS mode
4.4.3.1 Torque Distribution Strategy
As discussed previously, the control strategy that often charges the high voltage battery by using the engine
is expected to have greater fuel consumption in CS mode. Therefore, a new engine dominant control
strategy in CS mode is discussed below.
1) When SOC drops below CS_SOC_MIN which is lower limit for battery SOC, and driver requested
torque is less than optimal engine operation, then it’s desirable to have engine working at optimal
operation, and excess energy is taken to charge the battery to increase the SOC, since motor
assisting in this case will improve the engine operation region thus increasing the engine efficiency.

43
2) When SOC is higher than the pre-defined CS maximum SOC threshold, in addition, driver
requested torque is pre-defined torque threshold, which means it’s not mandatory to charge the
battery to sustain the SOC, therefore, vehicle can be driven in normal CD blended mode, since as
mentioned previously, the electric motor will produce majority of torque, while engine still needs
to produce a small amount of torque. When driver requested torque is very large and requires power
that is greater than maximum motor power, the electric motor will produce maximum power under
high voltage battery limited power and inverter limited power, while the engine compensates the
gap between motor command torque and driver requested torque but the torque commanded by
engine is limited under optimal engine operating line.
3) When SOC drops below a critical SOC level and driver torque request is greater than desired
operation region, if engine still works at optimal operating point then it’s hard for battery to sustain
at desired SOC level, battery working at low SOC may cause higher battery internal resistance, so
the torque distribution strategy implemented in this mode is to let engine deliver maximum torque
under current engine speed and motor acts as generator to charge the battery to increase the SOC.
Table 9 below shows the detailed torque distribution strategies in CS mode. Figure 29 shows the
sub-modes in charge sustaining mode and transition between two sub-modes.
Mode Torque Request and SOC
Threshold
Torque Distribution Strategy
CS
Mode-
Engine
Charging
,
CS_SOC_MIN
eng opt req
SOC
T T
, ,
, ,max ,max T ,
eng cmd eng opt
mot cmd mot req eng opt
T T
T T T
,
_critical
eng opt req
SOC SOC
T T
, ,max
, ,max mot,max eng,maxmax ,min ,
eng cmd eng
mot cmd mot req
T T
T T T T T
CS-
Mode-
Motor
Assisting
,small ,max
CS_SOC_MAX
req eng mot
SOC
T T T
,
, max 0,
eng cmd small
mot cmd req small
T T
T T T
,small ,max
CS_SOC_MAX
req eng mot
SOC
T T T
, ,opt ,max
, ,max
min ,eng cmd eng req mot
mot cmd mot
T T T T
T T
Table 9 Torque Control strategy in CS mode

44
Figure 29 Charge Sustaining Mode
4.4.3.2 Simulation Setup
As discussed previously, CS control strategies involve three cases associated with current battery SOC and
driver power demand. The E&EC city and highway drive cycle is used. As shown in Figure 30. the
difference between initial SOC and final SOC is within allowable limit, which is 5% for HEV.
Figure 32 the engine operating points for E&EC drive cycle. It’s clear that most of engine operating points
are located under optimal operating line which is the highest efficiency for engine.
Figure 30 Speed Trace and SOC under CS mode
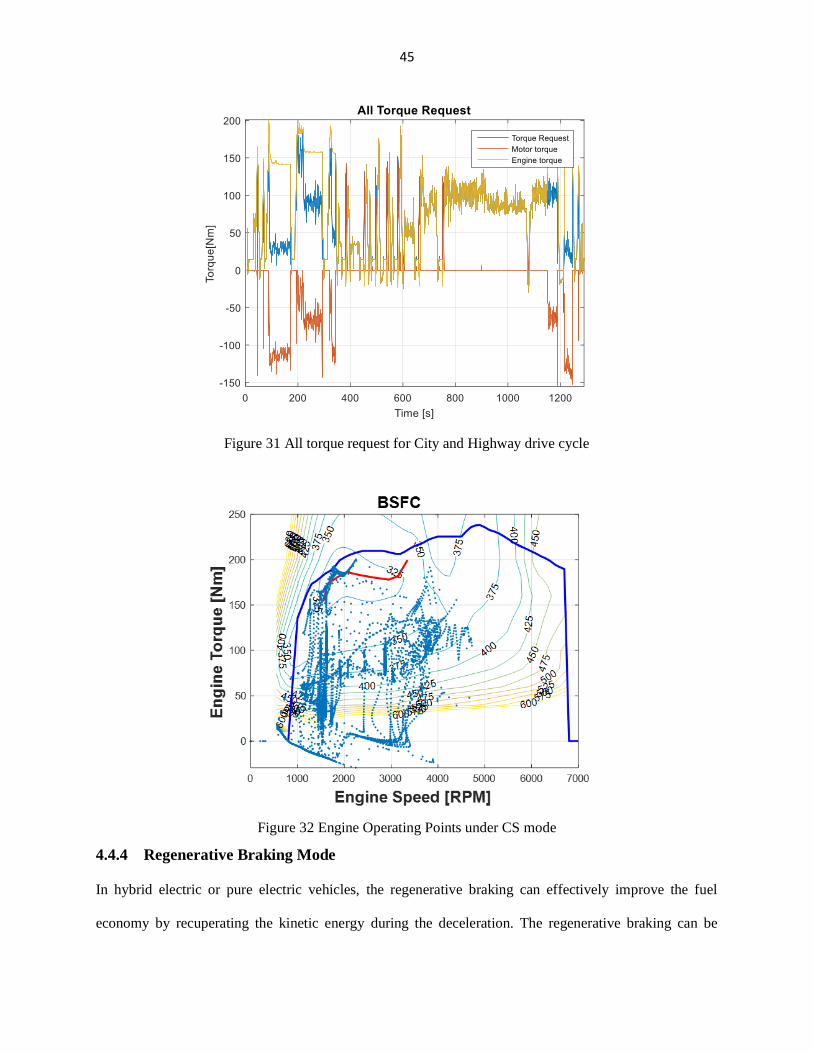
45
Figure 31 All torque request for City and Highway drive cycle
Figure 32 Engine Operating Points under CS mode
4.4.4 Regenerative Braking Mode
In hybrid electric or pure electric vehicles, the regenerative braking can effectively improve the fuel
economy by recuperating the kinetic energy during the deceleration. The regenerative braking can be

46
coupled with mechanical brake to decelerate the vehicle at the same time. Figure 33 illustrates the energy
flow from wheels to the battery. Figure 34 shows the drive cycle with 60mph to 0mph braking and battery
SOC changes with regenerative braking enabled and disabled. It’s clear that battery SOC increases
approximately by 0.2% when vehicle decelerates and the energy was captured back to the battery.
Figure 33 Energy path for Regenerative Braking
Figure 34 Speed Trace and Battery SOC with/without Regen

47
Figure 35 Motor output torque
4.5 Torque Request Subsystem
During the transient conditions, the engine cannot follow the driver torque request so this can be solved by
motor compensation, since the engine is much slower than the electric motor. Figure 36 below shows the
relationship between engine torque and electric motor torque.
Figure 36 Engine and motor torque control

48
Figure 37 Engine and electric motor torque request
If driver torque request changes from point C to point D in figure 36, due to the limit of engine response
dynamics, the engine cannot change operating points from C to D instantaneously, therefore, during
transient condition, the difference between actual engine torque and driver torque request is sent to the
electric motor, so that the motor can compensate the torque difference faster than the engine. Although this
strategy has small impact on fuel consumption, the drivability is greatly improved by this method.
4.6 Energy Analysis
As mentioned previously, Emissions and Energy Consumption (E&EC) in EcoCAR3 is an important event
during the competition where the on -road testing is conducted over a pre- defined drive cycle to evaluate
the total energy consumption of the vehicle that each team designed. In this section, a E&EC full drive
cycle was used with over approximately 103 miles, which consists of drive to track, seven repeating
City/Highway around circle track and drive back from track drive cycle, as shown below. This section
outlines the energy analysis over EcoCAR3 E&EC drive cycle based on the control strategies discussed in
previous sections.
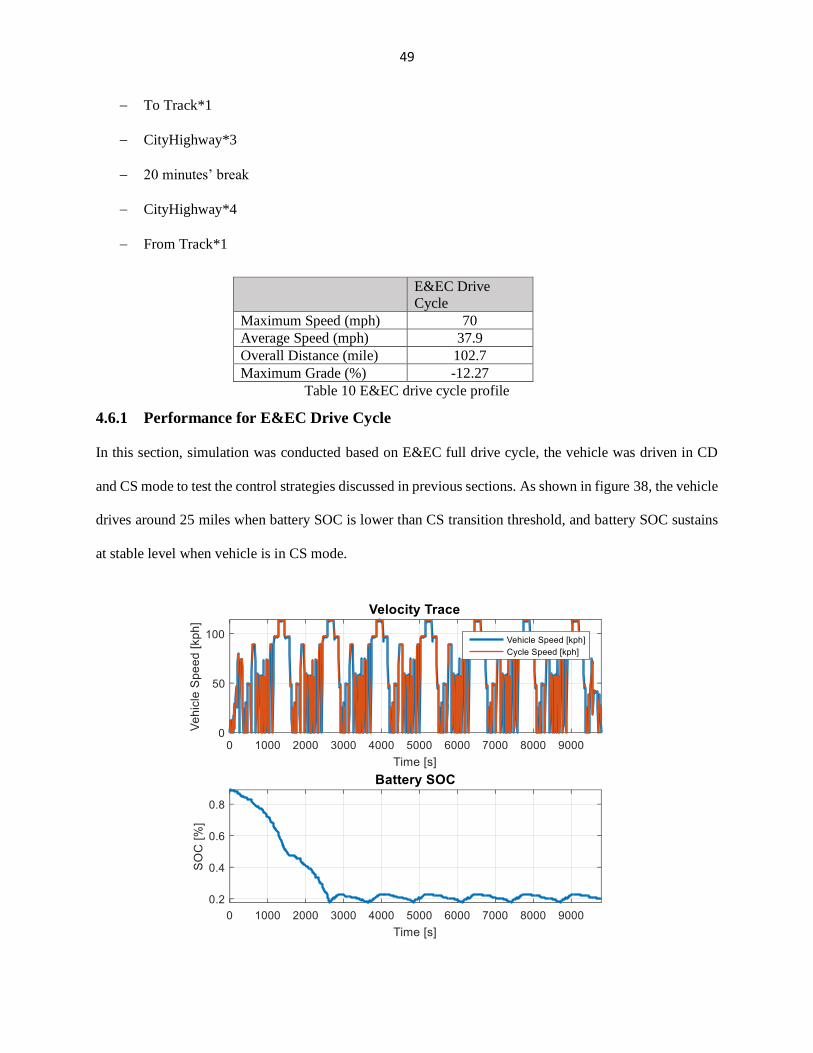
49
To Track*1
CityHighway*3
20 minutes’ break
CityHighway*4
From Track*1
E&EC Drive
Cycle
Maximum Speed (mph) 70
Average Speed (mph) 37.9
Overall Distance (mile) 102.7
Maximum Grade (%) -12.27
Table 10 E&EC drive cycle profile
4.6.1 Performance for E&EC Drive Cycle
In this section, simulation was conducted based on E&EC full drive cycle, the vehicle was driven in CD
and CS mode to test the control strategies discussed in previous sections. As shown in figure 38, the vehicle
drives around 25 miles when battery SOC is lower than CS transition threshold, and battery SOC sustains
at stable level when vehicle is in CS mode.

50
Figure 38 E&EC Full drive cycle and battery SOC depletes
Figure 39 Motor torque and engine torque request
With engine working during CD mode, the CD range of vehicle was significantly extended, however, the
energy consumption increases due to fuel consumption in CD mode. Figure 39 shows the all torque request
during the entire drive cycle, one can see that motor delivers most torque request in CD mode and also
captures the kinetic energy during regenerative braking. In CS mode, energy operates at optimal operating
line and extra torque is used to charge the battery to sustain SOC level.
4.6.2 Energy Consumption
To evaluate the energy consumption for CD and CS control strategies in E&EC drive cycle, For UF-
weighted energy consumption, fuel and electric consumption needs to be calculated by applying UF to the
CD and CS modes, the equations below show the total energy consumption calculation [29]:
𝐸𝑛𝑒𝑟𝑔𝑦 𝐶𝑜𝑛𝑠𝑢𝑚𝑝𝑡𝑖𝑜𝑛𝑈𝐹−𝑤𝑒𝑖𝑔ℎ𝑡𝑒𝑑[𝑘𝑊ℎ/𝑘𝑚] = (𝐸𝐶𝐶𝐷 ∗ 𝑈𝐹 + 𝐸𝐶𝐶𝑆 ∗ (1 − 𝑈𝐹))[𝑘𝑊ℎ/𝑘𝑚]
Table 11 shows the vehicle energy consumption for entire drive cycle, which meets the team’s VTS
requirements.
Table 11 Vehicle Energy Consumption for E&EC drive cycle

51
UF CD
Range
(mile)
Fuel
Consumption
(Gal)
Vehicle Energy Consumption (Wh/km) PEU WTW
(Wh PE/km)
GHG WTW
(g GHG/km) CD Energy
Consumption
(Wh/km)
Equivalent
CS Fuel
Consumption
(Wh/km)
UF-Weighted
Energy
Consumption
(Wh/km)
0.4884 26.98 4.50 506.06 724.91 618.03 154.08 175.86

52
5 Optimization-based Energy Management Strategy
5.1 Introduction
As discussed in the previous section, energy management strategy are algorithms that distribute the power
between engine and electric motor to reduce the energy consumption and improve the performance of HEVs,
energy management takes vehicle states, like pedal positions, battery SOC, etc. to make decisions.
A modified equivalent consumption minimization strategy (ECMS) is proposed in this section, the ECMS
is a real-time optimization method, which calculates the instantaneous fuel consumption at each time step
in the drive cycle and offers locally optimal operating point of engine and electric motor [15]. The ECMS
is designed by calculating the total energy consumption which is the sum of actual fuel consumption of
engine and virtual electric energy consumption of electric motor. Typically, this strategy is calculated based
on real-time and no predictions are necessary but only few vehicle state constraints are needed, such as
battery SOC, driver torque request at the wheels, etc. Compared to deterministic rule-based control strategy
which is discussed in the previous sections, this strategy can offer optimal torque distribution between ICE
and EM to improve the fuel economy while maintaining battery SOC at the same level.
In this chapter, the instantaneous equivalent fuel consumption is analyzed in charge sustaining mode, and
then torque distribution strategy based on ECMS is proposed to find the torque optimization among driver
torque request at each time step, and finally a penalty function for state constraints and charge sustainability
is developed to guarantee that the battery SOC does not exceed the limit.
Figure 40 Energy Management Strategy in HEVs
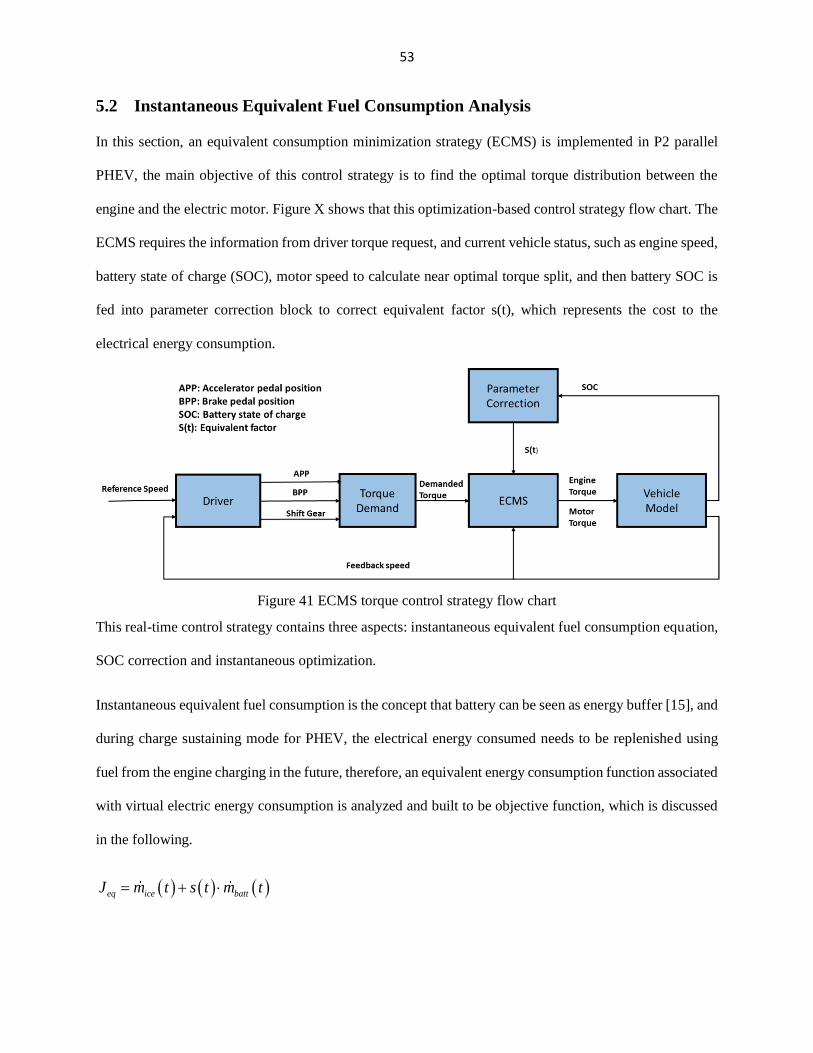
53
5.2 Instantaneous Equivalent Fuel Consumption Analysis
In this section, an equivalent consumption minimization strategy (ECMS) is implemented in P2 parallel
PHEV, the main objective of this control strategy is to find the optimal torque distribution between the
engine and the electric motor. Figure X shows that this optimization-based control strategy flow chart. The
ECMS requires the information from driver torque request, and current vehicle status, such as engine speed,
battery state of charge (SOC), motor speed to calculate near optimal torque split, and then battery SOC is
fed into parameter correction block to correct equivalent factor s(t), which represents the cost to the
electrical energy consumption.
Figure 41 ECMS torque control strategy flow chart
This real-time control strategy contains three aspects: instantaneous equivalent fuel consumption equation,
SOC correction and instantaneous optimization.
Instantaneous equivalent fuel consumption is the concept that battery can be seen as energy buffer [15], and
during charge sustaining mode for PHEV, the electrical energy consumed needs to be replenished using
fuel from the engine charging in the future, therefore, an equivalent energy consumption function associated
with virtual electric energy consumption is analyzed and built to be objective function, which is discussed
in the following.
eq ice battJ m t s t m t
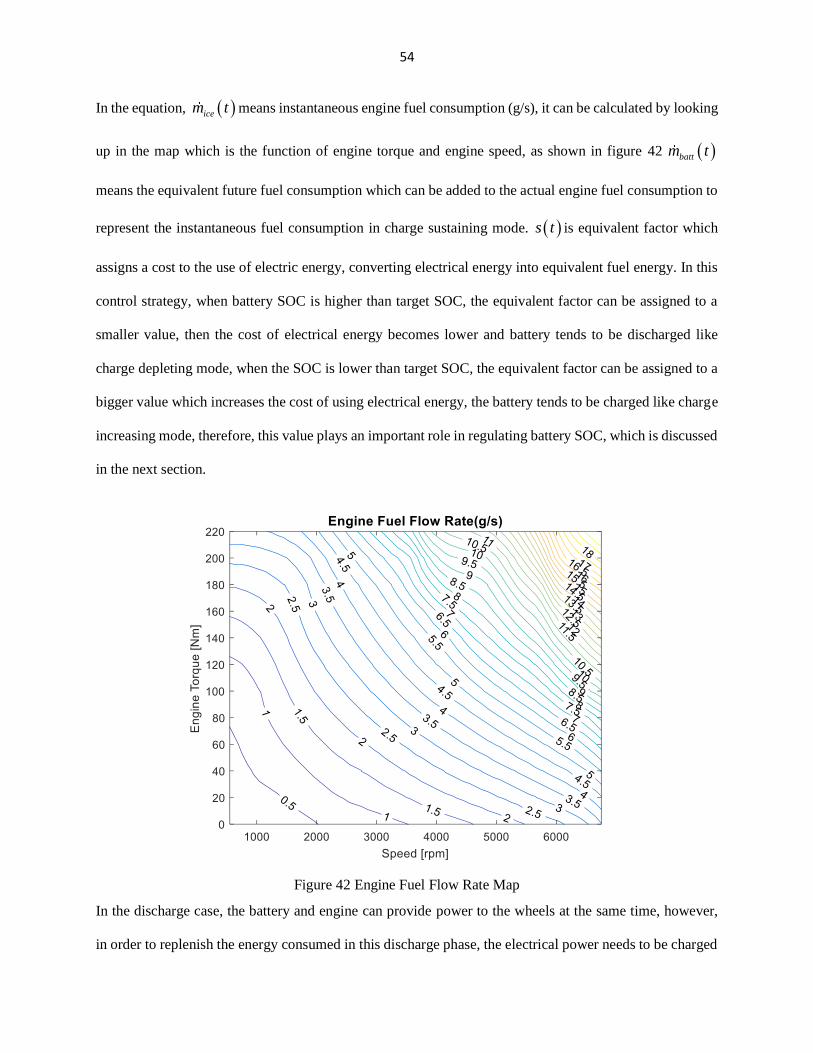
54
In the equation, icem t means instantaneous engine fuel consumption (g/s), it can be calculated by looking
up in the map which is the function of engine torque and engine speed, as shown in figure 42 battm t
means the equivalent future fuel consumption which can be added to the actual engine fuel consumption to
represent the instantaneous fuel consumption in charge sustaining mode. s t is equivalent factor which
assigns a cost to the use of electric energy, converting electrical energy into equivalent fuel energy. In this
control strategy, when battery SOC is higher than target SOC, the equivalent factor can be assigned to a
smaller value, then the cost of electrical energy becomes lower and battery tends to be discharged like
charge depleting mode, when the SOC is lower than target SOC, the equivalent factor can be assigned to a
bigger value which increases the cost of using electrical energy, the battery tends to be charged like charge
increasing mode, therefore, this value plays an important role in regulating battery SOC, which is discussed
in the next section.
Figure 42 Engine Fuel Flow Rate Map
In the discharge case, the battery and engine can provide power to the wheels at the same time, however,
in order to replenish the energy consumed in this discharge phase, the electrical power needs to be charged

55
using fuel from engine charging in the future. Figure 43 shows the energy path in the discharge phase. The
instantaneous fuel consumption equation in discharge case can be shown in the following:
m meq ice
dis mot lhv
TJ m t s t
Q
Where mT is motor command torque (Nm), m is motor speed (rpm), dis is battery discharge efficiency,
mot is motor efficiency, lhvQ is the fuel lower heating value (the energy content per unit of mass).
In this case, s t can be represented as the chain efficiencies of transforming fuel energy into electrical
energy, so 1 eng chgs t . From the energy path below, one can see that the electrical energy consumed
in discharge phase will be replenished in the future by engine, and thus in the energy domain, the chemical
energy converts to the mechanical energy and then to the electrical energy, which suffer the energy losses
in this process.
Figure 43 Energy path in discharge phase
In the charge case, the instantaneous fuel consumption equation in discharge case can be shown in the
following:

56
m meq ice mot chg
lhv
TJ m t s t
Q
Where chg is battery charge efficiency.
During the charge phase, the electrical power that charged by the engine in the future will save the actual
fuel, the mechanical energy provided by the engine is converted into electrical energy, battery SOC
increases, as shown in figure 44, the energy path in the rectangle represents that the electrical energy
charged by engine will be depleted in the future to save the actual energy.
The equivalent factor shows the chain of efficiency of converting electrical power to fuel as well, which is
the same with equivalent factor in discharge phase.
Figure 44 Energy path in charge case
5.3 Torque Distribution Strategy
As discussed in the previous section, the instantaneous fuel consumption has been presented to show the
total fuel consumption including actual fuel consumption and virtual fuel consumption associated with
electrical energy, the key point of ECMS is to find the instantaneous torque optimization which takes
account for all efficiencies of converting fuel to electrical energy or vice versa.

57
The purpose of torque distribution optimization is to take driver request torque, vehicle speed, accelerator
pedal position, equivalent factor, current gear position in the transmission and engine speed to find the
optimal torque split between engine and electric motor.
In order to find the optimal torque split between engine and electric motor, the minimal instantaneous fuel
consumption has to be found and then determine the respective engine torque and motor torque
corresponding to the minimal total fuel consumption. In this section, the equivalent fuel consumption is
calculated by using discretized electric motor torque as control variable, since the driver torque request is
fixed at each time step, the motor torque that gives the lowest equivalent fuel consumption is selected.
Figure 45 shows that at each time step, the sum of motor torque candidate and engine torque candidate is
always equal to driver torque request, therefore, in this case, torque request can be divided to several control
variables. Figure X shows the ECMS control algorithm flowchart which clearly explain how the optimal
torque distribution is obtained in this control algorithm. The equation below shows the objective function:
,min mineq eqJ J k
Per the P2 parallel architecture, the torque and speed are limited by mechanical constraints
min max
min maxm mT T T

58
Figure 45 ECMS Control Algorithm
5.3.1 Motor torque candidate and engine torque candidate
As discussed previously, the motor torque and engine torque candidate can be calculated by driver torque
request and their actuator mechanical constraints, as shown in figure 46. To calculate each possible motor
torque pairs at each time step, the lower limit for motor torque is
mot,min ,max ,max,max ,m req m eng m mot regen mT T T T
The maximum available motor regenerative torque is based on the motor limit and battery capability. The
upper limit for motor torque candidate is
mot,max mot,availminm req m mT T T
The upper and lower motor torque are used for determining available control variables at current motor
speed. The motor torque candidate can be
, ,min ,max: :mot candidate mot motT T T T

59
Therefore, the respective engine torque limit can be
,eng m req m mot candidateT T T
Figure 46 Torque control system and actuators constraints
5.3.2 Torque Split Optimization
After obtaining the motor torque candidate and engine torque candidate, the control algorithm in figure 45
is main process for optimizing torque split between engine and motor in real time. The ECMS algorithm
takes discretized motor torque as control variables and calculate the total equivalent fuel consumption for
each combinations of motor torque candidates and engine torque candidates, and then minimal equivalent
fuel consumption is selected to find the most efficient engine torque request and motor torque request for
driver total torque demand at each time step. Once the most efficient motor torque request is determined, it
can be sent to the engine torque determination block to calculate engine torque request to the ECM.
5.3.3 Torque Request Subsystem
The engine torque request determined by HSC usually changes rapidly, therefore a rate limiter is necessary
to prevent the engine from changing operating points too rapidly. A torque request strategy for engine and
electric motor was proposed to improve the drivability, as shown figure 47.

60
Figure 47 Engine torque and Motor torque request subsystem
The preliminary engine torque coming from torque distribution is limited by rate limit if the engine
operating point change too fast, and the difference between preliminary engine torque and demanded engine
torque is added to the preliminary motor torque to meet driver torque request.
5.4 SOC Correction
The ECMS algorithm does not guarantee the sustainability of battery state of charge, since it only finds the
minimal total equivalent fuel consumption. In charge sustaining mode for HEVs, the difference between
initial battery SOC and final SOC should be limited to 4%, therefore, a penalty function is applied to the
objective function to change the cost of electrical energy, the penalty is shown below [15]:
3
arg max min1 / 2t etp SOC t SOC SOC SOC
This subsystem compares the current SOC to targeted SOC for charge sustaining mode, based on the results
of comparison, this subsystem outputs an equivalent factor that is used for weighting the cost of electrical
energy consumption in instantaneous equivalent fuel consumption, as shown in equation below:
eq ice battJ m t p t s t m t

61
As shown in figure 48 below, when SOC is smaller than target SOC which is 18% in this case, the penalty
factor is greater than 1, then higher cost is assigned to the electrical power, and battery tends to more likely
be charged, when the cost is lower, the battery is more likely discharged.
Figure 48 Penalty function for SOC correction
In order to show the SOC sustainability based on penalty function, the figure 48 shows that with the SOC
correction function, the battery SOC can sustain at certain level, and only 0.48% of battery energy lost.
Without this SOC correction function, the controller tends to use electrical energy more likely since the
electrical energy has less contribution to the equivalent fuel consumption, that is, the path of energy from
engine to the battery and then to the wheels is less efficient than the path of energy from engine directly to
the wheels. Therefore, the adjustment of equivalent factor in real-time allows the vehicle to sustain battery
SOC adaptively based on drive cycles. Figure 49 shows the battery SOC changes when SOC correction
was applied for 505 drive cycle. It’s clear that battery SOC was back to the targeted SOC when SOC
correction was applied.
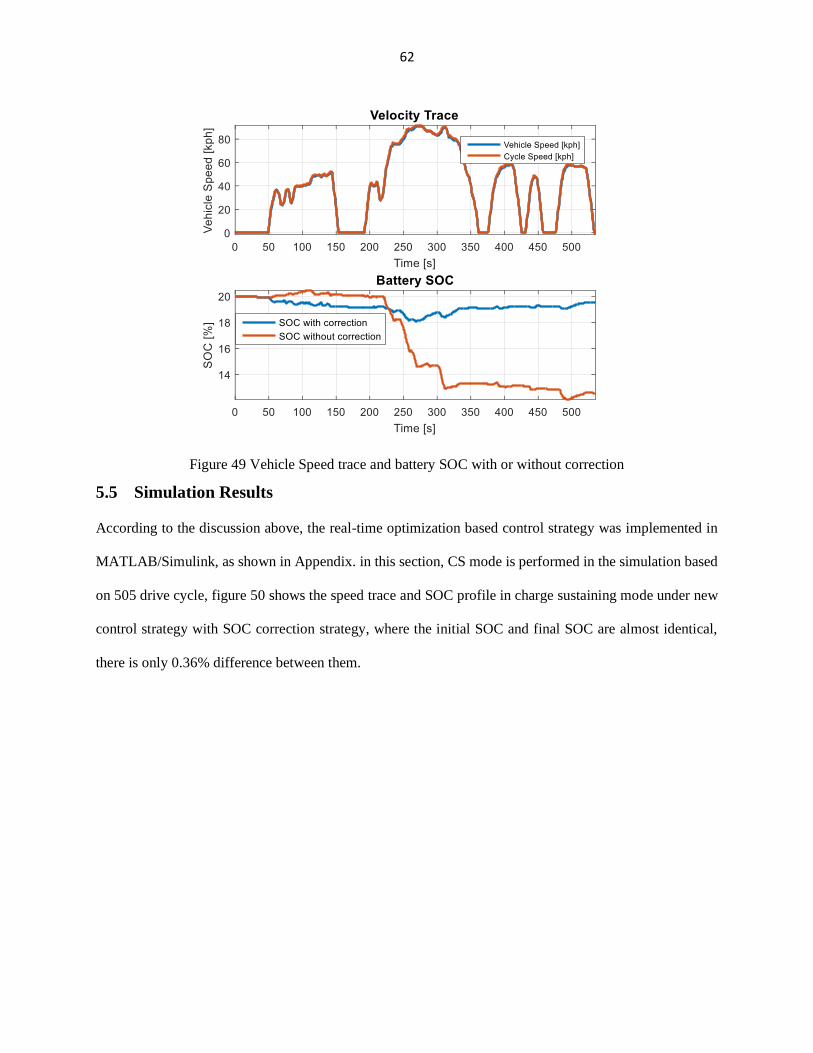
62
Figure 49 Vehicle Speed trace and battery SOC with or without correction
5.5 Simulation Results
According to the discussion above, the real-time optimization based control strategy was implemented in
MATLAB/Simulink, as shown in Appendix. in this section, CS mode is performed in the simulation based
on 505 drive cycle, figure 50 shows the speed trace and SOC profile in charge sustaining mode under new
control strategy with SOC correction strategy, where the initial SOC and final SOC are almost identical,
there is only 0.36% difference between them.
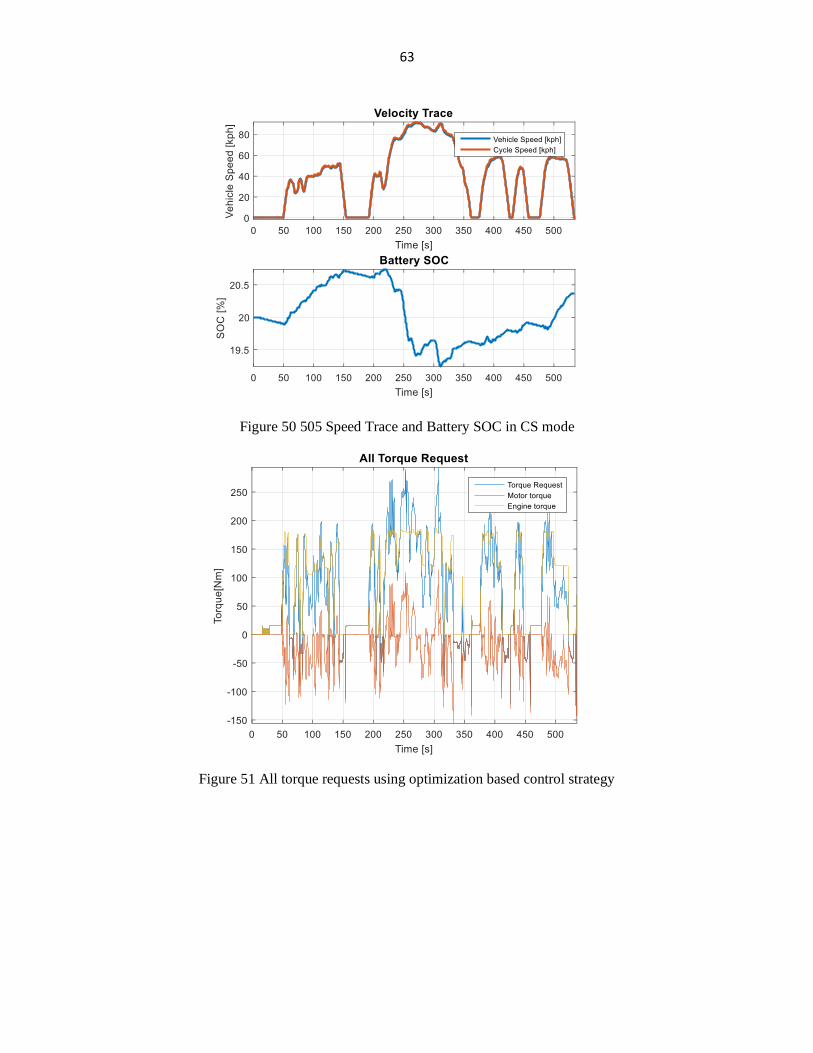
63
Figure 50 505 Speed Trace and Battery SOC in CS mode
Figure 51 All torque requests using optimization based control strategy

64
Figure 52 Transmission Estimated Gear
Figure 53 a) Engine Operating Points of 505 drive cycle for ECMS, b) Engine Operating Points for rule-
based control strategy
Figure 53 above shows that engine operating points in 505 drive cycle for rule-based control strategy and
ECMS controller, from the figure, one can see that most of engine operating points are in the lowest fuel
consumption area under new control strategy, which is shown in the red circle.

65
5.6 Energy Consumption Comparison
A rule-based control strategy was discussed in chapter 4, which has four different modes, charge depleting
mode is default mode, and when battery SOC is lower than a pre-defined threshold, the charge sustaining
mode is triggered to sustain the SOC at stable level.
To compare the energy consumption between the optimization based control strategy and rule-based control
strategy, four EcoCAR3 drive cycles are used in the MIL environment which include 505, HWFET and
US06 city and highway portion. Figure 54, 55, 56, 57 show all four drive cycles trace and SOC profile with
two different control strategies, and all engine operating points for optimization based controller plots are
shown in Appendix. Table 12, 13, 14 15 show the SOC-corrected total energy consumption comparison
between two control strategies during charging sustaining mode.
SOC -corrected fuel consumption can be calculated by the following equation [29]:
𝐹𝐶𝑆𝑂𝐶−𝑐𝑜𝑟𝑟𝑒𝑐𝑡𝑒𝑑 [𝑘𝑔
𝑘𝑚] =
(𝑀𝑎𝑠𝑠𝑓𝑢𝑒𝑙[𝑘𝑔] +
𝐸𝐶𝑒𝑙𝑒𝑐𝑡𝑟𝑖𝑐,𝐶𝑆[𝑘𝑊ℎ]0.25
𝐿𝐻𝑉𝑓𝑢𝑒𝑙 [𝑘𝑊ℎ𝑘𝑔
])
𝑐𝑦𝑐𝑙𝑒 𝑑𝑖𝑠𝑡𝑎𝑛𝑐𝑒[𝑘𝑚]
𝐸𝐶𝑒𝑞𝑢𝑖𝑣𝑎𝑙𝑒𝑛𝑡 𝑓𝑢𝑒𝑙,𝐶𝑆 [𝑘𝑊ℎ
𝑘𝑚] = 𝐹𝐶𝑆𝑂𝐶−𝑐𝑜𝑟𝑟𝑒𝑐𝑡𝑒𝑑 [
𝑘𝑔
𝑘𝑚] ∗ 𝐿𝐻𝑉𝑓𝑢𝑒𝑙 [
𝑘𝑊ℎ
𝑘𝑔]
One can see that both two strategies can sustain SOC within pre-defined limit. However, ECMS strategy
decreased the total energy consumption by 7.1%, 8.5% 5.7%, 1.6% compared with the rule-based control
strategy, while maintaining small SOC difference during CS mode. Therefore, from energy consumption
in table 12,13,14, 15, it’s clearly that ECMS controller reduced more energy consumption during city drive
cycles than highway drive cycles.

66
5.6.1 505 Drive Cycle
Figure 54 505 Drive Cycle and SOC profile
Ruel Based Control ECMS Control Strategy Comparison
Fuel Consumption (L) 0.6013 0.5647
-7.1% SOC-corrected fuel
consumption (Wh/km)
612.02 568.57
Delta SOC (%) 0.5732 0.3084
Table 12 Energy Consumption Comparison for 505 drive cycle
5.6.2 US06Highway

67
Figure 55 US06 Highway drive cycle and SOC profile
Ruel Based Control ECMS Control Strategy Improvement
Fuel Consumption (L) 1.0368 0.9627
-8.5% SOC-corrected fuel
consumption (Wh/km)
626.41 573.20
Delta SOC (%) 0.1669 0.082
Table 13 Energy Consumption Comparison for US06 Highway drive cycle
5.6.3 US06 City
Figure 56 US06 City drive cycle and SOC profile
Ruel Based Control ECMS Control Strategy Comparison
Fuel Consumption (L) 0.5502 0.4074
-5.7% SOC-corrected fuel
consumption (Wh/km)
1042.9 983.72
Delta SOC (%) 1.06 -0.78%
Table 14 Energy Consumption Comparison for US06 City drive cycle

68
5.6.4 HWFET Drive Cycle
Figure 57 HWFET drive cycle and SOC profile
Ruel Based Control ECMS Control Strategy Comparison
Fuel Consumption (L) 1.3018 1.22
-1.5% SOC-corrected fuel
consumption (Wh/km)
449.81 443.10
Delta SOC (%) 1.41 0.06
Table 15 Energy Consumption Comparison for HWFET drive cycle
5.6.5 Energy Consumption Comparison in E&EC event
A combination of rule-based for charge depleting mode and ECMS control strategy for charge sustaining
mode was implemented in the hybrid supervisory controller in EcoCAR3 plant model simulator. The
vehicle simulator was used to test different control strategies implemented in HSC and evaluate the effect
that new control strategies would have on the overall vehicle energy consumption as well as fuel economy.
In order to determine the new control strategy is effective or not, the energy consumption from new control
strategy is compared to the energy consumption results from rule-based control strategy. In charge depleting
mode, both rule-based control and ECMS based controller have the same control strategy, which is blended
CD control strategy. In charge sustaining mode, the ECMS based controller had different control strategy
from rule-based which is discussed in detail in chapter 4.

69
In order to compare the energy consumption between two control strategies under EcoCAR3 E&EC event,
the vehicle simulator is used to run full E&EC drive cycles in both charge depleting mode and charge
sustaining mode, the results for energy consumption for two control strategies are listed in table 16. Figure
58 shows the E&EC drive cycle for two control strategies and battery state of charge during the entire drive
cycle. It’s clearly that battery SOC sustains at targeted SOC level during CS mode with new control strategy,
while rule-based control strategy oscillates under certain upper and lower SOC threshold.
Figure 60 and Figure 61 shows the engine operating points for two control strategies, one can see that most
of engine operating points under new control strategy are within highest efficiency region, while for rule-
based control strategy, most of operating points scattered.
Figure 58 Three drive cycles speed trace and SOC profile
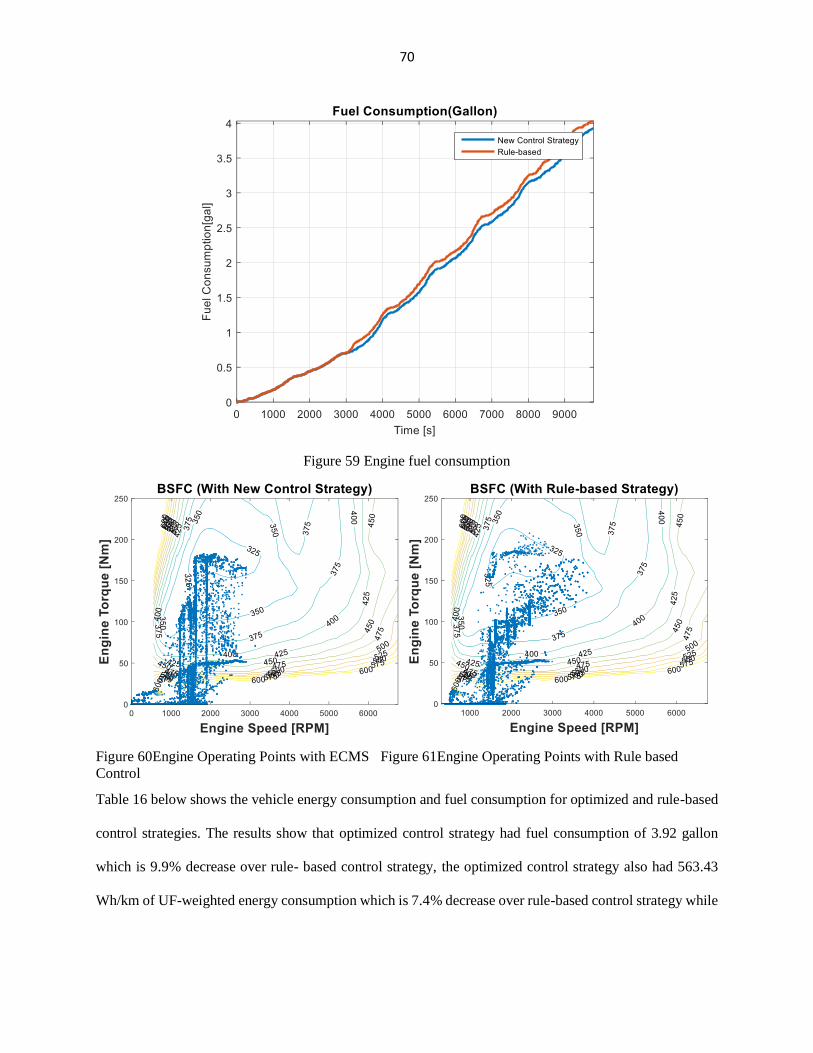
70
Figure 59 Engine fuel consumption
Figure 60Engine Operating Points with ECMS Figure 61Engine Operating Points with Rule based
Control
Table 16 below shows the vehicle energy consumption and fuel consumption for optimized and rule-based
control strategies. The results show that optimized control strategy had fuel consumption of 3.92 gallon
which is 9.9% decrease over rule- based control strategy, the optimized control strategy also had 563.43
Wh/km of UF-weighted energy consumption which is 7.4% decrease over rule-based control strategy while

71
maintaining the SOC at targeted level. The decreases that optimized control strategy had make a significant
difference on energy consumption for hybrid electric vehicles.
Table 16 Comparison of vehicle energy consumption for optimized and rule-based control strategies
Ruel Based Control ECMS Control Strategy Improvement
Fuel Consumption (gal) 4.35 3.92 -9.9%
UF weighted Energy
Consumption (Wh/km)
608.51 563.43 -7.4%
PEU WTW
(Wh PE/km)
151.15 137.36 -9.1%
GHG WTW (g GHG/km) 170.85 158.33 -7.3%
72
6 Conclusion and Future Work
6.1 Conclusion
This study presents a detailed control strategies for hybrid supervisory controller of plug-in hybrid electric
vehicles. Some techniques pertaining to control system development for clutch-less P2 architecture are
briefly discussed in the thesis, like model based design, and software development process, V-cycle, which
have great significant on development of vehicle control system.
A software development process was discussed in the thesis, which begins with the development of control
requirements, referring to figure 7, V-cycle plays a significant role in developing control strategies for
electric control units (ECUs). The requirements can be determined by the goal of competition and
components interface, which are used for designing control system algorithms.
The control requirements developed in the thesis are mainly for developing hybrid supervisory controller
(HSC), which is a high – level controller that interprets driver demand and controls interaction between
powertrain components by their respective control units, it determines the appropriate torque split between
two components as well as correct operating mode for hybrid electric vehicle. In this study, hybrid
supervisory controller is divided into four parts: driver requested torque subsystem, mode selection and
torque distribution, fault diagnostics as well as output. In torque distribution subsystem, the vehicle
distributes the torque between engine and electric motor based on driver demanded power and current
engine or electric motor power limits. This strategy is commonly used in automotive industry currently.
The HSC is also able to perform diagnostics for all critical components to detect faults and mitigate faults
as well as prevent faults. The clutch-less P2 architecture chosen by WSU EcoCAR 3 team leads to different
control strategy in CD mode compared to normal P2 architecture, In CD mode, control strategy enables the
engine always deliver limited torque so that the electric motor is not necessary to drag the engine for the
sake of reducing total energy consumption, the electric motor produces the remaining torque to meet the
driver requested torque. In CS mode, vehicle enables engine work at the highest efficient operation and
extra torque produced is used to charge the battery to sustain the battery SOC.

73
The HSC algorithms implemented in the thesis is tested under WSU EcoCAR3 vehicle simulator in Model
in the Loop (MIL), which contains all electric components and stock vehicle components modeled by
Simulink as well as Simscape. The vehicle simulator is used to test effectiveness of control strategies in
PHEV.
In addition, an optimized control strategy based on ECMS is proposed in the thesis, the charge depleting
has the same control strategies with rule-based control strategy, since due to the limitation of clutch-less P2
architecture, the engine cannot be off when vehicle is in CD mode. The charge sustaining contains a
different control strategy from rule-based control strategy. It optimizes the torque distribution between
engine and electric motor in real time, as illustrated explicitly in chapter 5. To test the effectiveness of
optimized control strategy for PHEV, the HSC with new control strategy was tested under EcoCAR3
vehicle simulator in MIL. Final results show that optimized control strategy had fuel consumption of 3.92
gallon which is 9.7% decrease over rule- based control strategy, the optimized control strategy also had
563.43 Wh/km of UF-weighted energy consumption which is 7.4% decrease over rule-based control
strategy while maintaining the SOC at targeted level. Another advantage of this optimized control strategy
is the sustainability of battery SOC whatever the drive conditions change. However, although optimized
control strategy had lower fuel consumption during E&EC event, the algorithm runs in real time and
evaluate each torque control variable at each time step which is computationally intensive when
implementing this control strategy in real controller in the vehicle.
6.2 Discussion and Future Work
6.2.1 Validation
The optimized control strategy and rule based control strategy proposed in the thesis still need to be
validated under hardware in the loop (HIL) and implemented in the vehicle’s controller. In the hardware in
the loop environment, the HSC needs to be configured in the real controller and communicate with
component controllers in dSPACE through CAN bus. This can be done before testing in the real vehicle.
Once the HSC control strategy is validated in the HIL, the strategy will be transferred to the real vehicle,
74
and this can be done by driving on the road and collecting data to compare with the results in the Simulink
model.
6.2.2 Future Work
As mentioned previously, the emissions in hybrid electric vehicles is also an important criterion for
evaluating the fuel economy of HEVs. However, the ECMS implemented in the thesis does not take
emissions into consideration, which may cause the torque distribution strategy to be not optimal solutions.
In order to optimize the torque distribution properly, the control strategy also needs to take consideration
for transmission gear shifting which is also important control variable in energy management strategy.
Therefore, those issues can be solved by multi-objective optimization strategy.
The huge disadvantage of the real-time optimized control strategy is computation time which may cause
issues in the real controller when implemented the control strategy in the vehicle. To solve this problem,
the control strategy can be optimized offline by perform simulation for all different kinds of drive cycle and
create optimal torque distribution map as a function of various inputs, like driver torque demand, accelerator
pedal position, engine speed, gear position, etc.
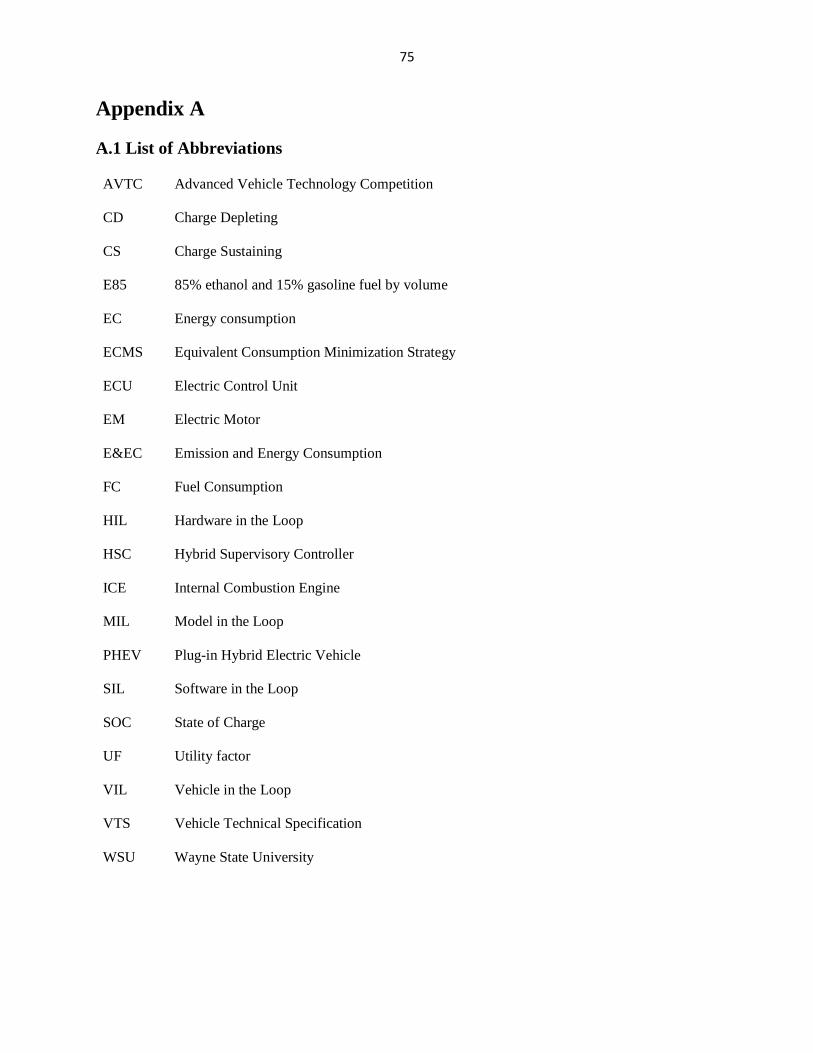
75
Appendix A
A.1 List of Abbreviations
AVTC Advanced Vehicle Technology Competition
CD Charge Depleting
CS Charge Sustaining
E85 85% ethanol and 15% gasoline fuel by volume
EC Energy consumption
ECMS Equivalent Consumption Minimization Strategy
ECU Electric Control Unit
EM Electric Motor
E&EC Emission and Energy Consumption
FC Fuel Consumption
HIL Hardware in the Loop
HSC Hybrid Supervisory Controller
ICE Internal Combustion Engine
MIL Model in the Loop
PHEV Plug-in Hybrid Electric Vehicle
SIL Software in the Loop
SOC State of Charge
UF Utility factor
VIL Vehicle in the Loop
VTS Vehicle Technical Specification
WSU Wayne State University

76
A.2 DFMEA
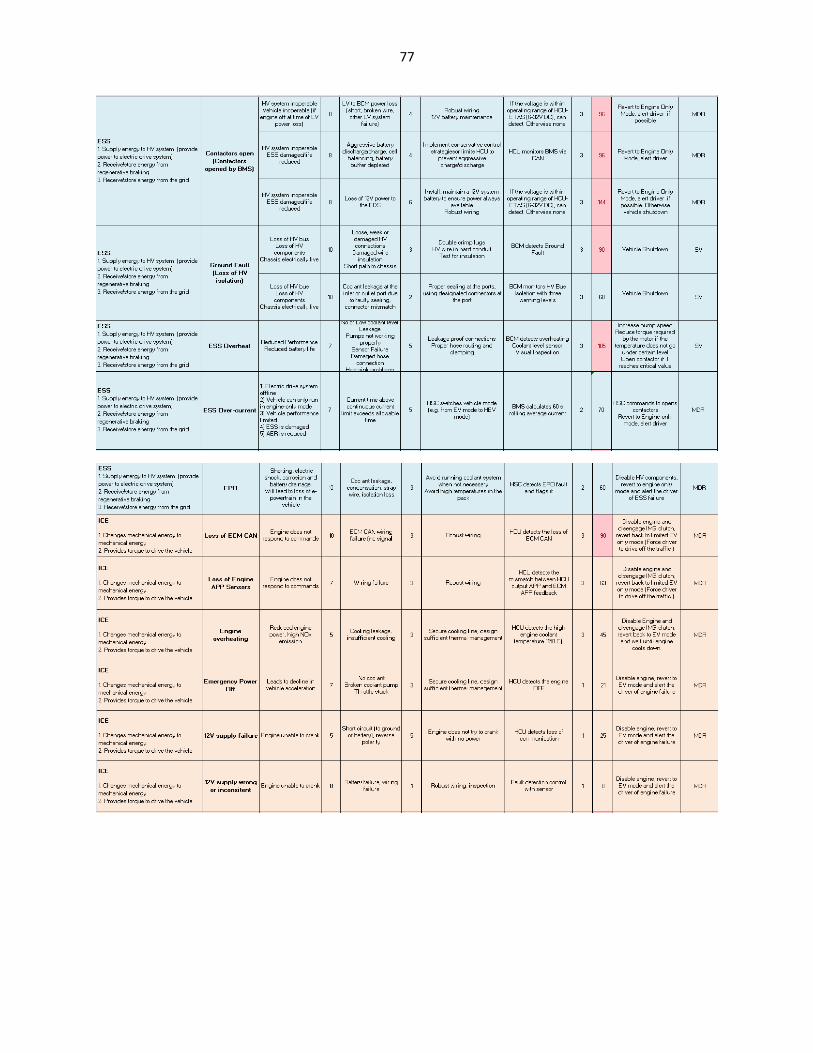
77

78

79
A.3 Test cases Documents for safety critical algorithms
Test Case Overview <APP1 and APP2 mismatch> Priority: High Version: 1.0 Test Platform: MIL, SIL, HIL Last Updated: 11/4/2016 DFMEA Number: Author: Guilin Zhu Test Case Description: The test simulates the case in which there is a mismatch fault between APP1
and APP2. When the pedal position value of the two sensors does not agree
within 1%, the Drv_APP_Agree and APP_Valid sets to 0. To implement the
fault, Mismatch_APP_ONwill be implemented intoAPP_Fault_Insertion
block, and when the fault triggers, APP2 signal will be set to
cal.APP.Mismatch_Value+0.01 value. To perform this test, the tester needs
to set the mismatch fault for APP1 and APP2 before running the simulation
and the fault will be implemented by running fault script. Once the
simulation is complete the tester will compare the obtained results with the
expected results to determine if the test is passed. The test is considered
“passed” when the simulation results match the expected results.
Test Case Procedure Test Initialization: 1)under the Input Conversions->DriverInput_Conversions-> Override APP1
(%), set control port to 0
2) under the Input Conversions->DriverInput_Conversions-> Override APP
(%)2, set control port to 0.
3) Select the 505 drive cycle from the GUI
4) Set SOC to 90% from the GUI in order to run CD mode as default mode.
5) Run initial fileMain_init.m to initialize the model parameters

80
Test Body: 1) Run Fault_Trigger.m to insert the fault, and Mismatch_APP_ON(under
Plant Actuators -> Analog ->APP_Fault_Insertion) will set to 1 and all other
faults will be 0 when fault triggers
2) Run the model
3) Check the results obtained in the Scope block for each fault
Test Completion: 1)Record the result
2)Restore the original state of model
3) Run Fault_Clean.m to clean the APP_Mismatch fault
Test Case Summary Expected Results: Pass/Fail criteria:
CD mode:
1) Vehicle speed=0;
2) Motor torque output =0;
Engine-Only mode:
1) Vehicle speed=0;
2) Engine torque output=0;
Under the Signal diagnostic-> Driver signal diagnostic,
Drv_APP_Agree will be 0, and
->systemDiag->eSystemDiagnostics, eSystemStatus will be 0 and
icsSystemStatus will also be 0;
Under Camaro Plant Model ->Chassis, chas_lin_spd_out, the
speed of vehicle will go to 0;
Under Camaro Plant Model->IMG->IMG Plant->Electric
Machine, mot_trq_out will be 0;
Test Case Overview <APP1 and APP2 Out of range> Priority: High Version: 1.0 Test Platform: MIL, SIL, HIL Last Updated: 11/4/2016 DFMEA Number: Author: Guilin Zhu Test Case Description: The test simulates the case in which there is an out-of-range fault between
APP1 and APP2. When the pedal position value of the two sensors exceed a
critical threshold, the Drv_APP1_[%]_SigValid
orDrv_APP2_[%]_SigValidset to 0. To implement the fault,
APP1_OOR_ON and APP2_OOR_ON will be implemented
intoAPP_Fault_Insertion block, and when the fault triggers, APP1 or APP2
signal will be set to cal.APP1.IN_Max_SC_Prcnt+1 value. To perform this
test, the tester needs to set out-of-range fault for APP1 or APP2 before
running the simulation and the fault will be implemented by running fault
script. Once the simulation is complete the tester will compare the obtained
results with the expected results to determine if the test is passed. The test is
considered “passed” when the simulation results match the expected results.
Test Case Procedure Test Initialization: 1)under the Input Conversions->DriverInput_Conversions-> Override APP1
(%), set control port to 0
2) under the Input Conversions->DriverInput_Conversions-> Override APP
(%)2, set control port to 0, and override all other signals
3) Select the 505 drive cycle from the GUI
4) Set SOC to 90% from the GUI in order to run CD mode as default mode.

81
5) Run initial fileMain_init.m to initialize the model parameters
Test Body: 1) Run Fault_Trigger.m to insert the fault, and APP1_OOR_ON or
APP2_OOR_ON (under Plant Actuators -> Analog ->APP_Fault_Insertion)
will set to 1 and all other faults will be 0 when fault triggers
2) Run the model
3) Check the results obtained in the Scope block for each fault
Test Completion: 1)Record the result
2)Restore the original state of model
3) Run Fault_Clean.m to clean the APP_OOR fault
Test Case Summary Expected Results: Pass/Fail criteria:
CD mode:
3) Vehicle speed=0;
4) Motor torque output =0;
Engine-Only mode:
3) Vehicle speed=0;
4) Engine torque output=0;
Under the Signal diagnostic-> Driver signal diagnostic,
Drv_APP1_[%]_SigValid or Drv_APP2_[%]_SigValidwill be 0,
and ->systemDiag->eSystemDiagnostics, eSystemStatus will be 0
and icsSystemStatus will also be 0;
Under Camaro Plant Model ->Chassis, chas_lin_spd_out, the
speed of vehicle will go to 0;
Under Camaro Plant Model->IMG->IMG Plant->Electric
Machine, mot_trq_out will be 0;
Test Case Overview <BPP Fault> Priority: High Version: 1.0 Test Platform: MIL, SIL, HIL Last Updated: 11/4/2016 DFMEA Number: Author: Guilin Zhu Test Case Description: The test simulates the case in which the brake pedal is depressed but the
vehicle fails to decelerate at an acceptable rate. When the commanded BPP
(%) failed to produce acceptable deceleration values or vehicle deceleration
is 0 when BPP>0, then the Brake_Failedflagsets to 1. To implement the
fault, BPP Fault will be inserted into the Chassis block. When the BPP fault
is triggered, the vehicle acceleration which is chas_plant_lin_accel will be
set to 1/10 of original value, therefore the vehicle will fail to decelerate at an
acceptable value. To perform this test, the tester needs to set fault for BPP
before running the simulation and the fault will be implemented by running
fault script. Once the simulation is complete the tester will compare the
obtained results with the expected results to determine if the test is passed.
The test is considered “passed” when the simulation results match the
expected results.
Test Case Procedure Test Initialization: 1) under the Input Conversions->DriverInput_Conversions-> Override BPP
(%), set control port to 0.

82
2) underCamaro Fault Detection->Input Conversions, override all other
signals to normal value.
3) Select the 505 drive cycle from the GUI
4) Set SOC to 90% from the GUI in order to run CD mode as default mode.
5) Run initial fileMain_init.m to initialize the model parameters Test Body: 1) Run Fault_Trigger.m to insert the fault, and BPP_Flt(under Camaro Plant
Model-> Chassis) will set to 1.
2) Run the model
3) Check the results obtained in the Scope block for each fault
Test Completion: 1)Record the result
2)Restore the original state of model
3) Run Fault_Clean.m to clean the BPP_Flt fault
Test Case Summary Expected Results: Pass/Fail criteria:
1) Vehicle speed=0;
2) Motor torque output/Engine torque output =0;
Under the Signal diagnostic-> Driver signal diagnostic,
Brak_Failed will be 1, and ->systemDiag->eSystemDiagnostics,
eSystemStatus will be 0 and icsSystemStatus will also be 0;
Under Camaro Plant Model ->Chassis, chas_lin_spd_out, the
speed of vehicle will go to 0;
Under Camaro Plant Model->IMG->IMG Plant->Electric
Machine, mot_trq_out will be 0;
Test Case Overview <PRNDL Fault> Priority: High Version: 1.0 Test Platform: MIL, SIL, HIL Last Updated: 11/4/2016 DFMEA Number: Author: Guilin Zhu Test Case Description: The test simulates the case in which the actual and commanded shift state is
not the same (i.e. commanded state is park, but the vehicle is in drive).
When the commanded shift state (ShftLvrPos) does not agree with the
actual shift state (TransEstGear), the propulsive net torque will be set to 0,
PRNDL shift failed then sets to 1.
To implement the fault, PRNDL Fault will be inserted into the Camaro
Plant Model->Transmission block. When commanded shift lever position is
in Park, drive or reserve, the fault actual shift state would set to be drive,
reverse, and drive which may cause severe accidents, then the
PRNDL_shift_failed will be 1 and vehicle will be shut down.
To perform this test, the tester needs to set fault for PRNDL fault before
running the simulation and the fault will be implemented by running fault
script. Once the simulation is complete the tester will compare the obtained
results with the expected results to determine if the test is passed. The test is
considered “passed” when the simulation results match the expected results.
Test Case Procedure Test Initialization: 1) under the Input Conversions->DriverInput_Conversions-> Override
LvrPosTrnsShft, set control port to 0.
2) underCamaro Fault Detection->Input Conversions->TransEstGear, set
control port to 0, override all other signals to normal value.

83
3) Select the 505 drive cycle from the GUI
4) Set SOC to 90% from the GUI in order to run CD mode as default mode.
5) Run initial fileMain_init.m to initialize the model parameters
Test Body: 1) Run Fault_Trigger.m to insert the fault, and PRNDL_Flt(under Camaro
Plant Model-> Transmission) will set to 1.
2) Run the model
3) Check the results obtained in the Scope block for each fault
Test Completion: 1)Record the result
2)Restore the original state of model
3) Run Fault_Clean.m to clean the PRNDL_Flt fault
Test Case Summary Expected Results: Pass/Fail criteria:
1) Vehicle speed=0;
2) Motor torque output/Engine torque output =0;
Under the Signal diagnostic-> Driver signal diagnostic,
PRNDL_shift_failed will be 1, and
->systemDiag->eSystemDiagnostics, eSystemStatus will be 0 and
icsSystemStatus will also be 0;
Under Camaro Plant Model ->Chassis, chas_lin_spd_out, the
speed of vehicle will go to 0;
Under Camaro Plant Model->IMG->IMG Plant->Electric
Machine, mot_trq_out will be 0;
Test Case Overview <Loss of CAN> Priority: High Version: 1.0 Test Platform: MIL, SIL, HIL Last Updated: 10/29/2016 DFMEA Number: Author: Guilin Zhu Test Case Description: The test simulates the case in which there is loss of component CAN
communication. Faults that occur include overruns, timeouts, and data
mismatch Alive Rolling Counters (ARC) are used as software watchdogs to
determine if a component is still communicating on the CAN network. In
this test, we can only test the case that loss of MCU CAN.
When the loss of CAN fault happens, the propulsive net torque will also be
set to 0, MCURollingAliveActive then sets to 0.
To implement the fault, Loss of CAN Fault will be inserted into the Camaro
Plant Model->IMG->Electric machine->Soft MCU. When
MCU_CAN_fault is inserted, data mismatch occurs when the ARC sent by
the component do not match the ARC expected by the HSC, so the motor
and MCU will be disabled, eSystemStatus will be offline, the vehicle thus
will be shutdown.
To perform this test, the tester needs to set fault for Loss of CAN fault before
running the simulation and the fault will be implemented by running fault
script. Once the simulation is complete the tester will compare the obtained
results with the expected results to determine if the test is passed. The test is
considered “passed” when the simulation results match the expected results.
Test Case Procedure Test Initialization: 1) under the Input Conversions->MCU_Conversions-> Override
rollingAliveCnt [123], set control port to 0.

84
2) underCamaro Fault Detection->Input Conversions, override all other
signals to normal value.
3) Select the 505 drive cycle from the GUI
4) Set SOC to 90% from the GUI in order to run CD mode as default mode.
5) Run initial fileMain_init.m to initialize the model parameters Test Body: 1) Run Fault_Trigger.m to insert the fault, and MCU_CAN_fault (under
Camaro Plant Model-> IMG->Electric Machine->Soft MCU) will set to 1.
2) Run the model
3) Check the results obtained in the Scope block for each fault
Test Completion: 1)Record the result
2)Restore the original state of model
3) Run Fault_Clean.m to clean the MCU_CAN_fault
Test Case Summary Expected Results: Pass/Fail criteria:
1) Motor torque output =0;
2) MCU_Status=0;
3) eSystemStatus=0; iceSystemStatus=2;
4) Vehicle mode switch to Engine only mode from CD mode;
Under the Signal diagnostic-> Mot signal diagnostic,
MCURollingAliveActivewill be 0, and
->systemDiag->eSystemDiagnostics, eSystemStatus will be 0 and
iceSystemStatus will be 1 when loss of MCU CAN triggers;
Under HSC ->Powertrain Manager->Torque Distribution, the
vehicle mode will change from 1 to 5 which is Engine only mode;
Under Camaro Plant Model->IMG->IMG Plant->Electric
Machine, mot_trq_out will be 0;
Test Case Overview <Motor Torque Mismatch> Priority: High Version: 1.0 Test Platform: MIL, SIL, HIL Last Updated: 10/29/2016 DFMEA Number: Author: Guilin Zhu Test Case Description: The test simulates the case in which there is a torque mismatch between
torque command from HSC and torque feedback from MCU. There are
three levels of torque mismatch which are torque degraded, limphome and
critical error level, and mitigation strategy thus will be different for each of
them.
When the Motor torque mismatch fault happens, the fault mitigation
strategy under Torque Distribution block will take actions based on types of
torque mismatch under fault detection block, if motor torque mismatch
occurs, MCU_Torque_Mismch will be set to 1.
To implement the fault, Motor torque mismatch fault will be inserted into
the Camaro Plant Model->IMG->Electric machine->mot_trq_out. When
MCU_Torque_Mismchis inserted, the motor torque output will be altered
and do not match the commanded torque from HSC, so the fault will be
detected by the Fault Detection block, then eSystemStatus will be offline or
limited based on the types of torque mismatch fault, remedial actions will be
in place.

85
To perform this test, the tester needs to set fault for motor torque mismatch
fault before running the simulation and the fault will be implemented by
running fault script. Once the simulation is complete the tester will compare
the obtained results with the expected results to determine if the test is
passed. The test is considered “passed” when the simulation results match
the expected results.
Test Case Procedure Test Initialization: 1) under the Input Conversions->MCU_Conversions-> Override
MCUTrqCmd_Nm, set control port to 0.
2) underCamaro Fault Detection->Input Conversions->Torq_Feedback, et
control port to 0.
3) Select the 505 drive cycle from the GUI
4) Set SOC to 90% from the GUI in order to run CD mode as default mode.
5) Run initial fileMain_init.m to initialize the model parameters
Test Body: 1) Run Fault_Trigger.m to insert the fault, and MotTrqMismatch (under
Camaro Plant Model-> IMG->Electric Machine) will be set to
corresponding mismatch value based on mismatch types.
2) Run the model
3) Check the results obtained in the Scope block for each fault
Test Completion: 1)Record the result
2)Restore the original state of model
3) Run Fault_Clean.m to clean the MotTrqMismatch
Test Case Summary Expected Results: Pass/Fail criteria (Mismatch type=1/2):
1) MCU_Status=1;
2) eSystemStatus=1;
3) mot_trq_out will be limited to corresponding limited torque.
1)Under the Component diagnostic-> Motor component diagnostic,
MCU_Torque_Mismchwill be 1, and ->systemDiag->eSystemDiagnostics,
eSystemStatus will be 1 when fault triggers;
2)Under Camaro Plant Model->IMG->IMG Plant->Electric Machine,
mot_trq_out will be 0;
Pass/Fail criteria (Mismatch type=3):
1) Motor torque output =0;
2) MCU_Status=0;
3) eSystemStatus=0; iceSystemStatus=2;
4) Vehicle mode switch to Engine only mode from CD mode;
Under the Component diagnostic-> Motor component diagnostic,
MCU_Torque_Mismchwill be 1, and
->systemDiag->eSystemDiagnostics, eSystemStatus will be 0 and
iceSystemStatus will be 1 when fault triggers;
Under HSC ->Powertrain Manager->Torque Distribution, the
vehicle mode will change from 1 to 5 which is Engine only mode;
Under Camaro Plant Model->IMG->IMG Plant->Electric
Machine, mot_trq_out will be 0;
Test Case Overview <Torque Direction Mismatch> Priority: High Version: 1.0

86
Test Platform: MIL, SIL, HIL Last Updated: 11/12/2016 DFMEA Number: Author: Guilin Zhu Test Case Description: The test simulates the case in which there is a regenerative braking torque
direction mismatch, result in propulsion rather than braking.
When the regenerative braking torque direction mismatch happens,
Regen_Torque_Dir will be set to 1.
To implement the fault, Regen_Torque_Dir will be inserted into the
Camaro Plant Model->IMG->Electric machine. When Regen_Torque_Dir
fault is inserted, the motor torque command will be altered when the vehicle
is required to use regenerative braking system however the vehicle will have
unintended acceleration, so the fault will be detected by the Fault Detection
block, eSystemStatus will be limited, and regenerative braking system will
be disabled.
To perform this test, the tester needs to set fault for Regen_Torque_Dir fault
before running the simulation and the fault will be implemented by running
fault script. Once the simulation is complete the tester will compare the
obtained results with the expected results to determine if the test is passed.
The test is considered “passed” when the simulation results match the
expected results.
Test Case Procedure Test Initialization: 1) under the Input Conversions->MCU_Conversions-> Override
MCUTrqCmd_Nm, set control port to 0.
2) underCamaro Fault Detection->Input Conversions->Torq_Feedback, set
control port to 0.
3) underCamaro Fault Detection->Input Conversions, override all other
signals to normal value.
4) Select the 505 drive cycle from the GUI
5) Set SOC to 90% from the GUI in order to run CD mode as default mode.
6) Run initial fileMain_init.m to initialize the model parameters Test Body: 1) Run Fault_Trigger.m to insert the fault, and Regen_Torque_Dir (under
Camaro Plant Model-> IMG->Electric Machine) will be set to
corresponding mismatch value based on mismatch types.
2) Run the model
3) Check the results obtained in the Scope block for each fault
Test Completion: 1)Record the result
2)Restore the original state of model
3) Run Fault_Clean.m to clean the Regen_Torque_Dir
Test Case Summary Expected Results: Pass/Fail criteria:
1) MCU_Status=1;
2) eSystemStatus=1;
3) Regenerative braking system will be disabled.
Under the Component diagnostic-> Motor component diagnostic,
Regen_Torque_Dir Mismatch will be 1, and
->systemDiag->eSystemDiagnostics, eSystemStatus will be 1 when
fault triggers;
Under Camaro Plant Model->IMG->IMG Plant->Electric
Machine, negative torque output will be 0;

87
Test Case Overview <Vehicle Direction Fault> Priority: High Version: 1.0 Test Platform: MIL, SIL, HIL Last Updated: 11/4/2016 DFMEA Number: Author: Guilin Zhu Test Case Description: The test simulates the case in which the vehicle does not move in the
intended direction when in drive gear. The propulsive net torque will be set
to 0, vehicle direction fault will be set to 1;
To implement the fault, Vehicle Direction Fault will be inserted into the
Camaro Plant Model->Transmission block->TransEstGear. When
commanded shift lever position is in drive, the vehicle will drive in reverse
which may cause severe accidents, then the vehicle direction fault will be 1
and vehicle will be shut down.
To perform this test, the tester needs to set fault for vehicle direction fault
before running the simulation and the fault will be implemented by running
fault script. Once the simulation is complete the tester will compare the
obtained results with the expected results to determine if the test is passed.
The test is considered “passed” when the simulation results match the
expected results.
Test Case Procedure Test Initialization: 1) under the Input Conversions->DriverInput_Conversions-> Override
LvrPosTrnsShft, set control port to 0.
2) underCamaro Fault Detection->Input Conversions->TransEstGear, set
control port to 0, override all other signals to normal value.
3) Select the 505 drive cycle from the GUI
4) Set SOC to 90% from the GUI in order to run CD mode as default mode.
5) Run initial fileMain_init.m to initialize the model parameters Test Body: 1) Run Fault_Trigger.m to insert the fault, and Vehicle Direction Fault
(under Camaro Plant Model-> Transmission) will set to 1.
2) Run the model
3) Check the results obtained in the Scope block for each fault
Test Completion: 1)Record the result
2)Restore the original state of model
3) Run Fault_Clean.m to clean the Vehicle Direction Fault
Test Case Summary Expected Results: Pass/Fail criteria:
1) Vehicle speed=0;
2) Motor torque output/Engine torque output =0;
Under the Signal diagnostic-> Driver signal diagnostic,
PRNDL_shift_failed will be 1, and
->systemDiag->eSystemDiagnostics, eSystemStatus will be 0 and
iceSystemStatus will also be 0;
Under Camaro Plant Model ->Chassis, chas_lin_spd_out, the
speed of vehicle will go to 0;
Under Camaro Plant Model->IMG->IMG Plant->Electric
Machine, mot_trq_out will be 0;

88
Appendix B
B.1 ECMS Algorithm in MATLAB
Figure X Engine and Motor torque control based on ECMS
function [Eq_Fuel,Ele_fuel,Mot_Cmd] = fcn(Mot_low,Mot_upper,EngSpd,T_req,s_dis,s_chg)
%#codegen
%#codegen
n=0;
i=0;
Equ=0;
Equ_Fuel=0;
Mot_Cmd=0;
delta=0;

89
Ele_fuel=0;
Mot_Fuel=0;
Eng_eff=0;
% Eff_eng=zeros(1,20);
Fuel=zeros(1,20);
coder.extrinsic('interp2','linspace');
coder.varsize('Fuel_flow', [1 1024]);
Mot=linspace(Mot_low,Mot_upper,20);
n=length(Mot);
delta=(Mot_upper-Mot_low)/(n-1);
Fuel_flow=zeros(1,20);
for i=1:n
MotTrq=Mot_low+(i-1)*delta;
EngTrq=T_req-MotTrq;
% MotTrq=Mot_low;
% EngTrq=T_req-MotTrq;
… % Engine fuel map and motor efficiency map
mot_eff_map = rot90(mot_eff_map,-1);
Eng_FuelRate = coder.nullcopy(zeros(size(EngSpd)));
Eng_FuelRate =interp2(Speed', Tq, FuelRate', EngSpd,EngTrq);
Mot_Trq=abs(MotTrq);
MotSpd=abs(EngSpd);
Heat_value=29401000; % (J/kg)Specific LHV
Eng_eff=EngTrq*EngSpd*(pi/30)/(Eng_FuelRate*Heat_value/1000);
Mot_Eff=coder.nullcopy(zeros(size(EngSpd)));
Mot_Eff =interp2(mot_eff_trq',mot_eff_spd, mot_eff_map',Mot_Trq,EngSpd,'linear')/100;
Mot_Fuel=coder.nullcopy(zeros(size(EngSpd)));
if MotTrq<0
Mot_Fuel=MotTrq*MotSpd*(pi/30)*s_chg*Mot_Eff/Heat_value*1000;

90
Fuel(i)=Mot_Fuel;
Equ = coder.nullcopy(zeros(size(EngSpd)));
Equ =Mot_Fuel+Eng_FuelRate;
else
Mot_Fuel=MotTrq*MotSpd*(pi/30)*s_dis/Mot_Eff/Heat_value*1000;
Fuel(i)=Mot_Fuel;
Equ =Mot_Fuel+Eng_FuelRate;
% Fuel_flow=coder.nullcopy(zeros(1,n));
% Fuel_flow=zeros(1,n);
end
Fuel_flow(i)=Equ;
% end
end
[M,I]=min(Fuel_flow);
Mot_Cmd=Mot_low+(I-1)*delta;
Eq_Fuel=M;
Ele_fuel=Fuel(I);

91
Reference
[1] C. C. Chan and K. T. Chau, Modern Electric Vehicle Technology, Oxford Science Publication, 2001
[2] M. Ehsani, Y. Gao., and A. Emadi, "Modern Electric, Hybrid Electric, and Fuel Cell Vehicles:
Fundamentals, Theory, and Design,” CRC Press, 2010.
[3] Kapadia, J., Kok, D., Jennings, M., Kuang, M. et al., "Powersplit or Parallel - Selecting the Right Hybrid
Architecture," SAE Int. J. Alt. Power. 6(1):2017, doi:10.4271/2017-01-1154.
[4] Yang Y, Hu X, Pei H, Peng Z. Comparison of power-split and parallel hybrid powertrain architectures
with a single electric machine: dynamic programming approach. Appl Energy 2016; 168:683-90
[5] N. Navet, Y. Song, F. Simonot-Lion and C. Wilwert, "Trends in Automotive Communication Systems,"
in Proceedings of the IEEE, vol. 93, no. 6, pp. 1204-1223, June 2005
[6] C. C. Lin, H. Peng, J. W. Grizzle, J. Liu, and M. Busdiecker, “Control System Development for an
Advanced-Technology Medium-Duty Hybrid Electric Truck,” SAE International, Warrendale, PA, 2003-
01-3369, Nov. 2003.
[7] K. Chau and Y. Wong, “Overview of Power Management in Hybrid Electric Vehicles,” Energy
Conversion and Management, vol. 43, no. 15, pp. 1953–1968, Oct. 2002.
[8] C. C. Lin, J. M. Kang, J. W. Grizzle, and H. Peng, “Energy management strategy for a parallel hybrid
electric truck,” presented at the Proceedings of the American Control Conference, 2001, vol. 4, pp. 2878 –
2883
[9] Z. Han, Z. Yuan, T. Guangyu, C. Quanshi, and C. Yaobin, “Optimal Energy Management Strategy for
Hybrid Electric Vehicles,” SAE International, Warrendale, PA, 2004-01-0576, Mar. 2004.
[10] Y. Zhu, Y. Chen, G. Tian, H. Wu, and Q. Chen, “A four-step method to design an energy management
strategy for hybrid vehicles,” in Proceedings of the 2004 American Control Conference, vol. 1, pp. 156 –
161.
92
[11] C. Desai and S. S. Williamson, “Comparative study of hybrid electric vehicle control strategies for
improved drivetrain efficiency analysis,” IEEE Electrical Power Energy Conference (EPEC), 2009, pp. 1–
6.
[12]Panday A, Bansal H O. A review of optimal energy management strategies for hybrid electric vehicle.
International Journal of Vehicular Technology, 2014, 2014: Article ID 160510
[13] A. Sciarretta, L. Guzzella, Control of hybrid electric vehicles. IEEE Control Syst. Mag.27 (2), 60-70
(2007)
[14] F. Salmasi, Control strategies for hybrid electric vehicles: evolution, classification, comparison, and
future trends. IEEE Trans. Veh. Technol. 56(5), 2393-2404 (2007)
[15] Simona Onori, Lorenzo Serrao, Giorgio Rizzoni, “Hybrid Electric Vehicles Energy Management
Strategies”, Springer, 2016
[16] D. Bertsekas, Dynamics Programming and Optimal Control (Athena Scientific, Belmont, 1995)
[17] A. Piccolo, L. Ippolito, V. Galdi, A. Vaccaro, Optimization of energy flow management in hybrid
electric vehicles via genetic algorithms, in Processing of the 2001 IEEE/ASME International Conference
on Advanced Intelligent Mechatronics (2001)
[18] S. Delprat, G. Paganelli, T.M Gueera, J.J. Santin, M. Delhorn, E. Combes, Algorithmic optimization
tool for the evaluation of HEV control strategies, in Proceedings of EVS 99 (1999)
[19] C. Musardo, G. Rizzoni, and B. Staccia, “A-ECMS: An Adaptive Algorithm for Hybrid Electric
Vehicle Energy Management,” in 44th IEEE Conference on Decision and Control, and 2005 European
Control Conference, pp. 1816 – 1823.
[20] P. Pisu and G. Rizzoni, “A Comparative Study Of Supervisory Control Strategies for Hybrid Electric
Vehicles,” IEEE Transactions on Control Systems Technology, vol. 15, no. 3, pp. 506 –518, May 2007.

93
[21] Goerke, D., Bargende, M., Keller, U., Ruzicka, N. et al., "Optimal Control based Calibration of Rule-
Based Energy Management for Parallel Hybrid Electric Vehicles," SAE Int. J. Alt. Power. 4(1):2015,
doi:10.4271/2015-01-1220.
[22] Yatsko, Margaret. "Development of a Hybrid Vehicle Control System." Electronic Thesis or
Dissertation. Ohio State University, 2016. OhioLINK Electronic Theses and Dissertations Center. 25 Apr
2017.
[23] Crain, T., Mallory, M., Cawley, M., Fabien, B. et al., "Controls Development and Vehicle Refinement
for a 99% Showroom Ready Parallel Through the Road Plug-In Hybrid Electric," SAE Technical Paper
2014-01-2906, 2014, doi:10.4271/2014-01-2906
[24] Harries, Brian Neal, "Development of a Supervisory Control Unit for a Series Plug-in Hybrid Electric
Vehicle" (2012). Dissertations and Theses. Paper 78.
[25] Manning, Peter C. Development of a Series Parallel Energy Management Strategy for Charge
Sustaining PHEV Operation. Thesis. Virginia Polytechnic Institute and State University, 2014.
VTechWorks. Web. 2 Mar. 2016.
[26] Karmustaji, Abdulla Abdulaziz, "Real-Time Optimization Based Power Flow Controller for Energy
Consumption and Emissions Reduction in a Parallel HEV" (2016). Dissertations and Theses. 271.
[27] Bovee, Katherine. "Design of the Architecture and Supervisory Control Strategy for a Parallel-Series
Plug-in Hybrid Electric Vehicle." Electronic Thesis or Dissertation. Ohio State University, 2012.
OhioLINK Electronic Theses and Dissertations Center. 25 Apr 2017.
[28] Sharer, P., Rousseau, A., Karbowski, D., and Pagerit, S., "Plug-in Hybrid Electric Vehicle Control
Strategy: Comparison between EV and Charge-Depleting Options," SAE Technical Paper 2008-01-0460,
2008, doi:10.4271/2008-01-0460.
[29] ECOCAR 3 NON-YEAR-SPECIFIC RULES - REVISION: - JANUARY 27, 2017
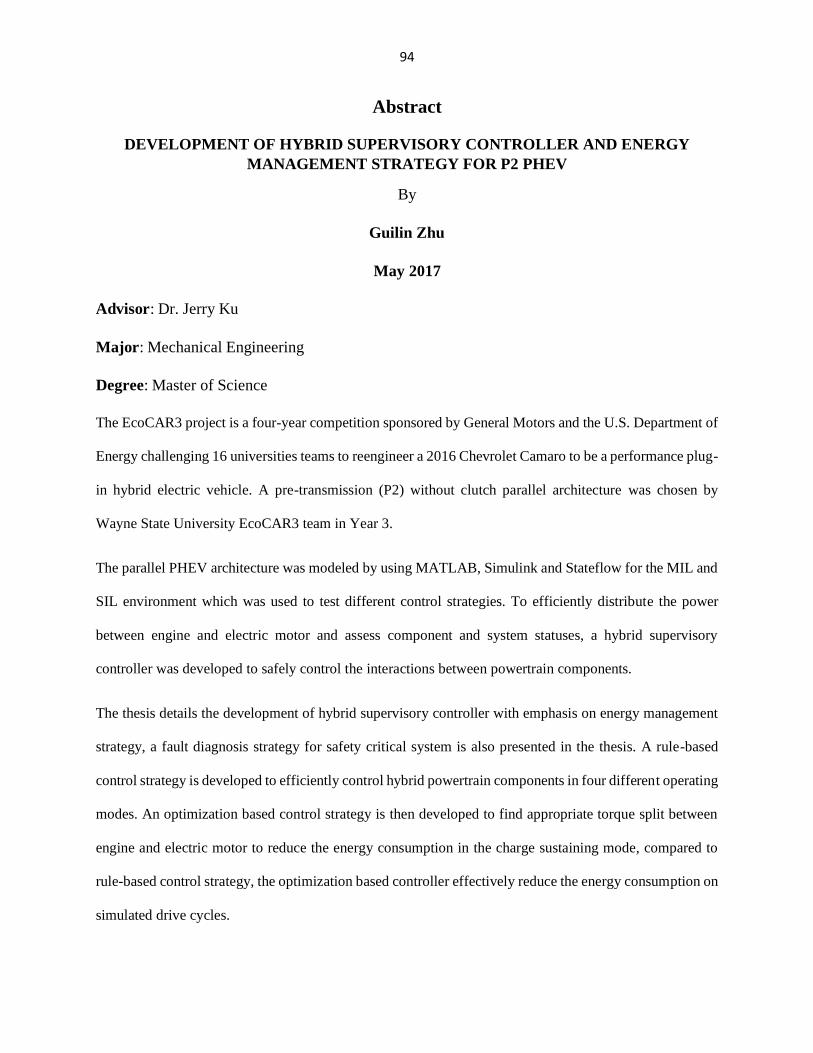
94
Abstract
DEVELOPMENT OF HYBRID SUPERVISORY CONTROLLER AND ENERGY
MANAGEMENT STRATEGY FOR P2 PHEV
By
Guilin Zhu
May 2017
Advisor: Dr. Jerry Ku
Major: Mechanical Engineering
Degree: Master of Science
The EcoCAR3 project is a four-year competition sponsored by General Motors and the U.S. Department of
Energy challenging 16 universities teams to reengineer a 2016 Chevrolet Camaro to be a performance plug-
in hybrid electric vehicle. A pre-transmission (P2) without clutch parallel architecture was chosen by
Wayne State University EcoCAR3 team in Year 3.
The parallel PHEV architecture was modeled by using MATLAB, Simulink and Stateflow for the MIL and
SIL environment which was used to test different control strategies. To efficiently distribute the power
between engine and electric motor and assess component and system statuses, a hybrid supervisory
controller was developed to safely control the interactions between powertrain components.
The thesis details the development of hybrid supervisory controller with emphasis on energy management
strategy, a fault diagnosis strategy for safety critical system is also presented in the thesis. A rule-based
control strategy is developed to efficiently control hybrid powertrain components in four different operating
modes. An optimization based control strategy is then developed to find appropriate torque split between
engine and electric motor to reduce the energy consumption in the charge sustaining mode, compared to
rule-based control strategy, the optimization based controller effectively reduce the energy consumption on
simulated drive cycles.
Related Documents