DEVELOPMENT OF EFFECTIVE MODIFIED PALM SHELL WASTE- BASED ACTIVATED CARBON ADSORBENTS FOR POLLUTANTS REMOVAL FARAHIN BINTI MOHD JAIS FACULTY OF ENGINEERING UNIVERSITY OF MALAYA KUALA LUMPUR 2017

Welcome message from author
This document is posted to help you gain knowledge. Please leave a comment to let me know what you think about it! Share it to your friends and learn new things together.
Transcript
DEVELOPMENT OF EFFECTIVE MODIFIED PALM SHELL WASTE- BASED ACTIVATED CARBON ADSORBENTS FOR POLLUTANTS REMOVAL
FARAHIN BINTI MOHD JAIS
FACULTY OF ENGINEERING
UNIVERSITY OF MALAYA KUALA LUMPUR
2017
DEVELOPMENT OF EFFECTIVE MODIFIED PALM
SHELL WASTE- BASED ACTIVATED CARBON
ADSORBENTS FOR POLLUTANTS REMOVAL
FARAHIN BINTI MOHD JAIS
DISSERTATION SUBMITTED IN FULFILMENT OF
THE REQUIREMENTS FOR THE DEGREE OF MASTER
OF ENGINEERING (SCIENCE)
FACULTY OF ENGINEERING
UNIVERSITY OF MALAYA
KUALA LUMPUR
2017
ii
UNIVERSITY OF MALAYA
ORIGINAL LITERARY WORK DECLARATION
Name of Candidate: Farahin Binti Mohd Jais (I.C/Passport No: )
Matric No: KGA 140043
Name of Degree: Master in Engineering of Science (Environmental)
Title of Project Paper/Research Report/Dissertation/Thesis (“this Work”):
Development of Effective Modified Palm Shell Waste-Based Activated Carbon
Adsorbents for Pollutants Removal.
Field of Study: Water and Wastewater Treatment
I do solemnly and sincerely declare that:
(1) I am the sole author/writer of this Work;
(2) This Work is original;
(3) Any use of any work in which copyright exists was done by way of fair dealing
and for permitted purposes and any excerpt or extract from, or reference to or
reproduction of any copyright work has been disclosed expressly and
sufficiently and the title of the Work and its authorship have been
acknowledged in this Work;
(4) I do not have any actual knowledge nor do I ought reasonably to know that the
making of this work constitutes an infringement of any copyright work;
(5) I hereby assign all and every rights in the copyright to this Work to the
University of Malaya (“UM”), who henceforth shall be owner of the copyright
in this Work and that any reproduction or use in any form or by any means
whatsoever is prohibited without the written consent of UM having been first
had and obtained;
(6) I am fully aware that if in the course of making this Work I have infringed any
copyright whether intentionally or otherwise, I may be subject to legal action
or any other action as may be determined by UM.
Candidate’s Signature Date:
Subscribed and solemnly declared before,
Witness’s Signature Date:
Name:
Designation:
ii
UNIVERSITI MALAYA
PERAKUAN KEASLIAN PENULISAN
Nama: Farahin Binti Mohd Jais (No. K.P/Pasport: 911017-01-6568)
No. Matrik: KGA 140043
Nama Ijazah: Sarjana Kejuruteraan Sains (Alam Sekitar)
Tajuk Kertas Projek/Laporan Penyelidikan/Disertasi/Tesis (“Hasil Kerja ini”):
Pembangunan Penjerap Efektif Berasaskan Karbon Diaktifkan Dari Sisa Buangan
Tempurung Kelapa Sawit yang Telah Diubah Suai Untuk Pembuangan Pencemaran.
Bidang Penyelidikan: Rawatan Air/Rawatan Air Sisa
Saya dengan sesungguhnya dan sebenarnya mengaku bahawa:
(1) Saya adalah satu-satunya pengarang/penulis Hasil Kerja ini;
(2) Hasil Kerja ini adalah asli;
(3) Apa-apa penggunaan mana-mana hasil kerja yang mengandungi hakcipta telah
dilakukan secara urusan yang wajar dan bagi maksud yang dibenarkan dan apa-
apa petikan, ekstrak, rujukan atau pengeluaran semula daripada atau kepada
mana-mana hasil kerja yang mengandungi hakcipta telah dinyatakan dengan
sejelasnya dan secukupnya dan satu pengiktirafan tajuk hasil kerja tersebut dan
pengarang/penulisnya telah dilakukan di dalam Hasil Kerja ini;
(4) Saya tidak mempunyai apa-apa pengetahuan sebenar atau patut
semunasabahnya tahu bahawa penghasilan Hasil Kerja ini melanggar suatu
hakcipta hasil kerja yang lain;
(5) Saya dengan ini menyerahkan kesemua dan tiap-tiap hak yang terkandung di
dalam hakcipta Hasil Kerja ini kepada Universiti Malaya (“UM”) yang
seterusnya mula dari sekarang adalah tuan punya kepada hakcipta di dalam
Hasil Kerja ini dan apa-apa pengeluaran semula atau penggunaan dalam apa
jua bentuk atau dengan apa juga cara sekalipun adalah dilarang tanpa terlebih
dahulu mendapat kebenaran bertulis dari UM;
(6) Saya sedar sepenuhnya sekiranya dalam masa penghasilan Hasil Kerja ini saya
telah melanggar suatu hakcipta hasil kerja yang lain sama ada dengan niat atau
sebaliknya, saya boleh dikenakan tindakan undang-undang atau apa-apa
tindakan lain sebagaimana yang diputuskan oleh UM.
Tandatangan Calon Tarikh:
Diperbuat dan sesungguhnya diakui di hadapan,
Tandatangan Saksi Tarikh:
Nama:
Jawatan:

iii
ABSTRACT
A simple and cost-effective water/wastewater treatment was approached by adsorption
technique. While, palm shell-waste based activated carbon widely used in variety field
and available in abundance in Malaysia. It was chosen as the basic raw adsorbent before
modification can be made. In order to achieve high adsorption performance, special
modification of adsorbent need to be made based on types of pollutant to be removed
which are in this study, Arsenic removal from groundwater and Methyl Orange &
Methylene Blue dye from textile wastewater.
The first modification of Palm Shell waste–based Activated Carbon (PSAC) is for
removal of Arsenate ion was synthesized through dual modification. At first, Magnetic
Palm Shell waste-based Activated Carbon (MPSAC) was developed via hydrothermal
impregnation of nano–magnetite, and secondly it was coated by various amounts of
lanthanum (La) followed by calcination. Numerous batch tests were carried out to observe
arsenate removal performance. Isotherm data showed that MPSAC–La(0.36) (weight
ratio of La to Fe = 0.36) gave the highest adsorption capacity (227.6 mg g–1), which was
16.5 and 1.6 times higher than PSAC and MPSAC, respectively. Based on the pH effect
and speciation modeling, arsenate was predominantly removed by precipitation at pH <
8, while it complexed on the surface of La(OH)3 at pH > 8. Lesser La dissolution resulted,
owing to a strong binding effect of nano–magnetite with La. XRD, FTIR, FESEM+EDX,
and N2 gas isotherms showed that the coating of nano–magnetite introduced substantial
clogging in the micropores of PSAC, but increased meso– and macropores. However,
lanthanum oxide/hydroxide (LO/LH) glued the spaces of nano–magnetite to eliminate
most pore structures, and effectively removed arsenate as LaAsO4 at pH 6.
iv
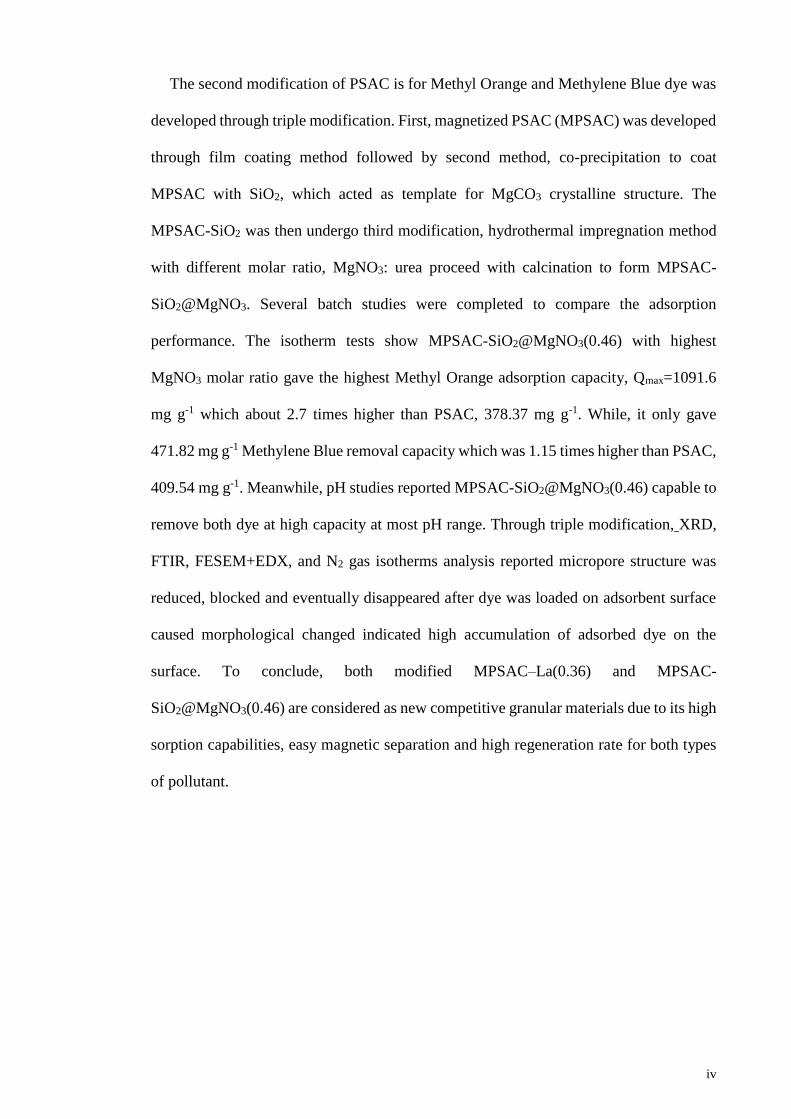
The second modification of PSAC is for Methyl Orange and Methylene Blue dye was
developed through triple modification. First, magnetized PSAC (MPSAC) was developed
through film coating method followed by second method, co-precipitation to coat
MPSAC with SiO2, which acted as template for MgCO3 crystalline structure. The
MPSAC-SiO2 was then undergo third modification, hydrothermal impregnation method
with different molar ratio, MgNO3: urea proceed with calcination to form MPSAC-
SiO2@MgNO3. Several batch studies were completed to compare the adsorption
performance. The isotherm tests show MPSAC-SiO2@MgNO3(0.46) with highest
MgNO3 molar ratio gave the highest Methyl Orange adsorption capacity, Qmax=1091.6
mg g-1 which about 2.7 times higher than PSAC, 378.37 mg g-1. While, it only gave
471.82 mg g-1 Methylene Blue removal capacity which was 1.15 times higher than PSAC,
409.54 mg g-1. Meanwhile, pH studies reported MPSAC-SiO2@MgNO3(0.46) capable to
remove both dye at high capacity at most pH range. Through triple modification, XRD,
FTIR, FESEM+EDX, and N2 gas isotherms analysis reported micropore structure was
reduced, blocked and eventually disappeared after dye was loaded on adsorbent surface
caused morphological changed indicated high accumulation of adsorbed dye on the
surface. To conclude, both modified MPSAC–La(0.36) and MPSAC-
SiO2@MgNO3(0.46) are considered as new competitive granular materials due to its high
sorption capabilities, easy magnetic separation and high regeneration rate for both types
of pollutant.

v
ABSTRAK
Rawatan air/air sisa secara mudah dan kos efektif telah didatangi oleh teknik
penjerapan. Sementara, karbon diaktifkan dari sisa buangan tempurung kelapa sawit telah
digunakan secara meluas dalam pelbagai bidang dan boleh didapati dengan mudah di
Malaysia. Ia dipilih sebagai asas penjerap sebelum pengubahsuaian dilakukan. Dalam
usaha untuk mencapai prestasi penjerapan yang tinggi, pengubahsuaian khas penjerap
perlu dibuat berdasarkan jenis bahan pencemar yang akan dikeluarkan iaitu dalam kajian
ini, penyingkiran Arsenik daripada air bawah tanah dan pewarna Metil Jingga & Metilena
biru daripada air sisa tekstil.
Pengubahsuaian pertama karbon diaktifkan berasaskan sisa buangan tempurung
kelapa sawit (PSAC) adalah untuk penyingkiran Arsenate telah dihasilkan melalui dwi
pengubahsuaian. Pada mulanya, karbon diaktifkan dari sisa buangan tempurung kelapa
bermagnet (MPSAC) telah dibangunkan melalui hidroterma nano magnetit, kemudian
disalut dengan pelbagai jumlah lantanum (La) diikuti oleh pengkalsinan. Beberapa ujian
berkumpulan telah dijalankan untuk melihat prestasi penyingkiran Arsenate. Data
isoterma menunjukkan bahawa MPSAC-La (0.36) (nisbah berat La untuk Fe = 0.36)
memberikan kapasiti penjerapan yang paling tinggi (227.6 mg g-1), iaitu 16.5 dan 1.6 kali
lebih tinggi daripada PSAC dan MPSAC. Berdasarkan kesan pH dan pemodelan
penspesiesan, sebahagian besar Arsenate dikeluarkan secara mendakan pada pH <8, dan
kompleks pada permukaan La (OH)3 pada pH> 8. Hanya sedikit La luntur, oleh kerana
kesan yang kuat mengikat nano -magnetite dengan La. XRD, FTIR, FESEM + EDX, dan
isoterma gas N2 menunjukkan bahawa penyalutan nano magnetit menyebabkan liang
mikro PSAC berkurang, dan liang meso dan makro meningkat. Walau bagaimanapun,
lantanum oksida / hidroksida (LO / LH) mengisi ruang antara nano magnetit dan
vi
menghapuskan kebanyakan struktur liang, dan berkesan menngeluarkan Arsenate sebagai
LaAsO4 pada pH 6.
Pengubahsuaian kedua PSAC adalah untuk Metil Jingga dan Metilena Biru telah
dibangunkan melalui tiga kali pengubahsuaian. Pertama, PSAC bermagnet (MPSAC)
telah dibangunkan melalui kaedah salutan filem diikuti oleh kaedah kedua, mendakan
SiO2 pada MPSAC, yang bertindak sebagai templat untuk struktur kristal MgCO3.
MPSAC-SiO2 kemudiannya menjalani pengubahsuaian ketiga, kaedah pengisitepuan
hidroterma dengan nisbah molar berbeza, MgNO3: urea diikuti pengkalsinan untuk
membentuk MPSAC-SiO2 @ MgNO3. Beberapa kajian kumpulan telah dijalankan. Ujian
isoterma menunjukkan MPSAC-SiO2 @ MgNO3 (0.46) dengan nisbah molar MgNO3:
urea tertinggi memberikan kapasiti penjerapan Metil Jingga tertinggi, Qmax = 1091.6 mg
g-1 kira-kira 2.7 kali lebih tinggi daripada PSAC, 378.37 mg g-1. Manakala, ia hanya
memberikan 471.82 mg g-1, kapasiti penyingkiran Metilena Biru iaitu 1.15 kali lebih
tinggi daripada PSAC, 409.54 mg g-1. Sementara itu, kajian kesan pH melaporkan
MPSAC-SiO2 @ MgNO3 (0.46) mampu untuk menjerap kedua-dua pewarna pada
kapasiti tinggi pada kebanyakan nilai pH. Melalui tiga kali pengubahsuaian, XRD, FTIR,
FESEM + EDX, dan gas N2 isoterma analisis melaporkan struktur liang mikro telah
berkurang, tersumbat dan akhirnya hilang selepas pewarna terjerap pada permukaan
menyebabkan morfologi berubah menandakan penjerapan pewarna pada permukaan
terkumpul tinggi. Kesimpulannya, kedua-dua MPSAC-La (0.36) dan MPSAC-SiO2 @
MgNO3 (0.46) penjerap yang telah diubah suai boleh dianggap sebagai bahan berbutir
kompetitif baru kerana keupayaan penjerapan yang sangat tinggi, pengasingan magnetic
secara mudah dan kadar penggunaan semula yang tinggi untuk kedua-dua jenis bahan
pencemar.
vii
ACKNOWLEDGEMENTS
Immeasurable appreciation and deepest gratitude for the help and support are extended
to the following persons who in one way or another have contributed in making this study
possible.
Prof. Shaliza Ibrahim, my main supervisor for her research adviser, support, advices,
guidance, valuable comments, suggestions, and for her time and effort in checking this
dissertation.
Prof. Min Jang, my co-supervisor for his positive encouragement, guidance, patience
in correcting and editing manuscript to be published together with me and for all the
experimental results analysis guidance.
Public Service Department (JPA), my sponsored scholarship for 3 semesters.
Mrs. Rozita Yusop, Environmental Engineering Laboratory Assistant, for her
guidance in the laboratory.
My family, family-in law and my beloved husband, for all their spiritual support,
love and care.
Ms. Nuzaima Che Mood & Syafiqah Janurin, my supportive friends, for her
courage words along this study journey.

viii
TABLE OF CONTENTS
Abstract ............................................................................................................................ iii
Acknowledgements ......................................................................................................... vii
Table of Contents ........................................................................................................... viii
List of Tables................................................................................................................... xv
List of Symbols and Abbreviations ................................................................................ xvi
List of SCHEMES ......................................................................................................... xvii
CHAPTER 1: INTRODUCTION .................................................................................. 1
Chapter Summary.............................................................................................................. 1
1.1 General Introduction ................................................................................................ 1
1.2 Problem Statement ................................................................................................... 5
1.3 Scope of Research.................................................................................................... 8
1.4 Objectives of Research ............................................................................................ 8
1.5 Research Outline ...................................................................................................... 9
CHAPTER 2: LITERATURE REVIEW .................................................................... 11
Chapter Summary............................................................................................................ 11
2.1 Pollution History .................................................................................................... 11
2.2 Water Pollution ...................................................................................................... 12
2.2.1 Sources of Water Pollution and Its Impact ............................................... 12
2.3 Arsenic in Groundwater ......................................................................................... 15
2.3.1 Source of arsenic ...................................................................................... 16
2.3.2 Arsenic Characteristic .............................................................................. 18
2.3.3 Impact towards Human Health ................................................................. 19
2.4 Textile Dyeing Wastewater ................................................................................... 21
ix
2.4.1 Type of Dyes ............................................................................................ 25
2.4.2 Impact of Dye Wastewater towards Environment................................... 29
2.5 Conventional Water & Wastewater Treatment...................................................... 30
2.6 Type of Adsorbents............................................................................................... 39
2.6.1 Commercial Adsorbent ................................................................................. 39
2.6.2 Low Cost Adsorbent ................................................................................. 42
2.7 Palm Shell-Waste Based Activated Carbon .......................................................... 46
2.7.1 Importance of Surface Modification ............................................................. 48
2.7.2 Activated Carbon Surface Modification Techniques ............................... 50
2.7.3 Advantageous of Magnetic Modification ................................................. 51
2.7.4 Advantages of Multi Metal Oxide/Hydroxide Modification .................... 52
2.8 Equilibrium Isotherm Model ................................................................................. 55
2.9 Adsorption Kinetic Model ..................................................................................... 57
CHAPTER 3: MATERIALS AND METHODOLOGY ............................................ 60
3.1 Materials ................................................................................................................ 60
3.2 Equipment .............................................................................................................. 61
a) Material preparation and sample analysis ................................................ 61
b) For characterization analysis .................................................................... 61
3.3 Materials Preparation ............................................................................................. 62
3.3.1 Preparation of Lanthanum and Nano-Magnetite Composite Incorporated
Palm Shell Waste-Based Activated Carbon (MPSAC-Las) ..................... 62
3.3.2 Preparation of MgNO3-SiO2 incorporated into nano-magnetite Palm Shell
Waste-Based Activated Carbon ................................................................ 64
3.4 Arsenic removal batch adsorption experiments ..................................................... 66
3.4.1 Adsorption isotherms ............................................................................... 66
3.4.2 Adsorption kinetics .................................................................................. 67
x
3.4.3 pH effects ................................................................................................. 68
3.4.4 Temperature effect.................................................................................... 69
3.4.5 Competition effects ................................................................................. 70
3.5 Regeneration .......................................................................................................... 71
3.6 Characterization analysis ...................................................................................... 71
3.7 Dye removal batch adsorption experiments .......................................................... 73
3.7.1 Adsorption isotherms ............................................................................... 73
3.7.2 Adsorption kinetics ................................................................................... 74
3.7.3 pH effects ................................................................................................ 75
3.7.4 Ionic Strength ........................................................................................... 76
3.8 Regeneration .......................................................................................................... 77
3.9 Characterization analysis ...................................................................................... 77
CHAPTER 4: RESULTS & DISCUSSION ................................................................ 79
4.1 Arsenate isotherms Studies .................................................................................... 80
4.2 Arsenate Kinetics .................................................................................................. 84
4.3 Arsenate pH effects................................................................................................ 89
4.4 Mechanism of arsenate removal by MPSAC–La ................................................. 93
4.5 Arsenate Thermodynamics .................................................................................. 104
4.6 Competition effect and regeneration ................................................................... 107
4.7 Dye Isotherm Studies ........................................................................................... 110
4.8 Dyes Kinetic Studies........................................................................................... 116
4.9 Dyes pH effects.................................................................................................... 124
4.10 Dyes Competition Anion Studies ........................................................................ 128
4.11 Dyes Regeneration Effect .................................................................................... 131
4.12 Mechanism of dye removal by MPSAC-SiO2@MgNO3(0.46) adsorbent .......... 133

xi
CHAPTER 5: CONCLUSION & RECOMMENDATIONS .................................. 148
6.1 Arsenic Removal Study ....................................................................................... 148
6.2 Dye Removal Study ............................................................................................. 149
6.3 Major Contribution .............................................................................................. 150
a) Arsenic Removal study .......................................................................... 150
b) Dye removal study .................................................................................. 152
6.5 Recommendation of future works ....................................................................... 153
References ..................................................................................................................... 155
LIST OF PUBLICATION .......................................................................................... 172
xii
LIST OF FIGURES
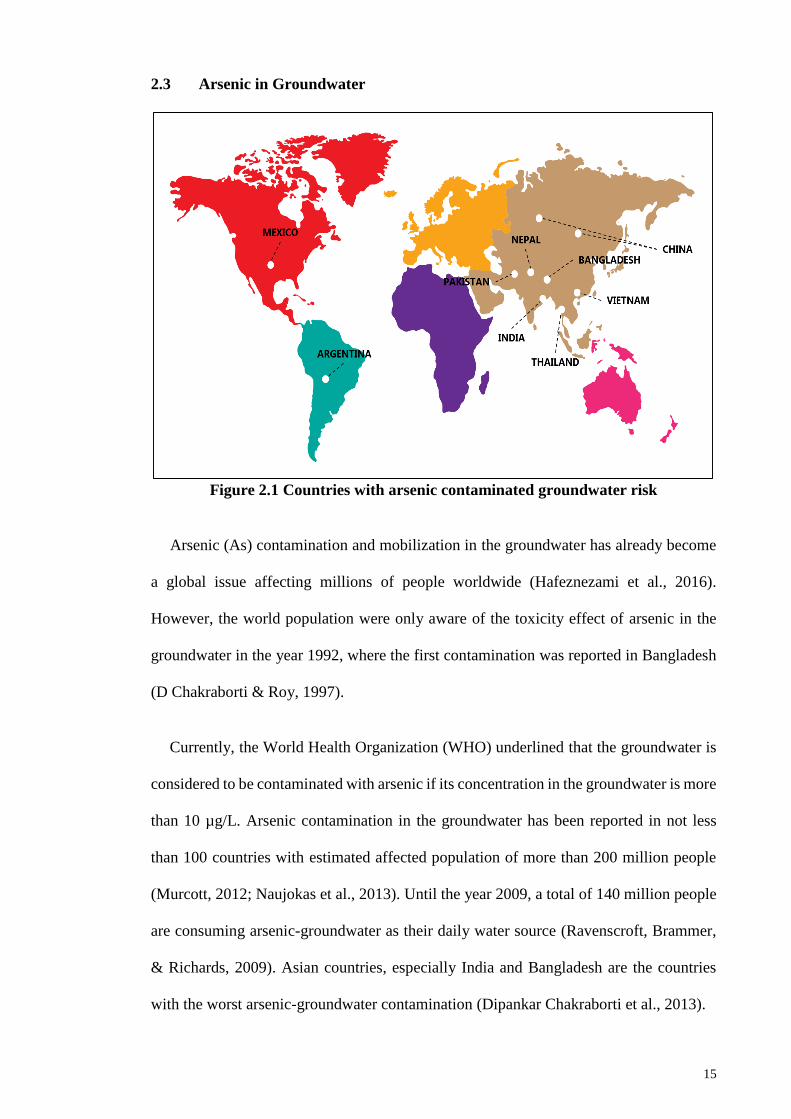
Figure 2.1 Countries with arsenic contaminated groundwater risk................................. 15
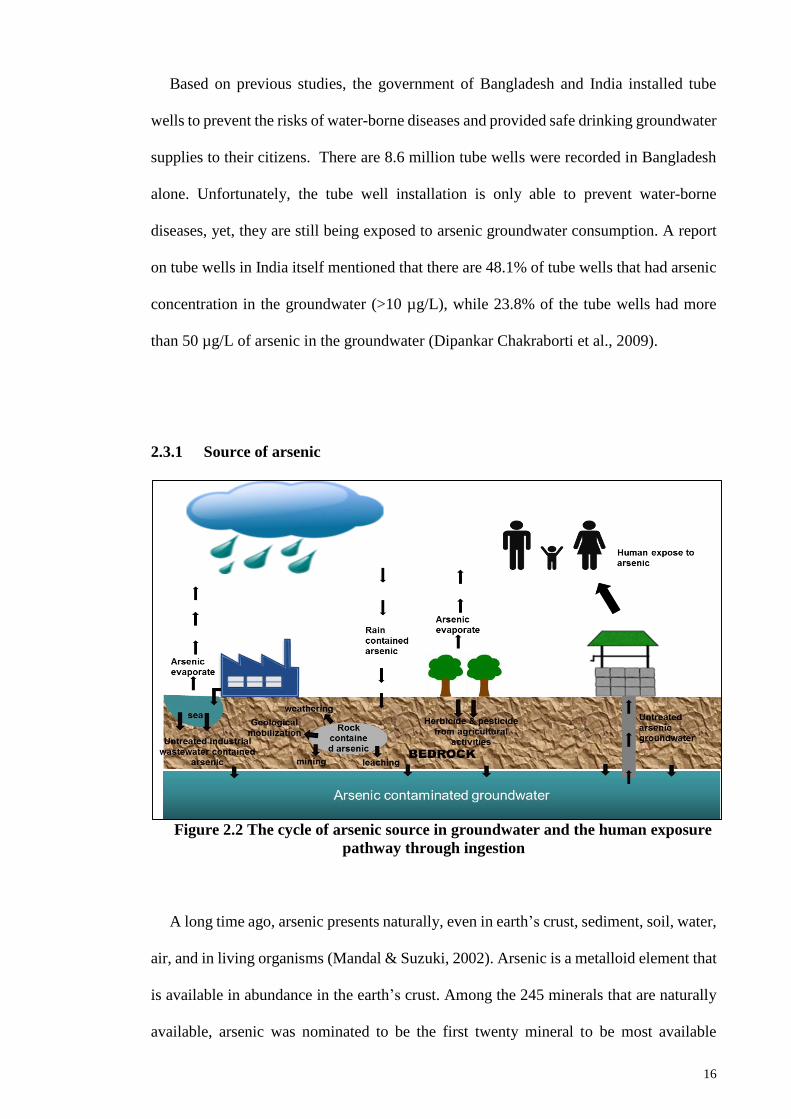
Figure 2.2 The cycle of arsenic source in groundwater and the human exposure pathway
through ingestion ............................................................................................................. 16
Figure 2.3 the molecular structure of A) arsenate and B) arsenite.................................. 19
Figure 2.4 Water consumption in the textile dyeing & finishing-woven cloth, and water
consumption in the textile dyeing and finishing-fiber & yarn ........................................ 21
Figure 2.5 Flow diagram of various steps involved in processing textile in a cotton mill
......................................................................................................................................... 22
Figure 2.6 Methylene Blue dye molecular structure ....................................................... 27
Figure 2.7 Methyl Orange dye molecular structure ........................................................ 28
Figure 2.8 The general activated carbon pore structure .................................................. 47
Figure 4.1 (A) Adsorption isotherm of arsenate on the PSAC, MPSAC and MPSAC
impregnated with different amounts of lanthanum at pH 6, Ci = 10 ~ 350 mg L-1 and 1 g
L-1 of adsorbent. Black color fit lines are the Langmuir and gray color fit lines are the
Freundlich isotherm model (B) Qmax and KL values vs. the ratio of La/Fe or the amounts
of La. ............................................................................................................................... 80
Figure 4.1 (C) Percentage removal of arsenate removal ................................................. 81
Figure 4.2 (A) kinetics of arsenate removal by MPSAC-La (0.36) for the removal of
arsenate at pH 6, Ci = 350 mg L-1, 1.0 g L-1 of adsorbent ............................................... 84
Figure 4.2 (B) intra-particle diffusion modelling of MPSAC-La (0.36) for the removal of
arsenate at pH 6, Ci = 350 mg L-1, 1.0 g L-1 of adsorbent ............................................... 85
Figure 4.2 (C) pHPZC of MPSAC-La (0.36) .................................................................... 85
Figure 4.3 (A) arsenate speciation and sorption capacity by MPSAC-La (0.36) at different
pH and (B) La3+ speciation and leaching concentrations of La3+ and Fe3+ ions ............. 89
Figure 4.4 XRD results of PSAC, MPSAC, MPSAC-La (0.28), MPSAC-La (0.36) and
MPSAC-La (0.36) after adsorption at pH 6, Ci = 350 mg L-1, 1 g L-1 of adsorbent. ...... 93
Figure 4.5 (A) FESEM for PSAC ................................................................................... 95
Figure 4.5 (B) FESEM+EDX for MPSAC ..................................................................... 95
xiii
Figure 4.5 (C) FESEM+EDX for MPSAC-La (0.36) ..................................................... 96
Figure 4.5 (D) FESEM+EDX for arsenate retained MPSAC-La (0.36) with the condition:
pH 6, Ci = 350 mg L-1, 1 g L-1 of adsorbent. ................................................................... 96
Figure 4.7 FT-IR spectra of MPSAC, MPSAC-La (0.36) and MPSAC-La (0.36) after
adsorption at pH 6, Ci = 350mg L-1, 1 g L-1 of adsorbent. ............................................ 101
Figure 4.8 (A) temperature effect on arsenate adsorption capacity of MPSAC–La (0.36),
(B) pseudo second order kinetic model at pH 6 Ci = 350 mg L-1, 1 g L-1 of adsorbent.
....................................................................................................................................... 104
Figure 4.8 (C) thermodynamics curve at pH 6 Ci = 350 mg L-1, 1 g L-1 of adsorbent. . 105
Figure 4.9(A) MPSAC and (B) MPSAC–La (0.36) competition effect of arsenate with 2.5
mmol L-1 of coexisting anion at pH 6, Ci = 50 and 350 mg L-1, 1 g L-1 of adsorbent ... 107
Figure 4.10 Regeneration effect for MPSAC–La (0.36) at pH 6, Ci = 350 mg L-1, 1 g L-1
of adsorbent ................................................................................................................... 108
Figure 4.11 (A) adsorption isotherm of Methyl Orange, Ci = 50 ~ 1000 mg L-1 (B)
adsorption isotherm of Methylene Blue, Ci = 50 ~ 500 mg L-1 on PSAC, MPSAC and
MPSAC-SiO2 impregnated with different amount of MgNO3 at pH 6 and 1 g L-1 of
adsorbent. The black color fit line is Langmuir and the gray color fit line is Freundlich
isotherm model .............................................................................................................. 110
Figure 4.11 (C) Percentage removal of Methylene Blue dye removal (D) Percentage
removal of Methyl Orange dye ..................................................................................... 111
Figure 4.12 (A) (i) kinetics of Methyl Orange dye removal at pH 6, Ci = 1300 mg L-1, 1.0
g L-1 of adsorbent, (ii) intra particle diffusion kinetic model for Methyl Orange dye
removal .......................................................................................................................... 116
Figure 4.12 B (i) kinetics of Methylene Blue dye removal at pH 6, Ci = 1300 mg L-1, 1.0
g L-1 of adsorbent by PSAC and MPSAC-SiO2@MgNO3 (0.46) (ii) intra particle diffusion
kinetic model for Methylene Blue dye removal ............................................................ 117
Figure 4.13 (A) pHpzc MPSAC-SiO2@MgNO3(0.46) ................................................. 124
Figure 4.13 (B) pH effect studies for Methyl Orange dye, Ci=500 mg L-1 (C) pH effect
studies for Methylene Blue dye, Ci=1300 mg L-1 ......................................................... 125
Figure 4.14 Effect of ionic strength (NaCl) on (A) Methyl Orange, Ci=1300 mg L-1 and
(B) Methylene Blue dye, Ci=500mg L-1 adsorption by ................................................. 128
Figure 4.15 Regeneration effect for MPSAC-SiO2@MgNO3 (0.46) at pH 6, Methyl
Orange dye, Ci = 1300 mg L-1, 1 g L-1 of adsorbent ..................................................... 131
xiv
Figure 4.16 XRD results of PSAC, MPSAC, MPSAC-SiO2, MPSAC-
SiO2@MgNO3(0.46) adsorbents ................................................................................... 133
Figure 4.17 (A) FESEM for PSAC ............................................................................... 135
Figure 4.17 (B) FESEM-EDX for MPSAC at low magnification and (C) MPSAC at high
magnification................................................................................................................. 136
Figure 4.17 (D) FESEM-EDX for MPSAC-SiO2@MgNO3 at low magnification (E)
MPSAC-SiO2@MgNO3 (0.46) high magnification ...................................................... 137
Figure 4.17 (E) FESEM-EDX for MPSAC-SiO2@MgNO3 (0.46) (F) Methyl Orange
loaded MPSAC-SiO2@MgNO3 (0.46) with the condition: pH 6, Ci = 1300 mg L-1, 1 g L-
1 of adsorbent................................................................................................................. 138
Figure 4.18 (A) N2 adsorption and desorption isotherms (B) pore size distribution (BJH)
curve of PSAC, MPSAC, MPSAC-SiO2@MgNO3(0.46) and MPSAC-SiO2@MgNO3
(0.46) with Methyl Orange loaded at pH 6, Ci = 1300mg L-1, 1 g L-1 of adsorbent...... 141
Figure 4.19 FT-IR spectra of PSAC, MPSAC, MPSAC-SiO2@MgNO3 (0.46) and
MPSAC-SiO2@MgNO3 (0.46) with Methyl Orange loaded at pH 6, Ci = 1300mg L-1, 1 g
L-1 of adsorbent. ............................................................................................................ 144
Figure 4.20 FT-IR spectra of initial Methyl Orange dye and degraded Methyl Orange dye
....................................................................................................................................... 146

xv
LIST OF TABLES
Table 2.1 List of wastewater generated in each cotton dyeing manufacturing process .. 25
Table 4.1(A) Langmuir and Freundlich isotherm parameters for arsenate adsorption onto
PSAC, MPSAC and MPSAC impregnated with different amount of lanthanum (III) at pH
6, Ci (350 mg L-1) .......................................................................................................... 82
Table 4.2 Parameters of the pseudo-first and pseudo-second order kinetic models for
arsenate adsorption by MPSAC–La (0.36) and MPSAC ................................................ 87
Table 4.3: Mixed metal ions complexes (soluble and solids species) for Medusa ......... 91
Table 4.4 Porosity characterization of PSAC, MPSAC, MPSAC–La (0.084), MPSAC–La
(0.28), MPSAC–La (0.36) ............................................................................................... 99
Table 4.5 Comparison of maximum adsorption capacities and sorption densities of
various media ................................................................................................................ 100
Table 4.6 Thermodynamic parameters of arsenate adsorption by MPSAC–La (0.36) . 106
Table 4.7 Langmuir and Freundlich isotherm parameters for Methyl Orange adsorption
onto PSAC, MPSAC an and MPSAC-SiO2 impregnated with different amount of MgNO3
at pH 6, Ci (1000 mg/L) ................................................................................................ 113
Table 4.8 Langmuir and Freundlich isotherm parameters for Methylene Blue adsorption
onto PSAC, MPSAC an and MPSAC-SiO2 impregnated with different amount of MgNO3
at pH 6, Ci (500 mg/L) .................................................................................................. 113
Table 4.9 Parameters of pseudo–first and pseudo–second order kinetic models for Methyl
Orange dye adsorption by MPSAC-SiO2@MgNO3 (0.46) and PSAC. ........................ 121
Table 4.10 Parameters of pseudo–first and pseudo–second order kinetic models for
Methylene Blue dye adsorption by MPSAC-SiO2@MgNO3 (0.46) and PSAC. .......... 121
Table 4.11 Comparison of Methyl Orange sorption capacities and speeds with other
references ...................................................................................................................... 122
Table 4.12 Comparison of Methylene Blue sorption capacities and speeds with other
references ...................................................................................................................... 123
Table 4.13 Porosity characterization of PSAC, MPSAC, MPSAC-SiO2@MgNO3(0.46)
and MPSAC-SiO2@MgNO3(0.46) with Methyl Orange ............................................. 143

xvi
LIST OF SYMBOLS AND ABBREVIATIONS
As
As(V)
: Arsenic
Arsenate
BET : Brunauer-Emmett-Teller
IPD : Intra Particle Diffusion
IUPAC : International Union of Pure and Applied Chemistry
JCPDS : Joint Committee on Powder Diffraction Standards
KL : Langmuir isotherm constant
Kdiff : Diffusion control rate constant
mg : milligram
mg g-1 : milligram per gram
mg L-1 : milligram per liter
ml : milliliter
pHpzc : Point of Zero Charge
Qmax : Maximum adsorption capacity
qeq : Amount of solute adsorbed per unit weight of the adsorbent
µg L-1 : microgram per liter
R2 : Coefficient of determination
ΔH° : Change of entropy
ΔS° : Change of enthalpy
ΔG° : Change of Gibbs free energy

xvii
LIST OF SCHEMES
Scheme 1 Schematics of MPSAC–La (0.36) preparation and arsenate removal mechanism
....................................................................................................................................... 103
1
CHAPTER 1: INTRODUCTION
Chapter Summary
The aim of this chapter is to give a brief introduction on the overall study, which
consists of the study on arsenic and dye removal (methylene blue and methyl orange dye).
The introduction chapter contained freshwater and wastewater profile summary, problem
statement, scope of research, objectives of research, and research outline.
1.1 General Introduction
Water has become scarce over the years and has been to a critical level. Rapid
urbanization, fast population growth, uncontrolled agricultural activities, lack of
environmental awareness and natural disasters are some examples contributed to global
water issues. Either freshwater or wastewater issues, both need full attention from the
eyes all around the world.
a) Freshwater
Freshwater can be classified into two categories: 1) surface water 2) groundwater. The
surface water is defined as water found on top of the ground, for example water in the
lake, river and sea. While, groundwater is defined as water found under the ground, such
as in the spaces and cracks in soils, rocks and sands. The groundwater is stored
underground and steadily move through aquifers (geological formations of soil, rocks and
sands).
2
Surface water has always been the top source used by many countries that has an
abundance surface water, but for countries with a lack of surface water, groundwater will
be the important alternative source of water to be consumed. However, more work and
costs are needed to use the groundwater as a daily supply as compared to the surface
water.
Almost half of the world’s groundwater source is being used by countries such as
China and those in the South Asia region (India, Nepal, Bangladesh and Pakistan).
Researchers have found that continuous extraction of groundwater will worsen the water
crisis in the South Asia region. World Water Development Report (WWDR) concluded
in year 2015 that 748 million people worldwide still use untreated groundwater for daily
used, where South Asia contributed to the most number of people.
Groundwater acts as a solvent, which is dissolved minerals from rocks, soil and sand
that came in contact with it. Calcium (Ca2+), chloride (Cl-), bicarbonate (CO32-),
magnesium (Mg2+), potassium (K+), sodium (Na+) and sulfate (SO42-) are the common
minerals dissolved in groundwater. These minerals would not cause harm to the consumer
unless the concentration of the dissolved minerals are higher than the allowable
concentration.

3
b) Wastewater
Wastewater is a general term used for water that has been in contact with any by-
product, products, raw material or waste from residential, commercial, or industrial
activities or processes. Originally, wastewater is considered as treated freshwater that has
been channeled to a different use with a different water quality standard. When the
freshwater has been used, it becomes wastewater. Different use of freshwater will produce
different types of wastewater.
Wastewater sources can be classified into several categories: 1) Domestic activities,
which is water used for residential activities, such as drinking, bathing, cleaning, food
preparation and watering the lawn. 2) Commercial activities, such as beauty salons,
furniture refurnishing, and auto body repair shops. In commercial activities, the
wastewater produced is more polluted than residential activities because the use of
chemical products, such as paint, dye and lubricant contained a high concentration of
inorganic contaminant. 3) Institutional activities is similar with the domestic activities,
but in a larger quantity, which are originated from shopping mall, hospital and school. 4)
Industrial activities use water for a variety of purposes, such as for heating, cooling, by-
product waste carrier, solvent, for dilution and food manufacturing.
Industrial and commercial activities may contribute to a high discharge of inorganic
contaminant and pollutant, which could affect wastewater treatment quality using the
conventional method. Specialized treatment is needed to treat a certain industrial and
commercial wastewater discharge, for example the textile manufacturing wastewater.
Generally, industrial wastewater contained a high concentration of suspended solids,
heavy metals (in example nickel, cadmium, calcium, iron and sodium), Biological
Oxygen Demand (BOD), Chemical Oxygen Demand (COD), and ammonia. Different
industry discharge will have different types of pollutant based on its activities.
4
For example, textile manufacturing industry involved several main steps; spinning,
weaving, dyeing, printing, finishing, and garments manufacturing. Dyeing, printing and
finishing processes involve the use of various chemicals, such as solubilizes, dispersants,
levelling agents, soaping agents, and dyeing agents. Furthermore, in printing process, the
chemicals used are vat levelling agents, thickeners, binders, stain removers, and anti-back
staining agents. Moreover, the cationic, non-ionic, anionic, reactive and cold water
soluble softeners flake or paste were commonly used for the finishing process. The use
of these textile chemicals contribute to the high amount of pollutant in the wastewater.
Other than textile chemicals, the application of dyes on the manufactured textile also
contributed to the high amount of pollutant in the wastewater. Different types of textile
use different types of dye. Cellulose fibers (cotton, linen and rayon), protein fibers (wool,
cashmere and silk) and synthetic fibers (polyester, nylon and spandex) are the three main
fibers used in the textile industry. Cellulose fibers textile commonly uses the reactive dyes
(remazol, cibaron F), direct dyes (congo red and methyl orange), naphtol dyes (fast yellow
GC and fast blue B), and indigo dyes (indigo white and tyrian purple). Furthermore, the
acid dyes (azo dye) and lanaset dyes (blue 5G) were used for the protein fibers textile and
finally, the basic dyes (methylene blue), dispersed dyes (dispersed yellow 218), and direct
dyes were used for synthetic fibers.
5
1.2 Problem Statement
a) Freshwater
Due to the uncontrolled agricultural activities and the lack of environmental conscious
by farmers, the groundwater source has been contaminated. Chemical pesticides,
herbicides and fertilizers contained nitrate (NO3-) and arsenic (As) were seen facilitate
agricultural activities. The unseen results from these act were not focus at early stage.
Nitrate and arsenic contained pesticides, herbicides and fertilizers that were sprayed at
the plant or poured on the soil will be dissolved into the groundwater through the soil and
sand. High concentration of nitrate and arsenic in the groundwater will cause serious
health problem towards a long-time consumer either an animal or a human being.
Untreated industrial effluents and municipal wastewater are another source of
groundwater contamination problem. Central Pollution Control Board of India found
untreated effluent as the dominant source of groundwater pollution, which has a trace of
heavy metal, such as Mercury (Hg), Lead (Pb), Zinc (Zn) and Cadmium (Cd) that were
present in the contaminated groundwater. As we know in India, it is considered as an
urban slum country with a high population growth. Some region still depends on a shallow
aquifer as their source of drinking water. Without treatment, the shallow aquifer has a
high risk of having a high concentration of contamination.
A long term consumption of the contaminated groundwater will bring harm towards
the consumers. As stated before, heavy metal contamination in groundwater will contain
a silver color pollutant called mercury, a toxic pollutant that will cause abortion,
neurological disorder, brain impairment, and retardation in children’s growth. However,
certain heavy metal is colorless and difficult to be detected by the naked eye, but it will
still harm the consumers. Normally, people always interpret clear water as clean and
uncontaminated, but it is not always the case. For example, arsenic can only be detected
by using a heavy metal equipment test. Arsenic contamination causes a disease called
6
arsenicosis and there is no effective treatment for it. It is the major disease caused by a
contaminant poisonous drinking water.
Naturally, arsenic is found in groundwater due to the climate and geological changes.
Arsenic can be in the organic and inorganic form, but the inorganic form of arsenic is
highly toxic than the organic form. The organic form of arsenic (Arsenobetaine and
arsenocholine) can be found in fish and shellfish, while the inorganic form of arsenic
(As+3, As+5) can be found in groundwater, soil and sediments. Arsenic can be found in
response to the natural (geochemical mobilization) or anthropogenic sources (mining
activities). Inorganic arsenic release from iron oxide is the most common source of high
concentration of arsenic (>10µg/L) in groundwater. The World Health Organization has
underlined the allowable arsenic concentration in drinking water, which is lower than
10µg/L.
Exposure to a high level of inorganic arsenic through drinking, breathing or skin
contact can cause vomiting, diarrhea and nausea. Furthermore, a long-term exposure to
the high level of inorganic arsenic can cause several types of cancer, skin lesion and
gastrointestinal injuries. Fortunately, the organic arsenic that can be found in seafood are
non-toxic to human.

7
b) Wastewater
The textile manufacturing industry does not need special skills for employment. Thus,
it provides millions of job opportunity to people, especially in the developing countries,
such as India, Vietnam, Myanmar, Bangladesh, and Sri Lanka. Unfortunately, lack of
knowledge in this field causes global wastewater treatment problem to rise. This problem
was not addressed earlier and people were not aware of the importance to treat the textile
wastewater.
Textile manufacturing industry uses freshwater in abundance during the dyeing and
finishing processes. Thus, an abundance of wastewater has been produced from this
industry. Among all industries, textile manufacturing wastewater was labelled as the most
polluted based on the type of pollutants found in the effluent and the volume of effluent
discharge.
Removal of the dye materials during wastewater treatment is very crucial because the
quality of water is highly influenced by its color. Moreover, most type of dyes are toxic
and carcinogenic, where it is difficult to degrade the dye molecule due to its stability to
light and the oxidation reaction and its complex structure that is consists of the aromatic
compound become barriers to treat the wastewater-contained dye through the
conventional method.
Meanwhile, methyl orange and methylene blue are common dyes used in the textile
industry. Methyl orange is an anionic dye and methylene blue is a cationic dye. Both dyes
carry different characteristics, but still caused the same impact, which is toxic. In addition,
the presence of the dyes in water will lead to the lack of light penetration into the water
and reduce the aqua photosynthesis activities. Meanwhile, the hazardous impact towards
human health are toxic blood, liver problem, upper respiratory tract problem, and central
nervous system problem.
8
1.3 Scope of Research
The fundamental scope of this research is to treat polluted water. Adsorption
technology was applied in this research because it is simple and cost-effective as
compared to the other current technologies such as electrocoagulation. However, arsenic
and dye are different in terms of physical, chemical and toxicity characteristic. Thus, a
different modified adsorbent was developed for different water treatments from the same
raw palm shell waste-based activated carbon. Meanwhile, a simulated arsenic water and
dye water were made in the laboratory and all experimental studies were conducted using
the laboratory scale.
1.4 Objectives of Research
The main objectives of this study were to develop new materials with high adsorption
rate to remove arsenic in the groundwater and dyes wastewater (Methylene Blue and
Methyl Orange). The specific objectives were as follows:
a) Arsenic in groundwater
• To prepare MPSAC–La adsorbents with different Fe:La mass ratio entitled as
MPSAC-La (0.084), MPSAC-La (0.16), MPSAC-La (0.32), and MPSAC-La (0.36)
adsorbent.
• To characterize the raw PSAC, MPSAC, and MPSAC–Las adsorbents by several
characterization techniques (XRD, FT-IR, FESEM+EDX, N2 gas isotherm, and
pHpzc).
• To compare the arsenate adsorption capacities, kinetics, pH, temperature, and co–
existing anions behavior on adsorbents.
• To analyze arsenate removal mechanism on MPSAC-La adsorbent.

9
• To investigate the MPSAC-La and MPSAC adsorbents regeneration, and the
recyclability in arsenate removal.
b) Dyes wastewater
• To prepare the MPSAC-SiO2@Mg adsorbents with a different Si:Mg mass ratio
entitled as (0.06), MPSAC-SiO2@MgNO3 (0.12), MPSAC-SiO2@MgNO3 (0.23),
and MPSAC-SiO2@MgNO3 (0.46).
• To characterize the raw PSAC, MPSAC and MPSAC-SiO2@MgNO3 adsorbents by
several characterization techniques (XRD, FT-IR, FESEM+EDX, N2 gas isotherm
& pHpzc)
• To compare the methylene blue and methyl orange adsorption capacities, kinetics,
pH and ionic strength behavior on adsorbents.
• To analyze the methylene blue and methyl orange removal mechanism on the
MPSAC-SiO2@MgNO3 adsorbent.
• To investigate the MPSAC-SiO2@MgNO3 and MPSAC adsorbents regeneration
and recyclability in dye removal.
1.5 Research Outline
Incorporation of the double layer, Magnetite and Lanthanum at a higher ratio into the
palm shell waste-based activated carbon improved the adsorbent performance in arsenic
removal. Meanwhile, the tri layer, Magnetite, Sodium Silicate, and Magnesium Nitrate
that were incorporated into the palm shell waste-based activated carbon at a higher ratio
were observed to be a better adsorbent for the methyl orange dye as compared to the
methylene blue dye.

10
To explain further, this thesis was organized into five chapters. The chapters in this
thesis are composed of: 1) introduction on the groundwater and wastewater; 2) literature
review on water pollution, arsenic in groundwater, textile dye wastewater, current
treatment technologies, types of adsorbent existed, palm shell waste-based activated
carbon characteristic and modification advantageous, isotherm and kinetic models; 3)
methodology on equipment used and procedure carried out during the whole research; 4)
results and discussion for the whole research; 5) conclusion.

11
CHAPTER 2: LITERATURE REVIEW
Chapter Summary
This chapter was divided into nine sections to explain further about pollution, types of
water and wastewater treatment, types of adsorbent available, detailed characteristic of
palm shell waste-based activated carbon, its modification trend and characteristics,
followed by isotherm and kinetic model that were applied to analyze the experiment data.
2.1 Pollution History
Pollution is an issue that will have no ending without any environmental awareness
and practice from everyone. It is an ancient issue that has been happening since the
Paleolithic Age where archaeologist found stone tools scraps. They also believe that the
use of the first wood-burning is the beginning of air pollution, which will give adverse
effects towards the environment. The beginning of pollution that affected the environment
and human health happened after World War II, when they first used nuclear weapon to
destroy Hiroshima and Nagasaki in Japan. Exposure to nuclear radiation may cause birth
defect, mutation, cancer, and even death. This incident was one of the example of air,
water and land pollution that occurred for a long period of time.
When World War II ended, industrialization, urbanization and agricultural activities
began to increase uncontrollably. People tried their hardest to improve the economy with
variety of ways without being aware of the adverse effects. Industries began to increase
their quantity and quality of manufacturing products and started using synthetic materials,
such as synthetic dyes and plastics in the manufacturing process. At the time, wastewater
produced were discharged without proper treatment, followed by the use of inorganic
insecticide and pesticide for agricultural activities as they thought it is more efficient to
kill pests and produce good quality agricultural product.

12
As time passed by, these scenarios showed its impact towards the environment and
health. Some of the synthetic material used for manufacturing process were not
biodegradable and high in toxicity. When the waste was accumulated in the water course,
it caused water pollution and increased the health risk of people who consumed it. This
is one of many example of human activities that caused pollution.
2.2 Water Pollution
Water pollution is defined as water bodies (lake, river, sea, groundwater, and aquifers)
containing harmful elements. It occurred when pollutants entered the water bodies
directly or indirectly and no adequate treatment has been used to remove the pollutants.
(Wikipedia, 2016). On the other hand, Lloyd (1992) described water pollution as the
addition of harmful thing into the water by human, which caused the chemical
composition, temperature, and biological composition of the water to alter to a certain
extent that will eventually affect the environment and humankind (R. Lloyd, 1992).
2.1.1 Sources of Water Pollution and Its Impact
a) Organic Matters
Dissolved Natural Organic Matters in the water causes foul smell and is
normally caused by untreated discharged domestic or industrial waste into the
water course (Heath, 1995; R. Lloyd, 1992). However, a major fraction that
contributes to the Dissolved Natural Organic Matters in water is humic
substances (Kaiya, Itoh, Fujita, & Takizawa, 1996). When the humic substances
interact with the potential pollutants such as chlorine that is used in water
disinfection process, it may interact and produce carcinogenic compounds.
Furthermore, the interaction of humic substances in the ozonation process may
13
lead to biodegradable-by-products production and eventually promote microbial
growth (Suffet, Maccarthy, MacCarthy, & Suffet, 1988).
b) Excessive nutrients
The excessive nutrients occur when agricultural run-off and
biodegradables were discharged in the water. By concerning on nitrate and
phosphate, the increment of these two nutrients may result in algae bloom (Blaas
& Kroeze, 2016). Excessive nutrient causes algae to grow in abundance and
stimulate the growth of phytoplankton where a high phytoplankton density will
cause dissolved oxygen depletion. This phenomenon is called eutrophication
(Heath, 1995).
c) Suspended Solids
Suspended solids are defined as mass (mg) or concentration (mg L-1) of
the organic and inorganic substances in the water bodies by flowing movement.
Typically, suspended solids composed of fine particles with a diameter less than
62 µm (Waters, 1995). Naturally, all streams carry suspended solids without
causing any harm. However, at a certain condition where the anthropogenic
interrupts the natural condition (Ryan, 1991), the amount of suspended solids is
increased and will lead to adverse impact towards the physical, chemical and
biological characteristic of the water bodies, such as reduced light penetration
and infilling stream (D. S. Lloyd, Koenings, & Laperriere, 1987).
14
d) Toxic chemicals
i) Metals
Metals in water generally are called as trace metals or heavy metals.
Cobalt, zinc, manganese, fluoride, and calcium are some of the general metals that
are present in water bodies. (Heath, 1995). It enters the water bodies through
natural or anthropogenic activities. Consuming a few of the heavy metals in water
at an allowable concentration is essential for health, but higher concentration will
cause a negative effect (USEPA, 2016). Industries such as chemical, textile, and
electroplating industries are a few examples of heavy metals source (arsenic,
mercury, lead and silica) in the water bodies (He et al., 2008) . In many developing
countries, domestic, industrial, and agricultural wastewater are usually discharged
into any water bodies without having a proper treatment (A. D. Gupta, 2008).
ii) Dyes
Dyes are used as coloring agents in textile, food, cosmetics, paper, and
plastic manufacturing industries (B. Chen et al.). When wastewater containing
dyes were discharged into any water bodies, it will cause the water bodies to
change its physical properties (color). Most of the dyes are toxic, mutagenic and
carcinogenic (Soni, Sharma, Srivastava, & Yadav, 2012). Dyes also prevent light
penetration in the water bodies and eventually reduce the photosynthetic activities
in the water.
15
2.3 Arsenic in Groundwater
Figure 2.1 Countries with arsenic contaminated groundwater risk
Arsenic (As) contamination and mobilization in the groundwater has already become
a global issue affecting millions of people worldwide (Hafeznezami et al., 2016).
However, the world population were only aware of the toxicity effect of arsenic in the
groundwater in the year 1992, where the first contamination was reported in Bangladesh
(D Chakraborti & Roy, 1997).
Currently, the World Health Organization (WHO) underlined that the groundwater is
considered to be contaminated with arsenic if its concentration in the groundwater is more
than 10 µg/L. Arsenic contamination in the groundwater has been reported in not less
than 100 countries with estimated affected population of more than 200 million people
(Murcott, 2012; Naujokas et al., 2013). Until the year 2009, a total of 140 million people
are consuming arsenic-groundwater as their daily water source (Ravenscroft, Brammer,
& Richards, 2009). Asian countries, especially India and Bangladesh are the countries
with the worst arsenic-groundwater contamination (Dipankar Chakraborti et al., 2013).
16
Based on previous studies, the government of Bangladesh and India installed tube
wells to prevent the risks of water-borne diseases and provided safe drinking groundwater
supplies to their citizens. There are 8.6 million tube wells were recorded in Bangladesh
alone. Unfortunately, the tube well installation is only able to prevent water-borne
diseases, yet, they are still being exposed to arsenic groundwater consumption. A report
on tube wells in India itself mentioned that there are 48.1% of tube wells that had arsenic
concentration in the groundwater (>10 µg/L), while 23.8% of the tube wells had more
than 50 µg/L of arsenic in the groundwater (Dipankar Chakraborti et al., 2009).
2.3.1 Source of arsenic
Figure 2.2 The cycle of arsenic source in groundwater and the human exposure
pathway through ingestion
A long time ago, arsenic presents naturally, even in earth’s crust, sediment, soil, water,
air, and in living organisms (Mandal & Suzuki, 2002). Arsenic is a metalloid element that
is available in abundance in the earth’s crust. Among the 245 minerals that are naturally
available, arsenic was nominated to be the first twenty mineral to be most available
17
(Mandal & Suzuki, 2002). Arsenic might co-precipitate at high concentration with iron
hydroxides or sulfides in sedimentary rocks (Mandal & Suzuki, 2002). In addition, arsenic
is available in more than 200 different mineral forms, whereby, about 60% of arsenic are
available in arsenate form, 20% in sulfides and sulfosalts, while other 20% present as
arsenide, arsenite, oxide, elemental arsenic and silicate (Wedepohl, 1969).
Arsenic was found to be more concentrated in soil than rocks (Peterson, Benson, &
Zieve, 1981). Usually, unpolluted soils may contain in between 1-40 mg Kg-1 of arsenic,
whereby, sandy soils and derived granites have the lowest arsenic concentration as
compared to the organic and alluvial soils (Kabata-Pendias & Pendias, 1992). Thus,
different type of soils will have different level of arsenic concentration.
Levels of arsenic in soils will eventually affect the level of arsenic in the groundwater.
Factors such as redox potential, climate, organic and inorganic element in soils are closely
related to the level of arsenic in soils (Mandal & Suzuki, 2002). The physical and
geochemical characteristic of arsenic causes accumulation and mobilization in
groundwater at a naturally high concentration (Smedley & Kinniburgh, 2002). Arsenic
may be mobilized through several natural occurrences such as rock weathering reactions,
volcanic emissions, and biological activity (Smedley & Kinniburgh, 2002).
Importantly, the natural source of arsenic was not a threat to human and the
environment, but the combination between the natural source and the anthropogenic
source is the main thing to tackle. Some examples of human activities that are causing
arsenic contamination are the use of arsenical pesticides fertilizers, the use of arsenic as
additive in livestock feed, mining activities, and industrial waste disposal (Mandal &
Suzuki, 2002; Smedley & Kinniburgh, 2002). Although the arsenical product usage is
decreasing, the use of arsenic in wood preservation still remain the same.
18
In the year 1955, arsenic was used widely for manufacturing insecticide and pesticide,
a total of 37,000 tons of white arsenic were produced globally in the form of pesticide
(Heishman, Olson, & Shelton, 1960). Lead Arsenate, Copper Acetoarsenite, monosodium
Methanearsonate (MSMA), and Disodium Methanearsonate are some of the pesticides
example that were used back then. Additionally, weed killer herbicide containing the
inorganic arsenic (Sodium Arsenite) was widely used back in the 1890s.
Meanwhile, during the mining activities, arsenic was exposed to the environment from
the mine and extraction plants. After the mine has closed down, the waste rock dumps
and tailing dams containing arsenic experienced weathering, while the acid mine drainage
was produced due to the sulfur and arsenic bearing mineral being oxidized by the water
run-offs and infiltrated through rain water (Sánchez-Rodas, Luis Gómez-Ariza, Giráldez,
Velasco, & Morales, 2005).
2.3.2 Arsenic Characteristic
Arsenic has the chemical and physical characteristics of being between a metal and a
non-metal. Thus, arsenic was called as metalloid or semi-metal element. Arsenic may be
present in an organic or inorganic form.
Based on the mobilization sensitivity of arsenic at a typical pH of groundwater, pH6.5
to 8.5, it was classified to have high sensitivity among other metalloid and oxyanion
element. It may exist in several oxidation numbers (-3, 0, +3, and +5). Commonly, when
arsenic was found in natural water, it present in an inorganic form, either Arsenite (+3)
or Arsenate (+5) (Jedryczko, Pohl, & Welna, 2016). Moreover, Arsenate is commonly in
water (AsO43-, HAsO4
2-, H2AsO4-), while Arsenite (AsO3
3-, As(OH)3, As(OH)4-,
AsO2OH2-) are the common species available in natural water (Zongliang, Senlin, & Ping,

19
2012). At a common pH for groundwater and natural water (pH6.5 to 8.5), water tends to
have aerobic conditions where this natural occurrence will lead arsenic to present
dominantly in Arsenite form, while the predominant form is Arsenate (Katsoyiannis, Hug,
Ammann, Zikoudi, & Hatziliontos, 2007).
On the other hand, the organic arsenic are said to be less toxic than the inorganic
arsenic while based on the inorganic arsenic itself, Arsenite was reported to be more toxic
than Arsenate (Zongliang et al., 2012). The ability of Arsenite to react with sulfur
containing compound and generated the Reactive Oxygen Species makes it being more
toxic (Hughes, Beck, Chen, Lewis, & Thomas, 2011).
Figure 2.3 the molecular structure of A) arsenate and B) arsenite
2.3.3 Impact towards Human Health
Arsenic was classified as a Class I human carcinogen (Humans, Organization, &
Cancer, 2004). A long term ingestion of drinking water source containing inorganic
arsenic may result to a serious health complication. The World Health Organization
(WHO) underlined several serious diseases that may affect people who consume arsenic
contaminated groundwater, for example having the effect on the respiratory tract, skin,
liver, kidney, and gastrointestinal tract. WHO also reported the first case related to arsenic
contaminated water exposure on the 19th century when the victim experienced
hyperkeratosis, pigmentation changes, and skin cancer (Compounds, 2001).
A B

20
A summary on several health effects caused by arsenic exposure are listed below:
i) Respiratory Effect
Long term exposure to inorganic arsenic may cause laryngitis, trachea
bronchitis, rhinitis, nasal congestion and shortness of breath (Naqvi, Vaishnavi, &
Singh, 1994).
ii) Carcinogenic Effect
Hundred years ago, arsenic was used as medicine to treat chronic diseases.
However, a number of medicated patients experienced a symptom where the number
of their basal cells and squamous cell carcinomas of their skin were increased
("Reports of Societies," 1887). Previous research studies reported that most arsenic
contaminated groundwater area such as Bangladesh, India, and Argentina will have
an increased cancer risk, which is due to the consumption of arsenic contaminated
drinking water (Hopenhayn-Rich et al., 1996; Report, Toxicology, Toxicology,
Studies, & Council, 2001). Significantly, lung, skin, bladder, kidney, and liver are the
common vital organ being attacked by the cancer cells that are caused by arsenic
contaminated groundwater.
iii) Gastrointestinal Effect
At a high arsenic dosage consumption, acute arsenic poisoning may occur,
which will show symptoms such as dry mouth and throat, heartburn, moderate
diarrhea or abdominal pains, and cramps. Meanwhile, at a low dosage consumption,
gastritis and lower abdominal discomfort may occur (Naqvi et al., 1994).
iv) Dermal Effects
High concentration of arsenic consumption will cause several skin diseases,
for example melanosis, keratosis, hyperkeratosis, Bowen’s disease, and cancer.
21
Hyperpigmentation also may occur where the skin area tend to be a little darker
(Shannon & Strayer, 1989).
2.4 Textile Dyeing Wastewater
Figure 2.4 Water consumption in the textile dyeing & finishing-woven cloth, and
water consumption in the textile dyeing and finishing-fiber & yarn
Source: (Envirowise, 1997)
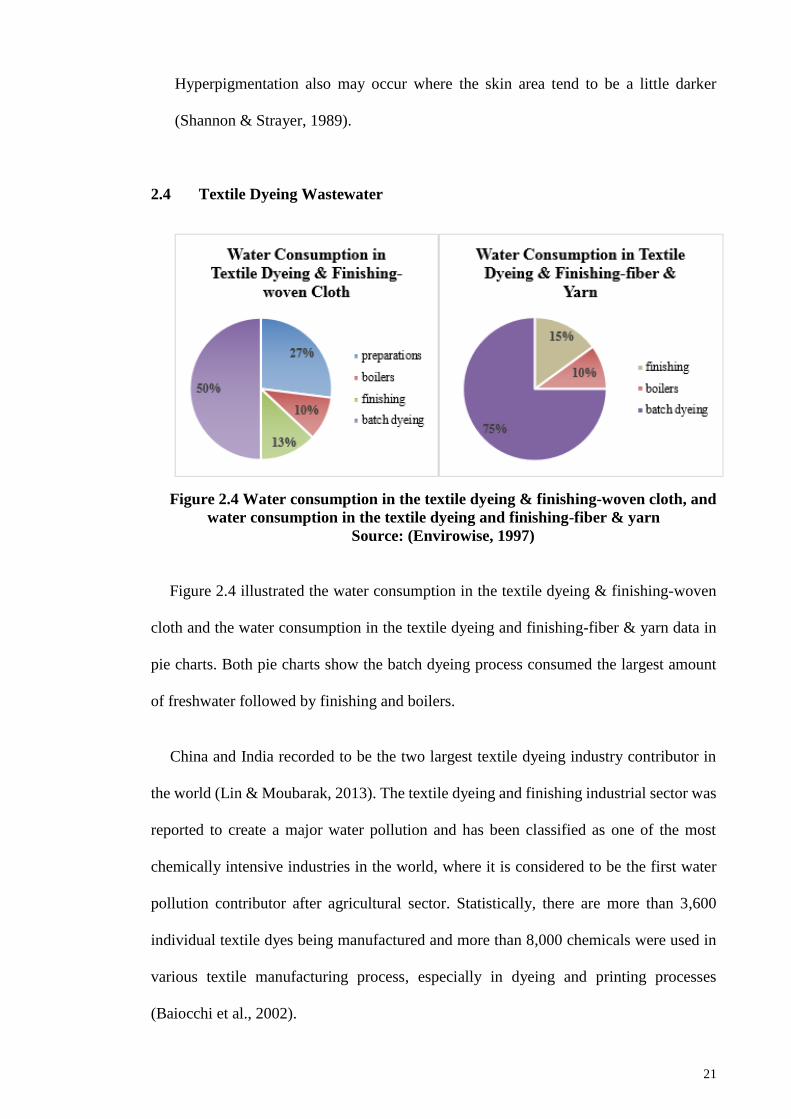
Figure 2.4 illustrated the water consumption in the textile dyeing & finishing-woven
cloth and the water consumption in the textile dyeing and finishing-fiber & yarn data in
pie charts. Both pie charts show the batch dyeing process consumed the largest amount
of freshwater followed by finishing and boilers.
China and India recorded to be the two largest textile dyeing industry contributor in
the world (Lin & Moubarak, 2013). The textile dyeing and finishing industrial sector was
reported to create a major water pollution and has been classified as one of the most
chemically intensive industries in the world, where it is considered to be the first water
pollution contributor after agricultural sector. Statistically, there are more than 3,600
individual textile dyes being manufactured and more than 8,000 chemicals were used in
various textile manufacturing process, especially in dyeing and printing processes
(Baiocchi et al., 2002).
22
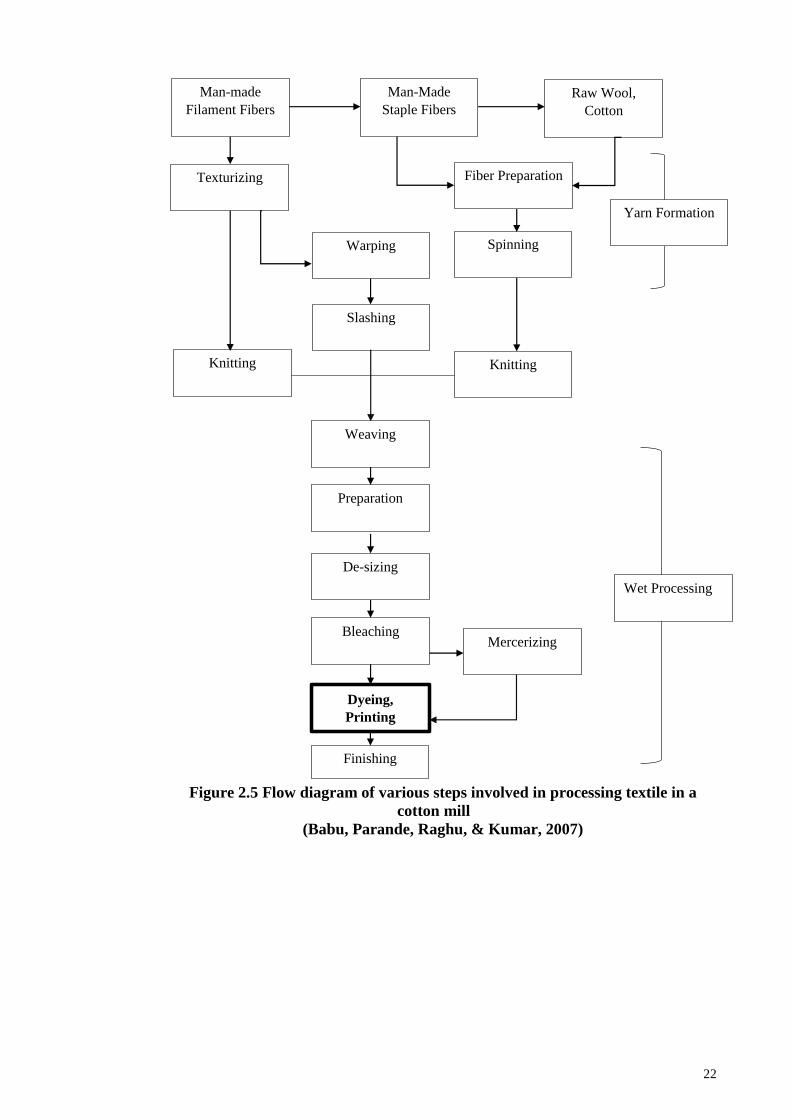
Figure 2.5 Flow diagram of various steps involved in processing textile in a
cotton mill
(Babu, Parande, Raghu, & Kumar, 2007)
Man-made
Filament Fibers
Man-Made
Staple Fibers
Raw Wool,
Cotton
Texturizing
Knitting
Fiber Preparation
Slashing
Spinning Warping
Knitting
Finishing
Dyeing,
Printing
Bleaching
De-sizing
Preparation
Weaving
Mercerizing
Yarn Formation
Wet Processing

23
Mercerization
Mercerization is a process to improve the dye uptake into the cotton fiber and fabric
by treating it in a concentrated NaOH solution (8-24%). The cotton material will be
washed-off after 1-3 minutes of soaking time. The used NaOH solution was then
recovered by the membrane techniques. The alternative recovery method, which is ZnCl2
helps to increase the weight of fabric and in the dye uptake, where it will also allow NaOH
to be recovered easily. Additionally, the process is environmental friendly and does not
required neutralization by acetic or formic acid (Karim, Das, & Lee, 2006).
Bleaching
Bleaching is a process to decolorize the creamy appearance of fabric due to the natural
color of yarn. In order to produce a pale and bright shades of color on fabric, hypochlorite
will be used as bleaching agents. Hypochlorite chemical produced toxic chlorinated
organic-by-product during the bleaching process. The other alternative to replace
hypochlorite is peracetic acid, which is an environmental friendly bleaching agent. It is
decomposed into a biodegradable product, oxygen and acetic acid. The advantage of
using the peracetic acid is that the fabric will experience less damage as compared to
when using hypochlorite (Rott & Minke, 1999).
Dyeing
The dyeing process involved an abundant uses of freshwater (hot water) to transfer the
dyes color onto the cotton fiber and fabric. The color of the dye is obtained from
auxochrome and chromophore functional group of the dye molecular compound, which
will contribute to water pollution (Szymczyk, El-Shafei, & Freeman, 2007). The world’s

24
most popular fabric being used in the textile manufacturing industry, which is cotton
needs a total of 0.6-0.8 kg NaCl, 30-60 g of dye and 70-150 L of freshwater to dye a 1kg
of cotton fabric (Chakraborty, De, Basu, & DasGupta, 2005).
At the end of the dyeing process, abundance of wastewater is produced from various
treatment processes containing a high concentration of salt (NaCl) and a highly colored
dyed water. The wastewater produced needs to be treated before it can be reused or
discharged into any water bodies. The common treatment methods used to treat dyed
wastewater are coagulation and membrane process. However, these processes are only
effective for diluted dyed wastewater (Babu et al., 2007).
Finishing
Finishing process is done to improve the specific properties in the finished fabric and
various finishing agent, such as softening agent, cross-linking and waterproofing were
used, and eventually contribute to water pollution. For the past years, the most
environmental friendly product being used in the finishing process is formaldehyde based
cross-linking agents. However, formaldehyde will undergo evolution in which it will
liberate chemical products and cause toxicity to the water used during the cross-linking
reaction.
25
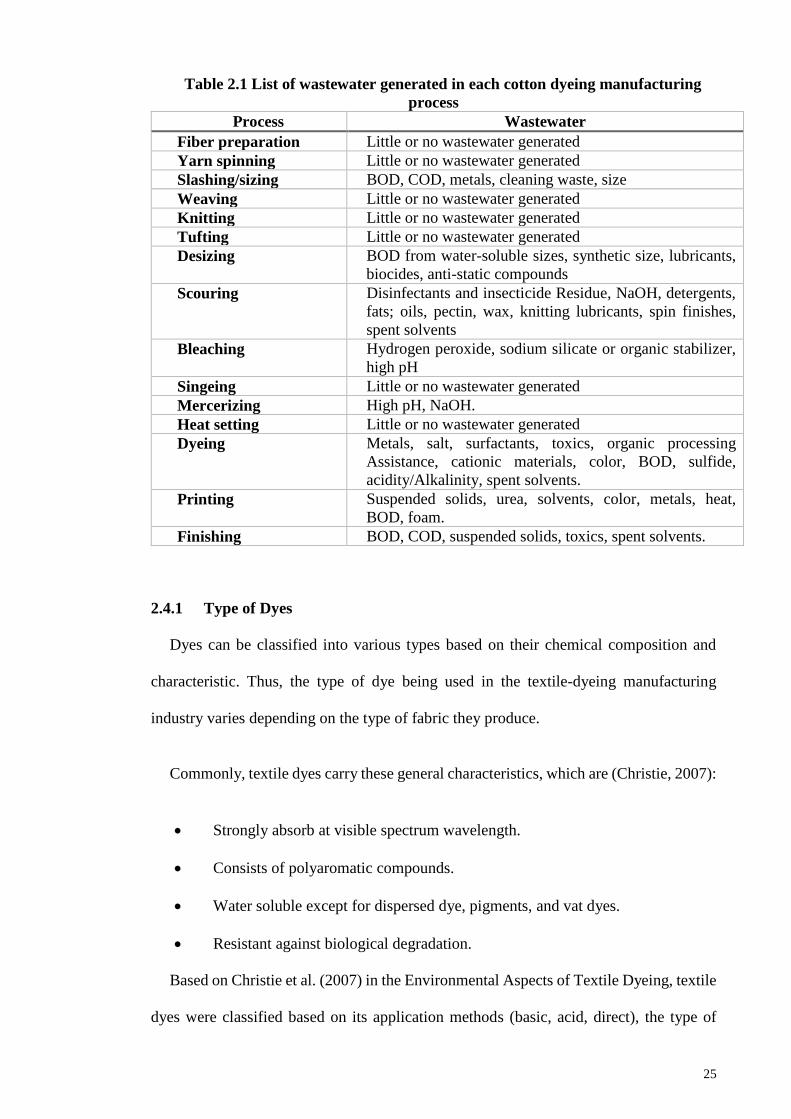
Table 2.1 List of wastewater generated in each cotton dyeing manufacturing
process
Process Wastewater
Fiber preparation Little or no wastewater generated
Yarn spinning Little or no wastewater generated
Slashing/sizing BOD, COD, metals, cleaning waste, size
Weaving Little or no wastewater generated
Knitting Little or no wastewater generated
Tufting Little or no wastewater generated
Desizing BOD from water-soluble sizes, synthetic size, lubricants,
biocides, anti-static compounds
Scouring Disinfectants and insecticide Residue, NaOH, detergents,
fats; oils, pectin, wax, knitting lubricants, spin finishes,
spent solvents
Bleaching Hydrogen peroxide, sodium silicate or organic stabilizer,
high pH
Singeing Little or no wastewater generated
Mercerizing High pH, NaOH.
Heat setting Little or no wastewater generated
Dyeing Metals, salt, surfactants, toxics, organic processing
Assistance, cationic materials, color, BOD, sulfide,
acidity/Alkalinity, spent solvents.
Printing Suspended solids, urea, solvents, color, metals, heat,
BOD, foam.
Finishing BOD, COD, suspended solids, toxics, spent solvents.
2.4.1 Type of Dyes
Dyes can be classified into various types based on their chemical composition and
characteristic. Thus, the type of dye being used in the textile-dyeing manufacturing
industry varies depending on the type of fabric they produce.
Commonly, textile dyes carry these general characteristics, which are (Christie, 2007):
Strongly absorb at visible spectrum wavelength.
Consists of polyaromatic compounds.
Water soluble except for dispersed dye, pigments, and vat dyes.
Resistant against biological degradation.
Based on Christie et al. (2007) in the Environmental Aspects of Textile Dyeing, textile
dyes were classified based on its application methods (basic, acid, direct), the type of

26
interaction between the dye and the fabric (reactive), the structural characteristic (azo) or
the historical characteristic (vat).
a) Azo dyes
Azo dyes, such as Methyl Orange (anionic dye) consists of one or more double-
bonded nitrogen units linking the aromatic units. The problem with azo dyes is the
capability to break down and form certain aromatic amines.
b) Basic dyes
Methylene Blue (cationic dye) is classified under the basic dye and the
characteristic of the basic dye is it carries the amino group (positive charged) that is
attached to the larger aromatic structures. Thus, it gives both water solubility and affinity
to the fabric, such as nylon that contains a dominant negative charge.
c) Acid dyes
Usually, acid dyes carry sulfonic acid group that gives them negative charge
characteristic. Under acidic conditions, amino groups in protein or polyamides fibers
become positive and eventually attract the negative dye anions.
d) Reactive dyes
Reactive dyes contain the functional group that are bind to the chromophore
allowing covalent bonds to be formed with the cellulosic and protein fibers. Reactive
dyes are not being absorbed onto the biomass to any degree.
e) Disperse dyes
Originally, dispersed dyes were developed for acetate fibers. The characteristic
of disperse dye is low solubility, which helps to color fibers that have a very high
hydrophobicity.
Methylene Blue and Methyl Orange dyes were used in this research as they are
the two typical dyes being used in the textile dyeing process. Furthermore, both dyes carry

27
different characteristics. Brief explanations on the Methylene Blue and Methyl Orange
dyes’ characteristics are stated as below:
i. Methylene Blue dye characteristic
Figure 2.6 Methylene Blue dye molecular structure
Figure 2.6 shows the molecular structure of Methylene Blue with the molecular
formula C6H18N3SCl. At standard room temperature, Methylene Blue will appear as
odorless, solid, and dark green powder, which will produce blue color when it is dissolved
in water (N. W. E. contributors). It is classified as cationic dye, with the maximum
absorption of light around 670 nm that is being used in many industries, including the
textile manufacturing industry (Umoren, Etim, & Israel, 2013) (W. contributors). To
emphasize, the Methylene Blue dye is known as an organic dye that is commonly used in
dyeing variety types of fabric materials including cotton, wool, acrylic fibers, and silk
(Tabbara & El Jamal, 2012).

28
ii. Methyl Orange dye Characteristics
Figure 2.7 Methyl Orange dye molecular structure
Figure 2.7 shows the molecular structure of Methyl Orange dye (acidic anion mono
azo dye) with the molecular formula C14H14N3NaO3S (Jain & Sikarwar, 2008). It was
listed in one of the most important class of commercial dyes and is categorized as a stable
dye in either visible or near UV light (Nam, Kim, & Han, 2002). Methyl Orange dye
usually shows a different color at different solution medium, such as red color in acidic
solution, and yellow color in basic solution (W. contributors). Thus, it is commonly used
as a color indicator in chemical laboratories. Other than that, Methyl Orange dye also
usually being used in printing, photography and textile industries (C. Guo, Xu, He, Zhang,
& Wang, 2011). However, Methyl Orange dye is classified as an azo dye, which is known
to be carcinogenic because of the degradation of the Methyl Orange into aromatic amines
(Guivarch, 2004). Thus, the detoxification and discoloration of azo dye will have an
increasingly important environmental significance in the recent years (Guivarch, 2004).

29
2.4.2 Impact of Dye Wastewater towards Environment
Textile wastewater contains various types of pollutant, for example trace metals, BOD,
COD, suspended solids and many more. Meanwhile, the dye itself contributes to a high
concentration of color in wastewater. Water containing dyes gives a bad color and may
cause diseases such as ulceration of skin, nausea, severe skin irritation, and dermatitis
when being consumed or exposed to it (Tüfekci, Sivri, & Toroz, 2007). It formed barrier
in water and blocks the sunlight penetration, which is the essential for photosynthesis of
aquatic plants (Laxman, 2009) where it will in turn causes the BOD level to increase and
the total photoautotrophic plants to decrease (Tüfekci et al., 2007). Among various types
of dye, reactive dyes were classified under the inorganic substances in textile wastewater
that caused toxicity towards aquatic environment (Blomqvist, 1996). However, the
organic dyes will also bring harm towards the aquatic environment through chemical and
biological changes, which will lead to reduction of DO (Tholoana, 2007).
The level of dye pollution in water is strongly depending on the quantity of freshwater
and the types of chemical used during the manufacturing process (Laxman, 2009). The
problem with textile dye is that it is difficult to be degraded as it contained a large amount
of organic substances, which also prevents it from aerobic degradation. The worst
problem is the ability of the dye to undergo reduction process and forms carcinogenic
agents under the anaerobic conditions (Jain, Bhargava, & Sharma, 2003), whereas some
of carcinogenic compound is formed through the azo dye degradation. More importantly,
human that are in contact with the Methyl Orange and Methylene Blue dyes may
experience vomiting, cyanosis, jaundice, shock, and tissue necrosis (Azami, Bahram,
Nouri, & Naseri, 2012).

30
2.5 Conventional Water & Wastewater Treatment
In water or wastewater treatment technologies, there are three treatment stages called
as primary, secondary, and tertiary treatment processes. The primary treatment is
commonly installed to remove the suspended solids, large waste, and coarse particles
from the water or wastewater, whereby screening, sedimentation, flotation, and filtration
processes were used. After the primary treatment, the water or wastewater will be treated
using the secondary treatment, whereby the biological pollutants will be removed. At this
treatment stage, the aerobic or anaerobic treatment process will be installed. Lastly, in
order to obtain safe water for a specific use, the remaining pollutants, which are
commonly chemicals, inorganic waste or any particles that were not removed
significantly during the primary and secondary treatment will then be removed during the
tertiary treatment (Vinod Kumar Gupta, Ali, Saleh, Nayak, & Agarwal, 2012). Likewise,
Tchobanoglous and Burton (1991) defined the tertiary treatment or also known as the
advanced treatment as the additional combination of the treatment process or the
operation used to reduce or remove other residual suspended solids and other constituents
that are not remarkably removed by the conventional secondary treatment
(Tchobanoglous & Burton, 1991).
The high cost of installation, operation and maintenance of certain treatment processes,
and the difficulty in implementation are some of the factors that made some countries
such as India unable to provide a low-cost drinking water supply equipment, for example
by installing shallow tube wells in the aquifer. However, the drinking water supplied from
tube wells were reported to contain arsenic concentration more than the allowable limit
for a safe drinking water. Meanwhile, other drinking water supply alternative such as
harvesting rainwater is an inconvenient way to be practiced because of the expensive
installation cost (Ahmed, 2001). On another note, the dye wastewater produced by the
textile manufacturing industry usually contained a high organic load, a strong and
31
resistant color that needed to be treated. In order to incur a low cost and simple treatment,
the biological treatment process is commonly used. Unfortunately, biological treatment
does not efficiently remove the organics and colors from the dye wastewater since most
of the dye molecules consist of a very complex structure and a non-biodegradable
characteristic due to their chemical nature and molecular size. These factors resulted in a
high sludge formation at the end of the treatment process (Yuan, Wen, Li, & Luo, 2006).
In between a variety of the tertiary treatment technologies, the most commonly used
to treat arsenic contaminated groundwater are ion exchange, aerobic and anaerobic
microbial degradation, coagulation and flocculation, membrane separation, advanced
oxidation process, solvent extraction, precipitation, electrocoagulation, electrolysis and
adsorption for a safe drinking water use and also to treat the dye wastewater in order for
it to be reused or discharged into any watercourse.
a) Ion Exchange
In domestic water treatment, ion exchange treatment is used to remove nitrate
and other natural organic matter. It is also widely used in household laundry detergent
and water filters to generate soft water by exchanging Ca2+ and Mg2+ with Na+ and H+ on
resin surface (W. contributors). The ion exchange process involved the exchange of toxic
ion in water or wastewater with non-toxic ion from solid material (Naden, 1984). There
are two types of ion exchange, which are anion and cation exchange, whereby in anion
exchange, the toxic anion is exchanged with anion on the resin surface, while in cation
exchange, the toxic cation is exchange with cation on the resin surface. The most common
resin (ion exchanger) used are zeolite, sodium silicate, polystyrene sulfonic acid, and
acrylic. Ion exchange treatment is usually used to remove low concentration of
contaminants (250 mgL-1). Thus, resin modification is needed in order to optimize the
32
contaminant removal capacity. However, ion exchange resin is easily polluted by the
toxic ion exchanged caused by the removal capacity that is reduced from time to time.
Thus, resin regeneration is needed to increase its removal capacity back again, but this
process incurred a high cost (VITO, 2010).
Ahmed et al. (2001) reported in his study that the oxidation treatment process is
usually used as the pre-treatment to convert As (III) to As (IV) before further treatment
can be made. Oxygen, ozone, free chlorine, permanganate, hypchlorite, hydrogen
peroxide, and Fulton’s reagent are some of the oxidizing agent used to oxidize As (III).
However, in developing countries, they usually use atmospheric oxygen, hypochloride
and permangate as the oxidizing agent (Ahmed, 2001).
The organic dye (Methylene Blue and Methyl Orange) can be treated using the
chemical oxidation method with an almost complete mineralization of the organic
pollutants. The oxidation with Fenton’s reagent is proven to be the effective technology
for the destruction of various numbers of toxic and organic pollutant. Unfortunately,
Fenton’s oxidation are not very suitable for pollutants with alkaline solution and the
sludge produced at the end of the oxidation process is high, which will resulted in a high
cost to dispose of the sludge (Dutta, Mukhopadhyay, Bhattacharjee, & Chaudhuri, 2001).
b) Microbial Degradation
Biological treatment or microbial degradation is classified as an eco-friendly
method, which are gaining more interest nowadays. Fungi, bacteria, algae, enzymes and
yeasts are some of the microorganisms used to remove a wide range of dyes through
anaerobic, aerobic, and anaerobic-aerobic treatment processes (Vinod K Gupta, Rastogi,
& Nayak, 2010). The microbial degradation is usually used for the removal of synthetic
dyes. This treatment process is usually cheap, has a low operation cost, and produced
33
non-toxic decolorized and mineralized product. However, various types of the dyes are
chemically stable and resistant to microbiological attack (Forgacs, Cserháti, & Oros,
2004).
Zouboulis et al. (2005) reported in his study that the biological remediation
treatment process was used to convert As (III) to As (V) and succeeded to reduce the
arsenic concentration from 60 to 80 µg/L to a final concentration lower than 10 µg/L.
However, over ten months treatment period, buy using the XPS analysis, he found that
only a partial of the As (III) was converted into As (V) (Zouboulis & Katsoyiannis, 2005).
This showed that the biological remediation is not a very efficient pre-treatment process.
c) Coagulation & Flocculation
Coagulation and flocculation are processed involving the use of coagulant and
flocculant. Coagulation is the rapid mixing process, where the coagulants will be added
during the rapid mixing process. Coagulants are chemicals used to aid the removal of total
suspended solid and color present in the untreated water. The coagulant will destabilize
the stable colloidal particle to become a settable particle in the form of flocs, which will
then be separated and removed through the downstream clarification or filtration
treatment process (Gebbie, 2006). Meanwhile, Flocculation is a process after the rapid
mixing process. The aim of flocculation is to form larger sizes of particles that will suit
the next process. It is a unit process treatment that will allow the collision between small
size particles. When the small particles collide with themselves, the particles will stick to
each other and flocculate, which will increase their sizes and become floc (Hendricks,
2006).

34
The coagulation-flocculation treatment process is more efficient for As (V) than
As (III) removal where FeCl3 acts as a better coagulant than Al2(SO4)3. The disadvantage
of using the coagulation-flocculation treatment is the high volume of arsenic-
concentrated-sludges produced at the end of process (R. Singh, Singh, Parihar, Singh, &
Prasad, 2015). Moreover, the sludge treatment incurred a high cost and these limitations
make this treatment to be less suitable (Mondal, Bhowmick, Chatterjee, Figoli, & Van
der Bruggen, 2013).
Coagulation of the dye wastewater has been used for many years as the main
treatment or pre-treatment due to its low capital cost (Anjaneyulu, Chary, & Raj, 2005).
However, the major barrier of coagulation process is thehigh sludge generation and
ineffective decolorization of some soluble dyes (Hai, Yamamoto, & Fukushi, 2007). The
sludge production can only be minimized in small volume of highly colored effluent,
which will directly be treated after the dyeing bath (Golob, Vinder, & Simonič, 2005).
On the other hand, due to the development of synthesis technology, a large number of
innovative dyes with complex structures have been developed, which contributed to the
difficulties in using the coagulation process (Y. Yu, Zhuang, Li, & Qiu, 2002).
d) Membrane Separation
Membrane separation or membrane filtration is a treatment process used to
separate heterogeneous particle from liquids or gaseous state through a selective barrier
(membrane). Reverse osmosis, ultrafiltration, microfiltration and pervaporation are the
major membrane separation processes used widely. Membrane filtration is used to
remove color, heavy metals, COD, and total dissolved solids from wastewater (SHUKLA,
KUMAR, & BANSAL, 2008). The advantage of membrane separation is the compact
system with easy control operation and maintenance. However, the ultrafiltration process
is only capable to treat low molecular weight organic material, while the reverse osmosis
35
consumed high energy. Another disadvantage of membrane separation is the flux decline
caused by membrane fouling. This problem reduced the rate of pollutant removal and its
efficiency (Ledakowicz, Solecka, & Zylla, 2001).
The application of membrane technology to treat the dye wastewater is very
effective (Ledakowicz et al., 2001). However, the main drawbacks of the membrane
treatment process are having a high cost, frequent membrane fouling, requiring different
pre-treatments, depending upon the type of influent wastewater and production of
concentration dyebath that needed the proper treatment before it can be disposed to the
environment (Robinson, McMullan, Marchant, & Nigam, 2001).
e) Advanced Oxidation Process
Advanced Oxidation Process (AOP) is the term used for multi-oxidation process
involving a highly reactive hydroxyl radical generation where one oxidation process is
not sufficient for water or wastewater treatment (Yoon, Lee, & Kim, 2000). AOP
techniques, such as Ultra Violet (UV) photolysis and Fenton’s reagent oxidation are
capable to degrade organic pollutants at normal pressure and temperature. These
techniques have already been applied at full scale, while techniques such as photo
catalysis and ultrasound are only applied at a pilot scale on laboratory benches (Parsons,
2004).
The advantage of AOP is the organic contaminants will be oxidized to CO2. Photo
catalysis is one of AOP being used for organic pollutant degradation. It involves the use
of UV or solar energy to excite electron from the valence bond of the photo catalyst to
the conduction band with a series of reaction to form hydroxyl radicals. Hydroxyl radicals
have a high oxidizing potential and can attack many organic pollutants. TiO2, ZnO, ZrO2,
36
Cds, and ZnS are the common photocatalysts used in photo catalysis process that are
suitable for a wide range of organic pollutants (Kabra, Chaudhary, & Sawhney, 2004).
f) Precipitation
Precipitation mechanism involved the conversion of dissolved contaminants into
solid precipitated by reducing the contaminant’s solubility to make it easily skimmed off
from the water surface. Precipitation process is usually used to remove ionic metal and
organic pollutants, but the presence of oil and grease in water may cause precipitation
problems. The rule in precipitation process is low contaminant’s solubility. Thus, some
chemicals will be added or water temperature will be reduced in order to reduce solubility.
Some of the chemical additives used are Alum, Ferric Chloride, lime, Sodium
Bicarbonate and Ferrous Sulphate. Unfortunately, chemical addition technique used at
commercial level consumes high cost.
The precipitation treatment process is simple and able to remove 60% of the
pollutant. Normally, wastewater from metal plating industries and water recycling will
install this treatment process to treat their wastewater before discharging it to the
environment. However, the end process by-product (sludge) is produced at a high volume
and the sludge produced is highly toxic as it contained all the precipitated contaminant
removed during the precipitation treatment, which will then be dumped at a general
landfill (Cavaco, Fernandes, Quina, & Ferreira, 2007).
g) Electrocoagulation
Electrolysis is a process whereby oxidation and reduction takes place when the
electric current is applied into the electrolytic solution (Kuokkanen & Kuokkanen, 2013).
Electrocoagulation consists of electrolysis element, whereby the anode is called as
‘sacrificial anode’, which produced metal ion that will act as the coagulant agents in the

37
water to be treated (Emamjomeh & Sivakumar, 2009; Holt, Barton, & Mitchell, 2005).
The electrode used in the electrocoagulation treatment process is usually made of iron,
aluminum or stainless steel because they are readily available, non-toxic, and cost-
effective (X. Chen, Chen, & Yue, 2000; Kumar, Chaudhari, Khilar, & Mahajan, 2004).
A previous study examined the ability of As (III) and As (V) removal using the
electrocoagulation process by installing three different electrodes, namely aluminum, iron
and titanium. Study results showed that arsenic removal is better when using the iron
electrode than the other two electrodes (Kumar et al., 2004). However, electrocoagulation
has several limitations, one of which the sacrificial anode will be eroded by time as a
result of oxidation. The eroded anode will be dissolved into the treated water and needs
to be replaced regularly. Meanwhile, impermeable oxide surface will be formed on the
cathode surface making the pollutant removal efficiency to be reduced. Lastly, the
electricity used for this treatment might be expensive depending on how long the
treatment process is taken (Sahu, Mazumdar, & Chaudhari, 2014).
h) Adsorption
Adsorption is a phase transfer process. It happened when the chemical species
from the fluid phase attached to the surface of the liquid or solid phase. In water or
wastewater treatment, adsorption has been proved to be the efficient treatment process to
remove a variety of contaminant in water to be treated. Adsorbent (usually solid phase),
adsorbate (chemical species in fluid phase) are two principles needed to succeed in the
adsorption mechanism. Whereas, adsorbent must have an active and energy-rich site to
enable it to interact with the adsorbate. The reverse process of adsorption is called as
desorption. It occurred when the adsorbate is attached on the surface and the adsorbent is
detached (Worch, 2012). Usually, desorption will be done after the adsorption process in
38
order to regenerate the surface of adsorbent. Thus, it can be reused again for another
treatment cycle.
As adsorption is a surface process, surface area of the adsorbent is the important
key to determine the efficiency of the adsorbent. An engineered adsorbent usually has a
high porosity with a surface area in the range of 102 -103 m2g-1, which is caused by its
internal surface constituted by the pore walls. Contrastingly, the external surface is
typically below 1 m2 g-1 (Worch, 2012).
The adsorption process typically undergoes three different steps, which are:
1) Mass transfer: the adsorbate particle molecules attached to the outer surface of
adsorbent.
2) Intra particle diffusion: the adsorbate particles went into the adsorbent pores.
3) Physical or chemical sorption
There are two different types of adsorption mechanism, named as physical
sorption and chemical sorption. Physical sorption involves weak intermolecular forces
between adsorbent surface and adsorbate. Meanwhile, the chemical sorption involves the
chemical bond between adsorbate and adsorbent surface. The other differences between
the physical sorption and chemical sorption are that physical sorption does not share their
electron. The adsorption does not occur at a specific site and the heat from the physical
sorption is low compared to the chemical sorption (Faust & Aly, 2013).

39
2.6 Type of Adsorbents
The commercial adsorbents are adsorbent produced commercially, whereby the cost
for commercial adsorbents are more expensive as compared with a low-cost adsorbent.
Low-cost adsorbents are typically cheaper than the commercial adsorbents because they
derived from waste products either from agricultural or industrial by-product.
Because there are various types of adsorbents, several adsorbent characteristics need
to be considered, which are selectivity, surface area, and regeneration ability. There are
adsorbents with multiple adsorbate particle selectivity and single adsorbate particle
selectivity. The surface area for each adsorbent is different, for example the activated
carbon has a very high surface area. High surface area helps the adsorbent to react with
the adsorbate more efficiently. Regeneration ability gives the capability for the adsorbent
to be reused again. There are some adsorbent capable to be recycled more than three
times. Thus, a high regeneration ability significantly helps to reduce the water or
wastewater treatment cost.
2.6.1 Commercial Adsorbent
a) Silica gel
Silica gel or silicon dioxide, SiO2 is a clear, transparent or translucent adsorbent.
Some of the silica gel manufactured contained alumina blended in them. Commonly,
silica gel is produced in the form of micro spherical particle known as beads, but there is
also granule, pellets and powder form of silica gel. Silica gel is commercially used as
desiccant to control humidity, food preservation, and various medical apparatus.
Additionally, it is also being used in adsorption treatment process to remove hydrocarbon
(Knaebel, 2008).
40
b) Activated alumina
Activated alumina adsorbent is made up of Aluminum Oxide, Al2O3. It is a white,
tan or opaque adsorbent. Commonly, activated alumina is produced in the form of balls,
pellets, powder or granules sizes. Commercially, activated alumina is used as a catalyst
or desiccant. The other usage of activated alumina is for the removal of fluoride (Ghorai
& Pant, 2005) and arsenic (T. S. Singh & Pant, 2004) through the adsorption treatment.
c) Zeolite
Most zeolites are aluminosilicate, which are made up of alumina and silica. Thus,
it generally appears in white, opaque and chalk-like. The zeolite characteristic is
influenced by the amount of alumina in it. A high amount of alumina gives the hydrophilic
characteristic to it, while the low amount of alumina gives the hydrophobic characteristic
to it. All commercial zeolites consist of a very fine crystal structure bound together by its
binder with a uniform microporous structure (Knaebel, 2008). Usually, zeolites are used
for gas or liquid drying, oxygen separation from air, purification of hydrogen and many
more.
d) Polymer
Polymer adsorbent is spherical beads with opaque appearance. It colors depends
on its manufacturing product, which is commonly in black, orange, brown, white or tan.
Typically, polymer is made up of polystyrene or divinyl-benzene copolymer with a
spherical shape and a high pore volume. Currently, polymer is used in decolorization,
industrial wastewater treatment, purification of antibiotics and vitamins, and VOC
recovery from off-gases. The disadvantage of polymer is that it is ten times more expensive

41
than other commercial adsorbent. In addition, polymer tends to shrink and swell upon
cyclic use (Knaebel, 2008).
e) Activated carbon
Activated carbon is a burned organic material (wood, tree trunk, fruit shells) until
it formed charcoal, which is a black color adsorbent with high porosity. The activation of
the burned organic material (carbon material) created the internal structure that consists of
varied pore structures where the dominant pore structure is micropore followed by
macropore and mesopore structures (Kasaoka, Sakata, Tanaka, & Naitoh, 1987). The types
of organic material used in the burning process will influence the amount of ash produced
at the end. The alkali ash formed at the pore surface can be removed by acid washing or
by impregnation with other elements.
Commonly, the activated carbon is produced at different granule sizes (fine,
medium, and coarse grain). Different activated carbon size gives different pollutant
removal adsorption capacity. Activated carbon with a fine particle size has the highest
surface area as compared to a coarse size. Effective surface area is generally ranges from
300 to 1500 m2g-1 depending on the base of the organic material and the activation method
(Knaebel, 2008).
42
2.6.2 Low Cost Adsorbent
i. Industrial by-product
a) Fly ash
Combustion of the coal will produce a by-product known as fly ash. Researchers
believed that fly ash is potentially able to substitute the use of a commercial adsorbent
(zeolite or activated carbon) for wastewater or water treatment. Additionally, fly ash
contained a high percentage of silica, alumina and magnetite. However, the performance
of fly ash to be a great adsorbent is strongly affected by the origin of the fly ash and the
chemical treatment (M. Ahmaruzzaman, 2011). On the other hand, fly ash was used
widely to remove the heavy metals from water and wastewater. It is able to remove Pb,
Cd, Cr, Ni, As, and Hg and it has been reported that fly ash from coal-char can also remove
As (V) at the adsorption capacity of 34.5 mg g-1 (Pattanayak, Mondal, Mathew, & Lalvani,
2000).
a) Used tire
Thoroughly, used tires have been a major disposal issue in many countries.
Researchers have found a solution to reduce the used tire dumping issue by recycling the
waste and utilizing it for rubber tiles and blocks or for cement manufacturing ingredients.
However, the cost of making waste tire into rubber powder is expensive and it is virtually
non-biodegradable and covers a lot of space at the landfill (Mousavi, Hosseynifar, Jahed,
& Dehghani, 2010). Contrastingly, used tire has a high carbon content and in this recent
years, Ali et al. (2012) have reported that there are many research studies using used tires
as a raw material to synthesize adsorbent for phenol and various dye removals (Ali, Asim,
& Khan, 2012). Meanwhile, Mousavi et al. (2010) found another use of used tire, which
43
is as an adsorbent where he reported in his study that it has a gray color consisting of a
heterogeneous pore size and shape with a high surface area. It is capable to remove Pb at
the adsorption capacity of 22.35 mg g-1 (Mousavi et al., 2010).
b) Blast furnace slag
A large volume of granular blast furnace slag was produced from steel plants. It
was utilized as fillers or as slag cement, and was also converted into a cost-effective
adsorbent for toxic organic contaminant in water and wastewater. In order for a raw blast
furnace slag to be converted into a good adsorbent, it has to be activated by the activation
method (Ali et al., 2012). Gupta et al. (1988) revealed the used of the blast furnace slag as
adsorbent by activating it through oven-dried method at a certain temperature and found
that the activated blast furnace slag has a high surface area of 107 m2g-1. Then, he used the
finished product to remove the malachite green dye and as a result, 99.9% of the dye
concentration was removed at a low concentration (G. Gupta, Prasad, Panday, & Singh,
1988). The main disadvantage of using a blast furnace slag as adsorbent is that the blast
furnace slag was classified as a non-product. Thus, the production cost is expensive
(Nilforoushan & Otroj, 2008). In various pH environment, slag properties may change and
toxic element in slag may be released through leaching (Yan, Moreno, & Neretnieks,
2000).
c) Peat
Peat is a porous structure with a complex material containing lignin and cellulose.
It has been used in many studies to remove heavy metals, dyes and oil from water and
wastewater. The ability of raw peat to directly be used as an adsorbent for wastewater or
water treatment is insignificant because raw peat has low stability and mechanical
strength, and it is difficult to regenerate (Smith, MacCarthy, Yu, & Mark Jr, 1977). Sun
44
et al. (2003) revealed that raw peat structure has to be chemically modified using the
plyvinylalcohol and formaldehyde in order to break the limitations. The modified peat-
resin particles contained polar functional groups (acids and alcohols) and act as a good
adsorbent for dye removal (Sun & Yang, 2003).
ii. Agricultural waste
a) Sugar cane bagasse
Bagasse pith is sugar industry waste by-product that is available in abundance
with no cost (Amin, 2008). Sugar cane bagasse consists of cellulose (45%),
hemicellulose (28%), and lignin (18%) (Pehlivan et al., 2013). It also contained hydroxyl
and carboxyl group, which shows the capacity to adsorb dye molecules by complexation
or ion exchange mechanisms (Dávila-Jiménez, Elizalde-Gonzalez, & Peláez-Cid, 2005).
b) Rice husk ash
Rice husk is obtained during the separation of rice from paddy through the rice
mills processing industry. It is widely used as fuel in boiler furnace to produce steam.
Rice husk ash is available in abundance and consumes almost no cost (Lakshmi,
Srivastava, Mall, & Lataye, 2009). It has a good adsorption capacity and has been used
to study various dye and heavy metal removal capacities.
c) Palm shell
Palm shell waste contains a high carbon content obtained from the palm oil
milling process, which is produced as an agricultural waste in some tropical countries.
The raw palm shell itself is available in abundance and cheap. To make palm shell waste
a better material for adsorption, it needs to be burned into ash and activated using a

45
specific activation method. The activation process will help the palm shell waste ash to
have high porosity, surface area and density. In this research study, palm shell waste
based activated carbon has been used as the basic raw material to remove arsenic in
both groundwater and dye (methylene blue and methyl orange) in textile industrial
wastewater. The justification will be described further in the next section.
46
2.7 Palm Shell-Waste Based Activated Carbon
To recall, adsorption is simple, easy to operate treatment process and widely used to
treat variety of pollutant at a high removal capacity as compared to others. However, high
adsorption performance is influenced by the type of adsorbent used. Thus, it is important
to select a great basic adsorbent before any modification can be made to treat the pollutant
in water or wastewater at optimum performance. As mentioned in the previous section,
there are many types of adsorbent synthesized by researchers and the palm shell-waste
based activated carbon was classified as the agricultural waste product that is being
utilized as an adsorbent.
Malaysia was reported to be the largest palm oil producer worldwide. Generally, there
are about 2.4 million tons of palm oil shell waste generated every year. Meanwhile,
Malaysia’s neighboring country, Thailand recorded over 100 thousand tons of palm oil
shell waste produced by 16 different palm oil mills factories every year where they were
disposed to the landfills (Lua & Guo, 2001; Prasertsan & Prasertsan, 1996). The palm
shell-waste production and disposal attracted many researchers to find ways to utilize it
and eventually reduced the volume of palm shell waste disposed to landfills. Many ways
to utilize the palm shell waste were studied by researchers, such as for light weight
concrete material, combustion steam fuel and as adsorbent.
In general, palm shell waste is a porous waste product containing a very rich carbon
structure. To produce a great adsorbent, a high pore surface area is one of the important
characteristics to determine the adsorption performance. Thus, palm shell waste needs to
undergo several preparation methods to improve its adsorption characteristics. Hence,
palm shell waste-based adsorbent production has to undergo two preparation steps, which
is carbonization and activation. Carbonization is a process whereby air moisture in the
palm shell waste will be taken out through the heating process at extreme temperature for

47
several hours. This process will reduce palm shell waste weight and increase pore surface
area. Then, palm shell waste need to undergo activation process or known as oxidization
process, either by gas or chemical treatment before it can be classified as the palm shell
waste-based activated carbon. At the end of the preparation process, a light-weight and
very high porosity activated carbon is produced.
The production of the activated carbon, either the commercial or low cost adsorbent is
almost the same. However, the difference is in the source of material. This research study
chose to use palm shell-waste based activated carbon as it was available in abundance in
Malaysia and cheap as compared to other materials. It will also contribute to waste
dumping reduction in Malaysia and other palm shell producer country.
Figure 2.8 The general activated carbon pore structure
Source: http://www.wateensolutions.com.au/page/carbon-filter

48
Furthermore, palm shell has the ability to be modified and eventually, increases its
carbon porosity, which is one of the important aspect to determine the adsorption
capability. This is because, the higher the adsorbent’s porosity, the better the adsorption
capacity by the adsorbent. Other than that, palm shell has a high lignin content, but low
cellulose content where these characteristics allow the palm shell to be activated at a short
time due to a less fibrous structure as compared to the other types of activated carbon
(Daud & Ali, 2004).
2.7.1 Importance of Surface Modification
The general activated carbon’s microporous structure allows to adsorb a large amount
of pollutant in a small enclosed space. The adsorptive structure of activated carbon
consists of the ordered carbon with aromatic planes similar to graphite. However, the
graphite consists of a well-ordered aromatic planes, while activated carbon consists of the
angular orientation of aromatic planes.
Commonly, activated carbon comprises of heteroatoms, for example oxygen, sulfur,
hydrogen and nitrogen, whereby in carbon matrix, the heteroatoms are present in the form
of functional groups (carboxyl, carbonyl, phenols) and oxygen atom acts as the
predominant atom in the functional group. The adsorption capacity of the activated carbon
is strongly controlled by the types of functional group present in the carbon matrix of
activated carbon. Interestingly, the types of activation treatment, either wet or dry
treatment influences the types of oxygen surface complexes (functional group) (Gaur,
2012). Laszlo et al. (2001) proposed that the characteristics of activated carbon surface,
either basic or acidic depend on the delocalized electron of the carbon structure (Laszlo
& Szűcs, 2001).
49
Nevertheless, a wide surface area and a high microporous structure owned by the
activated carbon gives an advantage for arsenic ion to accommodate in the activated
carbon’s microporous structure (Asadullah et al., 2014). The Arsenic uptake was not very
efficient. Additionally, the microporous structure arises a problem in adsorbing a large-
sized dye molecule, whereby the large-sized dye molecule was not fitted into the porous
structure of the activated carbon. Other than that, the activated carbon surface is lack of
polarity (Asadullah et al., 2014). Hence, reducing the surface affinity towards the
adsorbate (Yin, Aroua, & Daud, 2007).
The type of pollutant to be removed is heavily dependent on the activated carbon
surface chemical features. Thus, the surface chemical modification of the activated carbon
is important to produce an adsorbent for a specific pollutant removal. Thus, pollutant can
be removed at optimum capacity. This is because the surface chemical modification
method by oxidation usually will produce a high hydrophilic structure activated carbon
with a rich functional group containing oxygen (Rios et al., 2003).

50
2.7.2 Activated Carbon Surface Modification Techniques
a) Physical modification
Heat treatment is a common method under the physical modification techniques.
This method helps to enhance the physical characteristics (BET area and total pore
volume) of activated carbon. Other than that, heat treatment also helps the acidic
characteristic of activated carbon to be reduced to basic character by reducing the oxygen
containing functional group. High temperatures at more than 700˚C might be used for
this method because the majority of oxygen containing the functional group can be
decomposed at 800˚C to 1000˚C (Figueiredo, Pereira, Freitas, & Orfao, 1999).
b) Chemical modification
Chemical modification technique was aimed to reduce the internal surface area
and pore volume of the activated carbon. Other than that, the aim of the chemical
modification is to increase the acidic surface on the activated carbon since the heavy metal
in water, such as arsenic is more favorable to adsorb on a negatively charge acidic
character than basic character. The chemical modification uses oxidation method by
introducing oxidizing agent to create an acidic functional group on the activated carbon
surface. Unfortunately, the oxidation method will cause the activated carbon pore
structure to deconstruct. Thus, researchers have found that by introducing alkaline
solution treatment, the OH- ion from the alkaline solution, it will react with the activated
surface of the functional group and eventually reduce the pore destruction risk.
The most important method in the surface modification is surface impregnation
method. It is a method whereby the fine chemicals or metal particles are distributed evenly
on the activated carbon pore surface. The impregnation method increases the advantages
of using activated carbon as the adsorbent, such as to promote a built-in catalytic

51
oxidation capability and synergism between the impregnator and activated carbon.
Meanwhile, the most advantageous is that it optimizes the activated carbon adsorption
capacity.
Gaur et al. (2012) explained that the modification of the activated carbon by metal
impregnation method has increased interest among researcher because it enhance the
activated carbon sorption capacity in example fluoride and Arsenic in water (Gaur, 2012).
2.7.3 Advantageous of Magnetic Modification
Activated carbon, either in granular or fine particle sizes are widely used in water or
wastewater treatment as adsorbent. However, the activated carbon usage has its own
limitation because it is difficult to separate and regenerate when all the activated carbon
surface pore is fully used or exhausted. Traditionally, exhausted activated carbon was
separated using the filtration method and this leads to exhausted activated carbon
especially the fine sized activated carbon to block the pore filter where eventually will
reduce the filtered activated carbon collected for regeneration (Reza & Ahmaruzzaman,
2015).
By introducing the Iron Oxide nanoparticles (Fe2O3) through chemical modification
method, the activated carbon limitation can be overcome. The Fe2O3-activated carbon or
also known as the magnetically activated carbon is effective and has a low-cost adsorbent
that is able to remove both the organic and inorganic pollutant from water (Mezohegyi,
van der Zee, Font, Fortuny, & Fabregat, 2012). Furthermore, magnetically activated
carbon is easy to separate when exhausted by introducing the external magnetic field
without the need for filtration, which will eventually reduce the operation cost.

52
2.7.4 Advantages of Multi Metal Oxide/Hydroxide Modification
Nowadays, researchers have put their concern on the synthesized adsorbent with low
cost preparation but showing optimum adsorption capacity. Bimetallic oxide or hydroxide
modification is the answer. It was prepared by a double coat activated carbon using a
different metal oxide or hydroxide. There are many researchers already succeeded in
producing a good bimetallic adsorbent, such as Zhang et al (2005) that abled to synthesize
the Fe-Ce bi metal oxide adsorbent for arsenate removal (Y. Zhang, Yang, Dou, He, &
Wang, 2005) and Lu et al. (2016) that synthesized the Ni-Fe layered double hydroxide
for methyl orange dye removal (Lu et al., 2016). However, the bimetallic oxide or
hydroxide synthesized by them are nanoparticles and are not magnetically separable.
Practically, it is not very suitable to be used in real situations.
Nevertheless, the modified activated carbon by the bimetallic oxide or hydroxide will
overcome these limitations. The activated carbon porous structure provides a wide
medium for the nano-metal oxide or hydroxide particle to coat on the outer surface and
forms a layer. As previously discussed, activated carbon itself is a good adsorbent. Hence,
by introducing a bilayer nano-metal oxide or hydroxide layers on the activated carbon’s
outer surface, the modified bimetallic oxide or hydroxide activated carbon will integrate
their own unique characteristics and eventually, enhance the adsorption capacity (Kong,
Wang, Hu, & Olusegun, 2014).
As this research is focusing towards the magnetically modified palm shell-waste based
activated carbon, the Iron Oxide, Fe2O3 nanoparticle will be the first layer modifying the
activated carbon outer surface, while, the second layer for modification is determined
based on the pollutant to be removed.
53
i. MPSAC-La
For the removal study, the activated carbon was modified by coating the outer
surface with a nano-magnetite, Fe2O3 to form a magnetically palm shell-waste based
activated carbon and will eventually increase the affinity towards the arsenate ion. Then,
the magnetically palm shell-waste based activated carbon was impregnated with
Lanthanum oxide or hydroxide. Lanthanum was chosen to be the second layer coating the
activated carbon because it is a non-toxic metal (Jang, Park, & Shin, 2004). It is important
to identify the toxicity of the metal because the metal impregnated to the activated carbon
might leach out during the adsorption treatment process. Lanthanum oxide or hydroxide
is capable to remove arsenate at high removal capacities over a wide pH range (Xie et al.,
2014; W. Zhang, Fu, Zhang, & Zhang, 2014). Therefore, no specific pH has to be adjusted
in order to remove the arsenate at a high capacity. Modifications of the palm shell-waste
based activated carbon by the nano-magnetite, Fe2O3 and Lanthanum oxide or hydroxide,
LO/LH improve the adsorbent characteristic. Whereby, the modified adsorbent will have
the capability to be separated easily by using external magnetic field and enhanced
capability in arsenate removal.
i. MPSAC-SiO2@MgNO3
Contrastingly, Methyl Orange and Methylene Blue dyes removal study still
remained the magnetically palm shell-waste based activated carbon characteristics, but
modified the second layer with silica and finally, coated the silica layer with metal oxide
or hydroxide of Magnesium (nitrate salt). Silica is an inorganic material and non-metal
but is classified as good stabilizers. It is biocompatible and chemically inert, and does not
affect the redox reaction at the core surface (J. Yu, Jiang, Hao, & Liu, 2015). Furthermore,
silica provides abundance of silanol group (-OH group) on the silica layer that allows
various functional group to be activated on the coated surface (Fisli, Yusuf, Krisnandi, &

54
Gunlazuardi, 2014; J. Yu et al., 2015). However, pure silica consists of neutral frame-
structure that causes limitations in the cation-exchange capacities and reactivity (Parida,
Dash, Patel, & Mishra, 2006; Xu, Chu, & Luo, 2006), which leads several researchers to
study the silica modification by introducing metal oxide into the silica. Silica-nano-
magnetite has already been synthesized and investigated by Shariati et al. (2014) to
remove the methyl orange, while the silica coated magnetic nanocomposite was
synthesized and investigated by Yu et al. (2015) to remove methylene blue. However, the
adsorption capability results were not significant.
Magnesium oxide or hydroxide has been widely investigated and were used as
an adsorbent for various pollutants. It acts as a catalyst and catalyst support for a variety
of organic reactions and gives good performance in dye removal (Nga, Hong, Dai Lam,
& Huy, 2013). Additionally, Magnesium oxide or hydroxide is a unique oxide with a high
ionic character, simple stoichiometry, and can produce crystal structure with a variety of
particle sizes and shapes (Fakhri & Adami, 2014). Furthermore, it is also a non-toxic
metal, environmentally friendly with a high reactive surface and adsorption capacity (Nga
et al., 2013). Previous study showed that pHpzc of MgO is 12.4, which makes it more
suitable for anionic dye removal (Crittenden, Howe, Hand, Tchobanoglous, & Trussell,
2012). By integrating three types of adsorbent materials on the surface of activated
carbon, the adsorption capacity for methyl orange or methylene blue dyes potentially will
have an optimum increment.
55
2.8 Equilibrium Isotherm Model
Fundamental physiochemical data provided by the sorption equilibrium was used to
evaluate the applicability of sorption processes as a unit of operation. Commonly,
sorption equilibrium is described by an isotherm equation, whereby the parameter
equation indicates the surface properties and adsorbent affinity at a constant pH and
temperature. The accuracy of isotherm model to the experimental equilibrium data is
determined based on the coefficient of determination, R2, which is the closest R2 to unity
that will provide the best fit for the isotherm model. The most two common isotherm
models usually used are Langmuir and Freundlich models. Langmuir isotherm model
tends to give the best fit data for a high concentration experimental data, while Freundlich
tends to give the best data for a low concentration experimental data (Ho, Porter, &
McKay, 2002).
2.7.1 Langmuir isotherm model
Initially, Langmuir adsorption isotherm model was developed to explain the gas-solid
phase adsorption mechanism onto the activated carbon; and this model was applied to
analyze the performance of other types of adsorbents (Langmuir, 1916). Basically,
Langmuir isotherm equation model explained the monolayer (Vijayaraghavan, Padmesh,
Palanivelu, & Velan, 2006) and homogeneous adsorption, whereby each molecules have
the constant enthalpies and sorption activation energy (Kundu & Gupta, 2006). It is
characterized by a plateau, which is an equilibrium saturation point when the molecules
already occupied all the active sites, then no adsorption can occur further (Demirbas,
Kobya, & Konukman, 2008).

56
The linear form of Langmuir model equation can be expressed as shown below.
The Langmuir equation described as:
eqL
eqL
eqCK
CKQq
1
max (2.1)
Where qeq is the amount of solute adsorbed per unit weight of the adsorbent (mg g-1),
Ceq is the equilibrium concentration of solute in the bulk solution (mg L-1), Qmax is the
maximum adsorption capacity (mg g-1), and KL is the Langmuir constant related to the
energy of adsorption
2.8.2 Freundlich Isotherm model
Assuming that the adsorption is held onto the heterogeneous surface of adsorbent, the
Freundlich model is a better fit for the isotherm data. In the Freundlich model,
chemisorption and physisorption are applicable to the monolayer and multilayer
adsorptions, respectively. Originally, Freundlich isotherm model was developed to
describe the animal charcoal adsorption mechanism, where the ratio of adsorbate
adsorbed onto the adsorbent in the solute at different concentrations were not constant
(Md Ahmaruzzaman, 2008). Conceptually, Freundlich isotherm model characterized the
amount of adsorbate adsorbed as the total adsorption on all sites, with a stronger binding
sites are occupied first until the adsorption energy exponentially decreased upon the
completion of adsorption process (Zeldowitsch, 1934).
The linear form of the Freundlich equation is expressed as:
eqFeq C
nKq log
1loglog (2.2)
Where KF and n are the Freundlich isotherm constants related to the adsorption
capacity and adsorption intensity, respectively.
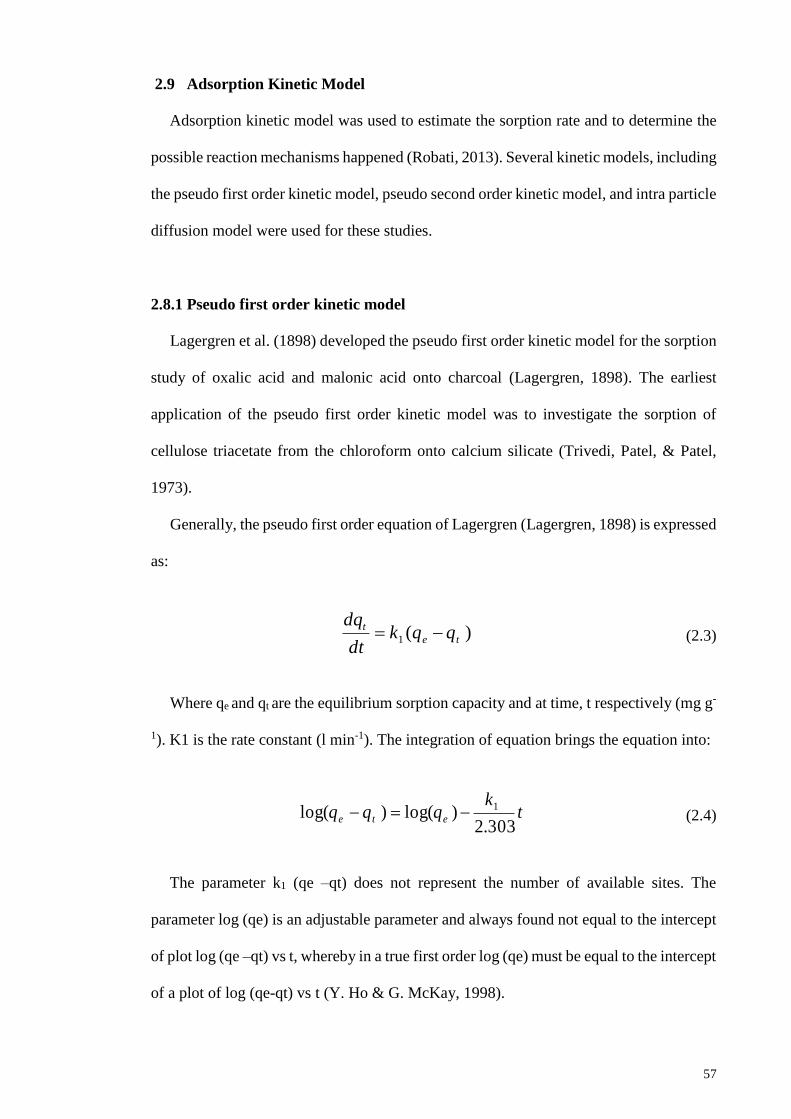
57
2.9 Adsorption Kinetic Model
Adsorption kinetic model was used to estimate the sorption rate and to determine the
possible reaction mechanisms happened (Robati, 2013). Several kinetic models, including
the pseudo first order kinetic model, pseudo second order kinetic model, and intra particle
diffusion model were used for these studies.
2.8.1 Pseudo first order kinetic model
Lagergren et al. (1898) developed the pseudo first order kinetic model for the sorption
study of oxalic acid and malonic acid onto charcoal (Lagergren, 1898). The earliest
application of the pseudo first order kinetic model was to investigate the sorption of
cellulose triacetate from the chloroform onto calcium silicate (Trivedi, Patel, & Patel,
1973).
Generally, the pseudo first order equation of Lagergren (Lagergren, 1898) is expressed
as:
)(1 te
t qqkdt
dq (2.3)
Where qe and qt are the equilibrium sorption capacity and at time, t respectively (mg g-
1). K1 is the rate constant (l min-1). The integration of equation brings the equation into:
tk
qqq ete303.2
)log()log( 1 (2.4)
The parameter k1 (qe –qt) does not represent the number of available sites. The
parameter log (qe) is an adjustable parameter and always found not equal to the intercept
of plot log (qe –qt) vs t, whereby in a true first order log (qe) must be equal to the intercept
of a plot of log (qe-qt) vs t (Y. Ho & G. McKay, 1998).

58
2.9.2 Pseudo second order kinetic model
The earliest application of the pseudo second order kinetic model in the solid or liquid
systems was used to explain the reaction mechanism between soils and minerals (Griffin
& Jurinak, 1974; Kuo & Lotse, 1972)
The pseudo second-order kinetic model is based on the equilibrium adsorption is
expressed as (Y. S. Ho & G. McKay, 1998):
eqeqt q
t
qKq
t
2
2
1 (2.5)
where qe (mg g-1) and qt (mg g-1) are the amount of adsorbate adsorbed at equilibrium
and specific time, respectively. And, K1 (min-1) and K2 [g (mg min)-1] are the rate constant
of the pseudo first-order and the pseudo second-order kinetic models, correspondingly.
2.8.3 Intra particle diffusion model
Weber and Morris has developed the intra particle diffusion model in the year 1962
(W. Weber & Morris; W. J. Weber & Morris, 1963).
The IPD kinetic model can be formulated by:
Ctkq it 5.0 (2.6)
where ki [(mg g-1 min-1/2)] is the intraparticle rate constant.
Multi linearity in qt against t0.5 plot is considered as there are two or three steps
involved in the reaction process (Sun & Yang, 2003). The first step indicates the external
surface adsorption or instantaneous adsorption occurred, following by the second step
that indicates the gradual adsorption where the intra particle diffusion acts as the

59
controlling step and the third step is indicated as the final equilibrium step, where slow
movement of solute from mesopore or macropore into micropores occurred (F.-C. Wu,
Tseng, & Juang, 2009).
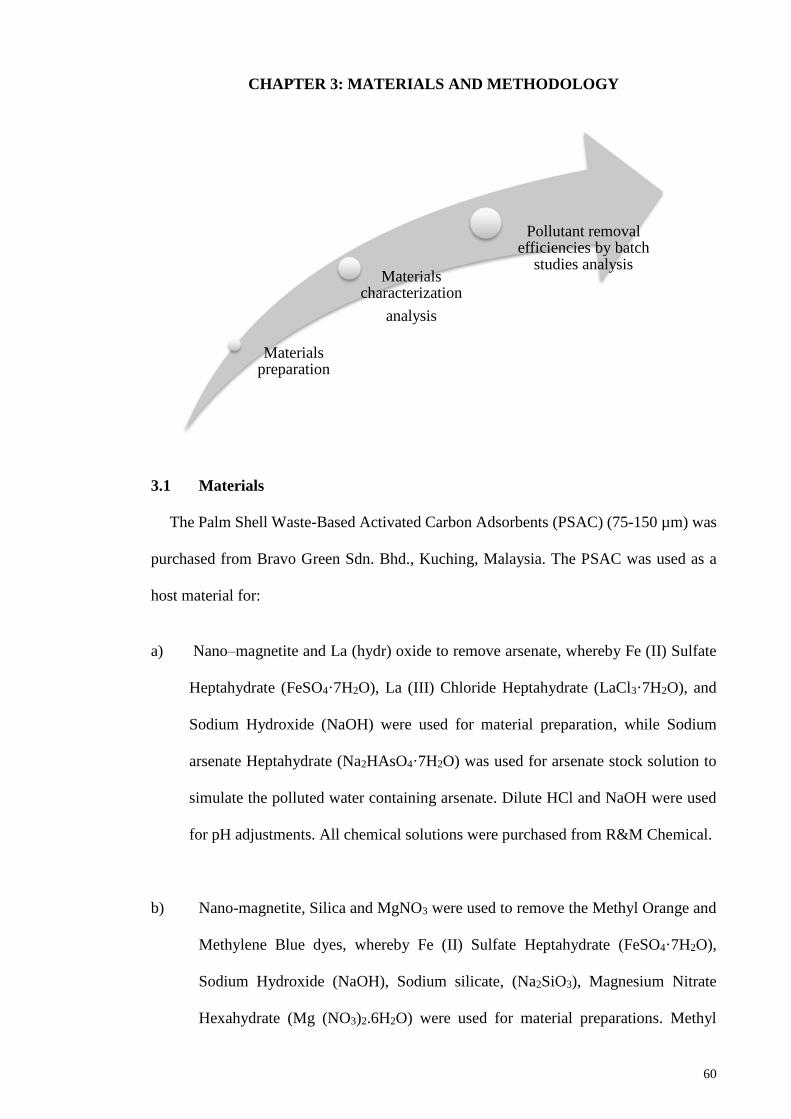
60
CHAPTER 3: MATERIALS AND METHODOLOGY
3.1 Materials
The Palm Shell Waste-Based Activated Carbon Adsorbents (PSAC) (75-150 µm) was
purchased from Bravo Green Sdn. Bhd., Kuching, Malaysia. The PSAC was used as a
host material for:
a) Nano–magnetite and La (hydr) oxide to remove arsenate, whereby Fe (II) Sulfate
Heptahydrate (FeSO4·7H2O), La (III) Chloride Heptahydrate (LaCl3·7H2O), and
Sodium Hydroxide (NaOH) were used for material preparation, while Sodium
arsenate Heptahydrate (Na2HAsO4·7H2O) was used for arsenate stock solution to
simulate the polluted water containing arsenate. Dilute HCl and NaOH were used
for pH adjustments. All chemical solutions were purchased from R&M Chemical.
b) Nano-magnetite, Silica and MgNO3 were used to remove the Methyl Orange and
Methylene Blue dyes, whereby Fe (II) Sulfate Heptahydrate (FeSO4·7H2O),
Sodium Hydroxide (NaOH), Sodium silicate, (Na2SiO3), Magnesium Nitrate
Hexahydrate (Mg (NO3)2.6H2O) were used for material preparations. Methyl
Materials preparation
Materials characterization
analysis
Pollutant removal efficiencies by batch
studies analysis

61
Orange (MO) and Methylene Blue dye (MB) were used for Methyl Orange and
Methylene Blue dyes stock solution. Dilute HCl and NaOH were used for pH
adjustments. All chemical solutions were purchased from R&M Chemical.
3.2 Equipment
a) Material preparation and sample analysis
An oven (Memmert Laboratory Oven) was used for drying purposes and for
heating samples up to 160oc. However, muffled furnace (Dae Heung Science, Korea) was
used when higher temperature is needed. The Ultrasonic Cleaning Bath (E120H,
Elmasonic E) was used for the preparation of material for Arsenic removal. An orbital
shaker (SK-300, Lab Companion) was used for all batches of test experiments. The pH
measurement was taken using Bante920 Benchtop pH/ORP/°C/°F meter and the
Inductively Coupled Plasma Optical Emission Spectrometry (ICP–OES, Optima 5300V,
Perkin Elmer) was used to determine the Arsenic (As), Iron (Fe), Lanthanum (La) ion
concentration. The concentration of Methyl Orange and Methylene Blue dyes were
determined by using the UV-visible spectrometer (Spectroquant® Pharo300).
b) For characterization analysis
Morphological changes of adsorbent particles were examined using the field
emission scanning electron microscopy (FESEM, FEG Quanta 450, EDX–OXFORD).
X–ray powder diffraction (XRD, PANalytical, EMPYREAN) was used to verify the
presence and the type of element over a range of 20° to 80°. Texture characterization was
performed on the N2 adsorption–desorption isotherm, which was obtained at 77 K using
the TriStar II 3020 (Micrometrics®, USA). The specific surface area and the pore specific
volume were measured by the Brunauer–Emmett–Teller (BET) method, whereas the pore
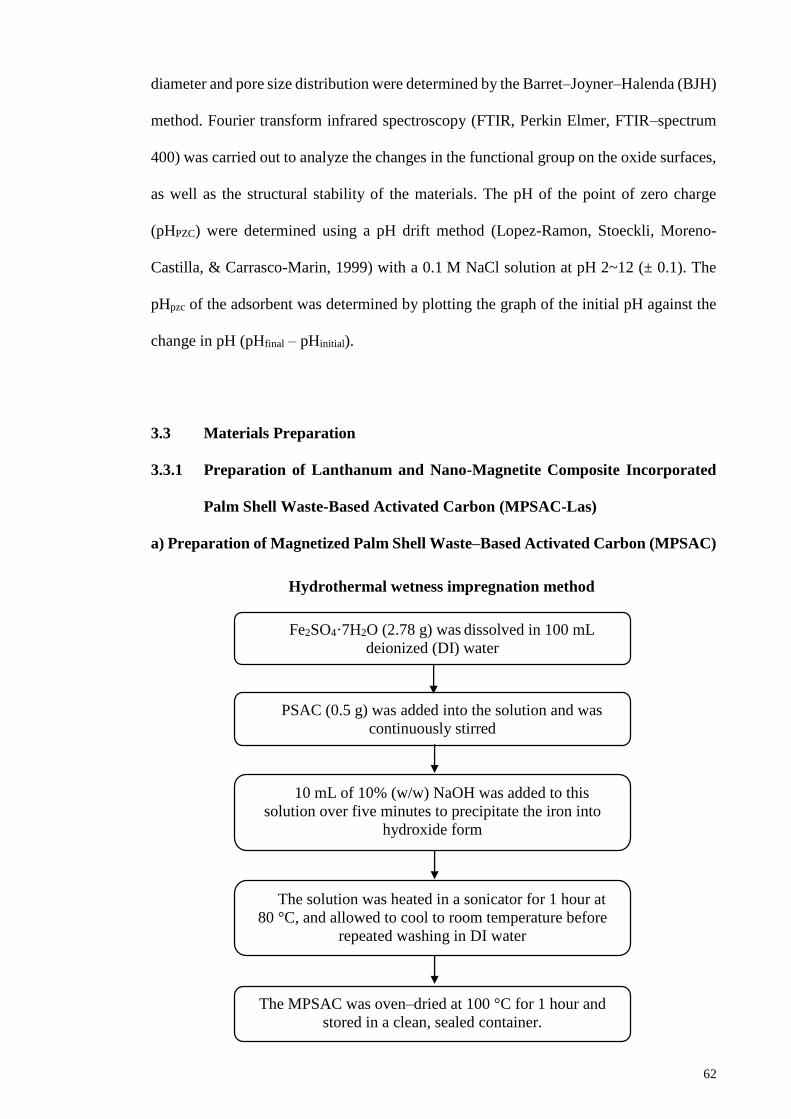
62
diameter and pore size distribution were determined by the Barret–Joyner–Halenda (BJH)
method. Fourier transform infrared spectroscopy (FTIR, Perkin Elmer, FTIR–spectrum
400) was carried out to analyze the changes in the functional group on the oxide surfaces,
as well as the structural stability of the materials. The pH of the point of zero charge
(pHPZC) were determined using a pH drift method (Lopez-Ramon, Stoeckli, Moreno-
Castilla, & Carrasco-Marin, 1999) with a 0.1 M NaCl solution at pH 2~12 (± 0.1). The
pHpzc of the adsorbent was determined by plotting the graph of the initial pH against the
change in pH (pHfinal – pHinitial).
3.3 Materials Preparation
3.3.1 Preparation of Lanthanum and Nano-Magnetite Composite Incorporated
Palm Shell Waste-Based Activated Carbon (MPSAC-Las)
a) Preparation of Magnetized Palm Shell Waste–Based Activated Carbon (MPSAC)
for 1 hour and stored in a clean, sealed container.
Hydrothermal wetness impregnation method
Fe2SO4·7H2O (2.78 g) was dissolved in 100 mL
deionized (DI) water
PSAC (0.5 g) was added into the solution and was
continuously stirred
10 mL of 10% (w/w) NaOH was added to this
solution over five minutes to precipitate the iron into
hydroxide form
The solution was heated in a sonicator for 1 hour at
80 °C, and allowed to cool to room temperature before
repeated washing in DI water
The MPSAC was oven–dried at 100 °C for 1 hour and
stored in a clean, sealed container.

63
b) Preparation of lanthanum impregnated MPSAC (MPSAC-Las)
Aqua–regia extraction was added to determine the volume of Fe and La in the MPSAC–
La. The weight ratios of La to Fe were 0.084, 0.23, 0.28, and 0.36, which were designated
as MPSAC–La (0.084), MPSAC–La (0.23), MPSAC–La (0.28), and MPSAC–La (0.36),
respectively.
The predetermined masses (0.801 g, 1.335 g, and
2.136 g) of LaCl3·7H2O were dissolved into 0.9 mL DI
water
Hydrothermal wetness impregnation method
1 g of MPSAC was added into the solution
Stirred for 24 hours
Calcined at 500 °C for 5 hours
The impregnated products were washed until the solution
produced was clear
Oven–dried at 100 °C for 2 hours
Oven–dried products were kept at room temperature in a
sealed container to prevent contamination

64
3.3.2 Preparation of MgNO3-SiO2 incorporated into nano-magnetite Palm Shell
Waste-Based Activated Carbon
a) Preparation of Magnetic Palm Shell Waste–Based Activated Carbon (MPSAC)
72 g of Fe2SO4·7H2O was dissolved in 200 mL deionized
(DI) water
Film coating method
50 g of PSAC was added to the solution and heated at
80 o C for 2 hours
50 ml of alkaline solution was prepared (2.25 g of KNO3
+15 g of NaOH)
The alkaline solution was added dropwise into the PSAC
suspension under constant stirring
The suspension was transferred into an autoclave
hydrothermal bottle and heated at 80oC for 8 hours
The precipitated MPSAC was allowed to cool at room
temperature before repeated washing in DI water
The MPSAC was oven–dried at 100 °C for 1 hour and
stored in a clean, sealed container
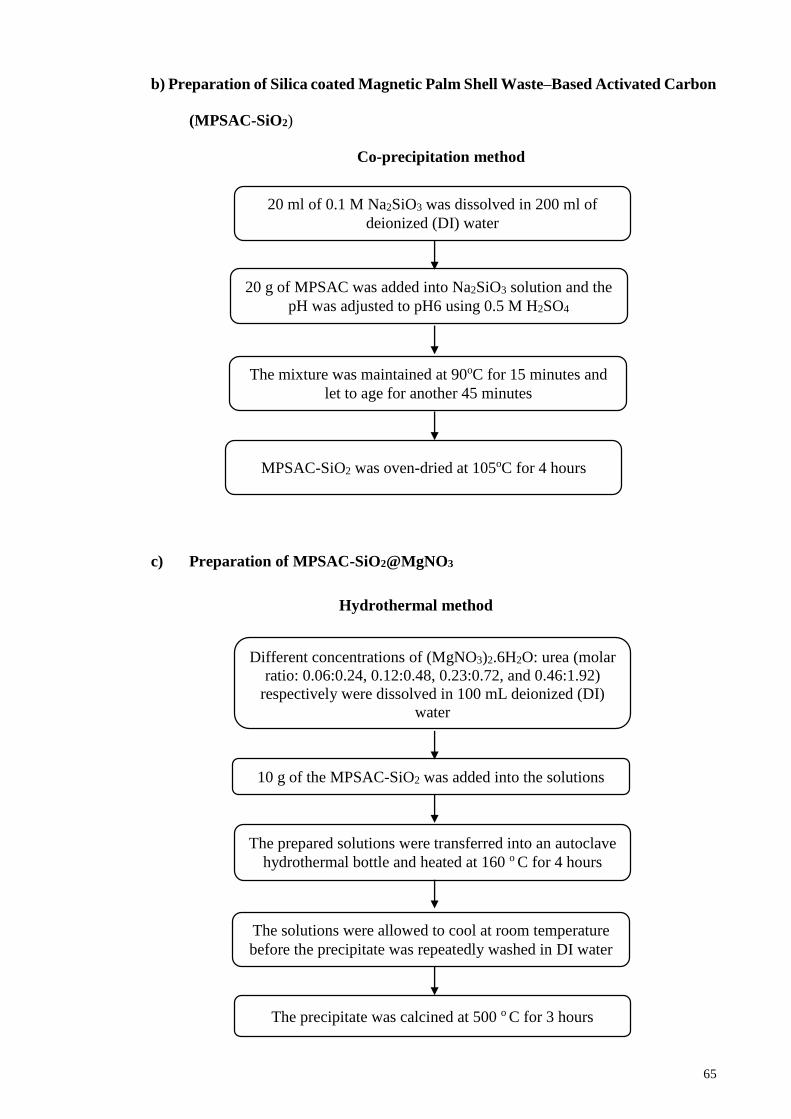
65
b) Preparation of Silica coated Magnetic Palm Shell Waste–Based Activated Carbon
(MPSAC-SiO2)
c) Preparation of MPSAC-SiO2@MgNO3
20 ml of 0.1 M Na2SiO3 was dissolved in 200 ml of
deionized (DI) water
Co-precipitation method
20 g of MPSAC was added into Na2SiO3 solution and the
pH was adjusted to pH6 using 0.5 M H2SO4
The mixture was maintained at 90oC for 15 minutes and
let to age for another 45 minutes
MPSAC-SiO2 was oven-dried at 105oC for 4 hours
Different concentrations of (MgNO3)2.6H2O: urea (molar
ratio: 0.06:0.24, 0.12:0.48, 0.23:0.72, and 0.46:1.92)
respectively were dissolved in 100 mL deionized (DI)
water
Hydrothermal method
10 g of the MPSAC-SiO2 was added into the solutions
The prepared solutions were transferred into an autoclave
hydrothermal bottle and heated at 160 o C for 4 hours
The solutions were allowed to cool at room temperature
before the precipitate was repeatedly washed in DI water
The precipitate was calcined at 500 o C for 3 hours
66
3.4 Arsenic removal batch adsorption experiments
3.4.1 Adsorption isotherms
Arsenate stock solution (1,000 mg L–1) was prepared by dissolving 4.165 g of
Na2HAsO4·7H2O into 1 L DI water. Then, AC, MPSAC, MPSAC-La (0.08), MPSAC-La
(0.16), MPSAC-La (0.32) and MPSAC-La (0.64) adsorbents (0.025 g) respectively were
added to 25 mL arsenate solution (with a concentration between 10 mg L–1 and 350 mg L–
1) in a 50 mL centrifuge tube. The initial pH of the solution was adjusted to pH 6 ± 0.1
and final pH was measured. The conical flasks were agitated on an orbital shaker for 24
hours at 150 rpm and room temperature (26 ± 1°C). After 24 hours, the final pH was
measured and 10 mL of the suspension was filtered out using a 0.45 µm–pore filter, and
the arsenate concentration of the filtrate was analyzed using the inductively coupled
plasma optical emission spectrometry (ICP–OES, Optima 5300V, Perkin Elmer).
The equilibrated adsorption capacity was calculated using the following equation:
M
VCCQ eqeq )( 0
, (3.1)
where, Qeq, Co, and Ceq are the adsorption capacity (mg g–1), initial concentration
(mg L–1), and final concentration (mg L–1), respectively. V and M are the volume of the
solution (L) and mass of adsorbent (g), respectively. The isotherm data were well–fitted
using the Langmuir and Freundlich isotherm models.
67
3.4.2 Adsorption kinetics
Arsenate stock solution (1,000 mg L–1) was prepared by dissolving 4.165 g of
Na2HAsO4·7H2O into 1 L DI water. Then, MPSAC and MPSAC-La (0.64) adsorbents
(0.025 g) respectively (0.5 g) was added to 500 mL arsenate solution with an initial
concentration, 350 mg L–1 in 1 L conical flask. The pH and solution temperature were
maintained at pH 6 ± 0.1 and 26 ± 1°C, and the conical flask was shaken at 150 rpm for
5 hours. At predetermined intervals, 5 mL of the sample suspensions were filtered out
using a 0.45 µm–pore filter, and the arsenate concentration of the filtrate was analyzed
using the inductively coupled plasma optical emission spectrometry (ICP–OES, Optima
5300V, Perkin Elmer).
The equilibrated adsorption capacity was calculated using the following equation:
M
VCCQ eqeq )( 0
, (3.2)
where, Qeq, Co, and Ceq are the adsorption capacity (mg g–1), initial concentration
(mg L–1), and final concentration (mg L–1), respectively. V and M are the volume of the
solution (L) and mass of adsorbent (g), respectively. All of the kinetic data were fitted
using the pseudo–second order kinetic and intra particle diffusion models.
68
3.4.3 pH effects
Arsenate stock solution (1,000 mg L–1) was prepared by dissolving 4.165 g of
Na2HAsO4·7H2O into 1 L DI water. Then, MPSAC and MPSAC-La (0.64) adsorbents
(0.025 g) respectively were added to 25 mL of arsenate solution with a concentration
350 mg L–1 in a 50 mL centrifuge tube. The initial pH of the solutions was adjusted to pH
2 to pH 10 with interval of pH 1. The conical flasks were agitated on an orbital shaker for
24 hours at 150 rpm and room temperature (26 ± 1°C). After 24 hours, the final pH for
each solution with different pH were measured and 10 mL of the suspension was filtered
out using a 0.45 µm–pore filter, and the arsenate concentration of the filtrate was analyzed
using the inductively coupled plasma optical emission spectrometry (ICP–OES, Optima
5300V, Perkin Elmer).
The equilibrated adsorption capacity was calculated using the following equation:
M
VCCQ eqeq )( 0
, (3.3)
where, Qeq, Co, and Ceq are the adsorption capacity (mg g–1), initial concentration
(mg L–1), and final concentration (mg L–1), respectively. V and M are the volume of the
solution (L) and mass of adsorbent (g), respectively. All of the pH data were recorded and
presented as the graph of arsenate adsorption capacity (mg g-1) versus final pH.
69
3.4.4 Temperature effect
Arsenate stock solution (1,000 mg L–1) was prepared by dissolving 4.165 g of
Na2HAsO4·7H2O into 1 L DI water. Then, MPSAC and MPSAC-La (0.64) adsorbents
(0.025 g) respectively (0.5g) was added to 500 mL arsenate solution with an initial
concentration of 350 mg L–1 in 1 L conical flask. Three sets of solution were prepared and
for each set, the pH and solution temperature were maintained at pH 6 ± 0.1 and the
solution temperatures were set to 288 K, 298 K, and 308 K respectively. The conical flask
was shaken at a rate of 150 rpm for 5 hours. At predetermined intervals, 5 mL sample
suspensions were filtered out using a 0.45 µm–pore filter, and the arsenate concentration
of the filtrate was analyzed using the inductively coupled plasma optical emission
spectrometry (ICP–OES, Optima 5300V, Perkin Elmer).
The equilibrated adsorption capacity was calculated using the following equation:
M
VCCQ eqeq )( 0
, (3.4)
where, Qeq, Co, and Ceq are the adsorption capacity (mg g–1), initial concentration
(mg L–1), and final concentration (mg L–1), respectively. V and M are the volume of the
solution (L) and mass of adsorbent (g), respectively. All of the temperature data were
recorded and presented as the graph of arsenate adsorption capacity (mg g-1) versus final
pH. Then, the kinetic data were fitted into the pseudo-second order kinetic model and
thermodynamic model studies.

70
3.4.5 Competition effects
Arsenate stock solution (1,000 mg L–1) was prepared by dissolving 4.165 g of
Na2HAsO4·7H2O into 1 L DI water. Then, MPSAC and MPSAC-La (0.64) adsorbents
(0.03 g) were added into the arsenate solution (30 mL), with initial concentration of
50 mg L–1 and 350 mg L–1 in a 50 mL centrifuge tube. Sodium salts (2.5 mmol L–1 of
NO3–, Cl–, HCO3
–, or SO42–) were also added to the solution. As a reference, a set of
arsenate solutions without competing anions was also prepared to compare the sorption
capacities. The pH and solution temperatures were maintained at pH 6 ± 0.1 and 26 ±
1°C, respectively. The suspensions were then agitated at 150 rpm for 24 hours.
After 24 hours, the final pH was measured and 10 mL of the suspension was filtered
out using a 0.45 µm–pore filter, and the arsenate concentration of the filtrate was analyzed
using the inductively coupled plasma optical emission spectrometry (ICP–OES, Optima
5300V, Perkin Elmer).
The equilibrated adsorption capacity was calculated using the following equation:
M
VCCQ eqeq )( 0
, (3.5)
where, Qeq, Co, and Ceq are the adsorption capacity (mg g–1), initial concentration
(mg L–1), and final concentration (mg L–1), respectively. V and M are the volume of the
solution (L) and mass of adsorbent (g), respectively. Then, the competition effect data
were presented as the graph of arsenate adsorption capacity (mg g-1) versus solution
containing the competing anion.
71
3.5 Regeneration
Three cycles of adsorption and desorption were carried out to investigate the
reusability of MPBAC–La (0.36) that exhibited the highest sorption capacity in previous
tests. The adsorption tests were carried out using a 0.2 g of adsorbent in a 350 mg L–1
arsenate solution. The suspensions were agitated for 24 hours at 150 rpm. The adsorbents
were separated from the solution using a magnet and dried at 105°C for 1 hour. The
adsorption capacity was measured for each cycle. Desorption tests were conducted by
stirring the dried adsorbent into a 100 mL NaOH solution (0.5 M) at 150 rpm for 6 hours.
Then, the adsorbents were washed with distilled water and dried in a vacuum oven under
the same conditions as described above prior to the re–adsorption tests.
3.6 Characterization analysis
The X-ray diffraction spectra for AC, MPSAC, MPSAC-La (0.28), MPSAC-La (0.36)
before and after adsorption test were obtained using the X-ray diffractometer with Cu K
radiation at 40 kV and 50 mA to determine the present phases (amorphous or crystalline).
The spectra were recorded from 20o to 80o at a scan rate of 1.2o min-1. Fourier Transform
Infrared (FT-IR) spectra of the adsorbents were recorded in the range of 500-4000 cm-1
on an FT-IR system to investigate the positions and numbers of the functional groups that
are available for the adsorbates binding. The surface morphology of the adsorbents was
visualized via a Field Emission Scanning Electron Microscope (FESEM) operated at the
accelerating voltafe of 20 keV and elemental mapping under high resolutions via the
Energy Dispersive X-ray. The Burnauer-Emmett-Teller (BET) surface area (SBET), and
pore structural of the adsorbents was detected using the Micrometrics (TriStar II 3020)
Surface Area and Porosity Analyzer. All the adsorbent samples were de-gassed at 200oC
for 4 hours, prior to adsorption-desorption experiments. The BET surface area was
calculated by the Brunauer-Emmett-Teller (BET) equation, micropore volume (Vmi) and
72
micropore specific area (Smi) were obtained using the t-plot. The total pore volume (Vt)
was obtained by converting the nitrogen adsorption amount at a relative preassure (P/PO)
of 0.98 to the liquid nitrogen volume. The mesopore volume (Vme) was calculated by
subtracting Vmi from Vt. The burn-off weight percentage, Pb for SAS was determined
and was used to measure the degree of activation process. It is defined as the ratio of
percentage weight loss of the material during the preparation to the original weight of the
raw material. It is mathematically expressed as:
100xw
wwp
o
fo
b
(3.6)
73
3.7 Dye removal batch adsorption experiments
3.7.1 Adsorption isotherms
Dye (Methylene Blue [MB] and Methyl Orange [MO] ) stock solution (1,000 mg L–1)
was prepared by dissolving 0.5 g of the MB and MO into 0.5 L DI water. PSAC, MPSAC-
SiO2@MgNO3(0.06), MPSAC-SiO2@MgNO3 (0.12), MPSAC-SiO2@MgNO3 (0.23)
and MPSAC-SiO2@MgNO3 (0.46) adsorbents (0.03 g) were added to 30 mL dye solution
(with a concentration between 50 mg L–1 and 1000 mg L–1) in a 50 mL centrifuge tube
respectively. The initial pH of the solution was adjusted to pH 6 ± 0.1 and the final pH
was measured. The conical flasks were agitated on an orbital shaker for 24 hours at
200 rpm and room temperature (26 ± 1°C). After 24 hours, the final pH was measured
and the final concentration for both MB and MO were determined by a UV–visible
spectrophotometer (Spectroquant® Pharo300) at an absorbance wavelength of 655 nm
for MB and 464 nm for MO. The equilibrated adsorption capacity was calculated using
the following equation:
M
VCCQ eqeq )( 0 , (3.7)
where, Qeq, Co, and Ceq are the adsorption capacity (mg g–1), initial concentration
(mg L–1), and final concentration (mg L–1), respectively. V and M are the volume of the
solution (L) and mass of adsorbent (g), respectively. The isotherm data were well–fitted
using the Langmuir and Freundlich isotherm models that are explained further in the next
section.

74
3.7.2 Adsorption kinetics
Dye (Methylene Blue (MB) (500 mg L–1) and Methyl Orange (MO) (1,300 mg L–1)
stock solution was prepared by dissolving 0.5 g of MB and 0.75 g of MO into 0.5 L DI
water. PSAC and MPSAC-SiO2@MgNO3 (0.46) adsorbents were added in a 1 L conical
flask with 500 mL dye solution (500mg L-1 initial concentration for MB and 1300 mg L–
1 for MO). The pH and solution temperature were maintained at pH 6 ± 0.1 and 26 ± 1°C,
and the conical flask was shaken at a rate of 200 rpm for 8 hours. At predetermined
intervals, 5 mL of the sample suspensions were taken out and measured using the UV–
visible spectrophotometer (Spectroquant® Pharo300) at an absorbance wavelength of 655
nm for MB and 464 nm for MO.
The equilibrated adsorption capacity was calculated using the following equation:
M
VCCQ eqeq )( 0 , (3.8)
where, Qeq, Co, and Ceq are the adsorption capacity (mg g–1), initial concentration
(mg L–1), and final concentration (mg L–1), respectively. V and M are the volume of the
solution (L) and mass of adsorbent (g), respectively. All of the kinetic data were fitted
using pseudo–second order kinetic and intra particle diffusion models.
75
3.7.3 pH effects
Dye (Methylene Blue (MB) (500 mg L–1) and Methyl Orange (MO) (1,300 mg L–1)
stock solution was prepared by dissolving 0.5 g of MB and 0.75 g of MO into 0.5 L DI
water. PSAC and MPSAC-SiO2@MgNO3 (0.46) adsorbents were added in a 1 L conical
flask with 500 mL dye solution (500mg L-1 initial concentration for MB and 1300 mg L–
1 for MO). The initial pH of the solutions was adjusted to pH 2 to pH 10 with interval of
pH 1. The conical flasks were agitated on an orbital shaker for 24 hours at 200 rpm and
room temperature (26 ± 1°C). After 24 hours, the final solution of the pH was recorded,
and the remaining dye concentrations were measured. At predetermined intervals, 5 mL
of the sample suspensions were taken out and measured using the UV–visible
spectrophotometer (Spectroquant® Pharo300) at an absorbance wavelength of 655 nm
for MB and 464 nm for MO.
The equilibrated adsorption capacity was calculated using the following equation:
M
VCCQ eqeq )( 0 , (3.9)
where, Qeq, Co, and Ceq are the adsorption capacity (mg g–1), initial concentration
(mg L–1), and final concentration (mg L–1), respectively. V and M are the volume of the
solution (L) and mass of adsorbent (g), respectively. All of the pH data were recorded and
presented as the graph of MB and MO adsorption capacity (mg g-1) versus the final pH.

76
3.7.4 Ionic Strength
Dye (Methylene Blue (MB) (500 mg L–1) and Methyl Orange (MO) (1,300 mg L–1)
stock solution was prepared by dissolving 0.5g of MB and 0.75g of MO into 0.5 L DI
water respectively. 0.5 g of PSAC and MPSAC-SiO2@MgNO3 (0.46) adsorbents were
added in a 1 L conical flask with 500 mL of the dye solution (500mg L-1 initial
concentration for MB and 1300 mg L–1 for MO).
Sodium Chloride (NaCl) at different initial concentrations (0.1M-0.5M) were added
to the solution. As a reference, a set of MB and MO solutions without NaCl were also
prepared to compare sorption capacities. The pH and solution temperatures were
maintained at pH 6 ± 0.1 and 26 ± 1°C, respectively. The suspensions were then agitated
at 200 rpm for 24 hours. After 24 hours, the final pH was measured and the final
concentration for MB and MO were determined by a UV–visible spectrophotometer
(Spectroquant® Pharo300) at an absorbance wavelength of 655 nm for MB and 464 nm
for MO. The equilibrated adsorption capacity was calculated using the following
equation:
M
VCCQ eqeq )( 0 , (3.10)
where, Qeq, Co, and Ceq are the adsorption capacity (mg g–1), initial concentration
(mg L–1), and final concentration (mg L–1), respectively. V and M are the volume of the
solution (L) and mass of adsorbent (g), respectively.

77
3.8 Regeneration
Four cycles of the adsorption-desorption were carried out to investigate the reusability
of MPSAC-SiO2@MgNO3 (0.46) that exhibited the highest sorption capacity in previous
tests. The adsorption tests were carried using 0.6 g of adsorbent in a 1300 mg L–1 MO
solution. The suspensions were agitated for 24 hours at 200 rpm. The adsorption capacity
was measured for each cycle. The adsorbents were separated from the solution using a
magnet and desorption tests were conducted by washing the used adsorbent using distilled
water until the orange color is lessen. Then, the washed adsorbent was oven-dried at
105°C for 1 hour followed by the calcination at 500˚C for 2 hours. Lastly, re-adsorption
test was conducted.
3.9 Characterization analysis
The X-ray diffraction spectra for PSAC, MPSAC, and MPSAC-SiO2@MgNO3 (0.46)
before and after adsorption test were obtained using the X-ray diffractometer with Cu K
radiation at 40 kV and 50 mA to determine the present phases (amorphous or crystalline).
The spectra were recorded from 20o to 80o at a scan rate of 1.2o min-1. Fourier Transform
Infrared (FT-IR) spectra of the adsorbents were recorded in the range of 500-4000 cm-1
on an FT-IR system to investigate the positions and numbers of functional groups
available for the adsorbates binding. The surface morphology of the adsorbents was
visualized via a Field Emission Scanning Electron Microscope (FESEM) operated at the
accelerating voltafe of 20 keV and elemental mapping under high resolutions via the
Energy Dispersive X-ray. The Burnauer-Emmett-Teller (BET) surface area (SBET) and
pore structural of the adsorbents were detected using the Micrometrics (TriStar II 3020)
Surface Area and Porosity Analyzer. All of the adsorbent samples were de-gassed at
200°C for 4 hours, prior to adsorption-desorption experiments. The BET surface area was
calculated by the Brunauer-Emmett-Teller (BET) equation, micropore volume (Vmi) and

78
micropore specific area (Smi) were obtained using the t-plot. The total pore volume (Vt)
was obtained by converting the nitrogen adsorption amount at a relative pressure (P/PO)
of 0.98 to the liquid nitrogen volume. The mesopore volume (Vme) was calculated by
subtracting the Vmi from Vt. The burn-off weight percentage, Pb for SAS was determine
and it measures the degree of activation process. It is defined as the ratio of percentage
weight loss of the material during preparation of the original weight of the raw material.
It is mathematically expressed as:
100xw
wwp
o
fo
b
(3.11)
79
CHAPTER 4: RESULTS & DISCUSSION
Chapter summary
This chapter was divided based on the removal studies, Sub-Chapter 4.1 – Sub-Chapter
4.7 are the results and discussions of the batch experimental and characterization analysis
on the arsenate removal studies, while Sub-Chapter 4.8 – Sub-Chapter 4.13 are the results
and discussions of the batch experimental and characterization analysis on the Methyl
Orange and Methylene Blue dyes removal.

80
4.1 Arsenate isotherms Studies
La/Fe ratio
0.0 0.2 0.4 0.6 0.8
Ceq (mg L
-1)
0 40 80 120 160
Qe
q (
mg g
-1)
0
50
100
150
200
250
PSAC
MPSAC
MPSAC-La(0.084)
MPSAC-La(0.23)
MPSAC-La(0.36)
MPSAC-La(0.28)
Amounts of La
0.0 0.1 0.2 0.3 0.4
KL
0.0
0.5
1.0
1.5
2.0
Qm
ax (
mg g
-1)
0
50
100
150
200
250
A
B
Figure 4.1 (A) Adsorption isotherm of arsenate on the PSAC, MPSAC and
MPSAC impregnated with different amounts of lanthanum at pH 6, Ci = 10 ~ 350
mg L-1 and 1 g L-1 of adsorbent. Black color fit lines are the Langmuir and gray
color fit lines are the Freundlich isotherm model (B) Qmax and KL values vs. the
ratio of La/Fe or the amounts of La.
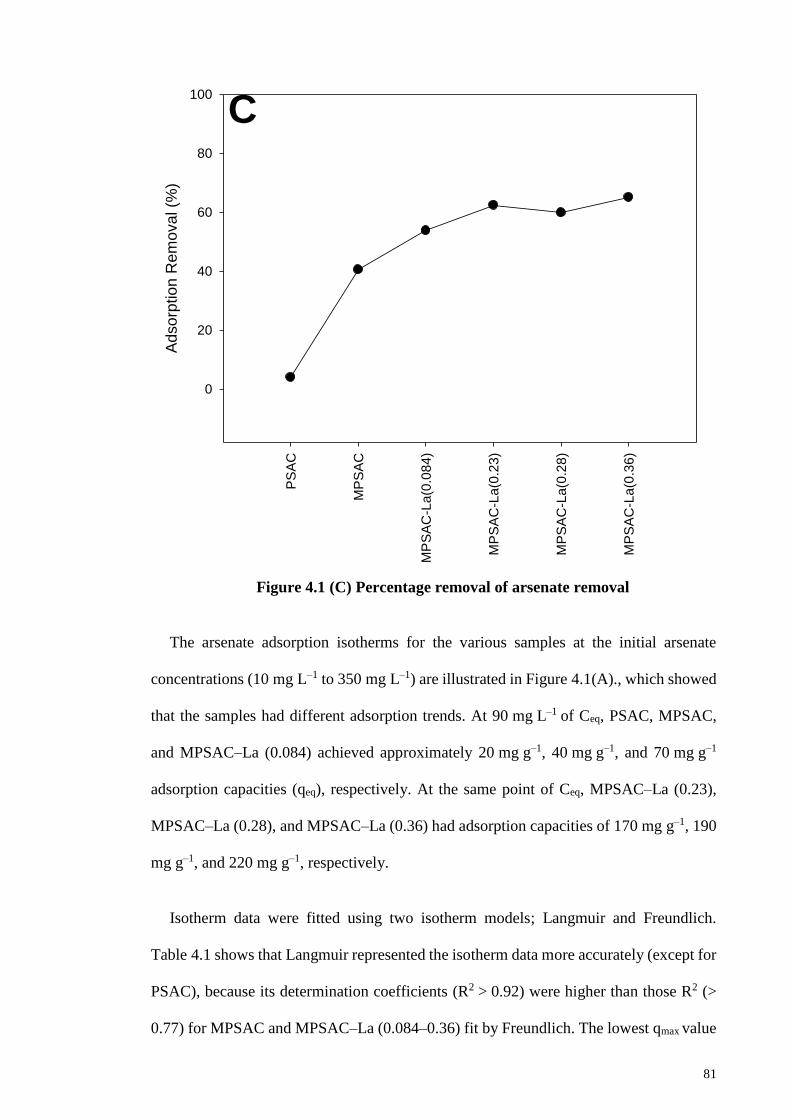
81
PS
AC
MP
SA
C
MP
SA
C-L
a(0
.08
4)
MP
SA
C-L
a(0
.23
)
MP
SA
C-L
a(0
.28
)
MP
SA
C-L
a(0
.36
)
Ad
so
rptio
n R
em
ova
l (%
)
0
20
40
60
80
100
C
Figure 4.1 (C) Percentage removal of arsenate removal
The arsenate adsorption isotherms for the various samples at the initial arsenate
concentrations (10 mg L–1 to 350 mg L–1) are illustrated in Figure 4.1(A)., which showed
that the samples had different adsorption trends. At 90 mg L–1 of Ceq, PSAC, MPSAC,
and MPSAC–La (0.084) achieved approximately 20 mg g–1, 40 mg g–1, and 70 mg g–1
adsorption capacities (qeq), respectively. At the same point of Ceq, MPSAC–La (0.23),
MPSAC–La (0.28), and MPSAC–La (0.36) had adsorption capacities of 170 mg g–1, 190
mg g–1, and 220 mg g–1, respectively.
Isotherm data were fitted using two isotherm models; Langmuir and Freundlich.
Table 4.1 shows that Langmuir represented the isotherm data more accurately (except for
PSAC), because its determination coefficients (R2 > 0.92) were higher than those R2 (>
0.77) for MPSAC and MPSAC–La (0.084–0.36) fit by Freundlich. The lowest qmax value

82
for PSAC was only 13.8 mg g−1, but MPSAC–La (0.36) had the highest qmax of
227.6 mg g−1. Thus, surface modification by the dual impregnation of Fe and La
[MPSAC–La (0.36)] increased the adsorption capacity by 16.5 times that of the
unmodified PSAC. Although MPSAC–La (0.36) had a qmax 1.6 times greater than that of
MPSAC (141.8 mg g–1), its Langmuir constant (KL = 2.25) was 230 times greater than
that of MPSAC (0.01) (see Figure 4.1(B)).
Limousin et al. (2007) specified four main types of Langmuir isotherm. La–
impregnated media (La/Fe mass ratio greater than 0.23) can be classified as an H–type
Langmuir isotherm, indicating a high affinity. The other media are L–type Langmuir
isotherms, as they have an adsorption capacity on arsenate concentration and active site
on adsorbent surface (Limousin et al., 2007).
Table 4.1(A) Langmuir and Freundlich isotherm parameters for arsenate
adsorption onto PSAC, MPSAC and MPSAC impregnated with different amount
of lanthanum (III) at pH 6, Ci (350 mg L-1)
adsorbent type Langmuir isotherm Freundlich isotherm
R2 KL qmax R2 Kf 1/n
PSAC 0.387 0.009 13.8 0.553 0.03 0.768
MPSAC 0.921 0.005 141.8 0.859 0.67 1.065
MPSAC-La(0.084) 0.987 0.010 188.3 0.822 1.14 1.055
MPSAC-La(0.23) 0.947 0.088 218.4 0.770 86.36 5.744
MPSAC-La(0.28) 0.989 0.594 209.4 0.863 131.88 10.296
MPSAC-La(0.36) 0.995 2.248 227.6 0.975 153.27 10.757
83
Based on Table 4.1, it was observed that the KL values significantly increased as the
impregnated amount of La increased. The higher value of KL, the stronger sorption
affinity between adsorbate and adsorbent can be obtained (Apostol, Mamasakhlisi, &
Subotta, 2015). The Fe-La composite hydroxide synthesized by Zhang et al. (2014) also
showed that the larger KL and qmax values were obtained with the higher ratio of La/Fe
(in the range of 1/3~1/0). In an interesting aspect, MPSAC–La (0.36) had a much higher
qmax than Fe–La composite [La/Fe (1/3), 116 mg g–1], which had a similar La/Fe ratio.
This might happened due to the structural differences since MPSAC–La has a sequence
of Fe and La at the inner and outer layers, respectively, while Fe-La composite has a
mixed matrix.
The following experiments were conducted using the MPSAC and MPSAC–La (0.36)
because the MPSAC–La (0.36) had the highest KL and qmax. The MPSAC was chosen as
a comparative media to find out the influence of La for the efficiency of arsenate removal.

84
4.2 Arsenate Kinetics
Time (min)
0 100 200 300 400
ad
so
rptio
n c
ap
acity (
mg
g-1
)
0
50
100
150
200
250
300
MPSAC-La (0.36)
MPSAC
A
Figure 4.2 (A) kinetics of arsenate removal by MPSAC-La (0.36) for the removal of
arsenate at pH 6, Ci = 350 mg L-1, 1.0 g L-1 of adsorbent

85
t0.55 10 15 20
ad
sorp
tion
ca
pa
city
(m
g g
-1)
0
50
100
150
200
250
300
B
Kd1
Kd2
Kd3
Kd1
Kd2
MPSAC-La (0.36)
MPSAC
Figure 4.2 (B) intra-particle diffusion modelling of MPSAC-La (0.36) for
the removal of arsenate at pH 6, Ci = 350 mg L-1, 1.0 g L-1 of adsorbent
Final pH
4 5 6 7 8 9 10
pH
fina
l - p
Hin
itia
l
-2
-1
0
1
2
3
4MPSAC
MPSAC-La(0.36)
C
Figure 4.2 (C) pHPZC of MPSAC-La (0.36)
86
Figure 4.2 (A) shows the kinetic data of MPSAC and MPSAC–La (0.36), as well as
the fit lines of the pseudo–second order kinetic model (R2 > 0.98). The adsorption trend
shows two patterns, which are the fast and slow rates. At the first ~30 minutes, MPSAC–
La (0.36) and MPSAC had fast sorption speeds with 78% and 87% arsenate removal
percentages over the equilibrated capacity (qeq), respectively. The qeq of the MPSAC and
MPSAC–La (0.36) were 134.5 mg g–1 and 240.6 mg g–1, which are almost similar to the
qeq of previous isotherm tests at the same condition. So, this proves that the performed
batch tests were reliable. To investigate the adsorption rate and removal mechanism of
arsenate by the MPSAC–La (0.36) and MPSAC, the pseudo first-order and pseudo
second-order kinetic models were utilized. By comparing their R2 values (Table 4.2), the
pseudo first-order kinetic model for MPSAC-La (0.36) had a higher value (0.994) than
the pseudo second-order kinetic model (0.988). Thus, it can be deduced that the physical-
sorption (precipitation) is an influenced removal mechanism by the MPSAC-La (0.36).
Meanwhile, the pseudo first-order kinetic model shown by the MPSAC is lower than the
pseudo second-order kinetic model, which means that there is no physical-sorption
influenced removal mechanism. In addition, the intra particle diffusion model was also
plotted to prove the diffusion mechanism.
Figure 4.2 (B) shows the kinetic data and fit lines using the IPD model. The linearized
curves for both media did not pass through the origin, proving that IPD is not the only
affecting factor (Yürüm, Kocabaş-Ataklı, Sezen, Semiat, & Yürüm, 2014). Generally,
adsorption can be affected by three steps: film and bulk boundary diffusion (kd1), intra
particle diffusion (kd2) and physical or chemical binding at the active sites (kd3) (K. Wu
et al., 2013). Lately, Liu et al. (2015) reported that the predominant formation of the
bidentate binuclear corner-sharing inner-sphere complexes between the arsenate and the
nano–magnetite is based on their spectroscopic analyses (C.-H. Liu et al., 2015). Through
XPS analyses, Zhang et al. (2009) also conveyed the nano–magnetite doped on the

87
activated carbon fiber had a major role to eliminate arsenate with the mechanism of inner-
sphere complexation (S. Zhang, Li, & Chen, 2009). Based on those evidences, further
tests were conducted to prove the removal mechanism of arsenate by the MPSAC–La
(0.36).
Table 4.2 Parameters of the pseudo-first and pseudo-second order kinetic
models for arsenate adsorption by MPSAC–La (0.36) and MPSAC
Adsorbent
Pseudo first order kinetic model Pseudo second order kinetic model
qe (mg g–1) Kad (min–1) R2
qe (mg g–
1)
k2 (g mg–
1 min–1)
v0 (mg
g–1 min–
1)
R2
MPSAC 167.4 0.005976
0.407
134.5 0.0017 6.7 0.997
MPSAC–
La (0.36)
265.2 0.0038 0.994 240.6 0.0003 20.8 0.988
Table 4.3 Comparison of sorption capacities and speed with other references
1MPSAC-La (0.36) (La–impregnated, magnetized PSAC 2Low-cost MFD (Modified Sawdust) 3NZVI–RGO (Nanoscale zero valent iron-reduce graphite oxide) 4p (APTMACl) microgels (cationic 3-Acrylamidopropyl)-trimethyl ammonium chloride microgels) *N/A: not available
Adsorbent
Pseudo second order kinetic model
Initial
arsenate
concentr
ation
(mg L-1)
Final
pH
qe (mg
g−1)
v0
(mg g-
1 min-
1)
R2 reference
1MPSAC-La
(0.36)
350 6.0 240.60 20.8 0.988 This study
2Low-cost
MFD
50 6.0 71.23 5.90 - (Hao, Liu, Li, Du,
& Wang, 2014) 3NZVI–RGO 7 7.0 17.00 0.04 0.999 (C. Wang et al.,
2014)
NiFe2O4 10 7.0 14.46 0.25 - (Y. Liu et al.,
2015)
Fe–La (3:1) 15 7.0 77.80 0.0005 0.945 (W. Zhang et al.,
2014)
Fe–La (1:3) 30 7.0 153.00 0.00013 0.963 (W. Zhang et al.,
2014) 4p(APTMAC
l) microgels
250 N/A
*
131.57 0.026 0.9989 (Rehman et al.,
2016)
88
Table 4.2 shows the kinetic parameters of MPSAC and MPSAC–La (0.36), as well as
their comparison with other references in Table 4.3. Accordingly, MPSAC–La (0.36) had
about 3.1 times higher initial sorption rate (v0) than MPSAC. Table 4.3 shows that
MPSAC–La (0.36) had the highest v0 (20.8 mg g–1 h–1). In fact, faster adsorption rate
might occur when a higher amount of positive charge of sorbent is available (Serizawa,
Kamimura, & Akashi, 2000) due to the electrostatic interaction with the arsenate
oxyanion (Pierce & Moore, 1982; W. Zhang et al., 2014).
To prove the electrostatic characteristics of the media, pHPZC was measured and the
data were presented as shown in Figure 4.2(C). Consequently, MPSAC–La (0.36) had a
higher pHPZC (7.4) than MPSAC (6.8). At pH < pHPZC, the positive charges will dominate
and increase the attraction effect with the arsenate oxyanion (Y. Liu et al., 2015; W.
Zhang et al., 2014), increasing the adsorption velocity. Thus, at the same pH condition,
MPSAC–La (0.36) has a higher amount of positive charge than MPSAC and eventually
gives a higher arsenate removal speed.
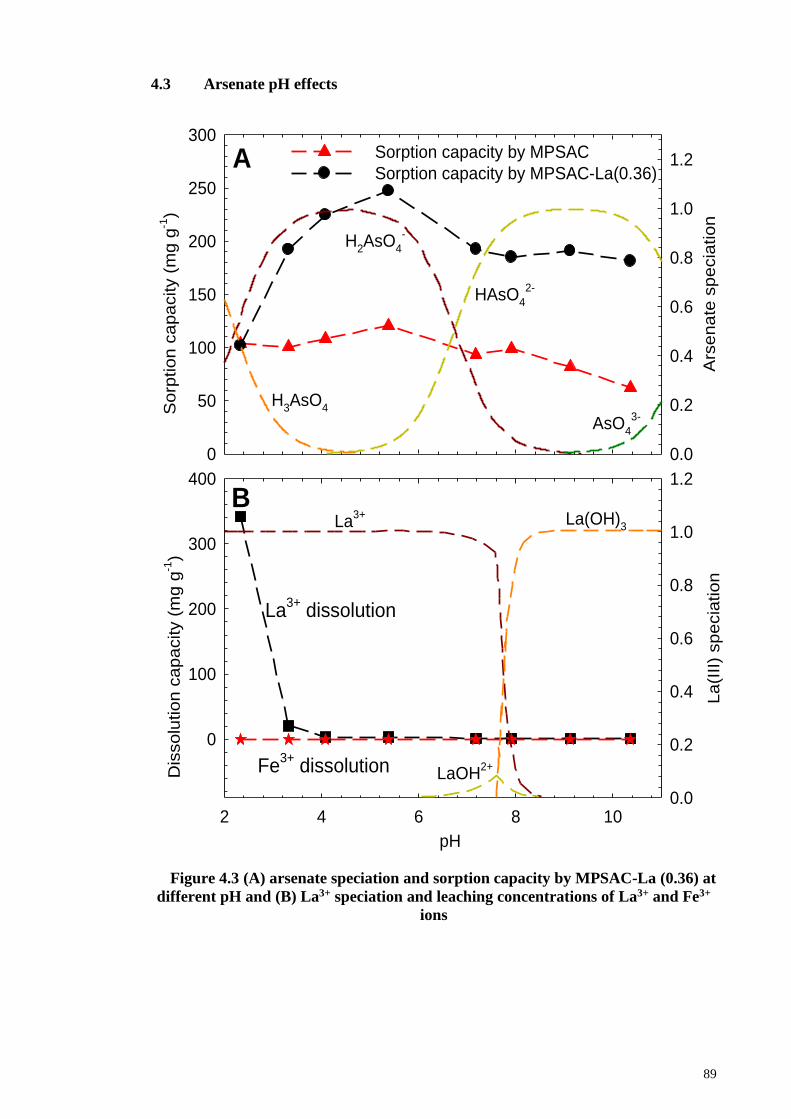
89
4.3 Arsenate pH effects
2 4 6 8 10
Dis
solu
tio
n c
apa
city (
mg g
-1)
0
100
200
300
400
La
(III)
sp
ecia
tion
0.0
0.2
0.4
0.6
0.8
1.0
1.2
So
rption
ca
pa
city (
mg g
-1)
0
50
100
150
200
250
300
Ars
en
ate
sp
ecia
tion
0.0
0.2
0.4
0.6
0.8
1.0
1.2Sorption capacity by MPSAC
Sorption capacity by MPSAC-La(0.36)
La3+
dissolution
Fe3+
dissolution
A
B
pH
H3AsO
4
H2AsO
4
-
HAsO4
2-
AsO4
3-
La3+
LaOH2+
La(OH)3
Figure 4.3 (A) arsenate speciation and sorption capacity by MPSAC-La (0.36) at
different pH and (B) La3+ speciation and leaching concentrations of La3+ and Fe3+
ions

90
Figure 4.3(A) shows arsenate speciation and equilibrated sorption capacity (qeq) by
MPSAC and MPSAC–La (0.36) at different pH. MPSAC–La (0.36) had higher sorption
capacities than MPSAC at most pH range. The highest sorption capacities for MPSAC–
La (0.36) and MPSAC were 247.3 and 120.7 mg g–1, respectively, at pH 5.4. These values
are well matched to the results of the isotherms and the kinetics conducted at pH 6,
revealing reliable experiments. As pH was lower than 5, qeq of MPSAC–La (0.36) was
reduced significantly and was even similar to that of MPSAC at pH 2.3. Figure 4.3 (B)
shows La3+/Fe3+ dissolution and La speciation according to pH. The dissolved
concentration of La3+ ions exponentially increased as the pH reduced. Zhang et al. (2014)
also measured the dissolution of La with various La–Fe composite by pH. As a result, the
La dissolution increased when the La/Fe increased. For example, La/Fe (1/3) started to
dissolve La at pH < 7, while La/Fe (1/0) had La dissolution at pH < 9. In this study,
however, MPSAC–La (0.36) (La/Fe, 0.36/1) had La dissolution occurred at pH < 4.
Accordingly, as shown at Zhang et al. (2014), this demonstrates that heterogeneous metal
oxide might have a particular stabilization effect on La dissolution, inferring that nano–
magnetite might have a strong binding strength to stabilize La.
The highest La3+ ion dissolution, 340 mg g–1 was obtained at pH 2.3 and this value was
equivalent to 94% of La amounts that were incorporated into the media. Thus, it can be
deduced that most La coated on media was dissolved out into the solution at acidic
condition. This minimized sorption capacity might be due to the dissolution of La3+,
which does not participate in the arsenate removal as a precipitation agent (N. Haque,
Morrison, Cano-Aguilera, & Gardea-Torresdey, 2008). Due to this fact, MPSAC–La
(0.36) had the same sorption capacity to MPSAC at pH 2.3. For all ranges of pH, Fe3+
was not dissolved due to the La coating and low solubility of magnetite (Cornell &
Schwertmann, 2003).

91
The sorption capacities of arsenate were gradually reduced from pH 5.4 to 8 and they
were stable to be about ~ 190 mg g–1 at pH > 8. In this study, the chemical equilibrium-
modeling program, ‘Medusa/Hydra’, was applied to generate the soluble and solid
complexes.
Table 4.3: Mixed metal ions complexes (soluble and solids species) for Medusa
Metals Soluble and Solid
Complexes
Species Reactions Log K
La(III) Soluble complexes La(OH)2+ La3+ = 2H+ + La(OH)2
+ -18.14
La(OH)3 La3+ = 3H+ + La(OH)3 -27.91
La(OH)4- La3+ = 4H+ + La(OH)4
- -40.86
La5(OH)96+ 5La3+ = 9H+ + La5(OH)9
6+ -71.2
LaOH2+ La3+ = 2H+ + LaOH2+ -8.66
OH- H+ + OH- -14.00
Solid complexes La(OH)3 (C) La3+ = 3H+ + La(OH)3 (C) -20.30
As(V) Soluble complexes H2AsO4- 2H+ + AsO4
3-= H2AsO4- 18.354
H3AsO4 3H+ + AsO43- = H3AsO4 20.597
HAsO42- H+ + AsO4
3- = HAsO42- 11.596
Solid complexes As2O5 (C) 6H+ + 2AsO43- = As2O5 (C) 13.90
Table 4.3 shows the soluble and solid species of individual metals, terms of reaction,
and equilibrium constants (log K). The La speciation shows that La3+ exists dominantly
as cationic species at pH < 8 and La (OH)3 is prevalent at pH > 8. Based on this speciation,
therefore, arsenate is dominantly removed by precipitation at pH < 8 while it complexes
on the surface of La (OH)3 at pH > 8. Soluble La3+ ions are expected to react with arsenate
to form LaAsO4 precipitate (W. Zhang et al., 2014). There are two available precipitation
reactions as shown below:
HLaAsOAsOHLa 2442
3 (4.1)
HLaAsOHAsOLa 44
3 (4.2)
92
The maximum sorption capacity was found when the species of H2AsO4– is dominant
(Shujuan Zhang, Li, & Chen, 2010). This might happened by the following
circumstances; as shown by the above precipitation reactions, R1 releases the double
hydrogen ions (H+) of R2 and soluble H+ ions help to further solubilize La (OH)3 to
release La3+ for precipitation. Along with the stability of La phase, dissolved La3+ was
not detected because it was involved in the precipitation reaction at 4 < pH < 8. When pH
is less than 4, however, H3AsO4, non-ionic prevalent species, does not react with La3+ ion
to form precipitate. The dissolution trend of La3+ was reversely related to the speciation
fraction of H3AsO4. Meanwhile, arsenate (as HAsO42– species) might be mainly removed
by the inner-sphere complexation (W. Zhang et al., 2014) onto the surface of La (OH)3
under alkaline condition (pH > 8).
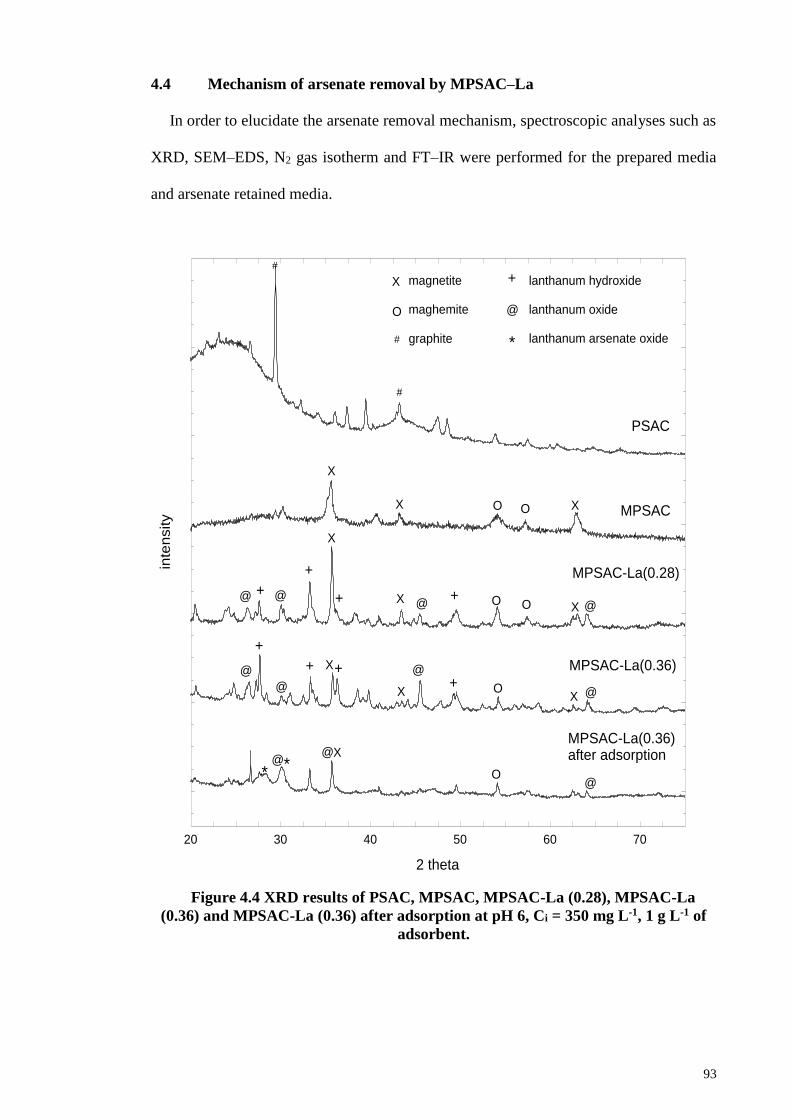
93
4.4 Mechanism of arsenate removal by MPSAC–La
In order to elucidate the arsenate removal mechanism, spectroscopic analyses such as
XRD, SEM–EDS, N2 gas isotherm and FT–IR were performed for the prepared media
and arsenate retained media.
2 theta
20 30 40 50 60 70
inte
nsity
PSAC
MPSAC
MPSAC-La(0.28)
MPSAC-La(0.36)
MPSAC-La(0.36) after adsorption
X
XX
X
X
O
OO
O
+
@@@+
@
++
+
@
@
+
@
+ X @+ O @
X
O@
*
**
X O X
X X
lanthanum hydroxide
lanthanum oxide
lanthanum arsenate oxide
magnetite
maghemite
+
@
graphite#
#
#
@
Figure 4.4 XRD results of PSAC, MPSAC, MPSAC-La (0.28), MPSAC-La
(0.36) and MPSAC-La (0.36) after adsorption at pH 6, Ci = 350 mg L-1, 1 g L-1 of
adsorbent.

94
Figure 4.4 shows the XRD results of PSAC, MPSAC, MPSAC–La (0.28), MPSAC–
La (0.36) and arsenate retained MPSAC–La (0.36) at pH 6. PSAC has significant graphite
peaks of (002) and (100) at 28o and 43o, respectively. The magnetic materials coated on
the surface of MPSAC were identified as magnetite and maghemite. Three broad peaks
at 37o, 43o and 62o of the 2 theta were corresponding to (311), (400) and (440) planes of
magnetite [JCPDS : 19–0629] (Maity, Kale, Kaul-Ghanekar, Xue, & Ding, 2009) while
the two broad peaks at 53o and 56o were identified as (422) and (511) planes of maghemite
[JCPDS:39-1346] (Kim et al., 2012). Although the magnetization properties between the
magnetite and maghemite are similar (S. R. Chowdhury, Yanful, & Pratt, 2011), the
oxidation of magnetite might lead to the formation of maghemite during the drying
process of MPSAC. Once Lanthanum was incorporated into MPSAC with a ratio of
0.28:1 (La:Fe), the peaks of lanthanum oxide (LO) phase were shown at 27o, 30o, 47o and
64o on (100), (101), (110), and (202) planes, while the phase of lanthanum hydroxide
(LH) was emerged at 28o, 33o, 37 and 49o on (110), (101), (200), (111), and (300) planes,
respectively. However, it still has the magnetite and maghemite peaks. As for MPSAC–
La (0.36), the phase of LH increased more than LO, and magnetite and maghemite phases
still existed, but reduced significantly. The peaks of LO and LH were determined to refer
to La2O3 [JCPDS: 05–0602] and La (OH)3 [JCPDS:36-1481]. The XRD pattern for
arsenate retained MPSAC–La (0.36) showed the formation of LaAsO4 phase [JCPDS:15-
756] at 28o and 30o which are the plane of (120) and (012), correspondingly. The results
exhibited that the arsenate was dominantly removed by the precipitation mechanism (W.
Zhang et al., 2014). In addition, as the LO peaks still existed, the disappearance of LH
peaks revealed that LH was leached away and LaAsO4 layer was covered on the LO phase
during the removal of arsenate from liquid phase.

95
Figure 4.5 (A) FESEM for PSAC
Figure 4.5 (B) FESEM+EDX for MPSAC
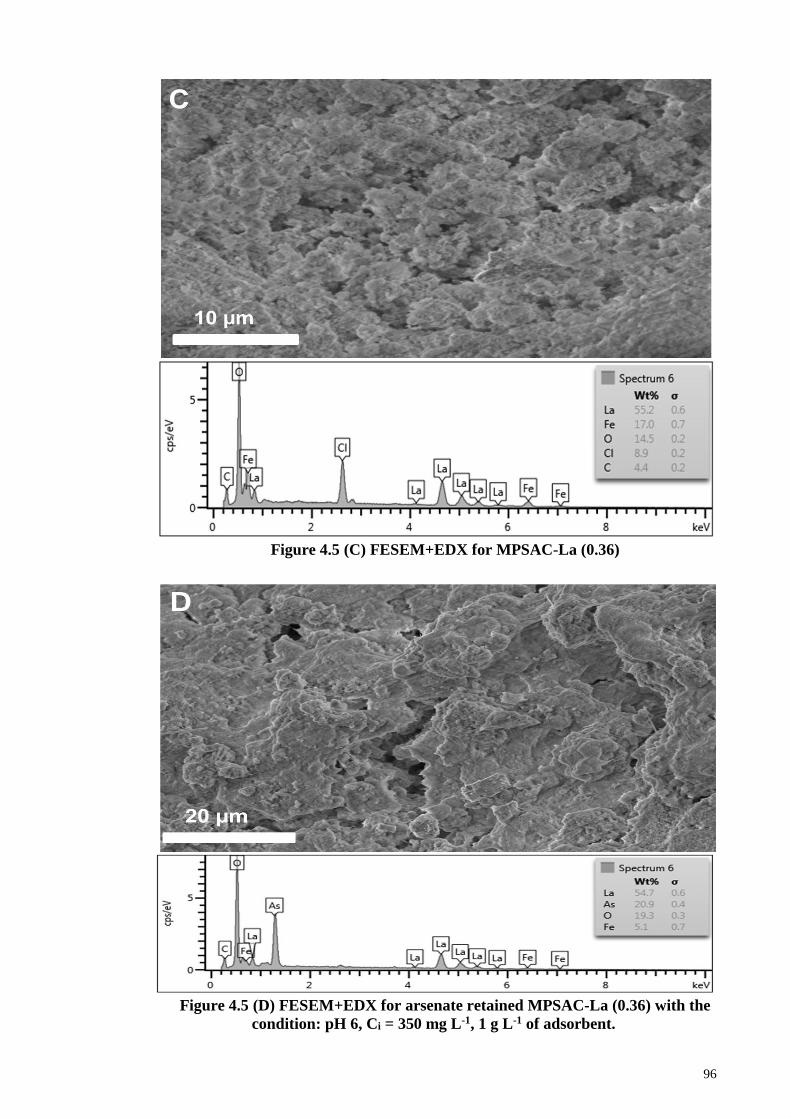
96
Figure 4.5 (C) FESEM+EDX for MPSAC-La (0.36)
Figure 4.5 (D) FESEM+EDX for arsenate retained MPSAC-La (0.36) with the
condition: pH 6, Ci = 350 mg L-1, 1 g L-1 of adsorbent.

97
The morphology of PSAC, MPSAC, MPSAC–La (0.36) and arsenate retained
MPSAC-La (0.36) at pH 6 were analyzed using the FESEM–EDX. Figure 4.5A show the
morphological structures of the PSAC, in which outer pores were highly developed.
Figure 4.5B shows the morphology of MPSAC and ball-like nanoparticles on the surface,
although the outer pores were still found. The EDX shows that MPSAC contained 72.3%
of Iron and 27.7% of Oxygen. Through the molecular weight calculation, the iron oxide
deposited on the PSAC was identified as a dominant phase of magnetite (Fe3O4). Figure
4.5C shows the morphological structure of MPSAC–La (0.36), in which the nano-
particles of magnetite and maghemite disappeared. Instead, a 3-Dimensional (3D) nano
plate-like and hexagonal layered structures of LO/LH were dominantly coated on the
surface (Y. Guo, Zhu, Qiu, & Zhao, 2012). The EDS analysis shows the MPSAC-La
(0.36) contained 55.2% of Lanthanum and 17% of Iron. It shows that the surface of
MPSAC-La (0.36) was not fully covered by LO/LH as shown in XRD results.
Figure 4.5D shows the dissolution-precipitation caused morphological changes of
arsenate retained MPSAC-La (0.36) that formed large plate-like and hexagonal layered
structure. Grover et al. (2010) suggested that the arsenate reacts with dissolved layered
double hydroxide (LDH) and formed small particles. However, the formed precipitates
had large morphological structures for the case of MPSAC–La (0.36). The EDS data
shows that 54.7%, 5.1% and 20.9% of Lanthanum, Iron and Arsenic weight percentages,
respectively. Thus, the weight ratio (2.62) of Lanthanum to Arsenic is higher than the
theoretical ratio (1.85) for LaAsO4 which was seen at XRD. This result is well matched
to the finding of XRD, in which LO and LaAsO4 phases were co-existed.

98
pore diameter(Å)
10 100 1000
dV
/dW
po
re v
olu
me
(cm
3g
-1Å
-1)
0.000
0.002
0.004
0.006
0.008
0.010
pore diameter (Å)
0.0 0.2 0.4 0.6 0.8 1.0
Vo
lum
e a
bso
rbe
d (
cm3/g
,ST
P)
0
50
100
150
200
250
300
PSAC
MPSAC-La(0.084)
MPSAC-La(0.36)
MPSAC-La(0.28)
PSAC
MPSAC-La(0.084)
MPSAC-La(0.36)
MPSAC-La(0.28)
A
B
Figure 4.6 (A) N2 adsorption and desorption isotherms (B) pore size distribution
(BJH) curve of MPSAC, MPSAC-La (0.084), MPSAC-La (0.28) and MPSAC-La
(0.36) at pH 6, Ci = 350mg L-1, 1 g L-1 of adsorbent.

99
Figure 4.6 shows N2 gas isotherm and BJH pore size distribution of various media.
According to the IUPAC standard classification, PSAC shows that the type I isotherm
curve represents the long horizontal knee feature of the isotherm, predominantly
consisting of micropore structures. Meanwhile, others show type IV isotherm curve.
Accordingly, with a small incorporation of Lanthanum, micropores largely reduced,
instead the meso and macropore structures were developed. However, as the
incorporation amount of Lanthanum increased, the microporous structure completely
disappeared and the meso and macropores also reduced. Based on those results, it can be
inferred that the meso and macropores were created by the inter-spaces of the nano-
magnetite and maghemite. However, incorporated LH/LO is glued between the nano-
particles to eliminate most pore structures.
Table 4.4 Porosity characterization of PSAC, MPSAC, MPSAC–La (0.084),
MPSAC–La (0.28), MPSAC–La (0.36)
Samples Mola
r
ratio
of La:
Fe
BET
surface
area
(m2g–1)
total
pore
volume
(cm3g–
1)
Micro
- pore
Area
(m2g–
1)
Volume
(cm3g–1)
primary
mesopore
Area
(m2g–
1)
Volume
(cm3g–1)
Size
(WKJ
S,Å)
PSAC NA* 842.5 0.428 777.8 0.428 153.1 0.116 18.4
MPSAC
–La
(0.084)
0.17:1 332.3 0.389 247.6 0.389 109.1 0.389 43.7
MPSAC
–La
(0.28)
0.56:1 23.0 0.098 3.1 0.001 20.0 0.095 169.7
MPSAC
–La
(0.36)
0.72:1 32.7 0.091 6.0 0.003 26.8 0.087 111.3
4
*not available
Based on Table 4.4, PSAC has the highest BET surface area (842.5 m2 g–1) and
micropore area (777.8 m2 g–1) so that micropores were dominant. Meanwhile, PSAC–La
(0.28) had the lowest BET surface area (23 m2 g–1) and micropore area (3.1 m2 g–1). About
99.6% of the micropores were disappeared with Lanthanum incorporation, indicating that
most pores were clogged by LO/LH.

100
Table 4.5 Comparison of maximum adsorption capacities and sorption densities
of various media
Adsorbents BET
surface
area (m2
g–1)
Maximum
arsenate
adsorption
capacity (qmax)
Sorption
density
(mg m–2)
pH references
Fe–La (3:1) 224.5 116 0.52 7 (W. Zhang et al.,
2014)
Fe–La (1:3) 54.8 235.4 4.3 7 (W. Zhang et al.,
2014)
MPBAC–La
(0.36)
32.7 227.6 6.9 6 This study
MPBAC 842.5 141.1 0.17 6 This study
La50SBA–15 184.7 124.4 0.67 7.2 (Jang et al.,
2004)
Cu/Mg/Fe/La
LDH
241 43.5 0.18 6 (Y. Guo et al.,
2012)
Mg–Fe–Al–
LDH
63.6 18.4 0.29 6 (J. Hong, Zhu,
Lu, & Qiu, 2014)
Table 4.5 shows the comparison of qmax and sorption densities with other references.
MPSAC–La (0.36) had a comparable qmax (227.6 mg g–1) to Fe–La (1:3) composite (hydr)
oxides (235.4 mg g–1) (W. Zhang et al., 2014). As shown in this study, Zhang et al. (2014)
presented that arsenate adsorption capacity is increased as Lanthanum amount is
increased. As a remarkable result, MPSAC–La (0.36) had a higher sorption density (6.9
mg m–2) than La–Fe (3:1) (4.3 mg m–2) (W. Zhang et al., 2014), even though it has a
smaller ratio of Lanthanum to Iron (0.36:1). Other than having a high sorption capacity,
MPSAC–La (0.36) has advantages in the physical aspects such as the granular-size and
its magnetism, while Fe:La (1:3) has a fine size and is non-magnetic.

101
Wave number (cm-1
)
5001000150020002500300035004000
Tra
nsm
itta
nce
(%
)
C-C=CH-H
-C=C-C-H
Fe-O
=CH-H- C-C
H-O-H-C=C-
O-HO-H
La(OH)3 La2O3Fe-O
O-H
As-O-La
Fe-O
PSAC
MPSAC
MPSAC-La(0.36)
MPSACLa(0.36) after adsorption
La(OH)3
H-O-H
H-O-H
C-H
La2O3
O-H
Figure 4.7 FT-IR spectra of MPSAC, MPSAC-La (0.36) and MPSAC-La (0.36)
after adsorption at pH 6, Ci = 350mg L-1, 1 g L-1 of adsorbent.

102
The FT–IR spectra for PSAC, MPSAC, MPSAC–La (0.36) and arsenate retained
MPSAC-La (0.36) were illustrated in Figure 4.7. The peaks at 2915/2917, 2074/2100 and
1409/1499 cm–1 in the IR spectra of PSAC/MPSAC, were indicated to C–H, –C=C–
(carbonyl) and C–C aromatic stretching, respectively. The peak at 612 cm–1 for MPSAC
is assigned to Fe–O stretching. The difference between PSAC and MPSAC is the OH
peak which can be seen at 3000 ~ 3500 cm–1. This difference shows that MPSAC media
was coated with the magnetite and maghemite.
When Lanthanum is impregnated, new IR peaks at 3395 and 3556 cm–1 were emerged
to indicate O–H stretching group of LH (Aghazadeh, Golikand, Ghaemi, & Yousefi,
2011). The peak at 1629 cm–1, H–O–H was observed to be the deformation of water
molecules by forming physi-sorbed water on the oxide. The IR peak at 1484 and 1423
cm–1 is attributed from the reaction of LH with CO2 (Aghazadeh et al., 2011). The IR peak
at 698 cm–1 is the characteristic of LO (Méndez et al., 2010). When arsenate is retained
at MPSAC–La (0.36), the peaks of O–H and LO/LH at 3556, ~1400, 500–700 cm–1 were
significantly reduced and new peaks at 808 and 839 cm–1 were assigned to As–O–La
precipitate as LaAsO4 (W. Zhang et al., 2014). Thus, these facts can infer that LO/LH
were utilized to form arsenate precipitate. Overall, scheme 1 presents MPSAC–La (0.36)
preparation and arsenate removal mechanism.
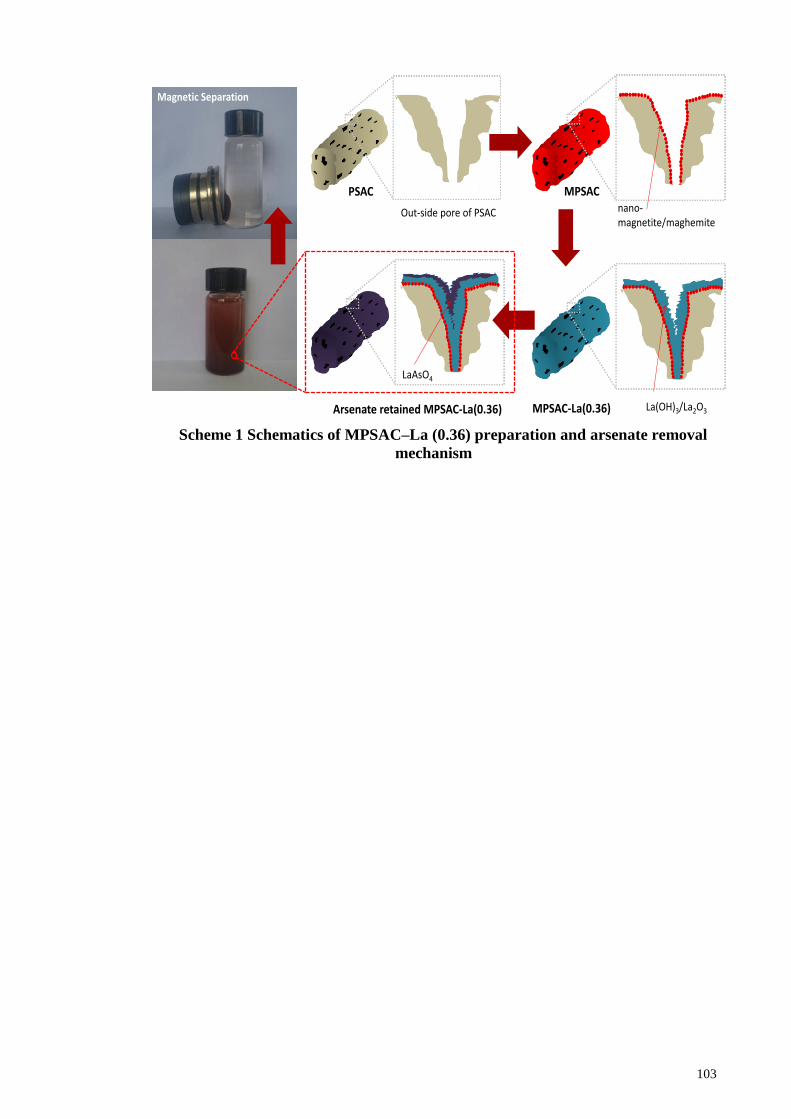
103
Scheme 1 Schematics of MPSAC–La (0.36) preparation and arsenate removal
mechanism
PSAC MPSAC
MPSAC-La(0.36)Arsenate retained MPSAC-La(0.36)
nano-magnetite/maghemite
La(OH)3/La2O3
LaAsO4
Out-side pore of PSAC
Magnetic Separation
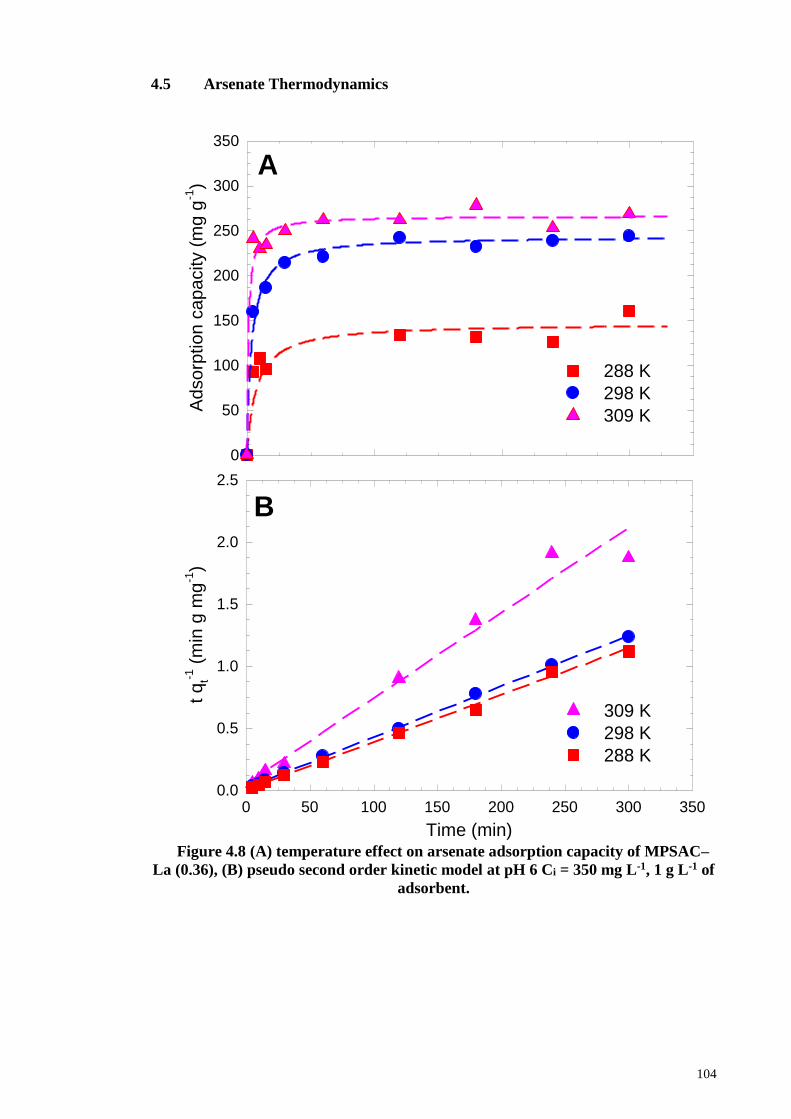
104
4.5 Arsenate Thermodynamics
Time (min)
0 50 100 150 200 250 300 350
t q
t-1 (
min
g m
g-1
)
0.0
0.5
1.0
1.5
2.0
2.5
309 K
298 K
288 K
Adso
rption
cap
acity (
mg g
-1)
0
50
100
150
200
250
300
350
288 K
298 K
309 K
A
B
1/T0.0032 0.0033 0.0034 0.0035
Ln
Kd
-0.4
-0.2
0.0
0.2
0.4
0.6
0.8
1.0
1.2
1.4
1.6
C
Figure 4.8 (A) temperature effect on arsenate adsorption capacity of MPSAC–
La (0.36), (B) pseudo second order kinetic model at pH 6 Ci = 350 mg L-1, 1 g L-1 of
adsorbent.
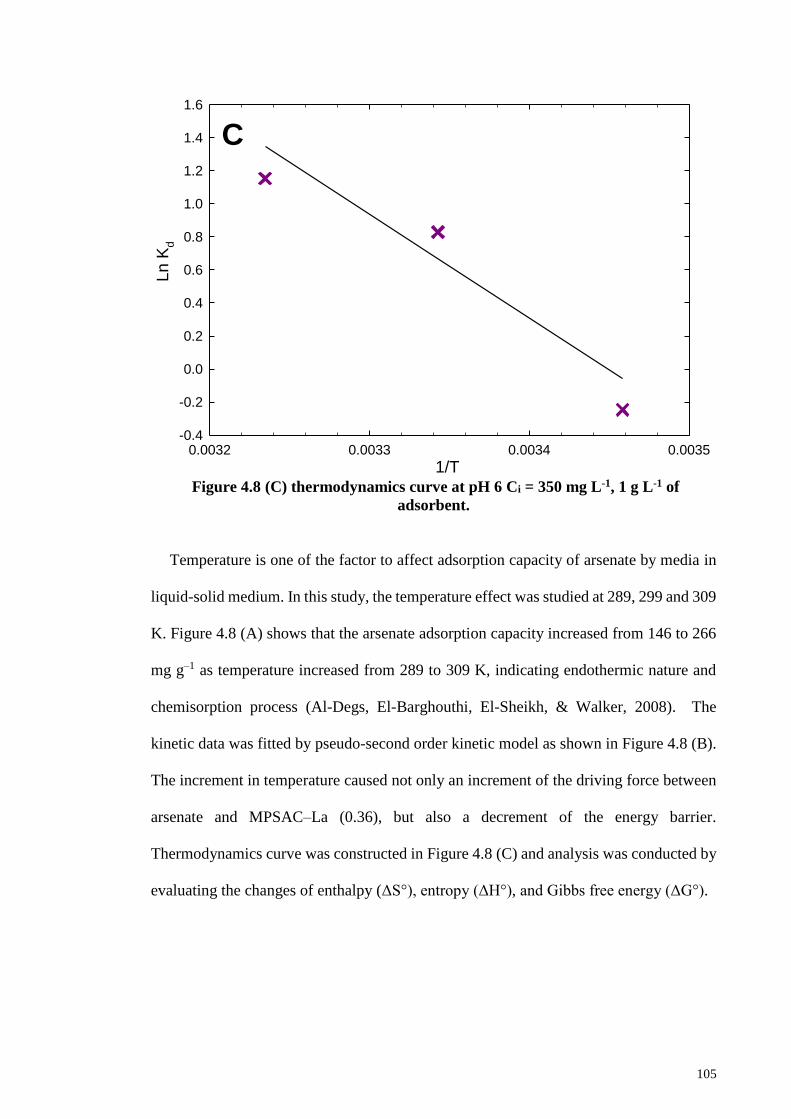
105
1/T0.0032 0.0033 0.0034 0.0035
Ln
Kd
-0.4
-0.2
0.0
0.2
0.4
0.6
0.8
1.0
1.2
1.4
1.6
C
Figure 4.8 (C) thermodynamics curve at pH 6 Ci = 350 mg L-1, 1 g L-1 of
adsorbent.
Temperature is one of the factor to affect adsorption capacity of arsenate by media in
liquid-solid medium. In this study, the temperature effect was studied at 289, 299 and 309
K. Figure 4.8 (A) shows that the arsenate adsorption capacity increased from 146 to 266
mg g–1 as temperature increased from 289 to 309 K, indicating endothermic nature and
chemisorption process (Al-Degs, El-Barghouthi, El-Sheikh, & Walker, 2008). The
kinetic data was fitted by pseudo-second order kinetic model as shown in Figure 4.8 (B).
The increment in temperature caused not only an increment of the driving force between
arsenate and MPSAC–La (0.36), but also a decrement of the energy barrier.
Thermodynamics curve was constructed in Figure 4.8 (C) and analysis was conducted by
evaluating the changes of enthalpy (ΔS°), entropy (ΔH°), and Gibbs free energy (ΔG°).
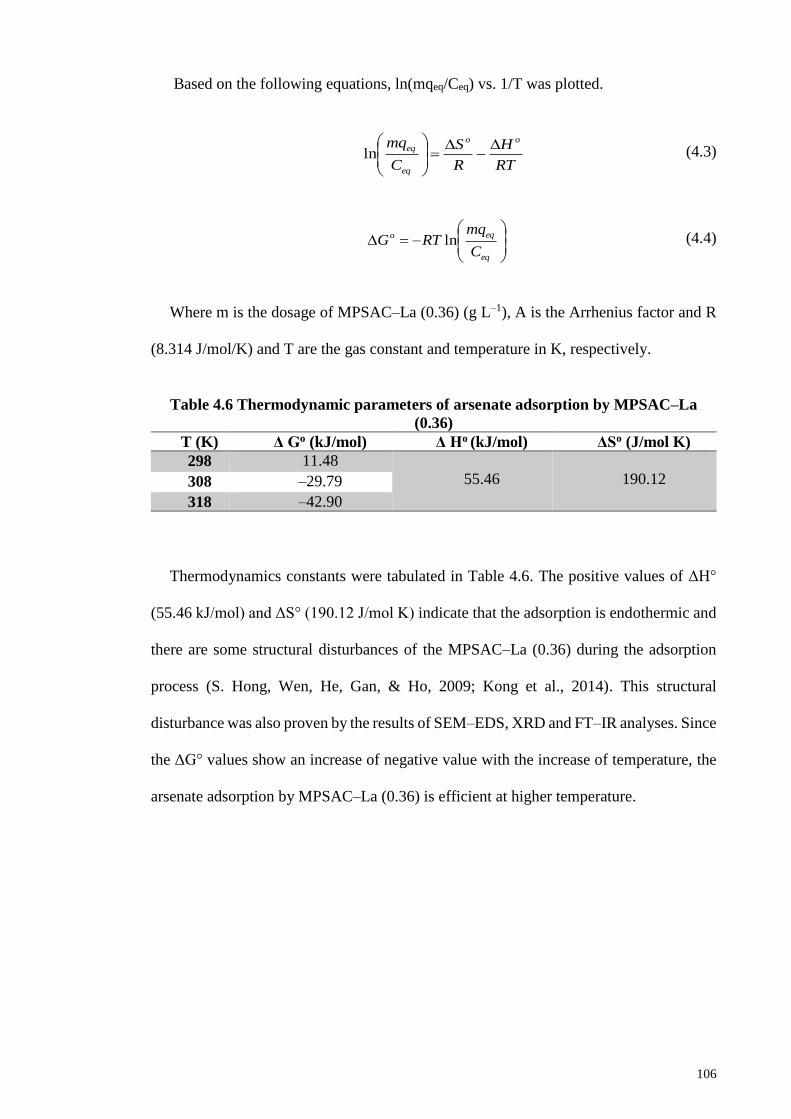
106
Based on the following equations, ln(mqeq/Ceq) vs. 1/T was plotted.
RT
H
R
S
C
mq oo
eq
eq
ln (4.3)
eq
eqo
C
mqRTG ln (4.4)
Where m is the dosage of MPSAC–La (0.36) (g L–1), A is the Arrhenius factor and R
(8.314 J/mol/K) and T are the gas constant and temperature in K, respectively.
Table 4.6 Thermodynamic parameters of arsenate adsorption by MPSAC–La
(0.36)
T (K) Δ Go (kJ/mol) Δ Ho (kJ/mol) ΔSo (J/mol K)
298 11.48
55.46
190.12
308 –29.79
318 –42.90
Thermodynamics constants were tabulated in Table 4.6. The positive values of ΔH°
(55.46 kJ/mol) and ΔS° (190.12 J/mol K) indicate that the adsorption is endothermic and
there are some structural disturbances of the MPSAC–La (0.36) during the adsorption
process (S. Hong, Wen, He, Gan, & Ho, 2009; Kong et al., 2014). This structural
disturbance was also proven by the results of SEM–EDS, XRD and FT–IR analyses. Since
the ΔG° values show an increase of negative value with the increase of temperature, the
arsenate adsorption by MPSAC–La (0.36) is efficient at higher temperature.
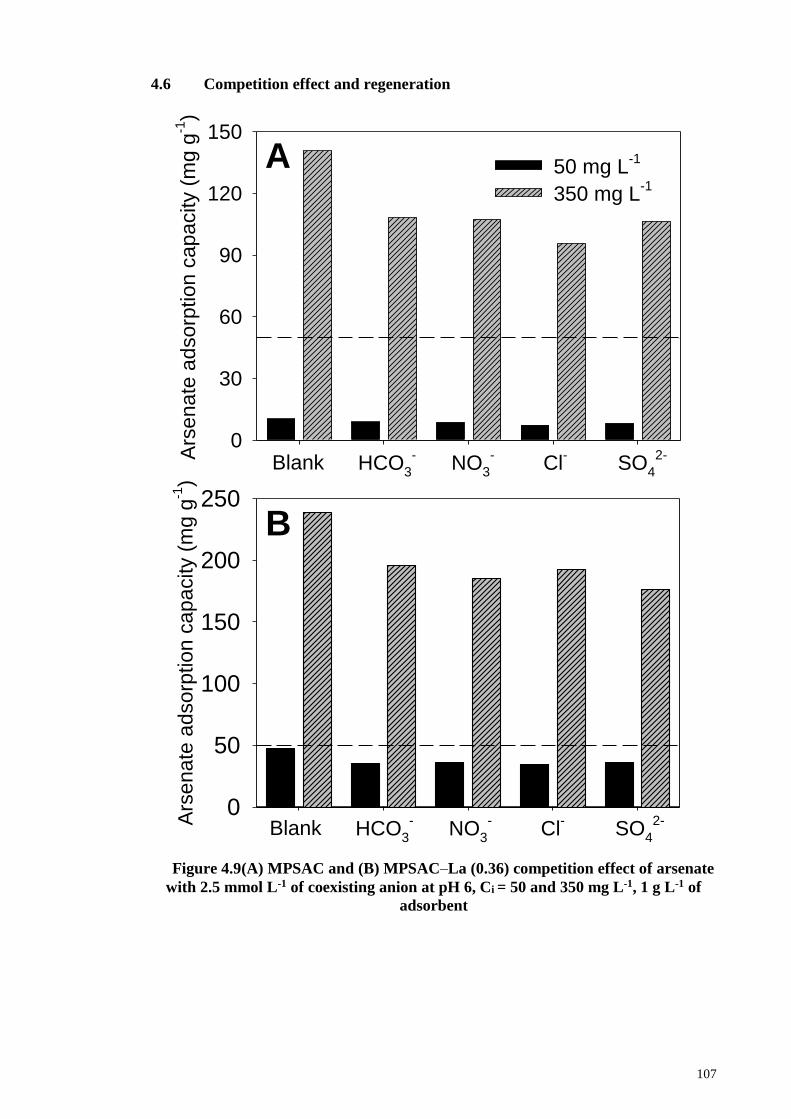
107
4.6 Competition effect and regeneration
Ars
ena
te a
dsorp
tion
cap
acity (
mg g
-1)
0
30
60
90
120
150
50 mg L-1
350 mg L-1
Blank HCO3
-NO
3
-Cl
-SO
4
2-
B
AA
rsena
te a
dsorp
tion
cap
acity (
mg g
-1)
0
50
100
150
200
250
B
Blank HCO3
-NO
3
-Cl
-SO
4
2-
Figure 4.9(A) MPSAC and (B) MPSAC–La (0.36) competition effect of arsenate
with 2.5 mmol L-1 of coexisting anion at pH 6, Ci = 50 and 350 mg L-1, 1 g L-1 of
adsorbent
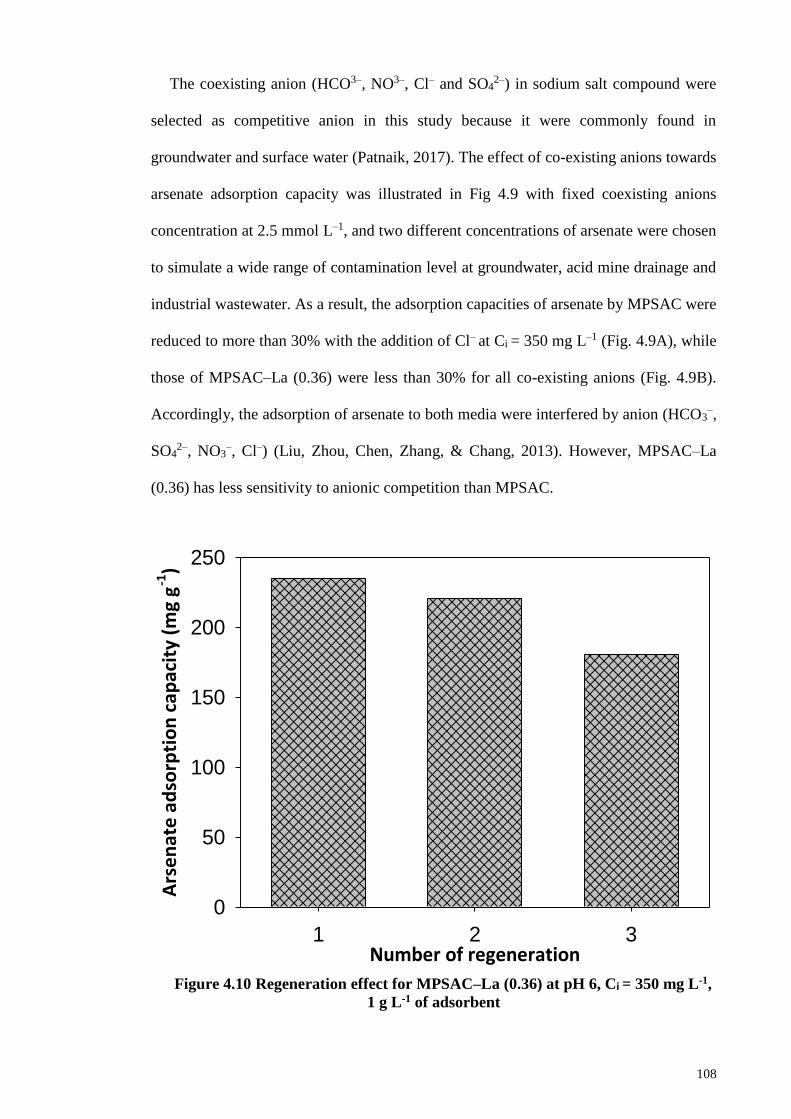
108
The coexisting anion (HCO3–, NO3–, Cl– and SO42–) in sodium salt compound were
selected as competitive anion in this study because it were commonly found in
groundwater and surface water (Patnaik, 2017). The effect of co-existing anions towards
arsenate adsorption capacity was illustrated in Fig 4.9 with fixed coexisting anions
concentration at 2.5 mmol L–1, and two different concentrations of arsenate were chosen
to simulate a wide range of contamination level at groundwater, acid mine drainage and
industrial wastewater. As a result, the adsorption capacities of arsenate by MPSAC were
reduced to more than 30% with the addition of Cl– at Ci = 350 mg L–1 (Fig. 4.9A), while
those of MPSAC–La (0.36) were less than 30% for all co-existing anions (Fig. 4.9B).
Accordingly, the adsorption of arsenate to both media were interfered by anion (HCO3–,
SO42–, NO3
–, Cl–) (Liu, Zhou, Chen, Zhang, & Chang, 2013). However, MPSAC–La
(0.36) has less sensitivity to anionic competition than MPSAC.
Number of regeneration1 2 3
Ars
en
ate
ad
sorp
tio
n c
ap
aci
ty (
mg
g-1
)
0
50
100
150
200
250
Figure 4.10 Regeneration effect for MPSAC–La (0.36) at pH 6, Ci = 350 mg L-1,
1 g L-1 of adsorbent
109
Figure 4.10 shows the regeneration effect for MPSAC-La (0.36) and up to three cycles
of adsorption and desorption were carried out with success to examine the reusability of
MPSAC–La (0.36). Once arsenate adsorption was completed, used MPSAC–La (0.36)
was regenerated using 0.5 M NaOH solution. As a result, MPSAC–La (0.36) had
approximately 75% of the first arsenate adsorption capacity at the third cycle. As per the
analogous case, Zhang et al. (2014) reported that Fe–La composite hydroxide achieved a
75% adsorption rate at the fourth re-adsorption cycle. Presumably, the NaOH solution
provides an alkaline condition either to desorb complexed arsenate due to the Donnan
exclusive effect (Donnan, 1995; S. Sarkar et al., 2010) or to refresh the surface of LO in
order to detach the precipitates LaAsO4 and create a fresh surface of LH. Thus, it can be
summarized that MPSAC–La (0.36) can be recycled effectively using NaOH solution,
providing an economic advantage.

110
4.7 Dye Isotherm Studies
Figure 4.11 (A) adsorption isotherm of Methyl Orange, Ci = 50 ~ 1000 mg L-1
(B) adsorption isotherm of Methylene Blue, Ci = 50 ~ 500 mg L-1 on PSAC,
MPSAC and MPSAC-SiO2 impregnated with different amount of MgNO3 at pH 6
and 1 g L-1 of adsorbent. The black color fit line is Langmuir and the gray color fit
line is Freundlich isotherm model
0 100 200 300 400
0
200
400
600
800
1000
QE
q (m
g g
-1)
0
200
400
600
800
1000
PSAC
MPSAC
MPSAC-SiO2@Mg (0.06)
MPSAC-SiO2@Mg (0.12)
MPSAC-SiO2@Mg (0.23)
MPSAC-SiO2@Mg (0.46)
Ceq (mg L-1)
QE
q (m
g g
-1)
A
B

111
Adso
rptio
n r
em
ova
l (%
)
0
20
40
60
80
100
PS
AC
MP
SA
C
MP
SA
C-S
iO2
@M
gN
O3
(0
.06
)
MP
SA
C-S
iO2
@M
gN
O3
(0
.12
)
MP
SA
C-S
iO2
@M
gN
O3
(0
.23
)
MP
SA
C-S
iO2
@M
gN
O3
(0
.46
)
Adso
rptio
n r
em
ova
l (%
)
0
20
40
60
80
100
120
C
D
Figure 4.11 (C) Percentage removal of Methylene Blue dye removal (D) Percentage
removal of Methyl Orange dye

112
The isotherm studies show the initial concentrations were between 50 to 1000 mg L-1
for Methyl Orange and between 50 to 500 mg L-1 for Methylene Blue. The maximum
initial concentration for Methyl Orange was double than Methylene Blue because
MPSAC-SiO2@MgNO3 (0.23) and MPSAC-SiO2@MgNO3 (0.46) adsorbent show that
Methyl Orange removal percentage is more than 90% removal at the initial concentration
of 500 mg L-1.
Based on Figure 4.11 (A), it shows that the Methyl Orange adsorption isotherm studies
at Ceq, 200 mg L-1 for MPSAC, PSAC, MPSAC-SiO2@MgNO3 (0.23) and MPSAC-
SiO2@MgNO3 (0.46) approximately achieved the removal capacities at 240 mg g-1, 260
mg g-1, 820 mg g-1, and 994 mg g-1. While at the same Ceq point, MPSAC-SiO2@MgNO3
(0.08) and MPSAC-SiO2@MgNO3 (0.12) show the removal capacities at 220 mg g-1 and
240 mg g-1 respectively.
Figure 4.11(B) were plotted to show the Methylene Blue adsorption isotherm studies
at 200 mg L-1 of Ceq, MPSAC, PSAC and MPSAC-SiO2@MgNO3 (0.46) approximately
achieved 320 mg g-1, 380 mg g-1, and 430 mg g-1 removal capacities. Meanwhile, for
MPSAC-SiO2@MgNO3 (0.06), MPSAC-SiO2@MgNO3 (0.12), and MPSAC-
SiO2@MgNO3 (0.23) achieved 100mg g-1, 220 mg g-1, and 280 mg g-1 respectively.
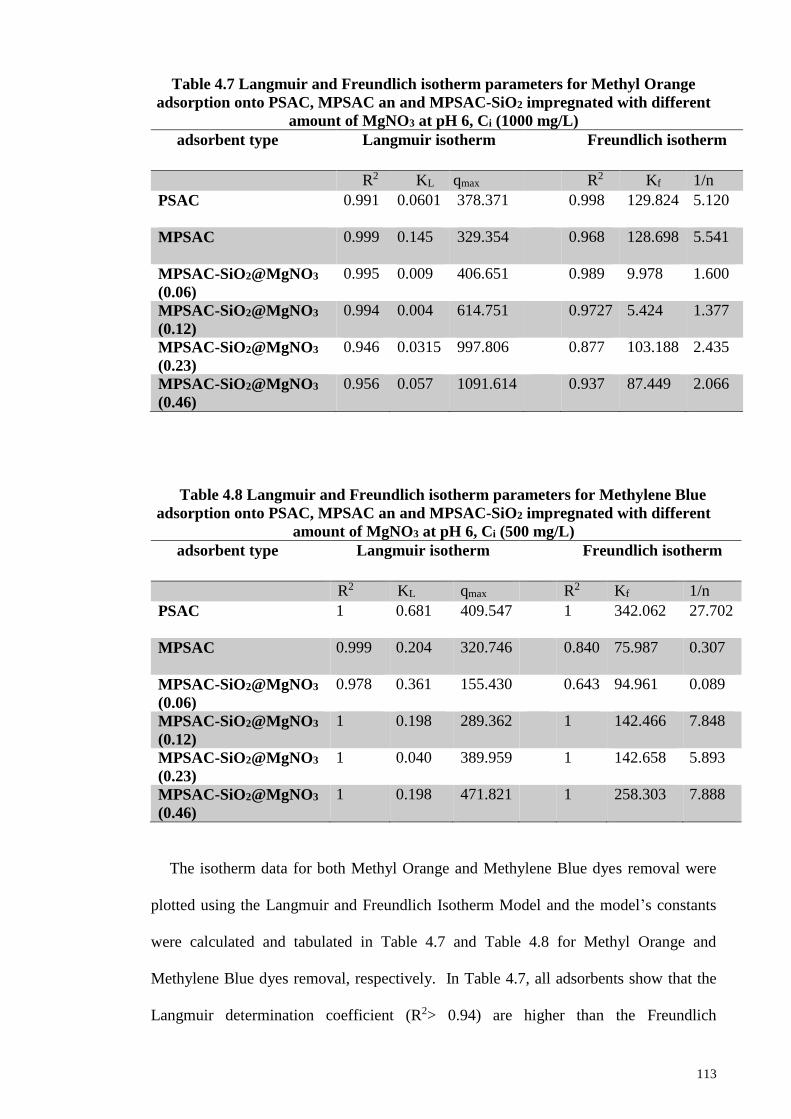
113
Table 4.7 Langmuir and Freundlich isotherm parameters for Methyl Orange
adsorption onto PSAC, MPSAC an and MPSAC-SiO2 impregnated with different
amount of MgNO3 at pH 6, Ci (1000 mg/L)
adsorbent type Langmuir isotherm Freundlich isotherm
R2 KL qmax R2 Kf 1/n
PSAC 0.991
0.0601
378.371
0.998
129.824
5.120
MPSAC 0.999 0.145
329.354 0.968
128.698
5.541
MPSAC-SiO2@MgNO3
(0.06)
0.995
0.009
406.651
0.989
9.978 1.600
MPSAC-SiO2@MgNO3
(0.12)
0.994
0.004
614.751
0.9727
5.424
1.377
MPSAC-SiO2@MgNO3
(0.23)
0.946
0.0315
997.806
0.877
103.188
2.435
MPSAC-SiO2@MgNO3
(0.46)
0.956
0.057
1091.614
0.937
87.449
2.066
Table 4.8 Langmuir and Freundlich isotherm parameters for Methylene Blue
adsorption onto PSAC, MPSAC an and MPSAC-SiO2 impregnated with different
amount of MgNO3 at pH 6, Ci (500 mg/L)
adsorbent type Langmuir isotherm Freundlich isotherm
R2 KL qmax R2 Kf 1/n
PSAC
1 0.681 409.547 1 342.062 27.702
MPSAC 0.999
0.204 320.746 0.840
75.987 0.307
MPSAC-SiO2@MgNO3
(0.06)
0.978
0.361 155.430 0.643 94.961
0.089
MPSAC-SiO2@MgNO3
(0.12)
1 0.198 289.362 1 142.466
7.848
MPSAC-SiO2@MgNO3
(0.23)
1 0.040
389.959
1 142.658
5.893
MPSAC-SiO2@MgNO3
(0.46)
1 0.198
471.821
1 258.303
7.888
The isotherm data for both Methyl Orange and Methylene Blue dyes removal were
plotted using the Langmuir and Freundlich Isotherm Model and the model’s constants
were calculated and tabulated in Table 4.7 and Table 4.8 for Methyl Orange and
Methylene Blue dyes removal, respectively. In Table 4.7, all adsorbents show that the
Langmuir determination coefficient (R2> 0.94) are higher than the Freundlich

114
determination coefficient (R2 > 0.87), which indicated that Methyl Orange removal
isotherm studies were best fitted using the Langmuir Isotherm Model. Next, in Table 4.8,
Langmuir and Freundlich models constant for Methylene Blue dye removal were
compared and showed that all of the Langmuir and Freundlich determination coefficient
for all adsorbents show R2=1, except for MPSAC and MPSAC-SiO2@MgNO3 (0.06)
adsorbent that showed the Langmuir determination coefficient as R2>0.97, which were
higher than the Freundlich determination coefficient (R2>0.64). From these observation,
Methylene Blue dye removal isotherm studies were found to be best fitted isotherm
studies using the Langmuir isotherm model, which is similar to Methyl Orange removal
isotherm studies.
To further confirm that the adsorption of both dyes were best fitted with Langmuir
isotherm model, a dimensionless constant separation factor, KL was used to determine the
Langmuir Isotherm characteristics. Different values of RL represent different types of
isotherms: irreversible (KL=0), favorable (0<KL<1), or unfavorable (KL>1). The
calculated KL values for all adsorbent in both dye removal shows KL values were between
0 and 1. Thus, it proved Langmuir Isotherm Model was favorable (H. Wang et al., 2014).
The qmax value for Methyl Orange removal by unmodified PSAC was 378.37 mg g-1,
but the highest removal was achieved by modified adsorbent with the highest MgNO3
content, MPSAC-SiO2@MgNO3 (0.46) at 1019.61 mg g-1, which was 2.7 times higher
than that unmodified PSAC. However, the qmax value for Methylene Blue removal by
unmodified PSAC was 409.54 mg g-1 and still MPSAC-SiO2@MgNO3 (0.46) was
achieved at the highest removal capacity at 471.82 mg g-1, which was only 1.15 times
higher than unmodified PSAC. The unmodified PSAC was recorded to have significant
removal capacity for Methylene Blue, which might be due to its fine particle size
(~0.074mm). Rahman et al. (2012) stated in his batch test study on Methylene Blue
115
removal by using the Activated Carbon at different particle sizes that the removal
efficiency is influenced by the adsorbent’s particle size due to the fact that with a smaller
particle size, the surface area of adsorbent were increased and eventually provide a greater
number of active sites for the adsorption to occur (Rahman, Amin, & Alam, 2012). On
the other hand, the modified adsorbent, MPSAC-SiO2@MgNO3 (0.46) show a very
significant removal capacity for Methyl Orange due to the cationic charges that acts as
additional properties that were carried by MgNO3 (Mg2+) and have electrostatic attraction
forces between the Methyl Orange (anionic dye). However, it is less efficient in
Methylene Blue dye because both carry the same charges. Therefore, in the next batch
test experiment, unmodified PSAC was used to compare its efficiency with the modified
adsorbent MPSAC-SiO2@MgNO3 (0.46).

116
4.8 Dyes Kinetic Studies
Time (min)
0 100 200 300 400 500
MO
ad
so
rptio
n c
ap
acity (
mg
g-1
)
0
200
400
600
800
1000
Time (min)
0 100 200 300 400 500
MB
ad
so
rptio
n c
ap
acity (
mg
g-1
)
0
200
400
600
800
1000
t1/2 (min-1)
0 5 10 15 20 25
MO
ad
so
rptio
n c
ap
acity (
mg
g-1
)
0
200
400
600
800
1000
t1/2(min-1)
0 5 10 15 20 25M
B a
dso
rptio
n c
ap
acity (
mg
g-1
)
0
200
400
600
800
1000
A (i) B(i)
A (ii)B (ii)
Kd1
Kd2
Kd1
Kd2
Kd1
Kd2
Kd1
Kd2
PSAC
PSAC
PSAC
PSAC
MPSAC-SiO2@MgNO3(0.46)
MPSAC-SiO2@MgNO3(0.46)
MPSAC-SiO2@MgNO3(0.46)
MPSAC-SiO2@MgNO3(0.46)
Figure 4.12 (A) (i) kinetics of Methyl Orange dye removal at pH 6, Ci = 1300 mg L-
1, 1.0 g L-1 of adsorbent, (ii) intra particle diffusion kinetic model for Methyl
Orange dye removal
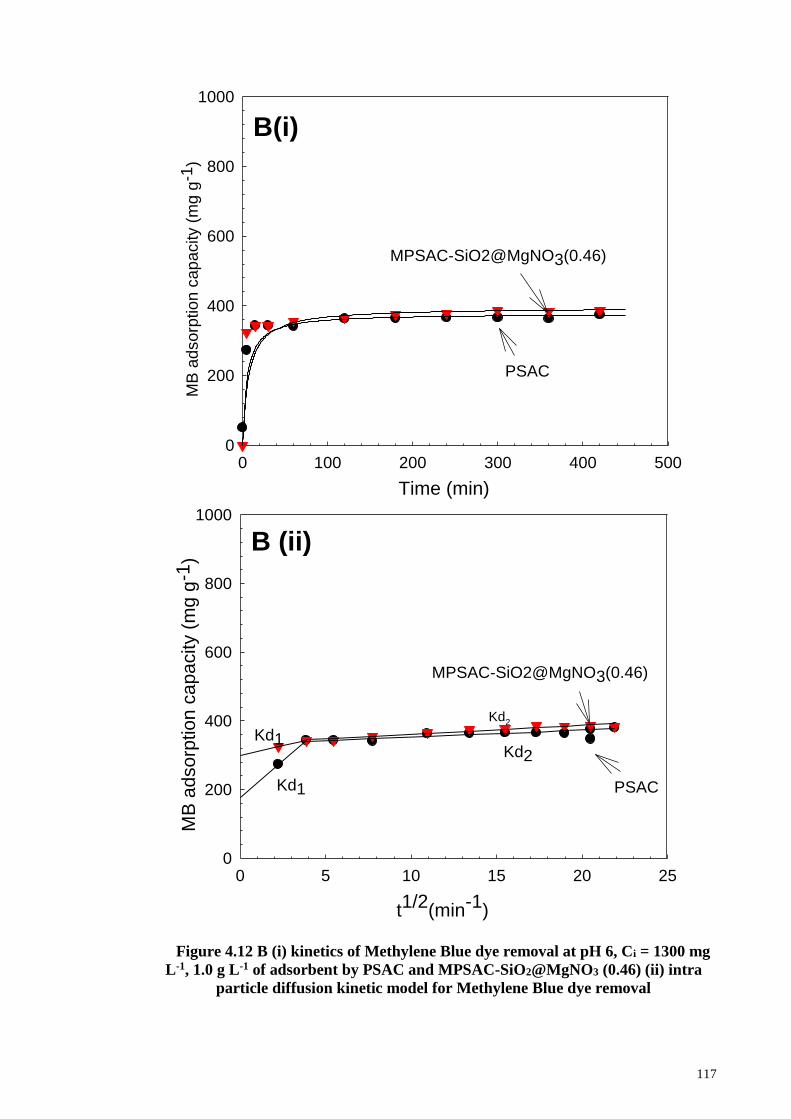
117
Time (min)
0 100 200 300 400 500
MB
ad
so
rptio
n c
ap
acity (
mg
g-1
)
0
200
400
600
800
1000
t1/2(min-1)
0 5 10 15 20 25
MB
adsorp
tion
ca
pa
city (
mg g
-1)
0
200
400
600
800
1000
B(i)
B (ii)
Kd1
Kd1
Kd2
Kd2
PSAC
PSAC
MPSAC-SiO2@MgNO3(0.46)
MPSAC-SiO2@MgNO3(0.46)
Figure 4.12 B (i) kinetics of Methylene Blue dye removal at pH 6, Ci = 1300 mg
L-1, 1.0 g L-1 of adsorbent by PSAC and MPSAC-SiO2@MgNO3 (0.46) (ii) intra
particle diffusion kinetic model for Methylene Blue dye removal
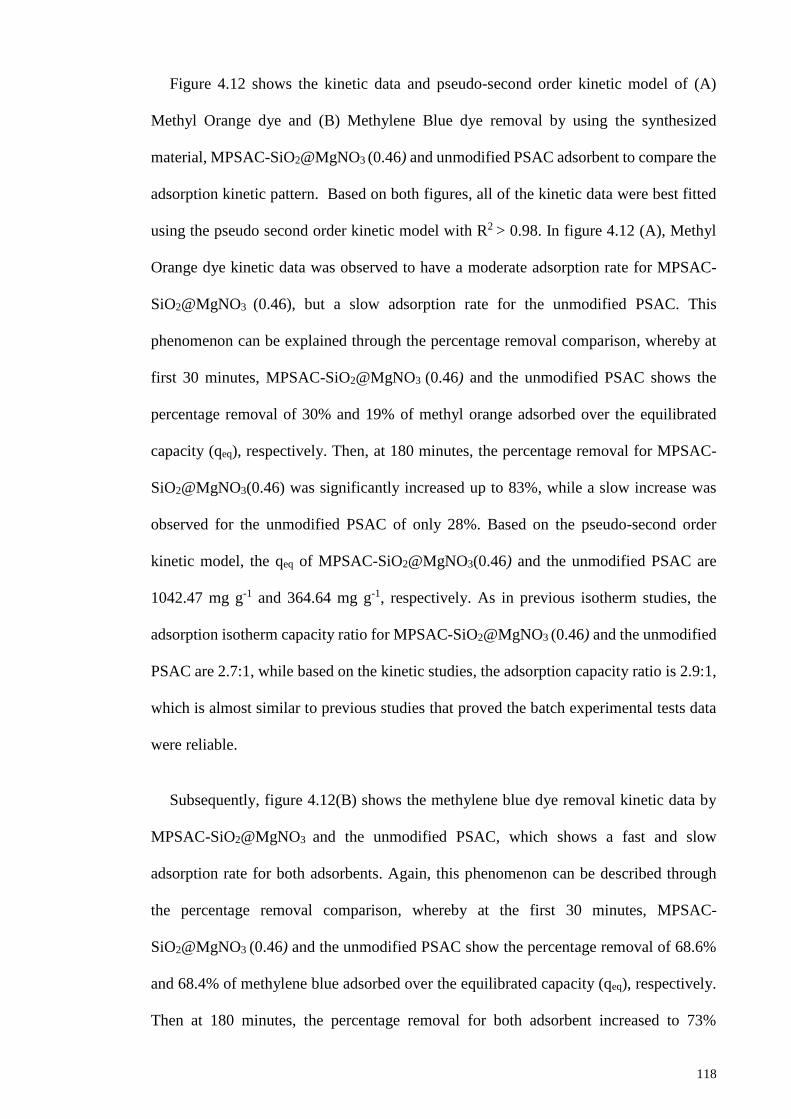
118
Figure 4.12 shows the kinetic data and pseudo-second order kinetic model of (A)
Methyl Orange dye and (B) Methylene Blue dye removal by using the synthesized
material, MPSAC-SiO2@MgNO3 (0.46) and unmodified PSAC adsorbent to compare the
adsorption kinetic pattern. Based on both figures, all of the kinetic data were best fitted
using the pseudo second order kinetic model with R2 > 0.98. In figure 4.12 (A), Methyl
Orange dye kinetic data was observed to have a moderate adsorption rate for MPSAC-
SiO2@MgNO3 (0.46), but a slow adsorption rate for the unmodified PSAC. This
phenomenon can be explained through the percentage removal comparison, whereby at
first 30 minutes, MPSAC-SiO2@MgNO3 (0.46) and the unmodified PSAC shows the
percentage removal of 30% and 19% of methyl orange adsorbed over the equilibrated
capacity (qeq), respectively. Then, at 180 minutes, the percentage removal for MPSAC-
SiO2@MgNO3(0.46) was significantly increased up to 83%, while a slow increase was
observed for the unmodified PSAC of only 28%. Based on the pseudo-second order
kinetic model, the qeq of MPSAC-SiO2@MgNO3(0.46) and the unmodified PSAC are
1042.47 mg g-1 and 364.64 mg g-1, respectively. As in previous isotherm studies, the
adsorption isotherm capacity ratio for MPSAC-SiO2@MgNO3 (0.46) and the unmodified
PSAC are 2.7:1, while based on the kinetic studies, the adsorption capacity ratio is 2.9:1,
which is almost similar to previous studies that proved the batch experimental tests data
were reliable.
Subsequently, figure 4.12(B) shows the methylene blue dye removal kinetic data by
MPSAC-SiO2@MgNO3 and the unmodified PSAC, which shows a fast and slow
adsorption rate for both adsorbents. Again, this phenomenon can be described through
the percentage removal comparison, whereby at the first 30 minutes, MPSAC-
SiO2@MgNO3 (0.46) and the unmodified PSAC show the percentage removal of 68.6%
and 68.4% of methylene blue adsorbed over the equilibrated capacity (qeq), respectively.
Then at 180 minutes, the percentage removal for both adsorbent increased to 73%
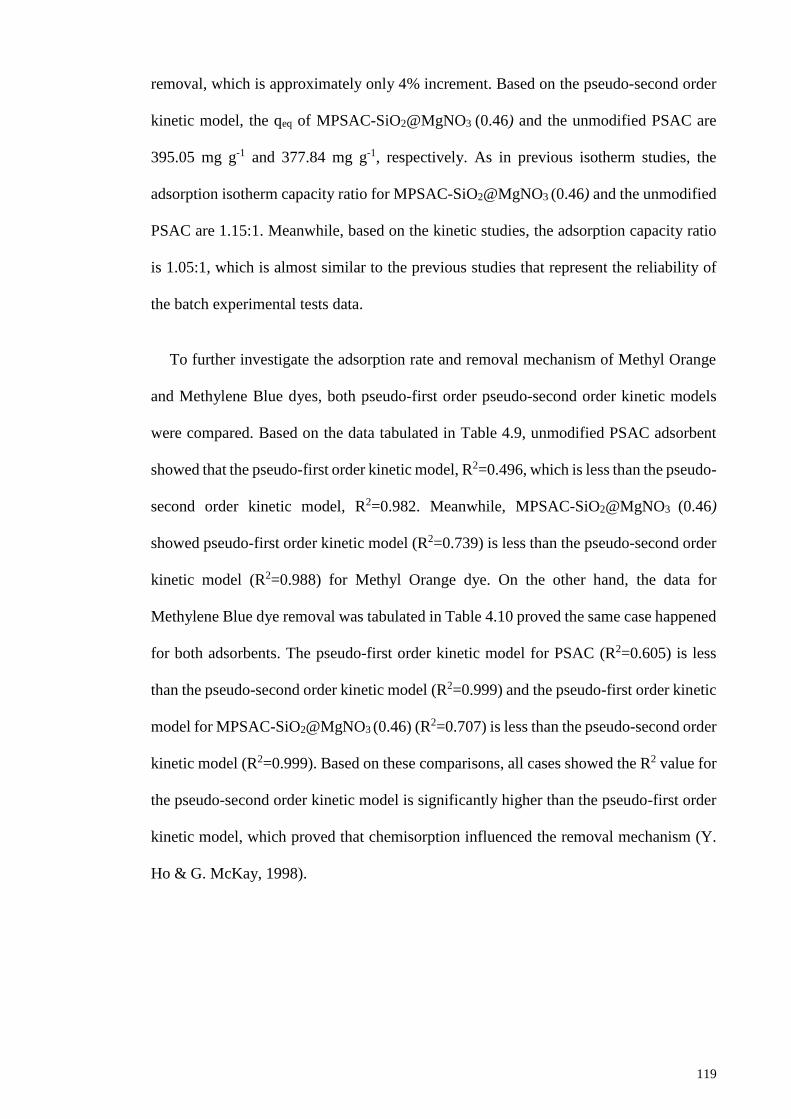
119
removal, which is approximately only 4% increment. Based on the pseudo-second order
kinetic model, the qeq of MPSAC-SiO2@MgNO3 (0.46) and the unmodified PSAC are
395.05 mg g-1 and 377.84 mg g-1, respectively. As in previous isotherm studies, the
adsorption isotherm capacity ratio for MPSAC-SiO2@MgNO3 (0.46) and the unmodified
PSAC are 1.15:1. Meanwhile, based on the kinetic studies, the adsorption capacity ratio
is 1.05:1, which is almost similar to the previous studies that represent the reliability of
the batch experimental tests data.
To further investigate the adsorption rate and removal mechanism of Methyl Orange
and Methylene Blue dyes, both pseudo-first order pseudo-second order kinetic models
were compared. Based on the data tabulated in Table 4.9, unmodified PSAC adsorbent
showed that the pseudo-first order kinetic model, R2=0.496, which is less than the pseudo-
second order kinetic model, R2=0.982. Meanwhile, MPSAC-SiO2@MgNO3 (0.46)
showed pseudo-first order kinetic model (R2=0.739) is less than the pseudo-second order
kinetic model (R2=0.988) for Methyl Orange dye. On the other hand, the data for
Methylene Blue dye removal was tabulated in Table 4.10 proved the same case happened
for both adsorbents. The pseudo-first order kinetic model for PSAC (R2=0.605) is less
than the pseudo-second order kinetic model (R2=0.999) and the pseudo-first order kinetic
model for MPSAC-SiO2@MgNO3 (0.46) (R2=0.707) is less than the pseudo-second order
kinetic model (R2=0.999). Based on these comparisons, all cases showed the R2 value for
the pseudo-second order kinetic model is significantly higher than the pseudo-first order
kinetic model, which proved that chemisorption influenced the removal mechanism (Y.
Ho & G. McKay, 1998).
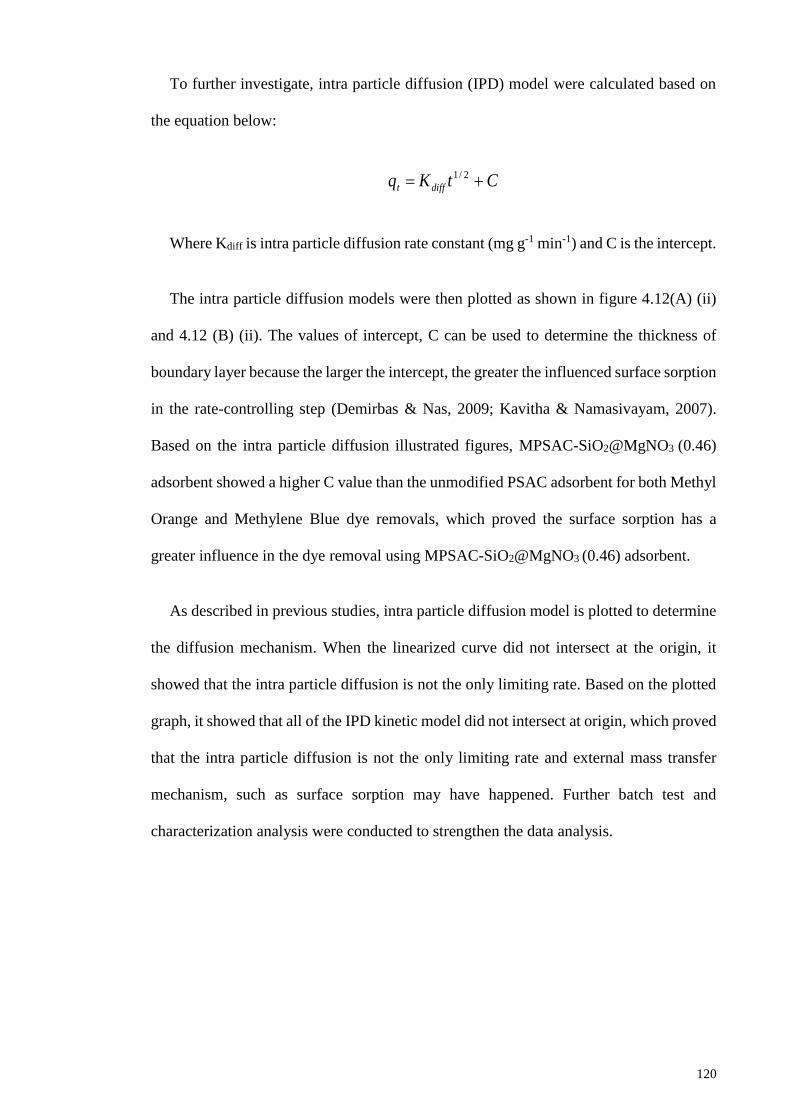
120
To further investigate, intra particle diffusion (IPD) model were calculated based on
the equation below:
CtKq difft 2/1
Where Kdiff is intra particle diffusion rate constant (mg g-1 min-1) and C is the intercept.
The intra particle diffusion models were then plotted as shown in figure 4.12(A) (ii)
and 4.12 (B) (ii). The values of intercept, C can be used to determine the thickness of
boundary layer because the larger the intercept, the greater the influenced surface sorption
in the rate-controlling step (Demirbas & Nas, 2009; Kavitha & Namasivayam, 2007).
Based on the intra particle diffusion illustrated figures, MPSAC-SiO2@MgNO3 (0.46)
adsorbent showed a higher C value than the unmodified PSAC adsorbent for both Methyl
Orange and Methylene Blue dye removals, which proved the surface sorption has a
greater influence in the dye removal using MPSAC-SiO2@MgNO3 (0.46) adsorbent.
As described in previous studies, intra particle diffusion model is plotted to determine
the diffusion mechanism. When the linearized curve did not intersect at the origin, it
showed that the intra particle diffusion is not the only limiting rate. Based on the plotted
graph, it showed that all of the IPD kinetic model did not intersect at origin, which proved
that the intra particle diffusion is not the only limiting rate and external mass transfer
mechanism, such as surface sorption may have happened. Further batch test and
characterization analysis were conducted to strengthen the data analysis.
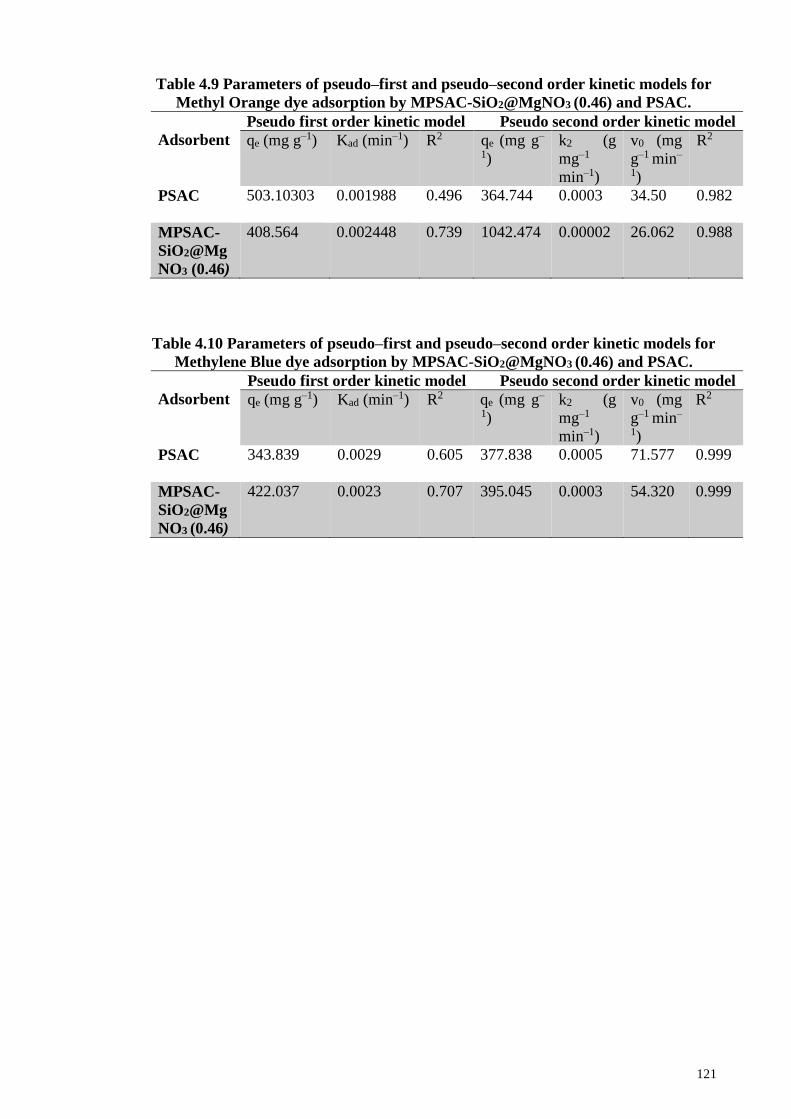
121
Table 4.9 Parameters of pseudo–first and pseudo–second order kinetic models for
Methyl Orange dye adsorption by MPSAC-SiO2@MgNO3 (0.46) and PSAC.
Adsorbent
Pseudo first order kinetic model Pseudo second order kinetic model
qe (mg g–1) Kad (min–1) R2
qe (mg g–
1)
k2 (g
mg–1
min–1)
v0 (mg
g–1 min–
1)
R2
PSAC 503.10303 0.001988 0.496 364.744
0.0003
34.50
0.982
MPSAC-
SiO2@Mg
NO3 (0.46)
408.564 0.002448 0.739 1042.474
0.00002
26.062
0.988
Table 4.10 Parameters of pseudo–first and pseudo–second order kinetic models for
Methylene Blue dye adsorption by MPSAC-SiO2@MgNO3 (0.46) and PSAC.
Adsorbent
Pseudo first order kinetic model Pseudo second order kinetic model
qe (mg g–1) Kad (min–1) R2
qe (mg g–
1)
k2 (g
mg–1
min–1)
v0 (mg
g–1 min–
1)
R2
PSAC 343.839 0.0029 0.605 377.838 0.0005 71.577 0.999
MPSAC-
SiO2@Mg
NO3 (0.46)
422.037 0.0023 0.707 395.045
0.0003
54.320
0.999
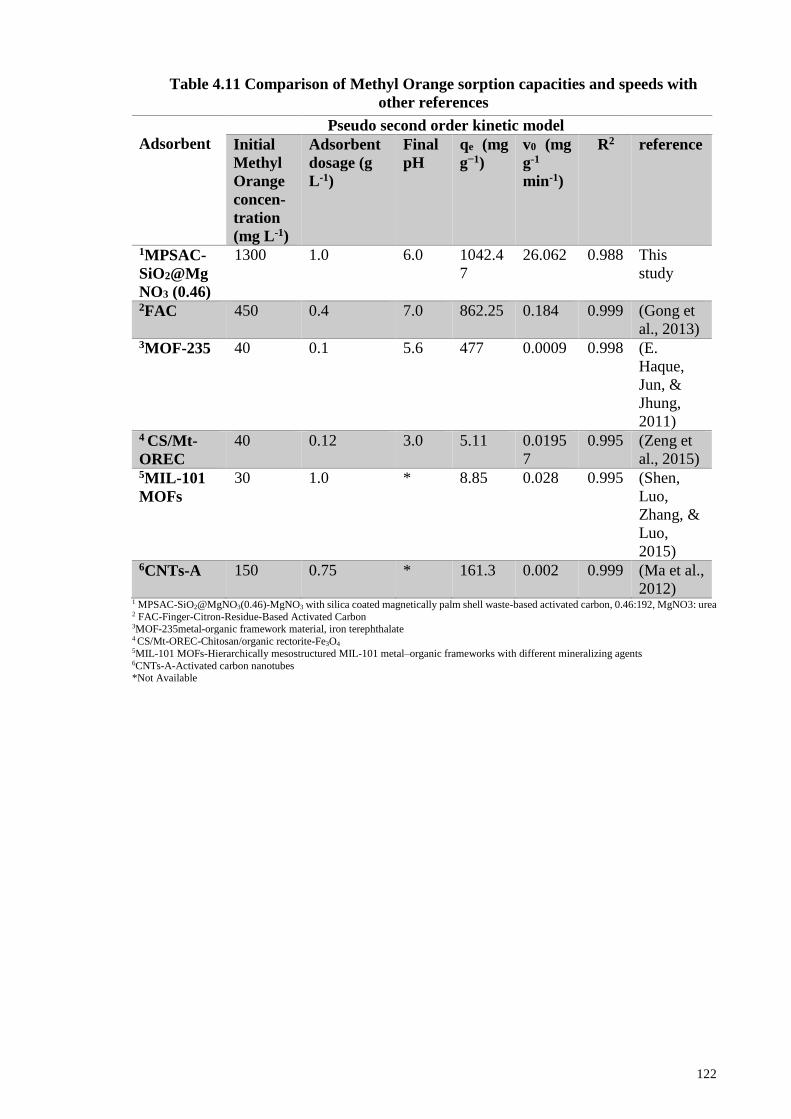
122
Table 4.11 Comparison of Methyl Orange sorption capacities and speeds with
other references
1 MPSAC-SiO2@MgNO3(0.46)-MgNO3 with silica coated magnetically palm shell waste-based activated carbon, 0.46:192, MgNO3: urea 2 FAC-Finger-Citron-Residue-Based Activated Carbon 3MOF-235metal-organic framework material, iron terephthalate 4 CS/Mt-OREC-Chitosan/organic rectorite-Fe3O4 5MIL-101 MOFs-Hierarchically mesostructured MIL-101 metal–organic frameworks with different mineralizing agents 6CNTs-A-Activated carbon nanotubes *Not Available
Adsorbent
Pseudo second order kinetic model
Initial
Methyl
Orange
concen-
tration
(mg L-1)
Adsorbent
dosage (g
L-1)
Final
pH
qe (mg
g−1)
v0 (mg
g-1
min-1)
R2 reference
1MPSAC-
SiO2@Mg
NO3 (0.46)
1300 1.0 6.0 1042.4
7
26.062
0.988
This
study
2FAC 450 0.4 7.0 862.25 0.184 0.999 (Gong et
al., 2013) 3MOF-235 40 0.1 5.6 477 0.0009 0.998 (E.
Haque,
Jun, &
Jhung,
2011) 4 CS/Mt-
OREC
40 0.12 3.0 5.11 0.0195
7
0.995 (Zeng et
al., 2015) 5MIL-101
MOFs
30 1.0 * 8.85 0.028 0.995 (Shen,
Luo,
Zhang, &
Luo,
2015) 6CNTs-A 150 0.75 * 161.3 0.002 0.999 (Ma et al.,
2012)

123
Table 4.12 Comparison of Methylene Blue sorption capacities and speeds with
other references
1 MPSAC-SiO2@MgNO3(0.46)-MgNO3 with silica coated magnetically palm shell waste-based activated carbon, 0.46:192,
MgNO3:urea 2 FAC-Finger-Citron-Residue-Based Activated Carbon 3MOF-235metal-organic framework material, iron terephthalate 4 CS/Mt-OREC-Chitosan/organic rectorite-Fe3O4 5MIL-101 MOFs-Hierarchically mesostructured MIL-101 metal–organic frameworks with different mineralizing agents 6CNTs-A-Activated carbon nanotubes
*Not Available
Adsorbent
Pseudo second order kinetic model
Initial
Methyl
Orange
concen-
tration
(mg L-1)
Adsorb
ent
dosage
(g L-1)
Final
pH
qe (mg
g−1)
v0
(mg g-
1 min-
1)
R2 reference
1MPSAC-
SiO2@Mg
NO3 (0.46)
500 1.0 6.0 395.04
54.320
0.988
This study
2FAC 450 0.4 7 548.17 0.396 0.999 (Gong et
al., 2013) 3MOF-235 40 0.1 5.6 187 0.00022 0.998 (E. Haque
et al.,
2011) 4 CS/Mt-
OREC
40 0.12 6.0 9.89 0.0322 0.999 (Zeng et
al., 2015) 5MIL-101
MOFs
30 1.0 * 67.4 -0.02 0.992 (Shen, Luo,
et al.,
2015) 6CNTs-A 300 0.75 * 454.5 0.0007 0.999 (Ma et al.,
2012)

124
4.9 Dyes pH effects
final pH2 4 6 8 10
initia
l pH
- fin
al p
H
0
pH2 4 6 8 10
MB
ad
so
rptio
n c
ap
acity (
mg
g-1
)
0
300
600
900
pH
2 4 6 8 10
MO
ad
so
rptio
n c
ap
acity (
mg
g-1
)
0
300
600
900
1200
1500
PSAC
MPSAC-SiO2@MgNO3(0.46)
A
B
C
MPSAC-SiO2@MgNO3(0.46)
PSAC
MPSAC-SiO2@MgNO3(0.46)
Figure 4.13 (A) pHpzc MPSAC-SiO2@MgNO3(0.46)
Figure 4.13 (A) illustrated pHpzc for MPSAC-SiO2@MgNO3 (0.46) adsorbent to
prove the influenced of electrostatic attraction force mechanism between adsorbent and
dye ion. The pHpzc for MPSAC-SiO2@MgNO3 (0.46) was 8.87. The pHpzc reported by
previous research on LDH (Layered Double Hydroxide) was between 6.8 to 8.9 and
consistent with the current study (Das, Das, & Parida, 2003; Yang, Shahrivari, Liu,
Sahimi, & Tsotsis, 2005). At pH < pHpzc, the adsorbent surface will be dominated by the
positive charged ion due to the presence of Fe2+ (nano-magnetite), Silica, Si2+ and
Magnesium, Mg2+ ion. Thus, at pH lower than pHpzc, Methyl Orange dye (anionic dye)
will be adsorbed at a higher rate because of the electrostatic attraction forces effect
between the anionic dye onto the positive charge on adsorbent surfaces (Reddy,
Krushnamurty, Mahammadunnisa, Dayamani, & Subrahmanyam, 2015). Unfortunately,
it gives disadvantage to the Methylene Blue dye (cationic dye) due to the repulsion effect
between similar charge ions.
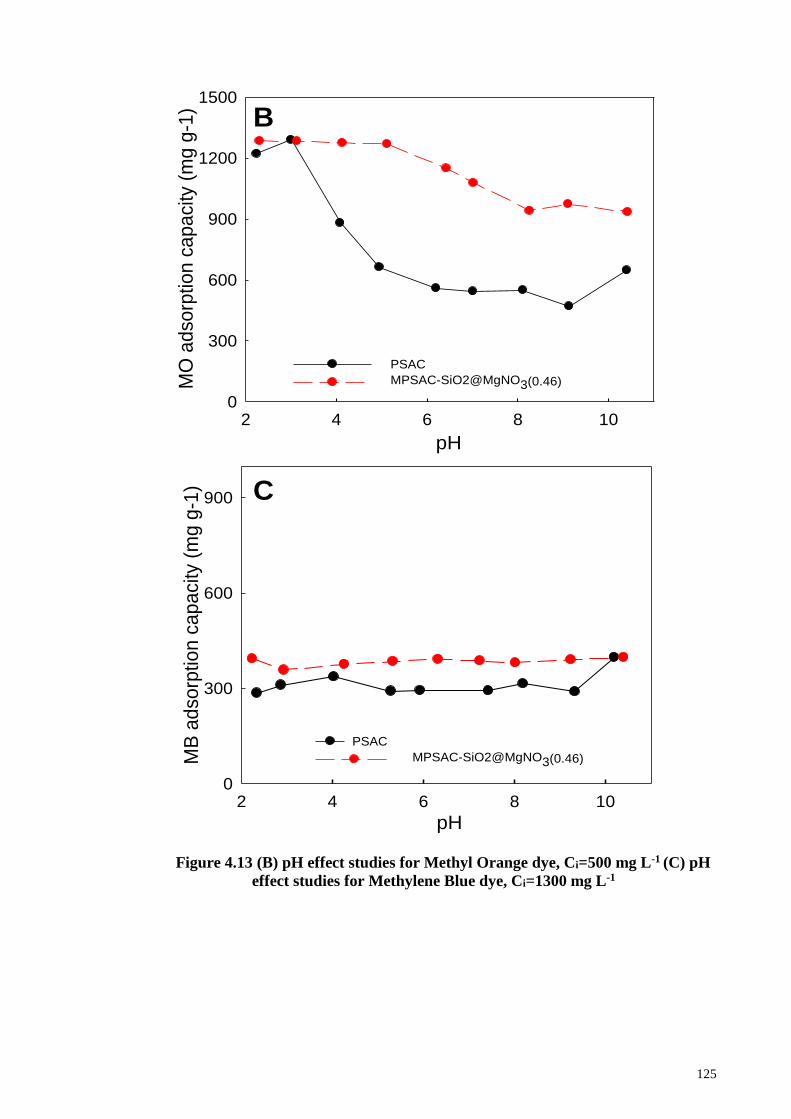
125
pH2 4 6 8 10
MB
ad
so
rptio
n c
ap
acity (
mg
g-1
)
0
300
600
900
pH
2 4 6 8 10
MO
ad
so
rptio
n c
ap
acity (
mg
g-1
)
0
300
600
900
1200
1500
PSAC
MPSAC-SiO2@MgNO3(0.46)
B
C
PSAC
MPSAC-SiO2@MgNO3(0.46)
Figure 4.13 (B) pH effect studies for Methyl Orange dye, Ci=500 mg L-1 (C) pH
effect studies for Methylene Blue dye, Ci=1300 mg L-1
126
Figure 4.13 (B) shows Methyl Orange dye removal pH studies by using the unmodified
PSAC and MPSAC-SiO2@MgNO3(0.46) adsorbents. Approximately at pH ~2 to ~5,
MPSAC-SiO2@MgNO3 (0.46) adsorbent is able to remove Methyl Orange dye at the
highest capacity of 1280 mg g-1 and made it decreased to 1270 mg g-1, where the
adsorption capacity continually decreased steadily at pH ~6 to ~7 with the adsorption
capacity of 1150 mg g-1 to 1080 mg g-1. As previous pH batch tests were kept constant
at pH~6. The adsorption capacity obtained from pH studies at pH ~6 to ~7 for Methyl
Orange is reliable as it is almost similar to the value of qmax during the isotherm studies
(1091 mg g-1). The Methyl Orange adsorption capacities were observed to further
decrease at pH~ 8, but a slight increment of adsorption capacity was observed as the pH
increased up to pH 10 proving that other mechanisms like π-π electron donor acceptor
and pore filling might have happened during the adsorption process (Ma et al., 2012).
The same phenomenon was observed when the unmodified PSAC was used to remove
Methyl Orange, whereby the highest capacity of 1290 mg g-1 was recorded at pH~3, but
decreased significantly when pH is more than 3.The same pattern were observed by
Ghasemian et al. (2016) using synthesized SiCNP-AC and Ai et al. (2011) using Mg-Al
double Hydroxide to remove Methyl Orange dye (Ai, Zhang, & Meng, 2011; Ghasemian
& Palizban, 2016). To explain this phenomena, Chen et al. (2010) stated that Methyl
Orange has chromophores with two different chemical structures, which are azo bond and
anthraquinone that are influenced by the pH of solution. The chemical structures are
illustrated below:
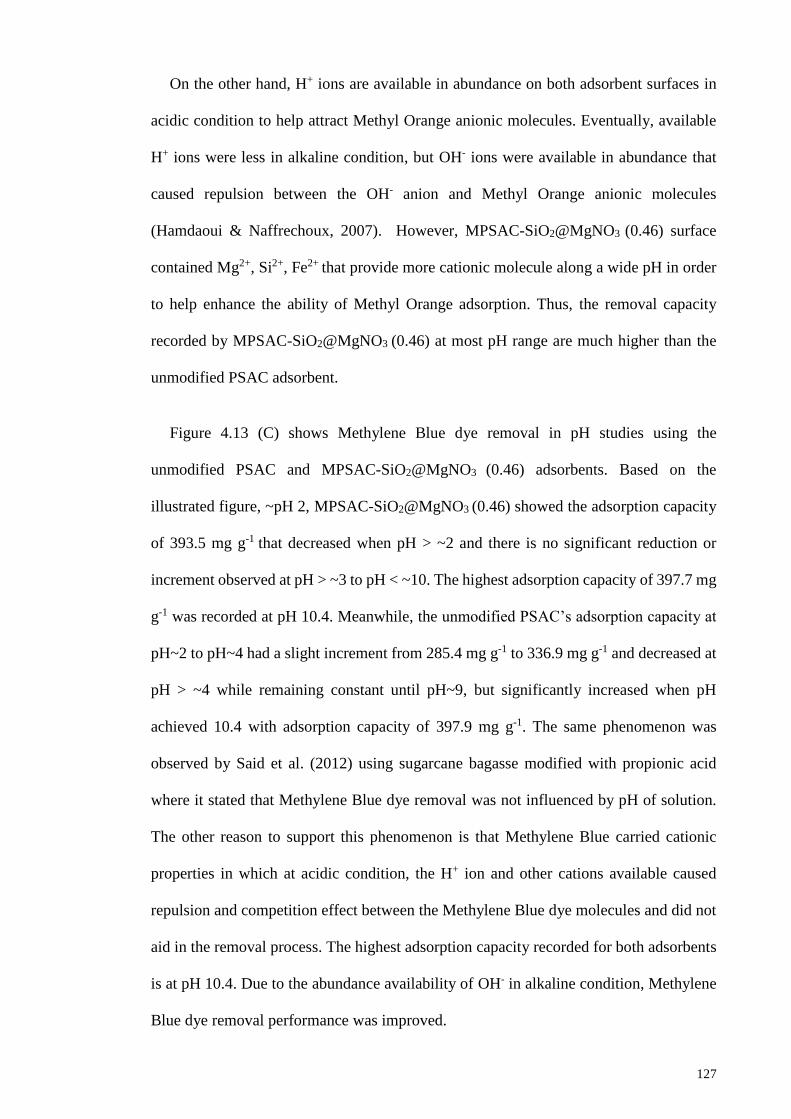
127
On the other hand, H+ ions are available in abundance on both adsorbent surfaces in
acidic condition to help attract Methyl Orange anionic molecules. Eventually, available
H+ ions were less in alkaline condition, but OH- ions were available in abundance that
caused repulsion between the OH- anion and Methyl Orange anionic molecules
(Hamdaoui & Naffrechoux, 2007). However, MPSAC-SiO2@MgNO3 (0.46) surface
contained Mg2+, Si2+, Fe2+ that provide more cationic molecule along a wide pH in order
to help enhance the ability of Methyl Orange adsorption. Thus, the removal capacity
recorded by MPSAC-SiO2@MgNO3 (0.46) at most pH range are much higher than the
unmodified PSAC adsorbent.
Figure 4.13 (C) shows Methylene Blue dye removal in pH studies using the
unmodified PSAC and MPSAC-SiO2@MgNO3 (0.46) adsorbents. Based on the
illustrated figure, ~pH 2, MPSAC-SiO2@MgNO3 (0.46) showed the adsorption capacity
of 393.5 mg g-1 that decreased when pH > ~2 and there is no significant reduction or
increment observed at pH > ~3 to pH < ~10. The highest adsorption capacity of 397.7 mg
g-1 was recorded at pH 10.4. Meanwhile, the unmodified PSAC’s adsorption capacity at
pH~2 to pH~4 had a slight increment from 285.4 mg g-1 to 336.9 mg g-1 and decreased at
pH > ~4 while remaining constant until pH~9, but significantly increased when pH
achieved 10.4 with adsorption capacity of 397.9 mg g-1. The same phenomenon was
observed by Said et al. (2012) using sugarcane bagasse modified with propionic acid
where it stated that Methylene Blue dye removal was not influenced by pH of solution.
The other reason to support this phenomenon is that Methylene Blue carried cationic
properties in which at acidic condition, the H+ ion and other cations available caused
repulsion and competition effect between the Methylene Blue dye molecules and did not
aid in the removal process. The highest adsorption capacity recorded for both adsorbents
is at pH 10.4. Due to the abundance availability of OH- in alkaline condition, Methylene
Blue dye removal performance was improved.
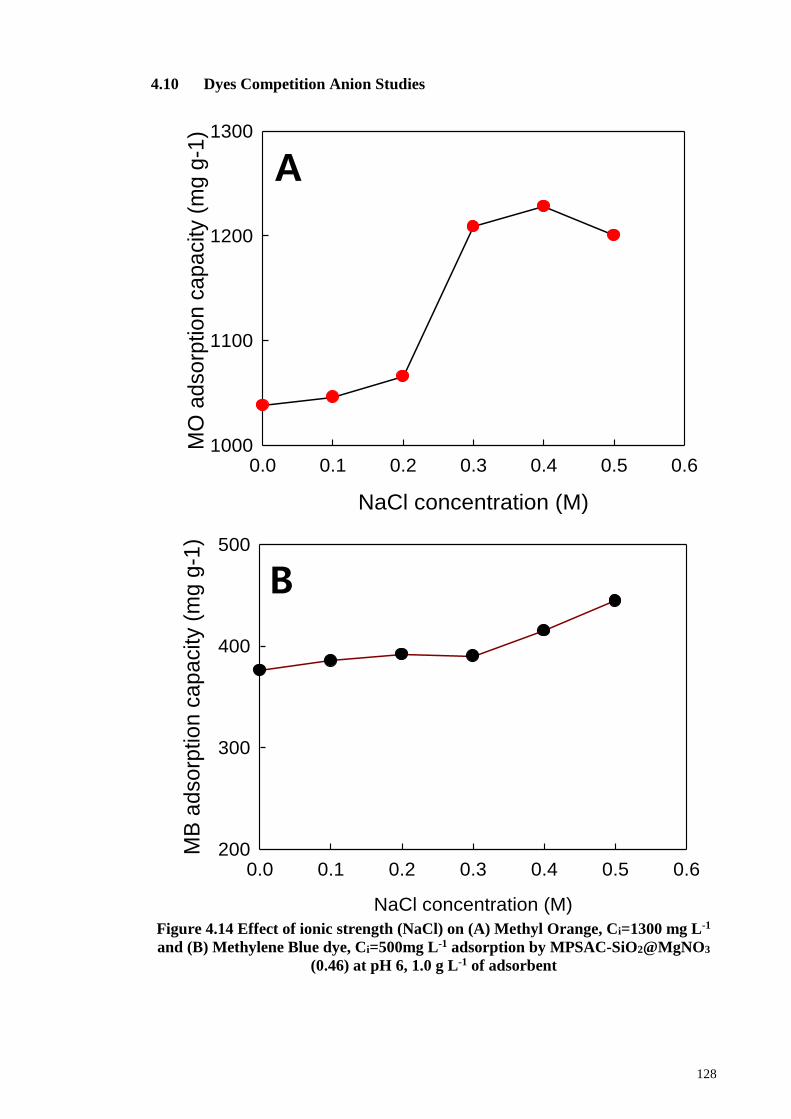
128
4.10 Dyes Competition Anion Studies
NaCl concentration (M)
0.0 0.1 0.2 0.3 0.4 0.5 0.6
MO
ad
so
rptio
n c
ap
acity (
mg
g-1
)
1000
1100
1200
1300
NaCl concentration (M)
0.0 0.1 0.2 0.3 0.4 0.5 0.6
MB
ad
so
rptio
n c
ap
acity (
mg
g-1
)
200
300
400
500
A
B
Figure 4.14 Effect of ionic strength (NaCl) on (A) Methyl Orange, Ci=1300 mg L-1
and (B) Methylene Blue dye, Ci=500mg L-1 adsorption by MPSAC-SiO2@MgNO3
(0.46) at pH 6, 1.0 g L-1 of adsorbent
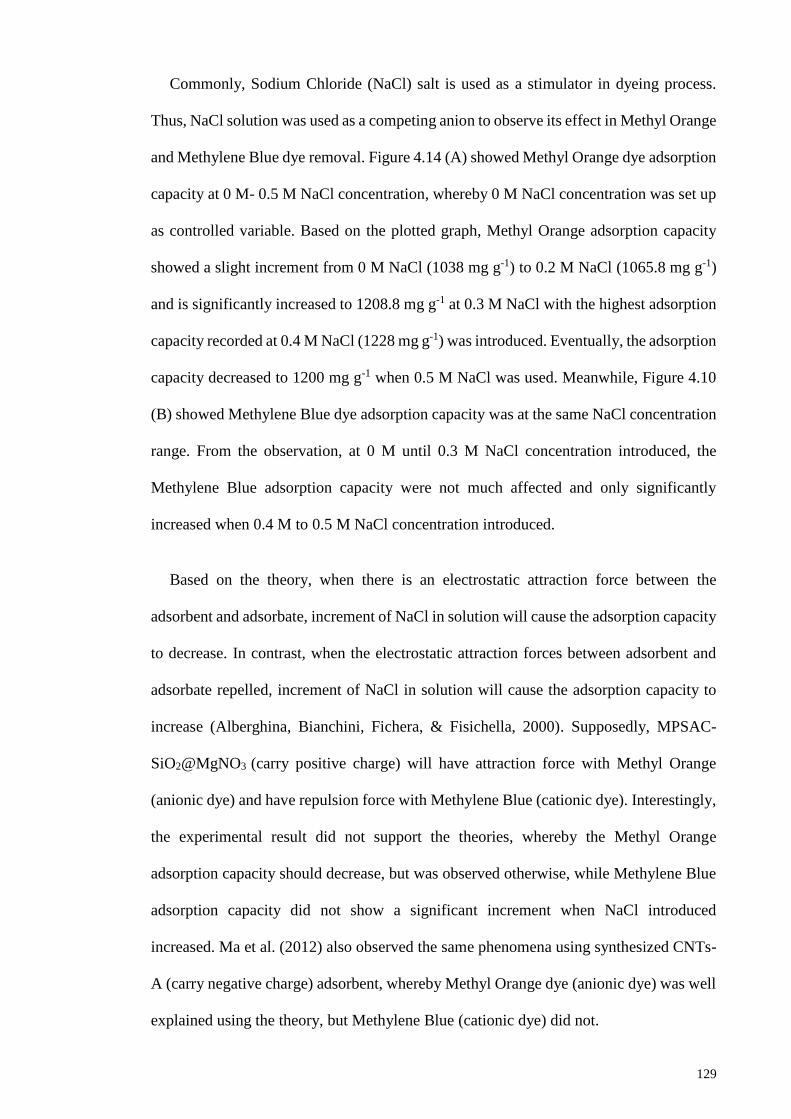
129
Commonly, Sodium Chloride (NaCl) salt is used as a stimulator in dyeing process.
Thus, NaCl solution was used as a competing anion to observe its effect in Methyl Orange
and Methylene Blue dye removal. Figure 4.14 (A) showed Methyl Orange dye adsorption
capacity at 0 M- 0.5 M NaCl concentration, whereby 0 M NaCl concentration was set up
as controlled variable. Based on the plotted graph, Methyl Orange adsorption capacity
showed a slight increment from 0 M NaCl (1038 mg g-1) to 0.2 M NaCl (1065.8 mg g-1)
and is significantly increased to 1208.8 mg g-1 at 0.3 M NaCl with the highest adsorption
capacity recorded at 0.4 M NaCl (1228 mg g-1) was introduced. Eventually, the adsorption
capacity decreased to 1200 mg g-1 when 0.5 M NaCl was used. Meanwhile, Figure 4.10
(B) showed Methylene Blue dye adsorption capacity was at the same NaCl concentration
range. From the observation, at 0 M until 0.3 M NaCl concentration introduced, the
Methylene Blue adsorption capacity were not much affected and only significantly
increased when 0.4 M to 0.5 M NaCl concentration introduced.
Based on the theory, when there is an electrostatic attraction force between the
adsorbent and adsorbate, increment of NaCl in solution will cause the adsorption capacity
to decrease. In contrast, when the electrostatic attraction forces between adsorbent and
adsorbate repelled, increment of NaCl in solution will cause the adsorption capacity to
increase (Alberghina, Bianchini, Fichera, & Fisichella, 2000). Supposedly, MPSAC-
SiO2@MgNO3 (carry positive charge) will have attraction force with Methyl Orange
(anionic dye) and have repulsion force with Methylene Blue (cationic dye). Interestingly,
the experimental result did not support the theories, whereby the Methyl Orange
adsorption capacity should decrease, but was observed otherwise, while Methylene Blue
adsorption capacity did not show a significant increment when NaCl introduced
increased. Ma et al. (2012) also observed the same phenomena using synthesized CNTs-
A (carry negative charge) adsorbent, whereby Methyl Orange dye (anionic dye) was well
explained using the theory, but Methylene Blue (cationic dye) did not.

130
The significant increase in Methyl Orange adsorption capacity when NaCl addition is
increased was assumed to happen because of the dimerization of Methyl Orange dye in
the solution (Al-Degs et al., 2008). Al degs et al. (2008) also explained the variety of
mechanisms that have been proposed to explain this aggregation. These forces can be
attributed to ion-dipole forces, dipole-dipole forces, van der Waals forces and dispersion
forces arising from delocalized π electrons, which occur between dye molecules in the
solution.
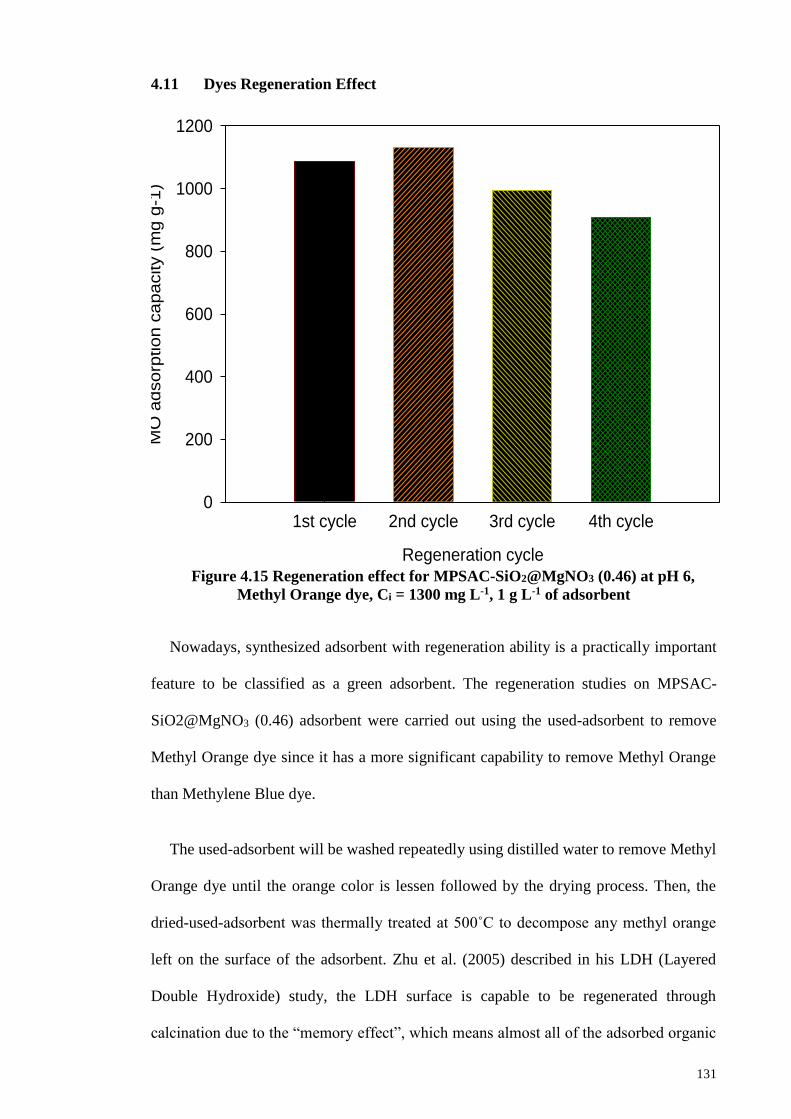
131
4.11 Dyes Regeneration Effect
Figure 4.15 Regeneration effect for MPSAC-SiO2@MgNO3 (0.46) at pH 6,
Methyl Orange dye, Ci = 1300 mg L-1, 1 g L-1 of adsorbent
Nowadays, synthesized adsorbent with regeneration ability is a practically important
feature to be classified as a green adsorbent. The regeneration studies on MPSAC-
SiO2@MgNO3 (0.46) adsorbent were carried out using the used-adsorbent to remove
Methyl Orange dye since it has a more significant capability to remove Methyl Orange
than Methylene Blue dye.
The used-adsorbent will be washed repeatedly using distilled water to remove Methyl
Orange dye until the orange color is lessen followed by the drying process. Then, the
dried-used-adsorbent was thermally treated at 500˚C to decompose any methyl orange
left on the surface of the adsorbent. Zhu et al. (2005) described in his LDH (Layered
Double Hydroxide) study, the LDH surface is capable to be regenerated through
calcination due to the “memory effect”, which means almost all of the adsorbed organic
Regeneration cycle
1st cycle 2nd cycle 3rd cycle 4th cycle
MO
adsorp
tion c
apacity (
mg g
-1)
0
200
400
600
800
1000
1200

132
pollutant can be eliminated (Zhu, Li, Xie, & Xin, 2005). Figure 4.15 shows the
regeneration effect for MPSAC-SiO2@MgNO3 (0.46) up to four successful cycle
adsorption-desorption. After the first regeneration, it was recorded that the adsorption
capacity for the second regeneration cycle increased up to 4% and achieved 104% of the
first regeneration cycle. However, it decreased down to 8% and achieved 92% of the first
regeneration cycle. The adsorption capacity further decreased in the next regeneration
cycle and 84% of the first regeneration cycle was obtained at the fourth regeneration
cycle. The same phenomenon was also experienced by Zhu et al. (2005) in the
regeneration of LDH/CLDHs, that indicated the thermal regeneration (calcination) is only
achievable for the first two regeneration cycles and further regeneration cycle will suffer
a loss in sorption capacities. Zhu et al. (2005) also described the large loss of sorption
capacities might be due to the LDH crystallinity structure, which was reduced because of
a certain amount of dye that was incorporated into the adsorbent surface and disturbed
the reconstruction of the crystallinity structure during the repeated thermal regeneration.
However, based on this study, even though the structural disturbance caused the
adsorption capacity to reduce during the thermal regeneration, the newly developed
adsorbent still shows a high adsorption capacity at the fourth cycle, which proved that it
is competent to be a cost-effective adsorbent.
133
4.12 Mechanism of dye removal by MPSAC-SiO2@MgNO3(0.46) adsorbent
In order to elucidate the Methyl Orange removal mechanism, spectroscopic analyses
such as XRD, FESEM–EDX, N2 gas isotherm and FT–IR were performed for the
prepared adsorbent and adsorbent with Methyl Orange loaded.
Figure 4.16 XRD results of PSAC, MPSAC, MPSAC-SiO2, MPSAC-
SiO2@MgNO3(0.46) adsorbents
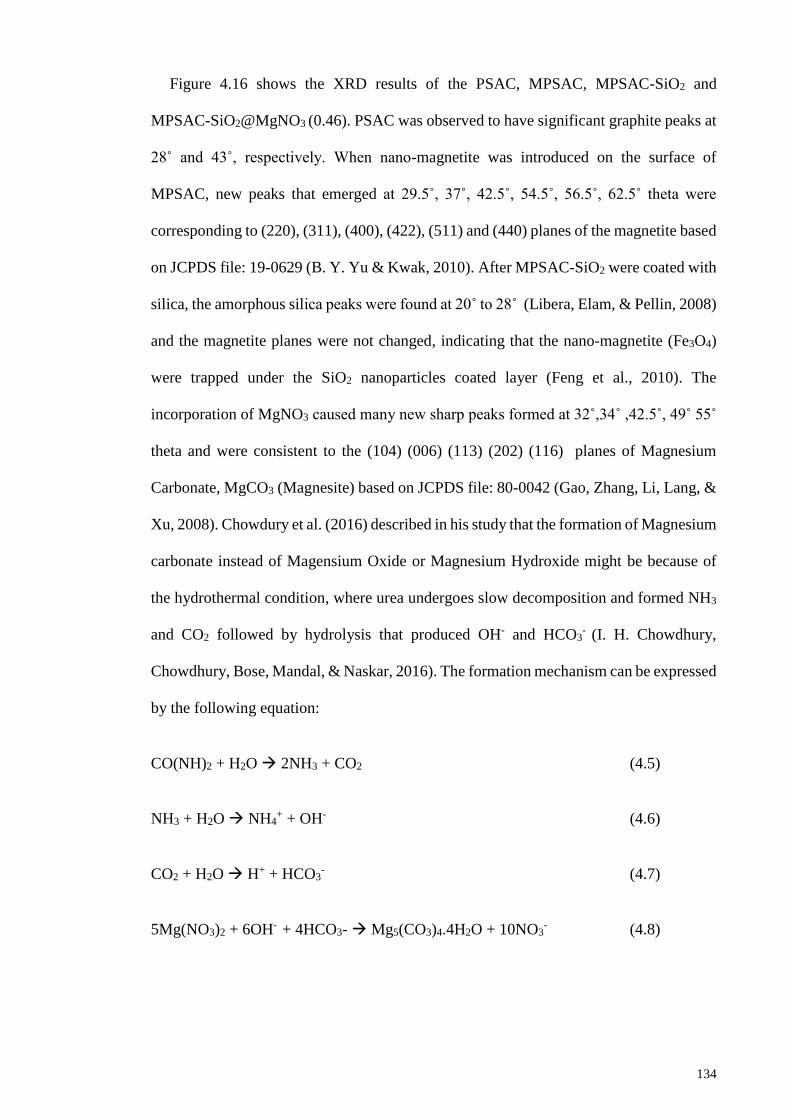
134
Figure 4.16 shows the XRD results of the PSAC, MPSAC, MPSAC-SiO2 and
MPSAC-SiO2@MgNO3 (0.46). PSAC was observed to have significant graphite peaks at
28˚ and 43˚, respectively. When nano-magnetite was introduced on the surface of
MPSAC, new peaks that emerged at 29.5˚, 37˚, 42.5˚, 54.5˚, 56.5˚, 62.5˚ theta were
corresponding to (220), (311), (400), (422), (511) and (440) planes of the magnetite based
on JCPDS file: 19-0629 (B. Y. Yu & Kwak, 2010). After MPSAC-SiO2 were coated with
silica, the amorphous silica peaks were found at 20˚ to 28˚ (Libera, Elam, & Pellin, 2008)
and the magnetite planes were not changed, indicating that the nano-magnetite (Fe3O4)
were trapped under the SiO2 nanoparticles coated layer (Feng et al., 2010). The
incorporation of MgNO3 caused many new sharp peaks formed at 32˚,34˚ ,42.5˚, 49˚ 55˚
theta and were consistent to the (104) (006) (113) (202) (116) planes of Magnesium
Carbonate, MgCO3 (Magnesite) based on JCPDS file: 80-0042 (Gao, Zhang, Li, Lang, &
Xu, 2008). Chowdury et al. (2016) described in his study that the formation of Magnesium
carbonate instead of Magensium Oxide or Magnesium Hydroxide might be because of
the hydrothermal condition, where urea undergoes slow decomposition and formed NH3
and CO2 followed by hydrolysis that produced OH- and HCO3- (I. H. Chowdhury,
Chowdhury, Bose, Mandal, & Naskar, 2016). The formation mechanism can be expressed
by the following equation:
CO(NH)2 + H2O 2NH3 + CO2 (4.5)
NH3 + H2O NH4+ + OH- (4.6)
CO2 + H2O H+ + HCO3- (4.7)
5Mg(NO3)2 + 6OH- + 4HCO3- Mg5(CO3)4.4H2O + 10NO3- (4.8)
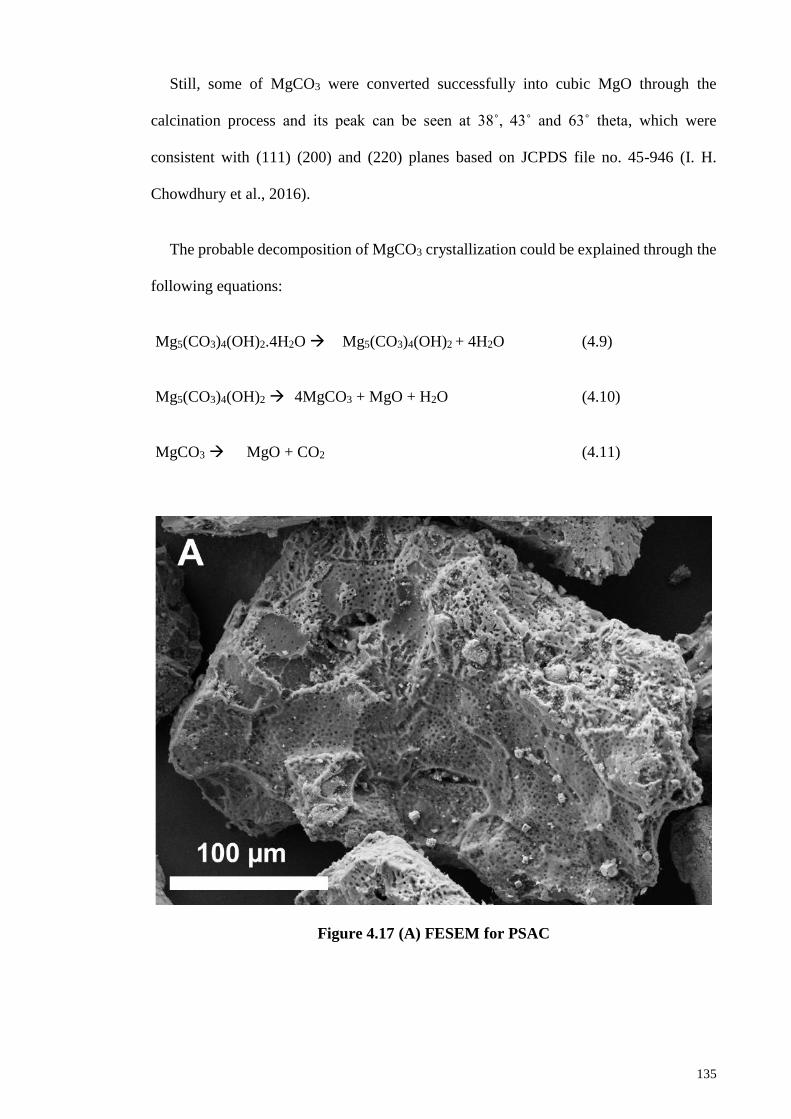
135
Still, some of MgCO3 were converted successfully into cubic MgO through the
calcination process and its peak can be seen at 38˚, 43˚ and 63˚ theta, which were
consistent with (111) (200) and (220) planes based on JCPDS file no. 45-946 (I. H.
Chowdhury et al., 2016).
The probable decomposition of MgCO3 crystallization could be explained through the
following equations:
Mg5(CO3)4(OH)2.4H2O Mg5(CO3)4(OH)2 + 4H2O (4.9)
Mg5(CO3)4(OH)2 4MgCO3 + MgO + H2O (4.10)
MgCO3 MgO + CO2 (4.11)
Figure 4.17 (A) FESEM for PSAC
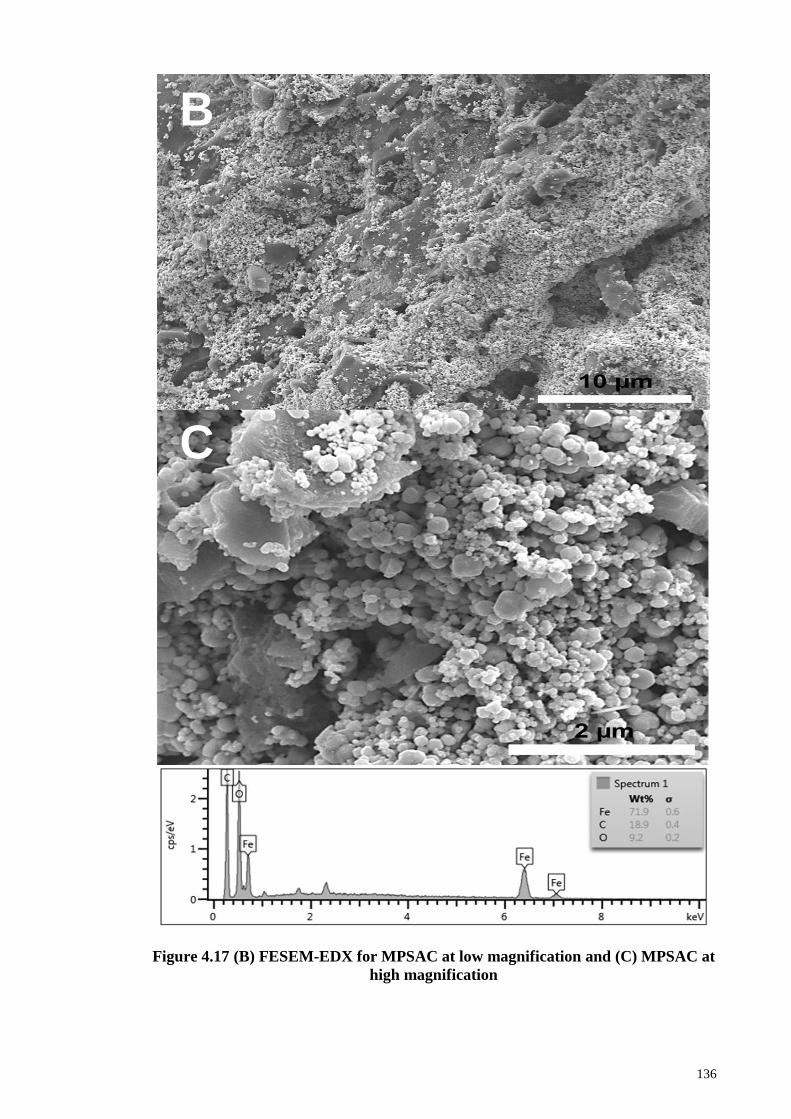
136
Figure 4.17 (B) FESEM-EDX for MPSAC at low magnification and (C) MPSAC at
high magnification
B
C
137
Figure 4.17 (D) FESEM-EDX for MPSAC-SiO2@MgNO3 at low magnification (E)
MPSAC-SiO2@MgNO3 (0.46) high magnification
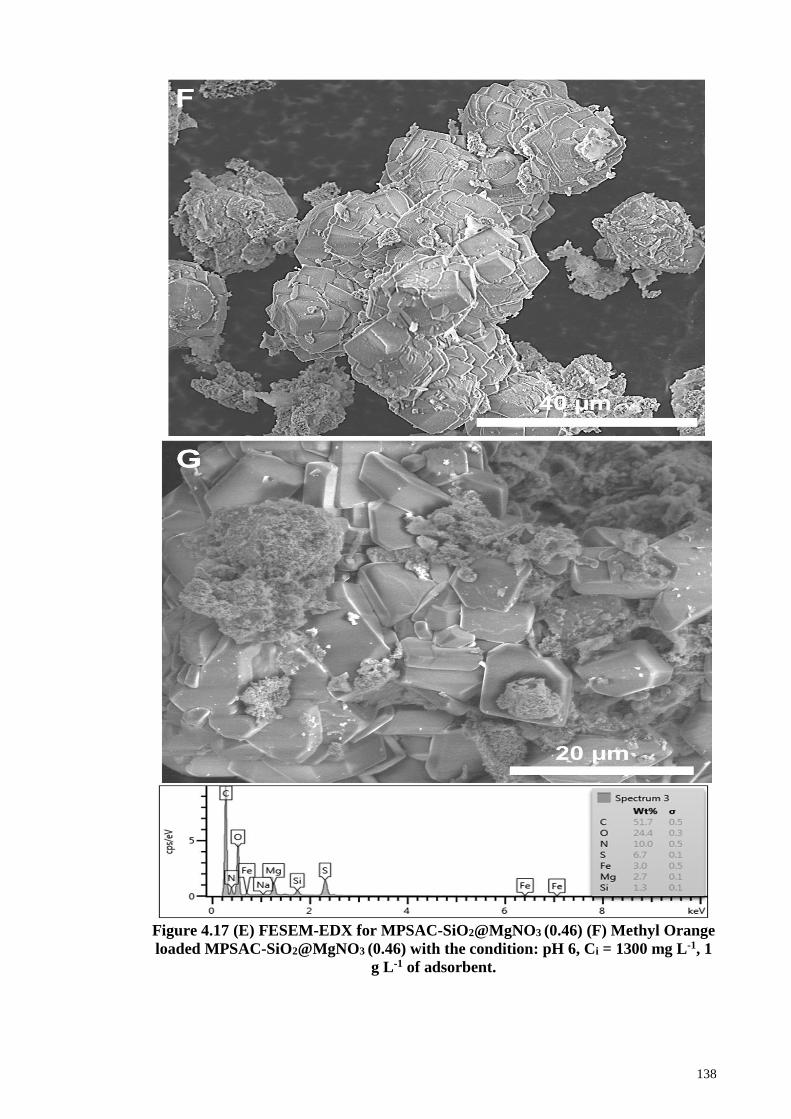
138
Figure 4.17 (E) FESEM-EDX for MPSAC-SiO2@MgNO3 (0.46) (F) Methyl Orange
loaded MPSAC-SiO2@MgNO3 (0.46) with the condition: pH 6, Ci = 1300 mg L-1, 1
g L-1 of adsorbent.
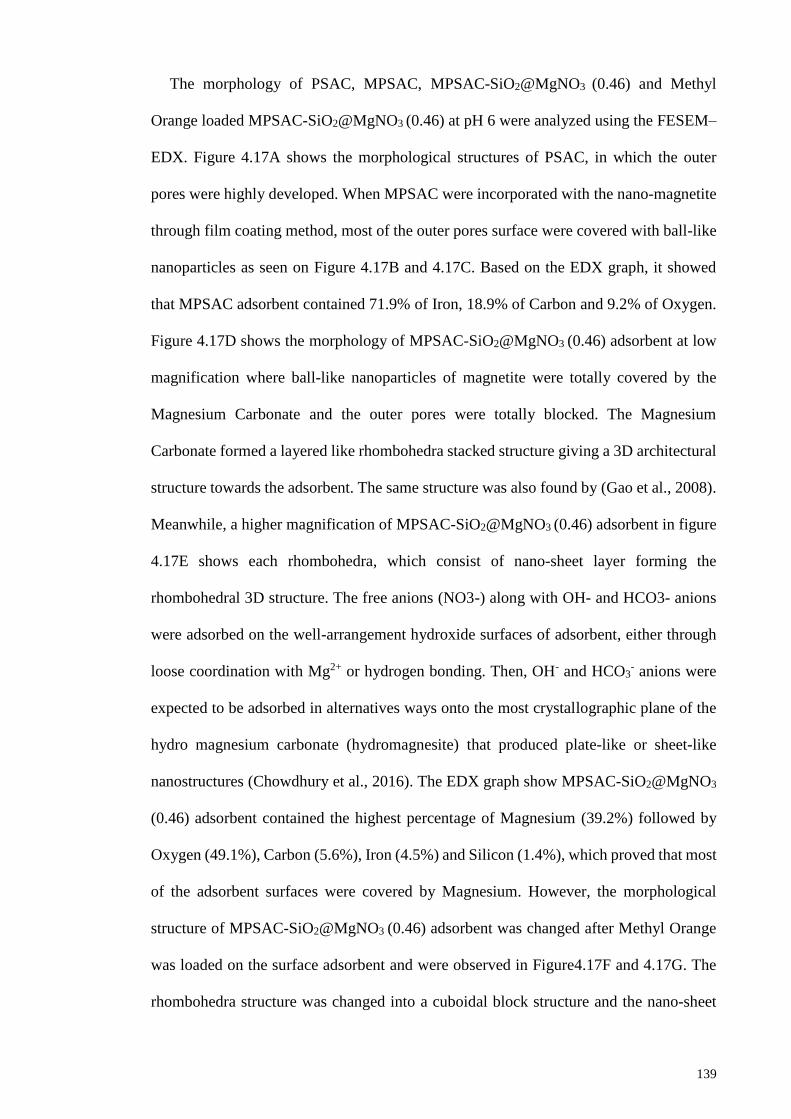
139
The morphology of PSAC, MPSAC, MPSAC-SiO2@MgNO3 (0.46) and Methyl
Orange loaded MPSAC-SiO2@MgNO3 (0.46) at pH 6 were analyzed using the FESEM–
EDX. Figure 4.17A shows the morphological structures of PSAC, in which the outer
pores were highly developed. When MPSAC were incorporated with the nano-magnetite
through film coating method, most of the outer pores surface were covered with ball-like
nanoparticles as seen on Figure 4.17B and 4.17C. Based on the EDX graph, it showed
that MPSAC adsorbent contained 71.9% of Iron, 18.9% of Carbon and 9.2% of Oxygen.
Figure 4.17D shows the morphology of MPSAC-SiO2@MgNO3 (0.46) adsorbent at low
magnification where ball-like nanoparticles of magnetite were totally covered by the
Magnesium Carbonate and the outer pores were totally blocked. The Magnesium
Carbonate formed a layered like rhombohedra stacked structure giving a 3D architectural
structure towards the adsorbent. The same structure was also found by (Gao et al., 2008).
Meanwhile, a higher magnification of MPSAC-SiO2@MgNO3 (0.46) adsorbent in figure
4.17E shows each rhombohedra, which consist of nano-sheet layer forming the
rhombohedral 3D structure. The free anions (NO3-) along with OH- and HCO3- anions
were adsorbed on the well-arrangement hydroxide surfaces of adsorbent, either through
loose coordination with Mg2+ or hydrogen bonding. Then, OH- and HCO3- anions were
expected to be adsorbed in alternatives ways onto the most crystallographic plane of the
hydro magnesium carbonate (hydromagnesite) that produced plate-like or sheet-like
nanostructures (Chowdhury et al., 2016). The EDX graph show MPSAC-SiO2@MgNO3
(0.46) adsorbent contained the highest percentage of Magnesium (39.2%) followed by
Oxygen (49.1%), Carbon (5.6%), Iron (4.5%) and Silicon (1.4%), which proved that most
of the adsorbent surfaces were covered by Magnesium. However, the morphological
structure of MPSAC-SiO2@MgNO3 (0.46) adsorbent was changed after Methyl Orange
was loaded on the surface adsorbent and were observed in Figure4.17F and 4.17G. The
rhombohedra structure was changed into a cuboidal block structure and the nano-sheet
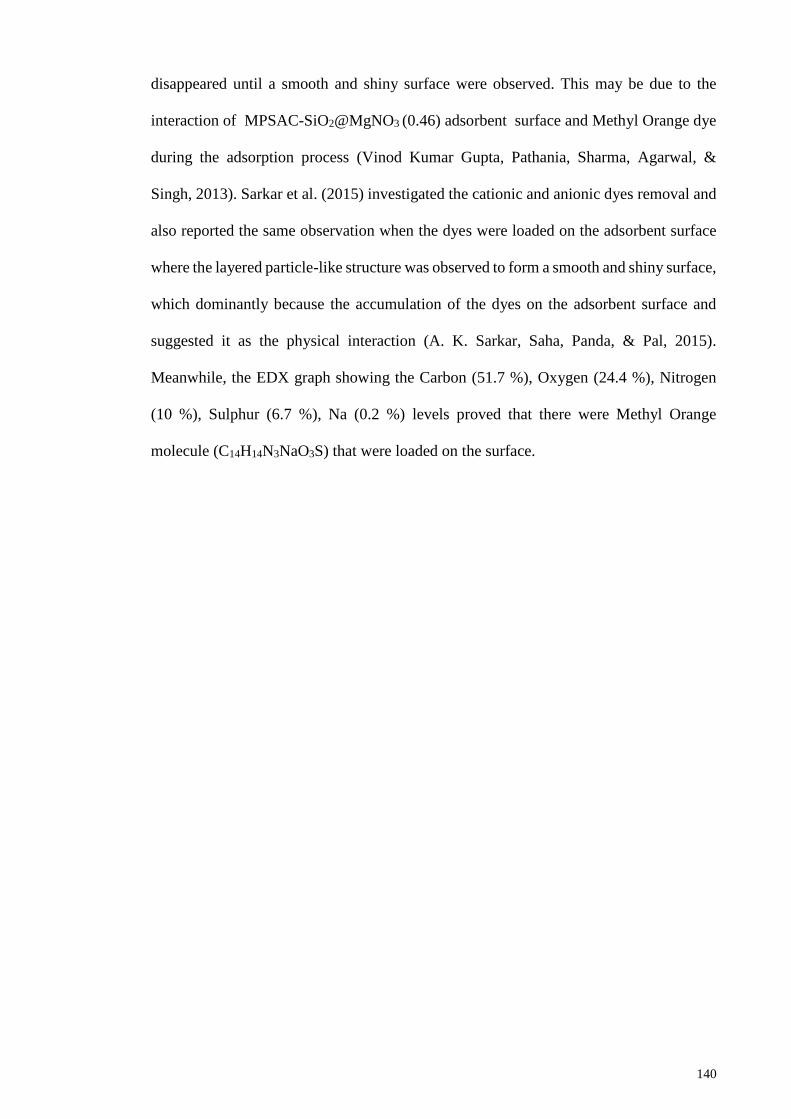
140
disappeared until a smooth and shiny surface were observed. This may be due to the
interaction of MPSAC-SiO2@MgNO3 (0.46) adsorbent surface and Methyl Orange dye
during the adsorption process (Vinod Kumar Gupta, Pathania, Sharma, Agarwal, &
Singh, 2013). Sarkar et al. (2015) investigated the cationic and anionic dyes removal and
also reported the same observation when the dyes were loaded on the adsorbent surface
where the layered particle-like structure was observed to form a smooth and shiny surface,
which dominantly because the accumulation of the dyes on the adsorbent surface and
suggested it as the physical interaction (A. K. Sarkar, Saha, Panda, & Pal, 2015).
Meanwhile, the EDX graph showing the Carbon (51.7 %), Oxygen (24.4 %), Nitrogen
(10 %), Sulphur (6.7 %), Na (0.2 %) levels proved that there were Methyl Orange
molecule (C14H14N3NaO3S) that were loaded on the surface.

141
pore diameter (Å)500 1000 1500 2000
dV
/dW
po
re v
olu
me
(cm
3g
-1Å
)
0.0000
0.0005
0.0010
0.0015
0.0020
0.0025
0.0030
pore diameter (Å)
0.0 0.2 0.4 0.6 0.8 1.0
Vo
lum
e a
bso
rbe
d (
cm3
/g,S
TP
)
0
100
200
300
400
PSAC
MPSAC
MPSAC-SiO2@MgNO3(0.46)
MPSAC-SiO2@MgNO3(0.46) with Methyl Orange loaded
PSAC
MPSAC
MPSAC-SiO2@MgNO3(0.46)
MPSAC-SiO2@MgNO3(0.46) with Methyl Orange loaded
A
B
Figure 4.18 (A) N2 adsorption and desorption isotherms (B) pore size
distribution (BJH) curve of PSAC, MPSAC, MPSAC-SiO2@MgNO3(0.46) and
MPSAC-SiO2@MgNO3 (0.46) with Methyl Orange loaded at pH 6, Ci = 1300mg L-
1, 1 g L-1 of adsorbent.

142
Figure 4.18 shows the N2 gas isotherm and BJH pore size distribution of the PSAC,
MPSAC, MPSAC-SiO2@MgNO3 (0.46) and MPSAC-SiO2@MgNO3 (0.46) loaded with
Methyl Orange. By referring to the IUPAC standard classification (Thommes et al.,
2015), PSAC and MPSAC showed type I isotherm curve to represent the long horizontal
knee feature of the isotherm. Predominantly, consisting of the micropore structures
proved the magnetization of the unmodified PSAC by using the film coating method,
which caused a thin nano-magnetite layer on the adsorbent surface that produced MPSAC
with a microporous structure. Meanwhile, MPSAC-SiO2@MgNO3 (0.46) shows the type
IV isotherm curve, which indicated the initial curve that is assigned to a monolayer and
multilayer adsorption with hysteris loop, H4 that were attributed to MPSAC-
SiO2@MgNO3 (0.46), consisting of a narrow slit-like pore (Harris, Kowalewski, & de
Menezes, 1998). This is to show when SiO2 and MgNO3 were incorporated on the surface
of MPSAC-SiO2@MgNO3 (0.46), it caused a significant reduction to the microporous
structure that was carried by the adsorbent. Instead. a mesoporous structure was
developed. The 3D crystal structure of MgNO3 built on the nano-magnetite layer at a
different angle completely covered the porous structure. After methyl orange was loaded
on the MPSAC-SiO2@MgNO3 (0.46), the isotherm curve showed type V, which indicated
a weak adsorbent-adsorbate interaction and was believed to be the cause of the ion-dipole
forces, dipole-dipole forces, van der Waals forces, and the dispersion forces arising from
the delocalized π electrons.

143
Table 4.13 Porosity characterization of PSAC, MPSAC, MPSAC-
SiO2@MgNO3(0.46) and MPSAC-SiO2@MgNO3(0.46) with Methyl Orange
Samples BET
surface
area
(m2g–1)
total
pore
volume
(cm3g–
1)
Micropore
Area (m2g–
1)
Volume
(cm3g–1)
primary
mesopore
Area
(m2g–
1)
Volume
(cm3g–1)
Size
(WKJ
S,Å)
PSAC 1558.2 1.762 984.851 0.4953 296.8 1.357 7.75
MPSAC 1,022.5 0.465 775.012 0.3087 247.5 0.046 18.1
8
MPSAC-
SiO2@MgNO3
(0.46)
296.1 0.459 26.464 0.0098 269.6 0.398 61.9
4
MPSAC-
SiO2@MgNO3
(0.46) with
Methyl
Orange
53.9 0.133 0.619 -0.0004 55.9 0.128 94.2
5
Based on Table 4.13, PSAC has the highest BET surface area (1558.2 m2g-1) and
micropore area (984.85 m2g-1), followed by MPSAC with BET surface area (1022.5m2g-
1) and micropore area (775.01m2g-1) showing both adsorbent carried a dominant
micropore structure. Meanwhile, the incorporation of SiO2 and MgNO3 caused the BET
surface area to experience a large reduction of 80% (296.1 m2g-1) followed by 97%
reduction of the micropore area (26.464 m2g-1). After Methyl Orange was loaded, the
BET surface area is further reduced to 97% reduction (53.9 m2g-1) and micropore area
was reduced to 99% (0.619 m2g-1). However, the mesopore size was observed to increase
from 7.75 Å to 94.25 Å with 91.7% increment, proving the adsorbent surface was covered
with MgNO3 crystal structure and Methyl Orange accumulation.
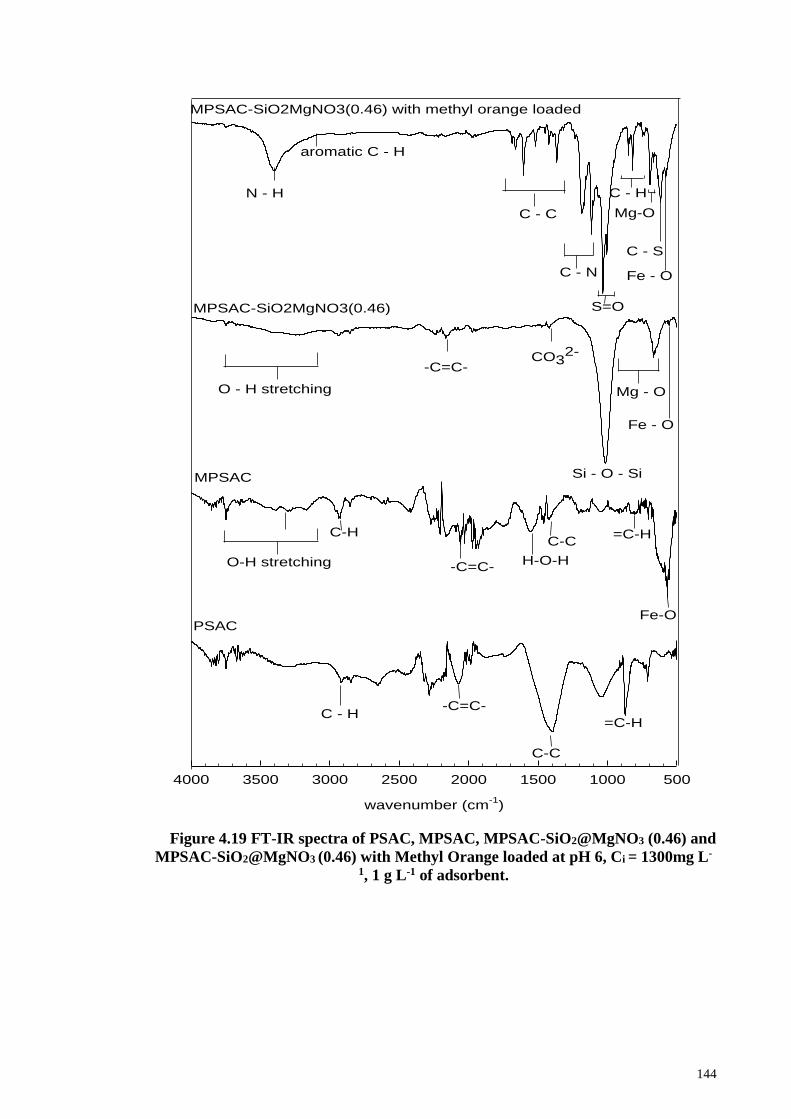
144
Figure 4.19 FT-IR spectra of PSAC, MPSAC, MPSAC-SiO2@MgNO3 (0.46) and
MPSAC-SiO2@MgNO3 (0.46) with Methyl Orange loaded at pH 6, Ci = 1300mg L-
1, 1 g L-1 of adsorbent.
wavenumber (cm-1
)
5001000150020002500300035004000
2D Graph 2
MPSAC-SiO2MgNO3(0.46) with methyl orange loaded
MPSAC-SiO2MgNO3(0.46)
MPSAC
PSAC
Si - O - Si
N - H
aromatic C - H
C - C
C - N
S=O
C - H
C - S
Mg - OO - H stretching
C - H-C=C-
C-C
=C-H
Fe-O
=C-HC-H
-C=C-
Fe - O
C-C
H-O-HO-H stretching
CO32-
-C=C-
Fe - O
Mg-O

145
The FT-IR spectra of PSAC, MPSAC, MPSAC-SiO2@MgNO3 (0.46) and MPSAC-
SiO2@MgNO3 (0.46) with Methyl Orange loaded were described in Figure 4.19. Based
on the illustrated figure, both PSAC and MPSAC have the same IR peaks at 900, 1409,
2100, and 2900 cm-1 in the IR spectra and were examined to be =C-H, C-C (aromatic
stretching), -C=C- (carbonyl) and C-H, respectively. However, MPSAC has different
peaks emerged at 612 cm-1 and 3150-3850 cm-1 which were assigned to Fe-O stretching
and O-H stretching. These were to show that MPSAC was coated with magnetite.
When SiO2 and MgNO3 were incorporated, the IR peaks of C-C, =C-H and C-H
disappeared and only –C=C- remained. The new IR peak at 1040cm-1 were indicated to
be SiO2 layer. Meanwhile, the Fe-O stretching and O-H stretching were observed to
experience slight reduction, which may be due to the incorporation of SiO2 and MgNO3
on the surface of magnetite layer (Quy et al., 2013). The characteristic of Mg-O stretching
vibration was noticed at 570-860 cm-1 and the CO32- ions were indicated at 1440 cm-1
IR spectra. The CO32- ions might be entrapped into the porous oxide and were
chemisorbed as monodentate onto the MgO when it is exposed to the atmosphere and
formed MgCO3 (I. H. Chowdhury et al., 2016).
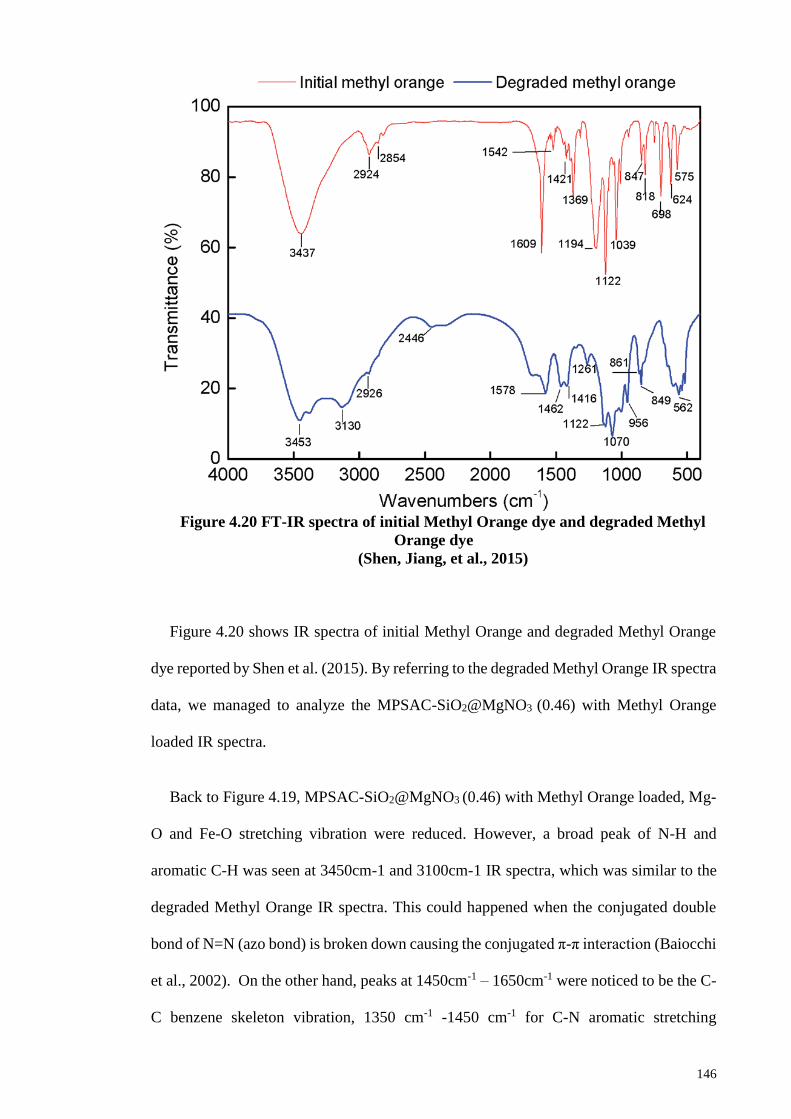
146
Figure 4.20 FT-IR spectra of initial Methyl Orange dye and degraded Methyl
Orange dye
(Shen, Jiang, et al., 2015)
Figure 4.20 shows IR spectra of initial Methyl Orange and degraded Methyl Orange
dye reported by Shen et al. (2015). By referring to the degraded Methyl Orange IR spectra
data, we managed to analyze the MPSAC-SiO2@MgNO3 (0.46) with Methyl Orange
loaded IR spectra.
Back to Figure 4.19, MPSAC-SiO2@MgNO3 (0.46) with Methyl Orange loaded, Mg-
O and Fe-O stretching vibration were reduced. However, a broad peak of N-H and
aromatic C-H was seen at 3450cm-1 and 3100cm-1 IR spectra, which was similar to the
degraded Methyl Orange IR spectra. This could happened when the conjugated double
bond of N=N (azo bond) is broken down causing the conjugated π-π interaction (Baiocchi
et al., 2002). On the other hand, peaks at 1450cm-1 – 1650cm-1 were noticed to be the C-
C benzene skeleton vibration, 1350 cm-1 -1450 cm-1 for C-N aromatic stretching
147
vibrations, 1060 cm-1 -980 cm-1 for S=O stretching vibrations. 850 cm-1 -870 cm-1 for the
aromatic C-H vibration and 640 cm-1 for the C-S bond formation of the new products with
a benzene ring or sulfonated aromatic ring (Shen, Jiang, et al., 2015). On the other hand,
Shen et al. (2015) also discussed the destruction of azo bond and formation of other
degradation intermediates containing benzene ring, which were proven to show the easy
decolorization of Methyl Orange dye. However, the destruction of the benzene ring was
shown to be difficult.

148
CHAPTER 5: CONCLUSION & RECOMMENDATIONS
6.1 Arsenic Removal Study
In this study, highly-effective sorption materials for the removal of arsenate were
prepared through the magnetization of PSAC followed by Lanthanum incorporation using
a wetness impregnation and calcination. The isotherm study showed that the arsenate
adsorption capacity and KL value were significantly increased with the increment of
Lanthanum impregnated to MPSAC. MPSAC–La (0.36) had about 16.5 or 1.6 times
higher qmax (227.6 mg g–1) for arsenate removal than the PSAC or MPSAC. Specifically,
it had 230 times higher KL than MPSAC, showing that Lanthanum impregnation had a
much stronger sorption affinity for arsenate. The experimental results of pH effect on
arsenate removal and speciation modeling revealed that arsenate is dominantly removed
by precipitation at pH < 8 while it complexes on the surface of La(OH)3 was at pH > 8.
In addition, the nano-magnetite might have a strong binding strength to stabilize
Lanthanum, providing a lesser dissolution. XRD, FTIR, SEM–EDS and N2 gas isotherms
disclosed that the nano-magnetite coating gave a considerable micropore clogging of
PSAC, but increased the meso and macropores due to the space created between the nano-
magnetite particles. Nevertheless, LO/LH cemented the spaces of nano-magnetite to
eliminate most of the pore structures and had an effective removal function of arsenate as
LaAsO4 at pH 6. Established on the results of batch tests, the granular-sized MPSAC–La
(0.36) has a potential to be a competitive and economic media because of the extremely
high sorption capabilities, easy magnetic separation and high regeneration rates.
149
6.2 Dye Removal Study
Both Methylene Blue dye (cationic) and Methyl Orange dye (anionic) carried different
ionic properties that were used to represent the common textile dye used in the textile
manufacturing industry. Highly effective MgNO3 with silica coated magnetically palm
shell waste-based activated carbon with a different MgNO3: urea molar ratio adsorbent
was prepared through the triple modification method. The isotherm study showed the
modified adsorbent with the highest MgNO3: urea ratio where the MPSAC-
SiO2@MgNO3 (0.46) gives the highest qmax value of 1019.61 mg g-1, which is 2.7 times
higher than the unmodified PSAC in Methyl Orange dye removal study and 1.15 times
higher than the unmodified PSAC in Methylene Blue dye removal study. Based on the
kinetic data, the pseudo first order, pseudo second order, and the intra particle diffusion
kinetic model was plotted and used to analyze the Methyl Orange and Methylene Blue
dyes removal mechanism by MPSAC-SiO2@MgNO3 (0.46), which revealed that the
chemisorption may influence the removal mechanism. The experimental results for
MPSAC-SiO2@MgNO3 (0.46) effects on pH showed that the Methyl Orange dye
adsorption capacity pattern were influenced by pH but not for Methylene Blue dye. Based
on the XRD, FESEM+EDX, FT-IR and BET+N2 gas analyses, the incorporation of
MgNO3: urea into the MPSAC-SiO2 resulted to the formation of MgCO3 instead of
MgO/Mg(OH)2 and caused the development of the 3D-rhombohedral structure with plate-
like nanostructure consisting of the hydromagnesite. The morphological structure was
changed after the Methyl Orange dye uptake resulted to the formation of 3D cuboidal
block structure with a smooth and shiny surfaces, which indicated the accumulation of
Methyl Orange dye. As a result, the micropore structure had totally disappeared and the
mesopore was significantly developed. It was believed that other than the electrostatic
attraction force between MPSAC-SiO2@MgNO3 (0.46) and the anionic Methyl Orange
dye, the ion-dipole, dipole-dipole, van der Waals, and π-π electron donor acceptor and

150
pore filling might have happened during the adsorption process. Established on the results
of batch tests, the granular-sized MPSAC-SiO2@MgNO3 (0.46) developed has a potential
to be a competitive and economic media for Methyl Orange dye removal because of the
extremely high sorption capabilities, easy magnetic separation and high regeneration
rates.
6.3 Major Contribution
Through time, a new material with a better removal efficiency than the current material
will always tried to be developed. The major contribution of both developed material is
to provide an alternative for water and wastewater treatment. Recently, researchers have
put more interest in using recycled material as their basic raw material. In this study, both
of the developed material used palm shell waste-based activated was used as a basic
adsorbent. Palm shell waste is available in abundance in Malaysia.
a) Arsenic Removal study
The major contribution of arsenic removal study towards the world are:
A new highly efficient adsorbent
As reported in section 4.1, the developed material, MPSAC-La (0.36) was
reported to have the capability to remove Arsenic (V) at high performance. This material
can be used in real groundwater treatment for drinking water usage as the capability of
developed material to remove Arsenic (V) is very high. Even though, the current highest
concentration of arsenic in groundwater did not achieve more than 1 mg L-1, meanwhile,
the MPSAC-La (0.36) is capable to remove 227.6 mg L-1.

151
A fast sorption rate adsorbent
As in the laboratory, shaker was used to mix the adsorbent, while in a real
treatment process, agitator will be used to agitate the adsorbent. Thus, the adsorbent will
continuously move in a uniform movement for a better adsorption performance. The
agitation process consumed high electricity rate and eventually will incurred a high
treatment cost. As reported in section 4.2, MPSAC-La (0.36) has a very fast sorption rate
in Arsenic (V) removal at initial concentration=350mg L-1. It is believed that the agitation
time taken to remove the arsenic from water to be treated will be reduced significantly as
the common arsenic concentration in real groundwater is <1 mg L-1.
Simple, easy to implement and cost-effective
Until now, developing countries such as Bangladesh and India still reported to
contain high arsenic contamination in groundwater. Most of the region in India still uses
tube wells at shallow aquifer for groundwater uptake because of the low installation and
operation cost. Thus, it is believed that the newly developed material, MPSAC-La (0.36)
is applicable to be used for arsenic (V) groundwater treatment as the adsorption process
is simple and no high installation cost will be incurred. The magnetic characteristic
carried by MPSAC-La (0.36) will make the separation method of adsorbent from treated
water much easier by using the external magnetic field. On the other hand, MPSAC-La
(0.36) also can be regenerated and reused again up to three times and this will contribute
to low operation cost.

152
b) Dye removal study
The major contribution of dye removal study towards the textile
manufacturing industry and environment are:
A new highly efficient adsorbent
As reported in section 4.7, MPSAC-SiO2@MgNO3 (0.46) was reported to show
a high performance in Methyl Orange dye and Methylene Blue dye uptake. It shows that
the developed material is capable to adsorb both dyes, which carry different ionic
properties. Meanwhile, Methyl Orange and Methylene Blue dyes are commonly used in
textile manufacturing industry. Thus, it is believed that the newly develop material is
capable to be applied in real dye wastewater. In addition, MPSAC-SiO2@MgNO3 (0.46)
showed a high adsorption capacity of about 1091 mg g-1 and 471 mg g-1 for Methyl
Orange and Methylene Blue dye uptake, respectively. Hence, it showed that the
developed material is capable to remove both dyes at a high concentration level.
Simple, easy to implement and cost-effective
In real textile manufacturing industry, a simple and easy to implement textile
wastewater treatment will be aimed. But, most of the simple textile wastewater treatment
is not very efficient in the dye removal uptake. Thus, it is believed by developing a new
adsorbent material with a magnetic characteristic, it will make the developed material to
be a good adsorbent alternative, as the used-adsorbent can be separated by external
magnetic field from the treated wastewater at the end of the treatment process. On the
other hand, the developed material has the ability to be regenerated and re-used for
another several adsorption treatment cycle, which will eventually reduce the treatment
cost.

153
6.5 Recommendation of future works
The method used in both studies has driven very promising results for arsenic in
groundwater contamination problem and dye wastewater treatment for the textile
manufacturing industry. However, there are several extents that need further analysis. In
both studies, simulated arsenic solution and dye solution were prepared in the laboratory.
In order to simulate real groundwater or dye wastewater, the co-existing anion and
competing anion studies were carried out to analyze its adsorption performance.
However, because of the time limitation, the developed material was unable to be tested
using the real groundwater and dye wastewater. Thus, for future work, it is recommended
to use the real groundwater and dye wastewater to support these findings.
In previous section, the synthesized materials were proven to have a high efficient
removal capacity for Arsenic (V) and in dye removal. Thus, to commercialize the
synthesized material, some convincing additional data needs to be included. Both of the
experimental studies were carried out using laboratory scale study, small scale and batch
tests. Meanwhile, in real water and wastewater treatment system, the treatment for
pollutants are in a large scale and in continuous system. It is believed that the application
of the pilot scale study can be used in a full scale study using the synthesized material and
column test study data, which will improve the justification of the study and showed the
effectiveness of the developed material. On the other hand, a detailed cost including the
material preparation cost, operation cost, and disposal cost are recommended to be carried
out so that a real sustainable (economic, environmental, social and engineering) approach
can be selected.
154
The development of both MPSAC-La (0.36) and MPSAC-SiO2@MgNO3 (0.46) were
developed by several modification techniques. The modification techniques applied had
helped to improve the efficiency of Arsenic (V) and dye adsorption. However, the
procedure of the modification is still quite complicated. To encounter this problem,
simpler modification needs to be investigated in the future. Furthermore, the possibility
of incorporating a larger amount of Lanthanum and MgNO3 into the synthesized material
during the modification needs to be investigated.
In the dye removal study, MgNO3 salt was used as the modification material. It is
recommended to investigate the adsorption performance, pore size, volume and structure,
and the morphological structure of the synthesized material by using other types of
Magnesium salt, such as MgSO4 and MgCl2.

155
REFERENCES
Aghazadeh, M., Golikand, A. N., Ghaemi, M., & Yousefi, T. (2011). A novel lanthanum
hydroxide nanostructure prepared by cathodic electrodeposition. Materials
Letters, 65(10), 1466-1468.
Ahmaruzzaman, M. (2008). Adsorption of phenolic compounds on low-cost adsorbents:
a review. Advances in Colloid and Interface Science, 143(1), 48-67.
Ahmaruzzaman, M. (2011). Industrial wastes as low-cost potential adsorbents for the
treatment of wastewater laden with heavy metals. Advances in Colloid and
Interface Science, 166(1–2), 36-59. doi:
http://dx.doi.org/10.1016/j.cis.2011.04.005
Ahmed, M. F. (2001). An overview of arsenic removal technologies in Bangladesh and
India. Paper presented at the Proceedings of BUET-UNU International Workshop
on Technologies for Arsenic Removal from Drinking Water, Dhaka.
Ai, L., Zhang, C., & Meng, L. (2011). Adsorption of methyl orange from aqueous solution
on hydrothermal synthesized Mg–Al layered double hydroxide. Journal of
Chemical & Engineering Data, 56(11), 4217-4225.
Al-Degs, Y. S., El-Barghouthi, M. I., El-Sheikh, A. H., & Walker, G. M. (2008). Effect
of solution pH, ionic strength, and temperature on adsorption behavior of reactive
dyes on activated carbon. Dyes and Pigments, 77(1), 16-23.
Alberghina, G., Bianchini, R., Fichera, M., & Fisichella, S. (2000). Dimerization of
Cibacron Blue F3GA and other dyes: influence of salts and temperature. Dyes and
Pigments, 46(3), 129-137.
Ali, I., Asim, M., & Khan, T. A. (2012). Low cost adsorbents for the removal of organic
pollutants from wastewater. Journal of Environmental Management, 113, 170-
183. doi: http://dx.doi.org/10.1016/j.jenvman.2012.08.028
Amin, N. K. (2008). European Desalination Society and Center for Research and
Technology Hellas (CERTH), Sani Resort 22–25 April 2007, Halkidiki,
GreeceRemoval of reactive dye from aqueous solutions by adsorption onto
activated carbons prepared from sugarcane bagasse pith. Desalination, 223(1),
152-161. doi: http://dx.doi.org/10.1016/j.desal.2007.01.203
Anjaneyulu, Y., Chary, N. S., & Raj, D. S. S. (2005). Decolourization of industrial
effluents–available methods and emerging technologies–a review. Reviews in
Environmental Science and Bio/Technology, 4(4), 245-273.
Apostol, I., Mamasakhlisi, J., & Subotta, D. (2015). Engaging the Public to Fight the
Consequences of Terrorism and Disasters: IOS Press.
Asadullah, M., Jahan, I., Ahmed, M. B., Adawiyah, P., Malek, N. H., & Rahman, M. S.
(2014). Preparation of microporous activated carbon and its modification for
arsenic removal from water. Journal of Industrial and Engineering Chemistry,
20(3), 887-896. doi: http://dx.doi.org/10.1016/j.jiec.2013.06.019
156
Azami, M., Bahram, M., Nouri, S., & Naseri, A. (2012). A central composite design for
the optimization of the removal of the azo dye, methyl orange, from waste water
using the Fenton reaction. J Serb Chem Soc, 77, 235-246.
Babu, B. R., Parande, A., Raghu, S., & Kumar, T. P. (2007). Cotton textile processing:
waste generation and effluent treatment. Journal of cotton science.
Baiocchi, C., Brussino, M. C., Pramauro, E., Prevot, A. B., Palmisano, L., & Marcı̀, G.
(2002). Characterization of methyl orange and its photocatalytic degradation
products by HPLC/UV–VIS diode array and atmospheric pressure ionization
quadrupole ion trap mass spectrometry. International Journal of Mass
Spectrometry, 214(2), 247-256.
Blaas, H., & Kroeze, C. (2016). Excessive nitrogen and phosphorus in European rivers:
2000–2050. Ecological Indicators, 67, 328-337. doi:
http://dx.doi.org/10.1016/j.ecolind.2016.03.004
Blomqvist, A. (1996). Food and fashion: Water management and collective action among
irrigation farmers and textile industrialists in South India.
Cavaco, S. A., Fernandes, S., Quina, M. M., & Ferreira, L. M. (2007). Removal of
chromium from electroplating industry effluents by ion exchange resins. Journal
of Hazardous Materials, 144(3), 634-638.
Chakraborti, D., Das, B., Rahman, M. M., Kumar, U., Chowdhury, B. B., Goswami, A.,
. . . Sengupta, S. A. (2009). Research Article Status of groundwater arsenic
contamination in the state of West Bengal, India: A 20-year study report. Mol.
Nutr. Food Res, 53, 542-551.
Chakraborti, D., Rahman, M. M., Das, B., Nayak, B., Pal, A., Sengupta, M. K., . . . Saha,
K. C. (2013). Groundwater arsenic contamination in Ganga–Meghna–
Brahmaputra plain, its health effects and an approach for mitigation.
Environmental earth sciences, 70(5), 1993-2008.
Chakraborti, D., & Roy, S. (1997). Groundwater arsenic calamity in Bangladesh. Current
Science, 73(1), 4859.
Chakraborty, S., De, S., Basu, J., & DasGupta, S. (2005). Treatment of a textile effluent:
application of a combination method involving adsorption and nanofiltration.
Desalination, 174(1), 73-85.
Chen, B., Liu, Y., Chen, S., Zhao, X., Meng, X., & Pan, X. Magnetically recoverable
cross-linked polyethylenimine as a novel adsorbent for removal of anionic dyes
with different structures from aqueous solution. Journal of the Taiwan Institute of
Chemical Engineers. doi: http://dx.doi.org/10.1016/j.jtice.2016.07.014
Chen, X., Chen, G., & Yue, P. L. (2000). Separation of pollutants from restaurant
wastewater by electrocoagulation. Separation and purification technology, 19(1),
65-76.
Chowdhury, I. H., Chowdhury, A. H., Bose, P., Mandal, S., & Naskar, M. K. (2016).
Effect of anion type on the synthesis of mesoporous nanostructured MgO, and its

157
excellent adsorption capacity for the removal of toxic heavy metal ions from
water. Rsc Advances, 6(8), 6038-6047.
Chowdhury, S. R., Yanful, E. K., & Pratt, A. R. (2011). Arsenic removal from aqueous
solutions by mixed magnetite–maghemite nanoparticles. Environmental earth
sciences, 64(2), 411-423.
Christie, R. M. (2007). Environmental Aspects of Textile Dyeing: Elsevier Science.
Compounds, W. A. (2001). Environmental Health Criteria 224. World Health
Organisation, Geneva.
contributors, N. W. E. Methylene blue (pp. 984958): New World Encyclopedia,.
Retrieved from
http://www.newworldencyclopedia.org/p/index.php?title=Methylene_blue&oldi
d=984958.
contributors, W. ion exchange: Wikipedia, The Free Encyclopedia.
contributors, W. Methyl orange: Wikipedia, The Free Encyclopedia.
contributors, W. Methylene blue: Wikipedia, The Free Encyclopedia.
Cornell, R. M., & Schwertmann, U. (2003). The Iron Oxides. Weinheim: Wiley-VCH.
Crittenden, J. C., Howe, K. J., Hand, D. W., Tchobanoglous, G., & Trussell, R. R. (2012).
Principles of Water Treatment: John Wiley & Sons, Incorporated.
Das, D. P., Das, J., & Parida, K. (2003). Physicochemical characterization and adsorption
behavior of calcined Zn/Al hydrotalcite-like compound (HTlc) towards removal
of fluoride from aqueous solution. Journal of colloid and interface science,
261(2), 213-220.
Daud, W. M. A. W., & Ali, W. S. W. (2004). Comparison on pore development of
activated carbon produced from palm shell and coconut shell. Bioresource
Technology, 93(1), 63-69.
Dávila-Jiménez, M., Elizalde-Gonzalez, M., & Peláez-Cid, A. (2005). Adsorption
interaction between natural adsorbents and textile dyes in aqueous solution.
Colloids and Surfaces A: Physicochemical and Engineering Aspects, 254(1), 107-
114.
Demirbas, E., Kobya, M., & Konukman, A. (2008). Error analysis of equilibrium studies
for the almond shell activated carbon adsorption of Cr (VI) from aqueous
solutions. Journal of Hazardous Materials, 154(1), 787-794.
Demirbas, E., & Nas, M. (2009). Batch kinetic and equilibrium studies of adsorption of
Reactive Blue 21 by fly ash and sepiolite. Desalination, 243(1), 8-21.
Donnan, F. G. (1995). Theory of membrane equilibria and membrane potentials in the
presence of non-dialysing electrolytes. A contribution to physical-chemical
physiology. Journal of Membrane Science, 100(1), 45-55.
158
Dutta, K., Mukhopadhyay, S., Bhattacharjee, S., & Chaudhuri, B. (2001). Chemical
oxidation of methylene blue using a Fenton-like reaction. Journal of Hazardous
Materials, 84(1), 57-71. doi: http://dx.doi.org/10.1016/S0304-3894(01)00202-3
Emamjomeh, M. M., & Sivakumar, M. (2009). Review of pollutants removed by
electrocoagulation and electrocoagulation/flotation processes. Journal of
Environmental Management, 90(5), 1663-1679.
Envirowise. (1997). 'Water and Chemical Use in the Textile Dyeing and Finishing
Industry GG62 (pp. 37): Environmental Technology Best Practice Program.
Fakhri, A., & Adami, S. (2014). Adsorption and thermodynamic study of Cephalosporins
antibiotics from aqueous solution onto MgO nanoparticles. Journal of the Taiwan
Institute of Chemical Engineers, 45(3), 1001-1006. doi:
http://dx.doi.org/10.1016/j.jtice.2013.09.028
Faust, S. D., & Aly, O. M. (2013). Adsorption processes for water treatment: Elsevier.
Feng, G., Hu, D., Yang, L., Cui, Y., Cui, X.-a., & Li, H. (2010). Immobilized-metal
affinity chromatography adsorbent with paramagnetism and its application in
purification of histidine-tagged proteins. Separation and purification technology,
74(2), 253-260. doi: http://dx.doi.org/10.1016/j.seppur.2010.06.013
Figueiredo, J., Pereira, M., Freitas, M., & Orfao, J. (1999). Modification of the surface
chemistry of activated carbons. Carbon, 37(9), 1379-1389.
Fisli, A., Yusuf, S., Krisnandi, Y. K., & Gunlazuardi, J. (2014). Preparation and
Characterization of Magnetite-Silica Nano-Composite as Adsorbents for Removal
of Methylene Blue Dyes from Environmental Water Samples. Paper presented at
the Advanced Materials Research.
Forgacs, E., Cserháti, T., & Oros, G. (2004). Removal of synthetic dyes from
wastewaters: a review. Environment international, 30(7), 953-971. doi:
http://dx.doi.org/10.1016/j.envint.2004.02.001
Gao, C., Zhang, W., Li, H., Lang, L., & Xu, Z. (2008). Controllable fabrication of
mesoporous MgO with various morphologies and their absorption performance
for toxic pollutants in water. Crystal Growth and Design, 8(10), 3785-3790.
Gaur, V. (2012). SURFACE MODIFICATION OF ACTIVATED CARBON FOR THE
REMOVAL OF WATER IMPURITIES. DISINFECTION. Retrieved 30 August
2016, from http://www.watertechonline.com/surface-modification-of-activated-
carbon-for-the-removal-of-water-impurities/
Gebbie, P. (2006). An operator’s guide to water treatement coagulants. Paper presented
at the 31st Annual QLD Water Industry Workshop—Operations Skills.
Ghasemian, E., & Palizban, Z. (2016). Comparisons of azo dye adsorptions onto activated
carbon and silicon carbide nanoparticles loaded on activated carbon. International
Journal of Environmental Science and Technology, 13(2), 501-512.
159
Ghorai, S., & Pant, K. (2005). Equilibrium, kinetics and breakthrough studies for
adsorption of fluoride on activated alumina. Separation and purification
technology, 42(3), 265-271.
Golob, V., Vinder, A., & Simonič, M. (2005). Efficiency of the coagulation/flocculation
method for the treatment of dyebath effluents. Dyes and Pigments, 67(2), 93-97.
Gong, R., Ye, J., Dai, W., Yan, X., Hu, J., Hu, X., . . . Huang, H. (2013). Adsorptive
removal of methyl orange and methylene blue from aqueous solution with finger-
citron-residue-based activated carbon. Industrial & Engineering Chemistry
Research, 52(39), 14297-14303.
Griffin, R., & Jurinak, J. (1974). Kinetics of the phosphate interaction with calcite. Soil
Science Society of America Journal, 38(1), 75-79.
Guivarch, E. (2004). Organic Pollutant Treatment in Aqueous Medium by
Electrochemical Advanced Oxidation Process Electro-Fenton: Application to the
Mineralization of Synthetic Dyes. University of l\/larne-La-Vallee, France,
Pages, 232.
Guo, C., Xu, J., He, Y., Zhang, Y., & Wang, Y. (2011). Photodegradation of rhodamine
B and methyl orange over one-dimensional TiO 2 catalysts under simulated solar
irradiation. Applied Surface Science, 257(8), 3798-3803.
Guo, Y., Zhu, Z., Qiu, Y., & Zhao, J. (2012). Adsorption of arsenate on Cu/Mg/Fe/La
layered double hydroxide from aqueous solutions. Journal of Hazardous
Materials, 239–240, 279-288. doi:
http://dx.doi.org/10.1016/j.jhazmat.2012.08.075
Gupta, A. D. (2008). Implication of environmental flows in river basin management.
Physics and Chemistry of the Earth, Parts A/B/C, 33(5), 298-303.
Gupta, G., Prasad, G., Panday, K., & Singh, V. (1988). Removal of chrome dye from
aqueous solutions by fly ash. Water, Air, and Soil Pollution, 37(1-2), 13-24.
Gupta, V. K., Ali, I., Saleh, T. A., Nayak, A., & Agarwal, S. (2012). Chemical treatment
technologies for waste-water recycling—an overview. Rsc Advances, 2(16),
6380-6388.
Gupta, V. K., Pathania, D., Sharma, S., Agarwal, S., & Singh, P. (2013). Remediation
and recovery of methyl orange from aqueous solution onto acrylic acid grafted
Ficus carica fiber: isotherms, kinetics and thermodynamics. Journal of Molecular
Liquids, 177, 325-334.
Gupta, V. K., Rastogi, A., & Nayak, A. (2010). Biosorption of nickel onto treated alga
(Oedogonium hatei): application of isotherm and kinetic models. Journal of
colloid and interface science, 342(2), 533-539.
Hafeznezami, S., Lam, J. R., Xiang, Y., Reynolds, M. D., Davis, J. A., Lin, T., & Jay, J.
A. (2016). Arsenic mobilization in an oxidizing alkaline groundwater:
Experimental studies, comparison and optimization of geochemical modeling

160
parameters. Applied Geochemistry, 72, 97-112. doi:
http://dx.doi.org/10.1016/j.apgeochem.2016.07.011
Hai, F. I., Yamamoto, K., & Fukushi, K. (2007). Hybrid treatment systems for dye
wastewater. Critical Reviews in Environmental Science and Technology, 37(4),
315-377.
Hamdaoui, O., & Naffrechoux, E. (2007). Modeling of adsorption isotherms of phenol
and chlorophenols onto granular activated carbon: Part II. Models with more than
two parameters. Journal of Hazardous Materials, 147(1), 401-411.
Hao, L., Liu, Q., Li, X., Du, Z., & Wang, P. (2014). A potentially low-cost modified
sawdust (MSD) effective for rapid Cr (VI) and As (V) removal from water. RSC
Advances, 4(91), 49569-49576.
Haque, E., Jun, J. W., & Jhung, S. H. (2011). Adsorptive removal of methyl orange and
methylene blue from aqueous solution with a metal-organic framework material,
iron terephthalate (MOF-235). Journal of Hazardous Materials, 185(1), 507-511.
doi: http://dx.doi.org/10.1016/j.jhazmat.2010.09.035
Haque, N., Morrison, G., Cano-Aguilera, I., & Gardea-Torresdey, J. L. (2008). Iron-
modified light expanded clay aggregates for the removal of arsenic(V) from
groundwater. Microchemical Journal, 88(1), 7-13. doi:
http://dx.doi.org/10.1016/j.microc.2007.08.004
Harris, R. K., Kowalewski, J., & de Menezes, S. C. (1998). International Union of Pure
and Applied Chemistry Physical Chemistry Division Commission on Molecular
Structure and Spectroscopy. Parameters and symbols for use in nuclear magnetic
resonance (IUPAC recommendations 1997). Magnetic Resonance in Chemistry,
36(2), 145-149.
He, T., Feng, X., Guo, Y., Qiu, G., Li, Z., Liang, L., & Lu, J. (2008). The impact of
eutrophication on the biogeochemical cycling of mercury species in a reservoir: a
case study from Hongfeng Reservoir, Guizhou, China. Environmental Pollution,
154(1), 56-67.
Heath, A. G. (1995). Water Pollution and Fish Physiology: Taylor & Francis.
Heishman, J. O., Olson, N. O., & Shelton, D. C. (1960). Control of Chronic Respiratory
Disease. II. The Effect of Low Calcium Diet, Terephthalic acid and
Chlortetracycline. Avian Diseases, 4(4), 413-418. doi: 10.2307/1587691
Hendricks, D. W. (2006). Water treatment unit processes: physical and chemical: CRC
press.
Ho, Y., & McKay, G. (1998). A comparison of chemisorption kinetic models applied to
pollutant removal on various sorbents. Process Safety and Environmental
Protection, 76(4), 332-340.
Ho, Y., Porter, J., & McKay, G. (2002). Equilibrium isotherm studies for the sorption of
divalent metal ions onto peat: copper, nickel and lead single component systems.
Water, Air, and Soil Pollution, 141(1-4), 1-33.
161
Ho, Y. S., & McKay, G. (1998). Sorption of dye from aqueous solution by peat. Chem.
Eng. J., 70(2), 115-124.
Holt, P. K., Barton, G. W., & Mitchell, C. A. (2005). The future for electrocoagulation as
a localised water treatment technology. Chemosphere, 59(3), 355-367.
Hong, J., Zhu, Z., Lu, H., & Qiu, Y. (2014). Synthesis and arsenic adsorption
performances of ferric-based layered double hydroxide with α-alanine
intercalation. Chemical Engineering Journal, 252, 267-274. doi:
10.1016/j.cej.2014.05.019
Hong, S., Wen, C., He, J., Gan, F., & Ho, Y.-S. (2009). Adsorption thermodynamics of
Methylene Blue onto bentonite. Journal of Hazardous Materials, 167(1), 630-
633.
Hopenhayn-Rich, C., Biggs, M. L., Fuchs, A., Bergoglio, R., Tello, E. E., Nicolli, H., &
Smith, A. H. (1996). Bladder cancer mortality associated with arsenic in drinking
water in Argentina. Epidemiology, 7(2), 117-124.
Hughes, M. F., Beck, B. D., Chen, Y., Lewis, A. S., & Thomas, D. J. (2011). Arsenic
Exposure and Toxicology: A Historical Perspective. Toxicological Sciences,
123(2), 305-332. doi: 10.1093/toxsci/kfr184
Humans, I. W. G. o. t. E. o. C. R. t., Organization, W. H., & Cancer, I. A. f. R. o. (2004).
Some Drinking-water Disinfectants and Contaminants, Including Arsenic: IARC
Monographs on the Evaluation of Carcinogenic Risks to Human: World Health
Organization.
Jain, R., Bhargava, M., & Sharma, N. (2003). Electrochemical studies on a
pharmaceutical azo dye: Tartrazine. Industrial & Engineering Chemistry
Research, 42(2), 243-247.
Jain, R., & Sikarwar, S. (2008). Removal of hazardous dye congored from waste material.
Journal of Hazardous Materials, 152(3), 942-948.
Jang, M., Park, J. K., & Shin, E. W. (2004). Lanthanum functionalized highly ordered
mesoporous media: implications of arsenate removal. Microporous and
mesoporous materials, 75(1), 159-168.
Jedryczko, D., Pohl, P., & Welna, M. (2016). Inorganic arsenic speciation in natural
mineral drinking waters by flow-through anodic stripping chronopotentiometry.
Talanta, 150, 265-271. doi: http://dx.doi.org/10.1016/j.talanta.2015.12.032
Kabata-Pendias, A., & Pendias, H. (1992). Trace elements in soils and plants: CRC Press.
Kabra, K., Chaudhary, R., & Sawhney, R. L. (2004). Treatment of Hazardous Organic
and Inorganic Compounds through Aqueous-Phase Photocatalysis: A Review.
Industrial & Engineering Chemistry Research, 43(24), 7683-7696. doi:
10.1021/ie0498551
Kaiya, Y., Itoh, Y., Fujita, K., & Takizawa, S. (1996). Study on fouling materials in the
membrane treatment process for potable water. Desalination, 106(1), 71-77.

162
Karim, M. M., Das, A. K., & Lee, S. H. (2006). Treatment of colored effluent of the
textile industry in Bangladesh using zinc chloride treated indigenous activated
carbons. Analytica chimica acta, 576(1), 37-42.
Kasaoka, S., Sakata, Y., Tanaka, E., & Naitoh, R. (1987). PREPARATION OF
ACTIVATED FIBROUS CARBON FROM PHENOLIC FABRIC AND ITS
MOLECULAR-SIEVING PROPERTIES. Nippon Kagaku Kaishi(6), 990-1000.
Katsoyiannis, I. A., Hug, S. J., Ammann, A., Zikoudi, A., & Hatziliontos, C. (2007).
Arsenic speciation and uranium concentrations in drinking water supply wells in
Northern Greece: correlations with redox indicative parameters and implications
for groundwater treatment. Science of The Total Environment, 383(1), 128-140.
Kavitha, D., & Namasivayam, C. (2007). Experimental and kinetic studies on methylene
blue adsorption by coir pith carbon. Bioresource Technology, 98(1), 14-21.
Kim, W., Suh, C.-Y., Cho, S.-W., Roh, K.-M., Kwon, H., Song, K., & Shon, I.-J. (2012).
A new method for the identification and quantification of magnetite–maghemite
mixture using conventional X-ray diffraction technique. Talanta, 94(0), 348-352.
doi: http://dx.doi.org/10.1016/j.talanta.2012.03.001
Knaebel, K. S. (2008). Adsorbent selection. Adsorption Research, Inc.
Kong, S., Wang, Y., Hu, Q., & Olusegun, A. K. (2014). Magnetic nanoscale Fe–Mn
binary oxides loaded zeolite for arsenic removal from synthetic groundwater.
Colloids and Surfaces A: Physicochemical and Engineering Aspects, 457, 220-
227.
Kumar, P. R., Chaudhari, S., Khilar, K. C., & Mahajan, S. (2004). Removal of arsenic
from water by electrocoagulation. Chemosphere, 55(9), 1245-1252.
Kundu, S., & Gupta, A. (2006). Arsenic adsorption onto iron oxide-coated cement
(IOCC): regression analysis of equilibrium data with several isotherm models and
their optimization. Chemical Engineering Journal, 122(1), 93-106.
Kuo, S., & Lotse, E. (1972). Kinetics of phosphate adsorption by calcium carbonate and
Ca-kaolinite. Soil Science Society of America Journal, 36(5), 725-729.
Kuokkanen, V., & Kuokkanen, T. (2013). Recent applications of electrocoagulation in
treatment of water and wastewater—a review.
Lagergren, S. (1898). About the theory of so-called adsorption of soluble substances.
Lakshmi, U. R., Srivastava, V. C., Mall, I. D., & Lataye, D. H. (2009). Rice husk ash as
an effective adsorbent: Evaluation of adsorptive characteristics for Indigo
Carmine dye. Journal of Environmental Management, 90(2), 710-720. doi:
http://dx.doi.org/10.1016/j.jenvman.2008.01.002
Langmuir, I. (1916). THE CONSTITUTION AND FUNDAMENTAL PROPERTIES OF
SOLIDS AND LIQUIDS. PART I. SOLIDS. Journal of the American Chemical
Society, 38(11), 2221-2295.

163
Laszlo, K., & Szűcs, A. (2001). Surface characterization of polyethyleneterephthalate
(PET) based activated carbon and the effect of pH on its adsorption capacity from
aqueous phenol and 2, 3, 4-trichlorophenol solutions. Carbon, 39(13), 1945-1953.
Laxman, M. (2009). Pollution and its control in textile industry. Dyes and Chemicals.
Ledakowicz, S., Solecka, M., & Zylla, R. (2001). Biodegradation, decolourisation and
detoxification of textile wastewater enhanced by advanced oxidation processes.
Journal of biotechnology, 89(2), 175-184.
Libera, J., Elam, J., & Pellin, M. (2008). Conformal ZnO coatings on high surface area
silica gel using atomic layer deposition. Thin Solid Films, 516(18), 6158-6166.
Limousin, G., Gaudet, J.-P., Charlet, C., Szenknect, S., Barthès, V., & Krimissa, M.
(2007). Sorption isotherms: A review on physical bases, modeling and
measurement. Applied Geochemistry, 22(2), 249-275.
Lin, B., & Moubarak, M. (2013). Decomposition analysis: change of carbon dioxide
emissions in the Chinese textile industry. Renewable and Sustainable Energy
Reviews, 26, 389-396.
Liu, C.-H., Chuang, Y. H., Chen, T.-Y., Tian, Y., Li, H., Wang, M.-K., & Zhang, W.
(2015). Mechanism of arsenic adsorption on magnetite nanoparticles from water:
thermodynamic and spectroscopic studies. Environmental Science and
Technology, 49, 7726-7734.
Liu, J., Zhou, Q., Chen, J., Zhang, L., & Chang, N. (2013). Phosphate adsorption on
hydroxyl–iron–lanthanum doped activated carbon fiber. Chemical Engineering
Journal, 215, 859-867.
Liu, Y., Zeng, G., Tang, L., Cai, Y., Pang, Y., Zhang, Y., . . . He, Y. (2015). Highly
effective adsorption of cationic and anionic dyes on magnetic Fe/Ni nanoparticles
doped bimodal mesoporous carbon. Journal of Colloid and Interface Science,
448, 451-459. doi: http://dx.doi.org/10.1016/j.jcis.2015.02.037
Lloyd, D. S., Koenings, J. P., & Laperriere, J. D. (1987). Effects of turbidity in fresh
waters of Alaska. North American Journal of Fisheries Management, 7(1), 18-33.
Lloyd, R. (1992). Pollution and freshwater fish: Fishing News Books Ltd.
Lopez-Ramon, M. V., Stoeckli, F., Moreno-Castilla, C., & Carrasco-Marin, F. (1999). On
the characterization of acidic and basic surface sites on carbons by various
techniques. Carbon, 37(8), 1215-1221. doi: http://dx.doi.org/10.1016/S0008-
6223(98)00317-0
Lu, Y., Jiang, B., Fang, L., Ling, F., Gao, J., Wu, F., & Zhang, X. (2016). High
performance NiFe layered double hydroxide for methyl orange dye and Cr (VI)
adsorption. Chemosphere, 152, 415-422.
Lua, A. C., & Guo, J. (2001). Microporous oil-palm-shell activated carbon prepared by
physical activation for gas-phase adsorption. Langmuir, 17(22), 7112-7117.

164
Ma, J., Yu, F., Zhou, L., Jin, L., Yang, M., Luan, J., . . . Chen, J. (2012). Enhanced
adsorptive removal of methyl orange and methylene blue from aqueous solution
by alkali-activated multiwalled carbon nanotubes. ACS applied materials &
interfaces, 4(11), 5749-5760.
Maity, D., Kale, S., Kaul-Ghanekar, R., Xue, J.-M., & Ding, J. (2009). Studies of
magnetite nanoparticles synthesized by thermal decomposition of iron (III)
acetylacetonate in tri (ethylene glycol). Journal of magnetism and magnetic
materials, 321(19), 3093-3098.
Mandal, B. K., & Suzuki, K. T. (2002). Arsenic round the world: a review. Talanta, 58(1),
201-235.
Méndez, M., Carvajal, J. J., Cesteros, Y., Aguiló, M., Díaz, F., Giguère, A., . . . Marsal,
L. F. (2010). Sol–gel Pechini synthesis and optical spectroscopy of
nanocrystalline La2O3 doped with Eu3+. Optical Materials, 32(12), 1686-1692.
doi: http://dx.doi.org/10.1016/j.optmat.2010.02.018
Mezohegyi, G., van der Zee, F. P., Font, J., Fortuny, A., & Fabregat, A. (2012). Towards
advanced aqueous dye removal processes: a short review on the versatile role of
activated carbon. Journal of Environmental Management, 102, 148-164.
Mondal, P., Bhowmick, S., Chatterjee, D., Figoli, A., & Van der Bruggen, B. (2013).
Remediation of inorganic arsenic in groundwater for safe water supply: a critical
assessment of technological solutions. Chemosphere, 92(2), 157-170.
Mousavi, H., Hosseynifar, A., Jahed, V., & Dehghani, S. (2010). Removal of lead from
aqueous solution using waste tire rubber ash as an adsorbent. Brazilian Journal of
Chemical Engineering, 27(1), 79-87.
Murcott, S. (2012). Arsenic contamination in the World: an international sourcebook
2012: IWA Publishing.
Naden, D. (1984). Ion exchange technology.
Nam, W., Kim, J., & Han, G. (2002). Photocatalytic oxidation of methyl orange in a three-
phase fluidized bed reactor. Chemosphere, 47(9), 1019-1024.
Naqvi, S. M., Vaishnavi, C., & Singh, H. (1994). Toxicity and metabolism of arsenic in
vertebrates. ADVANCES IN ENVIRONMENTAL SCIENCE AND
TECHNOLOGY-NEW YORK-, 27, 55-55.
Naujokas, M. F., Anderson, B., Ahsan, H., Aposhian, H. V., Graziano, J. H., Thompson,
C., & Suk, W. A. (2013). The broad scope of health effects from chronic arsenic
exposure: update on a worldwide public health problem. Environmental Health
Perspectives (Online), 121(3), 295.
Nga, N. K., Hong, P. T. T., Dai Lam, T., & Huy, T. Q. (2013). A facile synthesis of
nanostructured magnesium oxide particles for enhanced adsorption performance
in reactive blue 19 removal. Journal of colloid and interface science, 398, 210-
216.
165
Nilforoushan, M. R., & Otroj, S. (2008). Absorption of lead ions by various types of steel
slag. Iranian Journal of Chemistry and Chemical Engineering (IJCCE), 27(3),
69-75.
Parida, S. K., Dash, S., Patel, S., & Mishra, B. K. (2006). Adsorption of organic molecules
on silica surface. Advances in Colloid and Interface Science, 121(1–3), 77-110.
doi: http://dx.doi.org/10.1016/j.cis.2006.05.028
Parsons, S. (2004). Advanced Oxidation Processes for Water and Wastewater Treatment:
IWA Publishing.
Patnaik, P. (2017). Handbook of Environmental Analysis: Chemical Pollutants in Air,
Water, Soil, and Solid Wastes, Third Edition: CRC Press.
Pattanayak, J., Mondal, K., Mathew, S., & Lalvani, S. (2000). A parametric evaluation of
the removal of As (V) and As (III) by carbon-based adsorbents. Carbon, 38(4),
589-596.
Pehlivan, E., Tran, H., Ouédraogo, W., Schmidt, C., Zachmann, D., & Bahadir, M.
(2013). Sugarcane bagasse treated with hydrous ferric oxide as a potential
adsorbent for the removal of As (V) from aqueous solutions. Food chemistry,
138(1), 133-138.
Peterson, P. J., Benson, L. M., & Zieve, R. (1981). Metalloids. In N. W. Lepp (Ed.), Effect
of Heavy Metal Pollution on Plants: Effects of Trace Metals on Plant Function
(pp. 279-342). Dordrecht: Springer Netherlands.
Pierce, M. L., & Moore, C. B. (1982). Adsorption of arsenite and arsenate on amorphous
iron hydroxide. Water Research, 16(7), 1247-1253. doi:
http://dx.doi.org/10.1016/0043-1354(82)90143-9
Prasertsan, S., & Prasertsan, P. (1996). Biomass residues from palm oil mills in Thailand:
an overview on quantity and potential usage. Biomass and Bioenergy, 11(5), 387-
395.
Quy, D. V., Hieu, N. M., Tra, P. T., Nam, N. H., Hai, N. H., Thai Son, N., . . . Luong, N.
H. (2013). Synthesis of silica-coated magnetic nanoparticles and application in
the detection of pathogenic viruses. Journal of Nanomaterials, 2013.
Rahman, M. A., Amin, S. R., & Alam, A. S. (2012). Removal of methylene blue from
waste water using activated carbon prepared from rice husk. Dhaka University
Journal of Science, 60(2), 185-189.
Ravenscroft, P., Brammer, H., & Richards, K. (2009). Arsenic pollution: a global
synthesis (Vol. 28): John Wiley & Sons.
Reddy, P. M. K., Krushnamurty, K., Mahammadunnisa, S., Dayamani, A., &
Subrahmanyam, C. (2015). Preparation of activated carbons from bio-waste:
effect of surface functional groups on methylene blue adsorption. International
Journal of Environmental Science and Technology, 12(4), 1363-1372.
166
Rehman, S. u., Siddiq, M., Al-Lohedan, H., Aktas, N., Sahiner, M., Demirci, S., &
Sahiner, N. (2016). Fast removal of high quantities of toxic arsenate via cationic
p(APTMACl) microgels. Journal of Environmental Management, 166, 217-226.
doi: http://dx.doi.org/10.1016/j.jenvman.2015.10.026
Report, S. U. A. D. W., Toxicology, C., Toxicology, B. E. S., Studies, D. E. L., & Council,
N. R. (2001). Arsenic in Drinking Water: 2001 Update: National Academies
Press.
Reports of Societies. (1887). British Medical Journal, 2(1406), 1280-1283.
Reza, R. A., & Ahmaruzzaman, M. (2015). A novel synthesis of Fe 2 O 3@ activated
carbon composite and its exploitation for the elimination of carcinogenic textile
dye from an aqueous phase. Rsc Advances, 5(14), 10575-10586.
Rios, R. R. A., Alves, D. E., Dalmázio, I., Bento, S. F. V., Donnici, C. L., & Lago, R. M.
(2003). Tailoring activated carbon by surface chemical modification with O, S,
and N containing molecules. Materials Research, 6(2), 129-135.
Robati, D. (2013). Pseudo-second-order kinetic equations for modeling adsorption
systems for removal of lead ions using multi-walled carbon nanotube. Journal of
nanostructure in Chemistry, 3(1), 1-6.
Robinson, T., McMullan, G., Marchant, R., & Nigam, P. (2001). Remediation of dyes in
textile effluent: a critical review on current treatment technologies with a
proposed alternative. Bioresource Technology, 77(3), 247-255.
Rott, U., & Minke, R. (1999). Overview of wastewater treatment and recycling in the
textile processing industry. Water Science and Technology, 40(1), 137-144.
Ryan, P. A. (1991). Environmental effects of sediment on New Zealand streams: a review.
New Zealand journal of marine and freshwater research, 25(2), 207-221.
Sahu, O., Mazumdar, B., & Chaudhari, P. (2014). Treatment of wastewater by
electrocoagulation: a review. Environmental science and pollution research,
21(4), 2397-2413.
Sánchez-Rodas, D., Luis Gómez-Ariza, J., Giráldez, I., Velasco, A., & Morales, E.
(2005). Arsenic speciation in river and estuarine waters from southwest Spain.
Science of The Total Environment, 345(1–3), 207-217. doi:
http://dx.doi.org/10.1016/j.scitotenv.2004.10.029
Sarkar, A. K., Saha, A., Panda, A. B., & Pal, S. (2015). pH Triggered superior selective
adsorption and separation of both cationic and anionic dyes and photocatalytic
activity on a fully exfoliated titanate layer–natural polymer based nanocomposite.
Chemical Communications, 51(89), 16057-16060.
Sarkar, S., Greenleaf, J. E., Gupta, A., Ghosh, D., Blaney, L. M., Bandyopadhyay, P., . .
. SenGupta, A. K. (2010). Evolution of community-based arsenic removal systems
in remote villages in West Bengal, India: assessment of decade-long operation.
Water Research, 44(19), 5813-5822.

167
Serizawa, T., Kamimura, S., & Akashi, M. (2000). Electrostatic adsorption of polystyrene
particles with different surface charges onto the surface of an ultrathin polymer
film. Colloids and Surfaces A: Physicochemical and Engineering Aspects, 164(2–
3), 237-245. doi: http://dx.doi.org/10.1016/S0927-7757(99)00399-4
Shannon, R., & Strayer, D. (1989). Arsenic-induced skin toxicity. Human &
Experimental Toxicology, 8(2), 99-104.
Shen, T., Jiang, C., Wang, C., Sun, J., Wang, X., & Li, X. (2015). A TiO2 modified
abiotic-biotic process for the degradation of the azo dye methyl orange. Rsc
Advances, 5(72), 58704-58712. doi: 10.1039/C5RA06686G
Shen, T., Luo, J., Zhang, S., & Luo, X. (2015). Hierarchically mesostructured MIL-101
metal–organic frameworks with different mineralizing agents for adsorptive
removal of methyl orange and methylene blue from aqueous solution. Journal of
Environmental Chemical Engineering, 3(2), 1372-1383.
SHUKLA, S. K., KUMAR, V., & BANSAL, M. (2008). Application of Membrane
Filtration for Reuse of Bleaching Plant Effluent in the Process. ENVIRONMENT
and GEOSCIENCE.
Singh, R., Singh, S., Parihar, P., Singh, V. P., & Prasad, S. M. (2015). Arsenic
contamination, consequences and remediation techniques: a review.
Ecotoxicology and environmental safety, 112, 247-270.
Singh, T. S., & Pant, K. K. (2004). Equilibrium, kinetics and thermodynamic studies for
adsorption of As(III) on activated alumina. Separation and purification
technology, 36(2), 139-147. doi: http://dx.doi.org/10.1016/S1383-
5866(03)00209-0
Smedley, P., & Kinniburgh, D. (2002). A review of the source, behaviour and distribution
of arsenic in natural waters. Applied Geochemistry, 17(5), 517-568.
Smith, E., MacCarthy, P., Yu, T., & Mark Jr, H. (1977). Sulfuric acid treatment of peat
for cation exchange. Journal (Water Pollution Control Federation), 633-638.
Soni, M., Sharma, A. K., Srivastava, J. K., & Yadav, J. (2012). Adsorptive removal of
methylene blue dye from an aqueous solution using water hyacinth root powder
as a low cost adsorbent. International Journal of Chemical Sciences and
Applications, 3(3), 338-345.
Suffet, I. H., Maccarthy, P., MacCarthy, P., & Suffet, I. H. (1988). PREFACE,
Introduction Aquatic Humic Substances (Vol. 219, pp. xiii-xxx): American
Chemical Society.
Sun, Q., & Yang, L. (2003). The adsorption of basic dyes from aqueous solution on
modified peat–resin particle. Water research, 37(7), 1535-1544.
Szymczyk, M., El-Shafei, A., & Freeman, H. S. (2007). Design, synthesis, and
characterization of new iron-complexed azo dyes. Dyes and Pigments, 72(1), 8-
15.
168
Tabbara, M., & El Jamal, M. (2012). A kinetic study of the discoloration of methylene
blue by Na2SO3, comparison with NaOH. Journal of the University of Chemical
Technology and Metallurgy, 47(3), 275-282.
Tchobanoglous, G., & Burton, F. L. (1991). Wastewater engineering. Management, 7, 1-
4.
Tholoana, M. (2007). Water Management at a Textile Industry: A Case Study in Lesotho.
University of Pretoria.
Thommes, M., Kaneko, K., Neimark, A. V., Olivier, J. P., Rodriguez-Reinoso, F.,
Rouquerol, J., & Sing, K. S. (2015). Physisorption of gases, with special reference
to the evaluation of surface area and pore size distribution (IUPAC Technical
Report). Pure and Applied Chemistry, 87(9-10), 1051-1069.
Trivedi, H., Patel, V., & Patel, R. (1973). Adsorption of cellulose triacetate on calcium
silicate. European Polymer Journal, 9(6), 525-531.
Tüfekci, N., Sivri, N., & Toroz, İ. (2007). Pollutants of textile industry wastewater and
assessment of its discharge limits by water quality standards. Turkish journal of
fisheries and aquatic sciences, 7(2).
Umoren, S., Etim, U., & Israel, A. (2013). Adsorption of methylene blue from industrial
effluent using poly (vinyl alcohol). J Mater Environ Sci, 4, 75-86.
USEPA. (2016). Table of Regulated Drinking Water Contaminants. Retrieved 9 August
2016 https://www.epa.gov/ground-water-and-drinking-water/table-regulated-
drinking-water-contaminants
Vijayaraghavan, K., Padmesh, T., Palanivelu, K., & Velan, M. (2006). Biosorption of
nickel (II) ions onto Sargassum wightii: application of two-parameter and three-
parameter isotherm models. Journal of Hazardous Materials, 133(1), 304-308.
VITO. (2010, February 2010). Water Treatment Selection System. Ion Exchange.
Retrieved 22 August 2016, from https://emis.vito.be/en/techniekfiche/ion-
exchange
Wang, C., Luo, H., Zhang, Z., Wu, Y., Zhang, J., & Chen, S. (2014). Removal of As (III)
and As (V) from aqueous solutions using nanoscale zero valent iron-reduced
graphite oxide modified composites. Journal of Hazardous Materials, 268, 124-
131.
Wang, H., Yuan, X., Zeng, G., Leng, L., Peng, X., Liao, K., . . . Xiao, Z. (2014). Removal
of malachite green dye from wastewater by different organic acid-modified
natural adsorbent: kinetics, equilibriums, mechanisms, practical application, and
disposal of dye-loaded adsorbent. Environmental science and pollution research,
21(19), 11552-11564.
Waters, T. F. (1995). Sediment in streams: sources, biological effects, and control:
American Fisheries Society.
169
Weber, W., & Morris, J. Advances in water pollution research: removal of biologically
resistant pollutants fromwastewaters by adsorption. Paper presented at the
International Conference onWater Pollution Symposium.
Weber, W. J., & Morris, J. C. (1963). Kinetics of adsorption on carbon from solution.
Journal of the Sanitary Engineering Division, 89(2), 31-60.
Wedepohl, K. H. (1969). Handbook of geochemistry.
Wikipedia. (2016, 20 July 2016). Water pollution. Retrieved 8 August 2016, from
https://en.wikipedia.org/w/index.php?title=Water_pollution&oldid=730736569
Worch, E. (2012). Adsorption technology in water treatment: fundamentals, processes,
and modeling: Walter de Gruyter.
Wu, F.-C., Tseng, R.-L., & Juang, R.-S. (2009). Initial behavior of intraparticle diffusion
model used in the description of adsorption kinetics. Chemical Engineering
Journal, 153(1–3), 1-8. doi: http://dx.doi.org/10.1016/j.cej.2009.04.042
Wu, K., Liu, R., Li, T., Liu, H., Peng, J., & Qu, J. (2013). Removal of arsenic(III) from
aqueous solution using a low-cost by-product in Fe-removal plants—Fe-based
backwashing sludge. Chemical Engineering Journal, 226(0), 393-401. doi:
http://dx.doi.org/10.1016/j.cej.2013.04.076
Xie, J., Wang, Z., Lu, S., Wu, D., Zhang, Z., & Kong, H. (2014). Removal and recovery
of phosphate from water by lanthanum hydroxide materials. Chemical
Engineering Journal, 254, 163-170.
Xu, J., Chu, W., & Luo, S. (2006). Synthesis and characterization of mesoporous V-
MCM-41 molecular sieves with good hydrothermal and thermal stability. Journal
of Molecular Catalysis A: Chemical, 256(1–2), 48-56. doi:
http://dx.doi.org/10.1016/j.molcata.2006.03.078
Yan, J., Moreno, L., & Neretnieks, I. (2000). The long-term acid neutralizing capacity of
steel slag. Waste Management, 20(2), 217-223.
Yang, L., Shahrivari, Z., Liu, P. K., Sahimi, M., & Tsotsis, T. T. (2005). Removal of trace
levels of arsenic and selenium from aqueous solutions by calcined and uncalcined
layered double hydroxides (LDH). Industrial & Engineering Chemistry Research,
44(17), 6804-6815.
Yin, C. Y., Aroua, M. K., & Daud, W. M. A. W. (2007). Review of modifications of
activated carbon for enhancing contaminant uptakes from aqueous solutions.
Separation and purification technology, 52(3), 403-415.
Yoon, J., Lee, Y., & Kim, S. (2000). Investigation of the reaction pathway of OH radicals
produced by Fenton oxidation in the conditions of wastewater treatment. Water
science and technology: a journal of the International Association on Water
Pollution Research, 44(5), 15-21.

170
Yu, B. Y., & Kwak, S.-Y. (2010). Assembly of magnetite nanocrystals into spherical
mesoporous aggregates with a 3-D wormhole-like pore structure. Journal of
Materials Chemistry, 20(38), 8320-8328.
Yu, J., Jiang, D., Hao, Q., & Liu, J. (2015). Silica-coated Magnetic Nanocomposites as
an Adsorbent for the Removal of Methylene Blue Dyes from Water: Preparation
and Characterization.
Yu, Y., Zhuang, Y.-Y., Li, Y., & Qiu, M.-Q. (2002). Effect of dye structure on the
interaction between organic flocculant PAN-DCD and dye. Industrial &
Engineering Chemistry Research, 41(6), 1589-1596.
Yuan, Y.-l., Wen, Y.-z., Li, X.-y., & Luo, S.-z. (2006). Treatment of wastewater from
dye manufacturing industry by coagulation. Journal of Zhejiang University
Science A, 7(2), 340-344.
Yürüm, A., Kocabaş-Ataklı, Z. Ö., Sezen, M., Semiat, R., & Yürüm, Y. (2014). Fast
deposition of porous iron oxide on activated carbon by microwave heating and
arsenic (V) removal from water. Chemical Engineering Journal, 242, 321-332.
doi: http://dx.doi.org/10.1016/j.cej.2014.01.005
Zeldowitsch, J. (1934). Adsorption site energy distribution. Acta phys. chim. URSS, 1,
961-973.
Zeng, L., Xie, M., Zhang, Q., Kang, Y., Guo, X., Xiao, H., . . . Luo, J. (2015).
Chitosan/organic rectorite composite for the magnetic uptake of methylene blue
and methyl orange. Carbohydrate Polymers, 123, 89-98. doi:
http://dx.doi.org/10.1016/j.carbpol.2015.01.021
Zhang, S., Li, X.-Y., & Chen, J. P. (2009). An XPS study for mechanisms of arsenate
adsorption onto a magnetite-doped activated carbon fiber. Journal of Colloid and
Interface Science, 343, 232-238.
Zhang, S., Li, X.-y., & Chen, J. P. (2010). Preparation and evaluation of a magnetite-
doped activated carbon fiber for enhanced arsenic removal. Carbon, 48(1), 60-67.
Zhang, W., Fu, J., Zhang, G., & Zhang, X. (2014). Enhanced arsenate removal by novel
Fe–La composite (hydr) oxides synthesized via coprecipitation. Chemical
Engineering Journal, 251, 69-79.
Zhang, Y., Yang, M., Dou, X.-M., He, H., & Wang, D.-S. (2005). Arsenate adsorption on
an Fe-Ce bimetal oxide adsorbent: role of surface properties. Environmental
science & technology, 39(18), 7246-7253.
Zhu, M.-X., Li, Y.-P., Xie, M., & Xin, H.-Z. (2005). Sorption of an anionic dye by
uncalcined and calcined layered double hydroxides: a case study. Journal of
Hazardous Materials, 120(1–3), 163-171. doi:
http://dx.doi.org/10.1016/j.jhazmat.2004.12.029
Zongliang, H., Senlin, T., & Ping, N. (2012). Adsorption of arsenate and arsenite from
aqueous solutions by cerium-loaded cation exchange resin. Journal of Rare
Earths, 30(6), 563-572.

171
Zouboulis, A. I., & Katsoyiannis, I. A. (2005). Recent advances in the bioremediation of
arsenic-contaminated groundwaters. Environment international, 31(2), 213-219.
doi: http://dx.doi.org/10.1016/j.envint.2004.09.018

172
LIST OF PUBLICATION
a) Symposium
Farahin mohd jais, shaliza ibrahim, yeomin yoo, min jang. Enhanced arsenate removal by
lanthanum and nano–magnetite composite incorporated palm shell waste–based activated
carbon. Sustainable symposium. 2016. University of malaya.
a) Journal
Jais, F.M., Ibrahim, S.,Yoon, Y., & Jang, M. (2016). Enhanced arsenate removal by
Lathanum and nano-magnetite composite incorporated palm shell waste-based activated
carbon. Separation and purification technology, 169, 93-102.
Doi:http://dx.doi.org/10.1016/j.seppur.2016.05.034
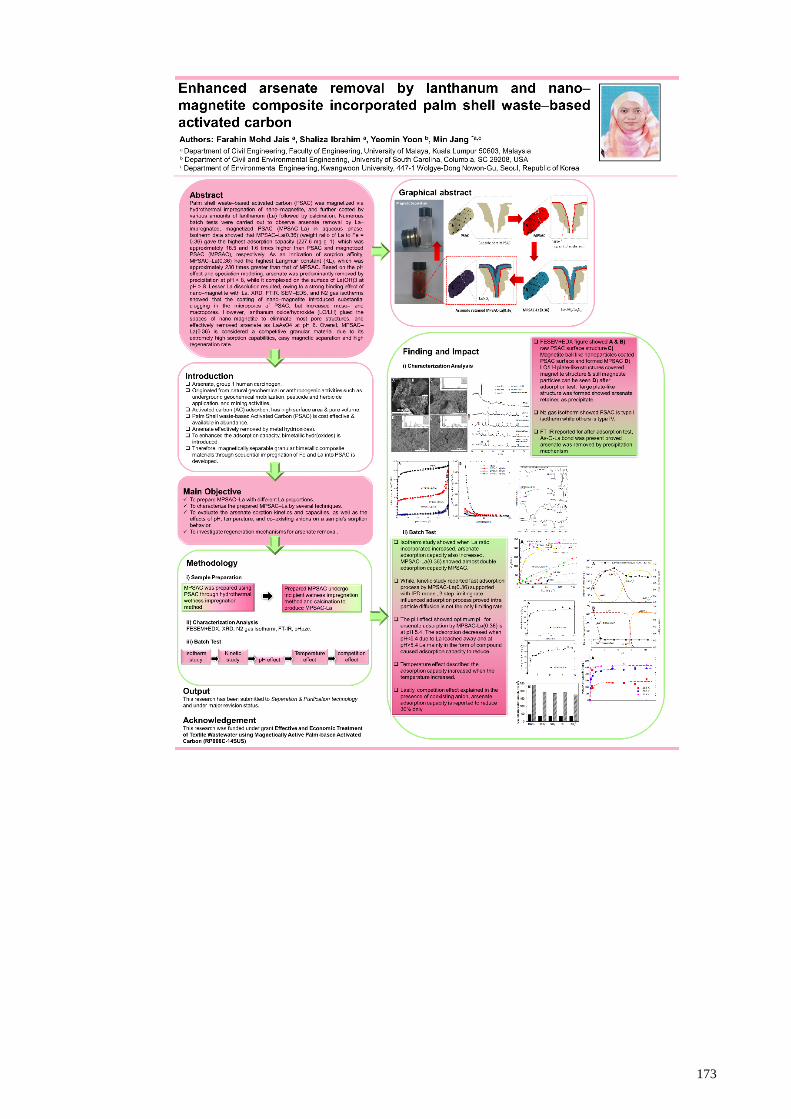
173
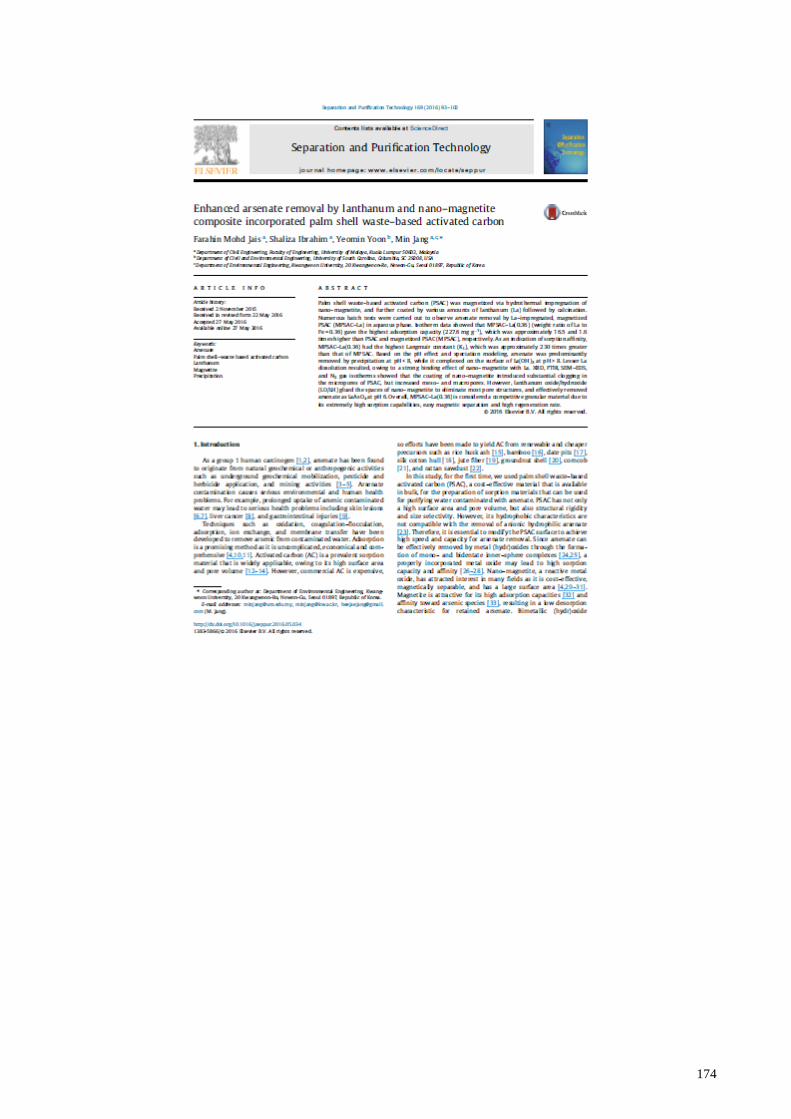
174
Related Documents