Development of Chinese Special Economic Zones in Nigeria measured by Nighttime Light Data How does the Chinese Involvement in Nigerian SEZs contribute to the Emission of Artificial Light hence, the Economic Development, compared to Domestic Zones? Theresa Wiedmann

Welcome message from author
This document is posted to help you gain knowledge. Please leave a comment to let me know what you think about it! Share it to your friends and learn new things together.
Transcript
Development of Chinese Special Economic Zones in Nigeria measured by Nighttime Light Data
How does the Chinese Involvement in Nigerian SEZs
contribute to the Emission of Artificial Light hence, the
Economic Development, compared to Domestic Zones?
Theresa Wiedmann
Master Thesis Theresa Wiedmann
Development of Chinese Special Economic Zones in Nigeria measured by Nighttime Light Data
How does the Chinese Involvement in Nigerian SEZs contribute to
the Emission of Artificial Light hence, the Economic Development,
compared to Domestic Zones?
Supervisor: Aradhna Aggarwal
Student Number: 116714
Date of Submission: 15. May 2019
Study Programme: BLC – Business & Development Studies
Number of Characters: 143,196
Cities, like Cats, will reveal themselves at Night.
Rupert Brooke
Abstract
The purpose of the thesis is to investigate how the Chinese involvement in
Nigerian special economic zones (SEZs) impacts the emission of artificial light
in the zones. Therefore, in accordance with several researchers, it is assumed
that nighttime light (NTL) data can be used as proxy for economic develop-
ment. This approach enjoys popularity especially in research areas where
there is a lack of data which particularly comprises developing countries.
In order to approach the topic, the economies of Nigeria and China were por-
trayed by paying special attention to their engagement with SEZs. Within these
chapters, it could be ascertained that both nations are actively involved in do-
mestic SEZs. Especially Chinese zones register impressive successes
throughout the years and hence decided to export their concept. As Nigeria
demonstrates an increasing economic growth and is considered as the largest
economy on the African continent, the Chinese consequently started to build
up SEZs on Nigerian grounds.
Measuring the economic performance of such Chinese zones in Nigeria poses
a particular challenge since there is neither Nigerian data on local level nor
Chinese data on zones’ development or output. Therefore, the NTL data was
used to measure the difference between Chinese SEZs in Nigeria compared
to domestic SEZs. Despite hypothesising that there is a significantly higher
development of artificial light in the Chinese zones, compared to the domestic
zones, the statistical analysis did not show any supporting evidence.
Consequently, reasons for the insignificant results were investigated. Finally,
when scrutinising the assumption that NTL data can be used as a proxy for
economic development, any proof for the case of Nigeria could be found. This
outcome is surprising since several researchers consider it a valid proxy and
applied this approach especially in the developing country context.
With respect to the statistical results, the findings of the literature review come
into focus with an emphasis on not only economical challenges in the Nigerian
SEZs but also on political, structural and methodological issues. Hence, the
major finding of the analysis is that a myriad of challenges is shaping the SEZs’
preconditions. Therefore, it can be discerned that despite the Chinese exper-
tise in SEZ development, the Nigerian economy implies obstacles and imped-
iments to building up SEZs and also businesses in general. As a result, first of
all, Nigeria has to improve their infrastructure, gain technology knowledge,
overcome power supply shortages and reduce poverty as well as corruption.
Therefore, having China as a business partner, who aims to build up success-
ful economic zones on Nigerian grounds, could help to mitigate the national
constraints to doing business and thereby improve Nigeria’s location for busi-
ness in general.
Ultimately, it is acknowledged that the same study could have a better chance
to show significant results if performed five to ten years later. Hence, the cho-
sen period from 1992 until 2013 might have been too short to find significant
results.
I
I. Table of Contents
II. List of Abbreviations ..................................................................................... III
III. List of Figures ................................................................................................ V
IV. List of Tables ................................................................................................ VII
1 Introduction .................................................................................................... 1
2 Special Economic Zones and their Evolution .............................................. 3
3 Nigeria – An Economy between National Development and International Involvement .................................................................................................... 6
3.1 Political and Social Environment in Nigeria ..................................................... 6
3.2 Economic Development and Growth in Nigeria.............................................. 8
3.2.1 Key Economic Figures and Trends ................................................... 8
3.2.2 The Resource Curse – Major Economic Impediment .............. 15
3.3 Development Opportunities for the Nigerian State ...................................... 19
3.4 Nigeria’s National Endeavours with Special Economic Zones ................. 19
4 China’s Domestic Advancement and International Endeavours............... 24
4.1 China’s Rise to a Global Industrial Power ..................................................... 24
4.1.1 The Role of SEZs in the Chinese Economic Success ................ 26
4.1.2 Beijing’s “Going Global” Approach .................................................. 28
4.2 Is the Chinese Investment a Panacea for African Development Ills? ..... 30
5 Joined Forces between China and Nigeria – Setting up SEZs .................. 33
5.1 Chinese Zones in Nigeria .................................................................................. 34
5.1.1 Lekki Free Trade Zone ....................................................................... 34
5.1.2 Ogun-Guangdong Free Trade Zone ............................................... 35
5.2 Challenges and Opportunities of the SEZs ................................................... 37
6 Data and Methodology ................................................................................. 38
6.1 Measuring the Performance of SEZs with Nighttime Light Data .............. 38
II
6.2 Data Description .................................................................................................. 39
6.2.1 NTL Data Access ................................................................................ 40
6.2.2 Creation of the NTL Data Set ........................................................... 41
6.2.3 Sample Selection ................................................................................ 45
6.3 Difference-in-Differences Analysis .................................................................. 46
6.3.1 Hypothesis ............................................................................................ 49
7 Empirical Results ......................................................................................... 50
7.1 Visual Analysis of Zone Development between 1992-2013 ...................... 50
7.2 Time Series Analysis on Zone Development 1992-2013 ........................... 52
7.3 Results from DID Analysis of NTL Data ......................................................... 54
7.4 Results from OLS Analysis of GDP and NTL Data...................................... 56
8 Analysis ........................................................................................................ 59
8.1 Four Issue Categories of SEZs in Nigeria ..................................................... 59
8.1.1 Economical Issues .............................................................................. 60
8.1.2 Structural Issues .................................................................................. 63
8.1.3 Political Issues ..................................................................................... 65
8.1.4 Methodological Issues ........................................................................ 66
8.2 Limitations and Drawbacks ............................................................................... 68
9 Conclusion.................................................................................................... 69
9.1 Outlook ................................................................................................................... 70
V. List of References ....................................................................................... VIII
VI. Appendix .................................................................................................... XVII
III
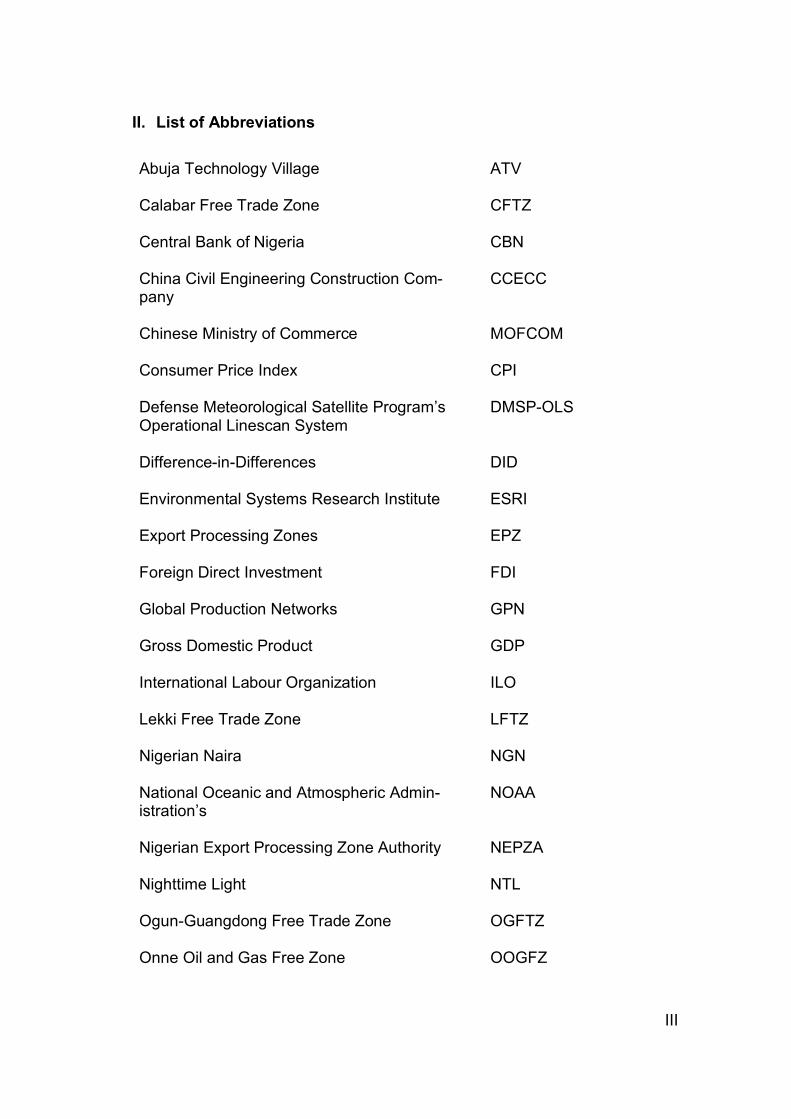
II. List of Abbreviations
Abuja Technology Village Calabar Free Trade Zone Central Bank of Nigeria China Civil Engineering Construction Com-pany Chinese Ministry of Commerce Consumer Price Index Defense Meteorological Satellite Program’s Operational Linescan System Difference-in-Differences Environmental Systems Research Institute Export Processing Zones Foreign Direct Investment Global Production Networks Gross Domestic Product International Labour Organization Lekki Free Trade Zone Nigerian Naira National Oceanic and Atmospheric Admin-istration’s Nigerian Export Processing Zone Authority Nighttime Light Ogun-Guangdong Free Trade Zone Onne Oil and Gas Free Zone
ATV CFTZ CBN CCECC MOFCOM CPI DMSP-OLS DID ESRI EPZ FDI GPN GDP ILO LFTZ NGN NOAA NEPZA NTL OGFTZ OOGFZ
IV
Organization for Economic Co-operation and Development Chinese Renminbi Snake Island Integrated Free Zone Special Economic Zones Sub-Sahara African United Nations Conference on Trade and Development United States Dollar Warri Industrial Business Park World Geodetic System World Trade Organization
OECD CNY SIIFZ SEZ SSA UNCTAD USD WIBP WGS WTO
V
III. List of Figures
Fig. 1: Sector and Sub-Sector Shares in Nigeria’s GDP (in percent) ........................ 9
Fig. 2: GDP Development Nigeria 1971-2017 ........................................................ 10
Fig. 3: GDP Growth Rate Development Nigeria 1971-2017 .................................... 10
Fig. 4: FDI Development in Nigeria 1970-2017 ....................................................... 12
Fig. 5: Top Constraints to Doing Business in Nigeria .............................................. 13
Fig. 6: Population Development in Nigeria 1950-2030 ............................................ 14
Fig. 7: Development of Inflation and Consumer Price Index 2016-2017 ................. 15
Fig. 8: Divergence of oil and non-oil exports in Nigeria ........................................... 16
Fig. 9: Crude Oil compared with GDP and Manufacturing GDP 1992-2013 ............ 18
Fig. 10: SEZs in Nigeria ......................................................................................... 22
Fig. 11: Percentage of Free Zone Firms Ranking Constraint as among their major
Obstacles ............................................................................................................... 23
Fig. 12: GDP Development in China 1971-2017 ..................................................... 25
Fig. 13: GDP Growth Development China 1971-2017 ............................................ 26
Fig. 14: Shapefile of Nigeria on DMSP-OLS file (2013) .......................................... 42
Fig. 15: Shapefile of Lagos State on DMSP-OLS file 1992 (left) and 2013 (right) ... 43
Fig. 16: Shapefile of the Local Government Area Lekki on DMSP-OLS file 1992 (left)
and 2013 (right) ...................................................................................................... 43
Fig. 17: Location of Zones listed in the Sample ...................................................... 45
Fig. 18: DID Estimation .......................................................................................... 47
Fig. 19: NTL Development (Level) 1992-2013 ........................................................ 51
VI
Fig. 20: NTL Growth 1992-2013 ............................................................................. 51
Fig. 21: NTL Time Serie from all Zones .................................................................. 52
Fig. 22: Time Series NTL Ogun-Guangdong (left) and Lekki (right) ........................ 53
Fig. 23: Simple Moving Average of Chinese (left) and Nigerian (right) zones ......... 53
VII
IV. List of Tables
Table 1: SEZs Overview ......................................................................................... 44
Table 2: Difference-in-Differences Method .............................................................. 48
Table 3: Regression Results DID Analysis .............................................................. 55
Table 4: OLS Results for National Accounts Data, using first Differences ............... 58
1
1 Introduction
Nigeria is considered as one of the most thriving developing countries on the
African continent. The Nigerian oil sector successfully exports resources and
is responsible for the largest share of the constantly growing gross domestic
product (GDP) (World Bank Group, 2018). Conversely, it has to be mentioned
that structural as well as political challenges hamper the economic upsurge and
prevent the state to finally annihilate poverty and get a seat at the international
table. In that sense, major issues such as corruption, poverty and terrorism still
unsettle the nation (Gekonge, 2013). Although Nigeria decided to actively par-
ticipate in special economic zones (SEZ), that were built to foster the domestic
economy and allure foreign investors, the zones did not yet register successful
development. The quote “Nigeria has set up export processing zones, but none
are considered successful.” (Bräutigam & Tang, 2014, p. 83) suitably describes
the current SEZs’ economic situation. In order to spur on the development of
the zones, Nigeria was drawing on the Chinese expertise with their domestic
SEZs. Consequently, the Nigerian officials reinforced and revived diplomatic
and economic affiliations with China and invited them to set up their own SEZs
in Nigeria. Finally, by 2006, China set up their first SEZs on Nigerian grounds.
These zones target to emulate the prosperous advancement of the zones in
China that were established already decades ago (Farole & Moberg, 2014).
Against this backdrop, aim of this thesis is to investigate whether the Chinese
formula for economic upsurge, which was introduced when China was still an
emerging economy, has the potential to be successfully applied to Nigeria. In
support of that, Bräutigam and Tang (2014) even state that “[t]he zones have
potential to help in African processes of structural adjustment” (p.84). Being an
incubator for rapid development, employment and technology transfer, the
zones function as breeding grounds for economic upsurge (Bräutigam & Tang,
2014). Merged with the Chinese business acumen, the Nigerian economy has
the potential to become Africa’s economic driving force.
The particularity when approaching a quantitative analysis of this topic is that
there is any data available on zone-level economic outcome. For this reason,
2
nighttime light (NTL) data is used as proxy for zone performance. Further, in
order to explore the distinctions between Chinese and Nigerian zones, a differ-
ence-in-differences (DID) analysis with NTL data is conducted.
Assuming that Chinese zones in Nigeria perform better than the ones under
Nigerian authority, it is expected to see an increasing emission of artificial light
after the entry of the Chinese compared to the domestic zones. Thus, the re-
search question reads as follows:
How does the Chinese involvement in Nigerian SEZs contribute to the emission
of artificial light hence, the economic development, compared to domestic
zones?
In a broader sense, this thesis seeks to contribute to the development studies’
literature on the economic crisis in which many African countries find them-
selves in. Furthermore, it aims to conduce to the discussion on the Chinese
way of making business and “Going Global”. Through combining these two is-
sues, the objective is to determine relevant insights into modern ideas of pro-
moting the developing countries’ economies contrary to the conventional de-
velopment aid.
3
2 Special Economic Zones and their Evolution
Throughout the course of the last few decades, developing countries all around
the globe started to set up SEZs mainly due to the adoption of export-led growth
strategies (Aggarwal, 2005). While there were only 176 SEZs in 47 countries
by the end of 1986, the International Labour Organization (ILO) reported al-
ready 3500 SEZs in 130 countries in 2006, accounting for almost 20 percent of
the world’s overall exports and employing more than 60 million people in the
developing countries (Boyenge, 2007; Farole & Moberg, 2017; Frick,
Rodríguez-Pose, & Wong, 2018). The latest number is given by the United
Conference on Trade and Development (UNCTAD) (2018) at the World Invest-
ment Forum 2018, that states a total of 4800 SEZs worldwide. In their 2011
book of Studies on Growth Economies of Asia, Carter and Harding (2010b)
describe SEZs as a clearly defined geographic area in which national, provin-
cial or local governments use policy tools such as tax holidays as an incentive
to improve infrastructure.
On the one hand, SEZs provide many advantages for foreign investors as well
as national businesses. Their success is mainly brought along by preferential
policies provided at the local, provincial and/or national level, which foster the
development of technology and industry through the establishment of a favour-
able investment climate (Bräutigam, Farole, & Xiaoyang, 2010; Farole &
Moberg, 2017; Ikeyi, 1998). These are less onerous or differentiated regula-
tions and incentives other than generally available in the rest of the country
employed to attract and promote private, usually foreign, investment from en-
terprises which commit to create jobs and export their products or services in
order to generate foreign currency for the host country. In general, SEZs offer
a combination of expedited procedures, a world-class infrastructure and fiscal
incentives. According to Aggarwal (2005), economic development in such
zones is only successful as a result from state-led policies which address bot-
tlenecks such as production failures that are a constituent part of emerging
economies. By building up whole SEZ programmes which provide service and
benefits to the companies that invest and do business in the SEZ, performance
is driven and sustainably developed (Frick et al., 2018). Moreover, the rules of
4
business are different from those prevailing in national territory and of rather
liberal nature (Farole & Moberg, 2017). Next to an advantageous cost-reduc-
ing, fiscal environment, such programmes comprise, for example, subsidised
utilities for companies, facilitation of administrative services as well as an ex-
emption from national labour regulations. This so-called “one-stop-shop” fea-
ture contributed to the success of many SEZ policies throughout the years
(Frick et al., 2018). Carter and Harding (2010) state that SEZs are the most
successful and potent vehicle for transporting foreign direct investment (FDI)
into developing country and emerging market economies. As a matter of fact,
the increase of global FDI flows is tremendous as they comprised United States
Dollar (USD) 50 billion in the 1980s and accrued up to USD 2.09 trillion in 2007,
currently prevailing at a level of USD 1.43 trillion as reported by UNCTAD
(UNCTAD, 2018b). Of course, during the economic recession in 2008 and 2009
the increase of FDI flows slowed down but picked up pretty rapidly after the
crisis (Carter & Harding, 2010a). It is further interesting to record that it is first
and foremost developing countries which both take up most of the FDI and set
up most of the SEZs.
On the other hand, in certain SEZ programmes there is discrimination against
companies that only induce low investment or employment which is however
required in order to access the tax breaks of the SEZs (Farole & Moberg, 2017).
Hence, the entry barrier is relatively high and excludes many small-scale busi-
nesses already at the beginning. As developing countries usually have a poor
access to financial resources, and microfinance only being able to provide
small credits, this entry barrier especially harms local businesses. On the con-
trary, larger multinational companies with a higher scale are privileged as they
reach the necessary scale more easily. In 2009, the Organization for Economic
Co-operation and Development (OECD) claimed these regulations to be erro-
neous as they would entail a bias against local firms. As a remedy, they sug-
gested the SEZ leaders to ensure compliance with the World Trade Organiza-
tion (WTO) regulations to improve investment opportunities for local busi-
nesses (Frick et al., 2018). Furthermore, it has to be said that the successful
adoption of incentives within SEZs is largely context-dependent. For example,
5
countries with a large agriculture sector will have issues implementing thriving
SEZs through the introduction of SEZ policies alone. Further, industrialization
cannot be achieved as simply because wider reforms must be applied first
(Frick et al., 2018). Lastly, the local and national integration of SEZs has not
yet fully unfolded since many zones are created to foster export.
In general, it should be born in mind that every nation that applies the SEZ
concept indeed follows the above mentioned but is, at the same time, bound to
national legislation and political structure. Therefore, in the following two chap-
ters an insight into the Nigerian as well as the Chinese economies and political
environments is given. Such being the stage for SEZ development, within this
thesis, it is regarded as necessary to understand the backgrounds to be able
to assess the SEZs’ development successfully.
6
3 Nigeria – An Economy between National Development and Interna-tional Involvement
Before diving into Nigerian economy and its endeavour with SEZs, the coun-
try’s geo-political and economic environment requires a short introduction. In
general, the African economies have to cope with limited attention as trade
partner due to their reputation to be home to states with poor leadership and
weak governance. These states are claimed to give way to “elected” govern-
ments with absence of honesty, implying rulers who enrich themselves as long
as possible (Call, 2008). Further, the African states are assumed to have weak
economic and political institutions, a low agricultural productivity and poorly
funded research institutions and education systems which result in comprehen-
sive poverty and deprivation (Agbiboa, 2012; Gekonge, 2013). Despite all that,
with increasing globalization and regional integration among the African coun-
tries, inter-Africa trade is increasing and also international trade has picked up
(Gekonge, 2013). As part of this development, African nations have built up
SEZs as driving forces for their domestic economies (Woolfrey, 2013; see
Appendix 1). Main objectives for them are also the typical targets such as at-
tracting FDI, facilitating economic diversification and generating employment
(COMCEC, 2017). Despite the fact that they are mostly considered as moder-
ately successful, it drew international investor’s attention as their natural re-
sources constitute a promising area of business (Bräutigam & Xiaoyang, 2011).
Especially Nigeria has become a focal point on the global markets and its
growth therefore is presumably influenced by international actors to a certain
extent. In order to better understand which circumstances both, domestic and
foreign investors of SEZs are facing, an introduction into Nigeria’s political and
social environment is provided in the next chapter.
3.1 Political and Social Environment in Nigeria
Nigeria is one of the most developed countries on the African continent. Con-
stituting of 36 states, which are home to 190 million people (in 2019, UNCTAD),
the country is bordered by the Gulf of Guinea, Cameroon, Benin, Niger and
Chad (Muhammad-Lawal & Atte, 2016). Despite its advancement, Nigeria’s
7
economy is often associated with nation-wide poverty and state failure with en-
demic corruption but counter-intuitively also with wealth which is oil-derived and
mainly reserved for the elite (Agbiboa, 2012; Ang, 2016). The oil-riches is also
a reason for the international interest that arouse during the last fifty years,
making the Nigerian nation a popular target for SEZ endeavours (Bräutigam &
Xiaoyang, 2011; Woolfrey, 2013). Further, the country is known for its ethnical
variety, that comprises around 350 different ethnicities and languages, and in-
volves a population that constitutes two world religions – Islam and Christianity
(Campbell, 2016). Among others, the resulting disunity can be seen as one of
the main reasons for the Nigerians lagging economically behind despite the
allegedly oil-riches of the country. Moreover, the former British colony had to
bear up against several crises stemming from colonialism and kleptocratic re-
gimes (Brautigam, Fjeldstad, & Moore, 2008).
It is assumed that Nigeria’s colonial history is still responsible for some of the
issues that the country faces nowadays. As a matter of fact, it can be said that
the British colonizers created Nigeria but failed to create the Nigerian nation
(Campbell, 2016). The absence of a strong state built on shared ideas led to a
disbalance in the nation’s societal advancement. For example, educational in-
stitutions in the North differ dramatically from those in the South of Nigeria. In
the North, education for the nonelites is weak, yet a good deal weaker than in
other parts of the country (Campbell, 2016). Consequently, it can be observed
that most of both, the domestic and foreign SEZs are situated in the South of
the country (NEPZA, 2019). The disbalance of economically developing re-
gions within Nigeria leaves parts of the society ill-prepared for participation in
modern economy and hinders them from getting a foothold on the international
stage (Campbell, 2016).
Moreover, a worrisome trouble spot in Nigeria are the terrorist groups who en-
gage in attacks that convulse the North-East of the country and constantly fight
the Nigerian security services. It is assumed that Nigeria’s weak governance,
its poorly developed sense of a national identity, an ever-increasing poverty
and exploitive elites represent a suitable breeding ground for terrorist organi-
sations (Campbell, 2016; Smith, 2010).
8
Besides the political and social environment, especially the condition of the
economy and its development are crucial for SEZs. Thus, in the next chapter,
Nigeria’s economic development and growth throughout the last half century is
outlined.
3.2 Economic Development and Growth in Nigeria
By the events that followed its independence, Nigeria’s path was accompanied
by civil war and the oil riches which resulted in a political system shaped by
embezzlement, violence and fraud (Campbell, 2016). In the late 1980s, vio-
lence was spread so widely that people stayed at home where they knew they
were safe. After the currency devaluation in 1986, the Nigerian economy was
in shambles (Ang, 2016). At the time of independence in 1960, the country had
a sizable agricultural export sector that was owned and organized locally by
Africans. Later, farmers and the rest of the Nigerian people had to watch the
indigenous manufacturing collapse. This downtrend turned Nigeria into a net
importer of food which it is still nowadays (Campbell, 2016; Marwah, 2015).
The lack of encouragement and the resulting absence of a modern Nigerian
manufacturing industry was a product of British politics (Marwah, 2015). An-
other factor hampering the economic growth and causing the agricultural de-
cline were the water shortages and the Sahara’s march South into regions of
Nigeria which used to be productive grazing lands. This is especially worrisome
since the agricultural sector is predominantly rainfed (Muhammad-Lawal &
Atte, 2016).
3.2.1 Key Economic Figures and Trends
In face of the above presented adversities, in 2019, Nigeria had its first elec-
tions which were neither decided by religious affiliation nor by ethnic back-
ground (Signer, 2019a). The ostensibly democratic president Muhammadu
Buhari got re-elected in February 2019 and announced two major campaign
pledges: the reconstruction of the economy and the avowed fight against cor-
ruption (Putsch, 2019; Signer, 2019a). In order to show why these are overdue
9
and sorely needed, an insight into Nigerian economic figures and their devel-
opment throughout time is provided in the following.
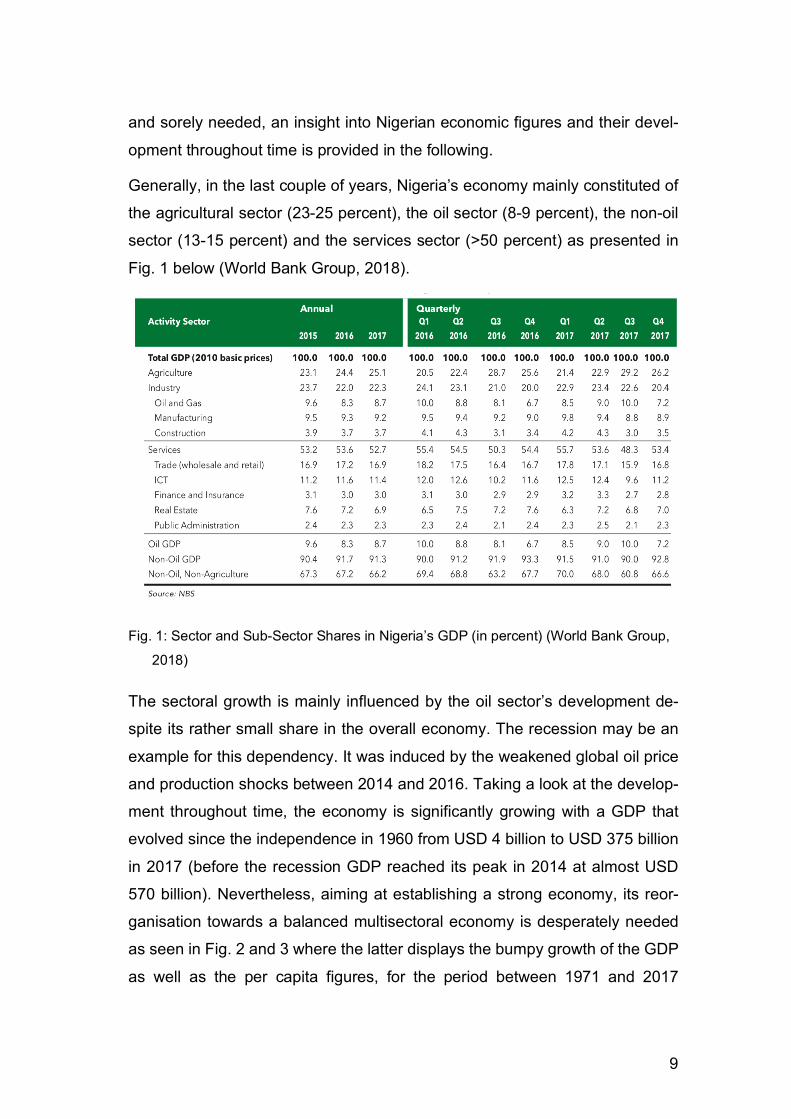
Generally, in the last couple of years, Nigeria’s economy mainly constituted of
the agricultural sector (23-25 percent), the oil sector (8-9 percent), the non-oil
sector (13-15 percent) and the services sector (>50 percent) as presented in
Fig. 1 below (World Bank Group, 2018).
Fig. 1: Sector and Sub-Sector Shares in Nigeria’s GDP (in percent) (World Bank Group,
2018)
The sectoral growth is mainly influenced by the oil sector’s development de-
spite its rather small share in the overall economy. The recession may be an
example for this dependency. It was induced by the weakened global oil price
and production shocks between 2014 and 2016. Taking a look at the develop-
ment throughout time, the economy is significantly growing with a GDP that
evolved since the independence in 1960 from USD 4 billion to USD 375 billion
in 2017 (before the recession GDP reached its peak in 2014 at almost USD
570 billion). Nevertheless, aiming at establishing a strong economy, its reor-
ganisation towards a balanced multisectoral economy is desperately needed
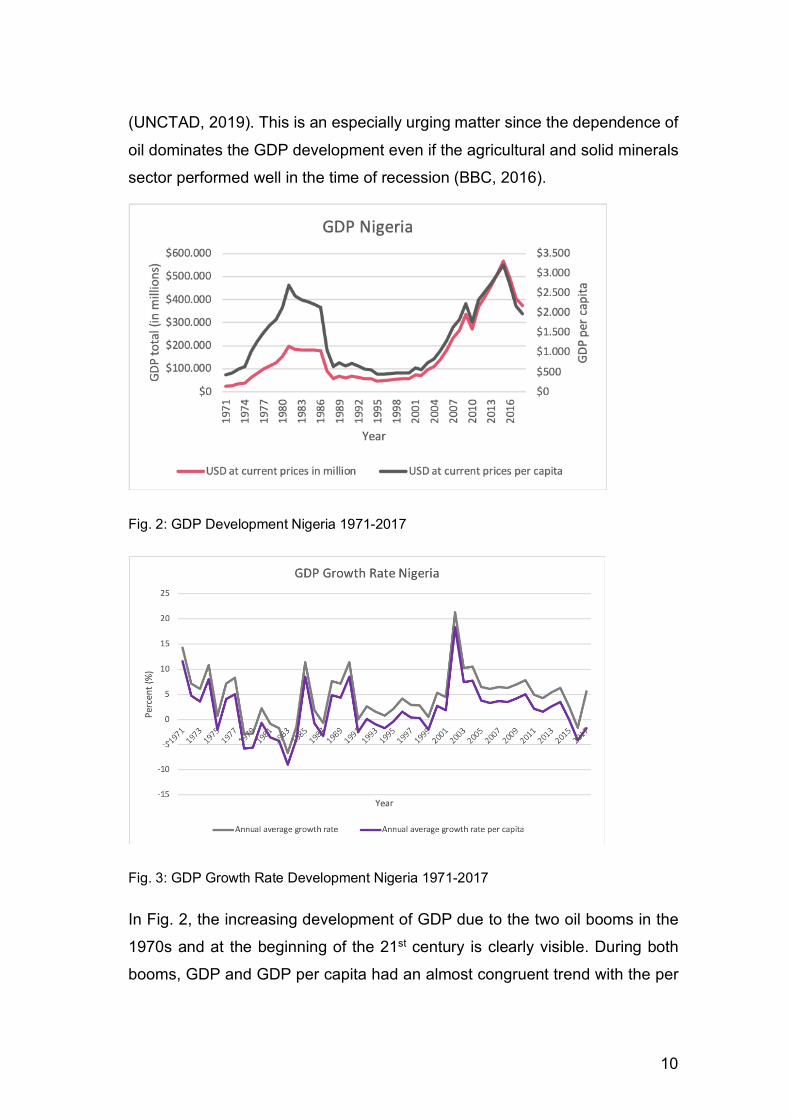
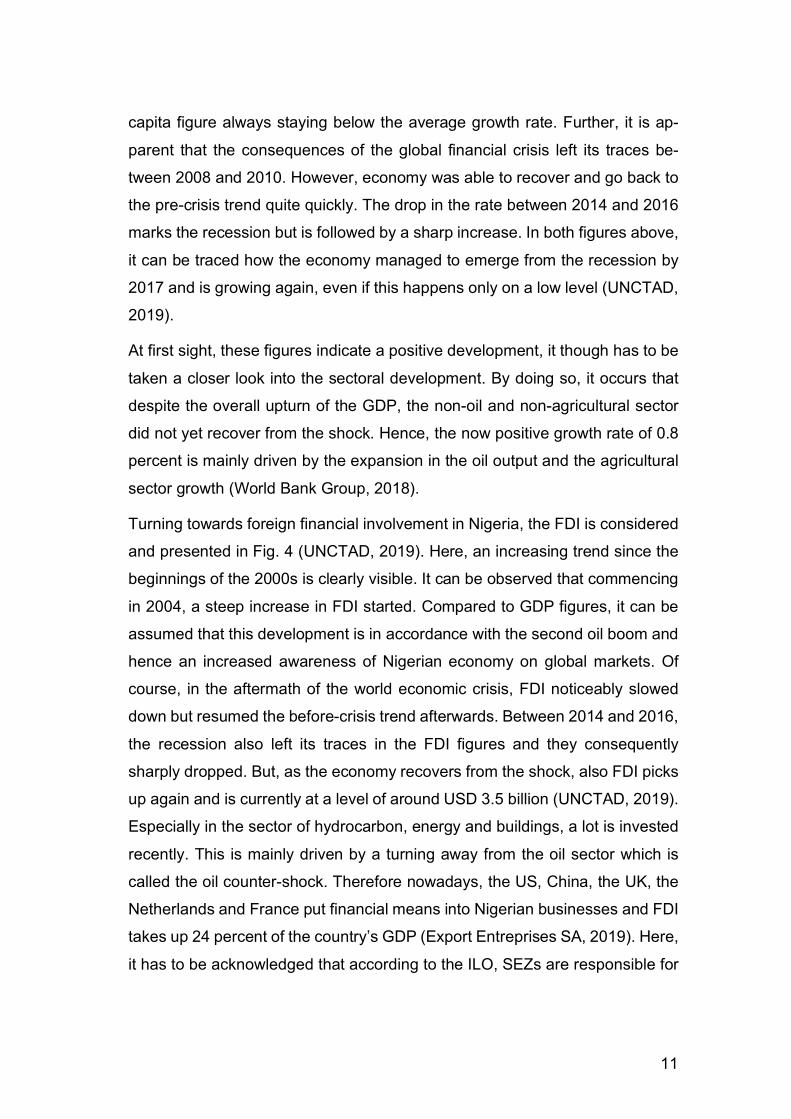
as seen in Fig. 2 and 3 where the latter displays the bumpy growth of the GDP
as well as the per capita figures, for the period between 1971 and 2017
10
(UNCTAD, 2019). This is an especially urging matter since the dependence of
oil dominates the GDP development even if the agricultural and solid minerals
sector performed well in the time of recession (BBC, 2016).
Fig. 2: GDP Development Nigeria 1971-2017
Fig. 3: GDP Growth Rate Development Nigeria 1971-2017
In Fig. 2, the increasing development of GDP due to the two oil booms in the
1970s and at the beginning of the 21st century is clearly visible. During both
booms, GDP and GDP per capita had an almost congruent trend with the per
11
capita figure always staying below the average growth rate. Further, it is ap-
parent that the consequences of the global financial crisis left its traces be-
tween 2008 and 2010. However, economy was able to recover and go back to
the pre-crisis trend quite quickly. The drop in the rate between 2014 and 2016
marks the recession but is followed by a sharp increase. In both figures above,
it can be traced how the economy managed to emerge from the recession by
2017 and is growing again, even if this happens only on a low level (UNCTAD,
2019).
At first sight, these figures indicate a positive development, it though has to be
taken a closer look into the sectoral development. By doing so, it occurs that
despite the overall upturn of the GDP, the non-oil and non-agricultural sector
did not yet recover from the shock. Hence, the now positive growth rate of 0.8
percent is mainly driven by the expansion in the oil output and the agricultural
sector growth (World Bank Group, 2018).
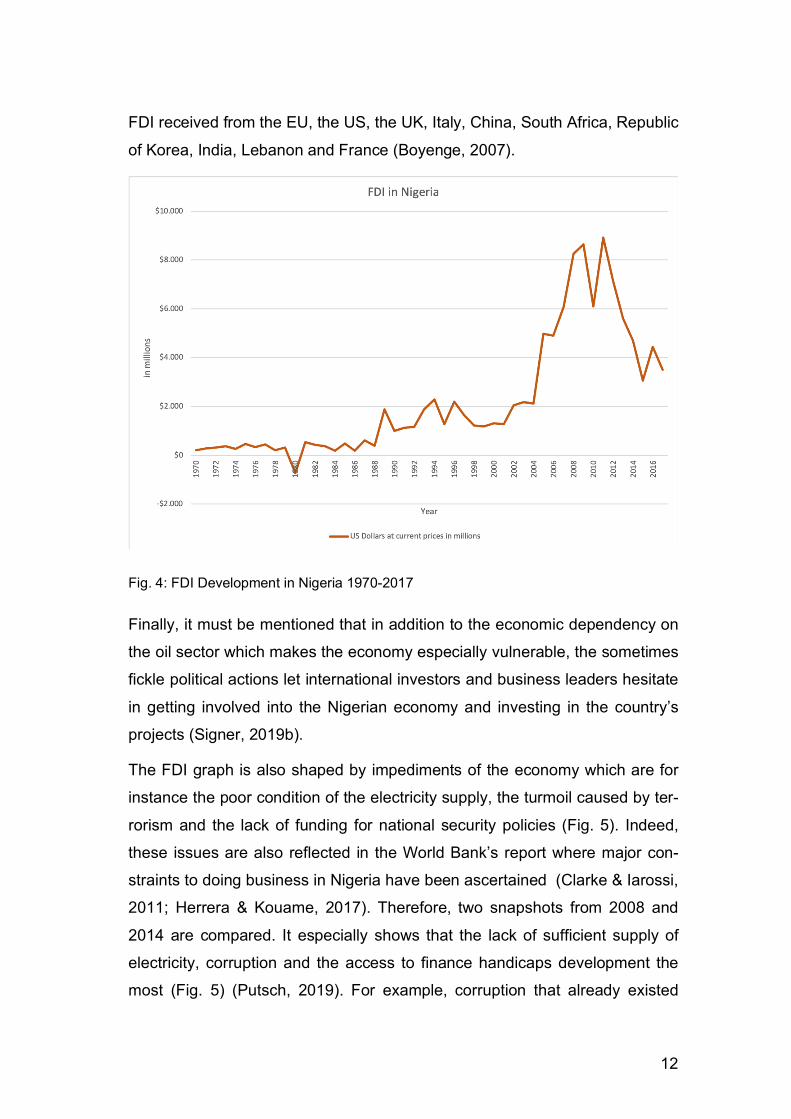
Turning towards foreign financial involvement in Nigeria, the FDI is considered
and presented in Fig. 4 (UNCTAD, 2019). Here, an increasing trend since the
beginnings of the 2000s is clearly visible. It can be observed that commencing
in 2004, a steep increase in FDI started. Compared to GDP figures, it can be
assumed that this development is in accordance with the second oil boom and
hence an increased awareness of Nigerian economy on global markets. Of
course, in the aftermath of the world economic crisis, FDI noticeably slowed
down but resumed the before-crisis trend afterwards. Between 2014 and 2016,
the recession also left its traces in the FDI figures and they consequently
sharply dropped. But, as the economy recovers from the shock, also FDI picks
up again and is currently at a level of around USD 3.5 billion (UNCTAD, 2019).
Especially in the sector of hydrocarbon, energy and buildings, a lot is invested
recently. This is mainly driven by a turning away from the oil sector which is
called the oil counter-shock. Therefore nowadays, the US, China, the UK, the
Netherlands and France put financial means into Nigerian businesses and FDI
takes up 24 percent of the country’s GDP (Export Entreprises SA, 2019). Here,
it has to be acknowledged that according to the ILO, SEZs are responsible for
12
FDI received from the EU, the US, the UK, Italy, China, South Africa, Republic
of Korea, India, Lebanon and France (Boyenge, 2007).
Fig. 4: FDI Development in Nigeria 1970-2017
Finally, it must be mentioned that in addition to the economic dependency on
the oil sector which makes the economy especially vulnerable, the sometimes
fickle political actions let international investors and business leaders hesitate
in getting involved into the Nigerian economy and investing in the country’s
projects (Signer, 2019b).
The FDI graph is also shaped by impediments of the economy which are for
instance the poor condition of the electricity supply, the turmoil caused by ter-
rorism and the lack of funding for national security policies (Fig. 5). Indeed,
these issues are also reflected in the World Bank’s report where major con-
straints to doing business in Nigeria have been ascertained (Clarke & Iarossi,
2011; Herrera & Kouame, 2017). Therefore, two snapshots from 2008 and
2014 are compared. It especially shows that the lack of sufficient supply of
electricity, corruption and the access to finance handicaps development the
most (Fig. 5) (Putsch, 2019). For example, corruption that already existed
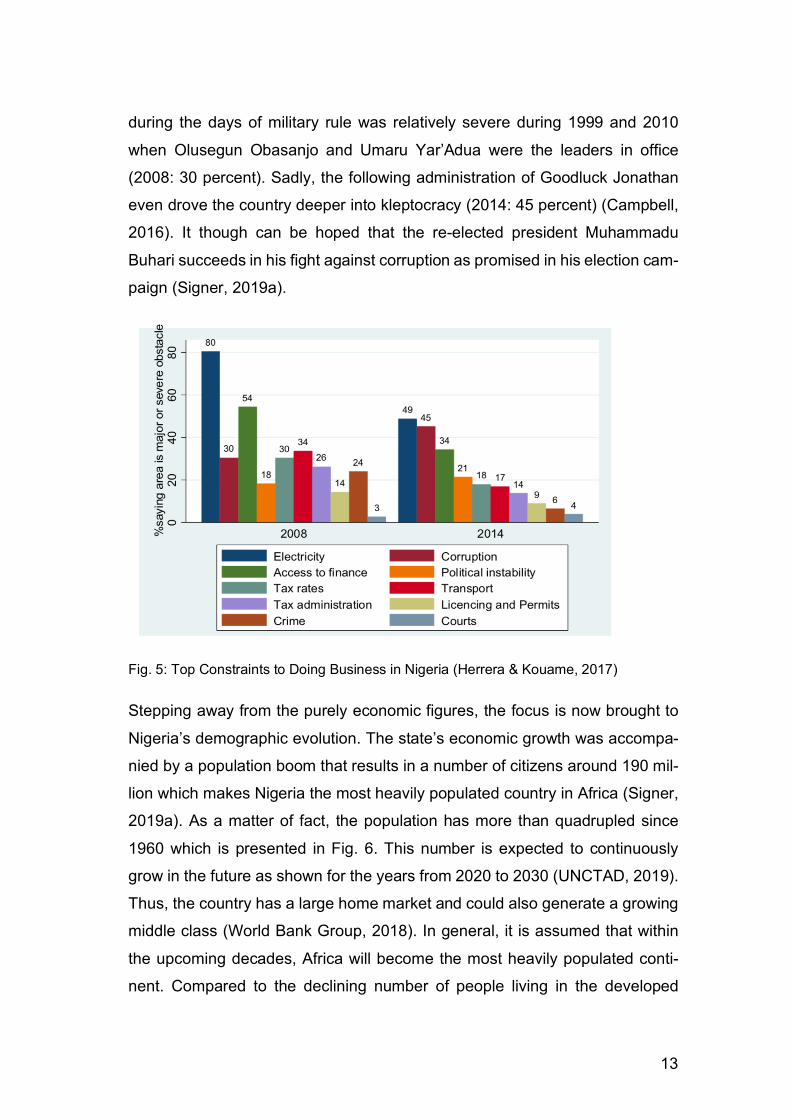
13
during the days of military rule was relatively severe during 1999 and 2010
when Olusegun Obasanjo and Umaru Yar’Adua were the leaders in office
(2008: 30 percent). Sadly, the following administration of Goodluck Jonathan
even drove the country deeper into kleptocracy (2014: 45 percent) (Campbell,
2016). It though can be hoped that the re-elected president Muhammadu
Buhari succeeds in his fight against corruption as promised in his election cam-
paign (Signer, 2019a).
Fig. 5: Top Constraints to Doing Business in Nigeria (Herrera & Kouame, 2017)
Stepping away from the purely economic figures, the focus is now brought to
Nigeria’s demographic evolution. The state’s economic growth was accompa-
nied by a population boom that results in a number of citizens around 190 mil-
lion which makes Nigeria the most heavily populated country in Africa (Signer,
2019a). As a matter of fact, the population has more than quadrupled since
1960 which is presented in Fig. 6. This number is expected to continuously
grow in the future as shown for the years from 2020 to 2030 (UNCTAD, 2019).
Thus, the country has a large home market and could also generate a growing
middle class (World Bank Group, 2018). In general, it is assumed that within
the upcoming decades, Africa will become the most heavily populated conti-
nent. Compared to the declining number of people living in the developed
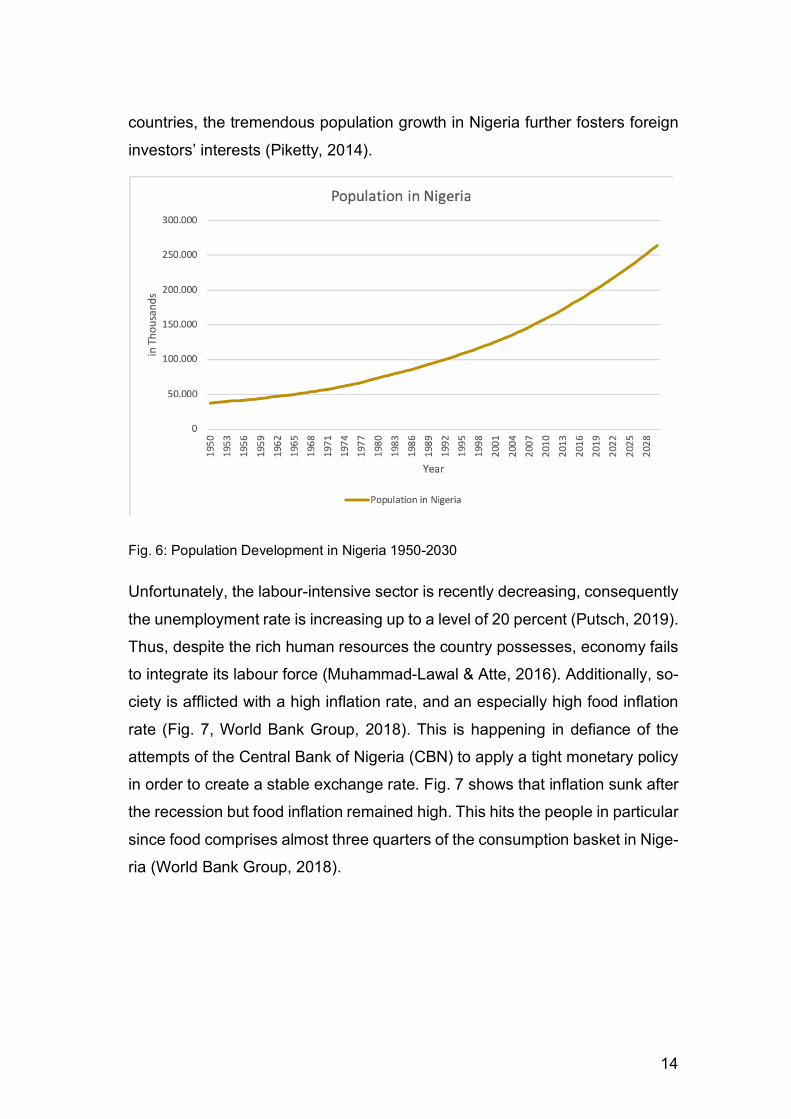
14
countries, the tremendous population growth in Nigeria further fosters foreign
investors’ interests (Piketty, 2014).
Fig. 6: Population Development in Nigeria 1950-2030
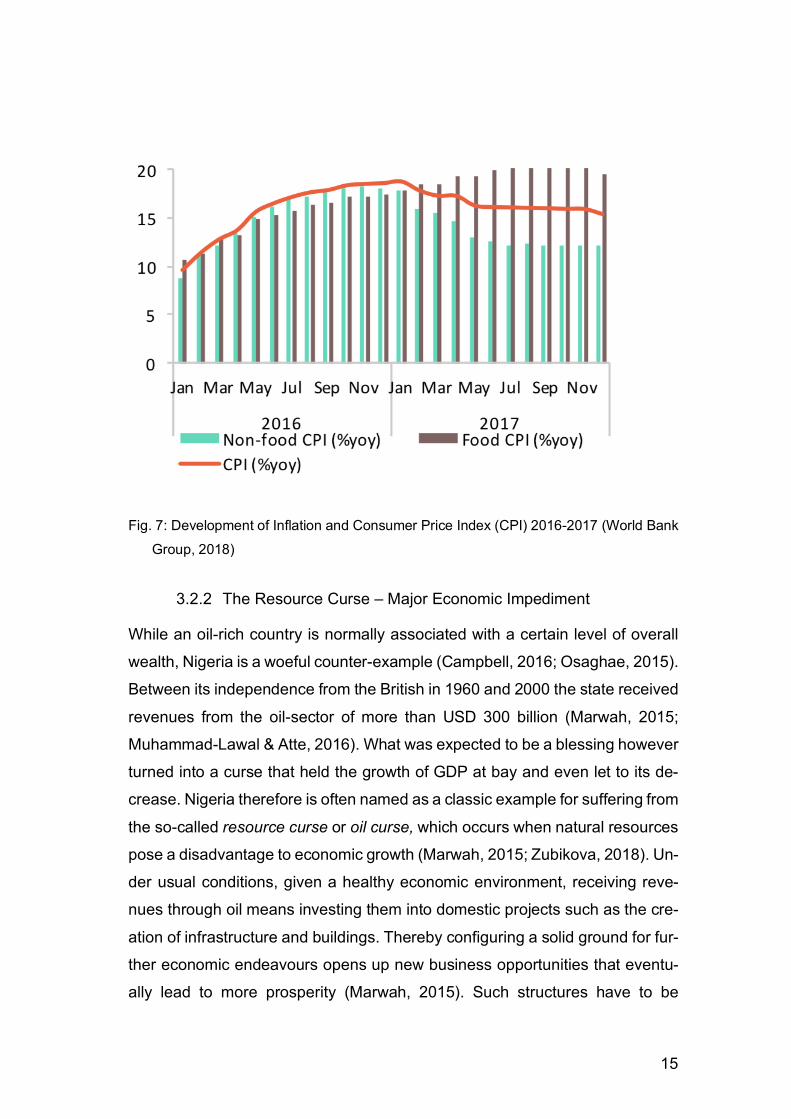
Unfortunately, the labour-intensive sector is recently decreasing, consequently
the unemployment rate is increasing up to a level of 20 percent (Putsch, 2019).
Thus, despite the rich human resources the country possesses, economy fails
to integrate its labour force (Muhammad-Lawal & Atte, 2016). Additionally, so-
ciety is afflicted with a high inflation rate, and an especially high food inflation
rate (Fig. 7, World Bank Group, 2018). This is happening in defiance of the
attempts of the Central Bank of Nigeria (CBN) to apply a tight monetary policy
in order to create a stable exchange rate. Fig. 7 shows that inflation sunk after
the recession but food inflation remained high. This hits the people in particular
since food comprises almost three quarters of the consumption basket in Nige-
ria (World Bank Group, 2018).
15
Fig. 7: Development of Inflation and Consumer Price Index (CPI) 2016-2017 (World Bank Group, 2018)
3.2.2 The Resource Curse – Major Economic Impediment
While an oil-rich country is normally associated with a certain level of overall
wealth, Nigeria is a woeful counter-example (Campbell, 2016; Osaghae, 2015).
Between its independence from the British in 1960 and 2000 the state received
revenues from the oil-sector of more than USD 300 billion (Marwah, 2015;
Muhammad-Lawal & Atte, 2016). What was expected to be a blessing however
turned into a curse that held the growth of GDP at bay and even let to its de-
crease. Nigeria therefore is often named as a classic example for suffering from
the so-called resource curse or oil curse, which occurs when natural resources
pose a disadvantage to economic growth (Marwah, 2015; Zubikova, 2018). Un-
der usual conditions, given a healthy economic environment, receiving reve-
nues through oil means investing them into domestic projects such as the cre-
ation of infrastructure and buildings. Thereby configuring a solid ground for fur-
ther economic endeavours opens up new business opportunities that eventu-
ally lead to more prosperity (Marwah, 2015). Such structures have to be
16
produced domestically to secure future development and magnify the impact
of construction on economic growth. However, in the case of Nigeria, govern-
ment officials and leaders did not put the funds into building up an infrastructure
but diverted them into different pockets which made the government institutions
suffer and hence deteriorate (Marwah, 2015). Agbiboa (2012) states that in the
period between 1960 and 1999, more than USD 500 billion have been stolen
by Nigerian state officials from governmental revenues.
Furthermore, the expansion of the mining sector made other sectors less com-
petitive, and consequently, the natural wealth additionally decreased the effi-
ciency of bureaucracy and the political effort by officials in Nigeria. This hap-
pened due to the fact that representatives regard natural resources as too im-
portant and subsequently fail to diversify the economy outside this sector.
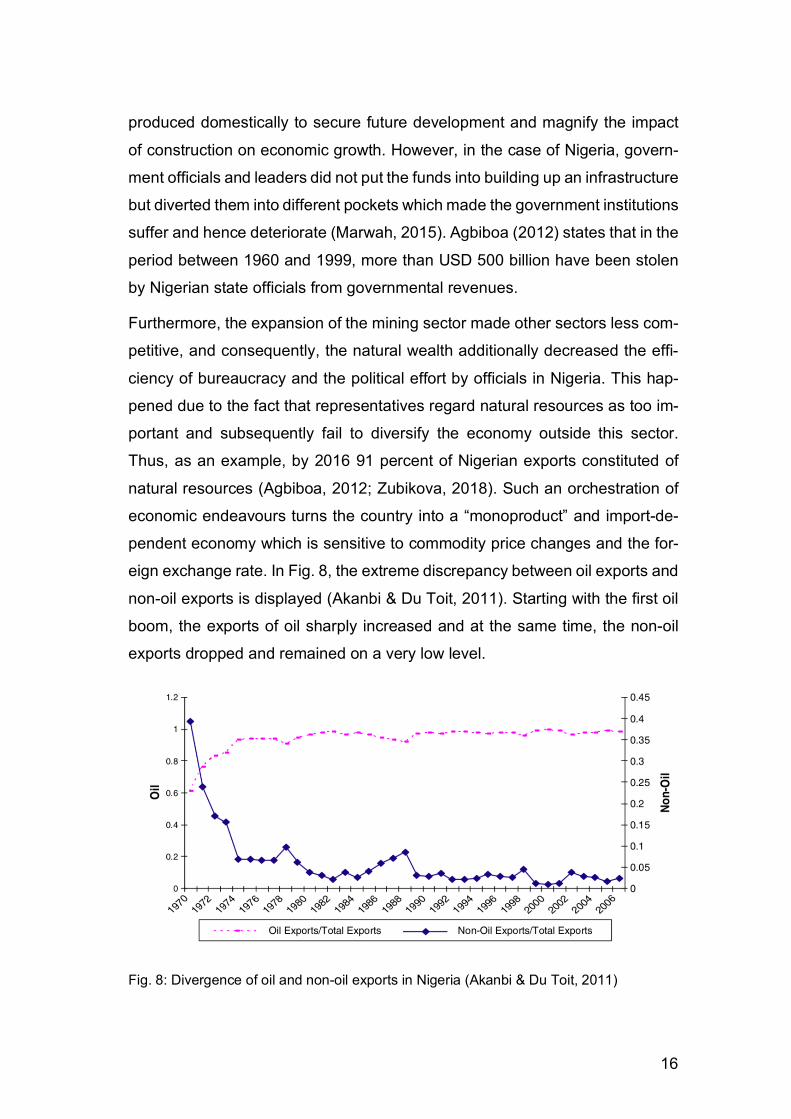
Thus, as an example, by 2016 91 percent of Nigerian exports constituted of
natural resources (Agbiboa, 2012; Zubikova, 2018). Such an orchestration of
economic endeavours turns the country into a “monoproduct” and import-de-
pendent economy which is sensitive to commodity price changes and the for-
eign exchange rate. In Fig. 8, the extreme discrepancy between oil exports and
non-oil exports is displayed (Akanbi & Du Toit, 2011). Starting with the first oil
boom, the exports of oil sharply increased and at the same time, the non-oil
exports dropped and remained on a very low level.
Fig. 8: Divergence of oil and non-oil exports in Nigeria (Akanbi & Du Toit, 2011)
17
Also, the good intentions of stabilizing the economy, e.g. ensuring investments,
promoting economic growth and stimulating exports by introducing the Struc-
tural Adjustment Program (SAP) in 1986 did not yet fully unfold. As for example,
the CBN attempts to realise these intentions by taking a hard line with monetary
policy. But as previously mentioned, the inflation rate unfortunately still remains
well above 10 percent, also in reference to the Nigerian Statistical Bulletin of
the Bank (Briggs & Musa, 2017; World Bank Group, 2018). This mechanism
was especially rogue in the response to the global financial crisis, when be-
tween 2008 and 2010 prices within Nigeria increased significantly because the
export collapsed while the imports remained stable (Zubikova, 2018).
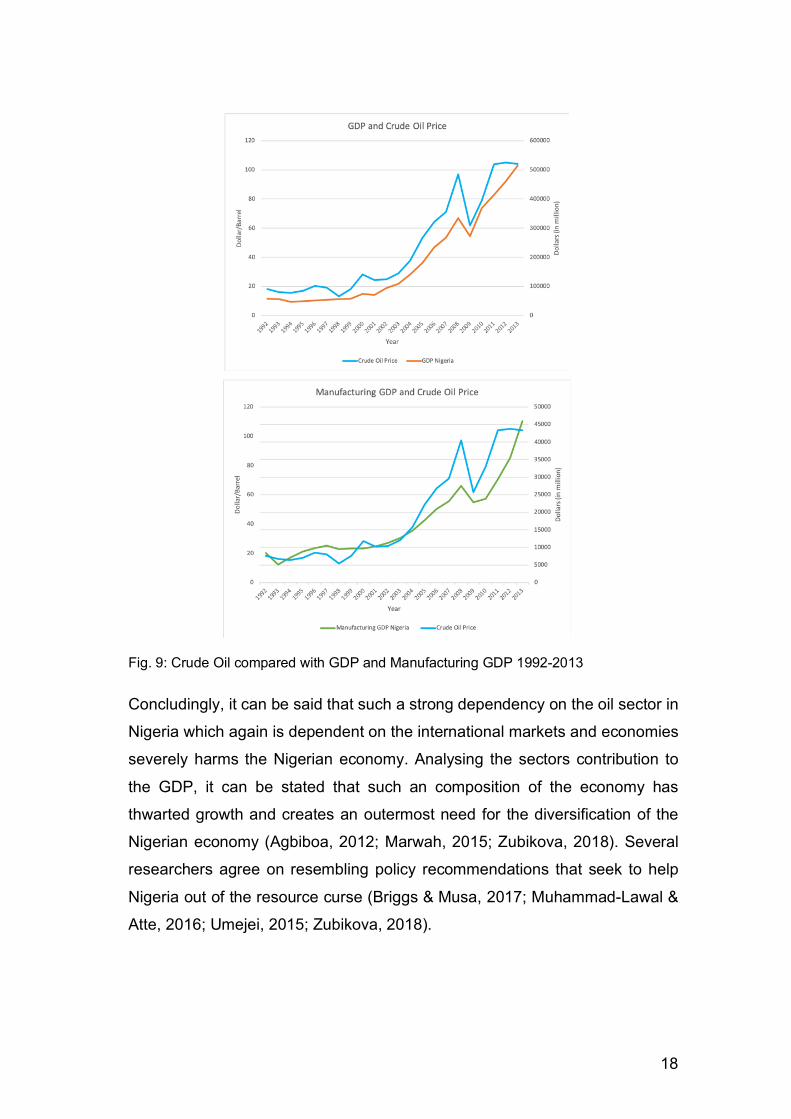
The impact of the resource curse is especially visible when following the devel-
opment of the global oil prices and consequently the oil sector’ development in
Nigeria. Despite the two booms, the exports of natural resources tremendously
decreased in 2013 and 2014 which can be mainly ascribed to the decreasing
export of crude oil that again occurred because of the fall in commodity prices
since 2013. This led to a drop of the export of natural resources by 50 percent
of its previous value that has destructive impact on the whole economy. When
comparing the GDP development of Nigeria and the oil price development in
Fig. 9 (UNCTAD, 2019) the parallel trend is obvious and highlights the depend-
ency of the GDP on the price of crude oil even more. Taking the manufacturing
GDP into comparison, with crude oil price a weaker dependency is visible.
18
Fig. 9: Crude Oil compared with GDP and Manufacturing GDP 1992-2013
Concludingly, it can be said that such a strong dependency on the oil sector in
Nigeria which again is dependent on the international markets and economies
severely harms the Nigerian economy. Analysing the sectors contribution to
the GDP, it can be stated that such an composition of the economy has
thwarted growth and creates an outermost need for the diversification of the
Nigerian economy (Agbiboa, 2012; Marwah, 2015; Zubikova, 2018). Several
researchers agree on resembling policy recommendations that seek to help
Nigeria out of the resource curse (Briggs & Musa, 2017; Muhammad-Lawal &
Atte, 2016; Umejei, 2015; Zubikova, 2018).
19
3.3 Development Opportunities for the Nigerian State
To begin with, an improvement in access to financial resources is highly de-
manded to spur the emergence of domestic businesses as well as small and
medium-sized enterprises. This is assumed to encourage local production and
reduce importation hence mitigate the dependence on it (Briggs & Musa, 2017).
Further, manufacturing activities are required to be stimulated by the govern-
ment by giving incentives and subsidies to local manufacturers. In response to
the dependency of the oil sector, a focus on sub-sectors’ improvement which
has not contributed to the GDP yet is requested. Moreover, the per capita
productivity is expected to grow by introducing improved technological innova-
tions and infrastructure advancement (Muhammad-Lawal & Atte, 2016). This
should also foster various sectors’ impact on the GDP as well as the employ-
ment within Nigeria. Another means to spur sectoral improvement and the
economy in general is the attempt to establish SEZs in Nigerian states which
has its commencements in 1991.
3.4 Nigeria’s National Endeavours with Special Economic Zones
When introducing SEZs in Africa, there was no blueprint for successful SEZ
policies. Hence, African authorities tried to replicate the SEZ model which is
known from East Asia. Especially the zone in Shenzhen, China is notorious for
a remarkable scale and a popular example. Despite such a strong paragon,
African SEZs often fell below expectations (Farole & Moberg, 2017). Neverthe-
less, by 2014 the majority of Sub-Sahara African (SSA) countries occupied ac-
tive SEZ programmes in the form of export processing zones (EPZ) or industrial
parks. Sadly, most of them failed owing to bad timing. Especially in the long-
run, generating a sustaining successful development was difficult (Bräutigam
& Tang, 2014). This is mainly due to an already established strong international
competition through Asian presence on global grounds. To put this into relation,
it has to be mentioned that for example the Chinese SEZ in Shenzhen did not
have to face any noteworthy international competition when the zone was initi-
ated. Additionally, compared to China in the 1970s, Africa was lacking the sud-
den emergence of Global Production Networks (GPN) on whose back their
20
SEZs could rise which was a distinct advantage for the Chinese zones. Focus-
sing back on Africa, besides external drawbacks, the even more detrimental
issues came from within the African zones (Farole & Moberg, 2017). Issues
such as the lack of social or physical infrastructure, policy instability and weak
implementation of capacity or institution coordination forced many zones to
cease their operations. Moreover, the poor choice of the location would cause
most severe troubles to the economic advancement (Farole & Moberg, 2017).
In the upsurge of the African economy, especially Nigeria grew and flourished
by taking a first major step towards national advancement in 1991, when intro-
ducing EPZ in the promulgation of Nigerian Export Processing Zones Decree.
In 1996, the federal government furthermore promulgated the Oil and Gas Ex-
port Free Zone Decree. Consequently, the Nigerian Export Processing Zone
Authority (NEPZA) established an EPZ in Calabar which has access to the sea
and is situated in the South-East of Nigeria, close to the Cameroonian boarder
(Farole & Moberg, 2014; Ikeyi, 1998). This zone concentrates on the manufac-
turing sector, namely on retail and services (Clarke & Iarossi, 2011). In addition
to this zone, an Oil and Gas Export Free Zone in Onne/Ikpokiri was opened
close to Calabar which puts it focus on the services sector (Clarke & Iarossi,
2011; Ikeyi, 1998).
Already back then, such economic zones were geographical sites, situated in
large tracts of land, that had been set apart for particular investments and eco-
nomic activities. Having special legislative and administrative regimes which
had to realise intended objectives that had been set by the zone’s administra-
tion are part of their particular concept (Ikeyi, 1998). The decree allowed three
types of establishment which comprised private and public businesses as well
as private-public partnerships which all had to be approved by the NEPZA and
which is still applying today (NEPZA, 2004). Hence, an enterprise that wishes
to operate within an EPZ has to hand in an application at the NEPZA that has
been previously registered at the governmental Corporate Affairs Commission
in the capital of Nigeria, Abuja. If granted, the NEPZA sets up a license upon
terms and condition to determine activities in the zone (Ikeyi, 1998; NEPZA,
2004).
21
To attract foreign investors to Nigeria and to win national businesses to start
off operations in the economic zones, a myriad of incentives is offered by the
zones’ authorities. They for instance charge no rent during the duration of con-
struction and offer tax breaks. Additionally, the companies are excluded from
the reach of laws relating to taxes, duties, levies and foreign exchange
(NEPZA, 2004). Moreover, at the end of the 20th century the general law in
Nigeria was already rather liberal towards foreign investors who could, for ex-
ample, enjoy free transfer of capital and returns on investment nation-wide
(Ikeyi, 1998). A 100 percent foreign ownership of business enterprises was also
granted with no law prohibiting the employment of expatriate staff.
Despite such a promising environment, the zones lacked linkages with other
enterprises or industries in Nigeria outside the EPZs. They were also lacking
obvious incentives for technology transfer or acquisition of skills through re-
search and development (Ikeyi, 1998). It seemed like the inducements were
only guiding towards the achievement of objectives for establishing the EPZ
but not to successfully perform business there. Also, the disputes between the
government and the customs officials of SEZs in Nigeria about the implemen-
tation of certain incentives lasted some twenty years and held the development
of the zones at bay (Farole & Moberg, 2017). Another drawback was the fear
of foreign investors of instable government policies and regulations since the
single power over the EPZs was in the hands of NEPZA who could unilaterally
alter the regulations. According to Farole And Kweka (2011), such institutional
issues are hindrance for prosperousness of the zones.
Concludingly, it can be agreed with Nduka Ikeyi who rated the effort of Nigerian
authorities as “commendable” (1998, p. 230) and classified the general frame-
work of the Nigerian EPZs as a good fit to traditional EPZ construct that has
been set as example by the East Asian zones. However, back in the end of the
1990s, Ikeyi (1998) expressed the apprehension that the foreign investment
will not ensure the desired gains in the zones neither will the benefits gained
within them reach the Nigerian economy as a whole.
22
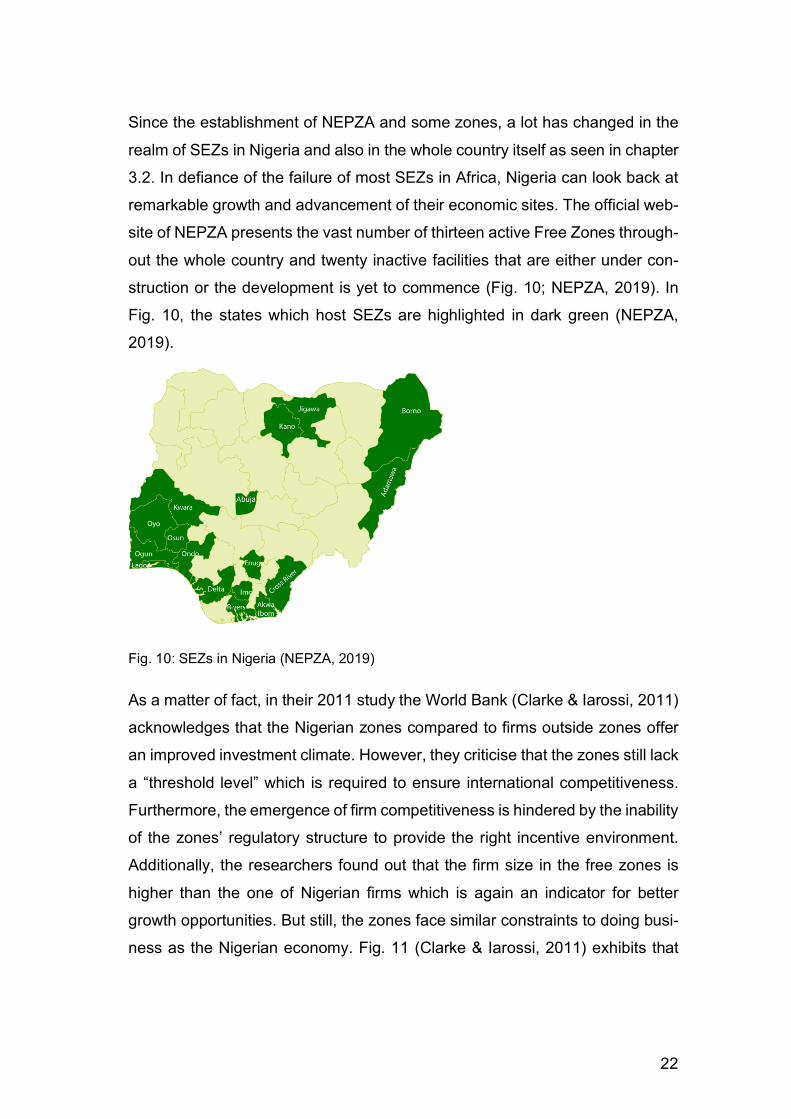
Since the establishment of NEPZA and some zones, a lot has changed in the
realm of SEZs in Nigeria and also in the whole country itself as seen in chapter
3.2. In defiance of the failure of most SEZs in Africa, Nigeria can look back at
remarkable growth and advancement of their economic sites. The official web-
site of NEPZA presents the vast number of thirteen active Free Zones through-
out the whole country and twenty inactive facilities that are either under con-
struction or the development is yet to commence (Fig. 10; NEPZA, 2019). In
Fig. 10, the states which host SEZs are highlighted in dark green (NEPZA,
2019).
Fig. 10: SEZs in Nigeria (NEPZA, 2019)
As a matter of fact, in their 2011 study the World Bank (Clarke & Iarossi, 2011)
acknowledges that the Nigerian zones compared to firms outside zones offer
an improved investment climate. However, they criticise that the zones still lack
a “threshold level” which is required to ensure international competitiveness.
Furthermore, the emergence of firm competitiveness is hindered by the inability
of the zones’ regulatory structure to provide the right incentive environment.
Additionally, the researchers found out that the firm size in the free zones is
higher than the one of Nigerian firms which is again an indicator for better
growth opportunities. But still, the zones face similar constraints to doing busi-
ness as the Nigerian economy. Fig. 11 (Clarke & Iarossi, 2011) exhibits that
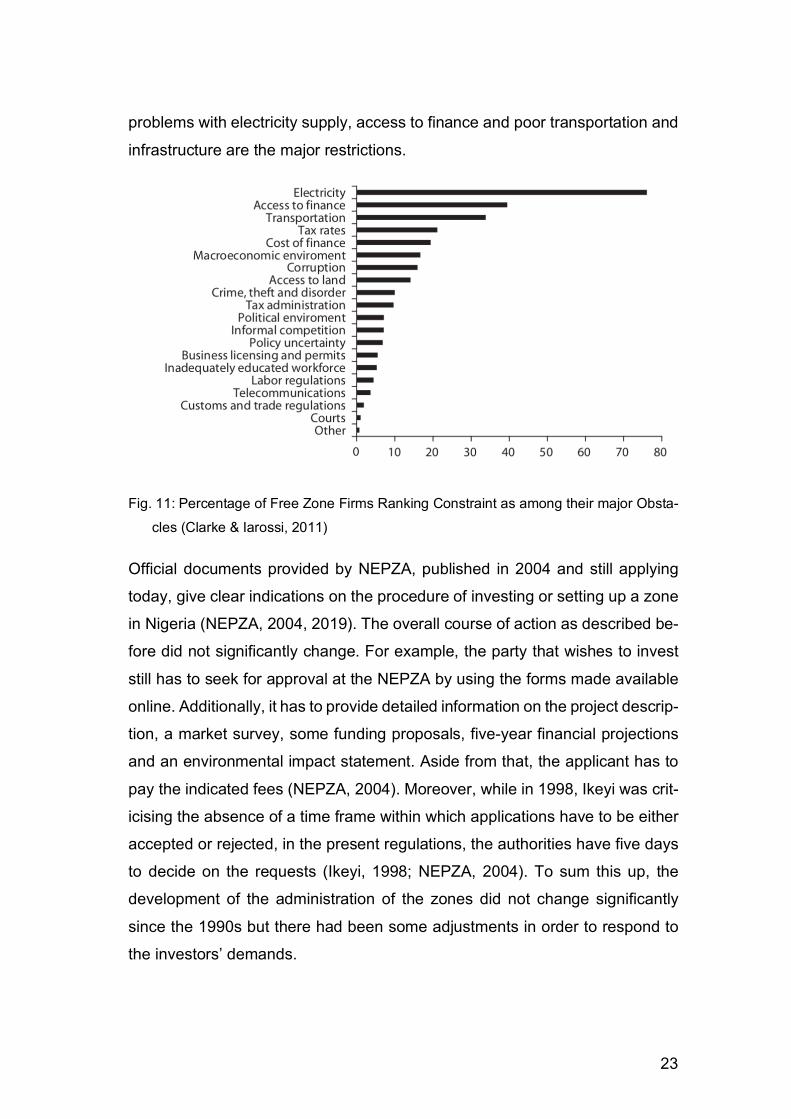
23
problems with electricity supply, access to finance and poor transportation and
infrastructure are the major restrictions.
Fig. 11: Percentage of Free Zone Firms Ranking Constraint as among their major Obsta-cles (Clarke & Iarossi, 2011)
Official documents provided by NEPZA, published in 2004 and still applying
today, give clear indications on the procedure of investing or setting up a zone
in Nigeria (NEPZA, 2004, 2019). The overall course of action as described be-
fore did not significantly change. For example, the party that wishes to invest
still has to seek for approval at the NEPZA by using the forms made available
online. Additionally, it has to provide detailed information on the project descrip-
tion, a market survey, some funding proposals, five-year financial projections
and an environmental impact statement. Aside from that, the applicant has to
pay the indicated fees (NEPZA, 2004). Moreover, while in 1998, Ikeyi was crit-
icising the absence of a time frame within which applications have to be either
accepted or rejected, in the present regulations, the authorities have five days
to decide on the requests (Ikeyi, 1998; NEPZA, 2004). To sum this up, the
development of the administration of the zones did not change significantly
since the 1990s but there had been some adjustments in order to respond to
the investors’ demands.
24
4 China’s Domestic Advancement and International Endeavours
Moving away from the African continent, this chapter is about China and its
economic advancement in the recent decades with a special emphasis on the
contribution to the development of SEZs. It gives further insight into the perpet-
ual research, speculating and theory-building about the reason why some re-
gions thrive and build powerful markets, while others seem to be stuck in vi-
cious circles of poverty, institutional voids and corruption (Acemoglu &
Robinson, 2005, 2012; Piketty, 2014). Especially the incomparable emergence
of the Chinese economy encourages such research. Thus, the focus lies upon
the country’s experiences during its upsurge, first, focusing particularly on
China’s domestic SEZs which opened the gates of the economy for interna-
tional trade and second, on the Chinese involvement in the Nigerian SEZs
which is claimed to be a win-win deal for both nations. Further, it is scrutinised
whether such an approach can be a panacea for development countries’ ills or
whether this involvement can rather be seen as a new form of colonialism
(Romer, 2010).
4.1 China’s Rise to a Global Industrial Power
Like Nigeria, also China faced major political turmoil throughout time and after
Mao Zedong passed away in 1976, the rousing economic upsurge of China
has not been anticipated (Schmidt, 1997). However, already in 1979, the gov-
ernment, mainly motivated by Deng Xiaoping started to experiment with SEZs
which were only heretical ideas back then. Throughout time, the plans of at-
tracting FDI and issuing flexible labour contracts proved to be a structural trans-
formation incubator and nowadays, zones host some of the global champions
as for example Chinese Huawei but also foreign corporations such as IBM,
Siemens and Samsung (Bräutigam & Xiaoyang, 2012). The advancement im-
pelled by Deng paid off since China’s economy has been steadily growing at
rates around 10 percent per year (see Fig. 13). This constitutes the largest
economic growth worldwide and is expected to supersede the United States of
America as world’s largest economy (Herd & Dougherty, 2005; Schmidt, 1997;
Sun, Jayaram, & Kassiri, 2017; World Bank Group, 2019).
25
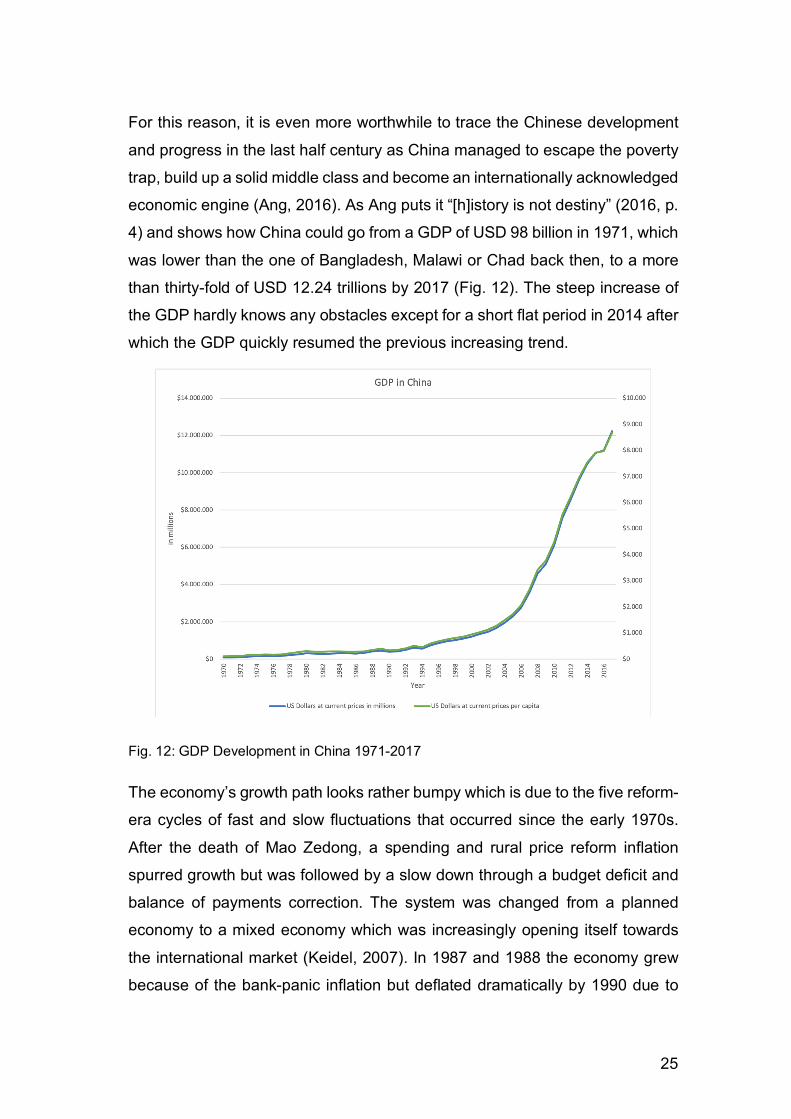
For this reason, it is even more worthwhile to trace the Chinese development
and progress in the last half century as China managed to escape the poverty
trap, build up a solid middle class and become an internationally acknowledged
economic engine (Ang, 2016). As Ang puts it “[h]istory is not destiny” (2016, p.
4) and shows how China could go from a GDP of USD 98 billion in 1971, which
was lower than the one of Bangladesh, Malawi or Chad back then, to a more
than thirty-fold of USD 12.24 trillions by 2017 (Fig. 12). The steep increase of
the GDP hardly knows any obstacles except for a short flat period in 2014 after
which the GDP quickly resumed the previous increasing trend.
Fig. 12: GDP Development in China 1971-2017
The economy’s growth path looks rather bumpy which is due to the five reform-
era cycles of fast and slow fluctuations that occurred since the early 1970s.
After the death of Mao Zedong, a spending and rural price reform inflation
spurred growth but was followed by a slow down through a budget deficit and
balance of payments correction. The system was changed from a planned
economy to a mixed economy which was increasingly opening itself towards
the international market (Keidel, 2007). In 1987 and 1988 the economy grew
because of the bank-panic inflation but deflated dramatically by 1990 due to
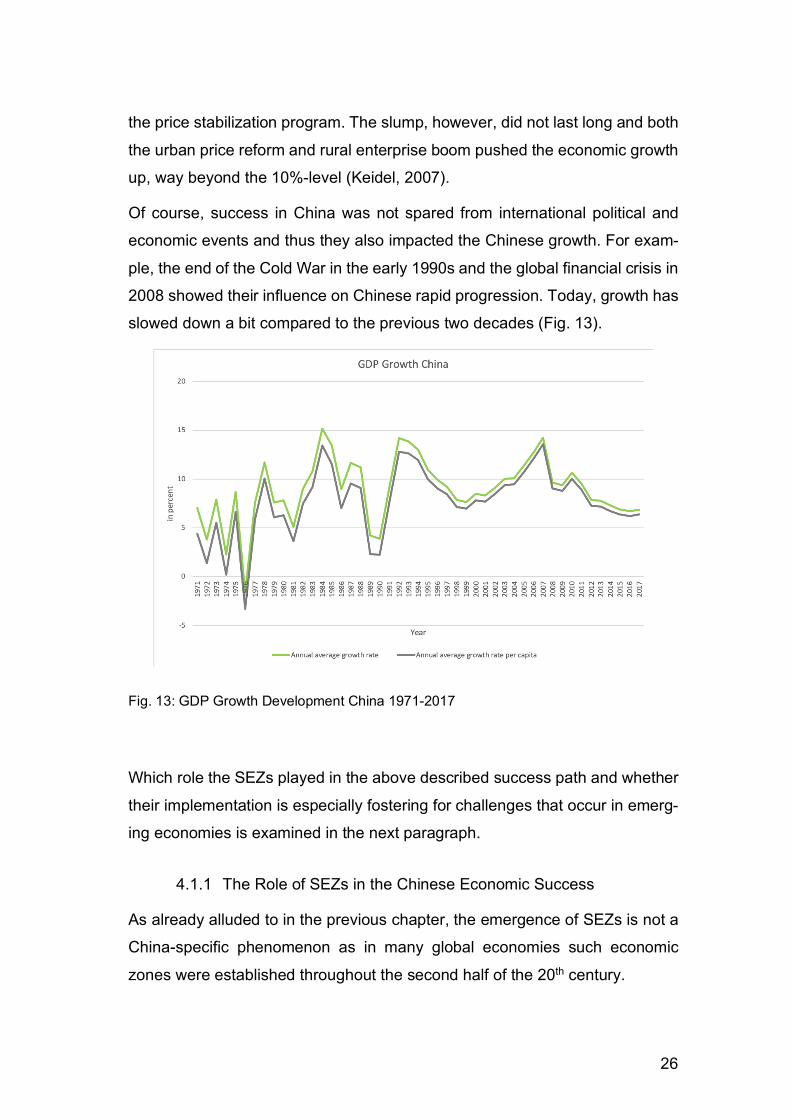
26
the price stabilization program. The slump, however, did not last long and both
the urban price reform and rural enterprise boom pushed the economic growth
up, way beyond the 10%-level (Keidel, 2007).
Of course, success in China was not spared from international political and
economic events and thus they also impacted the Chinese growth. For exam-
ple, the end of the Cold War in the early 1990s and the global financial crisis in
2008 showed their influence on Chinese rapid progression. Today, growth has
slowed down a bit compared to the previous two decades (Fig. 13).
Fig. 13: GDP Growth Development China 1971-2017
Which role the SEZs played in the above described success path and whether
their implementation is especially fostering for challenges that occur in emerg-
ing economies is examined in the next paragraph.
4.1.1 The Role of SEZs in the Chinese Economic Success
As already alluded to in the previous chapter, the emergence of SEZs is not a
China-specific phenomenon as in many global economies such economic
zones were established throughout the second half of the 20th century.
27
In the case of China, which sometimes is still described as a developing coun-
try, the SEZs meant an opening up of the Chinese gateways which were closed
for 30 years. They played a crucial role in the society’s transformation from a
planned economy to a market economy which is on the road to scientific de-
velopment. For the Chinese, it was a way to break out from the doctrine of
ideology and the rigid conventional system that was ruled by the ultra-left
(Yitao, 2017). China managed to create successful SEZs using them as a tool
for attracting FDI and promoting export-oriented industrialization (Bräutigam et
al., 2010). The institutional change of Chinese society was mainly highlighted
by the establishment of a market system which is suitably reflected by the cre-
ation of the first generation of SEZs in Shenzhen, Zhuhai, Shantou and Xiamen
in the 1980s. The focus of these zones was put on a common institutional fea-
ture – the proximity to big cities (Yitao, 2017; Yuan, 2017).
This specific example is known for its uniqueness and symbolises the main
features and future developmental trends of China’s characteristic path for
achieving modernisation. As being an international pioneer among the SEZs,
the policies of the Shenzhen zone were adopted by transitional countries and
emerging market economy countries (Yitao, 2017). To underpin the unique for-
ward development and to make it relatable, it can be determined that Shen-
zhen’s establishment dates back 30 years with an average growth rate of 15
percent which let them enter the mature period of steady growth. In numbers,
this encompasses an economic aggregate of Chinese renminbi (CNY) 2,249
billion (roughly USD 334 billion) and a per capita GDP of CNY 200,000 (roughly
USD 30,000) by 2018 (CEIC Data, 2018; Hongpei, 2019). Today, Shenzhen is
ranked number 4 among the large and medium-sized cities nationwide with an
annual increase of 31.2 percent in GDP and a total volume of import and export
trade of USD 287,533 million growing 38.34 percent each year (Jian, 2017).
Beyond the borders of the zone itself, Shenzhen reconnected Hong Kong and
Macau smoothly to mainland China while maintaining their prosperity and sta-
bility. Furthermore, its capability for independent innovation gradually en-
hanced and outstanding accomplishments in the realm of urban construction
modernisation and infrastructure systems have been adopted as standard.
28
Moreover, the Shenzhen programme leader introduced a comprehensive
transport system which further demanded for the employment of an elaborated
urban management of these new systems. As a consequence of that, people’s
standard of living as well as their quality of life profoundly improved. Addition-
ally, the head of the zone reformed the government’s administrative manage-
ment system and hence they instituted an operational mechanism and socialist
market economy system. This made Shenzhen the first SEZ that would carry
out a reform of a market-oriented economic system (Jian, 2017).
Summarised, it can be discerned that the heralded foundational economic
change was a crucial feature of building a market economy and smoothing the
path to scientific development of Chinese economy (Jian, 2017). Further, allur-
ing international investors was successfully accomplished and key to the
zones’ prosperity.
4.1.2 Beijing’s “Going Global” Approach
Since the domestic SEZs in China followed a very successful path, the Chinese
authorities also aimed to expand their business territory and “Go Global”. Al-
ready by 2006 China published the 11th five-year plan which entailed further
expansion of their policies that aim to support global trade and overseas in-
vestment (Lo, 2015). A study by McKinsey (Sun et al., 2017) states that in
whole Africa there are operating roughly 10,000 Chinese businesses of which
90 percent are privately owned. Further, Beijing is planning a resumption of
work on the so-called Silk Road to keep track in consolidating the ways be-
tween China and Africa. “One Belt, One Road” (Lo, 2015) shall spur interna-
tional trade in the long run and open up domestic and political objectives to the
global stage. The idea is to connect and respectively reinforce China with the
rest of Asia, Africa and also Europe by land and sea and to revitalize old, his-
torical paths and trade connections. This reinitialization is also an answer to
major international, mostly Western-induced pacts, where China has been ex-
cluded (Lo, 2015). This zouchuqu (“Going Global”) approach has been the cen-
tre of the internationalization strategy of China ever since and was followed
self-consciously (Bräutigam & Xiaoyang, 2011). By doing so, China resumes a
29
geo-political strategy that nowadays seems to be deserted among the leading
industrial powers (Gabriel, 2018).
The emergence of GPNs was a driving factor in the Chinese international de-
velopment and together with improvements in transport and telecommunication
infrastructure, vastly contributed to increasing FDIs (Frick et al., 2018). Addi-
tionally, in the 1980s and 1990s an impressive growth in international trade and
cross-border investments took place from which the Chinese zones could ben-
efit from it (Farole & Moberg, 2014). Particularly FDI became an important ve-
hicle for trading goods and services on global markets. Further, the Chinese
were integrating national production systems within the opening up of the
world’s economies and China’s authorities seized this development to leverage
their plans (Carter & Harding, 2010a).
To set them into motion, the Chinese overseas programme was launched as
the country’s tool to create “mutual benefit” in order to help other countries build
up manufacturing capabilities and value chains. Within China, the government
accelerated programs to put Chinese companies on the global market and mo-
tivate them to internationalize by setting incentives (Bräutigam & Tang, 2014).
Not only from the Chinese perspective but also from states all over the world,
this development was welcomed and authorities opened up their markets to be
host for Chinese businesses and receive FDI from China. This is especially
reflected in the fact that ten African countries expressed their interest in accom-
modating Chinese SEZs and established grounds for their investments. For
that reason, the Chinese Ministry of Commerce (MOFCOM) set up a pro-
gramme to support the establishment of economic cooperation and trade zones
in other countries. To allure investors for such zones, China held two rounds of
tenders which were successful because of the support winning proposals Bei-
jing offered through MOFCOM’s Trade and Economic Cooperation Zone De-
velopment Fund (Bräutigam & Xiaoyang, 2011). As mentioned above, China
has established a geo-political strategy which aims to expand their economic
reach and find new global trading partners. The question which arises is
whether their own internal development accompanied by opening up towards
international trade could also be a suitable approach for the African developing
30
countries and pose a response to the crisis the international development aid
currently finds itself in.
4.2 Is the Chinese Investment a Panacea for African Development Ills?
Interestingly, researchers found out that particularly foreign development aid
can be held responsible for the decreasing growth of emerging markets and
drove developing countries significantly deeper into corruption and poverty in-
stead of jump-starting the backward economy (Ang, 2016; Moyo, 2009; Ziai,
2013). This is why the concept of sending donations to the developing world
needs to be thoroughly scrutinised. One promising approach to help the devel-
oping countries to improve their economic development is building up SEZs
which represent the focus of this thesis and hence, are investigated in the fol-
lowing part.
As already explained above, China having established the very successful
zone in Shenzhen, is a forerunner in the field of setting up SEZs. Therefore, it
can be presumed that their economic concept, driven by FDI and international
cooperation, is also applicable to other developing economies (Bräutigam &
Tang, 2014). Supporting the Chinese method, the economist Jeffrey Sachs for
example states that growth comes from capital investments and that developed
countries should send vast amounts of foreign aid to foster the economic up-
surge of third world countries. His opinion conforms with the thinking in classi-
cal economics and puts a lot of weight on the benignity of developed nations
(Ang, 2016). Substantiating this, Deborah Bräutigam (2011) claims that China
is an economic engine that is pulling Africa out of poverty and economic defi-
ciency. Further, she claims that the public opinion of the African people is gen-
erally speaking positive towards China and their investment in African coun-
tries. This is contrived by several features. First, since Africa’s impediment of
high production costs still prevails in most economies, the Chinese remedy is
to build a profound infrastructure. This approach sets itself apart from Western
funds which primarily flow into the health and social sector as well as non-gov-
ernmental organisations. Second, it is highlighted that China is building up the
African manufacturing sector which has been purposely held down by the
31
colonizers before the nations gained independence (Campbell, 2016; Marwah,
2015). This also underpins Bräutigam’s statement against an introduction of re-
colonialization in Africa through the Chinese which has been brought as accu-
sation against their endeavours in Africa (Gekonge, 2013). For example, she
brings up that a Chinese shoe manufacturer moved their factory from China to
Ethiopia, hired locals and sent them to China in order to train them before open-
ing the factory (Bräutigam, 2011). Third, through such endeavours, the Chinese
are spreading employment in Africa. Though, while the Sino-Africa expert
claims that in Chinese companies there are more than 80 percent Africans em-
ployed, she also admits that the wages paid do not meet European standards
yet which needs to be adjusted (Bräutigam, 2011). Lastly, the prejudice that
Chinese would solely invest into states that offer them good terms while they
do not care for good governance reality seems to show, due to Bräutigam
(2011), that the Chinese mainly invest in stable and well-governed countries in
which property rights are secured. It is further believed that when creating an
environment of good governance, markets will grow by fulfilling best practice of
wealthy nations and implementing their strong and law-bound governmental
institutions (Ang, 2016).
In support of internationally integrated economic systems, Paul Romer (The
Nobel Foundation, 2018), the laureate of The Sveriges Riksbank Prize in Eco-
nomic Sciences in Memory of Alfred Nobel of 2018 "for integrating technologi-
cal innovations into long-run macroeconomic analysis", stated that rich econo-
mies should set up SEZs in poor economies in order to help them lift them-
selves out of their misery. This is to achieve in the same manner the British
Empire did in Hong Kong to help the “mother-nation”, here China, to rise sub-
sequently. Romer (2010) further admits that the term describing such proceed-
ings could be colonialism of the twenty-first century but at the same time this
would take place free of coercion and colonialization. Therefore, a more suita-
ble description of such actions is “neo-colonialism” which can be seen as a new
style of development aid (Romer, 2010).
For this reason, in the following chapter, it is investigated whether the Chinese
offer of “mutual benefit loans”, which comprise credits for construction of public
32
works is an improved way of giving aid without donating in its conventional
meaning but engaging in the economy directly. These Chinese loans would
help Nigeria to build power plants, railways and hospitals, where the repayment
of the Chinese is secured by existing exports that often happen in the form of
natural resources (Bräutigam & Xiaoyang, 2012).
33
5 Joined Forces between China and Nigeria – Setting up SEZs
The Chinese-Nigerian relationship dates back to before the set-up of Chinese
SEZs on Nigerian grounds. It commenced at the beginning of the 1970s as the
Nigerian governmental representatives visited Beijing and signed an open-end
agreement on economic and technological cooperation and trade. This rela-
tionship was framed as a “win-win” situation where both parties could profit
equally. The underlying basic idea is to export oil and gas from Nigeria to China
while Nigeria imports manufacturing goods such as machinery, textiles and
technical equipment. This notion was underpinned by the “memorandum of un-
derstanding” on the establishment of strategic partnerships (Umejei, 2015).
The deal “oil for infrastructure”, strongly promoted by the presidency of
Olusegun Obasanjo (1999–2007) shows that also the Nigerian leaders were
highly interested in the Chinese involvement in their economy. Oil blocs were
auctioned from the Nigerian side for the provision of major infrastructure pro-
jects led by China. However, after the state’s leader changed, the conditions
had to be renegotiated and it did not work out as smoothly as planned
(Mthembu-Salter, 2009a). Nevertheless, in 2013 there were 208 mainly state-
owned Chinese enterprises registered in Nigeria (Umejei, 2015).
Early in 2006, the Chinese government announced that they will continue to
pursue their so-called “Going Global” strategy. Within the scope of the govern-
ment’s plan, the Chinese announced further stated to build up to 50 overseas
economic and trade cooperation zones worldwide (Dannenberg, Yejoo, &
Schiller, 2013). The same year, the conference of the China-Africa Cooperation
(FOCAC) took place, where it was published that three to five of the overseas
zones would be built in Africa (Bräutigam et al., 2010; Bräutigam & Xiaoyang,
2011). After a board of Chinese experts assessed the possible regions, testing
for the overall feasibility of the establishment of such zones, the market poten-
tial, the host country’s investment environment and the degree of support that
the respective country could provide, seven zones in Africa were selected
(Bräutigam & Xiaoyang, 2011). Two of these Chinese zones are located in Ni-
geria’s South and run by private developers (Farole & Moberg, 2014).
34
5.1 Chinese Zones in Nigeria
To begin with, attention was drawn to the Chinese economic engagement in
Africa when Chinese president Hu Jintao pledged to establish three to five
SEZs during the Beijing summit of the Forum on China Africa Cooperation in
2006. In course of the Chinese Ministry of Commerce’s programme to support
SEZs abroad, China set up two zones in two Nigerian states (Bräutigam &
Tang, 2014).
The first zone initiated in 2006 is called Lekki Free Trade Zone (LFTZ) and is
located in Lekki in Lagos State. One year later, in 2007, the second zone
named Ogun-Guangdong Free Trade Zone (OGFTZ) situated in Igbesa in
Ogun State was established (Bräutigam & Tang, 2014; Mthembu-Salter,
2009b).
The Chinese offered incentives as for example grants and long-term loans
which were used to visit sites to plan and negotiate with the host authorities
and preparing a bid comprising the rent, insurance and legal fees. More than
60 Chinese companies initially expressed their interest. Additionally, the com-
panies that finally established their businesses in Africa were promise a a re-
imbursement of their moving costs into the zone. Though, the subsidies were
performance-based and after setting a performance benchmark, an evaluation
based on the companies’ own assessment was performed against this stipu-
lated benchmark (Bräutigam & Tang, 2014). Subsequently, the companies who
made it through the assessment directly negotiated with the host governments
about the establishment of policies and incentives in the zones. To give an
insight into the Nigerian-Chinese relationship, the two zones are described be-
low.
5.1.1 Lekki Free Trade Zone
The first Chinese zone in Nigeria is the LFTZ which is located 60 km east of
Lagos on the peninsula of the Local Government Area Lekki alongside a
planned deep-water port (Bräutigam & Tang, 2014). Discussions about trans-
ferring the Chinese zone model to Nigeria already begun by 2003 between
35
China Civil Engineering Construction Company (CCECC) and the governor of
Lagos State. At this point in time, CCECC operated for over a decade in Nigeria
and was thus a known stakeholder in the African country. Consorting with three
Chinese firms, CCECC together with Lagos State Government established the
Lekki Free Trade Zone. In November 2007, it won in the second MOFCOM
tender and the China-Africa Development Fund became their sponsor
(Bräutigam & Tang, 2014). Now, the majority stake in the Lekki Free Zone De-
velopment Company is held by a consortium called China-Africa Lekki Invest-
ment Co. Ltd. led by the CCECC (60 percent), the rest belongs in equal shares
to Lekki Worldwide Investments Ltd. and the Lagos State Government (Zeng,
2012). CCECC has a lease of 50 years on the site whose initial zone focus was
put on industrial estates (Mthembu-Salter, 2009b).
A target of some 200 companies was set for the zone and constructions of the
start-up area were initiated in October 2007. The developers of the zone dis-
tinguish between six sections: “transportation equipment; textiles and light in-
dustry; home appliances and communication technologies; warehousing; ex-
port processing; and living quarters and commercial areas” (Bräutigam & Tang,
2014, p. 84). By 2012, 85 companies had registered in Lekki zone, of which 30
signed lease agreements and four already had begun operating. Out of the 30
signees, 60 percent were from Nigeria, 20 percent from China and another 20
percent from countries from for instance the UK, India or Ukraine and mainly
constituted out of private companies that were fairly small.
Initially, LFZDC had to face issues stemming from a dispute within the Chinese
consortium and also from a continuing uncertainty about the power supply.
These obstacles were cleared away by a strong support from the governor of
Lagos State thus, pushing constructions forward.
5.1.2 Ogun-Guangdong Free Trade Zone
The second Chinese zone located in Nigeria is the OGFTZ (Bräutigam & Tang,
2014). It is a private-public project where the Nigerian local government pro-
vides the land and the Chinese partners are responsible for enterprising the
capital (Feng & Philling, 2019). The zone is situated in the Igbesa Region of
36
Ogun State within the reach of 60 km of Lagos. Further, it is only 50 km from
Murtala Mohammed International Airport and 55 km from Apapa, the largest
sea port in western Africa (Feng & Philling, 2019; MOFCOM, 2018). The zone
is run by a joint venture between Ogun State government and a Chinese con-
sortium called the China African Investment Company. The latter is based in
Guangdong and hired the Chinese Guangdong Xinguang International Group
Company Ltd as lead developer (Bräutigam & Tang, 2014; Mthembu-Salter,
2009b). Initially, in the joint venture, Ogun State holds 18 percent and the China
African Investment Company owns the remaining 82 percent. Furthermore,
they were ascribed with 100 percent management control and a roughly 100-
year concession (MOFCOM, 2018; Mthembu-Salter, 2009b). However, nowa-
days, the OGFTZ was taken over by the Chinese firm Guangdong New South
Group and is managed by the Chinese electrical engineer Wilson Wu (Feng &
Philling, 2019; Punch Nigeria, 2016).
Originally, the OGFTZ was situated in Imo State but several Chinese workers
were kidnapped there and hence, the location of the zone had to be changed.
This interruption is responsible for a long delay within the development of the
zone (Bräutigam & Tang, 2014; Mthembu-Salter, 2009b).
Referring to the official website of MOFCOM, the zones focusses on “research
& development, manufacturing, commerce, logistics, real estate development,
medical treatment, and the hotel and financial services will be followed up”
(MOFCOM, 2018). Being approved by NEPZA in mid-2008, construction of the
facilities started at the beginning of 2009 but was interrupted due to some
budget problems and led to for example, a delay in paving the road leading to
the zone. The first phase comprised the establishment of a start-up area and a
high-tech agricultural demonstration park is planned to be added in the future.
By 2013 the main roads within the start-up area were paved and a natural gas
power plant was under construction. At this point, already 34 enterprises were
registered in the zone and are of different nationalities, namely from China,
Nigeria, India and Lebanon. Unfortunately, Ogun State complained that the
agreement with the Chinese partner to hire a third of skilled workers from local
entities was not respected allegedly because the definition of “skilled” was not
37
obvious (Bräutigam & Tang, 2014). On the other hand do Chinese managers
hold the low skill level against the Nigerian employees who only had access to
the deteriorated state education system (Feng & Philling, 2019).
5.2 Challenges and Opportunities of the SEZs
As a matter of fact, Bräutigam (2011) quotes an OECD study which found out
that with every one percentage rise in Chinese growth 7.7 million people out-
side China were lifted out of poverty. Outside its borders, China may thus well
be the most potent poverty reduction engine that has been seen in the 21st
century. The question is whether this power can also help Nigeria when it
comes to set up successful SEZs.
Although, the Chinese concept of success is applied to their SEZs in Nigeria,
issues arising from the Nigerian economy and political structure harm the
zones’ development. One of the most severe problem is the shortage of basic
raw materials in Nigeria. Therefore, the Chinese businesses within the zones
are limited to perform only final assembly. Relying on imported parts and for-
eign inputs also entails the need to access scarce foreign currency and a tedi-
ous import procedure which can be hindered by sometime obstructive port of-
ficials (Feng & Philling, 2019). In comparison to local businesses, SEZs partic-
ularly suffer from such input restrictions as their ties to local businesses are not
well-established (Farole & Moberg, 2017).
Taking this into account, examining the Chinese involvement in Nigerian SEZs
aims to analyse and scrutinise how that impacts the economic development of
the African country (Dreher et al., 2016).
38
6 Data and Methodology
6.1 Measuring the Performance of SEZs with Nighttime Light Data
Throughout the years of research on human behaviour, urban habitation and
economic development, an increasing amount of scientist had to face lacking
data availability. In the course of finding proxies to fill the void, researchers
came across NTL data which they used as measure of urbanisation (Mellander,
Lobo, Stolarick, & Matheson, 2015). Beyond this, NTL data has been used for
research on electricity use, greenhouse gas emissions, energy consumption
and last but not least as proxy for national, regional and urban GDP. Especially
in the latter, it can be used as a predictor of often hard to observe economic or
national population data (Frick et al., 2018). Recorded by satellites from outer
space, data is stored in pixels of geographic image files.
On the one hand, the usage of NTL as an indicator for urban electricity con-
sumption is evident as artificial light is directly measurable by the use of energy.
Expanding this to a larger scale, NTL can be used as a proxy of overall energy
use in a region or country. On the other hand, however, NTL as an indicator for
economic activity requires a more thorough scan of what NTL effectively
measures and which implications can be derived from a fine-grained examina-
tion (Mellander et al., 2015). Many researches worked with NTL data during
the last three decades and concluded that it is a proxy for economic variables.
Weidmann and Schutte (2017) attribute this first, to the access to a power grid,
second, to a higher economic activity which guides to a higher level of wealth
and third, to a favoured treatment by the government of specific regions or so-
cietal groups such as street lamps. Also Elvidge et al. (1997) who use NTL data
to control for correlation between lit areas and population number present an
obvious correlation between illuminated areas and the economic output of the
respective area in their results. Additionally, Henderson Storeygard and Weil
(2012) observe changes in NTL data to predict income growth with the aim of
improving data on true income growth. Their work proposes the use of NTL
data as eligible weight in the combination with national accounts data. Such
findings with promising results are the reason for the adoption of NTL data in
39
social sciences which seek to approximate economic variables (Weidmann &
Schutte, 2017).
Despite its recent successful application, working with NTL data entails some
issues that need to be addressed. First, there is the problem of a spill-over of
light from one cell or pixel to the adjacent and hence a precise determination
of illuminated areas being next to a less illuminated area can be distorted. For
example, poor neighbourhoods can be “overglowed” by bordering rich neigh-
bourhoods. Second, the available data measures light on a scale from 1-63
(which goes from dark to very bright) and therefore might lead to top or bottom-
coding, i.e. among very low or very bright lights will not be further differentiated
since they would simply be pooled within the lowest (1) or highest (63) value.
Third, it has to be considered that especially in already developed regions, an
improvement of the agricultural sector does not necessarily entail an increase
in night lights but that its products can also be inputs for non-agricultural sectors
(Keola, Andersson, & Hall, 2015). Therefore, Henderson, Storeygard and Weil
(2012) as well as Keola et al. (2015) draw a difference between the agricultural
and non-agricultural sector in order to reduce such effect and avoid biased-
ness. In the present case though, this threat for bias is rather small since SEZs
mostly constitute of manufacturing (Bräutigam & Xiaoyang, 2011). Finally, NTL
data has its limits within the developed countries context as, with rising income
level, the NTL data loses its strong significance after having passed a certain
threshold of artificial light generation. Thus, it can mistakenly exhibit a decreas-
ing elasticity of demand (Keola et al., 2015; Mellander et al., 2015).
6.2 Data Description
As it has been widely applied as a proxy for economic activity and output in the
developing country context, the main data presented within this work is NTL
data (Elvidge et al., 1997; Frick et al., 2018; Henderson et al., 2012; Weidmann
& Schutte, 2017). As a matter of fact, there is a lack of data on economic per-
formance of SEZs in Nigeria, especially for those that are managed by Chinese
companies. NTL data will therefore be used as a proxy for the economic activity
in SEZs in Nigeria. Using NTL data as a proxy for such economic performance
40
holds the opportunity to make assumptions about SEZs’ economic activities
and further use it for econometric analyses also combining them with other
variables. Indeed, Henderson et al. (2012) classify NTL data as an optimal
weight to be combined with other national accounts data.
6.2.1 NTL Data Access
In order to approach the analyses, this section explains the set-up of the NTL
data. Therefore, time series of NTL image and data processing provided by the
National Oceanic and Atmospheric Administration’s (NOAA) National Geo-
physical Data Center were used. These files are recorded by the Defense Me-
teorological Satellite Program’s Operational Linescan System (DMSP-OLS)
and collected by the US Air Force Weather Agency (NOAA, 2019). The data
are available as annual rasters and have a resolution of 30 arc seconds which
corresponds to roughly 1 kilometre. Out of three files that are published on the
NOAA website for each year, the document with stable lights and the name
“F1?YYYY_v4b_stable_lights.avg_vis.tif” was chosen. Here, the “?” stands for
the satellite number and the “YYYY” represent the year of recording. It “con-
tains the lights from cities, towns, and other sites with persistent lighting, in-
cluding gas flares” (NOAA, 2019). Data are available on a yearly basis from
1992 until 20131 which is the chosen period to observed the SEZs in Nigeria
as the programme was initiated in 1992 and the Chinese partners entered the
market in 2006 and 2007 (Clarke & Iarossi, 2011). As stated above, the data
values range from 1-63. The downloaded images show the NTLs of the whole
world and numeric values are encoded in each pixel of the geographic image
files which have coordinate values (Bivand, Pebesma, Gómez-Rubio, &
Pebesma, 2008; NOAA, 2019). The extraction of these values is carried out in
four steps.
1 In some years however, the centre used a new satellite and hence there were two files available for downloading. In such a case, the new satellite’s pictures were downloaded.
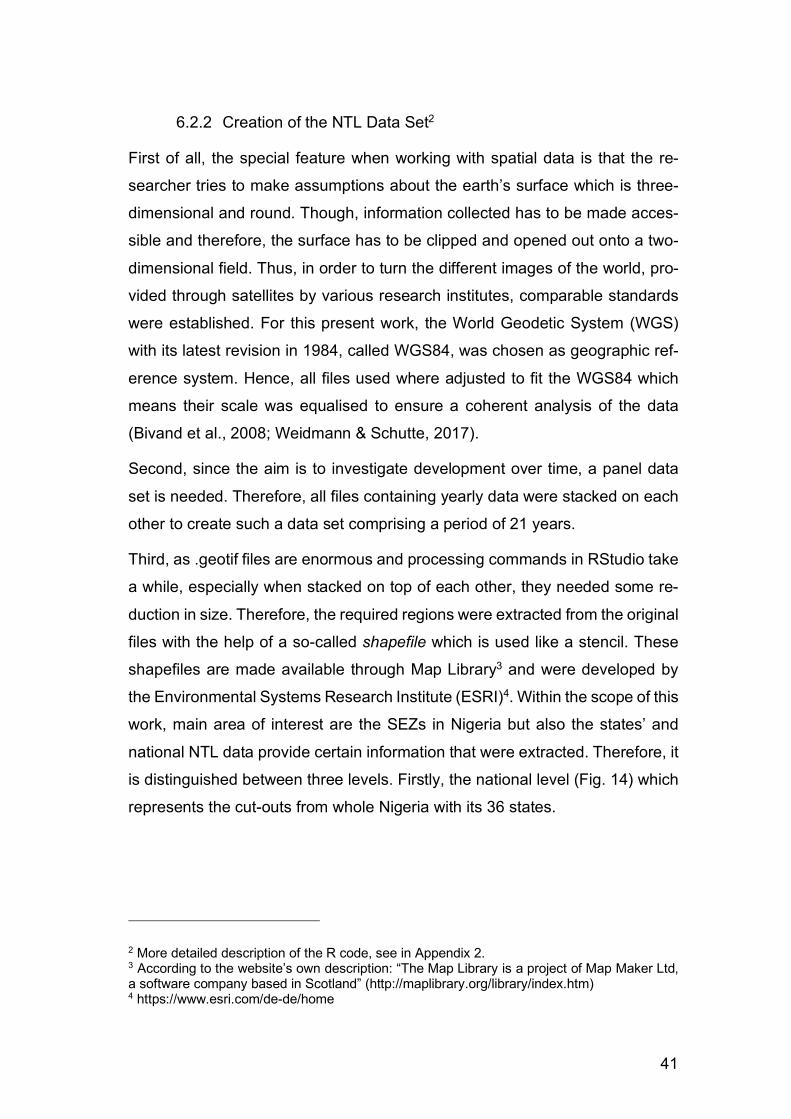
41
6.2.2 Creation of the NTL Data Set2
First of all, the special feature when working with spatial data is that the re-
searcher tries to make assumptions about the earth’s surface which is three-
dimensional and round. Though, information collected has to be made acces-
sible and therefore, the surface has to be clipped and opened out onto a two-
dimensional field. Thus, in order to turn the different images of the world, pro-
vided through satellites by various research institutes, comparable standards
were established. For this present work, the World Geodetic System (WGS)
with its latest revision in 1984, called WGS84, was chosen as geographic ref-
erence system. Hence, all files used where adjusted to fit the WGS84 which
means their scale was equalised to ensure a coherent analysis of the data
(Bivand et al., 2008; Weidmann & Schutte, 2017).
Second, since the aim is to investigate development over time, a panel data
set is needed. Therefore, all files containing yearly data were stacked on each
other to create such a data set comprising a period of 21 years.
Third, as .geotif files are enormous and processing commands in RStudio take
a while, especially when stacked on top of each other, they needed some re-
duction in size. Therefore, the required regions were extracted from the original
files with the help of a so-called shapefile which is used like a stencil. These
shapefiles are made available through Map Library3 and were developed by
the Environmental Systems Research Institute (ESRI)4. Within the scope of this
work, main area of interest are the SEZs in Nigeria but also the states’ and
national NTL data provide certain information that were extracted. Therefore, it
is distinguished between three levels. Firstly, the national level (Fig. 14) which
represents the cut-outs from whole Nigeria with its 36 states.
2 More detailed description of the R code, see in Appendix 2. 3 According to the website’s own description: “The Map Library is a project of Map Maker Ltd, a software company based in Scotland” (http://maplibrary.org/library/index.htm) 4 https://www.esri.com/de-de/home
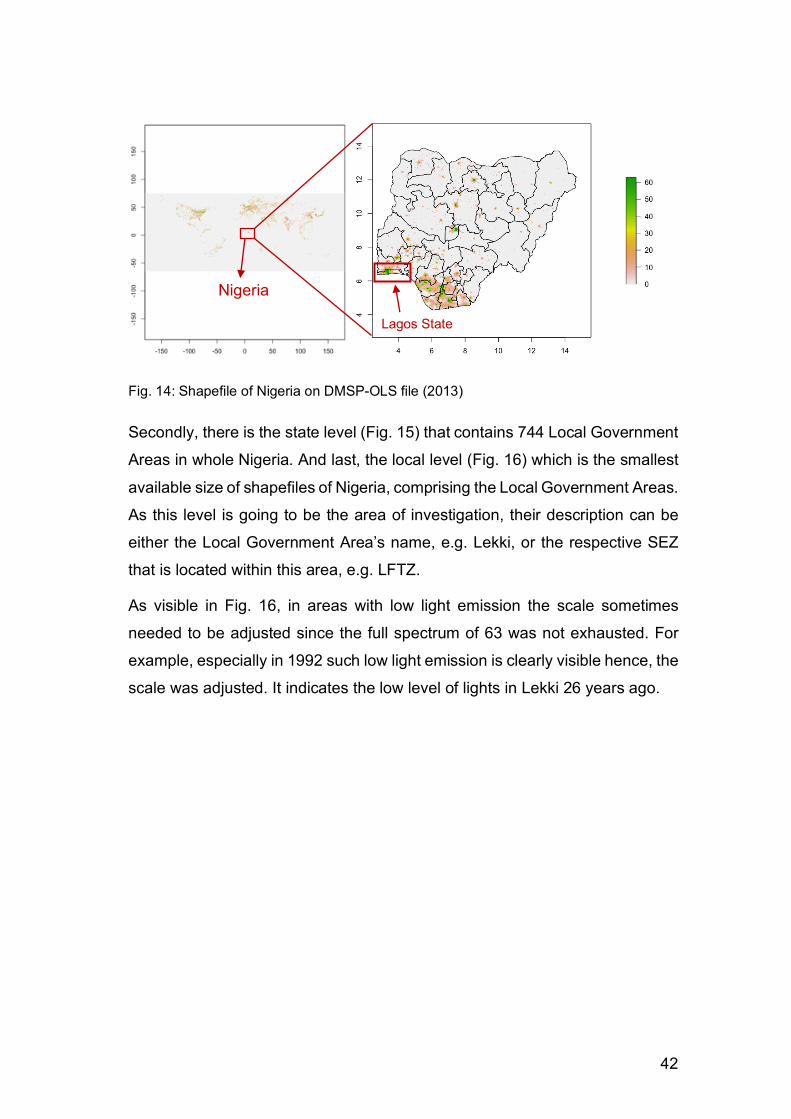
42
Fig. 14: Shapefile of Nigeria on DMSP-OLS file (2013)
Secondly, there is the state level (Fig. 15) that contains 744 Local Government
Areas in whole Nigeria. And last, the local level (Fig. 16) which is the smallest
available size of shapefiles of Nigeria, comprising the Local Government Areas.
As this level is going to be the area of investigation, their description can be
either the Local Government Area’s name, e.g. Lekki, or the respective SEZ
that is located within this area, e.g. LFTZ.
As visible in Fig. 16, in areas with low light emission the scale sometimes
needed to be adjusted since the full spectrum of 63 was not exhausted. For
example, especially in 1992 such low light emission is clearly visible hence, the
scale was adjusted. It indicates the low level of lights in Lekki 26 years ago.
Lagos State
Nigeria
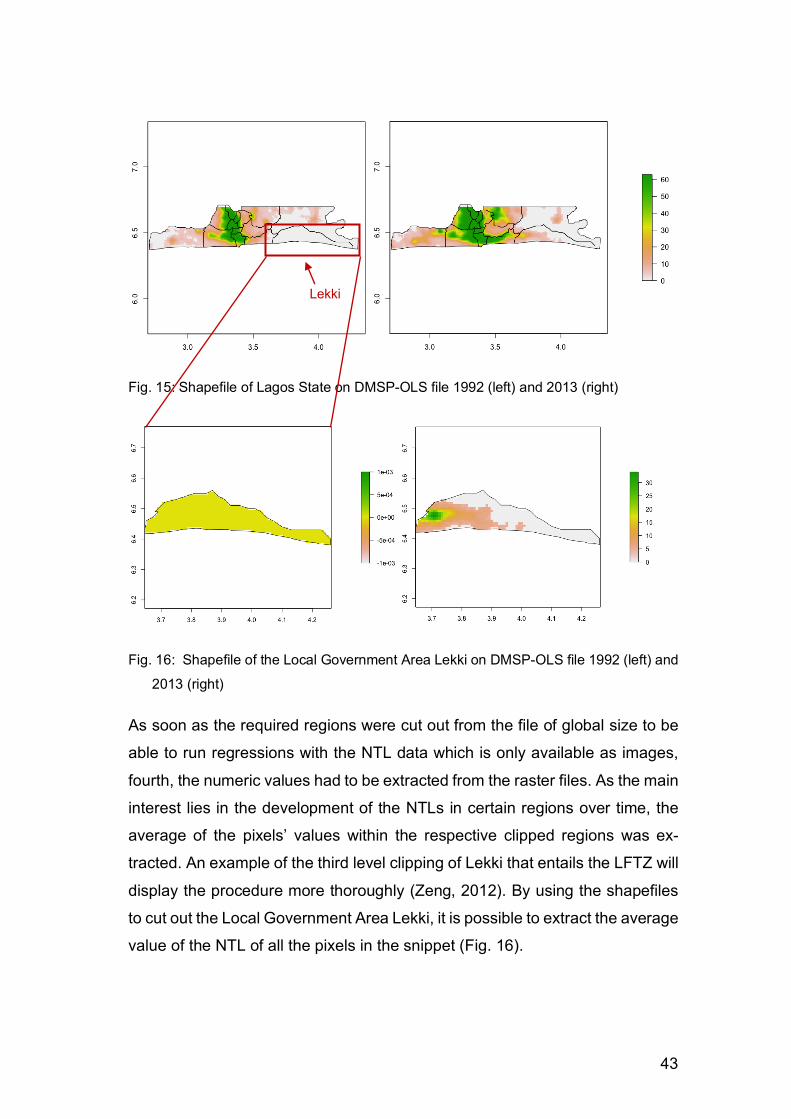
43
Fig. 15: Shapefile of Lagos State on DMSP-OLS file 1992 (left) and 2013 (right)
Fig. 16: Shapefile of the Local Government Area Lekki on DMSP-OLS file 1992 (left) and
2013 (right)
As soon as the required regions were cut out from the file of global size to be
able to run regressions with the NTL data which is only available as images,
fourth, the numeric values had to be extracted from the raster files. As the main
interest lies in the development of the NTLs in certain regions over time, the
average of the pixels’ values within the respective clipped regions was ex-
tracted. An example of the third level clipping of Lekki that entails the LFTZ will
display the procedure more thoroughly (Zeng, 2012). By using the shapefiles
to cut out the Local Government Area Lekki, it is possible to extract the average
value of the NTL of all the pixels in the snippet (Fig. 16).
Lekki
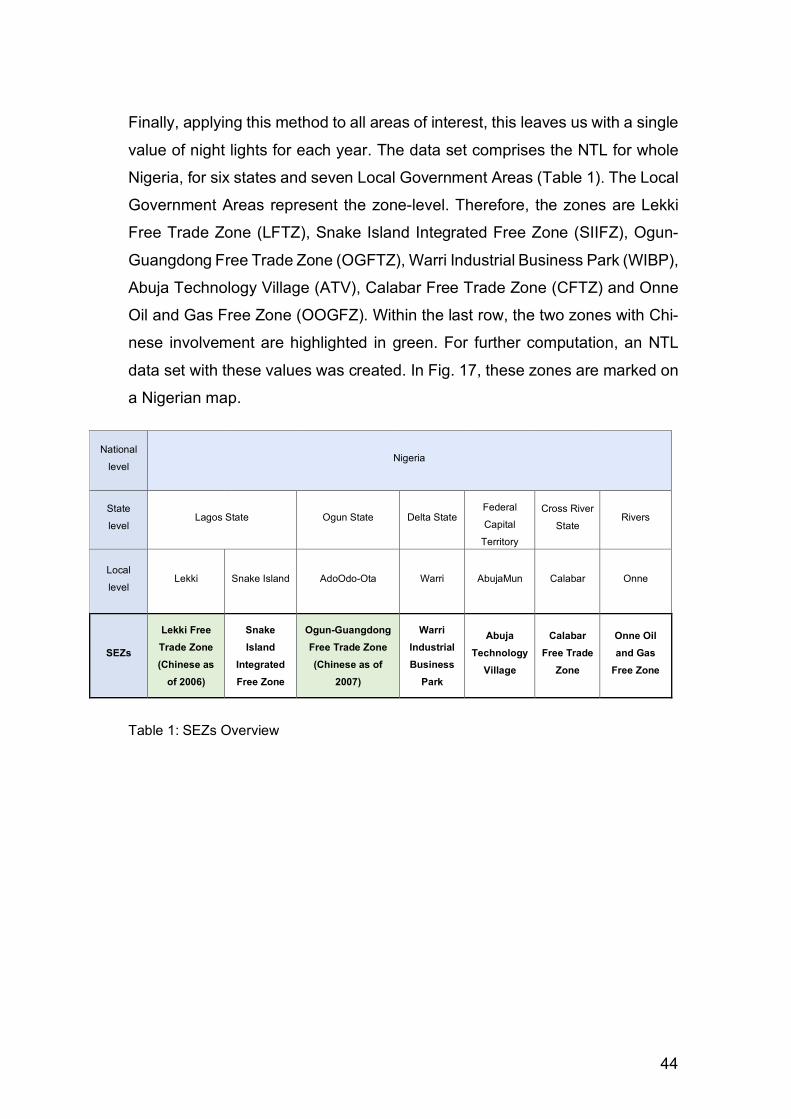
44
Finally, applying this method to all areas of interest, this leaves us with a single
value of night lights for each year. The data set comprises the NTL for whole
Nigeria, for six states and seven Local Government Areas (Table 1). The Local
Government Areas represent the zone-level. Therefore, the zones are Lekki
Free Trade Zone (LFTZ), Snake Island Integrated Free Zone (SIIFZ), Ogun-
Guangdong Free Trade Zone (OGFTZ), Warri Industrial Business Park (WIBP),
Abuja Technology Village (ATV), Calabar Free Trade Zone (CFTZ) and Onne
Oil and Gas Free Zone (OOGFZ). Within the last row, the two zones with Chi-
nese involvement are highlighted in green. For further computation, an NTL
data set with these values was created. In Fig. 17, these zones are marked on
a Nigerian map.
Table 1: SEZs Overview
SEZs
Local
level
State
level
National
level
Lekki Free
Trade Zone
(Chinese as
of 2006)
Lekki
Lagos State
Nigeria
Snake
Island
Integrated
Free Zone
Snake Island
Ogun-Guangdong
Free Trade Zone
(Chinese as of
2007)
AdoOdo-Ota
Ogun State
Warri
Industrial
Business
Park
Warri
Delta State
Abuja
Technology
Village
AbujaMun
Federal
Capital
Territory
Calabar
Free Trade
Zone
Calabar
Cross River
State
Onne Oil
and Gas
Free Zone
Onne
Rivers
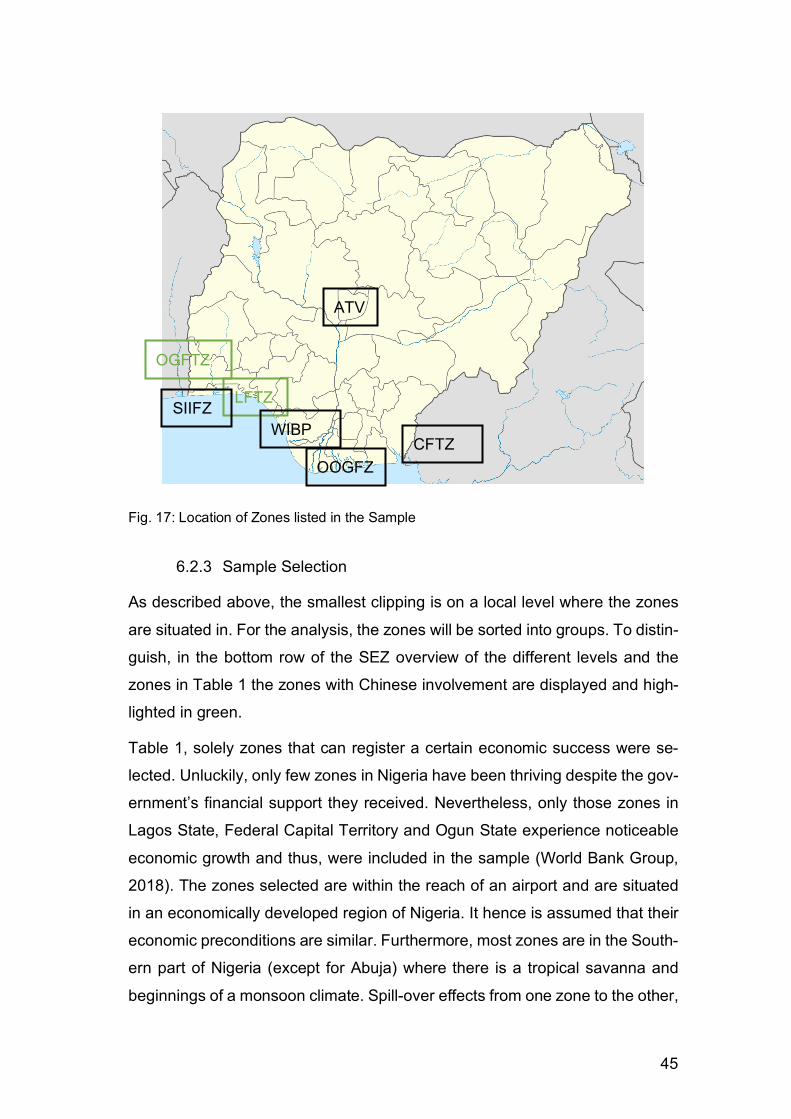
45
Fig. 17: Location of Zones listed in the Sample
6.2.3 Sample Selection
As described above, the smallest clipping is on a local level where the zones
are situated in. For the analysis, the zones will be sorted into groups. To distin-
guish, in the bottom row of the SEZ overview of the different levels and the
zones in Table 1 the zones with Chinese involvement are displayed and high-
lighted in green.
Table 1, solely zones that can register a certain economic success were se-
lected. Unluckily, only few zones in Nigeria have been thriving despite the gov-
ernment’s financial support they received. Nevertheless, only those zones in
Lagos State, Federal Capital Territory and Ogun State experience noticeable
economic growth and thus, were included in the sample (World Bank Group,
2018). The zones selected are within the reach of an airport and are situated
in an economically developed region of Nigeria. It hence is assumed that their
economic preconditions are similar. Furthermore, most zones are in the South-
ern part of Nigeria (except for Abuja) where there is a tropical savanna and
beginnings of a monsoon climate. Spill-over effects from one zone to the other,
OGFTZ
LFTZ
CFTZ OOGFZ
SIIFZ
ATV
WIBP
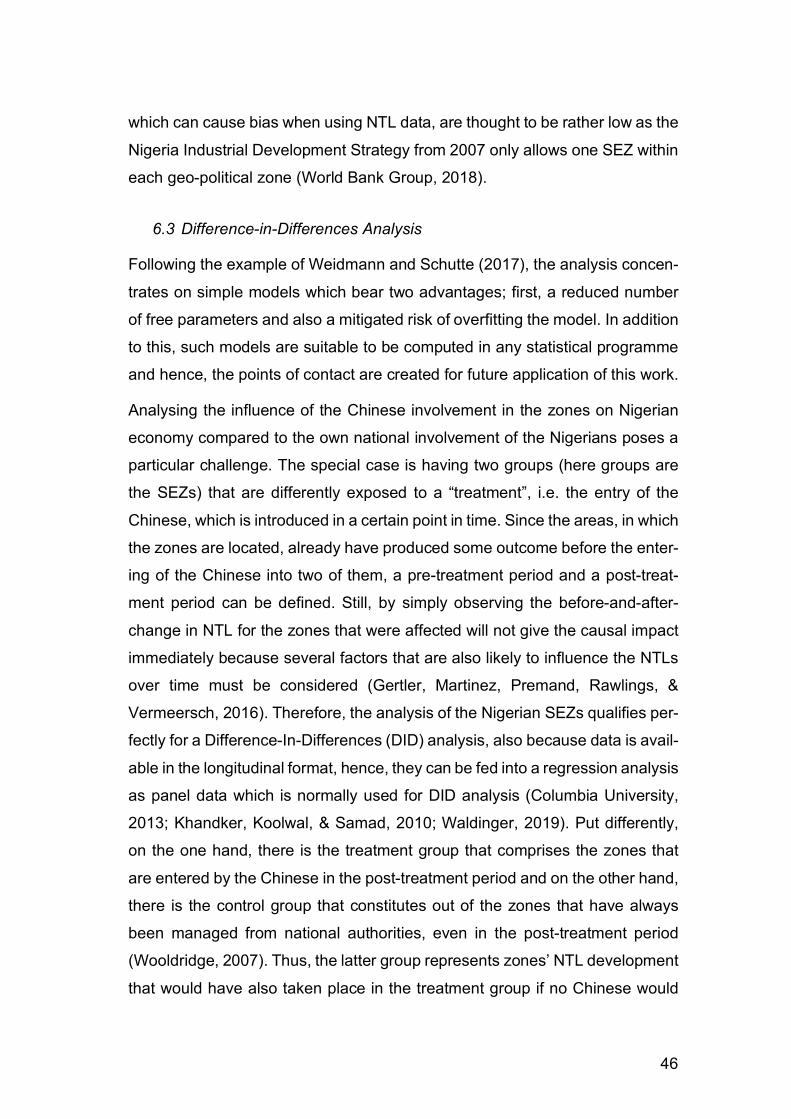
46
which can cause bias when using NTL data, are thought to be rather low as the
Nigeria Industrial Development Strategy from 2007 only allows one SEZ within
each geo-political zone (World Bank Group, 2018).
6.3 Difference-in-Differences Analysis
Following the example of Weidmann and Schutte (2017), the analysis concen-
trates on simple models which bear two advantages; first, a reduced number
of free parameters and also a mitigated risk of overfitting the model. In addition
to this, such models are suitable to be computed in any statistical programme
and hence, the points of contact are created for future application of this work.
Analysing the influence of the Chinese involvement in the zones on Nigerian
economy compared to the own national involvement of the Nigerians poses a
particular challenge. The special case is having two groups (here groups are
the SEZs) that are differently exposed to a “treatment”, i.e. the entry of the
Chinese, which is introduced in a certain point in time. Since the areas, in which
the zones are located, already have produced some outcome before the enter-
ing of the Chinese into two of them, a pre-treatment period and a post-treat-
ment period can be defined. Still, by simply observing the before-and-after-
change in NTL for the zones that were affected will not give the causal impact
immediately because several factors that are also likely to influence the NTLs
over time must be considered (Gertler, Martinez, Premand, Rawlings, &
Vermeersch, 2016). Therefore, the analysis of the Nigerian SEZs qualifies per-
fectly for a Difference-In-Differences (DID) analysis, also because data is avail-
able in the longitudinal format, hence, they can be fed into a regression analysis
as panel data which is normally used for DID analysis (Columbia University,
2013; Khandker, Koolwal, & Samad, 2010; Waldinger, 2019). Put differently,
on the one hand, there is the treatment group that comprises the zones that
are entered by the Chinese in the post-treatment period and on the other hand,
there is the control group that constitutes out of the zones that have always
been managed from national authorities, even in the post-treatment period
(Wooldridge, 2007). Thus, the latter group represents zones’ NTL development
that would have also taken place in the treatment group if no Chinese would
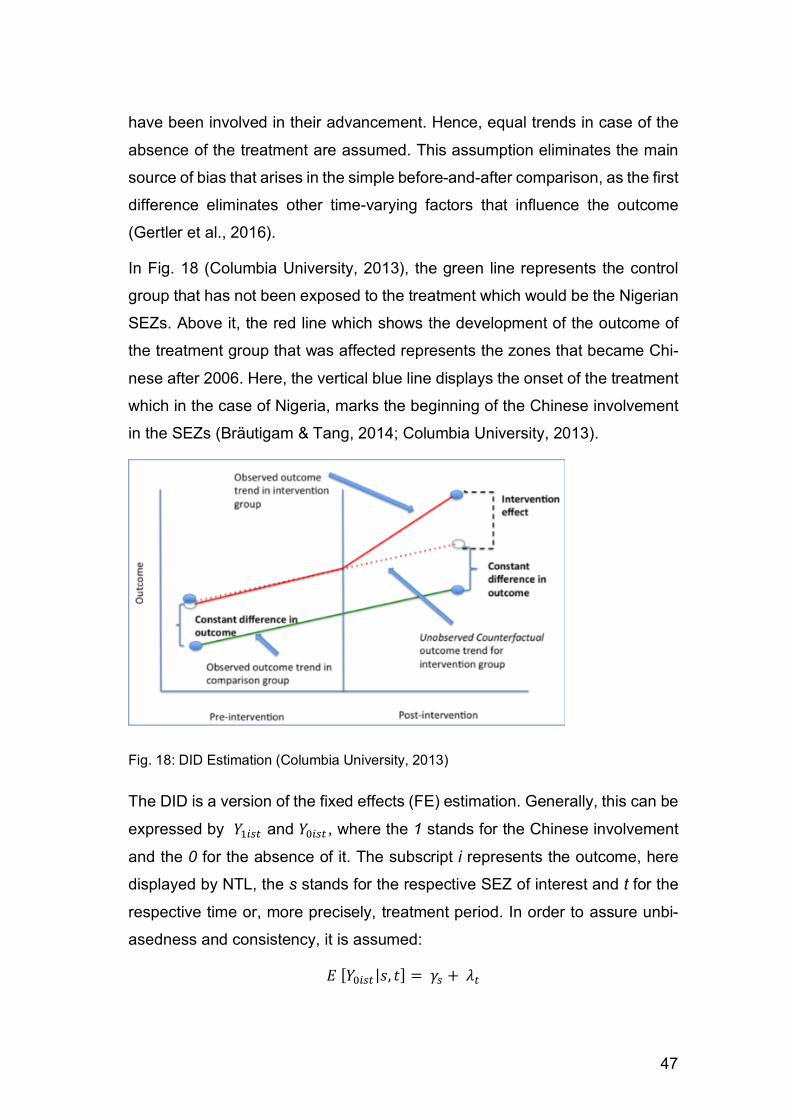
47
have been involved in their advancement. Hence, equal trends in case of the
absence of the treatment are assumed. This assumption eliminates the main
source of bias that arises in the simple before-and-after comparison, as the first
difference eliminates other time-varying factors that influence the outcome
(Gertler et al., 2016).
In Fig. 18 (Columbia University, 2013), the green line represents the control
group that has not been exposed to the treatment which would be the Nigerian
SEZs. Above it, the red line which shows the development of the outcome of
the treatment group that was affected represents the zones that became Chi-
nese after 2006. Here, the vertical blue line displays the onset of the treatment
which in the case of Nigeria, marks the beginning of the Chinese involvement
in the SEZs (Bräutigam & Tang, 2014; Columbia University, 2013).
Fig. 18: DID Estimation (Columbia University, 2013)
The DID is a version of the fixed effects (FE) estimation. Generally, this can be
expressed by 𝑌"#$% and 𝑌&#$% , where the 1 stands for the Chinese involvement
and the 0 for the absence of it. The subscript i represents the outcome, here
displayed by NTL, the s stands for the respective SEZ of interest and t for the
respective time or, more precisely, treatment period. In order to assure unbi-
asedness and consistency, it is assumed:
𝐸[𝑌&#$%|𝑠, 𝑡] = 𝛾$ +𝜆%
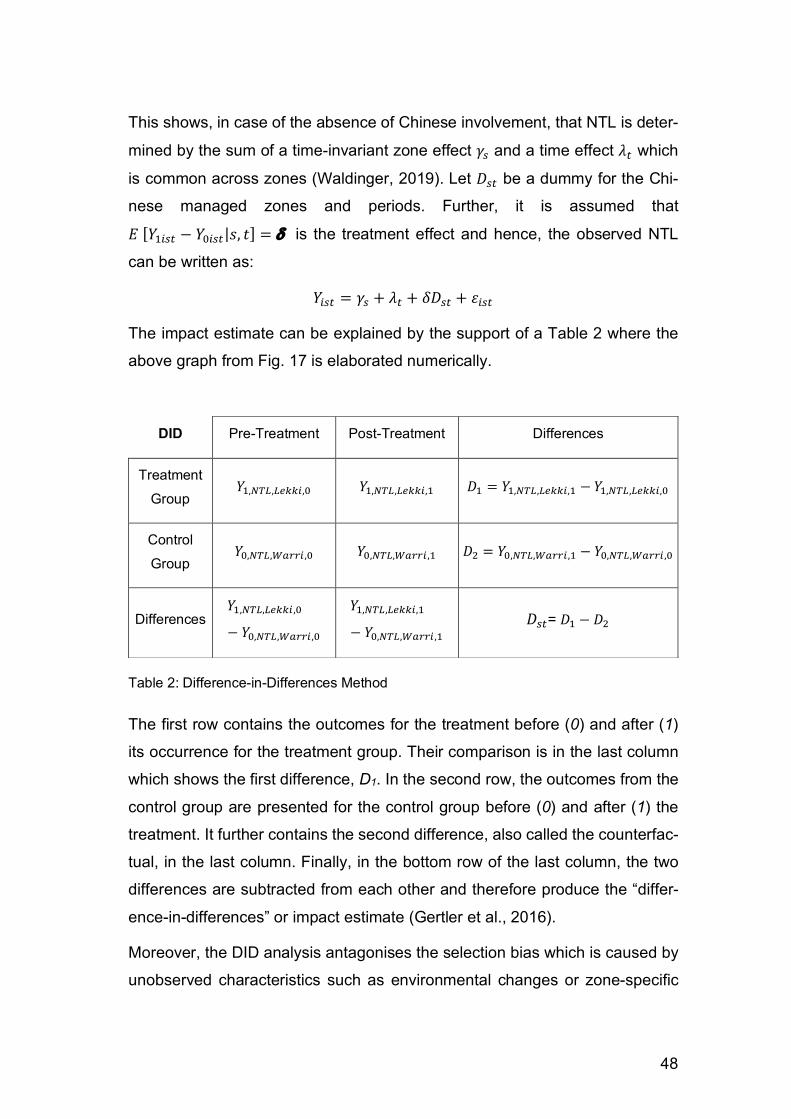
48
This shows, in case of the absence of Chinese involvement, that NTL is deter-
mined by the sum of a time-invariant zone effect 𝛾$ and a time effect 𝜆% which
is common across zones (Waldinger, 2019). Let 𝐷$% be a dummy for the Chi-
nese managed zones and periods. Further, it is assumed that
𝐸[𝑌"#$% − 𝑌&#$%|𝑠, 𝑡] = d is the treatment effect and hence, the observed NTL
can be written as:
𝑌#$% = 𝛾$ + 𝜆% + 𝛿𝐷$% + 𝜀#$%
The impact estimate can be explained by the support of a Table 2 where the
above graph from Fig. 17 is elaborated numerically.
Table 2: Difference-in-Differences Method
The first row contains the outcomes for the treatment before (0) and after (1)
its occurrence for the treatment group. Their comparison is in the last column
which shows the first difference, D1. In the second row, the outcomes from the
control group are presented for the control group before (0) and after (1) the
treatment. It further contains the second difference, also called the counterfac-
tual, in the last column. Finally, in the bottom row of the last column, the two
differences are subtracted from each other and therefore produce the “differ-
ence-in-differences” or impact estimate (Gertler et al., 2016).
Moreover, the DID analysis antagonises the selection bias which is caused by
unobserved characteristics such as environmental changes or zone-specific
DID Pre-Treatment Post-Treatment Differences
Treatment Group
𝑌",789,9:;;#,& 𝑌",789,9:;;#," 𝐷" = 𝑌",789,9:;;#," − 𝑌",789,9:;;#,&
Control Group
𝑌&,789,<=>>#,& 𝑌&,789,<=>>#," 𝐷? = 𝑌&,789,<=>>#," − 𝑌&,789,<=>>#,&
Differences 𝑌",789,9:;;#,&− 𝑌&,789,<=>>#,&
𝑌",789,9:;;#,"− 𝑌&,789,<=>>#,"
𝐷$%= 𝐷" − 𝐷?
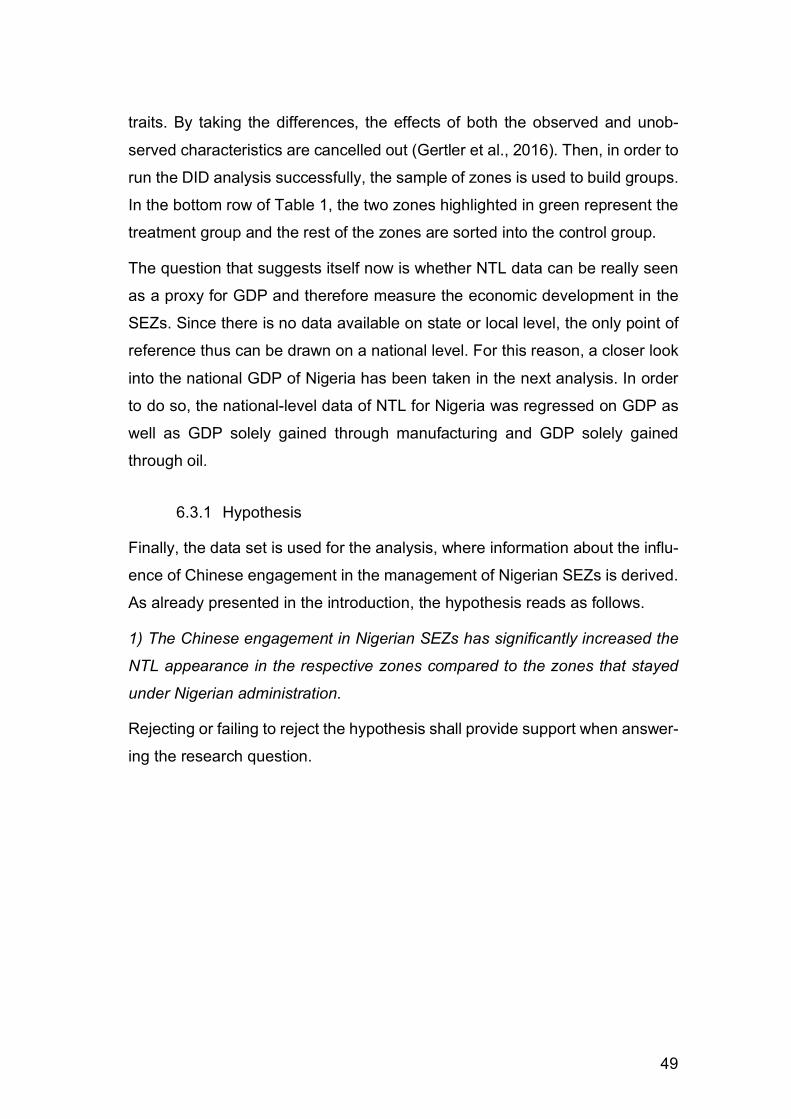
49
traits. By taking the differences, the effects of both the observed and unob-
served characteristics are cancelled out (Gertler et al., 2016). Then, in order to
run the DID analysis successfully, the sample of zones is used to build groups.
In the bottom row of Table 1, the two zones highlighted in green represent the
treatment group and the rest of the zones are sorted into the control group.
The question that suggests itself now is whether NTL data can be really seen
as a proxy for GDP and therefore measure the economic development in the
SEZs. Since there is no data available on state or local level, the only point of
reference thus can be drawn on a national level. For this reason, a closer look
into the national GDP of Nigeria has been taken in the next analysis. In order
to do so, the national-level data of NTL for Nigeria was regressed on GDP as
well as GDP solely gained through manufacturing and GDP solely gained
through oil.
6.3.1 Hypothesis
Finally, the data set is used for the analysis, where information about the influ-
ence of Chinese engagement in the management of Nigerian SEZs is derived.
As already presented in the introduction, the hypothesis reads as follows.
1) The Chinese engagement in Nigerian SEZs has significantly increased the
NTL appearance in the respective zones compared to the zones that stayed
under Nigerian administration.
Rejecting or failing to reject the hypothesis shall provide support when answer-
ing the research question.
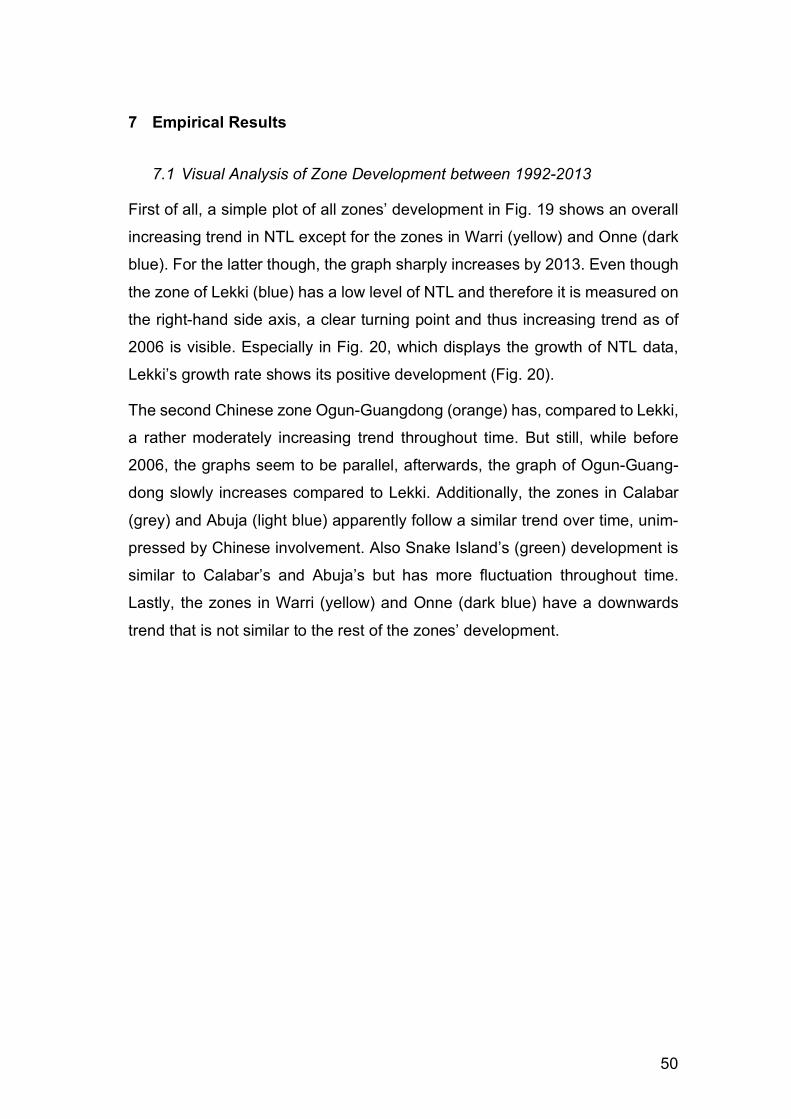
50
7 Empirical Results
7.1 Visual Analysis of Zone Development between 1992-2013
First of all, a simple plot of all zones’ development in Fig. 19 shows an overall
increasing trend in NTL except for the zones in Warri (yellow) and Onne (dark
blue). For the latter though, the graph sharply increases by 2013. Even though
the zone of Lekki (blue) has a low level of NTL and therefore it is measured on
the right-hand side axis, a clear turning point and thus increasing trend as of
2006 is visible. Especially in Fig. 20, which displays the growth of NTL data,
Lekki’s growth rate shows its positive development (Fig. 20).
The second Chinese zone Ogun-Guangdong (orange) has, compared to Lekki,
a rather moderately increasing trend throughout time. But still, while before
2006, the graphs seem to be parallel, afterwards, the graph of Ogun-Guang-
dong slowly increases compared to Lekki. Additionally, the zones in Calabar
(grey) and Abuja (light blue) apparently follow a similar trend over time, unim-
pressed by Chinese involvement. Also Snake Island’s (green) development is
similar to Calabar’s and Abuja’s but has more fluctuation throughout time.
Lastly, the zones in Warri (yellow) and Onne (dark blue) have a downwards
trend that is not similar to the rest of the zones’ development.
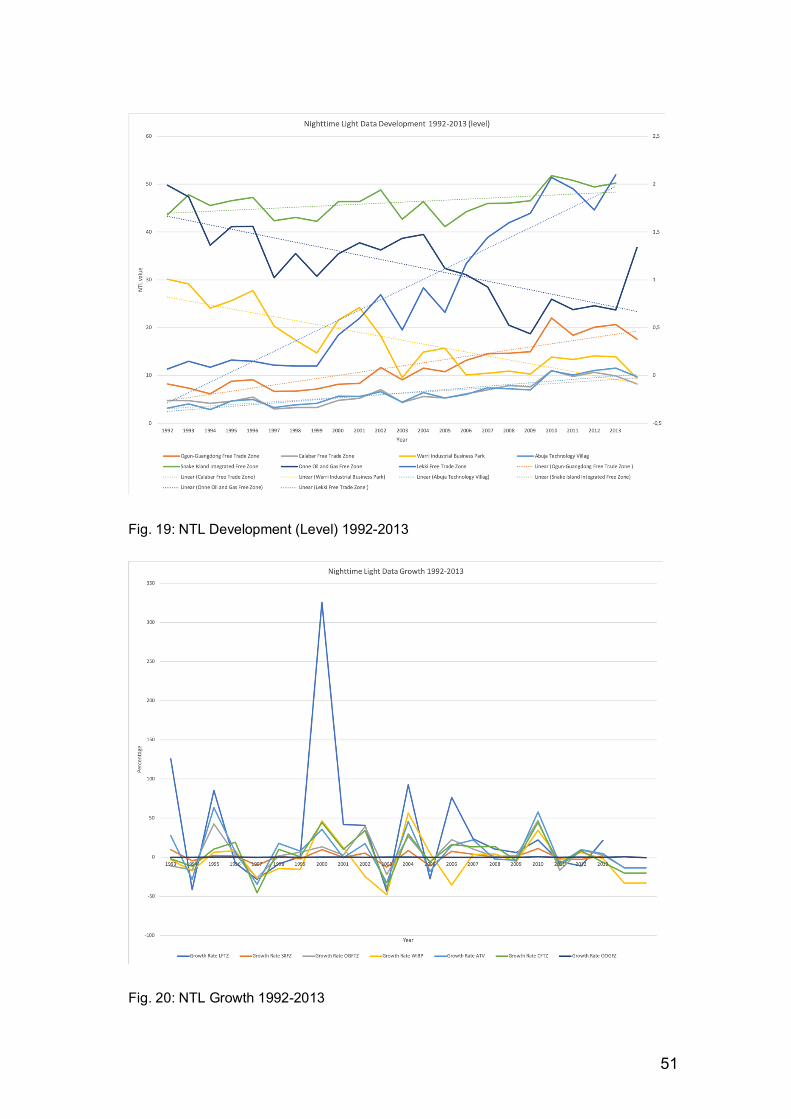
51
Fig. 19: NTL Development (Level) 1992-2013
Fig. 20: NTL Growth 1992-2013
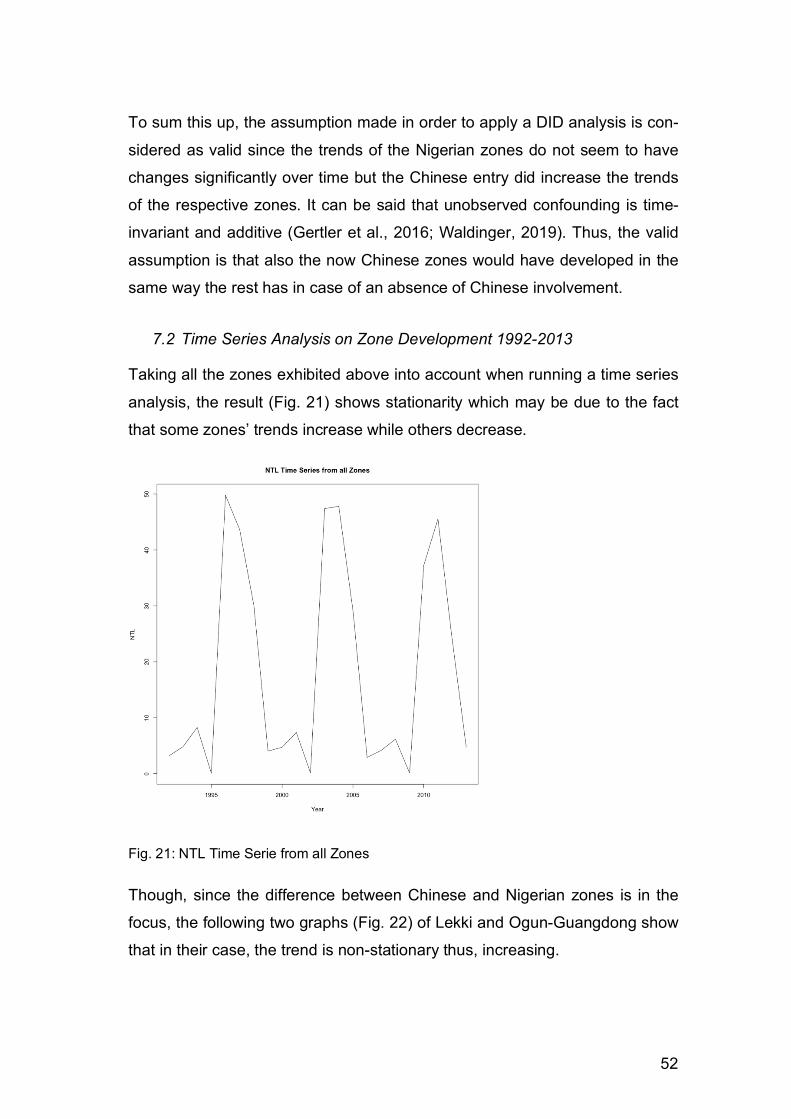
52
To sum this up, the assumption made in order to apply a DID analysis is con-
sidered as valid since the trends of the Nigerian zones do not seem to have
changes significantly over time but the Chinese entry did increase the trends
of the respective zones. It can be said that unobserved confounding is time-
invariant and additive (Gertler et al., 2016; Waldinger, 2019). Thus, the valid
assumption is that also the now Chinese zones would have developed in the
same way the rest has in case of an absence of Chinese involvement.
7.2 Time Series Analysis on Zone Development 1992-2013
Taking all the zones exhibited above into account when running a time series
analysis, the result (Fig. 21) shows stationarity which may be due to the fact
that some zones’ trends increase while others decrease.
Fig. 21: NTL Time Serie from all Zones
Though, since the difference between Chinese and Nigerian zones is in the
focus, the following two graphs (Fig. 22) of Lekki and Ogun-Guangdong show
that in their case, the trend is non-stationary thus, increasing.
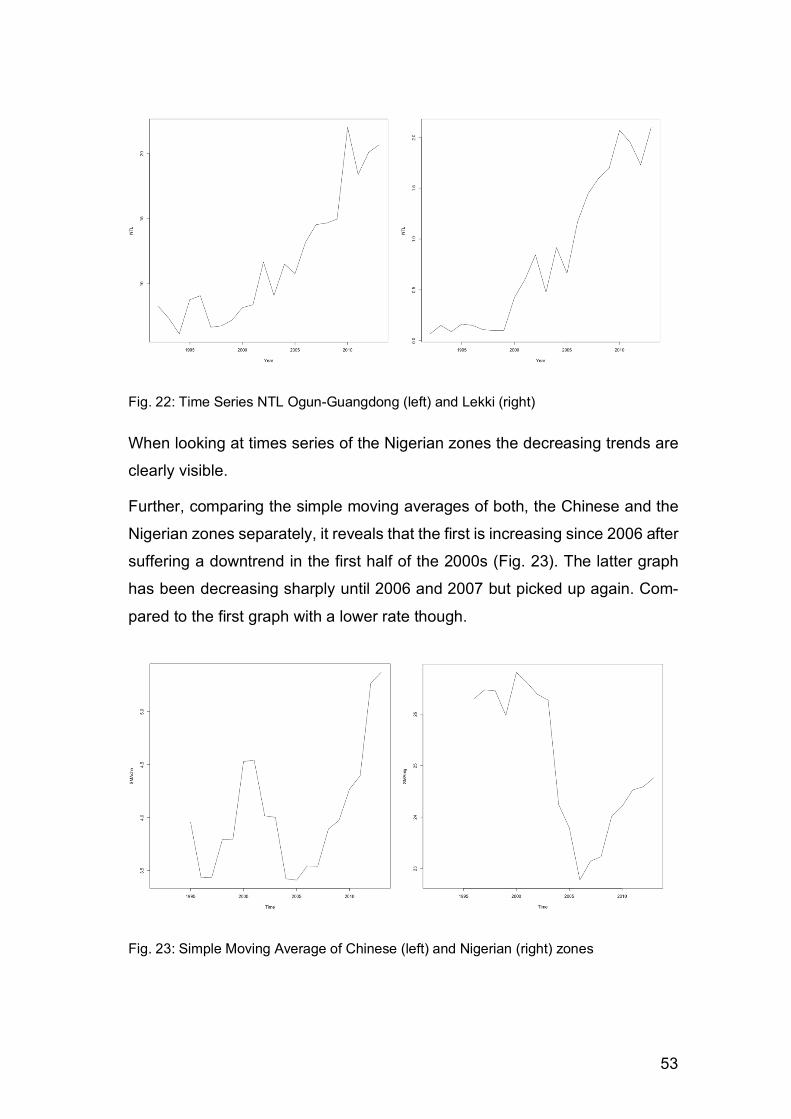
53
Fig. 22: Time Series NTL Ogun-Guangdong (left) and Lekki (right)
When looking at times series of the Nigerian zones the decreasing trends are
clearly visible.
Further, comparing the simple moving averages of both, the Chinese and the
Nigerian zones separately, it reveals that the first is increasing since 2006 after
suffering a downtrend in the first half of the 2000s (Fig. 23). The latter graph
has been decreasing sharply until 2006 and 2007 but picked up again. Com-
pared to the first graph with a lower rate though.
Fig. 23: Simple Moving Average of Chinese (left) and Nigerian (right) zones
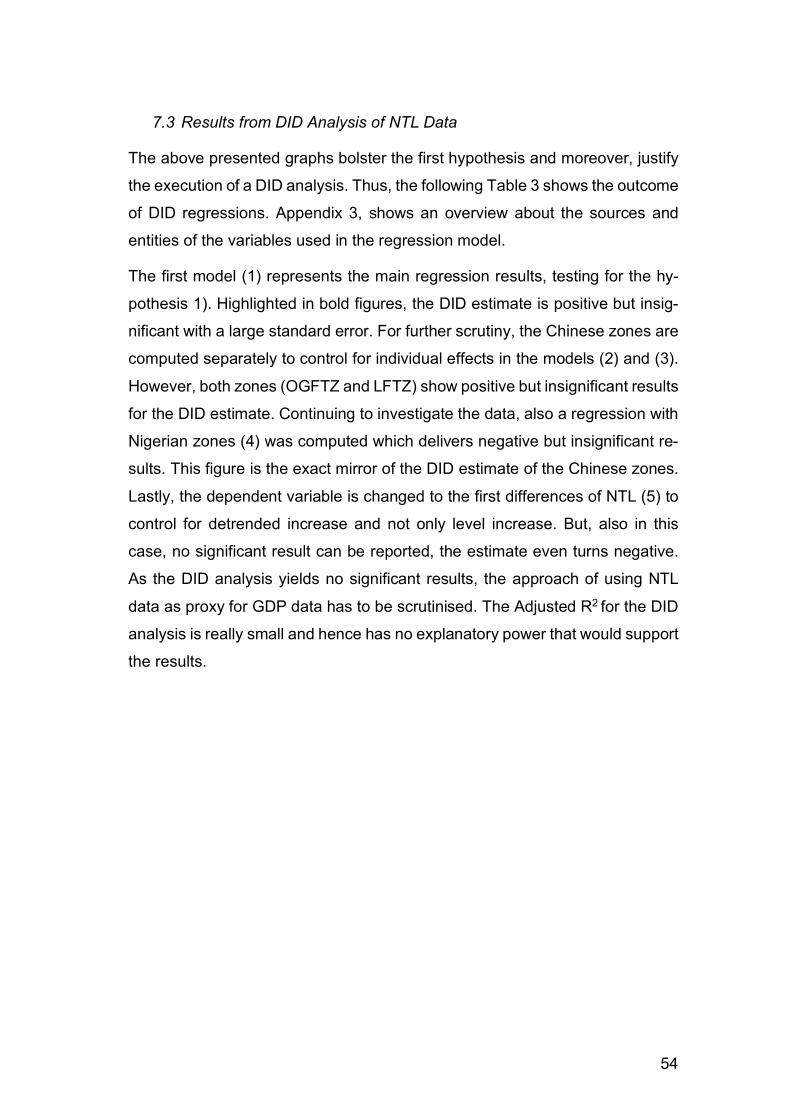
54
7.3 Results from DID Analysis of NTL Data
The above presented graphs bolster the first hypothesis and moreover, justify
the execution of a DID analysis. Thus, the following Table 3 shows the outcome
of DID regressions. Appendix 3, shows an overview about the sources and
entities of the variables used in the regression model.
The first model (1) represents the main regression results, testing for the hy-
pothesis 1). Highlighted in bold figures, the DID estimate is positive but insig-
nificant with a large standard error. For further scrutiny, the Chinese zones are
computed separately to control for individual effects in the models (2) and (3).
However, both zones (OGFTZ and LFTZ) show positive but insignificant results
for the DID estimate. Continuing to investigate the data, also a regression with
Nigerian zones (4) was computed which delivers negative but insignificant re-
sults. This figure is the exact mirror of the DID estimate of the Chinese zones.
Lastly, the dependent variable is changed to the first differences of NTL (5) to
control for detrended increase and not only level increase. But, also in this
case, no significant result can be reported, the estimate even turns negative.
As the DID analysis yields no significant results, the approach of using NTL
data as proxy for GDP data has to be scrutinised. The Adjusted R2 for the DID
analysis is really small and hence has no explanatory power that would support
the results.
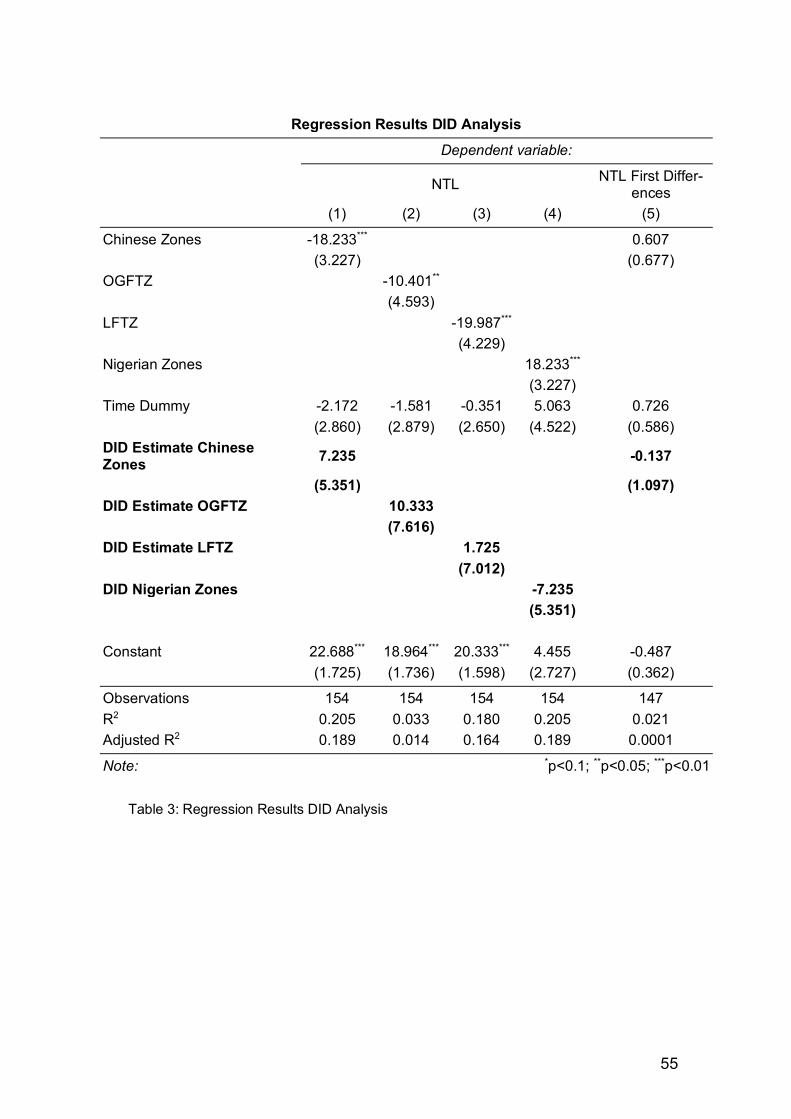
55
Regression Results DID Analysis Dependent variable:
NTL NTL First Differ-ences
(1) (2) (3) (4) (5)
Chinese Zones -18.233*** 0.607 (3.227) (0.677)
OGFTZ -10.401** (4.593)
LFTZ -19.987*** (4.229)
Nigerian Zones 18.233*** (3.227)
Time Dummy -2.172 -1.581 -0.351 5.063 0.726 (2.860) (2.879) (2.650) (4.522) (0.586)
DID Estimate Chinese Zones 7.235 -0.137
(5.351) (1.097) DID Estimate OGFTZ 10.333
(7.616) DID Estimate LFTZ 1.725
(7.012) DID Nigerian Zones -7.235
(5.351)
Constant 22.688*** 18.964*** 20.333*** 4.455 -0.487 (1.725) (1.736) (1.598) (2.727) (0.362)
Observations 154 154 154 154 147 R2 0.205 0.033 0.180 0.205 0.021 Adjusted R2 0.189 0.014 0.164 0.189 0.0001
Note: *p<0.1; **p<0.05; ***p<0.01
Table 3: Regression Results DID Analysis
56
7.4 Results from OLS Analysis of GDP and NTL Data
Thus, the next step is to run a robustness analysis where also GDP data is
considered. As applying such an iterative approach, a new hypothesis for the
analysis was formulated and reads as follows:
2) On a national level, NTL data of Nigeria can be used as proxy for GDP, GDP
gained through manufacturing or oil.
As the data set is a panel, the analysis is a times series analysis and hence,
the GDP data needs to be detrended to exclude serial correlation. Therefore,
the first differences were taken for each variable used in the OLS regression
above. Here, manufacturing GDP is of particular interest since the Nigerian
industry’s main sector is defined by manufacturing next to oil and gas and con-
struction (Fig. 1, p. 5). Moreover, the two Chinese SEZs primarily concentrate
on manufacturing (Campbell, 2016; Marwah, 2015).
As comparison, the regression results from the level OLS is in the Appendix 4.
As a matter of fact, the results changed but not to a surprisingly large extent.
Therefore, only the OLS with the first differences is showcased here.
In the first model (1), the dependent variable is manufacturing GDP which was
regressed on GDP and GDP generated through oil. Additionally, the variable
NTL data for whole Nigeria was added to the regression to test whether the
manufacturing GDP is also correlated with the NTL emission of Nigeria. The
results reveal that the coefficient of NTL is negative but not significant. As ex-
pected, the GDP variable’s effect is highly significant on a 1%-level. Hence, for
a one million US dollar increase in GDP there is, on average, a USD 105,000
increase in manufacturing GDP. The effect of oil GDP on manufacturing GDP
is negative and significant on a 5%-level. Thus, a surge of one million naira,
the Nigerian currency, let manufacturing GDP, on average, decline by USD
1,000.
Next to manufacturing GDP also oil GDP was regressed on the previous inde-
pendent variables, model (2). First of all, the effects in this model appear to be
larger compared to the ones in the other models. This is due to the fact that oil
GDP is not measured in USD, as for the other variables, but in Nigerian naira
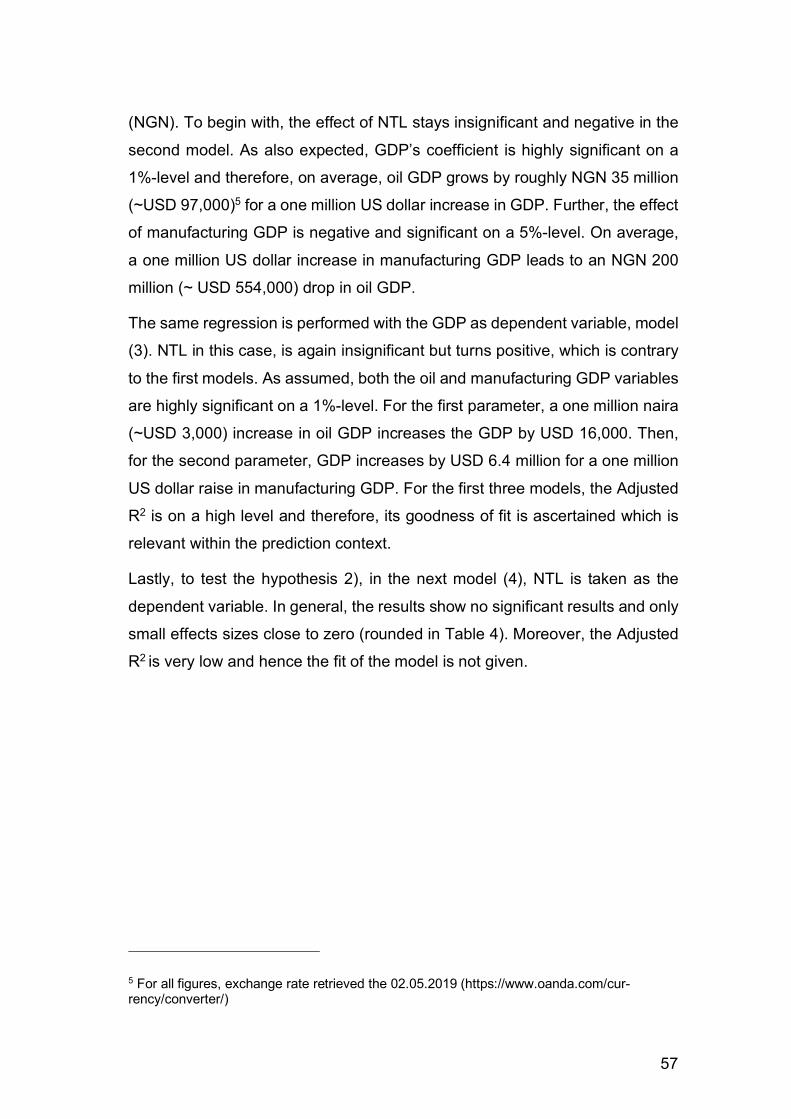
57
(NGN). To begin with, the effect of NTL stays insignificant and negative in the
second model. As also expected, GDP’s coefficient is highly significant on a
1%-level and therefore, on average, oil GDP grows by roughly NGN 35 million
(~USD 97,000)5 for a one million US dollar increase in GDP. Further, the effect
of manufacturing GDP is negative and significant on a 5%-level. On average,
a one million US dollar increase in manufacturing GDP leads to an NGN 200
million (~ USD 554,000) drop in oil GDP.
The same regression is performed with the GDP as dependent variable, model
(3). NTL in this case, is again insignificant but turns positive, which is contrary
to the first models. As assumed, both the oil and manufacturing GDP variables
are highly significant on a 1%-level. For the first parameter, a one million naira
(~USD 3,000) increase in oil GDP increases the GDP by USD 16,000. Then,
for the second parameter, GDP increases by USD 6.4 million for a one million
US dollar raise in manufacturing GDP. For the first three models, the Adjusted
R2 is on a high level and therefore, its goodness of fit is ascertained which is
relevant within the prediction context.
Lastly, to test the hypothesis 2), in the next model (4), NTL is taken as the
dependent variable. In general, the results show no significant results and only
small effects sizes close to zero (rounded in Table 4). Moreover, the Adjusted
R2 is very low and hence the fit of the model is not given.
5 For all figures, exchange rate retrieved the 02.05.2019 (https://www.oanda.com/cur-rency/converter/)
58
Regression Results OLS First Differences
Dependent variable: Manufacturing GDP Oil GDP GDP NTL (1) (2) (3) (4)
NTL whole Nigeria -4,501.204 -60,168.300 35,246.660 (2,772.554) (1,096,481.000) (21,610.570)
GDP 0.105*** 35.167*** 0.00000 (0.018) (7.630) (0.00000)
Oil GDP -0.001** 0.016*** -0.000 (0.001) (0.003) (0.00000)
Manufacturing GDP -200.467** 6.363*** -0.00003 (74.851) (1.094) (0.00002)
Constant 208.866 76,527.080 2,889.502 -0.033 (532.401) (195,937.200) (4,111.821) (0.043)
Observations 21 21 21 21 R2 0.676 0.640 0.821 0.291 Adjusted R2 0.619 0.576 0.790 0.166
Note: *p<0.1; **p<0.05; ***p<0.01
Table 4: OLS Results for National Accounts Data, using first Differences
As a summary, the most important results from chapter 7.3 and 7.4 are pre-
sented shortly. First, the DID estimate is positive but insignificant. Further scru-
tinizing the effects did not bear any contradictory results. Second, the OLS of
the first differences shows that NTL is not correlated with GDP. Third, oil GDP
and manufacturing GDP are negatively correlated whereas unsurprisingly they
are both positively correlated with overall GDP.
59
8 Analysis
The overall motivation of the thesis is to discuss whether the Chinese approach
using SEZs as catalysator for the whole economy could also work out in Nige-
ria. The Chinese zone Shenzhen counts as a prime example for a successfully
established SEZ which made it to the mature state with continuously increasing
growth rates. The question is whether the Chinese SEZ concept for success
can be exported and prosper on Nigerian grounds as it did in their own econ-
omy. Such being the case, the goal of the thesis is to investigate whether the
Chinese involvement influenced economic output in the Nigerian zones meas-
ured by NTL data.
8.1 Four Issue Categories of SEZs in Nigeria
To properly answer this question, the topics and issues are sorted into four
categories which will serve the analysis as guideline and framework. These
categories are concerned with economical, structural, political and methodo-
logical issues. The aim is to assess these issues in terms of SEZs. Within the
four categories, the analysis aims to discuss the general challenges that the
Nigerian economy, with its SEZ, has to tackle in comparison to the Chinese
economy.
To begin with, the impact of the Chinese engagement in Nigerian SEZs was
indeed expected to significantly increase the NTL emission of the zones com-
pared to those under Nigerian administration. However, the results of the DID
analysis show no significant results even though the estimate is positive. This
means that the entry of the Chinese into the Nigerian SEZs had no relevant
influence on the zones’ light emission for the period between 1992 and 2013.
As the NTL is assumed to be a proxy for economic output, namely GDP, it can
be thereby assumed that the Chinese set up of zones in Nigeria did not
60
significantly increase the economic output’s development compared to the one
in Nigerian zones. Thus, the hypothesis 1)6 has to be rejected.
Despite the fact that in the DID analysis, no significant results can be shown,
several implications for a successful establishment of SEZs in Nigeria can be
derived. The results from the robustness analysis, which finds out that in this
case, NTL data cannot be used as a proxy for GDP in Nigeria, is used to bolster
the arguments.
8.1.1 Economical Issues
The dependency on oil is in general a major problem in Nigeria. It produces
sectoral inequality and increases the importance of the oil sector. This is also
reflected by the fact that the variable of oil GDP is negatively correlated with
manufacturing GDP. Since the SEZs in Nigeria are mainly concentrated on
manufacturing, both Chinese and Nigerian, they are facing a difficult initial po-
sition. Considering the oil dependency, a possible explanation could be that,
as overall GDP mainly is generated by the oil sector, most governmental sup-
port and financial means flow into this sector. Conversely, the development of
the manufacturing sector is disregarded by the state authorities and falls be-
hind. Zubikova (2018) states that such a phenomenon is typical for a state suf-
fering from the resource curse. Being the driving economic power, the oil sector
gets the most attention and financial support from the national as well as inter-
national officials and the remaining sectors are neglected. Consequently, their
economic output suffers from the increasing investment in the oil sector and
the economy is vulnerable to changes in commodity prices. This vulnerability
also spreads to the SEZs and hampers their development. Ultimately, as the
domestic economy is not able to absorb the shocks that occurred in the last
decades the whole state is hit. Therefore, the Nigerian economy needs to di-
versify its sectors as well as the sub-sectors of the agricultural and the manu-
facturing sectors and guide them to technological innovation in order to
6 1) The Chinese engagement in Nigerian SEZs has significantly increased the NTL appear-ance in the respective zones compared to the zones that stayed under Nigerian administration.
61
sustainably build them up. By doing so, the currently decreasing domestic ag-
riculture production and manufacturing could be supported and import of goods
such as textiles, food and machinery should be mitigated. Some researchers
(Export Entreprises SA, 2019)state that they already observed an oil-counter
shock movement where foreign investment is predominantly fed into non-oil
sectors. In order to achieve this, the collaboration with China had been consol-
idated aiming at a technology and knowledge transfer as well as acquisition of
skills through research and development.
Likewise, in the SEZ context, establishing a strong manufacturing sector and
the role of China being the technology sponsor are assumed to apply. Espe-
cially the anticipated improved technological innovation was determined to spur
the development of the zones. On the one hand, the Chinese fulfilled this aspi-
ration by providing local training performed either within the zones or in China,
guided by their own experts. Such education means to prepare the local em-
ployees for taking over the senior management positions as the Chinese’ em-
ployment within the zones in Nigeria is not planned to be in office on a long-
term basis. It though has to be acknowledged that the Chinese foreign engage-
ment is rather acting as an enabler than an occupant that wants to create Chi-
nese enclaves. However, on the other hand, even if the win-win relationship
between Nigeria and China seems to be mutually beneficial, taking a closer
look into economic organisation, disadvantages within this connection can be
detected. For instance, the constantly negative trade deficit between Nigeria
and China reflects the disbalance. One crucial reason for that is the export of
natural resources from Nigeria to China which the Chinese feed into their own
manufacturing sector to later reimport cheap products to Nigeria that meet the
needs of many average Nigerian homes which tend to be rather poor. This is
why the Nigerian textile industry for example spends vast resources on imports
which would be better invested in their own development as there is subse-
quently a decline of textile plants in Nigeria. Such a unilaterally dependent re-
lationship with China prevents the Nigerian economy from building up their own
manufacturing sector and gaining economic resilience. Hence, flooding the Ni-
gerian market with cheap products undermines the Nigerian commercial
62
operations which lets the labour-intensive sector suffer. Finally, this also leads
to an increase in the unemployment rate.
Connecting this argument with the establishment of Chinese SEZs in Nigeria,
it can be expected that their manufacturing focus follows China’s example.
However, no difference between Chinese and Nigerian zones could be dis-
closed. Therefore, the other categories will present further issues that have
relevant influence on the economic development of the zones.
Besides the national economic issues, the geo-political and international eco-
nomic situation for the SEZs and the Nigerian economy have to be moved to
the front. Compared to the zones developed in China back in the 1970s, Nige-
rian zones experience troubles because they are confronted with high interna-
tional competition. Unlike nowadays, back then, the Chinese could take ad-
vantage of emerging GPNs and growing cross-border investment that helped
the zones in China to acquire investors and rapidly build up their facilities. To-
day, SEZs are formed worldwide especially in the developing countries. Be-
sides, China invested apart from Nigeria, also into several other African coun-
tries. They are expected to function as hubs for the newly invigorated silk road
that connects China not only with the West but particularly with Africa and its
emerging economies and growing number of people working and living within
them.
Yet, it has to be acknowledged that with the second oil boom, when commodity
prices skyrocketed, also FDI in Nigeria increased. It might be no coincidence
that at the same time China decided to further expand their economic collabo-
ration with Nigeria in the form of SEZs. Therefore, the fact that roughly 24 per-
cent of the Nigerian GDP is coming from FDI gives reason to assume that a
similar thriving investors environment as in China is possible. However, despite
the investments from foreign officials and the vast number of zones, it often is
the case that SEZs in developing countries are struggling to survive and to
keep up sustainable growth. Hence, financing seems not to be the only crucial
factor in successfully building up SEZs, therefore, further factors will be exam-
ined.
63
8.1.2 Structural Issues
Hence, the poor supply of electricity has to be analysed. Being named the most
important constraint to doing business in Nigeria and investing in SEZs (Clarke
& Iarossi, 2011; Herrera & Kouame, 2017), the lacking power supply are struc-
tural bottlenecks that hinder the economic advancement. In the case of OG-
FTZ, there was a delay in constructions as first of all, own power plants had to
be built as the supply was poor. The same issues arose in LFTZ, when the
Chinese zone developers had to face continuing uncertainty about the provi-
sion of electricity.
Besides this, delays also occurred when establishing OGFTZ due to budget
problems that Ogun State, which is the Chinese’ business partner, had to face.
Therefore, the poor access to financial means in Nigeria causes another issue
which scares off investors and hampers economic advancement in general.
Hence, it is obvious that the Nigerian financial sector has the need of improve-
ment as a healthy and well-functioning monetary market is required for growth.
It can be assumed that by diversifying the sectors, the whole economy will be-
come more resilient and less vulnerable to commodity price shocks occurring
from oil price changes. Again, this could support the CBN’s endeavours in sta-
bilizing the inflation rate which in turn will firm up the consumption. Such devel-
opment is assumed to give rise to encourage domestic production and to re-
duce import hence, further diminish oil and external dependency. To also sup-
port the emergence of domestic businesses, the access to credit should be
facilitated as well as the borrowing interest rate should be decreased. This
would further help especially domestic SEZs to develop and grow. Though,
improving financial accessibility is a difficult endeavour, as foreign investors
presumably seek to exploit the large Nigerian home market hence, their target
would not be to create a strong and independent Nigerian market. As these two
interests interfere, the arduousness of achieving Nigerian independency from
oil and exports is exhibited well.
This being determined, it as well has to be considered that the poorly built out
infrastructure in Nigeria implies major trouble for the economic upsurge. By
64
alluring the Chinese to Nigeria, the government officials anticipated an im-
provement of infrastructure. But as the deal “oil for infrastructure” failed, this
hope was initially denied. However, by the Chinese engagement in the Nigerian
SEZs, a fair chance to achieve their aim arose and Nigerian authorities got their
hopes high again. But still, as the Chinese also operate within Nigerian territory
and have Nigerian partners, for example in the OGFTZ infrastructure issues
occurred. As a matter of fact, the issue was stemming from budget problems
the zone developers had to handle. Consequently, it came to a halt in building
roads that are leading to the zone and delayed the whole construction plan.
Such an example again underpins the importance of establishing zones within
strong infrastructural areas that provide easily accessible facilities as well as a
smooth market entry. As prime example, back in the 1970s, Beijing situated
their domestic SEZs in the proximity to large cities which were already affiliated
to global markets. For example, Macau and Hong-Kong were well connected
with business partners worldwide and thus, had a solid international infrastruc-
ture and therefore, Shenzhen could benefit from synergy and spill-over effects
coming from these cities. This is also the reason why the Chinese in Nigeria
placed the zones close to the airports, ports and emerging cities. However,
they still had to be connected with each other first.
Generally, for SEZs in Nigeria, connecting zones with each other as well as
with other states, lags behind. As a consequence, the Nigerian zones have to
import many raw materials and products which could also be provided through
local firms who are well connected with each other. The problem lies within the
zone policies as their focus is mainly put on the coordination within the zone
and is not concerned with connecting it to other zones or states in Nigeria. As
a result, the zones are lacking ties to local businesses and the whole Nigerian
economy which puts them in an isolated position that limits the possibilities of
growth drastically. Of course, the bad condition of the infrastructure in whole
Nigeria exacerbates the connections between zones as explained previously.
As a result, it can be discerned that by improving the overall infrastructure and
then enhancing the relationships between zones and other zones or in general
65
businesses in Nigeria are crucial next steps the zones’ authorities should un-
dertake to guarantee sustainable growth.
Additionally, policies within the zones have to be carefully formulated to attract
and retain foreign investment. Essentially, the government has to provide an
investment climate which goes beyond financial incentives and also establish
a sphere where firm-level competitiveness is facilitated. As, for instance, the
Nigerian state fails to shield investors’ interests from uncertain macroeconomic
and political events a great policy uncertainty is created. Inevitably, this harms
the investment climate for SEZs. It though has to be considered that there is a
trade-off between incentives for international companies that seek international
competitive zones and incentives for regional businesses which mainly require
rather low entry levels.
8.1.3 Political Issues
Not only the zonal policies are important, also politics within the zones as well
as nationwide are. The example of LFTZ where there was an internal dispute
among the Chinese developers and also of OGFTZ where misunderstandings
came up between the Chinese and the zone authorities suitably represents that
within zones politics are further reasons for delays. The fact that in the case of
LFTZ, the state’s governor finally stepped in and supported the advancement
of the zones shows that a strong governmental facilitator can be very helpful.
As comparison, China’s government provided strong support for local SEZs in
setting up a policy framework for the zones’ management and thereby facili-
tated the infrastructure which was needed for a quick emergence of busi-
nesses. Having the encouragement of the Chinese state officials, the zones’
authority set up an own operational mechanism and socialist market economy
system which vastly contributed to its progress. For both, Nigerian and Chinese
zones, it shows that such a state power is an important push factor that decides
about basic preconditions. As long as such topics are not straightened out, de-
lay will keep on occurring.
Moreover, another issue in Nigerian politics is the weak political system which
has many windows in the administrative set-ups that allow kleptocratic and
66
corrupt behaviour. Agbiboa (2012) even states that in Nigeria, defective cultural
norms let the people in some cases rather be loyal to the ethnic group they live
in than complying to legal rules. Hereafter, a disunited society and bad govern-
ance with an exploitive elite are the results. Consequently, firstly, many civil
servants divert official financial means into their own pockets. And, as it is
mostly the elite dealing with the foreign investors and negotiating about inter-
national businesses, it can be assumed that it is also the elite who derives per-
sonal benefit from it. Secondly, the therefrom resulting institutional void creates
structural bottlenecks the people suffer from in terms of education, banking,
jurisdiction and many more. This gave again way to corrupt and nepotistic high
state officials who literally stole money from the state’s income while being in
office. Subsequently, there is a rich elite and a growing number of citizens living
in poverty. Such instability offers a breeding ground for terrorist organisations
that attack the Nigerian security services and hinder the society from sustaina-
bly building up businesses in a secure and wealthy environment as violence
holds all endeavours at bay. As Fig. 5 (p. 13) and Fig. 11 (p. 23) show, corrup-
tion and political instability still belong to the most severe constraints to doing
business. In this respect, restrictions are reasons for the limited opportunities
there are for Nigerians to engage in the private sector. Being surrounded by
fraud, bribery and corruption without taking part in it is nearly impossible and
makes it difficult to escape the vicious circle. The fact that the OGFTZ had to
change its location due to violent behaviour towards the Chinese workers is
another example for delays in the zone development and give an idea about
the challenges other businesses in whole Nigeria have to handle.
8.1.4 Methodological Issues
After all, it has to be said that all the issues discussed before might be the
reason for the insignificant DID results as China did not only have to rely on
their own knowledge and expertise but was also dependent on the environment
they were operating in. It though has to be acknowledged that Chinese zones
as a matter of fact do bear advantages that Nigerian zones lack but due to the
limited data period, drawing a final conclusion maybe too early at that stage of
67
development of the zones. It further has to be acknowledged that the coefficient
is positive for the Chinese zones compared to the Nigerian zones which already
reveals a glimpse into the directions the two groups develop.
As the results from the DID analysis were bolstered by the OLS regression of
the first differences7 of the GDP data regressed on the NTL data, it has to be
questioned whether for this specific case, the assumption of NTL as a proxy for
GDP is valid. Already allured to the regressions’ outcome in the previous par-
agraphs, it has to be ascertained that in the case of Nigeria, the application of
NTL data as a proxy for data on economic performance, namely GDP, is not
suitable despite research’s output.
This being the case, it is asked for what reasons the presumably firm assump-
tion of many researchers fails to apply here. One explanation could be the de-
lay that occurred within both Chinese zones. The above presented arguments
give reason to assume that despite the SEZs’ starting point in 2006 and 2007,
these delays prolonged development. Consequently, having data only availa-
ble up until 2013 might be too short as observation period, as the zone’s state
of development was maybe not yet as far as assumed by this point in time.
Another cause could be that since electricity supply is extraordinarily poorly
developed in Nigeria, a direct relationship between artificial lights and eco-
nomic growth is not yet valid. It hence is possible that some zones even grew
more than expected but since access to electricity is not yet stable in Nigeria,
it is not visible in NTL data. As a result, a certain threshold has to be passed
by the development of a state in order to draw further conclusions from artificial
lights. This finding further contributes to the research that occupies itself with
taking NTL data as a proxy for economic performance.
7 As the detrended OLS by using the first differences of the variables provides results that are statistically more correct than the simple OLS regression, only the first differences OLS will be considered in this paragraph.
68
All in all, the methodology indeed has the potential to bring forth significant
results but due to the limited period of time, its perks could not be fully ex-
hausted.
8.2 Limitations and Drawbacks
It of course has to be referred back to the methodology of the DID analysis
since it does control for unobserved heterogeneity and claims to counteract it.
The issue for the case of Nigeria and its SEZs is that the zones, and thereby
the areas where they are located, in fact are not exactly the same as they are
placed in different regions of Nigeria and their soil, climate and cultural envi-
ronment differ to a certain extent. Even though they were selected with the
greatest diligence when it comes to comparability, there are inherent differ-
ences that might not be caught precisely within the estimation since a lack of
data for the respective zone areas despite the assumption that these differ-
ences are constant over time (Gertler et al., 2016). Khandker et al. (2010) em-
inently highlight this issue for developing country research as interventions tak-
ing place in very poor areas who have low initial growth, one might expect a
dynamic response to the treatment in the targeted areas.
Furthermore, since the zone had substantial issues in the initial phase, the data
set which reaches only from 1992 until 2013 might not fully grasp the influence
that the Chinese involvement had on the zones compared to the Nigerian
zones. Hence, there is reason to assume that the DID analysis would deliver
significant results when extending the data set until nowadays.
Lastly, since the main focus lies on SEZs that concentrate on manufacturing,
the lights measured by night might be distorted from gas flares that stem from
oil refineries. In future research, this should be considered and maybe ex-
cluded.
69
9 Conclusion
Concludingly, it can be discerned that in order to answer the research ques-
tion8, the topic has to be highlighted from various perspectives. First of all, the
results from the DID analysis did not show any significant result. Obtaining sig-
nificant results would have underpinned the hypothesis of an increasing
amount of nightlight in Chinese SEZs. Reasons for that outcome were thus
searched for in iteratively scrutinising the underlying assumption of NTL data
being a valid proxy for GDP. Interestingly, the results could not proof the as-
sumption. In order to assess the two outcomes, the scope of the study was
opened up towards national issues of the Nigerian economy and its interaction
with China. By doing so, it can be finally showcased in the analysis that doing
business in Nigeria is influenced by the national as well as international econ-
omy and politics. In this context, it is particularly difficult for China to success-
fully establish their SEZ concept. It has to be realised that SEZ cannot function
well when being isolated from the rest of the economy they are set up in. In-
vestigating the example of Nigeria, especially the country’s dependency on oil,
which makes it suffer from the resource curse, weak governance stemming
from a poorly structured political system and finally the prevailing poverty of the
people, constitutes a business environment that bears many challenges and
threats to both, national and international actors.
Thus, the answer to the research question is that the analysis gives sufficient
evidence to assume that Chinese involvement indeed contributes positively to
the Nigerian SEZs’ development even if it is yet to become apparent in the
artificial light’s emission. Further, despite the fact that no significant results
could be ascertained, the general assessment of the Nigerian economic and
political situation delivers clear indicators for this conjecture. As a matter of fact,
China’s zone developers managed to attract foreign investors and started to
install an infrastructure which is expected to live up to Chinese standards. This
clearly can be rated as a crucial step towards zone success. Additionally,
8 How does the Chinese involvement in Nigerian SEZs contribute to the emission of artificial light hence, the economic development, compared to domestic zones?
70
having the support of the government and negotiating with the elites can
smoothen their path. Conversely, it has to be acknowledged that China’s goal
presumably does not only entail benevolent thoughts but also follows a plan
that ensures their own economic success’ persistence. Therefore, re-elected
President Muhammadu Buhari has enough reason to complain that the fact
that Nigeria imports everything from toothpicks to tomato purée is harming the
domestic economy (Feng & Philling, 2019). However, considering the Chinese
targets, the establishment of a desperately needed strong manufacturing sec-
tor in Nigeria and a valuable technology transfer through Chinese businesses,
which is needed to build up an independent economy, is debateable.
9.1 Outlook
Hence, further research regarding China’s actual aspirations from their en-
gagement in Nigeria should be pursued. Given the small range of information
that is available on this topic, there is the threat of being biased by a unilateral
view. As a consequence, Nigeria’s benefit from the engagement could be fur-
ther assessed by extending the SEZ sample, scrutinising the zone policies as
well as their long-term impact on the economy. To be able to better compare
the domestic zones with the Chinese zones, Nigerian endeavours within their
own zones could be further analysed. Also, investigating the Chinese involve-
ment in similar African economies such as Zambia could provide opportunities
for new insights. Next to international connections and their influence on their
economy would this also yield information on intracontinental synergy effects
which contributes to the intra-Africa business.
However, regarding the fact that NTL data could not serve as a proxy for GDP
in this thesis, its general applicability as proxy for economic performance could
be further investigated. Finally, beyond the Nigerian SEZs and economic per-
formance, NTL data as well as spatial data measured by satellites reveals a
hitherto sparsely explored research field. It though has the potential to unfold
and, as presented within this thesis, allow combining it with national accounts
data. Moreover, it could be used for research areas where data is not accessi-
ble.
VIII
V. List of References
Acemoglu, D., & Robinson, J. A. (2005). Economic origins of dictatorship and
democracy. Boston: Cambridge University Press.
Acemoglu, D., & Robinson, J. A. (2012). Why nations fail: The origins of
power, prosperity, and poverty. New York: Crown Books.
Agbiboa, D. E. (2012). Between corruption and development: The political
economy of state robbery in Nigeria. Journal of Business Ethics, 108(3),
325–345.
Aggarwal, A. (2005). Performance of export processing zones: A
comparative analysis of India, Sri Lanka and Bangladesh. Working
paper.
Akanbi, O. A., & Du Toit, C. B. (2011). Macro-econometric modelling for the
Nigerian economy: A growth–poverty gap analysis. Economic Modelling,
28(1–2), 335–350.
Ang, Y. Y. (2016). How China escaped the poverty trap. New York: Cornell
University Press.
BBC. (2016). Nigerian economy slips into recession.
Bivand, R. S., Pebesma, E. J., Gómez-Rubio, V., & Pebesma, E. J. (2008).
Applied spatial data analysis with R (Vol. 747248717). Springer.
Boyenge, S. (2007). ILO database on export processing zones (revised).
Geneva: International Labour Organization.
Bräutigam, D. (2011). Deborah Brautigam: China is successful in Africa
where NGOs are not - providing infrastructure. In Intelligence Squared
(UK) Ltd (Ed.). London: Intelligence Squared. Retrieved from
https://www.youtube.com/watch?v=qHEpsXmmD48
IX
Bräutigam, D., Farole, T., & Xiaoyang, T. (2010). China’s investment in
African special economic zones: Prospects, challenges, and
opportunities. World Bank, Washington, DC.
Brautigam, D., Fjeldstad, O.-H., & Moore, M. (2008). Taxation and state-
building in developing countries: Capacity and consent. Cambridge
University Press.
Bräutigam, D., & Tang, X. (2014). “Going Global in Groups”: Structural
Transformation and China’s Special Economic Zones Overseas. World
Development, 63, 78–91.
Bräutigam, D., & Xiaoyang, T. (2011). African Shenzhen: China’s special
economic zones in Africa. The Journal of Modern African Studies, 49(1),
27–54.
Bräutigam, D., & Xiaoyang, T. (2012). Economic statecraft in China’s new
overseas special economic zones: soft power, business or resource
security? International Affairs, 88(4), 799–816.
Briggs, S., & Musa, M. (2017). The Effect of Exchange Rates on Nigeria
Economic Growth (2006-2016). Macroeconomic Implications of Low Life
Expectancy in Sub-Sahara Africa Nations, 5.
Call, C. T. (2008). The fallacy of the ‘Failed State.’ Third World Quarterly,
29(8), 1491–1507.
Campbell, J. (2016). Boko Haram and Nigeria State Weakness. In Africa in
World Politics. Boulder: Hachette UK.
Carter, C., & Harding, A. (2010a). SEZs - Policy incubators or catalysts for
development? In Special Economic Zones in Asian Market Economies.
New York: Routledge.
Carter, C., & Harding, A. (2010b). Special economic zones in Asian market
economies. New York: Routledge.
X
CEIC Data. (2018). China CN: GDP: Guangdong: Shenzhen. Retrieved April
18, 2019, from https://www.ceicdata.com/en/china/gross-domestic-
product-prefecture-level-city/cn-gdp-guangdong-shenzhen
Clarke, G. R. G., & Iarossi, G. (2011). Nigeria 2011 : An Assessment of the
Investment Climate in 26 States. Washington, DC. Retrieved from
https://openknowledge.worldbank.org/handle/10986/27340
Columbia University. (2013). Difference-in-Difference Estimation.
COMCEC. (2017). Special Economic Zones in the OIC Region: Learning
from Experience. Ankara.
Dannenberg, P., Yejoo, K., & Schiller, D. (2013). Chinese Special Economic
Zones in Africa: a new species of globalisation? African East-Asian
Affairs, (2).
Dreher, A., Fuchs, A., Hodler, R., Parks, B., Raschky, P., & Tierney, M. J.
(2016). Aid on demand: African leaders and the geography of China’s
foreign assistance.
Elvidge, C. D., Baugh, K. E., Kihn, E. A., Kroehl, H. W., Davis, E. R., & Davis,
C. W. (1997). Relation between satellite observed visible-near infrared
emissions, population, economic activity and electric power
consumption. International Journal of Remote Sensing, 18(6), 1373–
1379.
Export Entreprises SA. (2019). Nigeria: Foreign Investment.
Farole, T., & Kweka, J. (2011). Institutional best practices for special
economic zones: An application to Tanzania. Africa Trade Policy Note,
(25).
Farole, T., & Moberg, L. (2014). It worked in China, so why not in Africa? The
political economy challenge of Special Economic Zones. WIDER
Working Paper.
XI
Farole, T., & Moberg, L. (2017). Special Economic Zones in Africa. In The
Practice of Industrial Policy: Government - Business Coordination in
Africa and East Asia. London: Oxford University Press.
Feng, E., & Philling, D. (2019). The other side of Chinese investment in
Africa. Retrieved May 12, 2019, from
https://www.ft.com/content/9f5736d8-14e1-11e9-a581-4ff78404524e
Frick, S. A., Rodríguez-Pose, A., & Wong, M. D. (2018). Toward
Economically Dynamic Special Economic Zones in Emerging Countries.
Economic Geography, 1–35.
Gabriel, S. (2018). Rede von Sigmar Gabriel bei der 54. Münchner
Sicherheitskonferenz vom 17.02.2018. Bonn: phoenix. Retrieved from
https://www.youtube.com/watch?v=Wovy7xKemCE
Gekonge, C. O. (2013). Emerging Business Opportunities in Africa: Market
Entry, Competitive Strategy, and the Promotion of Foreign Direct
Investments: Market Entry, Competitive Strategy, and the Promotion of
Foreign Direct Investments. IGI Global.
Gertler, P. J., Martinez, S., Premand, P., Rawlings, L. B., & Vermeersch, C.
M. J. (2016). Impact evaluation in practice. The World Bank.
Henderson, J. V., Storeygard, A., & Weil, D. N. (2012). Measuring economic
growth from outer space. American Economic Review, 102(2), 994–
1028.
Herd, R., & Dougherty, S. (2005). China’s economy: A remarkable
transformation. Retrieved May 12, 2019, from
http://oecdobserver.org/news/archivestory.php/aid/1685/China_92s_eco
nomy:_A_remarkable_transformation.html
Herrera, S., & Kouame, W. (2017). Productivity in the Non-Oil Sector in
Nigeria: Firm-Level Evidence (No. 8145). Washington, DC. Retrieved
from https://openknowledge.worldbank.org/handle/10986/27648
XII
Hongpei, Z. (2019). Shenzhen surpasses HK’s GDP in 2018 but has lower
GDP per capita.
Ikeyi, N. (1998). The export processing zones and foreign investment
promotion in Nigeria: A note on recent legislation. Journal of African
Law, 42(2), 223–230.
Jian, Z. (2017). The Course, Achievements and Inspirations of the Reform
and Opening-Up of the Shenzhen SEZ. In Studies on China’s Special
Economic Zones. Singapore: Springer.
Keidel, A. (2007). China’s Economic Fluctuations. Carnegie Endowment.
Keola, S., Andersson, M., & Hall, O. (2015). Monitoring economic
development from space: using nighttime light and land cover data to
measure economic growth. World Development, 66, 322–334.
Khandker, S. R., Koolwal, G. B., & Samad, H. A. (2010). Handbook on
Impact Evaluation: Quantitative Methods and Practices, the International
Bank for Reconstruction and Development/the World Bank.
Lo, C. (2015). China’s Silk Road strategy. The International Economy, 29(4),
54.
Marwah, H. (2015). Oil as sweet as honey. In Natural Resources and
Economic Growth. New York: Routledge.
Mellander, C., Lobo, J., Stolarick, K., & Matheson, Z. (2015). Night-time light
data: A good proxy measure for economic activity? PloS One, 10(10),
e0139779.
MOFCOM. (2018). Ogun-Guangdong Free Trade Zone. Retrieved May 12,
2019, from
http://english.mofcom.gov.cn/article/newsrelease/counselorsoffice/weste
rnasiaandafricareport/201807/20180702765135.shtml
XIII
Moyo, D. (2009). Dead aid: Why aid is not working and how there is a better
way for Africa. London: Macmillan.
Mthembu-Salter, G. (2009a). China’s engagement with the Nigerian oil
sector.
Mthembu-Salter, G. (2009b). Chinese Investment in African Free Trade
Zones: Lessons from Nigeria’s Experience.
Muhammad-Lawal, A., & Atte, O. A. (2016). An analysis of agricultural
production in Nigeria. African Journal of General Agriculture, 2(1).
NEPZA. (2004). Investment Procedures, Regulations and operational
Guidelines for Free Zones in Nigeria. Abuja.
NEPZA. (2019). Nigeria Export Processing Zones Authority.
NOAA. (2019). Version 4 DMSP-OLS Nighttime Lights Time Series.
Retrieved February 20, 2019, from
https://ngdc.noaa.gov/eog/dmsp/downloadV4composites.html
Osaghae, E. E. (2015). Resource curse or resource blessing: the case of the
Niger Delta ‘oil republic’in Nigeria. Commonwealth & Comparative
Politics, 53(2), 109–129.
Piketty, T. (2014). Capital in the Twenty-First Century: a multidimensional
approach to the history of capital and social classes. The British Journal
of Sociology, 65(4), 736–747.
Punch Nigeria. (2016). Ogun, Chinese firm back free trade zone. Retrieved
May 12, 2019, from https://punchng.com/ogun-chinese-firm-back-free-
trade-zone/
Putsch, C. (2019, February). Nigerias Präsident Buhari im schwierigsten Job
Afrikas bestätigt. Neue Züricher Zeitung, p. 3. Zürich.
Romer, P. (2010). Interview with Paul Romer. Ottawa: CBC Radio One.
XIV
Schmidt, H. (1997, February 28). Der Erneuerer Chinas. 10/1997. Hamburg.
Retrieved from https://www.zeit.de/1997/10/Der_Erneuerer_Chinas
Signer, D. (2019a, February 15). Nigeria zu regieren ist wie einen
brennenden Riesentanker durch den Sturm zu manövrieren. Neue
Züricher Zeitung, p. 4. Zürich. Retrieved from
https://www.nzz.ch/international/nigeria-wahl-des-geringeren-uebels-
ld.1459183
Signer, D. (2019b, February 17). Wahlen in Nigeria in letzter Minute
verschoben. Neue Züricher Zeitung, p. 2. Zürich.
Smith, D. J. (2010). A culture of corruption: Everyday deception and popular
discontent in Nigeria. Princeton University Press.
Sun, I. Y., Jayaram, K., & Kassiri, O. (2017). Dance of the lions and dragons:
How are Africa and China engaging, and how will the partnership
evolve? McKinsey.
The Nobel Foundation. (2018). The Sveriges Riksbank Prize in Economic
Sciences in Memory of Alfred Nobel 2018. Retrieved February 24, 2019,
from https://www.nobelprize.org/prizes/economic-
sciences/2018/romer/facts/
Umejei, E. (2015). China’s Engagement with Nigeria: Opportunity or
Opportunist? African East-Asian Affairs, (3–4).
UNCTAD. (2018a). Special Economic Zones: Challenges and Opportunities.
Retrieved April 8, 2019, from
https://worldinvestmentforum.unctad.org/session/free-special-economic-
zones-challenges-and-opportunities/
UNCTAD. (2018b). World Investment Report 2018. Geneva.
XV
UNCTAD. (2019). Data Center. Retrieved March 3, 2019, from
https://unctadstat.unctad.org/wds/ReportFolders/reportFolders.aspx?sC
S_ChosenLang=en
Waldinger, F. (2019). Applied Econometrics. Retrieved March 27, 2019, from
https://www.fabianwaldinger.com/applied-econometrics
Weidmann, N. B., & Schutte, S. (2017). Using night light emissions for the
prediction of local wealth. Journal of Peace Research, 54(2), 125–140.
Wooldridge, J. (2007). What’s new in econometrics? Lecture 10 difference-
in-differences estimation. NBER Summer Institute, Available at: Www.
Nber. Org/WNE/Slides7–31–07/Slides_10_diffindiffs. Pdf, Accessed
April, 9, 2011.
Woolfrey, S. (2013). Special economic zones and regional integration in
Africa. Cape to Cairo, 108.
World Bank Group. (2018). Nigeria Biannual Economic Update, April 2018:
Connecting to Compete. Washington, DC. Retrieved from
https://openknowledge.worldbank.org/handle/10986/29787
World Bank Group. (2019). The World Bank In China. Retrieved May 12,
2019, from https://www.worldbank.org/en/country/china/overview
Yitao, T. (2017). Special Economic Zones and China’s Path. In Studies on
China’s Special Economic Zones. Singapore: Springer.
Yuan, Y. (2017). The Dynamic Evolution of China’s Special Economic Zones
and Their Practice. In Studies on China’s Special Economic Zones.
Singapore: Springer.
Zeng, D. Z. (2012). An overview of six economic zones in Nigeria:
Challenges and opportunities. World Bank Policy Note.
Ziai, A. (2013). The discourse of “development” and why the concept should
XVI
be abandoned. Development in Practice, 23(1), 123–136.
Zubikova, A. (2018). Curse or blessing: economic growth and natural
resources (Comparison of the Development of Botswana, Canada,
Nigeria and Norway in the Early 21st Century). Agricultural and
Resource Economics: International Scientific E-Journal, 4(1868-2018–
2029).
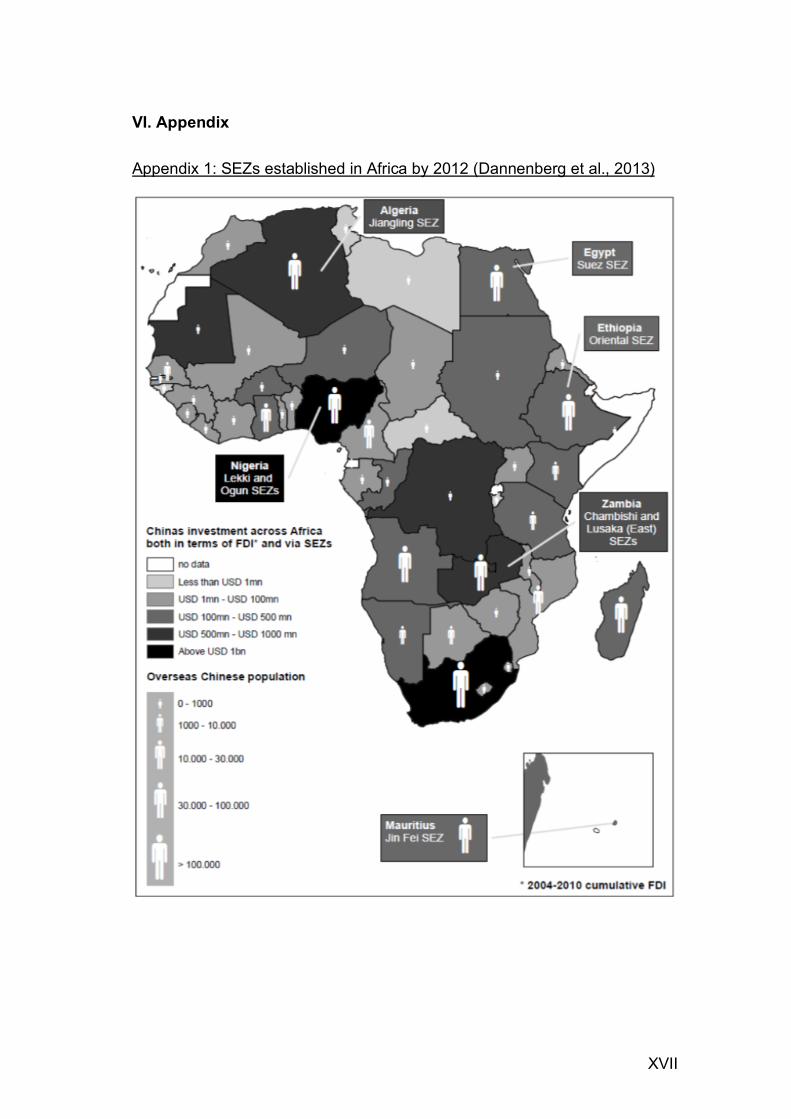
XVII
VI. Appendix
Appendix 1: SEZs established in Africa by 2012 (Dannenberg et al., 2013)
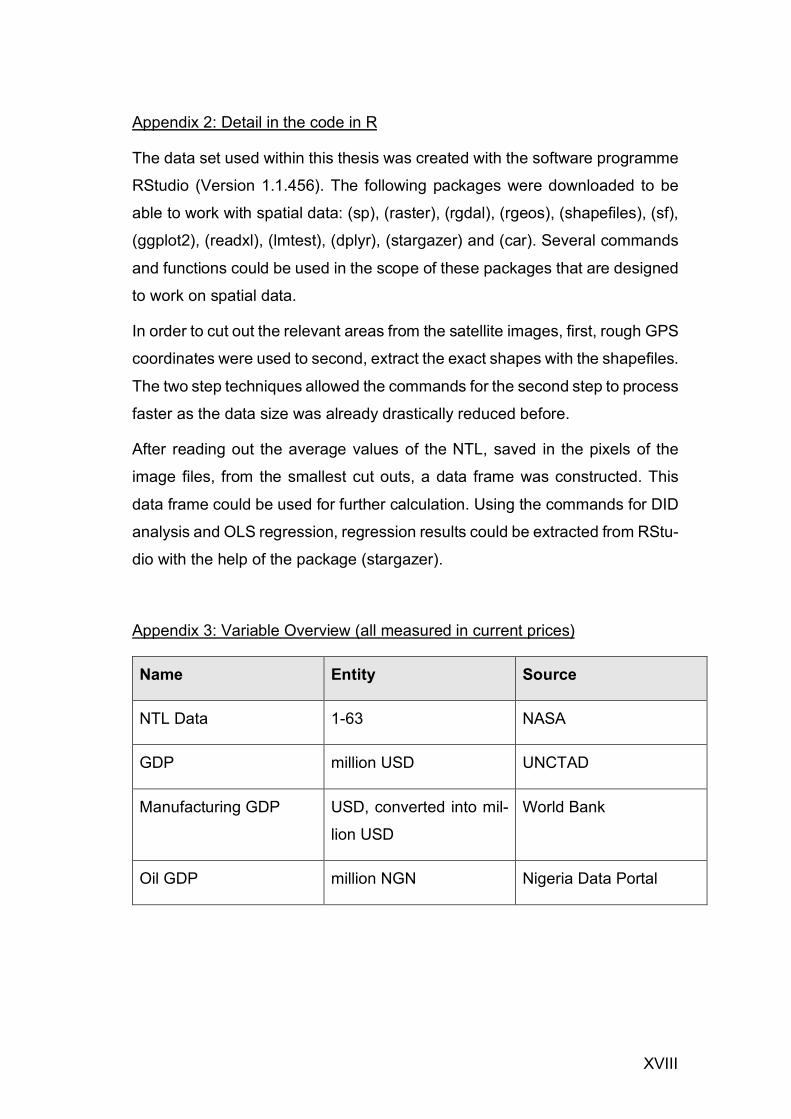
XVIII
Appendix 2: Detail in the code in R
The data set used within this thesis was created with the software programme
RStudio (Version 1.1.456). The following packages were downloaded to be
able to work with spatial data: (sp), (raster), (rgdal), (rgeos), (shapefiles), (sf),
(ggplot2), (readxl), (lmtest), (dplyr), (stargazer) and (car). Several commands
and functions could be used in the scope of these packages that are designed
to work on spatial data.
In order to cut out the relevant areas from the satellite images, first, rough GPS
coordinates were used to second, extract the exact shapes with the shapefiles.
The two step techniques allowed the commands for the second step to process
faster as the data size was already drastically reduced before.
After reading out the average values of the NTL, saved in the pixels of the
image files, from the smallest cut outs, a data frame was constructed. This
data frame could be used for further calculation. Using the commands for DID
analysis and OLS regression, regression results could be extracted from RStu-
dio with the help of the package (stargazer).
Appendix 3: Variable Overview (all measured in current prices)
Name Entity Source
NTL Data 1-63 NASA
GDP million USD UNCTAD
Manufacturing GDP USD, converted into mil-
lion USD
World Bank
Oil GDP million NGN Nigeria Data Portal
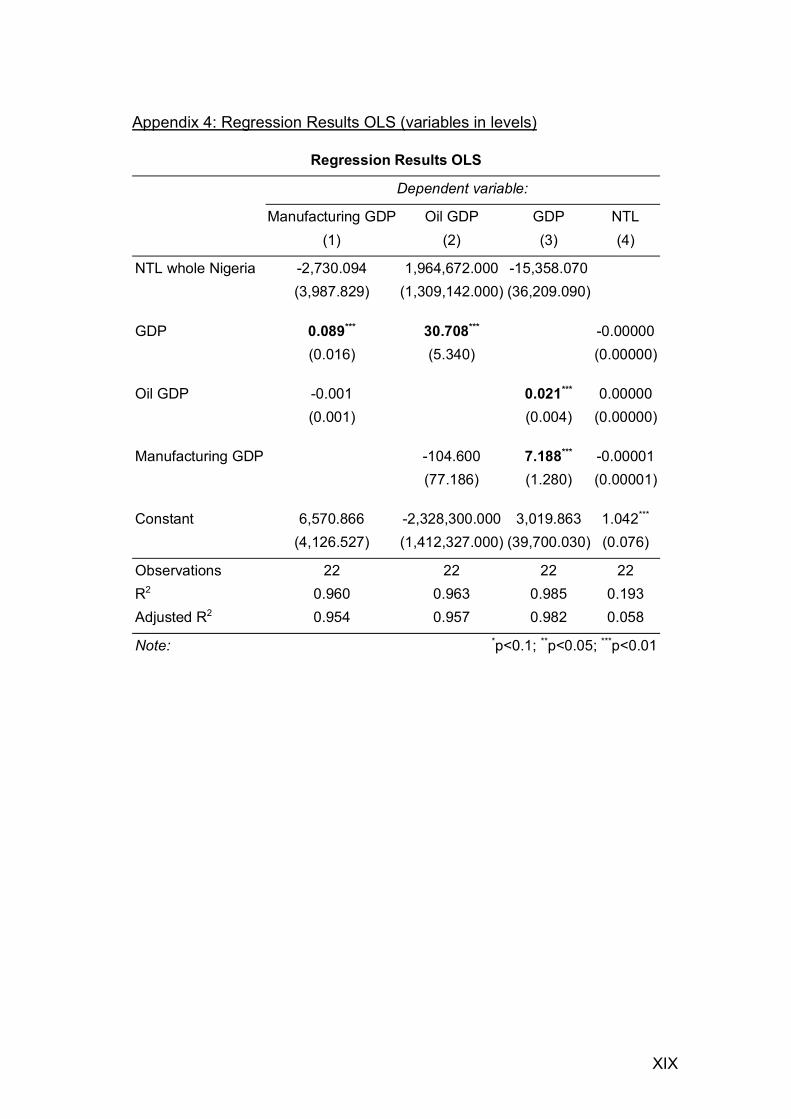
XIX
Appendix 4: Regression Results OLS (variables in levels)
Regression Results OLS Dependent variable: Manufacturing GDP Oil GDP GDP NTL (1) (2) (3) (4)
NTL whole Nigeria -2,730.094 1,964,672.000 -15,358.070
(3,987.829) (1,309,142.000) (36,209.090)
GDP 0.089*** 30.708*** -0.00000
(0.016) (5.340) (0.00000)
Oil GDP -0.001 0.021*** 0.00000
(0.001) (0.004) (0.00000)
Manufacturing GDP -104.600 7.188*** -0.00001
(77.186) (1.280) (0.00001)
Constant 6,570.866 -2,328,300.000 3,019.863 1.042*** (4,126.527) (1,412,327.000) (39,700.030) (0.076)
Observations 22 22 22 22 R2 0.960 0.963 0.985 0.193 Adjusted R2 0.954 0.957 0.982 0.058
Note: *p<0.1; **p<0.05; ***p<0.01
Related Documents


