Development of Development of Chemistry Indicators Chemistry Indicators Steven Bay Southern California Coastal Water Research Project (SCCWRP) [email protected]

Development of Chemistry Indicators Steven Bay Southern California Coastal Water Research Project (SCCWRP) [email protected].
Dec 18, 2015
Welcome message from author
This document is posted to help you gain knowledge. Please leave a comment to let me know what you think about it! Share it to your friends and learn new things together.
Transcript

Development of Development of Chemistry IndicatorsChemistry Indicators
Steven BaySouthern California Coastal Water Research Project
(SCCWRP)

Presentation OverviewPresentation Overview
Workplan update and response to comments
Project status
Preliminary results
– Data screening
– Normalization
– SQG comparison

Chemistry IndicatorsChemistry Indicators
A methodology for interpreting sediment chemistry data relative to impacts on benthic organisms (e.g., an SQG approach with numeric values)
Link to pollutants of concern Familiar approach Many available data Several challenges to effective use
– Bioavailability
– Unmeasured chemicals
– Mixtures
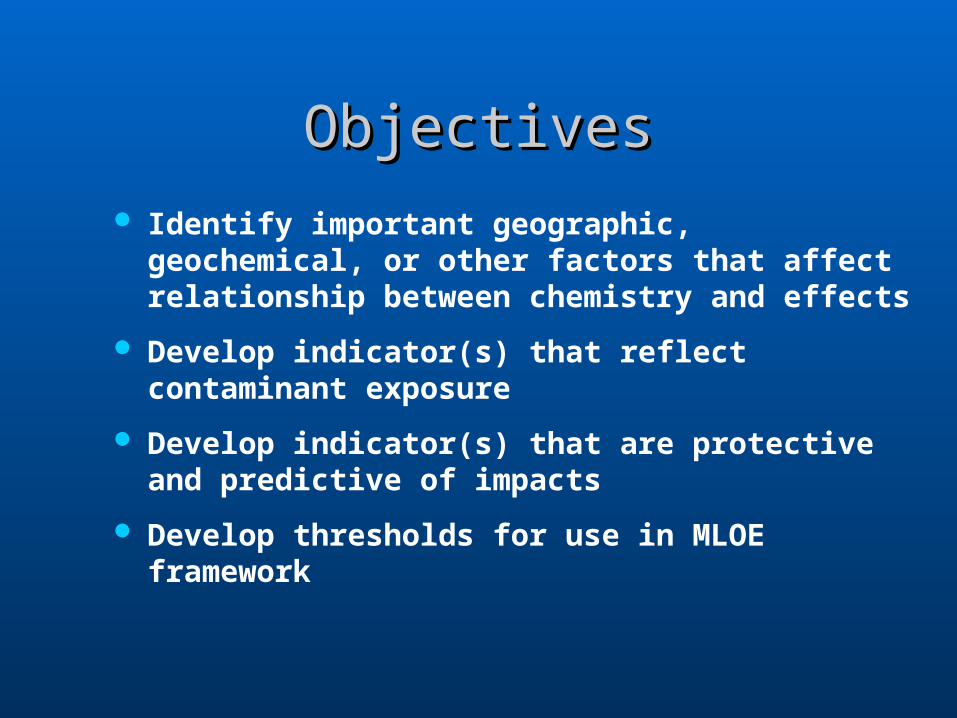
ObjectivesObjectives
Identify important geographic, geochemical, or other factors that affect relationship between chemistry and effects
Develop indicator(s) that reflect contaminant exposure
Develop indicator(s) that are protective and predictive of impacts
Develop thresholds for use in MLOE framework

ApproachApproach Develop a database of CA sediment quality
information for use in developing and validating indicators
– Address concerns and uncertainty regarding influence of regional factors
– Document performance of recommended indicators
Develop both empirical and mechanistic indicators, if possible
– Both types have desirable attributes for SQO use
– Investigate existing and new approaches
– Emphasis is on priority chemicals identified as likely causes of impairment

ApproachApproach Evaluate SQG performance
– Use CA data
– Use quantitative and consistent approach
– Select methods with best performance for expected applications
Describe response levels (thresholds)
– Consistent with needs of MLOE framework
– Based on observed relationships with biological effects
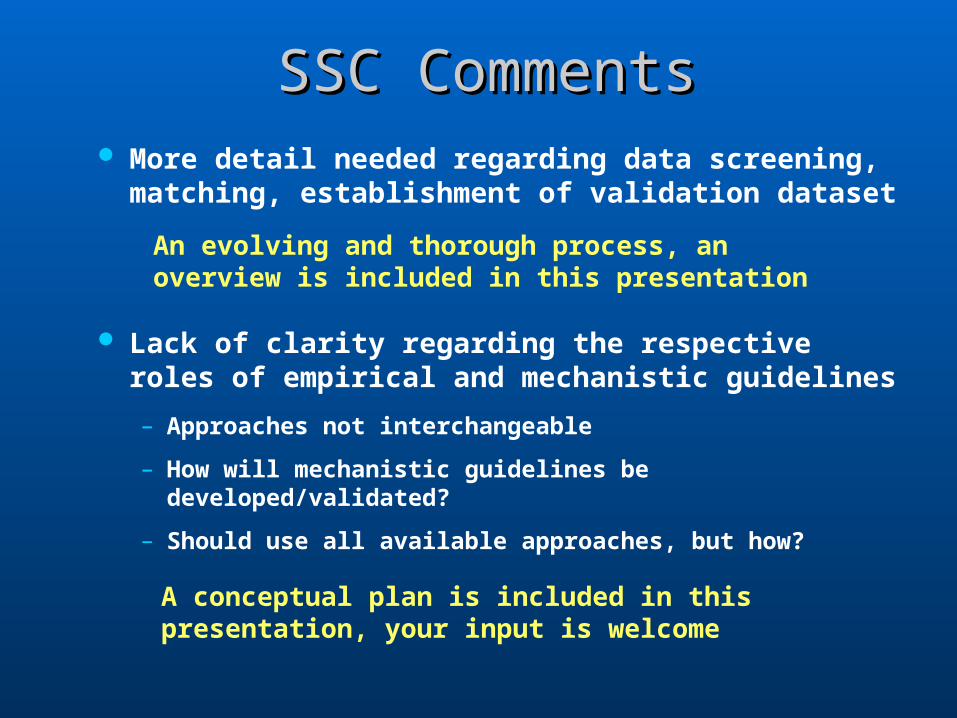
SSC CommentsSSC Comments More detail needed regarding data screening,
matching, establishment of validation dataset
Lack of clarity regarding the respective roles of empirical and mechanistic guidelines
– Approaches not interchangeable
– How will mechanistic guidelines be developed/validated?
– Should use all available approaches, but how?
An evolving and thorough process, an overview is included in this presentation
A conceptual plan is included in this presentation, your input is welcome

SSC CommentsSSC Comments Clarify how metals normalization results will be
used
Provide greater independence of chemistry line of evidence
More detail needed regarding calibration of guidelines and comparison of performance (within CA and nationally)
Will explore utility in improving guideline performance and establishing background concentrations
Agree this is an important goal, part of motivation for using mechanistic guidelines and metal normalization
A revised comparison approach is proposed that is more consistent with MLOE framework

TasksTasks
1. Prepare development and validation datasets
2. Develop and refine SQGs
3. Evaluate SQGs
4. Describe response levels
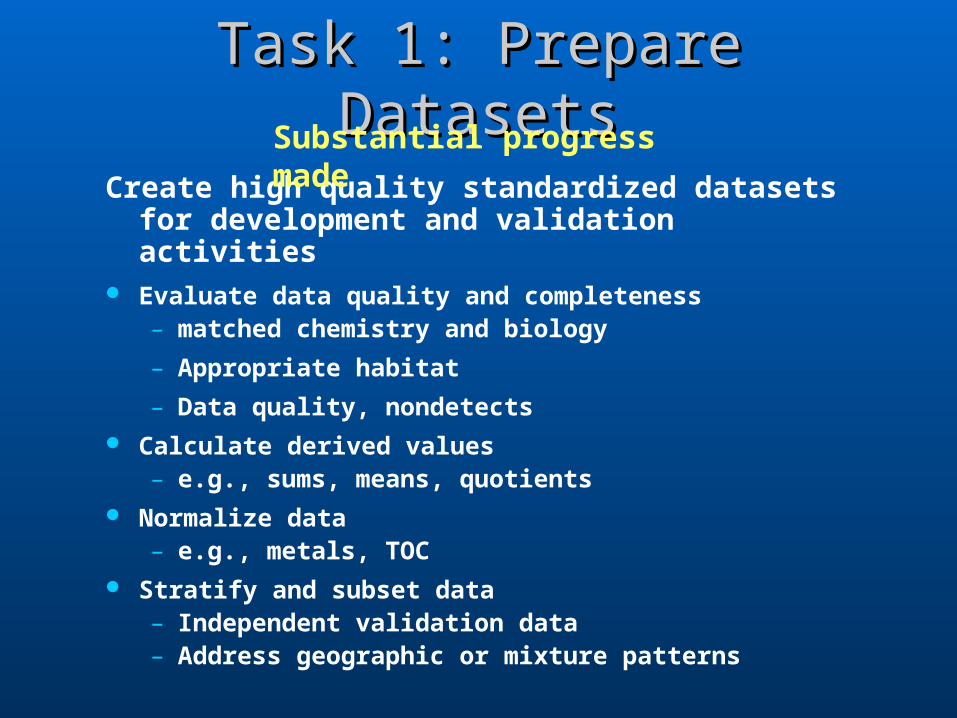
Task 1: Prepare DatasetsTask 1: Prepare Datasets
Create high quality standardized datasets for development and validation activities
Evaluate data quality and completeness– matched chemistry and biology
– Appropriate habitat
– Data quality, nondetects Calculate derived values
– e.g., sums, means, quotients Normalize data
– e.g., metals, TOC Stratify and subset data
– Independent validation data– Address geographic or mixture patterns
Substantial progress made

Bay/Estuary Samples inBay/Estuary Samples inDatabaseDatabase
Regional
BoardChem Tox Benthos
Chem
+
Tox
Chem
+
Benthos
Tox
+
Benthos
Chem
Tox
Benthos
North Coast 6 11 0 22 0 0 34
Central Coast 3 0 0 58 3 0 8
SF Bay 552 19 0 680 37 0 230
Los Angeles 827 11 0 294 15 0 187
Santa Ana 156 8 0 104 0 0 137
San Diego 216 2 0 271 3 0 285
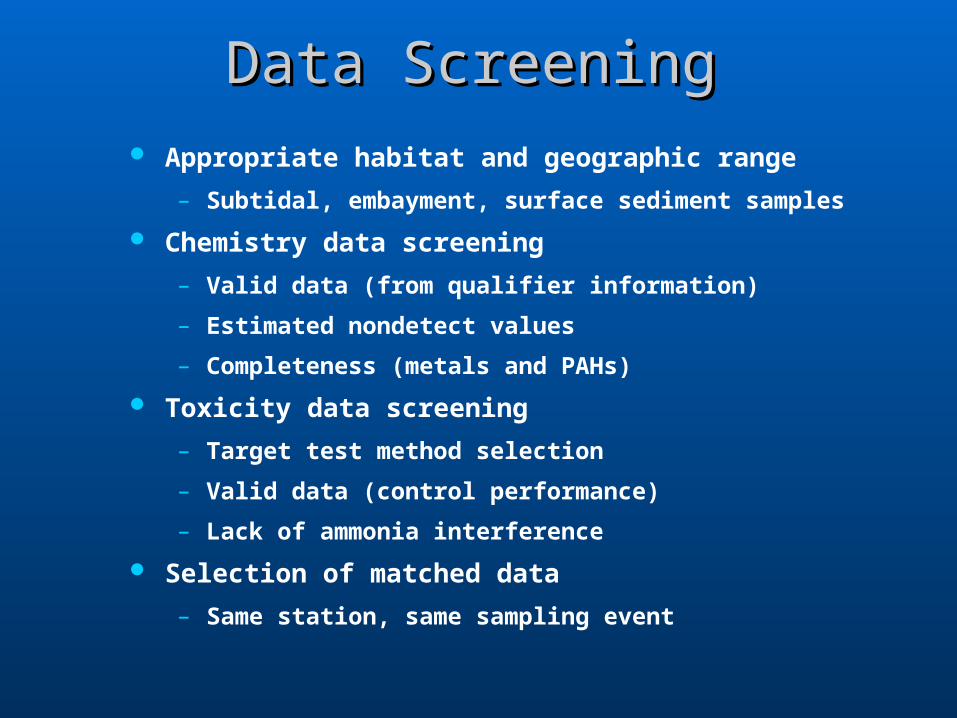
Data ScreeningData Screening Appropriate habitat and geographic range
– Subtidal, embayment, surface sediment samples
Chemistry data screening
– Valid data (from qualifier information)
– Estimated nondetect values
– Completeness (metals and PAHs)
Toxicity data screening
– Target test method selection
– Valid data (control performance)
– Lack of ammonia interference
Selection of matched data
– Same station, same sampling event

Bay/Estuary Samples inBay/Estuary Samples inDatabase After ScreeningDatabase After Screening
Regional
BoardChem Tox Benthos
Chem
+
Tox
Chem
+
Benthos
Tox
+
Benthos
Chem
Tox
Benthos
North Coast 0 0 0 13 0 0 34
Central Coast 0 0 0 45 0 0 8
SF Bay 0 0 0 351 0 0 184
Los Angeles 0 0 0 89 0 0 130
Santa Ana 0 0 0 101 0 0 122
San Diego 0 0 0 267 0 0 203
Validation DatasetValidation Dataset
Used to confirm performance of recommended SQGs
Independent subset of SQO database
Approximately 30% of data, selected randomly to represent contamination gradient
Includes acute and chronic toxicity tests

Metal NormalizationMetal Normalization Metals occur naturally in the environment
– Silts and clays have higher metal content– Source of uncertainty in identifying anthropogenic
impact– Background varies due to sediment type and regional
differences in geology
Need to differentiate between natural background levels and anthropogenic input– Investigate utility for empirical guideline development– Potential use for establishing regional background
levels

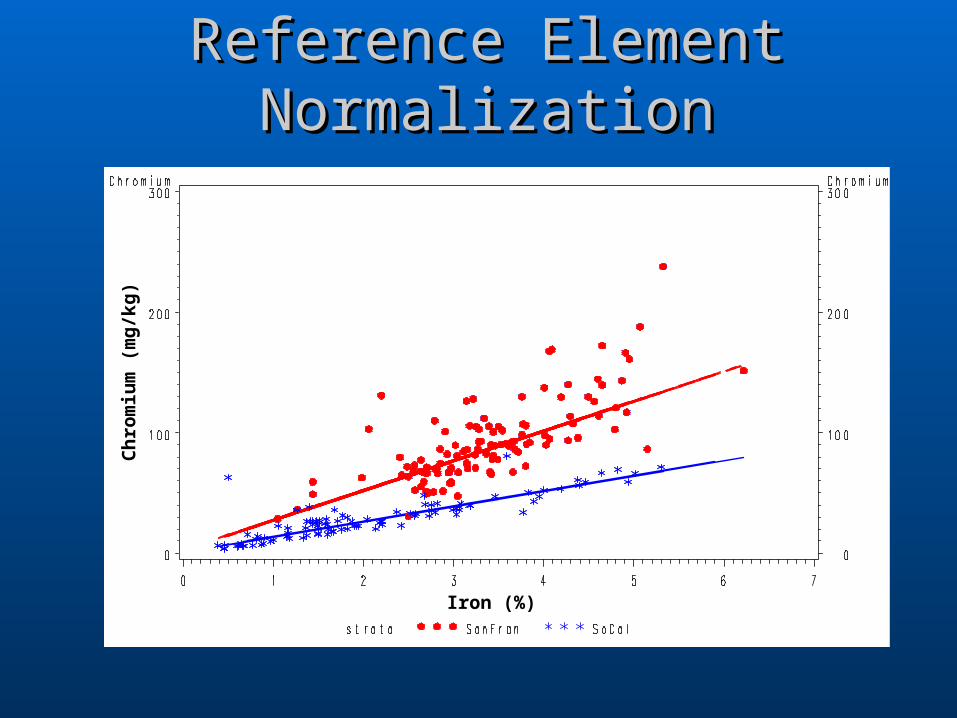
Reference Element NormalizationReference Element Normalization
Established methodology applied by geologists and environmental scientists
Reference element covaries with natural sediment metals and is insensitive to anthropogenic inputs
Use of iron as reference element validated for southern California
– 1994 and 1998 Bight regional surveys

Reference Element NormalizationReference Element NormalizationC
hro
miu
m (
mg
/kg
)
Iron (%)
Reference Element NormalizationReference Element NormalizationC
hro
miu
m (
mg
/kg
)
Iron (%)
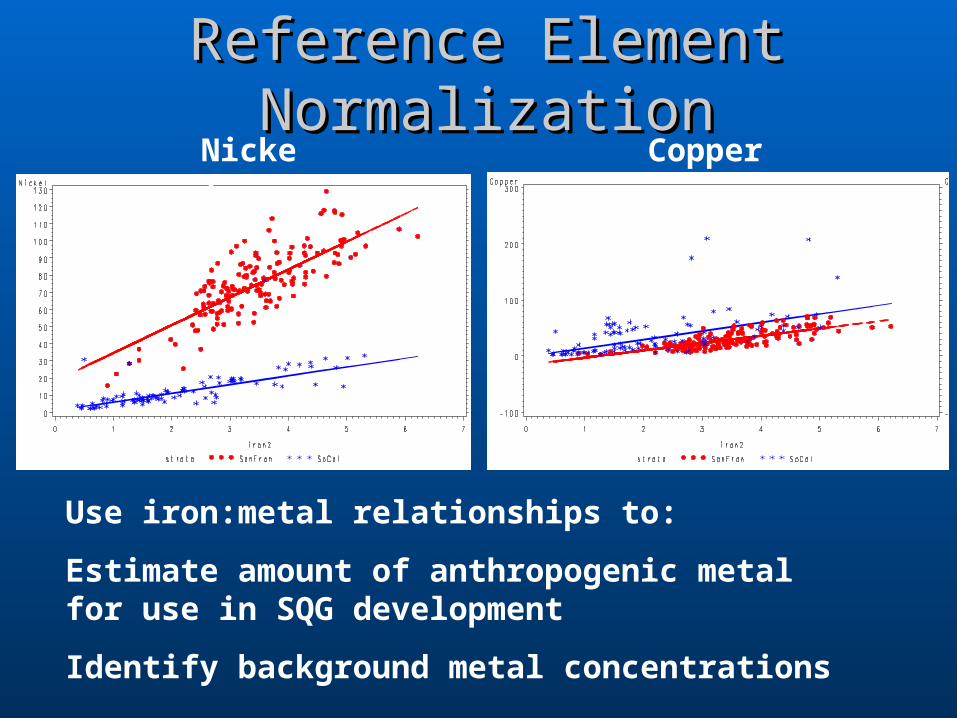
Reference Element NormalizationReference Element NormalizationNickel Copper
Use iron:metal relationships to:
Estimate amount of anthropogenic metal for use in SQG development
Identify background metal concentrations
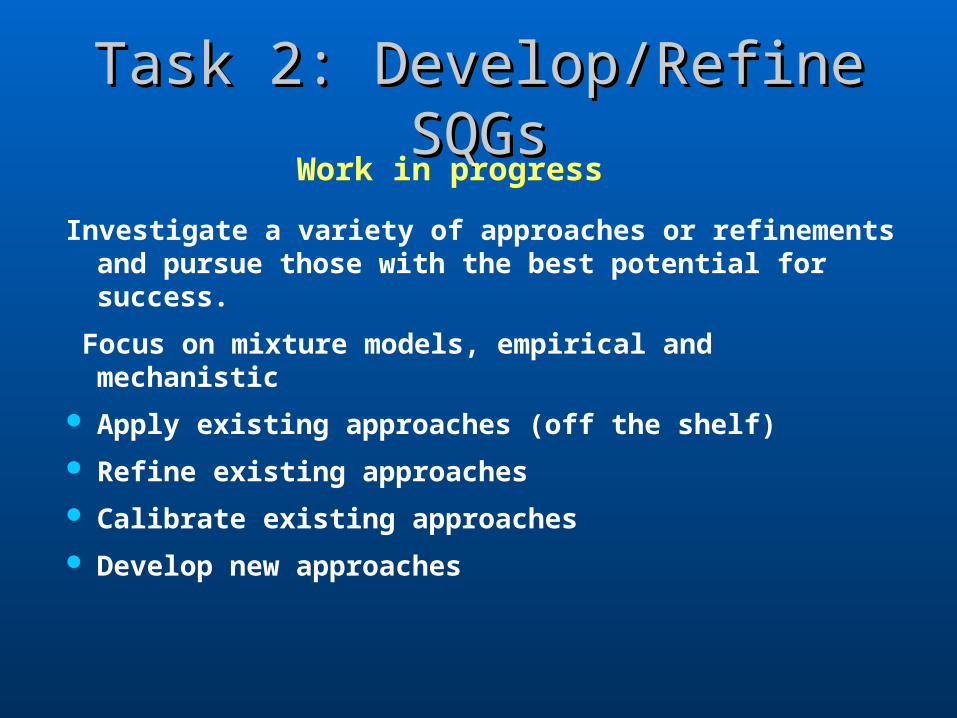
Task 2: Develop/Refine SQGsTask 2: Develop/Refine SQGs
Investigate a variety of approaches or refinements and pursue those with the best potential for success.
Focus on mixture models, empirical and mechanistic
Apply existing approaches (off the shelf)
Refine existing approaches
Calibrate existing approaches
Develop new approaches
Work in progress

SQG ApproachesSQG ApproachesSQG Metric Source
ERM Mean Quotient Long et al. &
CA-specific
Consensus MEC Mean Quotient MacDonald et al, Swartz, SCCWRP
SQGQ-1 Mean Quotient Fairey et al.
Logistic Regression
Pmax Field et al. &
CA-specific
AET Exceedance CA-specific
EqP Organics Sum TU EPA + CA Toxics Rule
EqP Metals Potential for Tox. EPA
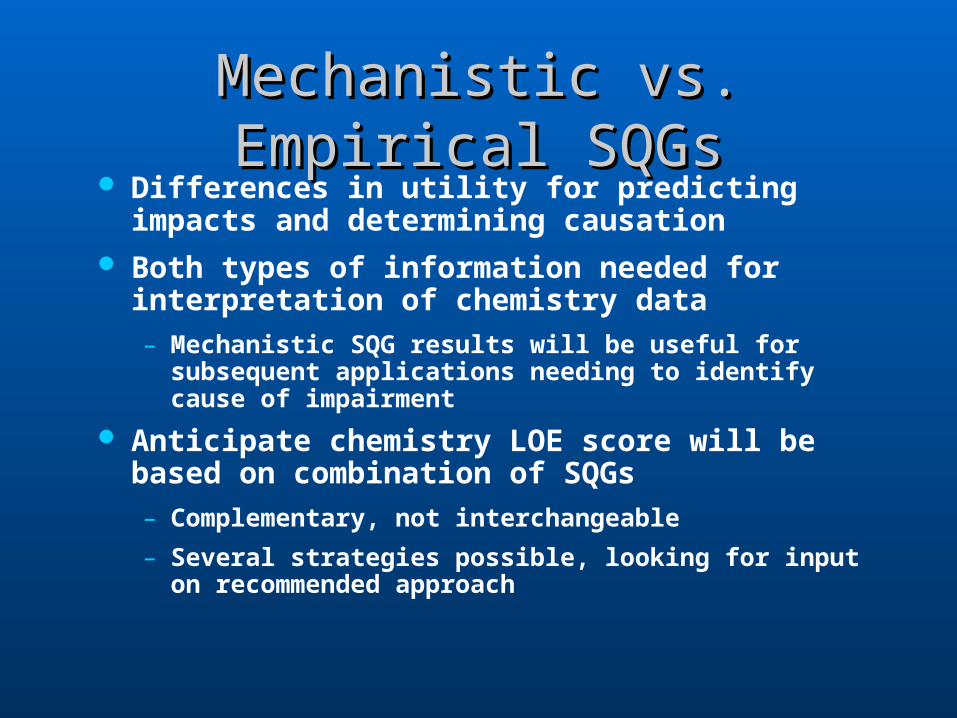
Mechanistic vs. Empirical SQGsMechanistic vs. Empirical SQGs Differences in utility for predicting impacts and
determining causation Both types of information needed for
interpretation of chemistry data
– Mechanistic SQG results will be useful for subsequent applications needing to identify cause of impairment
Anticipate chemistry LOE score will be based on combination of SQGs
– Complementary, not interchangeable
– Several strategies possible, looking for input on recommended approach
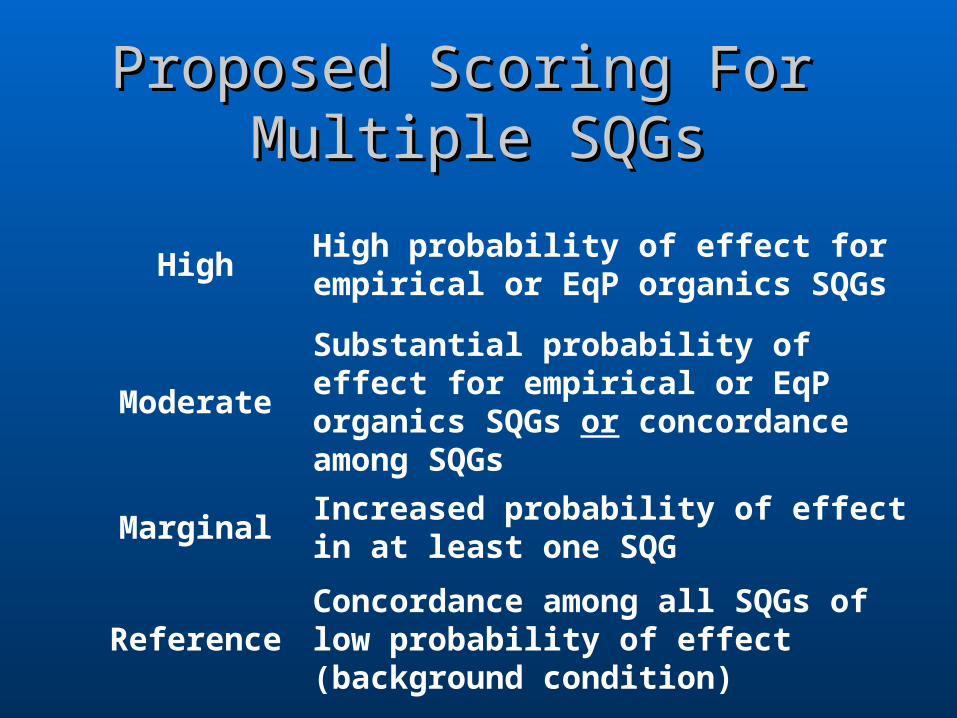
Proposed Scoring For Proposed Scoring For Multiple SQGsMultiple SQGs
HighHigh probability of effect for empirical or EqP organics SQGs
ModerateSubstantial probability of effect for empirical or EqP organics SQGs or concordance among SQGs
MarginalIncreased probability of effect in at least one SQG
ReferenceConcordance among all SQGs of low probability of effect (background condition)

Guideline CalibrationGuideline Calibration
Use of CA chemistry/effects data to adjust empirical guideline models or thresholds
– LRM: model and thresholds
– Effects range: CA-specific values and thresholds
– AET: CA-specific values
– Consensus & SQGQ-1: thresholds
Comparisons between existing and calibrated SQG results used to guide recommendations
– Only use calibrated values if improved performance can be demonstrated
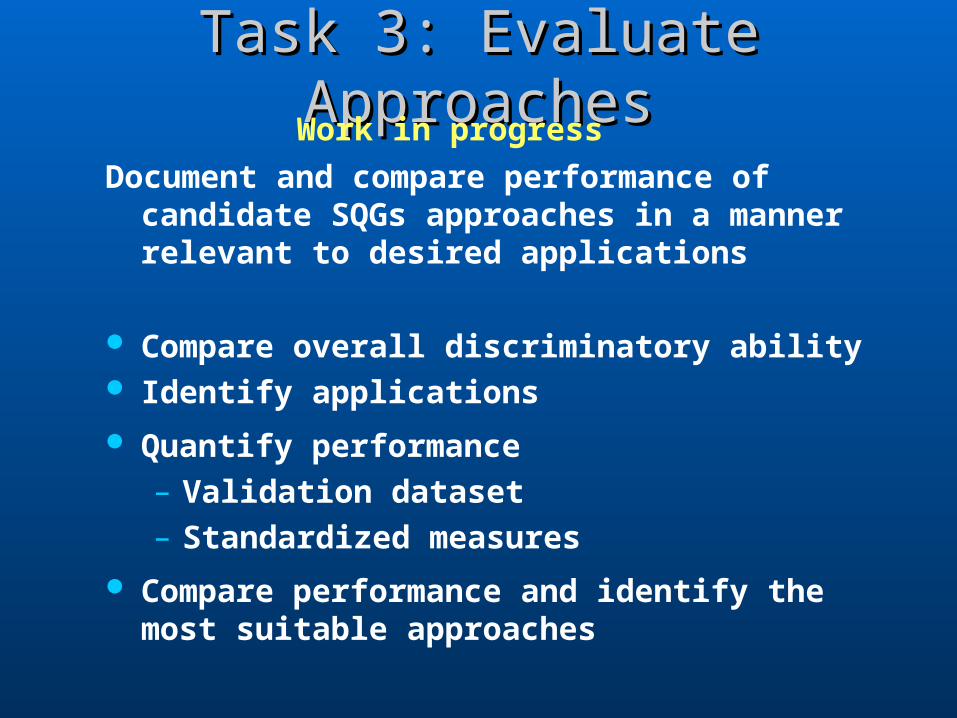
Task 3: Evaluate ApproachesTask 3: Evaluate Approaches
Document and compare performance of candidate SQGs approaches in a manner relevant to desired applications
Compare overall discriminatory ability Identify applications
Quantify performance– Validation dataset– Standardized measures
Compare performance and identify the most suitable approaches
Work in progress

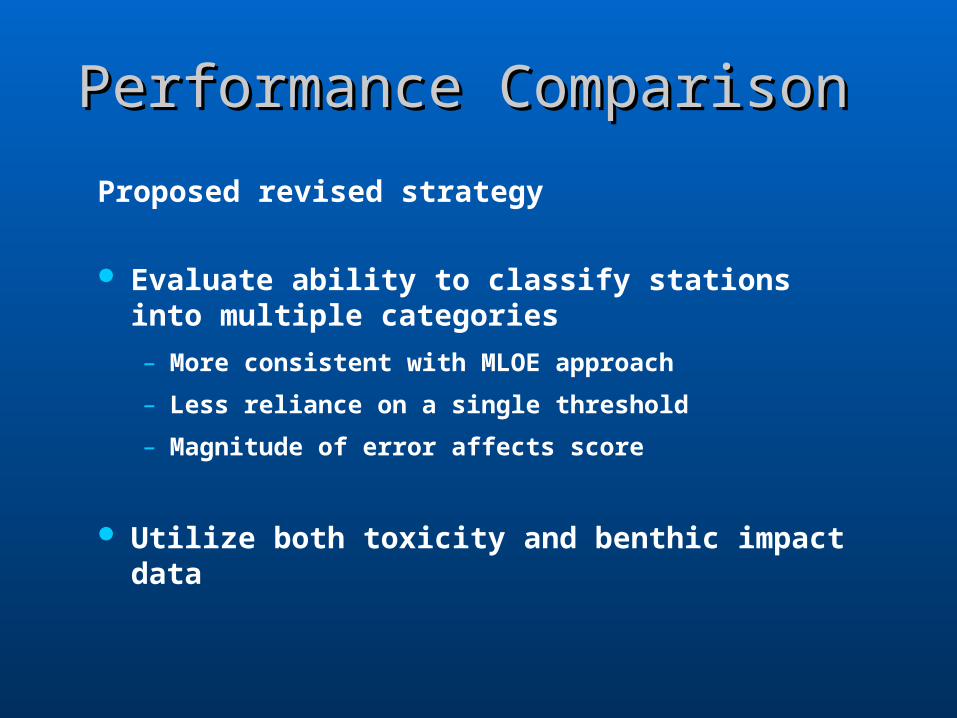
Performance ComparisonPerformance Comparison
Approach
– Focus on empirical guidelines
– Compare among candidates to select a short list
– Compare to existing approaches to evaluate need for new/calibrated approaches
Previous strategy for comparison
– Current work plan: Binary evaluation (effect/no effect)
– Calculate several measures of performance

Performance MeasuresPerformance Measures
Guideline Value
0 20 40 60 80 100 120
Freq
uenc
y
True Positive(Hit/Toxic)
Toxic Sample Distribution
A
BFalse Negative(No Hit/Toxic)
AB
Threshold
Nontoxic Sample Distribution
True Negative(No Hit/Nontoxic)
DC
False Positive(Hit/Nontoxic)
CD
Negative Predictive Value =C/(C+A) x 100(percent of no hits that are nontoxic)
Specificity=C/(C+D) x 100(percent of all nontoxic samples that are classified as a no hit)
Positive Predictive Value =B/(B+D) x 100(percent of hits that are toxic)
Sensitivity=B/(B+A) x 100(percent of all toxic samples that are classified as a hit)
Performance ComparisonPerformance Comparison
Proposed revised strategy
Evaluate ability to classify stations into multiple categories
– More consistent with MLOE approach
– Less reliance on a single threshold
– Magnitude of error affects score
Utilize both toxicity and benthic impact data

Observed Toxicity
Predicted Effect From SQG
High Moderate Marginal Reference
High 60 30 20 1
Moderate 33 50 25 0
Marginal 10 14 65 6
Reference 3 7 20 25
SQG 1 SQG 1

Kappa StatisticKappa Statistic
Developed in 1960-70’s
Used in medicine, epidemiology, & psychology
to evaluate observer agreement/reliability
– Similar problem to SQG assessment
– Can incorporate a penalty for extreme disagreement
Sediment quality assessment is a new application

Observed Toxicity
Kappa = 0.48 Predicted Effect From SQG
High Moderate Marginal Reference
High 60 30 20 1
Moderate 33 50 25 0
Marginal 10 14 65 6
Reference 3 7 20 25
SQG 1SQG 1(good association between adjacent categories) (good association between adjacent categories)
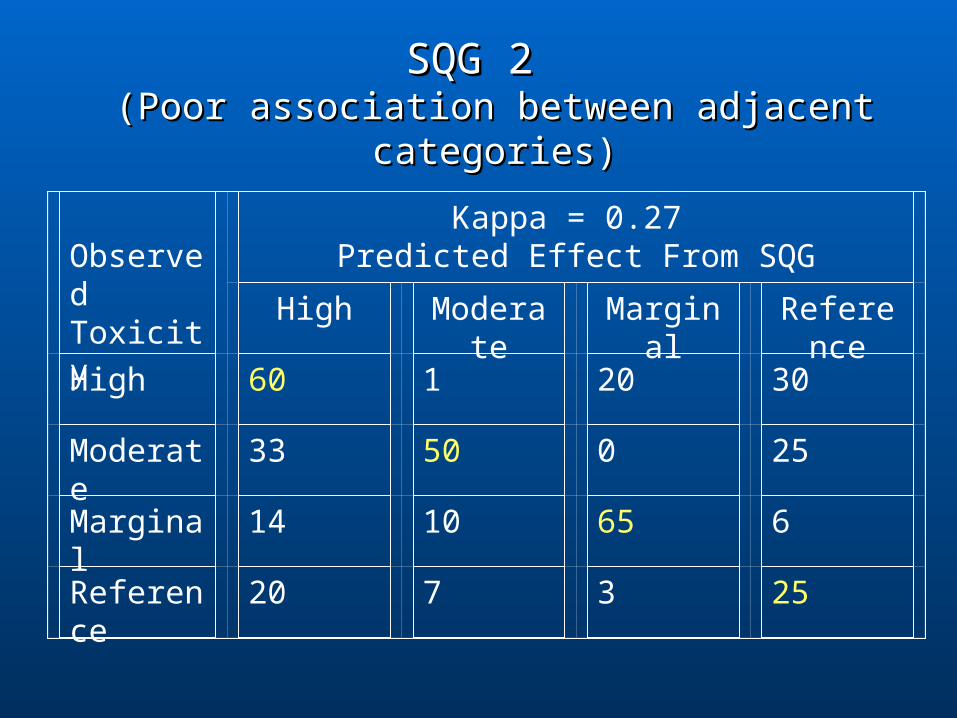
SQG 2 SQG 2 (Poor association between adjacent categories)(Poor association between adjacent categories)
Observed Toxicity
Kappa = 0.27 Predicted Effect From SQG
High Moderate Marginal Reference
High 60 1 20 30
Moderate 33 50 0 25
Marginal 14 10 65 6
Reference 20 7 3 25
Task 4: Describe Response LevelsTask 4: Describe Response Levels
Determine levels of response for the recommended SQG approaches
Relate SQGs to biological effect indicator responses (benthos & toxicity)
– May use statistical methods to optimize thresholds
Select response levels that correspond to objectives for performance and beneficial use protection
Methodology under development
SummarySummary Work on many key elements underway
– Priority is to build upon existing approaches
– Many of the technical obstacles have been dealt with
Overall approach is consistent with SSC recommendations
– Include empirical and mechanistic approaches
Expect to succeed in selecting recommended SQGs for use in MLOE framework
Much work remains, especially for development of thresholds
Related Documents