UNLV Theses, Dissertations, Professional Papers, and Capstones May 2018 Development of Chemical Separation Methods Using Transition Development of Chemical Separation Methods Using Transition Metals for Nuclear Forensic and Medicinal Applications Metals for Nuclear Forensic and Medicinal Applications Lucas Peter Boron-Brenner Follow this and additional works at: https://digitalscholarship.unlv.edu/thesesdissertations Part of the Radiochemistry Commons Repository Citation Repository Citation Boron-Brenner, Lucas Peter, "Development of Chemical Separation Methods Using Transition Metals for Nuclear Forensic and Medicinal Applications" (2018). UNLV Theses, Dissertations, Professional Papers, and Capstones. 3221. http://dx.doi.org/10.34917/13568394 This Dissertation is protected by copyright and/or related rights. It has been brought to you by Digital Scholarship@UNLV with permission from the rights-holder(s). You are free to use this Dissertation in any way that is permitted by the copyright and related rights legislation that applies to your use. For other uses you need to obtain permission from the rights-holder(s) directly, unless additional rights are indicated by a Creative Commons license in the record and/or on the work itself. This Dissertation has been accepted for inclusion in UNLV Theses, Dissertations, Professional Papers, and Capstones by an authorized administrator of Digital Scholarship@UNLV. For more information, please contact [email protected].

Welcome message from author
This document is posted to help you gain knowledge. Please leave a comment to let me know what you think about it! Share it to your friends and learn new things together.
Transcript

UNLV Theses, Dissertations, Professional Papers, and Capstones
May 2018
Development of Chemical Separation Methods Using Transition Development of Chemical Separation Methods Using Transition
Metals for Nuclear Forensic and Medicinal Applications Metals for Nuclear Forensic and Medicinal Applications
Lucas Peter Boron-Brenner
Follow this and additional works at: https://digitalscholarship.unlv.edu/thesesdissertations
Part of the Radiochemistry Commons
Repository Citation Repository Citation Boron-Brenner, Lucas Peter, "Development of Chemical Separation Methods Using Transition Metals for Nuclear Forensic and Medicinal Applications" (2018). UNLV Theses, Dissertations, Professional Papers, and Capstones. 3221. http://dx.doi.org/10.34917/13568394
This Dissertation is protected by copyright and/or related rights. It has been brought to you by Digital Scholarship@UNLV with permission from the rights-holder(s). You are free to use this Dissertation in any way that is permitted by the copyright and related rights legislation that applies to your use. For other uses you need to obtain permission from the rights-holder(s) directly, unless additional rights are indicated by a Creative Commons license in the record and/or on the work itself. This Dissertation has been accepted for inclusion in UNLV Theses, Dissertations, Professional Papers, and Capstones by an authorized administrator of Digital Scholarship@UNLV. For more information, please contact [email protected].

DEVELOPMENT OF CHEMICAL SEPARATION METHODS USING TRANSITION
METALS FOR NUCLEAR FORENSIC AND MEDICINAL APPLICATIONS
By
Lucas Peter Boron-Brenner
Bachelor of Science in Chemistry University of Maryland, College Park
2010
A dissertation submitted in partial fulfillment of the requirements for the
Doctor of Philosophy – Radiochemistry
Department of Chemistry and Biochemistry College of Sciences
The Graduate College
University of Nevada, Las Vegas May 2018

Copyright by Lucas Peter Boron-Brenner 2018 All Rights Reserved

ii
Dissertation Approval
The Graduate College The University of Nevada, Las Vegas
May 1, 2018
This dissertation prepared by
Lucas Peter Boron-Brenner
entitled
Development of Chemical Separation Methods Using Transition Metals for Nuclear Forensic and Medicinal Applications
is approved in partial fulfillment of the requirements for the degree of
Doctor of Philosophy – Radiochemistry Department of Chemistry and Biochemistry
Ralf Sudowe, Ph.D. Kathryn Hausbeck Korgan, Ph.D. Examination Committee Chair Graduate College Interim Dean
Ken Czerwinski, Ph.D. Examination Committee Member
Evelyn Bond, Ph.D. Examination Committee Member
Alexander Barzilov, Ph.D. Graduate College Faculty Representative
iii
ABSTRACT
Insufficient data exists on the effects of prompt fast neutron activation on metals found
commonly in nuclear devices and the urban environment. Different metals such as Ti, Au, Fe, and
Cu were activated using the Flattop Criticality Benchmark at the Device Assembly Facility on the
Nevada Test Site using a known neutron spectra and flux to determine a baseline cross section
value. Cross section information gathered from these neutron activation measurements could
provide information that helps government and law enforcement agencies to correctly trace the
origin of a nuclear device’s fuel or component features.
Based on activation products produced in the Flattop benchmark irradiations, chemical
separation methods were developed to isolate higher specific activity samples for doping simulated
urban melt glass debris. Extraction chromatography batch contact studies using resins from
Eichrom Technologies were performed to determine the retention of stable scandium and titanium.
Column studies adapted from these contact studies were optimized using higher mass loading for
later use to purify 46Sc, 47Sc, and 48Sc produced from natural titanium through the n-p nuclear
reaction.
This method shown above could also be applied to the field of nuclear medicine for use in
extracting 44Sc (a positron emitter) from 44Ti. Positron emitting radionuclides such as 44Sc, or
more commonly 13C, 14N, and 18F can be utilized in Positron Emission Tomography (PET), which
is a form of nuclear diagnostic medicine used to model metabolic processes. All of these isotopes
have half-lives of a few minutes to a few hours, which requires localized medical cyclotrons and
chemistry laboratories for production followed by separation.

iv
In recent years, interest has been shown in using longer-lived radioisotopes such as 52Mn
for positron emission tomography, which has a significantly longer half-life of 5.591 days and
similar positron decay energy. The isotope 52Mn could easily be produced at a cyclotron,
chemically separated, and shipped further distances allowing for a wider use of PET while
minimizing the need to purchase cyclotrons and chemistry laboratories. In this research, chemical
separation methods solvent extraction and extraction chromatography were employed to separate
stable Mn from Cr using trioctylamine (TOA) ligand. Once developed, this method will be used
to separation medically produced quantities of 52Mn from 52Cr.
v
TABLE OF CONTENTS
ABSTRACT ................................................................................................................................... iii
LIST OF TABLES .......................................................................................................................... x
LIST OF FIGURES ...................................................................................................................... xii
CHAPTER 1: INTRODUCTION ................................................................................................... 1
1.1 Motivation for Research ....................................................................................................... 1
1.2 Research Goals ..................................................................................................................... 3
1.3 Dissertation Overview .......................................................................................................... 4
1.4 Nuclear Forensics ................................................................................................................. 5
1.4.1 Pre and Post Detonation Analysis .................................................................................. 6
1.4.2 Neutron Activation ......................................................................................................... 9
1.4.3 Flattop Critical Assembly Benchmark ......................................................................... 10
1.4.4 Application to Research ............................................................................................... 13
1.5 Nuclear Medicine ................................................................................................................ 15
1.5.1 Application to Research ............................................................................................... 18
CHAPTER 2: CHEMICAL SEPARATIONS .............................................................................. 20
2.1 Solvent Extraction ............................................................................................................... 20
2.2 Extraction Chromatography ................................................................................................ 23
2.3 Application of Separation Methods .................................................................................... 26
2.3.1 Extraction of Scandium from Titanium ....................................................................... 26
2.3.2 Extraction of Manganese from Chromium .................................................................. 30
CHAPTER 3: METHODOLOGY ................................................................................................ 33
3.1 Materials ............................................................................................................................. 33
3.2 Cross Section Determination using Flattop Criticality Benchmark .................................... 34
3.2.1 Experimental Procedure ............................................................................................... 34
3.2.2 Flattop Data Analysis ................................................................................................... 34
3.2.2.1 Gamma Spectra Analysis ...................................................................................... 34
3.2.2.2 Flux and Cross Section Determination ................................................................. 35
3.3 Solvent Extraction Research ............................................................................................... 37
3.3.1 Solvent Extraction Study ............................................................................................. 37
3.3.1.1 Experimental Procedure ........................................................................................ 37
3.3.1.2 Data Analysis ........................................................................................................ 37
3.3.2 Kinetic Study ............................................................................................................... 38
vi
3.3.2.1 Experimental Procedure ........................................................................................ 38
3.3.2.2 Data Analysis ........................................................................................................ 38
3.3.3 Third Phase Formation Study ...................................................................................... 38
3.3.3.1 Experimental Procedure ........................................................................................ 38
3.3.3.2 Data Analysis ........................................................................................................ 38
3.4 Batch Contact Research ...................................................................................................... 39
3.4.1 Batch Contact Studies .................................................................................................. 39
3.4.1.1 Experimental Procedure ........................................................................................ 39
3.4.1.2 Data Analysis ........................................................................................................ 39
3.4.2 Kinetic Batch Contact Study ........................................................................................ 39
3.4.2.1 Experimental Procedure ........................................................................................ 39
3.4.2.2 Data Analysis ........................................................................................................ 40
3.4.3 Batch Contact Volume Correction ............................................................................... 40
3.4.3.1 Experimental Procedure ........................................................................................ 40
3.4.3.2 Data Analysis ........................................................................................................ 40
3.5 Column Studies ................................................................................................................... 41
3.5.1 Gravity Column Studies ............................................................................................... 41
3.5.1.1 Experimental Procedure ........................................................................................ 41
3.5.1.2 Data Analysis ........................................................................................................ 42
3.5.2 Vacuum Column Studies ............................................................................................. 42
3.5.2.1 Experimental Procedure ........................................................................................ 42
3.5.2.2 Data Analysis ........................................................................................................ 43
3.6 Instrumentation ................................................................................................................... 43
3.6.1 Inductively Coupled Plasma Atomic Emission Spectroscopy (ICP-AES) .................. 43
3.6.1.1 Theory ................................................................................................................... 43
3.6.1.2 Analysis Method ................................................................................................... 44
3.6.2 Inductively Coupled Plasma Mass Spectrometry (ICP-MS) ....................................... 44
3.6.2.1 Theory ................................................................................................................... 44
3.6.2.2 Analysis Method ................................................................................................... 45
3.6.3 High Purity Germanium (HPGe) Well Detector .......................................................... 45
3.6.3.1 Theory ................................................................................................................... 45
3.6.3.2 Analysis Method ................................................................................................... 45

vii
CHAPTER 4: DETERMINATION OF FAST NEUTRON CROSS SECTIONS USING ELEMENTS IRRADIATED ON THE FLATTOP CRITICALITY BENCHMARK ................. 46
4.1 Introduction ......................................................................................................................... 46
4.2 Materials ............................................................................................................................. 46
4.3 Experimental Procedure ...................................................................................................... 47
4.3.1 Metal Foil Measurements............................................................................................. 47
4.3.2 Data Analysis ............................................................................................................... 49
4.3.2.1 Gamma Spectra Analysis ...................................................................................... 50
4.3.2.2 Flux and Cross Section Determination ................................................................. 50
4.4 Results and Discussion ....................................................................................................... 50
4.3.1 Activity at Time Zero ................................................................................................... 50
4.4.2 Flux Determination ...................................................................................................... 52
4.4.3 Cross Section Determination ....................................................................................... 55
4.5 Conclusion .......................................................................................................................... 58
CHAPTER 5: BATCH CONTACT STUDIES OF SCANDIUM AND TITANIUM ON EXTRACTION CHROMATOGRAPHY RESINS FOR SEPARATION METHOD DEVELOPMENT ......................................................................................................................... 60
5.1 Introduction ......................................................................................................................... 60
5.2 Materials ............................................................................................................................. 60
5.3 Experimental Procedure ...................................................................................................... 61
5.3.1 Stock Solution Preparation .............................................................................................. 61
5.3.2 Ln 1 Resin .................................................................................................................... 61
5.3.2.1 Batch Contact Studies ........................................................................................... 61
5.3.2.2 Data Analysis ........................................................................................................ 62
5.3.3 DGA Normal Resin ...................................................................................................... 62
5.3.3.1 Batch Contact Studies ........................................................................................... 62
5.3.3.2 Data Analysis ........................................................................................................ 63
5.3.3.3 Kinetic Batch Contact Study ................................................................................. 64
5.3.3.4 Data Analysis ........................................................................................................ 64
5.4 Results and Discussion ....................................................................................................... 65
5.4.1 Ln 1 Resin .................................................................................................................... 65
5.4.2 DGA Resin ................................................................................................................... 68
5.4.2.1 Single Analyte Batch Studies ................................................................................ 68

viii
5.4.2.2 Kinetic Batch Study .............................................................................................. 70
5.4.2.3 Dual Analyte Batch Studies .................................................................................. 72
5.4.2.4 Comparison of Scandium Retention Studies ........................................................ 75
5.4.2.5 Comparison of Titanium Retention Studies .......................................................... 82
5.5 Conclusions ......................................................................................................................... 85
CHAPTER 6: SEPARATION OF TITANIUM AND SCANDIUM USING DGA RESIN COLUMN STUDIES .................................................................................................................... 87
6.1 Introduction ......................................................................................................................... 87
6.2 Materials ............................................................................................................................. 87
6.3 Experimental Procedure ...................................................................................................... 88
6.3.1 Gravity Column Studies ............................................................................................... 88
6.3.1.1 Data Analysis ........................................................................................................ 89
6.3.2 Vacuum Column Studies ............................................................................................. 89
6.3.2 Data Analysis ............................................................................................................... 90
6.4 Results and Discussion ....................................................................................................... 90
6.4.1 Gravity Column Studies ............................................................................................... 90
6.4.2 Vacuum Column Studies ............................................................................................. 94
6.5 Conclusion .......................................................................................................................... 97
CHAPTER 7: DEVELOPMENT OF A SOLVENT EXTRACTION SYSTEM USING TRIOCYTLAMINE FOR SEPARATION OF MANGANESE FROM CHROMIUM ............... 99
7.1 Introduction ......................................................................................................................... 99
7.2 Materials ........................................................................................................................... 100
7.3 Experimental Procedure .................................................................................................... 100
7.3.1 Solvent Extraction Study ........................................................................................... 100
7.3.1.1 NexION 350 ICP-MS Method ............................................................................ 101
7.3.1.2 Data Analysis ...................................................................................................... 101
7.3.2 Kinetic Study ............................................................................................................. 101
7.3.2.2 Data Analysis ...................................................................................................... 101
7.3.3 Third Phase Formation Study .................................................................................... 102
7.3.3.2 Data Analysis ...................................................................................................... 102
7.4 Results and Discussion ..................................................................................................... 103
7.4.1 Solvent Extraction Studies ......................................................................................... 103
7.4.1.1 Varied Acid Concentration Studies .................................................................... 103

ix
7.4.1.2 Varied TOA Concentration Studies .................................................................... 108
7.4.2 Kinetic Solvent Extraction Studies ............................................................................ 114
7.4.3 Third Phase Studies .................................................................................................... 116
7.5 Conclusion ........................................................................................................................ 117
CHAPTER 8: BATCH CONTACT STUDIES OF MANGANESE AND CHROMIUM ON EXTRACTION CHROMATOGRAPHY RESINS FOR SEPARATION METHOD DEVELOPMENT ....................................................................................................................... 120
8.1 Introduction ....................................................................................................................... 120
8.2 Materials ........................................................................................................................... 121
8.3 Experimental Procedure .................................................................................................... 121
8.3.1 Batch Contact Studies ................................................................................................ 121
8.3.1 Data Analysis ............................................................................................................. 122
8.4 Results and Discussion ..................................................................................................... 122
8.5 Conclusion ........................................................................................................................ 132
CHAPTER 9: CONCLUSIONS AND FUTURE WORK .......................................................... 134
9.1 Introduction ....................................................................................................................... 134
9.2 Flattop Irradiations ............................................................................................................ 134
9.3 Extraction of Scandium from Titanium ............................................................................ 136
9.4 Extraction of Manganese from Chromium ....................................................................... 137
APPENDIX A: FLATTOP CALCULATIONS .......................................................................... 140
A.1 Sample Calculation with Assumptions for Chapter 4 ...................................................... 140
A.1.1 Activity Determination for 198Au .............................................................................. 140
A.1.2 Flux Determination for 198Au .................................................................................... 142
APPENDIX B: RAW DATA FOR FIGURES ........................................................................... 145
REFERENCES ........................................................................................................................... 155
CURRICULUM VITAE ............................................................................................................. 161

x
LIST OF TABLES
Table 1: Comparison of costs saved per year using PET by clinical procedures in 2005 ............ 16
Table 2: Properties of some common positron emitting nuclides of interest3 .............................. 17
Table 3: Elements irradiated using the Flattop Benchmark Critical Assembly ............................ 47
Table 4: Target properties of elements irradiated in run 1 ............................................................ 48
Table 5: Target properties of elements irradiated in run 2 ............................................................ 48
Table 6: Target properties of elements irradiated in run 3 ............................................................ 49
Table 7: Target properties of elements irradiated in run 4 ............................................................ 49
Table 8: Measured activation products for run 1 .......................................................................... 51
Table 9: Measured activation products for run 2 .......................................................................... 51
Table 10: Measured activation products for run 3 ........................................................................ 51
Table 11: Measured activation products for run 4 ........................................................................ 52
Table 12: Parameters used to determine the Au-196 flux for all runs .......................................... 53
Table 13: Parameters used to determine the Au-198 flux for all runs .......................................... 53
Table 14: Comparison of fluxes determined for Au-196 and Au-198 in each run ...................... 54
Table 15: Comparison of calculated cross sections for each activation product in run 1 ............. 55
Table 16: Comparison of calculated cross sections for each activation product in run 2 ............. 56
Table 17: Comparison of calculated cross sections for each activation product in run 3 ............. 57
Table 18: Comparison of calculated cross sections for each activation product in run 4 ............. 58
Table 19: Physical constants of slurry-packed columns ............................................................... 64
Table 20: DGA resin volume corrections ..................................................................................... 64
Table 21: Percent analyte recovery for each elution phase of the 1:2 ratio Sc to Ti elution profile in figure 6.1 ................................................................................................................................... 91
Table 22: Decontamination factors for each elution phase of the 1:2 ratio Sc to Ti elution profile in figure 6.1 ................................................................................................................................... 92
Table 23: Percent analyte recovery for each elution phase using a 1:100 ratio of Sc to Ti .......... 93
Table 24: Decontamination factors for each elution phase using a 1:100 ratio of Sc to Ti .......... 94
Table 25: Decontamination factors for each elution phase using a 1:100 ratio of Sc to Ti at a flow rate 1 mL/min ................................................................................................................................ 95
Table 26: Decontamination factors for each elution phase using a 1:100 ratio of Sc to Ti at a flow rate 3 mL/min ................................................................................................................................ 96
Table 27: Decontamination factors for each elution phase using a 1:100 ratio of Sc to Ti at a flow rate 5 mL/min ................................................................................................................................ 96
Table 28: Kinetic solvent study of Mn and Cr in HNO3 ............................................................. 114

xi
Table 29: Kinetic solvent study of Mn and Cr in HCl ................................................................ 115
Table 30: Percent octanol needed to reduce third phase formation in HCl ................................ 116
Table 31: Percent octanol needed to reduce third phase in HNO3 .............................................. 117
Table 32: Triskem extraction chromatography resins using trioctylamine (TOA) ligand .......... 120
Table 33: Resin 1 volume corrections in hydrochloric and nitric acid ....................................... 122
Table 34: Volume corrections for resins 2, 3, 4, and 5 in hydrochloric acid .............................. 122
Table 35: Raw data used for figure 13 (values in italics means LOD) ....................................... 145
Table 36: Raw data used for figure 14 ........................................................................................ 145
Table 37: Raw data used for figures 15, 20, 22, and 24 ............................................................. 145
Table 38: Raw data used for figures 16, 17, 21, 23, and 25 ....................................................... 146
Table 39: Raw data used for figure 17 ........................................................................................ 146
Table 40: Raw data used for figures 18, 22, and 24 ................................................................... 146
Table 41: Raw data used for figures 19, 23, and 25 ................................................................... 147
Table 42: Raw data used for figures 22, and 24 ......................................................................... 147
Table 43: Raw data used for figures 23, and 25 ......................................................................... 147
Table 44: Raw data used for figure 22 ........................................................................................ 148
Table 45: Raw data used for figure 23 ........................................................................................ 148
Table 46: Raw data used for figure 26 ........................................................................................ 149
Table 47: Raw data used for figure 28 ........................................................................................ 150
Table 48: Raw data used for figure 29 ........................................................................................ 150
Table 49: Raw data used for figure 30 ........................................................................................ 150
Table 50: Raw data used for figure 31 ........................................................................................ 150
Table 51: Raw data used for figure 32 ........................................................................................ 151
Table 52: Raw data used for figure 33 ........................................................................................ 151
Table 53: Raw data used for figure 34 ........................................................................................ 151
Table 54: Raw data used for figure 35 and 36 ............................................................................ 151
Table 55: Raw data used for figure 37 ........................................................................................ 152
Table 56: Raw data used for figure 38 ........................................................................................ 152
Table 57: Raw data used for figure 39 ........................................................................................ 152
Table 58: Raw data used for figure 40 ........................................................................................ 153
Table 59: Raw data used for figure 41 ........................................................................................ 153
Table 60: Raw data used for figure 42 ........................................................................................ 153
Table 61: Raw data used for figure 43 ........................................................................................ 154

xii
LIST OF FIGURES
Figure 1: Isobar yield of fission of 233U, 235U, and 239Pu7............................................................... 7
Figure 2: Schematic of Flattop (Aerial View)10 ............................................................................ 11
Figure 3: Schematic of Flattop (Side View)10............................................................................... 12
Figure 4: Flattop Benchmark Criticality Assembly10 ................................................................... 12
Figure 5: Nuclear reactions n-p, n-2n, and n-γ ............................................................................. 13
Figure 6: An example of a positron emission tomography (PET) instrument20 ........................... 15
Figure 7: Schematic of solvent extraction phases in a test tube ................................................... 22
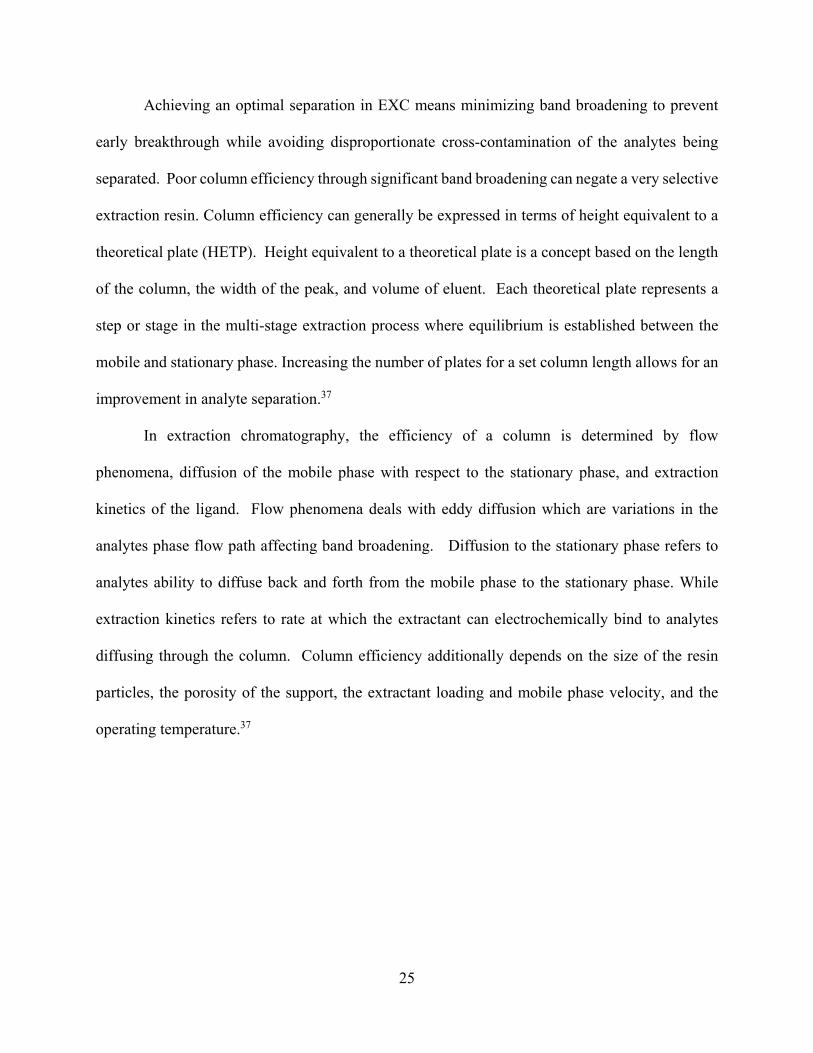
Figure 8: HDEHP ligand structure ................................................................................................ 28
Figure 9: Trivalent metal complexation structure using HDEHP ligands52,53 .............................. 29
Figure 10: TODGA ligand structure ............................................................................................. 29
Figure 11: Trioctylamine (TOA) ligand structure ........................................................................ 31
Figure 12: Equilibrium expression for the extraction of Mn(II) into the organic phase using TOA62 ............................................................................................................................................ 31
Figure 13: Single analyte batch contact studies using Ln 1 resin in nitric acid ............................ 65
Figure 14: Single analyte batch contact studies using Ln resin in hydrochloric acid ................... 66
Figure 15: UNLV single analyte batch contact study DGA resin in nitric acid ........................... 68
Figure 16: UNLV single analyte batch contact study using DGA resin in hydrochloric acid ...... 69
Figure 17: UNLV single analyte kinetic study using DGA resin in hydrochloric acid ................ 71
Figure 18: UNLV dual analyte batch contact study using DGA resin in nitric acid .................... 72
Figure 19: UNLV dual analyte batch contact study using DGA resin in hydrochloric acid ........ 74
Figure 20: Comparison of multiple scandium retention studies using DGA resin in nitric acid.The Roman, Alliot, and Dirks data was extracted from published papers16,80,81 .......................... 76
Figure 21: Comparison of multiple scandium retention studies using DGA resin in hydrochloric acid. The Roman, Alliot, and Dirks data was extracted from published papers16,80,81 ................ 78
Figure 22: Comparison of UNLV, CSU, and LANL methods for scandium retention on DGA resin in nitric acid.......................................................................................................................... 80
Figure 23: Comparison of UNLV, CSU, and LANL batch contact study methods for scandium using DGA resin in hydrochloric acid .......................................................................................... 81
Figure 24: Comparison of multiple titanium retention studies using DGA resin in nitric acid. Pourmand’s data was extrapolated from previously published work82 ........................................ 83
Figure 25: Comparison of multiple titanium retention studies using DGA resin from in hydrochloric acid. Pourmand’s data was extrapolated from previously published work82 ......... 84
Figure 26: Elution profile for the 1:2 ratio of Sc to Ti gravity column study using wet slurry DGA resin. Analyte recoveries of 98.62 ± 1.25% for Sc and 99.51 ± 2.22% for Ti. .................. 91
xiii
Figure 27: Gravity column elution fraction study for the 1:100 ratio of Sc to Ti using wet slurry DGA resin ..................................................................................................................................... 93
Figure 28: Vacuum column studies separating Sc from Ti at a 1:100 ratio using prepacked DGA resin cartridges at various flow rates ............................................................................................ 95
Figure 29: Solvent extraction study of Mn and Cr using 0.8 M TOA at varied nitric acid concentrations ............................................................................................................................. 103
Figure 30: Percent analyte extraction of Mn and Cr using 0.8 M TOA at varied nitric acid concentrations ............................................................................................................................. 105
Figure 31: Solvent extraction study of Mn and Cr using 0.8 M TOA at varied hydrochloric acid concentrations ............................................................................................................................. 106
Figure 32: Percent analyte extraction of Mn and Cr using 0.8 M TOA at varied hydrochloric acid concentrations ...................................................................................................................... 107
Figure 33: Solvent extraction study of Mn and Cr using 9 M nitric acid at varied TOA ligand concentrations ............................................................................................................................. 109
Figure 34: Percent analyte extraction of Mn and Cr using 9 M nitric acid at varied TOA ligand concentrations ............................................................................................................................. 110
Figure 35: Solvent extraction study of Mn and Cr using 9 M hydrochloric acid at varied TOA ligand concentrations .................................................................................................................. 111
Figure 36: TOA ligand to Mn coordination determination using a 9 M hydrochloric acid solvent extraction system ........................................................................................................................ 112
Figure 37: Percent analyte extraction of Mn and Cr using 9 M hydrochloric at varied TOA ligand concentrations ............................................................................................................................. 113
Figure 38: Single and dual analyte batch contact studies using resin 1 in nitric acid ................. 123
Figure 39: Single and dual analyte batch contact studies using resin 1 in hydrochloric acid ..... 124
Figure 40: Single and dual analyte batch contact studies using resin 2 in hydrochloric acid ..... 126
Figure 41: Single and dual analyte batch contact studies using resin 3 in hydrochloric acid ..... 127
Figure 42: Single and dual analyte batch contact studies using resin 4 in hydrochloric acid ..... 129
Figure 43: Single and dual analyte batch contact studies using resin 5 in hydrochloric acid ..... 131
1
CHAPTER 1: INTRODUCTION
1.1 Motivation for Research
“The Manhattan Project, effected by the United States during World War II, forever
changed the technical, social and political framework of the world.”1
Development of the nuclear industry led to the significant advancement in energy
production, medical treatments, and weapon capabilities. Fission of a nucleus provided the
capability to release 109 times more energy than the exothermic release from a chemical reaction
of equal mass. Controlled nuclear reactions can be used to produce energy in a reactor, or used to
produce radioisotopes useful to irradiation of cancerous tumors. However, the main driving force
behind the advent of nuclear technology was for the development of significantly more devastating
weapons compared to conventional explosives.
In the summer of 1945, two nuclear weapons, nicknamed Little Boy and Fat Man were
dropped on Japan over the course of three days. Little Boy, a gun-type design fueled by 235U with
an explosive yield of ~15 kilotons, and Fat Man, an implosion type design fueled by 239Pu with an
explosive yield of ~21 kilotons, caused a combined 210,000 fatalities by the end of 1945.1 Single
explosive devices of such devastation had never been seen before hence the name “Weapons of
Mass Destruction”.
After WWII, an arms race began between the United States and the Soviet Union (USSR)
leading to proliferation in the number, type, and explosive yield of nuclear weapons. By 1986, the
Soviet Union had an arsenal of 45,000 warheads averaging five hundred kilotons each which was
enough to destroy over 60% of the United States land and water mass from the combination of the
initiation detonation and the subsequent radiation fallout.1 The United State of America had

2
comparable arsenal as well which led to the term Mutually Assured Destruction (MAD) defining
the state of the world where either side could completely annihilate at least 40% of an adversary’s
population and 70% of its industry. Even today, after the Cold War, after significant reduction in
the nuclear weapons stockpile, the United States and Russia each possess thirty four tons of
weapons-grade plutonium waiting for disposal with a total potential up to 20,000 weapons if placed
in the wrong hands.2 In attempts to safeguard against use of these weapons, forensic methods have
been developed in an attempt to deter smuggling or misuse of nuclear materials.
In addition to a new class of weapons, the field of medicine was advanced by the nuclear
industry. Use of radioisotopes produced from nuclear reactors or accelerators have allowed for
significant advancements in imaging, diagnostics, and treatment in the fields of oncology,
cardiology, and neurology. Generally, gamma and x-ray emitters are useful for imaging tumors
or tracing the biological pathways of compounds in the human body. This is performed through
the addition of a tracer (radionuclide) to a biomolecule that emits electromagnetic radiation as it
passes through the system. The electromagnetic radiation produced from annihilation of a beta
and electron is measured using a detector and is converted images. Alpha and beta emitters are
useful for treating tumors through localized emission of radiation to cancer cells. An example of
this method is through the use of the 131I tracer which will concentrate in the thyroid gland.3–5
In either case, the production of nuclear fuels for weapons or radioisotopes used for medical
applications require separation methods to isolate isotopes of interest. In the case of nuclear fuels,
separations can be utilized to measure specific chemical or physical characteristics linking
materials to their production sources. In this dissertation work, chemical separation methods were
applied to concentrate radioisotopes to determine nuclear information useful for post detonation
nuclear forensics and isolate radioisotopes to perform imaging of the human body.

3
1.2 Research Goals
In the 1st portion of the dissertation, the fast neutron reaction capture cross sections of
elements found in the earth’s crust, weapon device composition, and urban construction materials
was determined using gamma decay measurements of activated metal foils. These activated metal
samples were produced simulating the effects of 235U fission using the Flattop Benchmark Critical
Assembly. Batch contact studies using extraction chromatography (EXC) resins from Eichrom
Technologies were performed to measure the retention of stable scandium and titanium in varying
concentrations of mineral acids. Additional kinetic studies were performed to insure sufficient
extraction was performed. Based on the optimal separation factor, the separation conditions were
applied to gravity column studies to separate Sc from Ti followed by adaption to vacuum column
studies allowing a significant increase in mass loading to simulate the quantities of 46-50Sc
produced from activated natTi foil.
In the 2nd portion of the dissertation, solvent extraction (SX) was employed to separate
stable Mn from Cr. This work is being performed for the purpose of isolating activated 52Mn from
52Cr for use in positron emission tomography (PET). Based on previous SX studies using the
trioctylamine (TOA) ligand, quantification and improvements in third phase reduction, extraction
kinetics, and retention studies were performed to determine optimal separation parameters. Resins
based on the SX studies were produced through Triskem International SAS for characterization by
batch contact studies to determine separation potential.

4
1.3 Dissertation Overview
Chapter 1 provides a general introduction to nuclear forensics and nuclear medicine in
addition to the project goals for this dissertation. Chapter 2 provides background information on
the separation methods used for the project goals. Chapter 3 provides experimental procedures,
data analysis, and background on instruments utilized. Chapter 4 displays the results of the neutron
activation on metal foils using the Flattop Critical Benchmark Assembly followed by flux and
cross section determination. Chapter 5, 6, 7, and 8 consist of experimental separation studies
followed by discussion of the results. Chapter 5 shows the use of extraction chromatography resins
for batch contact studies of titanium and scandium. Chapter 6 shows the gravity and vacuum
column separation studies of titanium and scandium based on the work in chapter 5. Chapter 7
shows the solvent extraction studies of manganese from chromium. Chapter 8 shows the use of
extraction chromatography resins based on chapter 7 to separate manganese from chromium.
Chapter 9 provides a conclusion of the work followed by an appendix displaying all of the raw
data for the dissertation.

5
1.4 Nuclear Forensics
In the event of a nuclear detonation, significant quantities of fissile material (233U, 235U, or
293Pu) or fissionable material (237Np, 238U, or 234U)1 in a supercritical form will fission emitting
thermal energy, radioactive particles, and fission products. Characteristics of the device, in
addition to the altitude of the detonation will affect the distribution of energy and the prompt versus
long term radiation effects from nuclear fallout. As part of the detonation, an enormous flux of fast
neutrons (1020 at ground zero for a device on the surface)6 would be emitted varying by distance
from the epicenter. The surrounding environment will be irradiated by neutrons in the form of
scatter or capture reactions and gamma/X-rays which contribute significantly to the dose received
near ground-zero.
The magnitude of the blast and energy of the emitted particles is determined by the
isotopics of the fuel being used and the type of device being utilized. The three fissile isotopes
designated special nuclear materials (SNM) refer to 233U, 235U, and 293Pu. Fissile isotopes are able
to fission through the capture of thermal (0.025 eV) neutrons causing the nucleus to be excited
causing deformation releasing into two primary fission fragments along with neutrons and gamma
radiation.
There are two general methods used in employment of supercritical masses. The one stage
fission device also known as the gun type weapon involves two subcritical masses propelled by an
explosive assembling a supercritical mass. One state fission devices are usually composed of 235U
or 233U. The second method, known as an implosion device involves a subcritical mass of fissile
fuel surrounded by explosive propellant. Compression of a subcritical mass causes the fuel density
to drastically increase while decreasing the surface area. Additionally, boosting was developed to

6
greatly increase the number of high energy neutrons release useful for extend the longevity and
efficiency of the fission fuel process.1 With the rapid compression by the explosive propellant,
the pressure and temperature increase radically causing fusion to occur in the secondary
component. Fusion as opposed to fission occurs through the combination of smaller atomic masses
isotopes (e.g. D-D, Li-D, D-T) producing fast energy neutrons. These neutrons energies vary from
3 to 4 MeV for D-D fusion and 14 MeV for D-T.1
It is important to note that each different fuel type has different enrichment thresholds
needed to be considered weapons grade material. For 235U, weapons grade fuel consists of greater
than 90% (93.5 wt.% in the US) while 239Pu requires greater than 93% 239Pu and 7% or less 240Pu.
Different quantities are necessary based on properties of the device such as propellant and
reflectors. A bare isolated sphere of critical mass needs far greater quantities of fuel (52 kg for
235U) as opposed to a fully reflected sphere (17 kg 235U). However, a bare isolate sphere of about
10-15 kg of 239Pu (based on metallurgical phase) or 233U would be all that is needed for
supercriticality.6
1.4.1 Pre and Post Detonation Analysis
In the field of nuclear forensic analysis (NFA), there is pre-detonation and post detonation
analysis. Pre-detonation analysis involves measurements of isotopic signatures and other well
characterized features of fuels, device materials, and or entire weapons which are generally
traceable to unique manufacturing and enrichment processes of each nuclear state. Post detonation
analysis is significantly more complicated as the process of a nuclear detonation will alter the
isotopic makeup of the fuel through fission creating fission products and releasing radiation
through heat and particulates that will changed the surrounding environmental. Depending where
7
the device is detonated will greatly affect how the components are spread out and mixed in the
surrounding area. It is unlikely that a significant fraction of the total analyte inventory will be
recovered for analysis.1
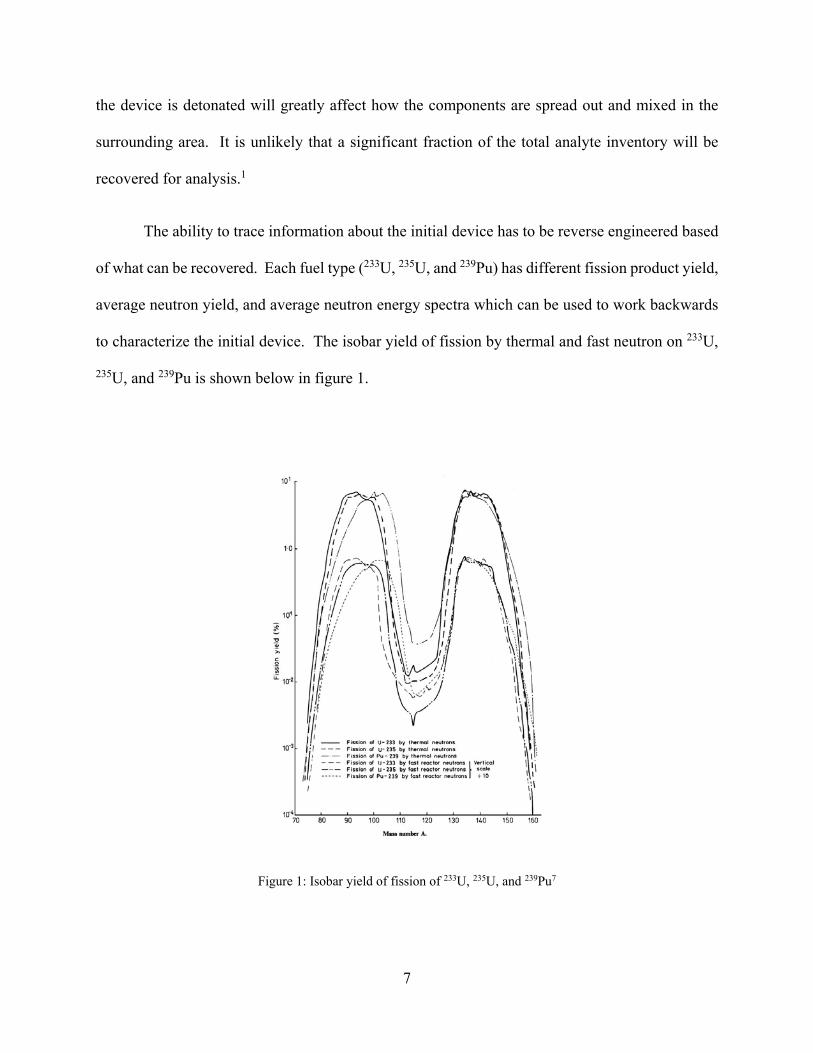
The ability to trace information about the initial device has to be reverse engineered based
of what can be recovered. Each fuel type (233U, 235U, and 239Pu) has different fission product yield,
average neutron yield, and average neutron energy spectra which can be used to work backwards
to characterize the initial device. The isobar yield of fission by thermal and fast neutron on 233U,
235U, and 239Pu is shown below in figure 1.
Figure 1: Isobar yield of fission of 233U, 235U, and 239Pu7

8
Each of the spectra differ enough that it may be feasible to trace enough information about
the device employed if the distribution of products was evenly spread. However, the radioactive
products will fractionate based on their relative volatility to a degree based the altitude, location,
weather patterns as well as inconsistent mixing with the natural and urban environment. Previous
nuclear testing performed were used to see the effects on the natural environment, but no testing
has been performed on a contemporary urban center. The common urban environment consists
mainly of roads, sidewalks, buildings, and automobiles which are comprised of cement, concrete,
metal, and glass. In the US, a standard composition for each common form of these materials has
been determined by the National Institute of Standards and Technology (NIST) which is invaluable
for post detonation analysis. Fast-neutrons (1-20 MeV)8 released from a detonation will interact
with elemental nuclei in these materials through capture or scatter reactions. Capture reactions
are of particular interest, as they will produce activation products based on the neutron flux and
energy of the fuel employed in the detonation.6
Post detonation analysis includes nondestructive (NDA) and destructive analysis (DA)
methods to collect information from debris such as melt glass. The NDA method generally refers
to radioanalytical measurements of samples to gain insight about isotopic composition. Isotopes
such as 137Cs, are ideal due to their significant γ transition ratios and small number of unique full
energy photopeaks. Other NDA tools such as microscopy are generally useful to gain
morphological or structure characteristics used in sample preparation. Samples with very high
versus low activity would ideally be treated differently such as would melt glass versus metal
samples. In many cases, conclusive information cannot be gained through NDA such as in the
case of multiple isotopes with interfering decay schemes or energies.

9
The DA method is essential for forensic samples such as melt glass that require changes in
physical and or chemical properties to measure other forms of radiation. Alpha, beta and x-ray
radiation has a significantly shorter range than gamma rays and will likely be attenuated in a solid
sample. Other methods can be employed to measure isotopic and elemental abundance
information through use of inductively coupled plasma mass spectrometry (ICP-MS) or optical
emission spectroscopy (ICP-OES) for samples in the ppm to ppt range. These methods are
generally used for lower activity samples. More information on these instruments is shown below
in chapter 3.
1.4.2 Neutron Activation
The process of neutron activation is used to simulate the effects of a specific neutron
spectra irradiating samples to produce radioisotopes. NDA of radioisotopes with neutrons is
known as Neutron Activation Analysis (NAA) while radioisotopes produced required chemical
separation to remove interfering species or require concentration to increase specific activity is
known as Radiochemical Neutron Activation Analysis (RNAA).1 The general equation for
neutron activation is shown below as equation 1.
∙ Φ ∙ (1)8
Rp or the rate of isotope production is determined from the initial flux of neutrons per unit
volume Φ, the capture cross section σ, and the number of targets per unit volume N.8 The flux and
targets employed can vary based on the needs of the production experiment while the cross section
10
is a physical constant based on the probability of capture of a neutron at a given energy for a
specific isotope. In an ideal situation, the neutron flux and average neutron energy can be
determined based on measuring the abundance and isotopic ratios of activation. However, in a
real world situation, activation products like fission products would be heterogeneously distributed
and activation product isotopics would be used synergistically with fission product isotopics to
trace origin of the material.
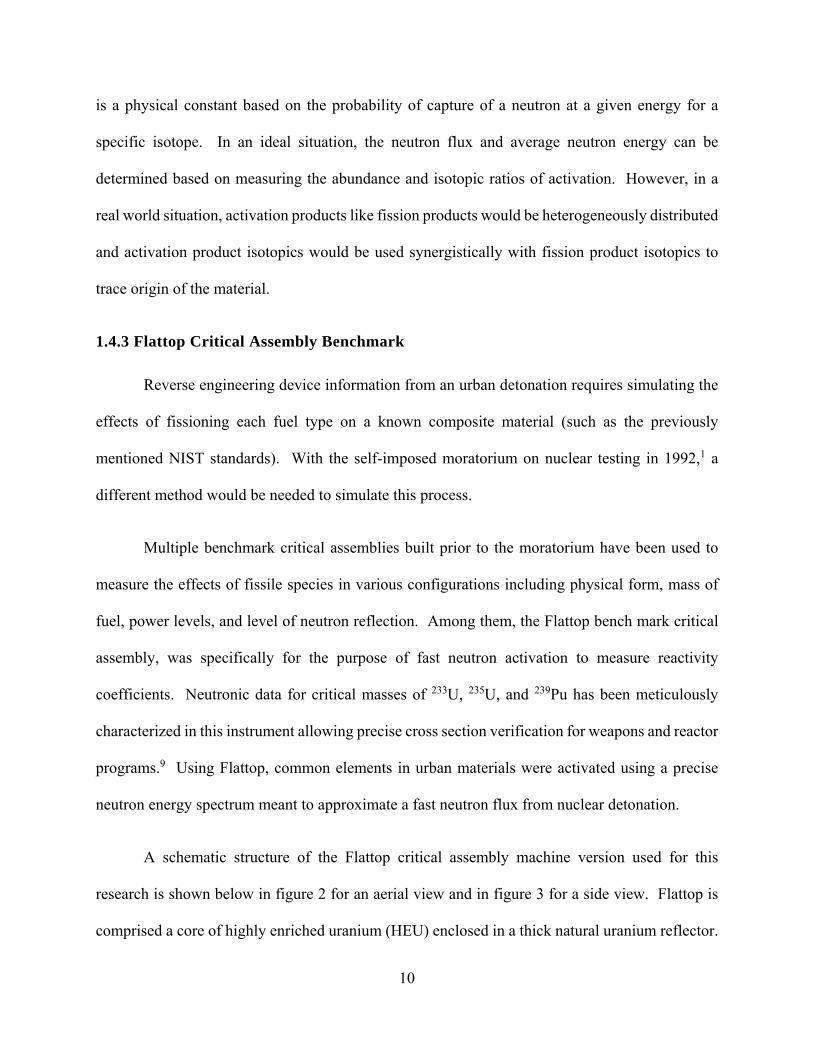
1.4.3 Flattop Critical Assembly Benchmark
Reverse engineering device information from an urban detonation requires simulating the
effects of fissioning each fuel type on a known composite material (such as the previously
mentioned NIST standards). With the self-imposed moratorium on nuclear testing in 1992,1 a
different method would be needed to simulate this process.
Multiple benchmark critical assemblies built prior to the moratorium have been used to
measure the effects of fissile species in various configurations including physical form, mass of
fuel, power levels, and level of neutron reflection. Among them, the Flattop bench mark critical
assembly, was specifically for the purpose of fast neutron activation to measure reactivity
coefficients. Neutronic data for critical masses of 233U, 235U, and 239Pu has been meticulously
characterized in this instrument allowing precise cross section verification for weapons and reactor
programs.9 Using Flattop, common elements in urban materials were activated using a precise
neutron energy spectrum meant to approximate a fast neutron flux from nuclear detonation.
A schematic structure of the Flattop critical assembly machine version used for this
research is shown below in figure 2 for an aerial view and in figure 3 for a side view. Flattop is
comprised a core of highly enriched uranium (HEU) enclosed in a thick natural uranium reflector.

11
The core consists of two screwed together sitting on a pedestal track that can be positioned using
a hand crank. The reflector is split into one stationary hemisphere, and two moveable quarter
spheres on tracks. One sphere is moved using either hydraulic pressure while the other uses a
motor. Additionally, there are three voids that can be filled with plugs or control rods composed
of natural uranium to control the neutronics of the system. Finally there is a glory hole between
the two quarter spheres going into the HEU core where samples were placed for irradiation.9,10 An
image of the Flattop assembly is shown below in figure 4.
Figure 2: Schematic of Flattop (Aerial View)10

12
Figure 3: Schematic of Flattop (Side View)10
Figure 4: Flattop Benchmark Criticality Assembly10

13
1.4.4 Application to Research
As previously stated in the research objectives, the Flattop critical assembly was used to
irradiate elements founds in the earth’s crust, components of detonation device, and urban
construction materials. Use of a known neutron energy spectra and flux, fast neutron reaction
cross sections by measuring the radioactive decay of activation products. The three main reactions
seen were n-p, n-2n, and n-γ. Examples of these reactions are shown below in figure 5.
→
→ 2
→
Figure 5: Nuclear reactions n-p, n-2n, and n-γ
For gamma emitting isotopes of significant activity produced, determining the amount of
activation product is simple and can be performed using NDA. Difficulty arises when activation
products produced do not have significant activity, clear gamma photopeaks, or are stable
preventing the use of NDA. DA must be used in these cases. The elements irradiated were
aluminum (Al) , gold (Au), chromium (Cr), cobalt (Co), copper (Cu), iron (Fe), iridium (Ir), nickel
(Ni), lead (Pb), platinum (Pt), titanium (Ti), and tungsten (W). All of these samples are found in
NIST reference alloys, concretes, and cements.11 Additionally, Ti, Ir, and Au can be used to
measure the fission rates of uranium and plutonium.12 Historically, test shots using Oralloy

14
incorporated Ti as an indicator of the fission fraction based on the fast neutron n-p reaction of 47Ti
to 47Sc.13
In real world situations, samples collected will be in a different matrix requiring
sophisticated DA to analyze isotopic composition. Samples produced from a nuclear detonation
will be composed variable amounts of metal, concrete, cement, and glass. Production and
characterization of melt glass standards is required matching similar environmental and detonation
conditions so as to develop specific radioisotope separation methods. Examples of different
synthetic melt glasses comparing environments, and different bomb designs has been produced by
Nizinski,14 and Molgaard.15 Experimental methods need to be produced to efficiently measure
isotopic prior to real world samples. Examples of sample digestion, and separation methodology
using simulated melt glass was performed by Roman, and Bond,16 for separating multiple 1st row
transition metals.
This dissertation work, involves developing a chemical separation method for application
to activated scandium (46-50Sc) from natural titanium (46-50Ti) for use in producing artificial debris.
The production of radioactive scandium is very minimal as shown later in the data and requires
separation and concentration to increase specific activity. The longest lived isotope produced is
46Sc with an 83.79 day half-life.17 Improving capture cross section measurements of radioisotopes
of Sc is important to the weapons stockpile in addition to use for nuclear forensics.
Additionally, this separation method developed for nuclear forensic purposes could be
applied to nuclear medicine. Chemical separation methods developed for nuclear forensic
purposes rely on the same principles and can be adapted for use in nuclear medicine. The Ti/Sc
separation mentioned previously could be applied to separate 44Ti from 45Sc which was found
useful in nuclear imaging.18,19

15
1.5 Nuclear Medicine
In the third part of the research, chromatographic separation methods were applied for use
in positron emission tomography (PET). Positron emission tomography is a medical diagnostic
tool that produced three-dimensional images of metabolic processes in the human body. A
radionuclide tracer that emits positron is chemically bound to a biomolecule which is ingested by
a patient. Different biomolecules and radionuclides tracers are used depending on where you want
it to concentrate in the human body. Positron emitted from the tracer combine with electrons and
annihilate into two 180 degrees 511 keV gammas. These gammas are measured in coincidence by
a ring of scintillation detectors such as sodium iodide (NaI). Each measured γ corresponds to a
slice of a total image constructed through computer analysis. PET individually or combined with
computer tomography (CT) or magnetic resonance imaging (MRI) allows for details
measurements of the body useful for diagnosing or determining treatment options.3 An example
of a PET instrument is shown below in figure 6.
Figure 6: An example of a positron emission tomography (PET) instrument20
16
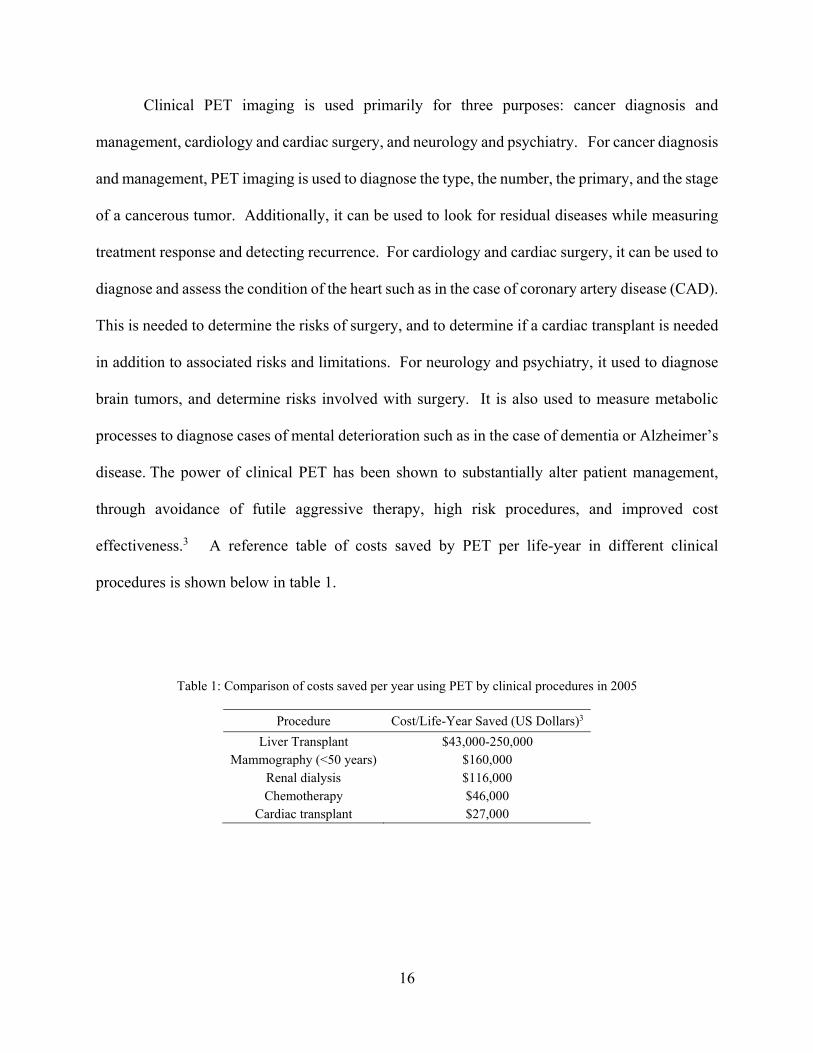
Clinical PET imaging is used primarily for three purposes: cancer diagnosis and
management, cardiology and cardiac surgery, and neurology and psychiatry. For cancer diagnosis
and management, PET imaging is used to diagnose the type, the number, the primary, and the stage
of a cancerous tumor. Additionally, it can be used to look for residual diseases while measuring
treatment response and detecting recurrence. For cardiology and cardiac surgery, it can be used to
diagnose and assess the condition of the heart such as in the case of coronary artery disease (CAD).
This is needed to determine the risks of surgery, and to determine if a cardiac transplant is needed
in addition to associated risks and limitations. For neurology and psychiatry, it used to diagnose
brain tumors, and determine risks involved with surgery. It is also used to measure metabolic
processes to diagnose cases of mental deterioration such as in the case of dementia or Alzheimer’s
disease. The power of clinical PET has been shown to substantially alter patient management,
through avoidance of futile aggressive therapy, high risk procedures, and improved cost
effectiveness.3 A reference table of costs saved by PET per life-year in different clinical
procedures is shown below in table 1.
Table 1: Comparison of costs saved per year using PET by clinical procedures in 2005
Procedure Cost/Life-Year Saved (US Dollars)3
Liver Transplant $43,000-250,000 Mammography (<50 years) $160,000
Renal dialysis $116,000 Chemotherapy $46,000
Cardiac transplant $27,000

17
Many different isotopes have been utilized previously for PET. In the past, the most
prevalent were ones with short half-lives, and positron energies of ~0.5 MeV. Some common
examples are shown below in table 2.
Table 2: Properties of some common positron emitting nuclides of interest3
Nuclide Emode (MeV) Half-life (Minutes) Average Range in Water (mm) 11C 0.326 20.4 1.1 13N 0.432 9.96 1.5 15O 0.696 2.03 2.5 18F 0.202 109.8 0.6
68Ga 0.783 68.3 2.9 82Rb 1.385 1.25 5.9
All of these isotopes consist of short half-lives that range from a few minutes to a few
hours. Use of these nuclides, require production and separation methods close to the treatment
centers. This requires a designated cyclotron, and staff to produce the isotopes of interest followed
by chemical separation prior to shipping while trying to maintain a significant activity for potential
medical use. In the case of 18F, one of the most common isotopes, the production, separation, and
medical treatment would have to be performed under 18.3 hours (10 half-lives). Each additional
treatment would require another round of production/separation.
18
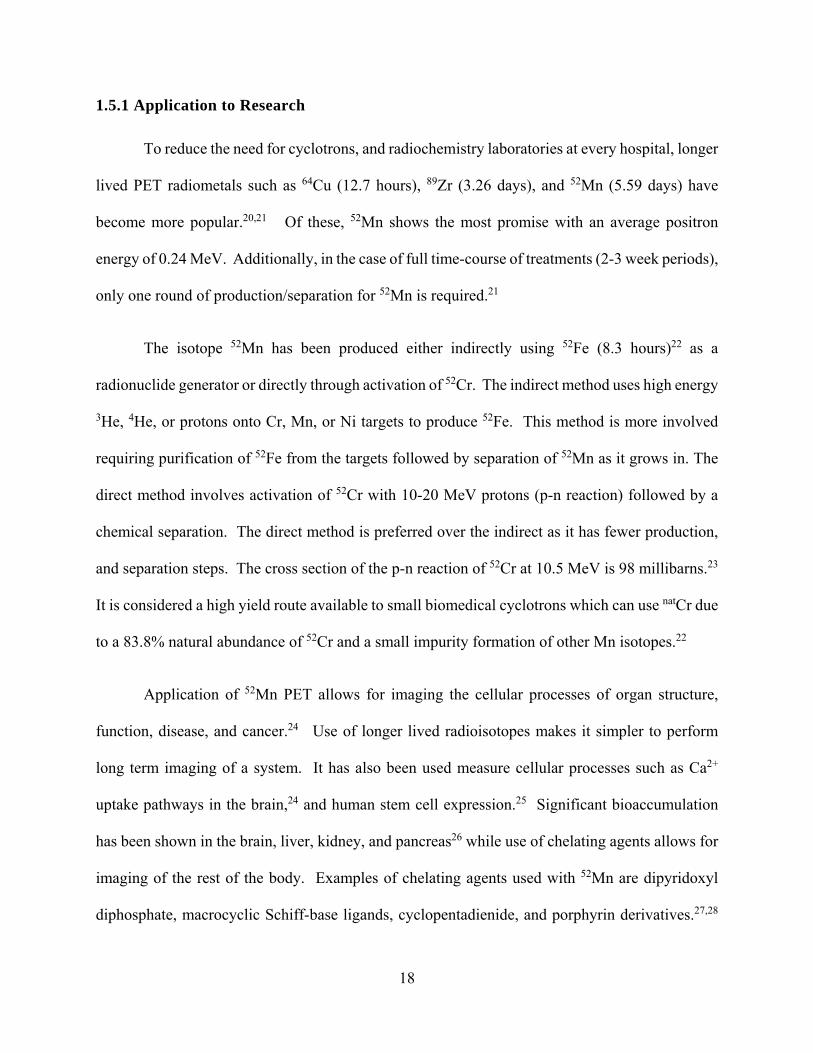
1.5.1 Application to Research
To reduce the need for cyclotrons, and radiochemistry laboratories at every hospital, longer
lived PET radiometals such as 64Cu (12.7 hours), 89Zr (3.26 days), and 52Mn (5.59 days) have
become more popular.20,21 Of these, 52Mn shows the most promise with an average positron
energy of 0.24 MeV. Additionally, in the case of full time-course of treatments (2-3 week periods),
only one round of production/separation for 52Mn is required.21
The isotope 52Mn has been produced either indirectly using 52Fe (8.3 hours)22 as a
radionuclide generator or directly through activation of 52Cr. The indirect method uses high energy
3He, 4He, or protons onto Cr, Mn, or Ni targets to produce 52Fe. This method is more involved
requiring purification of 52Fe from the targets followed by separation of 52Mn as it grows in. The
direct method involves activation of 52Cr with 10-20 MeV protons (p-n reaction) followed by a
chemical separation. The direct method is preferred over the indirect as it has fewer production,
and separation steps. The cross section of the p-n reaction of 52Cr at 10.5 MeV is 98 millibarns.23
It is considered a high yield route available to small biomedical cyclotrons which can use natCr due
to a 83.8% natural abundance of 52Cr and a small impurity formation of other Mn isotopes.22
Application of 52Mn PET allows for imaging the cellular processes of organ structure,
function, disease, and cancer.24 Use of longer lived radioisotopes makes it simpler to perform
long term imaging of a system. It has also been used measure cellular processes such as Ca2+
uptake pathways in the brain,24 and human stem cell expression.25 Significant bioaccumulation
has been shown in the brain, liver, kidney, and pancreas26 while use of chelating agents allows for
imaging of the rest of the body. Examples of chelating agents used with 52Mn are dipyridoxyl
diphosphate, macrocyclic Schiff-base ligands, cyclopentadienide, and porphyrin derivatives.27,28

19
These chelating agents have been repurposed from contrasting agents used in MRI procedure.27,28
Radiostable Mn2+ has previously been used in MRI to image anatomical details, and trace neutral
pathways.29 Mn2+ is a paramagnetic ion that works as analog for Ca2+ allowing it to enter excitable
cells such as cardiac or neurons through voltage gated channels. Once inside a cell, it can travel
along neural axons cross synapses to different neurons. This method of measuring neutral
pathways with Mn is called manganese enhance magnetic resonance imaging (MEMRI).29
Production and separation of 52Mn in the divalent oxidation state would allow for neural imaging
application looking at the metabolic processes with PET and the anatomical structure with MRI.

20
CHAPTER 2: CHEMICAL SEPARATIONS
2.1 Solvent Extraction
Solvent extraction (SX), otherwise known as liquid-liquid extraction, is a chemical
extraction technique used to separate solutes between two immiscible or partially miscible solvent
phases. Generally, there is an aqueous phase composed of a polar solvent such as water, acid or
base and an organic phase consisting of a nonpolar solvent and extracting ligand. Additionally,
modifiers may be added to each phase to aid in enhancing or suppressing extraction of a solute
between layers. Difference classes of extraction ligands based on strength of the donating atom in
addition to the oxidation, and ionic size of the analyte. In the case of a metal cation, a ligand
dissolved in the organic phase will form a chelate with the metal at one or more sites creating a
neutral species when contacted. The newly formed neutral species will have greater solubility in
nonpolar solvents and will migrate across the phase boundary into the organic layer. Certain
extracting ligands cannot readily complex with solutes unless aided by the addition of diluents to
improve its physical properties. For example, diluents are used to aid in solubilizing solid
extractants into the liquid organic phase. Alternatively, modifiers can be added to the aqueous
phase to complex solutes reducing their extractability.30
In a solvent extraction system, a solute dissolved the organic or aqueous layer will
distribute between phases until equilibrium. Usually the system requires mixing to increase
surface area contact thereby promoting distribution of the analyte. At system equilibrium, the
ratio of solute concentration in the organic phase [A]org to the solute concentration in the aqueous
phase [A]aq is known as the distribution ratio D of the solute concentration. The distribution ratio
equation is shown below as equation 2.30
21
(2)30
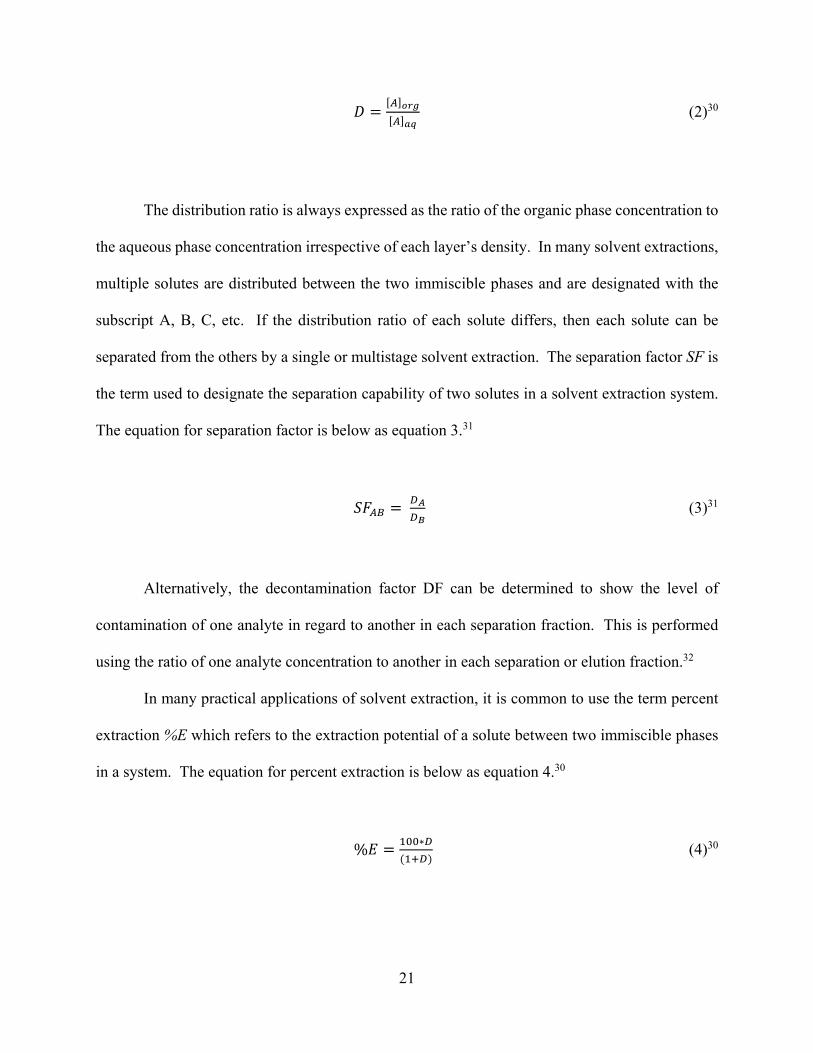
The distribution ratio is always expressed as the ratio of the organic phase concentration to
the aqueous phase concentration irrespective of each layer’s density. In many solvent extractions,
multiple solutes are distributed between the two immiscible phases and are designated with the
subscript A, B, C, etc. If the distribution ratio of each solute differs, then each solute can be
separated from the others by a single or multistage solvent extraction. The separation factor SF is
the term used to designate the separation capability of two solutes in a solvent extraction system.
The equation for separation factor is below as equation 3.31
(3)31
Alternatively, the decontamination factor DF can be determined to show the level of
contamination of one analyte in regard to another in each separation fraction. This is performed
using the ratio of one analyte concentration to another in each separation or elution fraction.32
In many practical applications of solvent extraction, it is common to use the term percent
extraction %E which refers to the extraction potential of a solute between two immiscible phases
in a system. The equation for percent extraction is below as equation 4.30
% ∗ (4)30

22
Use of this equation only occurs when a reasonable percent of the desired solute is extracted
in one solvent extraction step. For example, when the distribution ratio D equals 1 then the solute
is equally distributed between both phases.30
Different vessels such as a separatory funnel or test tube is used to separate the two phases.
Generally, the organic phase has a lower density and will form the upper layer while the aqueous
phase has a higher density and will form the lower layer.30 There is sometimes a third phase that
forms at the phase boundary which is a emulsion or colloid formation. This is caused by the
suspension of insoluble particles (dispersed phase) in another substance (continuous phase). A
schematic of the three phases is shown below in figure 7.33
Figure 7: Schematic of solvent extraction phases in a test tube

23
Phase disengagement or removal of the third phase is essential to extraction of the solute
between phases. There are many causes to third phase formation such as incompatibility of
solvents, higher concentration of extraction, or impurities in the system.34 Third phase can be
reduced/removed by the adding an aromatic diluent and or a modifier such as a strong Lewis base
(e.g. octanol or tributyl phosphate).30
2.2 Extraction Chromatography
Extraction chromatography (EXC) is chemical separation technique based on solvent
extraction composed of an inert support, a stationary phase, and a mobile phase. The inert support
consists of porous silica or an organic polymer usually ranging from 50 to 150 μm in diameter.
The stationary phase is comprised of a liquid extractant sorbed to the surface of the inert support
which extracts analytes from the mobile phase. The mobile phase is a aqueous polar phase
consisting usually of dissolved solute in an acid matrix.30 Similar to solvent extraction, diluents
may be added to aid solubilization of the extracting ligand while increasing the hydrophobicity of
the stationary phase. Other modifier such as complexants may be added to enhance selectivity of
an analyte or to promote stripping of strongly retained metal ions from a column.35 Extraction
chromatography is preferential to SX due to a great reduction in organic waste produced which is
compounded when dealing with radionuclides.30
In EXC, the volume distribution ratio D measured in a solvent extraction system (SX) can
be converted to the number of free column volumes to peak maximum defined as k’ (the resin
capacity factor) using the volume ratio of the stationary Vs and mobile phase Vm. This is shown
below in equation 5.35
′ ∙ (5)35
24
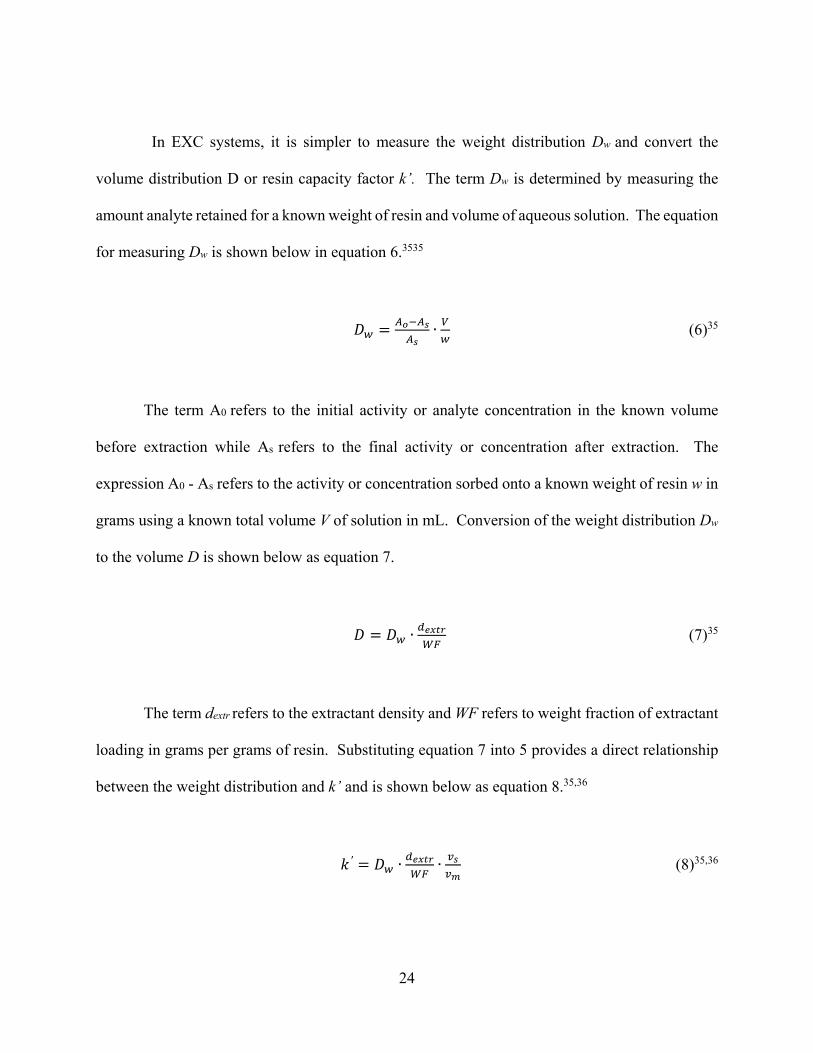
In EXC systems, it is simpler to measure the weight distribution Dw and convert the
volume distribution D or resin capacity factor k’. The term Dw is determined by measuring the
amount analyte retained for a known weight of resin and volume of aqueous solution. The equation
for measuring Dw is shown below in equation 6.3535
∙ (6)35
The term A0 refers to the initial activity or analyte concentration in the known volume
before extraction while As refers to the final activity or concentration after extraction. The
expression A0 - As refers to the activity or concentration sorbed onto a known weight of resin w in
grams using a known total volume V of solution in mL. Conversion of the weight distribution Dw
to the volume D is shown below as equation 7.
∙ (7)35
The term dextr refers to the extractant density and WF refers to weight fraction of extractant
loading in grams per grams of resin. Substituting equation 7 into 5 provides a direct relationship
between the weight distribution and k’ and is shown below as equation 8.35,36
′ ∙ ∙ (8)35,36
25
Achieving an optimal separation in EXC means minimizing band broadening to prevent
early breakthrough while avoiding disproportionate cross-contamination of the analytes being
separated. Poor column efficiency through significant band broadening can negate a very selective
extraction resin. Column efficiency can generally be expressed in terms of height equivalent to a
theoretical plate (HETP). Height equivalent to a theoretical plate is a concept based on the length
of the column, the width of the peak, and volume of eluent. Each theoretical plate represents a
step or stage in the multi-stage extraction process where equilibrium is established between the
mobile and stationary phase. Increasing the number of plates for a set column length allows for an
improvement in analyte separation.37
In extraction chromatography, the efficiency of a column is determined by flow
phenomena, diffusion of the mobile phase with respect to the stationary phase, and extraction
kinetics of the ligand. Flow phenomena deals with eddy diffusion which are variations in the
analytes phase flow path affecting band broadening. Diffusion to the stationary phase refers to
analytes ability to diffuse back and forth from the mobile phase to the stationary phase. While
extraction kinetics refers to rate at which the extractant can electrochemically bind to analytes
diffusing through the column. Column efficiency additionally depends on the size of the resin
particles, the porosity of the support, the extractant loading and mobile phase velocity, and the
operating temperature.37

26
2.3 Application of Separation Methods
2.3.1 Extraction of Scandium from Titanium
In this research, EXC will be used to extract scandium from titanium. Shown later in
chapter 4, fast neutron activation of titanium produces scandium in quantities less than 1% of the
initial mass. In any separation method, it is simpler, faster, and requires less extracting ligand to
extract a smaller quantity of analyte from the initial bulk concentration.
Extraction chromatography was used to separate Sc and Ti based on their difference in
oxidation states and ionic radii in aqueous solution. Neutral scandium has an electronic
configuration of [Ar]3d14s2 and acts as a strong reducing agent in aqueous solutions primarily
forming Sc3+.38,39 The diameter of the neutral Sc radius is 162 pm but decreases to 89 pm in
trivalent form. In hydrochloric acid, formation of ScCl3 becomes the predominant species from 1
to M up while in nitric acid, Sc(NO3)3 primarily forms as the nitrate concentration increases. At
very low acid concentrations speciation will split between the hydroxide, oxide, and acid ion
form.38,40 Alternatively, neutral titanium has an electronic configuration of [Ar]3d24s2 and
primarily is in the divalent form Ti2+ or tetravalent TiO2+ form in solution under a pH of 2 at a
voltaic potential above -1.5 volts. 38,39 The diameter of neutral Ti radius is 147 pm but decreases
to 60.5 pm in tetravalent and 86 in divalent form.38,39 In hydrochloric acid, Ti remain in the oxide
form TiO2 while at very low concentrations until ~9 M or higher when it may form the complex
TiCl6. In nitric acid, TiO2 may not react with nitrate unless the concentration is high forming
Ti(NO3)4.38,41
Separation methods using ion exchange, solvent extraction and extraction chromatography
have been used previously to separate Sc and Ti. Cation and anion exchange columns using AG
MP-50,42 Dowex 50 X8,43 and Dowex 1 X844 were able to separate scandium from titanium with

27
a separation factor up to 90 and recoveries from 50 to 90%. The main issue in using ion exchange
is the significantly larger volume of acid (orders of magnitude) needed for column elution
producing significantly more waste. Solvent extraction using tributyl phosphate (TBP),42,43
Trioctylamine (TOA),45 di(2-ethyl-1-hexyl) phosphoric acid (HDEHP),46 and N,N,N’,N’-tetra-n-
octyldiglycolamide (TODGA)47 showed better separation factors up to ~1000 with scandium
recovery greater than 90% Sc. Similar to ion exchange, solvent extraction produced large amount
of organic waste in each separation which is significantly costlier if radionuclides are involved.
Additionally, the HDEHP ligand was used in a EXC column and recovered greater than 98% of
the initial scandium. However, this method did not determine the titanium contamination.48,49 Use
of EXC resins instead of ion exchange and solvent extraction would allow for a potentially high
recovery while minimizing organic and aqueous waste.
In addition to getting a large separation factor, analyte recovery, and minimizing waste, the
separation process needs to be quick and efficient in the case of a nuclear detonation. For this
work, commercial available resins using ligands previously shown to separate scandium from
titanium were employed. Ln 1 (LaNthanide), and DGA resin produced by Eichrom technologies
relying on the HDEHP ligand and TODGA ligand have been shown to previously separate these
species.
The Ln 1 resin is comprised of 40% (w:w) di(2-ethyl-1-hexyl) phosphoric acid (HDEHP)
sorbed onto Amberchrom CG-71 beads (50-100μm).50,51 The structure of the ligand HDEHP is
shown below in figure 8.

28
Figure 8: HDEHP ligand structure
Ln 1 resin, Ln 2 and Ln 3 vary in the number of oxygen atoms bonded between the
phosphate and carbon chains. Ln 1, shown above has four oxygen atoms bound to the phosphate
while Ln 2 has only three and Ln 3 has only two.51,52 Having more oxygen atoms bound to the
phosphate group in the case of Ln 1 allows for greater resonance and a stronger extraction potential
than Ln 2 and Ln 3.
Two different coordination forms have been theorized for the complexation between
HDEHP ligands and a trivalent metal. The first involves the monodentate complexation of six
ligands around a single metal center acting as dimer pairs through shared hydrogen bonding while
the second involves the bidentate complexation of six ligands shared between two metal centers
(M2HDEHP6).52,53 Understanding of the coordination forms allow for prediction of the
coordination number between the metal ion and ligands. Both structures are shown below in figure
9.
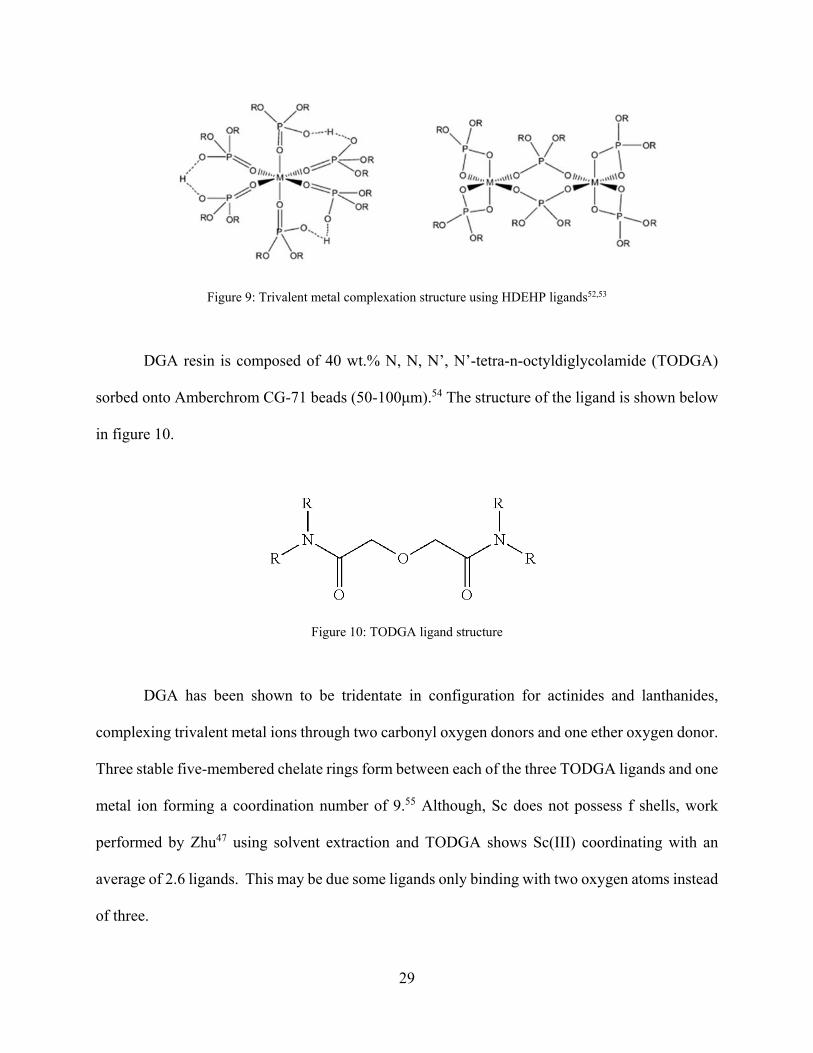
29
Figure 9: Trivalent metal complexation structure using HDEHP ligands52,53
DGA resin is composed of 40 wt.% N, N, N’, N’-tetra-n-octyldiglycolamide (TODGA)
sorbed onto Amberchrom CG-71 beads (50-100μm).54 The structure of the ligand is shown below
in figure 10.
Figure 10: TODGA ligand structure
DGA has been shown to be tridentate in configuration for actinides and lanthanides,
complexing trivalent metal ions through two carbonyl oxygen donors and one ether oxygen donor.
Three stable five-membered chelate rings form between each of the three TODGA ligands and one
metal ion forming a coordination number of 9.55 Although, Sc does not possess f shells, work
performed by Zhu47 using solvent extraction and TODGA shows Sc(III) coordinating with an
average of 2.6 ligands. This may be due some ligands only binding with two oxygen atoms instead
of three.

30
2.3.2 Extraction of Manganese from Chromium
Similar to the Sc/Ti separation, Mn produced from Cr will have a significantly smaller
atomic fraction and will likely require less material to extract. Separation of the two was
performed using solvent extraction to determine potential ligands followed by EXC to reduce
waste. The separation was based on the difference in oxidation states and ionic radii in aqueous
solution. Neutral manganese has an electronic configuration of [Ar]3d54s2 and is predominantly
Mn2+ in acid concentrations below a pH of 8. The neutral radius is 127 pm but decreases to 67 pm
in divalent form. In hydrochloric acid, Mn will form different chloride species as the acid
concentration increases. At very low acid (less than 1 M), Mn will form oxides or hydroxides,
from 1 to 4 M MnCl2 will be the dominant form, and from 6 to 12 M MnCl3- will be the dominant
form. In nitric acid, little complexation will occur and Mn will likely remain in the oxide or
hydroxide form.38,56 Alternatively, neutral chromium has an electronic configuration of [Ar]3d54s1
and is primarily Cr3+ in aqueous solutions below a pH of 4. The neutral radius is 128 pm and
decreases to 61.5 pm in trivalent form. Separation of divalent Mn from trivalent Cr can be
performed in acidic conditions under a pH of 4 with a voltaic potential between -0.6 and 1.4 volts.
38,39 In hydrochloric or nitric acid, Cr speciation more complicated as the Cr strongly binds with
water forming the species Cr(H2O)63+
Cr2O3 preventing formation of anionic complexes due to
strong binding of water.41
Separation methods using ion exchange and solvent extraction were used previously to
separate Mn from Cr. Cation and anion exchange columns using Dowex 50Wx8,57 and Ag-1x826
were used to separate Mn(II) from Cr(III) with separation factors up to 50, and recoveries from 73
to 99% but require significantly larger quantities of acid to run a column. Solvent extractions
using methyltrioctylammonium chloride (Aliquat 336),58 tris(2-ethyhexyl)phosphate,59 and

31
hexaacetateocalixarene60 demonstrated separation factors from 10 to 50 using Cr(VI) and Mn(II)
with analyte recoveries from 50 to 80%. The optimal method shown by Lahiri61 was to use the
ligand trioctylamine (TOA) to separate Mn(II) from Cr(III) with a separation factor >10,000.
Although, significant organic waste is produced in SX, it is necessary to determine ligand
extraction potential and was explored prior to development of a EXC resin.
The ligand TOA consists of a nitrogen atom bonded to three R groups consisting of eight
carbon chains. The nitrogen center of TOA acts as an electron donor extracting divalent species
in the case of Mn2+. The structure of the TOA ligand is shown below in figure 11. The equilibrium
expression for extraction of Mn(II) into the organic from the aqueous phase is shown below in
figure 12.
Figure 11: Trioctylamine (TOA) ligand structure
2 ↔
Figure 12: Equilibrium expression for the extraction of Mn(II) into the organic phase using TOA62

32
In hydrochloric acid, ~2 ligands of TOA are needed to extract Mn(II) from the aqueous to
the organic phase.56 Opposed to the Sc/Ti extraction, the extraction here is unidentate and should
not vary in the number of ligands of extractant coordinated to the metal center. In the Sc/Ti system,
both Ln and DGA resin use ligands that complex using bidentate configuration which may cause
a variation in measured ligand coordination while in solution. Instead of complexing with three
bidentate ligands, two ligands may attempt to partially coordinate with the metal center instead of
a single fully coordinated ligand creating a temporary four ligand coordination. This should not
occur in the Mn/Cr separation as the TOA ligand coordination is unidentate.

33
CHAPTER 3: METHODOLOGY
3.1 Materials
In this research, all standards used (Ti, Sc, Cr, and Mn) were ICP-MS certified reference
grade from British Drug Houses (BDH). All acid solutions were prepared from ARISTAR Plus
grade (metal impurities <1 ppb) nitric and hydrochloric acid from BDH. All acids were titrated
prior to use in any experiment using 0.1 N sodium hydroxide solution and phenolphthalein
indicator solution from Sigma Aldrich. All solutions were prepared using 18.2 MΩ.cm deionized
water from a Millipore or Pall water purification system. All pipetting performed used Eppendorf
pipettes and tips from VWR. All mixing or sample agitation performed used Labquake™ shaker
tables from Thermo Scientific. All plastic vials (2 mL, 5 mL, 15 ml, or 50 mL) used were composed
of polypropylene from VWR. All laboratory glassware, glass bottles used for chemical storage,
and glass scintillations vials were composed of borosilicate glass from VWR.
All high purity germanium measurements performed used a 5 mL solid in plastic liquid
scintillation vial source (84912-602) for energy calibration from 59.5 to 1836.1 keV. The source
was purchased from Eckert & Ziegler.
In the solvent extraction work performed, Trioctylamine ≥97.0% ligand, and 1-Octanol
≥99.0% was purchased from TCI America. ACS grade cyclohexane used was purchased from
BDH. Any deviation in solvent extraction materials used will be described in chapter 7.
In the batch contact studies performed, bulk 50 – 100 μm particle size Ln 1, and DGA resin
was purchased from Eichrom Technologies. Additional details about these resins are described in
chapters 2, and 5. All TOA resins used were specially produced from Triskem International and
are discussed further in chapter 6. Polypropylene spatulas for weighing resin, and BD Luer-lok
tipped syringes used for filtration were purchased from VWR. Acrodisc® syringe filters using

34
0.45 μm polytetrafluoroethylene membranes were purchased from Pall Life Sciences. Any
deviation in batch contact study materials used will be described in chapters 5, and 8.
In the column studies performed, 2 mL columns, 25 mL extension funnels, and a vacuum
system with associated parts (Part# AR-12-Box) was purchased from Eichrom Technologies. Any
deviation in column study materials used will be described in chapter 6.
3.2 Cross Section Determination using Flattop Criticality Benchmark
3.2.1 Experimental Procedure
An HPGe well detector was calibrated using a water standard matching the geometry,
volume, and container type of each activation sample. A background activity measurement was
taken of the room for one and twenty-four hours using a blank or empty plastic vial matching the
geometry, volume, and container of each activation sample. A comprehensive nuclide library of
potential activation products including γ decay ratios, and energies was prepared for all metal foils
planning to be irradiated.
After each neutron activation run, individual activation foil solutions were measured for
one hour to determine short-lived radioisotope production from the run. This was followed by a
twenty-four hour measurement to get a more accurate and precise activity value for each
radioisotope produced.
3.2.2 Flattop Data Analysis
3.2.2.1 Gamma Spectra Analysis
Data analysis of each gamma measurement was performed using the Genie 2000 gamma
software by Canberra. Calibration of the instrument involved taking a measurement of the water
standard for a few hours followed by calibration of the spectra using the certificate energy
distribution and efficiency. Each activation foil measurement spectra were processed using the

35
peak locate and area functions where peaks in a spectrum with counts above the baseline were
identified, followed by integration and summation of all counts within the energy region. The area
correction function was used subtract background counts from previously measured background
spectra matching volume, geometry, and measurement time. Each spectrum was then calibrated
for efficiency and energy distribution by channel using the previously made calibration file
followed by nuclide identification on a list of proposed elements being activated. The nuclide
identification process involves matching gamma peaks by their energy and decay ratio to provide
a total weighted activity and uncertainty in μCi for each isotope.
3.2.2.2 Flux and Cross Section Determination
Cross section determination for each radioisotope produced was performed using a
variation of the neutron activation equation shown in equation 1. Instead of solving for the rate of
production Rp, the cross section σ for each isotope produced can be determined using the activity
right after irradiation (time zero) A, the flux of neutrons Φ, the target density n, the length of
irradiation t, and the decay constant for said isotope λ. The full equation is shown below in
equation 9.
1 (9)63
For this work, the activity A at time zero was calculated using the measured activity of each
isotope produced or activity final Af , using the standard radioactive decay equation shown below
in equation 10. In equation 10, the time variable t refers to the total length of time after irradiation
(time zero) to the end of the measurement.

36
(10)63
To solve for the cross section σ of each isotope, the flux of neutrons Φ, and target density
n are still needed. The target density was based on the total number of isotope atoms in a known
target mass divided by the surface area of the target that was determined using the standard density
of the metal foil or salt. Certificate information was not provided for each run so it was assumed
that each target was without impurity and cubic in shape.
To determine the neutron flux in this calculation, the only information known was that the
power level was consistent for each run64 and that an Au foil was placed in the same relative
position to the 235U core, which has been used previously to calculate a 235U fission rate. This 235U
fission rate or neutron flux can be determined based on the production of 198Au from the nuclear
reaction 197Au(n, γ)198Au using a known amount of 197Au target.12 In each Flattop run, power
levels were measured ensuring consistency between all runs,64 it is fair to assume that the average
of these fluxes would be useable to determine individual nuclear reaction cross sections for each
foil activated. For this purpose, a fission spectra cross section average was taken from the Japanese
Atomic Energy Agencies JENDL-4.0 program. Each cross section determined beside Au was
compared to cross sections calculated from different runs in addition to fission spectra cross
section averages determined by the JENDL-4.0 program if available.

37
3.3 Solvent Extraction Research
3.3.1 Solvent Extraction Study
3.3.1.1 Experimental Procedure
Two solvent extraction studies based on previous methods used in literature were
performed to measure the extraction potential of a analyte by varying the ligand or analyte
concentration.59,61,62 In both studies a known volume and concentration of 1:1 ratio of ratio
organic to aqueous phase was added to a vial. The organic phase consisted of TOA ligand in
cyclohexane solvent and 1-octanol to reduce third phase formation. The aqueous phase consisted
of a known concentration of Cr and Mn analyte in a set hydrochloric or nitric acid concentration.
Each vial containing both phases was mixed on a Labquake shaker table for set period to promote
mixing. An aliquot of the aqueous phase was removed after mixing to measure the loss of analyte
to the organic phase. Samples from the aqueous phase were diluted and analyzed using an ICP-
AES or ICP-MS further detailed in section 3.6. Specific experimental details are described in
chapters 5 and 7.
3.3.1.2 Data Analysis
The analyte concentration measured in the aqueous phase was subtracted from the total
initial concentration to determine the analyte concentration in the organic phase. The distribution
ratio D, separation factor SF, and percent extraction %E were calculated using equations 2, 3, and
4 from chapter 2.

38
3.3.2 Kinetic Study
3.3.2.1 Experimental Procedure
The kinetic study procedure duplicated the solvent extraction procedure in section 3.3.1.1
using the optimal ligand and acid concentration determine while varying the mixing time needed
to test the extraction kinetics. Specific experimental details are described in chapters 5, and 7.
3.3.2.2 Data Analysis
The data was analyzed by the same method shown in section 3.3.1.2.
3.3.3 Third Phase Formation Study
3.3.3.1 Experimental Procedure
The third phase formation procedure duplicated the solvent extraction procedure in section
3.3.1.1 without any analyte in the aqueous phase and only TOA ligand and cyclohexane in the
organic phase. After mixing each solution, drops of 1-octanol were added to each vial using a
Pasteur pipette followed by mixing. This was repeated until the third phase disappeared. The
number of drops were recorded for each ligand/acid concentration. Using the same Pasteur pipette,
the average mass of one drop of 1-octanol was weighed on a laboratory scale. Specific
experimental details are described in chapters 5, and 7.
3.3.3.2 Data Analysis
The volume of 1-octanol needed to remove the third phase in each acid/ligand
concentration was determined by dividing the density of 1-octanol by the mass of 1-octanol
(number of drops) used to remove the colloid or third phase formation.
39
3.4 Batch Contact Research
3.4.1 Batch Contact Studies
3.4.1.1 Experimental Procedure
The batch contact procedure adapted for this work was based on previous literature
methods.35,36,65,66 A known mass of resin was added to a vial, which was preconditioned using a
set volume of acid. The vial was mixed on a Labquake shaker table for a set period expediting the
diffusion of the aqueous phase into the interstitial space between each resin bead. The swollen
resin was left for another set period ensure it reached equilibrium. A stock solution of analyte in
a set hydrochloric or nitric acid matrix was added to each resin vial followed by mixing for another
set period. The solution of each vial was filtered into a new clean vial by filtration using a syringe
and 0.45 μm PTFE filter. Samples from the aqueous phase were diluted and analyzed using an
ICP-AES or ICP-Ms further detailed in section 3.6. Specific experimental details are described in
chapters 5, and 7.
3.4.1.2 Data Analysis
The weight distribution Dw followed by conversion to k’ was determined equation 6, 7,
and 8 in section 2.2.
3.4.2 Kinetic Batch Contact Study
3.4.2.1 Experimental Procedure
The kinetic batch contact study replicated the batch study procedure per section 3.4.1. In
the kinetic study, each batch study was replicated using a varied mixing time after the spike
addition step.

40
3.4.2.2 Data Analysis
The data analysis method is described in section 3.4.1.2.
3.4.3 Batch Contact Volume Correction
3.4.3.1 Experimental Procedure
For each resin tested, two sets of vials labelled 1st and 2nd set were weighed for each acid
concentration. Set mass of resin was added to each vial in the 1st set followed by each vial being
weighed again. A known volume of for each acid concentration was added to each vial in the 1st
set followed by each vial being weighed again. Each vial in the 1st set was placed on mixing table
for a set period. The contents of each vial were filtered using a syringe and 0.45 μm PTFE filter
into a designated vial from the 2nd set. Each vial in the 2nd set was weighed again. Specific
experimental details are described in chapters 5, and 7.
3.4.3.2 Data Analysis
The difference in mass between the initial acid volume in the 1st vial set and the final acid
volume in the 2nd vial set divided by the mass of resin in each vial gives the mass loss of for a
specific acid concentration. The volume lost is determined from the specific density for that acid
concentration. Specific experimental details are described in chapters 5, and 7.
41
3.5 Column Studies
3.5.1 Gravity Column Studies
3.5.1.1 Experimental Procedure
The gravity column studies performed were based on previous work by Horwitz.32,33,59
Elution volumes in a column are based on the free column volume for a specific set up and required
determination. A set amount of resin was wet using DI water in a vial and allowed to swell. After
sufficient time, the Eichrom column was filled with DI water and the swelled resin was added
dropwise allowing the system to settle by gravity. The resin was added dropwise to reduce
formation of trapped air bubbles within the column. The height of the resin was measured, and
glass wool was added to prevent movement of the resin surface as additional liquids were added.
Excess DI water was drained until the solution level was in line with the bed height. The number
of DI water drops from the column were counted over time to determine a flow rate.
To determine the FCV, a small volume of acid was added to the top of the resin bed and
was eluted off the column in drops. Each drop was collected into a pre-weighed container with a
piece of litmus paper touching the surface. The litmus paper became acidified when the acid
dripped through the column and the volume collected was deemed one FCV for this system.
The set up for the gravity column study is similar to measuring the FCV. A set amount of
swelled resin at an acid concentration and type matching the load solution is added to a column
filled with DI water. Glass wool is added to the top of the wet slurry bed. Each column was
preconditioned/washed using 5-10 FCVs of acid matching the load solution. A load solution
containing the proper analyte concentration in acid was added to the column followed by collection
of drops in separate vial fractions. A wash fraction of matching acid concentration was added to
ensure complete elution of the analyte into the 1st set of vial fractions. In the case of multiple

42
analytes, the column can be reconditioned by washing with a different acid concentration and
matrix to cause elution of other analytes. Samples from the aqueous phase were diluted and
analyzed using an ICP-AES further detailed in section 3.6.1. Specific experimental details are
described in chapters 6.
3.5.1.2 Data Analysis
Analyte concentration in each fraction were measured to determine an elution profile or
distribution of the analyte. Recovery of the analyte was determined by summing the total analyte
concentration recovered.
3.5.2 Vacuum Column Studies
3.5.2.1 Experimental Procedure
The vacuum column procedure used was based on previous literature methods.35,36,66–68 A
vacuum box system from Eichrom was set up where only one column hole was left unsealed. The
spout on the side of the vacuum box was connected to a pressure gauge/regulator connected to a
vacuum system or outlet by rubber tubing. A pre-packed resin cartridge from Eichrom was
connected to the unsealed column hole atop the vacuum box. A syringe was connected to the top
of the pre-packed cartridge. A sample holder was placed in the box to collect elution fractions.
The vacuum was turned on to elute each fraction and turned off to change elution fraction
containers. The prepacked cartridge was conditioned using a set volume of acid matching the load
solutions concentration and matrix. A load solution containing analytes was added to the syringe
followed by elution through the column into a separate container. Another volume of clean acid
matching the load solution was added to the column to elute the analyte of interest off the column.
For multiple analyte solutions, another known volume of acid different from the load solution was
used to strip off different analytes. These column studies were repeated in triplicate at different

43
flow rates. Samples from the aqueous phase were diluted and analyzed using an ICP-AES or ICP-
Ms further detailed in section 3.6. Specific experimental details are described in chapters 6.
3.5.2.2 Data Analysis
The concentration of analyte in each fraction was measured to determine analyte recovery
from the column.
3.6 Instrumentation
3.6.1 Inductively Coupled Plasma Atomic Emission Spectroscopy (ICP-AES)
3.6.1.1 Theory
The ICP-AES is an instrument used to measure UV-Visible light produced by rapid de-
excitation of an electron from a higher electronic state to their ground state. This was performed
using a plasma source known as an ICP torch made of three concentric quartz tubes streams argon
gas, which is ionized using an induction coil. Ionization of the argon gas occurs through used of
a radio frequency-initiated spark using a tesla coil. The interactions of ions and flow of charge in
the gas causes the plasma to form and heat. Samples are introduced as liquids and pumped into a
nebulizer, which aspirates the solution transporting droplets into a spray chamber. As these
droplets enter the plasma, electrons in the outer shells of each element in the sample are excited to
higher energy states. Relaxation of these electrons causes emission of UV-Vis light characteristic
of the elements in the sample. The spectrometer acts to selectively grate or disperse light of interest
into a photomultiplier tube (PMT) detector. The intensity of the light that interacts with the PMT
is converted to electrical signal corresponding to the concentration of that element in the
sample.69,70

44
3.6.1.2 Analysis Method
A Perkin Elmer Optima 7000 (CSU), 8000 (UNLV) and Thermo Scientific ICAP 6500
Duo (LANL) was used to analyze samples in chapters 5, and 6. The accompanying Syngistix
software included in the instrument was used for data acquisition and analysis. For each study, an
aliquot from each sample added to 15 mL centrifuge vial and diluted to an analyte concentration
range of 1-100 ppm using 2% v/v HNO3. A 2% v/v HNO3 nitric blank solution and set of 5
calibration solutions ranging from 1-200% of the dilute analyte concentration were made from
analyte standards listed in sec 3.1. These were used as standards to produce a calibration curve
for comparing the intensity measured for each analyte in the sample solutions. Additional analyte
standards at 100% of the dilute analyte concentration were placed through the sample run order to
account for instrumental drift over time. Additional experimental details are described in chapters
5 and 6.
3.6.2 Inductively Coupled Plasma Mass Spectrometry (ICP-MS)
3.6.2.1 Theory
The ICP-MS is an instrument used to measure elemental or isotopic abundance of analytes
in a sample by ionization followed by separation based on the mass to charge ratio. An
introduction system involving ICP, and nebulizer detailed above in section 3.6.1.1 is used to bring
aliquot of solution from sample vials to the plasma for ionization. Ions produced in the plasma
will travel through a set of magnetic and electrostatic analyzers such as a quadrupole, which
through use of a RF field will separate ions by their mass to charge ratio. These sons of the interest
with will travel through a filter grate and interact with a semiconductor array such as a discrete
dynode detector. The intensity of each isotope measured will be amplified through secondary

45
electron multiplication and converted to a electrical signal corresponding to the concentration of
the isotope in the sample.69
3.6.2.2 Analysis Method
A Perkin Elmer NexION 350 (CSU) and ELAN DRC II (UNLV) ICP-MS was used to
analyze samples chapters 7, and 8. The general analysis method is shown above in section 3.6.1.2.
Additional experimental details are described in chapters 7, and 8.
3.6.3 High Purity Germanium (HPGe) Well Detector
3.6.3.1 Theory
An HPGe well detector is primarily used to measure γ or x rays through use of a well
capacity with near 4π geometry. The ideal energy range for radiation detector is 20 keV up to 10
MeV.65 In a standard system, a depleted region up to a thickness of a few centimeters is used to
absorb radiation. Under a reverse bias, an electric field extends over this region causing charge
carriers (holes and electrons) produced by the interaction of photons with the depleted volume to
migrate toward the anode or cathode. The measured signal at the electrodes is proportional to the
energy deposited in the depleted volume by the incoming photon. This charge is converted into a
voltage pulse through the system preamplifier. Additionally, each germanium system needs to be
cooled such as through use of liquid nitrogen to reduce the thermal generation of charge carrier
due to a low band gap.69,71,72
3.6.3.2 Analysis Method
An HPGe well detector from Canberra was used to measured samples in chapter 4. The
analysis method is shown above in section 3.2.2. Additional experimental details are described in
chapter 4.

46
CHAPTER 4: DETERMINATION OF FAST NEUTRON CROSS SECTIONS USING
ELEMENTS IRRADIATED ON THE FLATTOP CRITICALITY BENCHMARK
4.1 Introduction
In this experiment, several elements were irradiated using fast neutrons in an attempt to
simulate the effects of a nuclear detonation. A series of irradiation runs were performed using the
Flattop Critical Assembly Benchmark on the Nevada National Security Site under controlled
conditions such as neutron flux and length of irradiation. The focus of these experiments were to
irradiate elements found in the urban environment and used in nuclear device components using a
neutron flux and spectra similar to a device using HEU. In the form of metal foils or salts, samples
were activated by fast neutrons producing activation products based on a specific nuclear reaction
cross section. Measurements were taken of activation products to determine the specific activities
for each isotope produced. Based on the known conditions of the irradiation, the activity a time
zero (end of irradiation) can be determined and further used to determine specific nuclear reaction
cross sections for each activation product. However, many of the specific details about the
irradiations were not publically available so a series of academic calculations were performed to
determine cross sections instead.
4.2 Materials
All activation solutions consisted of individual elemental samples (foil or salt) dissolved
in clean acid to a volume of 5 mL in 5 mL plastic vials. All other materials used are described in
section 3.1.

47
4.3 Experimental Procedure
4.3.1 Metal Foil Measurements
The general procedure used is shown in section 3.2.1. The HPGe well detector was
calibration using a 5 mL water standard matching the same volume, geometry, container type as
each activation sample. A background activity measurement was taken of the room at one and
twenty four hour intervals using an empty 5 mL plastic vial matching the geometry, volume, and
container type used for each activation product solution. A comprehensive nuclide library of
potential activation products including gamma decay ratios, and energies was prepared for all
metal foils planning to be irradiated.
After each neutron activation run, individual activation foil solutions were provided in 5
mL vials and were measured for one hour intervals to determine short lived radioisotope
production from the run. This was followed by a twenty four hour measurement to get a more
accurate and precise activity value for each radioisotope produced. The process of measuring foils
followed by subsequent calculations occurred on four separate occasions. A list of all elements
irradiate by run is shown in table 3.
Table 3: Elements irradiated using the Flattop Benchmark Critical Assembly
Element Irradiated Run 1 March 2014 Run 2 October 2014 Run 3 March 2015 Run 4 June 2015
Au (Gold) X X X X
Co (Cobalt) X
Cr (Chromium) X
Fe (Iron) X
Ir (Iridium) X X
Ni (Nickel) X
Pb (Lead) X
Pt (Platinum) X X
Ti (Titanium) X X X
W (Tungsten) X

48
A list of properties for each target irradiated including mass, chemical form, chemical
composition and isotope composition for each run is shown below in tables 4, 5, 6, and 7. It was
assumed that each target was 100% pure as no certificate information was provided.
Table 4: Target properties of elements irradiated in run 1
Target Activation Element
Target Mass (mg)
Chemical Form
Chemical Composition
Isotopic Composition73
Atom Percent Fraction73
Au 305.9 metal foil natural Au-197 1.00
Ir 229.9
(69.1 mg of Ir) K2IrCl6 salt natural
Ir-191 0.37 Ir-193 0.63
Pt 109.4 metal foil natural
Pt-192 0.01 Pt-194 0.33 Pt-195 0.34 Pt-196 0.25 Pt-198 0.07
Ti 177.3 metal foil natural
Ti-46 0.08 Ti-47 0.07 Ti-48 0.74 Ti-49 0.05 Ti-50 0.05
Table 5: Target properties of elements irradiated in run 2
Target Activation Element
Target Mass (mg) Chemical
Form Chemical
Composition Isotopic
Composition73 Atom Percent
Fraction73 Au 152.5 metal foil natural Au-197 1.00
Fe 161.7 metal foil natural
Fe-54 0.06 Fe-56 0.92 Fe-57 0.02 Fe-58 0.00
Ni 176 metal foil natural
Ni-58 0.68 Ni-60 0.26 Ni-61 0.01 Ni-62 0.04 Ni-64 0.01
Ti 176.8 metal foil natural
Ti-46 0.08 Ti-47 0.07 Ti-48 0.74 Ti-49 0.05 Ti-50 0.05

49
Table 6: Target properties of elements irradiated in run 3
Target Activation Element
Target Mass (mg) Chemical
Form Chemical
Composition Isotopic
Composition73 Atom Percent
Fraction73 Au 152.2 metal foil natural Au-197 1.00
Ir 199.0
(59.8 mg of Ir) K2IrCl6
salt natural
Ir-191 0.37 Ir-193 0.63
Pt 142.3 metal foil natural
Pt-192 0.01 Pt-194 0.33 Pt-195 0.34 Pt-196 0.25 Pt-198 0.07
Ti 177.5 metal foil natural
Ti-46 0.08 Ti-47 0.07 Ti-48 0.74 Ti-49 0.05 Ti-50 0.05
Table 7: Target properties of elements irradiated in run 4
Target Activation Element
Target Mass (mg) Chemical
Form Chemical
Composition Isotopic
Composition73 Atom Percent
Fraction73 Au 76.2 metal foil natural Au-197 1.00 Co 144.4 metal foil natural Co-59 1.00
Cr 165.5 metal foil natural
Cr-50 0.04 Cr-52 0.84 Cr-53 0.10 Cr-54 0.02
Pb 86.5 metal foil natural
Pb-204 0.01 Pb-206 0.24 Pb-207 0.22 Pb-208 0.52
W 114.7 metal foil natural
W-180 0.00 W-182 0.27 W-183 0.14 W-184 0.31 W-186 0.28
4.3.2 Data Analysis
A sample calculation with description of assumptions used is shown in appendix A.

50
4.3.2.1 Gamma Spectra Analysis
The gamma spectra data analysis method used to process gamma spectra on the Genie 2000
Software is described in section 3.2.2.1.
4.3.2.2 Flux and Cross Section Determination
The general method for flux and cross section determination in greater detail is outlined in
section 3.2.2.2. Fission spectra cross section values for the n-2n and n-γ reactions for 196Au, and
198Au were obtained based on calculations performed using the JENDL-4.0 data library.74 Using
equation 9, the flux for both isotopes was determined in run 1 using the areal density of Au foil
irradiated, the time of irradiation, the activity at time zero (determined previously using the gamma
spectra and Genie 2000 software), and decay constant for each isotope. The flux determined for
196Au and 198Au was used to solve for the cross section of each activation product. Each calculated
cross section was compared to literature value determined using the JENDL-4.0 or ENDF data
libraries. This process was repeated for runs 2, 3, and 4.
4.4 Results and Discussion
4.3.1 Activity at Time Zero
Specific activities were determined for each activation product at time zero after
irradiation. The values for each activation product by run are shown below in tables 8, 9, 10, and
11.

51
Table 8: Measured activation products for run 1
Target Activation Element
Activation Product
Activity at Time Zero (Bq/gram)
1 σ
Au Au-196 4.06E+03 9.38E+01 Au-198 1.58E+06 3.43E+04
Ir Os-191 4.06E+02 1.62E+01 Ir-192 2.17E+03 4.07E+01 Ir-194 1.97E+05 3.93E+03
Pt Os-191 2.31E+04 1.15E+03 Pt-195m 1.94E+05 3.73E+03 Pt-197 5.15E+05 1.39E+04
Ti Sc-46 6.02E+02 1.71E+01 Sc-47 4.17E+04 1.70E+03 Sc-48 4.69E+03 8.15E+01
Table 9: Measured activation products for run 2
Target Activation Element
Activation Product
Activity at Time Zero (Bq/gram)
1 σ
Au Au-196 5.56E+02 1.53E+01 Au-198 2.69E+05 5.73E+03
Fe Mn-54 2.10E+02 6.19E+00 Fe-59 5.82E+00 1.64E-01
Ni Co-57 3.99E+00 1.23E+00 Co-58 1.01E+04 2.14E+02
Ti Sc-46 6.69E+01 1.33E+00 Sc-47 5.46E+03 2.23E+02 Sc-48 7.61E+02 1.10E+01
Table 10: Measured activation products for run 3
Target Activation Element
Activation Product
Activity at Time Zero (Bq/gram)
1 σ
Au Au-196 9.99E+01 1.90E+00 Au-198 1.31E+05 2.85E+03
Ir
Ir-190 1.55E+00 6.52E-02 Os-191 2.72E+01 7.80E-01 Ir-192 1.28E+02 1.86E+00 Ir-194 5.18E+04 7.13E+02
Pt Os-191 1.82E+03 8.89E+01 Pt-195m 2.12E+04 5.02E+02
Ti Sc-46 5.92E+01 1.22E+00 Sc-47 4.88E+03 1.99E+02 Sc-48 6.30E+02 9.83E+00

52
Table 11: Measured activation products for run 4
Target Activation Element
Activation Product
Activity at Time Zero (Bq/gram)
1 σ
Au Au-196 1.57E+01 2.51E-01 Au-198 3.73E+03 7.08E+01
Co Co-58 6.13E+00 2.12E-01 Fe-59 4.90E+01 1.07E+00 Co-60 1.24E+01 2.51E-01
Cr Cr-51 5.29E+01 2.30E+00 Pb Pb-203 2.95E+00 1.33E-01 W W-187 6.47E+03 7.68E+01
4.4.2 Flux Determination
No information regarding the flux or cross section was provided for each run performed at
Flattop. To solve for the cross section of each activation product, the flux would need to be
determined for each run. A target of natAu foil has been shown previously to be used to determine
the fission fractions from tests performed.12 In all runs, the Au foil was positioned in the center of
Flattop likely to be used for this purpose. Using this assumption, a neutron flux was calculated for
196Au and 198Au to be used for determine cross sections for activation products produced in each
run. The parameters used to determine a flux for each run are shown below in tables 12, and 13.

53
Table 12: Parameters used to determine the Au-196 flux for all runs
Parameter Run 1 1 σ Run 2 1 σ Run 3 1 σ Run 4 1 σ Fission Spectrum Ave.
(cm^2/1 atom) 3.91E-2775 N/A 3.91E-2775 N/A 3.91E-2775 N/A 3.91E-2775 N/A
Target Density (atoms/cm^2)
1.48E+22 N/A 1.18E+22 N/A 1.18E+22 N/A 9.33E+21 N/A
Irradiation Time (sec) 7.20E+03 N/A 4.84E+03 N/A 6.72E+03 N/A 7.20E+03 N/A
λ Decay Constants (1/s) 1.30E-0673 N/A 1.30E-0673 N/A 1.30E-0673 N/A 1.30E-0673 N/A Isotope Activity at
Time Zero (Bq) 1.24E+03 2.87E+01 8.48E+01 2.34E+00 5.79E+00 3.81E-02 1.20E+00 1.91E-02
Flux (neutrons/sec) 2.30E+09 5.33E+07 2.95E+08 8.14E+06 1.45E+07 9.57E+04 3.54E+06 5.63E+04
Table 13: Parameters used to determine the Au-198 flux for all runs
Parameter Run 1 1 σ Run 2 1 σ Run 3 1 σ Run 4 1 σ Fission Spectrum Ave.
(cm^2/1 atom) 9.13E-3175 N/A 9.13E-3175 N/A 9.13E-3175 N/A 9.13E-3175 N/A
Target Density (atoms/cm^2)
1.48E+22 N/A 1.18E+22 N/A 1.18E+22 N/A 9.33E+21 N/A
Irradiation Time (sec) 7.20E+03 N/A 4.84E+03 N/A 6.72E+03 N/A 7.20E+03 N/A
λ Decay Constants (1/s) 2.98E-0673 N/A 2.98E-0673 N/A 2.98E-0673 N/A 2.98E-0673 N/A
Isotope Activity at Time Zero (Bq)
4.84E+05 2.15E+04 4.11E+04 1.83E+03 2.59E+03 1.15E+02 2.84E+02 1.27E+01
Flux (neutrons/sec) 5.82E+09 2.59E+08 5.82E+09 2.59E+08 5.82E+09 2.59E+08 5.82E+09 2.59E+08

54
The fission spectrum average cross section listed was taken from literature based on the
JENDL-4.0 data library. The target density used for each run was calculated using the mass of
each foil and density of the material. The length of irradiation times were consistent for each run.
The isotope activity listed in Bq was determined using the properties of each foil listed in tables 4,
5, 6, and 7. Using equation 9, the parameters shown were used to solve for the Au-196 and Au-
198 flux values by run. Note that in the case of a N/A, there was no uncertainty due to a constant,
assumptions, or lack of information provided from Flattop runs. Additional details for this
calculations are shown in appendix section A.1.1.
A comparison of the flux values determined above are shown below in table 14.
Table 14: Comparison of fluxes determined for Au-196 and Au-198 in each run
Run # Au-196 Flux
(neutrons/second) 1 σ
Au-198 Flux (neutrons/second)
1 σ 198/196 1 σ
1 2.30E+09 5.33E+07 2.00E+10 4.33E+08 8.67 0.33 2 2.95E+08 8.14E+06 3.17E+09 6.75E+07 10.74 0.44 3 3.82E+07 7.26E+05 1.11E+09 2.42E+07 29.19 1.05 4 3.54E+06 5.63E+04 1.86E+07 3.54E+05 5.27 0.16
The neutron flux calculated in each run for both isotopes produced shows a decreasing
trend over time. This should not be the case as an order of magnitude decrease every few months
would mean that the critical assembly would need to be replaced every few years when it has been
used for at least a few decades. The uncertainties determined for each flux were less than 10%.
The flux determined for Au-198 is ~one order of magnitude larger for each run than Au-196 due
to an over assumption through use of the fission spectrum average cross section. Although both
cross sections used are within the millibarns range, Au-198 production through the n-2n reaction

55
has an energy threshold of 8.1 MeV that prevents neutrons below that energy from being captured.
Au-198 has a much lower energy threshold and has a thermal n-capture cross section in barns
causing greater production as neutron energies decrease. The ratio comparing 198/196 ideally
should be consistent between runs. However, due to assumptions made and lack of information
provided variation up to a factor of 3 was seen.
4.4.3 Cross Section Determination
Cross sections values were determined for each isotope produced through the n-p, n-2n, n-
γ, or n-α reaction. These values were determined using both flux values in each run. A comparison
of each calculated cross section by run to literature values is shown below in tables 15 through 18.
Note that all literature values were obtained using the JENDL-4.0 library except for Ir and Pt which
was obtained using the ENDF/B-VII.1 library.
Table 15: Comparison of calculated cross sections for each activation product in run 1
Target Activation Element
Activation Product
Nuclear Reaction
Lit. Fission Spectrum
Ave. (barns)
Au-196 Au-198 Calc. Cross
Section (barns)
Ratio (Calc./Lit.)
Calc. Cross Section (barns)
Ratio (Calc./Lit.)
Au Au-196 n-2n 3.91E-0375 - - - -
Au-198 n-γ 7.71E-0275 - - - -
Ir
Os-191 n-p 8.92E-0676 1.08E-03 121.12 1.25E-04 13.97
Ir-192 n-γ 1.85E-0176 2.77E-02 0.15 3.20E-03 0.02
Ir-194 n-γ 9.15E-0276 2.86E-02 0.31 3.30E-03 0.04
Pt
Os-191 n-α 3.31E-0776 2.56E-02 77336.41 2.95E-03 8917.80
Pt-195m n-γ 4.79E-0276 5.64E-02 1.18 6.50E-03 0.14
Pt-197 n-γ 4.07E-0276 3.20E-02 0.79 3.69E-03 0.09
Ti
Sc-46 n-p 2.66E-0375 3.35E-03 1.26 3.86E-04 0.15
Sc-47 n-p 2.66E-0375 9.55E-03 3.60 1.10E-03 0.41
Sc-48 n-p 2.66E-0375 6.00E-04 0.23 6.92E-05 0.03
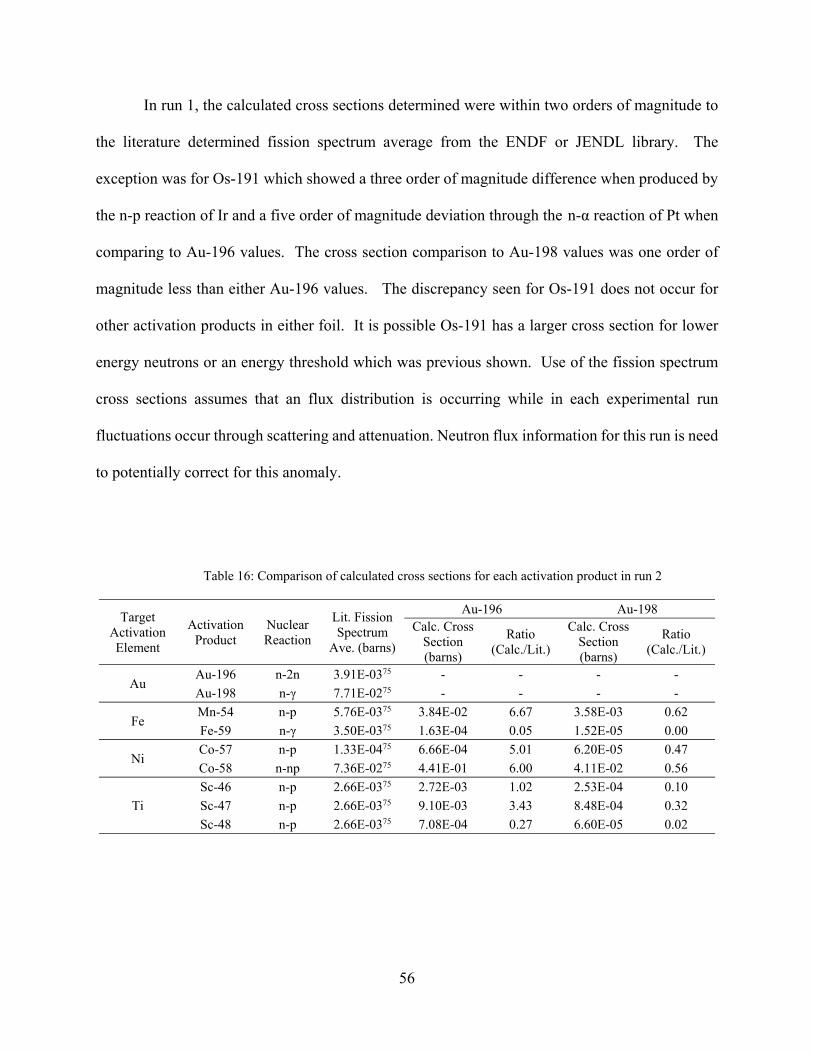
56
In run 1, the calculated cross sections determined were within two orders of magnitude to
the literature determined fission spectrum average from the ENDF or JENDL library. The
exception was for Os-191 which showed a three order of magnitude difference when produced by
the n-p reaction of Ir and a five order of magnitude deviation through the n-α reaction of Pt when
comparing to Au-196 values. The cross section comparison to Au-198 values was one order of
magnitude less than either Au-196 values. The discrepancy seen for Os-191 does not occur for
other activation products in either foil. It is possible Os-191 has a larger cross section for lower
energy neutrons or an energy threshold which was previous shown. Use of the fission spectrum
cross sections assumes that an flux distribution is occurring while in each experimental run
fluctuations occur through scattering and attenuation. Neutron flux information for this run is need
to potentially correct for this anomaly.
Table 16: Comparison of calculated cross sections for each activation product in run 2
Target Activation Element
Activation Product
Nuclear Reaction
Lit. Fission Spectrum
Ave. (barns)
Au-196 Au-198 Calc. Cross
Section (barns)
Ratio (Calc./Lit.)
Calc. Cross Section (barns)
Ratio (Calc./Lit.)
Au Au-196 n-2n 3.91E-0375 - - - -
Au-198 n-γ 7.71E-0275 - - - -
Fe Mn-54 n-p 5.76E-0375 3.84E-02 6.67 3.58E-03 0.62
Fe-59 n-γ 3.50E-0375 1.63E-04 0.05 1.52E-05 0.00
Ni Co-57 n-p 1.33E-0475 6.66E-04 5.01 6.20E-05 0.47
Co-58 n-np 7.36E-0275 4.41E-01 6.00 4.11E-02 0.56
Ti
Sc-46 n-p 2.66E-0375 2.72E-03 1.02 2.53E-04 0.10
Sc-47 n-p 2.66E-0375 9.10E-03 3.43 8.48E-04 0.32
Sc-48 n-p 2.66E-0375 7.08E-04 0.27 6.60E-05 0.02

57
In run 2, the calculated cross sections to literature cross sections were within two orders of
magnitude for all activation products. The calculated values for Au-196 were about one order of
magnitude larger than each cross section ratio determined for Au-198.
Table 17: Comparison of calculated cross sections for each activation product in run 3
Target Activation Element
Activation Product
Nuclear Reaction
Lit. Fission Spectrum
Ave. (barns)
Au-196 Au-198 Calc. Cross
Section (barns)
Ratio (Calc./Lit.)
Calc. Cross Section (barns)
Ratio (Calc./Lit.)
Au Au-196 n-2n 3.91E-0375 - - - -
Au-198 n-γ 7.71E-0275 - - - -
Ir
Ir-190 n-2n 6.42E-0376 1.85E-04 20.76 6.35E-06 0.71
Os-191 n-p 8.92E-0676 4.26E-03 477.12 1.46E-04 16.35
Ir-192 n-γ 1.85E-0176 9.60E-02 0.52 3.29E-03 0.02
Ir-194 n-γ 9.15E-0276 4.41E-01 4.82 1.51E-02 0.17
Pt Os-191 n-α 3.31E-0776 1.55E-01 470001.68 5.32E-03 16104.15
Pt-195m n-γ 4.79E-0276 4.75E-01 9.92 1.63E-02 0.34
Ti
Sc-46 n-p 2.66E-0375 2.13E-02 8.03 7.30E-04 0.27
Sc-47 n-p 2.66E-0375 7.22E-02 27.21 2.48E-03 0.93
Sc-48 n-p 2.66E-0375 5.21E-03 1.96 1.79E-04 0.07
In run 3, the calculated cross sections determined were within two orders of magnitude to
the literature values using either flux value except for Os-191. This run repeated the same target
materials used in run 1 showing similar deviation for each activation product. The discrepancy in
the Os-191 ratio was again larger for production through the n-α reaction of Pt opposed to the n-
p reaction using Ir. The ratio values for Au-196 were one order of magnitude larger relative to
Au-198 in both cases similar to run 1.

58
Table 18: Comparison of calculated cross sections for each activation product in run 4
Target Activation Element
Activation Product
Nuclear Reaction
Lit. Fission Spectrum
Ave. (barns)
Au-196 Au-198 Calc. Cross
Section (barns)
Ratio (Calc./Lit.)
Calc. Cross Section (barns)
Ratio (Calc./Lit.)
Au Au-196 n-2n 3.91E-0375 - - - -
Au-198 n-γ 7.71E-0275 - - - -
Co
Co-58 n-2n 1.69E-0475 1.34E-02 79.01 2.54E-03 14.99
Fe-59 n-p 1.48E-0375 6.71E-02 45.24 1.27E-02 8.58
Co-60 n-γ 5.58E-0575 7.33E-01 13143.21 1.39E-01 2493.96
Cr Pb-203 n-2n 5.18E-0375 5.03E-02 9.71 9.54E-03 1.84
Pb Cr-51 n-2n 1.45E-0475 4.15E-04 2.87 7.88E-05 0.54
W W-187 n-γ 4.76E-0275 3.27E-01 6.86 6.20E-02 1.30
In run 4, the calculated cross sections determined using either flux were within two orders
of magnitude relative to the literature values. The only exception was Co-60 produced through
the n-γ reaction of Co with a three order of magnitude increase relative to other isotopes produced
from Co. This is similar to what was seen with Os-191 and is likely caused by a sensitivity to
lower energy neutrons or energy threshold which was not accounted for when using the ideal
fission spectrum average.
4.5 Conclusion
Calculated cross sections in each run showed a ~two order of magnitude difference when
comparing to literature values. This was seen in Au-196 which consistently had a 1 to 2 order of
magnitude larger cross section while Au-198 generally had a 1-2 order of magnitude smaller cross
section. The variation seen between the two fluxes was due to the energy reaction threshold for
Au-196 decreasing the total flux determined while Au-198 had a slightly higher flux based on a
sensitivity to thermal neutrons. The only discrepancies seen were in the production of Os-191
from natural Ir or Pt or Co-60 produced from natural Co. In both fluxes, the ratio of cross sections
determined was off by at least three orders of magnitude likely due to use of the fission spectrum

59
average cross sections from literature. The fission spectrum cross section used was based on an
ideal neutron spectra which did not take correct for attenuation and neutron scattering caused by
the surrounding environment outside of the fission source. Improvement of these cross sections
could be performed by using the actual neutron spectra for each run to adjust each cross section
from literature. However, this information is not available to the public.

60
CHAPTER 5: BATCH CONTACT STUDIES OF SCANDIUM AND TITANIUM ON
EXTRACTION CHROMATOGRAPHY RESINS FOR SEPARATION METHOD
DEVELOPMENT
5.1 Introduction
In this chapter, batch contact studies were performed to determine the retention of stable
scandium and titanium to different extraction chromatography resins. These studies are used to
determine a separation factor based on differing retention of each analyte determined in different
acid conditions. In chapter 4, it was shown that small quantities of 46Sc, 47Sc, and 48Sc was
produced from natTi through the n-p reaction. In this work, strong acid systems will be employed
to separate scandium and titanium based on their differing oxidation states in solution. Optimal
parameters will be developed based on the extraction of trivalent scandium from tetravalent
titanium. In chapter 6, the optimal conditions determined will be adapted to column separation
studies.
Extraction chromatography resins Ln 1 and DGA normal (unbranched) produced from
Eichrom technologies, described in section 2.3, have been shown previously to preferentially
extract trivalent species such as lanthanides and actinides.35,36,77–79 Batch contact studies based on
the method outlined in chapter 3 will be performed in hydrochloric and nitric acid.
5.2 Materials
All materials used in this chapter are listed in Section 3.1.

61
5.3 Experimental Procedure
5.3.1 Stock Solution Preparation
All stock solutions were prepared by adding a aliquot of ICP-MS grade analyte standard
into a glass scintillation vials filled with concentrated nitric acid. Each vial was dried down on a
hot plate (105-110 C) to produce a reside of analyte followed by the addition of concentrated nitric
acid to redissolve the sample. This process was repeated twice more where the final solution was
brought up in the desired concentration of hydrochloric or nitric acid used for the study. A 1000
ppm stock solution of Sc, Ti, and combination solution at each concentration was produced unless
otherwise noted.
5.3.2 Ln 1 Resin
5.3.2.1 Batch Contact Studies
The general procedure for batch studies is described in section 3.4.1. Single and dual
analyte (interference) batch studies were performed in 0.1 to 8 M HCl and 0.1 to 11 M HNO3. A
resin mass of 50 ± 2% mg Ln 1 resin was weighed into a 2 mL microcentrifuge vial and
preconditioned using 1 mL of acid. Vials were mixed for 1 hour and left upright overnight to allow
the interstitial space between each resin been to expand. Each vial was spiked with 0.5 mL of a
matching acid solution containing of 1000 ± 1% ppm Sc followed by 1 hour of mixing. This spike
solution was produced prior to the experiment using the method outline in section 5.3.1. Each
solution was transferred into a syringe connected to a PTFE tip and filtered into a clean 2 mL
microcentrifuge vial. An aliquot from each vial was diluted and analyzed on an ELAN DRC II
ICP-MS per the method described in section 3.6.2.2. Four replicates were performed for each
62
acid concentration. This method was repeated using 1000 ± 1% ppm Ti, and a combination of
1000 ± 1% ppm Ti and Sc.
5.3.2.2 Data Analysis
The weight distribution Dw followed by conversion to k’ was using equation 8 described in
section 3.4.1.2 with the physical constants for Ln 1 resin shown below in table 19.
5.3.3 DGA Normal Resin
5.3.3.1 Batch Contact Studies
The general procedure for batch studies is described in section 3.4.1. Single and dual
analyte (interference) batch studies were performed using in 0.01 to 8 M HCl and 0.01 to 10.5 M
HNO3. Three variations of the batch contact studies were performed using DGA (normal) resin.
All stock solutions were prepared previously using the method outline in section 5.3.1.
In variation 1 (the UNLV method), the Ln 1 resin procedure in section 5.3.1.1 was
duplicated using DGA normal resin. In this method, analysis was performed using an Optima
8000 ICP-AES described in section 3.6.1.2.
In variation 2 (the CSU method), the Ln resin procedure in section 5.3.1.1 was duplicated
using DGA resin at analyte concentrations of 750 ± 1% ppb for single and dual analyte studies. In
this method, analysis was performed using a NexION 350 ICP-MS described in section 3.6.2.2.
Solutions were produced by diluting ICP-MS grade Sc and Ti stock solutions due to issues with
Ti precipitation during the dry down process described in section 5.3.1. A lower analyte
concentration was used due to a reduced upper limit of detection for the ICP-MS opposed to the
ICP-OES. This method was performed in an attempt to replicate the UNLV data using equipment
available at CSU.

63
In variation 3 (LANL method), a single analyte batch study was performed using Sc in HCl
and HNO3. Stock solutions were prepared using ACS grade Sc2O3 using the method outline in
5.3.1.
A 50 ± 2% mg sample of resin was weighed into a 1.2 mL Bio-Spin® chromatography
column followed by preconditioned using 0.9 mL of acid. Vials were capped followed by mixing
for 1 hour and left upright overnight to swell. Each column was spiked with a 0.3 mL matching
acid solution containing ~1000 ppm Sc followed by 1 hour of mixing. Each columns tip was
removed and solutions were drained into glass scintillation vials. Three replicates were performed
for each acid concentration. At each acid concentration, two additional samples with different
compositions were prepared. The first sample followed the procedure above but used 1.2 mL of
clean acid in resin without the addition of the Sc spike. The second sample used 0.9 mL of clean
acid and 0.3 mL of Sc spike without any resin. An aliquot of each sample diluted and analyzed
using the ICAP 6500 DUO ICP-AES described in section 3.6.1.2. This method was performed to
replicate previous work performed at LANL in an attempt to determine discrepancies between
batch study results.
5.3.3.2 Data Analysis
The weight distribution Dw followed by conversion to k’ was calculated using equation 8
per section 3.4.1.2 using the physical constants for DGA resin shown below in table 19. Volume
corrections for DGA resin in each acid were determined based on the volumes used in the UNLV
batch study. Description of the method is shown in section 3.4.3 and the values are listed below
in table 20. These were used to correct for the volume lost in each UNLV and CSU study as the
method is based on using microcentrifuge vials followed by filtration.

64
Table 19: Physical constants of slurry-packed columns
Physical Properties HDEHP33 TODGA34
Extractant Density (g/mL) 0.96 0.88 Bed Density (g/mL) 0.38 0.38 Resin Density (g/mL) 1.15 1.13 Vs (mL) 0.16 0.17 Vm (mL) 0.67 0.66 Vs/Vm 0.24 0.26 Dv Conversion Factor (C1) 0.239 2.2 K’ Conversion Factor (C2) 0.57 0.57 Capacity (mg Eu/g resin) 50 10.6
Table 20: DGA resin volume corrections
HCl Volume Lost (%) 1 σ HNO3 Volume Lost (%) 1 σ 0.1 M 7.63 0.02 8.45 0.06 1 M 7.97 0.01 8.69 0.02
10 M 8.57 0.03 8.77 0.04
5.3.3.3 Kinetic Batch Contact Study
The UNLV single analyte study method was replicated using a mixing time of 2.5 hours
instead of 1 hour after addition of the spike solution. This was performed in hydrochloric acid
using Sc and Ti. Three replicated were performed at each acid concentration.
5.3.3.4 Data Analysis
The data was analyzed in the same manner as the previous batch contact studies described
in section 5.3.2.2.
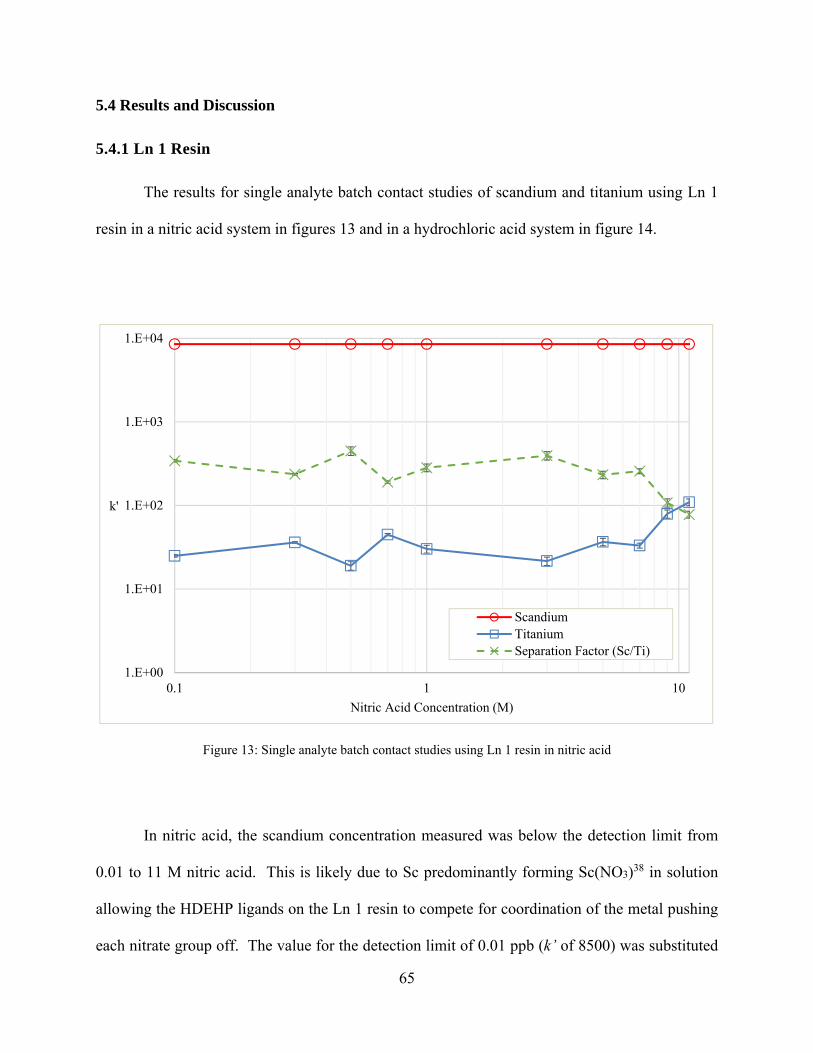
65
5.4 Results and Discussion
5.4.1 Ln 1 Resin
The results for single analyte batch contact studies of scandium and titanium using Ln 1
resin in a nitric acid system in figures 13 and in a hydrochloric acid system in figure 14.
Figure 13: Single analyte batch contact studies using Ln 1 resin in nitric acid
In nitric acid, the scandium concentration measured was below the detection limit from
0.01 to 11 M nitric acid. This is likely due to Sc predominantly forming Sc(NO3)38 in solution
allowing the HDEHP ligands on the Ln 1 resin to compete for coordination of the metal pushing
each nitrate group off. The value for the detection limit of 0.01 ppb (k’ of 8500) was substituted
1.E+00
1.E+01
1.E+02
1.E+03
1.E+04
0.1 1 10
k'
Nitric Acid Concentration (M)
ScandiumTitaniumSeparation Factor (Sc/Ti)

66
for purposes of determining a separation factor. A k’ of ~30 for titanium was determined from 0.1
to 6 M which is equivalent ~60% sorption to the resin. The retention of Ti seen is likely due to
formation of Ti(NO3)4 which will similarly extract by HDEHP coordinating to the metal center
and pushing the three of the nitrate off. The lower overall extraction may be due to a mixture of
the Ti(NO3)4, and TiO2 species. It is possible that the lower extraction is due to the inability of the
ligand to bind to TiO2 causing the lower overall retention. From 6 M to 11 M, a slight increase in
retention occurred up to a k’ of ~110 or 85% sorption which is likely caused by an increase in
Ti(NO3)4 species. The separation factor fluctuated around ~300 until 6 M followed by a slight
decrease to ~80 at 11 M.
Figure 14: Single analyte batch contact studies using Ln resin in hydrochloric acid
1.E+00
1.E+01
1.E+02
1.E+03
1.E+04
0.1 1 10
k'
Hydrochloric Acid Concentration (M)
Scandium
Titanium
Separation Factor (Sc/Ti)
67
In hydrochloric acid, the retention of Sc and Ti was consistent compared to previous nitric
acid batch studies. Scandium was highly retained over the entire range from a k’ of ~2600 up to
8500 which is equivalent to greater than 99% sorption. The increase in retention is likely due to a
rise in chloride anions complexing to form ScCl3.38,40
Similar to the nitric system, HDEHP ligands
in the Ln resin likely coordinated to the metal center pushing off chloride species so as to extract
the neutral Sc into the stationary phase. The value for the detection limit of 0.01 ppb (k’ of 8500)
was substituted for 2, 4, and 8 M hydrochloric acid as the scandium concentration measured was
below the detection limit. Similarly, Ti retention slowly increased with a k’ of ~10 at 0.1 M up to
90 at 8 M likely due a slight complexation with chloride anions to form a mixture of TiO2, and
TiCl2-4.41 It is likely that titanium chloride species became predominant after 5 M when the
retention surpassed 50. The separation factor gradually decreased from ~280 at 3 M to ~100 at
8 M as Sc retention did not change while Ti retention increased.
In both studies, scandium was retained at or above ~99% to Ln 1 resin. Titanium was
retained from ~35 to 85% in hydrochloric and ~60 to 85% in nitric acid which is high for a
separation. Overall, the retention of scandium was good but the even at titanium lowest retention
point (0.1 M HCl) ~35% was retained giving an overall separation factor of ~300. This might be
a reasonable separation factor if the intended solution contained a 1 to 1 ratio of scandium to
titanium but based on the few measurements of scandium produced by the n-p reaction of titanium
in chapter 4, less than 1% of the target converted to scandium.

68
5.4.2 DGA Resin
5.4.2.1 Single Analyte Batch Studies
The results for the UNLV variant single analyte batch contact studies using DGA resin in
nitric acid are shown in figure 15, and in hydrochloric acid in figure 16 below.
Figure 15: UNLV single analyte batch contact study DGA resin in nitric acid
Each element was contacted separately to determine the sorption potential on DGA resin
in nitric acid. Scandium retention increased ~24 to ~350 or in terms of percent sorption from ~45
to ~90% as the nitric acid concentration increased from 0.1 to 1 M. Similar to previous nitric acid
1.E-01
1.E+00
1.E+01
1.E+02
1.E+03
1.E+04
0.1 1 10
k'
Nitric Acid Concentration (M)
ScandiumTitaniumSeparation Factor (Sc/Ti)

69
work in Ln resin, Sc retention increased with anion concentration forming Sc(NO3) which was
extracted by DGA coordinating to the metal center. The retention of titanium remained below 1
across the entire range varying in sorption from ~0.7 to 3.5%. The lower trend seen in Ti is likely
due to the mechanism of extraction. In Ln resin, the ligand is unidentate while in DGA the ligand
bidentate likely making it more difficult to coordinate to Ti due to steric hindrance. This may also
account for the slightly lower retention of Sc to DGA resin across the entire range relative to the
Ln resin study. The separation factor of scandium to titanium increased from ~ 20 to 2000 by 3
M finally reaching ~8400 at 10.5 M.
Figure 16: UNLV single analyte batch contact study using DGA resin in hydrochloric acid
1.E-01
1.E+00
1.E+01
1.E+02
1.E+03
1.E+04
0.1 1 10
k'
Hydrochloric Acid Concentration (M)
ScandiumTitaniumSeparation Factor (Sc/Ti)

70
Each element was contacted separately to determine the sorption potential on DGA resin
in hydrochloric acid. Similar to the Ln resin studies, Sc retention increased with a rise in chloride
anion concentration. The significant change in retention from low to high acid is likely due to the
inability of the ligand to extract Sc(OH)3 while able to extract the ScCl3 which slowly became the
dominant species as the chloride concentration increased. This is shown through Sc retention
increasing from ~1 to ~1400 or a percent sorption of ~6 to ~99% from 0.1 to 4 M. As in the case
of nitric acid studies, titanium retention remained low and stagnant due to inability of the DGA
ligand to extract Ti in either the oxide or nitrate form.
Overall, Ti retention was higher in hydrochloric acid for the DGA studies fluctuating
around a k’ of ~2 to 3 with a percent sorption varying from ~8 to 16% over the range. The
separation factor of Sc to Ti increased from ~0.5 at 0.1 M up to a maximum of 583.41 at 8 M.
However, this was lower than separation factors determined in nitric acid which ranged from
~8000 to 25000 at high nitric acid concentration.
5.4.2.2 Kinetic Batch Study
The results for single analyte kinetic batch contact studies of scandium and titanium DGA
resin shown below in figure 17.

71
Figure 17: UNLV single analyte kinetic study using DGA resin in hydrochloric acid
A kinetic study was performed to confirm whether the batch study method had allowed
sufficient time for extraction of scandium and titanium in hydrochloric acid. Each element was
contacted separately to determine the sorption potential of DGA resin in hydrochloric acid at 2.5
hours to compared to previous batch study data. The difference between at each data point relative
to the average retention at each acid concentration showed a variance of ~9% at 0.1 up to 0.3 M,
decreasing to ~2.5% between 0.3 up to 1 M, finally decreasing to ~0.1% variation between 1 and
8 M hydrochloric acid. Little variation was seen between the two sets of data.
1.E-01
1.E+00
1.E+01
1.E+02
1.E+03
1.E+04
0.1 1 10
k'
Hydrochloric Acid Concentration (M)
Scandium 1 HrTitanium 1 HrSeparation Factor (Sc/Ti) 1 HrScandium 2.5 HrsTitanium 2.5 HrsSeparation Factor (Sc/Ti) 2.5 Hrs

72
5.4.2.3 Dual Analyte Batch Studies
The results for the dual analyte batch contact studies otherwise known as interference
studies using DGA resin in nitric acid are shown below in figure 18 and in hydrochloric acid in
figure 19.
Figure 18: UNLV dual analyte batch contact study using DGA resin in nitric acid
Scandium and titanium were contacted simultaneously to determine any significant
variation in sorption on DGA resin in nitric acid. Similar to the single analyte study, scandium
showed an increasing k’ of ~17 to ~4000 from 0.1 to 1 M. Scandium retention was shown to be
significantly lower than the single analyte study below 0.3 M while increasing at a larger slope
above 0.3 M. Scandium concentration from 3 to 10.5 M was below the detection limit so a value
1.E-01
1.E+00
1.E+01
1.E+02
1.E+03
1.E+04
1.E+05
0.1 1 10
k'
Nitric Acid Concentration (M)
ScandiumTitaniumSeparation Factor (Sc/Ti)

73
was substituted based on the instruments LOD of 0.01 ppm giving a ~99% retention or k’ of
~28,000.
Titanium retention remained stagnant around a k’ of 1 with slight fluctuations likely due
random processes such as sorption to the container walls. A slight decreasing trend was shown
up to 5 M followed by a slight increase up to 10.5 M. The entire retention range shifted from 0.48
to 2.01 with 2.01 at 0.1 M down to 1.56 at 10.5 M.
Overall, titanium retention to the resin was slight larger but not very significant with a
percent sorption range of ~3 to 10%. The separation factor of Sc to Ti showed an increasing trend
due to the significant increase in Sc extraction as the nitrate concentration increased from ~2 at 0.1
M to ~15,000 at 10.5 M. Similar to the single analyte studies, a large separation factor of 8000 or
more was seen at high nitric acid concentration.
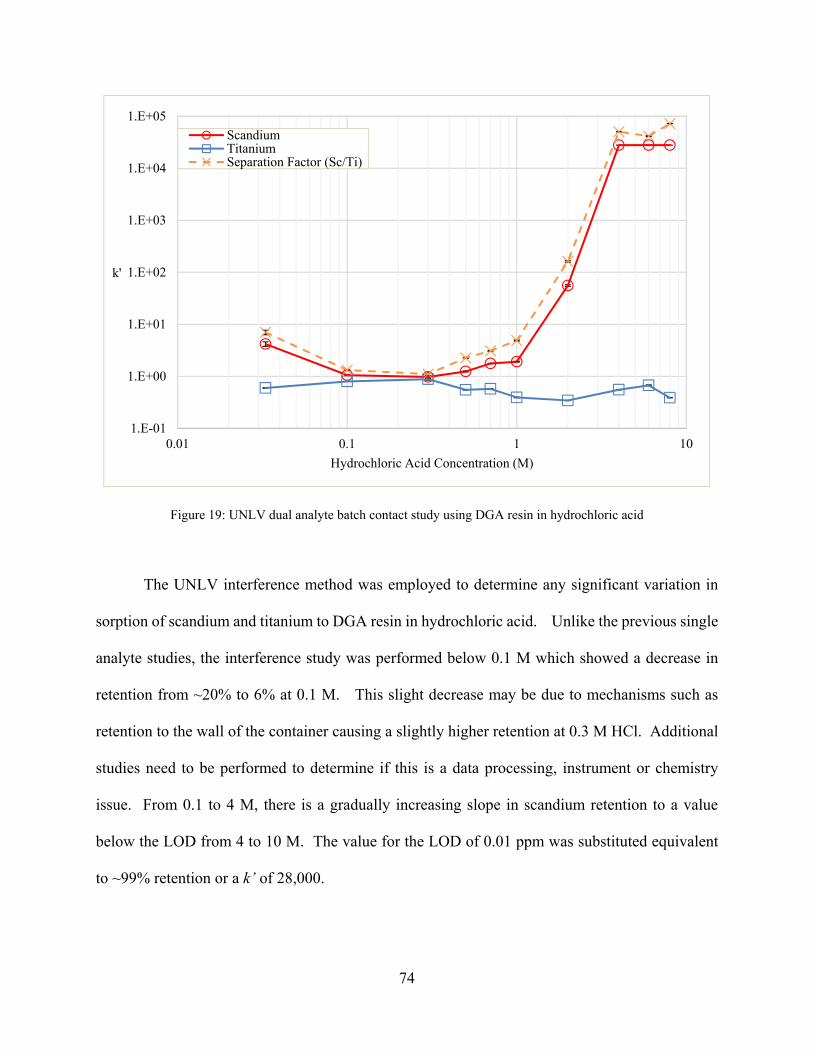
74
Figure 19: UNLV dual analyte batch contact study using DGA resin in hydrochloric acid
The UNLV interference method was employed to determine any significant variation in
sorption of scandium and titanium to DGA resin in hydrochloric acid. Unlike the previous single
analyte studies, the interference study was performed below 0.1 M which showed a decrease in
retention from ~20% to 6% at 0.1 M. This slight decrease may be due to mechanisms such as
retention to the wall of the container causing a slightly higher retention at 0.3 M HCl. Additional
studies need to be performed to determine if this is a data processing, instrument or chemistry
issue. From 0.1 to 4 M, there is a gradually increasing slope in scandium retention to a value
below the LOD from 4 to 10 M. The value for the LOD of 0.01 ppm was substituted equivalent
to ~99% retention or a k’ of 28,000.
1.E-01
1.E+00
1.E+01
1.E+02
1.E+03
1.E+04
1.E+05
0.01 0.1 1 10
k'
Hydrochloric Acid Concentration (M)
ScandiumTitaniumSeparation Factor (Sc/Ti)

75
As in the other studies, titanium remained stagnant around ~1 likely due to the inability of
the bidentate TODGA ligand to coordinate Ti. A slight titanium retention of ~2 to 4% was
observed across the acid range which may be due to other processes occurring such as adsorption
to the container walls or inert resin support. The separation factor of Sc to Ti increased from ~5
at 0.3 M up to ~70,000 at 8 M. Note again that the separation factor was significantly higher due
to use of the LOD value for the instrument used.
5.4.2.4 Comparison of Scandium Retention Studies
A comparison between published studies and batch studies performed for this dissertation
are shown below in hydrochloric and nitric acid. Comparison plots of these studies to the UNLV
single batch studies are shown in figures 20, and 21. Each set of data was converted from Dw to
k’ using the conversion factor shown in table 19 in attempt to compare different methods. The
retention values determined from the UNLV single analyte, Roman, and Dirks studies were
determined using a batch contact study method. The Alliot retention values were determined using
a column study.

76
Figure 20: Comparison of multiple scandium retention studies using DGA resin in nitric acid. The Roman, Alliot, and Dirks data was extracted from published papers16,80,81
All of the data sets show an increasing trend of scandium retention in DGA resin as the
nitric acid concentration increased. This was previously discussed to occur based on the increase
in Sc(NO3)3 species as the nitrate concentration increased. The work by Alliot and the UNLV
single analyte study showed the closest similarity across the range with fairly close k’ values from
0.1 to 6 M nitric acid. The difference between the Alliot and the UNLV values are under an order
of magnitude varying from ~1.3 to 6.5 while the Roman and Dirks data are consistently 2 to 3
orders of magnitude higher. The Dirks data show a low scandium retention at 0.01 M but swiftly
1.E+00
1.E+01
1.E+02
1.E+03
1.E+04
1.E+05
1.E+06
1.E+07
0.001 0.01 0.1 1 10
k'
Nitric Acid Concentration (M)
UNLV Single AnalyteRomanAlliotDirks

77
increases with a slope of ~2 and a k’ 2.5 orders of magnitude higher relative to the UNLV data at
0.1 M. Similarly, the Roman data increases with a slope of ~2 from 0.1 to 2 M.
Looking at the different methods, the UNLV, Dirks, and Roman methods were all very
similar using ppm quantities of Sc in 50 mg of resin. The volume of acid for each varied from 1.2
to 1.5 mL with mixing times from 30 minutes to 1 hour. Analytes were measured using a ICP-
AES for Roman and the UNLV data while a ICP-MS was used to analyte the Dirks data. The only
significant difference between the three procedures was the filtration method. In the UNLV study,
a PTFE filter and syringe was used while a 2 mL biospin column was drained in the Roman study,
and a centrifuge was used to separate the two phases in the Dirks study. It is unclear as to why
these methods should differ significantly as the Alliot method using column studies showed the
closest retention values to the UNLV data across the acid range. It should be noted that the Alliot
method used multiple analytes at unknown concentrations to achieve this distribution.
Based on the UNLV study, a scandium sorption of 99% is equivalent to a k’ value of 1000
which is still below majority of Roman and Dirks data. Their data seems to continuously increase
purely on their ability to detect signal. This is clearly shown at very high acid concentrations in
the Dirks study where retention values fluctuated significantly while maintaining sorption above
99%.

78
Figure 21: Comparison of multiple scandium retention studies using DGA resin in hydrochloric acid. The Roman, Alliot, and Dirks data was extracted from published papers16,80,81
All of the data sets show an increasing scandium retention trend from 1 to 10 M with minor
variations at high acid in the Dirks data likely due to a lower limit of detection through
measurement using a ICP-MS. This is likely due to increased formation of ScCl3 as the anion
concentration increased. Similar to the nitric acid comparison, the Alliot data was similar to the
UNLV study data in terms of slope with a slightly higher k’ overall. In the Dirks data, a slight
decrease in retention was shown from 0.001 to 0.1 M followed similar data to the Alliot and UNLV
data from 0.1 to 10 M.
The Roman data showed significantly higher sorption across the entire acid range similar
to the previous comparison in nitric acid. In hydrochloric acid, the data decreased by an order of
magnitude from 0.1 to 1 M followed by an increase in k’ retention similar to Dirks and the UNLV
1.E-01
1.E+00
1.E+01
1.E+02
1.E+03
1.E+04
1.E+05
0.001 0.01 0.1 1 10
k'
Hydrochloric Acid Concentration (M)
UNLV Single AnalyteRomanAlliotDirks

79
study up to 2 M. The decrease shown for Dirks and Roman at low acid may be caused by a
sorption to the container wall or additional mechanism not clearly explained in their procedures.
Although, there was some discrepancy in the retention values determined in each study, all
of the different studies came to the same conclusion that 0.1 M hydrochloric acid would be optimal
for stripping Sc from DGA resin. With large discrepancies in data, an attempt was made to
replicate the results from the Dirks and Roman studies.
In the Roman study, batch contact studies were performed used biospins columns noted in
the LANL method listed in 5.3.2.1 to measure single analyte Sc retention using ICP-AES. The
Dirks method utilized batch studies using a low ppm concentration of Sc in 1.4 mL of acid followed
by mixing for thirty minutes.81 Dirks used the method of separating samples using a centrifuge
which was hard to replicate as no experimental instructions were included. Samples from the
Dirks study were analyzed using ICP-MS which could explain why the retention values were
significantly higher due to a limit of detection In this work, the CSU interference method was
employed to replicate the Dirks data using a lower concentration of Sc and measured using a ICP-
MS. No attempt was made to replicate the Alliot method as it involved multiple additional
elements at concentrations not listed. Comparison plots of the UNLV single analyte, UNLV
interference, CSU interference, and LANL biospin data sets are shown below in figures 22, and
23.

80
Figure 22: Comparison of UNLV, CSU, and LANL methods for scandium retention on DGA resin in nitric acid
Each set of data follows a similar trend of scandium retention increasing with acid
concentration. The LANL and UNLV interference methods show a steeper increase in slope from
0.1 to 1 M reaching greater than ~ 90% sorption by ~0.5 M while the CSU interference and UNLV
single analyte data reached ~90% sorption by 1 M. From 1 M onward, the CSU and UNLV
interference studies reached their detection limits by ~3 M while the LANL data decreased slightly
due to human error in performing manipulating the biospin columns. In each of the studies, the
uncertainty between replicates at any acid concentration was under 20% while in the LANL study
uncertainties up to 75% were determined at k’ values at 1 M or higher. However, at these values
the sorption was significantly higher than 99%. The UNLV single analyte study slowly increased
1.E+00
1.E+01
1.E+02
1.E+03
1.E+04
1.E+05
1.E+06
0.01 0.1 1 10
k'
Nitric Acid Concentration (M)
UNLV Single AnalyteUNLV InterferenceCSU InterferenceLANL Biospin

81
reaching full retention near 10.5 M. Although, there was some discrepancy in retention between
the four runs, UNLV interference and LANL methods were consistently 1 order of magnitude
lower from 1 M onward compared to the Dirks and Roman data in figure 20. Replication of the
Roman method shown as LANL Biospin and the CSU interference method instead showed a
confirmation of the UNLV studies at up to 1 M followed by variation in retention values
representing sorption greater than 99% for all studies from 1 to 10 M nitric acid.
Figure 23: Comparison of UNLV, CSU, and LANL batch contact study methods for scandium using DGA resin in hydrochloric acid
Similar to the comparison in figure 22, each set of data shows a gradual increase in
scandium sorption up to ~95% or a k’ ~1400 at 3 M. The slight variations between the UNLV
1.E-01
1.E+00
1.E+01
1.E+02
1.E+03
1.E+04
1.E+05
1.E+06
0.01 0.1 1 10
k'
Hydrochloric Acid Concentration (M)
UNLV Single AnalyteUNLV InterferenceCSU InterferenceLANL Biospin

82
single analyte, LANL, and CSU interference studies are likely due to slight variations in
experimental reproducibility, instrumental drift, and data processing.
The significant decrease in retention shown in UNLV interference study is a bit harder to
determine as there is a sorption decrease of 15% from 0.03 to 0.1 M followed by a comparatively
steeper slope up from 1 to 4 M. It is possible that the CSU and LANL data may match closer to
the UNLV interference data if additional batch studies were performed between 0.1 and 1 M
hydrochloric acid. Both of these methods show a similar rising slope compared to the UNLV
studies below 1 M unlike the previous Roman data in figure 21. An additional replicate study
using the UNLV interference procedure and analysis method should be performed in an attempt
to deduce the deviation between data sets.
5.4.2.5 Comparison of Titanium Retention Studies
A comparison of titanium retention from the UNLV studies, CSU study, and previous work
by Pourmand82 are show below in figures 24, and 25.

83
Figure 24: Comparison of multiple titanium retention studies using DGA resin in nitric acid. Pourmand’s data was extrapolated from previously published work82
Each data set shows a decreasing retention of titanium from very low to ~5 M nitric acid
and increase in retention from 5 M onward. The sorption of Ti in the UNLV and CSU studies
from 0.01 to 9 M is under 10% or a k’ of ~2 while the Pourmand data fluctuated slight higher at
~20 to 25% sorption. It is unclear why there is a slight decreasing trend in titanium sorption from
0.1 to 6 M in the UNLV and CSU studies followed by a rapid increase up to 10 M. The rapid
increase shown at very high nitric acid may be explained by a speciation threshold where the
dominant species in the solution is Ti(NO3)4 allowing for small but significant increase in
extraction by DGA resin. Additional batch contact studies up to 16 M nitric acid should be perform
to determine if this increase is a fluke.
1.E-01
1.E+00
1.E+01
1.E+02
0.01 0.1 1 10
k'
Nitric Acid Concentration (M)
UNLV Single AnalyteUNLV InterferenceCSU InterferencePourmand

84
Figure 25: Comparison of multiple titanium retention studies using DGA resin from in hydrochloric acid. Pourmand’s data was extrapolated from previously published work82
There does not seem to an increasing or decreasing trend when comparing all of the UNLV
and CSU studies up to 2 M hydrochloric acid. After 2 M, there is a fairly steep increase in retention
for Pourmand and in the CSU interference data. The UNLV batch study and UNLV interference
study stay fairly stagnant from 2 to 8 M. For each the UNLV and CSU studies, Ti is only sorbed
from a few percent up to ~15% at any acid concentration. Similar to the nitric acid work, there
does not seem to be much extraction by DGA resin across the acid concentration except by
Pourmand at 10 M. However, replication of the Pourmand study wouldn’t be possible as the
number of analytes and concentrations used were not expressed for the batch studies. The only
concentrations expressed were for the column elution studies performed.
1.E-01
1.E+00
1.E+01
1.E+02
0.01 0.1 1 10
k'
Hydrochloric Acid Concentration (M)
UNLV Single AnalyteUNLV InterferenceCSU InterferencePourmand

85
5.5 Conclusions
The single analyte studies performed using Ln 1 resin showed a reasonable but not optimal
separation method for Sc and Ti. In both acid system, separation factors of ~100 to 300 were
achievable but significant retention of titanium was seen in nitric and hydrochloric acid at ~60 and
~85%. The UNLV single analyte studies using DGA resin showed a Sc retention of ~1000 or
higher as the acid concentration increased from 3 M in both acid systems. Although, the Sc
retention decreased by one order of magnitude on average DGA resin, Ti retention decreased by
at least two orders of magnitude with a retention around 1 in both acid systems at all
concentrations. A slightly larger SF of ~600 was observed in hydrochloric acid while the SF factor
in nitric acid at least ~8000 up to 25,000 at high acid concentration. The reason for this is likely
due to the coordination mechanism of each resin ligand. Ln 1 resin uses a monodentate ligand that
could coordinate to Ti allowing significant retention, while DGA resin used a bidentate ligand
which did not seem to in acid solution. The reason for this is likely due to steric hindrance
preventing extraction of Ti as a greater number of ligands would be required to extract a tetravalent
species (Ti) opposed to a trivalent (Sc). The difference in Sc retention between the resins is likely
due to the HDEHP ligand acting as a stronger electron donor than the TODGA ligand. The dual
analyte studies replicated similar results to the single analyte studies. The kinetic study showed
less than 10% difference in retention between 1 and 2.5 hour mixing time in hydrochloric acid.
The difference in extraction is likely due to the coordination mechanism of each resin ligand.
Comparison of the different DGA methods by Dirks, Roman, Alliot and studies performed
in this dissertation showed a general increase in Sc retention with acid concentration for both nitric
and hydrochloric acid. However, in nitric acid, the Dirks and Roman data showed Sc retention
values a few order of magnitude greater across the acid range. Additionally, a decrease in Sc

86
retention was shown at very low (0.001 to 0.1 M) to 1 M hydrochloric acid in the Roman and Dirks
data. Attempts to discern these issues by replicating the LANL method and repeating a slight
adaption of the UNLV method (the CSU method) showed retention values closer to those
determined from the UNLV single and dual analyte studies.
Based on the batch contact studies data, an optimal separation method was developed using
a nitric acid system to sorb Sc to DGA resin while separating Ti. This could be followed by a
stripping step using a low concentration of hydrochloric acid. Adaptation of this method to column
studies using 5 M nitric acid and 0.1 M hydrochloric acid is shown in chapter 6.

87
CHAPTER 6: SEPARATION OF TITANIUM AND SCANDIUM USING DGA RESIN
COLUMN STUDIES
6.1 Introduction
Using the separation parameters determined from batch contact studies in chapter 5,
column studies were performed to separate scandium from titanium. In this chapter, column
studies were performed using a wet slurry of DGA resin to determine the analyte distribution or
elution profile of Sc and Ti in smaller quantities. This method will be scaled up in mass loading
similar to the quantities used in chapter 4. If the gravity flow columns show a clean separation,
then the method will be converted to vacuum column studies using prepacked resin cartridges at
significantly faster flow rates. These faster flow rates through use of vacuum pressure is necessary
to push the solution through a smaller interstitial space in these more tightly packed resin
cartridges. In addition, these experiments at higher flow rates will be used to test if a high rate of
extraction is still possible while significantly reducing the time needed for each extraction.
In these column studies, a significantly larger mass of resin will be used to ensure sufficient
capacity while maintaining fast extraction kinetics. A 1:1 ratio of Sc to Ti is used initially for the
elution profile proof of concept followed by substantial increased in Ti mass. A ratio of 1:100 Sc
to Ti will be used in the later experiments with a two orders of magnitude mass loading increase
up to 100 mg based on the mass of each Ti foil (~80-100 mg) used in the Flattop irradiation. Only
1 mg of Sc was used at the highest mass loading based on measurements of Ti foil showing less
than 1% conversion to Sc.
6.2 Materials
All materials used are for these column studies are described in section 3.1
88
6.3 Experimental Procedure
6.3.1 Gravity Column Studies
The general procedure for gravity column studies including FCV determination using a
wet slurry of resin is described in 3.5.1. Two variations of the gravity column study using 500 mg
DGA resin were performed based on the concentration of analyte separated. For three replicates
using 500 mg of DGA resin, 10 ± 0.2 drops of DI water was measured before 1 M hydrochloric
acid eluted from the column. One FCV was determined to be equivalent to ~0.5 mL. Each
Eichrom cartridge used has a column volume of 2 mL.
In the first or elution profile study, a 5 mL load solution containing 5 ± 1% mg Sc and 10
± 1% mg Ti in 5 M nitric acid was prepared from stock standards referenced in section 3.1. A mass
of 500 ± 1% mg of DGA resin was weighed in a 20 mL glass scintillation vial followed by the
addition of ~1-2 M nitric acid. The resin solution was mixed on a shaker table for at least 2 hours
to allow time for swelling. The resin was added to a 2 mL Eichrom chromatography column
followed by the addition of glass wool. The column was conditioned using 5 FCVs of 5 M nitric
acid (2.5 mL) and the number of drops per minute was measured to determine a flow rate. Acid
was eluted until the solution level dropped to top of the resin bed. The 5 mL load solution was
added in 1 mL intervals as the solution flowed down to the level of the resin bed. The column
was washed with 5 FCVs of 5 M nitric acid (2.5 mL) to ensure complete Ti removal. A aliquot
containing 5 FCVs of 6 M hydrochloric acid was then added to the column to convert the acid
matrix without desorbing Sc. Finally, 15 FCVs of 0.1 M hydrochloric acid was added to strip Sc
from the resin. Fraction were collected in 2 mL microcentrifuge every 2 minutes or ~1 FCV.

89
In the second or elution fraction study, the method for preparing resin and the column
remained the same while the mass of analyte, volumes of acid, and fraction collection method
differed. In this method, a 15 mL load solution containing 1 ± 1% mg Sc and 100 ± 1% mg Ti in
5 M nitric acid was prepared from stock standards referenced in section 3.1. The column was
condition using 5 FCVs of 5 M nitric acid prior to addition of the load solution. After the load
solution was added, an addition 30 FCVs (15 mL) of 5 M nitric acid was used to wash the column
any residual Ti. After the Ti elution step, the column was conditioned using 20 FCVs of 6 M
hydrochloric acid (10 mL). Finally, the column was stripped of Sc using 60 FCVs of 0.1 M
hydrochloric acid. Three separate fractions were collected instead of a fraction for every FCV.
The first fraction or Ti elution step consisted of the 5 M nitric acid load and wash. The second
fraction or column conversion step consisted of the 6 M hydrochloric acid elution. The third
fraction or Sc stripping step consisted of the 0.1 M hydrochloric acid elution.
For each study, an aliquot from each fraction was diluted and analyzed using an Optima
8000 ICP-AES described in section 3.6.1.2. Each column study was replicated three times.
6.3.1.1 Data Analysis
The data analysis method used for the Optima 8000 ICP-AES is shown in section 3.5.1.2.
6.3.2 Vacuum Column Studies
The general procedure for the vacuum column studies including vacuum box set up is
described in section 3.5.2.1. A vacuum box from Eichrom was set up using the associated pressure
regulator, and tubing connected to a vacuum spout. A 15 mL load solution containing 1 ± 1% mg
Sc and 100 ± 1% mg Ti in 5 M nitric acid was prepared from stock standards referenced in section
3.1. A 2 mL prepacked DGA resin cartridge was connected to a 20 mL syringe and attached to an

90
open spout on top of the vacuum box. The resin was wet by adding 10 mL of 5 M nitric to a
syringe attached to the resin cartridge allowing the vacuum to pull the acid through the cartridge.
The flow rate was measured at a rate of ~1 mL per minute. Next, the 15 mL stock solution was
added to syringe followed by an additional 15 mL of clean 5 M nitric. The solution eluted off the
column was collected in the Ti fraction vial. Next, 10 mL of 6 M hydrochloric was added to
convert the resin prior to the Sc stripping step. The solution eluted off the column was collected
in a separate fraction. Finally, 30 mL of 0.1 M hydrochloric acid was added to strip Sc and was
collected in a separate fraction. This method was repeated at a flow rate of 3, and 5 mL per minute.
For each study, an aliquot from each fraction was diluted and analyzed using an Optima 8000 ICP-
AES per section 3.6.1.2. Each column study was replicated three times.
6.3.2 Data Analysis
The data analysis method used for the Optima 8000 ICP-AES is shown in section 3.5.1.2.
6.4 Results and Discussion
6.4.1 Gravity Column Studies
The results for the 1:2 Sc to Ti gravity column study using wet slurry DGA resin is shown
below in figure 26. The percent recovery of each analyte by elution phase is shown in table 21
while the decontamination factor for each phase is shown in table 22.

91
Figure 26: Elution profile for the 1:2 ratio of Sc to Ti gravity column study using wet slurry DGA resin. Analyte recoveries of 98.62 ± 1.25% for Sc and 99.51 ± 2.22% for Ti.
Table 21: Percent analyte recovery for each elution phase of the 1:2 ratio Sc to Ti elution profile in figure 6.1
Elution Phase FCV Range Sc Recovery (%) 1 σ Ti Recovery (%) 1 σ
5 M HNO3 Condition 1 to 5 <LOD <LOD <LOD <LOD
Load + 5 M HNO3 Wash 6 to 20 0.04 0.01 99.51 2.22
6 M HCl Conversion 21 to 25 0.26 0.01 0.01 0.01
0.1 M HCl Strip 26 to 40 98.62 1.25 0.02 0.01
0.0
5.0
10.0
15.0
20.0
0 5 10 15 20 25 30 35 40
Ana
lyte
Rec
over
ed (
%)
Elution Volume (FCV)
Scandium Titanium
5 M HNO3Condition Load + 5 M HNO3 Wash
6 M HCl Conversion 0.1 M HCl Strip

92
Table 22: Decontamination factors for each elution phase of the 1:2 ratio Sc to Ti elution profile in figure 6.1
Elution Phase DF (Sc/Ti) 1 σ DF (Ti/Sc) 1 σ
5 M HNO3 Condition N/A N/A N/A N/A
Load + 5 M HNO3 Wash 3.52E-04 1.01E-04 2.84E+03 8.15E+02
6 M HCl Conversion 3.94E+01 5.96E+01 2.54E-02 3.85E-02
0.1 M HCl Strip 5.36E+03 2.91E+03 1.87E-04 1.01E-04
The elution profile above shows the column elution spread between four phases or
fractions. The first (condition) phase was measured to determine if any residual Sc or Ti was
dissolved in the acid solution or part of the resin column. Recovery of both analytes were below
the detection limit of 0.01 ppb or 0.01% relative to the feed stock. The second (load plus wash
phase) shows 99.51 ± 2.22% of the Ti eluting off the column while nearly all of the Sc remained
sorbed to the column. In this phase, the decontamination factor (DF) of Ti was 2.84E3 as only
0.04% of the Sc eluted off. The third (conversation) phase shows less than 1% elution of Ti or Sc
as shown in table 13. This phase was important to determine if there would be any bleed over of
Ti from the 2nd phase. In the fourth (stripping) phase, 98.62 ± 1.25% of the Sc was eluted off the
column with less than 1% of the Ti stock. The DF for Sc was 5.36E3 for this phase as only 0.02%
of Ti was eluted. Overall, 98.62 ± 1.25% of the Sc was recovered during the strip step and 99.51
± 2.22% of the Ti was recovered during the load plus wash step. Less than 0.3% of the Sc was
shown to elute during the condition step which is likely due to the dilution of added 6 M
hydrochloric acid to the resin bed volume of 5 M nitric acid in the column from step 2.

93
The results for the for the 1:100 Sc to Ti gravity column study using wet slurry DGA resin
is shown below in figure 27. Note that neither the wash phase or conversion phase is shown as the
Sc and Ti recoveries were below 1%. The percent recovery of each analyte by elution phase is
shown in table 23 while the decontamination factor for each phase is shown in table 24.
Figure 27: Gravity column elution fraction study for the 1:100 ratio of Sc to Ti using wet slurry DGA resin
Table 23: Percent analyte recovery for each elution phase using a 1:100 ratio of Sc to Ti
Elution Phase Sc Recovery % 1 σ Ti Recovery % 1 σ
Load + 5 M HNO3 Wash 2.23E-03 4.45E-05 99.82 1.30
6 M HCl Conversion 5.56E-04 1.11E-05 0.063 0.001
0.1 M HCl Strip 96.79 1.94 3.61E-03 7.21E-05
0.0
10.0
20.0
30.0
40.0
50.0
60.0
70.0
80.0
90.0
100.0
110.0
Ana
lyte
Rec
over
ed (
%)
Elution Phase
Titanium Scandium
Load + 5 M HNO3 Wash 0.1 M HCl Stripping

94
Table 24: Decontamination factors for each elution phase using a 1:100 ratio of Sc to Ti
Elution Phase DF (Sc/Ti) 1 σ DF (Ti/Sc) 1 σ
Load + 5 M HNO3 Wash 2.23E-05 5.32E-07 4.49E+04 1.07E+03
6 M HCl Conversion 8.90E-03 2.52E-04 1.12E+02 3.18E+00
0.1 M HCl Strip 2.68E+04 7.59E+02 3.73E-05 1.05E-06
Adaption of first gravity column study using a higher mass loading of titanium at a 1:100
ratio of Sc to Ti showed high recoveries for both analytes. In this method, the Ti mass was
increased by a factor of 10 while Sc was lowered from 5 to 1 mg. In the load plus wash fraction,
99.82 ± 1.30% Ti was recovered with a DF for Ti of 4.49E4. In the conversion phase, less than
1% of either analyte was measured. In the strip phase, 96.79 ± 1.94% of Sc was recovered with a
DF for Sc of 2.68E4.
6.4.2 Vacuum Column Studies
The results for the vacuum column studies using a 1:100 Sc to Ti ratio solution in DGA
resin cartridges at varying flow rates are shown below in figure 28. Similar, to figure 27, the
conversion phase is not shown as the measured concentration of either analyte was less than 1%
in each study. The decontamination factors for each elution phase in each study are shown below
in tables 25, 26, and 27.
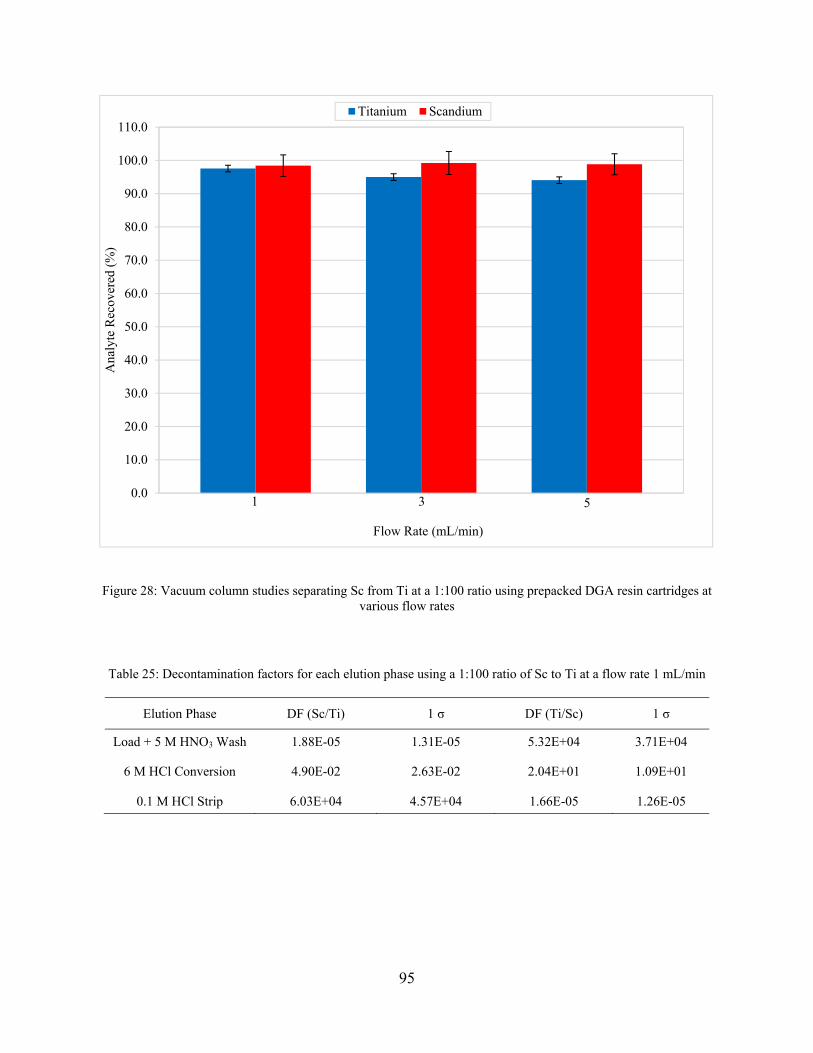
95
Figure 28: Vacuum column studies separating Sc from Ti at a 1:100 ratio using prepacked DGA resin cartridges at various flow rates
Table 25: Decontamination factors for each elution phase using a 1:100 ratio of Sc to Ti at a flow rate 1 mL/min
Elution Phase DF (Sc/Ti) 1 σ DF (Ti/Sc) 1 σ
Load + 5 M HNO3 Wash 1.88E-05 1.31E-05 5.32E+04 3.71E+04
6 M HCl Conversion 4.90E-02 2.63E-02 2.04E+01 1.09E+01
0.1 M HCl Strip 6.03E+04 4.57E+04 1.66E-05 1.26E-05
0.0
10.0
20.0
30.0
40.0
50.0
60.0
70.0
80.0
90.0
100.0
110.0A
naly
te R
ecov
ered
(%
)
Flow Rate (mL/min)
Titanium Scandium
1 3 5

96
Table 26: Decontamination factors for each elution phase using a 1:100 ratio of Sc to Ti at a flow rate 3 mL/min
Elution Phase DF (Sc/Ti) 1 σ DF (Ti/Sc) 1 σ
Load + 5 M HNO3 Wash 6.45E-06 1.72E-06 1.55E+05 4.14E+04
6 M HCl Conversion 1.17E+00 1.02E+00 8.57E-01 7.50E-01
0.1 M HCl Strip 6.51E+04 4.08E+04 1.54E-05 9.61E-06
Table 27: Decontamination factors for each elution phase using a 1:100 ratio of Sc to Ti at a flow rate 5 mL/min
Elution Phase DF (Sc/Ti) 1 σ DF (Ti/Sc) 1 σ
Load + 5 M HNO3 Wash 2.10E-05 1.20E-05 4.77E+04 2.72E+04
6 M HCl Conversion 1.07E-01 5.62E-02 9.37E+00 4.93E+00
0.1 M HCl Strip 6.36E+03 4.76E+03 1.57E-04 1.18E-04
Adaption of the 1:100 Sc to Ti gravity column study to vacuum column studies at flow
rates of 1, 3, and 5 mL/min showed high recoveries. An average ~99 ± ~3% Sc was recovered in
the stripping phase between the flow rates. An average ~95 ± ~3% Ti was recovered in the load
phase between the flow rates. The DF for Ti in each load plus wash phase showed at least 104 at
all three flow rates while the DF for Sc in each strip phase showed at least 103 at all three flow
rates. Recovery of Sc remained consistent between each run while Ti decreased a few percent as
the flow rate increased from 1 to 5 mL/min. At a flow rate of 1 mL/min, 97.56 ± 3.53% of the Ti
was recovered in the load/wash phase which decreased to 94.07 ± 3.21% at rate of 5 mL/min. This
decrease seen may be due to the loss to the walls of the column or trapped in the resin bed. This
issue was likely seen only in Ti due to the significantly higher mass loading.

97
6.5 Conclusion
Conversion of the batch contact studies to wet slurry studies show a successful separation
at low concentrations of Sc (5 mg) and Ti (10 mg). The elution profile shown in figure 26, showed
a clean separation between phases with 99.51 ± 2.22% of the Ti eluting in the load plus wash
phase and 98.62 ± 1.25% of the Sc eluting in the strip phase. An increase in mass loading of Ti
(100 mg) at a ratio of 1:100 Sc to Ti showed a similar recovery. This ratio was determined in
chapter 4 based on the Flattop irradiation of Ti foil. Similar results were shown for the elution
fraction study showing 99.82 ± 1.30% Ti recovery with a DF for Ti of 4.49E4 in the load plus
wash phase while showing 96.79 ± 1.94% of Sc recovery in with a DF for Sc of 2.68E4 in the strip
phase.
Adaption of the gravity column studies to vacuum column studies using prepacked resin
cartridges showed similar recovery and decontamination factors at flow rates of 1, 3, and 5 mL/min
opposed to a flow rate of 0.25 mL/min. The average recovery between the flow rates for Sc was
~99 ± ~3% and ~95 ± ~3% for Ti. At the highest flow rate of 5 mL/min, Sc had a recovery of 98.4
± 3.1% with a DF of 6.36E3 in the strip phase while Ti had a recovery of 94.07 ± 2.7% with a DF
of 4.77E4 in the load plus wash phase.
Overall, the scale up from gravity column studies at flow rates of 0.25 mL/min and resin
precondition times of a few hours required at least 4 hours to separate the 1:2 Sc to Ti solution
while at least 5 hours to separate the 1:100 Sc to Ti solution. Successful scale up in mass and use
of gravity columns up to flow rates of 5 mL/min would allow for significantly faster separation
times by conditions resin cartridges in less than 5 minutes followed by separating the stock solution
in less than 30 minutes. The next step in this research would be the application of the vacuum

98
column method to a sample of activated titanium foil to attempt purification of 46-48Sc for future
use in artificial glass production. Application of this method shown should be successful as the
chemistry properties of this separation should not change based on the use radioactive isotopes of
Sc and Ti.

99
CHAPTER 7: DEVELOPMENT OF A SOLVENT EXTRACTION SYSTEM USING
TRIOCYTLAMINE FOR SEPARATION OF MANGANESE FROM CHROMIUM
7.1 Introduction
As described previously in chapter 1, 52Mn has the potential application for use in positron
emission tomography (PET) as a positron emitter due to its comparable energy and longer half-
life of ~5.6 days. Commonly used positron emitters such as 19F or 13C have similar decay energies
but half-lives shorter than a few hours requiring medical cyclotrons and separation laboratory in
or near each hospital using these isotopes for medical diagnostics.
The method for producing 52Mn requires separation from 52Cr or natCr (~83% 52Cr) that has
been activated using the p-n reaction. In this chapter, the solvent extraction studies performed in
this chapter will use stable Mn and Cr as the chemical separation technique utilized will not differ
based on which isotope was used. Based on previous work, a solvent extraction was performed on
Mn and Cr using trioctylamine (TOA) in cyclohexane at varying strong acid concentrations.61
Additionally studies were performed testing the kinetics of extraction followed by determination
and reduction of the third phase formation in each system.
In these studies, a separate analysis method was developed for to measure Cr in solution.
Stock solutions used in this research were prepared from ICP-MS grade standards containing NatCr
(83.8% 52Cr). In these studies organics and hydrochloric acid were used causing isobaric
interferences through the formation of 40Ar12C+ and 35Cl16OH+ when measured on a ICP-MS.
Complexes formed in the instrument filter through and create a false signal requiring a separate
measurement method using a discrete reaction cell. To reduce false signal, the system is purged
with a reactive gas forming stable known compounds which can be filtered from detection.83 Based

100
on initial measurements using a standard quadrupole without reaction cell, at ppb quantities of Cr,
interferences of 5 to 50 times the standard concentration were measured.
7.2 Materials
All materials used in this chapter are shown in section 3.1.
7.3 Experimental Procedure
7.3.1 Solvent Extraction Study
The general solvent extraction method used is described in section 3.3.1. Two variants of
the general method were employed to test the extractability of Mn and Cr from acid solutions.
In the first variant, the organic ligand concentration was kept static based on previous work
performed by Lahiri61. A stock solution of 0.8 M TOA ligand dissolved in cyclohexane and 2%
(v/v) 1-octanol was produced. Multiple stock solutions containing 250 ppb of Cr and Mn in 0.01-
10 M hydrochloric acid were produced using certified standards. In a 2 mL vial at each acid
concentration, 0.75 mL of 250 ± 1% ppb Cr and Mn stock solution was added followed by 0.75
mL of the 8 M TOA stock solution so the total volume was 1.5 mL. Each vial was placed on a
Labquake shaker table for 1 hour. After mixing, the vials were placed upright to allow immiscible
phases to reform. An aliquot was taken from the aqueous layer, diluted, and measured on the
NexION ICP-MS described below in 7.3.1.2. This method was duplicated using stock solutions
in 0.01-10 M nitric acid. However, TOA stock solutions contained 3% (v/v) octanol in the nitric
acid method.
In the second variant, In the second variant, the acid concentration was kept static while
the ligand concentration was variable. The same procedure was performed as above using 9 M
hydrochloric or nitric acid and a range of 0.01 to 0.8 M TOA ligand. An aliquot was taken from

101
the aqueous layer, diluted, and measured on the NexION ICP-MS described below in 7.3.1.2.
Determination of the octanol volume used was determined in section 7.3.3 below. Both
experiments were replicated in triplicate at each varied acid or TOA concentration.
7.3.1.1 NexION 350 ICP-MS Method
The general measurement procedure for the NexION 350 ICP-MS was used and is
described in section 3.3.1.2. Additionally, studies performed in hydrochloric acid were diluted by
a factor of 100 to reduce chloride interference before introduction into the reaction cell. Ammonia
gas was used to react and filter out isobaric interferences caused by 40Ar12C+ and 35Cl16OH+ prior
to analysis. This method was repeated in nitric acid to reduce the 40Ar12C+ isobaric interference
and for consistency between measurement methods.
7.3.1.2 Data Analysis
The data was analyzed using the method shown in section 3.3.1.2.
7.3.2 Kinetic Study
The kinetic study method duplicated the solvent extraction procedure described in section
7.3.1.1 using only 0.8 M TOA, 9 M nitric, and 9 M hydrochloric acid. Samples were mixed for
10, 30, or 60 minutes followed by 5 minutes to allow phase reformation. An aliquot of 0.5 mL
was taken from the aqueous phase of each sample, diluted to 15 mL using 2% nitric acid and
measured on the NexION 350 ICP-MS using the method described in 7.3.1.2 above. The study
was performed in triplicate.
7.3.2.2 Data Analysis
The data was analyzed by the same method shown in section 7.3.1.3.
102
7.3.3 Third Phase Formation Study
The third phase formation procedure was adapted from the solvent extraction procedure in
section 7.3.1.1 without the use of Cr or Mn in the aqueous phase and only TOA ligand and
cyclohexane in the organic phase. This method was used to determine the quantity of 1-octanol
needed for the solvent extraction phase above in 7.3.1.1. A solution of 0.01, 0.1 and 0.8 M TOA
in cyclohexane was produced. A stock of 0.1, and 10 M hydrochloric and nitric acid was produced.
In a 15 mL centrifuge vial, 7 mL of 0.01 M TOA stock and 7 mL of 0.1 M hydrochloric acid was
added. This was repeated for using 0.01 M TOA with 10 M hydrochloric acid followed by 0.1 and
0.8 M TOA with both acid concentrations. Each solution was mixed for 30 minutes on a shaker
table to determine if a third phase would form. In solutions where one formed, a single drop of 1-
octanol was added a pasteur pipette followed by vigorous mixing by hand for 30 seconds. The
vial was set upright to see if the two or three phases would reform. This process was repeated until
the third phase was disappeared. This entire method duplicated using 0.1 and 10 M nitric acid.
For each acid/ligand concentration, the process was repeated in triplicate. The number of drops
were recorded for each ligand/acid concentration in each run. Using the same Pasteur pipette, the
average mass of one drop of 1-octanol was weighed on a laboratory scale by averaging the mass
of 10 drops.
7.3.3.2 Data Analysis
The data was analyzed using the method described in section 3.3.2.

103
7.4 Results and Discussion
7.4.1 Solvent Extraction Studies
7.4.1.1 Varied Acid Concentration Studies
The distribution ratio results of solvent extraction studies using 0.8 M TOA at varied nitric
and hydrochloric acid concentration are shown below in figures 29, and 31. The results of these
studies in percent extraction are shown below in figures 30 and 32.
Figure 29: Solvent extraction study of Mn and Cr using 0.8 M TOA at varied nitric acid concentrations
1.E-03
1.E-02
1.E-01
1.E+00
1.E+01
1.E+02
1.E+03
0.01 0.1 1 10
Dis
trib
utio
n R
atio
(O
rg/A
q)
Nitric Acid Concentration (M)
Mn (0.8 M TOA)Cr (0.8 M TOA)SF (Mn/Cr)

104
In figure 29, both analytes showed little to no distribution with ratios under 0.1 at any
concentration of nitric acid. In low acidic solution, Mn2+ will form Mn(OH2) or MnO with an
increasing shift to Mn(NO3)2 as the nitrate concentration increases.38,56 The formation of the
Mn(NO3)2 is weakly bound and should likely be extracted by the amine electron donor. This is
not case as the distribution ratio in nitric acid is low across the entire range possibly due to
additional competing interacting. Trivalent Cr3+ at low nitric acid concentration forms Cr2O3 due
to a strong binding to water molecules which prevents extraction into the organic phase due to the
hydrophobic nature of water.41 This strong binding to water continues to prevent extraction as the
nitrate concentration increases. At nitric concentrations above 10 M, a significant quantity of
Cr(NO3)338
may form and potentially extract although this was not studied here. Significant overlap
occurred between both analytes across the entire range. In nitric acid, neither analyte was
extracted as the separation factors varied from 0.1 to 2 with larger uncertainties than the value in
most cases. Ideally, the separation factor should be at least in the hundreds based the purity
required.

105
Figure 30: Percent analyte extraction of Mn and Cr using 0.8 M TOA at varied nitric acid concentrations
In figure 30, percent extraction values for Mn and Cr are shown based on the distribution
values determined for figure 7.1. Less than 5% of either analyte was extracted at any nitric acid
concentration. Any extraction shown does not follow a trend is likely due to human error or data
processing as the uncertainty shown for each acid concentration are less than 3% which is
determined by comparing replicates in the same experiment. The fluctuations seen seem to be due
to statistical drift of all replicates at each acid concentration.
0%
10%
20%
30%
40%
50%
60%
70%
80%
90%
100%
0 1 2 3 4 5 6 7 8 9 10
Ana
lyte
Ext
ract
ion
(%)
Nitric Acid Concentration (M)
Mn (0.8 M TOA)
Cr (0.8 M TOA)

106
Figure 31: Solvent extraction study of Mn and Cr using 0.8 M TOA at varied hydrochloric acid concentrations
In figure 31, the distribution ratios of Mn and Cr were similar with a slightly increasing
trend from 0.01 to 1 M hydrochloric acid. At 1 M, the slopes diverged with the distribution of Mn
increasing rapidly up to a value of ~6 from 8 to 10 while Cr showed a decrease in distribution ratio
to ~0.02 from 8 to 10 M. In hydrochloric acid, divalent Mn forms anionic species as the chloride
concentration increased from MnCl2 up to 5 M followed by the anion MnCl3- at above 6 M.56 The
anionic species formed are fairly weak and can be easily knocked off38 once the hydrochloric acid
concentration reach 1 M. Similar to the nitric acid system, Cr is strongly bound to water and likely
could not be extracted. The trend seen showing the Cr distribution slightly increasing may be due
1.E-03
1.E-02
1.E-01
1.E+00
1.E+01
1.E+02
1.E+03
0.01 0.1 1 10
Dis
trib
utio
n R
atio
(O
rg/A
q)
Hydrochloric Acid Concentration (M)
Mn (0.8 M TOA)
Cr (0.8 M TOA)
SF (Mn/Cr)

107
to other mechanisms at low acid such as adherence to the container while from 1 M up the
dominant species was Cr2O3. However, across the entire range, a distribution of 0.1 is not very
significant and may be due to human error. The separation factor of Mn to Cr show little change
from 0.01 to 1 M followed by a rapid increase up to 616.7 ± 15.4 at 9 M.
Figure 32: Percent analyte extraction of Mn and Cr using 0.8 M TOA at varied hydrochloric acid concentrations
In figure 32, percent analyte extraction for Mn and Cr are shown based on the distribution
values from figure 31. The single extraction of Mn showed a slight increase in from 0.01 to 2.5
M hydrochloric acid followed by a rapid increase up to ~85% at 8 to 10 M. Alternatively, Cr
increased from ~5 to 15% extraction up to 1 M followed by a rapid decrease to 2.5 M where percent
0%
10%
20%
30%
40%
50%
60%
70%
80%
90%
100%
0 1 2 3 4 5 6 7 8 9 10
Ana
lyte
Ext
ract
ion
(%)
Hydrochloric Acid Concentration (M)
Mn (0.8 M TOA)Cr (0.8 M TOA)

108
extraction remained below 3% up to 10 M. The slight increase in Cr extraction shown from 0.1 to
1 M hydrochloric acid is likely due to an alternative mechanism such as sorption to the contain
walls through hydrogen bonding. This mechanism is corrected once the chloride concentration
increases from 1 M up to 10 M hydrochloric acid.
7.4.1.2 Varied TOA Concentration Studies
The distribution ratio results of the solvent extraction study using 9 M hydrochloric or
nitric acid at varied TOA ligand concentration are shown below in figures 33, and 35. Percent
extraction results for Mn and Cr based on these distribution ratio values are shown in figures 34,
and 36.

109
Figure 33: Solvent extraction study of Mn and Cr using 9 M nitric acid at varied TOA ligand concentrations
In figure 33, a very low distribution ratio was shown for Mn and Cr across the entire TOA
concentration range in nitric acid. This is similar to what was shown in figure 29, Mn(NO3)2 did
not extract at any concentration of ligand. Similarly, Cr did not extract due to a strong bonding to
water molecules across the acid range. The distribution trend shows a slight increase occurred for
both analytes from 0.01 to 0.1 M meaning that there might be a slight extraction occurring based
on the order of magnitude increase in ligand concentration. This increase becomes flat from 0.1
to 0.8 M TOA meaning that a further increase in TOA ligand may not change the extraction. The
lack of extraction for both species is likely due to the species formed in nitric acid.
1.E-03
1.E-02
1.E-01
1.E+00
1.E+01
1.E+02
1.E+03
0.01 0.1 1
Dis
trib
utio
n R
atio
(O
rg/A
q)
TOA Ligand Concentration (M)
Mn (9 M Nitric Acid)Cr (9 M Nitric Acid)SF (Mn/Cr)

110
Figure 34: Percent analyte extraction of Mn and Cr using 9 M nitric acid at varied TOA ligand concentrations
In figure 34, the distribution ratios from figure 33 were converted to percent extraction
showing less than 5% extraction of either analyte at any concentration of ligand. This similar to
what was shown in figure 30, showing a slight extracting once the TOA concentration reaches 0.1
M. However, this extraction plateaus at 0.1 M so it is unlikely that a further increase in ligand
concentration would affect extraction.
0%
10%
20%
30%
40%
50%
60%
70%
80%
90%
100%
0 0.1 0.2 0.3 0.4 0.5 0.6 0.7 0.8
Ana
lyte
Ext
ract
ion
(%)
TOA Ligand Concentration (M)
Mn (9 M Nitric Acid)
Cr (9 M Nitric Acid)

111
Figure 35: Solvent extraction study of Mn and Cr using 9 M hydrochloric acid at varied TOA ligand concentrations
In figure 35, the distribution ratio of Cr and Mn showed a similar extraction from 0.01 to
0.1 M TOA in 9 M hydrochloric acid. From 0.1 up to 0.8 M TOA, the distribution ratio for Mn
increased up to a distribution ratio of 5.35 at 0.8 M TOA similar to ~6 in figure 31. Alternatively,
Cr showed a steady decreased down to 0.01 at 0.8 M TOA. Similar to plot 34, it seems that greater
than 0.1 M TOA ligand is need to begin extraction of MnCl2. The mechanism is ligand that of two
unidentate amine ligands donates electron density to the Mn center while pushing off the weak
chloride anions. Cr does not show extraction due to strong binding with water molecules
preventing migrating to the hydrophobic organic layer. The separation factor showed little change
from 0.01 to 0.1 M followed by a rapid increase up to ~800 at 0.5 M TOA due to a lower Cr
1.E-03
1.E-02
1.E-01
1.E+00
1.E+01
1.E+02
1.E+03
0.01 0.1 1
Dis
trib
utio
n R
atio
(O
rg/A
q)
TOA Ligand Concentration (M)
Mn (9 M HCl)Cr (9 M HCl)SF (Mn/Cr)

112
distribution relative to the study shown in figure 31. At 0.8 M, the separation factor was 536.2 ±
16.2 which was only slightly smaller than 616.7 ± 15.4 shown previously. The deviation between
these values is only 13.9 ± 3.6% and would likely be reduced through repetition of each study.
Figure 36: TOA ligand to Mn coordination determination using a 9 M hydrochloric acid solvent extraction system
In figure 36, the Mn distribution relative to the TOA concentration was compared using
the data from figure 35 to determine the number of TOA ligands coordinating to each Mn analyte
in 9 M hydrochloric acid. As the distribution between the two phases increases, the slope in the
log fit equation determined that the complexation occurs at a ratio of 2.64 TOA ligands to 1 Mn
atom as the ligand concentration increases. This value is the empirical value based on the
y = 2.64 ln(x) + 5.78R² = 0.98
1.E-02
1.E-01
1.E+00
1.E+01
0.1 1
Dis
trib
utio
n R
atio
(O
rg/A
q)
TOA Ligand Concentration (M)

113
complexation of multiple species. As the ratio is larger than 2, Mn would likely be extracted as a
neutral species through additional mechanism in addition to coordination of two unidentate tertiary
amines (TOA) for each metal center. It is possible that dimer is being formed between two metal
centers and more than two unidentate ligands pushing off the chloride species. This proposed
dimer species may explain why little extraction occurred in the nitric acid system as a nitrate dimer
system may be more strongly bound sharing five NO3- groups in addition to having have greater
steric hindrance preventing coordination.
Figure 37: Percent analyte extraction of Mn and Cr using 9 M hydrochloric at varied TOA ligand concentrations
0%
10%
20%
30%
40%
50%
60%
70%
80%
90%
100%
0 0.1 0.2 0.3 0.4 0.5 0.6 0.7 0.8
Ana
lyte
Ext
ract
ion
(%)
TOA Ligand Concentration (M)
Mn (9 M HCl)
Cr (9 M HCl)

114
In figure 37, percent analyte extraction for Mn and Cr are shown based on the distribution
values from figure 32. Mn showed little extraction from 0.01 to 0.1 M TOA followed by a rapid
increase up to ~85 like in figure 31. Similarly, less than 5% of Cr was extracted across the entire
range. This differs from figure 32, where Mn and Cr showed ~15% extraction from 0.01 to 0.1 M
hydrochloric acid. The difference is likely that at low acid concentration a mixed species is formed
causing an alternative mechanism for loss. This may be due to sorption to the container walls or
slight precipitation of either analytes oxide form followed by dissolution as the chloride
concentration increases.
7.4.2 Kinetic Solvent Extraction Studies
The results of the kinetic extraction studies for 1 and 10 M nitric and hydrochloric acid are
shown below in tables 28 and 29.
Table 28: Kinetic solvent study of Mn and Cr in HNO3
HNO3 Time (Minutes) DMn 1 σ DCr 1 σ SF (Mn/Cr) 1 σ
1 M 10 0.02 0.02 0.01 0.02 1.23 2.01 1 M 30 0.01 0.01 0.02 0.01 0.75 0.93 1 M 60 0.01 0.01 0.01 0.02 1.18 1.68
10 M 10 0.01 0.01 0.01 0.01 0.58 0.84 10 M 30 0.004 0.005 0.01 0.01 0.51 0.77 10 M 60 0.01 0.01 0.003 0.005 2.45 4.22
In table 28, there was little to no change in distribution ratio and separation factor across
based on the amount of time mixed on the shaker table. The distribution ratios measured had
extremely high uncertainty based on the initial measurements. The uncertainty on each value

115
increased significantly higher due to error propagation during the data analysis. The kinetic data
shown follows what was shown in the previous nitric acid studies shown in the previous section.
Table 29: Kinetic solvent study of Mn and Cr in HCl
HCl Time (Minutes) DMn 1 σ DCr 1 σ SF (Mn/Cr) 1 σ
1 M 10 0.25 0.06 0.24 0.04 1.02 0.29
1 M 30 0.23 0.08 0.22 0.08 1.03 0.32
1 M 60 0.18 0.17 0.20 0.12 0.95 0.39
10 M 10 5.39 0.06 0.010 0.001 544.67 53.39
10 M 30 5.70 0.12 0.010 0.001 570.58 70.92
10 M 60 5.97 0.03 0.010 0.002 590.79 95.82
In table 29, the distribution ratio of both analytes did not change significantly as mixing
time increased from 10 to 60 minutes. In 1 M hydrochloric acid, the separation factor fluctuated
around ~1. This is due to lack of chloride concentration causing formation of the weakly anionic
MnCl2. In the low acid system, the MnO or Mn(OH2) seems to be more strongly bound preventing
extraction. At 10 M hydrochloric acid, Cr shows a strong distribution of 5.39 to 5.97 while Cr
shows a decrease in distribution relative to the 1 M study. It is likely that this decrease occurs due
to lack of mixed species where at low acid concentration, partial loss or extraction of Cr is possible.
The SF at 10 M hydrochloric acid shows a slight increase from 544.67 at 10 minutes to 590.79 at
60 minutes. The deviation between these values is 8.12 ± 1.54% which may decrease by repetition
of the kinetic studies. In further studies, the kinetics of mixing for lengths of time greater than one
hour to determine if a larger SF is possible. An increase in SF would potentially increase the
percent extracted from each solvent extraction requiring fewer additional extractions to acquire
greater than 90% recovery. Based on this data, 10 minute mixing time is likely sufficient for
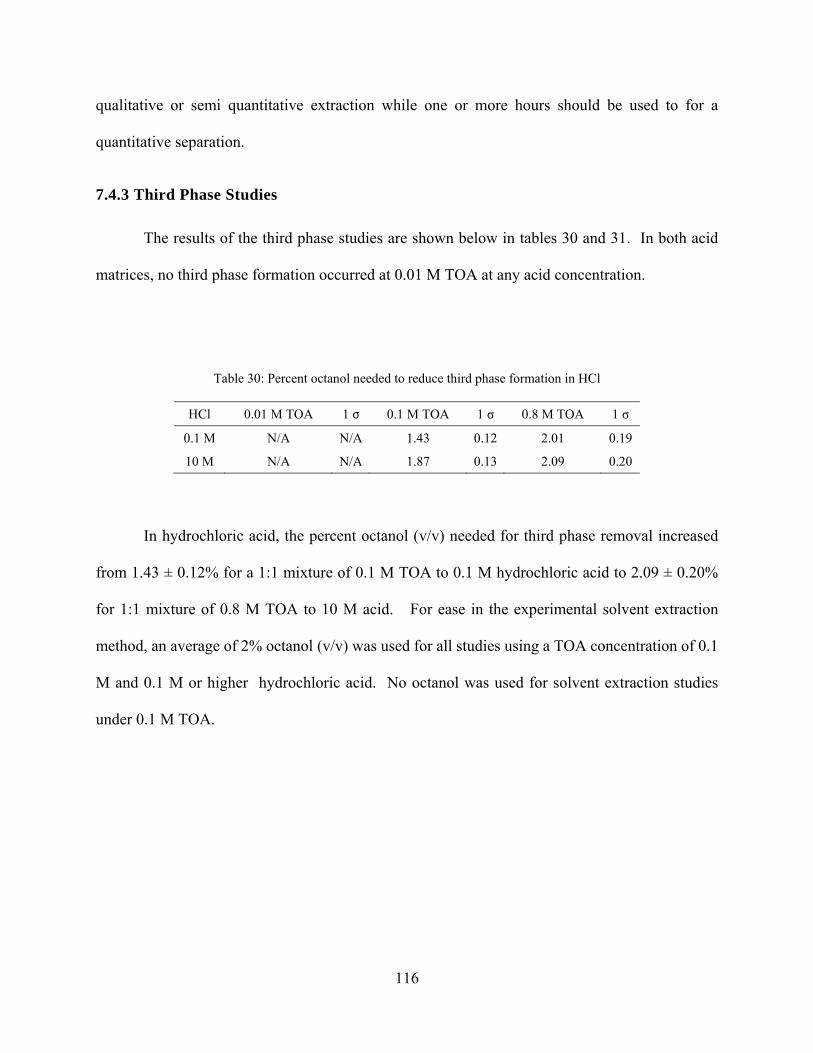
116
qualitative or semi quantitative extraction while one or more hours should be used to for a
quantitative separation.
7.4.3 Third Phase Studies
The results of the third phase studies are shown below in tables 30 and 31. In both acid
matrices, no third phase formation occurred at 0.01 M TOA at any acid concentration.
Table 30: Percent octanol needed to reduce third phase formation in HCl
HCl 0.01 M TOA 1 σ 0.1 M TOA 1 σ 0.8 M TOA 1 σ
0.1 M N/A N/A 1.43 0.12 2.01 0.19
10 M N/A N/A 1.87 0.13 2.09 0.20
In hydrochloric acid, the percent octanol (v/v) needed for third phase removal increased
from 1.43 ± 0.12% for a 1:1 mixture of 0.1 M TOA to 0.1 M hydrochloric acid to 2.09 ± 0.20%
for 1:1 mixture of 0.8 M TOA to 10 M acid. For ease in the experimental solvent extraction
method, an average of 2% octanol (v/v) was used for all studies using a TOA concentration of 0.1
M and 0.1 M or higher hydrochloric acid. No octanol was used for solvent extraction studies
under 0.1 M TOA.

117
Table 31: Percent octanol needed to reduce third phase in HNO3
HNO3 0.01 M TOA 1 σ 0.1 M TOA 1 σ 0.8 M TOA 1 σ
0.1 M N/A N/A 2.19 0.11 2.81 0.21
10 M N/A N/A 2.75 0.16 3.06 0.19
In nitric acid, the percent octanol (v/v) needed for third phase removal was slightly higher
than hydrochloric acid at 0.1 and 10 M. For a 1:1 mixture of 0.1 M TOA to 0.1 M nitric acid, 2.19
± 0.11% was determined up to 3.06 ± 0.19% for a 1:1 mixture of 0.8 M TOA to 10 M acid. For
ease in the experimental method, an average of 3% octanol (v/v) was used for all studies at 0.1 M
TOA concentration and 0.1 M or higher acid concentration. No octanol was used for solvent
extraction studies under 0.1 M TOA.
7.5 Conclusion
The solvent extraction method used in this chapter showed increasing distribution ratio in
hydrochloric acid using the TOA ligand as either variable was increased. In 0.8 M TOA, the
distribution ratio of Mn increased as the chloride concentration increased. This is likely due to the
formation of weakly bound MnCl2 at concentrations above 1 M56 or MnCl3- at hydrochloric acid
concentrations above 6 M. This is due to the electron donating nitrogen on the tertiary amine
coordinating to the metal center and pushing off the weak chlorides. At lower acid concentrations,
Mn oxide and hydroxide species were dominant preventing extraction. In figure 31, the
distribution ratio of Mn was ~0.1 from 0.01 to 1 M, followed by an increase to ~6 from 8 to 10 M.
Cr does not form significant complexes hydrochloric acid due to a strong binding to water
molecules.41 The distribution of Cr remained between 0.1 and 0.01 across the acid range. An
optimal SF of ~580 was determined in a system using 0.8 M TOA and 9 M hydrochloric acid. In
118
one separation, the percent extraction recovered for Mn was ~85% from 8 to 10 M. Less than 5%
of the Cr was extracted from 1 to 10 M while a slight increase to ~15% extraction was seen below
1 M likely due to other mechanisms extracting Cr such as sorption to the container wall.
A similar trend was seen for both analytes at 9 M hydrochloric acid and a varied TOA
ligand concentration. The distribution ratio of Mn increased from 0.04 to 5.35 as the chloride
concentration increased from 0.1 to 0.8 M TOA. Below 0.1 M, there was likely insufficient ligand
to extract. The distribution rate for Cr ranged from less than 0.1 to 0.01 showing little extraction
as the TOA concentration increased. A SF of 536.28 was determined at 0.8 M TOA which is
slightly less than the previous study due to a slight decrease in the Mn distribution ratio from ~6
to 5.35. Mn and Cr extracted similarly to before with ~ 85% Mn and less than 5% Cr at 0.8 M
TOA. In addition to determining the SF and percent extraction, the distribution ratio of Mn to the
TOA ligand concentration from 0.1 to 0.8 M was shown in figure 36. Although, Mn is divalent in
solution at these acid conditions, the ligand ratio determined through a log regression showed that
a ratio of 2.64:1 TOA ligand to Mn atom was extracted. This may explain why Mn was not
extracted in nitric due to other extracted species such a dimer which may be steric hindered
preventing extraction. A further explanation is shown above in the discussion.
In a varied nitric acid system using 0.8 M TOA, the distribution ratio of Mn and Cr
fluctuated below 0.1 as the nitric acid concentration increased. This was confounding as Mn
should have formed nitrate species as the nitric concentration increased extracting at higher acid.
It is possible that the competition between the nitrates in solution is stronger than the complex
formation between the tertiary amine or that Mn complexes with water preventing extracting into
the hydrophobic phase. Also, it is possible that the extraction mechanism differs from a 2 to 1
TOA ligand to Mn metal center but may extract in a dimer form. This is explained further in the

119
results sections. Similar to in hydrochloric acid, Cr forms strong bonds in water making it difficult
to extract in nitric acid at any concentration.
Kinetic studies were performed using 0.8 M TOA in 1 or 10 M nitric or hydrochloric acid.
In the nitric acid system, little to no extraction occurred for either analyte in varied acid or mixing
conditions. The SF of Mn to Cr was determined to fluctuate between 0.5 and 2.5 with uncertainties
higher than each SF factor in many cases. In the hydrochloric acid system, at 1 M acid, the SF
varied around ~1 regardless of the mixing time. At 10 M acid, the distribution ratio of Mn
increased by a factor of ~20 while the distribution ratio decreased by a factor of ~5. The SF based
on time showed an from 544.7 at 10 minutes to 590.8 at 60 minutes which is an improvement of
~8%. Further kinetic studies using longer mixing times should be performed to determine where
the equilibrium threshold.
Additionally, the effect of third phase formation was measured using different TOA and
acid concentrations. It was found that no octanol was needed below 0.1 M TOA concentration in
either acid but an average of ~2% and ~3% octanol (v/v) was required to reduce formation at 0.1
M TOA in hydrochloric and nitric acid. Further work need to be performed to determine a upper
limit for use of octanol as previous work has shown large quantities of diluent such as octanol or
TBP used for third phase formation can reduce the extraction potential.29
The data presented in this chapter showed that Mn can be separated from Cr using 0.8 M
TOA in 8 to 10 M hydrochloric acid. The purpose of this work was to develop a solvent extraction
method to be used for production of extraction chromatography resins. This will be explored in
the next chapter.

120
CHAPTER 8: BATCH CONTACT STUDIES OF MANGANESE AND CHROMIUM
ON EXTRACTION CHROMATOGRAPHY RESINS FOR SEPARATION METHOD
DEVELOPMENT
8.1 Introduction
In chapter 8, batch contact studies were performed to characterize Mn and Cr retention on
a series of extraction chromatography resins produced by Triskem International based on the TOA
ligand solvent extraction studies performed in chapter 7. Adaption of the liquid-liquid solvent
extraction system to a extraction chromatography resin system was performed in an attempt to
develop a streamlined commercial method reducing organic or mixed organic waste produced.
These resins were tested to determine a weight distribution and separation factor using stable Mn
and Cr. If successful, this process will be converted to column studies with increased mass loading
to separate 52Mn produced from activated nat,52Cr.
Five different resins were produced using a varied loading of TOA ligand in various
solvents, on either Amberchrom or polystyrene divinyl benzene inert support beads. The
shorthand name, Triskem name, and resin composition are shown below in table 32. No additional
information was provided for any resin due to proprietary reasons.
Table 32: Triskem extraction chromatography resins using trioctylamine (TOA) ligand
Shorthand Name
Triskem Resin Name Resin Composition
Resin 1 TOA in Cyclohexane 40% 0.8M nTOA in Cyclohexane / 60 % Amberchrom CG71 Resin 2 TOA on PS-DVB 40% nTOA / 60 % PS-DVB (Pure TOA used) Resin 3 TOA in Toluene 40% 0.8M nTOA in toluene / 60 % Amberchrom CG71 Resin 4 TK201A 170201 70% Amberchrom CG71 / 29% n-TriOctylAmine / 1% 1-Decanole Resin 5 TK201S 170202 60% Amberchrom CG71 / 37,5% n-TriOctylAmine / 2,5% 1-Decanole

121
Batch contact studies were performed using each resin in hydrochloric acid in an attempt
to replicate the separation factors determined from the solvent extraction studies in chapter 7. An
additional batch contact study was performed on resin 1 using nitric acid to ensure that little to no
retention occurred for manganese or chromium.
8.2 Materials
All materials used for the work in this chapter are listed in section 3.1. Each extraction
chromatography resin used will be referred to by the shorthand name listed in table 32 above.
8.3 Experimental Procedure
8.3.1 Batch Contact Studies
The general procedure for batch studies is described in section 3.4.1. Single and dual
analyte (interference) batch studies were performed in 0.01 to 10 M HCl and 0.01 to 10 M HNO3.
An mass of 25 ± 2% mg of resin 1 was weighed into a 2 mL microcentrifuge vial and
preconditioned using 1 mL of acid. Vials were mixed for 1 hour and left upright overnight to permit
resin swelling. Each vial was spiked with 0.5 mL of a matching acid solution containing 750 ±
1% ppb Mn followed by 1 hour of mixing. Each solution was transferred into a syringe with PTFE
tip and filtered into a clean 2 mL microcentrifuge vial. An aliquot from each vial was diluted and
analyzed on a NexION 350 ICP-MS per section 7.3.1.2. Four replicates were performed for each
acid concentration. This method was repeated using 750 ± 2% ppb Cr and using a solution
containing Mn and Cr at 750 ± 2% ppb. The experiment was repeated using nitric acid on resin 1
only. The hydrochloric batch contact study method was repeated using resins 2 through 5.

122
8.3.1 Data Analysis
The weight distribution Dw was determined in each study using equation 7 per section
3.4.1.2. Each weight distribution Dw was volume corrected using tables 33 and 34 below.
Table 33: Resin 1 volume corrections in hydrochloric and nitric acid
Resin 1 HCl Volume Lost (%) 1 σ HNO3 Volume Lost (%) 1 σ 0.1 M 7.67 0.80 8.93 0.53 1 M 7.78 0.41 7.75 0.74
10 M 8.09 0.55 6.13 0.65
Table 34: Volume corrections for resins 2, 3, 4, and 5 in hydrochloric acid
HCl Resin 2 Volume
Lost (%) 1 σ
Resin 3 Volume Lost (%)
1 σ Resin 4 Volume
Lost (%) 1 σ
Resin 5 Volume Lost (%)
1 σ
0.1 M 7.21 0.67 8.14 0.06 8.81 0.39 6.74 0.65 1 M 7.85 0.53 8.23 0.17 8.53 0.41 7.32 0.37
10 M 8.03 0.87 8.93 0.24 9.11 0.47 8.00 0.37
8.4 Results and Discussion
The results of the batch contact study for resin 1 in hydrochloric and nitric acid are shown
below in figure 37, and 38. The results of batch contact studies using resins 2, 3, 4, and 5 in
hydrochloric acid are further below in figures 39, 40, 41, and 42.

123
Figure 38: Single and dual analyte batch contact studies using resin 1 in nitric acid
A batch contact study using Mn and Cr was performed using nitric acid to determine if any
change in extraction occurred compared to the solvent extraction study performed in chapter 7.
The weight distribution Dw of Mn and Cr overlapped while fluctuating below a value of 10
equivalent to less than ~7.5% retention across the acid range. This was similar to what was seen
in the solvent extraction studies for both analytes. No significant variation could be discerned
comparing the single and dual analyte weight distributions. The separation factor determined for
the single and dual analyte studies ranged from ~0.3 to 3, which is not sufficient to separate Mn
from Cr. Ideally, a separation factor of at least 100 if not 1000 is necessary to purify one element
from another.
1.E-01
1.E+00
1.E+01
1.E+02
1.E+03
0.01 0.1 1 10
Dw
(W
eigh
t Dis
trib
utio
n)
Nitric Acid Concentration (M)
Mn Single Analyte
Cr Single Analyte
SF Mn/Cr Single Analyte
Mn Dual Analyte
Cr Dual Analyte
SF Mn/Cr Dual Analyte

124
Figure 39: Single and dual analyte batch contact studies using resin 1 in hydrochloric acid
In figure 39, the Dw of each analyte overlapped significantly showing little retention at any
point. The weight distribution and separation fraction for analytes in all studies ranged from ~2 to
~8 which is equivalent to a sorption of ~3 to ~11%. Based on the previous solvent extraction
studies, Mn distribution should increase as the chloride concentration increased. Below 1 M, low
retention is possible due to a mixture of hydroxide and oxide species. Above 1 M, MnCl2 and
MnCl3- should form followed by extraction by the TOA ligand. Alternatively, it is unlikely that
Cr would be extracted into the organic or stationary phase as it preferential binds with water over
chloride anions.41
1.E-01
1.E+00
1.E+01
1.E+02
1.E+03
0.01 0.1 1 10
Dw
(W
eigh
t Dis
trib
utio
n)
Hydrochloric Acid Concentration (M)
Mn Single Analyte
Cr Single Analyte
SF Mn/Cr Single Analyte
Mn Dual Analyte
Cr Dual Analyte
SF Mn/Cr Dual Analyte

125
Resin 1 produced for this study is composed of 40% 0.8 M TOA ligand in cyclohexane to
60% Amberchrom CG71. Based on previous experience with DGA and Ln resin by Eichrom,
40% loading on Amberchrom CG71 seems like a common choice for resin production. Although,
different particle and pore size35,84 can effect sorption of the resin during production, it is unlikely
that significant bleeding occurred when using such a standard method. Additional, studies were
performed to weigh out a known quantity of resin 1 into concentrated nitric and hydrochloric acid.
These were left out for at least a week to see if any phases would form due to loss of extractant in
acid. In addition, no change in retention either increasing or decreasing was seen at higher acids
which makes it unlikely that each unidentate ligand was being protonated. The most likely solution
is that the quantity of resin used for each resin bead was insufficient for extraction. In resin
production, the number of carbons on each ligand in addition to the volume of stationary phase in
each pore can decrease extraction if low and potential sterically interact with itself if high. With
a similar distribution for Mn and Cr it is unlikely that any extraction was occurring through
complexation with the ligand. It is likely that these fluctuations seen are due to another mechanism
such as adherence to the container or occlusion within the interstitial space in the form of a neutral
species. Additional information is needed about the production to decipher the reason by the lack
of extraction.

126
Figure 40: Single and dual analyte batch contact studies using resin 2 in hydrochloric acid
Similar to figure 40, the Dw and SF for each analyte in each study showed very low
retention with significant overlap while staying below ~5 across the acid range. A weight
distribution of ~5 is equivalent to a sorption of ~7.5% which is very low. Resin 2 produced for
this study using the same loading ratio of 40 to 60% TOA to inert support but used polystyrene
divinyl benzene as the support with a unknown pore and particle size. Additionally, no solvent
was used in the production method to sorb the ligand to the support. Similar to resin 1, the
speciation of the reaction should show Mn extracting as the chloride concentration increases. It is
hard to discern if there is a similar issues such as steric hindrance proposed for resin 1, or if there
was a production issue caused by bleed off of extractant due to small particle or pore size. It is
1.E-01
1.E+00
1.E+01
1.E+02
1.E+03
0.01 0.1 1 10
Dw
(W
eigh
t Dis
trib
utio
n)
Hydrochloric Acid Concentration (M)
Mn Single Analyte
Cr Single Analyte
SF Mn/Cr Single Analyte
Mn Dual Analyte
Cr Dual Analyte
SF Mn/Cr Dual Analyte

127
feasible that the lack of solvent prevented sorption of the TOA ligand to the inert support.
Repetition of these batch contact studies using the exact variation of PS-DVB could potentially
determine if the retention seen is due to adherence to the container or the support. Like resin 1, a
sample of bulk resin was left in concentrated nitric or hydrochloric acid for a week to see if phases
formed due to loss of extractant. However, no phases were seen to form in solution.
Figure 41: Single and dual analyte batch contact studies using resin 3 in hydrochloric acid
1.E-01
1.E+00
1.E+01
1.E+02
1.E+03
0.01 0.1 1 10
Dw
(W
eigh
t Dis
trib
utio
n)
Hydrochloric Acid Concentration (M)
Mn Single Analyte
Cr Single Analyte
SF Mn/Cr Single Analyte
Mn Dual Analyte
Cr Dual Analyte
SF Mn/Cr Dual Analyte

128
Similar to resin 1 and 2, the Dw and SF for each analyte in single and dual analyte studies
showed significant overlap while staying ~6.5 across the acid range. A weight distribution of ~6.5
is equivalent to a sorption of ~9.5% although most of the measured weight distribution fluctuated
even lower below ~5 equivalent to a sorption of 7.5%. Resin 3 produced is composed of 40%
0.8 M TOA ligand in toluene to 60% Amberchrom CG71. Potentially, this resin should act nearly
identical to resin 1 as the only difference in the information given was the choice of solvent. In
the process for producing resin, the solvent used should not contribute significantly to production
of the resin unless the concentration of ligand used is above the solubility of the solvent. The
method involves evaporating off the solvent while sorbing the extractant to each porous support
particle. Resin 3 like resin 1 should have worked based on the extraction method developed in
chapter 7 assuming that the none of the 0.8 M TOA added to the resin was lost. Like the previous
analysis of resin 1, it is likely that steric hindrance between ligands caused the lack of Mn
extraction.

129
Figure 42: Single and dual analyte batch contact studies using resin 4 in hydrochloric acid
In figure 42, a higher weight distribution was seen for Mn and Cr in both studies with
significant overlap over the acid range. At 0.01 M, retention by Cr and Mn was between ~8.5 and
21.3 representing a range in sorption equivalent to ~12 to 25%. All of the measured distribution
ratios show a slight decrease to ~12 at 0.1 through 2.5 M. A decrease in weight distribution to ~3
is shown as the acid concentration from 2.5 to 10 M. The SF for single and dual analyte studies
fluctuated at or slightly below 1 across the entire range.
1.E-01
1.E+00
1.E+01
1.E+02
1.E+03
0.01 0.1 1 10
Dw
(W
eigh
t Dis
trib
utio
n)
Hydrochloric Acid Concentration (M)
Mn Single Analyte
Cr Single Analyte
SF Mn/Cr Single Analyte
Mn Dual Analyte
Cr Dual Analyte
SF Mn/Cr Dual Analyte

130
Resin 4 produced for these studies was composed of 29 to 1 to 70% TOA to decanole to
Amberchrom CG71. The higher distribution seen at low acid showing a decreasing trend is likely
due to an increase in sorption to the inert support. Overall a higher distribution was shown across
the range relative to previous studies using only 60% Amberchrom CG71. The loading for this
resin of extracting ligand was decreased by 11% while the inert support was increased by 10%
which could account for small but significant increase in retention seen. It is likely that this is the
case as the retention was higher at low acids when oxide and hydroxide species would likely form
and have been known to adhere the container. As the chloride concentration increased, the
dominant species changed for Mn and Cr causing this decline. However, it is difficult to discern
why Cr has a slightly larger retention than Mn across the entire the acid range. Use of decanole in
this resin likely used as a slight diluent to help solvate the TOA ligand to promote sorption to the
inert support in production.

131
Figure 43: Single and dual analyte batch contact studies using resin 5 in hydrochloric acid
In figure 43, a lower weight distribution relative to resin 4 but similar to resins 1, 2, and 3
is shown for Mn and Cr in both studies with significant overlap over the acid range. The weight
distribution for both analytes was below ~5.7 equivalent to a sorption of ~8% while the separation
factor fluctuated slight above 1 across the entire range.
Resin 5 produced for these studies was composed of 37.5 to 2.5 to 60% TOA to decanole
to Amberchrom CG71. The return to a sorption less than 10% shows that the relative amount of
support used may dictate the sorption mechanism for at least low acids concentrations. From 5 M
1.E-01
1.E+00
1.E+01
1.E+02
1.E+03
0.01 0.1 1 10
Dw
(W
eigh
t Dis
trib
utio
n)
Hydrochloric Acid Concentration (M)
Mn Single Analyte
Cr Single Analyte
SF Mn/Cr Single Analyte
Mn Dual Analyte
Cr Dual Analyte
SF Mn/Cr Dual Analyte

132
up to 10 M the weight distribution measured for both acids is similar to resins 1 through 4 and
likely means that majority of the retention being seen in each resin may be due to other mechanism
aside from ligand extraction. This is likely as in none of the resins does extraction of Mn increase
as the chloride concentration increase which was shown to occur in chapter 7. Additionally, a
slight increase from 1 to 2.5% of decanole in addition to a 8.5% increase in ligand loading showed
less retention so it is likely that decanole was used for the purpose of improvement sorption of the
TOA ligand to the inert Amberchrom support. Similar to each of the previous resin studies, it
seems that either insufficient ligand was used to extract Mn from the hydrochloric acid matrix or
excessive ligand was used to causing steric hindrance. Alternatively, steric hindrance issue could
be causing lack of extraction for all these ligands due to excessively long carbon chains. The TOA
ligands relies on three R groups containing 8 carbons. Reduction in the number of carbons may
help promote extract by allowing less overlap and a larger volume in the stationary phase for Mn
to be extracted.
8.5 Conclusion
Overall, the weight distribution ratio of Mn and SF of Mn to Cr was not shown to occur
for any of the resins produced through Triskem. A weight distribution of less than ~10% was
shown for Mn and Cr in hydrochloric acid for resin 1, 2, 3, and 5. Resin 4 showed a higher
distribution ratio up to 25% at low acid followed by a decrease as the chloride concentration
increased. The SF of Mn to Cr was shown to fluctuate around 1 for each resin regardless of the
acid concentration. Additionally, the nitric acid studies using resin 1 replicated the lack of
extraction seen in the solvent extraction work for Mn and Cr.

133
There are a large number of issues that affect the lack of extraction being shown based on
the materials and production method. With limited information given, only the composition of
each resin could be compared to discern why little to retention was seen in all resins but 4. Many
factors influence the extraction potential such as pore size, particle size, inert support type,
concentration of ligand, and ability of solvent or diluent to sorb the ligand to the support. Between
resin 1, 2, 3, and 5, variations in solvent, inert support, and ligand concentration were adjusted
with little to no change in retention. The only resin with any retention was resin 4 which was
likely due to increase in the inert support relative to extracting ligand concentration. The
distribution of both analytes were retained ~20 at 0.01 M decreasing down to ~3 at 10 M which
seems to show that an increase in chloride concentration inhibition retention to the resin. The
likely mechanism is by occlusion or sorption to the inert support as it seems likely that the TOA
ligand was sterically hindered preventing extraction of Mn as the chloride concentration increased
and MnCl2 became the dominant species in solution. Further work needs to be performed by
replicating these batch studies using only the Amberchrom CG71 in an attempt to quantify the loss
of analyte based on the hydrochloric acid concentration. Further discussion with Triskem is
necessary to discern more information regarding this extraction and these resins. In the future,
additional extraction chromatography studies may be performed using DGA, Ln1, and or actinide
resin from Eichrom Technologies shown previously to preferentially extract trivalent species.
Although, extraction of trivalent Cr while eluting off divalent Mn would require larger quantities
of resin for a column separation to be performed.

134
CHAPTER 9: CONCLUSIONS AND FUTURE WORK
9.1 Introduction
In this research, three separate projects were performed for nuclear forensic and medicinal
application. The nuclear forensics research was divided into two projects. The purpose of the 1st
project to increase post detonation forensic knowledge through cross section determination of
nuclear reactions occurring from a nuclear detonation. This was performed through measurements
of activation products followed by calculation of cross sections using literature available to the
public. The purpose of the 2nd project was to develop separation methods using commercial
available materials for use in separating activation products. Separation of these activation
products important for use in doping artificial urban debris melt glass at higher specific activity
for further experimental studies. The purpose of the 3rd project was to develop a separation method
for separation long lived positron emitting radioisotopes. In partnership with Triskem
International, commercially available resins were produced based on separation method.
Characterization of these resins were performed to determine usability. A summation of the
different projects performed, their outcomes, and future work are described below in sections 9.2,
9.3, and 9.4.
9.2 Flattop Irradiations
In chapter 4, activity measurements were taken of fast neutron activated elements
commonly found in the urban environment and used in nuclear device materials. Individual
twenty-four hour measurements were taken using a HPGe well detector for each of the four runs
using the Flattop benchmark critical assembly. Samples in the critical assembly were irradiated
using a neutron spectra produced from highly enriched uranium surrounded by natural uranium to
135
simulate the effect of a nuclear detonation. Each target sample contained one of the elements Au,
Co, Cr, Fe, Ir, Ni, Pb, Pt, Ti, or W in a metal foil or salt form. Different elements were irradiated
in different runs with the only constant being Au foil which was placed at the center of the
assembly in each run. Previously, Au-196 and Au-198 produced from Au foil have been used to
measure fission fractions accurately.12 Based on this idea, and the knowledge that the power level
kept consistent between each run,64 neutron flux values for Au-196 and Au-198 were determined
through use of fission spectra average cross sections obtained from the JENDL-4.0 nuclear library.
These flux values were used to calculate cross section values for each activation product based on
each specific nuclear reaction. The calculated values were then compared to literature values in
an attempt to validate assumptions made during calculations. Literature cross sections for each
specific reaction were obtained through the JENDL-4.0 or ENDF nuclear data libraries.
In all four runs, the deviation between either calculated cross section and literature cross
sections was less than two orders of magnitude. The uncertainty of each cross section determined
was less than 5% as the uncertainty was based only on the deviation in the activity measurement
taken of each foil solution. In three of the runs, calculated cross sections for Os-191 (produced
from natural Ir or Pt) or Co-60 (produced from natural Co) was found deviate by at least three and
up to six orders of magnitude relative to literature value. This was likely due to a sensitivity to
thermal neutrons or an energy threshold that was not accounted for when using the fission spectra
average cross section to determine flux values. The fission spectra average values determined
were based on an ideal neutron spectra which was not likely seen in these runs due to attenuation
or scattering of neutrons in the assembly. Comparing the ratio of Au-198 to Au-196 flux values
showed a factor of ~5 to 30 variation when comparing runs. This was likely caused by the same
deviation from ideal conditions seen previously when comparing calculated cross section. A

136
correction would need to be made as Au-198 has a three order of magnitude increase for thermal
neutrons relative to the ideal fission spectra average while Au-196 has energy threshold of 8.1
MeV lowering the total production of Au-196 relative to Au-198. Deviations in the calculated
cross sections could be improved if the actual neutron energy spectra was made available for each
run.
9.3 Extraction of Scandium from Titanium
In chapter 5, multiple batch contact studies were performed to measure the retention of Sc
and Ti in hydrochloric and nitric acid at varying concentrations. The extraction chromatography
resins Ln 1 and DGA normal resin produced from Eichrom Technologies were characterized to
determine optimal conditions for separating Sc from Ti. Batch studies using Ln 1 resin
demonstrated retention of both analytes in hydrochloric and nitric acid with an optimal separation
factor of ~300. However, at low acid concentrations in hydrochloric and nitric acid, a sizable
portion of Ti (30%) was still retained to the resin. Retention of Ti increased with acid
concentration up to ~85% near concentrated nitric and hydrochloric acid. Batch contact studies
using DGA normal resin showed strong retention of Sc at nitric and hydrochloric acid
concentrations above 2 M while minimal retention of Ti occurred. Single and dual analyte studies
were performed using ppm quantities of analyte on DGA resin demonstrating a larger separation
factor of ~8000 up to 25,000. Based on these SFs, a separation method was developed for column
chromatography where a mixed solution of Sc and Ti could be separated on DGA resin in 5 M
nitric acid. At high nitric acid, Sc would adsorb strongly to the stationary phase while Ti eluted
through the column. Conversion of the resin to 0.1 M hydrochloric acid would allow for Sc to be
stripped and recovered. Subsequent studies were performed at Colorado State University and Los
Alamos National Laboratory showing similar results.

137
In chapter 6, gravity column studies were performed using ppm quantities of each analyte
to test the separation conditions determined from the batch contact studies determined in chapter
5. A solution containing a 1:1 ratio of Ti to Sc in 5 M nitric acid was loaded onto a column filled
with wet slurry resin. A elution profile was produced through collection of sequential free column
volumes (FCV) at a flow rate of 0.25mL/min (1 FCV is equivalent to 0.5 mL). Fractions collected
showed a clean distribution of Ti in the load plus wash phase (5 M nitric acid) while Sc was
recovered in the strip phase (0.1 M hydrochloric acid). Decontamination factors of at least 103
were determined for each fraction with a recovery of at least 98.6% for each analyte. The gravity
column study method was adapted to vacuum column studies for the purpose of increasing the
flow rate while separating a higher mass loading of Ti and Sc at a ratio of 1:100 which mimicked
the ratio produced in chapter 4. These studies were performed at higher flow rates of 1, 3, and 5
mL/min with an average Sc recovery of ~99% and Ti recovery of ~95%. In these studies, stable
Sc and Ti were used so further work should be performed to separate 46-48Sc from activated Ti foil
for the purpose of doping artificial melt glass at higher specific activity.
9.4 Extraction of Manganese from Chromium
In chapter 7, a separation method was developed using solvent extraction to test the
distribution of Mn from a mixed aqueous solution containing Mn and Cr in varied concentrations
of hydrochloric or nitric acid. Two sets of studies were performed using ppb quantities of Mn and
Cr to determine the distribution ratios based on varied trioctylamine (TOA) ligand and acid
concentrations. In the 1st set of studies sets of studies, the acid concentration was varied while the
ligand concentration remained static. This was reversed for the second set of studies. An
increasing trend in distribution ratio of Mn between the organic and aqueous phases as the TOA
and hydrochloric acid concentration was increased. Alternatively, Cr showed distribution ratios

138
less than 5 in both acids at any ligand concentration. At optimal conditions of 0.8 M TOA, and 8
to 10 hydrochloric acid, a distribution ratio of ~6 for Mn and ~0.01 for Cr was shown which is
equivalent to a separation factor of ~600. Using the distribution ratios and SF, ~85% of Mn and
less than 5% of Cr was extracted at these conditions. Alternatively, less than 5% extraction was
shown Mn in any concentration of ligand and nitric acid. Further work need to be performed to
test if Mn could be extracted by replacing the hydrochloric aqueous phase with nitric acid.
Additional kinetic and third phase formation studies were performed based on the initial
solvent extraction studies. Each kinetic study involved repeating previous solvent extraction
studies at mixing times of 10, 30, and 60 minutes to compare the distribution and SF of both
analytes. The distribution ratio for Mn and Cr was shown be consistent for most acid and ligand
conditions. The main difference seen was in 0.8 M TOA and 10 M hydrochloric acid which
showed an increase in SF from ~544 at 10 minutes to 590 at 60 minutes demonstrating a ~8%
change. In the third phase formation studies, the same TOA/acid concentrations as the kinetic
studies were used to determine third phase formation. All studies performed used a 1:1 ratio of
organic to aqueous phase with a total volume of 15 mL. Additionally, reduction studies were
performed by adding the diluent 1-octanol until the emulsion disperses and two phases reformed.
Third phase formation was found to occur in TOA concentrations of 0.1 M or higher in either acid
at any concentration. Reduction studies using octanol found that ~2% (v/v) was sufficient to
remove third phase formation in all hydrochloric acid systems while ~3% (v/v) was sufficient for
nitric acid. Further work should be performed to determine an upper limit for octanol addition, as
it has been shown that excessive use of diluents such as octanol or tri butyl phosphate (TBP) for
third phase reduction can decrease analyte extraction. Although the purpose of this work was to
develop a method for producing commercially available resins, this solvent extraction method

139
would be suitable for separating 52Mn produced from nat,52Cr. Additional work is required to test
the capacity of the extraction based on the ligand concentration followed by scale up to match the
concentration of each isotope produced from irradiation.
In chapter 8, extraction chromatography resins were produced by Triskem International
based on the separation method developed in chapter 7. Each of these resins were composed of
~30-40% TOA ligand in solvent on 60-70% inert support. Cyclohexane and toluene were tested
as solvents while Amberchrom CG71 and polystyrene divinyl benzene were used as inert supports.
These resins were characterized for the retention of Mn and Cr at varying acid concentrations.
Batch contact studies were performed using ppb concentrations of Mn and Cr in an attempt to
replicate separation factors seen in chapter 7. Single analyte and dual analyte studies were
performed using a slight variation of the method used in chapter 5. In each of the studies
performed, a weight distribution Dw of less than 20 was determined equivalent to a less than 25%
sorption to the resin. In resins 1, 2, 3, and 5, the retention was consistently below 10% in each
acid system at any concentration. Limited information was provided due to proprietary reasons
for each resin characterized. Additional information regarding the physical properties of each resin
in addition to the production method used is necessary to discern why the solvent extraction
method did not transfer to extraction chromatography. Further reasoning is outline in chapter 8 for
reasons each of the resins would not work in addition to discussion of the speciation in
hydrochloric and nitric acid at varied concentrations. Further attempts may be performed using
Actinide (Ac), DGA, and Ln 1 resin from Eichrom in nitric and hydrochloric acid to alternatively
extract trivalent Cr from divalent Mn.

140
APPENDIX A: FLATTOP CALCULATIONS
A.1 Sample Calculation with Assumptions for Chapter 4
A.1.1 Activity Determination for 198Au
A sample calculation for 198Au in run 1 (March 3rd, 2014 irradiation) is shown below using
equation 9 and 10. A description of each variable unit is listed below each equation.
1 (9)63
n = Target areal density (# of atoms/cm2)
σ = Cross section (cm2/1 atom)
Φ = Flux (neutrons/seconds)
t = Time of irradiation (seconds)
A = Activity at time zero/end of irradiation (Bq)
(10)63
A = Activity at time zero/end of irradiation (Bq)
Af = Activity of individual foil solution (μCi)
t = Time since end of irradiation plus detector measurement time (seconds)
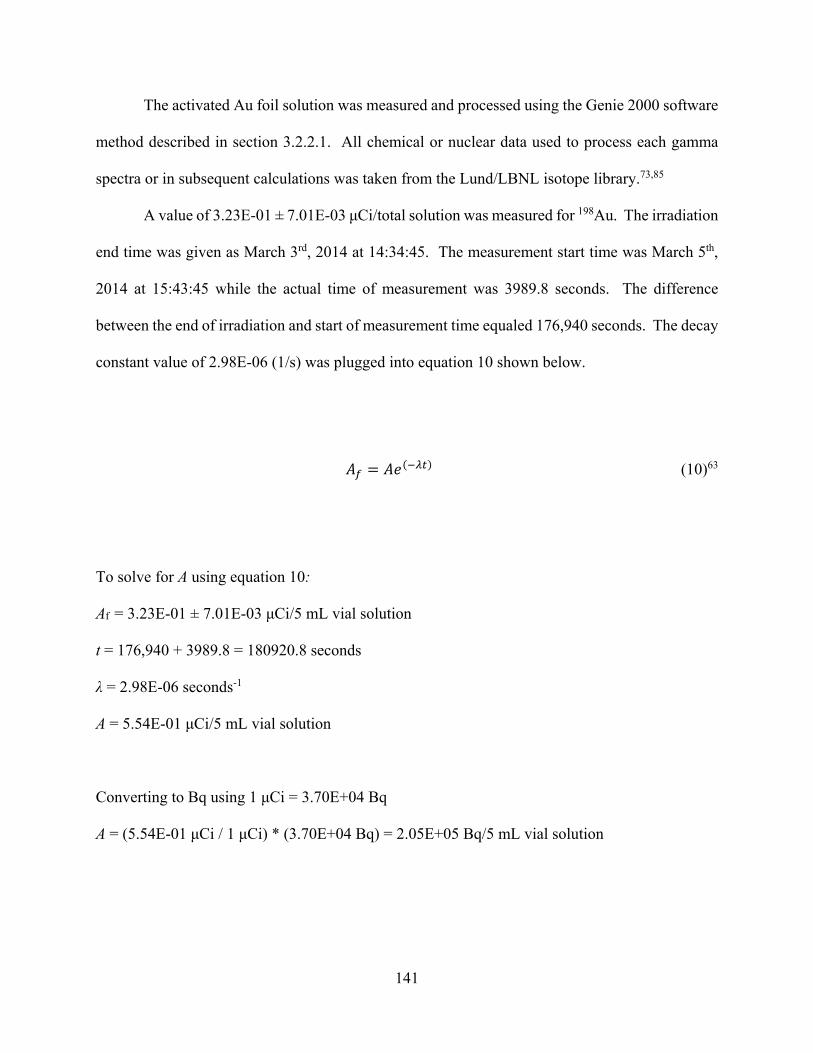
141
The activated Au foil solution was measured and processed using the Genie 2000 software
method described in section 3.2.2.1. All chemical or nuclear data used to process each gamma
spectra or in subsequent calculations was taken from the Lund/LBNL isotope library.73,85
A value of 3.23E-01 ± 7.01E-03 μCi/total solution was measured for 198Au. The irradiation
end time was given as March 3rd, 2014 at 14:34:45. The measurement start time was March 5th,
2014 at 15:43:45 while the actual time of measurement was 3989.8 seconds. The difference
between the end of irradiation and start of measurement time equaled 176,940 seconds. The decay
constant value of 2.98E-06 (1/s) was plugged into equation 10 shown below.
(10)63
To solve for A using equation 10:
Af = 3.23E-01 ± 7.01E-03 μCi/5 mL vial solution
t = 176,940 + 3989.8 = 180920.8 seconds
λ = 2.98E-06 seconds-1
A = 5.54E-01 μCi/5 mL vial solution
Converting to Bq using 1 μCi = 3.70E+04 Bq
A = (5.54E-01 μCi / 1 μCi) * (3.70E+04 Bq) = 2.05E+05 Bq/5 mL vial solution

142
For all calculations in this work it was assumed that 0.25 mL of foil solution was brought
up to 5 mL using a unknown acid in each vial measured for every run.86 For simplicity, the density
of water (1 mL/gram) was used to convert the total activity to units of Bq per gram.
A = (2.05E+05 Bq / 0.25 mL) * (1 mL / 1 gram) * 4 = 1.58E+06 Bq/gram
Error was propagated through based on mainly on the uncertainty of the activity as no error
was provided for the end of irradiation time, and insignificant uncertainty occurred for the elapsed
measurement time.
A or the activity at the end of irradiation (time zero) = 1.58E+06 ± 3.43E+04 Bq/gram
A.1.2 Flux Determination for 198Au
Using equation 9, the flux was calculated with an explanation of how each parameter was
determined below. The target areal density was determined using the mass value of Au foil
irradiated64 and the assumption that the geometry of the metal foil target was a cube. This
assumption was made due to a lack of geometric data for each foil in any run.86
The total mass of the naturally abundant 197Au foil was 305.90 mg with a assumed purity
of 100% for ease of calculation and lack of knowledge. No uncertainty was provided for the mass
of foil given. The standard atomic mass unit density of 196.97 (g/mole) and Avogadro’s number
was used to determine the total number of atoms. The surface area was determined using the
density of 197Au (19.32 g/cm3) based on the cube geometry stated previously.
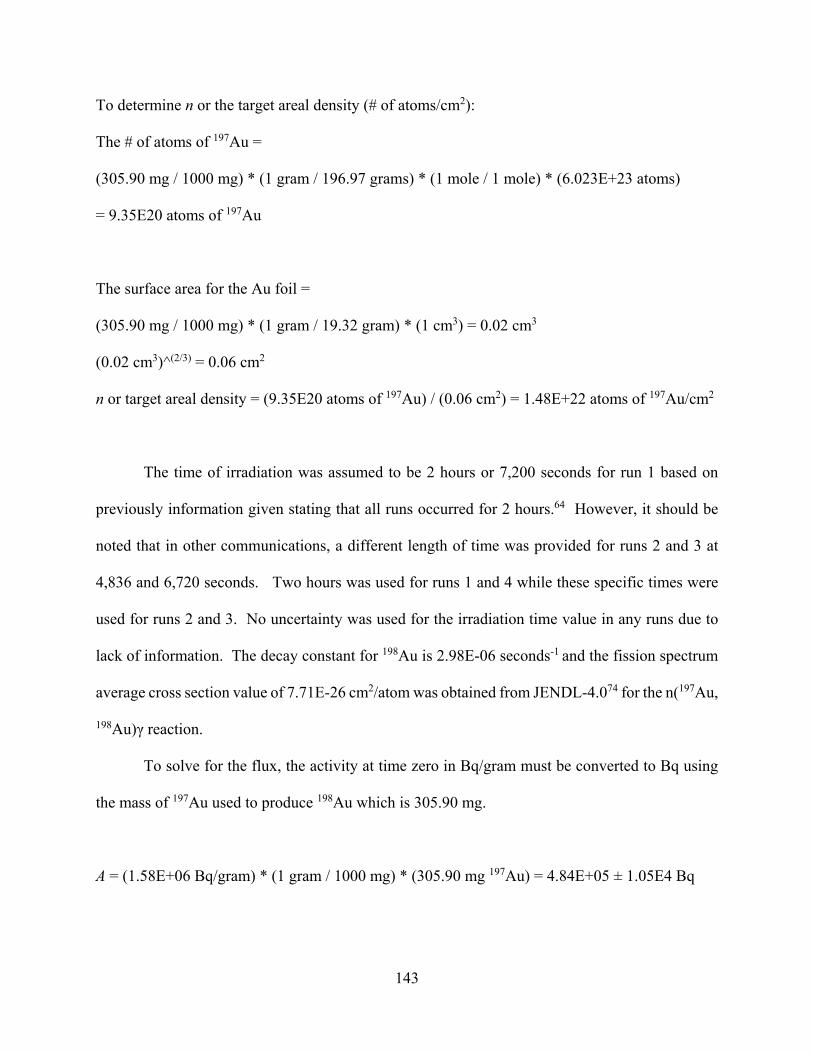
143
To determine n or the target areal density (# of atoms/cm2):
The # of atoms of 197Au =
(305.90 mg / 1000 mg) * (1 gram / 196.97 grams) * (1 mole / 1 mole) * (6.023E+23 atoms)
= 9.35E20 atoms of 197Au
The surface area for the Au foil =
(305.90 mg / 1000 mg) * (1 gram / 19.32 gram) * (1 cm3) = 0.02 cm3
(0.02 cm3)^(2/3) = 0.06 cm2
n or target areal density = (9.35E20 atoms of 197Au) / (0.06 cm2) = 1.48E+22 atoms of 197Au/cm2
The time of irradiation was assumed to be 2 hours or 7,200 seconds for run 1 based on
previously information given stating that all runs occurred for 2 hours.64 However, it should be
noted that in other communications, a different length of time was provided for runs 2 and 3 at
4,836 and 6,720 seconds. Two hours was used for runs 1 and 4 while these specific times were
used for runs 2 and 3. No uncertainty was used for the irradiation time value in any runs due to
lack of information. The decay constant for 198Au is 2.98E-06 seconds-1 and the fission spectrum
average cross section value of 7.71E-26 cm2/atom was obtained from JENDL-4.074 for the n(197Au,
198Au)γ reaction.
To solve for the flux, the activity at time zero in Bq/gram must be converted to Bq using
the mass of 197Au used to produce 198Au which is 305.90 mg.
A = (1.58E+06 Bq/gram) * (1 gram / 1000 mg) * (305.90 mg 197Au) = 4.84E+05 ± 1.05E4 Bq

144
1 (9)57
To solve for Φ:
n = Target areal density (# of atoms/cm2) = 1.48E+22 atoms of 197Au/cm2
σ = Cross section (cm2/1 atom) = 7.71E-26 cm2/atom
t = Time of irradiation (seconds) = 7,200 seconds
A = Activity at time zero/end of irradiation (Bq) = 4.84E+05 ± 1.05E4 Bq
λ = decay constant (1/s) = 2.98E-06 seconds-1
Φ = 2.00E+10 neutrons/second

145
APPENDIX B: RAW DATA FOR FIGURES
Table 35: Raw data used for figure 13 (values in italics means LOD)
HNO3 M Ti k’ 1 σ Sc k’ 1 σ SF (Ti k’/Sc k’) 1 σ
0.1 24.9 0.8 8532.9 <LOD 342.4 11.5
0.3 36.1 0.8 8532.9 <LOD 236.5 5.2
0.5 19.0 2.2 8532.9 <LOD 449.3 53.2
0.7 44.8 1.4 8532.9 <LOD 190.4 6.0
1 30.2 3.2 8532.9 <LOD 283.0 30.1
3 21.6 2.5 8532.9 <LOD 394.9 45.2
5 36.6 3.8 8532.9 <LOD 232.8 24.0
7 33.1 2.3 8532.9 <LOD 257.6 17.7
9 79.2 8.9 8532.9 <LOD 107.7 12.2
11 109.5 10.3 8532.9 <LOD 78.0 7.3
Table 36: Raw data used for figure 14
HCl M Ti k’ 1 σ Sc k’ 1 σ SF (Ti k’/Sc k’) 1 σ
0.1 9.3 1.1 2600.8 309.3 279.4 47.5
0.3 10.9 1.5 2552.0 607.9 234.3 64.7
0.5 13.0 1.1 3563.3 608.6 274.8 52.0
0.7 11.6 1.6 1501.6 228.3 129.4 26.4
1 28.5 3.9 2587.6 722.9 90.7 28.2
3 35.0 3.7 8532.9 <LOD 243.9 25.6
5 54.3 6.3 8532.9 <LOD 157.2 18.2
8 90.2 5.5 8532.9 <LOD 94.6 5.8
Table 37: Raw data used for figures 15, 20, 22, and 24
HNO3 M Ti k’ 1 σ Sc k’ 1 σ SF (Ti k’/Sc k’) 1 σ
0.1 0.62 0.02 14.65 2.48 23.55 4.04 0.3 0.40 0.01 55.36 8.25 138.56 21.27 0.5 0.52 0.01 120.13 21.04 231.35 40.96 0.7 0.30 0.01 143.77 15.11 476.07 53.22 1 0.45 0.01 155.79 26.04 347.63 58.83 3 0.12 0.00 257.07 41.57 2180.47 353.67 5 0.11 0.01 424.93 36.40 3783.23 473.35 7 0.19 0.01 757.33 103.91 4056.02 613.58 9 0.25 0.01 872.58 145.14 3497.50 601.91
10.5 0.40 0.01 3331.37 94.61 8405.54 357.43

146
Table 38: Raw data used for figures 16, 17, 21, 23, and 25
HCl M Ti k’ 1 σ Sc k’ 1 σ SF (Ti k’/Sc k’) 1 σ
0.1 2.42 0.01 1.12 0.01 0.46 0.00 0.3 2.15 0.03 2.21 0.01 1.03 0.02 0.5 1.57 0.04 6.39 0.11 4.07 0.13 0.7 1.75 0.07 9.12 1.35 5.23 0.80 1 2.19 0.02 38.35 1.41 17.53 0.66 2 2.87 0.01 488.76 20.72 170.32 7.23 4 3.17 0.02 1429.15 9.14 451.34 4.19 6 3.07 0.01 1459.12 3.54 474.60 1.74 8 2.51 0.03 1462.84 1.89 583.41 6.05
Table 39: Raw data used for figure 17
HCl M Ti k’ 2.5 hours 1 σ Sc k’ 2.5 hours 1 σ SF (Ti k’/Sc k’) 2.5 hours 1 σ 0.1 2.57 0.05 0.92 0.01 0.36 0.01 0.3 2.82 0.03 1.72 0.01 0.61 0.01 0.5 2.53 0.02 6.65 0.04 2.63 0.03 0.7 2.70 0.01 8.44 0.03 3.13 0.02 1 2.43 0.11 41.15 0.88 16.96 0.85 2 2.35 0.01 530.07 24.38 225.48 10.38 4 3.27 0.06 1430.45 13.25 437.13 9.42 6 2.86 0.04 1462.46 2.70 511.34 7.51 8 2.43 0.01 1465.47 1.43 603.56 2.81
Table 40: Raw data used for figures 18, 22, and 24
HNO3 M Ti k’ 1 σ Sc k’ 1 σ SF (Ti k’/Sc k’) 1 σ
0.1 1.8 0.0 3.7 0.2 2.0 0.1 0.3 1.4 0.0 40.9 0.6 30.2 0.5 0.5 1.1 0.0 167.4 2.1 151.0 3.5 0.7 1.0 0.0 533.9 11.0 537.7 12.2 1 0.9 0.0 3565.8 105.3 3892.5 116.5 3 0.8 0.0 23574.5 <LOD 31257.2 162.1 5 0.5 0.0 23560.0 <LOD 49399.2 719.6 7 0.7 0.0 23550.4 <LOD 32291.4 163.3 9 0.8 0.0 23543.3 <LOD 27863.8 390.6
10.5 1.6 0.0 23538.9 <LOD 15043.0 65.1

147
Table 41: Raw data used for figures 19, 23, and 25
HCl M Ti k’ 1 σ Sc k’ 1 σ SF (Ti k’/Sc k’) 1 σ
0.033 0.60 0.01 4.18 0.41 7.01 0.69 0.1 0.80 0.01 1.05 0.02 1.32 0.02 0.3 0.88 0.04 0.97 0.04 1.10 0.07 0.5 0.55 0.01 1.24 0.03 2.26 0.06 0.7 0.57 0.01 1.77 0.02 3.08 0.04 1 0.39 0.01 1.91 0.04 4.86 0.12 2 0.34 0.01 55.56 2.02 161.94 6.00 4 0.55 0.01 27870.15 <LOD 50432.40 331.54 6 0.67 0.01 27885.31 <LOD 41536.44 811.12 8 0.39 0.01 27896.07 <LOD 72127.98 453.50
Table 42: Raw data used for figures 22, and 24
HNO3 M Ti k’ 1 σ Sc k’ 1 σ 0.01 0.54 0.01 9.6 0.7 0.1 0.53 0.01 20.7 1.7 1 0.41 0.01 301.5 58.0
2.5 0.223 0.002 128232.9 <LOD 5 0.29 0.02 128232.9 <LOD
7.5 0.19 0.00 128232.9 <LOD 10 5.33 0.14 128232.9 <LOD
Table 43: Raw data used for figures 23, and 25
HCl M Ti k’ 1 σ Sc k’ 1 σ
0.01 0.65 0.02 4.77 0.46 0.1 0.284 0.001 2.26 0.12
1 0.33 0.01 21.48 2.53
2.5 0.34 0.01 356.25 60.22 5 1.27 0.01 1427.73 347.31
7.5 1.70 0.03 128233 <LOD
10 3.45 0.04 128233 <LOD
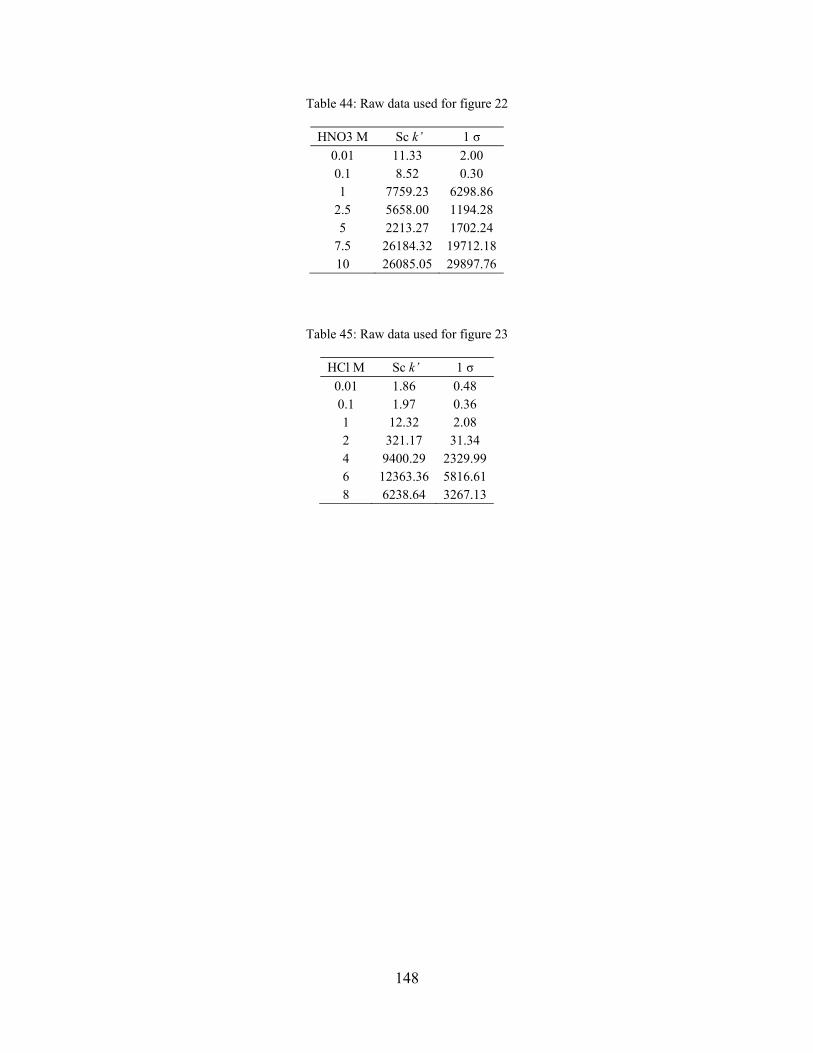
148
Table 44: Raw data used for figure 22
HNO3 M Sc k’ 1 σ
0.01 11.33 2.00 0.1 8.52 0.30 1 7759.23 6298.86
2.5 5658.00 1194.28 5 2213.27 1702.24
7.5 26184.32 19712.18 10 26085.05 29897.76
Table 45: Raw data used for figure 23
HCl M Sc k’ 1 σ
0.01 1.86 0.48 0.1 1.97 0.36 1 12.32 2.08 2 321.17 31.34 4 9400.29 2329.99 6 12363.36 5816.61 8 6238.64 3267.13

149
Table 46: Raw data used for figure 26
FCV # Sc Recovered
(%) 1 σ
Ti Recovered (%)
1 σ
1 <LOD <LOD <LOD <LOD 2 <LOD <LOD <LOD <LOD 3 <LOD <LOD <LOD <LOD 4 <LOD <LOD <LOD <LOD 5 <LOD <LOD <LOD <LOD 6 <LOD <LOD 0.01 <LOD 7 <LOD <LOD 2.07 0.04 8 <LOD <LOD 4.94 0.11 9 <LOD <LOD 7.82 0.17
10 <LOD <LOD 9.45 0.20 11 <LOD <LOD 12.27 0.27 12 <LOD <LOD 13.21 0.29 13 <LOD <LOD 12.77 0.28 14 <LOD <LOD 12.26 0.27 15 <LOD <LOD 11.75 0.25 16 <LOD <LOD 8.10 0.18 17 <LOD <LOD 4.15 0.09 18 <LOD <LOD 0.71 0.02 19 <LOD <LOD <LOD <LOD 20 <LOD <LOD <LOD <LOD 21 0.02 <LOD <LOD <LOD 22 0.09 <LOD <LOD <LOD 23 0.10 <LOD <LOD <LOD 24 0.05 <LOD <LOD <LOD 25 0.10 <LOD <LOD <LOD 26 0.29 <LOD <LOD <LOD 27 1.60 0.02 <LOD <LOD 28 2.41 0.03 <LOD <LOD 29 5.60 0.07 <LOD <LOD 30 8.73 0.11 <LOD <LOD 31 11.92 0.15 <LOD <LOD 32 14.91 0.19 <LOD <LOD 33 13.20 0.17 <LOD <LOD 34 12.43 0.16 <LOD <LOD 35 9.53 0.12 <LOD <LOD 36 8.32 0.11 <LOD <LOD 37 6.28 0.08 <LOD <LOD 38 2.41 0.03 <LOD <LOD 39 0.70 0.01 <LOD <LOD 40 0.19 <LOD <LOD <LOD
Table 33: Raw data used for figure 27
Elution Fraction Sc Recovered (%) 1 σ Ti Recovered (%) 1 σ
Load + Wash Phase <LOD <LOD 99.82 1.30
Conversion Phase <LOD <LOD 0.06 <LOD
Stripping Phase 96.79 1.94 <LOD <LOD
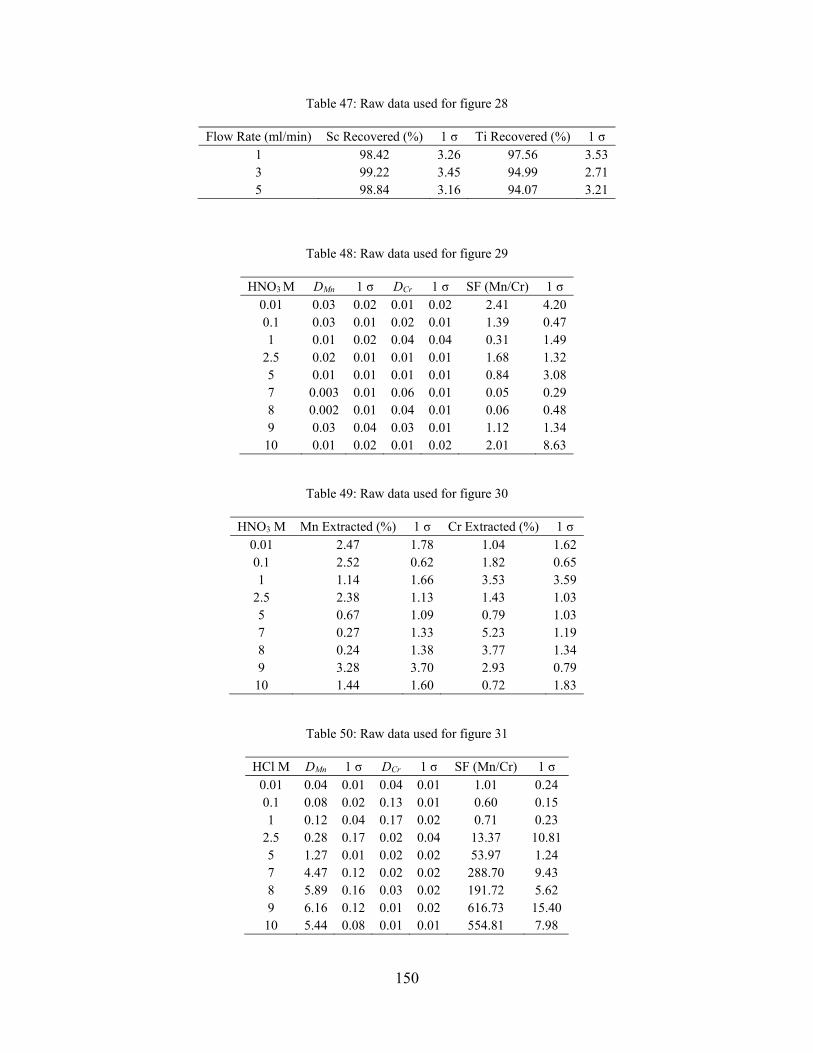
150
Table 47: Raw data used for figure 28
Flow Rate (ml/min) Sc Recovered (%) 1 σ Ti Recovered (%) 1 σ 1 98.42 3.26 97.56 3.53 3 99.22 3.45 94.99 2.71 5 98.84 3.16 94.07 3.21
Table 48: Raw data used for figure 29
HNO3 M DMn 1 σ DCr 1 σ SF (Mn/Cr) 1 σ 0.01 0.03 0.02 0.01 0.02 2.41 4.20 0.1 0.03 0.01 0.02 0.01 1.39 0.47 1 0.01 0.02 0.04 0.04 0.31 1.49
2.5 0.02 0.01 0.01 0.01 1.68 1.32 5 0.01 0.01 0.01 0.01 0.84 3.08 7 0.003 0.01 0.06 0.01 0.05 0.29 8 0.002 0.01 0.04 0.01 0.06 0.48 9 0.03 0.04 0.03 0.01 1.12 1.34
10 0.01 0.02 0.01 0.02 2.01 8.63
Table 49: Raw data used for figure 30
HNO3 M Mn Extracted (%) 1 σ Cr Extracted (%) 1 σ 0.01 2.47 1.78 1.04 1.62 0.1 2.52 0.62 1.82 0.65 1 1.14 1.66 3.53 3.59
2.5 2.38 1.13 1.43 1.03 5 0.67 1.09 0.79 1.03 7 0.27 1.33 5.23 1.19 8 0.24 1.38 3.77 1.34 9 3.28 3.70 2.93 0.79
10 1.44 1.60 0.72 1.83
Table 50: Raw data used for figure 31
HCl M DMn 1 σ DCr 1 σ SF (Mn/Cr) 1 σ 0.01 0.04 0.01 0.04 0.01 1.01 0.24 0.1 0.08 0.02 0.13 0.01 0.60 0.15 1 0.12 0.04 0.17 0.02 0.71 0.23
2.5 0.28 0.17 0.02 0.04 13.37 10.81 5 1.27 0.01 0.02 0.02 53.97 1.24 7 4.47 0.12 0.02 0.02 288.70 9.43 8 5.89 0.16 0.03 0.02 191.72 5.62 9 6.16 0.12 0.01 0.02 616.73 15.40
10 5.44 0.08 0.01 0.01 554.81 7.98
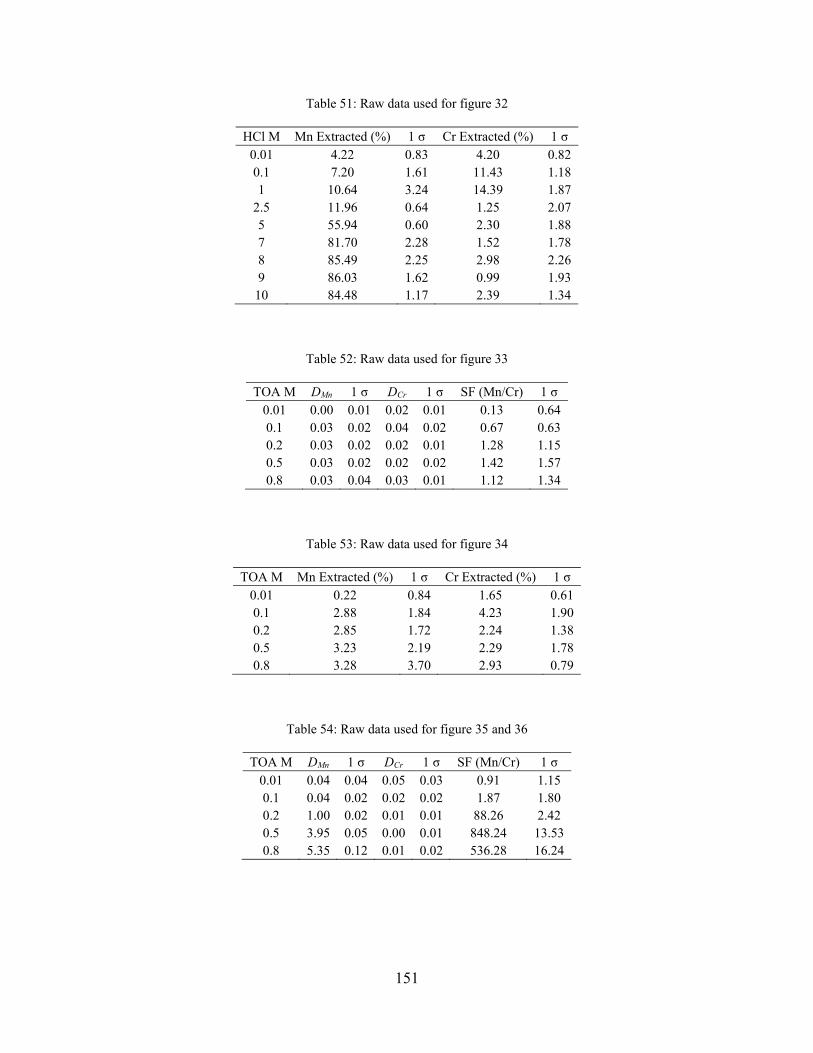
151
Table 51: Raw data used for figure 32
HCl M Mn Extracted (%) 1 σ Cr Extracted (%) 1 σ 0.01 4.22 0.83 4.20 0.82 0.1 7.20 1.61 11.43 1.18 1 10.64 3.24 14.39 1.87
2.5 11.96 0.64 1.25 2.07 5 55.94 0.60 2.30 1.88 7 81.70 2.28 1.52 1.78 8 85.49 2.25 2.98 2.26 9 86.03 1.62 0.99 1.93
10 84.48 1.17 2.39 1.34
Table 52: Raw data used for figure 33
TOA M DMn 1 σ DCr 1 σ SF (Mn/Cr) 1 σ 0.01 0.00 0.01 0.02 0.01 0.13 0.64 0.1 0.03 0.02 0.04 0.02 0.67 0.63 0.2 0.03 0.02 0.02 0.01 1.28 1.15 0.5 0.03 0.02 0.02 0.02 1.42 1.57 0.8 0.03 0.04 0.03 0.01 1.12 1.34
Table 53: Raw data used for figure 34
TOA M Mn Extracted (%) 1 σ Cr Extracted (%) 1 σ 0.01 0.22 0.84 1.65 0.61 0.1 2.88 1.84 4.23 1.90 0.2 2.85 1.72 2.24 1.38 0.5 3.23 2.19 2.29 1.78 0.8 3.28 3.70 2.93 0.79
Table 54: Raw data used for figure 35 and 36
TOA M DMn 1 σ DCr 1 σ SF (Mn/Cr) 1 σ 0.01 0.04 0.04 0.05 0.03 0.91 1.15 0.1 0.04 0.02 0.02 0.02 1.87 1.80 0.2 1.00 0.02 0.01 0.01 88.26 2.42 0.5 3.95 0.05 0.00 0.01 848.24 13.53 0.8 5.35 0.12 0.01 0.02 536.28 16.24

152
Table 55: Raw data used for figure 37
TOA M Mn Extracted (%) 1 σ Cr Extracted (%) 1 σ 0.01 4.25 3.89 4.67 2.65 0.1 3.70 1.56 2.01 2.02 0.2 50.08 1.05 1.12 0.84 0.5 79.81 1.10 0.46 0.63 0.8 84.26 1.96 0.99 1.93
Table 56: Raw data used for figure 38
HNO3 M Single Analyte Study Dual Analyte Study
Dw Mn
1 σ Dw Cr
1 σ SF
Mn/Cr 1 σ
Dw Mn
1 σ Dw Cr
1 σ SF
Mn/Cr 1 σ
0.01 4.73 0.11 5.39 0.09 0.88 0.04 2.05 0.02 1.84 0.02 1.11 0.02
0.1 2.33 0.13 6.34 0.10 0.37 0.07 2.70 0.05 2.08 0.03 1.30 0.03
1 3.43 0.08 2.60 0.09 1.32 0.06 4.35 0.07 4.79 0.07 0.91 0.03
2.5 2.26 0.03 4.13 0.03 0.55 0.02 3.32 0.05 3.20 0.04 1.04 0.03
5 4.93 0.06 1.80 0.03 2.73 0.03 1.75 0.01 0.72 0.01 2.42 0.02
7.5 1.42 0.03 3.54 0.07 0.40 0.04 2.41 0.01 2.28 0.02 1.05 0.01
10 1.55 0.01 1.96 0.02 0.79 0.02 1.41 0.03 2.36 0.10 0.60 0.06
Table 57: Raw data used for figure 39
HCl M Single Analyte Study Dual Analyte Study
Dw Mn
1 σ Dw Cr
1 σ SF
Mn/Cr 1 σ
Dw Mn
1 σ Dw Cr
1 σ SF
Mn/Cr 1 σ
0.01 6.59 0.19 3.62 0.02 1.82 0.03 5.71 0.42 4.84 0.07 1.18 0.09
0.1 7.91 0.26 3.06 0.06 2.59 0.05 4.03 0.19 3.91 0.22 1.03 0.10
1 5.81 0.30 1.80 0.05 3.22 0.08 5.74 0.32 8.76 0.39 0.66 0.10
2.5 2.64 0.12 3.52 0.14 0.75 0.08 2.94 0.06 2.08 0.03 1.41 0.03
5 3.72 0.09 3.34 0.19 1.11 0.08 8.65 0.09 2.94 0.04 2.94 0.03
7.5 6.52 0.31 4.80 0.09 1.36 0.07 7.18 0.21 3.24 0.09 2.21 0.06
10 5.26 0.21 1.91 0.09 2.75 0.09 4.39 0.08 4.60 0.09 0.95 0.04

153
Table 58: Raw data used for figure 40
HCl M Single Analyte Study Dual Analyte Study
Dw Mn
1 σ Dw Cr
1 σ SF
Mn/Cr 1 σ
Dw Mn
1 σ Dw Cr
1 σ SF
Mn/Cr 1 σ
0.01 1.95 0.01 4.42 0.04 0.44 0.01 6.47 0.32 4.95 0.02 1.31 0.05
0.1 2.05 0.02 3.86 0.08 0.53 0.03 1.64 0.04 4.81 0.09 0.34 0.04
1 2.76 0.01 0.56 0.02 4.88 0.04 1.30 0.01 4.79 0.03 0.27 0.01
2.5 2.65 0.03 0.62 0.02 4.28 0.04 1.39 0.02 4.02 0.07 0.35 0.04
5 4.49 0.08 5.50 0.11 0.82 0.04 4.62 0.03 4.13 0.06 1.12 0.02
7.5 3.74 0.03 3.46 0.28 1.08 0.09 4.35 0.10 4.20 0.10 1.04 0.05
10 2.89 0.02 3.92 0.04 0.74 0.02 5.14 0.09 4.23 0.02 1.21 0.02
Table 59: Raw data used for figure 41
HCl M Single Analyte Study Dual Analyte Study
Dw Mn
1 σ Dw Cr
1 σ SF
Mn/Cr 1 σ
Dw Mn
1 σ Dw Cr
1 σ SF
Mn/Cr 1 σ
0.01 1.95 0.01 4.42 0.04 0.44 0.01 6.47 0.32 4.95 0.02 1.31 0.05
0.1 2.05 0.02 3.86 0.08 0.53 0.03 1.64 0.04 4.81 0.09 0.34 0.04
1 2.76 0.01 0.56 0.02 4.88 0.04 1.30 0.01 4.79 0.03 0.27 0.01
2.5 2.65 0.03 0.62 0.02 4.28 0.04 1.39 0.02 4.02 0.07 0.35 0.04
5 4.49 0.08 5.50 0.11 0.82 0.04 4.62 0.03 4.13 0.06 1.12 0.02
7.5 5.09 0.04 3.46 0.28 1.47 0.09 4.35 0.10 4.20 0.10 1.04 0.05
10 5.33 0.03 3.92 0.04 1.36 0.02 5.14 0.09 4.23 0.02 1.21 0.02
Table 60: Raw data used for figure 42
HCl M Single Analyte Study Dual Analyte Study
Dw Mn
1 σ Dw Cr
1 σ SF
Mn/Cr 1 σ
Dw Mn
1 σ Dw Cr
1 σ SF
Mn/Cr 1 σ
0.01 9.61 0.15 11.31 0.07 0.85 0.02 8.55 0.08 21.27 0.14 0.40 0.02
0.1 7.13 0.13 9.08 0.15 0.79 0.03 9.59 0.24 12.43 0.25 0.77 0.05
1 8.37 0.05 9.20 0.20 0.91 0.03 9.33 0.18 14.05 0.13 0.66 0.03
2.5 5.88 0.29 8.71 0.12 0.67 0.06 10.51 0.18 14.19 0.56 0.74 0.06
5 3.17 0.10 2.58 0.04 1.23 0.05 1.99 0.02 4.96 0.03 0.40 0.02
7.5 3.26 0.03 4.09 0.10 0.80 0.04 2.93 0.02 5.62 0.06 0.52 0.02
10 1.83 0.02 3.86 0.03 0.47 0.02 2.86 0.04 4.41 0.05 0.65 0.03

154
Table 61: Raw data used for figure 43
HCl M Single Analyte Study Dual Analyte Study
Dw Mn
1 σ Dw Cr
1 σ SF
Mn/Cr 1 σ
Dw Mn
1 σ Dw Cr
1 σ SF
Mn/Cr 1 σ
0.01 3.61 0.10 2.98 0.06 1.21 0.05 4.08 0.06 3.08 0.03 1.33 0.02
0.1 2.80 0.02 3.56 0.02 0.79 0.01 5.65 0.03 4.02 0.03 1.41 0.01
1 3.48 0.05 4.25 0.20 0.82 0.06 3.96 0.10 1.42 0.05 2.80 0.06
2.5 3.45 0.02 2.83 0.06 1.22 0.03 3.23 0.07 2.23 0.04 1.45 0.04
5 2.41 0.07 2.83 0.02 0.85 0.04 3.11 0.04 0.97 0.02 3.22 0.03
7.5 3.59 0.04 3.34 0.02 1.07 0.02 2.63 0.05 2.59 0.06 1.02 0.04
10 2.97 0.08 0.82 0.02 3.61 0.05 1.74 0.02 1.47 0.01 1.18 0.02
155
REFERENCES
(1) Moody, K.; Hutcheon, I.; Grant, P. Nuclear Forensic Analysis, 2nd ed.; CRC Press: Boca Raton, Florida, 2015.
(2) Lyons, P. Russia Hasn’t Disposed of 34 Tons of Plutonium. It’s Our Fault. Politico. February 7, 2018.
(3) Bailey, D. L.; Townsend, D. W.; Valk, P. E.; Maisey, M. N.; Director, P.; Professor Emeritus, F. Positron Emission Tomography; Springer: London, 2005.
(4) General Nuclear Medicine https://www.radiologyinfo.org/en/info.cfm?pg=gennuclear (accessed Mar 21, 2018).
(5) Mazzaferri, E. L.; Jhiang, S. M. Long-Term Impact of Initial Surgical and Medical Therapy on Papillary and Follicular Thyroid Cancer. Ponte Verda Beach.
(6) Glasstone, S.; Dolan, P. The Effects of Nuclear Weapons. Eff. Nucl. weapons 1977, 653.
(7) Laby, T.; Kaye, G. Tables of Physical & Chemical Constants (16th edition 1995) http://www.kayelaby.npl.co.uk/atomic_and_nuclear_physics/4_7/4_7_1a.html (accessed Mar 21, 2018).
(8) Krane, K. S.; Halliday, D. Introductory Nuclear Physics; Wiley: New York, 1988.
(9) Malenfant, R. E. Los Alamos Critical Assemblies Facility LA-8762-MS; Los Alamos, 1981.
(10) Brewer, R. W.; McLaughlin, T. .; Dean, V. Uranium-235 Sphere Reflected By Normal Uranium Using Flattop; 2016; Vol. II.
(11) National Institute of Standards and Technology. NIST Standard Reference Materials® Technical Catalog; Gaithersburg, MD, 2013.
(12) Favorite, J. A. IER-163 Post-Experiment MNCP Calculations LA-UR-12-21888; Los Alamos, 2012.
(13) Glasstone, S. Weapons Activities of LANL Part 1 LA-1632; Los Alamos, 1954.
(14) Nizinski, C. A.; Giminaro, A. V.; Auxier, J. D.; Cook, M. T.; Hall, H. L. Production and Characterization of Synthetic Urban Nuclear Melt Glass. J. Radioanal. Nucl. Chem. 2017, 314 (3), 2349–2355.
(15) Molgaard, J. J.; Auxier, J. D.; Giminaro, A. V.; Oldham, C. J.; Gill, J.; Hall, H. L. Production of Synthetic Nuclear Melt Glass. J. Vis. Exp. 2016, No. 107, 1–7.
(16) Roman, A. R.; Bond, E. M. A New Method for Separating First Row Transition Metals and Actinides from Synthetic Melt Glass. J. Radioanal. Nucl. Chem. 2016, 307 (3), 2471–2478.
(17) Baum, E.; Ernesti, M.; Knox, H.; Miller, T.; Watson, A. Nuclides and Isotopes: Chart of the Nuclides, 17th ed.; Bechtel Marine Propulsion Corporation: Schenectady, NY, 2009.
(18) Radchenko, V.; Engle, J. W.; Medvedev, D. G.; Maassen, J. M.; Naranjo, C. M.; Unc, G. A.; Meyer, C. A. L.; Mastren, T.; Brugh, M.; Mausner, L.; et al. Proton-Induced Production and Radiochemical Isolation of44Ti from Scandium Metal Targets for44Ti/44Sc Generator Development. Nucl. Med. Biol. 2017, 50, 25–32.

156
(19) Radchenko, V.; Meyer, C. A. L.; Engle, J. W.; Naranjo, C. M.; Unc, G. A.; Mastren, T.; Brugh, M.; Birnbaum, E. R.; John, K. D.; Nortier, F. M.; et al. Separation of44Ti from Proton Irradiated Scandium by Using Solid-Phase Extraction Chromatography and Design of44Ti/44Sc Generator System. J. Chromatogr. A 2016, 1477, 39–46.
(20) PET https://humanhealth.iaea.org/HHW/Technologists/NuclearMedicineTech/Educationalresources/NuclearMedicinePhysicsforNMT/Equipment/PET/index.html (accessed Mar 21, 2018).
(21) Graves, S. A.; Hernandez, R.; Fonslet, J.; England, C. G.; Valdovinos, H. F.; Ellison, P. A.; Barnhart, T. E.; Elema, D. R.; Theuer, C. P.; Cai, W.; et al. Novel Preparation Methods of 52Mn for ImmunoPET Imaging. Bioconjug. Chem. 2015, 26 (10), 2118–2124.
(22) Atcher, R. W.; Friedman, A. M.; Huizenga, J. R. Production of 52Fe for Use in a Radionuclide Generator System. Int. J. Nucl. Med. Biol. 1980, 7 (1), 75–78.
(23) Wing, J.; Huizenga, J. (P,n) Cross Sections of 51V, 52Cr, 63Cu, 65Cu, 107Ag, 109Ag, 111Cd, 114Cd, and 139La from 5 to 10.5 MeV. Phys. Rev. 1962, 128 (1), 280–290.
(24) Brunnquell, C. L.; Hernandez, R.; Graves, S. A.; Smit-Oistad, I.; Nickles, R. J.; Cai, W.; Meyerand, M. E.; Suzuki, M. Uptake and Retention of Manganese Contrast Agents for PET and MRI in the Rodent Brain. Contrast Media Mol. Imaging 2016, 11 (5), 371–380.
(25) Lewis, C. M.; Graves, S. A.; Hernandez, R.; Valdovinos, H. F.; Barnhart, T. E.; Cai, W.; Meyerand, M. E.; Nickles, R. J.; Suzuki, M. 52Mn Production for PET/MRI Tracking of Human Stem Cells Expressing Divalent Metal Transporter 1 (DMT1). Theranostics 2015, 5 (3), 227–239.
(26) Zhou, Y.; Baidoo, K. E.; Brechbiel, M. W. Mapping Biological Behaviors by Application of Longer-Lived Positron Emitting Radionuclides . Adv. Drug Deliv. Rev. 2013, No. 65, 1098–1111.
(27) Aschner, M.; Erikson, K. M.; Dorman, D. Manganese Dosimetry: Species Differences and Implications for Neurotoxicity. Crit. Rev. Toxicol. 2005, 35 (1), 1–32.
(28) Nayak, T. K.; Brechbiel, M. W. Radioimmunoimaging with Longer-Lived Positron-Emitting Radionuclides: Potentials and Challenges. Bioconjug. Chem. 2009, 20 (5), 825–841.
(29) Massaad, C. A.; Pautler, R. G. Manganese-Enhanced Magnetic Resonance Imaging (MEMRI). Magn. Reson. Neuroimaging 2011, 711, 145–174.
(30) Solvent Extraction Principles and Practice, 2nd ed.; Rydberg, J., Cox, M., Musikas, C., Choppin, G. R., Eds.; Taylor & Francis Group, LLC: New York, 2004.
(31) Marcus, Y.; Kertes, A. Ion Exchange and Solvent Extraction of Metal Complexes, 1st ed.; John Wiley and Sons: London, 1969.
(32) Light, W. DECONTAMINATION FACTOR CALCULATIONS FOR REVERSE OSMOSIS. Nucl. Chem. WASTE Manag. 1980, 1, 99–101.
(33) Ritcey, G. M.; Ashbrook, A. W. Solvent Extraction, Principles and Application to Process Metallurgy, Parts 1 and 2, 1st ed.; Elsevier Science Publishers: Amsterdam, 1979.
157
(34) McKay, H. A. C.; Healy, T. V.; Jenkins, I. L.; Naylor, A. E. Solvent Extraction Chemistry of Metals; MacMillan: London, 1966.
(35) Philip Horwitz, E.; McAlister, D. R.; Dietz, M. L. Extraction Chromatography Versus Solvent Extraction: How Similar Are They? Sep. Sci. Technol. 2006, 41 (10), 2163–2182.
(36) Horwitz, E. P.; McAlister, D. R.; Bond, a H.; Barrans, R. E. Novel Extraction of Chromatographic Resins Based on Tetraalkyldiglycolamides: Characterization and Potential Applications. Solvent Extr. Ion Exch. 2005, 23 (3), 319–344.
(37) Braun, T.; Ghersini, G. Extraction Chromatography. J. Chromatogr. Libr. 1975, 2.
(38) Schweitzer, G.; Pesterfield, L. The Aqueous Chemistry of the Elements, 1st ed.; Oxford University Press: Oxford, 2010.
(39) Greenwood, N. N.; Earnshaw, A. Chemistry Of the Elements, 2nd ed.; Pergamon Press: Oxford, 1997.
(40) Korkisch, J. Handbook of Ion Exchange Resins, Volume 1; CRC Press: Boca Raton, 1988.
(41) Korkisch, J. Handbook of Ion Exchange Resins, Volume 4; CRC Press: Boca Raton, 1989.
(42) Kolsky, K. L.; Joshi, V.; Mausner, L. F.; Srivastava, S. C. Radiochemical Purification of No-Carrier-Added Scandium-47 for Radioimmunotherapy. Appl. Radiat. Isot. 1998, 49 (12), 1541–1549.
(43) Das, M. K.; Sarkar, B. R.; Ramamoorthy, N. Yields of Some Radioisotopes Formed in α-Particle Induced Reactions on Titanium and Recovery of Scandium Radionuclides. Radiochim. Acta 1990, 50 (3), 135–140.
(44) Greene, M.; Hillman, M. A Scandium Generator. Int. J. Appl. Radiat. Isot. 1967, 18 (7), 540–541.
(45) Das, Ν.; Banerjee, S.; Lahiri, S. Sequential Separation of Carrier Free 47Sc, 48V and 48,49,51Cr from α-Particle Activated Titanium with TOAe. Radiochim. Acta 1995, 69 (1), 61–64.
(46) Lahiri, S.; Banerjee, S.; Das, N. R. LLX Separation of Carrier-Free 47Sc, 48V and 48,49,51Cr Produced in α-Particle Activated Titanium with HDEHP. Appl. Radiat. Isot. 1996, 47 (1), 1–6.
(47) Zhu, Z. X.; Sasaki, Y.; Suzuki, H.; Suzuki, S.; Kimura, T. Cumulative Study on Solvent Extraction of Elements by N,N,N’,N’-tetraoctyl-3-Oxapentanediamide (TODGA) from Nitric Acid into N-Dodecane. Anal. Chim. Acta 2004, 527 (2), 163–168.
(48) Aly, H. F.; El-Haggan, M. A. Production of Carrier-Free Scandium Radioisotopes from a Neutron-Irradiated Potassium Titanium Oxalate Target. Mikrochim. Acta 1971, 59 (1), 4–8.
(49) Bokhari, T. H.; Mushtaq, a.; Khan, I. U. Separation of No-Carrier-Added Radioactive Scandium from Neutron Irradiated Titanium. J. Radioanal. Nucl. Chem. 2010, 283 (2), 389–393.
(50) Horwitz, P.; Mcalister, D. Eichrom’s LN Series of Resins: Charactization and Novel Applications. In Triskem International Spanish Users Group Meeting; Triskem International: Madrid, 2008; p 18.
158
(51) Ln Resins https://www.eichrom.com/eichrom/products/ln-resins/ (accessed Mar 21, 2018).
(52) Lumetta, G. J.; Sinkov, S. I.; Krause, J. A.; Sweet, L. E. Neodymium(III) Complexes of Dialkylphosphoric and Dialkylphosphonic Acids Relevant to Liquid-Liquid Extraction Systems. Inorg. Chem. 2016, 45 (4), 1633–1641.
(53) Marie, C.; Hiscox, B.; Nash, K. L. Characterization of HDEHP-Lanthanide Complexes Formed in a Non-Polar Organic Phase Using 31P NMR and ESI-MS. Dalt. Trans. 2012, 41 (3), 1054.
(54) DGA Resins https://www.eichrom.com/eichrom/products/dga-resins/ (accessed Mar 21, 2018).
(55) Antonio, M. R.; McAlister, D. R.; Horwitz, E. P. An Europium(iii) Diglycolamide Complex: Insights into the Coordination Chemistry of Lanthanides in Solvent Extraction. Dalt. Trans. 2015, 44 (2), 515–521.
(56) Korkisch, J. Handbook of Ion Exchange Resins, Volume 5; CRC Press: Boca Raton, 1989.
(57) Buchholz, M.; Spahn, I.; Scholten, B.; Coenen, H. H. Cross-Section Measurements for the Formation of Manganese-52 and Its Isolation with a Non-Hazardous Eluent. Radiochim. Acta 2013, 101 (8), 491–499.
(58) Sundaramurthi, N. .; Malvankar, P. L.; Shinde, V. M.; Snape, F. Ion-Pair Extraction and Determination of copper(II) and zinc(II) in Environmental and Pharmaceutical Samples. Analyst 1991, 116 (10), 1081.
(59) Nambiar, D. C.; Shinde, V. M. Solvent Extractive Separation of Manganese(II) with tris(2-Ethylhexyl) Phosphate. Anal. Lett. 1996, 29 (1), 141–152.
(60) Malkhede, D. D.; Dhadke, P. M.; Khopkar, S. M. Solvent-Extraction Separation of Manganese(II) with Calixarene Substituted with an Acetyl Group at the Lower Rim. Anal. Sci. 1999, 15 (8), 781–784.
(61) Lahiri, S.; Nayak, D.; Korschinek, G.; Lewis, C. M.; Graves, S. A.; Hernandez, R.; Valdovinos, H. F.; Barnhart, T. E.; Cai, W.; Meyerand, M. E.; et al. Separation of No-Carrier-Added 52 Mn from Bulk Chromium : A Simulation Study for Accelerator Mass Spectrometry Measurement of 53 Mn. Theranostics 2006, 78 (21), 7517–7521.
(62) Sato, T.; Adachi, K.; Kato, T.; Nakamura, T. The Extraction of Divalent Manganese, Cobalt, Copper, Zinc, and Cadmium from Hydrochloric Acid Solutions by Tri- N -Octylamine. Sep. Sci. Technol. 1982, 17 (13–14), 1565–1576.
(63) Loveland, W. D.; Morrissey, D. J.; Seaborg, G. T. Modern Nuclear Chemistry Second Edition, 2nd ed.; John Wiley and Sons: Hoboken New Jersey, 2017.
(64) Bandong, B. Personal E-Mail.
(65) Horwitz, E. P.; Chiarizia, R.; Dietz, M. L.; Diamond, H.; Nelson, D. M. Separation and Preconcentration of Actinides from Acidic Media by Extraction Chromatography. Anal. Chim. Acta 1993, 281 (2), 361–372.
(66) Gharibyan, N.; Dailey, A.; McLain, D. R.; Bond, E. M.; Moody, W. a.; Happel, S.; Sudowe, R. Extraction Behavior of Americium and Curium on Selected Extraction Chromatography Resins from Pure Acidic Matrices. Solvent Extr. Ion Exch. 2014, 32 (4), 391–407.

159
(67) Despotopulos, J. D.; Gostic, J. M.; Bennett, M. E.; Gharibyan, N.; Henderson, R. A.; Moody, K. J.; Sudowe, R.; Shaughnessy, D. A. Characterization of Group 5 Dubnium Homologs on Diglycolamide Extraction Chromatography Resins from Nitric and Hydrofluoric Acid Matrices. J. Radioanal. Nucl. Chem. 2015, 303 (1), 485–494.
(68) Thakkar, A. H. A Rapid Sequential Separation of Actinides Using Eichrom’s Extraction Chromatographic Material. J. Radioanal. Nucl. Chem. 2002, 252 (2), 215–218.
(69) Skoog, D. A.; Holler, F. J.; Crouch, S. R. Principles of Instrumental Analysis Sixth Edition, 6th ed.; Saunders College Pub.: Philadelphia, 1998.
(70) Boss, C.; Fredeen, K. Concepts, Instrumentation and Techniques in Inductively Coupled Plasma Optical Emission Spectrometry, 3rd ed.; Perkin Elmer, Inc: Shelton, CT, 2004.
(71) Knoll, G. F. Radiation Detection and Measurement 4th Edition, 4th ed.; Wiley, 2010.
(72) Canberra. Broad Energy Germanium Detectors (BEGe); Canberra Industries, Inc, 2013.
(73) Chu, S. Y. F.; Ekstrom, L. P.; Firestone, R. B. WWW Table of Radioactive Isotopes, database version 2 http://nucleardata.nuclear.lu.se/toi/index.asp (accessed Mar 21, 2018).
(74) Shibata, K.; Iwamoto, O.; Nakagawa, T.; Iwamoto, N.; Ichihara, A.; Kunieda, S.; Chiba, S.; Furutaka, K.; Otuka, N.; Ohsawa, T.; et al. JENDL-4.0: A New Library for Nuclear Science and Engineering. J. Nucl. Sci. Technol. 2011, 48 (1), 1–30.
(75) Shibata, K.; Iwamoto, O.; Nakagawa, T.; Iwamoto, N.; Ichihara, A.; Kunieda, S.; Chiba, S.; Furutaka, K.; Otuka, N.; Ohsawa, T.; et al. JENDL-4.0: A New Library for Nuclear Science and Engineering So KAMADA & Jun-Ichi KATAKURA JENDL-4.0: A New Library for Nuclear Science and Engineering. J. Nucl. Sci. Technol. 2011, 48 (1), 1–30.
(76) Chadwick, M. B.; Herman, M.; Obložinsk, P.; Dunn, M. E.; Danon, Y.; Kahler, A. C.; Smith, D. L.; Pritychenko, B.; Arbanas, G.; Arcilla, R.; et al. ENDF/B-VII.1 Nuclear Data for Science and Technology: Cross Sections, Covariances, Fission Product Yields and Decay Data. Nucl. Data Sheets 2011, 112, 2887–2996.
(77) Cerrai, E.; Testa, C. Chromatographic Separation of Rare Earths by Means of Paper Treated with the Liquid Cation Exchanger Di-(2-Ethylhexyl) Orthophosphoric Acid. J. Chromatogr. A 1962, 8, 232–244.
(78) Horwitz, E. P.; Dietz, M. L.; Chiarizia, R.; Diamond, H.; Maxwell, S. L.; Nelson, M. R. Separation and Preconcentration of Actinides by Extraction Chromatography Using a Supported Liquid Anion Exchanger: Application to the Characterization of High-Level Nuclear Waste Solutions. Anal. Chim. Acta 1995, 310 (1), 63–78.
(79) Hrdlicka, A.; Fialová, I.; Dolezalová, J. Dialkylphosphoric Acids as Carriers in Separation of Lanthanides and Thorium on Supported Liquid Membranes. Talanta 1996, 43 (4), 649–657.
(80) Alliot, C.; Kerdjoudj, R.; Michel, N.; Haddad, F.; Huclier-Markai, S. Cyclotron Production of High Purity 44m,44Sc with Deuterons from44CaCO3targets. Nucl. Med. Biol. 2015, 42 (6), 524–529.
(81) Dirks, C.; Happel, S.; Jungclas, H. Develop of Methods for Selection Separation of Scandium for Radiopharmceutical Applications. In Triskem International German Users

160
Group Meeting; Triskem International: Munich, 2012; pp 1–26.
(82) Pourmand, A.; Dauphas, N. Distribution Coefficients of 60 Elements on TODGA Resin: Application to Ca, Lu, Hf, U and Th Isotope Geochemistry. Talanta 2010, 81 (3), 741–753.
(83) May, T. W.; Weidmeyer, R. H. A Table of Polyatomic Interferences in ICP-MS. At. Spectrosc. 1998, 19 (5), 150–155.
(84) Nolte, R. F.; Specht, S.; Born, J. H. Influence of Geometry Relations on the Support Materials on the Capacity of an Extraction Chromatographic System I. Variation of Total Capacity and the Distribution Coefficient of Eu 3+ in the System HDEHP‐SiO 2‐HCl as a Function of the Pore Size of the Support Materials (Matrices). J. Chromatogr 1975, 110, 239–251.
(85) Rumble, J. R. CRC Handbook of Chemistry and Physics 98th Edition http://hbcponline.com/faces/contents/ContentsSearch.xhtml (accessed Mar 21, 2018).
(86) Harward, N. Personal E-Mail.
Special Permission to Reference Section
Figure 1.1: Reprinted from Laby, T.; Kaye, G. Tables of Physical & Chemical Constants (16th
edition 1995) http://www.kayelaby.npl.co.uk/atomic_and_nuclear_physics/4_7/4_7_1a.html
with permission from The National Physical Laboratory.
Figure 2.3: Reprinted from Lumetta, G. J.; Sinkov, S. I.; Krause, J. A.; Sweet, L. E.
Neodymium(III) Complexes of Dialkylphosphoric and Dialkylphosphonic Acids Relevant to
Liquid-Liquid Extraction Systems. Inorg. Chem. 2016, 45 (4), 1633–1641. Copyright 2016
with permission from American Chemistry Society.

161
CURRICULUM VITAE
Lucas Boron–Brenner
Current Address: 1301 Burton Court, Apt. 4, Fort Collins, CO 80521
Permanent Address: 4568 Brighton Drive, Las Vegas, NV 89121
[email protected] · (301) 704 – 9211
Education
University of Nevada Las Vegas, Las Vegas, NV. Expected graduation May 2018 Ph.D. Radiochemistry, GPA: 3.9
University of Maryland College Park, College Park, MD. December 2010 B.S. Chemistry
Research Experience
Colorado State University, Fort Collins, CO. August 2016 – Present
Visiting Scholar
Advisor: Dr. Ralf Sudowe
Determined and applied methods for separating radionuclides for use in positron emission tomography (PET) from activated target materials using solvent extraction and extraction chromatography.
Stable analytes were measured using inductively coupled plasma atomic emission spectroscopy (ICP-AES) and inductively coupled plasma mass spectrometry (ICP-MS), while radionuclides were measured using γ spectrometry.
University of Nevada Las Vegas, Las Vegas, NV. August 2012 – Present Graduate Researcher
Advisor: Dr. Ralf Sudowe
Measured prompt fast neutron activated transition metals to determine n, p capture cross sections using a high purity germanium detector (HPGe). Developed and applied methods to separate radionuclides from activated targets using extraction chromatography. Batch contact and column studies were performed with stable analytes and were measured using ICP-AES and MS.
Measured time dependent concentration and forms of degradation products from methanol and nitric acid solutions used for actinide separation. Degradation products were measured using conductivity and infrared spectroscopy (IR).

162
Los Alamos National Laboratory, Los Alamos, NM. Summer 2016 and 2017
Research Fellow
Advisor: Dr. Evelyn Bond
Developed and performed column studies using anion exchange resin in nitric acid and methanol to separate uranium, americium, curium and europium. Fractions containing γ emitting radionuclides were measured using by γ spectrometry while α emitting radionuclides were measured by gross α scintillation counting and α spectroscopy.
Lawrence Livermore National Laboratory, Livermore, CA. Summer 2013
Research Fellow
Advisor: Dr. Kim Knight
Performed characterization of post detonation melt glass by size and shape through measurement of uranium abundance and isotopic ratios using isotope dilution ICP-MS.
Spherical melt glass was digested using strong mineral acids and was spiked with a tracer prior to separation by ion exchange chromatography. Uranium isotopic concentrations were analyzed as a function of melt glass size and shape to determine glass formation by environmental and nuclear device mixing.
University of Maryland College Park, College Park, MD. December 2008 – August 2010
Undergraduate Researcher
Advisor: Dr. William McDonough
Performed laser ablation and standard addition ICP-MS of samples from the earth’s mantle to measure elemental abundance and isotopic ratios. Geological samples were digested using strong acids or prepared by polishing and mounting using epoxides.
Data processing was performed using Lamtrace data reduction software.
Fellowships and Awards
Nuclear Regulatory Commission (NRC) Graduate Fellowship, University of Nevada, Las Vegas, 2016 – 2018.
Seaborg Institute Research Fellowship, summer 2016 and 2017.
2nd place Oral Presentation at the Central Rocky Mountain Health Physics Meeting, 2017.
1st place Oral Presentation at the American Nuclear Society Student Conference, 2014
Glenn T Seaborg Nuclear Forensics Fellowship, summer 2013.

163
Professional Activities and Memberships
Institute on Global Conflict and Cooperation, Public Policy and Nuclear Threats Boot Camp. University of California, San Diego, July 2014.
Thermal Ionization Mass Spectrometry (TIMS) Workshop, Idaho Falls, Idaho, May 2013.
Nuclear Science and Security Consortium, Nuclear Analytical Techniques Summer School University of California, Davis, summer 2012.
President of Α Chi Sigma Professional Chemistry Fraternity. University of Maryland, Α Rho Chapter, 2009 – 2010.
Member of the Alpha Chi Sigma Professional Chemistry Fraternity.
Member of American Nuclear Society.
Skills and Areas of Knowledge
Handling radioactive material
Radioanalytical chemistry & Radiochemistry
Radiation detection methods
o Alpha (α), beta (β), gamma (γ), and x-ray radiation detection instrumentation.
Analytical chemistry detection methods
o ICP-MS, ICP-AES, UV-Vis, IR, IC, HPLC
Separation Techniques
o Extraction chromatography, ion exchange chromatography, solvent extraction
Presentations
L. Boron-Brenner, and R. Sudowe. "Separation Of 52Mn From 52Cr For Use In Positron Emission Tomography” Oral Presentation at the Methods & Applications of Radioanalytical Chemistry Meeting, Kailua-Kona, HI, April 2018.
L. Boron-Brenner, and R. Sudowe. "Separation Of 52Mn From 52Cr For Use In Positron Emission Tomography” Oral Presentation at the Health Physics Society Midyear Meeting, Denver, CO, February 2018.
L. Boron-Brenner, R. Sudowe, and E. Bond. "Chromatographic Separation of Actinides, Lanthanides, and Transition Metals” Poster Presentation at the Los Alamos National Laboratory Student Symposium, Los Alamos, NM, August 2017.

164
L. Boron-Brenner, and R. Sudowe. "Separation of Fast Neutron Activated Titanium for Post-Detonation Nuclear Forensics” Oral Presentation at the Central Rocky Mountain Health Physics Society Meeting, Fort Collins, CO, April 2017.
L. Boron-Brenner, R. Sudowe, and E. Bond. "Separation of Fast Neutron Activated Titanium for Post-Detonation Nuclear Forensics” Poster Presentation at the Los Alamos National Laboratory Student Symposium, Los Alamos, NM, August 2016.
L. Boron-Brenner, R. Sudowe, "Chromatic Separation of Fast Neutron Activated Titanium for Post-Detonation Nuclear Forensic Analysis" Oral Presentation at the American Chemistry Society National Meeting, San Francisco, CA, August 2014.
L. Boron-Brenner, and R. Sudowe. "Chromatic Separation of Fast Neutron Activated Titanium for Post-Detonation Nuclear Forensic Analysis" Oral Presentation at the American Nuclear Society Student Meeting, State College, PA, April 2014.
L. Boron-Brenner, G. Eppich, K. Knight, and R. Sudowe. "Uranium Isotopic Measurements of Fallout Spherules Using Isotope Dilution Mass Spectrometry" Poster presentation at the Lawrence Livermore National Laboratory Student Symposium, Livermore, CA, August 2013.
L. Boron-Brenner, and R. Sudowe. "Study of Scandium and Titanium Adsorption on Eichrom’s LN resin in Hydrochloric, Nitric, Sulfuric Acid Matrices" Poster presentation at the American Nuclear Society Student Meeting, Boston, MA, April 2013.
Related Documents