Development of Bio-gas Production Through The Bio-gas Plant. Page 1 Civil Engineering DEVELOPMENT OF BIOGAS PRODUCTION THROUGH THE BIOGAS PLANT BY TAPON CHAKRABARTI MD.REJAUL KARIM TANVIR DEPARTMENT OF CIVIL ENGINEERING STAMFORD UNIVERSITY BANGLADESH

Welcome message from author
This document is posted to help you gain knowledge. Please leave a comment to let me know what you think about it! Share it to your friends and learn new things together.
Transcript
Development of Bio-gas Production Through The Bio-gas Plant. Page 1
Civil Engineering
DEVELOPMENT OF BIOGAS PRODUCTION THROUGH
THE BIOGAS PLANT
BY
TAPON CHAKRABARTI
MD.REJAUL KARIM TANVIR
DEPARTMENT OF CIVIL ENGINEERING
STAMFORD UNIVERSITY BANGLADESH

Development of Bio-gas Production Through The Bio-gas Plant. Page 2
Introduction
Biogas is a renewable energy source with several applications e.g. car fuel heating cooking,
electricity production etc. Biogas consists mainly of methane and carbon dioxide but without
this there are some other gases such as Hydrogen sulfide, sulfur dioxide, ammonia etc. Soon
there will be 8 billion people living on our globe. This is an incredible number thinking that
only one hundred years ago there were not even 2 billion! Mankind has grown tremendously
and so have some problems. By producing biogas we could fight two major problems of
mankind.
The first is the growing amount of waste we produce – including also organic waste. When
organic waste rots, it sets free CO2 and methane. Both gases are known to be greenhouse
gases, which means, they make our earth warmer.
And second, our modern society depends on the energy of fossil fuels such as oil, gas or
coal. These fuels are limited and might be used up soon. Using them always means burning
them, which again leads to a higher amount of CO2 in the atmosphere.
Biogas is made of organic waste or agricultural crops especially grown for that purpose.
Thus it reduces the amount of waste in our landfills. Biogas is also a powerful fuel, which
can help to satisfy our energy needs in a sustainable and CO2 neutral way.
Biogas can be made of almost any kind of organic material.
-Organic wastes of cities, sewage sludge
- Industrial waste water
- Waste water of cities
- Organic wastes of farming (straw, leaves, manure…)
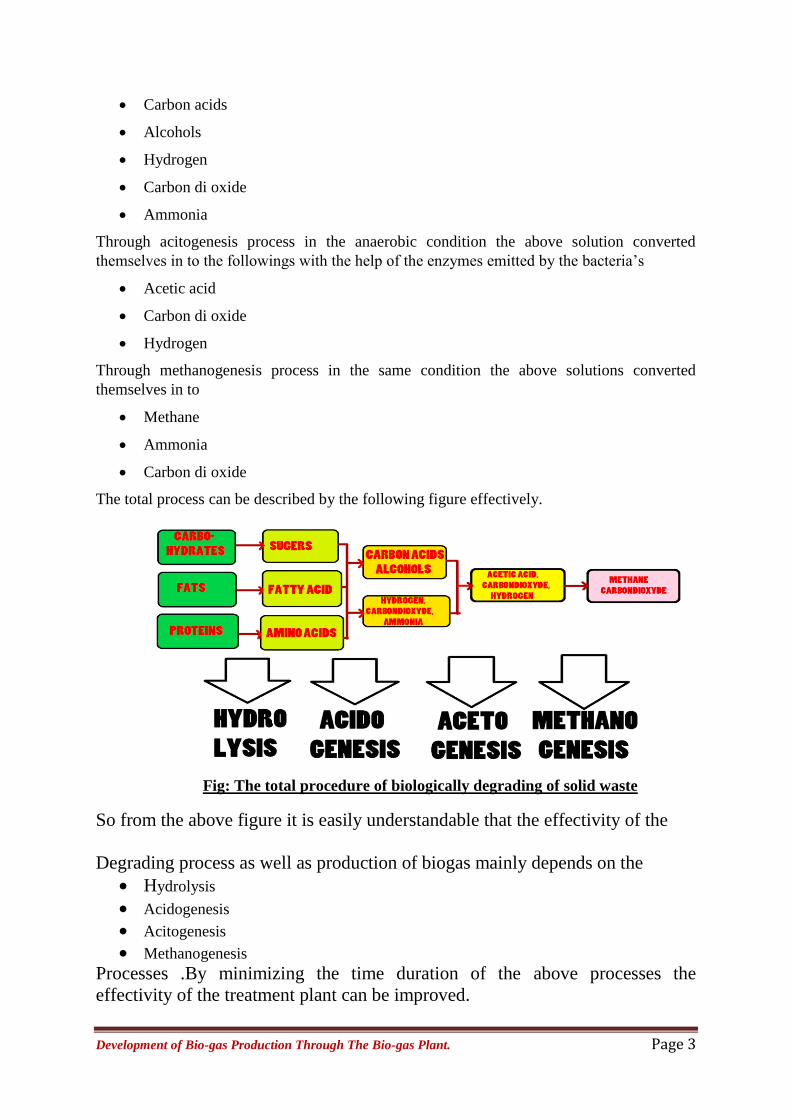
Types of the compounds present in the waste
Mainly degradable solid wastes are made of three individual components. They are as follows
Carbohydrates
Fats
Portions
Through hydrolysis process in the anaerobic condition they converted in to the following
parts
Sugar
Fatty acids
Amino Acids
Through acidogenesis processes they converted into
Development of Bio-gas Production Through The Bio-gas Plant. Page 3
Carbon acids
Alcohols
Hydrogen
Carbon di oxide
Ammonia
Through acitogenesis process in the anaerobic condition the above solution converted
themselves in to the followings with the help of the enzymes emitted by the bacteria’s
Acetic acid
Carbon di oxide
Hydrogen
Through methanogenesis process in the same condition the above solutions converted
themselves in to
Methane
Ammonia
Carbon di oxide
The total process can be described by the following figure effectively.
So from the above figure it is easily understandable that the effectivity of the
Degrading process as well as production of biogas mainly depends on the
Hydrolysis
Acidogenesis
Acitogenesis
Methanogenesis Processes .By minimizing the time duration of the above processes the
effectivity of the treatment plant can be improved.
Fig: The total procedure of biologically degrading of solid waste
Development of Bio-gas Production Through The Bio-gas Plant. Page 4
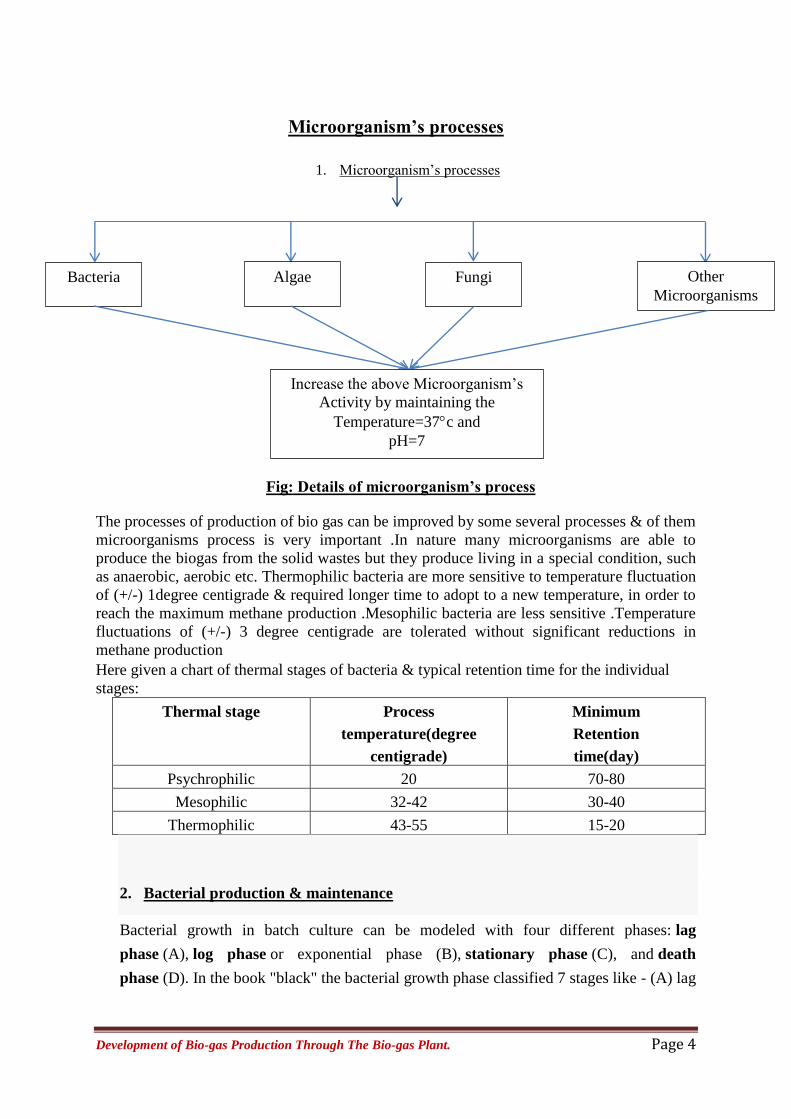
Microorganism’s processes
1. Microorganism’s processes
The processes of production of bio gas can be improved by some several processes & of them
microorganisms process is very important .In nature many microorganisms are able to
produce the biogas from the solid wastes but they produce living in a special condition, such
as anaerobic, aerobic etc. Thermophilic bacteria are more sensitive to temperature fluctuation
of (+/-) 1degree centigrade & required longer time to adopt to a new temperature, in order to
reach the maximum methane production .Mesophilic bacteria are less sensitive .Temperature
fluctuations of (+/-) 3 degree centigrade are tolerated without significant reductions in
methane production
Here given a chart of thermal stages of bacteria & typical retention time for the individual
stages:
Thermal stage Process
temperature(degree
centigrade)
Minimum
Retention
time(day)
Psychrophilic 20 70-80
Mesophilic 32-42 30-40
Thermophilic 43-55 15-20
2. Bacterial production & maintenance
Bacterial growth in batch culture can be modeled with four different phases: lag
phase (A), log phase or exponential phase (B), stationary phase (C), and death
phase (D). In the book "black" the bacterial growth phase classified 7 stages like - (A) lag
Bacteria Algae Fungi Other
Microorganisms
Increase the above Microorganism’s
Activity by maintaining the
Temperature=37c and
pH=7
Fig: Details of microorganism’s process

Development of Bio-gas Production Through The Bio-gas Plant. Page 5
phase (B) early log phase (C) log/exponential phase (D) early stationery phase (E)
stationary phase (F) early death phase (G) death phase.
3. Bacterial growth curve\Kinetic Curve
1. During lag phase, bacteria adapt themselves to growth conditions. It is the period
where the individual bacteria are maturing and not yet able to divide. During the lag
phase of the bacterial growth cycle, synthesis of RNA, enzymes and other molecules
occurs.
2. The log phase (sometimes called the logarithmic phase or the exponential phase) is a
period characterized by cell doubling. The number of new bacteria appearing per unit
time is proportional to the present population. If growth is not limited, doubling will
continue at a constant rate so both the number of cells and the rate of population increase
doubles with each consecutive time period.
3. The stationary phase is often due to a growth-limiting factor such as the depletion of
an essential nutrient, and/or the formation of an inhibitory product such as an organic
acid. Stationary phase results from a situation in which growth rate and death rate are
equal. At death phase, bacteria run out of nutrients and die.
Fig: Bacterial growth curve\Kinetic Curve
So from the above discussion of the bacterial growth curve, it is clear that the growth rate of
bacteria will be maximum in the log phage (b). It’s very important to maintain a high growth
rate in the plant which will help to maximize the production of gas by degrading the waste.
To maintain this rate there are some important steps which should be taken .Those are as
follows:
Maintain the optimum temperature (37 degree centigrade)
Maintain the pH of the solution(pH=7)
Maintain the nutrition efficiency.
Termites
Termites have the unusual digestive ability to turn plant fiber (cellulose) in to chemical
building blocks. Termites are considered the smallest and most efficient decomposing bio

Development of Bio-gas Production Through The Bio-gas Plant. Page 6
reactors of wood on earth. It’s possible for them to break down lignocellulose material in to
monosaccharaides with 90% efficiency.
Lower termite c. gestroi contain all enzymatic activity such as –
C m case
Glucosidases
Eneluglucanases
Xylanses
Manananses
Pectinases
Amaylases
The production chamber will be directly linked with the tank of area of termites.
Chemical process
To develop the processes of degrading of solid waste, some chemicals can be used .In
presence of this chemical; the time required in the degrading process can be reduced in a
notable manner.
Car boxy methyl cellulose [(cmc) ]:
Molar mass=variable
Molar formula=variable
It helps by DE crystallizing of cellulose and makes it ideal for endoglucanase action.
Increase amylase
enzyme activity
Increase lipase
enzyme activity
Increase protease
enzyme activity
𝐻(𝐶6𝐻10𝑂5)𝑋𝑂𝐻
Providing
Dextran
Formula=
Atomic weight=
variable
Providing
Alkali+ (𝑁𝐻4)𝐻2𝑃𝑂4𝐴+
𝑀𝑔𝑆𝑜4 At the rate of 1-6%
of the total
concentration
Providing
Isopropanol,
Benzene, Methanol
and metal
ions=𝑀𝑔2+,𝐶𝑎2+,
𝑍𝑛2+, 𝑀𝑛2+
𝑃𝑟𝑜𝑣𝑖𝑑𝑖𝑛𝑔 =Fructose2, 6 bisphosphatase𝐹𝑟𝑢𝑐𝑡𝑜𝑠𝑒1, 6 𝑏𝑖𝑠𝑝ℎ𝑜𝑠𝑝ℎ𝑎𝑡𝑒
𝐴𝑡𝑜𝑚𝑖𝑐 𝑤𝑒𝑖𝑔ℎ𝑡=340.116𝑔𝑚/𝑚𝑜𝑙𝑒
𝐹𝑜𝑟𝑚𝑢𝑙𝑎=𝐶6𝐻14𝑂12𝑃2
To increase the biologically degrading activity of enzyme
Fig: Details of chemical process
Development of Bio-gas Production Through The Bio-gas Plant. Page 7
Methane production by the encapsulated bacteria during 6 days in batch reactors was
analyzed a synthetic medium containing acetate, butyrate, propionate, methanol and
glucose as carbon sources (at ph. 7) was used.
The result show that methane production from encapsulated digesting bacteria using
natural and synthetic membranes was successful, but the capsules from Dura pore
membrane filter exhibited a heir stability in the disaster then the alginate passed
capsule, and that it is feasible to develop the encapsulation technology for biogas
production.
Plant construction process
To get efficiency, it’s important to construct the plant with much consciousness .The plant is
made with some several parts .those are here given below-
Food waste inlet & termite’s chamber
Slicing area
Digester
Out let Chamber
1. Food waste inlet & termite’s chamber
The pipe from toilet pan & the food waste line will directly joint with the Food waste inlet &
termites chamber. The effluent line will be adjusted with the slicing area. The dimensions of
the surface of the wastes will be greater than depth for high class result (not mandatory),
which will help to get a great contact between wastes & termite’s. The linked pipe will must
have to be angled so that the wastes can pass easily through the pipe.
2. Slicing area
The raw wastes will be directly entered into the slicing area from the Food waste inlet &
termite’s chamber. A slicing machine will be used here .It will be used as a cutter machine.
The solid wastes will be in the form of paste in this chamber with the help of the cutter
machine. This chamber must be settled down according to the figure
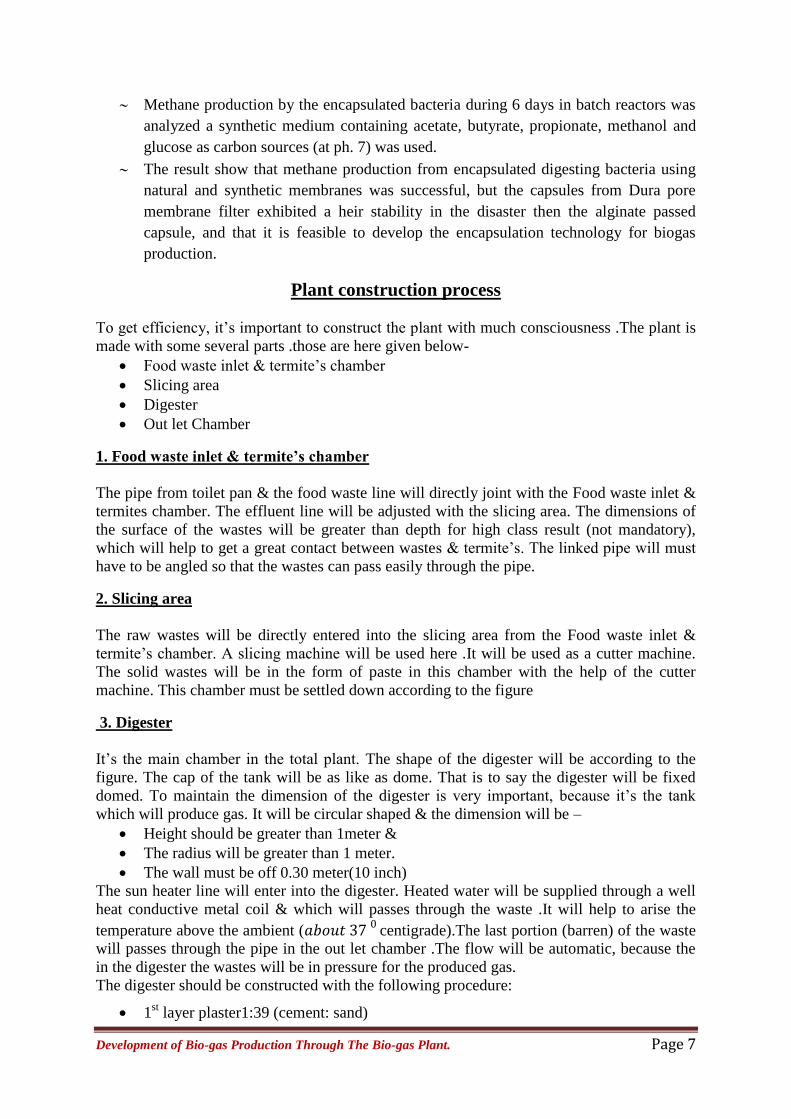
3. Digester
It’s the main chamber in the total plant. The shape of the digester will be according to the
figure. The cap of the tank will be as like as dome. That is to say the digester will be fixed
domed. To maintain the dimension of the digester is very important, because it’s the tank
which will produce gas. It will be circular shaped & the dimension will be –
Height should be greater than 1meter &
The radius will be greater than 1 meter.
The wall must be off 0.30 meter(10 inch)
The sun heater line will enter into the digester. Heated water will be supplied through a well
heat conductive metal coil & which will passes through the waste .It will help to arise the
temperature above the ambient ( 3 centigrade).The last portion (barren) of the waste
will passes through the pipe in the out let chamber .The flow will be automatic, because the
in the digester the wastes will be in pressure for the produced gas.
The digester should be constructed with the following procedure:
1st layer plaster1:39 (cement: sand)
Development of Bio-gas Production Through The Bio-gas Plant. Page 8
2nd
layer plaster 1:2 (cement: sand)
3rd
layer plaster 1:1 (cement: acrylic emulsion paint)
4th
layer painting only(acrylic emulsion paint)
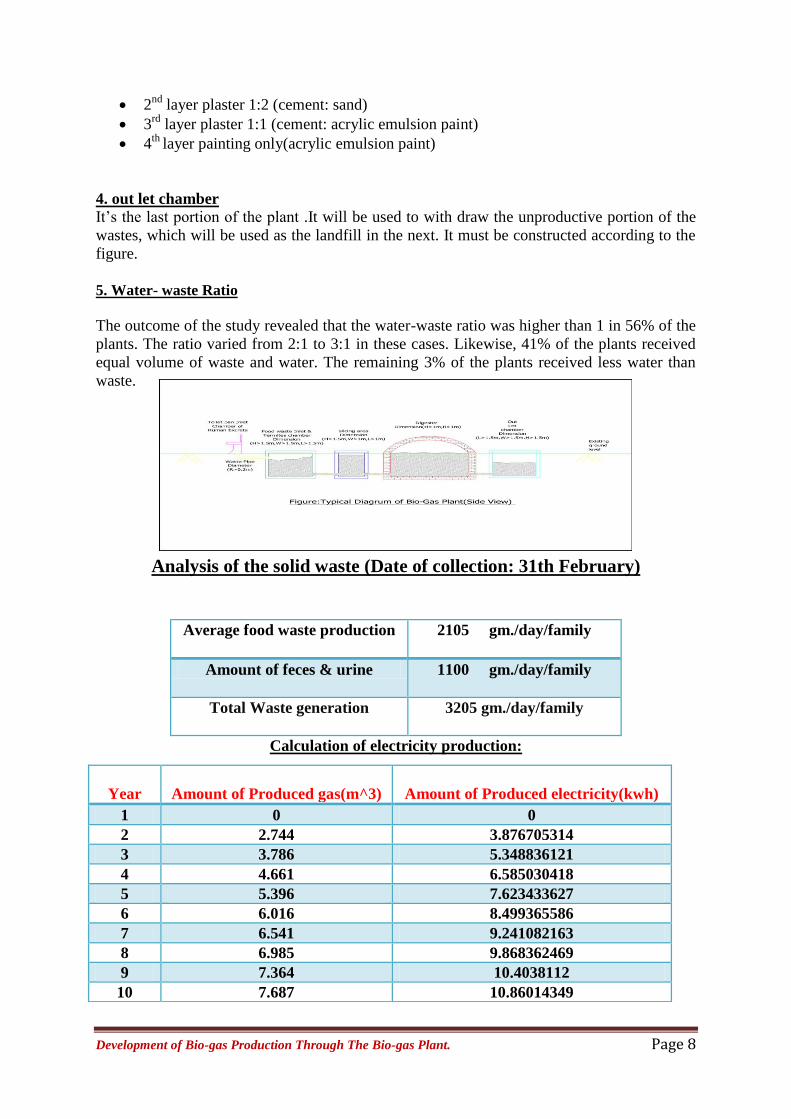
4. out let chamber
It’s the last portion of the plant .It will be used to with draw the unproductive portion of the
wastes, which will be used as the landfill in the next. It must be constructed according to the
figure.
5. Water- waste Ratio
The outcome of the study revealed that the water-waste ratio was higher than 1 in 56% of the
plants. The ratio varied from 2:1 to 3:1 in these cases. Likewise, 41% of the plants received
equal volume of waste and water. The remaining 3% of the plants received less water than
waste.
Analysis of the solid waste (Date of collection: 31th February)
Average food waste production 2105 gm./day/family
Amount of feces & urine 1100 gm./day/family
Total Waste generation 3205 gm./day/family
Calculation of electricity production:
Year
Amount of Produced gas(m^3)
Amount of Produced electricity(kwh)
1 0 0
2 2.744 3.876705314
3 3.786 5.348836121
4 4.661 6.585030418
5 5.396 7.623433627
6 6.016 8.499365586
7 6.541 9.241082163
8 6.985 9.868362469
9 7.364 10.4038112
10 7.687 10.86014349
Development of Bio-gas Production Through The Bio-gas Plant. Page 9
Number
of
family
Production
of
gas(m^3)
1 0
2 0
3 0
4 0
6 0
10 0
20 0
Number
of family
members
Production
of
gas(m^3)
1 0.836585
2 8.365854
3 12.54878
4 16.73171
6 25.09756
10 41.82927
20 83.65854
Number
of family
members
Production
of
gas(m^3)
1 1.154268
2 11.54268
3 17.31402
4 23.08537
6 34.62805
10 57.71341
20 115.4268
Number
of family
members
Production
of
gas(m^3)
1 1.421037
2 14.21037
3 21.31555
4 28.42073
6 42.6311
10 71.05183
20 142.1037
Number
of family
members
Production
of
gas(m^3)
1 1.645122
2 16.45122
3 24.67683
4 32.90244
6 49.35366
10 82.2561
20 164.5122
Number
of family
members
Production
of
gas(m^3)
1 1.834146
2 18.34146
3 27.5122
4 36.68293
6 55.02439
10 91.70732
20 183.4146
Number
of family
members
Production
of
gas(m^3)
1 1.994207
2 19.94207
3 29.91311
4 39.88415
6 59.82622
10 99.71037
20 199.4207
Number
of family
members
Production
of
gas(m^3)
1 2.129573
2 21.29573
3 31.70884
4 42.59146
6 63.8872
10 106.4787
20 212.9573
Number
of family
members
Production
of
gas(m^3)
1 2.245122
2 22.45122
3 33.67683
4 44.89939
6 67.35366
10 112.2561
20 224.5122
Number
of family
members
Production
of
gas(m^3)
1 2.343598
2 23.43598
3 35.15396
4 41.38415
6 62.07622
10 117.1799
20 234.3598
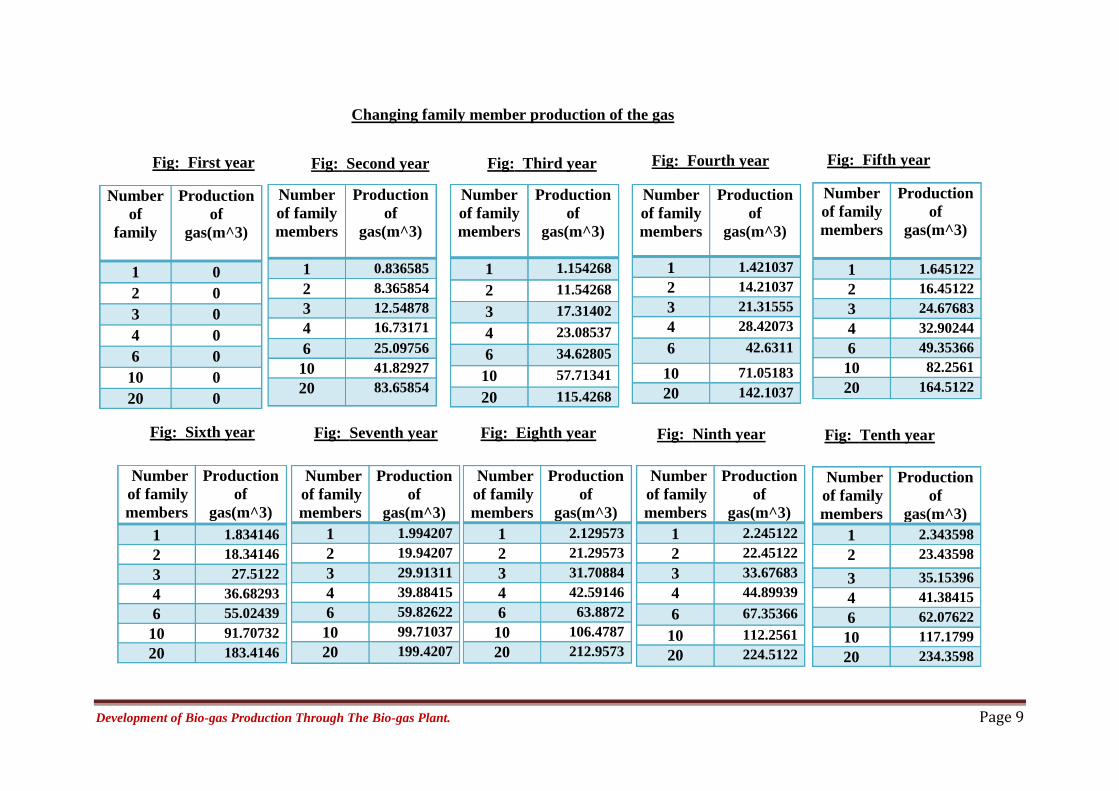
Fig: First year Fig: Second year Fig: Third year Fig: Fourth year Fig: Fifth year
Fig: Sixth year Fig: Seventh year Fig: Eighth year Fig: Ninth year Fig: Tenth year
Changing family member production of the gas
Development of Bio-gas Production Through The Bio-gas Plant. Page 10
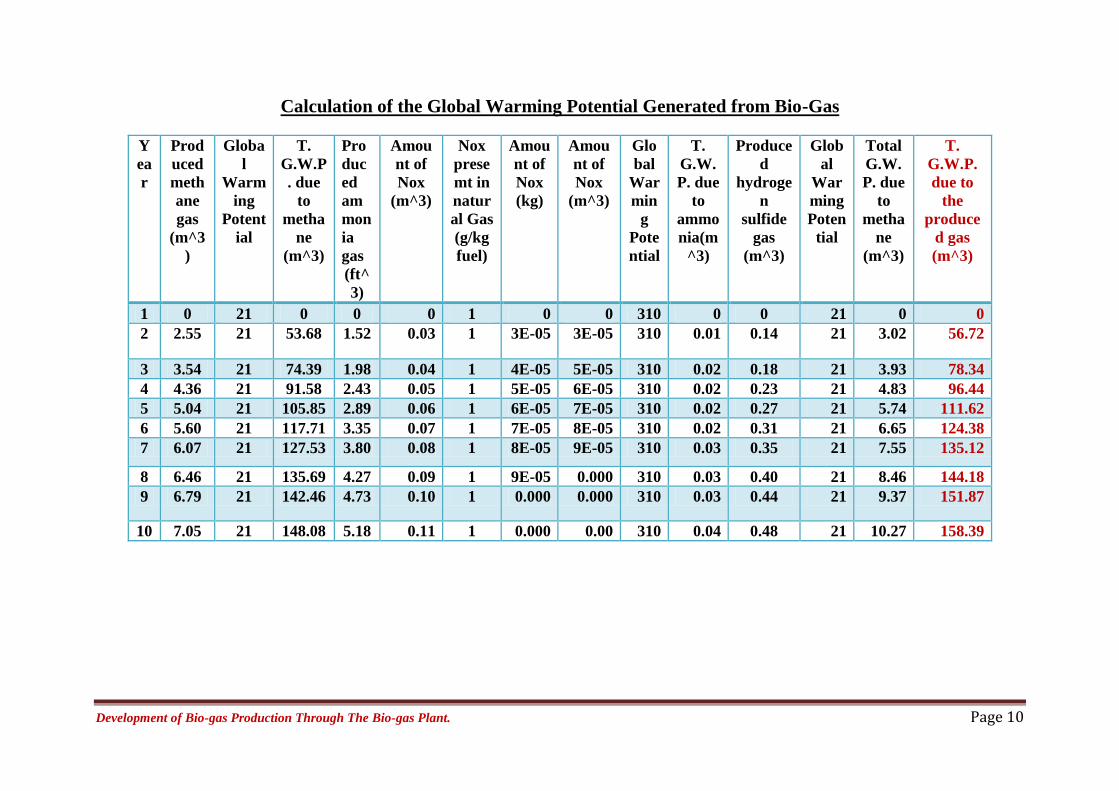
Calculation of the Global Warming Potential Generated from Bio-Gas
Y
ea
r
Prod
uced
meth
ane
gas
(m^3
)
Globa
l
Warm
ing
Potent
ial
T.
G.W.P
. due
to
metha
ne
(m^3)
Pro
duc
ed
am
mon
ia
gas
(ft^
3)
Amou
nt of
Nox
(m^3)
Nox
prese
mt in
natur
al Gas
(g/kg
fuel)
Amou
nt of
Nox
(kg)
Amou
nt of
Nox
(m^3)
Glo
bal
War
min
g
Pote
ntial
T.
G.W.
P. due
to
ammo
nia(m
^3)
Produce
d
hydroge
n
sulfide
gas
(m^3)
Glob
al
War
ming
Poten
tial
Total
G.W.
P. due
to
metha
ne
(m^3)
T.
G.W.P.
due to
the
produce
d gas
(m^3)
1 0 21 0 0 0 1 0 0 310 0 0 21 0 0
2 2.55 21 53.68 1.52 0.03 1 3E-05 3E-05 310 0.01 0.14 21 3.02 56.72
3 3.54 21 74.39 1.98 0.04 1 4E-05 5E-05 310 0.02 0.18 21 3.93 78.34
4 4.36 21 91.58 2.43 0.05 1 5E-05 6E-05 310 0.02 0.23 21 4.83 96.44
5 5.04 21 105.85 2.89 0.06 1 6E-05 7E-05 310 0.02 0.27 21 5.74 111.62
6 5.60 21 117.71 3.35 0.07 1 7E-05 8E-05 310 0.02 0.31 21 6.65 124.38
7 6.07 21 127.53 3.80 0.08 1 8E-05 9E-05 310 0.03 0.35 21 7.55 135.12
8 6.46 21 135.69 4.27 0.09 1 9E-05 0.000 310 0.03 0.40 21 8.46 144.18
9 6.79 21 142.46 4.73 0.10 1 0.000 0.000 310 0.03 0.44 21 9.37 151.87
10 7.05 21 148.08 5.18 0.11 1 0.000 0.00 310 0.04 0.48 21 10.27 158.39
Development of Bio-gas Production Through The Bio-gas Plant. Page 11
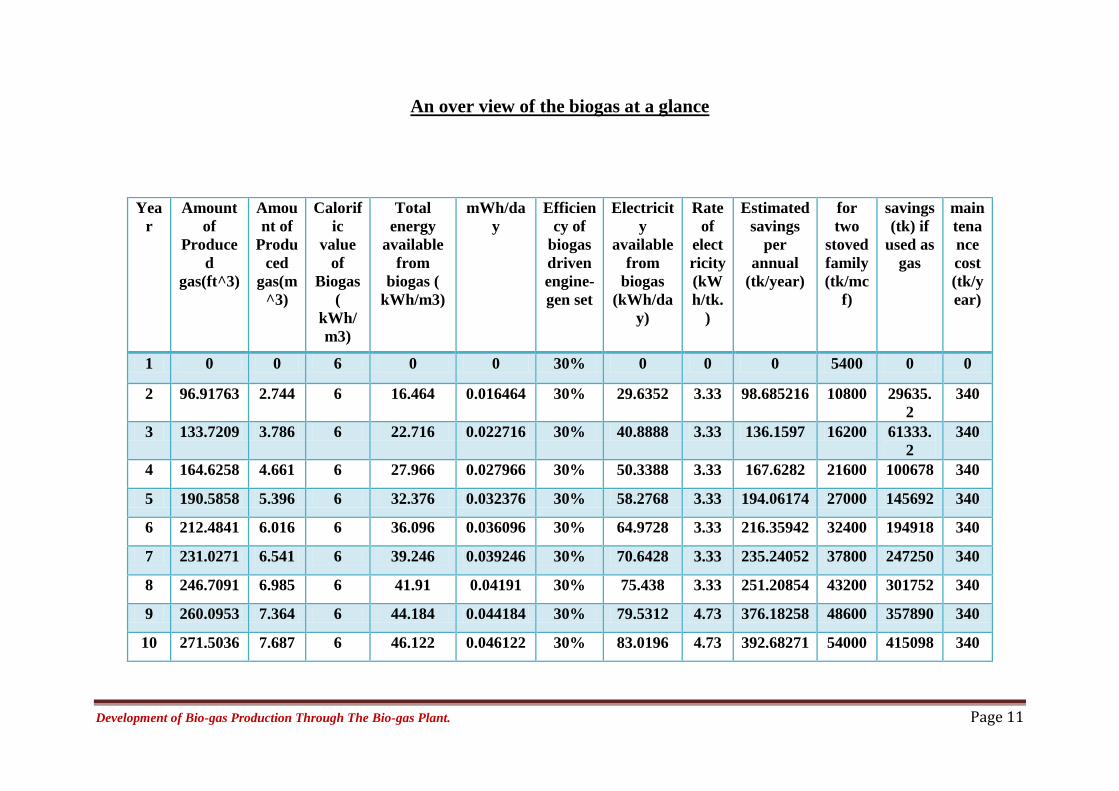
An over view of the biogas at a glance
Yea
r
Amount
of
Produce
d
gas(ft^3)
Amou
nt of
Produ
ced
gas(m
^3)
Calorif
ic
value
of
Biogas
(
kWh/
m3)
Total
energy
available
from
biogas (
kWh/m3)
mWh/da
y
Efficien
cy of
biogas
driven
engine-
gen set
Electricit
y
available
from
biogas
(kWh/da
y)
Rate
of
elect
ricity
(kW
h/tk.
)
Estimated
savings
per
annual
(tk/year)
for
two
stoved
family
(tk/mc
f)
savings
(tk) if
used as
gas
main
tena
nce
cost
(tk/y
ear)
1 0 0 6 0 0 30% 0 0 0 5400 0 0
2 96.91763 2.744 6 16.464 0.016464 30% 29.6352 3.33 98.685216 10800 29635.
2
340
3 133.7209 3.786 6 22.716 0.022716 30% 40.8888 3.33 136.1597 16200 61333.
2
340
4 164.6258 4.661 6 27.966 0.027966 30% 50.3388 3.33 167.6282 21600 100678 340
5 190.5858 5.396 6 32.376 0.032376 30% 58.2768 3.33 194.06174 27000 145692 340
6 212.4841 6.016 6 36.096 0.036096 30% 64.9728 3.33 216.35942 32400 194918 340
7 231.0271 6.541 6 39.246 0.039246 30% 70.6428 3.33 235.24052 37800 247250 340
8 246.7091 6.985 6 41.91 0.04191 30% 75.438 3.33 251.20854 43200 301752 340
9 260.0953 7.364 6 44.184 0.044184 30% 79.5312 4.73 376.18258 48600 357890 340
10 271.5036 7.687 6 46.122 0.046122 30% 83.0196 4.73 392.68271 54000 415098 340
Development of Bio-gas Production Through The Bio-gas Plant. Page 12
Conclusions
The following conclusions are made based on the study conducted in this work:
I. The quantity of methane gas produced by decomposition of food waste & fecal matter
produced by a family of 5persones in the second year is 1709 gm. /year (2.56 m^3/year)
which will increase to 3370 gm. (5.04m^3/year) & it will increase cumulatively.
II. Apart from methane 327 gm. (.49 m^3/year) of hydrogen sulfide gas & 98.079 m
(0.15m^3)/year of ammonia are produced in the tenth year.
III. If 20 families accumulate their wastes in a common digester, 83.65854 m^3/year in the
twenty year & 234.3598 m^3/year of bio gas in the tenth year is available.
IV. The gas produced by the waste of a single family can give firing capacity of a burner for
6.4 hours in the 20 year, which may increase to 12.4 hours in the fifth year & more than
twenty hours in the tenth year .This will help saving fuel cost of the family.
V. The process of conversion of waste into bio gas and use as fuel can significantly reduce
G.W.P from 158.39 to 7.541m^3 and residual digested sludge can be used as an organic
manure.
References
A campaign in the UK, Stop Climate Injustice – www.stopclimateinjustice.org
Satwik Mishra,Arvind Kumer Jain ,Tanmay Singh ,Rashmi Gupta.Optimizing.( 8,Ausust
2013 ) Energy Dependency of VIT University , International journal of scientific &
engineering issue ISSN 2229-5518
B.E.R.K report on electricity bill published on 01.08.2009.
Firoze Ahmed Siddiqui. Linking Innovation & Local Uptake In Rural Development
Potential For Renewable Energy Cooperatives in Bangladesh.(published in Murdoch
University Australia.)
Irena Matecko, Bjoern M. Burmann1, Kristian Schweimer, Hubert Kalbacher, Jürgen
Einsiedel,Peter Gmeiner and Paul Rösch.( 2,2008 ) .The Open Spectroscopy Journal, on
Structural Characterization ., of the E. coli Heat Stable Enterotoxin STh.
Jeffrey Tarrand, Kevin Menard .Metabolic Heat Associated with Viable Escherichia Coli.
Patrick Y. Jay,1,2 Brett S. Harris,Colin T. Maguire,1 Antje Buerger, Hiroko
Wakimoto,Makoto Tanaka,Sabina Kupershmidt, Dan M. Roden,Thomas M.
Development of Bio-gas Production Through The Bio-gas Plant. Page 13
Schultheiss,Terrence X. O’Brien,Robert G. Gourdie,Charles I. Berul,and Seigo Izumo.
Nkx2-5 mutation causes anatomic hypoplasia of the cardiac conduction system
Md. Mujibur Rahman1, Mohammad Adnan Rajib2 and Munaz Ahmed Noor3. (2010)
Proceedings of the International Symposium on Environmental Degradation &
Sustainable ISEDSD.
Ruth B. McMichens, I pledge. Algae as a Source for Biofuel.
Jos M. Raaijmakers and David M. Weller. (2001) .Applied & Environmental
Microbiology. Appl. Environ. Microbiol. DOI: 10.1128/AEM.67.6.2545-2554.2001.
Adria A. Bodour, Kevin P. Drees and Raina M. Maier. (2003).Applied & Environmental
Microbiology. Appl. Environ. Microbial. DOI: 10.1128/AEM.69.6.3280-3287.2003.
Amlan K. Patra and Zhongtang Yu. (2012) .Applied & Environmental Microbiology
10.1128/AEM.00309-12.Appl. Environ. Microbiol. DOI: Published Ahead of 2012.
(T. Wadstrom, A. aust-kettis, D. Habte, J. Holmgren, G. Meeuwisse, R. Mollby, and O.
Soderlind). Enterotoxin-producing bacteria and parasites in stools of Ethiopian children
with diarrhoeal disease.
Annual Biogas Users Survey 2010(Submitted toInfraStructure Development Company
limited (IDCOL)National Domestic Biogas and Manure Programme (NDBMP) 29
November 2011)
Supansa Young sukkasem,Sudip K.Rakshit,Mohammad J.Taherzadeh . Biogas &
production By Encapsulated Methane-Producing Bacteria.
Desko report on Power Generation 2009-2010
Divya, Masilamani Selvam. M .International Journal of Environmental Sciences Volume
2.
J. G. Hoggett, R. B. Moodie,J. R. Penton & K. Schofield. Nitration and aromatic
reactivity .
S.J.Collins, F.W.Ruscetti, R.E.Gallagher & R.C.Gallo .Normal Functional Characteristics
of Cultured Human Promyelocytic Leukemia Cells (HL-60) Induction of Differentietion
Dimethylsulfoxide.
Fanghua Liu, Amelia E. Rotaru, Pravin M. Shrestha, Nikhil S. Malvankar, Kelly P. Nevin
and Derek R. Lovley. Energy &Environmental Science.
Tryg J. Lundquist, Ph.D., P.E. Production of Algae in Conjunction with Wastewater
Treatment.

Development of Bio-gas Production Through The Bio-gas Plant. Page 14
Derek R. Lovley. Microbial Energizers: Fuel Cells That Keep on Going.
Mancinelli RL (1996). "The nature of nitrogen: an overview". Life support & biosphere
science: international journal of earth space 3 (1–2):17–24. PMID 11539154.
Belser LW (1979). "Population ecology of nitrifying bacteria". Annu. Rev. Microbiol. 33:
309–333.doi:10.1146/annurev.mi.33.100179.001521. PMID 386925.
Ward BB (1996). "Nitrification and ammonification in aquatic systems". Life support &
biosphere science: international journal of earth space 3 (1–2): 25–9. PMID 11539155.
Charlotte friend, William scher, J. G. Holland, and Toru sato, Hemoglobin Synthesis in
Murine Virus-Induced LeukemicCells In Vitro: Stimulation of Erythroid Differentiation
by Dimethyl Sulfoxide, Proceedings of the National Academy of SciencesVol. 68, No. 2,
pp. 378-382, February 1971.
Steven J. Collins, Francis W. Ruscetti, Robert E. Gallagher, and Robert C. Gallo, (May
1978).Terminal differentiation of human promyelocytic leukemia cells induced by
dimethyl sulfoxide and other polar compounds, Laboratory of Tumor Cell Biology,
National Cancer Institute, National Institutes of Health, Bethesda, Maryland 20014, Proc.
Nati. Acad. Sci. USAVol. 75, No. 5, pp. 2458-2462.
Qilei Song,S. K. Nataraj, Mina V. Roussenova,Jin Chong Tan,David J. Hughes,Wei
Li,Pierre Bourgoin, M. Ashraf Alam, Anthony K. Cheetham, Shaheen A. Al-Muhtaseb
and Easan Sivaniah , Energy & Environmental Science, Received 19th April 2012,
Accepted 12th June 2012.
Frank J. Stewart, Colleen M. Cavanaugh, Symbiosis of Thioautotrophic Bacteria with
Riftia pachyptila, Progress in Mo lecular and Sub cellular Biology Jörg Overmann (Ed.)
Molecular Basis of Symbiosis Springer-Verlag Berlin Heidelberg 2005.
Summary Report: Evaluation of Alternative Solid Waste Processing Technologies,
Prepared for:City of Los AngelesDepartment of Public WorksBureau of Sanitation.
Riitta Pipatti (Finland) Joao Wagner Silva Alves (Brazil), Qingxian Gao (China), Carlos
López Cabrera (Cuba), Katarina Mareckova (Slovakia), Hans Oonk (Netherlands),
Elizabeth Scheehle (USA), Chhemendra Sharma (India), Alison Smith (UK), Per Svardal
(Norway), and Masato Yamada (Japan). Biological Treatment of Solid Waste, 2006 IPCC
Guidelines for National Greenhouse Gas Inventories
Ir Amim, Solid Waste Management Policy in the Jerusalem District, September
2008.Dr.Kathir.Viswalingam & Dr.F.Emerson Solomon, Biomass and biogas for energy
generation: recent development and perspectives, International Journal of Scientific &
Engineering Research Volume 4, Issue3, March-2013 1,ISSN 2229-5518.
Prakash C. Ghimire, Final Report on Technical Study of Biogas Plants Installed in
Bangladesh, December 2005
M.M. Golam Hossain, Improved cook stove and biogas programmes in
Bangladesh,published -2013.

Development of Bio-gas Production Through The Bio-gas Plant. Page 15
Muhammad Riazul Hamid, Mohammad Nazmul Haque, M.A. Rouf, M.S.Islam
.Dissemination of Domestic Biogas Plants in Bangladesh - Current State, Problems faced
and Barriers. International Journal of Scientific & Engineering Research Volume 4,
Issue3, March-2013 1, ISSN 2229-5518.
Bangladesh Energy Regulatory Commission report, published on 30.07.2009.
Infrastructure Development Company Limited & Rural Electrification Board,
Bangladesh: rural electrification and renewable energy development project: ii (rered ii),
June, 2012
Dr.Kathir.Viswalingam & Dr.F.Emerson Solomon, Biomass and biogas for energy
generation: recent development and perspectives, International Journal of Scientific &
Engineering Research Volume 4, Issue3, March-2013 1, ISSN 2229-5518.
Naoko Fujimoto, Tomoyuki Kosaka, Toshihiko Nakao and Mamoru Yamada*, Bacillus
licheniformis Bearing a High Cellulose-Degrading Activity, which was Isolated as a
Heat-Resistant and Micro-Aerophilic Microorganism from Bovine Rumen, The Open
Biotechnology Journal, 2011, 5, 7-13
Dr.Kathir.Viswalingam & Dr.F.Emerson Solomon. Biomass and biogas for energy generation:
recent development and perspectives.
Related Documents