Journal of Mechanical Engineering and Sciences (JMES) ISSN (Print): 2289-4659; e-ISSN: 2231-8380; Volume 6, pp. 734-745, June 2014 © Universiti Malaysia Pahang, Malaysia DOI: http://dx.doi.org/10.15282/jmes.6.2014.1.0071 734 DEVELOPMENT OF ARTIFICIAL NEURAL NETWORK MODEL IN PREDICTING PERFORMANCE OF THE SMART WIND TURBINE BLADE E.E. Supeni 1 , J.A. Epaarachchi 2 , M.M. Islam 2 and K.T. Lau 2,3 1 Department of Mechanical Engineering, Faculty of Engineering, Universiti Putra Malaysia, Malaysia 2 Centre Excellence in Engineered Fibre Composites, University of Southern Queensland, Australia 3 Department of Mechanical Engineering, Hong Kong Polytechnic University HongKong, China E-mail: [email protected] ABSTRACT This paper demonstrates the applicability of artificial neural networks (ANNs) that use multiple bck-propagation networks (MBP) and a non-linear autoregressive exogenous model (NARX) for predicting the deflection of a smart wind turbine blade specimen. A neural network model has been developed to perform the deflection with respect to the number of wires required as the output parameter, and parameters such as load, current, time taken and deflection as the input parameters. The network has been trained with experimental data obtained from experimental work. The various stages involved in the development of a genetic algorithm based neural network model are addressed in detail in this paper. Keywords: Artificial neural network; back-propagation; multiple back-propagation; non-linear autoregressive exogenous model. INTRODUCTION Glass fiber reinforced polymer (GFRP) is a promising material for renewable energy which has been mainly used in wind turbine blades, due to its high and strength weight ratio (Aeyzarq Muhammad Hadzreel & Siti Rabiatull Aisha, 2013; M. Khairul Zaimy, Zafiah, Rus, Ab Latif, & Nurulsaidatulsyida, 2013; Nolet, 2011). The application of GFRP laminates improves the ultimate strength in capturing wind as a proportion of the diameter of the blade (Sorensen, Jørgensen, Christian, & Jensen, 2004). However, a longer blade will result in deflection since the bending moment is high from the tip to root. At this point, there is more blade outboard (contributing to bending moment) than at any other point along the blade (Peter & Richard, 2012). At the tip the bending moment drops to zero, as shown in Figure 1.The nature of the composite material is a high non-linear system. It is a crucial problem to describe the characteristics of composite load deflection. To alleviate the deflection of the GFRP, it will be enhanced to use shape memory alloy (SMA) wires (Supeni, Epaarachchi, Islam, & Lau, 2012a, 2012b). As ANNs have a strong ability to describe non-linear mapping, there are many uses in load modeling studies, and researchers are trying to describe the complex characteristics of the performance of the composite load precisely (Sapuan & Iqbal, 2010). The neural network is used in the parameter identification of traditional models such as difference equations models, power function models and polynomial function models, but the BP neural network is only used as an optimization algorithm, and the

Welcome message from author
This document is posted to help you gain knowledge. Please leave a comment to let me know what you think about it! Share it to your friends and learn new things together.
Transcript

Journal of Mechanical Engineering and Sciences (JMES)
ISSN (Print): 2289-4659; e-ISSN: 2231-8380; Volume 6, pp. 734-745, June 2014
© Universiti Malaysia Pahang, Malaysia
DOI: http://dx.doi.org/10.15282/jmes.6.2014.1.0071
734
DEVELOPMENT OF ARTIFICIAL NEURAL NETWORK MODEL IN
PREDICTING PERFORMANCE OF THE SMART WIND TURBINE BLADE
E.E. Supeni1, J.A. Epaarachchi
2, M.M. Islam
2 and K.T. Lau
2,3
1Department of Mechanical Engineering, Faculty of Engineering,
Universiti Putra Malaysia, Malaysia 2Centre Excellence in Engineered Fibre Composites,
University of Southern Queensland, Australia 3Department of Mechanical Engineering,
Hong Kong Polytechnic University HongKong, China
E-mail: [email protected]
ABSTRACT
This paper demonstrates the applicability of artificial neural networks (ANNs) that use
multiple bck-propagation networks (MBP) and a non-linear autoregressive exogenous
model (NARX) for predicting the deflection of a smart wind turbine blade specimen. A
neural network model has been developed to perform the deflection with respect to the
number of wires required as the output parameter, and parameters such as load, current,
time taken and deflection as the input parameters. The network has been trained with
experimental data obtained from experimental work. The various stages involved in the
development of a genetic algorithm based neural network model are addressed in detail
in this paper.
Keywords: Artificial neural network; back-propagation; multiple back-propagation;
non-linear autoregressive exogenous model.
INTRODUCTION
Glass fiber reinforced polymer (GFRP) is a promising material for renewable energy
which has been mainly used in wind turbine blades, due to its high and strength weight
ratio (Aeyzarq Muhammad Hadzreel & Siti Rabiatull Aisha, 2013; M. Khairul Zaimy,
Zafiah, Rus, Ab Latif, & Nurulsaidatulsyida, 2013; Nolet, 2011). The application of
GFRP laminates improves the ultimate strength in capturing wind as a proportion of the
diameter of the blade (Sorensen, Jørgensen, Christian, & Jensen, 2004). However, a
longer blade will result in deflection since the bending moment is high from the tip to
root. At this point, there is more blade outboard (contributing to bending moment) than
at any other point along the blade (Peter & Richard, 2012). At the tip the bending
moment drops to zero, as shown in Figure 1.The nature of the composite material is a
high non-linear system. It is a crucial problem to describe the characteristics of
composite load deflection. To alleviate the deflection of the GFRP, it will be enhanced
to use shape memory alloy (SMA) wires (Supeni, Epaarachchi, Islam, & Lau, 2012a,
2012b). As ANNs have a strong ability to describe non-linear mapping, there are many
uses in load modeling studies, and researchers are trying to describe the complex
characteristics of the performance of the composite load precisely (Sapuan & Iqbal,
2010). The neural network is used in the parameter identification of traditional models
such as difference equations models, power function models and polynomial function
models, but the BP neural network is only used as an optimization algorithm, and the
Supeni et al. / Journal of Mechanical Engineering and Sciences 6(2014) 734-745
735
structure of the models has not improved, owing to disadvantages such as slow
convergence and local minimum (Gayan, Jayantha, Hao, & Lau, 2013). The
performance of GFRP-plated specimens depends upon the load applied, the internal
structure of the SMA and the current applied. This paper presents the results of
experimental investigations carried out on 6 SMA wires used to reinforce a rectangular
plate along with an artificial neural network (ANN) based model for performance
prediction.
Figure 1.Bending moment against radius in a large turbine blade (Nolet, 2011)
RESEARCH SIGNIFICANCE
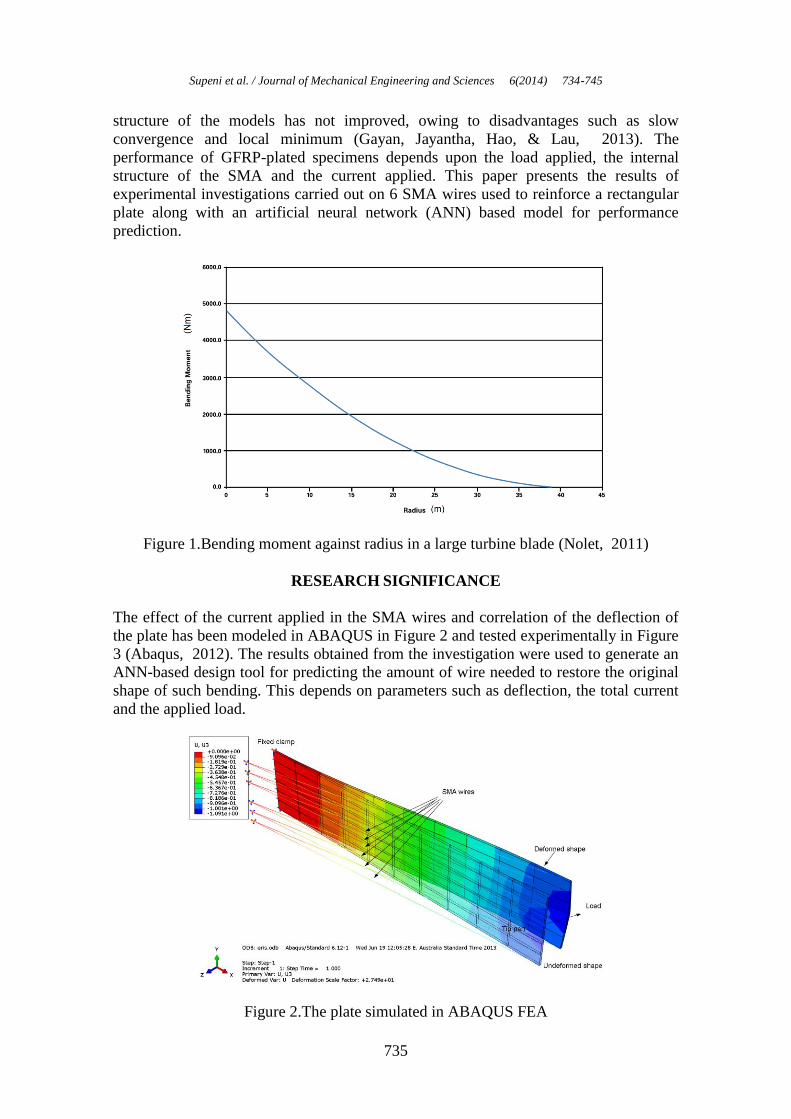
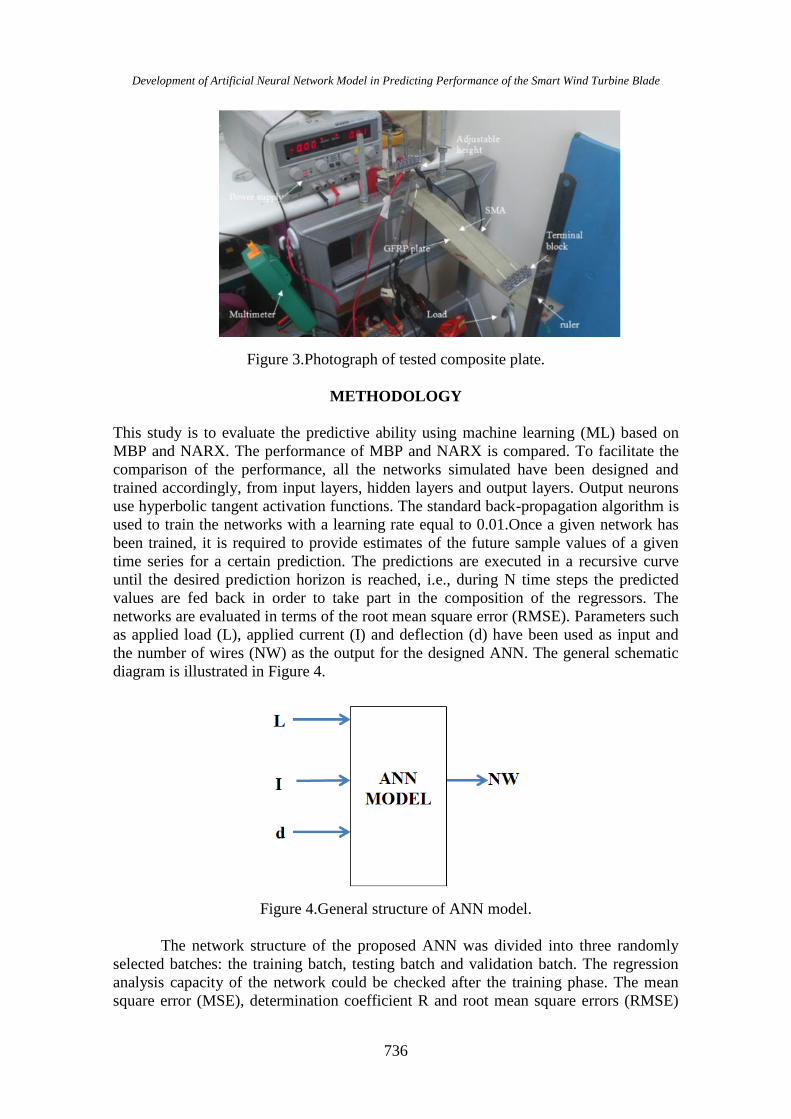
The effect of the current applied in the SMA wires and correlation of the deflection of
the plate has been modeled in ABAQUS in Figure 2 and tested experimentally in Figure
3 (Abaqus, 2012). The results obtained from the investigation were used to generate an
ANN-based design tool for predicting the amount of wire needed to restore the original
shape of such bending. This depends on parameters such as deflection, the total current
and the applied load.
Figure 2.The plate simulated in ABAQUS FEA
Development of Artificial Neural Network Model in Predicting Performance of the Smart Wind Turbine Blade
736
Figure 3.Photograph of tested composite plate.
METHODOLOGY
This study is to evaluate the predictive ability using machine learning (ML) based on
MBP and NARX. The performance of MBP and NARX is compared. To facilitate the
comparison of the performance, all the networks simulated have been designed and
trained accordingly, from input layers, hidden layers and output layers. Output neurons
use hyperbolic tangent activation functions. The standard back-propagation algorithm is
used to train the networks with a learning rate equal to 0.01.Once a given network has
been trained, it is required to provide estimates of the future sample values of a given
time series for a certain prediction. The predictions are executed in a recursive curve
until the desired prediction horizon is reached, i.e., during N time steps the predicted
values are fed back in order to take part in the composition of the regressors. The
networks are evaluated in terms of the root mean square error (RMSE). Parameters such
as applied load (L), applied current (I) and deflection (d) have been used as input and
the number of wires (NW) as the output for the designed ANN. The general schematic
diagram is illustrated in Figure 4.
Figure 4.General structure of ANN model.
The network structure of the proposed ANN was divided into three randomly
selected batches: the training batch, testing batch and validation batch. The regression
analysis capacity of the network could be checked after the training phase. The mean
square error (MSE), determination coefficient R and root mean square errors (RMSE)
Supeni et al. / Journal of Mechanical Engineering and Sciences 6(2014) 734-745
737
are measured by the suggested neural network. In total, 162 data sets were selected for
this designed ANN and are broken down into each target time step as follows: 130, 16
and 16 for training, testing and validation respectively.
MBP Method
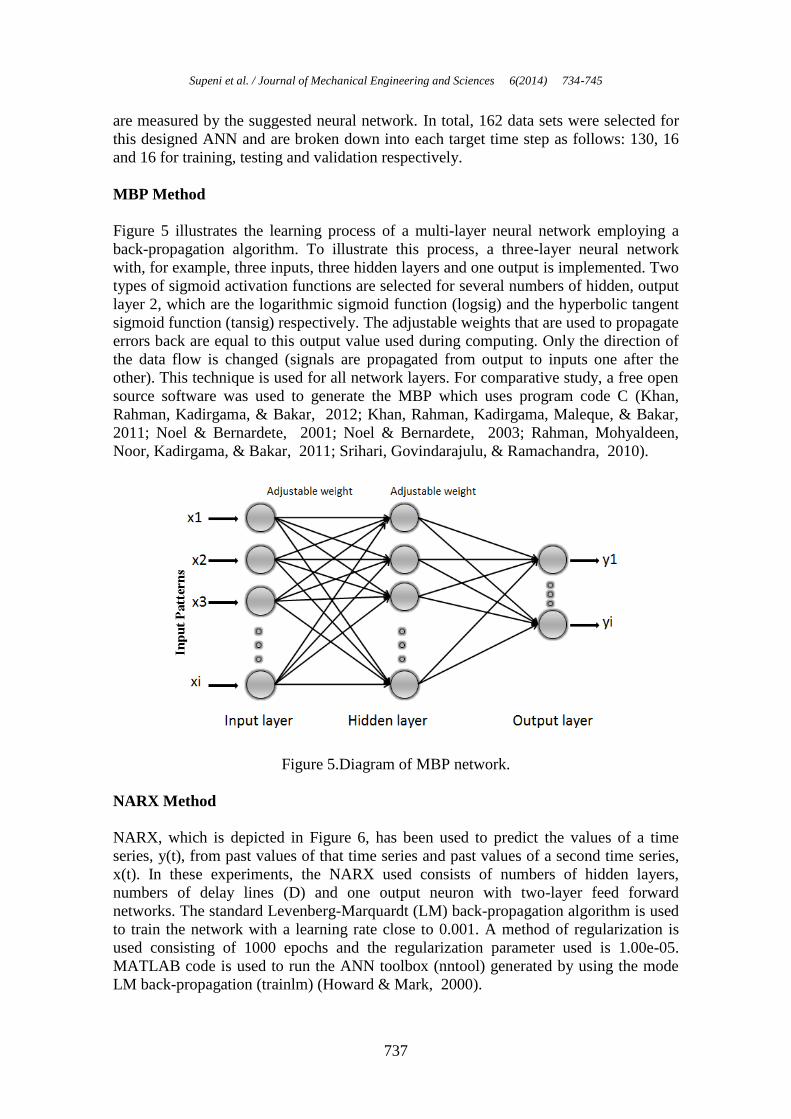
Figure 5 illustrates the learning process of a multi-layer neural network employing a
back-propagation algorithm. To illustrate this process, a three-layer neural network
with, for example, three inputs, three hidden layers and one output is implemented. Two
types of sigmoid activation functions are selected for several numbers of hidden, output
layer 2, which are the logarithmic sigmoid function (logsig) and the hyperbolic tangent
sigmoid function (tansig) respectively. The adjustable weights that are used to propagate
errors back are equal to this output value used during computing. Only the direction of
the data flow is changed (signals are propagated from output to inputs one after the
other). This technique is used for all network layers. For comparative study, a free open
source software was used to generate the MBP which uses program code C (Khan,
Rahman, Kadirgama, & Bakar, 2012; Khan, Rahman, Kadirgama, Maleque, & Bakar,
2011; Noel & Bernardete, 2001; Noel & Bernardete, 2003; Rahman, Mohyaldeen,
Noor, Kadirgama, & Bakar, 2011; Srihari, Govindarajulu, & Ramachandra, 2010).
Figure 5.Diagram of MBP network.
NARX Method
NARX, which is depicted in Figure 6, has been used to predict the values of a time
series, y(t), from past values of that time series and past values of a second time series,
x(t). In these experiments, the NARX used consists of numbers of hidden layers,
numbers of delay lines (D) and one output neuron with two-layer feed forward
networks. The standard Levenberg-Marquardt (LM) back-propagation algorithm is used
to train the network with a learning rate close to 0.001. A method of regularization is
used consisting of 1000 epochs and the regularization parameter used is 1.00e-05.
MATLAB code is used to run the ANN toolbox (nntool) generated by using the mode
LM back-propagation (trainlm) (Howard & Mark, 2000).

Development of Artificial Neural Network Model in Predicting Performance of the Smart Wind Turbine Blade
738
Figure 6.Diagram of NARX network
RESULTS AND DISCUSSION
The number of SMA wires applied has been considered as an output vector. Applied
current, deflection and load are considered as the input vectors. All calculations of the
neural network were made using MATLAB (Levenberg-Marquardt) and MBP open
source code. The schematic diagrams of both models are displayed in Figures 7 and 8.
Both the LM and MBP algorithms for training were applied to the network. The
application randomly divides input vectors and target vectors into three sets, as follows:
80% are used for training: 10% are used to validate that the network is generalizing and
to stop training before over-fitting. The last 10% are used as a completely independent
test of network generalization.
Figure 7.Example of NARX network with 10 hidden layers and 2 delays
Timed by MATLAB
Supeni et al. / Journal of Mechanical Engineering and Sciences 6(2014) 734-745
739
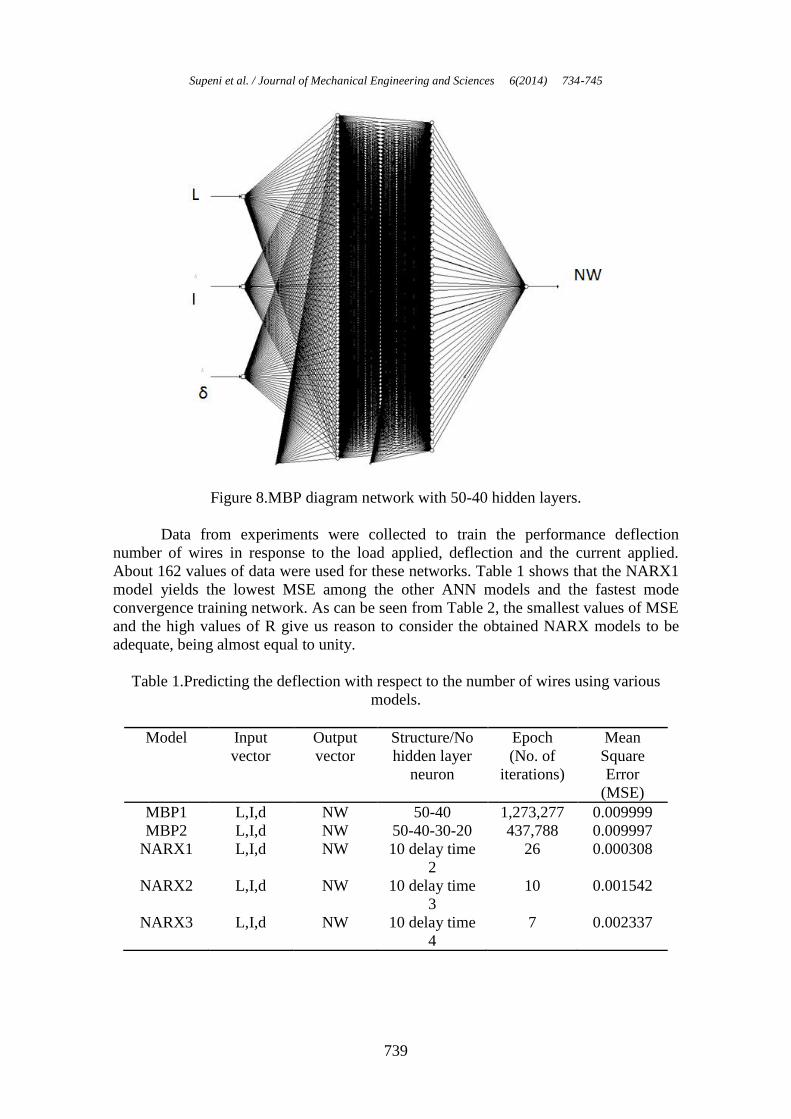
Figure 8.MBP diagram network with 50-40 hidden layers.
Data from experiments were collected to train the performance deflection
number of wires in response to the load applied, deflection and the current applied.
About 162 values of data were used for these networks. Table 1 shows that the NARX1
model yields the lowest MSE among the other ANN models and the fastest mode
convergence training network. As can be seen from Table 2, the smallest values of MSE
and the high values of R give us reason to consider the obtained NARX models to be
adequate, being almost equal to unity.
Table 1.Predicting the deflection with respect to the number of wires using various
models.
Model Input
vector
Output
vector
Structure/No
hidden layer
neuron
Epoch
(No. of
iterations)
Mean
Square
Error
(MSE)
MBP1 L,I,d NW 50-40 1,273,277 0.009999
MBP2 L,I,d NW 50-40-30-20 437,788 0.009997
NARX1 L,I,d NW 10 delay time
2
26 0.000308
NARX2 L,I,d NW 10 delay time
3
10 0.001542
NARX3 L,I,d NW 10 delay time
4
7 0.002337
Development of Artificial Neural Network Model in Predicting Performance of the Smart Wind Turbine Blade
740
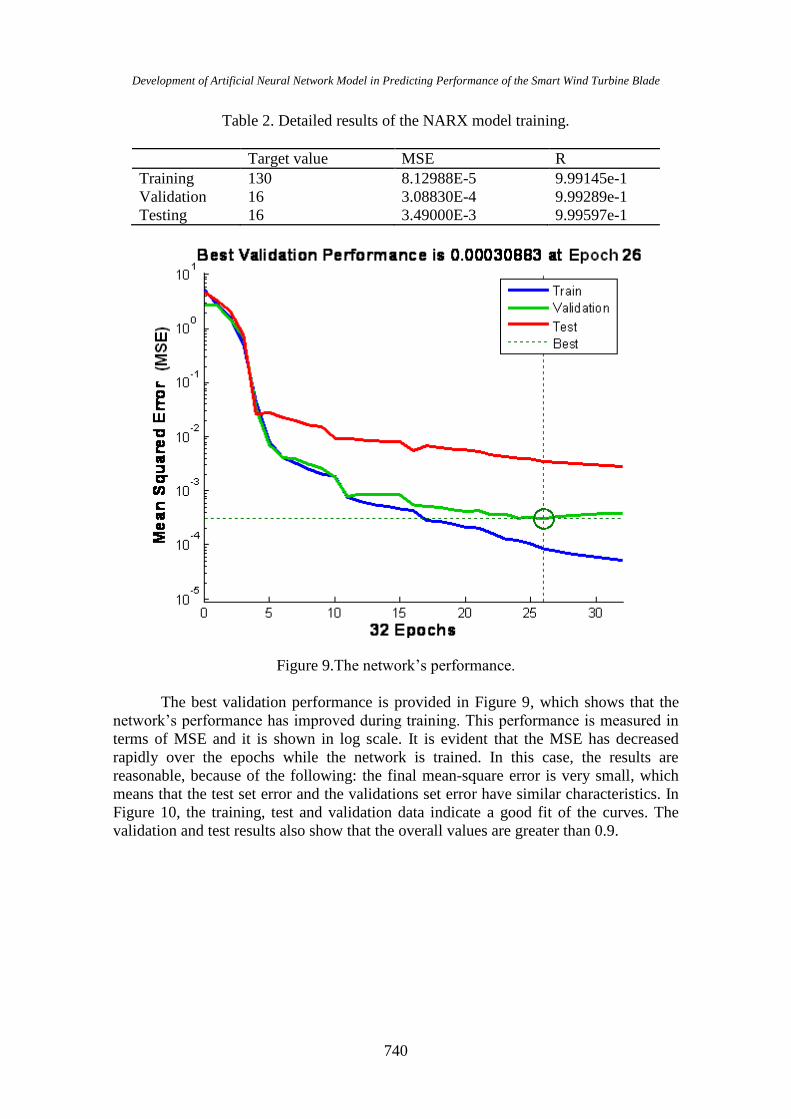
Table 2. Detailed results of the NARX model training.
Target value MSE R
Training 130 8.12988E-5 9.99145e-1
Validation 16 3.08830E-4 9.99289e-1
Testing 16 3.49000E-3 9.99597e-1
Figure 9.The network’s performance.
The best validation performance is provided in Figure 9, which shows that the
network’s performance has improved during training. This performance is measured in
terms of MSE and it is shown in log scale. It is evident that the MSE has decreased
rapidly over the epochs while the network is trained. In this case, the results are
reasonable, because of the following: the final mean-square error is very small, which
means that the test set error and the validations set error have similar characteristics. In
Figure 10, the training, test and validation data indicate a good fit of the curves. The
validation and test results also show that the overall values are greater than 0.9.
Supeni et al. / Journal of Mechanical Engineering and Sciences 6(2014) 734-745
741
2 4 61
2
3
4
5
6
Target
Ou
tpu
t ~=
1*T
arg
et
+ 0
.005
4 Training: R=0.99999
Data
Fit
Y = T
2 4 61
2
3
4
5
6
Target
Ou
tpu
t ~=
1*T
arg
et
+ 0
.003
4 Validation: R=0.99994
Data
Fit
Y = T
2 4 61
2
3
4
5
6
Target
Ou
tpu
t ~=
1*T
arg
et
+ 0
.027 Test: R=0.99914
Data
Fit
Y = T
2 4 61
2
3
4
5
6
Target
Ou
tpu
t ~=
1*T
arg
et
+ 0
.007 All: R=0.99992
Data
Fit
Y = T
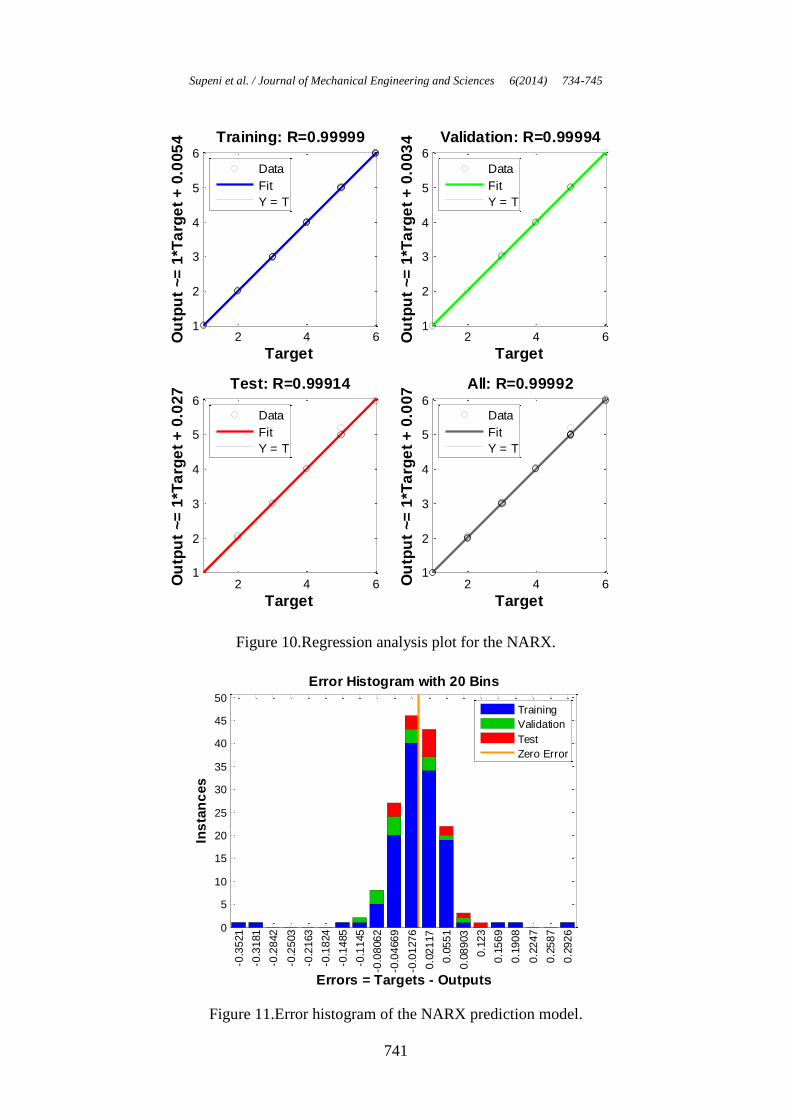
Figure 10.Regression analysis plot for the NARX.
0
5
10
15
20
25
30
35
40
45
50
Error Histogram with 20 Bins
Ins
tan
ces
Errors = Targets - Outputs
-0.3
521
-0.3
181
-0.2
842
-0.2
503
-0.2
163
-0.1
824
-0.1
485
-0.1
145
-0.0
806
2
-0.0
466
9
-0.0
127
6
0.0
21
17
0.0
55
1
0.0
89
03
0.1
23
0.1
56
9
0.1
90
8
0.2
24
7
0.2
58
7
0.2
92
6
Training
Validation
Test
Zero Error
Figure 11.Error histogram of the NARX prediction model.
Development of Artificial Neural Network Model in Predicting Performance of the Smart Wind Turbine Blade
742
Figure 11 shows how the error sizes are reasonably well distributed. Typically,
when most errors are near zero, this indicates a better trained model. In this case
however, it is confirmed that the network also has errors near zero. The correlation
between input and error is provided in Figure 12. This figure illustrates how the errors
are correlated with the input sequence. In a perfect prediction model, all the correlations
should be zero. In this case, all of the correlations are within the confidence bounds
around zero.
-20 -15 -10 -5 0 5 10 15 20
-1
0
1
2
3
4
x 10-3 Autocorrelation of Error 1
Co
rrela
tio
n
Lag
Correlations
Zero Correlation
Confidence Limit
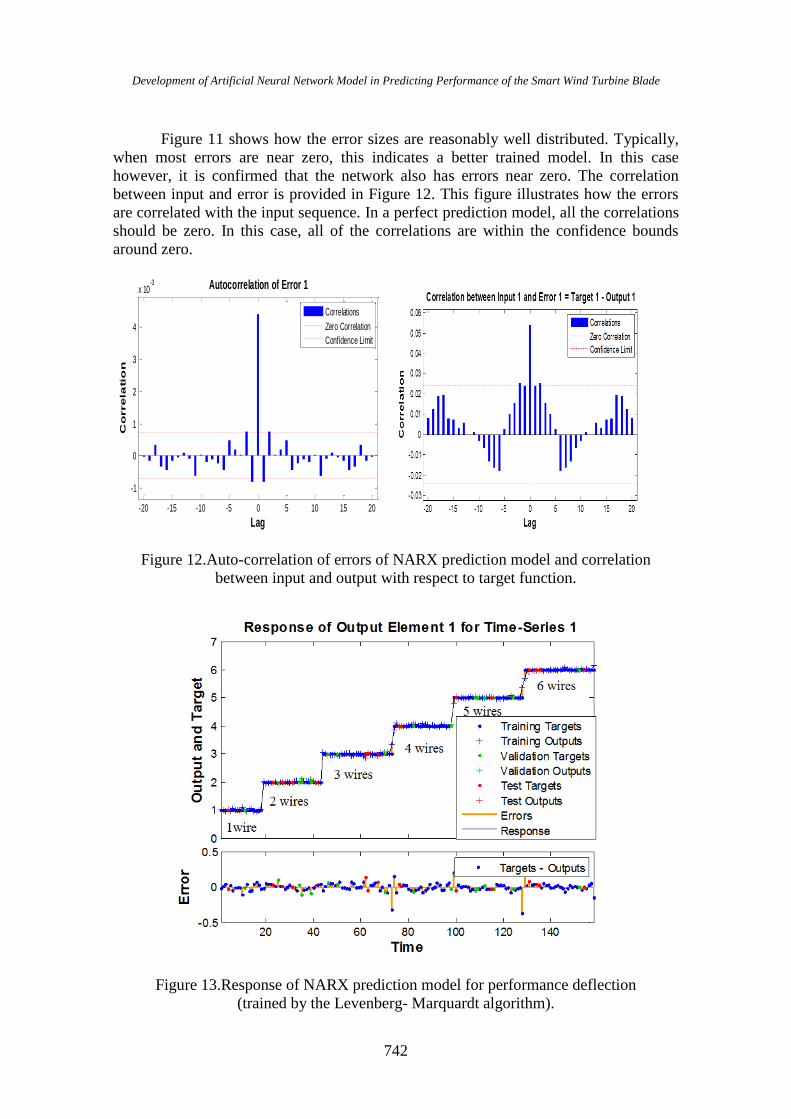
Figure 12.Auto-correlation of errors of NARX prediction model and correlation
between input and output with respect to target function.
Figure 13.Response of NARX prediction model for performance deflection
(trained by the Levenberg- Marquardt algorithm).
Supeni et al. / Journal of Mechanical Engineering and Sciences 6(2014) 734-745
743
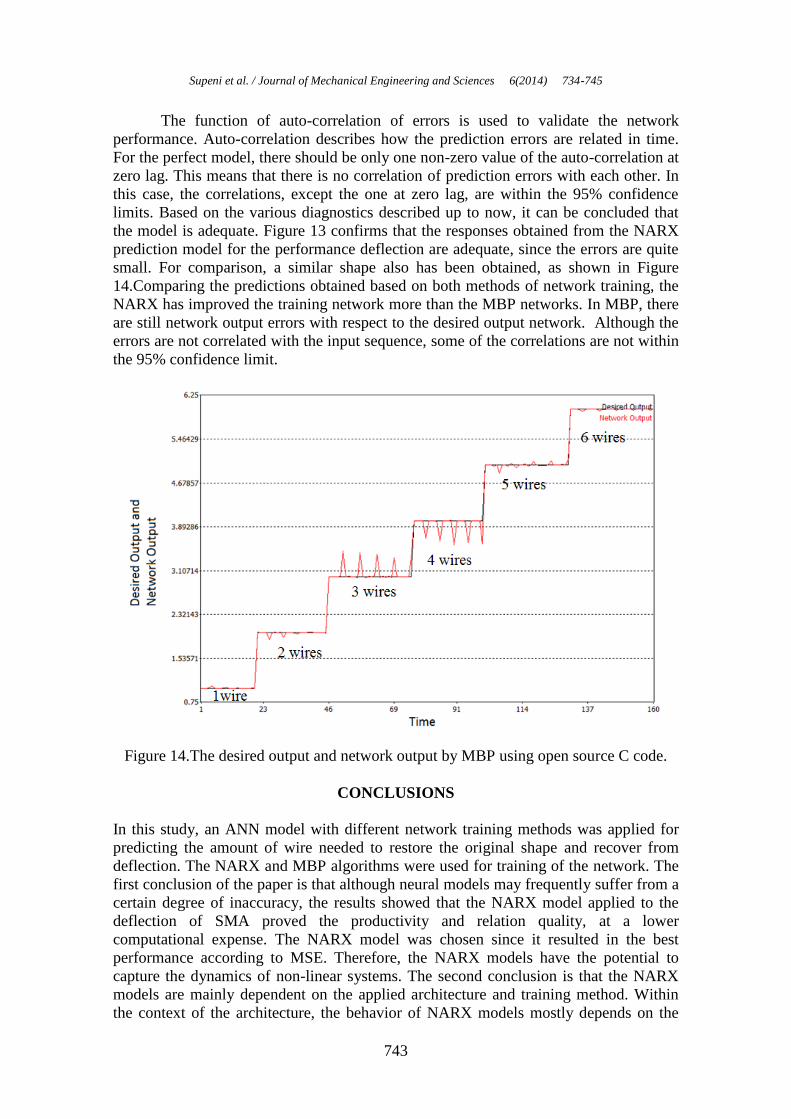
The function of auto-correlation of errors is used to validate the network
performance. Auto-correlation describes how the prediction errors are related in time.
For the perfect model, there should be only one non-zero value of the auto-correlation at
zero lag. This means that there is no correlation of prediction errors with each other. In
this case, the correlations, except the one at zero lag, are within the 95% confidence
limits. Based on the various diagnostics described up to now, it can be concluded that
the model is adequate. Figure 13 confirms that the responses obtained from the NARX
prediction model for the performance deflection are adequate, since the errors are quite
small. For comparison, a similar shape also has been obtained, as shown in Figure
14.Comparing the predictions obtained based on both methods of network training, the
NARX has improved the training network more than the MBP networks. In MBP, there
are still network output errors with respect to the desired output network. Although the
errors are not correlated with the input sequence, some of the correlations are not within
the 95% confidence limit.
Figure 14.The desired output and network output by MBP using open source C code.
CONCLUSIONS
In this study, an ANN model with different network training methods was applied for
predicting the amount of wire needed to restore the original shape and recover from
deflection. The NARX and MBP algorithms were used for training of the network. The
first conclusion of the paper is that although neural models may frequently suffer from a
certain degree of inaccuracy, the results showed that the NARX model applied to the
deflection of SMA proved the productivity and relation quality, at a lower
computational expense. The NARX model was chosen since it resulted in the best
performance according to MSE. Therefore, the NARX models have the potential to
capture the dynamics of non-linear systems. The second conclusion is that the NARX
models are mainly dependent on the applied architecture and training method. Within
the context of the architecture, the behavior of NARX models mostly depends on the

Development of Artificial Neural Network Model in Predicting Performance of the Smart Wind Turbine Blade
744
numbers of neurons in the hidden layers. Too many hidden neurons in the network
cause over-fitting that, in turn, leads to poor predictions. Future modeling of the NARX
is as follows: to model ANN 2 and ANN 3 which use deflection and applied current as
the output vectors respectively.
ACKNOWLEDGEMENT
The authors would like to thank the UPM and MOHE of Malaysia for providing the
research facilities and support in CEEFC of University of Southern Queensland,
Australia.
REFERENCES
Abaqus. (2012). Abaqus/cae release note 6.12.
Aeyzarq Muhammad Hadzreel, M. R., & Siti Rabiatull Aisha, I. (2013). Effect of
reinforcement alignment on the properties of polymer matrix composite. Journal
of Mechanical Engineering and Sciences, 4, 548-554.
Gayan, C. K., Jayantha, A. E., Hao, W., & Lau, K. T. (2013). Prediction of obsolete fbg
sensor using ann for efficient and robust operation of shm systems. Key
Engineering Materials, 558, 546-553.
Howard, D., & Mark, B. (2000). Neural network toolbox for computation, visualization
and programming-user's guide The MathWorks, I. (Ed.) pp. 323.
Khan, M. A. R., Rahman, M. M., Kadirgama, K., & Bakar, R. A. (2012). Artificial
neural network model for material removal rate of ti-15-3 in electrical discharge
machining. Energy Education Science and Technology Part A: Energy Science
and Research, 29(2), 1025-1038.
Khan, M. A. R., Rahman, M. M., Kadirgama, K., Maleque, M. A., & Bakar, R. A.
(2011). Artificial intelligence model to predict surface roughness of ti-15-3 alloy
in edm process. World Academy of Science, Engineering and Technology, 74,
198-202.
M. Khairul Zaimy, A. G., Zafiah, A., Rus, M., Ab Latif, N., & Nurulsaidatulsyida, S.
(2013). Mechanical and thermal properties of waste bio-polymer compound by
hot compression molding technique. Journal of Mechanical Engineering and
Sciences, 5, 582-591.
Noel, L., & Bernardete, R. (2001). Hybrid learning multi neural architecture. IEEE
International Joint Conference on Neural Networks, 4, 2788-2793.
Noel, L., & Bernardete, R. (2003). An efficient gradient-based learning algorithm
applied to neural networks with selective actuation neurons. Neural Parallel and
Scientific Computations, 11, 253-272.
Nolet, S. C. (2011). Composite wind blade engineering and manufacturing. Indepedent
activities period mini-course. from http://web.mit.edu/windenergy/windweek/
Presentations/Nolet_Blades.pdf.
Peter, J. S., & Richard, J. C. (2012). Wind turbine blade design: Review. Energies, 5,
3425-3449
Rahman, M. M., Mohyaldeen, H. M., Noor, M. M., Kadirgama, K., & Bakar, R. A.
(2011). Linear static response of suspension arm based on artificial neural
network technique Advanced Materials Research, 213, 419-426.
Sapuan, S. M., & Iqbal, M. M. (2010). Composite materials technology : Neural
network applications: CRC Press Taylor and Francis Group.

Supeni et al. / Journal of Mechanical Engineering and Sciences 6(2014) 734-745
745
Sorensen, B. F., Jørgensen, E., Christian, P. D., & Jensen, F. M. (2004). Improved
design of large wind turbine blade of fibre composites based onstudies of scale
effects (phase 1) Risø-R-1390 (En) Denmark.
Srihari, P. V., Govindarajulu, K., & Ramachandra, K. (2010). A method to improve
reliability of gearbox fault detection with artificial neural networks.
International Journal of Automotive and Mechanical Engineering, 2, 221-230.
Supeni, E. E., Epaarachchi, J. A., Islam, M. M., & Lau, K. T. (2012a). Design and
analysis of a smart composite beam for small wind turbine blade construction.
Paper presented at the The Southern Region Engineering Conference (SREC)
USQ, Toowoomba, Australia.
Supeni, E. E., Epaarachchi, J. A., Islam, M. M., & Lau, K. T. (2012b). Development of
smart wind turbine blades. Paper presented at the The 8th Asian-Australasian
Conference on Composite Materials (AACM-8), (KLCC),Kuala Lumpur,
Malaysia.
Related Documents