Sensors 2006, 6, 578-592 sensors ISSN 1424-8220 © 2006 by MDPI http://www.mdpi.org/sensors Full Research Paper Development of an In-Fiber Nanocavity Towards Detection of Volatile Organic Gases Cesar Elosua, Ignacio R. Matias*, Candido Bariain and Francisco J. Arregui Departamento de Ingeniería Eléctrica y Electrónica, Universidad Pública de Navarra, Campus de Arrosadia s/n, 31006 Pamplona, Spain E-mails: [email protected], [email protected], [email protected], [email protected] * Authors to whom correspondence should be addressed; e-mail: [email protected]; Phone: +34 948169288, Fax.: +34 948169720 Received: 29 March 2006 / Accepted: 14 June 2006 / Published: 16 June 2006 Abstract: A fiber optic sensor for Volatile Organic Compounds (VOCs) detection has been developed and characterized for some organic gasses. The sensor is based on a novel vapochromic material, which is able to change its optical properties in presence of organic vapors in a reversely way. A nano Fabry Perot is constructed onto a cleaved ended optical fiber pigtail by Electrostatic Self Assembly method (ESA), doping this structure with the vapochromic material. Employing a reflection scheme, a change in the intensity modulated reflected signal at 850 nm have been registered. The response of the sensor has been evaluated for five different VOCs, and a deeper study has been made for vapors of three different alcohols. Keywords: Fiber optic sensor, Volatile Organic Compound, Vapochromic complex, Electrostatic Self Assembly method, nanocavity 1. Introduction It is well known that organic volatile compounds detection is an important aim in sensor technology. There are many and assorted fields where these kind of sensors are demanded, just to mention a few, environmental applications [1], electronic noses [2, 3], chemical industry [4] or non invasive food analysis [5]. For the development of these applications, electronic sensors have been mostly used. Most of these sensors are based on the VOC absorption of a polymer [6], which depends

Welcome message from author
This document is posted to help you gain knowledge. Please leave a comment to let me know what you think about it! Share it to your friends and learn new things together.
Transcript
Sensors 2006, 6, 578-592
sensorsISSN 1424-8220© 2006 by MDPI
http://www.mdpi.org/sensorsFull Research Paper
Development of an In-Fiber Nanocavity Towards Detection ofVolatile Organic Gases
Cesar Elosua, Ignacio R. Matias*, Candido Bariain and Francisco J. Arregui
Departamento de Ingeniería Eléctrica y Electrónica, Universidad Pública de Navarra, Campus deArrosadia s/n, 31006 Pamplona, Spain
E-mails: [email protected], [email protected], [email protected], [email protected]
* Authors to whom correspondence should be addressed; e-mail: [email protected]; Phone: +34948169288, Fax.: +34 948169720
Received: 29 March 2006 / Accepted: 14 June 2006 / Published: 16 June 2006
Abstract: A fiber optic sensor for Volatile Organic Compounds (VOCs) detection has beendeveloped and characterized for some organic gasses. The sensor is based on a novelvapochromic material, which is able to change its optical properties in presence of organicvapors in a reversely way. A nano Fabry Perot is constructed onto a cleaved ended opticalfiber pigtail by Electrostatic Self Assembly method (ESA), doping this structure with thevapochromic material. Employing a reflection scheme, a change in the intensity modulatedreflected signal at 850 nm have been registered. The response of the sensor has beenevaluated for five different VOCs, and a deeper study has been made for vapors of threedifferent alcohols.
Keywords: Fiber optic sensor, Volatile Organic Compound, Vapochromic complex,Electrostatic Self Assembly method, nanocavity
1. Introduction
It is well known that organic volatile compounds detection is an important aim in sensortechnology. There are many and assorted fields where these kind of sensors are demanded, just tomention a few, environmental applications [1], electronic noses [2, 3], chemical industry [4] or noninvasive food analysis [5]. For the development of these applications, electronic sensors have beenmostly used. Most of these sensors are based on the VOC absorption of a polymer [6], which depends
Sensors 2006, 6 579
on some factors, such as the organic vapor concentration, the chemical properties of polymer and itsreactivity with the solvent among others. Some examples of these devices are Surfaces Acoustic Wave(SAW) [7] or capacitive sensors [8], just to mention a couple.
Fiber optic sensors came on this scene just fifteen years ago [9], offering some importantadvantages versus electronic ones that have motivated their investigation and development. Theirelectromagnetic immunity is one of the most important, because they can be used in high noisyambient where the electronic ones have serious operating problems. Besides, they are passive devices,so no electric power is need in the sensing zone, which is very important in atmospheres with a highinflammable complex concentration. Other interesting properties are their small size and light weight,remote operation or capability of multiplexing [10].
Taking advantage of great potential that fiber optic sensors offer, a novel vapochromic material,whose optical properties change reversely in presence of organic vapors, has been employed todevelop an optical fiber volatile organic compounds sensor. A nanocavity doped with this material isdeposited following the ESA protocol [11], which can be implemented in an automated way, offering agreat reproducibility. Furthermore, this process has been made chemically compatible with thevapochromic material, so it keeps its original optical characteristics during and after the depositionprocess.
2. Experimental Set-up
A multimode optical fiber with core and cladding diameters of 62.5 and 125 µm respectively waschosen to fabricate the sensor. A pigtail of this fiber is cut at one end with a Siemens S46999-M9-A8precision fiber cleaver. A nanocavity doped with the vapochromic material is deposited onto thiscleaved end; in other studies, this small size has shown very important advantages [12].
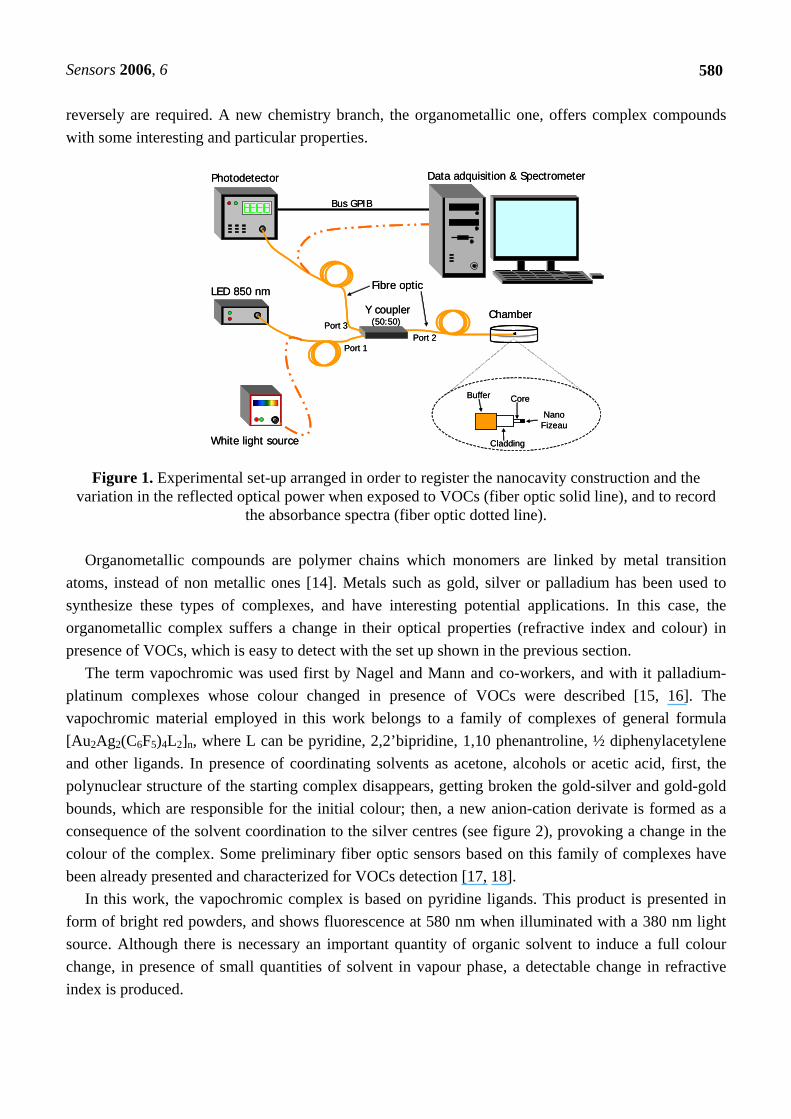
The same reflection experimental set up, which is shown in figure 1, has been used for both sensorconstruction and response analysis. The sensor head is connected to the port 2 of a directional Y 50:50coupler, while a light source is connected to port 1and a photodetector is connected to port 3. So, theoptical power from the source goes through port 1 and reaches the sensor head; the reflected opticalpower gets the coupler back reaching the detector. Just to reduce insertion loss, all optical devices havea 62.5 µm core diameter.
During the nanocavity construction process, the fiber end is stayed on air. When studying theresponse of the sensor in presence of different VOCs, the sensor head is introduced into a chamberclosed hermetically, which dimensions are 9 cm of diameter, 2 cm high, and a volume of 275 cm3,inside where the organic solvents are injected in liquid phase.
3. Nanosensor construction
3.1. Vapochromic material
The working principle of most chemical fiber optic sensors is based on the modulation of the fiberguided light intensity produced by a change in the optical properties of a sensing substance [13].Because of that, for the preparation of detectors of VOCs, complexes able to achieve such changes
Sensors 2006, 6 580
reversely are required. A new chemistry branch, the organometallic one, offers complex compoundswith some interesting and particular properties.
Chamber
Photodetector
White light source
Bus GPIB
Y coupler(50:50)
LED 850 nm
Data adquisition & Spectrometer
NanoFizeau
Buffer Core
Cladding
Fibre optic
Port 1
Port 3Port 2
Chamber
Photodetector
White light source
Bus GPIB
Y coupler(50:50)
LED 850 nm
Data adquisition & Spectrometer
NanoFizeau
Buffer Core
Cladding
Fibre optic
Port 1
Port 3Port 2
Figure 1. Experimental set-up arranged in order to register the nanocavity construction and thevariation in the reflected optical power when exposed to VOCs (fiber optic solid line), and to record
the absorbance spectra (fiber optic dotted line).
Organometallic compounds are polymer chains which monomers are linked by metal transitionatoms, instead of non metallic ones [14]. Metals such as gold, silver or palladium has been used tosynthesize these types of complexes, and have interesting potential applications. In this case, theorganometallic complex suffers a change in their optical properties (refractive index and colour) inpresence of VOCs, which is easy to detect with the set up shown in the previous section.
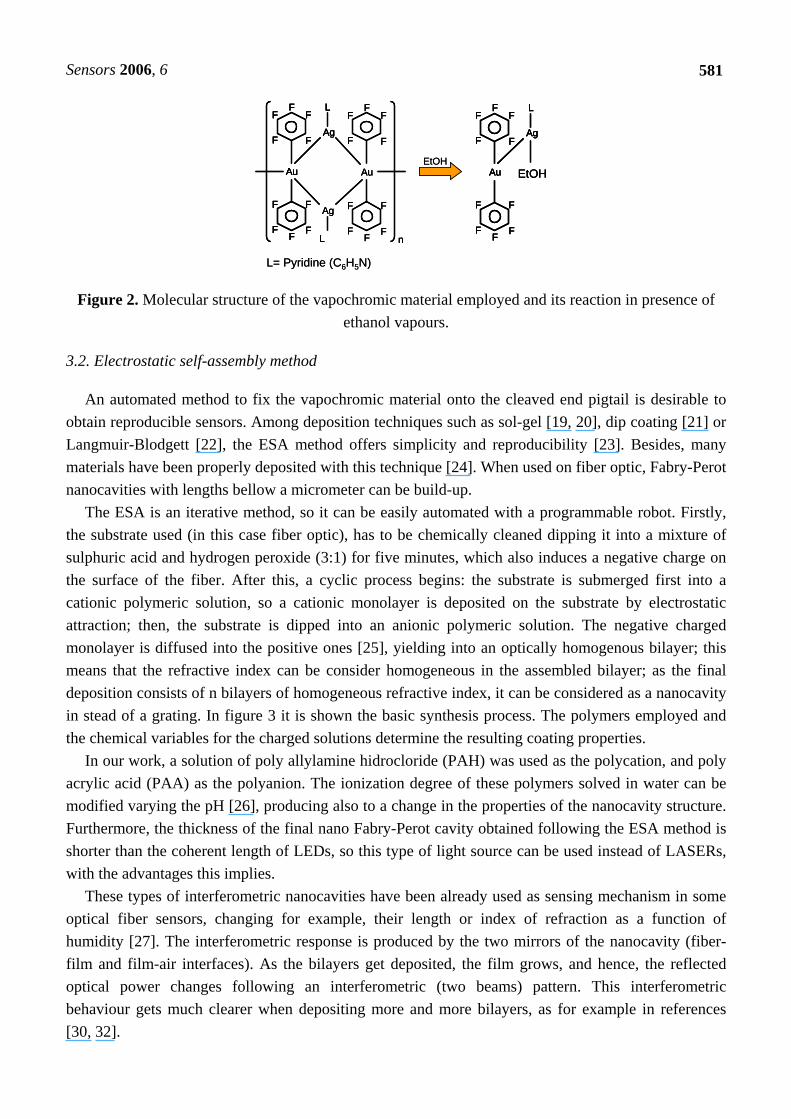
The term vapochromic was used first by Nagel and Mann and co-workers, and with it palladium-platinum complexes whose colour changed in presence of VOCs were described [15, 16]. Thevapochromic material employed in this work belongs to a family of complexes of general formula[Au2Ag2(C6F5)4L2]n, where L can be pyridine, 2,2’bipridine, 1,10 phenantroline, ½ diphenylacetyleneand other ligands. In presence of coordinating solvents as acetone, alcohols or acetic acid, first, thepolynuclear structure of the starting complex disappears, getting broken the gold-silver and gold-goldbounds, which are responsible for the initial colour; then, a new anion-cation derivate is formed as aconsequence of the solvent coordination to the silver centres (see figure 2), provoking a change in thecolour of the complex. Some preliminary fiber optic sensors based on this family of complexes havebeen already presented and characterized for VOCs detection [17, 18].
In this work, the vapochromic complex is based on pyridine ligands. This product is presented inform of bright red powders, and shows fluorescence at 580 nm when illuminated with a 380 nm lightsource. Although there is necessary an important quantity of organic solvent to induce a full colourchange, in presence of small quantities of solvent in vapour phase, a detectable change in refractiveindex is produced.
Sensors 2006, 6 581
EtOH
n
Au
Ag
L
FFF
F FAg
L
Au
FFF
F F
FF
FF F
FF
FF F
L= Pyridine (C6H5N)
Ag
L
Au
FFF
F F
FF
FF F
EtOHEtOH
n
Au
Ag
L
FFF
F FAg
L
Au
FFF
F F
FF
FF F
FF
FF F
n
Au
Ag
L
FFF
F FAg
L
Au
FFF
F F
FF
FF F
Ag
L
Au
FFF
F F
FF
FF F
FF
FF F
L= Pyridine (C6H5N)
Ag
L
Au
FFF
F F
FF
FF F
EtOH
Ag
L
Au
FFF
F F
FF
FF F
Ag
L
Au
FFF
F F
FF
FF F
EtOH
Figure 2. Molecular structure of the vapochromic material employed and its reaction in presence ofethanol vapours.
3.2. Electrostatic self-assembly method
An automated method to fix the vapochromic material onto the cleaved end pigtail is desirable toobtain reproducible sensors. Among deposition techniques such as sol-gel [19, 20], dip coating [21] orLangmuir-Blodgett [22], the ESA method offers simplicity and reproducibility [23]. Besides, manymaterials have been properly deposited with this technique [24]. When used on fiber optic, Fabry-Perotnanocavities with lengths bellow a micrometer can be build-up.
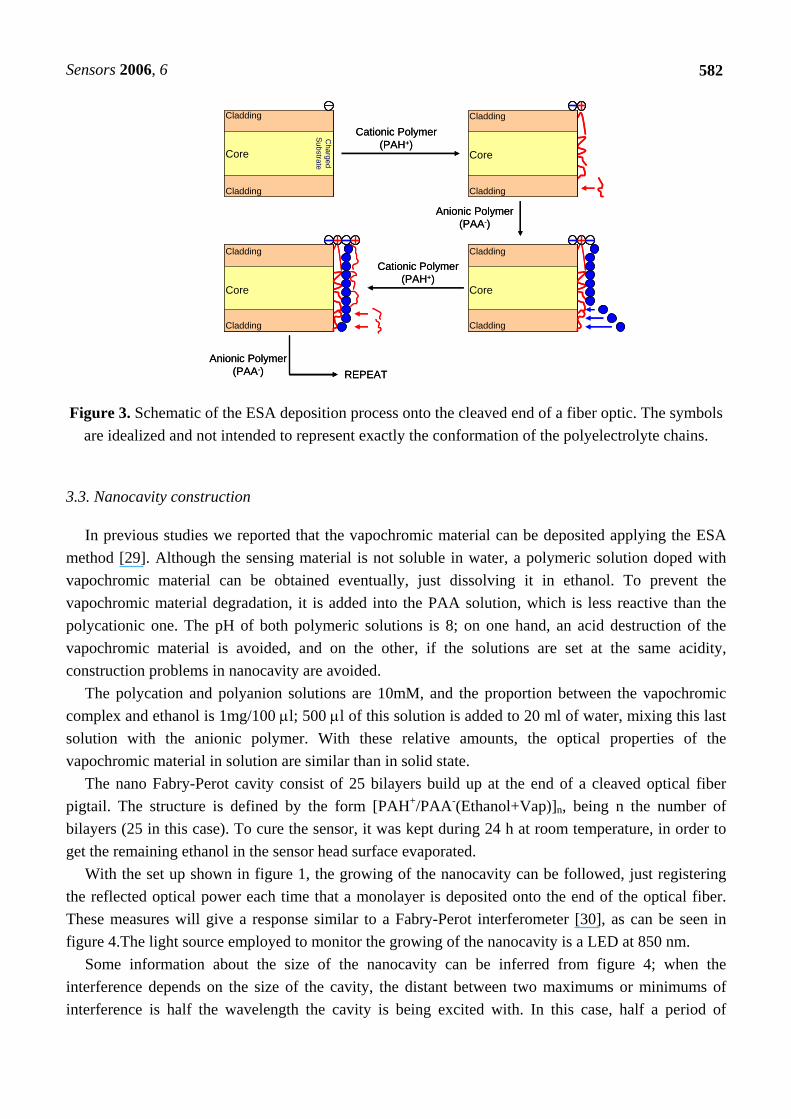
The ESA is an iterative method, so it can be easily automated with a programmable robot. Firstly,the substrate used (in this case fiber optic), has to be chemically cleaned dipping it into a mixture ofsulphuric acid and hydrogen peroxide (3:1) for five minutes, which also induces a negative charge onthe surface of the fiber. After this, a cyclic process begins: the substrate is submerged first into acationic polymeric solution, so a cationic monolayer is deposited on the substrate by electrostaticattraction; then, the substrate is dipped into an anionic polymeric solution. The negative chargedmonolayer is diffused into the positive ones [25], yielding into an optically homogenous bilayer; thismeans that the refractive index can be consider homogeneous in the assembled bilayer; as the finaldeposition consists of n bilayers of homogeneous refractive index, it can be considered as a nanocavityin stead of a grating. In figure 3 it is shown the basic synthesis process. The polymers employed andthe chemical variables for the charged solutions determine the resulting coating properties.
In our work, a solution of poly allylamine hidrocloride (PAH) was used as the polycation, and polyacrylic acid (PAA) as the polyanion. The ionization degree of these polymers solved in water can bemodified varying the pH [26], producing also to a change in the properties of the nanocavity structure.Furthermore, the thickness of the final nano Fabry-Perot cavity obtained following the ESA method isshorter than the coherent length of LEDs, so this type of light source can be used instead of LASERs,with the advantages this implies.
These types of interferometric nanocavities have been already used as sensing mechanism in someoptical fiber sensors, changing for example, their length or index of refraction as a function ofhumidity [27]. The interferometric response is produced by the two mirrors of the nanocavity (fiber-film and film-air interfaces). As the bilayers get deposited, the film grows, and hence, the reflectedoptical power changes following an interferometric (two beams) pattern. This interferometricbehaviour gets much clearer when depositing more and more bilayers, as for example in references[30, 32].
Sensors 2006, 6 582
Core
Cladding
Cladding
Core
Cladding
Cladding
Core
Cladding
Cladding
Core
Cladding
Cladding
Charged
Substrate
Cationic Polymer(PAH+)
Cationic Polymer(PAH+)
Anionic Polymer(PAA-)
REPEATAnionic Polymer
(PAA-)
Core
Cladding
Cladding
Core
Cladding
Cladding
Core
Cladding
Cladding
Core
Cladding
Cladding
Charged
Substrate
Cationic Polymer(PAH+)
Cationic Polymer(PAH+)
Anionic Polymer(PAA-)
REPEATAnionic Polymer
(PAA-)
Figure 3. Schematic of the ESA deposition process onto the cleaved end of a fiber optic. The symbolsare idealized and not intended to represent exactly the conformation of the polyelectrolyte chains.
3.3. Nanocavity construction
In previous studies we reported that the vapochromic material can be deposited applying the ESAmethod [29]. Although the sensing material is not soluble in water, a polymeric solution doped withvapochromic material can be obtained eventually, just dissolving it in ethanol. To prevent thevapochromic material degradation, it is added into the PAA solution, which is less reactive than thepolycationic one. The pH of both polymeric solutions is 8; on one hand, an acid destruction of thevapochromic material is avoided, and on the other, if the solutions are set at the same acidity,construction problems in nanocavity are avoided.
The polycation and polyanion solutions are 10mM, and the proportion between the vapochromiccomplex and ethanol is 1mg/100 µl; 500 µl of this solution is added to 20 ml of water, mixing this lastsolution with the anionic polymer. With these relative amounts, the optical properties of thevapochromic material in solution are similar than in solid state.
The nano Fabry-Perot cavity consist of 25 bilayers build up at the end of a cleaved optical fiberpigtail. The structure is defined by the form [PAH+/PAA-(Ethanol+Vap)]n, being n the number ofbilayers (25 in this case). To cure the sensor, it was kept during 24 h at room temperature, in order toget the remaining ethanol in the sensor head surface evaporated.
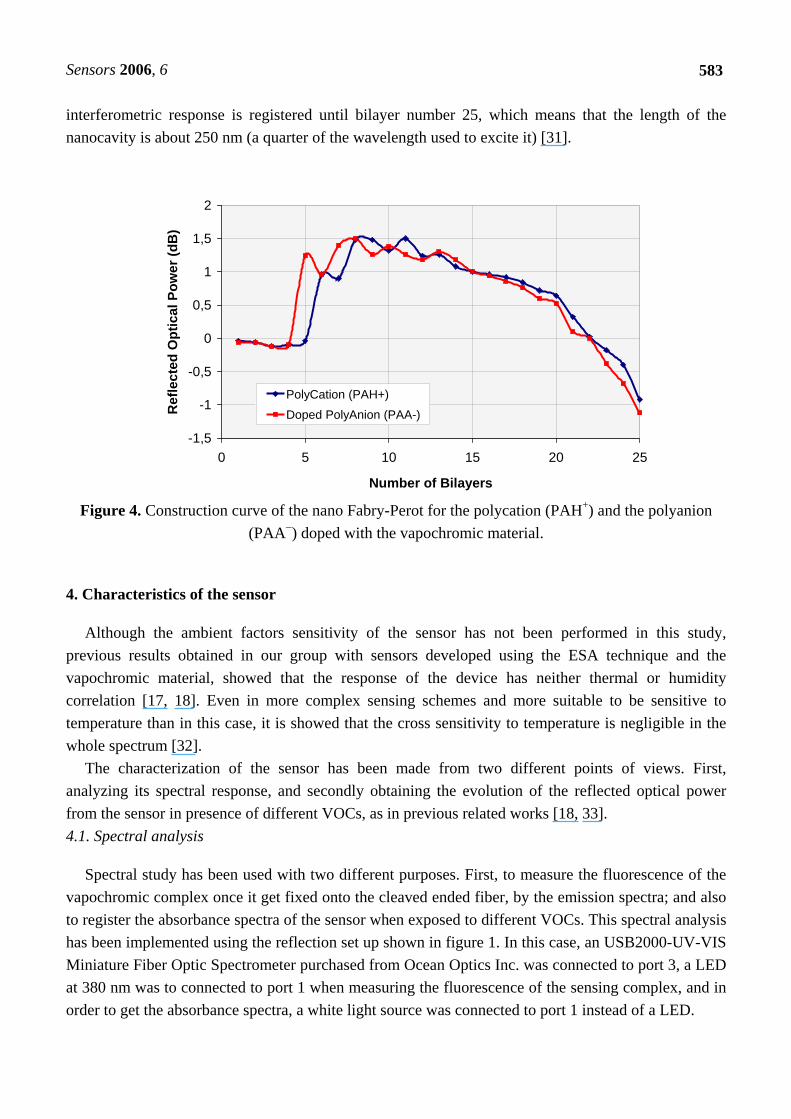
With the set up shown in figure 1, the growing of the nanocavity can be followed, just registeringthe reflected optical power each time that a monolayer is deposited onto the end of the optical fiber.These measures will give a response similar to a Fabry-Perot interferometer [30], as can be seen infigure 4.The light source employed to monitor the growing of the nanocavity is a LED at 850 nm.
Some information about the size of the nanocavity can be inferred from figure 4; when theinterference depends on the size of the cavity, the distant between two maximums or minimums ofinterference is half the wavelength the cavity is being excited with. In this case, half a period of
Sensors 2006, 6 583
interferometric response is registered until bilayer number 25, which means that the length of thenanocavity is about 250 nm (a quarter of the wavelength used to excite it) [31].
-1,5
-1
-0,5
0
0,5
1
1,5
2
0 5 10 15 20 25
Number of Bilayers
Ref
lect
ed O
ptic
al P
ower
(dB
)
PolyCation (PAH+)Doped PolyAnion (PAA-)
Figure 4. Construction curve of the nano Fabry-Perot for the polycation (PAH+) and the polyanion(PAA−) doped with the vapochromic material.
4. Characteristics of the sensor
Although the ambient factors sensitivity of the sensor has not been performed in this study,previous results obtained in our group with sensors developed using the ESA technique and thevapochromic material, showed that the response of the device has neither thermal or humiditycorrelation [17, 18]. Even in more complex sensing schemes and more suitable to be sensitive totemperature than in this case, it is showed that the cross sensitivity to temperature is negligible in thewhole spectrum [32].
The characterization of the sensor has been made from two different points of views. First,analyzing its spectral response, and secondly obtaining the evolution of the reflected optical powerfrom the sensor in presence of different VOCs, as in previous related works [18, 33].4.1. Spectral analysis
Spectral study has been used with two different purposes. First, to measure the fluorescence of thevapochromic complex once it get fixed onto the cleaved ended fiber, by the emission spectra; and alsoto register the absorbance spectra of the sensor when exposed to different VOCs. This spectral analysishas been implemented using the reflection set up shown in figure 1. In this case, an USB2000-UV-VISMiniature Fiber Optic Spectrometer purchased from Ocean Optics Inc. was connected to port 3, a LEDat 380 nm was to connected to port 1 when measuring the fluorescence of the sensing complex, and inorder to get the absorbance spectra, a white light source was connected to port 1 instead of a LED.
Sensors 2006, 6 584
A. Vapochromic complex fluorescence
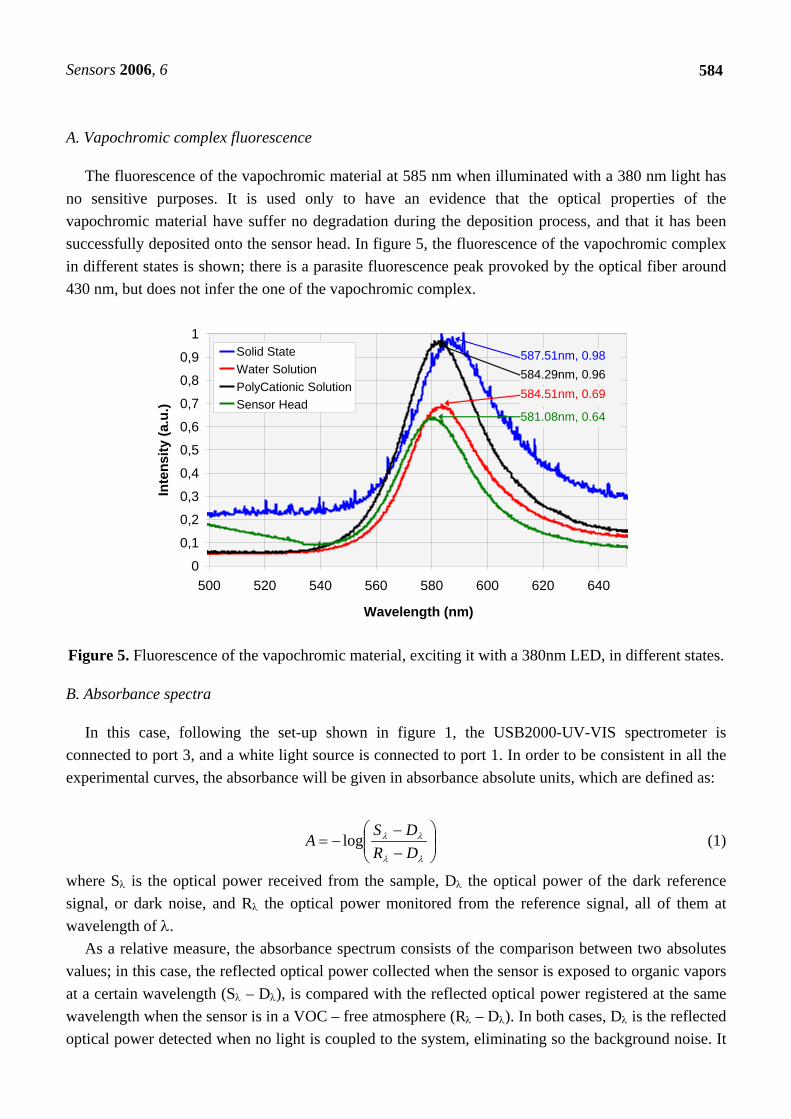
The fluorescence of the vapochromic material at 585 nm when illuminated with a 380 nm light hasno sensitive purposes. It is used only to have an evidence that the optical properties of thevapochromic material have suffer no degradation during the deposition process, and that it has beensuccessfully deposited onto the sensor head. In figure 5, the fluorescence of the vapochromic complexin different states is shown; there is a parasite fluorescence peak provoked by the optical fiber around430 nm, but does not infer the one of the vapochromic complex.
0
0,1
0,2
0,3
0,4
0,5
0,6
0,7
0,8
0,9
1
500 520 540 560 580 600 620 640
Wavelength (nm)
Inte
nsity
(a.u
.)
Solid StateWater SolutionPolyCationic SolutionSensor Head
587.51nm, 0.98
584.51nm, 0.69584.29nm, 0.96
581.08nm, 0.64
Figure 5. Fluorescence of the vapochromic material, exciting it with a 380nm LED, in different states.
B. Absorbance spectra
In this case, following the set-up shown in figure 1, the USB2000-UV-VIS spectrometer isconnected to port 3, and a white light source is connected to port 1. In order to be consistent in all theexperimental curves, the absorbance will be given in absorbance absolute units, which are defined as:
⎟⎟⎠
⎞⎜⎜⎝
⎛−−
−=λλ
λλ
DRDS
A log (1)
where Sλ is the optical power received from the sample, Dλ the optical power of the dark referencesignal, or dark noise, and Rλ the optical power monitored from the reference signal, all of them atwavelength of λ.
As a relative measure, the absorbance spectrum consists of the comparison between two absolutesvalues; in this case, the reflected optical power collected when the sensor is exposed to organic vaporsat a certain wavelength (Sλ – Dλ), is compared with the reflected optical power registered at the samewavelength when the sensor is in a VOC – free atmosphere (Rλ – Dλ). In both cases, Dλ is the reflectedoptical power detected when no light is coupled to the system, eliminating so the background noise. It
Sensors 2006, 6 585
is remarkable that the absorbance spectra obtained gives no information about the spectral response ofthe device, only about the change that the VOCs provoke on it.
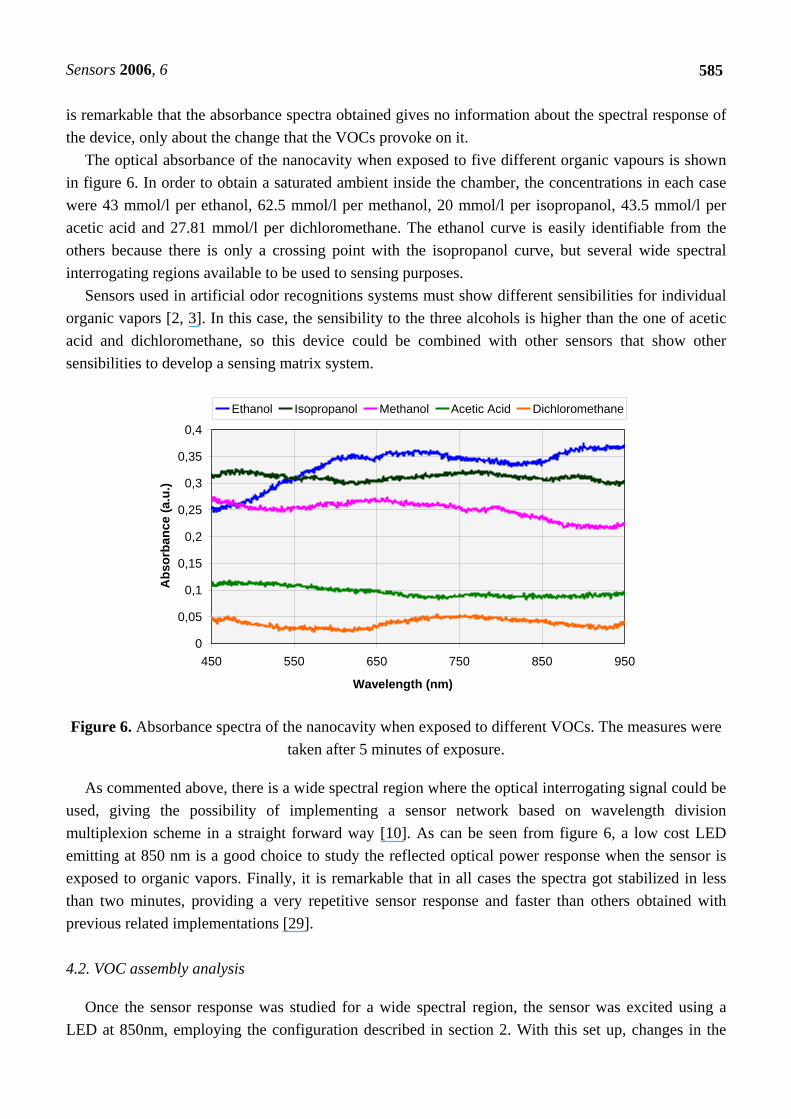
The optical absorbance of the nanocavity when exposed to five different organic vapours is shownin figure 6. In order to obtain a saturated ambient inside the chamber, the concentrations in each casewere 43 mmol/l per ethanol, 62.5 mmol/l per methanol, 20 mmol/l per isopropanol, 43.5 mmol/l peracetic acid and 27.81 mmol/l per dichloromethane. The ethanol curve is easily identifiable from theothers because there is only a crossing point with the isopropanol curve, but several wide spectralinterrogating regions available to be used to sensing purposes.
Sensors used in artificial odor recognitions systems must show different sensibilities for individualorganic vapors [2, 3]. In this case, the sensibility to the three alcohols is higher than the one of aceticacid and dichloromethane, so this device could be combined with other sensors that show othersensibilities to develop a sensing matrix system.
0
0,05
0,1
0,15
0,2
0,25
0,3
0,35
0,4
450 550 650 750 850 950
Wavelength (nm)
Abs
orba
nce
(a.u
.)
Ethanol Isopropanol Methanol Acetic Acid Dichloromethane
Figure 6. Absorbance spectra of the nanocavity when exposed to different VOCs. The measures weretaken after 5 minutes of exposure.
As commented above, there is a wide spectral region where the optical interrogating signal could beused, giving the possibility of implementing a sensor network based on wavelength divisionmultiplexion scheme in a straight forward way [10]. As can be seen from figure 6, a low cost LEDemitting at 850 nm is a good choice to study the reflected optical power response when the sensor isexposed to organic vapors. Finally, it is remarkable that in all cases the spectra got stabilized in lessthan two minutes, providing a very repetitive sensor response and faster than others obtained withprevious related implementations [29].
4.2. VOC assembly analysis
Once the sensor response was studied for a wide spectral region, the sensor was excited using aLED at 850nm, employing the configuration described in section 2. With this set up, changes in the
Sensors 2006, 6 586
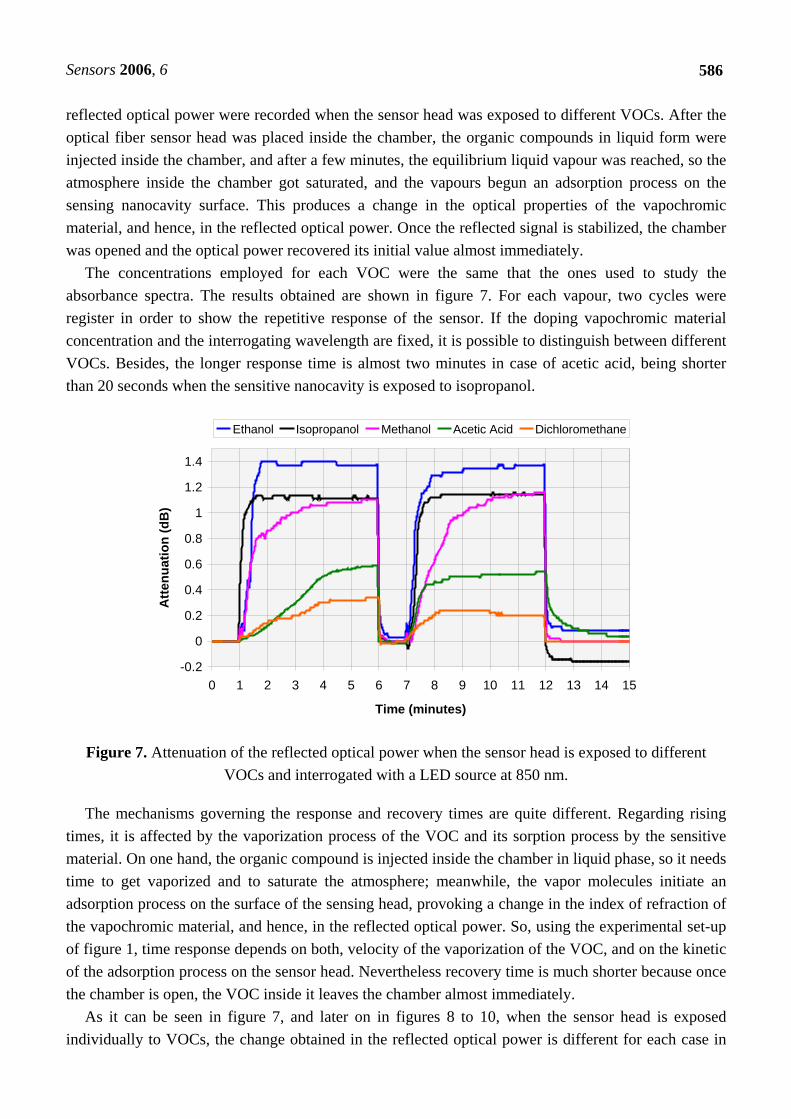
reflected optical power were recorded when the sensor head was exposed to different VOCs. After theoptical fiber sensor head was placed inside the chamber, the organic compounds in liquid form wereinjected inside the chamber, and after a few minutes, the equilibrium liquid vapour was reached, so theatmosphere inside the chamber got saturated, and the vapours begun an adsorption process on thesensing nanocavity surface. This produces a change in the optical properties of the vapochromicmaterial, and hence, in the reflected optical power. Once the reflected signal is stabilized, the chamberwas opened and the optical power recovered its initial value almost immediately.
The concentrations employed for each VOC were the same that the ones used to study theabsorbance spectra. The results obtained are shown in figure 7. For each vapour, two cycles wereregister in order to show the repetitive response of the sensor. If the doping vapochromic materialconcentration and the interrogating wavelength are fixed, it is possible to distinguish between differentVOCs. Besides, the longer response time is almost two minutes in case of acetic acid, being shorterthan 20 seconds when the sensitive nanocavity is exposed to isopropanol.
-0.2
0
0.2
0.4
0.6
0.8
1
1.2
1.4
0 1 2 3 4 5 6 7 8 9 10 11 12 13 14 15
Time (minutes)
Atte
nuat
ion
(dB
)
Ethanol Isopropanol Methanol Acetic Acid Dichloromethane
Figure 7. Attenuation of the reflected optical power when the sensor head is exposed to differentVOCs and interrogated with a LED source at 850 nm.
The mechanisms governing the response and recovery times are quite different. Regarding risingtimes, it is affected by the vaporization process of the VOC and its sorption process by the sensitivematerial. On one hand, the organic compound is injected inside the chamber in liquid phase, so it needstime to get vaporized and to saturate the atmosphere; meanwhile, the vapor molecules initiate anadsorption process on the surface of the sensing head, provoking a change in the index of refraction ofthe vapochromic material, and hence, in the reflected optical power. So, using the experimental set-upof figure 1, time response depends on both, velocity of the vaporization of the VOC, and on the kineticof the adsorption process on the sensor head. Nevertheless recovery time is much shorter because oncethe chamber is open, the VOC inside it leaves the chamber almost immediately.
As it can be seen in figure 7, and later on in figures 8 to 10, when the sensor head is exposedindividually to VOCs, the change obtained in the reflected optical power is different for each case in
Sensors 2006, 6 587
terms of attenuation (which depends on the changes in the refractive index provoked by each VOC)and time response (governed by both the vaporization process and the VOC diffusion kinetic onto thesensor head). So, chemical properties of the VOC determine the response for each organic vaporanalyzed, and hence, an individual VOC may be estimated by measuring attenuation and timeresponse, but never in case of gas mixtures.
From the experimental results presented in figure 7, it is possible to infer that the sensor developedis sensitive to at least 5 different VOCs, so the sensor head itself can not be used to handle organicvapor mixtures; but this low selectivity is desirable to perform an artificial odor recognition system, ashas been already demonstrated in several electronic noses.
The sensitive material employed in this work belongs to a family of vapochromic complexes(whose members only differs on chemical ligands) that have been probed to have sensing propertiessimilar to the one shown here (fast response to different VOCs and low selectivity). So although it cannot be used to handle VOCs mixtures, it may be used to perform a sensor array system. Data treatmentsuch neural networks or PCA algorithms for systems based in sensors arrays are well know and havebeen used successfully to identify different gas mixtures (odors) from different nature. In this field, thesensor developed offers a great potential use.
4.3 VOC individual analyse
Finally, the sensor response was studied for different concentrations of ethanol, methanol andisopropanol vapours in order to complete its characterization. To achieve this, the same processpresented previously was used, but using three different concentrations for each organic solvent.
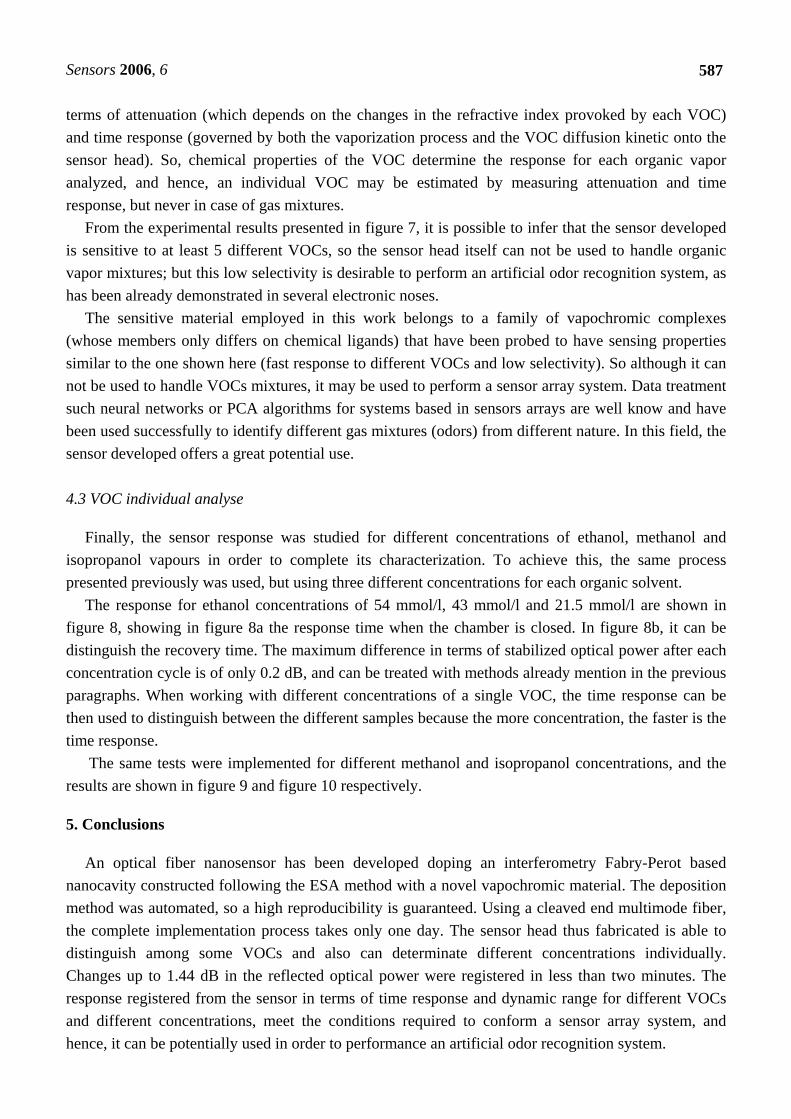
The response for ethanol concentrations of 54 mmol/l, 43 mmol/l and 21.5 mmol/l are shown infigure 8, showing in figure 8a the response time when the chamber is closed. In figure 8b, it can bedistinguish the recovery time. The maximum difference in terms of stabilized optical power after eachconcentration cycle is of only 0.2 dB, and can be treated with methods already mention in the previousparagraphs. When working with different concentrations of a single VOC, the time response can bethen used to distinguish between the different samples because the more concentration, the faster is thetime response.
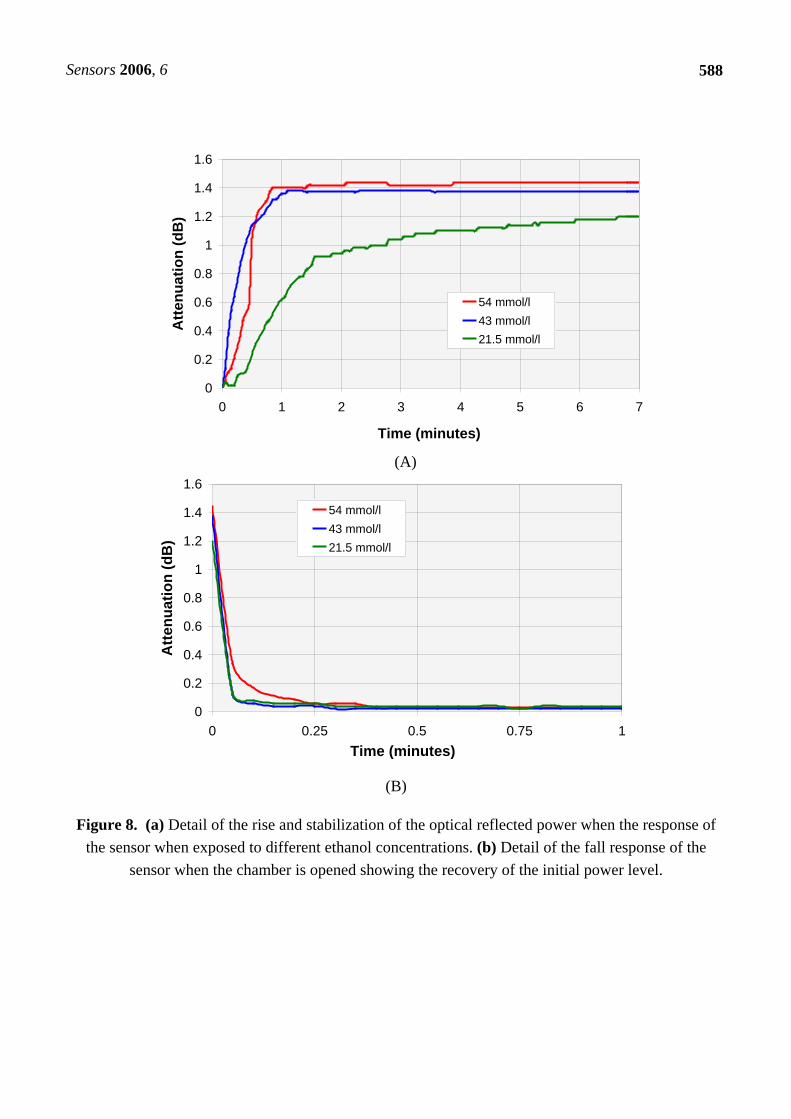
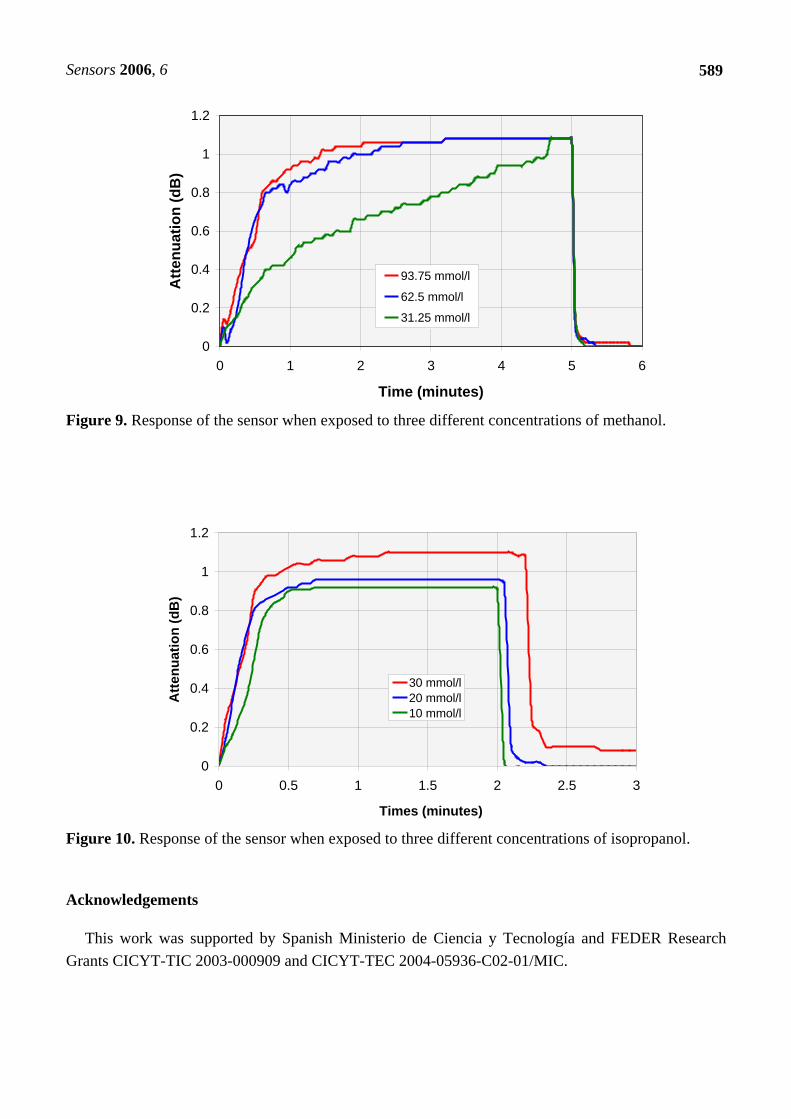
The same tests were implemented for different methanol and isopropanol concentrations, and theresults are shown in figure 9 and figure 10 respectively.
5. Conclusions
An optical fiber nanosensor has been developed doping an interferometry Fabry-Perot basednanocavity constructed following the ESA method with a novel vapochromic material. The depositionmethod was automated, so a high reproducibility is guaranteed. Using a cleaved end multimode fiber,the complete implementation process takes only one day. The sensor head thus fabricated is able todistinguish among some VOCs and also can determinate different concentrations individually.Changes up to 1.44 dB in the reflected optical power were registered in less than two minutes. Theresponse registered from the sensor in terms of time response and dynamic range for different VOCsand different concentrations, meet the conditions required to conform a sensor array system, andhence, it can be potentially used in order to performance an artificial odor recognition system.
Sensors 2006, 6 588
0
0.2
0.4
0.6
0.8
1
1.2
1.4
1.6
0 1 2 3 4 5 6 7
Time (minutes)
Atte
nuat
ion
(dB
)
54 mmol/l43 mmol/l21.5 mmol/l
(A)
0
0.2
0.4
0.6
0.8
1
1.2
1.4
1.6
0 0.25 0.5 0.75 1Time (minutes)
Atte
nuat
ion
(dB
)
54 mmol/l43 mmol/l21.5 mmol/l
(B)
Figure 8. (a) Detail of the rise and stabilization of the optical reflected power when the response ofthe sensor when exposed to different ethanol concentrations. (b) Detail of the fall response of the
sensor when the chamber is opened showing the recovery of the initial power level.
Sensors 2006, 6 589
0
0.2
0.4
0.6
0.8
1
1.2
0 1 2 3 4 5 6
Time (minutes)
Atte
nuat
ion
(dB
)
93.75 mmol/l
62.5 mmol/l
31.25 mmol/l
Figure 9. Response of the sensor when exposed to three different concentrations of methanol.
0
0.2
0.4
0.6
0.8
1
1.2
0 0.5 1 1.5 2 2.5 3
Times (minutes)
Atte
nuat
ion
(dB
)
30 mmol/l20 mmol/l10 mmol/l
Figure 10. Response of the sensor when exposed to three different concentrations of isopropanol.
Acknowledgements
This work was supported by Spanish Ministerio de Ciencia y Tecnología and FEDER ResearchGrants CICYT-TIC 2003-000909 and CICYT-TEC 2004-05936-C02-01/MIC.
Sensors 2006, 6 590
References and Notes
1. Delpha, C.; Lumbreras, M.; Siadat, M. Discrimination and identification of a refrigerant gas in ahumidity controlled atmosphere containing or not carbon dioxide: application to the electronicnose. Sensors and Actuators B 2004, 98, 46–53.
2. D’Amico, A.; Di Natale, C.; Macagnano, A.; Davide, F.; Mantini, A.; Tarizzo, E.; Paolesse, R.;Boschi, T. Technologies and tools for mimicking olfaction: status of the Rome “Tor Vergata”electronic nose. Biosensors & Bioelectronics 1998, 13, 711–721.
3. S. Ampuero, J.O. Bosset, The electronic nose applied to dairy products: a review. Sensors andActuators B 2003, 94, 1–12.
4. Gouws, G.J.; Gouws, D.J. Analyte identification using concentration modulation and waveletanalysis of QCM sensors. Sensors and Actuators B 2003, 91, 326–332.
5. Brezmes, J.; Llobet, E.; Vilanova, X; Saiz, G.; Correig, X. Fruit ripeness monitoring using anElectronic Nose. Sensors and Actuators B 2000, 69, 223–229.
6. Lonergan, M.C.; Severin, E.J.; Doleman, B.J.; Beaber, S.A.; Grubbs, R.H.; Lewis, N.S. Array-based vapor sensing using chemically sensitive carbon black-polymer resistors. ChemicalMaterials 1996, 8, 2298–2312.
7. Yang, Y.; Yang, P.; Wang, X. Electronic nose based on SAWS array and its odor identificationcapability. Sensors and Actuators B 2000, 66, 167–170.
8. Delapierre, G.; Grange, H.; Chambaz, B.; Destannes, L. Polymer-based capacitive humiditysensor: characteristics and experimental results. Sensors and Actuators B 1983, 4, 97–104.
9. El-Sherif, M. A. On-Fiber sensor and modulator. IEEE Transactions on Instrumentation andMeasurement 1989, 38, 595–598.
10. Achaerandio, E.; Jarabe, S.; Abad, S.; Lopez-Amo, M. New WDM Amplified Network for OpticalSensor Multiplexing. IEEE Photonics Technology Letters 1999, 11, 1644-1946.
11. Decher, G. Fuzzy Nano Assemblies: toward layered polymeric multicomposites. Science 1997,277, 1232-1237.
12. Kolle, C.; Gruber, W.; Trettnak, W.; Biebernik, K.; Dolezal, C.; Reininger, F. Fast optochemicalsensor for continuous monitoring of oxygen in breath–gas analysis. Sensors and Actuators B 1997,38, 141–149.
13. Grattan, K.T.V.; Sun, T. Fibre optic sensor technology: an overview. Sensors and Actuators A2000, 82, 40–61.
14. Usón, R.; Laguna, A.; Laguna, M.; Manzano, B. R. Syntesis and Reactivity of BimetallicPolyfluorophenyl Complexes; Crystal and Molecular Structures of [{AuAg(C6F5)2(SC4H8)}n]and [{AuAg(C5F5)2(C6H6)}n]. Chemical Society Dalton Trans 1984, 285-292
15. (a) Nagel, C.C. U.S. Patent 4,826,774; (b) Nagel, C.C. U.S. Patent 48,349,093.16. Buss, C.E.; Anderson, C.E.; Pomije, M.K.; Luzt, C.M.; Britton, D.; Mann, K.R. Structural
investigations of vapochromic behaviour – X-ray single-crystal and powder diffraction studies of[Pt(CN-iso-C3H7)4][M(CN)4] for M= Pt or Pd. Journal of the American Chemical Society 1998,120, 7783-7790.
Sensors 2006, 6 591
17. Bariain, C.; Matias, I. R.; Fernandez-Valdivielso, C.; Elosua, C.; Luquin, A.; Garrido, J.; LagunaM. Optical fibre sensors based on vapochromic gold complexes for environmental applications.Sensors and Actuators B 2005, 108, 535-54.
18. Luquin, A.; Bariain, C.; Vergara, E.; Cerrada, E.; Garrido, J.; Matias I. R.; Laguna, M. Newpreparation of gold–silver complexes and optical fibre environmental sensors based onvapochromic[Au2Ag2(C6F5)4(phen)2]n. Applied Organometallic Chemistry 2005, 19, 1232–1238.
19. Grant, S. A.; Satcher J. H. Jr.; Bettencourt, K. Development of sol–gel-based fiber optic nitrogendioxide gas sensors. Sensors and Actuators B 2000, 69, 132–137.
20. Lobnik, A.; Majcen, N.; Niederreiter, K.; Uray, G. Optical pH sensor based on the absorption ofantenna generated europium luminescence by bromothymolblue in a sol - gel membrane. Sensorsand Actuators B 2001, 74, 200-206.
21. Arregui, F.J.; Otano, M.; Fernández-Valdivielso, C.; Matias, I.R. An experimental study about theutilization of Liquicoat® solutions for the fabrication of pH optical fibre sensors, Sensors andActuators B 2002, 87 (2), 291-297.
22. Bariain, C.; Matias, I.R.; Fernandez-Valdivielso, C.; Arregui, F.J.; Rodriguez-Mendez, M.L.; deSaja, J.A. Optical fiber sensor based on lutetium bisphthalocyanine for the detection of gasesusing standard telecommunication wavelengths, Sensors and Actuators B 2003, 93, 153–158.
23. Arregui, F.J.; Latasa, I.; Matias, I.R.; Claus, R.O. An optical fiber pH sensor based on theelectrostatic self-assembly method, Proceedings of the Second IEEE Sensors Conference 2003.
24. Lenahan, K.M.; Wang, Y.-X.; Liu, Y.; Claus, R.O.; Heflin, J.R.; Marciu, D.; Figura, C. Novelpolymer dyes for nonlinear optical applications using ionic self assembled monolayer technology,Advanced Materials 1998, 853–855.
25. Zhanga, J.; Sengera, B.; Vautiera, D.; Picarta, C.; Schaafc, P.; Voegela, J.C.; Lavallea, P. Naturalpolyelectrolyte films based on layer-by layer deposition of collagen and hyaluronic acid.Biomaterials 2005, 26, 3353–3361.
26. Choi, J.; Rubner, M.F. Influence of the degree of ionization on weak polyelectrolyte multilayerassembly, Macromolecules 2005, 38, 124–166.
27. Arregui F. J.; Cooper K. L.; Liu Y. J. Optical fiber humidity sensor with a fast response time usingthe ionic self-assembly method, IEICE Transactions on electronics, 2000, E83C (3), 360-365.
28. Arregui, F. J.; Matías, I. R.; Claus, R. O. Optical fiber gas sensors based on hydrophobic aluminathin films formed by the Electrostatic Self-Assembly Monolayer process, IEEE Sensors Journal,2003, 3, 56-61.
29. Elosua, C.; Bariain, C.; Matias, I. R.; Arregui, F. J.; Luquin, A.; Laguna, M. Volatile alcoholiccompunds fibre optic nano sensor, Sensors and Actuators B 2005, 115, 444-449.
30. Yoshino, T.; Kurosawa, K.; Itoh, K.; Ose, T. Fiber-Optic Fabry-Perot Interferometer and ItsSensor Applications, IEEE Journal of quantum electronics 1982, 18 (10), 1624-1633.
31. Arregui, F. J.; Matias, I. R.; Liu, Y.; Lenahan, K. M.; Claus, R. O.; Optical fiber nanometer-scaleFabry–Perot interferometer formed by the ionic self-assembly monolayer process, Optics Letters,1999, 24 (9), 596-598.

Sensors 2006, 6 592
32. Arregui, F. J.; Richard, O. C.; Cooper, K. L.; Fernández-Valdivielso, C.; Matias I. R. Optical FiberGas Sensor Based on Self-Assembled Microgratings. IEEE Journal of Lightwave Technology,2001, 19, 1932-1937.
33. Casado, S.; Elosúa, C.; Bariain, C.; Segura, A.; Matias, I.R.; Fernandez, A.; Luquin, A.; Garrido,J.; Laguna, M. A volatile-organic-compound optic-fibre sensor using a gold-silver vapochromiccomplex, Optical Engineering 2006, 45 (4), 044401.
© 2006 by MDPI (http://www.mdpi.net). Reproduction is permitted for noncommercial purposes.
Related Documents