Sains Malaysiana 48(5)(2019): 1011–1018 http://dx.doi.org/10.17576/jsm-2019-4805-09 Development of an HPLC Method for Formic Acid Analysis through Peak Exclusion Approach (Pembangunan Kaedah HPLC bagi Analisis Asid Formik melalui Pendekatan Pengecualian Puncak) DANIYAL HASAN, IRAM MAHMOOD*, ISHFAQ AHMAD, FARAH AZIZ & ISHAQ AHMAD ABSTRACT High Performance Liquid Chromatography (HPLC) is a chemical analysis technique that gives both the quantitative and qualitative analysis of liquid samples. A certain set of parameters, called HPLC method, are defined for analysis of every discrete mixture. Often literature is not available or specifically reported expensive HPLC apparatus is not available for every set of mixtures. Present study concentrated on analysis of formic acid from a mixture of methanol, formaldehyde and water. Formic acid is a basic carboxylic acid that has growing industrial and commercial uses, especially as a refrigerant. A C-18 column was utilized for the analysis by optimizing the parameters like dimensions of the stationary column, nature of mobile phase, flow rate of mobile phase and wavelength of the ultraviolet detector. Comprehendible and reproducible results for the analysis of formic acid were obtained on 25 cm long C-18 stationary column, by tuning the combined effect of water as mobile phase at a flow rate of 1 mL/min and by excluding the unnecessary peaks at 250 nm wavelength of ultraviolet detector, called peak exclusion approach. The calibration curve was found to be linear over the range of 1.25 % v/v formic acid solution in methanol up to 100 % pure formic acid. Limit of detection (LOD) and limit of quantitation (LOQ) were found to be 2.25 % and 6.83 %, respectively. Keywords: C-18 columns; calibration; flow rate; formic acid; peak exclusion ABSTRAK Kromatografi Cecair Prestasi Tinggi (HPLC) adalah teknik analisis kimia yang memberikan analisis kuantitatif dan kualitatif bagi sampel cecair. Satu set parameter yang dipanggil kaedah HPLC ditakrifkan untuk analisis setiap campuran diskret. Selalunya, kajian kepustakawan tidak diperoleh atau dilaporkan secara khusus untuk setiap set campuran kerana radas HPLC yang mahal. Kajian terkini tertumpu kepada analisis asid formik daripada campuran metanol, formaldehid dan air. Asid formik adalah asid karboksilik asas yang digunakan secara meluas di dalam industri dan komersial, khususnya sebagai bahan penyejuk. Kolum C-18 telah digunakan untuk analisis dengan mengoptimumkan parameter seperti dimensi kolum pegun, jenis fasa mudah alih, kadar aliran fasa mudah alih dan panjang gelombang pengesan ultraungu. Keputusan yang boleh difahami dan boleh ulang untuk analisis asid formik telah diperoleh pada 25 cm panjang kolum pegun C-18, oleh penalaan kesan gabungan air sebagai fasa bergerak pada kadar aliran 1 mL/min dan tidak termasuk puncak tak perlu pada 250 nm panjang gelombang pengesan ultraungu, dikenali sebagai pendekatan pengecualian puncak. Lengkung tentukuran didapati linear ke atas julat larutan asid formik 1.25 % v/v dalam metanol sehingga 100 % asid formik tulen. Had pengesanan (LOD) dan had pengiraaan (LOQ) masing-masing ialah 2.25% dan 6.83%. Kata kunci: Asid formik; kadar aliran; kolum C-18; penentukuran; pengecualian puncak INTRODUCTION High Performance Liquid Chromatography (HPLC), is also referred as High-Pressure Liquid Chromatography for the high working pressure. It is an analytical technique, in which the constituents of an otherwise inseparable chemical mixture are analyzed both qualitatively and quantitatively (Hostettmann et al. 1998). Constituents are carried by a mobile carrier phase or solvent on a stationary column. Depending on the nature of the column packing and the mobile phase, the constituents have different affinities towards the material of the column and under high pressure; the constituent molecules are forced through a packed column that separate the mixture on the basis of size and the nature. Based on the difference in affinity of each species within the stationary column, they are retained on the column for different times and each species elute one by one, the one having highest affinity elutes last (McMurry 2011). The detector attached to the HPLC unit generates ultraviolet rays of particularly specified wavelength and the eluting sample is subjected to these ultraviolet rays. Molecules of the eluting species get excited by absorbing the energy of the ultraviolet rays, during the process of de-excitation energy is released which is being recorded by the detector (Taylor 2015). A signal proportional to

Welcome message from author
This document is posted to help you gain knowledge. Please leave a comment to let me know what you think about it! Share it to your friends and learn new things together.
Transcript

Sains Malaysiana 48(5)(2019): 1011–1018 http://dx.doi.org/10.17576/jsm-2019-4805-09
Development of an HPLC Method for Formic Acid Analysis through Peak Exclusion Approach
(Pembangunan Kaedah HPLC bagi Analisis Asid Formik melalui Pendekatan Pengecualian Puncak)
DANIYAL HASAN, IRAM MAHMOOD*, ISHFAQ AHMAD, FARAH AZIZ & ISHAQ AHMAD
ABSTRACT
High Performance Liquid Chromatography (HPLC) is a chemical analysis technique that gives both the quantitative and qualitative analysis of liquid samples. A certain set of parameters, called HPLC method, are defined for analysis of every discrete mixture. Often literature is not available or specifically reported expensive HPLC apparatus is not available for every set of mixtures. Present study concentrated on analysis of formic acid from a mixture of methanol, formaldehyde and water. Formic acid is a basic carboxylic acid that has growing industrial and commercial uses, especially as a refrigerant. A C-18 column was utilized for the analysis by optimizing the parameters like dimensions of the stationary column, nature of mobile phase, flow rate of mobile phase and wavelength of the ultraviolet detector. Comprehendible and reproducible results for the analysis of formic acid were obtained on 25 cm long C-18 stationary column, by tuning the combined effect of water as mobile phase at a flow rate of 1 mL/min and by excluding the unnecessary peaks at 250 nm wavelength of ultraviolet detector, called peak exclusion approach. The calibration curve was found to be linear over the range of 1.25 % v/v formic acid solution in methanol up to 100 % pure formic acid. Limit of detection (LOD) and limit of quantitation (LOQ) were found to be 2.25 % and 6.83 %, respectively.
Keywords: C-18 columns; calibration; flow rate; formic acid; peak exclusion
ABSTRAK
Kromatografi Cecair Prestasi Tinggi (HPLC) adalah teknik analisis kimia yang memberikan analisis kuantitatif dan kualitatif bagi sampel cecair. Satu set parameter yang dipanggil kaedah HPLC ditakrifkan untuk analisis setiap campuran diskret. Selalunya, kajian kepustakawan tidak diperoleh atau dilaporkan secara khusus untuk setiap set campuran kerana radas HPLC yang mahal. Kajian terkini tertumpu kepada analisis asid formik daripada campuran metanol, formaldehid dan air. Asid formik adalah asid karboksilik asas yang digunakan secara meluas di dalam industri dan komersial, khususnya sebagai bahan penyejuk. Kolum C-18 telah digunakan untuk analisis dengan mengoptimumkan parameter seperti dimensi kolum pegun, jenis fasa mudah alih, kadar aliran fasa mudah alih dan panjang gelombang pengesan ultraungu. Keputusan yang boleh difahami dan boleh ulang untuk analisis asid formik telah diperoleh pada 25 cm panjang kolum pegun C-18, oleh penalaan kesan gabungan air sebagai fasa bergerak pada kadar aliran 1 mL/min dan tidak termasuk puncak tak perlu pada 250 nm panjang gelombang pengesan ultraungu, dikenali sebagai pendekatan pengecualian puncak. Lengkung tentukuran didapati linear ke atas julat larutan asid formik 1.25 % v/v dalam metanol sehingga 100 % asid formik tulen. Had pengesanan (LOD) dan had pengiraaan (LOQ) masing-masing ialah 2.25% dan 6.83%.
Kata kunci: Asid formik; kadar aliran; kolum C-18; penentukuran; pengecualian puncak
INTRODUCTION
High Performance Liquid Chromatography (HPLC), is also referred as High-Pressure Liquid Chromatography for the high working pressure. It is an analytical technique, in which the constituents of an otherwise inseparable chemical mixture are analyzed both qualitatively and quantitatively (Hostettmann et al. 1998). Constituents are carried by a mobile carrier phase or solvent on a stationary column. Depending on the nature of the column packing and the mobile phase, the constituents have different affinities towards the material of the column and under high pressure; the constituent molecules are forced through a
packed column that separate the mixture on the basis of size and the nature. Based on the difference in affinity of each species within the stationary column, they are retained on the column for different times and each species elute one by one, the one having highest affinity elutes last (McMurry 2011). The detector attached to the HPLC unit generates ultraviolet rays of particularly specified wavelength and the eluting sample is subjected to these ultraviolet rays. Molecules of the eluting species get excited by absorbing the energy of the ultraviolet rays, during the process of de-excitation energy is released which is being recorded by the detector (Taylor 2015). A signal proportional to
1012
the energy change is generated and recorded in the form of a graph called chromatogram. The absorption of the ultraviolet rays depends on the functional group of the eluting species, because every functional group requires a particular amount of energy for its excitation, which is carried by ultraviolet light of a certain wavelength. However, sometimes specifically reported costly apparatus is often not available in the research labs. To achieve the desired analysis on the available set of apparatus, certain parameters need to be tuned, this is called HPLC method development. In this paper, we have demonstrated the impact of each parameter and the required approach to tune it for formic acid analysis. Several methods for the determination of formic acid have been reported (Lee et al. 2013; Mubeen et al. 2011). However, the reported apparatus was not available in the laboratory. The desired separation was achieved on the available C-18 column, which is usually used for the separation of polar organic compounds. Choice of mobile phase and its flow rate were adjusted to achieve the separation. Wavelength of the detector was tuned to identify formic acid. The results were reported to elaborate the importance and effect of each parameter, thereby giving a guideline to achieve any separation on a given set of resources.
MATERIALS AND METHODS
MATERIALS
All the chemicals were of commercial grade and highest purity available including: Formic acid 94 w/w percent (Sigma Aldrich); HPLC grade methanol (Sigma Aldrich); Formaldehyde (Merck); Acetonitrile (Sigma Aldrich); HPLC grade water (Sigma Aldrich). Perkin-Elmer, 200 series, HPLC module coupled with Ultraviolet detector and auto sampler, was used for the analysis. Octadecylsilane (C-18) columns of dimensions (250 mm length × 3 mm ID × 5 mm particle size) and (100 mm length × 3 mm ID × 5 mm particle size) were used.
HPLC ANALYSIS METHOD
To test the required dimensions of the column, formic acid solution (50 % v/v in methanol) was run on C-18 columns of 10 cm and 25 cm length. Formic acid, methanol and formaldehyde were used as solvents using water, methanol and acetonitrile as mobile phase (25 cm C-18 column). Flow rate was used in the range of 0.5 to 1.5 mL/min. Wavelength was varied between the maximum absorption spectrum of methanol (205 nm) and maximum absorption spectrum of formic acid (256 nm). The other parameters were kept constant with water as solvent at a flow rate of 1 mL/min over 25 cm long C-18 column. Samples of formic acid in water, with concentrations varying from 1.25 % to 100 %, were used to obtain a calibration curve.
RESULTS AND DISCUSSION
HPLC COLUMN
An HPLC column provides the necessary structure which has varying affinities for different species and will separate them by holding them for varying retention time (Ettre et al. 1993). The column is selected on the basis of species in the mixture; this choice is made based upon the columns reported in literature for the separation of similar species. Different combinations of columns and mobile phases could be used to achieve the same separation; however the efficiency of separation and resolution of peaks would be different for different peaks. Mubeen et al. (2011) have reported the use of normal phase hyper silica column for the separation of formic acid and imidurea; however, the method was reported to be valid specifically for the mixtures of formic acid and imidurea. For the separation of polar species, reverse phase chromatography is generally preferred where polar species are separated by using a combination of a non-polar column and a polar solvent (McNaught et al. 1997). Reversed phase columns, especially C-18 column, in combination with water as mobile phase have been reported to achieve similar separation (Krummen et al. 2004; Levigne et al. 2002) and C-18 column is reported to have an appropriate retention time at high concentrations of formic acid (Tagami et al. 2008). Available C-18 columns were tested to achieve the separation, which gave the better separation of methanol and formic acid, as C-18 column has a larger structure providing a suitable molecular structure over which the species having close difference of polarity and functional groups could be separated.
LENGTH OF COLUMN
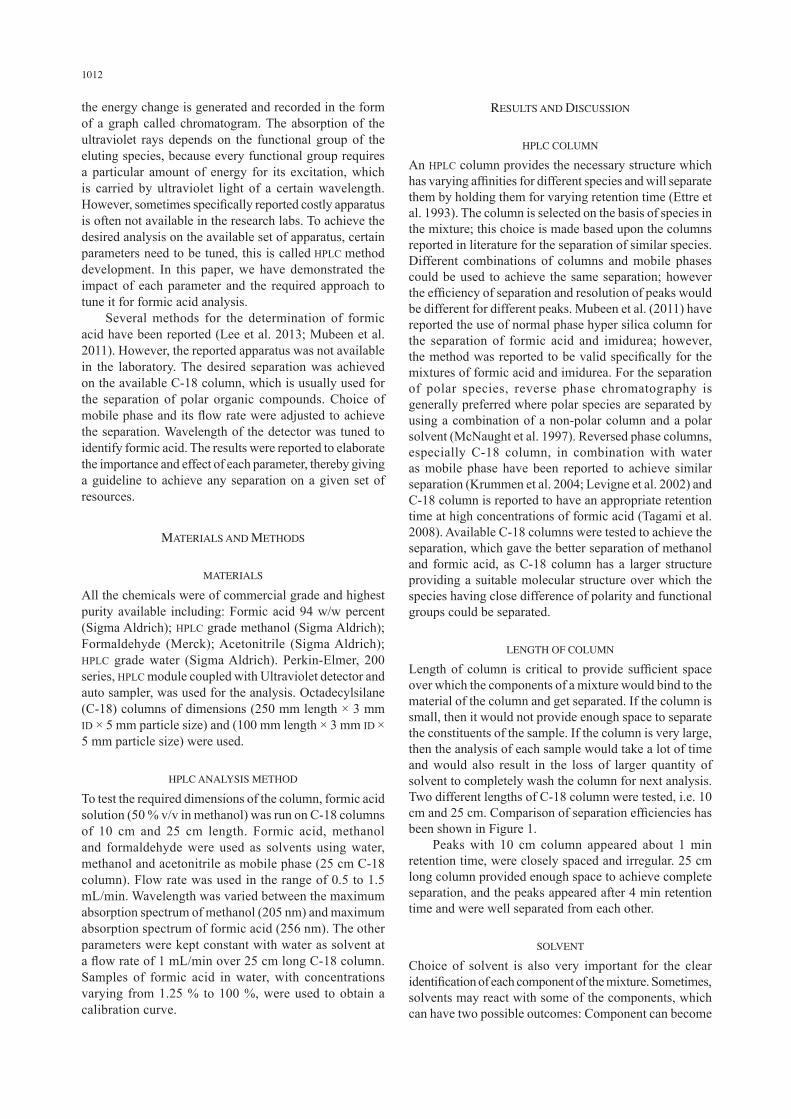
Length of column is critical to provide sufficient space over which the components of a mixture would bind to the material of the column and get separated. If the column is small, then it would not provide enough space to separate the constituents of the sample. If the column is very large, then the analysis of each sample would take a lot of time and would also result in the loss of larger quantity of solvent to completely wash the column for next analysis. Two different lengths of C-18 column were tested, i.e. 10 cm and 25 cm. Comparison of separation efficiencies has been shown in Figure 1. Peaks with 10 cm column appeared about 1 min retention time, were closely spaced and irregular. 25 cm long column provided enough space to achieve complete separation, and the peaks appeared after 4 min retention time and were well separated from each other.
SOLVENT
Choice of solvent is also very important for the clear identification of each component of the mixture. Sometimes, solvents may react with some of the components, which can have two possible outcomes: Component can become

1013
undetectable and thus the peak could get excluded from the chromatogram. However, in cases where the component is not easily detectable then, the solvent is chosen so that it forms a detectable complex with the component of interest. The interaction of the components with the solvent is also controlled by changing the pH of the solvent, which changes the polarity and the nature of the solvent, thus, the detectability of the component is improved as desired.Water, methanol, acetonitrile or any concentration of their mixture is generally used for the reverse phase HPLC. During experiments, pure methanol was tested as a solvent, also because it would exclude one of the components present in the sample i.e. methanol; however, it did not give any detection for formic acid which had been the main component of interest. Acetonitrile was tried as a solvent but it also did not give any detection. Water gave clear identification for the standard samples of methanol and formic acid; However, it did not give any peak with standard samples of formaldehyde because formaldehyde reacted with water and formed diol, which is a characteristic property of aldehydes, and became undetectable because of the presence of methanol having the same functional group. A solution of 50% v/v methanol in water was also used but a clear peak of formic acid did not appear on the chromatogram.
FLOW RATE OF THE SOLVENT
Beside the nature of the solvent, which provides the force of attraction that separates the constituents of a sample on the column, the flow rate of the solvent is also important to provide the time necessary to separate the constituents and to carry out the sample over the entire column. If the flow rate is high, then the constituents of the sample are not separated enough to be detected separately. If the flow rate
is very low, then the species would be clearly separated but then each run of the sample would require a longer time and the constituents of the sample would not completely elute out of the column. Hence, a suitable flow rate is adjusted where the required separation would be achieved and the constituents would also be completely eluted out of the column. Flow rate of the solvent is also important in the situation, where a certain column of reported dimensions is not available in the lab; then flow rate of the solvent could be adjusted to provide the necessary time for separation and achieve the separation using the given apparatus. Initially a flow rate of 1.5 mL/min was selected and the formic acid peak appeared around retention time of 1 min. The flow rate was then decreased to 1 mL/min and the peaks appeared around retention time of 3.5 min. Flow rate of 0.5 mL/min was also tested and the peaks appeared around retention time of 6 min. Solvent flow rate was adjusted at 1 mL/min to achieve the given separation. Changes in retention time with change in solvent rate have been shown in Figure 2. The similar trend of decrease in retention time with the increase in flow rate has also been reported by Mubeen et al. (2011).
WAVELENGTH OF UV DETECTOR
A detector is the last part in the assembly of HPLC tool, which subjects to the eluting material to ultraviolet rays of pre-specified wavelength, and records the energy changes during this bombardment. Ultraviolet rays are high energy rays, with wavelength ranging from 10-400 nm. According to Plank’s law, the shorter the wavelength, the larger is the amount of energy the rays carry. The energy of these ultraviolet rays is being absorbed by the molecules and the molecules get excited, and during the process of de-excitation the energy is released which is being recorded
FIGURE 1. Comparison of separation efficiencies on columns of different lengths (a) 10 cm and (b) 25 cm long C-18 column

1014
by the detector and appear as a peak. Each species has a specific ultraviolet spectrum under which it responds, the energy of the spectrum corresponds to the bandwidth of its orbitals. At 205 nm wavelength, samples of both methanol and formic acid showed chromatographic peaks, 50% solution of formic acid in methanol was analyzed and it gave two clear peaks. Figure 3 shows the chromatogram of 50% solution of formic acid in methanol, by comparing the chromatograms of methanol and formic acid samples, it was analysed that earlier peak corresponds to methanol, while later peak is of formic acid.
METHANOL PEAK EXCLUSION
Owing to the presence of same hydroxyl group in the two compounds, methanol and formic acid, have a complexity that their chromatographic peaks appear at almost the same retention time. In Figure 2, it was observed that peaks for both species are appearing around retention time of 3 min, and the two peaks are almost identical and are very close to each other. Under the presence of other reaction species, the pH of the reaction sample was expected to be changed; hence the two peaks could be confused with each other. To avoid the ambiguity, the wavelength of the UV detector was tuned to a specific wavelength where formic acid peak appears while that for methanol would not appear. While increasing the wavelength from the maximum absorption spectra of methanol, i.e. 205 nm, towards the maximum absorption spectra of formic acid, i.e. 256 nm,
it was observed that at 250 nm wavelength peaks of formic acid are clear and comprehendible while for methanol, no peak was observed at 250 nm wavelength. Detailed comparison at various concentrations has been shown in Figure 4. Hence, 250 nm wavelength was selected to exclude the peak of methanol and make the chromatogram understandable. Energy of 250 nm wavelength UV rays is less than that of 205 nm wavelength UV rays; hence, the UV rays are not able to excite the methanol molecules.
DEVELOPMENT OF CALIBRATION CURVE AND ITS LINEARITY
The position of the peak gives the identification that what specie is present in the sample. The amount of the specie present in the sample is calculated by finding the area under its peak. HPLC modules have this inbuilt capability of calculating the area under each peak, it needs to be specified in the report settings before starting the run otherwise the area is to be calculated using the cumbersome integration method. The HPLC report also shows the percentage of each specie in the sample but this percentage is based on the percentage area of each peak out of the cumulative area occupied by all the peaks. Percentages shown by HPLC report can be taken as a good approximation, but the data is not reliable when some of the peaks are excluded. Even when the peaks are not excluded intentionally, there is a possible presence of some specie, which might not give any peak at the specified conditions, or some of the area could be occupied by impurities. To calculate the right amount
FIGURE 2. Comparison of change in retention time with change in flow rate of solvent (a) 0.5 mL/min, (b) 1.0 mL/min and (c) 1.5 mL/min

1015
of species in a sample, it is better to make a calibration curve or data of area occupied by each standard solution of known concentration (Figure 5). Known concentrations of formic acid were analyzed to find the area under their peaks. Figure 5 shows the response data against each concentration. Data showed a linear trend which could be best described by equation:
y = 66.701x + 616.28Response data (mAU) = 66.701 × (Percentage concentration of formic acid) + 616.28
Krumen et al. (2004) have also shown that the response data, for Liquid Chromatography Mass Spectrometry, is almost linear against the concentration of the species under
FIGURE 3. Chromatogram of 50% formic acid solution in methanol
FIGURE 4. Exclusion of methanol peak by changing wavelength of detector from 205 to 250 nm, methanol concentrations from 10% to 100%

1016
analysis; the linear trend has also been reported for volatile fatty acids (Heuer et al. 2006) and leucine (an a-amno acid) (Godin et al. 2005). Linear trend of the data has validated our method. Linear trend has also given the possibility of using a linear equation to find the concentration of a species.
LIMITS OF DETECTION
In any analysis with given equipment there are certain limits of detection which are based on the sensitivity of the HPLC equipment. Each analysis method is reported to be valid within certain upper and lower limits of concentration. Below the lower detection limit, the changes in energy would be too small to be detected by the detector while above the upper detection limits the energy changes would be so high that it could actually burn out the detector or at least the signal would become irregular or bifurcated thus becoming not comprehendible. Our HPLC method was validated between the concentrations of 1.25% formic acid in methanol up to 100% pure formic acid which shows the analytical parameters of the HPLC method. Statistical analysis of the trend line was also performed. Limits of Detection and Limits of Quantification were statistically calculated to be 2.25 % and 6.83 %, respectively.
EFFECT OF CHANGE IN WAVELENGTH ON LIMITS OF DETECTION
Sometimes the concentrations of samples are not in the given range of limits of detection. The samples above the higher limits of detection are diluted and then the results of the signals are extrapolated. Samples with low detection or very low concentration are derivative to form species that are easily detectable (Morrison 2014; Shrivastava et al. 2011). However, these steps increase the probability of error in the analysis. The same could be achieved by tuning the wavelength of detector’s ultraviolet rays, and subsequently receiving a controlled response signal, which could avoid the hassle of extrapolation. Figure 6 shows that in formic acid analysis, when the detector’s UV wavelength was shifted from 205 to 250 nm, the response peak noticeably increased in height. Thus, to analyze samples of concentration higher than the upper detection limit, the wavelength of detector should be shifted away from the maximum absorption spectrum. To analyze samples of concentration below the lower detection limit, the wavelength of detector should be shifted towards the maximum absorption spectrum. However, with the change in wavelength, the response data would change so the calibration of response data needs to be done if the wavelength of detector is changed.
FIGURE 5. Linear curve for HPLC response data
TABLE 1. Optimized analytical parameters for HPLC method
Parameters ValuesConcentration range (v/v % formic acid) 1.25-100
Regression equation y = 66.701x + 616.28 (Where x is concentration and y is peak area)
Intercept ± SD 616.28 ± 45.6124Slope ± SD 66.701 ± 0.9057
Correlation coefficient (R2) 0.9982LOD (v/v % formic acid) 2.2LOQ (v/v % formic acid) 6.83

1017
CONCLUSION
Results of the present study showed that formic acid can be separated and analyzed through HPLC on a 25 cm long C-18 column, using water at a flow rate of 1 mL/min as mobile phase and setting the wavelength of the ultraviolet detector at 250 nm wavelength. Generally, we concluded that through the optimum tuning of the parameters, the utility of given equipment can be greatly increased by using the equipment for maximum analysis rather than searching for specific equipment for each analysis. The combination of nature of column and the solvent plays a vital role in the efficient separation of the constituents. The larger the dimensions of the column, the better the separation achieved due to a larger binding surface. Better and complete separation is achieved by decreasing the flow rate. The area under peak and the concentration have a linear trend. Magnitude of response of each constituent depends upon the chosen wavelength.
ACKNOWLEDGEMENTS
Authors are thankful to the deanship of scientific research at King Khalid University, Kingdom of Saudi Arabia for technical and administrative support.
REFERENCES
Ettre, L. 1993. Nomenclature for chromatography (IUPAC Recommendations 1993). Pure and Applied Chemistry 65(4): 819-872.
Godin, J.P., Hau, J., Fay, L.B. & Hopfgartner, G. 2005. Isotope ratio monitoring of small molecules and macromolecules by liquid chromatography coupled to isotope ratio mass spectrometry. Rapid Communications in Mass Spectrometry 19(18): 2689-2698.
Hostettmann, K.M., Hostettmann, M. & Marston, A. 1998. Preparative Chromatography Techniques Applications in Natural Product Isolation. 2nd ed. Berlin Heidelberg: Springer Berlin Heidelberg.
Heuer, V., Elvert, M., Tille, S., Krummen, M., Mollar, X.P., Hmelo, L.R. & Hinrichs, K.U. 2006. Online δ13C analysis of volatile fatty acids in sediment/porewater systems by liquid chromatography-isotope ratio mass spectrometry. Limnol. Oceanogr. Methods 4: 346-357.
Krummen, M., Hilkert, A.W., Juchelka, D., Duhr, A., Schlüter, H.J. & Pesch, R. 2004. A new concept for isotope ratio monitoring liquid chromatography/mass spectrometry. Rapid Commun. Mass Spectrom. 18(19): 2260-2266.
Lee, X., Zhang, L., Huang, D., An, N., Yang, F., Jiang, W. & Fang, B. 2013. Analysis of the stable carbon isotope composition of formic and acetic acids. Analytical Biochemistry 436(2): 178-186.
Levigne, S., Thomas, M., Ralet, M.C., Quemener, B. & Thibault, J.F. 2002. Determination of the degrees of methylation and acetylation of pectins using a C18 column and internal standards. Food Hydrocolloids 16(6): 547-550.
McMurry, J. 2011. Organic Chemistry: With Biological Applications. 2nd ed. Belmont, CA: Brooks/Cole. p. 395.
McNaught, A.D. & Wilkinson, A. 1997. Compendium of Chemical Terminology. IUPAC Recommendations. 2nd ed. USA: Blackwell Science.
Morrison, F.A. 2014. Obtaining Uncertainty Measures on Slope and Intercept of a Least Squares Fit with Excel’s LINEST. Houghton, Michigan, USA Department of Chemical Engineering, Michigan Technological University. p. 25.
Mubeen, A.K., Sinha, S., Parashar, V. & Khandekar, N. 2011. A validated NP-HPLC method for the determination of formic acid in pharmaceutical excipient imidurea. International Journal of Pharmaceutical and Biomedical Research 2(3): 140-144.
Shrivastava, A. & Gupta, V. 2011. Methods for the determination of limit of detection and limit of quantitation of the analytical methods. Chronicles of Young Scientists 2(1): 21-25.
FIGURE 6. Change in detector’s response with change in wavelength (a) 205 nm and (b) 250 nm

1018
Tagami, K. & Uchida, S. 2008. Online stable carbon isotope ratio measurement in formic acid, acetic acid, methanol and ethanol in water by high performance liquid chromatography-isotope ratio mass spectrometry. Analytica Chimica Acta 614(2): 165-172.
Taylor, T. 2015. Important aspects of UV detection for HPLC. LCGC North America 33(11): 870.
Daniyal HasanSchool of Chemical and Materials EngineeringNational University of Science and TechnologySector H-12, Islamabad Pakistan
Iram Mahmood *Department of Industrial EngineeringCollege of EngineeringKing Khalid University, Abha 61413Kingdom of Saudi Arabia
Ishfaq AhmadDepartment of Mathematics and StatisticsFaculty of Basic and Applied SciencesInternational Islamic University, Islamabad Pakistan
Farah AzizDepartment of Public HealthFaculty of Applied Medical SciencesKing Khalid University Khamis MushaitKingdom of Saudi Arabia
Ishaq AhmadNational Center for PhysicsIslamabad, 44000 Pakistan
Ishaq AhmadNPU-NCP Joint International Research Center for Advanced Nanomaterials and Defects EngineeringNorthwestern Polytechnical UniversityXi’an 710072China
*Corresponding author; email: [email protected]
Received: 6 February 2019Accepted: 7 March 2019
Related Documents


