Development of an ePortfolio System Success Mode Balaban, Igor Doctoral thesis / Disertacija 2011 Degree Grantor / Ustanova koja je dodijelila akademski / stručni stupanj: University of Zagreb, Faculty of Organization and Informatics Varaždin / Sveučilište u Zagrebu, Fakultet organizacije i informatike Varaždin Permanent link / Trajna poveznica: https://urn.nsk.hr/urn:nbn:hr:211:807791 Rights / Prava: In copyright Download date / Datum preuzimanja: 2022-09-19 Repository / Repozitorij: Faculty of Organization and Informatics - Digital Repository

Welcome message from author
This document is posted to help you gain knowledge. Please leave a comment to let me know what you think about it! Share it to your friends and learn new things together.
Transcript

Development of an ePortfolio System Success Mode
Balaban, Igor
Doctoral thesis / Disertacija
2011
Degree Grantor / Ustanova koja je dodijelila akademski / stručni stupanj: University of Zagreb, Faculty of Organization and Informatics Varaždin / Sveučilište u Zagrebu, Fakultet organizacije i informatike Varaždin
Permanent link / Trajna poveznica: https://urn.nsk.hr/urn:nbn:hr:211:807791
Rights / Prava: In copyright
Download date / Datum preuzimanja: 2022-09-19
Repository / Repozitorij:
Faculty of Organization and Informatics - Digital Repository
PODACI O DISERTACIJI
I. AUTOR
Ime i prezime: Igor Balaban
Datum i mjesto rođenja: 23. siječnja 1981., Čakovec
Naziv fakulteta i datum diplomiranja na VII/1 stupnju: FOI Varaždin, 23. lipnja 2004.
Naziv fakulteta i datum diplomiranja na VII/2 stupnju: FOI Varaždin, znanstveni PDS Informacijske znanosti, odobren završetak studija izradom doktorske disertacije
Sadašnje zaposlenje: Asistent na Fakultetu organizacije i informatike Varaždin
II. DISERTACIJA
Naslov: Razvoj Modela uspješnosti ePortfolio sustava (Development of an ePortfolio System Success Model: An Information System approach)
Broj stranica, tablica, grafikona, slika: 268 stranica, 37 tablica, 23 slike
Znanstveno područje i polje iz kojeg je postignut doktorat znanosti: društvene znanosti, polje informacijske i komunikacijske znanosti
Fakultet na kojem je obranjena disertacija: Fakultet organizacije i informatike Varaždin
III. OCJENA I OBRANA
Datum prijave teme: 20. svibnja 2009.
Datum sjednica vijeda na kojoj je prihvadena tema: 14. srpnja 2009.
Datum predaje rada: 11. siječnja 2011.
Datum sjednice vijeda na kojoj je rad prihvaden: 08. ožujka 2011.
Sastav povjerenstva koje je rad ocijenilo: prof. dr. sc. Josip Brumec, predsjednik prof. dr. sc. Blaženka Divjak, mentor i član prof. dr. sc. Enrique Mu, sumentor i član prof. dr. sc. Diana Šimid, član prof. dr. sc. Jadranka Lasid-Lazid, član
Datum obrane rada: 1. travnja 2011.
Sastav povjerenstva pred kojim je rad obranjen: prof. dr. sc. Diana Šimid, predsjednica prof. dr. sc. Blaženka Divjak, mentor i član prof. dr. sc. Enrique Mu, sumentor i član prof. dr. sc. Josip Brumec, član prof. dr. sc. Mladen Varga, član
Datum promocije:

UNIVERSITY OF ZAGREB
FACULTY OF ORGANIZATION AND INFORMATICS VARAŽDIN
IGOR BALABAN
DEVELOPMENT OF AN EPORTFOLIO SYSTEM SUCCESS MODEL:
AN INFORMATION SYSTEM APPROACH
(RAZVOJ MODELA USPJEŠNOSTI EPORTFOLIO SUSTAVA)
DOCTORAL DISSERTATION
VARAŽDIN, 2011

UNIVERSITY OF ZAGREB
FACULTY OF ORGANIZATION AND INFORMATICS VARAŽDIN
Research supervisors: Dr. Blaženka Divjak, full professor
Dr. Enrique Mu, associate professor
To my parents
(Mojim roditeljima)

I
PREFACE
This thesis represents a culmination of research that has been conducted since 2007. I
decided to pursue this research topic due to the fact that ePortfolio had been
insufficiently explored. Moreover, showing that ePortfolio is an information system
provided me with the opportunity to apply the IS success measures to the emerging field
of ePortfolio implementation and application. As a result, I developed an instrument to
evaluate ePortfolio success, based on the DeLone&McLean updated IS success model as
the assessment framework. Drawing on the results of the developed instrument and the
D&M model, I proposed a model of ePortfolio success. It is worthwhile mentioning that
during the research I gained immensely valuable international experience through
cooperating with ePortfolio and IS experts in Europe and USA.
The first two chapters describe the problem, motivation for research and give insight
into the current state in the field of ePortfolio. Chapter 3 describes preliminary research
conducted at the Faculty of Organization and Informatics in Varaždin that resulted in
implementation of the ePortfolio system in several hybrid courses. Chapter 4 introduces
the rationale for using IS success measures on ePortfolio that provides a solid ground for
instrument development. Chapter 5 describes the research methodology, instrument
development process as well as the data collection procedure. In Chapter 6 the
ePortfolio success instrument validation process is described in detail. The development
and testing of the ePortfolio success model are presented in Chapter 7. The results are
discussed in Chapter 8. Finally, the scientific contribution of this research, limitations of
the study as well as implications for further research are given in Chapter 9.
I would like to express my sincere gratitude to my research supervisors, Dr. Blaženka
Divjak from FOI and Dr. Enrique Mu from Carlow University. Their guidance,
persistence, expertise and support were invaluable and remain highly appreciated.
I would also like to thank Dr. Diana Šimić from FOI for her assistance with SEM and Dr.
Josip Brumec from FOI for the valuable knowledge I acquired concerning the Genetic
taxonomy method.
I would also like to thank my colleague Andreja Kovačić, English lecturer, for
proofreading the text of the thesis.
Finally, I wish to express my gratitude to my beloved family for their encouragement
and to my friends and colleagues who would support me and show sincere
understanding while I was occupied with my research.
Igor Balaban, January 2011.

II
TABLE OF CONTENTS
1 Introduction ............................................................................................................................................. 1
1.1 Definitions and terminology ..................................................................................................... 3
1.1.1 Portfolio context ................................................................................................................... 3
1.1.2 Information System context ............................................................................................. 6
1.2 Research problem ......................................................................................................................... 8
1.3 Complementary research ......................................................................................................... 11
1.4 The purpose of the research ................................................................................................... 15
1.5 The original scientific contribution of the research ...................................................... 17
2 Portfolio: historical and learning context ................................................................................... 19
2.1 From paper to electronic media ............................................................................................ 20
2.2 The role of Portfolio in teaching and learning ................................................................. 25
2.3 Lifelong Learning ......................................................................................................................... 27
2.3.1 Personal Development Plan ........................................................................................... 29
2.3.2 Personal Learning Environment ................................................................................... 30
2.3.3 Reflective learning.............................................................................................................. 31
2.4 Artefacts .......................................................................................................................................... 33
2.5 Types of Portfolio ........................................................................................................................ 34
2.6 Experiences with implementation in an academic institution .................................. 38
3 Preliminary research .......................................................................................................................... 44
3.1 Introducing and selecting the ePortfolio system ............................................................ 46
3.1.1 Introducing the ePortfolio concept .............................................................................. 48
3.1.2 Choosing the ePortfolio system .................................................................................... 54
3.2 Using ePortfolio in hybrid courses ....................................................................................... 55
4 Information System approach to ePortfolio .............................................................................. 57
4.1 EPortfolio as Information System ......................................................................................... 58
4.1.1 Descriptive methods .......................................................................................................... 59
4.1.2 Genetic taxonomy method .............................................................................................. 61
4.1.3 Conclusion ............................................................................................................................. 67
4.2 The ePortfolio meta-model ...................................................................................................... 69
4.3 EPortfolio success ....................................................................................................................... 75

III
4.3.1 Different approaches to measuring IS success ........................................................ 76
4.3.2 Choosing an appropriate approach ............................................................................. 78
4.3.3 Using the D&M Model to assess ePortfolio success ............................................... 79
4.3.4 Critical Success Factors of ePortfolio success ......................................................... 87
5 Research methodology....................................................................................................................... 89
5.1 Choice of research methodology ........................................................................................... 90
5.2 Operationalization of research constructs ........................................................................ 93
5.2.1 System Quality ..................................................................................................................... 94
5.2.2 Information Quality ........................................................................................................... 94
5.2.3 Service Quality ..................................................................................................................... 95
5.2.4 Use ............................................................................................................................................ 95
5.2.5 User Satisfaction ................................................................................................................. 96
5.2.6 Net Benefits ........................................................................................................................... 96
5.3 Operationalization of Critical Success Factors ................................................................. 98
5.4 Instrument development ...................................................................................................... 102
5.4.1 Item creation ..................................................................................................................... 102
5.4.2 Scale development .......................................................................................................... 114
5.4.3 Pilot test .............................................................................................................................. 121
5.5 Data collection ........................................................................................................................... 124
5.6 Sample characteristics............................................................................................................ 128
5.7 Reliability of scales .................................................................................................................. 132
6 Instrument validation ...................................................................................................................... 133
6.1 Content validity ......................................................................................................................... 135
6.2 Construct validity ..................................................................................................................... 136
6.2.1 Establishing convergent validity and unidimensionality ................................ 139
6.2.2 Extracting the subconstructs ...................................................................................... 144
6.2.3 Adjusting the model fit .................................................................................................. 147
6.2.4 Assessment of discriminant validity ........................................................................ 170
6.3 Reliability..................................................................................................................................... 173
7 Assessing the structural model .................................................................................................... 175
7.1 Defining relationships in the model .................................................................................. 178
7.2 Structural model testing ........................................................................................................ 184
IV
8 Results and discussion .................................................................................................................... 194
8.1 Instrument for measuring ePortfolio success ............................................................... 194
8.2 The ePortfolio Success Model .............................................................................................. 199
9 Conclusion ............................................................................................................................................ 202
9.1 Scientific contribution ............................................................................................................ 202
9.1.1 Theoretical contribution ............................................................................................... 202
9.1.2 Methodological contribution ....................................................................................... 204
9.2 Limitations of the study ......................................................................................................... 207
9.3 Implications for further research ....................................................................................... 208
Appendix A: EPortfolio experts involved in research .................................................................. 209
Appendix B: Excel spreadsheet used for CSFs identification .................................................... 211
Appendix C: First version of statements sent to experts for evaluation .............................. 214
Appendix D: Field-test instrument statements .............................................................................. 221
Appendix E: Screenshots of ePortfolio success instrument (Final version – English) ... 224
Appendix F: Screenshots of ePortfolio success instrument (Final version – Croatian) . 233
Appendix G: Screenshots of CSFs survey (Final version) ........................................................... 239
Appendix H: Invitation letter to Institution Representative ..................................................... 245
Appendix I: Invitation letter to students .......................................................................................... 248
Appendix J: List of institutions that participated in CSFs survey ............................................ 249
Appendix K: Results from the bootstrap procedure for CFA .................................................... 250
Appendix L: Structural model testing – bootstrap results ......................................................... 253
References .................................................................................................................................................... 255

V
LIST OF TABLES
Table 1. Analysis of existing Portfolio definitions .............................................................................. 5
Table 2. Overview of different management levels ......................................................................... 39
Table 3. Stages of ePortfolio implementation .................................................................................... 49
Table 4. Comparison between definitions of IS and ePortfolio ................................................... 60
Table 5. The initial pool of items in the ePortfolio success instrument ............................... 104
Table 6. Number of items in the constructs after CVR ................................................................ 114
Table 7. Item placement ratios and Cohen's Kappa for the 1st round of Q-sort ............... 116
Table 8. Number of items in the constructs after the 1st round of Q-sort ........................... 117
Table 9. Item placement ratios after the 2nd round of Q-sort ................................................. 118
Table 10. Number of items in the constructs after the 2nd round of Q-sort ...................... 118
Table 11. Number of items in the constructs after the 3rd round of Q-sort ....................... 120
Table 12. Summary of reliability analysis ........................................................................................ 122
Table 13. Demographic structure of respondents ........................................................................ 127
Table 14. Respondents’ age ................................................................................................................... 128
Table 15. Number of courses in which respondents used ePortfolio .................................... 129
Table 16. Frequency of ePortfolio usage .......................................................................................... 130
Table 17. Number of artefacts in ePortfolio .................................................................................... 130
Table 18. Descriptive statistics of research constructs ............................................................... 131
Table 19. Reliability coefficients .......................................................................................................... 132
Table 20. CFA factor structure for each construct ........................................................................ 141
Table 21. Constructs’ structure after CFA ........................................................................................ 143
Table 22. Factor pattern for each construct .................................................................................... 146
Table 23. Summary of modification process for System Quality construct ........................ 150
Table 24. Summary of modification process for Information Quality construct .............. 152
Table 25. Summary of modification process for Service Quality construct ........................ 154
Table 26. Summary of modification process for Use construct ............................................... 156
Table 27. Summary of modification process for User Satisfaction construct .................... 157
Table 28. Summary of modification process for Net Benefits construct .............................. 159
Table 29. Factors in each construct .................................................................................................... 170
Table 30. Chi-Square differences between factors in the constructs .................................... 172
Table 31. Reliability of measurement factors ................................................................................. 174
Table 32. Overview of hypothesized relationships and relevant literature ....................... 182
Table 33. Communalities, determination and predictability coefficients
in both structural models .................................................................................................... 187
Table 34. Summary of hypotheses testing ....................................................................................... 189
Table 35. The effect and relevance of paths in the final structural model .......................... 191
Table 36. Effects of variables in the final structural model ....................................................... 191
Table 37. Final items for the ePortfolio success instrument .................................................... 195
VI
LIST OF FIGURES
Figure 1. Appropriateness of technology at different levels of maturity ................................ 22
Figure 2. Example of student's Showcase ePortfolio ...................................................................... 51
Figure 3. Organizational system and its information subsystem ............................................... 62
Figure 4. EPortfolio in Genetic Taxonomy Cube ............................................................................... 65
Figure 5. The ePortfolio meta-model .................................................................................................. 70
Figure 6. LLL continuum ............................................................................................................................ 74
Figure 7. Updated D&M IS Success Model ........................................................................................... 80
Figure 8. Measurement Model for System Quality ........................................................................ 151
Figure 9. Measurement Model for Information Quality .............................................................. 153
Figure 10. Measurement Model for Service Quality ..................................................................... 155
Figure 11. Measurement Model for User Satisfaction ................................................................. 158
Figure 12. Measurement Model for Net Benefits ........................................................................... 161
Figure 13. Full Measurement Model for System Quality construct ........................................ 163
Figure 14. Full Measurement Model for Information Quality construct .............................. 164
Figure 15. Full Measurement Model for Service Quality construct ........................................ 165
Figure 16. Full Measurement Model for Use construct ............................................................... 166
Figure 17. Full Measurement Model for User Satisfaction construct .................................... 167
Figure 18. Full Measurement Model for Net Benefits construct ............................................. 168
Figure 19. Proposed research model for ePortfolio success ..................................................... 183
Figure 20. First structural model ......................................................................................................... 184
Figure 21. Second structural model .................................................................................................... 185
Figure 22. The final structural model with significant paths.................................................... 193
Figure 23. The proposed ePortfolio Success Model ..................................................................... 199

1
1 Introduction
Along with the development of LMS (Learning Management Systems) and Web
technologies, it is learning support that has recently evolved in unprecedented ways
(Zemsky&Massy, 2004). In light of these developments the idea of having a user
oriented learning environment that would enable students to showcase their work and
skills has finally been made possible through the Portfolio concept. Moreover, beside for
presentation purposes, Portfolio is also used as an assessment tool thus changing the
perspective of learning and teaching (Buzzeto-More&Alade, 2006; Fernández, 2008;
Stevenson, 2006).
Electronic Portfolio, or ePortfolio, constitutes an extension to e-learning and has
therefore been very strongly popularized in the last few years. An extensive ePortfolio
literature review made for the purpose of this dissertation revealed that ePortfolio is
widely used but still not properly explored and a model that would describe its
successful implementation in the academic environment still does not exist. Prior to
developing such a model, it is important to stress that all the processes supported by
ePortfolio need to be thoroughly analyzed to ensure its successful implementation.
Similarly, it is necessary to analyze both the pedagogical and technological potential of
ePortfolio since it is becoming widely utilized by students, educators and academic
institutions in general. In addition, an increased usage of such a system points to the
conclusion that ePortfolio is likely to become an inevitable part of the education process.
Academic institutions, along with students and teachers, will therefore become
dependent on the ePortfolio use both for pedagogical and (self)presentation purposes.
Consequently, it is obvious that successful implementation and usage of ePortfolio will
have a key role in education and personal presentation in the future. However, so far no
assessment frameworks for ePortfolio success have been developed, so in terms of
evaluation of ePortfolio success there is a research gap which was established by the
comprehensive literature review made by the author of this dissertation.
Regarding the fact that ePortfolio is an Information System, a whole set of Information
System techniques and methods can be applied in order to analyze ePortfolio success,
such as the EUCS instrument by Torkzadeh&Doll (1999), Updated DeLone&McLean

2
Information System Success Model (2003), Sedera et al.’s Measures for IS Success
(2004), and IS Impact Measurement Model by Gable, Sedera&Chan (2008). One of those
methods is the DeLone&McLean Information System Success Model (DeLone&McLean,
1992), initially developed in 1992, which is designed as a framework to assess
successful implementation of an IS.
With respect to the fact that ePortfolio is still not properly explored and a model of its
successful implementation does not exist, in this dissertation an ePortfolio success
evaluation framework applicable at the individual level of analysis will be proposed
based on the Updated D&M IS Success Model (DeLone&McLean, 2003), introduced in
2002, and the research on ePortfolio conducted by the author of the dissertation.

3
1.1 Definitions and terminology
This research will focus on two key terms: 1. Portfolio, and 2. Information System
success. Since numerous definitions for both of these contexts currently exist it is
essential to first agree on the terms and definitions that will be used in this doctoral
dissertation. In the following sections the clarification of the contexts will therefore be
provided for the purpose of their accurate interpretation within this particular research.
1.1.1 Portfolio context
Since Portfolio is mainly related to learning and was developed to support the learning
process, there are numerous definitions of student learning portfolios proposed by
educators. Literature review has revealed a dozen possible definitions of the term
Portfolio, three of which are presented in this section, each of them sheding light on a
different aspect of the term.
An excellent definition was offered by Paulson et al. (1991), who described Portfolio as
“a meaningful collection of student work that demonstrates progress and/or mastery
guided by standards and includes evidence of student self-reflection”.
Abrenica (1996) defined Portfolio as “a collection of student achievement artefacts
created during a period of time that serve as authentic assessment tools used to evaluate
student learning”.
Barret (1998) defined Portfolio as “a purposeful collection of student's work that
illustrates efforts, progress and achievement”.
All these definitions describe Portfolio as a concept or a set of procedures and data that
result in the demonstration of a student’s capabilities. However, to fully utilize Portfolio
potential, the procedures and data identified in the aforementioned definitions need to
be supported by Information and Communication Technology (ICT). As nowadays it is
common for Portfolio systems to be supported by ICT, this research will refer to
Portfolio systems that are Web-based. In order to differentiate a paper Portfolio from its
electronic counterpart, the letter ‘e’ will be added to the word ‘Portfolio’. Therefore, the

4
term ePortfolio will be used hereafter to denote the currently most popular type of
electronic Portfolio, i.e. the Web-based Portfolio.
Although the analysis of the aforementioned definitions may suggest that they mainly
focus on the student, other entities (e.g. administration, potential employers) can use
ePortfolio as well. Drawing on previous definitions and taking into consideration that
none of them specifically included the IT component, new definitions of ePortfolio were
coined, some of which are presented in this paragraph. According to Barker (2003),
ePortfolio is considered to be “an electronic learning record which enables an individual
to store, organize and present their work and accomplishments”. The European Institute
for E-learning (EIfEL), which leads the Europortfolio consortium and is a founding
member of the European Foundation for Quality in E-Learning (EFQUEL), defines
ePortfolio as “a personal digital collection of information describing and illustrating a
person's learning, career, experience and achievements”. Furthermore, the definition
proposed by EIfEL emphasizes that ePortfolios are privately owned and the owner has a
complete control over who has access to what and when. The Inter/National Coalition
for Electronic Portfolio Research that mostly deals with ePortfolios across the USA,
defines ePortfolio as a “collection of diverse evidence created in authentic activity that is
brought together and recontextualized to say something about what I know and can do
(how I have grown or changed) … and with an added interpretation intended for one or
more specific audiences” (Cambridge et al., 2009, p. 145).
In the three ePortfolio definitions above certain shortcomings of the previous ones have
been overcome. They focus on the IT aspect of ePortfolio and generalize the ePortfolio
owner. On the other hand, it seems that another very important aspect of ePortfolio is
still overlooked, i.e. the learning component, which does not only embrace the storage
and presentation of past work and experience, but also encompasses reflection and
feedback. It is the two latter features that represent the biggest potential of ePortfolio
with respect to Lifelong Learning it supports, and should therefore not be neglected.
5
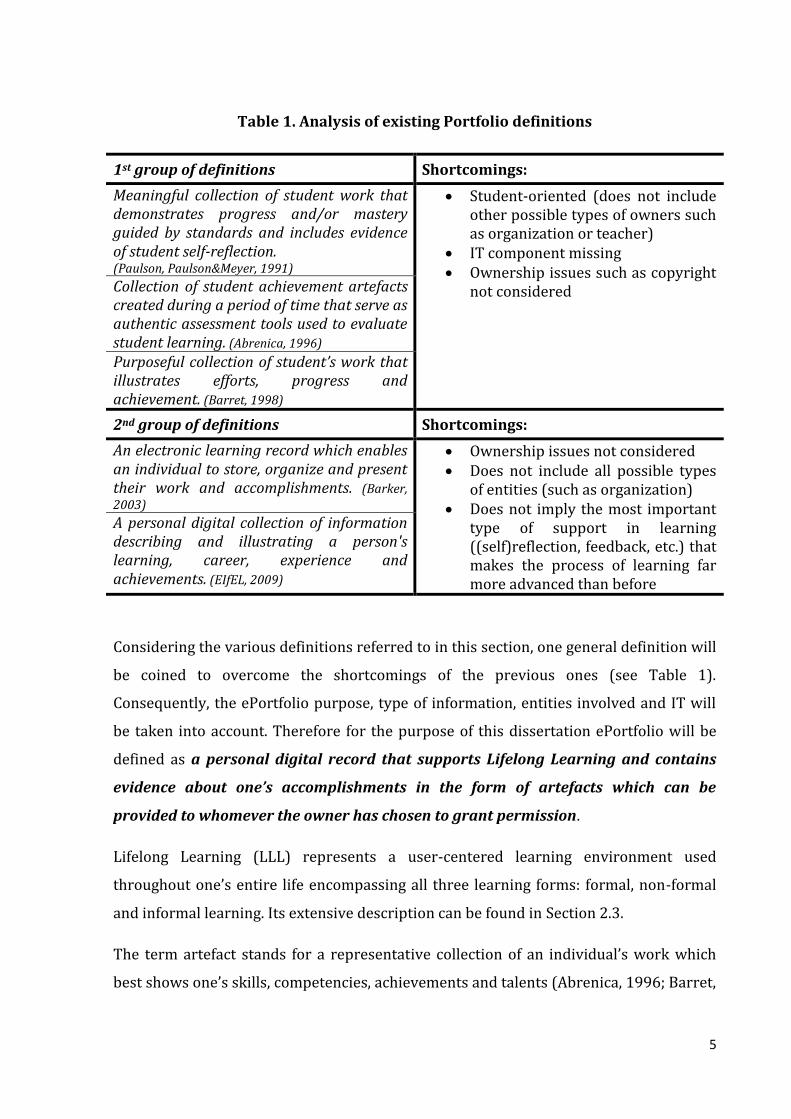
Table 1. Analysis of existing Portfolio definitions
1st group of definitions Shortcomings:
Meaningful collection of student work that demonstrates progress and/or mastery guided by standards and includes evidence of student self-reflection. (Paulson, Paulson&Meyer, 1991)
Student-oriented (does not include other possible types of owners such as organization or teacher)
IT component missing Ownership issues such as copyright
not considered
Collection of student achievement artefacts created during a period of time that serve as authentic assessment tools used to evaluate student learning. (Abrenica, 1996) Purposeful collection of student’s work that illustrates efforts, progress and achievement. (Barret, 1998)
2nd group of definitions Shortcomings:
An electronic learning record which enables an individual to store, organize and present their work and accomplishments. (Barker, 2003)
Ownership issues not considered Does not include all possible types
of entities (such as organization) Does not imply the most important
type of support in learning ((self)reflection, feedback, etc.) that makes the process of learning far more advanced than before
A personal digital collection of information describing and illustrating a person's learning, career, experience and achievements. (EIfEL, 2009)
Considering the various definitions referred to in this section, one general definition will
be coined to overcome the shortcomings of the previous ones (see Table 1).
Consequently, the ePortfolio purpose, type of information, entities involved and IT will
be taken into account. Therefore for the purpose of this dissertation ePortfolio will be
defined as a personal digital record that supports Lifelong Learning and contains
evidence about one’s accomplishments in the form of artefacts which can be
provided to whomever the owner has chosen to grant permission.
Lifelong Learning (LLL) represents a user-centered learning environment used
throughout one’s entire life encompassing all three learning forms: formal, non-formal
and informal learning. Its extensive description can be found in Section 2.3.
The term artefact stands for a representative collection of an individual’s work which
best shows one’s skills, competencies, achievements and talents (Abrenica, 1996; Barret,
6
1998; Barker, 2003, EIfEL, 2009). Artefacts can appear in the form of information, links,
tools or other personal or non-personal records that can be selectively provided by the
ePortfolio owner. A more detailed explanation of artefacts can be found in Section 2.4.
1.1.2 Information System context
According to Laudon&Laudon (2002), organizations tend to make large investments in
information systems assuming that they will have a positive impact, most notably on
performance. The same authors report that after the investment is implemented, the
biggest concern is that of measuring the impact of IS in the organization. In other words,
the question ‘What makes an IS successful?’ needs to be addressed.
Researchers have derived a number of models to explain what IS success relies on.
However, success has been interpreted in different ways by different researchers. In
1989, Davis devised the Technology Acceptance Model (TAM) to explain why an IS is not
equally accepted by users and explore the factors that drive user acceptance of IS.
Sabherwal et al. (2006) noticed that despite considerable empirical research the
determinants of IS success are often inconsistent. Following that, DeLone and McLean,
who are among the first and most successful contributors in the field of IS success,
argued that acceptance “... is not equivalent to success, although acceptance of
information system is a necessary precondition to success” (Petter et al., 2008, p. 237).
Although many authors have dealt with IS success in the last two decades, the scope and
approach of the evaluation studies has varied, so there is little consensus on the
appropriate measures of IS success.
To date, the D&M IS Success Model (1992) has been one of the most cited models (as
shown in Petter et al., 2008) and has served as a reference point for many other models
that tried to encompass IS success. The model was so well accepted that the authors
proceeded to update it in 2003 (DeLone&McLean, 2003) taking into consideration the
results of research that had been based on the D&M Model. The updated model was even
more successful than its predecessor. This was confirmed by Petter et al. (2008) as well
as the very authors of the model in their research in which they analyzed over 80
7
scientific papers1 in which the D&M Model was used to assess IS success
(DeLone&McLean, 2008).
Based on their research results, DeLone and McLean (1992) suggested that IS success
should be defined as a complex variable composed of several interdependent constructs
based on the multi-dimensional nature of IS. In accordance with that, they identified six
variables they called components of IS success. In their Updated IS Success Model they
classified those variables as: System Quality, Information Quality, Service Quality, Use,
User Satisfaction and Net Benefits. They also suggested that in order to develop a
comprehensive measurement model and instrument for a particular context, the
constructs and measures should be systematically selected considering contextual
contingencies, such as the organization’s size or structure, or the technology and the
individual characteristics of the system. Hereafter, the Updated D&M IS Success Model
will be referred to as the D&M Model and will be used to assess ePortfolio success in this
dissertation. The model is explained in detail in Section 4.3.3.
1Most of the papers were published in MIS Quarterly, Journal of Management Information Systems,
Information&Management, and Information Systems Research.
8
1.2 Research problem
When educational institutions embraced e-learning for the first time, they realized they
needed to adjust their business (i.e. teaching and learning) processes to fully utilize the
new concept. EPortfolio, as an extension of e-learning, aims to remove obstacles
between the learner’s ‘inner world’ and the ‘outside world’. A learner’s ‘inner world’
includes a Learning Management System (LMS), which used to be considered an
environment closed to an audience and was limited to the learner and the learning
organization. The ‘outside world’ includes procedures, events, systems, people and other
entities that do not have permission to view an individual’s personal or private learning
data from their ‘inner world’. EPortfolio, on the contrary, offers a new approach, a new
philosophy of teaching and learning, giving the learner an opportunity to express
oneself, to show one’s past work and experience to all the interested parties ranging
from teachers to potential employers (see Paulson et al., 1991; Abrenica, 1996; Barret,
1998; Barker, 2003; Gray, 2008). As far as an academic organization is concerned, this
calls for new adjustments in both the system and the process because ePortfolio is not
merely a technology. It is a whole new set of educational rules and approaches that
should be incorporated into academic organizations curricula (see Tosh, 2004; O’Brien,
2006; Emmett et al., 2006; Stefani et al., 2007). By eliminating a strict division between
the learner’s ‘inner world’ and the ‘outside world’, both ‘worlds’ have gained something
valuable. Moreover, a new entity has appeared in the process of lifelong learning, i.e. the
employer. With ePortfolio, the learner has the ability to show their work to the educator
as well as to the potential employer. As a result, ePortfolio implementation in an
academic institution is by no means simple because it involves several entities (Hartnell-
Young et al., 2007; Gray, 2008). Consequently, an extended study is required to enable
all the parties involved, i.e. the learner, educator, organization and potential employer,
to benefit most from its implementation (for examples, see Gray, 2008). Since ePortfolio
is mainly used by students in the academic environment that presents a starting point
for individual’s further personal development, it is natural for successful
implementation of ePortfolio to be investigated in that specific context.
In order to successfully implement ePortfolio in an academic institution, a new approach
is needed that will take into account several different aspects: ePortfolio as an

9
educational innovation, ePortfolio as a software platform that needs to be incorporated
into the existing ICT structure and organization’s curriculum; and ePortfolio as a new
phenomenon that will bring the learner closer to the potential employer. Such a complex
study that would take all the previously mentioned aspects into consideration requires
an Information System approach. EPortfolio needs to be represented as an Information
System since it fulfils all the required characteristics. The success of ePortfolio can
therefore be interpreted as equivalent to the success of a particular IS. The motivation
for studying ePortfolio success based on IS success comes from Briggs et al. (2003),
which further justifies its importance. Namely, according to Briggs et al. (2003), in a
study comprising 8,000 projects in 352 companies, the Standish Group found that more
than half of software projects undertaken in the United States fail after deployment. In
other words, systems get deployed but eventually do not meet the expectations. The
issue of IS success should therefore be of great importance to researchers as well as to
organizations and the society. With respect to problems identified in other studies, the
D&M Model will be used to assess the success of ePortfolio, as it is the most appropriate
model for this purpose. Since the D&M Model was not previously used in this context, a
whole new set of criteria needs to be developed to match ePortfolio requirements.
According to the D&M Model, IS success consists of six constructs that are
interconnected. The existence or absence of ‘inner connections’ between the six
categories need to be established to comprehend the exact structure and dependencies
between the constructs that constitute successful ePortfolio implementation. In
addition, critical factors of success should be determined and incorporated into the
model to show their relationship with the six constructs within the model.
By following the Model of ePortfolio success that describes relationships between the
components of ePortfolio success as well as critical success factors needed for successful
implementation of ePortfolio, an academic institution will ensure that ePortfolio
implementation is successful. In other words, it will not only embrace the requirements
of all the interested parties but also give certain consideration to critical success factors.
This is the only way to ensure that information technology serves the people and not the
other way around.

10
To conclude, the research problem addressed in this dissertation is to develop an
instrument to measure the ePortfolio success from the student’s perspective following
the D&M IS Success Model and propose the ePortfolio Success Model based on empirical
results. The ePortfolio Success Model and the corresponding instrument will both enable
the assessment of ePortfolio success in an academic institution. In addition, a group of
factors that moderate relationships between the categories in the ePortfolio Success
Model are to be identified for a complete insight into components that constitute
ePortfolio success.

11
1.3 Complementary research
Within its E-learning strategy devised in July 2007, the University of Zagreb defined that
it will “establish and maintain an ePortfolio system at the University and/or at the
faculties within the University” (Kučina-Softić, 2007; E-learning strategy, 2007, p.14).
The report (Bekić&Kučina-Softić, 2008) from the Centre for e-learning at the University
of Zagreb states that its 11 constituents have announced the planning of conducting
other activities defined by the E-learning strategy, among which is ePortfolio. Several
studies presently exist within the Centre for e-learning that deal with certain
professional aspects of ePortfolio, such as the possibilities of tools that support
ePortfolio. However, neither any more complex research nor an integral strategy for
ePortfolio implementation currently exists. A similar state of affairs applies to other
universities in Croatia as well. On the other hand, universities all around Europe and
globally have started to use ePortfolio and stress the importance of its use, e.g. the
University of Porto (Martins et al., 2008), Carlow University2, Penn State University3, etc.
An integral model for ePortfolio implementation in academic institutions that would
take into account three different levels of stakeholders: 1. Individual (student and
teacher); 2. Institution; and 3. Employer, has not been developed. A lot of research on
ePortfolio (see Batson, 2002; Gathercoal et al., 2002; Love et al. 2004; Stevenson, 2006;
Ring&Foti, 2006; Stefani et al., 2007) mainly focuses on the process of its development
within an institution, defining ePortfolio requirements and case studies of institutions
that have implemented ePortfolio on the course level. However, “... ePortfolio system
implementation is in general a comprehensive educational innovation and therefore
support has to be provided in both pedagogical and technical sense” (Ring&Foti, 2006,
p.353). Furthermore, for the relevance and validity of ePortfolio implementation in
academic institutions to be increased, an entire set of factors that affect its
implementation has to be taken into account. It is very important to determine the value
in terms of benefits that all the stakeholders using ePortfolio gain. Moreover, the
2 Carlow University started to introduce an experiential learning portfolio based on their ongoing research about
ePortfolio importance. Details about ePortfolio at Carlow University can be found at
http://caa.carlow.edu/experiential.html 3 Penn State University has quite a long tradition in using ePortfolio, which can bee seen at
http://portfolio.psu.edu/.
12
promising strands of ePortfolio research include identifying the impact ePortfolio has on
job quality (Stevenson, 2006), taking into account all the possible future users, potential
benefits and its universality (Jafari, 2004).
By approaching the ePortfolio as an Information System, the D&M Model (Petter et al.,
2008) can be used to measure the success of ePortfolio system implementation. The
authors themselves suggest possible methods that can be used to measure the
constructs within the model, although so far none of the suggested methods has been
applied in the ePortfolio context. Since no specific methods exist for measuring a specific
construct, they need to be compiled for the needs of a specific research. Petter et al.
(2008) restated that problem as well in their latest research where they identified
several different approaches to measuring each construct in the model. They also noted
that other authors either used some generic, i.e. general, instruments (such as TAM or
SERVQUAL) or created their own indices for measuring constructs. An example of the
latter approach is found in Gable et al. (2003), where the authors analyzed gaps in the
existing IS success studies and proposed their own IS success model. Similarly,
Alberto&Gianluca (2007) considered several IS success research streams, one of which
was the D&M IS Success Model, and proposed their own theoretical framework to assess
IS success combining technology acceptance, task-technology fit and IS success streams.
An example of applying the D&M Model for measuring online learning systems success
can be found in Lin (2007). Having slightly modified the D&M Model, he tested it in the
learning systems context. Significant correlations between all the constructs of the
model were established, which means that all the constructs and their interrelationships
are important for the success of online learning systems.
Katerattankul&Siau (2008) went one step further by analyzing information quality, as
one of the constructs from the D&M Model, in the ePortfolio context. They tried to
validate the instrument for measuring information quality of ePortfolios. However,
regarding the D&M Model, the factors identified in that study do not refer only to the
information quality construct. For example, Web page length, visual settings, Web page
layout and other similar elements analyzed in the mentioned study are related to system
quality rather than information quality, if the D&M Model is considered as a whole.

13
Therefore for the purpose of this doctoral dissertation, none of the existing
aforementioned approaches is appropriate for the following reasons:
1. Existing instruments are either to general or inadequate as they encompass more
than one construct or just a part of the construct.
2. Assessment methods created by others are applicable only in a specific context
for which the measure was created. Since the ePortfolio context as a whole was
not included in any of the previous studies, neither of those measures is
appropriate for this doctoral dissertation.
With respect to the absence of suitable measures, in this doctoral dissertation an
individual specific for the ePortfolio context will be given to each construct and
corresponding measures will be developed.
In their latest paper (Petter et al., 2008), the authors of the D&M Model reviewed and
analyzed over 90 empirical studies in which the model was tested in different contexts,
but none of them was in the ePortfolio context. Based on study results, the same authors
suggest that future researchers should test the model on different IS as well as explore
the type and strengths of relationships between the constructs in a specific context.
“Empirical research is also needed to establish the strength of interrelationships across
different contextual boundaries. Researchers must take a step further and apply
rigorous success measurement methods to create a comprehensive, replicable, and
informative measure of IS success” (Petter et al., 2008, p. 258). Moreover, the same
authors suggested two possible levels of analysis: individual and organizational. Having
all this in mind, an ePortfolio success instrument will be developed to assess ePortfolio
success at the individual level of analysis encompassing all the measures specified in the
previous step. Based on the results obtained from the ePortfolio success instrument the
ePortfolio Success Model that will show relationships between the constructs of
ePortfolio success will be developed.
Another stand of research in the ePortfolio literature, apart from the ePortfolio model,
are the criteria that affect the maturity of ePortfolio (Gathercoal et al., 2002) and
ePortfolio critical success factors (Love et al., 2004). By reviewing these criteria and
factors as well as several dozen other sources and ePortfolio project reports, in this
14
dissertation a new set of critical success factors for ePortfolio implementation will be
proposed. In addition, the ePortfolio Success Model will be updated with those factors as
moderating factors between constructs for successful implementation of an ePortfolio
system.
Critical factors for successful implementation of enterprise systems are extensively
discussed in literature (see Fiona et al., 2001). However, in case of ePortfolio, the
available critical factors are insufficient on the account that:
1. Identified critical success factors are rather outdated as they were identified by
Love et al. in 2004. They need to be re-examined since, although observing the
ePortfolio in its entirety, some of them are not critical any more, and some of
those that should be proclaimed critical due to the technological and pedagogical
development are missing.
2. Several attempts have been made to identify factors that are important for using
ePortfolio (Gibson&Barret, 2003; Challis, 2005; Brant, 2006). Some of them were
rendered only in a narrative manner without any support of quantitative
research methods. All the studies mainly observed ePortfolio solely from the
learner’s perspective, while neglecting other perspectives.
With regard to arguments brought up in this paragraph, all the identified factors that
have an effect on ePortfolio implementation and usage will be taken into consideration
and included in the process of critical success factors identification.
Finally, the ePortfolio success instrument will be used to measure the ePortfolio success,
while the ePortfolio Success Model will show the structure of ePortfolio success,
providing insight into relationships between constructs and the impact of moderating
factors on the constructs of ePortfolio success at the individual level of analysis.

15
1.4 The purpose of the research
The purpose of the research in this dissertation is reflected in research goals. Two wider
goals that underlie the entire research can be identified:
1. Development of an instrument to assess ePortfolio success that leans on the very
well accepted DeLone&McLean Updated IS Success Model.
2. Further development and testing of the ePortfolio Success Model in the academic
environment.
Both the ePortfolio success instrument and the ePortfolio Success Model will be
considered at the individual unit of analysis in order to make them applicable to student
population.
Neither of the two aforementioned goals is simple or trivial. On the contrary, they are
fairly complex and therefore a whole set of activities and pre-research are needed in
order to fulfill them.
Bearing this in mind, the first goal will be decomposed into two sub-goals that will
present milestones in achieving the wider goal. Prior to the development of the
ePortfolio success instrument that will be based on the D&M Model it is necessary (1a)
to determine whether the D&M model is an adequate model to assess ePortfolio success.
Explanation and argumentation regarding this problem is given in Chapter 4. In that
chapter the connection between ePortfolio and IS is established and explained along
with the appropriateness of the D&M Model to be used in this context. After the
interrelationship has been determined and the use of the D&M Model found to be
legitimate, I will proceed (1b) to develop an instrument for measuring ePortfolio
success. In doing so, I will observe the recommendations of authors of the D&M IS
Success Model that the instrument is based on. Moreover, it needs to be mentioned that
an initial set of items will be developed for the all three levels of stakeholders:
individual, institution and employer, although due to sample restriction, the initial set of
items will be reduced to only one that can be perceived by students. In other words,
instrument validation will be performed at the individual level of analysis. The process
of instrument development will be covered in detail in Section 5.4.
16
The second wider goal needs to be decomposed and achieved by defining milestones.
After the ePortfolio success instrument has been developed and its validity tested, it is
necessary (2a) to identify a new set of Critical Success Factors (CSFs) based on the
existing factors found in literature and the ones based on experience of international
ePortfolio experts that will participate in the research process. Critical Success Factors
will be interpreted as Moderating Factors (MF) because they will either affect the
constructs or will moderate the relationships between constructs. A significant
difference between CSFs and the ePortfolio success instrument is that the former can be
detected only at the institution level, i.e., they are institution specific, while the latter is
applied to students and reflects students’ attitudes towards ePortfolio. A detailed
description of Critical Success Factors (CSF) and Moderating Factors (MF) important for
ePortfolio success is given in Sections 4.3.4 and 5.3. After the factors are identified and
ePortfolio success instrument is tested, it is possible (2b) to develop the ePortfolio
Success Model that will consist of:
a) Constructs from the D&M IS Success Model (supported by the ePortfolio success
instrument); and
b) Relationships between constructs derived from results of the developed
instrument.
In addition, CSFs for ePortfolio implementation will also be identified and the
implications for their inclusion in the ePortfolio Success Model will be given.
As a result, the ePortfolio Success Model will be developed with all its constructs,
relationships and the associated instrument.

17
1.5 The original scientific contribution of the research
In the previous section research goals that show the purpose of this research were
presented. The original scientific contribution this research will make is contained in the
hypotheses.
H1. Considering ePortfolio as an Information System, it is possible to develop a
measurement instrument to assess ePortfolio success.
Explanation for H1:
For this purpose, the ePortfolio system will be approached as an IS and the existing
literature on IS (for example, the D&M Model) and ePortfolio will be used to develop the
measurement model.
When the first wider goal and its sub-goals are considered, their correlation with this
hypothesis is obvious. The selection of the research methodology and instrument
development is described in Chapter 5. Chapter 6 deals with instrument validation. In
addition, Structural Equation Modeling (SEM) will be used to determine whether the
measurement instrument fits the data. The hypothesis is supported if the measurement
model (instrument) is valid and if it indicates a good fit.
H2: Based on the developed instrument, D&M IS Success Model and ePortfolio
literature, it is possible to develop an ePortfolio Success Model.
Explanation for H2:
For this purpose, paths between different ePortfolio success constructs (based on
DeLone&McLean) will be tested using multivariate data analysis. Critical success factors
from ePortfolio will be included in the model.
The identification of CSFs is presented in Section 5.3. If the first hypothesis is supported,
which would mean that the instrument is valid and fits the data, the Partial Least

18
Squares SEM (PLS SEM) will be used to explore the existence of paths between the
constructs in the structural model. The hypothesis is supported if the structural model
shows a good fit and if significant paths exist between the constructs. The whole process
is described in Chapter 7.
Results from both hypotheses testing are discussed in detail in Chapter 8.
The original scientific contribution of this research can be summarized as follows:
1. By combining different scientific approaches and emerging findings in the field of
ePortfolio it will be shown that ePortfolio is an Information System.
2. The instrument to assess ePortfolio success will be developed following the
Updated D&M IS Success Model.
3. Factors critical for the success of ePortfolio will be identified.
4. Based on the results obtained by administration of the instrument, an ePortfolio
Success Model will be proposed.

19
2 Portfolio: historical and learning context
Generally speaking, a Portfolio presents a personal record containing artefacts which
can be provided to the faculty, peers, friends, prospective employers, or the general
public. Owing to the ePortfolio concept, the user has finally been brought to the centre of
learning. The main purpose of e-learning is to bring the content to the learner in a most
suitable form thus enabling the learner to be more effective. This can be achieved by
embracing the ePortfolio technology.
However, Portfolio has not always been considered as powerful a tool as it is today. To
better understand its current role, an overview of the historical development of
Portfolio will be given in this chapter. Furthermore, since an artefact represents a
central and most important entity in a Portfolio, a comprehensive explanation of this
concept is also needed. The purpose and the structure of artefacts grouped together and
presented in a meaningful way determine the Portfolio type. According to the literature,
there are many types of Portfolio and therefore it is necessary to present and summarize
them into a few most cited and widely used ones. At the end of this chapter theoretical
assumptions and instructions for Portfolio implementation in teaching and learning will
also be presented.

20
2.1 From paper to electronic media
According to Love et al. (2004, p. 24) Portfolios offer “… a viable alternative to current,
high-stakes testing, which focuses education on test-taking rather that teaching and
learning”. Numerous authors (see Batson, 2003; Love et al., 2004; Stefani et al., 2007)
agree that Portfolios have had the most significant effect on education since the
introduction of formal schooling. Of course, when Portfolio was just a set of data stored
on paper, its potential was not fully exploited and therefore not so meaningful. Along
with the development of the media which store information (artefacts), Portfolio has
become increasingly more interesting to the end-user. Several levels of Portfolio
maturity considering Portfolio’s physical and theoretical qualities have been identified.
For example, Love et al. (2004) distinguish 5 levels of maturity in academic
surroundings, with each level presenting a stepping stone for the next one. Each of the
levels is briefly described below.
Level 1 – Scrapbook
Students develop portfolios on their own initiative. It is not mandatory to have a
personal Portfolio and students are unaware of each other’s activities. There is no
template or official Portfolio system. Student work can be presented either on paper
or some electronic media (hard-drive, CD-ROM, Web etc.).
Level 2 – Curriculum Vitae
The institution identifies a template which helps students to organize their work.
Their work can be guided by the educator, department or institution. No formal
feedback from the educator exists, but students can see each other’s work. Data can
be on paper or stored on electronic media.
Level 3 – Curriculum Collaboration Between Student and Faculty
From this stage and above, paper and standalone electronic media such as CD-
ROMs, hard drives etc. do not provide the needed functionality to satisfy all the
requirements that can only be met by a Web-based Portfolio or a Webfolio. In a
Webfolio, students can nominate who can view which items in their Portfolios.

21
Furthermore, it is possible to leave comments on other persons’ work. This level is
enriched with input from educators, student and the institution itself. Employers
can also easily view a student's Portfolio.
Level 4 – Mentoring Leading to Mastery
Portfolios allow students to receive feedback from mentors and educators. The
system is advanced so the educator can ‘lock out’ students from making further
iterations on a certain work assignment. Portfolio is used by students and educators
as well. Educators are given the opportunity to copy course syllabi and assignments
from one semester to the next. Employers can see student’s assignments along with
course syllabi, assessment criteria and a lot of other information. The advanced
usage of Portfolio can be clearly seen in this stage.
Level 5 – Authentic Evidence as Authoritative Evidence for Assessment,
Evaluation, and Reporting
Portfolios are very structured and organized according to institution standards.
Students and educators have the finest possibilities for managing their Portfolio.
Portfolio is of the highest value for students, educators, institution and employers.
Student work along with feedbacks, summative and formative assessment, syllabi,
links to standards, goals and other taxonomies can be presented. At this stage,
Portfolio can be used to assist with program assessment and revision.
At the first three levels, the Portfolio maturity model actually captures the utilization of
features of ICT for use in the Portfolio context, the number of which increases with each
level. On the other hand, at higher levels it is more oriented towards the academic
institution’s acceptance and readiness. By looking at the explanation of each maturity
stage, two conclusions can be drawn:
1. EPortfolio is of the highest value for the individual at Level 3. This is the level at
which an individual uses a Web-based Portfolio and has all its artefacts in the
digital form. A Web platform enables a lightweight presentation of artefacts as
well as collaboration with other peers and instructors.
22
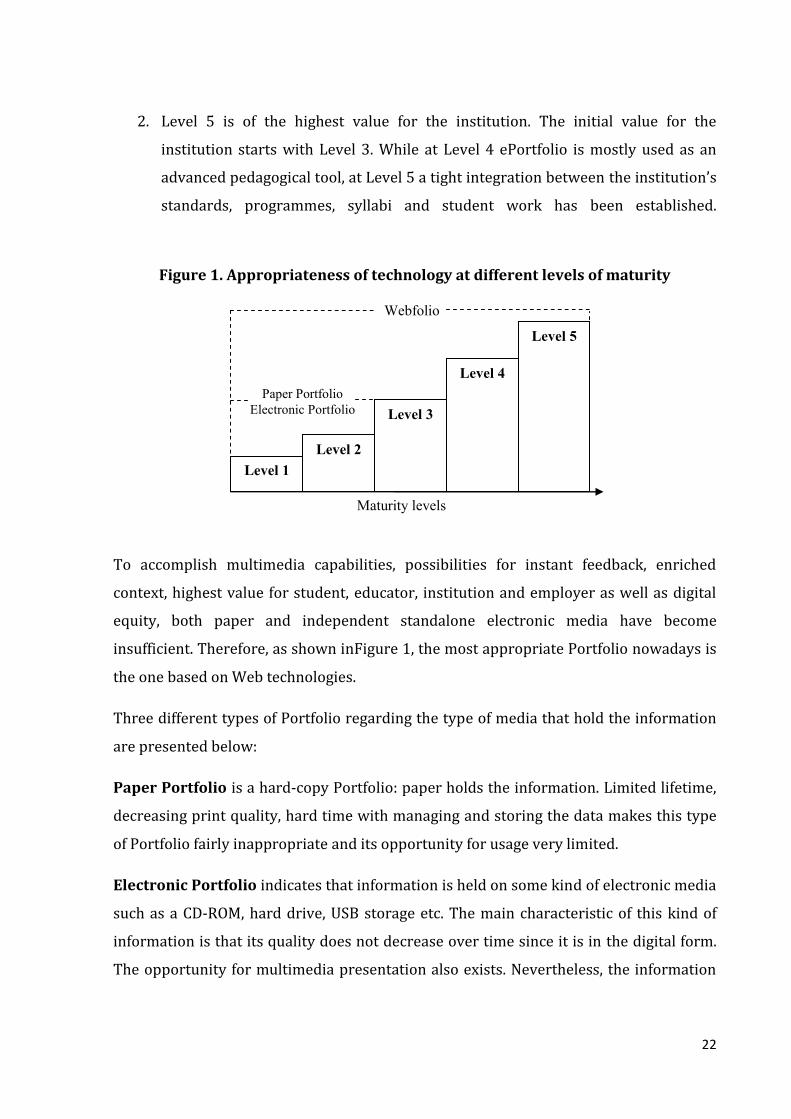
2. Level 5 is of the highest value for the institution. The initial value for the
institution starts with Level 3. While at Level 4 ePortfolio is mostly used as an
advanced pedagogical tool, at Level 5 a tight integration between the institution’s
standards, programmes, syllabi and student work has been established.
Figure 1. Appropriateness of technology at different levels of maturity
To accomplish multimedia capabilities, possibilities for instant feedback, enriched
context, highest value for student, educator, institution and employer as well as digital
equity, both paper and independent standalone electronic media have become
insufficient. Therefore, as shown inFigure 1, the most appropriate Portfolio nowadays is
the one based on Web technologies.
Three different types of Portfolio regarding the type of media that hold the information
are presented below:
Paper Portfolio is a hard-copy Portfolio: paper holds the information. Limited lifetime,
decreasing print quality, hard time with managing and storing the data makes this type
of Portfolio fairly inappropriate and its opportunity for usage very limited.
Electronic Portfolio indicates that information is held on some kind of electronic media
such as a CD-ROM, hard drive, USB storage etc. The main characteristic of this kind of
information is that its quality does not decrease over time since it is in the digital form.
The opportunity for multimedia presentation also exists. Nevertheless, the information
Maturity levels
Paper Portfolio
Electronic Portfolio
Level 1
Level 2
Level 3
Level 4
Level 5
Webfolio

23
remains isolated, being stored on a single electronic medium without enough
possibilities for sharing it with others.
Webfolio, or a Web-based Portfolio, represents the ultimate stage in the Portfolio
development. Information is kept on a Web server which can be easily accessed by many
users simultaneously. Since server storage is also an electronic medium, all features
from Electronic Portfolios remained the same, while additional functionalities and
flexibility were added making it possible to share the information and gain instant
access to that information.
There are three main differences between a Webfolio and a paper based Portfolio
(Stefani, 2007):
With a digital portfolio, it is easy to rearrange, edit and combine materials.
The student manages their own storage; content can be searched and accessed in
a non-linear fashion. Modifications can be made more frequently and more easily
than on paper.
The Webfolio is a ‘connected document’. Hyperlinks allow a student to connect
documents together thus forming a network of documents which can be stored
internally or on some external source.
It is not possible to retain portability without the electronic form. All
documents are stored and maintained as a set of digital files that can be easily
transported and transferred in accordance with needs. Therefore, a Webfolio can
be accessed and used in a variety of locations.
According to Buzzetto-More (2006), electronic portfolios have a number of advantages
over those that are paper-based as they support a greater variety of artefacts and allow
for increased learner expression; are dynamic and multimedia driven; accessible by a
large audience; contain meta-documentation; easy to store; and may serve to promote a
student academically or professionally.
Upon analyzing the main characteristics of different types of Portfolio it can be
concluded that a Webfolio as the cutting edge technology brings the most benefits to all
interested parties – from a student to a potential employer. In addition, a Webfolio can

24
be considered an extension of electronic types of Portfolio because the information is
also in the electronic form. In case of a Webfolio, however, a Web application that
utilizes Portfolio processes is also present. Therefore in this dissertation the term
ePortfolio will be used to denote a Webfolio as a special instance of an electronic
Portfolio.

25
2.2 The role of Portfolio in teaching and learning
Nowadays most universities tend to enhance learning by adding the online component,
which results in a new way of learning called e-learning that is increasingly being
enriched by ePortfolios. According to Stefani et al. (2007), ePortfolios can be used in
distributed, blended and totally online learning programmes and institutions. Lorenzo
and Ittelson (2005) depicted electronic portfolios as the biggest innovation in
educational technology since the introduction of course management systems showing
promise across disciplines, institutions, and applications. Moreover, they are changing
the perspective of learning, transferring it from the behaviorist theory towards
constructivist principles. For this reason, the underlying pedagogy of the ePortfolio is
probably one of the biggest contributions of this new phenomenon.
According to the ePortConsortium’s White Paper (2003), the benefits of electronic
portfolios in education are numerous, serving a number of purposes and stakeholders,
including: helping the student to develop organizational skills; recognize skills, abilities,
and shortcomings; assess their progress; demonstrate how skills are developed over
time; make career decisions; and promote themselves professionally. In addition, the
cited document refers to innovations in assessment: while traditional assessment is
‘one-dimensional’, ePortfolios offer an alternative approach that is more authentic and
user-centered. As a result, it is asserted that ePortfolios enable an expression of a broad
range of student knowledge and learning experience that may not be considered with
traditional assessment.
The constructivist theory places the emphasis on the learner instead of on the teacher.
The learner becomes the ‘centre of learning’, interacts with the content and gains
understanding and new ideas about the presented topic. Instead of the content, the focus
is on the learner and their way of understanding. The learner becomes autonomous,
feels encouraged and takes initiative.

26
According to Batson (2002), ePortfolio integrates three trends:
Student work is now mostly in the electronic form, or based on a canonical
electronic file even if it is printed out: papers, reports, proposals, simulations,
solutions, experiments, renditions, graphics, or just about any other kind of
student work.
The Web is everywhere: We assume that our students have ready access to the
Web (which is not always true, of course). The work is ‘out there’ on the Internet,
and therefore the first step for transferring work to a Web site has already been
taken.
Databases are available through Web sites, allowing students to manage large
volumes of their work. The ‘dynamic’ Web site that is database-driven, instead of
HTML link-driven, has become the norm for Web developers.
These characteristics enable ePortfolio to become a central supporting system to some
of the 21st century phenomena. Among them is Lifelong Learning (LLL), the
characteristics of which will be described in the next section. Furthermore, Personal
Development Plan (PDP), Personal Learning Environment (PLE) and reflective learning
will be extracted and explained as the most interesting trends and processes in LLL.

27
2.3 Lifelong Learning
The European Qualifications Framework (EQF)4, a common European reference
framework that enables European countries to interlink their qualifications systems,
distinguishes three forms of learning. According to Schugurensky (2000), these forms
can be defined as follows:
Formal learning goes from preschool to graduate studies. It comprises the
following features:
o it is highly institutionalized;
o it includes a period called ‘basic education’, which is compulsory and
implements a prescribed curriculum;
o each level prepares learners for the next one, and to enter into a certain
level it is prerequisite to satisfactorily complete the previous level;
o it is a hierarchical system;
o at the end of each level and grade, graduates are granted a diploma or a
certificate.
Non-formal learning refers to all organized educational programs that take
place outside the formal schooling system, and are usually short term or
voluntary. These programs usually do not require prerequisites in terms of
previous schooling. Teachers and curriculum exist, but with much more flexibility
than in formal education. An example of non-formal learning is driving lessons.
Informal learning takes place outside the curricula provided by formal and non-
formal educational institutions and programs. In the process of informal learning
there are no educational institutions, instructions or prescribed curricula. Three
forms of informal learning exist:
o Self-directed, in which learning is undertaken by individuals without the
assistance of an educator. It is intentional because the learner has defined
4 EQF issued the Recommendations of the European Parliament and of the Council on establishment of the
European Qualifications Framework for LifeLong Learning. The recommendations should contribute to
modernising education and building bridges between formal, non-formal and informal learning. For detailed
information, see http://www.qcda.gov.uk/libraryAssets/media/EQF_Recommendations%281%29.pdf.

28
the goal of learning something new even before the learning process
begins.
o Incidental, which occurs when the learner did not have any previous
intention of learning something out of that experience, but after the
experience one becomes aware that some learning has taken place.
o Socialization or tacit learning, which refers to the internalization of
values, attitudes, behaviors, skills, etc. in everyday life that learner has no
a priori intention of acquiring. They are not aware that they learned
something either when acquisition occurs.
Most formal learning ends at some point of human life, usually after formal schooling.
Unlike formal learning, informal learning starts almost from the birth, occurring in
parallel with formal learning and lasts throughout one’s entire life. Regardless of its
type, we can say that ‘modern’ learning continues throughout the entire lifespan of an
individual and combines all the aforementioned learning forms. Such a new way of
understanding learning is referred to as Lifelong Learning (LLL). Therefore ePortfolios,
except for providing an inventory of acquired knowledge and skills, should “have a
richer purpose: to facilitate lifelong learning” (Hartnell-Young, 2006, p. 126). Lifelong
learners should actively use PLEs and PDPs and should be reflective learners. If we
consider ePortfolio functionalities, it is therefore obvious that it could appropriately
support LLL.
Hargreaves (2004) suggests that lifelong learners know what they know, what they have
to learn, and what they can do for an employer. According to the same author, there is
increasing evidence that LLL does not start after schooling ends. EPortfolio provides an
environment for an individual to store and manage their artefacts throughout one’s
entire life. By facilitating reflections and feedbacks, ePortfolio supports both individual
and collaborative learning that makes for a very important component in LLL. In other
words, by supporting the processes in LLL, ePortfolio exceeds the boundaries of formal
education and takes place throughout one’s life.
PDP and PLE both represent ‘virtual processes and environments’ within LLL and occur
in formal, non-formal and informal learning.

29
2.3.1 Personal Development Plan
One of the features that ePortfolio shares with e-learning is that it enables individuals to
set their learning goals or develop action plans for the future. By setting one’s own
learning goals, an individual can track their progress toward the achievement of each
goal. In such a way, ePortfolio helps an individual to plan and track their personal
development. In the United Kingdom, a PDP encompasses a number of activities such as
(Grant&Richardson, 2006):
Discussing a learner's personal situation/experiences;
Compiling a list of experiences or past activities, including employment;
Reviewing and reflecting on logs;
Reviewing past written goals and action plans against more recent past
experience;
Listing achievements/qualifications (with documentation if available);
Relating experiences to skills (or vice versa);
Reviewing progress in/development of skills;
Reviewing personal interests;
Setting goals for skills development;
Setting goals related to subject development;
Originating action plan for the achievement of academic goals;
Revising CV/personal statement/other compilation;
Originating action plan for personal/skills development/goals;
Revising action plan for personal goals in the context of feedback/discussion, etc.
Identifying the key components of a PDP is essential for creating Web-based IT systems
that would support all the needed activities. In brief, a PDP can be described as a process
of supporting an individual’s theory of oneself as a learner. According to Grant et al.
(2006, p. 148) “this happens as part of a reflective cycle which we characterize as having
seven steps: noticing, documenting, recollecting, theorizing, goal setting, action planning,
and acting”. All these steps can be seen through the activities mentioned above. Today’s
ePortfolio systems can support most of these activities.

30
Embedding ePortfolio into a curriculum also contributes to integration of PDP into the
curriculum, many examples of which can be found in current literature, especially in the
United Kingdom, where a very high concern for quality in e-learning exists. PDP is
supported by reflection and (self)assessment processes. These two kinds of processes
enable the learner to plan their own development and actions that will lead them to
fulfill their goals.
2.3.2 Personal Learning Environment
Learning management systems have enabled the creation of the so-called Virtual
Learning Environment (VLE) in which a learner can enroll. In a VLE, all the tools and
materials needed in a course can be found in one place. Since the learner is virtually
present in a virtual class, the environment created in such a way was named a VLE. Such
an environment represented an organization-centered environment in which an
individual was enrolled. By introducing ePortfolio, the centre was shifted from the
organization and from VLEs towards another concept in which an individual plays the
central role by using information from different sources. As a result, a new environment
was created around the individual, called a Personal Learning Environment (PLE). That
environment enables the learner to learn in different contexts thus combining formal
and informal learning. According to Attwell (2007, p. 1), “the idea of a Personal Learning
Environment recognizes that learning is ongoing and seeks to provide tools to support
that learning”. Consequently, PLE is actually a set of tools that an individual uses in their
everyday life for learning. It can vary from a word processor, instant messaging tools, e-
mail, LMS, to a wide range of Web 2.0 tools.
A number of different forms of learning, new approaches to assessment and fast-
changing technologies exist nowadays. The purpose of contemporary and emerging
technologies should be their adaptability to end-user needs (especially their learning
styles) and simplicity or ease of use. It is not the user who should adapt to technology,
but vice versa.

31
It can be clearly seen that in a PLE individuals can choose which tools they will use.
Since an individual is the one who will ‘fetch’ all the necessary information from many
different systems, ePortfolio should be the central system in a PLE to enable the
individual to store, maintain and present the information obtained from various sources.
2.3.3 Reflective learning
In the constructivist theory of learning the emphasis should be put on the learners’
previous knowledge, their personal impression and personal field of interest regarding
the new content. In such a form of learning, learners need to be given a chance to
express themselves and connect their pre-existing knowledge with new facts or things
being learned. Such critical thinking about the matter that is being learned is called
reflection. ‘Reflection’ is often used to refer to activity individuals engage in concerning
things or events. According to Stefani et al. (2007), reflection seems to be part of the
forms of learning in which learners try to understand the material that they encounter
and relate it to what they already know.
In the ePortfolio context reflection means “contemplation on the meaning of artefacts,
ideas, expressions, and the processes that supported their creation, including a
consideration of intent” (Gibson, 2006, p. 145).
To become a reflective learner, one needs to develop certain skills such as critical
thinking. As a critical thinker, an individual is capable of thinking in a purposeful,
reasoned and goal-directed way, i.e. “the thinker is using skills that are thoughtful and
effective for the particular context and type of thinking task” (Blackburn&Hakel, 2006, p.
89).
Reflection is a very important process in modern schooling. Owing to its features,
ePortfolio offers support for reflection process, which is one of its main advantages over
other systems that support modern schooling. Despite all its potential benefits, there are
a few issues that should be taken into consideration regarding reflection. According to
Riedinger (2006), in an academic institution there should be a unique definition of
reflection along with instructions about what is expected from the reflection process.

32
Furthermore, students should be taught how to reflect in a purposeful way. Resistance
to reflection and clichéd responses is something that can be expected since the process
is relatively new to students so steps should be taken to prevent that from happening.
EPortfolios offer a great potential in enhancing dimensions for reflection. An academic
institution needs to nourish the culture of reflection in all organizational aspects.
According to Riedinger (2006, p. 100), effective reflection will depend “... on the
willingness of all to take risks, think outside of their disciplines, and learn childhood
curiosity – the art of asking why”.

33
2.4 Artefacts
Among other things, an ePortfolio is intended to act as a file repository. By adding
certain business logic it becomes a system for managing a user’s PLE and LLL
environment. “Documents, projects, and video that students felt represented their best
works and abilities were collected as artefacts for the portfolios” (Flanigan&Amirian,
2006, p. 105). An artefact is created for presentation purposes and can appear in the
form of text, presentation or a spreadsheet document, Web page, video, image or some
other multimedia content. The concept of artefact “captures the physical nature of those
items” (Gibson, 2006, p. 141). In other words, not every piece of data in a file repository
is an artefact and, when it becomes an artifact, it can have more than one meaning.
Gibson (2006) states the example of an artefact that represents a person and at the same
time, although maybe not intentionally, also captures the essence of a culture. By taking
all this into consideration, we can conclude that artefacts refer to a representative
collection of someone's work that best shows their skills, competencies, and talents. In
educational assessment, “artefacts provide evidence of what the person or group knows
and can do” (Gibson, 2006, p. 145).
One of the fundamental purposes of ePortfolio is to present one’s work through
artefacts. Therefore it is very important that these artefacts are authentic and valid.
However, not all artefacts can be verified for validity and authenticity. Since ePortfolio is
widely used in academic organizations for assessment purposes, one of the best ways to
start ensuring artefact validity is in an academic environment. Within an ePortfolio,
artefacts can be presented in different ways or views, depending on its purpose.
Actually, any electronic data becomes an artefact when it is published within the
ePortfolio and acts as evidence of one’s accomplishments.

34
2.5 Types of Portfolio
During the maturation process, ePortfolio has undergone many changes and different
perspectives of its perception. Numerous definitions of ePortfolio exist corresponding to
the phases of its development over time. Some of them were presented in the first
chapter of this dissertation.
Nowadays the term ePortfolio can be used to express several different aspects of
Portfolio such as the software; a particular representation of material (Portfolio view);
or all of the content (set of materials) from which a particular presentation will be
selected. In terms of the context in which ePortfolio is applied several types of ePortfolio
can be distinguished.
Depending on the level of institution, according to the scope of ePortfolio, three main
types exist (Stefani et al., 2007):
Course portfolio, where ePortfolio is assembled by students of one course;
Programme portfolio, which is related to a specific university programme and
used by students to document skills and outcomes they have learned and/or
gained in the academic programme; and
Institutional portfolio, which belongs to an institution and in which employees
record their achievements, future plans etc.
According to the same authors, if we use ePortfolio as e-learning tool, different
ePortfolio types can be recognized:
Assessment Portfolio for demonstrating achievements;
Presentation Portfolio used to evidence learning;
Learning Portfolio, in which a student documents and advances their learning
over time;
Personal development, which is related to professional development;
Multiple owner Portfolio, which allows more than one person to participate in
content development; and
Working Portfolio, which combines previous types of ePortfolios.

35
The European Portfolio Initiatives Co-ordination Committee (EPICC), which is part of
the European Institute for E-learning, classifies ePortfolios in terms of their purpose as:
Assessment Portfolios – used for assessment; however, they differ from other
assessment tools in that they are not based on testing. Portfolio owners are
instead required to provide evidence of their competencies.
Showcase Portfolios – showcase portfolios perhaps most closely resemble the
traditional notion of what a Portfolio is. Typically, they contain examples of the
portfolio owner’s best or most relevant work.
Development Portfolios – these portfolios are used to create personal
development plans and are best used in situations where learning is tailored to
the individual.
Reflective Portfolios – individuals use these portfolios to monitor their own
progress and development.
Joint Information Systems Committee (JISC), which is the leading organization in UK that
manages and funds over 200 projects related to innovative use of ICT in education and
research, has undertaken many projects concerning the development and
implementation of ePortfolio. JISC provides a different classification of ePortfolios
regarding their purpose:
Presentation – selected material for application for admission to study, job,
induction, appraisal or assessment;
Transition – supporting learners as they move between and across institutions
and sectors; and
Learning – personal and reflective, to guide and develop learning over time (both
formal and informal) in education, training and employment.
Another classification offered by Stevenson (2006) distinguishes three types of
ePortfolio according to their purpose:
Showcase ePortfolio – used to display work to prospective employers or
clients. It can be also used for peer assessment.

36
Structured ePortfolio – designed to meet preset requirements by an
accrediting agency or institution of higher education. Criteria or requirements
should be given as a template.
Learning ePortfolio – exhibit what students have learned, but are more
student-directed and less rigid in their makeup. It is a sort of a working
ePortfolio in which students develop reflective and learning skills.
With respect to numerous classifications presented above, several conclusions will be
drawn for the purpose of this dissertation:
1. Most ePortfolio classifications are based on one common criterion: its purpose. By
considering its purpose and role in Lifelong Learning it will be concluded here that
such a classification is the only one that is acceptable and applicable in the context
of ePortfolio. An institution that has reached Level 5 according to ePortfolio
maturity levels can define different classification types for its purpose, although
they will not be an object of this dissertation.
2. Considering the purpose of ePortfolio as a classification criterion and the diversity
of existing classifications (McGrath et al., 2004; IMS GLC, 2005; JISC, 2006;
Stevenson, 2006; Stefani et al., 2007), three main types of ePortfolios will be coined
here and used in this dissertation hereafter:
1. Assessment ePortfolio: Demonstrates individuals’ competences and skills for
well-defined areas. The purpose is to evaluate individual’s competency as defined by
program standards and/or outcomes in case of an educational institution. An
individual can publish their work and educators as well as peers can leave their
feedback.
2. Development ePortfolio: Demonstrates the advancement and development of
skills over a period of time. It is a direct support to Personal Development Planning.
3. Showcase ePortfolio: Demonstrates exemplary work and skills. Individuals
typically show this portfolio to potential employers, peers or educators. For
example, it can be one’s CV.

37
In addition, a Hybrid ePortfolio can be drawn by combining all the three types of
ePortfolio. As a matter of fact, this is the most widely used ePortfolio today. For example,
a job application ePortfolio is a type of Hybrid ePortfolio because it contains a CV as a
Showcase ePortfolio and a set of artefacts by which some work is demonstrated or
proven and according to which an individual will be assessed by the employer, which is
a characteristic of an Assessment ePortfolio.
It has to be noted, however, that these types are not to be taken for granted. In most
cases individuals will create an ePortfolio without being aware of the type they are
creating. Even if someone intends to create a Showcase ePortfolio, that same ePortfolio
can be used to assess that individual. In that particular case it will become an
Assessment ePortfolio.

38
2.6 Experiences with implementation in an academic institution
For users to effectively use an ePortfolio it is of great importance to introduce it into the
organization in a strategic way. It is also essential to select the system that will support
ePortfolio features according to users’ specific needs. In literature there are numerous
descriptions of different experiences with ePortfolio implementation at different levels
of education, from curriculum to course implementation. Key findings from the current
research will be presented in this chapter and used as a theoretical background for the
pre-pilot research of introducing ePortfolio at the course level at the Faculty of
Organization and Informatics (FOI) in Varaždin described in Chapter 3.
When implementing ePortfolio, three major management levels in organization are to be
taken into consideration (see Table 2). This is consistent with traditional organization
management as well as with levels of IS support (for example see Laudon&Laudon,
2002). The implementation process should be introduced at all the three levels to
ensure that this phenomenon is fully embraced by an academic institution. Of course,
step-by-step implementation is also possible and may be the one most often used,
especially with pilot projects. The three levels identified are common in every business
environment. They correspond to (1) strategic level; (2) tactical level; and (3)
operating level in organization management.

39
Table 2. Overview of different management levels
Level Strategic Tactical Operating
Description Identified by institution’s Mission, Vision and Strategy.
Characterized by teaching and learning processes.
Includes infrastructure components and user acceptance (the use of ePortfolio and user satisfaction).
Basic characteristics
- EPortfolio integrated into curriculum
- Assist in organization’s development
- Used for revision of study programmes
- Align ePortfolio with employability frameworks
- Improves student learning (by enabling reflections)
- Assist faculty to extend learning terrain
- Assessment tool - Improves self-
presentation
- All faculty staff should be involved in choosing and implementing ePortfolio
- Implementation should be a step-by-step process
- Education on use of ePortfolio (workshops, helpdesk etc.)
Implementation examples
- Alverno College Faculty (O’Brien, 2006)
- Queensland University of Technology (QUT) (Emmett et al., 2006)
- University of Strathclyde (Stefani et al., 2007)
- Alverno College Faculty (O’Brien, 2006)
- Montclair State University (Flanigan&Amirian, 2006)
- East Stroudsburg University (Flanigan&Amirian, 2006)
- University of Strathclyde (Stefani et al., 2007)
- University of Dundee (Doig et al., 2006)
- Montclair State University (Flanigan&Amirian, 2006)
- East Stroudsburg University (Flanigan&Amirian, 2006)
- Virginia Tech’s Department of Communication (Hickerson&Preston, 2006)
- Queensland University of Technology (Emmett et al., 2006)
The strategic level of implementation can be identified by the institution’s Mission,
Vision and Strategy. Starting from the top of the academic organization’s structure and
having in mind its mission, vision and strategy, it is considered that ePortfolios should
be integrated into the curriculum because they are shifting the control towards the
learner enabling student-centeredness and adoption of new learning models. In that
way they are inevitably affecting curriculum design and development. EPortfolio will
become a societal need in near future, and if they are not implemented into the

40
curriculum “they may never fulfill their potential and become a tool that alters learning
pedagogy” (Tosh, 2004). EPortfolio requires changes in the curriculum that was based
on traditional pedagogic methods. A learner will have the opportunity to show their
accomplishments to the society, to learn from the populace and to share resources with
the global community.
Alverno College Faculty (O’Brien, 2006) has implemented ePortfolio and stresses its
power to assist in the organization’s development. According to their experience,
ePortfolio allows faculties to explore and evaluate their own assessment practice over
time by specific courses and outcomes. This valuable feedback can be used to modify the
curriculum, and to positively influence the faculty’s development.
According to Emmett et al. (2006), Queensland University of Technology (QUT) aligned
ePortfolio implementation with the University’s key policies. Before the actual
implementation within the entire university, they did a series of extensive piloting and
testing. This enabled the institution to establish what modifications were needed in the
curriculum to align it with ePortfolio and vice versa. The project staff attained support
from senior management so the university did not only embed ePortfolio into the
curriculum, strategy and other teaching and learning structures but also opened up the
possibility to align ePortfolio to the Employability Skills Framework.
A few other examples of embedding ePortfolio into the curriculum can be found in
Stefani et al. (2007). The University of Strathclyde in Glasgow, Scotland and Alverno
College in Milwaukee embraced the idea of embedding personal development planning
into the curriculum. As a result, the institutions’ strategies as well as teaching and
learning processes were changed accordingly, thus enabling personal development
planning supported by ePortfolio to be implemented.
Teaching and learning correspond to the tactical level. Both teaching and learning
processes should be carefully designed bearing in mind the new pedagogical approach,
ICT development and students’ capabilities. It has been proven in several occasions that
ePortfolio improves student learning. The case of ePortfolio implementation at Alverno
College Faculty (O’Brien, 2006) is just one of the examples where ePortfolio served as a
pedagogical tool and helped students to connect learning across courses, assisting the

41
faculty to extend the learning terrain of their majors. It helped them to discover their
learning patterns. Stefani et al. (2007) stress the proper use of ePortfolio in the
assessment of knowledge as a key to successful ePortfolio implementation. The authors
extensively describe issues related to the assessment process such as improving
assessment reliability and authenticity, advantages of self and peer assessments, etc.
Some of those issues need to be solved at the lower level within the ePortfolio system
and need to be considered when choosing the ePortfolio system.
To fully utilize the ePortfolio potential, students and teachers should be prepared to act
reflectively. Reflection and self-regulated learning are one of the most interesting and
most important benefits ePortfolio brings to formal schooling. A brief overview of
reflection and reflective learning can be found in Section 2.3.3. Based on his experience,
Riedinger (2006) described how to teach students to reflect and underlined a few
challenges in reflection such as: (a) defining reflection in the most accurate way; (b)
teaching students how to reflect; (c) resolving issues in resistance to reflection; and (d)
recognizing and dealing with clichéd responses. Doig et al. (2006) also stressed the
importance of reflection and proper preparation of students and teachers for the
process.
An exemplary case of ePortfolio implementation in two courses (Flanigan&Amirian,
2006) shows how two university teachers, although teaching at separate universities
and in very different programmes, collaborated on the ePortfolio strategy, processes,
and results over a two-year period. As a result of their cooperation, they developed an
outline of the ePortfolio development process with concrete suggestions on the steps to
follow, design process, and modes of distribution.
Infrastructure (both hardware and software) and user acceptance are the essential
components at the operating level. Each of the two higher levels ultimately depends on
this basic level of implementation. In order for all ePortfolio functionalities and benefits
to find their application in an academic institution, two basic assumptions are: (a) to
find the most appropriate ePortfolio system; and (b) to prepare (i.e. train) all the
potential users to embrace the system. Research shows that students are by far the most
satisfied users of the system with some exceptions (for examples, see O’Brien, 2006;

42
Doig et al., 2006; Hickerson&Preston, 2006; Stefani et al., 2007). Most of the previously
mentioned research indicates that all faculty members including the management,
teachers, students and IT administration staff were involved in the process of choosing
and implementing the ePortfolio system. In case of the two courses at Montclair State
University in New Jersey and East Stroudsburg University in Pennsylvania
(Flanigan&Amirian, 2006), ePortfolio implementation was performed step-by-step, from
introducing the process, following the pre-designed templates for structure, to
introducing the artefacts, tutorials and reflection. Choosing the adequate software that
would support desired functionalities and requirements presented a challenge.
The University of Dundee (Doig et al., 2006) has also recognized the importance of
professional education in the process of using ePortfolios. Students were introduced to
the university’s ICT and VLE in order to develop appropriate skills needed for ePortfolio.
As a result of the project a long checklist was devised concerning processes that were
required to achieve an acceptable quality of reflections using ePortfolios. This university
has also embraced ePortfolio because of it's “... huge potential as a vehicle for helping
students to collect, record and evidence their achievements” (Doig et al., 2006, p. 165).
The implementation at QUT (Emmett et al., 2006) included workshops and an e-mail
help desk in order to help students with issues that may occur. Workshops addressed
faculty needs, using ePortfolio for assessment purposes, reflective practices for
workplace learning, and integration into the curriculum.
Another example of ePortfolio implementation at the course level can be found at the
Virginia Tech’s Department of Communication (Hickerson&Preston, 2006). Their
portfolio team selected a course first and then identified the Department’s needs. Along
with implementation in the classroom they made a checklist with transition to Portfolio
items that related to program, expense, assessment, implementation and refinement
planning. The ePortfolio team also made a survey analysis and confirmed once again the
usefulness of ePortfolios, but also identified some gaps in the process. In addition, the
consistency of ePortfolio use during both semesters as well as its ease of use were
confirmed.

43
Taking into consideration the experiences with ePortfolio implementation described in
this section, we can conclude that the needs of learners in higher education are rapidly
changing so it is very important to identify the existing requirements and anticipate
some of those likely to emerge in near future. An appropriate mechanism can be
embedded in all the three levels of organization’s management to ensure that ePortfolio
is well-accepted and judiciously used.

44
3 Preliminary research
This chapter describes preliminary research that had to be carried out prior to choosing
a research methodology and developing an ePortfolio success instrument in order to
fulfill all the necessary prerequisites for the main research. It should be noted that
preliminary research started two years before the ePortfolio instrument was developed
to allow full insight into the process of ePortfolio implementation and usage to be
gained.
Since ePortfolio implementation and usage had neither been reported in Croatia’s
universities nor at the Faculty of Organization and Informatics (FOI) in Varaždin before
the beginning of this research (Kučina-Softić, 2008) it was necessary to first implement
ePortfolio in teaching and learning at FOI. Three main goals to be achieved in that
respect were:
1. Intensive ePortfolio usage at FOI would be carried out for at least one academic
year that would enable FOI students to become potential respondents for the
ePortfolio success instrument.
2. The results of ePortfolio success instrument based on the results obtained from
Croatian students would be combined with those obtained from other
universities in Europe and USA.
3. The author of this dissertation would get fully acquainted with ePortfolio, its
implementation and usage, as well as with possible issues arising from those
processes.
It was fairly convenient that this institution was one of the pioneers in e-learning in
Croatia, so e-learning had already been established there. Moreover, a number of
Croatian faculties had adopted FOI’s e-learning strategy that was evaluated as one of the
most comprehensive e-learning strategies in Croatia, in the development of which the
author of this dissertation also participated. E-learning at FOI is based on the Moodle
platform and currently more than 190 courses from the undergraduate to the doctoral
level of study are implemented in the system. All of the courses have already reached
Level 2 (out of three prescribed levels) of e-learning maturity, which includes basic

45
course information, learning outcomes, forums, literature, selected educational
materials organized by units, calendar of important events, online exams, online
dictionary, homework upload and grading. So far only a few courses have reached Level
3, which includes online questionnaires, systematic grading of all online student
activities (discussions, exams, and access to materials) as well as audio and video
educational materials organized by units.
The research environment was prepared in two phases: 1. Introducing and selecting the
ePortfolio system; and 2. Using the ePortfolio in hybrid courses. In the first phase (2008)
students and several teachers were introduced to ePortfolio, its functionalities and its
purpose in teaching and learning. Moreover, two ePortfolio systems were presented,
both of which had to be used and evaluated by students. Based on their evaluation, one
ePortfolio system was chosen to be used in all the courses at FOI. In the second phase
(2009) the chosen ePortfolio system was used as a pedagogical tool and as a tool for self-
presentation in three blended courses, which enabled the students and educators to
actively use the system for teaching and learning as well as for self-presentation
purposes.

46
3.1 Introducing and selecting the ePortfolio system
During the winter semester of the 2008/2009 academic year the implementation of the
ePortfolio system in a hybrid (blended) course Security of Information Systems was
initiated at FOI. Instruction for the fifty-four students enrolled in the course included
conventional face-to-face lectures and practical sessions in a computer lab.
Supplementary teaching materials and discussion forums were placed in the Moodle
Learning Management System (LMS). Most of the students were in their third year of
undergraduate study.
This first implementation phase was motivated by two main goals:
1. Introducing the ePortfolio concept to students and educators. Here a common
strategy found in literature was followed, in which starting with small-scale
pilots aimed at exploring the ePortfolio in a specific context and training the key
players is preferred to introducing the system to all students at once.
2. Choosing which ePortfolio system would be most suitable for use at FOI
regarding the course structure, since most courses at the Faculty are organized in
a similar manner.
Since this was the first case of ePortfolio implementation at FOI and within the
University of Zagreb as well, three main aspects were taken into consideration:
1. Recommendations for ePortfolio specification by IMS/GLC;
2. Organizational/course requirements and possibilities, and
3. Available ePortfolio systems.
As suggested in the IMS ePortfolio specification, types of information that an ePortfolio
can contain include those related to (IMS, 2005):
digital and non-digital works created or part-created by the subject;
subject of the ePortfolio;
activities in which the subject has participated, is participating or plans to
participate;
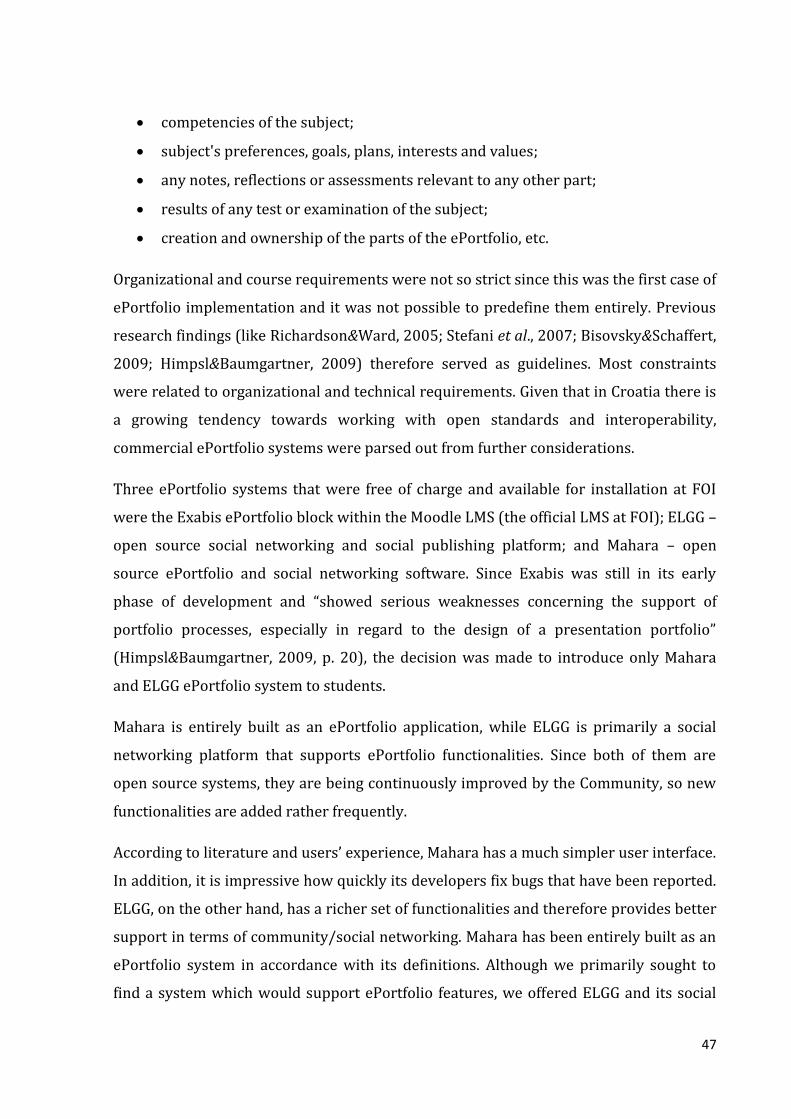
47
competencies of the subject;
subject's preferences, goals, plans, interests and values;
any notes, reflections or assessments relevant to any other part;
results of any test or examination of the subject;
creation and ownership of the parts of the ePortfolio, etc.
Organizational and course requirements were not so strict since this was the first case of
ePortfolio implementation and it was not possible to predefine them entirely. Previous
research findings (like Richardson&Ward, 2005; Stefani et al., 2007; Bisovsky&Schaffert,
2009; Himpsl&Baumgartner, 2009) therefore served as guidelines. Most constraints
were related to organizational and technical requirements. Given that in Croatia there is
a growing tendency towards working with open standards and interoperability,
commercial ePortfolio systems were parsed out from further considerations.
Three ePortfolio systems that were free of charge and available for installation at FOI
were the Exabis ePortfolio block within the Moodle LMS (the official LMS at FOI); ELGG –
open source social networking and social publishing platform; and Mahara – open
source ePortfolio and social networking software. Since Exabis was still in its early
phase of development and “showed serious weaknesses concerning the support of
portfolio processes, especially in regard to the design of a presentation portfolio”
(Himpsl&Baumgartner, 2009, p. 20), the decision was made to introduce only Mahara
and ELGG ePortfolio system to students.
Mahara is entirely built as an ePortfolio application, while ELGG is primarily a social
networking platform that supports ePortfolio functionalities. Since both of them are
open source systems, they are being continuously improved by the Community, so new
functionalities are added rather frequently.
According to literature and users’ experience, Mahara has a much simpler user interface.
In addition, it is impressive how quickly its developers fix bugs that have been reported.
ELGG, on the other hand, has a richer set of functionalities and therefore provides better
support in terms of community/social networking. Mahara has been entirely built as an
ePortfolio system in accordance with its definitions. Although we primarily sought to
find a system which would support ePortfolio features, we offered ELGG and its social

48
networking functionalities to students to see if they would use them too. Moreover,
Mahara supports single-sign-on (SSO) from Moodle so that when users log in Moodle
they are automatically logged in Mahara as well. However, no such connection was
activated in order to preserve the independence of the systems and avoid giving any
advantage to Mahara, considering that our students were using Moodle LMS and would
perhaps prefer to use a system that is interoperable with it.
3.1.1 Introducing the ePortfolio concept
Since ePortfolio had previously not been introduced in any of the courses at FOI, this
was the students’ first encounter with such a system. In order to avoid possible issues
and provide students with necessary information, a lecture was given as an introduction
to the concept of ePortfolio and also to ePortfolio as a tool to be used in the course. In
addition, an agenda with ePortfolio implementation stages and its usage was developed
and presented to students. Thus the students had a full insight into the entire process;
they knew what their assignments were and what would be expected from them at any
moment. In the same week in their laboratory sessions they were given a quick tutorial
on the use of ePortfolio systems Mahara and ELGG (see Table 3). All the students used
both systems and had to upload their artefacts in both of them.

49
Table 3. Stages of ePortfolio implementation
Stage Title and description:
1 Introduction to ePortfolio
1. Introduction to the ePortfolio concept and systems; The need for an
ePortfolio; Power of reflection
2. Logging into the systems and artefact upload:
a. Upload course related artefacts: seminar, presentation, practical work
b. Personal artefact upload (4-5 artefacts) -> ‘Best of me’ section
c. Tag the artefacts as follows:
i. All course related artefacts are to be tagged with SIS08
ii. Tag all personal related artefacts arbitrarily
3. Fill in your personal profile (including the resume) and review at least 5
profiles of your peers
2 Reflecting on ePortfolio
1. Monitor progress, problem solving ...
2. Reflect by answering the questions according to the template:
a. What have I learned about the ePortfolio?
b. What was the most interesting thing about using the ePortfolio so far?
Explain why.
c. What in the ePortfolio was less interesting? Why?
d. Where can I apply the ePortfolio in the process of my Lifelong
Learning?
3. Split in groups. Make a view available only to peers from your group in
which you will include the reflection made in Step 2. Use the ePortfolio systems
to give feedback on reflections made by other peers within your group.
3 Using ePortfolio to make course related reflections
1. Monitor progress, problem solving ...
2. Now the set of tasks has been created. Reflect on all 4 major units learned in
laboratory exercises. For each of them, answer the following questions by
using the given template:
a. What have I learned in this unit?
b. What was the most interesting part of this unit? Why?
c. What was less interesting? Why?
d. Where can I apply it in future?
4 Analyzing the results and evaluating the systems
1. Final conversation about students’ experience and impressions.
2. Analyzing and scoring students’ work in ePortfolio.
3. Evaluating the ePortfolio systems used during classes.
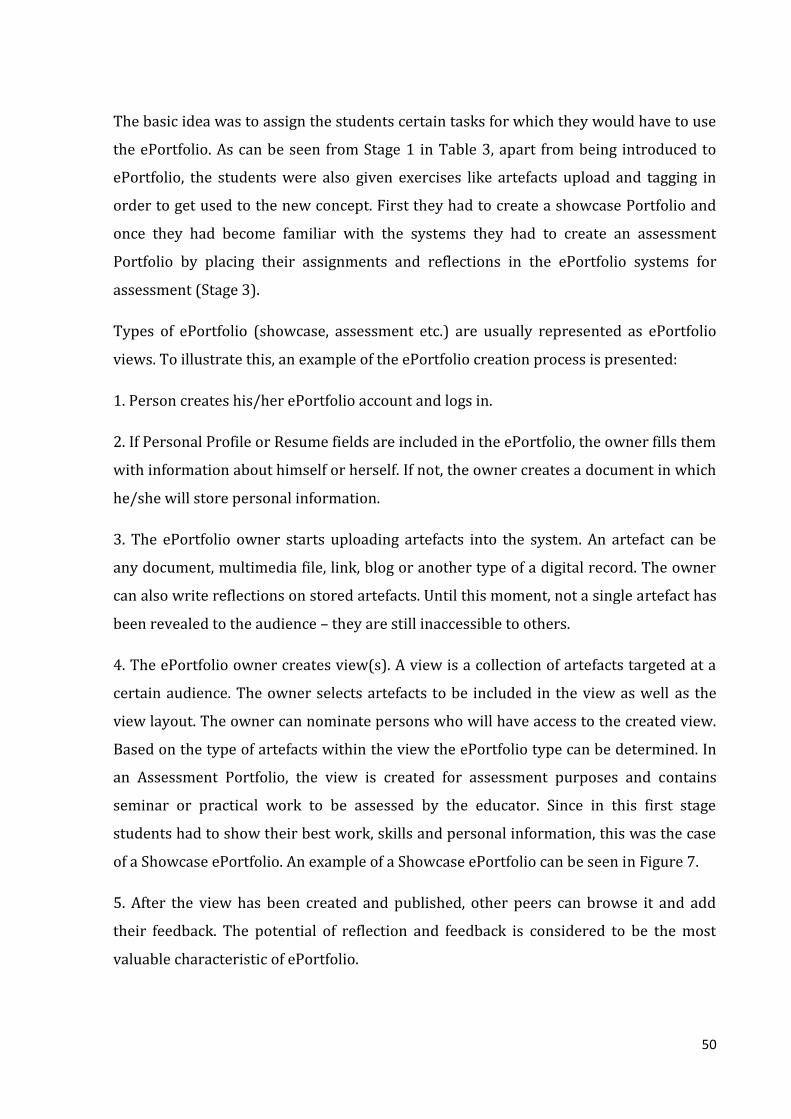
50
The basic idea was to assign the students certain tasks for which they would have to use
the ePortfolio. As can be seen from Stage 1 in Table 3, apart from being introduced to
ePortfolio, the students were also given exercises like artefacts upload and tagging in
order to get used to the new concept. First they had to create a showcase Portfolio and
once they had become familiar with the systems they had to create an assessment
Portfolio by placing their assignments and reflections in the ePortfolio systems for
assessment (Stage 3).
Types of ePortfolio (showcase, assessment etc.) are usually represented as ePortfolio
views. To illustrate this, an example of the ePortfolio creation process is presented:
1. Person creates his/her ePortfolio account and logs in.
2. If Personal Profile or Resume fields are included in the ePortfolio, the owner fills them
with information about himself or herself. If not, the owner creates a document in which
he/she will store personal information.
3. The ePortfolio owner starts uploading artefacts into the system. An artefact can be
any document, multimedia file, link, blog or another type of a digital record. The owner
can also write reflections on stored artefacts. Until this moment, not a single artefact has
been revealed to the audience – they are still inaccessible to others.
4. The ePortfolio owner creates view(s). A view is a collection of artefacts targeted at a
certain audience. The owner selects artefacts to be included in the view as well as the
view layout. The owner can nominate persons who will have access to the created view.
Based on the type of artefacts within the view the ePortfolio type can be determined. In
an Assessment Portfolio, the view is created for assessment purposes and contains
seminar or practical work to be assessed by the educator. Since in this first stage
students had to show their best work, skills and personal information, this was the case
of a Showcase ePortfolio. An example of a Showcase ePortfolio can be seen in Figure 7.
5. After the view has been created and published, other peers can browse it and add
their feedback. The potential of reflection and feedback is considered to be the most
valuable characteristic of ePortfolio.

51
Figure 2. Example of student's Showcase ePortfolio
3.1.1.1 Working with ePortfolio: educators’ perspective
Since the implementation involved a hybrid (blended) course it was much easier to
introduce ePortfolio to students than it would have been in a completely online course.
Laboratory exercises showed that students did not have any problems with either of the
ePortfolio systems since they were familiar with Web 2.0 technologies and e-learning in
general. At this point it has to be mentioned that, since the subject of the course was
information systems security, it was also expected that the students enrolled in the
course would be comfortable using (new) information technologies.
In Stage 1, the main goal was to get students interested in the ePortfolio. Previous
experience and literature review showed that students were likely to be more interested
in the type of work during which they could both create something for themselves and
show their competencies. This was the reason the students’ assignment consisted of

52
uploading their personal information as well as the information they found relevant for
showing ‘the best of them’. Another reason was the research (Fernández, 2008) which
showed that the information of the contents of ePortfolio must be selected by the owner
of the digital portfolio “to be able to show his or her educative achievement and
reflections about his or her own learning, in such a way that it reflects to himself or
herself and to the others (teachers or ‘peers’), the knowledge acquired in a certain
period” (Fernández, 2008, p. 56). That proved to be a complete success, because
students were very enthusiastic about this new idea of using ePortfolio. In fact, some of
them completed Stage 2 ahead of schedule.
The scope of Stage 2 was threefold. Firstly, the students needed to learn how to reflect,
which is in line with the user-centered constructivist approach and represents a crucial
step in using ePortfolio. The tendency of new ePortfolios in Web-based environments
needs to be more oriented towards the modern theories of learning, typically including
aspects like social learning with a constructivist perspective while taking into
consideration its individualization aspect (Fernández, 2008). Secondly, by dividing the
students into groups within which they were supposed to browse and comment on
views of their peers, they had to realize the potential of using ePortfolio views for
presentation and feedback from others. Thirdly, it was important to get feedback from
students about ePortfolio to find out their opinion about the ePortfolio and its usage in
teaching and learning.
Stage 3 had a single purpose: to create an Assessment ePortfolio. When assessment is
concerned, it has to be noted that certain types of work are suitable for assessment
using ePortfolio, whereas others are better assessed with an LMS. For example,
ePortfolio can be used for peer to peer assessment and as a reflection-based assessment
tool, while LMS is more suitable for traditional assessment types such as tests and
quizzes. The feedback received from the students at this stage was of great value for this
research and it could even be considered as an added value. A detailed insight into the
parts of the course that the students found either less appealing or too comprehensive
was also obtained. It was also indicated which aspects of the course should be changed
and why, as seen from the students’ perspective. As a result, improvements in the course
were made for the next generation of students, using the participants’ suggestions.

53
3.1.1.2 Students’ experience
The initial part of Stage 4 included a face-to-face discussion with the students about the
ePortfolio concept, which was an opportunity for students to update their reflections
and feedback from the previous stages. In addition, their impressions about ePortfolio in
the form of reflections were analyzed. Judging by students’ reactions, there is a huge
potential for ePortfolio implementation at FOI to be exploited in the future. Selected
parts of students’ feedback are presented below:
“So far I didn’t know there were systems as good as ePortfolio. The famous Facebook
and similar systems are used for creating a personal profile and communication, but
they do not provide what is important, what ePortfolio systems do provide, especially
Mahara. Those systems offer a possibility to find a job much faster and more easily, to
work on projects and maintain relationships with other peers that use the same system.
By all means, I fully support educators in introducing ePortfolio to students. It is most
likely those systems will replace a job interview in the future.”
“EPortfolio has enabled me to record my qualifications and experience in course of
education. My own ePortfolio could assist me in student mobility, in finding a right job
and starting my career. EPortfolio enables me to introduce myself, my competencies,
skills and work to potential employers.”
“EPortfolio has a special purpose in fulfilling personal goals. Namely, when you have
your life goals written out in a single place like an ePortfolio, you tend to look at them
more often and therefore ask yourself whether they are being fulfilled. If one of those
goals is lifelong learning, it can be assumed that some of the activities in your life would
be directed towards fulfilling that goal.”
“I see ePortfolio application in lifelong learning primarily as an opportunity to express
our soft skills we didn't acquire in formal education but rather through working on
projects or teams or while doing some other job ( ... ). Furthermore I like the possibilities
the ePortfolio offers, such as the ability to benchmark with other peers. In that way we
can perceive our weaknesses and strengths to work on in order to improve our own
capabilities.”
54
3.1.2 Choosing the ePortfolio system
In the final step of Stage 4 students had to complete a comprehensive questionnaire
aimed at the evaluation and comparison of the two ePortfolio systems used in the
course. Statements in the questionnaire were mostly focused on (a) application features
such as the ePortfolio application in general, organization of artefacts, file management,
communication, security and privacy, as well as (b) technical features. Furthermore, in
order to find out more about the students’ impressions regarding the use of ePortfolio as
a new way of learning, several statements were included in the questionnaire for that
purpose only. It is important to mention that the questionnaire was based on an
extensive overview of ePortfolio literature, as well as on a questionnaire developed for
online course evaluation in the previous research (Bubaš et al., 2007).
By analyzing the students’ responses in the questionnaire, some interesting results were
obtained. In the process of selecting the ePortfolio system, Mahara outperformed ELGG
in all the categories. Therefore Mahara was the system introduced to students in several
other courses during the summer semester 2008/2009. More than 500 students are
currently using Mahara as an ePortfolio system at the Faculty. The second goal of
introducing the ePortfolio as a new concept and teaching and learning methodology has
also been fully realized. Namely, based on students’ reflections presented in the previous
section and the results of the first part of the questionnaire, in which the students
expressed their opinion about the ePortfolio in general, we can conclude that they were
impressed with this new tool. Most of them (76%) intend to use Mahara and ePortfolio
in general in the future to show their competencies, work results, goals and reflections.
The students did not only find the ePortfolio very useful, but also reported that learning
how to build a personal ePortfolio was fairly easy for them. Detailed data about the
questionnaire items and validation as well as the results obtained can be found in
Balaban&Bubaš (2009).
55
3.2 Using ePortfolio in hybrid courses
Based on the results from the pilot project, a second phase was initiated. For this phase a
twofold goal was defined: 1. To install and provide support for the needed ICT
functionalities; and 2. To prepare students to work with ePortfolio. Concerning the ICT-
related issues, it was necessary to decide on hardware and software requirements, study
the possibilities of Moodle and Mahara integration and determine whether changes in
the application interface would be needed.
The process of introducing the ePortfolio concept to students through training tasks was
conducted within the course Informatics 2 (approximately 200 students). This blended
course is taught in the summer semester and is enrolled by most of the undergraduate
students at FOI. Since it was used to introduce ePortfolio to students, several lectures
were delivered to students accompanied by ePortfolio materials explaining ePortfolio
and its purpose in lifelong learning. These introductory actions were almost identical to
Stages 1 and 2 in the pilot project. In addition, laboratory sessions were held to make
students familiar with Mahara as an ePortfolio application and its functionalities. After
that, students had two weeks to try out the application, explore the reflections segment
and do their first task in ePortfolio. It consisted of making their own reflections about
the ePortfolio following the questions provided in the template. The questions were the
same as those in Stage 2 of the pilot project (see Table 3, Stage 2, task 2). Other
reflections were related to the remaining three main topics of the laboratory exercises:
Linux OS, Open Office and Python programming. Students were asked to reflect on those
topics according to the instructions provided in the template. The template for reflection
was provided at the end of each topic. At the end of the semester the students stated that
they had found the reflections very interesting. On the other hand, the teachers were
given feedback about the topics and the attractiveness of the content, which enabled
them to make slight modifications accordingly. In the course of the semester the
students got familiar with ePortfolio and learned how to use the system. They also
learned how to use ePortfolio as a pedagogical tool since their reflections were
evaluated. Moreover, they were prepared to show their CV or to create a showcase
ePortfolio to present themselves in different contexts. With all this, prerequisites were
met for a comprehensive usage of ePortfolio in other courses.

56
The full scale use of ePortfolio at FOI is conducted in the fourth semester of the
undergraduate study, where students enroll in Selected Chapters of Mathematics (SCM),
which is quite a complex course consisting of six chapters. In addition to monthly tests,
students have to work on many problem-solving exercises that imply using
mathematical theory and ICT tools that support problem solving. The ePortfolio was
therefore introduced in order to fulfill two goals: 1. To enable students to reflect on their
progress in the course; and 2. To provide a tool for the assessment of learning outcomes
to be used both by students and teachers. Students continuously had to reflect on the
issues they had learned, referring to the learning outcomes for each particular chapter.
Students’ reflections in ePortfolio needed to be written within two weeks after the
lectures on a certain chapter had finished. The students’ work done in ePortfolio was not
an obligatory condition for fulfilling their course requirements and getting the
professor’s signature in their student’s transcript. However, by participating in it
students were able to collect 6% of the total amount of points awarded for coursework
in SCM (i.e., 6 points, or one for each chapter). In awarding these points, teachers used
the following criteria: student understanding of the basic course concepts presented in
the reflection, student achievement evidenced by the attached artefacts and creativity of
their choice. The teachers’ motivation for introducing this new kind of assessment was
to gather reflections and evaluation of learning outcomes in working with a large group
of students (approximately 250 students in SCM and only 3 teachers – 1 professor and 2
teaching assistants). In such an instructional environment there is a significant number
of students who do not have the opportunity to express their opinion and the teachers
can hardly manage to monitor their individual achievements. The intention of using
ePortfolio was thus to obtain better insight into the progress and work of individual
students. Detailed analysis of this process can be found in Balaban et al. (2010b).
The whole process of ePortfolio implementation described in this section lasted for
almost 18 months, starting from the pilot project and ending with its full scale
implementation. Such thorough planning and implementation of ePortfolio presented a
solid ground for further research. Today more than 500 students are using ePortfolio at
the Faculty of Organization and Informatics, some of whom will be used as respondents
in this research.

57
4 Information System approach to ePortfolio
From the description of ePortfolio, its main characteristics and possibilities for its
implementation it is obvious that ePortfolio is a system that supports LLL
(Richardson&Ward, 2005; Hartnell-Young, 2006). To determine whether ePortfolio
fulfils its purpose (by, for instance, supporting required educational processes in a
corresponding manner) or whether it is successfully implemented and applied within an
academic institution, a method for measuring ePortfolio performance should be
developed. From the current ePortfolio literature review mostly contained in Chapter 2
and Section 4.3 it can be noted that so far very little attention has been given to
ePortfolio success, while successful ePortfolio implementation has been reduced to case
studies only. Moreover, the research results related to popular IS Success Models (such
as the D&M Model and Gable et al.'s Model) do not mention the usage of such models in
the ePortfolio context (see Seddon et al., 1999; Petter et al., 2008; and Gable et al., 2008).
In this chapter, a comparison between ePortfolio and IS will be made to show that an
ePortfolio is in fact an IS. In order to reveal and comprehend the processes that an
ePortfolio system should support, the ePortfolio meta-model that describes
data/information flows, processes and entities will also be presented. By perceiving
ePortfolio as an IS it is possible to apply IS success methods for measuring ePortfolio
success. While some of the methods for IS success will only be briefly presented, the
D&M IS Success Model to be used in this research to assess ePortfolio success will be
explained thoroughly along with reasons for choosing that model. Beside the D&M
Model constructs that determine ePortfolio success, Moderating Factors (MF) of
ePortfolio success to be embedded into the D&M Model will be revealed and argued for.

58
4.1 EPortfolio as Information System
Several examples that indicate the interrelationship between ePortfolio and IS can be
found in literature (see Jafari, 2004; Richardson&Ward, 2005; Mu et al., 2010). In his
description of ePortfolio, Jafari (2004) approached its development using the IS
framework. Mu et al. (2010) attempted to conceptualize the functional requirements for
ePortfolio systems referring to ePortfolio as a concept which consists of people and
technology. Although ePortfolio is frequently considered merely as an IT tool, its very
concept actually comprises a lot more than that. As with any other IS, when ePortfolio is
concerned, it is not sufficient to merely embrace the technology; it has to be adopted and
used by people supporting all the required business processes in a proper way. An
ePortfolio is a set of interrelated or ‘meshed’ components and functionalities, which also
applies to IS. Therefore, ePortfolio applications should be put in a wider organizational
context. Such an approach was taken in the research by Mu et al. (2010) in order to
understand ePortfolio functionalities and their prioritization criteria. In the same paper,
the authors discussed the challenges associated with the adoption of ePortfolios
drawing on the literature about IS adoption and assimilation. Furthermore, in their
survey conducted in the UK, Richardson&Ward (2005) argued that ePortfolios should
support LLL. They also reported a significant discrepancy between ePortfolio
applications and the requirements of a LLL environment as an organizational system to
be supported with ePortfolio. In their study, the authors interpreted ePortfolio as an
electronic system that supports LLL.
These examples justify the attempt to view ePortfolio as IS, suggesting that it should also
be treated as such during deployment, while paying particular attention to its
organizational context. In this dissertation two different approaches are used to provide
evidence that ePortfolio is IS:
1. Descriptive method describes a phenomenon as such and is opposed to the
genetic method. In addition, Johnson (1953) argues that this method is in
contrast with exemplifying the causes of a phenomenon or ascertaining its value
or significance. Since this approach is not adequate for understanding a life-cycle
59
of a phenomenon it cannot be used in the process of the IS development.
However, it can be used to show the functions and goals of an IS to the end-user.
2. Genetic taxonomy (Brumec, 1997) provides a rationale for the existence of an
IS, its development, source and origin. It is derived from a philosophical approach
named the ‘genetic method’ (see Jensen, 1939; Žugaj, 2007) that tries to analyze
and understand a phenomenon in terms of its genesis or origin. In case of IS, it
explains why a particular IS exists and how it operates to support business
system processes5.
It is important to emphasize that these two approaches are not mutually exclusive. On
the contrary, they observe the same phenomenon from two different aspects. The
genetic taxonomy is used to define and explain an IS from the perspective of an IS
analyst and is therefore much more comprehensive than the other method. On the other
hand, the descriptive method describes an IS to the end-user and therefore does not
need to be as exhaustive as the genetic one. In this research more attention will be given
to the genetic taxonomy bearing in mind its complexity and the potential of using it in IS
design.
4.1.1 Descriptive methods
In this section comparison between IS and ePortfolio definitions will be made. The
resemblance between the definitions will be highlighted that can be attributed to
similarities between the systems themselves. In Table 4 common attributes (3)
extracted from IS definitions (1) and ePortfolio definitions (2) are grouped. It is
assumed that similarities in definitions reflect similarities between objects.
5 According to Brumec (1997) and Alter (2002), a business process is a set of mutually connected activities and
decisions undertaken to achieve some specific parts of a common goal of the organizational system, for
performance of which some resources and time are necessary. Different participants perform the same activities
differently due to differences in their skills and knowledge.
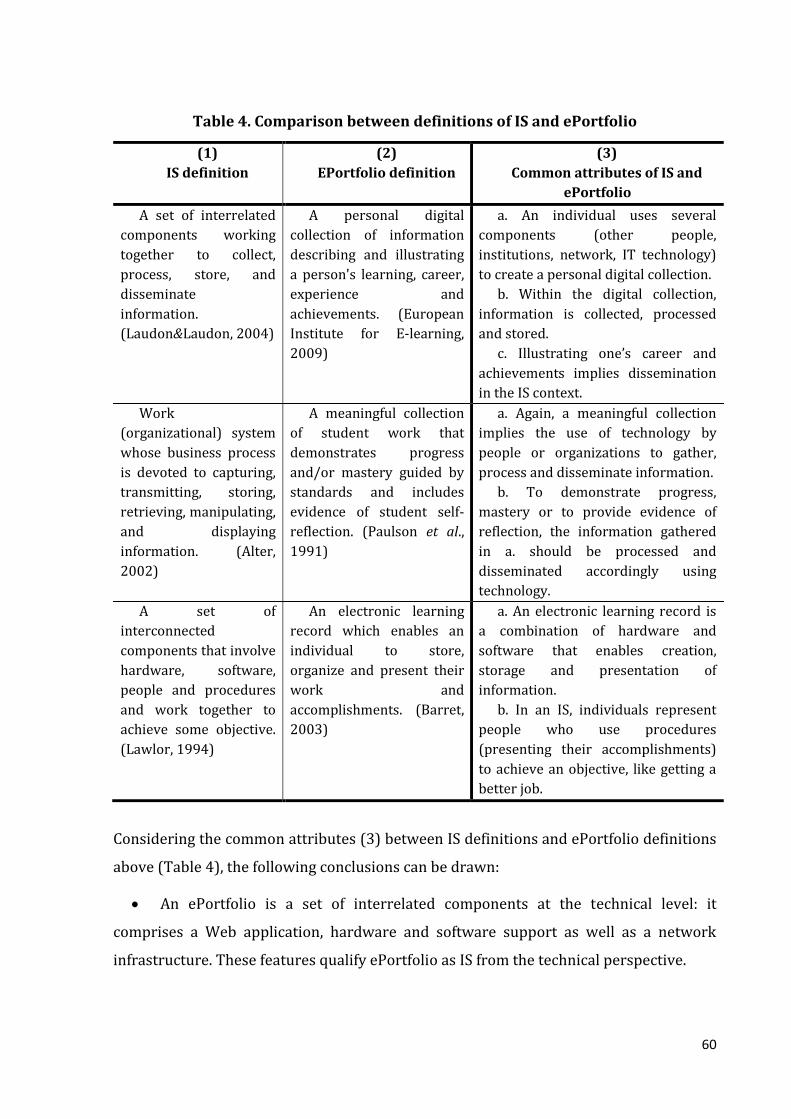
60
Table 4. Comparison between definitions of IS and ePortfolio
(1)
IS definition
(2)
EPortfolio definition
(3)
Common attributes of IS and
ePortfolio
A set of interrelated
components working
together to collect,
process, store, and
disseminate
information.
(Laudon&Laudon, 2004)
A personal digital
collection of information
describing and illustrating
a person's learning, career,
experience and
achievements. (European
Institute for E-learning,
2009)
a. An individual uses several
components (other people,
institutions, network, IT technology)
to create a personal digital collection.
b. Within the digital collection,
information is collected, processed
and stored.
c. Illustrating one’s career and
achievements implies dissemination
in the IS context.
Work
(organizational) system
whose business process
is devoted to capturing,
transmitting, storing,
retrieving, manipulating,
and displaying
information. (Alter,
2002)
A meaningful collection
of student work that
demonstrates progress
and/or mastery guided by
standards and includes
evidence of student self-
reflection. (Paulson et al.,
1991)
a. Again, a meaningful collection
implies the use of technology by
people or organizations to gather,
process and disseminate information.
b. To demonstrate progress,
mastery or to provide evidence of
reflection, the information gathered
in a. should be processed and
disseminated accordingly using
technology.
A set of
interconnected
components that involve
hardware, software,
people and procedures
and work together to
achieve some objective.
(Lawlor, 1994)
An electronic learning
record which enables an
individual to store,
organize and present their
work and
accomplishments. (Barret,
2003)
a. An electronic learning record is
a combination of hardware and
software that enables creation,
storage and presentation of
information.
b. In an IS, individuals represent
people who use procedures
(presenting their accomplishments)
to achieve an objective, like getting a
better job.
Considering the common attributes (3) between IS definitions and ePortfolio definitions
above (Table 4), the following conclusions can be drawn:
An ePortfolio is a set of interrelated components at the technical level: it
comprises a Web application, hardware and software support as well as a network
infrastructure. These features qualify ePortfolio as IS from the technical perspective.
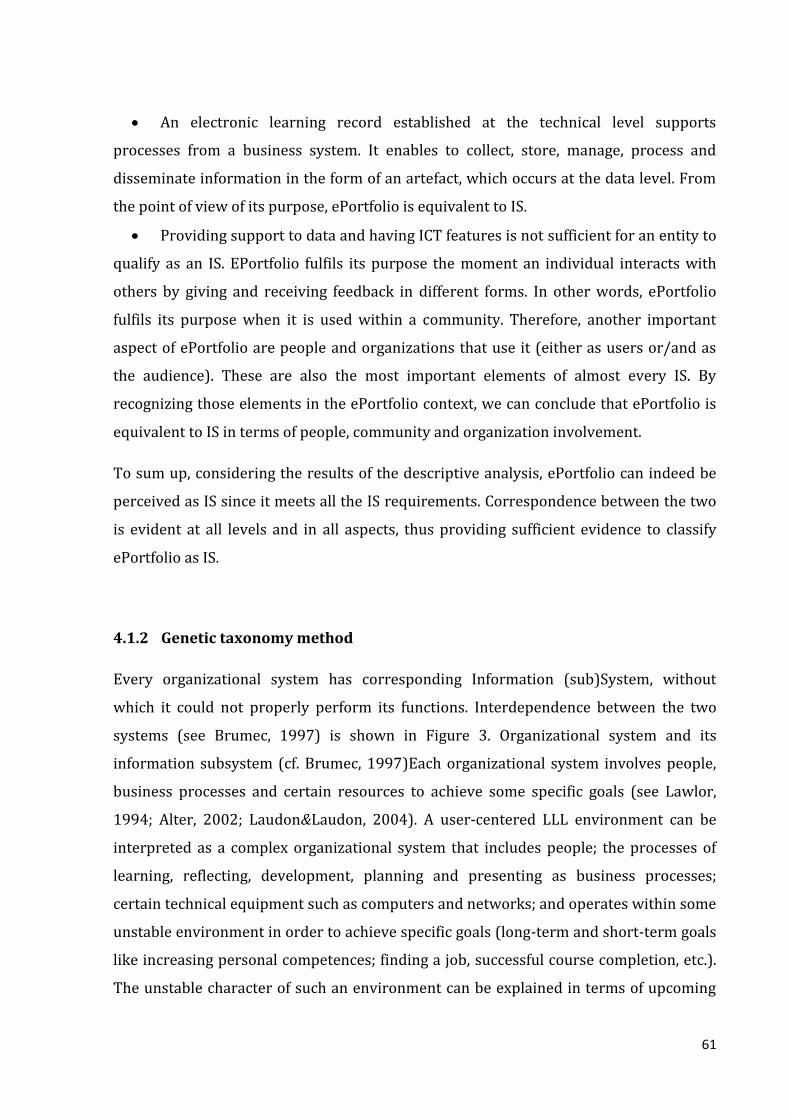
61
An electronic learning record established at the technical level supports
processes from a business system. It enables to collect, store, manage, process and
disseminate information in the form of an artefact, which occurs at the data level. From
the point of view of its purpose, ePortfolio is equivalent to IS.
Providing support to data and having ICT features is not sufficient for an entity to
qualify as an IS. EPortfolio fulfils its purpose the moment an individual interacts with
others by giving and receiving feedback in different forms. In other words, ePortfolio
fulfils its purpose when it is used within a community. Therefore, another important
aspect of ePortfolio are people and organizations that use it (either as users or/and as
the audience). These are also the most important elements of almost every IS. By
recognizing those elements in the ePortfolio context, we can conclude that ePortfolio is
equivalent to IS in terms of people, community and organization involvement.
To sum up, considering the results of the descriptive analysis, ePortfolio can indeed be
perceived as IS since it meets all the IS requirements. Correspondence between the two
is evident at all levels and in all aspects, thus providing sufficient evidence to classify
ePortfolio as IS.
4.1.2 Genetic taxonomy method
Every organizational system has corresponding Information (sub)System, without
which it could not properly perform its functions. Interdependence between the two
systems (see Brumec, 1997) is shown in Figure 3. Organizational system and its
information subsystem (cf. Brumec, 1997)Each organizational system involves people,
business processes and certain resources to achieve some specific goals (see Lawlor,
1994; Alter, 2002; Laudon&Laudon, 2004). A user-centered LLL environment can be
interpreted as a complex organizational system that includes people; the processes of
learning, reflecting, development, planning and presenting as business processes;
certain technical equipment such as computers and networks; and operates within some
unstable environment in order to achieve specific goals (long-term and short-term goals
like increasing personal competences; finding a job, successful course completion, etc.).
The unstable character of such an environment can be explained in terms of upcoming
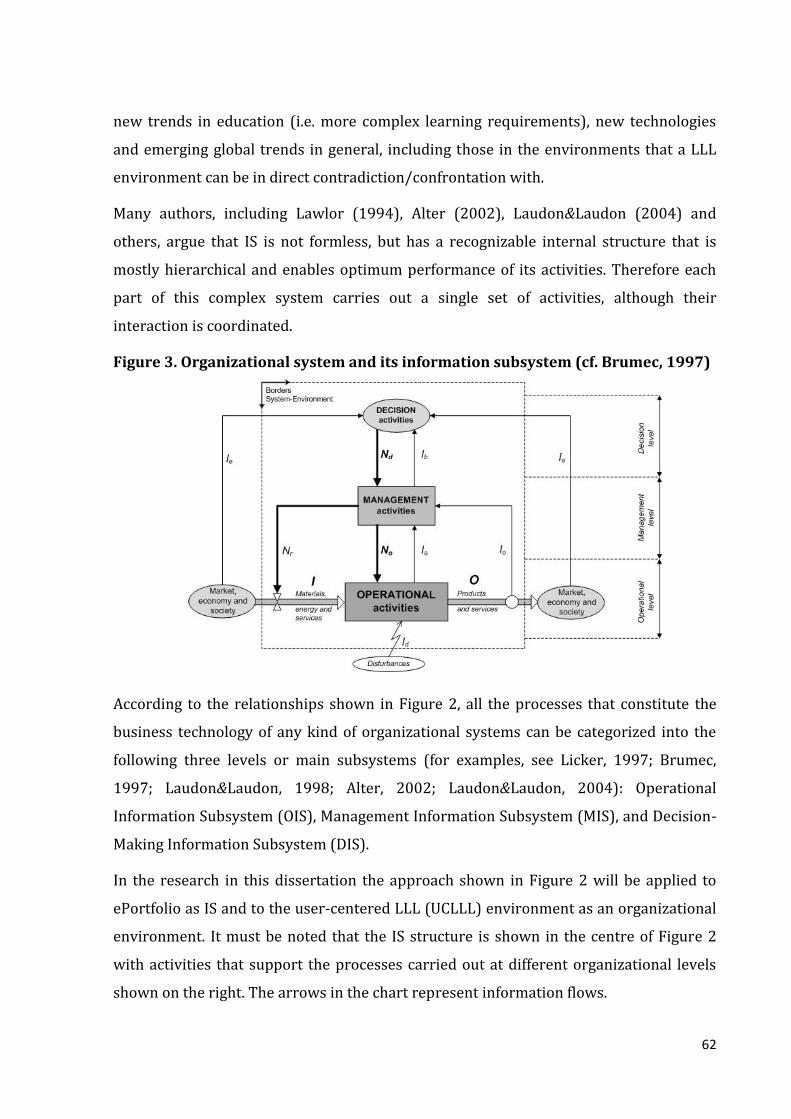
62
new trends in education (i.e. more complex learning requirements), new technologies
and emerging global trends in general, including those in the environments that a LLL
environment can be in direct contradiction/confrontation with.
Many authors, including Lawlor (1994), Alter (2002), Laudon&Laudon (2004) and
others, argue that IS is not formless, but has a recognizable internal structure that is
mostly hierarchical and enables optimum performance of its activities. Therefore each
part of this complex system carries out a single set of activities, although their
interaction is coordinated.
Figure 3. Organizational system and its information subsystem (cf. Brumec, 1997)
According to the relationships shown in Figure 2, all the processes that constitute the
business technology of any kind of organizational systems can be categorized into the
following three levels or main subsystems (for examples, see Licker, 1997; Brumec,
1997; Laudon&Laudon, 1998; Alter, 2002; Laudon&Laudon, 2004): Operational
Information Subsystem (OIS), Management Information Subsystem (MIS), and Decision-
Making Information Subsystem (DIS).
In the research in this dissertation the approach shown in Figure 2 will be applied to
ePortfolio as IS and to the user-centered LLL (UCLLL) environment as an organizational
environment. It must be noted that the IS structure is shown in the centre of Figure 2
with activities that support the processes carried out at different organizational levels
shown on the right. The arrows in the chart represent information flows.

63
4.1.2.1 Interpreting ePortfolio in terms of Genetic taxonomy
Based on an extensive ePortfolio literature overview (Barker, 2003; Barret, 1998;
Bisovsky&Schaffert, 2009; Blackburn&Hakel, 2006; Brant, 2006; Challis, 2005; Doig et
al., 2006; Emmet et al., 2006; Flanigan&Amirian, 2006; Gibson&Barret, 2003; Hartnell-
Young, 2006; Hickerson&Preston, 2006; Himpsl&Baumgartner, 2009; Jafari, 2004;
Fernández, 2008; Martins et al., 2008; Paulson, 1991; Riedinger, 2006; Stefani et al.,
2007; Stevenson, 2006; Zhang et al., 2009, etc.) and on the research by the author
(Balaban&Bubaš, 2009; Balaban, 2010) an explanation will be given for each level
independently in accordance with the original model shown in Figure 2:
At the operational level all the basic processes of an organizational system are carried
out. Those are the processes whereby a system can be easily identified by an
independent observer. At the operational level, input factors (I) are transformed into
output values (O) that the system delivers to its environment. In case of ePortfolio,
inputs (I) include learning methods, personal data, prior work and experience,
certificates, exams, reflections and other types of previous learning as well as evidence
of it. Operational activities include all types of manipulation with input factors which
result in artefacts and ePortfolio views available to a wider audience (O). The
transformation of input factors into artefacts and views presents an added value to an
individual and a wider community. Every system tends to improve the efficiency of this
transformation.
At the management level work is planned and organized. Furthermore, the needs for
resources are identified, the success of the organizational system is monitored, and
actions for eliminating disturbances from the environment or processes from the lower
level are run. In case of ePortfolio it includes managing learning activities, PLE,
ePortfolio artefacts and views, etc. To successfully manage the activities, information
about activities at the operational level (Ia), information about outgoing effects of the
system (Io), and information about disturbances (Id) is needed. In case of ePortfolio,
those three categories of information are represented as follows:
Ia = created artefacts and views in the ePortfolio;

64
Io = feedback from the audience delivered in multiple ways (inside the ePortfolio, by
e-mail, verbally etc.); and
Id = all the different types of disturbances such as failed expectations, artefacts in a
certain view not matching the requirements set by the audience, wrong items processed
at the level of transformation, etc.
Disturbances (Id) should be defined in the general sense as any disturbance coming from
the environment, not necessarily a negative one. Moreover, in case of ePortfolio they can
be in the form of upcoming new technologies that can eventually lead to enhanced self-
presentation possibilities.
Based on the three categories of information presented above and goals set at the
decision level (Nd), orders about carrying out transformation processes (No) and input
resources usage (Nr) are set at the management level. In the ePortfolio context, orders
about carrying out transformation processes (No) include the ways of constructing the
view and designing and formatting artefacts. Using input resources (Nr) refers to
different means of gathering and preparing the data to become Input factors (I). The
efficiency of a user-centered LLL environment as a whole depends on the management
level quality.
At the decision level goals are proposed in the form of decisions (Nd) that represent
instructions for management activities. In case of ePortfolio, one’s own mission and
vision are set or re-examined. At this level an individual plans and develops one’s own
career. Information about the influence of the environment (Ie) and information on
business status (Ib) obtained from the management level is needed in order to carry out
decision activities. In the ePortfolio context, those terms can be explained as follows:
Nd = decisions about view templates for different uses, such as job finding or further
education; view and artefact tagging strategy, decisions about PDP activities;
Ib = usability, view completeness, tagging usefulness; and
Ie = new multimedia and ePortfolio capabilities, feedbacks, number of visits and
comments for each view, information obtained from other persons’ ePortfolios.
The stability of the user-centered LLL environment as well as one’s personal growth
and development depend on the quality of decisions made at this level.
65
4.1.2.2 Genetic Taxonomy Space (GTS)
Since all IS do not have the same goals and do not support similar processes in the same
manner, they do not have the same internal structure. A Genetic Taxonomy Cube shown
in Figure 3 comprises three different levels described as the taxonomy criteria. The
criteria shown in that way constitute a ‘Genetic Taxonomy Space’ (GTS) allowing for 27
partial subspaces to be identified. Each of them corresponds to one group (type) of IS.
Brumec (1997) and Brumec&Dušak (1999) indicated its openness and applicability in IS
strategic planning as basic characteristics of GTS.
By considering GTS and ePortfolio from the perspective of GTS dimensions, two
different terms can be distinguished: ePortfolio as an IT tool, and ePortfolio as a system.
The GTS dimensions will be used in drawing a solid line between the two concepts.
Figure 4. EPortfolio in Genetic Taxonomy Cube

66
With respect to GTS and its dimensions, ePortfolio as a system shall be classified as
follows (parameters for ePortfolio as an IT tool are given in parentheses):
Type of process (v) = 3(3)
EPortfolio, both as a system and an IT tool, supports inventive type processes which
are not determined in advance and whose structure cannot be completely known
until completion. Feedback and (self)reflection are examples of inventive processes.
Level of process (r) = 2(1)
If ePortfolio as a system is used as a pedagogical tool, the teacher uses it to partially
manage teaching but it can also be used by the learner to manage one’s learning.
EPortfolio as a system enables managing teaching and learning by using artefacts and
feedbacks received from others as well as inputs from the environment. Therefore
parameter 2 can be designated to ePortfolio as a system. On the other hand, ePortfolio
as an IT tool provides support only at the operations level while management
activities are not directly supported. Therefore parameter 1 is designated to
ePortfolio as an IT tool.
Level of computer involvement (t) = 3(2)
EPortfolio as an IT tool presents a computer- or ICT-supported portfolio which
consists of a Web application with a database. With respect to this taxonomy and the
level of computer involvement, parameter 2 is designated to ePortfolio. On the other
hand, ePortfolio as a system uses ePortfolio as an IT tool and other available Web 2.0
tools as well as all the information available within the IT tools and outside them.
These are used as a knowledge base for making decisions about personal growth and
development and to manage teaching and learning. Owing to that, an IT tool becomes
an instrument merely used for achieving higher goals. In that sense, parameter 3 is
designated to ePortfolio as a system.
This classification can also be presented in another way with respect to the Genetic-
Taxonomical Order (GTO), in other words, as parameter: Rv,r,t=[3,2,3] for ePortfolio as a
system and Rv,r,t=[3,1,2] for ePortfolio as an IT tool. It has to be noted that, when GTS is
concerned, ePortfolio as a system takes up four times more space than ePortfolio as a

67
tool (see Fig. 3). This means that ePortfolio as a tool is entirely contained within
ePortfolio as a system.
To summarize, considering the results of the genetic approach to ePortfolio it can be
concluded that ePortfolio can be explained and interpreted as IS. It was previously
shown that conceiving of ePortfolio only as an IT tool and restricting its usage to such a
narrow interpretation implies that all ePortfolio functionalities are not entirely used. In
other words, ePortfolio as an IT tool captures only certain aspects of ePortfolio as a
system, which results in a significant misinterpretation of this phenomenon. Namely, by
viewing ePortfolio only as an IT tool some of its crucial characteristics are clearly
disregarded, such as the learning management support or support to decisions
concerning personal growth and development. Using the genetic approach to ePortfolio,
on the other hand, enables a broader insight into the ePortfolio concept.
4.1.3 Conclusion
In this chapter, departing from two contrary methods, ePortfolio was approached as IS.
Both of them yielded the same result in proving that ePortfolio can be conceived as IS.
Between the two methods, more attention was given to the genetic taxonomy, in the
context of which the user-centered LLL environment was considered as an
organizational system, while ePortfolio was considered as IS that provides support to
the organizational system.
Consequently, a new definition of ePortfolio has been proposed with respect to the
genetic taxonomy. EPortfolio can thus be defined as a subsystem of a user-centered
lifelong learning organization, whose task is to link processes on the operational,
management and decision-making level and the goal of which is to improve
personal competencies, support learning management and increase decision-
making reliability regarding personal growth and development.
Moreover, distinction between ePortfolio as an IT tool and ePortfolio as a system was
established. It was stated that ePortfolio as an IT tool represents a subsystem of
ePortfolio as IS. With respect to GTS the smaller cube representing ePortfolio as an IT
68
tool can be expanded by two dimensions: Process level and Computer involvement level.
A perfect alignment or match between the two cubes indicates that the IT tool fully
supports all IS functionalities. Therefore, the aim of ePortfolio applications developers
should be to enrich the applications’ functionalities in a way that the application (IT)
cube is expanded as much as possible towards the bigger cube pertaining to the
ePortfolio system. In the ePortfolio literature numerous examples can be found of
researchers and users conceiving and using ePortfolio only as an IT tool. Its possibilities,
use and importance in LLL are therefore often misinterpreted. The findings presented
here are intended to clarify the difference between the two terms so as to enable future
users and researchers to approach and comprehend ePortfolio as a system rather than
only as an IT tool.
69
4.2 The ePortfolio meta-model
In order to adequately comprehend ePortfolio functionalities it is necessary to
understand the organizational environment in which ePortfolio operates, i.e. the User-
Centered Lifelong Learning environment (UCLLL) with all its characteristics and
subspaces (such as PLE). Based on the extensive ePortfolio literature overview
(Abrenica, 1996; Barker, 2003; Barret, 1998; Batson, 2002; Bisovsky&Schaffert, 2009;
Blackburn&Hakel, 2006; Brant, 2006; Challis, 2005; Doig et al., 2006; Emmet et al., 2006;
Flanigan&Amirian, 2006; Gibson&Barret, 2003; Gibson, 2006; Hartnell-Young, 2006;
Hickerson&Preston, 2006; Himpsl&Baumgartner, 2009; Jafari, 2004; Fernández, 2008;
Lorenzo&Ittelson, 2005; Martins et al., 2008; Paulson, 1991; Riedinger, 2006; Ring&Foti,
2006; Stefani et al., 2007; Stevenson, 2007; Tosh&Werdmuller, 2004; Zhang et al., 2009,
etc.) as well as the author’s own experience with ePortfolio, a meta-model shown in
Figure 5 was developed to represent a possible usage of ePortfolio as a central system in
Lifelong Learning. Moreover, it represents ePortfolio in the way it is comprehended in
the context of this dissertation. In the following sections it will be shown that the success
of ePortfolio greatly depends on how well it supports all the possible processes in LLL.
Five basic scenarios can be identified regarding ePortfolio usage in LLL that will be
briefly described in the following part of this section.

70
Figure 5. The ePortfolio meta-model
Scenario I: ePortfolio usage within an educational institution
Three entities are present in this case: Student, Educator and Educational Institution.
Since the primary function of ePortfolio is to support the learning process it is obvious
that formal education is the point of departure. In this case Student collects, organizes
and presents their data through ePortfolio. Educator can use the ePortfolio system in
two ways: 1. To present their data and to contribute to the Institution's ePortfolio; and 2.
To communicate with Students and support their learning process. Concerning its
internal structure, every ePortfolio consists of two main parts: 1. Private: set of data in
ePortfolio available only to the owner; and 2. Public: set of data grouped and published
as an ePortfolio view to the wider audience.
Most ePortfolio views developed in the context of formal education are intended for
assessment. The process will be simplified and described as follows:
71
1. Student creates a view that holds artefacts to be graded by Educator. Although in
formal education it is common for Institution to host the ePortfolio system, in this
case it is not relevant. An artefact can be sent for grading through the Institution’s
services, or it can be uploaded on the Institution’s LMS.
2. Educator receives/downloads a Student’s artefact, grades it and makes some
comments and recommendations for improvement if needed.
3. The graded artefact is uploaded to LMS or some other service. During that
procedure the artefact with its metadata (grade, comments, date, author, etc.) is
certified by Institution to preserve its integrity and validity.
4. Student downloads/receives the certified artefact and stores it in ePortfolio for
later usage.
5. By repeating steps 1 to 4, Student enriches their own ePortfolio with certified
artefacts that will be used in the second step, i.e. the job application or job
retention process.
Modern schooling offers students an opportunity to be mobile during the study period
and spend it on different institutions (universities). EPortfolio can assist in this process
and enable a quicker, easier and more transparent process of switching between
institutions or study programmes in a way that competences and prior learning are
documented and proven in an easy and transparent manner.
Scenario II: Switching between educational institutions/study programmes
Three entities included in the previous scenario remain present in this one as well, with
the possible addition of another entity, i.e. another educational institution, which can
basically be perceived as an Educational Institution entity.
1. Student creates a view and includes artefacts needed to apply for a study
programme, change Educational Institution or simply spend one semester or year
in a mobility scheme (for example, Erasmus). The view is published and a
potential institution has access to it.

72
2. During education artefacts are certified by Educational Institution. This enables
the Institution to check the consistency and validity of artefacts in a Student’s
ePortfolio.
3. Based on the results of audit from step 2 and the quality of the given
credentials/artefacts, feedback is sent back to Student.
4. If Student returns to their home institution after a certain study period spent in
mobility at a host institution, the home institution can find proofs of Student’s
achievements in ePortfolio.
After the student completes the formal education process it is time to apply for a job.
Scenario III: Job application
In this scenario, the student evolves into an employee. Different types of entities appear
in this case: Student, Educational Institution and Employment Institution.
1. Student creates a view and includes artefacts needed for a job application. The
view is published and a potential employer has access to it.
2. During education artefacts are certified by Educational Institution. This enables
the potential employer to check the consistency and validity of artefacts in a
Student’s ePortfolio as well as to assess their quality and appropriateness.
3. Based on the results of audit from step 2 and the quality of the given
credentials/artefacts, feedback is sent back to Student.
The artefact verification/certification process presents a very serious issue today and
should therefore be addressed properly. To support this claim, a recent research should
be mentioned which showed that in 91 ePortfolio systems not a single artefact could be
verified for its consistency or validity (Balaban et al., 2010a). The author of this
dissertation has attempted to address the artefact certification problem and suggested a
lightweight protocol as a possible solution (Balaban&Kišasondi, 2010).
On a different note, it has to be mentioned that the meta-model in this section shows
general processes in a real (business) system that ePortfolio should support. It

73
represents a basic view or a starting point in approaching ePortfolio as a concept. For
every scenario described in the meta-model, more detailed decomposition can be made
along with the corresponding model. In addition, the success of the ePortfolio system
will be seen as a percentage in which ePortfolio can support all the required processes in
a real system.
Scenario IV: Switching between employment institutions
This scenario is very similar to Case II scenario. Moreover, Case V scenario can be
comprehended as Case II applied in an employment organization. Three main entities
can be identified: Employee, Employer and Educational Institution. In addition, another
employer to which an employee wants to apply for a job can also be identified, although
technically this is still an instance of an entity named Employer.
1. Employee creates a view and includes artefacts needed to apply for a study
programme or to change the institution. The view is published and a potential
institution has access to it.
2. During education artefacts are certified by Educational Institution. This enables
the Institution to check the consistency and validity of artefacts in an Employee’s
ePortfolio.
3. Based on the results of audit from step 2 and the quality of the given
credentials/artefacts, feedback is sent back to Employee.
Scenario V: Part-time study/job retention
This is a combination of several scenarios presented so far. An individual is an employee
but at the same time wants to continue their education. In most cases it is related to non-
formal education, although in some countries it is organized as a part-time study in
which an individual enrolls a university or a polytechnic. This scenario enables an
individual to study and work at the same time using on-line or blended education. As in
Case I, all the achievements in the form of artefacts can be signed and verified by the
educational institution. Moreover, an individual can interact directly with the educator if

74
needed. The results of an individual’s working experience and education are stored in
ePortfolio.
In addition to scenarios, it is important to mention processes which occur in the life of
every individual often considered as ‘the background processes’ that refer to non-formal
and informal learning. Those are presented as ovals and also result in artefacts stored in
ePortfolio.
Figure 6. LLL continuum
It is important to notice that the scenario sequence follows the LLL concept shown in
Figure 5. In Scenarios I and II the student acquires knowledge mainly during formal
education. In addition to knowledge, they learn how to think and reflect. After formal
schooling the student becomes an employee, as described in Scenarios III and IV. To stay
competitive, they must enrich their knowledge throughout life. Therefore Scenario V
shows the employee who acquires new knowledge through different education
mechanisms and uses an ePortfolio to document their knowledge and accomplishments,
show their competencies, and manage their own personal growth and development.
Scenarios I to V represent foundations of this dissertation. The meta-model and
extensive literature overview helped in understanding ePortfolio as a concept, including
its mission and purpose. In addition, the five scenarios show how IS should work or how
it should provide support for an employment organization. In this case, the LLL concept
is perceived as an employment organization while ePortfolio is seen as its IS supported
by ICT.

75
4.3 EPortfolio success
The previous sections (4.1 and 4.2) provided grounds for the discussion of ePortfolio as
IS. Consequently, it is justifiable to apply theoretical findings from IS success literature
to measure ePortfolio success. However, a specific environmental context, the UCLLL
environment (described as a meta-model in section 4.2) in which ePortfolios operate,
has to be taken into account in the process.
Since the function of IS is to support business processes entirely or partially (that is,
supporting only some of their subunits), the functionality of the supported business
processes depends on the underlying IS (Laudon&Laudon, 2002). Therefore, IS
performance and business performance are causally related (Gable et al., 2008). Until
the 1990s there had not been many serious attempts to measure IS success, mostly
because researchers did not approach this complex phenomenon in an adequate way.
Sabherwal et al. (2006, p. 1849) analyzed previous work in the field of IS success and
noticed that “despite considerable empirical research, results on the relationships
among constructs related to information systems (IS) success, as well as the
determinants of IS success, are often inconsistent.”
The first serious attempt to measure IS success was in 1992, when DeLone and McLean
developed a multidimensional IS success model that comprehended the complexity of IS
success. After that many researchers were encouraged to try to develop their own
models or to adapt the D&M Model in terms of developing new measures or adapting the
existing ones to measure the constructs in the D&M Model. Some of the researchers that
developed their own models, like Mirani&Lederer (1998); Seddon et al. (1999); Gable et
al. (2003); and Sedera et al. (2004) are worthwhile mentioning here. However, most of
them derived their models from the D&M Model, while others used the D&M Model to
assess IS success as a whole. A brief and systematic overview of some alternative models
of IS success are presented in the next section.

76
4.3.1 Different approaches to measuring IS success
A number of measures dealing with IS success has been developed over the last decade.
However, a commonly accepted index or a unique set of measures that would enable a
comparison of results does not exist because of the difficulty of having generic measures
for each construct. For example, Gable et al. (2003) developed specific measures for
Enterprise System (ES) success although they used the D&M Model as the theoretical
framework for their measures. DeLone and McLean based their model on an e-
commerce system and therefore developed measures for the e-commerce context. By
analyzing previous work of Smithson&Hirchheim (1998), Mirani&Lederer (1998),
Seddon et al. (1999), Torkzadeh&Doll (1999), Gable et al. (2003), Sedera et al. (2004) as
well as DeLone&McLean’s work between 1992 and 2008, it is evident that a unique
index will be difficult to establish for following reasons:
1. Numerous models and measures of IS success exist.
2. Existing measures do not measure the same constructs and/or do not use the
same scales.
3. Although some common constructs between measures exist, too many deviations
can still be found within constructs and in relationships between constructs.
Seddon (1997) started his work relying on the first version of the D&M Model developed
in 1992. His research resulted in a re-specification and extension of the D&M Model.
Some of his findings were found to be interesting and valuable by the authors of the
D&M Model themselves so they were integrated into the update of the D&M Model in
2003. Seddon et al. (1999) continued to study IS success and the D&M Model, leading to
a proposal of an IS effectiveness matrix based on data warehouse systems. The basic
message of their research was that different measures are needed to assess the impact
and effectiveness of IS.
Gable et al. (2008) analyzed issues with current IS success models and measurement.
They suggested that IS success should be multi-dimensional, basing most of their
analyses on empirical studies of DeLone&McLean from 1992 to 2005. In fact, Gable et al.
(2008) wanted to separate IS impact from IT function to enable organizations to track
their IT performance. To accomplish that, they reconciled the D&M IS Success Model

77
with IS-Net from Benbasat&Zmud (2003) and performed their research on the newly
suggested model. Gable et al. (2008) thus obtained 4 constructs that determine IS
impact: System Quality, Information Quality, Individual Impact and Organizational
Impact. It is very interesting that they parsed out, i.e. eliminated User Satisfaction
because it added little explanatory power to the model on the whole. Use was also
eliminated because the system use was mandatory and therefore constant practice
influenced satisfaction. Their model has not been widely tested yet and the authors
themselves have raised the questions of “whether the initial list of impact citations used
in the development of the a-priori model was complete and representative of
contemporary IS in general” and “whether the final list of measures and dimensions can,
indeed, be generalized” (Gable et al., 2008, p. 397). It is important to mention that the
model was developed for enterprise systems and so far it has not been proven that it is
applicable to other types of IS.
Many authors decided to focus on a single aspect of measuring IS effectiveness or
success. Rivard et al. (1997) developed a comprehensive instrument to capture system
quality. The instrument is widely used today and DeLone and McLean recommend it to
be used along with their model. Gable et al. (2003) developed their own index of system
quality. Coombs et al. (2001) and Wixom&Watson (2001) developed their own scales for
measuring information quality using literature review. On the other hand, Venkatesh et
al. (2003) developed a very well accepted and commonly used Unified Theory of
Acceptance and Use of Technology (UTAUT) method for assessing use and user
satisfaction. Torkzadeh&Doll (1999) developed an instrument that specifically measures
the individual impact of IS.
For the purpose of this doctoral dissertation, only a model that has the ability to be
applied on a variety of IS types and that has been proved to be widely accepted can be
taken into consideration.

78
4.3.2 Choosing an appropriate approach
Instead of trying to develop a common measure for IS success, researches are still
struggling to prove that their model or measure is the best under certain circumstances
while criticizing other models (e.g. Seddon, 1997; Sedera et al., 2004; Gable et al., 2008).
However, if researchers engaged themselves in analyzing several models that measure
IS success, they would perceive that all models share certain constructs, although
different interpretations of each construct are used. Therefore, when such common
constructs are considered, it is obvious for each construct different factors are measured
and different measure scales are used. Furthermore, different interpretation of
constructs between models and construct diversity are also caused by different contexts
in which a model/measure was developed.
Bearing all this in mind, three possible solutions should be considered:
1. Developing common model/measures for IS success that could be used in all
contexts.
2. Developing a unique model for IS success that will measure success in a specific
context.
3. Adopting one of the most widely used models for IS success and using it in a
specific context.
Developing a common model can be very demanding in terms of complexity and time. A
detailed analysis of a very large number of IS success models and measures in all
possible contexts is needed in order to comprehend the nature of IS success and to form
constructs that could be universally applied. It can be assumed that the resulting model
would not be analogous to any of the existing models. This could happen since many
researchers tried to develop a common model. Also, a very large number of tests are
needed in order to prove that the model could be applied in different contexts.
The awareness of the aforementioned issues has led some researchers to try to develop
a unique model for a specific context rather than generalize and prove that their model
can be applied in several contexts. Most of them used the existing models as a starting
point, while others started from scratch and ended up developing their own scales and

79
indices. As a result, new models were built but without any possibilities for result
comparison between them. DeLone&McLean (1992) started developing a unique model
for measuring IS success in e-commerce and proposed a common model which had a
potential to be applied in general (that is, in different contexts). After several iterations
the model became well-known and was used and cited in more than hundred papers in
the academic literature (Petter et al., 2008).
Therefore it can be claimed that the D&M Model (DeLone&McLean, 2003) is a very
widely accepted model for measuring IS success. Many researchers have adopted the
D&M Model and measured the success of a particular IS. Since many researchers used
the same model, it is possible to compare results and to obtain some valuable
information about IS success in different contexts. Moreover, Petter et al. (2008)
analyzed over 90 empirical studies and gave suggestions for further research in which
they further encouraged the use of the D&M Model in a variety of contexts. Such a wide
adoption of the D&M Model has prompted researchers to adopt the model rather than
try to develop their own. In this dissertation, the D&M Model will also be used to assess
the success of ePortfolio. However, it will be enhanced with Moderating Factors (MF) in
order to provide a more profound insight into the nature of relationships between the
constructs in the D&M Model.
4.3.3 Using the D&M Model to assess ePortfolio success
The original D&M Model for measuring IS success was developed in 1992. Its primary
purpose was synthesizing previous research involving IS success and providing
guidelines to future researches. The multidimensional model was proposed considering
“communications research of Shannon and Weaver and the information ‘influence’
theory of Mason, as well as empirical management information systems (MIS) research
studies from 1981-87” (DeLone&McLean, 2003, p. 70). As a result, both process and
causal model based on six dimensions (constructs) of success were developed. These
two features, causality and processing, embedded into a single model would raise major
issues concerning the model and eventually lead to confusing interpretations. However,
DeLone and McLean did a citation research in 2002 and yielded 285 refereed papers in

80
journals and proceedings that referenced the original model. Taking into consideration
the criticism expressed in some papers regarding model validation, as well as
suggestions and implications from other researchers who had tested the model, the
original D&M Model was updated and published in the Journal of Management
Information Systems (DeLone&McLean, 2003). The Updated D&M IS Success Model will
be used in this dissertation, hereafter referred to as the D&M Model.
Figure 7. Updated D&M IS Success Model
All the process and causal elements from the original model were transferred to the
Updated version of the original D&M Model shown in Figure 6 since its authors argued
that “in order to understand fully the dimensions of IS success, a variance model is also
needed” (DeLone&McLean, 2003, p. 76). In other words, the process model states that B
follows A. In this example we can say that some benefits occur due to system use (i.e. Net
Benefits follow Use). A variance or causal model postulates that A causes B; in other
words, by increasing A we will cause B to increase (or decrease) as well. Following the
same example, if we assume that an increased or even extensive system use will occur,
81
which can be inappropriate in some cases, there may also be no benefits. Therefore, both
aspects (process and causal) should be encompassed and considered when assessing IS
success.
Since this model presents the backbone of this dissertation, each of its six dimensions of
success will be explained separately along with indications for measuring each
dimension. Construct descriptions are mostly based on literature review
(DeLone&McLean, 1992; DeLone&McLean, 2002; DeLone&McLean, 2003; Petter et al.,
2008) and the author’s personal experience gained during the development of measures
for each category. DeLone and McLean distinguish and explain in detail two possible
levels of analysis: individual and organizational. Regarding the fact that most of the
institutions contacted for the purpose of this dissertation reported a very low level of
ePortfolio maturity as well as early stages of implementation (see section 5.6), which
leads to specific sample limitations in terms of academic institutions, the ePortfolio
success will be analyzed at the individual level, i.e. from a student's perspective.
Accordingly, the constructs will be operationalized and described having in mind the
individual level of application.
CONSTRUCTS:
(1) System Quality: Measures of the Information Processing System Itself
This dimension measures the desirable characteristics of IS. Since this dimension
captures the system itself it is oriented towards technical specifications like data
processing capabilities, response time, ease of use, system reliability, sophistication
etc. According to DeLone and McLean (2003), the System Quality construct should
measure technical success that Shannon and Weaver (1942) defined as the accuracy
and efficiency of the communication system that produces information. The most
common measure of System Quality is the perceived ease of use related to the
Technology Acceptance Model (TAM). However, many researchers, including DeLone
and McLean, believe that the perceived ease of use does not capture the construct as
a whole (Petter et al., 2008). Therefore researchers have created their own indices of
System Quality based on literature review or DeLone and McLean’s
recommendations.

82
In the ePortfolio context: The system for processing information is the ePortfolio
(Web) application itself. Today’s ePortfolios are Internet applications, so this
construct measures the desired characteristics of an ePortfolio application (tool) in
the Internet environment. Usability, functionality, user interface and security are
examples of qualities that are valued by users of ePortfolio application from the
users’ point of view. More specifically, the ePortfolio system quality is reflected in the
ease of use, availability of help functions, ability of the ePortfolio system to
continuously be up and running, its ability to provide sufficiently quick response, its
integration with other on-line tools, etc.
(2) Information Quality: Measures of Information System Output
This construct includes the desirable characteristics of system outputs. The quality of
information the system produces, primarily in the form of a report or a Web page, is
measured. Since DeLone and McLean developed their IS Success Model considering
the Shanon&Weaver’s (1942) framework, this construct measures Shanon&Weaver’s
semantic success, which is the success of the information in conveying the intended
meaning. According to Petter et al. (2008) the Information Quality construct has
proven to be problematic to capture and measure as it is not often distinguished as a
unique construct. While some researchers used the existing generic scales of
Information Quality, others developed their own scales. Some categories of
Information Quality that can be measured are relevance, understandability, accuracy,
completeness, usability, importance etc.
In the ePortfolio context: Information is processed by the ePortfolio application.
Outputs present added value to the society and to individuals themselves. Outputs
should be valid, relevant, well formatted, easy to understand and up to date if we
expect students, teachers or employers to use ePortfolio. Two main types of
information are produced in the ePortfolio in conjunction with the user: artefacts
and views. It needs to be mentioned, however that views can also be interpreted as
artefacts. Therefore this construct measures the quality of views and artefacts
produced by the ePortfolio application and the user. The quality is reflected in terms
of whether the artefacts can be verified, whether the artefacts or views are concise,
readable, up-to-dated, etc.

83
(3) Service Quality: Measures of Support Provided to the End-User
Except for quality software and satisfactory information, the nature and the extent to
which end-users receive support in working with the system plays a very important
role in IS success. Therefore in this construct the quality of support that system users
receive from the IS department and IT support personnel is measured. This
construct was added to the Updated D&M Model on grounds of previous research
based on the original D&M Model that identified the need for this construct. The
importance of this construct is determined by the context, since Service Quality can
be of great importance when measuring the success of an IS department, as opposed
to that of individual systems. The most widely used method for measuring Service
Quality is SERVQUAL. Possible characteristics of this construct are responsiveness,
accuracy, reliability, technical competence etc.
In the ePortfolio context: All the means of support in using ePortfolio that differ
depending on the context and range from online help, manuals and help-desk service
to the ability of using the ICT equipment in institutions. Its importance is great since
inadequate user support can actually lead to poor use of ePortfolio. Therefore this
construct measures end-users assurance, empathy and clarity. In the ePortfolio-
specific environment, service quality measures the individual attention paid to the
user by the institution, the available means of end-user support, how well the
ePortfolio assessment and usage criteria are described in course requirements, etc.
(4) System Use: Recipient Consumption of the System’s Capabilities
Indicates the degree and manner to which staff and customers utilize the capabilities
of IS. Intention to Use and Use are strongly interconnected and the authors suggest
using Intention to Use as an alternative to Use in some contexts. Although Intention
to Use describes an attitude and Use relates to behavior, either of them can be used
depending on the context. Some authors suggested the removal of this construct as a
success variable because in most research the construct was too trivially defined.
Since this is a complex variable it is crucial to consider the nature of use and not only
the frequency of use. Wrongfully, some researchers assumed that System Use was
the most objective and the easiest to quantify and therefore tried to interpret the
concept by measuring only the frequency of use. Therefore, when updating the D&M

84
Model, its authors stressed the importance of this construct and suggested that
researchers “consider the nature, extent, quality, and appropriateness of the system
use” (DeLone&McLean, 2003, p. 76). There was also a debate about appropriate
measures. Namely, in empirical studies a lot of measures of use were adopted, but in
most cases those measures led to mixed results between use and other constructs.
Therefore considerable attention needs to be given to choosing appropriate
measures in a specific context.
In the ePortfolio context: The purpose of ePortfolio is to support LLL. This construct
assesses the degree and manner in which an individual uses the ePortfolio
application and realizes its potential and usage for LLL. In terms of ePortfolio it
measures the system’s functionalities being used by the user such as features for
organizing the ePortfolio content, joining groups, artefacts tagging as well as
facilitating conditions that are present during the use of ePortfolio.
(5) User Satisfaction: Recipient Response to the Use of the Output of an Information
System
Users’ level of satisfaction with reports, Web sites, and support services is measured
with this construct. The main difference between this concept and the previous one
can be noted when system use is mandatory. In that case, User Satisfaction becomes
a very useful construct because satisfaction will eventually lead to greater efficiency.
Use and User Satisfaction are interrelated in both process and causal sense. Use
precedes User Satisfaction, while greater Satisfaction will lead to greater Use. As in
case of System Use, the most popular measures for this construct also contain items
related to other constructs. This is due to the fact that these measures were
originally designed to measure different categories but many researchers simply
adopted them and applied them to the D&M Model. Therefore some researchers
parsed out elements that do not measure this construct or used their own scales.
In the ePortfolio context: This construct assesses user satisfaction with the
ePortfolio application and the information produced by that application. User’s
satisfaction with views, artefacts and feedback received will probably lead to a
greater use of the ePortfolio as an application and a concept. The attitude toward
using the system and its usefulness are considered to be two of the most important
85
elements of User Satisfaction in the ePortfolio context. Therefore this construct
measures whether the ePortfolio system makes work more interesting, whether all
necessary resources are met in order to use ePortfolio, whether an individual has the
knowledge to work with the ePortfolio, etc.
(6) Net Benefits: The Effect of Information System on Specific Contextual Levels
The extent to which IS contribute to the success of individuals, groups and other
stakeholders is represented as Net Benefits. In the original model the term ‘impact’
was used to describe the effect of IS on individuals and/or groups. Over the years, in
the course of implementation of the D&M Model it has become clear that individual
and group impacts are not sufficient to measure success. In the light of those
findings, rather than complicate the model with more ‘impact’ categories and
measures, its authors decided to group all the measures into a single category – Net
Benefits. Depending on the level of study and the context, a finer granularity may be
needed in order to distinguish and address sub-categories of benefits specific to the
level of analysis and the observed context. This is the only construct that is ‘case
specific’ and entirely depends on the type of IS. This means that characteristics of e-
commerce systems such as improved decision-making, improved productivity,
market efficiency, cost reductions, etc. that DeLone and McLean analyzed with the
D&M Model (DeLone&McLean, 2003) may not be applicable to other IS domain such
as ePortfolio. On the contrary, it is a rather complex construct that requires a whole
new set of measures and characteristics to be developed for a specific type of the IS
domain.
In the ePortfolio context: This is the most comprehensive and delicate construct
because it is specific for every context. It needs to be developed separately for each
type of IS because it captures the contribution of a specific type of IS to different
target groups. This construct measures the extent to which ePortfolio enhances LLL.
One of the key aspects of Net Benefits concerning the individual is enhanced learning
through developing a positive attitude to LLL, fulfilling learning outcomes, increased
transparency in evaluation, enhanced communication between student and teacher
etc. The other important aspect of Net Benefits for an individual can be seen through
personal growth and development in terms of evaluating one’s progress towards the
86
achievement of personal goals, the ability to choose co-workers, benchmarking, etc.
At the same time, based on the information from ePortfolio, institutions can show
their particular strengths and advantages or re-group employees into project teams
based on their interests, skills and work experience and advance work efficiency.
Moreover, employers can benefit from ePortfolio in the recruitment process by, for
instance, narrowing the list of potential employees based on the information
provided in their ePortfolios. Students can also benefit in that respect by enhancing
their learning and managing their own growth and development.
RELATIONSHIPS:
As can be seen in Figure 5, the first three constructs (System Quality, Information
Quality and Service Quality) are independent and present a starting point in assessing
the success of each IS in the D&M Model. In a process sense, those three constructs
precede Use and User Satisfaction. In a causal sense, as an example it can be stated that a
higher System Quality will lead to a greater Use of the system. So, generally speaking,
relations between all the first three constructs on the one hand and Use and User
Satisfaction on the other are possible.
Use precedes User Satisfaction in a process sense, but greater satisfaction will lead to an
increased Use. Those two constructs are mutually tightly related and depend on the first
three constructs as well as on Net Benefits.
Net Benefits is also a dependent construct. It directly depends on Use and User
Satisfaction, and indirectly on System Quality, Information Quality and Service Quality.
In addition, the construct is related to its immediate predecessors, which means that
every change in Net Benefits will be reflected on Use and User Satisfaction.
Since a variance model exists based on causal relationships between constructs, the
‘strength of relationships’ can be determined and measured. Moreover, the cause of
change in the strengths of relationships should be identified in order to fully explain the
variance model. Therefore, besides explaining the nature of changes related only to the
constructs, an additional set of Critical Success Factors (CSFs) will be introduced that

87
also influences the nature of interconnections. It is important to stress that those
interrelationships can be investigated at two levels: individual and organizational. As
already mentioned, in this dissertation the support for interrelationships between the
D&M Model constructs will be researched at the individual level of analysis.
4.3.4 Critical Success Factors of ePortfolio success
Besides the six basic groups of factors presented as constructs in the D&M Model that
determine the success of ePortfolio, a set of other factors can be identified
independently that are essential for ePortfolio implementation. In this dissertation these
factors are referred to as Critical Success Factors (CSF) and according to Gathercoal et al.
(2002, p. 34) they “must be present and active” in order to implement an ePortfolio
system. Those factors are reflected in a particular institution’s strategy and approach
towards ePortfolio implementation and usage, grading system for educators and
students, training opportunities, financial and other material resources, etc. Therefore, a
set of identified CSFs can only be applied to the institutional level of ePortfolio usage.
Since CSFs are vital for ePortfolio implementation and their importance should not be
neglected when ePortfolio success is concerned, it is very important to identify them.
Regarding the nature of CSFs, they do not fit into any of the constructs of the D&M Model
because they are related to a particular institution’s strategy and organization in using
ePortfolio, while constructs in the D&M Model are measured at the level of an individual.
Moreover, considering the constructs description, CSFs do not capture any one of them.
Therefore they could be treated as contextual factors primarily related to the
organizational rather than the individual level of study. However, since the D&M Model
assesses the ePortfolio success, and CSFs are vital for that success, their influence on the
ePortfolio success should be considered. In this research it will be assumed that some
CSFs moderate the relationships between the constructs in the D&M Model. According to
Jaccard et al. (1990) moderation occurs when the relationship between X and Y depends
on Z. For the purpose of this dissertation, Moderating Factors (MF) shall be defined as
“Critical Success Factors that moderate relationship(s) between constructs in the D&M
88
Model”. In other words, MFs influence on the ‘strength of relationships’ between the
constructs.
Bearing all this in mind, a set of updated CSFs needs to be defined parallel to instrument
development. To support this claim, it has to be noted that CSFs identified by Gathercoal
et al. (2002) are fairly outdated and some of them, such as the requirement that all
classes have an Internet access with computer display projection units, are nowadays
fulfilled by default so there is no need for them to be categorized as critical.
Consequently, apart from revising the existing CSFs, current literature, experts opinion
and self-experience in using ePortfolio will be used in order to update the list of CSFs.
Moreover, it is important to mention that not all CSFs necessarily moderate
relationships in the D&M Model, which can also be perceived from the definition of MFs.
This research will therefore also determine which CSFs can effectively be perceived as
MFs and which relationships they moderate.

89
5 Research methodology
In previous chapters all the prerequisites for carrying out the main research were
described. All aspects of the ePortfolio concept were taken into account, studied and
elaborated in detail in Chapter 2 to ensure its thorough comprehension. The author of
this dissertation gained profound insight into the process of ePortfolio implementation
(see Chapter 3), which provided a solid ground for claiming that ePortfolio can be
comprehended as an IS and that a whole set of techniques to assess IS success can be
applied to ePortfolio (see Chapter 4). This section describes the selection of the research
methodology, operationalization of research constructs, development of measurement
instruments, and data collection procedures. Each of these steps is reported in the
following sections, along with the details of the pre-pilot and pilot tests.

90
5.1 Choice of research methodology
Considering there are three main objectives to be identified in this doctoral dissertation,
the research methodology will be presented with regard to these goals, with the choice
of a respective research methodology justified accordingly.
The main objectives of this dissertation are identified as follows:
1. Development of a measurement instrument to assess ePortfolio success at the
individual level based on the D&M IS Success Model.
In order to ensure instrument validity, in this dissertation the instrument will be
developed in accordance with the steps typical for instrument development in IS (Straub
et al., 2004). Since the unit of analysis is individual, the whole instrument will be
designed to be applied to student population. In the process of instrument development,
the extant ePortfolio literature overview and Delphi method that will include more
than 20 ePortfolio experts and researchers from Croatia, Slovenia, Austria, Germany,
Poland, Estonia, Great Britain and USA will be used. The result will be the content
validity of the instrument.
In the second step the card sorting method will be used with experts to card sort
instrument statements within the proposed constructs (constructs are a part of the D&M
Model). After obtaining all the remaining statements within the constructs, another
round of card sorting will be conducted, but this time the respondents will be from FOI.
The aim will be to card sort statements into subcategories within constructs according
to the D&M Model’s implications for researchers. The result of this step will be the
construct validity of the instrument.
After both content and construct validity have been established, respondents will be
used for instrument reliability verification. Concerning the sample restrictions,
instrument reliability will be verified at the individual level of analysis. Therefore
students and educators involved in different years of study at FOI will be potential
respondents.
91
The reliability of measure scales will be determined by means of Cronbach Alpha
coefficient, and instrument reliability by means of Structural Equation Modeling
(SEM). Factor analysis will be used to determine instrument reliability only if the
number of statements in the instrument is reduced to an acceptable level after the first
two steps considering the number of possible respondents.
2. Identification of critical success factors groups that will moderate relationships
within the model.
Beside instrument evaluation, the extant literature overview will be conducted to
identify ePortfolio critical success factors. Furthermore, the Delphi method will be used
for critical success factors evaluation by experts and researchers. The identified critical
success factors will first be included in the instrument developed in the previous step.
After the results of the instrument have been obtained, they will also be included in the
ePortfolio Success Model as moderating factors. Here it is important to mention that not
all critical success factors will be moderating factors.
By analyzing results from the multiple regression analysis it will be shown which
group of critical success factors moderate which relationships between the constructs in
the D&M Model (Armstrong&Sambamurthy, 1999). The ePortfolio Success Model to be
developed in the third step will be updated with moderating factors. It needs to be noted
that common errors in identifying moderating factors will be taken into account
(Carte&Russell, 2003) in the process.
As already mentioned, concerning the sample limitations, both the instrument and the
model will be verified at the individual level of analysis. Since the initial version of the
instrument contains statements related to both the academic institution and the
employer, it should be fairly easy to verify the instrument at the organizational level of
analysis in future research. Despite that, testing and verifying the results at the
organization level of analysis exceeds the limits of this doctoral dissertation.
92
3. Development of an ePortfolio Success Model based on D&M Model.
The instrument developed in the first step and the D&M Model will serve as the basis for
ePortfolio Success Model development. In order to show that the instrument fits the
D&M Model, the SEM method or Partial Least Squares (PLS) as a subset of SEM will be
used (Kline, 1998; Schumacker&Lomax, 2004). Using SEM or PLS SEM is justified in this
research because it implies the existence of a model which needs to be verified by means
of certain analysis. The instrument will enable to test relationships between constructs
in the D&M Model and these relationships will be shown in the ePortfolio Success Model
along with moderating factors.

93
5.2 Operationalization of research constructs
In respect to the D&M Model, six constructs were operationalized in this study:
Information Quality, System Quality, Service Quality, Use, User Satisfaction and Net
Benefits. All the constructs were measured with multiple items. Besides, it should be
emphasized that the statements from the D&M Model could not be entirely applied to
ePortfolio since DeLone&McLean developed their model based on generic information
systems. Therefore, besides adopting the statements from the original D&M Model, a
whole new set of items needed to be developed to capture the ePortfolio concept.
Consequently, the existing items from other related instruments that were empirically
tested were adopted and used in this research to enhance the validity and reliability of
the instrument. In addition, new measures were developed based on the extensive
ePortfolio literature overview and experience in ePortfolio implementation at FOI. In the
following sections each construct is operationalized. It should be mentioned that the
result of operationalization was the initial pool of items that captured their prospective
constructs, some of which might be redundant, not relevant for ePortfolio or might
capture another construct better than the one in which they were initially placed. In the
following step, content and construct validities were carried out to ensure that all
statements were relevant to ePortfolio and captured their prospective construct.
Moreover, subcategories within constructs were created and named in order to get a
clearer picture of all the possible subdimensions comprised within each construct.
Subcategories also enabled to get a better view of the initial pool of statements since the
number of statements in each construct was very large. In all the other steps of the
instrument validation process those subcategories were not shown. The only exception
was the pilot phase where those subcategories were determined again based on the 3rd
round of Q-sorting since a large number of statements was omitted during the Q-sorting
procedure.
Although one of the aims of this dissertation was to develop an ePortfolio success
instrument applicable at the individual level of analysis, the initial pool of statements
was designed for a wider range of possible stakeholders, such as teachers, institutions
and employers. However, having in mind that the final instrument is targeted for
students, the initial pool of statements needed to be refined through a series of

94
procedures to be applicable only to students. Accordingly, the subsequent construct
descriptions will focus on the individual level of analysis.
5.2.1 System Quality
This construct defines the characteristics of a system that utilizes ePortfolio. According
to the original D&M Model, the measures of the information processing system itself are
defined in this construct. Since ePortfolio is a Web-based application, it was possible to
use statements related to the quality of Web applications such as those in
Alberto&Gianluca (2007) or Wang&Wang (2009) to assess the quality of an ePortfolio
system. Apart from DeLone&McLean's measures developed for this construct, several
new items from other instruments were added. Therefore the statements from the
instrument in Gable et al. (2008) were used since the instrument itself was developed as
an alternative to the D&M Model. In addition, the instrument from Rivard et al. (1997)
was used following the recommendations for its usage in Peter et al. (2008). Some
statements from the latter were omitted since they were not relevant to ePortfolio.
5.2.2 Information Quality
The main purpose of ePortfolio is to process information. In Chapter 4, the genetic
taxonomy was used to show that the purpose of information produced as an output is to
add value to the society. Therefore this construct captures a vital part of ePortfolio. In
the previous chapter it was also explained that information in ePortfolio appears in the
form of an artefact and a view, and stated that the quality of information can be
measured by various means. In this research, beside the statements from the D&M
Model, some items concerning the information as a whole were adopted from Gable et
al. (2008). Some other characteristics like validity, completeness, consistency,
correctness etc. were adopted from Fraser et al. (1995) and Wixom&Watson (2001), in
accordance with DeLone and McLean’s suggestions (Petter et al., 2008). The research by
Roldán&Leal (2003) was used to reflect conciseness and clarity of information.

95
5.2.3 Service Quality
This construct originally refers to measures of support provided to the end user. It
includes all kinds of support (online help, manuals toward help-desk service, the ability
to use the ICT equipment in institutions, etc.) that a user receives from the official
support desk, instructor (teacher) and in the online form. Besides the statements from
the D&M Model, the statements from the SERVQUAL method were also used. Although
the latter is considered to be the most common method for measuring service quality, it
does not contain some key components considering the ePortfolio context. Most of its
statements are related to the so called offline components such as employees in the
aforementioned services. Mekovec et al. (2007) reviewed an entire set of service quality
measures that are oriented towards online services or Web services. Since ePortfolio is
utilized as a Web application, it is very important to measure the quality of e-service.
Therefore a set of statements from E-S-QUAL (Kim et al., 2006) and WebQual/eQual
(Barnes&Vidgen, 2005) were used to encompass the online service components such as
efficiency, interaction, availability, privacy, virtual community and contacts.
5.2.4 Use
Following DeLone and McLean’s recommendations (Petter et al., 2008) several
instruments were reviewed. Some of them were from Burton-Jones&Straub (2006),
Torkzadeh&Doll (1999), Venkatesh et al. (2003) as well as from the D&M Model itself.
Considering the essence of this construct, which is to capture the recipient’s
consumption of the system’s capabilities, the Unified Theory of Acceptance and Use of
Technology (UTAUT) instrument developed by Venkatesh et al. (2003) was found to be
the best choice. Moreover, one part of the instrument assesses all the necessary
characteristics of the ePortfolio system regarding its use, so no additional statements
were needed. Instead, the part of the UTAUT instrument concerning performance
expectancy, effort expectancy, social influence, self-efficacy and behavioral intention to
use the system was used to capture this construct.
96
5.2.5 User Satisfaction
Petter et al. (2008) suggested the End-User Computing Support (EUCS) or User
Information Satisfaction (UIS) instruments as a means of measuring user satisfaction.
However, by analyzing both instruments it was noted that in respect to the D&M Model
those instruments include statements related to almost all the constructs of the
mentioned model. The authors of the D&M Model also reported this by stating that both
models “contain items related to system quality, information quality, and service quality,
rather than only measuring overall user satisfaction with the system” (Petter et al.,
2008, p. 242). Therefore, following the description of the User Satisfaction construct,
according to which it captures the recipient’s response to the use of the output of an
ePortfolio system, the other part of the UTAUT instrument was used in this research. In
other words, the previously unused part of the UTAUT instrument concerning the
attitude towards using technology, facilitating conditions and anxiety was used in this
context. In addition, it was possible to use statements from the same instrument for both
Use and User Satisfaction constructs since DeLone&McLean confirmed a very tight
relationship between those constructs. In addition, UTAUT also captures the essence of
Use and User Satisfaction: the intention to use the system and subsequent usage
behavior that results in different satisfaction modalities.
5.2.6 Net Benefits
The effect of an ePortfolio system on specific contextual levels is captured in this
construct. According to DeLone&McLean (2003), the measures for this construct should
be domain specific since different types of information systems cause different benefits
in different contexts. Although DeLone and McLean differentiate between measures
developed at the individual and organizational level, for the purpose of this research net
benefits were captured on both levels simultaneously. As a result, the instrument would
be applicable on different levels, although for the purpose of this dissertation it would be
verified only at the individual level of analysis.

97
Several statements from Gable et al. (2008) were adopted in this study. Moreover, EUCS
instrument (Doll et al., 1994) and the instrument for measuring perceived impact
(Torkzadeh&Doll, 1999) were considered. However, most of the statements did not fit
this construct or had already been covered by the instrument from Gable et al. (2008). In
addition, the characteristics of ePortfolio maturity levels from Love et al. (2004) were
used to reflect net benefits. Researches from Gathercoal et al. (2002), Blackburn&Hakel
(2006), Kim (2006), Marcoul-Burlinson (2006), Hickerson&Preston (2006) and Helen
Barrett6 that describe benefits from ePortfolio were also considered in designing the
statements.
6 Dr. Helen Barrett has been researching strategies and technologies for electronic portfolios since 1991,
publishing a Website (http://electronicportfolios.org), chapters in several books on electronic portfolios, and
numerous articles. She has been providing training and technical assistance on electronic portfolios for teacher
education programs throughout the U.S. under a federal PT3 grant for many years. At the European ePortfolio
Conference in Maastricht, October 2007, Dr. Barrett received the first EIFEL Lifetime Achievement Award for
her contribution to ePortfolio research and development. More information can be found at
http://electronicportfolios.org/.
98
5.3 Operationalization of Critical Success Factors
In their research on implementing Web-based Portfolios, Gathercoal et al. (2002)
identified Critical Success Factors (CSFs) for ePortfolio implementation. According to
their definition, CSFs “must be present and active in order to implement a Webfolio
system” Gathercoal et al. (2002, p. 34). The authors also stressed that the order of
factors is not relevant because all of them are equally important and required for
ePortfolio success. In other words, they can be termed ‘necessary conditions’.
For the purpose of this research those factors were used as the initial factors for
ePortfolio success. Since they were identified several years ago, it was to be expected
that with the development of ICT some of those factors would be fulfilled by default and
would therefore not need to be interpreted as critical any more. On the other hand, there
was a possibility that some other factors appear as critical in respect to changes in
teaching and learning as well as in the maturity of academic institutions. It should be
mentioned that none of the CSFs was contained in any of instrument constructs.
Moreover, concerning their nature, they did not fit into any of research constructs either.
To ensure the comprehensiveness of CSFs, the initial list of CSFs was sent to experts for
review. Their task was to mark the factors they believed to be the critical and if needed,
to add the ones that they found to be critical for the success of ePortfolio. The initial list
of CSFs based on the work of Gathercoal et al. (2002) sent to 12 international ePortfolio
experts7 was as follows:
1. Students and educators are encouraged to use ePortfolio (rewards for educators,
extra scores for students within the course).
2. Faculty participants are not punished for negative feedback on student
evaluations of teaching.
3. All participants have equitable access to the ePortfolio services.
4. All classrooms have Internet access with computer display projection units.
5. Students complete Portfolios as a program requirement.
6. Students complete Portfolios as requirements in courses.
7 EPortfolio experts involved in CSFs analysis were drawn from the pool of experts that participated in the
ePortfolio success instrument development. More information about experts can be found in Appendix A.

99
7. The student’s work in the ePortfolio strongly contributes to define the student to
faculty and recruiters.
8. Multiple faculty/supervisors/mentors read and comment on students’ portfolio
work.
9. Faculty members routinely give students assignments in written form.
10. Students routinely address unstructured problems.
11. Faculty grade and provide feedback on students’ work.
12. The push for adoption and implementation of ePortfolios comes from faculty
management, students and educators.
13. A group of faculty members has the commitment and stamina to make the
ePortfolio system work.
14. An implementation plan exists, with reasonable milestones that are measurable
and that collectively lead to full implementation (adoption).
15. Open computer lab assistance is available for students and faculty.
16. Opportunities exist for student/faculty/mentor training (multiple times and
places).
17. Documentation about using the ePortfolio as a pedagogical tool is available for
faculty/mentors and students.
18. Faculty commit to casting course assignments into a uniform format, such as
Statement of Standard; Student Assignment; Detail/Help/Internet Resources;
Assessment Description.
19. Teams of faculty agree to cast program standards into a uniform format to
adopt ePortfolio as an assessment tool.
20. Faculty teams periodically review and revise the content of the curriculum and
are aware of the content of courses making up the entire program.
21. Courses and/or program requirements are designed and sequenced to build
student mastery of standards.
The experts were sent an Excel spreadsheet with CSFs definition and instructions for
completing the sheet (see Appendix B). They needed to check only those statements
they found to be critical for ePortfolio success and explain why they think the statement
is critical (or not) for ePortfolio success. In addition, it was possible to suggest CSF they

100
considered to be critical for ePortfolio success. After each round, Content Validity Ratio
(CVR) slightly adapted for the needs of this research was calculated for each CSF. Based
on the table in Lawsche (1975) the CVR for each item was evaluated for statistical
significance (.05 alpha level). Statistical significance meant that more than 50% of the
panelists rated the item as critical for ePortfolio success. Items that were not significant
at the level of 0.05 were excluded. Based on the experts’ responses, six statements were
excluded (No. 4, 5, 8, 9, 15, and 17) and five statements added to the list. The modified
list was once again sent to the same pool of experts for another review of CSFs. After the
2nd round four statements were excluded, while some of the remaining ones were
modified in accordance with the experts’ remarks. This resulted in a final set of 16 CSFs
that were retained as critical ones for ePortfolio success:
1. Students and educators are encouraged to use ePortfolio (rewards for educators,
extra scores for students within the course).
2. All participants have equitable access to the ePortfolio services.
3. Students complete ePortfolios as requirements in courses.
4. The student's work in the ePortfolio strongly contributes to define the student to
faculty and recruiters.
5. Faculty grade and provide feedback on students’ work.
6. The push for adoption and implementation of ePortfolios comes from faculty
management, students and educators.
7. A group of faculty members has the commitment and stamina to make the
ePortfolio system work.
8. An implementation plan exists, with reasonable milestones that are measurable
and that collectively lead to full implementation (adoption).
9. Opportunities exist for student/faculty/mentor training (multiple times and
places).
10. Faculty commit to casting course assignments into a uniform format to adopt
ePortfolio as an assessment tool.
11. Financial and other material and technical resources are committed to the
implementation and evaluation of ePortfolio.

101
12. Faculty teams periodically review and revise the content of the curriculum and
are aware of the content of courses making up the entire program.
Newly added CSFs:
13. The ePortfolio initiative is part of the strategic IT vision of the institution.
14. The ePortfolio is approached as a process, not a product.
15. The long-term adoption (assimilation) of the ePortfolio system is approached as
an organizational change management initiative.
16. There is a permanent ePortfolio adoption (post-implementation) group
monitoring and searching for mutual technology-organization adaptation.
The identified CSFs would be given to the institution representatives as a separate
survey following the main ePortfolio success instrument based on the D&M Model, since
CSFs represent contextual factors and are therefore institution specific. Only an
institutional representative such as the director, dean, vice-dean, ePortfolio project
manager or a person familiar with the ePortfolio strategy and the institution’s mission
and vision can identify CSFs that are present in their institution. Students cannot be used
as respondents in this case because they simply do not have the insight into the
existence or absence of factors such as ‘The ePortfolio initiative is part of the strategic IT
vision of the institution’ or ‘Financial and other material and technical resources are
committed to the implementation and evaluation of ePortfolio’. In addition to CSFs,
certain questions to collect general background information about the institution were
also included in the survey. Since this instrument was to be sent to institutions
worldwide and Croatian institution representatives are proficient in English it was not
necessary to translate it to Croatian language, which was not the case with the main
ePortfolio success instrument. For the final version of the online CSFs survey, see
Appendix G.

102
5.4 Instrument development
In order to develop a measurement instrument with good psychometric properties, the
instrument creation process suggested by Moore&Benbasat (1991) was followed in this
research. They proposed three main stages of instrument development: item creation,
scale development and instrument testing. The purpose of item creation was to create
pools of items for each construct. For this purpose operationalization of research
constructs described in the previous section that included items from the existing scales
as well as additional items was performed. The second stage, scale development,
included several rounds of card sorting (henceforth, Q-sort) with different sets of judges
in order to card sort the items within constructs and to eliminate any inappropriately
worded or ambiguous items. In the instrument testing stage, the validity of instrument
was assessed in three steps: 1. Pre-pilot test with a few respondents to get an initial
indication of the scales’ reliability; 2. Pilot test with a larger number of respondents; and
3. Final field test of the instrument. In addition to following the traditional instrument
development paradigm, some other guidelines and examples of instrument
development typical for IS research (Lewis et al., 1995; Armstrong&Sambamurthy,
1999; Straub et al., 2004) were also followed. The subsequent sections describe each
step in detail.
5.4.1 Item creation
The objective of this phase was to ensure the content validity of the instrument.
According to Straub et al. (2004) several different techniques can be used in this step.
For the purpose of operationalization of research constructs, literature review, existing
scales and expert panels were used. This resulted in 175 statements categorized into six
dimensions of the D&M Model that they were originally intended to address (see Table
5). As a result, an initial pool of items for each construct was created. Since the target
instrument would be developed at the individual level of analysis, that is, from the
students’ perspective, it should be mentioned that the initial pool of statements involved
all the statements related to the ePortfolio, regardless of the perspective (student,

103
employer, organization, etc.). Subsequently, Q-sort process and the pilot-test would
ensure that only the statements related to students remain in the pool.

104
Table 5. The initial pool of items in the ePortfolio success instrument
SYSTEM QUALITY
USABILITY 1. The system is easy to use. 2. The system is easy to learn. 3. It is not difficult to get access to information that is in the ePortfolio. 4. The views (selected collections of artefacts for self-presentation) are easy to create
and understand. 5. The terms used in data-entry screens and menus are familiar to users. 6. Menus have a maximum of three to four sub-menus. 7. The documentation is easy to access and use. 8. Help functions provide sufficient information for using the application. 9. Help functions are available/accessible throughout the application. 10. The users can be easily trained to access and operate the system – build their own
portfolios. 11. Users are able to quickly search and retrieve portfolio materials partly or fully. 12. Users can collaborate (work together) on creating and organizing portfolios from
scratch to completion. 13. Users can create views in flexible styles and formats so that the overall
presentation is not confined in a linear or a hierarchical structure. 14. Sitemap of the portfolio system clearly shows site construction and organization of
materials. 15. To achieve a task with a portfolio system, a minimal number of screens, tasks and
actions are required.
DATA ACCESS 16. Only authorized users can access and change the data files or their part. 17. Each user owns a unique password. 18. The system performs an automatic backup of data. 19. Data recovery and retrieval procedures are available in case of an application
malfunction. 20. The system includes controls to detect unauthorized access. 21. The system provides reports showing all unauthorized accesses and errors within
a given period.
DATA PROTECTION
22. The system does not delete/destroy any information without asking for confirmation and getting a positive response.
23. The system never modifies a field without asking for confirmation and getting a positive response.
24. In case of an artefact update, the view that contains that artefact can also be automatically updated.
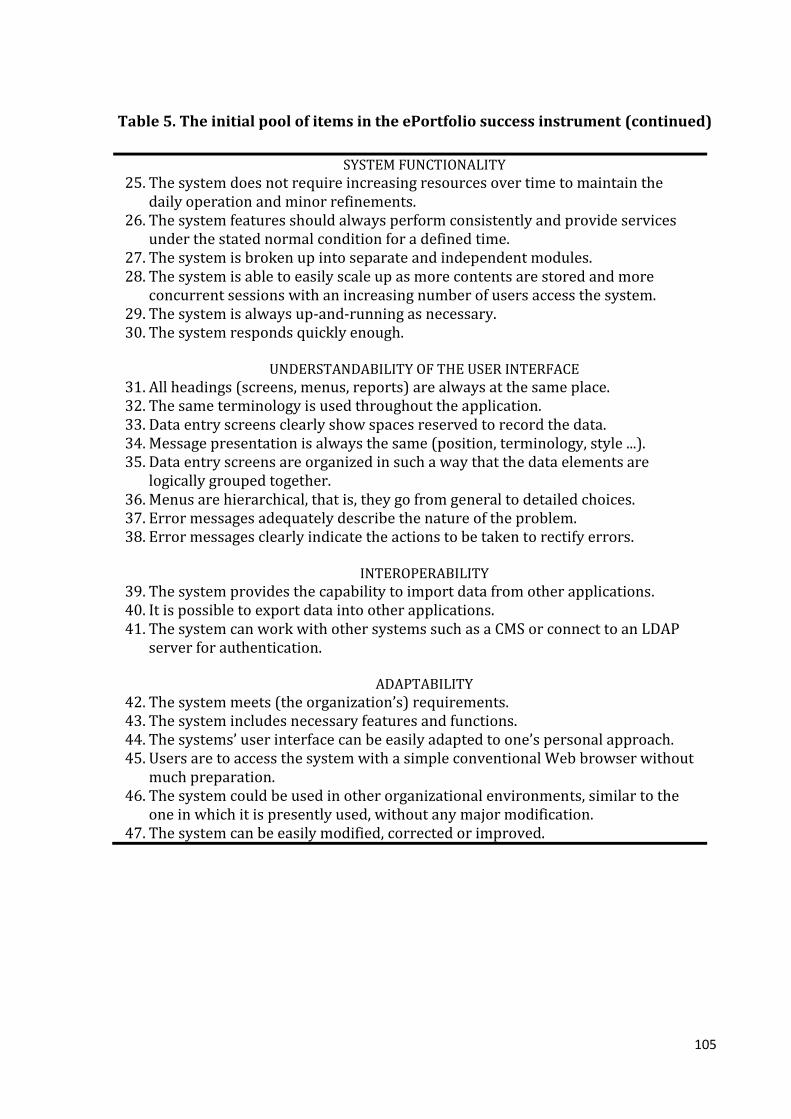
105
Table 5. The initial pool of items in the ePortfolio success instrument (continued)
SYSTEM FUNCTIONALITY 25. The system does not require increasing resources over time to maintain the
daily operation and minor refinements. 26. The system features should always perform consistently and provide services
under the stated normal condition for a defined time. 27. The system is broken up into separate and independent modules. 28. The system is able to easily scale up as more contents are stored and more
concurrent sessions with an increasing number of users access the system. 29. The system is always up-and-running as necessary. 30. The system responds quickly enough.
UNDERSTANDABILITY OF THE USER INTERFACE
31. All headings (screens, menus, reports) are always at the same place. 32. The same terminology is used throughout the application. 33. Data entry screens clearly show spaces reserved to record the data. 34. Message presentation is always the same (position, terminology, style ...). 35. Data entry screens are organized in such a way that the data elements are
logically grouped together. 36. Menus are hierarchical, that is, they go from general to detailed choices. 37. Error messages adequately describe the nature of the problem. 38. Error messages clearly indicate the actions to be taken to rectify errors.
INTEROPERABILITY
39. The system provides the capability to import data from other applications. 40. It is possible to export data into other applications. 41. The system can work with other systems such as a CMS or connect to an LDAP
server for authentication.
ADAPTABILITY
42. The system meets (the organization’s) requirements. 43. The system includes necessary features and functions. 44. The systems’ user interface can be easily adapted to one’s personal approach. 45. Users are to access the system with a simple conventional Web browser without
much preparation. 46. The system could be used in other organizational environments, similar to the
one in which it is presently used, without any major modification. 47. The system can be easily modified, corrected or improved.

106
Table 5. The initial pool of items in the ePortfolio success instrument (continued)
INFORMATION QUALITY
VALIDITY
1. Information available from the ePortfolio is important. 2. Information provided by the ePortfolio is complete. 3. The ePortfolio provides output that seems to be exactly what is needed/required. 4. Information produced by the ePortfolio is valid (i.e. presents real evidence of
accomplishments). 5. Information provided by the ePortfolio is verifiable (i.e. can be checked by some
other means).
FORMAT
6. Information from the ePortfolio is concise (i.e. contains only necessary data). 7. Information from the ePortfolio is in a form that is readily usable. 8. Information from the ePortfolio is easy to understand. 9. Information from the ePortfolio appears readable, clear and well formatted.
AVAILABILITY
10. Users can easily access exclusive/unique information available only through the ePortfolio system.
11. Information needed from the ePortfolio is always available. 12. The ePortfolio provides up to date information. 13. Information from the ePortfolio is always timely.

107
Table 5. The initial pool of items in the ePortfolio success instrument (continued)
SERVICE QUALITY
ASSURANCE FOR END-USERS
1. Users find the organization (University) which provides the portfolio service to have good credibility.
2. It feels safe to work with the ePortfolio. 3. Your personal information feels secure. 4. E-mail and telephone contacts are available in case of problems while using
ePortfolio. 5. FAQ page is included and covers all relevant questions. 6. The behavior of teachers instills confidence in you. 7. Teachers/instructors/ePortfolio staff has the knowledge to answer your questions. 8. On-line help is available.
TANGIBLES
9. The organization has modern looking equipment available for accessing ePortfolio services.
10. The organization’s facilities from which the user can access its Portfolio are visually appealing.
11. The organization’s ePortfolio office staff is neat appearing.
EMPATHY
12. When you have a problem regarding ePortfolio, the organization shows a sincere interest in solving it.
13. The faculty/institution gives you individual attention. 14. The teacher/instructor understands your specific needs. 15. A certain degree of freedom for you to express your own individuality and personal
strengths is allowed. 16. Teachers/instructors give you a prompt service/response. 17. Teachers/instructors are always willing to help you.
CLARITY
18. EPortfolio completion is well described within program requirements. 19. Evaluation criteria for selecting and assessing the e-Portfolio contents, as well as the
overall ePortfolio goal, are clear and very well explained prior to developing the ePortfolio.
20. Privacy policy exists and clearly states all related privacy issues. 21. Security policy exists and clearly states all related security issues. 22. Terms of use as well as ethics regulations are clearly shown.

108
USE PERFORMANCE EXPECTANCY
1. I would find the system useful in teaching and learning. 2. Using the system enables me to present my accomplishments more quickly. 3. Using the system increases my learning capacities. 4. If I use the system, I will increase my chances of being awarded.
EFFORT EXPECTANCY
5. My interaction with the system would be clear and understandable. 6. It would be easy for me to become skillful in using the system. 7. I would find the system easy to use. 8. Learning to operate the system is easy for me.
SOCIAL INFLUENCE
9. People who influence my behavior think that I should use the system. 10. People who are important to me think that I should use the system. 11. The ePortfolio staff has been helpful in the use of the system. 12. In general, the organization has supported the use of the system.
SELF-EFFICACY
13. I could complete a job or task using the system… 14. …if there was no one around to tell me what to do as I go. 15. …if I could call someone for help if I got stuck. 16. …if I had a lot of time to complete the job for which the software was provided. 17. …if I had just the built-in help facility for assistance.
BEHAVIORAL INTENTION TO USE THE SYSTEM
18. I intend to use the system in the next <n> months. 19. I predict I would use the system in the next <n> months. 20. I plan to use the system in the next <n> months.
COGNITIVE ABSORPTION
21. When I was using ePortfolio, I was able to block out all other distractions. 22. When I was using ePortfolio, I felt totally immersed in what I was doing. 23. When I was using ePortfolio, I got distracted very easily. 24. When I was using ePortfolio, I felt completely absorbed in what I was doing. 25. When I was using ePortfolio, my attention did not get diverted very easily.
DEEP STRUCTURE USAGE
26. When I was using ePortfolio, I did not use features that would help me present my artefacts.
27. When I was using ePortfolio, I used features that helped me tag my artefacts. 28. When I was using ePortfolio, I used features that helped me test different views. 29. When I was using ePortfolio, I used features that helped me join the groups. 30. When I was using ePortfolio, I used features that helped me organize my artefacts.
Table 5. The initial pool of items in the ePortfolio success instrument (continued)
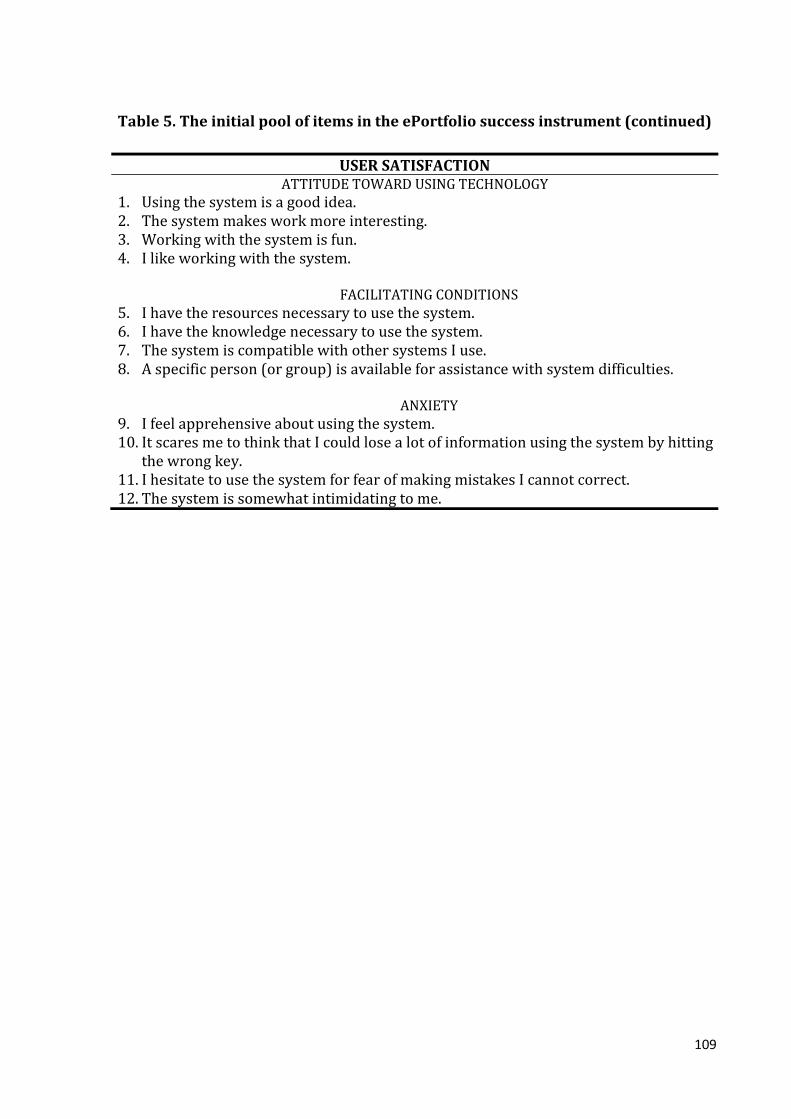
109
Table 5. The initial pool of items in the ePortfolio success instrument (continued)
USER SATISFACTION ATTITUDE TOWARD USING TECHNOLOGY
1. Using the system is a good idea. 2. The system makes work more interesting. 3. Working with the system is fun. 4. I like working with the system.
FACILITATING CONDITIONS
5. I have the resources necessary to use the system. 6. I have the knowledge necessary to use the system. 7. The system is compatible with other systems I use. 8. A specific person (or group) is available for assistance with system difficulties.
ANXIETY
9. I feel apprehensive about using the system. 10. It scares me to think that I could lose a lot of information using the system by hitting
the wrong key. 11. I hesitate to use the system for fear of making mistakes I cannot correct. 12. The system is somewhat intimidating to me.

110
Table 5. The initial pool of items in the ePortfolio success instrument (continued)
NET BENEFITS
SELF-PRESENTATION
1. I can show my comprehensive profile through ePortfolio. 2. I have the ability to generate my own views for displaying work samples and
achievements. 3. I can generate portals for displaying work samples and achievements within the
same curricular structure. 4. I can generate portals for displaying work samples and achievements within the
institutional standard. 5. I can nominate who can view my Portfolio. 6. I can nominate who can provide feedback for each item in my ePortfolio. 7. Potential employers can view the Showcase Portfolio with the benefit of contextual
clues from the institution, assessment criteria, and student-generated descriptions of achievements.
ENHANCED LEARNING
8. Using ePortfolio helped me to become a more effective, independent and confident self-directed learner.
9. EPortfolio helped me to understand how I learn. 10. EPortfolio helped me to relate my learning to a wider context. 11. EPortfolio helped me to make connections among my formal (structured learning
within the school or faculty) and informal (unstructured learning occurring in everyday life) learning experiences.
12. My ePortfolio enables me to learn more effectively through interaction with other students including the feedback received from them.
13. The use of ePortfolio enabled me to receive important comments and suggestions from my teacher.
14. EPortfolio enabled me to have multiple opportunities to better evaluate the products of my work based on the feedback received from educators.
15. EPortfolio encouraged me to develop a positive attitude to lifelong learning. 16. The enhanced communication between students and educators enhances the
chances for student success. 17. The potential for enhanced communication between peers stimulates my motivation
to work and learn through the ePortfolio system. 18. The mean and frequency of students’ work can be easily monitored. 19. The educator can give summative assessment to students’ work based on stored
artefacts and feedback. 20. EPortfolio provides evidence of students’ understanding of course-specific
knowledge and skills. 21. Using ePortfolio has led to increased transparency for evaluation and
benchmarking. 22. I can choose my co-workers according to various criteria presented in ePortfolio. 23. EPortfolio has resulted in improved learning outcomes or outputs.

111
Table 5. The initial pool of items in the ePortfolio success instrument (continued)
IMPROVED STANDARDS AND CURRICULUM
24. EPortfolio clearly reflects learning objectives as identified in the course curriculum. 25. Standards, department goals and other descriptors can be linked to specific
ePortfolio items. 26. EPortfolios are organized by curricular requirements and electives or by standards
established by the cadre of educators or the institution. 27. There is a possibility to repeat instructional implementation by copying the course
content as well as goals and standards from one instructor to others, each time enriching the content through additional resources and new curricular initiatives.
28. The assessment data generated from the ePortfolio system can be used each semester to assist with program assessment and revision.
29. There is a possibility to copy course syllabi and assignments along with complete links to standards and department goals from one semester to the next, each time enriching the content through additional resources and new curricular initiatives.
30. I can use the assessment data generated within the ePortfolio system each semester to assist with course revision.
31. It can be ascertained which students met or exceeded standards linked to specific work samples and achievements.
32. EPortfolio has resulted in improved quality assurance process.
PERSONAL GROWTH AND DEVELOPMENT
33. I can monitor my own improvement. 34. I can monitor changes in my ideas, criteria and attitudes. 35. I am able to compare myself with others. 36. I can show my personal growth and development over time. 37. I have improved my general skills for education/learning. 38. I have improved my general skills for career management. 39. I can articulate personal goals. 40. I am able to evaluate progress towards the achievement of my personal goals. 41. I can reflect on artefacts 42. I can enrich the course content based on received feedback in ePortfolio. 43. EPortfolio enabled me to track the efficiency of teaching (changes in attitudes,
increased interest for some part of the content, interpretation clarity …) 44. I can monitor the efficiency of strategies I use in teaching. 45. I can show how artefacts match my goals and standards. 46. Reflections enable me to get insight into individual thinking processes,
introspection, and thoughts on problem-solving. 47. Reflections enable me to observe intellectual strengths and weaknesses. 48. Reflections enable me to develop decision-making skills. 49. I can solve problems much more easily by using ePortfolio with all its features. 50. EPortfolio has resulted in my own better positioning among others. 51. EPortfolio brings about benefits that are more important than its costs (e.g. time and
money).

112
To ensure the content validity of the instrument, a survey was constructed along with
detailed instructions for evaluation (see Appendix C) and sent to ePortfolio experts by e-
mail in the form of an MS Excel spreadsheet. The spreadsheet form was chosen as the
most appropriate for this type of research for several reasons:
1. It can be sent by e-mail worldwide thus presenting the fastest way for data
collection and processing.
2. It enables very easy manipulation with a large number of statements (horizontal
and vertical scrolling).
3. Certain cells can be locked out from making any changes. Only the cells that
require data input can be left unlocked thus enabling experts to input the data
only to the required cells.
Before the spreadsheet was sent to the experts it was pre-tested at FOI for: 1. possible
issues with the spreadsheet itself such as compatibility, visibility and formatting; 2.
clarity of instructions, 3. spelling and grammar; and 4. time needed for completion. One
graduate and two doctoral students were used in this process. After they filled in the
spreadsheet an interview/meeting was held to reconcile their notes and comments.
Once the spreadsheet was modified according to the suggestions it was sent by e-mail to
23 ePortfolio experts. Some of the experts were persons the author of the dissertation
had previously cooperated with, while others were contacted through
recommendations.
Eighteen experts from 9 different countries (Austria, Croatia, New Zealand, Poland,
Russia Slovenia, Spain, United Kingdom and USA) returned the completed sheet. Their
level of expertise could be divided into three categories: institution representatives
(experts in implementing ePortfolio at the institution level), educators (experts in using
ePortfolio in teaching) and students (primarily experienced in using ePortfolio in
learning and for self-presentation). More detailed information about their expertise is
provided in Appendix A. Their task was to score the 175 items using the scale ‘0 –
Cannot answer, 1 – Not relevant, 2 – Important (but not essential), and 3 – Essential’.
From the data obtained, the content validity ratio (CVR) was computed for each item
using the Lawsche’s formulation (1975):
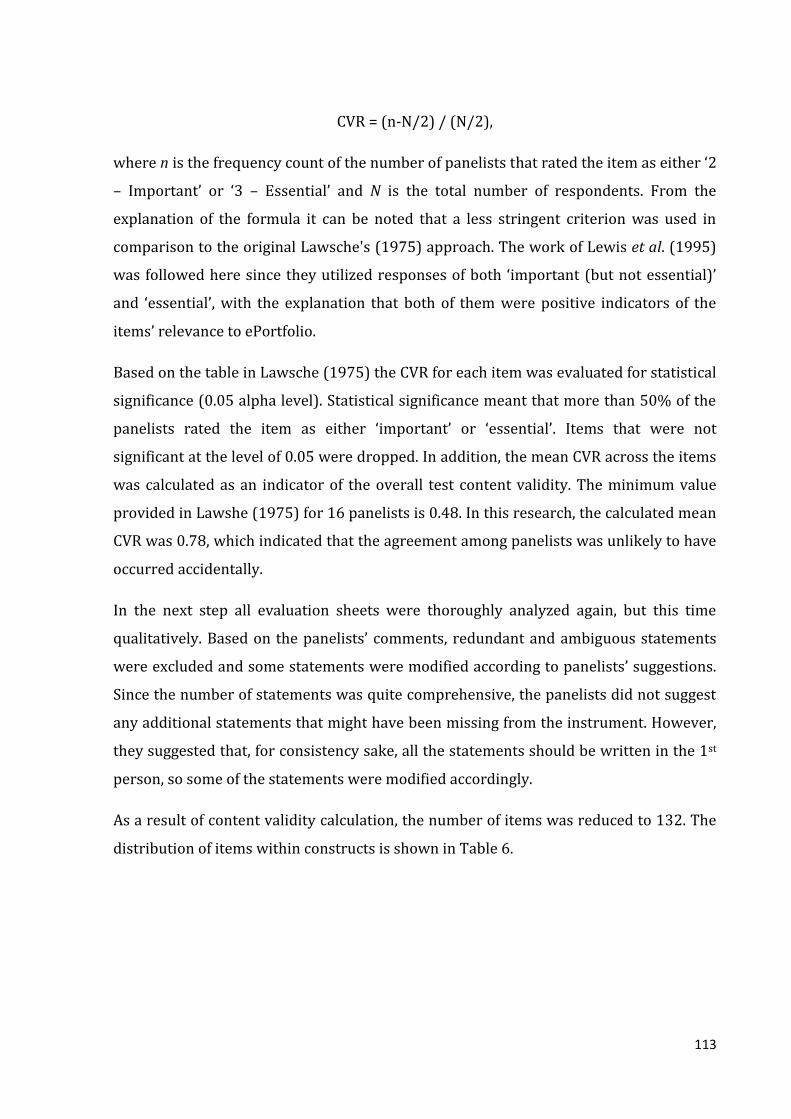
113
CVR = (n-N/2) / (N/2),
where n is the frequency count of the number of panelists that rated the item as either ‘2
– Important’ or ‘3 – Essential’ and N is the total number of respondents. From the
explanation of the formula it can be noted that a less stringent criterion was used in
comparison to the original Lawsche's (1975) approach. The work of Lewis et al. (1995)
was followed here since they utilized responses of both ‘important (but not essential)’
and ‘essential’, with the explanation that both of them were positive indicators of the
items’ relevance to ePortfolio.
Based on the table in Lawsche (1975) the CVR for each item was evaluated for statistical
significance (0.05 alpha level). Statistical significance meant that more than 50% of the
panelists rated the item as either ‘important’ or ‘essential’. Items that were not
significant at the level of 0.05 were dropped. In addition, the mean CVR across the items
was calculated as an indicator of the overall test content validity. The minimum value
provided in Lawshe (1975) for 16 panelists is 0.48. In this research, the calculated mean
CVR was 0.78, which indicated that the agreement among panelists was unlikely to have
occurred accidentally.
In the next step all evaluation sheets were thoroughly analyzed again, but this time
qualitatively. Based on the panelists’ comments, redundant and ambiguous statements
were excluded and some statements were modified according to panelists’ suggestions.
Since the number of statements was quite comprehensive, the panelists did not suggest
any additional statements that might have been missing from the instrument. However,
they suggested that, for consistency sake, all the statements should be written in the 1st
person, so some of the statements were modified accordingly.
As a result of content validity calculation, the number of items was reduced to 132. The
distribution of items within constructs is shown in Table 6.

114
Table 6. Number of items in the constructs after CVR
Constructs Number of items
Initial After CVR
System Quality 47 42 Information Quality 13 12 Service Quality 22 19 Use 30 9 User Satisfaction 12 9 Net Benefits 51 40
Total 175 132
5.4.2 Scale development
In order to ensure that the items represented the six constructs from the D&M Model,
construct validation was conducted. According to Straub et al. (2004, p. 388) construct
validity “raises the basic question of whether the measures chosen by researcher fit
together in such way to capture the essence of the construct”. The research by Davis
(1986, 1989), Moore&Benbasat (1991), Segars&Groover (1998), Chang&King (2005) as
well as examples from Straub et al. (2004) were followed in this research and the Q-sort
technique was used to validate the constructs and sub-constructs in the instrument.
Straub et al. (2004) and Moore&Benbasat (1991) recommend the usage of Q-sort to
ensure both discriminant (divergent) and convergent validity of the construct.
According to Moore&Benbasat (1991), if the item is consistently placed within a
particular construct, it is considered to demonstrate convergent validity with a related
construct and discriminant validity with other constructs.
To assess the reliability of the sorting procedure, two different measures were used.
First, Cohen's Kappa was used to measure the level of agreement between the judges as
a part of inter-rater reliability that according to Straub et al. (2004) should be
mandatorily performed in IS research. Therefore the Kappa score was calculated for
each pair of judges. Moore&Benbasat (1991) claim that no general authority exists with
respect to required scores, but suggest that, according to literature, scores greater than
0.65 are acceptable. On the other hand, following extensive literature overview, Straub
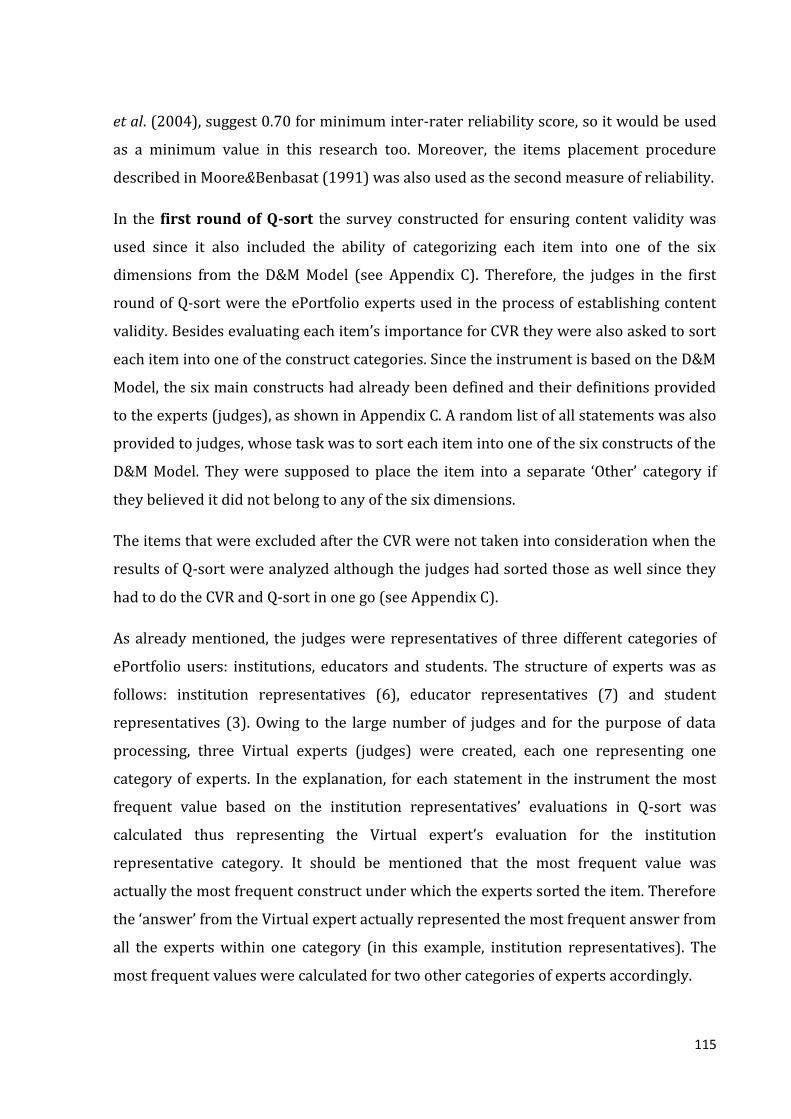
115
et al. (2004), suggest 0.70 for minimum inter-rater reliability score, so it would be used
as a minimum value in this research too. Moreover, the items placement procedure
described in Moore&Benbasat (1991) was also used as the second measure of reliability.
In the first round of Q-sort the survey constructed for ensuring content validity was
used since it also included the ability of categorizing each item into one of the six
dimensions from the D&M Model (see Appendix C). Therefore, the judges in the first
round of Q-sort were the ePortfolio experts used in the process of establishing content
validity. Besides evaluating each item’s importance for CVR they were also asked to sort
each item into one of the construct categories. Since the instrument is based on the D&M
Model, the six main constructs had already been defined and their definitions provided
to the experts (judges), as shown in Appendix C. A random list of all statements was also
provided to judges, whose task was to sort each item into one of the six constructs of the
D&M Model. They were supposed to place the item into a separate ‘Other’ category if
they believed it did not belong to any of the six dimensions.
The items that were excluded after the CVR were not taken into consideration when the
results of Q-sort were analyzed although the judges had sorted those as well since they
had to do the CVR and Q-sort in one go (see Appendix C).
As already mentioned, the judges were representatives of three different categories of
ePortfolio users: institutions, educators and students. The structure of experts was as
follows: institution representatives (6), educator representatives (7) and student
representatives (3). Owing to the large number of judges and for the purpose of data
processing, three Virtual experts (judges) were created, each one representing one
category of experts. In the explanation, for each statement in the instrument the most
frequent value based on the institution representatives’ evaluations in Q-sort was
calculated thus representing the Virtual expert’s evaluation for the institution
representative category. It should be mentioned that the most frequent value was
actually the most frequent construct under which the experts sorted the item. Therefore
the ‘answer’ from the Virtual expert actually represented the most frequent answer from
all the experts within one category (in this example, institution representatives). The
most frequent values were calculated for two other categories of experts accordingly.
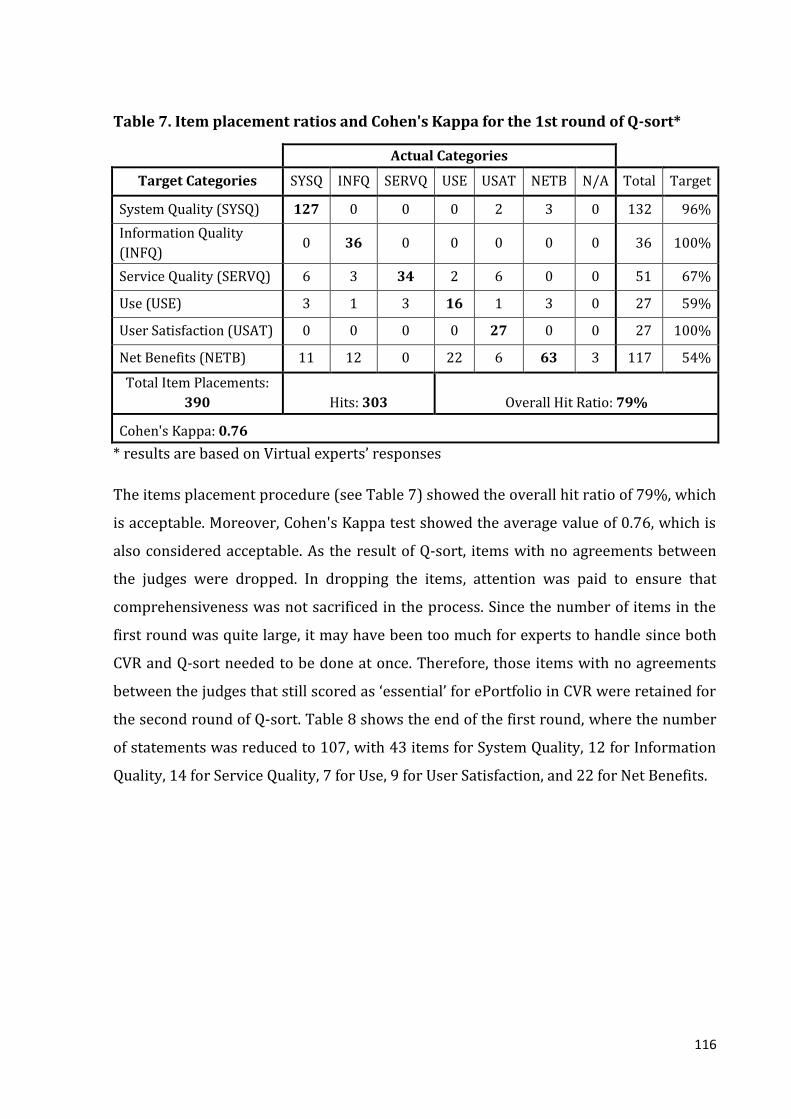
116
Table 7. Item placement ratios and Cohen's Kappa for the 1st round of Q-sort*
Actual Categories
Target Categories SYSQ INFQ SERVQ USE USAT NETB N/A Total Target
System Quality (SYSQ) 127 0 0 0 2 3 0 132 96%
Information Quality
(INFQ) 0 36 0 0 0 0 0 36 100%
Service Quality (SERVQ) 6 3 34 2 6 0 0 51 67%
Use (USE) 3 1 3 16 1 3 0 27 59%
User Satisfaction (USAT) 0 0 0 0 27 0 0 27 100%
Net Benefits (NETB) 11 12 0 22 6 63 3 117 54%
Total Item Placements:
390 Hits: 303 Overall Hit Ratio: 79%
Cohen's Kappa: 0.76
* results are based on Virtual experts’ responses
The items placement procedure (see Table 7) showed the overall hit ratio of 79%, which
is acceptable. Moreover, Cohen's Kappa test showed the average value of 0.76, which is
also considered acceptable. As the result of Q-sort, items with no agreements between
the judges were dropped. In dropping the items, attention was paid to ensure that
comprehensiveness was not sacrificed in the process. Since the number of items in the
first round was quite large, it may have been too much for experts to handle since both
CVR and Q-sort needed to be done at once. Therefore, those items with no agreements
between the judges that still scored as ‘essential’ for ePortfolio in CVR were retained for
the second round of Q-sort. Table 8 shows the end of the first round, where the number
of statements was reduced to 107, with 43 items for System Quality, 12 for Information
Quality, 14 for Service Quality, 7 for Use, 9 for User Satisfaction, and 22 for Net Benefits.
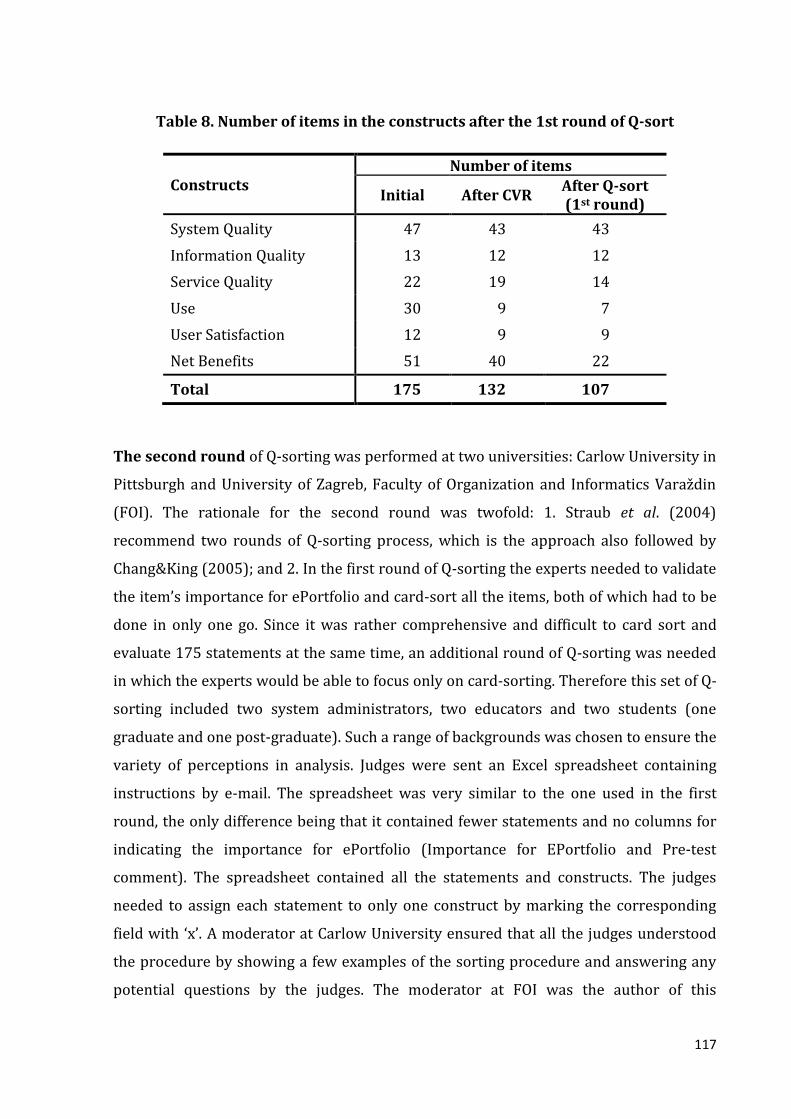
117
Table 8. Number of items in the constructs after the 1st round of Q-sort
Constructs Number of items
Initial After CVR After Q-sort (1st round)
System Quality 47 43 43
Information Quality 13 12 12
Service Quality 22 19 14
Use 30 9 7
User Satisfaction 12 9 9
Net Benefits 51 40 22
Total 175 132 107
The second round of Q-sorting was performed at two universities: Carlow University in
Pittsburgh and University of Zagreb, Faculty of Organization and Informatics Varaždin
(FOI). The rationale for the second round was twofold: 1. Straub et al. (2004)
recommend two rounds of Q-sorting process, which is the approach also followed by
Chang&King (2005); and 2. In the first round of Q-sorting the experts needed to validate
the item’s importance for ePortfolio and card-sort all the items, both of which had to be
done in only one go. Since it was rather comprehensive and difficult to card sort and
evaluate 175 statements at the same time, an additional round of Q-sorting was needed
in which the experts would be able to focus only on card-sorting. Therefore this set of Q-
sorting included two system administrators, two educators and two students (one
graduate and one post-graduate). Such a range of backgrounds was chosen to ensure the
variety of perceptions in analysis. Judges were sent an Excel spreadsheet containing
instructions by e-mail. The spreadsheet was very similar to the one used in the first
round, the only difference being that it contained fewer statements and no columns for
indicating the importance for ePortfolio (Importance for EPortfolio and Pre-test
comment). The spreadsheet contained all the statements and constructs. The judges
needed to assign each statement to only one construct by marking the corresponding
field with ‘x’. A moderator at Carlow University ensured that all the judges understood
the procedure by showing a few examples of the sorting procedure and answering any
potential questions by the judges. The moderator at FOI was the author of this

118
dissertation. As in the first round of Q-sort, the judges were introduced to the constructs
and their definitions. Again, items with no agreement between the judges were dropped
(see Table 9). As a result of the second round, the number of statements was reduced to
85 (see Table 10). The Cohen's Kappa test was not calculated in this particular round
since the Item Placement Ratio is adequate for showing the reliability of the raters
(judges) (Chang&King, 2005; Moore&Benbasat, 2001; Straub et al., 2004).
Table 9. Item placement ratios after the 2nd round of Q-sort
Actual Categories
Target Categories SYSQ INFQ SERVQ USE USAT NETB N/A Total Target
System Quality (SYSQ) 181 29 9 17 9 3 4 252 72%
Information Quality (INFQ) 8 47 4 3 6 4 0 72 65%
Service Quality (SERVQ) 5 3 53 12 5 3 3 84 63%
Use (USE) 6 0 1 29 7 5 0 48 60%
User Satisfaction (USAT) 6 0 2 12 47 4 1 72 65%
Net Benefits (NETB) 4 3 3 19 15 69 1 114 61%
Total Item Placements: 642 Hits: 426 Overall Hit Ratio: 66%
Table 10. Number of items in the constructs after the 2nd round of Q-sort
Constructs Number of items
Initial After CVR After Q-sort (1st round)
After Q-sort (2nd round)
System Quality 47 43 43 39
Information Quality 13 12 12 9
Service Quality 22 19 14 9
Use 30 9 7 6
User Satisfaction 12 9 9 9
Net Benefits 51 40 22 13
Total 175 132 107 85

119
Exploring subcategories within constructs
Having firmly established that the items in each dimension did represent the desired
dimension, the third round of Q-sorting was conducted at the Faculty of Organization
and Informatics in Varaždin. This round was aimed at gaining insight into possible
subcategories within the constructs and further refinement of the statements. Here it
should be mentioned that the identified sub-categories would still need empirical
testing. For this factor analysis would be used after the field-test results are obtained
(see Section 6.2).
This time each item was printed on one 3x5 cm index card and cards were separated by
dimension. Therefore the maximum amount of cards to sort was 39 for System Quality,
while for other categories the number was much smaller. Three different judges
(doctoral students) were read a standard set of instructions prior to sorting the cards
and were demonstrated the card-sorting process. In addition, they were allowed to ask
as many questions as necessary to ensure they understood the procedure. Their task
was to sort the cards one dimension at a time into as few categories as possible and to
name the categories. After all the judges had completed their sorting, a
meeting/interview was conducted to reconcile the differences among their results. This
resulted in a number of sub-categories with multiple items for each dimension, which
matched well with sub-constructs suggested by the literature:
System Quality – usability, functionality, user interface, and security;
Information Quality – validity and format;
Service Quality – assurance for end users, empathy, and clarity;
Use – deep structure usage, and facilitating conditions;
User Satisfaction – attitude towards using the system, and usefulness; and
Net Benefits – enhanced learning, and personal growth and development.
Beside indications of the existence of subcategories within the constructs, two
statements with no agreements between judges were dropped. It is worth mentioning
that those statements had the lowest level of agreement between the judges in the first
two rounds of the card-sorting process. Moreover, the judges noted that several
statements in the System Quality construct were very similar, while some measured the
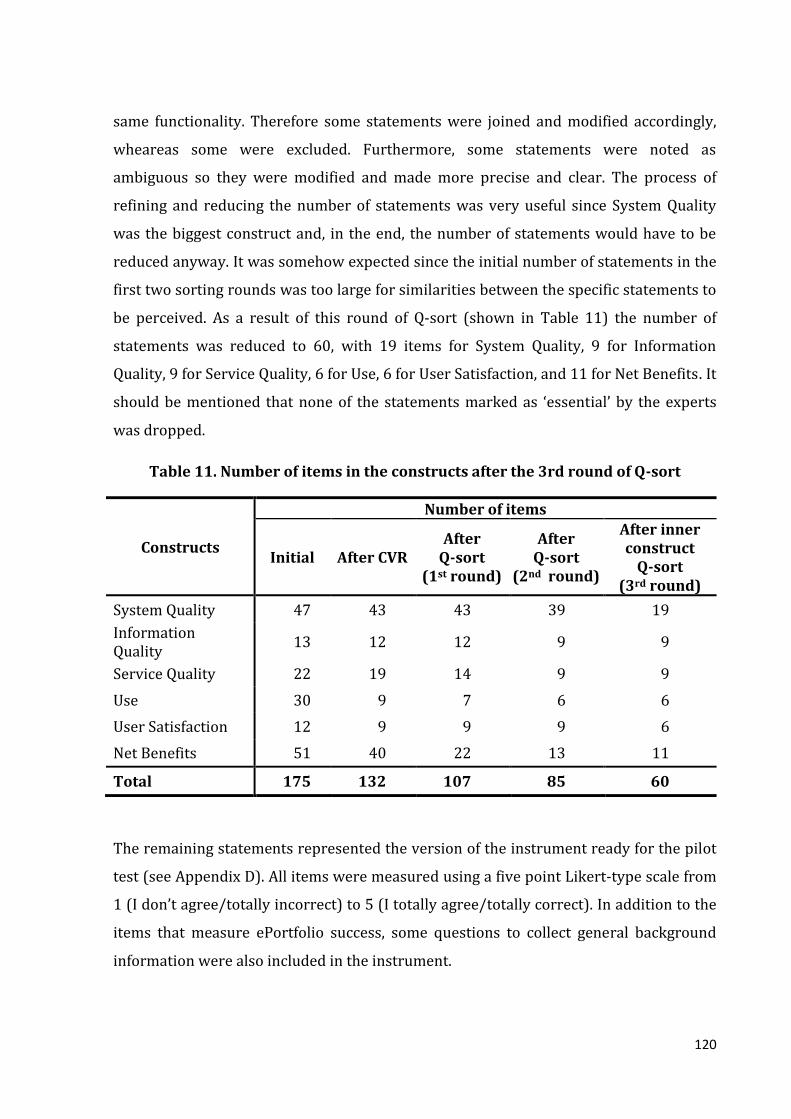
120
same functionality. Therefore some statements were joined and modified accordingly,
wheareas some were excluded. Furthermore, some statements were noted as
ambiguous so they were modified and made more precise and clear. The process of
refining and reducing the number of statements was very useful since System Quality
was the biggest construct and, in the end, the number of statements would have to be
reduced anyway. It was somehow expected since the initial number of statements in the
first two sorting rounds was too large for similarities between the specific statements to
be perceived. As a result of this round of Q-sort (shown in Table 11) the number of
statements was reduced to 60, with 19 items for System Quality, 9 for Information
Quality, 9 for Service Quality, 6 for Use, 6 for User Satisfaction, and 11 for Net Benefits. It
should be mentioned that none of the statements marked as ‘essential’ by the experts
was dropped.
Table 11. Number of items in the constructs after the 3rd round of Q-sort
Constructs
Number of items
Initial After CVR After
Q-sort (1st round)
After Q-sort
(2nd round)
After inner construct
Q-sort (3rd round)
System Quality 47 43 43 39 19
Information Quality
13 12 12 9 9
Service Quality 22 19 14 9 9
Use 30 9 7 6 6
User Satisfaction 12 9 9 9 6
Net Benefits 51 40 22 13 11
Total 175 132 107 85 60
The remaining statements represented the version of the instrument ready for the pilot
test (see Appendix D). All items were measured using a five point Likert-type scale from
1 (I don’t agree/totally incorrect) to 5 (I totally agree/totally correct). In addition to the
items that measure ePortfolio success, some questions to collect general background
information were also included in the instrument.

121
After the first version of the instrument was developed, a pretest was made with ten
undergraduate students in order to get feedback about the visibility, clarity, readability
and time needed for completion. After incorporating the comments from the pretest, a
localized version of the instrument was also created since most respondents were from
Croatia. The process of translation was conducted as follows:
1. Statements from English were translated to Croatian by three independent
persons. There were certain slight differences in translations but those were
reconciled during the meeting with translators after they did the translation.
2. The translated statements were given to a teacher of English, who translated
those statements back to English.
3. The initial English statements and the ones obtained after the translation
from Croatian were compared to ensure that the core meaning had not been
lost in translation.
After ensuring that both instruments were equivalent, online versions of the
instruments were created. In that way they it was possible to send them to national and
international students, making the data analysis faster. The same process of translation
was conducted for the CSFs survey as well.
5.4.3 Pilot test
The aim of the pilot-test was twofold: The first aim was to become aware of the typical
and possible anomalous responses from potential respondents, as well as of potential
problems with statistical analyses. For that purpose at the end of the questionnaire the
respondents were able to comment on its length, wording and instructions in the last
field of the online survey reserved for comments. Moreover, technical reliability and
usability of the online survey system was also tested. The online instruments were
created in the Unit Command Climate Assessment and Survey System (UCCASS)8 hosted
at FOI.
8 UCCASS ver 1.8.1, available at: http://www.bigredspark.com/survey.html
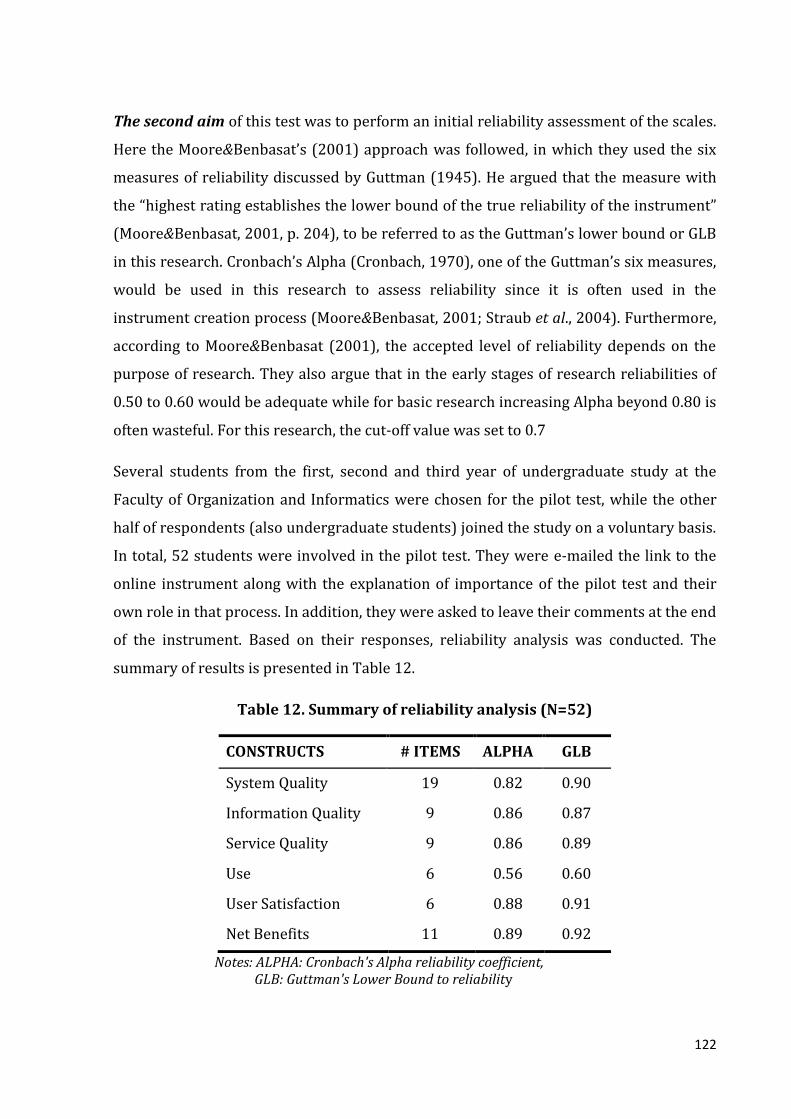
122
The second aim of this test was to perform an initial reliability assessment of the scales.
Here the Moore&Benbasat’s (2001) approach was followed, in which they used the six
measures of reliability discussed by Guttman (1945). He argued that the measure with
the “highest rating establishes the lower bound of the true reliability of the instrument”
(Moore&Benbasat, 2001, p. 204), to be referred to as the Guttman’s lower bound or GLB
in this research. Cronbach’s Alpha (Cronbach, 1970), one of the Guttman’s six measures,
would be used in this research to assess reliability since it is often used in the
instrument creation process (Moore&Benbasat, 2001; Straub et al., 2004). Furthermore,
according to Moore&Benbasat (2001), the accepted level of reliability depends on the
purpose of research. They also argue that in the early stages of research reliabilities of
0.50 to 0.60 would be adequate while for basic research increasing Alpha beyond 0.80 is
often wasteful. For this research, the cut-off value was set to 0.7
Several students from the first, second and third year of undergraduate study at the
Faculty of Organization and Informatics were chosen for the pilot test, while the other
half of respondents (also undergraduate students) joined the study on a voluntary basis.
In total, 52 students were involved in the pilot test. They were e-mailed the link to the
online instrument along with the explanation of importance of the pilot test and their
own role in that process. In addition, they were asked to leave their comments at the end
of the instrument. Based on their responses, reliability analysis was conducted. The
summary of results is presented in Table 12.
Table 12. Summary of reliability analysis (N=52)
CONSTRUCTS # ITEMS ALPHA GLB
System Quality 19 0.82 0.90
Information Quality 9 0.86 0.87
Service Quality 9 0.86 0.89
Use 6 0.56 0.60
User Satisfaction 6 0.88 0.91
Net Benefits 11 0.89 0.92
Notes: ALPHA: Cronbach's Alpha reliability coefficient, GLB: Guttman's Lower Bound to reliability
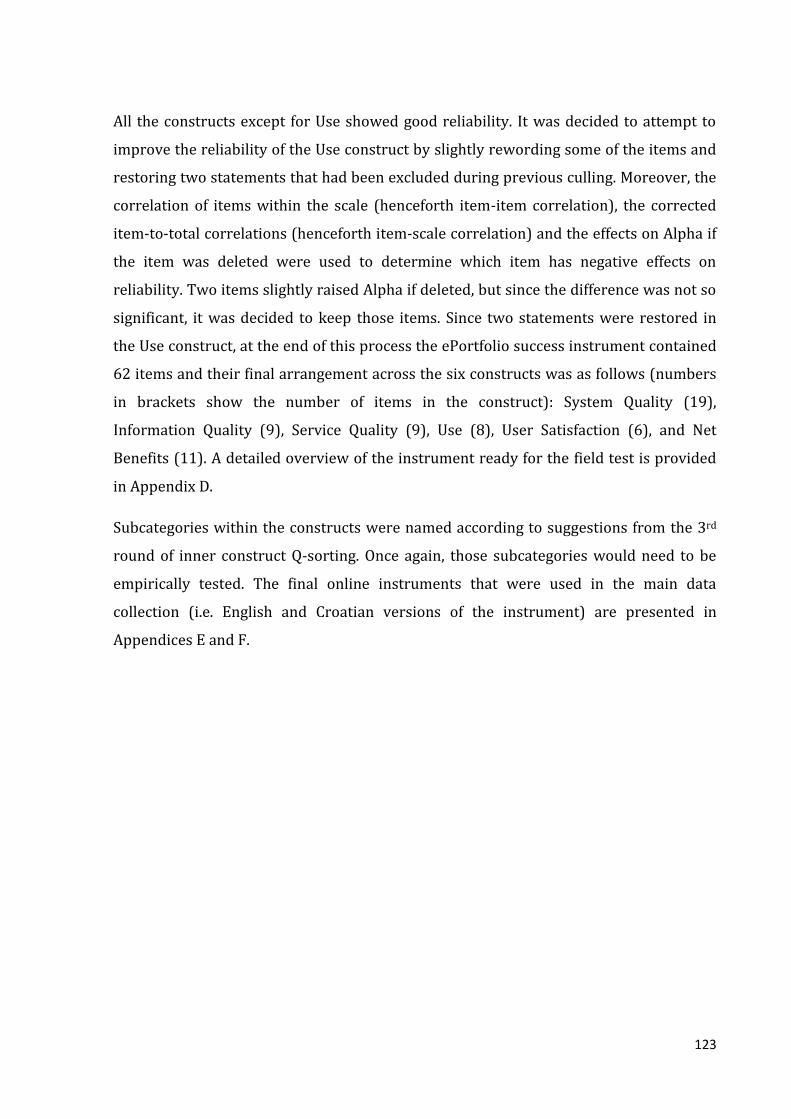
123
All the constructs except for Use showed good reliability. It was decided to attempt to
improve the reliability of the Use construct by slightly rewording some of the items and
restoring two statements that had been excluded during previous culling. Moreover, the
correlation of items within the scale (henceforth item-item correlation), the corrected
item-to-total correlations (henceforth item-scale correlation) and the effects on Alpha if
the item was deleted were used to determine which item has negative effects on
reliability. Two items slightly raised Alpha if deleted, but since the difference was not so
significant, it was decided to keep those items. Since two statements were restored in
the Use construct, at the end of this process the ePortfolio success instrument contained
62 items and their final arrangement across the six constructs was as follows (numbers
in brackets show the number of items in the construct): System Quality (19),
Information Quality (9), Service Quality (9), Use (8), User Satisfaction (6), and Net
Benefits (11). A detailed overview of the instrument ready for the field test is provided
in Appendix D.
Subcategories within the constructs were named according to suggestions from the 3rd
round of inner construct Q-sorting. Once again, those subcategories would need to be
empirically tested. The final online instruments that were used in the main data
collection (i.e. English and Croatian versions of the instrument) are presented in
Appendices E and F.

124
5.5 Data collection
The pilot test ensured that no major flaws in the instrument existed and that the online
survey software was adequate for this type of research. The instrument was once again
carefully examined to ensure it was easily readable and to reduce the effort needed by
the respondents. To avoid possible problems with skipping a question or overseeing an
item, all the answers in the instrument were marked as mandatory so the system would
not let the respondent proceed to the next page unless all the items on the current page
were previously answered. In addition, short and friendly links to the surveys were
created with tinyurl.com, since the existing links to the surveys were rather
comprehensive, which may prevent potential respondents from participating.
Since ePortfolio implementation is relatively new in Croatia, a research has been
conducted in order to determine which educational institutions use ePortfolio in Croatia.
The results were not as good as expected. Only the Faculty of Organization and
Informatics (FOI) (domestic institution) actively uses ePortfolio with more than 350
students. Three other institutions in Croatia use ePortfolio but with a smaller number of
students. Therefore it was decided to contact institutions in Europe and USA to obtain
the number of respondents required for a stable factor analysis and SEM. In addition, a
cross-national sample was needed for the results to be generally applicable. It was
necessary to obtain about 300 responses in total to achieve the 5:1 ratio between
students and instrument items. In case of a smaller sample, PLS would be used for factor
analysis since it is more robust for smaller samples. Since the ePortfolio is mostly in the
pilot phase it was rather difficult to find institutions/universities that actively use
ePortfolio. The following strategy of collecting participants outside Croatia was used:
1. An online research was conducted to collect as many institutions as possible in
Europe and USA that might have experience in implementing and using
ePortfolio. Based on the results, 72 institutions that reported any kind of
experience with ePortfolio were targeted.
2. An invitation letter presented in Appendix H was mailed to an institution
representative such as the dean, director or manager to find out whether they
were willing to participate in research, how many respondents they would be

125
able to provide, and if there were any additional requirements for their
participation (for example, some institutions required a special form to be
submitted and approved by the board in order to conduct any kind of research
involving students). The letter also stated that, in return, after the analysis, a full
report of the institution’s score would be sent to the institution representative if
the institution provided a sufficient number of respondents.
3. If the institution decided to participate, another mail (see Appendix I) was sent to
students in agreement with the institution representative. Prior to this mail, the
students were e-mailed by the institution and informed that they would get the
invitation letter to join the survey. The e-mails sent to students in different
institutions were not identical in their structure because it depended on the
institution’s regulations and requirements.
If no reply was received from the institution representative, a gentle reminder was sent
two weeks after the first e-mail. The same procedure was used for students if the
response rate was low. At FOI, students were e-mailed in the same way as those outside
FOI, but their teachers were also asked to remind them to complete the survey.
Two instruments for analysis were administered in this research. The first one, which
measured ePortfolio success, was intended for students since the unit of analysis was
individual. The second one, which assessed CSFs, was intended for institutions in order
to collect some general data and information about maturity level and CSFs that were
present in a respective institution. Since one of the aims of this research was to establish
the connection between CSFs and ePortfolio success, it was important that an institution
whose students participated in the ePortfolio success survey also participated in the CSF
survey.
The data collection process started in June 2010 and ended in November 2010. At the
end of the process, 28 different institutions worldwide completed the CSFs survey (see
Appendix J), while 248 students completed the ePortfolio success survey. Careful
screening of the responses in the latter survey showed that 62 user responses were not
usable since 54 users reported the ePortfolio usage in only one course and 8 answers
were not valid (for example, students provided identical answers to all the questions).

126
Therefore, 186 valid students’ responses were left for further analysis. The response
rate for institutions that participated in the CSFs survey was calculated by taking into
account the number of targeted institutions and the Dillman’s formula (Dillman, 1987)
for calculating the responses rate adapted for this research as:
9
.
The response rate for the institutions was 42%. However, calculating student responses
to the ePortfolio success survey was much more difficult because almost none of the
institutions that agreed to participate in this research and complete the CSFs survey
reported the exact number of targeted students. Therefore this research ended when it
was determined that there were enough data points in the ePortfolio success survey to
perform the analysis and no institutions were left in the pool of potential participants.
Prior to a detailed sample analysis, it should be determined whether the sample is
adequate for further statistical analysis. First, the universities’ responses to the CSFs
survey were analyzed in conjunction with students’ responses to the ePortfolio success
survey to check how many students from each institution had completed the survey and
whether the sample for further CSF analysis was valid. Table 13 shows the geographical
dispersion of the institutions together with their students as well as the number of
institutions’ responses and the corresponding students’ responses. Since some
universities wanted to remain anonymous, only general data is displayed. In Croatia, the
Faculty of Organization and Informatics participated with 81 students, while the other
faculty participated with 20 students. Other respondents outside Croatia were located in
countries ranging from Russia to USA. Owing to such geographical dispersion, based on
the survey data, the ePortfolio success instrument would be generally applicable and the
ePortfolio Success Model would reflect ePortfolio success in general.
9 Response rate =
=0,42

127
Table 13. Demographic structure of respondents
Country
No. of
universities Frequency Total Percentage
Croatia Croatia 2 101 101 54.3
Outside
Croatia
Slovenia 2 19 85 45.7
Russia 1 19
UK 2 12
Spain 1 11
USA 2 24
Total 10 186 186 100
However, the fact that students from only 10 universities (compared to 28 universities
that completed the CSF survey) filled the ePortfolio success survey presented a problem.
Therefore, despite the respectably high response rate by institutions (42%), too few
institutions providing student responses (only 10 universities) were usable to analyze
the influence of CSFs on the ePortfolio success, so the results would have no statistical
meaning. In respect to this finding, it was decided that further analysis of CSFs would be
omitted from this research and recommendations for further research would be given in
the final chapter of this dissertation.

128
5.6 Sample characteristics
The student population that represents respondents for the ePortfolio success survey is
analyzed in terms of age, number of courses in which they used ePortfolio, frequency of
use, and number of artefacts in ePortfolio. It should be mentioned that concerning the
gender in the student population there were 55.4% female and 44.6% male
respondents, which in terms of gender is a balanced sample.
Table 14 shows the age of students who completed the ePortfolio success survey.
Generally, most students (80.6%) fall into category aged 18–23, which actually
corresponds to most of the university student population. Namely, in Croatia, as well as
in other European countries, students tend to enroll university at the age of 18 and,
according to the Bologna Process, should be finishing their study at the age of 23.
Table 14. Respondents’ age
Age Frequency Percentage Cumulative
Percentage
18-20 78 41.9 41.9
21-23 72 38.7 80.6
24-26 12 6.5 87.1
27-31 8 4.3 91.4
Over 31 16 8.6 100.0
Total 186 100.0
The targeted population comprised students that had used ePortfolio in at least two
courses or for a period of at least six months. According to Balaban et al. (2010),
students participating in research need to have used ePortfolio in at least one subject or
course and it is only when they have finished the course that they can start perceiving
the benefits of ePortfolio. Table 15 shows the number of courses in which the
respondents had the opportunity to use ePortfolio. Most of them had used ePortfolio in
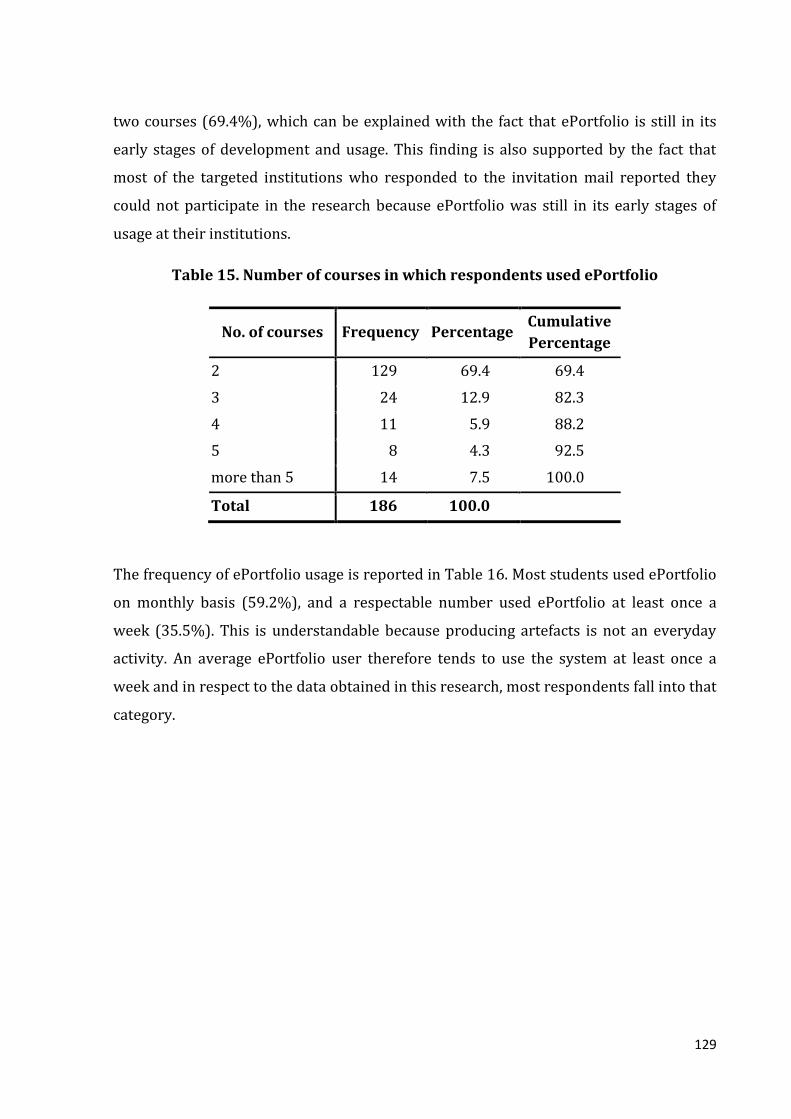
129
two courses (69.4%), which can be explained with the fact that ePortfolio is still in its
early stages of development and usage. This finding is also supported by the fact that
most of the targeted institutions who responded to the invitation mail reported they
could not participate in the research because ePortfolio was still in its early stages of
usage at their institutions.
Table 15. Number of courses in which respondents used ePortfolio
No. of courses Frequency Percentage Cumulative
Percentage
2 129 69.4 69.4
3 24 12.9 82.3
4 11 5.9 88.2
5 8 4.3 92.5
more than 5 14 7.5 100.0
Total 186 100.0
The frequency of ePortfolio usage is reported in Table 16. Most students used ePortfolio
on monthly basis (59.2%), and a respectable number used ePortfolio at least once a
week (35.5%). This is understandable because producing artefacts is not an everyday
activity. An average ePortfolio user therefore tends to use the system at least once a
week and in respect to the data obtained in this research, most respondents fall into that
category.
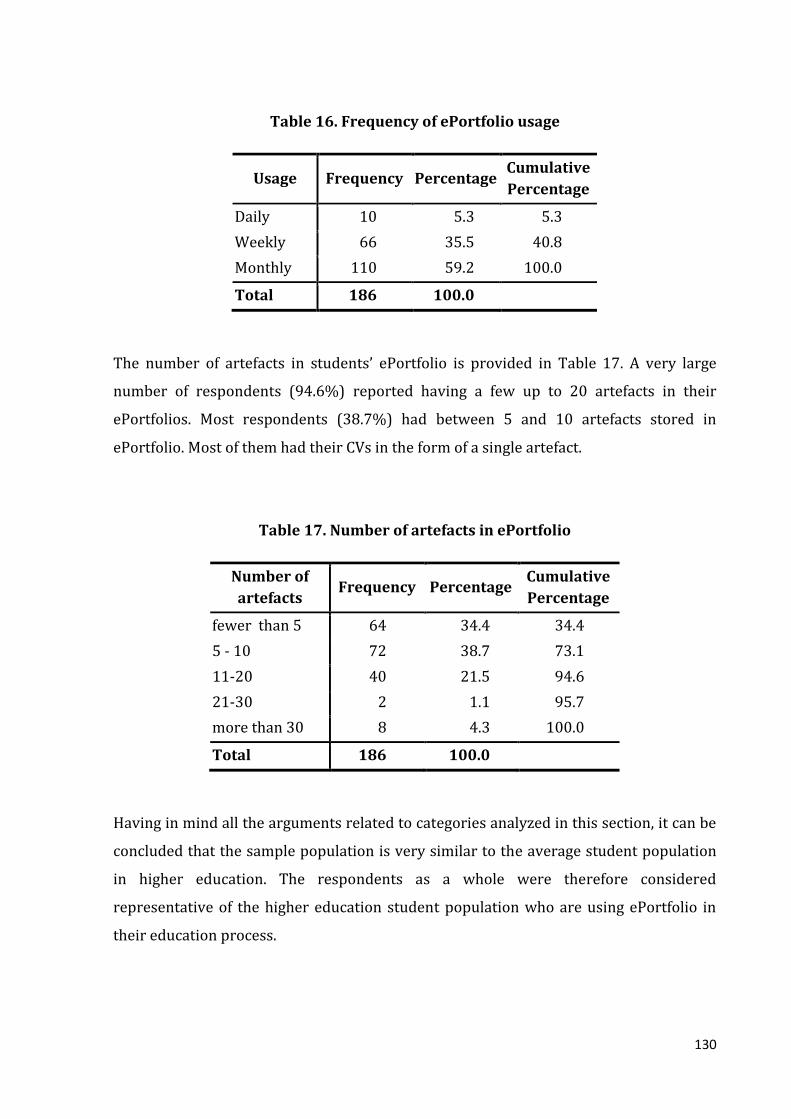
130
Table 16. Frequency of ePortfolio usage
Usage Frequency Percentage Cumulative
Percentage
Daily 10 5.3 5.3
Weekly 66 35.5 40.8
Monthly 110 59.2 100.0
Total 186 100.0
The number of artefacts in students’ ePortfolio is provided in Table 17. A very large
number of respondents (94.6%) reported having a few up to 20 artefacts in their
ePortfolios. Most respondents (38.7%) had between 5 and 10 artefacts stored in
ePortfolio. Most of them had their CVs in the form of a single artefact.
Table 17. Number of artefacts in ePortfolio
Number of
artefacts Frequency Percentage
Cumulative
Percentage
fewer than 5 64 34.4 34.4
5 - 10 72 38.7 73.1
11-20 40 21.5 94.6
21-30 2 1.1 95.7
more than 30 8 4.3 100.0
Total 186 100.0
Having in mind all the arguments related to categories analyzed in this section, it can be
concluded that the sample population is very similar to the average student population
in higher education. The respondents as a whole were therefore considered
representative of the higher education student population who are using ePortfolio in
their education process.
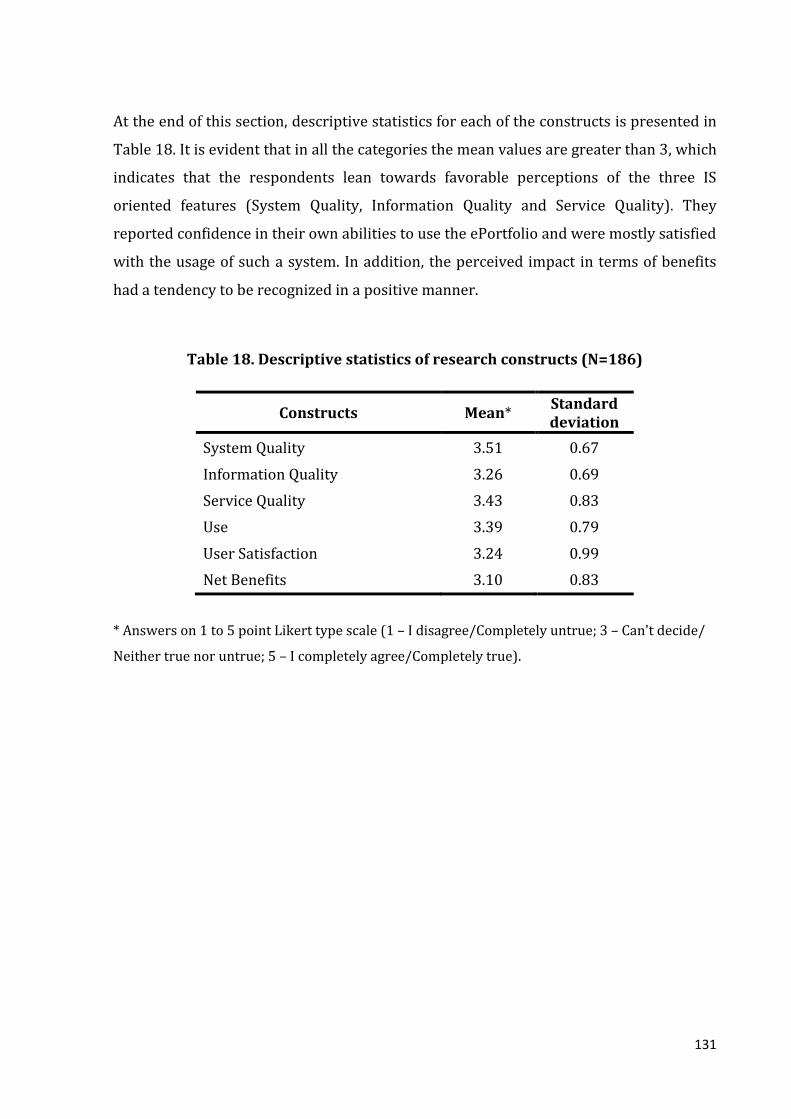
131
At the end of this section, descriptive statistics for each of the constructs is presented in
Table 18. It is evident that in all the categories the mean values are greater than 3, which
indicates that the respondents lean towards favorable perceptions of the three IS
oriented features (System Quality, Information Quality and Service Quality). They
reported confidence in their own abilities to use the ePortfolio and were mostly satisfied
with the usage of such a system. In addition, the perceived impact in terms of benefits
had a tendency to be recognized in a positive manner.
Table 18. Descriptive statistics of research constructs (N=186)
Constructs Mean* Standard deviation
System Quality 3.51 0.67
Information Quality 3.26 0.69
Service Quality 3.43 0.83
Use 3.39 0.79
User Satisfaction 3.24 0.99
Net Benefits 3.10 0.83
* Answers on 1 to 5 point Likert type scale (1 – I disagree/Completely untrue; 3 – Can't decide/
Neither true nor untrue; 5 – I completely agree/Completely true).
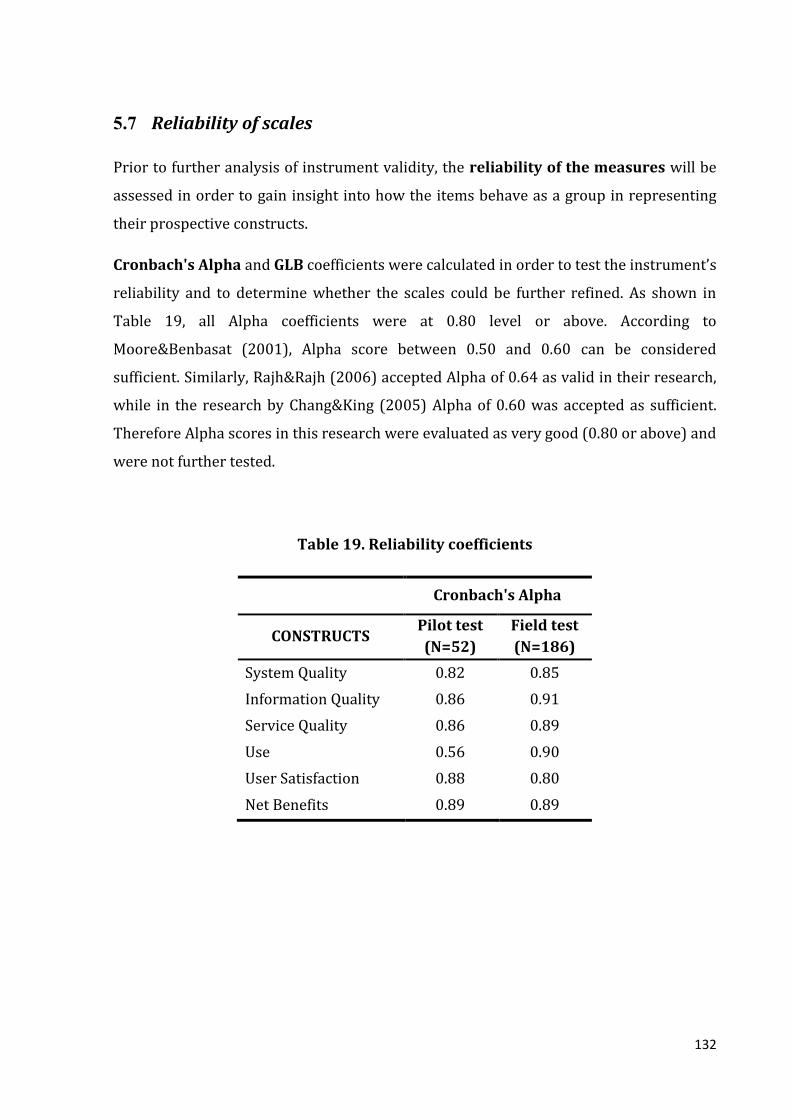
132
5.7 Reliability of scales
Prior to further analysis of instrument validity, the reliability of the measures will be
assessed in order to gain insight into how the items behave as a group in representing
their prospective constructs.
Cronbach's Alpha and GLB coefficients were calculated in order to test the instrument’s
reliability and to determine whether the scales could be further refined. As shown in
Table 19, all Alpha coefficients were at 0.80 level or above. According to
Moore&Benbasat (2001), Alpha score between 0.50 and 0.60 can be considered
sufficient. Similarly, Rajh&Rajh (2006) accepted Alpha of 0.64 as valid in their research,
while in the research by Chang&King (2005) Alpha of 0.60 was accepted as sufficient.
Therefore Alpha scores in this research were evaluated as very good (0.80 or above) and
were not further tested.
Table 19. Reliability coefficients
Cronbach's Alpha
CONSTRUCTS Pilot test
(N=52)
Field test
(N=186)
System Quality 0.82 0.85
Information Quality 0.86 0.91
Service Quality 0.86 0.89
Use 0.56 0.90
User Satisfaction 0.88 0.80
Net Benefits 0.89 0.89
133
6 Instrument validation
In Structural Equation Modeling (henceforth SEM), a SEM model can be decomposed
into two sub-models: measurement and structural model. According to Byrne (2010, p.
13), the measurement model defines relationships between the observed and
unobserved variables, in this case items as indicators and their constructs. In other
words, it shows the pattern by which each measurement item loads on a particular
factor. On the other hand, the structural model shows relationships between unobserved
variables or constructs. In this chapter, the measurement model is estimated using
Confirmatory Factor Analysis (CFA) to examine overall fit, validity, and reliability of
the model. This process is often referred to as the instrument validation process. In the
next chapter, the hypotheses between constructs are examined using the structural
model.
According to validation guidelines given by Straub et al. (2004), instrument validation
requires evaluation of content validity, construct validity and reliability. Content validity
was performed during the instrument creation process and was described in detail in
Section 5.4.1. Therefore in this chapter only a summary of the content validity process is
presented. The construct validity by using Q-sorting method was conducted afterwards
to sort the items into the corresponding constructs and to make sure those items
actually represent those constructs (as described in Section 5.4.2). That procedure
ensured convergent and divergent (discriminant) validity of the constructs (Straub
et al., 2004).
In this chapter, the construct validity is further explored. In addition to suggestions
given by Straub et al. (2004) and Moore&Benbasat (2001), Segars’ (1997) work is also
followed. First, CFA is used to establish convergent validity and unidimensionality of
the constructs. Gefen&Straub (2005) define unidimensionality as the property of the
scale where each of its measurement items relates to it better than to any others. After it
has been ensured that each item represents the desired dimension, Exploratory Factor
Analysis (henceforth EFA) is used to determine the existence of subconstructs within
each dimension. After that, CFA is used to eliminate items that loaded on multiple factors

134
within constructs as well as to establish unidimensionality of the factors. Measurement
model fit for all the constructs as well as for the instrument as a whole is assessed.
Even though the instrument follows the D&M Model whose constructs are based on a
substantial body of prior research, factor analysis is appropriate because 1) in this study
several different instruments were combined, and 2) a whole new set of statements
related to ePortfolio were introduced.
If the instrument (i.e. measurement model) proves to be valid considering all the terms
explained this section, as well as reliable, the hypothesis H1 stating that “Considering
ePortfolio as an Information System, it is possible to develop a measurement
instrument to assess ePortfolio success” will be supported.
135
6.1 Content validity
Content validity is an issue of representation (Straub et al., 2004). According to
Cronbach (1970), content validity is established when the instrument items are pulled in
a representative manner from all the ways that could be used to measure the content of
a given construct. Straub et al. (2004) suggest that literature review and expert judges
or panels should be used in the process of establishing content validity. Those
recommendations were followed in this research in the process described in detail in
Section 5.4.1.
The instruments recommended by DeLone and McLean, which had already been
developed for their instrument, were used in the item creation process together with the
available ePortfolio literature. After that, expert judges (see Appendix A) were asked to
coin the missing ePortfolio related items if needed.
In the end, the initial items were refined through a series of Q-sorting procedures (see
Section 5.4.2). All those techniques ensured the content validity of the instrument.

136
6.2 Construct validity
According to Straub et al. (2004, p. 388), construct validity shows “whether the
measures chosen by researcher ‘fit’ together in such as way as to capture the essence of
the construct”. In the instrument construction process, Q-sorting was conducted not
only to eliminate unnecessary items and ensure content validity, but also to assess
convergent and discriminant validity of the constructs (see Section 5.4.2). In the
following subsections, the description of CFA used to verify convergent validity and to
establish the unidimensionality of the instrument is provided. Once construct validity
was confirmed, EFA would be conducted to determine the number of subconstructs for
each of the dimension because the Q-sorting procedure indicated the existence of
subconstructs within each dimension which needed to be empirically tested and
verified. After that, another CFA would be performed to examine the measurement
model fit for each of the subconstructs and constructs as a whole.
In respect to factor analysis, it should be mentioned that in general, it attempts to
determine which set of observed variables share common variance-covariance
characteristics that define theoretical constructs or factors. A researcher collects data
and uses factor analysis either to confirm that a set of variables define a construct
(factor) (CFA), or to explore which variables relate to which factors (EFA). Depending on
the strength of factor loadings (or correlation coefficients) and elimination criteria set
by the researcher, some items are dropped from further research. For that reason it is
often considered that factor analysis enables to ‘clean up’ the construct.
EFA does not assume that an a priori model exists, but the researcher explores possible
factors, whether the factors are correlated and which measurement items (observed
variables) best measure which factor. The aim is to identify the smallest number of
factors that explain most of the variance in the measurement items. The loading pattern
is usually rotated with Varimax rotation to simplify the interpretation of the results
(Gefen&Straub, 2005). In this research, EFA was run in statistical program R10.
10
R is a language and environment for statistical computing and graphics under the Linux operating system. In
this research R ver 2.8.1 was used in Ubuntu 10.10 operating system.

137
On the other hand, in CFA the researcher specifies the measurement model by adding
the measurement items to their prospective constructs. Factorial validity is established
“when each item correlates with a much higher correlation coefficient on its proposed
construct than on other constructs and when the square root of each construct’s AVE is
notably larger than its correlation with other constructs” (Straub et. al, 2004, p. 379).
Furthermore, CFA enables to test “whether the sample data confirm the model”
(Schumacker&Lomax, 2004, p. 169) through series of fit indices. For assessing construct
validity via CFA, two basic methods were used: Structural Equation Modeling (SEM) and
Partial Least Squares (PLS).
SEM is a covariance-based technique and attempts to minimize the difference between
the sample covariance and that predicted by the theoretical model (Haenlein&Kaplan,
2004). According to Schumacker&Lomax (2004), it is used to determine how sets of
variables define constructs (i.e. measurement model) and how these constructs are
related to each other (i.e. structural model). It includes a large set of powerful statistical
indices for testing measurement and structural models. Its goal is to determine to which
extent the model fits the sample data. According to Schumacker&Lomax (2004), the
minimum recommended sample size is 150 samples and/or 5 respondents per item.
Same authors suggest the desirable sample size of 300, 400 or more and/or 10
respondents per item. LISREL11, which is a synonym for covariance-based SEM, would
be used to perform CFA and examine the model fit for each construct and subconstructs.
PLS is also a type of SEM, but it is a variance-based technique that “… focuses on
maximizing the variance of the dependent variables explained by the independent ones
instead of reproducing the empirical covariance matrix” (Haenlein&Kaplan, 2004, p.
290). It was developed as an alternative to SEM and likewise consists of a measurement
model that is often called the outer model and the structural model often called the
inner model. Besides those two models, PLS has a third component, the weight relations,
which are used to estimate case values for latent variables (Haenlein&Kaplan, 2004). It
is a very popular technique in IS research and in other areas as well (Henseler et al.,
2009). Chin et al. (1996) reviewed over 80 articles that had used PLS and concluded
that, although some authors reported an extremely small sample size amounting to 20, 11
LISREL ver 8.80 Student Edition, obtained from www.ssicentral.com/lisrel/student.html
138
the desirable sample size for stable results is 100. These same authors also claim that,
among complex models, PLS is virtually without competition (Chin et al., 1996). In this
research SmartPLS12 was used to run PLS.
According to Henseler et al. (2009), the main difference between the two methods is that
SEM is more appropriate for theory testing due to its powerful statistical features, while
PLS is much more appropriate for prediction. Of course, both of them can perform CFA,
but in general SEM can generate many more statistical interpretations than PLS,
especially for the measurement model. Research has showed that PLS is more robust for
smaller samples than SEM and that CFA can be performed by any of those methods, only
with a different set of fit indices (Straub et al, 2004; Henseler et al., 2009; Gefen et al.,
2000).
Bearing in mind the advantages and constraints elaborated in previous sections, both
SEM and PLS were used in this research. SEM was used to examine model fit for each
construct and its subconstructs (to assess the measurement model) while PLS was used
to test the relationships between the constructs (to test the hypotheses in the structural
model). Such a selection of methods is justified by the fact that if we limit the analysis to
only one construct at a time, we have a maximum of 10 measurement items per
construct which, in respect to sample size (N=186), gives us the ratio >18:1 that is more
than adequate for SEM (Haenlein&Kaplan, 2004; Schumacker&Lomax, 2004). On the
other hand, if we want to analyze the structural model, we are confronted with all
measurement items (62) in the model, which leaves us with a 3:1 ratio. In that case, SEM
usage is not recommended due to its sensitivity to sample size and the number of items
in the model. PLS combined with the bootstrap method was therefore used to obtain t-
statistics to assess the statistical significance of the results. A similar approach was
already used by Mahmood et al. (2004), where PLS was used for analyzing the
relationships in the structural model, while AMOS (as a SEM tool) was used for fit
statistics.
12
Ringle, C.M.; Wende, S.; Will, S.: SmartPLS 2.0 (M3) Beta, Hamburg 2005, http://www.smartpls.de.

139
6.2.1 Establishing convergent validity and unidimensionality
The CFA process started following the guidelines by Segar (1997), Straub et al. (2004)
and Gefen&Straub (2005) to eliminate items that had significant cross loading on more
than one construct. Because of a relatively small sample (N=186) that yielded a subject
to item ratio of 3:1, PLS rather than SEM would be used to determine whether all the
items load on their prospective constructs. For all PLS calculations in SmartPLS, the
following settings were selected:
1. Weighting Scheme: Path Weighting Scheme
2. Data Metric: Mean 0, Var 1
3. Maximum Iterations: 300
4. Abort criterion: 1.0E-5
5. Initial Weights: 1.0
The starting point was the construct structure obtained from the Q-sorting process.
Since the strict rules on when to eliminate items in factor analysis do not exist or the
process of dropping the items at least depends on the researcher and the case, a
threshold needed to be defined in this research. In doing so, recommendations from
Segar (1997), Straub et al. (2004) and Gefen&Straub (2005) were followed. The items
that loaded over 0.6 into their prospective construct were retained. It was a slightly
higher threshold than usual (0.5) but it is important to have only the items with high
loadings in their latent constructs and not to leave any space for possible cross-loadings.
This ensured convergent validity. According to Gefen&Straub (2005), convergent
validity is shown when each of the measurement items loads with a significant t-value
on its latent construct. In addition, the difference in loadings of one item between its
prospective construct and all the other constructs needs to be greater than 0.1. For
example, if an item loads on its latent construct with 0.60 coefficient, the loadings of all
the measurement items on any latent construct but its own should be below 0.50. This
ensured that an item did not load highly on any other construct and represented a first
step in ensuring discriminant validity that would be tested in the next chapter. Finally,
unidimensionality was established by eliminating the items that cross loaded on more
than one construct (i.e. over 0.5 on at least two constructs).
140
Owing to a relatively small sample size (N=186) and low subject to item ratio (3:1), the
bootstrap method was conducted to obtain t-statistics as estimates of significance of
factor loadings. The usage of bootstrap is often found in literature in case of a smaller
sample size to provide confidence intervals for all parameter estimates and also because
PLS, if used, does not provide such information (Armstrong&Sambamurthy, 2000;
Henseler et al., 2009). Bootstrap provides the mean value and standard error for each
item or path model coefficient and this information is adequate to calculate t-value using
the following formula (Henseler et al., 2009):
where represents t-value for i-th item or path coefficient, the original PLS estimate
of a certain item or path coefficient, and the bootstrapping standard error. By
using this method, 300 random samples of observations from the original data set by
sampling through replacement were generated. Each sample size was kept similar to the
size of the original data set (Armstrong&Sambamurthy, 2000; Henseler et al., 2009).
Factor loadings were re-estimated and t-values generated for each item loading (see
Appendix K). T-statistics is significant at the 0.05 level if its value exceeds 1.96 and at
the 0.01 level if its value exceeds 2.56 (Hoyle, 1999). The minimum t-value was 3.65
while all the other values were much higher. T-statistics tables revealed that the factor
loadings were significant at p=0.001, so the results obtained from CFA can be
interpreted with confidence. The construct structure is showed in Table 20.

141
Table 20. CFA factor structure for each construct
Items
Constructs
Information Quality
Net Benefits
Service Quality
System Quality
Use User
Satisfaction
IQ1 0.561870* 0.355098 0.351565 0.471267 0.300571 0.243907
IQ2 0.664136 0.367241 0.325707 0.411204 0.111374 0.220117
IQ3 0.682665 0.452174 0.436260 0.455407 0.271837 0.347734
IQ4 0.427042* 0.170434 0.249055 0.311775 0.117765 0.126308
IQ5 0.660310 0.433610 0.439306 0.410617 0.152077 0.380395
IQ6 0.774088 0.464365 0.539741 0.526521 0.390551 0.506003
IQ7 0.827949 0.518380 0.619878 0.606508 0.485866 0.486276
IQ8 0.664386 0.386339 0.399933 0.459301 0.245550 0.304088
IQ9 0.696356 0.490521 0.522550 0.506127 0.425922 0.421820
NB1 0.430672 0.762500 0.430933 0.347933 0.329339 0.696507
NB10 0.484396 0.787869 0.545523 0.474434 0.436266 0.629834
NB11 0.504047 0.671806 0.503258 0.485879 0.471711 0.522282
NB2 0.415232 0.749175 0.404843 0.410182 0.367378 0.618784
NB3 0.493210 0.695852 0.438566 0.329910 0.288642 0.576377
NB4 0.458601 0.744093 0.517773 0.386141 0.367052 0.631212
NB5 0.406418 0.754515 0.502735 0.345943 0.370253 0.609179
NB6 0.524526 0.763810 0.618498 0.528891 0.458119 0.634886
NB7 0.449066 0.743244 0.537314 0.541533 0.527507 0.548730
NB8 0.405629 0.664250 0.454763 0.521135 0.586975 0.494030
NB9 0.496954 0.736109 0.577436 0.444982 0.424207 0.567137
SERQ1 0.506799 0.515084 0.737984 0.497495 0.450284 0.438885
SERQ2 0.432754 0.477159 0.718202 0.563190 0.529478 0.452250
SERQ3 0.528813 0.510200 0.705597 0.353032 0.312128 0.550537
SERQ4 0.608448 0.590995 0.802290 0.534694 0.455531 0.649305
SERQ5 0.515984 0.565611 0.783461 0.501389 0.441018 0.563607
SERQ6 0.423809 0.519045 0.791834 0.489391 0.416833 0.530198
SERQ7 0.495365 0.491803 0.782510 0.539544 0.482009 0.487938
SERQ8 0.461977 0.401843 0.609900** 0.602052 0.455553 0.374183
SERQ9 0.535032 0.475161 0.725482 0.525055 0.436172 0.513673
SYSQ1 0.448683 0.361571 0.474226 0.722215 0.501032 0.372632
SYSQ10 0.444445 0.440117 0.522805 0.716277 0.554186 0.438411
SYSQ11 0.456536 0.260003 0.271351 0.567353* 0.305737 0.145426
SYSQ12 0.498061 0.352070 0.288551 0.562248* 0.241808 0.340828
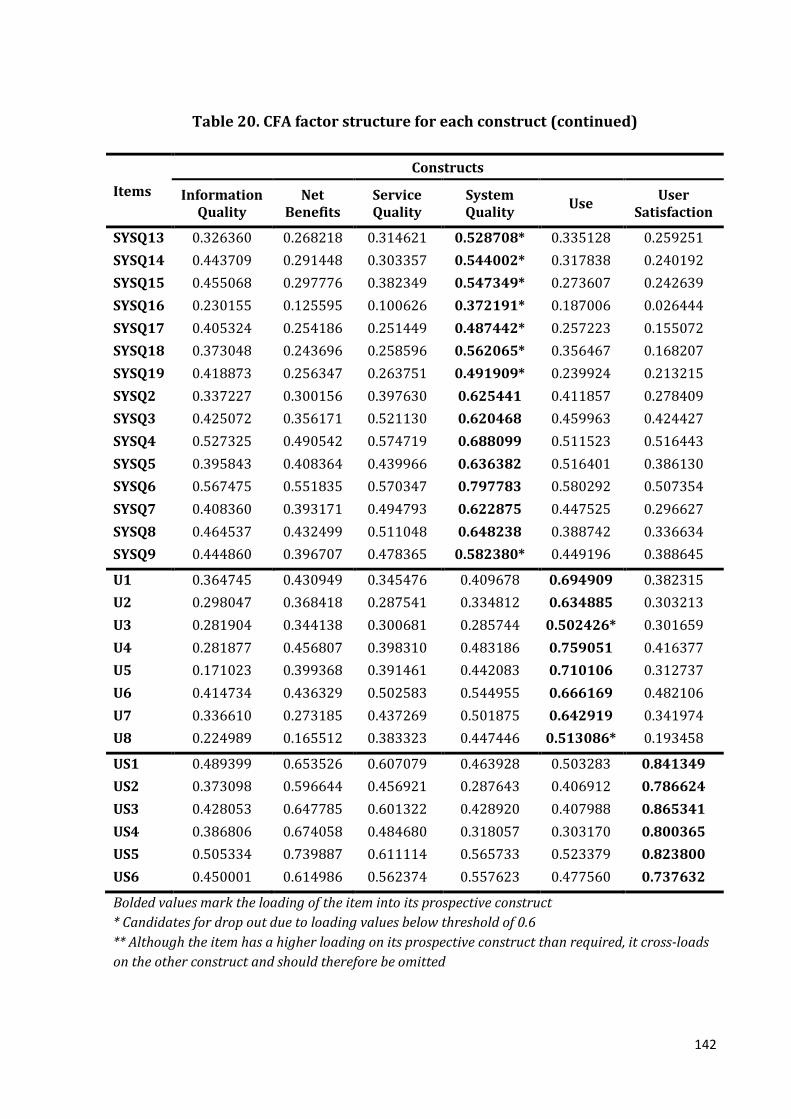
142
Table 20. CFA factor structure for each construct (continued)
Items
Constructs
Information Quality
Net Benefits
Service Quality
System Quality
Use User
Satisfaction
SYSQ13 0.326360 0.268218 0.314621 0.528708* 0.335128 0.259251
SYSQ14 0.443709 0.291448 0.303357 0.544002* 0.317838 0.240192
SYSQ15 0.455068 0.297776 0.382349 0.547349* 0.273607 0.242639
SYSQ16 0.230155 0.125595 0.100626 0.372191* 0.187006 0.026444
SYSQ17 0.405324 0.254186 0.251449 0.487442* 0.257223 0.155072
SYSQ18 0.373048 0.243696 0.258596 0.562065* 0.356467 0.168207
SYSQ19 0.418873 0.256347 0.263751 0.491909* 0.239924 0.213215
SYSQ2 0.337227 0.300156 0.397630 0.625441 0.411857 0.278409
SYSQ3 0.425072 0.356171 0.521130 0.620468 0.459963 0.424427
SYSQ4 0.527325 0.490542 0.574719 0.688099 0.511523 0.516443
SYSQ5 0.395843 0.408364 0.439966 0.636382 0.516401 0.386130
SYSQ6 0.567475 0.551835 0.570347 0.797783 0.580292 0.507354
SYSQ7 0.408360 0.393171 0.494793 0.622875 0.447525 0.296627
SYSQ8 0.464537 0.432499 0.511048 0.648238 0.388742 0.336634
SYSQ9 0.444860 0.396707 0.478365 0.582380* 0.449196 0.388645
U1 0.364745 0.430949 0.345476 0.409678 0.694909 0.382315
U2 0.298047 0.368418 0.287541 0.334812 0.634885 0.303213
U3 0.281904 0.344138 0.300681 0.285744 0.502426* 0.301659
U4 0.281877 0.456807 0.398310 0.483186 0.759051 0.416377
U5 0.171023 0.399368 0.391461 0.442083 0.710106 0.312737
U6 0.414734 0.436329 0.502583 0.544955 0.666169 0.482106
U7 0.336610 0.273185 0.437269 0.501875 0.642919 0.341974
U8 0.224989 0.165512 0.383323 0.447446 0.513086* 0.193458
US1 0.489399 0.653526 0.607079 0.463928 0.503283 0.841349
US2 0.373098 0.596644 0.456921 0.287643 0.406912 0.786624
US3 0.428053 0.647785 0.601322 0.428920 0.407988 0.865341
US4 0.386806 0.674058 0.484680 0.318057 0.303170 0.800365
US5 0.505334 0.739887 0.611114 0.565733 0.523379 0.823800
US6 0.450001 0.614986 0.562374 0.557623 0.477560 0.737632
Bolded values mark the loading of the item into its prospective construct
* Candidates for drop out due to loading values below threshold of 0.6
** Although the item has a higher loading on its prospective construct than required, it cross-loads
on the other construct and should therefore be omitted

143
It should be stressed that the System Quality construct experienced serious dropouts,
which was expected since that construct contained too many items from the beginning.
After a close examination of items that were dropped, it is evident that most of them are
related to system security. Therefore it can be concluded that it is adequate for
ePortfolio systems to have only standard (default) security mechanisms built in while
some further and finer security features are not mandatory. In addition, it should be
mentioned that items were dropped in a way that would not decrease the
comprehensiveness of the instrument. To summarize, during the item reduction process
10 items were eliminated from System Use, 2 from Information Quality, 2 from Use, 1
from Service Quality, while User Satisfaction and Net Benefits did not suffer any
eliminations.
After cleaning up the constructs, Cronbach’s alpha was calculated again to ensure the
reliability of the scales was not compromised. This was particularly important for
System Quality, as it had suffered some serious dropouts. Table 21 shows that reliability
of the constructs remained at a satisfactory level.
Table 21. Constructs’ structure after CFA
Constructs No. of items Cronbach’s
Alpha
System Quality 9 0.88
Information Quality 7 0.84
Service Quality 8 0.90
Use 6 0.79
User Satisfaction 6 0.89
Net Benefits 11 0.91
As a result of this analysis, both convergent validity and unidimensionality of the
constructs were established.
144
6.2.2 Extracting the subconstructs
After it had been ensured that the items indeed represented the constructs and all the
constructs were “clean”, following recommendations in Gefen et al. (2000), Straub et al.
(2004) and Gefen&Straub (2005), an EFA was used to determine the number of
subconstructs in each dimension. The method used for extracting the factors was
Common Factor Analysis with Varimax rotation. Costello&Osborne (2005) reported that
Varimax rotation is by far the most common choice of many researchers. Gefen&Straub
(2005) also recommend using the Varimax method to rotate the loading pattern in order
to simplify the interpretation of results. Varimax rotation creates orthogonal factors
with minimized high loadings of the measurement items on other factors. In the
explanation of the extracting method, Principal Component Analysis (PCA) is very often
used in EFA. It seeks a linear combination of variables such that the maximum variance
is extracted from the variables. After that, it removes that variance and seeks for another
linear combination that explains most of the variance. On the other hand, Common
Factor Analysis (CFA), also called Principal Factor Analysis (PFA) or Principal Axis
Factoring (PAF), seeks the least number of factors that can account for a common
variance of a set of variables. Costello&Osborne (2005) analyzed many cases of EFA
usage and came to the conclusion that there is no optimal extraction procedure so the
researcher must choose the most appropriate method in each specific case. Moreover,
the authors stressed the importance of running CFA to confirm the obtained result due
to the fact that EFA is exploratory.
The purpose of this stage of the research was to extract a minimum number of factors
within each construct considering the initial number of items in individual constructs
did not exceed 10. Therefore the more factors were extracted, the less chance there
would be to run CFA because it works with a minimum of 4 items per factor. Following
this rationale, Common Factor Analysis was used for extracting the factors.
The sample size (N=186) was adequate for this analysis because six separate
exploratory factor analyses were conducted one construct at the time, which led to a
substantially higher subject to item ratio. The lowest ratio was established for Net
145
Benefits (17:1), due to the highest number of items. This presented a respectable
starting point for further analysis.
Prior to each analysis the Kaiser-Meyer-Olkin Measure of Sampling Adequacy and
Barlett’s test of sphericity were performed to check whether the data scales are suitable
for further factor analysis (Gefen et al., 2000; Costello&Osborne, 2004). The Kaiser-
Meyer-Olkin measure of sampling adequacy was greater than 0.7 for all the constructs
and Barlett’s test of sphericity was significant at 0.00 level. This implied that the factor
model was appropriate and factor analysis could be conducted.
Since this was an exploratory factor analysis, it was run without specifying the number
of factors to be extracted. Moreover, in determining the final number of the factors two
different criteria were combined (Loehlin, 2004): Cattell’s scree test (Cattell, 1966) and
Guttman-Keiser criterion (Yeomans&Golder, 1982) with eigenvalue grater than 1.0. The
results are two factors for System Quality, Information Quality, Use and Net Benefits,
and only one factor for Service Quality and User Satisfaction.
Although the convention in EFA is to eliminate the items with factor loading below 0.5
(Chang&King, 2005; Gefen&Straub, 2005), numerous examples of different thresholds
can be found in literature varying from 0.40 to 0.70 (Costello&Osborne, 2004). In this
research, items with loadings below 0.50 were dropped. In general, all the items had
high loadings mostly due to the prior Q-sorting and CFA. After a careful examination of
all the constructs and factor loadings only two issues were detected. Firstly, there was
one item that loaded below 0.5 on its prospective factor in the Information Quality
construct but it was retained because otherwise it would result in one factor having
fewer than 4 items, which is not sufficient for a confirmatory factor analysis. The second
issue occurred in the Net Benefits construct, where one item cross loaded significantly
(above 0.5) on two factors. It was decided to eliminate that item. Table 22 shows the
factor structure for each construct.

146
Table 22. Factor pattern for each construct (N=186)
Construct SYSTEM QUALITY INFORMATION
QUALITY SERVICE QUALITY
Factors
1 2
1 2
1
Items and
loadings SYSQ1 0.609 0.421 IQ2 0.190 0.765 SERQ1 0.704
SYSQ2 0.522 0.360 IQ3 0.208 0.770 SERQ2 0.652
SYSQ3 0.723 0.141 IQ5 0.262 0.605 SERQ3 0.677
SYSQ4 0.634 0.318 IQ6 0.850 0.218 SERQ4 0.777
SYSQ5 0.649 0.203 IQ7 0.824 0.297 SERQ5 0.769
SYSQ6 0.669 0.416 IQ8* 0.368 0.485 SERQ6 0.771
SYSQ7 0.187 0.774 IQ9 0.604 0.231 SERQ7 0.755
SYSQ8 0.255 0.638
SERQ9 0.658
SYSQ10 0.424 0.592
Total variance explained:
62.7%
Total variance
explained: 68.4%
Total Variance
explained: 58.0 %
Construct USE USER
SATISFACTION NET BENEFITS
Factors 1 2
1
1 2
Items and
loadings U1 0.556 0.260 US1 0.817 NB1 0.249 0.809
U2 0.599 0.136 US2 0.757 NB2 0.271 0.762
U4 0.865 0.149 US3 0.856 NB3 0.322 0.609
U5 0.698 0.208 US4 0.760 NB4 0.302 0.712
U6 0.218 0.708 US5 0.759 NB5 0.419 0.602
U7 0.169 0.770 US6 0.649 NB6 0.701 0.346
NB7 0.769 0.262
NB8 0.694 0.203
NB9 0.673 0.330
NB10** 0.566 0.509
NB11 0.577 0.315
Total variance explained:
68.1 %
Total Variance
explained: 65.7 %
Total Variance explained:
65.1 %
Bolded values mark the highest loading of the item on its prospective factor Method of extraction was Common Factor Analysis with Varimax rotation * Item with a lower loading (below 0.5) that was retained ** Item that cross loaded on two factors was dropped

147
6.2.3 Adjusting the model fit
After identifying the subconstructs (factors) within each dimension, a confirmatory
factor analysis was used again, but this time to examine the measurement model fit for
each of the subconstructs and finally, for the constructs as a whole. The measured
factors would first be modeled in isolation, then in pairs, and finally as a collective
network, representing the whole construct, as suggested by Segars&Groover (1998).
Even though at the beginning of this analysis PLS was used because of a small sample
size, LISREL, which is a SEM tool, was be used here for several reasons: 1. PLS does not
provide all the necessary information about measurement model fit; 2. Factors and
constructs are modeled in isolation (i.e. only few items are analyzed at the same time)
which gives us both a respectable sample size and a subject to item ratio for conducting
SEM.
The process started by analyzing the items that loaded on the same factor with CFA in
LISREL to verify the results obtained from EFA. Exceptions were factors with only 3
items. Those would only be identified for CFA and analyzed in conjunction with other
factors in the same dimension. Each model went through an iterative modification
process to improve its model fit. As was already mentioned, the model fit was analyzed
and modified for each factor in isolation and then in pair.
Therefore, the modification process started with an individual factor by examining the
individual item loadings. The equation for a single item is given as:
where is the ith indicator from a set of unidimensional factors, is the corresponding
factor loading, is the latent factor being measured, and is the corresponding error
term assumed to be uncorrelated with any factors or other residuals (Chang&King,
2005). Since the Q-sorting process and first CFA ensured that all the items had a high
loading on their prospective factor, and EFA showed high loadings for almost all factors,
it was expected that this CFA would only confirm the results from previous methods.
Again, since there is no consensus on the minimum standardized loading for retaining an
item, a standardized loading of 0.5 was used in this dissertation. In factor analysis, an
148
item with a low standardized loading indicates that only a small portion of a factor score
is measured by that indicator and therefore it should be dropped from the model. In this
research, if the individual item loading was below the cut off value, the item was
carefully examined to ensure that it was not eliminated except if it decreased the model
fit.
After it was determined that all factors loaded highly on their latent constructs, the
model was tested again to examine its fit. Since it is advised that several model fit indices
are combined to estimate the model fit, in this research the following goodness-of-fit
indicators were used:
Chi-square ( ): Widely used for making decisions about the model fit. However, it is
sensitive to sample size so with very large samples it can lead to rejection of an
otherwise highly satisfactory model (Loehlin, 2004). Therefore it should be used in
combination with other fit indices. Three estimation methods are used to calculate
and in this research a maximum likelihood method was chosen as one of the widely used
methods (Schumacker&Lomax, 2004).
Goodness-of-Fit Index (GFI): Compares the fit of a given model to that of no model at
all (Loehlin, 2004). It measures the absolute fit because it is unadjusted for degrees of
freedom. It is one of the most widely used fit indices and is usually combined with AGFI.
Its values are in range from 0 to 1. Values greater than 0.9 indicate a good fit.
Adjusted Goodness-of-Fit Index (AGFI): Measures the model fit and takes into account
the degrees of freedom. In other words, it is adjusted for the degrees of freedom of a
model relative to the number of variables (Loehlin, 2004). Its values are in range from 0
to 1. Values greater than 0.9 indicate a good fit.
Comparative Fit Index (CFI): Derived from Normative Fit Index (NFI) that has been a
strongly popularized in the last decade (Byrne, 2010). In comparison with NFI, CFI is
adjusted for sample size, which makes it a better choice, especially for smaller samples.
CFI ranges from 0 to 1, with a larger value indicating a better model fit. The acceptable
model fit was indicated by a value greater than 0.90, which was also used in this
research.

149
Root Mean Square Error of Approximation (RMSEA): A population-based index
related to residual in the model. RMSEA values range from 0 to 1, with a smaller RMSEA
value indicating a better model fit. Values below 0.05 are considered to show a very
good fit.
In this research, in cases of an unsatisfactory model fit, the modification index of the
model was examined. The modification index for a single factor measurement model
indicated the possibility of error correlation, which suggested that items influenced each
other. Consequently, by allowing the error terms to correlate, the model fit was
improved. However, this modification is only feasible when there is a theoretical reason
to suggest that the two items should be correlated. If the suggested modification is not
rational, it will not be implemented. It is important to mention that the process of
improving the model fit needs to be done iteratively, with one modification made at a
time, until either a satisfactory model fit is achieved or no modification is suggested. The
summary of the modification process for each construct and its subconstructs (factors)
is presented in Tables 23-28, while the final measurement model is shown in Figures 8-
12.

150
Table 23. Summary of modification process for System Quality construct
Factors Modification process Factor 1 Initial Model
Items: Sysq1, Sysq2, Sysq3, Sysq4, Sysq5 Fit indices: = 34.16 p = 0.00 RMSEA = 0.120 GFI = 0.94 CFI = 0.96 df = 9 AGFI = 0.87
Final Model Items: Sysq1, Sysq2, Sysq3, Sysq4, Sysq5 Fit indices: = 8.99 p = 0.25 RMSEA = 0.039 GFI = 0.98 CFI = 1.00 df = 7 AGFI = 0.95 Modifications: 1. Using the system will be easier to learn if help functions are available and sufficient (Sysq1&Sysq2). 2. The system’s sitemap clearly shows the organization of materials was suggested to correlate negatively with the process of easily managing the views (Sysq3&Sysq4). Since there is no rationale for such a relationship, this modification was not implemented. 3. It would be possible to quickly search (e.g. using a search engine) through ePortfolio content if the system included necessary features and functions (Sysq5&Sysq6).
Factor 2 Not analyzed in isolation because it consisted of only 3 items

151
Figure 8. Measurement Model for System Quality
= 8.99 p = 0.25 RMSEA = 0.039 GFI = 0.98 CFI = 1.00
df = 7 AGFI = 0.95

152
Table 24. Summary of modification process for Information Quality construct
Factors Modification process Factor 1 Initial Model
Items: Iq2, Iq3, Iq5, Iq8 Fit indices: = 6.78 p = 0.037 RMSEA = 0.114 GFI = 0.98 CFI = 0.98 df = 2 AGFI = 0.91 Modifications: 1. The more frequently updated information in ePortfolio will be more complete. (IQ2&IQ3)
Final Model Items: Iq2, Iq3, Iq5, Iq8 Fit indices: = 0.68 p = 0.41 RMSEA = 0.000 GFI = 1.00 CFI = 1.00 df = 1 AGFI = 0.98
Factor 2 Not analyzed in isolation because it consisted of only 3 items

153
Figure 9. Measurement Model for Information Quality
= 0.68 p = 0.41 RMSEA = 0.000 GFI = 1.00 CFI = 1.00
df = 1 AGFI = 0.98

154
Table 25. Summary of modification process for Service Quality construct
Factors Modification process Factor 1 Initial Model
Items: Serq1, Serq2, Serq3, Serq4, Serq5, Serq6, Serq7, Serq9 Fit indices: = 66.49 p = 0.00 RMSEA = 0.110 GFI = 0.92 CFI = 0.97 df = 20 AGFI = 0.86
Final Model Items: Serq1, Serq2, Serq3, Serq4, Serq5, Serq6, Serq7, Serq9 Fit indices: = 25.16 p = 0.091 RMSEA = 0.051 GFI = 0.97 CFI = 0.99 df = 17 AGFI = 0.93 Modifications: 1. The existence of a specific person (or group) to assist with system difficulties leads to the existence of e-mail and other types of on-line help in case of problems and vice versa (Serq1&Serq2). 2. Teachers/ePortfolio support staff are more helpful for using the system if they have better competences in ePortfolio (Serq3&Serq4). 3. The more individual attention the institution gives to the user it needs to educate the ePortfolio staff/Teachers that will be competent to answer the user questions (Serq4&Serq5). 4. Teachers/ePortfolio support staff are helpful for using the system was suggested to correlate negatively with giving the institution giving the user individual attention (Serq3&Serq5). Since there is no rationale for such a relationship, this modification was not implemented.
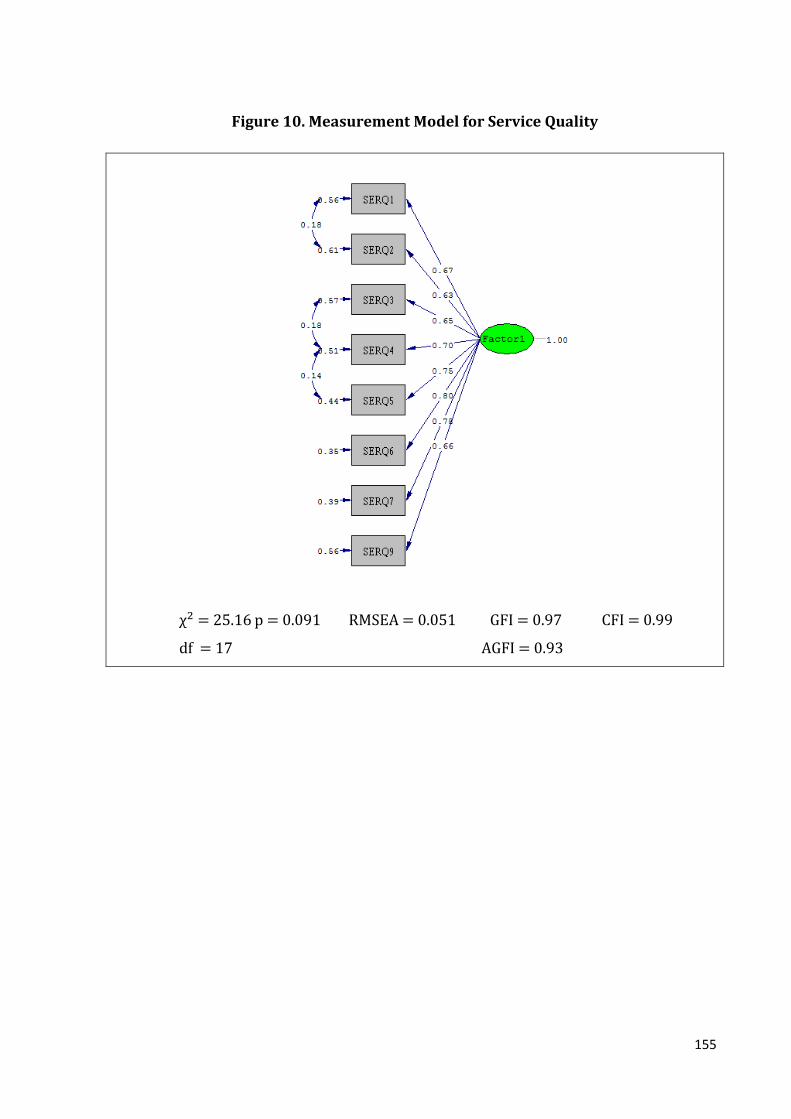
155
Figure 10. Measurement Model for Service Quality
= 25.16 p = 0.091 RMSEA = 0.051 GFI = 0.97 CFI = 0.99
df = 17 AGFI = 0.93
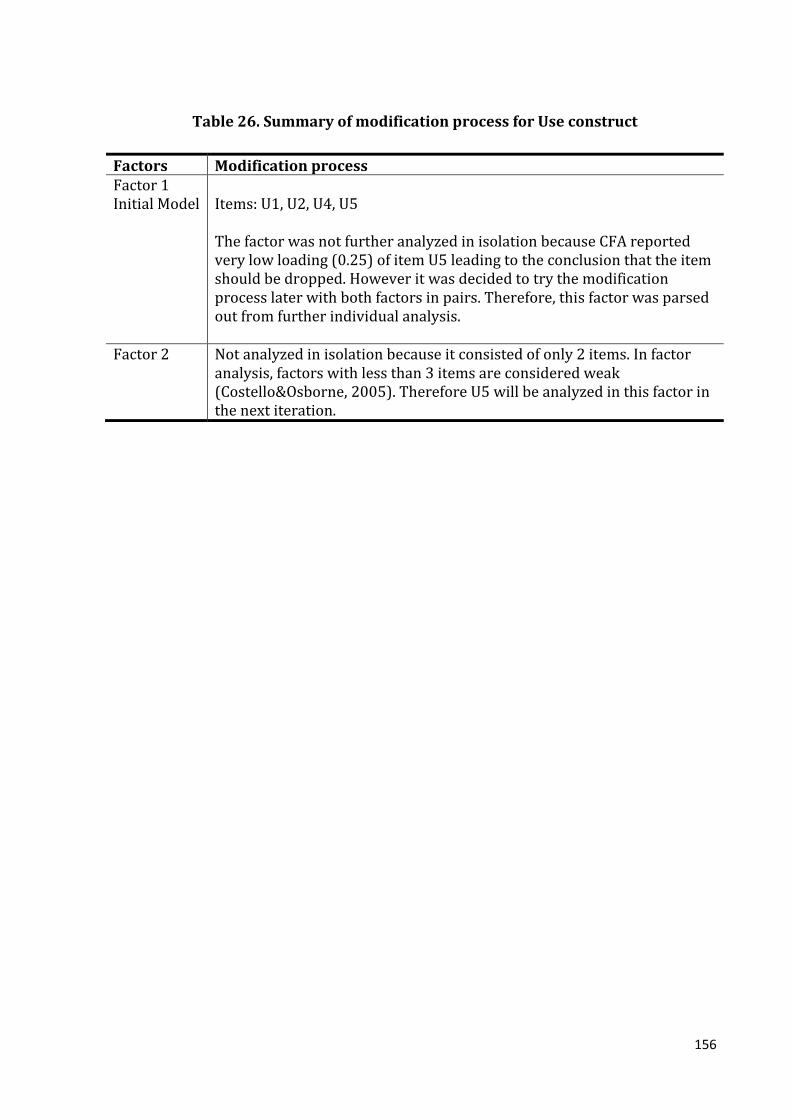
156
Table 26. Summary of modification process for Use construct
Factors Modification process Factor 1 Initial Model
Items: U1, U2, U4, U5 The factor was not further analyzed in isolation because CFA reported very low loading (0.25) of item U5 leading to the conclusion that the item should be dropped. However it was decided to try the modification process later with both factors in pairs. Therefore, this factor was parsed out from further individual analysis.
Factor 2 Not analyzed in isolation because it consisted of only 2 items. In factor analysis, factors with less than 3 items are considered weak (Costello&Osborne, 2005). Therefore U5 will be analyzed in this factor in the next iteration.
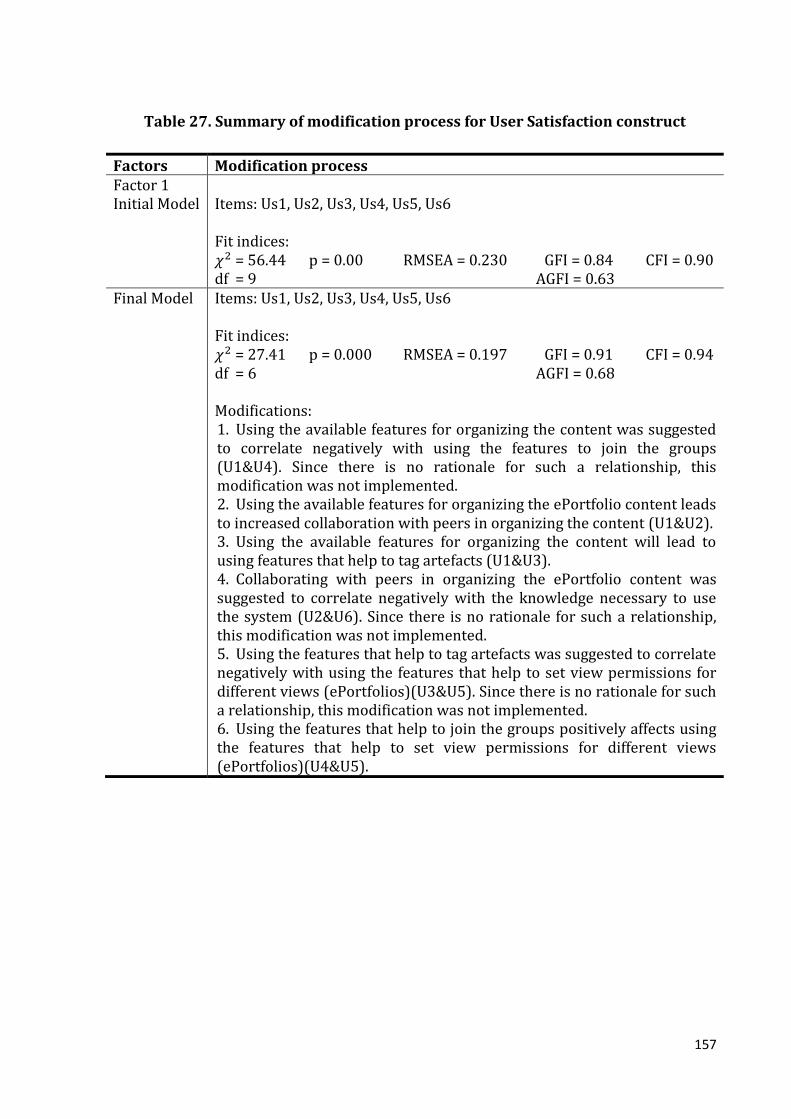
157
Table 27. Summary of modification process for User Satisfaction construct
Factors Modification process Factor 1 Initial Model
Items: Us1, Us2, Us3, Us4, Us5, Us6 Fit indices: = 56.44 p = 0.00 RMSEA = 0.230 GFI = 0.84 CFI = 0.90 df = 9 AGFI = 0.63
Final Model Items: Us1, Us2, Us3, Us4, Us5, Us6 Fit indices: = 27.41 p = 0.000 RMSEA = 0.197 GFI = 0.91 CFI = 0.94 df = 6 AGFI = 0.68 Modifications: 1. Using the available features for organizing the content was suggested to correlate negatively with using the features to join the groups (U1&U4). Since there is no rationale for such a relationship, this modification was not implemented. 2. Using the available features for organizing the ePortfolio content leads to increased collaboration with peers in organizing the content (U1&U2). 3. Using the available features for organizing the content will lead to using features that help to tag artefacts (U1&U3). 4. Collaborating with peers in organizing the ePortfolio content was suggested to correlate negatively with the knowledge necessary to use the system (U2&U6). Since there is no rationale for such a relationship, this modification was not implemented. 5. Using the features that help to tag artefacts was suggested to correlate negatively with using the features that help to set view permissions for different views (ePortfolios)(U3&U5). Since there is no rationale for such a relationship, this modification was not implemented. 6. Using the features that help to join the groups positively affects using the features that help to set view permissions for different views (ePortfolios)(U4&U5).

158
Figure 11. Measurement Model for User Satisfaction
= 27.41 p = 0.000 RMSEA = 0.197 GFI = 0.91 CFI = 0.94
df = 6 AGFI = 0.68
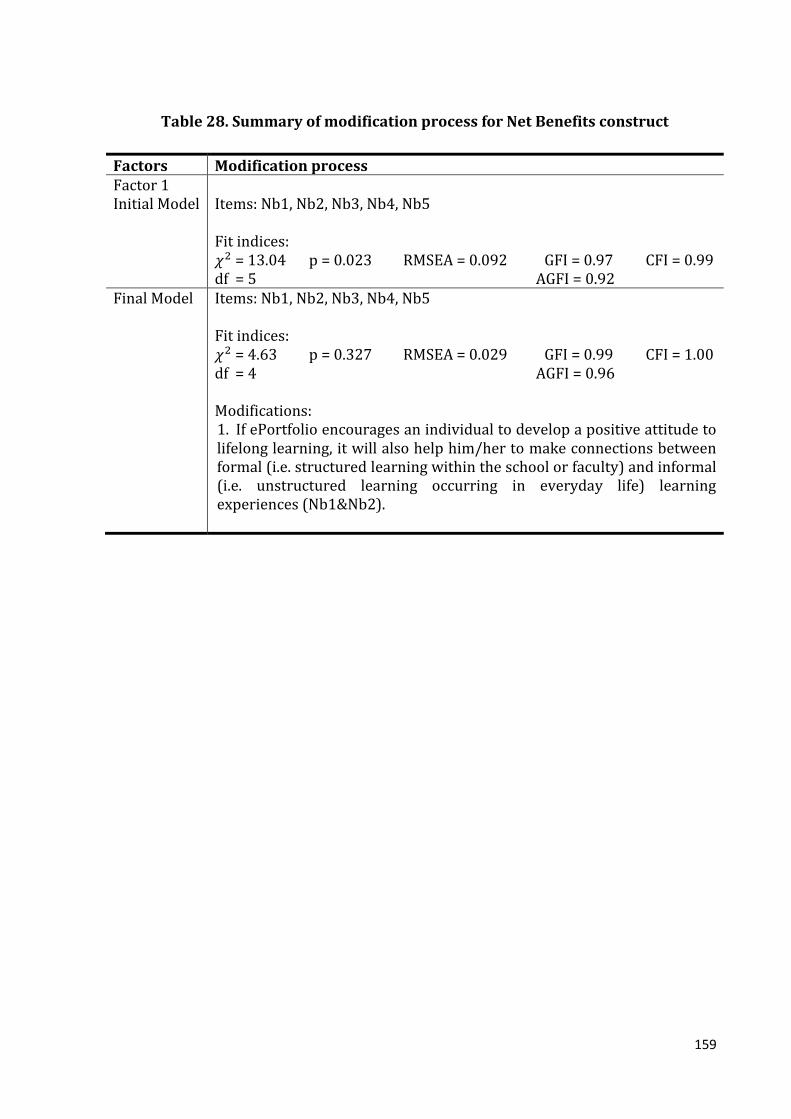
159
Table 28. Summary of modification process for Net Benefits construct
Factors Modification process Factor 1 Initial Model
Items: Nb1, Nb2, Nb3, Nb4, Nb5 Fit indices: = 13.04 p = 0.023 RMSEA = 0.092 GFI = 0.97 CFI = 0.99 df = 5 AGFI = 0.92
Final Model Items: Nb1, Nb2, Nb3, Nb4, Nb5 Fit indices: = 4.63 p = 0.327 RMSEA = 0.029 GFI = 0.99 CFI = 1.00 df = 4 AGFI = 0.96 Modifications: 1. If ePortfolio encourages an individual to develop a positive attitude to lifelong learning, it will also help him/her to make connections between formal (i.e. structured learning within the school or faculty) and informal (i.e. unstructured learning occurring in everyday life) learning experiences (Nb1&Nb2).
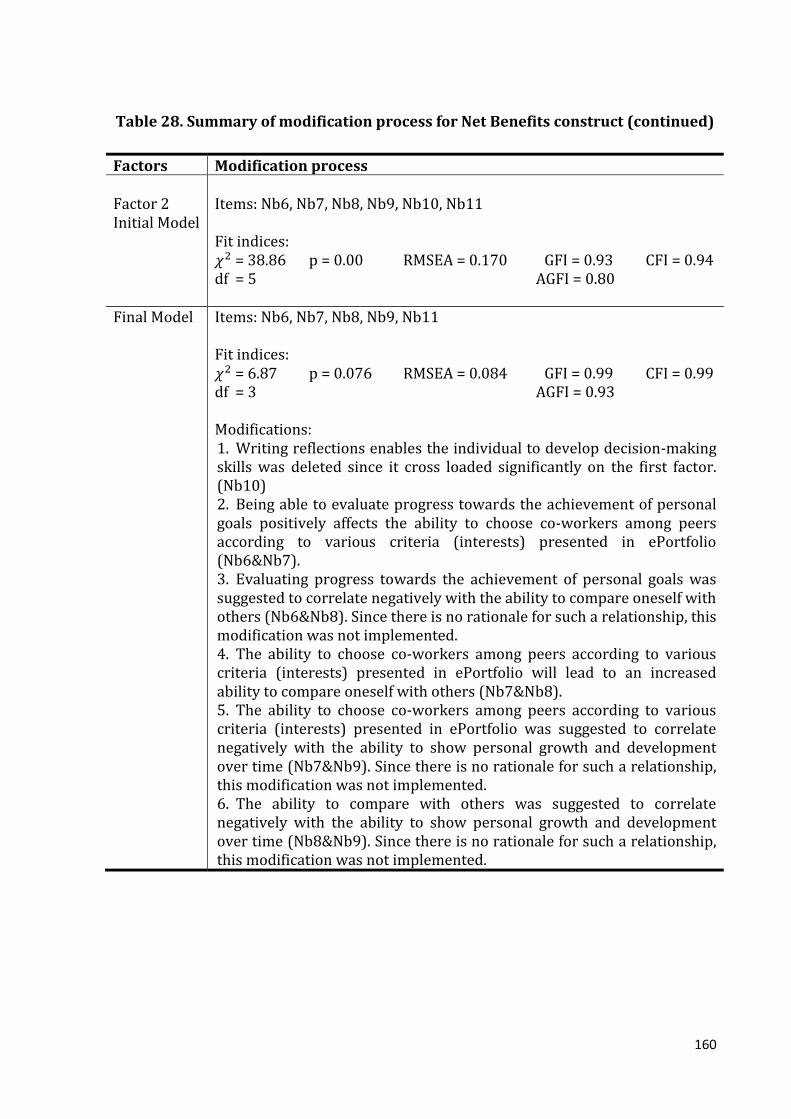
160
Table 28. Summary of modification process for Net Benefits construct (continued)
Factors Modification process Factor 2 Initial Model
Items: Nb6, Nb7, Nb8, Nb9, Nb10, Nb11 Fit indices: = 38.86 p = 0.00 RMSEA = 0.170 GFI = 0.93 CFI = 0.94 df = 5 AGFI = 0.80
Final Model Items: Nb6, Nb7, Nb8, Nb9, Nb11 Fit indices: = 6.87 p = 0.076 RMSEA = 0.084 GFI = 0.99 CFI = 0.99 df = 3 AGFI = 0.93 Modifications: 1. Writing reflections enables the individual to develop decision-making skills was deleted since it cross loaded significantly on the first factor. (Nb10) 2. Being able to evaluate progress towards the achievement of personal goals positively affects the ability to choose co-workers among peers according to various criteria (interests) presented in ePortfolio (Nb6&Nb7). 3. Evaluating progress towards the achievement of personal goals was suggested to correlate negatively with the ability to compare oneself with others (Nb6&Nb8). Since there is no rationale for such a relationship, this modification was not implemented. 4. The ability to choose co-workers among peers according to various criteria (interests) presented in ePortfolio will lead to an increased ability to compare oneself with others (Nb7&Nb8). 5. The ability to choose co-workers among peers according to various criteria (interests) presented in ePortfolio was suggested to correlate negatively with the ability to show personal growth and development over time (Nb7&Nb9). Since there is no rationale for such a relationship, this modification was not implemented. 6. The ability to compare with others was suggested to correlate negatively with the ability to show personal growth and development over time (Nb8&Nb9). Since there is no rationale for such a relationship, this modification was not implemented.
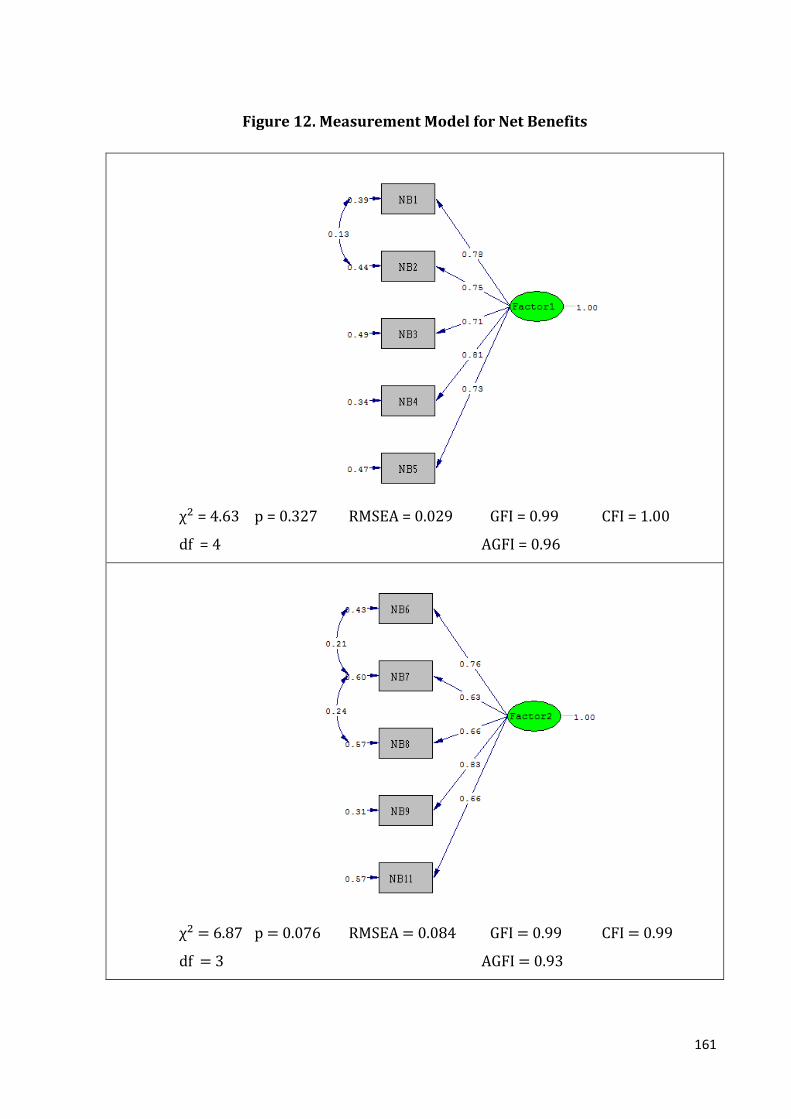
161
Figure 12. Measurement Model for Net Benefits
= 4.63 p = 0.327 RMSEA = 0.029 GFI = 0.99 CFI = 1.00
df = 4 AGFI = 0.96
= 6.87 p = 0.076 RMSEA = 0.084 GFI = 0.99 CFI = 0.99
df = 3 AGFI = 0.93
162
Following the procedure suggested by Segars&Groover (1998), after the factors were
analyzed in isolation, they needed to be further analyzed in pairs and then as a collective
network. Since all the constructs in this research consisted of at most two factors, pair
analysis was equivalent to collective network analysis. The main aim of this analysis was
to determine if any items with cross-loadings between factors in the construct still
existed in order to eliminate them. That would ensure unidimensionality of factors
within the construct.
There were also several exceptions to be taken into consideration:
1. Use construct, whose factors could not be modified in isolation due to a small
number of items. It would be modified for the first time in this iteration.
2. Factor 2 in System Quality construct and Factor 2 in Information Quality
construct that also consisted of only 3 items. They would be modified in pair with
other factor within their respective construct.
3. Service Quality and User Satisfaction constructs would be excluded from this
analysis since those were single factor constructs and as such were analyzed in
the previous step.
After the careful examination of all the constructs and their factors, no items remained
that cross-loaded on two factors. It means all factors are unidimensional. In addition,
CFA performed on all constructs (see Section 6.2.1) also ensured that all constructs were
unidimensional. Full measurement models for each construct are represented in Figures
13-18.

163
Figure 13. Full Measurement Model for System Quality construct
= 45.76 p = 0.00 RMSEA = 0.070 GFI = 0.95 CFI = 0.98
df = 24 AGFI = 0.90

164
Figure 14. Full Measurement Model for Information Quality construct
= 15.64 p = 0.21 RMSEA = 0.040 GFI = 0.96 CFI = 0.98
df = 12 AGFI = 0.91

165
Figure 15. Full Measurement Model for Service Quality construct
= 25.16 p = 0.09 RMSEA = 0.051 GFI = 0.97 CFI = 0.99
df = 17 AGFI = 0.93
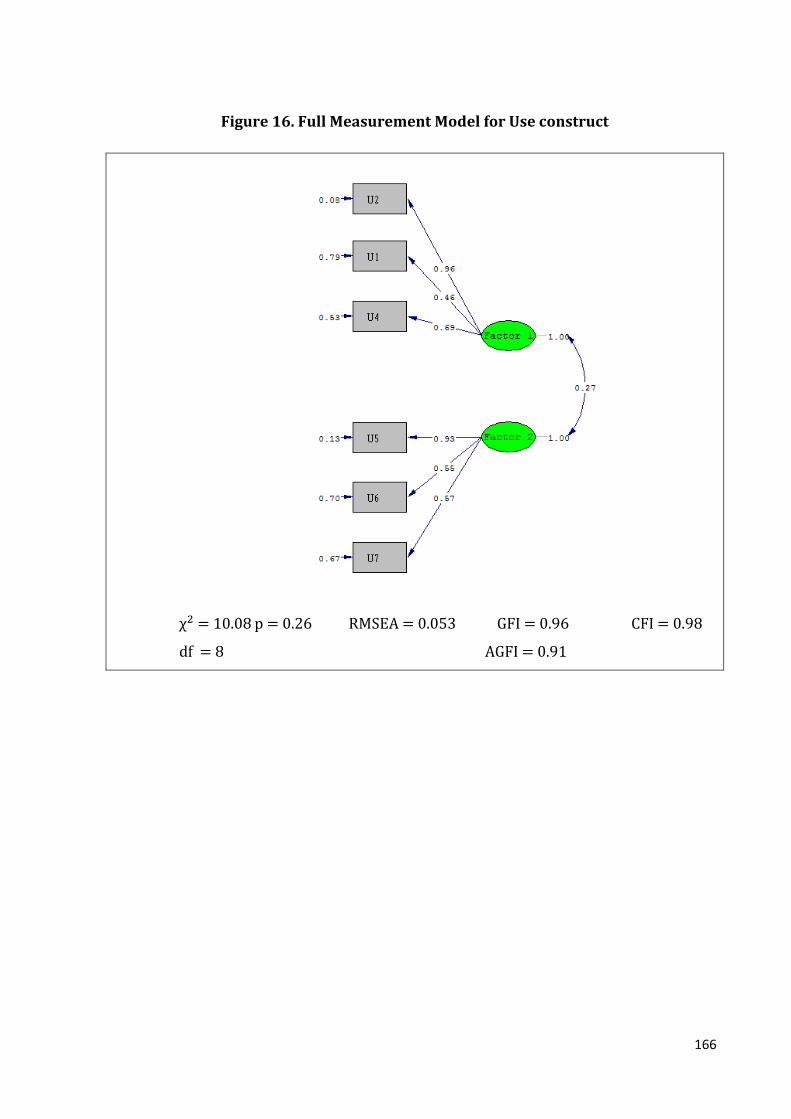
166
Figure 16. Full Measurement Model for Use construct
= 10.08 p = 0.26 RMSEA = 0.053 GFI = 0.96 CFI = 0.98
df = 8 AGFI = 0.91

167
Figure 17. Full Measurement Model for User Satisfaction construct
= 27.41 p = 0.00 RMSEA = 0.197 GFI = 0.91 CFI = 0.94
df = 6 AGFI = 0.68

168
Figure 18. Full Measurement Model for Net Benefits construct
= 41.88 p = 0.09 RMSEA = 0.044 GFI = 0.96 CFI = 0.99
df = 31 AGFI = 0.92

169
In reviewing the model fit indices, it can be noted that all the measurement models had
very satisfactory model fit indices, except the User Satisfaction construct. This could
have been noticed even earlier, during the single factor modification process since User
Satisfaction is a one factor construct. By reviewing the modifications indices for this
construct, the following was established:
1. (27.41) and its degrees of freedom (6), according to Gefen et al. (2003),
showed a little higher ratio (1:3.57) than recommended (df : < 1:3).
Considering the limitations, mostly due to the sample size and
recommendations that it should be interpreted in terms of model adjustments
(or model improvement) rather than its fit, no clear judgments could be made
based on this result.
2. Henseler (2009) reported that GFI and AGFI can be very sensitive to the
sample size, but in this case one index (GFI) reported a satisfactory fit (0.91),
while the other reported the opposite (0.68).
3. RMSEA reported an unsatisfactory measurement model fit (0.197).
4. CFI reported a good model fit (0.94).
Since it was not possible to interpret the model fit results with confidence having in
mind the results obtained from fit indices, two additional model fit indices were
calculated for this construct: NFI (Normed Fit Index), which is used to compare a
restricted model with a full model using a baseline null model; and SRMR (Standardized
Root Mean Square Residual), which is a standardized difference between the observed
covariance and predicted covariance. Both of those measures are also frequently used in
literature for assessing model fit. For NFI, values greater than 0.90 present a good fit,
while for SRMR values smaller than 0.05 indicate a good fit. For User Satisfaction
construct NFI = 0.93 and SRMR = 0.049, which indicated a good model fit.
Therefore the User Satisfaction construct showed an acceptable fit, and since no further
modifications were possible to improve it, it was retained as such.
After the unidimensionality and convergence had been achieved for all the factors, factor
names were assigned, as shown in Table 29.

170
Table 29. Factors in each construct
Constructs and Factor Names Factor Number
System Quality Usability Functionality
Factor 1 Factor 2
Information Quality Validity Format
Factor 1 Factor 2
Service Quality*
Use** Deep Structure Usage Facilitating Conditions
Factor 1 Factor 2
User Satisfaction*
Net Benefits Enhanced Learning Personal Growth and Development
Factor 1 Factor 2
* A single factor construct
** This construct was entirely derived from the UTAUT13 instrument and therefore the
categories were named in respect to the UTAUT instrument
6.2.4 Assessment of discriminant validity
Discriminant or divergent validity is established when a set of items that measure a
specific construct differ from those measuring the other constructs. Straub et al. (2004)
suggest several techniques to assess discriminant validity. One of them is the Q-sorting
method used earlier in this research. According to Straub et al. (2004), Q-sorting
combines the validation of the content and construct through experts who group items
according to their similarity. This process allows experts to eliminate the items that do
not match the posited constructs and to ensure discriminant validity. Therefore,
discriminant validity for all the constructs was established as the result of the Q-sorting
process. However, the EFA extracted additional factors within some constructs and it
13
Developed by Venkatesh et al. (2003)
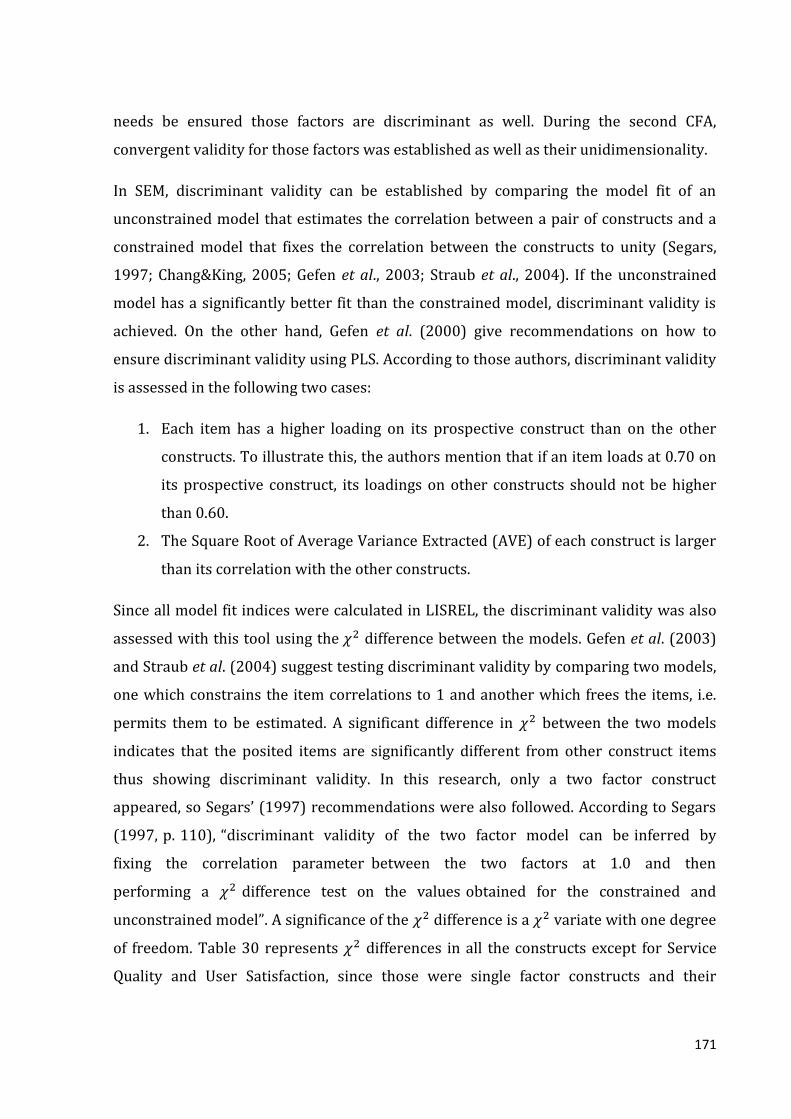
171
needs be ensured those factors are discriminant as well. During the second CFA,
convergent validity for those factors was established as well as their unidimensionality.
In SEM, discriminant validity can be established by comparing the model fit of an
unconstrained model that estimates the correlation between a pair of constructs and a
constrained model that fixes the correlation between the constructs to unity (Segars,
1997; Chang&King, 2005; Gefen et al., 2003; Straub et al., 2004). If the unconstrained
model has a significantly better fit than the constrained model, discriminant validity is
achieved. On the other hand, Gefen et al. (2000) give recommendations on how to
ensure discriminant validity using PLS. According to those authors, discriminant validity
is assessed in the following two cases:
1. Each item has a higher loading on its prospective construct than on the other
constructs. To illustrate this, the authors mention that if an item loads at 0.70 on
its prospective construct, its loadings on other constructs should not be higher
than 0.60.
2. The Square Root of Average Variance Extracted (AVE) of each construct is larger
than its correlation with the other constructs.
Since all model fit indices were calculated in LISREL, the discriminant validity was also
assessed with this tool using the difference between the models. Gefen et al. (2003)
and Straub et al. (2004) suggest testing discriminant validity by comparing two models,
one which constrains the item correlations to 1 and another which frees the items, i.e.
permits them to be estimated. A significant difference in between the two models
indicates that the posited items are significantly different from other construct items
thus showing discriminant validity. In this research, only a two factor construct
appeared, so Segars’ (1997) recommendations were also followed. According to Segars
(1997, p. 110), “discriminant validity of the two factor model can be inferred by
fixing the correlation parameter between the two factors at 1.0 and then
performing a difference test on the values obtained for the constrained and
unconstrained model”. A significance of the difference is a variate with one degree
of freedom. Table 30 represents differences in all the constructs except for Service
Quality and User Satisfaction, since those were single factor constructs and their
172
discriminant validity was already determined during the Q-sorting and first round of
CFA.
Table 30. Chi-Square differences between factors in the constructs
Constructs differences
System Quality Usability Functionality
55.24*
Information Quality Validity Format
107.53*
Use Deep Structure Usage Facilitating Conditions
51.2*
Net Benefits Enhanced Learning Personal Growth and Development
63.75*
* significant at p<0.001 level
All differences were with one degree of freedom and were significant at p<0.001,
indicating that each scale seemed to capture the construct that was unique and
independent of other constructs in the model. This provided evidence of discriminant
validity between the factors corresponding to each construct.
173
6.3 Reliability
Straub et al. (2004, p. 400) define reliability as the statement about measurement
accuracy or as “the extent to which the respondent can answer the same questions or
close approximations the same way each time”. In previous cases, the internal
consistency (Cronbach Alpha coefficient), as one of the measures of reliability, was used
to assess the reliability for each construct prior to comprehensive analysis of its validity.
Since EFA extracted subcategories (factors) within several constructs the reliability of
those factors needed to be assessed as well. Beside internal consistency, several other
techniques for assessing reliability exist.
Schumacker&Lomax (2004) reported that a Composite Reliability (CR) is a better
indicator of a single common factor model than the Cronbach Alpha internal consistency
coefficient. Composite Reliability is “a measure of internal consistency of the construct
indicators, depicting the degree to which they ‘indicate’ the common latent
(unobserved) construct” (Hair et al., 1998). It is calculated as:
where is the i-th standardized loading of indicator x on factor . Its value should
exceed 0.7 to indicate good reliability (Segars, 1997).
Segars (1997) reports Average Variance Extracted (AVE) that reflects the overall
amount of variance due to the measurement error, as another measure of reliability. It is
defined by the following formula:
where is the i-th standardized loading of indicator x on factor . The AVE value should
exceed 0.5 to indicate that the variance captured by the construct is larger than the
measurement error.

174
In performing CFA, both CR and AVE can be calculated for each factor
(Schumacker&Lomax, 2004; Gefen&Straub, 2005). In this research, SmartPLS was used
for calculations, the results of which are presented in Table 31.
Table 31. Reliability of measurement factors
Constructs and Factor Names Composite reliability
AVE
System Quality Usability Functionality
0.89 0.86
0.58 0.68
Information Quality Validity Format
0.88 0.88
0.70 0.64
Service Quality
0.92
0.58
Use Deep Structure Usage Facilitating Conditions
0.85 0.79
0.65 0.57
User Satisfaction
0.92
0.65
Net Benefits Enhanced Learning Personal Growth and Development
0.91 0.90
0.67 0.64
By reviewing the data in Table 31 it was concluded that all the factors showed good
reliability. CR for all the factors was much greater than 0.7 and all AVEs were above 0.5.
On the whole, the measurement model was valid and reliable. Therefore, the
hypothesis H1 stating that “Considering ePortfolio as an Information System, it is
possible to develop a measurement instrument to assess ePortfolio success” is
supported.

175
7 Assessing the structural model
Every structural equation model can be demarcated into a measurement and structural
part. The measurement model was tested in the previous chapter indicating a good fit. In
this chapter, the test of the structural part of the model is described.
According to Loehlin (2004), the structural part of a model specifies the relationships
among the latent variables, while the measurement model specifies the relationship of
the latent to the observed variables. As was already mentioned in Chapter 6, PLS was
used to test the structural model and relationships among its variables concerning the
sample size. Compared to LISREL, PLS does not provide such exhaustive data about the
model fit and so different fit indices need to be used to demonstrate model fit.
Henseler et al. (2009) suggest using the coefficient of determination (R2) of the
endogenous latent variables as the essential criterion for structural model assessment.
In PLS, endogenous latent variables are caused by one or other latent variables in the
model while exogenous latent variables are only caused by the indicators (measurement
items). Whereas AVE captures the amount of variance explained by the latent exogenous
variable, R2 captures the amount of variance explained by endogenous variables. Chin
(1998) describes R2 values above the cutoffs of 0.67, 0.33, and 0.19 as “substantial”,
“moderate”, and “weak”, respectively. In addition, Henseler et al. (2009) explain that if
an endogenous variable is explained by only one or two exogenous latent variables,
“moderate” R2 is acceptable. However, in case of several exogenous variables explaining
one endogenous variable, R2 should exhibit a substantial level.
Another measure for assessing a structural model is prediction relevance (Q2) that
explains the model’s predictive capability. It is calculated based on the blindfolding
procedure as:
,
where D is the omission distance, SSE is the sum of squares of prediction errors, and SSO
is the sum of squares of observations. According to Henseler et al. (2009), Q2 values
above zero indicate that the model has predictive relevance, while values below zero
176
indicate the model lacks predictive relevance. This technique represents a synthesis of
function fitting and cross-validation. Chin (1998, p. 320) also points out the importance
of the technique by saying that “the prediction of observables or potential observables is
of much greater relevance than the estimator of what are often artificial construct
parameters”. In PLS, two kinds of Q2 statistics are estimated, that is, cross-validated
communality (H2j) and cross-validated redundancy (F2j).
A cross-validated communality (H2j) is obtained if the prediction of the omitted data
points in the manifest variables (or indicators) block is made by the underlying latent
variable (Chin, 1998). In other words, the cross-validated communality measures the
capacity of the path model to predict the manifest variables directly from their own
latent variable by cross-validation. It uses only the measurement model (Karim, 2009).
On the other hand, a cross-validated redundancy (F2j) predicts the omitted data points
by constructs that are predictors of the blindfolded construct in the PLS model (Chin,
1998). In other words, the cross-validated redundancy F2j measures the capacity of the
path model to predict the endogenous manifest variables indirectly from a prediction of
their own latent variable using the related structural relation, by cross-validation
(Karim, 2009). Henseler et al. (2009) also indicate that the blindfolding procedure to
obtain the cross-validated redundancy F2j instead of cross-validated communality H2j fits
the PLS very well. Therefore, this index was used for measuring the quality of the path
model in this research. According to Chin (1998), the blindfolding procedure omits a
part of the data matrix for the construct being examined and then estimates the model
parameters. This is done a number of times based on the blindfold omission distance.
Chin (1998) argues that the omission distance parameter should be a prime integer
between the number of indicators and the number of cases to ensure proper execution
of the algorithm. It should be mentioned that the blindfolding procedure is only applied
to reflective endogenous latent variables.
Tenenhaus et al. (2005) suggest a global Goodness-of-fit index (GoF) to be used in PLS
as an alternative to a series of fit indices used in SEM. It is employed to judge the overall
fit of the model. GoF, which is the geometric mean of the average communality (outer
measurement model) and the average R2 of endogenous latent variables, represents an
index for validating the PLS model globally, as a compromise between the performance
177
of the measurement and the structural model (Karim, 2009). Therefore it is calculated
as:
.
Its values range between 0 and 1, where a higher value represents better path model
estimations.
The fourth criterion for the structural model assessment used in this research is
estimates for path coefficients or regression weights, known as standard beta
coefficient . The path relationships would be evaluated in terms of sign, magnitude,
and significance (via bootstrap). Structural paths, whose sign is in keeping with the a
priori proposed algebraic signs, provide partial empirical validation of the theoretically
assumed relationships between the latent variables (Henseler et al., 2009). Paths
possessing the sign contrary to expectations did not support the hypothesis. In order to
determine the significance of path magnitude, the bootstrapping technique would be
used. Henseler et al. (2009) also suggest that direct effects proposed by hypotheses
should be analyzed first, followed by additional analyses for mediating and moderating
effects.
In this chapter series of techniques used to test the hypothesis H2 that states “Based on
the developed instrument, D&M IS Success Model and ePortfolio literature, it is
possible to develop an ePortfolio Success Model” are shown. First, Coefficient of
determination (R2) and Prediction relevance (Q2) are examined to determine whether
all the constructs are well explained and can be used for prediction. Afterwards, path
coefficients are analyzed to determine causal relationships in the structural model.
Bootstrapping is used to show the statistical significance of the path coefficients.
Indirect effects are also identified to obtain additional information about possible
spurious or suppressor effects of individual variables in the model.

178
7.1 Defining relationships in the model
Prior to testing the structural model, relationships between latent variables need to be
proposed. In this section, the rationale for each proposed connection between the latent
variables is brought up and argued. Here it must be mentioned that over 50 ePortfolio
papers were analyzed for any relationships between the constructs that might be
reported. However, in almost all cases only case studies of ePortfolio usage,
implementation and development were reported without any in-depth analysis of
possible causal relationships between factors that can be identified in the process of
ePortfolio usage. This is also supported by the fact that out of 25 institutions targeted for
this research and that reported the usage of ePortfolio in an ongoing ePortfolio pilot
project, 17 of them replied that they either did not use it any more or that they were still
in the early stages of adoption and not ready for any deeper analysis of its usage.
Owing to a serious lack of information on relationships between factors in the process of
ePortfolio usage, a more general approach is used to propose the relationships in the
structural model. This is possible since it was previously shown that ePortfolio can be
perceived and interpreted in terms of Information System (see Chapter 4) so a priori
relationships determined for IS are applicable to ePortfolios. Evidently, an ePortfolio is
also a Web-based information system, so relationships determined for Web-based
systems and online information systems in general can be applied to ePortfolio as
well.Since the D&M IS Success Model also serves as a framework in this research, several
presumptions from that model are used for justifying relations in the structural model.
Taking all of the above into consideration, hypotheses about relationships in the model
along with corresponding discussions are presented:
H2.1: System quality has a positive effect on Use of ePortfolio.
Wang&Wang (2009) analyzed the effects of System Quality on Use and reported that the
former construct influenced the latter through the perceived ease of use. Petter et al.
(2008) also reported possible positive influence of System Quality on Use. In the meta-
analysis of their own research model, Sabherwal et al. (2006) showed a significant
positive relationship between the two constructs.
179
H2.2: System Quality has a positive effect on User Satisfaction with ePortfolio.
Wang&Wang (2009) reported that System Quality positively affects User Satisfaction.
Lin (2007) also reported the existence of a positive relationship between System Quality
and User Satisfaction. Peter et al. (2008) analyzed 21 papers in IS studies that dealt with
the relationship between System Quality and User Satisfaction, all of which confirmed
the existence of such a relationship. In the meta-analysis of their own research model,
Sabherwal et al. (2006) showed a significant relationship between the two constructs.
H2.3: Information Quality has a positive effect on Use of ePortfolio.
Wang&Wang (2009) reported an indirect positive influence of Information Quality
construct on the Intention to Use and, eventually, System Use constructs, which in the
D&M IS Success Model are contained in the Use construct. Lin (2007) also established
that Information Quality directly influences intention to use an online learning system,
and indirectly affects its actual use.
H2.4: Information Quality has a positive effect on User Satisfaction with
ePortfolio.
Wang&Wang (2009) argued that Information Quality has a direct positive effect on
Perceived Usefulness, which is a part of the User Satisfaction construct. Lin (2007)
supported the relationship between Information Quality and User Satisfaction in the
context of learning systems. Petter et al. (2008) agreed that a strong support for
Information Quality influencing User Satisfaction exists based on the fact that 15 of 16
papers in IS research reported the existence of such a relationship.
H2.5: Information Quality has a positive effect on Net Benefits.
Katerattanakul&Siau (2008) conducted a research about factors that influence the
Information Quality of ePortfolios. They established that Information Quality has a
significantly positive importance for the final benefits. Doig et al. (2006) also reported
the importance of use of the information generated in ePortfolio for further growth and
development as one of the Net Benefits. The positive influence of Information Quality on
Net Benefits was also confirmed by Petter et al. (2008).
180
H2.6: Service Quality has a positive effect on the Use of ePortfolio.
Lin (2007) argued that Service Quality positively influences intention to use and
indirectly leads to the actual use of online learning systems. Wang&Wang (2009) also
reported a direct influence of Service Quality on perceived ease of use that is a part of
the Use construct.
H2.7: Service Quality has a positive effect on User Satisfaction with ePortfolio.
Wang&Wang (2009) reported a direct positive influence of Service Quality on Perceived
Usefulness of the system that is part of the User Satisfaction construct. Furthermore,
Alberto&Gianluca (2006) showed a similar effect indicating that training and support
directly positively influence User Satisfaction. Lin (2007) also reported a significant
relationship between Service Quality and User Satisfaction.
H2.8: The Use of ePortfolio has a positive effect on User Satisfaction.
Wang&Wang (2009) found out that self-efficacy as part of the Use construct in this case
has positive effects on User Satisfaction. Fernández&Rodriguez-Illera (2008) reported a
high positive influence of the use of a digital course ePortfolio on their attitudes and
satisfaction, both of which are included in User Satisfaction construct in this research. In
measuring IS success, Peter et al. (2008) identified that 4 of 5 papers reported that Use
directly influences User Satisfaction.
H2.9: User Satisfaction has a positive effect on Use of ePortfolio.
Wang&Wang (2009) established that greater User Satisfaction will lead to greater
Intention to Use and, eventually, greater Use. Alberto&Gianluca (2006) also supported
this by proving that facilitating conditions as part of User Satisfaction influence Use. Lin
(2007) reported the influence of User Satisfaction on Use in the online learning systems
context as one of the strongest relationships in his model. In measuring IS success, Peter
et al. (2008) identified that 17 out of 21 papers provided evidence for the effect of User
Satisfaction on Use.

181
H2.10: Use of ePortfolio has a positive effect on User satisfaction.
Lopez-Fernández&Rodriguez-Illera (2008) investigated student learning ePortfolios and
reported a strong positive impact of Use on students’ opinions and on enhancing their
learning as part of Net Benefits. Petter et al. (2008) and Burton-Jones&Straub (2006)
indicated the existence of a relationship between Use and Net Benefits.
H2.11: User Satisfaction has a positive effect on Net Benefits.
In measuring Web-based IS success, Alberto&Gianluca (2006) showed that User
Satisfaction directly positively influences Net Benefits. Petter et al. (2008) found a very
strong positive relationship between User Satisfaction and Net Benefits. In their
analysis, all the 14 papers reported a positive relationship between the two constructs.
H2.12: Net Benefits have a positive effect on User Satisfaction with ePortfolio.
Petter et al. (2008) provided evidence for the existence of a very strong positive
relationship between Net Benefits and User Satisfaction. All the 11 papers encompassed
by their analysis confirmed the existence of such a relationship.
The summary of the proposed hypotheses is shown in Table 32, while the structural
model with hypothesized relationships among latent variables (constructs) is shown in
Figure 19. During the extensive literature review no cases that would refute or oppose
the relationships proposed in the aforementioned hypotheses were found. Only in a few
cases it was reported that some relationships were evaluated as non-significant.

182
Table 32. Overview of hypothesized relationships and relevant literature
Hypothesis Relationship Literature
H2.1 System Quality -> Use Wang&Wang (2009), Petter et al. (2008), Sabherwal et al. (2006)
H2.2 System Quality -> User
Satisfaction
Wang&Wang (2009), Lin (2007), Petter et al. (2008), Sabherwal et al.
(2006)
H2.3 Information Quality -> Use Wang&Wang (2009), Lin (2007)
H2.4 Information Quality -> User
Satisfaction Wang&Wang (2009), Lin (2007),
Petter et al. (2008)
H2.5 Information Quality -> Net
Benefits Katerattanakul&Siau (2008), Doig et
al. (2006), Petter et al. (2008)
H2.6 Service Quality -> Use Lin (2007), Wang&Wang (2009)
H2.7 Service Quality -> User
Satisfaction Wang&Wang (2009),
Alberto&Gianluca (2006), Lin (2007)
H2.8 Use -> User Satisfaction Wang&Wang (2009), Peter et al. (2008), Fernandez&Rodriguez-
I.(2008)
H2.9 User Satisfaction-> Use Wang&Wang (2009),
Alberto&Gianluca (2006), Lin (2007), Peter et al. (2008)
H2.10 Use -> Net Benefits Fernandez&Rodriguez-I.(2008), Peter
et al. (2008), Burton-Jones&Straub (2006)
H2.11 User Satisfaction -> Net Benefits Alberto&Gianluca (2006), Peter et al.
(2008)
H2.12 Net Benefits -> User Satisfaction Peter et al. (2008)
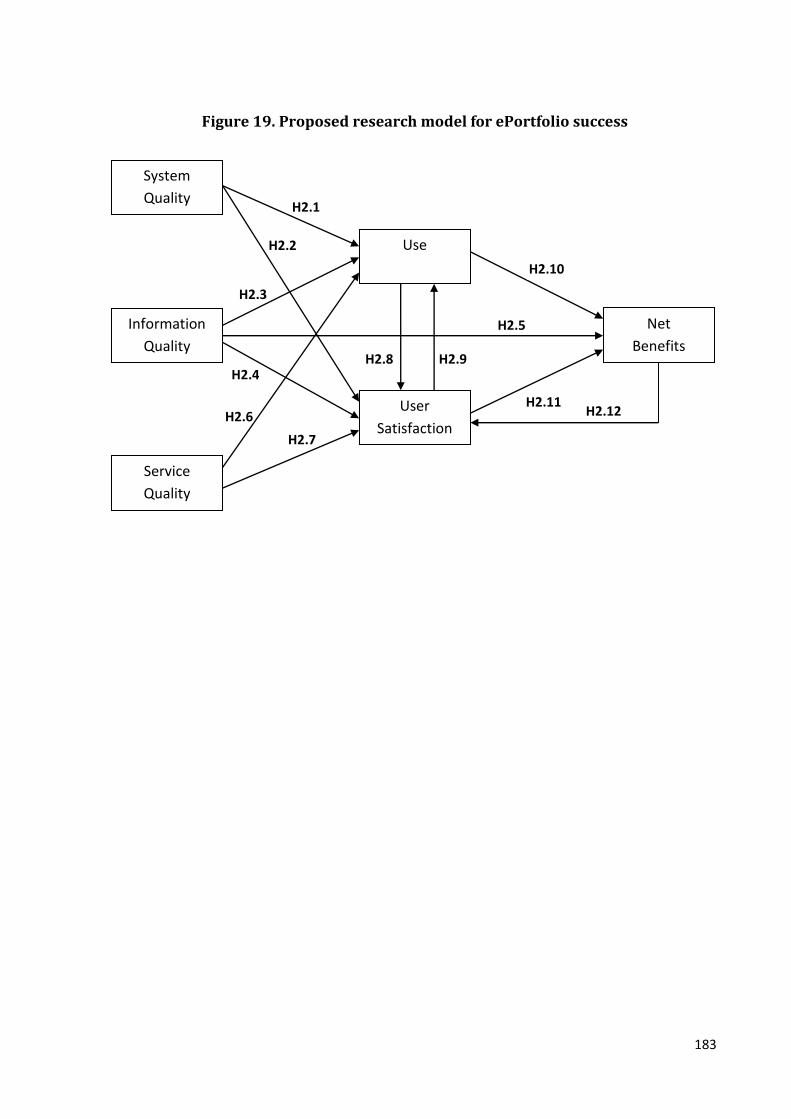
183
Figure 19. Proposed research model for ePortfolio success
System
quality
Information
Quality
Service
Quality
User
Satisfaction
Net
Benefits
H2.10
H2.11
H2.1
H2.2
H2.3
H2.6
H2.7
H2.4
H2.5
H2.9 H2.8
H2.12
System
Quality
Use

184
7.2 Structural model testing
The proposed research model could not be drawn in PLS with all the proposed
relationships due to several constraints:
1. PLS does not allow drawing mutual influences, i.e. paths leading from
construct A to construct B and then from construct B to A (example: H2.8 and
H2.9; H2.11 and H2.12).
2. It is not allowed to draw feedback loops or extended feedback loops (A->B-
>C->A). For example, Use leads to Net Benefits (H2.10), Net Benefits leads to
User Satisfaction (H2.12) and then User Satisfaction back to Use (H2.9).
Therefore, the proposed research model was decomposed into two separate structural
models that would be analyzed in PLS in order to test all the hypotheses. In the first
model, all the hypotheses were tested except H2.9 and H2.12. In the second model the
latter hypotheses were included in the model, but due to the constraints of PLS, H2.8,
H2.10 and H2.11 were parsed out from the model. The results for the first and the
second structural model are shown in Figures 20 and 21, respectively. Appendix L
shows detailed results from the bootstrap procedure for both models.
Figure 20. First structural model
* p<0.05, ** p<0.001
Net
Benefits
R2=0.72, Q2=0.37
System
Quality
Information
Quality
Service
Quality
Use R
2=0.48, Q2=0.22
User
Satisfaction R
2=0.53, Q2=0.34
0.54**
0.04
-0.04
0.14
0.23*
0.47**
0.21*
0.20*
0.55**
0.13

185
Figure 21. Second structural model
* p<0.05, ** p<0.001
The analysis process started by examining the model quality coefficients and the paths
between the constructs for the first structural model. Coefficient of determination (R2)
indicated a substantial level for Net Benefits (0.72), and moderate level for Use (0.48)
and User Satisfaction (0.53). However, taking into consideration significant paths that
explain the Use and User Satisfaction constructs, “moderate” R2 was acceptable for those
constructs. According to Henseler et al. (2009), if an endogenous latent variable is
explained by only a few (i.e. one or two) exogenous latent variables, “moderate” R2 is
acceptable. However, in case an endogenous latent variable is explained by several
exogenous variables, R2 should exceed the 0.67 cutoff for the substantial level. Prediction
relevance (Q2) for all endogenous constructs was above zero, which gave evidence that
the observed values were well constructed and that the model had predictive relevance
(see Table 33). GoF value was 0.56, which could be evaluated as an acceptable overall fit.
For example, Karim (2009) reported GoF of 0.37 as acceptable.
Net
Benefits R
2=0.40, Q2=0.21
System
Quality
Information
Quality
Service
quality
Use R
2=0.51, Q2=0.24
User
Satisfaction R
2=0.70, Q2=0.45
0.53**
0.05
-0.07
0.63**
-0.05
0.11
0.26*
0.22*
0.64**
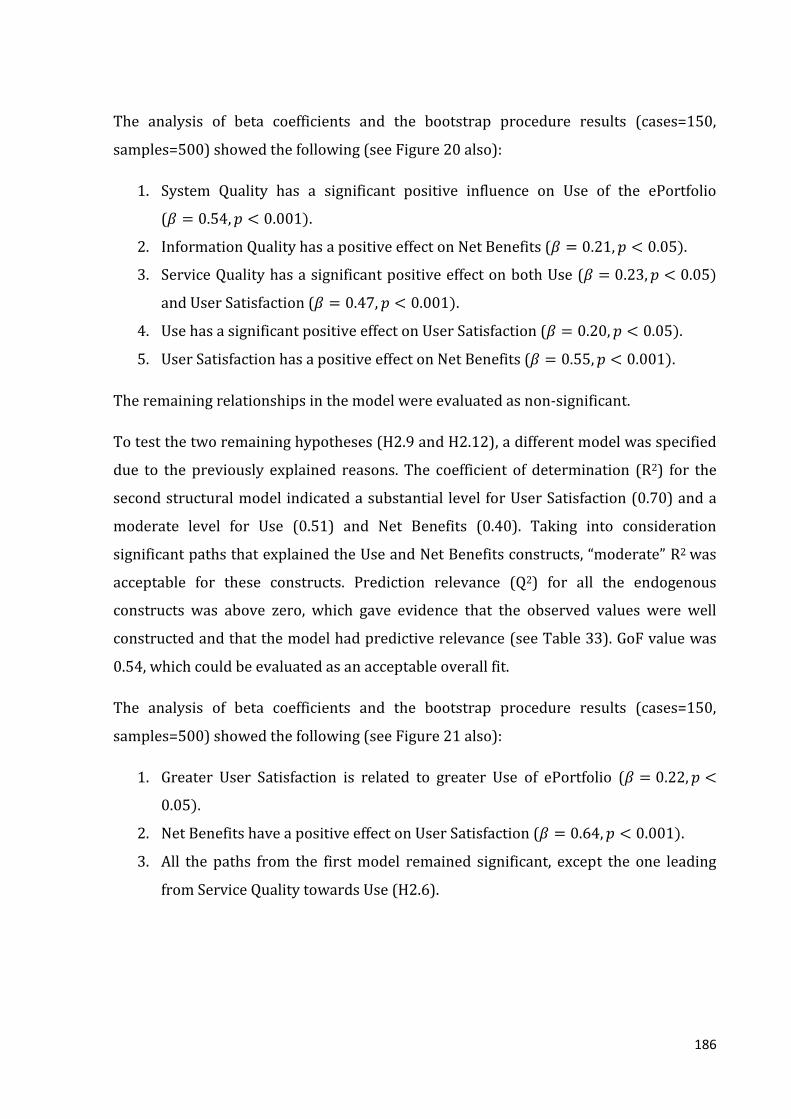
186
The analysis of beta coefficients and the bootstrap procedure results (cases=150,
samples=500) showed the following (see Figure 20 also):
1. System Quality has a significant positive influence on Use of the ePortfolio
( .
2. Information Quality has a positive effect on Net Benefits ( .
3. Service Quality has a significant positive effect on both Use (
and User Satisfaction ( .
4. Use has a significant positive effect on User Satisfaction ( .
5. User Satisfaction has a positive effect on Net Benefits ( .
The remaining relationships in the model were evaluated as non-significant.
To test the two remaining hypotheses (H2.9 and H2.12), a different model was specified
due to the previously explained reasons. The coefficient of determination (R2) for the
second structural model indicated a substantial level for User Satisfaction (0.70) and a
moderate level for Use (0.51) and Net Benefits (0.40). Taking into consideration
significant paths that explained the Use and Net Benefits constructs, “moderate” R2 was
acceptable for these constructs. Prediction relevance (Q2) for all the endogenous
constructs was above zero, which gave evidence that the observed values were well
constructed and that the model had predictive relevance (see Table 33). GoF value was
0.54, which could be evaluated as an acceptable overall fit.
The analysis of beta coefficients and the bootstrap procedure results (cases=150,
samples=500) showed the following (see Figure 21 also):
1. Greater User Satisfaction is related to greater Use of ePortfolio (
.
2. Net Benefits have a positive effect on User Satisfaction ( .
3. All the paths from the first model remained significant, except the one leading
from Service Quality towards Use (H2.6).

187
Table 33. Communalities, determination and predictability coefficients in both
structural models
First model Second model
Constructs Communalities R2 Q2 Communalities R2 Q2
SYSQ 0.51
0.51
INFQ 0.54
0.54
SERVQ 0.58
0.58
USE 0.51 0.48 0.22 0.51 0.51 0.24
USAT 0.48 0.53 0.34 0.48 0.70 0.45
NETB 0.66 0.72 0.37 0.66 0.40 0.21
Average 0.55 0.58
0.55 0.54
GoF 0.56
0.54
* Q2 was calculated by blindfolding procedure with the omission distance parameter set to 73
Prior to a deeper analysis of the paths in the structural model it was necessary to
compare the results obtained from the two structural models, determine the cause of the
changed weights of some of the paths and explain the change in the coefficient of
determination (R2) values. It should be mentioned once again that the aim of the second
model test was to assess the significance of the paths that could not be analyzed with the
first model due to restrictions in PLS.
In order to interpret the PLS results, one should take into consideration both indirect
effects and direct effects (Henseler et al., 2009; Wang&Wang, 2009). The first group of
variables (System Quality, Information Quality and Service Quality) is exogenous and
therefore only has the causing effect in the model.
Paths leading from System Quality remained almost unchanged. The situation was
somewhat different with Information Quality, where the path leading from this
construct to Net Benefits changed positively to a great extent. This can be attributed to
the fact that Information Quality has a direct effect on Net Benefits as well as an indirect
effect on User Satisfaction and Use. In the first model such a relationship was not
assumed. Therefore, the change in the beta value can be attributed to the change that is
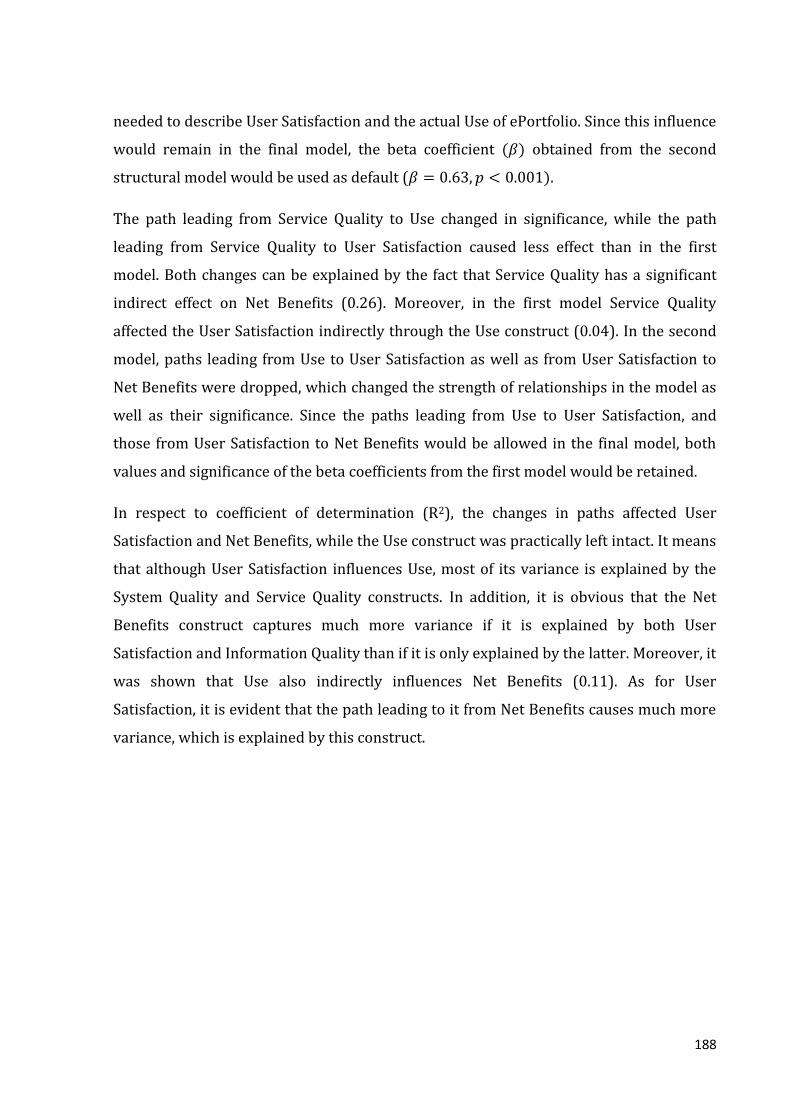
188
needed to describe User Satisfaction and the actual Use of ePortfolio. Since this influence
would remain in the final model, the beta coefficient obtained from the second
structural model would be used as default ( .
The path leading from Service Quality to Use changed in significance, while the path
leading from Service Quality to User Satisfaction caused less effect than in the first
model. Both changes can be explained by the fact that Service Quality has a significant
indirect effect on Net Benefits (0.26). Moreover, in the first model Service Quality
affected the User Satisfaction indirectly through the Use construct (0.04). In the second
model, paths leading from Use to User Satisfaction as well as from User Satisfaction to
Net Benefits were dropped, which changed the strength of relationships in the model as
well as their significance. Since the paths leading from Use to User Satisfaction, and
those from User Satisfaction to Net Benefits would be allowed in the final model, both
values and significance of the beta coefficients from the first model would be retained.
In respect to coefficient of determination (R2), the changes in paths affected User
Satisfaction and Net Benefits, while the Use construct was practically left intact. It means
that although User Satisfaction influences Use, most of its variance is explained by the
System Quality and Service Quality constructs. In addition, it is obvious that the Net
Benefits construct captures much more variance if it is explained by both User
Satisfaction and Information Quality than if it is only explained by the latter. Moreover, it
was shown that Use also indirectly influences Net Benefits (0.11). As for User
Satisfaction, it is evident that the path leading to it from Net Benefits causes much more
variance, which is explained by this construct.

189
Table 34. Summary of hypotheses testing
Hypothesis Relationship t-value Standardized Coefficient
Result
H2.1 System Quality -> Use 7.29** 0.54 Supported
H2.2 System Quality -> User Satisfaction 0.38 0.04 Rejected
H2.3 Information Quality -> Use 0.51 -0.04 Rejected
H2.4 Information Quality -> User Satisfaction 1.44 0.14 Rejected
H2.5 Information Quality -> Net Benefits 3.37** 0.63 Supported
H2.6 Service Quality -> Use 2,41* 0.23 Supported
H2.7 Service Quality -> User Satisfaction 4.87** 0.47 Supported
H2.8 Use -> User Satisfaction 2.40* 0.20 Supported
H2.9 User Satisfaction-> Use 2,51* 0.22 Supported
H2.10 Use -> Net Benefits 1.52 0.13 Rejected
H2.11 User Satisfaction -> Net Benefits 5.42** 0.55 Supported
H2.12 Net Benefits -> User Satisfaction 6.24** 0.63 Supported
* p<0.05, ** p<0.001; t-values are calculated by the bootstrap with 150 cases and 500 samples
Taking into account the differences between the two structural models and the
corresponding explanations as well as the results of hypotheses testing shown in Table
34, a more detailed analysis of the effect size and predictive relevance was carried out
on paths that were identified as significant.
Two additional criteria for assessing structural models in PLS can be found in literature.
Karim (2009) and Henseler et al. (2010) stress the significance of effect size (f2) and
the relative impact of the structural model on the observed measures for latent
dependent variable that is evaluated by means of q2.
The effect size (f2) of a single predictor can be calculated by comparing the explained
variance when the predictor is either included or not included in the model, that is:
,
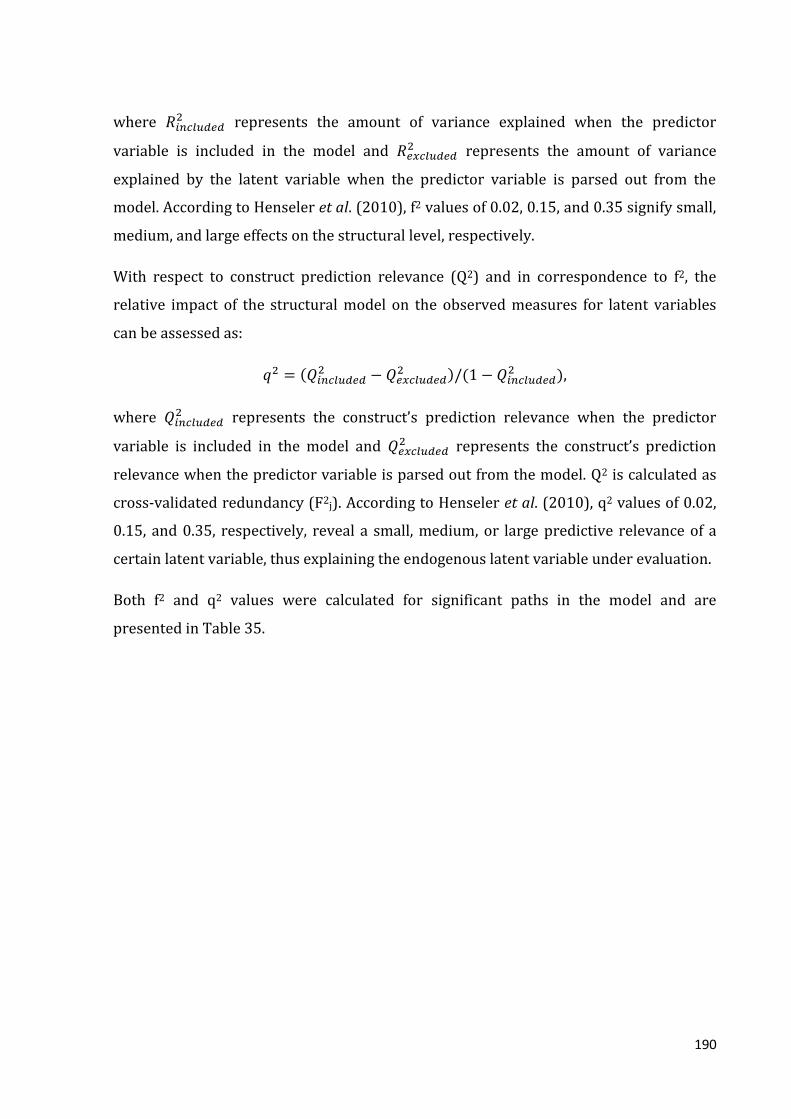
190
where represents the amount of variance explained when the predictor
variable is included in the model and represents the amount of variance
explained by the latent variable when the predictor variable is parsed out from the
model. According to Henseler et al. (2010), f2 values of 0.02, 0.15, and 0.35 signify small,
medium, and large effects on the structural level, respectively.
With respect to construct prediction relevance (Q2) and in correspondence to f2, the
relative impact of the structural model on the observed measures for latent variables
can be assessed as:
,
where represents the construct’s prediction relevance when the predictor
variable is included in the model and represents the construct’s prediction
relevance when the predictor variable is parsed out from the model. Q2 is calculated as
cross-validated redundancy (F2j). According to Henseler et al. (2010), q2 values of 0.02,
0.15, and 0.35, respectively, reveal a small, medium, or large predictive relevance of a
certain latent variable, thus explaining the endogenous latent variable under evaluation.
Both f2 and q2 values were calculated for significant paths in the model and are
presented in Table 35.
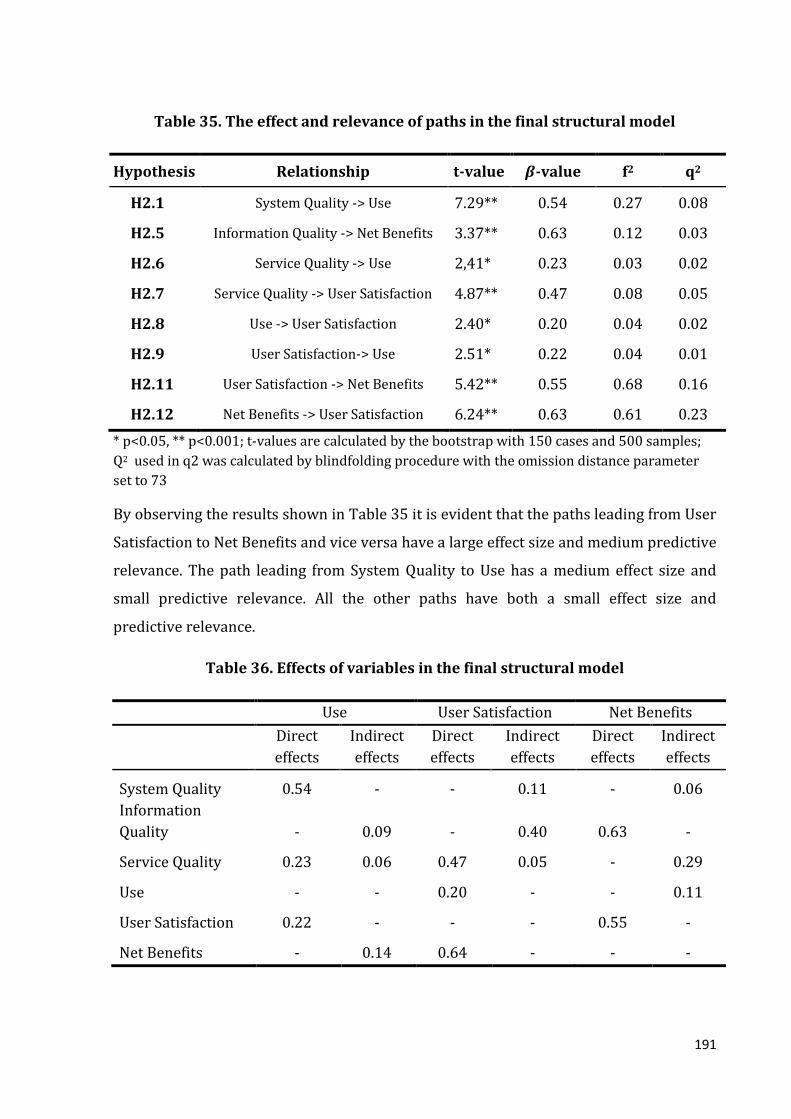
191
Table 35. The effect and relevance of paths in the final structural model
Hypothesis Relationship t-value -value f2 q2
H2.1 System Quality -> Use 7.29** 0.54 0.27 0.08
H2.5 Information Quality -> Net Benefits 3.37** 0.63 0.12 0.03
H2.6 Service Quality -> Use 2,41* 0.23 0.03 0.02
H2.7 Service Quality -> User Satisfaction 4.87** 0.47 0.08 0.05
H2.8 Use -> User Satisfaction 2.40* 0.20 0.04 0.02
H2.9 User Satisfaction-> Use 2.51* 0.22 0.04 0.01
H2.11 User Satisfaction -> Net Benefits 5.42** 0.55 0.68 0.16
H2.12 Net Benefits -> User Satisfaction 6.24** 0.63 0.61 0.23
* p<0.05, ** p<0.001; t-values are calculated by the bootstrap with 150 cases and 500 samples;
Q2 used in q2 was calculated by blindfolding procedure with the omission distance parameter
set to 73
By observing the results shown in Table 35 it is evident that the paths leading from User
Satisfaction to Net Benefits and vice versa have a large effect size and medium predictive
relevance. The path leading from System Quality to Use has a medium effect size and
small predictive relevance. All the other paths have both a small effect size and
predictive relevance.
Table 36. Effects of variables in the final structural model
Use User Satisfaction Net Benefits
Direct
effects
Indirect
effects
Direct
effects
Indirect
effects
Direct
effects
Indirect
effects
System Quality 0.54 - - 0.11 - 0.06
Information
Quality - 0.09 - 0.40 0.63 -
Service Quality 0.23 0.06 0.47 0.05 - 0.29
Use - - 0.20 - - 0.11
User Satisfaction 0.22 - - - 0.55 -
Net Benefits - 0.14 0.64 - - -

192
In addition to the effects and relevance of the paths several authors such as
Haenlein&Kaplan (2004), Karim (2009) and Henseler et al. (2010) recommend that
besides the direct effects hypothesized in the model, indirect effects should also be
examined to gain insight into possible moderating or mediating effects of particular
latent variables. Indirect effects can be calculated as a product of direct paths (Loehlin,
2009). For example, System Quality has an indirect effect on User Satisfaction through
the Use construct. This particular indirect effect can be subsequently calculated as a
product of direct paths leading from System Quality to Use and from Use to User
Satisfaction. Table 36 shows both direct and indirect effects in the model.
After a detailed analysis of indirect effects in the final model, several conclusions can be
drawn:
1. User Satisfaction can be identified as an important mediating variable because all
constructs in the model affect other constructs through this variable.
2. Use mediates the relationship between System Quality and User Satisfaction as
well as between Service Quality and User Satisfaction.
3. Information Quality has a strong indirect effect on User Satisfaction, and a
noticeable indirect effect on Use.
4. Service Quality also has a strong indirect effect on Net Benefits, and a minor
indirect effect on Use of ePortfolio.
5. System Quality has a noticeable indirect effect on User Satisfaction.
The remaining indirect effects shown in Table 36 are weak but not negligible.
To summarize, Figure 22 shows the significant paths in the model that were identified
and evaluated in detail in terms of their predictive relevance and effect size. Moreover,
the constructs were analyzed for predictability and reliability. In addition, the global
goodness-of-fit index was calculated to show an overall model fit. While the significant
paths were explained in detail, the model was identified as satisfactory taking into
account all the previously mentioned indices supported by PLS. Although two models
were suggested due to limitations in PLS and both were evaluated as satisfactory, the
identified paths can be joined into a single model explaining the success of an ePortfolio.
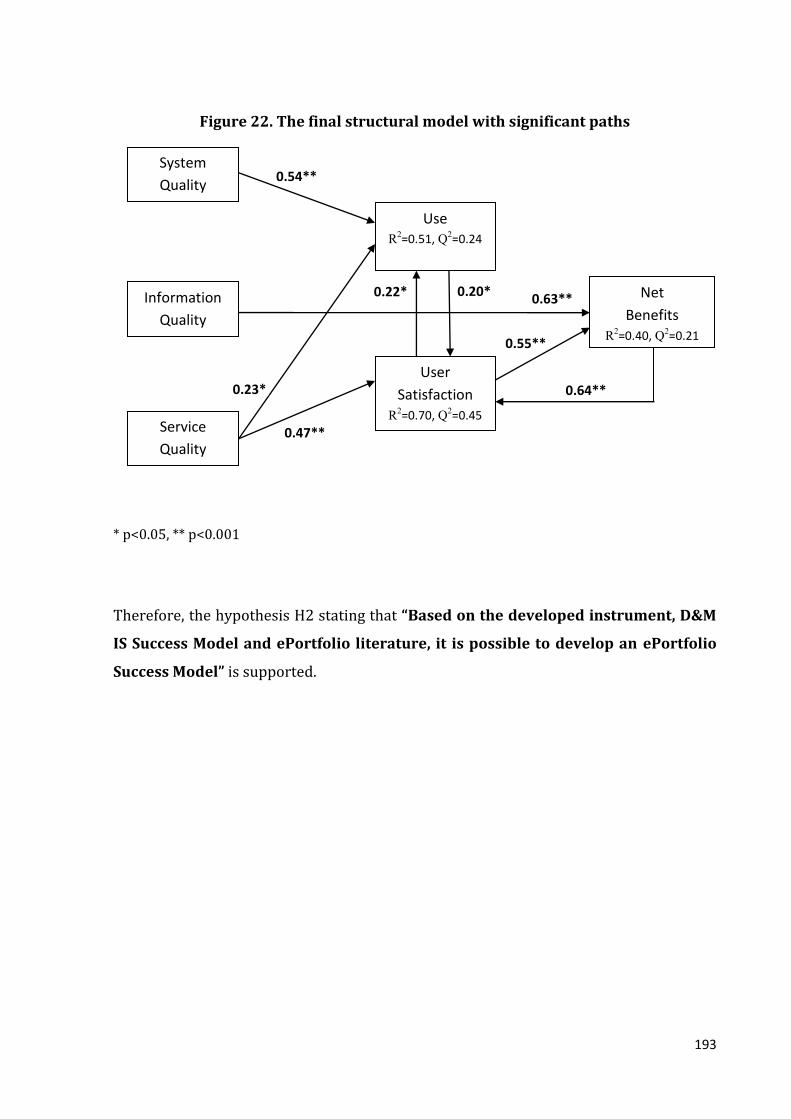
193
Figure 22. The final structural model with significant paths
* p<0.05, ** p<0.001
Therefore, the hypothesis H2 stating that “Based on the developed instrument, D&M
IS Success Model and ePortfolio literature, it is possible to develop an ePortfolio
Success Model” is supported.
Net
Benefits R
2=0.40, Q2=0.21
System
Quality
Information
Quality
Service
Quality
Use R
2=0.51, Q2=0.24
User
Satisfaction R
2=0.70, Q2=0.45
0.54**
0.63**
0.23*
0.47**
0.22*
0.64**
0.20*
0.55**
194
8 Results and discussion
This chapter discusses the results of the data analysis presented in previous chapters
and is divided into two sections. The first section focuses on the instrument developed
to measure ePortfolio success. The second section discusses the ePortfolio Success
Model based on the measurement model.
8.1 Instrument for measuring ePortfolio success
The ePortfolio instrument is the first comprehensive measurement model that assesses
ePortfolio success from the individual perspective. Prior to instrument development, as
a rationale for applying the D&M Model on ePortfolio, evidence that ePortfolio can be
interpreted as IS was provided. A series of methodological procedures were carried out
in Chapter 4 in order to show that ePortfolio is indeed an IS. The comprehensiveness of
the instrument was presented in Chapter 5, with the description of how the emerging
ePortfolio literature and international ePortfolio experts were used to create an initial
set of items for the instrument. The instrument was subsequently made more
comprehensive by involving all the interested parties, from student to employer, in the
item creation process. The empirical testing of the instrument was discussed in Chapter
6. Through a series of well accepted and rigorous developmental methodologies and
statistical procedures, a valid and reliable instrument for measuring the ePortfolio
success from the students’ perspective was developed. A summary of the final ePortfolio
success instrument composed of 46 items is presented in Table 37.
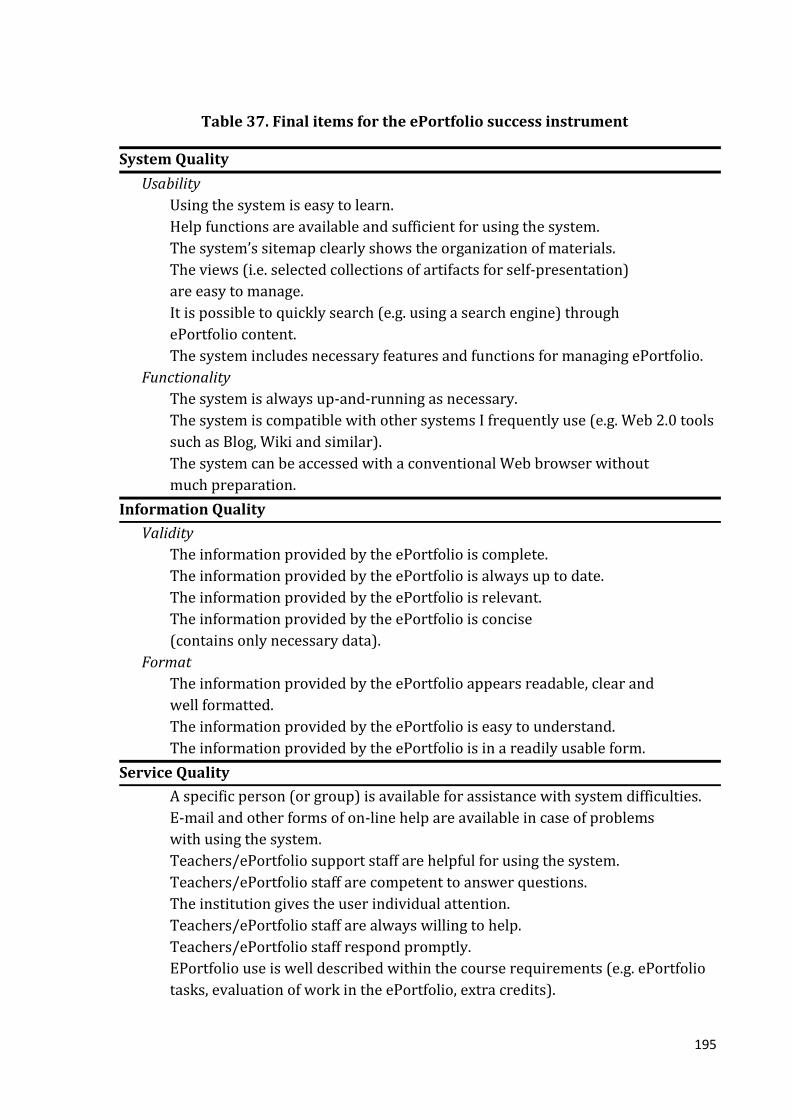
195
Table 37. Final items for the ePortfolio success instrument
System Quality
Usability
Using the system is easy to learn.
Help functions are available and sufficient for using the system.
The system’s sitemap clearly shows the organization of materials.
The views (i.e. selected collections of artifacts for self-presentation)
are easy to manage.
It is possible to quickly search (e.g. using a search engine) through
ePortfolio content.
The system includes necessary features and functions for managing ePortfolio.
Functionality
The system is always up-and-running as necessary.
The system is compatible with other systems I frequently use (e.g. Web 2.0 tools
such as Blog, Wiki and similar).
The system can be accessed with a conventional Web browser without
much preparation.
Information Quality
Validity
The information provided by the ePortfolio is complete.
The information provided by the ePortfolio is always up to date.
The information provided by the ePortfolio is relevant.
The information provided by the ePortfolio is concise
(contains only necessary data).
Format
The information provided by the ePortfolio appears readable, clear and
well formatted.
The information provided by the ePortfolio is easy to understand.
The information provided by the ePortfolio is in a readily usable form.
Service Quality
A specific person (or group) is available for assistance with system difficulties.
E-mail and other forms of on-line help are available in case of problems
with using the system.
Teachers/ePortfolio support staff are helpful for using the system.
Teachers/ePortfolio staff are competent to answer questions.
The institution gives the user individual attention.
Teachers/ePortfolio staff are always willing to help.
Teachers/ePortfolio staff respond promptly.
EPortfolio use is well described within the course requirements (e.g. ePortfolio
tasks, evaluation of work in the ePortfolio, extra credits).

196
Table 37. Final items for the ePortfolio success instrument (continued)
Use
Deep Structure Usage
While using the ePortfolio, I use available features for organizing my content.
While using the ePortfolio, I collaborate with my peers in organizing ePortfolio
content.
While using the ePortfolio, I use features that help me to join the groups.
Facilitating Conditions
While using the ePortfolio, I use features that help me to set view permissions for
different views (ePortfolios).
I have the knowledge necessary to use the system.
I was able to complete a task using the system even if there was no one around to
tell me what to do as I go.
User Satisfaction
I like working with the system.
The system makes work more interesting.
Using the system is a good idea.
I find the system useful in learning.
The degree of freedom for expressing one’s own individuality is satisfactory.
The ePortfolio presentation capabilities (e.g. quick upload, format and
presentation of personal information) are satisfactory.
Net Benefits
Enhanced Learning
The ePortfolio encourages me to develop a positive attitude to lifelong learning.
The ePortfolio helps me to make connections between formal (i.e. structured
learning within the school or faculty) and informal (i.e. unstructured learning
occurring in everyday life) learning experiences.
The ePortfolio helps me to fulfill learning outcomes.
Using ePortfolio leads to increased transparency in evaluation.
The enhanced communication between me and educators enhances the chances
for my success.
Personal Growth and Development
I am able to evaluate progress towards achievement of my personal goals.
I am able to choose my co-workers among peers according to various criteria
(interests) presented in ePortfolio.
I am able to compare myself with others.
I am able to show my personal growth and development over time.
Potential employers can view my showcase Portfolio within the context of my
institution’s requirements, assessment criteria, and my personal descriptions
of achievements.
197
Regarding the fact that the instrument is based on the D&M Model, it accordingly
comprises six major dimensions: System Quality (9 items), Information Quality (7
items), Service Quality (8 items), Use (6 items), User Satisfaction (6 items) and Net
Benefits (10 items). Service quality and User Satisfaction dimensions are single-factor
constructs, while other dimensions contain two unidimensional factors that are
measured by at least two items (see Table 37). Evidences from convergent and
discriminant validity showed that each factor measures only its prospective construct
that is different from other constructs.
The fact that the instrument was designed to assess ePortfolio success through 6
dimensions at the individual level allows educational institutions that use ePortfolio to
assess its success from the end-user’s (i.e. students’) perspective. Using this instrument,
an educational institution can find out, for example, whether the ePortfolio system
needs improvement or whether the institution needs to raise the quality of services for
its students. In other words, the ePortfolio success instrument allows educational
institutions to pinpoint specific areas that need improvement. Of course, certain results,
such as the feedback obtained through User Satisfaction or Net Benefits cannot be
directly improved by the institution. Therefore, if the institution wants to raise the
satisfaction of its students or wants them to gain greater benefits from ePortfolio, it
needs to be aware of the relationships that exist between the dimensions of ePortfolio
success. A more detailed explanation of relationships between the dimensions depicted
in the ePortfolio Success Model is given in the next section.
In respect to the ePortfolio success instrument, it should be mentioned that educational
institutions can also use it for comparison with other institutions, self-benchmarking or
monitoring personal progress over time. The first two evaluations can be done anytime,
whereas the latter should be performed in the way to ensure at least three month
intervals between the initial evaluation and re-evaluation. This requirement is explained
with the fact that the time needed for students to perceive changes, for example in
service quality or system quality, and to actually react to such changes in terms of higher
satisfaction or realize that some of the benefits became much clearer and more visible,
can be measured in months. With such evaluation, changes that indicate improvements
or degradation in ePortfolio implementation and usage can be detected.
198
To ensure the generalization of the ePortfolio success instrument, the data from a cross-
sectional field survey was used in this research. Therefore, the resulting instrument is
applicable to educational institutions worldwide. When applied, the instrument needs to
be administered to a wide range of students to ensure appropriate representation of the
diverse uses of the ePortfolio by students. The average score for each dimension and/or
each factor within that dimension would be indicators of successful implementation and
use of a particular ePortfolio system.
The ePortfolio success instrument addresses the question “How well is ePortfolio
implemented and used?” taking into account the end-user’s perception. When applied
within an educational institution among students, it can provide a valuable insight into
all the components that make a successful implementation of an ePortfolio system.
Based on the results of the ePortfolio success instrument, institutions that have
introduced major changes and succeeded to improve the ePortfolio implementation and
usage could provide others with examples of best practice.
On the whole, the goal of developing measures to assess successful implementation and
usage of ePortfolio was successfully achieved in this dissertation. The resulting
instrument is not only comprehensive enough to cover all the aspects of ePortfolio
implementation and usage but also sensitive enough to pinpoint areas that need
improvement. Therefore, the instrument could be a very useful tool for educational
organizations to detect potential problems in ePortfolio usage and implementation as
well as to monitor progress toward their improvement.

199
8.2 The ePortfolio Success Model
By creating a valid instrument to measure successful implementation and usage of
ePortfolio, relationships between the dimensions could be explored. It should be noted
again, however, that the ePortfolio success instrument can only indicate the dimensions
that need improvement. It can neither reveal the potential causes of those problems nor
provide general guidelines on how the problems should be solved or which dimensions
should be primarily concerned in the process. Besides, some dimensions like User
Satisfaction obviously depend on other dimensions and cannot be directly controlled by
the institution. For that reason, a set of statistical procedures was used to identify
whether the proposed relationships between the dimensions exist. The whole process,
described in detail in Chapter 7, has resulted in the final ePortfolio Success Model shown
in Figure 23.
Figure 23. The proposed ePortfolio Success Model
The principal aim of the ePortfolio Success Model is to show the effects its dimensions
have on each other. Furthermore, based on the established relationships, institutions
can consider dimensions to be affected in order to improve the success of ePortfolio
Net
Benefits
System
Quality
Information
Quality
Service
Quality
Use
User
Satisfaction

200
implementation and usage. For example, if the instrument pinpoints User Satisfaction as
a problematic dimension, the institution will be made aware that it should try to
improve Service Quality and, possibly, System Quality, to improve the benchmark of
User Satisfaction. Higher User Satisfaction will lead to higher Net Benefits that will in
turn affect User Satisfaction again.
Moreover, Figure 23 clearly shows that Use and User Satisfaction dimensions are very
tightly connected, that is, Use affects User Satisfaction and vice versa. Such relationships
are in accordance with the DeLone&McLean's theory which argues that the six
dimensions should be interrelated showing not only process flows but causality flows as
well (DeLone&McLean, 2003). The same applies to Net Benefits and User Satisfaction.
Another interesting finding is that Information Quality neither affects Use nor User
Satisfaction, at least not directly. Instead, it was shown that the Information Quality
dimension affects Net Benefits, and from there User Satisfaction and Use. This is in line
with expectations, since information is a product of Use and is in direct service of
benefits that arise from ePortfolio usage. Namely, Users use ePortfolio to produce
information about themselves or to be assessed based on the produced information.
Therefore, information from ePortfolio is a direct product that can be used as a trigger
for other activities in Lifelong Learning. The quality of produced information in
ePortfolio actually presents an added value to the individual and to the society. Based on
the information produced in ePortfolio, the individual sees the benefits in terms of
enhanced learning and personal growth and development. Owing to those benefits, the
individual will be satisfied with ePortfolio, which will lead to a greater use of that
system.
The ePortfolio Success Model addresses the questions “Where to start the improvement
process and what effects on other dimensions will it have?” or “What can I expect if I
improve certain dimension?”. It is intended for educational institutions that employ
ePortfolio and have students as users. Based on the ePortfolio success instrument
intended for students, institutions can be guided by the ePortfolio Success Model on how
to improve their ePortfolio usage and implementation.

201
On the whole, the goal of developing the model that is based on the well known D&M
Model and reflects relationships between the dimensions of ePortfolio success was
successfully achieved in this dissertation. The resulting model revealed the very
important fact of information and its quality being a direct product of ePortfolio usage.
Therefore, the resulting model could prove very useful for educational organizations in
indicating the dimensions that will be or need to be affected by the improvement
process.

202
9 Conclusion
This doctoral dissertation focused on two main aims: to develop an ePortfolio success
instrument for assessing ePortfolio success and to develop a corresponding ePortfolio
Success Model that would explain the relationships between the dimensions of
ePortfolio success. Achieving the aforementioned aims required a comprehensive
preliminary research to be carried out; involvement of international ePortfolio experts;
and a whole set of recent statistical techniques and findings to be applied for data
analysis and interpretation. In the following sections the scientific contribution of the
dissertation are presented through a brief review of procedures undertaken to achieve
the aims. The limitations of this study are also brought up, followed by directions for
future research.
9.1 Scientific contribution
The original scientific contribution of this dissertation is twofold and as such can be
explained in terms of contributing to theory and methodology. Its theoretical
contribution refers to providing evidence that ePortfolio is an IS, proposal of the
ePortfolio meta-model, ePortfolio success instrument development and validation,
ePortfolio Success Model proposal as well as the validation and identification of critical
success factors for ePortfolio implementation. Methodological contribution
comprehends the use of different scientific approaches to provide evidence that
ePortfolio is an IS. A combination of existing instrument development and model testing
methodologies and techniques was used to design the ePortfolio success instrument and
to propose the ePortfolio success model. Each of the contributions is described
separately below.
9.1.1 Theoretical contribution
This dissertation is the first to show that ePortfolio is an IS. This allows for a whole new
field of IS research methodologies to be applied to ePortfolio. By introducing the IS field

203
to the field of ePortfolio and vice versa two direct benefits were achieved. First,
ePortfolio can be greatly improved by comprehending it as an IS and applying a whole
new set of measures and techniques that may eventually lead to development of new
theories. On the other hand, establishing that ePortfolio is IS implies that the IS field will
be introduced to a specific type of IS that supports Lifelong Learning, in contrast to
traditional business systems. This may expand the comprehension of IS and eventually
lead to the development of new ideas and approaches in the theory of IS. Moreover, the
Genetic taxonomy method and the Genetic Taxonomy Space were used to support the
direct comparison between ePortfolio and other types of IS. In addition, the difference
between ePortfolio as a system and ePortfolio as a tool was demonstrated thus
providing further clarification of different ways of conceiving ePortfolio.
The ePortfolio meta-model was developed as a result of the extensive ePortfolio
literature overview and personal experience in ePortfolio usage and implementation.
That comprehensive five-scenario model depicts a possible usage of ePortfolio as a
central system in Lifelong Learning. It can be valuable to individuals, educational
institutions as well as employment organizations in explaining the information flow, the
potential for its usage in different contexts and the benefits for all parties.
According to Chang&King (2005), instrument development contributes to a field by
providing valid and interpretable measures in theory building and hypothesis testing.
Based on the IS literature that emphasizes the multi-dimensional nature of IS success
(for examples, see Seddon, 1997; Gable et al., 2003; Sedera et al., 2004; DeLone&McLean,
2003 and others), in this dissertation an instrument for assessing the ePortfolio success
from the individual’s perspective in the academic environment was developed and
validated. The successful validation of the ePortfolio success instrument supported the
proposition that the success of an ePortfolio is multi-dimensional and that it can be
measured through six dimensions suggested by DeLone&McLean (2003). The results of
data analysis also supported this proposition by confirming the structures in the
ePortfolio success instrument. Therefore, the success of an ePortfolio system is indeed
multi-dimensional and can be accessed through six major dimensions proposed by the
D&M Model (DeLone&McLean, 2003): System Quality, Information Quality, Service
Quality, Use, User Satisfaction and Net Benefits. For the instrument to be comprehensive

204
and applicable in all universities worldwide, in this dissertation a set of international
ePortfolio experts was used to create an initial pool of ePortfolio measurement items
and several universities across Europe and USA were used to validate the instrument.
Moreover, additional comprehensiveness was introduced by involving all the interested
parties, from student to employer.
The model of ePortfolio success was also developed and validated based on the
aforementioned instrument. Significant paths between the major dimensions were
found, which allows us to conclude that the model provides significant insight into
relationships between the dimensions of ePortfolio success in the academic
environment. Beside significant direct connections between the dimensions, indirect
influences were also found as well as those that mediate relationships between other
dimensions of ePortfolio success.
This dissertation also contributes to the field of ePortfolio by proposing a new set of
critical success factors firstly established by Gathercoal et al. (2002). The set of critical
success factors is extremely valuable and vital for institutions that plan to implement
ePortfolio since, according to Gathercoal et al. (2002) they need to be present and active
in order to implement an ePortfolio system. Identifying the presence or absence of those
factors in universities that implemented ePortfolio on one hand and explaining the
connection between them and ePortfolio implementation success on the other can
significantly contribute to new theories regarding the ePortfolio implementation and
usage.
9.1.2 Methodological contribution
This dissertation demonstrated the use of different scientific approaches to provide
evidence that ePortfolio is an IS. Except for the descriptive method, this dissertation
used the Genetic taxonomy method (Brumec, 1997) and provided a rationale for the
existence of ePortfolio, its development, source and origin. Moreover, the Genetic
Taxonomy Space was used to show the difference between ePortfolio as a tool and
ePortfolio as a system. Successful application of the Genetic taxonomy method and the
205
Genetic Taxonomy Space provides validation for the methodology and adds to the
accumulation of knowledge on its use.
A significant methodological contribution of this dissertation is the development of the
ePortfolio success instrument. This instrument enables the comprehensive assessment
of ePortfolio success in the academic environment through six dimensions and is
applicable at the individual level of analysis. Moreover, the instrument enables
researchers to assess ePortfolio success in different universities or within the same
university over a period of time. A comparison of results between universities would
allow for accumulation of knowledge about ePortfolio success, while comparing the
results within a single institution collected over a period of time would enable a detailed
analysis of progress in successful implementation of ePortfolio.
While following recommendations in Straub et al. (2004) as the backbone for
instrument development, several other recommendations were also combined and
followed in this dissertation (e.g. Gefen et al., 2000, Moore&Benbasat, 2001;
Gefen&Straub, 2005), resulting in the dissertation’s value and applicability. Owing to
rigor in the early stages of instrument development, items that had good content validity
were obtained. The usage of Q-sorting ensured that items converged to their prospective
constructs while differentiating them from other constructs. Confirmatory factor
analysis was applied for further clearing on instrument items (Segar, 1997; Straub et al.,
2004, Gefen&Straub,2005), while exploratory factor analysis was used for further
extraction of subcategories within dimensions (Gefen&Straub, 2005). Finally, the two-
phase pair wise model fitting (Segars&Groover, 1998) resulted in a good model fit for
the ePortfolio success instrument. Successful application of the instrument development
methodology in IS provides validation for the methodology and adds to the
accumulation of knowledge on its use.
Using PLS SEM to detect significant paths between the dimensions of ePortfolio success
is another contribution to methodology. Apart from detecting direct paths, the power of
PLS SEM was demonstrated by detecting and explaining indirect impacts between
dimensions and validating the model fit. Due to limitations in path analysis, the
proposed model was decomposed into two models in order to analyze all the

206
hypothesized paths. By careful interpretation of the results from both models, a unique
model was identified that explains relationships between the dimensions of ePortfolio
success. Decomposition of the model as well as the subsequent integration of results into
one general model presents a valuable contribution to the methodology used for path
estimation. Successful application of PLS SEM to detect and explain relationships in the
ePortfolio Success Model also provides validation for the methodology used.
207
9.2 Limitations of the study
There are several limitations of this dissertation that need to be considered when
interpreting the results. The first is the inadequate number of institutions for CSFs
analysis and the consequently low response rate within institutions. For a stable CSFs
analysis the institutions’ sample should have included around 100 or more institutions,
each one of them providing at least 40-50 students. Since the desired number of data
points was not accomplished, the analysis of the moderating effect that CSFs have on the
Portfolio success was omitted from this dissertation.
On the other hand, the data points to analyze and validate the ePortfolio success
instrument were sufficient. To alleviate the concern that the results may not be
generally applicable, the sample was thoroughly analyzed in terms of age of the
respondents, frequency of ePortfolio usage, number of artefacts in ePortfolio and
number of courses in which the respondents used ePortfolio. The analysis showed that
the age span on the whole encompasses the student population. Other attributes also
showed that the sample encompassed a variety of students, from the ones that have a
small number of artefacts and work with ePortfolio on a monthly basis to the ones that
have a great number of artefacts and work with ePortfolio on a daily basis. The low
response rate obtained in the study, although a cause for concern, can be attributed to
the fact that most institutions that reported the use of ePortfolio are still in very early
stages of implementation and usage and therefore currently hardly have any students
who have experience with using the system.
In this dissertation the ePortfolio success instrument was developed, along with the
corresponding model to be applied at the individual level of analysis in the academic
environment. In other words, the ePortfolio success can be used by an academic
institution for interpreting the results of ePortfolio implementation based on students’
responses. Furthermore, the ePortfolio Success Model can be used by an academic
institution in the process of improving the implementation and usage of ePortfolio.
Finally, the low concentration of respondents aged above 31 also limits the
generalizability of research findings to older students, which especially applies to part-
time students.

208
9.3 Implications for further research
In this dissertation an instrument was developed to assess the success of an ePortfolio
system following the D&M Model of IS success. Based on data analysis, the ePortfolio
Success Model was proposed. The current study can be further extended and verified by
conducting additional exploratory factor analysis with a greater number of respondents
from Europe and USA to confirm the generalizability of the instrument and to detect
possible additional dimensions or factors within dimensions. Furthermore, in respect to
the required number of respondents, SEM analysis in LISREL could be performed to
detect if certain correlations exist between the dimensions in the model. Moreover, the
model fit can be re-tested in LISREL to verify the fit determined in this dissertation.
In addition, the authors of the D&M Model that was followed in this dissertation
emphasize two possible units of analysis regarding the model: individual and
organizational. This dissertation assessed the ePortfolio success at the individual level,
from the point of view of a student. One possible direction for further work is to analyze
the ePortfolio success at the organizational level. In that case a large pool of institutions
that actively use ePortfolio is needed and the initial pool of items developed for this
instrument should be re-determined and filtered to correspond to the organizational
level of perception.
Another important aspect that was not covered in this dissertation due to a lack of
respondents was the analysis of CSFs as moderating factors in the ePortfolio Success
Model. This certainly presents a very solid starting point for further research. Since CSFs
have already been identified, a large number of institutions that use ePortfolio together
with several dozen students within each institution would be needed to test the
moderating effects of CSFs. A scenario of such possible future research is as follows:
After the institutions complete the CSFs survey and students complete the ePortfolio
success survey, the ePortfolio Success Model for each institution is obtained. The success
models of each institution are then analyzed and compared. The existence or absence of
paths between the dimensions in accordance with CSFs that were identified at the
institutional level will point to the moderating effect of the CSFs.
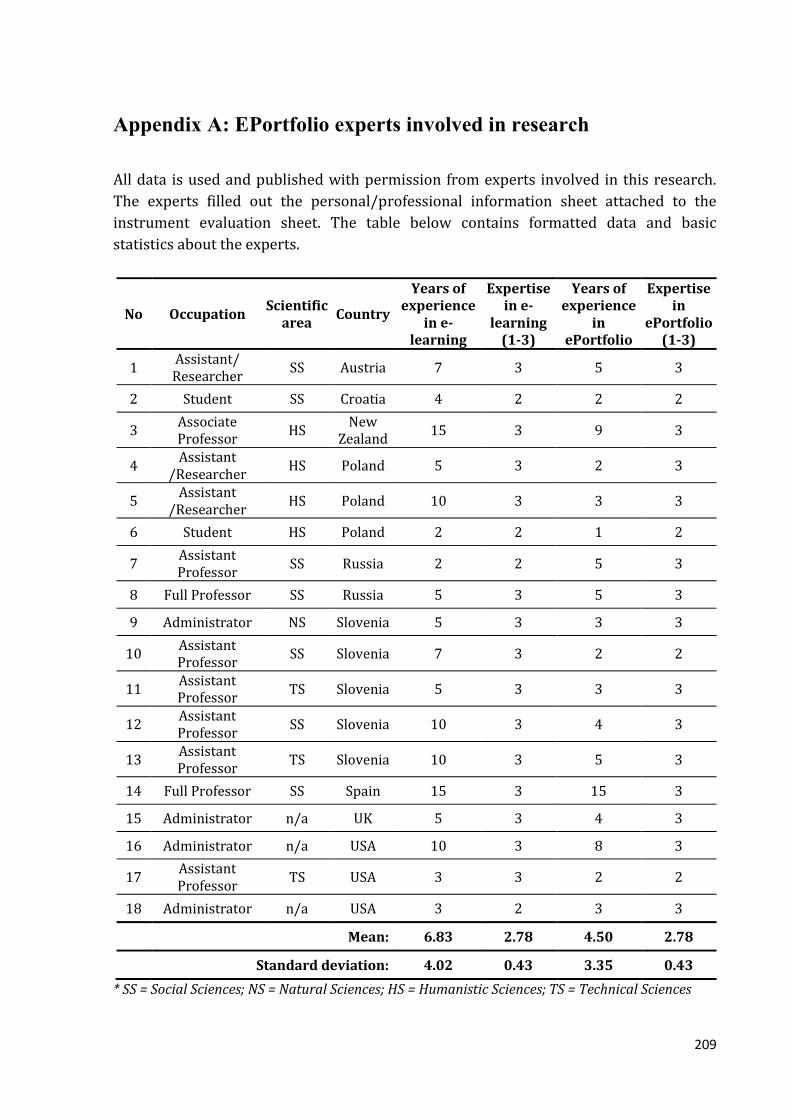
209
Appendix A: EPortfolio experts involved in research
All data is used and published with permission from experts involved in this research.
The experts filled out the personal/professional information sheet attached to the
instrument evaluation sheet. The table below contains formatted data and basic
statistics about the experts.
No Occupation Scientific
area Country
Years of experience
in e-learning
Expertise in e-
learning (1-3)
Years of experience
in ePortfolio
Expertise in
ePortfolio (1-3)
1 Assistant/ Researcher
SS Austria 7 3 5 3
2 Student SS Croatia 4 2 2 2
3 Associate Professor
HS New
Zealand 15 3 9 3
4 Assistant
/Researcher HS Poland 5 3 2 3
5 Assistant
/Researcher HS Poland 10 3 3 3
6 Student HS Poland 2 2 1 2
7 Assistant Professor
SS Russia 2 2 5 3
8 Full Professor SS Russia 5 3 5 3
9 Administrator NS Slovenia 5 3 3 3
10 Assistant Professor
SS Slovenia 7 3 2 2
11 Assistant Professor
TS Slovenia 5 3 3 3
12 Assistant Professor
SS Slovenia 10 3 4 3
13 Assistant Professor
TS Slovenia 10 3 5 3
14 Full Professor SS Spain 15 3 15 3
15 Administrator n/a UK 5 3 4 3
16 Administrator n/a USA 10 3 8 3
17 Assistant Professor
TS USA 3 3 2 2
18 Administrator n/a USA 3 2 3 3
Mean: 6.83 2.78 4.50 2.78
Standard deviation: 4.02 0.43 3.35 0.43
* SS = Social Sciences; NS = Natural Sciences; HS = Humanistic Sciences; TS = Technical Sciences

210
In total, there were 12 male and 6 female respondents. Both students involved in
the research were graduate students. The age range of all respondents was from 22 to
55. As can be seen from the table, their average length of experience in e-learning was
6.83 years while that in ePortfolio was 4.5 years. All of the respondents self-evaluated
their expertise on the scale from 1 to 3 (1–familiar only with LMS/ePortfolio
applications, 2–experienced both in using LMS/ePortfolio applications and
LMS/ePortfolio as a pedagogical tool; and 3–have experience in LMS/ePortfolio
implementation at the institutional level as well as a pedagogical tool and in using the
system). In both cases (e-learning and ePortfolio) their average score was 2.78, which
shows a respectable level of expertise.

211
Appendix B: Excel spreadsheet used for CSFs identification
Dear Sir/Madam,
This is the second part of instrument evaluation. This time your task is much easier and
will take about 30 minutes at the most.
On next page, under the title “Critical Success Factors (CFS)” you will find a list of all
ePortfolio related critical success factors according to Love et al., 2004.
Love et al. (2004) comprehend CFSs as factors that need to be present and active in
order to implement an ePortfolio system.
Your task will be to mark with “x” only those factors you believe to be critical.
If you believe that a certain critical success factor in the list is no longer critical (because
it is fulfilled in most cases, such as the factor “A high-speed Internet connection exists”,
which is fulfilled in most cases today), please put “0” next to it.
Example:
One critical success factor states:
All classrooms have Internet access with computer display projection units.
If you find this not to be critical for ePortfolio success any longer, put “0” in the column
to the right. Otherwise put “x” next to it.
As in the first evaluation, most of the document fields are locked in this second stage as
well.
Thank you very much for your effort.
Sincerely,
Igor Balaban
Faculty of Organization and Informatics
Varazdin
Croatia

212
Cri
tica
l su
cce
ss f
act
ors
= f
act
ors
wh
ich
ha
ve
to
be
pre
sen
t a
nd
act
ive
in
ord
er
to i
mp
lem
en
t a
n e
Po
rtfo
lio
sy
ste
m.
x =
su
cce
ss
fact
or
0 =
no
t a
succ
ess
fact
or
If y
ou
ha
ve
pu
t 0
(ze
ro),
ple
ase
ex
pla
in w
hy
yo
u
be
lie
ve
th
is i
s n
ot
a c
riti
cal
succ
ess
fa
cto
r a
ny
mo
re
OR
if y
ou
th
ink
th
e s
tate
me
nt
sho
uld
be
re
wo
rde
d,
ple
ase
do
it
he
re
1.
Stu
den
ts a
nd
ed
uca
tors
are
en
cou
rage
d t
o u
se e
Po
rtfo
lio
(re
war
ds
for
edu
cato
rs, e
xtra
sco
res
for
stu
den
ts w
ith
in c
ou
rse)
.
2.
Fac
ult
y p
arti
cip
ants
are
no
t p
un
ish
ed f
or
neg
ativ
e fe
edb
ack
on
stu
den
t ev
alu
atio
ns
of
teac
hin
g.
3.
All
par
tici
pan
ts h
ave
equ
itab
le a
cces
s to
th
e eP
ort
foli
o s
erv
ices
.
4.
All
cla
ssro
om
s h
ave
Inte
rnet
acc
ess
wit
h c
om
pu
ter
dis
pla
y
pro
ject
ion
un
its.
5.
Stu
den
ts c
om
ple
te P
ort
foli
os
as a
pro
gram
req
uir
emen
t.
6.
Stu
den
ts c
om
ple
te P
ort
foli
os
as r
equ
irem
ents
in c
ou
rses
.
7.
Th
e st
ud
ent’
s w
ork
in t
he
ePo
rtfo
lio
def
ines
th
e st
ud
ent
to f
acu
lty
and
rec
ruit
ers.
8.
Mu
ltip
le f
acu
lty/
sup
ervi
sors
/men
tors
rea
d a
nd
co
mm
ent
on
stu
den
ts' p
ort
foli
o w
ork
.
9.
Fac
ult
y m
emb
ers
rou
tin
ely
giv
e st
ud
ents
ass
ign
men
ts in
wri
tten
form
.
10
. St
ud
ents
ro
uti
nel
y a
dd
ress
un
stru
ctu
red
pro
ble
ms.
11
. F
acu
lty
grad
e an
d p
rovi
de
feed
bac
k o
n s
tud
ents
’ wo
rk.
12
. T
he
pu
sh f
or
ado
pti
on
an
d im
ple
men
tati
on
of
ePo
rtfo
lio
s co
mes
fro
m f
acu
lty.
13
. A
gro
up
of
facu
lty
mem
ber
s h
as t
he
com
mit
men
t an
d s
tam
ina
to
mak
e th
e eP
ort
foli
o s
yste
m w
ork
.
14
. A
n im
ple
men
tati
on
pla
n e
xist
s, w
ith
rea
son
able
mil
esto
nes
th
at a
re
mea
sura
ble
an
d t
hat
co
llec
tiv
ely
lead
to
fu
ll im
ple
men
tati
on
.
15
. O
pen
co
mp
ute
r la
b a
ssis
tan
ce is
ava
ilab
le f
or
stu
den
ts a
nd
fac
ult
y.
16
. O
pp
ort
un
itie
s ex
ist
for
stu
den
t/fa
cult
y/m
ento
r tr
ain
ing
(mu
ltip
le
tim
es a
nd
pla
ces)
.
17
. D
ocu
men
tati
on
ab
ou
t u
sin
g th
e eP
ort
foli
o a
s a
ped
ago
gica
l to
ol i
s
avai
lab
le f
or
facu
lty/
men
tors
an
d s
tud
ents
.
18
.
Fac
ult
y co
mm
it t
o c
asti
ng
cou
rse
assi
gnm
ents
into
a u
nif
orm
form
at, s
uch
as
Stat
emen
t o
f st
and
ard
; Stu
den
t A
ssig
nm
ent;
Det
ail/
Hel
p/I
nte
rnet
res
ou
rces
; Ass
essm
ent
Des
crip
tio
n.
19
. T
eam
s o
f fa
cult
y ag
ree
to c
ast
pro
gram
sta
nd
ard
s in
to a
un
ifo
rm
form
at t
o a
do
pt
ePo
rtfo
lio
as
an a
sses
smen
t to
ol.
20
.
Fac
ult
y te
ams
per
iod
ical
ly r
evie
w a
nd
rev
ise
the
con
ten
t o
f th
e
curr
icu
lum
an
d a
re a
war
e o
f th
e co
nte
nt
of
cou
rses
mak
ing
up
th
e
enti
re p
rogr
am.

213
14
. A
n im
ple
men
tati
on
pla
n e
xist
s, w
ith
rea
son
able
mil
esto
nes
th
at a
re
mea
sura
ble
an
d t
hat
co
llec
tiv
ely
lead
to
fu
ll im
ple
men
tati
on
.
15
. O
pen
co
mp
ute
r la
b a
ssis
tan
ce is
ava
ilab
le f
or
stu
den
ts a
nd
fac
ult
y.
16
. O
pp
ort
un
itie
s ex
ist
for
stu
den
t/fa
cult
y/m
ento
r tr
ain
ing
(mu
ltip
le
tim
es a
nd
pla
ces)
.
17
. D
ocu
men
tati
on
ab
ou
t u
sin
g th
e eP
ort
foli
o a
s a
ped
ago
gica
l to
ol i
s
avai
lab
le f
or
facu
lty/
men
tors
an
d s
tud
ents
.
18
.
Fac
ult
y co
mm
it t
o c
asti
ng
cou
rse
assi
gnm
ents
into
a u
nif
orm
form
at, s
uch
as
Stat
emen
t o
f st
and
ard
; Stu
den
t A
ssig
nm
ent;
Det
ail/
Hel
p/I
nte
rnet
res
ou
rces
; Ass
essm
ent
Des
crip
tio
n.
19
. T
eam
s o
f fa
cult
y ag
ree
to c
ast
pro
gram
sta
nd
ard
s in
to a
un
ifo
rm
form
at t
o a
do
pt
ePo
rtfo
lio
as
an a
sses
smen
t to
ol.
20
.
Fac
ult
y te
ams
per
iod
ical
ly r
evie
w a
nd
rev
ise
the
con
ten
t o
f th
e
curr
icu
lum
an
d a
re a
war
e o
f th
e co
nte
nt
of
cou
rses
mak
ing
up
th
e
enti
re p
rogr
am.
21
. C
ou
rses
an
d/o
r p
rogr
am r
equ
irem
ents
are
des
ign
ed a
nd
seq
uen
ced
to b
uil
d s
tud
ent
mas
tery
of
stan
dar
ds.
If y
ou
be
lie
ve
th
ere
are
mo
re f
act
ors
th
at
cou
ld b
e c
riti
cal
for
succ
ess
ful
eP
ort
foli
o i
mp
lem
en
tati
on
, ple
ase
sp
eci
fy t
he
m b
elo
w a
nd
ass
ign
the
m t
o a
co
rre
spo
nd
ing
co
nn
ect
ion
(re
lati
on
ship
) n
um
be
r.
1.
2.
3.
4.
5.

214
Appendix C: First version of statements sent to experts for
evaluation
Dear Sir/Madam,
Thank you for being a part of a team that will be the first to read the questionnaire and
evaluate it with valuable comments. You have been chosen as an expert very well familiar with
ePortfolio systems and therefore have the knowledge and ability to make valuable contribution
to this questionnaire. This questionnaire is an essential part of my PhD and it is of vital
importance for it to be correctly designed in order to get valid data. The estimated time needed
for evaluation is approximately 2 hours.
To make the process of completing the questionnaire as easy as possible I have included the
following guidelines:
1. This phase is only intended to ensure content validity and construct validity of the instrument.
2. The goal is to ensure that:
a) Instrument contains only necessary statements by rating the importance of each
statement (Column D: Importance for ePortfolio implementation)
b) All the statements are clear enough for the potential respondents, for which you are
invited to add comments and propose reformulated statements (Columns E&F).
c) Each statement is assigned to only one category (construct).
d) Instrument contains all the necessary statements related to ePortfolio, for which you
are invited to add statements that you find are missing or necessary.
3. Document structure:
Instructions – first worksheet you are reading now to prepare for filling the
questionnaire.
1. User data – contains fields for entering some information about yourself.
2. Instrument evaluation – the ‘main’ worksheet that contains all instrument
statements.
3. Comments – contains fields in which you can post your comments.

215
Instructions for filling the questionnaire:
1. Carefully read the instructions (this page). In case of any issues or problems, please
do not hesitate to contact me any time at [email protected].
2. Fill the User data page with required information.
3. Start with the instrument evaluation on the 3rd worksheet (Page name: 2.
Instrument evaluation). Please evaluate the statements according to the following instructions:
a) Column C contains instrument statements.
b) Rank each statement from 1 to 3 according to the instructions in column D. Put 0
(zero) if you believe you are not the right person to rank a specific statement. For example, you
will put 0 if you are an educator and you believe the statement is intended to be ranked by a
student, institution or employer and vice versa.
c) If you think the statement should be reworded, please explain why (briefly, in a few
words) in column E. Also, use the same column (E) to explain why you were not able to rank the
statement, if this was the case.
d) If you think the statement should be reworded, do it in column F. Otherwise, leave
the column blank.
e) Assign each statement to one of the following categories: 1. System Quality, 2.
Service Quality, 3. Information Quality, 4. Use, 5. User Satisfaction, 6. Net Benefits or 7. Other.
Please consider that only one answer per statement is possible.
In addition, please find the explanation for each category. These explanations are also stated
as comments in each category header on the 3rd worksheet (Instrument evaluation).
1. System Quality = the desirable characteristics of an ePortfolio system. For example:
ease of use, system flexibility, reliability, response times etc.
2. Information Quality = the desirable characteristics of the system outputs. For
example: relevance, understandability, accuracy, conciseness, completeness, usability,
understandability etc.
3. Service quality = the quality of the support that system users receive from the
ePortfolio department and IT support personnel. For example: responsiveness, empathy of the
personnel staff etc.
4. Use = the degree and manner in which users (students, educators, managers...) utilize
the capabilities of an ePortfolio system. For example: amount of use, frequency of use, nature of
use, extent of use, purpose of use etc.
5. User Satisfaction = users’ level of satisfaction with the system as a whole. For
example: attitude toward using technology, anxiety etc.
216
6. Net Benefits = the extent to which ePortfolio is contributing to the success of
individuals, groups, organizations and industries. For example: enhanced learning, personal
growth and development etc.
7. Other if you believe the statement does not belong to any of the categories from 1 to 6.
f) If you find some statements missing but necessary for ePortfolio implementation,
please:
1. Add them at the end of the instrument (row 179 and below);
2. Rank them;
3. Assign them to the corresponding category.
Additional notes:
1. Instrument evaluation worksheet has some fixed parts: 1. Header & 2. Statements
2. Try to scroll with the horizontal slider (at the bottom of the screen): you will notice that
statements remain fixed while other columns are moving left or right. This is to make the
evaluation process easier.
3. After completing the instrument evaluation add your comments in the next worksheet – 3.
Comments.
Important:
1. All the fields that should not be filled are locked. Only the fields that are requested to be filled
remained unlocked.
2. It is not necessary to evaluate the whole instrument at once! You can save your work at any
time by saving the Excel document using the Save button somewhere on your Computer.
Thank you very much for your effort!
Sincerely,
Igor Balaban
Faculty of Organization and Informatics
Varazdin
Croatia

217
Statements evaluation sheet:
Syst
em
qu
alit
y
Info
rmat
io
n Q
ual
ity
Serv
ice
Qu
alit
yU
seU
ser
sati
sfac
tio
nN
et b
enef
its
Oth
er
1.I c
an r
efle
ct o
n ar
tifa
cts.
2.In
form
atio
n fr
om t
he e
Por
tfol
io a
ppea
rs r
eada
ble,
cle
ar
and
wel
l for
mat
ted
.
3.In
form
atio
n fr
om t
he e
Por
tfol
io is
ea
sy t
o un
ders
tand
.
4.Th
e sy
stem
is a
lway
s up
-and
-run
ning
as
nece
ssar
y.
5.M
essa
ge p
rese
nta
tion
is a
lway
s th
e sa
me
(pos
itio
n, t
erm
inol
ogy,
sty
le..
.).
6.Th
e te
ach
er/i
nstr
ucto
r un
ders
tand
you
r sp
ecif
ic n
eeds
.
7.I w
ould
fin
d th
e sy
stem
ea
sy t
o us
e.
8.Th
e sy
stem
is e
asy
to
lea
rn.
9.Th
e sy
stem
is c
ompa
tibl
e w
ith
othe
r sy
stem
s I u
se.
10.
The
pote
nti
al f
or e
nha
nced
com
mun
icat
ion
betw
een
pee
rs s
tim
ulat
es m
y m
otiv
atio
n to
wor
k an
d le
arn
trou
gh t
he e
Por
tfol
io s
yste
m.
11.
Ref
lect
ions
en
able
me
to g
et in
sigh
t in
to in
divi
dual
thi
nkin
g pr
oces
ses,
intr
ospe
ctio
n, a
nd t
houg
hts
on
prob
lem
-sol
ving
.
12.
The
syst
ems'
use
r in
terf
ace
can
be e
asi
ly a
dapt
ed t
o on
e's
pers
onal
app
roac
h.
13.
The
info
rmat
ion
prod
uced
by
the
ePor
tfol
io is
val
id (
pres
ents
rea
l evi
den
ce o
f ac
ompl
ishe
men
ts).
14.
Ref
lect
ions
en
able
me
to o
bser
ve o
n in
telle
ctua
l str
engt
hs a
nd w
eakn
esse
s.
15.
The
data
en
try
scre
ens
cle
arl
y sh
ow t
he s
pace
s re
serv
ed t
o re
cord
the
dat
a.
16.
If I
use
the
sys
tem
, I w
ill in
crea
se m
y ch
ance
s of
bei
ng a
war
ded
.
17.
Site
map
of
the
port
folio
sys
tem
cle
arl
y sh
ows
site
con
stru
ctio
n an
d or
gani
zati
on o
f m
ater
ials
.
18.
Whe
n I
was
usi
ng e
Por
tfol
io, I
use
d f
eatu
res
that
hel
ped
me
orga
nize
my
arti
fact
s.
19.
My
ePor
tfol
io e
nab
les
me
to le
arn
mor
e ef
ecti
vely
thr
ough
inte
ract
ion
wit
h ot
her
stud
ents
incl
udin
g th
e
fee
dbac
k re
ceiv
ed f
rom
the
m.
20.
The
sam
e te
rmin
olog
y is
use
d t
hrou
ghou
t th
e ap
plic
atio
n.
21.
I am
abl
e to
com
pare
mys
elf
wit
h ot
hers
.
22.
The
info
rmat
ion
prov
ided
by
the
ePor
tfol
io is
com
plet
e.
23.
The
ePor
tfol
io s
taff
has
bee
n he
lpfu
l in
the
use
of t
he s
yste
m.
24.
The
syst
em c
an b
e ea
sily
mod
ifie
d, c
orre
cted
or
impr
oved
.
25.
Whe
n I
was
usi
ng e
Por
tfol
io, I
was
abl
e to
blo
ck o
ut a
ll ot
her
dist
ract
ions
.
26.
The
syst
em d
oes
not
dele
te/d
estr
oy a
ny in
form
atio
n w
itho
ut a
skin
g fo
r a
conf
irm
atio
n an
d ge
ttin
g a
posi
tive
res
pons
e.
27.
The
syst
em c
an w
ork
wit
h ot
her
syst
ems
such
as
a C
MS
or c
onne
ct t
o LD
AP
serv
er f
or a
uthe
nti
cati
on.
28.
Secu
rity
pol
icy
exis
t an
d cl
earl
y st
ates
all
rela
ted
sec
urit
y is
sues
.
29.
In c
ase
of a
n ar
tifa
ct u
pdat
e, t
he v
iew
tha
t co
ntai
ns t
hat
arti
fact
can
als
o be
aut
omat
ical
ly u
pdat
ed.
30.
FAQ
pag
e is
incl
uded
and
cov
ers
all r
elev
ant
ques
tion
s.
31.
The
ePor
tfol
io p
rovi
de u
p to
dat
e in
form
atio
n.
32.
I pre
dic
t I w
ould
use
the
sys
tem
in t
he n
ext
<n>
mon
ths.
33.
Info
rmat
ion
nee
ded
fro
m t
he e
Por
tfol
io is
alw
ays
avai
labl
e.
34.
I can
mon
itor
the
eff
icie
ncy
of
stra
teg
ies
I use
in t
each
ing.
35.
My
inte
ract
ion
wit
h th
e sy
stem
wou
ld b
e cl
ear
and
unde
rsta
ndab
le.
36.
The
syst
em is
som
ewha
t in
tim
idat
ing
to m
e.
37.
He
lp f
unct
ions
are
ava
ilabl
e/ac
cesi
ble
thro
ugho
ut t
he a
pplic
atio
n.
38.
Use
rs a
re a
ble
to q
uick
ly s
earc
h an
d re
trie
ve p
art
or f
ull p
ortf
olio
mat
eria
ls.
39.
The
syst
em in
clud
es c
ontr
ols
to d
etec
t un
auth
oriz
ed a
cces
s.
40.
A c
erta
in d
egre
e o
f fr
eedo
m f
or y
ou t
o ex
pres
s yo
ur o
wn
indi
vidu
alit
y an
d pe
rson
al s
tren
gths
is
allo
wed
.
41.
I fee
l app
reh
ensi
ve a
bout
usi
ng t
he s
yste
m.
42.
ePor
tfol
io h
elpe
d m
e to
mak
e co
nnec
tion
s am
ong
my
form
al(s
truc
ture
d le
arn
ing
wit
hin
scho
ol o
r
facu
lty)
and
info
rmal
(uns
truc
ture
d le
arn
ing,
occ
urs
in e
very
day
life)
lea
rnin
g ex
peri
ence
s.
43.
ePor
tfol
io b
ring
s ab
out
ben
efit
s th
at a
re m
ore
impo
rtan
t th
an it
s co
sts
(tim
e an
d m
oney
).
44.
Lea
rnin
g to
ope
rate
the
sys
tem
is e
asy
for
me.
45.
ePor
tfol
io c
ompl
etio
n is
wel
l des
crib
ed w
ithi
n pr
ogra
m r
equi
rem
ents
.
Wh
ich
co
nst
ruct
do
yo
u t
hin
k th
e s
tate
me
nt
be
lon
gs t
o?
(Mar
k fi
eld
wit
h X
:
only
one
pos
sibl
e an
swer
for
ea
ch it
em)
If y
ou
th
ink
this
sta
tem
en
t sh
ou
ld b
e r
ew
ord
ed
, do
it h
ere
(lea
ve it
bla
nk
if y
ou
agr
ee w
ith
th
e st
atem
ent
or
if y
ou
co
uld
no
t ra
nk
the
stat
emen
t)
Pre
-te
st c
om
me
nt
(Her
e yo
u c
an in
dic
ate
wh
y yo
u
can
no
t re
spo
nd
to
th
e st
atem
ent
OR
exp
lain
th
e re
aso
n(s
) if
yo
u
thin
k th
is s
tate
men
t sh
ou
ld b
e
mo
dif
ied
/rew
ord
ed; O
THER
WIS
E
leav
e it
bla
nk)
STA
TEM
ENTS
Imp
ort
ance
fo
r
eP
ort
folio
imp
lem
en
tati
on
(1
- 3
)1
- N
ot
rele
van
t
2 -
Imp
ort
ant(
bu
t n
ot
ess
en
tial
)
3 -
Ess
en
tial
0 -
can
no
t an
swe
r

218
46.
The
asse
ssm
ent
data
gen
erat
ed f
rom
the
eP
ortf
olio
sys
tem
can
be
used
ea
ch s
emes
ter
to a
ssis
t w
ith
prog
ram
ass
essm
ent
and
revi
sion
.
47.
Use
rs a
re t
o ac
cess
the
sys
tem
wit
h a
sim
ple
conv
enti
onal
Web
bro
wse
r w
itho
ut m
uch
prep
arat
ion.
48.
I can
sho
w h
ow a
rtef
acts
mat
ch m
y go
als
and
stan
dard
s.
49.
Priv
acy
polic
y ex
ist
and
clea
rly
stat
es a
ll re
late
d p
riva
cy is
sues
.
50.
I can
sol
ve p
robl
ems
muc
h ea
sier
by
usin
g eP
ortf
olio
wit
h al
l its
fea
ture
s.
51.
The
info
rmat
ion
prov
ided
by
the
ePor
tfol
io is
ver
ifia
ble
(it
can
be c
heck
ed b
y so
me
othe
r m
eans
).
52.
Erro
r m
essa
ges
clea
rly
indi
cate
the
act
ions
to
be t
aken
to
rect
ify
erro
rs.
53.
Tea
cher
s/in
stru
ctor
s gi
ve y
ou p
rom
pt s
ervi
ce/r
espo
nse.
54.
Dat
a en
try
scre
ens
are
org
aniz
ed in
suc
h a
way
tha
t th
e da
ta e
lem
ents
are
logi
cally
gro
uped
tog
ethe
r.
55.
I pla
n to
use
the
sys
tem
in t
he n
ext
<n>
mon
ths.
56.
The
ePor
tfol
io p
rovi
des
outp
ut t
hat
see
ms
to b
e ex
actl
y w
hat
is n
eede
d.
57.
The
orga
niza
tion
s' f
acilt
ies
from
whi
ch u
ser
can
acce
ss it
's P
ortf
olio
are
vis
ually
app
ealin
g.
58.
Use
rs c
an e
asi
ly a
cces
s ex
clus
ive/
uniq
ue in
form
atio
n av
aila
ble
only
thr
ough
the
eP
ortf
olio
sys
tem
.
59.
Eval
uati
on c
rite
ria
for
sele
ctin
g an
d as
sess
ing
the
e-po
rtfo
lio c
onte
nts
, as
wel
l as
the
over
all e
-
port
folio
goa
l, ar
e cl
ear
and
very
wel
l exp
lain
ed p
rior
to
deve
lopi
ng t
he e
-por
tfol
io.
60.
The
mea
n an
d fr
eque
ncy
of
stud
ents
wor
k ca
n be
ea
sily
mon
itor
ed.
61.
ePor
tfol
io h
elpe
d m
e to
rel
ate
my
lea
rnin
g to
a w
ider
con
text
.
62.
I can
sho
w m
y co
mpr
ehen
sive
pro
file
thr
ough
eP
ortf
olio
.
63.
I can
mon
itor
cha
nges
in m
y id
eas,
cri
teri
as a
nd a
ttit
udes
.
64.
I lik
e w
orki
ng w
ith
the
syst
em.
65.
The
beh
avio
ur o
f te
ach
ers
inst
ils c
onfi
den
ce in
you
.
66.
ePor
tfol
io e
nco
urag
ed m
e to
dev
elop
a p
osit
ive
atti
tude
to
life-
long
lea
rnin
g.
67.
I int
end
to u
se t
he s
yste
m in
the
nex
t <n
> m
onth
s.
68.
ePor
tfol
io h
elpe
d m
e to
und
erst
and
how
I le
arn
.
69.
I can
gen
erat
e po
rtal
s fo
r di
spla
ying
wor
k sa
mpl
es a
nd a
chie
vem
ents
wit
hin
the
sam
e cu
rric
ular
stru
ctur
e.
70.
Whe
n I
was
usi
ng e
Por
tfol
io, I
use
d f
eatu
res
that
hel
ped
me
test
dif
fere
nt
view
s.
71.
The
syst
em in
clud
es n
eces
sary
fea
ture
s an
d fu
ncti
ons.
72.
Info
rmat
ion
from
the
eP
ortf
olio
is a
lway
s ti
mel
y.
73.
I am
abl
e to
eva
luat
e pr
ogre
ss t
owar
ds a
chie
vem
ent
of m
y pe
rson
al g
oals
.
74.
The
docu
men
tati
on is
ea
sy t
o ac
cess
and
use
.
75.
Use
rs f
ind
the
orga
niza
tion
(Uni
vers
ity)
whi
ch p
rovi
des
the
port
folio
ser
vice
to
have
a g
ood
cred
ibili
ty.
76.
Whe
n I
was
usi
ng e
Por
tfol
io, m
y at
ten
tion
did
not
get
div
erte
d v
ery
easi
ly.
77.
It is
pos
sibl
e to
exp
ort
data
into
oth
er a
pplic
atio
ns.
78.
Wor
king
wit
h th
e sy
stem
is f
un.
79.
I cou
ld c
ompl
ete
a jo
b or
tas
k us
ing
the
syst
em if
I h
ad ju
st t
he b
uilt
-in
help
fac
ility
for
ass
ista
nce.
80.
Tea
cher
s/in
stru
ctor
s/eP
ortf
olio
sta
ff h
ave
the
know
led
ge t
o an
swer
you
r qu
esti
ons.
81.
In g
ener
al, t
he o
rgan
izat
ion
has
supp
orte
d t
he u
se o
f th
e sy
stem
.
82.
Usi
ng e
Por
tfol
io h
as le
ad
to in
crea
sed
tra
nspa
ren
cy f
or e
valu
atio
n an
d be
nch
mar
king
.
83.
The
syst
em n
ever
mod
ifie
s a
fiel
d w
itho
ut a
skin
g fo
r a
conf
irm
atio
n an
d ge
ttin
g a
posi
tive
ans
wer
.
84.
Whe
n I
was
usi
ng e
Por
tfol
io, I
fel
t co
mpl
etel
y ab
sorb
ed in
wha
t I w
as d
oing
.
85.
I can
art
icul
ate
pers
onal
goa
ls.
86.
Term
s of
use
as
wel
l as
ethi
cs r
egul
atio
ns a
re c
lea
rly
show
n.
87.
I can
gen
erat
e po
rtal
s fo
r di
spla
ying
wor
k sa
mpl
es a
nd a
chie
vem
ents
wit
hin
inst
itut
iona
l sta
ndar
d.
88.
I cou
ld c
ompl
ete
a jo
b or
tas
k us
ing
the
syst
em if
I c
ould
cal
l som
eone
for
hel
p if
I g
ot s
tuck
.
89.
I can
use
the
ass
essm
ent
data
gen
erat
ed w
ithi
n eP
ortf
olio
sys
tem
ea
ch s
emes
ter
to a
ssis
t w
ith
cour
se
revi
sion
.
90.
Use
rs c
an c
rea
te v
iew
s in
fle
xibl
e st
yles
and
for
mat
s so
tha
t th
e ov
eral
l pre
sen
tati
on is
not
con
fine
d in
linea
r or
hie
rarc
hica
l str
uctu
re.
91.
The
enha
nced
com
mun
icat
ion
betw
een
stud
ents
and
ed
ucat
ors
enha
nces
the
cha
nces
for
stu
den
t
succ
ess.
92.
The
syst
em m
akes
wor
k m
ore
inte
rest
ing.
93.
The
view
s(a
sele
cted
col
lect
ion
of a
rtif
acts
for
sel
f-pr
esen
tati
on)
are
easy
to
crea
te a
nd u
nder
stan
d.
94.
Erro
r m
essa
ges
adeq
uate
ly d
escr
ibe
the
natu
re o
f th
e pr
oble
m.
95.
The
term
s us
ed in
dat
a-en
try
scre
ens
and
men
us a
re f
amili
ar t
o us
ers.
96.
I can
mon
itor
my
own
impr
ovem
ent.
97.
Men
us a
re h
iera
rchi
cal,
that
is, t
hey
go f
rom
gen
eral
to
deta
iled
cho
ices
.
98.
Whe
n I
was
usi
ng e
Por
tfol
io, I
use
d f
eatu
res
that
hel
ped
me
join
ing
the
grou
ps.
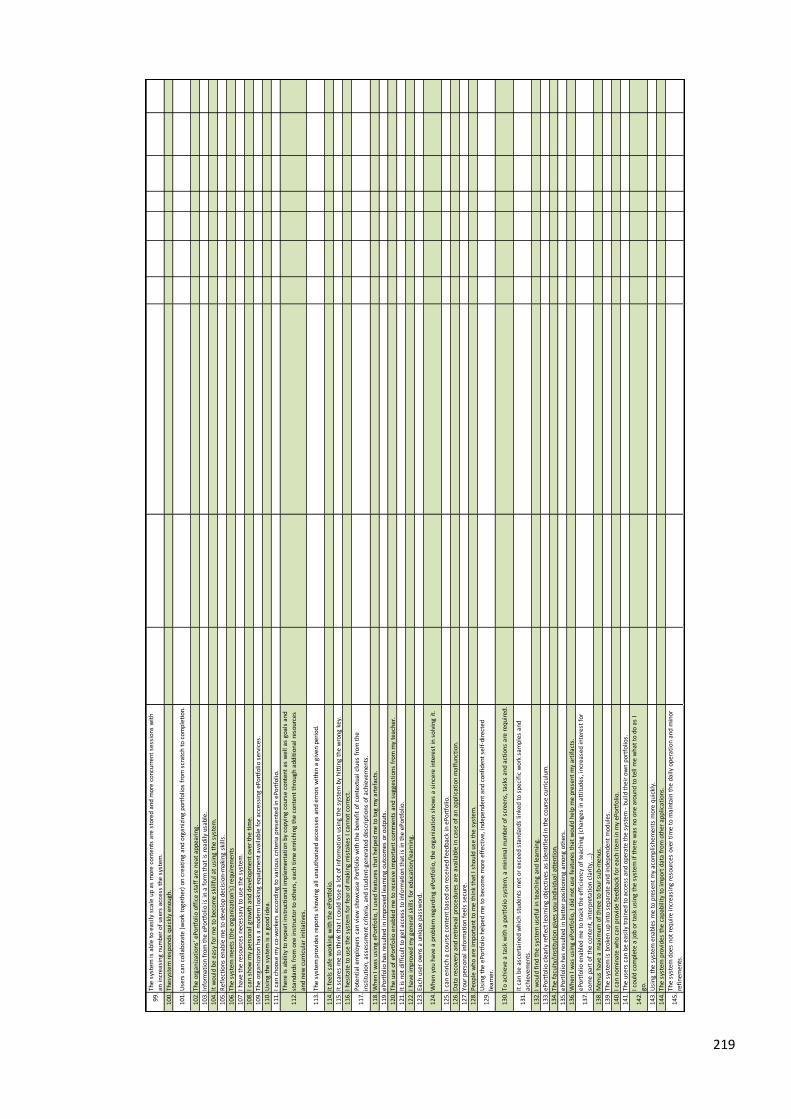
219
99
.Th
e sy
stem
is a
ble
to
ea
sily
sca
le u
p a
s m
ore
co
nte
nts
are
sto
red
an
d m
ore
co
ncu
rren
t se
ssio
ns
wit
h
an in
crea
sin
g n
um
ber
of
use
rs a
cces
s th
e sy
stem
.
10
0.
Thes
yste
m r
esp
on
ds
qu
ickl
y en
ou
gh.
10
1.
Use
rs c
an c
olla
bo
rate
(w
ork
to
geth
er)
on
cre
ati
ng
and
org
aniz
ing
po
rtfo
lios
fro
m s
crat
ch t
o c
om
ple
tio
n.
10
2.
The
org
aniz
atio
ns'
eP
ort
folio
off
ice
staf
f ar
e n
eat
app
eari
ng.
10
3.
Info
rmat
ion
fro
m t
he
ePo
rtfo
lio is
in a
fo
rm t
hat
is r
ead
ily u
sab
le.
10
4.
It w
ou
ld b
e ea
sy f
or
me
to b
eco
me
skill
ful a
t u
sin
g th
e sy
stem
.
10
5.
Ref
lect
ion
s en
able
me
to d
evel
op
dec
isio
n-m
akin
g sk
ills.
10
6.
The
syst
em m
eets
(th
e o
rgan
izat
ion
's)
req
uir
emen
ts
10
7.
I hav
e th
e re
sou
rces
nec
essa
ry t
o u
se t
he
syst
em.
10
8.
I can
sh
ow
my
per
son
al g
row
th a
nd
dev
elo
pm
ent
ove
r th
e ti
me.
10
9.
The
org
aniz
ato
n h
as a
mo
der
n lo
oki
ng
equ
ipm
ent
avai
lab
le f
or
acce
ssin
g eP
ort
folio
ser
vice
s.
11
0.
Usi
ng
the
syst
em is
a g
oo
d id
ea.
11
1.
I can
ch
oo
se m
y co
-wo
rker
s ac
cord
ing
to v
ario
us
crit
eria
pre
sen
ted
in e
Po
rtfo
lio.
11
2.
Ther
e is
ab
ility
to
rep
eat
inst
ruct
ion
al im
ple
men
tati
on
by
cop
yin
g co
urs
e co
nte
nt
as w
ell a
s go
als
and
stan
dar
ds
fro
m o
ne
inst
ruct
or
to o
ther
s, e
ach
tim
e en
rich
ing
the
con
ten
t th
rou
gh a
dd
itio
nal
res
ou
rces
and
new
cu
rric
ula
r in
itia
tive
s.
11
3.
The
syst
em p
rovi
des
rep
ort
s sh
ow
ing
all u
nau
tho
rize
d a
cces
ses
and
err
ors
wit
hin
a g
iven
per
iod
.
11
4.
It f
eels
saf
e w
ork
ing
wit
h t
he
ePo
rtfo
lio.
11
5.
It s
care
s m
e to
th
ink
that
I c
ou
ld lo
se a
lot
of
info
rmat
ion
usi
ng
the
syst
em b
y h
itti
ng
the
wro
ng
key.
11
6.
I hes
itat
e to
use
th
e sy
stem
fo
r fe
ar
of
mak
ing
mis
take
s I c
ann
ot
corr
ect.
11
7.
Po
ten
tial
em
plo
yers
can
vie
w s
ho
wca
se P
ort
folio
wit
h t
he
ben
efit
of
con
text
ual
clu
es f
rom
th
e
inst
itu
tio
n, a
sses
smen
t cr
iter
ia, a
nd
stu
den
t-ge
ner
ated
des
crip
tio
ns
of
ach
ieve
men
ts.
11
8.
Wh
en I
was
usi
ng
ePo
rtfo
lio, I
use
d f
eatu
res
that
hel
ped
me
to t
ag m
y ar
tefa
cts.
11
9.
ePo
rtfo
lio h
as r
esu
lted
in im
pro
ved
lea
rnin
g o
utc
om
es o
r o
utp
uts
.
12
0.
The
use
of
ePo
rtfo
lio e
nab
led
me
to r
ecei
ve i
mp
ort
ant
com
men
ts a
nd
su
gges
tio
ns
fro
m m
y te
ach
er.
12
1.
It is
no
t d
iffi
cult
to
get
acc
ess
to in
form
atio
n t
hat
is in
th
e eP
ort
folio
.
12
2.
I hav
e im
pro
ved
my
gen
eral
ski
lls f
or
edu
cati
on
/lea
rnin
g.
12
3.
Each
use
r o
wn
s a
un
iqu
e p
assw
ord
.
12
4.
Wh
en y
ou
hav
e a
pro
ble
m r
egar
din
g eP
ort
folio
, th
e o
rgan
izat
ion
sh
ow
s a
sin
cere
in
tere
st in
so
lvin
g it
.
12
5.
I can
en
rich
a c
ou
rse
con
ten
t b
ased
on
rec
eive
d f
eed
bac
k in
eP
ort
folio
.
12
6.
Dat
a re
cove
ry a
nd
ret
riev
al p
roce
du
res
are
avai
lab
le i
n c
ase
of
an a
pp
licat
ion
mal
fun
ctio
n.
12
7.
You
r p
erso
nal
info
rmat
ion
fee
ls s
ecu
re.
12
8.
Peo
ple
wh
o a
re i
mp
ort
ant
to m
e th
ink
that
I s
ho
uld
use
th
e sy
stem
.
12
9.
Usi
ng
the
ePo
rtfo
lio h
elp
ed m
e to
bec
om
e m
ore
eff
ecti
ve,
ind
epen
den
t an
d c
on
fid
ent
self
-dir
ecte
d
lea
rner
.
13
0.
To a
chie
ve a
tas
k w
ith
a p
ort
folio
sys
tem
, a m
inim
al n
um
ber
of
scre
en
s, t
asks
an
d a
ctio
ns
are
req
uir
ed.
13
1.
It c
an b
e as
cert
ain
ed w
hic
h s
tud
ents
met
or
exce
ed
sta
nd
ard
s lin
ked
to
sp
ecif
ic w
ork
sam
ple
s an
d
ach
ieve
men
ts.
13
2.
I wo
uld
fin
d t
he
syst
em u
sefu
l in
tea
chin
g an
d le
arn
ing.
13
3.
ePo
rtfo
lio c
lea
rly
refl
ect
lea
rnin
g o
bje
ctiv
es a
s id
enti
fied
in t
he
cou
rse
curr
icu
lum
.
13
4.
The
facu
lty/
inst
itu
tio
n g
ives
yo
u in
div
idu
al a
tten
tio
n.
13
5.
ePo
rtfo
lio h
as r
esu
lted
in b
ette
r p
osi
tio
nin
g am
on
g o
ther
s.
13
6.
Wh
en I
was
usi
ng
ePo
rtfo
lio, I
did
no
t u
se f
eatu
res
that
wo
uld
hel
p m
e p
rese
nt
my
arti
fact
s.
13
7.
ePo
rtfo
lio e
nab
led
me
to t
rack
th
e ef
fici
ency
of
tea
chin
g (c
han
ges
in a
ttit
ud
es, i
ncr
ease
d in
tere
st f
or
som
e p
art
of
the
con
ten
t, in
terp
reta
tio
n c
lari
ty, …
)
13
8.
Men
us
hav
e a
max
imu
m o
f th
ree
to
fo
ur
sub
-men
us.
13
9.
The
syst
em is
bro
ken
up
into
sep
arat
e an
d in
dep
end
ent
mo
du
les.
14
0.
I can
no
min
ate
wh
o c
an p
rovi
de
fee
db
ack
for
each
item
in m
y eP
ort
folio
.
14
1.
The
use
rs c
an b
e ea
sily
tra
ined
to
acc
ess
and
op
erat
e th
e sy
stem
- b
uild
th
eir
ow
n p
ort
folio
s.
14
2.
I co
uld
co
mp
lete
a jo
b o
r ta
sk u
sin
g th
e sy
stem
if t
her
e w
as n
o o
ne
aro
un
d t
o t
ell m
e w
hat
to
do
as
I
go.
14
3.
Usi
ng
the
syst
em e
nab
les
me
to p
rese
nt
my
aco
mp
lish
emen
ts m
ore
qu
ickl
y.
14
4.
The
syst
em p
rovi
des
th
e ca
pab
ility
to
imp
ort
dat
a fr
om
oth
er a
pp
licat
ion
s.
14
5.
The
syst
em d
oes
no
t re
qu
ire
incr
easi
ng
reso
urc
es o
ver
tim
e to
mai
nta
in t
he
dai
ly o
per
atio
n a
nd
min
or
refi
nem
ents
.
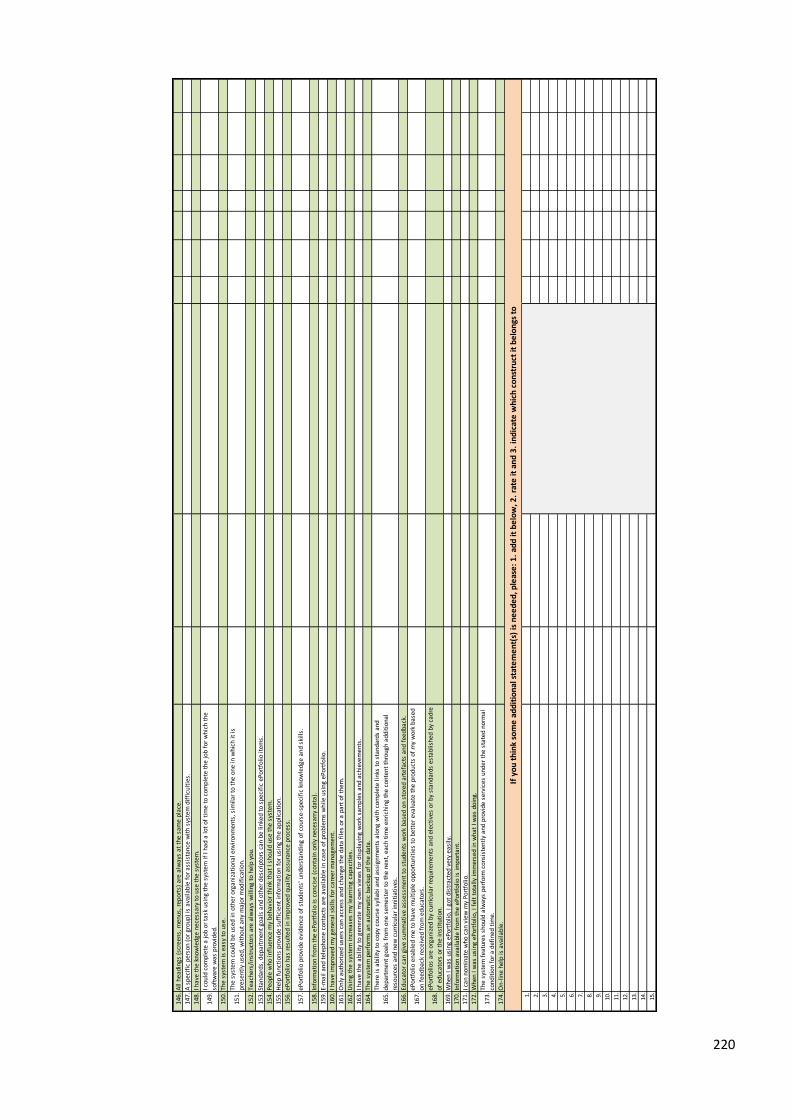
220
146.
All
hea
ding
s (s
cree
ns, m
enus
, rep
orts
) ar
e al
way
s at
the
sam
e pl
ace.
147.
A s
peci
fic
pers
on (
or g
roup
) is
ava
ilabl
e fo
r as
sist
ance
wit
h sy
stem
dif
ficu
ltie
s.
148.
I hav
e th
e kn
owle
dge
nec
essa
ry t
o us
e th
e sy
stem
.
149.
I cou
ld c
ompl
ete
a jo
b or
tas
k us
ing
the
syst
em if
I h
ad a
lot
of t
ime
to c
ompl
ete
the
job
for
whi
ch t
he
soft
war
e w
as p
rovi
ded
.
150.
The
syst
em is
ea
sy t
o us
e.
151.
The
syst
em c
ould
be
used
in o
ther
org
aniz
atio
nal e
nvi
ronm
ents
, sim
ilar
to t
he o
ne in
whi
ch it
is
pres
entl
y us
ed, w
itho
ut a
ny m
ajor
mod
ific
atio
n.
152.
Tea
cher
s/in
stru
ctor
s ar
e al
way
s w
illin
g to
hel
p yo
u.
153.
Stan
dard
s, d
epar
tmen
t go
als
and
othe
r de
scri
ptor
s ca
n be
link
ed t
o sp
ecif
ic e
Por
tfol
io it
ems.
154.
Peo
ple
who
infl
uen
ce m
y be
hav
ior
thin
k th
at I
sho
uld
use
the
syst
em.
155.
He
lp f
unct
ions
pro
vide
suf
fici
ent
info
rmat
ion
for
usin
g th
e ap
plic
atio
n.
156.
ePor
tfol
io h
as r
esul
ted
in im
prov
ed q
ualit
y as
sura
nce
proc
ess.
157.
ePor
tfol
io p
rovi
de e
vide
nce
of
stud
ents
' und
erst
andi
ng o
f co
urse
-spe
cifi
c kn
owle
dge
and
ski
lls.
158.
Info
rmat
ion
from
the
eP
ortf
olio
is c
onci
se (
cont
ain
only
nec
esar
ry d
ata)
.
159.
E-m
ail a
nd t
elep
hone
con
tact
s ar
e av
aila
ble
in c
ase
of p
robl
ems
whi
le u
sing
eP
ortf
olio
.
160.
I hav
e im
prov
ed m
y ge
ner
al s
kills
for
car
eer
man
agem
ent.
161.
Onl
y au
thor
ized
use
rs c
an a
cces
s an
d ch
ange
the
dat
a fi
les
or a
par
t of
the
m.
162.
Usi
ng t
he s
yste
m in
crea
ses
my
lea
rnin
g ca
paci
ties
.
163.
I hav
e th
e ab
ility
to
gen
erat
e m
y ow
n vi
ews
for
disp
layi
ng w
ork
sam
ples
and
ach
ieve
men
ts.
164.
The
syst
em p
erfo
rms
an a
utom
atic
bac
kup
of t
he d
ata.
165.
Ther
e is
abi
lity
to c
opy
cour
se s
ylla
bi a
nd a
ssig
nmen
ts a
long
wit
h co
mpl
ete
links
to
stan
dard
s an
d
dep
artm
ent
goal
s fr
om o
ne s
emes
ter
to t
he n
ext,
ea
ch t
ime
enri
chin
g th
e co
nten
t th
roug
h ad
diti
onal
reso
urce
s an
d ne
w c
urri
cula
r in
niti
ativ
es.
166.
Educ
ator
can
giv
e su
mm
ativ
e as
sess
men
t to
stu
den
ts w
ork
base
d o
n st
ored
art
efac
ts a
nd f
eedb
ack.
167.
ePor
tfol
io e
nab
led
me
to h
ave
mul
tipl
e op
port
unit
ies
to b
ette
r ev
alua
te t
he p
rodu
cts
of m
y w
ork
base
d
on f
eedb
ack
rece
ived
fro
m e
duc
ator
s.
168.
ePor
tfol
ios
are
orga
nize
d b
y cu
rric
ular
req
uire
men
ts a
nd e
lect
ives
or
by s
tand
ards
est
ablis
hed
by
cadr
e
of e
duc
ator
s or
the
inst
itut
ion.
169.
Whe
n I
was
usi
ng e
Por
tfol
io, I
got
dis
trac
ted
ver
y ea
sily
.17
0.In
form
atio
n av
aila
ble
from
the
eP
ortf
olio
is im
port
ant.
171.
I can
nom
inat
e w
ho c
an v
iew
my
Port
folio
.
172.
Whe
n I
was
usi
ng e
Por
tfol
io, I
fel
t to
tally
imm
erse
d in
wha
t I w
as d
oing
.
173.
The
syst
em f
eatu
res
shou
ld a
lway
s pe
rfor
m c
onsi
sten
tly
and
prov
ide
serv
ices
und
er t
he s
tate
d n
orm
al
cond
itio
n fo
r a
defi
ned
tim
e.
174.
On-
line
help
is a
vaila
ble.
1. 2. 3. 4. 5. 6. 7. 8. 9. 10.
11.
12.
13.
14.
15.
If y
ou
th
ink
som
e a
dd
itio
nal
sta
tem
en
t(s)
is n
ee
de
d, p
leas
e:
1.
add
it b
elo
w, 2
. ra
te it
an
d 3
. in
dic
ate
wh
ich
co
nst
ruct
it b
elo
ngs
to

221
Appendix D: Field-test instrument statements
SYSTEM QUALITY
SYSQ1 SYSQ2 SYSQ3 SYSQ4 SYSQ5 SYSQ6 SYSQ7 SYSQ8 SYSQ9 SYSQ10 SYSQ11 SYSQ12 SYSQ13 SYSQ14 SYSQ15 SYSQ16 SYSQ17 SYSQ18 SYSQ19
USABILITY Using the system is easy to learn. Help functions are available and sufficient for using the system. The system’s sitemap clearly shows the organization of materials. The views (i.e. selected collections of artifacts for self-presentation) are easy to manage. It is possible to quickly search (e.g. using a search engine) through ePortfolio content. The system includes necessary features and functions for managing ePortfolio.
FUNCTIONALITY The system is always up-and-running as necessary. The system is compatible with other systems I frequently use (e.g. Web 2.0 tools). The system supports import and export of data (html, pdf and other useful formats). The system can be accessed with a conventional Web browser without much preparation. In case of content update, the same content is automatically updated throughout the system.
USER INTERFACE The system’s user interface is easy to use. The system’s user interface can be easily customized. Message presentation is always the same (position, terminology, style...). Error messages are clear and understandable.
SECURITY Each user owns a unique password. Only authorized users can access and change the ePortfolio content. It is possible to set up the view permissions for individual ePortfolios or ePortfolio views. The system does not modify/delete any data without asking for confirmation and getting a positive response.
INFORMATION QUALITY
IQ1 IQ2 IQ3 IQ4 IQ5 IQ6 IQ7 IQ8 IQ9
VALIDITY The information provided by the ePortfolio is valid (i.e. presents real evidence of accomplishments). The information provided by the ePortfolio is complete. The information provided by the ePortfolio is always up to date. The information provided by the ePortfolio is verifiable (it can be checked by means of verification mechanisms). The information provided by the ePortfolio is relevant.
FORMAT The information provided by the ePortfolio appears readable, clear and well formatted. The information provided by the ePortfolio is easy to understand. The information provided by the ePortfolio is in a readily usable form. The information provided by the ePortfolio is concise (contains only necessary data).

222
SERVICE QUALITY
SERQ1 SERQ2 SERQ3 SERQ4 SERQ5 SERQ6 SERQ7 SERQ8 SERQ9
ASSURANCE FOR THE END-USERS A specific person (or group) is available for assistance with system difficulties. E-mail and other forms of on-line help are available in case of problems with using the system. Teachers/ePortfolio support staff are helpful for using the system. Teachers/ePortfolio staff are competent to answer questions.
EMPATHY The institution gives the user individual attention. Teachers/ePortfolio staff are always willing to help. Teachers/ePortfolio staff respond promptly.
CLARITY Terms of use are clearly shown (in the ePortfolio application, institution’s web site, within the course description...). EPortfolio use is well described within the course requirements (e.g. ePortfolio tasks, evaluation of work in the ePortfolio, extra credits...).
USE
U1 U2 U3 U4* U5* U6 U7 U8
DEEP STRUCTURE USAGE While using the ePortfolio, I used available features for organizing my content. While using the ePortfolio, I collaborated with my peers in organizing ePortfolio content. While using the ePortfolio, I used features that helped me to tag my artefacts. While using the ePortfolio, I used features that helped me to join the groups. While using the ePortfolio, I used features that helped me to set view permissions for different views (ePortfolios).
FACILITATING CONDITIONS I have the knowledge necessary to use the system. I was able to complete a task using the system even if there was no one around to tell me what to do as I go. I have the resources necessary to use the system (e.g. PC, internet connection, instructions, tasks).
USER SATISFACTION
US1 US2 US3 US4 US5 US6
ATTITUDE TOWARD USING THE SYSTEM I like working with the system. The system makes work more interesting. Using the system is a good idea.
USEFULNESS I find the system useful in learning. The degree of freedom for expressing one's own individuality and personal strengths is satisfactory. The ePortfolio presentation capabilities (e.g. quick upload, format and presentation of personal information) are satisfactory.

223
* Statements that had been eliminated during the earlier culling, but were restored after the pilot-
test in order to increase the reliability of the Use scale
NET BENEFITS
NB1 NB2 NB3 NB4 NB5 NB6 NB7 NB8 NB9 NB10 NB11
ENHANCED LEARNING The ePortfolio encouraged me to develop a positive attitude to lifelong learning. The ePortfolio helps me to make connections between formal (i.e. structured learning within the school or faculty) and informal (i.e. unstructured learning occurring in everyday life) learning experiences. The ePortfolio helps me to fulfill learning outcomes. Using ePortfolio led to increased transparency in evaluation. The enhanced communication between me and educators enhances the chances for my success.
PERSONAL GROWTH AND DEVELOPMENT I am able to evaluate progress towards achievement of my personal goals. I am able to choose my co-workers among peers according to various criteria (interests) presented in ePortfolio. I am able to compare myself with others. I am able to show my personal growth and development over time. Writing reflections enable me to develop decision-making skills. Potential employers can view my showcase Portfolio with the benefit of contextual clues from the institution, assessment criteria, and my personal descriptions of achievements.

224
Appendix E: Screenshots of ePortfolio success instrument
(Final version – English)
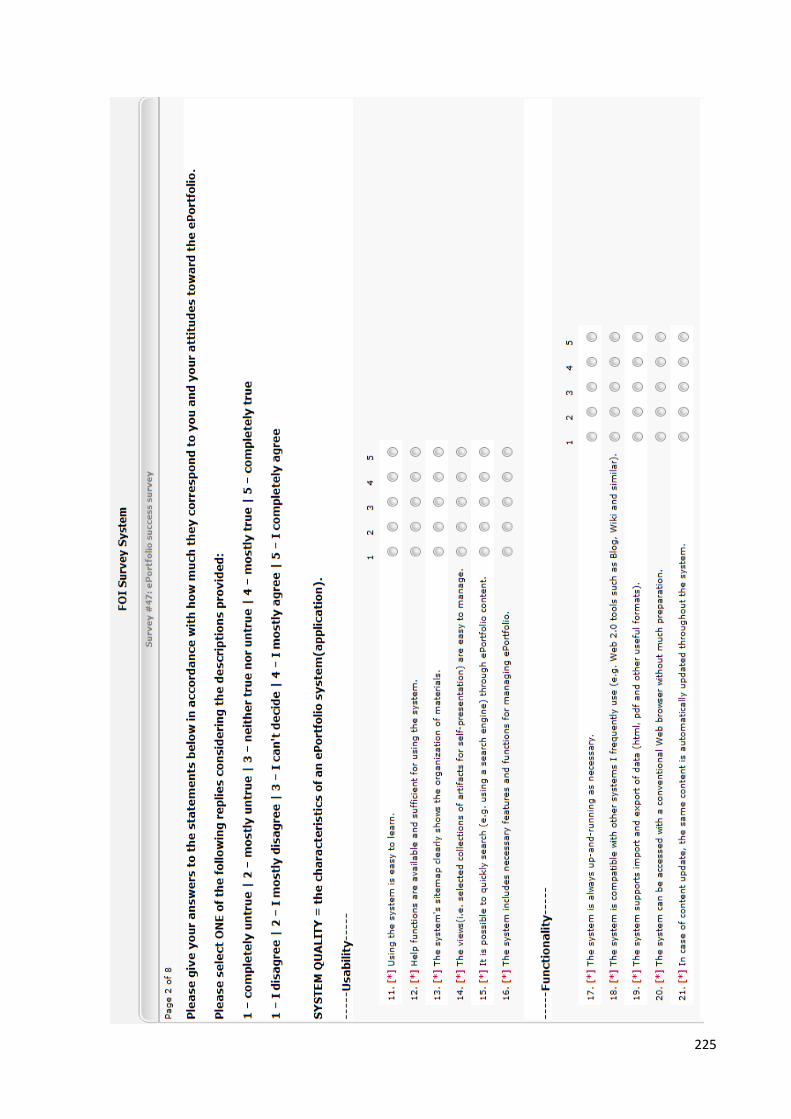
225
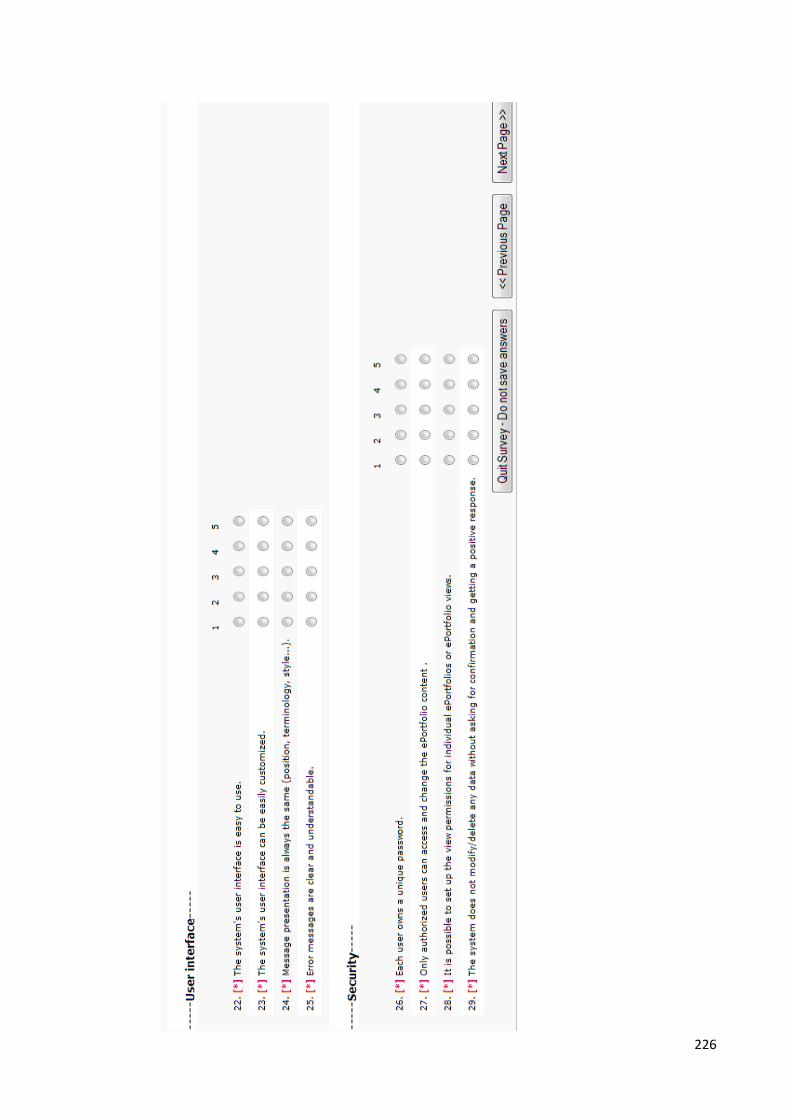
226
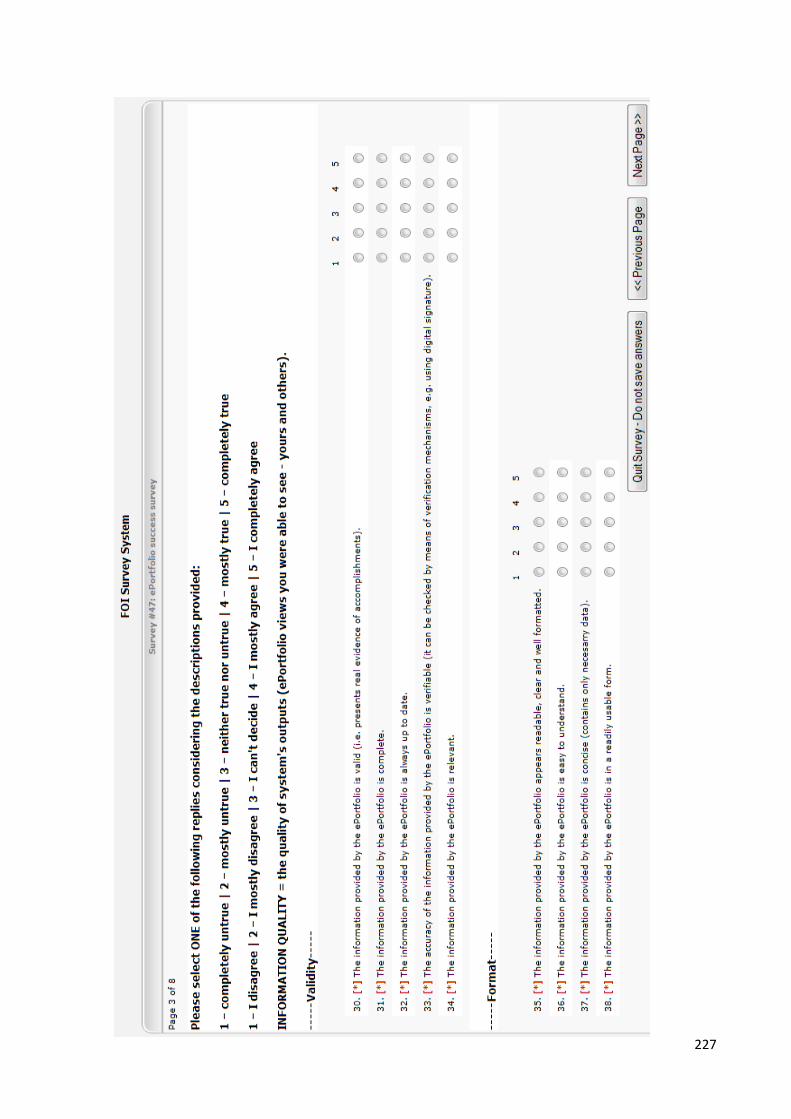
227
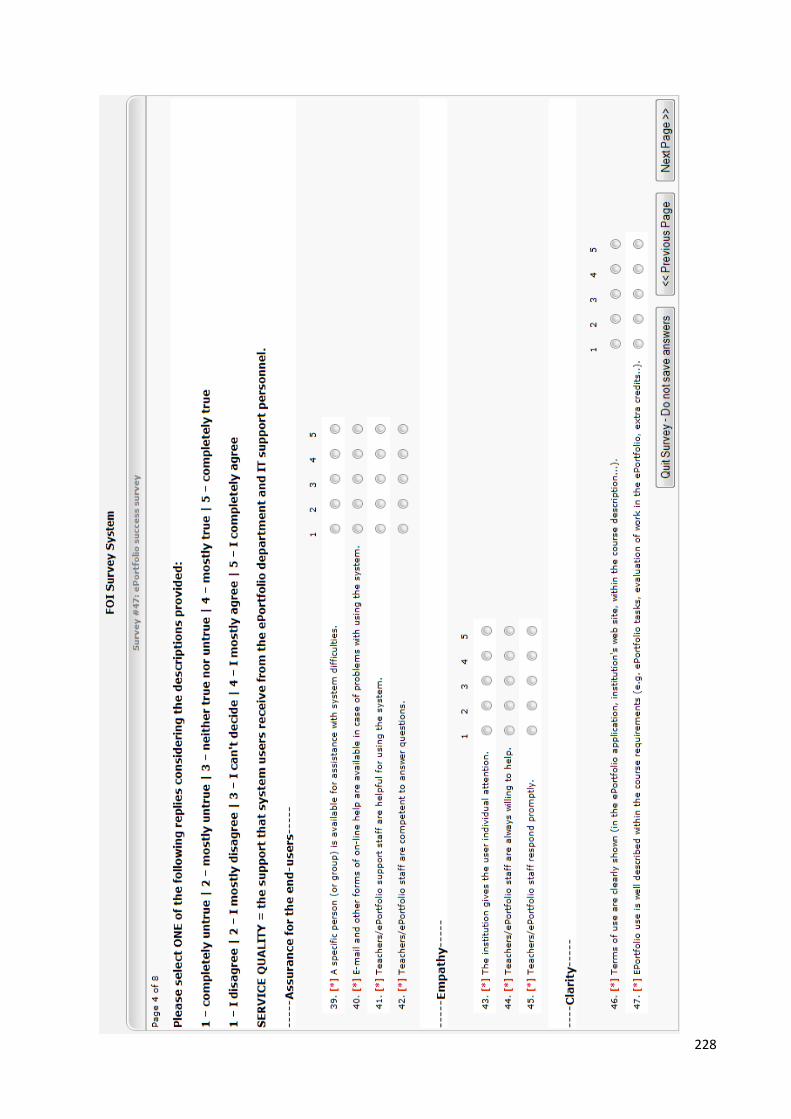
228

229

230

231

232
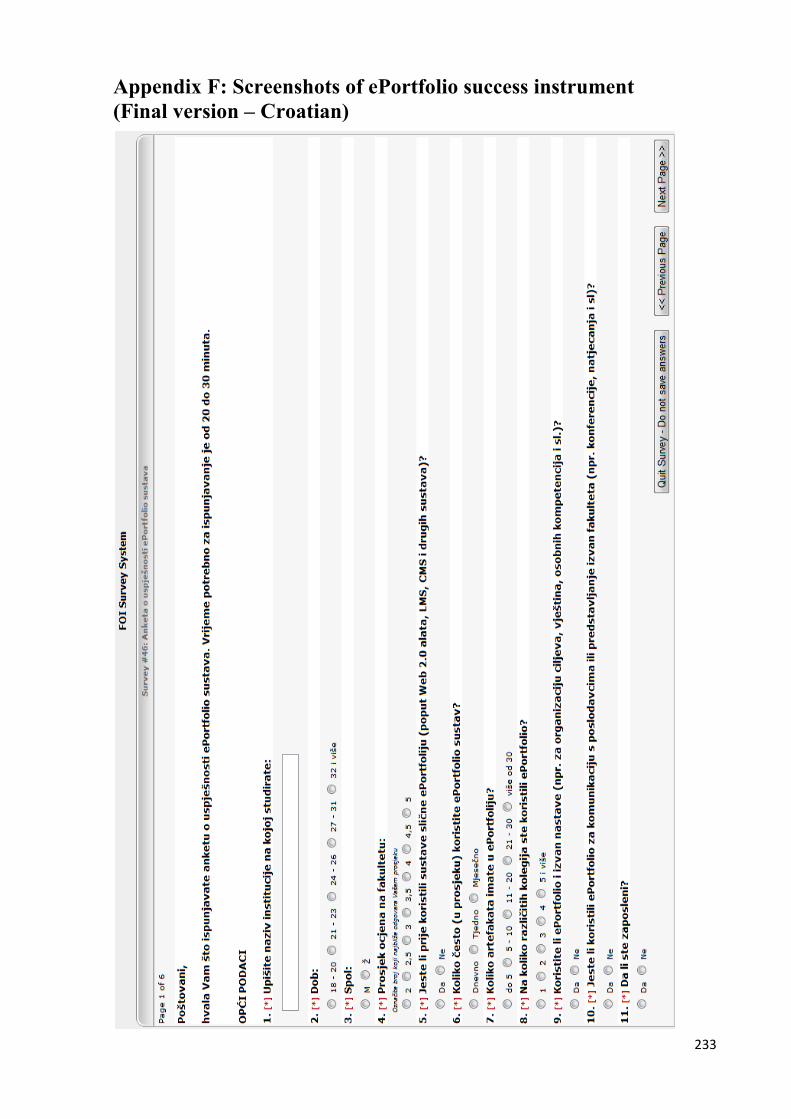
233
Appendix F: Screenshots of ePortfolio success instrument
(Final version – Croatian)

234
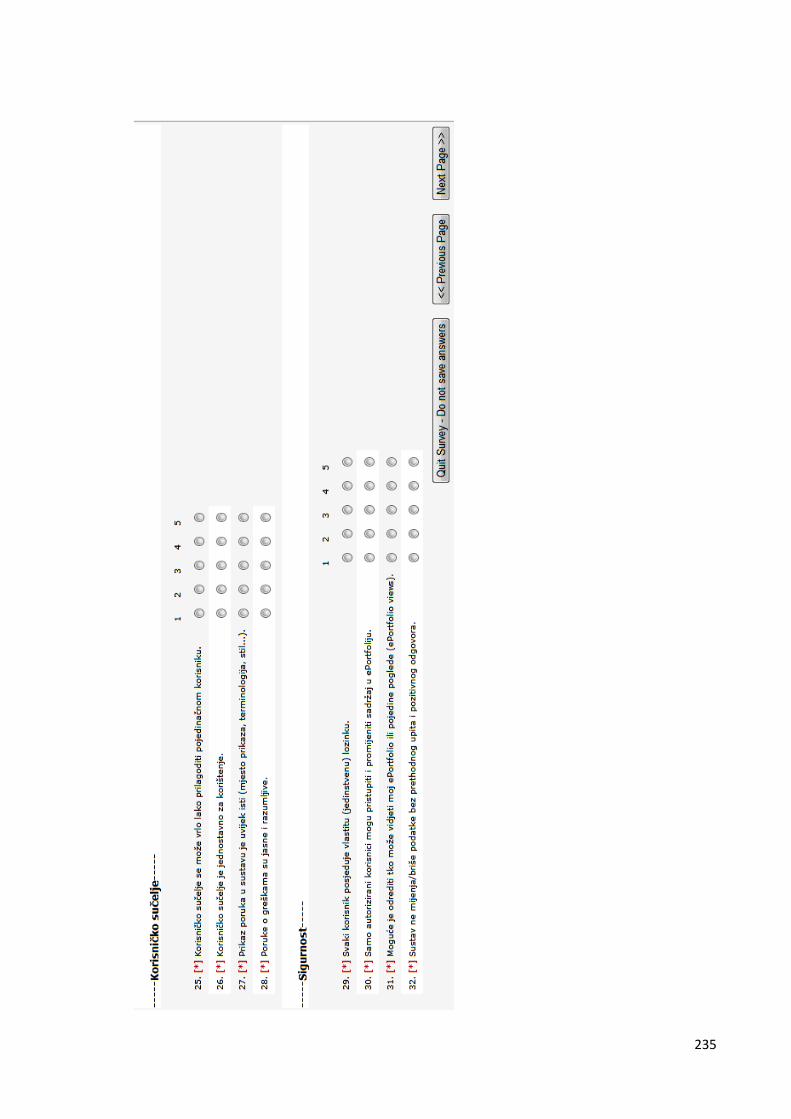
235
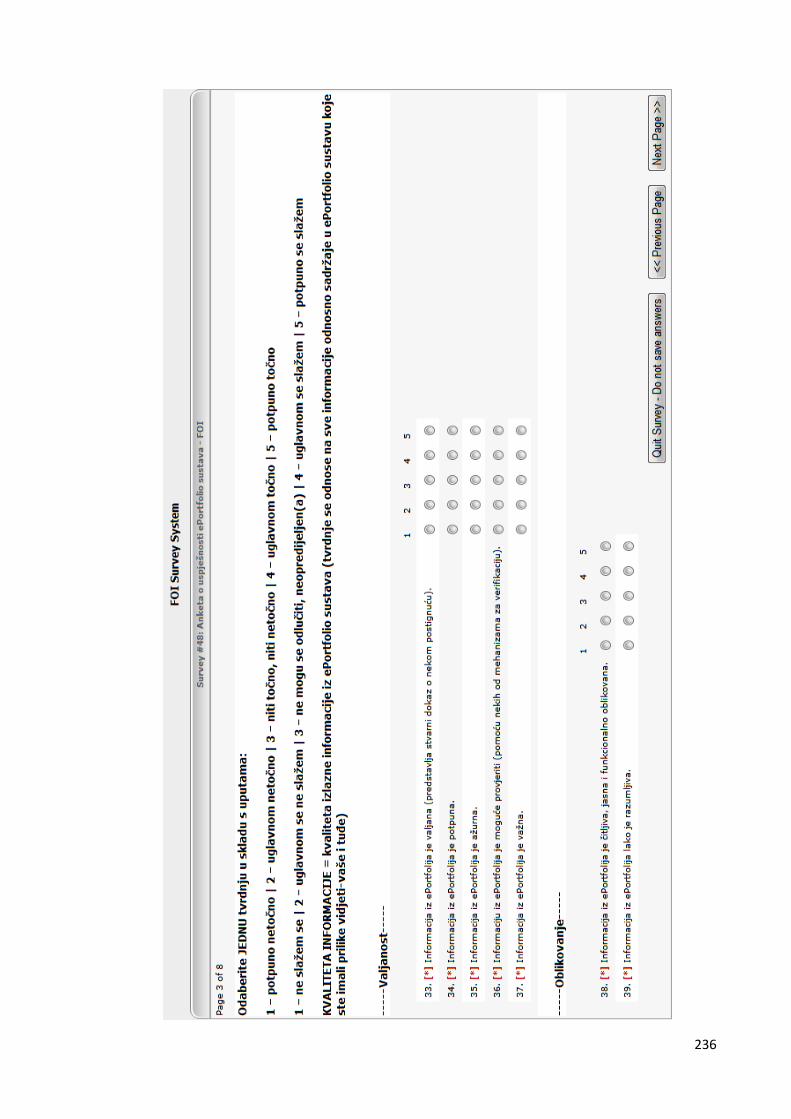
236
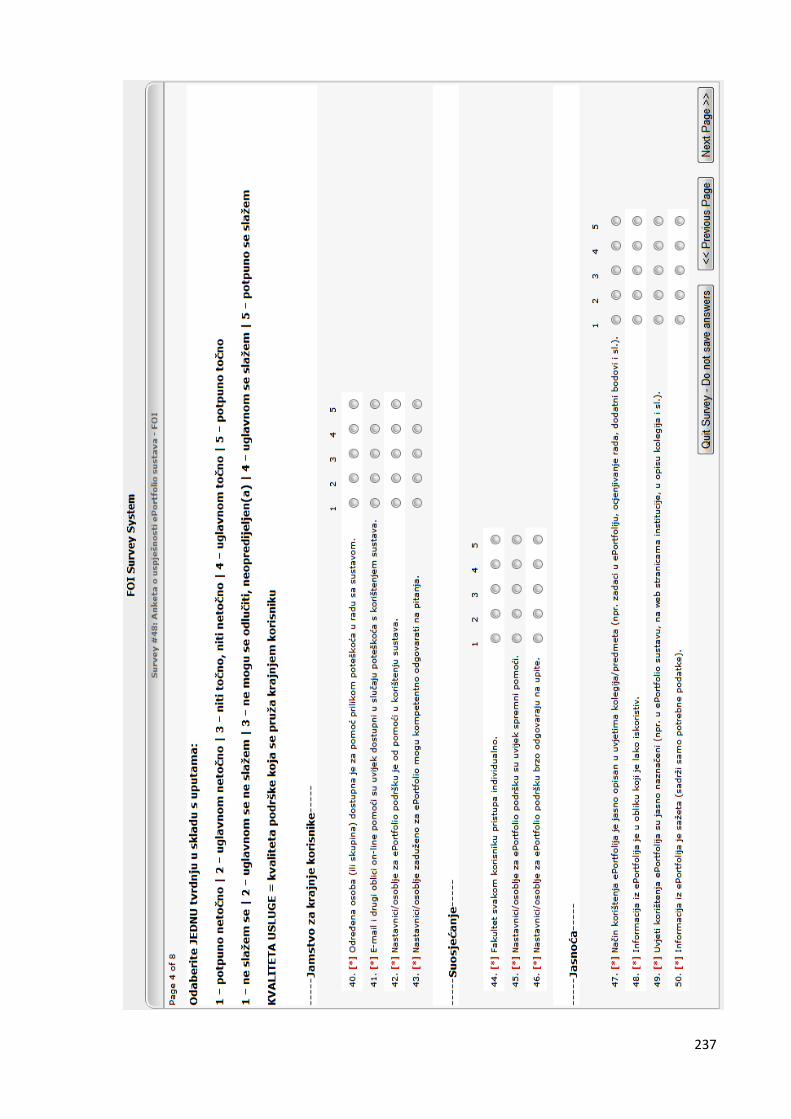
237
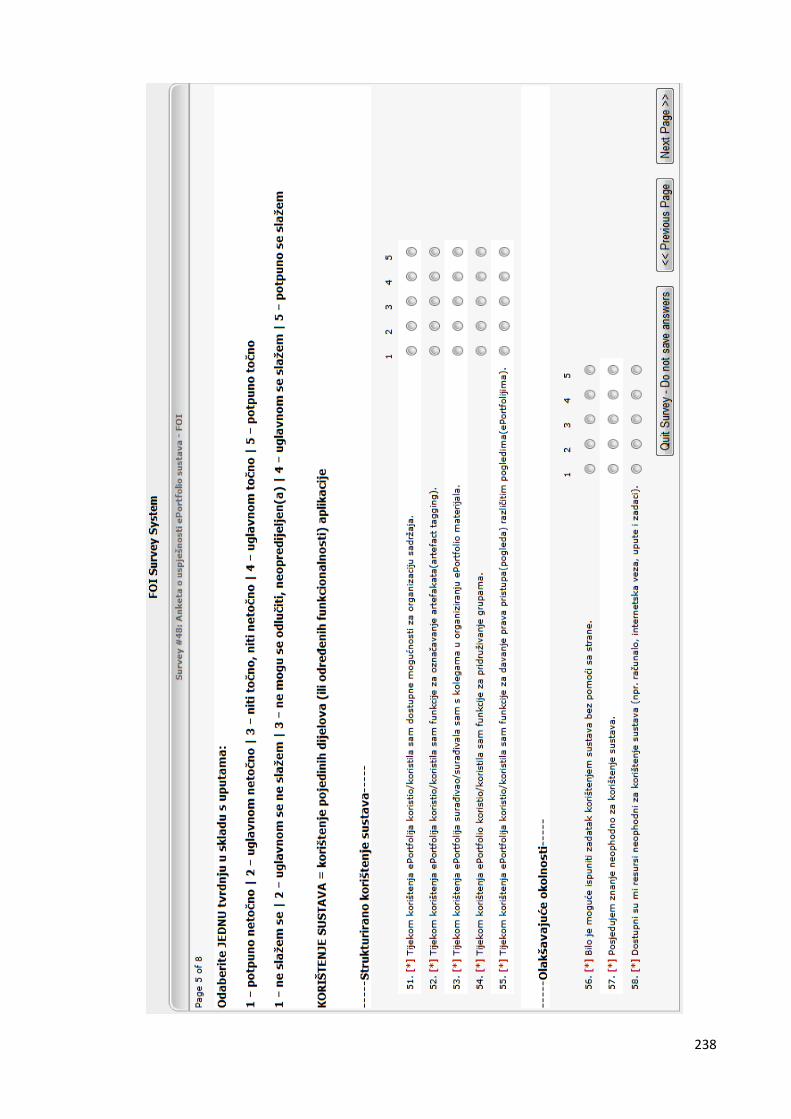
238
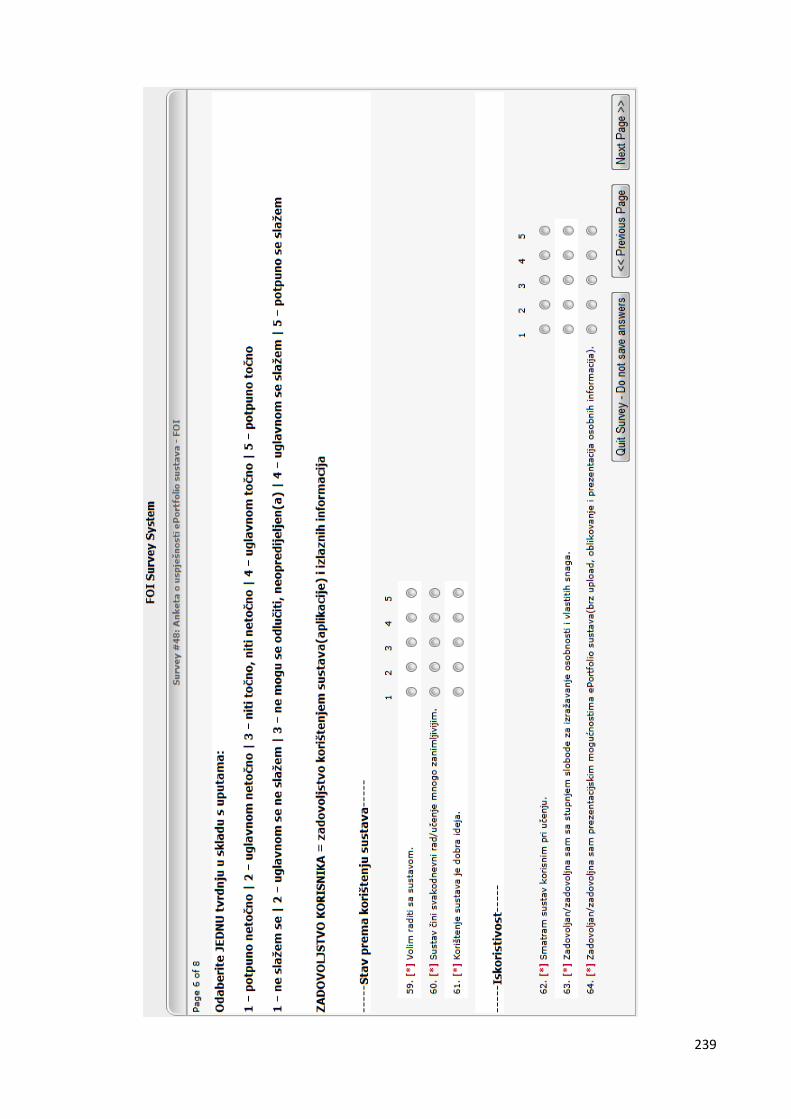
239

240
241
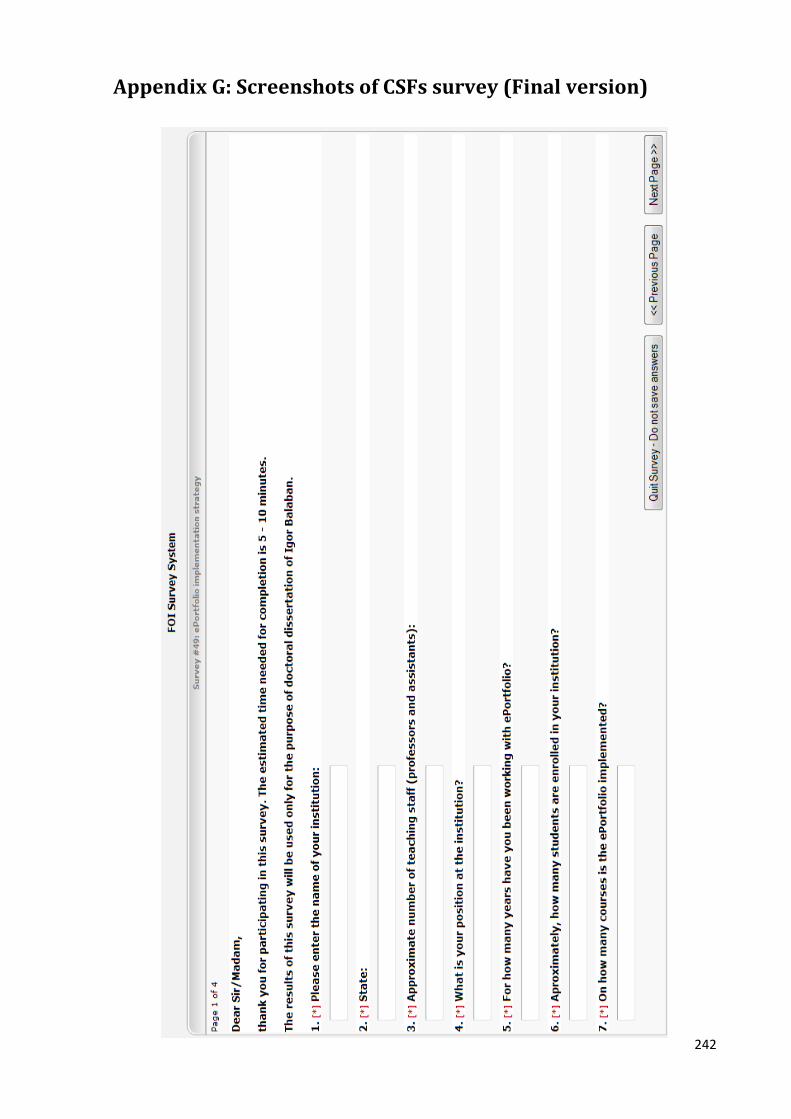
242
Appendix G: Screenshots of CSFs survey (Final version)
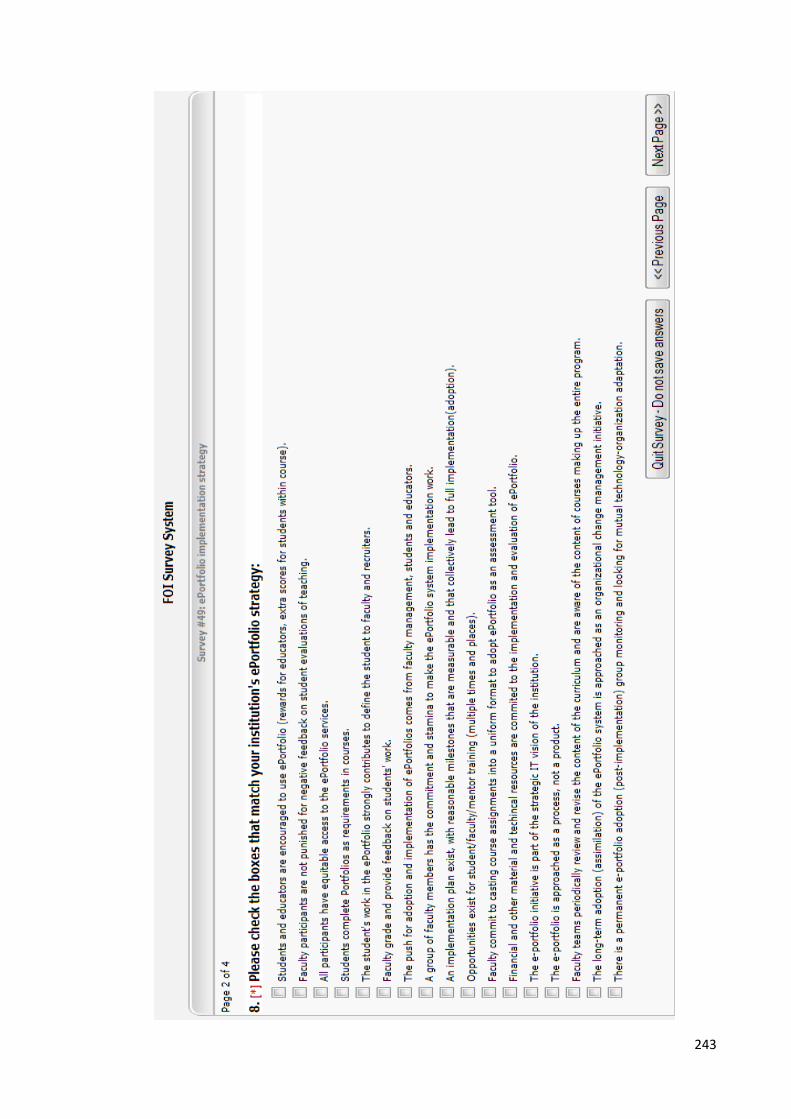
243

244

245

246
Appendix H: Invitation letter to Institution Representative
Dear (the name of Institution Representative the mail was addressed to),
My name is Igor Balaban and I am working as a novice researcher (PhD student)
at the University of Zagreb, Croatia. Currently I am in the final stage of my PhD research
that deals with an ePortfolio Success Model. My research supervisors are Dr. Enrique
Mu, Carlow faculty member, and Dr. Blazenka Divjak from the University of Zagreb,
Croatia.
The aim of my research is to develop an instrument that will assess the ePortfolio
success at the individual level. Moreover, the instrument results will serve as a basis for
building an ePortfolio Success Model.
For that purpose I have developed two different questionnaires. The first of them
should be filled by an institution representative (such as the dean, director or
university/faculty board member) who is familiar with ePortfolio implementation. The
second survey should be filled by students that have used ePortfolio in two or more
courses. Since only two institutions in Croatia are using ePortfolio (one of which is mine)
I need respondents from other institutions outside Croatia in order to finish my work.
Therefore I kindly ask you for help in filling the surveys.
I will summarize the tasks as follows:
There are two surveys:
The first one should be filled by students who worked with ePortfolio in at least
two or more courses. The estimated time for completion is 15-20 minutes.
Link: http://tinyurl.com/ePortfolio-eng
The second one should be filled by an institution representative (e.g. an
institution representative or educator who has knowledge about ePortfolio
implementation at the institution). The time needed for completion is about 5 minutes at
the most. This survey is very short.
Link: http://tinyurl.com/ePortfolioCSF

247
Both surveys are available online, so there will be no need for students to do it in
class. They could work from home if necessary. The data will be used only for my
research and surveys are anonymous. The data about the institution will not be revealed
in any way. If you are interested, I can provide you with a report on your institution’s
score after I analyze the data.
I sincerely hope you will find some time to help me with my research.
Thank you very much in advance.
Sincerely,
Igor Balaban
University of Zagreb, Croatia

248
Appendix I: Invitation letter to students
Dear students,
My name is Igor Balaban and I am working as a novice researcher (PhD student)
at the University of Zagreb, Croatia. Currently I am in the final stage of my PhD research
that deals with an ePortfolio Success Model. My research supervisors are Dr. Enrique
Mu, Carlow faculty member, and Dr. Blazenka Divjak from the University of Zagreb,
Croatia. The aim of my research is to develop an instrument that will assess ePortfolio
success at the individual level. Moreover, the instrument results will serve as a basis for
building an ePortfolio Success Model.
For this study to have a broad validity it is fundamental that students from all
over the world participate. Therefore I kindly ask you for help with collecting the data
by filling the survey since you have experience with ePortfolio.
Your task would be to fill the survey available at
http://tinyurl.com/ePortfolio-eng
The estimated time for completion is about 20 minutes. The data will be used
only for my research and surveys are anonymous. If you decide not to take the survey
after you’ve seen the questions, just click "Quit survey". Otherwise, please save your
answers by clicking the "Finish" button on the last page of the survey. If you are
interested in the results, I can share those with you upon your request.
I would like to stress that you are not required to participate and if you decide
not to participate, your decision will not affect your current or future relations with the
University staff or teachers. In addition, please be informed that this activity has been
approved by the University.
Thank you for your valuable contribution to this research.
Sincerely,
Igor Balaban
University of Zagreb, Croatia
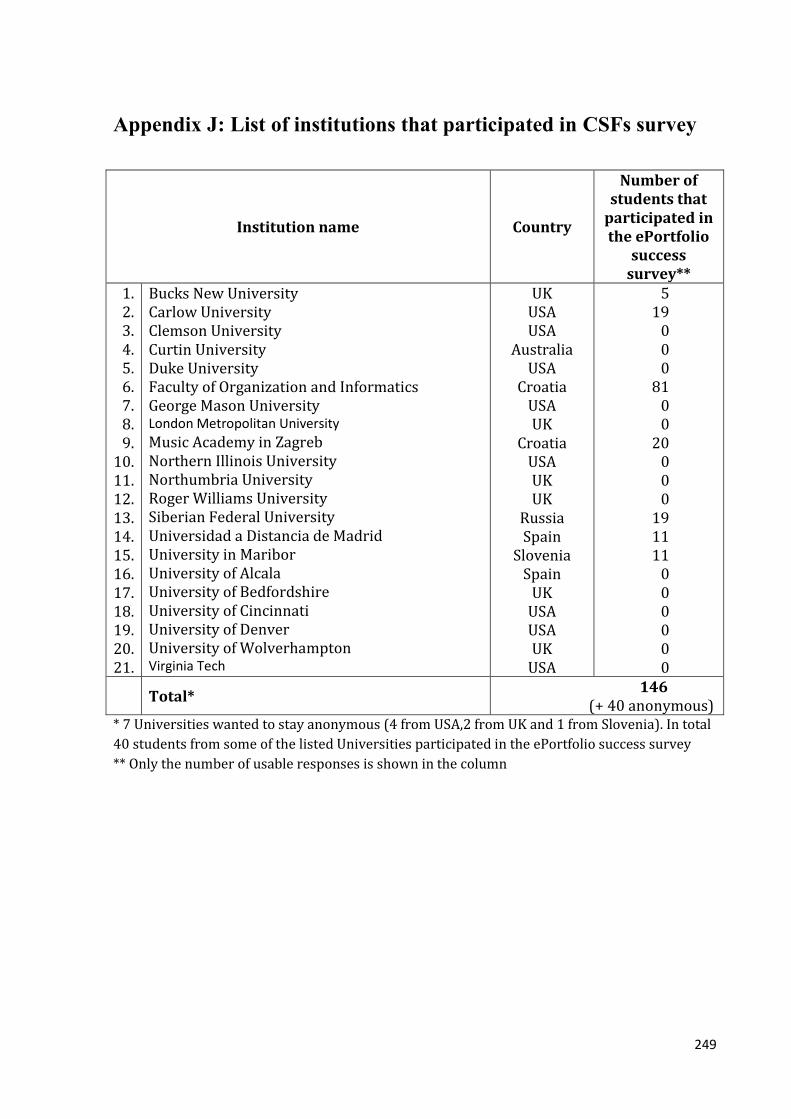
249
Appendix J: List of institutions that participated in CSFs survey
Institution name Country
Number of students that
participated in the ePortfolio
success survey**
1. 2. 3. 4. 5. 6. 7. 8. 9.
10. 11. 12. 13. 14. 15. 16. 17. 18. 19. 20. 21.
Bucks New University Carlow University Clemson University Curtin University Duke University Faculty of Organization and Informatics George Mason University London Metropolitan University
Music Academy in Zagreb Northern Illinois University Northumbria University Roger Williams University Siberian Federal University Universidad a Distancia de Madrid University in Maribor University of Alcala University of Bedfordshire University of Cincinnati University of Denver University of Wolverhampton Virginia Tech
UK USA USA
Australia USA
Croatia USA UK
Croatia USA UK UK
Russia Spain
Slovenia Spain
UK USA USA UK
USA
5 19
0 0 0
81 0 0
20 0 0 0
19 11 11
0 0 0 0 0 0
Total*
146 (+ 40 anonymous)
* 7 Universities wanted to stay anonymous (4 from USA,2 from UK and 1 from Slovenia). In total
40 students from some of the listed Universities participated in the ePortfolio success survey
** Only the number of usable responses is shown in the column
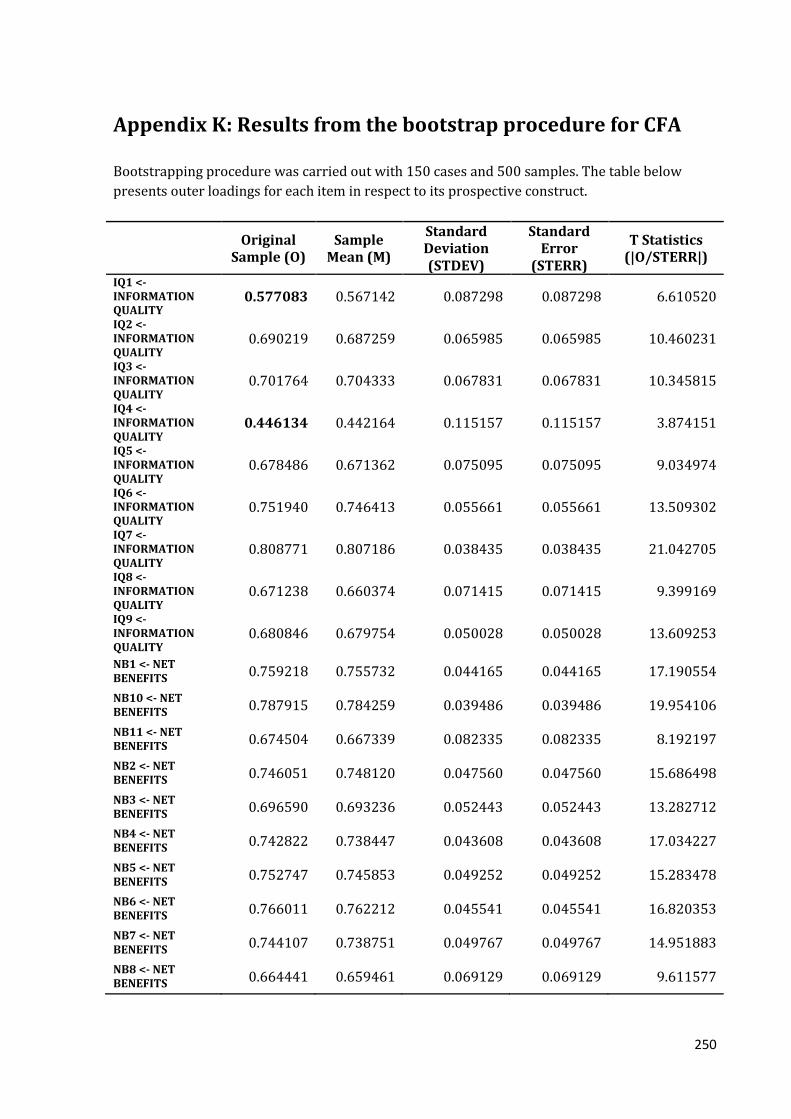
250
Appendix K: Results from the bootstrap procedure for CFA
Bootstrapping procedure was carried out with 150 cases and 500 samples. The table below
presents outer loadings for each item in respect to its prospective construct.
Original
Sample (O) Sample
Mean (M)
Standard Deviation (STDEV)
Standard Error
(STERR)
T Statistics (|O/STERR|)
IQ1 <- INFORMATION QUALITY
0.577083 0.567142 0.087298 0.087298 6.610520
IQ2 <- INFORMATION QUALITY
0.690219 0.687259 0.065985 0.065985 10.460231
IQ3 <- INFORMATION QUALITY
0.701764 0.704333 0.067831 0.067831 10.345815
IQ4 <- INFORMATION QUALITY
0.446134 0.442164 0.115157 0.115157 3.874151
IQ5 <- INFORMATION QUALITY
0.678486 0.671362 0.075095 0.075095 9.034974
IQ6 <- INFORMATION QUALITY
0.751940 0.746413 0.055661 0.055661 13.509302
IQ7 <- INFORMATION QUALITY
0.808771 0.807186 0.038435 0.038435 21.042705
IQ8 <- INFORMATION QUALITY
0.671238 0.660374 0.071415 0.071415 9.399169
IQ9 <- INFORMATION QUALITY
0.680846 0.679754 0.050028 0.050028 13.609253
NB1 <- NET BENEFITS 0.759218 0.755732 0.044165 0.044165 17.190554
NB10 <- NET BENEFITS 0.787915 0.784259 0.039486 0.039486 19.954106
NB11 <- NET BENEFITS 0.674504 0.667339 0.082335 0.082335 8.192197
NB2 <- NET BENEFITS 0.746051 0.748120 0.047560 0.047560 15.686498
NB3 <- NET BENEFITS 0.696590 0.693236 0.052443 0.052443 13.282712
NB4 <- NET BENEFITS 0.742822 0.738447 0.043608 0.043608 17.034227
NB5 <- NET BENEFITS 0.752747 0.745853 0.049252 0.049252 15.283478
NB6 <- NET BENEFITS 0.766011 0.762212 0.045541 0.045541 16.820353
NB7 <- NET BENEFITS 0.744107 0.738751 0.049767 0.049767 14.951883
NB8 <- NET BENEFITS 0.664441 0.659461 0.069129 0.069129 9.611577

251
NB9 <- NET BENEFITS 0.739294 0.731123 0.059040 0.059040 12.521949
SERQ1 <- SERVICE QUALITY 0.740163 0.733070 0.046001 0.046001 16.089985
SERQ2 <- SERVICE QUALITY 0.716132 0.705860 0.056622 0.056622 12.647529
SERQ3 <- SERVICE QUALITY 0.708389 0.703640 0.052916 0.052916 13.386969
SERQ4 <- SERVICE QUALITY 0.803482 0.802206 0.036173 0.036173 22.212042
SERQ5 <- SERVICE QUALITY 0.785144 0.781845 0.036643 0.036643 21.426900
SERQ6 <- SERVICE QUALITY 0.792601 0.788403 0.039577 0.039577 20.026829
SERQ7 <- SERVICE QUALITY 0.781353 0.773626 0.045055 0.045055 17.342221
SERQ8 <- SERVICE QUALITY 0.605710 0.598939 0.063309 0.063309 9.567575
SERQ9 <- SERVICE QUALITY 0.723628 0.717497 0.049226 0.049226 14.700248
SYSQ1 <- SYSTEM QUALITY 0.716786 0.708768 0.055394 0.055394 12.939855
SYSQ10 <- SYSTEM QUALITY 0.712839 0.694971 0.061025 0.061025 11.681155
SYSQ11 <- SYSTEM QUALITY 0.572681 0.568633 0.091921 0.091921 6.230125
SYSQ12 <- SYSTEM QUALITY 0.568821 0.566337 0.077844 0.077844 7.307232
SYSQ13 <- SYSTEM QUALITY 0.529772 0.532575 0.094734 0.094734 5.592209
SYSQ14 <- SYSTEM QUALITY 0.549721 0.543968 0.089597 0.089597 6.135478
SYSQ15 <- SYSTEM QUALITY 0.552829 0.554055 0.080591 0.080591 6.859703
SYSQ16 <- SYSTEM QUALITY 0.379806 0.384278 0.103952 0.103952 3.653677
SYSQ17 <- SYSTEM QUALITY 0.495889 0.499175 0.097348 0.097348 5.093964
SYSQ18 <- SYSTEM QUALITY 0.566902 0.566320 0.093447 0.093447 6.066563
SYSQ19 <- SYSTEM QUALITY 0.499517 0.499824 0.097901 0.097901 5.102258
SYSQ2 <- SYSTEM QUALITY 0.620707 0.612443 0.060774 0.060774 10.213326
SYSQ3 <- SYSTEM QUALITY 0.612729 0.606032 0.081358 0.081358 7.531305
SYSQ4 <- SYSTEM QUALITY 0.683700 0.682749 0.051628 0.051628 13.242824
SYSQ5 <- SYSTEM QUALITY 0.631699 0.628534 0.057982 0.057982 10.894671
SYSQ6 <- SYSTEM QUALITY 0.796558 0.792308 0.034187 0.034187 23.299988
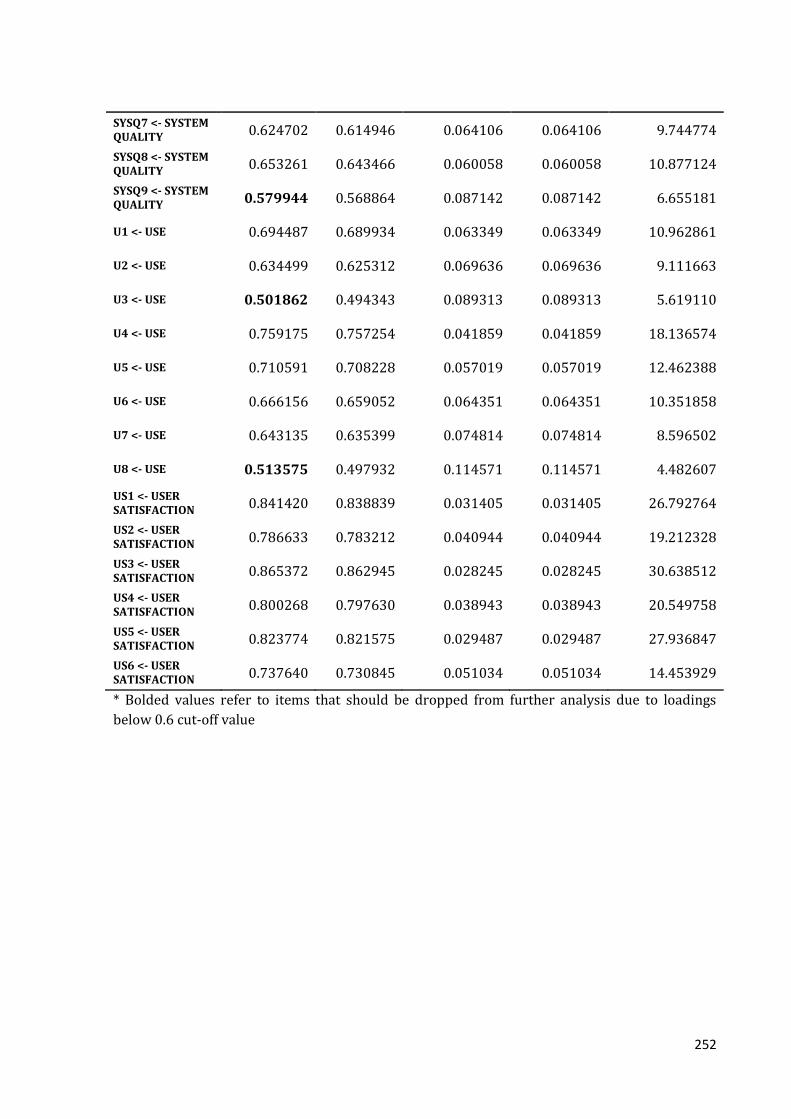
252
SYSQ7 <- SYSTEM QUALITY 0.624702 0.614946 0.064106 0.064106 9.744774
SYSQ8 <- SYSTEM QUALITY 0.653261 0.643466 0.060058 0.060058 10.877124
SYSQ9 <- SYSTEM QUALITY 0.579944 0.568864 0.087142 0.087142 6.655181
U1 <- USE 0.694487 0.689934 0.063349 0.063349 10.962861
U2 <- USE 0.634499 0.625312 0.069636 0.069636 9.111663
U3 <- USE 0.501862 0.494343 0.089313 0.089313 5.619110
U4 <- USE 0.759175 0.757254 0.041859 0.041859 18.136574
U5 <- USE 0.710591 0.708228 0.057019 0.057019 12.462388
U6 <- USE 0.666156 0.659052 0.064351 0.064351 10.351858
U7 <- USE 0.643135 0.635399 0.074814 0.074814 8.596502
U8 <- USE 0.513575 0.497932 0.114571 0.114571 4.482607
US1 <- USER SATISFACTION 0.841420 0.838839 0.031405 0.031405 26.792764
US2 <- USER SATISFACTION 0.786633 0.783212 0.040944 0.040944 19.212328
US3 <- USER SATISFACTION 0.865372 0.862945 0.028245 0.028245 30.638512
US4 <- USER SATISFACTION 0.800268 0.797630 0.038943 0.038943 20.549758
US5 <- USER SATISFACTION 0.823774 0.821575 0.029487 0.029487 27.936847
US6 <- USER SATISFACTION 0.737640 0.730845 0.051034 0.051034 14.453929
* Bolded values refer to items that should be dropped from further analysis due to loadings
below 0.6 cut-off value
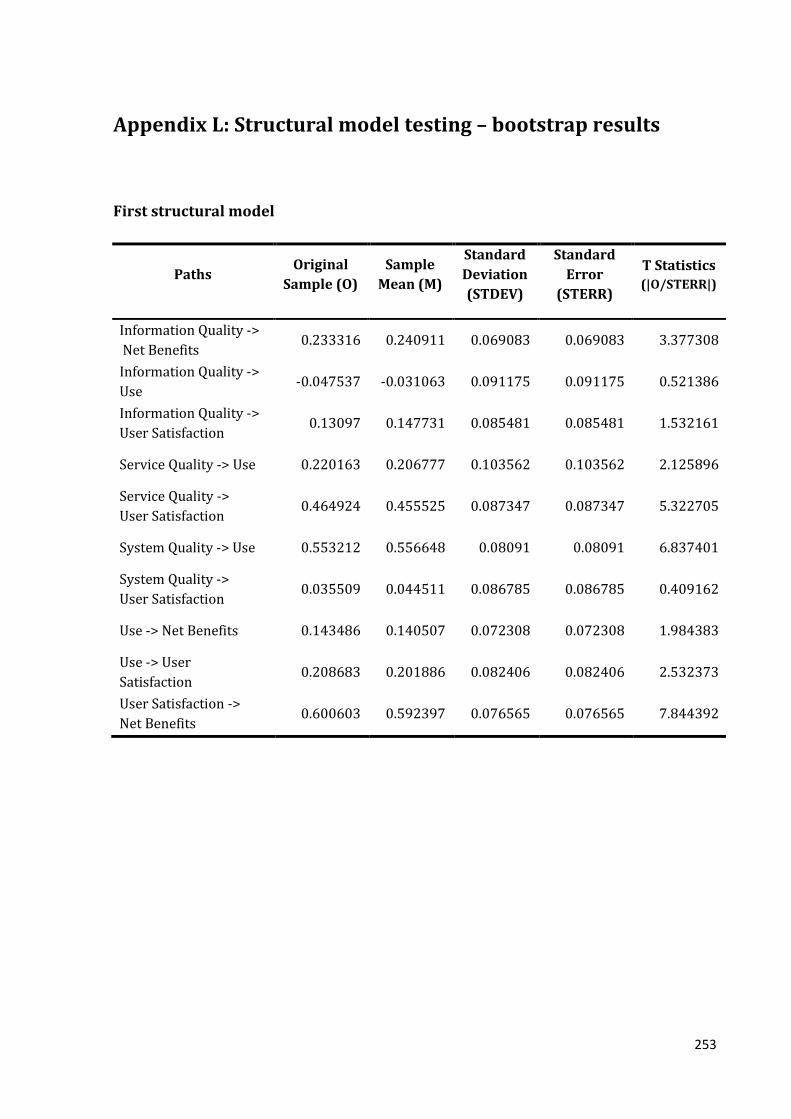
253
Appendix L: Structural model testing – bootstrap results
First structural model
Paths Original
Sample (O)
Sample
Mean (M)
Standard
Deviation
(STDEV)
Standard
Error
(STERR)
T Statistics
(|O/STERR|)
Information Quality ->
Net Benefits 0.233316 0.240911 0.069083 0.069083 3.377308
Information Quality ->
Use -0.047537 -0.031063 0.091175 0.091175 0.521386
Information Quality ->
User Satisfaction 0.13097 0.147731 0.085481 0.085481 1.532161
Service Quality -> Use 0.220163 0.206777 0.103562 0.103562 2.125896
Service Quality ->
User Satisfaction 0.464924 0.455525 0.087347 0.087347 5.322705
System Quality -> Use 0.553212 0.556648 0.08091 0.08091 6.837401
System Quality ->
User Satisfaction 0.035509 0.044511 0.086785 0.086785 0.409162
Use -> Net Benefits 0.143486 0.140507 0.072308 0.072308 1.984383
Use -> User
Satisfaction 0.208683 0.201886 0.082406 0.082406 2.532373
User Satisfaction ->
Net Benefits 0.600603 0.592397 0.076565 0.076565 7.844392

254
Second structural model
Paths Original
Sample (O)
Sample
Mean (M)
Standard
Deviation
(STDEV)
Standard
Error
(STERR)
T Statistics
(|O/STERR|)
Information Quality ->
Net Benefits 0.62812 0.627812 0.067882 0.067882 9.253095
Information Quality ->
Use -0.073722 -0.066862 0.089709 0.089709 0.821789
Information Quality ->
User Satisfaction -0.04831 -0.04825 0.073321 0.073321 0.658876
Net Benefits ->
User Satisfaction 0.636191 0.639609 0.081618 0.081618 7.794715
Service Quality -> Use 0.10864 0.117688 0.097216 0.097216 1.117512
Service Quality ->
User Satisfaction 0.252642 0.253811 0.086496 0.086496 2.920851
System Quality -> Use 0.522514 0.519017 0.07958 0.07958 6.565913
System Quality ->
User Satisfaction 0.055098 0.052516 0.074824 0.074824 0.736367
User Satisfaction ->
Use 0.220487 0.211868 0.084097 0.084097 2.621827

255
References
***: E-learning strategy 2007-2010, University of Zagreb, 2007, retrieved from
http://www.unizg.hr/fileadmin/rektorat/dokumenti/eucenje_strategija/Sveuciliste_u_
Zagrebu_Strategija_e_ucenja_Senat_v1.pdf (March 2009)
Abrenica, Y.: Electronic portfolios, College of Education, San Diego State University, USA,
1996, retrieved from
http://edweb.sdsu.edu/courses/edtec596r/students/abrenica/abrenica.html (August
2009)
Alberto D. T., Gianluca, Z.: Web-based Information Systems Success: A Measurement
Model of Technology Acceptance and Fit, EuroMOT 2006 Conference, September 2007,
retrieved from:
http://www.iamot.org/conference/index.php/ocs/9/paper/view/1835/847 (October
2010)
Alter, S.: Information Systems: The Foundation of E-Business, 4th Edition, Prentice Hall,
New Jersey, USA, 2002
Armstrong, C.P., Sambamurthy, V.: Information Technology Assimilation in Firms: The
Influence of Senior Leadership and IT Infrastructures, Information Systems Research
10(4), December 1999, pp. 304-327
Attwell, G.: The Personal Learning Environments – the future of eLearning?, eLearning
Papers, 2(1), Barcelona, Spain, 2007, retrieved from
http://www.elearningeuropa.info/files/media/media11561.pdf (September 2009)
Balaban I., Divjak, B., Grabar, D., Žugec, B., Towards successful implementation of
ePortfolios in blended learning, Proceedings of the iLearning Forum 2010 London, Serge
Ravet (Ed.), London, United Kingdom, 2010(b), pp. 146-153
Balaban I., Divjak, B., Kopić, M., Emerging issues in using ePortfolio, Proceedings of the
iLearning Forum 2010 London, Serge Ravet (Ed.),London, United Kingdom, 2010(a), pp.
212-218

256
Balaban I., Kišasondi, T.: A Lightweight ePortfolio Artefact Integrity Method, Proceedings
of the ICL 2009 conference: The Challenges of Life Long Learning, Villach, Austria, 2009,
pp. 681-686
Balaban, I., Bubaš, G.: Evaluating an ePortfolio system: the Case of a Hybrid University
Course, Proceedings of the ICL 2009 conference: The Challenges of Life Long Learning,
Villach, Austria, 2009, pp. 638-643
Balaban, I.: First steps in using ePortfolio in a university course, E-learning new
tendencies and innovation didactic activities, Ana Landeta Etxeberria (Ed.), CEF, Spain,
2010, pp. 155-164
Barker, K.C.: ePortfolio Quality Standards: An International Development Project,
discussion paper, FuturEd, Vancouver, Canada, September 2003, retrieved from
http://www.futured.com/pdf/ePortfolio%20Quality%20Discussion%20Paper.pdf
(January, 2010)
Barnes, S., Vidgen, R.: Data triangulation in action: using comment analysis to refine web
quality metrics, Proceedings of the 13th European Conference on Information Systems
[CD-ROM], Regensburg, Germany, 2005
Barret, H. C.: Strategic questions: What to consider when planning for electronic
portfolios, Learning&Leading with Technology, 26(2), 1998, pp. 6-13, retrieved from
http://electronicportfolios.org/portfolios/LLTOct98.html (October 2009)
Batson, T.: The electronic portfolio boom: what's it all about?, Campus Technology, New
York, USA, 2002, retrieved from
http://www.campustechnology.com/Articles/2002/11/The-Electronic-Portfolio-
Boom-Whats-it-All-About.aspx (August 2009)
Bekić Z., Kučina-Softić, S.: The results of e-learning survey at University of Zagreb, Center
for e-learning, Zagreb, Croatia, October 2008, retrieved from
http://www.unizg.hr/fileadmin/rektorat/dokumenti/e-
ucenje/Sveuciliste_u_Zagrebu_Anketa_e_ucenje_2008_Rezultati.pdf (October 2009)

257
Benbasat I., Zmud R. W.: The Identity Crisis Within the IS Discipline: Defining and
Communicating the Discipline's Core Properties, MIS Quarterly, 27(2), 2003, pp. 183-194.
Bisovsky G, Schaffert S.: Learning and Teaching with E-Portfolios: Experiences in and
Challenges for Adult Education, International Journal of Emerging Technologies in
Learning 2009, 4(1), pp. 13-15
Blackburn, J.L., Hakel, M.D.: Enhancing Self-Regulation and Goal Orientation with
ePortfolios, Handbook of Research on ePortfolios, Jafari A.&Kaufman C. (Ed.), IGI Global,
London, UK, 2006, pp. 83-89
Brant, J.: Factors affecting use / non-use of ePortfolios by learners, Report from EPISTLE
Project, University of Wolverhampton, 2006, retrieved from
http://www.jiscinfonet.ac.uk/case-studies/e-
portfolios/wolverhampton/epistleguide5.pdf (January 2009)
Briggs R.O., Vreede, G.D., Nunamaker, J., Sprague, R.: Special Issue: Information Systems
Success, Journal of Management Information Systems,, 19(4), 2003, pp. 5-8, retrieved
from: http://www.jmis-web.org/articles/v19_n4_p5/index.html (January, 2010)
Brumec J., Dušak V.: The Assesment of IS Complexity Based on Genetic Taxonomy,
Evolution and Challenges in System Development, J. Župančić, (Ed.), Kluwer
Academic/Plenum Publishers, New York, 1999, pp. 381-389
Brumec, J.: A Contribution to IS General Taxonomy, Conference Proceedings, 21(1),
Faculty of Organization and Informatics, Varaždin, Croatia, 1997, pp. 1-14
Bubaš G., Balaban, I., Begičević, N.: Course evaluation in e-learning by a comparative
analysis of two or more e-learning courses, Proceedings of the 18th International
Conference on Information and Intelligent Systems, Faculty of Organization and
Informatics, 2007, Varaždin, Croatia, pp. 65-72
Burton-Jones A., Straub, D.: Reconceptualizing system usage: an approach and empirical
test, Information Systems Research, 17(3), 2006, pp. 220-246

258
Buzzetto-More N., Alade, A.: Best practices in e-assessment, Journal of Information
Technology Education, 5, 2006, pp. 251-269 , retrieved from
http://jite.org/documents/Vol5/v5p251-269Buzzetto152.pdf (September 2009)
Byrne B. M.: Structural Equation Modeling with AMOS: Basic Concepts, Applications, and
Programming, 2nd edition, Taylor&Francis Group, New York, USA, 2010
Cambridge D., Cambridge, B., Yancey, K. B.: Electronic portfolio technology and design for
learning, Electronic portfolios 2.0: Emergent research on implementation and impact
Cambridge et al. (Ed.), Virginia, USA, 2009
Carte T.A., Russell, C.J.: In Pursuit of Moderation: Nine Common Errors and Their
Solutions, MIS Quarterly, 27(3), September 2003, pp. 479-501
Cattell R. B.: The scree test for the number of factors, Multivariate Behavioral Research, 1,
1966, pp. 245-276
Challis D.: Towards the mature ePortfolio: Some implications for higher education,
Canadian Journal of Learning and Technology, 31(3), 2005
Chang C.J., King, W. R.: Measuring the Performance of Information Systems: A Functional
Scorecard, Journal of Management Information Systems, 22(1), 2005, pp. 85-116
Chin W. W., Marcolin, B. L., Newsted, P. R., A Partial Least Squares Latent Variable
Modeling Approach for Measuring Interaction Effects: Results from a Monte Carlo
Simulation Study and Voice Mail Emotion/Adoption Study, Proceedings of the 17th
International Conference on Information Systems, Cleveland, Ohio, 1996, pp. 21 - 41
Chin W. W.: The partial least squares approach to structural equation modeling, Modern
Methods for Business Research, G. A. Marcoulides (Ed.), Mahwah, Lawrence Erlbaum
Associates, 1998, pp. 295 – 358
Costello A. B., Osborne, J. W.: Best Practices in Exploratory Factor Analysis: Four
Recommendations for Getting the Most From Your Analysis, Practical Assessment,
Research&Evaluation, 10(7), 2005, obtained from:
http://pareonline.net/pdf/v10n7a.pdf (August 2010)

259
Cronbach L. J.: Essentials of Psychological Testing, 3rd Edition, Harper and Row, New
York, 1970
Davis F. D.: A Technology Acceptance Model for Empirically Testing New End User
Information Systems: Theory and Results, doctoral dissertation, Massachusetts Institute
of Technology, 1986, retrieved from http://dspace.mit.edu/handle/1721.1/15192
(January 2010)
Davis F.D.: Perceived Usefulness, Perceived Ease of Use, and User Acceptance of
Information Technology”, MIS Quarterly, 13(3), September 1989, pp. 319 – 340
DeLone W. H., McLean, E. R.: Information Systems Success Revisited, Proceedings of the
35th Hawaii International Conference on System Sciences, Big Island, Hawaii, 2002, pp.
238-249
DeLone, W. H., McLean, E. R: The DeLone and McLean Model Of Information Systems
Success: A Ten Years Update, Journal of Management Information Systems 19(4), 2003,
pp. 9-30
DeLone, W.H., McLean, E. R.: Information systems success: The quest for the dependent
variable, Information Systems Research, 3(1), 1992, pp. 60–95
Dillman R.: Mail and telephone surveys: Total Design Method, John Wiley, New York, USA,
1978
Doig B., Ilisley, B., McLuckie, J., Parsons, R.: Using ePortfolios to Enhance Reflective
Learning and Development, Handbook of Research on ePortfolios, Jafari
A.&Kaufman(Ed.) C., IGI Global, London, 2006, pp. 158 – 167
Doll W., Xia, W., Torkzadeh, G.: A confirmatory factor analysis of the end-user computing
satisfaction instrument, MIS Quarterly, 18(4), 1994, pp. 453 – 461
Electronic Portfolio Consortium: Electronic Portfolio White Paper, Version 1.0, 2003,
retrieved from http://eportconsortium.org (May 2009)

260
Emmett D., Harper, W., Hauville, K.: Creating a Strategy for the Implementation of the
QUT ePortfolio, Handbook of Research on ePortfolios, Jafari A.&Kaufman C. (Ed.), IGI
Global, London, UK, 2006, pp. 410 – 419
European Institute for E-learning: Why do we need an ePortfolio?, retrieved from
http://www.eife-l.org, (September 2009)
Fernández O. L.: Digital learner portfolio as a tool for innovating assessment in the
European Higher Education Area, Interactive Educational Multimedia, No. 16, April
2008, pp. 54 – 65
Fiona F. N., Janet, L. L., Jinghua, K.: Critical Factors for Successful Implementation of
Enterprise Systems, Business Process Management Journal, 7(3), 2001, pp. 285-296
Flanigan E., Amirian, S.: ePortfolios: Pathway from Classroom to Career, Handbook of
Research on ePortfolios, Jafari A.&Kaufman C. (Ed.), IGI Global, London, 2006, pp. 102 -
111
Fraser S., Salter, G.: A motivational view of information systems success: a
reinterpretation of DeLone&McLean’s model, Proceedings of the Sixth Australasian
Conference on Information Systems, Curtin University of Technology, Australia, 1997,
pp. 119-140
Gable G., D. Sedera, and T. Chan.: Enterprise Systems Success: A Measurement Model,
Proceedings of the 24th International Conference on Information Systems, Seattle,
Washington, USA, 2003, pp. 576-591
Gable G., Sedera, D., Chan, T.: Re-conceptualizing Information System Sucess: The IS-
Impact Measurement Model, Journal of the Association for Information Systems (JAIS),
9(7), July 2008, USA, pp. 377 – 408
Gathercoal P., Love, D., Bryde, B., McKean, G.: On Implementing Web-Based Electronic
Portfolios, Educause Quarterly, No. 2, 2002, pp. 29 – 37
Gefen D., Karahanna, E., Straub, D. W.: Trust and TAM in Online Shopping: An Integrated
Model, MIS Quarterly, 27(1), 2003, pp. 51 – 90, retrieved from

261
http://iris.nyit.edu/~kkhoo/Spring2008/Topics/TAM/Trust&TAM_MIS.pdf
(November, 2010)
Gefen D., Straub, D. W., Boudreau, M.: Structural Equation Modeling and Regression:
Guidelines for Research Practice, Communication of the Association For Information
Systems, 4, August 2000, pp., retrieved from
http://www.cis.gsu.edu/~dstraub/Papers/Resume/Gefenetal2000.pdf (October 2010)
Gefen D., Straub, D.: A Practical Guide to Factorial Validity Using PLS-Graph: Tutorial and
Annotated Example, Communications of the Association for Information Systems, 16,
2005, pp. 91 – 109
Gibson D., Barrett, H.: Directions in electronic portfolio development, Contemporary
Issues in Technology and Teacher Education, 2(4), 2003, pp. 559-576, retrieved from
http://www.citejournal.org/vol2/iss4/general/CITEGibsonGeneral2.pdf (February
2009)
Gibson D.: ePortfolio Decisions and Dilemmas, Handbook of Research on ePortfolios,
Jafari A.&Kaufman C. (Ed.), IGI Global, London, UK, 2006, pp. 135 – 145
Grant S., Marshall, A., Strivens, J., Clark, R.: Development Issues for PDP with ePortfolios:
Web Services and Skills, Handbook of Research on ePortfolios, Jafari A.&Kaufman C.
(Ed.), IGI Global, London, UK, 2006, pp. 146 -157
Grant S., Richardson, H.: PDP Generic activity types version 2.5, The Centre for Recording
Achievement, 2006, retrieved from
http://zope.cetis.ac.uk/members/PDPcontent/viewActivityTypes (September 2009)
Gray L.: Effective Practice with e-Portfolios, Higher Education Funding Council for
England, JISC, Bristol, 2008, retrieved from
http://www.jisc.ac.uk/media/documents/publications/effectivepracticeeportfolios.pdf
(January, 2010)
Guttman L.: A Basis for Analyzing Test-Retest Reliability, Psyhometrika, 10(4), December
1945, pp. 255-282

262
Haenlein M., Kaplan, A. M.: A Beginner's Guide to Partial Least Squares Analysis,
Understanding statistics, 3(4), 2004, pp. 283 – 297, retrieved from
www.stat.umn.edu/~sandy/courses/8801/articles/pls.pdf (September 2010)
Hair J.F. Jr., Anderson, R.E., Tatham, R.L., Black, W.C.: Multivariate Data Analysis, 5th
Edition, Upper Saddle River, Prentice Hall, USA, 1998
Hargreaves D.: Learning for life: The foundations of lifelong learning, The Policy Press,
Bristol, 2004
Hartnell-Young E.: ePortfolios for Knowledge and Learning, Handbook of Research on
ePortfolios, Jafari A.&Kaufman C. (Ed.), IGI Global, London, UK, 2006, pp. 125 -134
Hartnell-Young E.: Impact study of e-portfolios on learning, Becta, 2007, retrieved from
http://partners.becta.org.uk/upload-
dir/downloads/page_documents/research/impact_study_eportfolios.doc (February,
2010)
Henseler J., Ringle ,C. M., Sinkovics, R. R.: The Use of Partial Least Squares Path Modeling
in International Marketing, Advances in International Marketing, 20, 2009, pp. 277 –
319
Hickerson C., Preston, M..: Transition to ePortfolios: A Case Study of Student Attitudes,
Handbook of Research on ePortfolios, Jafari A.&Kaufman C. (Ed.), IGI Global, London,
UK, 2006, pp. 460 – 473
Himpsl K., Baumgartner P: Evaluation of e-Portfolio Software, International Journal of
Emerging Technologies in Learning 2009, 4(1), pp. 16-22
Hoyle R. H., Kenny, D. A.: Sample size, reliability, and tests of mediation, Statistical
strategies for small sample research, Thousand Oaks, CA, 1999, pp. 195-222
IMS Global Learning Consortium: IMS ePortfolio Best Practice and Implementation Guide,
IMS/GLC, Inc., June 2005, retrieved from http://www.imsglobal.org (February, 2010)

263
Jaccard J., Turrisi, R., Wan, C.K.: Interaction Effects in Multiple Regression, Sage
University Paper Series on Quantitative Applications in the Social Sciences 07-072,
Newbury Park, CA, 1990
Jafari A.: The sticky e-portfolio system: Tackling challenges and identifying attributes,
Educause Review, 39(4), 2004, pp. 38-49
Jensen K.: Genetic Method, Review of Educational Research, 9(5), Methods of Research
in Education, American Educational Research Association, December 1939, pp. 491-497
JISC: e-Portfolio Reference Model, JISC ePortfolio Project Report, September 2006
retrieved from
http://www.jisc.ac.uk/media/documents/programmes/elearningframework/ep4llfina
lreport1b.pdf (October 2009)
Johnson L. H.: Limitations of the Descriptive Method, Phi Delta Kappa International,
34(6), 1953, pp. 241-245
Karim J., Emotional Labor and Psychological Distress: Testing the Mediatory Role of
Work-Family Conflict, European Journal of Social Sciences, 11(4), 2009, pp. 584 – 598
Katerattanakul P., Siau, K.: Factors Affecting the Information Quality of Personal Web
Portfolios, Journal of the American Society for information Science and Technology,
59(1), 2008, pp. 63 – 76
Kim M., Kim J.H., Lennon, S.: Online service attributes available on apparel retail web
sites: An E-S-QUAL approach, Managing Service Quality, 16(1), 2006, pp. 51 – 77
Kim P.: Perspectives on a Visual Map-Based Electronic Portfolio System, Handbook of
Research on ePortfolios, Jafari A.&Kaufman C. (Ed.), IGI Global, London, UK, 2006, pp.
44 – 53
Kline R.B.: Principles and Practice of Structural Equation Modeling, The Guilford Press,
New York, NY, 1998
Kučina-Softić, S.: Report from Centre for e-learning on e-learning strategy
implementation and plans for 2008 within University of Zagreb, Centre for e-learning,
264
Zagreb, Croatia, January 2008, retrieved from
http://www.unizg.hr/fileadmin/rektorat/dokumenti/e-
ucenje/Izvjesce_UEU_o_planovima_sastavnica_za_2008.pdf (November 2008)
Laudon K.C., Laudon, J.P.: Essentials of Management Information Systems: Managing the
Digital Firm, 5th Edition, Prentice Hall, New Jersey, 2002
Laudon K.C., Laudon, J.P.: Management Information Systems: New Approaches to
Organization&Technology, 5th Edition, Prentice Hall, New Jersey, 1998
Lawlor S.C.: Computer Information Systems, 3rd Edition, The Dryden Press, Fort Worth,
USA, 1994
Lawshe C. H.: A Quantitative Approach to Content Validity, Personnel Psychology, 28,
1975, pp. 563-575
Lewis B. R., Snyder, C.A., Rainer, R.K.: An Empirical Assessment of the Information
Resource Management Construct, Journal of Management Information Systems, 12(1),
Summer 1995, pp. 199 – 223
Licker P. S.: Management Information Systems: A Strategic Leadership Approach, The
Dryden Press, Fort Worth, USA, 1997
Lin H-F.: Measuring Online Learning Systems Success: Applying the Updated DeLone and
McLean Model, CyberPsychology&Behaviour, 10(6), 2007, pp. 817 – 820
Loehlin J. C.: Latent Variable Models: an introduction to factor, path, and structural
equation analysis, Fourth edition, Lawrence Erlbaum Associates, USA, 2004
Lorenzo G., Ittelson, J.: Demonstrating and assessing student learning with e-portfolios,
Educause Learning Initiative Paper, 3, 2005, retrieved from
http://net.educause.edu/ir/library/pdf/ELI3003.pdf (December 2009)
Love D., McKean, G., Gathercoal, P.: Portfolios to Webfolios and Beyond: Levels of
Maturation, Educause Quarterly, No. 2, 2004, pp. 24 – 37

265
Mahmood M. A., Bagci, K., Ford, T. C.: On-line shopping behavior: Cross-country empirical
research, International Journal of Electronic Commerce, 9(1), 2004, pp. 9 - 30
Marcoul-Burlinson I.: ePortfolio: Constructing Learning, Handbook of Research on
ePortfolios, Jafari A.&Kaufman C. (Ed.), IGI Global, London, UK, 2006, pp. 168 – 179
Martins I., Correia, T., Soeiro,A.: Digital Portfolios in University of Porto: defining goals,
University of Porto, 2008, retrieved from
http://repositorio.up.pt/aberto/bitstream/10216/13802/2/Digital%20Portfolios%20i
n%20University%20of%20Porto%20defining%20goals.pdf (November 2009)
McGrath S., Molder, M., Quon, P., Trapnell, T., Wilton, D.: Types of ePortfolios, ePortfolio
portal, December 2004, retrieved from
http://www.danwilton.com/eportfolios/types.php (January, 2009)
Mekovec R., Bubaš, G., Vrček, N.: A method for improvement of objectivity of e-service
quality evaluation, Journal of information and organizational sciences, 31(2), 2007, pp.
15 – 27
Mirani R., Lederer, A.L.: An instrument for assessing the organizational benefits of IS
projects, Decision Sciences, 29(4), 1998, pp. 803-838
Moore G. C., Benbasat, I.: Development of an Instrument to Measure the Perceptions of
Adopting an Information Technology Innovation, Information Systems Research, 2(3),
September 1991, pp. 192 - 222
Mu E., Wormer, S., Foizey, R., Barkon, B.,Vehec, M.: Conceptualizing the Functional
Requirements for a Next-Generation E-Portfolio System, EDUCAUSE Quarterly, 33(1),
January-March 2010
O’Brien K.: ePortfolios as Learing Construction Zones: Provost’s Perspective, Handbook of
Research on ePortfolios, Jafari A.&Kaufman C. (Ed.), IGI Global, London, UK, 2006, pp.
74 - 82
Paulson F. L., Paulson, P. R.,, Meyer, C.: What makes a portfolio a portfolio?, Educational
Leadership, 48(5), 1991, pp. 60-63

266
Petter S., DeLone, W., McLean, E.: Measuring information system success: models,
dimensions, measures, and interrelationships, EJIS, 17, 2008, pp. 236 – 263
Richardson H.,C, Ward. R: Getting what you want: Implementing Personal Development
Planning through e-portfolio, CRA, 2005, retrieved from
http://www.jisc.ac.uk/uploaded_documents/Guidance_final.doc (January 2010)
Riedinger B.: Mining for Meaning: Teaching Students How to Reflect, Handbook of
Research on ePortfolios, Jafari A.&Kaufman C. (Ed.), IGI Global, London, UK, 2006, pp.
90 - 101
Ring G., Foti, S.: Using ePortfolios to Facilitate Professional Development Among Pre-
Service Teachers, Handbook of Research on ePortfolios, Jafari A.&Kaufman C. (Ed.), IGI
Global, London, UK, 2006, pp. 340 – 355
Rivard S., Poirier, G., Rayond, L., Bergeron, F.: Development of a Measure to Assess the
Quality of User-Developed Applications, The DATA BASE for Advances in Information
Systems, 28(3), 1997, pp. 44-58
Roldán J.L., Leal, A.: A validation test of an Adaptation of the DeLone and McLean’s Model
in the Spanish EIS Field, Critical reflections on information systems: a systemic
approach, Jeimy J. Cano (Ed.), IGI Publishing, Hershey, PA, USA, 2003, pp. 66 – 84,
retrieved from: http://citeseerx.ist.psu.edu (September, 2009)
Ruža F., Zver, B., Hutinski, Ž.: Ekonomika poduzeća, FOI, Varaždin, 1996
Sabherwal R., A. Jeyaraj, and C. Chowa: Information System Success: Individual and
Organizational Determinants, Management Science, (52)12, 2006, pp. 1849-1864
Schugurensky, D.: The forms of informal learning: Towards a conceptualization of the
field, The Research Network on New Approaches to Lifelong Learning, Ontario Institute
for Studies in Education of the University of Toronto, October 2000, Canada, retrieved
from http://www.oise.utoronto.ca/depts/sese/csew/nall/res/19formsofinformal.htm
(November 2009)

267
Schumacker R. E., Lomax, R. G.: A Beginner's Guide to Structural Equation Modeling, 2nd
edition, Taylor&Francis Group, New York, USA, 2004
Seddon P. B., Staples, S., Patnayakuni, R., Bowtell, M.: Dimensions of Information Systems
Success, Coomunications of Association for Information Systems, 2(20), November
1999, pp. 2 - 61
Seddon P. B.: A Respecification and Extension of the DeLone and McLean Model of IS
Success, Information Systems Research, 8(3), September 1997, retrieved from
http://fag.grm.hia.no/ikt4100/seddon.pdf (February, 2010)
Segars A. H., Grover V.: Strategic Information Systems Planning Success: An Investigation
of the Construct and its Measurement, MIS Quarterly 22(2), June 1998, pp. 139 – 163
Segars A.H.: Assessing the Unidimensionality of Measurement: a Paradigm and Illustration
Within the Context of Information Systems Research, Omega, 25(1), pp. 107 – 121, 1997,
retrieved from http://infosys.coba.usf.edu/rm/Segars97-ScaleUnidimensionality.pdf
(September, 2010)
Shannon C.E., Weaver, W.: The Mathematical Theory of Communication, Urbana, IL:
University of Illinois Press, 1949
Smithson S., Hirschheim, R.: Analysing information system evaluation: Another look at an
old problem, European Journal of Information Systems, 7(3), 1998, pp. 158 – 174
Stefani L., Mason, R., Pegler, C.: The educational potential of e-Portfolios, Routledge T&F
Group, Great Britain, 2007
Stevenson H. J.: Using ePortfolios to Foster Peer Assessment, Critical Thinking, and
Collaboration, Handbook of Research on ePortfolios, Jafari A.&Kaufman C. (Ed.), IGI
Global, London, UK, 2006, pp. 112 – 123
Straub D., Boudreau, M-C., Gefen, D.: Validation Guidelines for IS Positivist Research,
Communications of the Association for Information Systems, 13, 2004, pp. 380 – 427
268
Tenenhaus M., Esposito Vinzi, V., Chatelin,Y.-M., Lauro, C.: A global Goodness–of–Fit
index for PLS structural equation modeling, Computational Statistics&Data Analysis,
48(1), 2005, pp. 159–205
Torkzadeh G., Doll, W.J. : The development of a tool for measuring the perceived impact of
information technology on work, Omega – The International Journal of Management
Science, 27(3), 1999, pp. 327 – 339
Tosh D., Werdmuller, B.: E-portfolios and Weblogs: One vision for e-portfolio
development, 2004, retrieved from:
http://eduspaces.net/bwerdmuller/files/61/178/ePortfolio_Weblog.pdf
Venkatesh V., Morris, M.G., Davis, G.B., Davis, F.D.: User Acceptance of Information
Technology: Toward a Unified View, MIS Quarterly, 27(3), pp. 425-478
Wang W., Wang C., An empirical study of instructor adoption of web-based learning
systems, Computers&Education, 53, 2009, pp. 761 – 774
Wixom B. H., Watson, H.T.: An Empirical Investigation of the Factors Affecting Data
Warehousing Success, MIS Quarterly25(1), pp. 17-41, retrieved from
http://www.jstor.org/stable/3250957 (March, 2010)
Yeomans K. A., Golder, P.A.: The Guttman –Kaiser Criterion as a Predictor of the Number
of Common Factors, Journal of the Royal Statistical Society (The Statistican), 31(3),
September 1982, pp. 221 – 229
Zemsky R., Massy, William, F., Thwarted Innovation: What Happened to e-learning and
Why, The Learning Alliance, University of Pennsylvania, 2004, USA
Zhang X, Olfman L, Ractham P, Firpo D.: The Implementation and Evaluation of KEEP
SLS: An ePortfolio System Supporting Social Constructive Learning, Proceedings of the
Special interest Group on Management Information System's 47th Annual Conference
on Computer Personnel, Limerick, Ireland, 2009, pp. 13-18.
Žugaj M.: Znanstvena istraživanja u društvenim znanostima i nastanak znanstvenog djela,
Tonimir, Varaždinske toplice, Croatia, 2007

DD(FOI) Tekudi broj: 93 (Sveučilište u Zagrebu) UDK: 007.5:004(043.3)
Doktorska disertacija
Razvoj Modela uspješnosti ePortfolio sustava
I. Balaban
Fakultet organizacije i informatike, Varaždin, Hrvatska
Elektronički Portfolio ili ePortfolio predstavlja proširenje e-učenja, te se vrlo snažno
popularizira u posljednjih nekoliko godina. Kako je područje još uvijek vrlo neistraženo, ne
postoji model koji opisuje mogudnosti uspješne implementacije ePortfolio sustava koji bi
obuhvadao pojedinca (studenta, nastavnika), akademsku instituciju, te poslodavca
(industrije). Dosadašnja istraživanja upuduju na važnost ePortfolio sustava, te sugeriraju
izgradnju cjelovitog modela koji de obuhvadati i pedagoški i ICT potencijal ePortfolio sustava.
U ovoj doktorskoj disertaciji razvit de se instrument za vrednovanje uspješnosti
ePortfolija korištenjem DeLone i McLean poboljšanog modela uspješnosti informacijskog
sustava (u daljnjem tekstu: D&M model) kao okvira za procjenu. Na temelju rezultata
razvijenog instrumenta i spomenutog D&M modela predložit de se cjeloviti model
uspješnosti ePortfolio sustava.
Rad nije objavljen.
Voditelji rada: prof. dr. sc. Blaženka Divjak i prof. dr. sc. Enrique Mu
Povjerenstvo za ocjenu: prof. dr. sc. Josip Brumec, predsjednik prof. dr. sc. Blaženka Divjak, mentor i član prof. dr. sc. Enrique Mu, sumentor i član prof. dr. sc. Diana Šimid, član prof. dr. sc. Jadranka Lasid-Lazid, član
Povjerenstvo za obranu: prof. dr. sc. Diana Šimid, predsjednica prof. dr. sc. Blaženka Divjak, mentor i član prof. dr. sc. Enrique Mu, sumentor i član prof. dr. sc. Josip Brumec, član prof. dr. sc. Mladen Varga, član
Datum obrane: 1. travnja 2011.
Datum promocije:
Rad je pohranjen na Fakultetu organizacije i informatike Varaždin.
(stranica 268, slika 23, tablica 37, bibliografskih jedinica 133, original na engleskom jeziku)
I. Balaban

DD(FOI) UDK: 007.5:004(043.3) Tekudi broj: 93
I. Razvoj modela uspješnosti ePortfolio sustava
II. Balaban, I.
III. Fakultet organizacije i informatike, Varaždin, Republika Hrvatska
Cjeloživotno učenje
DeLone&Mclean model
Eportfolio
Instrument
Model
PLS
SEM
Uspješnost informacijskog sustava

DD(FOI) Current file number: 93 (University of Zagreb) UDK: 007.5:004(043.3)
Doctoral Dissertation
Development of an ePortfolio System Success Model: An Information System approach
I. Balaban
Faculty of Organization and Informatics, Varaždin, Republic of Croatia
Electronic Portfolio constitutes an extension to e-learning and has therefore been
very strongly popularized in the last few years. Since the field of ePortfolio is still unexplored,
there is not a model to describe the successful implementation of an ePortfolio taking into
account the individual (student, educator), academic institution, and industry (employer)
level. However, research conducted so far refer to the importance of ePortfolio system and
suggest the need to develop an integral model which will comprehend both the pedagogical
and ICT potential of an ePortfolio system.
In this doctoral dissertation, an instrument to evaluate ePortfolio success, using the
DeLone&McLean updated IS success model as the assessment framework, will be
developed. Based on the results of instrument developed and D&M model, an integral
model of ePortfolio success will be proposed.
The thesis was not published.
Supervisors: prof. Blaženka Divjak, PhD and prof. Enrique Mu, PhD
Apointed members for evaluation of dissertation: prof. Josip Brumec, PhD, chair prof. Blaženka Divjak, PhD, supervisor and member prof. Enrique Mu, PhD, supervisor and member prof. Diana Šimid, PhD, member prof. Jadranka Lasid-Lazid, PhD, member
Apointed members for oral examination: prof. dr. sc. Diana Šimid, PhD, chair prof. Blaženka Divjak, PhD, supervisor and member prof. Enrique Mu, PhD, supervisor and member prof. Josip Brumec, PhD, member prof. Mladen Varga, PhD, member
Oral examination: April, 1st 2011
Degree confered:
This thesis is deposited at the Faculty of Organization and Informatics in Varaždin. (pages 268, figures 23, tables 37, references 133, original in English language)
I. Balaban
DD(FOI) UDC: 007.5:004(043.3) Current file number: 93
I. Development of an ePortfolio System Success Model: An information System Approach
II. Balaban, I.
III. Faculty of Organization and Informatics, Varaždin, Republic of Croatia
Eportfolio
Information system success
DeLone&Mclean model
Instrument
Lifelong learning
Model
PLS
SEM
Ž I V O T O P I S
Igor Balaban, mag. inf. Katedra za informatičke tehnologije i računarstvo Fakultet organizacije i informatike Varaždin Pavlinska 2, 42 000 Varaždin Tel. 042/390-858 e-mai: [email protected]
Datum i mjesto rođenja: 23. siječnja 1981., Čakovec Kudna adresa: Stjepana Mlinarida 6 40 323 Prelog
OBRAZOVANJE
1995.-1999. I. Gimnazija Varaždin, prirodoslovno-matematički smjer
1999.-2004. Fakultet organizacije i informatike Varaždin, smjer Informacijski sustavi
Od 2004. Poslijediplomski studij Informacijske znanosti, Fakultet organizacije i informatike
Varaždin
ZAPOSLENJE
Od 2004. Znanstveni novak/Asistent na Fakultetu organizacije i informatike Varaždin
AKADEMSKI NASLOV
2004. Diplomirani informatičar (diplomski rad: "Usporedba nekih sigurnosnih mjera
Windows XP Professional i Linux operacijskih sustava", mentor: prof. dr sc. Željko
Hutinski)
NAGRADE
2000. Nagrađen u Top 10 najboljih studenata na prijemnom ispitu
2001., 2002. Nagrada za najboljeg studenta na godini na Fakultetu organizacije i
i 2003. informatike Varaždin
OSTALE AKTIVNOSTI
2000.-2004. Demonstrator na Fakultetu organizacije i informatike Varaždin, kolegij "Matematika"
2004.-2005. Član projektnog tima "E!2963 EuroLearn IT Center - Learning Management
System For E-Learning", voditelj prof. dr. sc. Željko Hutinski
2004.-2006. Član projektnog tima "Razvoj metoda upravljanja sigurnošdu informacijskih sustava",
voditelj: prof. dr. sc. Željko Hutinski
2007.-2009. Član ICT Skills i ICT Support modula u sklopu Tempus InterProject "Enhancing
Absoption Capacity of EU Programmes in Croatia", koordinator: Blaženka Divjak
2008. E-mentor u sklopu FP6 STREP projekta "iCamp - Innovative, Inclusive, Interactive &
Intercultural Learning Campus", Trials 3, nositelj Barbara Kieslinger
2009.-2010. Član projektnog tima znanstveno-tehnološke suradnje sa Slovenijom "Evaluacija
kvalitete i upotrebljivosti online tečajeva i Web 2.0 alata u e-učenju", voditelj u
Hrvatskoj prof. dr. sc. Goran Bubaš
2009.-2011. Član projektnog tima "Portal za testiranje i promociju edukacije pomodu Web 2.0
alata", glavni istraživač prof. dr. sc. Goran Bubaš

POPIS RADOVA:
Poglavlja u knjizi:
1. Balaban, Igor: First steps in using ePortfolio in a university course // Nuevas tendencias de e-
learning y actividades didácticas innovadoras / Ana Landeta Etxeberria (ur.). Madrid : Centro de
estudios financieros, 2010. Str. 155-163.
2. Balaban, Igor: Alati za vođenje financija na projektu // Projekti u znanosti i razvoju, Europski
programi / Divjak, Blaženka (ur.). Varaždin : TIVA Tiskara Varaždin, 2009. Str. 258-268.
Radovi u časopisima:
1. Hutinski, Željko; Zlatović, Miran; Balaban, Igor.
Identification of the frequency and the intensity of the threats in the function of development of the
information system. // Journal of Information and Organizational Sciences. 30 (2006) , 1; str. 63-
81
Radovi na znanstvenim skupovima:
1. Hutinski, Željko; Zlatović, Miran; Balaban, Igor.
Risk and Threat Assessment as a Foundation for Development of the Security System in the Business
System // Proceedings of the 16th IIS International Conference in Varaždin : FOI, 2005., str. 269-
278
2. Bubaš, Goran; Zlatović, Miran; Balaban, Igor.
Social software and applications for knowledge sharing in e-learning: Use of weblogs, wikis and
social bookmarks as elements of instructional design // Proceedings of the 17th IIS International
Conference in Varaždin : FOI, 2006., str. 441-448
3. Hutinski, Željko; Zlatović, Miran; Balaban, Igor.
Security Model for Development of the E-learning System // Proceedings of the 17th IIS
International Conference in Varaždin : FOI, 2006., str. 247-255
4. Hutinski, Željko; Balaban, Igor; Bambir, Danijela. Hybrid e-learning model dependency upon
used LMS system // Proceedings of the 26th Creative organization International Conference in
Portorož : FOS, 2007., str. 620-629
5. Hutinski, Željko; Zlatović, Miran; Balaban, Igor. Online knowledge assessment in the context of
Bologna process // Proceedings of the 26th Creative organization International Conference in
Portorož : FOS, 2007., str. 629-636
6. Vidaček-Hainš, Violeta; Kovačić, Andreja; Balaban, Igor. Analysis of Various Aspects of
Computer-Mediated Communication in the Context of Language Skills Development and
Communication Apprehension in English as a Foreign Language // Proceedings of the 30th
MIPRO 2007 International Convention in Opatija, Vol. IV., MIPRO, 2007., str. 44-49
7. Bubaš, Goran; Balaban, Igor; Begičević, Nina. Evaluation of Online Courses as an Element of
Instructional Design: The Case of Two Hybrid University Courses // Proceedings of the 30th
MIPRO 2007 International Convention in Opatija, Vol. IV., MIPRO, 2007., str. 216-222
8. Kovačić, Andreja; Vidaček-Hainš, Violeta; Balaban, Igor. Optimizing the Methodological and
Communicative Aspect of Learning English as a Foreign Language through ICT // Proceedings of
the 18th IIS International Conference in Varaždin : FOI, 2007., str. 93-100
9. Bubaš, Goran; Balaban, Igor; Begičević, Nina. Course Evaluation in e-Learning by
Comparative Analisys of Two or More e-Learning Courses // Proceedings of the 18th IIS
International Conference in Varaždin : FOI, 2007., str. 65-72

10. Bubaš, Goran; Balaban, Igor; Zlatović, Miran. The use of social software in the online
presentation of cultural heritage // The Future of Information Sciences: Digital Information and
Heritage : Proceedings of the 1st International Conference The Future of Information Sciences -
INFuture 2007, 2007, str. 403-412
11. Radošević, Danijel; Bubaš, Goran; Balaban, Igor. The use of search engines for locating
information on cultural heritage of Croatia // Proceedings of the 1st International Conference
The Future of Information Sciences - INFuture 2007, 2007, str. 389-401
12. Balaban, Igor; Bubaš, Goran. Evaluating an ePortfolio system: the Case of a Hybrid University
Course // Proceedings of the ICL 2009 conference: The Challenges of Life Long Learning, Villach:
Kassel University Press, 2009., str. 638-643
13. Balaban, Igor; Kišasondi, Tonimir. A Lightweight ePortfolio Artifact Integrity Method //
Proceedings of the ICL 2009 Conference: The Challenges of Life Long Learning, Villach : Kassel
University Press, 2009., str. 681-686
14. Balaban, Igor; Brumec, Josip. EPortfolio as an Information System: The Genetic Taxonomy
Approach // Proceedings of the 21st Central European Conference on Information and
Intelligent Systems (CECIIS) : FOI, 2010., str. 179-188
15. Balaban, Igor; Bubaš, Goran. Educational Potentials of ePortfolio Systems: Student
Evaluations of Mahara and Elgg // Proceedings of the ITI 2010 32nd International Conference
on Information Technology Interfaces: University Computing Center SRCE, University of Zagreb,
2010., str. 329-336
16. Balaban, Igor; Divjak, Blaženka; Kopić, Matija. Emerging issues in using ePortfolio //
Proceedings of the iLearning Forum 2010 London, 2010, pp. 212 - 218
17. Balaban, Igor; Divjak, Blaženka; Grabar, Darko; Žugec, Bojan. Towards successful
implementation of ePortfolios in blended learning // Proceedings of the iLearning Forum 2010
London, 2010., str. 146 - 153
Radovi na stručnim skupovima:
1. Balaban, Igor; E-mentor: Nova uloga nastavnika u on-line tečaju // CARNet Users Conference
CUC 2008.
2. Boban, Mate; Grabar, Darko; Balaban, Igor.
Strateško planiranje i implementacija LMS sustava Moodle na fakultetu organizacije i informatike
u Varaždinu // CARNet Users Conference CUC 2006.
Zagreb : Hrvatska akademska istraživačka mreža CARNet, 2006.
3. Bubaš, Goran; Balaban, Igor. Analiza činitelja koji imaju utjecaj na opću evaluaciju on-line
tečaja od strane polaznika // Stručno-znanstveni skup "E-obrazovanje", Zbornik radova FOI
Varaždin, 2007, str. 93-105
4. Kovačić, Andreja; Zlatović, Miran; Balaban, Igor. Oblikovanje obrazovnih aktivnosti u nastavi
engleskog jezika korištenjem wiki sustava // Stručno-znanstveni skup "E-obrazovanje", Zbornik
radova FOI Varaždin, 2007, str. 119-135
5. Bubaš, Goran; Balaban, Igor; Begičević, Nina.
Evaluacija on-line tečaja kao obrazovne komponente u hibridnom sveučilišnom kolegiju // CARNet
Users Conference CUC 2004.
Related Documents