Master of Science Thesis Development of an animal in vivo 124 I-MicroPET/MicroCAT imaging model of the thyroid Martin Emanuelsson Supervisor: Henrik Hussein El-Ali 1 Assistant supervisors: Andreas Kjær 1 and Sven-Erik Strand 1 Cluster for Molecular Imaging, Panum Institute, University of Copenhagen, Denmark Medical Radiation Physics Clinical Sciences, Lund Lund University, 2006

Welcome message from author
This document is posted to help you gain knowledge. Please leave a comment to let me know what you think about it! Share it to your friends and learn new things together.
Transcript

Master of Science Thesis
Development of an animal in vivo 124
I-MicroPET/MicroCAT imaging model of the thyroid
Martin Emanuelsson
Supervisor: Henrik Hussein El-Ali1
Assistant supervisors: Andreas Kjær1
and Sven-Erik Strand
1 Cluster for Molecular Imaging, Panum Institute,
University of Copenhagen, Denmark
Medical Radiation Physics
Clinical Sciences, Lund
Lund University, 2006

Abstract Introduction: To our knowledge a biomedical model for validation of combined
MicroPET/MicroCAT studies of the thyroid with 124
I has not yet been developed. Such an in
vivo physiological rat model could be of great interest for enhancing the possibilities of
studying common thyroid diseases realistically and repeatedly. Furthermore, a well
developed, realistic, and flexible model can also be of great importance for studies of pre 131
I-
therapy dose calculations.
Materials and Methods: Seven adult, healthy Wistar rats (354 – 533.4 g) were used for
thyroid imaging performed with the MicroCAT II scanner (Siemens Medical Solutions USA,
Inc.) and the MicroPET scanner (Focus 120, Siemens Medical Solutions USA, Inc.). The rats
were anesthetized with Hypnorm/Dormicum and divided into four groups, each group
receiving injections of ~20 MBq, ~10 MBq, ~5 MBq and ~0.7 MBq of 124
I-NaCl solution.
The rats were scanned in the MicroPET for 40 minutes at approximately 0, 3, 24, 48 and 72
hours post injection. The acquired MicroPET images were analyzed using the ASIPro toolbox
(Siemens Medical Solutions USA, Inc.). A 6.5-minute MicroCAT scan was acquired directly
after the last MicroPET scan, using a volume of 4-5 ml of a contrast agent (Ultravist® 300 mg
I/ml) continuously injected in the lateral tail vein during the entire scan time. The Amira 4.1
analysis program (Mercury Computer Systems) was used for image evaluations. For control
of the system performance, a phantom mimicking the thyroid was designed and scanned with
the same protocols as for the rats.
Results and Conclusion: Volumetric measurements based on the MicroCAT images showed a
difference in thyroid volume ranging from 34.3 – 70.6 l in the seven rats. The wide span in
thyroid volume between the individual rats demonstrates the importance of a good volume
measuring technique. Corresponding measurements based on MicroPET images proved that
MicroPET images alone cannot be used for correct volume determination of the thyroid due
to the limitation in the resolution. These results indicate that a combination between
MicroCAT and 124
I-MicroPET is necessary for an accurate thyroid imaging. Measurements of
the distribution of 124
I in the thyroid showed a maximum uptake of 4.0 – 6.2% of
administrated activity at 24 h post infusion. Furthermore the study shows that this
physiological model could be applied for absorbed dose measurements, resulting in absorbed
doses to the rats’ thyroids ranging from 5.2 – 225.7 Gy. These are the maximum absorbed
dose to the thyroid, but because of technical problems the minimum absorbed dose could not
be calculated. The model could however be suitable for further in vivo studies of the thyroid
e.g. pre 131
I-therapy absorbed dose calculations.

2
II
Table of contents
1 INTRODUCTION 1
1.1 Purpose 1
1.2 Background 1 1.2.1 The thyroid 1 1.2.2 Iodine 2
1.3 Interaction 4 1.3.1 Annihilation 4 1.3.2 Coherent scattering, Compton scattering, Photoelectric Effect and Pair production 4
2 MATERIALS AND METHODS 6
2.1 The MicroPET Focus 120 6 2.1.1 Detection 6 2.1.2 Data acquisition 7 2.1.3 Reconstruction 7 2.1.4 Image degradation 7
2.2 The MicroCAT® II System 8
2.3 Wistar rats 10
2.4 The performance procedures of 124
I MicroPET and MicroCAT scans 10 2.4.1 MicroPET scan 11 2.4.2 MicroCAT scan 12
2.5 Hollow sphere thyroid phantom 12
2.6 Image analysis 13 2.6.1 Image Segmentation with Amira 4.1 13 2.6.2 Volume measurements with ASIPro 15
2.7 Activity quantification 16
2.8 Calculation of absorbed dose 17
2.9 Error calculation 18 2.9.1 Activity quantification 18 2.9.2 Volume measurements 19
3 RESULTS AND DISCUSSION 20
3.1 Quantification of the activity concentration in the phantom 20
3.2 Volume measurements 21 3.2.1 Hollow sphere volume measurements 21
3.2.1.1 MicroPET 21 3.2.1.2 MicroCAT 22
3.2.2 Thyroid volume measurements 23
3.3 Images 25
3.4 124I quantification and distribution in the thyroid 28

2
III
3.5 Absorbed dose 32
4 CONCLUSIONS AND FUTURE WORK 35
ACKNOWLEDGEMENTS 37
APPENDIX I I
APPENDIX II III

2
1
1 Introduction
1.1 Purpose
The aim of this work is to introduce an in vivo animal model for 124
I imaging of the thyroid
combining the Micro Positron Emission Tomography (MicroPET) and the Micro Computed
Axial Tomography (MicroCAT) modalities. Such a realistic and well applicable animal model
is required for the possibility of mimicking the different conditions of human thyroid
physiology. Moreover, such a well applicable animal model could be superior to static and
computed phantom studies, since the animal model offers a wider knowledge of thyroid
diseases which can then be applied onto human studies. Co-registration of 124
I-PET and CT
modalities has earlier been applied on patient studies (1-5). However, use of an animal model
for validation of this method could be of great usefulness, offering the researchers the
opportunity to design their “patient groups” and minimize the individual variations between
patients. To our knowledge there is no animal model reported for combined 124
I
MicroPET/MicroCAT thyroid imaging to date. In this work the animal model is also applied
on dosimetry, and the importance of MicroCAT for volume determination of the thyroid and
absorbed dose calculations is investigated.
1.2 Background
1.2.1 The thyroid
The thyroid gland, which consists of two lobes connected by a narrow neck (isthmus),
produces thyroid hormones which regulate cell activity and growth in virtually all tissues
(Figure 1). The two most important hormones are tetraiodothyronine (thyroxine or T4) and
triiodothyonine (T3), which are peptides containing iodine. Iodine is therefore essential for
their production. The thyroid gland efficiently traps iodine circulating in blood, and the part
that is not taken up by the thyroid is mostly excreted by urine, but also through sweating and
breathing (6).
Figure 1 – Anatomical drawing of the human thyroid
gland (7)
2
2
Hypothyroidism is the most common thyroid disease and is a state where the thyroid doesn’t
produce enough thyroid hormone, resulting in symptoms as fatigue, unexplained weight gain,
hair loss and depression (8). This reason might be due to autoimmune disease, radiation or
drugs that have disabled the thyroid. It can also be the result of treatment of hyperthyroidism;
when the thyroid starts producing too much thyroid hormone, which leads to increased heart
rate, increased blood pressure and enhanced metabolism. The most common underlying cause
is Graves’ disease (9;10). Hyperthyroidism can result in an enlargement of the thyroid, but an
enlargement can also be the result of hypothyroidism, compensating the fact that the thyroid is
not producing enough hormones. The enlarged thyroid is called a goitre. It is also common for
the thyroid to develop benign lumps and cysts, known as nodules. Malignant tumours of the
thyroid are however unusual. This type of cancer stands for 1.2 % of all new cancers (outside
skin cancer) diagnosed annually in the United States.
1.2.2 The role of iodine 124
Iodine is a halogen with atomic number 53. It forms compounds with most elements, but is
not as reactive as the other halogens, which makes it suitable for labelling with
radiopharmaceuticals (11;12), However, for thyroid studies there is no need for labelling since
the thyroid is naturally absorbing iodine. In the past, 123
I and 131
I has been used together with
a gamma camera, used for planar imaging as well as Single Photon Emission Computed
Tomography (SPECT) studies. 123
I produces reasonable scintigrams with low absorbed dose,
but its short half-life (13.22 h) makes it not suitable for studies of biological distributions over
several days. On the other hand 131
I has a longer half-life (8.02 days), whereas a
comparatively high absorbed dose and a poor image quality making this nuclide less suitable
for imaging. When Pentlow et al in 1996 showed that 124
I could be used for PET-studies of
tumour-like objects surrounded by a relatively low background activity (13), it indicated that
positron emitting 124
I could be the optimal iodine isotope for thyroid studies regarding to
image quality and half-life (4.18 days). The absorbed dose per administered activity is higher
than that of 131
I, but the effective radiation exposure is significantly lower since the sensitivity
of PET is higher than that of a scintillation camera. The contrast and spatial resolution of PET
images also exceeds that of scintigrams (14). Added to this, the life-time of 124
I makes it
suitable for dosimetry studies of radionuclide therapy based on 131
I.
On the down-side, 124
I has a complicated decay-scheme where only 22 % of the
disintegrations are positrons, as well as a cascade of prompt gammas irradiated in every
disintegration (Figure 2).

2
3
Figure 2 – Decay-scheme of
124I (15).
124I has more than 70% high energy gamma decays close to the
annihilation energy of 511 keV.
Furthermore 124
I has more than 70% high energy gamma decays (63% 602 keV, 10% 723
keV), which can produce non-annihilation true coincidences that will contribute to the
background activity. The energy of the positrons is also a problem; the maximum energy of
positrons from 124
I are 1.5 MeV (11.5% branching ratio) and 2.1 MeV (11.5%). These high
kinetic energies of the positron cause a positron range of ~3 mm in water for 124
I, compared to
~0.6 mm for 18
F (0.6 MeV), resulting in a significant degradation in image resolution (see
section 2.1.4) (16).
Availability is also a problem. 124
I can be produced by cyclotrons, by bombarding a 124
Te
target with deuterons, giving the reaction 124
Te(d,2n) 124
I (different deuteron energies can be
used but it has been shown that the yield of the reaction has a peak around 18 MeV)(17).
However, not all cyclotrons are able to accelerate deuterons and starting up such a production
is both expensive and time consuming which demands an everyday need from the clinical side
for 124
I. For this study, 124
I was therefore ordered from Ritverc GmbH, St. Petersburg, Russia.
1.2.3 Why combine MicroPET with MicroCAT?
The poor resolution, the lack of identifiable anatomical structures and the fact that the volume
is vital in the definition of the expression of absorbed dose (see Appendix I) introduces the
importance of CT for visualising the thyroid. Other groups have showed that CT has an
important role in patient studies (2-4;18), but MicroCAT has yet never been used for studies
of the thyroid of a rat combined with 124
I-MicroPET imaging. The reason might be due to the
difficulties of visualizing a small object with a little variation in the Hounsfield values as its
surrounding (A Hounsfield value is the mass attenuation value of a specific material related to
the mass attenuation value of water in the reconstructed image). The thyroid of the rat is such
an object that can be difficult to image without a contrast agent intended for the animal
thyroid imaging.

2
4
1.3 Interaction
1.3.1 Annihilation
Examples of accessible positron emitters used in the PET imaging are; 11
C, 13
N, 15
O, 18
F and 124
I. The positrons lifetime in an electron-rich material, such as tissue, is very short. The
positron loses its kinetic energy through inelastic collisions with the atomic electrons in the
material until it reaches a thermal energy that allows for an interaction with electrons. The
positron then combines with an electron, forming a hydrogen-like state called positronium.
This state, however, lasts for about 10-10
seconds before the annihilation process occurs. The
annihilation process converts the mass of the positronium into two electromagnetic particles
called annihilation photons. The two annihilation photons escape the annihilation place with a
511 keV each forming so called back-to-back 511 keV annihilation photons. Since the
positron’s and electron’s energy at this point almost only consists of rest energy, the energy
converted comes mainly from the mass of the particles. The energy released can be computed
from Einstein’s mass-energy equivalence as
2 2 2
e pE mc m c m c (1)
where c is the speed of light ( 83 10 m/s), em represents the mass of the electron ( 319.1 10
kg) and pm represents the mass of the positron ( 319.1 10 kg). Inserting the values into the
equation and converting the unit to electron volts gives the total energy released; 1.022 MeV.
Since both the electron and the positron are almost at rest when the annihilation occurs, the
net momentum is close to zero. Momentum and energy must be conserved during the process;
therefore it is not possible for the annihilation process to result in just one photon. To
conserve the momentum close to zero, two photons will be released simultaneously in
opposite directions, sharing the total energy released, i.e. 0.511 MeV each. (19)
1.3.2 Coherent scattering, Compton scattering, Photoelectric Effect and Pair production
When the emitted photons travel through the tissues, it interacts with its atoms through
different interaction processes, elastic as well as inelastic processes e.g. Coherent scattering,
Compton scattering, photoelectric effect and pair production.
Coherent scattering (or Rayleigh scattering) is an elastic interaction where the photon changes
its direction with essentially losing none of its energy. Coherent scattering contributes nothing
to dose since no energy is given to any charged particle, and no ionization or excitation is
produced. (20)
Compton scatter changes a photons direction and energy when the photon interacts with a free
or loosely bound electron (Figure 3). Some of the photons initial energy (h ) is transferred to
the electron, resulting in an ejected Compton recoil electron (Ee) and a scattered photon of
lower energy (h ’).

2
5
Figure 3 – Compton scattering: An interaction
where a photon changes its direction and
transfers some of its initial energy to a recoil
electron.
The photoelectric effect occurs when a 511-keV photon is transferring all of its energy to an
orbital electron resulting in a complete absorption of the initial photon (Figure 4). Both
Compton scatter and photoelectric effect result in an ejected electron that is quickly absorbed
in solids and liquids. The photoelectric effect also generates low-energy x-rays. These x-rays
typically have energies of tens of keV and are also quickly absorbed in the medium. These
types of interactions contribute to degradation in resolution and poorer image quality. (19)
Figure 4 – Photoelectric effect: A photon is
completely absorbed, resulting in an ejected
electron.
Pair production is an absorption process where an electron and a positron are produced from
an initial photon. It can be regarded as “reversed” annihilation, but with one photon instead of
two. It usually occurs near an atomic nucleus and requires a minimum photon energy of 2m0c2
= 1022 keV (20). Because of the (compared to other commonly used PET-isotopes) non-
trivial decay-scheme of 124
I this is a process that can occur, especially with a probability of
over 10% for photon energy of 1691 keV (Figure 2). Even at this energy there is however
only a 1 % chance for pair production in water compared to Compton scatter, so the effect of
this process is of lesser interest. Pair production can of course be directly followed by
annihilation, producing two new photons with energy 511 keV.

2
6
2 Materials and Methods
2.1 The MicroPET Focus 120
The MicroPET Focus 120 (Siemens Medical Solutions USA, Inc.) consists of 4 contiguous
rings containing a total of 168 lutetium oxyorthosilicate (LSO) detectors. Each detector
consists of a 12 x 12 array of crystal elements coupled via an optical fibre bundle, consisting
of 8 x 8 elements of square multiclad plastic fibres each measuring 2.2 x 2.2 x 100.0 mm3, to
a position-sensitive photomultiplier tube (Hamamatsu R5900-C12). The size of each LSO
crystal is 1.51 x 1.51 x 10.00 mm3 and all the crystals are enveloped on all, but one, sides by a
thin reflective material. This reflective material is also surrounding each optical fiber,
providing optical isolation and improving light collection efficiency.
A 185 kBq (01-03-2006) 57
CO point source (Isotope Products Inc., Valencia, CA) rotating
mechanism is used for system calibration and transmission scans for attenuation correction.
The system has a laser-positioning marker for the centre Field Of View (cFOV) positioning.
The diameter of the animal opening port is 15 cm (21).
Figure 5 – MicroPET Focus 120 with operating station in background.
2.1.1 Detection
The scintillation detectors are linked together so that they detect two photons only when they
are registered within a defined timing window (a so called coincidence event). The detectors’
scintillation material is chosen so that they can attenuate a large fraction of the incident 511-
keV photons, in this case the material is LSO. The interactions described in the “Interactions”
section also occur when the photons are detected. When a photon incidents the detector, its

2
7
energy is absorbed by the scintillation material mainly through Compton scattering
interactions. However, photo electric effect has to occur to detect the photon. Every detected
photon results in optical photons (light). The light is emitted isotropically and proportional to
the energy absorbed in the scintillation material. After conversion to an electrical pulse the
signal is amplified through multiplication of the signal. The resulting current pulse is hence
also proportional to the deposited energy and a threshold can therefore easily be set so that
low signals are ignored by the system, rejecting low-energy photons that have been scattered
on its way to the detectors (19).
2.1.2 Data acquisition
When a pair of photons is detected (within a defined detection time) a line of response (LOR)
is simulated between them. The annihilation process is assumed to have occurred somewhere
along this line. This is done for every detected photon pair. The data acquisition is done in list
mode (fully three dimensional, i.e. there are no collimating septa) and the system initially
stores all events from all possible LOR:s in a list mode raw data file. The absence of
collimating septa enhances the sensitivity (since photons otherwise absorbed by the septa are
detected) and gives the investigator several options of post scanning reconstructions (22).
2.1.3 Reconstruction
The MicroPET offers five choices of reconstruction algorithms: Two-dimensional Filtered
Back Projection (2D FBP), Three-dimensional Reprojection (3DRP), Ordered Subset
Expectation Maximization 2D (OSEM2D), OSEM3D and Maximum a Posteriori (MAP) (22).
The main choice fell on 2D FBP because of the short reconstructing time, reasonable image
quality and the fact that preliminary measurements showed no significant difference between
2D FBP and the more computer and time demanding iterative MAP reconstruction regarding
activity quantification. MAP reconstructions were however used as comparison for volume
measurements for some animals, since MAP is superior to 2D FBP as regards producing
smooth images with better defined edges (23). Before data can be reconstructed by a 2D
reconstruction algorithm like 2D FBP, the 3D raw list data must be binned into sinograms.
For such sinogram rebinning, the Fourier Rebin Algorithm was used.
2.1.4 Effects that causes image degration and affects quantification
There are three effects in PET that contribute to errors when determining the LOR. These
errors add blur to the final image and limit the spatial resolution since the line doesn’t
represent the true decaying radionuclide site (Figure 6).
When 124
I decays into 124
Te, the emitted positron loses its kinetic energy by multiple inelastic
interactions with atomic electrons in the tissue, hence changing its direction several times. A
distance known as “positron range” between the decay and annihilation sites is created. The
positron range is defined as the distance from the site of decay perpendicular to the site of
annihilation, but the actual distance travelled by the positron is considerably longer than the
positron range. Since the line defined by the annihilation photons is not the same as the
emission site this causes miss-positioning and affects the spatial resolution (Figure 6a).
The energy of the emitted positron has great influence on how far from the decay site the
annihilation process will occur. Positrons with high kinetic energy travels a longer distance
compared to those with lower kinetic energy, since it takes more interactions with
surrounding electrons to make them loose all their kinetic energy.
The other effect that affects spatial resolution comes from the fact that the positron and the
electron is not at rest when the annihilation process occurs. This results in a small net

2
8
momentum that causes the two annihilating photons not to be emitted in exactly 180◦ (Figure
6b). Instead, the photons emitted from a positron and electron not at rest will be emitted with
a distribution of angels close to 180◦. When the photons are detected by the scanner, PET
assumes the emission being exactly back to back causing a small error in locating the line of
annihilation. This is called noncolinearity and is independent of the positrons initial energy
(and therefore also independent of radionuclide) since the positron must lose most of its initial
energy before annihilation. (19)
The third effect is called random coincidence, and describes the possibility that two photons
not originated from the same annihilation process are detected within the time window. The
result of this is an undesired LOR that doesn’t define a true position of an annihilation process
(Figure 6c). This effect increases image noise, rather than affecting the spatial resolution.
MicroPET® Manager™ uses the standard method for correcting randoms, whereby events that
arrived in a time shifted window are subtracted from the detected events (24).
The random coincidence effect can also occur if two non-annihilation photons with energy
close to the annihilation energy is detected within the time window. This effect is of certain
importance for this study, because of the high amount of gamma with energy close to the
annihilation energy of 511 keV emitted when using 124
I (Figure 2). The high amount of these
photons makes it possible that they can contribute to the background activity and affect the
activity quantification. The effect is hard to correct for but, the magnitude of these non-
annihilation events has been investigated by Yao et. al. through Monte Carlo simulations (25).
Their work also introduces a method of recovering the spatial resolution degradation due to
positron range. Due to the limited time of this project their result could be of interest for
future studies.
Figure 6 – Positron range, noncolinearity and random effect causes errors that degrade the spatial
resolution of the final image.
2.2 The MicroCAT® II System
The most important difference between a common clinical spiral CT scanner and the
MicroCAT, apart from the obvious differences in sizes, is that the bed is not moving during
the scan. This technique is called “step and shoot” and means that the scanner acquires
diagnostic information from the entire field of view in one shot, in every scanning angle. This
result in a much longer scanning time compared to clinical scanners (6 – 30 min) which
means that the scanned animal needs to be anaesthetised during the scanning period. Another
aspect of this scanning technique is the increased absorbed dose to the scanned animal.
However, for this work it is of less importance (as long as ethical considerations are kept in
mind and scanning times doesn’t get unacceptably long) because of the short life time of a rat.
A MicroCAT® II (Siemens Medical Solutions USA, Inc.), designed to acquire 3D
tomographic data for small animals, were used for the CT-scans. The scanner is a third
generation “step and shoot” system which is fully shielded, holds a low-voltage x-ray tube
and a 2048 x 3096 element CCD array coupled to a phosphor screen via a fiber-optic taper.

2
9
The x-ray source is a Tungsten anode with a focal spot of ~40 microns, a maximal potential of
80 kVp and a maximum current of 500 A. (26)
Figure 7 – MicroCAT® II is, unlike a clinical scanner, a shielded
gantry enclosure.
According to the manufacturer it is possible to reach a resolution of ~20 microns. This was
not possible for this study, since it was done in the 4-bin mode. This means that 4 x 4 pixels
are binned into a single pixel to obtain a practical image size regarding the image storage (27).
4-binning minimizes noise and increases sensitivity in acquired data, since 16 pixels summed
as one pixel register 16 times more photons compared to a single pixel. However, the price
paid for binning pixels is a decrease in spatial resolution. The resolution of the FBP-
reconstructed CT images is about 160 µm. This resolution is adequate to determine the size of
the thyroid since the diameter of the thyroid is at least 3-4 times greater than the resolution of
the system.
For reconstruction, there is an option of choosing between a Shepp-Logan filter and a
Hamming filter. The Shepp-Logan filter was chosen for this study, since it produces high
resolution images and the role of the CT in this case is to identify a sharp edge between the
thyroid and its surrounding tissues. The Hamming filter produces smoother images, and was
therefore less suitable. For precise animal positioning lasers are used for alignment. The
scanner is manoeuvred with a Windows based graphical user interface which gives full
2
10
control of the scanner and allows changing for example voltage, current, field-of-view and the
cameras shutter speed.
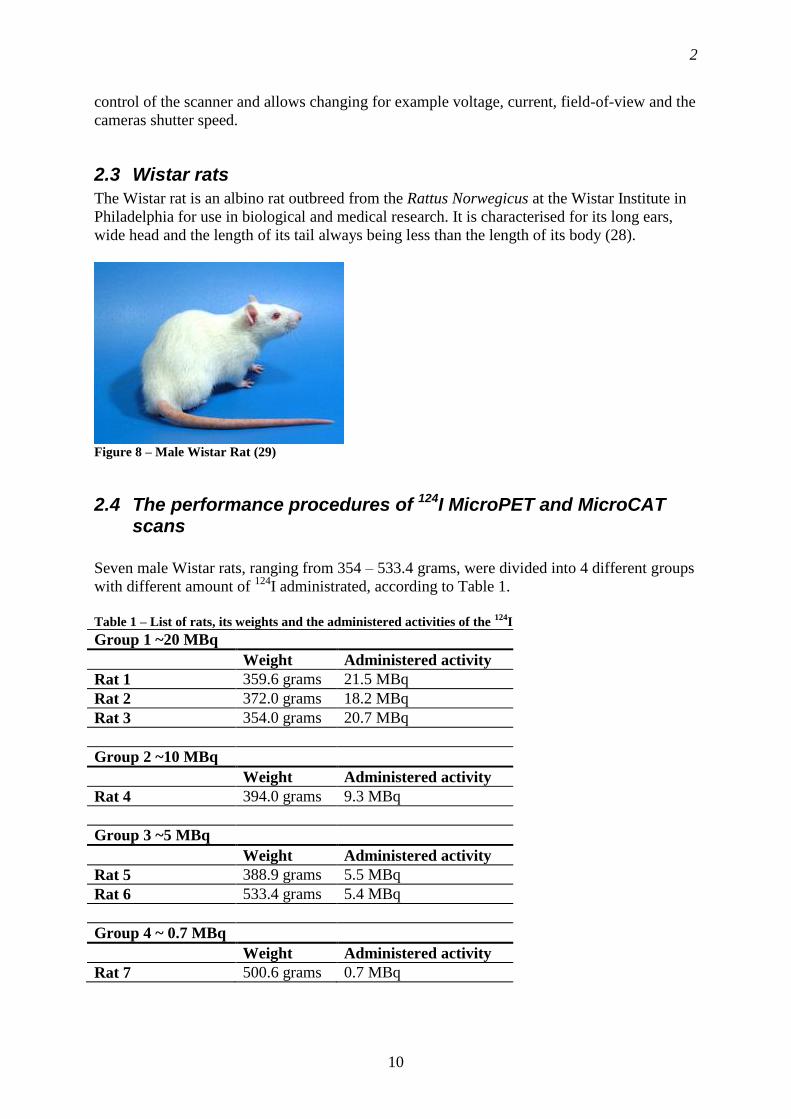
2.3 Wistar rats
The Wistar rat is an albino rat outbreed from the Rattus Norwegicus at the Wistar Institute in
Philadelphia for use in biological and medical research. It is characterised for its long ears,
wide head and the length of its tail always being less than the length of its body (28).
Figure 8 – Male Wistar Rat (29)
2.4 The performance procedures of 124I MicroPET and MicroCAT scans
Seven male Wistar rats, ranging from 354 – 533.4 grams, were divided into 4 different groups
with different amount of 124
I administrated, according to Table 1.
Table 1 – List of rats, its weights and the administered activities of the
124I
Group 1 ~20 MBq
Weight Administered activity
Rat 1 359.6 grams 21.5 MBq
Rat 2 372.0 grams 18.2 MBq
Rat 3 354.0 grams 20.7 MBq
Group 2 ~10 MBq
Weight Administered activity
Rat 4 394.0 grams 9.3 MBq
Group 3 ~5 MBq
Weight Administered activity
Rat 5 388.9 grams 5.5 MBq
Rat 6 533.4 grams 5.4 MBq
Group 4 ~ 0.7 MBq
Weight Administered activity
Rat 7 500.6 grams 0.7 MBq

2
11
Since no other MicroPET-study of the thyroid of a rat with 124
I has been published, the high
amount of activity (20 MBq) in the first group was chosen to be sure that the thyroid uptake
of the 124
I could be visible with a PET-scan. Thereafter, the rats in Group 2 were given half of
the activity as in Group 1 and the rats in Group 3 were given half of the activity as in Group 2.
Rat 7 were given an activity amount that corresponds to the amount given orally to man (100
MBq) in studies of the thyroid (2;3;5) scaled down to the weight of Rat 7.
The rats were anesthetised by inhaling Sevofluran and then 1 ml of Hypnorm/Dormicum was
subcutaneously injected. Thereafter, 0.5 ml of Hypnorm/Dormicum were administrated every
thirtieth minute to keep the rats unconscious.
2.4.1 MicroPET scan
The 124
I solution, independently of the activity concentration, was diluted with a NaCl
solution to a volume of ~0.5 ml before administering into the rats in the different groups. The
activity concentration in the 0.5 ml volume was measured in a Radioisotope Calibrator ARC-
120 (Amersham, United Kingdom) and then injected into one of the lateral tail veins through
a neonatal venflom (Neoflom®) followed by an injection of 0.2 – 0.3 ml NaCl to make sure
that as little activity as possible was left in the Neoflom®. The activity left in the syringe and
the Neoflom® were measured in the radioisotope calibrator and subtracted from the initially
measured activity to get the total injected activity.
Directly after the activity injection, a MicroPET scan with the thyroid in the centre field of
view (cFOV) started for 40 minutes, followed by a 10 minute transmission scan using the 57
Co point source. This procedure was repeated (apart from the injection of 124
I) at
approximately 0, 3, 24, 48 and 72 hours post injection (some rats were also scanned a sixth
time, due to the practical reason of a physician needed to be present to insert a Neoflom® for
the last scan). All acquisitions were carried out in list mode with energy window setting 350
– 650 keV for the emission scans, and 120 – 125 keV for the transmission scans.
Before the last MicroPET scan a Neoflom® was again inserted into the lateral tail vein. The
rat was positioned on the scanning bed, together with fiducial markers on the rat and the bed
(Figure 6, 7). After the finishing MicroCAT scan the sedated rats where sacrificed by
dissection of the heart. The thyroid was also dissected for in-vitro measuring of the activity
concentration in the thyroid using the radioisotope calibrator.
Figure 9 – Fiducial markers
Figure 10 – Fiducial markers placed with tape on a rat
(1, 2). Two additional markers are placed with tape on
the bed as well (3, 4).
1
2
3
4

2
12
2.4.2 MicroCAT scan
The fiducial markers hold a 68
Ge/57
Co source (Siemens Medical Solution, USA, Inc.) and are
visible on both PET- and CT-images. After the last MicroPET scan the entire bed is moved to
the MicroCAT II scanner, without moving the rat from the bed. A 6 minutes and 30 seconds
CT scan is then performed in 360 different angles, with a tube voltage of 70 kV, a tube
current of 500 A and a camera shutter speed of 230 ms. Contrast agent Ultravist®, 300 mg
I/ml (Schering, Berlin, Germany) (4.5 – 5 ml) was injected through the Neoflom® throughout
the entire scan time. These settings were found to be the best compromise between scanning
time and image quality. Early scans showed that a bolus injection of contrast agent did not
visualise the thyroid, therefore a continuous injection needed to be done. According to The
Danish Animal Doctors Association the maximum volume of a slow infusion allowed in a rat
is 5 ml. MicroCAT scans usually takes about 20 minutes, but the use of a slow infusion
required the scanning time to be significantly shorter.
Since the bed is interchangeable between the PET and the CT, a fusion of the anatomical CT
image and the functional PET image is possible. The problem is the lack of consistent
information in the two different types of images and the fiducial markers are therefore helpful,
since they are visible on both pictures.
2.5 Hollow sphere thyroid phantom
Studies with a static phantom give important information about the performance of the system
and therefore a water-filled, cylindrical phantom with two hollow spheres (Data Spectrum
Corporation, Hillsborough, North Carolina, USA) was designed (Figure 11). The hollow
spheres are interchangeable, come in three different volumes (31 l, 125 l and 250 l) and
are separated by an air-filled tube representing the windpipe, to imitate the thyroid of a rat.
The phantom was filled with water and the hollow spheres were filled with a mixture of
contrast agent Ultravist® (to enable the MicroCAT scan) and different amount of activity of
the 124
I solution at each PET scan (Table 2). The phantom was then scanned with the same
protocols as the rats in the MicroPET- and the MicroCAT scanner.
Figure 11 – Hollow sphere thyroid phantom, made to imitate the two thyroid lobes
on both sides of the windpipe. The picture shows the 31 l spheres.
80 mm
30 mm

2
13
57
Co, which is used for the transmission scans, has an energy peak of 122 keV resulting in that
these low energy photons suffer more absorption compared to photons with 511 keV energy.
Since a blank transmission of the Co-57 is required for attenuation correction, this effect can
be minimized. On the other hand, MicroPET software energy scales the attenuation maps
from 122 keV to 511 keV by using a mathematical method that also compensate and consider
such effect among others.
Table 2 – Sphere volumes and activities used
Volume Outer diameter (mm) Inner diameter (mm) Activity (kBq)
31 l 5.95 3.95 Scan 1: 140.6
Scan 2: 43.69
Scan 3: 25.75
Scan 4: 323.0
125 l 8.23 6.23 1886.7
250 l 9.86 7.86 1765.1
2.6 Image analysis
2.6.1 Image Segmentation with Amira 4.1
Image segmentation means an image divided into different sub regions with common features.
The subregions (or segments) can for example be different organs or tissue types, in this case
the thyroid. Image segmentation was done with the program Amira 4.1 (Mercury Computer
Systems) by first selecting voxels, and then assigning these voxels to the desired tissue
(Figure 12). Since a tissue doesn’t have a unique Houndsfield Unit (HU) (for CT images) or a
unique intensity of registered annihilation photons (for PET images), the selection of voxels
can’t be done automatically. Instead, the selection of voxels was done manually, by
contouring the thyroid in orthogonal slices. Amira allows very precise contouring by a
number of different drawing tools. Fot this study either the “lasso” or the “brush” was used.
The “lasso” tool is faster, since you just have to define the contour of the thyroid lobe and the
tool fills up the area you have created. However, only on “lasso”-area is allowed per slide, and
since the thyroid consists of two lobes which are only partially connected by an isthmus, at
least two areas needed to be defined in most of the slices. If this was the case, the “brush” tool
was used for the additional area.
For speeding up the otherwise very time consuming process, voxel selection in the CT-scans
were done in every fifth slice. Linear interpolation was then performed between these slices.
To get consistency between measurements in different animals, window settings were set to
centre: 859 and width: 910 for every measurement.
When the voxels were selected and assigned to a tissue, a 3D visualisation with a Surface
Generator was done (Figure 13). This tool computes a triangular approximation of the
interfaces between different tissue types with either uniformed or stacked coordinates. The
module generates a smooth surface by generating sub-voxel weights, such that the surface is
naturally smooth. The tool Tissue Statistics then delivers information of the segmented
volumes, such as number of voxels, volume, min- and max values and standard deviation. The
statistics refers to the voxels before the triangular approximation; hence the Surface Generator
doesn’t affect this statistics (30).

2
14
Figure 12 – Screenshot of segmentation in Amira 4.1. Segmentation is done by selecting voxels in the
MicroCAT images in the transverse slices (1). This is done in every fifth slice. Linear interpolation
between the selected voxels creates a volume (2).
Figure 13 – 3D-visualisation of a rat’s
thyroid (blue) and trachea (purple) from
a MicroCAT image with the Surface
Generator in Amira 4.1
Volume determination in PET-scans is somewhat different. Because of the poorer resolution
each voxel is larger, making the slices covering the thyroid fewer. There is therefore no need
to exclude any slices; segmentation is instead done in every slice. Another difference is the
problem of getting consistency in the measurements. Different amount of activity in the
thyroid gives different intensity in the pictures making it impossible to keep the same window
settings in every scan. For MAP reconstructed images, the window can be set to defining a
1 2

2
15
maximum value in the thyroid, making all other values relative to this value. This setting
results on visually similar images although they haven’t got the same window settings. For
2D FBP reconstructed images this is not possible, since a definition of a maximum value in
the thyroid results in an image with an overexposed look, making volume determination
impossible.
2.6.2 Volume measurements with ASIPro
It is well known that CT is superior to PET when it comes to the spatial resolution, and
therefore more suitable for volume measurements. To find out the difference in volume
measurements between CT and PET, the program ASIPro – Acquisition Sinogram and Image
Processing (Siemens Medical Solutions USA Inc.) was used. The volume of the thyroid was
determined by defining a ROI in every slice where the thyroid was visible. Interpolation
between the slices then created a VOI with a certain volume. Since the reconstructed PET
images lack sharp edges of the different organs due to the limited resolution (Gaussian shape),
the definition of the border of the organ might vary quite a lot depending on the investigator.
Even volumes measured on the same thyroid by the same investigator tend to vary, which is
why a more standardised method is needed to minimize the variation in measurements of the
same object. We therefore used the profile technique where the Gaussian profile was applied
onto each slice of the reconstructed images that cover the thyroid. The full width at half
maximum (FWHM) of the profile was then used as the diameter of the ROI, to more precisely
define the border of the thyroid.
The PET scan resulted in a thyroid with two lobes, with no isthmus visible. In every scan each
lobe was approximated with a circular ROI, whose diameter was determined by the FWHM of
an assigned Gaussian fit to the profile of the lobe (Figure 14). The size of the ROI is then
depending on the statistics in the image, instead of the investigators eye, which result in a
more consistent way of defining a VOI (Figure 15).
Figure 14 – Profile of a thyroid lobe (white line) with assigned Gaussian fit (blue line). A perfect profile of
a slice of a sphere should have a rectangular profile (here schematically illustrated with a dotted yellow
rectangle), but because of the resolution of the MicroPET the edges are blurred out.
2
16
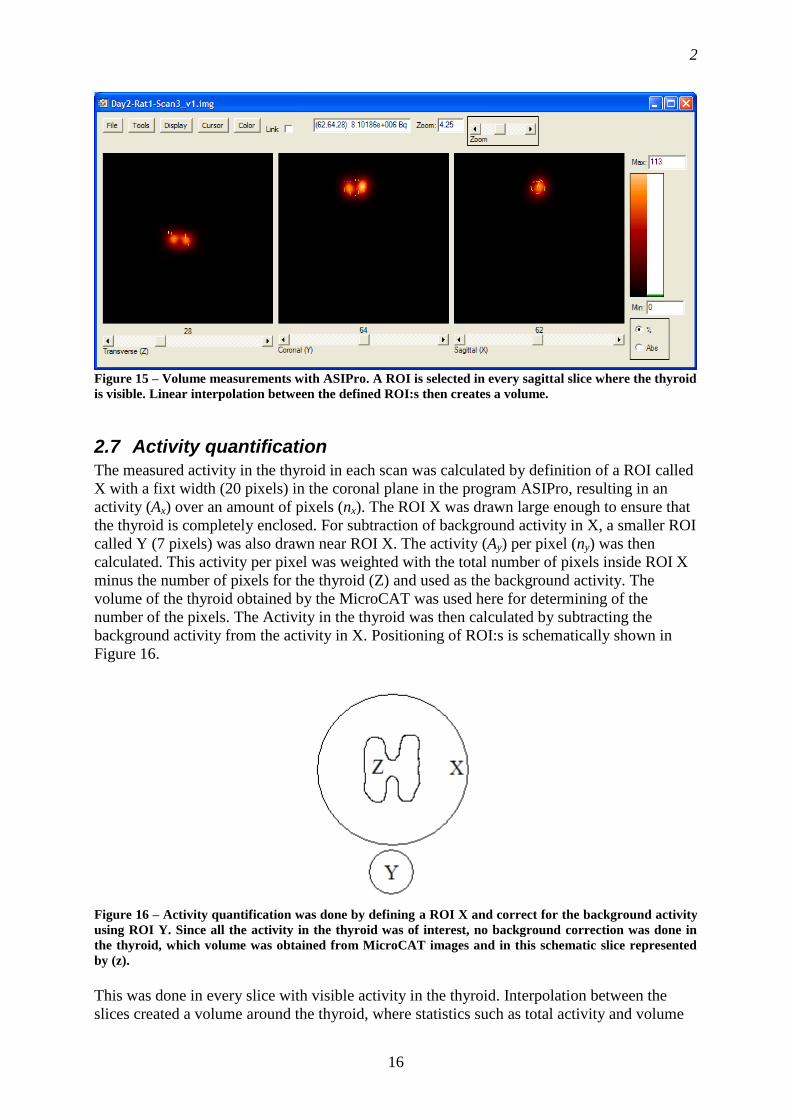
Figure 15 – Volume measurements with ASIPro. A ROI is selected in every sagittal slice where the thyroid
is visible. Linear interpolation between the defined ROI:s then creates a volume.
2.7 Activity quantification
The measured activity in the thyroid in each scan was calculated by definition of a ROI called
X with a fixt width (20 pixels) in the coronal plane in the program ASIPro, resulting in an
activity (Ax) over an amount of pixels (nx). The ROI X was drawn large enough to ensure that
the thyroid is completely enclosed. For subtraction of background activity in X, a smaller ROI
called Y (7 pixels) was also drawn near ROI X. The activity (Ay) per pixel (ny) was then
calculated. This activity per pixel was weighted with the total number of pixels inside ROI X
minus the number of pixels for the thyroid (Z) and used as the background activity. The
volume of the thyroid obtained by the MicroCAT was used here for determining of the
number of the pixels. The Activity in the thyroid was then calculated by subtracting the
background activity from the activity in X. Positioning of ROI:s is schematically shown in
Figure 16.
Figure 16 – Activity quantification was done by defining a ROI X and correct for the background activity
using ROI Y. Since all the activity in the thyroid was of interest, no background correction was done in
the thyroid, which volume was obtained from MicroCAT images and in this schematic slice represented
by (z).
This was done in every slice with visible activity in the thyroid. Interpolation between the
slices created a volume around the thyroid, where statistics such as total activity and volume

2
17
could be obtained. Since the scans were performed at different times, resulting in different
amount of activity, fixed window scale settings could not be used. The scale was instead set to
a relative maximum in the thyroid, making it visible in every scan. Note that the window scale
setting is just a visual setting and doesn’t affect the activity quantification as long as ROI X is
placed over the thyroid. It can however affect the volume determination since the size of the
“active area” (the thyroid) in each slice changes when the window scale setting is changed.
According to Report No. 5 in the Mird Primer (31) no other organ near the thyroid is
absorbing iodine. The activity measured in the background ROI Y is therefore assumed to
come from 124
I circulating in the blood. Since we are interested in the activity in the thyroid,
this includes the iodine in the blood vessels within the thyroid. To exclude the pixels
representing the volume of the thyroid (nz) from the background correction, the rats’
individual thyroid volumes obtained from MicroCAT images were used to calculate how
many pixels the thyroid occupied in the MicroPET images. These pixels were subtracted from
the number of pixels obtained by ROI X before background correction, giving the equation
for the total activity (Atotal) in the thyroid
yxtotal x
x z y
AAA n
n n n (2)
Atotal = Total activity in the thyroid after background correction
Ax = Activity in ROI X
Ay = Activity in ROI Y
nx = Number of pixels in ROI X
ny = Number of pixels in ROI Y
nz = Number of pixels in ROI Z i.e. the thyroid
2.8 Calculation of absorbed dose
The absorbed dose to the thyroid was calculated as
thyr thyr thyrthyrD A S (3)
thyrD is the self absorbed dose to the thyroid and only accounts for the absorbed dose
originating from the thyroid (Gy). thyr
A is the cumulated activity in the thyroid, i.e. the total
activity accumulated in the thyroid for the considered time (MBqs). thyr thyrS is the S-value,
which is defined by The Mird Committee as the absorbed dose per unit cumulated activity
(mGy/MBqs). The S-value is specific for each target and source and was calculated by Monte
Carlo simulations with the Electron Gamma Shower code (EGS4) (32) simulated with the
MOBY mouse phantom (33), scaled up to the size of a rat. All Monte Carlo simulations were
done by Erik Larsson, PhD student, Medical Radiation Physics, Lund University. The
volume, determined from MicroCAT images, of the thyroid were set individually for each rat
with an assumption of a density of 1.04 g/cm3 for the thyroid. See Appendix for further
information of absorbed dose (34;35).

2
18
thyr
A was determined individually for each animal by plotting the activity quantification
against time to get a time-activity curve. The integral of the curve equals the cumulated
activity and was calculated by determination of two equations for the curve; one for the
uptake and one for the outflow of 124
I resulting in uptake
A and outflow
A (separated by the dotted
line in Figure 17). Microsoft Office Excel 2003 (Microsoft Corporation, Redmond, WA) was
used for determination of the equations of the curves and Maple 10 (Maplesoft – Waterloo
Maple Inc, Waterloo, Canada) was used for calculations of the integrals.
Figure 17 – The cumulated activity equals the integral of the time-activity curve for each animal.
2.9 Error calculation
2.9.1 Activity quantification
When ROI:s are defined in ASIPro they cover pixels with very high counts as well as pixels
with low counts. Because of the large differences in counts, the expression for standard
deviation
2
1
x x
n (4)
results in a deviation that is sometimes larger than the mean counts in the defined volume.
This mean value is then automatically calculated by ASIPro into total activity in the defined
volume, so if the standard deviation were used it would result in error bars larger than the
quantified activity. If the error in time is excluded from the activity quantifications (Bq = s-1
)
and the activity is regarded as counts, a rough error calculation using a Gaussian distribution
can be assumed, resulting in an error of

2
19
N (5)
where N is the number of counts in the defined volume. Equation 5 is therefore used for a
rough estimation of the error in the activity quantification.
2.9.2 Volume measurements
Volume measurements are subjective and dependant on the investigator. One investigator can
have a different opinion on which voxels that should be defined, compared to another
investigator. This makes error calculations complex and for a correct estimation of error bars
a repeated study of several investigators ability to define a volume should be done. In this
study the error bars are based on repeated volume measurements of a 31 l hollow sphere
(Figure 11) done by the same investigator and the standard deviation of these measurements
are calculated according to equation 4.
2
20
3 Results and discussion
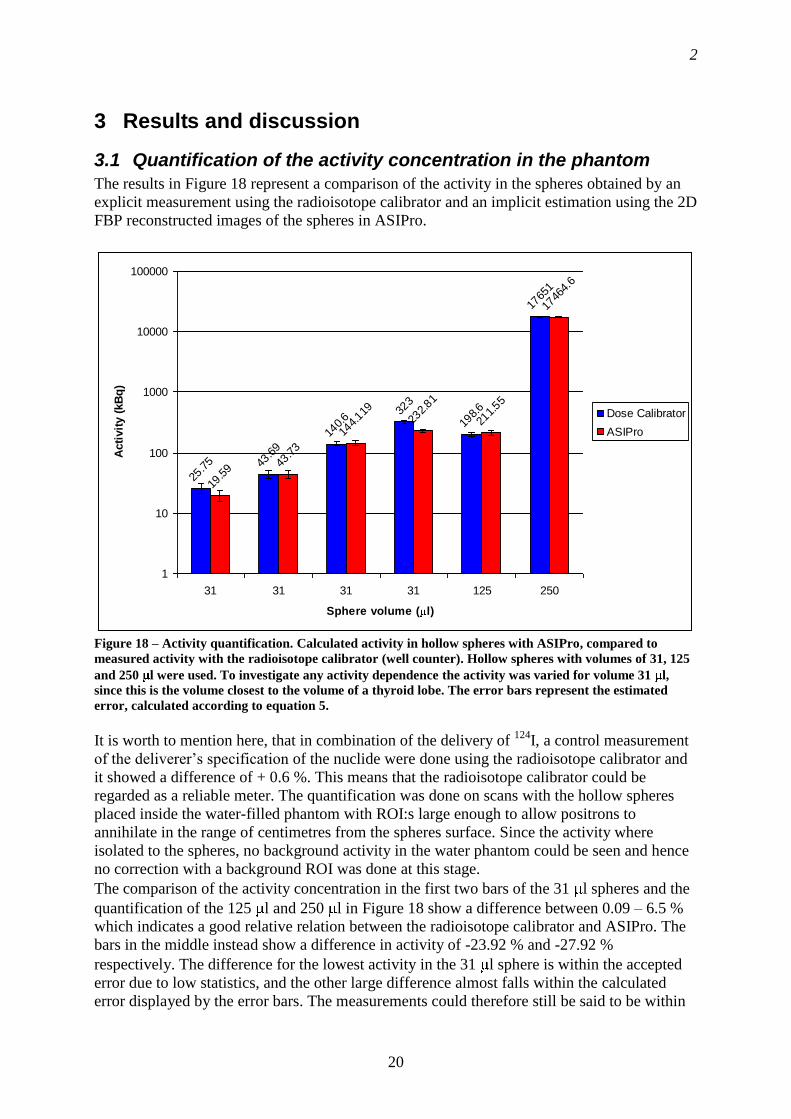
3.1 Quantification of the activity concentration in the phantom
The results in Figure 18 represent a comparison of the activity in the spheres obtained by an
explicit measurement using the radioisotope calibrator and an implicit estimation using the 2D
FBP reconstructed images of the spheres in ASIPro.
25.75 43
.69
140.6
323
198.6
1765
1
19.59
43.73
144.119
232.81
211.55
1746
4.6
1
10
100
1000
10000
100000
31 31 31 31 125 250
Sphere volume ( l)
Acti
vit
y (
kB
q)
Dose Calibrator
ASIPro
Figure 18 – Activity quantification. Calculated activity in hollow spheres with ASIPro, compared to
measured activity with the radioisotope calibrator (well counter). Hollow spheres with volumes of 31, 125
and 250 l were used. To investigate any activity dependence the activity was varied for volume 31 l,
since this is the volume closest to the volume of a thyroid lobe. The error bars represent the estimated
error, calculated according to equation 5.
It is worth to mention here, that in combination of the delivery of 124
I, a control measurement
of the deliverer’s specification of the nuclide were done using the radioisotope calibrator and
it showed a difference of + 0.6 %. This means that the radioisotope calibrator could be
regarded as a reliable meter. The quantification was done on scans with the hollow spheres
placed inside the water-filled phantom with ROI:s large enough to allow positrons to
annihilate in the range of centimetres from the spheres surface. Since the activity where
isolated to the spheres, no background activity in the water phantom could be seen and hence
no correction with a background ROI was done at this stage.
The comparison of the activity concentration in the first two bars of the 31 l spheres and the
quantification of the 125 l and 250 l in Figure 18 show a difference between 0.09 – 6.5 %
which indicates a good relative relation between the radioisotope calibrator and ASIPro. The
bars in the middle instead show a difference in activity of -23.92 % and -27.92 %
respectively. The difference for the lowest activity in the 31 l sphere is within the accepted
error due to low statistics, and the other large difference almost falls within the calculated
error displayed by the error bars. The measurements could therefore still be said to be within

2
21
an acceptable range. The result from the delivery control and the other measurements of the
spheres shows that the quantification function in ASIPro and the radioisotope calibrator can
both be considered to be reliable.
3.2 Volume measurements
3.2.1 Hollow sphere volume measurements
3.2.1.1 MicroPET
As mentioned in the introduction MicroPET is inferior to MicroCAT when it comes to
volume determination. The diffuse edges of the spheres caused by the MicroPET system
makes volume measurements subjective, wherefore a more standardised method was tried out
here with ASIPro. It is also worth to mention that the volume measurements using the
reconstructed MicroPET images are strongly dependent on the choise of threshold level (36)
as well as on the choice of the reconstruction method even though a standardized method is
used.
Figure 19 – Volume measurements of 31 l hollow sphere with different amount of activity
124I. The
horizontal black line shows the actual volume of the hollow sphere. The error bars represent the estimated
error, based on repeated measurements by one investigator and calculated according to equation 4.
A comparison between the 2D FBP and MAP reconstructed images was performed and the
differences between the two methods are obvious (Figure 19). Dependence between activity
concentration and volume can be noticed, with volume increasing with increasing activity
concentration for 2D FBP in ASIPro and for 2D FBP and MAP evaluated in Amira. MAP
reconstructions evaluated in ASIPro instead show a reverse dependence, with a decrease in
volume with increasing activity concentration. This indicates that, although attempting to
create a method that is independent of the investigator, ASIPro is not reliable for exact
volume determination of MicroPET images, whatever reconstruction method is used.
0,00
10,00
20,00
30,00
40,00
50,00
60,00
70,00
80,00
90,00
100,00
25,75 43,69 140,60 323,00
Activity (kBq)
Vo
lum
e (
l) ASIPro 2D FBP
ASIPro MAP
AMIRA 2D FBP
AMIRA MAP

2
22
The only combination of reconstruction and evaluation program that show consistency when
determining the volume of a sphere phantom is MAP reconstructions evaluated in Amira (2D
FBP evaluated with ASIPro indicates consistency as well, but with a larger difference from
the actual volume). There is however still a slight activity concentration dependence with
MAP and there even seems to be a threshold for using MAP in Amira since the spheres
weren’t visible for the lowest activity (25.75 kBq). The activity concentration dependence in
both ASIPro and Amira could perhaps be corrected with an experimental determined factor
that is compensating for the overestimation in volume, but that requires further studies and is
not the purpose of this work. The important thing is that these results show the importance of
using a more precise technique, such as MicroCAT, for volume determination.
3.2.1.2 MicroCAT
As mentioned in the
Image analysis section, image segmentation of MicroCAT images in Amira 4.1 is time
consuming because of the numerous slices covering the thyroid. To speed up the process
voxels were defined in every fifth slice with linear interpolation between the slices. Figure 15
shows a comparison in resulting volume between this technique and defining voxels in every
slice.
31
125
250
31.19
118.5
248.59
31.12
121.4
248.09
0
50
100
150
200
250
300
Vo
lum
e (
ul)
Actual sphere volume
Every slice
Every fifth slice
Figure 20 – Sphere volumes, MicroCAT scans. Comparison of different measuring techniques in Amira
4.1. The error bars shows the standard deviation, based on repeated measurements by one investigator
and calculated according to equation 4.
No significant difference between defined voxels in every slice compared to defined voxels in
every fifth slice can be noticed, and the measured volumes are within the range of the error
bars. A noticeable thing is that larger volumes (125 l, 250 l) tend to be underestimated
(Figure 15). The thyroid of a rat is however closer to 31 l where the volume determination
seems to be more precise, with a smaller standard deviation. The application of this technique

2
23
in Amira 4.1 can therefore be considered as a valuable tool for determination of volumes of
structures, such as the thyroid, in MicroCAT-images.
3.2.2 Thyroid volume measurements
Figure 20 proved that MicroCAT images evaluated in Amira is reliable for volume
determination so the bars representing volumes determined on MicroCAT images is regarded
as the true thyroid volume, although a truth with modification; As mentioned before it is not
the actual thyroid tissue that is displayed, but rather the capillaries within the thyroid.
However, the magnitude of capillaries within the thyroid (well vascularised) motivates that
using contrast agent can represent the physical volume of the thyroid.
0,00
20,00
40,00
60,00
80,00
100,00
120,00
140,00
Rat 1 Rat 2 Rat 3 Rat 4 Rat 5 Rat 6 Rat 7
Vo
lum
e (
l) MicroCAT
2D FBP
MAP
ASIPro
Figure 21 – Volume comparison of MicroCT- and MicroPET-scans. The first three groups of bars are
evaluated in Amira 4.1 whereas the last bar is 2D FBP reconstructed MicroPET images evaluated in
ASIPro.
Since the MicroCAT images represent the true thyroid volume they are compared to thyroid
volumes determined with MicroPET (Figure 21). When comparison of volumes determined
from different imaging techniques one should bare in mind that MicroCAT displays the
anatomical volume, whereas MicroPET shows the functional volume. These volumes do not
have to be equal, but for a healthy thyroid they principally should. Since the volume later on
is to be used to calculate the absorbed dose to the entire organ the anatomical volume is more
interesting for this work because of the exact measuring that is possible in MicroCAT images.
Strictly speaking the functional volume should be used for calculation of S-value for the
source, and the anatomical volume should be used for the targets S-value, but since Figure 21
show that the functional volume almost always exceeds the anatomical volume (because of
the poorer resolution of MicroPET) the anatomical volume is used for S-values for the target
as well as the source.

2
24
The phantom study showed that Amira were superior ASIPro for volume determination
(Figure 19). Furthermore, the 2D FBP reconstructed MicroPET images were proved to be
more consistent in volume determination using ASIPro than MAP reconstructed images. For
this reason, the thyroid volumes of 2D FBP reconstructed images estimated by ASIPro have
only been used for the comparison with the thyroid volumes of MicroCAT- and MicroPET
thyroid images estimated by Amira. In Figure 21 the value of MicroCAT becomes even
clearer than what was shown in the phantom study. None of the other methods show
consistency relative the MicroCAT measurements;
2D FBP reconstructions evaluated in ASIPro is constantly overestimating the volume
with, contrary to what the phantom study showed, no activity dependence. The
overestimation compared to MicroCAT is ranging from +52% – +184%. For Rat 3, 4,
5 and 7 the differences the overestimation is quite similar, and studies with a larger
quantity of rats can perhaps result in a correction factor for volume determination with
this technique. But again, that falls outside the purpose of this work.
2D FBP reconstruction evaluated in Amira is sometimes quite close to the result from
MicroCAT, but since a method needs to be consistent to be reliable the range +20% –
+112% is not acceptable. The slight energy dependence noticed in Figure 19 cannot be
seen here.
MAP reconstructions seems to be the reconstruction method with the best potential
(23) and Figure 21 shows that MAP evaluated with Amira is the MicroPET
reconstruction that is closest to MicroCAT for volume determination. The problem is
that the result varies from over- to underestimation (-20% – +30%) which is
problematic if you want to determine a correction factor volume measuring.
Figure 21 (together with Figure 20) proves how valuable it is to use MicroCAT images for
volume measurements (Table 3), and confirms the importance of using a technique with better
spatial resolution than MicroPET. Further studies of using MicroPET for volume
measurements have to be done if the technique is to be considered as reliable. With the
resolution of the machines available today such a study can however only result in a
correction factor, and cannot be as reliable as MircoCAT.
The small volume of Rat 6 may be a result of a poorer defined thyroid compared to the other
rats. The case can however as well be that Rat 6 has a smaller thyroid, but when analysing the
result it should be noted that this rat’s thyroid wasn’t as well defined as the rest of the rats’.
Table 3 – Thyroid volumes obtained from MicroCAT images
Weight (g) Thyroid Volume ( l)
Rat 1 359.6 49.3
Rat 2 372.0 41.9
Rat 3 354.0 47.8
Rat 4 394.0 70.6
Rat 5 388.9 45.8
Rat 6 533.4 34.3
Rat 7 500.6 51.6
The results of the volume measurements show no relation between the rats’ body weight and
the size of their thyroids (Figure 22). This is also an indication that MicroCAT imaging is
important, since the thyroid volume cannot be derived from the body weight.

2
25
0
10
20
30
40
50
60
70
80
300 350 400 450 500 550
Weight (g)
Vo
lum
e (
ml)
Figure 22 – No relationship between body weight and thyroid volume could be found
3.3 Images
The rapid uptake of 124
I in the thyroid makes it visual even at early scans (Figure 23). Scans of
the same animal three hours later show that the activity concentrates to the thyroid and is
cleared around it (Figure 24). Both pictures are coronary slices with window settings set to a
relative maximum in the thyroid, and are examples of ASIPro-pictures used for activity
quantification in the thyroid.
Figure 23 – A 40 min MicroPET scan of Rat 1
starting at 0 h post injection
Figure 24 – A 40 min MicorPET scan of Rat 1
starting at 3 h post injection

2
26
Visualization of the thyroid of the rat using the MicroCAT scanner is done combined with the
continuously injection of the contrast agent (Figure 25). The visualisation is possible because
the thyroid is such a well vascularised glandule, so what is displayed is basically the contrast
agent in the capillaries within the thyroid. Other blood vessels are visible as well, which is a
good indicator that the Neoflom® is inserted correctly into the lateral tail vein.
Figure 25 – Orthogonal MicroCAT slice of Rat 1 with contrast agent Ultravist continuously injected,
displayed with the window settings used for volume determination. The two lobes of the thyroid (marked
with arrows) can be seen as lighter, kidney shaped structures on both sides of trachea (the windpipe).
Because the scanning time needed to be as short as possible a certain amount of artefacts had
to be accepted, as long as the visibility of the thyroid wasn’t affected. In Figure 25 artefacts
resulting from the higher density of the spinal cord is especially noticeable as lines in the
image. The artefacts appear extra clear above because of the window settings, which are set to
create large differences in contrast between the thyroid and surrounding tissue, which is why
the spinal cord (with its much higher HU) appears as if it is almost glowing. Such artefacts
mainly affects the investigators ability to detect small objects (i.e. the resolution) and since
the most important thing in this study is to get a high difference in contrast between the
thyroid and its surrounding tissues, artefacts such as in Figure 25 is not a big problem.
As mentioned in the Materials and Methods section the contrast agent was continuously
injected during the entire scanning time. This was done manually, which perhaps can affect
the result regarding how well the thyroid is visualised. It is hard to manually keep the same
injection speed, so the concentration of contrast agent in the thyroid may vary during the time
of the scan. If this part was done automatically with dedicated equipment the concentration in
the thyroid would be constant during the scan, resulting in better homogeneity of contrast
agent in the thyroid, and perhaps deliver a different result.
The fiducial markers make the developed model suitable for fusion of MicroPET- and
MicroCAT images in ASIPro (Figure 26). Fusion of images presupposes that the rat is
transported from the MicroPET to the MicroCAT without being moved from the bed, making

2
27
that the fiducial markers are in the exact same position on both images. Fusion (or co-
registration) was however not used in this study since we only were interested in determining
the anatomical volume of the thyroid using the CT Images. Observe that the anatomical and
functional images in Figure 26 have not the same zooming factor, which can easily be
adjusted to be. Figure 26 is intended for a demonstration purpose to show that the fusion
between the MicroPET and MicroCAT images is possible.
Figure 26 – Screen capture of ASIPro fusion of MicroCAT- and MicroPET images with fiducial markers
as guidance. The top three images shows MicroCAT images in three planes, the bottom three shows
MicroPET images in three planes and the middle three images shows the fusion of the two modalities.

2
28
3.4 124I quantification and distribution in the thyroid
The time-activity curves in Figure 27 show the fractional distribution of 124
I in the thyroid for
all the seven rats. To make the figure easier to look at the bars representing the calculated
error in each measuring point are left out, but the error for an individual measuring point does
never exceed ±2.1 % (calculated according to equation 5). Each measuring point is compared
to the injected activity at the time of injection i.e. no decay correction is done, hence Figure
27 is a combination of physical and biological half life i.e. the effective half life. This makes
the curves in Figure 27 usable for calculating the cumulated activity for each rat, rather than
studying biokinetics of iodine, where a correction for physical decay has to be done.
0
1
2
3
4
5
6
7
0 20 40 60 80 100 120 140
Time (h)
% o
f in
jecte
d a
cti
vit
y Rat 1
Rat 2
Rat 3
Rat 4
Rat 5
Rat 6
Rat 7
Figure 27 – Time-activity curve of
124I in the thyroid displaying the biokinetics of iodine in rats. Error
bars are left out, but the maximum error never exceeds ±0.022 percent points.
It is worth to mention that the result of Rat 7, which was injected with a significantly smaller
amount of activity compared to the others (Table 1), is well comparable with the result of the
rest of the rats. This shows that investigations of the thyroid can be done with as little as 0.7
MBq of 124
I administered.
The distributions for the seven animals shows the same pattern, with an uptake of 124
I until a
maximum is reached at 24 hours post injection, followed by an exponential decrease.
Although showing the same pattern there are some individual differences;
The maximum fractional uptake differs from 4.0% – 6.2%, corresponding to a relative
difference of 50% between the minimum and maximum fractional uptake. This
difference has nothing to do with the amount of activity injected since the figures refer
to Rat 1 and Rat 3, which are both in the ~20 MBq group (Table 1).

2
29
The measuring points tend to spread more after the maximum uptake, indicating a
difference in biokinetics between the rats which motivates individual activity
measurements for determination of absorbed dose to the thyroid.
Scan 5 for Rat 1 (72 h post injection) shows a significantly higher percentage uptake.
Since this is the last measuring point for this animal this will lead to a higher resulting
cumulated activity when the integral of the curve for Rat 5 is calculated.
A general observation in Figure 27 is the overall low iodine uptake in the thyroid of a rat
compared to what others are suggesting for human uptake of iodine in the thyroid (31;37).
Report No. 5 in the Mird Primer (31) suggests a fractional thyroid uptake of 13.8% after 24
hours of oral administrated activity whereas the result of Johansson et al (37) shows a
fractional thyroid uptake of 22% – 30% after 24 hours depending on which model is used.
These results are all decay-corrected, but the relatively long half-time of 124
I doesn’t affect the
result in this study much. After decay correction the maximum iodine uptake in the thyroid
only reaches 7.3%. Iodine uptake can depend on many factors e.g. nutrition or the fact that the
rats were given too much iodine, resulting in a saturated thyroid.
A comparison between the subtracted background and the measured activity in the thyroid
shows that the measured background follows the same pattern as the measured activity in the
thyroid (Figure 28).
Rat 1
0
100
200
300
400
500
0 20 40 60 80
Time (h)
Acti
vit
y (
Bq
/pix
el)
Thyroidea
Background
Rat 2
0
50
100
150
200
250
300
0 50 100 150
Time (h)
Acti
vit
y (
Bq
/pix
el)
Thyroidea
Background
Rat 3
0
50
100
150
200
250
0 20 40 60 80
Time (h)
Acti
vit
y (
Bq
/pix
el)
Thyroidea
Background
Rat 4
0
10
20
30
40
50
60
70
80
90
0 50 100
Time (h)
Acti
vit
y (
Bq
/pix
el)
Thyroidea
Background

2
30
Rat 5
0
10
20
30
40
50
60
0 20 40 60 80
Time (h)
Acti
vit
y (
Bq
/pix
el)
Thyroidea
Background
Rat 7
0
2
4
6
8
10
0 50 100
Time (h)
Acti
vit
y (
Bq
/pix
el)
Thyroidea
Background
Rat 6
0
10
20
30
40
50
60
0 20 40 60 80
Time (h)
Acti
vit
y (
Bq
/pix
el)
Thyroidea
Background
Figure 28 – Relation between measured activity in
the thyroid and subtracted background in Bq/pixel
for the seven rats. The subtracted background
varies with time and follows the same pattern as the
measured activity in the thyroid.
During the study, four rats had to be excluded because of low uptake of 124
I in the thyroid
(Table 4). The low uptake could be linked to the time of the injection of contrast agent
Ultravist®.
Table 4 – List of excluded rats, where the injection of contrast agent prevented iodine uptake in
the thyroid.
Administered activity Time of contrast agent injection
Rat A 9.0 MBq Directly after Scan 2
Rat B 9.9 MBq Directly after Scan 2
Rat C 4.0 MBq Just before Scan 1
Rat D 5.2 MBq Just before Scan 1
As can be seen in Figure 29 and Figure 30 the uptake of 124
I in the thyroid stopped after
injection of Ultravist®. Ultravist300 (used in this study) is a non-ionic contrast agent used for
contrast enhancement in computed tomography. Although the iodine in Ultravist® is bound to
elements such as carbon and hydrogen, there is a precaution for laboratory usage saying that
tests following injection of Ultravist® will not accurately reflect the uptake of iodine in the
thyroid for at least 16 days after administration (38). Ultravist® is used clinically for human
PET/CT investigations but Figure 29, where the uptake stops immediately post injection, and
Figure 30, where the uptake is low compared to the other rats in Figure 27, shows that for
iodine investigations of rats the contrast agent must be used after the MicroPET scans.

2
31
0
0,2
0,4
0,6
0,8
1
1,2
1,4
0 10 20 30 40 50 60 70 80
Time (h)
% o
f in
jecte
d a
cti
vit
y
Rat A
Rat B
Figure 29 – Time-activity curve for Rat A & B where MicroCT-scan with contrast agent performed after
MicroPET-scan 2. The absorption of iodine stops after injection of contrast agent.
0
0,2
0,4
0,6
0,8
1
1,2
1,4
0 5 10 15 20 25 30
Time (h)
% o
f in
jecte
d a
cti
vit
y
Rat C
Rat D
Figure 30 – Time-activity curve for Rat C & D where MicroCAT-scan with contrast agent performed
before the first MicroPET-scan. The absorption of iodine stops after injection of contrast agent.

2
32
3.5 Absorbed dose
When the S-values used for the absorbed dose calculations were calculated, the volume of the
thyroid determined from MicroCAT images could not be equal to the volume used in EGS4
and MOBY. It was of practical reasons not possible to define the voxels that represented the
thyroid exact and therefore values that are as close to the MicroCAT volumes as possible
were used (Table 5). As can be seen, the S-values increase with decreased volume, resulting
in a higher absorbed dose according to equation 3.
Table 5 – S-values and differences between MicroCAT measured volumes and volumes used for Monte
Carlo simulations with the EGS4 code and MOBY mouse phantom.
MicroCAT Volume ( l) Used Volume ( l) S-value (mGy/MBqs)
Rat 1 49.3 47.3 0.54
Rat 2 41.9 43.4 0.57
Rat 3 47.8 47.3 0.54
Rat 4 70.6 69.8 0,40
Rat 5 45.8 47.3 0.54
Rat 6 34.3 33.2 0.70
Rat 7 51.6 51.3 0.51
The limited availability of earlier published work made the choice of administered activity
difficult. As mentioned in the Materials and Methods section the rats in Group 1 were injected
with an amount of activity of ~20 Gy to make sure that the thyroid became visible on the
MicroPET images (Table 1). The result of the absorbed dose calculations indicates that the
rats in Group 1 received an absorbed dose to the thyroid that corresponds to therapy doses of a
human thyroid (Table 6) (39). Group 2 and Group 3 don’t reach those therapy doses, but it is
clear that all of the rats received an absorbed dose that is high for imaging studies. The
absorbed dose per unit administered activity is furthermore ~100 times higher than 38
mGy/MBq, that is suggested by the Mird Primer, for a human thyroid with a maximum
thyroid uptake of 5% (31).
Table 6 – Absorbed doses for the seven rats.
Absorbed dose (Gy) Absorbed dose per unit
administered activity (Gy/MBq)
Rat 1 225.7 10.5
Rat 2 82.6 4.5
Rat 3 115.7 5.6
Rat 4 44.7 4.8
Rat 5 38.0 7.0
Rat 6 39.7 7.4
Rat 7 5.2 7.7
However, comparing animal research with human studies according to absorbed dose should
not be regarded as trying to come as close to the result from human studies as possible.
Animal research with radioisotopes almost always result in an absorbed dose that is higher
than the corresponding dose to a human, because of tighter dose restrictions for human
studies. The comparison is just done to give an impression of the meaning of the calculated
absorbed doses.

2
33
0
50
100
150
200
250
0 5 10 15 20 25
Administered Activity (MBq)
Ab
so
rbed
Do
se (
Gy)
Figure 31 – The absorbed dose’s dependence of the administered activity. Except for the last measuring
point a linear tendency between administered activity and absorbed dose can be seen.
As mentioned earlier, Figure 27 showed a significantly higher percentage uptake for Rat 1
than the rest of the rats in Scan 5. This resulted in a larger absorbed dose compared to the rest
of the rats in Group 1 (Table 6). It can also be seen in Figure 31 where the last point differs
from the otherwise linear tendency between administered activity and absorbed dose.
0
50
100
150
200
250
Rat 1 Rat 2 Rat 3 Rat 4 Rat 5 Rat 6 Rat 7
Ab
so
rbed
Do
se (
Gy)
Individual volume
Standard volume
Figure 32 – Differences in absorbed dose using the measured individual volume compared to using a
standard volume of 51.3 l.
The importance of a precise method for volume determination has been stated many times in
this study. Figure 32 shows this importance, where the absorbed dose to each rat is compared
to an absorbed dose calculated by using an S-value representing a volume of 51.3 l. This is
as close to the mean volume (49.3 l) for the seven thyroids as was possible. The absorbed

2
34
dose is in all cases (except for Rat 4) underestimated because of the fact that the standard
volume is larger than the rats’ individual thyroid volumes. The differences in absorbed doses
range from -37.4% – 20.8%, motivating the use of MicroCAT for volume determination for a
correct estimation of absorbed dose. It is however important to be aware of that the absorbed
dose in this study is calculated using a mouse phantom scaled up to the size of a rat. A similar
rat phantom is under development, and should be used for absorbed dose calculations when
finished.
When using the volume obtained from MicroCAT images to represent the volume of the
thyroid, the result is a precise volume. This true thyroid volume has in this study been used
together with the total activity in the thyroid when calculating the absorbed dose. Because of
the positron range of 124
I this will lead to an overestimation of the absorbed dose to the
thyroid, since some of the positrons emitted close to the surface of the thyroid will deposit
part of their energy to the surroundings rather than to the thyroid. But because of the fact that
the entire activity in the thyroid is taken into account, this energy deposit is included when the
absorbed dose is calculated. This overestimation in absorbed dose is schematically shown in
Figure 34 as area (B). The results in this study should therefore be regarded as the maximum
possible absorbed dose to the thyroid.
There is an option of using the MicroCAT images for defining ROI:s in the MicroPET images
in ASIPro. By defining the thyroid from MicroCAT images and apply these ROI:s to the
corresponding MicorPET image, only the annihilation photons detected within these ROI:s
(i.e. the thyroid) would be considered. If the activity quantified in this way were to be used
with the true thyroid volumes, it would result in an underestimation of the absorbed dose to
the thyroid. Again, this is a result of the positron range, since many of the positrons
annihilated outside the thyroid has deposited some of its energy within the thyroid, but since
they are detected outside the thyroid they will not be taken into account when calculating the
absorbed dose. This underestimation in absorbed dose is schematically represented in Figure
34 by area (A). Calculating the dose in this way would give the minimum possible absorbed
dose to the thyroid.
Figure 33 – Schematic profile of the absorbed dose
in a slice of the thyroid, compared to a profile of
the volume obtained from MicroCAT images
(rectangular)
Figure 34 – Using the total activity together with
the true volume result in an overestimation of the
absorbed dose to the thyroid, here represented by
area (B). If the rectangle, representing the true
thyroid area in any given slice, should be used for
activity quantification as well would instead give
an underestimation of the absorbed dose to the
thyroid, represented by area (A).

2
35
Future studies should include such a fusion, showing the differences in the maximum and the
minimum absorbed dose, which will be of interest to see how much the positron range and the
resolution of the system affects the result.
4 Conclusions and future work The accurate determination of the thyroid volume based on the MicroPET scans was not
possible due to many physical factors associated with the PET technique. Other groups have
investigated this, which questions the use of PET-based images for volume determination
(36;40-42). The high positron range of the I-124 affects the spatial resolution of the camera
lending in inaccurate definition of the edges of the thyroid. The other factors such as spillover
and partial volume factors make a small structure appears to have lower activity concentration
than its actual value and a region located close to a structure containing high activity
concentration appears more intense than its actual value respectively. These factors are an
issue in this study since they can affect the determination of the activity concentration in the
thyroid. Correction techniques for these factors should be taken into consideration to obtain as
accurate determinations of both thyroid volume and activity concentration as possible.
Currently, the commercial MAP reconstruction technique can deal with the spillover effect
but still not be able to correct for the positron range. Such a correction has however been
developed by Yao et. al. (25) through Monte Carlo simulations. They have also investigated
the magnitude of non-annihilation coincidence, which would be interesting to implement on
the developed in vivo animal model described in this work.
The development of an in vivo animal model has resulted in a model suitable for repeated
studies of the thyroid of a rat. It has been shown that the MicroCAT produces images
resulting in accurate volume determinations, making the use of MicroCAT essential for
volumetric measurements of the thyroid, since MicroPET alone doesn’t produce images
where reliable volumes can be obtained. It has furthermore been shown that MicroPET is
reliable for activity quantification. The accurate volume determination combined with the
activity quantification makes this in vivo model applicable for future pre 131
I-therapy studies
of a rat, where the results and experiences perhaps can be applied on human studies. For a
correct estimation of absorbed dose, activity quantification and simulation of S-values should
be done for the rest of the organs in the rat, as well as repeating the study to see the difference
between the maximum and the minimum absorbed dose to the thyroid. It would also be
interesting to compare the result of the absorbed dose calculations with other iodine isotopes
such as 123
I and 125
I, using the MOBY mouse phantom. Another application of this model is
for studies of thyroid diseases where fused images e.g. can show if the entire thyroid is active,
or if a part of it is dysfunctional.
Some other performance procedures are also of interest in the future such as:
Use gas anaesthesia instead of subcutaneous injections. With gas anaesthesia the
animal wakes up within minutes, whereas subcutaneous injections keep the animal
unconscious for several hours. This makes subcutaneous injections a risky procedure
and we had some problem with mortality, which could perhaps be reduced by use of
gas anaesthesia.
Use an infusion pump for continuous infusions, instead of manual injection of the
contrast agent. It would also be of interest to repeat the study with Fenestra™, which
is a contrast agent developed for single dose administration in animals, i.e. there is no

2
36
need for a continuous infusion. It is considerably more expensive compared to
Ultravist® though.
Introduce MicroMR instead of MicroCAT for volume determination to see if there are
any differences.
A rat phantom such as the MOBY mouse phantom is under development. When
finished it should be used for simulation of S-values for a better estimation of the
absorbed dose.
The hollow sphere thyroid phantom design is not optimal at the moment. It is good for
controlling the system performance, but the thickness of the walls of the spheres and
the tube representing the windpipe make the distance between the spheres too large to
be seen as a thyroid with two lobes. For a better imitation of the thyroid, the windpipe
should be changed to a tube with thinner walls, or be completely removed.

2
37
Acknowledgements This study was supported by grants from the Swedish Cancer Foundation.
I would like to take the opportunity to thank several people without whom this Master’s
Thesis would not have been possible. First, I want to thank my primary supervisor Henrik
Hussein El-Ali for constant support, excellent guidance and for always taking your time to
discuss problems and possibilities with me. I would also like to thank my assistant supervisors
Andreas Kjær and Sven-Erik Strand for your comments on this thesis.
Panum Institute is possessing a large number of employees that I owe a big thank you; Dorthe
Skovgaard, Henrik Gutte, Ulrik Kristoffersen for helping me with everything practical with
the animals, even though you were swamped with work with your PhD:s; Peter Andreas
Andersen for helping me with the design of the phantom and with radiation safety; Anne Kiil
Berthilsen for radiological advice and for helping me identifying the thyroid; Søren Holm and
Linda Kragh for guiding me through the radiation safety laws in Denmark and for helping me
with the ordering and delivering of 124
I; Tomas Olsson (Lund University) for administrative
help with the ordering of 124
I.
I would also like to express my gratitude to the rest of the staff of The Cluster for Molecular
Imaging at The Panum Institute for their patience with my Swedish, my trouble to understand
Danish and for making me feel half Danish in the coffee room.
Finally, I would like to thank my girlfriend Maria for her constant support, even though she’s
been 1300 km away.

2
i
Appendix I
Absorbed dose Absorbed dose is defined as the energy absorbed per unit mass of tissue (34):
ED
m (1)
(m) = mass of tissue. In nuclear medicine (E) corresponds to:
E = (number of radionuclide disintegrations in a particular volume) *
(energy emitted per disintegration of the radionuclide) *
(fraction of emitted energy that is absorbed by a particular mass) (2)
which can be written as
~
AD
m (3)
The first term in equation 2 is depending on the half-life of the radionuclide and its spatial and
temporal resolution. While the former is well known, the latter isn’t and therefore this term
has to be measured in some way. In this study this was done by using MicroPET images
collected at different times after injection. The estimated activity in a defined region (in this
case the thyroid), plotted against time, gives a time-activity curve. The integral of this curve
equals the cumulated activity (Ã), which corresponds to the total number of disintegrations in
the defined region.
The next part of equation 2 is simple and is easily looked up, but the last term needs some
explanation. The last term, the absorbed fraction factor ( ) is depending on the characteristics
of the radionuclide (type, energy) as well as on the target, the source and the distance between
them, and is determined by Monte Carlo calculations.
When calculating the absorbed dose it’s important to define the source (S) and the target (T).
The source is the region which holds the cumulated activity and the target is the region where
the absorbed dose is desired to be calculated. Of course, the source and the target can be the
same region, which is then referred to as “self-dose”. Equation 3 now gets more specific:
~
S T ST S
T
AD
m (4)
The MIRD Committee reduces this equation by defining the S-value
T S
T
Sm
(5)
The S-value is specific for each target and source and is determined by Monte Carlo
calculations. The total absorbed dose ( T SD ) to a target (T) is the sum of all dose
distributions from different sources:

2
ii
1 1 2 2 3 3
~ ~ ~
...T S S T S S T S S T SD A S A S A S (6)
In this study equation 6 is simplified to the self dose of the thyroid and the final expression for
absorbed dose is
thyr thyr thyrthyrD A S (7)
Calculation of cumulated activity (Bqs)
Rat 1
24
4 3 2 6 0.008
1
0 24
8
0.5094 60.221 1428.1 25069 156527 1 10
1.166923449 10
xA x x x x dx e dx
Rat 2
24,55
4 3 2 6 0.0228
2
0 24,55
7
0.0837 22.93 2078.6 63455 173655 1 10
4.012617085 10
xA x x x x dx e dx
Rat 3
24,17
4 3 2 6 0,0268
3
0 24,17
7
0.4125x 33.088x 848.96x +81933x+123766 2 10
5.983150572 10
xA dx e dx
Rat 4
25,3
5 4 3 2 0.0184x
4
0 25,3
7
0.0023x 0.4825x 31.283x +362.37x +19384x+25676 715477 e
3.090357510 10
A dx dx
Rat 5
26.6
3 2 0.0159 7
5
0 26.6
2.683 417.95 17629 9818.1 374983 1.966185613 10xA x x x dx e dx
Rat 6
25.53
4 3 2 0.0181
6
0 25.53
7
0.0824 9.0197 103.18 9351.5 26662 353108
1.581114378 10
xA x x x x dx e dx
Rat 7
25.83
4 3 2 0.0162
7
0 25.83
6
0.0121 1.4684 13.43 1826.5 2182.1 54987
2.840892021 10
xA x x x x dx e dx

2
iii
APPENDIX II
Schematic drawing of the hollow sphere thyroid phantom
Hollow plexiglass
tube – trachea
Hollow sphere
– thyroidea
Hollow sphere outer diameter
5.94 mm
(mm)
Lid 3 Lid 2
30
11.3
18.7
30
11.3
18.7
30
11.3
18.7
Lid 1
Plexiglass cylinder
Hollow sphere outer diameter
6.95 mm
Hollow sphere outer diameter
8.23 mm
80

2
iv
Reference List
(1) Erdi YE, Macapinlac H, Larson SM, Erdi AK, Yeung H, Furhang EE et al. Radiation
Dose Assessment for I-131 Therapy of Thyroid Cancer Using I-124 PET Imaging.
Clin Positron Imaging 1999; 2(1):41-46.
(2) Freudenberg LS, Antoch G, Gorges R, Knust J, Pink R, Jentzen W et al. Combined
PET/CT with iodine-124 in diagnosis of spread metastatic thyroid carcinoma: a case
report. Eur Radiol 2003; 13 Suppl 4:L19-L23.
(3) Freudenberg LS, Antoch G, Jentzen W, Pink R, Knust J, Gorges R et al. Value of
(124)I-PET/CT in staging of patients with differentiated thyroid cancer. Eur Radiol
2004; 14(11):2092-2098.
(4) Palmedo H, Bucerius J, Joe A, Strunk H, Hortling N, Meyka S et al. Integrated
PET/CT in differentiated thyroid cancer: diagnostic accuracy and impact on patient
management. J Nucl Med 2006; 47(4):616-624.
(5) Sgouros G, Kolbert KS, Sheikh A, Pentlow KS, Mun EF, Barth A et al. Patient-
specific dosimetry for 131I thyroid cancer therapy using 124I PET and 3-dimensional-
internal dosimetry (3D-ID) software. J Nucl Med 2004; 45(8):1366-1372.
(6) The Thyroid Gland: A General Introduction,
http://www.thyroid.ca/Guides/HG01.html. Thyroid Foundation of Canada . 12-13-
2006.
Ref Type: Electronic Citation
(7) Iverson C. Thyroid Gland Image,
http://www.yourdictionary.com/images/ahd/jpg/A4thyroi.jpg. 12-15-2006.
Ref Type: Data File
(8) Shomon MJ. Your Guide to Thyroid Disease - Hypothyroidism,
http://thyroid.about.com/cs/basicinformation/l/aathyroid101_b.htm. About Inc., The
New York Times Company . 12-13-2006.
Ref Type: Electronic Citation
(9) Shomon MJ. Your Guide to Thyroid Disease - Hyperthyroidism,
http://thyroid.about.com/library/weekly/aathyroid101-c.htm. About Inc., The New
York Times Company . 12-13-2006.
Ref Type: Electronic Citation
(10) Hyperthyroidism - Overactivity of the Thyroid Gland, Part 2: Causes of
hyperthyroidism, http://www.endocrineweb.com/hyper2.html. Endocrine Web, the
Norman Endocrine Surgery Clinic . 1-30-2005.
Ref Type: Electronic Citation
(11) Winter M. Periodic Table - Iodine,
http://www.webelements.com/webelements/elements/text/I/key.html. The University
of Sheffield and WebElements Ltd, UK . 12-13-2006.
Ref Type: Electronic Citation

2
v
(12) Bockisch A, Freudenberg L, Rosenbaum S, Jentzen W. (124)I in PET imaging: impact
on quantification, radiopharmaceutical development and distribution. Eur J Nucl Med
Mol Imaging 2006; 33(11):1247-1248.
(13) Pentlow KS, Graham MC, Lambrecht RM, Daghighian F, Bacharach SL, Bendriem B
et al. Quantitative imaging of iodine-124 with PET. J Nucl Med 1996; 37(9):1557-
1562.
(14) Dingli D, Kemp BJ, O'Connor MK, Morris JC, Russell SJ, Lowe VJ. Combined I-124
positron emission tomography/computed tomography imaging of NIS gene expression
in animal models of stably transfected and intravenously transfected tumor. Mol
Imaging Biol 2006; 8(1):16-23.
(15) Firestone RB. Table of Isotopes, Eigth Edition. Lawrence Berkeley National
Laboratory, University of California, 1999.
(16) Partridge M, Spinelli A, Ryder W, Hindorf C. The effect of energy on performance
of a small animal PET camera. Nuclear Instruments & Methods in Physics Research
2006;933-936.
(17) Firouzbakht ML, Schlyer DJ, Finn RD, Laguzzi G, Wolf AP. Iodine-124 production:
excitation function for the 124
Te(d,2n)124
I and the 124Te(d,3n)123I reactions from 7 to 24 MeV
.
Nuclear Instruments & Methods in Physics Research 1993;909-910.
(18) Kluetz PG, Meltzer CC, Villemagne VL, Kinahan PE, Chander S, Martinelli MA et al.
Combined PET/CT Imaging in Oncology. Impact on Patient Management. Clin
Positron Imaging 2000; 3(6):223-230.
(19) Phelps ME. PET: Molecular Imaging and Its Biological Applications. Springer, 2003.
(20) Attix FH. Introduction to Radiological Physic and Radiation Dosimetry. John Wiley &
Sons, Inc., 1986.
(21) Tai YC, Ruangma A, Rowland D, Siegel S, Newport DF, Chow PL et al. Performance
evaluation of the microPET focus: a third-generation microPET scanner dedicated to
animal imaging. J Nucl Med 2005; 46(3):455-463.
(22) MicroPET Help. 2006.
(23) Wang CX, Snyder WE, Bilbro G, Santago P. Performance evaluation of filtered
backprojection reconstruction and iterative reconstruction methods for PET images.
Comput Biol Med 1998; 28(1):13-24.
(24) Hoffman EJ, Huang SC, Phelps ME, Kuhl DE. Quantitation in positron emission
computed tomography: 4. Effect of accidental coincidences. J Comput Assist Tomogr
1981; 5(3):391-400.
(25) Quantitative Iodine-124 Imaging on Animal PET. 2005 IEEE Nuclear Science
Symposium Conference Record; 2005.
(26) MicroCAT II - Hardware and Data Aquisition Software User Manual. CTI Concorde /
Siemens Medical Solutions, 2004.

2
vi
(27) Pixel Binning, http://www.ccd.com/ccd103.html. Apogee Instruments Inc . 9-27-2006.
Ref Type: Electronic Citation
(28) Wistar Rat, http://www.answers.com/topic/wistar-rat. Wikipedia - The Free
Encyclopedia, Wikimedia Foundation, Inc. 12-15-2006.
Ref Type: Electronic Citation
(29) Wistar Rat Image, http://www.iar.or.jp/shodobutsu/wi_rat/images/wistar_image02.jpg.
12-15-2006. Institute for Animal Reproduction.
Ref Type: Data File
(30) Amira 3.1 User's Guide and Reference Manual. Konrad-Zuse-Zentrum für
Informationstechnik, Berlin and Indeed - Visual Concepts GmbH, Berlin, 2003.
(31) Loevinger R, Budinger TF, Watson EE. Mird Primer for Absorbed Dose Calculations.
New York: The Society of Nuclear Medicine, Inc., 1991.
(32) Nelson RF, Hirayama H, Rogers DWO. The EGS4 Code System. SLAC-265. 1985.
Stanford CA:SLAC.
Ref Type: Report
(33) Segars WP, Tsui BM, Frey EC, Johnson GA, Berr SS. Development of a 4-D digital
mouse phantom for molecular imaging research. Mol Imaging Biol 2004; 6(3):149-
159.
(34) Sgouros G. Dosimetry of internal emitters. J Nucl Med 2005; 46 Suppl 1:18S-27S.
(35) Loevinger R, Budinger TF, Watson EE. Mird Primer For Absorbed Dose Calculations.
New York: The Society of Nuclear Medicine, Inc., 1991.
(36) Ford EC, Kinahan PE, Hanlon L, Alessio A, Rajendran J, Schwartz DL et al. Tumor
delineation using PET in head and neck cancers: threshold contouring and lesion
volumes. Med Phys 2006; 33(11):4280-4288.
(37) Johansson L, Leide-Svegborn S, Mattsson S, Nosslin B. Biokinetics of iodide in man:
refinement of current ICRP dosimetry models. Cancer Biother Radiopharm 2003;
18(3):445-450.
(38) Ultravist Information, http://www.drugs.com/pro/ultravist_injection.html. Drugs.com,
Drug Information Online, Micromedex and Multum . 11-25-2006.
Ref Type: Electronic Citation
(39) Reinhardt MJ, Brink I, Joe AY, Von Mallek D, Ezziddin S, Palmedo H et al.
Radioiodine therapy in Graves' disease based on tissue-absorbed dose calculations:
effect of pre-treatment thyroid volume on clinical outcome. Eur J Nucl Med Mol
Imaging 2002; 29(9):1118-1124.
(40) Nestle U, Kremp S, Schaefer-Schuler A, Sebastian-Welsch C, Hellwig D, Rube C et
al. Comparison of different methods for delineation of 18F-FDG PET-positive tissue
for target volume definition in radiotherapy of patients with non-Small cell lung
cancer. J Nucl Med 2005; 46(8):1342-1348.

2
vii
(41) Biehl KJ, Kong FM, Dehdashti F, Jin JY, Mutic S, El N, I et al. 18F-FDG PET
definition of gross tumor volume for radiotherapy of non-small cell lung cancer: is a
single standardized uptake value threshold approach appropriate? J Nucl Med 2006;
47(11):1808-1812.
(42) Lavrenkov K, Partridge M, Cook G, Brada M. Positron emission tomography for
target volume definition in the treatment of non-small cell lung cancer. Radiother
Oncol 2005; 77(1):1-4.
Related Documents


