Yang et al. Plant Methods (2016) 12:39 DOI 10.1186/s13007-016-0139-1 METHODOLOGY Development of a universal and simplified ddRAD library preparation approach for SNP discovery and genotyping in angiosperm plants Guo‑Qian Yang 1,2 , Yun‑Mei Chen 1,2 , Jin‑Peng Wang 3 , Cen Guo 1,2 , Lei Zhao 1,2 , Xiao‑Yan Wang 1 , Ying Guo 1,2 , Li Li 3 , De‑Zhu Li 1* and Zhen‑Hua Guo 1* Abstract Background: The double digest restriction‑site associated DNA sequencing technology (ddRAD‑seq) is a reduced representation sequencing technology by sampling genome‑wide enzyme loci developed on the basis of next‑ generation sequencing. ddRAD‑seq has been widely applied to SNP marker development and genotyping on animals, especially on marine animals as the original ddRAD protocol is mainly built and trained based on animal data. However, wide application of ddRAD‑seq technology in plant species has not been achieved so far. Here, we aim to develop an optimized ddRAD library preparation protocol be accessible to most angiosperm plant species without much startup pre‑experiment and costs. Results: We first tested several combinations of enzymes by in silico analysis of 23 plant species covering 17 families of angiosperm and 1 family of bryophyta and found AvaII + MspI enzyme pair produced consistently higher number of fragments in a broad range of plant species. Then we removed two purifying and one quantifying steps of the orig‑ inal protocol, replaced expensive consumables and apparatuses by conventional experimental apparatuses. Besides, we shortened P1 adapter from 37 to 25 bp and designed a new barcode‑adapter system containing 20 pairs of bar‑ codes of varying length. This is an optimized ddRAD strategy for angiosperm plants that is economical, time‑saving and requires little technical expertise or investment in laboratory equipment. We refer to this simplified protocol as MiddRAD and we demonstrated the utility and flexibility of our approach by resolving phylogenetic relationships of two genera of woody bamboos (Dendrocalamus and Phyllostachys). Overall our results provide empirical evidence for using this method on different model and non‑model plants to produce consistent data. Conclusions: As MiddRAD adopts an enzyme pair that works for a broad range of angiosperm plants, simplifies library constructing procedure and requires less DNA input, it will greatly facilitate designing a ddRAD project. Our optimization of this method may make ddRAD be widely used in fields of plant population genetics, phylogenetics, phylogeography and molecular breeding. Keywords: RAD‑seq, ddRAD, MiddRAD, Genotype‑by‑sequencing, Next‑generation sequencing © 2016 The Author(s). This article is distributed under the terms of the Creative Commons Attribution 4.0 International License (http://creativecommons.org/licenses/by/4.0/), which permits unrestricted use, distribution, and reproduction in any medium, provided you give appropriate credit to the original author(s) and the source, provide a link to the Creative Commons license, and indicate if changes were made. The Creative Commons Public Domain Dedication waiver (http://creativecommons.org/ publicdomain/zero/1.0/) applies to the data made available in this article, unless otherwise stated. Open Access Plant Methods *Correspondence: [email protected]; [email protected] 1 Germplasm Bank of Wild Species, Kunming Institute of Botany, Chinese Academy of Sciences, Kunming 650201, China Full list of author information is available at the end of the article

Welcome message from author
This document is posted to help you gain knowledge. Please leave a comment to let me know what you think about it! Share it to your friends and learn new things together.
Transcript

Yang et al. Plant Methods (2016) 12:39 DOI 10.1186/s13007-016-0139-1
METHODOLOGY
Development of a universal and simplified ddRAD library preparation approach for SNP discovery and genotyping in angiosperm plantsGuo‑Qian Yang1,2, Yun‑Mei Chen1,2, Jin‑Peng Wang3, Cen Guo1,2, Lei Zhao1,2, Xiao‑Yan Wang1, Ying Guo1,2, Li Li3, De‑Zhu Li1* and Zhen‑Hua Guo1*
Abstract
Background: The double digest restriction‑site associated DNA sequencing technology (ddRAD‑seq) is a reduced representation sequencing technology by sampling genome‑wide enzyme loci developed on the basis of next‑generation sequencing. ddRAD‑seq has been widely applied to SNP marker development and genotyping on animals, especially on marine animals as the original ddRAD protocol is mainly built and trained based on animal data. However, wide application of ddRAD‑seq technology in plant species has not been achieved so far. Here, we aim to develop an optimized ddRAD library preparation protocol be accessible to most angiosperm plant species without much startup pre‑experiment and costs.
Results: We first tested several combinations of enzymes by in silico analysis of 23 plant species covering 17 families of angiosperm and 1 family of bryophyta and found AvaII + MspI enzyme pair produced consistently higher number of fragments in a broad range of plant species. Then we removed two purifying and one quantifying steps of the orig‑inal protocol, replaced expensive consumables and apparatuses by conventional experimental apparatuses. Besides, we shortened P1 adapter from 37 to 25 bp and designed a new barcode‑adapter system containing 20 pairs of bar‑codes of varying length. This is an optimized ddRAD strategy for angiosperm plants that is economical, time‑saving and requires little technical expertise or investment in laboratory equipment. We refer to this simplified protocol as MiddRAD and we demonstrated the utility and flexibility of our approach by resolving phylogenetic relationships of two genera of woody bamboos (Dendrocalamus and Phyllostachys). Overall our results provide empirical evidence for using this method on different model and non‑model plants to produce consistent data.
Conclusions: As MiddRAD adopts an enzyme pair that works for a broad range of angiosperm plants, simplifies library constructing procedure and requires less DNA input, it will greatly facilitate designing a ddRAD project. Our optimization of this method may make ddRAD be widely used in fields of plant population genetics, phylogenetics, phylogeography and molecular breeding.
Keywords: RAD‑seq, ddRAD, MiddRAD, Genotype‑by‑sequencing, Next‑generation sequencing
© 2016 The Author(s). This article is distributed under the terms of the Creative Commons Attribution 4.0 International License (http://creativecommons.org/licenses/by/4.0/), which permits unrestricted use, distribution, and reproduction in any medium, provided you give appropriate credit to the original author(s) and the source, provide a link to the Creative Commons license, and indicate if changes were made. The Creative Commons Public Domain Dedication waiver (http://creativecommons.org/publicdomain/zero/1.0/) applies to the data made available in this article, unless otherwise stated.
Open Access
Plant Methods
*Correspondence: [email protected]; [email protected] 1 Germplasm Bank of Wild Species, Kunming Institute of Botany, Chinese Academy of Sciences, Kunming 650201, ChinaFull list of author information is available at the end of the article

Page 2 of 17Yang et al. Plant Methods (2016) 12:39
BackgroundRestriction-site associated DNA sequencing technol-ogy (RAD-seq) is a reduced representation sequencing technology by sampling genome-wide single enzyme loci developed on the basis of next-generation sequencing [1, 2]. The technology breaks genome into a certain size of DNA fragments by employing a restriction endonucle-ase (usually a low-frequency cutter) combined with the ultrasonic shearing method, then the fragmented DNA is enriched for constructing a sequencing library so that sequences beside the cleavage site can be acquired for high-throughput sequencing [3]. Because RAD-tags are DNA fragments beside a specific restriction site from the whole genome, so they can generally reflect the sequence characteristics of the entire genome. It is now possible to obtain hundreds to thousands of single nucleotide poly-morphism (SNP) markers within a species or between closely related species through RAD-seq. Until now RAD-seq has been successfully applied to SNP marker development, high-density genetic map construction, QTL mapping, population genetics and phylogenetic research on eggplants, chickpeas, sesames, soybeans, cucurbit bottle gourds, bamboos, beetles, and other organisms [4–13]. But on one aspect experimental proce-dure of this technology is much complex and it requires a Covaris ultrasonicator and some other specialized instru-ments, so personnels under professional training are usu-ally required to master the technique; on the other hand, random physical shearing methods implemented in the library construction process will result in losing lots of DNA, thereby leading to out control of the final tag num-ber [3, 14]. So several laboratories have improved and simplified the traditional RAD-seq method, from which a variety of low cost, high throughput reduced repre-sentation sequencing methods are available. At present, reduced representation sequencing methods developed from the RAD-seq mainly includes GBS series tech-niques and RAD series techniques [14]. GBS and RAD-seq techniques share several basic steps while differ only in the order or details of enzyme digestion, adapter ligation, barcoding and size selection. Each alternative RAD method has both advantages and drawbacks. RAD series control number of the tags by both choosing the enzyme and size selection while GBS series techniques or close derivatives control the number of tags only by selecting different enzymes (though some GBS users may also add a size selection step in their modified GBS protocol [15], the original intention of GBS is to reduce library preparation workflow without size selection). GBS series techniques include single and double enzyme GBS [16, 17], both of which employ simple library construct-ing processes, but they can only enrich small fragments less than ~350 bp [18]. It’s easy to sequence through the
short fragment with pair-end sequencing mode as the sequencing length is gradually becoming longer, which will result in a waste of data and the potential to discover more SNPs. Furthermore, fragments of various lengths will increase the potential for amplification bias [19, 20] and cause a decline in the data quantity and data qual-ity. RAD series mainly includes 2b-RAD [21], ddRAD [22] and ezRAD [23]. 2b-RAD adopts a kind of type II restriction endonuclease to digest the genome, produc-ing only ~33 bp fragments, which lack of biases due to fragment size selection but may restrict the potential for discovering more SNPs. ezRAD is the only protocol that relies on illumina authoritative kits to construct the library with customer support but the cost is still not as low as the author claimed [24]. ddRAD can tune frag-ments number by employing two different enzymes and size selection, and the process of constructing a library is quite simple while genomic DNA it requires is of the highest quality in all the RAD methods [24].
All RAD protocols have been proved to be powerful tools for SNP discovery and genotyping of model and non-model species. However, startup of them all usually involves pre-experiment of (1) testing candidate endonu-clease that could produce a suitable RAD or GBS library [25], and (2) purchasing some relatively expensive con-sumables and apparatus (e.g. Agilent 2100 Bioanalyzer). This requires a significant initial investment for labs focused on traditional genotyping methods (e.g. SSR gen-otyping). Besides, many labs (e.g. phylogenetic bio-labs) are probably focusing on different model or non-model plant species, once a pair of enzymes selected and adapt-ers purchased for one target species, they have to con-sider if these consumables could be applied to another species efficiently to be studied even some commonly used enzyme pairs could produce hundreds to thousands of markers across wide-range species. Enzyme pairs sim-ulation of the original ddRAD protocol is mainly based on animal genomes and it is hard for us to know if perfor-mance of the enzyme pairs is good as well in plant species as Santiago et al. found that a given restriction enzyme may have strikingly variable recognition-sequence fre-quencies among broad eukaryotic taxonomic groups, and only phylogenetic related species could produce similar recognition-sequence frequencies [26]. In another study, Burford et al. found some enzyme pairs work more con-sistently than others across a wide range of taxonomic groups after optimizing ddRAD protocol and testing several restriction enzyme pairs for five genera of insects and fish [27]. Here, we sought to test the universality of several commonly used enzyme pairs across most angio-sperm plants, simplify the ddRAD protocol and reduce the overall costs. Our protocol is generally according to the protocol described by Peterson et al. [22], but with
Page 3 of 17Yang et al. Plant Methods (2016) 12:39
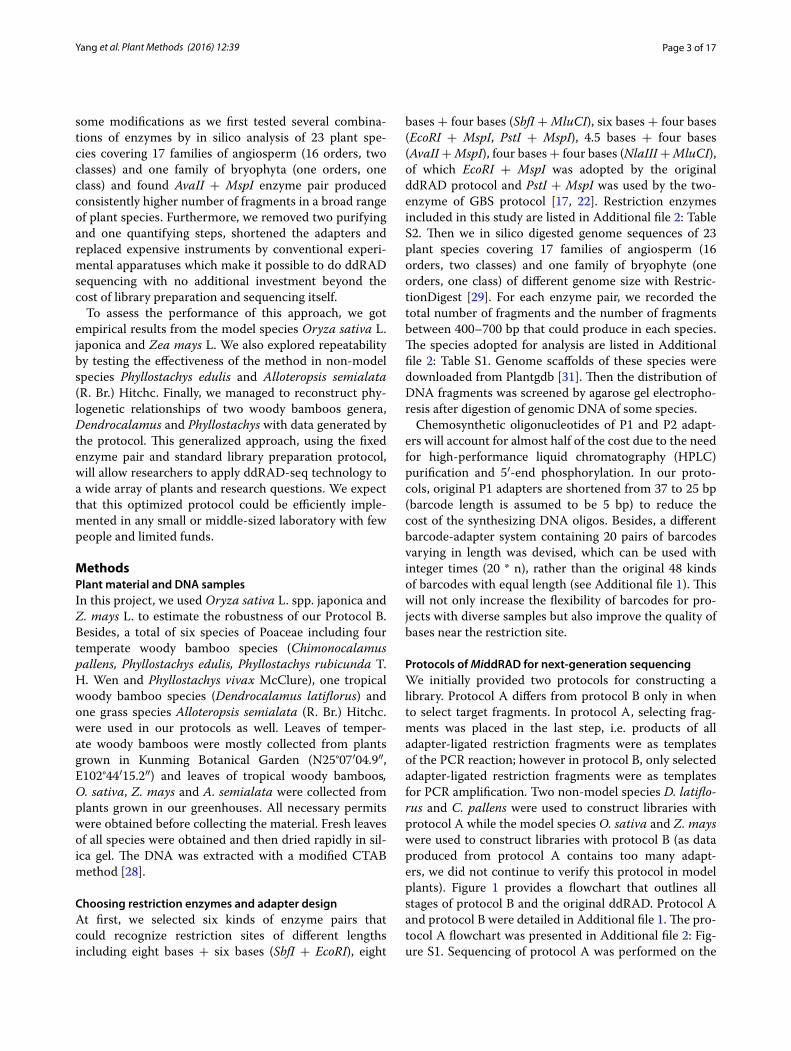
some modifications as we first tested several combina-tions of enzymes by in silico analysis of 23 plant spe-cies covering 17 families of angiosperm (16 orders, two classes) and one family of bryophyta (one orders, one class) and found AvaII + MspI enzyme pair produced consistently higher number of fragments in a broad range of plant species. Furthermore, we removed two purifying and one quantifying steps, shortened the adapters and replaced expensive instruments by conventional experi-mental apparatuses which make it possible to do ddRAD sequencing with no additional investment beyond the cost of library preparation and sequencing itself.
To assess the performance of this approach, we got empirical results from the model species Oryza sativa L. japonica and Zea mays L. We also explored repeatability by testing the effectiveness of the method in non-model species Phyllostachys edulis and Alloteropsis semialata (R. Br.) Hitchc. Finally, we managed to reconstruct phy-logenetic relationships of two woody bamboos genera, Dendrocalamus and Phyllostachys with data generated by the protocol. This generalized approach, using the fixed enzyme pair and standard library preparation protocol, will allow researchers to apply ddRAD-seq technology to a wide array of plants and research questions. We expect that this optimized protocol could be efficiently imple-mented in any small or middle-sized laboratory with few people and limited funds.
MethodsPlant material and DNA samplesIn this project, we used Oryza sativa L. spp. japonica and Z. mays L. to estimate the robustness of our Protocol B. Besides, a total of six species of Poaceae including four temperate woody bamboo species (Chimonocalamus pallens, Phyllostachys edulis, Phyllostachys rubicunda T. H. Wen and Phyllostachys vivax McClure), one tropical woody bamboo species (Dendrocalamus latiflorus) and one grass species Alloteropsis semialata (R. Br.) Hitchc. were used in our protocols as well. Leaves of temper-ate woody bamboos were mostly collected from plants grown in Kunming Botanical Garden (N25°07′04.9″, E102°44′15.2″) and leaves of tropical woody bamboos, O. sativa, Z. mays and A. semialata were collected from plants grown in our greenhouses. All necessary permits were obtained before collecting the material. Fresh leaves of all species were obtained and then dried rapidly in sil-ica gel. The DNA was extracted with a modified CTAB method [28].
Choosing restriction enzymes and adapter designAt first, we selected six kinds of enzyme pairs that could recognize restriction sites of different lengths including eight bases + six bases (SbfI + EcoRI), eight
bases + four bases (SbfI + MluCI), six bases + four bases (EcoRI + MspI, PstI + MspI), 4.5 bases + four bases (AvaII + MspI), four bases + four bases (NlaIII + MluCI), of which EcoRI + MspI was adopted by the original ddRAD protocol and PstI + MspI was used by the two-enzyme of GBS protocol [17, 22]. Restriction enzymes included in this study are listed in Additional file 2: Table S2. Then we in silico digested genome sequences of 23 plant species covering 17 families of angiosperm (16 orders, two classes) and one family of bryophyte (one orders, one class) of different genome size with Restric-tionDigest [29]. For each enzyme pair, we recorded the total number of fragments and the number of fragments between 400–700 bp that could produce in each species. The species adopted for analysis are listed in Additional file 2: Table S1. Genome scaffolds of these species were downloaded from Plantgdb [31]. Then the distribution of DNA fragments was screened by agarose gel electropho-resis after digestion of genomic DNA of some species.
Chemosynthetic oligonucleotides of P1 and P2 adapt-ers will account for almost half of the cost due to the need for high-performance liquid chromatography (HPLC) purification and 5′-end phosphorylation. In our proto-cols, original P1 adapters are shortened from 37 to 25 bp (barcode length is assumed to be 5 bp) to reduce the cost of the synthesizing DNA oligos. Besides, a different barcode-adapter system containing 20 pairs of barcodes varying in length was devised, which can be used with integer times (20 * n), rather than the original 48 kinds of barcodes with equal length (see Additional file 1). This will not only increase the flexibility of barcodes for pro-jects with diverse samples but also improve the quality of bases near the restriction site.
Protocols of MiddRAD for next‑generation sequencingWe initially provided two protocols for constructing a library. Protocol A differs from protocol B only in when to select target fragments. In protocol A, selecting frag-ments was placed in the last step, i.e. products of all adapter-ligated restriction fragments were as templates of the PCR reaction; however in protocol B, only selected adapter-ligated restriction fragments were as templates for PCR amplification. Two non-model species D. latiflo-rus and C. pallens were used to construct libraries with protocol A while the model species O. sativa and Z. mays were used to construct libraries with protocol B (as data produced from protocol A contains too many adapt-ers, we did not continue to verify this protocol in model plants). Figure 1 provides a flowchart that outlines all stages of protocol B and the original ddRAD. Protocol A and protocol B were detailed in Additional file 1. The pro-tocol A flowchart was presented in Additional file 2: Fig-ure S1. Sequencing of protocol A was performed on the

Page 4 of 17Yang et al. Plant Methods (2016) 12:39
Illumina HiSeq 2000 System (San Diego, CA, USA) using the pair read, 100 nucleotide configuration at Kunming Institute of Zoology, CAS while Sequencing of Protocol B was performed on the Illumina HiSeq X Ten System (San Diego, CA, USA) using the pair read, 150 nucleotide configuration at Cloud Health Genomics Ltd. To test the universality of MiddRAD and the restriction enzymes on more plant species, we constructed libraries for P. edu-lis and A. semialata with the same enzyme pairs. Librar-ies were constructed strictly according to Protocol B and were sent to Cloud Health Genomics Ltd. for sequencing using Illumina HiSeq X Ten (San Diego, CA, USA) with PE150 bp sequencing mode.
Then we adopted protocol B to construct libraries for three bamboo species (contains two D. latiflorus individ-uals, one P. rubicunda individual and one P. vivax individ-ual) to explore the applicability of MiddRADseq-derived genotypes/markers in resolving phylogenetic problems. The library constructing process is according to Protocol B and fragments selected were set to 600–700 bp. Rea-gents and enzymes used were mainly purchased from New England Biolabs Inc. (R0153S, R0106S), Vazyme Biotech Co., Ltd. (C301-01) and SunShineBio Co., Ltd.
(SN124). Libraries were then sequenced in Cloud Health Genomics Ltd. Sequencing platform was Illumina HiSeq X Ten (San Diego, CA, USA) with sequence length PE150 bp.
To evaluate the shortened adapters and redesigned barcodes, we constructed four MiddRAD sub-libraries according to protocol B for 40 offsprings of a D. latiflo-rus F1 population and sequenced the final library with a single illumina HiSeq X ten lane (PE150 bp). The coef-ficient of variation (CV = standard deviation/mean) of data generated by each barcode and each sub-library were analyzed to evaluate the newly designed barcodes, indexes and shortened P1 adapters.
Sequence quality analysis, SNP calling and genotypingRaw reads were demultiplexed by process_radtags pro-gram in Stacks software version 1.24 [30, 31]. Average sequence quality per read and GC–content were checked using FastQC version 0.11.3 [32]. Adapter reads were searched by Cutadapt 1.9.1 [33]. Reads containing cor-rect restriction sites in read1 and read2 were obtained by searching restriction sites sequences in the raw reads respectively. Clean data were produced by removing the adapter reads and reads with ambiguous or low qual-ity (below a Phred score of Q10) bases. To determine the mapping ratio of sampled reads to the genome, clean reads of O. sativa, Z. mays and A. semialata were mapped onto the rice, maize and sorghum genome scaf-folds, CDS-DNA and repeats region respectively, while clean reads of temperate bamboo individuals onto the P. edulis reference genome, CDS-DNA region and repeats region and reads of tropical bamboo individuals onto the D. latiflorus survey genome (Zhenhua Guo et al. unpub-lished data) with bowtie [34]. Rice, maize and sorghum genome scaffolds, CDS-DNA and repeats region were downloaded from Plantgdb [35] while P. edulis reference genome, CDS region, and repeats region were down-loaded from BambooGDB [36]. To obtain the number of tags, clean reads (we only used read1 for analysis) of all individuals were first trimmed 140 bp (when read length is PE150) and clustered with ustacks/pstacks program, then the reducing efficiency was determined by calcu-lating the percentage of total tag length in total nuclear genome length.
To estimate the performance of MiddRAD protocol, tags of rice and maize produced by empirical sequenc-ing results were compared with those predicted from in silico analysis to show how actual data meet the in silico expectations.
In order to identify SNP markers and genotypes for inferring phylogeny of three woody bamboo species, the Stacks software pipeline was implemented for the pro-cessing of Illumina sequence read data and screening
Fig. 1 Library preparation flowchart of MiddRAD protocol B and the original ddRAD protocol. a MiddRAD protocol B. b The original ddRAD library constructing flowchart, this procedure is adopted by Peterson et al. Protocol B contains nine steps while the original ddRAD protocol contains 12 steps. Only size‑selected fragments are as templates for PCR amplification in protocol B

Page 5 of 17Yang et al. Plant Methods (2016) 12:39
SNPs that are fixed-within a species while vary among different species. Sequence trimming was first performed using process_radtags program to remove adapter reads and reads with bases below a Phred score of Q10 within a 15 bases sliding window. Clean sequences were truncated to a final length of 140 base pairs (excluding the barcode but containing enzyme recognition site) prior to cluster-ing. For each sample, the ustacks program was used to merge short-read sequences into tags/loci using removal algorithm and deleveraging algorithm (−m10, −M3). Then a catalog was built from all samples by the cstacks program (−n5). Tags from each sample were matched against the catalog to determine alleles with sstacks pro-gram and the populations program was used to output SNPs in Phylip format. The minimum number of taxa required for an informative unrooted phylogenetic tree is three. The major parameters m (minimum number of identical reads required to form a stack), M (maximum number of nucleotides mismatches allowed between stacks before fusing stacks into a locus) and n (num-ber of mismatches allowed between loci in the catalog) were tuned to get the matrix with a variable number of SNPs. Furthermore, to validate the genotyping accuracy, we presented linkage map results of one D. latiflorus F1 mapping population (Guoqian Yang et al., unpublished data) according to MiddRAD protocol and 55 genotypes (eight markers, seven individuals and one genotype was missing during the SNP calling pipeline) were randomly selected and verified by independent Sanger sequencing.
Phylogenetic tree construction of three woody bamboo speciesWe inferred ML phylogenies for each data matrix using RAxML version 8.0.0 [37]. ML searches were conducted in RAxML with the GTRGAMMAI model for sequence data, and a rapid bootstrapping analysis with 100 boot-strap replicates was conducted. Phylogenetic accuracy was determined by comparing inferred trees with pub-lished reference phylogenies. The reference phylogeny for woody bamboos from [38, 39], was estimated using parsi-mony analyses (MP) and Bayesian inference (BI).
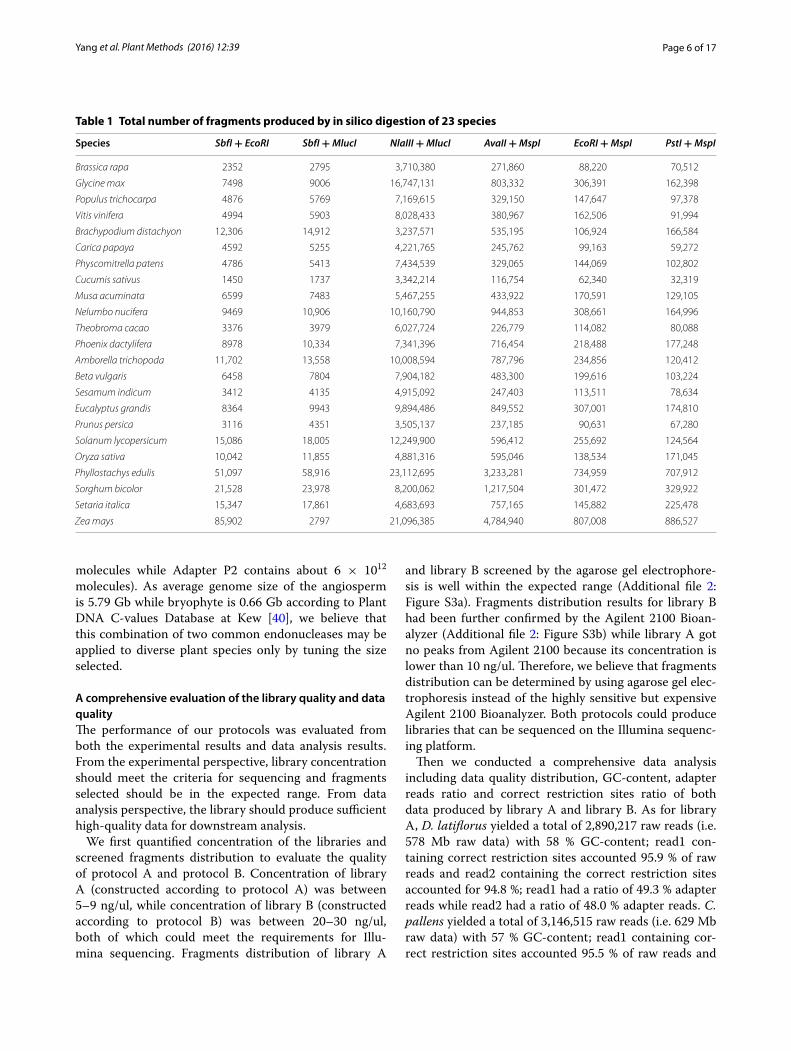
ResultsChoosing universal restriction enzyme pairs across angiosperm plantsSix combinations of endonucleases identifying 4–8 nucleotide bases were tested on genomes of 23 plant spe-cies (covering 17 families of angiosperm and one fam-ily of bryophyta). The ideal combination should be able to generate a consistently higher number of sequence-able fragments across species. The four bases + eight bases enzyme pair and six bases + eight bases enzyme pair usually produced a few thousand fragments, which
were far from the requirement for large-scale genotyping (Table 1). However, the four bases + four bases enzyme pair produced up to ~23,112,695 fragments which made it difficult to control error in practice and required deep sequencing depth. Meanwhile, the four bases + six bases enzyme pair generally produced 32,319–886,527 frag-ments which made it easy for people to obtain a sufficient number of fragments without sequencing a large amount of data. PstI + MspI which was used in the original two-enzyme GBS protocol performed well in most plants, but only produced 3791 fragments between 400–700 bp for Cucumis sativus and 8258 fragments for Carica papaya (Table 2). EcoRI + MspI which was used in the original ddRAD protocol performed better than PstI + MspI in any simulated species by producing thousands or more tags, but only 8173 fragments fell into within 400–700 bp for C. sativus, which could not meet the demand for more tags in some studies. We found AvaII + MspI enzyme pair was superior to both of EcoRI + MspI and PstI + MspI. This enzyme pair could produce at least 13,958 segments between 400–700 bp in the 23 simulated species and was predicted to provide sufficient tags across diverse plant species. The largest genome (Z. mays, 2300 Mb) could produce 4,784,940 tags with 517,204 tags between 400–700 bp while even the smallest genome (Prunus per-sica, 226.6 Mb) could produce 237,185 tags with 34,514 tags between 400–700 bp (Fig. 2a; Table 2). Both of the enzymes are common enzymes with AvaII identifying 4.5 bases and MspI identifying four bases which are different from the combination with a common enzyme and a rare enzyme adopted in ddRAD or two-enzyme GBS. Corre-lation analysis showed that the total tag number is cor-related positively with genome size with R2 = 0.9185 and tag number between 400–700 bp is correlated positively with genome size as well with R2 = 0.9476 (Fig. 2b, c). So once we get to know the genome size of one plant, the tag number produced could be estimated and the expected tag number could be tuned by selecting a proper size range. EcoRI + MspI and PstI + MspI could also be taken into consideration when designing a ddRAD project as they may produce hundreds to thousands of mark-ers across a wide range of plant species and the total tag number or tag number between 400–700 bp is correlated positively with genome size as well (Additional file 2: Fig-ure S2). After conducting the above simulations, we built ddRAD libraries with the AvaII + MspI enzyme pair. Fragments between 400–700 bp are highly recommended for their high sequencing efficiency on illumina system. Optimization of the ratio of sample DNA to the adapters is not required when the genome size is less than 20 Gb because we have added excess adapters in our protocol which could make each fragment be ligated with corre-sponding adapters (Adapter P1 contains about 3 × 10¹²
Page 6 of 17Yang et al. Plant Methods (2016) 12:39
molecules while Adapter P2 contains about 6 × 10¹² molecules). As average genome size of the angiosperm is 5.79 Gb while bryophyte is 0.66 Gb according to Plant DNA C-values Database at Kew [40], we believe that this combination of two common endonucleases may be applied to diverse plant species only by tuning the size selected.
A comprehensive evaluation of the library quality and data qualityThe performance of our protocols was evaluated from both the experimental results and data analysis results. From the experimental perspective, library concentration should meet the criteria for sequencing and fragments selected should be in the expected range. From data analysis perspective, the library should produce sufficient high-quality data for downstream analysis.
We first quantified concentration of the libraries and screened fragments distribution to evaluate the quality of protocol A and protocol B. Concentration of library A (constructed according to protocol A) was between 5–9 ng/ul, while concentration of library B (constructed according to protocol B) was between 20–30 ng/ul, both of which could meet the requirements for Illu-mina sequencing. Fragments distribution of library A
and library B screened by the agarose gel electrophore-sis is well within the expected range (Additional file 2: Figure S3a). Fragments distribution results for library B had been further confirmed by the Agilent 2100 Bioan-alyzer (Additional file 2: Figure S3b) while library A got no peaks from Agilent 2100 because its concentration is lower than 10 ng/ul. Therefore, we believe that fragments distribution can be determined by using agarose gel elec-trophoresis instead of the highly sensitive but expensive Agilent 2100 Bioanalyzer. Both protocols could produce libraries that can be sequenced on the Illumina sequenc-ing platform.
Then we conducted a comprehensive data analysis including data quality distribution, GC-content, adapter reads ratio and correct restriction sites ratio of both data produced by library A and library B. As for library A, D. latiflorus yielded a total of 2,890,217 raw reads (i.e. 578 Mb raw data) with 58 % GC-content; read1 con-taining correct restriction sites accounted 95.9 % of raw reads and read2 containing the correct restriction sites accounted for 94.8 %; read1 had a ratio of 49.3 % adapter reads while read2 had a ratio of 48.0 % adapter reads. C. pallens yielded a total of 3,146,515 raw reads (i.e. 629 Mb raw data) with 57 % GC-content; read1 containing cor-rect restriction sites accounted 95.5 % of raw reads and
Table 1 Total number of fragments produced by in silico digestion of 23 species
Species SbfI + EcoRI SbfI + MlucI NlaIII + MlucI AvaII + MspI EcoRI + MspI PstI + MspI
Brassica rapa 2352 2795 3,710,380 271,860 88,220 70,512
Glycine max 7498 9006 16,747,131 803,332 306,391 162,398
Populus trichocarpa 4876 5769 7,169,615 329,150 147,647 97,378
Vitis vinifera 4994 5903 8,028,433 380,967 162,506 91,994
Brachypodium distachyon 12,306 14,912 3,237,571 535,195 106,924 166,584
Carica papaya 4592 5255 4,221,765 245,762 99,163 59,272
Physcomitrella patens 4786 5413 7,434,539 329,065 144,069 102,802
Cucumis sativus 1450 1737 3,342,214 116,754 62,340 32,319
Musa acuminata 6599 7483 5,467,255 433,922 170,591 129,105
Nelumbo nucifera 9469 10,906 10,160,790 944,853 308,661 164,996
Theobroma cacao 3376 3979 6,027,724 226,779 114,082 80,088
Phoenix dactylifera 8978 10,334 7,341,396 716,454 218,488 177,248
Amborella trichopoda 11,702 13,558 10,008,594 787,796 234,856 120,412
Beta vulgaris 6458 7804 7,904,182 483,300 199,616 103,224
Sesamum indicum 3412 4135 4,915,092 247,403 113,511 78,634
Eucalyptus grandis 8364 9943 9,894,486 849,552 307,001 174,810
Prunus persica 3116 4351 3,505,137 237,185 90,631 67,280
Solanum lycopersicum 15,086 18,005 12,249,900 596,412 255,692 124,564
Oryza sativa 10,042 11,855 4,881,316 595,046 138,534 171,045
Phyllostachys edulis 51,097 58,916 23,112,695 3,233,281 734,959 707,912
Sorghum bicolor 21,528 23,978 8,200,062 1,217,504 301,472 329,922
Setaria italica 15,347 17,861 4,683,693 757,165 145,882 225,478
Zea mays 85,902 2797 21,096,385 4,784,940 807,008 886,527

Page 7 of 17Yang et al. Plant Methods (2016) 12:39
read2 containing the correct restriction sites accounted for 94.5 %; read1 had a ratio of 40.3 % adapter reads while read2 had a ratio of 39.6 % adapter reads. Raw reads of D. latiflorus and C. pallens both had an average base Qual-ity Score larger than 20. Furthermore, bases of restriction enzyme cutting site had an average base Quality Score larger than 30. As for library B, O. sativa yielded a total of 14,732,449 raw reads (i.e. 4.1 Gb raw data) with 51.5 % GC-content (Fig. 3a, c); read1 containing correct restric-tion sites accounted 95.80 % of raw reads and read2 con-taining the correct restriction sites accounted for 95.39 % (Fig. 3b); read1 had a ratio of 2.63 % adapter reads while read2 had a ratio of 3.37 % adapter reads (Fig. 3d). Zea mays yielded a total of 7,414,009 raw reads (i.e. 2.1 Gb raw data) with 57 % GC-content; read1 containing cor-rect restriction sites accounted 96.18 % of raw reads and read2 containing correct restriction sites accounted for 96.37 %; read1 had 2.48 % adapter reads while read2 had 3.29 % adapter reads. Raw reads of O. sativa and Z. mays both had an average base Quality Score larger than 20 while bases of restriction enzyme cutting site had an average base Quality Score larger than 30 (Fig. 3e, f ). To determine the mapping ratio of sampled reads to the ref-erence genome, we mapped clean reads of rice and maize onto the rice and maize reference genome scaffolds,
CDS-DNA and repeats region respectively. Overall scaf-folds mapping rate was 82.5–90.66 %, reads mapping to the CDS-DNA accounts 2.38–2.83 % for maize and accounts ~19.50 % for rice. Yet reads mapping on the repeats region accounted for less than 11.00 % (Table 3).
Per Bases Quality Score is a major index of the sequence quality, the higher the Quality Score, the lower probability of sequencing error occurs. Q20 and Q30 represent the sequencing error probability of 1 and 0.1 %. Illumina sequencing was found to favor the more GC-balanced regions, leading to few or no reads from the many GC-poor regions and GC bias can be introduced at several processes of Illumina sequencing, e.g. PCR amplification of the library, cluster amplification, and the sequencing step [41]. So if GC-content is around 50 %, we can conclude no bias exists in library preparation and sequencing process. Adapter reads ratio is the percent-age of reads with adapters in raw reads and is an indica-tor of data quality. Adapter reads should be removed in the subsequent analysis. Through percentage of reads containing correct restriction sites, we can determine whether the enzyme digestion reaction works in the right way. Comprehensive analysis of data quality distribution, GC-content, adapter reads ratio and correct restriction sites ratio showed that both MiddRAD protocols could
Table 2 Number of fragments between 400–700 bp produced by in silico digestion of 23 species
Species SbfI + EcoRI SbfI + MlucI NlaIII + MlucI AvaII + MspI EcoRI + MspI PstI + MspI
Brassica rapa 132 287 42,400 42,261 14,803 11,512
Glycine max 521 524 51,073 105,780 42,596 18,519
Populus trichocarpa 441 226 20,508 45,611 23,272 13,128
Vitis vinifera 386 383 32,588 50,912 21,822 11,769
Brachypodium distachyon 796 1948 50,586 60,014 18,552 21,701
Carica papaya 276 235 19,405 32,969 14,169 8258
Physcomitrella patens 433 481 30,274 45,223 20,689 14,832
Cucumis sativus 103 83 10,113 13,958 8173 3791
Musa acuminata 389 913 51,225 55,068 26,123 17,209
Nelumbo nucifera 783 607 80,253 140,632 49,260 24,250
Theobroma cacao 242 209 16,355 31,259 17,838 12,145
Phoenix dactylifera 622 876 64,497 95,233 36,744 26,304
Amborella trichopoda 1285 972 61,985 121,796 35,348 16,701
Beta vulgaris 541 472 42,743 65,689 29,666 13,827
Sesamum indicum 277 152 15,658 37,530 17,857 11,229
Eucalyptus grandis 655 666 65,729 129,175 53,775 26,496
Prunus persica 274 123 14,466 34,514 14,194 9910
Solanum lycopersicum 2250 421 42,919 93,748 36,617 16,313
Oryza sativa 696 1451 61,098 75,621 23,537 24,080
Phyllostachys edulis 2309 7086 367,267 458,669 130,850 116,861
Sorghum bicolor 1923 2740 128,588 161,131 56,433 56,091
Setaria italica 896 2434 81,751 96,716 26,592 31,528
Zea mays 3344 289 521,797 517,204 122,210 131,141

Page 8 of 17Yang et al. Plant Methods (2016) 12:39
produce high-quality data (We did not compare our data with original ddRAD data as the original ddRAD proto-col did not supply their raw data, but the quality of our data is self-explaining). However, protocol A produced too many (nearly half of raw reads) reads with adapters which indicated many short fragments may exist in the selected gel, so we did not continue testing protocol A in model plants and took protocol B as the final protocol of MiddRAD.
Comparison of empirical and simulated data and inference tags origin from the genomeA comprehensive evaluation of the protocol B was fur-ther conducted by comparison of the simulated data with the actual fragments we got. Clean data of rice and maize were clustered into tags using pstacks program.
The number of tags obtained from rice was ~66,547 with an average depth of 212.58X while maize got 290,001 tags with an average depth of 25.30X (Table 4). The expected number of tags accounted for 86.54 and 97.99 % of the actual number respectively which is simi-lar to the results done by Sun et al.(82.86 % for rice) [42]. Then we estimated the number of fragments dis-tributed on 12 chromosomes of rice and 10 chromo-somes of maize respectively. The actual number of tags obtained was compared to the expected data to test the degree of consistency (Fig. 4). We found each of the 12 rice chromosomes was expected to produce 3521–6414 fragments while each actually generated 4121–7404 tags with the Pearson correlation coefficient r = 0.8374. The 10 maize chromosomes each was expected to produce 20,555–41,216 fragments while each was observed to
Fig. 2 In silico digestion genome sequences of 23 plant species by AvaII + MspI. The line graph shows tag number at every 100 bp interval from 0–1500 bp (a). Both total tag number (b) and tag number within 400–700 bp (c) are correlated positively with genome size

Page 9 of 17Yang et al. Plant Methods (2016) 12:39
generate 21,491–42,376 tags with the Pearson correla-tion coefficient r = 0.9792. The actual and predicted data correlate well for maize while slightly worse for rice which is maybe due to the deviations introduced by cutting the gel. However, the observed tag number within the CDS region correlates better with expec-tation in rice than in maize (Table 4). It is noteworthy that while rice and maize own 39 and 85 % of repeat sequences respectively, only 15.83 and 31.44 % of tags fall into repeats region which indicates that the selected enzyme pair may be efficient in avoiding genome areas with highly repetitive DNA. It is supposed that this is because of a lack of restriction sites in some types of repetitive DNA as the two species contain more than
10 kinds of transposable elements respectively [43, 44]. As rice holds an average genome size of ~383 Mb and maize holds an average genome size of ~2300 Mb, the sampled tags only accounted for 1.77–2.43 % of the whole nuclear genome. In this sense, the efficiency of this reduced representation method on reducing genome complexity is reasonably high. From the over-all mapping rate, we can infer that fragments should mainly fall into the intergenic region rather than CDS or repeats region. Our simplified approach effectively avoids repeats region in rice and maize which mainly includes transposons and retrotransposons that usually bring problems in determining orthologous fragments among different individuals.
Fig. 3 A comprehensive analysis of data produced by library B. This includes raw reads and clean reads number (a), correct restriction sites ratio (b), GC‑content (c), adapter reads ratio (d), data quality of O. sativa read1 (e) and O. sativa read2 (f)

Page 10 of 17Yang et al. Plant Methods (2016) 12:39
Evaluation of protocol B on more plant species and genotypes validationTo test the universality of our protocol and the restric-tion enzymes on more plant species, we used Protocol B to construct libraries for P. edulis and A. semialata which represent two subfamilies of Gramineae (Bambusoideae and Panicoideae). We first inspected library quality. The ultimate library concentration was between 20–30 ng/ul, and fragments distribution was well within the expected range when screened by the agarose gel electrophoresis. Both libraries met the qualification for sequencing.
Then we conducted the data quality analysis of both P. edulis and A. semialata as shown in Table 5. Both P. edu-lis and A. semialata yielded more than 8 Mb raw reads (i.e. ~2 Gb raw data) with ~52 % GC-content; read1 con-taining correct restriction sites accounted 96.08–97.94 % of raw reads and read2 containing the correct restriction sites accounted for 94.85–96.39 %; read1 had 1.19–2.32 % adapter reads while read2 had 2.45–3.96 % adapter reads. Raw reads of P. edulis and A. semialata both had an aver-age base Quality Score larger than 20, and Quality Score of bases of restriction enzyme cutting site was larger than 30.
Next, we mapped clean reads of P. edulis onto the P. edulis genome scaffolds, CDS-DNA, and repeats region and clean reads of A. semialata onto the sorghum genome scaffolds, CDS-DNA, and repeats region respec-tively. For P. edulis, overall scaffolds mapping rate was 79.93–83.80 %, reads hits to the CDS-DNA accounted 2.38–2.87 % (Table 3). Yet reads localization on the repeats region accounted for 0.11–0.17 %. For A. semial-ata, the overall scaffolds alignment rate was 3.37–3.71 %, reads hits to the CDS-DNA accounted 1.08–1.11 %. Yet reads localization on the repeats region accounted for 0.00–0.22 %. Overall scaffolds alignment rate is relatively low for A. semialata is because of the sequence differ-ences between A. semialata and Sorghum bicolor.
At last, clean data of both individuals were clustered into tags. The number of tags obtained from P. edulis was 128,803 with an average depth 30.18X which correlated well with the expectation. While A. semialata got 98,869 tags, with an average depth of 96.18X which was not within expectation as the sorghum genome was used as the reference. Since P. edulis has an average genome size
Table 3 Summary of alignment statistics of sequencing data
As CDS and repeats region were not available for D. latiflorus survey genome sequences, MiddRAD data of D. latiflorus individuals were only mapped to the assembled scaffolds
Individual no. Scaffolds (%) CDS (%) Repeats (%)
Read1 Read2 Read1 Read2 Read1 Read2
Protocol A
D. latiflorus‑3 63.21 61.35 – – – –
C. pallens 15.83 13.95 3.31 3.10 0.49 0.39
Protocol B
Oryza sativa 88.22 82.50 19.39 19.64 6.85 7.70
Zea mays 90.66 84.86 2.38 2.83 10.95 8.82
P. edulis 83.80 79.93 2.38 2.87 0.11 0.17
A. semialata 3.37 3.71 1.08 1.11 0.00 0.22
D. latiflorus‑1 62.23 61.97 – – – –
D. latiflorus‑2 64.15 62.59 – – – –
P. rubicunda 23.19 21.72 1.40 1.59 0.10 0.15
P. vivax 25.56 24.66 1.39 1.64 0.11 0.16
Table 4 MiddRAD-seq data summary in rice and maize
Genome information Oryza sativa Zea mays
Genome size (Mb) 383 2300
% of repeats in genome 39.11 85.00
GC content (%) 43.56 46.83
Expected information
Enzyme pairs AvaII + MspI AvaII + MspI
Expected RAD tag size range (bp) 460–680 500–680
Expected no. of RAD tags 60,925 284,179
Tags density per 100 kb 15.92 12.36
% of tags in CDS 25.10 3.04
Observed information
Raw reads 14,732,449 7,414,009
Clean reads 14,146,516 7,337,556
Observed no. of tags 66,547 290,001
Tag average depth 212.58 25.30
Tags per 100 kb 17.38 12.61
Simplification ratio (%) 2.43 1.77
% of tags in CDS 31.49 1.15
% of tags in repeats 15.83 31.44

Page 11 of 17Yang et al. Plant Methods (2016) 12:39
Fig. 4 Comparison of the real sequencing data with in silico predicted results. a Each of the 12 rice chromosomes is expected to produce 3521–6414 fragments while each actually generates 4121–7404 tags with the Pearson correlation coefficient r = 0.8374. b The 10 maize chromo‑somes each is expected to produce 20,555–41,216 fragments while each is observed to generate 21,491–42,376 tags with the Pearson correlation coefficient r = 0.9792

Page 12 of 17Yang et al. Plant Methods (2016) 12:39
of ~2000 Mb and A. semialata has an average genome size of ~600 Mb (personal communications with Ms. Yang Yang), the tags we got accounted for 1.80 % of the P. edulis nuclear genome and 4.61 % of the A. semialata nuclear genome.
To verify how genotyping accuracy is maintained in the MiddRAD protocol, we have recently constructed a linkage map of D. latiflorus (Guoqian Yang et al., unpub-lished data) according to MiddRAD protocol and got a high-quality map of 2365 markers with an average map distance 1.56 cM. The 36 linkage groups generated were corresponding to the 36 haploid chromosomes of D. latiflorus and 52 of the 55 selected genotypes (94.55 %) were agreed with independent Sanger sequencing results (Additional file 2: Table S3). We believe that genotypes from MiddRAD-seq derived data should be of high gen-otyping accuracy as the fundamental of constructing a high-quality linkage map with tight map distances are the correct genotypes of most markers/loci [22, 45].
Evaluation of shortened adapters and new barcodesTo evaluate the shortened adapters and redesigned bar-codes, we constructed four MiddRAD sub-libraries con-taining 40 D. latiflorus individuals and sequenced the final library with a single Illumina lane. We used the dou-ble index strategy to distinguish each individual, which means each individual was identified by a unique barcode and index as the original ddRAD protocol implemented. We performed analysis of data generated by each bar-code and found that each barcode and adapter could produce a relatively large amount of data with average 9,451,891 reads and CV value 0.0021–0.2381 (Fig. 5a). In addition, each sub-library could produce comparable amounts of data with a mean of 94,946,435 reads and CV value 0.0587 (Fig. 5b). This suggests that the newly designed barcodes and shortened P1 adapters are of high efficiency.
Phylogenetic tree construction of three bamboo speciesMaximum likelihood phylogenetic reconstruction is fully resolved with high support for all clades (2532 SNPs) (see Fig. 6). Two clades were found: the first contains the genus Dendrocalamus (100 % Bootstrap). D. latiflorus
individual 1 is sister to D. latiflorus individual 2. In the second clade, P. rubicunda is sister to P. vivax (100 % Bootstrap), which themselves form a monophyletic clade (100 % Bootstrap). The relationships between two gen-era are well resolved and the topology of the two genera in our tree agrees well with current taxonomy [38, 39]. One additional RAxML analysis using alternatives data set (1005 SNPs) from Stacks analyses displayed identical topology and minor changes in branch lengths (Addi-tional file 2: Figure S4).
DiscussionIn this study, we tested the universality of several com-monly used enzyme pairs across the angiosperm plants, simplified the ddRAD protocol and reduced the over-all costs. MiddRAD library construction protocol has optimized the following areas compared with original ddRAD protocol. (1) MiddRAD protocol tests the uni-versality of several commonly used enzyme pairs and three pairs of restriction endonucleases are maybe uni-versal in digesting plant genomic DNA. We recommend AvaII + MspI > EcoRI +MspI > PstI +MspI when design-ing plant ddRAD projects; (2) In MiddRAD protocol sev-eral expensive consumables and apparatuses are replaced by conventional experimental apparatuses, for example, the magnetic beads purification method is replaced by a simple column purification to get rid of the dependence on the magnet, DNA fragments are selected by cutting low melting point agarose gel rather than the automati-cally select device Pippin-Prep, and low melting point agarose gel electrophoresis is used to screen fragments distribution instead of an expensive Agilent 2100 Bioana-lyzer; (3) MiddRAD removes 3 steps in ddRAD protocol, namely purifying the enzyme-digested products, quanti-fying the DNA concentration before ligation and purify-ing ligation products after pooling samples, all of which simplify the process of constructing a library; (4) In Mid-dRAD protocol original P1 adapters are shortened from 37 to 25 bp (barcode is assumed to be of 5 bp length), which will reduce the cost of the synthesizing adapter oligos partially; (5) In MiddRAD a new barcode-adapter system containing 20 pairs of barcodes varying in length were devised, which can be used with integer times (20
Table 5 A comprehensive data analysis of P. edulis and A. semialata
Species Raw reads no. Percentage of adapter reads (%)
Percentage of reads with correct restric‑tion sites (%)
GC content (%)
Clean reads no. Tag no. Average tag depth
Read1 Read2 Read1 Read2
P. edulis 8,142,517 1.19 2.45 97.94 96.39 52 8,045,315 128,803 30.18
A. semialata 14,651,272 2.32 3.96 96.08 94.85 53 14,299,253 98,869 96.18

Page 13 of 17Yang et al. Plant Methods (2016) 12:39
* n), rather than the original 48 kinds of barcode with equal length. This will not only reduce the cost of syn-thesizing DNA oligos but also increase the flexibility for projects with different samples and help improve the quality of bases near the restriction site. The comparison
of MiddRAD with most commonly used RAD and GBS sequencing methodologies and associated costs are listed in Additional file 2: Table S4.
Since the thorough library construction process minimizes the purification times, random DNA loss is
Fig. 5 Histograms of data generated by each barcode and sub‑library. a Distribution of reads across 40 barcoded samples in a single lane for the D. latiflorus F1 population. Each barcode was used twice. White bars represent data generated by each barcode the first time and black bars represent data generated by each barcode the second time. b Distribution of reads number across four indexed sub‑libraries for the D. latiflorus F1 population

Page 14 of 17Yang et al. Plant Methods (2016) 12:39
greatly reduced. The highly simplified process allows library preparation be accomplished with as low as 50 ng genomic DNA. Meanwhile, we found that reducing the two purification steps did not reduce the quality of the data by sequence quality analysis. Through data analy-sis of 40 individuals from a single lane, omitting the step quantifying DNA concentration of each individual before pooling samples does have influence on the amount of data among each individual (CV = 0.2146) but in our experience even if quantifying DNA concentration of each individual, pooling equal quantity DNA of each individual is still impossible as different volumes of liq-uid may adhere to the tips when using the pipette. As adequate data (>6 M reads) could be generated for each individual, we suggest deleting this quantifying step as the GBS protocol does (CV = 0.23) [16]. The redesigned adapters and variable length barcodes have high recogni-tion efficiency on various individuals and could produce high-quality data which is similar to the results Burford et al. got [27]. Some people may worry that the combi-nation of restriction endonucleases may easily cut the
repeats region with high GC-content as is shown in maize about 10 % of reads fall into repeats region. Nevertheless, we still have enough reads left for analysis. Research-ers may strictly follow the protocol without re-selecting novel combination of enzymes (but have to adjust the size-selection range) if they do not want to invest too much on pilot experiments. As synthetic adapters can be used in diverse plant species and transferred across labs, our protocol will greatly reduce the overall costs.
A possible drawback of our method is that degraded DNA will not produce adequate data because once one of the enzyme sites was impaired the whole tag will be lost. Nonetheless, as long as the DNA provided shows a clear major band when detected by the agarose gel electropho-resis, it could usually generate sufficient amount of data for analysis. In addition, the final library may be a pool of tens to a hundred of samples and we only designed 20 kinds of barcodes, so it is inevitable to cut gel sev-eral times when performing the procedure. In order to maintain the consistency of the selected fragments, electrophoresis conditions must be strictly controlled,
Fig. 6 Maximum likelihood phylogenetic reconstruction of three bamboo species. Two clades are formed: the first contains the genus Dendro-calamus. D. latiflorus individual 1 is sister to D. latiflorus individual 2. In the second clade, P. rubicunda is sister to P. vivax, which themselves form a monophyletic clade

Page 15 of 17Yang et al. Plant Methods (2016) 12:39
and practice cutting the gel is needed before the formal experiment begins. Besides, electrophoresis time should be long enough (1–2 h) to prevent that size selection maybe ‘leaky’.
To demonstrate the applicability of MiddRADseq-derived markers in no-model species, we used MiddRAD data to resolve phylogenetic relationships of two woody bamboos genera, Dendrocalamus and Phyllostachys. Dendrocalamus is a tropical woody bamboo genus while Phyllostachys belongs to temperate woody bamboos. Our tree is congruent well with the current taxonomy. In comparison to previous studies in this clade, which used chloroplast regions [39] or nuclear DNA regions [38], the ddRAD data set is prominent for its simpleness in getting an amount of data (over 200 loci in the smallest data set). Though RAD-seq has been demonstrated to be feasible in clades as old as 40–60 million years with simulated RAD tags of Drosophila [46] and bona fide sequence of Ameri-can oak [47], RAD sequences are usually considered use-ful for phylogenetic reconstruction in younger clades in which sufficient numbers of orthologous restriction sites are retained across species [46]. However, RAD-seq is now receiving increased attention at deeper evolutionary time scales, such as genus- or family-level phylogenetics even the problem of efficiently obtaining sequence data across many individuals exists [48]. Our study demon-strates the utility of MiddRAD data for reconstructing phylogenetic relationships in a group that spans 43–47 million-year-old divergences [49]. What we should bear in mind is that the performance of RAD or MiddRAD depends in part on the level of divergence between species. Determining orthologous RAD tags between samples should also be taken carefully in the future phy-logenetic analysis with RAD sequencing [50]. The data set and analyses we provide here are a novel step forward in the use of ddRAD data to address questions in woody bamboo phylogenetic reconstruction. We show that it is possible to assemble genome-wide RAD-tags into phylo-genetic matrices without the use of a reference genome.
ConclusionsIn this study, we first tested the universality of several commonly used enzyme pairs across 23 plant species and found AvaII + MspI enzyme pair produced a con-sistently higher number of fragments in a broad range of angiosperm plant species. Then we simplified the ddRAD protocol and designed a new barcode-adapter system that could reduce the overall costs. At last, we demon-strated the use of MiddRAD-seq data in resolving phy-logenetic relationships of two woody bamboos genera. This protocol could help botanist quickly get ideal experi-mental data at a relatively low cost and without being specially trained. We expect that the protocol could be
implemented efficiently nearly in any ordinary molecular laboratory without relying on large sequencing centers or next-generation sequencing companies.
AbbreviationsRAD‑seq: restriction‑site associated DNA sequencing; ddRAD: double digest restriction associated DNA; MiddRAD: modified double digest restriction associated DNA; 2b‑RAD: IIB restriction endonucleases restriction‑site associ‑ated DNA; GBS: genotyping by sequencing; Read1: forward read of pair‑end fastq data; Read2: reverse read of pair‑end fastq data; CDS: coding sequences; Repeats region: repetitive sequences in a genome; SNPs: single nucleotide polymorphism; Rare‑cutter enzyme: a restriction enzyme with a recognition sequence which occurs only rarely in a genome; Common‑cutter enzyme: a restriction enzyme with a recognition sequence which occurs frequently in a genome; Adapter: double‑stranded product by annealing two oligos; Barcodes: short DNA sequence for identifying different individuals.
Authors’ contributionsZHG and DZL organized the project. GQY performed the experiments, ana‑lyzed the data, and wrote the paper; YMC, CG, GQY and YG harvested leaves of samples and extracted DNA. ZHG, DZL, JPW, LL, LZ and XYW reviewed and edited the manuscript. All authors read and approved the final manuscript.
Author details1 Germplasm Bank of Wild Species, Kunming Institute of Botany, Chinese Acad‑emy of Sciences, Kunming 650201, China. 2 Kunming College of Life Sciences, University of Chinese Academy of Sciences, Kunming 650201, China. 3 Key Laboratory of Experimental Marine Biology, Institute of Oceanology, Chinese Academy of Sciences, Qingdao 266071, China.
AcknowledgementsWe are grateful to Ms. Yang Yang (Kunming Institute of Botany, Chinese Acad‑emy of Sciences) for kindly providing the Oryza sativa and Alloteropsis semi-alata material. We would like to thank Ms. Zhao‑Li Ding (Kunming Institute of Zoology, Chinese Academy of Sciences) and Ms. Li Zhong (Yunnan University) for advice and supports on Illumina sequencing. We would like to thank Prof. Guo‑Fan Zhang (Institute of Oceanology, Chinese Academy of Sciences) for helpful suggestions in this project. We would also like to thank Mr. Hui‑Fu Zhuang, Dr. Peng‑Fei Ma and Dr. Yu‑Xiao Zhang at Kunming Institute of Botany for computational supports.
Competing interestsThe authors declare that they have no competing interests.
Availability of data and materialsThe datasets supporting the conclusions of this article are available in the NCBI SRA repository, SRP077085 and hyperlink to datasets in http://www.ncbi.nlm.nih.gov/home/submit.shtml.
Additional files
Additional file 1. Details of MiddRAD library constructing protocol. Mid‑dRAD contains protocol A and protocol B and we take protocol B as the final protocol. A step‑by‑step tutorial was presented in this file.
Additional file 2. A list of Additional Figures and Tables. Figure S1. Library preparation flowchart of MiddRAD protocol A. Figure S2. In silico digestion genome sequences of 23 plant species by EcoRI + MspI and PstI + MspI. Figure S3. Fragments distribution of library A and library B. Figure S4. Maximum likelihood phylogenetic reconstruction of three bamboo species. Table S1. Species adopted for in silico digestion and the corresponding genome size. Table S2. Restriction enzymes included in this study. Table S3. Independent Sanger sequencing for genotype validation of MiddRAD‑seq genotyping. Table S4. Comparison of most commonly used RAD and GBS sequencing methodologies and associated costs.

Page 16 of 17Yang et al. Plant Methods (2016) 12:39
FundingThis project was supported by the National Natural Science Foundation of China (31470322 and 31430011).
Received: 17 May 2016 Accepted: 26 July 2016
References 1. Baird NA, Etter PD, Atwood TS, Currey MC, Shiver AL, Lewis ZA, Selker EU,
Cresko WA, Johnson EA. Rapid SNP discovery and genetic mapping using sequenced RAD markers. PLoS One. 2008;3(10):e3376.
2. Davey JW, Hohenlohe PA, Etter PD, Boone JQ, Catchen JM, Blaxter ML. Genome‑wide genetic marker discovery and genotyping using next‑generation sequencing. Nat Rev Genet. 2011;12(7):499–510.
3. Etter PD, Bassham S, Hohenlohe PA, Johnson EA, Cresko WA. SNP discov‑ery and genotyping for evolutionary genetics using RAD sequencing. In: Etter PD, Bassham S, Hohenlohe PA, Johnson EA, Cresko WA, editors. Molecular methods for evolutionary genetics. Berlin: Springer; 2011. p. 157–78.
4. Barchi L, Lanteri S, Portis E, Acquadro A, Valè G, Toppino L, Rotino GL. Identification of SNP and SSR markers in eggplant using RAD tag sequencing. BMC Genomics. 2011;12(1):304.
5. Deokar AA, Ramsay L, Sharpe AG, Diapari M, Sindhu A, Bett K, Warkentin TD, Tar’an B. Genome wide SNP identification in chickpea for use in devel‑opment of a high density genetic map and improvement of chickpea reference genome assembly. BMC Genomics. 2014;15:708.
6. Wu K, Liu HY, Yang MM, Tao Y, Ma HH, Wu WX, Zuo Y, Zhao YZ. High‑density genetic map construction and QTLs analysis of grain yield‑related traits in Sesame (Sesamum indicum L.) based on RAD‑Seq techonology. BMC Plant Biol. 2014;14:274.
7. Xu P, Xu SZ, Wu XH, Tao Y, Wang BG, Wang S, Qin DH, Lu ZF, Li GJ. Popula‑tion genomic analyses from low‑coverage RAD‑Seq data: a case study on the non‑model cucurbit bottle gourd. Plant J. 2014;77(3):430–42.
8. Wang XQ, Zhao L, Eaton DAR, Li DZ, Guo ZH. Identification of SNP mark‑ers for inferring phylogeny in temperate bamboos (Poaceae: Bambu‑soideae) using RAD sequencing. Mol Ecol Resour. 2013;13(5):938–45.
9. Cruaud A, Gautier M, Galan M, Foucaud J, Sauné L, Genson G, Dubois E, Nidelet S, Deuve T, Rasplus J‑Y. Empirical assessment of RAD sequencing for interspecific phylogeny. Mol Biol Evol. 2014;31(5):1272–4.
10. DaCosta JM, Sorenson MD. ddRAD‑seq phylogenetics based on nucleo‑tide, indel, and presence‑absence polymorphisms: analyses of two avian genera with contrasting histories. Mol Phylogenet Evol. 2016;94:122–35.
11. Qi ZC, Yu Y, Liu X, Pais A, Ranney T, Whetten R, Xiang QY. Phylogenomics of polyploid Fothergilla (Hamamelidaceae) by RAD‑tag based GBS‑insights into species origin and effects of software pipelines. J Syst Evol. 2015;53(5):432–47.
12. Zhang N, Zhang L, Tao Y, Guo L, Sun J, Li X, Zhao N, Peng J, Li X, Zeng L. Construction of a high density SNP linkage map of kelp (Saccharina japonica) by sequencing Taq I site associated DNA and mapping of a sex determining locus. BMC Genomics. 2015;16(1):189.
13. Zhou L, Wang SB, Jian J, Geng QC, Wen J, Song Q, Wu Z, Li GJ, Liu YQ, Dunwell JM. Identification of domestication‑related loci associated with flowering time and seed size in soybean with the RAD‑seq genotyping method. Sci Rep. 2015;5:9350.
14. Andrews KR, Good JM, Miller MR, Luikart G, Hohenlohe PA. Harnessing the power of RADseq for ecological and evolutionary genomics. Nat Rev Genet. 2016;17(2):81–92.
15. Liu H, Bayer M, Druka A, Russell JR, Hackett CA, Poland J, Ramsay L, Hedley PE, Waugh R. An evaluation of genotyping by sequencing (GBS) to map the Breviaristatum‑e (ari‑e) locus in cultivated barley. BMC Genomics. 2014;15:104.
16. Elshire RJ, Glaubitz JC, Sun Q, Poland JA, Kawamoto K, Buckler ES, Mitchell SE. A robust, simple genotyping‑by‑sequencing (GBS) approach for high diversity species. PLoS One. 2011;6(5):e19379.
17. Poland JA, Brown PJ, Sorrells ME, Jannink JL. Development of high‑density genetic maps for barley and wheat using a novel two‑enzyme genotyping‑by‑sequencing approach. PLoS One. 2012;7(2):e32253.
18. Poland JA, Rife TW. Genotyping‑by‑sequencing for plant breeding and genetics. Plant Genome. 2012;5(3):92–102.
19. DaCosta JM, Sorenson MD. Amplification biases and consistent recovery of loci in a double‑digest RAD‑seq protocol. PLoS One. 2014;9(9):e106713.
20. Quail MA, Kozarewa I, Smith F, Scally A, Stephens PJ, Durbin R, Swerdlow H, Turner DJ. A large genome center’s improvements to the Illumina sequencing system. Nat Methods. 2008;5(12):1005–10.
21. Wang S, Meyer E, McKay JK, Matz MV. 2b‑RAD: a simple and flexible method for genome‑wide genotyping. Nat Methods. 2012;9(8):808–10.
22. Peterson BK, Weber JN, Kay EH, Fisher HS, Hoekstra HE. Double digest RADseq: an inexpensive method for de novo SNP discovery and geno‑typing in model and non‑model species. PLoS One. 2012;7(5):e37135.
23. Toonen RJ, Puritz JB, Forsman ZH, Whitney JL, Fernandez‑Silva I, Andrews KR, Bird CE. ezRAD: a simplified method for genomic genotyping in non‑model organisms. PeerJ. 2013;1:e203.
24. Puritz JB, Matz MV, Toonen RJ, Weber JN, Bolnick DI, Bird CE. Demystifying the RAD fad. Mol Ecol. 2014;23(24):5937–42.
25. Glaubitz JC, Casstevens TM, Lu F, Harriman J, Elshire RJ, Sun Q, Buckler ES. TASSEL‑GBS: a high capacity genotyping by sequencing analysis pipeline. PLoS One. 2014;9(2):e90346.
26. Herrera S, Reyes‑Herrera PH, Shank TM. Predicting RAD‑seq Marker numbers across the eukaryotic tree of life. Genome Biol Evol. 2015;7(12):3207–25.
27. Burford Reiskind MO, Coyle K, Daniels HV, Labadie P, Reiskind MH, Roberts NB, Roberts RB, Vargo EL, Schaff J. Development of a universal double‑digest RAD sequencing approach for a group of non‑model, ecologically and economically important insect and fish taxa. Mol Ecol Resour. 2016. doi:10.1111/1755‑0998.12527.
28. Doyle JJ. A rapid DNA isolation procedure for small quantities of fresh leaf tissue. Phytochem Bull. 1987;19:11–5.
29. Wang J, Li L, Qi H, Du X, Zhang G. RestrictionDigest: a powerful Perl module for simulating genomic restriction digests. Electron J Biotechnol. 2016. doi:10.1016/j.ejbt.2016.02.003.
30. Catchen J, Hohenlohe PA, Bassham S, Amores A, Cresko WA. Stacks: an analysis tool set for population genomics. Mol Ecol. 2013;22(11):3124–40.
31. Catchen JM, Amores A, Hohenlohe P, Cresko W, Postlethwait JH. Stacks: building and genotyping loci de novo from short‑read sequences. G3 (Bethesda). 2011;1(3):171–82.
32. Andrews S. Fast QC: a quality control tool for high throughput sequence data. http://www.bioinformatics.babraham.ac.uk/projects/fastqc/. Accessed 20 Dec 2015.
33. Martin M. Cutadapt removes adapter sequences from high‑throughput sequencing reads. EMBnet J. 2011;17(1):10–2. doi:10.14806/ej.17.1.200.
34. Langmead B, Trapnell C, Pop M, Salzberg SL. Ultrafast and memory‑efficient alignment of short DNA sequences to the human genome. Genome Biol. 2009;10(3):R25.
35. Plantgdb. http://www.plantgdb.org/. Accessed 28 Sept 2015. 36. BambooGDB. http://www.bamboogdb.org/page/download.jsp.
Accessed 28 Sept 2015. 37. Stamatakis A. RAxML version 8: a tool for phylogenetic analysis and post‑
analysis of large phylogenies. Bioinformatics. 2014;30(9):1312–3. 38. Triplett JK, Clark LG, Fisher AE, Wen J. Independent allopolyploidization
events preceded speciation in the temperate and tropical woody bam‑boos. New Phytol. 2014;204(1):66–73.
39. Sungkaew S, Stapleton CM, Salamin N, Hodkinson TR. Non‑monophyly of the woody bamboos (Bambuseae; Poaceae): a multi‑gene region phylo‑genetic analysis of Bambusoideae s.s. J Plant Res. 2009;122(1):95–108.
40. Plant DNA C‑values database. http://www.data.kew.org/cvalues/. Accessed 25 Dec 2015.
41. Chen YC, Liu T, Yu CH, Chiang TY, Hwang CC. Effects of GC bias in next‑generation‑sequencing data on de novo genome assembly. PLoS One. 2013;8(4):e62856.
42. Sun XW, Liu DY, Zhang XF, Li WB, Liu H, Hong WG, Jiang CB, Guan N, Ma CX, Zeng HP, et al. SLAF‑seq: an efficient method of large‑scale de novo SNP discovery and genotyping using high‑throughput sequencing. PLoS One. 2013;8(3):e58700.
43. International Rice Genome Sequencing Project. The map‑based sequence of the rice genome. Nature. 2005;436(7052):793–800.
44. Schnable PS, Ware D, Fulton RS, Stein JC, Wei F, Pasternak S, Liang C, Zhang J, Fulton L, Graves TA, et al. The B73 maize genome: complexity, diversity, and dynamics. Science. 2009;326(5956):1112–5.
45. Cartwright DA, Troggio M, Velasco R, Gutin A. Genetic mapping in the presence of genotyping errors. Genetics. 2007;176(4):2521–7.
Page 17 of 17Yang et al. Plant Methods (2016) 12:39
• We accept pre-submission inquiries
• Our selector tool helps you to find the most relevant journal
• We provide round the clock customer support
• Convenient online submission
• Thorough peer review
• Inclusion in PubMed and all major indexing services
• Maximum visibility for your research
Submit your manuscript atwww.biomedcentral.com/submit
Submit your next manuscript to BioMed Central and we will help you at every step:
46. Rubin BER, Ree RH, Moreau CS. Inferring phylogenies from RAD sequence data. PLoS One. 2012;7(4):e33394.
47. Hipp AL, Eaton DA, Cavender‑Bares J, Fitzek E, Nipper R, Manos PS. A framework phylogeny of the American oak clade based on sequenced RAD data. PLoS One. 2014;9(4):e93975.
48. Eaton DA. PyRAD: assembly of de novo RADseq loci for phylogenetic analyses. Bioinformatics. 2014. doi:10.1093/bioinformatics/btu121.
49. Zhang XZ, Zeng CX, Ma PF, et al. Multi‑locus plastid phylogenetic bioge‑ography supports the Asian hypothesis of the temperate woody bam‑boos (Poaceae: Bambusoideae). Mol Phylogenet Evol. 2016;96:118‑29.
50. Takahashi T, Nagata N, Sota T. Application of RAD‑based phylogenetics to complex relationships among variously related taxa in a species flock. Mol Phylogenet Evol. 2014;80:137–44.
Related Documents