UWB The CROW, 2016 91 DEVELOPMENT OF A THERMAL DESORPTION AND CRY-GC-MC METHOD FOR THE MEASURMENT OF VOCs IN AMBIENT AIR ABSTRACT: Wildfires increased across North America in recent years (Jaffe et al. 2012, 2013). Acetonitrile (CH 3 CN) is chosen as a trace molecule, as it indicates biomass burning, while anthropogenic sources are limited. Previous studies of acetonitrile in ambient air required transport of massive equipment to the site of the fire, giving importance to developing a simple, portable and inexpensive method to trace the production of acetonitrile in wildfires. We propose a new method with higher sensitivity, reproducibility and recovery for measuring volatile organic compounds VOCs, such as CH 3 CN in ambient air, using thermal desorption-cryofocusing-gas chromatography-mass spectrometry (TD-Cryo-GC-MS). Focus is given on calibration and optimization of the new method, in addition to water vapor (WV) and ozone management; breakthrough tests of the sample and optimization of the conditioning of the TD tubes prior sampling. The range for the calibration is based on previous studies, analyzing the biomass burning in rural/urban areas. We were able to detect concentrations of 0.47ng using the Cryo-GC-MS. The TD tubes were packed with adsorbent: PorapakN, chosen for its affinity of retaining CH 3 CN, high hydrophobicity and low breakthrough volume. However, PorapakN did not show the expected hydrophobicity (<1mg), making WV management necessary for sampling on the TD tubes and subsequent analysis on the GC-MS. As ozone trap, Na 2 SO 4 showed high recovery (99.8%) of the samples. Breakthrough tests had recovery of 1.87 ±0.56% for sampling concentrations of up to 60ng CH 3 CN, over the period of 2 hours. The recovery of the samples was increased by conditioning the blank tubes longer and using the SIMS mode of the GC-MS instrument to look at the mass-to-charge ratio of only acetonitrile. Finally, a validation experiment was designed, showing good first results of recovery in each step of the process. Validation experiment can be used for understanding the sensitivity of TD-Cryo-GC-MS. 1. Introduction 1.1. VOCs and biomass burning V olatile organic compounds (VOCs) are important trace gases emitted generally from wildfires and biomass burning and are greatly studied in atmospheric chemistry. The majority of the studies done before on VOCs provide a good scope on the anthropogenic sources of these compounds (Primbs et al, 2007; Goldstain and Galbally, 2007), however the impact from the emissions from fire plumes is more difficult to determine (Friedli et al, 2001; Holzinger et al, 1999, Guenther et al, 1995). The importance in knowing this information comes from the numerous effects wild fires have on the global atmosphere, such as climate change, smog development and increased acid depositions (Guenther et al, 1995; Crutzen, Andreae, 1990), especially studied has been the impact on the second aerosol and ozone production (Jaffe et al, 2008, 2012, 2013; Wang et al, 2007; Akagi et al, 2011). Additionally, many VOCs have adverse human health effects. This includes acetonitrile’s acute toxicity due to its rapid metabolism to cyanide and thiocyanate, and uniform distribution throughout the body (Jordan et al, 1995; Singh et al, 2003; Crutzen and Andreae, 1990). Therefore, exposure to acetonitrile is recommended not to exceed a time-weighted average of 40ppm in air (Singh et al, 2003). 1.2. Methods for measuring VOCs and previous uses of TD-GC-MS method This study focuses on developing a new method for measuring VOCs, in particular Angela Angelevska, and Crystal McClure Under the Direction of Dr. Daniel A. Jaffe Research: Work in Progress

Welcome message from author
This document is posted to help you gain knowledge. Please leave a comment to let me know what you think about it! Share it to your friends and learn new things together.
Transcript

UWB The CROW, 2016 91
DEVELOPMENT OF A THERMAL DESORPTION AND CRY-GC-MC METHOD FOR THE MEASURMENT OF VOCs IN AMBIENT AIR
ABSTRACT: Wildfires increased across North America in recent years (Jaffe et al. 2012, 2013). Acetonitrile (CH3CN) is chosen as a trace molecule, as it indicates biomass burning, while anthropogenic sources are limited. Previous studies of acetonitrile in ambient air required transport of massive equipment to the site of the fire, giving importance to developing a simple, portable and inexpensive method to trace the production of acetonitrile in wildfires.We propose a new method with higher sensitivity, reproducibility and recovery for measuring volatile organic compounds VOCs, such as CH3CN in ambient air, using thermal desorption-cryofocusing-gas chromatography-mass spectrometry (TD-Cryo-GC-MS). Focus is given on calibration and optimization of the new method, in addition to water vapor (WV) and ozone management; breakthrough tests of the sample and optimization of the conditioning of the TD tubes prior sampling. The range for the calibration is based on previous studies, analyzing the biomass burning in rural/urban areas. We were able to detect concentrations of 0.47ng using the Cryo-GC-MS. The TD tubes were packed with adsorbent: PorapakN, chosen for its affinity of retaining CH3CN, high hydrophobicity and low breakthrough volume. However, PorapakN did not show the expected hydrophobicity (<1mg), making WV management necessary for sampling on the TD tubes and subsequent analysis on the GC-MS. As ozone trap, Na2SO4 showed high recovery (99.8%) of the samples. Breakthrough tests had recovery of 1.87 ±0.56% for sampling concentrations of up to 60ng CH3CN, over the period of 2 hours. The recovery of the samples was increased by conditioning the blank tubes longer and using the SIMS mode of the GC-MS instrument to look at the mass-to-charge ratio of only acetonitrile. Finally, a validation experiment was designed, showing good first results of recovery in each step of the process. Validation experiment can be used for understanding the sensitivity of TD-Cryo-GC-MS.
1. Introduction
1.1. VOCs and biomass burning
Volatile organic compounds (VOCs) are important trace gases emitted generally
from wildfires and biomass burning and are greatly studied in atmospheric chemistry. The majority of the studies done before on VOCs provide a good scope on the anthropogenic sources of these compounds (Primbs et al, 2007; Goldstain and Galbally, 2007), however the impact from the emissions from fire plumes is more difficult to determine (Friedli et al, 2001; Holzinger et al, 1999, Guenther et al, 1995). The importance in knowing this information comes from the numerous effects wild fires have on the global atmosphere, such as climate change, smog development and increased acid depositions
(Guenther et al, 1995; Crutzen, Andreae, 1990), especially studied has been the impact on the second aerosol and ozone production (Jaffe et al, 2008, 2012, 2013; Wang et al, 2007; Akagi et al, 2011). Additionally, many VOCs have adverse human health effects. This includes acetonitrile’s acute toxicity due to its rapid metabolism to cyanide and thiocyanate, and uniform distribution throughout the body (Jordan et al, 1995; Singh et al, 2003; Crutzen and Andreae, 1990). Therefore, exposure to acetonitrile is recommended not to exceed a time-weighted average of 40ppm in air (Singh et al, 2003). 1.2. Methods for measuring VOCs and previous uses of TD-GC-MS method
This study focuses on developing a new method for measuring VOCs, in particular
Angela Angelevska, and Crystal McClureUnder the Direction of Dr. Daniel A. Jaffe
Research: Work in Progress
UWB The CROW, 201692
acetonitrile(CH3CN) in ambient air. In recent studies, it has been suggested that the biomass burning emissions of CH3CN dominate the global source of this compound, making it a unique tracer for biomass burning because of its long atmospheric lifetime (Holzinger, 1999, Loberte et al., 1990; Wang et al, 2007).
Determining the concentration of acetonitrile in air has been done using various instrumental methods, such as GC, IR, laser absorption, polarography, PTRMS etc. (Yokelson et al, 1997, 1996; Jordan et al, 1995; Holzinger et al, 1999; Christian et al, 2003, 2004; Wang et al, 2007; de Gouw, 2003; Warneke, 2004; Crespo, 2012; Apel, 2003). All of them were able to detect the compound, but with different efficiency and each method experienced several interferences.
The PTR-MS method (proton transfer reaction - mass spectrometry) used in the study of deGouw et al (2003) (and similar studies by Lindinger et al, Poschl et al and Goldan et al) had limited precision because of background signal of impurities and interference of H3O
+
and H3O+ (H2O) reagent ions from the humidity.
Additionally, all the samples had to be analyzed immediately after the sampling. The only advantage of using PTR-MS over GC-MS (gas chromatography-mass spectrometry), they conclude, is measuring close to emission sources where atmospheric changes are rapid. As we are not interested in measuring VOCs close to fires and want to be able to remote sample VOCs, PTR-MS was not of interest in our study.
The use of TD (thermal desorption) tubes for collection of VOCs in breathing air was studied by Crespo et al (2012), as a substitute for Tedlar bags bags to measure off-line volatiles, as previously done in the study of Jordan et al (1995). This validation experiment of the TD tubes, showed that these tubes were able to effectively collect acetonitrile in breathing air, with the range of 32 g/mol up to 136 g/mol.
The study showed that the packing of the TD tubes was important to be selected in collecting different VOCs. The diference in sorbent
packing was examined in the study done by Maria Rosa Ras-Mallorqu et al (2007). VOCs were determined using TD tubes packed with two multisorbent beds Carbograph 1/Carboxen 1000 and Tenax/Carbograph 1TD and were after analyzed with GC-MS with recoveries of 98.9%. The importance was placed on the clean blanks, as they saw better results with cleaner blank tubes packed with Tenax/Carbograph.
1.3. Optimization of TD-GC-MSThe literature review (Crespo (2012), Lee
et al (2012), Peng and Batterman (2000), Jia et al (2006), Grote et al (2002), Batterman et al (2002) and Maria Rosa Ras-Mallorqu et al (2007)) showed that TD tubes can be used for determining VOCs in ambient air, analyzed by Cryo-GC-MS. The use of Cryo-GC-MS method has been extensive and well known. Additionally, the sensitivity of the GC-MS method has been proven to be increased by using selective ion monitoring modes (Jia et al, 2006).
However, the use of different sorbent packing, particularly for nitrile VOCs, the interference with humidity and ozone, the interference with background concentrations of impurities in the sample are not well understood.
The main idea of this study is to deveop a new method for measuring acetonitrile in ambient air, by increasing the sensitivity and lowering the cost of the process. Based on the papers by Woolfenden (2010a, 2010b) an extensive study of using thermal desorption tubes and optimizing the methods showed that significant attention needs to be given to the choosing of :
•the sorbent in terms of the inertness to other compounds present in the air;
•the flow at which the sampling will take place in terms of the breakthrough volume at higher sampling flows;
•the water management of the sample, which also affects the sorbent material;
•the artefacts not only while sampling but also in the conditioning of the sorbent material;
Angelevska, McClure and Jaffe

UWB The CROW, 2016 93
Thermal Desorption & CRY-GC-MC: VOCs in Abient Air
•the stability of the sorbent at higher temperature, which affects the choice of the thermal desorption temperature and conditioning of the tube;
• possible interference with ozone on the sorbent material;
• Length and temperature of storage of tubes that have been used in sampling and on tubes that are conditioned.
The need for a reliable, portable, fast and inexpensive method for quantifying VOCs in air urged us to ask the following question:
Can we create a new method with higher sensitivity, reproducibility and recovery for
measuring VOCs (focus on acetonitrile) in ambient air, using TD-Cryo-GC-MS?
In this paper, the optimization and development of the calibration method for determining acetonitrile using TD-GC-MS is going to be presented. Ambient air sampling and sample analysis is going to be presented in following papers. As a reference goal for this study, the atmospheric concentrations of acetonitrile determined by Wang et al (2007) and de Gouw (2003, 2004) are being used, aiming at reaching sensitivity of the method for background concentrations of acetonitrile in ambient air below 0.1ppbv.
2. Methodology
2.1. Permeation source calibrationThe standard for acetonitrile was prepared as
a permeating gas source placing it in a setting described previously in the study by McClure et al, 2014. A G-Cal Acetonitrile permeation tube (Vici, model GC23-7912,3) was used as a permeation source in order to generate the desired vapor concentration throughout the experiment.
The tube was placed in a flow chamber with a constant flow of 100sccm, using critical orifice to control the flow rate, Nitrogen gas (5.0 UHP grade) and inserted in a housing that was held at constant temperature of 300oC. To monitor the change of the flow a mass controller (FMA 1812
Omega, 0-500ml/min) was placed upstream of the heated housing and the temperature was monitored with a thermo-controller (TE Tech PS-24-6.5) placed inside the housing.
The permeation source was measured using a scale (model Mettler AE 163), calibrated using 1, 2, and 500 mg standards, Mettler-Troemner class 1. The permeation rate was calculated using Equation 1.
2.2. Cryofocusing-Gas Chromatography-Mass Spectrometry
2.2.1 BackgroundThe cryofocusing-GC/MS system was based on previous research done by Goldan et al

UWB The CROW, 201694
Angelevska, McClure and Jaffe
(2004) and Apel et al (2003). To calibrate the CF-GC-MS system, the gaseous acetonitrile was collected on the cryofocusing unit (model 961 GC Cryo-Trap from SIS,4 Inch) at -145oC, using a guard column (Intermediate polarity deactivated 0.53mm ID). After 5 min of cooling, the unit was heated at 100oC in 21.1 seconds average and quickly instated into an (30m, 0.25mm ID,1.4µm film DB-624) analytical column, in a (Agilent 7890B) GC system and (Agilent 5977A) MSD.
The cryotrap was cooled using liquid nitrogen (LN2). The carrier gas for the cryofocusing unit and for the transferring the sample into the GC-MS was Helium (5.0 grade).
The sample was split 99:1 using the split/splitless inlet liner (Agilent 5184-4647, 4mm ID LPD) with a gas flow of 100sccm. The GC oven was heated at 35oC for 5 min, followed by increasing the temperature 8.4oC/min to 127oC. For the analysis, MassHunter softer by Agilent was used for 5977. The calibration of this setup was done by changing the cryofocusing collection time from 5 minutes to 2.5 minutes, 1 minute and 30 seconds.
2.2.1. Blanking the instrumentThe instrument was blanked each day, using three steps:1. Autotune of the MSD2. Oven blank, by running the carrier gas only
through the GC-MS, using the parameters described in Section 2.
3. Cryotrap blank, by cryotrapping the carrier gas with the same set-up described in Section 2.
2.3. Thermal desorption tubes (TD tubes)2.3.1. Sorbent tube packing
The sorbent bed chosen for this experiment was PoraPakN, (50/80 mesh size) from Markes International, (product number C-2PPKN).
This sorbent was selected based on literature review. The selection process included several characteristics needed in air sampling of acetonitrile including:
•Acetonitrile retention on the sorbent•Sampling volume (2-10 L)•Minimizing water vapor interference•Breakthrough volume less than 5%
PorapakN was suggested for use when selecting volatile nitriles (EPA Compendium to TO-17, Table 1) because of its hydrophobicity, as acetonitrile is soluble in water and the absorption of water vapor on the sorbent tube can result in loss of the initial acetonitrile concentration that was sampled. Additionally, PorapakN was selected because of its capacity related to the breakthrough volume.
The sorbent tubes were also purchased from Markes International, (product number C0-BXXX-0000), as empty glass tubes with restriction on one side at 15mm. Each package came with torsion springs (one per each tube). In addition, ¼’’ tubing caps were purchased (Motion Industries, SMC KQ2C07-00A) to close each sorbent tube after packing, as well as SS nuts and ferrules from Vici-Valco. The decision to purchase the second set of caps was made because of the lower cost and easier handing of the tubes. A validation experiment of the caps was performed to check for difference between the two sets of caps.
Each tube was packed with 200 mg of PorapakN, secured on both sides with quartz wool, and a torsion spring on the side that does not have restriction. The weight of each tube was measured empty, with PoraPakN and packed, using the same scale and standards described in Section 1. A picture of the packed tube is shown on Picture 1. Each tube was then wrapped in aluminum foil and stored in an airtight container at <4 degrees Celsius, until ready for use.
Picture 1: Example of a packed thermal desorption tube, prepared for packing in the aluminum foil.

UWB The CROW, 2016 95
Thermal Desorption & CRY-GC-MC: VOCs in Abient Air
2.3.2. Sorbent tube conditioningThe setup for the conditioning of the packed tubes was done according to the EPA Compendium Method TO-17 (1999). The newly packed tubes were conditioned for 2 hours at 180oC, by passing nitrogen gas at a flow rate of at least 100mL/min.
2.3.3. Sorbent tube storageThe newly packed or used tubes were capped, wrapped in aluminum foil and placed in a clean, airtight, opaque container in a refrigerator at temperature <4oC.
2.3.4. Testing of Blank tubesThe tubes were desorbed using the same parameters for the Cryo-GC-MS described in section 2. To desorb the tubes, the same furnace for conditioning was used. Nitrogen gas was flowing through the tube with 45mL/min, at 160oC, with reverse flow. For the lines for the connections between the carrier gas, tube and the cryotrap unit, ¼’ PFA tubing was used, with Swagelok Stainless steel fittings.
The SIM/SCAN mode was used in the MassHunter Softer to scan particularly at 38,39,40,41 and 42 mass-to-charge ratio (m/z)
of the mass spectrums generated by the TD tubes analyzed by the Cryo-GC-MS system. The 41 m/z was checked for any peaks due to artifacts near the expected acetonitrile peak. If the blank was not satisfactory, in other words, it was showing a peak in the region of the expected acetonitrile peak, the tube was re-conditioned again.
2.4. Sampling and calibration of the thermal desorption-cryofocusing-GC/MS method
For sampling, a manifold was made to ensure proper mixing of the ambient air and the spiking of acetonitrile from the source. The sampling setup is shown in Figure 1.
By regulating the flow of the air going through the tube packed with PoraPakN using the pump downstream of the tube and the pump that was regulating the dilution of the source before going into the manifold, the concentration of acetonitrile on each tube can be calculated. The calibration is explained in Section 4.1. Based on previous studies, background concentrations of 0.1 ppbv were considered the minimum, while the maximum concentration expected to be seen in the air was 10ppbv.
Figure 1: Schematic for the sampling procedure. The manifold and the connecting lines are Teflon tubing.

UWB The CROW, 201696
Angelevska, McClure and Jaffe
2.4.1. Collection efficiency testsTo check for consistency among tubes,
acetonitrile was sampled onto 5 tubes, using the same set up shown in Figure 1. The manifold was used to make a 6-point calibration curve with acetonitrile. Each tube was sampled for 5 minutes with constant flow of 30mL/min, regulated by a pump used downstream of the tube.
The spiking concentration was decreased by reducing the flow of the acetonitrile permeation from 100 to 25 mL/min. The desired concentrations were obtained by changing the flow of the gas used in the manifold for mixing with the acetonitrile permeation gas between 0.1 L/m to 10 L/m.
The tubes were immediately desorbed after sampling. The area of the peaks was compared.
2.4.1.1. Breakthrough testsOn the first and last tube, sampled with the same concentration, a breakthrough tube was added. These tubes were chosen to check for possible difference in the flow and concentration between the first and the last tube in the experiment of the collection efficiency test. A breakthrough tube is added to measure the breakthrough volume, which is the concentration of the analyte which may be passed through the sampling tube. The breakthrough volume should not be more than 5% of the sampling volume.
2.4.2. Humidity testingThe sorbent bed was hydrophobic, however tests for water vapor uptake were performed, to test the level of humidity at which the sorbent would give incorrect results. Using breathing air (UN1002 compressed), flowing through a bubbler, several levels of relative humidity were delivered. The relative humidity was detected with a HOBO Micro Station (MAN-H21-002), also detecting temperature and pressure. Two rotometers were used to regulate the air flowing through the bubbler. The sorbent tube was placed in a mixing chamber next to the HOBO detector and a pump was added downstream of
the sorbent tube, with a MFM, to control the flow going through the tube at 45mL/min. For higher humidity levels, a hot plate was placed under the bubbler. The relative humidity was then used to calculate for the absolute humidity levels using Equation 2.
The tubes were measured before exposing them to high humidity and after, using the same scale and standards used in Section 1.
2.4.3. Water vapor and ozone trapsTeflon tube filled with 26.5g Na2SO3, served
as ozone trap. Similarly constructed Teflon tube, filled with 65 g of 3A molecular sieve trap served as water vapor trap. Both traps were tested for acetonitrile uptake. The tests were done with and without the traps in line, 3 tubes for each test, using the same concentration of acetonitrile.
In addition, for minimizing the humidity interferences, dry purging tests were done, to ensure minimum acetonitrile loss of the sample, while lowering the water vapor concentration in the tube. The dry purging was done by flowing cold carrier gas through the tube for 30 seconds, 1 minute and 2 minutes, right before desorbing the tube into the Cryo-GC-MS system.
2.5. Validation of the method A second standard was made for validation
of the method and permeation source, to understand the sensitivity of the GC-MS. Liquid stock solution of acetonitrile was purchased (UN 1648, CAS 75-05-8) with 99.9% purity. From that standard, a single–step dilution was made using methanol, to minimize the error in the diluting steps. Same concentration of the acetonitrile was inserted using a syringe into the GC column directly, into the cryotrap and collected on a tube. The syringe that was used was 0.5-5µL Hamilton Syringe (cat#24938).
The first step was done by direct injection in the GC-MS inlet, while it is held hot, immediately

UWB The CROW, 2016 97
Thermal Desorption & CRY-GC-MC: VOCs in Abient Air
after starting the GC-MS run. The second step was done by adding a septa,
wrapped in a heat tape, upstream of the cryotrap, while flowing He gas through it. The injection of the liquid acetonitrile was done using the same syringe used in the first step. The cryotrap was held cold for 2.5 min.
The third step was done by placing the tube downstream of the septa and collecting on the tube for 2.5 min. Then the tube was desorbed with reverse flow on the cryotrap for 2.5 min.
The area, height and width of the peaks from the three steps were compared to check for sensitivity of the GC-MS and for method validation of the collection efficiency of the tubes.
3. Results and Discussion
3.1. Permeation source calibrationWe measured a known source of acetonitrile
over a period of 7 months, to find the mass loss due to permeation of the liquid source at 300oC and flow of 100 std ccm. We found that
the permeation rate is 0.0002 g/day, as seen from the slope (Fig 1), which is equivalent to 138.89ng/min. For this calculation Equation 1 was used.
The concentration this permeation rate gives in gaseous acetonitrile is calculated by dividing the rate with the known flow (100mL/min) and is equal to 1.39ng/mL, or 1.19ppm. Using this known concentration, the subsequent dilutions for the calibration of the instrument were calculated.
3.2. Cryofocusing-GS-MSFor calibrating the Cryo-GC-MS system, we
collected gaseous acetonitrile on the cryotrap with immediate GC-MS analysis, using the Manifold (Figure 1) and diluting the flow with N2 instead of ambient air. The source flow was reduced to 30sccm in this step. The calibration showed positive linear correlation between the concentration of acetonitrile and the area and height of the peak from the chromatograph. This analysis also showed constant 21 second heat time of the cryo trap, for each sampling time.
Figure 2: Permeation source mass loss over time.

UWB The CROW, 201698
Angelevska, McClure and Jaffe
3.2.1. Blanking of the instrumentAn issue we encountered using this set up was the increased level of O2 that was especially apparent during the first Autotune of the day. By running an oven blank through the GC-MS, followed by a cryo-trap blank, which includes concentrating N2 (5.0) for 5 min, the level of O2 in the column decreased. In addition, the GC-MS was particularly sensitive to any impurities from the gas tanks provided by the distributors. Therefore, Ultra High Purity Helium tanks were ordered from a new lot from AirGas, instead of Praxair.
3.3. Thermal desorption tubes3.3.1. Sorbent tube packing
The tubes were packed with PorapakN and weighted as described in section 2.3.1. Each tube had on average 200±27mg of PorapakN, as suggested by EPA (12).
3.3.2. Sorbent tube conditioningTD tubes were conditioned according to the
suggested EPA method. After conditioning, each tube was tested with the method as a blank, described in Section 3.3.4.
Figure 3: Graph showing the relationship between the concentration of gaseous acetonitrile in ng and the area under the chromatogram obtained from the Cryo-GC-MS
UWB The CROW, 2016 99
Thermal Desorption & CRY-GC-MC: VOCs in Abient Air
3.3.3. Sorbent tube storageAll the tubes were stored in a refrigerator
at 0oC. Before either sampling or testing the tubes, they were left in their packaging on room temperature for 5 minutes.
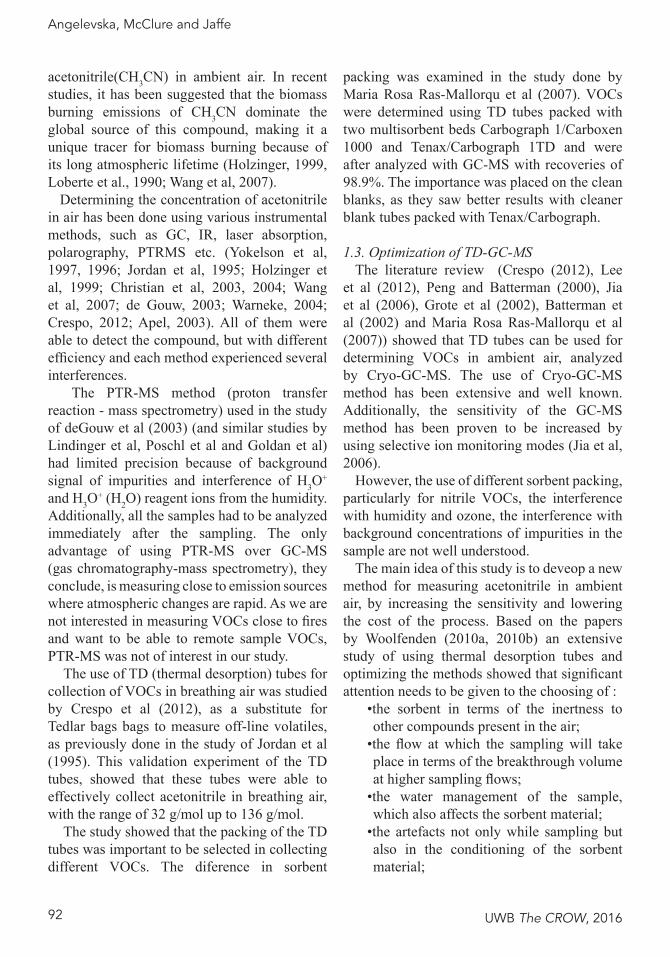
3.3.4. Tests of blank tubesThe TIC/SCAN mode, the chromatogram
did not show any artifacts or peaks that would suggest impurities of the TD tubes. However, in the SIMs mode, the chromatogram had artifact peaks that showed presence of hydrocarbons or other compounds that can be components of PorapakN.
Because some of these artifacts were showing peaks around the RT of acetonitrile, the TD tubes were re-conditioned. The reconditioning that showed best results was 2 more hours of flowing 100-200ccm N2 gas through heated (160-1750C) TD tube. Figure 4 shows an acceptable example of a GC response for a blank tube, where the Abundance of the peaks in the SIMs mode is lower than 5000, and in the SCAN mode lower than 10000.\
3.4. Sampling and calibration of TD-Cryo-GC-MS
3.4.1. Collection efficiency testsThe collection efficiency test was performed by collecting specific concentration of gaseous acetonitrile, using the manifold described in Figure 2. The concentrations used in this calibration setting are presented in Table 4. The sampling flow for each tube was 45mL/min. The concentration from the source was not reduced, instead the dilution with N2 was altered to obtain different concentrations, as shown in Table 4.
Table 4: Calibration concentrations and results of TD tubes.
Figure 4: Acceptable example of a blank tube, showing the TIC, Scan mode on the top and the SIMs mode of the GC response on the bottom.

UWB The CROW, 2016100
Angelevska, McClure and Jaffe
Figure 5: TD tube calibration showing the SIMS area and SIMS height response of the GC, against the concentration of each sample.
Table 5.3.4.1.1. Breakthrough testsBreaktrhough tests were performed on the first and last sampling tube from the 6-point calibration described in the previous section. The chromatograms showed no visible peaks in the SCAN mode. In the SIMS mode, the average area of the peak was 1.87% ± 0.56%. These results were satisfactory, as the BV was <5%.
UWB The CROW, 2016 101
Thermal Desorption & CRY-GC-MC: VOCs in Abient Air
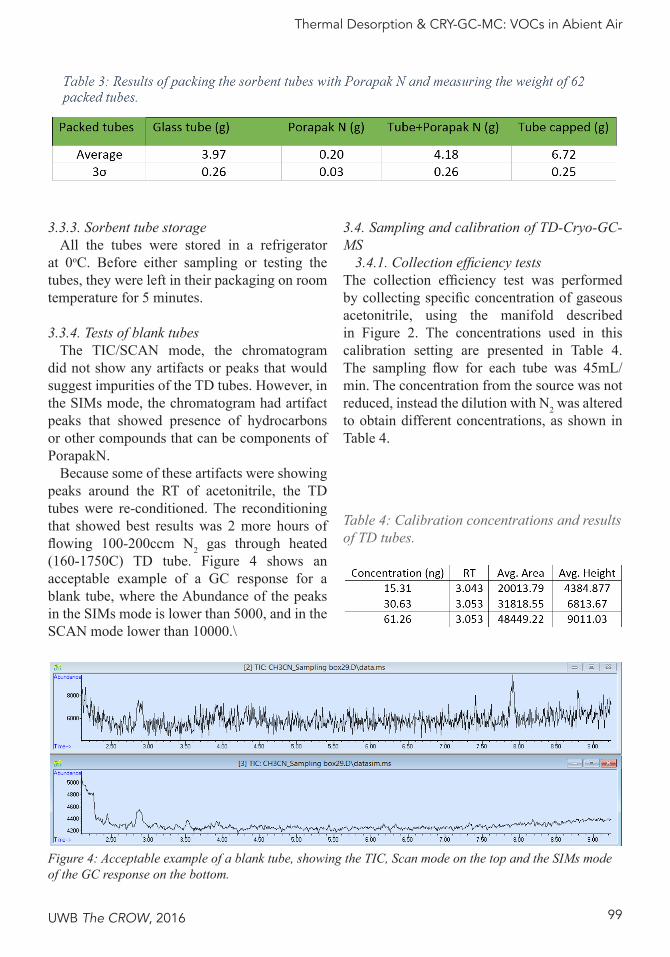
3.4.2. Humidity testsThe goal for the humidity tests was determining how much water vapor PorapakN absorbs. According to the manufacturer, the maximum amount of water vapor needs to be below 1 mg. Otherwise the sorbent will not give efficient results. This tests also gives a clear picture of the requirement of further water management procedures while sampling.
Table 6 shows the results for the weight difference for each level of relative and absolute humidity. Even at average relative or absolute humidity of 45% and 6.6g/kg, the weight of
the TD tube increased by 2mg. The weight increased up to 11.5mg for 92.9% relative, or 13.8g/kg absolute humidity.
This result was not expected as PorapakN is a hydrophobic sorbent, chosen as such for this study. We choose Molecular sieve 3A as a water vapor trap for the water management.
3.4.3. Water vapor and ozone trapsAs an ozone trap, 26mg of sodium sulfate (Na2SO4) was packed in a Teflon tubing and placed upstream of the sampling tube.
Figure 6: The weight difference of the measurement of TD tubes exposed to different levels of humidity.

UWB The CROW, 2016102
Angelevska, McClure and Jaffe
The unsatisfactory results of the molecular sieve trap validation required a new tool water management. Two different methods are proposed:
a) Dry purging the TD tubes before desorbing on cryo for 2 minutes and
b) Water vapor trap in a form of a metal tube kept on cold, positioned upstream of the TD tube when sampling. Tests and results of these water management methods are going to be presented in other papers.
3.5. Validation methodTable 8 shows the results of the validation
experiment. These preliminary results suggest that the direct injection into the GC inlet, into the cryo and onto a TD tube, give similar results. In addition, the TD tube showed full recovery during this experiment.
The results evinced acceptable method for validation of the three steps in the TD-Cryo-GC-MS method proposed in this study.
Acknowledgements:
This project was supported by NSF grant AES-1447832 to D. A. Jaffe.
UWB The CROW, 2016 103
Thermal Desorption & CRY-GC-MC: VOCs in Abient Air
References
Akagi, S. K.; Yokelson, R. J.; Wiedinmyer, C.; Alvarado, M. J.;Reid, J. S.; Karl, T.; Crounse, J. D. and Wennberg, P. O. (2011). Emission factors for open and domestic biomass burning for use in atmospheric models. Atmos. Chem. Phys., 11, 4039−4072. DOI: 10.5194/acp-11-4039-2011
Atkinson, R., and J. Arey. (2003). Atmospheric degradation of volatile organic compounds. Chem. Rev., 103, 4605– 4638. DOI: 10.1021/cr0206420
Apel E. C., Hills A. J., Lueb R., Zindel S., and Eisele S.. (2003). A fast-GC/MS system to measure C2 to C4 carbonyls and methanol aboard aircraft. J. Geophys. Res., 108 (D20). DOI: 10.1029/2002JD003199
Batterman S., Metts T., Kalliokoski P. and Barnett E.. (2002). Low-flow active and passive sampling of VOCs using thermal desorption tubes: theory and application at an offset printing facility. JEM, 4, 361-70. Doi: 10.1039/B203289A
Crespo E., Devasena S., Sikkens C., Centeno R., Cristescu S.M. and Harren F.J.M. (2012). Proton transfer reaction mass spectrometry (PTRMS) in combination with thermal desorption (TD) for sensitive off-line analysis of volatiles. Rapid Commun. Mass Spetrom., 26, 990-996. doi:10.1002/rcm.6191
Christian, T. J., B. Kleiss, R. J. Yokelson, R. Holzinger, P. J. Crutzen,W. M. Hao, B. H. Saharjo, and D. E. Ward. (2003). Comprehensive laboratory measurements of biomass-burning emissions: 1. Emissions from Indonesian, African and other fuels. J. Geophys. Res:Atmospheres, 108(D23). Doi:10.1029/2003JD003704
Christian, T. J., B. Kleiss, R. J. Yokelson, R. Holzinger, P. J. Crutzen,W. M. Hao, T. Shirai, and D. R. Blake. (2004). Comprehensive laboratory measurements of biomass-burning emissions: 2. First intercomparison of open-path FTIR, PTR-MS, and GC-MS/FID/ECD J. Geophys. Res., 109 (D2). Doi:10.1029/2003JD003874
Crutzen P. J. and Andreae M.O.. (1990). Biomass Burning in the Tropics: Impact on Atmospheric Chemistry and Biogeochmical Cycles. Science., 250, 1669-1678 Retrieved from http://search.proquest.com.offcampus.lib.washington.edu/docview/213545471?accountid=14784
Crutzen, P.J., L.E. Heidt, J.P. Krasnec, W.H. Pollock, and W. Seiler. (1979). Biomass burning as a source of atmospheric gases CO, H2, N20, NO, CH3CI, and COS. Nature, 282, 253-256. doi:10.1038/282253a0
de Gouw, J. A., Goldan, P.D., Warneke, C, Kuster, W.C., Roberts, J.M., Marchewka, M. , Bertman S. B., Pszenny, A.A. P. and Keene, W. C. (2003). Validation of proton transfer reaction-mass spectrometry (PTR-MS) measurements of gas-phase organic compounds in the atmosphere during the New England Air Quality Study (NEAQS) in 2002. J. Geophys. Res:Atmospheres, 108(D21). Doi: 10.1029/2003JD003863
de Gouw J.A., Warneke C. , Karl T., Eerdekens G., van der Veen C. and Fall R. (2003). Sensitivity and specificity of atmospheric trace gas detection by proton-transfer-reaction mass spectrometry. Int. J. Mass Spectrom., 223-224, 365-382. doi:10.1016/S1387-3806(02)00926-0
Compendium of Methods for the Determination of Toxic Organic Compounds in Ambient Air, Second Edition. Compendium Method TO-17: Determination of Volatile Organic Compounds in Ambient Air Using Active Sampling Onto Sorbent Tubes. EPA, January 1999. Retrieved from: http://www3.epa.gov/ttnamti1/files/ambient/airtox/to-17r.pdf
Goldan P. D., Kuster W. C. , Williams E., Murphy P. C., Fehsenfeld F. C. and Meagher J.( 2004). Nonmethane hydrocarbon and oxy hydrocarbon measurements during the 2002 New England Air Quality Study. J. Geophys. Res., 109(D21). Doi: 10.1029/2003JD004455

UWB The CROW, 2016104
Jaffe D.A., Widger N., Downey N., Pfister G., Boynard A. and Reid S.B. (2013). Impact of Wildfires on Ozone Exceptional Events in the Western U.S. Environ. Sci. Technol., 47, 11065-72 DOI: 10.1021/es402164f
Jaffe, D. A., Hafner, W., Chand, D., Westerling, A. and Spracklen D. (2008) Influence of fires on O3 concentrations in the western U.S. Environ. Sci.Technol., 42, 5885−5891. DOI: 10.1021/es800084k
Jaffe, D. A., Hafner, W., Chand, D., Westerling, A. and Spracklen, D. (2008). Interannual variations in PM2.5 due to wildfires in the Western United States. Environ. Sci. Technol., 42, 2812−2818. DOI: 10.1021/es702755v
Jaffe, D. A. and Wigder, N. L.(2012). Ozone production from wildfires: A critical review. Atmos. Environ., 51, 1−10. doi:10.1016/j.atmosenv.2011.11.063
Jia C., Batterman S. and Chernyak S.(2006). Development and comparison of methods using MS scan and selective ion monitoring modes for a wide range of airborne VOCs. J. Environ. Monit, 8, 1029-1042. DOI: 10.1039/B607042F
Lee J.H, Jia ., C., Kim Y.D., Kim H. H., Pham T. T., Choi Y. S., Seo Y. U. and Lee I.W.( 2012). An optimized adsorbent sampling combined to thermal desorption GC-MS method for Trimethylsilanol in industrial environments. International Journal of Analytical Chemistry, 2012,1-10. http://dx.doi.org/10.1155/2012/690356
McClure C. D., Jaffe D.A. and Edgerton E.S. (2014). Evaluation of the KCl Denuder Method for Gaseous Oxidized Mercury using HgBr2 at an In-Service AMNet Site. Environ. Sci. Technol., 48, 11437−11444. DOI: 10.1021/es502545k
Ras-Mallorquí, M. R., Marcé-Recasens, R. M., and Borrull- Ballarín, F. (2007). Determination of volatile organic compounds in urban and industrial air from Tarragona by thermal desorption and gas chromatography mass spectrometry. Talanta, 72, 941–950. doi:10.1016/j.talanta.2006.12.025
Grote A.A and Kennedy, E.R.(2002). Workplace monitoring for volatile organic compounds using thermal desorption-gas chromatography-mass spectrometry. J. Environ. Monit., 4, 679-684. DOI: 10.1039/B203000B
Goldstein A.H. and Galbally I.E.( 2007). Known and Unexplored Organic Constituents in the Earth’s Atmosphere. Environ. Sci. Technol., 41, 1514-1521. DOI: 10.1021/es072476p
Guenther A., Hewitt C. N., Erickson D. , Fall R., Geron C., Graedel T., Harle P., Klinger L., Lerdau M., McKay W.A., Pierce T., Schles B., Steinbrecher R., Tallamraju R., Taylor J. and Zimmerman P. (1995). A global model of natural volatile organic compound emissions. J. Geophys. Res., 100, 8873-8892. Doi: 10.1029/94JD02950
Friedli H. R., Atlas E., Stroud V. R., Giovanni L., Campos T. and Radke L.F.( 2001). Volatile organic trace gases emitted from North American wildfires. Global Biochemical Cycles, 15, 435-452. Doi: 10.1029/2000GB001328
Holzinger R.,Jordan A., Hansel A. and Lindinger W.. (2001). Automobile Emissions of Acetonitrile: Assessment of its Contribution to the Global Source. Journal of Atmospheric Chemistry, 28, 187-193. Doi: 10.1023/A:1006435723375
Holzinger, R., C. Warneke, A. Haensel, A. Jordan, W. Lindinger, D.H. Scharffe, G. Schade, and P.J. Crutzen. (1999). Biomass burning as a source of formaldehyde, acetaldehyde, methanol, acetonitrile, and hydrogen cyanide. Geophys. Res. Lett., 26, 1161-1164. DOI: 10.1029/1999GL900156
Jordan A., Hansel A., Holzinger W. and Lindinger W. (1995). Acetonitrile and benzene in the breath of smokers and non-smokers investigated by proton transfer reaction mass spectrometry (PTR-MS). Int. J. Mass Spectrom. Ion Proc., 148, L1-L3. doi:10.1016/0168-1176(95)04236-E
Angelevska, McClure and Jaffe

UWB The CROW, 2016 105
Peng C.Y. and Batterman S.( 2000). Performance evaluation of a sorbent tube sampling method using short path thermal desorption for volatile organic compounds. J. Environ. Monit., 2, 313-324 DOI: 10.1039/B003385P
Primbs T., Simonich S.,Schmedding D., Wilson G., Jaffe D., Takami A., Kato S., Hatakeyama S. and Kajii Y. (2007) .Atmospheric outflow of anthropogenic semivolatile organic compounds from East Asia in Spring 2004. Environmental Science and Technology, 41(10) DOI: 10.1021/es062256w
Rothweiler H., Waeger P. A. and Schlatter C. (1991). Comparison of Tenax TA and Carbotrap for sampling and analysis of volatile organic compounds in air. Atmos. Environ., 25, 231-235. doi:10.1016/0957-1272(91)90058-M
Singh H. B., Salas L., Herlth D., Kolyer R., Czech E., Viezee W., Li Q., Jacob D. J., Blake D., Sachse G., Harward C. N., Fuelberg H., Kiley C. M., Zhao Y. and Kondo Y.( 2003) In situ measurements of HCN and CH3CN over the Pacific Ocean: Sources, sinks, and budgets. J. Geophys. Res., 108(D20) DOI: 10.1029/2002JD003006
Woolfenden E. (2010). Sorbent-based sampling methods for volatile and semi-volatile organic compounds in air: Part 1: Sorbent-based air monitoring options. Journal of Chromatography A.,1217, 2674-2684 doi:10.1016/j.chroma.2009.12.042
Woolfenden E. (2010). Sorbent-based sampling methods for volatile and semi-volatile organic compounds in air. Part 2. Sorbent selection and other aspects of optimizing air monitoring methods. Journal of Chromatography A.,1217,, 2685–2694. doi:10.1016/j.chroma.2010.01.015
Wang Q. , Shao M., Liu Y., William K., Goldan P., Xiaohua L., Yuan L. and Sihua L. (2007). Impact of biomass burning on urban air quality estimated by organic tracers: Guangzhou and Beijing as cases. Atmospheric Environment, 41, 8380–8390 doi:10.1016/j.atmosenv.2007.06.048
Warneke C, Rosén S., Lovejoy E., de Gouw J.A. and Fall R.( 2004). Two additional advantages of proton transfer ion trap mass spectrometry. Rapid Commun. Mass Spectrom.18, 133. DOI: 10.1002/rcm.1281
Yokelson, R.J., D.W.T. Griffith, and D.E. Ward. (1996). Open-path FTIR studies of large-scale laboratory biomass fires. J. Geophys. Res., 101(D15), 21067-21080 doi:10.1029/96JD01800.
Yokelson, R.J., R. Susott, D.E. Ward, J. Reardon, and D.W.T. Griffith. (1997). Emissions from smoldering combustion of biomass measured by open path Fourier transform infrared spectroscopy. J. Geophys. Res., 102(D15), 18865-18877. doi:10.1029/97JD00852.
Thermal Desorption & CRY-GC-MC: VOCs in Abient Air
Related Documents