Development of a specific enzyme linked immunosorbent assay (ELISA) for the detection of fluoroquinolone antibiotic residues in chicken liver, prawn and milk Author: Zahid, Muhammad Publication Date: 2011 DOI: https://doi.org/10.26190/unsworks/15516 License: https://creativecommons.org/licenses/by-nc-nd/3.0/au/ Link to license to see what you are allowed to do with this resource. Downloaded from http://hdl.handle.net/1959.4/51962 in https:// unsworks.unsw.edu.au on 2022-07-27

Welcome message from author
This document is posted to help you gain knowledge. Please leave a comment to let me know what you think about it! Share it to your friends and learn new things together.
Transcript

Development of a specific enzyme linked immunosorbentassay (ELISA) for the detection of fluoroquinolone antibioticresidues in chicken liver, prawn and milk
Author:Zahid, Muhammad
Publication Date:2011
DOI:https://doi.org/10.26190/unsworks/15516
License:https://creativecommons.org/licenses/by-nc-nd/3.0/au/Link to license to see what you are allowed to do with this resource.
Downloaded from http://hdl.handle.net/1959.4/51962 in https://unsworks.unsw.edu.au on 2022-07-27
Development of a Specific Enzyme Linked Immunosorbent Assay
(ELISA) for the Detection of Fluoroquinolone Antibiotic Residues
in Chicken Liver, Prawn and Milk
Muhammad Zahid
Thesis submitted in partial fulfilment of the requirement
for the Degree of Master of Science (Research)
School of Chemical Engineering
The University of New South Wales
April, 2011
i
ABSTRACT
Extensive utilisation of fluoroquinolones (FQs) in agricultural and aquacultural practices
leads to two major food safety issues: 1) the issues regarding the presence of FQs
residues in food and 2) the development of FQs resistant bacteria in animals, which may
be transferable to humans. This may have an implication to human health, in particular
for the treatment of infection.
This thesis describes the design and synthesis of novel haptens for (enrofloxacin) ENR,
ciprofloxacin and norfloxacin, the production of specific antibodies, and the formatting
and characterizing of an indirect competitive Enzyme‐Linked ImmunoSorbent Assay (ELISA)
for detection of ENR. The design and synthesis of FQs haptens involved the following
approaches: 1) synthesising ENR hapten by attaching a tert‐butyl linker on a carboxylic
group, and 2) synthesising ciprofloxacin and norfloxacin haptens by attaching a 4‐
bromobutane NHS ester and bromocrotyl NHS ester linkers respectively on the
piperazinyl moiety.
Highly specific polyclonal antibodies were generated against the ENR‐Keyhole Limpet
Haemocyanine (KLH) conjugate. The optimized ELISA exhibited higher sensitivity in a
homologous assay than a heterologous assay, suggesting the developed antibody was
extremely specific to ENR. The ELISA displayed an IC50 value of 11.7 µg L‐1 ± 1.7 with a limit
of detection (LOD) value of 2.4 µg L‐1 ± 0.4. High specificity of the developed assay was
evidenced by low cross‐reactivity to seven structurally related FQs compounds
(danofloxacin, enofloxacin, sarafloxacin, perfloxacin, nalidixic acid, ciprofloxacin and
norfloxacin). The effects of surfactants (Tween 20), water miscible organic solvent
(methanol, ethanol, acetonitrile, and acetone) and pH conditions (5.5‐9.5) were also
evaluated. Briefly, Tween 20 affected considerably on colour development, but not the
assay sensitivity. Of the solvents tested, up to 5% methanol showed no significant effects
on the assay sensitivity. The sample preparation were also optimized for milk, chicken
liver and prawn, yielding the recoveries between 64 (± 3) and 125 (± 8)%.
This ELISA will be particularly useful for screening ENR residues in animal and marine
derived products to improve antibiotic safety in developing countries such as Indonesia.

ii
ACKNOWLEDGEMENTS
“In the name of ALLAH, the most gracious and merciful”
First and foremost I would like to express my sincerest gratitude to ALLAH SWT, my Lord
and Cherisher, for guiding and blessing in every single step of my life. Indeed, without his
help and will, nothing is accomplished.
I am heartily thankful to my supervisor, Dr. Nanju Alice Lee, whose encouragement,
guidance and support from the very early to the final stage of this research, enabled me
to develop an understanding of the subject as well as gave me extraordinary experiences
throughout the work. Her encouragement has triggered and nourished my intellectual
maturity that I will benefit from. I am grateful in every possible way and hope to keep up
our collaboration in the future.
I gratefully acknowledge my co‐supervisor, A/Prof. Naresh Kumar for his advice, expertise,
and supervision. It has been an honour to have had the opportunity to work in his
laboratory. I also would like to express my gratitude to Dr. George Iskander for his
involvement, ideas, research passion and crucial contribution has made him one of the
backbones of this research.
Many thanks go to Dr. Victor Wong for the precious time rendered in proofreading this
thesis, including the critical comments and scientific ideas forwarded. I would like to
thank Camillo Toraborelli for his technical assistance in the laboratory and his kindness in
putting every requested chemical on my bench.
Special thanks also to all fellow researchers in the Food Science and Nutrition Research
laboratory, School of Chemical Engineering; Eriyanto Yusnawan, Maria Veronica Hoie,
Karrie Kam, Yang Lu, Kim‐Yen Phan‐Thien, Ebtihal Khodijah, Chatchaporn Uraipong and
Norma Karim, as well as those who are affiliated with, the Organic Chemistry laboratory,
School of Chemistry; Samuel Kutty, Hakan Kandemir, Kitty Ho, Ren Chen, Rick Zhang,
Raymond Chen, Adeline Lukmantara and Asep Kurnia Permana, for their support,
knowledge, sharing, laughs, and even tears. I am so grateful to have you guys who are
always around. You are such wonderful people and always make our laboratory such an
incredible place to be.

iii
For financial assistance, I would like to express my deepest gratitude to AusAID through
Australian Development Scholarship (ADS) for giving me a great opportunity to study at
The University of New South Wales, Australia. Without this support, this research project
would have been impossible. I would like to record my gratitude to the Indonesian
government, and more specifically, The National Veterinary Drug Assay Laboratory, The
Ministry of Agriculture of Republic of Indonesia, for allowing me to improve my skills and
knowledge through this research project in Australia.
This research project would not have been possible without the support of numerous
other people, so I offer my regards and blessings to all who supported me in any way for
the duration of the project.
Lastly, I would like to dedicate this thesis to my beloved families and especially for my
beloved wife; Isnindar, my little angel; Maura Thalita Chairinniswa, for their prayers,
patience, understanding and endless love, throughout the duration of my studies.

iv
ABBREVIATIONS
Ab‐ENR1 polyclonal antibody of ENR
Amax maximum absorbance
APCI atmospheric pressure chemical ionization
BSA bovine serum albumin
cBSA cationised‐bovine serum albumin
CBT checkerboard titration
CDCl3 deuterated chloroform
CIP ciprofloxacin
CIP1‐OA a conjugate of ciprofloxacin N‐hydroxysuccinimide ester and ovalbumin
CIP2‐OA a conjugate of ciprofloxacin butyl N‐hydroxysuccinimide ester and ovalbumin
CMC 1‐cyclohexyl‐3‐(2‐morphplinyl‐4‐ethyl) carbodiimide methyl p‐toluene sulfonate
CNS central nervous system
CV coefficient of variation
D2O deuterium oxide
DAD diode array detection
DAN danofloxacin
DCC dicyclohexylcarbodiimide
DCM dichloromethane
DEPT distortionless enhancement by polarization transfer
DIC diisopropylcarbodiimide
DMAP 4‐dimethylaminopyridine
DMF dimethylformamide
DMSO dimethylsulfoxide
DNA deoxyribonucleic acid
EDC 1‐ethyl‐3‐(3‐dimethyl‐aminopropyl) carbodiimide hydrochloride

v
ELISA enzyme linked immunosorbent assay
ENO enoxacin
ENR enrofloxacin
ENR1‐KLH a conjugate of ENR N‐hydroxysuccinimide ester and keyhole limpet haemocyanin
ENR1‐OA a conjugate of ENR N‐hydroxysuccinimide ester and ovalbumin
ENR2‐OA conjugate of ENR acid and keyhole limpet haemocyanin
ESI electrospray ionization
EtOH ethanol
EU European Union
FAO/WHO Food and Agriculture Organisation/World Health Organisation
FCL full cream liquid milk
FCP full cream milk powder
FG fish gelatine
FLD fluorescence detection
FLU flumequine
FQs fluoroquinolones
FSANZ Food Standard Australia New Zealand
GAT gatifloxacin
GC/MS gas chromatography/mass spectrometry
GI gastrointestinal
HAS human albumin serum
HPLC high performance liquid chromatography
HRMS high resolution mass spectrometry
HRP horseradish peroxidise
IBCF isobutylchloroformate
Ig immunoglobulin
IgG immunoglobulin g
JEFCA joint expert committee on food additives
vi
KLH keyhole limpet haemocyanin
LC/MS liquid chromatography mass spectrometry
LC/MS‐MS liquid chromatography/tandem mass spectrometry
LOD limit of detection
LOQ limit of quantification
LRMS low resolution mass spectrometry
Lv1 chicken liver from an organic source
Lv2 chicken liver from Coles supermarket
Lv3 chicken liver from butcher
MAb monoclonal antibody
MAR marbofloxacin
MeOH methanol
MRLs maximum residue limits
NaH sodium hydride
NAL nalidixic acid
NAL‐OA a conjugate of nalidixic acid and ovalbumin
NHS N‐hydroxysuccinimide
NMR nuclear magnetic resonance
NOR norfloxacin
NOR‐OA a conjugate of norfloxacin and ovalbumin
NSAID non steroid anti inflammatory drug
OFL ofloxacin
OA ovalbumin
OXO oxolinic acid
PAb polyclonal antibody
PBS phosphate buffer saline
PEF pefloxacin
PEF‐OA a conjugate of pefloxacin ovalbumin

vii
Pr1 local prawn
Pr2 Thai prawn
Pr3 Malaysian prawn
Rf retardation factor
RO reverse osmosis
SAR sarafloxacin
SAR‐OA a conjugate of sarafloxacin and ovalbumin
SARs structure activity relationships
SD standard deviation
SKL skim milk liquid
SKP skim milk powder
TEA triethylamine
TFA tetrafluoroacetic acid
TLC thin layer chromatography
TMB 3,3’,5,5’‐tetramethylbenzidine
USP the U.S. of pharmacopeia
UV ultraviolet

viii
TABLE OF CONTENTS
ABSTRACT ....................................................................................................... I
ACKNOWLEDGEMENTS ..................................................................................... II
ABBREVIATIONS ............................................................................................. IV
LIST OF FIGURES ........................................................................................... XIII
LIST OF TABLES ............................................................................................. XX
CHAPTER 1. INTRODUCTION .............................................................................. 1
1.1BACKGROUND OF RESEARCH ................................................................................................. 1
1.2 METHOD DEVELOPMENT FOR FLUOROQUINOLONE RESIDUES ..................................................... 3
1.3 THE OBJECTIVES AND SIGNIFICANCE OF STUDY ......................................................................... 4
CHAPTER 2. LITERATURE REVIEW ........................................................................ 5
2.1. FLUOROQUINOLONE ANTIBACTERIAL AGENTS ......................................................................... 5
2.1.1. Overview of quinolone .......................................................................................... 5
Figure 2.1 Structure of 7‐chloro‐4‐quinoline (Nalidixic acid). ............................. 5
2.1.2. Chemical structure of fluoroquinolone antibiotics ............................................... 5
2.1.3. Generations of Quinolones ................................................................................... 7
2.1.4. Mechanism of action ............................................................................................ 9
2.1.5. Structure activity relationships of fluoroquinolones .......................................... 10
2.1.6. Clinical use in animal and human ....................................................................... 10
2.1.7 Fluoroquinolones used in this study .................................................................... 13
2.1.7.2. ENR .............................................................................................................. 14
2.1.7.3. Norfloxacin .................................................................................................. 15
2.1.8. Pharmacokinetics and toxicity ........................................................................... 16
2.1.7. Adverse effects and drug interactions ................................................................ 16
2.2. PUBLIC HEALTH CONCERNS ............................................................................................... 18
2.2.1. Food safety ......................................................................................................... 19
2.2.2. Maximum residue limits (MRLs) ......................................................................... 19
2.2.3. Fluoroquinolone resistant bacteria .................................................................... 22
2.3 ANALYTICAL METHODS FOR DETECTING OF FLUOROQUINOLONES ANTIBIOTIC RESIDUES .................. 23
2.3.1. Instrument‐based methods ................................................................................ 24
2.3.1.1. High performance liquid chromatography (HPLC) ...................................... 24
2.3.1.2. Liquid chromatography / mass spectrometry (LC/MS) and (LC‐MS/MS).... 25
2.3.1.3. Gas Chromatography / Mass Spectrometry (GC/MS) ................................. 25
2.3.2. Bioanalytical or immunochemical methods ....................................................... 27
2.3.2.1. Immunoaffinity chromatography (IAC) ....................................................... 27

ix
2.3.2.2. Biosensors/Immunosensors ........................................................................ 28
2.3.2.3. Immunoassays ............................................................................................. 28
2.4. ELISA (ENZYME‐LINKED IMMUNOSORBENT ASSAY) .............................................................. 30
2.4.1. Principle .............................................................................................................. 30
2.4.2 ELISA Format ....................................................................................................... 30
2.5. DEVELOPMENT OF IMMUNOASSAY FOR FLUOROQUINOLONE ANTIBIOTICS .................................. 36
2.5.1. Hapten design and synthesis .............................................................................. 36
2.5.1.1. Selection of spacer arm point attachment for fluoroquinolone antibiotics 37
2.5.1.2. Competing hapten to carrier protein ratio.................................................. 38
2.5.1.3. Conjugation methods .................................................................................. 39
2.5.1.3.1. Carboxylic groups .................................................................................. 40
2.5.1.3.2. Amine groups ........................................................................................ 42
2.5.2. Antibody production ........................................................................................... 43
2.5.2.1. Overview ...................................................................................................... 43
2.5.2.2. Polyclonal antibodies ................................................................................... 43
2.5.2.3. Monoclonal antibodies ................................................................................ 44
2.5.3. Immunoassay format ......................................................................................... 45
2.5.4. Assay characterization ....................................................................................... 46
2.5.4.1. Calibration curve ......................................................................................... 46
2.5.4.2. Sensitivity, limit of detection (LOD) and limit of quantification (LOQ) ....... 46
2.5.4.3. Specificity and cross reactivity .................................................................... 47
2.5.4.4. Matrix interference ..................................................................................... 48
2.5.4.5. Assay accuracy and precision ...................................................................... 49
2.6 CONCLUSION .................................................................................................................. 49
CHAPTER 3. HAPTEN SYNTHESIS ....................................................................... 51
3.1 INTRODUCTION ............................................................................................................... 51
3.2 MATERIALS AND INSTRUMENTATION ................................................................................... 53
3.2.1 Materials and chemicals ..................................................................................... 53
3.2.1.1 Materials ....................................................................................................... 53
3.2.1.2 Chemicals ...................................................................................................... 53
3.2.2 Equipment and instrumentation ......................................................................... 54
3.2.2.1 Thin Layer Chromatography (TLC) ................................................................ 54
3.2.2.2 Nuclear Magnetic Resonance (NMR) spectroscopy ..................................... 54
3.2.2.3 Mass Spectrometry ....................................................................................... 54
3.3 HAPTEN SYNTHESIS .......................................................................................................... 54
3.3.1 The attachment via carboxylic group of FQs as a spacer arm for ENR acid hapten
...................................................................................................................................... 55
3.3.1.1 Synthesis of tert‐butyl 3‐(1‐cyclopropyl‐7‐(4‐ethylpiperazin‐1‐yl)‐6‐fluoro‐4‐
oxo‐1,4‐dihydroquinoline‐3‐carboxamido)propanoate, [ENRtert‐butyl], compound
(1), scheme 1 ............................................................................................................ 55
x
3.3.1.2 Synthesis of 3‐(1‐cyclopropyl‐7‐(4‐ethylpiperazin‐1‐yl)‐6‐fluoro‐4‐oxo‐1,4‐
dihydroquinoline‐3‐carboxamido)propanoic acid, [ENR acid], compound (2),
scheme 2 ................................................................................................................... 55
3.3.2 The spacer arm attachment via the piperazinyl moiety of ciprofloxacin to create
ciprofloxacinbutyl NHS ester hapten ............................................................................ 57
3.3.2.1 Synthesis of 4‐bromobutane NHS ester linker, compound (3), scheme 3 ... 57
3.3.2.2 Synthesis of 1‐cyclopropyl‐7‐(4‐(4‐((2,5‐dioxopyrrolidin‐1‐
yl)oxy)butyl)piperazin‐1‐yl)‐6‐fluoro‐4‐oxo‐1,4‐dihydroquinoline‐3‐carboxylic acid,
[ciprofloxacin butyl NHS ester hapten], compound (4), scheme 4 .......................... 58
3.3.3 The spacer arm attachment via piperazinyl moiety of norfloxacin to form
norfloxacin crotyl NHS ester ......................................................................................... 59
3.3.3.1 Synthesis of 4‐bromocrotonic acid compound (5), scheme 5 ...................... 60
3.3.3.2 Synthesis of bromocrotyl NHS ester linker, compound (6), scheme 6 ........ 60
3.3.3.3 Synthesis of (E)‐7‐(4‐(4‐((2,5‐dioxopyrrolidin‐1‐yl)oxy)‐4‐oxobut‐2‐en‐1‐
yl)piperazin‐1‐yl)‐1‐ethyl‐6‐fluoro‐4‐oxo‐1,4‐dihydroquinoline‐3‐carboxylic acid
[Norfloxacincrotyl NHS ester hapten], compound (7), scheme 7 ............................ 60
3.4 RESULT AND DISCUSSION ................................................................................................... 62
3.4.1 Hapten selection and synthesis ........................................................................... 62
3.4.2 ENR acid hapten synthesis................................................................................... 63
3.4.2.1 Synthesis of tert‐butyl 3‐(1‐cyclopropyl‐7‐(4‐ethylpiperazin‐1‐yl)‐6‐fluoro‐4‐
oxo‐1,4‐dihydroquinoline‐3‐carboxamido)propanoate, ENR tert‐butyl .................. 63
3.4.2.2 Synthesis of 3‐(1‐cyclopropyl‐7‐(4‐ethylpiperazin‐1‐yl)‐6‐fluoro‐4‐oxo‐1,4‐
dihydroquinoline‐3‐carboxamido)propanoic acid, ENR acid hapten ....................... 65
3.4.3 Ciprofloxacin bromobutane NHS ester hapten synthesis .................................... 65
3.4.3.1 Synthesis of (1‐(4‐bromobutoxy)pyrrolidine‐2,5‐dione), 4‐bromobutane
NHS ester linker ........................................................................................................ 66
3.4.3.2. Synthesis of (1‐cyclopropyl‐7‐(4‐(4‐((2,5‐dioxopyrrolidin‐1‐yl)oxy)butyl)
piperazin‐1‐yl)‐6‐fluoro‐4‐oxo‐1,4‐dihydroquinoline‐3‐carboxylic acid),
ciprofloxacin butane NHS ester hapten ................................................................... 66
3.4.4 Norfloxacin crotyl NHS ester hapten synthesis ................................................... 68
3.4.4.1 Synthesis of 4‐bromocrotonic acid ............................................................... 69
3.4.4.2 Synthesis of bromocrotyl NHS ester linker ................................................... 69
3.4.4.3 Synthesis of norfloxacin crotyl NHS ester hapten ........................................ 70
3.5 CONCLUSION .................................................................................................................. 70
CHAPTER 4. DEVELOPMENT OF THE SPECIFIC ENR ELISA (ENR‐ELISA) ........................ 71
4.1 INTRODUCTION ............................................................................................................... 71
4.2 MATERIALS AND METHODS ................................................................................................ 73
4.2.1 Materials and Instrumentation ........................................................................... 73
4.2.1.1 Materials ....................................................................................................... 73
4.2.1.2 Instruments .................................................................................................. 73
4.2.2 Antibody production and characterization ......................................................... 73

xi
4.2.2.1 Preparation of conjugates of hapten and carrier proteins or enzyme ........ 73
4.2.2.2 Immunisation and antibody production ...................................................... 74
4.2.2.3 Purification of Rabbit IgG ............................................................................. 75
4.2.2.4 Determining antibody concentration ........................................................... 75
4.2.2.5 Determining optimum working concentration by checkerboard titration .. 75
4.2.2.6 Determining Sensitivity ................................................................................ 76
4.2.2.6.1 Preparation of standard solution ........................................................... 76
4.2.2.6.2 Indirect Competitive ELISA protocol ...................................................... 76
4.2.2.6.3 Determination of standard curve parameter ........................................ 77
4.2.2.7 Optimisation of ENR ELISA conditions .......................................................... 78
4.2.2.7.1 The effect of antiserum diluents ........................................................... 78
4.2.2.7.2 The effect of organic solvents ................................................................ 78
4.2.2.7.3. The effect of buffer solutions (pH conditions) ..................................... 78
4.2.2.8 Determining specificity ................................................................................. 78
4.2.2.9 Study of Matrix Effects ................................................................................. 79
4.2.2.9.1 Animal and marine product samples ..................................................... 79
4.2.2.9.2 Protocol for sample extraction of chicken liver and prawn .................. 79
4.2.2.9.3 Protocol for matrix effect determination of milk .................................. 80
4.2.3 Spiking and recovery studies ............................................................................... 80
4.2.3.1 Protocol for spiking of chicken liver and prawn with ENR ........................... 80
4.2.3.2 Protocol for spiking of milk with ENR ........................................................... 80
4.3 RESULTS AND DISCUSSION ................................................................................................. 81
4.3.1 Antibody production and optimal concentration of ENR1 antiserum ................. 81
4.3.2 Antibody characterisation ................................................................................... 82
4.3.2 Assay Sensitivity .................................................................................................. 84
4.3.3 Evaluation of assay parameters (IC80, IC50, IC20 and maximum absorbance) ..... 85
4.3.4 Characteristics of ENR ELISA ................................................................................ 87
4.3.4.1 Assay specificity ............................................................................................ 87
4.3.4.2 Assay Optimisation ....................................................................................... 90
4.3.4.2.1 Effects of diluents .................................................................................. 91
4.3.4.2.2 Effects of organic solvents ................................................................ 93
4.3.4.2.3 Effect of pH ............................................................................................ 99
4.3.5 Matrix Interferences .......................................................................................... 100
4.3.5.1 Effect of matrix in milk ............................................................................... 101
4.3.5.2 Effect of matrix in chicken liver and shrimp samples ................................. 110
*Extraction solvent is 50 mM NaOH:MeOH:PBS=1:9:90. Each value represents
the mean of triplicates (n=3) with a standard deviation (SD). *no significant
difference with PBS. ^significant difference with extraction solvent (control)
......................................................................................................................... 111
4.3.6 Recovery studies ................................................................................................ 122
4.3.7 Linear regression of spiking and recoveries ...................................................... 126
CHAPTER 5. CONCLUSIONS AND RECOMMENDATIONS ....................................... 130

xii
5.1 CONCLUSIONS ............................................................................................................... 130
5.2. RECOMMENDATIONS ..................................................................................................... 132
REFERENCES ............................................................................................... 133

xiii
LIST OF FIGURES
FIGURE 2.1 STRUCTURE OF 7‐CHLORO‐4‐QUINOLINE (NALIDIXIC ACID)...............................5
FIGURE 2.2 GENERAL CHEMICAL STRUCTURE OF A FQ.........................................................6
FIGURE 2.3 CHEMICAL STRUCTURE OF CIPROFLOXACIN.....................................................13
FIGURE 2.4 CHEMICAL STRUCTURE OF ENR........................................................................14
FIGURE 2.5 CHEMICAL STRUCTURE OF NORFLOXACIN.......................................................15
FIGURE 2.6 SCHEMATIC PRESENTATION OF AN INDIRECT COMPETITIVE ELISA.................32
FIGURE 2.7 AN IMMUNOGEN IS MADE BY COUPLING A HAPTEN WITH A CARRIER
MOLECULE USING A CONJUGATION REAGENT...................................................................37
FIGURE 2.8 REACTION OF A CARBOXYLIC ACID WITH A CHLORFORMATE FORMS AN
AMINE‐REACTIVE MIXED ANHYDRIDE.................................................................................41
FIGURE 2.9 REACTION OF A CARBOXYLIC ACID WITH CARBODIIMIDE FORMS AN O‐
ACYLISOUREA......................................................................................................................42
FIGURE 2.10 REACTION OF A CARBOXYLIC ACID GROUP WITH CARBODIIMIDE‐NHS FORMS
AN ACTIVE‐SUCCINIMIDE ESTER.........................................................................................43
FIGURE 3.1 FQ DRUGS USED IN SYNTHESISING HAPTENS...................................................53
FIGURE 3.2 POINT OF THE ATTACHMENT OF LINKERS ON FQ ANTIBIOTICS.......................54
FIGURE 3.3 THE CHEMICAL STRUCTURE OF TERT‐BUTYL ENR HAPTEN……………………………65
FIGURE 3.4 THE CHEMICAL STRUCTURE OF ENR ACID HAPTEN..........................................67
FIGURE 3.5 THE CHEMICAL STRUCTURE OF 4‐BROMOBUTANE NHS ESTER LINKER...........68
FIGURE 3.6 THE CHEMICAL STRUCTURE OF CIPROFLOXACIN BUTANE NHS ETHER
HAPTEN...............................................................................................................................68
FIGURE 3.7 SYNTHESIS OF CIPROFLOXACIN BUTANE NHS ETHER HAPTEN CATALYSED BY
TEA......................................................................................................................................69
FIGURE 3.8 SYNTHESIS OF CIPROFLOXACIN BROMO NHS ETHER HAPTEN CATALYSED BY
K2CO3...................................................................................................................................70
FIGURE 3.9 THE CHEMICAL STRUCTURE OF 4‐BROMOCROTONIC ACID.............................71
FIGURE 3.10 THE CHEMICAL STRUCTURE BROMOCROTYL NHS ESTER...............................71
FIGURE 4.1 THE SCHEMATIC REACTION OF ENR HAPTEN‐PROTEIN CONJUGATION...........76
FIGURE 4.2 SCHEMATIC PRESENTATION OF AN INDIRECT COMPETITIVE ELISA FOR
ENR......................................................................................................................................79
FIGURE 4.3 TITRATION CURVE OF ABENR1‐KLH AGAINST ENR1‐OA FROM SIX DIFFERENT
xiv
BLEEDS (FIRST BLEED TO SIXTH BLEED) BY AN INDIRECT ELISA FORMAT............................84
FIGURE 4.4 TITRATION CURVES OF ABENR1‐KLH#1 (FROM BLEED#1) AGAINST THE EIGHT
HAPTEN‐PROTEIN CONJUGATES (PEF‐OA, SAR‐OA, ENR2‐OA, NOR‐OA, NAL‐OA, CIP2‐OA,
CIP1‐OA AND ENR1‐OA).....................................................................................................85
FIGURE 4.5 CALIBRATION CURVES FOR ABENR1‐KLH (AVERAGE OF 25 ANALYSES) BASED
ON THE ABSORBANCE () VS ENR CONCENTRATION AND THE % INHIBITION () VS ENR
CONCENTRATION USING THE OPTIMISED CONCENTRATIONS OF ANTI‐ENR ANTIBODIES
AND IMMOBILISED ENRANTIGENWITH AN IC50 VALUE OF 11.8µG L‐1 ± 1.7 AND LOD 2.4 µG
L‐1± 0.4. ± REPRESENTS STANDARD DEVIATION……………………………………………………………….88
FIGURE 4.6 %CV OF THE ABSORBANCE () AND THE % INHIBITION () BASED ON AN
AVERAGE OF 25 ANALYSES.................................................................................................89
FIGURE 4.7 PLOT OF IC20 (), IC50 () AND IC80 () VALUES OF THE 25 STANDARD CURVES..
THE MIDDLE SOLID LINES INDICATE THE AVERAGE VALUES OF IC20, IC50 AND IC80. THE
DOTTED LINES INDICATE THE UPPER AND LOWER LIMITS OF STANDARD DEVIATION;
SD........................................................................................................................................89
FIGURE 4.8 EFFECTS OF DILUENTS (PBS, 1% FG‐PBS, 1% FG‐PBS + 0.05% TWEEN 20 AND 1%
FG‐PBS + 0.1% TWEEN 20) ON COLOUR DEVELOPMENT OF THE ELISA BASED ON
ABENR1‐KLH. EACH VALUE REPRESENTS A MEAN OF TRIPLICATES (N=3) WITH A
STANDARD DEVIATION (SD) VALUE OF PBS, 1% FG‐PBS, 1% FG‐PBS + 0.05% TWEEN 20
AND 1% FG‐PBS + 0.1% TWEEN 20 WAS 0.01, 0.02, 0.02 AND 0.01, RESPECTIVELY.
STATISTICAL ANALYSIS WAS CALCULATED USING T‐TEST ( = 0.05)...................................94
FIGURE 4.9 STANDARD CURVES OF ENR IN DIFFERENT DILUENTS (PBS, 1% FG‐PBS, 1% FG‐
PBS + 0.05% TWEEN 20 AND 1% FG‐PBS + 0.1% TWEEN 20). EACH VALUE REPRESENTS THE
MEAN OF TRIPLICATES (N=3) WITH A STANDARD DEVIATION (SD) VALUE OF PBS, 1% FG‐
PBS, 1% FG‐PBS + 0.05% TWEEN 20 AND 1% FG‐PBS + 0.1% TWEEN 20 WAS 1.5, 3.4, 0.8
AND 0.7, RESPECTIVELY. STATISTICAL ANALYSIS WAS CALCULATED USING T‐TEST ( =
0.05)....................................................................................................................................95
FIGURE 4.10 EFFECTS OF METHANOL (5% MEOH, 10% MEOH AND 20% MEOH) ON
COLOUR DEVELOPMENT OF THE ENR1‐ELISA. EACH VALUE REPRESENTS THE MEAN OF
TRIPLICATES (N=3) WITH A STANDARD DEVIATION (SD) VALUE OF PBS, 5% MEOH, 10%
MEOH AND 20% MEOH WAS 0.01, 0.01, 0.02 AND 0.01, RESPECTIVELY. STATISTICAL
ANALYSIS WAS CALCULATED USING T‐TEST (Α = 0.05).......................................................96

xv
FIGURE 4.11 STANDARD CURVES OF ENR DISSOLVED IN DIFFERENT CONCENTRATIONS OF
METHANOL (5% MEOH, 10% MEOH AND 20% MEOH). EACH VALUE REPRESENTS THE
MEAN OF TRIPLICATES (N=3) WITH A STANDARD DEVIATION (SD) VALUE OF PBS, 5%
MEOH, 10% MEOH AND 20% MEOH WAS 1.1, 0.9, 4.7 AND 0.8, RESPECTIVELY.
STATISTICAL ANALYSIS WAS CALCULATED USING T‐TEST (Α = 0.05)...................................96
FIGURE 4.12 EFFECTS OF ACETONITRILE (5% ACETONITRILE, 10% ACETONITRILE AND 20%
ACETONITRILE) ON COLOUR DEVELOPMENT. EACH VALUE REPRESENTS THE MEAN OF
TRIPLICATES (N=3) WITH A STANDARD DEVIATION (SD) VALUE OF PBS, 5% ACETONITRILE,
10% ACETONITRILE AND 20% ACETONITRILE WAS 0.03, 0.03, 0.03 AND 0.02, RESPECTIVELY.
STATISTICAL ANALYSIS WAS CALCULATED USING T‐TEST (Α = 0.05)..................................97
FIGURE 4.13 STANDARD CURVES OF ENR IN DIFFERENT CONCENTRATIONS OF
ACETONITRILE (5% ACETONITRILE, 10% ACETONITRILE AND 20% ACETONITRILE). EACH
VALUE REPRESENTS THE MEAN OF TRIPLICATES (N=3) WITH A STANDARD DEVIATION (SD)
OF PBS, 5% ACETONITRILE, 10% ACETONITRILE AND 20% ACETONITRILE WAS 0.2, 12.4, 2.2
AND 3.6, RESPECTIVELY. STATISTICAL ANALYSIS WAS CALCULATED USING T‐TEST (Α =
0.05)....................................................................................................................................97
FIGURE 4.14 EFFECTS OF ACETONE (5% ACETONE, 10% ACETONE AND 20% ACETONE) ON
COLOUR DEVELOPMENT. EACH VALUE REPRESENTS THE MEAN OF TRIPLICATES (N=3)
WITH A STANDARD DEVIATION (SD) OF PBS, 5% ACETONE, 10% ACETONE AND 20%
ACETONE WAS 0.07, 0.03, 0.02 AND 0.04, RESPECTIVELY. STATISTICAL ANALYSIS WAS
CALCULATED USING T‐TEST (Α = 0.05)................................................................................98
FIGURE 4.15 STANDARD CURVES OF ENR IN DIFFERENT CONCENTRATIONS OF ACETONE (5%
ACETONE, 10% ACETONE AND 20% ACETONE). EACH VALUE REPRESENTS THE MEAN OF
TRIPLICATES (N=3) WITH A STANDARD DEVIATION (SD) OF PBS, 5% ACETONE, 10%
ACETONE AND 20% ACETONE WAS 2.2, 3.7, 1.8 AND 5.1, RESPECTIVELY. STATISTICAL
ANALYSIS WAS CALCULATED USING T‐TEST (Α = 0.05)........................................................98
FIGURE 4.16 EFFECTS OF ETHANOL (5% ETHANOL, 10% ETHANOL AND 20% ETHANOL) ON
COLOUR DEVELOPMENT OF THE ENR1‐ELISA. EACH VALUE REPRESENTS THE MEAN OF
TRIPLICATES (N=3) WITH A STANDARD DEVIATION (SD) OF PBS, ETOH 5%, ETOH 10% AND
ETOH 20% WAS 0.03, 0.01, 0.01 AND 0.03, RESPECTIVELY. STATISTICAL ANALYSIS WAS
CALCULATED USING T‐TEST (Α = 0.05)................................................................................99
xvi
FIGURE 4.17 STANDARD CURVES OF ENR IN DIFFERENT CONCENTRATIONS OF ETHANOL (5%
ETHANOL, 10% ETHANOL AND 20% ETHANOL) FOR ENR1‐ELISA AND EACH VALUE
REPRESENTS THE MEAN OF TRIPLICATES (N=3) WITH A STANDARD DEVIATION (SD) OF PBS,
ETOH 5%, ETOH 10% AND ETOH 20% WAS 1.9, 4.1, 2.5 AND 3.4, RESPECTIVELY.
STATISTICAL ANALYSIS WAS CALCULATED USING T‐TEST (Α = 0.05)...................................99
FIGURE 4.18 EFFECTS OF THE PH ON THE ENR1‐ELISA. THE CIRCLE INDICATES
ABSORBANCE AND THE TRIANGLE INDICATES IC50 VALUES AGAINST PH AND EACH VALUE
REPRESENTS A MEAN OF TRIPLICATES (N=3) OF PH 5.5, 6.5, 7.5, 8.5 AND 9.5 WITH A
STANDARD DEVIATION (SD) VALUE WAS 4.5, 0.8, 0.1, 4.5 AND 0.6, RESPECTIVELY.
STATISTICAL ANALYSIS WAS CALCULATED USING T‐TEST (Α = 0.05).................................102
FIGURE 4.19 EFFECTS OF SKIM MILK LIQUID (SKL), DILUTED 1:5, 1:10 AND 1:20 WITH PBS
ON COLOUR DEVELOPMENT. EACH VALUE REPRESENTS THE MEAN OF TRIPLICATES (N=3)
WITH A STANDARD DEVIATION (SD) VALUE OF PBS, DILUTED SKL 1:5, 1:10 AND 1:20 WITH
PBS WAS 0.01, 0.04, 0.01 AND 0.04, RESPECTIVELY. STATISTICAL ANALYSIS WAS
CALCULATES USING T‐TEST (Α = 0.05).............................................................................104
FIGURE 4.20 STANDARD CURVES OF ENR DISSOLVED IN SKIM MILK LIQUID (SKL), DILUTED
1:5, 1:10 AND 1:20 WITH PBS.EACH VALUE REPRESENTS THE MEAN OF TRIPLICATES (N=3)
WITH STANDARD DEVIATION (SD) VALUE OF PBS, DILUTED SKL 1:5, 1:10 AND 1:20 WITH
PBS WAS 0.8, 1.7, 1.2 AND 0.6, RESPECTIVELY. STATISTICAL ANALYSIS WAS CALCULATED
USING T‐TEST (Α = 0.05)....................................................................................................104
FIGURE 4.21 EFFECTS OF SKIM MILK POWDER (SKP), DILUTED 1:5, 1:10 AND 1:20 WITH
PBS, ON COLOUR DEVELOPMENT OF THE ENR1‐ELISA. EACH VALUE REPRESENTS THE
MEAN OF TRIPLICATES (N=3) WITH STANDARD DEVIATION (SD) OF PBS, DILUTED SKP 1:5,
1:10 AND 1:20 WITH PBS WAS 0.01, 0.04, 0.01 AND 0.04, RESPECTIVELY. STATISTICAL
ANALYSIS WAS CALCULATED USING T‐TEST (Α = 0.05)......................................................105
FIGURE 4.22 STANDARD CURVES OF ENR DISSOLVED IN SKIM MILK POWDER (SKP), 1:5,
1:10 AND 1:20 WITH PBS. EACH VALUE REPRESENTS THE MEAN OF TRIPLICATES (N=3)
WITH A STANDARD DEVIATION (SD) OF PBS, DILUTED SKP 1:5, 1:10 AND 1:20 WITH PBS
WAS 0.7, 1.6, 1.2 AND 0.6, RESPECTIVELY. STATISTICAL ANALYSIS WAS CALCULATED
USING T‐TEST (Α = 0.05)...................................................................................................105
FIGURE 4.23 EFFECTS OF FULL CREAM MILK LIQUID (FCL), DILUTED 1:5, 1:10 AND 1:20
WITH PBS ON COLOUR DEVELOPMENT OF THE ENR1‐ELISA. EACH VALUE REPRESENTS THE
xvii
MEAN OF TRIPLICATES (N=3) WITH A STANDARD DEVIATION (SD) OF PBS, DILUTED FCL 1:5,
1:10 AND 1:20 WITH PBS WAS 0.01, 0.04, 0.01 AND 0.04, RESPECTIVELY. STATISTICAL
ANALYSIS WAS CALCULATED USING T‐TEST (Α = 0.05).....................................................106
FIGURE 4.24 STANDARD CURVES OF ENR DISSOLVED IN FULL CREAM MILK LIQUID (FCL),
DILUTED 1:5, 1:10 AND 1:20. EACH VALUE REPRESENTS THE MEAN OF TRIPLICATES (N=3)
WITH A STANDARD DEVIATION (SD) OF PBS, DILUTED FCL 1:5, 1:10 AND 1:20 WITH PBS
WAS 0.8, 1.7, 1.2 AND 0.6, RESPECTIVELY. STATISTICAL ANALYSIS WAS CALCULATED
USING T‐TEST (Α = 0.05)....................................................................................................106
FIGURE 4.25 EFFECTS OF FULL CREAM MILK POWDER (FCP), DILUTED 1:5, 1:10 AND 1:20
WITH PBS ON COLOUR DEVELOPMENT. EACH VALUE REPRESENTS THE MEAN OF
TRIPLICATES (N=3) WITH A STANDARD DEVIATION (SD) OF PBS, DILUTED FCP 1:5, 1:10
AND 1:20 WITH PBS WAS 0.01, 0.04, 0.01 AND 0.04, RESPECTIVELY. STATISTICAL ANALYSIS
WAS CALCULATED USING T‐TEST (Α = 0.05)......................................................................107
FIGURE 4.26 STANDARD CURVES OF ENR DISSOLVED IN FULL CREAM MILK POWDER (FCP),
DILUTED 1:5, 1:10 AND 1:20 WITH PBS. EACH VALUE REPRESENTS THE MEAN OF
TRIPLICATES (N=3) WITH A STANDARD DEVIATION (SD) OF PBS, DILUTED FCP 1:5, 1:10
AND 1:20 WITH PBS WAS 1.1, 1.2, 0.9, 1.3, RESPECTIVELY. STATISTICAL ANALYSIS WAS
CALCULATED USING T‐TEST (Α = 0.05)..............................................................................107
FIGURE 4.27 EFFECTS OF SKIM MILK LIQUID (SKL) AND SKIM MILK POWDER (SKP),
DILUTED 1:10 WITH PBS, ON COLOUR DEVELOPMENT OF THE ENR1‐ELISA. EACH VALUE
REPRESENTS THE MEAN OF FIVE REPLICATES (N=5) WITH A STANDARD DEVIATION (SD)
VALUE OF PBS, DILUTED SKL AND SKP 1:10 WITH PBS WAS 0.1, 0.2 AND 0.2, RESPECTIVELY.
STATISTICAL ANALYSIS WAS CALCULATED USING T‐TEST (Α = 0.05).................................109
FIGURE 4.28 STANDARD CURVES OF ENR IN SKIM MILK LIQUID (SKL) AND SKIM MILK
POWDER (SKP), DILUTED 1:10 WITH PBS. EACH VALUE REPRESENTS THE MEAN OF FIVE
REPLICATES (N=5) WITH A STANDARD DEVIATION (SD) VALUE OF PBS, DILUTED SKL AND
SKP 1:10 WITH PBS WAS 1.2, 2.5 AND 2.8, RESPECTIVELY. STATISTICAL ANALYSIS WAS
CALCULATED USING T‐TEST (Α = 0.05)..............................................................................110
FIGURE 4.29 EFFECT OF FULL CREAM MILK LIQUID (FCL) AND FULL CREAM MILK POWDER
(FCP), DILUTED 1:10 WITH PBS, ON COLOUR DEVELOPMENT. EACH VALUE REPRESENTS
THE MEAN OF FIVE REPLICATES (N=5) WITH A STANDARD DEVIATION (SD) OF PBS,

xviii
DILUTED SKL AND SKP 1:10 WITH PBS WAS 0.1, 0.2 AND 0.1, RESPECTIVELY. STATISTICAL
ANALYSIS WAS CALCULATED USING T‐TEST (Α = 0.05)......................................................110
FIGURE 4.30 STANDARD CURVES OF ENR DISSOLVED IN FULL CREAM MILK LIQUID (FCL)
AND FULL CREAM MILK POWDER (FCP), DILUTED 1:10 WITH PBS. EACH VALUE
REPRESENTS THE MEAN OF FIVE REPLICATES (N=5) WITH A STANDARD DEVIATION (SD) OF
PBS, DILUTED SKL AND SKP 1:10 WITH PBS WAS 1.6, 2.0 AND 2.0, RESPECTIVELY.
STATISTICAL ANALYSIS WAS CALCULATED USING T‐TEST (Α = 0.05).................................111
FIGURE 4.31 EFFECTS OF CHICKEN LIVER (COLES, LV2), DILUTED 1:20 WITH PBS, ON
COLOUR DEVELOPMENT. EACH VALUE REPRESENTS THE MEAN OF TRIPLICATES (N=3)
WITH A STANDARD DEVIATION (SD) VALUE OF PBS, EXTRACTION SOLVENT AND
EXTRACTED LIVER WAS 0.03, 0.04 AND 0.03, RESPECTIVELY. STATISTICAL ANALYSIS WAS
CALCULATED USING T‐TEST (Α = 0.05)..............................................................................113
FIGURE 4.32 STANDARD CURVES OF ENR DISSOLVED IN CHICKEN LIVER EXTRACT (COLES,
LV2). EACH VALUE REPRESENTS THE MEAN OF TRIPLICATES (N=3) WITH A STANDARD
DEVIATION (SD) VALUE OF PBS, EXTRACTION SOLVENT AND EXTRACTED LIVER WAS 0.8,
0.9 AND 0.6, RESPECTIVELY. STATISTICAL ANALYSIS WAS CALCULATED USING T‐TEST (Α =
0.05)..................................................................................................................................114
FIGURE 4.33 EFFECTS OF LOCAL PRAWN EXTRACT (PR1) ON COLOUR DEVELOPMENT.
EACH VALUE REPRESENTS THE MEAN OF TRIPLICATES (N=3) WITH A STANDARD
DEVIATION (SD) VALUE OF PBS, EXTRACTION SOLVENT AND EXTRACTED LIVER WAS 0.02,
0.01 AND 0.01, RESPECTIVELY. STATISTICAL ANALYSIS WAS CALCULATED USING T‐TEST (Α
= 0.05)...............................................................................................................................114
FIGURE 4.34 STANDARD CURVES OF ENR DISSOLVED IN THE LOCAL PRAWN EXTRACT
(PR1). EACH VALUE REPRESENTS THE MEAN OF TRIPLICATES (N=3) WITH A STANDARD
DEVIATION (SD) VALUE OF PBS, EXTRACTION SOLVENT AND EXTRACTED LIVER WAS 0.7,
3.1 AND 1.8, RESPECTIVELY. STATISTICAL ANALYSIS WAS CALCULATED USING T‐TEST (Α =
0.05)..................................................................................................................................115
FIGURE 4.35 EFFECTS OF ORGANIC CHICKEN LIVER (LV1), DILUTED 1:50 WITH PBS, ON
COLOUR DEVELOPMENT. EACH VALUE REPRESENTS THE MEAN OF FIVE REPLICATES (N=5)
WITH A STANDARD DEVIATION (SD) VALUE OF PBS, EXTRACTION SOLVENT, AND
EXTRACTED ORGANIC CHICKEN LIVER (LV1) WAS 0.2, 0.1 AND 0.2, RESPECTIVELY.
STATISTICAL ANALYSIS WAS CALCULATED USING T‐TEST (Α = 0.05).................................117

xix
FIGURE 4.36 STANDARD CURVES OF ENR DISSOLVED IN ORGANIC CHICKEN LIVER EXTRACT
(LV1). EACH VALUE REPRESENTS THE MEAN OF REPLICATES (N=5) WITH A STANDARD
DEVIATION (SD) VALUE OF PBS, EXTRACTION SOLVENT, AND EXTRACTED ORGANIC
CHICKEN LIVER (LV1) WAS 2.2, 0.8 AND 0.8, RESPECTIVELY. STATISTICAL ANALYSIS WAS
CALCULATED USING T‐TEST (Α = 0.05)..............................................................................117
FIGURE 4.37 EFFECTS OF CHICKEN LIVER EXTRACT (LV2), DILUTED 1:50 WITH PBS, ON
COLOUR DEVELOPMENT. EACH VALUE REPRESENTS THE MEAN OF FIVE REPLICATES (N=5)
WITH A STANDARD DEVIATION (SD) OF PBS, EXTRACTION SOLVENT, AND EXTRACTED
CHICKEN LIVER (LV2) WAS 0.2, 0.2 AND 0.2, RESPECTIVELY. STATISTICAL ANALYSIS WAS
CALCULATED USING T‐TEST (Α = 0.05)............................................................................118
FIGURE 4.38 STANDARD CURVES OF ENR DISSOLVED IN CHICKEN LIVER EXTRACT (LV2),
DILUTED 1:50 WITH PBS. EACH VALUE REPRESENTS THE MEAN OF FIVE REPLICATES (N=5)
WITH A STANDARD DEVIATION (SD) OF PBS, EXTRACTION SOLVENT, AND EXTRACTED
CHICKEN LIVER (LV2) WAS 2.6, 2.9 AND 2.0, RESPECTIVELY. STATISTICAL ANALYSIS WAS
CALCULATED USING T‐TEST (Α = 0.05)..............................................................................118
FIGURE 4.39 EFFECTS OF CHICKEN LIVER EXTRACT (LV3), DILUTED 1:50 WITH PBS, ON
COLOUR DEVELOPMENT. EACH VALUE REPRESENTS THE MEAN OF FIVE REPLICATES (N=5)
WITH A STANDARD DEVIATION (SD) OF PBS, EXTRACTION SOLVENT, AND EXTRACTED
CHICKEN LIVER (LV2) WAS 0.2, 0.2 AND 0.2, RESPECTIVELY. STATISTICAL ANALYSIS WAS
CALCULATED USING T‐TEST (Α = 0.05)..............................................................................119
FIGURE 4.40 STANDARD CURVES OF ENR DISSOLVED INA CHICKEN LIVER EXTRACT
(LV3).EACH VALUE REPRESENTS THE MEAN OF FIVE REPLICATES (N=5) WITH A STANDARD
DEVIATION (SD) OF PBS, EXTRACTION SOLVENT, AND EXTRACTED CHICKEN LIVER (LV3)
WAS 5.4, 4.7 AND 3.5, RESPECTIVELY. STATISTICAL ANALYSIS WAS CALCULATED USING T‐
TEST (Α = 0.05)...................................................................................................................119
FIGURE 4.41 EFFECTS OF LOCAL PRAWN EXTRACT (PR1), DILUTED 1:50 WITH PBS, ON
COLOUR DEVELOPMENT. EACH VALUE REPRESENTS THE MEAN OF FIVE REPLICATES (N=5)
WITH A STANDARD DEVIATION (SD) OF PBS, EXTRACTION SOLVENT, AND EXTRACTED
PRAWN (PR1) WAS 0.2, 0.2 AND 0.2, RESPECTIVELY. STATISTICAL ANALYSIS WAS
CALCULATED USING T‐TEST (Α = 0.05)..............................................................................120
FIGURE 4.42 STANDARD CURVES OF ENR IN LOCAL PRAWN EXTRACT (PR1). EACH VALUE
REPRESENTS THE MEAN OF FIVE REPLICATES (N=5) WITH A STANDARD DEVIATION (SD) OF

xx
PBS, EXTRACTION SOLVENT, AND EXTRACTED LOCAL PRAWN (PR1) WAS 6.3, 2.7 AND 3.6,
RESPECTIVELY. STATISTICAL ANALYSIS WAS CALCULATED USING T‐TEST (Α =
0.05)..................................................................................................................................120
FIGURE 4.43 EFFECTS OF PRAWN FROM COLES SUPERMARKET (PR2), EXTRACT DILUTED
1:50 WITH PBS ON COLOUR DEVELOPMENT. EACH VALUE REPRESENTS THE MEAN OF FIVE
REPLICATES (N=5) WITH A STANDARD DEVIATION (SD) PBS, EXTRACTION SOLVENT, AND
EXTRACTED LOCAL PRAWN (PR2) WAS 0.1, 0.1 AND 0.1 RESPECTIVELY. STATISTICAL
ANALYSIS WAS CALCULATED USING T‐TEST (Α = 0.05)......................................................121
FIGURE 4.44 STANDARD CURVES OF ENR IN AN EXTRACT FROM THE PRAWN PURCHASED
FROM COLES SUPERMARKET (PR2). EACH VALUE REPRESENTS THE MEAN OF FIVE
REPLICATES (N=5) WITH A STANDARD DEVIATION (SD) PBS, EXTRACTION SOLVENT, AND
EXTRACTED PRAWN (PR2) WAS 2.2, 1.6 AND 2.5, RESPECTIVELY. STATISTICAL ANALYSIS
WAS CALCULATED USING T‐TEST (Α = 0.05)......................................................................121
FIGURE 4.45 EFFECTS OF EXTRACT FROM THE PRAWN PURCHASED FROM A LOCAL
BUTCHER (PR3) ON COLOUR DEVELOPMENT. EACH VALUE REPRESENTS THE MEAN OF
FIVE REPLICATES (N=5) WITH A STANDARD DEVIATION (SD) PBS, EXTRACTION SOLVENT,
AND EXTRACTED PRAWN (PR3) WAS 0.1, 0.1 AND 0.1, RESPECTIVELY. STATISTICAL
ANALYSIS WAS CALCULATED USING T‐TEST (Α = 0.05)......................................................122
FIGURE 4.46 STANDARD CURVES OF ENR IN AN EXTRACT FROM THE PRAWN PURCHASED
FROM A LOCAL BUTCHER (PR3). EACH VALUE REPRESENTS THE MEAN OF FIVE REPLICATES
(N=5) WITH A STANDARD DEVIATION (SD) PBS, EXTRACTION SOLVENT, AND EXTRACTED
PRAWN (PR3) WAS 4.4, 1.3 AND 2.3, RESPECTIVELY. STATISTICAL ANALYSIS WAS
CALCULATED USING T‐TEST (Α = 0.05)..............................................................................122
FIGURE 4.47 CORRELATION BETWEEN THE LEVELS OF ENR SPIKING IN SKIM MILK LIQUID
(SKL), SKIM MILK POWDER (SKP), FULL CREAM MILK LIQUID (SKL), FULL CREAM MILK
POWDER (SKP) AND ESTIMATES BY THE ENR1‐ELISA. AVERAGE VALUES (µG L‐1) OF
SPIKING AND SPIKING LEVEL (µG L‐1) FROM IN PBS BUFFER.............................................127
FIGURE 4.48 CORRELATION BETWEEN THE LEVELS OF ENR SPIKING IN SKIM MILK LIQUID
(SKL), SKIM MILK POWDER (SKP), FULL CREAM MILK LIQUID (SKL), FULL CREAM MILK
POWDER (SKP) AND ESTIMATES BY THE ENR1‐ELISA. AVERAGE VALUES (µG L‐1) OF
SPIKING AND SPIKING LEVEL (µG L‐1) FROM IN DILUTED SAMPLES...................................128
xxi
FIGURE 4.49 CORRELATION BETWEEN THE LEVELS OF ENR SPIKING IN ORGANIC CHICKEN
LIVER (LV1), CHICKEN LIVER FORM COLES (LV2), CHICKEN LIVER FROM BUTCHER (LV3),
LOCAL PRAWN (PR1), THAI PRAWN (PR2) AND MALAYSIAN PRAWN (PR3) AND ESTIMATES
BY THE ENR1‐ELISA. AVERAGE VALUES (µG L‐1) OF SPIKING AND SPIKING LEVEL (µG L‐1)
FROM IN EXTRACTION SOLVENT.......................................................................................128
FIGURE 4.50 CORRELATION BETWEEN THE LEVELS OF ENR SPIKING IN ORGANIC CHICKEN
LIVER (LV1), CHICKEN LIVER FORM COLES (LV2), CHICKEN LIVER FROM BUTCHER (LV3),
LOCAL PRAWN (PR1), THAI PRAWN (PR2) AND MALAYSIAN PRAWN (PR3) AND ESTIMATES
BY THE ENR1‐ELISA. AVERAGE VALUES (µG L‐1) OF SPIKING AND SPIKING LEVEL (µG L‐1)
FROM IN EXTRACTED SAMPLES.........................................................................................129
xxii
LIST OF TABLES
TABLE 2.1 GENERATIONS OF FQS..........................................................................................7
TABLE 2.1 GENERATIONS OF FQS (CONTINUED)...................................................................8
TABLE 2.2 FQ ANTIBIOTIC USED IN VETERINARY MEDICINES................................................8
TABLE 2.3 OLDER FQS MARKETED FOR BOTH HUMAN AND VETERINARY USES.................10
TABLE 2.4 MODERN FLUOROQUINOLONES MARKETED FOR BOTH HUMAN AND
VETERINARY USES...............................................................................................................11
TABLE 2.5 PROPOSED AND/OR APPROVED DOSAGES OF VARIOUS FQS USED IN
VETERINARY MEDICINE.......................................................................................................12
TABLE 2.6 COMMON ADVERSE REACTIONS ASSOCIATED WITH SOME FQS.......................16
TABLE 2.7 MRL VALUES ESTABLISHED BY THE EU AND JECFA FOR RESIDUES OF FQS AND
QUINOLONES USED IN VETERINARY MEDICINE……………………………………………………………….20
TABLE 2.7 MRL VALUES ESTABLISHED BY THE EU AND JECFA FOR RESIDUES OF FQS AND
QUINOLONES USED IN VETERINARY MEDICINE(CONTINUED)...........................................21
TABLE 2.7 MRL VALUES ESTABLISHED BY THE EU AND JECFA FOR RESIDUES OF FQS AND
QUINOLONES USED IN VETERINARY MEDICINE(CONTINUED)............................................22
TABLE 2.8 ELISAS DEVELOPED FOR FQ ANTIBIOTICS...........................................................32
TABLE 2.8 ELISAS DEVELOPED FOR FQ ANTIBIOTICS (CONTINUED)....................................33
TABLE 2.8 ELISAS DEVELOPED FOR FQ ANTIBIOTICS (CONTINUED)....................................34
TABLE 2.8 ELISAS DEVELOPED FOR FQ ANTIBIOTICS (CONTINUED)....................................35
TABLE 2.8 ELISAS DEVELOPED FOR FQ ANTIBIOTICS (CONTINUED)....................................36
TABLE 2.8 ELISAS DEVELOPED FOR FQ ANTIBIOTICS (CONTINUED)....................................37
TABLE 4.1 THE CONCENTRATIONS OF ENR USED TO SPIKE SAMPLES.................................83
TABLE 4.2 THE IC50 VALUES (µG L‐1) OF THE ASSAYS BASED ON THE COMBINATION OF 14
FQ HAPTEN‐OA CONJUGATES COMPETED WITH ENR FOR ABENR1‐KLH BY INDIRECT COMPETITIVE ELISA.............................................................................................................86
TABLE 4.3 STANDARD CURVE PARAMETERS AND PRECISION OF ENR ASSAY......................88
TABLE 4.4 THE IC50 (µG L‐1) AND CROSS REACTIVITY (%CR) FOR FQS RELATED
COMPOUNDS.......................................................................................................................91

xxiii
TABLE 4.4 THE IC50 (µG L‐1) AND CROSS REACTIVITY (%CR) FOR FQS RELATED COMPOUNDS
(CONTINUED)......................................................................................................................92
TABLE 4.5 EFFECT OF DILUENTS ON ANTIBODY’S SENSITIVITY...........................................93
TABLE 4.6 EFFECTS OF WATER MISCIBLE ORGANIC SOLVENTS ON THE PERFORMANCE OF
THE ENR ELISA...................................................................................................................100
TABLE 4.7 EFFECTS OF MILK MATRIX ON COLOUR DEVELOPMENT (AMAX) AND ASSAY
SENSITIVITY (IC50)..............................................................................................................108
TABLE 4.8 MATRIX EFFECTS OF PRE‐TREATED MILK, DILUTED 1:10 WITH PBS, ON COLOUR
DEVELOPMENT (AMAX) AND ASSAY SENSITIVITY (IC50)......................................................111
TABLE 4.9 EFFECTS OF CHICKEN LIVER (LV2) AND PRAWN (PR1) SAMPLES, IN A 20‐FOLD
DILUTION WITH PBS ON COLOUR DEVELOPMENT (AMAX) AND ASSAY SENSITIVITY
(IC50)..................................................................................................................................112
TABLE 4.10 EFFECTS OF CHICKEN LIVER AND PRAWN EXTRACTS, ON COLOUR
DEVELOPMENT (AMAX) AND ASSAY SENSITIVITY (IC50).......................................................115
TABLE 4.11 % RECOVERIES ENR SPIKED IN MILK AS DETECTED BY ELISA..........................124
TABLE 4.12 %RECOVERIES OF ENR SPIKED IN CHICKEN LIVER AS DETECTED BY
ELISA..................................................................................................................................125
TABLE 4.13 % RECOVERIES OF ENR SPIKED IN PRAWN AS DETECTED BY
ELISA..................................................................................................................................126

1
CHAPTER 1. INTRODUCTION
1.1 Background of research
An antibiotic is defined as any substance produced by a microorganism that inhibits or kills
other microorganisms, primarily bacteria (Klotins, 2005). Antibiotics can also be produced
synthetically. The main function of antibiotics is for treatment of diseases, as well as
prophylaxis to prevent illness before the development of clinical signs (Smith et al., 1999).
Fluoroquinolones (FQs) belong to a class of synthetic antibiotics that have broad‐spectrum
biological mechanisms for the treatment and prevention of a wide range of bacterial
infections in both humans and veterinary animals. They act through the inhibition of
essential bacterial enzymes, namely DNA gyrase and topoisomerase IV, by interfering the
DNA rejoining reaction (Huet et al., 2006). FQs are highly effective against most Gram‐
negative bacteria, mycoplasma, and some Gram‐positive bacteria, but are less effective
against the Streptococci group and obligate anaerobic bacteria (Brown, 1996).
ENR, ciprofloxacin, and norfloxacin are the most frequently used FQs in veterinary
medicines, particularly in poultry, and are also often administered to large animals, such as
cattle and pigs, as well as pets, cats and dogs. According to the sample entry data of the
pharmaceutical products from the National Veterinary Drug Assay Laboratory, the Ministry
of Agriculture, Gunungsindur‐Bogor, West Java Province, Indonesia, FQs totaled 30% of the
pharmaceutical products used between 2004 and 2007. ENR has the largest number of
brand names among the single active ingredient products. Currently there are about 54
brand names of ENR being distributed in Indonesian. The Ministry of Agriculture of
Indonesia also has approved ENR for use in aquaculture since 2005.
Recently, there are about 44 generic names of quinolones and FQs are being distributed
worldwide for use as human and animal medicines, with some being banned, such as
trovafloaxcin, grepafloxacin, clinafloxacin and gatifloxacin, due to severe adverse effects in
humans and animals (i.e. crystalluria, lethal hepatic damage, cardiovascular disorder,
2
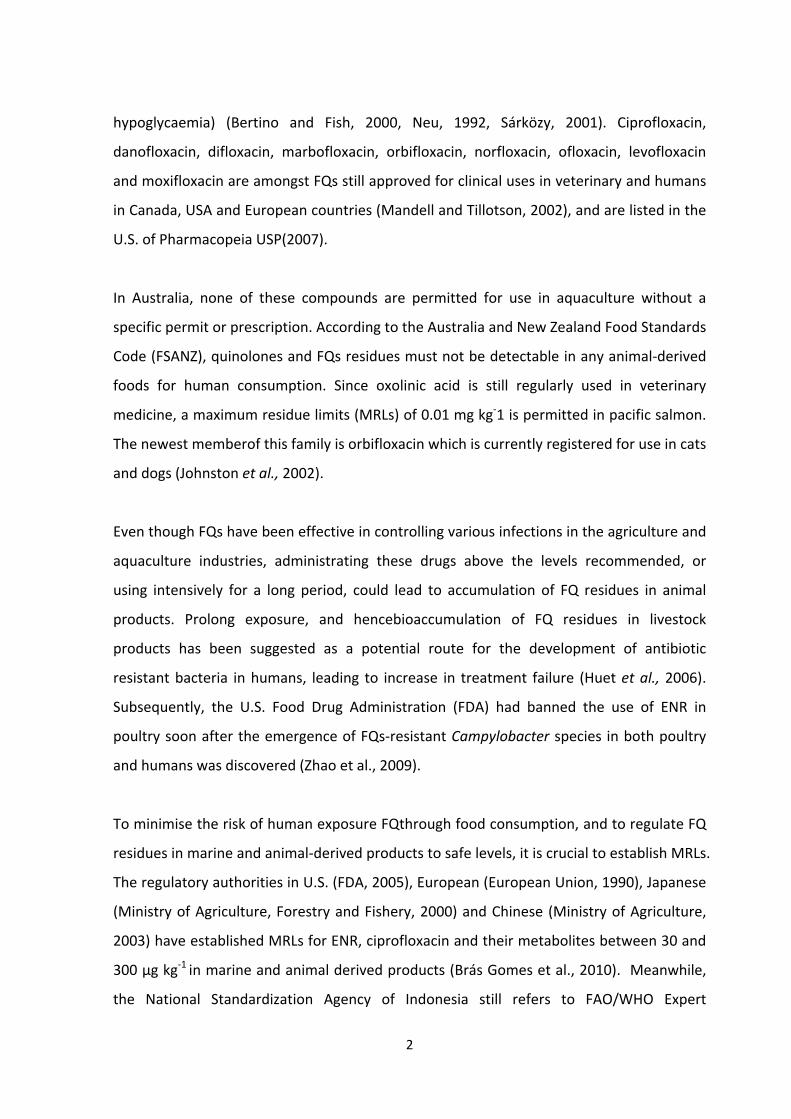
hypoglycaemia) (Bertino and Fish, 2000, Neu, 1992, Sárközy, 2001). Ciprofloxacin,
danofloxacin, difloxacin, marbofloxacin, orbifloxacin, norfloxacin, ofloxacin, levofloxacin
and moxifloxacin are amongst FQs still approved for clinical uses in veterinary and humans
in Canada, USA and European countries (Mandell and Tillotson, 2002), and are listed in the
U.S. of Pharmacopeia USP(2007).
In Australia, none of these compounds are permitted for use in aquaculture without a
specific permit or prescription. According to the Australia and New Zealand Food Standards
Code (FSANZ), quinolones and FQs residues must not be detectable in any animal‐derived
foods for human consumption. Since oxolinic acid is still regularly used in veterinary
medicine, a maximum residue limits (MRLs) of 0.01 mg kg‐1 is permitted in pacific salmon.
The newest memberof this family is orbifloxacin which is currently registered for use in cats
and dogs (Johnston et al., 2002).
Even though FQs have been effective in controlling various infections in the agriculture and
aquaculture industries, administrating these drugs above the levels recommended, or
using intensively for a long period, could lead to accumulation of FQ residues in animal
products. Prolong exposure, and hencebioaccumulation of FQ residues in livestock
products has been suggested as a potential route for the development of antibiotic
resistant bacteria in humans, leading to increase in treatment failure (Huet et al., 2006).
Subsequently, the U.S. Food Drug Administration (FDA) had banned the use of ENR in
poultry soon after the emergence of FQs‐resistant Campylobacter species in both poultry
and humans was discovered (Zhao et al., 2009).
To minimise the risk of human exposure FQthrough food consumption, and to regulate FQ
residues in marine and animal‐derived products to safe levels, it is crucial to establish MRLs.
The regulatory authorities in U.S. (FDA, 2005), European (European Union, 1990), Japanese
(Ministry of Agriculture, Forestry and Fishery, 2000) and Chinese (Ministry of Agriculture,
2003) have established MRLs for ENR, ciprofloxacin and their metabolites between 30 and
300 µg kg‐1 in marine and animal derived products (Brás Gomes et al., 2010). Meanwhile,
the National Standardization Agency of Indonesia still refers to FAO/WHO Expert

3
Committee on Food Authority (JECFA) for guidance in establishing MRLs for FQ residues in
Indonesia. The MRLs for ENR, ciprofloxacin and their active metabolites have been set at
between 100 µg kg‐1 and 300 µg kg‐1 in milk, muscle and edible tissues, in Indonesia. While
much lower MRL of 30 µg kg‐1for ENR and its metabolites is set by the European
commission, Regulation 2377/90 (Volmer et al., 1997), causing some conflicts for
international trade.
1.2 Method Development for Fluoroquinolone Residues
Generally, there are two main analytical techniques used to identify and quantify antibiotic
residues in food, namely conventional methods using instrumentation and immunoassay
methods based on antigen‐antibody binding interaction. Instrument‐based methods
include high performance liquid chromatography (HPLC) with UV/fluorescence detection
(Carlucci, 1998, Yorke and Froc, 2000, Espinosa‐Mansilla et al., 2006,Hung, 2007,), liquid
chromatography‐mass spectrometry (LC/MS) (Marchesini et al., 2007), liquid
chromatography‐tandem mass spectrometry (LC‐MS/MS) (Johnston et al., 2002, Bogialli et
al., 2008), capillary electrophoresis (Fierens et al., 2000) gas chromatography (GC)
(Takatsuki, 1991) and thin layer chromatography (TLC) and high performance thin layer
chromatography (HPTLC) (Choma et al., 2004, Gaugin and Abjean, 1998).
Although the instrument‐based methods are very sensitive and highly accurate, they are
also laborious often involving extensive sample preparation and sample interference
removing steps. Hence, these methods are not sufficiently cost‐effective, are technically
complex, and requires highly skilled operators, in many instances not suited to analytical
environment of the developing countries. In view of the above, the immunoassay method
is preferred as complement to instrument‐based methods, since it is simple and faster,
with high sample throughput for a single analyte, shows high sensitivity, high specificity,
greater cost‐effectiveness, require little training on the technique, available in convenient
kits for analyses of specific compounds and for families of compounds (Toldra and Reig,
2006).
4
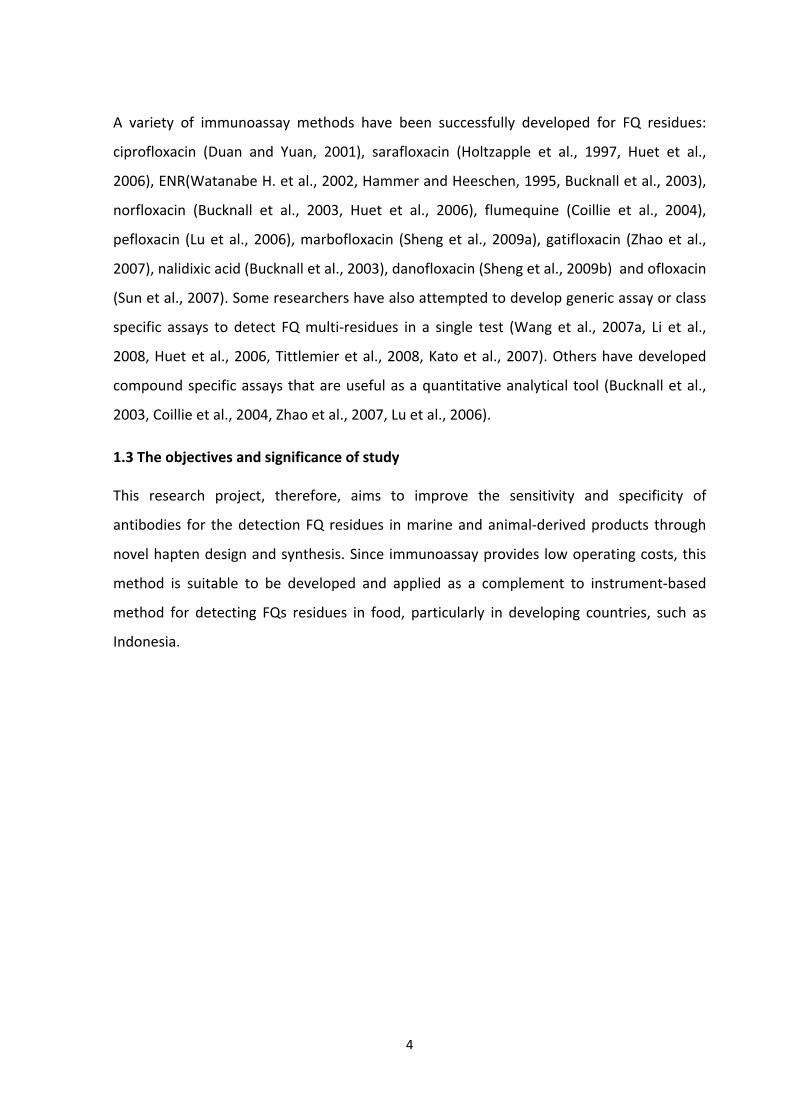
A variety of immunoassay methods have been successfully developed for FQ residues:
ciprofloxacin (Duan and Yuan, 2001), sarafloxacin (Holtzapple et al., 1997, Huet et al.,
2006), ENR(Watanabe H. et al., 2002, Hammer and Heeschen, 1995, Bucknall et al., 2003),
norfloxacin (Bucknall et al., 2003, Huet et al., 2006), flumequine (Coillie et al., 2004),
pefloxacin (Lu et al., 2006), marbofloxacin (Sheng et al., 2009a), gatifloxacin (Zhao et al.,
2007), nalidixic acid (Bucknall et al., 2003), danofloxacin (Sheng et al., 2009b) and ofloxacin
(Sun et al., 2007). Some researchers have also attempted to develop generic assay or class
specific assays to detect FQ multi‐residues in a single test (Wang et al., 2007a, Li et al.,
2008, Huet et al., 2006, Tittlemier et al., 2008, Kato et al., 2007). Others have developed
compound specific assays that are useful as a quantitative analytical tool (Bucknall et al.,
2003, Coillie et al., 2004, Zhao et al., 2007, Lu et al., 2006).
1.3 The objectives and significance of study
This research project, therefore, aims to improve the sensitivity and specificity of
antibodies for the detection FQ residues in marine and animal‐derived products through
novel hapten design and synthesis. Since immunoassay provides low operating costs, this
method is suitable to be developed and applied as a complement to instrument‐based
method for detecting FQs residues in food, particularly in developing countries, such as
Indonesia.

5
CHAPTER 2. LITERATURE REVIEW
2.1. Fluoroquinolone antibacterial agents
2.1.1. Overview of quinolone
George Lesher and his coworkers discovered the first quinolone, nalidixic acid, in 1962.
Since then it had been medically important as an antimicrobial agent for the treatment of
urinary tract infections in humans. Nowadays a wide range of antibiotics has been derived
based on the core unit of the quinolone structure (Wagman and Wentland, 2007). For
example, nalidixic acid, as shown on Figure 2.1, was derived from a recrystallisation of 7‐
chloro‐4‐quinoline during the synthesis of chloroquine which was used to treat malaria
during World War II. The majority of quionolones in clinical use belong to a subset of
fluoroquinolones (FQs), which have a fluorine atom attached to the central ring system,
typically at the C‐6 position or C‐7 position.
Figure 2.1 Structure of 7‐chloro‐4‐quinoline (Nalidixic acid).
Several quinolone antibiotics, such as oxolinic acid, cinoxacin and pipemidic acid,
introduced in the 1970s, had a narrow spectrum of antibacterial activity, frequent
incidence of adverse effects, poor tissue penetration and distribution, and subsequent
inadequate serum concentration. Further development work led to a more powerful class
of agents known as FQs. Norfloxacin was the first FQs synthesized, which exhibited better
spectrum of bacterial activity (Wagman and Wentland, 2007).
2.1.2. Chemical structure of fluoroquinolone antibiotics
The 6‐fluoroquinolones are also known as 4‐quinolones or quinolones and are derived
from or related to nalidixic acid and oxolinic acid. Some substitutions on the FQ structural
backbone (Figure 2.2), such as the R1 substitutions, are usually alkyl groups (e.g.

6
cyclopropyl, ethyl, fluorethyl, methylamino), fluorophenyl group, thiazine or oxazine ring.
The R2substitutions are often piperazine derivatives (piperazin‐1‐yl, 4‐methylpiperazin‐1‐yl,
3‐methylpiperazin‐1‐yl) and X substitutions are either carbon or nitrogen atom (Figure 2.2).
Figure 2.2 General chemical structure of a FQ.
The basic backbone of FQ has the following features: A nitrogen atom at position 1 on the
bicyclic aromatic ring structure, a carboxylic acid group at position 3 is important for
antimicrobial activity. A fluorine atom at position 6 enhances the efficacy and spectrum
activity against Gram negative and positive bacterial pathogens (Brown, 1996). Moreover,
the carboxylic group at position 3 renders these compounds acidic, whereas the 7‐
piperazinylquinolones include additional amine groups which are basic. Therefore, the 7‐
piperazinylquinolones in an aqueous solution may be present as three different species, i.e.
cationic, zwitterionic and anionic, while the other FQs and quinolones are either neutral or
anionic (Hernandez‐Arteseros et al., 2002).
FQs and quinolones with a piperazinyl moiety have two pKa values: pKa1≈6 and pKa2≈9, thus
they are always charged. They exist mostly in cationic forms at acidic pH, anionic forms at
basic pH and as zwitterionic at neutral pH. The carboxylic acid group have a pKa of ≈6 and
present as a neutral compound at acidic pH and as an anionic form at neutral and basic pH
(Yorke and Froc, 2000). Most FQs are highly soluble in both acidic and alkaline aqueous
solutions. Water solubility at physiological pH varies widely across these compounds,
depending on the substitutions on the FQs or quinolones’ carboxylic acid nucleus. Salt
forms of the FQs are freely soluble and are generally stable in aqueous solution (Brown,
1996).

7
2.1.3. Generations of Quinolones
The quinolones are divided and grouped based on features such as antibacterial spectrum
(either narrow or broad spectrum activity), fluorinated compounds (is known as
fluoroquinolones; FQs), the methods employed (to synthesise and develop new
generation), patent dates, specific decade (i.e. 60s, 70s, 80s etc.) and the structural
modification (to enhance biological and pharmacological activities) (Blondeau, 2004).
However, there is no standard used to determine which drugs belong to which generation.
Generally, the first generation drugs exhibit narrower spectrum activity than the later ones.
Nowadays, the first generation drug is rarely used due to severe toxicity. For instance,
nalidixic acid was the first quinolone drug listed as a carcinogen in 1998, including some
other generations being banned from clinical practice due to the same reason. The most
frequently prescribed drugs today are moxifloxacin, ciprofloxacin, levofloxacin and some
generic equivalents (Oliphant and Green, 2002). Table 2.1 shows FQ antibiotics have been
produced based on their generations and Table 2.2 presents FQ antibiotics used in
veterinary medicines (Oliphant and Green, 2002, Mella M et al., 2000, King et al., 2000,
Beneš, 2005, Ball, 2000).
Table 2.1 Generations of FQs
Generation Drugs Status
First generation Cinoxacin (Cinobac®)
Flumequine (Flubactin®)
Nalidixic acid (NegGam®, Wintomylon®)
Oxolinic acid (Uroxin®)
Piromidic acid (Panacid®)
Pipemidic acid (Dolcol®)
Rosoxacin (Eradacil®)
Removed from clinical use
Carcinogenic
Carcinogenic
Unavailable
Unavailable
Unavailable
Restricted use
Second generation Ciprofloxacin (Ciprobay®, Cipro®)
Enoxacin (Enroxil®, Penetrex®)
Fleroxacin (Megalone®, Roquinol®)
Lomefloxacin (Maxaquin®)
Nadifloxacin (Acuatim®, Nadoxin®)
Available
Removed from clinical use
Removed from clinical use
Discontinued
Unavailable
8
Norfloxacin (Lexinor®, Noroxin®)
Ofloxacin (Floxin®, Oxaldin®)
Pefloxacin (Peflacine®)
Rufloxacin (Uroflox®)
Restricted use
Discontinued
Unavailable
Unavailable
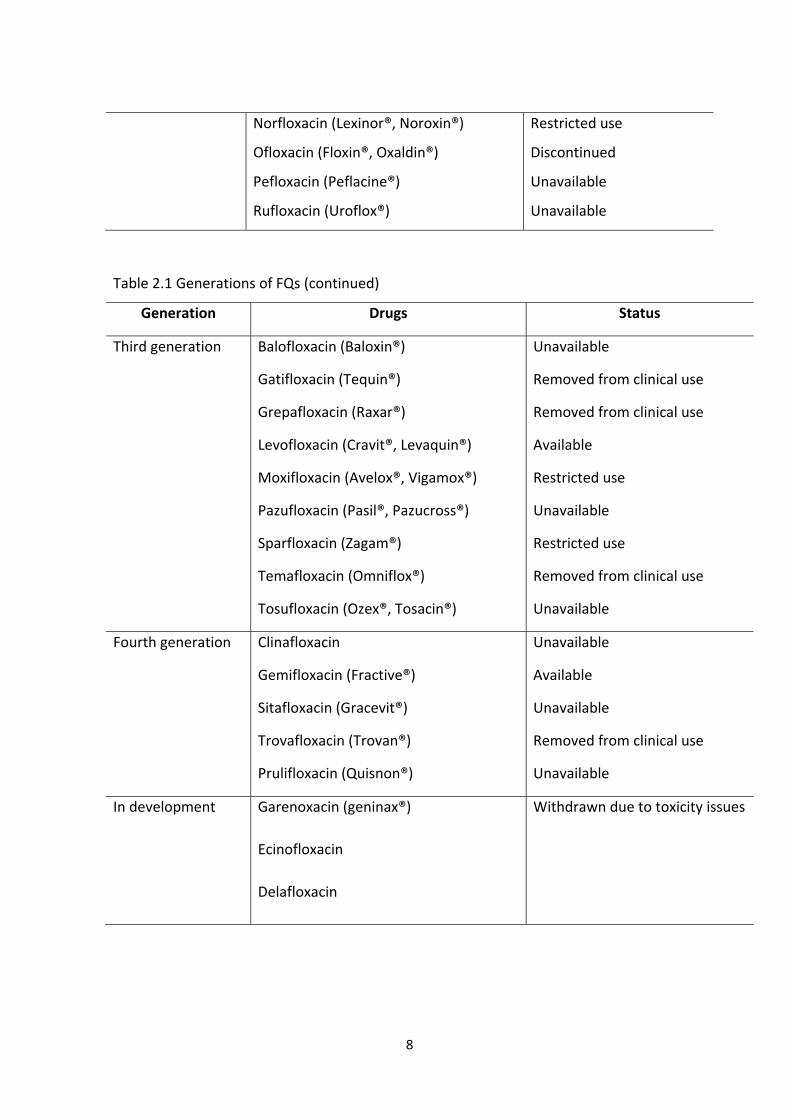
Table 2.1 Generations of FQs (continued)
Generation Drugs Status
Third generation Balofloxacin (Baloxin®)
Gatifloxacin (Tequin®)
Grepafloxacin (Raxar®)
Levofloxacin (Cravit®, Levaquin®)
Moxifloxacin (Avelox®, Vigamox®)
Pazufloxacin (Pasil®, Pazucross®)
Sparfloxacin (Zagam®)
Temafloxacin (Omniflox®)
Tosufloxacin (Ozex®, Tosacin®)
Unavailable
Removed from clinical use
Removed from clinical use
Available
Restricted use
Unavailable
Restricted use
Removed from clinical use
Unavailable
Fourth generation Clinafloxacin
Gemifloxacin (Fractive®)
Sitafloxacin (Gracevit®)
Trovafloxacin (Trovan®)
Prulifloxacin (Quisnon®)
Unavailable
Available
Unavailable
Removed from clinical use
Unavailable
In development Garenoxacin (geninax®)
Ecinofloxacin
Delafloxacin
Withdrawn due to toxicity issues
9
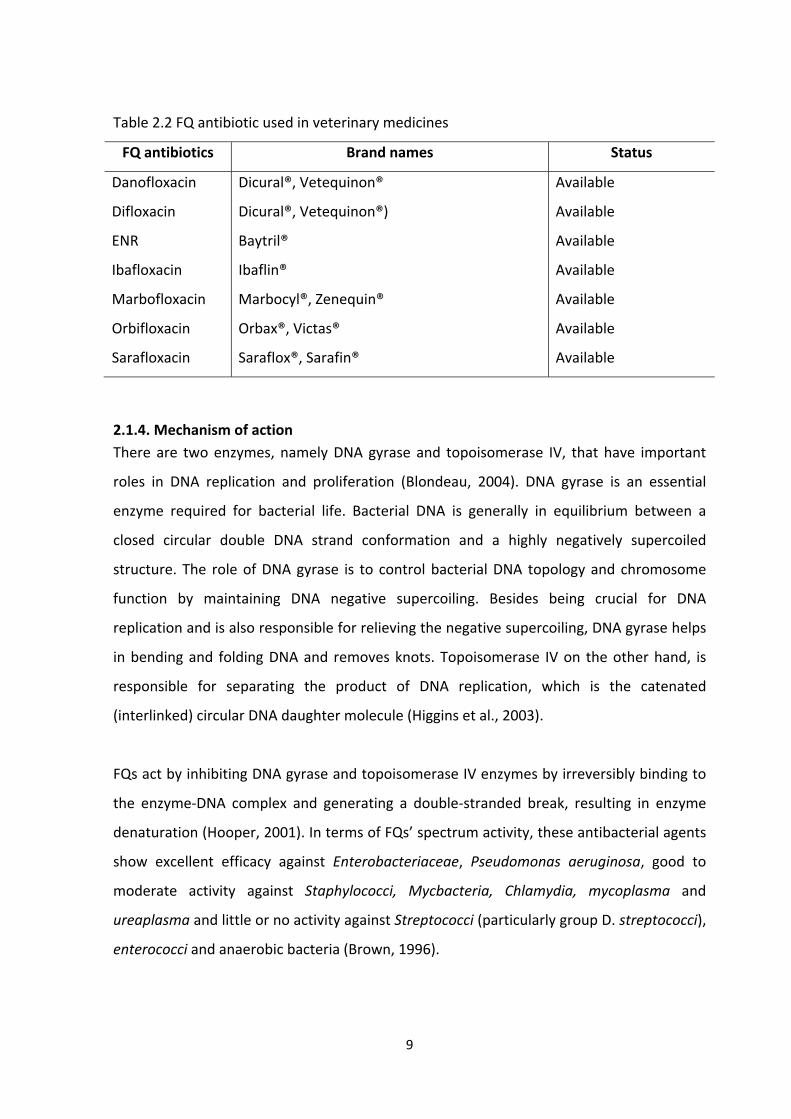
Table 2.2 FQ antibiotic used in veterinary medicines
FQ antibiotics Brand names Status
Danofloxacin
Difloxacin
ENR
Ibafloxacin
Marbofloxacin
Orbifloxacin
Sarafloxacin
Dicural®, Vetequinon®
Dicural®, Vetequinon®)
Baytril®
Ibaflin®
Marbocyl®, Zenequin®
Orbax®, Victas®
Saraflox®, Sarafin®
Available
Available
Available
Available
Available
Available
Available
2.1.4. Mechanism of action
There are two enzymes, namely DNA gyrase and topoisomerase IV, that have important
roles in DNA replication and proliferation (Blondeau, 2004). DNA gyrase is an essential
enzyme required for bacterial life. Bacterial DNA is generally in equilibrium between a
closed circular double DNA strand conformation and a highly negatively supercoiled
structure. The role of DNA gyrase is to control bacterial DNA topology and chromosome
function by maintaining DNA negative supercoiling. Besides being crucial for DNA
replication and is also responsible for relieving the negative supercoiling, DNA gyrase helps
in bending and folding DNA and removes knots. Topoisomerase IV on the other hand, is
responsible for separating the product of DNA replication, which is the catenated
(interlinked) circular DNA daughter molecule (Higgins et al., 2003).
FQs act by inhibiting DNA gyrase and topoisomerase IV enzymes by irreversibly binding to
the enzyme‐DNA complex and generating a double‐stranded break, resulting in enzyme
denaturation (Hooper, 2001). In terms of FQs’ spectrum activity, these antibacterial agents
show excellent efficacy against Enterobacteriaceae, Pseudomonas aeruginosa, good to
moderate activity against Staphylococci, Mycbacteria, Chlamydia, mycoplasma and
ureaplasma and little or no activity against Streptococci (particularly group D. streptococci),
enterococci and anaerobic bacteria (Brown, 1996).

10
2.1.5. Structure activity relationships of fluoroquinolones
Structure activity relationships (SARs) of FQ antibiotics have been studied intensively to
enhance the efficacy and broaden the antibacterial spectrum activity. An alkyl group at
position 1 (R1) helps in antimicrobial activity. Optimization of the alkyl substitution in the
quinolone structure (i.e. ethyl group in norfloxacin and cyclopropyl group of ciprofloxacin)
has improved antibacterial activity in terms of sensitivity and minimum inhibitor
concentration (MIC) against bacteria. A fluorine atom at position 6 has been shown to
improve the efficacy against Gram negative bacteria and broadens the spectrum activity
against Gram positive bacteria. A basic nitrogen‐containing moiety enhances tissue
penetration and minimises central nervous system toxicity. Furthermore, alteration of
pharmacokinetics of compounds could be done by modifying substitution groups at
positions 2, 5 and 7 of the basic structure (Brown, 1996, Wagman and Wentland, 2007).
2.1.6. Clinical use in animal and human
FQs are synthetic antibacterial agents that are broadly employed for human and veterinary
administration against a variety of bacterial infections (Brown, 1996). There are about 50
FQs used in veterinary and human medicine worldwide. In veterinary medicine, amifloxacin,
ciprofloxacin, danofloxacin, ENR, gatifloxacin, marbofloxacin, norfloxacin are used. The
major FQs used in human medicine include ciprofloxacin, enoxacin, ofloxacin, sparfloxacin,
temafloxacin and tosufloxacin (Brown, 1996). FQs have general pharmacokinetic
characteristics such as good oral absorption (Hooper and Wolfson, 1991), well absorbed
from parenteral injection sites (Gyrd‐Hansen and Nielsen, 1994) and readily distributed to
various tissues in the body (Brown, 1996). The older and modern FQs available in the
market are used in both human and animal medicines, as presented in Tables 2.3 and 2.4.

11
Table 2.3 Older FQs marketed for both human and veterinary uses
Generic name Brand name First introduced Company
Norfloxacin Noroxin 1983 Kyorin/Merck
Pefloxacin Peflacine 1985 Roger Bellon
Ofloxacin Floxin 1985 Daiichi/Ortho
Ciprofloxacin Cipro 1986 Bayer
Enoxacin Penetrex 1986 Dainippon/RPR
Lomafloxacin Maxaquin 1989 Hokuriku/Unimed
Tosufloxacin Tosuxacin 1990 Abbott/Toyama
Temafloxacin* Omniflox 1992 Abbott
Fleroxacin Quinodic 1992 Roche
Nadifloxacin Acutim 1992 Otsuka
Rufloxacin Qari 1992 Mediolanum
*withdrawn from market
Table 2.4 Modern fluoroquinolones marketed for both human and veterinary uses
Generic name Brand name First introduced Company
Levofloxacin Levaquin 1993 Daiichi/Ortho
Sparfloxacin Zagam 1993 Dainippon/RPR
Grepafloxacin Raxar 1997 Otsuka/GW
Trovafloxacin Trovan 1997 Pfizer
Gatifloxacin Tequin 1999 Kyorin/BMS
Moxifloxacin Avelox 1999 Bayer
Gemifloxacin Factive 2003 GeneSoft/LG Life Science
FQs have better potency and activity against most Enterobacteriaceae, fastidious Gram‐
negative species such Haemophillus, including Gram negative cocci, such as Neisseria
gonorrhoeae, Neisseria meningitides, Moraxellacatarrhalis. Ciprofloxacin is the most active
of the available FQs, and inhibits 90% of Enterobacteriaceae at concentrations that are <0.5
12
µg mL‐1. Among all FQs agents, nalidixic acid has the highest minimum inhibition
concentration (MICs) value against these organisms (Hooper and Wolfson, 1991).
In human beings, FQs are highly effective against the majority of bacteria responsible for
urinary tract infection with cure rates of between 90 to 100% in general, with treatment
periods between 7 and 10 days. Norfloxacin, enoxacin and ciprofloxacin can reduce the
symptoms of traveler’s diarrhea in gastrointestinal infections caused by organisms such as
Salmonella, Shigella and phatogenic E. coli and Vibrio species, with a typical treatment
duration being approximately 24 to 90 hours. Ciprofloxacin and ofloxacin have also been
proven to cure skin and soft tissue infections such as cellulitis, superficial wounds and
ischemic ulcers. With regard to lower respiratory tract infections, in which Haemophilus
influenza is the primary pathogen, FQs are better than ampicillin and are comparable or
superior to amoxicillin (Neu, 1992).
For therapeutic uses in animals, only ENR and sarafloxacin are approved in the US; in other
countries such as Indonesia, ENR, norfloxacin and ciprofloxacin are also permitted for use.
ENR is used for complicated and uncomplicated urinary tract infection in dogs with doses
up to 11 mg/kg every 12 hours. ENR is also effective for acute salmonella infections in
calves, colibacillosis in swine, colibacillosis and mycobacterial disease in poultry. Other FQs
such as danofloxacin, has been effective against bovine respiratory disease and
myoplasmosis in poultry (Jordan et al., 1993). Table 2.4 describes the dosages of different
FQs antibiotics for animal medication (Brown, 1996).
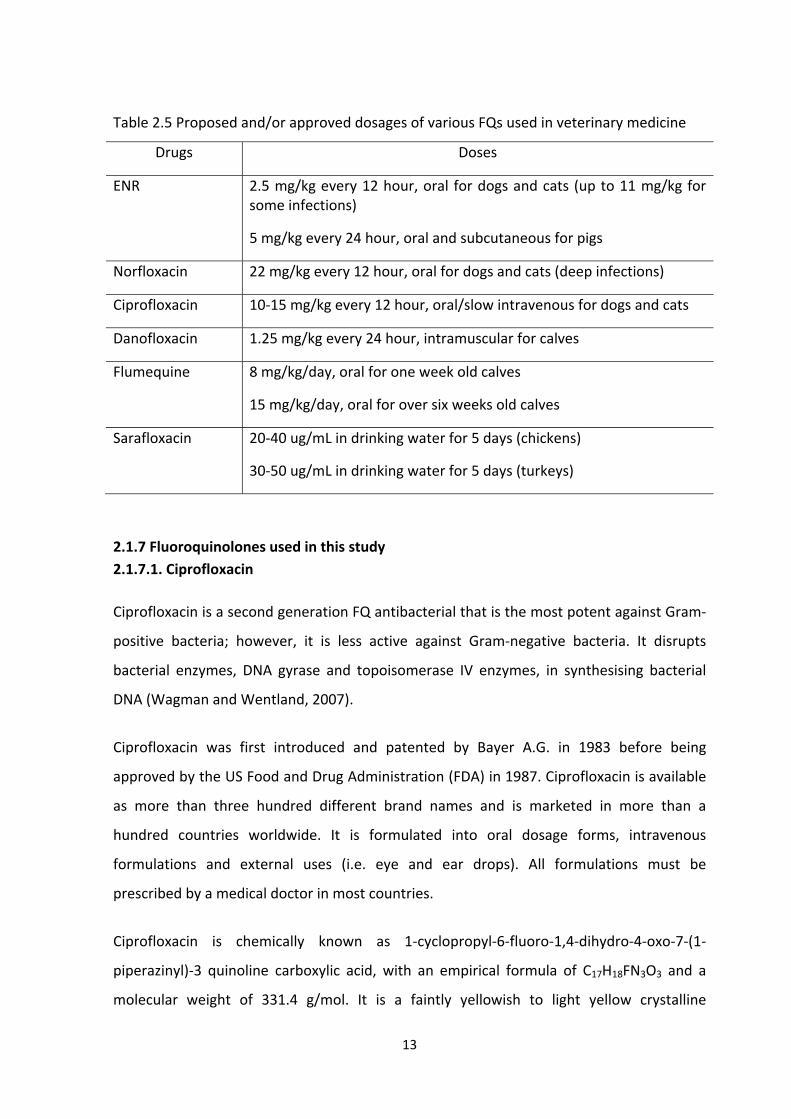
13
Table 2.5 Proposed and/or approved dosages of various FQs used in veterinary medicine
Drugs Doses
ENR 2.5 mg/kg every 12 hour, oral for dogs and cats (up to 11 mg/kg for some infections)
5 mg/kg every 24 hour, oral and subcutaneous for pigs
Norfloxacin 22 mg/kg every 12 hour, oral for dogs and cats (deep infections)
Ciprofloxacin 10‐15 mg/kg every 12 hour, oral/slow intravenous for dogs and cats
Danofloxacin 1.25 mg/kg every 24 hour, intramuscular for calves
Flumequine 8 mg/kg/day, oral for one week old calves
15 mg/kg/day, oral for over six weeks old calves
Sarafloxacin 20‐40 ug/mL in drinking water for 5 days (chickens)
30‐50 ug/mL in drinking water for 5 days (turkeys)
2.1.7 Fluoroquinolones used in this study
2.1.7.1. Ciprofloxacin
Ciprofloxacin is a second generation FQ antibacterial that is the most potent against Gram‐
positive bacteria; however, it is less active against Gram‐negative bacteria. It disrupts
bacterial enzymes, DNA gyrase and topoisomerase IV enzymes, in synthesising bacterial
DNA (Wagman and Wentland, 2007).
Ciprofloxacin was first introduced and patented by Bayer A.G. in 1983 before being
approved by the US Food and Drug Administration (FDA) in 1987. Ciprofloxacin is available
as more than three hundred different brand names and is marketed in more than a
hundred countries worldwide. It is formulated into oral dosage forms, intravenous
formulations and external uses (i.e. eye and ear drops). All formulations must be
prescribed by a medical doctor in most countries.
Ciprofloxacin is chemically known as 1‐cyclopropyl‐6‐fluoro‐1,4‐dihydro‐4‐oxo‐7‐(1‐
piperazinyl)‐3 quinoline carboxylic acid, with an empirical formula of C17H18FN3O3 and a
molecular weight of 331.4 g/mol. It is a faintly yellowish to light yellow crystalline

14
substance. Ciprofloxacin hydrochloride (as listed in The U.S. of Pharmacopeia USP, 2007)
exists as the monohydrochloride monohydrate salt of ciprofloxacin. It is a faintly yellowish
to light yellow crystalline substance with a molecular weight of 385.8 g/mol and an
empirical formula of C17H18FN3O3HCl.H2O (Figure 2.3) (Kuijper et al., 2007).
Figure 2.3 Chemical structure of ciprofloxacin.
2.1.7.2. Enrofloxacin
ENR is a synthetic antibacterial agent from the carboxylic acid family of FQs. It has
antibacterial activity against a broad spectrum of Gram‐negative and Gram‐positive
bacteria and is active in both stationary and growth phases of bacterial replication. Its
mechanism of action is not thoroughly understood, however, it is believed to act by
inhibiting bacterial DNA gyrase, thereby preventing DNA supercoiling and DNA synthesis.
The bactericidal activity of ENR occurs within 20‐30 min of exposure.
ENR is chemically known as 3‐quinolinecarboxylic acid, 1‐cycloprpyl‐7‐(4‐ethyl‐1‐
piperazinyl)‐6‐fluoro‐1,4‐dihydro‐4‐oxo, with an empirical formula C9H22FN3O3 of and a
molecular weight of 359.4 g/mol, as shown in Figure 2.4. It is white or slightly yellow
needle‐like crystalline powder, odorless and tasteless and available in hydrochloride,
lactate, and sodium salts. ENR is very soluble in acid or alkaline media, soluble in dimethyl
formamide, slightly soluble in chloroform, methanol and insoluble in water (as listed in the
US of Pharmacopeia USP, 2007). ENR is sold under the trade name Baytril by Bayer
Corporation. It is approved by the U.S. FDA to treat pets and domestic animals. It could be
dissolved in water to treat flocks of poultry; however, due to FQs resistant strains of the
Campylobacter bacteria, it has been withdrawn in September 2005.

15
Figure 2.4 Chemical structure of ENR
2.1.7.3. Norfloxacin
Norfloxacin is a second generation FQs and has a similar mode of action to other FQs drugs.
Norfloxacin was developed by Kyorin Seiyaku K.K from the Japanese Society of
Chemotherapy and patented in 1979. Kyorin later granted Merck and Company, Inc., an
exclusive license in Japan on September 4th 1980. It was then imported in certain countries
including European countries and the U.S. and distributed under the brand name of
Noroxin. Noroxin was approved by the U.S. Food and Drug Administration on October 31,
1986.
Norfloxacin was the first quinolone antibacterial agent with a fluorine atom substituted at
the C‐6 position and a piperazine at C‐7. This substitution enhanced antibacterial activity
compared to the previous quinolone (nalidixic acid) (Carlucci, 1998). Norfloxacin is a 1‐
ethyl‐6‐fluoro‐1,4‐dihydro‐4‐oxo‐7‐(1‐piperazinyl)‐3quinoline carboxylic acid with an
empirical formula of C16H18FN3O3, as shown in Figure 2.5. It is a white to pale yellow
crystalline powder with a molecular weight of 319.34 g/mol and a melting point of about
221°C. It is freely soluble in glacial acetic acid, and very sparingly soluble in ethanol,
methanol and water (as listed in The U.S. of Pharmacopeia, 2007).
Figure 2.5 Chemical structure of norfloxacin.

16
2.1.8. Pharmacokinetics and toxicity
All of the FQs are absorbed through the gastrointestinal tract. The degree of absorption
however, remains variable, from a low absorption rate of 55% for norfloxacin to 95% for
ofloxacin, lomefloxacin, temafloxacin, and pefloxacin. Peak serum concentrations are
achieved 1‐4h after the drug is ingested before a meal, while it reaches maximal peak
serum concentration approximately 2h after a meal. Elderly or patients with poor renal
function will absorb the drug slowly, resulting in delaying peak serum concentration.
Peak serum level after ingestion of 400 mg of norfloxacin and pefloxacin are 1.5 µg mL‐1, 4
µg mL‐1, and 3 µg mL‐1after enoxacin. A 500 mg dose of ciprofloxacin induces a blood level
of approximately 2.5 µg mL‐1 and from 3.5 to 4 µg mL‐1for the 750 mg dose. The half‐lives
of FQs are as follows: norfloxacin 3‐4 h, ciprofloxacin 4 h, ofloxacin 6‐7 h, enoxacin 6 h,
pefloxacin 10 h, lomefloxacin 8 h, temafloxacin 8 h, fleroxacin 8‐10 h, and sparfloxacin 18 h
(Neu, 1992).
Following intravenous administration of FQs such ciprofloxacin, ofloxacin, enoxacin,
fleroxacin, lomefloxacin and pefloxacin, there are no differences in the pharmacokinetics
profile when compare to oral administration. Also, half‐lives of elimination, volume of
distribution, extra renal elimination, and metabolism are the same with oral administration.
FQs, once absorbed into a body, are widely distributed within body tissues and fluids, and
reach high concentrations in many tissues. Interstitial fluid concentrations range from 50 to
100% of the peak serum concentration in the first a few hours, and then it exceeds serum
concentrations. There are different clearance pathways for FQs. Renal mechanism is
important for pefloxacin and lomefloxacin, whereas, hepatic mechanism is important for
pefloxacin. Both renal and hepatic mechanisms are utilised by norfloxacin, ciprofloxacin,
enoxacin, tosufloxacin and sparfloxacin (Neu, 1992).
2.1.7. Adverse effects and drug interactions
FQs are generally well tolerated and the adverse effects are fairly similar among various
quinolone‐based agents. Generally, the overall percentage of adverse reaction occurs in
human is 2 to 4% (Neu, 1992). The most common adverse effect associated with FQs in
human are gastrointestinal (GI) effects such as nausea, vomiting and diarrhea (about 1 to
5%), skin disorder (<2.5%) and central nervous system (CNS) effects, including headaches
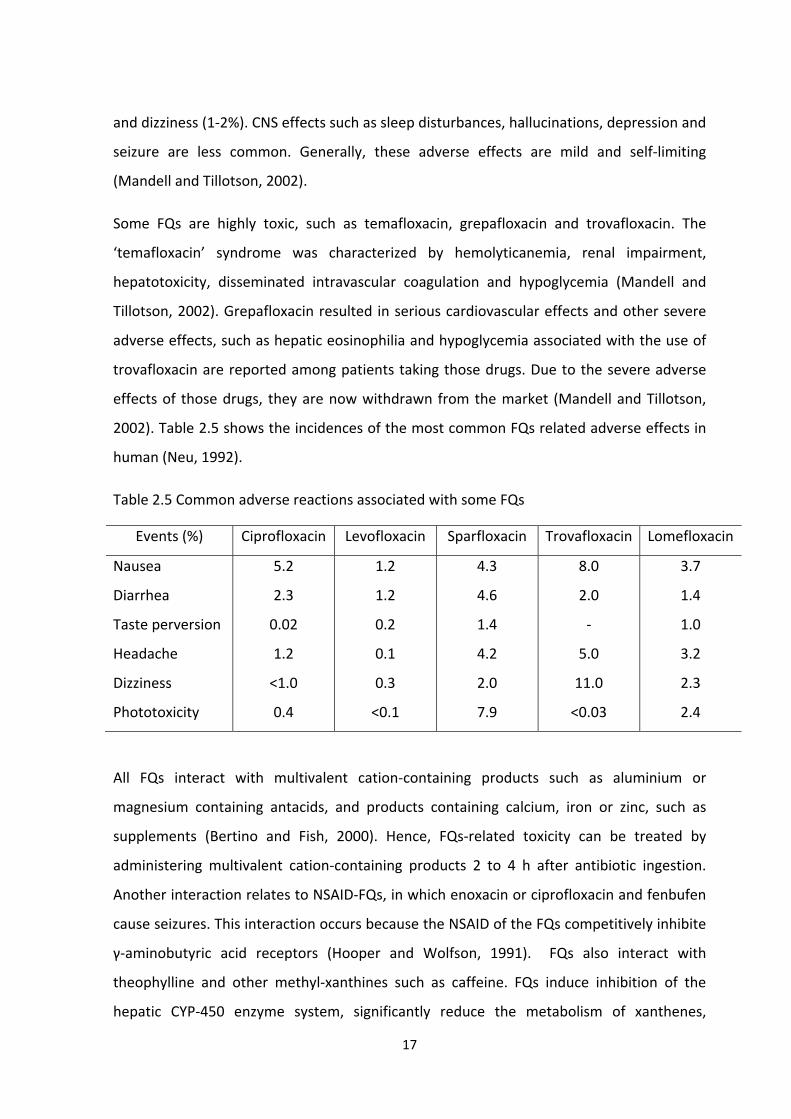
17
and dizziness (1‐2%). CNS effects such as sleep disturbances, hallucinations, depression and
seizure are less common. Generally, these adverse effects are mild and self‐limiting
(Mandell and Tillotson, 2002).
Some FQs are highly toxic, such as temafloxacin, grepafloxacin and trovafloxacin. The
‘temafloxacin’ syndrome was characterized by hemolyticanemia, renal impairment,
hepatotoxicity, disseminated intravascular coagulation and hypoglycemia (Mandell and
Tillotson, 2002). Grepafloxacin resulted in serious cardiovascular effects and other severe
adverse effects, such as hepatic eosinophilia and hypoglycemia associated with the use of
trovafloxacin are reported among patients taking those drugs. Due to the severe adverse
effects of those drugs, they are now withdrawn from the market (Mandell and Tillotson,
2002). Table 2.5 shows the incidences of the most common FQs related adverse effects in
human (Neu, 1992).
Table 2.5 Common adverse reactions associated with some FQs
Events (%) Ciprofloxacin Levofloxacin Sparfloxacin Trovafloxacin Lomefloxacin
Nausea
Diarrhea
Taste perversion
Headache
Dizziness
Phototoxicity
5.2
2.3
0.02
1.2
<1.0
0.4
1.2
1.2
0.2
0.1
0.3
<0.1
4.3
4.6
1.4
4.2
2.0
7.9
8.0
2.0
‐
5.0
11.0
<0.03
3.7
1.4
1.0
3.2
2.3
2.4
All FQs interact with multivalent cation‐containing products such as aluminium or
magnesium containing antacids, and products containing calcium, iron or zinc, such as
supplements (Bertino and Fish, 2000). Hence, FQs‐related toxicity can be treated by
administering multivalent cation‐containing products 2 to 4 h after antibiotic ingestion.
Another interaction relates to NSAID‐FQs, in which enoxacin or ciprofloxacin and fenbufen
cause seizures. This interaction occurs because the NSAID of the FQs competitively inhibite
γ‐aminobutyric acid receptors (Hooper and Wolfson, 1991). FQs also interact with
theophylline and other methyl‐xanthines such as caffeine. FQs induce inhibition of the
hepatic CYP‐450 enzyme system, significantly reduce the metabolism of xanthenes,

18
resulting in increasing elimination half‐lives of theophylline and caffeine (Bertino and Fish,
2000, Brown, 1996). This increases the toxicity of xanthenes, especially for patients or
elderly population with renal and hepatic impairment (Wagman and Wentland, 2007).
Moreover, ciprofloxacin can result in nephrotoxicity when it is administered with
cyclosporine (Bertino and Fish, 2000).
2.2. Public health concerns
Many zoonotic foodborne pathogens such as Salmonella, Campylobacter, shiga toxin‐
producing E. coli, Listeria and Yersinia are generally transferred from food animals to
humans (Tollefson and Karp, 2004). FQ antibiotics are currently administered in feed to
treat, prevent, and control infectious diseases and to enhance feed efficiency and
productivity. The use of antibiotics in food‐producing animals could represent a serious
public health concern because it promotes the selection and dissemination of antibiotic
resistant bacteria to humans. The spread of resistant pathogens from food animals to
humans has serious implication to human health, in particular for the treatment of
infection. Many antimicrobial agents including FQs administered to food animals are either
identical or chemically related drugs used in human medicine such as penicillin,
tetracycline and cephalosporins. Once a resistant pathogen occurs, there is a possibility
that genes will encode resistance not just to a particular antibiotic, but to an entire class of
antimicrobials or may cause cross‐resistance to structurally related compounds. This
problem may lead to limitations in treatment choice, resulting in long term medical
complications and high costs, and even treatment failure (Angulo et al., 2000).
The evidence of public health consequences of the use of FQs in food animals has been
documented. Wegener, in 2009, reported that 10 % of 459 Danish patients with
Campylobacter jejuni infections were untreatable with FQs. Study conducted in Minnesota,
US, showed that patients who were infected with resistant C. jejuni and treated with FQs
were found to have a longer duration of diarrhea that lasted almost 3 days. Three extra
days of diarrhea indicated a mild complication of treatment. More importantly,
Campylobacter infections can be serious in vulnerable patients with underlying health
problems. For immune‐compromised patients who have invasive Campylobacter
infections, treatment failure could be fatal (Nelson et al., 2007).
19
2.2.1. Food safety
Veterinary medicines including antimicrobial agents have been widely used to treat
infectious diseases as well as to improve the health of livestock. A variety of drugs such as
antibiotics and feed additives are also being given to animals to artificially enhance weight
gain, improve feed efficiency and productivity. Over the last decade, antibiotic growth
promoters have been intensively administered in animal farming worldwide. In the U.S., for
instance, approximately 80% of the poultry, 75% of the swine, 60% of the beef cattle, and
75% of the dairy calves receive antibiotics at some time in their life.
In terms of human safety, use of FQs in food‐producing animals could lead to presence of
FQs residues in animal derived products. Gips et al., 1994, reported that after
administration of 10 mg norfloxacin/kg body weight at an intramuscular dose to calves,
norfloxacin residue was found in the liver at a concentration of 50‐100 µg kg‐1 after 72‐120
h. Moreover, administering ENR intramuscularly at a dose of 8 mg kg‐1 daily for 4 days led
to both parent drug and oxometabolite persisting in kidney and liver for 12 days at a
concentration of 0.015 µg g‐1 (Anadon et al., 1995).
2.2.2. Maximum residue limits (MRLs)
To protect consumers against unacceptably high residues and to ensure the chemical
safety of food commodities, MRLs must be set by regulatory authorities at national and
international levels. Over the last three decades, two joint FAO/WHO committees have
evaluated a large number of food chemicals, food additives, contaminants, veterinary drug
and pesticide residues. A residue is defined as drug and/or its metabolites still present in
edible tissue of the treated animal at the time of slaughter or that have been passed to
other edible products such as milk and eggs (Heidjen et al., 1999). MRLs are regulatory
tools to specify the maximum amount of a residue of the active ingredients of a particular
veterinary drug that is acceptable in a particular food commodity (Heidjen et al., 1999).
Residue studies provide information about presence and persistence of veterinary drug
residues in edible tissues of the target organs such as muscle tissue, fat, liver and kidney.
Important information reported in residue studies is the method of drug administration (i.e.
in feed or drinking water, per injection or other routes) and the duration of drug

20
administration that should be identical with the intended route of administration and
period of treatment (Heidjen et al., 1999).
With regard to FQ antibiotic residues in animal‐derived food products which might affect
public health, some authorities have established maximum residue limits (MRLs). For
example, the maximum residue limit for ENR in the European Union (EU) is 30 µg kg‐1 for
kidney, liver and muscle in swine, cattle and poultry, which is calculated by summing the
residues of ENR and its major active metabolite, ciprofloxacin (Brown, 1996). In 1998,
European Agency for the Evaluation of Medicinal Products has made a recommendationon
MRL for ENR of 200 µg kg‐1 in ovine kidney and 100 µg kg‐1 in bovine milk (Bucknall et al.,
2003). The MRL values established by the European Union (EU) and the joint FAO/WHO
Expert Committee on Food Additives (JECFA) for FQs and quinolones of veterinary use are
presented in Table 2.6 (Hernandez‐Arteseros et al., 2002).
Table 2.7 MRL values established by the EU and JECFA for residues of FQs and quinolones
used in veterinary medicine(Hernandez‐Arteseros et al., 2002)
Fluoroquinolones Animal species Target tissues MRLs (EU)
(µg kg‐1)
MRLs (JEFCA)
(µg kg‐1)
Danofloxacin Bovine, chicken
Porcine
Muscle
Fat
Liver, Kidney
Milk
Muscle
Skin, fat
Fat
Liver
Kidney
200
100
400
30
100
50
‐
200
200
200
100
400
‐
100
‐
100
50
200
Difloxacin Bovine, porcine
Chicken, turkey
Muscle
Fat, skin, fat
Liver
Kidney
Muscle
400
100
1400
800
300
‐
‐
‐
‐
‐
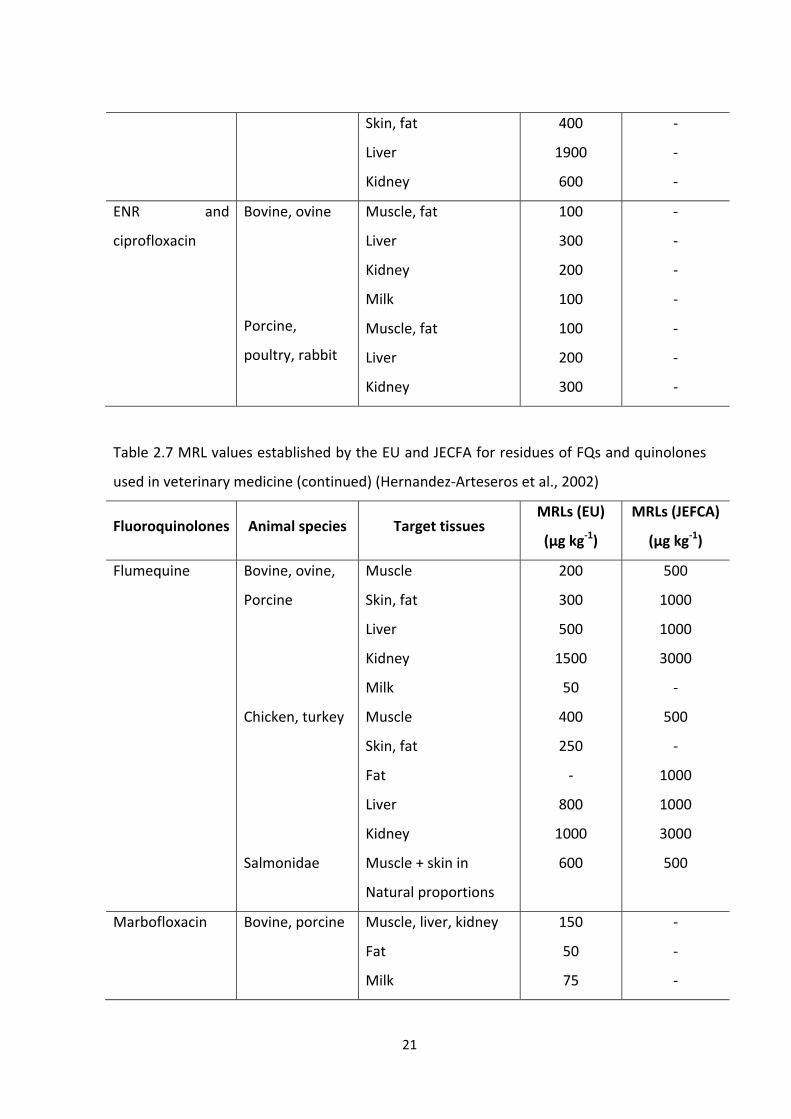
21
Skin, fat
Liver
Kidney
400
1900
600
‐
‐
‐
ENR and
ciprofloxacin
Bovine, ovine
Porcine,
poultry, rabbit
Muscle, fat
Liver
Kidney
Milk
Muscle, fat
Liver
Kidney
100
300
200
100
100
200
300
‐
‐
‐
‐
‐
‐
‐
Table 2.7 MRL values established by the EU and JECFA for residues of FQs and quinolones
used in veterinary medicine (continued) (Hernandez‐Arteseros et al., 2002)
Fluoroquinolones Animal species Target tissues MRLs (EU)
(µg kg‐1)
MRLs (JEFCA)
(µg kg‐1)
Flumequine Bovine, ovine,
Porcine
Chicken, turkey
Salmonidae
Muscle
Skin, fat
Liver
Kidney
Milk
Muscle
Skin, fat
Fat
Liver
Kidney
Muscle + skin in
Natural proportions
200
300
500
1500
50
400
250
‐
800
1000
600
500
1000
1000
3000
‐
500
‐
1000
1000
3000
500
Marbofloxacin Bovine, porcine Muscle, liver, kidney
Fat
Milk
150
50
75
‐
‐
‐
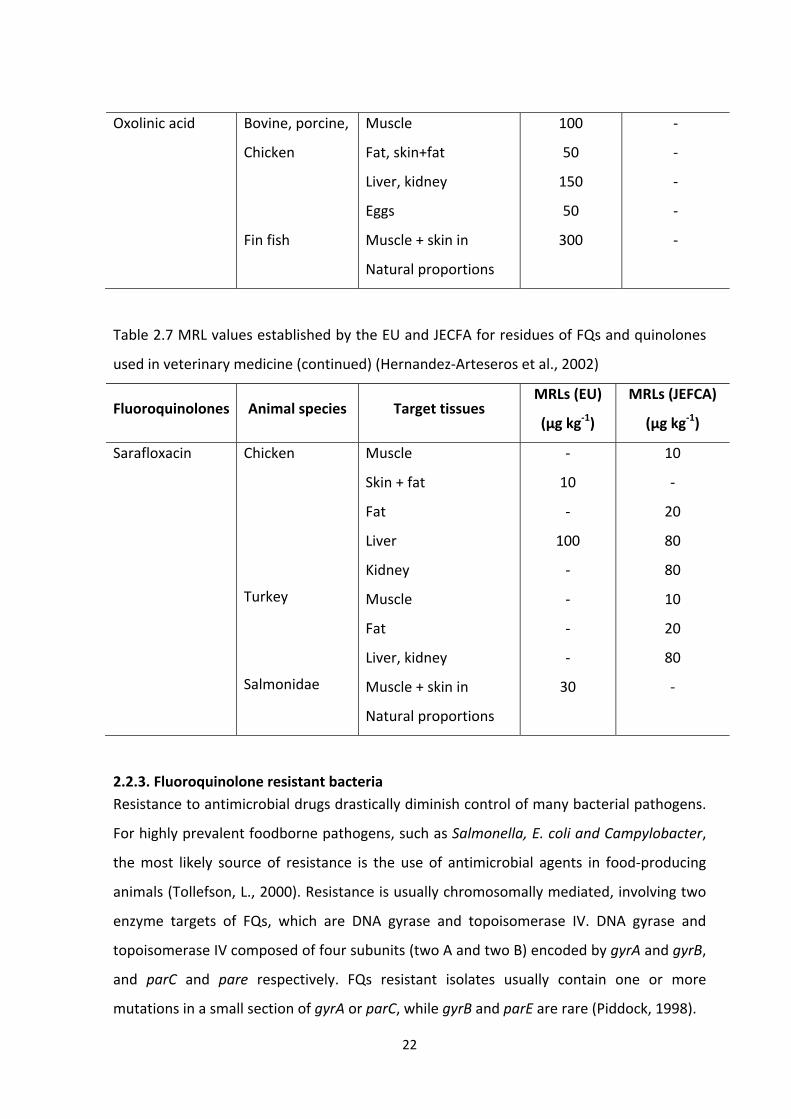
22
Oxolinic acid Bovine, porcine,
Chicken
Fin fish
Muscle
Fat, skin+fat
Liver, kidney
Eggs
Muscle + skin in
Natural proportions
100
50
150
50
300
‐
‐
‐
‐
‐
Table 2.7 MRL values established by the EU and JECFA for residues of FQs and quinolones
used in veterinary medicine (continued) (Hernandez‐Arteseros et al., 2002)
Fluoroquinolones Animal species Target tissues MRLs (EU)
(µg kg‐1)
MRLs (JEFCA)
(µg kg‐1)
Sarafloxacin Chicken
Turkey
Salmonidae
Muscle
Skin + fat
Fat
Liver
Kidney
Muscle
Fat
Liver, kidney
Muscle + skin in
Natural proportions
‐
10
‐
100
‐
‐
‐
‐
30
10
‐
20
80
80
10
20
80
‐
2.2.3. Fluoroquinolone resistant bacteria
Resistance to antimicrobial drugs drastically diminish control of many bacterial pathogens.
For highly prevalent foodborne pathogens, such as Salmonella, E. coli and Campylobacter,
the most likely source of resistance is the use of antimicrobial agents in food‐producing
animals (Tollefson, L., 2000). Resistance is usually chromosomally mediated, involving two
enzyme targets of FQs, which are DNA gyrase and topoisomerase IV. DNA gyrase and
topoisomerase IV composed of four subunits (two A and two B) encoded by gyrA and gyrB,
and parC and pare respectively. FQs resistant isolates usually contain one or more
mutations in a small section of gyrA or parC, while gyrB and parE are rare (Piddock, 1998).

23
Bacterial resistance to FQs can also be triggered by a non‐specific mechanism, known as
up‐regulation of drug efflux pumps, and alteration in bacterial membrane that reduces the
drug’s permeation into the cell(Hooper and Wolfson, 1991). Efflux pumps are a primary
mechanism of resistance in Gram negative species such P. aeruginosa in resulting at least
one of the multiple efflux pumps. In contrast, the efflux pumps in Grampositive species
such as P. pneumoniae seems to be limited.
More recently, increased incidence of antibiotic resistance has been reported for
P.aeruginosa, Serratia marcescens and Staphylococci in chronic infections or chronic
bacterial exposure (e.g. inner venous catheter or urinary catheter). FQs resistance to other
antimicrobial agents also may occur, for instance, cross resistance with β‐lactam antibiotics,
aminoglycosides, tetracyclines, macrolide and polypeptide antibiotics, sulfonamides and
diaminopyrimidines (Hooper and Wolfson, 1991).
2.3 Analytical methods for detecting of fluoroquinolones antibiotic residues
There are two main analytical methods to identify and quantify contaminant in foods,
namely instrumental and bioanalytical methods. Instrumental methods include high
performance liquid chromatography (HPLC) with UV/fluorescence detectors (Hung, 2007,
Carlucci, 1998, Espinosa‐Mansilla et al., 2006, Gigosos et al., 2000, Hassonuan et al., 2007a,
Hassonuan et al., 2007b, Holtzapple et al., 2000, Yorke and Froc, 2000, Zheng et al., 2005,
Holtzapple et al., 2001, Holtzapple and Stanker, 1998, Pena et al., 2010, Shim et al., 2003,
Cinquina et al., 2003, Idowu and Peggins, 2004), liquid chromatography mass spectrometry
(LC‐MS) (Marchesini et al., 2007), liquid chromatography tandem mass spectrometry (LC‐
MS/MS) (Bogialli et al., 2008, Ikegawa, 1998, Johnston et al., 2002, Toussaint et al., 2005a,
Toussaint et al., 2005b, Van Vyncht et al., 2002, Dufresne et al., 2007, Volmer et al., 1997),
capillary electrophoresis (Fierens et al., 2000) gas chromatography (GC) (Takatsuki, 1991)
and thin layer chromatography (TLC) and high performance thin layer chromatography
(HPTLC) (Choma et al., 1999, Choma et al., 2004, Choma et al., 2002, Gaugin and Abjean,
1998, Simonovska et al., 1999). Example of bioanalytical techniques is
immunochromatography (Sun et al., 2007, Zhu et al., 2008, Watanabe H. et al., 2002), and
immunosensors(Cao et al., 2007, Giroud et al., 2009, Marchesini et al., 2007, Haasnoot et
al., 2007, Huet et al., 2008, Tsekenis G. et al., 2008). Another immunochemically based

24
method is immunoassays, which rely on specific antigen and antibody interaction. Coupling
of the two methods is high performance immunoaffinity chromatography (HPIAC)
(Holtzapple and Stanker, 1998, Holtzapple et al., 1999, Holtzapple et al., 2000, Holtzapple
et al., 2001, Zhao et al., 2009).
Immunoassays are a method based on antibody‐antigen binding properties, commonly
used to determine low molecular weight contaminants, including veterinary drugs, in food.
Immunoassay plays an important role in ensuring food safety, due to the increasing
number of contaminants in food (Chen et al., 2009a, Chen et al., 2009b). Recently, many
immunoassay as screening tools have been successfully developed as alternatives or
complement to instrument‐based methods for detecting FQs contaminants in food
commodities(Wang et al., 2007a, Bucknall et al., 2003, Burkin, 2008, Li et al., 2008, Huet et
al., 2006, Kato et al., 2008, Tittlemier et al., 2008).
2.3.1. Instrument‐based methods
Instrumental techniques offer high sensitivity and selectivity analyses, and provide highly
accurate and precise results, but this method requires extensive sample preparation,
sample clean‐up which is often time‐consuming, needs large volumes of solvent or
chemical reagents. In addition, they cannot be used with high efficiency in the routine
screening of a large number of sample specimens (Kato et al., 2007), also need highly
trained and experienced individual to operate sophisticated instruments and interpret
complicated results (Beier et al., 1996), and furthermore, it can be very expensive.
2.3.1.1. High performance liquid chromatography (HPLC)
A reversed‐phase high‐performance liquid chromatography has been developed for the
detection of FQs residues in animal derived products in the last two decades. Separation is
usually performed using silica‐based reversed‐phased columns, mainly C18 or C8, but in
some cases phenyl and amides phases have been employed. Due to the residual silanol
groups and metal ions as impurities in column‐packing material, conventional reversed‐
phase columns lead to severe tailing peaks. Therefore, end capped columns or ultra purity
silica columns, such as Inertsil, Kromasil, Puresil, LUNA or Zorbax RX, which are relatively
free of trace metals to strengthen the acidic properties of silanol groups (Hernandez‐
Arteseros et al., 2002) have been encouraged. For acidic quinolone group (AQ), excitation

25
and emission wavelengths are set around 325 and 360 nm respectively, while for
piperazinyl quinolone groups, they are at 275‐280 nm and 440‐450 nm, respectively
(Hernandez‐Arteseros et al., 2002).
Fluorescence detection (FLD) is most commonly employed in HPLC since it is more sensitive
and selective than UV or diode array detection (DAD) (Shim et al., 2003, Hung, 2007, Yorke
and Froc, 2000, Idowu and Peggins, 2004). For instance the limit of detection (LOD) and the
limit of quantification (LOQ) values obtained using FLD were 0.5‐30 µg L‐1and 1µg L‐1,
respectively (Yorke and Froc, 2000, Idowu and Peggins, 2004), which were significantly
lower compared to those established by DAD i.e. 50 µg L‐1and 20 µg L‐1, respectively
(Cinquina et al., 2003). Lower LOD values using FLD were also exhibited, at 25 µg kg‐1 in
chicken tissues (Maraschiello et al., 2001), from 5 to 20 µg kg‐1 in chicken eggs (Zeng et al.,
2005), and LOQ value at 2.4 to 10 µg L‐1 in milk (Marazuela and Moreno‐Bondi, 2004).
2.3.1.2. Liquid chromatography / mass spectrometry (LC‐MS) and (LC‐MS/MS)
Liquid chromatography coupled with mass spectrometry (LC‐MS) is a technique that
merges the physical separation technique of liquid chromatography with the mass analysis
capabilities of mass spectrometry. It is a powerful tool which was developed to overcome
the limitation of HPLC (Toldra and Reig, 2006). This technique has high sensitivity and
specificity, and is used for analysis of compounds that are highly polar, thermally labile and
relatively high molecular weight (Yoon et al., 2003).
Vyncht et al., 2002 determined multi‐residues of FQs in swine kidney with limits of
detection (LOD) that was much lower than the respective residue limits (MRL) by HPLC. LC‐
MS‐MS is another powerful analytical technique that has higher sensitivity and greater
selectivity for determining FQs residues in foods. Toussaint et al., 2005 have demonstrated
the capability of LC‐MS‐MS with LOQ from 1 to 7 µg kg‐1 and LOD from 0.3 to 2.1 µg kg‐1
for11 FQs antibiotics in pig kidney, which were much lower than the MRL values (200 –
1500 µg kg‐1).
2.3.1.3. Gas Chromatography / Mass Spectrometry (GC/MS)
Since FQs are relatively polar and non‐volatile in character, volatile derivatives must be
prepared prior to GC analysis. The most common derivatisation method used is reduction
with NaBH4leading to more volatile properties. Most researchers applied a DB‐5 or

26
equivalent column for the separation with a temperature gradient from 100 to 270oC. In all
cases, detection was carried out by MS in the positive ion mode and signal monitoring is
performed in the SIM mode. GC‐MS is used as a confirmatory tool after determination by
LC‐FLD (liquid chromatography‐fluorescence detector) and also for quantification of
analytes (Hernandez et al., 2002). Takatsuki (1991) developed GC methods to analyse
nalidixic acid, oxolinic acid and piromidic acid in fish and animal edible tissues, resulting in
better sensitivity with the LOD of 1µg kg‐1.
2.3.1.4 Thin Layer Chromatography (TLC) and High Performance Thin Layer
Chromatography (HPTLC)
TLC and HPTLC have been applied successfully for the qualitative and quantitative
detection on multi‐residues in food samples even though their use have rapidly decreased
during the last decade (Toldra and Reig, 2006). These methods are based on
chromatography principle followed by visualization of the separated components bya
means of chromogenic reagent or illuminating with UV light (Toldra and Reig, 2006). Native
fluorescence, indirect fluorescence and terbium sensitized luminescence are other several
detection systems have been used (Hernandez‐Arteseros et al., 2002). The relative
intensity of the spot on the plate can be measured against the internal standard by
scanning densitometry for quantitative analysis, such as detection of clenbuterol and other
agonist drug residues in meat (Toldra and Reig, 2006). The advantages of these methods
are a high throughput, automatisation for higher productivity and that separated sample
can be recovered for further confirmation. However, they have some drawbacks, such as
require skilled and experienced personal, need sample preparation, in some cases, which
can be time consuming, and high false positives.
The above mentioned methods have been used for detecting different FQ residues such as
flumequine in milk samples (Choma et al., 2002), and ciproflaxacin, danofloxacin, ENR,
flumequine, nalidixic acid, norfloxacin and oxolinic acid in pig muscle (Juhel‐Gaugain and
Abjean, 1998) and flumequine and oxolinic acid in edible muscle tissue and fish (Vega et al.,
1995). Gaugain and Abjean (1998) determined seven FQs simultaneously in pork and the
developed method exhibited the IC50 value at 0.96µg kg‐1. Vega et al., 1995 were able to
quantify flumequine and oxolinic acid in edible muscle tissue and fish with a LOD of 0.2 µg

27
kg‐1 and 8‐9 µg kg‐1, respectively. A TLC‐bioautography consisted of a combination of TLC
and microbiological detections directly on the plate has also been developed for detecting
flumequine in milk sample, resulting in an enhanced sensitivity (Choma et al., 2002).
2.3.2. Bioanalytical or immunochemical methods
Food is a complex mixture of lipids, carbohydrates, proteins, vitamins, organic compounds,
and other naturally occurring substances (Van Emon, 2010). It sometimes get exposed to
residues of pesticides, veterinary and human drugs, microbial toxins, preservatives,
contaminants from food processing and packaging, and other residues. These
contaminants can cause difficulties in the analysis of food. Therefore, there is a need for
rapid, simple, and cost‐effective methods for contaminant analysis to secure reliable food
supply. Bioanalytical or immunochemical methods are the method of choice for many food
contaminants (Van Emon, 2010).These methods include immunoaffinity chromatography,
immunosensors, and immunoassays, and are providing important information regarding
the presence of contaminants in food that may impact human health and the environment
(Van Emon et al., 2007).
2.3.2.1. Immunoaffinity chromatography (IAC)
Immunoaffinity chromatography requires sample extraction and cleanup prior to analysis.
The resultant extracts can be coupled with immunochemical assay or instrumentation. Sol‐
gel IAC is a method where the antibodies are trapped in a ceramic SiO2 sol‐gel matrix to
bind target analytes in the samples, and samples are loaded onto a sol‐gel based
immunoaffinity purification (IAP) column. An elution step releases the analytes from the
antibody binding and the analytes are then detected using either an immunoassay or
instrumentation (Van Emon, 2010). The advantages of this technique is utilizing low levels
of organic solvent and small volumes of samples, thus effective in removing interfering
components resulting in high recovery rates with low intereference.
IAC has been applied by many researchers to detect FQ residues in food (Holtzapple et al.,
2001, Sun et al., 2007, Zhao et al., 2009, Watanabe H. et al., 2002). Zhao and coworkers
(2009) successfully developed an IAC method that is coupled to HPLC equipped with a
fluorescence detector for the isolation and purification of 10 FQs in chicken muscle. This
assay provided an analysis with a limit of detection at 0.1 µg kg‐1 for danofloxacin and 0.15
28
µg kg‐1 for other FQs tested. High recoveries from chicken liver muscle, and milk were also
obtained employing this technique, with the mean recovery values being 77 – 96 %, 72 ‐92 %
and 84 ‐ 99%, respectively (Watanabe H. et al., 2002).
2.3.2.2. Biosensors/Immunosensors
Biosensors employ a method composed of a recognition element (e.g. an antibody) and a
transducer that converts binding of an antibody with an antigen into a measureable
physical signal. Such a system is able to detect analyte continuously and selectively,
yielding a response in real time (Van Emon, 2010). Several types of immunosensors have
been used for pesticide and FQ residues detections in foods, including optical, evanescent
wave, surface‐plasmon resonance, fluorescence and electrochemical impedance
spectroscopy (Van Emon, 2010, Cao et al., 2007, Marchesini et al., 2007, Giroud et al.,
2009). This technique provides higher productivity and shorter cycle times which can
analyse multiple residues in one analytical run and up to 120 samples per hour (Toldra and
Reig, 2006). The technique also possesses extremely low detection limit at 1 x 10‐12 g mL‐1
or 3 pmol L‐1, where the signals were detected and characterised by electrochemical
impendance spectroscopy (Giroud et al., 2009). However, the number of biochip arrays
ready to use is still commercially limited. In any case, it requires high operative costs and
initial investment for equipment.
Cao and coworkers (2007) developed a DNA‐based surface plasmon resonance biosensor
for the detection of ENR residue in milk samples. This surface plasmon resonance
biosensor based‐DNA assay works where heating denatured DNA immobilised on the gold‐
coated glass surface. The immobilization was performed by a layer‐by‐layer co‐deposition
with a cationic polymer. The sensor performance was tested with real biological probes.
The detection limit delivered was 3 µg L‐1in milk. Another plasma resonance biosensor
developed for FQ residues able to generate an IC50 values between 2 and 10 µg L‐1 and %
cross‐reactivity between 30 and 100% for five FQs evaluated in chicken muscle (Marchesini
et al., 2007).
2.3.2.3. Immunoassays
Immunoassays are based on the specificity of the antibody and antigen reaction. The
technique has the ability to measure analytes at low concentrations without extensive
29
sample preparation. This method proves to be advantageous for environmental monitoring
where contaminants are typically present at very low levels and theycannot be detected
accurately by other conventional methods without investing on extensive cleanup time.
Hence, this method has been used as a complement to instrumental methods for many
years to detect a wide range of food constituents including substances responsible for
adulterations and from accidental contaminations (Toldra and Reig, 2006).
Specificity electivity is a factor dependent on the complementary nature of an antigen
surface and an antibody binding site. This governs the specificity of an immunoassay. The
affinity constant (Keq), which the ratio of bound and unbound antigen and antibody at
equilibrium as shown in Eq (1), is a measure of how well an antibody can function in an
immunoassay. For food contaminant immunoassay, Keq is typically in the order of 10‐4 to
10‐12 L/mol (Lee and Kennedy, 2007).
Ab + Ag Ab – Ag complex…..(Eq. 1)
Keq (Lmol‐1) = [Ab – Ag] / [Ab][Ag]
Ab = antibody
Ag = antigen
Keq = equilibrium constant or affinity constant
[Ab – Ag] = concentration of bound antigen
[Ab] = concentration of free antibody
[Ag] = concentration of free antigen
An immunoassay provides a fast, simple and cost‐effective method of analysis, with
sensitivity and specificity comparable to or better (in some cases) than the chemical
instrumentation method. One of the key advantages of immunoassay is the speed of
analysis. Immunoassay does not need the laborious sample preparation step, such as
extensive sample clean‐up, to remove interferences. Also, the technique can often handle
numerous samples simultaneously, thereby greatly enhancing sample throughput (Lee and
Kennedy, 2007).

30
2.4. ELISA (Enzyme‐Linked Immunosorbent Assay)
Many immunoassays have been reported for detecting FQs residues and other
contaminants in food matrixes; the most common is the Enzyme Linked‐ImmunSorbent
Assay (ELISA) (Van Emon, 2010). ELISA is a detection system based on enzyme‐labelled
reagents. ELISAs have shown good performance for the analysis of FQ antibiotic residues in
animal meat (Kato et al., 2007, Li et al., 2008, Burkin, 2008, Kato et al., 2008), animal edible
tissues (Duan and Yuan, 2001, Watanabe et al., 2002, Huet et al., 2006, Zhu et al., 2008)
milk (Coillie et al., 2004, Zhao et al., 2007, Kato et al., 2008, Bucknall et al., 2003, Huang et
al., 2010, Duan and Yuan, 2001), eggs (Wang et al., 2007a, Huet et al., 2006), in honey
(Wang et al., 2007a), in shrimp (Tittlemier et al., 2008, Wang et al., 2007a) and eel (Cao et
al., 2011).
2.4.1. Principle
An ELISA involves an enzyme, a protein that catalyses a biochemical reaction and an
antibody or antigen as immunologic molecules. ELISA also requires the stepwise addition
and reaction of reagents to a solid phase bound substance, through incubation and
separation of bound and unbound molecules using washing steps. An enzymatic reaction is
utilised to produce a colour for quantification purposes.
2.4.2 ELISA Format
The key feature of an ELISA is flexibility, as more than one assay format can be formatted
to measure the same analyte. In general, ELISA is divided into three formats; competitive
ELISA, non‐competitive ELISA and double antibody sandwich ELISA. A double antibody
sandwich ELISA is usually employed to measure larger molecular analytes such as proteins,
viruses, and bacteria. A competitive ELISA has been widely employed to detect small
molecular contaminants in food such as mycotoxin, pesticides, and antibiotics. A
competitive ELISA may be either direct (immobilised antibody) or indirect (immobilised
hapten conjugate or antigen) competitive ELISA (Wang et al., 2007a). Whereas, the
principle of a non‐competitive ELISA method is where antigen is bound to the solid phase,
then labelled antibody is then bound to the antigen. The amount of labelled antibody is
then measured. Unlike the competitive format, the results of the non‐competitive assay
are directly proportional to the concentration of the antigen. This is because
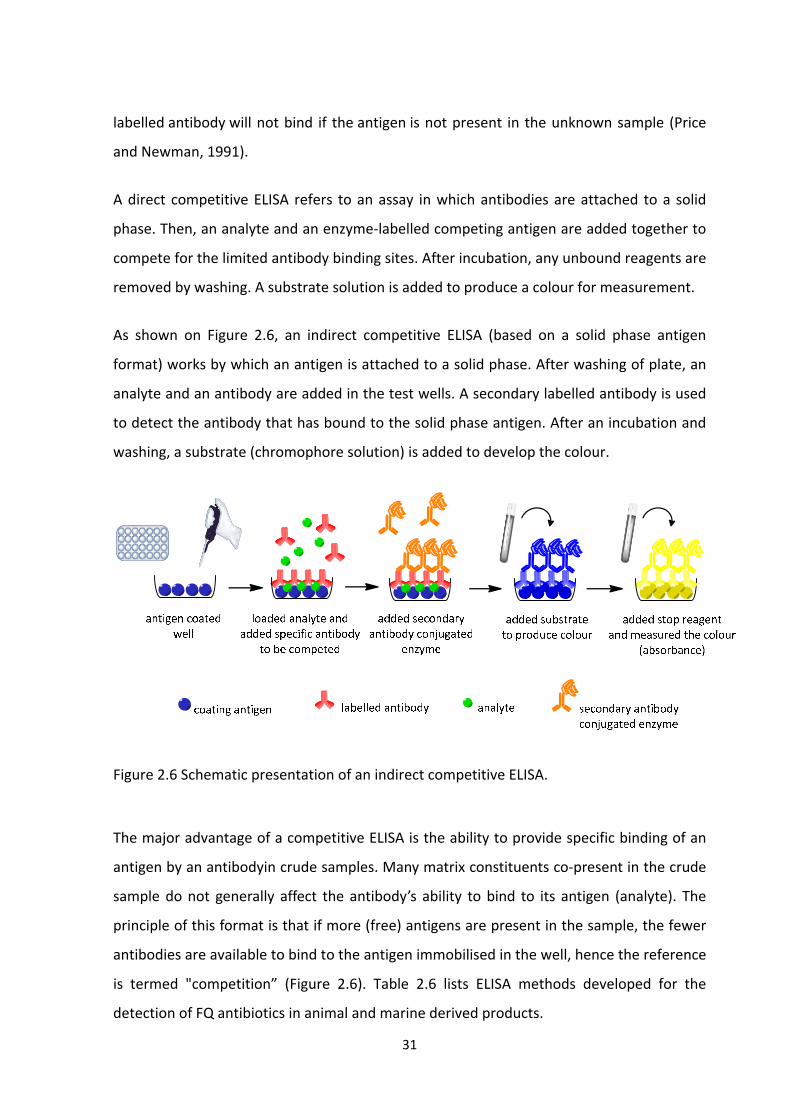
31
labelled antibody will not bind if the antigen is not present in the unknown sample (Price
and Newman, 1991).
A direct competitive ELISA refers to an assay in which antibodies are attached to a solid
phase. Then, an analyte and an enzyme‐labelled competing antigen are added together to
compete for the limited antibody binding sites. After incubation, any unbound reagents are
removed by washing. A substrate solution is added to produce a colour for measurement.
As shown on Figure 2.6, an indirect competitive ELISA (based on a solid phase antigen
format) works by which an antigen is attached to a solid phase. After washing of plate, an
analyte and an antibody are added in the test wells. A secondary labelled antibody is used
to detect the antibody that has bound to the solid phase antigen. After an incubation and
washing, a substrate (chromophore solution) is added to develop the colour.
Figure 2.6 Schematic presentation of an indirect competitive ELISA.
The major advantage of a competitive ELISA is the ability to provide specific binding of an
antigen by an antibodyin crude samples. Many matrix constituents co‐present in the crude
sample do not generally affect the antibody’s ability to bind to its antigen (analyte). The
principle of this format is that if more (free) antigens are present in the sample, the fewer
antibodies are available to bind to the antigen immobilised in the well, hence the reference
is termed "competition” (Figure 2.6). Table 2.6 lists ELISA methods developed for the
detection of FQ antibiotics in animal and marine derived products.
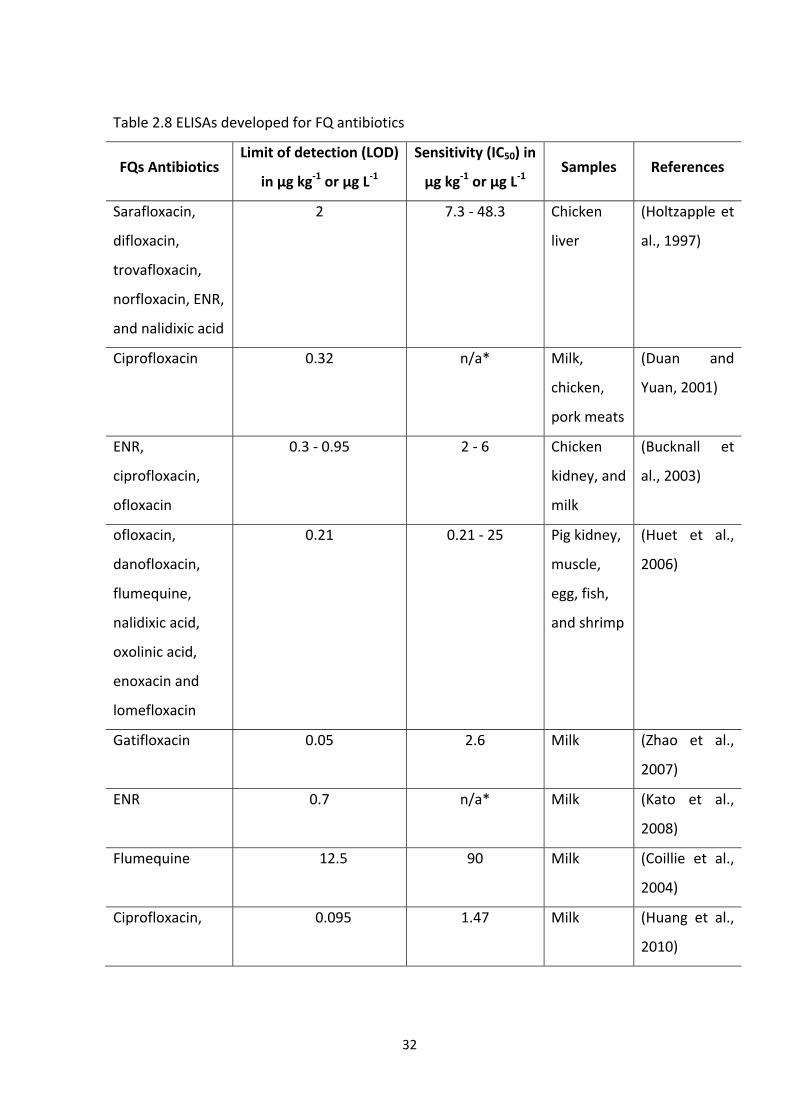
32
Table 2.8 ELISAs developed for FQ antibiotics
FQs Antibiotics Limit of detection (LOD)
in µg kg‐1 or µg L‐1
Sensitivity (IC50) in
µg kg‐1 or µg L‐1 Samples References
Sarafloxacin,
difloxacin,
trovafloxacin,
norfloxacin, ENR,
and nalidixic acid
2 7.3 ‐ 48.3 Chicken
liver
(Holtzapple et
al., 1997)
Ciprofloxacin 0.32 n/a* Milk,
chicken,
pork meats
(Duan and
Yuan, 2001)
ENR,
ciprofloxacin,
ofloxacin
0.3 ‐ 0.95 2 ‐ 6 Chicken
kidney, and
milk
(Bucknall et
al., 2003)
ofloxacin,
danofloxacin,
flumequine,
nalidixic acid,
oxolinic acid,
enoxacin and
lomefloxacin
0.21 0.21 ‐ 25 Pig kidney,
muscle,
egg, fish,
and shrimp
(Huet et al.,
2006)
Gatifloxacin 0.05 2.6 Milk (Zhao et al.,
2007)
ENR 0.7 n/a* Milk (Kato et al.,
2008)
Flumequine 12.5 90 Milk (Coillie et al.,
2004)
Ciprofloxacin, 0.095 1.47 Milk (Huang et al.,
2010)

33
Table 2.8 ELISAs developed for FQ antibiotics (continued)
FQs Antibiotics Limit of detection (LOD)
in µg kg‐1 or µg L‐1
Sensitivity (IC50) in
µg kg‐1 or µg L‐1
Samples References
Ciprofloxacin,
ENR,
norlfoxacin,
ofloxacin,
danofloxacin,
pefloxacin,
amifloxacin,
lomefloxacin,
enoxacin,
flumequine,
oxolinic acid,
marbofloxacin,
difloxacin, and
sarafloxacin
0.2 ‐ 3.4 2.1 ‐ 23 Chicken
liver,
muscle,
eggs
shrimp,
honey
(Wang et al.,
2007b)
Norfloxacin,
ENR,
ciprofloxacin,
difloxacin,
sarafloxacin,
ofloxacin,
danofloxacin,
flumequine,
nalidixic acid
and oxolinic acid
0.1 – 17 n/a* Shrimp (Tittlemier et
al., 2008)

34
Table 2.8ELISAs developed for FQ antibiotics (continued)
FQs Antibiotics Limit of detection (LOD)
in µg kg‐1 or µg L‐1
Sensitivity (IC50) in
µg kg‐1 or µg L‐1 Samples References
Norfloxacin,
ENR,
ciprofloxacin,
difloxacin,
sarafloxacin,
ofloxacin,
danofloxacin,
flumequine,
nalidixic acid
and oxolinic acid
0.1 ‐ 17 n/a* Shrimp (Tittlemier et
al., 2008)
Norfloxacin,
ENR,
ciprofloxacin,
difloxacin,
pefloxacin,
cinoxacin,
sarafloxacin,
marbofloxacin,
ofloxacin,
danofloxacin,
flumequine,
nalidixic acid,
oxolinic acid,
enoxacin,
lomefloxacin,
pipemidic acid,
difloxacin, and
orbifloxacin
0.01 0.04 – 10.2 Pork and
chicken
meats
(Li et al.,
2008)

35
Table 2.8ELISAs developed for FQ antibiotics (continued)
FQs Antibiotics Limit of detection (LOD)
in µg kg‐1 or µg L‐1
Sensitivity (IC50)
in µg kg‐1 or µg L‐1Samples References
Pefloxacin,
fleroxacin, ENR,
ofloxacin,
enoxacin,
norfloxacin,
lomefloxacin,
ciprofloxacin,
sarafloxacin,
gatifloxacin,
pipemidic acid
0.16 6.7 Chicken
liver
(Lu et al.,
2006)
Marbofloxacin
Ofloxacin, ENR,
ciprofloxacin,
and difloxacin
0.6 4.6 Beef and
pork
meats
(Sheng et
al., 2009a)
Danofloxacin,
ENR,
ciprofloxacin,
difloxacin,
norfloxacin,
marbofloxacin,
ofloxacin,
oxolinic acid,
and flumequine
0.1 5.4 Beef,
chicken
and pork
meats
(Sheng et
al., 2009b)

36
Table 2.8 ELISAs developed for FQ antibiotics (continued)
FQs Antibiotics Limit of detection (LOD)
in µg kg‐1 or µg L‐1
Sensitivity (IC50)
in µg kg‐1 or µg L‐1Samples References
ENR,
ciprofloxacin,
norfloxacin,
ofloxacin,
sarfloxacin,
enoxacin,
levofloxacin,
sparfloxacin,
and pefloxacin
2.5 8.3 Chicken
muscle
tissue
(Chen et
al., 2009a)
2.5. Development of immunoassay for fluoroquinolone antibiotics
2.5.1. Hapten design and synthesis
The initial step in the immunoassay development for FQs is the design and synthesis of
haptens. As FQs have low molecular weight of less than a few thousand daltons, they are
not immunogenic and unable to elicit immune responses in animals. In order to cause
immunogenicity or to produce antibodies against these molecules, they must be coupled
to suitable larger carrier molecules, usually proteins, so that they can stimulate the cellular
immune system. These molecules are called haptens and when coupled to carrier proteins,
they can act as immunogens (Beier et al., 1996), as shown in Figure 2.7 (Hermanson, 1996).
Figure 2.7 An immunogen is made by coupling a hapten to a carrier molecule using a
conjugation reagent.
37
Antigens are usually macromolecules that contain distinct antigenic sites called epitopes
that recognize and interact with the various immune system components (Hermanson,
1996). Antigens are composed of synthetic organic chemicals, lipoproteins, glycoproteins,
RNA, DNA, or polysaccharides as an individual molecule or antigens are parts of cellular
structure such as bacteria, fungi or viruses (Harlow and Lane, 1988).
There are some general criteria in designing haptens for antibody production. The
optimum hapten for a selected target analyte should be a near perfect mimic of the target
structure in size, shape, electronic and hydrogen bonding capabilities and in its
hydrophobic properties (Lee and Kennedy, 2007, Sheng et al., 2009a). An appropriate
functional group for covalent attachment to the protein must be compatible with the
chemistry of the functional group on the target. Moreover, the chemistry of the target
molecule must be understood, and evaluated for methods of insertion of the attachment
handle by established chemistry (Goodrow and Hammock, 1998). Hence, an appropriate
hapten design and synthesis is important in manipulating the specificity and sensitivity of
an antibody (Crowther, 2001, Lee and Kennedy, 2007).
2.5.1.1. Selection of spacer arm point attachment for fluoroquinolone antibiotics
Generally, there are two common selection points of attachment on FQ structure to design
FQ haptens, attached to either a carboxylic group or a piperazynil moiety. Formation of an
active ester of N‐hydroxysuccinimide (NHS) in the presence of carbodiimide is often
employed as a coupling procedure of FQs to the carrier protein. A carboxylate group of FQ
is a target attachment to the carrier protein. This coupling procedure has the advantage
that the active ester acquired is relatively stable under acidic condition, so it is possible to
purify and store the compound. The active ester of NHS reacts quickly with amino acid
groups of proteins, particularly with lysine(Lee and Kennedy, 2007).
A spacer arm of haptens containing 3 to 6 carbons is preferred. A long spacer arm (Lee and
Kennedy 2007, Tittlemier et al., 2008) generally containing more than 6 carbons may lead
to unstable protein or hapten conjugate. Moreover, using bulky functional groups such as
aromatic, cyclic rings or conjugated double bonds could minimise the recognition of this
region by the antibodies (Lee and Kennedy, 2007).
38
From the structural point of view, attaching a secondary amine on the piperazinyl moiety
of FQs to a carrier protein allows the carboxylic acid group to remain unchanged; and this
approach helps to extend the variable moiety away from the point of attachment to the
carrier protein, resulting in good specificity of antibodies (Bucknall et al.,2003; Huet et
al.,2006; Wang et al.,2007; Tittlemieret al.,2008; Li et al., 2008; Burkin, 2008). In addition,
this design exposes 4‐quinolone carboxylic acid common to FQ antibiotics as an
immunodominant region. Consequently, the antibody has high cross‐reactivity of between
10% and 100% (Huet et al., 2006) and between 35‐100% (Wang et al., 2007a) for most
related compounds, making this a useful screening tool.
On the other hand, the carboxylic group on the FQs may be linked to an amino group of the
carrier protein, which enhances the sensitivity and specificity of the antibody. For instance,
Zhao et al., 2007 developed an ELISA test kit using the method which has a limit of
detection of 0.05 µg L‐1 in milk. The results also showed that anti‐gatifloxacin antibody
produced a high specificity towards gatifloxacin. This is due to that gatifloxacin hasa
uniquemethoxy group located in position 8 that may contribute to better specificity.
Coillieet al. (2004) also employed this attachment point to improve specificity of their
antibody. The resulting cross‐reactivity with ENR, ciprofloxacin, difloxacin, danofloxacin,
marbofloxacin and oxolinic acid was less than 0.1%.
In order to obtain better specificity with low cross‐reaction, coupling of a carboxylic acid to
a carrier protein is generally preferred. While a piperazynil moiety coupled to a carrier
protein is more useful when detection of a wide range of FQs is preferred. Apparently,
there is little difference between LOD values of the both approaches. The LOD values of the
carboxylic acid and a piperazynil moeity attachments were 0.32 µg kg‐1 (Duan and Yuan,
2001) and 0.2 µg kg‐1 (Wang et al., 2007a), respectively.
2.5.1.2. Competing hapten to carrier protein ratio
There is a number of proteins used as carriers, e.g. bovine serum albumin (BSA; MW
67,000), ovalbumin (OVA; MW 43,000), keyhole limpet hemocyanin (KLH; MW 4.5 x 10⁵ to
1.3 x 10⁷), aminoethylated (or cationized) BSA (cBSA), human serum albumin (HAS) and co‐
albumin. Generally, BSA and OVA are used as carrier proteinsbecause of their numerous
39
functional groups and high solubility during cross‐linking or even after extensive
modification with hapten molecules (Hermanson, 1996).
DMSO is generally used to solubilize hapten molecules containing bovine serum albumin
(BSA) or ovalbumin (OVA). To maintain the solubility of haptens, a solvent or aqueous
phase mixture may be used in conjugation reactions. BSA remains soluble in the presence
of up to 35% DMSO and precipitates in 45% and above. In contrast, OVA is soluble in up to
70% and precipitates in 80% and above (Hermanson, 1996).
KLH is derived from the mollusk Megathuracrenulata, an extremely large multi‐subunit
protein that contains chelated copper of non‐heme origin. When KLH is dissolved in basic
solution, it produces blue colour solution, while, the solution turns to green when it is
dissolved in an acidic solution. KLH also should not be frozen as the protein denatured
easily, increasing in insolubility, and making conjugation reactions difficult. Stability and
solubility of KLH is preserved in buffers containing 0.9M NaCl, not in buffers containing 0.9%
NaCl. When the concentration of NaCl is less than approximately 0.6 M, the protein will
start to denature and precipitate. Hence, conjugation reaction using KLH should be done
under high‐salt conditions to maintain solubility of the hapten‐carrier complex (Hermanson,
1996).
There are specific requirements for carrier proteins; they must be highly immunogenic and
sufficiently large in size so that they can impart immunogenicity to covalently coupled
haptens. Another criteria for carrier proteins is the presence of suitable functional groups
for conjugation with haptens, maintain high solubility even after extensive modification
with hapten molecules and also present low toxicity in animals’ body (Hermanson, 1996).
2.5.1.3. Conjugation methods
There is a number of conjugation methods employed. They are chosen according to the
functional groups of a hapten, such as hydroxyl, carbonyl, phenol, thiol and sulfhydryl
groups. However, coupling through carboxylic and amine groups remain the most popular
procedure due to the high success rate and high stability of the resulting conjugates(Lee
and Kennedy, 2007).

40
2.5.1.3.1. Carboxylic groups
A carboxylic acid of a hapten is generally conjugated to a protein using either the
anhydride or carbodiimide with N‐hydroxysuccinimide (NHS). Carboxylic groups – mixed
function anhydride is a simple method since it does not require isolation of an active ester.
A carboxylic group of a hapten is converted to an anhydride acid which reacts with an
amino group of a carrier protein in aqueous‐water miscible solvent mixture or reagents
such as isobutylchloroformate (IBCF) with tributyl or triethylamine (Lee and Kennedy,
2007), as shown in Figure 2.8 (Hermanson, 1996).
Figure 2.8 Reaction of a carboxylic acid with a chlorformate forms an amine‐reactive mixed
anhydride.
Carbodiimides are zero‐length cross‐linking agents used to mediate hapten‐carrier
conjugation via carboxylic groups. It is called zero‐length cross‐linking agents, as there is no
additional carbon in forming bonds between the conjugation molecules. N‐substituted
carbodiimides react with carboxylic acids to form highly reactive O‐acylisourea
intermediate which reacts with a primary amine to form an amide bond, soluble isoureais
released as a by‐product (Figure 2.9;Hermanson, 1996).
Figure 2.9 Reaction of a carboxylic acid with carbodiimide forms an O‐acylisourea.
41
There are two basic types of carbodiimides: water soluble carbodiimides, such as 1‐ethyl‐3‐
(3‐dimethyl‐aminopropyl) carbodiimide hydrochloride (EDC), dicyclohexylcarbodiimide
(DCC), 1‐cyclohexyl‐3‐(2‐morphplinyl‐4‐ethyl) carbodiimide methyl p‐toluene sulfonate
(CMC), and water insoluble carbodiimides; such as diisopropylcarbodiimide (DIC). EDC and
DCC are the most common water soluble carbodiimides used for FQ hapten‐carrier protein
conjugation.
Carbodiimide formation effectively occurs between pH 4.5 and 7.5 (Hermanson, 1996).
EDC and CMC are stable in acidic condition (pH 5.5), whereas, DCC is stable in a neutral
environment (pH 7.2). MES (2‐(N‐morpholino)ethanesulfonic acid) or phosphate buffer is
usually used to stabilize the pH during the reactions. In general, the reaction is performed
by derivatizing small molecules with carbodiimides in a water‐miscible organic solvent and
the product is added to an aqueous protein solution for the coupling stage. Organic
solvents may prevent isourea formation in the conugation solution (Wild, 2001).
A carboxylate group conjugated with carbodiimide‐NHS to a protein is often used as a
coupling procedure to develop immunoassays for food contaminants. Many researchers
have employed this coupling procedure to develop better sensitivity and specificity for the
detection FQ residues in seafood and animal‐derived products (Bucknall et al., 2003, Wang
et al., 2007a, Coillie et al., 2004, Duan and Yuan, 2001, Huang et al., 2010).
The active ester obtained from this coupling method is stable under acidic conditions. It is
also highly reactive towards amine functional groups on proteins and other molecules to
form stable amide bonds. Moreover, the conjugation reaction is complete within 2 h at
room temperature and the active ester reacts quickly with the amino groups of proteins
resulting in good yield (i.e., higher epitope density) (Lee and Kennedy, 2007).
The reaction is carried out by activating a carboxylic acid group in an organic solvent with a
mixture of DCC and NHS, and the active ester is added to an aqueous protein solution as
shown in (Figure 2.10;Hermanson, 1996).

42
Figure 2.10 Reaction of a carboxylic acid group with carbodiimide‐NHS forms an active‐
succinimide ester.
2.5.1.3.2. Amine groups
There is a number of ways to conjugate an amine group to a carrier protein. In general,
aromatic amine is converted with nitrous acid to form a diazonium salt. The coupling
reaction is carried out by mixing the diazonium salt and a protein at an alkaline pH. The
reaction mainly occurs with tyrosine, histidine and tryptophan residues of the carrier
protein (Garden and Sporns, 1994). This coupling method produces bonds which are easily
dissociated and has been successfully employed in pesticide immunoassays. For instance,
parathion was converted to a diazonium salt and coupled with bovine serum albumin to
produce specific antibodies (Lee and Kennedy, 2007).
Following the coupling reaction is the conversion of the aliphatic amines with succinic
anhydride carboxylic group to protein. Coupling of aliphatic amines can also be achieved
using 4,4’‐difluoro‐3,3’dinitrophenyl sulfone, cyanuric chloride or toluene 2,4‐diisocyanate.
However, using these reagents attracts some drawbacks; they are hydrophobic, so they
must be dissolved in a solvent before adding to the protein solution, generally resulting in
low conjugation. Hydrolysis may also occur simultaneously, and the active ester of these

43
reagents becomes less available for conjugation. In addition, under alkaline conditions,
these reagents will react with other amino groups containing hydrogen such as sulfhydryl
group of cysteine, phenolic group of tyrosine and imidazole group of histidine (Lee and
Kennedy, 2007).
An alternative approach is available through reacting aromatic amines with succinic
anhydride in pyridine to provide the ester of succinic acid (Wang et al., 1998). Coupling
through succinic acid provides advantages over diazonium salts coupling due to a bridge
group introduced at the same time between hapten and protein, resulting in a more
sensitive assay (Wang et al., 1998). Diazonium salts linking leads to the loss of enzyme
activity as histidine and lysine are present near or in the most active sites of the enzyme
(Lee and Kennedy, 2007). Also, there are no spacer arms between diazonium salts and the
protein, this may result in low assay sensitivity (Wang et al., 1998).
2.5.2. Antibody production
2.5.2.1. Overview
The availability of antibodies with the desired affinity and specificity is the most important
factor governing immunoassay performance. Antibodies are primarily synthesised and
produced by specialized plasma cell lymphocytes (Wild, 1994), its primary function is to
bind antigen specifically or neutralize foreign matters (e.g., on bacterial toxin or viral
penetration of cells) (Deshpande, 1996). A hapten‐protein conjugate (an immunogen) is
used to produce antibody by immunizing an animal (Lee and Kennedy, 2007). There are
generally two techniques for production of antibody, namely polyclonal (via in vivo
technique) and monoclonal antibody (in vitro technique).
2.5.2.2. Polyclonal antibodies
Polyclonal antibodies , sometimes called antisera, are antibodies derived from different B‐
cell lines, a mixture of immunoglobulin molecules secreted against a specific antigen (Beier
et al., 1996). These antibodies are typically produced by immunisation of a
suitable mammal, such as a mouse, rabbit or goat. This induces the B‐lymphocytes to
produce IgG (immunoglobulin G) specific for the antigen. Animals frequently used for
polyclonal antibody production include chickens, goats, guinea pigs, hamsters, horses, mice,

44
rats, and sheep. However, rabbit is the most commonly used laboratory animal due to the
ease of handling (Lee and Kennedy, 2007).
Most of the sensitive immunoassays developed for detection of food contaminants have
been based on polyclonal antibodies (Lee and Kennedy, 2007). Many researchers (Duan
and Yuan, 2001, Bucknall et al., 2003, Coillie et al., 2004, Zhao et al., 2009, Tittlemier et al.,
2008, Huet et al., 2006) applied polyclonal antibodies for detection of FQ antibiotic
residues in edible animal tissues with high sensitivity. For example an immunoassay for
ciprofloxacin (Duan and Yuan, 2001) has a detection limit of 0.32 µg kg‐1. Another sensitive
immunoassay was developed for gatifloxacin (Zhao et al., 2007) has a detection limit of
0.05 µg kg‐1 with an IC50 value of 2.6 µg kg‐1.
There is no standardised protocol for immunization. Injection of the immunogen is done
via two steps, beginning with an initial injection and then followed by subsequent boosting
injections according to a regular schedule (Lee and Kennedy, 2007). Immunogens are
prepared by emulsifying hapten conjugated protein with 0.9% NaCl (saline) and an
adjuvant. The optimal initial boosting dose for rabbit is about 100 µg per mL, whereas for
subsequent boosting a much lower immunogen level is required; about 5‐20 µg per mL
(Wild, 1994). In terms of blood collections, the first bleed is taken about 14 days after the
booster immunization, while subsequent bleeds are taken at regular intervals, usually
monthly. The main routes of immunization for polyclonal antibody production for rabbit
are generally either subcutaneous, intradermal or intramuscular routes or a combination of
these (Lee and Kennedy, 2007).
2.5.2.3. Monoclonal antibodies
Monoclonal antibodies are those produced by one type of immune‐cell clones originated
from a single parent cell, called hybridoma cell. Mice are the most commonly animal used
to produce monoclonal antibodies. Hybridomas are cell lines produced by fusion of an
immunized B‐lymphocyte and myeloma (tumor) cell (Lee and Kennedy, 2007). Since an
individual lymphocyte produces only a single antibody type, all of the antibody molecules
produced by a hybridoma cell line are identical. Thus all of the antibodies have the same
amino acid sequence and binding properties. In contrast, polyclonal antibodies are
produced by immunizing with a hapten protein conjugate, resulting in a mixture of

45
antibodies with different binding properties. For example, antibodies produced by binding
specifically with the hapten‐linkage chemistry complex will have different affinities and
cross‐reactivities (Beier et al., 1996).
Some reseachers have reported sensitive immunoassays based on monoclonal antibodies.
For example, immunoassay for ENR (Kato et al., 2007) exhibited a detection limit of 0.76 µg
kg‐1. Another sensitive immunoassay using monoclonal antibody was developed for
norfloxacin (Li et al., 2008) and had a detection limit of 0.01‐1 µg kg‐1 which was
comparable to other immunoassay based on polyclonal antibodies. Some monoclonal
antibodies displayed lower sensitivity and higher limit of detection values compared with
polyclonal antibodies. Bucknall et al. (1997) used monoclonal antibodies to develop
sarafloxacin, difloxacin, troflavoxacin, norfloxacin, ENR and nalidixic acid and reported a
limit of detection of 10 to 100 µg kg‐1. Monoclonal antibodies were also used by Zhu and
coworkers (2008) to develop assays for norfloxacin and perfloxacin. The assay showed the
sensitivity at 25 µg kg‐1 for the targeted FQs and for other FQs (ENR, ciprofloxacin,
flumequine, ofloxacin, lomefloxacin, enoxacin, danoxacin and marbofloxacin,) the
sensitivity was at 100 µg kg‐1.
2.5.3. Immunoassay format
There are two classifications of immunoassays; the homogeneous immunoassay where the
detection system is measured without separation of free and antibody bound components,
and heterogeneous immunoassay where the measurement is conducted after a separation
of free and antibody bound components (Lee and Kennedy, 2007). The heterogeneous
immunoassays are often employed to generate sensitive immunoassays by utilizing an
enzyme as a detection system. The sensitivity of immunoassay determined by antibody
affinity, type of label or detection system used for the label, type of format employed and
manipulation of reagents in a given format (Deshpande, 1996).
Heterogeneous immunoassays can be formatted as either competitive or non‐competitive.
In a competitive immunoassay format, free analytes compete with labelled antigens for
limited antibody binding sites. The amount of labelled antigen bound to antibody site is
inversely proportional to antigen concentration. In non‐competitive immunoassays
format,in contrast to a competitive format, antibody‐antigen binding occurs in excess of

46
antibody (labelled). The amount of labelled antibody measured is directly proportional to
antigen concentration (Crowther, 2001).
2.5.4. Assay characterization
In order to determine the efficacy of an ELISA test kit for detecting FQs in animal‐derived
products, it is important to fully characterise a competitive immunoassay for its analytical
parameters. Antibody characterization includes the determination of sensitivity, limit of
detection, specificity, matrix interferences, data precision and accuracy and reagent
stability. In competitive immunoassays, presence of analyte is reflected as inhibition of
colour development with a log‐linear relationship between analyte concentration and
colour development. Thus, the curve is typically sigmoidal in shape, when plotted
absorbance vs concentration in a log‐scale format (Lee and Kennedy, 2007).
The % control absorbance is determined by Eq. (2) where it is determined by adding a
sample matrix without FQs with enzyme conjugate as maximum colour generated by the
assay. The blank is usually generated for determination of background (Lee and Kennedy,
2007).
2..........100/% Eq
AA
AABoB
blankcontrol
blank
A = absorbance
Acontrol = absorbance of analyte at zero concentration
Ablank = absorbance of blank wells
2.5.4.1. Calibration curve
The calibration curves (dose‐response) of the analytes in the immunoassay are usually
obtained by plotting concentration on the X‐axis against either absorbance (A) or %
inhibition on the Y‐axis.
2.5.4.2. Sensitivity, limit of detection (LOD) and limit of quantification (LOQ)
Sensitivity is the competence of an assay to detect the smallest amount of a target analyte
under defined conditions (Crowther, 2001). Sensitivity of animmunoassay is generally
determined by an IC50 value, which is the concentration of an analyte required to reduce

47
the colour development by 50%. Equation 3 shows the determination of %Inhibition for
each standard:
3..........1001% Eq
AA
AAInhibition
blankcontrol
blank
Where:
A = average absorbance for each standard and sample
Ablank = average absorbance for blank
Acontrol = average absorbance for control
Blank = matrix with no analyte, containing only solvents, with enzyme
conjugate
Control = matrix with no analyte, containing solvents and diluents, with
enzyme conjugate
A limit of detection is determined by the concentration of analyte that reproducibly
provides either 15% or 20% inhibition of colour development (IC15 or IC20) which must lie
within the linear portion of the curve(Lee and Kennedy, 2007).
Sensitive immunoassays have been described for FQ antibiotics, with the limit of detection
ranging from 0.05 µg kg‐1 to 50 µg kg‐1. The required assay sensitivity and limit of detection
vary depending on intended use or the legal requirement. For example, the maximum
residue limits (MRLs) for various FQs in meat products, poultry, fish and milk is established
by the European Union (CR ECC, 1990) from 10 to 1900 µg kg‐1. However, some
immunoassays are designed to detect lower concentrations, for example, in environmental
water to meet legal requirements at very low part‐per‐billion or high part‐per‐trillion(Lee
and Kennedy, 2007).
2.5.4.3. Specificity and cross reactivity
Specificity of the immunoassay can be defined as the ability of the assay to detect the
analyte of interest in a heterogeneous mixture (Wang et al., 1999). The ability depends on
the properties of the antibodies as well as the properties of each set of immuno‐reagents

48
used for the assay. Generally, better specificity can be obtained by employing monoclonal
antibodies than polyclonal antibodies since they react as a single population of antibody
with a single affinity (Crowther, 2001).
Cross‐reactivity is defined as the ability of a population of antibodies to bind different
molecules other than the analyte(s) of interest. Hence, cross‐reactivity is a measure of
antibody responses to substances other than the analyte of interest and is directly related
to the specificity of immunoassay. The specificity can be determined by cross‐reactivity of
an antibody using compounds of structural similarity. The cross‐reactivity of FQs antibiotics
is calculated using the following formula:
%CrossReactivity IC50ofENR
IC50ofotherfluoroquinolonesx100… . . . 4
2.5.4.4. Matrix interference
One key advantage of immunoassay is that it does not need extensive sample preparation.
Hence, immunoassay is generally less affected by sample matrix than the instrument‐based
methods. Generally, water samples are analysed as is or diluted form. For example, milk
samples are diluted with purified water or buffer, and animal food or edible tissues derived
from animal sources are extracted with a water miscible solvent and the extract is then
analysed after simple dilution with purified water or buffer.
It is known that various substances present in complex biological system can affect
antigen‐antibody interaction in an immunoassay and can reduce the sensitivity and
reliability of the immunoassay. There are a number of ways to reduce matrix effects;
perform either sample interfering removal procedure, sample extraction or dilute the
sample solution. Zhao et al., (2007) employed the latter method to maintain the sensitivity
of the assay, by diluting defatted milk with PBS buffer.
The matrix effects can be determined by comparing the standard curve of the analyte‐free
matrix and the standard curve prepared in certain pH buffers or solvent system (Wang et
al., 1998; Lee and Kennedy, 2007) or by contracting dose‐response curves with the real
sample spiked, including a blank (Henniona and Barcelo, 1998; Lee and Kennedy, 2007). If
these two curves are superimposed on one another, it means that the matrix effect is

49
insignificant. However if the curves shift either to left or right, it corresponds to a loss or
increase in the sensitivity of the assay.
2.5.4.5. Assay accuracy and precision
The accuracy of an immunoassay is generally determined by two ways. First, immunoassay
data are compared to the levels of analyte spiked into a food matrix. This is usually used
when the performance of the immunoassay is initially validated. Second, by comparing the
results obtained in immunoassay data with those obtained from instrument‐based analysis
methods such HPLC, GC or MS. There are three parameters to correlate between
immunoassay data and instrument‐based analysis; these include: 1) determining the
correlation coefficient as either r or r2; the value should usually be greater than 0.99 ±
0.001, 2) the slope of the regression line should be 1, and 3) how close the plot is from the
origin and generally the regression plot should pass above the origin (Lee and Kennedy,
2007).
2.6 Conclusion
Infectious diseases are now becoming a major problem for the livestock industries and may
affect the productivity, which may result in a decrease of food‐producing animals. Hence, a
wide variety of antibacterial drugs is administered to prevent and treat diesease. FQs are
one family of synthetic antibiotics with broad spectrum antibacterial activity, which has an
important application in veterinary medicine for the treatment of antibacterial infections.
FQ antibiotics have been intensively used in animal treatment. This has led to the presence
and accumulation of FQ residues in food, posing potential risks in the development of FQs
resistant bacteria in animals. This may have an implication to human health, in particular
for the treatment of human infection.
Maximum residue limits (MRLs) are one food safety parameter usedto ensure the
antibiotic safety and protect consumers from unacceptably high residue levels in food
commodities. The maximum residue limits (MRLs) of FQs in seafood and animal‐derived
products have been established by various authorities such as the European Union (EU),
the joint FAO/WHO Expert Committee on Food Additives (JECFA). These authorities have
established MRLs values for FQs and their metabolite between 100 and 300 µg L‐1 in
muscle tissues, fat and milk for all species (Hernandez‐Arteseros et al., 2002).
50
There are two common analytical methods applied to monitoring and determine FQ
residues in foodstuffs of animal origin. These are instrument‐based methods (i.e. HPLC,
LC/MS, LC‐MS/MS GC/MS, and HPTLC) and bioanalytical or immunochemical methods
(immunoaffinity chromatography, immunosensors and immunoassays). Instrumentation
methods suffer from drawbacks such as extensive samples preparation which is time
consuming and laborious. They also need trained personnel to run instruments properly,
require high operating costs and require very expensive equipment. An immunochemical
assay, such as immunoassay is an alternative method that complements instrumental
methods. The advantages of immunoassays are low operating costs, minimise reliance for
highly trained staff, and moreover, it is convenient and rapid performance for screening
purposes.

51
CHAPTER 3. HAPTEN SYNTHESIS
3.1 Introduction
The key step in developing the immunoassay for fluoroquinolone (FQ) antibiotics is the
design and synthesis of optimum haptens (Figure 3.1). Several general criteria have been
established in designing ideal haptens for antibody production. For a selected target
analyte, an optimum hapten should be a near perfect mimic of the target structure in size,
shape, electronic and hydrogen bonding capabilities as well as hydrophobic properties
(Skerritt et al., 1995, Goodrow et al., 1995). Another criterion is the selection of functional
groups for a covalent attachment to a carrier protein, which must be compatible with the
chemistry of the functional groups on the targets (Goodrow and Hammock, 1998b). In
general, a spacer arm length of three to six carbons is preferable, and the use of the bulky
functional groups such as aromatic, cyclic rings or conjugated double bonds should be
avoided to minimise the recognition of this region by the antibodies (Lee and Kennedy,
2007).
Figure 3.1 FQ drugs used in synthesising haptens
There are two common selection points for the attachment of linkers onto the FQ
structures, namely the carboxylic acid group or piperazynil group (Figure 3.2). Treatment of
the carboxyl group with N‐hydroxysuccinimide (NHS) in the presence of carbodiimide as a
coupling reagent has often been used to link FQs to carrier proteins via a peptide bond.
This gives advantages such as the resulting active ester is stable under acidic conditions, so
it is possible to purify and store the compound. An active ester of NHS reacts quickly with
amino groups of proteins resulting in good epitope density (Lee and Kennedy, 2007).
Authors who have synthesised FQs by using the carboxylic acid moiety as a point of linker
attachment, have reported highly specific antibody with cross‐reactivity of less than 0.1%
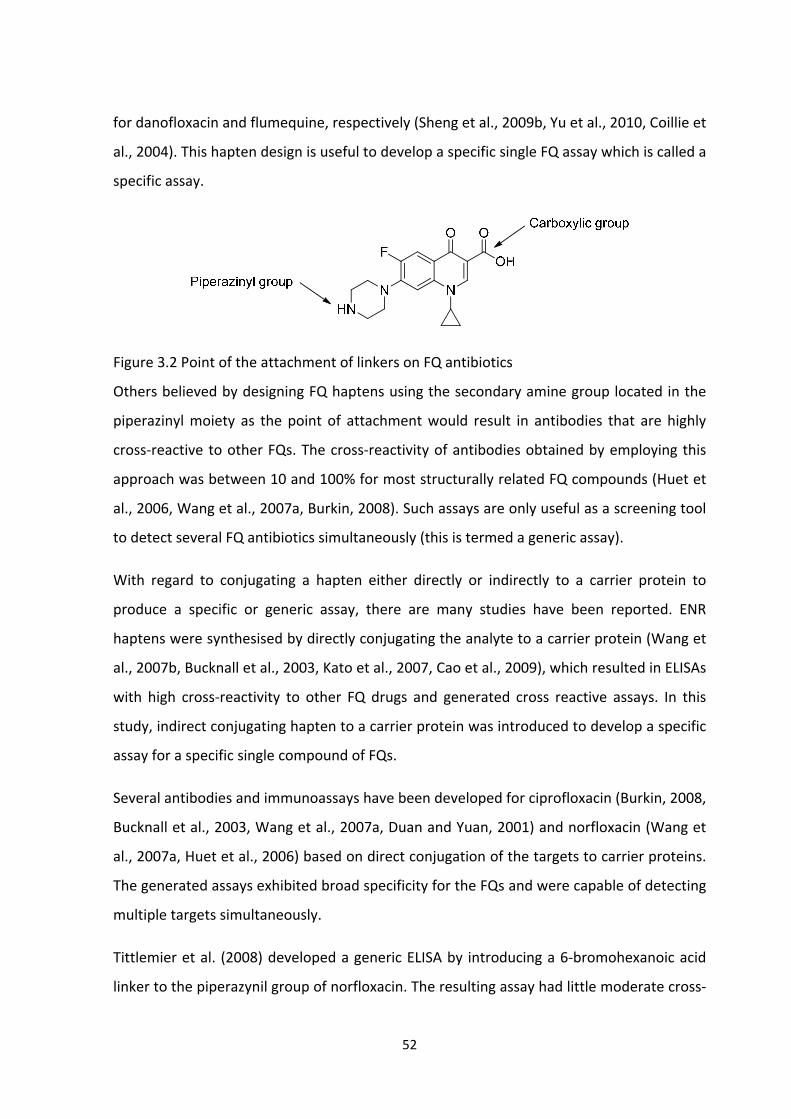
52
for danofloxacin and flumequine, respectively (Sheng et al., 2009b, Yu et al., 2010, Coillie et
al., 2004). This hapten design is useful to develop a specific single FQ assay which is called a
specific assay.
Figure 3.2 Point of the attachment of linkers on FQ antibiotics
Others believed by designing FQ haptens using the secondary amine group located in the
piperazinyl moiety as the point of attachment would result in antibodies that are highly
cross‐reactive to other FQs. The cross‐reactivity of antibodies obtained by employing this
approach was between 10 and 100% for most structurally related FQ compounds (Huet et
al., 2006, Wang et al., 2007a, Burkin, 2008). Such assays are only useful as a screening tool
to detect several FQ antibiotics simultaneously (this is termed a generic assay).
With regard to conjugating a hapten either directly or indirectly to a carrier protein to
produce a specific or generic assay, there are many studies have been reported. ENR
haptens were synthesised by directly conjugating the analyte to a carrier protein (Wang et
al., 2007b, Bucknall et al., 2003, Kato et al., 2007, Cao et al., 2009), which resulted in ELISAs
with high cross‐reactivity to other FQ drugs and generated cross reactive assays. In this
study, indirect conjugating hapten to a carrier protein was introduced to develop a specific
assay for a specific single compound of FQs.
Several antibodies and immunoassays have been developed for ciprofloxacin (Burkin, 2008,
Bucknall et al., 2003, Wang et al., 2007a, Duan and Yuan, 2001) and norfloxacin (Wang et
al., 2007a, Huet et al., 2006) based on direct conjugation of the targets to carrier proteins.
The generated assays exhibited broad specificity for the FQs and were capable of detecting
multiple targets simultaneously.
Tittlemier et al. (2008) developed a generic ELISA by introducing a 6‐bromohexanoic acid
linker to the piperazynil group of norfloxacin. The resulting assay had little moderate cross‐
53
reactivity, i.e., detected 4 out of 11 FQs tested and had limit detection values from 1 to 17
µg L‐1 for the four FQs. The criticism about this approach is that this hapten design formed
another carboxylic acid group on the spacer arm, resulting in two carboxyl groups in space
before the conjugation to a carrier protein. Both of these carboxyl groups could attach to
the carrier protein, potentially forming a cyclic structure on the protein surface. As well,
long spacer arm leads to unstable hapten and protein conjugates (Li et al., 2008).
Meanwhile, Li et al., (2008) introduced a suitable spacer arm in length(two carbons) for
synthesising a norfloxacin hapten, which resulted in a sensitive assay with an IC50 value at
0.6 µg L‐1 and high cross‐reactivity between 10 and 100% for 13 out of 17 FQs tested.
In this study, we approached conjugation of FQ haptens to carrier proteins by designing
novel ENR, ciprofloxacin and norfloxacin haptens. We employed both piperazinyl and
carboxyl moieties of the FQs for spacer arm attachment but took different synthesis routes
to compare the cross reactivity and specificity of different conjugates. The carboxyl group
of ENR was attached to a four carbon linker of tert‐butyl β‐alanine, to generate a highly
specific assay. Conversely, the piperazinyl moiety of ciprofloxacin and norfloxacin was
linked with 1,4‐dibromobutane and 4‐bromocrotonic acid, respectively to generate assay
with broader specificity. Preparation of conjugates of derivatives ENR, ciprofloxacin and
norfloxacin haptens to carrier proteins was carried out by employing a NHS active ester
coupling method.
3.2 Materials and instrumentation
3.2.1 Materials and chemicals
3.2.1.1 Materials
TLC plates were purchased from Merck Chemical Ltd., silica gel H (TLC grade), neutral
alumina and celite were bought from Sigma Aldrich, USA. Silica gel H was obtained from
Merck, Darmstadt, Germany and solvents for NMR such as dimethylsulfoxide (DMSO‐d6),
deuteriochloroform (CD3Cl) and deuterium oxide (D2O) were obtained from Cambridge
Isotope Laboratories, Inc. USA.
3.2.1.2 Chemicals
ENR, ciprofloxacin, norfloxacin, methyl 4‐bromocrotonate, dicyclohexylcarbodiimide (DCC),
N‐hydroxysuccinimide (NHS), tert‐butyl β‐alanine, 4‐di‐(methylamino) pyridine (DMAP)
54
were bought from Sigma Aldrich, USA. ENR HCl, ciprofloxacin HCl and norfloxacin HCl were
obtained from Ruland Chemistry Company Ltd., China. 1.4‐dibromobutanewas purchased
from Aldrich Chemical Company, inc. 1‐Ethyl‐3‐(3‐dimethylaminopropyl) carbodiimide
hydrochloride (EDC) was purchased from Alfa‐Aesar.
3.2.2 Equipment and instrumentation
3.2.2.1 Thin Layer Chromatography (TLC)
The Rf values refer to TLC on alumina or silica gel 60 F254 pre‐coated plates with
visualisation under UV light.
3.2.2.2 Nuclear Magnetic Resonance (NMR) spectroscopy
Proton (1H), carbon (13C) and 135DEPT‐NMR were recorded on Bruker DPX 300 Instrument
(300 MHz). Chemical shifts were reported in δ (ppm), coupling constants in J (hertz) and
the following abbreviations were used to describe multiplicities: s, singlet; t, triplet; q:
quartet; dd, doublet of doublet; dt, doublet of triplet; m, multiplet. DEPT stands for
Distortion less Enhancement by Polarization Transfer, and was used to determine the
presence of primary, secondary and tertiary carbon atoms. The DEPT method differentiates
between CH, CH2 and CH3 groups by variation of the selection angle parameter (45 o, 90 o
and 135o). 135DEPT gives all CH and CH3 in a phase opposite to CH2.
3.2.2.3 Mass Spectrometry
All electrospray ionization (ESI) mass spectrometry (MS) spectra were carried out using an
Agilent MD‐1100 ESI/APCI LC‐MS (Bioanalytical Mass Spectrometry Facility, the University
of New South Wales (UNSW)) and using Bruker‐FTMS 4.7T LC‐MS/MS (Monash University).
The following abbreviations were used for MS: HRMS; high resolution mass spectrometry,
LRMS; low resolution mass spectrometry.
3.3 Hapten Synthesis
There are two main synthetic routes of spacer arm attachment to FQ hapten employed in
this study. These protocols are described as follows:

55
3.3.1 The attachment via carboxylic group of FQs as a spacer arm for ENR acid hapten
ENR was first attached to a linker of tert‐butyl β‐alanine via the carboxylic group of ENR to
give the compound 1 (scheme 1) which was treated with trifluoroacetic acid (TFA) to yield
acid2 (scheme 2) without further purification.
3.3.1.1 Synthesis of tert‐butyl 3‐(1‐cyclopropyl‐7‐(4‐ethylpiperazin‐1‐yl)‐6‐fluoro‐4‐oxo‐
1,4‐dihydroquinoline‐3‐carboxamido)propanoate, [ENRtert‐butyl], compound (1),
scheme 1
ENR (500 mg, 1.39 mmol) was dissolved in dry dichloromethane, DCM (20 mL) and cooled
in an icebath for 15 min. Dicyclohexylcarbodiimide, (DCC, 574 mg, 2.78 mmol) and
dimethylaminopyridine, (DMAP, 20 mg) were added and the mixture was stirred for a
further 15 min. Tert‐butyl β‐alanine (404 mg, 2.78 mmol) was then added and the mixture
was stirred overnight at room temperature. A white precipitate of dicyclohexylurea by‐
product was removed by filtration through celite. The crude reaction mixture (1.5 g) was
purified by gravity column (i.e. packed with neutral alumina; column size; diameter: 30 mm,
length: 20 cm; flow rate: 5 mL/min) using ethyl acetate as an elution solvent and the
fraction was evaporated to dryness under vacuum, giving a white compound (808 mg, 55%).
The purified product (compound 1) was then confirmed by TLC (Al2O3), Rf = 0.45 (ethyl
acetate). 1H‐NMR (300 MHz, DMSO‐d6): δ 1.43‐1.58 (m, 3H, [CH3], 1.43‐1.58(m, 4H,
[N(CH2)2]‐1) 1.86 (s, 9H, [3CH3], tert‐butyl group), 2.84‐2.95 (m, 2H, [CH2]‐5’), 3.02 (s, 4H,
[CH2]‐2’3’), 3.60‐3.67 (m, 4H, [N(CH2)2]‐1’,4’), 3.95 (q, J = 6.0 Hz, 2H [CH2]‐4’), 4.18 (t, J = 4.5
Hz, 1H, [N(CH)]‐1), 4.48 (q, J = 7.5 Hz, 2H [CH2]‐3”), 7.03 (q, J = 3.0 Hz, 1H, [CH]‐8), 7.93 (d, J
= 6.0 Hz, 1H [NH]‐2”)., 8.29 (d, J = 6.0 Hz, 1H, [CH]‐5), 8.54 (s, 1H, [CH]‐2).13C‐NMR (75 MHz,
DMSO‐d6):δ 7.89 (C‐1), 12.29 (C‐6’), 29.07 (C‐4”), 30.70 (N‐C‐1), 33.71 (C‐7”), 47.86 (C‐1’,4’),
49.82 (C‐2’,3’), 51.90 (C‐5’), 80.37 (O‐C‐6”), 107.80 (C‐5), 110.33 (C‐8), 139.31 (C‐3), 146.98
(C‐2), 149.17 (C‐6), 154.41 (C‐7), 156.96 (C‐1”), 167.20 (C‐5”), 171.11 (C‐4).
3.3.1.2 Synthesis of 3‐(1‐cyclopropyl‐7‐(4‐ethylpiperazin‐1‐yl)‐6‐fluoro‐4‐oxo‐1,4‐
dihydroquinoline‐3‐carboxamido)propanoic acid, [ENR acid], compound (2), scheme 2
Compound 1 (808 mg, 1.66 mmol) was treated with trifluoroacetic acid (TFA) 1 mL at room
temperature for 30 min. The excess TFA was removed under vacuum to yield a crude acid
as an oily yellow product with a yield of 395 mg (49%) which was used in the next step
without further purification. The cleavage of the tert‐butyl group (compound 2) was
confirmed by TLC (Al2O3), Rf = 0.13 (ethyl acetate).1H‐NMR (300 Hz, DMSO‐d6): δ 0.60‐0.09

56
(m, 3H [CH3], 0.60‐0.09 (m, 4H [N(CH2)2]‐1) 1.82‐1.86 (m, 2H [CH2]‐5’), 2.60‐2.72 (m, 4H
[CH2]‐2’3’), 2.78‐2.90 (m, 4H, [N(CH2)2]‐1’,4’), 2.99 (s, 2H [CH2]‐4’’), 3.10 (t, J = 3 Hz, 1H,
[N(CH)]‐1), 3.19‐3.36 (m, 2H [CH2]‐3”), 6.38 (d, J = 9 Hz, 1H, [CH]‐8), 6.99 (d, J = 9 Hz, 1H
[NH]‐2”)., 7.26 (d, J = 12 Hz, 1H, [CH]‐5), 8.00 (s, 1H, [CH]‐2), 9.33 (t, J = 6, 1H [COOH]‐
6”).13C‐NMR (75 Hz, DMSO‐d6): δ 7.92 (C‐1), 9.28 (C‐6’), 30.07 (C‐4”), 31.85 (C‐3”), 33.68
(N‐C‐1), 47.89 (C‐1’,4’), 50.46 (C‐2’,3’), 55.73 (C‐5’), 107.20 (d, J = 15.75 Hz, C‐8), 110.49 (C‐
3), 138.66 (C‐5), 139.47 (C‐9), 147.32 (C‐10), 149.92 (C‐2), 156.99 (C‐7), 158.47 (C‐6),
158.96 (C‐1”), 164.23 (C‐5”), 173.42 (C‐4). ESI‐LRMS: calculated for C22H27FN4O4: 430.20,
found m/z 431.30 [M + Na]+; and for relative abundance (%): 430.20 (100.0%), 431.20
(25.3%), 432.21 (3.6%), found m/z 431.30 (100.0%), 432.30 (26.5%), 433.30 (3.5%).
Scheme 1. Synthesis of compound 1 (denoted as tert‐butyl ENR hapten)
NN
N
F
H
O O
+
OH
H2N
O
O
DCM, DCC, DMAP
NN
N
F
H
O O
NH
O
O
H3C
H3C
Enrofloxacin
tert-butyl beta alanine
tert-butyl 3-(1-cyclopropyl-7-(4-ethylpiperazin-1-yl)-6-fluoro-4-oxo-1,4-dihydroquinoline-3-carboxamido)propanoate(enrofloxacin tert-butyl)
RT, 24 hrs

57
Scheme 2. Synthesis of compound 2 (denoted as ENR acid hapten)
3.3.2 The spacer arm attachment via the piperazinyl moiety of ciprofloxacin to create
ciprofloxacinbutyl NHS ester hapten
The ciprofloxacin butyl NHS ester hapten was derived via the conjugation of 4‐
bromobutane NHS ester linker to the piperazynil group on ciprofloxacin. 1,4‐
Dibromobutane was attached to NHS under basic condition (pH 9.5) to give a linker of 4‐
bromobutane NHS (1‐[4‐bromobutoxy]pyrrolidine‐2,5‐dione), compound 3 (scheme 3).
Compound 3 was then coupled via the piperazinyl group of ciprofloxacin to form
compound 4 (scheme 4). The product was purified using flash column chromatography
packed with silica gel (column size; diameter: 30 mm, length: 20 cm; flow rate: 1 mL/min;
eluent: ethyl acetate/MeOH = 8:2).
3.3.2.1 Synthesis of 4‐bromobutane NHS ester linker, compound (3), scheme 3
1,4‐Dibromobutane (1032 mg, 4.78 mmol) was added to N‐Hydroxysuccinimide (NHS; 500
mg, 4.34 mmol) dissolved in dried dimethylsulfoxide (DMSO; 10 mL),=The mixture was
stirred for 15 min. Anhydrous potassium carbonate(K2CO3; 500 mg) was added to the
reaction mixture and stirred for 36 h at room temperature (approximately at 25oC). The
crude reaction mixture was washed with saturated brine solution (3 x 15 mL) and extracted
with ethyl acetate (30 mL). The aqueous layer was removed and ethyl acetate layer was
filtered through anhydrous sodium sulphate. The organic layer (ethyl acetate) was

58
evaporated to dryness under vacuum, yielding a brown viscous product (700mg, 35%).
Compound 3 was then confirmed by TLC, Rf = 0.67 (ethyl acetate) 1H‐NMR (300 Hz, CDCl3):
δ 1.88‐1.92 (m, 2H, CH2), 2.06‐2.11 (m, 2H, CH2), 2.70 (s, 4H, 2CH2, cyclopentana), 3.50 (t, J
= 6 Hz, 2H, CH2‐Br), 4.11 (t, J = 6 Hz, 2H, O‐CH2).
3.3.2.2 Synthesis of 1‐cyclopropyl‐7‐(4‐(4‐((2,5‐dioxopyrrolidin‐1‐yl)oxy)butyl)piperazin‐
1‐yl)‐6‐fluoro‐4‐oxo‐1,4‐dihydroquinoline‐3‐carboxylic acid, [ciprofloxacin butyl NHS
ester hapten], compound (4), scheme 4
Ciprofloxacin HCl (250 mg, 0.78 mmol) was dissolved in dried dimethysulfoxide (5 mL), and
compound 3 (375 mg, 1.55 mmol) was added and stirred for 30 min. Sodium hydride,
(NaH,45 mg, 1.88 mol) was added and the mixture was refluxed in a flask immersed an oil
bath at 60‐70oC for 36 h. The reaction mixture was washed with petroleum ether (3 x 10
mL) and extracted with DCM (10 mL). The organic layer (DCM) was evaporated to dryness
under vacuum. The crude product was purified by the chromatography column(i.e. packed
with silica gel; column size; diameter: 30 mm, length: 20 cm; flow rate: 1 mL/min; eluent:
ethyl acetate/MeOH = 8:2) and evaporated to dryness under high vacuum, giving a pale
brown product (430 mg, 65%).Compound 4 was then confirmed by TLC, Rf = 0.26 (ethyl
acetate/MeOH = 8:2) 1H‐NMR (300 Hz, DMSO‐d6): δ 1.52‐1.60 (m, 4H, [N(2CH2)]‐1) 2.31‐
2.44 (m, 2H, [CH2]‐6’), 2.31‐2.44 (m, 2H, [CH2]‐7’), 2.67 (s, 4H, [2(CH2)]‐3”4”), 2.73 (m, 2H
[CH2]‐5’), 3.73 (q, J = 4.5 Hz, 4H [2CH2]‐2’3’), 3.81‐3.89 (q, J = 10.5 Hz, 4H, [N(2CH2)]‐1’,4’),
3.97 (s, 2H [CH2]‐8’), 4.05‐4.17 (m, 1H, [N(CH)]‐1), 7.72 (d, J = 6 Hz, 1H, [CH]‐8), 8.04 (d, J =
3 Hz, 1H [NH]‐5)., 8.26 (s, 1H, [CH]‐2), 8.78 (s, 1H, [COOH]‐2).13C‐NMR (300 Hz, DMSO‐d6): δ
7.97 (d, [N(CH2CH3)]‐1), 25.83 (C‐3”,4”), 29.19 (C‐6’,7’), 34.34 (C‐5’), 36.32 (C‐8’), 39.31
([N(CH2CH3)]‐1), 40.74 (C‐2’3’), 49.45 (C‐1’,4’), 107.11 (C‐8), 111.51 (C‐3), 119.29 (C‐5),
139.46 (C‐9), 145.30 (d, J = 10.5 Hz, C‐10), 148.43 (C‐2’), 161.43 (C‐7), 166.27 (C‐6), 172.59
(C‐3), 173.94 (C‐2”,5”), 176.70 (C‐4).ESI‐HRMS: calculated for C25H29FN4O6: 500.21, found
m/z 501.2142 [M+H]+.

59
Scheme 3. Synthesis of compound 3 (4‐bromobutyl NHS ester)
Scheme 4. Synthesis of compound 4 (denoted as ciprofloxacin butyl NHS ester hapten)
3.3.3 The spacer arm attachment via piperazinyl moiety of norfloxacin to form
norfloxacin crotyl NHS ester
Norfloxacin crotyl NHS ester hapten was derived from the indirect conjugation of a
bromocrotyl NHS ester to the piperazynil group on norfloxacin. Initially, 4‐bromocrotonic
acid was prepared by hydrolysing 4‐bromocrotonate with dilute sodium hydroxide solution
and acidifying with diluted hydrochloride acid solution to give compound 5 (scheme 5). To

60
form a bromocrotyl NHS ester linker, 4‐bromocrotonic acid was reacted with DCC and NHS
in dimethoxy ethanol and DME to give compound 6 (scheme 6). Bromocrotyl NHS ester
was then attached through the piperazinyl group of norfloxacin in the presence of NHS to
make norfloxacin crotyl NHS ester hapten, compound 7 (scheme 7). Product was washed
with water and extracted with ethyl acetate. No further purification was performed.
3.3.3.1 Synthesis of 4‐bromocrotonic acid compound (5), scheme 5
Sodium hydroxide solution (1M, 10 mL) was added to methyl 4‐bromocrotonate (3000 mg,
17.0 mmol). The mixture was stirred at 0‐5oC for 5 h and left to stand at 4oC for 12‐24 h.
The mixture was acidified with hydrochloride acid (1M, 20 mL) and extracted with ether (3
x 25 mL). The organic layer was dried with anhydrous sodium sulphate and evaporated to
dryness under high vacuum. The product was purified by a flash column chromatography
(i.e. packed with silica gel; column size; diameter: 30 mm, length: 20 cm; flow rate: 1
mL/min; eluent: ethyl acetate/MeOH = 19:1) and the fraction containing the product was
evaporated to dryness under vacuum, giving a light yellow solid product (850 mg, 30%). 1H‐
NMR (300 Hz, CDCl3): δ 4.03 (dd, J= 3 Hz, 2H, [(CH2)Br]‐4), 6.05 (dt, J = 3 Hz, 15 Hz, 1H,
[(CH)]‐2), 7.07‐7.17 (m, 1H,[(CH)]‐3).
3.3.3.2 Synthesis of bromocrotyl NHS ester linker, compound (6), scheme 6
NHS (430 mg, 5.7 mmol) and DCC (1189 mg, 5.7 mmol) were added to a solution of 4‐
bromocrotonic acid (850 mg, 5.15 mmol) in DME (4 mL). The mixture was stirred at 0‐5oC
for 5 h and allowed to stand at 4oC for 12‐24 h. The product was purified by a flash column
chromatography (silica; column size; diameter: 30 mm, length: 20 cm; flow rate: 1 mL/min;
DCM/n‐hexane = 1:2) and evaporated to dryness under vacuum, giving a white solid (1000
mg, 41%). 1H‐NMR (300 Hz, CDCl3):δ 2.86 (s, 4H [(2CH2)]‐2’,3’), 4.07 (dd, J= 3 Hz, 2H,
[(CH2)Br]‐4), 6.25 (dt, J = 3 Hz, 15 Hz, 1H, [(CH)]‐2), 7.23‐7.33 (m, 1H, [(CH)]‐3).
3.3.3.3 Synthesis of (E)‐7‐(4‐(4‐((2,5‐dioxopyrrolidin‐1‐yl)oxy)‐4‐oxobut‐2‐en‐1‐
yl)piperazin‐1‐yl)‐1‐ethyl‐6‐fluoro‐4‐oxo‐1,4‐dihydroquinoline‐3‐carboxylic acid
[Norfloxacincrotyl NHS ester hapten], compound (7), scheme 7
To a dry DMSO (5mL), sodium hydride (NaH; 25.4 mg, 1.06 mmol) was added and stirred at
room temperature (approximately 25oC) for 10min. Norfloxacin (200 mg, 0.6 mmol) was
added and the mixture was stirred at room temperature for another 10 min. Bromocrotyl
NHS ester was then added and the mixture was stirred at room temperature for 24 h. The
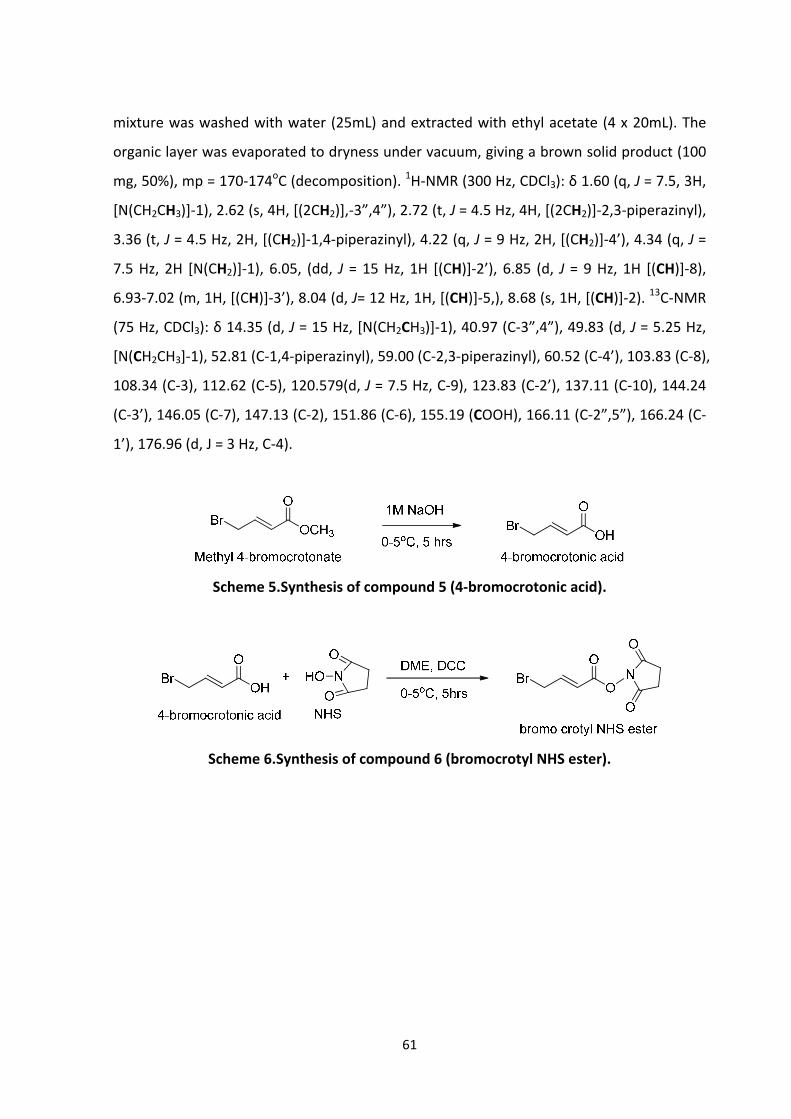
61
mixture was washed with water (25mL) and extracted with ethyl acetate (4 x 20mL). The
organic layer was evaporated to dryness under vacuum, giving a brown solid product (100
mg, 50%), mp = 170‐174oC (decomposition). 1H‐NMR (300 Hz, CDCl3): δ 1.60 (q, J = 7.5, 3H,
[N(CH2CH3)]‐1), 2.62 (s, 4H, [(2CH2)],‐3”,4”), 2.72 (t, J = 4.5 Hz, 4H, [(2CH2)]‐2,3‐piperazinyl),
3.36 (t, J = 4.5 Hz, 2H, [(CH2)]‐1,4‐piperazinyl), 4.22 (q, J = 9 Hz, 2H, [(CH2)]‐4’), 4.34 (q, J =
7.5 Hz, 2H [N(CH2)]‐1), 6.05, (dd, J = 15 Hz, 1H [(CH)]‐2’), 6.85 (d, J = 9 Hz, 1H [(CH)]‐8),
6.93‐7.02 (m, 1H, [(CH)]‐3’), 8.04 (d, J= 12 Hz, 1H, [(CH)]‐5,), 8.68 (s, 1H, [(CH)]‐2). 13C‐NMR
(75 Hz, CDCl3): δ 14.35 (d, J = 15 Hz, [N(CH2CH3)]‐1), 40.97 (C‐3”,4”), 49.83 (d, J = 5.25 Hz,
[N(CH2CH3]‐1), 52.81 (C‐1,4‐piperazinyl), 59.00 (C‐2,3‐piperazinyl), 60.52 (C‐4’), 103.83 (C‐8),
108.34 (C‐3), 112.62 (C‐5), 120.579(d, J = 7.5 Hz, C‐9), 123.83 (C‐2’), 137.11 (C‐10), 144.24
(C‐3’), 146.05 (C‐7), 147.13 (C‐2), 151.86 (C‐6), 155.19 (COOH), 166.11 (C‐2”,5”), 166.24 (C‐
1’), 176.96 (d, J = 3 Hz, C‐4).
Scheme 5.Synthesis of compound 5 (4‐bromocrotonic acid).
Scheme 6.Synthesis of compound 6 (bromocrotyl NHS ester).
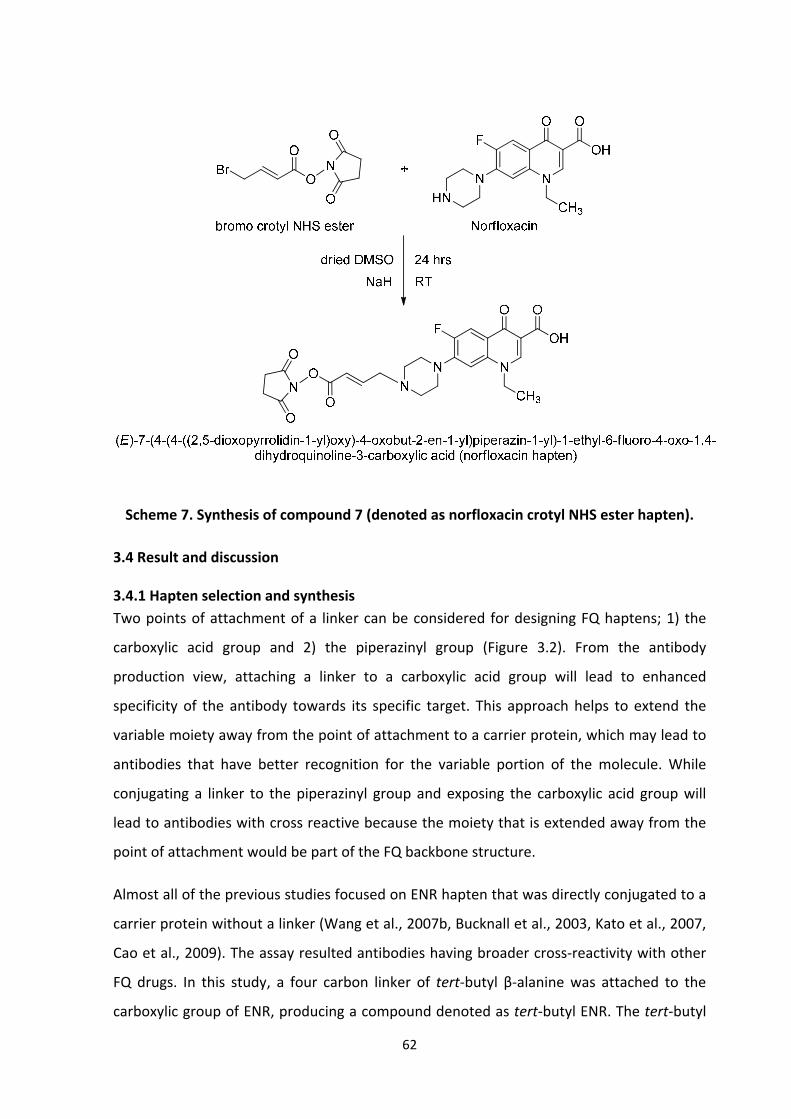
62
Scheme 7. Synthesis of compound 7 (denoted as norfloxacin crotyl NHS ester hapten).
3.4 Result and discussion
3.4.1 Hapten selection and synthesis
Two points of attachment of a linker can be considered for designing FQ haptens; 1) the
carboxylic acid group and 2) the piperazinyl group (Figure 3.2). From the antibody
production view, attaching a linker to a carboxylic acid group will lead to enhanced
specificity of the antibody towards its specific target. This approach helps to extend the
variable moiety away from the point of attachment to a carrier protein, which may lead to
antibodies that have better recognition for the variable portion of the molecule. While
conjugating a linker to the piperazinyl group and exposing the carboxylic acid group will
lead to antibodies with cross reactive because the moiety that is extended away from the
point of attachment would be part of the FQ backbone structure.
Almost all of the previous studies focused on ENR hapten that was directly conjugated to a
carrier protein without a linker (Wang et al., 2007b, Bucknall et al., 2003, Kato et al., 2007,
Cao et al., 2009). The assay resulted antibodies having broader cross‐reactivity with other
FQ drugs. In this study, a four carbon linker of tert‐butyl β‐alanine was attached to the
carboxylic group of ENR, producing a compound denoted as tert‐butyl ENR. The tert‐butyl
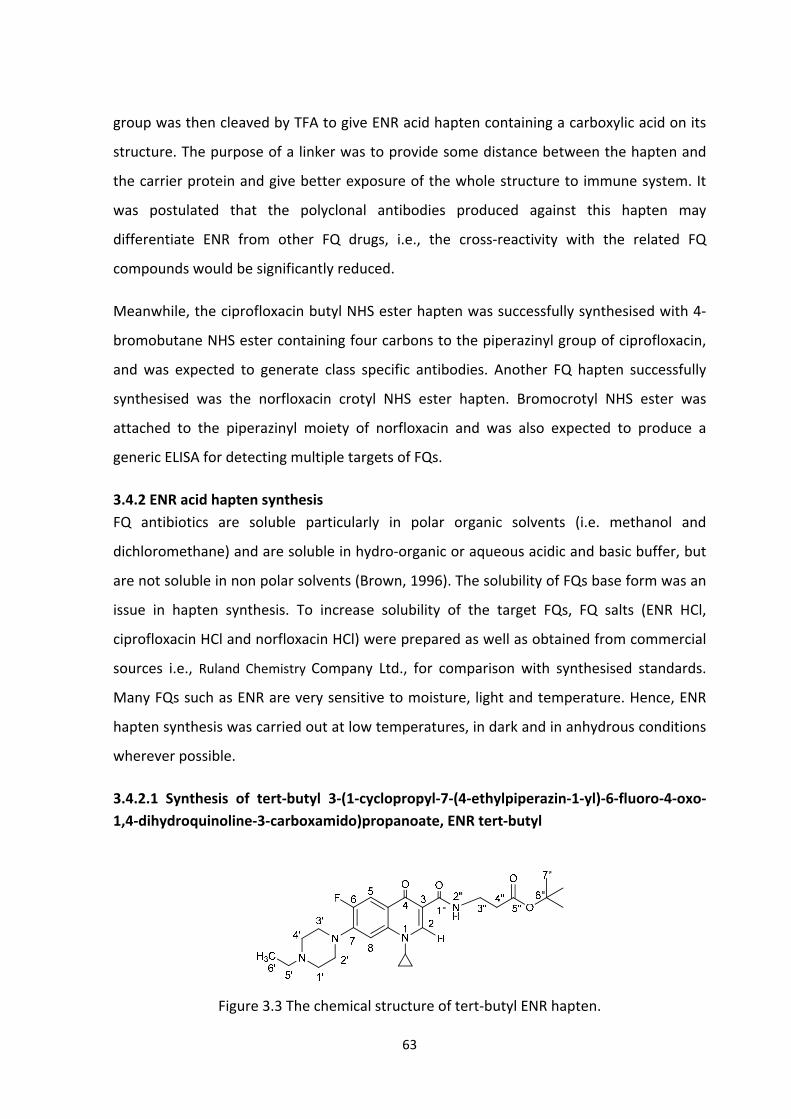
63
group was then cleaved by TFA to give ENR acid hapten containing a carboxylic acid on its
structure. The purpose of a linker was to provide some distance between the hapten and
the carrier protein and give better exposure of the whole structure to immune system. It
was postulated that the polyclonal antibodies produced against this hapten may
differentiate ENR from other FQ drugs, i.e., the cross‐reactivity with the related FQ
compounds would be significantly reduced.
Meanwhile, the ciprofloxacin butyl NHS ester hapten was successfully synthesised with 4‐
bromobutane NHS ester containing four carbons to the piperazinyl group of ciprofloxacin,
and was expected to generate class specific antibodies. Another FQ hapten successfully
synthesised was the norfloxacin crotyl NHS ester hapten. Bromocrotyl NHS ester was
attached to the piperazinyl moiety of norfloxacin and was also expected to produce a
generic ELISA for detecting multiple targets of FQs.
3.4.2 ENR acid hapten synthesis
FQ antibiotics are soluble particularly in polar organic solvents (i.e. methanol and
dichloromethane) and are soluble in hydro‐organic or aqueous acidic and basic buffer, but
are not soluble in non polar solvents (Brown, 1996). The solubility of FQs base form was an
issue in hapten synthesis. To increase solubility of the target FQs, FQ salts (ENR HCl,
ciprofloxacin HCl and norfloxacin HCl) were prepared as well as obtained from commercial
sources i.e., Ruland Chemistry Company Ltd., for comparison with synthesised standards.
Many FQs such as ENR are very sensitive to moisture, light and temperature. Hence, ENR
hapten synthesis was carried out at low temperatures, in dark and in anhydrous conditions
wherever possible.
3.4.2.1 Synthesis of tert‐butyl 3‐(1‐cyclopropyl‐7‐(4‐ethylpiperazin‐1‐yl)‐6‐fluoro‐4‐oxo‐
1,4‐dihydroquinoline‐3‐carboxamido)propanoate, ENR tert‐butyl
Figure 3.3 The chemical structure of tert‐butyl ENR hapten.

64
Tert‐butyl ENR strongly interacted with silica (<20% recovery) and upon interaction it was
very susceptible to degradation on silica chromatography. Initial attempts to purify tert‐
butyl ENR were performed by flash column chromatography using silica gel. The 1H‐NMR
spectrum of the purified tert‐butyl ENR indicated that it decomposed since there was no
cyclopropyl group on the primary amine at 4.18 ppm, no aromatic group at 7.03 and 8.29
ppm, and no tert‐butyl group at 1.38 ppm (Figure 3.6). The purification was then optimized
using a basic eluent system consisting of a mixture of ethyl acetate and triethylamine (TEA)
to neutralize the acidity of the silica gel on a flash chromatography system. However, this
condition did not prevent degradation of the product. To overcome this problem,
preparative thin layer chromatography (PTLC) was carried out, but was unsuccessful.
Consequently, conjugation of the ENR hapten to a carrier protein via two step reactions
was conducted without purification of the NHS active ester.
After putting considerable efforts on silica column without much success, gravity column
chromatography using neutral alumina was investigated, using ethyl acetate as an elution
solvent. Characterization by 1H‐NMR, as shown in Appendix A, confirmed an intact tert‐
butyl ENR hapten with no significant decomposition. A signal at 1.86 ppm corresponded to
the tert‐butyl group containing nine hydrogen atoms. More characteristic signals were a
doublet at 7.93 ppm that corresponds to the proton at position 2” and the quartet signals
at 3.95 and 4.48 ppm that belong to the tert‐butyl side chain at position 4” and 3”,
respectively. However, a dicyclohexylcarbodiimide urea by product was still visible in the
NMR spectra, showing several broad peaks with multiplets at 1.62 to 2.46 ppm. The signals
of dicyclohexylcarbodiimide urea by‐product usually can be detected at around 1.70 ppm
(multiplet), 2.46 and 3.38 ppm (triplet) and 2.26 ppm (single), which corresponds to six
hydrogen atoms on its structure (Mock and Ochwat, 2002). The singlet at 2.44 ppm was
also present on the tert‐butyl ENR1H‐NMR spectrum. This impurity, however, was not
removed to avoid potential decomposition of the product. 13C‐NMR and 135 DEPT‐NMR
characterizations were also performed to confirm the backbone of tert‐butyl ENR
(Appendix B and C).

65
3.4.2.2 Synthesis of 3‐(1‐cyclopropyl‐7‐(4‐ethylpiperazin‐1‐yl)‐6‐fluoro‐4‐oxo‐1,4‐
dihydroquinoline‐3‐carboxamido)propanoic acid, ENR acid hapten
Tert‐butyl ENR was treated with TFA to form the ENR butyric acid hapten (Figure 3.8). The
cleavage of tert‐butyl was confirmed to occur during TLC as determined using 1H‐NMR, 13C‐
NMR and LC/MS. Therefore, no purification was performed
Figure 3.4 The chemical structure of ENR acid hapten.
Based on the TLC, there were three spots which were subsequently eluted with ethyl
acetate namely, ENR, tert‐butyl ENR, and ENR acid hapten. All spots were intensely visible
under UV light at different Rf. The 1H‐NMR spectrum of ENR acid hapten (Appendix D)
confirmed the absence of hydrogen atoms belonging to a tert‐butyl group (9H, 3CH3),
which indicated the successful cleavage of the tert‐butyl group. Other characteristic signals
determined using1H‐NMR were the number of protons that correspond to the side chain of
ENR acid hapten structure at positions 2”, 3” and 4”. Further confirmation was conducted
using 13C‐NMR and 135 DEPT‐NMR to evaluate ENR acid hapten (Appendix E and F).
As shown in Appendix G, low resolution mass spectrometry (LRMS) confirmed the
formation of ENR acid hapten, with the m/z 431.30 [M + Na]+ being consistent with
C22H27FN4O4. An exact mass measurement verified the presence of m/z peaks
corresponding to the molecular weight of ENR acid hapten of 430.47.
3.4.3 Ciprofloxacin bromobutane NHS ester hapten synthesis
Another attachment point for a spacer arm was used for the ciprofloxacin hapten synthesis
which was through a piperazinyl group of the FQ structure. This hapten was expected to
generate a class specific assay by exposing a carboxylic moiety as an immunodominant
region of FQs structures. To prepare ciprofloxacin bromobutane NHS ester hapten, a 4‐
bromobutane NHS ester linker was first formed by an attachment to the piperazinyl group
of ciprofloxacin as described below.
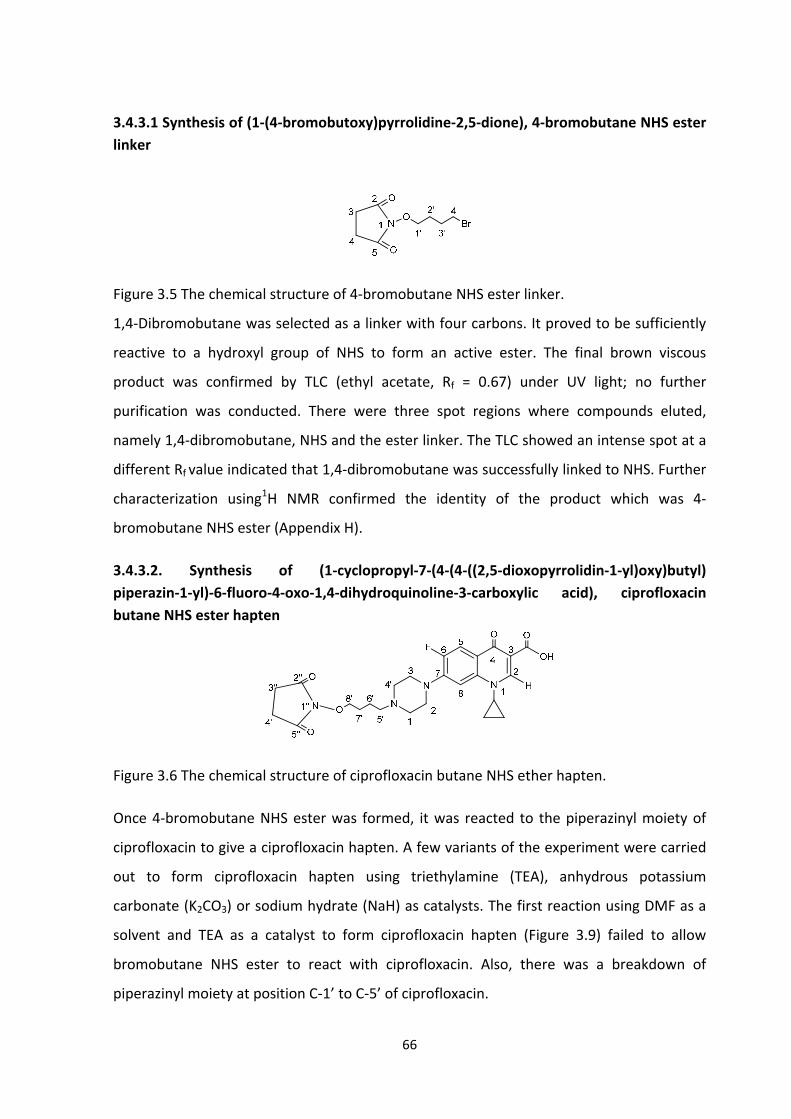
66
3.4.3.1 Synthesis of (1‐(4‐bromobutoxy)pyrrolidine‐2,5‐dione), 4‐bromobutane NHS ester
linker
Figure 3.5 The chemical structure of 4‐bromobutane NHS ester linker.
1,4‐Dibromobutane was selected as a linker with four carbons. It proved to be sufficiently
reactive to a hydroxyl group of NHS to form an active ester. The final brown viscous
product was confirmed by TLC (ethyl acetate, Rf = 0.67) under UV light; no further
purification was conducted. There were three spot regions where compounds eluted,
namely 1,4‐dibromobutane, NHS and the ester linker. The TLC showed an intense spot at a
different Rf value indicated that 1,4‐dibromobutane was successfully linked to NHS. Further
characterization using1H NMR confirmed the identity of the product which was 4‐
bromobutane NHS ester (Appendix H).
3.4.3.2. Synthesis of (1‐cyclopropyl‐7‐(4‐(4‐((2,5‐dioxopyrrolidin‐1‐yl)oxy)butyl)
piperazin‐1‐yl)‐6‐fluoro‐4‐oxo‐1,4‐dihydroquinoline‐3‐carboxylic acid), ciprofloxacin
butane NHS ester hapten
Figure 3.6 The chemical structure of ciprofloxacin butane NHS ether hapten.
Once 4‐bromobutane NHS ester was formed, it was reacted to the piperazinyl moiety of
ciprofloxacin to give a ciprofloxacin hapten. A few variants of the experiment were carried
out to form ciprofloxacin hapten using triethylamine (TEA), anhydrous potassium
carbonate (K2CO3) or sodium hydrate (NaH) as catalysts. The first reaction using DMF as a
solvent and TEA as a catalyst to form ciprofloxacin hapten (Figure 3.9) failed to allow
bromobutane NHS ester to react with ciprofloxacin. Also, there was a breakdown of
piperazinyl moiety at position C‐1’ to C‐5’ of ciprofloxacin.

67
Figure 3.7 Synthesis of ciprofloxacin butane NHS ether hapten catalysed by TEA.
A mild catalyst, K2CO3, was attempted to form a ciprofloxacin haptensinceK2CO3 was
successfully used in the reaction of 4‐bromobutane NHS ester. The reaction (Figure 3.10)
was again periodically monitored by TLC and 1H‐NMR, but the 1H‐NMR spectrum indicated
no success. Therefore, a more harsh condition using NaH as a catalyst and dry DMSO was
conducted. NaH is a strong base and reacts easily with an amine of the piperazinyl moiety.
The TLC showing an intense spot at a different Rf value indicated that 4‐bromobutane NHS
ester was successfully linking to ciprofloxacin to form ciprofloxacin bromo NHS ester
hapten

68
Figure 3.8 Synthesis of ciprofloxacin bromo NHS ether hapten catalysed by K2CO3.
Further characterization by 1H‐NMR showed that proton corresponded to proton at
position C‐5’ which was the triplet at 2.73 ppm (methylene group attached to piperazinyl
moiety), and other protons that corresponded to the five member ring of ester linker at
position C‐6’, C‐7’, C‐8’ were present (Appendix I). However, the proton at position C‐8’
(methylene group attached to oxygen of the ester linker) showed a broad singlet at 3.97
ppm, which was expected to be a triplet. This was likely due to the proximity to an oxygen
group resulting in merging of anion and thus broadening of the signal. The13C‐NMR
spectrum also confirmed the backbone of ciprofloxacin hapten. The ESI‐HRMS (Appendix L)
confirmed the presence of m/z peaks corresponding to the molecular weight of
ciprofloxacin butane NHS ester hapten of 500.52.
3.4.4 Norfloxacin crotyl NHS ester hapten synthesis
Norfloxacin crotyl NHS ester hapten was formed by attaching bromocrotyl NHS ester to the
piperazinyl group of norfloxacin so that the spacer arm could then be attached. Norfloxacin
hapten was synthesised using bromocrotyl NHS ester as a linker to develop a broad cross
reactive assay. Bromocrotyl NHS ester was chosen because it was an active electrophile,
and was sufficiently reactive to an amine on the piperazinyl group of norfloxacin. Also,
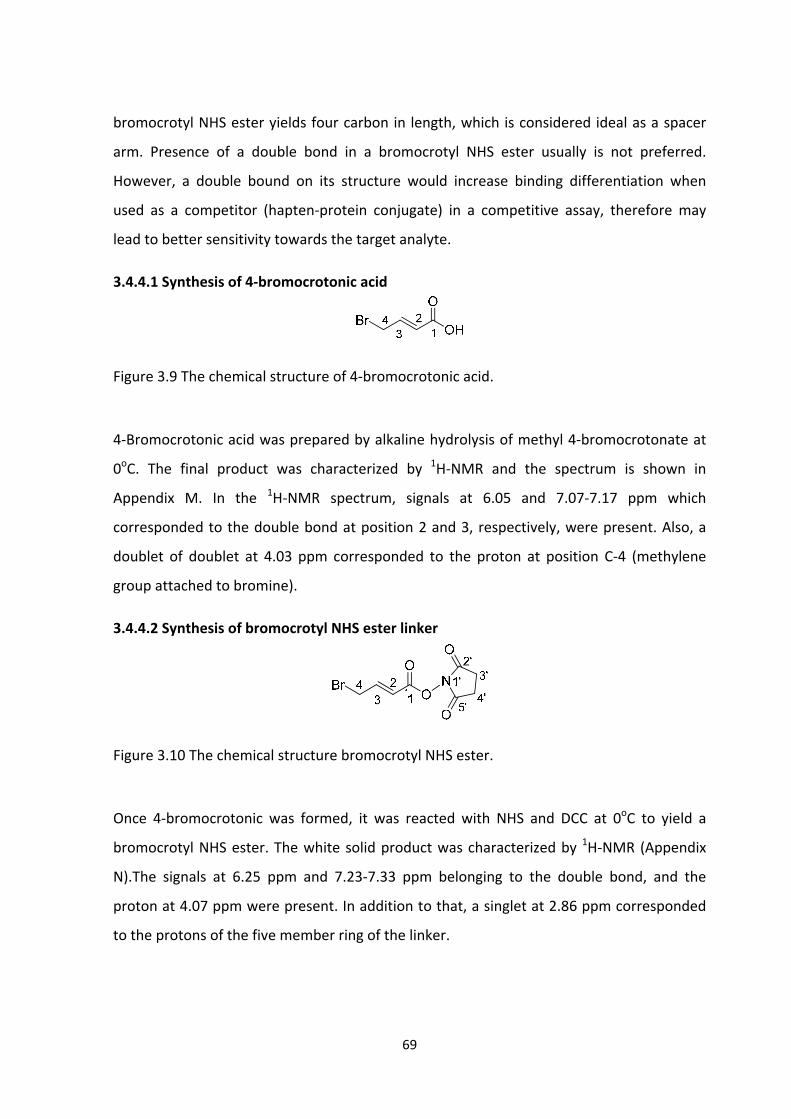
69
bromocrotyl NHS ester yields four carbon in length, which is considered ideal as a spacer
arm. Presence of a double bond in a bromocrotyl NHS ester usually is not preferred.
However, a double bound on its structure would increase binding differentiation when
used as a competitor (hapten‐protein conjugate) in a competitive assay, therefore may
lead to better sensitivity towards the target analyte.
3.4.4.1 Synthesis of 4‐bromocrotonic acid
Figure 3.9 The chemical structure of 4‐bromocrotonic acid.
4‐Bromocrotonic acid was prepared by alkaline hydrolysis of methyl 4‐bromocrotonate at
0oC. The final product was characterized by 1H‐NMR and the spectrum is shown in
Appendix M. In the 1H‐NMR spectrum, signals at 6.05 and 7.07‐7.17 ppm which
corresponded to the double bond at position 2 and 3, respectively, were present. Also, a
doublet of doublet at 4.03 ppm corresponded to the proton at position C‐4 (methylene
group attached to bromine).
3.4.4.2 Synthesis of bromocrotyl NHS ester linker
Figure 3.10 The chemical structure bromocrotyl NHS ester.
Once 4‐bromocrotonic was formed, it was reacted with NHS and DCC at 0oC to yield a
bromocrotyl NHS ester. The white solid product was characterized by 1H‐NMR (Appendix
N).The signals at 6.25 ppm and 7.23‐7.33 ppm belonging to the double bond, and the
proton at 4.07 ppm were present. In addition to that, a singlet at 2.86 ppm corresponded
to the protons of the five member ring of the linker.
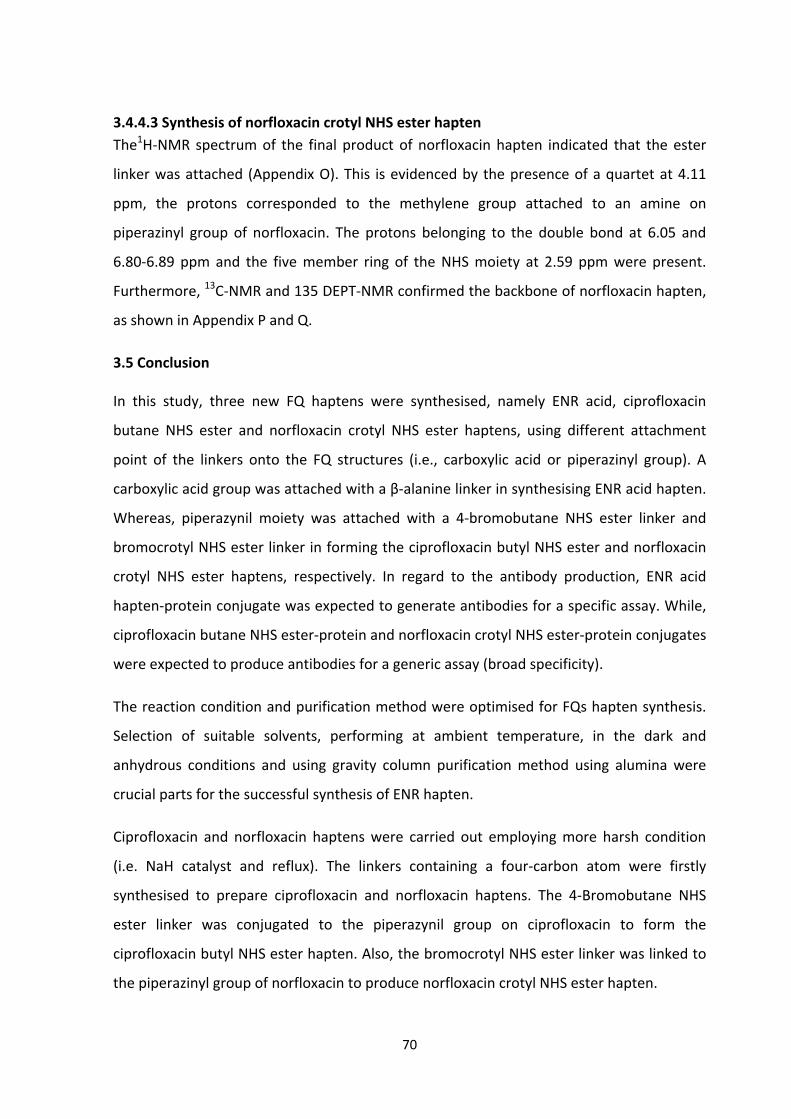
70
3.4.4.3 Synthesis of norfloxacin crotyl NHS ester hapten
The1H‐NMR spectrum of the final product of norfloxacin hapten indicated that the ester
linker was attached (Appendix O). This is evidenced by the presence of a quartet at 4.11
ppm, the protons corresponded to the methylene group attached to an amine on
piperazinyl group of norfloxacin. The protons belonging to the double bond at 6.05 and
6.80‐6.89 ppm and the five member ring of the NHS moiety at 2.59 ppm were present.
Furthermore, 13C‐NMR and 135 DEPT‐NMR confirmed the backbone of norfloxacin hapten,
as shown in Appendix P and Q.
3.5 Conclusion
In this study, three new FQ haptens were synthesised, namely ENR acid, ciprofloxacin
butane NHS ester and norfloxacin crotyl NHS ester haptens, using different attachment
point of the linkers onto the FQ structures (i.e., carboxylic acid or piperazinyl group). A
carboxylic acid group was attached with a β‐alanine linker in synthesising ENR acid hapten.
Whereas, piperazynil moiety was attached with a 4‐bromobutane NHS ester linker and
bromocrotyl NHS ester linker in forming the ciprofloxacin butyl NHS ester and norfloxacin
crotyl NHS ester haptens, respectively. In regard to the antibody production, ENR acid
hapten‐protein conjugate was expected to generate antibodies for a specific assay. While,
ciprofloxacin butane NHS ester‐protein and norfloxacin crotyl NHS ester‐protein conjugates
were expected to produce antibodies for a generic assay (broad specificity).
The reaction condition and purification method were optimised for FQs hapten synthesis.
Selection of suitable solvents, performing at ambient temperature, in the dark and
anhydrous conditions and using gravity column purification method using alumina were
crucial parts for the successful synthesis of ENR hapten.
Ciprofloxacin and norfloxacin haptens were carried out employing more harsh condition
(i.e. NaH catalyst and reflux). The linkers containing a four‐carbon atom were firstly
synthesised to prepare ciprofloxacin and norfloxacin haptens. The 4‐Bromobutane NHS
ester linker was conjugated to the piperazynil group on ciprofloxacin to form the
ciprofloxacin butyl NHS ester hapten. Also, the bromocrotyl NHS ester linker was linked to
the piperazinyl group of norfloxacin to produce norfloxacin crotyl NHS ester hapten.

71
CHAPTER 4. DEVELOPMENT OF THE SPECIFIC ENR ELISA (ENR‐ELISA)
4.1 Introduction
ENR (ENR) is a member of the FQ family of antibiotics, with high bactericidal action. It was
the first FQs drug used in veterinary medicine and for pets and domestic animals treatment
since 1995 (Nelson et al., 2007). It is also used frequently in cattle and poultry to eliminate
Salmonella infection (Mitchell, 2006). However, due to increases in the resistant strain of
Campylobacter sp., it has been withdrawn from the U.S. market in 2005, (Nelson et al.,
2007), Zhao et al., 2009). The use of ENR as a veterinary drug in many countries (other than
the U.S.) leads to the concern about the presence and accumulation of ENR residues in
food. Residues of ENR in animal edible tissues entering into the human food chain could
pose a serious hazard to human health and a potential risk for an emergence and spread of
FQ resistant bacteria (Sheng et al., 2009a).
To prevent the negative impact of FQ residues on human health, the maximum residue
limits (MRLs) of FQs in seafood and animal‐derived products have been established and
regulated by various agencies such as the European Union (EU) and, and the Regulation for
Usage Veterinary Medicines in Japan. The EU and the joint FAO/WHO Expert Committee on
Food Additives (JECFA) have established MRLs for ENR, ciprofloxacin and their active
metabolites between 100 and 300 µg kg‐1 in muscle tissues, fat and milk for all species
(Hernandez‐Arteseros et al., 2002). The National Standardization Agency of Indonesia
refers to FAO/WHO Expert Committee on Food Authority (JECFA) for guidance in
establishing MRLs for FQ residues. Meanwhile, in Australia, FQ antibiotics are not
permitted for use in agriculture or aquaculture without a specific permit or prescription.
In order to regulate FQs residues in foodstuffs of animal origin, a wide range of analytical
methods have been applied. Analytical methods used for the determination of FQs
residues include high performance liquid chromatography (HPLC) with UV/fluorescence
detectors (Hung, 2007, Carlucci, 1998, Espinosa‐Mansilla et al., 2006, Gigosos et al., 2000,
Hassonuan et al., 2007a, Hassonuan et al., 2007b, Holtzapple et al., 2000, Yorke and Froc,
2000, Zheng et al., 2005, Holtzapple et al., 2001, Holtzapple and Stanker, 1998, Pena et al.,

72
2010), liquid chromatography mass spectrometry (LC‐MS) (Marchesini et al., 2007), liquid
chromatography tandem mass spectrometry (LC‐MS/MS) (Bogialli et al., 2008, Ikegawa,
1998, Johnston et al., 2002, Toussaint et al., 2005a, Toussaint et al., 2005b, Van Vyncht et
al., 2002), capillary electrophoresis (Fierens et al., 2000) gas chromatography (GC)
(Takatsuki, 1991), thin layer chromatography (TLC) / immuno‐chromatography (Sun et al.,
2007, Zhu et al., 2008). More recently, bio sensors for FQ detection, which require no
separation steps, have been reported (Cao et al., 2007, Giroud et al., 2009, Marchesini et
al., 2007).
These instrumental methods often required extensive sample preparation that involves
interference removal and concentration, which is a time‐consuming and laborious process.
These methods also require technically skilled personnel to maintain instruments and
interpret instrument outputs. Moreover, many of these instruments are very expensive in
both setting up and running costs. Therefore, developing simple, rapid and cost‐effective
methods, such as immunoassays, that provide advantages over the instrumentation
techniques would be beneficial for laboratories that cannot afford such expensive
instruments, such as those regulatory laboratories in Indonesia.
Immunoassays are a method principally based on antibody‐antigen binding properties.
They have been applied to determine a wide range of contaminants, including pesticides
and veterinary drugs in food. The technique increasingly play an important role in food
analysis by improving analytical capacity, thus ensuring food safety (Chen et al., 2009b).
Many immunoassays as screening methods also have been successfully used as
alternatives or complementary to instrument‐based methods for detecting FQs
contaminants in food commodities ( Bucknall et al., 2003, Huet et al., 2006, Wang et al.,
2007a, Li et al., 2008).
Most of the ENR immunoassays also detect other FQs to certain degrees (Wang et al.,
2007b, Bucknall et al., 2003, Kato et al., 2007, Cao et al., 2009). To our best knowledge,
there have been no reports on an assay that is highly specific to ENR. Hence, this study
reports, for this first time, the synthesis of novel haptens of ENR with a suitable spacer arm
and the development of an indirect competitive ELISA highly specific to ENR. The validation
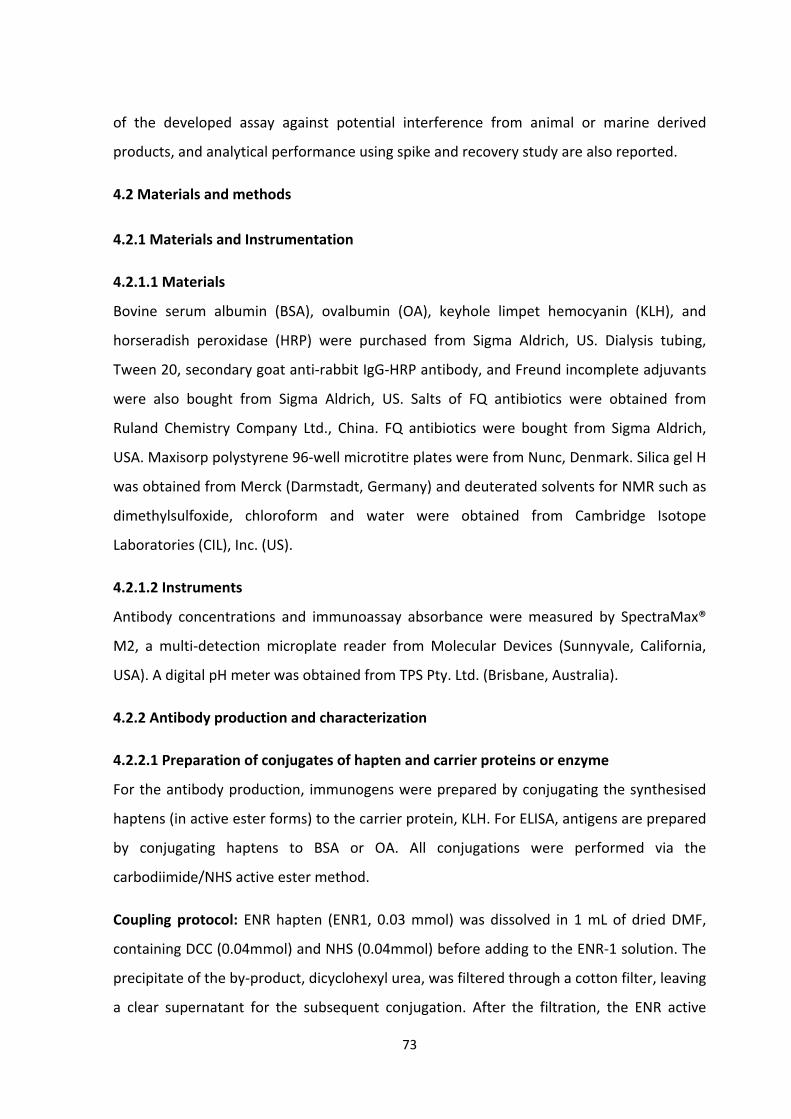
73
of the developed assay against potential interference from animal or marine derived
products, and analytical performance using spike and recovery study are also reported.
4.2 Materials and methods
4.2.1 Materials and Instrumentation
4.2.1.1 Materials
Bovine serum albumin (BSA), ovalbumin (OA), keyhole limpet hemocyanin (KLH), and
horseradish peroxidase (HRP) were purchased from Sigma Aldrich, US. Dialysis tubing,
Tween 20, secondary goat anti‐rabbit IgG‐HRP antibody, and Freund incomplete adjuvants
were also bought from Sigma Aldrich, US. Salts of FQ antibiotics were obtained from
Ruland Chemistry Company Ltd., China. FQ antibiotics were bought from Sigma Aldrich,
USA. Maxisorp polystyrene 96‐well microtitre plates were from Nunc, Denmark. Silica gel H
was obtained from Merck (Darmstadt, Germany) and deuterated solvents for NMR such as
dimethylsulfoxide, chloroform and water were obtained from Cambridge Isotope
Laboratories (CIL), Inc. (US).
4.2.1.2 Instruments
Antibody concentrations and immunoassay absorbance were measured by SpectraMax®
M2, a multi‐detection microplate reader from Molecular Devices (Sunnyvale, California,
USA). A digital pH meter was obtained from TPS Pty. Ltd. (Brisbane, Australia).
4.2.2 Antibody production and characterization
4.2.2.1 Preparation of conjugates of hapten and carrier proteins or enzyme
For the antibody production, immunogens were prepared by conjugating the synthesised
haptens (in active ester forms) to the carrier protein, KLH. For ELISA, antigens are prepared
by conjugating haptens to BSA or OA. All conjugations were performed via the
carbodiimide/NHS active ester method.
Coupling protocol: ENR hapten (ENR1, 0.03 mmol) was dissolved in 1 mL of dried DMF,
containing DCC (0.04mmol) and NHS (0.04mmol) before adding to the ENR‐1 solution. The
precipitate of the by‐product, dicyclohexyl urea, was filtered through a cotton filter, leaving
a clear supernatant for the subsequent conjugation. After the filtration, the ENR active

74
ester solution was added dropwise to each protein (BSA, OA or KLH) dissolved in pre‐
cooled coupling buffer (50mM phosphate buffer, pH 9.1). The schematic reaction is shown
in Figure 4.1. The reaction solution was gently stirred and was allowed to stand at 4C
overnight. The conjugated solution was then dialysed against 50mM phosphate buffered
saline (PBS, pH 7.4) with several buffer changes and the protein conjugate solution was
stored at 4C until use.
Figure 4.1 The schematic reaction of ENR hapten‐protein conjugation.
4.2.2.2 Immunisation and antibody production
An immunogen was prepared by emulsifying ENR‐1‐KLH with 0.9% NaCl (saline) and
TitreMax Gold adjuvantor Freund’s incomplete adjuvant. The New Zealand white rabbits
were immunised with the immunogen by subcutaneous injections. Subsequent booster
injections were given at monthly intervals for six months. The blood was collected from the
marginal ear vein on a monthly basis and the antiserum was isolated from the blood by
centrifugation.

75
4.2.2.3 Purification of Rabbit IgG
Sera were purified by an affinity chromatography on protein A/G Sepharose (Pharmacia‐GE
healthcare). Firstly, the serum was diluted with an equal volume of phosphate buffer and
the mixture was loaded onto the protein A/G column (protein A/G Sepharose,
size/volume/capacity = 5 mL, flow rate = 1.5 mL/min). The IgG was eluted with acetate
buffer at pH 4. The eluent which contained the IgG fraction was immediately neutralised
with 1 M Tris base (pH 11). The purified antibody was then dialysed against PBS, pH 7.4,
before storing at 4°C.
4.2.2.4 Determining antibody concentration
The concentration of purified polyclonal antibodies (pAbs) was determined by measuring
the absorbance at 280 nm. The absorbance was measured against PBS as a reference. The
concentration of antibody was calculated using Equation 1:
Antibody concentration (mg/mL) = 1........EqdA
Where: A = absorbance at 280 nm
d = dilution factor
ε = IgG extinction coefficient, which is 1.35 (Nikolayenko et al., 2005).
4.2.2.5 Determining optimum working concentration by checkerboard titration
The checkerboard titration (CBT) was performed to determine the optimum working
concentrations of each antibody and enzyme‐conjugate pair. The CBT was carried out as
follows:
1. A coating conjugate (e.g., either OA‐ or BSA‐hapten conjugate) was immobilised on a
96‐microwell plate by incubating a coating antigen at 10 µg mL‐1 (1 µg per well)
dissolved in the coating buffer (50mM carbonate buffer, pH 9.6). After the plate was
left to stand overnight at room temperature, it was washed for three times with
deionized water and dried by tapping on an absorbent paper towel.

76
2. For blocking of the unoccupied space in the microwells, the plate was incubated with 3%
skim milk solution at 200 µL per well for 1 h at room temperature, prior to being
washed three times with deionized water.
3. Antibodies were diluted in 1% fish gelatine in PBS (denoted as FG/PBS) and were
titrated in 3‐fold serial dilutions. The plate was incubated for 1h and washed as
previously described.
4. A solution of anti‐rabbit IgG‐HRP conjugate (1:2000 in 1% FG/PBS‐0.05% Tween 20, 100
µL per well) was incubated for an additional 1h at room temperature.
5. The colour reaction was developed by incubating with a substrate/chromogen solution
(1.25mM 3,3’5,5’‐tetramethylbenzidine(TMB)in acetate buffer (pH 5.0) containing urea
hydrogen peroxide, 100 µL per well) for 30 min.
6. The reaction was stopped by adding the stop solution (1.25M sulfuric acid, 50 µL per
well).
7. The absorbance was measured at 450 nm and 650 nm.
4.2.2.6 Determining Sensitivity
4.2.2.6.1 Preparation of standard solution
A 1000 µg L‐1 stock solution of ENR was prepared and diluted in 50 mM NaOH (0.5%) in PBS
(pH 7.4). A serial dilution of working standards at 1000, 300, 100, 30, 10, 3, 1, 0.3 and 0.1
ng L‐1 was prepared from the 1000µg L‐1stock solution.
4.2.2.6.2 Indirect Competitive ELISA protocol
The ENR‐ovalbumin conjugate (ENR‐OA) was immobilised onto a microwell plate at 1 ng
per well. The plate was washed three times with deionized water and dried. The unbound
sites on the microtitre plates were blocked with 3% skim milk (200 µL of per well) by
incubating for 1 h at room temperature, prior to washing and drying of the plate.
For the blank, the respective wells were loaded with 100 µL of deionized water and100 µL
of 50mMNaOH (0.5%) in PBS (pH 7.4). For the control, the respective wells were loaded
with 100 µL of 50mMNaOH 0.5% in PBS and 100 µL of 1% FG/PBS (as an antiserum diluent).
ENR standard solutions (100 µL per well) were added to the respective wells, followed by
77
an antiserum solution (100 µL per well). The mixture was incubated for 1 h at room
temperature. The microwells were washed again and a solution of anti‐rabbit IgG‐HRP
conjugate solution was incubated for 1h (100 µL per well). After washing the plate, colour
reaction was developed by incubating the substrate solution for 30 min and the reaction
was stopped with1.25M H2SO4. The absorbance was measured at 450nm and 650 nm.
Figure 4.2 illustrates the above procedure diagrammatically.
Figure 4.2 Schematic presentation of an indirect competitive ELISA for ENR.
4.2.2.6.3 Determination of standard curve parameter
A calibration curve (dose‐response) of an analyte was constructed by plotting
concentration on the x‐axis versus absorbance on the y‐axis. Percent inhibition (%I) for
each standard point and sample were calculated according to the Equation 2.The assay
sensitivity, calculated as an IC50, and a limit of detection (LOD), were obtained from the
calibration curves. An IC50 is a concentration of an analyte required to inhibit antigen‐
antibody interaction by 50%. The LOD for the assay was determined by a concentration
that reproducibly producing 20% inhibition of colour development.
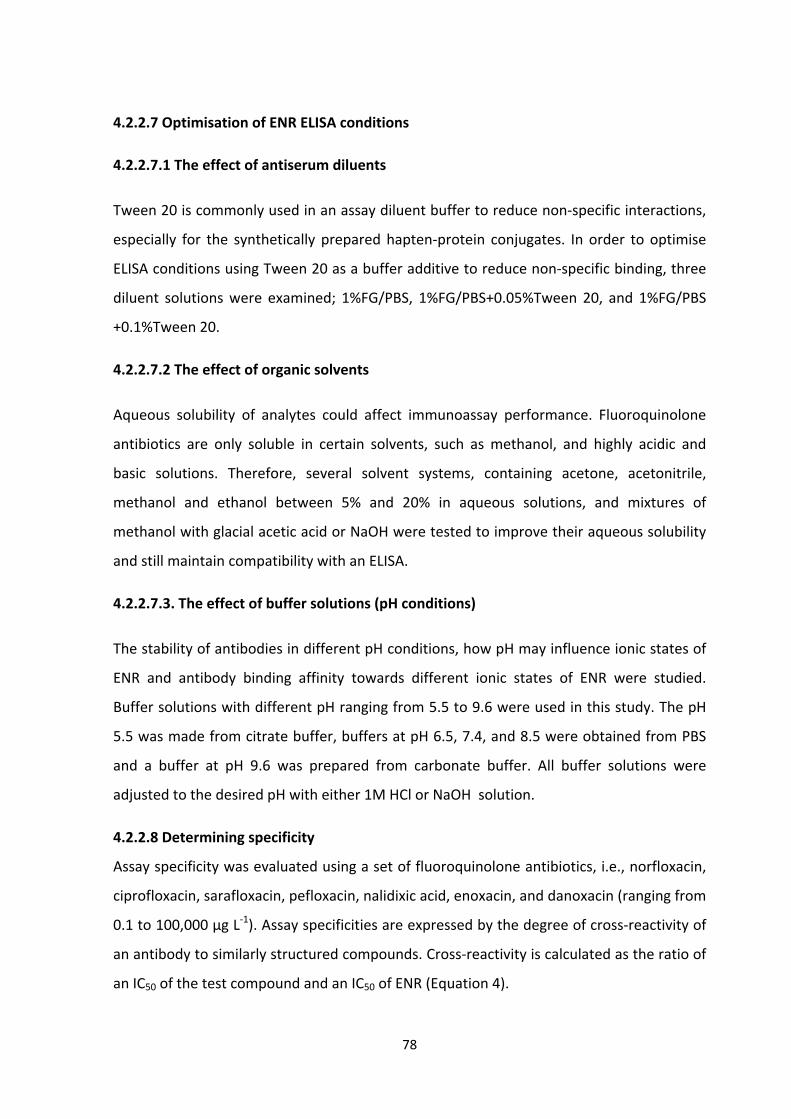
78
4.2.2.7 Optimisation of ENR ELISA conditions
4.2.2.7.1 The effect of antiserum diluents
Tween 20 is commonly used in an assay diluent buffer to reduce non‐specific interactions,
especially for the synthetically prepared hapten‐protein conjugates. In order to optimise
ELISA conditions using Tween 20 as a buffer additive to reduce non‐specific binding, three
diluent solutions were examined; 1%FG/PBS, 1%FG/PBS+0.05%Tween 20, and 1%FG/PBS
+0.1%Tween 20.
4.2.2.7.2 The effect of organic solvents
Aqueous solubility of analytes could affect immunoassay performance. Fluoroquinolone
antibiotics are only soluble in certain solvents, such as methanol, and highly acidic and
basic solutions. Therefore, several solvent systems, containing acetone, acetonitrile,
methanol and ethanol between 5% and 20% in aqueous solutions, and mixtures of
methanol with glacial acetic acid or NaOH were tested to improve their aqueous solubility
and still maintain compatibility with an ELISA.
4.2.2.7.3. The effect of buffer solutions (pH conditions)
The stability of antibodies in different pH conditions, how pH may influence ionic states of
ENR and antibody binding affinity towards different ionic states of ENR were studied.
Buffer solutions with different pH ranging from 5.5 to 9.6 were used in this study. The pH
5.5 was made from citrate buffer, buffers at pH 6.5, 7.4, and 8.5 were obtained from PBS
and a buffer at pH 9.6 was prepared from carbonate buffer. All buffer solutions were
adjusted to the desired pH with either 1M HCl or NaOH solution.
4.2.2.8 Determining specificity
Assay specificity was evaluated using a set of fluoroquinolone antibiotics, i.e., norfloxacin,
ciprofloxacin, sarafloxacin, pefloxacin, nalidixic acid, enoxacin, and danoxacin (ranging from
0.1 to 100,000 µg L‐1). Assay specificities are expressed by the degree of cross‐reactivity of
an antibody to similarly structured compounds. Cross‐reactivity is calculated as the ratio of
an IC50 of the test compound and an IC50 of ENR (Equation 4).

79
4.2.2.9 Study of Matrix Effects
An ELISA is usually affected by the physical, biological, and chemical components in the
matrices such as protein, fat, sugar, pigments and tannins (Lee and Kenney, 2007). To
minimise matrix interferences, a number of techniques, such as extraction of an analyte
into a water miscible solvent, dilution, preheating to denature protein or a combination of
these techniques, was employed. As ENR is frequently used in farm animal and aquaculture,
edible tissue and animal‐derived products, such as liver, milk and prawn were chosen for
matrix effect studies.
4.2.2.9.1 Animal and marine product samples
Animal‐derived products (such as milk and chicken liver) and seafood products (such as
prawn) were obtained from various local sources, from Coles supermarket, local markets
and butchers in Kensington, Kingsford and Randwick, New South Wales. Milk samples
consisted of full cream milk, full cream milk powder, skim milk and skim milk powder.
Samples were also obtained from organic food markets (e.g., chicken liver) and imported
sources (e.g., prawn).
4.2.2.9.2 Protocol for sample extraction of chicken liver and prawn
Chicken liver and prawn samples were homogenised using a homogeniser. Homogenised
chicken liver or prawn (2.0 g) was mixed with 2 mL of 10% 50 mM NaOH in MeOH in a 50
mL polypropylene centrifuge tube, prior to being vortexed for 2 min. The PBS (18mL) was
added to the sample mixture and the solution was vortexed for 30 sec. The sample was
allowed to stand for 30 min and they were placed in a water‐bath shaker at 40oC for 15 min.
The solution was centrifuged at 4500 rpm (2268 g) for 10 min. The supernatant was
transferred into another centrifuge tube, and the sample was re‐extracted with 15 mL of
the extraction buffer twice and centrifuged using the same condition. The supernatants
were combined. Together with the blank solution, the extracted samples were spiked with
ENR for the matrix effect study.

80
4.2.2.9.3 Protocol for matrix effect determination of milk
Milk samples were preheated to 80oC for 5 min; 30 min heating was required for skim and
full cream milk samples. Samples were diluted by 5, 10 and 20‐fold (v/v) with PBS and were
centrifuged at 4500 rpm (2268 g) for 10 min.
4.2.3 Spiking and recovery studies
The recovery was determined by spiking ENR into milk, chicken liver and prawn samples to
the final concentrations of 5, 10, 20 and 50 µg L‐1, and the spiked samples were analysed by
ENR1 ELISA using AbαENR1‐KLH against ENR1‐OA.
4.2.3.1 Protocol for spiking of chicken liver and prawn with ENR
Chicken liver and prawn samples were spiked with various concentrations of ENR above
and below the MRL values prior to the extraction. Homogenised samples were weighed
(approximately 2.0 g) and placed into a 50 mL polypropylene centrifuge tube. ENR (not
exceeding 100 µL for a 2 g sample) at 250, 500, 1000 and 2500 µg L‐1 were spiked into the
homogenised samples to give the final concentrations of 5, 10, 20 and 50 µg L‐1 in the test
samples. The spiked samples were allowed to stand for 30 min at room temperature
before proceeding with the extraction.
4.2.3.2 Protocol for spiking of milk with ENR
Milk samples were spiked with ENR to achieve concentrations above and below the MRL
values for milk (between 10 and 3000 µg L‐1). ENR (not exceeding 100 µL) was spiked to the
final concentrations of 5, 10, 20 and 50 µg L‐1. Samples were allowed to stand for 30 min at
room temperature prior to the thermal treatment.
Table 4.1 shows the concentrations of ENR that were spiked into food samples and dilution
factors that were applied to the sample extraction. The recovery was calculated by
interpolating the ENR concentration from a % inhibition calibration curve.
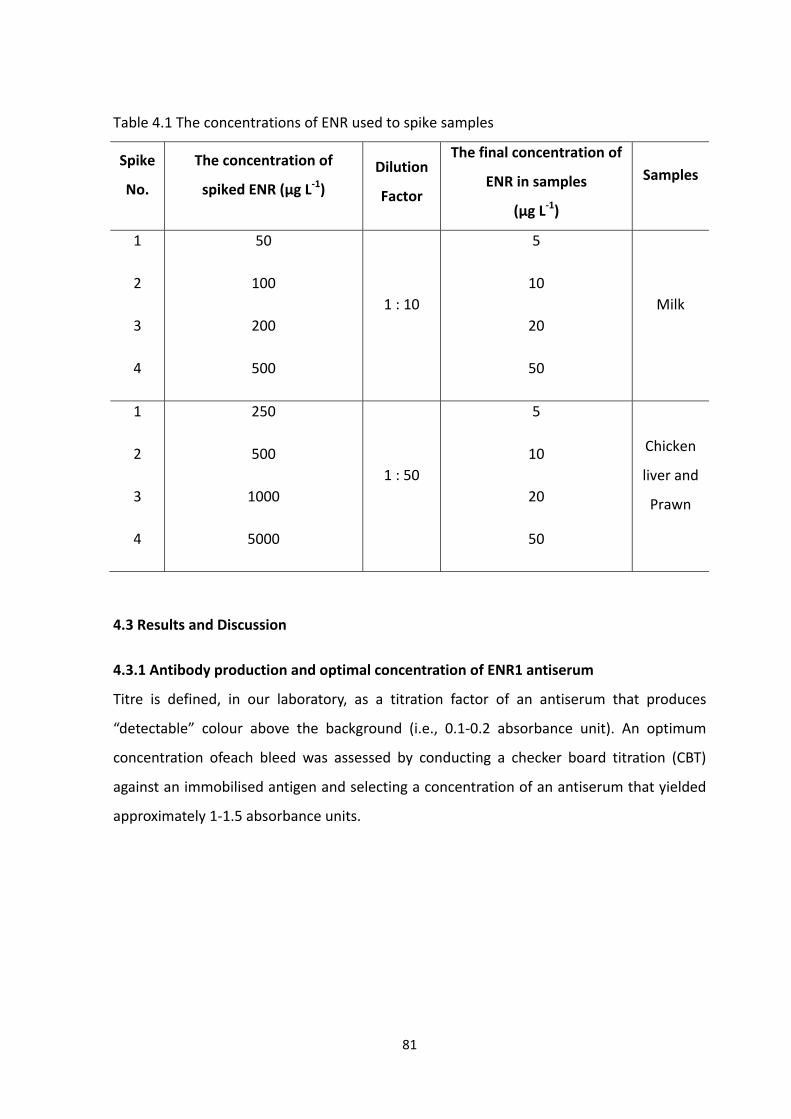
81
Table 4.1 The concentrations of ENR used to spike samples
Spike
No.
The concentration of
spiked ENR (µg L‐1)
Dilution
Factor
The final concentration of
ENR in samples
(µg L‐1)
Samples
1
2
3
4
50
100
200
500
1 : 10
5
10
20
50
Milk
1
2
3
4
250
500
1000
5000
1 : 50
5
10
20
50
Chicken
liver and
Prawn
4.3 Results and Discussion
4.3.1 Antibody production and optimal concentration of ENR1 antiserum
Titre is defined, in our laboratory, as a titration factor of an antiserum that produces
“detectable” colour above the background (i.e., 0.1‐0.2 absorbance unit). An optimum
concentration ofeach bleed was assessed by conducting a checker board titration (CBT)
against an immobilised antigen and selecting a concentration of an antiserum that yielded
approximately 1‐1.5 absorbance units.

82
Figure 4.3 Titration curve of AbENR1‐KLH against ENR1‐OA from six different bleeds (first
bleed to sixth bleed) by an indirect ELISA format.
The Figure 4.3 presents titration curves of antisera from the first to the sixth collection
(defined as bleed). Each antiserum was titrated against ENR1‐OA antigen in an indirect
ELISA to allow selection of the optimum serum dilutions for further characterization in a
competitive format. The optimum concentration of first bleed (B#1), second bleed (B#2),
third bleed (B#3), forth bleed (B#4), fifth bleed (B#5) and sixth bleed (B#6) were 1/15,000,
1/10,000, 1/10,000, 1/5,000,1/5,000 and 1/2500, respectively. As shown in Figure 4.3, the
first bleed of AbENR1‐KLH yielded the highest titre of ENR specific antibody with a gradual
decrease in the titre values of the subsequent bleeds. This was unexpected and may be due
to the hydrolysis of the immunogen ENR1‐KLH conjugate, resulting in cleavage of the
hapten from the carrier protein during the storage at 4oC. Further immunization with newly
prepared immunogens, however, did not improve the immune response of the animals.
4.3.2 Antibody characterisation
The coating antigens were prepared by conjugating various FQ haptens to OA via the NHS
active ester method, yielding eight different FQ haptens‐OA conjugates. To evaluate assay
0.0
0.5
1.0
1.5
2.0
2.5
3.0
3.5
500 5000 50000 500000 5000000 50000000
Absorban
ce (450 nm)
Antisera dilution factor
B#1
B#2
B#3
B#4
B#5
B#6
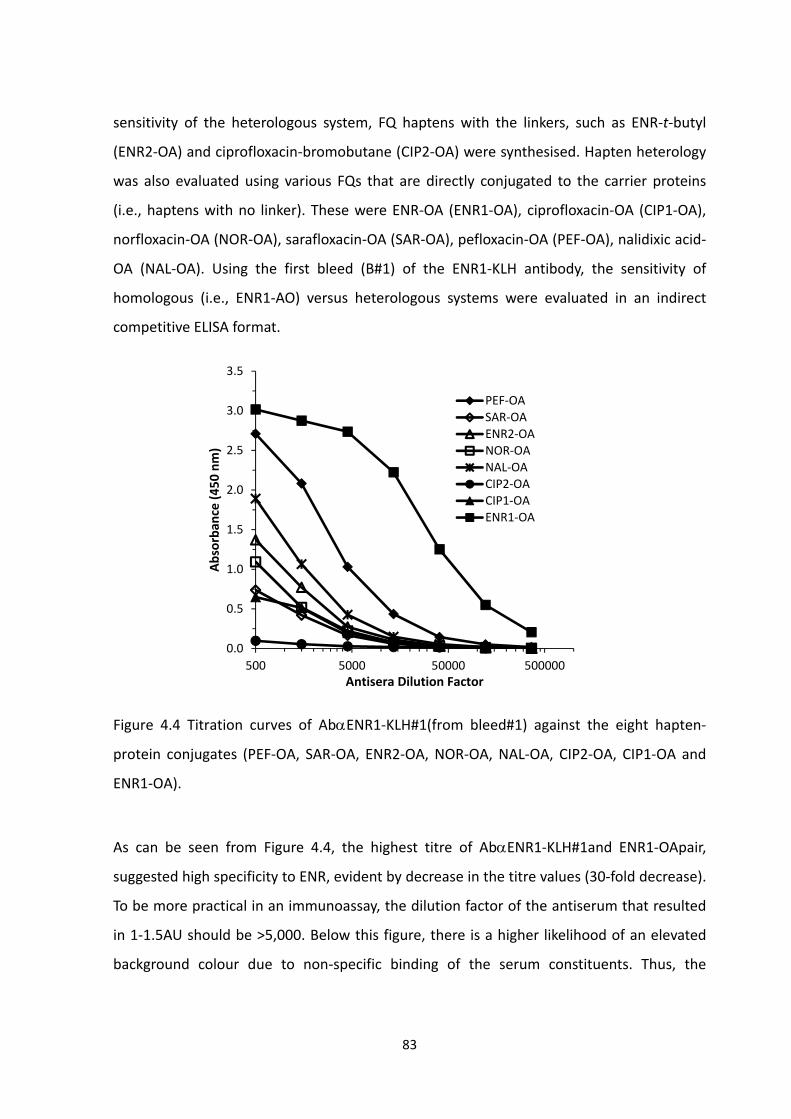
83
sensitivity of the heterologous system, FQ haptens with the linkers, such as ENR‐t‐butyl
(ENR2‐OA) and ciprofloxacin‐bromobutane (CIP2‐OA) were synthesised. Hapten heterology
was also evaluated using various FQs that are directly conjugated to the carrier proteins
(i.e., haptens with no linker). These were ENR‐OA (ENR1‐OA), ciprofloxacin‐OA (CIP1‐OA),
norfloxacin‐OA (NOR‐OA), sarafloxacin‐OA (SAR‐OA), pefloxacin‐OA (PEF‐OA), nalidixic acid‐
OA (NAL‐OA). Using the first bleed (B#1) of the ENR1‐KLH antibody, the sensitivity of
homologous (i.e., ENR1‐AO) versus heterologous systems were evaluated in an indirect
competitive ELISA format.
Figure 4.4 Titration curves of AbENR1‐KLH#1(from bleed#1) against the eight hapten‐
protein conjugates (PEF‐OA, SAR‐OA, ENR2‐OA, NOR‐OA, NAL‐OA, CIP2‐OA, CIP1‐OA and
ENR1‐OA).
As can be seen from Figure 4.4, the highest titre of AbENR1‐KLH#1and ENR1‐OApair,
suggested high specificity to ENR, evident by decrease in the titre values (30‐fold decrease).
To be more practical in an immunoassay, the dilution factor of the antiserum that resulted
in 1‐1.5AU should be >5,000. Below this figure, there is a higher likelihood of an elevated
background colour due to non‐specific binding of the serum constituents. Thus, the
0.0
0.5
1.0
1.5
2.0
2.5
3.0
3.5
500 5000 50000 500000
Absorban
ce (450 nm)
Antisera Dilution Factor
PEF‐OA
SAR‐OA
ENR2‐OA
NOR‐OA
NAL‐OA
CIP2‐OA
CIP1‐OA
ENR1‐OA

84
homologous assay utilising AbENR1‐KLH (antibody) and ENR1‐OA as a competing antigen
was selected for further characterisation.
4.3.2 Assay Sensitivity
Assay sensitivity was defined by running standard curves of ENR in the homologous assay
using AbENR1‐KLH and ENR1‐OApair. The seven antigens derived from FQs‐OA conjugates
againstthe first and second bleeds of AbENR1‐KLH (B#1 and B#2) were evaluated (Table
4.2). The homologous assay generated better sensitivity than heterologous system, with an
IC50 value of 15 µg L‐1. The antibodies from the first bleed (B#1, IC50= 15 µg L
‐1) exhibited
better sensitivity than those from the second bleed (B#2, IC50 = 100 µg L‐1). The assay with
the hapten homology and linker heterology (i.e., using ENR2‐OA as a competing antigen)
gave very poor sensitivity (>1000 µg L‐1). While the hapten heterologous assays which were
based on other FQs‐OA conjugates exhibited very low colour development and poor
sigmoidal dose‐response curves.
Table 4.2 The IC50 values (µg L‐1) of the assays based on the combination of 14 FQ hapten‐
OA conjugates competed with ENR for AbENR1‐KLH by the indirect competitive ELISA
OA‐Conjugates
(Coating antigens)
IC50(µg L‐1)
First Bleed (B#1) Second Bleed (B#2)
ENR‐1‐OA
ENR‐2‐OA
CIP‐OA
NOR‐OA
SAR‐OA
NAL‐OA
PEF‐OA
15
>1000
ND*
ND*
ND*
ND*
ND*
100
>1000
ND*
ND*
ND*
ND*
ND*
ND* the assay exhibited very low colour, and did not show the ideal standard curves.
In this study, the absolute homologous assays using a combination of AbENR1‐KLH‐#1 as
an antibody and ENR‐1‐OA as an immobilised antigen (i.e., both hapten and linkage are the

85
same for the immunogen and the competing antigen) gave the best sensitivity of 15 µg L‐1.
A calibration curve using ENR‐1‐BSA as a solid phase antigen also did not show an ideal
dose‐response relationship. This was probably due to an interaction between BSA with ENR,
resulting in less available competing hapten (or epitope) on ENR1‐BSA conjugates or free
ENR (analyte) for binding with the antibody. BSA has been reported to increase non‐
specific binding of ciprofloxacin, resulting in lower sensitivity and specific and sensitivity in
an immunoassay (Snitkoff et al., 1998. Duan and Yuan, 2001).
4.3.3 Evaluation of assay parameters (IC80, IC50, IC20 and maximum absorbance)
Nine point calibration curves of ENR are shown in Figure 4.5. The results were averaged
over 25 analyses carried out on different days. The % CV of % inhibition decreased as the
concentration of ENR increased as shown in Figure 4.6. This curve indicates a typical
precision of a sigmoidal dose‐response relationship of an immunoassay (Lee and Kennedy,
2007). As shown in Table 4.3, the IC50 value was 11.8± 1.7 µg L‐1 (%CV = 14%). An IC20 value
refers to, in this study, as the LOD, was 2.4 ± 0.4 µg L‐1 (%CV = 17%). An IC80 value, which
referred to a concentration of ENR to inhibit 80% of colour development and defined as
upper detection limit of the detection range, was 91.4 ± 6.1 µg L‐1 (%CV = 7%). The average
maximum absorbance was 1.6± 0.1, with a %CV of 6%. The %CV of the absorbance of nine
ENR concentrations ranged from 5 to 35% (Figure 4.6).
Table 4.3 Standard curve parameters and precision of ENR assay
Parameters Concentration
(µg L‐1) S.D.a %CVb
IC50
IC20
IC80
Maximum absorbance
11.7
2.4
91.41
1.6
1.7
0.4
6.1
0.1
14
17
7
6
a standard deviation
b%coefficient variation
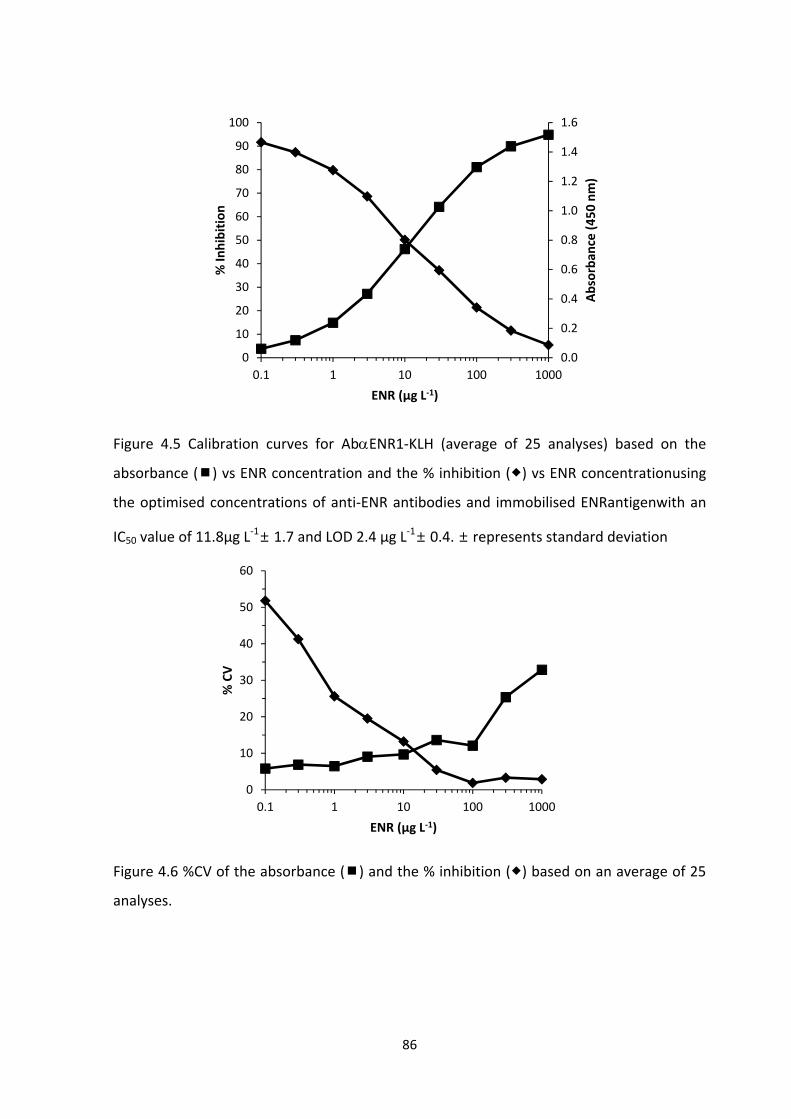
86
Figure 4.5 Calibration curves for AbENR1‐KLH (average of 25 analyses) based on the
absorbance () vs ENR concentration and the % inhibition () vs ENR concentrationusing
the optimised concentrations of anti‐ENR antibodies and immobilised ENRantigenwith an
IC50 value of 11.8µg L‐1± 1.7 and LOD 2.4 µg L‐1± 0.4. ± represents standard deviation
Figure 4.6 %CV of the absorbance () and the % inhibition () based on an average of 25
analyses.
0.0
0.2
0.4
0.6
0.8
1.0
1.2
1.4
1.6
0
10
20
30
40
50
60
70
80
90
100
0.1 1 10 100 1000
Absorban
ce (450 nm)
% In
hibition
ENR (µg L‐1)
0
10
20
30
40
50
60
0.1 1 10 100 1000
% CV
ENR (µg L‐1)
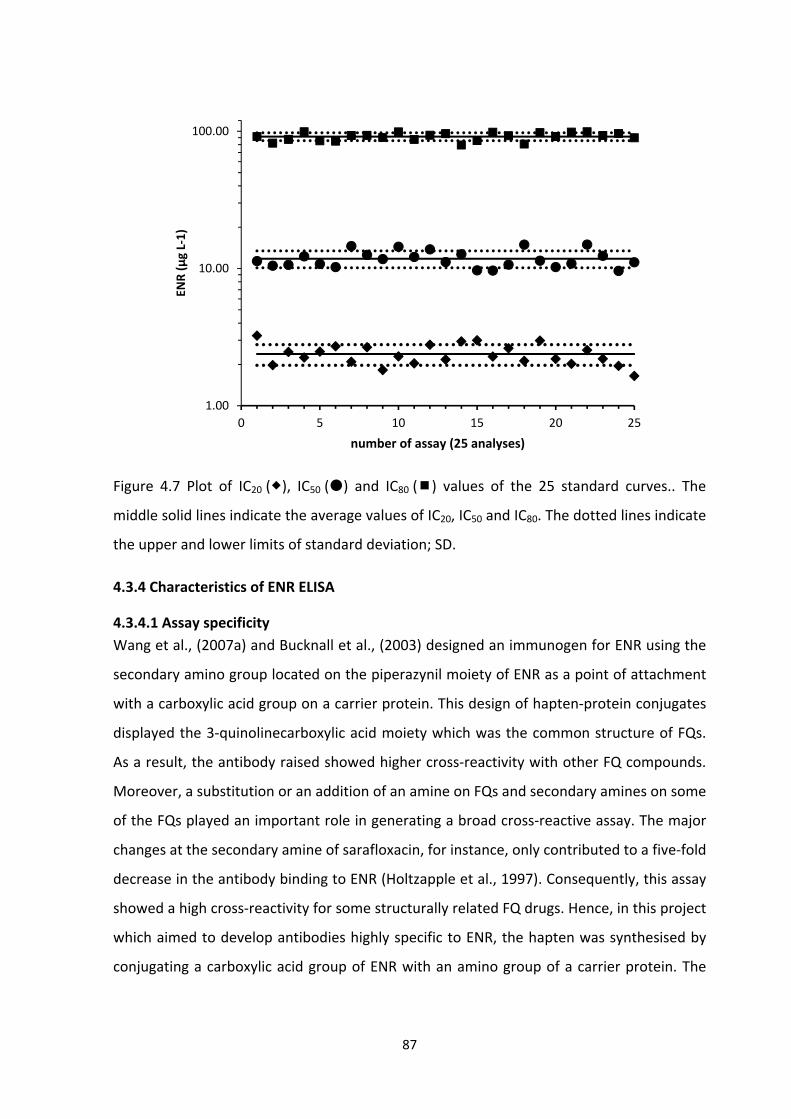
87
Figure 4.7 Plot of IC20 (), IC50 () and IC80 () values of the 25 standard curves.. The
middle solid lines indicate the average values of IC20, IC50 and IC80. The dotted lines indicate
the upper and lower limits of standard deviation; SD.
4.3.4 Characteristics of ENR ELISA
4.3.4.1 Assay specificity
Wang et al., (2007a) and Bucknall et al., (2003) designed an immunogen for ENR using the
secondary amino group located on the piperazynil moiety of ENR as a point of attachment
with a carboxylic acid group on a carrier protein. This design of hapten‐protein conjugates
displayed the 3‐quinolinecarboxylic acid moiety which was the common structure of FQs.
As a result, the antibody raised showed higher cross‐reactivity with other FQ compounds.
Moreover, a substitution or an addition of an amine on FQs and secondary amines on some
of the FQs played an important role in generating a broad cross‐reactive assay. The major
changes at the secondary amine of sarafloxacin, for instance, only contributed to a five‐fold
decrease in the antibody binding to ENR (Holtzapple et al., 1997). Consequently, this assay
showed a high cross‐reactivity for some structurally related FQ drugs. Hence, in this project
which aimed to develop antibodies highly specific to ENR, the hapten was synthesised by
conjugating a carboxylic acid group of ENR with an amino group of a carrier protein. The
1.00
10.00
100.00
0 5 10 15 20 25
ENR (µg L‐1)
number of assay (25 analyses)
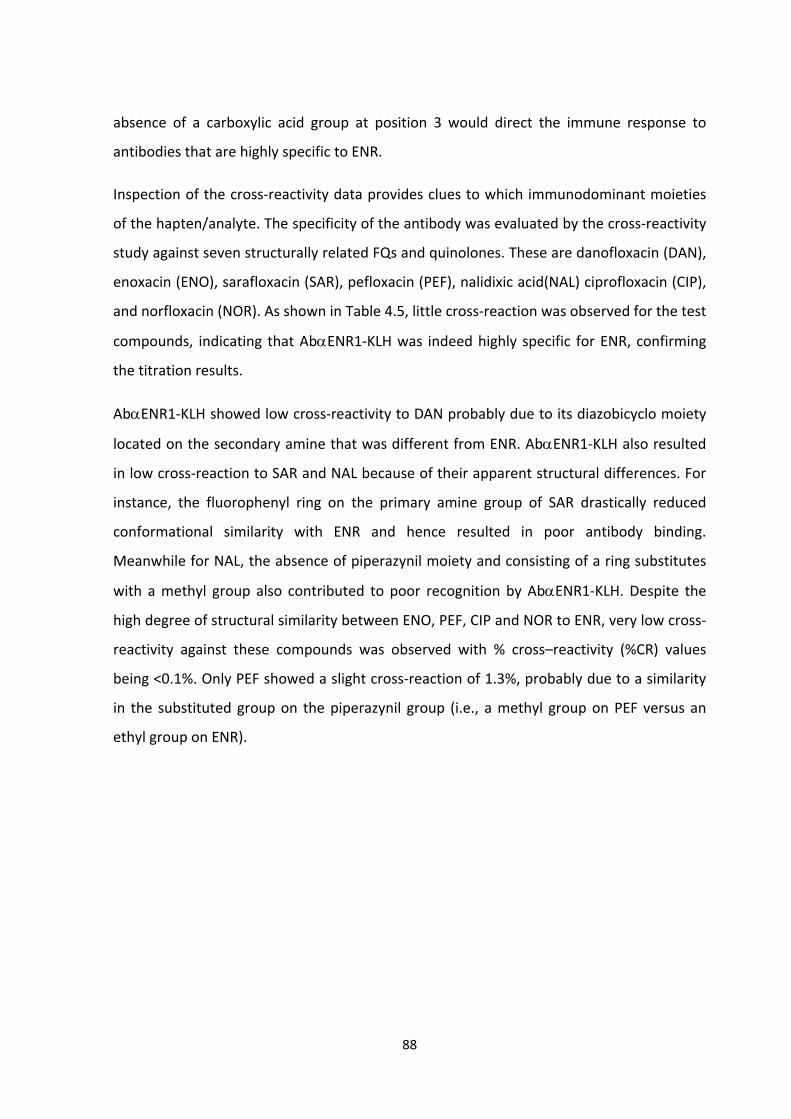
88
absence of a carboxylic acid group at position 3 would direct the immune response to
antibodies that are highly specific to ENR.
Inspection of the cross‐reactivity data provides clues to which immunodominant moieties
of the hapten/analyte. The specificity of the antibody was evaluated by the cross‐reactivity
study against seven structurally related FQs and quinolones. These are danofloxacin (DAN),
enoxacin (ENO), sarafloxacin (SAR), pefloxacin (PEF), nalidixic acid(NAL) ciprofloxacin (CIP),
and norfloxacin (NOR). As shown in Table 4.5, little cross‐reaction was observed for the test
compounds, indicating that AbENR1‐KLH was indeed highly specific for ENR, confirming
the titration results.
AbENR1‐KLH showed low cross‐reactivity to DAN probably due to its diazobicyclo moiety
located on the secondary amine that was different from ENR. AbENR1‐KLH also resulted
in low cross‐reaction to SAR and NAL because of their apparent structural differences. For
instance, the fluorophenyl ring on the primary amine group of SAR drastically reduced
conformational similarity with ENR and hence resulted in poor antibody binding.
Meanwhile for NAL, the absence of piperazynil moiety and consisting of a ring substitutes
with a methyl group also contributed to poor recognition by AbENR1‐KLH. Despite the
high degree of structural similarity between ENO, PEF, CIP and NOR to ENR, very low cross‐
reactivity against these compounds was observed with % cross–reactivity (%CR) values
being <0.1%. Only PEF showed a slight cross‐reaction of 1.3%, probably due to a similarity
in the substituted group on the piperazynil group (i.e., a methyl group on PEF versus an
ethyl group on ENR).

89
Table 4.4 The IC50 (µg L‐1) and cross reactivity (%CR) for FQs related compounds
Compound Chemical structure IC
parameters µg L‐1
%CR
(µg L‐1) mol L‐1
%CR
(mol L‐1)
Enrofloxacin
(ENR)
IC50 27.31 100 7.6 x 10‐8 100
IC20 4.53 100 1.3 x 10‐8 100
IC80 232.06 100 6.5 x 10‐7 100
Danofloxacin
(DAN)
IC50 >1000 0.1 7.8 x 10‐5 0.1
IC20 >1000 0.2 8.4 x 10‐6 0.1
IC80 >1000 0.1 4.8 x 10‐4 0.1
Enoxacin
(ENO)
IC50 >1000 <0.1 4.6 x 10‐4 <0.1
IC20 >1000 <0.1 7.0 x 10‐5 <0.1
IC80 >1000 <0.1 4.6 x 10‐3 <0.1
Pefloxacin
(PEF)
IC50 >1000 1.3 7.2 x 10‐6 1.2
IC20 >1000 0.3 1.0 x 10‐6 0.3
IC80 >1000 1.8 6.0 x 10‐5 1.2

90
Table 4.4The IC50 (µg L‐1) and cross reactivity (%CR) for FQs related compounds (continued)
Compound Chemical structure
IC
parameter
s
µg L‐1 %CR
(µg L‐1) mol L‐1
%CR
(mol L‐1)
Nalidixic acid
(NAL)
IC50 >1000 <0.1 0.64 <0.1
IC20 >1000 <0.1 3.9 x 10‐3 <0.1
IC80 >1000 <0.1 106.53 <0.1
Ciprofloxacin
(CIP)
IC50 >1000 <0.1 2.7 x 10‐4 <0.1
IC20 >1000 <0.1 1.9 x 10‐5 <0.1
IC80 >1000 <0.1 1.4 x 10‐3 <0.1
Norfloxacin
(NOR)
IC50 >1000 <0.1 6.9 x 10‐4 <0.1
IC20 >1000 <0.1 3.7 x 10‐5 <0.1
IC80 >1000 <0.1 4.2 x 10‐3 <0.1
Sarafloxacin
(SAR)
IC50 >1000 <0.1 6.2 x 10‐4 <0.1
IC20 >1000 <0.1 8.7 x 10‐5 <0.1
IC80 >1000 <0.1 3.6 x 10‐3 <0.1
4.3.4.2 Assay Optimisation
Immunoassay performance may be affected by surfactants, organic solvents, pH, sample
matrices or salt concentrations (Lee and Kennedy, 2007; Sheng et al., 2009b). The effects of
these variables on the assay were tested by analysing changes in the maximum absorbance
values at zero concentration of ENR (denoted as the maximum absorbance, Amax), and IC50

91
values of standard curves of diluents containing Tween 20, organic solvents and varying pH
values.
4.3.4.2.1 Effects of diluents
Tween 20 is a non‐ionic surfactant and is commonly added to assay buffers to minimise
non‐specific binding (Lee and Kennedy, 2007). In order to determine the effect of this
surfactant on assay performance, four serum diluents consisting of PBS, 1% FG‐PBS, 1% FG‐
PBS + 0.05% Tween 20, 1% FG‐PBS + 0.1% Tween 20 were evaluated. As can be seen in
Table 4.6, these diluents, except for PBS, did not affect significantly on the assay
performance, with regards to both assay sensitivity and colour development. Briefly,
addition of fish gelatine enhanced both colour development and assay sensitivity as
measured by %I. An addition of Tween 20 enhanced colour development slightly, but did
not alter the sensitivity.
Table 4.5 Effect of diluents on antibody’s sensitivity
Assay diluents PBS ± SD (n=3) 1% FG‐PBS (control) ± SD (n=3)
1% FG‐PBS + 0.05%Tween 20
± SD (n=3)
1% FG‐PBS + 0.1% Tween 20
± SD (n=3)
Absorbance
maximum (Amax) ^0.8 ± 0.01 1.3 ± 0.02 ^1.6 ± 0.02 ^1.6 ± 0.01
%CV (Amax) 1.6 1.2 1.3 0.4
IC50 (µg L‐1) ^18.9 ± 1.5 11.0 ± 3.4 *11.5 ± 0.8 *13.4 ± 0.7
%CV (IC50) 7.9 30.7 7.0 5.6
Each value represents the mean of triplicates (n=3) with standard deviation (SD). Statistical
analysis was calculated using t‐test (α = 0.05). *no significant difference with control (1%
FG‐PBS). ^significant difference with control (1% FG‐PBS).
When PBS was used alone as a serum diluent without 1%FG and Tween 20, the IC50 values
increased approximately by two‐folds and the Amax values decreased by almost 50%
compared with 1%FG‐PBS as a control. Diluents containing Tween 20 affected colour
development considerably, by showing 0.2‐0.3 AU increase in Amax values. However, there
was no difference among the IC50 values of the assay diluents with and without Tween 20.
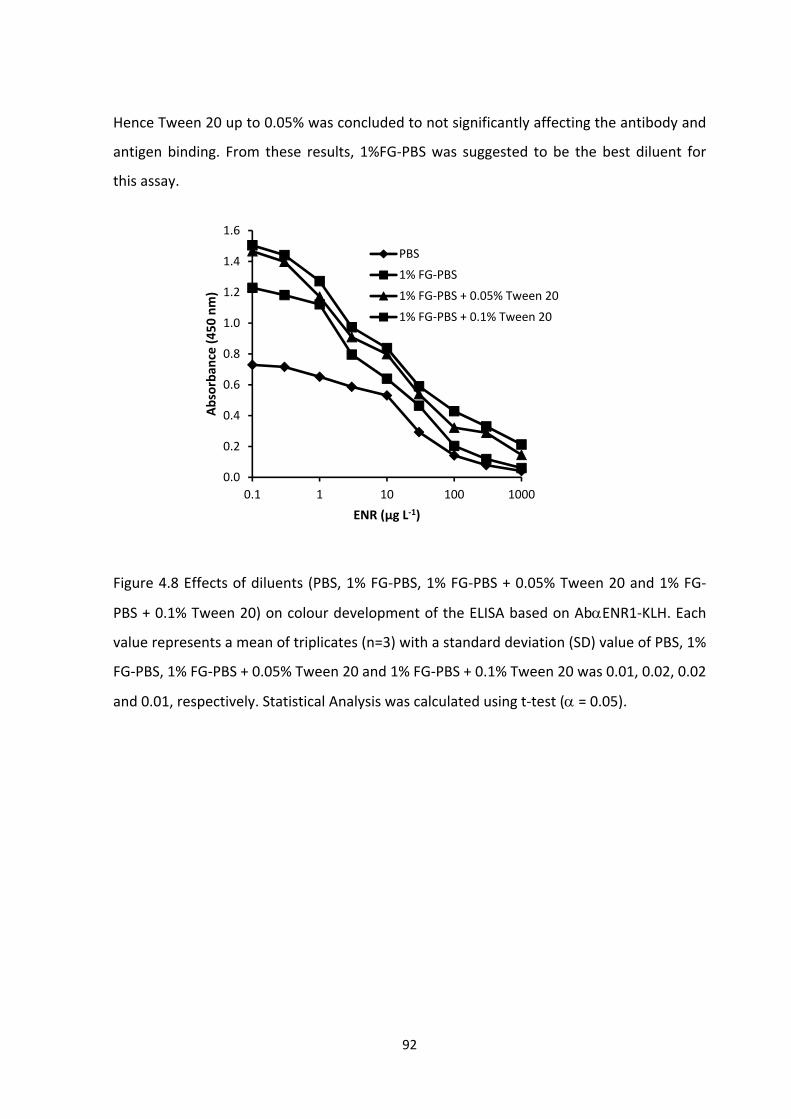
92
Hence Tween 20 up to 0.05% was concluded to not significantly affecting the antibody and
antigen binding. From these results, 1%FG‐PBS was suggested to be the best diluent for
this assay.
Figure 4.8 Effects of diluents (PBS, 1% FG‐PBS, 1% FG‐PBS + 0.05% Tween 20 and 1% FG‐
PBS + 0.1% Tween 20) on colour development of the ELISA based on AbENR1‐KLH. Each
value represents a mean of triplicates (n=3) with a standard deviation (SD) value of PBS, 1%
FG‐PBS, 1% FG‐PBS + 0.05% Tween 20 and 1% FG‐PBS + 0.1% Tween 20 was 0.01, 0.02, 0.02
and 0.01, respectively. Statistical Analysis was calculated using t‐test ( = 0.05).
0.0
0.2
0.4
0.6
0.8
1.0
1.2
1.4
1.6
0.1 1 10 100 1000
Absorban
ce (450 nm)
ENR (µg L‐1)
PBS
1% FG‐PBS
1% FG‐PBS + 0.05% Tween 20
1% FG‐PBS + 0.1% Tween 20

93
Figure 4.9 Standard curves of ENR in different diluents (PBS, 1% FG‐PBS, 1% FG‐PBS + 0.05%
Tween 20 and 1% FG‐PBS + 0.1% Tween 20). Each value represents the mean of triplicates
(n=3) with a standard deviation (SD) value of PBS, 1% FG‐PBS, 1% FG‐PBS + 0.05% Tween 20
and 1% FG‐PBS + 0.1% Tween 20 was 1.5, 3.4, 0.8 and 0.7, respectively. Statistical Analysis
was calculated using t‐test ( = 0.05).
4.3.4.2.2 Effects of organic solvents
Most FQ antibiotics are highly soluble in aqueous solutions either at high or low pHs, and
insoluble in many water miscible organic solvents. Amongst FQs, only ENR is soluble in
methanol. The solubility of an analyte is an aqueous solution can directly affect the assay
sensitivity. For this reason, various organic solvents at different concentrations were tested
for ENR solubility and their effects on the assay sensitivity. Colour development (Amax) and %
inhibition (IC50) reflecting the antibody binding to the immobilised antigen are presented in
Figures 4.10 to 4.17.
0
10
20
30
40
50
60
70
80
90
100
0.1 1 10 100 1000
Inhibition (%)
ENR (µg L‐1)
PBS
1% FG‐PBS
1% FG‐PBS + 0.05% Tween 20
1% FG‐PBS + 0.1% Tween 20
94
Figure 4.10 Effects of methanol (5% MeOH, 10% MeOH and 20% MeOH) on colour
development of the ENR1‐ELISA.Each value represents the mean of triplicates (n=3) with a
standard deviation (SD) value of PBS, 5% MeOH, 10% MeOH and 20% MeOH was 0.01, 0.01,
0.02 and 0.01, respectively. Statistical analysis was calculated using t‐test (α= 0.05)
Figure 4.11 Standard curves of ENR dissolved in different concentrations of methanol (5%
MeOH, 10% MeOH and 20% MeOH).Each value represents the mean of triplicates (n=3)
with a standard deviation (SD) value of PBS, 5% MeOH, 10% MeOH and 20% MeOH was 1.1,
0.9, 4.7 and 0.8, respectively. Statistical analysis was calculated using t‐test (α= 0.05)
0.0
0.2
0.4
0.6
0.8
1.0
1.2
1.4
1.6
1.8
2.0
0.1 1 10 100 1000
Absorban
ce (450 nm)
ENR (µg L‐1)
PBS
5% MeOH
10% MeOH
20% MeOH
0
10
20
30
40
50
60
70
80
90
100
0.1 1 10 100 1000
% In
hibition
ENR (µg L‐1)
PBS5% MeOH10% MeOH20% MeOH
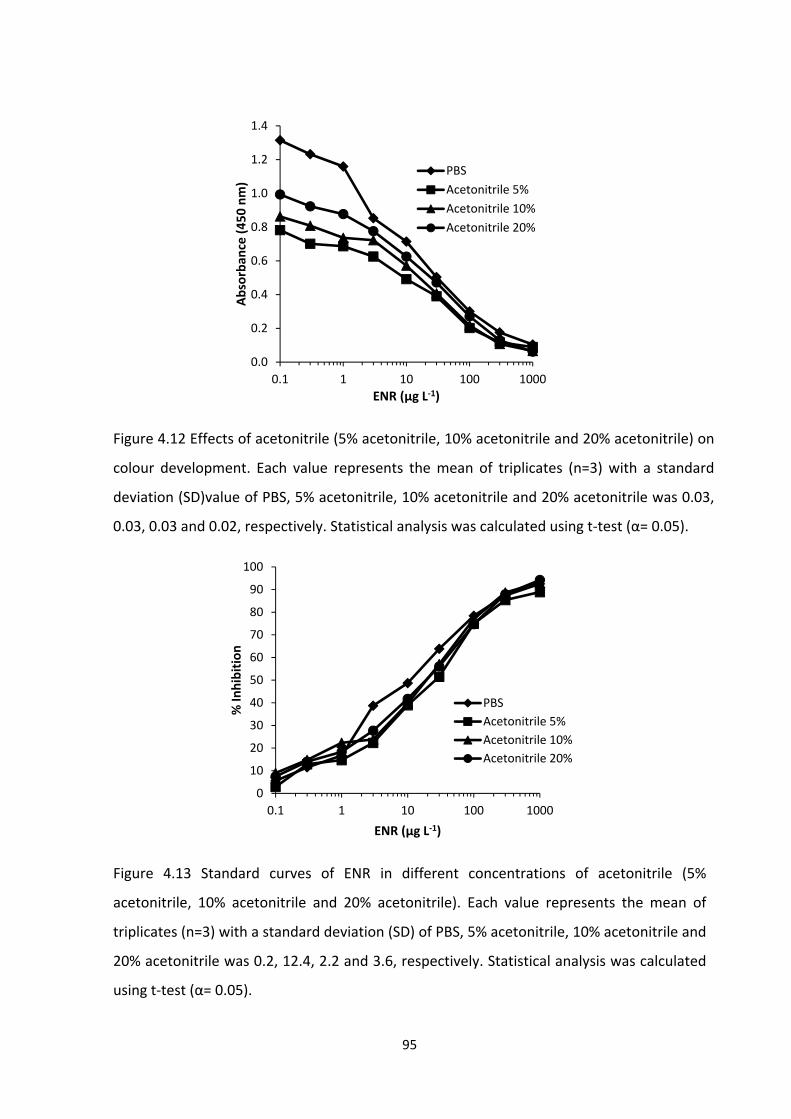
95
Figure 4.12 Effects of acetonitrile (5% acetonitrile, 10% acetonitrile and 20% acetonitrile) on
colour development. Each value represents the mean of triplicates (n=3) with a standard
deviation (SD)value of PBS, 5% acetonitrile, 10% acetonitrile and 20% acetonitrile was 0.03,
0.03, 0.03 and 0.02, respectively. Statistical analysis was calculated using t‐test (α= 0.05).
Figure 4.13 Standard curves of ENR in different concentrations of acetonitrile (5%
acetonitrile, 10% acetonitrile and 20% acetonitrile). Each value represents the mean of
triplicates (n=3) with a standard deviation (SD) of PBS, 5% acetonitrile, 10% acetonitrile and
20% acetonitrile was 0.2, 12.4, 2.2 and 3.6, respectively. Statistical analysis was calculated
using t‐test (α= 0.05).
0.0
0.2
0.4
0.6
0.8
1.0
1.2
1.4
0.1 1 10 100 1000
Absorban
ce (450 nm)
ENR (µg L‐1)
PBS
Acetonitrile 5%
Acetonitrile 10%
Acetonitrile 20%
0
10
20
30
40
50
60
70
80
90
100
0.1 1 10 100 1000
% In
hibition
ENR (µg L‐1)
PBS
Acetonitrile 5%
Acetonitrile 10%
Acetonitrile 20%

96
Figure 4.14 Effects of acetone (5% acetone, 10% acetone and 20% acetone) on colour
development. Each value represents the mean of triplicates (n=3) with a standard
deviation (SD) of PBS, 5% acetone, 10% acetone and 20% acetone was 0.07, 0.03, 0.02 and
0.04, respectively. Statistical analysis was calculated using t‐test (α= 0.05).
Figure 4.15 Standard curves of ENR in different concentrations of acetone (5% acetone, 10%
acetone and 20% acetone). Each value represents the mean of triplicates (n=3) with a
standard deviation (SD) of PBS, 5% acetone, 10% acetone and 20% acetone was 2.2, 3.7,
1.8 and 5.1, respectively. Statistical analysis was calculated using t‐test (α= 0.05).
0.0
0.2
0.4
0.6
0.8
1.0
1.2
1.4
1.6
0.1 1 10 100 1000
Absorban
ce (450 nm)
ENR (µg L‐1)
PBS
Acetone 5%
Acetone 10%
Acetone 20%
0
10
20
30
40
50
60
70
80
90
100
0.1 1 10 100 1000
% In
hibition
ENR (µg L‐1)
PBS
Acetone 5%
Acetone 10%
Acetone 20%

97
Figure 4.16 Effects of ethanol (5% ethanol, 10% ethanol and 20% ethanol) on colour
development of the ENR1‐ELISA. Each value represents the mean of triplicates (n=3) with a
standard deviation (SD) of PBS, EtOH 5%, EtOH 10% and EtOH 20% was 0.03, 0.01, 0.01 and
0.03, respectively. Statistical analysis was calculated using t‐test (α= 0.05).
Figure 4.17 Standard curves of ENR in different concentrations of ethanol (5% ethanol, 10%
ethanol and 20% ethanol) for ENR1‐ELISA and each value represents the mean of triplicates
(n=3) with a standard deviation (SD) of PBS, EtOH 5%, EtOH 10% and EtOH 20% was 1.9, 4.1,
2.5 and 3.4, respectively. Statistical analysis was calculated using t‐test (α= 0.05).
0.0
0.2
0.4
0.6
0.8
1.0
1.2
1.4
1.6
0.1 1 10 100 1000
Absorban
ce (450 nm)
ENR (µg L‐1)
PBS
EtOH 5%
EtOH 10%
EtOH 20%
0
10
20
30
40
50
60
70
80
90
100
0.1 1 10 100 1000
% In
hibition
ENR (µg L‐1)
PBS
EtOH 5%
EtOH 10%
EtOH 20%
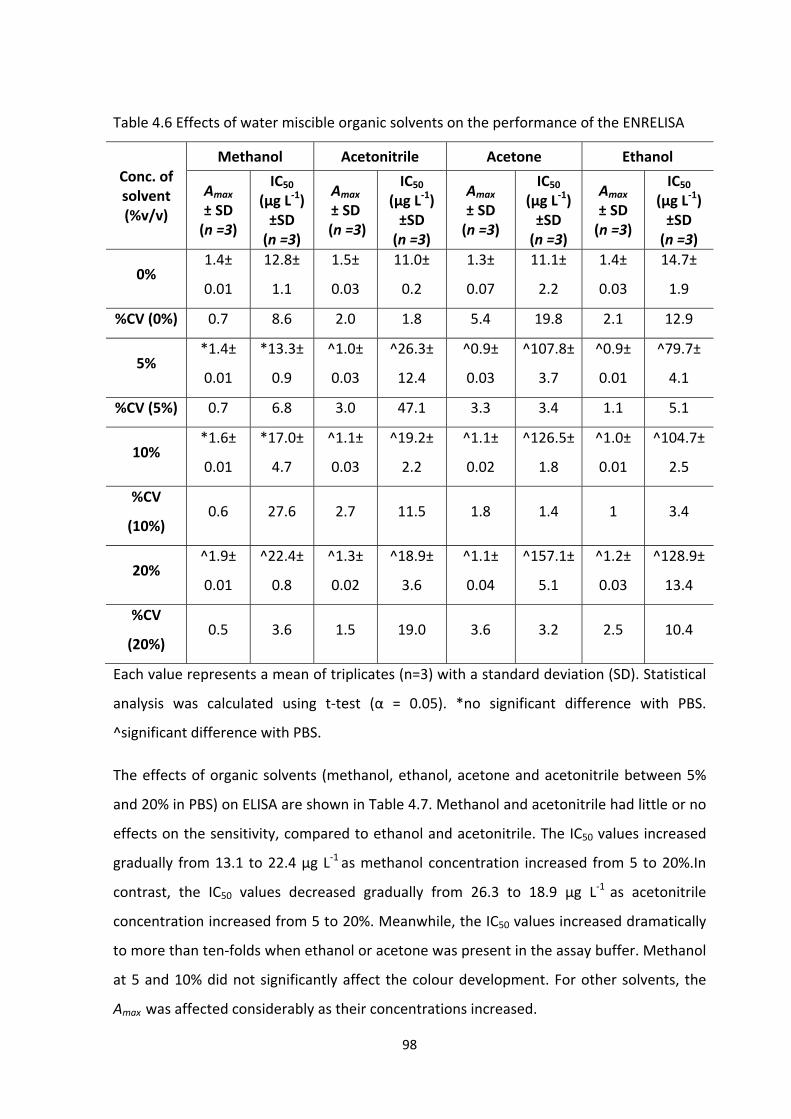
98
Table 4.6 Effects of water miscible organic solvents on the performance of the ENRELISA
Conc. of solvent (%v/v)
Methanol Acetonitrile Acetone Ethanol
Amax
± SD (n =3)
IC50 (µg L‐1) ±SD (n =3)
Amax
± SD (n =3)
IC50 (µg L‐1) ±SD (n =3)
Amax
± SD (n =3)
IC50 (µg L‐1) ±SD (n =3)
Amax
± SD (n =3)
IC50 (µg L‐1) ±SD (n =3)
0% 1.4±
0.01
12.8±
1.1
1.5±
0.03
11.0±
0.2
1.3±
0.07
11.1±
2.2
1.4±
0.03
14.7±
1.9
%CV (0%) 0.7 8.6 2.0 1.8 5.4 19.8 2.1 12.9
5% *1.4±
0.01
*13.3±
0.9
^1.0±
0.03
^26.3±
12.4
^0.9±
0.03
^107.8±
3.7
^0.9±
0.01
^79.7±
4.1
%CV (5%) 0.7 6.8 3.0 47.1 3.3 3.4 1.1 5.1
10% *1.6±
0.01
*17.0±
4.7
^1.1±
0.03
^19.2±
2.2
^1.1±
0.02
^126.5±
1.8
^1.0±
0.01
^104.7±
2.5
%CV
(10%) 0.6 27.6 2.7 11.5 1.8 1.4 1 3.4
20% ^1.9±
0.01
^22.4±
0.8
^1.3±
0.02
^18.9±
3.6
^1.1±
0.04
^157.1±
5.1
^1.2±
0.03
^128.9±
13.4
%CV
(20%) 0.5 3.6 1.5 19.0 3.6 3.2 2.5 10.4
Each value represents a mean of triplicates (n=3) with a standard deviation (SD). Statistical
analysis was calculated using t‐test (α = 0.05). *no significant difference with PBS.
^significant difference with PBS.
The effects of organic solvents (methanol, ethanol, acetone and acetonitrile between 5%
and 20% in PBS) on ELISA are shown in Table 4.7. Methanol and acetonitrile had little or no
effects on the sensitivity, compared to ethanol and acetonitrile. The IC50 values increased
gradually from 13.1 to 22.4 µg L‐1 as methanol concentration increased from 5 to 20%.In
contrast, the IC50 values decreased gradually from 26.3 to 18.9 µg L‐1 as acetonitrile
concentration increased from 5 to 20%. Meanwhile, the IC50 values increased dramatically
to more than ten‐folds when ethanol or acetone was present in the assay buffer. Methanol
at 5 and 10% did not significantly affect the colour development. For other solvents, the
Amax was affected considerably as their concentrations increased.

99
In summary, methanol up to 10% and acetonitrile up to 20% have no considerable
interference on the assay performance and are still able to maintain the same sensitivity.
Hence methanol up to 10 % was used routinely in the ENR‐1‐ELISA.
4.3.4.2.3 Effect of pH
Antibodies and enzymes are susceptible to extreme pHs. They generally have an optimum
pH range within which they function optimally. They are normally stable at a neutral pH
tolow alkaline conditions, ranging between pH 7 and 9. Acidic pH lower than pH 5 can
irreversibly inhibit the protein or enzyme activity (Hermanson, 1996). The pH of an
aqueous environment also influences ionic states of both the analytes and antibodies,
hence they may affect sensitivity and specificity of the assay (Sheng et al., 2009b). To
investigate the effects of pH on assay performance, standard curves of ENR prepared in
pH5.5, 6.5, 8.5 and 9.5 were compared with that of a curve generated using PBS at pH 7.4,
as a control.
Figure 4.18 illustrates the effects of pH on assay performance. There were no significant
changes in the IC50 values in a pH range of 6.5 and 8.5. This indicated that the assay was
stable in the pH range tested. At pHs 5.5 and 9.5, the IC50 values increased by 3‐ and 2‐folds,
respectively. With regard to the colour development, Amax gradually decreased at pHs
above and below 7.5.The optimum pH for this assay was atneutral (pH 7), hence, PBS (pH
7.4) solution was employed for further characterisation.

100
Figure 4.18 Effects of the pH on the ENR1‐ELISA. The circle indicates absorbance and the
triangle indicates IC50 values against pH and each value represents a mean of triplicates
(n=3) of pH 5.5, 6.5, 7.5, 8.5 and 9.5 with a standard deviation (SD) value was 4.5, 0.8, 0.1,
4.5 and 0.6, respectively. Statistical analysis was calculated using t‐test (α = 0.05).
4.3.5 Matrix Interferences
An ELISA is usually affected by the chemical, physical and biological components on the
matrices such as pigments, tannins, protein and fat (Lee and Kennedy, 2007). Matrix
interference of the samples may affect either assay sensitivity or the colour development
or both of these. There are a number of ways to remove or minimise the influence of
matrix interference on an ELISA. Common procedures for ELISA are extraction with water
miscible solvents, acidic or enzymatic hydrolysis, or simple dilution. Extraction of an
analyte from a sample matrix is influenced by many factors including solubility of an
analyte and interfering substances, diffusion rate of solvent into a sample matrix, partition
of the analyte between sample matrix and extraction solvent (mass transfer)and particle
size to which matrix is ground (Mitra, 2003). Solid samples are generally prepared by
grinding into finer size particles first, followed by liquid extraction using appropriate
solvents and then the extract is either concentrated or undergoing an additional
interference removal procedures (Ridgway et al., 2007). Moist or wet samples, such as
animal or fish tissues are generally prepared by mincing or homogenising. Liquid samples,
0
0.2
0.4
0.6
0.8
1
1.2
1.4
1.6
1.8
0.0
5.0
10.0
15.0
20.0
25.0
30.0
35.0
5.5 6.5 7.5 8.5 9.5
Absorban
ce (450 nm)
IC50(µg L‐1)
pH
101
such as syrups, soft drinks, milks or other liquid drinks can be prepared by a simple dilution
with aqueous solutions, extraction using water immiscible solvents to remove specific
matrix interference(e.g., fat in milk or pigment in vegetables), and addition of chelating
agents (e.g., interfering ions in soft drinks).
In this study solid samples (chicken liver and prawn) were homogenised using a
homogeniser and the homogenised sample was extracted three times with 50mM NaOH :
methanol : PBS = 1:9:90 in a shaking waterbath at 40oC for 15 min without further
treatment. Meanwhile, liquid samples (milk) were diluted with PBS (1:5, 1:10, and 1:20),
followed by heating in a waterbath at 80oC for 5 min and 30 min for skim milk and full
cream milk samples, respectively. The matrix effects were examined by running a serial
dilution of ENR in the extracts or diluted samples and comparing the results with those
obtained in PBS buffer as a control. The matrix interference was evaluated by comparing
the maximum absorbance (Amax) and the sensitivity (IC50) as the indicators of antibody‐
antigen binding and enzyme activity.
4.3.5.1 Effect of matrix in milk
Skim milk has much lower fat contents (0.3%) than full cream milk (3.3% to 5%). To
evaluate the effects of fat contents in various milk samples on the ELISA, the fat globules
were dispersed by preheating the sample in a waterbath at 80oC for 5 min. In this study,
three dilutions (1:5, 1:10 and 1:20) were examined to compare the effects on the colour
development (Amax) and % inhibition (IC50) (Figures 4.19 to 4.26).

102
Figure 4.19 Effects of skim milk liquid (SKL), diluted 1:5, 1:10 and 1:20 with PBS on colour
development. Each value represents the mean of triplicates (n=3) with a standard
deviation (SD) value of PBS, diluted SKL 1:5, 1:10 and 1:20 with PBS was 0.01, 0.04, 0.01
and 0.04, respectively. Statistical analysis was calculates using t‐test (α = 0.05).
Figure 4.20 Standard curves of ENR dissolved in skim milk liquid (SKL), diluted 1:5, 1:10 and
1:20 with PBS. Each value represents the mean of triplicates (n=3) with standard deviation
(SD) value of PBS, diluted SKL 1:5, 1:10 and 1:20 with PBS was 0.8, 1.7, 1.2 and 0.6,
respectively. Statistical analysis was calculated using t‐test (α = 0.05).
0.0
0.2
0.4
0.6
0.8
1.0
1.2
1.4
1.6
0.1 1 10 100 1000
Absorban
ce (450 nm)
ENR (µg L‐1)
1 in 5
1 in 10
1 in 20
PBS
0
10
20
30
40
50
60
70
80
90
100
0.1 1 10 100 1000
% In
hibition
ENR (µg L‐1)
1 in 5
1 in 10
1 in 20
PBS

103
Figure 4.21 Effects of skim milk powder (SKP), diluted 1:5, 1:10 and 1:20 with PBS, on
colour development of the ENR1‐ELISA. Each value represents the mean of triplicates (n=3)
with standard deviation (SD) of PBS, diluted SKP 1:5, 1:10 and 1:20 with PBS was 0.01, 0.04,
0.01 and 0.04, respectively. Statistical analysis was calculated using t‐test (α = 0.05).
Figure 4.22 Standard curves of ENR dissolved in skim milk powder (SKP), 1:5, 1:10 and 1:20
with PBS. Each value represents the mean of triplicates (n=3) with a standard deviation (SD)
of PBS, diluted SKP 1:5, 1:10 and 1:20 with PBS was 0.7, 1.6, 1.2 and 0.6, respectively.
Statistical analysis was calculated using t‐test (α = 0.05).
0.0
0.2
0.4
0.6
0.8
1.0
1.2
1.4
1.6
0.1 1 10 100 1000
Absorban
ce (450 nm)
ENR (µg L‐1)
1 in 5
1 in 10
1 in 20
PBS
0
10
20
30
40
50
60
70
80
90
100
0.1 1 10 100 1000
% In
hibtion
ENR (µg L‐1)
1 in 5
1 in 10
1 in 20
PBS

104
Figure 4.23 Effects of full cream milk liquid (FCL), diluted 1:5, 1:10 and 1:20 with PBS on
colour development of the ENR1‐ELISA. Each value represents the mean of triplicates (n=3)
with a standard deviation (SD) of PBS, diluted FCL 1:5, 1:10 and 1:20 with PBS was 0.01,
0.04, 0.01 and 0.04, respectively. Statistical analysis was calculated using t‐test (α = 0.05).
Figure 4.24 Standard curves of ENR dissolved in full cream milk liquid (FCL), diluted 1:5,
1:10 and 1:20. Each value represents the mean of triplicates (n=3) with a standard
deviation (SD) of PBS, diluted FCL 1:5, 1:10 and 1:20 with PBS was 0.8, 1.7, 1.2 and 0.6,
respectively. Statistical analysis was calculated using t‐test (α = 0.05).
0.0
0.2
0.4
0.6
0.8
1.0
1.2
1.4
1.6
0.1 1 10 100 1000
Absorban
ce (450 nm)
ENR (µg L‐1)
1 in 5
1 in 10
1 in 20
PBS
0
10
20
30
40
50
60
70
80
90
100
0.1 1 10 100 1000
% In
hibition
ENR (µg L‐1)
1 in 51 in 101 in 20PBS

105
Figure 4.25 Effects of full cream milk powder (FCP), diluted 1:5, 1:10 and 1:20 with PBS on
colour development. Each value represents the mean of triplicates (n=3) with a standard
deviation (SD) of PBS, diluted FCP 1:5, 1:10 and 1:20 with PBS was 0.01, 0.04, 0.01 and 0.04,
respectively. Statistical analysis was calculated using t‐test (α = 0.05).
Figure 4.26 Standard curves of ENR dissolved in full cream milk powder (FCP), diluted 1:5,
1:10 and 1:20 with PBS. Each value represents the mean of triplicates (n=3) with a standard
deviation (SD) of PBS, diluted FCP 1:5, 1:10 and 1:20 with PBS was 1.1, 1.2, 0.9, 1.3,
respectively. Statistical analysis was calculated using t‐test (α = 0.05).
0.0
0.2
0.4
0.6
0.8
1.0
1.2
1.4
1.6
0.1 1 10 100 1000
Absorban
ce (450 nm)
ENR (µg L‐1)
1 in 5
1 in 10
1 in 20
PBS
0
10
20
30
40
50
60
70
80
90
100
0.1 1 10 100 1000
% In
hibition
ENR (µg L‐1)
1 in 51 in 101 in 20PBS

106
Table 4.7 Effects of milk matrix on colour development (Amax) and assay sensitivity (IC50).
Dilution
factor
(in PBS)
*SKL SKP FCL FCP
Amax
± SD
(n=3)
IC50
(µg L‐1)
±SD (n=3)
Amax
± SD
(n=3)
IC50
(µg L‐1)
±SD
(n=3)
Amax
± SD
(n=3)
IC50
(µg L‐1)
±SD
(n=3)
Amax
± SD
(n=3)
IC50
(µg L‐1)
±SD
(n=3)
1:5 ^1.4±
0.04
^19.3±
1.7
^1.3±
0.04
^14.2±
1.6
^1.2±
0.04
^19.3±
1.7
^1.1±
0.04
^18.8±
1.2
%CV (1:5) 3.3 8.9 3.3 11.3 3.3 8.8 3.3 6.4
1:10 ^1.5±
0.01
*12.6±
1.2
*1.4±
0.01
*12.4±
1.2
*1.4±
0.01
*13.9±
1.2
*1.4±
0.01
*12.9±
0.9
%CV(1:10) 0.7 8.4 0.7 9.5 0.7 8.3 *0.7 6.9
1:20 *1.6±
0.04
*12.7±
0.6
*1.5±
0.04
*9.0±
1.5
*1.4±
0.04
*12.7±
0.6
*1.4±
0.04
*12.4±
1.3
%CV (1:20) 0.7 4.7 0.7 16.7 0.7 4.7 0.7 10.5
PBS 1.6±
0.01
11.7±
0.8
1.5±
0.01
10.3±
0.7
1.4±
0.01
11.7±
0.8
1.5±
0.01
10.7±
1.1
%CV (PBS) 0.7 6.4 0.7 7.3 0.7 6.8 0.7 10.3
*SKL= skim milk liquid; SKP= skim milk powder; FCL= full cream liquid; FCP= full cream
powder. Each value represents the mean of triplicates (n=3) with standard deviation (SD).
Statistical analysis was calculated using t‐test (α = 0.05).*no significant difference with PBS
(control). ^significant difference with PBS (control).
As shown in Table 4.8, when dilution of milk increased from 1:5 to 1:20, the absorbance
gradually approached that of PBS buffer, indicating that increasing dilution decreased
matrix effects. The Amax values of skim milk and full cream milk at different dilutions did not
superimpose, larger differences were seen at dilutions lower than 5‐folds. The 10‐ and 20‐
fold dilutions did not significantly change Amax. It was apparent from the IC50 values that
the milk matrix inhibited the antibody‐antigen interaction. More analytically acceptable
results were obtained when the sample was diluted by 10‐folds or more with PBS.
Furthermore, the 10 and 20‐fold dilutions did not considerably affect the assay sensitivity.

107
While dilution is a solution to matrix interference, it also reduces assay sensitivity by the
same degree. To improve the sensitivity for diluted milk but still maintain low interference
of antibody‐antigen interaction, pre‐treatment was increased to 30 min, then followed by
centrifugation for 10 min before diluting with PBS. The results suggest that a ten‐fold
dilution would provide acceptable results (Figure 4.27 to 4.30).
Figure 4.27 Effects of skim milk liquid (SKL) and skim milk powder (SKP), diluted 1:10 with
PBS, on colour development of the ENR1‐ELISA.Each value represents the mean of five
replicates (n=5) with a standard deviation (SD) value of PBS, diluted SKL and SKP 1:10 with
PBS was 0.1, 0.2 and 0.2, respectively. Statistical analysis was calculated using t‐test (α =
0.05).
0.0
0.2
0.4
0.6
0.8
1.0
1.2
1.4
1.6
0.1 1 10 100 1000
Absorban
ce (450 nm)
ENR (µg L‐1)
PBS
SKL
SKP

108
Figure 4.28 Standard curves of ENR in skim milk liquid (SKL) and skim milk powder (SKP),
diluted 1:10 with PBS. Each value represents the mean of five replicates (n=5) with a
standard deviation (SD) value of PBS, diluted SKL and SKP 1:10 with PBS was 1.2, 2.5 and
2.8, respectively. Statistical analysis was calculated using t‐test (α = 0.05).
Figure 4.29 Effect of full cream milk liquid (FCL) and full cream milk powder (FCP), diluted
1:10 with PBS, on colour development. Each value represents the mean of five replicates
(n=5) with a standard deviation (SD) of PBS, diluted SKL and SKP 1:10 with PBS was 0.1, 0.2
and 0.1, respectively. Statistical analysis was calculated using t‐test (α = 0.05).
0
10
20
30
40
50
60
70
80
90
100
0.1 1 10 100 1000
% In
hibition
ENR (µg L‐1)
PBS
SKL
SKP
0.00
0.20
0.40
0.60
0.80
1.00
1.20
1.40
1.60
0.1 1 10 100 1000
Absorban
ce (450 nm)
ENR (µg L‐1)
PBS
FCL
FCP

109
Figure 4.30 Standard curves of ENR dissolved in full cream milk liquid (FCL) and full cream
milk powder (FCP), diluted 1:10 with PBS. Each value represents the mean of five replicates
(n=5) with a standard deviation (SD) of PBS, diluted SKL and SKP 1:10 with PBS was 1.6, 2.0
and 2.0, respectively. Statistical analysis was calculated using t‐test (α = 0.05).
Table 4.8 Matrix effects of pre‐treated milk, diluted 1:10 with PBS, on colour development
(Amax) and assay sensitivity (IC50)
Milk samples Skim milk ± SD (n=5) Full cream milk ± SD (n=5)
PBS SKL SKP PBS FCL FCP
Amax 1.6 ± 0.1 1.4 ± 0.2 1.4 ± 0.2 1.6 ± 0.1 1.5 ± 0.2 1.4 ± 0.1
%CV(Amax) 0.7 11.3 10.8 3.7 10.4 9.4
IC50 (µg L‐1) 10 ± 1.2 13 ± 2.5 14 ± 2.8 9 ± 1.6 12 ± 2.0 12 ± 2.0
%CV(IC50) 16.8 19.4 23.8 12.0 17.8 16.6
Each value represents the mean of five replicates (n=5) with standard deviation (SD).
0
10
20
30
40
50
60
70
80
90
100
0.1 1 10 100 1000
% inhibition
ENR (µg L‐1)
PBS
FCL
FCP
110
4.3.5.2 Effect of matrix in chicken liver and shrimp samples
FQ antibiotics are only soluble in certain organic solvents, hydro‐organic (a mixture of
organic solvent and aqueous acidic or basic solution), aqueous acidic or basic media.
Therefore, adding organic solvent or basic aqueous solution or a mixture of those solvents
to PBS would help to increase the solubility of FQ residues and subsequent extractability
during sample extraction.
To reduce matrix interference from chicken liver and prawn, both extraction and dilution
were employed. Briefly, chicken liver from a local butcher (Lv3) and local prawn (Pr1) were
extracted with a mixture of 50mM sodium hydroxide, methanol, PBS (1:9:90) and the
extracts were diluted in 1:20 with PBS. As shown in Table 4.10, a 20‐fold dilution increased
the sensitivity by approximately two‐fold for both chicken liver and prawn samples. It can
be seen from the IC50 values that the extracts of blank samples diluted in 1:20 with PBS still
showed interfering and inhibiting effects on antibody‐antigen binding. Moreover, the
extracts diluted in 1:20 with PBS did not yield curves that are super imposable on the
curves of PBS and extraction solvents (50 mM NaOH, methanol, PBS = 1:9:90) (Figures 4.31
to 4.34). Therefore, to improve the sensitivity and maximise antibody‐antigen interaction,
the dilution factor was increased to 1:50 with PBS.

111
Table 4.9 Effects of chicken liver (Lv2) and prawn (Pr1) samples, in a 20‐fold dilution with
PBS on colour development (Amax) and assay sensitivity (IC50).
Samples
Absorbance maximum (Amax) IC50 (µg L‐1)
PBS ±
SD (n=3)
*Extraction solvent (control)
± SD (n=3)
Extracted samples
± SD (n=3)
PBS ±
SD (n=3)
*Extraction solvent (control)
± SD (n=3)
Extracted samples
± SD (n=3)
Liver
(Coles, Lv2) 1.5 ± 0.03 *1.5 ± 0.04 ^1.8 ± 0.03 13.8 ± 0.8 *12.8 ± 0.9 ^22.8 ± 0.6
%CV (Lv2) 1.4 2.6 1.7 5.7 7.1 2.6
Prawn
(raw, local,
Pr1)
1.9± 0.02 *1.8 ± 0.01 ^2.2 ± 0.01 10.9 ± 0.7 *12.2 ± 3.1 ^27.1 ± 1.8
%CV (Pr1) 1.0 0.3 0.6 6.6 25.2 6.8
*Extraction solvent is 50 mM NaOH:MeOH:PBS=1:9:90.Each value represents the mean of
triplicates (n=3) with a standard deviation (SD).*no significant difference with PBS.
^significant difference with extraction solvent (control)
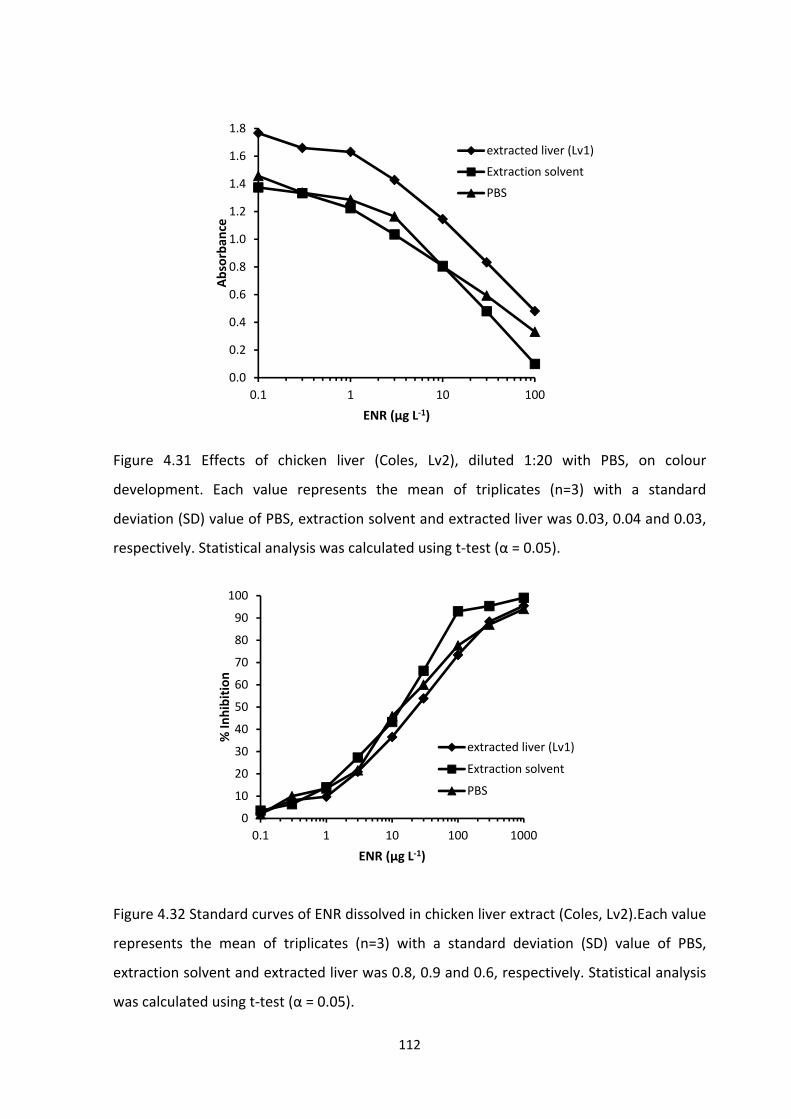
112
Figure 4.31 Effects of chicken liver (Coles, Lv2), diluted 1:20 with PBS, on colour
development. Each value represents the mean of triplicates (n=3) with a standard
deviation (SD) value of PBS, extraction solvent and extracted liver was 0.03, 0.04 and 0.03,
respectively. Statistical analysis was calculated using t‐test (α = 0.05).
Figure 4.32 Standard curves of ENR dissolved in chicken liver extract (Coles, Lv2).Each value
represents the mean of triplicates (n=3) with a standard deviation (SD) value of PBS,
extraction solvent and extracted liver was 0.8, 0.9 and 0.6, respectively. Statistical analysis
was calculated using t‐test (α = 0.05).
0.0
0.2
0.4
0.6
0.8
1.0
1.2
1.4
1.6
1.8
0.1 1 10 100
Absorban
ce
ENR (µg L‐1)
extracted liver (Lv1)
Extraction solvent
PBS
0
10
20
30
40
50
60
70
80
90
100
0.1 1 10 100 1000
% In
hibition
ENR (µg L‐1)
extracted liver (Lv1)
Extraction solvent
PBS
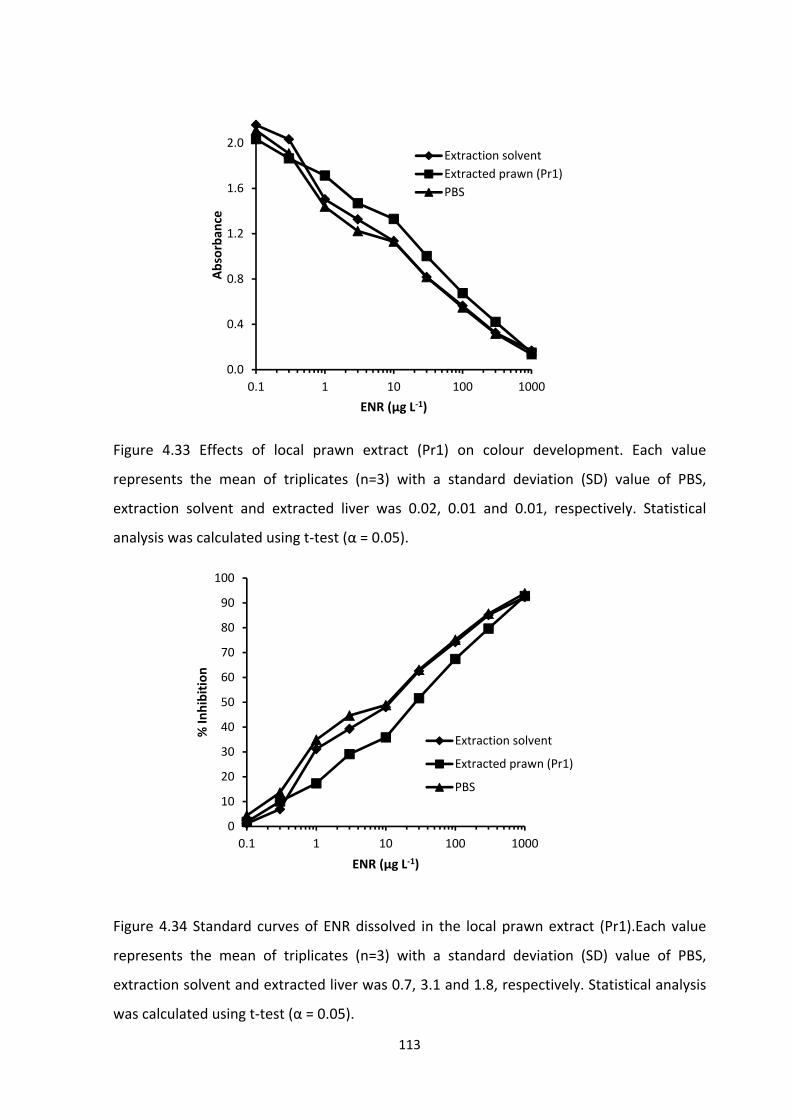
113
Figure 4.33 Effects of local prawn extract (Pr1) on colour development. Each value
represents the mean of triplicates (n=3) with a standard deviation (SD) value of PBS,
extraction solvent and extracted liver was 0.02, 0.01 and 0.01, respectively. Statistical
analysis was calculated using t‐test (α = 0.05).
Figure 4.34 Standard curves of ENR dissolved in the local prawn extract (Pr1).Each value
represents the mean of triplicates (n=3) with a standard deviation (SD) value of PBS,
extraction solvent and extracted liver was 0.7, 3.1 and 1.8, respectively. Statistical analysis
was calculated using t‐test (α = 0.05).
0.0
0.4
0.8
1.2
1.6
2.0
0.1 1 10 100 1000
Absorban
ce
ENR (µg L‐1)
Extraction solvent
Extracted prawn (Pr1)
PBS
0
10
20
30
40
50
60
70
80
90
100
0.1 1 10 100 1000
% In
hibition
ENR (µg L‐1)
Extraction solvent
Extracted prawn (Pr1)
PBS

114
Table 4.10 Effects of chicken liver and prawn extracts, on colour development (Amax) and
assay sensitivity (IC50).
Samples
Amax ± S.D. (n=5) IC50 (µg L‐1) ± S.D. (n=5)
PBS Extraction solvent
Extracted samples
PBS Extraction solvent
Extracted samples
Liver
(Organic, Lv1) 1.2 ± 0.2 1.2 ± 0.1 *1.2 ± 0.1 9 ± 2.2 11 ± 0.8 *11 ± 0.8
%CV (Lv1) 13.8 8.7 7.9 23.6 7.7 7.5
Liver
(Coles, Lv2) 1.2 ± 0.2 1.4 ± 0.2 *1.3 ± 0.2 11 ± 2.6 13 ± 2.9 *13 ± 2.0
%CV (Lv2) 17.9 11.8 12.7 24.6 21.5 15.4
Liver
(Butcher, Lv3) 1.2 ± 0.2 1.4 ± 0.2 *1.4 ± 0.2 13 ± 5.4 14 ± 4.7 *15 ± 3.5
%CV (Lv3) 16.6 12.0 11.8 42.2 31.5 24.7
Prawn
(raw, local, Pr1) 1.9 ± 0.2 1.8 ± 0.2 *1.8 ± 0.2 12 ± 6.3 14 ± 2.7 *15 ± 3.6
%CV (Pr1) 12.7 9.3 9.0 53.4 18.8 23.9
Prawn
(cooked, imported‐
Thailand, Pr2)
1.5 ± 0.1 1.5 ± 0.1 *1.5 ± 0.1 9 ± 2.2 14 ± 1.6 *15 ± 2.5
%CV (Pr2) 2.5 0.6 1.8 23.6 13.8 14.8
Prawn
(peeled off, imported‐
Malaysia, Pr3)
1.5 ± 0.1 1.5 ± 0.1 *1.5 ± 0.1 12 ± 4.4 14 ± 1.3 *16 ± 2.3
%CV (Pr3) 2.4 0.6 1.1 37.6 9.2 14.0
Extracts were prepared by diluting 1:50 with PBS. Each value represents the mean of
triplicates (n=3) with a standard deviation (SD). Statistical analysis was calculated using t‐
test (α = 0.05). *no significant difference with PBS and control.

115
As shown in Table 4.11, an improved sample extraction by increasing the dilution factor to
50‐fold showed apparent removal of matrix effects in all solid samples (chicken liver and
prawn), resulting in a better assay sensitivity of about 13 µg L‐1. The IC50 values of 1:50
dilution decreased by approximately two‐fold compared to that obtained in 1:20 dilution. A
50‐fold dilution yielded the IC50 values between 11 ± 0.8 µg L‐1 and 13 ± 5.4 µg L‐1in the
extraction solvents and 11 ± 0.8 µg L‐1 and 16 ± 2.3 µg L‐1 in liver and prawn sample extracts,
respectively. Also, there was no significant difference in the IC50 values obtained from the
extraction solvent and food sample extracts compared to that of PBS buffer (matrix free).
Evidently, a 50‐fold dilution was adequate to remove interferences from liver and prawn
matrices. Therefore, a mixture of 50mM sodium hydroxide, methanol, PBS (1:9:90) as a
solvent extraction followed by a 50‐fold dilution with PBS were then adopted in the spike
and recovery studies (Figures 4.35 to 4.46).

116
Figure 4.35 Effects of organic chicken liver (Lv1), diluted 1:50 with PBS, on colour
development. Each value represents the mean of five replicates (n=5) with a standard
deviation (SD) value of PBS, extraction solvent, and extracted organic chicken liver (Lv1)
was 0.2, 0.1 and 0.2, respectively. Statistical analysis was calculated using t‐test (α = 0.05)
Figure 4.36 Standard curves of ENR dissolved inorganic chicken liver extract (Lv1).Each
value represents the mean of replicates (n=5) with a standard deviation (SD) value of PBS,
extraction solvent, and extracted organic chicken liver (Lv1) was 2.2, 0.8 and 0.8,
respectively. Statistical analysis was calculated using t‐test (α = 0.05)
0.0
0.2
0.4
0.6
0.8
1.0
1.2
1.4
0.1 1 10 100 1000
Ab
sorb
ance
(45
0 n
m)
ENR (µg L-1)
Extraction solvent
Extracted liver (Lv1)
PBS
0
10
20
30
40
50
60
70
80
90
100
0.1 1 10 100 1000
% In
hibition
ENR (µg L‐1)
Extraction solvent
Extracted liver (Lv1)
PBS

117
Figure 4.37 Effects of chicken liver extract (Lv2), diluted 1:50 with PBS, on colour
development. Each value represents the mean of five replicates (n=5) with a standard
deviation (SD) of PBS, extraction solvent, and extracted chicken liver (Lv2) was 0.2, 0.2 and
0.2, respectively. Statistical analysis was calculated using t‐test (α = 0.05)
Figure 4.38 Standard curves of ENR dissolved in chicken liver extract (Lv2), diluted 1:50
with PBS. Each value represents the mean of five replicates (n=5) with a standard deviation
(SD) of PBS, extraction solvent, and extracted chicken liver (Lv2) was 2.6, 2.9 and 2.0,
respectively. Statistical analysis was calculated using t‐test (α = 0.05).
0.0
0.2
0.4
0.6
0.8
1.0
1.2
1.4
1.6
0.1 1 10 100 1000
Absorban
ce (450 nm)
ENR (µg L‐1)
Extraction solvent
Extracted liver (Lv2)
PBS
0
10
20
30
40
50
60
70
80
90
100
0.1 1 10 100 1000
% In
hibition
ENR (µg L‐1)
Extraction solvent
Extracted liver (Lv2)
PBS

118
Figure 4.39 Effects of chicken liver extract (Lv3), diluted 1:50 with PBS, on colour
development. Each value represents the mean of five replicates (n=5) with a standard
deviation (SD) of PBS, extraction solvent, and extracted chicken liver (Lv2) was 0.2, 0.2 and
0.2, respectively. Statistical analysis was calculated using t‐test (α = 0.05)
Figure 4.40 Standard curves of ENR dissolved in a chicken liver extract (Lv3).Each value
represents the mean of five replicates (n=5) with a standard deviation (SD) of PBS,
extraction solvent, and extracted chicken liver (Lv3) was 5.4, 4.7 and 3.5, respectively.
Statistical analysis was calculated using t‐test (α = 0.05)
0.0
0.2
0.4
0.6
0.8
1.0
1.2
1.4
0.1 1 10 100 1000
Absorban
ce (450 nm)
ENR (µg L‐1)
Extraction solvent
Extracted liver (Lv3)
PBS
0
10
20
30
40
50
60
70
80
90
100
0.1 1 10 100 1000
% In
hibition
ENR (µg L‐1)
Extraction solvent
Extracted liver (Lv3)
PBS
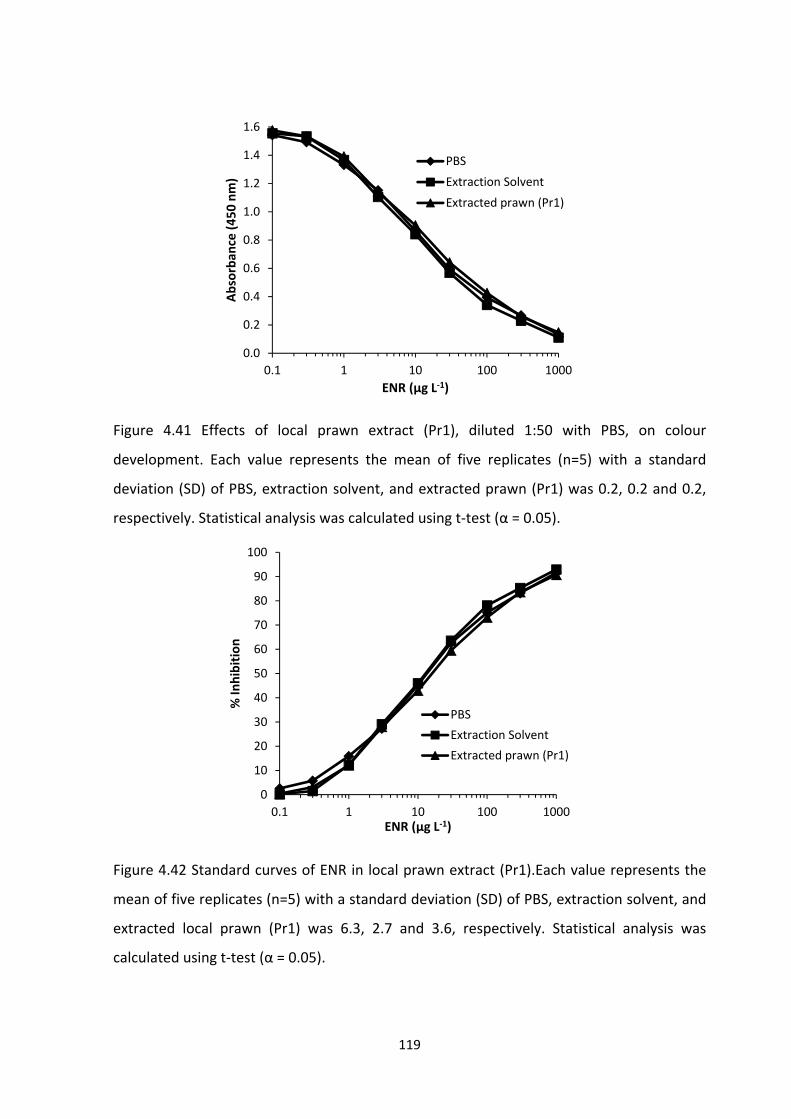
119
Figure 4.41 Effects of local prawn extract (Pr1), diluted 1:50 with PBS, on colour
development. Each value represents the mean of five replicates (n=5) with a standard
deviation (SD) of PBS, extraction solvent, and extracted prawn (Pr1) was 0.2, 0.2 and 0.2,
respectively. Statistical analysis was calculated using t‐test (α = 0.05).
Figure 4.42 Standard curves of ENR in local prawn extract (Pr1).Each value represents the
mean of five replicates (n=5) with a standard deviation (SD) of PBS, extraction solvent, and
extracted local prawn (Pr1) was 6.3, 2.7 and 3.6, respectively. Statistical analysis was
calculated using t‐test (α = 0.05).
0.0
0.2
0.4
0.6
0.8
1.0
1.2
1.4
1.6
0.1 1 10 100 1000
Absorban
ce (450 nm)
ENR (µg L‐1)
PBS
Extraction Solvent
Extracted prawn (Pr1)
0
10
20
30
40
50
60
70
80
90
100
0.1 1 10 100 1000
% In
hibition
ENR (µg L‐1)
PBS
Extraction Solvent
Extracted prawn (Pr1)
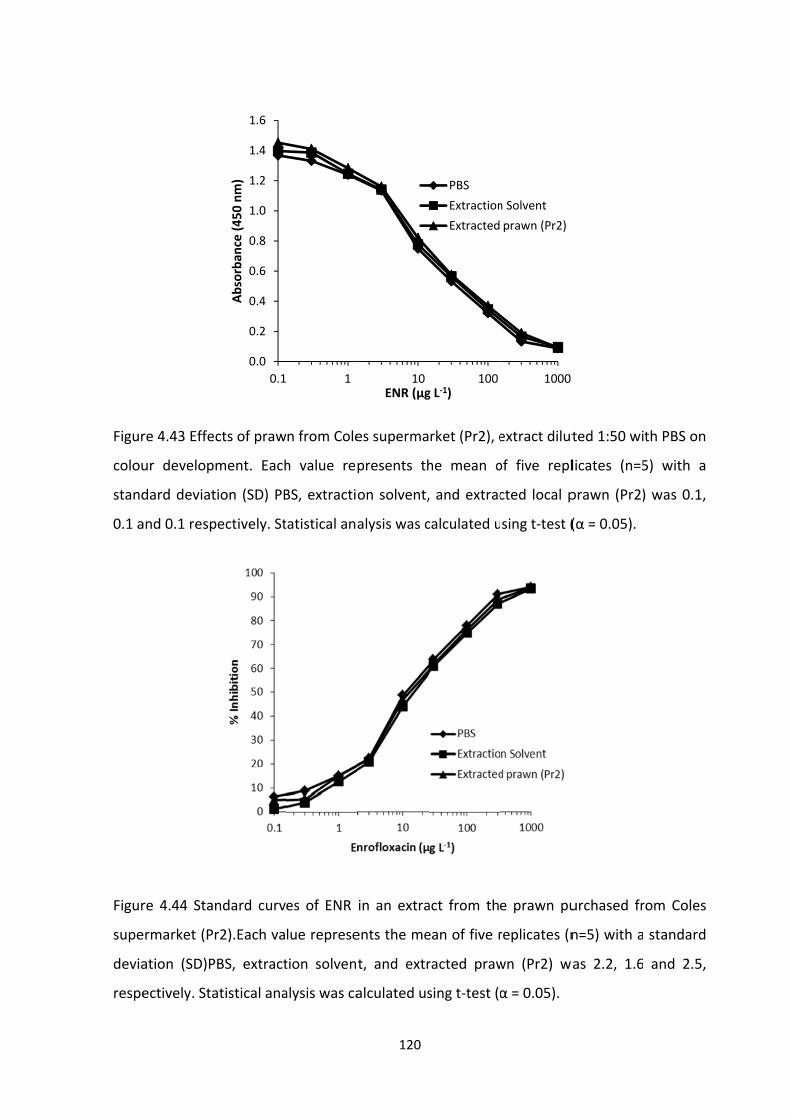
Figur
colou
stand
0.1 a
Figur
supe
devia
respe
re 4.43 Effe
ur develop
dard deviat
and 0.1 resp
re 4.44 Sta
ermarket (P
ation (SD)P
ectively. Sta
cts of praw
ment. Each
tion (SD) PB
pectively. St
ndard curv
r2).Each va
PBS, extract
atistical ana
0.0
0.2
0.4
0.6
0.8
1.0
1.2
1.4
1.6
0.1
Absorban
ce (450 nm)
n from Cole
h value rep
BS, extractio
tatistical ana
es of ENR
lue represe
tion solvent
alysis was ca
1
120
es superma
presents th
on solvent,
alysis was c
in an extra
ents the me
t, and extr
alculated us
10ENR (µg
rket (Pr2), e
he mean o
, and extrac
calculated u
act from th
ean of five r
racted praw
sing t‐test (α
100g L‐1)
PBS
Extraction
Extracted
extract dilut
of five repl
cted local p
sing t‐test (
e prawn pu
replicates (n
wn (Pr2) w
α = 0.05).
1000
n Solvent
prawn (Pr2)
ted 1:50 wi
licates (n=5
prawn (Pr2)
(α = 0.05).
urchased fr
n=5) with a
as 2.2, 1.6
th PBS on
5) with a
) was 0.1,
rom Coles
standard
and 2.5,
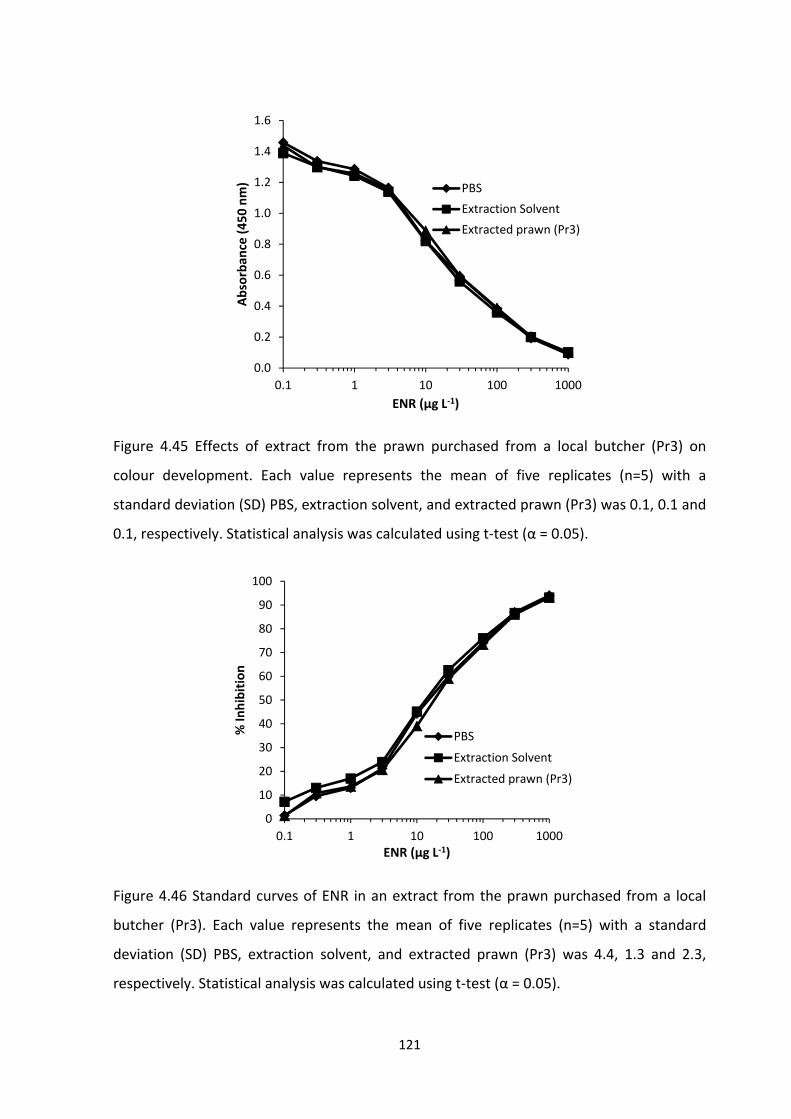
121
Figure 4.45 Effects of extract from the prawn purchased from a local butcher (Pr3) on
colour development. Each value represents the mean of five replicates (n=5) with a
standard deviation (SD) PBS, extraction solvent, and extracted prawn (Pr3) was 0.1, 0.1 and
0.1, respectively. Statistical analysis was calculated using t‐test (α = 0.05).
Figure 4.46 Standard curves of ENR in an extract from the prawn purchased from a local
butcher (Pr3). Each value represents the mean of five replicates (n=5) with a standard
deviation (SD) PBS, extraction solvent, and extracted prawn (Pr3) was 4.4, 1.3 and 2.3,
respectively. Statistical analysis was calculated using t‐test (α = 0.05).
0.0
0.2
0.4
0.6
0.8
1.0
1.2
1.4
1.6
0.1 1 10 100 1000
Absorban
ce (450 nm)
ENR (µg L‐1)
PBS
Extraction Solvent
Extracted prawn (Pr3)
0
10
20
30
40
50
60
70
80
90
100
0.1 1 10 100 1000
% In
hibition
ENR (µg L‐1)
PBS
Extraction Solvent
Extracted prawn (Pr3)
122
4.3.6 Recovery studies
The MRLs for FQ residues in food are in the range of 50 to 1000 µg kg‐1 (Hernandez‐
Arteseros et al., 2002). For ENR and its metabolites in particular, the MRLs are between
100 and 300 µg kg‐1in edible animal tissues, muscle, seafood, and milk (Hernandez‐
Arteseros et al., 2002). Three food samples (milk, chicken liver and prawn) were chosen to
evaluate anayte recovery by the ELISA. ENR was spiked in PBS buffer or extraction solvent
and in milk samples (skim and full cream milk) each at four concentrations (50, 100, 200
and 500 µg L‐1).Chicken liver and prawn samples were spiked at 250, 500, 1000 and 2500
µg L‐1 (Table 4.1). Spiking ENR in the tested samples were based on their respective MRL
ideally covering a range that was ten times lower and higher than the MRL values(10 and
3000 µg kg‐1). The final concentrations of ENR in samples after the dilution (a 10‐fold in
milk and a 50‐fold in chicken liver and prawn samples) were5, 10, 20 and 50 µg L‐1.The
spiked samples were analysed by ENR1‐ELISA using AbENR1‐KLH and ENR1‐OA
combination.

123
Table 4.11 %Recoveries ENR spiked in milk as detected by ELISA.
Samples (liquid)
Spiked concentration
(µg L‐1)
Detected concentration (µg L‐1) ± SD (n=3)
Recovery (%) ± SD (n=3)
in PBS in diluted samples
in PBS in diluted samples
Skim milk (liquid) (SKL)
50
100
200
500
54.4 ± 4.2
122.9 ± 8.2
201.8 ± 8.8
445.1 ± 30.6
59.7 ± 4.2
125.1 ± 8.3
204.5 ± 8.8
462.7 ± 33.9
109 ± 8
123 ± 8
101 ± 4
89 ± 6
119 ± 8
125 ± 8
102 ± 4
93 ± 7
Skim milk powder
(SKP)
50
100
200
500
55.9 ± 3.5
130.4 ± 7.3
225.6 ± 9.4
439.6 ± 26.7
52.9 ± 2.9
124.0 ± 7.2
219.0 ± 9.5
494.8 ± 41.2
112 ± 7
130 ± 7
113 ± 5
88 ± 5
106 ± 6
124 ± 7
110 ± 5
99 ± 8
Full cream milk (liquid)
(FCL)
50
100
200
500
32.7 ± 2.0
79.8 ± 10.2
143.0 ± 8.0
541.2 ± 26.0
34.0 ± 1.8
71.4 ± 7.6
137.7 ± 8.6
559.6 ± 25.4
65 ± 4
80 ± 10
72 ± 4
108 ± 5
68 ± 4
71 ± 8
69 ± 4
112 ± 5
Full cream milk(powder)
(FCP)
50
100
200
500
39.7 ± 4.3
71.0 ± 5.2
140.4 ± 3.6
594.9 ± 20.5
35.3 ± 3.6
60.7 ± 4.2
130.8 ± 3.4
577.4 ± 20.5
79 ± 9
71 ± 11
70 ± 5
119 ± 8
71 ± 7
61 ± 9
65 ± 4
116 ± 8
Each value represents the mean of triplicates (n=3) with a standard deviation (SD).
Statistical analysis was calculated using t‐test (α = 0.05)
As can been seen on Table 4.12, the % recovery by the ELISA ranged between 89 (± 6) and
119 (± 8)% for skim milk liquid, 65 (± 4)% and 130 (± 7)% for skim milk powder, 69 (± 4)%
and 112 (± 5)% for full cream milk, 61 (± 9)% and 116 (± 8)% for full cream liquid. While
the % recovery of ENR by the ENR1‐ELISA was acceptable, generally, milk with low fat
contents will relatively higher recovery. For the later samples, the recovery rate was
dependent of concentration. That is, lower recovery was observed at lower concentrations

124
of ENR. Overall, good recoveries of ENR in milk samples were obtained. It can therefore be
concluded that the optimised sample preparation procedure with increasing preheating
time and centrifuging the sample to remove large particulates prior to further diluting with
PBS minimised significant matrix interference from milk.
Table 4.12% Recoveries of ENR spiked in chicken liver as detected by ELISA.
Solid samples (chicken liver)
Spiked conc. (µg L‐1)
Detected concentration (µg L‐1) ± SD (n=3)
Recovery (%) ± SD (n=3)
ENR spiked in extraction solvent
ENR spiked in extracted sample
ENR spiked in extraction solvent
ENR spiked in extracted sample
Chicken liver
(Organic,
Lv1)
250
500
1000
2500
147.7 ± 14.5
431.8 ± 40.0
683.8 ± 49.4
1553.2 ± 109.9
155.0 ± 15.1
541.9 ± 48.9
764.0 ± 54.4
1759.0 ± 128.9
59 ± 6
86 ± 8
68 ± 5
62 ± 4
62 ± 6
108 ± 10
76 ± 5
70 ± 5
Chicken liver
(Coles,
Lv2)
250
500
1000
2500
290 ± 23.1
678.8 ± 28.1
760.6 ± 44.1
1736.3 ± 134.2
257.5 ± 18.4
571.6 ± 28.6
690.7 ± 42.6
1599.2 ± 119.1
116 ± 9
136 ± 6
76 ± 4
70 ± 5
103 ± 7
114 ± 6
69 ± 4
64 ± 5
Chicken liver
(Butcher,
Lv3)
250
500
1000
2500
288.2 ± 14.6
370.3 ± 27.6
1173.6 ± 107.8
1847.5 ± 154.3
216.4 ± 17.9
321.9 ± 36.3
1057.8 ± 77.1
1521.0 ± 245.4
115 ± 9
74 ± 9
117 ± 9
74 ± 6
87 ± 10
64 ± 12
106 ± 7
61 ± 5
Each value represents the mean of triplicates (n=3) with standard deviation (SD). Statistical
analysis was calculated using t‐test (α = 0.05)

125
Table 4.13% Recoveries of ENR spiked in prawn as detected by ELISA
Solid
samples
(prawn)
Spiked
conc.
(µg L‐1)
Detected concentration
(µg L‐1) ± SD (n=3)
Recovery (%)
± SD (n=3)
ENR spiked in
extraction
solvent
ENR spiked in
extracted
sample
ENR spiked
in extraction
solvent
ENR spiked
in extracted
sample
Prawn
(raw, local,
Pr1)
250
500
1000
2500
151.4 ± 9.6
300.3 ± 23.6
1069.1 ± 91.9
1963.5 ± 136.6
238.0 ± 12.8
428.7 ± 27.5
1200.1 ± 83.7
2116.7 ± 140.3
61 ± 4
60 ± 5
107 ± 9
79 ± 5
95 ± 5
86 ± 6
120 ± 8
85 ± 6
Prawn
(cooked,
imported‐
Thailand,
Pr2)
250
500
1000
2500
179.2 ± 4.6
421.9 ± 26.3
742.5 ± 68.1
1738.5 ± 57.7
168.0 ± 4.0
355 ± 19.7
637.9 ± 67.4
1647.1 ± 51.3
72 ± 2
84 ± 5
74 ± 7
70 ± 2
67 ± 2
72 ± 4
64 ± 7
66 ± 2
Prawn
(peeled off,
imported‐
Malaysia,
Pr3)
250
500
1000
2500
166.7 ± 15.4
330.8 ± 12.9
643.7 ± 30.1
1693.5 ± 158.0
185.1 ± 20.2
416.9 ± 19.4
812.2 ± 33.9
2106.3 ± 189.9
67 ± 6
66 ± 3
64 ± 3
68 ± 6
74 ± 8
83 ± 4
81 ± 3
84 ± 8
Each value represents the mean of triplicates (n=3) with standard deviation (SD). Statistical
analysis was calculated using t‐test (α = 0.05)
As shown on Table 4.13, the % recovery ranged from 59 (± 6) to 108 (± 10)% for organic
chicken liver, 64 (± 5) to 136 (± 6)% for regular chicken liver from Coles supermarket, 61 (±
5) to117 (± 9)% for the regular chicken liver from a local butcher shop, 60 (± 5) to 120 (± 8)%
for the local prawn, 66 (± 2) to 84 (± 5)% for the imported prawn (Thailand), 64 (± 3) to 84
(± 8)% for the imported prawn (Malaysia). In general, the % recovery of prawn was lower
than those of milk. Differences were observed in % recovery between raw and cooked
prawn, suggesting ENR may be more tightly absorbed to the denatured prawn protein than
the unprocessed protein. Overall, the recoveries obtained from chicken liver and prawn

126
samples, although slightly lower than the generally accepted range of 80‐120% for ELISA,
were acceptable considering extraction of (incurred) ENR residue from prawn have been
known to be challenging, resulting in < 80% recovery even for the instration techniques.
Further refinement of the sample preparation and improvement of recovery rate would be
desirable.
4.3.7 Linear regression of spiking and recoveries
A linear regression of spike and recovery data of ENR spiked in PBS buffer and diluted
samples (for milks), and in extraction solvent and extracted samples (for chicken liver and
prawn) was evaluated, (Figure 4.47 to 4.50). The linearity or coefficient of correlation (R2)
values obtained in liquid samples (milks) were 0.985 ± 0.01, %CV = 0.8% (in PBS buffer),
and 0.988 ± 0.01, %CV = 1.1% (in diluted samples), and in solid samples (chicken liver and
prawn) were 0.973 ± 0.03, %CV = 3.0% (in extraction solvent) and 0.968 ± 0.04, %CV = 4.6%
(in extracted samples).
Figure 4.47 Correlation between the levels of ENR spiking in skim milk liquid (SKL), skim
milk powder (SKP), full cream milk liquid (SKL), full cream milk powder (SKP) and estimates
by the ENR1‐ELISA. Average values (µg L‐1) of spiking and spiking level (µg L‐1) from in PBS
buffer.
0
100
200
300
400
500
0 100 200 300 400 500
Spiked (µg L‐1)
ENR‐ELISA (µg L‐1)
SKL (y = 0.843x + 26.75; R2 = 0.995)
SKP (y = 0.820x + 38.72; R2 = 0.984)
FCL (y = 1.143x ‐ 43.78; R2 = 0.985)
FCP (y = 1.270x ‐ 58.45; R2 = 0.976)
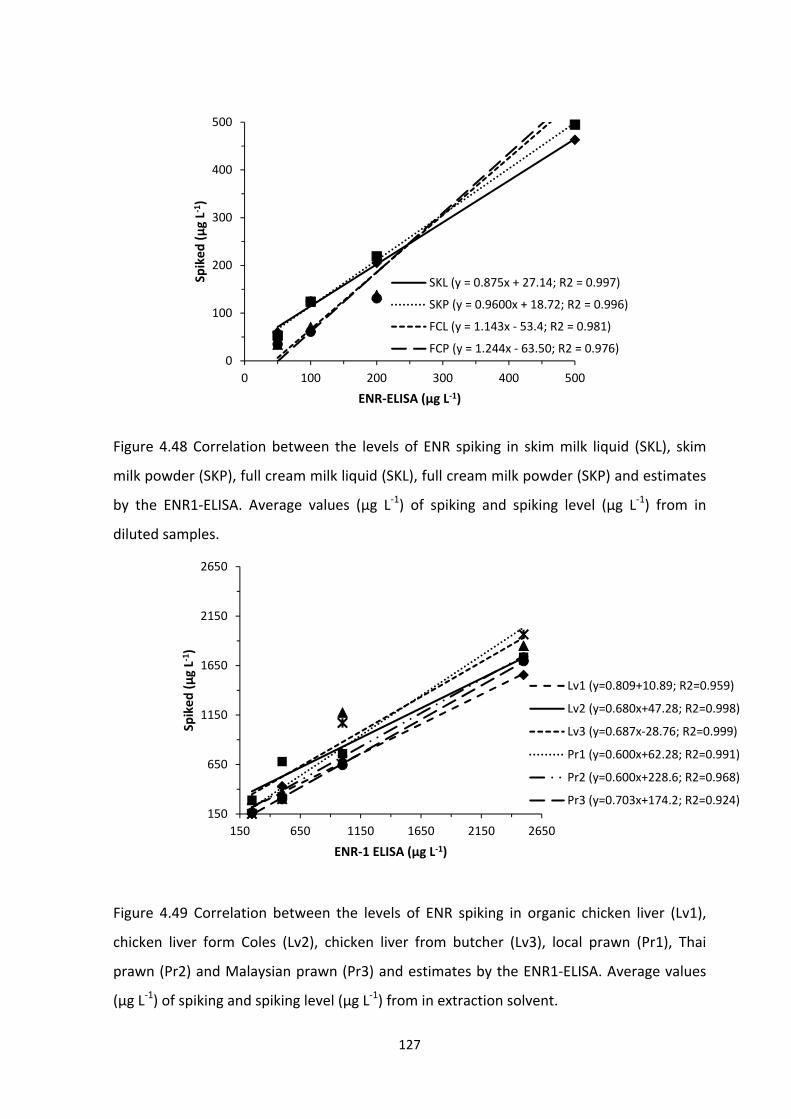
127
Figure 4.48 Correlation between the levels of ENR spiking in skim milk liquid (SKL), skim
milk powder (SKP), full cream milk liquid (SKL), full cream milk powder (SKP) and estimates
by the ENR1‐ELISA. Average values (µg L‐1) of spiking and spiking level (µg L‐1) from in
diluted samples.
Figure 4.49 Correlation between the levels of ENR spiking in organic chicken liver (Lv1),
chicken liver form Coles (Lv2), chicken liver from butcher (Lv3), local prawn (Pr1), Thai
prawn (Pr2) and Malaysian prawn (Pr3) and estimates by the ENR1‐ELISA. Average values
(µg L‐1) of spiking and spiking level (µg L‐1) from in extraction solvent.
0
100
200
300
400
500
0 100 200 300 400 500
Spiked (µg L‐1)
ENR‐ELISA (µg L‐1)
SKL (y = 0.875x + 27.14; R2 = 0.997)
SKP (y = 0.9600x + 18.72; R2 = 0.996)
FCL (y = 1.143x ‐ 53.4; R2 = 0.981)
FCP (y = 1.244x ‐ 63.50; R2 = 0.976)
150
650
1150
1650
2150
2650
150 650 1150 1650 2150 2650
Spiked (µg L‐1)
ENR‐1 ELISA (µg L‐1)
Lv1 (y=0.809+10.89; R2=0.959)
Lv2 (y=0.680x+47.28; R2=0.998)
Lv3 (y=0.687x‐28.76; R2=0.999)
Pr1 (y=0.600x+62.28; R2=0.991)
Pr2 (y=0.600x+228.6; R2=0.968)
Pr3 (y=0.703x+174.2; R2=0.924)

128
Figure 4.50 Correlation between the levels of ENR spiking in organic chicken liver (Lv1),
chicken liver form Coles (Lv2), chicken liver from butcher (Lv3), local prawn (Pr1), Thai
prawn (Pr2) and Malaysian prawn (Pr3) and estimates by the ENR1‐ELISA. Average values
(µg L‐1) of spiking and spiking level (µg L‐1) from in extracted samples.
4.4 Conclusion
This chapter presented the development of an indirect competitive ELISA method for
quantification of ENR in milk, chicken liver and prawn. The ENR specific polyclonal
antibodies were raised against the conjugates of the ENR hapten, to KLH, as a carrier
protein, using the carbodiimide‐NHS mediated coupling reaction. The ENR‐1 ELISA
exhibited an IC50 value of 11.8 µg L‐1, a LOD of 2.4µg L‐1 and a LOQ of 8.0 µg L‐1, evidently
exhibiting high sensitivity of the assay.
The homologous system generated higher sensitivity compared to the heterologous
systems in this study. The hapten homologous and linkage heterologous (i.e., using ENR2‐
OA as a competing antigen) system exhibited poorer sensitivity and displayed very low
colour development. The Ab‐ENR1 was highly specific for ENR and no apparent cross‐
reactivity that is more than 0.1% was detected despite their close structural similarity to
ENR.
150
650
1150
1650
2150
150 650 1150 1650 2150 2650
Spiked (µg L‐1)
ENR‐ELISA (µg L‐1)
Lv1 (y = 0.674x + 89.26; R2 = 0.983)
Lv2 (y = 0.562x + 186.4 ; R2 = 0.982)
Lv3 (y = 0.579x + 163.5; R2 = 0.882)
Pr1 (y = 0.829x + 114.5; R2 = 0.960)
Pr2 (y = 0.652x + 9.641; R2 = 0.999)
Pr3 (y = 0.850x ‐ 24.97; R2 = 0.999)

129
The effects of surfactants (Tween 20), organic solvent (methanol, ethanol, acetonitrile and
acetone) and pH conditions (5.5‐9.5) were evaluated to optimize assay performance.
Tween 20 affected colour development, but it did not affect the assay sensitivity. Of the
tested solvents, only methanol gave no or very low interference on the assay performance.
Up to 10% methanol could be used without significantly affecting the assay sensitivity. No
significant changes in the IC50 values were observed for pH between 6.5 and 8.5, however,
a slight difference in colour development was found in those pH values. Hence, PBS with
pH 7.4 was employed for the ENR1‐ELISA.
The matrix interference of the developed ENR ELISA were studied by running calibration
curves prepared in three different samples matrices, namely milk, chicken liver and prawn.
Using the optimized pre‐treatment of milk followed by a 10‐fold dilution, the IC50 values
and colour development were similar to that of matrix free solution. The extraction of
chicken liver and prawn samples were optimized by using a mixture of extraction solvents
(50mMNaOH 0.5%, MeOH, PBS; 1:9:90) with a 50‐fold dilution in PBS. Recovery values for
milk, chicken liver and prawn were between 59 (± 6) and 136 (± 6)%. Therefore, it can be
concluded that the newly developed assay is suitable for the analysis of ENR in milk,
chicken liver and prawn samples.

130
CHAPTER 5. CONCLUSIONS and RECOMMENDATIONS
5.1 Conclusions
Fluoroquinolones (FQs) are one of the synthetic antibacterial groups administered as
medicine to treat and prevent various infectious diseases for both humans and animals
(Brown, 1996). Due to increasing concerns of FQ residues entering the food chain and
contributing to bacterial resistance that might affect human health, regulatory authorities
in many countries set up the maximum residue limits (MRLs) for FQs. The MRLs of FQs are
set in the range between 30 and 1500 µg kg‐1 according to different food resources (i.e.
animal edible tissue, meat, fish and milk) and authorities (i.e. U.S. FDA, FAO/WHO/JECFA,
EU, Canada, China and Japan) ( Lu et al., 2006, Zhao et al., 2007,Huang et al., 2010,).
Indonesia has had adopted and followed the MRLs for FQs and their metabolites at a range
from 100‐300 µg kg‐1 in any type of animal origin foods that have been set up by FAO/WHO
(JECFA) (Hernandez‐Arteseros et al., 2002). FQ antibiotics are recently becoming more
frequently used in livestock and aquaculture farms in Indonesia. According to the sample
entry data of pharmaceutical products from the National Veterinary Drug Assay Laboratory,
the Ministry of Agriculture, Gunungsindur‐Bogor, West Java Province, Indonesia, FQs
totalled 30% of pharmaceutical products used between 2004 and 2007. ENR has the largest
number of brand names amongst single active ingredient products, and about 54 brand
names of ENR being distributed in the Indonesian market. It is important for Indonesia to
evaluate the adequacy of MRLs for FQs that were adopted from FAO/WHO (JECFA).
Chemical instrumental methods, such as HPLC and LC‐MS have been widely used for
screening of FQ residues because of their accuracy and sensitivity. However, these
methods are time consuming, expensive, and they require highly trained staff. An
immunochemical assay is an alternative method that is fast and can be just as sensitive as
those instrumental methods, for routine screening as well as quantifying of FQs. As
immunochemical assay provides low operating costs, this would be beneficial for
laboratories which could not afford such expensive instrumentations, particularly in
developing countries, such as Indonesia, for routine screening or even quantification of FQ
residues in animal and marine derived products,. Moreover, increasing routine monitoring
131
of FQs residues of food products in Indonesia will ensure safer and healthier food and help
to increase its trade capacity.
This research project, therefore, aims to improve the sensitivity and specificity of
antibodies for the detection FQ residues in marine and animal‐derived products through
novel hapten design and synthesis. A series of novel ENR, ciprofloxacin and norfloxacin
hapten syntheses haptens were carried out. The haptens were designed and synthesised
based on the attachment of linkers on carboxylic or piperazinyl groups. The ENR hapten
was synthesised by attaching a tert‐butyl linker on the carboxylic group of ENR. The
piperazinyl group of ciprofloxacin and norfloxacin were attached with the linker containing
a4‐bromobutane NHS ester and a bromocrotyl NHS ester, respectively.
On the immunochemical method development, polyclonal antibodies raised against ENR
hapten‐KLH immunogen showed specific recognition to ENR without significant cross‐
reactivity to seven FQs structurally related compounds (danofloxacin, enofloxacin,
sarafloxacin, perfloxacin, nalidixic acid, ciprofloxacin and norfloxacin). The ELISAs had an
IC50 value of 11.7 µg L‐1 ± 1.7 and the limit of detection (LOD) value of 2.4 µg L‐1 ± 0.4.
The effects of surfactants (Tween 20), organic solvent (methanol, ethanol, acetonitrile and
acetone) and pH conditions (5.5‐9.5) were evaluated to optimize assay performance.
Tween 20 affected considerably on colour development, but it did not affect the assay
sensitivity. Up to 10% of methanol can be used without significantly affected with the assay
sensitivity. No significant changes in the IC50 values were observed for pH 6.5 to 8.5,
although a slightly different in colour development was found in pH below and above 7.4.
The sample preparation techniques were also optimized for milk, chicken liver and prawn,
yielding recoveries between 59 ± 6 and 136 ± 6%. ENR is known to bind to protein and it is
speculated that recovery rate being affected probably due to binding of ENR residues to
matrix proteins. This suggests further refinement of the sample preparation to improve the
recovery of ENR residues from chicken liver and prawn samples.
As shown in this thesis, the assay was able to generate highly specific assay for the
detection of a single FQ compound. This ELISA can be used for the routine screening and
quantitative analyses for ENR residues in animal and marine derived products.

132
5.2. Recommendations
Further validation of this assay with conventional instrumentation methods such as HPLC
or LC‐MS is needed as a future work. While immunoassays as demonstrated in this thesis is
simple, fast and sensitive, development of label‐free immunosensors using the existing
antibodies for detection of FQ residues in foods would provide further benefits of
immunodiagnostics technology.
Regards to Indonesia, the extend of FQ residues in animal and seafood samples is not
known and surveys of FQ residues in such samples from traditional markets are urgently
needed for adequately assess the potential risks pose on human health. The outcomes of
such studies may urge Indonesian regulatory agents to re‐enforce their regulations in order
to project the general public.

133
REFERENCES
Anadon, A., Martinez‐Larranaga, M. R., Diaz, M. J., Bringas, P., Martinez, M. A., Fernandez‐Cruz, M. L., Fernandez, M. C. & Fernandez, R. 1995. Pharmacokinetics and Residues Of ENR In Chickens. American Journal of Veterinary Research, 56, 501‐506.
Angulo, F. J., Johnson, K. R., Tauxe, R. V. & Cohen, M. L. 2000. Origins And Consequences Of Antimicrobial‐Resistant Nontyphoidal Salmonella: Implications for the Use of Fluoroquinolones in Food Animals. Microbial Drug Resistance, 6, 77‐83.
Ball, P. 2000. Quinolone Generations: Natural History Or Natural Selection? Journal of Antimicrobial Chemotherapy, 46, 17‐24.
Beier, R. C., Stanker, L. H. & 1996, I. F. R. A., American Chemical Society, Washington DC., USA. 1996. Immunoassays for Residue Analysis,. American Chemical Society.
Beneš, J. 2005. Review and Categorization Of Quinolone Antibiotics. Přehled A Rozdělení Chinolonových Antibiotik, 11, 4‐14.
Bertino, J. & Fish, D. 2000. The Safety Profile of The Fluoroquinolones. Clinical Therapeutics, 22, 798‐817.
Blondeau, J. M. 2004. Fluoroquinolones: Mechanis of Action, Classification, and Development of Resistance. Survey of Ophthalmology, 49, 73‐78.
Bogialli, S., D'ascenzo, G., Corcia, A. D., Lagana, A. & Nicolardi, S. 2008. A Simple and Rapid Assay Based on Hot Water Extraction and Liquid Chromatography‐Tandem Mass Spectrometry for Monitoring Quinolone Residue in Bovine Milk. Food Chemistry 180, 354‐360.
Brás Gomes, F. B. M., Riedstra, S. & Ferreira, J. P. M. 2010. Development Of an Immunoassay for Ciprofloxacin Based on Phage‐Displayed Antibody Fragments. Journal of Immunological Methods, 358, 17‐22.
Brown, S. A. 1996. Fluoroquinolones in Animal Health. Journal of Veterinary Pharmacological Therapy, 19.
Bucknall, S., Silverlight, J., Coldham, N., Thorne, L. & Jackman, R. 2003. Antibodies to the Quinolones and Fluoroquinolones for the Development of Generic and Specific Immunoassays for Detection of these Residues in Animal Products. Journal of Food Additives and Contaminants 20, 221‐228.
Burkin, M. A. 2008. Enzyme‐Linked Immunosorbent Assays Of Fluoroquinolones with Selective and Group Specificities. Journal of Food and Agricultural Immunology, 19, 131‐140.
Cao, L., Kong, D., Sui, J., Jiang, T., Li, Z., Ma, L. & Lin, H. 2009. Broad‐Specific Antibodies for A Generic Immunoassay Of Quinolone: Development of A Molecular Model for Selection of Haptens Based on Molecular Field‐Overlapping Journal of Analytical Chemistry, 81.
Cao, L., Lin, H. & Mirsky, V. M. 2007. Surface Plasmon Resonance Biosensor for ENR Based On Deoxyribonucleic Acid. Journal of Analytica Chimica Acta, 589, 1‐5.
Cao, L., Sui, J., Kong, D., Li, Z. & Lin, H. 2011. Generic Immunoassay of Quinolones: Production and Characterization Of Anti‐Pefloxacin Antibodies as Broad Selective Receptors. Journal of Food Analytical Methods, Doi: 10.1007/S12161‐011‐9196‐2.
Carlucci, G. 1998. Analysis of Fluoroquinolones in Biological Fluids By High Performance Liquid Chromatography. Journal of Chromatography, 812, 343‐367.

134
Chen, J., Xu, F., Jiang, H., Hou, Y., Rao, Q., Guo, P. & Ding, S. 2009a. A Novel Quantum Dot‐Based Fluoroimmunoassay Method for Detection Of ENR Residue in Chicken Muscle Tissue. Food Chemistry, 113, 1197‐1201.
Chen, J., Xu. F., Jiang, H., Hou, Y., Rao, Q., Guo, P. & Ding, S. 2009b. A Novel Quantum Dot‐Based Fuoroimmunoassay Method for Detection Of Enrofloxacin Residue in Chicken Muscle Tissue, Journal of Food Chemistry, 113, 1197‐1201.
Choma, I., Grenda, D., Malinowska, I. & Suprynowicz, Z. 1999. Determination of Flumequine and Doxycycline in Milk By A Simple Thin‐Layer Chromatographic Method. Journal of Chromatography B: Biomedical Sciences And Applications, 734, 7‐14.
Choma, I. M., Choma, A., Komaniecka, I., Pilorz, K. & Staszezuk, K. 2004. Semiquantitative Estimation of ENR And Ciprofloxacin by Thin‐Layer Chromatography ‐ Direct Bioautography. Journal of Liquid Chromatography and Related Technologies, 27, 2071‐2085.
Choma, I. M., Choma, A. & Staszczuk, K. 2002. Determination of Flumequine in Milk by Thin‐Layer Chromatography‐Bioautography. Journal of Liquid Chromatography & Related Technologies, 25, 1579 ‐ 1587.
Cinquina, A. L., Roberti, P., Giannetti, L., Longo, F., Draisci, R., Fagiolo, A. & Brizioli, N. R. 2003. Determination of ENR and Its Metabolite Ciprofloxacin in Goat Milk by High‐Performance Liquid Chromatography with Diode‐Array Detection: Optimization and Validation. Journal of Chromatography A, 987, 221‐226.
Coillie, E. V., Block, J. D. & Reybroeck, W. 2004. Development of An Indirect Competitive Elisa for Flumequine Residues in Raw Milk Using Chicken Egg Yolk Antibodies. Journal of Agricultural and Food Chemistry, 52, 4975‐4978.
Crowther, J. R. 2001. The Elisa Guidebook. Deshpande, S. S. 1996. Enzyme Immunoassay’ from Concept to Product Development. Duan, J. & Yuan, Z. 2001. Development of An Indirect Competitive Elisa for Ciprofloxacin
Residues in Food Animal Edible Tissues. Journal of Agricultural and Food Chemistry, 49, 1087‐1089.
Dufresne, G., Fouquet, A., Forsyth, D. & Tittlemier, S. A. 2007. Multiresidue Determination of Quinolone and Fluoroquinolone Antibiotics in Fish and Shrimp by Liquid Chromatography/Tandem Mass Spectrometry. Journal of AOAC International, 90, 604‐612.
Espinosa‐Mansilla, A., De La Pena, A. M., Gomez, D. G. & Lopez, F. S. 2006. Determination of Fluoroquinolones in Urine and Serum by Using High Performance Liquid Chromatography and Multiemission Scan Fluorimetric Detection. Journal of Talanta 68, 1215‐1221.
Fierens, C., Hillaert, S. & Van Den Bossche, W. 2000. The Qualitative And Quantitative Determination of Quinolones of First And Second Generation by Capillary Electrophoresis. Journal of Pharmaceutical and Biomedical Analysis, 22, 763‐772.
Garden, S. W. & Sporns, P. 1994. Development and Evaluation of An Enzyme Immunoassay for Sulfamerazine In Milk. Journal of Agricultural and Food Chemistry, 42, 1379‐1391.
Gaugin, M. & Abjean, J. P. 1998. Screening of Quinolone Residues in Pig Muscle by Planar Chromatography. Journal of Chromatographia, 47 (1‐2), 101‐104.
135
Gigosos, P., Revesado, P. R., Cadahia, O., Fente, C. A., Vazquez, B. I., Franco, C. M. & Cepeda, A. 2000. Determination of Quinolones in Animal Tissues And Eggs By HPLC with Photodiode‐Array Detection. Journal of Chromatography, 871, 31‐36.
Giroud, F., Gorgy, K., Gondran, C., Cosnier, S., Pinacho, D. G., Marco, M. P. & Sanchez‐Baeza, F. J. 2009. Impedimetric Immunosensor Based on A Polypyrrole‐Antibiotic Model Film for The Label‐Free Picomolar Detection Of Ciprofloxacin. Analytical Chemistry, 81, 8405–8409.
Goodrow, M. H. & Hammock, B. D. 1998a. Hapten Design For Compound‐Selective Antibodies: ELISAs for Environmentally Deleterious Small Molecules. Analytica Chimica Acta, 376, 83‐91.
Goodrow, M. H., Sanbom, J. R., Stoutamire, D. W., Gee, S. J. & Hammock, B. D. 1995. Strategies For Immunoassay Hapten Design. in Immunoanalysis of Agrochemicals ; Nelson, J. O., Karu, A. E., Wong, R. B., Eds.; Acs Symposium Series 586; . American Chemical Society, Pp.119‐139.
Haasnoot, W., Gercek, H., Cazemier, G. & Nielen, M. W. F. 2007. Biosensor Immunoassay for Flumequine in Broiler Serum and Muscle. Analytica Chimica Acta, 586(1‐2), 312‐318.
Hammer, P. & Heeschen, W. 1995. Antibody‐Captured Immunoassay for The Detection of ENR in Raw Milk. . Milchwissenschaft 50, 513‐514.
Harlow, E. & Lane, D. 1988. Antibodies : A Laboratory Manual. Hassonuan, M. K., Ballesteros, O., Taofiki, J., Vilchez, J. L., Cabrera‐Aguilera, M. & Navalon,
A. 2007a. Multiresidue Determination of Quinolones Antibacterials in Eggs of Laying Hens By Liquid Chromatography with Fluorescence Detection. Journal of Chromatography, 859(2), 282‐288.
Hassonuan, M. K., Ballesteros, O., Zafra, A., Vilchez, J. L. & Navalon, A. 2007b. Multiresidue Method for Simultaneous Determination of Quinolones Antibacterials in Pig Kidney Samples By Liquid Chromatography With Fluorescence Detection. Journal of Chromatography, 859(2), 282‐288.
Henniona, M. C. & Barcelo, D. 1998. Strengths and Limitations of Immunoassays For Effective and Efficient Use for Pesticide Analysis in Water Samples: A Review. Analytica Chimica Acta, 362 (1), 3‐34.
Hermanson, G. T. 1996. Bioconjugate Techniques. Hernandez‐Arteseros, J. A., Barbosa, J., Compano, R. & Prat, M. D. 2002. Analysis of
Quinolone Residues in Edible Animal Products. Journal Of Chromatography, 945, 1‐24.
Higgins, P. G., Fluit, A. C. & Schmitz, F. J. 2003. Fluoroquinolones: Structure And Target Sites. Current Drug Targets, 4, 181‐190.
Holtzapple, C. K., Buckley, S. A. & Stanker, L. H. 1997. Production and Characterization of Monoclonal Antibodies Against Sarafloxacin and Cross‐Reactivity Studies of Related Fluoroquinolones. Journal of Agricultural and Food Chemistry, 45, 1984‐1990.
Holtzapple, C. K., Buckley, S. A. & Stanker, L. H. 1999. Determination of Four Fluoroquinolones in Milk By On‐Line Immunoaffinity Capture Coupled with Reversed‐Phase Liquid Chromatography. Journal of AOAC International, 82, 607‐613.
Holtzapple, C. K., Buckley, S. A. & Stanker, L. H. 2001. Determination of Fluoroquinolones in Serum Using an On‐Line Clean‐Up Column Coupled to High‐Performance

136
Immunoaffinity–Reversed‐Phase Liquid Chromatography. Journal of Chromatography, 754, 1‐9.
Holtzapple, C. K., Pishko, E. J. & Stanker, L. H. 2000. Separation and Quantification of Two Fluoroquinolones in Serum by On‐Line High‐Performance Immunoaffinity Chromatography. Journal of Analytical Chemistry, 72, 4148‐4153.
Holtzapple, C. K. & Stanker, L. H. 1998. Affinity Selection of Compounds in a Fluoroquinolone Chemical Library By On‐Line Immunoaffinity Deletion Coupled to Column HPLC. Analytical Chemistry, 70, 4817‐4821.
Hooper, D. C. 2001. Mechanism of Action Of Antimicrobials: Focus on Fluoroquinolones. The Infectious Disease Society of America, 32, 9‐13.
Hooper, D. C. & Wolfson, J. S. 1991. Fluoroquinolone Antimicrobial Agents, The New England Journal of Medicine Editorial, 324, 384‐394.
Huang, B., Yin, Y., Lu, L., Ding, H., Wang, L., Yu, T., Zhu, J. J., Zheng, X. D. & Zhang, Y. Z. 2010. Preparation of High‐Affinity Rabbit Monoclonal Antibodies for Ciprofloxacin and Development of An Indirect Competitive Elisa for Residues in Milk. Journal of Zhejiang University‐Science B (Biomedicine & Biotechnology), 11(10), 812‐818.
Huet, A. C., Charlier, C., Singh, G., Godefroy, S. B., Leivo, J., Vehniäinen, M., Nielen, M. W. F., Weigel, S. & Delahauta, P. 2008. Development of an Optical Surface Plasmon Resonance Biosensor Assay For (Fluoro)Quinolones In Egg, Fish, And Poultry Meat. Analytica Chimica Acta, 623, 195–203.
Huet, A. C., Charlier, C., Tittlemier, S., Singh, G., Benrejeb, S. & Delahaut, P. 2006. Simultaneous Determination of (Fluoro)Quinolone Antibiotics In Kidney, Marine Products, Eggs, and Muscle by Enzyme‐Linked Immunosorbent Assay (Elisa). Journal of Agricultural and Food Chemistry, 54, 2822‐2827
Hung, S. 2007. New Detection Technique for Fluoroquinolone‐Conjugated Proteins by High Performance Liquid Chromatography with UV/Fluorescence Detectors. Journal of Food and Drug Analysis, 15, 71‐74.
Idowu, O. R. & Peggins, J. O. 2004. Simple, Rapid Determination of ENR and Ciprofloxacin in Bovine Milk and Plasma by High‐Performance Liquid Chromatography with Fluorescence Detection. Journal of Pharmaceutical and Biomedical Analysis, 35, 143‐153.
Ikegawa, S. 1998. Separatory Determination of Diastereomeric Ibuprofen Glucuronides in Huma Urine by Liquid Chromatography/Electrospray Ionization‐Mass Spectrometry. Journal of Biomedical Chromatography, 12, 317‐321.
Johnston, L., Mackay, L. & Croft M. 2002. Determination of Quinolones and Fluoroquinolones in Fish Tissue and Seafood by High Performance Liquid Chromatography with Electrospray Ionisation Tandem Mass Spectrometric Detection. Journal of Chromatography, 982, 97‐109.
Juhel‐Gaugain, M. & Abjean, J. P. 1998. Screening of Quinolone Residues in Pig Muscle by Planar Chromatography. Chromatographia, 47, 101‐104.
Kato, M., Ihara, Y., Kasai, D. & Kodaira, T. 2008. The Development of Release‐Competitive Assay To Detect Residual Quinolones in Contaminated Milk’, Journal af Food and Agricultural Immunology, 19, 241‐246.
Kato, M., Ihara, Y., Nakata, E., Miyazawa, M., Sasaki, M., Tsukasa, K. & Nakazawa, H. 2007. Development of ENR Elisa Using A Monoclonal Antibody Tolerating An Organic

137
Solvent with Broad Cross‐Reactivity To Other Newquinolones. Journal of Food and Agricultural Immunology, 18, 179‐197.
King, D. E., Malone, R. & Lilley, S. H. 2000. New Classification and Update on the Quinolone Antibiotics. American Family Physician, 61, 2741‐2748.
Klotins, K. 2005. Antibiotic Use for Growth Improvement ‐ Controversy and Resolution. http://www.omafra.gov.on.ca/english/livestock/animalcare/amr/facts/05‐041.htm. Downloaded on May 12th 2008.
Kuijper, E. J., Van Dissel, J. T. & Wilcox, M. H. 2007. Clostridium Difficile: Changing Epidemiology And New Treatment Options. Current Opinion in Infectious Diseases, 20, 376‐383.
Lee, N. A. & Kennedy, I. R. 2007. Immunoassay, Food Toxicants Analysis: Techniques, Strategies and Development. Elsevier, Valencia, Spain.
Li, Y., Ji, B., Chen, W., Liu, C., Peng, C. & Wang, L. 2008. Production of New Class‐Specific Polyclonal Antibody for Determination of Fluoroquinolone Antibiotics by Indirect Competitive Elisa. Journal of Food and Agricultural Immunology, 19, 251‐264.
Lu, S. L., Zhang, Y., Liu, J., Zhao, C., Liu, W. & Xi, R. 2006. Preparation of Anti‐Pefloxacin Antibody and Development of An Indirect Competitive Enzyme‐Linked Immunosorbent Assay for Detection of Pefloxacin Residue in Chicken Liver. Journal of Agricultural and Food Chemistry, 54, 6995‐7000
Mandell, L. & Tillotson, G. 2002. Safety of Fluoroquinolones: An Update. Canadian Journal of Infectious Diseases, 13, 54‐61.
Maraschiello, C., Cusidó, E., Abellán, M. & Vilageliu, J. 2001. Validation of An Analytical Procedure for the Determination of the Fluoroquinolone Ofloxacin in Chicken Tissues. Journal of Chromatography B: Biomedical Sciences And Applications, 754, 311‐318.
Marazuela, M. D. & Moreno‐Bondi, M. C. 2004. Multiresidue Determination of Fluoroquinolones in Milk by Column Liquid Chromatography with Fluorescence and Ultraviolet Absorbance Detection. Journal of Chromatography A, 1034, 25‐32.
Marchesini, G. R., Haasnoot, W., Delahaut, P., Gercek, H. & Nielen, M. W. F. 2007. Dual Biosensor Immunoassay‐Directed Identification of Fluoroquinolones in Chicken Muscle by Liquid Chromatography Electrospray Time‐of‐Flight Mass Spectrometry. Analytica Chimica Acta, 259–268
Mehlhorn, A. J. & Brown, D. A. 2007. Safety Concerns with Fluoroquinolones. Annals of Pharmacotherapy, 41, 1859‐1866.
Mella M, S., Acuña L, G., Muñoz Q, M., Perez C, C., Labarca L, J., Gonzalez R, G., Bello T, H., Dominguez Y, M. & Zemelman Z, R. 2000. Quinolones: General Characteristics of Structure and Classification. Quinolonas: Aspectos Generales Sobre Su Estructura Y Clasificación, 17, 53‐66.
Mitchell, M. A. 2006. ENR. Journal of Exotic Pet Medicine, 15(1), 66‐69. Mitra, S. 2003. Sample Preparation Techniques In Analytical Chemistry. Mock, W. L. & Ochwat, K. J. 2002. Substituent Effects in The Addition of Carboxylic Acids to
Arylcarbodiimides. Journal of Chemical Society, Perkin Transaction 2, 843‐847. Nelson, J. M., Chiller, T. M., Powers, J. H. & Angulo, F. J. 2007. Fluoroquinolone‐Resistant
Campylobacter Species and the Withdrawal of Fluoroquinolones from Use in Poultry: A Public Health Success Story. Clinical Infectious Diseases, 44, 977‐980.
Neu, H. C. 1992. Quinolone Antimicrobial Agents Annual Review Medicine, 43, 465‐486.
138
Nikolayenko, I. V., Galkin, O. Y., Grabchenko, N. I. & Spivak, M. Y. 2005. Preparation of Highly Purified Human Igg, Igm, and Iga for Immunization and Immunoanalysis. Ukrainica Bioorganica Acta 2, 3‐11.
Oliphant, C. M. & Green, G. M. 2002. Quinolones: A Comprehensive Review. American Family Physician, 65, 455‐464.
Pena, A., Silva, L. J. G., Pereira, A., Meisel, L. & Lino, C. M. 2010. Determination of Fluoroquinolone Residues In Poultry Muscle In Portugal. Analytical and Bioanalytical Chemistry, 397, 2615‐2621.
Price, C. P. & Newman, D. J. 1991. Principle And Practice of Immunoassay. Ridgway, K., Lalljie, S. P. D. & Smith, R. M. 2007. Sample Preparation Techniques for the
Determination of Trace Residues and Contaminants in Foods. Journal of Chromatography A, 1153, 36‐53.
Sárközy, G. 2001. Quinolones: A Class of Antimicrobial Agents. Veterinarni Medicina, 46, 257‐274.
Sheng, W., Xia, X., Wei, K., Li, J., Li, Q. X. & Xu, T. 2009a. Determination of Marbofloxacin Residues in Beef and Pork with An Enzyme‐Linked Immunosorbent Assay. Journal of Agricultural and Food Chemistry, 57, 5971‐5975.
Sheng, W., Xua, T., Maa, H., Wanga, X., Li, Q. & Li, J. 2009b. Development of An Indirect Competitive Enzyme‐Linked Immunosorbent Assay for Detection of Danofloxacin Residues in Beef, Chicken and Pork Meats. Journal of Food and Agricultural Immunology, 20, 35‐47.
Shim, J. H., Shen, J. Y., Kim, M. R., Lee, C. J. & Kim, I. S. 2003. Determination ff The Fluoroquinolone ENR in Edible Chicken Muscle by Supercritical Fluid Extraction And Liquid Chromatography With Fluorescence Detection. Journal of Agricultural and Food Chemistry, 7528‐7532.
Simonovska, B., Andrensek, S., Vovk, I. & Prosek, M. 1999. High‐Performance Thin‐Layer Chromatography Method for Monitoring Norfloxacin Residues on Pharmaceutical Equipment Surfaces. Journal of Chromatography A, 862, 209‐215.
Skerritt, J. H., Kurtz, D. A. & Stanker, L. 1995. New Frontiers in Agrochemical Immunoassay. AOAC International.
Smith, K. E., Besser, J. M., Hedberg, C. W., Leano, F. T., Bender, J. B., Wicklund, J. H., Johnson, B. P., Moore, K. A. & Osterholm, M. T. 1999. Quinolone‐Resistant Campylobacter Jejuni Infections in Minnesota, 1992–1998. The New England Journal of Medicine, 340(20), 1525‐1532.
Snitkoff, G. G., Grabe, D. W., Holt, R. & Bailie, G. R. 1998. Development of An Immunoassay For Monitoring Of The Level Ciprofloxacin In Patients Sample. Journal of Immunoasssy, 19(4), 227‐238.
Sun, W. Y., Liu, W. Y. & Qu, L. B. 2007. Development Of ELISA and Immunochromatographic Assay for Ofloxacin. Chinese Chemical Letters, 18, 1107‐1110.
Tittlemier, S. A., Gelinas, J. M., Dufrense, G., Haria, M., Queery, J., Cleroux, C., Menard, C., Delahaut, P., Singh, G., Durand, N. & Godefroy, S. 2008. Development of A Direct Competitive Enzyme‐Linked Immunosorbent Assay for The Detection Of Fluoroquinolone Residues In Shrimp. Journal Analytical Methods, 1, 28‐35.
Toldra, F. & Reig, M. 2006. Methods for Rapid Chemical and Veterinary Drug Residues in Animal Foods. Trends in Food Science and Technology, 17, 482‐489
139
Tollefson, L. & Karp, B. E. 2004. Human Health Impact from Antimicrobial Use in Food Animals. Médecine E T Maladies Infectieuses 34, 514‐521.
Toussaint, B., Chedin, M., Bordin, G. & Rodriquez, A. R. 2005a. Determination (Fluoro)Quinolone Antibiotic Residues in Pig Kidney Using Liquid Chromatography‐Tandem Mass Spectrometry: I. Laboratory‐Validated Method. Journal of Chromatography, 1088(1‐2), 32‐39.
Toussaint, B., Chedin, M., Vincent, U. & Rodriquez, A. R. 2005b. Determination (Fluoro)Quinolone Antibiotic Residues in Pig Kidney Using Liquid Chromatography‐Tandem Mass Spectrometry: Part Ii. Intercomparison Exercise. Journal of Chromatography, 1088(1‐2), 40‐48.
Tsekenis G., Garifallou, G. Z., Davis, F., Millner, P. A., Pinacho, D. G., Baeza, F. S., Marco, M. P., Gibson, T. D. & Higson, P. J. 2008. Detection of Fluoroquinolone Antibiotics in Milk Via A Labeless Immunoassay Based Upon an Alternating Current Impedance Protocol. Journal of Analytical Chemistry 80, 9233‐9239.
Van Emon, J. M. 2010. Bioanalytical Methods for Food Contaminant Analysis. Journal of AOAC International, 93 (6), 1681‐1691.
Van Emon, J. M., Chuang, J. C., Trejo, R. M. & Durnford, J. 2007. Immunoassay and Other Bioanalytical. 1‐43.
Van Vyncht, G., Janosi, A., Bordin, G., Toussaint, B., Maghuinrogister, G., De Pauw, E. & Rodriguez, A. R. 2002. Multiresidue Determination of (Fluoro)Quinolone Antibiotics in Swine Kidney Using Liquid Chromatography‐Tandem Mass Spectrometry. Journal of Chromatography, 952.
Vega, M., Rios, G., Saelzer, R. & Herlitz, E. 1995. Analysis of Quinolonic Antibiotics By HPTLC. Oxolinic Acid Residue Analysis in Fish Tissue. Journal of Planar Chromatography, 8, 378‐381
Volmer, D. A., Mansoori, B. & Locke, S. J. 1997. Study Of 4‐Quinolone Antibiotics in Biological Samples by Short‐Column Liquid Chromatography Coupled with Electrospray Ionization Tandem Mass Spectrometry. Analytical Chemistry, 69, 4143‐4155.
Wagman, A. S. & Wentland, M. P. M. 2007. Quinolone Antibacterial Agents. Comprehensive Medicinal Chemistry, 7, 567‐596.
Wang, S., Allan, R. D., Skerritt, J. H. & Kennedy, I. V. 1998. Development of A Class‐Specific Competitive Elisa For The Benzoylphenylurea Insecticides. Journal of Agricultural and Food Chemistry, 46 (8), 3330–3338.
Wang, Z., Zhu, Y., Ding, S., He, F., Beier, R. C., Li, J., Jiang, H., Feng, C., Wan, Y., Zhang, S., Kai, Z., Yang, X. & Shen, J. 2007a. Development of A Monoclonal Antibody‐Based Broad‐Specificity ELISA for Fluoroquinolone Antibiotics in Foods And Molecular Modeling Studies Of Cross‐Reactive Compounds. Journal of Analytical Chemistry, 79, 4471‐4483.
Wang, Z., Zhu, Y., Ding, S. Y., He, F. Y., Beire, R. C., Li, J. C., Jiang, H., Feng, C., Wan, Y., Zhang, S., Kai, Z., Yang, X. & Shen, J. 2007b. Development of A Monoclonal Antibody‐Based Broad‐Specificity ELISA for Fluoroquinolone Antibiotics in Foods and Molecular Modeling Studies of Cross‐Reactive Compounds. Journal of Analytical Chemistry, 79, 4471‐4483.

140
Watanabe, H., Satake, A., Kido, Y. & Tsuji, A. 2002. Monoclonal‐Based Enzyme‐Linked Immunosorbent Assay and Immunochromatographic Assay for ENR in Biological Matrices. Analyst, 127, 98‐103.
Watanabe H., Satake., Kido, Y. & Tsuji, A. 2002. Monoclonal‐Based Enzyme‐Linked Immunosorbent Assay and Immunochromatographic Assay for ENR in Biological Matrices. The Analyst, 127, 98‐103.
Wild, D. 1994. The Immunoassay Handbook. Yoon, Y., Westerhoff, P., Snyder, S. A. & Esparza, M. 2003. HPLC‐Fluorescence Detection
and Adsorption of Bisphenol A, 17β‐Estradiol, and 17α‐Ethynyl Estradiol on Powdered Activated Carbon. Water Research, 37, 3530‐3537.
Yorke, J. C. & Froc, P. 2000. Quantitation of Nine Quinolones in Chicken Tissues By High‐Performance Liquid Chromatography with fluorescence Detection, Journal of Chromatography, 882, 63‐77.
Yu, W., Yu‐Dong, S., Zhen‐Lin, X., Hong‐Tao, L., Hong, W. & Yuan‐Ming, S. 2010. Production and Identification of Monoclonal Antibody Against Flumequine and Development of Indirect Competitive Enzyme‐Linked Immunosorbent Assay. Chinese Journal of Analytical Chemistry, 38(3), 313‐317.
Zeng, Z., Dong, A., Yang, G., Chen, Z. & Huang, X. 2005. Simultaneous Determination of Nine Fluoroquinolones in Egg White and Egg Yolk by Liquid Chromatography with Fluorescence Detection. Journal of Chromatography B: Analytical Technologies in The Biomedical and Life Sciences, 821, 202‐209.
Zhao, C., Liu, W., Ling, H., Lu, S., Zhang, Y., Liu, J. & Xi, R. 2007. Preparation of Anti‐Gatifloxacin Antibody and Development An Indirect Competitive Enzyme‐Linked Immunosorbent Assay for The Detection of Gatifloxacin Residue in Milk. Journal of Agricultural and Food Chemistry, 55, 6879‐6884.
Zhao, S., Li, X., Ra, Y., Li, C., Jiang, H., Li, J., Qu, Z., Zhang, S., He, F., Wan, Y., Feng, C., Zheng, Z. & Shen, J. 2009. Developing and Optimizing An Immunoaffinity Cleanup Technique for Determination of Quinolones from Chicken Muscle. Journal of Agricultural and Food Chemistry, 57, 365‐371.
Zheng, Z., Dong, A. G., Yang, G. X., Chen, Z. L. & Huang, X. H. 2005. Simultaneous Determination of Nine Fluoroquinolones in Egg White And Egg Yolk by Liquid Chromatography with Fluorescence Detection. Journal of Chromatography, 821, 202‐209.
Zhu, Y., Li, L., Wang, Z., Chen, Y., Zhao, Z., Zhu, L., Wu, X., Wan, Y., He, F. & Shen, J. 2008. Development of An Immunochromatography Strip for the Rapid Detection Of 12 Fluoroquinolones in Chicken Muscle and Liver. Journal of Agricultural and Food Chemistry, 55, 5469‐5474.
Related Documents


![ENZYME-LINKED IMMUNOSORBENT ASSAY [ELISA]¡Enzyme-linked immunosorbent assay. ¡Is a biochemical plate-based assay technique designed for detecting and quantifying substances such](https://static.cupdf.com/doc/110x72/5f4f5b992afa395c6303586c/enzyme-linked-immunosorbent-assay-elisa-enzyme-linked-immunosorbent-assay-is.jpg)