Development of a Regional Public Transportation GIS Architecture and Data Model May 2012 PROJECT NO. BDK85 977-29 PREPARED FOR Florida Department of Transportation

Welcome message from author
This document is posted to help you gain knowledge. Please leave a comment to let me know what you think about it! Share it to your friends and learn new things together.
Transcript

Development of a Regional Public Transportation
GIS Architecture and Data Model
May 2012
PROJECT NO. BDK85 977-29
PREPARED FOR
Florida Department of Transportation

i
Development of a Regional Public Transportation
GIS Architecture and Data Model
BDK85 977-29
Prepared for:
Florida Department of Transportation Thomas M. Kelly, Co-Project Manager Raymond Miller, Co-Project Manager
Elba Lopez, Co-Project Manager
Prepared by:
USF Center for Urban Transportation Research Sean J. Barbeau, Research Associate
Khoa Tran, Graduate Research Assistant Edward L. Hillsman, Senior Research Associate
Final Report
May 2012

ii
DISCLAIMER The opinions, findings, and conclusions expressed in this publication are those of the authors and not necessarily those of the State of Florida Department of Transportation.
iii
METRIC CONVERSION TABLE
SYMBOL WHEN YOU KNOW MULTIPLY BY TO FIND SYMBOL
LENGTH
in inches 25.4 millimeters mm
ft feet 0.305 Meters m
yd yards 0.914 Meters m
mi miles 1.61 kilometers km
VOLUME
fl oz fluid ounces 29.57 milliliters mL
gal gallons 3.785 Liters L
ft3 cubic feet 0.028 cubic meters m3
yd3 cubic yards 0.765 cubic meters m3
NOTE: volumes greater than 1000 L shall be shown in m3
MASS
oz ounces 28.35 Grams g
lb pounds 0.454 kilograms kg
T short tons (2000 lb) 0.907 megagrams (or "metric ton") Mg (or "t")
TEMPERATURE (exact degrees)
oF Fahrenheit 5 (F-32)/9 or (F-32)/1.8 Celsius oC

iv
TECHNICAL REPORT DOCUMENTATION PAGE
1. Report No. 2. Government Accession No. 3. Recipient's Catalog No.
4. Title and Subtitle Development of a Regional Public Transportation GIS Architecture and Data Model
5. Report Date May 2012 6. Performing Organization Code
7. Author(s) Sean J. Barbeau, Khoa Tran, and Edward L. Hillsman
8. Performing Organization Report No. USF 21177935
9. Performing Organization Name and Address National Center for Transit Research Center for Urban Transportation Research , University of South Florida 4202 East Fowler Avenue, CUT100 Tampa, FL 33620-5375
10. Work Unit No. (TRAIS) 11. Contract or Grant No. BDK85 977-29
12. Sponsoring Agency Name and Address Research Center Florida Department of Transportation 605 Suwannee Street, MS 30 Tallahassee, FL 32399-0450 Research and Innovative Technology Administration U.S. Department of Transportation Mail Code RDT-30 1200 New Jersey Ave, SE, Room E33 Washington, D.C. 20590-0001
13. Type of Report and Period Covered Final – February 2011 to May 2012
14. Sponsoring Agency Code
15. Supplementary Notes FDOT Project Managers – Thomas M. Kelly, District Seven GIS/EDMS Coordinator, Raymond Miller, District 7 GIS Coordinator, Elba Lopez, District 7 Public Transit/Intermodal Administrator 16. Abstract Coordinated data sharing is important for government jurisdictions that overlap the same geographic area. For efficient planning and operations purposes, each jurisdiction should have knowledge of the other organizations’ activities that may affect them. Florida Department of Transportation (FDOT) District 7 (D7) has identified the need to obtain and view spatial data from many public transportation agencies within FDOT D7 and across the West Central Florida region. This ability will greatly increase the efficiency of FDOT D7 employees that use public transportation information in their workflows. Furthermore, it will assist the regional public transportation planning efforts in FDOT D7. Past efforts for intra-regional data sharing have included the manual transmission of datasets via email or File Transfer Protocol. However, manual data sharing is difficult to sustain at a high frequency due to the manual effort involved in collecting, formatting, sending, receiving, and processing the data. Additionally, each dataset may be in a different format, which makes comparison and coordination among agency datasets difficult and time-consuming. If the perceived effort to exchange data is too great, old and outdated datasets may be used in place of new data, even if new data are available. The research team, along with feedback from FDOT D7 and the transit agencies in its region, successfully developed and demonstrated a prototype software system that is able to automatically retrieve General Transit Feed Specification (GTFS)-based datasets (describing transit stops, routes, and schedules) from local transit agency websites and store them in the FDOT D7 enterprise geodatabase. Additionally, a Web application was developed to visualize and query transit data alongside FDOT D7 data. The resulting Web application is capable of showing multimodal data for the regional transportation systems that is always based on the most recent data available from the transit agency. Challenges encountered in this project included working with proprietary Environmental Systems Research Institute (ESRI) software that has limited examples and documentation and coordinating with transit agencies that are in various stages of collecting and maintaining their bus stop inventory data. Next steps for this project are the deployment of the system to FDOT D7 staff as well as replication of this system to other districts, such as FDOT District 1. Tools exist to assist transit agencies in developing an accurate bus stop inventory and in creating and maintaining GTFS datasets. Increasing the awareness and expertise of agencies in the use of these tools will be useful for deploying this system with data from additional agencies.

v
17. Key Word Transit, data, GTFS, multimodal, public transportation, geographic information systems, regional, district, model, architecture
18. Distribution Statement Available to the public through the National Technical Information Service (NTIS), 5285 Port Royal Road, Springfield, VA 22161, (703) 487-4650, http://www.ntis.gov/ , and through the NCTR website at http://www.nctr.usf.edu/
19. Security Classif. (of this report) unclassified
20. Security Classif. (of this page)
unclassified
21. No. of Pages 49
22. Price

vi
ACKNOWLEDGMENTS This report was prepared by the National Center for Transit Research (NCTR) at the Center for Urban Transportation Research (CUTR) at the University of South Florida (USF) through the sponsorship of the Florida Department of Transportation (FDOT) and the U.S. Department of Transportation.
The authors would like to acknowledge the time and helpful comments contributed by the following at meetings held to identify available data, suggest needs to be met by the project results, and review drafts:
• Hillsborough Area Regional Transit • Pinellas Suncoast Transit Authority • Pasco County Public Transportation • Pasco County Metropolitan Planning Organization • Pasco County Board of County Commissioners • Hillsborough County GIS Office • FDOT District 7 • City of Tampa • Tindale-Oliver & Associates, Inc.
The research team would like to thank the following transit agencies for their cooperation as part of this project and for providing data used in this project:
• Hillsborough Area Regional Transit • Pinellas Suncoast Transit Authority • Pasco County Public Transportation
The research team is also thankful for the help of the project managers who helped facilitate communication among the various stakeholders in this project:
• Thomas M. Kelly • Raymond Miller • Elba Lopez
The research team is especially grateful to Richard Pascoe and Carey Rankin for sharing their expertise and knowledge of the FDOT District 7 GIS system. They helped solve numerous technical issues and were vital to the success of this project.

vii
EXECUTIVE SUMMARY Coordinated data sharing is important for various government jurisdictions that overlap the same geographic area. For efficient planning and operations purposes, each jurisdiction should have knowledge of the other organizations’ activities that may affect them. Florida Department of Transportation (FDOT) District 7 (D7) has identified the need to obtain and view spatial data from many public transportation agencies within FDOT D7 and across the West Central Florida region. This ability will greatly increase the efficiency of FDOT D7 employees that use public transportation information in their workflows. Furthermore, it will assist the regional public transportation planning efforts in FDOT D7.
Past efforts for intra-regional data sharing have included the manual transmission of datasets via email or File Transfer Protocol (FTP). However, manual data sharing is difficult to sustain at a high frequency due to the manual effort involved in collecting, formatting, sending, receiving, and processing the data. Additionally, each dataset may be in a different format, which makes comparison and coordination among agency datasets difficult and time-consuming. Data are often transferred on an ad hoc basis as requests are made from one organization to another. If the perceived effort to exchange data is too great, old and outdated datasets may be used in place of new data, even if new data are available. As a result, maintaining an updated common dataset at each agency is extremely difficult when using manual methods.
Ideally, regional data would be compiled into a common geodatabase schema that unifies the data formats from the various public transportation systems. This database should be easily accessible from a Web-based GIS application that provides tools for viewing and querying the GIS data and facilitates regional public transportation planning so all involved parties are seeing the same updated snapshot of data. This system should also support an automated update process that minimizes efforts required by transit agencies and FDOT D7 to quickly and repeatedly update the centralized, shared geodatabase with any changes in agency data on a regular schedule.
Meetings with the various data stakeholders in FDOT D7 that had an interest in a centralized regional dataset were convened throughout the project. Meeting participants included representatives from Hillsborough Area Regional Transit (HART), Pinellas Suncoast Transit Authority (PSTA), Pasco County Public Transportation (PCPT), Pasco County Metropolitan Planning Organization (MPO), Hillsborough County GIS office, FDOT D7, City of Tampa, Tindale-Oliver & Associates, Inc. (who were assisting PSTA with bus stop inventory data collection efforts), and Pasco County MPO. After initial meetings and discussions, HART, PSTA, and PCPT were selected to be part of the pilot project as the three participating transit agencies within FDOT D7.
The research team, with feedback from the regional transit agencies and FDOT D7, successfully developed a regional GIS architecture and data model and implemented this design in two software applications:
1) A GTFS Data Sync desktop application – This software automatically retrieves the General Transit Feed Specification (GTFS)-based datasets from individual transit agency Web servers and stores them in the FDOT D7 spatial database. It was written in Java using Eclipse and is discussed in detail in Chapter 4.

viii
2) Regional Data Visualization Web Application – This software queries and visualizes the regional data from transit agencies and FDOT that are stored in the FDOT D7 spatial database. The application is accessible via a Web browser and is capable of showing multimodal data for the regional transportation systems that are always based on the most recent data available from the transit agency. It was written in C# and XAML using Visual Studio . NET, the Silverlight 5 SDK, and the ArcGIS API for Silverlight 2.3. The Web application is discussed in detail in Chapter 5.
One challenge encountered in this project was that while Environmental Systems Research Institute (ESRI) provides powerful Geographic Information System(s) (GIS) software, the license for ESRI products can be cost-prohibitive for many GIS developers. Because of the relatively small audience working with the Application Programming Interface (API)s for ESRI products, especially for the ArcSDE Java API, finding relevant working programmatic examples or documentation of others’ problems and solutions can be very difficult. Additionally, Javadoc documentation for the ArcSDE Java API is lacking for relatively basic contents, such as data types, which often leaves the developer guessing what the input or output of a method should be.
During this project, all the transit agencies involved were in varying stages of collecting and maintaining their bus stop data. HART was the most advanced at the beginning of the project, with a complete geocoded bus stop inventory in addition to amenity information for each bus stop. Therefore, to provide the enhanced GTFS data that were requested as part of this project, HART was able to manipulate the data they already maintained into the required format for this project. PSTA was going through the process of creating a new bus stop inventory with amenity information but was unable to complete this process during the course of the project. However, because PSTA does have a basic GTFS dataset, these data (without amenity information) were used to test the system.
Of the three agencies involved with this project, PCPT started with the least amount of data available and did not have a complete geocoded bus stop inventory. PCPT also went through several route service area changes in July and December 2011, which delayed data collection efforts initially planned to be concurrent with this project, as PCPT did not want to collect data on routes that may be changing. PCPT is currently planning an Intelligent Transportation Systems (ITS) Request for Proposals (RFP), and its current plan is to collect GIS data as part of the installation of the systems procured from the RFP, which is planned for late 2012 to early 2013.
Based on the experience of the research team in this project, the completion and maintenance of a bus stop inventory for smaller transit agencies that do not have an internal GIS department may be challenging. Given the small budgets and required outsourcing of the effort, there seems to be a temptation to wait until the system is “stable” before conducting the bus stop inventory. While this certainly makes sense for certain situations when major service changes are imminent, it can also have the effect of indefinitely deferring data collection and the benefits of using the data, because the system is never going to be completely static without any planned changes. For these agencies, crowd-sourcing bus stop location and amenity information may be a cost-effective solution for creating a simple bus stop inventory.
Next steps for this research beyond this project are the deployment of the system to FDOT D7 staff as well as replication of this system to other districts, such as District 1. Tools exist to assist transit agencies in developing an accurate bus stop inventory and in creating and maintaining GTFS datasets.

ix
Increasing the awareness and expertise of agencies in the use of these tools will be useful in deploying this system with data from additional agencies.

x
TABLE OF CONTENTS Disclaimer...................................................................................................................................................... ii Metric Conversion Table .............................................................................................................................. iii TECHNICAL REPORT DOCUMENTATION PAGE ............................................................................................. iv Executive Summary ..................................................................................................................................... vii List of Figures ............................................................................................................................................... xi List of Tables ...............................................................................................................................................xiii List of Acronyms .......................................................................................................................................... xiv Chapter one – Introduction .......................................................................................................................... 1 Project Objectives ......................................................................................................................................... 2 Participating Agencies ................................................................................................................................... 3 Report Organization ...................................................................................................................................... 3 Chapter Two – Regional GIS Architecture .................................................................................................... 4 Chapter Three – Transit Data Schema .......................................................................................................... 6 General Transit Feed Specification (GTFS) .................................................................................................... 6 GTFS-based Data Schema ............................................................................................................................. 7 FDOT D7 Geodatabase ................................................................................................................................ 11 Chapter Four – Desktop Application For Uploading Agency Datasets ....................................................... 13 Environment Setup ..................................................................................................................................... 14 Desktop Application .................................................................................................................................... 15 Demonstration ............................................................................................................................................ 17 Chapter Five – Web Application to Visualize Multimodal Regional Data ................................................... 21 Chapter Six – Conclusions ........................................................................................................................... 30 Summary of Project Findings ...................................................................................................................... 30
Challenge – Working with ESRI software ................................................................................................................... 30 Challenge – Coordinating with Agencies .................................................................................................................... 31 Challenge – Potential Lack of GTFS shapes.txt File .................................................................................................... 32
Next Steps and Recommendations ............................................................................................................. 32 References .................................................................................................................................................. 34

xi
LIST OF FIGURES Figure 1 – High-level architecture used for automated data transfer of transit agency data to
FDOT D7 system .........................................................................................................................................4 Figure 2 – GTFS dataset from a transit agency consists of several text files within a ZIP file...................................7 Figure 3 - Data schema used to share transit information with FDOT D7 ............................................................ 10 Figure 4 – Transit schema for FDOT D7 geodatabase (part 1) ................................................................................ 11 Figure 5 – Transit schema for FDOT D7 geodatabase (part 2) ............................................................................... 12 Figure 6 – Detailed Architecture Showing GTFS Data Exchange between Transit Agencies and
FDOT D7 .................................................................................................................................................. 13 Figure 7 – Components of CUTR GTFS Data Sync Desktop Application ................................................................. 14 Figure 8 – Contents of data-source.xml file ............................................................................................................. 16 Figure 9 – Contents of AgencyInfo.csv file define GTFS URLs and whether or not stoptimes.txt
file should be imported .......................................................................................................................... 17 Figure 10 – Files in CUTR GTFS Data Sync application folder .................................................................................. 18 Figure 11 – Application requires users to log in with valid FDOT D7 credentials on FDOT D7
network ................................................................................................................................................... 18 Figure 12 – An error message is shown for incorrect login credentials or lack of FDOT D7
network access ........................................................................................................................................ 18 Figure 13 – Example output during execution of CUTR GTFS Data Sync desktop application ............................. 19 Figure 14 – Desktop application indicates which GTFS text files and attributes have been
provided by agency during GTFS pre-processing. ................................................................................. 19 Figure 15 – Application will automatically download and process all GTFS files for all
participating agencies ............................................................................................................................. 19 Figure 16 – Progress of database upload via command prompt ............................................................................ 20 Figure 17 – Each GTFS data upload takes place in its own connection to ensure that success
or failure is specific per each transaction. ............................................................................................. 20 Figure 18 –Command prompt is left open after program finishes so user can see output and
can be closed by pressing any key ......................................................................................................... 20 Figure 19 – Detailed architecture showing regional data visualization website ................................................... 21 Figure 20 – Operating systems and browsers compatible with Silverlight 5, technology used
to develop Web application ................................................................................................................... 22 Figure 21 – Minimum system requirements for Silverlight 5 ................................................................................. 23 Figure 22 – When Web application first loads, it shows user a progress bar as data are being
retrieved from the geodatabase. ........................................................................................................... 24 Figure 23 – Bus routes for PSTA and HART after data loads from geodatabase ................................................... 24 Figure 24 – When user zooms in from initial zoom level, further details about transit stops
and routes and FDOT Work Programs are visible. ................................................................................ 26

xii
Figure 25 – At higher zoom levels, stops are grouped; number in circle represents number of stops in that group. ................................................................................................................................. 26
Figure 26 – When user hovers mouse cursor over bus stop, information about stop appears based on data from agency's GTFS feed. .............................................................................................. 27
Figure 27 – The website allows users to display or hide data layers ...................................................................... 28 Figure 28 – A search toolbar allows users to filter stops and routes shown on the map ..................................... 28 Figure 29 - Using a combination of layer select and bus stop search toolbar, all bus stops that
have shelters and FDOT Work Programs located in surrounding area are shown ............................. 28 Figure 30 – Different types of routes can be selected for viewing using the ROUTE_SUB_TYPE
field. ......................................................................................................................................................... 29 Figure 31 – Example of route search toolbar being used to identify all HART express routes ............................. 29

xiii
LIST OF TABLES Table 1 – Data Fields for Routes in Proposed Schema ...............................................................................................7 Table 2 – Data Fields for Transit Stops in Proposed Schema .....................................................................................8 Table 3 – Example of Extended Fields in Proposed Schema for Stops .....................................................................9 Table 4 – Example of Extended Fields in Proposed Schema for Routes ...................................................................9 Table 5 - Various Icons That Allow the User to Interact With the Map.................................................................. 25

xiv
LIST OF ACRONYMS API Application Programming Interface APC Automatic Passenger Counting AVAS Automatic Voice Annunciator System AVL Automatic Vehicle Location CSV Comma-Separated Values GIS Geographic Information System(s) CUTR Center for Urban Transportation Research ESRI Environmental Systems Research Institute FDOT Florida Department of Transportation FTA Federal Transit Administration FTP File Transfer Protocol GIS Geographic Information System(s) GPS Global Positioning System GTFS General Transit Feed Specification HART Hillsborough Area Regional Transit HTTP Hypertext Transfer Protocol IIS Internet Information System ITS Intelligent Transportation Systems JRE Java Runtime Environment JVM Java Virtual Machine MPO Metropolitan Planning Organization NTD National Transit Database OSM OpenStreetMap PSTA Pinellas Suncoast Transportation Authority PCPT Pasco County Public Transportation RFP Request for Proposals RTAP Rural Transit Assistance Program SDK Software Developer’s Kit TAD Travel Assistance Device USF University of South Florida VPN Virtual Private Network XAML Extensible Application Markup Language

1
C H A P T ER O NE – I N T RO D UC T I O N
Coordinated data sharing is important for various government jurisdictions that overlap the same geographic area. For efficient planning and operations purposes, each jurisdiction should have knowledge of the other organizations’ activities that may affect them.
Florida Department of Transportation (FDOT) District 7 (D7) has identified the need to obtain and view spatial data from many public transportation agencies within FDOT D7 and across the West Central Florida region. This ability will greatly increase the efficiency of FDOT D7 employees that use public transportation information in their workflows. Furthermore, it will assist the regional public transportation planning efforts in FDOT D7.
The safe movement of people and goods is a mission-critical goal for FDOT D7 to promote a fully-integrated and sustainable transportation system that promotes quality of life and economic well-being. By harnessing existing technological opportunities, such as Geographic Information System(s) GIS and geospatial analysis capabilities, FDOT D7 seeks to support improvements in local decision-making for the strategic and systematic placement of effective transportation options to induce economic vitality. As national policies and discussions surrounding sustainable and livable communities continue, FDOT truly sees the need to consider how to make data available for:
• creating and evaluating alternative transportation, land-use, and development scenarios • estimating a range of community, economic, fiscal, and environmental impacts associated with
transportation and development scenarios • notifying and coordinating with other jurisdictions and agencies (especially public transportation
agencies) that use FDOT facilities or rights-of-way in preparation for construction, maintenance, or operations that affect the rights-of-way
• forecasting the land use impacts of transportation plans and projects
Past efforts for intra-regional data sharing have included the manual transmission of datasets via email or File Transfer Protocol (FTP). However, manual data sharing is difficult to sustain at a high frequency due to the manual effort involved in collecting, formatting, sending, receiving, and processing the data. Additionally, each dataset may be in a different format, which makes comparison and coordination among agency datasets time-consuming and costly. Data are often transferred on an ad hoc basis as requests are made from one organization to another. If the perceived effort to exchange data is too great, old and outdated datasets may be used in place of new data, even if new data are available. As a result, the costs of construction, maintenance, and operations may increase.
Ideally, regional data would be compiled into a common geodatabase schema (i.e., database design that includes geographic information) that unifies the data formats from the various public transportation systems. This database should be easily accessible from a Web-based GIS application that provides tools

2
for viewing and querying the GIS data and facilitates regional public transportation planning so all involved parties are seeing the same updated snapshot of data. This system should also support an automated update process that minimizes efforts required by transit agencies and FDOT D7 to quickly and repeatedly update the centralized, shared geodatabase with any changes in agency data on a regular schedule. By providing updated and commonly formatted transit data, this process would also enable advanced information services for the general public such as cost-effective multimodal trip planning [1].
PROJECT OBJECTIVES The objective of this project was to enable efficient and sustainable communication of spatial transit data between FDOT D7 and transit agencies within the District. This ability, in turn, would support the regional planning and operations efforts of FDOT D7 and transit agencies within the District.
To further this objective, the research team assisted FDOT D7 in developing a regional GIS architecture and data model for public transportation data supporting the automatic exchange of transit GIS data between transit agencies within district and FDOT D7. An architecture defines the different components in an information system (e.g., transit agency server, FDOT servers, software applications) and how information flows between these entities. A data model defines the various entities (e.g., bus stops, bus routes) and their attributes about which information will be collected and maintained. A database schema is the translation of a data model to a particular database format (e.g., Oracle, ArcSDE).
Existing data models and schemas such as the General Transit Feed Specification (GTFS) [2] and the Hillsborough Area Regional Transit (HART) bus stop inventory database were used in this project. The GIS architecture and data model developed as part of this project can be replicated by other FDOT Districts and, therefore, this project should be considered a prototype for the potential use by all of FDOT.
The tasks performed as part of this project included:
1. Identify Specific Data Needs – work with FDOT D7 and local transit agencies to identify data that would be useful to both parties for internal operations.
2. Design and Implement a Data Sharing Forum – coordinate with agencies to design and implement a data sharing forum that will allow for the automated sharing of transit data.
3. Design a Regional Geodatabase Schema for Transit Data – including additional fields beyond GTFS that are useful for the transit agency and district.
4. Design and Implement a GIS Web Interface – that will allow the display of transit agency data along with district GIS data.

3
PARTICIPATING AGENCIES Meetings with the various data stakeholders in FDOT D7 that would have an interest in a centralized regional dataset were convened throughout the project. Meeting participants included representatives from HART, Pinellas Suncoast Transit Authority (PSTA), Pasco County Public Transportation (PCPT), Pasco County Metropolitan Planning Organization (MPO), Hillsborough County GIS office, FDOT D7, City of Tampa, Tindale-Oliver & Associates, Inc. (who were assisting PSTA with bus stop inventory data collection efforts), and Pasco County MPO.
After initial meetings and discussions, HART, PSTA, and PCPT were selected to be part of the pilot project as the three participating transit agencies within FDOT D7.
REPORT ORGANIZATION The remainder of the report is organized as follows: Chapter Two defines the regional GIS architecture used to share data between transit agencies and FDOT districts. Chapter Three presents the data schema based on GTFS used to format data for this architecture. Chapter Four discusses the desktop application developed as part of this project to synchronize the datasets between the transit agencies and the FDOT districts. Chapter Five outlines the Web application developed during this project to visualize the transit agency data with the district data. Finally, Chapter Six presents the project conclusions and recommendations for future research.

4
C H A P T ER T W O – RE GI O N A L GI S A RC H I T EC T UR E
To support frequent automated sharing of updated datasets between FDOT D7 and local transit agencies, an architecture was developed that defined how data was transferred from each transit agency to the FDOT D7 database. A high-level view of this architecture is shown in Figure 1. GTFS has become a de facto standard for exchanging transit route and schedule data, as evidenced by the increasing adoption of the specification, from six agencies in 2006 to 227 transit agencies in the United States in February 2012 [3]. An alternative format for schedule data is the Transit Communications Interface Profile (TCIP), but this technology, initially developed in the late 1990s, has only been used at a handful of U.S. agencies as of early 2012 [4]. Because of the national prevalence of GTFS as a formatting standard, and since two of the three participating agencies (i.e., HART and PSTA) already maintained GTFS datasets, the GTFS format was chosen as the basis for the common data schema developed in this project. Chapter Three discusses GTFS, and the data schema is discussed in further detail.
Figure 1 – High-level architecture used for automated data transfer of transit agency data to FDOT D7 system

5
Two software applications were developed as part of this project:
1) GTFS Data Sync Desktop Application – This software retrieves the GTFS-based datasets from individual transit agency Web servers and stores them in the FDOT D7 spatial database. It was written in Java using Eclipse and is discussed in detail in Chapter Four.
2) Regional Data Visualization Web Application – This software visualizes the regional data from transit agencies and FDOT that is stored in the FDOT D7 spatial database and is accessible via a Web browser. It was written in C# and Extensible Application Markup Language (XAML) using Visual Studio.NET, the Silverlight Software Developer’s Kit (SDK) 5, and the ArcGIS Application Programming Interface (API) for Silverlight 2.3. The Web application is discussed in detail in Chapter Five.
Fetching GTFS data from a transit agency website via HyperText Transfer Protocol (HTTP) has become a de facto method for the automation of scheduled transit data synchronization. A transit agency can use any method it prefers to produce a new GTFS ZIP file and then simply drop the file into a folder on its Web server to make it accessible to external applications. External applications can download the GTFS data file, pre-process it, and extract or generate the data necessary to support Web, desktop, or mobile applications.
The GTFS Data Sync application developed in this project performs the automated update of the FDOT D7 database by fetching GTFS-based datasets from each transit agency Web server, pre-processing the data, and inserting the data into the FDOT D7 geodatabase.
The Regional Data Visualization Web Application developed in this project is used to view the data in the FDOT D7 geodatabase, which includes both District 7 data as well as the automatically updated GTFS-based data from the transit agencies.

6
C H A P T ER T H RE E – T R A N S I T D A T A S C H EMA
After the general architecture to automatically exchange data was created, the next step was to define the exact format of data to be exchanged. As previously mentioned, since HART and PSTA already maintained GTFS datasets, GTFS was selected as the base data format.
After a series of meetings with PSTA, HART, PCPT, and FDOT D7, a set of additional data fields was selected that are not currently specified in the GTFS format but that would be useful to the transit agencies and FDOT D7 in their planning and operations. Additionally, although some data fields in the GTFS specification are optional, for the purpose of data exchange between the agencies and FDOT D7, they were required. The following sections give a brief description of GTFS and define the exact data schema used to exchange data between the transit agencies and FDOT D7.
GENERAL TRANSIT FEED SPECIFICATION (GTFS)
Originally called the Google Transit Feed Specification, the General Transit Feed Specification (GTFS) has become a popular format for public transit agencies to provide scheduled transit data to software developers so they can develop innovative transit applications [2]. Created in 2005 by Google and TriMet, the public transportation agency in Portland, Oregon, GTFS is also a means for transit agencies to represent their schedule, route, and bus stop data in a series of text file compressed into a ZIP file extension. Currently, GTFS feeds have been provided by hundreds of agencies and benefit millions of riders all over the world [5]. GTFS feeds are used by the Google Transit Web-based trip planner and other online trip planners such as Microsoft’s Bing, OneBusAway for real-time transit information in Seattle, BayTripper for real-time transit information in San Francisco, Carnegie Mellon University’s Tiramisu that provides real-time crowd-sourced transit information in Pittsburgh, and USF’s Travel Assistance Device (TAD) mobile phone application that provides real-time navigation instructions to users of public transportation [6-10].
A GTFS dataset consists of several plain text files that have been formatted as Comma-Separated Values (CSV) and are contained within a single ZIP file, which is hosted on a transit agency’s website so software applications can automatically retrieve it. Figure 2 shows the contents of a GTFS ZIP file from HART and the contents of the stops.txt file within it that contains information about the name, ID, and location of every HART bus stop. The routes.txt file contains information about the routes of the transit agency, the calendar.txt and calendar_dates.txt files contain schedule information, and the trips.txt and stop_times.txt files contain information about the order of visitation of bus stops for a particular route according to a particular schedule. The shapes.txt file contains information on the spatial representation of a route so it can be accurately drawn on a map. A full explanation of all files and fields is available on the GTFS website [2].

7
Figure 2 – GTFS dataset from a transit agency consists of several text files within a ZIP file
GTFS-BASED DATA SCHEMA
In discussions with the transit agencies and FDOT D7, a set of fields was identified as important data related to bus stops and routes. Table 1 and Table 2 show these fields, as well as a mapping to related GTFS fields and files, if possible.
Table 1 – Data Fields for Routes in Proposed Schema
Routes
Name Data Type Description GTFS file mapping Included in GTFS
Spec?
agency_id Long FTA's National Transit Database (NTD) ID, a unique identifier for agency agency.txt x (does not specify
NTD ID)
agency_name String Agency name agency.txt x route_id String Router identifier routes.txt x route_short_name String Route short name/number routes.txt x route_long_name String Route long name routes.txt x
route_type Long Type of service (0-7) routes.txt Add’l types defined beyond GTFS
route_sub_type Long Sub category from route_type routes.txt
direction_id String Inbound/outbound trips.txt x avg_dly_ride Double Average daily ridership routes.txt Mon, Tues,Weds, etc. String Weekday, Sat, Sun calendar.txt x (types changed)
headway_secs Long Peak headway in minutes frequencies.txt x (units changed)
price Double Cost of trip fare_attributes.txt x avg_wkdy_rev Double Average weekday revenue routes.txt

8
Table 2 – Data Fields for Transit Stops in Proposed Schema
Stops
Name Data Type Description GTFS file mapping Included in
GTFS Spec? agency_name String Agency name agency.txt x stop_id String Stop ID unique to each agency stops.txt x stop_name String Stop name / description / intersection stops.txt x stop_lat Double Latitude stops.txt x stop_lon Double Longitude stops.txt x
route_id String Routes served routes.txt/trips.txt/stoptimes.txt x
intermodal Boolean (0/1) Servers intermodal facility stops.txt
intermodal_desc String Intermodal facility served stops.txt
location_type Boolean (0/1) Transfer center stops.txt x
vanpool String Served by vanpool - type of services (Zipcar, Wecar) stops.txt
bike_avail Boolean (0/1) Bike sharing exists stops.txt
car_avail Boolean (0/1) Car sharing exists stops.txt
flex_route Boolean (0/1) FlexRoute exists stops.txt
boardings Double Average weekday boardings stops.txt alightings Double Average weekday alightings stops.txt
sign Boolean (0/1) Sign exists stops.txt
ag_bench Boolean (0/1) Agency bench exists stops.txt
oth_bench_own Long Other bench owner (city, developer, Jaycees, etc.) stops.txt
shelter Boolean (0/1) Agency shelter exists stops.txt
trash_can Boolean (0/1) Agency trash can exists stops.txt
restroom Boolean (0/1) Restroom exists stops.txt
bike_rack Boolean (0/1) Bike rack exists stops.txt
last_update Date Specifies the date data were collected for each stop stops.txt
park_and_ride Long Number of parking slots stops.txt
staff Boolean (0/1) Any staff at that stop? stops.txt
ped_infastructure Boolean (0/1)
Can we get to some places from this stop on foot? stops.txt

9
For defining benches existing at a bus stop belonging to an agency other than the transit agency, the values are defined according to Table 3. If more than one type of bench exists, the numbers for those two values should be added to get the field value. For example, if a city bench and a developer bench exist, the field value should be 1+2=3. If a city and Jaycee bench exists, the field value should be 1+4=5. If no other benches exist, the value should be 0.
Table 3 – Example of Extended Fields
in Proposed Schema for Stops
oth_bench_own owner value
city 1 developer 2
Jaycee 4 To further define the types of routes beyond the definitions provided in GTFS, a route_sub_type field was created. These subtypes are intended to be children elements, with the parent elements being route_type values. The list of route_sub_types, and their mapping to the parent route_type, is shown below in Table 4.
Table 4 – Example of Extended Fields in Proposed Schema for Routes
route_sub_type
subtypeID subName route_type mapping 0 Tram 0 1 Streetcar 0 2 Light rail 0 3 Local Bus 3 4 BRT 3
5 Express 3
6 Subway 1 7 Metro 1 8 Rail 2 9 Ferry 4
10 Cable Car 5 11 Gondola 6 12 Suspended Cable Car 6
13 Funicular 7
10
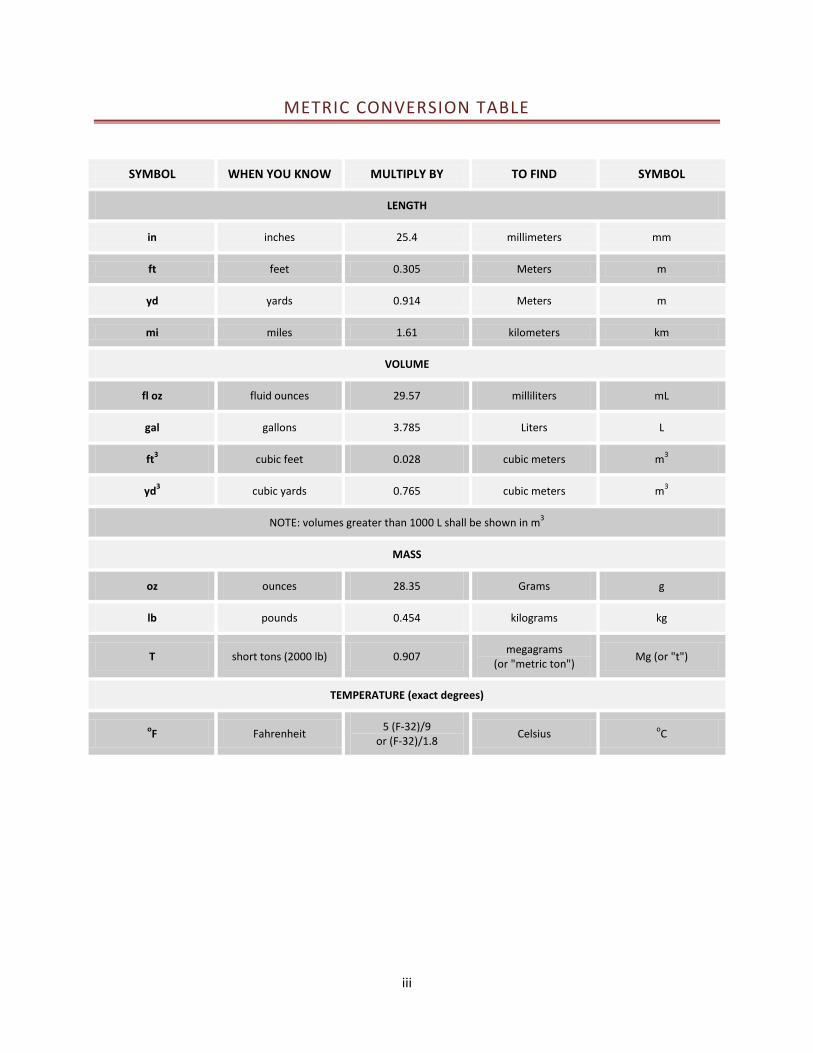
After all possible fields were defined and mapped to GTFS files, a schema for regional transit data was created that included both the GTFS and non-GTFS fields. This schema, shown in, represents the actual specification that the transit agencies should use to format their data and is the expected input for the Center for Urban Transportation Research (CUTR) GTFS Data Sync desktop application. Additional fields were created in the appropriate GTFS files for any fields that did not map directly to existing GTFS fields, and the definitions of some existing GTFS fields were expanded to meet the needs of transit agencies and District 7. Fields required by the schema created for this project, but not required for GTFS, are marked with an asterisk (*) in the below tables. Although “shapes.txt” file is optional in the description of GTFS, we strongly recommend agencies to have this file. The Web application uses this file as a basis to draw transit routes on the map. If an agency does not have this data, accurate shapes and routes information cannot be displayed on the Web application.
Routes.txt
Field Name Data Type
route_id String
route_short_name String
route_long_name String
route_type String
route_sub_type* Long
avg_dly_ride* Double avg_wkdy_rev* Double
Shapes.txt*
Field Name Data Type
shape_id String
shape_pt_lat String
shape_pt_lon String
shape_pt_sequence String
Stops.txt
Field Name Data Type
stop_id String
stop_name String
stop_lat String
stop_lon String
location_type* Long
Intermodal* Long
intermodal_desc* String
vanpool* String
bike_avail* Long
car_avail* Long
flex_route* Long
sign* Long
ag_bench* Long
oth_bench_own* Long
shelter* Long
trash_can* Long
restroom* Long
last_update* String
park_and_ride* Long
staff* Long
ped_infastructure* Long
boardings* Double
alightings* Double
bike_rack* Long
Agency.txt
Field Name Data Type
agency_id* Long
agency_name String
agency_url String
agency_timezone String
Trips.txt
Field Name Data Type route_id String
service_id String
trip_id String
direction_id* String
block_id String
shape_id String
Figure 3 - Data schema used to share transit information with FDOT D7

11
FDOT D7 GEODATABASE
The CUTR GTFS Data Sync desktop application imports the transit data from the GTFS files and then inserts this data into the FDOT D7 geodatabase. The schema for the FDOT D7 geodatabase is shown in
Figure 4 and
Figure 5.
Agency
Calendar_dates
Calendar
Fare_attributes
Fare_rules
Routes
Shapes
Figure 4 – Transit schema for FDOT D7 geodatabase (part 1)

12
Stop_times
Stops
Transfers
Trips
Frequencies
Figure 5 – Transit schema for FDOT D7 geodatabase (part 2) As discussed in Chapter Five, an Environmental Systems Research Institute (ESRI) Web service (i.e., map service) must exist so the FDOT geodatabase can be accessed from a Silverlight Web application. The research team selected the Silverlight platform because it is being used for the statewide enterprise GIS system that is currently being deployed to all FDOT Districts. Therefore, to be able to publish these data as services in ArcGIS 9.3.1, all tables need to be defined as a feature layer in ArcSDE. In addition to the actual two feature layers “Stops” and “Shapes,” other tables need to have a field of type “Geometry” in the geodatabase for implementation purposes. All tables have a field named “DATASET_ID,” which assigns the records to originating agency and date and time of the upload.

13
C H A P T E R F O UR – D ES K T O P A P P L I C A T I O N F O R UP L O A D I N G A G EN C Y D A T A S ET S
Public transit data can be obtained from transit agencies by downloading GTFS datasets, which are usually publicly available on the agencies’ websites or feed exchange forums.
The CUTR GTFS Data Sync desktop application was developed to automatically fetch multiple transit agencies’ GTFS datasets and upload them into the FDOT D7 geodatabase, a critical feature for minimizing the effort required to share up-to-date multimodal data. A detailed architecture describing this GTFS data synchronization software is shown in Figure 6.
Figure 6 – Detailed Architecture Showing GTFS Data Exchange between Transit Agencies and FDOT D7
Because the application uploads data directly into the FDOT D7 geodatabase, the program can be used only by FDOT D7 employees who have access to the geodatabase and the appropriate user credentials.
14
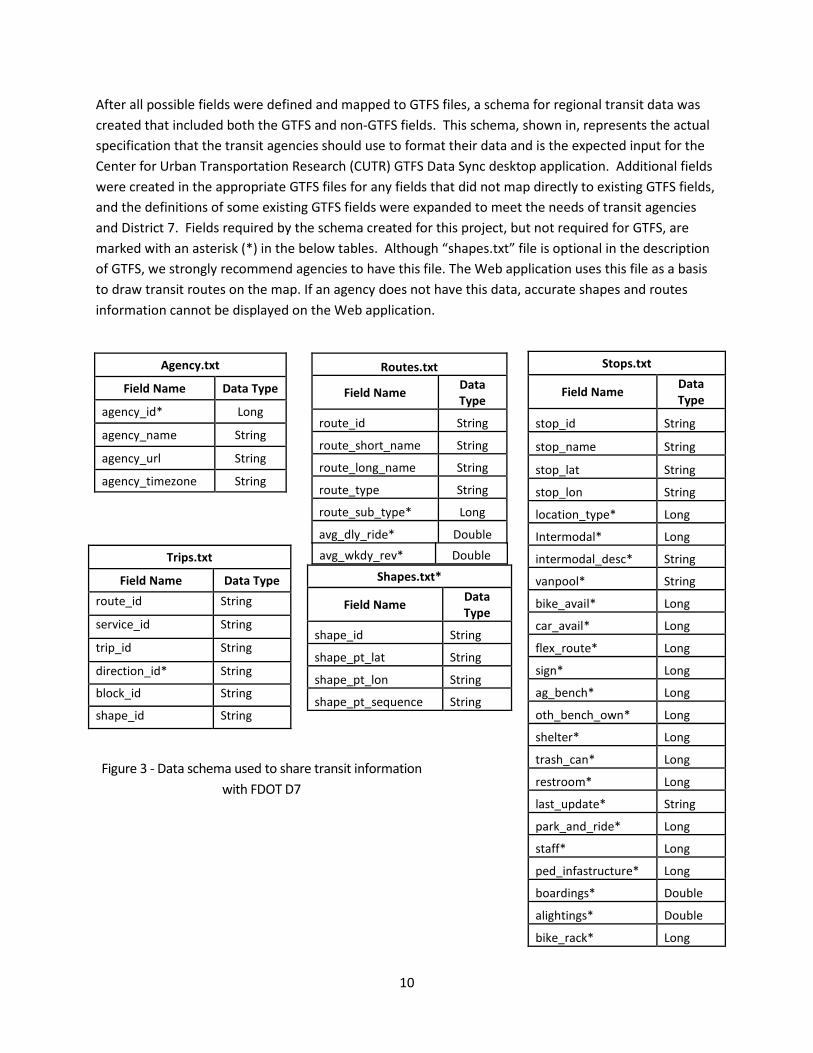
At the time of this report, FDOT D7 is currently running ArcGIS 9.3.1, Oracle 10g as an enterprise geodatabase, and Oracle client 10g.
To interact with the FDOT D7 geodatabase, an ArcSDE connection is required. Currently, there are two types of ArcSDE connection:
1) Application Server Connection 2) Direct Connection
After careful consideration, the research team decided to use Direct Connection. Direct Connection provides enough tools to manipulate the geodatabase, and it shifts the majority of the processing load to the client. Additionally, there is no need to maintain ArcSDE service, which is required in the Application Server Connection.
ENVIRONMENT SETUP
The desktop application is developed in Java and uses the ArcSDE Java API 10.0 to interact with FDOT D7’s geodatabase. Figure 7 illustrates the components of this desktop application.
Figure 7 – Components of CUTR GTFS Data Sync Desktop Application
Requirements for computers running this desktop application are as follows:
1) Java Virtual Machine (JVM), also known as Java Runtime Environment (JRE) (refer to http://java.com/en/download/ for the latest runtime download)
2) ArcSDE Java SDK 10.0 3) Oracle Client 10g

15
4) Set up “tnsnames.ora” corresponding to FDOT D7 specifications; Net Configuration Assistant utility is recommended.
5) Must be logged onto FDOT D7 network; use Virtual Private Network (VPN) if accessing the network from off-site.
6) Program must be authorized for read/write permission on the computer on which it is being executed.
DESKTOP APPLICATION Four files are required to run the desktop application. For this application to work properly, these four files cannot be renamed. Descriptions of the four files are as follows:
1. AutoRun.bat: Provides an easy way to execute this desktop application via a simple double-click. This BAT file contains several parameters that define how the JAR file should be executed. This file is created for the convenience of the user.
2. D7_Desktop_App.jar: Main Java-executable file; contains the code that allows this application to run anywhere that has a Java Runtime Environment installed.
3. data-source.xml: Provides the required information to establish a connection to the FDOT D7 geodatabase; also has a mirror of the schema for the FDOT D7 geodatabase so the program can insert data into the database properly (Figure 8).
a. Bean “connection_specs”: Enables easy modification of the connection properties for the geodatabase in case FDOT D7 wants to switch servers or rename the database; simply change the values of the corresponding properties if there is any change in the geodatabase.
b. Bean “agency,” “stops,” “routes,” “trips,” “stop_times,” “calendar,” “calendar_dates,” “fare_attributes,” “fare_rules,” “shapes,” “frequencies,” “transfers”: Defines the structure of the geodatabase. All beans have five properties: “fname” (describes the name of the geodatabase table into which the data are going to be inserted), “fields” (describes the name of each column in that table), “types” (describes the type of the corresponding column), “sizes” (describes the sizes of the corresponding column), and “isNullAble” (describes if the corresponding column can contain null values). The values of the “type” property should be obtained from: http://edndoc.esri.com/arcsde/9.2/api/japi/docs/constant-values.html#com.esri.sde.sdk.client.SeColumnDefinition

16
Figure 8 – Contents of data-source.xml file
c. For best practice, only the properties of the bean “connection_specs” and the property “fname” of other beans should be modified; any other properties should not be modified because this may cause the desktop application to stop functioning correctly.
4. AgencyInfo.csv: The AgencyInfo.csv file (Figure 9) contains the following fields:
a. “agency_name”: defines the name of the agency.
b. “agency_url”: defines the URL where the agency stores its GTFS feed on the Web. Notice that the values for this field must end with a ZIP file extension. Occasionally, transit

17
agencies may change their location where they store their GTFS feeds. The AgencyInfo.csv file should be modified to reflect any changes in GTFS URLs.
c. “isStopTimes”: defines whether or not stop_times values should be inserted into FDOT D7 geodatabase. There are only two possible values that this field can have: “TRUE” or “FALSE.” Each GTFS feed contains thousands of stops, trips, and stop_times records and, therefore, uploading data to a geodatabase can be very time consuming. Stop_times.txt is typically several times the size of the other GTFS text files, since it contains a record for each visitation of each bus stop for each bus route schedule. While stop and route information are necessary for planning purposes, at this time, stop_times information is not used in the Web application. To reduce the amount of time required for a GTFS file upload into the FDOT D7 geodatabase, the stop_times data from the GTFS file can be omitted from the import process by setting the “isStopTimes” field in the AgencyInfo.csv file to FALSE.
Figure 9 – Contents of AgencyInfo.csv file define GTFS URLs and
whether or not stoptimes.txt file should be imported
During the execution of the CUTR GTFS Data Sync desktop application, a folder named “GTFS_Temp” will be created to temporarily store the downloaded GTFS zip file from the agency’s website. Therefore, it is necessary to allow the program read and write permission for the computer on which the application is being executed.
DEMONSTRATION After all necessary environments have been configured and the CUTR GTFS Data Sync application is located in a writable location, the application folder should have the following four files, as shown in Figure 10:
• AgencyInfo.csv • Autorun.bat • D7_Desktop_App.jar • data-source.xml

18
Figure 10 – Files in CUTR GTFS Data Sync application folder
Users can double-click on the “Autorun.bat,” which allows users to conveniently execute the program.
The desktop application first asks the users for their credentials to log-in to FDOT D7 system (Figure 11). The credentials must have permission to write. Furthermore, the password needs to be associated with a suffix previously specified in the “tnsnames.ora” (e.g., [email protected])
Figure 11 – Application requires users to log in with
valid FDOT D7 credentials on FDOT D7 network
If the credential cannot be verified or the program is not running under FDOT D7 network, an error message will appear and tell the user to log-in again (Figure 12).
Figure 12 – An error message is shown for incorrect login credentials or lack of FDOT D7 network access

19
Next, the desktop application reads the AgencyInfo.csv file to obtain the URLs for the transit agencies’ feeds. Then, it downloads, reads, and checks each GTFS feed. All progress of the program is shown in the command prompt window (Figure 13).
Figure 13 – Example output during execution of CUTR GTFS Data Sync desktop application
GTFS feeds contain several optional tables and fields. Therefore, agencies usually do not include data for the entire GTFS specification. If a table is not included in the GTFS feed, the log clearly shows there is no data for that corresponding table, and the procedure skips the upload step for that table (Figure 14).
Figure 14 – Desktop application indicates which GTFS text files and attributes have been
provided by agency during GTFS pre-processing.
When one feed is completed, another feed will be executed. Note that this process is performed automatically without any user involvement (Figure 15).
Figure 15 – Application will automatically download and process all GTFS files for all participating agencies
After the credentials are verified, the program automatically goes to the next step of uploading data into the FDOT D7 geodatabase. The feeds will be uploaded one-by-one. All progress is displayed via the command prompt for easy tracking (Figure 16).

20
Figure 16 – Progress of database upload via command prompt
After finishing one feed, the old connection is closed and a new connection is created to ensure that one feed is finished and the old transaction is complete (Figure 17).
Figure 17 – Each GTFS data upload takes place in its own connection to ensure that
success or failure is specific per each transaction.
When the last feed finishes its uploading process, the program holds the command window open so the user can see any output (Figure 18).
Figure 18 –Command prompt is left open after program finishes so user can see output
and can be closed by pressing any key
Since the process of uploading thousands of records into the geodatabase is time-consuming, it may take 1 or 2 hours for the application to complete the upload.

21
C H A P T ER F I V E – W EB A P P L I CA T I O N T O V I S UA L I Z E MUL T I MO D A L REGI O N A L D A T A
As part of this project, the research team created a Web application that allows the visualization of downloaded transit agency GTFS datasets along with FDOT D7 data. This website allows FDOT D7 and transit agencies to view multimodal data through a common interface. A detailed architecture for this software application is shown in .
Figure 19 – Detailed architecture showing regional data visualization website
ESRI currently provides Web application APIs for three different platforms: Javascript, Flex, and Silverlight. The Web application was developed in Microsoft Visual Studio 2010, ArcGIS Silverlight API 2.3, Silverlight 5 SDK, Runtime, and Developer using C# and XAML.
22
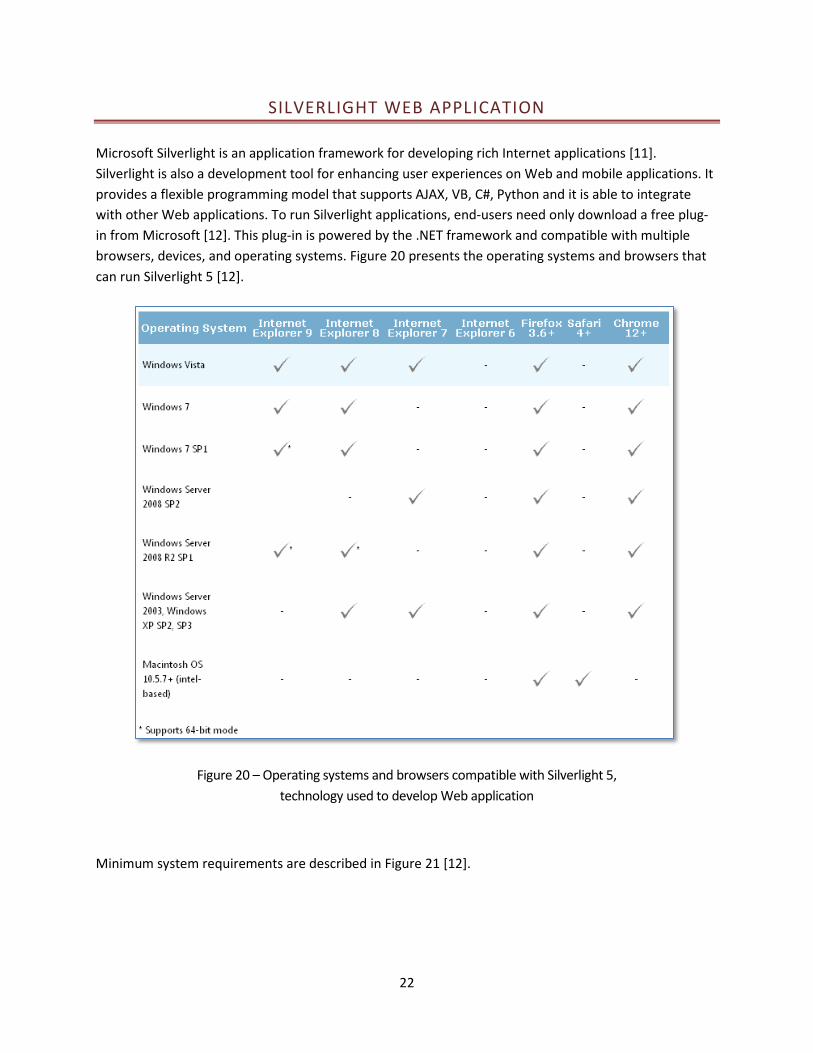
SILVERLIGHT WEB APPLICATION Microsoft Silverlight is an application framework for developing rich Internet applications [11]. Silverlight is also a development tool for enhancing user experiences on Web and mobile applications. It provides a flexible programming model that supports AJAX, VB, C#, Python and it is able to integrate with other Web applications. To run Silverlight applications, end-users need only download a free plug-in from Microsoft [12]. This plug-in is powered by the .NET framework and compatible with multiple browsers, devices, and operating systems. Figure 20 presents the operating systems and browsers that can run Silverlight 5 [12].
Figure 20 – Operating systems and browsers compatible with Silverlight 5, technology used to develop Web application
Minimum system requirements are described in Figure 21 [12].

23
Figure 21 – Minimum system requirements for Silverlight 5
DEPLOYMENT To deploy the Silverlight Web application on a Web server such as Internet Information System (IIS), the following MIME types should be supported:
1) .xap: application/x-silverlight-app 2) .xaml: application/xaml+xml 3) .xbap: application/x-ms-xbap
The Web application should then be added to the ASP .NET v4.0 application pool. The ASP .NET application should also be registered with IIS by executing the command “aspnet_regiis.exe –i.”
END-USER DEMONSTRATION After successful installation of the Silverlight plug-in, end-users can view the Web application in their browser. The Web application may take some time to initially load the transit data due to the number of records. During this time, a progress bar displays the percentage of time remaining (Figure 22).
After the data are loaded, the user can see the routes and stops for each transit agency. In Figure 23, the routes for HART and PSTA are shown.

24
Figure 22 – When Web application first loads, it shows user a progress bar
as data are being retrieved from the geodatabase.
Figure 23 – Bus routes for PSTA and HART after data loads from geodatabase

25
Table 5 - Various Icons That Allow the User to Interact With the Map
Enables users to zoom on a specified region
Enables users to zoom out on a specified region
Enables users to pan
Enables users to go back to the previous extent
Enables users to go to the next extent
Enables users to go the the default extent
Enables users to view the map full-screen
The icon to the left enables users to zoom in and zoom out with slider and move left, right, up, and down with navigation arrows.
Since there are thousands of Stops and Work Program features, to maintain a reasonable level of performance, the Web application will not show all data at all zoom levels. Instead, all Transit Stops and FDOT Work Program features have a minimum scale of 50,000, meaning users need to zoom in to a ratio of 1:50,000 for these features to be visible on the map. Figure 24 shows the detail available for transit stops and routes at several zoom levels higher than the initial zoom level. Note that a single circle represents a group of bus stops in that area, with the number of stops in the group shown in the circle. Stops are displayed as a cluster at higher zoom levels to limit the number of data points loaded on the map. The number displayed on the circle for a group specifies the number of stops in that region (Figure 25). The user can continue to zoom in until stops are displayed as single points.

26
Figure 24 – When user zooms in from initial zoom level, further details about transit stops and routes and
FDOT Work Programs are visible.
Figure 25 – At higher zoom levels, stops are grouped; number in circle represents number of stops in that group.

27
When users mouse-over a stop, information of that specific stop is shown ( Figure 26).
Figure 26 – When user hovers mouse cursor over bus stop, information about stop appears based on data from agency's GTFS feed.

28
Figure 27 shows a list of layers being displayed on the map. The checkboxes allow users to turn on/off the corresponding layers and make them visible/invisible.
Figure 27 – The website allows users to display or hide data layers
Figure 28 – A search toolbar allows users to filter stops and routes shown on the map
Figure 28 is a search toolbar, used for filtering stops and routes based on criteria entered by the user. For stops information, users can perform any valid queries on columns that exist in the stops tables in the FDOT D7 geodatabase (e.g., SHELTER > 0, TRASH_CAN > 0). Figure 29 combines the search toolbar with the layers menu to show an example displaying the FDOT Work program layer and all bus stops that have at least one shelter; HART bus routes are not displayed.
Figure 29 - Using a combination of layer select and bus stop search toolbar, all bus stops that have shelters
and FDOT Work Programs located in surrounding area are shown
For routes information, the Web application currently supports the field named “ROUTE_SUB_TYPE,” which is specific to FDOT D7 schema, as described in Chapter Two. When the user selects “routes,” the text of the toolbar changes to show that ROUTE_SUB_TYPEs are being filtered (Figure 30). The value of

29
this field should match the numeric values for the sub-types, as discussed in Chapter Two (e.g., “3” is Local Bus; “5” is Express).
Figure 30 – Different types of routes can be selected for viewing using the ROUTE_SUB_TYPE field.
Figure 31 shows a display of all HART express routes, filtered using the search toolbar.
Figure 31 – Example of route search toolbar being used to identify all HART express routes
When the user holds the mouse cursor over a route, information of the corresponding route is displayed.

30
C H A P T ER S I X – C O N C L US I O N S
This chapter outlines a summary of the project findings and presents some open issues as well as next steps and recommendations.
SUMMARY OF PROJECT FINDINGS The research team, along with feedback from the regional transit agencies and FDOT D7, successfully demonstrated a prototype software system that is able to retrieve GTFS-based datasets from local transit agency websites and store them in the FDOT D7 enterprise geodatabase. Additionally, a Web application was developed to visualize and query transit data alongside FDOT D7 data. The resulting Web application is capable of showing multimodal data for the regional transportation systems.
Many challenges were encountered throughout this project, and the following section describes several of these issues.
CHALLENGE – WORKING WITH ESRI SOFTWARE Since FDOT D7 uses an ESRI-based enterprise GIS system, the project team had to work with ESRI APIs for both ArcSDE to insert data into the geodatabase and the ArcGIS Silverlight API to visualize GIS data from the geodatabase.
While ESRI provides powerful GIS software, the license for ESRI products can be cost-prohibitive for many GIS developers. Because of the relatively small audience working with the APIs for ESRI products, especially for the ArcSDE Java API, finding relevant working programmatic examples or documentation of others’ problems and solutions can be very difficult. Additionally, Javadoc documentation for the ArcSDE Java API is lacking for relatively basic contents such as data types, which often leaves the developer guessing at what the input or output of a method should be.
While USF has a site license for ESRI software, the research team encountered challenges regarding the licensing of the application during this project. ArcGIS 9 requires a connection with the USF ArcGIS site license server before it allows the user access to the software. To develop the CUTR GTFS Data Sync desktop software, it was necessary to manage the geodatabase through ArcCatalog. However, accessing the geodatabase in ArcCatalog requires the developer to be on a Virtual Private Network (VPN) for the FDOT D7 network. These requirements create a mutually-exclusive situation where one computer cannot be on two different domains at the same time and, thus, the ArcGIS software at USF cannot be used while managing the FDOT D7 geodatabase. The work-around was a time-consuming iterative connect/disconnect process to sequentially use ArcGIS, then test the software, and repeat. ArcGIS 10 allows for caching of the license for a certain amount of time, which allows a developer to verify the

31
license and then connect to the VPN to remove the mutual exclusion condition. Using ArcGIS 10, the research team was able to get access to the FDOT D7 spatial database while working with the desktop application. However, a compatibility issue occurred when the team tried to manage ArcGIS service in ArcGIS 10 while working with the Web application, as ArcGIS 9 was required to manage the service. The research team resolved this issue by working with the FDOT D7 GIS coordinator, and further edits were completed by placing requests with the FDOT D7 GIS coordinator and having him make the modifications. When working with other Districts, these issues must be taken into consideration to ensure that an efficient development and testing process can be performed with both the GTFS Data Sync desktop software and the Web application.
CHALLENGE – COORDINATING WITH AGENCIES During this project, all the transit agencies involved were in varying stages of bus stop data collection and maintenance. HART was the most advanced at the beginning of the project, with a complete geocoded bus stop inventory in addition to amenity information for each bus stop. Therefore, to provide the enhanced GTFS data that were requested as part of this project, HART was able to manipulate the data they already maintained into the required format for this project.
PSTA was actively maintaining a GTFS dataset at the start of this project, but did not have a list of amenities for each stop. Data collection efforts were initially planned during this project by PSTA in conjunction with Tindale-Oliver & Associates, Inc. However, due to several delays, PSTA was only able to collect amenities data on a few routes during the course of this project. PSTA was not able to provide the amenities data along with the GTFS data during this project, although it plans to complete the amenities data collection effort in 2012.
Of the three agencies involved with this project, PCPT started with the least amount of data available and did not have a complete geocoded bus stop inventory. PCPT also went through several route service area changes in July and December 2011, which delayed data collection efforts initially planned to be concurrent with this project. PCPT did not want to collect data on routes that it may be changing; it is currently planning an Intelligent Transportation Systems (ITS) Request for Proposals (RFP) that will include paratransit scheduling software, fixed-route management, Automatic Passenger Counters (APC), Automatic Voice Annunciator System (AVAS), GPS, and Automatic Vehicle Location (AVL). PCPT’s current plan is to collect GIS data as part of the installation of the systems procured from the RFP, which is planned for late 2012 to early 2013.
Based on the experience of the research team in this project, the completion and maintenance of a bus stop inventory for smaller transit agencies that do not have an internal GIS department may be challenging. Given the small budgets and required outsourcing of the effort, there seems to be a temptation for both small and large agencies to wait until the system is “stable” before conducting the bus stop inventory. While this certainly makes sense for certain situations when major service changes are imminent, it can also have the effect of data collection paralysis since the system is never going to be completely static without any planned changes. Imperfect data is better than no data.

32
For small transit systems that have challenges with geocoding their bus stop inventory, the concept of “crowd-sourcing” may be a cost-effective solution. Systems such as OpenStreetMap (OSM) allow any registered users to upload and modify a geographic map of the world, including transit stops and amenities. The research team has previously examined OSM in the context of a pedestrian and bike data source for multimodal trip planners and as part of this past project created GO-Sync, a tool that is able to synchronize GTFS datasets with OSM [1]. With some modifications, this tool should be able to generate a geocoded bus stop inventory from OSM data. While trust and accuracy are certainly issues that must be considered when using any crowd-sourced data, having some data that originates from OpenStreetMap is better than having no data while waiting for a transit agency to make service changes.
CHALLENGE – POTENTIAL LACK OF GTFS SHAPES.TXT FILE The shapes.txt file, which contains spatial information about the travel path of the transit vehicle, is optional in GTFS. However, for the purposes of this project, shapes.txt is required. The GTFS data for HART and PSTA both contained the shapes.txt data. As the software developed in this project is deployed to FDOT D7 and other transit agencies, there is a possibility that some agencies with GTFS data may not have the shapes.txt file. In this case, the shapes.txt file would need to be generated. There may be a need for a simple tool that would allow the easy creation of the shapes.txt data.
NEXT STEPS AND RECOMMENDATIONS The next step beyond this project for the regional GIS architecture and data model developed in this project is the deployment of the system to FDOT D7. As part of this process, users of the system will need to be trained on how to best use it, and feedback from users on how the site could be improved should be considered. It is also anticipated that further work with stakeholders will yield additional use cases of the Web application that have not previously been considered. The Web application can be extended to included additional functionality for more detailed queries, including preset queries for common actions performed by various stakeholders.
There are also technical considerations for deployment. In testing the system, the research team had access to two accounts: a “user” account with restricted permissions and an “admin” account with full permissions on the system. The “admin” account was used in testing since permission problems were encountered when using the “user” account. For the deployment, these permission issues should be resolved so the “user” account can be used in place of the “admin” account for security purposes. Additionally, FDOT D7 will be moving to ArcGIS 10 as well as a new statewide enterprise GIS Framework, so testing of this system with this new GIS infrastructure will be needed.
Currently, the extensions to the standard GTFS dataset are specific to this project data schema as requested by FDOT D7 and participating transit agencies. A proposed addition to GTFS for stop amenities (i.e., stop_features.txt) exists, although it has been dormant since 2009 and has not yet been

33
officially accepted into the specification [13]. If there are agencies implementing the GTFS proposed features, the CUTR GTFS Data Sync software could be modified to support importing this schema as well as the schema currently used in the software.
The Web application designed in this project was designed to be useful to both transit agencies and FDOT D7. However, one challenge to making the website available to transit agencies is that FDOT D7 Information Technology (IT_ has strict policies about making internal servers available to users outside of the FDOT D7 network. FDOT D7 has been optimistic that this obstacle can be overcome, but it will take effort to work with FDOT IT to accomplish this task.
Another next step for this research beyond this project is the testing of this system at another district. FDOT District 1 has expressed interested in using the regional GIS architecture and data model developed in this project. This process will require interactions with the District and regional transit agency personnel to communicate the requirements for participation and aid the agencies in data collection and formatting. Additionally, the software may need to be modified based on the internal GIS infrastructure for District 1 and any potential differences from District 7.
As Districts seek to add transit agencies to the system, the agencies will need to prepare and publish their data in the GTFS format, which requires an accurate bus stop inventory. Various tools currently exist to create and maintain GTFS datasets, including Trillium Transit [14], Rural Transit Assistance Program (RTAP) GTFS Builder [15], Transit Data Feeder [16], and Google Transit Data Feed Open Source Project [17]. Therefore, agencies could benefit from educational resources or technical assistance programs that would help them understand the various options available to assist them in creating a GTFS dataset for their agency and select the solution that is best for them.
34
REFERENCES [1] Edward L. Hillsman and Sean J. Barbeau (2011). "Enabling Cost-Effective Multimodal Trip
Planners through Open Transit Data," National Center for Transit Research. [2] Google, Inc. "General Transit Feed Specification Reference." Accessed February 24, 2012 from
https://developers.google.com/transit/gtfs/reference. [3] Front Seat Management, LLC. "City-Go-Round." Accessed March 1, 2012 from
http://www.citygoround.org/agencies/. [4] American Public Transportation Association. "Transit Communications Interface Profiles (TCIP)
Standard Development Program." Accessed March 1, 2012 from http://www.aptatcip.com/. [5] Google, Inc. "Google Transit." Accessed February 27, 2012 from
http://www.google.com/intl/en/landing/transit/text.html#mdy. [6] Brian Hendricks. "Bing Maps Gets Transit Directions." Accessed February 16, 2010 from
http://www.bing.com/community/site_blogs/b/maps/archive/2010/09/16/bing-maps-gets-transit-directions.aspx?PageIndex=2.
[7] Brian Ferris (January-March 2010). "Location-Aware Tools for Improving Public Transit Usability." IEEE Pervasive Computing, Vol. 9, pp. 13-19. Accessed at: http://doi.ieeecomputersociety.org/10.1109/MPRV.2009.87.
[8] Jerald Jariyasunant, Daniel B. Work, Branko Kerkez, Raja Sengupta, Alexandre M. Bayen, and Steven Glaser (2010), "Mobile Transit Trip Planning with Real-Time Data," in Transportation Research Board 89th Annual Meeting, Washington, D.C. ,U.S., p. 17, January 10-14, 2010.
[9] Aaron Steinfeld, John Zimmerman, Anthony Tomasic, Daisy Yoo, and Rafae Dar Aziz (2011), "Mobile Transit Rider Information via Universal Design and Crowdsourcing," in Transportation Research Board 90th Annual Meeting, Washington, D.C., U.S., p. 16, January 23-27, 2011.
[10] S. J. Barbeau, P. L. Winters, N. L. Georggi, M. A. Labrador, and R. Perez (2010), "Travel assistance device: utilising global positioning system-enabled mobile phones to aid transit riders with special needs," Intelligent Transport Systems, IET, Vol. 4, pp. 12-23.
[11] Microsoft, Inc. "Microsoft Silverlight." Accessed February 27, 2012 from http://www.microsoft.com/silverlight/.
[12] Microsoft, Inc. "Get Microsoft Silverlight." Accessed February 27, 2012 from http://www.microsoft.com/getsilverlight/Get-Started/Install/Default.aspx.
[13] Google, Inc. "General Transit Feed Spec Changes - stop_features.txt." Accessed February 29, 2012 from https://sites.google.com/site/gtfschanges/proposals/stop-amenity.
[14] Trillium Solutions. "Trillium Transit Internet Solutions." Accessed February 24, 2012 from http://www.trilliumtransit.com/.
[15] National Rural Transit Assistance Program. "GTFS Builder." Accessed February 24, 2012 from http://www.nationalrtap.org/public/WebApps/GTFSBuilder.aspx.
[16] Aaron Antrim. "Transit Data Feeder." Accessed February 24, 2012 from http://code.google.com/p/transitdatafeeder/.
[17] Joachim Pfeiffer. "Google Transit Data Feed Open Source Project." Accessed February 24, 2012 from http://code.google.com/p/googletransitdatafeed/.
Related Documents