DEVELOPMENT OF A RAPID TEST TO DETERMINE MOISTURE SENSTIVITY OF HMA (SUPERPAVE) MIXTURES By Harihar Shiwakoti Submitted to the Department of Civil, Environmental, and Architectural Engineering and the Graduate Faculty of the University of Kansas in partial fulfillment of the requirements for the degree of Master’s of Science. _______________________ Dr. Jie Han, Chairperson Committee members ______________________ Dr. Robert L. Parsons ______________________ Dr. Steven D. Schrock Date defended:__________________

Welcome message from author
This document is posted to help you gain knowledge. Please leave a comment to let me know what you think about it! Share it to your friends and learn new things together.
Transcript

DEVELOPMENT OF A RAPID TEST TO DETERMINE MOISTURE
SENSTIVITY OF HMA (SUPERPAVE) MIXTURES
By
Harihar Shiwakoti
Submitted to the Department of Civil, Environmental, and Architectural Engineering
and the Graduate Faculty of the University of Kansas in partial fulfillment of the
requirements for the degree of Master’s of Science.
_______________________ Dr. Jie Han, Chairperson
Committee members
______________________ Dr. Robert L. Parsons
______________________ Dr. Steven D. Schrock
Date defended:__________________

ii
The Thesis Committee for Harihar Shiwakoti certifies
That this is the approved version of the following thesis:
DEVELOPMENT OF RAPID TEST TO DETERMINE MOISTURE SENSITIVITY
OF HMA (SUPERPAVE) MIXTURES
Committee:
_______________________ Dr. Jie Han, Chairperson
_______________________ Dr. Robert L. Parsons
_______________________ Dr. Steven D. Schrock
Date approved: _______________________

iii
Acknowledgement
First and foremost I would like to express my gratefulness to my advisor Dr. Jie Han
for providing me opportunity to work in this interesting project and for his continuous
encouragement and valuable suggestions throughout this research project. I would
like to thank Dr. Robert L. Parsons and Dr. Steven D. Schrock for their support and
time.
I got great cooperation from Mr. Chandra Manandhar, Ph.D. candidate in Kansas
State University throughout the project and my friend Justin Clay during the entire
process of sample preparation. This project would not have come to this stage without
great support from our lab supervisor Mr. Jim Weaver. I express my special thanks to
all of them.
I would also like to thank all of my fellow classmates in the KU Geotechnical Society
who always helped and supported me when I needed. All my friends who encouraged
me continuously and provided moral support also deserve my thanks.
Finally, I would like to express my emotional gratitude to my parents back home in
Nepal for all the support, understanding, and encouragement they have provided to
me.
iv
Table of Contents
Abstract...........................................................................................................................vi
List of Tables .................................................................................................................vii
List of Figures.............................................................................................................. viii
1. INTRODUCTION...................................................................................................1
1.1. Problem Statement ............................................................................................1
1.2. Objective ...........................................................................................................2
1.3. Organization......................................................................................................3
2. LITERATURE REVIEW ......................................................................................5
2.1. Mechanisms of Moisture Damage in HMA......................................................5
2.2. Nature of Asphalt-aggregate Interaction.........................................................14
2.3. Test Methods to Predict Moisture Sensitivity in HMA ..................................24
2.4 Techniques for Limiting Moisture Sensitivity................................................47
3. EXPERIMENTAL STUDY .................................................................................51
3.1. Introduction.....................................................................................................51
3.2. Test Equipment ...............................................................................................57
3.2.1 Superpave Gyratory Compactor ................................................................ 57
3.2.2 Hamburg Wheel Testing Device................................................................ 58
3.2.3 Asphalt Pavement Analyzer....................................................................... 59
3.3. Test Procedure ................................................................................................67
3.3.1 Sample preparation .................................................................................... 67
3.3.2 Sample conditioning and testing................................................................ 73

v
4. TEST RESULTS AND ANALYSIS ....................................................................76
4.1. Introduction.....................................................................................................76
4.2. Visual Observation of Stripping Phenomenon ...............................................76
4.3 Test Results and Analysis .....................................................................................79
4.3.1 District 2 (2G06015A -Wet 50oC) ............................................................. 80
4.3.2 District 3 (3G06020A -Wet 50oC) ............................................................. 84
4.3.3 District 5 (5G06016A -Wet 50oC) ............................................................. 88
4.3.4 District 6 (6G06011A -Wet 50oC) ............................................................. 92
4.3.7 District 6 (6G07002A -Wet 60oC) ........................................................... 106
4.3.8 District 6 (6G07002A -Dry 50oC)............................................................ 107
4.3.9 District 6 (6G07002A –Dry 60oC)........................................................... 108
4.4 Comparisons of Test Results for District 6 - 6G07002A Mix ............................109
4.4.1 Wet vs. dry tests at 50oC.......................................................................... 109
4.4.2 Wet vs. dry tests at 60oC.......................................................................... 110
4.4.3 Wet tests at 50oC vs. 60oC ....................................................................... 111
4.4.4 Dry tests at 50oC vs. 60oC........................................................................ 112
4.4.5 Samples prepared at KSU vs. KU............................................................ 112
5. CONCLUSIONS AND RECOMMENDATIONS............................................119
5.1. Conclusions...................................................................................................119
5.2. Recommendations.........................................................................................120
Appendix – APA Test Data ........................................................................................133

vi
Abstract
Exiting test methods to determine moisture sensitivity in hot mix asphalt are time
consuming and inconsistent. This research focused on wheel tracking devices to
develop a rapid test method to evaluate moisture sensitivity. The Asphalt Pavement
Analyzer (APA) and the Hamburg Wheel Tracking Device (HWTD) were used for
this research. Compacted cylindrical samples were fabricated using the Superpave
Gyratory Compactor. Results show that although most mixes without any additive
show stripping behavior, APA results do not indicate any stripping inflection points.
The HWTD results show stripping inflection points. The APA results show wet tests
are severe at lower temperatures whereas dry tests show high rut depth at higher
temperatures. The HWTD results show improvement in the performance by the use
of anti-stripping agents at later stage. Further studies should be carried out using
HWTD to relate number of passes for stripping inflection point with severity of
striping. Lab results should be correlated with field performance.

vii
List of Tables
Table 2-1 Gibbs free energy per unit mass (ergs/gm × 103) (Cheng et al. 2002) 19
Table 2-2 Moisture sensitivity tests on loose samples (Solaimaninan et al., 2003) 25
Table 2-3 Moisture sensitivity tests on compacted samples (Solaimaninan et al., 2003) 25
Table 2-4 Summary of test parameters for AASHTO T283 (Aschenbrener 1996) 32
Table 2-5 Summary of ECS test procedure (Ashenbrener 1996) 34
Table 2-6 CalTrans low environmental risk zone 50
Table 2-7 CalTrans moderate and high environmental risk zones 50
Table 3-1 Samples made for APA and Hamburg tests 52
Table 3-2 Project Information 54
Table 4-1 Summary of tests carried out on different mixes. 77
Table 4-2 Aggregate-binder types D2: 2G06015A 80
Table 4-3 Aggregate-binder types D3: 3G06020A 84
Table 4-4 Aggregate-binder types D5: 5G06016A 88
Table 4-5 Aggregate-binder types D6: 6G06011A 92
Table 4-6 Aggregate-binder types D6: 6G06016A 96
Table 4-7 Aggregate-binder types D6: 6G07002A 100
Table 5-1 Summary of test results 115

viii
List of Figures
Figure 2-1 Factors considered in moisture damage analysis. ..................................... 12
Figure 2-2 Interpretation of ECS Modular Curve....................................................... 36
Figure 3-1 Pine Superpave Gyratory Compactor Control Panel ................................ 58
Figure 4-1 Stripping in samples without additive (Left) and non stripping with
additive (right) ............................................................................................................ 78
Figure 4-2 Close up view of the left sample in Figure 4-1 ......................................... 78
Figure 4-3 Rut depth vs. number of cycles from the APA tests of D2-2G06015A mix
(50oC wet) ................................................................................................................... 81
Figure 4-4 Rut depth vs. number of cycles from the HWTD tests of D2-2G06015A
mix (50oC wet)............................................................................................................ 82
Figure 4-5 Rut depth vs. number of cycles from the APA and the HWTD Tests of
D2-2G06015A mix (50oC wet)................................................................................... 83
Figure 4-6 Rut depth vs. number of cycles from the APA tests of D3-3G06020A mix
(50oC wet) ................................................................................................................... 85
Figure 4-7 Rut depth vs. number of cycles from the HWTD tests of D3-3G06020A
mix (50oC wet)............................................................................................................ 86
Figure 4-8 Rut depth vs. number of cycles from the APA and the HWTD tests of D3-
3G06020A mix (50oC wet) ......................................................................................... 87
Figure 4-9 Rut depth vs. number of cycles from the APA tests of D5-5G06016A mix
(50oC wet) ................................................................................................................... 89

ix
Figure 4-10 Rut depth vs. number of cycles from the HWTD tests of D5-5G06016A
mix (50oC wet)............................................................................................................ 90
Figure 4-11 Rut depth vs. number of cycles from APA and the HWTD tests of D5-
5G06016A mix (50oC wet) ......................................................................................... 91
Figure 4-12 Rut depth vs. number of cycles from the APA tests of D6-6G06011A
mix (50oC wet)............................................................................................................ 93
Figure 4-13Rut depth vs. number of cycles from the HWTD tests of D6-6G06011A
mix (50oC wet)............................................................................................................ 94
Figure 4-14 Rut depth vs. number of cycles from the APA and the HWTD tests of
D6-6G06011A mix (50oC wet)................................................................................... 95
Figure 4-15 Rut depth vs. number of cycles from the APA tests of D6-6G06016A
mix (50oC wet)............................................................................................................ 97
Figure 4-16 Rut depth vs. number of cycles from the HWTD tests of D6-6G06016A
mix (50oC wet)............................................................................................................ 98
Figure 4-17 Rut depth vs. number of cycles from the APA and the HWTD tests of
D6-6G06016A mix (50oC wet)................................................................................... 99
Figure 4-18 Rut depth vs. number of cycles from the APA tests of D6-6G07002A
mix (samples prepared at KSU, 50oC wet) ............................................................... 102
Figure 4-19 Rut depth vs. number of cycles from the APA tests of D6-6G07002A
mix (samples prepared at KU, 50oC wet) ................................................................. 103
Figure 4-20: Rut vs. number of cycles from the HWTD tests of D6-6G07002A mix
(samples prepared at KSU, 50oC wet) ...................................................................... 104

x
Figure 4-21 Rut depth vs. number of cycles from the APA and the HWTD tests of
D6-6G07002A mix (50oC wet)................................................................................. 105
Figure 4-22: Rut depth vs. number of cycles from the APA tests of D6-6G07002A
mix (60oC wet).......................................................................................................... 106
Figure 4-23 Rut depth vs. number of cycles from the APA tests of D6-6G07002A
mix (50oC dry) .......................................................................................................... 107
Figure 4-24 Rut depth vs. number of cycles from the APA tests of D6-6G07002A
mix (60oC dry) .......................................................................................................... 108
Figure 4-25 Rut depths for samples tested under wet 50oC vs. dry 50oC................. 109
Figure 4-26 Rut depths for samples tested under wet 60oC vs. dry 60oC................. 111
Figure 4-27 Wet tests at 50oC vs. 60oC..................................................................... 111
Figure 4-28 Dry tests at 50oC vs. 60oC..................................................................... 112
Figure 4-29: Samples made at KSU vs. KU ............................................................. 113

1
1. INTRODUCTION
1.1. Problem Statement
The Kansas Department of Transportation (KDOT) is increasingly using Superpave
mixtures. The moisture susceptibility or stripping which causes loss of bonding
between aggregate and binder is currently evaluated by the Kansas Standard Test
Method KT-56. KT-56 is similar to the American Association of State Highway
Transportation Officials (AASHTO) T-283 procedure adopted during the Superpave
research but has minor modifications in the conditioning procedure. According to
current KDOT specifications for Superior Performing Asphalt Pavements
(Superpave) mixes, this KT-56 test at best takes 4 days to run and takes two failing
tests to shut down the production. This requirement potentially can result in eight
days of Superpave mixture production that could be susceptible to stripping. Another
criticism on the current test procedure is that the use of anti-stripping agents could
rectify the low Tensile Strength Ratio (TSR) or make the mixture meet the minimum
TSR requirements. Instead of increasing the conditioned strength, the current test
procedure lowers the tensile strength of the anti-stripping treated unconditioned
specimen. This problem with the AASHTO T-283/KDOT KT-56 procedure has been
recognized at the national level and the National Cooperative Highway Research
Program (NCHRP) Project 9-34 - Improved Conditioning Procedure for Predicting
the Moisture Susceptibility of Hot Mix Asphalt (HMA) Pavements looked into the
2
conditioning procedure of the AASHTO T-283. This project investigated the
possibility of correlating the moisture sensitivity of paving mixes measured with the
Environmental Conditioning System (ECS)/dynamic modulus (from the Simple
Performance Tester) combination to (a) the known field performance of the mixes
and (b) their moisture sensitivity measured with the Hamburg Wheel Tracking Device
(HWTD) test method and the ASTM method D 4867 (moisture sensitivity test). The
study showed that the HWTD identified moisture susceptibility of six Superpave
mixtures out of eight tested (75% success rate). Some state agencies have already
adopted “wheel tracking” type tests like the HWTD and the Asphalt Pavement
Analyzer (APA) to evaluate moisture sensitivity of Superpave mixtures. Notables are
Texas, Colorado, and Georgia. Research at Kansas State University (Gogula et al.,
2003) demonstrated that the HWTD is capable of identifying moisture sensitivity of
Superpave mixtures in Kansas.
1.2. Objective
Moisture sensitivity (also known as “stripping”) is one of the major problems in
HMA pavements, potentially leading to premature pavement distress. Moisture
damage in asphalt pavements can occur either by adhesive fracture, i.e. failure at the
aggregate-mastic interface or cohesive fracture, i.e. failure within the mastic. Tests to
determine moisture sensitivity suffer from inconsistency and the results from
laboratory tests may not correlate well with field experiences. Extensive research is

3
still needed for wheel tracking devices such as the HWTD and the APA before they
can be considered as rapid tests useful in evaluating moisture susceptibility. The
objective of the present research is to develop a rapid test to determine moisture
sensitivity of HMA (Superpave) mixtures. In cooperation with KDOT, research was
carried out jointly at the University of Kansas (KU) and the Kansas State University
(KSU). Six superpave mixtures were selected for evaluation. HWTD tests were
conducted at KSU. APA tests were conducted at KU. The results obtained from
these tests are analyzed to evaluate how well they can detect moisture sensitivity.
1.3. Organization
This thesis contains five chapters:
Chapter 1 presents the statement of the problem, the objective of the research and the
organization of the thesis.
Chapter 2 provides a literature review of the mechanisms of water induced damage in
hot mix asphalt pavements, the state of the research to evaluate the moisture damage,
and the techniques for remedying the stripping damage.
4
Chapter 3 documents the experimental study carried on for the present research,
which includes the use of the equipment, the preparation of the samples, and the test
procedures.
Chapter 4 presents the test results obtained from the experimental study using APA
and Hamburg test methods. Analysis and comparison of these test results are
provided.
Chapter 5 summarizes the test results and makes conclusions and recommendations
based on this research.
Data of the APA tests are presented in the Appendix at the end of this thesis.

5
2. LITERATURE REVIEW
2.1. Mechanisms of Moisture Damage in HMA
Asphalt mixtures lose their strength and durability due to effects of moisture, termed
as moisture damage. This damage can occur due to loss of bond between asphalt
cement or the mastic (asphalt cement plus the mineral filler minus 74 μm and smaller
aggregate) and the fine and coarse aggregate. When water permeates, the mastic is
weakened so that it is more susceptible to damage during cyclic traffic loading.
Little and Jones (2003) identified six contributing mechanisms to moisture damage:
detachment, displacement, spontaneous emulsification, pore pressure–induced
damage, hydraulic scour, and the effects of the environment on the aggregate–asphalt
system.
2.1.1 Detachment
Detachment is the separation of an asphalt film from an aggregate surface by a thin
film of water without an obvious break in the film (Majidzadeh and Brovold, 1968).
According to Majidzadeh and Brovold (1968), if a three-phase interface consisting of
aggregate, asphalt, and water exist, water reduces the free energy of the system more
than asphalt to form a thermodynamically stable condition of minimum surface
energy. Little and Jones (2003) indicated that the aggregate surface has a strong

6
preference for water over asphalt. Water has lower viscosity and surface tension than
asphalt. Thus it is a better wetting agent.
Little and Jones (2003) also concluded that most asphalts have relatively low polar
activity and the bond between the aggregate and asphalt is mainly due to relatively
weak dispersion forces. Water molecules are, on the other hand, highly polar and can
replace the asphalt at the asphalt–aggregate interface.
2.1.2 Displacement
Displacement differs from detachment because it involves displacement of asphalt at
the aggregate surface through a break in the asphalt film (Tarrer and Wagh, 1991).
Displacement often results from incomplete coating of the aggregate surface, rupture
of the film at sharp aggregate corners or edges, pinholes originating in the asphalt
film because of aggregate coatings.
The process of displacement can proceed through the changes in the pH value of the
water at the aggregate surface, which enters through the point of disruption. These
changes alter the type of adsorbed polar groups, which lead to the buildup of
opposite, and negatively charged electrical double layers on the aggregate and asphalt
surfaces. The drive to reach equilibrium attracts more water and leads to physical
separation of the asphalt from the aggregate (Tarrer and Wagh 1991).

7
2.1.3 Spontaneous emulsification
Spontaneous emulsification is an inverted emulsion of water droplets in asphalt
cement. Fromm (1974) demonstrated how an emulsion forms and the adhesive bond
is broken once the emulsion formation penetrates the substrata. Literature indicates
that the formation of such emulsions is further aggravated by the presence of
emulsifiers such as clays and asphalt additives. Fromm (1974) observed that
spontaneous emulsification occurs when asphalt films are immersed in water and that
the rate of emulsification depends on the nature of the asphalt and the presence of
additives. Organic amines, which are basic nitrogen compounds, can bond strongly
to aggregates in the presence of water (Robertson 2000). Kiggundu (1986)
demonstrated how the rate of emulsification is dependent on the nature and viscosity
of asphalt, with AC-5 asphalt emulsifying in distilled water much faster than AC-10
asphalt. Kiggundu (1986) also demonstrated that this process is reversible upon
drying.
2.1.4 Pore pressure
Pore pressure is developed under traffic loading when water is entrapped in asphalt
concrete. Stresses imparted to the entrapped water from repeated traffic load
applications will worsen the damage as the continued buildup in pore pressure
disrupts the asphalt film from the aggregate surface or can cause the growth of
microcracks in the asphalt mastic. Bhairampally et al. (2000) used a tertiary damage

8
model developed by Tseng and Lytton (1987) to demonstrate that well-designed
asphalt mixtures tend to “strain harden” on repeated loading. Little and Jones (2003)
indicated that this “strain hardening” differs from the classical strain hardening
occurring when metals are cold-worked to develop interactive dislocations to prevent
slip, instead, strain hardening seen in asphalt concrete is due to the “locking” of the
aggregate matrix caused by densification during repeated loading.
Some mixtures also exhibit microcracks in the mastic under heavy repeated loading.
The formation of cracks results in progressive cohesive or adhesive failure, or both.
In the presence of water, the rate of formation of cracks increases due to the pore
pressure in the microcracks voids. Terrel and Al-Swailmi (1994) described the
concept of pessimum air voids, i.e., the range of air void contents within which most
asphalt mixtures are typically compacted (between about 8% and 10%). Above this
level the air voids become interconnected and moisture can flow out under a stress
gradient developed by traffic loading. Below this value the air voids are disconnected
and are relatively impermeable and thus do not become saturated with water. Within
the pessimum range, water can enter the voids but cannot escape freely. The
presence of such water causes the increase in pore pressure when subjected to
loading.

9
2.1.5 Hydraulic scour
Hydraulic scour occurs from the action of tires on a saturated pavement surface.
Water is sucked under the tire into the pavement by the tire action. Osmosis and
pullback have been suggested as possible mechanisms of scour (Fromm, 1974).
Fromm (1974) indicated that osmosis occurs in the presence of salts or salt solutions
in aggregate pores and creates an osmotic pressure gradient that actually sucks water
through the asphalt film. Fromm (1974)’s explanation is in agreement with Mack’s
(1964) while Thelen (1958) pointed out that osmosis is a slow process so that it
cannot be the reason. However, several factors affect the potential occurrence of this
mechanism including the facts that some asphalt is treated with caustics during
manufacture, some aggregates possess salts (compositionally), and asphalt films are
permeable. Cheng et al. (2002) demonstrated that the diffusion of water vapor
through asphalt cement itself is considerable and asphalt mastics can hold a rather
surprisingly large amount of water. Cheng et al. (2002) have shown that the amount
of water held by asphalt is related to the level of moisture damage that occurs in the
mixtures using that asphalt.
2.1.6 pH instability
Little and Jones (2003) mention Scott (1978) and Yoon (1987) demonstrated that
asphalt–aggregate adhesion is strongly influenced by the pH value of the contact
water. Kennedy et al. (1984) investigated the effect of various sources of water on

10
the level of damage that occurred in a boiling test. Scott (1978) observed that the
value of interfacial tension between asphalt and glass peaked at intermediate pH
values, up to about 9, and then dropped as pH increased. Yoon (1987) found that the
pH of contact water was aggregate-specific and increased with duration of contact
then stabilized after approximately 5 to 10 minutes of boiling. Yoon (1987)
determined that the coating retention in boiling tests decreased as pH increased.
Kiggundu and Roberts (1988) pointed out that stabilization of the pH sensitivity at the
asphalt–aggregate interface can minimize the potential for bond breakage, provide
strong, durable bonds, and reduce stripping.
Tarrer (1996) concluded that (a) the bond between asphalt and aggregate depends on
surface chemical activity, (b) water at the aggregate surface (in the field) has a high
pH, (c) some liquids used as anti-stripping agents require a long curing period (in
excess of about 3 hours) to achieve resistance to loss of bond at higher pH levels, and
(d) it is possible to achieve a strong chemical bond between aggregate and asphalt
cement that is resistant to pH shifts and a high pH environment. This strong chemical
bond can be achieved by the formation of insoluble organic salts (such as calcium-
based salts), which form rapidly and are not affected by high pH levels or pH shifts.
Little and Jones (2003) indicated that pH values as high as 9 or 10 do not dislodge
amines from the acidic surfaces of aggregates, nor do they affect hydrated lime.
11
Values of pH greater than 10 are not normally developed in asphalt mixtures unless a
caustic such as lime is added. However, pH values below approximately 4 can
dislodge amines from an aggregate surface and can dissolve lime depending on the
type of acid used; these low pH values are not found in hot-mix asphalt.
2.1.7 Environmental effects on the aggregate–asphalt system
Terrel and Shute (1989) reported that factors such as temperature, air, and water have
a profound effect on the durability of asphalt concrete mixtures. In mild climates,
when good-quality aggregates and asphalt cements are available, the major
contribution to deterioration is traffic loading. Premature failure may occur when
poor materials and traffic are coupled with severe weather. Terrel and Al-Swailmi
(1994) identified a number of environmental factors of concern: water from
precipitation or groundwater sources, temperature fluctuations (including freeze–thaw
conditions), and aging of the asphalt. They considered traffic and construction
techniques as important factors external to the environment.
Cohesion in the mastic is influenced by the rheology of the filled binder. Kim et al.
(2002) described how the resistance of mastic to microcracks development is strongly
influenced by the dispersion of mineral filler. Cohesive strength of asphalt concrete
mastic is controlled by the combination and interaction of both asphalt cement and
the mineral filler. Water can affect cohesion in different ways including weakening
12
of the mastic due to moisture saturation and void swelling or expansion. Cohesion
properties would logically influence the properties in the mastic beyond the region
where interfacial properties dominate. The Schmidt and Graf (1972) studies showed
that an asphalt mixture can lose approximately 50 percent of its modulus upon
saturation. This loss may continue with time, but upon drying, the modulus can be
completely recovered. Cheng et al. (2002) described the severe weakening of asphalt
mixtures when they are subjected to moisture conditioning. They indicated that this
strength loss is predictable when one compares the wet adhesive bond strength
between the asphalt and the aggregate with the much higher dry adhesive bond
strength. But Cheng et al. (2002) also demonstrated that the rate of damage in
various mixtures is related to the diffusion of water into the asphalt mastic and the
asphalts holding the greater amount of water accumulate damage at a faster rate.
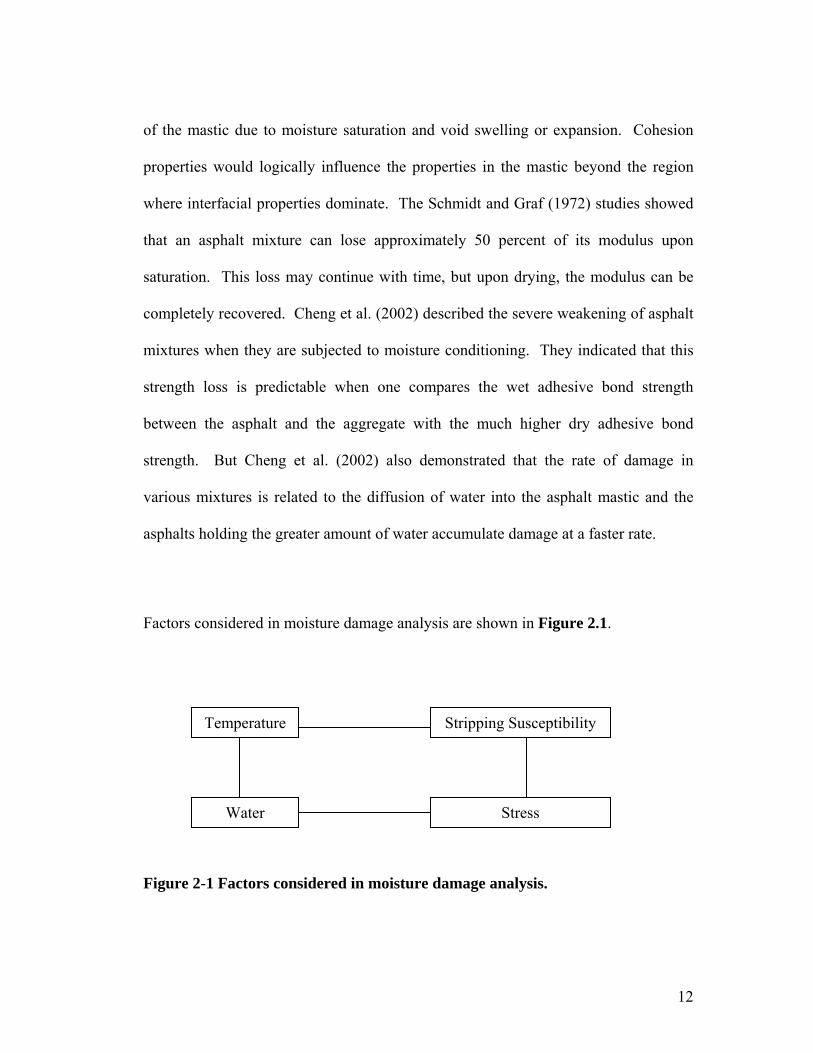
Factors considered in moisture damage analysis are shown in Figure 2.1.
Figure 2-1 Factors considered in moisture damage analysis.
Temperature Stripping Susceptibility
Water Stress

13
Essential ingredients to promote stripping are:
• Air voids
• Presence of water
• High stress
• High temperature
Saturation is the main cause of the problem and stripping is the outcome. The degree
of saturation of pavements and asphalt layers is a critical element in the appraisal of
stripping failures. If subsurface drainage of the pavement is inadequate, moisture
and/or moisture vapor can move upwards due to capillary action and saturate the
asphalt courses. Thermal pumping of moisture may occur if trafficking does not
reduce the permeability of typical dense-graded HMA, and saturation may follow. If
the HMA is not permeable for capillary flow, then there is no saturation and less
chance of scouring. However, if saturation exists, stripping is highly likely and results
from the hydraulic scouring of the binder from the aggregate surface due to extreme
cyclic pore water pressure generated by heavy traffic.
To simulate the actual field condition, laboratory samples should be submerged under
water then tested by applying repeated pulses of water pressure.

14
2.2. Nature of Asphalt-aggregate Interaction
2.2.1 Adhesive failure versus cohesive failure
Moisture damage (stripping) in asphalt pavements can occur in two ways: (1)
adhesive fracture or failure. In this process, damage occurs at the aggregate-mastic
interface, (2) cohesive fracture or failure. In this process, damage occurs within the
mastic. The actual type of failure depends on the nature of the mastic and the relative
thickness of the mastic around the coarse and fine aggregate.
Little and Jones (2003) mention that Lytton (2002) used micromechanics to assess the
“thickness” of the asphalt film at which adhesive failure gives way to cohesive
failure. It was explained that asphalt mixtures with thin asphalt films fail in tension
by adhesive bond rupture, while those with thicker asphalt films (or mastic films) fail
because of damage within the mastic (cohesive failure) as opposed to interfacial
debonding. The film thickness that differentiates these two types of failure is
dependent on the rheology of the asphalt (or mastic), the amount of damage for the
asphalt or mastic to withstand prior to failure, the rate of loading, and the temperature
at the time of testing.
2.2.2 Effect of aggregate characteristics
It is generally believed that acidic aggregates are hydrophobic while basic aggregates
are hydrophilic. However, no aggregate can completely resist the stripping action of

15
water. Tarrer and Wagh (1991) listed several factors that influence the asphalt–
aggregate bond: surface texture, penetration of pores and cracks with asphalt,
aggregate angularity, aging of the aggregate surface through environmental effects,
adsorbed coatings on the surface of the aggregate, and the nature of dry aggregates
versus wet aggregates.
Maupin (1982) demonstrated that surface texture of the aggregate affects its ability to
be properly coated, however, a good initial coating is necessary to prevent HMA from
stripping. Calculating from basic surface energy measurements of the asphalt and
aggregate, Cheng et al. (2002) demonstrated that the adhesive bond between certain
granites and asphalt was higher than that between limestone aggregate and asphalt
when the bond was quantified as the energy per unit of surface area. However, when
the bond was quantified as energy per unit of aggregate mass, the bond energy was
far greater for the calcareous aggregates than for the siliceous. These results clearly
demonstrate the importance of the interaction of the physical and the chemical bonds.
Gzemski et al. (1968) determined that stripping is severe in more angular aggregates
because the angularity may promote bond rupture of the binder or mastic, leaving a
point of intrusion for the water. Cheng et al. (2002) substantiated this argument that,
regardless of the strength of the bond between the asphalt and aggregate, the bond
between water and aggregate is considerably stronger. Cheng et al. (2002) also
showed that the bond between water and aggregates is at least 30% stronger than that
for any of the asphalts.

16
A freshly crushed aggregate surface would have a greater free energy than an
uncrushed aggregate surface. This phenomenon is because broken bonds due to
fracture should substantially increase the internal energy even though such broken
bonds have a counter-effect on randomness (entropy increase). However, Tarrer and
Wagh (1991) pointed out that sometimes newly crushed faces tend to strip faster than
stockpiled aggregates. They stated that it is characteristic of many aggregates that
one or more layers of water molecules become strongly adsorbed on the aggregate
surface as a result of electrochemical attractions.
Tarrer and Wagh (1991) indicated that heating aggregates may remove free water and
the outermost adsorbed water molecules on the aggregates and reduce the interfacial
tension between the aggregate and the asphalt so that the stripping potential is
reduced. Little and Jones (2003) explained that heating reduces asphalt viscosity,
allows better penetration of asphalt into the aggregate surface, and promotes a more
effective physical bond.
According to Tarrer and Wagh (1991), the asphalt–aggregate bond can be enhanced
by three processes: (a) preheating the aggregate, (b) weathering the aggregate, and (c)
removing aggregate coatings. When the aggregate surface is heated, the outermost
adsorbed water layer is removed so as to improve the state of interfacial tension
between the asphalt and aggregate and, in turn, to improve the bond between asphalt
17
and aggregate. The weathering process results in a replacement of the adsorbed water
layer with organic fatty acids from the air. This process results in an improved
asphalt–aggregate bond (Fromm, 1974). A dust coating on the aggregate surface
promotes stripping by preventing intimate contact between the asphalt and aggregate
and creating channels through which water can penetrate (Castan, 1968).
2.2.3 Material properties for accessing distress processes on HMA
Surface energy can be related to material processes and failure mechanisms. From
this relationship, Little and Jones (2003) established a set of principles that can be
used to measure material properties needed for assessing the basic distress processes
of HMA. These principles are listed as follows:
• Both asphalt and aggregate have surface energies.
• Surface energies have different components: permanent deformation distress,
fatigue failure process, cohesive strength reduction, and adhesive failure
(stripping) in the presence of moisture.
• The theory of adhesive and cohesive bonding has been developed and used
reliably in industrial surface chemistry and chemical engineering.
• Fracture and healing involve both chemical and mechanical properties.
Neither fracture nor healing can be properly described without the use of both

18
properties: chemical—surface energies; mechanical—modulus, tensile
strength and their change with age.
• The presence of moisture at the asphalt–aggregate interface interrupts the
bond and accelerates the rate of fracture damage. The presence of moisture in
the mastic reduces cohesive strength and fracture resistance, therefore, it
reduces the healing potential for microcracks in the mastic.
• On the basis of surface energy characteristics, calculations may be performed
to determine appropriate combinations of aggregate and asphalt to ensure
them bond and heal well.
Little and Jones (2003) suggested in selecting materials for an asphalt pavement
mixture among several available alternatives, the best combination of all of the
available aggregate and asphalt should be selected to resist fracture, heal and bond
them well, and resist moisture damage. Prediction of HMA performance requires the
measurement of physical properties.
Cheng et al. (2002) determined the free energy per unit mass for different aggregates
and binders as shown in Table2-1. They used two types of binder AAM and AAD
which were used by Strategic Highway Research Program (SHRP). They described
that the AAM asphalt bonds strongly with either the limestone or granite aggregate
than the AAD asphalt. The AAD asphalt has more water holding capacity than the

19
AAM asphalt, which leads to a higher level of damage. Limestone has a higher value
of energy per unit mass than granite. Thus the bonding energy of limestone with the
binder is greater than that of granite.
Table 2-1 Gibbs free energy per unit mass (ergs/gm × 103) (Cheng et al. 2002)
Binder Georgia
Granite
Texas
Limestone
Colorado
Limestone
AAD-1 158 614 375
AAM-1 206 889 536
Rubber asphalt 219 819 497
Aged rubber asphalt 178 714 435
Asphalt molecules are comprised primarily of carbon and hydrogen (between 90%
and 95%) by weight. Remaining atoms, called heteroatoms, are very important to the
interaction of asphalt molecules as well as their performance. These heteroatoms
consist of oxygen, nitrogen, sulfur, nickel, vanadium, and iron.
Asphalt atoms are linked together to form molecules. Aliphatic carbon–carbon chain
saturated with hydrogen bonds is the simplest form. The carbon–carbon bonds can

20
also form rings saturated with hydrogen. These carbon atoms saturated by hydrogen
atoms in asphalt molecules are non-polar and interact primarily through relatively
weak Van der Waals forces. A second class of asphalt molecules involves aromatics.
This molecule has six carbon atoms in the form of a hexagonal ring. This ring
possesses a unique bond with alternating single and double bonds between carbon
atoms (Little and Jones, 2003).
2.2.4 Asphalt chemistry and adhesion
Polarity or separation of charge within the organic molecules promotes attraction of
polar asphalt components to the polar surfaces of aggregates. Even though neither
asphalt nor aggregate has a net charge, their components have non-uniform charge
distributions, and both behave as if they have charges that attract the opposite charge
of the other material (Little and Jones, 2003). Curtis et al. (1992) showed that
aggregates vary widely in terms of surface charge and are influenced by
environmental changes.
Robertson (2000) pointed out that adhesion between asphalt and aggregate arises
between the polar nature of the asphalt and the polar surface of the aggregate and
polarity alone in asphalt is not sufficient to achieve good adhesion in pavements
because asphalt is affected by the environment. Robertson (2000) further stated that

21
asphalt has the capability of incorporating and transporting water. Cheng et al.
(2002) showed that a substantial quantity of water can diffuse and be retained in a
film of asphalt cement or asphalt mastic so as to change the rheology of the binder.
Curtis (1992) found acidic groups, carboxylic acids, and sulfoxides had the highest
adsorptions, while ketone and nonbasic nitrogen groups had the least. However, the
sulfoxide and carboxylic acids were more susceptible to desorption in the presence of
water. According to Curtis (1992), the general trend of desorption potential of polar
groups from aggregate surfaces is as follows: sulfoxide > carboxylic acid > nonbasic
nitrogen ≥ ketone > basic nitrogen > phenol.
2.2.5 Effect of aggregate properties on adhesion
Various aggregate properties affect the adhesive bond between asphalt and aggregate,
which include size and shape of aggregate, pore volume and size, surface area,
chemical constituents at the surface, acidity and alkalinity, adsorption size surface
density, and surface charge or polarity. The asphalt–aggregate bond is affected by
aggregate mineralogy, adsorbed cations on the aggregate surface, surface texture, and
porosity. Asphalt must be able to wet and permeate the aggregate surface. The ability
of bonding asphalt to aggregate is dynamic and changes with time. This ability is
largely affected by the shift in pH at the aggregate–water interface, which can be

22
triggered by dissociation of aggregate minerals near the surface or by the nature of
the pore water (cation type and concentration).
2.2.6 Requirements of moisture sensitivity tests
For successful moisture susceptibility test procedure for mix design and field quality
control, the following criteria must be satisfied (Solaimanian et al., 2003):
1. It is representative of the mechanisms that cause moisture damage in the field and
produce results that match those occurring in the field under similar conditions
2. It is capable of distinguishing between poor and good performers in regard to
stripping. Even when the lab test does not replicate the mechanisms of failures in
the field, it can still discriminate between the high and low moisture susceptive
mixtures using any other parameters, however, the results must still be tied to
field performance.
3. It is repeatable and reproducible, with the allowable variance depending on the
constraint of the fourth criterion.
4. It is feasible, practical, and economical enough that it can be included in routine
mix design practice.
23
2.2.7 Summary
Several processes contribute simultaneously to the moisture damage in asphalt
pavements. The literature review shows that neither asphalt nor aggregate has a net
charge, but their components have non-uniform charge distributions. Asphalt and
aggregate both behave as if they have charges that attract the opposite charged
materials. By treating asphalt with additives, more tenacious and long lasting bonds
can be developed. The most durable bonds appear to be formed by interaction of
phenolic groups and nitrogen bases from the bitumen, which form insoluble salts and
have less chance to be affected by water. Since sulfoxides and carboxylic acids have
a greater affinity for the aggregate surfaces, they are most susceptible to dissolution
on water.
Along with adhesive failure, moisture damage is also associated with the weakening
of cohesive strength of the mastic due to moisture infiltration. The literature review
shows that water can diffuse into asphalt of mastics, weaken the asphalt mixture in a
long run, and make it more susceptible to damage. Hence, the deleterious effects of
moisture on the adhesive and cohesive properties, both of which influence asphalt
mixture performance, must be considered. Little and Jones (2003) indicated that the
propensity for either adhesive or cohesive failure in an asphalt mixture is dependent
on the thickness of mastic cover. Since the distribution of aggregates on asphalt as

24
well as the thickness of asphalt matrix varies considerably within the mixture, the
statistical distribution will determine the controlling mechanism (Jones and Little,
2003). Thicker asphalt matrix will lead to cohesive failure in asphalt (separation of
film) whereas thin asphalt matrix will lead to the adhesive bond failure in aggregate-
asphalt interface.
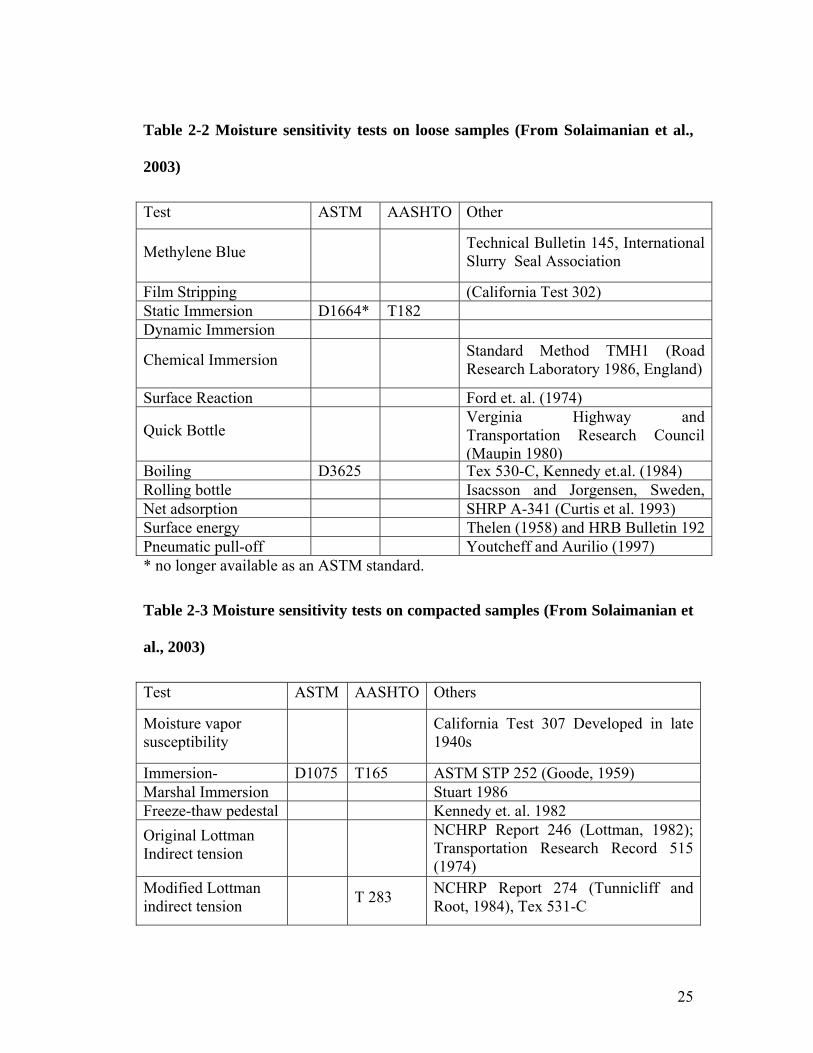
2.3. Test Methods to Predict Moisture Sensitivity in HMA
Various test methods to predict moisture sensitivity have been developed. Tests may
be carried out in loose samples as well as on compacted specimens. These test
methods are presented in Table 2-2 for loose samples and Table 2-3 for compacted
specimens.
2.3.1 Boiling Water Test
ASTM D 3625 (Boiling Water Test) has been used to predict moisture sensitivity of
hot mix asphalt pavements. This test is used primarily as an initial screening test of a
HMA mix. The test involves immersion of samples in boiling water for 10 minutes
and the retained coated area is determined. Usually more than 95% of retained coated
area is required.
25
Table 2-2 Moisture sensitivity tests on loose samples (From Solaimanian et al.,
2003)
Test ASTM AASHTO Other
Methylene Blue Technical Bulletin 145, International Slurry Seal Association
Film Stripping (California Test 302) Static Immersion D1664* T182Dynamic Immersion
Chemical Immersion Standard Method TMH1 (Road Research Laboratory 1986, England)
Surface Reaction Ford et. al. (1974)
Quick Bottle Verginia Highway and Transportation Research Council (Maupin 1980)
Boiling D3625 Tex 530-C, Kennedy et.al. (1984)Rolling bottle Isacsson and Jorgensen, Sweden, Net adsorption SHRP A-341 (Curtis et al. 1993)Surface energy Thelen (1958) and HRB Bulletin 192 Pneumatic pull-off Youtcheff and Aurilio (1997)* no longer available as an ASTM standard.
Table 2-3 Moisture sensitivity tests on compacted samples (From Solaimanian et
al., 2003)
Test ASTM AASHTO Others
Moisture vapor susceptibility California Test 307 Developed in late
1940s
Immersion- D1075 T165 ASTM STP 252 (Goode, 1959) Marshal Immersion Stuart 1986Freeze-thaw pedestal Kennedy et. al. 1982Original Lottman Indirect tension
NCHRP Report 246 (Lottman, 1982); Transportation Research Record 515 (1974)
Modified Lottman indirect tension T 283 NCHRP Report 274 (Tunnicliff and
Root, 1984), Tex 531-C

26
Tunnicliff-Root D 4867 NCHRP Report 274 (Tunnicliff and
Root, 1984)
ECS with resilient modulus SHRP-A-403 (Al-Swailmi and Terrel,
1994)
Hamburg wheel 1993 Tex-242-FAsphalt Pavement Analyzer
ECS/ SPT NCHRP 9-34 2002-03 Multiple freeze-thaw 2.3.2 Texas Boiling Water Test
The Texas Boiling Water Test (TBWT) is to visually determine the degree of
stripping after the sample is placed in the boiling water. Asphalt cement is heated at
325oF (163oC) for 24 hours to 26 hours. One hundred grams or 300 grams of
unwashed aggregate is heated at the same temperature for 1 to 1.5 hours. The
aggregate and asphalt are mixed and allowed to cool for two hours. A 1000 ml
beaker is filled half-way with distilled water and boiled. The mixture is placed in
boiling water for 10 minutes. Asphalt cement that is floating is skimmed off the top.
The water is cooled to room temperature and then poured off. The mixture is emptied
onto a paper towel and graded. A same panel of observers grade the mixture at that
time and again the next day, when the mixture is dry. A mixture that retains 65% to
75% of the asphalt cement is favorable for use in the field (Kennedy et al., 1984).

27
2.3.3 Texas Freeze-Thaw Pedestal Test
The Texas Freeze-Thaw Pedestal Test (TFTPT) is conducted on a HMA mix with
uniform aggregate sizes. Since a uniform aggregate size is used, the effects of
mechanical properties of the aggregate are minimized in the test. Thus, the effects of
bonding are maximized. To perform this test, asphalt and aggregate are mixed using
the Texas Mixture Design Procedure. After initial mixing, the mixture is reheated
and mixed for two additional times.
A cylindrical mold is used to form the specimen, which has a height of 19.05 mm
(0.75 in) and a 41.3 mm (1.6 in.) diameter. A constant load of 27.6 kN (6200 lbs) is
applied for 20 minutes. The specimen is cured at ambient temperature for three days.
Thermal cycling is performed on the specimen. The specimen is placed on a stress
pedestal in a jar and covered with 12.7 mm (0.5 in) of distilled water. It is cycled
through -12oC (-10oF) for 12 hours then 49oC (120oF) for 12 hours. The number of
freeze-thaw cycles to induce cracking indicates moisture susceptibility of the HMA.
Kennedy et al. (1984) found that mixes susceptible to moisture survived less then 10
cycles. Mixtures that were not susceptible to moisture survived more than 20 cycles.
2.3.4 Static Immersion Test
Static Immersion Test (AASHTO T-182) is a subjective test. An HMA mix sample is
immersed in a distilled water bath at 77oF (25oC). The mix is left in the water bath
28
for 16 to 18 hours. Similar to the Boiling Water Test, the percentage of total visible
area that remains coated with asphalt cement is estimated as above or below 95%
(Solaimanian 2003)
2.3.5 The Lottman Test
Lottman (1982) developed this test at the University of Idaho. Nine specimens are
used in the laboratory procedure. They are compacted to the field air void content.
The nine cores are split into three groups. Group one is the control group, in which
no conditioning is done. In the second group, the cores are vacuum-saturated with
water for 30 minutes up to 660mmHg. Group two reflects the field performance of
the HMA mix for the first four years of life. The third group is also vacuum-saturated
but the cores are then subjected to a freeze-thaw cycle. Group three cores are frozen
at 0oF (-18oC) for 15 hours. Then they are thawed at 140oF (60oC) for 24 hours.
Group three is designed to reflect the field performance from the fourth to the twelfth
year (Lottman, 1982; Roberts et al., 1996)
The Resilient Modulus (MR) Test and/or the Indirect Tensile Strength Test (ITS) are
performed on each core after the prescribed conditioning has been completed. These
tests can be performed at either 55oF (13oC) or 73oF (23oC). ITS is determined using
a loading rate of 0.065 in/min. The retained tensile strength (TSR) is calculated for
the cores in groups of two and three. The TSR is equivalent to the ITS of the

29
conditioned specimens divided by the ITS of the control specimens. TSR greater
than 0.7 is typically recommended. However, field cores showed visual stripping
when TSR value was 0.8. (Lottman, 1982; Roberts et al., 1996)
The indirect tensile strength is defined as the maximum stress from a diametrical
vertical force that a specimen can withstand and can be expressed as follows:
tDP2000t π
=σ (3-1)
where, σt = tensile strength (kPa)
P = maximum load carried by the specimen (N)
t = thickness of specimen (mm), and
D = diameter of specimen (mm).
The Tensile Strength Ratio (TSR) was first suggested by Lottman (1982) and has
been used as a parameter to identify moisture sensitive mixtures. TSR is defined as
the ratio of the strength of conditioned (wet) specimens to the strength of
unconditioned specimens and can be expressed as:
30
( )( )specimen nedunconditio
specimen dconditione
t
tTSRσ
σ= (3-2)
where σt = tensile strength.
Other parameters may also be used, such as: the flexural stiffness and the fatigue life.
The flexural stiffness is the repeated flexural stress divided by the corresponding
strain. The flexural stiffness ratio (FSR) is defined as the ratio of conditioned to
unconditioned stiffness values:
FSR = Sconditioned /Sunconditioned (3-3)
where FSR = flexural stiffness ratio,
Sconditioned = stiffness of conditioned specimens,
Sunconditioned = stiffness of unconditioned specimens.
The fatigue life is defined as the number of cycles to reach 50 percent of the initial
flexural stiffness of the beam specimen and can be expressed as follows:
FLR = FLconditoned /FLunconditioned (3-4)

31
where FLR = flexural stiffness ratio,
FLconditioned = fatigue life of conditioned specimens,
FLunconditioned = fatigue life of unconditioned specimens.
2.3.6 The Tunicliff and Root Conditioning
The Tunicliff and Root conditioning is a strength test that utilizes ITS. Six specimens
are produced with air voids between 6 and 8 percent. The six samples are split into
two groups of three. The first group is the control group without any conditioning.
The second group is vacuum-saturated at 28.6 in. Hg for five minutes. Saturation
limits for the specimens are 55 to 80 percent. After saturation, group two cores are
placed in a 140oF (60oC) water bath for 24 hours. The ITS test is performed at 77oF
(25oC) with a loading rate of 2 in/min. The minimum acceptable TSR used is 0.7 to
0.8 (ASTM D4867, “Standard Test Method for Effect of Moisture on Asphalt
Concrete Paving Mixtures,”).
2.3.7 The Modified Lottman Test (AASHTO T-283)
AASHTO accepted the Modified Lottman Test (AASHTO T-283) in 1985. It is the
combination of the Lottman Test and the Tunicliff and Root Test. Six specimens are
produced with air voids between six and eight percent. The higher percentage of air
voids helps accelerate moisture damage on the cores. Two groups of three specimens
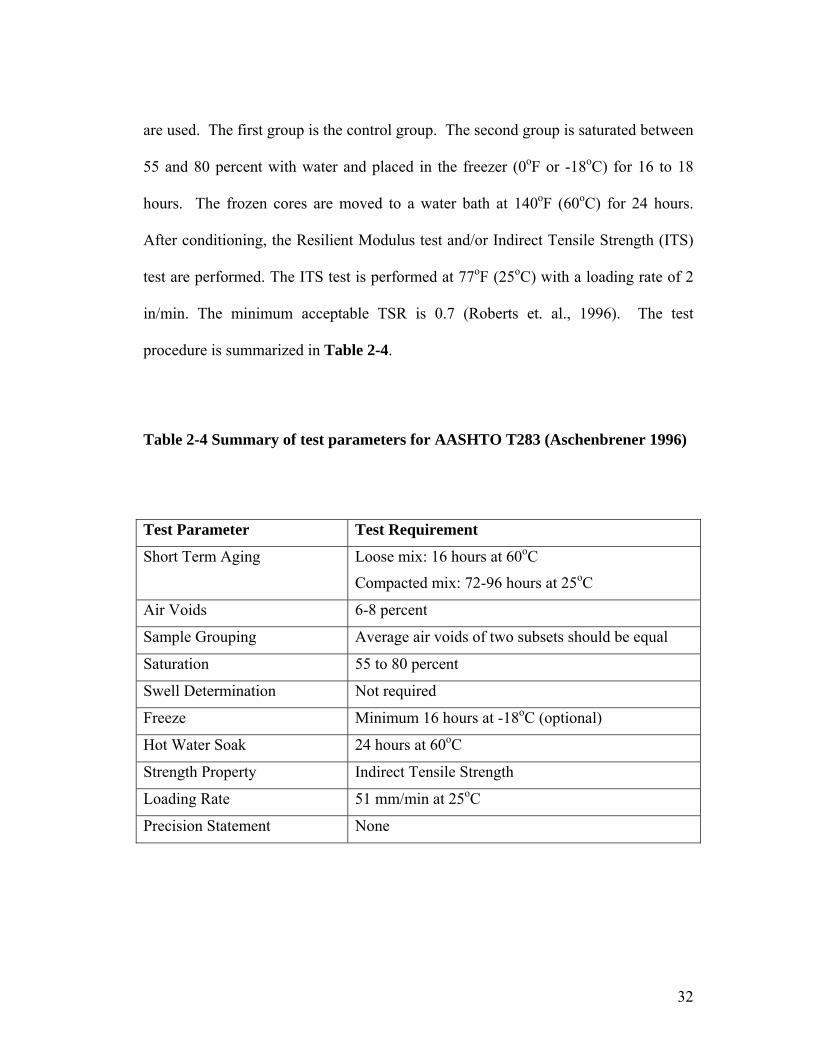
32
are used. The first group is the control group. The second group is saturated between
55 and 80 percent with water and placed in the freezer (0oF or -18oC) for 16 to 18
hours. The frozen cores are moved to a water bath at 140oF (60oC) for 24 hours.
After conditioning, the Resilient Modulus test and/or Indirect Tensile Strength (ITS)
test are performed. The ITS test is performed at 77oF (25oC) with a loading rate of 2
in/min. The minimum acceptable TSR is 0.7 (Roberts et. al., 1996). The test
procedure is summarized in Table 2-4.
Table 2-4 Summary of test parameters for AASHTO T283 (Aschenbrener 1996)
Test Parameter Test Requirement
Short Term Aging Loose mix: 16 hours at 60oC
Compacted mix: 72-96 hours at 25oC
Air Voids 6-8 percent
Sample Grouping Average air voids of two subsets should be equal
Saturation 55 to 80 percent
Swell Determination Not required
Freeze Minimum 16 hours at -18oC (optional)
Hot Water Soak 24 hours at 60oC
Strength Property Indirect Tensile Strength
Loading Rate 51 mm/min at 25oC
Precision Statement None
33
2.3.8 Immersion-Compression Test
The immersion-Compression Test (AASHTO T-165) utilizes six cores. Each core is
four inches in diameter and four inches in height. The cores are compacted with a
double plunger at 3,000 psi (20.6 MPa) for two minutes. An air void content of 6
percent is attained. The six cores are split into two groups. The first group is the
control group. The second group is conditioned in a water bath at 120oF (49oC) for
four days or at 140oF (60oC) for one day.
After conditioning, the unconfined compressive strength of each core is determined.
A testing temperature of 77oF (25oC) and a loading rate of 0.2 in/min (5 mm/min) are
used. The retained compressive strength is calculated. A retained strength of 70
percent is specified by many agencies (Roberts et al., 1996).
The Immersion-Compression Test has produced retained strengths close to 100
percent even when stripping is visually evident in cores. Thus, this test is not
sensitive enough to measure damage induced by moisture. This problem is attributed
to the internal pore water pressure that develops (Roberts et al., 1996).
34
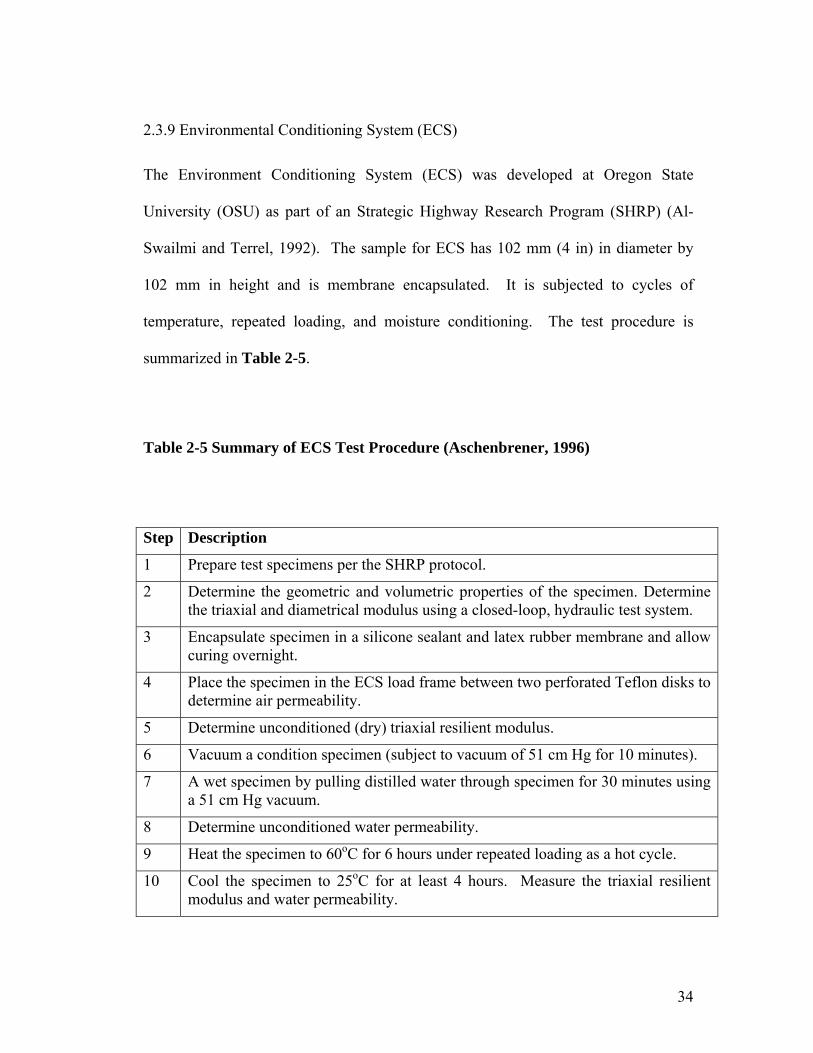
2.3.9 Environmental Conditioning System (ECS)
The Environment Conditioning System (ECS) was developed at Oregon State
University (OSU) as part of an Strategic Highway Research Program (SHRP) (Al-
Swailmi and Terrel, 1992). The sample for ECS has 102 mm (4 in) in diameter by
102 mm in height and is membrane encapsulated. It is subjected to cycles of
temperature, repeated loading, and moisture conditioning. The test procedure is
summarized in Table 2-5.
Table 2-5 Summary of ECS Test Procedure (Aschenbrener, 1996)
Step Description
1 Prepare test specimens per the SHRP protocol.
2 Determine the geometric and volumetric properties of the specimen. Determine the triaxial and diametrical modulus using a closed-loop, hydraulic test system.
3 Encapsulate specimen in a silicone sealant and latex rubber membrane and allow curing overnight.
4 Place the specimen in the ECS load frame between two perforated Teflon disks to determine air permeability.
5 Determine unconditioned (dry) triaxial resilient modulus.
6 Vacuum a condition specimen (subject to vacuum of 51 cm Hg for 10 minutes).
7 A wet specimen by pulling distilled water through specimen for 30 minutes using a 51 cm Hg vacuum.
8 Determine unconditioned water permeability.
9 Heat the specimen to 60oC for 6 hours under repeated loading as a hot cycle.
10 Cool the specimen to 25oC for at least 4 hours. Measure the triaxial resilient modulus and water permeability.
35
11 Repeat steps 9 and 10 for additional hot cycles.
12 Cool the specimen to -18oC for 6 hours without repeated loading as a freeze cycle. This procedure is optional.
13 Heat the specimen to 25oC for at least 4 hours and measure the triaxial resilient modulus and the water permeability.
14 Split the specimen and perform a visual evaluation of stripping.
15 Plot the triaxial resilient modulus and water permeability ratios.
Resilient modulus (MR) is determined before or after conditioning in the ECS
procedure. The ECS-MR ratio (ratio of conditioned to unconditioned) and the visual
observation of stripping from the split specimen after conditioning are the bases for
evaluating moisture damage.
Aschenbrener (1996) suggested that the moisture resisting specimen requires the
ECS-MR ratio to be greater than 0.7 after the final conditioning cycle. The SHRP
research suggested that additional insight to mixture behavior might be gained by
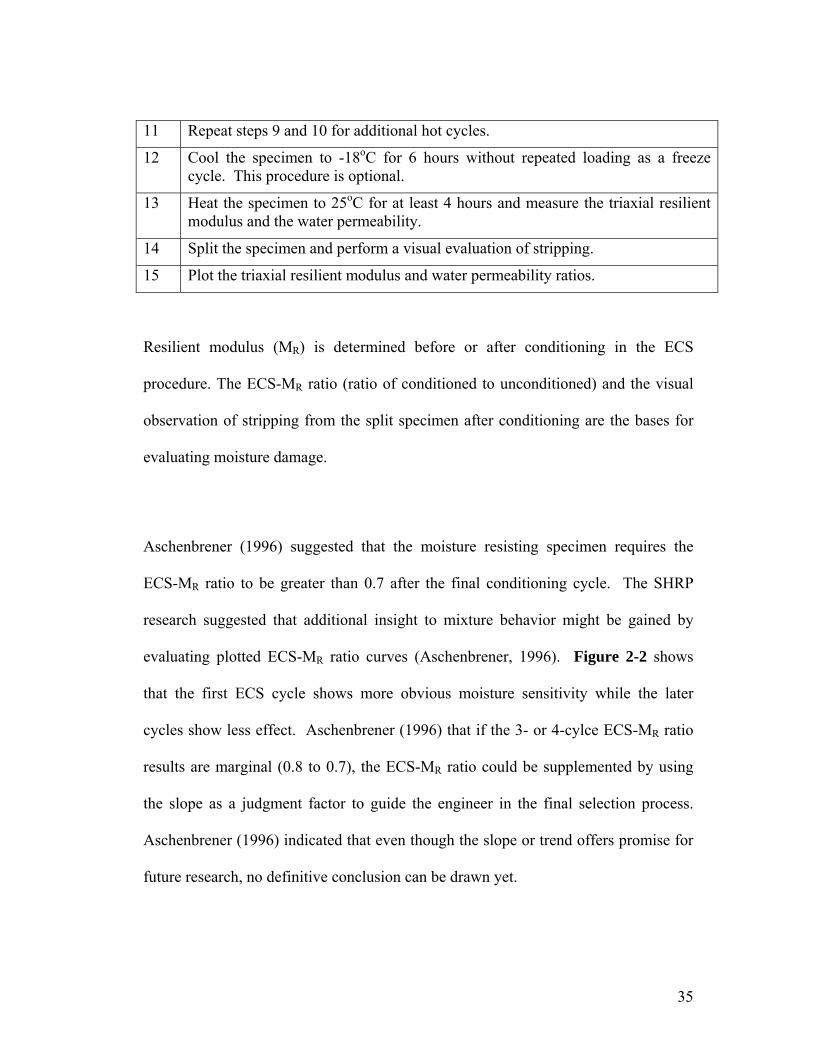
evaluating plotted ECS-MR ratio curves (Aschenbrener, 1996). Figure 2-2 shows
that the first ECS cycle shows more obvious moisture sensitivity while the later
cycles show less effect. Aschenbrener (1996) that if the 3- or 4-cylce ECS-MR ratio
results are marginal (0.8 to 0.7), the ECS-MR ratio could be supplemented by using
the slope as a judgment factor to guide the engineer in the final selection process.
Aschenbrener (1996) indicated that even though the slope or trend offers promise for
future research, no definitive conclusion can be drawn yet.
36
The correlation between Tensile Strength Ratio (TSR) from AASHTO T283 with the
ECS-MR ratio after 4 cycles is expressed by the following regression equation
(Aschenbrener 1996):
MR = 0.96TSR + 0.23 (3-5)
where y = MR ratio from ECS cycle after 4 cycles,
x = TSR from AASHTO T 283.
Figure 2-2 Interpretation of ECS Modular Curve

37
The coefficient of determination r2 is 0.52. The slope of the regression is
approximately 1.0 indicating a 1:1 relationship of the TSR and ECS-MR. In addition,
MR is approximately 0.23 higher than the TSR.
The correlation between TSR from AASHTO T283 and the percent of asphalt coating
from ASTM D 3625 is expressed by the following regression equation (Aschenbrener
1996):
y = 4.11x + 65 (3-6)
where y = percent of asphalt coating from ASTM D 3625,
x = TSR from AASHTO T 283
The coefficient of determination r2 is 0.003. There is no correlation between these
two tests.
2.3.10 APA tests
The APA as shown in Figure 2-3 is a multifunctional loaded wheel tester used for
evaluating permanent deformation (rutting), fatigue cracking, and moisture
susceptibility of both hot and cold asphalt mixes. This machine is available at most

38
DOTs in the U.S. APA is a laboratory scale accelerated load wheel tester and
modified from the version of the Georgia loaded wheel tester (GLWT). APA has a
wheel running back and forth over a pressurized hose placed on top of the sample
inside a chamber under a wide range of conditions. The APA machine and sample
testing in APA machine are shown in Figure 2-3 and Figure 2-4. Details of the APA
machine used in the current study will be presented in Chapter 3.
Figure 2-3 Asphalt Pavement Analyzer machine

39
Figure 2-4 Sample testing in APA machine
Mohammad, N. (2001) mention that Georgia DOT used the APA to evaluate the
permanent deformation characteristics of stone mastic asphalt mixture, large stone
asphalt mix, and a heavy-duty conventional 19mm mix and they concluded that APA
rut depth was consistent with the actual field rut depth.
Cross and Voth (2001) conducted APA tests in Kansas to evaluate the effects of
sample preconditioning on rut depths and the suitability of APA for determining
moisture susceptible mixtures. In their study, Cross and Voth (2001) measured rut
depths at 500, 1000, 2000, 4000, and 8000 cycles. Eight different mixes from seven
project sites were evaluated. Air and water bath temperatures were set at 40oC.
Samples were tested using four different preconditioning procedures. First
preconditioning was done by placing samples in APA at a chamber temperature of
40oC for 4 hours before running APA. This is referred as 40oC dry condition state.
Second preconditioning was done by soaking samples in a 40oC water bath for 2
hours before running the APA. The samples were tested while submerged in water at

40
40oC. This test procedure is referred as 40oC soak. Third preconditioning was done
by vacuum saturation of the samples in accordance with the AASHTO T283 and then
placed in a 60oC water bath for 24 hours. Next the samples were placed in the APA’s
water bath at 40oC for two hours and then tested in APA while submerged in 40oC
water. This procedure is referred as 40oC saturated. Fourth preconditioning was
done by vacuum saturation as in the third state, but freeze-thaw cycle following the
AASHTO T283 was added. Then the samples were placed in water bath for 2 hours
at 40oC and tested in APA submerged in water at 40oC. This procedure is referred as
40oC freeze. Tests were conducted with or without anti-stripping additives and
hydrated lime. Measured rut depth data were analyzed using two-way analysis of
variance (ANOVA), in which rut depth was the response variable (Y-variable) and
the project site and the condition state were two effects (X-variable). A statistical
comparison using the Tukey-Kramer test was conducted.
The test results suggested that the AASHTO T-283 preconditioning had little effect
upon the rutting results. 40oC soak preconditioning had the greatest rut depth
followed by 40oC saturated, 40oC dry, and 40oC freeze, which had the least amount of
rutting. Rut depths for the soak conditioning were greater than the freeze
conditioning on all 8 sites, and greater than the saturated conditioning on 7 out of 8
sites. Cross and Voth (2001) suggested that pore pressure was likely created during
the rut testing due to the vacuum saturated conditioning of the samples and this pore
pressure could have provided some resistance to rutting. Therefore, testing of
41
samples with dry and soak conditioning may be all that is necessary for developing a
test method for predicting moisture susceptibility with the APA. However, Cross and
Voth (2001) could not establish good correlation between rut depths and the results
obtained from other test methods like TSR values, methylene blue values, and sand
equivalent. APA tests were able to detect the influence of liquid anti-strip agents but
could not detect the influence of lime additives. APA tests were not able to identify
all the sites with TSR values below 80%.
Cross and Voth (2001) also suggested that any potential test procedure for
determining the moisture susceptibility of mixes should incorporate two or three tests,
such as the loaded wheel test and a methylene blue test. A 2.0 mm and/or 50%
increase in rut depth from samples with dry and soak conditioning appear to be
threshold values that provide some correlation with conventional moisture sensitivity
test results. They indicated that 50oC testing temperature could result in more
definitive results.
2.3.11 Hamburg tests
The HWTD as shown in Figure 2-5 is originally manufactured by Helmut-Wind, Inc
of Hamburg, Germany. Test samples are typically 260 mm (10.2 in) wide, 320 mm
(12.6 in) long, and 40 mm (1.6 in) thick and they are compacted at approximately 7
percent air voids using a plate compactor. Two samples are tested simultaneously.
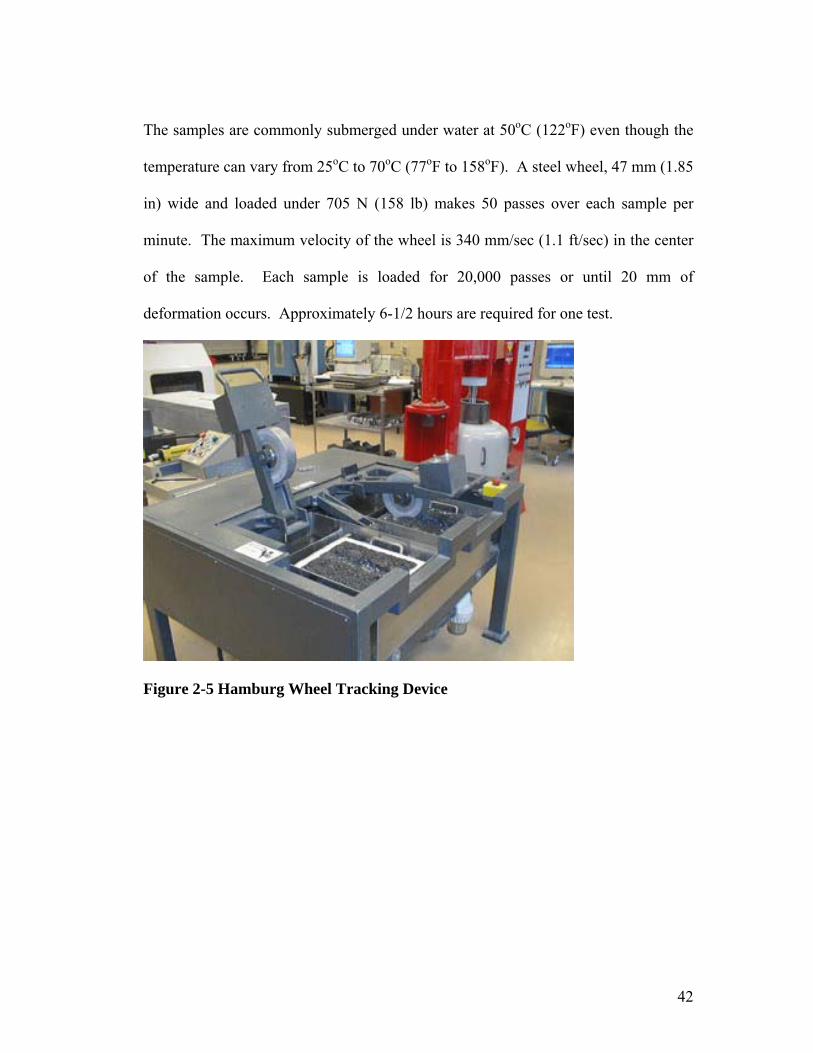
42
The samples are commonly submerged under water at 50oC (122oF) even though the
temperature can vary from 25oC to 70oC (77oF to 158oF). A steel wheel, 47 mm (1.85
in) wide and loaded under 705 N (158 lb) makes 50 passes over each sample per
minute. The maximum velocity of the wheel is 340 mm/sec (1.1 ft/sec) in the center
of the sample. Each sample is loaded for 20,000 passes or until 20 mm of
deformation occurs. Approximately 6-1/2 hours are required for one test.
Figure 2-5 Hamburg Wheel Tracking Device
43
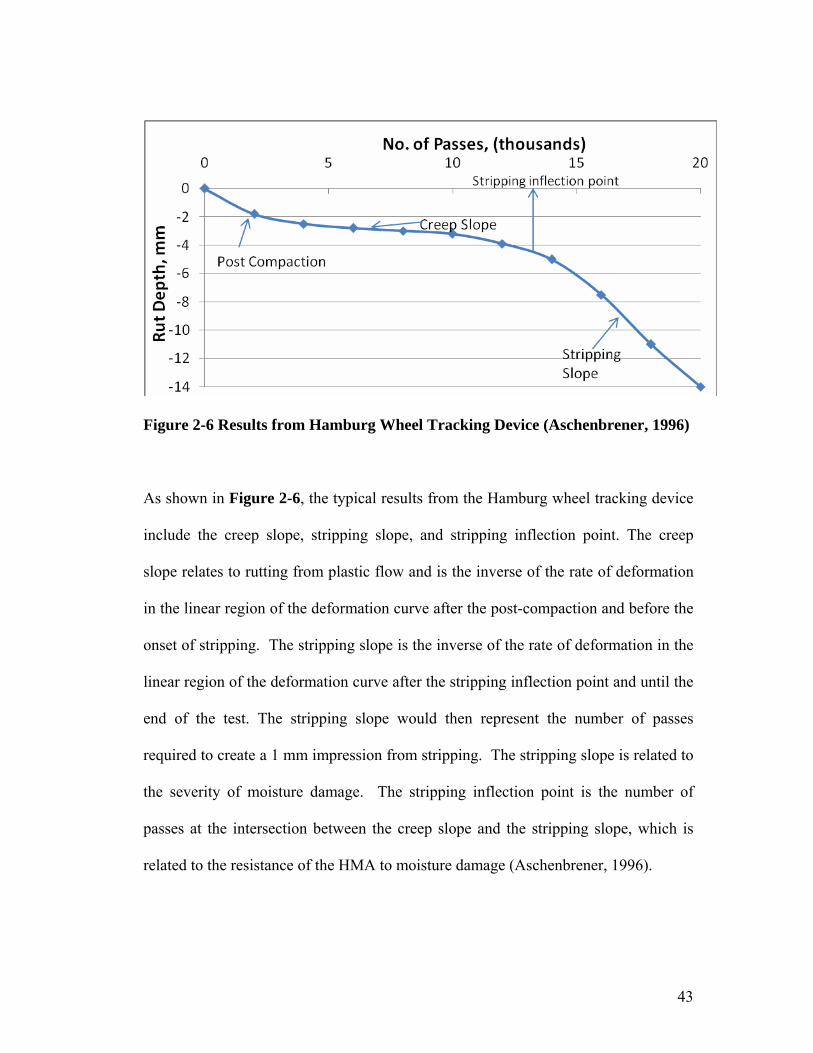
Figure 2-6 Results from Hamburg Wheel Tracking Device (Aschenbrener, 1996)
As shown in Figure 2-6, the typical results from the Hamburg wheel tracking device
include the creep slope, stripping slope, and stripping inflection point. The creep
slope relates to rutting from plastic flow and is the inverse of the rate of deformation
in the linear region of the deformation curve after the post-compaction and before the
onset of stripping. The stripping slope is the inverse of the rate of deformation in the
linear region of the deformation curve after the stripping inflection point and until the
end of the test. The stripping slope would then represent the number of passes
required to create a 1 mm impression from stripping. The stripping slope is related to
the severity of moisture damage. The stripping inflection point is the number of
passes at the intersection between the creep slope and the stripping slope, which is
related to the resistance of the HMA to moisture damage (Aschenbrener, 1996).

44
The manufacturer, Hamburg in Germany, specifies a rut depth of less than 4 mm after
20,000 passes. Based on the studies in Colorado, Aschenbrener (1996) indicated that
the 4 mm specification is too severe and he suggested that a rut depth of less than 10
mm after 20,000 passes should be used instead.
Aschenbrener (1996) tested HMA mixes used in the pavements of known stripping
performances using the HWTD. Seven good pavements (sites 1 to 7), five pavements
requiring high maintenance (sites 8 to12), and eight pavements that lasted less than 1
year (sites 13 to 20) were tested. Aschenbrener (1996) found excellent correlation
between the stripping inflection point and the known stripping performance. Good
pavements (sites 1 to 7) had stripping inflection points generally greater than 10,000
passes. The high-maintenance pavements (sites 8 to 12) had stripping inflection
points generally between 5,000 and 10,000 passes. The pavements that lasted less
than 1 year (sites 13 to 20) had stripping inflection points less than 3,000 passes.
Based on these tests, Aschenbrener (1996) concluded:
• The HWTD has the potential to distinguish pavements of varying field
stripping performance.
• The HWTD results are sensitive to aggregate properties including clay
content, high dust to asphalt ratios, and dust coating on aggregates.
• An increase of the asphalt cement stiffness at the same testing temperature
makes the stripping inflection point to occur at a larger number of passes.

45
Using the same grade of asphalt cement but reducing the testing temperature,
the stripping inflection point would occur at a larger number of passes.
Moisture resistance improves as asphalt cement stiffness is increased and
when temperature is decreased.
• The HWTD results are sensitive to the amount of short-term aging. As short-
term aging time increases, the samples become more resistant to moisture
damage.
• The HWTD results are sensitive to the crude oil source and refining process.
Even for the same AC-10 or PG 58-22 grading asphalt cement, it may have
different adhesion properties. The HWTD results are affected by the
components and quality of asphalt cement.
• Liquid anti-stripping additives can increase the passes required for the
stripping inflection point from the Hamburg for most aggregates. Hydrated
lime can increase more passes as compared to all other additives.
• Samples compacted in the laboratory using the linear kneading compactor
(steel wheel) gave slightly better results than samples compacted with the
French plate compactor (pneumatic tire) in the field. In general, the
laboratory–compacted samples performed similarly. The field compacted
samples did significantly worse than the laboratory compacted samples. This
result may be due to higher air voids in field samples or lower compaction
efforts.
46
• When the target density of the HMA samples was achieved at a higher
temperature during compaction, the HWTD wheel-tracking device would
produce higher passes of the stripping inflection point.
2.3.12 Fatigue testing
This test is carried out on the apparatus positioned in a temperature control cabinet
under conditions prescribed in the Austroads standard (Rickards, 2003). This test uses
a constant stress test regime in the belief that it can best replicate the field condition.
The standard testing temperature and stress frequency are 20oC and 10 Hz,
respectively. A constant stress required to achieve a strain of approximately 400
microstrain is calculated as 1200 kPa (Rickards, 2003). Fatigue life is calculated as
the number of cycles at which the modulus of the beam is reduced to half its initial
modulus. The field validation has suggested that this test is extremely severe.
This test postulates that stripping damage would occur (even in the most compatible
system), if the asphalt is at or near saturation and the pavement temperature and
traffic loading are high. Rickards (2003) indicated that “In a heavily trafficked high
temperature environment even the best asphalt systems will fail if near saturation. In
this case the problem is saturation, not stripping.”

47
2.4 Techniques for Limiting Moisture Sensitivity
2.4.1 Liquid anti-stripping agents
Liquid anti-stripping agents are chemical compounds containing amines. According
to Tunicliff et al. (1984), these compounds reduce surface tension between the asphalt
and aggregate in a mixture. The reduction of surface tension increases the adhesion
of the asphalt to the aggregate. Anti-stripping agents are surface active agents. These
anti-stripping agents can be addend with the asphalt by heating the asphalt to a liquid
state or by adding the additive directly to the aggregate prior to the addition of binder.
Liquid anti-stripping agents are added directly to the asphalt binder either at the
refinery or asphalt terminal, or at the contractor’s asphalt facility during production of
the mix with an in-line blending system. Liquid anti-stripping agents are commonly
used in cold-applied, asphalt-bound patching materials, asphalt binders for chip seals,
and the binder for pre-coating the aggregates in chip seals.
2.4.2 Lime additives
Lime can reduce the potential for moisture to disrupt the adhesive bond that exists
between asphalt binder and aggregate. The contribution of lime is to change the
surface chemistry or molecular polarity of the aggregate surface.

48
Lime can be added to the aggregate either dry or as lime slurry. When dry lime is
used, a fixed percent of hydrated lime (by dry weight of aggregate) is added to pre-
wetted aggregate (for example, 5% water added to aggregate and then 1.5% dry
hydrated lime added to aggregate). On the other hand, lime slurry can also be used,
in which a fixed percent of hydrated lime (for example, 1.5% by dry weight of
aggregate) is introduced in form of a lime –water slurry mixed in a fixed ratio (for
example, 1 to 3 by weight).
Lime-aggregate is cured (1 or 2 days to 1 or 2 months) to allow for pozzolanic
reaction to take place between lime and aggregates.
The T283 tests have showed that lime treatment increases the strength value and
tensile strength ratio (Shatnawi, 1995). The strength improvement can be computed
by the following formula:
SI = [(στCL − στCNL)/στCNL)]x 100% (3-7)
where SI = strength improvement (%),
στCL = tensile strength of conditioned lime treated specimens, and
στCNL = tensile strength of unconditioned specimens without lime treatment.

49
The analysis has showed that lime treatment can extend the performance life of HMA
pavements by an average of 3 years (Martin et al. 2003), which is equivalent to an
average increase of 38% in the expected pavement life. Percentage increase in the
pavement life of 38% compares favorably with the percent increase in the cost of
HMA mixtures of 6% ($2/ton) by the use of lime treatment.
California Department of Transportation (CalTrans) pre-coated all the aggregates
with lime slurry when they were mixed at the plant (Martin et al., 2003). The pre-
coated aggregate was stockpiled for a maximum marination period of 24 hours to 21
days for chemical reaction to take place on the aggregate surface. The AASHTO T
283 test was used initially and a TSR of 80% or above was required. But the industry
claimed that the results of the T 283 tests were not consistent and had high variability.
Then CalTrans District 02 discontinued the T 283 test, instead, made it mandatory to
lime treat all the aggregates for all asphalt concrete for all major projects.
Recommendations for low, moderate, and high environmental risk zones are
presented in Tables 2-6 and Table 2-7 (Martin et al., 2003).
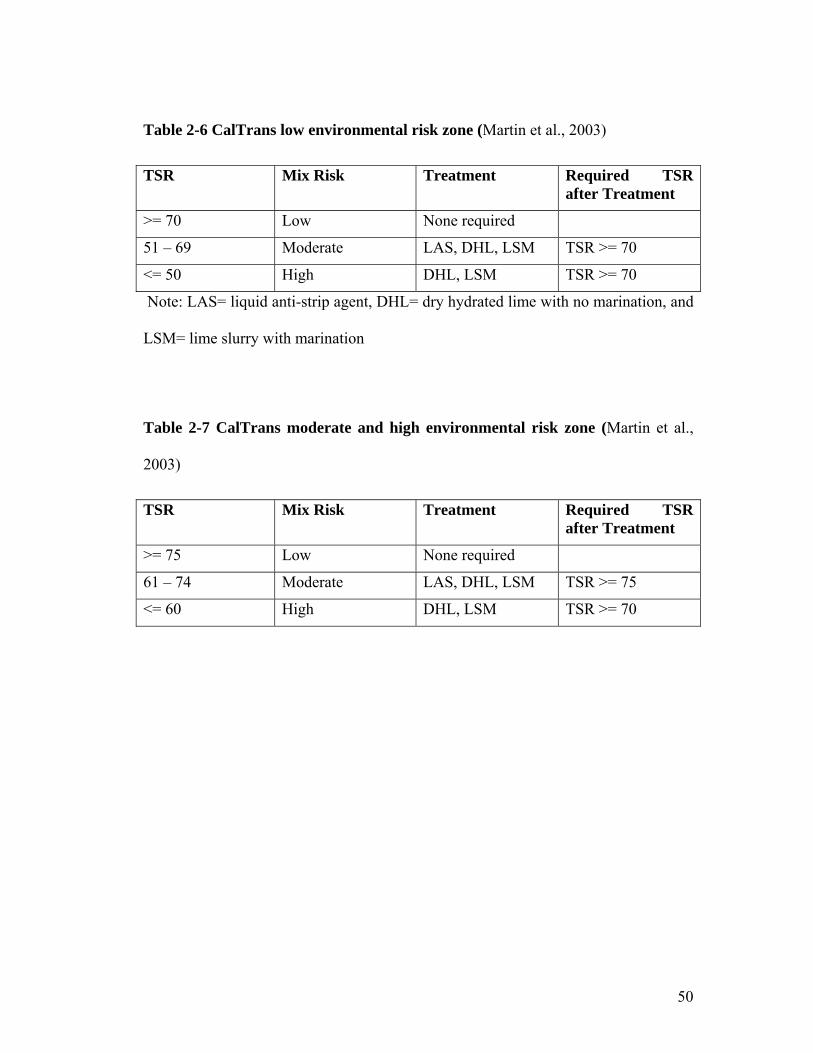
50
Table 2-6 CalTrans low environmental risk zone (Martin et al., 2003)
TSR Mix Risk Treatment Required TSR after Treatment
>= 70 Low None required
51 – 69 Moderate LAS, DHL, LSM TSR >= 70
<= 50 High DHL, LSM TSR >= 70
Note: LAS= liquid anti-strip agent, DHL= dry hydrated lime with no marination, and
LSM= lime slurry with marination
Table 2-7 CalTrans moderate and high environmental risk zone (Martin et al.,
2003)
TSR Mix Risk Treatment Required TSR after Treatment
>= 75 Low None required
61 – 74 Moderate LAS, DHL, LSM TSR >= 75
<= 60 High DHL, LSM TSR >= 70
51
3. EXPERIMENTAL STUDY
3.1. Introduction
This experimental study is part of the joint research efforts between the KU and KSU
sponsored by KDOT through the Kansas Transportation Research and New-
Developments (K-TRAN) program to develop a rapid test method for evaluating
moisture sensitivity of HMA samples. APA tests were conducted at KU while
HWTD tests were conducted at KSU. To eliminate possible variations of sample
preparation, a series of test samples for APA and HWTD tests were prepared at KSU
by the same members. These samples were tested parallel using APA and HWTD
testers between KU and KSU. To extend the research scopes for the K-TRAN
project, additional samples were prepared and tested at KU.
For this experimental study, Superpave HMA cylindrical samples were fabricated
using Superpave gyratory compactors. The diameter of all the samples was 150 mm.
Table 3.1 provides the dimensions and volumes of these cylindrical samples. For
APA tests, the height of samples was 75 mm whereas for HWTD tests it was 60 mm.
Six samples were made with additive and six without additive for both APA and
HWTD tests. Aggregate, binder, and additive were obtained from KDOT. One
design mix each for Districts 2, 3 and 5 and three design mixes for District 6 were

52
used to prepare lab samples for the joint research portion between KU and KSU.
Eight sets of additional samples (4 with additive and 4 without additive) were made at
KU based on the D607002A mix of District 6 and will be further discussed later.
Table 3-1 Samples made for APA and Hamburg tests.
APA HWTD Diameter of sample, d (mm) 150 150 Height of sample, h (mm) 75 60 Volume of 1 sample (cc) 1325.36 1060.29 Volume of 6 samples (cc) 7952.16 6361.73
Table 3.2 presents overall project information on the HMA mixes used in different
districts, the name of county, and the contractor who was involved in the real project.
Mixing and molding temperatures, aggregate type and ratio, binder type, additive
type, and their amount each mix are also provided.
All samples used for the HWTD tests at KSU were soaked in water at 50oC. The
delay time after the water reached 500C was thirty minutes. Rut depth in the
cylindrical sample vs. number of cycle was recorded automatically.
In case of the APA tests done at KU, samples were subjected to vacuum saturation
(20in Hg) for six minutes before wet tests. Samples were soaked for one hour after
the required temperature was reached. For APA tests, two sets of temperature were
used. All those parallel samples using 50oC in HWTD were tested at same
temperature in the APA too. Eight additional sets of samples were fabricated at KU.
53
Tests were conducted at 50oC dry and 60oC dry conditions as well to evaluate the
effect of saturation and temperature on the samples. Manual measurements were
taken using a steel plate and a dial gauge.
The analysis and discussion on the results of both Hamburg and APA tests are
presented in Chapter 4.
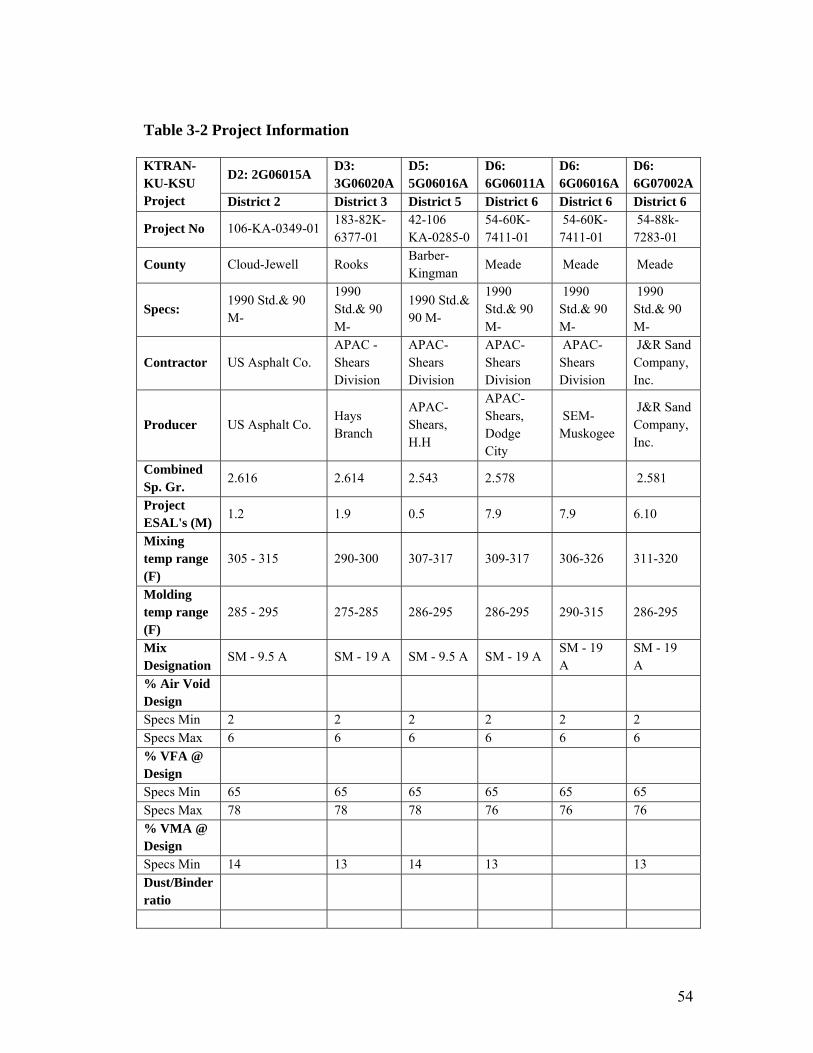
54
Table 3-2 Project Information
D2: 2G06015A D3: 3G06020A
D5: 5G06016A
D6: 6G06011A
D6: 6G06016A
D6: 6G07002A
KTRAN-KU-KSU Project District 2 District 3 District 5 District 6 District 6 District 6
Project No 106-KA-0349-01 183-82K-6377-01
42-106 KA-0285-0
54-60K-7411-01
54-60K-7411-01
54-88k-7283-01
County Cloud-Jewell Rooks Barber-Kingman
Meade Meade Meade
Specs: 1990 Std.& 90 M-
1990 Std.& 90 M-
1990 Std.& 90 M-
1990 Std.& 90 M-
1990 Std.& 90 M-
1990 Std.& 90 M-
Contractor US Asphalt Co. APAC - Shears Division
APAC-Shears Division
APAC-Shears Division
APAC-Shears Division
J&R Sand Company, Inc.
Producer US Asphalt Co. Hays Branch
APAC-Shears, H.H
APAC-Shears, Dodge City
SEM-Muskogee
J&R Sand Company, Inc.
Combined Sp. Gr.
2.616 2.614 2.543 2.578 2.581
Project ESAL's (M)
1.2 1.9 0.5 7.9 7.9 6.10
Mixing temp range (F)
305 - 315 290-300 307-317 309-317 306-326 311-320
Molding temp range (F)
285 - 295 275-285 286-295 286-295 290-315 286-295
Mix Designation
SM - 9.5 A SM - 19 A SM - 9.5 A SM - 19 A SM - 19 A
SM - 19 A
% Air Void Design
Specs Min 2 2 2 2 2 2 Specs Max 6 6 6 6 6 6 % VFA @ Design
Specs Min 65 65 65 65 65 65 Specs Max 78 78 78 76 76 76 % VMA @ Design
Specs Min 14 13 14 13 13 Dust/Binder ratio

55
Table 3.2 Project information (continued) D2: 2G06015A
D3: 3G06020A
D5: 5G06016A
D6: 6G06011A
D6: 6G06016A
D6: 6G07002A
K-TRAN-KU-KSU Project
District 2 District 3 District 5 District 6 District 6 District 6 Specs Min 0.6 0.6 0.6 0.6 0.6 0.6 Specs Max 1.2 1.2 1.2 1.2 1.2 1.2 Tensile Strength Ratio (TSR)
80 80 80 80 80 80
Sand Equivalent (Min)
40 40 40 45 45 45
Uncompacted Voids (Min)
42 42 42 42 42 42
Course Aggr. Angularity
1 Face 75 50 75 60 60 60 % Flat & Elongated Pieces (Max)
10 10 10 10 10 10
CS 1A (40%)
CS 1 (23%)
CS 1A (20%)
CG 1 (20%)
CG 1 (18%)
CG 1 (15%)
CS 1B (10%)
CS 1B (30%)
CS 1B (15%)
CG 2 (10%)
CG 2 (10%)
CG 2 (15%)
CS 2 (15%)
CS 2C (12%)
CS 2A (20%)
CG 3 (10%)
CG 3 (27%)
CG 4 (15%)
SSG 1 (10%)
SSG 1 (35%)
CS 2 (10%)
CG 4 (25%)
CG 4 (20%)
CG 5 (20%)
SSG 2 (25%)
SSG 3 (35%)
SSG 2 (25%)
SSG 2 (25%)
SSG 1 (35%)
Aggregate type and ratio
SSG 4 (10%)
Mass of each specimen (gm)
2950 2980 2900 2880 2950 2970
No. of samples with additive
6 6 6 6 6 6
No. of samples without additive
6 6 6 6 6 6
Total Mass 35400 35760 34800 34560 35400 35640 Binder type PG 64-22 PG 64-22 PG 64-22 PG 64-22 PG 70-28 PG 64-22
Additive type Arr-maz Arr-maz Arr-maz LA-2
Arr-Mazz, LA-2
Arr-Mazz, LA-2
AD-Here HP Plus
Design % Asphalt
5.5 5.1 6.75 5.15 5.00 4.70
Asphalt Source Sinclair, Phillipsburg
Sinclair Valero-Ark City
SEM Dodge City
SEM-Muskogee
SEM Mat. DC, KS
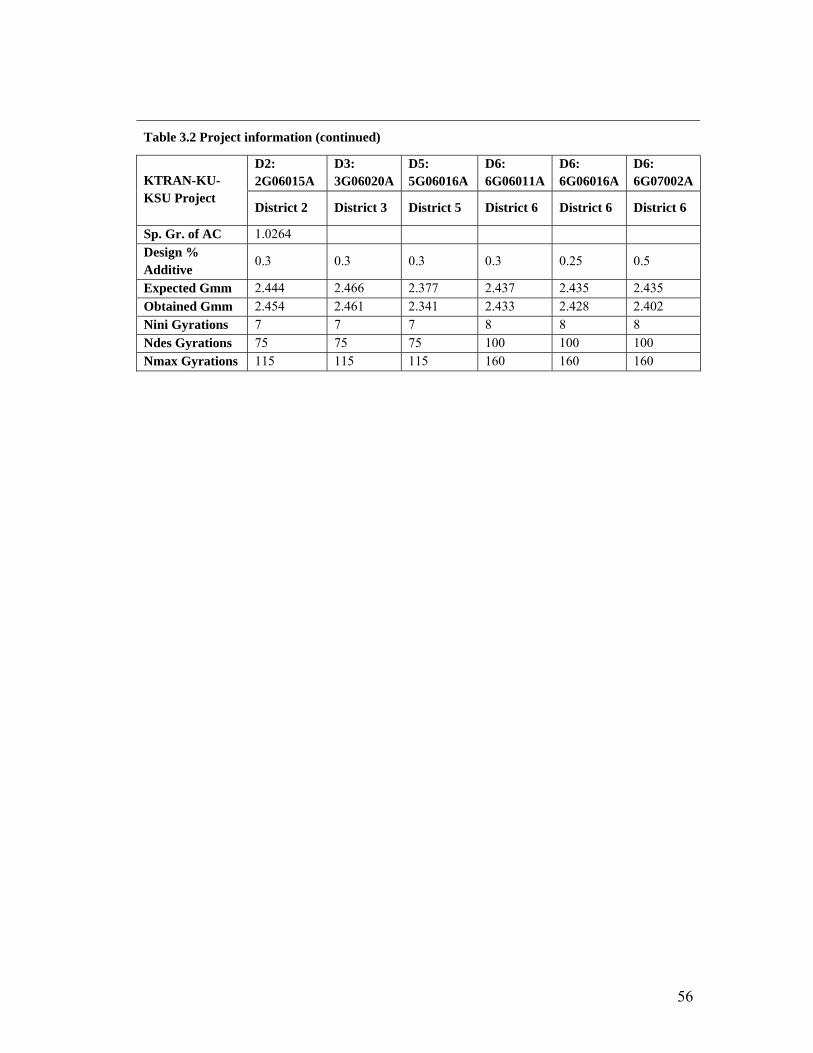
56
Table 3.2 Project information (continued)
D2: 2G06015A
D3: 3G06020A
D5: 5G06016A
D6: 6G06011A
D6: 6G06016A
D6: 6G07002A KTRAN-KU-
KSU Project District 2 District 3 District 5 District 6 District 6 District 6
Sp. Gr. of AC 1.0264 Design % Additive
0.3 0.3 0.3 0.3 0.25 0.5
Expected Gmm 2.444 2.466 2.377 2.437 2.435 2.435 Obtained Gmm 2.454 2.461 2.341 2.433 2.428 2.402 Nini Gyrations 7 7 7 8 8 8 Ndes Gyrations 75 75 75 100 100 100 Nmax Gyrations 115 115 115 160 160 160
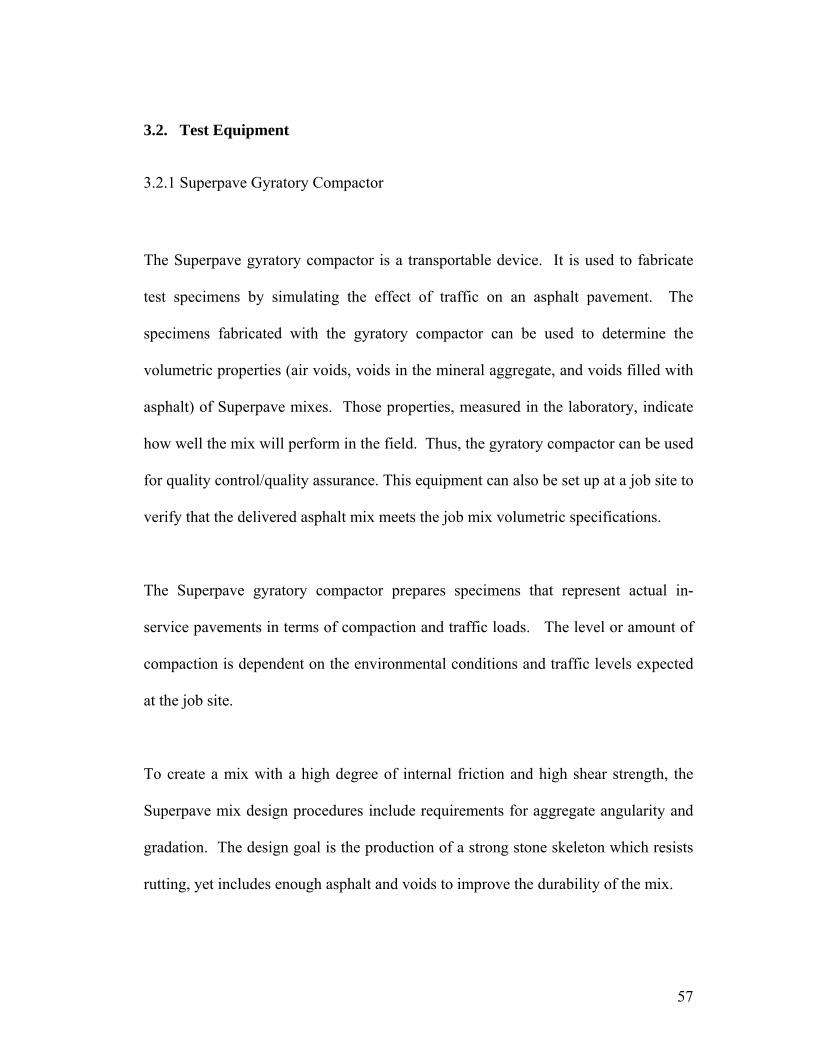
57
3.2. Test Equipment
3.2.1 Superpave Gyratory Compactor
The Superpave gyratory compactor is a transportable device. It is used to fabricate
test specimens by simulating the effect of traffic on an asphalt pavement. The
specimens fabricated with the gyratory compactor can be used to determine the
volumetric properties (air voids, voids in the mineral aggregate, and voids filled with
asphalt) of Superpave mixes. Those properties, measured in the laboratory, indicate
how well the mix will perform in the field. Thus, the gyratory compactor can be used
for quality control/quality assurance. This equipment can also be set up at a job site to
verify that the delivered asphalt mix meets the job mix volumetric specifications.
The Superpave gyratory compactor prepares specimens that represent actual in-
service pavements in terms of compaction and traffic loads. The level or amount of
compaction is dependent on the environmental conditions and traffic levels expected
at the job site.
To create a mix with a high degree of internal friction and high shear strength, the
Superpave mix design procedures include requirements for aggregate angularity and
gradation. The design goal is the production of a strong stone skeleton which resists
rutting, yet includes enough asphalt and voids to improve the durability of the mix.

58
Sample height, number of gyrations as well as pressure to be applied can be set in the
Superpave gyratory compactor as shown in Figure 3-1. The sample height of 75 mm
for APA tests and the sample height of 60 mm for HWTD tests were fixed in this
study.
Figure 3-1 Pine Superpave Gyratory Compactor Control Panel
3.2.2 Hamburg Wheel Testing Device
The HWTD was used to evaluate the moisture sensitivity at KSU. Details of this
testing device have been reviewed in Chapter 2.

59
3.2.3 Asphalt Pavement Analyzer
This APA machine available at KU was manufactured by Pavement Technology Inc.,
(PTI) Covington, GA. It is 2.03 m (6.5 ft) long, 0.9 m (2.9 ft) wide, and 1.78 m (5.7
ft) high. The total weight of this machine is 1358.4 kg (3000 lb). This machine has
retractable legs with wheels to make it portable and anchored while in use.
Importantly, although the air consumption is low, the minimum pressure of 827.4 kPa
(120 psi) is critical to maintain the adequate hose inflation. Since the machine is
normally operated from the front, a space of one meter in the front of the APA should
be adequate for the operation, and a space of one meter is also needed on both sides
of the machine to access the service door.
This following section briefly discusses the major parts of the APA machine, the
calibration, and the data acquisition system:
Wheel tracking/loading system
The APA is designed to simulate a rolling wheel condition by rolling three concave
metal wheels on three rubber hoses which can provide the pressure ranging from 0
kPa to 827kPa (120 psi) to simulate the effect of tire pressures. In this study, 0.44 kN
(100 lb) loaded wheels on rubber hoses that have air pressures of 690 kPa (100 psi)
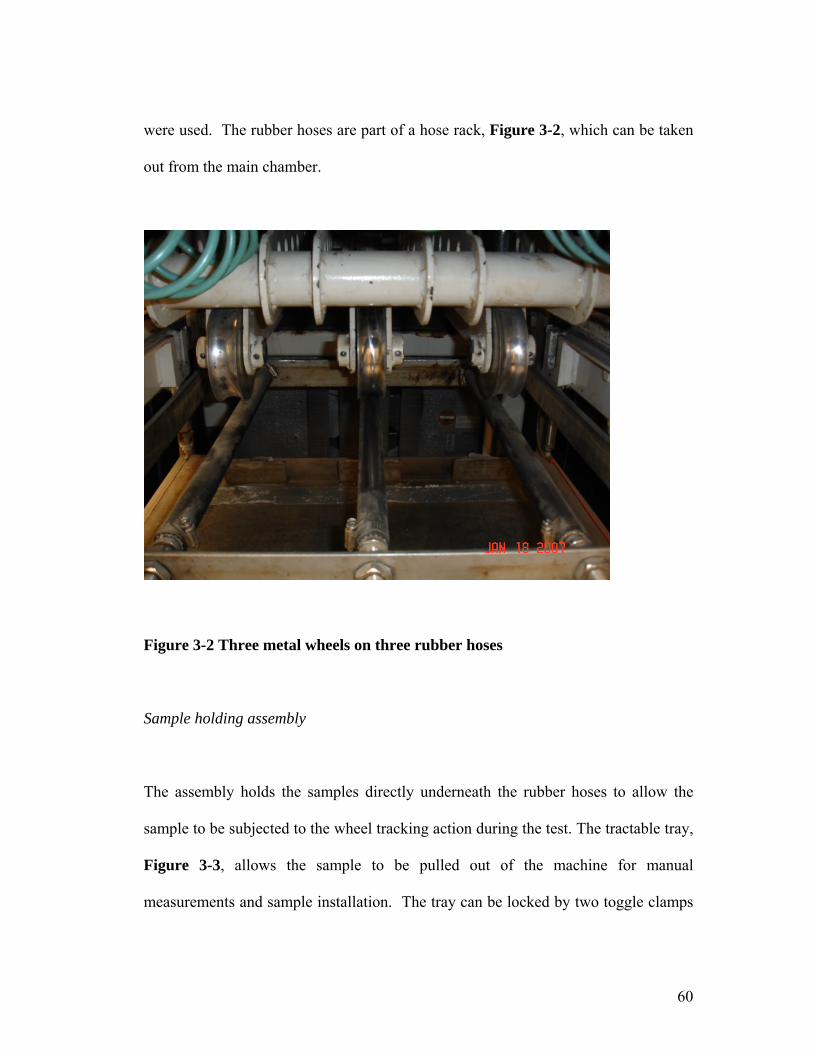
60
were used. The rubber hoses are part of a hose rack, Figure 3-2, which can be taken
out from the main chamber.
Figure 3-2 Three metal wheels on three rubber hoses
Sample holding assembly
The assembly holds the samples directly underneath the rubber hoses to allow the
sample to be subjected to the wheel tracking action during the test. The tractable tray,
Figure 3-3, allows the sample to be pulled out of the machine for manual
measurements and sample installation. The tray can be locked by two toggle clamps
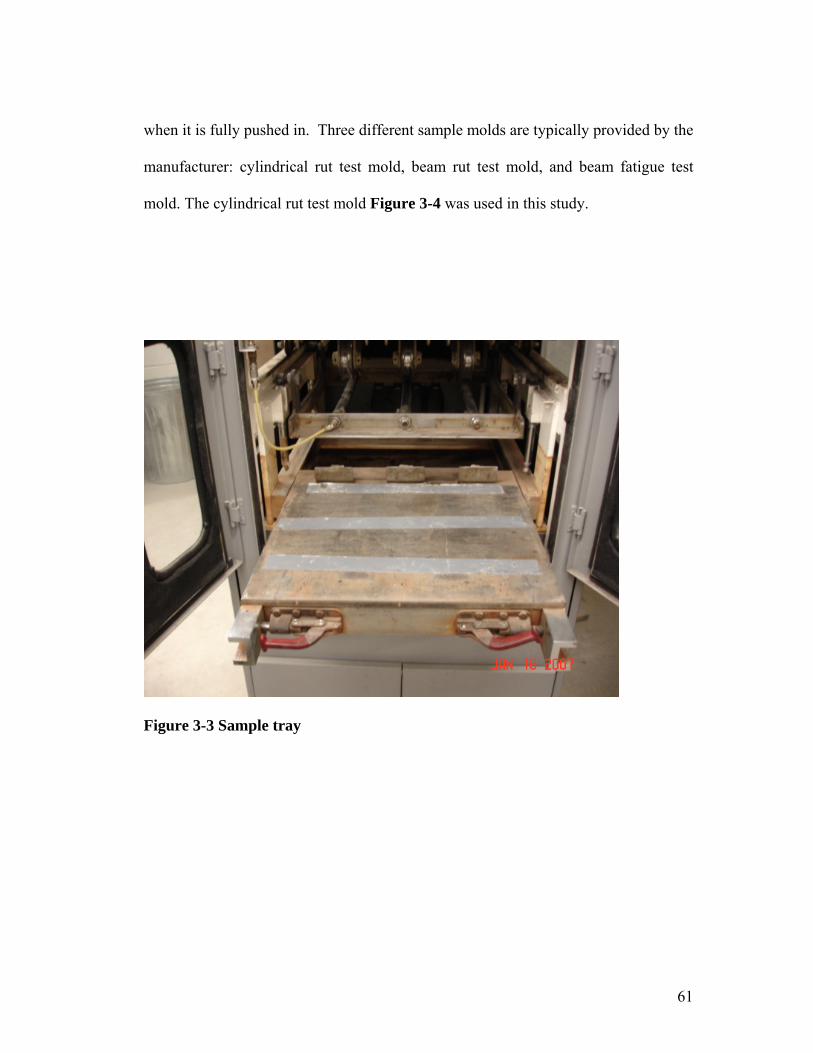
61
when it is fully pushed in. Three different sample molds are typically provided by the
manufacturer: cylindrical rut test mold, beam rut test mold, and beam fatigue test
mold. The cylindrical rut test mold Figure 3-4 was used in this study.
Figure 3-3 Sample tray
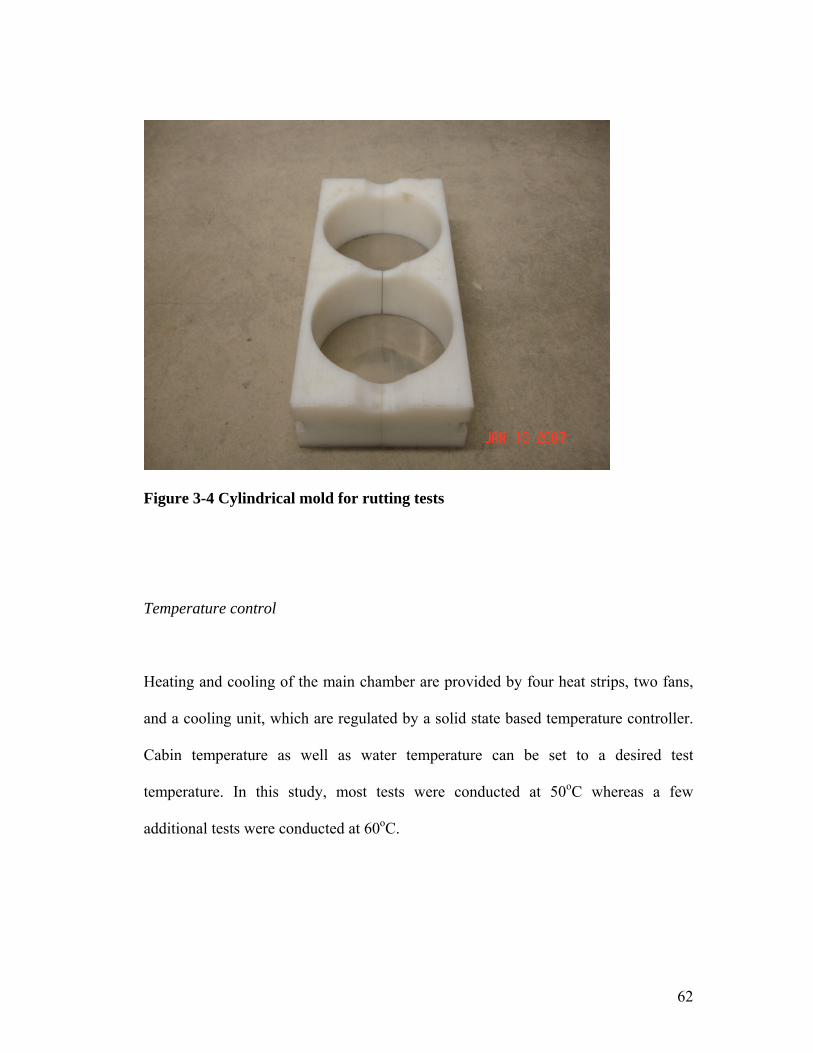
62
Figure 3-4 Cylindrical mold for rutting tests
Temperature control
Heating and cooling of the main chamber are provided by four heat strips, two fans,
and a cooling unit, which are regulated by a solid state based temperature controller.
Cabin temperature as well as water temperature can be set to a desired test
temperature. In this study, most tests were conducted at 50oC whereas a few
additional tests were conducted at 60oC.

63
Water submerging system
The water submerging system allows the water to cover the test samples in the
submerged-in-water tests. A water heater heats the water to a set temperature and a
water pump circulates the water from the lower water tank (reservoir) to the upper
water tank (where the sample is conditioned). For manual measurements, the upper
water tank is lowered, then the sample tray is pulled out for data recording. When the
water tray is lowered, the water is drained down to the lower water reservoir. The
upper water tank can be raised again to continue the wet test.
Sample temperature conditioning shelf
The shelf is located inside the lower front doors. It allows the heat conditioning of
extra samples.
Air regulator
This system consists of an air inlet regulator controlling the maximum air pressure to
the APA, an electronic regulator controlling the hose pressure, three regulators
controlling the left, middle, and right wheel cylinders, and the pressure booster
regulator doubling the incoming air pressure.

64
Operating controls
The APA is controlled by a Programmable Logic Computer (PLC). The control
panel is shown in Figure 3-5.
Figure 3-5 Control panel of APA
Calibration
The following items should be calibrated no less than once per year: (1) the wheel
load, (2) calibration of the automated vertical measuring system, (3) the chamber
temperature, and (4) the hose pressure. Instructions for each of these calibration
procedures are included in this section. A load cell as shown in Figure 3-6 was used
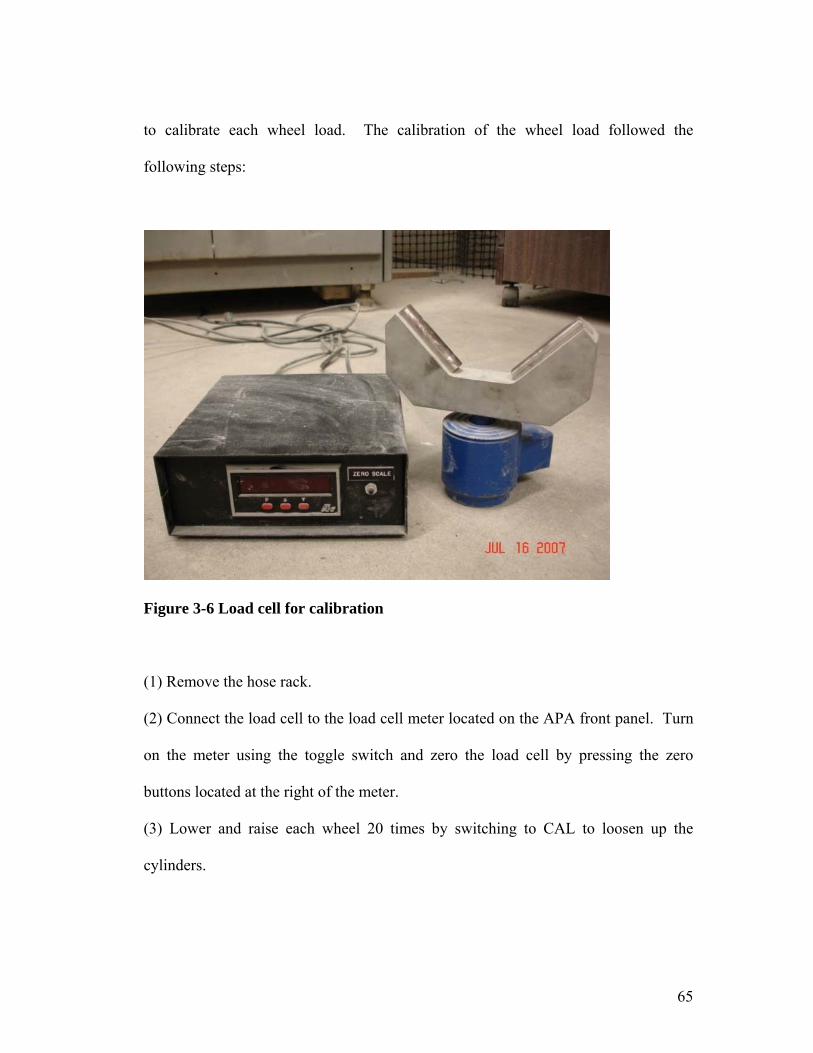
65
to calibrate each wheel load. The calibration of the wheel load followed the
following steps:
Figure 3-6 Load cell for calibration
(1) Remove the hose rack.
(2) Connect the load cell to the load cell meter located on the APA front panel. Turn
on the meter using the toggle switch and zero the load cell by pressing the zero
buttons located at the right of the meter.
(3) Lower and raise each wheel 20 times by switching to CAL to loosen up the
cylinders.

66
(4) Do not lock the sample tray in place (release the “Red Toggle Clamps). It must
be able to move freely during the calibration so that the load cell always rests evenly
on the sample tray.
(5) Place the load cell on the table under the first wheel.
(6) If all three wheels are used during the test, then place two empty specimen molds
(turned upside down) under the other two wheels. This setup simulates the loading
condition the carriage is under during the test.
(7) Lower the wheels by switching each one to CAL (on control panel).
(8) If adjustment needs to be made, raise the wheel that is being calibrated and turn
the regulator up or down (The other two wheels should be left in the down position).
(9) The final adjustment made to a regulator, should always be in a clockwise
direction. The final adjustment should never be made in a counter clockwise
direction to avoid a malfunction in the regulator.
(10) Lower the wheel and allow the meter to stabilize.
(11) All three wheels should be calibrated to within 5 pounds of each other.
(12) Repeat steps 5-10 for each wheel.
Data acquisition
The APA system has automatic and manual measurements. The APA machine is
connected to a computer. Software installed in this computer can automatically

67
perform data acquisition to take the measurements of the rut depth with the number of
cycles. Automatic measurement was not taken in this study due to its malfunction.
All measurements for the present study were made manually. The measurement was
recorded by using a steel plate and a dial gauge. The steel plate is fitted in the slot of
the mold, and a dial gauge is placed on the top of the plate to take a measurement. It
should be noted that there is a unique position for the plate to fit in the cylindrical
mold so that the plate is at the same level for every measurement.
3.3. Test Procedure
3.3.1 Sample preparation
Cylindrical samples were prepared for the APA and the HWTD wheel tests. Diameter
of all the samples was 150 mm. For the APA tests, the height of the sample was 75
mm whereas for the HWTD tests, the height of the sample was 60 mm. All samples
for KDOT districts were prepared at KSU for uniformity in preparing samples.
Design mixes provided by KDOT and shown in Table 3-2 for Districts 2, 3, 5 and 6
were used. One set of samples each for Districts 2, 3, and 5 were prepared whereas
three sets were prepared for District 6. Each set consist of 6 cylindrical samples
without any anti-stripping agent and 6 cylindrical samples with an anti-stripping
agent for the APA tests and equal number of samples for the HWTD tests.

68
The contents of the asphalt binder used in this study were in the range of 4.7-6.75%.
The contents of additives were in the ratio of 0.25-0.5%.
Mix and compaction temperatures were selected based on the requirements of the
KDOT design. Aggregate was weighed and heated in oven to the desired mix
temperature, Figure 3-7. An asphalt heater as shown in Figure 3-8 was used to heat
the binder. Once the desired temperature was reached, aggregate was mixed with
binder in an electrical mixer, Figure 3.9. A hand scoop was also used to mix and to
make sure aggregate was mixed properly. When the additive was used, the required
quantity of additive was added and mixed along with binder and aggregate. The mix
was then again heated for two hours for short term aging as shown in Figure 3-10.
Figure 3-7 Heating of aggregate up to the required mixing temperature

69
Figure 3-8 Heating of asphalt binder up to the required mixing temperature
Figure 3-9 Mixing of aggregate and binder
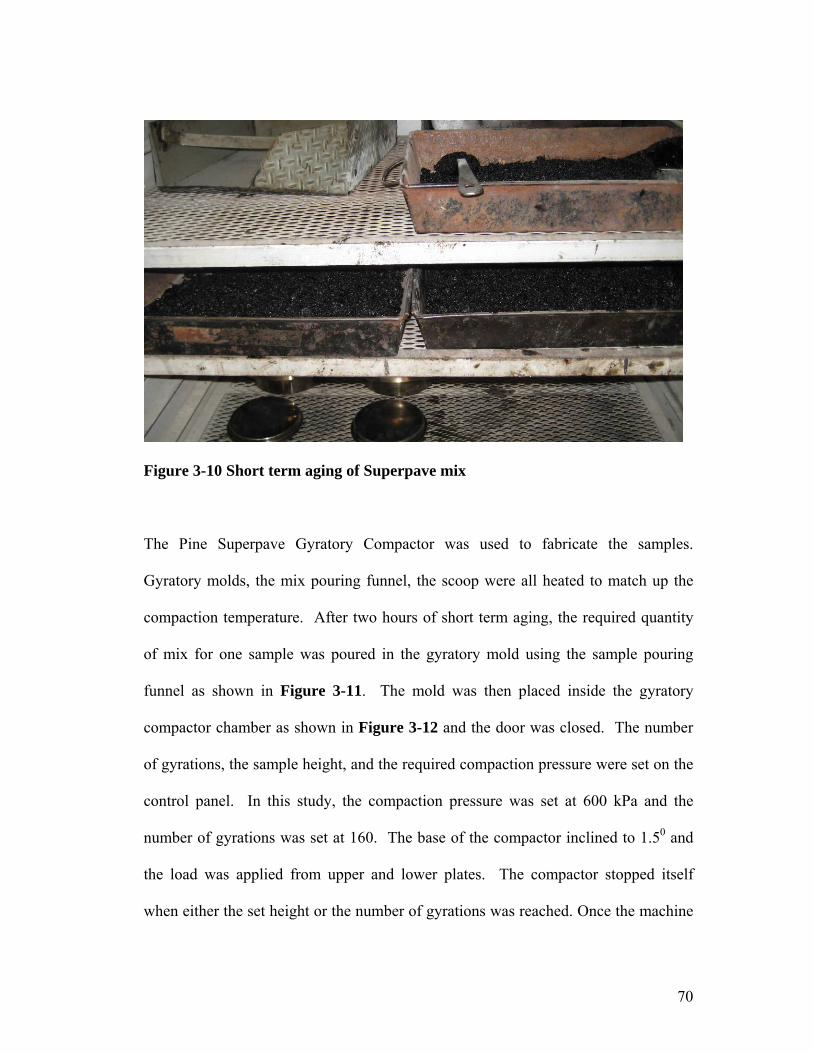
70
Figure 3-10 Short term aging of Superpave mix
The Pine Superpave Gyratory Compactor was used to fabricate the samples.
Gyratory molds, the mix pouring funnel, the scoop were all heated to match up the
compaction temperature. After two hours of short term aging, the required quantity
of mix for one sample was poured in the gyratory mold using the sample pouring
funnel as shown in Figure 3-11. The mold was then placed inside the gyratory
compactor chamber as shown in Figure 3-12 and the door was closed. The number
of gyrations, the sample height, and the required compaction pressure were set on the
control panel. In this study, the compaction pressure was set at 600 kPa and the
number of gyrations was set at 160. The base of the compactor inclined to 1.50 and
the load was applied from upper and lower plates. The compactor stopped itself
when either the set height or the number of gyrations was reached. Once the machine
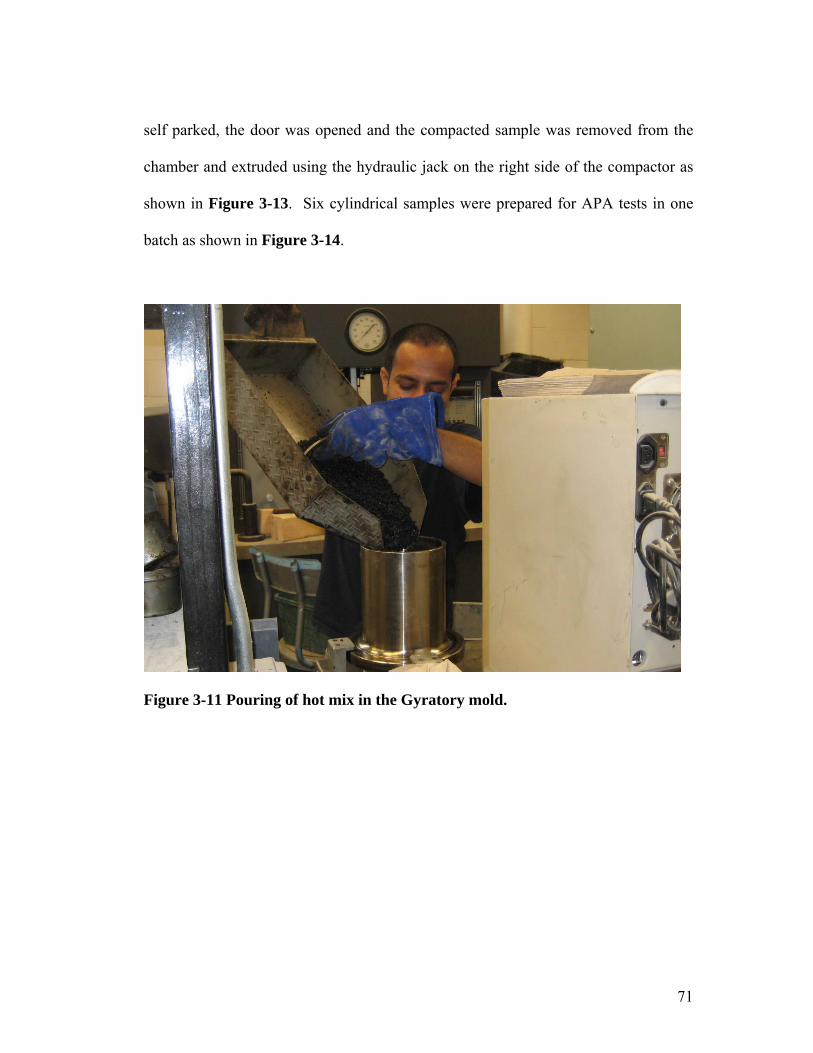
71
self parked, the door was opened and the compacted sample was removed from the
chamber and extruded using the hydraulic jack on the right side of the compactor as
shown in Figure 3-13. Six cylindrical samples were prepared for APA tests in one
batch as shown in Figure 3-14.
Figure 3-11 Pouring of hot mix in the Gyratory mold.

72
Figure 3-12 Mold with loose mix in the Superpave Gyratory Compactor
Figure 3-13 Extrusion of the compacted sample from the Gyratory mold

73
Figure 3-14 Compacted Samples ready for testing
3.3.2 Sample conditioning and testing
Before running an APA wheel test on wet samples, samples were subjected to 20in
Hg vacuum saturation for six minutes each as shown in Figure 3-15. Three molds
were used in one set of test. Each mold contained two samples. Hence six samples
were tested in one set. Water temperature and cabin temperature were raised and
samples were soaked in the APA machine before running the test. All the wet
samples were pre-conditioned for at least one hour after the water and chamber
temperatures reached the desired temperature. The number of required cycles was set

74
on the APA machine control panel. The air compressor was turned on and the
required hose pressure was set on the control panel. The wheel load was applied on
the cylindrical samples by switching the green button in the control panel as shown in
Figure 3-16. All rut depths were measured manually for this study. The relationship
of rut depth vs. number of cycles for each test is plotted in spreadsheet for analysis.
Figure 3-15 Vacuum saturation of a sample before wet testing
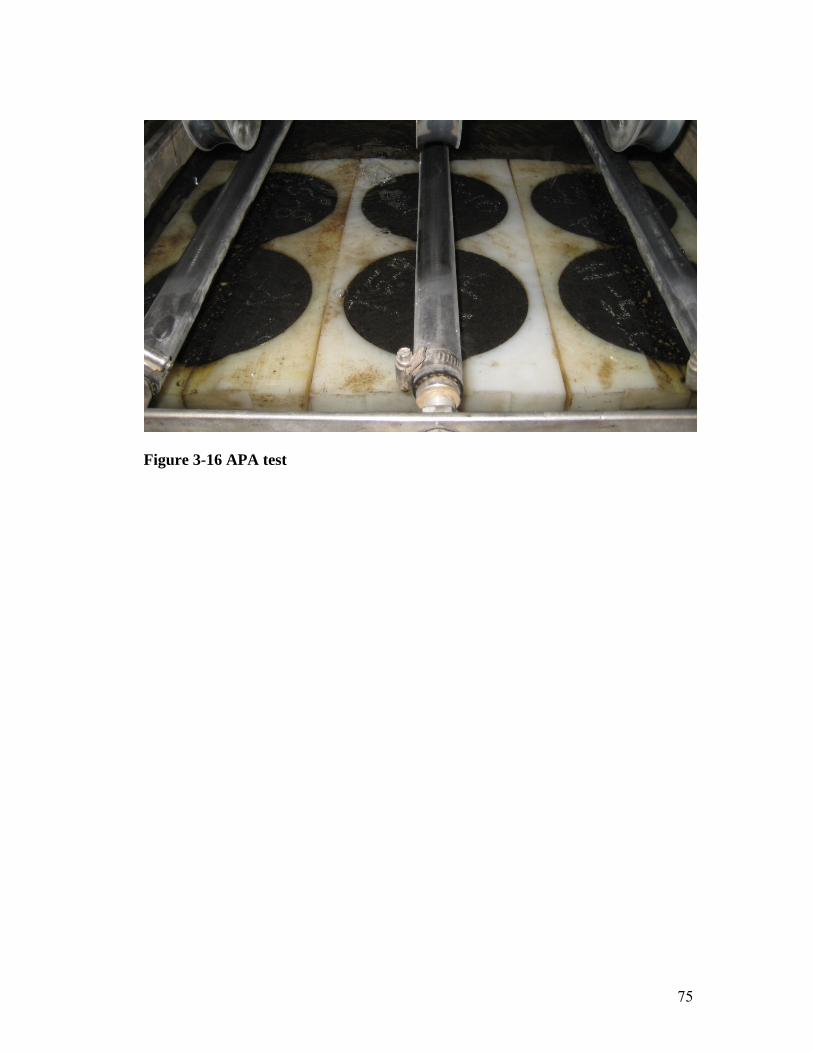
75
Figure 3-16 APA test

76
4. TEST RESULTS AND ANALYSIS
4.1. Introduction
A summary of APA tests carried on at KU is presented in Table 4-1. All tests from
No. 1 to 12 were conducted using the samples prepared at KSU. The tests included
the HWTD tests at KSU and the APA tests at KU. Since these samples were
prepared under the same condition, their test results should compare well. The test
results for these samples obtained from the HWTD tests as well as the APA tests are
presented in this chapter. Additional samples were prepared at KU to carry out some
dry tests as well as tests at higher temperature (60oC). The comparisons of results
obtained from the HWTD and APA tests, between dry and wet tests, and between
high and low temperatures are presented in the following sections.
4.2. Visual Observation of Stripping Phenomenon
After each test, samples were examined visually to inspect the degree of stripping.
Most samples prepared without additive showed clear or some degree of stripping
after the APA tests. The stripping exhibited in forms of debonding of binder and
aggregate and washing out of particles as shown in Figure 4-1. The samples in
Figure 4-1 had the same mix design except the use of the additive. Close up view of
the striping is shown in Figure 4-2, in which free or washed out sand can be seen. In
case of samples prepared with additive, there was no obvious stripping phenomenon.

77
The visual observation of the stripping phenomenon for each mix is provided in the
summary of the test results later.
Table 4-1 Summary of tests carried out on different mixes.
No. 1-12: the KU-KSU joint project, all samples prepared at KSU, and HWTD tests
conducted at KSU but APA tests at KU.
No. 13-20: additional samples prepared and tested using APA at KU.
* and **: repeated tests for the same mixes prepared at KSU and KU for comparison
purposes
No. District Design Number Mix Lab Designation Number
Type of test done
1 2 2G06015A 9.5 A T3 (w/o additive) Wet (50oC)
2 2 2G06015A 9.5 A T5 (w additive) Wet (50 oC )
3 3 3G06020A SM-19A T13 (w/o additive) Wet (50 oC )
4 3 3G06020A SM-19A T15 (w additive) Wet (50 oC )
5 5 5G06016A 9.5 A T7 (w/o additive) Wet (50 oC )
6 5 5G06016A 9.5 A T11 (w additive) Wet (50 oC )
7 6 6G06011A SM-19A T18 (w/o additive) Wet (50 oC )
8 6 6G06011A SM-19A T20(w additive) Wet (50 oC )
9* 6 6G07002A SM-19A T23 (w/o additive) Wet (50 oC )
10** 6 6G07002A SM-19A T25 (w additive) Wet (50 oC )
11 6 6G06016A SM-19A T28 (w/o additive) Wet (50 oC )
12 6 6G06016A SM-19A T30 (w additive) Wet (50 oC )
13* 6 6G07002A SM-19A K1 (w/o additive) Wet (50 oC )
14 6 6G07002A SM-19A K2 (w/o additive) Wet (60 oC )
15 6 6G07002A SM-19A K5 (w/o additive) Dry (60 oC )
16 6 6G07002A SM-19A K6 (w/o additive) Dry (50 oC )
17** 6 6G07002A SM-19A K3 (w additive) Wet (50 oC )
18 6 6G07002A SM-19A K4 (w additive) Wet (60 oC )
19 6 6G07002A SM-19A K7 (w additive) Dry (60 oC )
20 6 6G07002A SM-19A K8 (w additive) Dry (50 oC )
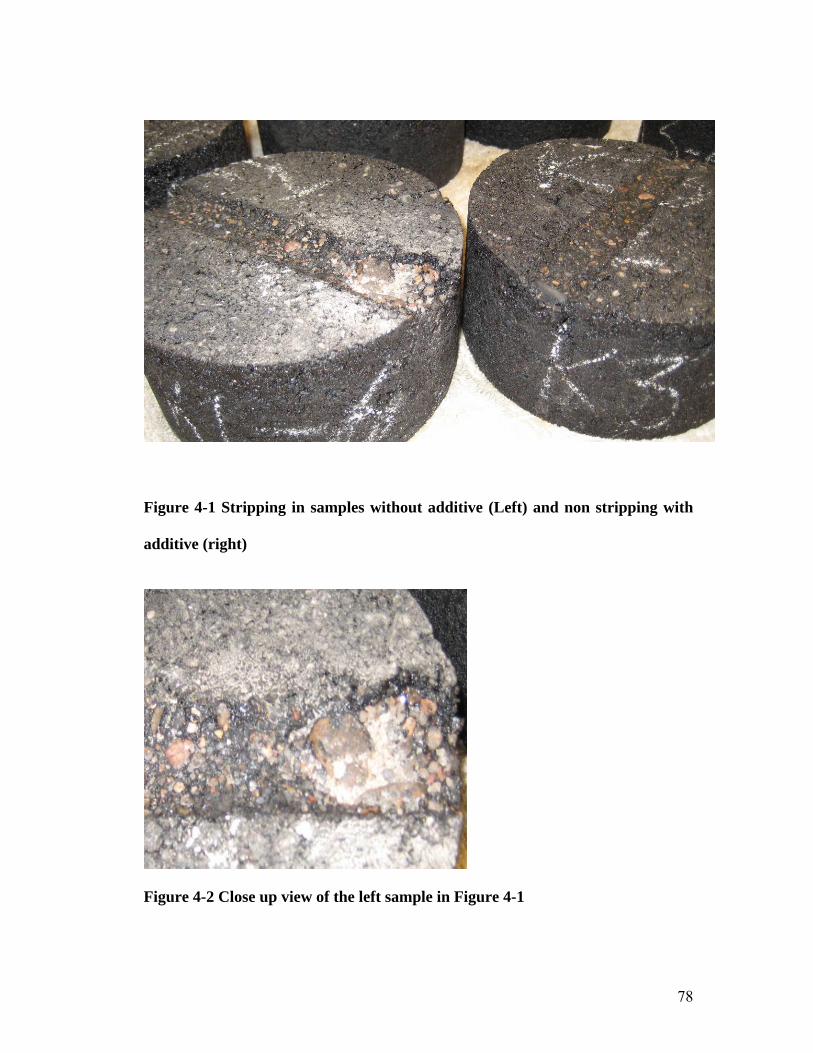
78
Figure 4-1 Stripping in samples without additive (Left) and non stripping with
additive (right)
Figure 4-2 Close up view of the left sample in Figure 4-1
79
4.3 Test Results and Analysis
All manual readings taken for the APA tests are presented in the Appendix of this
thesis. The test results from the HWTD tests were obtained and provided by KSU.
The curves from the APA and the HWTD tests are presented and discussed in terms
of samples for different districts in the following section.

80
4.3.1 District 2 (2G06015A -Wet 50oC)
The Superpave HMA mix used in Cloud Jewel County of Kansas District 2 was used
to make lab samples. The estimated equivalent single axle load (ESAL) was 1.2
million. The temperature used for mixing of aggregate and binder was 305-315oF
(151-157oC) whereas the molding temperature was 285-295oF (140-146oC). The
design mix used for this project was 2G06015A. The aggregate type and ratio and
the type of percent of binder and additive used for this mix are provided in Table 4-2.
Table 4-2 Aggregate-binder types of D2 - 2G06015A mix
D2 - 2G06015A
K-TRAN-KU-KSU Project District 2
CS 1A (40%)
CS 1B (10%)
CS 2 (15%)
SSG 1 (10%)
Aggregate type and ratio
SSG 2 (25%)
Binder type PG 64-22
Additive type Arr-maz
Design % Asphalt 5.5
Design % Additive 0.3
Mixing temp range (oF) 305 - 315
Molding temp range (oF) 285 - 295
Mix Designation SM - 9.5 A

81
APA test results
APA tests were carried out on six samples with additive and six samples without
additive. Samples were subjected to 6 min vacuum saturation and one hour soak in
water at 50oC. Figure 4-3 shows the measured rut vs. the number of cycles from the
APA tests. Even though stripping was observed on the sample without additive, the
rut depth was smaller for the mix without additive than that of the mix with additive.
No definitive stripping inflection point exists for either curve.
Figure 4-3 Rut depth vs. number of cycles from the APA tests of D2-2G06015A
mix (50oC wet)

82
HWTD test results
HWTD tests were conducted on the same mixes at KSU. The measured rut vs. the
number of cycles for this mix is shown in Figure 4-4. For the sample without
additive, the stripping inflection point occurred around 1500 cycles. Figure 4-4
shows that the use of the additive increased the number of cycles corresponding to the
inflection point and reduced the rut depth.
Figure 4-4 Rut depth vs. number of cycles from the HWTD tests of D2-
2G06015A mix (50oC wet)

83
APA vs. HWTD test results
Figure 4-5 presents the comparison of rut depths obtained from the APA and the
HWTD tests. From the curves, the APA tests could not identify the benefit of using
additive whereas the HWTD tests could identify some benefits. The curves from the
HWTD tests show stripping inflection points but those from the APA do not show
any inflection points. Visual inspection show stripping in the sample after the APA
tests. The HWTD results match with visual inspection. In addition, the overall rut
depths from the HWTD tests are larger than those from the APA curves, therefore,
the HWTD tests are more severe than the APA tests.
Figure 4-5 Rut depth vs. number of cycles from the APA and the HWTD Tests
of D2-2G06015A mix (50oC wet)
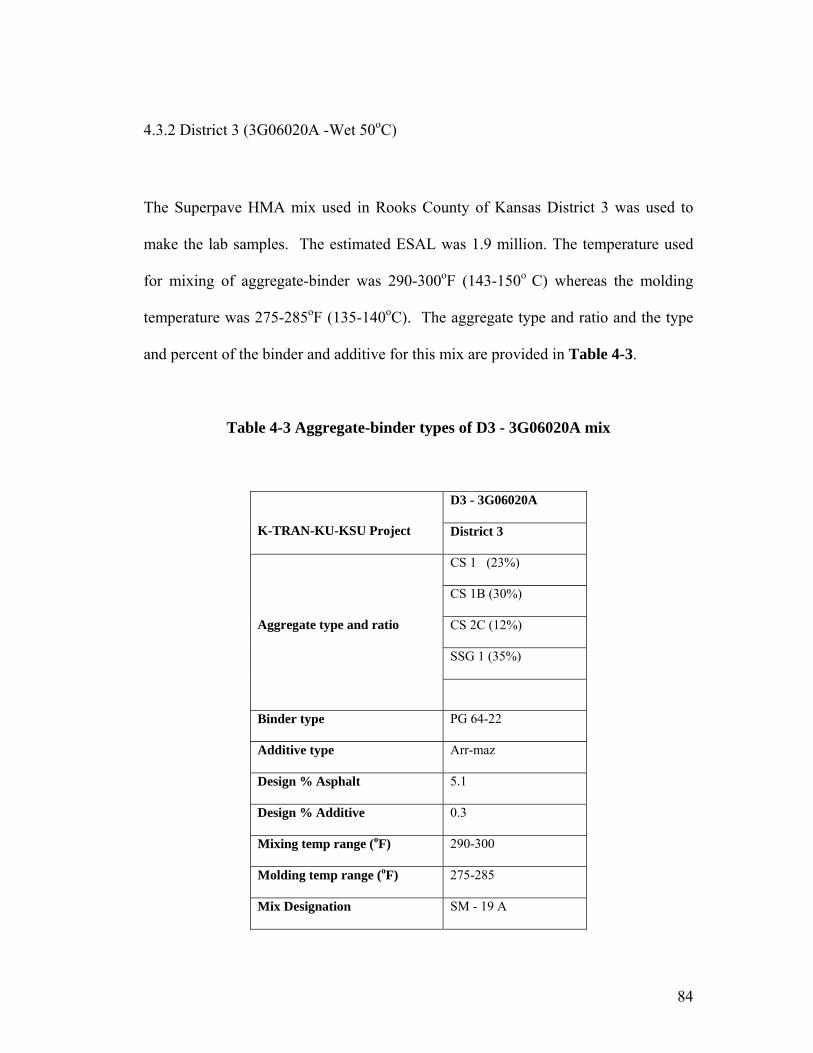
84
4.3.2 District 3 (3G06020A -Wet 50oC)
The Superpave HMA mix used in Rooks County of Kansas District 3 was used to
make the lab samples. The estimated ESAL was 1.9 million. The temperature used
for mixing of aggregate-binder was 290-300oF (143-150o C) whereas the molding
temperature was 275-285oF (135-140oC). The aggregate type and ratio and the type
and percent of the binder and additive for this mix are provided in Table 4-3.
Table 4-3 Aggregate-binder types of D3 - 3G06020A mix
D3 - 3G06020A
K-TRAN-KU-KSU Project District 3
CS 1 (23%)
CS 1B (30%)
CS 2C (12%)
SSG 1 (35%)
Aggregate type and ratio
Binder type PG 64-22
Additive type Arr-maz
Design % Asphalt 5.1
Design % Additive 0.3
Mixing temp range (oF) 290-300
Molding temp range (oF) 275-285
Mix Designation SM - 19 A

85
APA test results
Figure 4-6 presents the measured rut depth vs. number of cycles for the APA tests on
D3-3G06020A at 50oC. The measured curves for samples with and without additive
virtually overlap. Even though the number of cycles for the sample with additive was
continued up to 20000, no definitive stripping inflection point occurred in either
curve.
Figure 4-6 Rut depth vs. number of cycles from the APA tests of D3-3G06020A
mix (50oC wet)
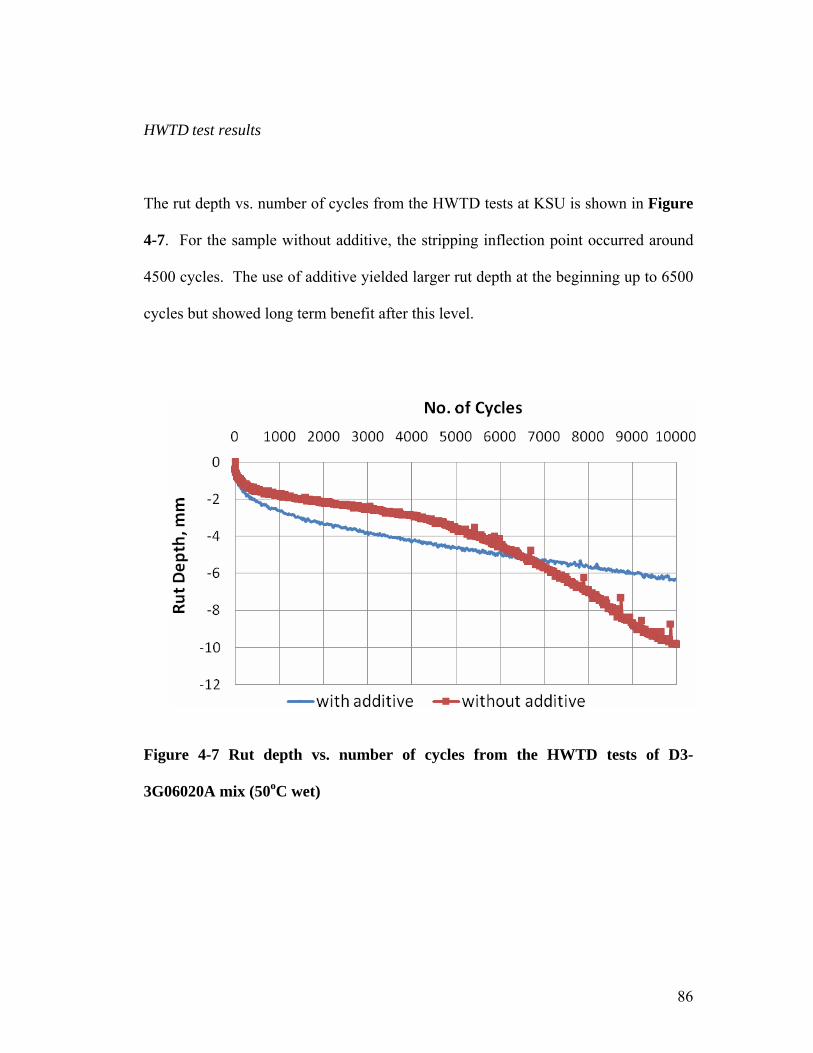
86
HWTD test results
The rut depth vs. number of cycles from the HWTD tests at KSU is shown in Figure
4-7. For the sample without additive, the stripping inflection point occurred around
4500 cycles. The use of additive yielded larger rut depth at the beginning up to 6500
cycles but showed long term benefit after this level.
Figure 4-7 Rut depth vs. number of cycles from the HWTD tests of D3-
3G06020A mix (50oC wet)
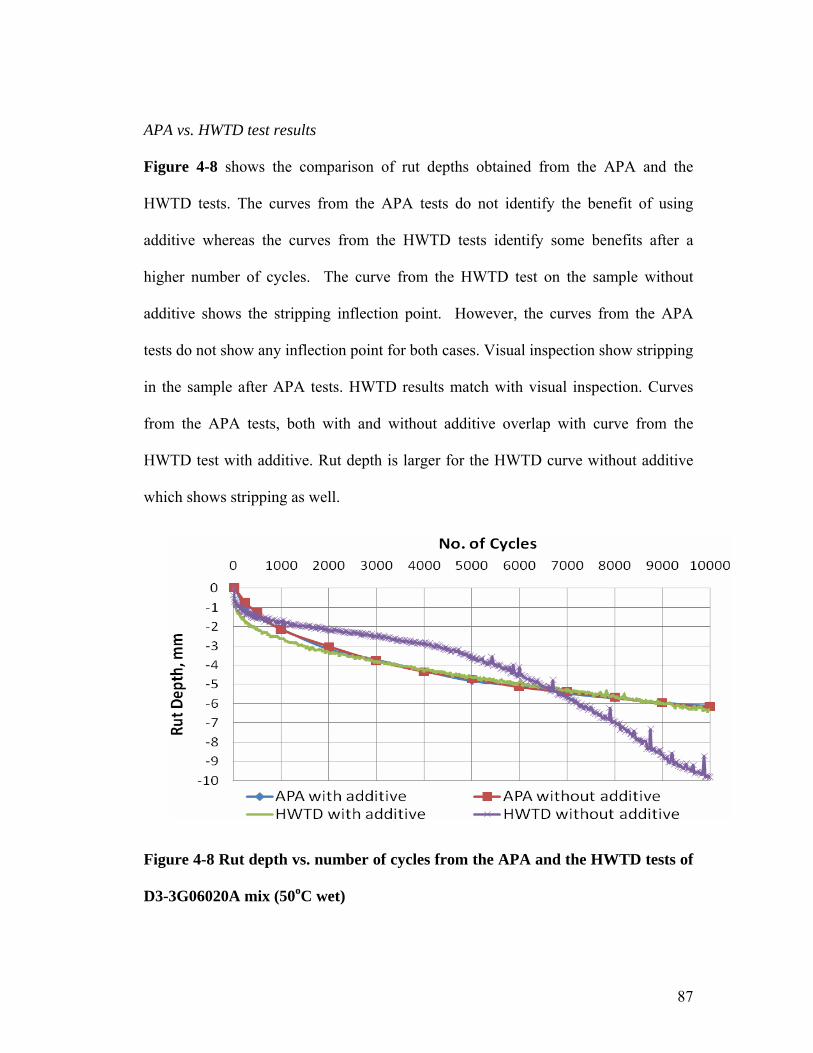
87
APA vs. HWTD test results
Figure 4-8 shows the comparison of rut depths obtained from the APA and the
HWTD tests. The curves from the APA tests do not identify the benefit of using
additive whereas the curves from the HWTD tests identify some benefits after a
higher number of cycles. The curve from the HWTD test on the sample without
additive shows the stripping inflection point. However, the curves from the APA
tests do not show any inflection point for both cases. Visual inspection show stripping
in the sample after APA tests. HWTD results match with visual inspection. Curves
from the APA tests, both with and without additive overlap with curve from the
HWTD test with additive. Rut depth is larger for the HWTD curve without additive
which shows stripping as well.
Figure 4-8 Rut depth vs. number of cycles from the APA and the HWTD tests of
D3-3G06020A mix (50oC wet)
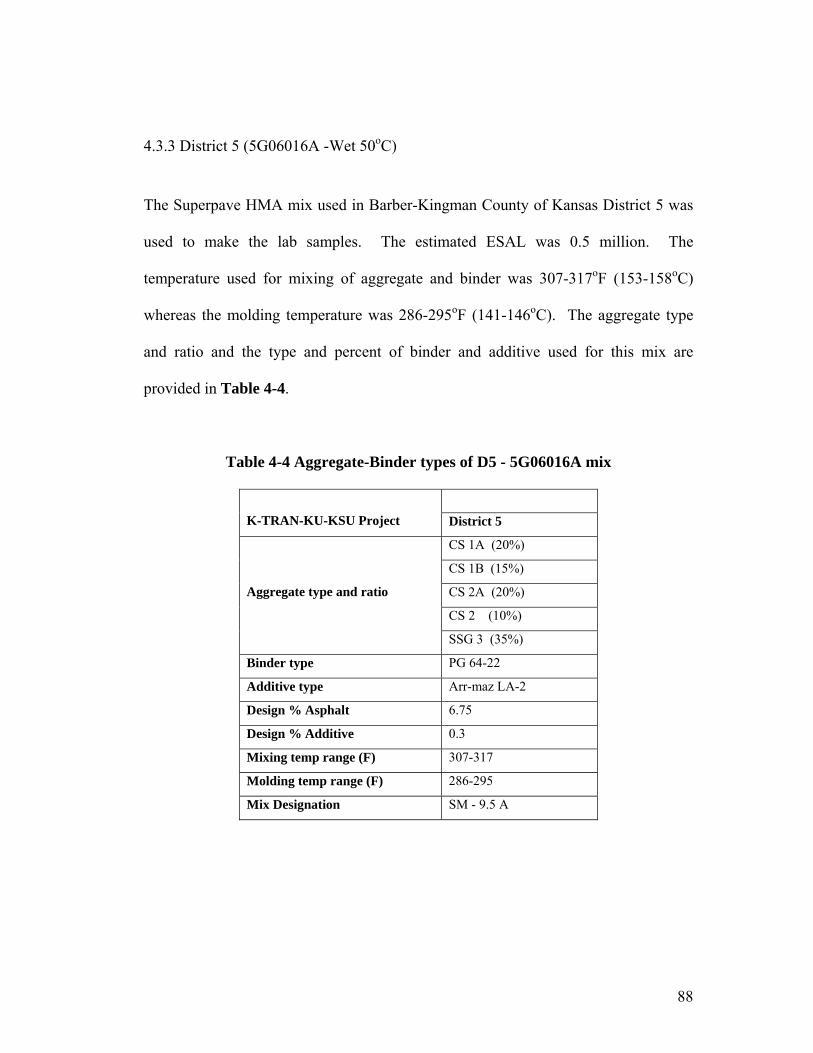
88
4.3.3 District 5 (5G06016A -Wet 50oC)
The Superpave HMA mix used in Barber-Kingman County of Kansas District 5 was
used to make the lab samples. The estimated ESAL was 0.5 million. The
temperature used for mixing of aggregate and binder was 307-317oF (153-158oC)
whereas the molding temperature was 286-295oF (141-146oC). The aggregate type
and ratio and the type and percent of binder and additive used for this mix are
provided in Table 4-4.
Table 4-4 Aggregate-Binder types of D5 - 5G06016A mix
K-TRAN-KU-KSU Project District 5
CS 1A (20%)
CS 1B (15%)
CS 2A (20%)
CS 2 (10%)
Aggregate type and ratio
SSG 3 (35%)
Binder type PG 64-22
Additive type Arr-maz LA-2
Design % Asphalt 6.75
Design % Additive 0.3
Mixing temp range (F) 307-317
Molding temp range (F) 286-295
Mix Designation SM - 9.5 A

89
APA test results
Figure 4-9 presents the measured rut depth vs. number of cycles from the APA tests.
Similar to District 2 samples, the APA tests did not detect any benefit of using
additive. Even though the visual inspection showed that the sample without additive
had more obvious stripping behavior than that with additive. The rut depth for the
sample with additive was larger than that without additive. In addition, there is no
obvious stripping inflection point for either curve.
Figure 4-9 Rut depth vs. number of cycles from the APA tests of D5-5G06016A
mix (50oC wet)
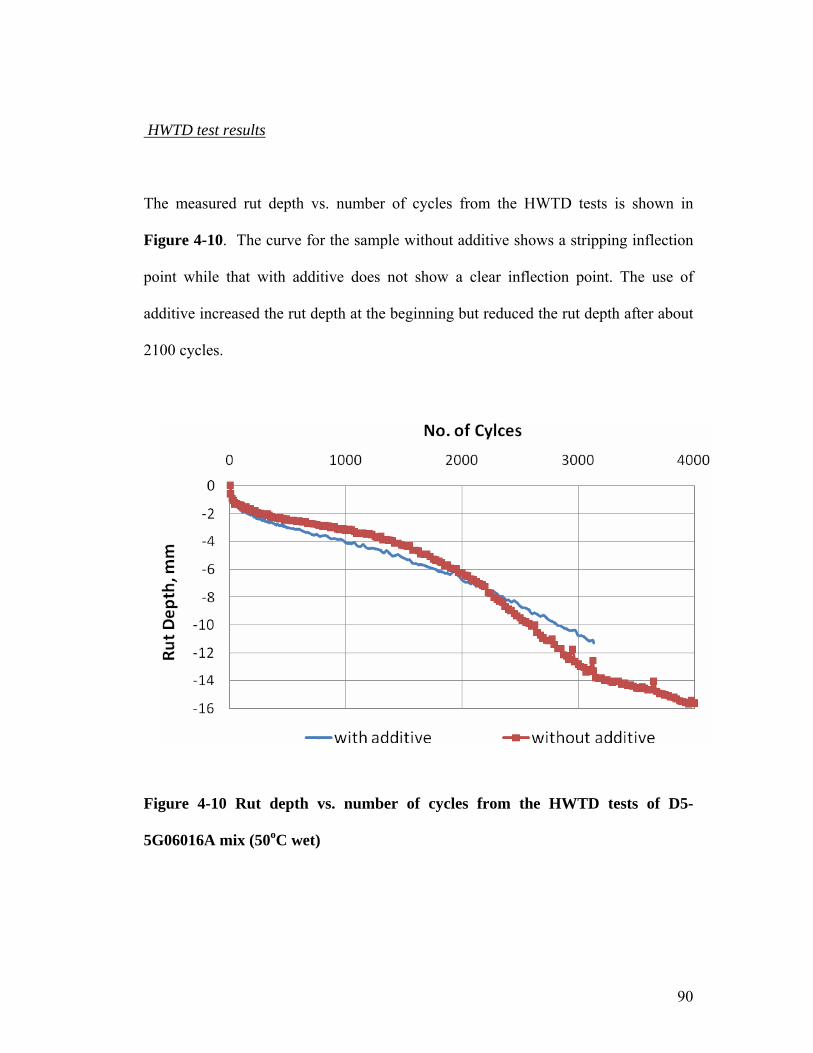
90
HWTD test results
The measured rut depth vs. number of cycles from the HWTD tests is shown in
Figure 4-10. The curve for the sample without additive shows a stripping inflection
point while that with additive does not show a clear inflection point. The use of
additive increased the rut depth at the beginning but reduced the rut depth after about
2100 cycles.
Figure 4-10 Rut depth vs. number of cycles from the HWTD tests of D5-
5G06016A mix (50oC wet)
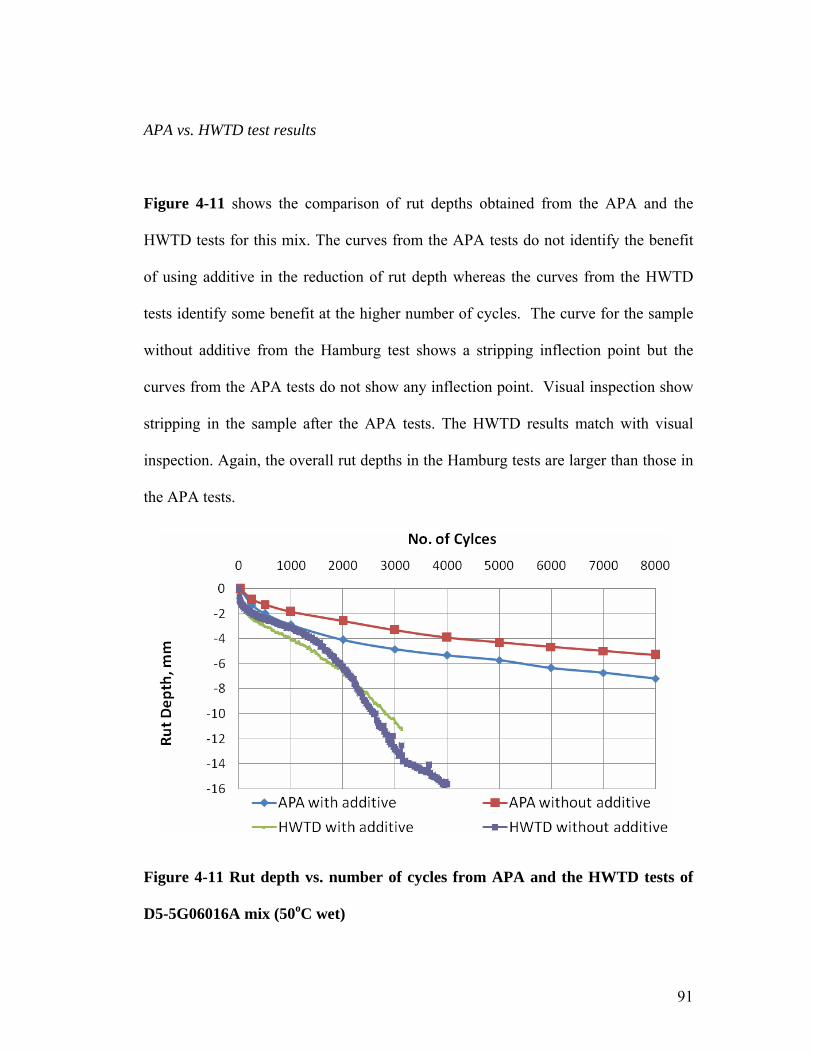
91
APA vs. HWTD test results
Figure 4-11 shows the comparison of rut depths obtained from the APA and the
HWTD tests for this mix. The curves from the APA tests do not identify the benefit
of using additive in the reduction of rut depth whereas the curves from the HWTD
tests identify some benefit at the higher number of cycles. The curve for the sample
without additive from the Hamburg test shows a stripping inflection point but the
curves from the APA tests do not show any inflection point. Visual inspection show
stripping in the sample after the APA tests. The HWTD results match with visual
inspection. Again, the overall rut depths in the Hamburg tests are larger than those in
the APA tests.
Figure 4-11 Rut depth vs. number of cycles from APA and the HWTD tests of
D5-5G06016A mix (50oC wet)

92
4.3.4 District 6 (6G06011A -Wet 50oC)
The Superpave HMA mix used in Meade County of Kansas District 6 was used to
make lab samples in this study. The estimated ESAL for this mix was 7.9 million.
The temperature used for mixing of aggregate and binder was 311-320oF (155-160oC)
whereas the molding temperature was 286-295oF (141-146oC). The aggregate type
and ratio and the type and percent of binder and additive used for this mix are as in
Table 4-5.
Table 4-5 Aggregate and binder types of D6 - 6G06011A mix
K-TRAN-KU-KSU Project District 6
CG 1 (20%)
CG 2 (10%)
CG 3 (10%)
CG 4 (25%)
SSG 2 (25%)
Aggregate type and ratio
SSG 4 (10%)
Binder type PG 64-22
Additive type Arr-Mazz, LA-2
Design % Asphalt 5.15
Design % Additive 0.3
Mixing temp range (oF) 311-320
Molding temp range (oF) 286-295
Mix Designation SM - 19 A
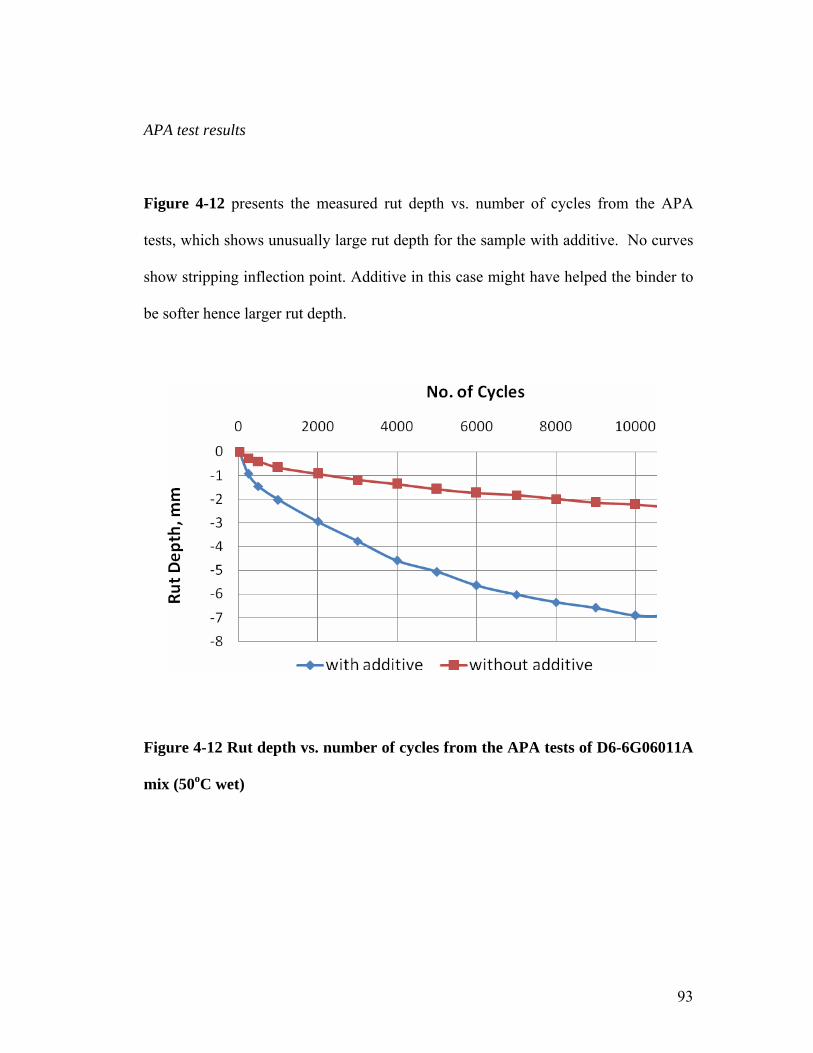
93
APA test results
Figure 4-12 presents the measured rut depth vs. number of cycles from the APA
tests, which shows unusually large rut depth for the sample with additive. No curves
show stripping inflection point. Additive in this case might have helped the binder to
be softer hence larger rut depth.
Figure 4-12 Rut depth vs. number of cycles from the APA tests of D6-6G06011A
mix (50oC wet)

94
Hamburg test results
The measured rut depth vs. number of cycles from the HWTD tests is shown in
Figure 4-13. Curves for this test do not show stripping inflection point. Similar to
the APA tests, rut depth for sample with additive is much larger than that without
additive. Additive in this case might have helped the binder to be softer and hence
higher rut depth.
Figure 4-13Rut depth vs. number of cycles from the HWTD tests of D6-
6G06011A mix (50oC wet)

95
APA vs. Hamburg test results
Figure 4.14 shows comparison of curves obtained from the APA and the HWTD
tests. Both APA and HWTD tests do not show stripping inflection point. Visual
inspection after APA tests shows that the samples do not have stripping. Test results
match with visual inspection results. Both tests show larger rut depths in samples
using additive. This unexpected behavior may be due to binder softening.
Figure 4-14 Rut depth vs. number of cycles from the APA and the HWTD tests
of D6-6G06011A mix (50oC wet)

96
4.3.5 District 6 (6G06016A -Wet 50oC)
The Superpave HMA mix used in Meade County of Kansas District 6 was used to
make lab samples. The estimated ESAL was 7.9 million. The temperature used for
mixing of aggregate and binder was 309-317oF (154-158oC) whereas the molding
temperature was 286-295oF (141-146oC). The aggregate type and ratio and the type
and percent of binder and additive for this mix are listed in Table 4-6.
Table 4-6 Aggregate and binder types of D6 - 6G06016A
D6: 6G06016A
K-TRAN-KU-KSU Project District 6
CG 1 (18%)
CG 2 (10%)
CG 3 (27%)
CG 4 (20%)
Aggregate type and ratio
SSG 2 (25%)
Binder type PG 70-28
Additive type Arr-Mazz, LA-2
Design % Asphalt 5.00
Design % Additive 0.25
Mixing temp range (F) 309-317
Molding temp range (F) 286-295
Mix Designation SM - 19 A

97
APA test results
Figure 4-15 presents the rut depth vs. number of cycles from the APA tests for this
mix. It is shown that the samples with and without additive basically performed
equally. No obvious stripping inflection point can be identified in either curve.
Figure 4-15 Rut depth vs. number of cycles from the APA tests of D6-6G06016A
mix (50oC wet)

98
Hamburg test results
The measured rut depth vs. number of cycles from the HWTD tests is shown in
Figure 4-16. Curves for this test do not show stripping inflection point. Use of
additive has shown benefit against rut depth.
Figure 4-16 Rut depth vs. number of cycles from the HWTD tests of
D6-6G06016A mix (50oC wet)

99
APA vs. HWTD test results
Figure 4.17 show comparison of results from the APA and the HWTD for this mix.
Both tests do not show stripping inflection point. Visual inspection after the APA
tests show that the samples do not have stripping. Test results match with visual
inspection results. The HWTD results show smaller rut depth in samples with
additive whereas the APA results show both curves almost overlap each other.
Sample with additive tested in the HWTD almost overlap with curves obtained from
APA tests. Hence rut depth obtained from the HWTD and the APA match reasonably
well.
Figure 4-17 Rut depth vs. number of cycles from the APA and the HWTD tests
of D6-6G06016A mix (50oC wet)
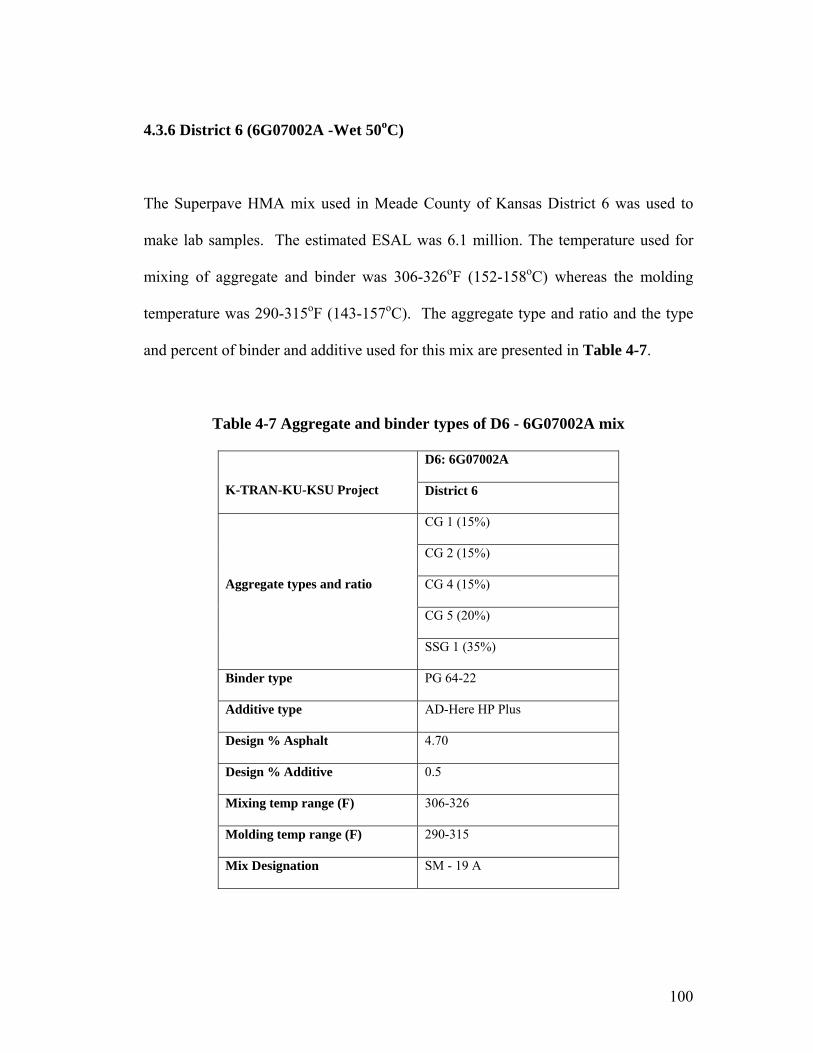
100
4.3.6 District 6 (6G07002A -Wet 50oC)
The Superpave HMA mix used in Meade County of Kansas District 6 was used to
make lab samples. The estimated ESAL was 6.1 million. The temperature used for
mixing of aggregate and binder was 306-326oF (152-158oC) whereas the molding
temperature was 290-315oF (143-157oC). The aggregate type and ratio and the type
and percent of binder and additive used for this mix are presented in Table 4-7.
Table 4-7 Aggregate and binder types of D6 - 6G07002A mix
D6: 6G07002A
K-TRAN-KU-KSU Project District 6
CG 1 (15%)
CG 2 (15%)
CG 4 (15%)
CG 5 (20%)
Aggregate types and ratio
SSG 1 (35%)
Binder type PG 64-22
Additive type AD-Here HP Plus
Design % Asphalt 4.70
Design % Additive 0.5
Mixing temp range (F) 306-326
Molding temp range (F) 290-315
Mix Designation SM - 19 A

101
Six samples with additive and six without additive were prepared at KSU for the
APA tests. The same mix was used to prepare an equal number of samples at KU to
investigate possible effect of sample preparation at two different labs. In addition,
extra samples were prepared at KU using this mix to run APA tests under different
preconditioning (dry vs. wet) and test conditions (60oC vs. 50oC). The test results of
these extra tests will be presented in the later sections.
APA test results
Figure 4-18 presents the measured rut depth vs. number of cycles from the APA tests
on samples prepared at KSU. It is shown that the samples without any additive had
slightly larger rut depth than those with the additive. To investigate the stripping
inflection point, the APA tests were run up to 20,000 cycles, which are commonly
used for the HWTD tests. However, no stripping inflection point was observed even
up to 20,000 cycles.
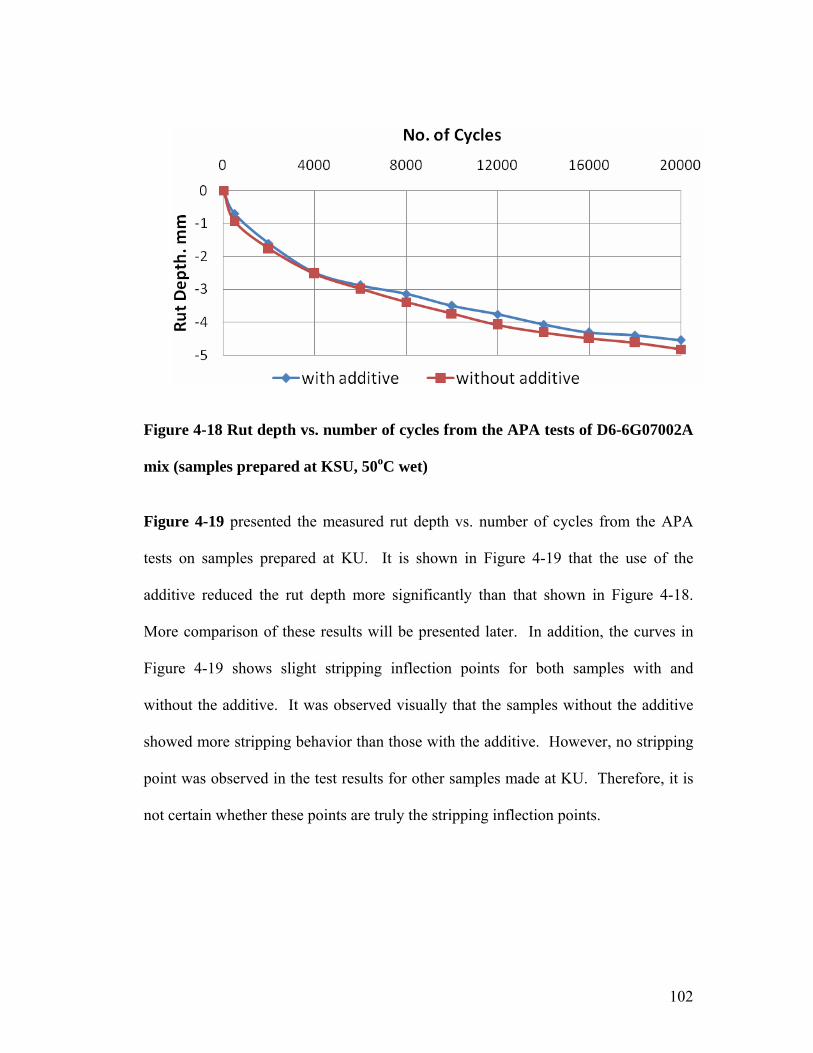
102
Figure 4-18 Rut depth vs. number of cycles from the APA tests of D6-6G07002A
mix (samples prepared at KSU, 50oC wet)
Figure 4-19 presented the measured rut depth vs. number of cycles from the APA
tests on samples prepared at KU. It is shown in Figure 4-19 that the use of the
additive reduced the rut depth more significantly than that shown in Figure 4-18.
More comparison of these results will be presented later. In addition, the curves in
Figure 4-19 shows slight stripping inflection points for both samples with and
without the additive. It was observed visually that the samples without the additive
showed more stripping behavior than those with the additive. However, no stripping
point was observed in the test results for other samples made at KU. Therefore, it is
not certain whether these points are truly the stripping inflection points.
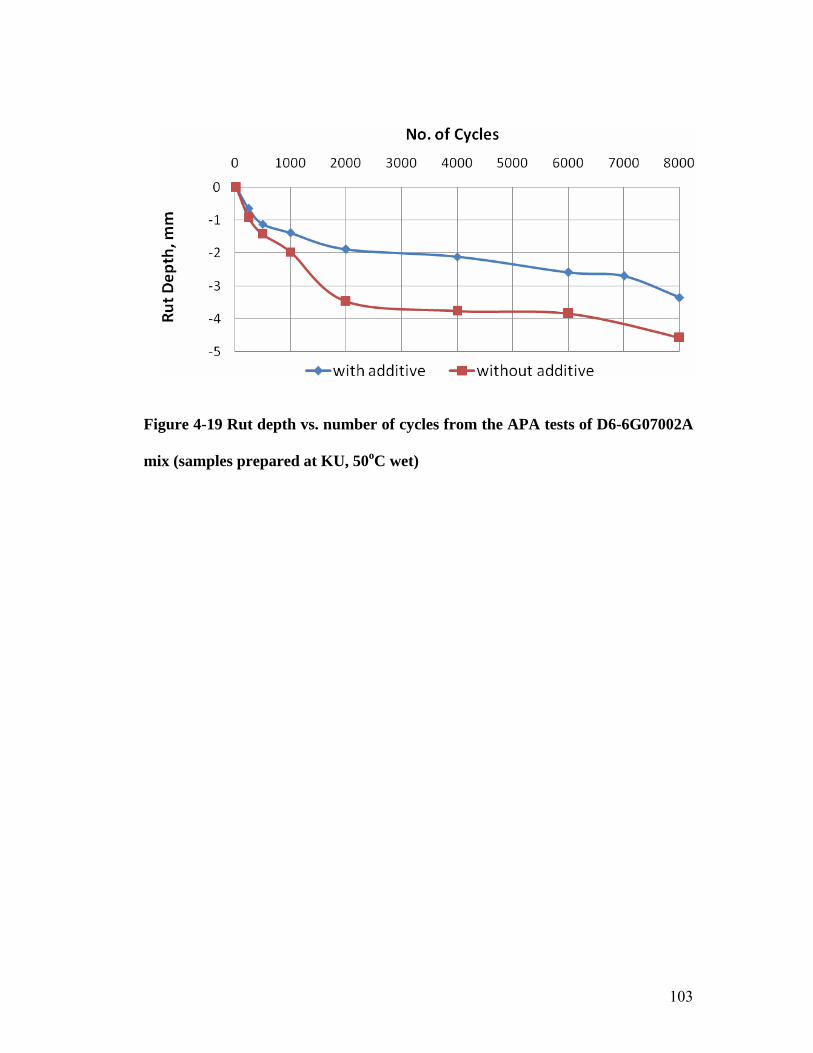
103
Figure 4-19 Rut depth vs. number of cycles from the APA tests of D6-6G07002A
mix (samples prepared at KU, 50oC wet)
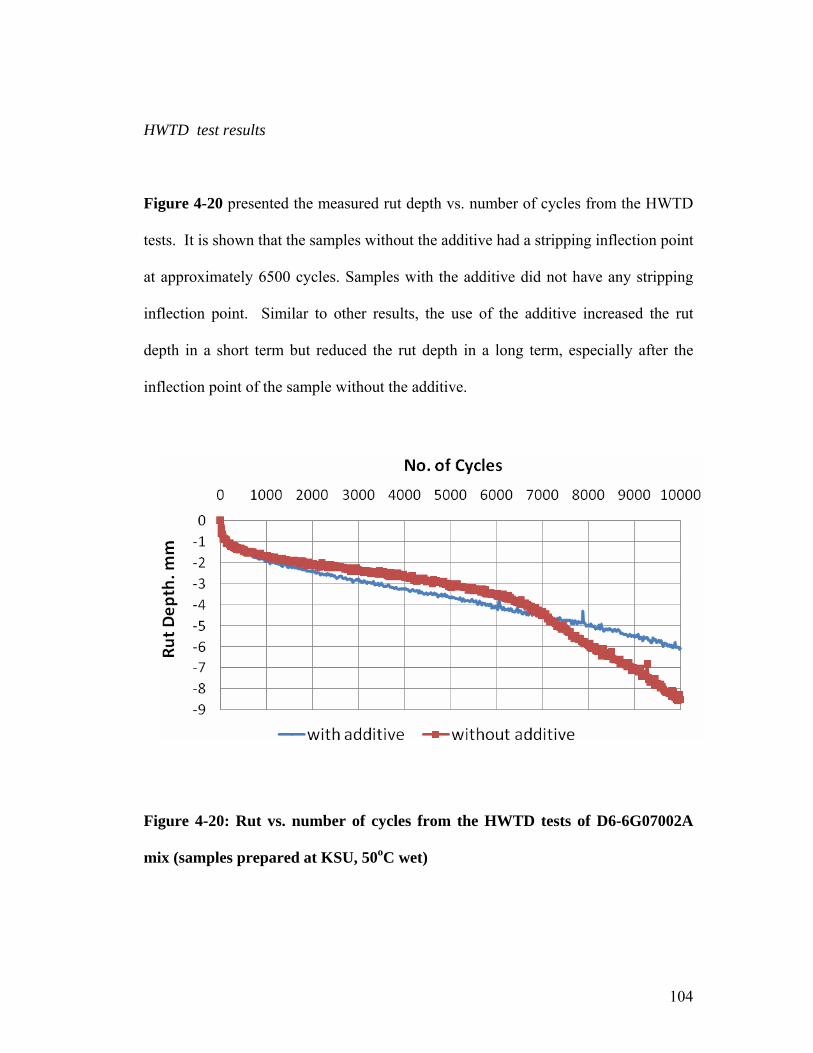
104
HWTD test results
Figure 4-20 presented the measured rut depth vs. number of cycles from the HWTD
tests. It is shown that the samples without the additive had a stripping inflection point
at approximately 6500 cycles. Samples with the additive did not have any stripping
inflection point. Similar to other results, the use of the additive increased the rut
depth in a short term but reduced the rut depth in a long term, especially after the
inflection point of the sample without the additive.
Figure 4-20: Rut vs. number of cycles from the HWTD tests of D6-6G07002A
mix (samples prepared at KSU, 50oC wet)
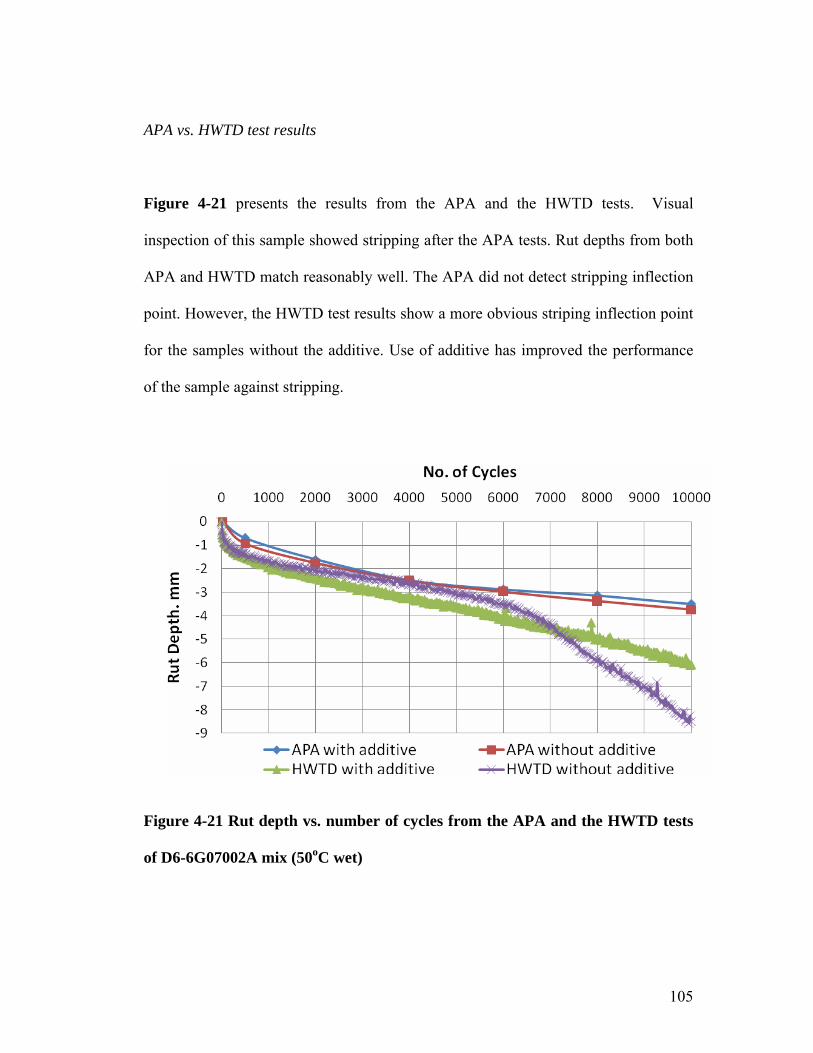
105
APA vs. HWTD test results
Figure 4-21 presents the results from the APA and the HWTD tests. Visual
inspection of this sample showed stripping after the APA tests. Rut depths from both
APA and HWTD match reasonably well. The APA did not detect stripping inflection
point. However, the HWTD test results show a more obvious striping inflection point
for the samples without the additive. Use of additive has improved the performance
of the sample against stripping.
Figure 4-21 Rut depth vs. number of cycles from the APA and the HWTD tests
of D6-6G07002A mix (50oC wet)

106
4.3.7 District 6 (6G07002A -Wet 60oC)
To investigate the temperature effect on the test results, six samples with the additive
and six samples without any additive were made at KU. These samples were
subjected to 6 min vacuum saturation and one hour soak in water at 60oC before
testing. Figure 4-22 presents the measured rut depth vs. number of cycles from the
APA tests. The test results show that the use of the additive reduced the rut depth.
However, neither curves had any obvious stripping inflection point. The comparison
of the test results for the samples tested at 50oC and 60oC will be presented in the
later section.
Figure 4-22: Rut depth vs. number of cycles from the APA tests of D6-6G07002A
mix (60oC wet)

107
4.3.8 District 6 (6G07002A -Dry 50oC)
To investigate the preconditioning effect on the test results, six samples with the
additive and six samples without the additive were made at KU and tested in a dry
condition. The air temperature was raised to 50oC in the APA chamber. Figure 4-23
presents the rut depth vs. number of cycles from the APA tests. The test results show
that the samples without the additive had slightly smaller rut depth than those with
the additive. Neither curves had any stripping inflection point as expected for dry
samples.
Figure 4-23 Rut depth vs. number of cycles from the APA tests of D6-6G07002A
mix (50oC dry)

108
4.3.9 District 6 (6G07002A –Dry 60oC)
To investigate the combined effect of temperature and preconditioning, six samples
with the additive and six samples without the additive were made at KU and tested at
a temperature of 60oC in a dry condition. Figure 4-24 presents the rut depth vs.
number of cycles from the APA tests. The test results clearly show the benefit of the
additive in the reduction of rut depth. Neither curves had any stripping inflection
point as expected for dry samples.
Figure 4-24 Rut depth vs. number of cycles from the APA tests of D6-6G07002A
mix (60oC dry)
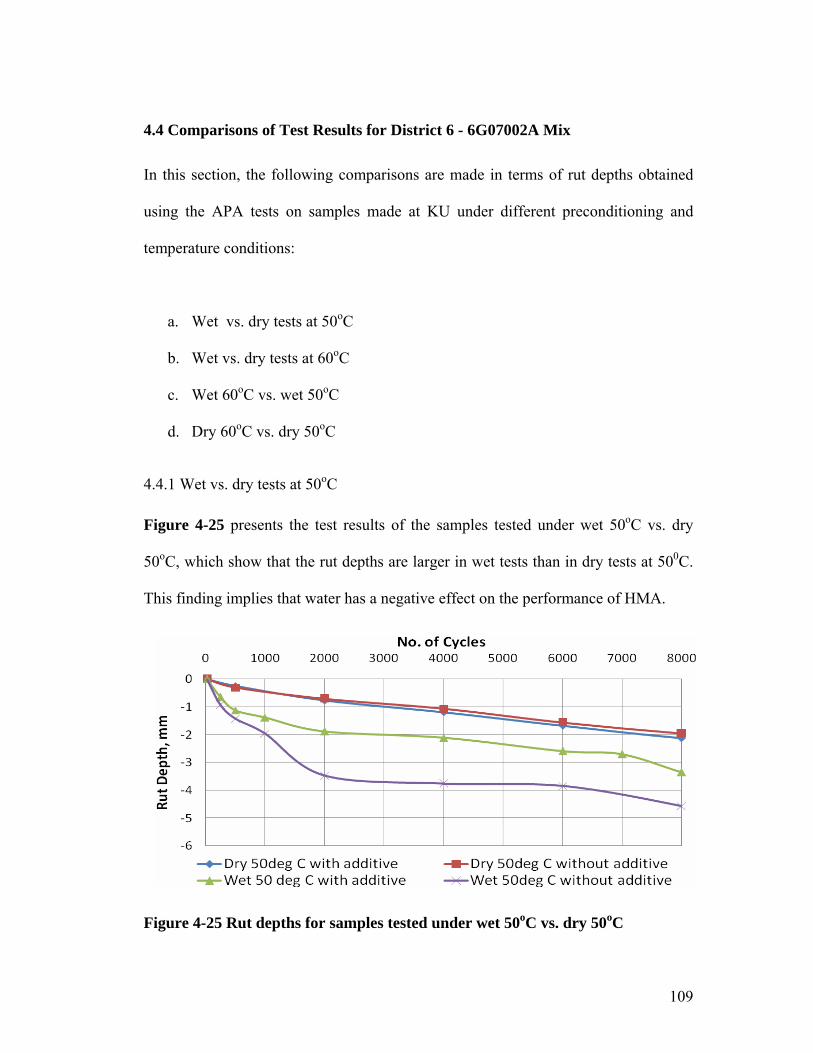
109
4.4 Comparisons of Test Results for District 6 - 6G07002A Mix
In this section, the following comparisons are made in terms of rut depths obtained
using the APA tests on samples made at KU under different preconditioning and
temperature conditions:
a. Wet vs. dry tests at 50oC
b. Wet vs. dry tests at 60oC
c. Wet 60oC vs. wet 50oC
d. Dry 60oC vs. dry 50oC
4.4.1 Wet vs. dry tests at 50oC
Figure 4-25 presents the test results of the samples tested under wet 50oC vs. dry
50oC, which show that the rut depths are larger in wet tests than in dry tests at 500C.
This finding implies that water has a negative effect on the performance of HMA.
Figure 4-25 Rut depths for samples tested under wet 50oC vs. dry 50oC

110
4.4.2 Wet vs. dry tests at 60oC
The binder used for this mix was PG 64-22. As compared with Figure 4-21, Figure
4-22 shows that the samples tested at a higher temperature (60oC) had different
behavior from those tested at a lower temperature (50oC).
Interestingly, in the case of samples without any additive, the rut depth was lower in
the wet test than in the dry test. In the dry test, the sample showed higher rut depth
with heaving on the sides of the wheel path. It was observed during the test that the
binder was soft at the higher temperature thus causing more rut depth and heaving on
the sides. In the case of the wet test there was no heaving on sides and the rut depth
was lower. In the case of the samples with additive, the rut depth was higher in the
wet test than that in the dry test.
Another comparison can be made based on the results in Figure 4-22. For the wet
tests at 60oC, the use of the additive showed slight benefit in the reduction of the rut
depth. For the dry tests at 60oC, the use of the additive showed significant benefit in
the reduction of the rut depth. This comparison implies that the additive not only
improves the performance of HMA against stripping but also reduces the overall
rutting deformation under dry and wet conditions.

111
Figure 4-26 Rut depths for samples tested under wet 60oC vs. dry 60oC
4.4.3 Wet tests at 50oC vs. 60oC
Figure 4-27 shows the comparison of the test results obtained by the wet tests at
different temperatures. It is quite obvious that the rut depths were larger at 60oC than
those at 50oC. Both sets of curves show the benefit of the additive in the reduction of
the rut depth.
Figure 4-27 Wet tests at 50oC vs. 60oC
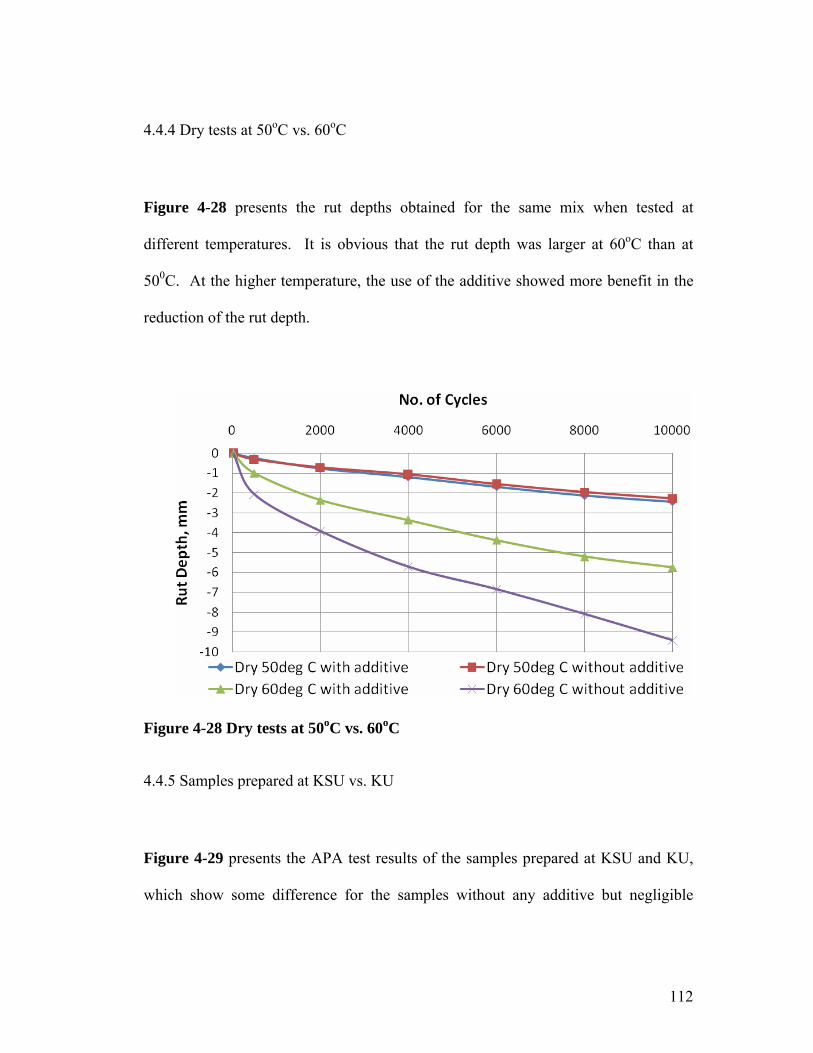
112
4.4.4 Dry tests at 50oC vs. 60oC
Figure 4-28 presents the rut depths obtained for the same mix when tested at
different temperatures. It is obvious that the rut depth was larger at 60oC than at
500C. At the higher temperature, the use of the additive showed more benefit in the
reduction of the rut depth.
Figure 4-28 Dry tests at 50oC vs. 60oC
4.4.5 Samples prepared at KSU vs. KU
Figure 4-29 presents the APA test results of the samples prepared at KSU and KU,
which show some difference for the samples without any additive but negligible
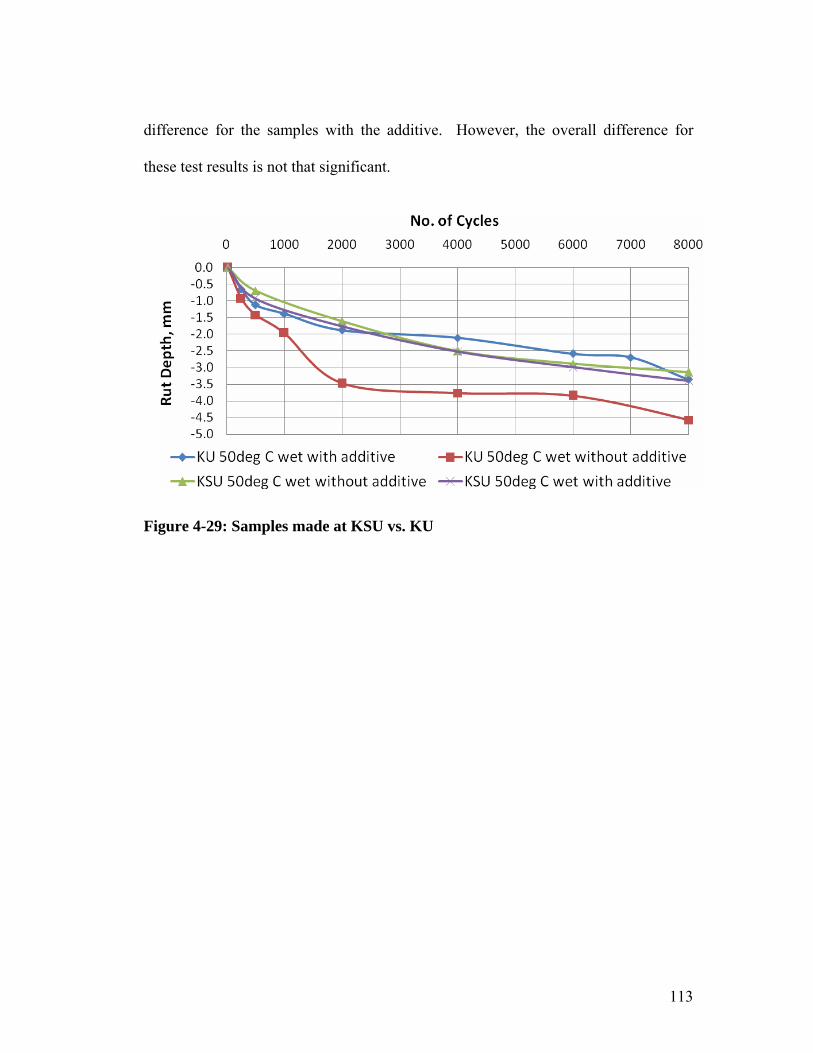
113
difference for the samples with the additive. However, the overall difference for
these test results is not that significant.
Figure 4-29: Samples made at KSU vs. KU

114
4.5 Summary of Test Results
Table 4-8 summarizes the test information and results obtained using the APA and
the HWTD tests, which includes the district, the project design number, the mix, the
lab designation number, the type or conditioning of the test, and the test results.
The comparisons of test results yield the following conclusions:
(1) Wet vs. dry tests at 50oC
rut depths were larger in the wet test than in the dry test
visible stripping was shown in the wet test
benefit of the additive in the wet test was shown but not in the dry test

115
Table 4-8 Summary of test information and results.
APA tests Hamburg tests No. District Design Number
Mix Lab Designation Number
Type of test done
Stripping inflection point
Benefit of Additive
Visual inspection of sample
Stripping inflection point
Benefit of Additive
1 2 2G06015A 9.5 A
T3 (w/o additive)
Wet-50oC
Not seen Stripping, loss of bonding
After about 1500 cycles
2 2 2G06015A 9.5 A
T5 (w additive)
Wet-50oC
Not seen Negative impact
No stripping
Not seen Benefit seen
3 3 3G06020A SM-19A
T13 (w/o additive)
Wet-50oC
Not seen Stripping seen
After about 4500 cycles
4 3 3G06020A SM-19A
T15 (w additive)
Wet-50oC
Not seen Not seen No stripping
Not seen Benefit seen only at later stage
5 5 5G06016A 9.5 A
T7 (w/o additive)
Wet-50oC
Not seen Stripping seen
After about 1500 cycles
6 5 5G06016A 9.5 A
T11 (w additive)
Wet-50oC
Not seen Negative impact
No stripping
After about 2000 cycles
Slight Benefit
7 6 6G06011A SM-19A
T18 (w/o additive)
Wet-50oC
Not seen No stripping
Not seen
8 6 6G06011A SM-19A
T20(w additive)
Wet-50oC
Not seen Negative impact
No stripping
Not seen Negative impact
9 6 6G07002A SM-19A
T23 (w/o additive)
Wet-50oC
Not seen Stripping seen
After about 6000 cycles

116
Table 4-8 Summary of test information and results (continued).
APA tests Hamburg tests No. District Design Number
Mix Lab Designation Number
Type of test done
Stripping inflection point
Benefit of Additive
Visual inspection of sample
Stripping inflection point
Benefit of Additive
10 6 6G07002A SM-19A
T25 (w additive)
Wet-50oC
Not seen Slight benefit
No stripping
Not seen Benefit seen in later stage
11 6 6G06016A SM-19A
T28 (w/o additive)
Wet-50oC
Not seen No stripping seen
Not seen
12 6 6G06016A SM-19A
T30 (w additive)
Wet-50oC
Not seen Not seen No stripping seen
Not seen Benefit seen
13 6 6G07002A SM-19A
K1 (w/o additive)
Wet-50oC
Not clear Shows stripping, loss of bonding
14 6 6G07002A SM-19A
K2 (w/o additive)
Wet-60oC
Not seen No stripping seen
15 6 6G07002A SM-19A
K5 (w/o additive)
Dry-60oC
Not seen No stripping seen, heave on the sides of the load path seen
16 6 6G07002A SM-19A
K6 (w/o additive)
Dry-50oC
Not seen No stripping seen
17 6 6G07002A SM-19A
K3 (w additive)
Wet-50oC
Not clear Benefit seen
No stripping seen
18 6 6G07002A SM-19A
K4 (w additive)
Wet-60oC
Not seen Benefit seen
No stripping seen
19 6 6G07002A SM-19A
K7 (w additive)
Dry-60oC
Not seen Benefit seen
No stripping seen
20 6 6G07002A SM-19A
K8 (w additive)
Dry-50oC
Not seen Slight Benefit
No stripping seen
These tests not done in Hamburg Device.

117
(2) Wet vs. dry tests at 60oC
For the samples without the additive
rut depth was smaller in the wet test than in the dry test
high rut in the dry test with heaving on sides developed but no heaving on the wet
test
For the samples with the additive
rut depth was larger in the wet test than in the dry test
no heaving developed on sides
benefit of the additive was not high in the west test
benefit of the additive was higher in the dry test
additive improved not only stripping resistance but also overall performance of
HMA against rutting.
(3) Wet 60oC vs. wet 50oC
Rut depth was larger at 60oC than at 50oC in the wet test
Both tests showed benefit of the additive.
(4) Dry 60oC vs. dry 50oC

118
rut depth was larger at 60oC than at 50oC
additive showed more benefit at a high temperature than at a low temperature.
(5) Samples prepared at KSU vs. KU
both samples had rut depths in the range of 3-4 mm after 8000 cycles
results matched reasonably well.
119
5. CONCLUSIONS AND RECOMMENDATIONS
5.1. Conclusions
1. Visual observation showed stripping in four out of six mixes used for the
tests. Loss of bonding between aggregate and binder occurred in these
samples. Sand particles were washed out of binder in a few stripped samples.
2. None of the APA tests conducted in this study showed a stripping inflection
point. However, the HWTD tests did show such a stripping inflection point in
all four mixes which showed stripping. The HWTD tests did not show
stripping point for two mixes which did not show stripping during visual
inspection.
3. The use of the additive showed the benefit in the reduction of the rut depth in
some cases of the APA tests but not in all. However, most of the HWTD test
results showed the benefit in the later stage of the tests. In the earlier stage,
the samples with the additive had larger rut depths than those without any
additive. In one mix (D6G06011A), the use of additive showed high negative
impact for both APA and HWTD tests.
120
4. At the higher temperature (60oC for PG 64-22 binder), the rut depths were
higher in the dry test than in the wet test. More heaving on the sides of the
wheel path was observed in the dry test than that in the wet test. Rutting
damage is more critical at higher temperature when the binder becomes soft.
At the lower temperature (50oC for PG 64-22 binder), rut depths were higher
in the wet test than in the dry test. Stripping was seen in the wet test. Thus
stripping has more contribution to rut depth at low temperature than at high
temperature.
5. Both the APA and the HWTD tests take around 4-6 hours to complete. These
methods are faster than conventional test methods used to determine moisture
sensitivity. APA tests can show stripping behavior visually. On the other
hand, Hamburg tests can detect stripping behavior in HMA mixes based on
rut depth vs. number of cycles curve. Thus the HWTD tests are more effective
as a rapid test method in case of determining moisture sensitivity.
5.2. Recommendations
1. This study shows that the HWTD tests can better predict the stripping
behavior. More studies and laboratory tests using the HWTD device should be
conducted to investigate more influential factors on moisture sensitivity.

121
2. More studies should be carried out to relate number of passes for stripping
inflection point with severity of stripping.
3. Correlating laboratory test data with actual performance in the field would be
necessary to verify the test results obtained in this study.

122
6. REFERENCES
1. Al-Swailmi, S. and Terrel, R. L. (1992). “Evaluation of water damage of
asphalt concrete mixtures using the Environmental Conditioning System
(ECS)” Journal of the Association of Asphalt Paving Technologists, Vol. 61.
2. Anjelo, J. and Anderson, R. (2003). “Material production, mix design, and
pavement design effects on moisture damage”, Moisture Sensitivity of
Asphalt Pavements, TRB Seminar Paper, 187-201.
3. Aschenbrener, T. (1995). “Evaluation of Hamburg Wheel-Tracking Device to
predict moisture damage in hot mix asphalt”, Transportation Research
Record, 1492, 193-201.
4. Aschenbrener, T. (1996). “Comparison of several moisture susceptibility tests
to pavements of known field performance”, Asphalt Paving Technology,
Association of Asphalt Paving Technologists, Volume 64, 163-208.
5. Bhairampally, R. K., Lytton, R. L., and Little, D. N. (2000). “Numerical and
graphical method to assess permanent deformation potential for repeated
compressive loading of asphalt mixtures”. In Transportation Research Record:

123
Journal of the Transportation Research Board, No. 1723, TRB, National
Research Council, Washington, D.C., pp. 150–158.
6. Castan, M. (1968). “Rising of binder to the surface of an open-graded
bituminous mix”. Bulletinde liaison des laboratoires routiers, No. 33, pp. 77–
84.
7. Cheng, D., Little, D. N., Lytton, R. L., and Holste, J. C. (2002). “Surface
energy measurement of asphalt and its application to predicting fatigue and
healing in asphalt mixtures”. in Transportation Research Record: Journal of
the Transportation Research Board, No.1810, TRB, National Research
Council, Washington, D.C., pp. 44–53.
8. Coplantz, S. (1988). “Water sensitivity test methods for asphalt concrete
mixtures, a laboratory comparison”, Transportation Research Board, 1171,
44-50.
9. Cross, S.A. and Voth, M.D. (2001). “Effects of sample preconditioning on
Asphalt Pavement Analyzer (APA) wet rut depths”, Transportation Research
Board, Paper No. 01-0392, 1-20.

124
10. Curtis, C. W. (1992). “Fundamental properties on asphalt aggregate
Interactions adhesion and adsorption”. Final Report on Contract A-003B.
Strategic Highway Research Program, National Research Council,
Washington, D.C
11. Fromm, H. J. (1974). “The mechanisms of asphalt stripping from aggregate
surfaces”. Association of Asphalt Paving Technologists, Vol. 43, pp. 191–
223.
12. Gordon, D.A. (2005). “Combined laboratory ageing/ moisture sensitivity
assessment of high modulus base asphalt mixtures” Asphalt Paving
Technology: Association of Asphalt Paving Technologists, Issn. No. 0270-
2932, 307-345.
13. Gzemski, F. C., McGlashan, D. W., and Dolch, W. L. (1968).
“Thermodynamic Aspects of the Stripping Problem”. Highway Research
Circular 78 HRB, National Research Council, Washington, D.C.
14. Huang, S.H., Robertson, R.E, Branthaver, J.F., and Peterson, J.C. (2005).
“Impact of lime modification of asphalt and freeze-thaw cycling on the
asphalt-aggregate interaction and moisture resistance to moisture damage.”
Journal of Materials in Civil Engineering, ASCE, 711-718
125
15. Hubbard, P. (1938). “Adhesion of asphalt to aggregates in presence of water”.
Highway Research Board Proceedings, Vol. 18, Part 1, pp. 238—249.
16. Hunter, E. and Ksaibati, K. (2002). “Evaluating moisture susceptibility of
asphalt mixes”, University of Wyoming, United States Department of
Transportation to the Mountain-Plains Consortium (MPC), 1-37.
17. Kandhal, P. (2002). “Premature failure of asphalt overlays from stripping:
Case histories”, Asphalt Pavement Technology, Association of Asphalt
Pavement Technologists, Volume 70, 301-351.
18. Kandhal, P. and Mallick, R. (1999) “Potential of Asphalt Pavment Analyzer
(APA) to predict rutting of Hot Mix Asphalt”, International Conference on
Accelerated Pavement Testing, 1-23.
19. Kennedy, T. W., Roberts, F. L., and Anagnos, J. N. (1984). “Texas Boiling
Test for evaluating moisture susceptibility of asphalt mixtures” Research
Report
253-5. Center for Transportation Research, University of Texas at Austin, Jan.
20. Kennedy, T. W., Roberts, F. L., and Lee, K. W. (1984). “Evaluating moisture
susceptibility of asphalt mixtures using the Texas Boiling Test”. In

126
Transportation Research Record 968, TRB, National Research Council,
Washington, D.C., pp. 45—54.
21. Kennedy, T. W., Roberts, F. L., Lee, K. W., and Anagnos, J. N. (1982).
“Texas Freeze–Thaw Pedestal test for evaluating moisture susceptibility for
asphalt mixtures”. Research Report 253-3. Center for Transportation
Research, University of Texas at Austin, Feb.
22. Kiggundu, B. M. (1986). “Effects of Submergence in Distilled Water on the
Surface Coloration of Asphalt”. Unpublished data, NMERI.
23. Kiggundu, B. M., and Roberts, F. L. (1988). “The success/failure of methods
used to predict the stripping potential in the performance of bituminous
pavement mixtures”. Submitted to TRB.
24. Kim, Y.-R., Little, D. N., and Lytton, R. L. (2002). “Fatigue and healing
characterization of asphalt mixtures”. Journal of Materials in Civil
Engineering, American Society of Civil Engineers
25. Kruz, N.C. (1990). “Relationship between permanent deformation of asphalt
concrete and moisture sensitivity”, Transportation Research Record, 1259,
163-168.

127
26. Little. D. and Jones, D. (2003). “Chemical and mechanical processes of
moisture damage in hot mix asphalt pavements”, Moisture Sensitivity of
Asphalt Pavements, TRB Seminar Paper, 37-70.
27. Lottman, R. P. (1988). “Methods of predicting and controlling moisture
damage in asphalt concrete”, Transportation Research Record, 1171, 1-11.
28. Lottman, R. P. (1978). NCHRP Report 192: “Predicting moisture-induced
damage to asphaltic concrete”. TRB, National Research Council, Washington,
D.C.
29. Lottman, R. P. (1982). NCHRP Report 246: “Predicting moisture-induced
damage to asphaltic concrete: field evaluation”. TRB, National Research
Council, Washington, D.C.
30. Mack, C. (1964). “Bituminous Materials”. Vol. 1 (A. Holberg, ed.),
Interscience Publishers, New York.
31. Majidzadeh, K. and Brovold, F. N. (1968). Special Report 98: “State of the
Art: effect of water on bitumen–aggregate mixtures”. HRB, National
Research Council, Washington, D.C.
128
32. Martin, J., Cooley, L., and Hainin, H. (2003). Moisture Sensitivity of Asphalt
Pavements, Topic 6: Production and construction issues for moisture sensitive
hot mix asphalt pavements, TRB Seminar Paper, 209-222.
33. Martin,A., Rand, D., Tedford, D., Sebaaly, P., Bressetti, T., and Maupin, G.
(2003). Moisture Sensitivity of Asphalt Pavements, Topic 7: Field
experiences, TRB Seminar Paper, 229-255.
34. Maupin, G. W. (1982). “The use of anti-stripping additives in Virginia”,
submitted at the 51st Association of Asphalt Paving Technologists, Kansas
City, MO.
35. McCann, M. and Sebaaly, P.E. (2003). “Evaluation of moisture sensitivity and
performance of lime in hot mix asphalt – resilient modulus, tensile strength,
and simple shear tests.” Transportation Research Record 1832, 9-16.
36. Mohamed, H. (1993). “Debonding location in asphalt concrete associated with
moisture change”, Journal of Materials in Civil Engineering, 4, 497-509.
37. Mohammad N. (2001). “Characterization of HMA mixtures with the Asphalt
Pavement Analyzer”, ASTM Special Technical Publication, Volume 1412,
16-29.
129
38. Moulthrop, J., Button, J. and Hejl, F. (2003). Moisture Sensitivity of Asphalt
Pavements, Topic 9: Implementation and strategic plan, TRB Seminar Paper,
265-273.
39. NCHRP Report 192 (1978). “Predicting moisture – induced damage to
asphaltic concrete”. TRB National Research Council, Washington D.C.,
40. Nguyen, T. (2005). “In Situ spectroscopic study of water at the asphalt/
siliceous substrate interface and its implication in stripping”, Journal of
Adhesion, 1, 1-28.
41. Pan, C. (1998). “Evaluation of stripping for asphalt concrete mixtures using
accelerated testing methods.” Transportation Research Record, 1630, 98-105.
42. Randy, W., Zhang, J., and Cooley, A. (2004). “Evaluation of Asphalt
Pavement Analyser for moisture sensitivity testing”, National Center for
Asphalt Technology (NCAT) Report 04-04, 1-23.
43. Rickards, I. (2003). “Fatigue testing of asphalt to improve the discrimination
of moisture sensitivity in aggregate and bitumen systems”, Australian Road
Research Board, Volume 21, 243-255.

130
44. Roberts, F., Kandhal, P., Brown, E., Lee, D., and Kennedy, T. (1996). “Hot
Mix Asphalt Materials, Mixture Design, and Construction”. 2nd Edition.
Lanham, Maryland: NAPA Education Foundation
45. Robertson, R. E. (2000). “Chemical Properties of Asphalts and Their Effects
on Pavement Performance”. Transportation Research Circular 499, TRB,
National Research Council, Washington, D.C.
46. Saleh, A. (1992). “Evaluation of water damage of asphalt concrete mixtures
using the environmental conditioning system (ECS)”, Association of Asphalt
Paving Technologist, Technical Session, Volume 61, 405-445.
47. Schmidt, R. J., and Graf, P. E. (1972). “The effect of water on the resilient
modulus of asphalt treated mixes”. Proc., Association of Asphalt Paving
Technologists, Vol. 41, pp. 118– 162
48. Scott, J. A. N. (1978). “Adhesion and Disbonding mechanisms of asphalt used
in highway construction and maintenance”. Proc., Association of Asphalt
Paving Technologists, Vol. 47, pp. 19–48.
49. Shatnawi, S. (1995). “Moisture sensitivity evaluation of binder-aggregate
mixtures”, Transportation Research Record, 1492, 71-84.

131
50. Solaimanian, M., Harvey, J., Tahmoressi, M. and Tandon, V. (2003).
Moisture Sensitivity of Asphalt Pavements, Topic 3: Test methods to predict
moisture sensitivity of hot mix asphalt pavements, TRB Seminar Paper, 77-
110.
51. Tarrer, A. R. (1996). “Use of hydrated lime to reduce hardening and stripping
in asphalt mixtures”. Presented at the 4th Annual International Center for
Aggregate Research Symposium, Atlanta, GA.
52. Tarrer, A. R., and Wagh, V. (1991). “The effect of the physical and chemical
characteristics of the aggregate on bonding”. Strategic Highway Research
Program, National Research Council, Washington, D.C.
53. Terrel, R. L., and Shute, J. W. (1989). “Summary report on water sensitivity”.
SHRP-A/IR-89-003. Strategic Highway Research Program, National Research
Council, Washington, D.C.
54. Terrel, R. L., and Al-Swailmi, S. (1994). “Water sensitivity of asphalt–
aggregate mixes: Test Selection”. SHRP Report A-403. Strategic Highway
Research Program, National Research Council, Washington, D.C

132
55. Thelen, E. (1958). “Surface energy and adhesion properties in asphalt–
aggregate” Systems Bulletin 192, HRB, National Research Council,
Washington, D.C., pp. 63–74.
56. Tseng, K. H., and Lytton, R. L. (1987). “Prediction of permanent deformation
in flexible pavement materials. Implication of aggregates in design,
construction, and performance of flexible pavements”, ASTM STP 1016
(Schreuders, H. G. and Marek, C. R., eds.), American Society for Testing and
Materials, Philadelphia, PA.
57. Tunnicliff, D. G., and Root, R. E. (1984). Use of Anti-stripping Additives in
Asphaltic Concrete Mixtures, NCHRP Report 274, Laboratory phase. TRB,
National Research Council, Washington, D.C
58. Williams, R. (2005). “Utilization of an Asphalt Pavement Analyzer for Hot
Mix Asphalt laboratory mix design”, Journal of ASTM International, 91-105.
59. Yoon, H. J. (1987). “Interface phenomenon and surfactants in asphalt paving
materials dissertation”, Auburn University.
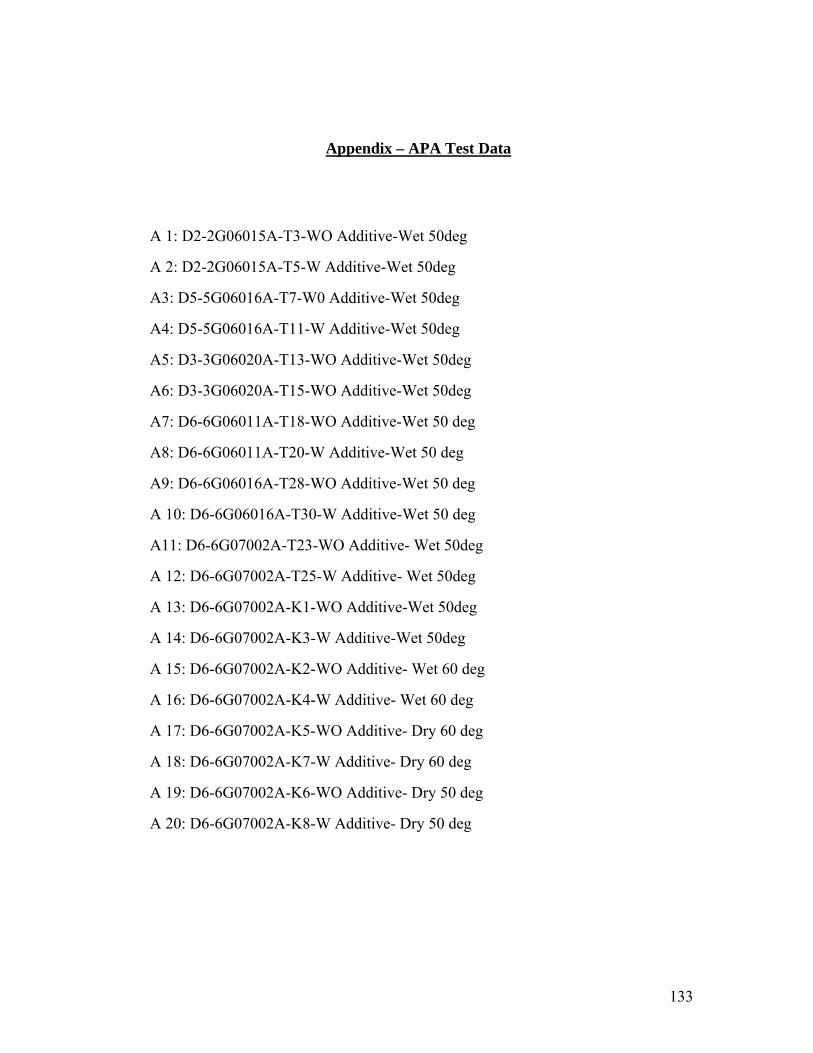
133
Appendix – APA Test Data
A 1: D2-2G06015A-T3-WO Additive-Wet 50deg
A 2: D2-2G06015A-T5-W Additive-Wet 50deg
A3: D5-5G06016A-T7-W0 Additive-Wet 50deg
A4: D5-5G06016A-T11-W Additive-Wet 50deg
A5: D3-3G06020A-T13-WO Additive-Wet 50deg
A6: D3-3G06020A-T15-WO Additive-Wet 50deg
A7: D6-6G06011A-T18-WO Additive-Wet 50 deg
A8: D6-6G06011A-T20-W Additive-Wet 50 deg
A9: D6-6G06016A-T28-WO Additive-Wet 50 deg
A 10: D6-6G06016A-T30-W Additive-Wet 50 deg
A11: D6-6G07002A-T23-WO Additive- Wet 50deg
A 12: D6-6G07002A-T25-W Additive- Wet 50deg
A 13: D6-6G07002A-K1-WO Additive-Wet 50deg
A 14: D6-6G07002A-K3-W Additive-Wet 50deg
A 15: D6-6G07002A-K2-WO Additive- Wet 60 deg
A 16: D6-6G07002A-K4-W Additive- Wet 60 deg
A 17: D6-6G07002A-K5-WO Additive- Dry 60 deg
A 18: D6-6G07002A-K7-W Additive- Dry 60 deg
A 19: D6-6G07002A-K6-WO Additive- Dry 50 deg
A 20: D6-6G07002A-K8-W Additive- Dry 50 deg
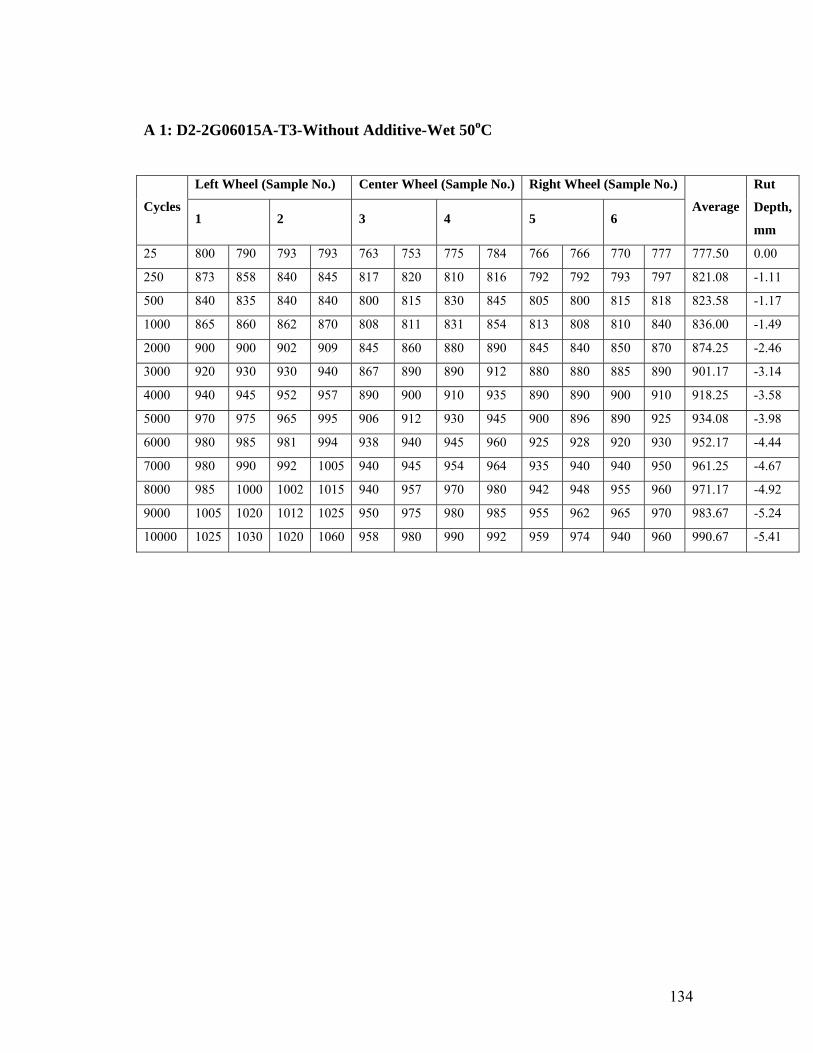
134
A 1: D2-2G06015A-T3-Without Additive-Wet 50oC
Left Wheel (Sample No.) Center Wheel (Sample No.) Right Wheel (Sample No.)
Cycles 1 2 3 4 5 6
Average
Rut
Depth,
mm
25 800 790 793 793 763 753 775 784 766 766 770 777 777.50 0.00
250 873 858 840 845 817 820 810 816 792 792 793 797 821.08 -1.11
500 840 835 840 840 800 815 830 845 805 800 815 818 823.58 -1.17
1000 865 860 862 870 808 811 831 854 813 808 810 840 836.00 -1.49
2000 900 900 902 909 845 860 880 890 845 840 850 870 874.25 -2.46
3000 920 930 930 940 867 890 890 912 880 880 885 890 901.17 -3.14
4000 940 945 952 957 890 900 910 935 890 890 900 910 918.25 -3.58
5000 970 975 965 995 906 912 930 945 900 896 890 925 934.08 -3.98
6000 980 985 981 994 938 940 945 960 925 928 920 930 952.17 -4.44
7000 980 990 992 1005 940 945 954 964 935 940 940 950 961.25 -4.67
8000 985 1000 1002 1015 940 957 970 980 942 948 955 960 971.17 -4.92
9000 1005 1020 1012 1025 950 975 980 985 955 962 965 970 983.67 -5.24
10000 1025 1030 1020 1060 958 980 990 992 959 974 940 960 990.67 -5.41
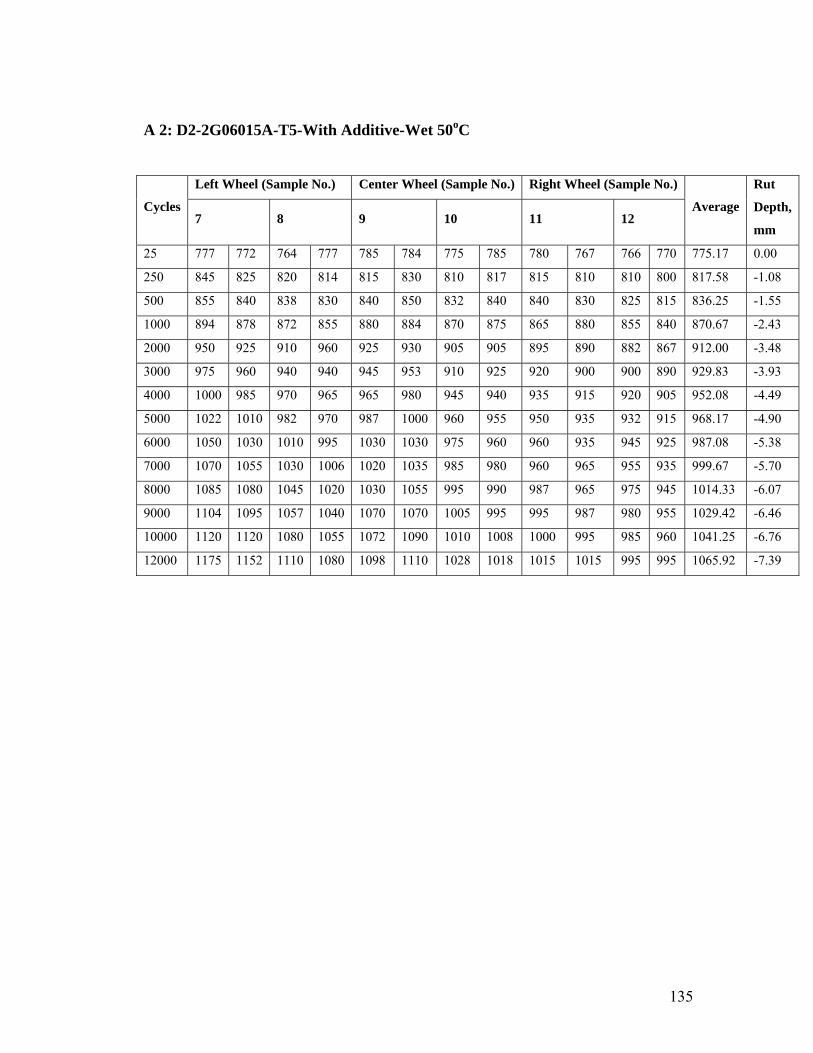
135
A 2: D2-2G06015A-T5-With Additive-Wet 50oC
Left Wheel (Sample No.) Center Wheel (Sample No.) Right Wheel (Sample No.)
Cycles 7 8 9 10 11 12
Average
Rut
Depth,
mm
25 777 772 764 777 785 784 775 785 780 767 766 770 775.17 0.00
250 845 825 820 814 815 830 810 817 815 810 810 800 817.58 -1.08
500 855 840 838 830 840 850 832 840 840 830 825 815 836.25 -1.55
1000 894 878 872 855 880 884 870 875 865 880 855 840 870.67 -2.43
2000 950 925 910 960 925 930 905 905 895 890 882 867 912.00 -3.48
3000 975 960 940 940 945 953 910 925 920 900 900 890 929.83 -3.93
4000 1000 985 970 965 965 980 945 940 935 915 920 905 952.08 -4.49
5000 1022 1010 982 970 987 1000 960 955 950 935 932 915 968.17 -4.90
6000 1050 1030 1010 995 1030 1030 975 960 960 935 945 925 987.08 -5.38
7000 1070 1055 1030 1006 1020 1035 985 980 960 965 955 935 999.67 -5.70
8000 1085 1080 1045 1020 1030 1055 995 990 987 965 975 945 1014.33 -6.07
9000 1104 1095 1057 1040 1070 1070 1005 995 995 987 980 955 1029.42 -6.46
10000 1120 1120 1080 1055 1072 1090 1010 1008 1000 995 985 960 1041.25 -6.76
12000 1175 1152 1110 1080 1098 1110 1028 1018 1015 1015 995 995 1065.92 -7.39

136
A3: D5-5G06016A-T7-W0 Add-Wet 50deg
Left Wheel (Sample No.) Center Wheel (Sample No.) Right Wheel (Sample No.)
Cycles 1 2 3 4 5 6
Average
Rut
Depth,
mm
25 540 526 510 510 530 522 524 526 505 510 517 522 520.17 0.00
250 562 556 530 538 562 566 541 550 560 562 560 558 553.75 -0.85
500 585 572 547 542 580 586 562 560 574 570 585 575 569.83 -1.26
1000 594 597 574 577 600 613 580 583 590 595 600 607 592.50 -1.84
2000 622 615 590 604 644 622 597 610 625 635 650 640 621.17 -2.57
3000 645 655 618 635 674 690 623 635 660 650 655 665 650.42 -3.31
4000 655 670 642 660 693 707 656 655 670 680 705 690 673.58 -3.90
5000 676 673 650 660 715 720 680 682 690 700 720 704 689.17 -4.29
6000 700 683 673 680 720 743 693 693 700 710 735 715 703.75 -4.66
7000 705 690 690 665 735 765 700 700 720 735 750 735 715.83 -4.97
8000 710 720 695 685 748 785 710 710 740 740 756 740 728.25 -5.29
9000 720 720 695 695 753 798 710 718 735 750 760 750 733.67 -5.42
10000 720 730 705 705 763 800 715 725 760 775 775 758 744.25 -5.69

137
A4: D5-5G06016A-T11-W Add-Wet 50deg
Left Wheel (Sample No.) Center Wheel (Sample No.) Right Wheel (Sample No.)
Cycles 7 8 9 10 11 12
Average
Rut
Depth,
mm
25 547 548 550 562 525 530 524 530 523 540 548 552 539.92 0.00
250 598 610 600 615 577 573 565 567 575 574 620 625 591.58 -1.31
500 630 635 645 635 605 595 588 590 575 595 660 660 617.75 -1.98
1000 667 675 675 677 630 625 620 625 610 635 705 700 653.67 -2.89
2000 715 715 735 705 677 660 660 678 658 665 775 760 700.25 -4.07
3000 753 763 767 735 698 699 680 694 680 692 805 795 730.08 -4.83
4000 770 775 795 775 700 702 700 714 684 708 835 830 749.00 -5.31
5000 790 800 802 780 703 722 710 718 698 735 870 850 764.83 -5.71
6000 810 820 845 807 725 740 725 735 718 750 910 880 788.75 -6.32
7000 838 840 858 818 735 755 740 745 730 765 920 910 804.50 -6.72
8000 857 858 880 840 745 770 750 760 738 768 967 942 822.92 -7.19
10000 895 890 920 885 780 795 777 790 770 785 1000 980 855.58 -8.02
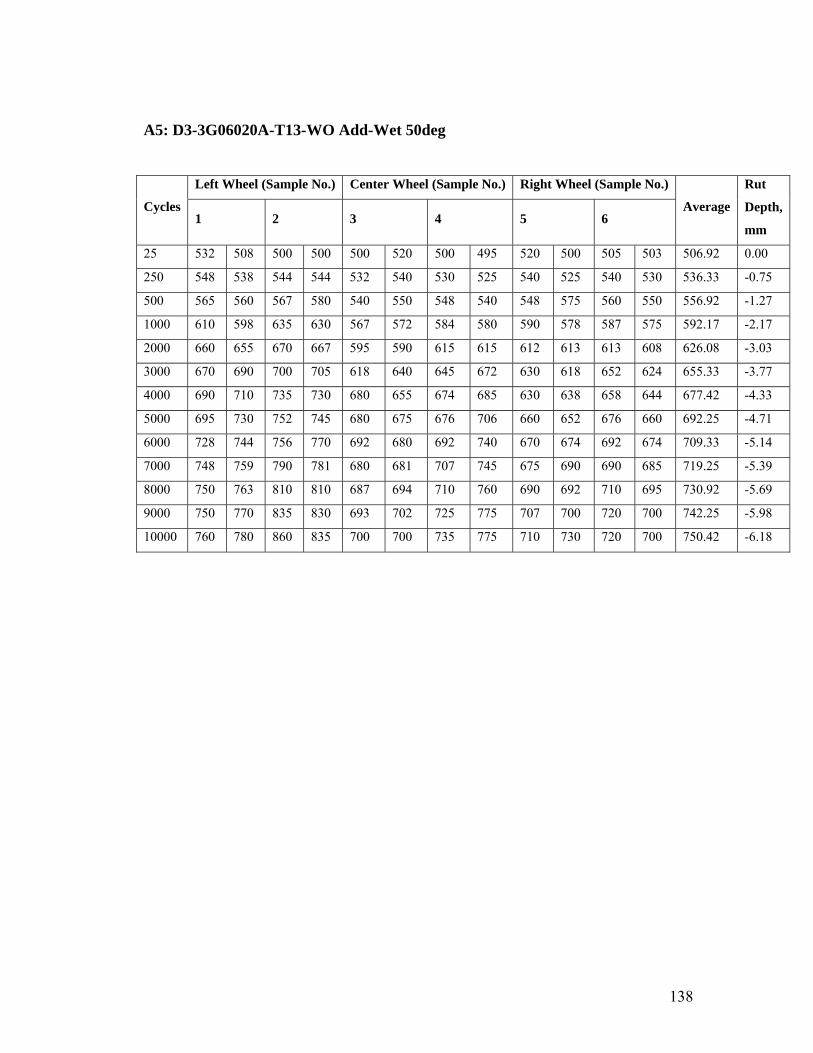
138
A5: D3-3G06020A-T13-WO Add-Wet 50deg
Left Wheel (Sample No.) Center Wheel (Sample No.) Right Wheel (Sample No.)
Cycles 1 2 3 4 5 6
Average
Rut
Depth,
mm
25 532 508 500 500 500 520 500 495 520 500 505 503 506.92 0.00
250 548 538 544 544 532 540 530 525 540 525 540 530 536.33 -0.75
500 565 560 567 580 540 550 548 540 548 575 560 550 556.92 -1.27
1000 610 598 635 630 567 572 584 580 590 578 587 575 592.17 -2.17
2000 660 655 670 667 595 590 615 615 612 613 613 608 626.08 -3.03
3000 670 690 700 705 618 640 645 672 630 618 652 624 655.33 -3.77
4000 690 710 735 730 680 655 674 685 630 638 658 644 677.42 -4.33
5000 695 730 752 745 680 675 676 706 660 652 676 660 692.25 -4.71
6000 728 744 756 770 692 680 692 740 670 674 692 674 709.33 -5.14
7000 748 759 790 781 680 681 707 745 675 690 690 685 719.25 -5.39
8000 750 763 810 810 687 694 710 760 690 692 710 695 730.92 -5.69
9000 750 770 835 830 693 702 725 775 707 700 720 700 742.25 -5.98
10000 760 780 860 835 700 700 735 775 710 730 720 700 750.42 -6.18
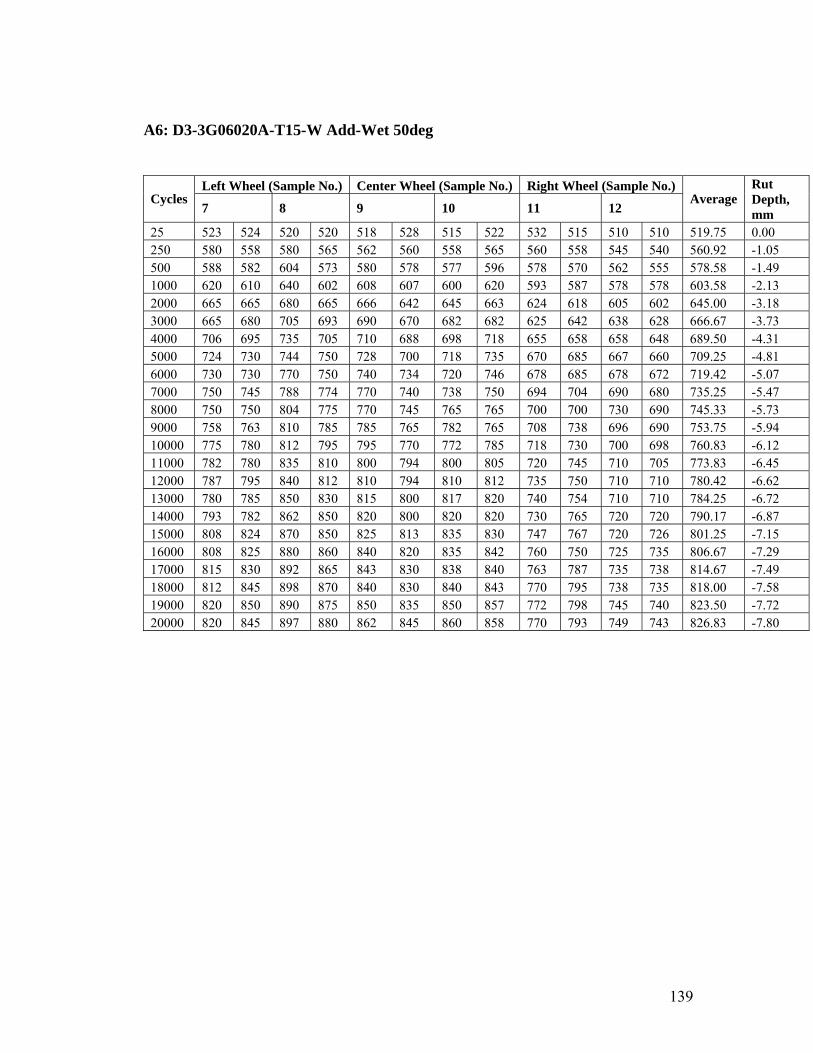
139
A6: D3-3G06020A-T15-W Add-Wet 50deg
Left Wheel (Sample No.) Center Wheel (Sample No.) Right Wheel (Sample No.) Cycles
7 8 9 10 11 12 Average
Rut Depth, mm
25 523 524 520 520 518 528 515 522 532 515 510 510 519.75 0.00 250 580 558 580 565 562 560 558 565 560 558 545 540 560.92 -1.05 500 588 582 604 573 580 578 577 596 578 570 562 555 578.58 -1.49 1000 620 610 640 602 608 607 600 620 593 587 578 578 603.58 -2.13 2000 665 665 680 665 666 642 645 663 624 618 605 602 645.00 -3.18 3000 665 680 705 693 690 670 682 682 625 642 638 628 666.67 -3.73 4000 706 695 735 705 710 688 698 718 655 658 658 648 689.50 -4.31 5000 724 730 744 750 728 700 718 735 670 685 667 660 709.25 -4.81 6000 730 730 770 750 740 734 720 746 678 685 678 672 719.42 -5.07 7000 750 745 788 774 770 740 738 750 694 704 690 680 735.25 -5.47 8000 750 750 804 775 770 745 765 765 700 700 730 690 745.33 -5.73 9000 758 763 810 785 785 765 782 765 708 738 696 690 753.75 -5.94 10000 775 780 812 795 795 770 772 785 718 730 700 698 760.83 -6.12 11000 782 780 835 810 800 794 800 805 720 745 710 705 773.83 -6.45 12000 787 795 840 812 810 794 810 812 735 750 710 710 780.42 -6.62 13000 780 785 850 830 815 800 817 820 740 754 710 710 784.25 -6.72 14000 793 782 862 850 820 800 820 820 730 765 720 720 790.17 -6.87 15000 808 824 870 850 825 813 835 830 747 767 720 726 801.25 -7.15 16000 808 825 880 860 840 820 835 842 760 750 725 735 806.67 -7.29 17000 815 830 892 865 843 830 838 840 763 787 735 738 814.67 -7.49 18000 812 845 898 870 840 830 840 843 770 795 738 735 818.00 -7.58 19000 820 850 890 875 850 835 850 857 772 798 745 740 823.50 -7.72 20000 820 845 897 880 862 845 860 858 770 793 749 743 826.83 -7.80

140
A7: D6-6G06011A-T18-WO ADD-Wet 50 deg
Left Wheel (Sample No.) Center Wheel (Sample No.) Right Wheel (Sample No.)
Cycles 1 2 3 4 5 6
Average
Rut
Depth,
mm
25 410 405 405 425 448 445 438 460 429 410 406 415 426.00 0.00
250 425 422 418 440 463 460 445 474 435 410 410 430 437.00 -0.28
500 425 425 430 450 475 460 450 474 435 410 420 435 442.18 -0.41
1000 440 430 440 465 485 460 453 495 438 418 440 450 452.18 -0.67
2000 445 445 457 485 487 480 480 505 438 420 444 448 462.64 -0.93
3000 453 445 460 505 505 488 490 510 443 435 460 460 472.82 -1.19
4000 453 445 460 520 510 490 496 518 450 440 480 467 479.64 -1.36
5000 462 455 470 530 520 500 495 525 455 450 485 484 488.09 -1.58
6000 462 457 475 540 525 498 508 535 460 455 495 490 494.36 -1.74
7000 465 460 475 540 540 504 515 535 474 455 494 490 498.36 -1.84
8000 468 464 478 550 545 500 520 545 498 454 500 498 504.73 -2.00
9000 472 469 488 550 547 508 520 547 525 455 504 504 510.64 -2.15
10000 475 469 480 558 554 508 525 560 517 457 510 510 513.45 -2.22
11000 480 465 485 555 560 520 534 570 525 470 510 512 518.73 -2.36
12000 480 470 490 565 565 520 540 580 520 470 514 512 522.36 -2.45
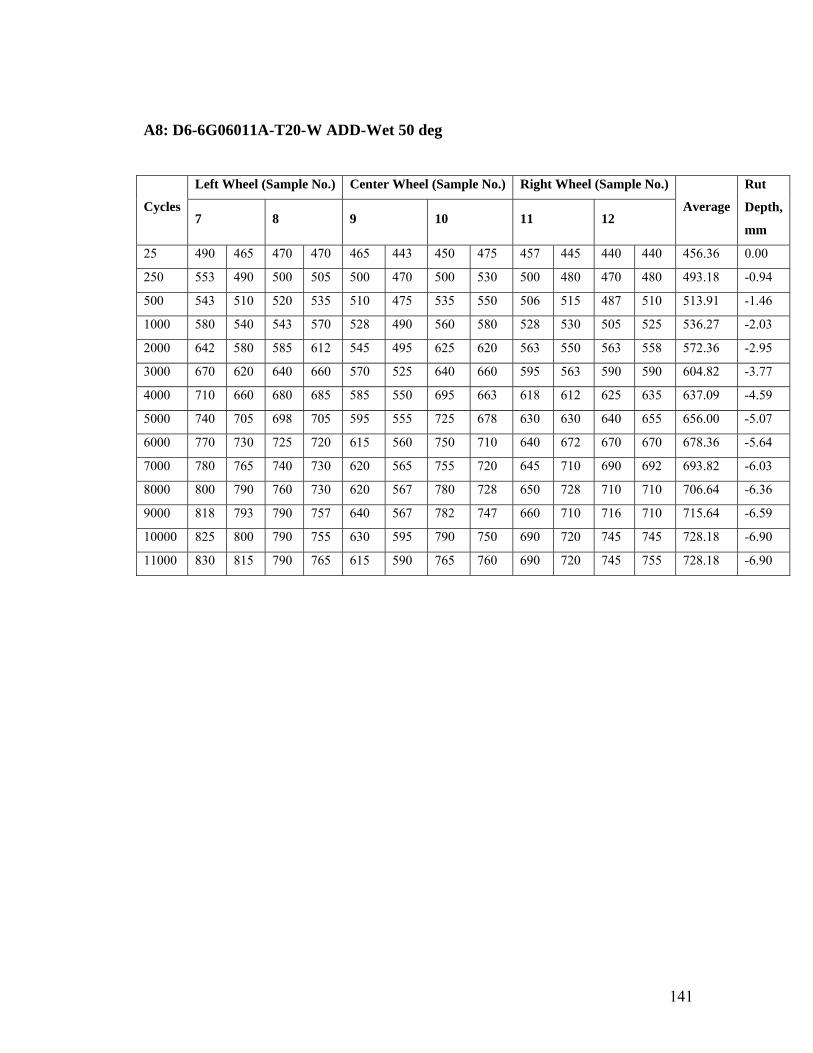
141
A8: D6-6G06011A-T20-W ADD-Wet 50 deg
Left Wheel (Sample No.) Center Wheel (Sample No.) Right Wheel (Sample No.)
Cycles 7 8 9 10 11 12
Average
Rut
Depth,
mm
25 490 465 470 470 465 443 450 475 457 445 440 440 456.36 0.00
250 553 490 500 505 500 470 500 530 500 480 470 480 493.18 -0.94
500 543 510 520 535 510 475 535 550 506 515 487 510 513.91 -1.46
1000 580 540 543 570 528 490 560 580 528 530 505 525 536.27 -2.03
2000 642 580 585 612 545 495 625 620 563 550 563 558 572.36 -2.95
3000 670 620 640 660 570 525 640 660 595 563 590 590 604.82 -3.77
4000 710 660 680 685 585 550 695 663 618 612 625 635 637.09 -4.59
5000 740 705 698 705 595 555 725 678 630 630 640 655 656.00 -5.07
6000 770 730 725 720 615 560 750 710 640 672 670 670 678.36 -5.64
7000 780 765 740 730 620 565 755 720 645 710 690 692 693.82 -6.03
8000 800 790 760 730 620 567 780 728 650 728 710 710 706.64 -6.36
9000 818 793 790 757 640 567 782 747 660 710 716 710 715.64 -6.59
10000 825 800 790 755 630 595 790 750 690 720 745 745 728.18 -6.90
11000 830 815 790 765 615 590 765 760 690 720 745 755 728.18 -6.90

142
A9: D6-6G06016A-T28-WO Add-Wet 50 deg
Left Wheel (Sample No.) Center Wheel (Sample No.) Right Wheel (Sample No.)
Cycles 1 2 3 4 5 6
Average
Rut
Depth,
mm
25 495 496 480 490 490 485 480 490 481 490 485 482 486.27 0.00
250 512 508 492 495 500 492 495 504 480 490 515 495 496.91 -0.27
500 512 512 495 500 500 495 500 528 495 493 540 495 504.82 -0.47
1000 515 500 495 500 500 500 498 525 498 495 540 498 504.45 -0.46
2000 520 505 520 505 504 510 505 520 498 495 550 500 510.18 -0.61
3000 520 507 515 510 511 510 505 518 500 495 550 510 511.91 -0.65
5000 525 510 530 525 510 518 508 520 515 504 560 518 519.82 -0.85
7000 535 518 530 535 526 524 518 525 525 512 570 522 527.73 -1.05
8000 535 528 538 540 528 526 520 525 525 512 570 520 530.18 -1.12
10000 535 528 540 541 537 534 520 525 525 512 580 525 533.36 -1.20
12000 538 530 540 540 535 535 530 530 525 515 580 530 535.45 -1.25

143
A 10: D6-6G06016A-T30-W Add-Wet 50 deg
Left Wheel (Sample No.) Center Wheel (Sample No.) Right Wheel (Sample No.)
Cycles 7 8 9 10 11 12
Average
Rut
Depth,
mm
25 485 485 500 480 492 500 482 482 481 478 482 483 485.83 0.00
250 502 491 501 489 499 510 495 490 487 482 486 485 493.08 -0.18
1000 472 485 475 470 480 485 482 495 482 485 500 485 500.00 -0.36
2000 478 490 490 487 500 515 515 518 490 490 518 508 516.92 -0.79
3000 490 498 490 488 503 505 510 510 490 492 515 505 516.67 -0.78
4000 491 498 495 488 520 515 510 517 490 498 516 504 520.50 -0.88
5000 492 498 495 488 500 530 525 545 490 500 515 505 523.92 -0.97
6000 490 502 495 490 510 520 515 535 495 505 530 520 525.92 -1.02
7000 493 500 497 508 510 535 515 535 493 498 522 510 526.67 -1.04
8000 495 505 505 510 535 535 520 537 495 505 520 518 532.00 -1.17
10000 495 505 502 512 535 538 520 540 495 505 518 520 532.42 -1.18
12000 495 503 502 512 535 540 525 540 495 505 515 520 532.58 -1.19
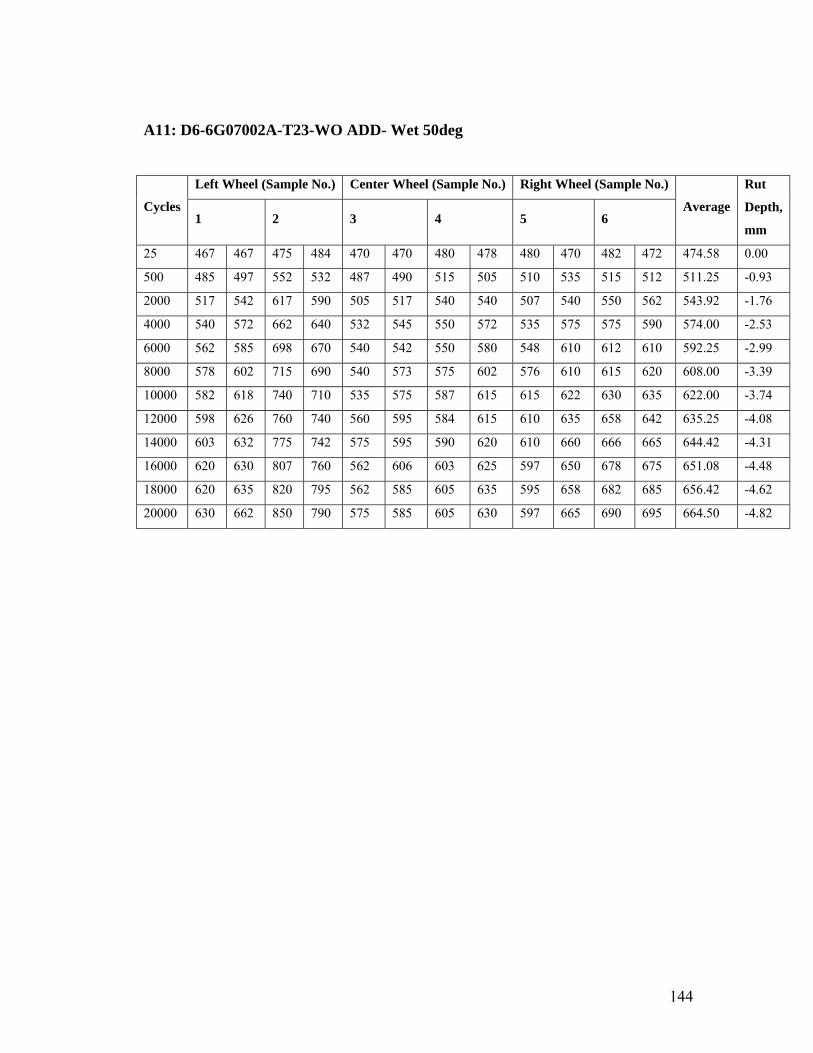
144
A11: D6-6G07002A-T23-WO ADD- Wet 50deg
Left Wheel (Sample No.) Center Wheel (Sample No.) Right Wheel (Sample No.)
Cycles 1 2 3 4 5 6
Average
Rut
Depth,
mm
25 467 467 475 484 470 470 480 478 480 470 482 472 474.58 0.00
500 485 497 552 532 487 490 515 505 510 535 515 512 511.25 -0.93
2000 517 542 617 590 505 517 540 540 507 540 550 562 543.92 -1.76
4000 540 572 662 640 532 545 550 572 535 575 575 590 574.00 -2.53
6000 562 585 698 670 540 542 550 580 548 610 612 610 592.25 -2.99
8000 578 602 715 690 540 573 575 602 576 610 615 620 608.00 -3.39
10000 582 618 740 710 535 575 587 615 615 622 630 635 622.00 -3.74
12000 598 626 760 740 560 595 584 615 610 635 658 642 635.25 -4.08
14000 603 632 775 742 575 595 590 620 610 660 666 665 644.42 -4.31
16000 620 630 807 760 562 606 603 625 597 650 678 675 651.08 -4.48
18000 620 635 820 795 562 585 605 635 595 658 682 685 656.42 -4.62
20000 630 662 850 790 575 585 605 630 597 665 690 695 664.50 -4.82

145
A 12: D6-6G07002A-T25-W ADD- Wet 50deg
Left Wheel (Sample No.) Center Wheel (Sample No.) Right Wheel (Sample No.)
Cycles 7 8 9 10 11 12
Average
Rut
Depth,
mm
25 463 483 485 500 493 498 494 498 507 498 490 505 492.83 0.00
500 524 526 525 512 498 508 518 508 526 530 535 532 520.17 -0.69
2000 580 585 587 575 530 535 522 515 552 560 570 562 556.08 -1.61
4000 610 635 644 630 545 558 565 560 572 584 610 580 591.08 -2.50
6000 630 640 655 640 565 575 577 575 592 618 619 590 606.33 -2.88
8000 640 638 672 664 567 590 587 584 603 630 630 591 616.33 -3.14
10000 648 652 695 678 588 597 595 587 600 645 665 615 630.42 -3.49
12000 662 670 707 687 590 607 604 615 604 650 670 625 640.92 -3.76
14000 680 700 720 710 600 610 602 632 615 660 675 635 653.25 -4.07
16000 690 715 738 710 607 620 614 650 614 665 684 644 662.58 -4.31
18000 687 705 780 720 610 625 610 640 617 670 687 644 666.25 -4.40
20000 694 705 784 740 615 640 610 620 630 665 687 670 671.67 -4.54

146
A 13: D6-6G07002A-K1-WO Add-Wet 50deg
Left Wheel (Sample No.) Center Wheel (Sample No.) Right Wheel (Sample No.)
Cycles 1 2 3 4 5 6
Average
Rut
Depth,
mm
25 752 754 750 751 750 750 748 762 757 750 747 758 752.42 0.00
250 795 801 830 815 776 770 780 780 778 768 770 800 788.58 -0.92
500 822 818 843 825 788 782 806 818 785 795 802 815 808.25 -1.42
1000 845 842 860 853 810 812 840 834 800 810 820 830 829.67 -1.96
2000 892 895 935 950 860 870 910 910 825 845 870 908 889.17 -3.47
4000 915 920 935 950 887 895 930 872 837 882 880 905 900.67 -3.77
6000 920 925 940 940 895 890 935 900 845 878 880 897 903.75 -3.84
8000 940 960 955 980 930 935 957 920 860 915 908 930 932.50 -4.57
9000 995 1004 990 1010 935 950 960 930 855 950 915 950 953.67 -5.11
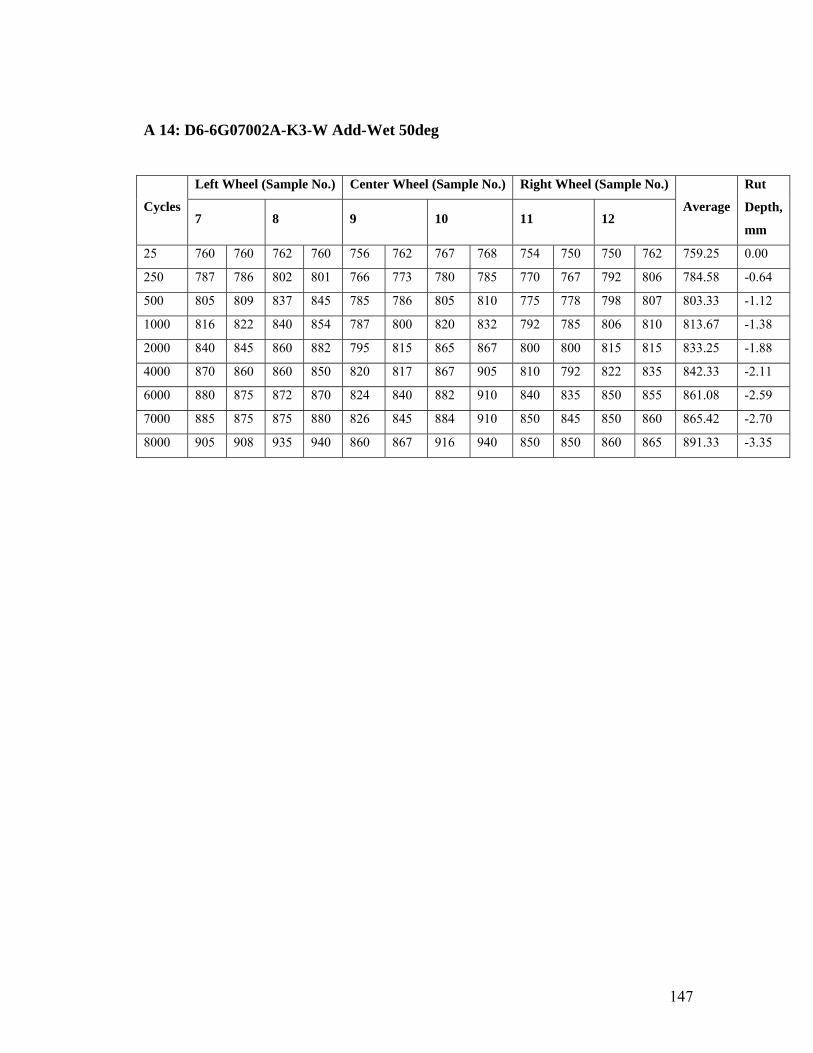
147
A 14: D6-6G07002A-K3-W Add-Wet 50deg
Left Wheel (Sample No.) Center Wheel (Sample No.) Right Wheel (Sample No.)
Cycles 7 8 9 10 11 12
Average
Rut
Depth,
mm
25 760 760 762 760 756 762 767 768 754 750 750 762 759.25 0.00
250 787 786 802 801 766 773 780 785 770 767 792 806 784.58 -0.64
500 805 809 837 845 785 786 805 810 775 778 798 807 803.33 -1.12
1000 816 822 840 854 787 800 820 832 792 785 806 810 813.67 -1.38
2000 840 845 860 882 795 815 865 867 800 800 815 815 833.25 -1.88
4000 870 860 860 850 820 817 867 905 810 792 822 835 842.33 -2.11
6000 880 875 872 870 824 840 882 910 840 835 850 855 861.08 -2.59
7000 885 875 875 880 826 845 884 910 850 845 850 860 865.42 -2.70
8000 905 908 935 940 860 867 916 940 850 850 860 865 891.33 -3.35

148
A 15: D6-6G07002A-K2-WO Add- Wet 60 deg
Left Wheel (Sample No.) Center Wheel (Sample No.) Right Wheel (Sample No.)
Cycles 1 2 3 4 5 6
Average
Rut
Depth,
mm
25 520 510 520 535 502 498 515 520 516 505 492 503 511.33 0.00
250 580 595 580 585 518 535 580 580 540 535 515 538 556.75 -1.15
500 607 630 598 595 540 572 608 610 568 580 545 548 583.42 -1.83
1000 640 668 635 625 575 618 640 645 575 600 565 568 612.83 -2.58
2000 685 705 680 665 603 668 685 680 605 602 570 608 646.33 -3.43
3000 718 740 720 715 650 705 712 706 625 618 618 630 679.75 -4.28
4000 738 778 732 730 676 715 740 720 648 640 630 640 698.92 -4.76
5000 762 780 762 770 682 730 758 746 660 660 630 655 716.25 -5.20
6000 785 820 790 820 690 752 776 765 670 680 640 670 738.17 -5.76
7000 800 890 795 830 710 765 795 778 698 693 650 682 757.17 -6.24
8000 835 930 832 832 740 778 810 790 685 704 660 695 774.25 -6.68
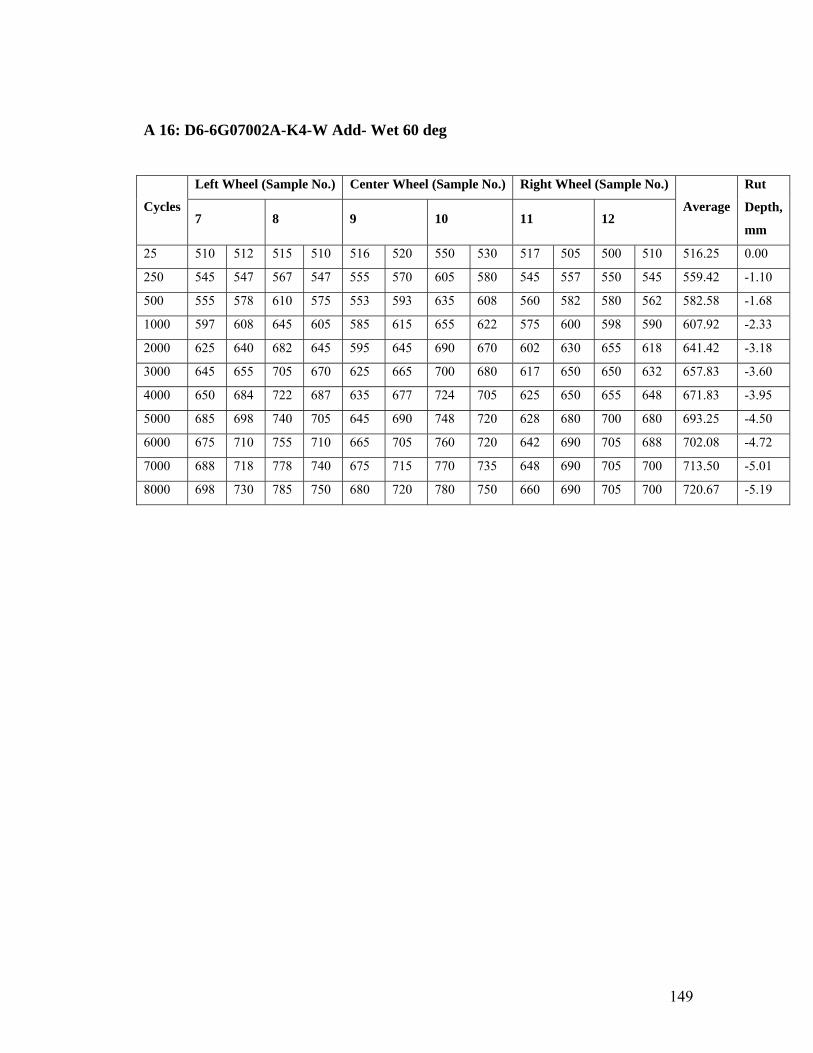
149
A 16: D6-6G07002A-K4-W Add- Wet 60 deg
Left Wheel (Sample No.) Center Wheel (Sample No.) Right Wheel (Sample No.)
Cycles 7 8 9 10 11 12
Average
Rut
Depth,
mm
25 510 512 515 510 516 520 550 530 517 505 500 510 516.25 0.00
250 545 547 567 547 555 570 605 580 545 557 550 545 559.42 -1.10
500 555 578 610 575 553 593 635 608 560 582 580 562 582.58 -1.68
1000 597 608 645 605 585 615 655 622 575 600 598 590 607.92 -2.33
2000 625 640 682 645 595 645 690 670 602 630 655 618 641.42 -3.18
3000 645 655 705 670 625 665 700 680 617 650 650 632 657.83 -3.60
4000 650 684 722 687 635 677 724 705 625 650 655 648 671.83 -3.95
5000 685 698 740 705 645 690 748 720 628 680 700 680 693.25 -4.50
6000 675 710 755 710 665 705 760 720 642 690 705 688 702.08 -4.72
7000 688 718 778 740 675 715 770 735 648 690 705 700 713.50 -5.01
8000 698 730 785 750 680 720 780 750 660 690 705 700 720.67 -5.19

150
A 17: D6-6G07002A-K5-WO Add- Dry 60 deg
Left Wheel (Sample No.) Center Wheel (Sample No.) Right Wheel (Sample No.)
Cycles 1 2 3 4 5 6
Average
Rut
Depth,
mm
25 499 500 506 500 500 508 500 510 500 495 505 495 501.50 0.00
500 585 605 605 595 540 585 585 590 570 580 570 585 582.92 -2.07
2000 680 690 695 690 600 665 690 660 600 605 625 670 655.83 -3.92
4000 740 760 800 820 670 730 755 715 645 695 675 715 726.67 -5.72
6000 795 785 840 855 670 785 805 765 695 750 735 770 770.83 -6.84
8000 880 920 875 860 700 820 860 820 730 810 760 805 820.00 -8.09
10000 930 940 930 980 780 860 905 860 775 845 815 845 872.08 -9.41

151
A 18: D6-6G07002A-K7-W Add- Dry 60 deg
Left Wheel (Sample No.) Center Wheel (Sample No.) Right Wheel (Sample No.)
Cycles 7 8 9 10 11 12
Average
Rut
Depth,
mm
25 510 505 512 505 510 515 518 510 510 500 510 520 510.42 0.00
500 545 558 558 575 535 545 550 535 545 560 550 545 550.08 -1.01
2000 595 625 628 575 580 610 595 570 625 615 620 603.45 -2.36
4000 635 670 625 655 640 600 635 630 595 675 670 685 642.92 -3.37
6000 665 698 715 700 665 670 675 675 620 670 715 720 682.33 -4.37
8000 685 720 740 730 690 718 700 705 635 730 755 775 715.25 -5.20
10000 708 745 750 750 720 718 718 722 665 755 785 805 736.75 -5.75

152
A 19: D6-6G07002A-K6-WO Add- Dry 50 deg
Left Wheel (Sample No.) Center Wheel (Sample No.) Right Wheel (Sample No.)
Cycles 1 2 3 4 5 6
Average
Rut
Depth,
mm
25 493 485 486 510 515 495 485 485 480 482 480 480 489.67 0.00
500 510 492 510 515 520 510 500 502 490 490 487 495 501.75 -0.31
2000 528 520 532 538 530 528 515 515 500 505 498 502 517.58 -0.71
4000 548 545 566 552 545 548 526 526 502 507 505 510 531.67 -1.07
6000 570 575 598 585 565 570 540 545 510 515 515 525 551.08 -1.56
8000 587 597 620 608 585 590 555 550 515 523 530 540 566.67 -1.96
10000 590 608 632 625 602 605 570 578 520 530 540 550 579.17 -2.27
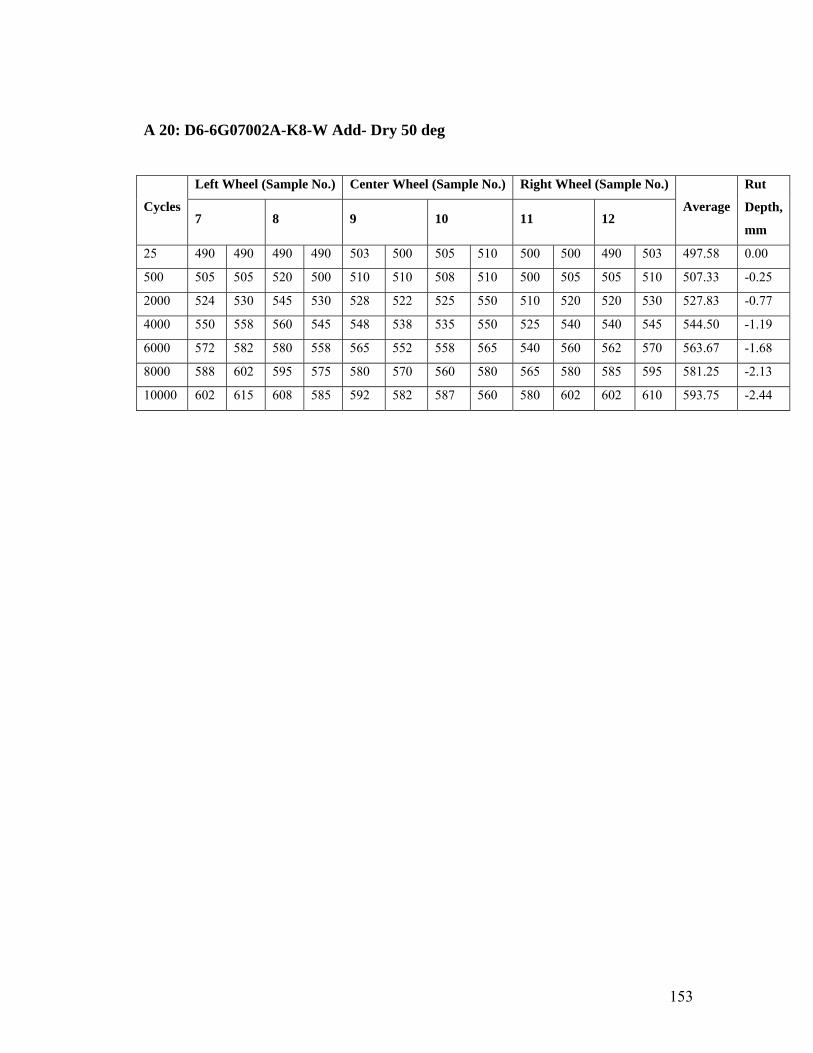
153
A 20: D6-6G07002A-K8-W Add- Dry 50 deg
Left Wheel (Sample No.) Center Wheel (Sample No.) Right Wheel (Sample No.)
Cycles 7 8 9 10 11 12
Average
Rut
Depth,
mm
25 490 490 490 490 503 500 505 510 500 500 490 503 497.58 0.00
500 505 505 520 500 510 510 508 510 500 505 505 510 507.33 -0.25
2000 524 530 545 530 528 522 525 550 510 520 520 530 527.83 -0.77
4000 550 558 560 545 548 538 535 550 525 540 540 545 544.50 -1.19
6000 572 582 580 558 565 552 558 565 540 560 562 570 563.67 -1.68
8000 588 602 595 575 580 570 560 580 565 580 585 595 581.25 -2.13
10000 602 615 608 585 592 582 587 560 580 602 602 610 593.75 -2.44
Related Documents