DEVELOPMENT OF A MINI RACE BOAT POWERED BY SOLAR MUHAMMAD FARIS BIN FADZIL UNIVERSITI TEKNIKAL MALAYSIA MELAKA

Welcome message from author
This document is posted to help you gain knowledge. Please leave a comment to let me know what you think about it! Share it to your friends and learn new things together.
Transcript

DEVELOPMENT OF A MINI RACE BOAT POWERED BY SOLAR
MUHAMMAD FARIS BIN FADZIL
UNIVERSITI TEKNIKAL MALAYSIA MELAKA

MU
HD
. FA
RIS
BIN
FA
DZ
IL B
AC
HE
LO
R O
F M
EC
HA
NIC
AL
EN
G. (T
HE
RM
AL
-FL
UID
) (HO
NS
.) 2012 U
TeM

DEVELOPMENT OF A MINI RACE BOAT POWERED BY SOLAR
MUHAMMAD FARIS BIN FADZIL
This report is submitted in order to fulfill a part of the requirements for award of
Degree in Bachelor of Mechanical Engineering (Thermal-Fluid)
Faculty of Mechanical Engineering
Universiti Teknikal Malaysia Melaka
JULY 2012

“I hereby declared that I have read this thesis, and in my opinion, this thesis is
sufficient in terms of scope and quality for achieving award of
Degree in Bachelor of Mechanical Engineering (Thermal-Fluid)”
Signature : ………………………………..
Supervisor : En. Imran Syakir bin Mohamad
Date : ………………………………..

“I hereby declared that this report and all that comes with it is my own work, except
the ideas and summaries in which I have clarified their sources”
Signature : …………………………….
Author : Muhammad Faris bin Fadzil
Date : …………………………….

Special dedication is dedicated to my family, supervisor, lecturers, friends and all others that
aid me in completing this thesis.

xiii
ACKNOWLEDGEMENT
Alhamdulillah, I am most grateful to Allah Almighty for His small gift in
blessing, health and kindness that has allowed me to perform and successfully complete
this thesis in time.
Tons of thank and appreciation to my former supervisor, En. Mohd Afzanizam
bin Mohd Rosli and my current supervisor, En. Imran Syakir bin Mohamad for his
continuous support and assistance, relentless guidance and lots of advice and
encouragement along the way of completing this progress report.
Also, I would like to thank my fellow classmates and students in which without
them, my work won’t go as smoothly as needs be. My appreciation to all of you knows
no boundaries.
Last but not least, I would like to thank my family members, especially my
parents, and close friends, also to the Assistant Director of National Science Centre for
the organization’s aid and encouragement during completing this thesis.
xiii
ABSTRACT
The project is about research of the usage of photovoltaic cells for use in a direct
current circuit, which are then attached to a mini prototype boat that is to be tested and
run in water, and based on yearly competition of solar-powered boat that is held in
National Science Centre.
Several boat prototypes are designed using the Computer Aided Design (CAD)
software that is abundance in designing technology. Such software is SolidWorks 2008,
CATIA V6 and Autodesk Inventor Professional 2010, whereby the main software that is
applied for drawings in this research is Autodesk Inventor software. The solar boat is
then fabricated and tested for it to meet the criteria of best design through analysis done.
Tests are conducted using Computational Fluid Dynamics (CFD) software,
which analyzes the overall fluid flow around the models tested. The models is then
constructed using the materials and correct tools for it to achieve the proper flow
properties as analyzed, which is then attached with the purposed solar circuits.
The results of flow analysis using CFD software is recorded between three
purposed designs, which are RB1, RB2 and RB3. It is concluded that the best design is
RB3 by referring to the drag coefficient of CFD analysis. Solar circuit designs are also
concluded to be using 6.0 V solar panel pairings for maximum voltage and current
generated. Combined together, this can produce the best mini race boat that moves using
solar power, and is able to achieve estimated target time of 36.6 second, which is ahead
of previous year’s winning record time.

xiii
ABSTRAK
Projek ini adalah berdasarkan penggunaan sel berkuasa solar yang akan
diaplikasikan dalam sesuatu litar arus terus, yang dimana kemudiannya akan
disambungkan pada bot prototaip yang akan diuji dan dijalankan atas air berdasarkan
pertandingan bot berkuasa solar yang dianjurkan di Pusat Sains Negara setiap tahun.
Beberapa bot prototaip telah direka bentuk dengan menggunakan perisian
Lukisan Berbantu Komputer (CAD) yang banyak terdapat dalam teknologi lukisan.
Contoh-contoh bagi perisian tersebut adalah SolidWorks 2008, CATIA V6 dan
Autodesk Inventor Professional 2010, dan dilukis terutamanya dengan menggunakan
perisian Autodesk Inventor dalam penyelidikan ini. Bot berkuasa solar ini
kemudiannya difabrikasi dan diuji agar ia memenuhi criteria rekabentuk terbaik dari
segi analisa yang akan dijalankan.
Ujian-ujian yang dijalankan adalah dengan menggunakan perisian
Perkomputeran Dinamik Bendalir (CFD), dimana ia berupaya menganalisa segala
peraliran bendalir disekeliling model yang diuji. Model yang dipilih ini kemudiannya
dibina dengan menggunakan bahan-bahan dan peralatan yang sesuai agar ia dapat
mencapai pengalian yang baik seperti yang dianalisa, dan kemudiannya
disambungkan dengan litar solar yang dipilih.
Keputusan yang didapati daripada analisa pengaliran bendalir dengan
menggunakan perisian CFD direkodkan antara tiga rekabentuk, iaitu RB1, RB2 dan
RB3. Konklusi dibuat berdasarkan pekali seretan didalam analisa CFD, dimana
rekabentuk RB3 telah dipilih. Rekabentuk litar solar disimpulkan agar dipilih panel
berkembar berkuasa 6.0 V untuk menghasilkan voltan dan arus maksima.
Digabungkan kedua-duanya, ini mampu menghasilkan bot lumba mini berkuasa solar
yang bagus dan mencapai masa 36.6 saat, lebih laju dari masa yang direkodkan oleh
pemenang tahun-tahun sebelumnya.

xiii
CONTENT
CHAPTER TITLE PAGE
ACKNOWLEDGEMENT i
ABSTRACT ii
ABSTRAK iii
TABLE OF CONTENT iv
LIST OF TABLES vii
LIST OF FIGURES ix
LIST OF SYMBOLS xii
LIST OF APPENDICES xiii
CHAPTER 1 INTRODUCTION
1.1 Background 1
1.2 Objective 3
1.3 Scope 4
1.4 Problem Statement 5
xiii
CHAPTER TITLE PAGE
CHAPTER 2 LITERATURE REVIEW
2.1 Materials of Photovoltaic Panel 6
2.2 Categorization of Solar Panels 10
2.2.1 Mono-crystalline Solar panel 10
2.2.2 Poly-crystalline Solar panel 12
2.2.3 Amorphous Solar Panel 13
2.2.4 Thin-film Solar Panel 14
2.2.5 Latest Panel Technology 15
CHAPTER 3 METHODOLOGY
3.1 Flow Chart 19
3.2 Gantt Chart 21
3.3 Mini Boat Design 23
3.4 Solar Electronic Circuit 32
CHAPTER 4 RESULTS
4.1 Results for the Mini Race Boat 35
4.2 Results for Electronic Solar Circuit 38
4.3 Results for Mini Solar Race Boat 47

xiii
CHAPTER TITLE PAGE
CHAPTER 5 DISCUSSION 49
CHAPTER 6 CONCLUSION AND RECOMMENDATION
6.1 Conclusion 54
6.2 Recommendation 55
REFERENCES 56
APPENDICES 59

xiii
LIST OF TABLES
NO. TITLE PAGE
2.1 Thermal conductivity of materials usually
considered for construction of PV panels 9
(Source: Solar Collector and Panels, Reccab
M. Ochieng, 2010)
2.2 Production Capacities of Various PV Technologies
in 2002 (Source: Renewable Energy World, 16
Montgomery J., 2003)
3.1 Gantt Chart for PSM 1 21
3.2 Gantt Chart for PSM 2 22
3.3 Proposal of Required Components in Assembling a 32
Solar Circuit
4.1 Table of Drag Coefficient for Boat Designs 37
4.2 Voltage and Current analysis of set of 6.0 V Solar Panel 39
4.3 Theoretical Values of Voltage and Current 41
4.4 Readings of a 7.5 V Solar Panel 43
4.5 Readings of a pairing of 6.0 V Solar Panels 44
4.6 Readings of a 5.0 V Solar Panel 45

xiii
4.7 Competition Winners for 2011 Mini Solar Race Boat 47
(Source: MyRobotz Enterprise, 2011)
4.8 Obtained Results for Design Model RB2 and Design 48
Model RB3
5.1 Table of Items Price List for Solar Electronic Circuit 53

xiii
LIST OF FIGURES
NO. TITLE PAGE
1.1 The photovoltaic effect experiment
(Source: Solar Power in Building Design, 2
Gevorkian P., 2009)
1.2 The electronic work flow of the circuit 2
2.1 Periodic Table of Elements (Source:
The Physics of Solar Cells, Nelson J., 2003) 6
2.2 Concept of the electron flow in an N-P-N transistor
(Source: Solar Power in Building Design, 8
Gevorkian P., 2009)
2.3 Comparisons between mono-crystalline and
poly-crystalline panel (Source: National Science 17
Center, Kuala Lumpur)
2.4 Comparisons between poly-crystalline and
amorphous panel (Source: National Science 18
Center, Kuala Lumpur)
3.1 The Flow Work of the Project 20

xiii
3.2 Ark-Concept of Mini Race Boat 23
3.3 Hovercraft-Concept of Mini Race Boat 23
3.4 Barge-Concept of Mini Race Boat 24
3.5 Detail Drawing of Mini Boat Design RB1 25
3.6 Detail Drawing of Mini Boat Design RB2 26
3.7 Detail Drawing of Mini Boat Design RB3 27
3.8 Fabrication of Design RB1 (just after taken out of 29
Fabrication Machine)
3.9 Fabrication of Design RB2 (after residues of plastic is 29
removed)
3.10 Fabrication of Design RB3 (after residues of plastic is 30
removed)
3.11 Florist’s sponge 30
3.12 Polystyrene 31
3.13 Fan blade; and other miscellaneous items 31
3.14 Two different types of wires used 33
3.15 A Two-Way Switch 34
3.16 A Soldering Iron 34
4.1 Sample Velocity Streamline of CFD Analysis 35
4.2 Sample Pressure Contour of CFD Analysis 36
4.3 Drag Coefficient of Benchmark Prototype Analysis 36
4.4 Electronic circuit of solar panel 38
xiii
4.5 4 pieces of 6.0 V solar panels, or 2 pairs (7.4 cm 39
X 4.5 cm) each
4.6 A 7.5 V solar panel (15 cm X 8.5 cm) 41
4.7 A 5.0 V solar panel (11cm X 5.5 cm) 41
4.8 A multi-meter used to record readings of voltage and 42
current currently passing through a circuit
4.9 The mini solar boat before the electronic circuit is 47
attached atop of it
5.1 Graph of Voltage Generated, V according to Time of 49
Data Measured
5.2 Graph of Current Generated, I according to Time of 50
Data Measured
5.3 A Sample of 3.0 V motor 51
5.4 A Sample of 5.9 V motor 51
5.5 A Sample of 9.0 V motor 51
5.6 A Sample of 12.0 V motor 52
xiii
LIST OF SYMBOLS
I = Current, Ampere (A)
V = Voltage, Volt (V)
R = Resistance, Ohm (Ω)
P = Power, Watt (W)

xiii
LIST OF APPENDICES
NO. TITLE PAGE
A Solar Boat Race Competition 2011 59
B Amphibious Solar Vehicle Open Category 2012 63

1
CHAPTER 1
INTRODUCTION
1.1 Background
Solar, or photovoltaic (PV), cells are electronic devices that essentially
convert the solar energy of sunlight into electric energy or electricity. The physics of
solar cells is based on the same semiconductor principles as diodes and transistors,
from which it form the building blocks of the entire world of electronics.
Solar cells convert energy as long as there is sunlight. In the evenings and
during cloudy conditions, the conversion process diminishes. It stops completely at
dusk and resumes at dawn. Solar cells do not store electricity, but batteries can be
used to store the energy.
One of the most fascinating aspects of solar cells is their ability to convert the
most abundant and free form of energy into electricity, without moving parts or
components and without producing any adverse forms of pollution that affect the
ecology, as is associated with most known forms of nonrenewable energy production
methods, such as fossil fuel, hydroelectric, or nuclear energy plants.

2
Figure 1.1: The photovoltaic effect experiment
(Source: Solar Power in Building Design, Gevorkian P., 2009)
The solar energy obtained from the photovoltaic panels is used to power up,
per circuit flow, the mechanical components in the boat’s circuit. The flow of the
generated electricity in the circuit itself will move and work according to the flow:-
Figure 1.2: The electronic work flow of the circuit
3
The main body of the mini boat itself must be able to move through the water.
The criteria that are needed to accomplish this are by adjusting the necessary
specifications involving:-
• Low drag coefficient
• Aerodynamic properties of boat’s body
• Stable, lightweight and durable
1.2 Objective
The objective of this project is to achieve these main points:-
• To design and obtain the best electronic circuit that goes well with the solar
panels
• To design and fabricate the best design of a mini race boat.
• Able to integrate the use of solar energy (photovoltaic technology) with the
mini boat.

4
1.3 Scope
The main target for this project to accomplish is to consider the following
criterions:-
• To design a low cost, high efficiency mini boat that is suitable and applicable
for installing a solar circuit
• Testing of various prototypes (boats and solar panels) through experimental
procedures (measurement and simulations)
Thus, it is essential that in order to complete this project, the solar panel, its
components, and the mini boat is necessary. Designing of mini solar race boat is
done without using any battery or other source of power, except from solar itself,
either direct power from sunlight or through an AC/DC convertor.
By using the concept of a low-power solar cell, sufficient electricity must be
able to be generated by the photovoltaic panels to move the mini boat through its
components. The boat itself must be stable to move at high speed in the water.
5
1.4 Problem Statement
The solar cell energy which directly produced by the sun can be converted to
electric energy by using solar cell. The power generated from these cells will be fully
used to move a mini race boat, through the use of mechanical engineering technique.
The performance will then and is evaluated in terms of speed. Also, bigger
understanding is needed to develop a better product
Thus, the main problem statement for the project is:-
• The best design of the mini race boat that is able to move smoothly and fast
on top of water is researched. Analysis and tests are done, to determine the
best design
• The best and suitable solar electronic circuit to move motors and propellers,
and in turn move the race boat is done. Options are aplenty, but searching for
the best takes tests and calculations.
• The best and most suitable design of mini race boat that is able to be
integrated with solar panels are much more difficult than simply designing a
race boat or solar electronic circuit. Thus, compatible settings must be
researched so it does not hinder the boat movements on water.

6
CHAPTER 2
LITERATURE REVIEW
2.1 Materials of Photovoltaic Panel
Most solar cells are constructed from semiconductor material, such as silicon
(the fourteenth element in the Mendeleyev table of elements). Silicon is a
semiconductor that has the combined properties of a conductor and an insulator.
Figure 2.1: Periodic Table of Elements
(Source: The Physics of Solar Cells, Nelson J., 2003)
*Lanthanide series
**Actinide series

7
Metals (located generally from left and middle side of the Periodic Table of
Elements) such as gold, copper, and iron are conductors; in which their properties
have loosely bound electrons in the outer shell or orbit of their atomic configuration.
These electrons can be detached from respective atomic configuration when
subjected to an electric voltage or current. On the contrary, atoms of insulators
(mostly from right side of Periodic Table), such as glass, carbon and other gasses,
have a strong bond of electrons in the atomic configuration and does not allow the
flow of electrons even under the high application of voltage or current. On the other
hand, semiconductor materials such as silicon, that is the focus of this topic, bind
electrons midway between that of metals and insulators. (Source: Solar Engineering
of Thermal Processes, Duffie J.A., 2006)
In electronics, the semiconductor materials are constructed by combining the
two adjacently doped wafer elements, which is constructed from silicon. Doping
implies impregnation of silicon by positive and negative agents, such as phosphorus,
P and boron, B. Phosphorus (15th
element) creates a free electron that produces N-
type material, while boron (5th
element) have a shortage of an electron, which
produces the P-type material. Impregnation or combination is accomplished by
depositing the previously referenced doping material on the surface of silicon using a
certain heating or chemical process. The N-type material has a propensity to lose
electrons and gain holes, thus it acquires a positive charge while the P-type material
has a propensity to lose holes and gain electrons, so it acquires a negative charge.
When N-type and P-type doped silicon wafers are fused together, they form a
P-N junction. The negative charge on P-type material prevents electrons from
crossing the junction, and the positive charge on the N-type material prevents holes
from crossing the junction. A space created by the P and N, or PN, wafers creates a
potential barrier across the junction. (Source: Solar Power in Building Design,
Gevorkian P., 2009)

8
Figure 2.2: Concept of the electron flow in an N-P-N transistor
(Source: Solar Power in Building Design, Gevorkian P., 2009)

9
Thermal concepts are also applied in a solar panel. Usually, thermal
substrates are used, in order to drain out the high heat flux generated by the
concentrated beam on the small cells; as every PV devices, the cells for
concentration decrease their performances, as previously described, with the
temperature. To efficiently drain the heat from damaging the cells, a heat exchange is
performed to spread the heat onto a large area of external air, with other cooling
means can also be added.
For this purpose, ceramic materials like alumina (Al2O3) or aluminium nitride
(AlN) are often used, as in hybrid electronics that when the thermal flux are very
high just because of their properties of thermal conductivity. When the thermal
budget is lower, cheaper material can be employed as, for example, insulated metal
substrate as an electronic support fabricated laminating an insulator between a
massive mechanical substrate of aluminium and a foil of copper used as electrically
conductive layer. Depending on the material and thickness adopted for the insulator
layer, the circuit will have consequent thermal properties as well as dielectric
capabilities. These insulating materials have usually a thermal conductivity in the
range of 0.8 – 3 W/mK.
Table 2.1: Thermal conductivity of materials usually considered for construction of
PV panels
(Source: Solar Collector and Panels, Reccab M. Ochieng, 2010)
Material Type Thermal Conductivity (W/mK)
Aluminium 204
Copper 390
Tin 67
Silicon 150
Germaium 60
Alumina 25
Aluminium Nitrade 160
Silicones 0.1 - 0.2
Electrically conductive adhesive 4 - 5
Thermal conductive adhesive 1 - 4

10
2.2 Categorization of Solar Panels
Solar cell technologies at present fall into three main categories: mono-
crystalline (single-crystal construction), polycrystalline (semi-crystalline),
amorphous silicon and thin-film materials. A more recent undisclosed solar
technology, known as organic photovoltaic, is also currently under commercial
development. Each of the technologies has unique physical, chemical,
manufacturing, and performance characteristics and is best suited for specialized
applications.
2.2.1 Mono-crystalline solar panel
A mono-crystalline silicon-made panel is the base material of the electronic
industry. It consists of silicon in which the crystal lattice of the entire solid is
continuous, unbroken (with no grain boundaries) to its edges.
The heart of the most mono-crystalline photovoltaic solar cells is a crystalline
silicon semiconductor. This semiconductor is manufactured by a silicon purification
process, ingot fabrication, wafer slicing, etching, and doping which finally forms the
aforementioned P-N-P junction that traps photons, resulting in the release of
electrons within the junction barrier, thereby creating a current flow. (Source:
Handbook of Photovoltaic Science and Engineering, Luque A., 2003)
The manufacturing of a solar photovoltaic cell in itself is only a part of the
process of manufacturing a solar panel product. To manufacture a functionally viable
product that will last over 25 years requires that the materials be specially assembled,
sealed, and packaged to protect the cells from natural climatic conditions and to
provide proper conductivity, electrical insulation, and mechanical strength.
11
One of the most important materials used in sealing solar cells is the fluoro-
polymer. This chemical compound is manufactured from ethylene vinyl acetate resin
which is then extruded into a film and used to encapsulate the silicon wafers that are
sandwiched between tempered sheets of glass to form the solar panel. One special
physical characteristic of the sealant is that it provides optical clarity while matching
the refractive index of the glass and silicon, thereby reducing photon reflections.
A manufactured chemical material called Tedlar, is a polyvinyl fluoride film
that is coextruded with polyester film and applied to the bottom of silicon-based
photovoltaic cells as a backplane that provides electrical insulation and protection
against climatic and weathering conditions. Another manufactured material, called
Solamet, is a silver metallization paste used to conduct electric currents generated by
individual solar silicon cells within each module. Solamet appears as micronwide
conductors that are so thin that they do not block the solar rays. A dielectric silicon-
nitride product used in photovoltaic manufacturing creates a sputtering effect that
enhances silicon to trap sunlight more efficiently. (Source: Solar Power in Building
Design, Gevorkian P., 2009)

12
2.2.2 Poly-crystalline solar panel
In the polycrystalline process, the silicon melt is cooled very slowly, under
controlled conditions. The silicon ingot produced in this process has crystalline
regions, which are separated by grain boundaries. After solar cell production, the
gaps in the grain boundaries cause this type of cell to have a lower efficiency
compared to that of the mono-crystalline process just described. Despite the
efficiency disadvantage, a number of manufacturers favor polycrystalline PV cell
production because of the lower manufacturing cost. (Source: Solar Power in
Building Design, Gevorkian P., 2009)
But although they are considered less efficient than a single crystal, once the
polycrystalline cells are set into a frame that includes 30 or so other cells, the actual
difference in power output in Watts per square foot (W/ft2) is not that large. The
panels are also sliced from long cylinders of silicon, but the silicon used is pure
multi-crystalline, which is easier and cheaper to be manufactured. (Source:
Handbook of Photovoltaic Science and Engineering, Luque A., 2003)
Several production techniques can be used to create polycrystalline panels:-
i) Cast Poly-silicon
In this process, molten silicon is first cast in a large block to form
crystalline silicon. Then the block is shaved across its width to create thin
wafers to be used in PV cells. These cells are then assembled in a panel.
Conducting metal strips are laid over the cells, connecting them to each other
and forming a continuous electrical current throughout the panel.
ii) String Ribbon Silicon
String ribbon PVs use a variation on the polycrystalline production
process. Molten silicon is drawn into thin strips of crystalline silicon using
metal strings. These strips of PV material are then assembled in a panel.
Metal conductor strips are attached to each strip to create a path for the
electrical current. This technology reduces costs and it eliminates the process
of producing wafers.

13
2.2.3 Amorphous Solar Panel
Amorphous silicon is disordered thin-film PV material. Amorphous silicon is
a material where some atoms in the structure remain un-bonded, thus lacking a long-
range order. In the amorphous process, a thin wafer of silicon is deposited on a
carrier material and doped in several process steps. An amorphous silicon film is
produced by a method similar to the mono-crystalline manufacturing process and is
sandwiched between glass plates, which form the basic PV solar panel module.
(Source: Solar Power in Building Design, Gevorkian P., 2009)
Even though the process yields relatively inexpensive solar panel technology,
it has the following disadvantages:-
• Larger installation surface
• Lower conversion efficiency
• Inherent degradation during the initial months of operation, which continues
over the life span of the PV panels
By considering the disadvantages of amorphous photovoltaic panel
technology, several advantages can also be seen:-
• Relatively simple manufacturing process
• Lower manufacturing cost
• Lower production energy consumption

14
2.2.4 Thin-film Solar Panel Technology
The core material of thin-film solar cell technology is amorphous silicon.
Instead of using solid polycrystalline silicon wafers uses silane gas, which is a
chemical compound that costs much less than crystalline silicon. Solar cell
manufacturing involves a lithographic-like process where the silane film is printed on
flexible substrates such as stainless steel or Plexiglas material on a roll-to-roll
process. Silane (SiH4) is also called silicon tetrahydride, silicanel, or monosilane,
which is a flammable gas with a repulsive odor.
Silane is principally used in the industrial manufacture of semiconductor
devices for the electronic industry. It is used for polycrystalline deposition,
interconnection or masking, growth of epitaxial silicon, chemical vapor deposition of
silicon diodes, and production of amorphous silicon devices such as photosensitive
films and solar cells.
Even though thin-film solar power cells have about 4 percent efficiency in
converting sunlight to electricity compared to the 15 to 20 percent efficiency of poly-
silicon products, they have an advantage that they do not need direct sunlight to
produce electricity, and as a result, they are capable of generating electric power over
a longer period of time.
Thin-film is a relatively new product, so only up to 20-year performance can
be estimated. One company guarantees less than 20 percent degradation over 20
years, which compares with 10 percent for the other types of panels mentioned.
The primary advantages of thin-film panels are the low manufacturing costs
and versatility. The production process is more energy-efficient than that of the other
cell types, so the cells are typically cheaper for the same rated power. Thin-film
panels are less efficient, but amorphous silicon does not depend on the long,
expensive process of creating silicon crystals, so these panels can be produced more
quickly and efficiently. Additional components are not required, so costs are reduced
further.

15
Thin-film panels have several significant disadvantages. Production cost is
low but so is efficiency. Thin-film technologies also depend on silicon, which has
high levels of impurities. This reduces efficiency rapidly over the life of the product.
(Source: Solar Power in Building Design, Gevorkian P., 2009)
2.2.5 Latest Panel Technology
i) Thin-film cadmium telluride cell technology
In this process, thin crystalline layers of cadmium telluride (CdTe, of
about 15 percent efficiency) or copper indium diselenide (CuInSe2, of about
19 percent efficiency) are deposited on the surface of a carrier base. This
process uses very little energy and is very economical. It has simple
manufacturing processes and relatively high conversion efficiencies.
ii) Gallium-arsenide cell technology
This manufacturing process yields a highly efficient PV cell. But as a
result of the rarity of gallium deposits and the poisonous qualities of arsenic,
the process is very expensive. The main feature of gallium arsenide (GaAs)
cells, in addition to their high efficiency, is that their output is relatively
independent of the operating temperature and is primarily used in space
programs.
iii) Multi-junction cell technology
This process employs two layers of solar cells, such as silicon (Si) and
GaAs components, one on top of another, to convert solar power with higher
efficiency. Staggering of two layers provides trapping of wider bandwidth of
solar rays thus enhancing the solar cell solar energy conversion efficiency.

16
There are other prevalent production processes that are currently being
researched and will be serious contenders in the future of solar power production
technology. But for now, only three main types of technology will be considered,
that is the mono-crystalline, poly-crystalline and amorphous types. (Source: Solar
Power in Building Design, Gevorkian P., 2009 and Solar Engineering of Thermal
Processes, Duffie J.A., 2006)
The following numbers are the advertised percentages of efficiency for each
of the different types of solar panels:
• Mono-crystalline: 19 percent
• Polycrystalline: 15 percent
• Amorphous (thin-film): 10 percent
Unfortunately, the best solar panels, under ideal conditions, are about 19
percent efficient. This means that 81 percent of the energy that reaches your solar
panel is not used. Of the 19 percent energy captured, under ideal conditions, the
inverter then wastes 5 to 10 percent of that energy (so, on average, only 77 percent of
the total energy is used). The electric meter, wiring, and any additional components
waste more of the original 19 percent captured energy.
Table 2.2: Production Capacities of Various PV Technologies in 2002
(Source: Renewable Energy World, Montgomery J., 2003)
PV Technology Production in 2002
Capacity (MW) Percentage of Total
Mono-crystalline 306 56.15
Polycrystalline 162 29.72
Amorphous 33 6.06
All others 44 8.07
TOTAL 545 100

17
Basically a 100 Watt mono-crystalline solar panel should have the same
output as a 100 Watt polycrystalline panel and a 100 Watt amorphous panel. The
main difference is the amount of space which the panel occupies, as to reach 100
Watt of power for amorphous requires large amount of surface area compared to
mono-crystalline. (Source: Renewable Energy World, Montgomery J., 2003)
Figure 2.3: Comparisons between mono-crystalline (left) and poly-crystalline (right)
panels
(Source: National Science Center, Kuala Lumpur)
18
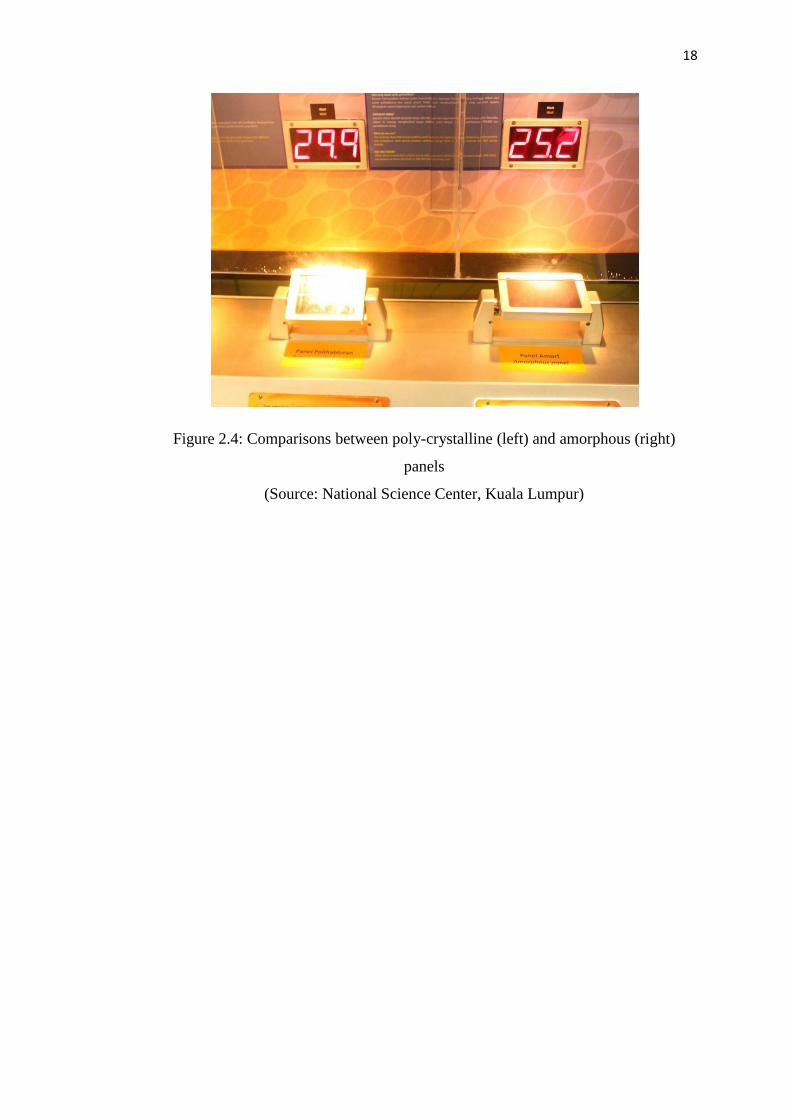
Figure 2.4: Comparisons between poly-crystalline (left) and amorphous (right)
panels
(Source: National Science Center, Kuala Lumpur)

19
CHAPTER 3
METHODOLOGY
To conduct this research of competitive-made solar-powered mini boat,
several steps are needed to be done.
3.1 Flow Chart
After obtaining the objectives and scope according to the title of the project,
reading materials and references are needed to know and obtain sufficient knowledge
to complete this project. Such references include on the concept of photovoltaic
panels, electronic plans and components of the proposed circuit, and the layout of the
mini race boat.
The completed work flow of both sessions of the Final Year Project can be
simplified in a flowchart, as shown in Figure 3.1:-

20
Figure 3.1: The Work Flowchart of the Project
YES
START
Acquiring materials for literature
review and references
Analyzing mini boat drag
coefficient (CFD) to be
suitable with objective
END
Detail designing using software (CAD, etc.)
Initial design by simple sketching
of basic shapes of boat
Searching the right and suitable
component for solar circuit
Fabricating and constructing the model and
prototype mini boat
Attaching electronic circuit with the mini boat
and tested under actual condition
NO
Testing of electronic voltage
and current under sunlight to
be suitable with objective NO
YES
YES

21
3.2 Gantt Chart
Table 3.1: Gantt Chart for PSM I
ITEM ACTIVITIES WEEK
1 2 3 4 5 6 7 8 9 10 11 12 13 14 15 16 17
1 Topic selection & Briefing
about PSM 1
2 Topic conformation & planning
project flow
3 Searching materials for
reference and study
4 Presentation 1: Poster
5 Observing and designing the
project requirements
6 Presentation 2: Draft Report &
Presentation
7 Logbook update & report
progress
8 Draft report submission
Actual week of activities
Mid-term holiday
Planned week of activities

22
Table 3.2: Gantt Chart for PSM II
ITEM ACTIVITIES WEEK
1 2 3 4 5 6 7 8 9 10 11 12 13 14 15 16 17
1 Review and discussion
according to PSM 1 progress
2 Designing the mini race boat
using Computer Aided Design (CAD)
3 Planning and assembly of
electrical circuit
4 Fabrication of the mini race
boat
5 Test run of the mini race boat
6 Logbook update & report
progress
7 Full report submission
Actual week of activities
Mid-term holiday
Planned week of activities

23
3.3 Mini Boat Design
Initial sketching is needed to be done in order to get a concept of the mini race
boat’s initial design. Several sketches were proposed:-
Figure 3.2: Ark-Concept of Mini Race Boat
Figure 3.3: Hovercraft-Concept of Mini Race Boat
Solar Panels
Propeller
Solar Panels
Propeller

24
Figure 3.4: Barge-Concept of Mini Race Boat
Three different types of designs were drawn, and can be observed the difference
in basic shapes. Since theoretically the basic shapes of aerodynamic is to be pointy at the
front end and curves flow along the sides of boat, thus the Ark-Concept is chosen to be
the basic parameter design of the mini boat.
A more detailed design is needed to be done in order to fabricate a mini boat.
The detail design, precise with dimensions and its curves can be constructed using 3-
dimensional (3D) software such as CATIA, Solidworks and Autodesk Inventor
Professional, although the detail design is done using Autodesk Inventor Professional
2010 finally.
Propeller (Hidden)
Solar Panels

25
Figure 3.5: Detail Drawing of Mini Boat Design RB1

26
Figure 3.6: Detail Drawing of Mini Boat Design RB2
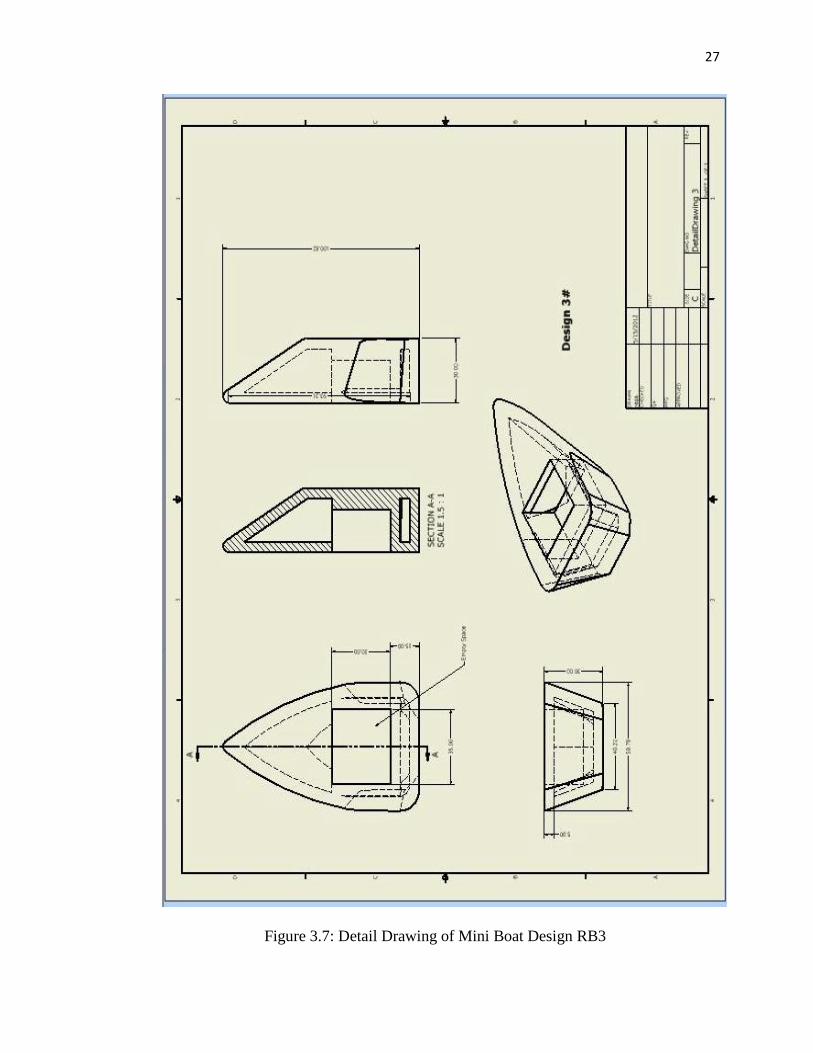
27
Figure 3.7: Detail Drawing of Mini Boat Design RB3

28
Once the design is done according to the concepts inserted into the 3D drawing,
the fabricating process can begin. This process, which will be conducted in a laboratory
located at the Faculty of Manufacturing Engineering in UTeM (Rapid Prototyping
Laboratory), enables the drawing to be constructed for further testing. Material that will
be used to construct the mini boat is plastic.
Since the amount of materials available for constructing is quite limited, the
fabrication process can be done only on three designs, and only once per design. These
designs, is later to be tested in Wind Tunnel Machine, also in Faculty of Mechanical
Engineering, for its aerodynamics properties. But, under some circumstances the Wind
Tunnel Machine has malfunctioned and is to be under maintenance. Thus, other methods
are needed to analyze the design to be the best design of mini boat. The other design
proposed is by using Computational Fluid Dynamics (CFD) analysis.
The CFD analysis is a type of analysis that focuses on fluid mechanics system,
numerical methodology and algorithm indexing of fluid controls to analyze and solve
equations and problems that involves fluid flow in a system. High-powered computers
are necessary to perform such calculations which include interactions of fluids that pass
through the entire system with boundary condition for those systems are defined.
By using ANSYS FLUENT 12.1 software, is a type of software where we will be
able to simulate CFD analysis, and it is also related to ANSYS Workbench which
combines the ANSYS application with utilities that manages the product flow, such as
geometry sketching and meshing. ANSYS FLUENT is mainly the main component for
setting up and solving fluid dynamics analysis, and performing complete CFD analysis
which follows from processes that allow creating geometry; generate mesh and reading
solutions in simpler way. Some of the parameters that are usually manipulated are
velocity, density, pressure, materials related and flow types.
29
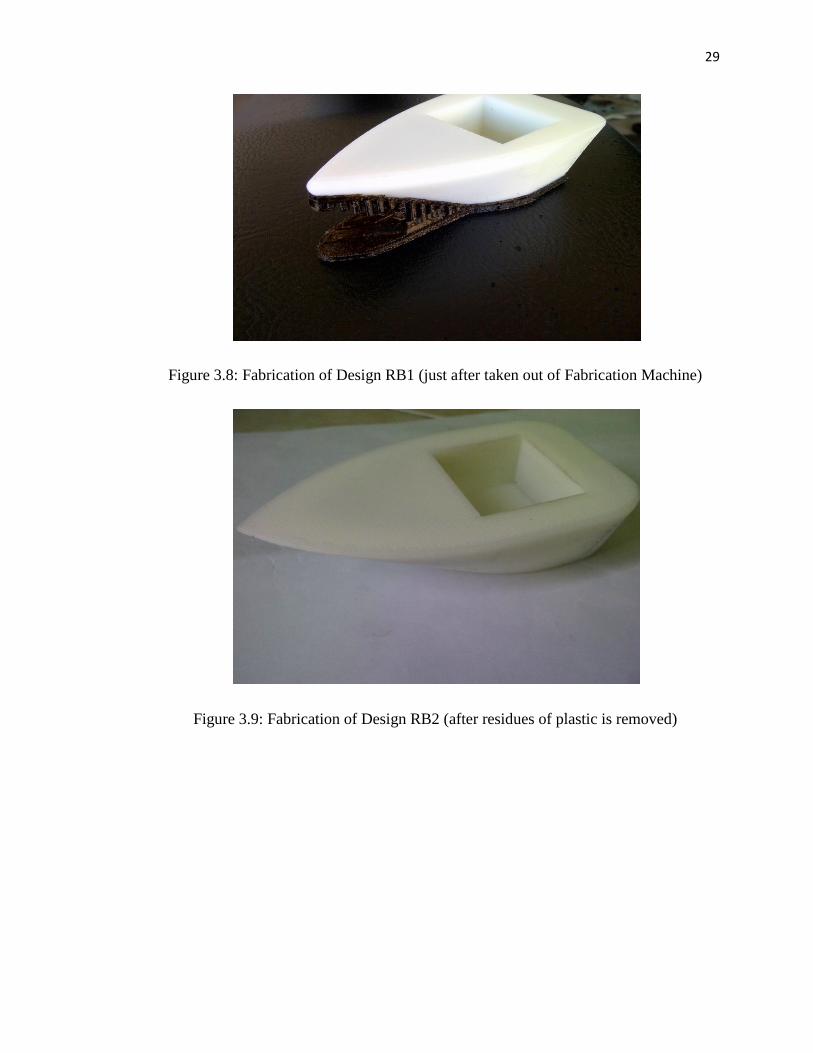
Figure 3.8: Fabrication of Design RB1 (just after taken out of Fabrication Machine)
Figure 3.9: Fabrication of Design RB2 (after residues of plastic is removed)

30
Figure 3.10: Fabrication of Design RB3 (after residues of plastic is removed)
Once the fabricating process is done, the mini race boat must be tested for its
efficiency and performance on water. Tests, by referring to CFD analysis and solar
running test, are conducted over and over again under variable conditions.
When the analysis is done, the boats are then constructed to be tested against the
water surface. With design RB1 is used as a benchmark, boats are constructed using
materials such as:-
Figure 3.11: Florist’s sponge
31
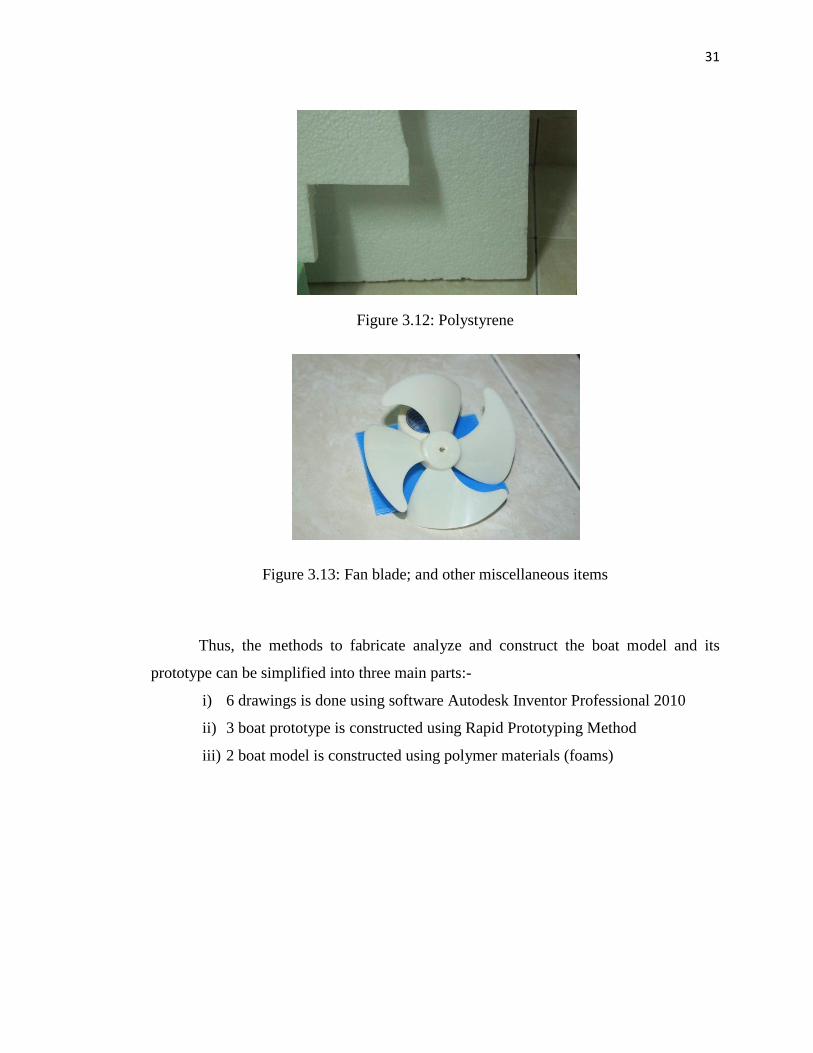
Figure 3.12: Polystyrene
Figure 3.13: Fan blade; and other miscellaneous items
Thus, the methods to fabricate analyze and construct the boat model and its
prototype can be simplified into three main parts:-
i) 6 drawings is done using software Autodesk Inventor Professional 2010
ii) 3 boat prototype is constructed using Rapid Prototyping Method
iii) 2 boat model is constructed using polymer materials (foams)
32
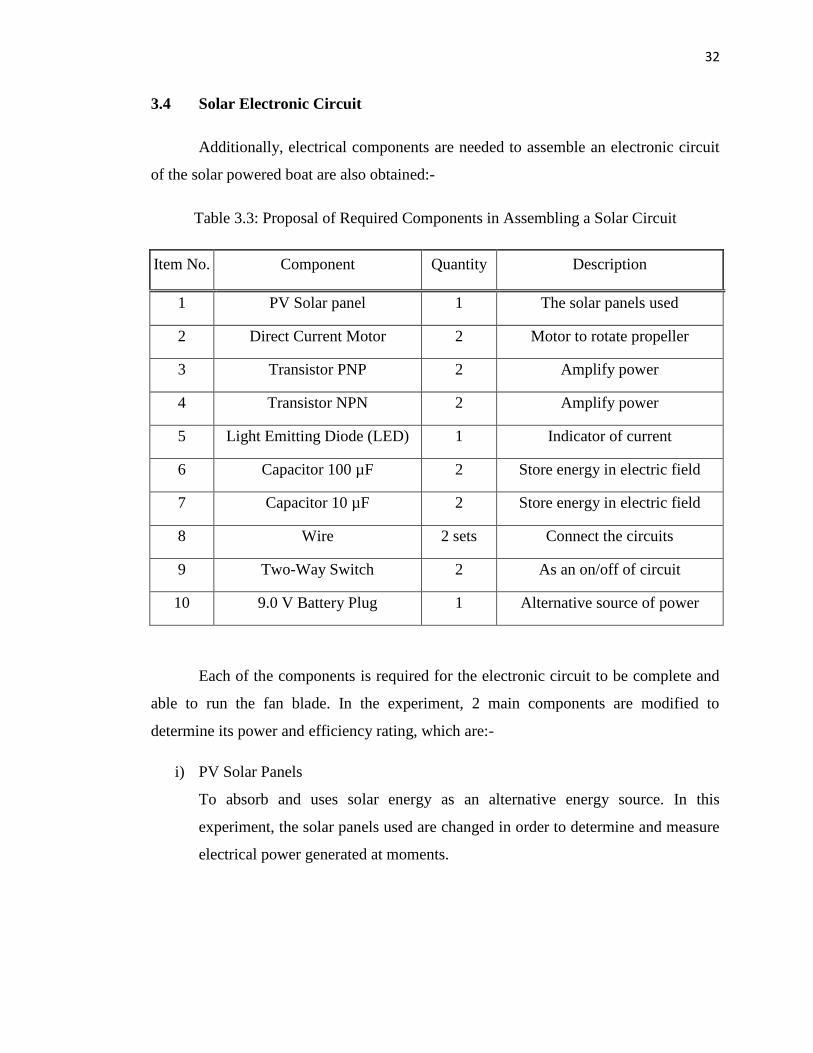
3.4 Solar Electronic Circuit
Additionally, electrical components are needed to assemble an electronic circuit
of the solar powered boat are also obtained:-
Table 3.3: Proposal of Required Components in Assembling a Solar Circuit
Item No. Component Quantity Description
1 PV Solar panel 1 The solar panels used
2 Direct Current Motor 2 Motor to rotate propeller
3 Transistor PNP 2 Amplify power
4 Transistor NPN 2 Amplify power
5 Light Emitting Diode (LED) 1 Indicator of current
6 Capacitor 100 µF 2 Store energy in electric field
7 Capacitor 10 µF 2 Store energy in electric field
8 Wire 2 sets Connect the circuits
9 Two-Way Switch 2 As an on/off of circuit
10 9.0 V Battery Plug 1 Alternative source of power
Each of the components is required for the electronic circuit to be complete and
able to run the fan blade. In the experiment, 2 main components are modified to
determine its power and efficiency rating, which are:-
i) PV Solar Panels
To absorb and uses solar energy as an alternative energy source. In this
experiment, the solar panels used are changed in order to determine and measure
electrical power generated at moments.
33
ii) Direct Current (DC) Motors
Motors are used to rotate mechanisms, and in this case, fan blades. Different
specification of motors is able to rotate at faster revolution per minute (rpm) at
the cost of higher voltage and current requirements.
Several other components are essential in connecting the circuit, and delivering
maximum potential input, such as:-
i) Transistor
Used to amplify power on a 3-way circuit, 2 type of transistor can be used, which
are the N-P-N and P-N-P transistor.
ii) Light Emitting Diode (L.E.D)
Emit a small light, is used to indicate an electric current is currently passing
through a circuit.
iii) Capacitor
Capacitors are used to store electricity temporarily at different capacities.
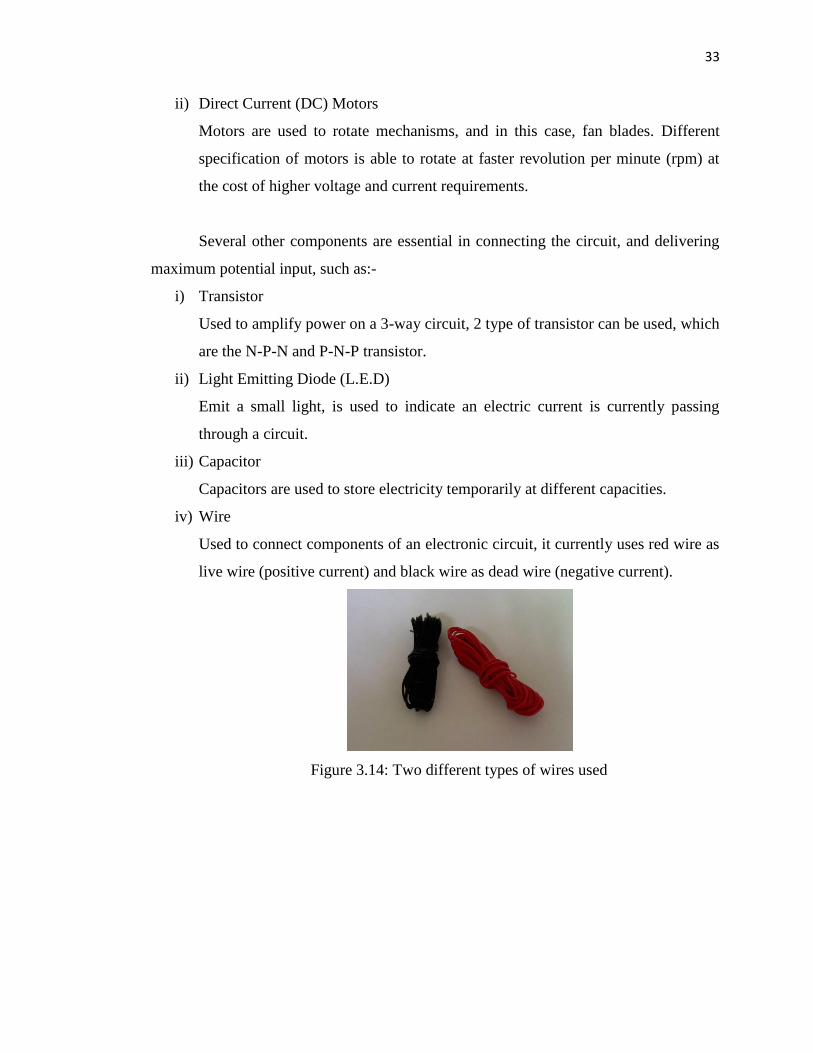
iv) Wire
Used to connect components of an electronic circuit, it currently uses red wire as
live wire (positive current) and black wire as dead wire (negative current).
Figure 3.14: Two different types of wires used

34
v) Two-Way Switch
This type of switch is used as an alternating switch. When it is open on the solar
panel side, only voltage from solar panels are used to provide current.
Alternatively, when it is switched off, current will be provided from the battery
attached.
Figure 3.15: A Two-Way Switch
vi) 9.0 V Battery Plug
Used to attach and connect 9.0 V batteries to the circuit.
The solar circuit is then connected by soldering the components together.
Figure 3.16: A Soldering Iron
Thus, the process and circuit analysis for assembling the solar-powered
components for the mini boat, referred to as solar power generation, can be simplified
as:-
i) 3 types and assemblies of solar panel is planned and fixed.
ii) Each assembly is measured for its voltage and current flow, both on multi-meter
and circuit.
iii) Circuit is soldered and attached on the mini boat.

35
CHAPTER 4
RESULTS
4.1 Results for the Mini Race Boat
The mini boat models of RB1, RB2 and RB3 are analyzed using Computational
Fluid Dynamics (CFD) software, named ANSYS FLUENT 12.1, which is summarized
before, are used.
Figure 4.1: Sample Velocity Streamline of CFD Analysis

36
Figure 4.2: Sample Pressure Contour of CFD Analysis
One of the many analyses is done on the detail drawing of RB1, and can be seen
on Figure 4.1 and 4.2. The Design RB1, which will also be referred to as the benchmark
prototype, also omit the result as shown in Figure 4.3:-
Figure 4.3: Drag Coefficient of Benchmark Prototype Analysis

37
Based on the Figure 4.3 above, the drag coefficient of the benchmark analysis is
analyzed to be 0.0209. Thus, in order to obtain a better result in terms of drag coefficient
of the designed boat, the other two designs (Design RB2 and Design RB3) should have
lower coefficient value than 0.0209.
After Computational Fluid Dynamics analysis is done on both remaining designs,
the results shows each drag coefficients, respectively:-
Table 4.1: Table of Drag Coefficient for Boat Designs
Drag Coefficient
Value
Design RB1 Design RB2 Design RB3
0.0209 0.0187 0.0162
Based on the observations done from the output of CFD’s analysis, the Design
RB3 has the lowest (and best) value of drag coefficient, which has the drag coefficient
value of 0.0162. Thus, it is concluded that Design RB3 has the best aerodynamic
properties among other designs.

38
4.2 Results for Electronic Solar Circuit
An electronic solar circuit is assembled by using the components
aforementioned. Although several components mentioned before are not included in this
circuit, the other parts were present and soldered into the circuit.
Figure 4.4: Electronic circuit of solar panel
The Ohm’s Rule of Voltage across a circuit, either serial circuit or parallel, must
be observed in order to estimate the maximum and minimum voltage and current that
passes through a circuit at a time.
𝐼 = 𝑉
𝑅 - - - - - - - (Equation 4.1)
where:-
V = Voltage across a circuit, in unit Volt, V
I = Current across a circuit, in unit Ampere, A
R = Resistance across a part of the circuit. Measured in unit Ohm, Ω

39
Voltage, Current and Power Analysis of Purposed Solar Panel (a set of 6.0 V
solar panel). By referring to the Table 4.1 below, total output voltage and current for the
set of 6.0 V panels can be estimated:-
Table 4.2: Voltage and Current analysis of set of 6.0 V Solar Panel
Series Circuit Parallel Circuit
Voltage, V 𝑉1 + 𝑉2 + 𝑉3 = 𝑉𝑡 𝑉1 = 𝑉2 = 𝑉3 = 𝑉𝑡
Current, I 𝐼1 = 𝐼2 = 𝐼3 = 𝐼𝑡 𝐼1 + 𝐼2 + 𝐼3 = 𝐼𝑡
Figure 4.5: 4 pieces of 6.0 V solar panels, or 2 pairs (7.4 cm X 4.5 cm) each
First, the calculation of the solar panel will start with the pair of upper panels,
termed P1 and P2. These calculations will be based on the serial electric circuit flow:-
Voltage:
𝑉1 + 𝑉2 + 𝑉3 = 𝑉𝑡
𝑉𝑡 = 6.0 𝑉 + 6.0 𝑉 = 12.0 𝑉
Current:
𝐼1 = 𝐼2 = 𝐼3 = 𝐼𝑡
𝐼𝑡 = 55.0 𝑚𝐴 = 55.0 𝑚𝐴

40
Assume the voltage generated for the pair of lower panels, P3 and P4 is the same
as P1 and P2. Thus, to calculate the combination of P12 and P34, calculations will then
be based on parallel circuit flow:-
Voltage:
𝑉1 = 𝑉2 = 𝑉3 = 𝑉𝑡
𝑉𝑡 = 12.0 𝑉 = 12.0 𝑉
Current:
𝐼1 + 𝐼2 + 𝐼3 = 𝐼𝑡
𝐼𝑡 = 55.0 𝑚𝐴 + 55.0 𝑚𝐴 = 110.0 𝑚𝐴
Thus, by referring to the equation of power:-
𝑃 = 𝐼 ∙ 𝑉 - - - - - - - (Equation 4.2)
In which the Equation 4.2 can be applied as:-
𝑃 = 110 𝑚𝐴 ∙ 12.0 𝑉 = 1.32 𝑊𝑎𝑡𝑡
While the equation based on Ohm’s Law and its relativity to the serial and
parallel circuit may be used for combination panels, it does not prove to be useful for
calculating a single solar panel, such as the 7.5 V and 5.0 V solar panels.

41
Figure 4.6: A 7.5 V solar panel (15 cm X 8.5 cm)
Figure 4.7: A 5.0 V solar panel (11cm X 5.5 cm)
Thus, for the three different sets of solar panels that are to be tested, the
maximum voltage and current can be estimated theoretically:-
Table 4.3: Theoretical Values of Voltage and Current
Solar Panels
Data Obtained
Voltage (V) Current, mA Power (Watt)
6.0 V pairing 12.0 110.0 1.32
7.5 V 7.5 220 1.65
5.0 V 5.0 170 0.85

42
Thus, the obtained readings for each of the solar panel sets are recorded at
different time, but same locations. The readings are taken using a multi-meter, which is
mainly used to record readings of voltages, currents and resistance across a circuit
within a large value range. The readings are taken by touching the tip of the pointed
probes at a positive (red point) and negative (black point) pole of the circuit.
Figure 4.8: A multi-meter used to record readings of voltage and current currently
passing through a circuit
The readings taken are not always the same, but ultimately results are produced
as shown in Table 4.4, Table 4.5 and Table 4.6:-
43
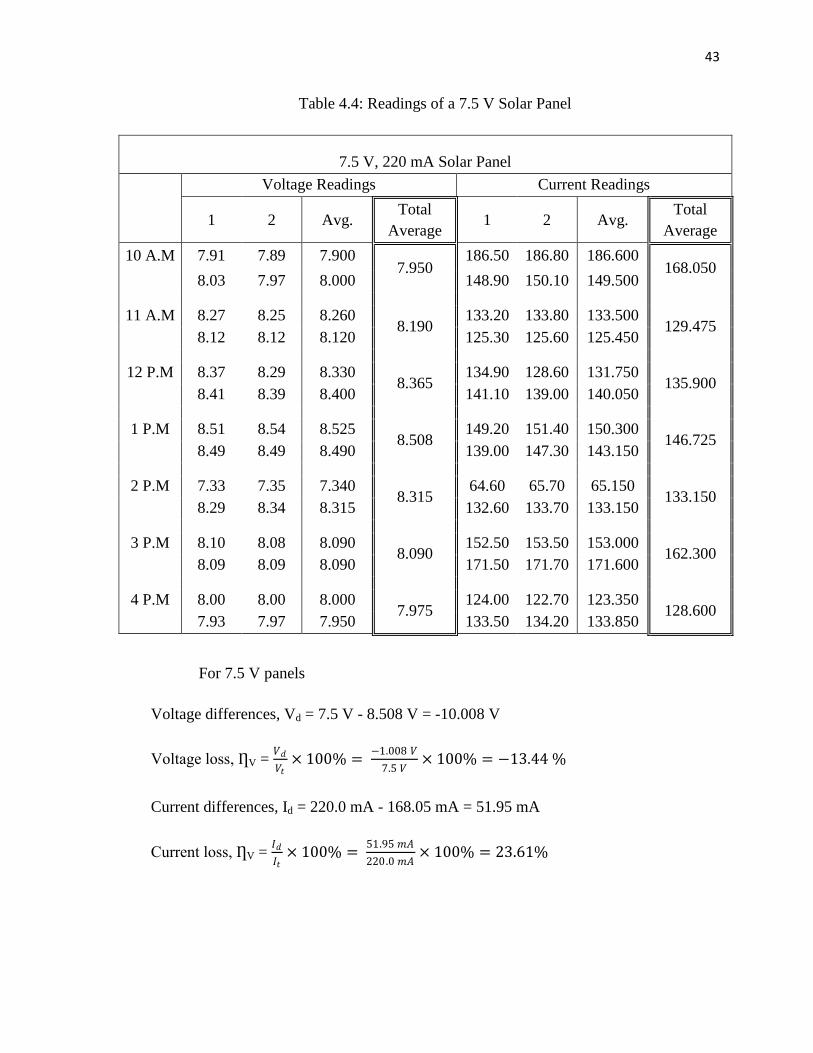
Table 4.4: Readings of a 7.5 V Solar Panel
7.5 V, 220 mA Solar Panel
Voltage Readings Current Readings
1 2 Avg.
Total
Average 1 2 Avg.
Total
Average
10 A.M 7.91 7.89 7.900 7.950
186.50 186.80 186.600 168.050
8.03 7.97 8.000 148.90 150.10 149.500
11 A.M 8.27 8.25 8.260 8.190
133.20 133.80 133.500 129.475
8.12 8.12 8.120 125.30 125.60 125.450
12 P.M 8.37 8.29 8.330 8.365
134.90 128.60 131.750 135.900
8.41 8.39 8.400 141.10 139.00 140.050
1 P.M 8.51 8.54 8.525 8.508
149.20 151.40 150.300 146.725
8.49 8.49 8.490 139.00 147.30 143.150
2 P.M 7.33 7.35 7.340 8.315
64.60 65.70 65.150 133.150
8.29 8.34 8.315 132.60 133.70 133.150
3 P.M 8.10 8.08 8.090 8.090
152.50 153.50 153.000 162.300
8.09 8.09 8.090 171.50 171.70 171.600
4 P.M 8.00 8.00 8.000 7.975
124.00 122.70 123.350 128.600
7.93 7.97 7.950 133.50 134.20 133.850
For 7.5 V panels
Voltage differences, Vd = 7.5 V - 8.508 V = -10.008 V
Voltage loss, ȠV = 𝑉𝑑
𝑉𝑡× 100% =
−1.008 𝑉
7.5 𝑉× 100% = −13.44 %
Current differences, Id = 220.0 mA - 168.05 mA = 51.95 mA
Current loss, ȠV = 𝐼𝑑
𝐼𝑡× 100% =
51.95 𝑚𝐴
220.0 𝑚𝐴× 100% = 23.61%
44
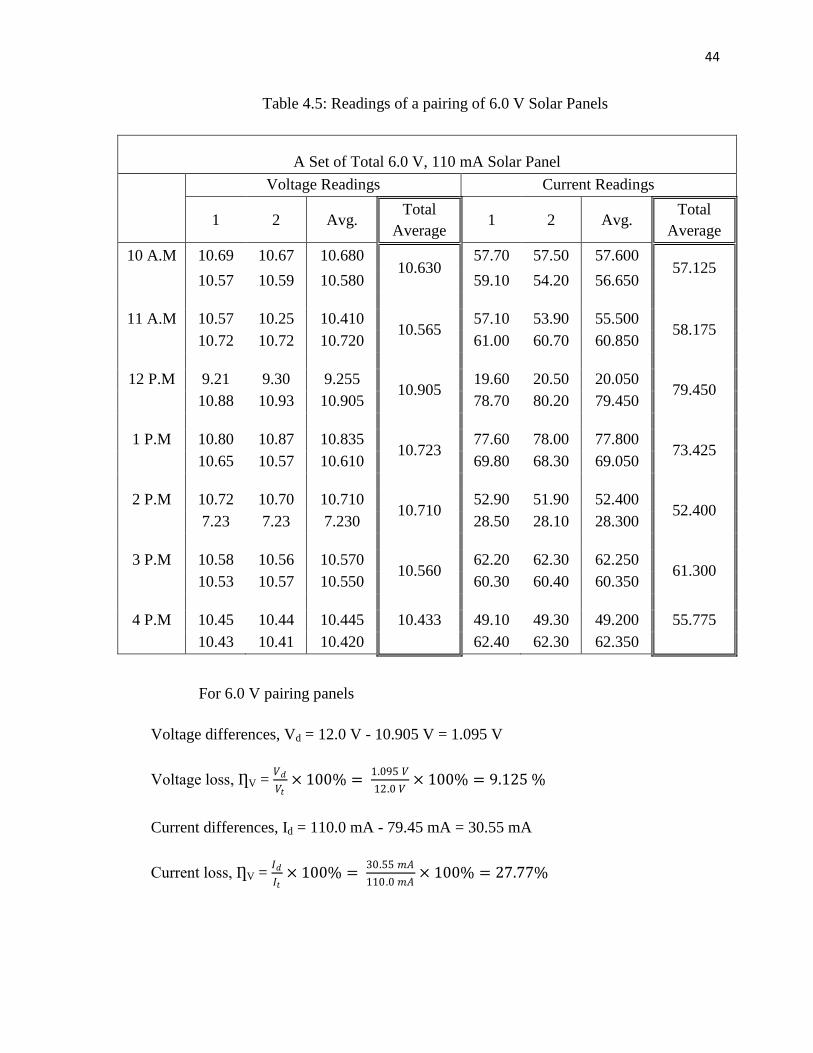
Table 4.5: Readings of a pairing of 6.0 V Solar Panels
A Set of Total 6.0 V, 110 mA Solar Panel
Voltage Readings Current Readings
1 2 Avg.
Total
Average 1 2 Avg.
Total
Average
10 A.M 10.69 10.67 10.680 10.630
57.70 57.50 57.600 57.125
10.57 10.59 10.580 59.10 54.20 56.650
11 A.M 10.57 10.25 10.410
10.565 57.10 53.90 55.500
58.175
10.72 10.72 10.720 61.00 60.70 60.850
12 P.M 9.21 9.30 9.255
10.905 19.60 20.50 20.050
79.450
10.88 10.93 10.905 78.70 80.20 79.450
1 P.M 10.80 10.87 10.835
10.723 77.60 78.00 77.800
73.425
10.65 10.57 10.610 69.80 68.30 69.050
2 P.M 10.72 10.70 10.710
10.710 52.90 51.90 52.400
52.400
7.23 7.23 7.230 28.50 28.10 28.300
3 P.M 10.58 10.56 10.570
10.560 62.20 62.30 62.250
61.300
10.53 10.57 10.550 60.30 60.40 60.350
4 P.M 10.45 10.44 10.445 10.433 49.10 49.30 49.200 55.775
10.43 10.41 10.420
62.40 62.30 62.350
For 6.0 V pairing panels
Voltage differences, Vd = 12.0 V - 10.905 V = 1.095 V
Voltage loss, ȠV = 𝑉𝑑
𝑉𝑡× 100% =
1.095 𝑉
12.0 𝑉× 100% = 9.125 %
Current differences, Id = 110.0 mA - 79.45 mA = 30.55 mA
Current loss, ȠV = 𝐼𝑑
𝐼𝑡× 100% =
30.55 𝑚𝐴
110.0 𝑚𝐴× 100% = 27.77%
45
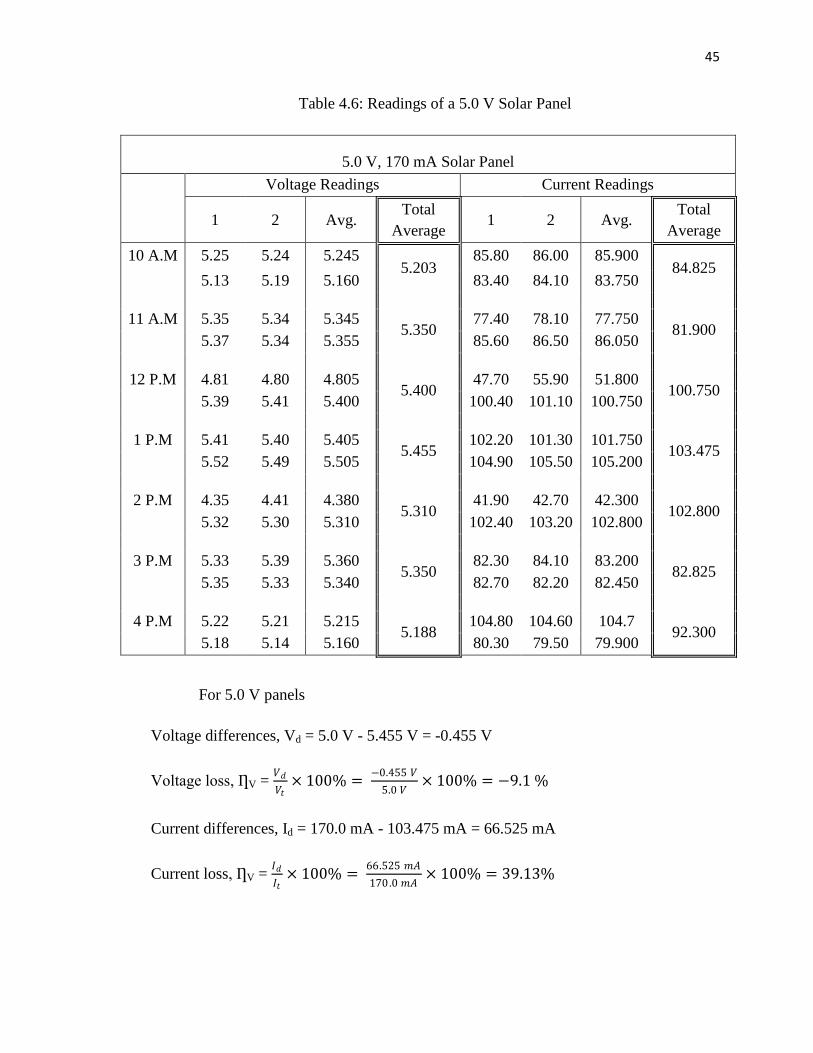
Table 4.6: Readings of a 5.0 V Solar Panel
5.0 V, 170 mA Solar Panel
Voltage Readings Current Readings
1 2 Avg.
Total
Average 1 2 Avg.
Total
Average
10 A.M 5.25 5.24 5.245 5.203
85.80 86.00 85.900 84.825
5.13 5.19 5.160 83.40 84.10 83.750
11 A.M 5.35 5.34 5.345
5.350 77.40 78.10 77.750
81.900
5.37 5.34 5.355 85.60 86.50 86.050
12 P.M 4.81 4.80 4.805
5.400 47.70 55.90 51.800
100.750
5.39 5.41 5.400 100.40 101.10 100.750
1 P.M 5.41 5.40 5.405
5.455 102.20 101.30 101.750
103.475
5.52 5.49 5.505 104.90 105.50 105.200
2 P.M 4.35 4.41 4.380
5.310 41.90 42.70 42.300
102.800
5.32 5.30 5.310 102.40 103.20 102.800
3 P.M 5.33 5.39 5.360
5.350 82.30 84.10 83.200
82.825
5.35 5.33 5.340 82.70 82.20 82.450
4 P.M 5.22 5.21 5.215
5.188 104.80 104.60 104.7
92.300
5.18 5.14 5.160 80.30 79.50 79.900
For 5.0 V panels
Voltage differences, Vd = 5.0 V - 5.455 V = -0.455 V
Voltage loss, ȠV = 𝑉𝑑
𝑉𝑡× 100% =
−0.455 𝑉
5.0 𝑉× 100% = −9.1 %
Current differences, Id = 170.0 mA - 103.475 mA = 66.525 mA
Current loss, ȠV = 𝐼𝑑
𝐼𝑡× 100% =
66.525 𝑚𝐴
170.0 𝑚𝐴× 100% = 39.13%
46
The readings are all taken at the duration of time within 10 A.M. until 4 P.M, and
the timeline is valid for all of the used solar panels. All of the time taken is taken twice
to determine its accuracy, and the average value is compared between readings at
different times to be included in the calculation as the maximum value for differences in
voltages and current, thus leading to losses.
As can be observed, each set of solar panel readings can be seen to obtain a
completely different value of reading, which deviates a lot from the average value
obtained during that hour. This signifies the readings are taken during weather
conditions to be cloudy/partially sunny, and total amount of solar power may not be able
to be absorbed during that time, resulting in lower reading value.

47
4.3 Results for Mini Solar Race Boat
The completed electronic solar circuit is then attached atop of the mini race boat,
and fixed so that it would hold when the mini boat is tested on water.
Figure 4.9: The mini solar boat before the electronic circuit is attached atop of it.
The parameter time set before this project is performed is based on the National
Mini Solar Race Boat Competition organized by MyRobotz Enterprise, as attached in
Appendix A. The previous competition, which is held in 2011, all with the same
specification used in this project, has a competition record which is as shown in Table
4.7:-
Table 4.7: Competition Winners for 2011 Mini Solar Race Boat
(Source: MyRobotz Enterprise, 2011)
Placing Group Time Taken (s)
1st place Universiti Tun Hussein Onn (UTHM) 37.6
2nd
place Universiti Tun Hussein Onn (UTHM) 39.2
3rd
place Sek. Men. Agama Rasa 42.6
4th
place Politeknik Ungku Omar 42.9

48
The running time for the model boat of Design Model RB2 and Design Model
RB3 is recorded at a same place and with the same specification for competition, but at
different time which emit results as displayed in Table 4.8:-
Table 4.8: Obtained Results for Design Model RB2 and Design Model RB3
A.M/P.M Location
Time (s)
Design Model RB2 Design Model RB3
11:00 A.M
Taman Tasik Utama
40.1 39.6
1.00 P.M 38.2 36.6
2.30 P.M 48.6 46.7
Thus, it is proven that the running time of the Model RB3 is able to best the
previous year’s record of Mini Solar Boat Race Competition using the same set
specifications.

49
CHAPTER 5
DISCUSSION
Based on the obtained data of solar panels, the data of obtained voltage and
current can be represented in the graph of Figure 5.1 and Figure 5.2, with the circled
number/point is the highest value recorded for a set of solar panel:-
Figure 5.1: Graph of Voltage Generated, V according to Time of Data Measured
7.950 8.190 8.365 8.508 8.315 8.090 7.975
10.630 10.565 10.905 10.723 10.710 10.560 10.433
5.203 5.350 5.400 5.455 5.310 5.350 5.188
0.000
2.000
4.000
6.000
8.000
10.000
12.000
10 A.M 11 A.M 12 P.M 1 P.M 2 P.M 3 P.M 4 P.M
Vo
ltag
e G
en
era
ted
, V (
Vo
lt)
Time
Voltage Generation
7.5 V
6.0 V pairing
5.0 V

50
Figure 5.2: Graph of Current Generated, I according to Time of Data Measured
The voltage and current generation of each set of solar panels has each
advantages and disadvantages. While the pairing of 6.0 V panels has proven to reach the
highest value of voltage compared to others, it has a low current value. It is the opposite
for the 7.5 V solar panel, where voltage is not the highest but has the highest current
output. The 5.0 V panel, however, has a small amount of current and smallest voltage
value.
Voltage differences, Vd, and current differences, Id, is used to observe the
differences between maximum harvested voltage and current, compared to the maximum
theoretically obtained voltage. It can be seen that for 7.5 V and 5.0 V panels, the
differences are negative in value, which indicates that the theoretical values of those
panels are lower than values obtained through experimentation for each panels.
While losses, Ƞ, for both voltage and current, are calculated by comparing the
differences calculated to the theoretical values of each panels. The percentage
differential values are then calculated to estimate the efficiencies of each working solar
panels.
168.050
129.475 135.900146.725
133.150
162.300
128.600
57.125 58.17579.450
73.425
52.40061.300
84.825 81.900
100.750 103.475 102.800
82.82592.300
0.000
20.000
40.000
60.000
80.000
100.000
120.000
140.000
160.000
180.000
10 A.M 11 A.M 12 P.M 1 P.M 2 P.M 3 P.M 4 P.M
Cu
rre
nt
Ge
ne
rate
d, A
(am
pe
re)
Time
Current Generation
7.5 V
6.0 V pairing
5.0 V

51
Voltages are required to generally make an electrical components work by
providing power to the said components, while currents are necessary for a component,
generally speaking, energies to move at speeds according to the volume of current
provided. Here are the samples of motors that were directly connected to the power
source (in this case, the solar panels), and further rotates the fan blades:-
Figure 5.3: A Sample of 3.0 V motor
Figure 5.4: A Sample of 5.9 V motor
Figure 5.5: A Sample of 9.0 V motor

52
Figure 5.6: A Sample of 12.0 V motor
The motors were tested for its compatibility to run using solar power, and for its
potential to run on voltage and current that is able to be generated by the solar panels. It
is observed that the 3.0 V, 5.9 V and 9.0 V are able to run by the panels, but not the 12.0
V motor as the highest value of generated voltage does not even meet with the required
amount of 12.0 V necessary.
Based on previously shown Table 4.1 of drag coefficients, the Design RB3 has
the lowest drag coefficient between the three designs. However, it is probable to get a far
better design by referring to current technology and information to create a better design
of boat.
Drag coefficient can be lowered theoretically by reducing jagged and sharpened
edges around, reducing thickness level by level or polishing surfaces of boat that is
against the flow; or all of it can be done simultaneously. Either way, it is a easy but long
way to achieve better drag coefficient.
When combining the two different concepts of mini race boat and solar-powered
electronic circuit, the mini solar race boat is produced. The mini boat is tested for its
capability to run on open water for a distance, and time is recorded. It is known that the
model RB3 are able to beat the previously set record, although at only small gap of time.
Thus, improvements can be made on items that are related to both sides of concept,
which can be highlighted on the motor and propeller.

53
Here are the items price lists that are generally required to construct the mini
solar boat. Some of the items, however, are not included in the calculations due to the
unnecessary calculations and cheap prices of these items in market.
Table 5.1: Table of Items Price List for Solar Electronic Circuit
No. Item Quantity Price per Item (RM) Price (RM)
1 Solar Panel 7.5 V 1 38.00 38.00
2 Solar Panel 6.0 V 4 10.00 40.00
3 Solar Panel 5.0 V 1 25.00 25.00
4 Wire 2 2.00 4.00
5 Two-Way Switch 4 0.80 3.20
6 DC Motor 3V 1 5.00 5.00
7 DC Motor 5.9 V 1 5.00 5.00
8 DC Motor 9.0 V 2 9.00 18.00
9 DC Motor 12.0 V 1 18.00 18.00
10 Fan Blade 2 4.00 8.00
11 9.0 V battery holder 1 0.50 0.50
TOTAL (RM) 164.70
The total estimated costs that can be presumed in making and completing this
project is RM 164.70. Thus, it can be assumed that the total costs for constructing a
simple, solar-powered mini race boat including miscellaneous items is less than
RM200.00.

54
CHAPTER 6
CONCLUSIONS AND RECOMMENDATIONS
6.1 Conclusions
By referring to the objective, several conclusions can be made:-
i) A right combination of solar panels is able to move electrical components,
provided that they generate enough electricity to power up the circuit.
ii) A well-constructed solar boat is a boat that moves aerodynamically well on
water against the wind.
iii) The model solar boat will be to move on water by harnessing energy of the
sun
THE DESIGN RB3 is proven to be the current fastest of the solar boat models!
According to the obtained data, further conclusions can be stated:-
i) The maximum obtained solar energy is able to be collected when the sun is
high (within 11:00 A.M to 2:00 P.M, or simply when the sun’s orientation is
75°-90°)
ii) The shape of the boat will less drag force is able to move faster compared to
models with higher drag force.

55
6.2 Recommendations
i) The solar panels may generate more power with better sunlight (right angle of
orientation for panels and density of light/time of running).
ii) The solar boat may be constructed with materials of higher density and tensile
stress, but at the same time light and durable.
iii) Components needed to assemble the solar electronic circuit must be compatible
with the voltage and current generated. For example, a 12.0 V is less suitable for
panels that are able to generate at maximum 11.0 V, thus 9.0 V motor is used
(though it has lower speed)

56
REFERENCES
Bradley D. Duncan (2007) Multi-Disciplinary Aerodynamics Analysis for Vehicles:
Application of External Flow Simulations to Aerodynamics, Aero-acoustics and
Thermal Management. SAE Paper 2007-01-0100
Brewer, T. (1993) Understanding Boat Design, 4th
Edition. International
Marine/Ragged Mountain Press
Chapelle, H.I (1994) Boatbuilding: A Complete Handbook of Wooden Boat
Constuction. W.W. Norton & Company
Devlin, S. (1995) How to Build Any Boat the Stitch-and-Glue Way, 1st Edition.
International Marine/Ragged Mountain Press
Duffie, J.A. (1980) Solar Engineering of Thermal Processes, 2nd
Edition. Wiley-
Interscience Publications.
E. Guilmineau (2007) Experimental and Numerical Analysis of the Effect of Side Wind
on a Simplified Car Model. SAE Paper 2007-01-0108
Findley, D.S (2010) Solar Power for Your Home. McGraw-Hill Professional Edition.
Fossati, F. (2009) Aero-Hydrodynamics and the Performance of Sailing Yachts: The
Science Behind Sailboats and Their Design. International Marine/Ragged Mountain
Press

57
Gerr, D. (2001) The Propeller Handbook: The Complete Reference for Choosing,
Installing and Understanding Boat Propellers, 1st Edition. International Marine/Ragged
Mountain Press
Gevorkian, P. (2009) Solar Power in Building Design. McGraw-Hill's Access
Engineering.
Haberlin, H. (2012) Photovoltaic System Design and Practice, Wiley Publications.
Harper, G.D.J (2007) Solar Energy Projects for the Evil Genius, 50 Build-It-Yourself.
McGraw-Hill Professional Edition
Hobbs, M. (2007) Journal of Measurement of Accelerations and Keel Loads on Canting
Keel Race Yachts. RINA Modern Yacht Conference.
Komp, R.J (1995) Practical Photovoltaic Electricity from Solar Cells, 3rd
Edition.Aatec
Publications.
Luque, A. (2010) Handbook for Photovoltaic Science and Engineering, 2nd
Edition.
Wiley Publications.
Montgomery, J. (2003) Renewable Energy World. Science Publishers Ltd.
Nelson, J. (2003) The Physics of Solar Cells (Properties of Semiconductor Materials).
Imperial College Press
Ochieng, R.M. (2010) Solar Collectors and Panels, Theory and Applications. Sciyo
Publications.
Patel, M.R. (2006) Wind and Solar Power Systems, Design, Analysis and Operation, 2nd
Edition. Taylor & Francis Group
Payson, H. (1986) Build The New Instant Boats. International Marine Publishing
Company, Camden, Maine.
58
Petela, R. (2010) Engineering Thermodynamics of Thermal Radiation for Solar Power
Utilization. McGraw-Hill Companies Inc.
Richter, E. (2010) Los Altos High School Solar Boat Team Work Sheet, Los Altos High
School Journals Archive
Steward, R. (2010) Boatbuilding Manual, 5th
Edition. International Marine/Ragged
Mountain Press
Sze, S.M. (2007) The Physics of Semiconductor Materials, 3rd
Edition. Wiley
Publications
Teale, J. (2003) How To Design A Boat, 3rd
Edition. Sheridan House
Related Documents