June 2014 Development of a Macroinvertebrate- Based Index of Biological Integrity for Minnesota’s Rivers and Streams

Welcome message from author
This document is posted to help you gain knowledge. Please leave a comment to let me know what you think about it! Share it to your friends and learn new things together.
Transcript

June 2014
Development of a Macroinvertebrate-Based Index of Biological Integrity for Minnesota’s Rivers and Streams

Minnesota Pollution Control Agency 520 Lafayette Road North | Saint Paul, MN 55155-4194 | www.pca.state.mn.us | 651-296-6300
Toll free 800-657-3864 | TTY 651-282-5332
This report is available in alternative formats upon request, and online at www.pca.state.mn.us .
Document number: wq-bsm4-01
Author Joel Chirhart
Contributors John Sandberg John Genet Kevin Stroom Dan Helwig Scott Niemela Mike Feist Bryan Spindler Brenda Asmus R. William Bouchard, Jr. Benjamin Lundeen
The Minnesota Pollution Control Agency (MPCA) is reducing printing and mailing costs by using the Internet to distribute reports and information to wider audience. Visit our website for more information.
MPCA reports are printed on 100% post-consumer recycled content paper manufactured without chlorine or chlorine derivatives.
Recommended Citation: MPCA (2014) Development of a macroinvertebrate-based Index of Biological Integrity for assessment of Minnesota’s rivers and streams. Minnesota Pollution Control Agency, Environmental Analysis and Outcomes Division, St. Paul, MN.

Table of Contents List of Tables ........................................................................................................................................ 2
List of Figures ....................................................................................................................................... 3
1. Overview ......................................................................................................................................... 1
2. Introduction ..................................................................................................................................... 1
3. Methods .......................................................................................................................................... 4 3.1 Study Area ..................................................................................................................................... 4 3.2 Program details ............................................................................................................................. 6 3.3 Field Methods and Processing ...................................................................................................... 7 3.4 Study Design/Site Selection .......................................................................................................... 7 3.5 Human Disturbance Score ............................................................................................................ 8 3.6 Stream Classification ..................................................................................................................... 8 3.7 IBI Development Dataset ............................................................................................................ 10 3.8 Taxonomic Characteristics .......................................................................................................... 12 3.9 Metric Evaluations ...................................................................................................................... 12
3.9.1 Range Test and Metric Transformation .............................................................................. 12 3.9.2 Signal-to-noise test ............................................................................................................. 13 3.9.3 Correlation with natural gradients...................................................................................... 13 3.9.4 Responsiveness test............................................................................................................. 14 3.9.5 Redundancy test .................................................................................................................. 14 3.9.6 Range test for metric scores ................................................................................................ 14 3.9.7 Metric scoring and evaluation ............................................................................................ 14
4. Results ........................................................................................................................................... 15 4.1 Classification ............................................................................................................................... 15 4.2 Metric Selection .......................................................................................................................... 17 4.3 High Gradient Streams ................................................................................................................ 20 4.4 Low Gradient Streams ................................................................................................................. 21 4.5 Large Rivers ................................................................................................................................. 22 4.6 Northern Coldwater .................................................................................................................... 23 4.7 Southern Coldwater .................................................................................................................... 24
5. Discussion ...................................................................................................................................... 25
6. Literature Cited .............................................................................................................................. 28
Appendices ........................................................................................................................................ 31 Appendix A. Data reduction for classification analysis .......................................................................... 31 Appendix B. Decision Criteria for Riffle Run (RR) /Glide Pool (GP) designation. ................................... 33 Appendix C. List of metrics evaluated for inclusion in M-IBI, associated metric category assignments, and metric descriptions ................................................................................................... 34 Appendix D. List of metrics evaluated for inclusion in F-IBI. (+) indicates metric satisfied all testing criteria within a particular class. (IBI metric) indicates metric was included in F-IBI within a particular class. (NT) indicates metric was not tested within a particular class. ..................... 43

List of Tables Table 1. Sum of stream miles covered by previously existing macroinvertebrate IBIs (2003-2004), and percentage of Minnesota's total stream miles covered by each. ......................................................................... 4
Table 2. Human Disturbance Score metrics ........................................................................................................ 9
Table 3. Description of site classes resulting from classification strength analysis. ............................................. 17
Table 4. Summary of metric count, trait category, metric type, and response for each M-IBI. ............................. 18
Table 5. Analysis of variance for M-IBI versus disturbance level (most, least) ..................................................... 18
Table 6. Pearson correlation coefficients for M-IBI versus HDS, watershed area, and stream gradient. ............... 19
Table 7. Metrics selected for the Northern High Gradient streams MIBI. The p-values are from a one-way Kruskal-Wallis test to distinguish between the least- and most-disturbed sites.. ................................................ 20
Table 8. Metrics selected for Statewide Low-Gradient Streams MIBI. This includes the Northern, Prairie, and Southern Low-Gradient stream classes. ............................................................................................................. 21
Table 9. Metrics selected for Statewide Rivers MIBI. This includes the Northern and Southern River stream classes. ............................................................................................................................................................. 22
Table 10. Metrics selected for Northern Coldwater Streams MIBI. The p-values are from a one-way Kruskal-Wallis test to distinguish between the least- and most-disturbed sites. ............................................................. 23
Table 11. Metrics selected for Southern Coldwater Streams MIBI. The p-values are from a one-way Kruskal-Wallis test to distinguish between the least- and most-disturbed sites. ............................................................. 24

List of Figures
Figure 1. Map of Minnesota depicting regions previously encompassed (2003-2004) by macroinvertebrate IBIs. ................................................................................................................................................................... 3
Figure 2. Map of Minnesota depicting major ecotypes (MDNR ECS Provinces), continental watersheds, major rivers and large lakes. ........................................................................................................................................ 5
Figure 3. IBI Development process used by the MPCA ......................................................................................... 6
Figure 4. Maps of (a) warmwater and (b) coldwater stream monitoring sites used to develop M-IBI for the State of Minnesota. Large lakes and major rivers are also depicted. .................................................................. 11
Figure 5. Example of metric value relationships with a natural gradient before and after correction. Metric value is Coldwater Biotic Index in the Southern Coldwater M-IBI class. Raw metric values (a) demonstrate a positive relationship with stream gradient. Replacing metric values with the residual values from a simple linear regression (b) reduces or eliminates the natural gradient relationship. .............................................................. 13
Figure 6. Map of invertebrate classes resulting from classification strength analysis. ......................................... 15
Figure 7. Distribution of human disturbance score amongst optimal geographic classification groups, and groups selected for metric selection and M-IBI development. ............................................................................ 17
Figure 8. M-IBI scores among least- and most-disturbed sites for each M-IBI. Differences in M-IBI scores among least - and most-disturbed sites are significant (Analysis of Variance, α=0.001). ..................................... 19

Development of a Macroinvertebrate-Based Index of Biological Integrity Minnesota Pollution Control Agency for Minnesota’s Rivers and Streams • June 2014
1
1. Overview This report documents the development of a macroinvertebrate community-based Index of Biological Integrity (M-IBI) for Minnesota’s streams and rivers. The primary intended use for this tool is the assessment of aquatic life use support by the Minnesota Pollution Control Agency (MPCA). More detailed descriptions of biomonitoring, bioassessment, biological assessment guidance (MPCA 2012c), human disturbance score (HDS) (MPCA 2012d), and biological condition gradient (BCG) can be found in other documents.
The passage of Minnesota’s Clean Water Legacy Act (CWLA) in 2006 provided a policy framework and resources to state and local governments to accelerate efforts to monitor, assess, and restore impaired waters, and to protect unimpaired waters. With the passage of the Clean Water, Land and Legacy Amendment in 2008, additional funding was made available to the MPCA and its partner agencies to continue and expand on the efforts outlined in the CWLA.
Beginning in 2007, the MPCA began using a 10-year, rotating watershed approach for the comprehensive monitoring and assessment of Minnesota’s rivers and lakes. While the MPCA has used indices of biological integrity and chemical measures together to assess the integrity of streams since the mid-1990s, IBIs previously developed for assessing Minnesota’s rivers and streams were applicable to specific regions of Minnesota and could not be used statewide. In order to conduct biological assessments in every watershed, it was necessary for the MPCA to develop new indicators that were applicable to the entire state of Minnesota. Biological assessments are a particularly powerful tool as they provide an accurate measure of the condition of the biological communities and are a direct determinant of the attainment of aquatic life uses. As a result, the development and implementation of a robust biological monitoring and assessment program is integral to Minnesota’s goals of protecting and restoring the integrity of aquatic resources.
Development of the M-IBI utilized a standardized protocol developed by researchers from the United States Environmental Protection Agency and elsewhere (Whittier et al. 2007). Minnesota’s streams and rivers were first partitioned into five distinct classes, and a unique IBI was developed for each. Within each stream class, biological metrics were sequentially ranked and eliminated by a series of tests, and selected for inclusion in each IBI. Among the most important tests was an evaluation of each metric’s ability to distinguish most-disturbed sites from least-disturbed sites.
This document describes the process used in the development of M-IBI for Minnesota’s rivers and streams, representing the state’s first comprehensive, statewide tool for assessing the biological integrity of riverine macroinvertebrate communities. These indices will be utilized during the first iteration of the 10-year watershed monitoring and assessment cycle.
2. Introduction Waterbody monitoring and condition assessment provide resource managers with information needed to guide restoration and protection efforts. A wide variety of indicators are used in water monitoring and assessment programs, but among the most useful are those that integrate and reflect cumulative impacts to aquatic systems. The degradation of surface waters can be attributed to multiple sources including: chemical pollutants from municipal and industrial point source discharges; agricultural runoff of sediment, nutrients, and pesticides; hydrologic alteration in the form of ditching, drainage, dams, and diversions; and habitat alteration associated with agricultural, urban, and residential development. The timing and magnitude of these impacts may vary through time, and be difficult to detect and measure utilizing traditional chemical evaluations that focus on a single indicator or small suite of parameters.

Development of a Macroinvertebrate-Based Index of Biological Integrity Minnesota Pollution Control Agency for Minnesota’s Rivers and Streams • June 2014
2
However, biota reside in these waterbodies, utilize the available aquatic habitats, and have life spans ranging from weeks to years. They experience the entire spectrum of environmental conditions, including stressors caused by human activities. Aquatic biota are known to be responsive to a wide variety of anthropogenic impacts and, at the community level, reflect the integrated result of physical, chemical, and biological processes through time (Barbour et al. 1999). In this manner, aquatic communities provide a direct, comprehensive perspective on water quality, and lend themselves well to tools that utilize community-level parameters, such as the Index of Biological Integrity (IBI).
The IBI was originally developed as a tool for assessing the condition of rivers and streams in the Midwestern United States (Karr 1981, Karr et al 1986). The concept has since been expanded to a wide variety of geographic regions and ecological systems, and has demonstrated its effectiveness in several applications (e.g. condition monitoring, stressor identification). At its core, the IBI provides a framework for translating biological community data into information regarding ecological integrity (“the capability of supporting and maintaining a balanced, integrated, functional organization comparable to that of the natural habitat of the region”, Frey 1977). It utilizes a variety of attributes (“metrics”) of the biological community, each of which responds in a predictable way to anthropogenic disturbance. The metrics are based on ecological traits of the organisms present at a given site, represent different aspects of ecological structure and function, and are scored numerically to quantify the deviation of the site from least-disturbed conditions. When the individual metric scores are summed together, the composite IBI score characterizes biological integrity (Karr et al 1986).
The composite IBI score is typically compared to a threshold to assess a waterbody’s condition. However, it is also possible to deconstruct the index into its component metrics to determine which aspects of ecological structure and function are particularly robust or diminished at a given site. Relationships between specific stressors and the composite IBI or component metrics can be explored, and the trait-environment linkages that underlie the IBI concept extended to diagnostic applications (Culp et al 2010). The stressor-response relationships implicit in the IBI concept may provide important information towards stressor identification and the development of watershed protection and restoration strategies.
Since the 1990s, the MPCA has utilized the IBI concept in its stream monitoring and assessment program. Narrative language within Minnesota Administrative Rule identifies an IBI calculation as the primary determinant for evaluating impairment of aquatic biota (Chapter 7050.0150, subp. 6, Impairment of biological community and aquatic habitat). Details regarding the development and calibration of the IBI are included in an associated Statement of Need and Reasonableness, and use of this framework has been upheld in legal proceedings challenging its use.

Development of a Macroinvertebrate-Based Index of Biological Integrity Minnesota Pollution Control Agency for Minnesota’s Rivers and Streams • June 2014
3
In 2003 and 2004, IBIs based on macroinvertebrate communities were developed for streams in specific major basins of Minnesota, and used to conduct Aquatic Life Use assessments. Invertebrate IBIs were developed for the St. Croix River Basin (Chirhart, 2003), and the Upper Mississippi River Basin (Genet and Chirhart, 2004) (Figure 1). However, nearly three fourths of Minnesota’s rivers and streams were not covered by these IBIs (Table 1). In 1993, macroinvertebrate data collected in the Minnesota River Basin was analyzed (Zischke and Ericksen, 1993) by looking at several aspects of the macroinvertebrate community, as well as by using an index developed for Ohio’s river and streams (Ohio EPA, 1987a, 1989a). Since the index used in the Minnesota River Basin was not developed and calibrated for Minnesota streams, is was not used for aquatic life use assessment for streams subsequently sampled in the basin.
Figure 1. Map of Minnesota depicting regions previously encompassed (2003-2004) by macroinvertebrate IBIs.

Development of a Macroinvertebrate-Based Index of Biological Integrity Minnesota Pollution Control Agency for Minnesota’s Rivers and Streams • June 2014
4
Table 1. Sum of stream miles covered by previously existing macroinvertebrate IBIs (2003-2004), and percentage of Minnesota's total stream miles covered by each.
Passage of Minnesota’s CWLA in 2006, and the Clean Water, Land and Legacy Amendment in 2008 accelerated efforts to monitor, assess, restore, and protect the state’s water resources. With this increased emphasis on water quality, it became evident that monitoring and assessment tools applicable on a statewide scale were needed, and that the resources necessary to develop those tools were available. Our objective was to develop a series of IBIs for assessing the condition of fish communities in rivers and streams across the state of Minnesota.
In this document, we describe the development and calibration of macroinvertebrate-based Indices of Biological Integrity for streams and rivers across the State of Minnesota. Using a methodology developed by researchers at the U.S. Environmental Protection Agency’s (U.S. EPA) (Whittier et al 2007), metrics representing the structure and function of Minnesota’s stream macroinvertebrate communities were systematically tested for inclusion in IBIs based on statistical criteria (e.g. responsiveness to disturbance, strong signal, low noise, etc.). These IBIs will be used in conjunction with numeric biocriteria to assess the biological integrity of Minnesota’s rivers and streams, and, in conjunction with water chemistry data and standards, to assess whether waterbodies are meeting their designated Aquatic Life Uses as outlined in Minnesota Rules and the federal Clean Water Act.
3. Methods
3.1 Study Area The State of Minnesota lies in a water-rich region, at the headwaters of three major continental watersheds (Gulf of Mexico, Laurentian Great Lakes, Hudson Bay) and at the intersection of western prairies, eastern deciduous forests, and northern boreal forests (Figure 2). Much of the state lies in a transition zone between these ecotypes, and its watercourses reflect this diversity. A wide variety of rivers and streams are found within Minnesota’s borders, including: short, steep bedrock-controlled cascades; broad, meandering prairie rivers; clear, cold spring-fed creeks; and tannic, low-gradient streams draining large bogs and swamps. The diversity of aquatic invertebrate fauna is a reflection of the diversity of its stream and ecotypes. Additionally, Minnesota is located at a crossroads for the distribution of many North American freshwater invertebrate taxa; many taxa in Minnesota exist at the geographic extremes of their native distributions.
Humans have substantially modified the landscape of Minnesota. Most of the native prairies have been converted to agricultural land, with extensive systems of surface and subsurface drainage. Nearly all of the native forests have been logged at some point in the past 150 years. Urban areas have been steadily expanding in all regions of the state. Associated with this transformation, many of Minnesota’s waterbodies have experienced historical and ongoing impacts, including stressors related to agricultural practices, urbanization, mining, logging, channel modification, and industrial discharges. However,
Index of Biotic Integrity Stream Miles Percentage
St. Croix River Basin 3775 3.7%
Upper Mississippi River Basin 19942 19.6%
No IBI 77782 76.60%

Development of a Macroinvertebrate-Based Index of Biological Integrity Minnesota Pollution Control Agency for Minnesota’s Rivers and Streams • June 2014
5
substantial portions of the state have retained natural vegetative cover, relatively intact stream habitats, and connectivity within watersheds. The contemporary structure and function of Minnesota’s stream ecosystems are shaped by these interacting factors of natural variability and human disturbance; the resulting level of biological integrity can be interpreted by tools such as the IBI.
Figure 2. Map of Minnesota depicting major ecotypes (MDNR ECS Provinces), continental watersheds, major rivers and large lakes.

Development of a Macroinvertebrate-Based Index of Biological Integrity Minnesota Pollution Control Agency for Minnesota’s Rivers and Streams • June 2014
6
3.2 Program details The Biological Monitoring Unit of the MPCA’s Environmental Analysis and Outcomes Division conducts ecological surveys on rivers and streams across the state. Since the early 1990s, an extensive dataset has been maintained, describing physical, chemical, and biological characteristics of rivers and streams. As of late 2012, more than 3,500 individual stream invertebrate collection efforts are represented, from more than 3,000 monitoring sites across the state. The vast majority of these surveys were conducted by MPCA staff. These data are used to support waterbody condition assessments in concordance with state and federal requirements (Anderson et al. 2012, Figure 3).
Figure 3. IBI Development process used by the MPCA
Methods Development
Study Design
Statewide Data Collection
IBI Development
BiocriteriaDevelopment
Monitoring & Assessment
Selection of standard field protocols, including fish, macroinvertebrate, and habitat sampling techniques.
Selection of sampling locations to ensure a broad distribution of stream sizes and human disturbance gradient.
Multiyear, statewide data collection of fish, macroinvertebrate , habitat, and water chemistry samples.
Selection of biological endpoints for determining impairment status.
Multistep, metric selection, scoring, and validation process following the general procedure of Whittier et. al. (2007)
Geographic Classification
Selection of geographic classification system based on similarity of biological communities
Intensive watershed monitoring and assessment using a weight of evidence approach.
Development of Disturbance Gradient
Development of human disturbance gradient based on quantifiable, anthropogenic changes to the landscape.

Development of a Macroinvertebrate-Based Index of Biological Integrity Minnesota Pollution Control Agency for Minnesota’s Rivers and Streams • June 2014
7
3.3 Field Methods and Processing Field sampling was conducted during late summer base-flow conditions, August through October, with the majority of the data collected in August. Samples were collected using a d-frame dipnet with a .25 square meter opening, and a 500 micrometer mesh net. Stream reaches were established during field reconnaissance in the spring. In both wadeable and non-wadeable environments macroinvertebrate samples were collected in reaches representing 35 times the mean stream width, with a minimum reach length of 150 meters, and a maximum reach length of 500 meters (reference recon sop). Macroinvertebrate samples were collected from four primary habitats in each reach: riffle-runs, undercut banks, aquatic macrophytes, and woody debris. Sampling consisted of dividing 20 sampling efforts equally among the prevalent primary habitats present in the reach. For example, if four habitats were present in the reach, five samples were collected in each habitat (Chirhart, 2010).
Macroinvertebrate samples were processed in the laboratory using a quantitative subsampling technique and a qualitative large/rare pick. Samples were placed in a gridded tray, and random grids were picked until a minimum of 300 organisms was obtained. Each grid was picked in its entirety unless doing so would increase sample size above 20% of the target number. In this case grids were further divided and subdivided grids were randomly selected and completely picked. After the 300 organism target was reached, an additional qualitative pick was conducted, targeting large or rare organisms. Taxa added from the additional pick were applied to taxonomic richness measures. These individuals were kept separate from the initial subsample for the purposes of metric calculation to ensure that relative abundance measures were not affected.
Field habitat parameters were also collected at all sites used in the IBI development process. At wadeable streams a quantitative habitat evaluation was done (MPCA, 1998). The quantitative habitat evaluation consisted of dividing the established stream reach into 11 transects, and evaluating in-stream physical habitat characteristics, condition of stream banks, the extent and condition of the riparian zone and adjacent landuse, and the availability of cover for fish and macroinvertebrates at each transect. Measurements were also taken characterizing the channel characteristics of the entire reach, including the number, extent, and spacing of riffles, pools, runs, logjams, and bends. Water chemistry parameters were collected at all sites, and stream flow was collected at all wadeable sites (reference habitat and chemistry sop). At both wadeable and non-wadeable streams a qualitative habitat evaluation was done using the Minnesota Stream Habitat Assessment (MSHA) protocol (MPCA, 2002). The MSHA consists of assigning categorical scores on the reach scale to landuse, riparian zone, instream habitat, and channel morphology characteristics. The end result of the MSHA was a habitat score allowing the ranking of sites based on habitat quality.
3.4 Study Design/Site Selection From 1996 through 2007, the primary objectives of the MPCA Biological Monitoring Program were to collect data for the purposes of determining biological condition at the 4-digit HUC basin scale, and the development of indices of biotic integrity. Sites were selected for basin wide condition monitoring using a random survey design established by the U.S. EPA’s Environmental Monitoring and Assessment Program (EMAP). The target population was all perennial streams and rivers within Minnesota, excluding the Mississippi River in the Lower Mississippi River Basin, that were incorporated into U.S. EPA’s reach file 3. Sites were selected separately for each of Minnesota’s ten major basins. Within each basin sites were grouped by Strahler order class: 1st, 2nd, 3rd, and 4th+. Site selection was weighted to achieve equal distribution of sites across each of the Strahler order classes. The target sample size was 50 for the larger basins, and 25 for the smaller basins (Cedar River, DesMoines River, Missouri River).
Development of a Macroinvertebrate-Based Index of Biological Integrity Minnesota Pollution Control Agency for Minnesota’s Rivers and Streams • June 2014
8
Sites selected for the development of biotic indices were chosen to represent the spectrum of the human disturbance gradient present in each basin. Specifically, sites were targeted at the upper and lower ends of the disturbance gradient to fill in gaps left by the random surveys. We also attempted to fill in spatial gaps to ensure a comprehensive geographic coverage. In 2006, the MPCA data collection effort began a transition to an intensive watershed survey design. This intensive design is focused on the 8-digit HUC watershed scale. Sites are located throughout the watershed at the pour points of smaller watersheds, in order to provide a comprehensive perspective of watershed health. Data collected as part of this effort was used to supplement the IBI development dataset where data gaps were present.
3.5 Human Disturbance Score A composite Human Disturbance Score (HDS) was developed to represent potential cumulative anthropogenic disturbance experienced by stream environments, assessed at both a reach- and watershed scale. The disturbance metrics selected for inclusion in the HDS are grounded in the concept of a “Generalized Stressor Gradient” (U.S. EPA 2005), and are evaluated on a site-by-site basis, using readily-available statistics on land use, feedlot and point source density and proximity, reach- and watershed-scale channelization, impervious surfaces, road density, and riparian conditions (Table 2). Eight primary metrics are first individually scored on a 0 (highly disturbed) to 10 (minimally disturbed) scale and summed to derive a composite score. Metric scores represent rescaled (0-10) values for each stressor variable, after excluding values greater or less than three times the interquartile range.
Up to seven additional “adjustment” metrics are then applied, each of which potentially deducts one point from the composite score. One of the adjustment metrics (watershed road density) may also result in the addition of a point. The final, composite Human Disturbance Score ranges from a minimum of 0 (highly disturbed) to a maximum of 81 (minimally disturbed).
3.6 Stream Classification Indices of biological integrity provide numeric expressions of the structure of biological communities. We understand that community structures can change along natural gradients such as watershed size, gradient, and geographic location. To facilitate the development of IBIs, we attempted to develop a geographic stream classification framework for Minnesota streams based on natural differences of aquatic macroinvertebrate communities. Biological communities are affected by both broad (e.g. ecoregion) and reach-scale (e.g. stream gradient) deterministic processes. These processes are in turn influenced by the history of natural and anthropogenic impacts that have occurred in the stream channel and on the landscape. Anthropogenic influences are so significant that it is nearly impossible to factor out their influence when characterizing biological communities, as very often changes to the landscape followed natural landscape patterns. To develop a framework reflective of the natural potential of the biological community, we used least impacted reference sites, and considered broad and reach scale parameters with minimal potential influence by anthropogenic changes. Parameters, such as nutrients or total suspended solids, while naturally occurring, were not considered as potential variables because of the strong potential for anthropogenic sources of influence.

Development of a Macroinvertebrate-Based Index of Biological Integrity Minnesota Pollution Control Agency for Minnesota’s Rivers and Streams • June 2014
9
Table 2. Human Disturbance Score metrics
To ensure a consistent dataset for classification analysis, we developed operational taxonomic units (OTUs) at the genus and family level, and reduced data resolution at each site when needed using an approach which removes ambiguous parent taxa when their abundance is less than the collective abundance of their children taxa (Appendix A). This approach was applied to the dataset on a statewide scale.
Stream classification was carried out separately for warm- and coldwater streams. The distinction between the two thermal classes was largely based on whether a site was located on a Minnesota Department of Natural Resources (MDNR) Designated Trout Stream, but some consideration was given towards whether coldwater fish species (e.g., trout, sculpin) were present or known to have been present in the past. A few sites on Designated Trout Streams were excluded from the Coldwater dataset, and vice-versa.
To further refine invertebrate classification analysis, we assigned each site a gradient class based on the types of habitat sampled, qualitative and quantitative habitat measurements, and observations of flow at the time of sampling. Sites in which riffles or rocky habitat were sampled, that had observable turbulent flow over riffle areas, or higher flow over deeper rocky habitats, were considered high gradient. Sites that did not meet this criteria were considered low gradient. A decision tree was used in conjunction with a weight of evidence approach when gradient classification was not clear. (Appendix B)
Within each dataset (warmwater, coldwater), a set of least-disturbed sites was identified based on the 75th percentile threshold of the HDS distribution. The classification analyses were carried out using both the least-impacted dataset and the full dataset of all eligible sites. While the most emphasis was placed on patterns emerging from the least-impacted dataset, the entire dataset was analyzed in a similar manner to provide supplementary information.
We used a two-step analytical process to evaluate various regionalization schemes to determine which classification best explained the variation in the biological data. The regionalization schemes included combinations of a priori geographic classifications and hydrological and reach scale parameters. Regionalization schemes for testing site classes included geographic boundaries of ecoregion (level 2, 3, 4) (Omernik, 1995), MDNR Ecological Classification System provinces (Hansen and Hargrave, 1996),

Development of a Macroinvertebrate-Based Index of Biological Integrity Minnesota Pollution Control Agency for Minnesota’s Rivers and Streams • June 2014
10
4-digit HUC drainage basins, and latitudinal/watershed areas, as well as drainage area, gradient, and site habitat characteristics. The first step included using Hierarchical Cluster Analysis to define groups of sites based on community similarity. Hierarchical cluster analysis defines groups of sites such that sites in each group are more similar to each other than sites in other groups. Clusters ranging from 2 to 15 site groups were analyzed geospatially, and summary statistics were calculated to examine relationships with natural variables. Observations of strong geographic groupings, or strong relationships with natural variables were used to determine potential classes to be analyzed in classification strength analysis. Non-metric multidimensional scaling (NMS) was used to visualize the relationship between different classification schemes in ordination space. Ordination used Bray-Curtis dissimilarities, which is considered robust for ecological analysis. A matrix of a priori and derived geographic classes and natural variables was used to create a series of possible classification schemes to be analyzed with ordination. The selection and analysis of environmental variables proceeded in an iterative manner, with candidate classification variables tested at different levels of partition and in combination with other variables. The strongest classifications resulting from Cluster and Ordination analyses were used to inform variable selection for classification strength analyses. Mean Similarity Analysis (MEANSIM, Van Sickle, 1998) was used to evaluate classification strength of groups by measuring within-class and between-class dissimilarity; it was used to evaluate the classification strengths of the various regionalization schemes. Each regionalization scheme was ranked based on classification strength and examined in geographic and ordination space, to determine the strongest final classification framework. The final choice was based on a balance of classification strength, compatibility with currently used frameworks, and a desire to have a reasonable number of final classes for which IBIs would be developed.
Following initial classification analysis a comparative analysis of peak community level information between potentially overlapping classes was conducted by a group of regional biologists. Genus and species level data of peak communities can reveal patterns that are masked by ordination techniques when rare community information is not included. Patterns revealed in this analysis were used to modify and retest initial classification schemes for classification strength. Each class within the strongest classification framework resulting from the classification strength analysis was analyzed to ensure an adequate range of human disturbance for metric testing and validation. An inadequate distribution of sites in either the high or low range of human disturbance can make it difficult to validate metrics on a human disturbance gradient, leading to a low number of metrics passing metric testing criteria.
Ultimately, a classification framework was developed that divides lotic sites into nine “invertebrate classes”, differentiated by region, drainage area, gradient, and thermal regime (Appendix A). An IBI was developed for five individual invertebrate class groupings, with high gradient and low gradient stream classes being combined for the purposed of metric testing and evaluation due to a lack of adequate disturbance gradient.
3.7 IBI Development Dataset Warmwater streams were prioritized for Index of Biological Integrity (IBI) development because they make up the vast majority (>90%) of Minnesota’s stream miles and a sufficient dataset existed by 2009. Coldwater streams make up less than 10% of Minnesota’s stream miles, and evaluation of existing data indicated that additional, targeted sampling in 2010 was required to assemble a suitable IBI development dataset. The definition of “warmwater stream” used in this analysis encompassed all non-coldwater streams, including some that might be properly classified as “coolwater.” Warmwater IBI development began in 2009 and was completed in early 2010; coldwater IBI development began

Development of a Macroinvertebrate-Based Index of Biological Integrity Minnesota Pollution Control Agency for Minnesota’s Rivers and Streams • June 2014
11
following the supplemental field sampling carried out in the summer of 2010, and was completed in early 2011.
Data used for the development and validation of the macroinvertebrate-based Index of Biological Integrity (M-IBI) was collected by the MPCA from 1996 to 2010. Data used for development of the warmwater MIBIs was primarily collected from 1996 to 2008.
Figure 4. Maps of (a) warmwater and (b) coldwater stream monitoring sites used to develop M-IBI for the State of Minnesota. Large lakes and major rivers are also depicted.
Additional data was collected from coldwater streams through 2010 for the development of coldwater MIBIs. The 2,217 samples were collected in this period, of which 1,502 samples were used for IBI development. Samples were excluded due to study design variations or drought conditions at the time of sampling that made the associated data unsuitable for IBI development. We divided the data into calibration and validation data sets. One third of all sites were randomly selected and assigned as validation data. Only the calibration data was used for metric testing. Reference site data from both calibration and validation data sets was used to evaluate correlation with natural gradients, and to determine the resulting correction factors. Final metric and index scoring was based on the calibration dataset only. Of the 1,502 samples used for IBI development, 150 were from within year revisits. Revisit data was used to determine metric precision (signal-to-noise test), and in the development of error values for the final MIBI. In sites with more than one visit, the most recently collected sample was used for MIBI development and validation. All data was recorded electronically, and stored in a Microsoft Access database. The database was developed to automatically generate 248 metrics, all of which were evaluated in the MIBI development process. The metrics represented tolerance ranges, functional feeding and behavior groups, and taxonomic groups. Many of the metrics tested were expressed in three different manners; taxa richness, relative abundance of taxa within the subsample, and relative richness of taxa within the subsample. Some metrics were calculated with the Chironomidae grouped at both the family level, and the genus level. The HBI metrics, and all tolerance value metrics, were calculated using previously developed tolerance values (Hilsenhoff, U.S. EPA), as well as tolerance values developed using data only from Minnesota
Development of a Macroinvertebrate-Based Index of Biological Integrity Minnesota Pollution Control Agency for Minnesota’s Rivers and Streams • June 2014
12
3.8 Taxonomic Characteristics An autecology database based on previously published sources was developed for all taxa collected where data was available, the primary source of information was a draft of the Freshwater Biological Traits Database (2012, U.S. EPA). Information for each taxon included traits such as functional feeding group, life habitat, legless condition, and lifespan. We assigned taxa tolerance values based on a generalized disturbance measure, and coldwater sensitivity values based on stream temperature readings. The disturbance measure used was the first principal component of a principal components analysis of six disturbance variables – HDS, Minnesota Stream Habitat Assessment score, total phosphorus, TSS, NH4, and nitrate/nitrite. Tolerance and coldwater sensitivity values were calculated using a weighted average approach, using taxa relative abundances as the weighting factor. Tolerance values were examined two ways, by looking at the weighted average, and weighted average plus it is standard deviation. The addition of the standard deviation is a way to understand the upper tolerance range of each taxa. For the generalized disturbance gradient, the upper tolerance range was used as the final tolerance score. For taxa that we did not have more than 10 records for, tolerance values previously develop in other regions were used.
3.9 Metric Evaluations After an analysis of stream classification we decided to evaluate metrics at two different spatial scales due to a lack of disturbance gradient associated with four classes. We evaluated metrics at each of the classes resulting from the classification work, as well as at five broad streams types also determined to show strong classification strength. The same process was used for each stream group separately.
For warmwater streams, 230 candidate metrics were calculated from invertebrate community data. The coldwater IBI development effort included an additional five metrics for a total of 235 (Appendix B). Metrics were summarized in three ways (taxa richness, relative taxa abundance, and relative taxa richness), and were assigned to one of seven metric classes (taxa richness, composition, tolerance, life history, habitat, reproductive, trophic), intended to represent different components of biotic integrity.
To develop each IBI we evaluated metrics using a series of tests, following the general procedure of Whittier et al (2007). Metrics were tested, eliminated or selected, and scored separately within each of the nine stream classes using the same methodology throughout. The IBI development dataset was used for each test unless otherwise noted.
3.9.1 Range Test and Metric Transformation Metrics with poor range are unlikely to differentiate disturbed and non-disturbed sites because the response gradient is highly compressed. We eliminated richness metrics if the range was less than three species and eliminated any metric if more than 75% of the values were identical.
In cases where the distribution of metric values within a class was highly skewed, transformation was used to normalize the data (or reduce skew). Several transformations were considered, including: log10, natural log, square root, and arcsine square root. Metrics were not rejected if a normal distribution could not be achieved but, in general, we attempted to reduce absolute skew values to less than one through transformation of metric values. The metric scoring process (described below) also reduced skewness in many cases.

Development of a Macroinvertebrate-Based Index of Biological Integrity Minnesota Pollution Control Agency for Minnesota’s Rivers and Streams • June 2014
13
3.9.2 Signal-to-noise test The precision of metric values can be evaluated by comparing variance among sites (“signal”) to variance within sites (“noise”) (Kauffmann et al 1999). The “noise” portion of this comparison was determined by sampling a subset of sites twice within the index period of the same year. Low “signal-to-noise” ratios (S:N) indicate low-precision metrics that are unable to distinguish well among sites (Whittier et al 2007). We used a conservative approach in evaluating metric precision, calculating S:N on a statewide basis rather than individually within each class. Metrics with S:N less than two were eliminated from the candidate metric pool. In a few cases, metrics with S:N values slightly below the established threshold were allowed to “pass” this test if a strong conceptual basis existed for inclusion.
3.9.3 Correlation with natural gradients The classification of sites into different stream classes minimized the influence of natural gradients on metric response. However, we also evaluated each metric against natural gradients within each class to further ensure that metric response was not obscured or amplified. To minimize the potentially covarying effect of human disturbance, natural gradient relationships were evaluated using the subset of least-disturbed sites within each class. We used simple linear regression to evaluate the relationship between metric values, watershed area, and stream gradient, examined plots of the data points, and calculated correlation coefficients for the relationship. For metrics where a significant (α=0.05) relationship existed and the correlation coefficient (r2) was greater than 0.3 (or the relationship was deemed “strong” through visual inspection of plots), we derived a natural-gradient corrected metric by calculating the residual for all sites based on the regression equation. This “adjusted” metric value then replaced the original metric in the IBI development process. Both calibration and validation datasets were used to determine whether natural gradient correction was necessary, to ensure consistency across both datasets.
Figure 5. Example of metric value relationships with a natural gradient before and after correction. Metric value is Coldwater Biotic Index in the Southern Coldwater M-IBI class. Raw metric values (a) demonstrate a positive relationship with stream gradient. Replacing metric values with the residual values from a simple linear regression (b) reduces or eliminates the natural gradient relationship.

Development of a Macroinvertebrate-Based Index of Biological Integrity Minnesota Pollution Control Agency for Minnesota’s Rivers and Streams • June 2014
14
3.9.4 Responsiveness test To test metric responsiveness to human disturbance, we used the non-parametric Mann-Whitney U test to evaluate the difference between metric values at least- and most-disturbed sites. The magnitude of the Mann-Whitney p-value was used to gauge responsiveness, essentially the ability of a metric to distinguish least-disturbed sites from most-disturbed sites. Spearman rank correlation between metric values and HDS was also used to evaluate metric responsiveness, primarily by ranking metrics with similar p-values according to their Spearman rs value. Finally, box plots of metric values within each disturbance quartile were also used to visually assess metric responsiveness. Non-responsive metrics (i.e. those with non-significant U-statistics at the p=0.05 level) were eliminated from the candidate metric pool. The validation dataset was used to confirm the responsiveness of metrics with significant Mann-Whitney p-values; if a metric’s validation dataset produced a non-significant difference, it was eliminated. In a few cases, metrics at or near the responsiveness threshold were allowed to pass the test if a strong conceptual rationale existed for inclusion. IBI development and validation datasets were evaluated separately, and metrics were considered responsive if they passed this test for both datasets
3.9.5 Redundancy test A correlation matrix of metric values was created to examine metric redundancy and avoid selecting IBI metrics that contained redundant information. We evaluated redundancy using the subset of least-disturbed sites within each class, to avoid rejecting metrics simply because their response to disturbance was similar. We also evaluated metric redundancy using all sites, regardless of disturbance level, but more emphasis was given to correlations in the least-disturbed dataset. In general, we considered metrics to be redundant when their Spearman correlation coefficients were greater than 0.7. However, “conceptual redundancy” was also considered in cases where the Spearman coefficient approached the threshold; metrics were sometimes included despite Spearman correlations greater than 0.7 if we considered them to represent distinct components of biological integrity, and sometimes rejected despite Spearman correlations less than 0.7 if we considered them to be conceptually redundant.
Within each class, metrics that passed the Range, Signal-to-Noise, and Responsiveness tests were ranked by their Responsiveness F-statistic (most responsive to least responsive). Metrics were selected for inclusion in the IBI in order of descending F-statistic, provided they were not redundant with more-responsive metrics. To obtain representation across the seven metric classes, a maximum of two non-redundant metrics from any single metric class was chosen until each class was represented by at least one metric. In some cases, it was not possible to select a metric from each metric class, due either to a lack of metrics passing earlier tests, or redundancy with highly-responsive metrics.
3.9.6 Range test for metric scores In cases where box plots and scatter plots indicated that a majority of sites within a class would receive the same metric score regardless of disturbance level, the metric was rejected. When metrics were eliminated by this test, we returned to the metric selection process described in the previous step and replaced it with the next most responsive metric.
3.9.7 Metric scoring and evaluation Each selected metric was scored on a continuous scale from 0 to 10. Maximum and minimum values for each metric were defined as the 5th and 95th percentile values observed across all sites within each class. For positive metrics (those that decrease with disturbance), values less than the 5th percentile (minimum) were given a score of 0; those with values greater than the 95th percentile (maximum) were given a score of 10. Metric scores in between the 5th and 95th percentile were interpolated linearly.

Development of a Macroinvertebrate-Based Index of Biological Integrity Minnesota Pollution Control Agency for Minnesota’s Rivers and Streams • June 2014
15
Negative metrics (those than increase with disturbance) were scored in the same manner, with the minimum defined as the 95th percentile value and the maximum defined as the 5th percentile value. Metric scores were summed within each class, and the resulting value re-scaled to a 0-100 range (multiplied by 10, divided by the number of metrics within each index).
4. Results
4.1 Classification At higher taxonomic levels, natural biological communities tend to become increasingly similar as you narrow the geographical scale at which they are considered. One of the useful properties of metrics is that they can provide meaningful information at broader geographic scales (Karr and Chu, 1999). A useful geographic framework should consider genus or species level similarity, as well as metric similarity. For the purpose of IBI development, we needed a geographic framework that was narrow
Figure 6. Map of invertebrate classes resulting from classification strength analysis.
enough to provide meaningful regional interpretation of biological community data, and broad enough to fit within existing spatial frameworks that had already been defined in Minnesota (e.g. watershed, ecoregion, agro ecoregion, ecological classification system). Cluster analysis revealed broad spatial groupings for both wadeable and non-wadeable streams. The primary geographic boundaries associated with these clusters were the boundary between the northern forest the hardwood forest and prairies. This grouping corresponds with the level two ecoregion boundaries that define many recently developed IBIs.
The results of non-metric multidimensional scaling showed a similar pattern, as well as broad groupings based on gradient (high gradient/low gradient), size class (rivers >500 square miles/streams <500 square miles), and temperature (warmwater/coldwater). The lack of coldwater information at the time of

Development of a Macroinvertebrate-Based Index of Biological Integrity Minnesota Pollution Control Agency for Minnesota’s Rivers and Streams • June 2014
16
classification analysis lead us to give independent class designations to each of the coldwater regions of the state. This was justified due to the distinct temperature regimes, geology, and source water for each of the coldwater regions. Streams in the southern half of the state, particularly in the karst region of southeastern Minnesota, are groundwater dominated systems with colder temperatures, and high hardness. Coldwater streams in the northern part of the state are surface water driven, with higher average temperatures, and softer water. Once a more robust coldwater dataset had been collected, a similar analysis was repeated on just coldwater data, showing that placement in northern and southern coldwater classes was justified.
Classification strength analysis revealed the strongest classification framework to be that which factored in gradient, size class, and a distinction between northern forests, and southern hardwoods and prairies. (Figure 6). The result was a nine class classification scheme (Table 3).

Development of a Macroinvertebrate-Based Index of Biological Integrity Minnesota Pollution Control Agency for Minnesota’s Rivers and Streams • June 2014
17
Table 3. Description of site classes resulting from classification strength analysis.
Analysis of disturbance gradients at each of the strongest classes, showed a lack of disturbance gradient at the low end in the northern classes, and a lack of disturbance gradient at the high end in the southern classes. A screening of commonly used metrics showed a lack of responsiveness, suggesting that an alternative framework might be necessary for metric selection.
Figure 7. Distribution of human disturbance score amongst optimal geographic classification groups, and groups selected for metric selection and M-IBI development.
4.2 Metric Selection Due to a lack of a strong disturbance gradient in the Northern Provincial Forests, metrics were tested using two classification schemes. The first scheme consisted of five metric classes comprised of two gradient classes for wadeable streams (high gradient, low gradient), a large river class (> 500 square mile drainage area), northern coldwater streams, and southern coldwater stream. The second scheme was consisted of nine metrics classes comprised of the seven optimal classes resulting from classification strength analysis, as well as northern coldwater, and southern coldwater streams. The changes in landuse from the northeastern part of Minnesota, to the south and western parts of the state, represent the strongest disturbance gradient available for metric testing and validation (Figure 6). Using the five-metric-class scheme related to the statewide gradient resulted in a more robust set of candidate metrics
Site Class Class Geographic Criteria Drainage Area Criteria1 Rivers in the Laurentian Mixed Forest (LMF) province. >= 500 Sq. Miles
2 Rivers in the Eastern Broadleaf forest, Prairie Parklands, and Tall Aspen Parklands ecological provinces.
>= 500 Sq. Miles
3 High Gradient streams in Laurentian mixed forest ecological province. <500 Sq. Miles4 Low Gradient streams in the Laurentian mixed forest ecological province . <500 Sq. Miles
5High Gradient streams in the Eastern Broadleaf forest, Prairie Parklands, and Tall Aspen Parklands ecological provinces, as well as streams in HUC 07030005.
<500 Sq. Miles
6Low gradient streams in the Eastern broadleaf forest ecological province, as well as streams in HUC 07030005.
<500 Sq. Miles
7 Low gradient streams Prairie Parklands and Tall Aspen Parklands ecological provinces. <500 Sq. Miles
8Coldwater streams in the Northern portions of Minnesota characterized by the Laurentian Mixed Forest (LMF) ecological province.
N/A
9Coldwater streams in the Southern portions of Minnesota, which are often characterized by the Eastern Broadleaf forest, Prairie Parklands, and Tall Aspen Parklands ecological provinces.
N/A

Development of a Macroinvertebrate-Based Index of Biological Integrity Minnesota Pollution Control Agency for Minnesota’s Rivers and Streams • June 2014
18
passing the metric screening process. It was decided that metric selection would be based on the more robust set of candidate metrics, and that future determinations of biocriteria would be based upon the optimal classification scheme related to community similarity.
Table 4. Summary of metric count, trait category, metric type, and response for each M-IBI.
Table 5. Analysis of variance for M-IBI versus disturbance level (most, least)

Development of a Macroinvertebrate-Based Index of Biological Integrity Minnesota Pollution Control Agency for Minnesota’s Rivers and Streams • June 2014
19
Table 6. Pearson correlation coefficients for M-IBI versus HDS, watershed area, and stream gradient.
Figure 8. M-IBI scores among least- and most-disturbed sites for each M-IBI. Differences in M-IBI scores among least - and most-disturbed sites are significant (Analysis of Variance, α=0.001).

Development of a Macroinvertebrate-Based Index of Biological Integrity Minnesota Pollution Control Agency for Minnesota’s Rivers and Streams • June 2014
20
4.3 High Gradient Streams Table 7. Metrics selected for the Northern High Gradient streams MIBI. The p-values are from a one-way Kruskal-Wallis test to distinguish between the least- and most-disturbed sites. The signal-to-noise ratio (S:N) is the ratio of variance among sites to that within sites. Floor and ceiling values are 5th and 95th percentile metric values used to define minimum and maximum metric scores.
A total of 91 metrics failed either the range or signal-to-noise test in the Low Gradient Streams IBI class. There were no metrics needing correction due to a significant relationship with watershed area or gradient. An additional 29 metrics were removed due to the responsiveness test, leaving 110 metrics that met all testing criteria. Ten metrics in four categories were selected for wadeable high gradient streams (Table 7). These metrics were used in the Northern Forest Streams, High Gradient class and the Southern Streams, High Gradient class. High gradient streams M-IBI scores differed significantly (α=0.05) between least- and most-disturbed sites (Table 5, Figure 8). We observed a strong correlation between M-IBI and HDS, a moderate correlation between M-IBI and watershed area, and a weak correlation between M-IBI and stream gradient. (Table 6).
Metric Name Metric Description Category Response p-value S:N Ceiling Floor
ClimberCh Taxa richness of climbers Habitat Decrease <.001 2.01 12.0 2.7
ClingerChTxPctRelative percentage of taxa adapted to cling to substrate in swift flowing water
Habitat Decrease <.001 3.04 46.0 20.0
DomFiveChPctRelative abundance (%) of dominant five taxa in subsample (chironomid genera treated individually)
Composition Increase <.001 2.49 38.2 78.2
HBI_MNA measure of pollution based on tolerance values assigned to each individual taxon, developed by Chirhart
Tolerance Increase <.001 5.92 4.9 8.3
InsectTxPct Relative percentage of insect taxa Composition Decrease <.001 4.05 93.6 72.5
Odonata Taxa richness of Odonata Richness Decrease <.001 2.04 5.0 0.0
Plecopotera Taxa richness of Plecoptera Richness Decrease <.001 3.41 3.0 0.0
PredatorCh Taxa richness of predators Richness Decrease <.001 2.64 16.0 3.0
Tolerant2ChTxPctRelative percentage of taxa with tolerance values equal to or greater than 6, using MN TVs
Tolerance Increase <.001 12.06 93.7 47.1
Trichoptera Taxa richness of Trichoptera Richness Decrease <.001 5.76 12.0 2.0

Development of a Macroinvertebrate-Based Index of Biological Integrity Minnesota Pollution Control Agency for Minnesota’s Rivers and Streams • June 2014
21
4.4 Low Gradient Streams Table 8. Metrics selected for Statewide Low-Gradient Streams MIBI. This includes the Northern, Prairie, and Southern Low-Gradient stream classes. The p-values are from a one-way Kruskal-Wallis test to distinguish between the least and most-disturbed sites. The signal-to-noise ratio (S:N) is the ratio of variance among sites to that within sites. Floor and ceiling values are 5th and 95th percentile metric values used to define minimum and maximum metric scores.
A total of 104 metrics failed either the range or signal-to-noise test in the Low Gradient Streams IBI class. There were no metrics needing correction due to a significant relationship with watershed area or gradient. An additional 14 metrics were removed due to the responsiveness test, leaving 129 metrics that met all testing criteria. Ten metrics in five metric categories were selected for low gradient streams (Table 8). These metrics were used in the Northern Forest Streams, Low Gradient class, the Southern Forest Streams, Low Gradient class, and the Prairie Streams, Low Gradient class. Low gradient streams M-IBI scores differed significantly (α=0.05) between least- and most-disturbed sites (Table 5, Figure 8). We observed a strong correlation between M-IBI and HDS, a moderate correlation between M-IBI and watershed area, and a weak correlation between M-IBI and stream gradient. (Table 6).
Metric Name Metric Description Category Response p-value S:N Ceiling Floor
ClimberCh Taxa richness of climbers Habitat Decrease <.001 2.01 17.0 2.0
Collector-filtererPctRelative abundance (%) of collector-filterer individuals in a subsample
Trophic Decrease <.001 2.37 37.9 0.3
DomFiveChPctRelative abundance (%) of dominant five taxa in subsample (chironomid genera treated individually)
Composition Increase <.001 2.49 43.2 90.8
HBI_MNA measure of pollution based on tolerance values assigned to each individual taxon, developed by Chirhart
Tolerance Increase <.001 5.92 5.8 8.8
Intolerant2ChTaxa richness of macroinvertebrates with tolerance values less than or equal to 2, using MN TVs
Tolerance Decrease <.001 10.88 3.0 0.0
POETTaxa richness of Plecoptera, Odonata, Ephemeroptera, & Trichoptera (baetid taxa treated as one taxon)
Richness Decrease <.001 7.36 16.0 2.0
PredatorCh Taxa richness of predators Richness Decrease <.001 2.64 18.0 4.0
TaxaCountAllChir Total taxa richness of macroinvertebrates Richness Decrease <.001 3.69 53.0 19.0
TrichopteraChTxPct Relative percentage of taxa belonging to Trichoptera Composition Decrease <.001 3.99 16.4 0.0
TrichwoHydroPctRelative abundance (%) of non-hydropsychid Trichoptera individuals in subsample
Composition Decrease <.001 2.32 10.8 2.0

Development of a Macroinvertebrate-Based Index of Biological Integrity Minnesota Pollution Control Agency for Minnesota’s Rivers and Streams • June 2014
22
4.5 Large Rivers Table 9. Metrics selected for Statewide Rivers MIBI. This includes the Northern and Southern River stream classes. The p-values are from a one-way Kruskal-Wallis test to distinguish between the least and most-disturbed sites. The signal-to-noise ratio (S:N) is the ratio of variance among sites to that within sites. Floor and ceiling values are 5th and 95th percentile metric values used to define minimum and maximum metric scores.
A total of 104 metrics failed either the range or signal-to-noise test in the Large Rivers IBI class. There were no metrics needing correction due to a significant relationship with watershed area or gradient. An additional 63 metrics were removed due to the responsiveness test, leaving 80 metrics that met all testing criteria. Eight metrics in three metric categories were selected for non-wadeable rivers (Table 9). These metrics were used in the Northern Forest Rivers class, and the Prairie/Hardwoods River class. Larger river M-IBI scores differed significantly (α=0.05) between least- and most-disturbed sites (Table 5, Figure 8). We observed a strong correlation between M-IBI and HDS, a moderate correlation between M-IBI and watershed area, and a weak correlation between M-IBI and stream gradient. (Table 6).
Metric Name Metric Description Category Response p-value S:N Ceiling Floor
DomFiveCHPctRelative abundance (%) of dominant five taxa in subsample (Chironomid genera treated individually)
Composition Increase <0.001 2.49 41.7 82.3
HBI_MNA measure of pollution based on tolerance values assigned to each individual taxon within Minnesota developed by Chirhart
Tolerance Increase <0.001 5.92 5.5 8.3
Intolerant2lessChTaxa richness of macroinvertebrates with tolerance values less than or equal to 4, using MN TVs
Tolerance Decrease <0.001 13.23 18.2 0
Odonata Taxa richness of Odonata Richness Decrease <0.001 2.02 5 0
PredatorCh Taxa richness of predators Richness Decrease <0.001 2.64 18.3 3.5
TaxaCountAllChir Total taxa richness of macroinvertebrates Richness Decrease <0.001 3.69 57.6 24
TrichwoHydroPctRelative abundance (%) of non-hydropsychid Trichoptera individuals in subsample
Composition Decrease 0.001 2.32 22.8 0
VeryTolerant2PctRelative abundance (%) of macroinvertebrate individuals in subsample with tolerance values equal to or greater than 8; metric
Tolerance Increase 0.002 4.18 12.8 78.7

Development of a Macroinvertebrate-Based Index of Biological Integrity Minnesota Pollution Control Agency for Minnesota’s Rivers and Streams • June 2014
23
4.6 Northern Coldwater Table 10. Metrics selected for Northern Coldwater Streams MIBI. The p-values are from a one-way Kruskal-Wallis test to distinguish between the least- and most-disturbed sites. The signal-to-noise ratio (S:N) is the ratio of variance among sites to that within sites. Floor and ceiling values are 5th and 95th percentile metric values used to define minimum and maximum metric scores.
A total of 114 metrics failed either the range or signal-to-noise test in the Northern Coldwater IBI class. There were no metrics needing correction due to a significant relationship with watershed area or gradient. An additional 74 metrics were removed due to the responsiveness test, leaving 55 metrics that met all testing criteria. Nine metrics in five metric categories were selected for northern coldwater streams (Table 10). Northern Coldwater streams M-IBI scores differed significantly (α=0.05) between least- and most-disturbed sites (Table 5, Figure 8). We observed a strong correlation between M-IBI and HDS, a moderate correlation between M-IBI and watershed area, and a weak correlation between M-IBI and stream gradient. (Table 6).
Metric Name Metric Description Category Response p-value S:N Ceiling Floor
Percent (%) Collector-Gatherer Relative percentage of collector-gatherer taxa Trophic Increase 0.003 2.31 22.1 41.90
Hilsenhoff Biotic Index, MN TVsA measure of pollution based on tolerance values assigned to each individual taxon, developed by Chirhart
Tolerance Increase 0.001 3.90 4.22 7.03
Intolerant Taxa Richness, 2Taxa richness of macroinvertebrates with tolerance values less than or equal to 2, Using MN TVs
Tolerance Decrease <.001 10.96 12 0.00
Percent (%) Long-lived Taxa Relative percentage of long-lived taxa Life History Decrease 0.012 3.34 26 6.00
Percent (%) Non-insect Taxa Relative percentage of non-insect taxa Composition Increase 0.011 3.22 2.47 20.79
Percent (%) Odonata Taxa Relative percentage of taxa belonging to Odonata Composition Decrease 0.002 2.15 9.5 0.00
POETTaxa richness of Plecoptera, Odonata, Ephemeroptera, & Trichoptera (baetid taxa treated as one taxon)
Richness Decrease 0.002 9.96 29 8.00
Predator Taxa Richness Taxa richness of predators (excluding Chironomidae predator taxa) Trophic Decrease 0.008 2.85 16 5.00
Percent (%) Very Tolerant Taxa, 2Relative percentage of taxa with tolerance values equal to or greater than 8, using MN TVs.
Tolerance Increase 0.003 3.43 9.2 32.50
Development of a Macroinvertebrate-Based Index of Biological Integrity Minnesota Pollution Control Agency for Minnesota’s Rivers and Streams • June 2014
24
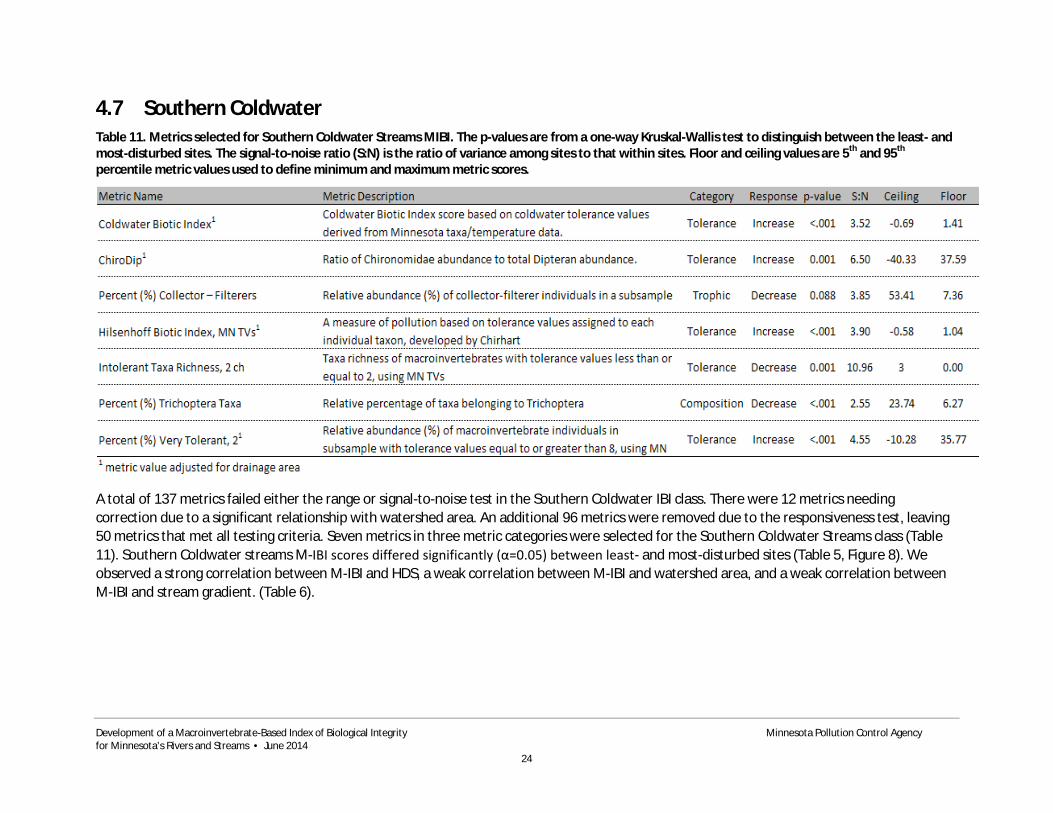
4.7 Southern Coldwater Table 11. Metrics selected for Southern Coldwater Streams MIBI. The p-values are from a one-way Kruskal-Wallis test to distinguish between the least- and most-disturbed sites. The signal-to-noise ratio (S:N) is the ratio of variance among sites to that within sites. Floor and ceiling values are 5th and 95th percentile metric values used to define minimum and maximum metric scores.
A total of 137 metrics failed either the range or signal-to-noise test in the Southern Coldwater IBI class. There were 12 metrics needing correction due to a significant relationship with watershed area. An additional 96 metrics were removed due to the responsiveness test, leaving 50 metrics that met all testing criteria. Seven metrics in three metric categories were selected for the Southern Coldwater Streams class (Table 11). Southern Coldwater streams M-IBI scores differed significantly (α=0.05) between least- and most-disturbed sites (Table 5, Figure 8). We observed a strong correlation between M-IBI and HDS, a weak correlation between M-IBI and watershed area, and a weak correlation between M-IBI and stream gradient. (Table 6).

Development of a Macroinvertebrate-Based Index of Biological Integrity Minnesota Pollution Control Agency for Minnesota’s Rivers and Streams • June 2014
25
5. Discussion The class-specific indices described here together represent the first comprehensive, statewide tool for assessing the biological integrity of aquatic macroinvertebrate communities in the State of Minnesota. Our statewide approach encompassed both the full geographic extent and variety of lotic environments found across the state, including large rivers, moderate-sized streams, headwaters, low-gradient and coldwater streams. Some transitional habitats, such as estuaries, impoundments, wetland flowages, and “Great Rivers”, fell beyond the scope of this project but future work may address the development and application of macroinvertebrate community-based indicators for these systems.
The process of IBI development began as coordinated effort between groups developing indicators for fish and macroinvertebrates. The intention was to follow an identical path of developing a regional classification framework, followed by metric selection/IBI development for each class resulting from the classification analysis, as well as northern and southern coldwater classes. Early in the process it was decided that the selection of an optimal regional classification scheme would occur independently, and that it was acceptable to have differing regionalization schemes for each assemblage. This decision was based on the underlying principles that dictate the natural distribution of fishes and macroinvertebrates. Invertebrate distributions, for the most part, follow broad changes in landscape patterns. Thus, classifications such as ecoregion can be effective in capturing the natural variation of invertebrate communities. While classifications such as ecoregion have been effectively used throughout the United States in defining biomonitoring program objectives, their use may have more to do with convenience than effectiveness (Hawkins et al 2000), especially when dealing with fish communities. Ecoregions fail to account for landscape features, such as major waterfalls, that play a large role in determining fish community structure across the state. For example, within the St. Croix Basin, several species of fish are native to rivers and streams below Taylors Falls, but absent upstream; as a result, distinct differences exist between the fish assemblages above and below this barrier. The classification frameworks resulting from the independent analysis of fish and macroinvertebrate communities, showed some similarities, but were ultimately different. We acknowledge that this can cause some confusion when trying to interpret overlapping results from fish and invertebrates communities, but it was decided that the differences driving the community structures of the two assemblages were strong enough to merit independent classifications.
Most of the recent work on development of biological indicators treats regional classification similarly; either a priori assignments of level II or III ecoregions, or combinations of ecoregions, are made, or an analysis of classification strength is done exploring the relationship of the structure of reference biological communities between various classification frameworks to determine an optimal framework. Minnesota is located in an area that encompasses a transition between prairie and forest regions. Unlike areas of US where landscapes change abruptly, such as where prairies meet mountain ranges, the transition from prairies to forest is more subtle. As one moves from the northeastern corner of the state, to southern and western parts of the state, the landscape gradually changes from a conifer and aspen dominated ecosystem, to mixed hardwoods, oak savannah, and finally to prairies. Previously developed classification frameworks define three primary natural regions of the state, boreal forest, hardwood forest, and prairie, with the hardwood forests acting as a transitional zone. Other than in a few areas, the changes between these regions are not abrupt, thus the lines that define these natural areas are not exact. Defining differences along the transitional zone is further complicated by modifications that have been made to landscape over the past 100 years, making the hardwood forest appear more like prairie in many areas. Due to the transitional nature of Minnesota’s natural landscape,

Development of a Macroinvertebrate-Based Index of Biological Integrity Minnesota Pollution Control Agency for Minnesota’s Rivers and Streams • June 2014
26
it was determined that it was necessary to explore the relationship between the peak biological communities across the state, understanding that previously developed classification schemes might not adequately characterize community structures in the context of landscape changes and varying site specific habitat changes. We evaluated several possible regional frameworks (e.g. ecoregion, MDNR ecological classification system, major drainage basin), including components of gradient and streams size to allow us to further refine regional differences. We ultimately decided on a customized regional framework that made use of the MDNR Ecological Classification System province level designations, incorporating both a size and gradient/habitat component to further refine classes.
The river continuum concept suggests that stream macroinvertebrate community structure changes as streams transition from headwaters to large rivers (Vannote, et. al., 1980). These community changes are a result of the associated natural changes in energy input, flow regimes, and habitat availability that occur in streams as they increase in size. As such, a discernible change in macroinvertebrate community structure is very gradual, and measurable differences occur over broad scales. When selecting a classification scheme it must be understood that these gradual changes that occur within riverine systems will result in a loss of precision when attempting to quantify community structure across broad geographic, size, and habitat scales. In addition to establishing geographic class boundaries, the classification framework we developed further partitions stream into size and habitat/gradient classes. Despite the fact that we attempted to either correct for a correlation with drainage area, or dismissed metrics highly correlated with drainage area, there are often community structural differences between the smaller headwater streams, and streams that fall just shy of the large river size threshold of 500 square miles. These differences could be reflected in an IBI score, so it is necessary when using the associated IBIs, that we recognize these differences by ensuring that sites are classified appropriately, or consider reclassifying or excluding a site from analysis if it is determined that the assemblage associated with a site does not fit within the current set of stream classes, i.e., either too small, or too large. The same goes for habitat/gradient classification. After construction and analysis of the IBI development dataset, it became apparent that some of the low gradient sites did not correspond to expectations based on our human disturbance gradient. Some very low gradient sites in pristine watersheds showed very low IBI scores, typically due to depauperate richness, with a preponderance of organisms tolerant to low dissolved oxygen. It is likely that these types of communities are naturally occurring in healthy ecosystems, but that our dataset lacked a large enough set of these sites to show a distinct class during classification analysis. As with size classes, it may be necessary to reclassify or exclude sites from analysis when the gradient conditions are such that they diverge significantly from streams commonly found in the associated class. As our dataset grows, and more sites are analyzed, it may become clear that additional streams classes will need to be explored to ensure that sites are being analyzed in a fair manner.
The approach outlined by Whittier et al (2007) provided an objective methodological template for metric evaluation. Using a series of standardized metric tests, we developed sensitive, robust, community-based indices that provide reliable information about biological integrity. This method was developed to maintain some of the structural approach of the original Karr IBI (1981) by incorporating metrics that encompass as many of the biologically important features of the assemblage. Unlike previously developed fish IBIs, invertebrate IBIs have shown considerable variability in metric use, so we did not deem it necessary to incorporate “classic” invertebrate metrics.
Our approach maintained the conceptual foundation of the IBI – a trait-based, multi-metric index that is demonstrably sensitive to anthropogenic disturbance – but we assumed little regarding the a priori utility of specific metrics and considered a wider variety of candidates. However, while the metric

Development of a Macroinvertebrate-Based Index of Biological Integrity Minnesota Pollution Control Agency for Minnesota’s Rivers and Streams • June 2014
27
selection tests were designed with objective criteria for removing candidates from the pool, those with test values slightly over the threshold for a particular test were sometimes allowed to “pass” if a sound conceptual basis for doing so could be identified. While few of these “borderline” metrics made it into the final indices, this interplay between a conceptual and quantitative approach strengthened our understanding of how invertebrate communities respond to anthropogenic disturbance and ensured the resulting indices were well-balanced and representative of the wide spectrum of biological integrity.
The relationship between selecting a set of robust candidate metrics, and choosing an optimal classification framework was not something we considered to be problematic until we began the metric selection process. While going through the process of metric development it was soon realized that the covariance of landscape development with naturally occurring boundaries confounded our efforts to select a robust set of metrics.
The northern boreal forests, representing a region of relatively intact watersheds, with relatively little development compared to the remainder of Minnesota, showed very little range along the human disturbance gradient; most sites displayed very little to no disturbance in both landscape and habitat variables. The central hardwood region of the state showed a wide range of landscape influences, allowing for the development of a robust set of metrics, while the prairie region showed a much more heavily developed landscape, with relatively few intact watersheds. The result was that three of the seven classes had very few metrics make it through the testing and evaluation phase. And those few metrics that made it through showed a relatively weak response along the disturbance gradient. In order to increase the range of disturbance available for metric selection, metrics were grouped by size and gradient class, and tested using a statewide dataset. The resulting suite of metrics and related IBIs showed a stronger relationship with disturbance than any that were previously tested, so it was decided to use these metrics in the final M-IBI.
While the overall relationship between metrics, IBIs, and disturbance proved to be stronger when using a statewide disturbance gradient, the same relationship is not always stronger on a smaller geographic scale. It is possible that assessments resulting from the use of the M-IBI developed from the statewide dataset will not be as precise as IBI’s developed at smaller scales. But this will always be the case.
When developing a classification framework, and related IBIs, we must attempt to find a balance between available data, range of disturbance, the effort related to IBI development, and the precision of the final IBI score relative to impairment status. While we were intent on developing an IBI for each class related to our classification analysis, our final assessment was that fewer IBI groups was preferable to underperforming IBIs. We also thought that fewer IBIs which function similarly across the state would be easier for stakeholders to understand.
To further validate the decision to use metrics selected on a statewide scale, we also did analysis comparing the M-IBIs from both IBI development groups using a tool designed to assign class specific biological categories to each site for the purposes of understanding the departure of the present biological community from a potential peak community (Gerritsen, 2012). This analysis showed very similar results for both IBI groups, suggesting that an IBI developed using statewide data is able to discern a change in condition equivalent to an IBI developed using a more refine dataset. The reason this is likely the case is that many metrics are known to perform well across a broad range of conditions, due to species being replaced by similar species as you move from one ecotype to another (Karr).
The development of invertebrate and fish IBIs was a parallel effort. The only notable difference between the final IBIs was related to the grouping of classes for the purpose of metric selection and IBI

Development of a Macroinvertebrate-Based Index of Biological Integrity Minnesota Pollution Control Agency for Minnesota’s Rivers and Streams • June 2014
28
developed. The process of grouping similar invertebrate classes was necessitated by the lack of disturbance gradient that was related directly to the final invertebrate classification framework. This was not the case for the fish IBI development dataset and classification framework, and an IBI was able to be developed for each class related to classification analysis. Had all things been equal, the final process would have been identical for both assemblages. There is not one way to develop IBIs, so we don’t think that the subtle differences in approach should have an impact on any of the resulting uses of the invertebrate or fish IBIs.
The most problematic classes in the metric selection and IBI development process were the northern classes. This was primarily due to a lack of disturbance gradient, and resulted in the eventual grouping of classes for metric selection. This was not the case for the northern coldwater class. We considered combining the northern and southern coldwater classes for the purposes of metric selection, but determined that the background geographic, geochemical, habitat, and landuse (HDS) conditions, as well as peak taxonomic communities, were different enough to merit separate efforts. One of the main problems with the streams in this part of the state is that many of them flow from a low gradient area to a high gradient area as they approach Lake Superior. Many are located in watersheds with very little to no recent history of human disturbance, additionally, many of them flow throw extensive wetland complexes. The low gradient, wetland dominated nature of these systems create stream conditions with high organic carbon, low dissolved oxygen, and often little habitat due to soft sediment stream bottoms. There were not an adequate number of low gradient sites to allow for the development of a separate, low gradient, coldwater IBI, so these sites were combined with high gradient data in the IBI development process. The result being that some of the low-gradient systems have lower IBI scores relative to the entire set of northern coldwater streams.
The MPCA has committed extensive time and effort towards the development of biological indicators and a framework for their use in its surface water monitoring and assessment process (Anderson et al. 2012). The stream classification system and macroinvertebrate-based Indices of Biological Integrity described in this document have been utilized (in concert with other indicators) since 2010 to annually assess the condition of aquatic life in Minnesota’s rivers and streams. Continuing work may attempt to expand the IBI concept to waterbodies not covered here, including lakes, reservoirs, and large rivers. Diagnostic applications of the IBI and its component metrics will also be explored. Large-scale changes in environmental condition across Minnesota, or advances in the science of biological indicators may require periodic evaluation of these indices to ensure their relevancy as an assessment tools.
6. Literature Cited Barbour, M.T., J. Gerritsen, B.D. Snyder, and J.B. Stribling. 1999. Rapid bioassessment protocols for use in streams and wadeable rivers: periphyton, benthic macroinvertebrates, and fish. U.S. Environmental Protection Agency, EPA 841-B-99-002. Washington, D.C.
Chirhart, J, 2003. Development of a Macroinvertebrate Index of Biological Integrity (MIBI) for Rivers and Streams of the St. Croix River Basin. Minnesota Pollution Control Agency. St. Paul, MN.
Culp, J.M., D.G. Armanini, M.J. Dunbar, J.M. Orlofske, N.L. Proff, A.I. Pollard, A.G. Yates, and G.C. Hose. 2010. Incorportating traits in aquatic biomonitoring to enhance casual diagnosis and prediction. Integrated Environmental Assessment and Management, 7: 187-197.

Development of a Macroinvertebrate-Based Index of Biological Integrity Minnesota Pollution Control Agency for Minnesota’s Rivers and Streams • June 2014
29
Fago, D., and J. Hatch. 1993. Aquatic resources of the St. Croix River Basin. In Proceedings of the symposium on: Restoration planning for the rivers of the Mississippi River Ecosystem. Edited by L. W. Heese, C. B. Stalnaker, N. G. Benson, and J. R. Zuboy. National Biological Survey Biological Report 19.
Feist, M. 2011. Fish community sampling protocol for stream monitoring sites. Minnesota Pollution Control Agency. http://www.pca.state.mn.us/index.php/view-document.html?gid=6087
Frey, D.G. 1975. Biological integrity of water – an historical approach. Pages 127-140 in R.K. Ballantine and L.J. Guarraia, editors. The integrity of water. U.S. Environmental Protection Agency, Washington, D.C.
Genet, J, and J. Chirhart, 2004. Development of a Macroinvertebrate Index of Biological Integrity (MIBI) for Rivers and Streams of the Upper Mississippi River Basin. Minnesota Pollution Control Agency. St. Paul, MN.
Hansen, D, and B Hargrave, 1996. Development of a Multilevel Ecological Classification System for the State of Minnesota. Environmental Monitoring and Assessment 39: 75–84.
Karr, J. and E.W. Chu. 1999. Restoring Life in Running Waters: Better Biological Monitoring. Island Press, Washington D.C. 206p.
Karr, J.R. 1981. Assessment of biotic integrity using fish communities. Fisheries 6: 21-27.
Karr, J.R., K.D. Fausch, P.L. Angermeier, P.R. Yant, and I.J. Schlosser. 1986. Assessing biological integrity in running waters: a method and its rationale. Illinois Natural History Survey Special Publication 5. 28 p.
Kauffmann, P.R. P. Levine, E.G. Robison, C. Seeliger, and D.V. Peck. 1999. Quantifying physical habitat in wadeable streams. EPA/620/R-99/003. U.S. Environmental Protection Agency, Washington, D.C.
Lyons, J. 1992. Using the Index of Biological Integrity (IBI) to measure environmental quality in warmwater streams of Wisconsin. U.S. Department of Agriculture, Forest Service, North Central Experiment Station Gen. Tech. Rep. NC-149. St. Paul, MN. 51 p.
Lyons, J., L. Wang, and T.D. Simonson. 1999. Development and validation of an Index of Biotic Integrity for coldwater streams in Wisconsin. North American Journal of Fisheries Management 16: 241-256.
MPCA 1998. Physical Habitat and Water Chemistry Assessment Protocol for Wadeable Stream Monitoring Sites. Minnesota Pollution Control Agency. http://www.pca.state.mn.us/index.php/view-document.html?gid=6089
MPCA 2000. Minnesota Stream Habitat Assessment (MSHA) Protocol for Stream Monitoring Sites. Minnesota Pollution Control Agency. http://www.pca.state.mn.us/index.php/view-document.html?gid=6088
MPCA 2012. Guidance manual for assessing the quality of Minnesota surface waters for determination of impairment: 305(b) report and 303(d) list. 2012 Assessment Cycle. Minnesota Pollution Control Agency report wq-iw 1-04.
Niemela, S. and M. Feist. 2000. Index of Biotic Integrity (IBI) guidance for coolwater rivers and streams of the St. Croix River Basin in Minnesota. Minnesota Pollution Control Agency, St. Paul, MN.
Niemela, S., E. Pearson, T.P. Simon, R.M. Goldstein, and P.A. Bailey. 1999. Development of an index of biotic integrity for the species-depauperate Lake Agassiz Plain ecoregion, North Dakota and Minnesota.

Development of a Macroinvertebrate-Based Index of Biological Integrity Minnesota Pollution Control Agency for Minnesota’s Rivers and Streams • June 2014
30
In Simon, T.P. ed: Assessing the Sustainability and Biological Integrity of Water Resources Using Fish Communities. CRC Press, Boca Raton, FL. 339-365.
Ohio EPA (Environmental ProtectionAgency). 1988. Biological criteria for the protection of aquatic life. Vol. 2. Users manual for biological field assessment of Ohio surface waters. Columbus, OH: Environmental Protection Agency.
Omernik, J.M. 1995. Ecoregions: A spatial framework for environmental management. In: Biological Assessment and Criteria: Tools for Water Resource Planning and Decision Making. Davis, W.S. and T.P. Simon (eds.), Lewis Publishers, Boca Raton, FL. p. 49-62
U.S. EPA. 2005. Use of biological information to better define designated aquatic life uses in state and tribal water quality standards: tiered aquatic life uses. EPA-822-R-05-001. U.S. Environmental Protection Agency, Washington, D.C.
Vannote, R.L., G. W. Minshall, K. W. Cummins, J. R. Sedell, C.E. Cushing. 1980. The river continuum concept. Canadian Journal of Fisheries and Aquatic Sciences, Vol. 37, No. 1. (1980), pp. 130-137 by.
Van Sickle, J. and R.M. Hughes. 2000. Classification strengths of ecoregions, catchments and geographic. clusters for aquatic vertebrates in Oregon. Journal of the North American Benthological Society 19: 370-384.
Van Sickle, J. Documentation for MEANSIM, Version 6.0. United States Environmental Protection Agency, Western Ecology Division. 2008. Web. 6 Nov 2012.
Whittier, T.R., R.M. Hughes, J.L. Stoddard, D.V. Peck, and A.T. Herlihy. 2007. A structured approach for developing indices of biotic integrity: three examples from streams and rivers in the western USA. Transactions of the American Fisheries Society 136, 718-735.
Zischke, J.A., G. Ericksen, D. Waller, R. Bellig. 1994. Analysis of Benthic Macroinvertebrate Communities of the Minnesota River Watershed, in Minnesota River Assessment Project Report, Volume III, Biological and Toxicological Assessment. Minnesota Pollution Control Agency, St. Paul, MN.

Development of a Macroinvertebrate-Based Index of Biological Integrity Minnesota Pollution Control Agency for Minnesota’s Rivers and Streams • June 2014
31
Appendices
Appendix A. Data reduction for classification analysis Removing redundant taxa from the database:
Developing a geographic classification system requires that biota be identified to a consistent level of taxonomy. The level of taxonomy used can vary among taxa, but no individuals can be ambiguous, e.g., individuals within a family cannot be identified to family part of the time, genus some of the time, and species some of the time. When we build models, we scrutinize the original data to determine the frequency with which individuals in different taxonomic groupings are identified to different levels of resolution. Depending on these frequency distributions, we make decisions to either aggregate taxa (e.g., species within genera) or exclude individuals from analyses (e.g., those individuals identified only to order or family when most others were identified to a lower level). The result of this exercise is a list of operational taxonomic units (OTUs) that can vary in their level of taxonomic resolution, but which are unique from one another.
When creating a list of OTUs several decisions must be made to ensure that the list provides the most meaningful information for the classification process. The method used by the MPCA to remove ambiguous taxa has recently been described by Cuffney et. al. The approach is described as the RPMC-G method- remove parent, or merge parent with child depending on their abundances. The method is applied in two steps depending on the status of child-parent abundances.
If the collective abundance of children is greater than the abundance of an ambiguous parent, then the remove parent keep child (RPKC) approach is taken (Step 1). If the abundance of a parent is greater than the collective abundance of the children, then the merge child with parent (MCWP) approach is taken (Step 2).
The RPKC approach removes ambiguous parents when their abundance is less than the collective abundance of their children. The approach taken by the MPCA considers the entire data set collectively when making decisions about ambiguous taxa. For this reason, it is possible to lose taxa from samples that contain ambiguous parents with no children. In this case, the abundance of the ambiguous parent is assigned to the child that occurs most frequently in the data set. This step maintains the taxonomic diversity of the sample but creates the occurrence of a taxon that was not collected in the sample. Other, less conservative options include dividing the abundance of the ambiguous parent proportionally to children that are known in the data set, or assigning the abundance of the ambiguous parent to children that are known to occur at similar sites. The later two options allow for an increase in taxonomic diversity from the original sample data, and are not used.
The MCWP approach merges the abundances of the children with their parent when the collective abundance of the children is less than the parent. The taxonomic designations and related abundances of the children are then removed from the data set.

Development of a Macroinvertebrate-Based Index of Biological Integrity Minnesota Pollution Control Agency for Minnesota’s Rivers and Streams • June 2014
32
Query process:
Step 1: Determine taxa identified at the sub-generic level. Monospecific taxa can be left alone or changed to reflect the genus level determination. Multiple species representing a single genus, within and across samples must be changed to reflect genus level identification. Aggregation is done site by site.
Step 2: Determine which taxa are identified at each taxonomic step below genus. Group all taxa identified below this level to compare which taxonomic level is more frequently determined. This step involves developing queries for each taxonomic level, then comparing the individual taxa of each level to every other parent and/or child. In a typical stream invertebrate dataset there will be very few taxonomic determinations above the family level, so the majority of the work in this step involves comparing taxa at the genus, tribe, subfamily, and family level. Although comparisons must also be made at the order level and higher.
Step 3: Based on Step 2, if children are determined to be more common than parents, then parent level ID’s are removed, including taxonomic designations and abundances. Using the queries in Step 2, the parent child relationship for each record is examined for occurrence and abundance. If it is clear that abundances are unduly weighted by a few records, a decision can be made to keep parents and proceed to Step 4 for the selected taxon.
Step 4: If the parent level IDs are more common than children, then children are merged with parent. As with Step 3, the parent child relationship for each record is examined for occurrence and abundance. If it is clear that abundances are unduly weighted by a few records, a decision can be made to return to Step 3 and remove parents for the selected taxon. In this step a macro was used that relied on the results of Step 2. The macro runs a series of queries that do the following.
1) Asks for a Taxonomic Serial Number (TSN) of parents for children that need to be merged with a more abundant parent that is present in the sample, and creates a table with a record for each child that needs to be merged.
2) Flags the dataset for each record identified in the previous step. 3) Deletes each record from the dataset flagged in the previous step. 4) Using the table created in the first query, the parents are updated, or merged, with the relevant
children. (mcwp). 5) If no TSN is provided in the first step, asks for a TSN of children that need to be merged with
parents that do not exist in the sample, then creates a table with each record for that child, and assigns it the relevant parent TSN to which it will be updated.
6) Flags the dataset for each record identified in the previous step. 7) Deletes each record from the dataset flagged in the previous step. 8) Using the table created in the first query, the nonexistent parent TSN is added to the dataset
with the appropriate counts from the merged child.
Step 5: Once all records have been either merged or removed, the dataset is queried to determine rare taxa, which are those occuring at less than five percent of all sites. A backup dataset is created including all taxa remaining after Step 4, then rare taxa are removed from the working dataset.

Development of a Macroinvertebrate-Based Index of Biological Integrity Minnesota Pollution Control Agency for Minnesota’s Rivers and Streams • June 2014
33
Appendix B. Decision Criteria for Riffle Run (RR) /Glide Pool (GP) designation.
Criteria Yes No1. Has the sampler indicated on the stream visit form that ‘riffle/run’ is the ‘Dominant invertebrate habitat in reach’?
RR #2
2. In the mulithabitat sample, was any portion collected from riffles or rocky runs?
go to #3 GP
3. Was there a riffle present in the sample reach? go to #4 GP4. Flow over riffle perceptible? go to #5 GP5. # ‘Riffle/run, rocky substrate’ samples > 4? RR go to #6
RR GPExtent of riffle in sample reach (%) > 5% < 5%Gradient of sample reach > 1 < 1Geomorphology of Minnesota GIS layer, based on location of sample reach:TOPO = 3, 4, or 5 1 or 2SED_ASSOC = A, D, or T L or PSite photos suggests (check one)Aerial photos suggests (check one)
6. Use a weight of evidence approach pulling in comments from macroinvertebrate visit form, habitat data from fish visit, sample reach photos, aerial photos, and geomorphology GIS layer to address the following:
Riffle/Run (RR) vs. Glide Pool (GP) Designation Guidance

Development of a Macroinvertebrate-Based Index of Biological Integrity Minnesota Pollution Control Agency for Minnesota’s Rivers and Streams • June 2014
34
Appendix C. List of metrics evaluated for inclusion in M-IBI, associated metric category assignments, and metric descriptions
MetricName Metric
Category Metric Description Amphipoda Richness Taxa richness of Amphipoda AmphipodaChTxPct Composition Relative percentage of taxa belonging to Amphipoda AmphipodaPct Composition Relative abundance (%) of amphipod individuals in subsample Annelida Richness Taxa richness of Annelida AnnelidaChTxPct Composition Relative percentage of taxa belonging to Annelida AnnelidaPct Composition Relative abundance (%) of annelid individuals in subsample BaetEphem Tolerance Percent of mayfly individuals in the family Baetidae BaetidaeCh Richness Taxa richness of baetid mayflies BaetidaeChTxPct Composition Relative percentage of taxa belonging to Baetidae BaetidaePct Composition Relative abundance (%) of baetid individuals in subsample Bivalvia Richness Taxa richness of Bivalvia BivalviaChTxPct Composition Relative percentage of taxa belonging to Bivalvia BivalviaPct Composition Relative abundance (%) of mussels in subsample Burrower Habit Taxa richness of burrowers (excluding chironomid burrower taxa) BurrowerCh Habit Taxa richness of burrowers BurrowerChTxPct Habit Relative percentage of taxa that burrow BurrowerPct Habit Relative abundance (%) of burrowers in subsample CaenEphem Tolerance Percent of mayfly individuals in the family Caenidae CaenidaeCh Richness Taxa richness of caenid mayflies CaenidaeChTxPct Composition Relative percentage of taxa belonging to Caenidae CaenidaePct Composition Relative abundance (%) of caenid individuals in subsample CBI Composition Coldwater Biotic Index score based on coldwater tolerance values derived from Minnesota taxa/temperature data
ChiroDip Tolerance Ratio of chironomid abundance to total dipteran abundance ChiroIntol Tolerance Taxa richness of Chironomidae with tolerance values less than or equal to 3

Appendix C. (continued)
Development of a Macroinvertebrate-Based Index of Biological Integrity Minnesota Pollution Control Agency for Minnesota’s Rivers and Streams • June 2014
35
MetricName Metric
Category Metric Description ChiroIntolTxPct Tolerance Relative percentage of intolerant chironomid taxa ChironomidaeCh Richness Taxa richness of Chironomidae ChironomidaeChPct Composition Relative abundance (%) of chironomid individuals in subsample ChironomidaeChTxPct Composition Relative percentage of taxa belonging to Chironomidae ChironominiCh Richness Taxa richness of midge tribe Chironomini ChironominiChTxPct Composition Relative percentage of taxa belonging to midge tribe Chironomini ChironominiPct Composition Percent of chironomid individuals in the tribe Chironomini ChiroVeryIntol Tolerance Taxa richness of Chironomidae with tolerance values less than or equal to 2 ChiroVeryIntolTxPct Tolerance Relative percentage of chironomid taxa with tolerance values less than or equal to 2 Climber Habit Taxa richness of climbers (excluding chironomid climber taxa) ClimberCh Habit Taxa richness of climbers ClimberChTxPct Habit Relative percentage of taxa that climb ClimberPct Habit Relative abundance (%) of climbers in subsample Clinger Habit Taxa richness of clingers (excluding chironomid clinger taxa) ClingerCh Habit Taxa richness of clingers ClingerChTxPct Habit Relative percentage of taxa adapted to cling to substrate in swift flowing water ClingerPct Habit Relative abundance (%) of clinger individuals in subsample CoenagrionidaeCh Richness Taxa richness of Coenagrionidae CoenagrionidaeChTxPct Composition Relative percentage of taxa belonging to Coenagrionidae CoenagrionidaePct Composition Relative abundance (%) of coenagrionid individuals in subsample CoenOdo Tolerance Percent of odonates in the family Coenagrionidae Coleoptera Richness Taxa richness of Coleoptera ColeopteraChTxPct Composition Relative percentage of taxa belonging to Coleoptera ColeopteraPct Composition Relative abundance (%) of coleopteran individuals in subsample Collector-filterer Trophic Taxa richness of collector-filterers (excluding chironomid collector-filterer taxa) Collector-filtererCh Trophic Taxa richness of collector-filterers Collector-filtererChTxPct Trophic Relative percentage of collector-filterer taxa Collector-filtererPct Trophic Relative abundance (%) of collector-filterer individuals in subsample Collector-gatherer Trophic Taxa richness of collector-gatherers (chironomid and baetid taxa each treated as one taxon)

Appendix C. (continued)
Development of a Macroinvertebrate-Based Index of Biological Integrity Minnesota Pollution Control Agency for Minnesota’s Rivers and Streams • June 2014
36
MetricName Metric
Category Metric Description Collector-gathererCh Trophic Taxa richness of collector-gatherers Collector-gathererChTxPct Trophic Relative percentage of collector-gatherer taxa Collector-gathererPct Trophic Relative abundance (%) of collector-gatherer individuals in subsample Crustacea Richness Taxa richness of crustaceans CrustaceaChTxPct Composition Relative percentage of taxa belonging to Crustacea CrustaceaPct Composition Relative abundance (%) of crustacean individuals in subsample CrustMoll Richness Taxa richness of Crustacea & Mollusca CrustMollChTxPct Composition Relative percentage of taxa belonging to Crustacea and Mollusca CrustMollPct Composition Relative abundance (%) of crustacean and molluscan individuals in subsample CW165Pct Tolerance Relative abundance of organisms with coldwater tolerance of 16.5 or less CW17Pct Tolerance Relative abundance of organisms with coldwater tolerance of 17 or less CW175Pct Tolerance Relative abundance of organisms with coldwater tolerance of 17.5 or less CW18Pct Tolerance Relative abundance of organisms with coldwater tolerance of 18 or less CW185Pct Tolerance Relative abundance of organisms with coldwater tolerance of 18.5 or less CW19Pct Tolerance Relative abundance of organisms with coldwater tolerance of 19 or less CW165TaxaPct Tolerance Relative percentage of taxa with coldwater tolerance of 16.5 or less. CW17TaxaPct Tolerance Relative percentage of taxa with coldwater tolerance of 17 or less. CW175TaxaPct Tolerance Relative percentage of taxa with coldwater tolerance of 17.5 or less. CW18TaxaPct Tolerance Relative percentage of taxa with coldwater tolerance of 18 or less. CW185TaxaPct Tolerance Relative percentage of taxa with coldwater tolerance of 18.5 or less. CW19TaxaPct Tolerance Relative percentage of taxa with coldwater tolerance of 19 or less. CW165Taxa Tolerance Taxa richness of organisms with coldwater tolerance of 16.5 or less CW17Taxa Tolerance Taxa richness of organisms with coldwater tolerance of 17 or less CW175Taxa Tolerance Taxa richness of organisms with coldwater tolerance of 17.5 or less CW18Taxa Tolerance Taxa richness of organisms with coldwater tolerance of 18 or less CW185Taxa Tolerance Taxa richness of organisms with coldwater tolerance of 18.5 or less CW19Taxa Tolerance Taxa richness of organisms with coldwater tolerance of 19 or less DipNIPct Composition Relative abundance (%) of Diptera & non-insect individuals in subsample Diptera Richness Taxa richness of Diptera (chironomid taxa treated as one taxon)

Appendix C. (continued)
Development of a Macroinvertebrate-Based Index of Biological Integrity Minnesota Pollution Control Agency for Minnesota’s Rivers and Streams • June 2014
37
MetricName Metric
Category Metric Description DipteraCh Richness Taxa richness of Diptera DipteraChPct Composition Relative abundance (%) of dipteran individuals in subsample DipteraChTxPct Composition Relative percentage of taxa belonging to Diptera DipteraPct Composition Relative abundance (%) of dipteran individuals in subsample (excluding all chironomids) DomFiveChAs1Pct Composition Relative abundance (%) of dominant five taxa in subsample (chironomids grouped at family level) DomFiveCHPct Composition Relative abundance (%) of dominant five taxa in subsample (chironomid genera treated individually) DomFivewoCHPct Composition Relative abundance (%) of dominant five taxa in subsample (excluding all chironomids) DomFourChAs1Pct Composition Relative abundance (%) of dominant four taxa in subsample (chironomids grouped at family level) DomFourCHPct Composition Relative abundance (%) of dominant four taxa in subsample (chironomid genera treated individually) DomFourwoCHPct Composition Relative abundance (%) of dominant four taxa in subsample (excluding all chironomids) DomOneChAs1Pct Composition Relative abundance (%) of dominant taxon in subsample (chironomids grouped at family level) DomOneCHPct Composition Relative abundance (%) of dominant taxon in subsample (chironomid genera treated individually) DomOnewoCHPct Composition Relative abundance (%) of dominant taxon in subsample (excluding all chironomids) DomThreeChAs1Pct Composition Relative abundance (%) of dominant three taxa in subsample (chironomids grouped at family level) DomThreeCHPct Composition Relative abundance (%) of dominant three taxa in subsample (chironomid genera treated individually) DomThreewoCHPct Composition Relative abundance (%) of dominant three taxa in subsample (excluding all chironomids) DomTwoChAs1Pct Composition Relative abundance (%) of dominant two taxa in subsample (chironomids grouped at family level) DomTwoCHPct Composition Relative abundance (%) of dominant two taxa in subsample (chironomid genera treated individually) DomTwowoCHPct Composition Relative abundance (%) of dominant two taxa in subsample (excluding all chironomids) EOT Richness Taxa richness of Ephemeroptera, Odonata, & Trichoptera (baetid taxa treated as one taxon) EOTCh Richness Taxa richness of Ephemeroptera, Odonata, & Trichoptera EOTPct Composition Relative abundance (%) of Ephemeroptera, Odonata & Trichoptera individuals in subsample EP Richness Taxa richness of Ephemeroptera & Plecoptera (baetid taxa treated as one taxon) EPCh Richness Taxa richness of Ephemeroptera & Plecoptera EPChTxPct Composition Relative percentage of taxa belonging to Ephemeroptera & Plecoptera Ephemeroptera Richness Taxa richness of Ephemeroptera (baetid taxa treated as one taxon) EphemeropteraCh Richness Taxa richness of Ephemeroptera EphemeropteraChTxPct Composition Relative percentage of taxa belonging to Ephemeroptera EphemeropteraPct Composition Relative abundance (%) of Ephemeroptera individuals in subsample

Appendix C. (continued)
Development of a Macroinvertebrate-Based Index of Biological Integrity Minnesota Pollution Control Agency for Minnesota’s Rivers and Streams • June 2014
38
MetricName Metric
Category Metric Description EPPct Composition Relative abundance (%) of Ephemeroptera & Plecoptera individuals in subsample EPT Richness Taxa richness of Ephemeroptera, Plecoptera & Trichoptera (baetid taxa treated as one taxon) EPT_Chiro Tolerance Ratio of EPT abundance to EPT + Chironomidae abundance EPTCh Richness Taxa richness of Ephemeroptera, Plecoptera & Trichoptera EPTChTxPct Composition Relative percentage of taxa belonging to Ephemeroptera, Plecoptera & Trichoptera EPTPct Composition Relative abundance (%) of Ephemeroptera, Plecoptera & Trichoptera individuals in subsample Gastropoda Richness Taxa richness of snails GastropodaChTxPct Composition Relative percentage of snail taxa GastropodaPct Composition Relative abundance (%) of snails in subsample GathFiltPct Trophic Relative abundance (%) of collector-gatherer & collector-filterer individuals in subsample HBI Tolerance A measure of organic pollution based on tolerance values assigned to each individual taxon developed by Hilsenhoff HBI_MN Tolerance A measure of pollution based on tolerance values assigned to each individual taxon developed by Chirhart HCDNIPct Composition Relative abundance (%) of Heteroptera, Coleoptera, Diptera, & non-insect individuals in subsample HCDPct Composition Relative abundance (%) of Heteroptera, Coleoptera, & Diptera individuals in subsample HetCol Richness Taxa richness of Heteroptera + Coleoptera HetColChTxPct Composition Relative percentage of taxa belonging to Heteroptera & Coleoptera HetColNIPct Composition Relative abundance (%) of Heteroptera, Coleoptera, & non-insect individuals in subsample HetColPct Composition Relative abundance (%) of Heteroptera & Coleoptera individuals in subsample Heteroptera Richness Taxa richness of Heteroptera HeteropteraPct Composition Relative abundance (%) of heteropteran individuals in subsample HydropsychidaeCh Richness Taxa richness of hydropyschid caddisflies HydropsychidaeChTxPct Composition Relative percentage of taxa belonging to Hydropsychidae HydropsychidaePct Composition Relative abundance (%) of hydropsychid caddisfly individuals in subsample HydrTrich Tolerance Percent of caddisfly individuals in the family Hydropsychidae Insect Richness Taxa richness of insects InsectPct Composition Relative abundance (%) of insect individuals in subsample InsectTxPct Composition Relative percentage of insect taxa Intolerant Tolerance Taxa richness of macroinvertebrates with tolerance values less than or equal to 2 (excluding intolerant chironomid
and baetid taxa)

Appendix C. (continued)
Development of a Macroinvertebrate-Based Index of Biological Integrity Minnesota Pollution Control Agency for Minnesota’s Rivers and Streams • June 2014
39
MetricName Metric
Category Metric Description Intolerant2 Tolerance Taxa richness of macroinvertebrates with tolerance values less than or equal to 2, Using MN TVs
Intolerant2ch Tolerance Taxa richness of macroinvertebrates with tolerance values less than or equal to 2, using MN TVs Intolerant2chTxPct Tolerance Relative percentage of taxa with tolerance values less than or equal to 2, using MN TVs Intolerant2less Tolerance Taxa richness of macroinvertebrates with tolerance values less than or equal to 4 (excluding intolerant chironomid
and baetid taxa), using MN TVs Intolerant2lessCh Tolerance Taxa richness of macroinvertebrates with tolerance values less than or equal to 4, using MN TVs
Intolerant2LessChTxPct Tolerance Relative percentage of taxa with tolerance values less than or equal to 4, using MN TVs Intolerant2lessPct Tolerance Relative abundance (%) of macrioinvertabrate individuals in subsample with tolerance values less than or equal to 4 Intolerant2Pct Tolerance Relative abundance (%) of macroinvertebrate individuals in subsample with tolerance values less than or equal to 2 IntolerantCh Tolerance Taxa richness of macroinvertebrates with tolerance values less than or equal to 2
IntolerantChTxPct Tolerance Relative percentage of taxa with tolerance values less than or equal to 2 IntolerantPct Tolerance Relative abundance (%) of macroinvertebrate individuals in subsample with tolerance values less than or equal to 2 Isopoda Richness Taxa richness of Isopoda IsopodaChTxPct Composition Relative percentage of taxa belonging to Isopoda IsopodaPct Composition Relative abundance (%) of isopod individuals in subsample LeglessCh Habit Taxa richness of legless macroinvertebrates LeglessChTxPct Habit Relative percentage of taxa without legs LeglessPct Habit Relative abundance (%) of legless individuals in subsample LongLived Life History Taxa richness of longlived macroinvertebrates LongLivedChTxPct Life History Relative percentage of longlived taxa LongLivedPct Life History Relative abundance (%) of longlived individuals in subsample Mollusca Richness Taxa richness of Mollusca MolluscaChTxPct Composition Relative percentage of taxa belonging to Mollusca MolluscaPct Composition Relative abundance (%) of Mollusca individuals in subsample NonInsect Richness Taxa richness of non-insect macroinvertebrates NonInsectPct Composition Relative abundance (%) of non-insect individuals in subsample NonInsectTxPct Composition Relative percentage of non-insect taxa

Appendix C. (continued)
Development of a Macroinvertebrate-Based Index of Biological Integrity Minnesota Pollution Control Agency for Minnesota’s Rivers and Streams • June 2014
40
MetricName Metric
Category Metric Description Odonata Richness Taxa richness of Odonata OdonataChTxPct Composition Relative percentage of taxa belonging to Odonata OdonataPct Composition Relative abundance (%) of Odonata individuals in subsample Oligochaeta Richness Taxa richness of Oligochaeta OligochaetaChTxPct Composition Relative percentage of taxa belonging to Oligochaeta OligochaetaPct Composition Relative abundance (%) of oligochaete individuals in subsample OligoHir Richness Taxa richness of Oligochaeta + Hirudinea OligoHirChTxPct Composition Relative percentage of taxa belonging to Oligochaeta & Hirudinea OligoHirPct Composition Relative abundance (%) of Oligochaeta & Hirudinea individuals in subsample OrthocladiinaeCh Richness Taxa richness of Orthocladiinae OrthocladiinaeChTxPct Composition Relative percentage of taxa belonging to Orthocladiinae OrthocladiinaePct Composition Percent of chironomid individuals in the subfamily Orthocladiinae OrthoTanyCh Tolerance Taxa richness of Orthocladiinae & Tanytarsini OrthoTanyChTxPct Tolerance Relative percentage of taxa belonging to Orthocladiinae & Tanytarsini OrthoTanyPct Tolerance Relative abundance (%) of Orthocladiinae & Tanytarsini individuals in subsample OT Richness Taxa richness of Odonata & Trichoptera OTPct Composition Relative abundance (%) of Odonata & Trichoptera individuals in subsample Plecoptera Richness Taxa richness of Plecoptera PlecopteraChTxPct Composition Relative percentage of taxa belonging to Plecoptera PlecopteraPct Composition Relative abundance (%) of Plecoptera individuals in subsample POET Richness Taxa richness of Plecoptera, Odonata, Ephemeroptera, & Trichoptera (baetid taxa treated as one taxon) POETCh Richness Taxa richness of Plecoptera, Odonata, Ephemeroptera, & Trichoptera
POETChTxPct Composition Relative percentage of taxa belonging to Plecoptera, Odonata, Ephemeroptera, & Trichoptera POETPct Composition Relative abundance (%) of Plecoptera, Odonata, Ephemeroptera & Trichoptera individuals in subsample Predator Trophic Taxa richness of predators (excluding chironomid predator taxa) PredatorCh Trophic Taxa richness of predators PredatorChTxPct Trophic Relative percentage of predator taxa PredatorPct Trophic Relative abundance (%) of predator individuals in subsample Scraper Trophic Taxa richness of scrapers (excluding chironomid and baetid scraper taxa)

Appendix C. (continued)
Development of a Macroinvertebrate-Based Index of Biological Integrity Minnesota Pollution Control Agency for Minnesota’s Rivers and Streams • June 2014
41
MetricName Metric
Category Metric Description ScraperCh Trophic Taxa richness of scrapers ScraperChTxPct Trophic Relative percentage of scraper taxa ScraperPct Trophic Relative abundance (%) of scraper individuals in subsample ScrapFilt Trophic Ratio of scraper abundance to scraper + collector-filterer abundance ScrapHerb Trophic Taxa richness of scrapers and herbivores Shannon Composition Shannon Diversity Index: -1*sum(p*natural log(p)) Shredder Trophic Taxa richness of shredders (excluding chironomid and baetid scraper taxa) ShredderCh Trophic Taxa richness of shredders ShredderChTxPct Trophic Relative percentage of shredder taxa ShredderPct Trophic Relative abundance (%) of shredder individuals in subsample Simpson Composition Simpson Diversity Index: sum((n*(n-1))/(N*(N-1))) SimuliidaeCh Richness Taxa richness of Simuliidae SimuliidaeChTxPct Composition Relative percentage of taxa belonging to Simuliidae Sprawler Habit Taxa richness of sprawlers (excluding chironomid and baetid sprawler taxa) SprawlerCh Habit Taxa richness of sprawlers SprawlerChTxPct Habit Relative percentage of sprawler taxa SprawlerPct Habit Relative abundance (%) of sprawler individuals in subsample Swimmer Habit Taxa richness of swimmers (excluding chironomid, baetid taxa treated as one taxon) SwimmerCh Habit Taxa richness of swimmers SwimmerChTxPct Habit Relative percentage of swimmer taxa SwimmerPct Habit Relative abundance (%) of swimmer individuals in subsample TanypodinaeCh Richness Taxa richness of Tanypodinae TanypodinaeChTxPct Composition Relative percentage of taxa belonging to Tanypodinae TanypodinaePct Composition Percent of chironomid individuals in the subfamily Tanypodinae TanytarsiniCh Richness Taxa richness of Tanytarsini TanytarsiniChTxPct Composition Relative percentage of taxa belonging to Tanytarsini TanytarsiniPct Composition Percent of chironomid individuals in the tribe Tanytarsini TaxaCount Richness Total taxa richness of macroinvertebrates (chironomid and baetid taxa each treated as one taxon) TaxaCountAllChir Richness Total taxa richness of macroinvertebrates

Appendix C. (continued)
Development of a Macroinvertebrate-Based Index of Biological Integrity Minnesota Pollution Control Agency for Minnesota’s Rivers and Streams • June 2014
42
MetricName Metric
Category Metric Description Tolerant Tolerance Taxa richness of macroinvertebrates with tolerance values equal to or greater than 6 (excludes tolerant baetid taxa
and treats tolerant chironomid taxa as one taxon) Tolerant2 Tolerance Taxa richness of macroinvertebrates with tolerance values equal to or greater than 6 (excludes tolerant baetid taxa
and treats tolerant chironomid taxa as one taxon) Tolerant2Ch Tolerance Taxa richness of macroinvertebrates with tolerance values equal to or greater than 6, Using MN TVs Tolerant2ChTxPct Tolerance Relative percentage of taxa with tolerance values equal to or greater than 6, using MN TVs Tolerant2Pct Tolerance Relative abundance (%) of macroinvertebrate individuals in subsample with tolerance values equal to or greater
than 6 TolerantCh Tolerance Taxa richness of macroinvertebrates with tolerance values equal to or greater than 6
TolerantChTxPct Tolerance Relative percentage of taxa with tolerance values equal to or greater than 6 TolerantPct Tolerance Relative abundance (%) of macroinvertebrate individuals in subsample with tolerance values equal to or greater
than 6 Trichoptera Richness Taxa richness of Trichoptera
TrichopteraPct Composition Relative abundance (%) of Trichoptera individuals in subsample TrichwoHydroPct Composition Relative abundance (%) of non-hydropsychid Trichoptera individuals in subsample VeryTolerant Tolerance Taxa richness of macroinvertebrates with tolerance values equal to or greater than 8 (excluding very tolerant
chironomid and baetid taxa) VeryTolerant2 Tolerance Taxa richness of macroinvertebrates with tolerance values equal to or greater than 8 (excluding very tolerant
chironomid and baetid taxa) VeryTolerant2Ch Tolerance Taxa richness of macroinvertebrates with tolerance values equal to or greater than 8
VeryTolerant2ChTxPct Tolerance Relative percentage of taxa with tolerance values equal to or greater than 8, using MN TVs VeryTolerant2Pct Tolerance Relative abundance (%) of macroinvertebrate individuals in subsample with tolerance values equal to or greater
than 8, Using MN TVs VeryTolerantCh Tolerance Taxa richness of macroinvertebrates with tolerance values equal to or greater than 8
VeryTolerantChTxPct Tolerance Relative percentage of taxa with tolerance values equal to or greater than 8 VeryTolerantPct Tolerance Relative abundance (%) of macroinvertebrate individuals in subsample with tolerance values equal to or greater
than 8
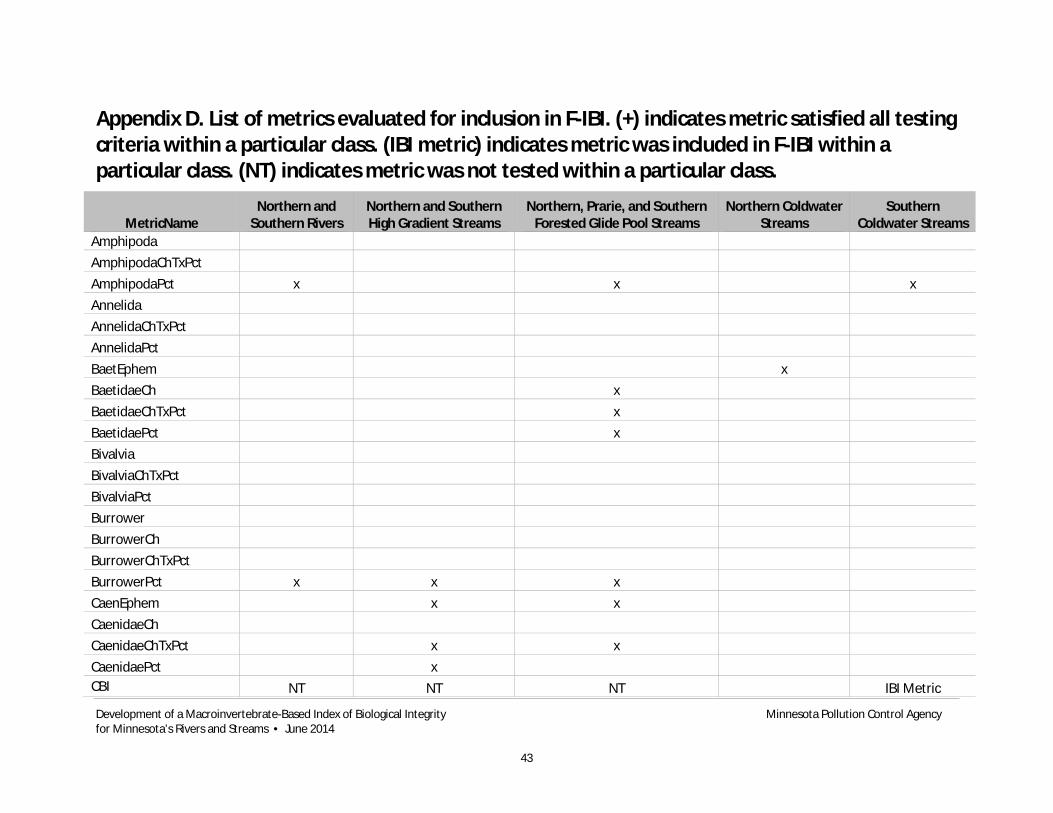
Development of a Macroinvertebrate-Based Index of Biological Integrity Minnesota Pollution Control Agency for Minnesota’s Rivers and Streams • June 2014
43
Appendix D. List of metrics evaluated for inclusion in F-IBI. (+) indicates metric satisfied all testing criteria within a particular class. (IBI metric) indicates metric was included in F-IBI within a particular class. (NT) indicates metric was not tested within a particular class.
MetricName Northern and
Southern Rivers Northern and Southern High Gradient Streams
Northern, Prarie, and Southern Forested Glide Pool Streams
Northern Coldwater Streams
Southern Coldwater Streams
Amphipoda AmphipodaChTxPct AmphipodaPct x x x Annelida AnnelidaChTxPct AnnelidaPct BaetEphem x BaetidaeCh x BaetidaeChTxPct x BaetidaePct x Bivalvia BivalviaChTxPct BivalviaPct Burrower BurrowerCh BurrowerChTxPct BurrowerPct x x x CaenEphem x x CaenidaeCh CaenidaeChTxPct x x CaenidaePct x CBI NT NT NT IBI Metric

Appendix D. (continued)
Development of a Macroinvertebrate-Based Index of Biological Integrity Minnesota Pollution Control Agency for Minnesota’s Rivers and Streams • June 2014
44
MetricName Northern and
Southern Rivers Northern and Southern High Gradient Streams
Northern, Prarie, and Southern Forested Glide Pool Streams
Northern Coldwater Streams
Southern Coldwater Streams
ChiroDip x x IBI Metric ChiroIntol ChiroIntolTxPct ChironomidaeCh x x x ChironomidaeChPct x x x ChironomidaeChTxPct x ChironominiCh ChironominiChTxPct ChironominiPct ChiroVeryIntol ChiroVeryIntolTxPct Climber x x x x ClimberCh x IBI Metric x x ClimberChTxPct x x ClimberPct Clinger x x x ClingerCh x x IBI Metric ClingerChTxPct IBI Metric x x ClingerPct x x CoenagrionidaeCh CoenagrionidaeChTxPct x x CoenagrionidaePct x x CoenOdo x x Coleoptera ColeopteraChTxPct

Appendix D. (continued)
Development of a Macroinvertebrate-Based Index of Biological Integrity Minnesota Pollution Control Agency for Minnesota’s Rivers and Streams • June 2014
45
MetricName Northern and
Southern Rivers Northern and Southern High Gradient Streams
Northern, Prarie, and Southern Forested Glide Pool Streams
Northern Coldwater Streams
Southern Coldwater Streams
ColeopteraPct Collector-filterer x x Collector-filtererCh x x Collector-filtererChTxPct x x Collector-filtererPct x IBI Metric Collector-gatherer IBI Metric Collector-gathererCh
Collector-gathererChTxPct IBI Metric Collector-gathererPct x Crustacea CrustaceaChTxPct x CrustaceaPct x x x x CrustMoll CrustMollChTxPct x x x CrustMollPct x x CW165Pct NT NT NT CW17Pct NT NT NT CW175Pct NT NT NT x x CW18Pct NT NT NT CW185Pct NT NT NT x x CW19Pct NT NT NT CW165TaxaPct NT NT NT CW17TaxaPct NT NT NT CW175TaxaPct NT NT NT CW18TaxaPct NT NT NT x x

Appendix D. (continued)
Development of a Macroinvertebrate-Based Index of Biological Integrity Minnesota Pollution Control Agency for Minnesota’s Rivers and Streams • June 2014
46
MetricName Northern and
Southern Rivers Northern and Southern High Gradient Streams
Northern, Prarie, and Southern Forested Glide Pool Streams
Northern Coldwater Streams
Southern Coldwater Streams
CW185TaxaPct NT NT NT CW19TaxaPct NT NT NT CW165Taxa NT NT NT CW17Taxa NT NT NT CW175Taxa NT NT NT CW18Taxa NT NT NT x x CW185Taxa NT NT NT CW19Taxa NT NT NT DipteraCh x x x DipteraChPct x DipteraChTxPct x DipteraPct x x x DomFiveChAs1Pct x x x DomFiveCHPct IBI Metric IBI Metric IBI Metric DomFivewoCHPct x x x x DomFourChAs1Pct x x DomFourCHPct x x x x DomFourwoCHPct x x x x DomOneChAs1Pct DomOneCHPct DomOnewoCHPct DomThreeChAs1Pct x x DomThreeCHPct x x x DomThreewoCHPct x x x x DomTwoChAs1Pct

Appendix D. (continued)
Development of a Macroinvertebrate-Based Index of Biological Integrity Minnesota Pollution Control Agency for Minnesota’s Rivers and Streams • June 2014
47
MetricName Northern and
Southern Rivers Northern and Southern High Gradient Streams
Northern, Prarie, and Southern Forested Glide Pool Streams
Northern Coldwater Streams
Southern Coldwater Streams
DomTwoCHPct x x x DomTwowoCHPct x x x x EOT x x x x EOTCh x x x x EOTChTxPct x x x EOTPct x x x EP x x x EPCh x x x EPChTxPct x x x Ephemeroptera x x x EphemeropteraCh x x EphemeropteraChTxPct x x EphemeropteraPct x x EPPct x x EPT x x x x EPT_Chiro x x EPTCh x x x x EPTChTxPct x x x x EPTPct x x x Gastropoda GastropodaChTxPct x x GastropodaPct GathFiltPct x x HBI x x x x HBI_MN IBI Metric IBI Metric IBI Metric IBI Metric IBI Metric

Appendix D. (continued)
Development of a Macroinvertebrate-Based Index of Biological Integrity Minnesota Pollution Control Agency for Minnesota’s Rivers and Streams • June 2014
48
MetricName Northern and
Southern Rivers Northern and Southern High Gradient Streams
Northern, Prarie, and Southern Forested Glide Pool Streams
Northern Coldwater Streams
Southern Coldwater Streams
HCDNIPct x x x HCDPct HetCol HetColChTxPct x HetColNIPct x x x HetColPct Heteroptera HeteropteraChTxPct HeteropteraPct HydropsychidaeCh x x x HydropsychidaeChTxPct x x HydropsychidaePct x x HydrTrich x x x Insect x x x x InsectPct x x x InsectTxPct x IBI Metric x x Intolerant x x x x Intolerant2 x x x IBI Metric x Intolerant2ch x IBI Metric x IBI Metric Intolerant2chTxPct x x x x x Intolerant2less x x x x x Intolerant2lessCh IBI Metric x x x x Intolerant2LessChTxPct x x x x x Intolerant2lessPct x x x x x Intolerant2Pct x x x x x

Appendix D. (continued)
Development of a Macroinvertebrate-Based Index of Biological Integrity Minnesota Pollution Control Agency for Minnesota’s Rivers and Streams • June 2014
49
MetricName Northern and
Southern Rivers Northern and Southern High Gradient Streams
Northern, Prarie, and Southern Forested Glide Pool Streams
Northern Coldwater Streams
Southern Coldwater Streams
IntolerantCh x x x IntolerantChTxPct x x x x x IntolerantPct x x x Isopoda IsopodaChTxPct x IsopodaPct x x Legless LeglessCh LeglessChTxPct x x LeglessPct x x x LongLived x x x x LongLivedChTxPct x IBI Metric LongLivedPct x Mollusca x MolluscaChTxPct x x x MolluscaPct NonInsect NonInsectPct x x x NonInsectTxPct x x x IBI Metric Odonata IBI Metric IBI Metric x x OdonataChTxPct x x IBI Metric OdonataPct x x Oligochaeta OligochaetaChTxPct OligochaetaPct

Appendix D. (continued)
Development of a Macroinvertebrate-Based Index of Biological Integrity Minnesota Pollution Control Agency for Minnesota’s Rivers and Streams • June 2014
50
MetricName Northern and
Southern Rivers Northern and Southern High Gradient Streams
Northern, Prarie, and Southern Forested Glide Pool Streams
Northern Coldwater Streams
Southern Coldwater Streams
OligoHir OligoHirChTxPct OligoHirPct OrthocladiinaeCh x x x OrthocladiinaeChTxPct OrthocladiinaePct OrthoTanyCh OrthoTanyChTxPct OrthoTanyPct OT x x x x OTChTxPct x x x x x OTPct x x Plecoptera IBI Metric x x PlecopteraChTxPct x x x PlecopteraPct POET x x IBI Metric IBI Metric POETCh x x x x POETChTxPct x x x POETPct x x x Predator x x x x PredatorCh IBI Metric IBI Metric IBI Metric IBI Metric PredatorChTxPct x x PredatorPct Scraper ScraperCh

Appendix D. (continued)
Development of a Macroinvertebrate-Based Index of Biological Integrity Minnesota Pollution Control Agency for Minnesota’s Rivers and Streams • June 2014
51
MetricName Northern and
Southern Rivers Northern and Southern High Gradient Streams
Northern, Prarie, and Southern Forested Glide Pool Streams
Northern Coldwater Streams
Southern Coldwater Streams
ScraperChTxPct ScraperPct ScrapFilt x ScrapHerb x Shannon x x x x Shredder ShredderCh ShredderChTxPct ShredderPct Simpson x x x SimuliidaeCh SimuliidaeChTxPct x SimuliidaePct x x x Sprawler SprawlerCh SprawlerChTxPct SprawlerPct x x Swimmer SwimmerCh SwimmerChTxPct SwimmerPct x TanypodinaeCh TanypodinaeChTxPct TanypodinaePct TanytarsiniCh

Appendix D. (continued)
Development of a Macroinvertebrate-Based Index of Biological Integrity Minnesota Pollution Control Agency for Minnesota’s Rivers and Streams • June 2014
52
MetricName Northern and
Southern Rivers Northern and Southern High Gradient Streams
Northern, Prarie, and Southern Forested Glide Pool Streams
Northern Coldwater Streams
Southern Coldwater Streams
TanytarsiniChTxPct TanytarsiniPct TaxaCount x x x TaxaCountAllChir IBI Metric x IBI Metric x Tolerant Tolerant2 Tolerant2Ch x x Tolerant2ChTxPct x IBI Metric x x x Tolerant2Pct x x x x x TolerantCh TolerantChTxPct x x x x TolerantPct x x x Trichoptera x IBI Metric x TrichopteraChTxPct x IBI Metric IBI Metric TrichopteraPct x x TrichwoHydroPct IBI Metric x IBI Metric VeryTolerant x x VeryTolerant2 VeryTolerant2Ch VeryTolerant2ChTxPct x x x IBI Metric x VeryTolerant2Pct IBI Metric x x IBI Metric VeryTolerantCh VeryTolerantChTxPct x x VeryTolerantPct x x x x
Related Documents


