http://researchcommons.waikato.ac.nz/ Research Commons at the University of Waikato Copyright Statement: The digital copy of this thesis is protected by the Copyright Act 1994 (New Zealand). The thesis may be consulted by you, provided you comply with the provisions of the Act and the following conditions of use: Any use you make of these documents or images must be for research or private study purposes only, and you may not make them available to any other person. Authors control the copyright of their thesis. You will recognise the author’s right to be identified as the author of the thesis, and due acknowledgement will be made to the author where appropriate. You will obtain the author’s permission before publishing any material from the thesis.

Welcome message from author
This document is posted to help you gain knowledge. Please leave a comment to let me know what you think about it! Share it to your friends and learn new things together.
Transcript

http://researchcommons.waikato.ac.nz/
Research Commons at the University of Waikato Copyright Statement:
The digital copy of this thesis is protected by the Copyright Act 1994 (New Zealand).
The thesis may be consulted by you, provided you comply with the provisions of the
Act and the following conditions of use:
Any use you make of these documents or images must be for research or private
study purposes only, and you may not make them available to any other person.
Authors control the copyright of their thesis. You will recognise the author’s right
to be identified as the author of the thesis, and due acknowledgement will be
made to the author where appropriate.
You will obtain the author’s permission before publishing any material from the thesis.

Development of a High Protein
Frozen Dessert
A thesis submitted in fulfilment of the
requirements for the degree of
Master of Engineering
at The University of Waikato
Seán Nixon
Hamilton, New Zealand
February 2012

ii
Abstract
It was identified that there is a potential market for a low fat, low carbohydrate,
high protein frozen dessert that has similar sensory attributes to ice cream. Such a
product could be utilized by athletes, obesity sufferers and anyone seeking a
healthy alternative to ice cream. Ingredients were sourced that could replace and
replicate those found in traditional ice cream products.
A key challenge in producing the dessert was identifying suitable ingredients to
control the freezing point depression (FPD). Fructose, erythritol, xylitol and
polydextrose were identified as being suitable options and 18 prototype formulae
were generated using Design-Expert® V8 software to try and find the best
combination of these four ingredients. Ingredients used in fixed amounts were
water, whey protein isolate, Simplesse® 100, vanilla flavour, Novagel GP 3282,
carboxy methyl cellulose and mono/di-glycerides. The prototype desserts were
prepared using a Breville Ice Cream Wizz. The hardness and viscosity of each
prototype was measured, and the internal structures of selected prototypes were
analysed using cryo-SEM. The results were compared to regular ice cream
products, and then the formulation was optimized accordingly using the software.
The optimum prototype contained 11.6% protein, 14.3% carbohydrate and only
1.6% fat. It was estimated that if taken to market, the finished product could have
a recommended retail price of $10.18 for 1L, placing it in the lower end of the
premium ice cream products range. Using a 9-point hedonic scale, this optimised
prototype received an overall appeal score of 7.18 ± 1.08 from a consumer panel,
with a score of 7 corresponding to „Like Moderately‟ and a score of 8
corresponding to „Like Very Much‟. However it received a lower score than the
regular ice cream control (8.35 ± 0.77), and the difference was found to be
statistically significantly (p<0.05). Despite this, due to its high protein and low fat
contents, this unique product could fill a niche in the market, particularly if its
consumer appeal could be further increased.
Future work should study the effect of increasing the air content in order to
produce a softer product with a more favourable texture. Carbohydrate content
should be lowered as product becomes softer and efforts should be made to
correlate the relationship between FPD, hardness and overrun.
iii
Acknowledgments
Firstly, I would like to acknowledge my Supervisor, Dr James Carson, for his
advice and support through the duration of this project. Thanks must also be given
to Helen Turner, Stella Raynova and Yuanji Zhang for the technical help and
advice they provided.
Thank you to Tuatara Nutritional Technologies Ltd, who provided the idea for this
project, along with most of the ingredients used. A mention must be given to Dr
Nicholas Gill for his advice and opinions on the nutritional composition of the
product. Thanks also to Hawkins Watts Ltd and GS Hall and Company Limited
for supplying additional ingredients free of charge.
A special thank you must be given to Dick and Mary Earle and New Zealand
Universities for awarding me the Dick and Mary Earle Scholarship in Technology,
which supported me financially through this year. I am also grateful to Greg
O‟Carroll, members of the Sir Edmund Hillary Scholarship staff and fellow
scholars for another invaluable year on the Hillary Scholarship program.
To my family and friends, thank you for supporting me when I needed it, and
distracting me when I needed that too. This work is dedicated to you all.
Finally, thank you to all who participated in my consumer trials, you know who
you are!

iv
Table of Contents
Abstract ................................................................................................................... ii
Acknowledgments .................................................................................................. iii
Table of Contents ................................................................................................... iv
List of Figures ....................................................................................................... vii
List of Tables.......................................................................................................... ix
1. Introduction ...................................................................................................... 1
2. Literature Review ............................................................................................ 2
2.1 The Ice Cream Market in New Zealand ................................................... 2
2.2 A History of Ice Cream ............................................................................ 3
2.3 Ice Cream Ingredients and Manufacture .................................................. 5
2.3.1 Manufacturing Process ...................................................................... 5
2.3.2 Properties Attributed to Manufacturing Process ............................... 6
2.3.3 Traditional Ingredients ...................................................................... 7
2.3.4 Benefits of High Protein Diets .......................................................... 8
2.3.5 Ingredient Search ............................................................................ 10
2.3.6 Frozen Desserts for the Health Conscious Consumer ..................... 17
2.3.7 Food Product Development Procedures .......................................... 19
2.4 Aims and Objectives .............................................................................. 21
3. Product Design Specification......................................................................... 22
3.1.1 Product Concept .............................................................................. 22
3.1.2 Product qualities .............................................................................. 22
3.1.3 Target consumers ............................................................................ 22
3.1.4 Production design specifications ..................................................... 22
3.1.5 Marketing design specifications ...................................................... 24
4. Methodology .................................................................................................. 25

v
4.1 Ingredient Identification ......................................................................... 25
4.2 Theoretical Formulation Development .................................................. 27
4.3 Prototype preparation ............................................................................. 29
4.4 Property Testing ..................................................................................... 34
4.4.1 Hardness Testing ............................................................................. 35
4.4.2 Viscosity Measurements ................................................................. 37
4.4.3 Scanning Electron Microscopy ....................................................... 38
4.4.4 Optimization .................................................................................... 39
4.5 Consumer Panel Testing ......................................................................... 40
4.5.1 Preference Ranking Test ................................................................. 40
4.5.2 Acceptance Test .............................................................................. 42
5. Results and Discussion .................................................................................. 45
5.1 Observations made during Ad-Hoc Experiments ................................... 45
5.2 Formulation Generation ......................................................................... 45
5.3 Hardness Testing .................................................................................... 46
5.4 Viscosity Measurements ......................................................................... 51
5.5 SEM Results ........................................................................................... 52
5.6 Nutritional and Cost Information ........................................................... 55
5.7 Consumer Panel Results ......................................................................... 58
6. Conclusions and Recommendations .............................................................. 64
7. References ...................................................................................................... 65
8. Appendices..................................................................................................... 75
8.1 Appendix 1: Overrun Values for Frozen Dessert Prototypes ................. 75
8.2 Appendix 2: CAD Drawings for Hardness Probe Attachment, Fastener
and Cutter .......................................................................................................... 76
8.3 Appendix 3: Example of Product Development Spreadsheet Template 79
8.4 Appendix 4: Formulae and Observations used in Ad-Hoc Experiments 81

vi
8.5 Appendix 5: Observations Made During Prototype Production ............ 97
8.6 Appendix 6: Design Summary Table Produced During Frozen Dessert
Prototype Formulation ..................................................................................... 101
8.7 Appendix 7: Screenshots taken from Design-Expert ® V8 Software
during Formulation Development ................................................................... 103
8.8 Appendix 8: Application for Ethics Approval, Participants Covering
Letter and Consent From ................................................................................. 116
8.9 Appendix 9: Data Collected During Consumer Panel Testing and Results
From Statistical Analysis ................................................................................. 126

vii
List of Figures
Figure 1: Flowchart outlining the basic steps used in the manufacture of ice
cream. ...................................................................................................................... 5
Figure 2: Summary of roles of ingredients used to replace sweetener functionality
in frozen dessert products...................................................................................... 13
Figure 3: Activities in product design and process development. ....................... 20
Figure 4: Blending the frozen dessert mix. .......................................................... 33
Figure 5: Pouring the frozen dessert mix into the Breville Ice Cream Wizz. ...... 33
Figure 6: Breville Ice Cream Wizz ...................................................................... 34
Figure 7: Instron 33R4204 ................................................................................... 36
Figure 8: Probe penetrating frozen dessert sample, which is contained in a
40x40x40mm stainless steel cutter........................................................................ 36
Figure 9: Brookfield Viscometer ......................................................................... 37
Figure 10: Hitachi S-4700 SEM being prepared for use. ..................................... 38
Figure 11: Cryogenically-frozen frozen dessert sample being coated with
platinum in preparation for viewing under the SEM. ........................................... 39
Figure 12: Questionnaire completed by panellists during sensory testing........... 41
Figure 13: Form consumers completed during Preference Ranking tests ........... 42
Figure 14: Labelled affective magnitude (LAM) scale. ....................................... 43
Figure 15: Form completed by consumer panellists during Acceptance Testing of
frozen dessert prototypes....................................................................................... 44
Figure 16: Plot of FPD Factor verses the Mean Maximum Force Required to
Penetrate Frozen Dessert Prototypes 20mm using Instron 33R4204. ................... 49
viii
Figure 17: Response surface plot showing relationship between xylitol, erythritol
and fructose on product hardness („R1‟), for a fixed amount of polydextrose and
flax seed oil. .......................................................................................................... 50
Figure 18: Plot of FPD Factor verses the Mean Viscosity for Ice Cream
Prototypes. ............................................................................................................. 51
Figure 19: Micrograph of Frozen Dessert Prototype 9. ....................................... 52
Figure 20: Micrograph of Frozen Dessert Prototype11. ...................................... 53
Figure 21: Micrograph taken of Tip Top™ Vanilla Ice Cream. .......................... 54
Figure 22: Photo of OHPP. .................................................................................. 62
Figure 23: Close-up photo of OHPP. ................................................................... 62
Figure 24: Clockwise from top: OHPP, Tip Top™ Vanilla Ice Cream and
Zilch!® Vanilla Bean Ice Cream .......................................................................... 63

ix
List of Tables
Table 1: Nutritional and cost information for pureMUSCLE WPI, reduced fat
milk and per serve as consumed.............................................................................. 9
Table 2: Properties of sugar alcohols and carbohydrates that can be used in frozen
dessert formulations .............................................................................................. 14
Table 3: Summary of frozen desserts targeted toward health conscious consumers.
............................................................................................................................... 18
Table 4: Desired qualities of different attributes for a high protein frozen dessert.
............................................................................................................................... 23
Table 5: Ingredients chosen for formulating a high protein frozen dessert. ........ 26
Table 6: Values calculated for non-soluble solids content and FPD Factor of
commercial products. ............................................................................................ 28
Table 7: Timeframe used for hardness testing of frozen dessert prototypes. ....... 35
Table 8: Non-variable ingredients and amounts selected for use in frozen dessert
prototypes. ............................................................................................................. 46
Table 9: Variable ingredient amounts generated for frozen dessert prototypes by
Design-Expert® V8 software. ............................................................................... 47
Table 10: Results from hardness and viscosity testing of frozen dessert prototypes.
............................................................................................................................... 48
Table 11: Nutritional Information for the OHPP Compared with Commercial
Products. ................................................................................................................ 55
Table 12: Calculation of RRP for OHPP. ............................................................ 56
Table 13: Comparison of unit prices between a selection of supermarket ice
cream brands and the OHPP. ................................................................................ 56

x
Table 14: Nutritional and cost comparisons between OHPP and pureMUSCLE
WPI. ...................................................................................................................... 57
Table 15: Results from consumer questionnaire. ................................................. 59
Table 16: Results from consumer acceptance test of frozen dessert prototype and
a control product. .................................................................................................. 60
Table 17: Results from Anderson-Darling Test for normality of consumer panel
data. ....................................................................................................................... 61
Table 18: Results from Mann-Whitney U-test on sensory data for different
product attributes. .................................................................................................. 61

Introduction 1
1. Introduction
Tuatara Nutritional Technologies Ltd (TNT) is a New Zealand owned Sports
Nutrition Company that focuses on developing natural nutritional supplements for
athletes. Their customers include athletes of all abilities, from school level
through to provincial, national and international representatives. Research carried
out by TNT suggested that there is a market for an ice cream type product that is
low in fat and carbohydrates whilst being high in protein, making it suitable for
athletes, dieters and health-conscious individuals.
Ice cream, while a good source of calcium and energy, does not offer many other
functional benefits. A product that contained more protein, with reduced sugar and
fat levels could have many markets and applications. If 1 % of the current market
for ice cream and related products could be captured for such a product, over
900,000 litres could be sold.
The aim of this work was to develop a new ice cream-like frozen dessert which is
less than 3% fat and has a protein: carbohydrate ratio of at least 1:1; significantly
higher than any commercial product currently available in New Zealand.
Literature Review 2
2. Literature Review
This review provides an overview of the ice cream market in New Zealand, a brief
history of ice cream, the ingredients used in ice cream and the process used to
manufacture ice cream. The potential benefits of high protein diets for athletes and
obesity patients is discussed, leading to an investigation into ingredients that could
be used to produce a low fat, low carbohydrate, high protein frozen dessert.
Current frozen dessert options for health conscious individuals are covered, and a
brief outline of food product development procedures is also included.
2.1 The Ice Cream Market in New Zealand
The New Zealand food industry is large and diverse. Products range from fresh
produce like fruit, vegetables and meats to highly processed tinned foods, dairy
products and instant meals. The food industry contributes over $15 billion in
exports to the New Zealand economy each year (NZTE, 2010). Dairy product
exports alone account for over $8 billion of that figure.
Frozen desserts are a favourite food product for many people. The frozen dessert
of choice for many New Zealanders is ice cream, and Kiwis consume an average
of 22 litres of ice cream and related products per person per annum (NZICMA,
2008). Vanilla is the most popular flavour, followed by Hokey Pokey and
Chocolate (NZICMA, 2008). In 2008, the total New Zealand production of ice
cream and related products was over 90 million litres, with exports totalling $37
million (NZICMA, 2008). The domestic market is much greater, with the moving
annual total to August 14th
2011 of over $164 million for all ice cream sales
(FMCG, 2011a).
Ice cream is a frozen emulsion consisting of air cells dispersed in an aqueous
matrix (Marshall, Goff, & Hartel, 2003). Under Standard 2.5.6 of the Australia
New Zealand Food Standards Code, ice cream is defined as the frozen product
prepared from milk, cream or milk products consisting of not less than 10 % milk

Literature Review 3
fat, and not less than 168 g/L of food solids (FSANZ, 2011b). Tip Top™ Vanilla
flavoured Ice Cream contains 10.7 g of fat, 1.5 g of protein and 19.6 g of sugar per
100 g, and was awarded „Best in Category‟ at the 2011 New Zealand Ice Cream
Awards (FMCG, 2011b).
2.2 A History of Ice Cream
Despite many publications on the matter, it has been stated that much of the early
history of ice cream remains unproven folklore (Goff, 1995). A timeline of the
popular accounts include the following:
Roman Emperor Nero Claudius Caesar (0037 – 0068) sent slaves to the
mountains to bring snow and ice to cool and freeze fruit drinks (IAICM,
1978).
Marco Polo (1254-1324) witnessed ice creams being made during a trip to
China (Liddell & Weir, 1993).
In the early 1600‟s, King Charles 1 of England was hosting a state banquet.
The King‟s French chef served up a sweetened form of frozen cream for
dessert, which was described as resembling “fresh fallen snow”. The chef,
named DeMirco, was subsequently paid 500 pounds and ordered to
promise that he would keep the recipe secret. He did not keep his promise
(IAICM, 1978)!
An early American record of ice cream comes from 1774, when
confectioner Phillip Lenzi announced via a New York newspaper that he
would be offering ice cream for sale (IAICM, 1978).
In 1813, ice cream was served at U.S. President James Madison‟s
Inaugural Ball (IAICM, 1978).
In 1846, American Nancy Johnson is credited with inventing a hand
cranked ice cream freezer. By turning the freezer handle, a container of ice
cream mix, sitting in a bed of salt and ice, was agitated until frozen
(IAICM, 1978).
Jacob Fussel is credited with beginning commercial production of ice
cream in North America, when he began manufacturing ice cream in
Baltimore in 1851 (IAICM, 1978).

Literature Review 4
It has been pointed out that the history of ice cream is closely associated with the
development of refrigeration techniques. This can be traced in several stages
(Clarke, 2004):
1. Cooling food and drink by mixing it with snow or ice.
2. The discovery that dissolving certain salts (such as potassium chloride) in
water produces cooling.
3. The discovery that mixing salts and snow or ice lowers temperatures even
further. This occurred around the mid to late 17th century. The inclusion
of cream in the water-ice mixes also evolved around this time.
4. The invention of the ice cream maker in 1846.
5. The development of mechanical refrigeration, which led to the
development of the modern ice cream industry.
New Zealand‟s largest ice cream manufacturer, Tip Top™, traces its beginnings
to 1936, when two friends, Len and Albert, opened an ice cream parlour in
Wellington. Described as being innovators, they began making their own ice
cream. The business continued to grow until, in 1962, they built the iconic Tip
Top™ factory on Auckland‟s Southern Motorway (Tip Top, 2010).
Today, the New Zealand Ice Cream Manufacturers Association (NZICMA) has 17
member companies who manufacture ice cream, along with 29 associate members
who provide services to the industry (NZICMA, 2008). The author counted more
than twenty different flavours at a local supermarket, ranging from plain vanilla to
raspberry ripple to chocolate-chip cookie dough and everything in between!

Literature Review 5
2.3 Ice Cream Ingredients and Manufacture
2.3.1 Manufacturing Process
The basic steps in the ice cream manufacturing process are outlined in Figure 1.
Figure 1: Flowchart outlining the basic steps used in the manufacture of ice cream.
Blending
•The dry and wet ingredients are mixed in a high speed blender (Goff, 1995).
Pastuerization
•The mix is pasteurized to conform to food safety regulations. The presence of this step depends on the ingredients that have gone into the mix and whether or not they require pasteurization (Goff, 1995).
Homogenization
•The mix is homogenized to form a stable and uniform suspension of the fat , such that it will not cream (Goff, 1995).
Aging the mix
•The mix is cooled to <4°C and aged for 4-24 hours, which allows the fat present to cool and crystallize. Aging improves the whipping qualities of the mix and the body and texture of the ice cream (Goff, 1995).
Freezing
•The mix undergoes a dynamic freezing process, where a portion of the water is frozen and air is whipped into the mix. A "barrel" freezer is used which is essentially a tubular heat exchanger with a scraped surface. Rotating blades inside the barrel scrape ice of the surface of the freezer and dashers inside the machine whip the mix and incorporate air (Goff, 1995).
Packaging
•The ice cream is packed appropriately, depending on its destination after manufacture. Packaging must be done aseptically is important to ensure a long shelf life and prevent growth of spoilage and pathogenic organisms (Goff, 1995).
Hardening
•Hardening occurs by placing the ice cream in a blast freezer at -30 to -40°C. The remaining water is frozen and the ice cream should be stable indefinitely at these temperatures, without risk of ice crystal growth (Goff, 1995).

Literature Review 6
2.3.2 Properties Attributed to Manufacturing Process
During ice cream manufacture, the whipping process incorporates air into the
product in the form of tiny bubbles 50-80 µm in diameter. During freezing and
aeration of the mix, the fat present undergoes partial coalescence, forming clusters
that surround and stabilize the air bubbles (Goff, 2006).
The air content of ice cream is expressed in terms of „overrun‟. Overrun is defined
as “the percentage increase in volume of ice cream greater than the amount of mix
used to produce that ice cream” (Goff, 1995). In commercial manufacture,
operators are often able to set their equipment to produce ice cream with an
overrun of a desired value or range. This is done at the freezing stage of
manufacture, with high dasher speeds ranging from 200-700 rpm used to whip
and incorporate the air into the mixture (Drewett & Hartel, 2007; Goh, Ye, & Dale,
2006). Overrun can be up to 100% (Goff, 1995), and can be calculated using
Equation 1:
Equation 1:
( )
(Goff, 1995)
The size and volume fraction of air bubbles is influenced by the size of the fat
globules. Smaller fat globules produce a greater surface area from the same
amount of fat. In commercial preparation, a two stage homogenizer is normally
used to break up fat clusters and reduce globule size. This is carried out at 14 – 17
MPa for the first stage and 3 – 7 MPa on the second stage (Goff, 1995). The size
of the air bubbles present influences the texture of the product, with smaller air
bubbles providing a smoother texture (Goff, 1995).
Overrun, along with ice crystal size, ice phase volume fraction, and extent of fat
destabilization, also affects the hardness of ice cream (Muse & Hartel, 2004). The
hardness of ice cream can be defined as “the measure of the resistance of the ice
cream to deformation when an external force is applied“ (Muse & Hartel, 2004).
An inverse relationship exists between hardness and overrun (Goff, et al., 1995;

Literature Review 7
Tanaka, Pearson, & deMan, 1972; Wilbey, Cooke, & Dimos, 1998). It is unknown
whether air bubble size influences the hardness of ice cream (Muse & Hartel,
2004). It has also been found that ice creams with large ice crystals are harder
than those with smaller ice crystals, for the same ice phase volume (Sakurai,
Kokubo, Hakamata, Tomita, & Yoshida, 1996). The hardness of ice cream is
exponentially related to ice phase volume (Wilbey, et al., 1998).
The melting rate of ice cream is also affected by overrun. Ice creams with high
overruns melt more slowly than those with low overrun. This is attributed to a
reduced rate of heat transfer due to the larger air volume fraction (Sakurai, et al.,
1996) which reduces its thermal diffusivity (Rahman, 2009).
2.3.3 Traditional Ingredients
The following ingredients are often found in ice cream: Skim milk, cream, sugar,
milk solids, cocoa, egg yolk, locust bean gum, natural flavour. These ingredients
all provide some functional purpose in the product, and can be classified under the
following headings:
Milk fat: Milk fat is added to ice cream to provide body, texture and the desirable
melting characteristics that ice cream is known for (Goff, 1995). It is added in the
form of whole milk, cream or anhydrous milk fat.
Milk solids non-fat (MSNF): The major components of MSNF are milk proteins
and lactose. The presence of milk proteins improves the texture of ice cream and
the milk solids also provide body (Goff, 1995).
Emulsifier: Emulsifiers are compounds that have both a hydrophilic portion and a
hydrophobic portion. This enables them to bind both fat and water, contributing to
the formation of the appropriate fat structure which provides good textural and
melting characteristics in the product (Goff, 1995).
Stabilizers: Stabilizers add viscosity and also extend the shelf life by limiting ice
recrystallization during storage. Stabilizers also help prevent heat shock, which

Literature Review 8
occurs when the ice present in ice cream partially melts then forms larger ice
crystals as the product is re-frozen (Goff, 1995).
Sweeteners: Sweeteners not only contribute to the sweet taste desired by the
consumer, but also contribute to freezing point depression (FPD). This means that
the ice cream has some water which is unfrozen, without which the product would
be too hard to scoop. Sweeteners are typically added at 12-16% by weight. The
lactose present in the non-fat milk solids also contributes to FPD (Goff, 1995).
Flavours: Flavours and other ingredients for taste purposes are added as desired
and required. Some flavour inclusions, such as fruit swirls and nut pieces, also
contribute textural properties to ice cream (Goff, 1995).
2.3.4 Benefits of High Protein Diets
It is commonly accepted that the performance and recovery of athletes is
enhanced by optimal nutrition (ADA, DOC, & ACSM, 2009). The protein needs
of athletes must be met during times of high physical activity in order to maintain
body weight and build and repair tissue (ADA, et al., 2009). High protein diets
have consistently been shown to result in greater weight loss, greater fat loss, and
greater preservation of lean mass as compared with lower protein diets (Phillips,
2006), and are useful for athletes wanting to maintain lean muscle mass while
losing weight (Mettler, Mitchell, & Tipton, 2010). Protein is also an important
macro nutrient for increasing strength and muscle bulk during resistance exercise
training (Tarnopolsky, 2008).
According to consumer research from Tuatara Nutritional Technologies Ltd,
many athletes consume their pureMUSCLE Whey Protein Isolate (WPI) product
(30g) mixed with reduced fat milk (approximately 300ml). pureMUSCLE WPI
retails for $109 for 1.5kg, which is 50 servings at a cost of $2.18 per serving.
Typical consumption times are mid-morning, mid-afternoon, post-training and
immediately before bed. Table 1 shows a breakdown of the nutritional
information for pureMUSCLE WPI, reduced fat milk and per serve as consumed.

Literature Review 9
Athletes would be able to utilize a frozen dessert that is high in protein as part of
their diet, as it would provide a change from more commonly used protein sources
such as meat, fish and whey or soy protein supplements. By finding suitable
ingredients, it may be possible to develop a frozen dessert which is high in protein,
whilst being low in fat and carbohydrates, whilst still maintaining the sensory
attributes of ice cream.
Table 1: Nutritional and cost information for pureMUSCLE WPI, reduced fat milk and per serve as
consumed.
Nutritional Content Per 100g
Per 30g
pureMUSCLE
WPI (Chocolate
flavour)
Per 300ml
Reduced Fat
Milk
Per Serve as
Consumed
(30g WPI
mixed in
300ml
Reduced Fat
Milk)
Energy (kJ)
443 600 1043
Protein (g)
26.1 11.0 37.1
Fat Total (g) 0.3 5.0 5.3
Saturated (g) 0.2 3.0 3.2
Carbohydrates Total (g) 1.2 15.0 16.2
Sugar (g) 0.1 15.0 15.1
Sodium (mg)
48 132 180
Cost/serve $2.18 $0.57 $2.75
High protein diets also have applications in countering the growing obesity
epidemic. Obesity is a significant problem in the modern world, and it is
attributed to an energy imbalance. The energy imbalance is being generated by
greater food (calorie) intake and/or sedentary lifestyles (ADA, 2005). High calorie
foods rich in sugars and fat, when consumed in excess, can contribute to the
energy imbalance of obesity sufferers. It has been shown that high protein, low fat,
low carbohydrate diets are useful for managing body weight and composition and
Literature Review 10
reducing risk of cardio-vascular disease in overweight and obese patients (Clifton,
Bastiaans, & Keogh, 2009; Torbay, et al., 2002). A high protein, low fat, low
carbohydrate dessert may be useful for weight management of obesity patients.
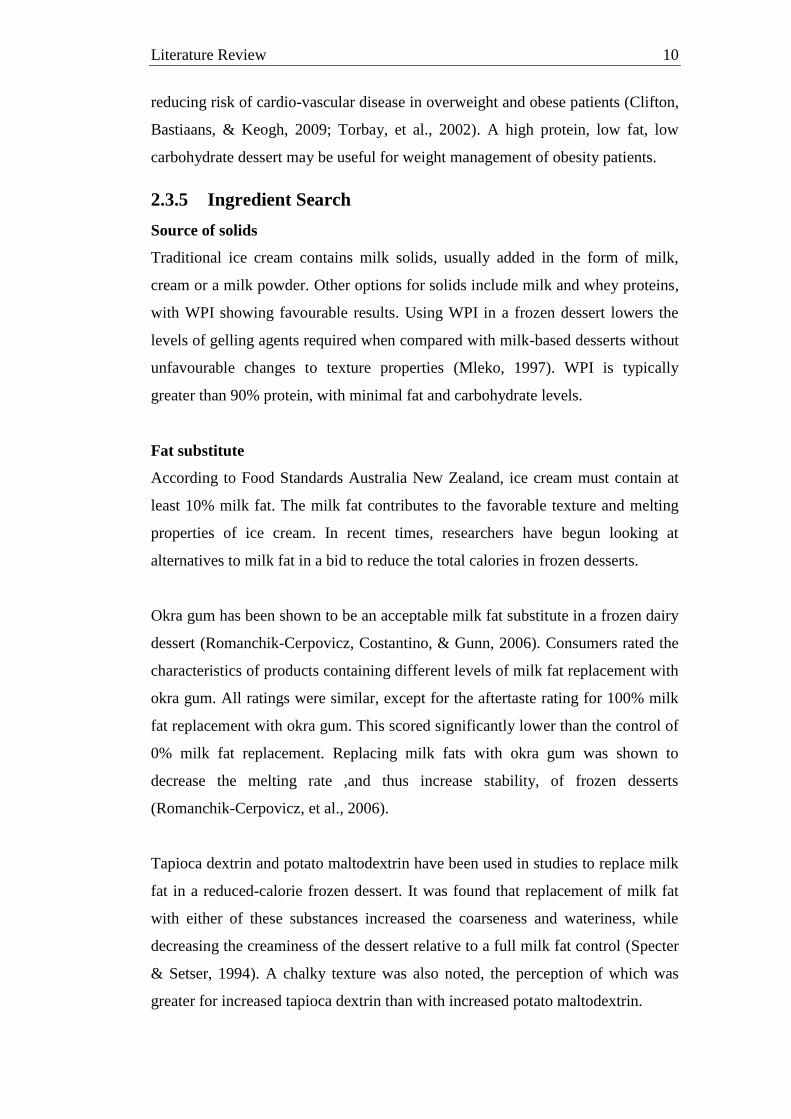
2.3.5 Ingredient Search
Source of solids
Traditional ice cream contains milk solids, usually added in the form of milk,
cream or a milk powder. Other options for solids include milk and whey proteins,
with WPI showing favourable results. Using WPI in a frozen dessert lowers the
levels of gelling agents required when compared with milk-based desserts without
unfavourable changes to texture properties (Mleko, 1997). WPI is typically
greater than 90% protein, with minimal fat and carbohydrate levels.
Fat substitute
According to Food Standards Australia New Zealand, ice cream must contain at
least 10% milk fat. The milk fat contributes to the favorable texture and melting
properties of ice cream. In recent times, researchers have begun looking at
alternatives to milk fat in a bid to reduce the total calories in frozen desserts.
Okra gum has been shown to be an acceptable milk fat substitute in a frozen dairy
dessert (Romanchik-Cerpovicz, Costantino, & Gunn, 2006). Consumers rated the
characteristics of products containing different levels of milk fat replacement with
okra gum. All ratings were similar, except for the aftertaste rating for 100% milk
fat replacement with okra gum. This scored significantly lower than the control of
0% milk fat replacement. Replacing milk fats with okra gum was shown to
decrease the melting rate ,and thus increase stability, of frozen desserts
(Romanchik-Cerpovicz, et al., 2006).
Tapioca dextrin and potato maltodextrin have been used in studies to replace milk
fat in a reduced-calorie frozen dessert. It was found that replacement of milk fat
with either of these substances increased the coarseness and wateriness, while
decreasing the creaminess of the dessert relative to a full milk fat control (Specter
& Setser, 1994). A chalky texture was also noted, the perception of which was
greater for increased tapioca dextrin than with increased potato maltodextrin.

Literature Review 11
A micro-particulated whey protein concentrate (WPC), commercially sold as
Simplesse®, has also been used as a fat substitute in frozen desserts (Widhalm,
Stargel, Burns, & Tschanz, 1994). It is claimed by the manufacturer that
Simplesse® micro particles, in suspension, behave like a creamy fluid (CPKelco,
2010). Simplesse® can be used to enhance the quality of low-fat foods, as its
particle size allows it to behave almost identically to fat globules (CPKelco, 2010).
As it is a form of WPC, Simplesse® is also a natural ingredient and would
increase the protein content of products in which it is used.
Sweeteners
When developing a sweetening system in ice cream, three factors must be
considered; desired sweetness and taste, freezing point depression (FPD) and
contribution to total solids (Güven & Karaca, 2002; Rothwell, 1985; Stampanoni
Koeferli, Piccinali, & Sigrist, 1996). Previous development carried out by the
author determined that the FPD plays a crucial role in developing an acceptable
product (Nixon & Carson, 2010). It has also been recognized that there are two
types of sweetening alternatives to sugar; natural/plant derived sweeteners and
artificial/synthetic sweeteners (Sardesai & Waldshan, 1991).
Goff (1995) describes the FPD of a solution as:
“A colligative property associated with the number of dissolved molecules. The
lower the molecular weight, the greater the ability of a molecule to depress the
freezing point for any given concentration. In ice cream manufacturing,
monosaccharide’s such as fructose or glucose produce a much softer ice cream
than disaccharides such as sucrose, if the concentration of both is the same”.
By substituting sucrose for lower molecular weight carbohydrates, it is possible to
achieve the same hardness with less sugar/carbohydrate content.
There are a range of different ingredient groups that can be used to provide the
functions of conventional sweeteners in ice cream, including: sugar alcohols,
bulking agents, milk solids non-fat (MSNF), stabilizer/emulsifier systems and
Literature Review 12
high intensity sweeteners (Tharp, 2010). Tharp (2010) published Figure 2 which
summarizes the role of some ingredients used to replace sweetener functionality in
frozen dessert products.
It is noteworthy that the sugar alcohols do not provide water immobilization
properties, so if any of these compounds were to be used, other ingredients would
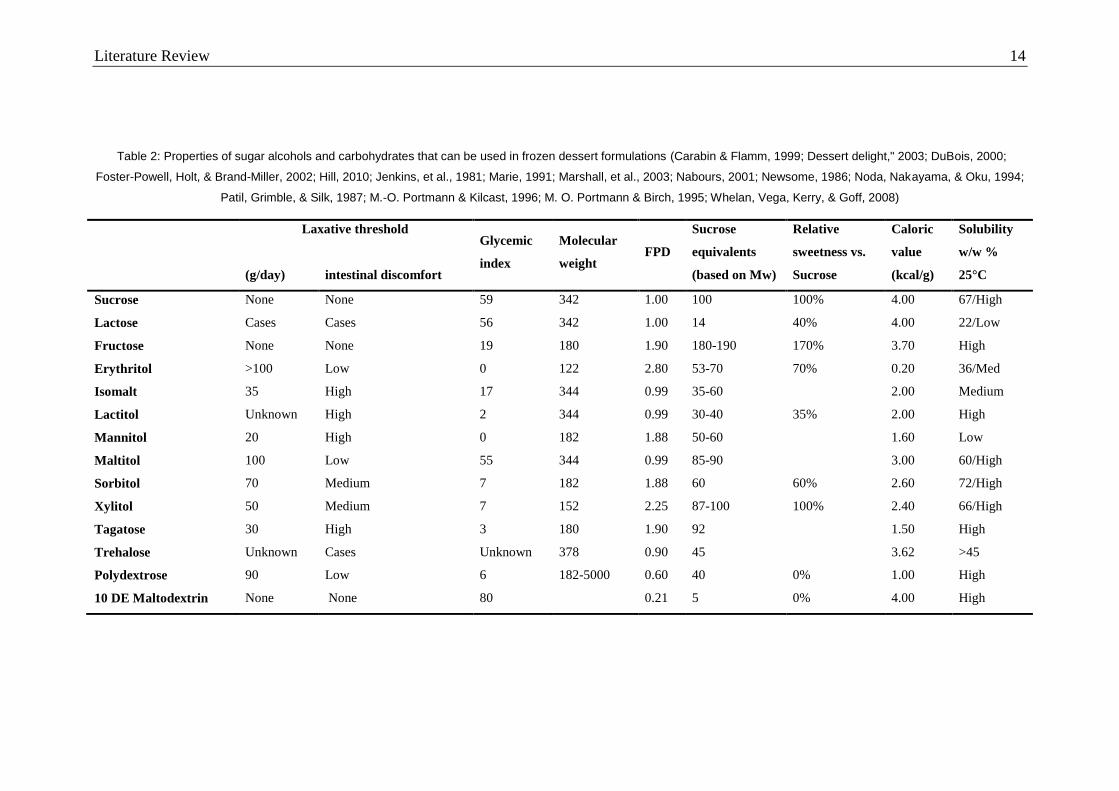
need to be added to serve this purpose. Table 2 summarizes properties of sugar
alcohols and carbohydrates that can be used in frozen dessert formulations.
Xylitol has been used to depress the freezing point and hence replace sucrose in
frozen desserts (Mitchell, 2008), however a combination of compounds such as
those listed in Table 2 and Figure 2 may be the best method of achieving suitable
FPD and water immobilization whilst producing an acceptable product. Using a
higher molecular weight, low nutritive carbohydrate like polydextrose in
conjunction with a low molecular weight sugar alcohol will enable easy
modification of hardness (Mitchell, 2008). Factors such as laxation threshold,
solubility in the mix and any texture imparted to the product also have to be
considered.
Several studies have used sugar alcohols or high molecular weight carbohydrates
in frozen dessert formulations. Specter & Setser (1994) created a frozen dessert by
replacing sucrose with polydextrose-aspartame and milk fat with tapioca dextrin
or potato maltodextrin. Ice cream sweetened with combinations of xylitol and
sucrose have been shown to have characteristics similar to ice cream sweetened
with sucrose alone (Marco & Pearson, 1982). Ice creams sweetened with maltitol
have been shown to be preferred over ice cream sweetened with sorbitol by
diabetic patients (Ozdemir, Dagdemir, Celik, & Ozdemir, 2003). Maltitol
sweetened ice cream has also been shown to have overall preference over a
regular 12% fat ice cream by a large consumer panel (Bordi, Cranage, Stokols,
Palchak, & Powell, 2004).

Literature Review 13
Figure 2: Summary of roles of ingredients used to replace sweetener functionality in frozen dessert products (Tharp, 2010)
Literature Review 14
Table 2: Properties of sugar alcohols and carbohydrates that can be used in frozen dessert formulations (Carabin & Flamm, 1999; Dessert delight," 2003; DuBois, 2000;
Foster-Powell, Holt, & Brand-Miller, 2002; Hill, 2010; Jenkins, et al., 1981; Marie, 1991; Marshall, et al., 2003; Nabours, 2001; Newsome, 1986; Noda, Nakayama, & Oku, 1994;
Patil, Grimble, & Silk, 1987; M.-O. Portmann & Kilcast, 1996; M. O. Portmann & Birch, 1995; Whelan, Vega, Kerry, & Goff, 2008)
Laxative threshold Glycemic
index
Molecular
weight FPD
Sucrose
equivalents
(based on Mw)
Relative
sweetness vs.
Sucrose
Caloric
value
(kcal/g)
Solubility
w/w %
25°C
(g/day) intestinal discomfort
Sucrose None None 59 342 1.00 100 100% 4.00 67/High
Lactose Cases Cases 56 342 1.00 14 40% 4.00 22/Low
Fructose None None 19 180 1.90 180-190 170% 3.70 High
Erythritol >100 Low 0 122 2.80 53-70 70% 0.20 36/Med
Isomalt 35 High 17 344 0.99 35-60 2.00 Medium
Lactitol Unknown High 2 344 0.99 30-40 35% 2.00 High
Mannitol 20 High 0 182 1.88 50-60 1.60 Low
Maltitol 100 Low 55 344 0.99 85-90 3.00 60/High
Sorbitol 70 Medium 7 182 1.88 60 60% 2.60 72/High
Xylitol 50 Medium 7 152 2.25 87-100 100% 2.40 66/High
Tagatose 30 High 3 180 1.90 92 1.50 High
Trehalose Unknown Cases Unknown 378 0.90 45 3.62 >45
Polydextrose 90 Low 6 182-5000 0.60 40 0% 1.00 High
10 DE Maltodextrin None None 80 0.21 5 0% 4.00 High

Literature Review 15
There are also high intensity, low-calorie alternatives to sugar that could be used
to sweeten the frozen dessert. Such ingredients do not provide any contribution to
FPD. Natural sweeteners include perillaldehyde, stevioside, rabaudioside,
glycyrrhizin, osladin, thaumatins, and monellin (Sardesai & Waldshan, 1991).
Stevioside is an extract from the leaf of Stevia rebaudiana Bertoni, a shrub native
to parts of South America. It is non-calorific and has a sweetness level
approximately 300 times that of sucrose (Santini, Ferrara, Naviglio, Aragon, &
Ritieni, 2008). The safety of stevia has been confirmed by various toxicity,
mutagenicity and other studies (Panpatil & Polasa, 2008), and it has been
approved for use as a food additive in New Zealand and Australia (Daniells, 2008).
Due to its non-calorific properties, Stevia also has played an important role in
medical research for treating diabetes, obesity, high blood pressure and tooth
cavity and skin problems (Panpatil & Polasa, 2008). Studies have also indicated
that Stevia rebaudiana is a source of natural antioxidants (Ghanta, Banerjee,
Poddar, & Chattopadhyay, 2007).
Thaumatin is a low calorie protein sweetener, and is currently available as a
commercial sweetener sold under the brand name Talin®. Like other naturally
occurring sweet proteins, Thaumatin was discovered in a species of West African
fruit (Gibbs, Alli, & Mulligan, 1996). It can also be produced by genetic
modification of the yeast Saccharomyces cerevisiae (Gibbs, et al., 1996).
According to the manufacturer, Talin® is a suitable sweetener for dairy based
desserts. It is claimed that Talin® provides a perceived increase in texture and
flavour perception in low fat desserts (Naturex, 2009).
Stabilizer
Stabilizers are required to bind the ingredients together and improve the texture of
the product. Locust bean gum is used in various products including dairy products
such as ice cream. Typical dose rates are 0.1 to 1.0% (Absolute Ingredients Ltd,
2010).
Literature Review 16
Guar gum is the name given to the natural, cold water soluble stabilizer that is the
milled endosperm of the legume Cyamopsis tetragonolobus. When used in ice
cream, it can prevent ice crystals from forming and also adds a fat-like mouth feel
(Absolute Ingredients Ltd, 2010). It can be mixed with locust bean gum to
increase viscosity more than when either one is used alone, so lower doses can be
used (Absolute Ingredients Ltd, 2010).
Other stabilizers that may be suitable for this application include lambda
carrageenan and carboxy methyl cellulose (CMC) (Hawkins Watts Ltd, 2010).
Both gums prevent ice crystal growth and control viscosity in frozen dessert
applications.
Emulsifier
Egg yolk is the emulsifier traditionally used in ice cream. In modern recipes,
mono and di-glycerides (derived from the partial hydrolysis of fats or oils) or
Polysorbate-80 are more commonly used. Combined, stabilizers and emulsifiers
make up less than 0.5 % w/w of ice cream (Goff, 1995).
Functional Ingredients
Polydextrose could be used to contribute to freezing point depression and mouth
feel and would also be a source of fiber (Tharp, 2010). Products are continually
being released with manufacturers making claims to fiber content, being high in
fiber or having added fiber (Fuhrman, 2010), using the associated health benefits
to aid sales. Fiber is said to prevent weight gain, disease, and also enhance
cardiovascular and gastrointestinal function (Bales, 2010).
Flaxseed oil has been used to replace milk fat in ice cream without altering
functionality, at a rate of 2% w/w in a 12% w/w fat ice cream (Goh, et al., 2006).
Flaxseed oil is an excellent source of alpha-linolenic acids, which have been
reported to help in the prevention and treatment of diseases such as diabetes,
cancer, heart disease and autoimmune diseases (Larsson, Kumlin, Ingelman-
Sundberg, & Wolk, 2004; Simopoulos, 1997). In modern western diets, there is a
low intake of the healthy alpha-linolenic acids compared with linolenic acids

Literature Review 17
(James, 2000). Ice cream is considered to be an ideal food system for
incorporating flaxseed oil due to its low storage temperature (Goh, et al., 2006).
2.3.6 Frozen Desserts for the Health Conscious Consumer
A review of products available in a local supermarket showed that there are
several frozen desserts targeted toward the health conscious consumer wanting a
reduced fat and/or reduced sugar option. The products, their nutritional properties
and prices are summarized in Table 3.
It is observed that all of the products in Table 3 are low in protein, with Zilch!®
Vanilla Bean Ice Cream having the most at 6.4%. This product also has the lowest
carbohydrate content but has the highest fat levels. With 4.6% fat, it is labeled as a
„reduced fat‟ ice cream.
The Lite Licks® Dairy Free product has highest carbohydrate level and the lowest
protein content. The two frozen yogurts are in between the other two products for
protein, fat and carbohydrate content. A product which has more protein than
carbohydrate (a ratio of 1:1 or greater), whilst being low in fat, could have a
unique place in the market of frozen desserts. It would provide an attractive option
for consumers looking to increase their protein intake and/or who could benefit
from reducing carbohydrate and fat intake.

Literature Review 18
Table 3: Summary of frozen desserts targeted toward health conscious consumers.
Nutritional Content Per 100g
Zilch!®
Vanilla
Bean Ice
Cream
Lite Licks®
Dairy Free
Vanilla
Frozen
Dessert
Zilch!®
Passionfruit
& Mango
Frozen
Yogurt
Bulla®
Mango
Frozen
Yogurt
Energy (kJ)
620 640 490 587
Protein (g)
6.4 1.6 3.4 3.5
Fat Total (g) 4.6 2.8 2.8 3
Saturated (g) 3.2 2.1 2.3 1.8
Carbohydrates Total (g) 8.4 28.7 19.5 25.7
Sugar (g) 2.2 15.9 5.4 22.9
Other a (g) 9.5
12.5
Sodium (mg)
38 72 63 48
Price b /100g $1.41 $1.57 $1.48 $0.70
a Refers to low nutritive carbohydrates added, including sugar alcohols and
polydextrose, as listed on the Nutritional Information panel of the product.
b Prices taken from Pak 'n Save Clarence Street, Hamilton, on 11/04/11

Literature Review 19
2.3.7 Food Product Development Procedures
According to Earle & Earle (2001) there are four generic stages in food product
development process:
1. Product strategy
2. Product design and process development
3. Product commercialisation
4. Product launch and post-launch evaluation
Figure 3 provides an outline of the product and process development steps used to
take a product design specification (PDS) to a final product prototype.
Before experiments can begin, a base formula or recipe for the product must be
produced. Five steps can be used to systematically develop a formula (Earle &
Earle, 2001):
1. Set the required product qualities
2. Find the raw material compositions and costs
3. Determine the processing variables and any limits on the raw materials
being used.
4. Use quantitative techniques such as linear programming, experimental
designs and mixture designs to produce experimental formulations
5. Use technical tests to relate changes in formulation to changes in product
qualities.

Literature Review 20
Figure 3: Activities in product design and process development (Earle & Earle, 2001).

Literature Review 21
2.4 Aims and Objectives
Since frozen desserts are so popular, the documented benefits of low fat, low
carbohydrate, and high protein diets for certain segments of the population,
combined with the general public‟s increasing awareness of the importance of a
healthy diet, there is a clear incentive to produce a product which has similar
sensory attributes to ice cream, but has better nutritional qualities. Therefore, the
purpose of the study was to develop a new ice cream-like frozen dessert which is
less than 3% fat and has a protein: carbohydrate ratio of at least 1:1; significantly
higher than any commercial product currently available in New Zealand.
The study was to focus on Stage 2 of the product development procedure (as
defined by Earle & Earle, 2001), the product design and process development.
Stage one was carried out by Tuatara Nutritional Technologies Ltd. Stages three
and four will be carried out by the company upon completion of Stage Two.The
specific objectives of this project were to:
1. Carry out a literature search for possible ingredients to make the frozen
dessert.
2. Develop prototypes of the frozen dessert that will be suitable for the target
market.
3. Carry out instrumental measurements of the prototypes, compare them
with a control sample and then optimize the formulation to achieve the
desired physical properties.
4. Carry out consumer trials using volunteers from the target markets to
determine acceptability of the product.
In addition to the product containing less than 3% fat and having a protein:
carbohydrate ratio of at least 1:1, the following guidelines were also to be met:
Product should have a similar sensory attributes to ice cream.
Product should be composed of natural, naturally derived and nature
identical ingredients only.
All ingredients should be approved for use in food products.
An attempt should be made to source ingredients locally so that the
product can be labeled “New Zealand Made”.
Product Design Specification 22
3. Product Design Specification
A Product Design Specification (PDS), following the outline published by Earle
& Earle (2001), was produced in conjunction with Tuatara Nutritional
Technologies:
3.1.1 Product Concept
The product will be a frozen dessert, similar to ice cream with respect to texture,
hardness and flavour, but higher in protein and lower in fat and carbohydrates.
The product will be packed in similar packaging to regular ice cream, and stored
under the same conditions. It will be targeted at athletes, obesity sufferers,
diabetics and health conscious individuals on carbohydrate-controlled diets, but
will also be suitable for the general population. It will incorporate dairy proteins,
flavours, sweeteners, emulsifiers and stabilizers as a frozen emulsion with similar
overrun and solids-content to regular ice cream.
3.1.2 Product qualities
Table 4 outlines the desired qualities that the high protein frozen dessert should
have.
3.1.3 Target consumers
The target consumers are athletes, obesity sufferers, diabetics as well as health
conscious individuals. The product should also appeal to the general public.
3.1.4 Production design specifications
Raw materials/ingredients:
Dairy proteins to provide a source of protein and solids.
Freezing point depressor to control the freezing point of the product.
High intensity sweetener, if required, to enhance the sweetness of the
product in addition to the freezing point depressor.
Emulsifier, to aid in the formation of the water/air/fat emulsion.
Stabilizer, to prevent formation of ice crystals and provide viscosity.
Flavours to provide appropriate flavour to the product.

Product Design Specification 23
Additional „functional‟ ingredients, which contribute to both the sensory
attributes of the product and to the health and wellbeing of the consumer.
Table 4: Desired qualities of different attributes for a high protein frozen dessert.
Attribute Desired qualities
Nutritional Protein: carbohydrate ration of 1:1 or greater, less than 3% fat
and low in sodium.
Sensory Similar texture, hardness and flavour to regular ice cream. The
colour of the product is dependent on the flavour.
Physical A frozen emulsion with similar solids content and overrun to
regular ice cream.
Chemical Contains only naturally occurring or naturally derived
ingredients approved for food use.
Microbiological Microbiologically stable, free from Coliforms and Salmonella.
Shelf life will be determined by the tendency of water in the
product to crystallize and become “icy”.
Processing A similar process to that used in traditional ice cream
manufacture will be used to form and freeze the emulsion.
Storage Stable under storage conditions of regular ice cream for at least
6 months.
Packaging Packaging will be confirmed at the completion of the product
development stage.
Price Not more than $1.50 per serve
Product Design Specification 24
Processing/formulation
The product must be able to be made in an existing ice cream
manufacturing plant with little or no modification.
Packaging
Packaging size is to be confirmed.
The packaging materials should be recyclable in NZ
Storage, transport
The product must be stable under the storage and transport conditions of
regular ice cream so that it can be stored in existing facilities, and
transported similarly. It is envisaged that distribution will be via an
existing distribution network with another company selling frozen dessert
products, mainly to supermarkets.
3.1.5 Marketing design specifications
Packaging design: Up-market branding that reflects target markets.
Promotion: Directed to the target markets as well as the general
population. Emphasis is directed to supermarkets, food outlets selling ice
cream products and health food retailers in that order of priority.
Competition: Major competition will come from regular ice cream
products, which start at lower prices and come in a greater variety of
flavours. Other competition will come from existing frozen desserts
targeting the health conscious market, which are covered in Section 2.3.6.

Methodology 25
4. Methodology
Using the work published by Earle & Earle, the following steps were produced
and followed during the product design process (Earle & Earle, 2001):
Product Design Phase 1: Using a calculated base or theoretical formula, carry
out „ad hoc‟ experiments to recognise the variables.
Product Design Phase 2: Carry out simple experiments to test the variables and
the relationships between different variables.
Product Design Phase 3: Use computer software to develop elementary product
prototypes. Carry out instrumental testing of prototypes and compare with a
control samples.
Product Design Phase 4: Optimise the product using stepwise variable changes.
Product Design Phase 5: Test the optimum product prototype for market
acceptability by using a consumer panel of 30-50 people.
4.1 Ingredient Identification
Based on the literature search (Section 2.3), commercial ingredients were chosen
which met criteria for suitability, availability and price. The selected ingredients
are summarised in Table 5.

Methodology 26
Table 5: Ingredients chosen for formulating a high protein frozen dessert.
Raw material Description Supplier
Whey Protein Isolate (WPI) 894 Instantized Whey
Protein Isolate powder
Fonterra
Total Milk Protein (TMP) 1180 Milk protein powder
isolated from skim
milk
Fonterra
Stevia extract Stevioside 90% extract Hawkins Watts Ltd
Simplesse® 100 A micro-particulated
whey protein
concentrate
CP Kelco
Vanilla flavouring powder 443-00154-00 Nature identical
Vanilla flavouring
powder
Givauden / GS Hall
Ltd
Cekol 4000 Carboxy methyl
cellulose powder
Formula Foods Ltd
Novagel GP 3282 Powdered
Microcrystalline
Cellulose blend
Hawkins Watts Ltd
Mono/di-glycerides Mono/di-glycerides
from vegetable oil
Hawkins Watts Ltd
Fructose 100% Fructose powder Hawkins Watts Ltd
Erythritol 100% Erythritol
powder
Annie‟s
Marlborough Ltd
Xylitol 100% Xylitol powder Annie‟s
Marlborough Ltd
Polydextrose 100% Polydextrose
powder
Hawkins Watts Ltd
Flaxseed oil 100% Cold pressed
Flaxseed oil
Healtheries NZ Ltd

Methodology 27
4.2 Theoretical Formulation Development
Nutritional and cost information for the selected ingredients were combined into
an MS Excel database. A spreadsheet was set up that could be used to calculate
the following information for a particular high protein dessert recipe (see
Appendix 3):
Nutritional information
FPD level
Total solids content
Soluble solids content
Non-soluble solids content
Cost of ingredients in each prototype
It was determined that the non-soluble solids content should be set at a maximum
of 15%, while the FPD Factor (as calculated by Equation 2) should be in the range
of 19-23.
Equation 2:
Where „x1‟ is the freezing point depression factor of ingredient „1‟ and „a1‟ is the
percentage of ingredient „1‟ in the recipe. The level of soluble solids and hence
total solids was dependent on the FPD ingredient(s) chosen and how much was
required to meet the FPD range specification.
Both the non-soluble solids level and FPD Factor values were determined based
on a combination of:
1. Values for commercial frozen dessert products
2. Observations made during ad-hoc experiments
The non-soluble solids level for commercial products was approximated by
calculating the sum of the protein and fat, as listed in the nutritional information
panel. The calculated values for the three commercial products used can be seen
in Table 6.

Methodology 28
Table 6: Values calculated for non-soluble solids content and FPD Factor of commercial products.
Ice Cream
Property
Approximate non-
soluble solids
Approximate
FPD Factor
Zilch!® Vanilla Bean Ice Cream 11% 15.5
Tip Top™ Vanilla Ice Cream 12% 20
Brent and Toby's Indulgent Chocolate
Ice Cream 17% 23
Supplier recommendations were used to determine the levels of non-soluble
ingredients; Simplesse® 100, Cekol 4000, Novagel GP 3282, Mono/di-glycerides
and flavouring powder. The protein sources (WPI 894 and TMP 1180 – see Table
5) were used to make up the balance of the 15% allocated to non-soluble solids.
Product formulas were created using the spreadsheet, then trialled in ad-hoc
experiments. Due to the prohibitively large number of experiments that would be
required to test the complete range of possible compositions of the frozen dessert,
a trial and error approach was used to gain an understanding of the interactions
between different ingredients and the effects that varying ingredient levels had on
these interactions.
The nutritional information of the raw materials, which were supplied by the
manufacturers, were used to carry out nutritional analyses of the prototypes.
Nutritional information, as required under Standard 1.2.8 of the Australia New
Zealand Food Standards Code, was calculated using Equation 3 for the
components of energy, protein, total fat, saturated fat, total carbohydrate, sugar
and sodium (FSANZ, 2011a).

Methodology 29
Equation 3:
(
)
(
)
Where “M” is the mass in grams of the ingredient, and “value” represents one
component of the required nutritional information (e.g. protein, fat, carbohydrate
etc).
The material cost for each prototype was calculated using Equation 4:
Equation 4:
∑( ) ( )
4.3 Prototype preparation
After carrying out ad-hoc experiments, elementary product prototypes were
developed with the aid of Design-Expert® Version 8 (V8) software, developed by
Stat-Ease Inc.
Design-Expert® provides users with different statistical methods for designing
experiments, including response surface, factorial, combined and mixture design
structures. An Optimal Mixture design structure was used in this study as it is
most suitable for carrying out food product formulations and allows for the
greatest flexibility in the component ranges (Stat-Ease Inc, 2011)

Methodology 30
The fundamental principle of mixture designs is the fact that the proportions must
add up to one (Buyske & Trout, 2009) as shown by Equation 5:
Equation 5:
∑
where ≥ 0, and is the proportion of component the mixture. Equation 6 shows
what a first order model would look like:
Equation 6:
( ) ∑
Where ( ) is the overall response and represents the response to the linear
blending of pure component (Piepel, Szychowski, & Loeppky, 2002).
Combining Equation 5 and Equation 6, for a mixture model the terms will not
be uniquely determined (Buyske & Trout, 2009). Rather than eliminate one of the
terms, Henry Scheffé developed his famous equations by multiplying by
∑ to get Equation 7:
Equation 7:
( ) ∑( )
From this follows Scheffé‟s equations, Equation 8 and Equation 9, as used in
mixture designs (Buyske & Trout, 2009; Stat-Ease Inc, 2011):
Equation 8: Linear
( ) ∑
Equation 9: Quadratic
( ) ∑
∑∑

Methodology 31
where q is the number of products and represents the expected change in
response due to the blending of components and (Piepel, et al., 2002).
Mixture designs in Design-Expert® V8 are based on models published by Scheffé.
A D-Optimal Point Exchange design using a quadratic model was used for this
study. D-Optimal Point Exchange designs search for the best design points whilst
maximising information about the polynomial coefficients, allowing identification
of the most vital variables (Stat-Ease Inc, 2011). A quadratic Scheffé model was
used as, for this study, it produced a suitable number of „runs‟ (prototype
formulae) and provided a good fit. A summary of the design can be found in
Appendix 6 and screen shots from the software can be viewed in Appendix 7.
The ad-hoc and simple experiments determined limits for four ingredients that
were suitable for controlling the freezing point; fructose (A), erythritol (B), xylitol
(C) and polydextrose (D). The combined freezing point depression calculated by
Equation 10 was to be between 19 and 23. Flax seed oil (E) was also included in
the design for its potential health benefits (James, 2000; Larsson, et al., 2004;
Simopoulos, 1997). The mass sum of A, B, C, D and E was set to be 14%. This
was for two reasons:
1. It would provide a total solids level of 29-32%, observed to be most
suitable during ad-hoc experiments.
2. Using the product development spreadsheet, it was observed that 14%
should allow for a protein: carbohydrate ratio in the vicinity of 1:1 to be
achieved.
In summary, the following constraints were used:

Methodology 32
Equation 10:
22 prototype composition formulae were generated. Of these, 18 were unique
formulae with the remaining 4 being duplicates of 4 of the others. Only the 18
unique prototypes were manufactured; duplicate samples were not.
For each prototype, the calculated amounts of fructose (A), erythritol (B), xylitol
(C) and polydextrose (D) were mixed with the calculated volume of water at 65°C
until completely dissolved. WPI, Simplesse® 100, vanilla flavour and mono/di-
glycerides were weighed and pre-mixed in a large beaker using a spatula. CMC
and Novagel GP3282 were weighed and combined into a separate beaker, as was
flax seed oil (E) for some of the prototypes. The sugar solution was added to a Zip
Elegance Blender (Figure 4) along with the pre-mixed WPI, Simplesse® 100,
vanilla flavour and mono/di-glycerides. The blender was „pulsed‟ 4 times then left
to run for 10 seconds. For prototypes containing flaxseed oil, this was added after
5 seconds with the blender still running. The CMC and Novagel GP3282 were
then added and the blender was pulsed 4 times then left to run for 10 seconds. The
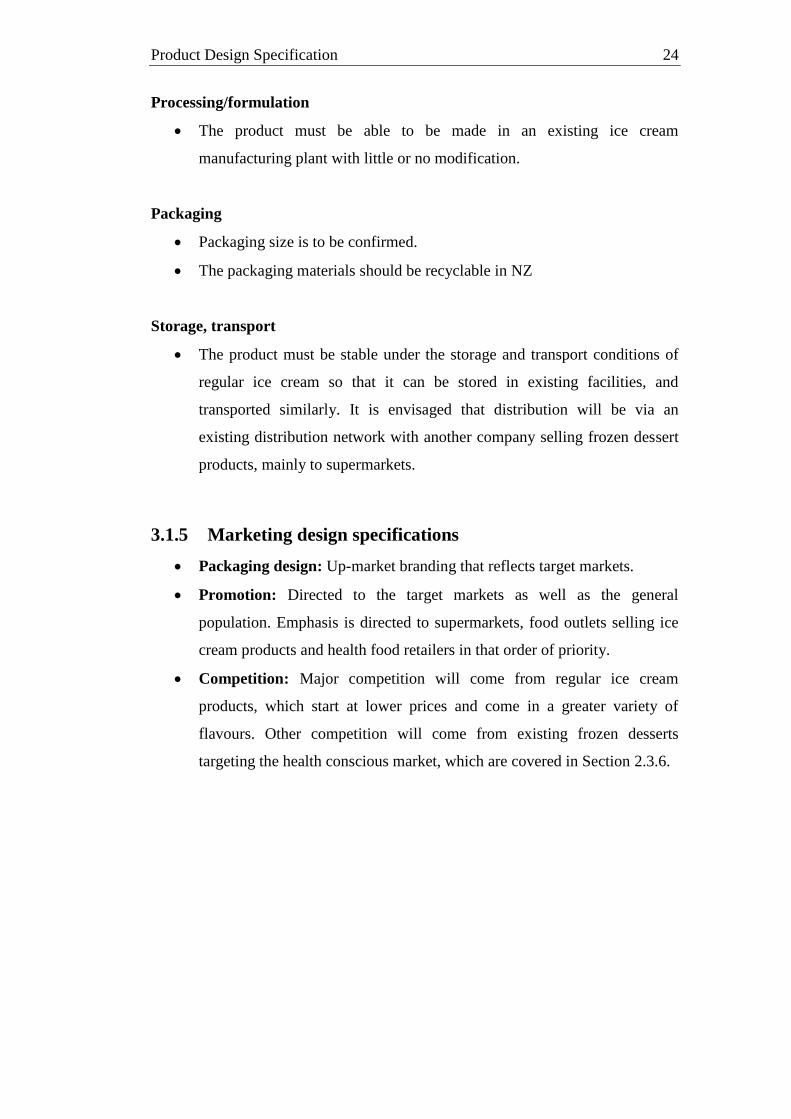
solution was poured into a Breville Ice Cream Wizz (Figure 5, Figure 6), which
was turned on and placed in a domestic freezer set at -16 ºC. After freezing,
prototypes were transferred into 2 L polypropylene containers. Both the
prototypes and the control products, described in Section 4.4, were stored at -
16 °C for one week before analysis.

Methodology 33
Figure 4: Blending the frozen dessert mix.
Figure 5: Pouring the frozen dessert mix into the Breville Ice Cream Wizz.
Methodology 34
Figure 6: Breville Ice Cream Wizz
4.4 Property Testing
Prototypes were tested using instruments to measure hardness and viscosity, with
micrographs being taken to analyze the internal structure. Two control samples
were used;
1. Tip Top™ Vanilla flavoured Ice Cream (a regular, full fat ice cream).
2. Zilch!® Vanilla Bean Ice Cream (a reduced fat, low sugar ice cream
deemed to be a competitor of the new product).
Results from the testing of frozen dessert prototypes were compared with data
obtained from the control samples. The results were used to optimize the
composition for the next design phase using Design-Expert®, such that the
physical properties could be similar to the control samples.

Methodology 35
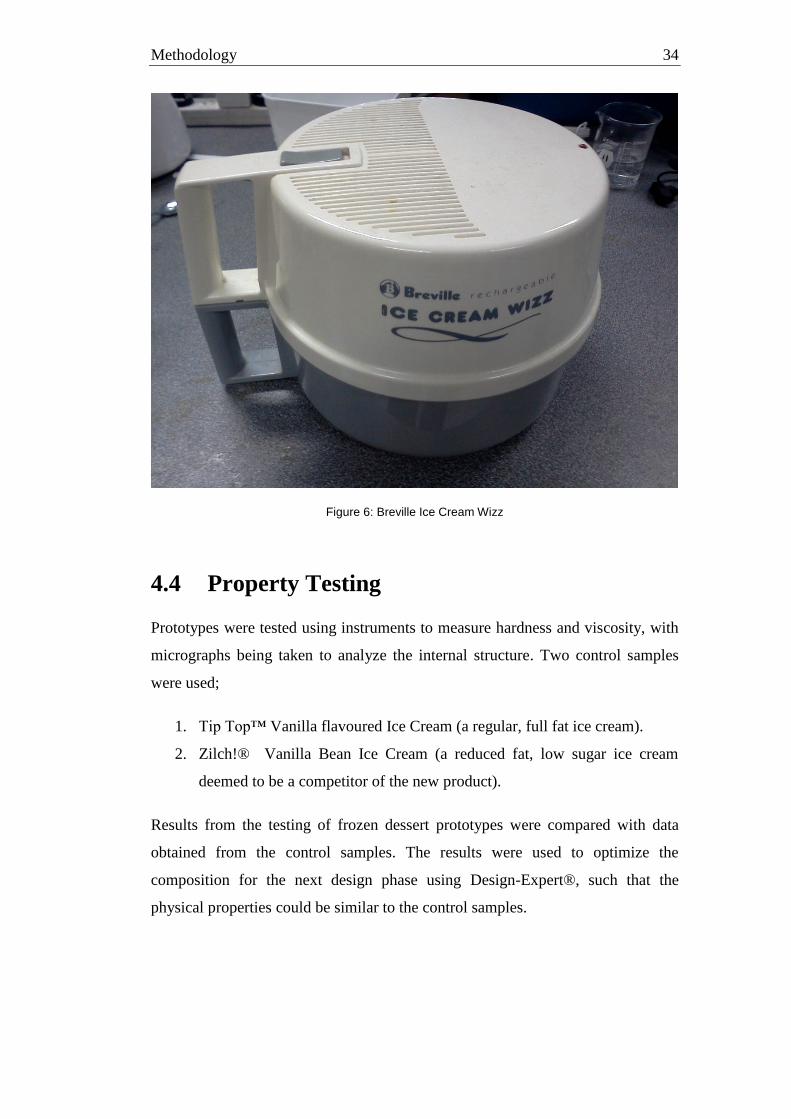
4.4.1 Hardness Testing
Hardness was measured as the maximum force required to penetrate a prototype
to a depth of 20mm (Goh, et al., 2006). This was carried out using an Instron
33R4204 Tensile Tester fitted with a stainless steel probe, 11mm in diameter and
40mm in length, moving at 0.5 mm/s (Figure 7, Figure 8). The probe dimensions
and speed were the same as those used by Goh et al. (2006). Technical drawings
of the probe used can be seen in Appendix 2.
Prototypes were stored in a freezer at -16°C for 1 week prior to testing. Once
ready for testing, prototypes were removed from the freezer individually and
placed in an insulated container filled with ice. A stainless steel cutter,
40x40x40mm (see Appendix 2), was used to extract a sub-sample, which was then
tested under ambient conditions (18°C ± 3.5). Three sub-samples from each
prototype were measured, following the timeframe as shown in Table 7:
Table 7: Timeframe used for hardness testing of frozen dessert prototypes.
Time
(Minutes)
Activity
0-2 Remove prototype from freezer, transfer to insulated container
and move to instrument room.
2-4 Prepare and test first sub-sample.
4-6 Prepare and test second sub-sample.
6-8 Prepare and test third sub-sample.
Methodology 36
Figure 7: Instron 33R4204
Figure 8: Probe penetrating frozen dessert sample, which is contained in a 40x40x40mm stainless
steel cutter.
Methodology 37
4.4.2 Viscosity Measurements
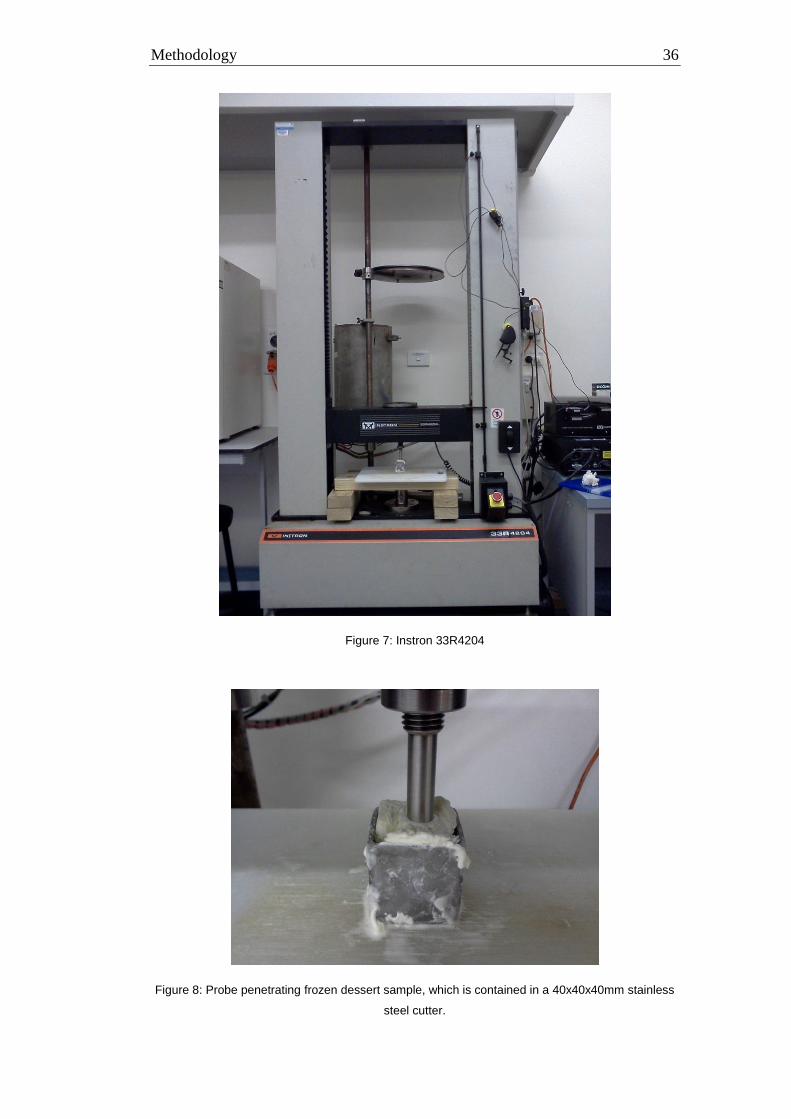
Prototypes were left in a refrigerator at 4°C overnight to soften slowly. 300 cm³ of
each melted prototype was transferred to an individual beaker. Viscosity was
measured using a Brookfield Digital Viscometer DV-II (Figure 9). The LV
Spindle #2 was used and the motor was set to 12 RPM. This combination of
spindle and motor speed was used because it produced a viscosity reading
between 10% and 100% torque, cited as being the requirement for selecting a
spindle by the manufacturer (Brookfield Engineering Labororatories, 1985).
Instructions provided by the manufacturer were followed for calibrating the
viscometer before each use (Brookfield Engineering Labororatories, 1985).
Figure 9: Brookfield Viscometer

Methodology 38
4.4.3 Scanning Electron Microscopy
Selected prototypes were analysed using a Hitachi S-4700 Scanning Electron
Microscope (Figure 10). Two representative prototypes (Prototype 9 and
Prototype 11) were chosen, based on the fact that they contained all five of the
variable ingredients between them, and their microstructures were compared to a
commercial sample.
1. Prototype 9: Contained fructose, xylitol, polydextrose.
2. Prototype 11: Contained fructose, erythritol, and polydextrose and
flaxseed oil.
3. Tip Top™ Vanilla Ice Cream.
Sub-samples of the selected prototypes were taken and frozen using liquid
nitrogen before being inserted into the charging chamber. The blade was used to
fracture the surface of the sub-samples so that the undisturbed internal structure
could be observed. Sub-samples were then coated with platinum (Figure 11)
before being transferred to the electron chamber. The surfaces were then analysed
on the computer monitor display and images taken.
Figure 10: Hitachi S-4700 SEM being prepared for use.

Methodology 39
Figure 11: Cryogenically-frozen frozen dessert sample being coated with platinum in preparation for
viewing under the SEM.
4.4.4 Optimization
Using the response data collected from the prototypes, optimum formulae were
calculated using Design-Expert® V8 software. Criteria were selected such that the
program generated sample formulations that would best replicate both the
hardness and viscosity of the controls i.e. low hardness and high viscosity.
Methodology 40
4.5 Consumer Panel Testing
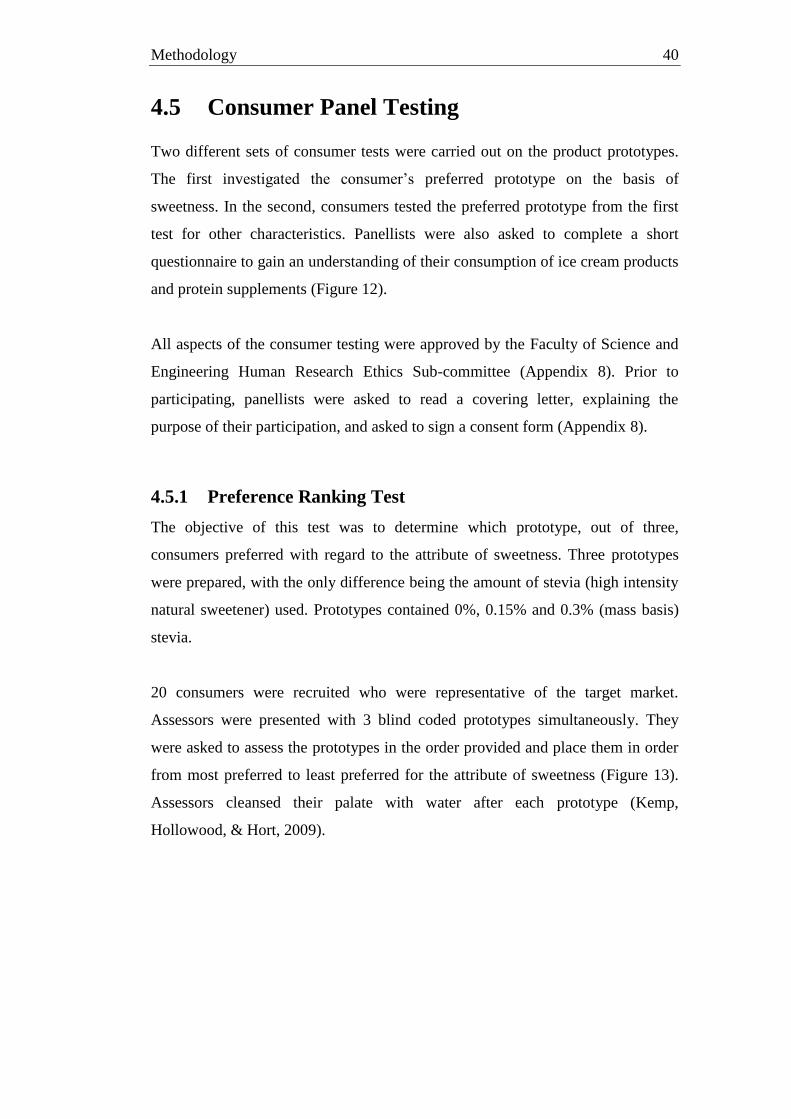
Two different sets of consumer tests were carried out on the product prototypes.
The first investigated the consumer‟s preferred prototype on the basis of
sweetness. In the second, consumers tested the preferred prototype from the first
test for other characteristics. Panellists were also asked to complete a short
questionnaire to gain an understanding of their consumption of ice cream products
and protein supplements (Figure 12).
All aspects of the consumer testing were approved by the Faculty of Science and
Engineering Human Research Ethics Sub-committee (Appendix 8). Prior to
participating, panellists were asked to read a covering letter, explaining the
purpose of their participation, and asked to sign a consent form (Appendix 8).
4.5.1 Preference Ranking Test
The objective of this test was to determine which prototype, out of three,
consumers preferred with regard to the attribute of sweetness. Three prototypes
were prepared, with the only difference being the amount of stevia (high intensity
natural sweetener) used. Prototypes contained 0%, 0.15% and 0.3% (mass basis)
stevia.
20 consumers were recruited who were representative of the target market.
Assessors were presented with 3 blind coded prototypes simultaneously. They
were asked to assess the prototypes in the order provided and place them in order
from most preferred to least preferred for the attribute of sweetness (Figure 13).
Assessors cleansed their palate with water after each prototype (Kemp,
Hollowood, & Hort, 2009).
Methodology 41
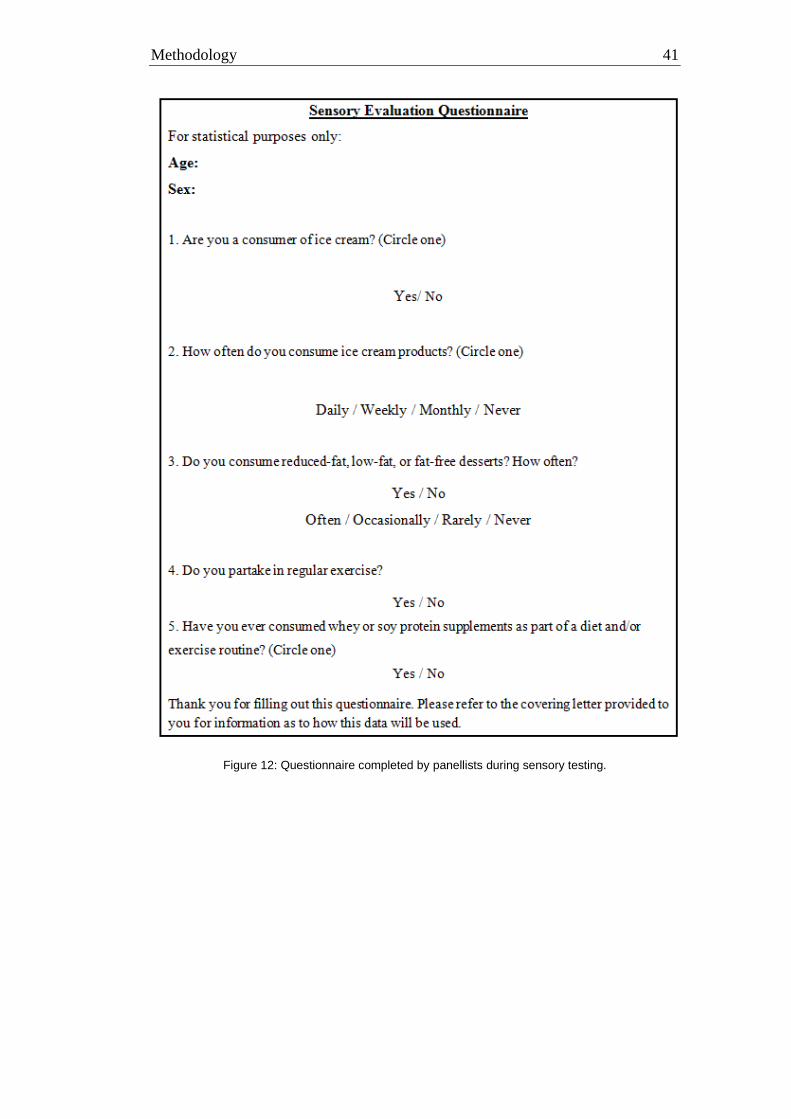
Figure 12: Questionnaire completed by panellists during sensory testing.

Methodology 42
Figure 13: Form consumers completed during Preference Ranking tests (modified from that
presented in Kemp, et al, 2009)
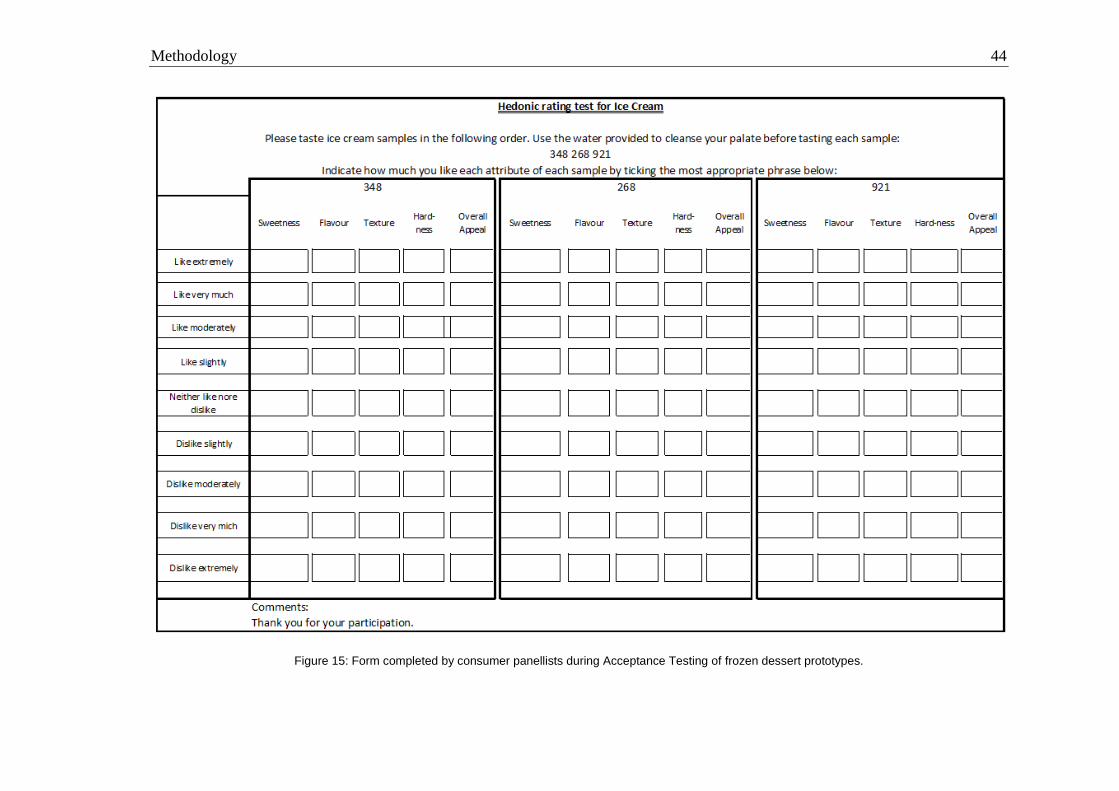
4.5.2 Acceptance Test
The objective of this test was to provide an indication of the magnitude of
consumer acceptability of the product (Kemp, et al., 2009), compared to Tip
Top™ Vanilla Ice Cream, using a hedonic rating system.
40 consumers were recruited who were representative of the target market. For
each prototype, subjects are asked to complete a form, indicating their level of
liking on a nine point hedonic scale. The scale ranges from “dislike extremely” to
“like extremely” (Figure 15). Assessors cleansed their palate with water after each
prototype. Prototypes were presented to each consumer individually. As
individuals are prone to scoring initial samples abnormally high (Kemp, et al.,
2009), a „dummy‟ prototype, similar to those in the sample set, was presented first
to remove this source of bias. Its data was discarded. The remaining prototypes
were then presented to each assessor according to a randomized design (Kemp, et
al., 2009).
Data from consumer testing was analyzed using QI Macros Statistical Process
Control Software, a statistics add-on package for MS Excel (Arthur, 2011).

Methodology 43
Because the hedonic scale has problems related to un-equal scale intervals when
used in consumer trials (Kemp, et al., 2009; Schutz & Cardello, 2001), the
labelled affective magnitude (LAM) scale (Figure 14) published by Schutz &
Cardello (2001) was be applied to the data before analysis for significance.
Significance was set at p=0.05, in accordance with most sensory studies (Kemp, et
al., 2009).
Figure 14: Labelled affective magnitude (LAM) scale, produced by Schutz & Cardello (2001) and
taken from Kemp, et al.(2009).
Methodology 44
Figure 15: Form completed by consumer panellists during Acceptance Testing of frozen dessert prototypes.
Results and Discussion 45
5. Results and Discussion
5.1 Observations made during Ad-Hoc
Experiments
Samples made with TMP 1180 protein had a chewy, gum-like texture when
compared with samples made with WPI 894. Samples with a 50/50 blend of TMP
1180 and WPI 894 also showed this trait. As a result, it was decided that only
WPI 894 would be used as the protein source.
Samples made with erythritol appeared harder and had an icier texture than
samples made with xylitol, for samples calculated to have the same overall
freezing point depression factor. This was observed for a range of different
samples. A full list of sample recipes and observations can be found in Appendix
4.
Reasonable sweetness and flavour intensity was being achieved without the aid of
a high intensity sweetener. The sweetness provided by erythritol, xylitol and/or
fructose was sufficient in most cases; therefore no stevia was included in the first
stage of prototype formulation.
5.2 Formulation Generation
Table 8 presents the amounts of the non-variable ingredients used in the
prototypes. Table 9 shows the amounts of the variable ingredients (Fructose,
Erythritol, Xylitol, Polydextrose and Flax Seed Oil) used in each prototype, as
calculated by Design-Expert®. A summary of the experiment design, produced by
Design-Expert®, can be found in Appendix 6.

Results and Discussion 46
Table 8: Non-variable ingredients and amounts selected for use in frozen dessert prototypes.
Category Ingredient Ingredient
Amount %
Protein source WPI 894 9.79
Fat substitute Simplesse® 100 5.00
Flavour Vanilla 1.00
Stabilizers CMC 0.40
Novagel GP 3282 0.80
Emulsifier Mono/di-glycerides 0.40
Water Water 68.61
5.3 Hardness Testing
Table 10 shows the results from the hardness and viscosity testing of frozen
dessert prototypes.

Results and Discussion 47
Table 9: Variable ingredient amounts generated for frozen dessert prototypes by Design-Expert® V8 software.
Ingredient amount (%)
Prototype Number* A:Fructose B:Erythritol C:Xylitol D:Polydextrose E:Flax Seed
Oil
Total FPD
Factor
1 4.44 4.56 0.00 3.00 2.00 23.00
2 0.00 2.55 5.45 6.00 0.00 23.00
3 4.00 0.00 4.00 4.00 2.00 19.00
4 2.22 3.14 3.64 3.00 2.00 23.00
5 1.67 5.80 0.00 6.00 0.54 23.00
6 5.60 1.05 1.73 4.54 1.09 20.18
7 0.00 1.00 8.00 3.00 2.00 22.60
8 1.38 0.00 8.00 3.96 0.66 23.00
9 3.71 0.00 4.29 6.00 0.00 20.30
10 8.00 1.91 0.00 4.09 0.00 23.00
11 0.15 7.00 0.00 4.85 2.00 22.80
12 0.00 4.74 2.73 6.00 0.54 23.00
13 0.00 0.00 6.84 6.00 1.16 19.00
15 7.89 0.16 0.00 5.95 0.00 19.00
16 8.00 0.00 2.67 3.00 0.33 23.00
17 1.56 4.44 0.00 6.00 2.00 19.00
18 8.00 1.00 0.00 3.00 2.00 19.80
21 0.00 2.96 4.63 4.98 1.43 21.71
Optimised Prototype 1 6.43 0.00 1.75 4.75 1.07 19.00
Optimised Prototype 2 4.10 0.00 5.96 3.00 0.94 23.00
* Duplicate prototypes 14, 19, 20 and 22 have been excluded.
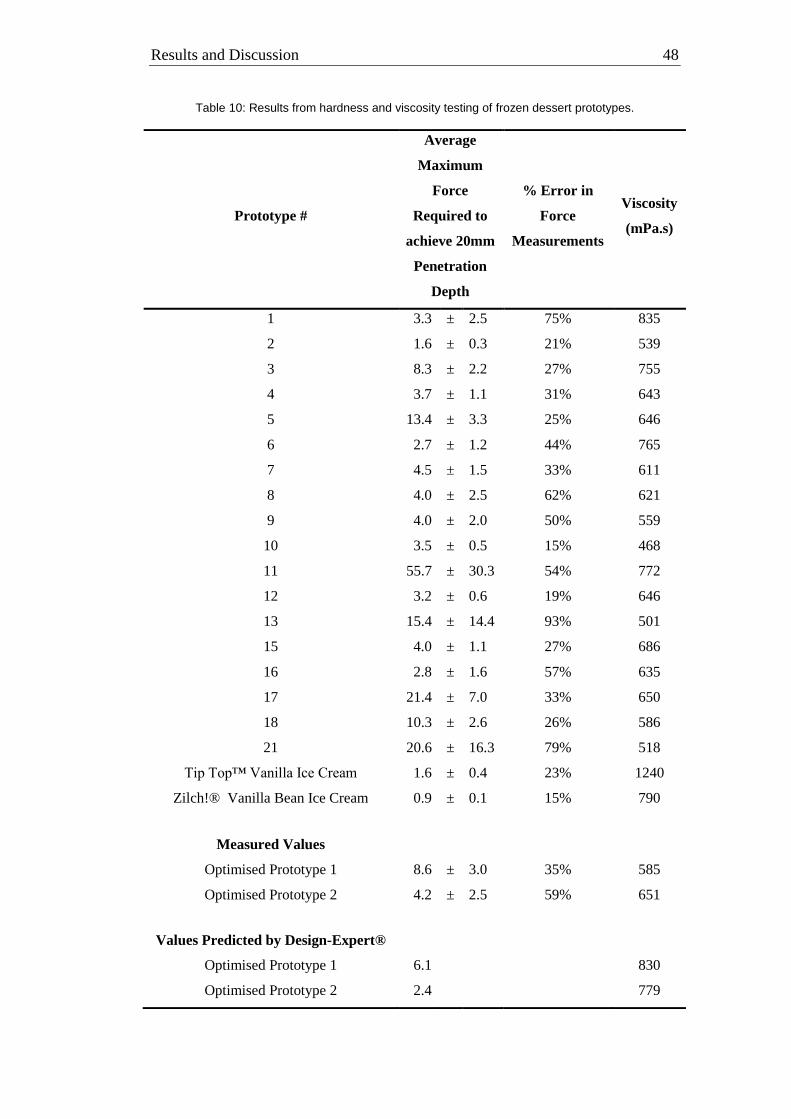
Results and Discussion 48
Table 10: Results from hardness and viscosity testing of frozen dessert prototypes.
Prototype #
Average
Maximum
Force
Required to
achieve 20mm
Penetration
Depth
% Error in
Force
Measurements
Viscosity
(mPa.s)
1 3.3 ± 2.5 75% 835
2 1.6 ± 0.3 21% 539
3 8.3 ± 2.2 27% 755
4 3.7 ± 1.1 31% 643
5 13.4 ± 3.3 25% 646
6 2.7 ± 1.2 44% 765
7 4.5 ± 1.5 33% 611
8 4.0 ± 2.5 62% 621
9 4.0 ± 2.0 50% 559
10 3.5 ± 0.5 15% 468
11 55.7 ± 30.3 54% 772
12 3.2 ± 0.6 19% 646
13 15.4 ± 14.4 93% 501
15 4.0 ± 1.1 27% 686
16 2.8 ± 1.6 57% 635
17 21.4 ± 7.0 33% 650
18 10.3 ± 2.6 26% 586
21 20.6 ± 16.3 79% 518
Tip Top™ Vanilla Ice Cream 1.6 ± 0.4 23% 1240
Zilch!® Vanilla Bean Ice Cream 0.9 ± 0.1 15% 790
Measured Values
Optimised Prototype 1 8.6 ± 3.0 35% 585
Optimised Prototype 2 4.2 ± 2.5 59% 651
Values Predicted by Design-Expert®
Optimised Prototype 1 6.1
830
Optimised Prototype 2 2.4
779

Results and Discussion 49
The model values predicted for both Optimised prototypes fell within the error
limits of the measured values. The percentage error in the hardness measurements
ranged from 15% to 93%, with an average of 41%. Measuring the hardness of the
frozen dessert prototypes in a consistent manner proved difficult. It is likely that
melting rates of the ice creams and the prototype frozen desserts once exposed to
room temperature, despite the short time involved, contributed more to
inconsistent readings than hardness variability within the same batch.
Figure 16: Plot of FPD Factor verses the Mean Maximum Force Required to Penetrate Frozen
Dessert Prototypes 20mm using Instron 33R4204.
Figure 16 shows that no correlations could be drawn between calculated FPD
factor and hardness in this study, when hardness is measured as described in
Section 4.4.1. It is possible that the range of calculated FPD factors (19-23) is not
large enough to produce noticeable trends relating to hardness, as despite one
outlying point at (x,y) = (24,56), most values are in a relatively narrow range.
Optimised Prototypes 1 and 2 are harder than Tip Top™ Vanilla by 438% and
163% respectively, and harder than Zilch!® Vanilla Bean by 856% and 367%
respectively. However, the 163% difference between Optimised Prototype 2 and
Tip Top™ Vanilla is only 2.6 N. Using standard deviation, the upper limit for Tip
0.00
10.00
20.00
30.00
40.00
50.00
60.00
0 5 10 15 20 25
Max
imu
m F
orc
e, N
FPD Factor
High Protein Prototypes
Tip Top Vanilla
Zilch Vanilla Bean
Optimised Prototype 1
Optimised Prototype 2

Results and Discussion 50
Top™ and the lower limit for Optimised Prototype 2 are in an overlapping range
of 1.7-2 N, a positive result.
Both of the optimized prototypes were calculated to have an overrun of 35% using
Equation 1. Overrun and hardness have an inverse relationship (Goff, et al., 1995;
Tanaka, et al., 1972; Wilbey, et al., 1998), therefore an overrun value of 35%,
significantly less than the 75% achieved by Goh et al. (2006), has probably been
responsible for the prototype samples being harder than the two control products.
It was not possible to control the overrun in this study due to limitations in the
equipment being used. A table containing the overrun values for all prototype
samples can be found in Appendix 1.
Figure 17: Response surface plot showing relationship between xylitol, erythritol and fructose on
product hardness (‘R1’), for a fixed amount of polydextrose and flax seed oil.
Figure 17 shows that increasing amounts of erythritol and decreasing amounts
fructose and xylitol produced the hardest prototypes. This supports the
observations made during ad-hoc experiments and therefore erythritol was
deemed to be unsuitable for use in this high protein frozen dessert. Further
observations made during the preparation of the high protein prototypes include:

Results and Discussion 51
Prototypes that contained no or low amounts of fructose were found to be
bland tasting and would need a high intensity sweetener to enhance
sweetness and bring out the flavour.
8 of the 18 prototypes prepared were observed to have an icy texture to
some degree.
„Scooping hardness‟, while not numerically measured during observations,
was found to be acceptable when scooped with an ice cream scoop for
most of the prototypes.
Specific observations for each individual prototype can be found in Appendix 5.
5.4 Viscosity Measurements
Figure 18: Plot of FPD Factor verses the Mean Viscosity for Ice Cream Prototypes.
Figure 18 shows a similar trend to Figure 16; no correlations can be drawn
between calculated FPD Factor and viscosity. It is noted that the Tip Top™
Vanilla Ice Cream is softer and more viscous than most of the prototypes despite
not having a high FPD Factor. The viscosity measurements for Optimised
0
200
400
600
800
1000
1200
1400
0 5 10 15 20 25
Vis
cosi
ty,
mP
a.s
FPD Factor
High Protein Prototypes
Tip Top Vanilla
Zilch Vanilla Bean
Optimised Prototype 1
Optimised Prototype 2

Results and Discussion 52
Prototypes 1 and 2 show differences of 30% and 16% from the values predicted
by Design-Expert® respectively (shown in Table 10).
Optimised Prototype 2 is only 16% or 139 mPa.s less viscous than Zilch!®
Vanilla Bean. This places it in the vicinity of the control samples for both
hardness and viscosity measurements. Because of this, Optimised Prototype 2 was
determined to be the Optimum High Protein Prototype (OHPP). It was also softer
and had a higher viscosity when compared to Optimised Prototype 1.
5.5 SEM Results
Figure 19 shows the fracture surface structure of Prototype 9. The round
structures are air bubbles formed by the 3-D networks resulting from fat
coalescence (Goff, 1995).
Figure 19: Micrograph of Frozen Dessert Prototype 9.

Results and Discussion 53
Figure 20: Micrograph of Frozen Dessert Prototype11.
Figure 20 shows a micrograph of Prototype 11. This prototype did not fracture as
well as Prototype 9. Significant „charging‟ on the surface also made viewing
difficult. Charging occurs when there is an excessive build-up of electrons on the
surface of the sample. This build up creates an electric field, which deflects the
electron beam of the instrument, inhibiting its ability to generate detailed images
(Rice, 2011). Figure 20 does however show that air bubbles, similar to those
observed in Figure 19, were formed in the prototype and can be seen in the centre
of the image.

Results and Discussion 54
Figure 21: Micrograph taken of TipTop™ Vanilla Ice Cream.
Figure 21 shows a significantly more air bubbles in the Tip Top™ sample than the
prototype samples in Figure 19 and Figure 20. They range in size from less than
10µm, up to approximately 100 µm.
The dasher speed of the Breville Ice Cream Whiz used in this study was only 30
rpm. This has resulted in less air being incorporated into the product, resulting in a
product which is harder and has greater density compared with Tip Top™ Vanilla
Ice Cream. The low air content was also shown in the low overrun values
calculated for the optimised prototypes (see Appendix 1). It is also observed that
some of the air bubbles in Prototype 9 (Figure 19) are up to 100 µm, or 100%,
larger than those seen in Figure 21. It is likely that the low dasher speed has
influenced the air bubble size, as well as the total air content.
In the case of the high protein prototypes, the Simplesse® 100 was to take the
place of the fat globules. It is stated by the manufacturer that Simplesse® 100 can
be processed under standard homogenization pressures (CP Kelco, 2000). Using
a homogenization process that mimics commercial procedures, it may be possible
to better disperse the Simplesse® 100 particles. Combined with a higher dasher

Results and Discussion 55
speed, it should be possible to incorporate more air into the product and with
smaller air bubble size.
5.6 Nutritional and Cost Information
As well as being in the same range of hardness and viscosity values as the control
samples, Optimised Prototype 2, the Optimum High Protein Prototype (OHPP)
calculated using Design-Expert® V8 software, met most of the points in the
design specification for nutritional information (Table 11). The OHPP has a
protein to carbohydrate ration of 0.81:1 and less than 2% fat, meeting the PDS in
this regard. It contains 82% more protein and 65% less fat than Zilch!® Vanilla
Bean Ice Cream.
Table 11: Nutritional Information for the OHPP Compared with Commercial Products.
Nutritional Content Per 100g
Zilch!®
Vanilla Bean
Ice Cream
Tip Top™
Vanilla Ice
Cream
OHPP
Energy (kJ)
620 853 477
Protein (g)
6.4 1.5 11.6
Fat Total (g) 4.6 10.7 1.6
Saturated (g) 3.2 6.3 0.4
Carbohydrates Total (g) 8.4 25 14.3
Sugar (g) 2.2 19.6 6.5
Other ¹ (g) 9.5
2.5
Sodium (mg)
38 36 14
Composition Information
alpha-Linolenic
acid (mg) 0 0 570
¹ Refers to low nutritive carbohydrates added, including sugar alcohols and
polydextrose, as listed on the Nutritional Information panel of the product.

Results and Discussion 56
Cost factors were used to determine an approximate recommended retail price
(RRP) from the cost of the ingredients for the OHPP (Table 12). According to
Tharp & Young (2011), ingredients can be 55-60% of the final product cost,
packaging is typically 15-20% and fixed and variable costs are usually 25%.
Freight, warehousing and merchandising have been approximated by the author to
add 20% to the total cost. A manufacturers margin of 20% (Tharp & Young, 2011)
and a retail margin of 30% were also added.
Table 12: Calculation of RRP for OHPP.
Cost / L Factor/margin
Ingredients $2.99 55% of Finished product
Finished Product $5.44
Distribution $6.52 20%
Wholesale Price $7.83 20%
RRP $10.18 30%
Table 13: Comparison of unit prices between a selection of supermarket ice cream brands and the
OHPP.
Zilch!®
Vanilla
Bean Ice
Cream
Tip
Top™
Vanilla
Ice
Cream
OHPP
Kapiti®
Vanilla Bean
Ice Cream
Kohu Road®
Vanilla Ice
Cream
Pack Size (L) 0.946 2 1 1 1
RRP $8.81¹ $7.49¹ $10.18 $11.49¹ $19.41¹
RRP/L $9.31 $3.75 $10.18 11.49 19.41
¹ Price as at 29/11/11, taken from www.shop.countdown.co.nz

Results and Discussion 57
The OHPP would be 2.71 and 1.09 times more expensive than Tip Top™ Vanilla
Ice Cream and Zilch!® Vanilla Bean Ice Cream respectively (Table 13). It would
be 11% cheaper than Kapiti® Vanilla Bean Ice Cream and 48% cheaper than
Kohu Road® Vanilla Ice Cream. This would place it in the middle of the market,
at the lower-end of the premium branded products.
Table 14: Nutritional and cost comparisons between OHPP and pureMUSCLE WPI.
Per Serve as
Consumed (30g
pureMUSCLE
WPI mixed in
300ml Reduced
Fat Milk)
1 serve
(100g) OHPP
2 serves
(200g)
OHPP
Energy (kJ)
1043 477 954
Protein (g)
37 11.6 23.2
Fat Total (g) 5 1.6 3.2
Saturated (g) 3 0.4 0.8
Carbohydrates Total (g) 16 14.3 28.6
Sugar (g) 16 6.5 13
Other¹(g) 0 2.5 5
Sodium (mg)
167 14 28
Cost/serve $2.75 $1.02 $2.04
A single serve of OHPP delivers significantly less protein than a serve of
pureMUSCLE WPI but with a similar amount of carbohydrate (Table 14).
However, a double serve of OHPP delivers 63% of the protein at 74% of the cost
and with 9% less calories. This would make the OHPP a viable option as an
evening protein source for athletes if the additional carbohydrates are not an issue
for the individual. The price of $1.02 per single serve is considerably less than the
$1.50 maximum specified in the PDS.

Results and Discussion 58
It is possible that increasing the air content and reducing air bubble size would
enable the carbohydrate content to be decreased. As mentioned previously, an
inverse relationship exists between hardness and overrun so increasing air content
will provide a softer product and reduce the amount of carbohydrate required to
control FPD. Reducing the carbohydrate levels further would add to the
nutritional appeal of this product compared with regular ice cream.
5.7 Consumer Panel Results
40 people took part in the acceptance test component of the consumer trials, 16 of
whom were female and 24 were male. The results from the questionnaire in
Figure 12 are presented in Table 15. Interestingly, only 2 respondents reported
consuming reduced-fat, low-fat, or fat-free desserts often, yet most reported
consuming regular ice cream products weekly. This could suggest that consumers
prefer the regular ice cream products because of the sensory properties, the cost,
the accessibility, or a combination of all three factors.
In the preference ranking test, in which only 20 consumers were asked to partake,
100% of the consumers ranked the 0% stevia prototype as their most preferred,
followed by 0.15% and 0.3%. All consumers commented on experiencing a
slightly bitter aftertaste for the prototypes containing stevia. The results from the
acceptance test, which used the hedonic scale as shown in Figure 15, can be seen
in Table 16.

Results and Discussion 59
Table 15: Results from consumer questionnaire.
Question Response
Male Female Combined
Average Age:
21.2 ± 2.5 23.5 ± 3.3 22.2 ± 3.0
1. Are you a
consumer of ice
cream?
Yes 79% 81% 80%
No 21% 19% 20%
2. How often do
you consume ice
cream products?
Daily 13% 13% 15%
Weekly 38% 44% 40%
Monthly 29% 25% 25%
Never 21% 19% 20%
3. Do you consume
reduced-fat, low-fat,
or fat-free desserts?
How often?
Yes 63% 63% 60%
No 38% 38% 40%
Often 4% 7% 5%
Occasionally 25% 21% 20%
Rarely 42% 43% 40%
Never 29% 29% 35%
4. Do you partake in
regular exercise?
Yes 100% 100% 100%
No 0% 0% 0%
5. Have you ever
consumed whey or
soy protein products
as part of a diet
and/or exercise
routine?
Yes 54% 56% 55%
No 46% 44% 45%

Results and Discussion 60
Table 16: Results from consumer acceptance test of frozen dessert prototype and a control product.
Sensory
characteristic* OHPP Tip Top® Vanilla Ice Cream
mean ± standard deviation
Sweetness 7.00 ± 1.13 8.13 ± 1.04
Flavour 6.58 ± 1.17 8.35 ± 0.86
Texture 7.33 ± 1.31 8.25 ± 0.90
Hardness 6.75 ± 1.45 8.40 ± 0.71
Overall
Appeal 7.18 ± 1.08 8.35 ± 0.77
*Characteristics were evaluated by consumers on a nine point hedonic scale
The level of consumer acceptance for the different sensory characteristics of the
OHPP range from „like slightly‟ to „like moderately‟ on the 9 point hedonic scale.
With an overall appeal of 7.18, or „like moderately‟, this is a positive outcome.
Panellists rated all characteristics for Tip Top® Vanilla Ice Cream in the „like
very much‟ category, giving it an overall appeal 1 point higher than the OHPP.
The average values for texture and overall appeal were the highest two scores for
the OHPP. This suggests that the product seemed and looked like ice cream (see
Figure 22, Figure 23 and Figure 24) and with some improvement to the flavour
and sweetness combination, along with work on the hardness (as discussed in
Section 5.5), a higher overall appeal and more acceptable product could be
produced.
After applying the LAM scale, the full data set for each characteristic was
checked for normality on MS Excel using the Anderson-Darling method
(Stephens, 1974). The results are presented in Table 17.

Results and Discussion 61
Table 17: Results from Anderson-Darling Test for normality of consumer panel data.
Product Attribute A-Squared p Result Distribution Type
Sweetness 3.59 <0.001 A² ≥ p Non normal
Flavour 3.94 <0.001 A² ≥ p Non normal
Texture 4.46 <0.001 A² ≥ p Non normal
Hardness 4.11 <0.001 A² ≥ p Non normal
Overall Appeal 3.67 <0.001 A² ≥ p Non normal
According to Figure 3.3 in Kemp, et al. (2009), the appropriate test for 2 unrelated
samples with non-normal data distribution is the Mann-Whitney U-test. The
results of such analysis, presented in Table 18, showed that all attribute scores for
the OHPP were significantly different from those obtained for Tip Top® Vanilla
Ice Cream. The complete results obtained from the Mann-Whitney U-test can be
found in Appendix 9.
Table 18: Results from Mann-Whitney U-test on sensory data for different product attributes.
Product Attribute Compared p Result
Sweetness <0.001 Reject Null Hypothesis at p = 0.05
Flavour <0.001 Reject Null Hypothesis at p = 0.05
Texture <0.001 Reject Null Hypothesis at p = 0.05
Hardness <0.001 Reject Null Hypothesis at p = 0.05
Overall Appeal <0.001 Reject Null Hypothesis at p = 0.05

Results and Discussion 62
Figure 22: Photo of OHPP.
Figure 23: Close-up photo of OHPP.
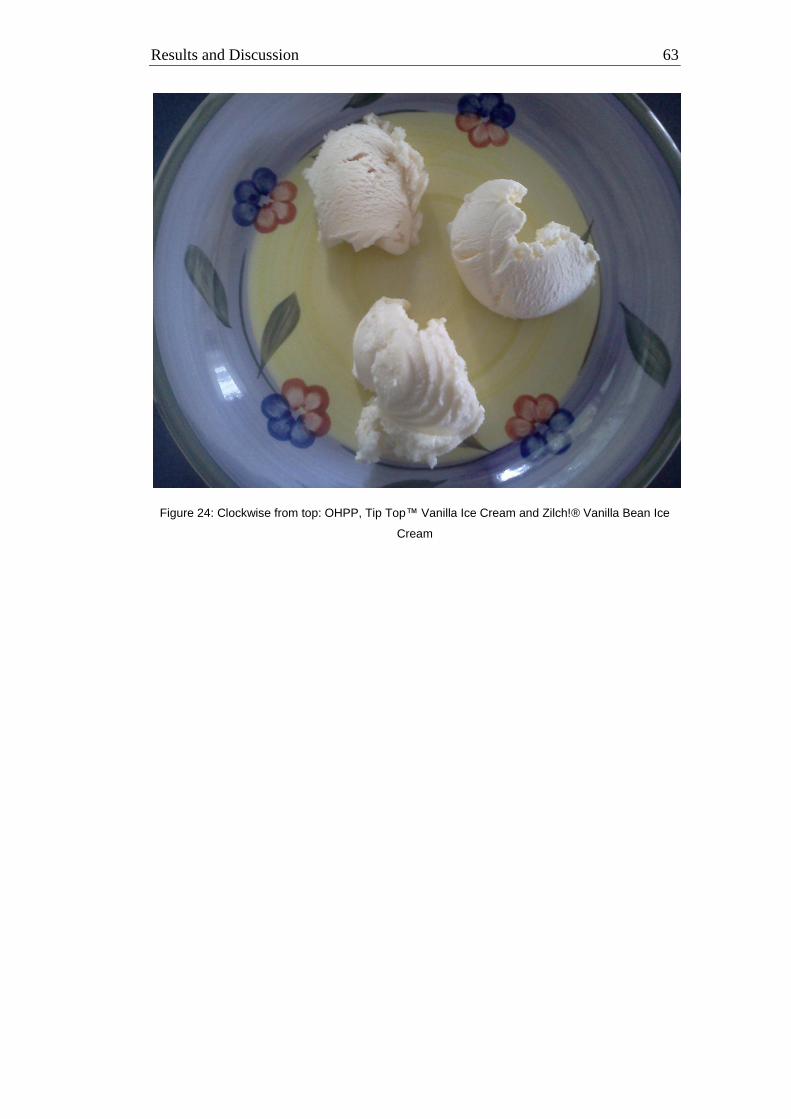
Results and Discussion 63
Figure 24: Clockwise from top: OHPP, Tip Top™ Vanilla Ice Cream and Zilch!® Vanilla Bean Ice
Cream

Conclusions and Recommendations 64
6. Conclusions and Recommendations
High-protein frozen dessert prototypes were produced that met the design criteria
for nutritional composition. The prototypes were generally harder and had lower
overrun than both commercial samples tested. No correlations could be observed
between FPD factor, hardness and viscosity within the range of compositions
tested.
Three ingredients, fructose, xylitol and polydextrose, were found to be suitable for
controlling the freezing point of high protein frozen desserts. Erythritol was found
to produce harder samples for same overall FPD factor, and was thus deemed
unsuitable for use in such products.
Optimised Prototype 2 (containing 68.61% water, 9.79% WPI, 5.96% xylitol, 5%
Simplesse® 100, 4.1 % fructose, 3% polydextrose, 1% vanilla flavour, 0.94% flax
seed oil, 0.8% Novagel GP 3282, 0.4% CMC, 0.4% mono/di-glycerides), the
Optimum High Protein Prototype (OHPP), was found to have hardness and
viscosity values of a similar order of magnitude to the control samples. It also met
the design criteria for nutritional composition. With an estimated recommended
retail price of $1.02 per serve, the OHPP would feature at the lower end of the
premium ice-cream range in the market. During consumer trials, the OHPP
received an overall appeal of 7.18 ± 1.08, slightly lower than that given to Tip
Top® Vanilla Ice Cream of 8.35 ± 0.77. Differences in scores for all attributes
between the two products were found to be statistically significantly (p<0.05).
Future development work should focus on lowering the hardness by increasing
overrun. Carbohydrate and hence sugar content should be lowered as product
becomes softer and further efforts should be made to correlate the relationship
between FPD factors, hardness and overrun. Once hardness and texture have been
perfected, the flavour and sweetness combination should be optimised and large
scale consumer panels used to evaluate the final product.

References 65
7. References
Absolute Ingredients Ltd. (2010). Retrieved 7th June, 2010, from
http://www.ingredientstop.co.nz/
ADA. (2005). Position of the American Dietetic Association: Fat replacers.
[Editorial Material]. Journal of the American Dietetic Association, 105(2),
266-275.
ADA, DOC, & ACSM. (2009). Position of the American Dietetic Association,
Dietitians of Canada, and the American College of Sports Medicine:
Nutrition and Athletic Performance. [Review]. Journal of the American
Dietetic Association, 109(3), 509-527.
Arthur, J. (2011). QI Macros and Lean Six Sigma Products. Denver, CO, USA:
KnowWare International Inc.
Bales, C. W. (2010, 2010/06//). The considerable health benefits of fiber: fiber
helps prevent weight gain and disease, and enhances cardiovascular and
gastrointestinal function. Duke Medicine Health News, p. 6. Retrieved
from
http://go.galegroup.com/ps/i.do?id=GALE%7CA228451269&v=2.1&u=w
aikato&it=r&p=AONE&sw=w
Bordi, P., Cranage, D., Stokols, J., Palchak, T., & Powell, L. (2004). Effect of
polyols versus sugar on the acceptability of ice cream among a student and
adult population. Foodservice Research International, 15, 41-50.
Brookfield Engineering Labororatories. (1985). The Brookfield Digital
Viscometer Model DV-II Operating Instructions, Manual No. M/85-160-G.
Middleboro, MA 02356, USA.: Brookfield Engineering Laboratories, Inc.

References 66
Buyske, S., & Trout, R. (2009). Design of Experiments: Mixture Designs,
Statistics 591: Advanced Design of Experiments. Piscataway, NJ: Statistics
Department, Rutgers University.
Carabin, I. G., & Flamm, W. G. (1999). Evaluation of Safety of Inulin and
Oligofructose as Dietary Fiber. [doi: DOI: 10.1006/rtph.1999.1349].
Regulatory Toxicology and Pharmacology, 30(3), 268-282.
Clarke, C. (2004). The science of ice cream: Royal Society of Chemistry.
Clifton, P. M., Bastiaans, K., & Keogh, J. B. (2009). High protein diets decrease
total and abdominal fat and improve CVD risk profile in overweight and
obese men and women with elevated triacylglycerol. [Article]. Nutrition
Metabolism and Cardiovascular Diseases, 19(8), 548-554.
CP Kelco. (2000). Simplesse® Technical Bulletin, Simplesse® for use in Ice
Cream: CP Kelco.
CPKelco. (2010). SIMPLESSE® Microparticulated Whey Protein Concentrate.
Retrieved May 14th, 2010, from
http://www.cpkelco.com/market_food/prod-simplesse.html
Daniells, S. (2008). Stevia gets Australian approval for food and beverages.
Retrieved 14th May, 2010, from
http://www.nutraingredients.com/Publications/Food-Beverage-
Nutrition/FoodNavigator.com/Legislation/Stevia-gets-Australian-
approval-for-food-and-
beverages/?c=cx5s4%2FyMnL6tPysyNYz6zg%3D%3D
Dessert delight. (2003). [Article]. Dairy Industries International, 68(10), 26.
Drewett, E. M., & Hartel, R. W. (2007). Ice crystallization in a scraped surface
freezer. [doi: 10.1016/j.jfoodeng.2005.12.018]. Journal of Food
Engineering, 78(3), 1060-1066.

References 67
DuBois, G. E. (2000). Non-Nutritive Sweeteners. In F. J. Francis (Ed.),
Encyclopaedia of Food Science and Technology (pp. 2245-2265). New
York, NY: John Wiley & Sons.
Earle, M. D., & Earle, R. L. (2001). Creating New Foods: The Product
Developer's Guide Available from
http://www.nzifst.org.nz/creatingnewfoods/
FMCG. (2011a). Cool Delights. Retrieved from
http://www.fmcg.co.nz/features/category-reports/968-category-check-
frozen-desserts-a-ice-cream-cool-delights
FMCG. (2011b). Tip Top scoops up big in NZ Ice Cream Awards. Retrieved from
http://www.fmcg.co.nz/c-store/50-c-store/803-cstore-tip-top-scoops-up-
big-in-nz-ice-cream-awards
Foster-Powell, K., Holt, S. H., & Brand-Miller, J. C. (2002). International table of
glycemic index and glycemic load values: 2002. The American Journal of
Clinical Nutrition, 76(1), 5-56.
FSANZ. (2011a). Standard 1.2.8 - Nutrition Information Requirements, Australia
New Zealand Food Standards Code: Food Standards Australia New
Zealand.
FSANZ. (2011b). Standard 2.5.6 - Ice Cream., Australia New Zealand Food
Standards Code: Food Standards Australia New Zealand.
Fuhrman, E. (2010, 2010/10//). Research moves fiber forward: fiber fortified
beverages help boost diets. Beverage Industry, 101, 68+.
Ghanta, S., Banerjee, A., Poddar, A., & Chattopadhyay, S. (2007). Oxidative
DNA damage preventive activity and antioxidant potential of Stevia
rebaudiana (Bertoni) Bertoni, a natural sweetener. [Article]. Journal of
Agricultural and Food Chemistry, 55(26), 10962-10967.

References 68
Gibbs, B. F., Alli, I., & Mulligan, C. (1996). Sweet and taste-modifying proteins:
A review. [Review]. Nutrition Research, 16(9), 1619-1630.
Goff, H. D. (1995). Ice Cream. Dairy Science and Technology Education
Retrieved 14th March, 2011, from
http://www.foodscience.uoguelph.ca/dairyedu/icingr.html
Goff, H. D. (2006). Ice Cream Structure. Guest food Microscopists Retrieved 7th
October, 2011, from
http://www.foodsci.uoguelph.ca/dairyedu/Kalab/Guelph.htm
Goff, H. D., Freslon, B., Sahagian, M. E., Hauber, T. D., Stone, A. P., & Stanley,
D. W. (1995). Structural development in ice cream-dynamic rheological
measurements. Journal of Texture Studies., 26, 517-536.
Goh, K. K. T., Ye, A., & Dale, N. (2006). Characterisation of ice cream
containing flaxseed oil. International Journal of Food Science &
Technology, 41(8), 946-953.
Güven, M., & Karaca, O. B. (2002). The effects of varying sugar content and fruit
concentration on the physical properties of vanilla and fruit ice-cream-type
frozen yogurts. [Article]. International Journal of Dairy Technology,
55(1), 27-31.
Hawkins Watts Ltd. (2010). Gum Selector. Retrieved 5th July, 2010, from
http://www.hawkinswatts.com/selector_01.htm
Hill, B. L. (2010). Low Carb Sweeteners. Retrieved 14th April, 2011, from
http://mysite.verizon.net/bonniehill/pages/lcsweeteners.html
IAICM. (1978). International Association of Ice Cream Manufacturers: The
History of Ice Cream. Wasington DC.

References 69
James, M. J., Gibson, R.A., Cleland, L.G. (2000). Dietary polyunsaturated fatty
acids and inflammatory mediator production. American Journal of
Clinical Nutrition, 71, 343s-348.
Jenkins, D., Wolever, T., Taylor, R., Barker, H., Fielden, H., Baldwin, J., et al.
(1981). Glycemic index of foods: a physiological basis for carbohydrate
exchange. The American Journal of Clinical Nutrition, 34(3), 362-366.
Kemp, S., Hollowood, T., & Hort, J. (2009). Sensory Evaluation : A Practical
Handbook. Hoboken, NJ, USA: Wiley-Blackwell.
Larsson, S. C., Kumlin, M., Ingelman-Sundberg, M., & Wolk, A. (2004). Dietary
long-chain n–3 fatty acids for the prevention of cancer: a review of
potential mechanisms. The American Journal of Clinical Nutrition, 79(6),
935-945.
Liddell, C., & Weir, R. (1993). Ices: The Definitive Guide: Hodder and Stoughton.
Marco, G. M., & Pearson, A. M. (1982). Xylitol as an ice cream sweetener.
Modern Dairy, 61, 16-18.
Marie, S. (Ed.). (1991). Sweeteners. New York, NY: Blackie Academic.
Marshall, R. T., Goff, H. D., & Hartel, R. W. (2003). Ice Cream (6th ed.). New
York: Kluwer Academic/Plenum Publishers.
Mettler, S., Mitchell, N., & Tipton, K. D. (2010). Increased Protein Intake
Reduces Lean Body Mass Loss during Weight Loss in Athletes. [Article].
Medicine and Science in Sports and Exercise, 42(2), 326-337.
Mitchell, H. (2008). Sweeteners and Sugar Alternatives in Food Technology.
Chichester, England: Wiley.
Mleko, S. (1997). Rheological properties of milk and whey protein desserts.
[Article]. Milchwissenschaft-Milk Science International, 52(5), 262-266.

References 70
Muse, R. M., & Hartel, R. W. (2004). Ice Cream Structural Elements that Affect
Melting Rate and Hardness. [General Information]. Journal of Dairy
Science, 87(1), 10.
Nabours, L. O. (2001). Alternative Sweeteners (3rd ed.). New York: Marcel
Dekker, Inc.
Naturex. (2009). Those with taste choose Talin®. Retrieved 14th May, 2010,
from http://www.thaumatinnaturally.com/food.html
Newsome, R. L. (1986). Sweeteners nutritive and non-nutritive. Food
Technology(40), 195-206.
Nixon, S. C., & Carson, J. K. (2010). Development of a Functional Frozen
Dessert. The University of Waikato, School of Engineering.
Noda, K., Nakayama, K., & Oku, T. (1994). Serum glucose and insulin levels and
erythritol balance after oral-administration of erythritol in healthy-subjects.
[Article]. European Journal of Clinical Nutrition, 48(4), 286-292.
NZICMA. (2008). The NZ Ice Cream Industry. Retrieved 27th April, 2010, from
http://www.nzicecream.org.nz/index.htm
NZTE. (2010). New Zealand facts and figures: Exports - Top 15 commodities.
Retrieved 3rd May, 2010, from
http://www.investmentnz.govt.nz/section/15291.aspx
Ozdemir, C., Dagdemir, E., Celik, S., & Ozdemir, S. (2003). An alternative ice
cream production for diabetic patients. [Article]. Milchwissenschaft-Milk
Science International, 58(3-4), 164-166.
Panpatil, V. V., & Polasa, K. (2008). Assessment of stevia (Stevia rebaudiana)-
natural sweetener: A review. [Article]. Journal of Food Science and
Technology-Mysore, 45(6), 467-473.

References 71
Patil, D. H., Grimble, G. K., & Silk, D. B. A. (1987). Lactitol, a new
hydrogenated lactose derivative; intestinal absorption and laxitive
threshold in normal human subjects. British Journal of Nutrition, 57, 195.
Phillips, S. M. (2006). Dietary protein for athletes: from requirements to
metabolic advantage. [Article]. Applied Physiology Nutrition and
Metabolism-Physiologie Appliquee Nutrition Et Metabolisme, 31(6), 647-
654.
Piepel, G. F., Szychowski, J. M., & Loeppky, J. L. (2002). Augmenting Scheffe
linear mixture models with squared and/or crossproduct terms. Journal of
Quality Technology, 34(3), 297-315.
Portmann, M.-O., & Kilcast, D. (1996). Psychophysical characterization of new
sweeteners of commercial importance for the EC food industry. [doi: DOI:
10.1016/0308-8146(96)00026-X]. Food Chemistry, 56(3), 291-302.
Portmann, M. O., & Birch, G. (1995). Sweet taste and solution properties of
alpha,alpha-trehalose. [Article]. Journal of the Science of Food and
Agriculture, 69(3), 275-281.
Rahman, S. (2009). Food properties handbook: CRC Press.
Rice, P. (2011). Charging Effects on SEM Images. University of Colorado
Boulder: Nanomaterials Characterization Facility.
Romanchik-Cerpovicz, J. E., Costantino, A. C., & Gunn, L. H. (2006). Sensory
evaluation ratings and melting characteristics show that okra gum is an
acceptable milk-fat ingredient substitute in chocolate frozen dairy dessert.
[Article]. Journal of the American Dietetic Association, 106(4), 594-597.
Rothwell, J. (1985). Diabetic ice cream. Ice Cream and Frozen Confectionary, 36,
442.

References 72
Sakurai, K., Kokubo, S., Hakamata, K., Tomita, M., & Yoshida, S. (1996). Effect
of production conditions on ice cream melting resistance and hardness.
[Article]. Milchwissenschaft-Milk Science International, 51(8), 451-454.
Santini, A., Ferrara, L., Naviglio, D., Aragon, A., & Ritieni, A. (2008). Stevia:
non-caloric natural sweetener. [Article]. Progress in Nutrition, 10(1), 3-+.
Sardesai, V. M., & Waldshan, T. H. (1991). Natural and synthetic intense
sweeteners. [Review]. Journal of Nutritional Biochemistry, 2(5), 236-244.
Schutz, H. G., & Cardello, A. V. (2001). A labeled affective magnitude (lam)
scale for assessing food liking/disliking. Journal of Sensory Studies, 16(2),
117-159.
Simopoulos, A. P. (1997). Nutrition tid‐bites: Essential fatty acids in health and
chronic disease. [doi: 10.1080/87559129709541143]. Food Reviews
International, 13(4), 623-631.
Specter, S. E., & Setser, C. S. (1994). Sensory and physical-properties of a
reduced-calorie frozen dessert system made with milk-fat and sucrose
substitutes. [Article]. Journal of Dairy Science, 77(3), 708-717.
Stampanoni Koeferli, C. R., Piccinali, P., & Sigrist, S. (1996). The influence of fat,
sugar and non-fat milk solids on selected taste, flavor and texture
parameters of a vanilla ice-cream. [doi: DOI: 10.1016/0950-
3293(95)00038-0]. Food Quality and Preference, 7(2), 69-79.
Stat-Ease Inc. (2011). Design-Expert® Version 8 (Version 8). Minneapolis: Stat-
Ease Inc.
Stephens, M. A. (1974). EDF Statistics for Goodness of Fit and Some
Comparisons. Journal of the American Statistical Association, 69(347),
730-737.
References 73
Tanaka, M., Pearson, A. M., & deMan, J. M. (1972). Measurement of ice cream
with a constant speed penetrometer. Canadian Institute of Food Science
and Technology Journal 51(8), 451-454.
Tarnopolsky, M. A. (2008). Building muscle: nutrition to maximize bulk and
strength adaptations to resistance exercise training. [Review]. European
Journal of Sport Science, 8(2), 67-76.
Tharp, B. (2010). Ice cream dream. Food Technology International. Retrieved
from http://www.fpi-
international.com/articles/ingredients_additives/FTI008_10.pdf
Tharp, B., & Young, S. (2011). Cost Management in Ice Cream Manufacture.
Retrieved 29th November, 2011, from
http://www.onicecream.com/qa_cost_mgment.htm
Tip Top. (2010). The Tip Top Story. Retrieved 15 November, 2011, from
http://www.tiptop.co.nz/About-Tip-Top/Tip-Top-Story.aspx
Torbay, N., Baba, N. H., Sawaya, S., Bajjani, R., Habbal, Z., Azar, S., et al.
(2002). High protein vs high carbohydrate hypoenergetic diet in treatment
of obese normoinsulinemic and hyperinsulinemic subjects. [Article].
Nutrition Research, 22(5), 587-598.
Whelan, A. P., Vega, C., Kerry, J. P., & Goff, H. D. (2008). Physicochemical and
sensory optimisation of a low glycemic index ice cream formulation.
[Article]. International Journal of Food Science & Technology, 43(9),
1520-1527.
Widhalm, K., Stargel, W. W., Burns, T. S., & Tschanz, C. (1994). Evaluation of
clinical and biochemical parameters in children after consumption of
microparticulated protein fat substitute (SIMPLESSE®). [Article]. Journal
of the American College of Nutrition, 13(4), 392-396.

References 74
Wilbey, R. A., Cooke, T., & Dimos, G. (1998). Effects of solute concentration,
overrun and storage on the hardness of ice cream. Paper presented at the
Ice Cream: Proceedings of the International Symposium, Athens, Greece,
18-19 September 1997.

Appendices 75
8. Appendices
8.1 Appendix 1: Overrun Values for Frozen
Dessert Prototypes
Table A1: List of overrun values for frozen dessert prototypes.
Prototype # Overrun
(%)
1 32
2 42
3 32
4 30
5 30
6 42
7 38
8 40
9 41
10 37
11 41
12 42
13 34
14 32
15 41
16 35
17 32
18 41
19 31
20 35
21 33
22 37
Optimized
Prototype 1 35
Optimized
Prototype 2 35

Appendices 76
8.2 Appendix 2: CAD Drawings for Hardness
Probe Attachment, Fastener and Cutter
Figure A1: CAD drawing for probe attachment used to measure hardness of frozen dessert
prototypes.

Appendices 77
Figure A2: CAD drawing for fastener used to attach probe to Instron 33R4204 during hardness
testing of frozen dessert prototypes.
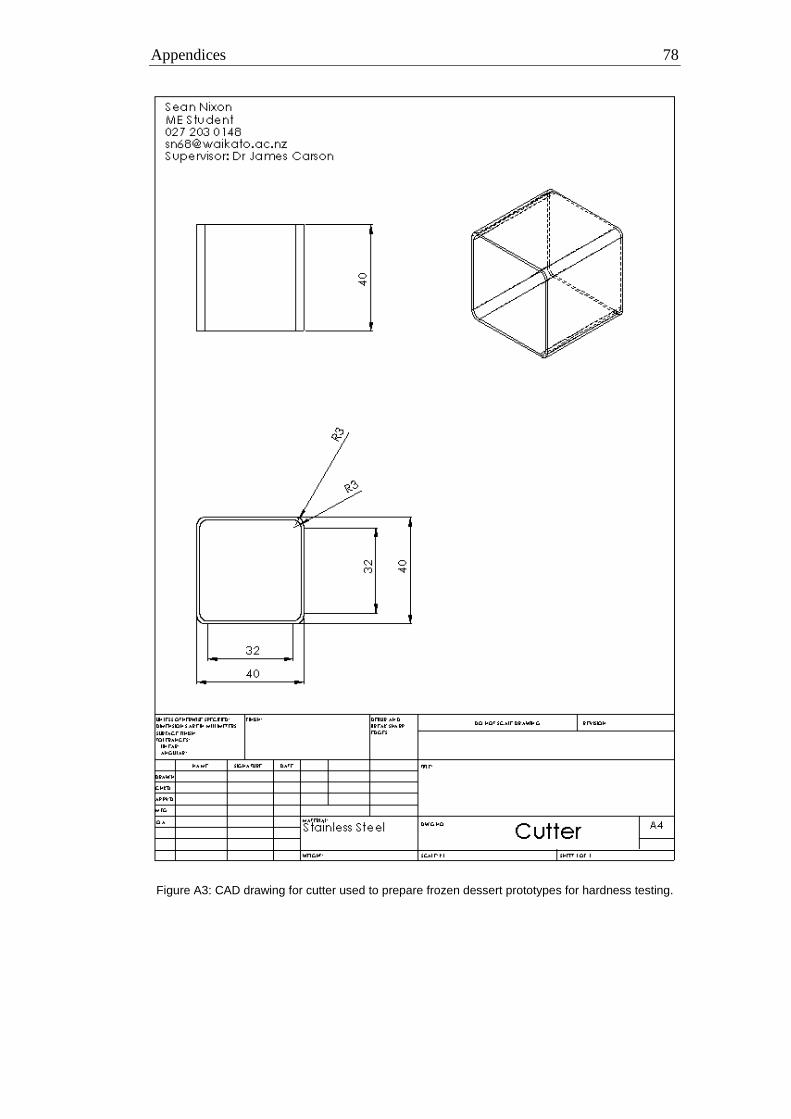
Appendices 78
Figure A3: CAD drawing for cutter used to prepare frozen dessert prototypes for hardness testing.

Appendices 79
8.3 Appendix 3: Example of Product Development Spreadsheet Template
Table A2: Spreadsheet layout used during product development of high protein frozen dessert samples.
FIXED FACTORS Target Actual
Total Solids: 32% 31%
Non soluble solids
(g/100g): 15.0 13.2
FPD 22 23.00%
Protein:Carb 1 0.81
Serve size
(g): 100
Category
Ingredient Ratio (g) Per 100g Per
serve %
kg / kg
product
ingredient
cost /kg
cost /kg
product
Amount
/ 600g
batch
Protein source WPI 894 9.79 9.79 9.79 9.79% 0.0979
$
18.50
$
1.81 58.76
Fat substitute Simplesse 5.00 5.00 5.00 5.00% 0.0500
$
17.00
$
0.85 30.00
Flavour Vanilla 1.00 1.00 1.00 1.00% 0.0100
$
81.70
$
0.82 6.00
0.00
Stabilizer CMC 0.40 0.40 0.40 0.40% 0.0040
$
10.00
$
0.04 2.40
Novagel GP 3282 0.80 0.80 0.80 0.80% 0.0080
$
10.00
$
0.08 4.80
Emulsifier
Mono/di-
glycerides 0.40 0.40 0.40 0.40% 0.0040
$
50.00
$
0.20 2.40
Freezing Point Depressor Fructose 4.10 4.10 4.10 4.10% 0.0410
$
6.50
$
0.27 24.62
Erythritol 0.00 0.00 0.00 0.00% 0.0000
$
11.00 $ - 0.00
Xylitol 5.96 5.96 5.96 5.96% 0.0596
$
8.50
$
0.51 35.75
Polydextrose 3.00 3.00 3.00 3.00% 0.0300
$
6.90
$
0.21 18.00
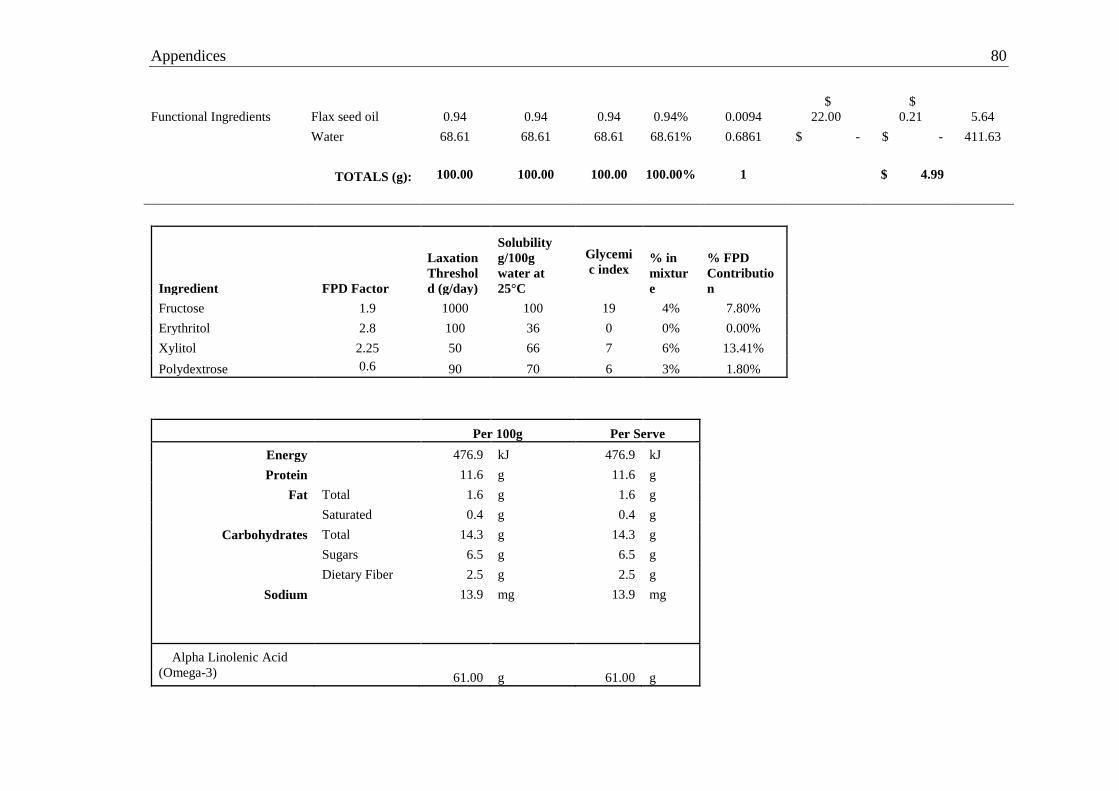
Appendices 80
Functional Ingredients Flax seed oil 0.94 0.94 0.94 0.94% 0.0094
$
22.00
$
0.21 5.64
Water 68.61 68.61 68.61 68.61% 0.6861 $ - $ - 411.63
TOTALS (g): 100.00 100.00 100.00 100.00% 1 $ 4.99
Ingredient FPD Factor
Laxation
Threshol
d (g/day)
Solubility
g/100g
water at
25°C
Glycemi
c index % in
mixtur
e
% FPD
Contributio
n
Fructose 1.9 1000 100 19 4% 7.80%
Erythritol 2.8 100 36 0 0% 0.00%
Xylitol 2.25 50 66 7 6% 13.41%
Polydextrose 0.6 90 70 6 3% 1.80%
Per 100g Per Serve
Energy
476.9 kJ 476.9 kJ
Protein
11.6 g 11.6 g
Fat Total 1.6 g 1.6 g
Saturated 0.4 g 0.4 g
Carbohydrates Total 14.3 g 14.3 g
Sugars 6.5 g 6.5 g
Dietary Fiber 2.5 g 2.5 g
Sodium
13.9 mg 13.9 mg
Alpha Linolenic Acid
(Omega-3) 61.00 g 61.00 g
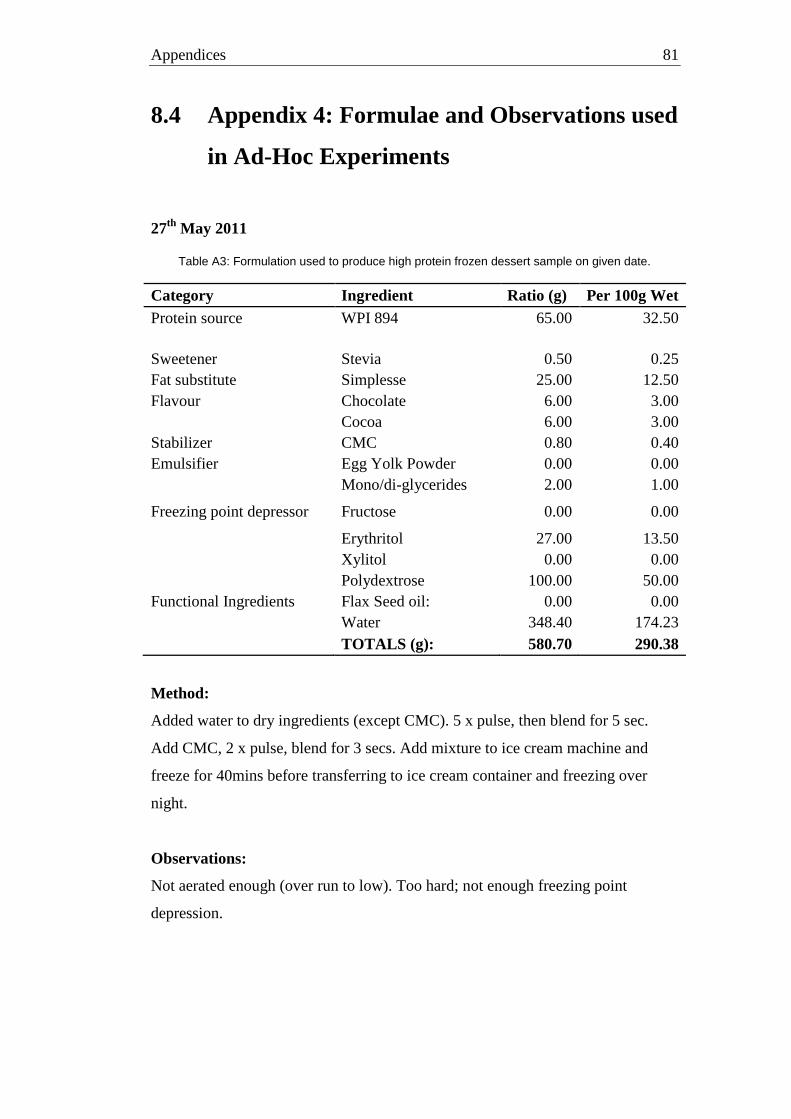
Appendices 81
8.4 Appendix 4: Formulae and Observations used
in Ad-Hoc Experiments
27th
May 2011
Table A3: Formulation used to produce high protein frozen dessert sample on given date.
Category Ingredient Ratio (g) Per 100g Wet
Protein source WPI 894 65.00 32.50
Sweetener Stevia 0.50 0.25
Fat substitute Simplesse 25.00 12.50
Flavour Chocolate 6.00 3.00
Cocoa 6.00 3.00
Stabilizer CMC 0.80 0.40
Emulsifier Egg Yolk Powder 0.00 0.00
Mono/di-glycerides 2.00 1.00
Freezing point depressor Fructose 0.00 0.00
Erythritol 27.00 13.50
Xylitol 0.00 0.00
Polydextrose 100.00 50.00
Functional Ingredients Flax Seed oil: 0.00 0.00
Water 348.40 174.23
TOTALS (g): 580.70 290.38
Method:
Added water to dry ingredients (except CMC). 5 x pulse, then blend for 5 sec.
Add CMC, 2 x pulse, blend for 3 secs. Add mixture to ice cream machine and
freeze for 40mins before transferring to ice cream container and freezing over
night.
Observations:
Not aerated enough (over run to low). Too hard; not enough freezing point
depression.
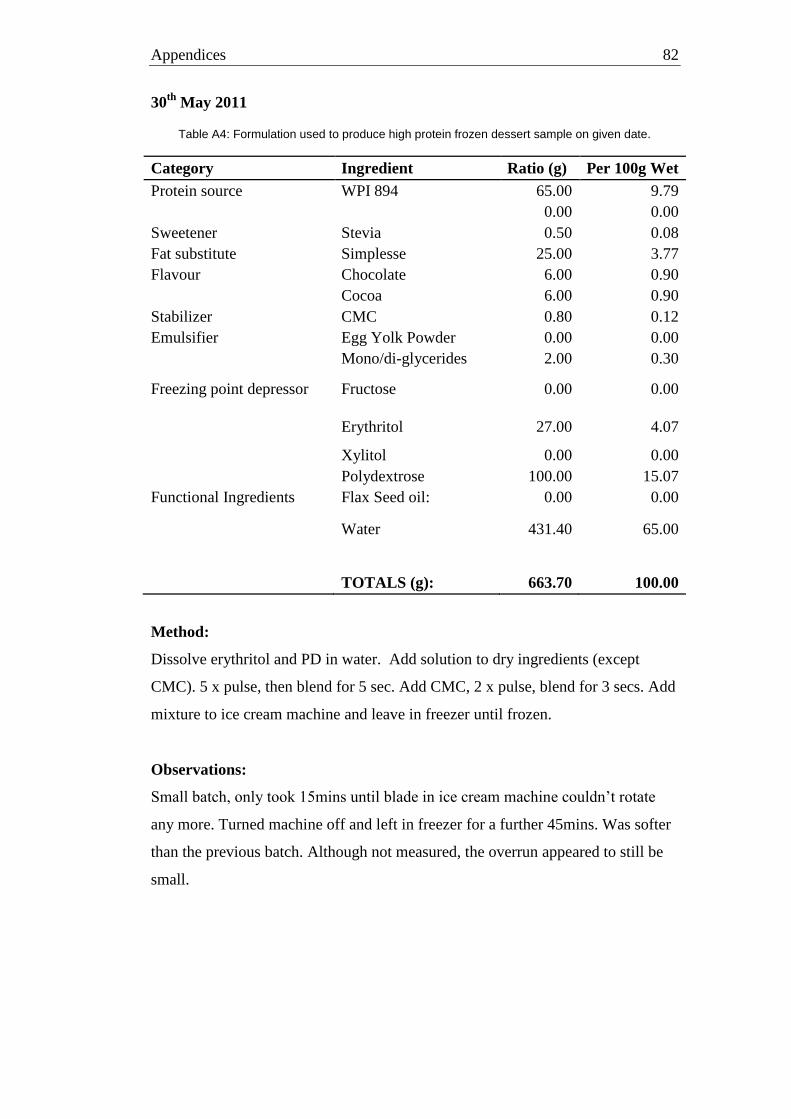
Appendices 82
30th
May 2011
Table A4: Formulation used to produce high protein frozen dessert sample on given date.
Category Ingredient Ratio (g) Per 100g Wet
Protein source WPI 894 65.00 9.79
0.00 0.00
Sweetener Stevia 0.50 0.08
Fat substitute Simplesse 25.00 3.77
Flavour Chocolate 6.00 0.90
Cocoa 6.00 0.90
Stabilizer CMC 0.80 0.12
Emulsifier Egg Yolk Powder 0.00 0.00
Mono/di-glycerides 2.00 0.30
Freezing point depressor Fructose 0.00 0.00
Erythritol 27.00 4.07
Xylitol 0.00 0.00
Polydextrose 100.00 15.07
Functional Ingredients Flax Seed oil: 0.00 0.00
Water 431.40 65.00
TOTALS (g): 663.70 100.00
Method:
Dissolve erythritol and PD in water. Add solution to dry ingredients (except
CMC). 5 x pulse, then blend for 5 sec. Add CMC, 2 x pulse, blend for 3 secs. Add
mixture to ice cream machine and leave in freezer until frozen.
Observations:
Small batch, only took 15mins until blade in ice cream machine couldn‟t rotate
any more. Turned machine off and left in freezer for a further 45mins. Was softer
than the previous batch. Although not measured, the overrun appeared to still be
small.

Appendices 83
30th
May 2011
Table A5: Formulation used to produce high protein frozen dessert sample on given date.
Category Ingredient Ratio (g) Per 100g Wet
Protein source WPI 894 65.00 9.28
0.00 0.00
Sweetener Stevia 0.30 0.04
Fat substitute Simplesse 25.00 3.57
Flavour Chocolate 12.00 0.86
Cocoa 0.00 0.86
Stabilizer CMC 0.80 0.11
Emulsifier Egg Yolk Powder 0.00 0.00
Mono/di-glycerides 2.00 0.29
Freezing point
depressor Fructose 0.00 0.00
Erythritol 40.00 5.71
Xylitol 0.00 0.00
Polydextrose 100.00 14.28
Functional
Ingredients Flax Seed oil: 0.00 0.00
Water 455.20 65.00
TOTALS (g): 700.30 100.00
Method:
Dissolve erythritol and PD in water. Mix in solution in blender for 10 seconds to
ensure sugars are fully dissolved. Add dry ingredients (except CMC) to solution.
5 x pulse, then blend for 5 sec. Add CMC, 2 x pulse, blend for 3 secs. Add
mixture to ice cream machine and leave in freezer until frozen. Transferred from
machine to ice cream container after 55mins
Observations:
Hardness favourable and appearance is like regular ice cream. Not creamy enough
and feels watery as it melts. Taste pretty good with just Cocoa as flavouring.
Needs improved creaminess and melting characteristics.

Appendices 84
1st June 2011
Table A6: Formulation used to produce high protein frozen dessert sample on given date.
Category Ingredient Ratio (g) Per 100g Wet
Protein source WPI 894 65.00 9.10
TMP 1180 0.00
Sweetener Stevia 0.30 0.04
Fat substitute Simplesse 25.00 3.50
Flavour Chocolate 4.00 0.56
Cocoa 8.00 1.12
Stabilizer CMC 0.80 0.11
Novagel GP 3282 5.00 0.70
Emulsifier Egg Yolk Powder 0.00 0.00
Mono/di-glycerides 2.00 0.28
Freezing point
depressor Fructose 0.00 0.00
Erythritol 40.00 5.60
Xylitol 0.00 0.00
Functional
Ingredients Flax Seed oil: 0.00 0.00
Water 464.50 65.00
TOTALS (g): 714.60 100.00
Method:
Dissolve erythritol and PD in water. Mix in solution in blender for 10 seconds to
ensure sugars are fully dissolved. Add dry ingredients (except stabilizers, CMC
and Novagel) to solution. 5 x pulse, then blend for 15 sec. Add stabilizers, 2 x
pulse, blend for 10 secs. Add mixture to ice cream machine and leave in freezer
until frozen.
Observations:
Product was „crunchy‟. A little hard, not smooth and creamy. Taste not as good as
with pure cocoa.

Appendices 85
3rd
June 2011
Table A7: Formulation used to produce high protein frozen dessert sample on given date.
Category Ingredient Ratio (g) Per 100g Wet
Protein source WPI 894 0.00 0.00
TMP 1180 65.00
Sweetener Stevia 0.30 0.04
Fat substitute Simplesse 25.00 3.50
Flavour Chocolate 0.00 0.00
Cocoa 12.00 1.68
Stabilizer CMC 0.80 0.11
Novagel GP 3282 5.00 0.70
Emulsifier Egg Yolk Powder 0.00 0.00
Mono/di-glycerides 2.00 0.28
Freezing point
depressor Fructose 0.00 0.00
Erythritol 40.00 5.60
Xylitol 0.00 0.00
Polydextrose 100.00 13.99
Functional
Ingredients Flax Seed oil: 0.00 0.00
Water 464.50 74.10
TOTALS (g): 714.60 100.00
Method:
Dissolve erythritol and PD in warm water. Mix in solution in blender for 10
seconds to ensure sugars are fully dissolved. Add dry ingredients (except
stabilizers, CMC and Novagel) to solution. 5 x pulse, then blend for 15 sec. Add
stabilizers, 2 x pulse, blend for 10 secs. Add mixture to ice cream machine and
leave in freezer until frozen.
Observations:
Ice cream was gummy and reasonably hard (freezer too cold? Need thermometer).
Mixture was thick before freezing, think this was reflected in the texture. Need to
measure overrun as this may need to be increased. May need to reduce solids to
30% for next batch and ensure sugars are fully dissolved before adding remaining
ingredients.

Appendices 86
16th
June 2011
Table A8: Formulation used to produce high protein frozen dessert sample on given date.
Category Ingredient Ratio (g) Per 100g Wet
Protein source WPI 894 65 7.09
TMP 1180 0
Sweetener Stevia 0.3 0.03
Fat substitute Simplesse 30 3.27
Flavour Chocolate 4 0.44
Cocoa 8 0.87
Stabilizer CMC 0.8 0.09
Novagel GP 3282 5 0.55
Emulsifier Egg Yolk Powder 0 0
Mono/di-glycerides 2 0.22
Freezing point
depressor Fructose 0 0
Erythritol 60 6.54
Xylitol 0 0
Polydextrose 100 10.91
Functional
Ingredients Flax Seed oil: 0 0
Water 641.9 70
TOTALS (g): 917 100
Method:
Dissolve erythritol and PD in 70deg water. Ensure sugars are fully dissolved.
Blend then add dry ingredients (except stabilizers, CMC and Novagel) to solution.
5 x pulse, then blend for 15 sec. Add stabilizers, 2 x pulse, blend for 10 secs. Add
mixture to ice cream machine and leave in freezer until frozen.
Observations:
30% solids. Still very hard. Think the PD and erythritol may not be dissolving
properly. Should try fructose instead of PD? Taste good with just Cocoa. Need to
get some ice cream flavours from D S Hall and bring some fructose from home.

Appendices 87
21st June 2011
Table A9: Formulation used to produce high protein frozen dessert sample on given date.
Category Ingredient Ratio (g) Per 100g Wet
Protein source WPI 894 65.00 6.58
TMP 1180 0.00
Sweetener Stevia 0.30 0.03
Fat substitute Simplesse 30.00 3.04
Flavour Chocolate 0.00 0.00
Cocoa 12.00 1.21
Stabilizer CMC 2.00 0.20
Novagel GP 3282 5.00 0.51
Emulsifier Egg Yolk Powder 0.00 0.00
Mono/di-glycerides 2.00 0.20
Freezing point
depressor Fructose 0.00 0.00
Erythritol 0.00 0.00
Xylitol 80.00 8.10
Polydextrose 100.00 10.12
Functional
Ingredients Flax Seed oil: 0.00 0.00
Water 691.40 70.00
TOTALS (g): 987.70 100.00
Method:
Dissolve xylitol and PD in 70deg water. Ensure sugars are fully dissolved. Blend
then add dry ingredients (except stabilizers, CMC and Novagel) to solution. 5 x
pulse, then blend for 15 sec. Add stabilizers, 2 x pulse, blend for 10 secs. Add
mixture to ice cream machine and leave in freezer until frozen (1hr 30mins).
Observations:
30% solids. On day after manufacture, sample is reasonably soft (scoop able).
Could be the xylitol? Further samples will see. Texture ok, a little icy. Some small
ice crystal growth. Product is still too dense and needs to have a greater overrun.
5/07/11: Ice crystal formation on type. Hardness and texture (apart from ice
crystals) still pretty good.

Appendices 88
22nd
June 2011
Table A10: Formulation used to produce high protein frozen dessert sample on given date.
Category Ingredient Ratio (g) Per 100g Wet
Protein source WPI 894 32.50 3.29
TMP 1180 32.50 3.29
Sweetener Stevia 0.30 0.03
Fat substitute Simplesse 30.00 3.04
Flavour Chocolate 0.00 0.00
Cocoa 12.00 1.21
Stabilizer CMC 2.00 0.20
Novagel GP 3282 5.00 0.51
Emulsifier Egg Yolk Powder 0.00 0.00
Mono/di-glycerides 2.00 0.20
Freezing point
depressor Fructose 0.00 0.00
Erythritol 0.00 0.00
Xylitol 80.00 8.10
Polydextrose 100.00 10.12
Functional
Ingredients Flax Seed oil: 0.00 0.00
Water 691.40 70.00
TOTALS (g): 987.70 100.00
Method:
Dissolve xylitol and PD in 70deg water. Ensure sugars are fully dissolved. Blend
then add dry ingredients (except stabilizers, CMC and Novagel) to solution. 5 x
pulse, then blend for 15 sec. Add stabilizers, 2 x pulse, blend for 10 secs. Add
mixture to ice cream machine and leave in freezer until frozen (left in for 2hours).
Sample was refrigerated overnight, re blended for 10sec, then frozen as above.
Observations:
Quite chewy, this has been observed previously with samples containing TMP.
Hardness was good – again could be the xylitol. Texture ok apart from the
chewiness. 5/07/11: ice crystal formation on surface. Other factors still pretty
good.

Appendices 89
23rd
June 2011
Table A11: Formulation used to produce high protein frozen dessert sample on given date.
Category Ingredient Ratio (g) Per 100g Wet
Protein source WPI 894 65.00 10.36
TMP 1180 0.00 0.00
Sweetener Stevia 0.30 0.05
Fat substitute Simplesse 30.00 4.78
Flavour Chocolate 0.00 0.00
Cocoa 12.00 1.91
Stabilizer CMC 2.00 0.32
Novagel GP 3282 5.00 0.80
Emulsifier Egg Yolk Powder 0.00 0.00
Mono/di-glycerides 2.00 0.32
Freezing point
depressor Fructose 30.00 4.78
Erythritol 0.00 0.00
Xylitol 42.00 6.69
Polydextrose 0.00 0.00
Functional
Ingredients Flax Seed oil: 0.00 0.00
Water 439.40 70.00
TOTALS (g): 627.70 100.00
Method:
Dissolve xylitol and FR in 70deg water. Ensure sugars are fully dissolved. Blend
then add dry ingredients (except stabilizers, CMC and Novagel) to solution. 5 x
pulse, then blend for 15 sec. Add stabilizers, 2 x pulse, blend for 10 secs. Add
mixture to ice cream machine and leave in freezer until frozen (was left for
45mins).
Observations:
Hardness is very good – conclude that the xylitol is much better than the erythritol
for this. Will try a fructose-erythritol combination to confirm. Texture is pretty
good. Flavour is strong as percentage levels were higher than samples with PD.
Not much ice crystal formation. 5/07/11: ice crystal formation on surface. Other
factors still pretty good.

Appendices 90
24th
June 2011
Table A12: Formulation used to produce high protein frozen dessert sample on given date.
Category Ingredient Ratio (g) Per 100g Wet
Protein source WPI 894 65.00 11.06
TMP 1180 0.00 0.00
Sweetener Stevia 0.30 0.05
Fat substitute Simplesse 30.00 5.10
Flavour Chocolate 0.00 0.00
Cocoa 12.00 2.04
Stabilizer CMC 2.00 0.34
Novagel GP 3282 5.00 0.85
Emulsifier Egg Yolk Powder 0.00 0.00
Mono/di-glycerides 2.00 0.34
Freezing point
depressor Fructose 30.00 5.10
Erythritol 30.00 5.10
Xylitol 0.00 0.00
Polydextrose 0.00 0.00
Functional
Ingredients Flax Seed oil: 0.00 0.00
Water 411.40 70.00
TOTALS (g): 587.70 100.00
Method:
Dissolve erythritol and FR in 70deg water. Ensure sugars are fully dissolved.
Blend then add dry ingredients (except stabilizers, CMC and Novagel) to solution.
5 x pulse, then blend for 15 sec. Add stabilizers, 2 x pulse, blend for 10 secs. Add
mixture to ice cream machine and leave in freezer until frozen (was left for
50mins). Then frozen overnight.
Observations:
Hardness is very good – possible that fructose helping more than PD. Texture is
pretty good. Flavour is strong as percentage levels were higher than samples with
PD. Not much ice crystal formation. 5/07/11: ice crystal formation on surface.
Other factors still pretty good.

Appendices 91
27th
June 2011
Table A13: Formulation used to produce high protein frozen dessert sample on given date.
Category Ingredient Ratio (g) Per 100g Wet
Protein source WPI 894 65.00 11.32
TMP 1180 0.00 0.00
Sweetener Stevia 0.00 0.00
Fat substitute Simplesse 30.00 5.22
Flavour Vanilla 443-00154-00 6.00 1.04
0.00 0.00
Stabilizer CMC 2.00 0.35
Novagel GP 3282 5.00 0.87
Emulsifier Egg Yolk Powder 0.00 0.00
Mono/di-glycerides 2.00 0.35
Freezing point
depressor Fructose 30.00 5.22
Erythritol 0.00 0.00
Xylitol 32.00 5.57
Polydextrose 0.00 0.00
Functional
Ingredients Flax Seed oil: 0.00 0.00
Water 402.00 70.00
TOTALS (g): 574.00 100.00
Method:
Dissolve xylitol and FR in 65 deg water. Ensure sugars are fully dissolved. Blend
then add dry ingredients (except stabilizers, CMC and Novagel) to solution. 5 x
pulse, then blend for 15 sec. Add stabilizers, 2 x pulse, blend for 10 secs. Add
mixture to ice cream machine and leave in freezer (at -16deg) until frozen (was
left for 50mins). Then frozen overnight.
Observations:
Flavour is great – even at 1%. Hardness seems good. Texture looks good and is ok
but a little icy on the tongue. Will try adding more stabilizers. Will also try a
combination of CMC and Guar – using two might help more than adding more!
21/07/11: Minimal ice crystal growth. Hardness, texture and taste still pretty good.
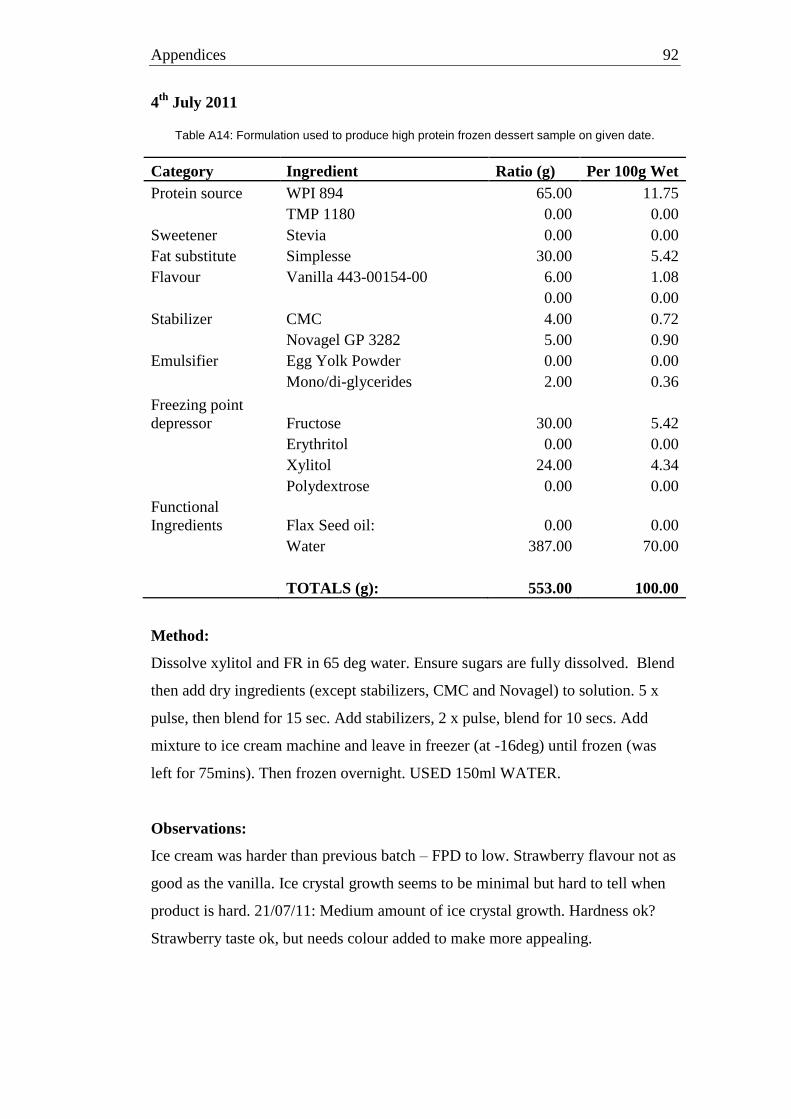
Appendices 92
4th
July 2011
Table A14: Formulation used to produce high protein frozen dessert sample on given date.
Category Ingredient Ratio (g) Per 100g Wet
Protein source WPI 894 65.00 11.75
TMP 1180 0.00 0.00
Sweetener Stevia 0.00 0.00
Fat substitute Simplesse 30.00 5.42
Flavour Vanilla 443-00154-00 6.00 1.08
0.00 0.00
Stabilizer CMC 4.00 0.72
Novagel GP 3282 5.00 0.90
Emulsifier Egg Yolk Powder 0.00 0.00
Mono/di-glycerides 2.00 0.36
Freezing point
depressor Fructose 30.00 5.42
Erythritol 0.00 0.00
Xylitol 24.00 4.34
Polydextrose 0.00 0.00
Functional
Ingredients Flax Seed oil: 0.00 0.00
Water 387.00 70.00
TOTALS (g): 553.00 100.00
Method:
Dissolve xylitol and FR in 65 deg water. Ensure sugars are fully dissolved. Blend
then add dry ingredients (except stabilizers, CMC and Novagel) to solution. 5 x
pulse, then blend for 15 sec. Add stabilizers, 2 x pulse, blend for 10 secs. Add
mixture to ice cream machine and leave in freezer (at -16deg) until frozen (was
left for 75mins). Then frozen overnight. USED 150ml WATER.
Observations:
Ice cream was harder than previous batch – FPD to low. Strawberry flavour not as
good as the vanilla. Ice crystal growth seems to be minimal but hard to tell when
product is hard. 21/07/11: Medium amount of ice crystal growth. Hardness ok?
Strawberry taste ok, but needs colour added to make more appealing.

Appendices 93
5th
July 2011
Table A15: Formulation used to produce high protein frozen dessert sample on given date.
Category Ingredient Ratio (g) Per 100g Wet
Protein source WPI 894 65.00 11.37
TMP 1180 0.00 0.00
Sweetener Stevia 0.00 0.00
Fat substitute Simplesse 30.00 5.25
Flavour Van DC10139 6.00 1.05
0.00 0.00
Stabilizer CMC 5.00 0.87
Novagel GP 3282 5.00 0.87
Emulsifier Egg Yolk Powder 0.00 0.00
Mono/di-glycerides 2.00 0.35
Freezing Point Depressor Fructose 0.00 0.00
Erythritol 10.00 1.75
Xylitol 48.55 8.49
Polydextrose 0.00 0.00
Functional Ingredients Flax Seed oil: 0.00 0.00
Water 400.00 70.00
TOTALS (g): 572.00 100.00
Method:
Dissolve xylitol and erythritol in 65 deg water. Ensure sugars are fully dissolved.
Blend then add dry ingredients (except stabilizers, CMC and Novagel) to solution.
5 x pulse, then blend for 15 sec. Add stabilizers, 2 x pulse, blend for 10 secs. Add
mixture to ice cream machine and leave in freezer (at -16deg) until frozen (was
left for 45mins). Then frozen overnight.
Observations:
Taste is bad. A little hard. No ice crystal growth yet (7/07/11). Still no IC growth
(21/07/11). Texture ok. Possible that combination of this vanilla and the vanilla
used in the batch on 27/06/11 will produce a nice flavour.
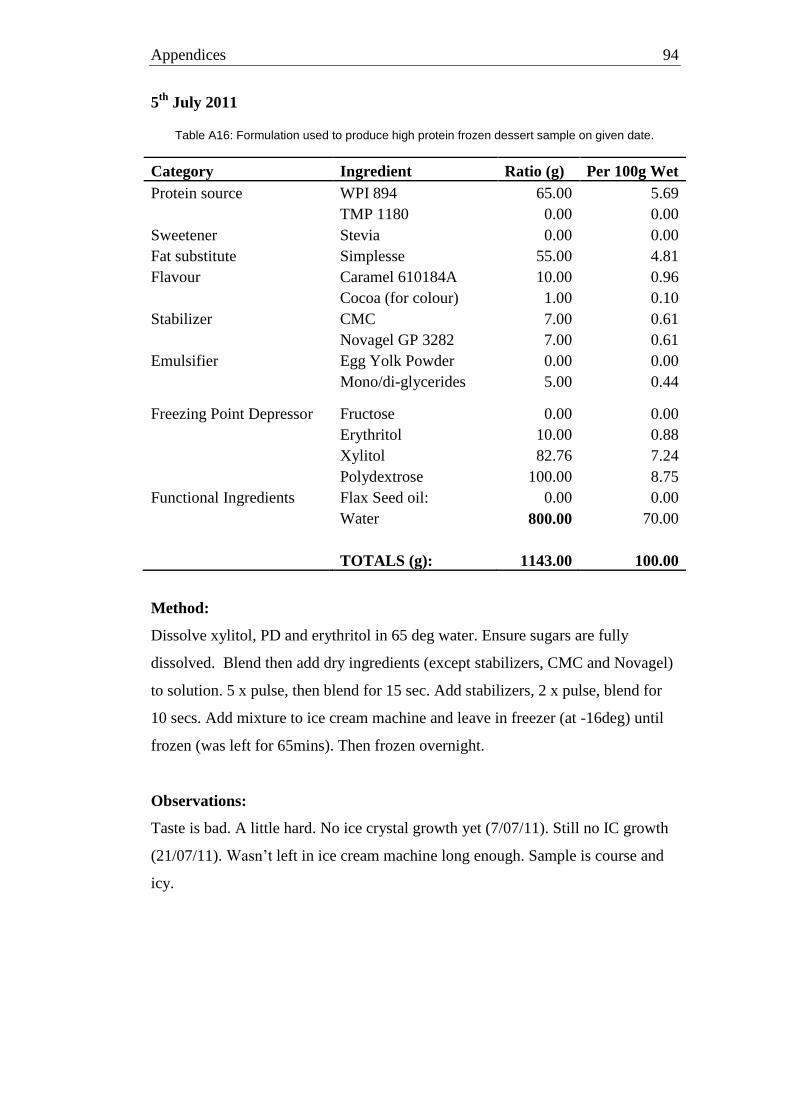
Appendices 94
5th
July 2011
Table A16: Formulation used to produce high protein frozen dessert sample on given date.
Category Ingredient Ratio (g) Per 100g Wet
Protein source WPI 894 65.00 5.69
TMP 1180 0.00 0.00
Sweetener Stevia 0.00 0.00
Fat substitute Simplesse 55.00 4.81
Flavour Caramel 610184A 10.00 0.96
Cocoa (for colour) 1.00 0.10
Stabilizer CMC 7.00 0.61
Novagel GP 3282 7.00 0.61
Emulsifier Egg Yolk Powder 0.00 0.00
Mono/di-glycerides 5.00 0.44
Freezing Point Depressor Fructose 0.00 0.00
Erythritol 10.00 0.88
Xylitol 82.76 7.24
Polydextrose 100.00 8.75
Functional Ingredients Flax Seed oil: 0.00 0.00
Water 800.00 70.00
TOTALS (g): 1143.00 100.00
Method:
Dissolve xylitol, PD and erythritol in 65 deg water. Ensure sugars are fully
dissolved. Blend then add dry ingredients (except stabilizers, CMC and Novagel)
to solution. 5 x pulse, then blend for 15 sec. Add stabilizers, 2 x pulse, blend for
10 secs. Add mixture to ice cream machine and leave in freezer (at -16deg) until
frozen (was left for 65mins). Then frozen overnight.
Observations:
Taste is bad. A little hard. No ice crystal growth yet (7/07/11). Still no IC growth
(21/07/11). Wasn‟t left in ice cream machine long enough. Sample is course and
icy.

Appendices 95
26th
July 2011
Table A17: Formulation used to produce high protein frozen dessert sample on given date.
Category Ingredient Ratio (g) Per 100g Wet
Protein source WPI 894 65.00 9.97
TMP 1180 0.00 0.00
Sweetener Stevia 0.00 0.00
Fat substitute Simplesse 28.00 4.29
Flavour Van DC10139 5.60 0.86
0.00 0.00
Stabilizer CMC 4.00 0.61
Novagel GP 3282 4.00 0.61
Emulsifier Egg Yolk Powder 0.00 0.00
Mono/di-glycerides 4.00 0.61
Freezing Point
Depressor Fructose 35.00 5.37
Erythritol 0.00 0.00
Xylitol 35.00 5.37
Polydextrose 0.00 0.00
Functional
Ingredients Flax seed oil 15.00 2.30
Water 456.40 70.00
TOTALS (g): 652.00 100.00
Method:
Dissolve xylitol and fructose in 65 deg water. Ensure sugars are fully dissolved.
Blend then add dry ingredients (except stabilizers, CMC and Novagel) to solution.
3 x pulse, then blend for 5 sec. Add flaxseed oil, 3 x pulse, blend for 10 secs. Add
stabilizers, 2 x pulse, blend for 10 secs. Add mixture to ice cream machine and
leave in freezer (at -16deg) until frozen (was left for 35mins). Then frozen
overnight.
Observations:
Hardness ok. Texture pretty good – less icy and nice smooth feeling on tongue.
Flavour great (using the nice vanilla). Update 18/08/11: One of the best samples
so far. Texture and appearance still good. Taste still great

Appendices 96
27th
July 2011
Table A18: Formulation used to produce high protein frozen dessert sample on given date.
Category Ingredient Ratio (g) Per 100g Wet
Protein source WPI 894 65.00 12.70
TMP 1180 0.00 0.00
Sweetener Stevia 0.00 0.00
Fat substitute Simplesse 25.59 5.00
Flavour Dark Choc flavour 5.12 1.00
Cocoa 5.12 1.00
Stabilizer CMC 2.05 0.40
Novagel GP 3282 4.61 0.90
Emulsifier Egg Yolk Powder 0.00 0.00
Mono/di-glycerides 4.61 0.90
Freezing Point
Depressor Fructose 27.13 5.30
Erythritol 0.00 0.00
Xylitol 27.13 5.30
Polydextrose 0.00 0.00
Functional
Ingredients Flax seed oil 12.80 2.50
Water 332.67 65.00
TOTALS (g): 511.80 100.00
Method:
Dissolve xylitol and fructose in 65 deg water. Ensure sugars are fully dissolved.
Blend then add dry ingredients (except stabilizers, CMC and Novagel) to solution.
3 x pulse, then blend for 5 sec. Continue blending, adding flaxseed oil, blend for 5
secs. Continue blending, add stabilizers, and blend for 10 secs. Add mixture to ice
cream machine and leave in freezer (at -16deg) until frozen (was left for 2 hours).
Then frozen overnight. Took a long time to freeze!
Observations:
Taste average. Texture and harness pretty good. Not too icy.

Appendices 97
8.5 Appendix 5: Observations Made During
Prototype Production
11th August 2011
Recipe: Run 1, with TMP
Method: As described in Methodology section.
Observations: Initial observations: product too chewy with TMP – will try same
recipe with WPI for a comparison. Looks like I will drop the idea of using TMP
and stick with WPI.
12th August 2011
Recipe: Run 1, with WPI
Method: As described in Methodology section.
Observations: Initial observations: product still chewy, but far less than TMP
sample. I will compare both once hardening is complete. After hardening,
prototype is much better than TMP prototype. As this is in line with previous
observations, I will change all formulas to use WPI instead of TMP.
15th August 2011
Recipe: Run 2, WPI
Method: As described in Methodology section.
Observations: Product reasonably hard, but acceptably. Not very creamy, taste
ok. Appearance good.
17th August 2011
Recipe: Run 3, WPI
Method: As described in Methodology section.
Observations: Very hard, expected with only FPD of 19. Taste and appearance
good.

Appendices 98
18th August 2011
Recipe: Run 4, WPI
Method: As described in Methodology section.
Observations: Hardness pretty good. Texture, appearance and taste also good.
19th August 2011
Recipe: Run 5, WPI
Method: As described in Methodology section.
Observations: Prototype not really distinguishable from other previous 4
prototypes. Texture, hardness and taste all pretty good.
22nd
August 2011
Recipe: Run 6, WPI
Method: As described in Methodology section.
Observations: Product quite hard. Taste and texture very good (no ice crystals
noticeable).
23rd
August 2011
Recipe: Run 7, WPI
Method: As described in Methodology section.
Observations: Hardness and appearance both good. Texture is a little icy. Taste is
quite bland; needs something to „bring it out‟.
24th
August 2011
Recipe: Run 8, WPI
Method: As described in Methodology section.
Observations: Taste, texture and harness all pretty good.
25th
August 2011
Recipe: Run 9, WPI
Method: As described in Methodology section.
Observations: Some ice crystal growth. Taste texture and appearance otherwise
all good. Meltdown feels good, although a slight icy texture can be felt.
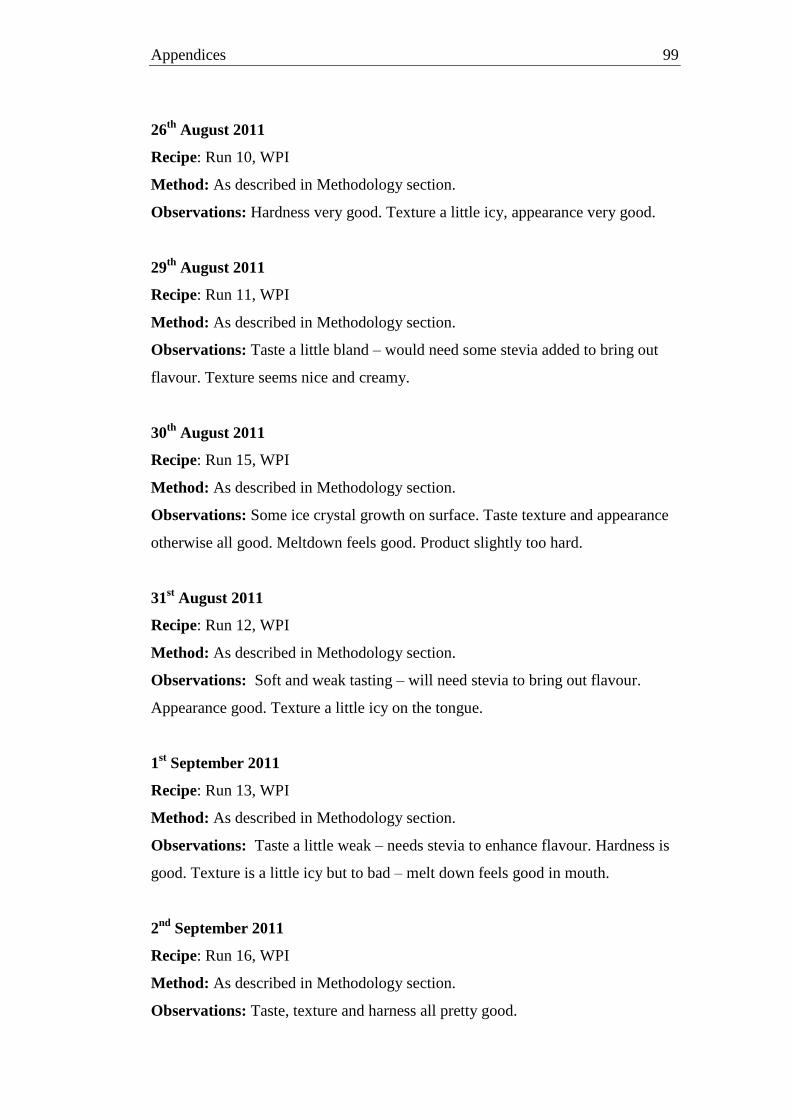
Appendices 99
26th
August 2011
Recipe: Run 10, WPI
Method: As described in Methodology section.
Observations: Hardness very good. Texture a little icy, appearance very good.
29th
August 2011
Recipe: Run 11, WPI
Method: As described in Methodology section.
Observations: Taste a little bland – would need some stevia added to bring out
flavour. Texture seems nice and creamy.
30th
August 2011
Recipe: Run 15, WPI
Method: As described in Methodology section.
Observations: Some ice crystal growth on surface. Taste texture and appearance
otherwise all good. Meltdown feels good. Product slightly too hard.
31st August 2011
Recipe: Run 12, WPI
Method: As described in Methodology section.
Observations: Soft and weak tasting – will need stevia to bring out flavour.
Appearance good. Texture a little icy on the tongue.
1st September 2011
Recipe: Run 13, WPI
Method: As described in Methodology section.
Observations: Taste a little weak – needs stevia to enhance flavour. Hardness is
good. Texture is a little icy but to bad – melt down feels good in mouth.
2nd
September 2011
Recipe: Run 16, WPI
Method: As described in Methodology section.
Observations: Taste, texture and harness all pretty good.

Appendices 100
12th
September 2011
Recipe: Run 17, WPI
Method: As described in Methodology section.
Observations: Took ages to freeze. Taste quite bland. Texture a little icy.
Hardness pretty good.
13th
September 2011
Recipe: Run 18, WPI
Method: As described in Methodology section.
Observations: Took ages to freeze. Taste ok. Texture a little icy. Hardness pretty
good.
14th
September 2011
Recipe: Run 21, WPI
Method: As described in Methodology section.
Observations: Freezing time normal. Taste is good but is quite hard and has an
icy texture. Appearance ok.

Appendices 101
8.6 Appendix 6: Design Summary Table Produced During Frozen Dessert Prototype
Formulation
Table A19: Design summary table produced by Design-Expert® V8.
Design
Summary
File Version 8.0.6.1
Study Type Mixture
Runs 22
Design Type D-optimal
Point
Exchange Blocks No Blocks
Design
Model Quadratic
Build Time
(ms) 1640.346397
Component Name Units Type Minimum Maximum Coded Values Mean Std. Dev.
A Fructose % Mixture 0 8 0.000=0.000
0.727=8.00
0
3.0100886
82
3.108065
176
B Erythritol % Mixture 0 7 0.000=0.000
0.636=7.00
0
2.3589154
53
2.372212
273
C Xylitol % Mixture 0 8 0.000=0.000
0.727=8.00
0
2.6738696
23
2.866474
63
D
Polydextro
se % Mixture 3 6 0.000=3.000
0.273=6.00
0
4.8258211
49
1.212073
044
E
Flax Seed
Oil % Mixture 0 2 0.000=0.000
0.182=2.00
0
1.1313050
94
0.821648
101
Total = 14
L_Pseudo
Coding

Appendices 102
Response Name Units Obs Analysis Minimum Maximum Mean Std. Dev. Ratio
Tra
ns Model
Y1 R1 N 0 Polynomial No Data No Data No Data No Data N/A
Non
e
No model
chosen
Y2 R2 mPa 0 Polynomial No Data No Data No Data No Data N/A
Non
e
No model
chosen
Point Exchange searches a set of candidates for the best design points. The candidates can be generated by the program,
or read in from a file.
D-optimal designs maximize information about the polynomial coefficients. D-optimality is desirable for factorial and
screening designs where you want to identify the most vital variables. The algorithm picks points that minimize the
volume of the confidence ellipsoid for the coefficients (i.e. it minimizes the determinant of the X'X inverse matrix).

Appendices 103
8.7 Appendix 7: Screenshots taken from Design-Expert ® V8 Software during
Formulation Development
Figure A4: Entering the design constraints into Design-Expert® V8 software.

Appendices 104
Figure A5: Choosing the mixture model type in Design-Expert® V8 software.

Appendices 105
Figure A6: Entering the experiment responses (force, N, and viscosity, mPa.s, the variables being tested) into Design-Expert® V8 software.

Appendices 106
Figure A7: Prototype formulae generated by Design-Expert® V8 software.

Appendices 107
Figure A8: Design summary produced by Design-Expert® V8 software.

Appendices 108
Figure A9: Preparing to evaluate the model using Design-Expert® V8 software.

Appendices 109
Figure A10: A summary of the experiment constraints provided by Design-Expert® V8 software.

Appendices 110
Figure A11: Entering the response data (force, N, and viscosity, mPa.s, the variables being tested) into Design-Expert® V8 software.

Appendices 111
Figure A12: Viewing response surface plots for hardness testing results in Design-Expert® V8 software.

Appendices 112
Figure A13: Viewing response surface plots for viscosity testing results in Design-Expert® V8 software.

Appendices 113
Figure A14: Optimizing the product formulation for the attribute of hardness, based on testing results, using Design-Expert® V8 software.

Appendices 114
Figure A15: Optimizing the product formulation for the attribute of viscosity, based on testing results, using Design-Expert® V8 software.

Appendices 115
Figure A16: The top 14 solutions provided during the optimization process, generated by Design-Expert® V8 software.

Appendices 116
8.8 Appendix 8: Application for Ethics Approval,
Participants Covering Letter and Consent
From
The University of Waikato
Application for Ethics Approval
By FSEN Students
Faculty of Science and Engineering
Human Research Ethics Sub-committee
1 Title of Project
Development of a High Protein Ice Cream
2 Researcher(s) and Contact Details
a Name of applicant
Sean Nixon
b Department/Centre/Unit
School of Engineering
c Qualifications
BE (Hons) Biochemical
d Other personnel
Supervisor: Dr James Carson

Appendices 117
A. 3. Research Design Proposal
The committee needs to see some detail about your research design so it can judge
if you have thought through all the ethical issues in your research. Describe your
research design in points 3a-c below.
a. Research Objectives
There are two objectives to this research:
1. To carry out a preference ranking test, where participants will determine if
a difference exists between three samples with regard to the attribute of
sweetness, and then rank the samples in their preferred order.
2. To carry out acceptance tests using the most preferred sample, as indicated
in the first set of tests. A hedonic rating will be used to compare the level
of liking of attributes of the sample to those of a similar product that is on
the market.
b. Research Methodology
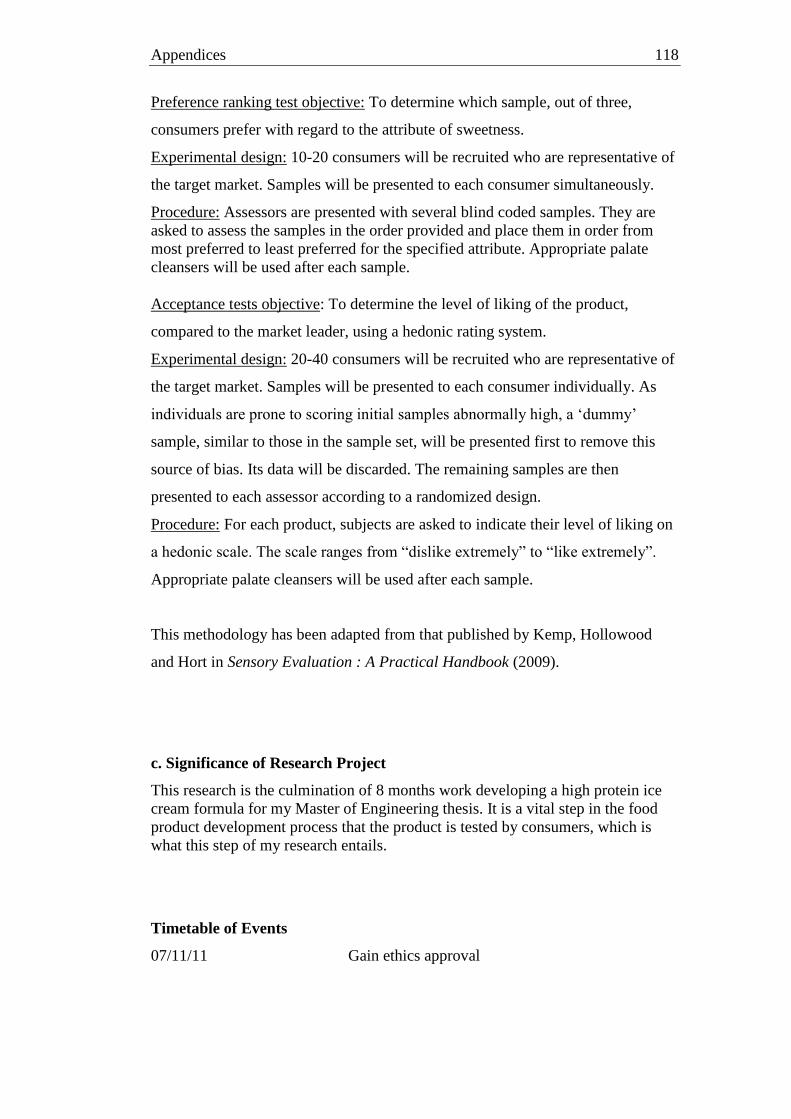
Appendices 118
Preference ranking test objective: To determine which sample, out of three,
consumers prefer with regard to the attribute of sweetness.
Experimental design: 10-20 consumers will be recruited who are representative of
the target market. Samples will be presented to each consumer simultaneously.
Procedure: Assessors are presented with several blind coded samples. They are
asked to assess the samples in the order provided and place them in order from
most preferred to least preferred for the specified attribute. Appropriate palate
cleansers will be used after each sample.
Acceptance tests objective: To determine the level of liking of the product,
compared to the market leader, using a hedonic rating system.
Experimental design: 20-40 consumers will be recruited who are representative of
the target market. Samples will be presented to each consumer individually. As
individuals are prone to scoring initial samples abnormally high, a „dummy‟
sample, similar to those in the sample set, will be presented first to remove this
source of bias. Its data will be discarded. The remaining samples are then
presented to each assessor according to a randomized design.
Procedure: For each product, subjects are asked to indicate their level of liking on
a hedonic scale. The scale ranges from “dislike extremely” to “like extremely”.
Appropriate palate cleansers will be used after each sample.
This methodology has been adapted from that published by Kemp, Hollowood
and Hort in Sensory Evaluation : A Practical Handbook (2009).
c. Significance of Research Project
This research is the culmination of 8 months work developing a high protein ice
cream formula for my Master of Engineering thesis. It is a vital step in the food
product development process that the product is tested by consumers, which is
what this step of my research entails.
Timetable of Events
07/11/11 Gain ethics approval

Appendices 119
07/11/11 – 18/11/11 Gather research data
18/11/11 – 25/11/11 Analyse data
4 Research Procedures
a Procedure for recruitment of participants
Participants will be recruited from University sports teams (athletes are
one of the target markets) and from Sir Edmund Hillary Scholars.
Participants will be contacted via a combination of email, face to face
contact and text message. It is hoped that between 10 and 20 participants
can be recruited for the first part and 20-40 participants for the second
part of the research.
b Procedures in which research participants will be involved
Participants will be asked to taste ice cream samples and rank / rate them,
depending on the test being undertaken (please refer to part 3b).
Participants will also be asked to fill out a short questionnaire relating to
their use and consumption of ice cream:
Each part of the research would only take an individual participant 5-10
minutes to complete.
c Procedures for handling information and materials produced in the
course of the research
Hard data, in the form of paper questionnaires, will be kept in a locked
filing cabinet. Electronic files used to record and analyze the data will be
stored on a password protected USB storage device. Data will be kept for
five years after collection before being destroyed, as required by national
law.
5 Ethical Concerns
a Access to participants

Appendices 120
Sir Edmund Hillary program staff will be consulted before Scholars are
recruited via the scholar email database (as a Sir Edmund Hillary
Scholar, I have access to the database). Members of the University
Rugby Club, of which I am a member, will be consulted directly on a
face to face or via text message.
b Informed consent
Participants will be asked to read a covering letter, providing
background to the project, and then sign a consent form. All
participants will be over 16 years of age.
c Confidentiality
No personal details will be collected other than the participants name
and signature on the consent forms. This information will not be used
for data analysis purposes. Signed consent forms will be kept locked in
a filing cabinet for five years after collection before being destroyed, as
required by national law.
d Potential harm to participants
As the research involves consuming a food product, the food product
will be produced and served in accordance with NZFSA regulations to
ensure its safety. Allergy information for the product will be provided
to participants in the background information sheet.
e Participants right to decline
Participants will be advised that they have the right to decline to be
involved in the study and that they have the right to withdraw at any
time, without stating any reason.
f Arrangements for participants to receive information
A summary of the study‟s findings will be sent via email to all
participants.
g Use of information
The collected data will be published in my Master of Engineering
thesis. Data obtained from the information gathered may be published
in a journal article.
h Conflicts of interest
Not applicable.

Appendices 121
i Cultural sensitivity
Participants will be informed that samples do not meet any
religious/cultural standards (Halal, Kosher etc).
j Compensation for participation
Participants will not be compensated for their participation.
k Procedure for resolution of disputes
Participants will be advised, in the covering letter, that disputes can be
brought to the attention of the researcher, in the first instance, or the
supervisor should they not be resolved.
6 Ethical Statement
The project will follow the University of Waikato Human Research
Ethics Regulations 2008 and the ethical guidelines of the NZARE
and include the following. Informed consent of participants will be
obtained, without coercion. Exploitation (or perception of
exploitation) of researcher-participant relationship will be prevented.
Privacy and confidentiality will be respected. The participant will
own the raw material collected, and their requests regarding the
material will be honored. Participation in the research will not impact
academically on the participants.
7 Legal Issues
a Copyright
No intellectual property rights will be infringed during the course of
this research.

Appendices 122
b Ownership of materials produced
Researcher‟s notes and interpretation of those notes will remain the
property of the researchers. Participants will be advised that they own
their own raw data and, in the event of a withdrawal by the participant,
any data obtained from them will be returned and not used in the study,
where possible.
c Any other legal issues relevant to the research
None.
8 Place in which the research will be conducted
The research will be conducted on the University of Waikato campus.
9 Has this application in whole or part previously been declined or
approved by another ethics committee?
No.
10 For research to be undertaken at other facilities under the control of
another ethics committee, has an application also been made to that
committee?
Not applicable.
11 Further conditions
In the event of this application being approved, the undersigned agrees to
request approval from the FSEN Human Research Ethics sub-committee
for any change subsequently proposed.

Appendices 123
12 Applicant Request for Approval of Ethics Application
For the study described, I agree to follow the conditions as specified in this
application
Signed
Date
2/11/11

Appendices 124
Participants‟ covering letter:

Appendices 125
Participants consent form:

Appendices 126
8.9 Appendix 9: Data Collected During
Consumer Panel Testing and Results From
Statistical Analysis
Table A20 : Raw data collected during hedonic testing off the Optimum High Protein Prototype
frozendessertandTipTop™Vanilla Ice Cream.
Categor
y/
Assessor
Product/Score
OHPP Tip Top™ Vanilla Ice Cream
Hedonic
Score
Corresponding LAM
Value
Hedonic
Score
Corresponding LAM
Value
Sweetne
ss 6 55.62 9 87.11
6 55.62 9 87.11
7 68.12 9 87.11
8 78.06 7 68.12
8 78.06 9 87.11
6 55.62 9 87.11
6 55.62 9 87.11
7 68.12 9 87.11
8 78.06 6 55.62
8 78.06 9 87.11
7 68.12 9 87.11
8 78.06 7 68.12
8 78.06 9 87.11
8 78.06 9 87.11
6 55.62 9 87.11
7 68.12 9 87.11
4 44.69 8 78.06
7 68.12 9 87.11
8 78.06 8 78.06
6 55.62 8 78.06
6 55.62 7 68.12
5 50 9 87.11
7 68.12 9 87.11
7 68.12 9 87.11
8 78.06 8 78.06
8 78.06 8 78.06
6 55.62 8 78.06
7 68.12 8 78.06
9 87.11 7 68.12
4 44.69 6 55.62
8 78.06 7 68.12

Appendices 127
8 78.06 7 68.12
7 68.12 8 78.06
7 68.12 7 68.12
8 78.06 9 87.11
6 55.62 6 55.62
7 68.12 6 55.62
7 68.12 8 78.06
8 78.06 9 87.11
8 78.06 9 87.11
Flavour 5 50 9 87.11
6 55.62 9 87.11
8 78.06 9 87.11
6 55.62 8 78.06
8 78.06 9 87.11
5 50 9 87.11
6 55.62 9 87.11
8 78.06 9 87.11
6 55.62 8 78.06
8 78.06 9 87.11
8 78.06 9 87.11
6 55.62 8 78.06
8 78.06 9 87.11
5 50 9 87.11
6 55.62 9 87.11
7 68.12 9 87.11
4 44.69 8 78.06
7 68.12 9 87.11
8 78.06 8 78.06
6 55.62 8 78.06
6 55.62 7 68.12
5 50 9 87.11
7 68.12 9 87.11
7 68.12 9 87.11
8 78.06 9 87.11
8 78.06 8 78.06
6 55.62 8 78.06
7 68.12 8 78.06
5 50 7 68.12
4 44.69 9 87.11
8 78.06 7 68.12
7 68.12 7 68.12
7 68.12 8 78.06
7 68.12 9 87.11
6 55.62 9 87.11

Appendices 128
6 55.62 6 55.62
7 68.12 6 55.62
7 68.12 8 78.06
6 55.62 8 78.06
8 78.06 9 87.11
Texture 7 68.12 9 87.11
7 68.12 9 87.11
8 78.06 9 87.11
7 68.12 7 68.12
9 87.11 9 87.11
7 68.12 9 87.11
7 68.12 9 87.11
8 78.06 9 87.11
7 68.12 7 68.12
9 87.11 9 87.11
8 78.06 9 87.11
7 68.12 7 68.12
9 87.11 9 87.11
7 68.12 9 87.11
7 68.12 9 87.11
4 44.69 8 78.06
7 68.12 9 87.11
8 78.06 8 78.06
9 87.11 8 78.06
6 55.62 7 68.12
5 50 9 87.11
7 68.12 9 87.11
9 87.11 9 87.11
8 78.06 8 78.06
8 78.06 8 78.06
8 78.06 8 78.06
7 68.12 8 78.06
4 44.69 7 68.12
5 50 9 87.11
9 87.11 7 68.12
6 55.62 8 78.06
7 68.12 8 78.06
8 78.06 9 87.11
6 55.62 9 87.11
7 68.12 7 68.12
8 78.06 6 55.62
8 78.06 7 68.12
9 87.11 9 87.11
7 68.12 7 68.12

Appendices 129
9 87.11 9 87.11
Hardnes
s 7 68.12 9 87.11
7 68.12 9 87.11
4 44.69 9 87.11
6 55.62 8 78.06
8 78.06 9 87.11
7 68.12 9 87.11
7 68.12 9 87.11
4 44.69 9 87.11
6 55.62 8 78.06
8 78.06 9 87.11
4 44.69 9 87.11
6 55.62 8 78.06
8 78.06 9 87.11
7 68.12 9 87.11
7 68.12 9 87.11
7 68.12 9 87.11
8 78.06 8 78.06
6 55.62 8 78.06
6 55.62 7 68.12
5 50 9 87.11
7 68.12 9 87.11
9 87.11 9 87.11
9 87.11 8 78.06
7 68.12 8 78.06
8 78.06 8 78.06
6 55.62 8 78.06
4 44.69 7 68.12
6 55.62 7 68.12
6 55.62 7 68.12
8 78.06 7 68.12
7 68.12 8 78.06
9 87.11 9 87.11
6 55.62 9 87.11
7 68.12 9 87.11
8 78.06 8 78.06
8 78.06 8 78.06
9 87.11 8 78.06
4 44.69 9 87.11
6 55.62 8 78.06
8 78.06 9 87.11
Overall
Appeal
6 55.62 9 87.11
8 78.06 9 87.11

Appendices 130
7 68.12 9 87.11
7 68.12 8 78.06
8 78.06 9 87.11
6 55.62 9 87.11
8 78.06 9 87.11
7 68.12 9 87.11
7 68.12 8 78.06
8 78.06 9 87.11
7 68.12 9 87.11
7 68.12 8 78.06
8 78.06 9 87.11
6 55.62 9 87.11
8 78.06 9 87.11
7 68.12 9 87.11
8 78.06 8 78.06
6 55.62 8 78.06
6 55.62 7 68.12
8 78.06 9 87.11
7 68.12 9 87.11
9 87.11 9 87.11
8 78.06 8 78.06
8 78.06 8 78.06
9 87.11 8 78.06
6 55.62 8 78.06
4 44.69 7 68.12
5 50 7 68.12
6 55.62 7 68.12
8 78.06 8 78.06
7 68.12 8 78.06
7 68.12 8 78.06
6 55.62 9 87.11
7 68.12 6 55.62
8 78.06 8 78.06
8 78.06 8 78.06
9 87.11 9 87.11
7 68.12 9 87.11
7 68.12 8 78.06
8 78.06 9 87.11
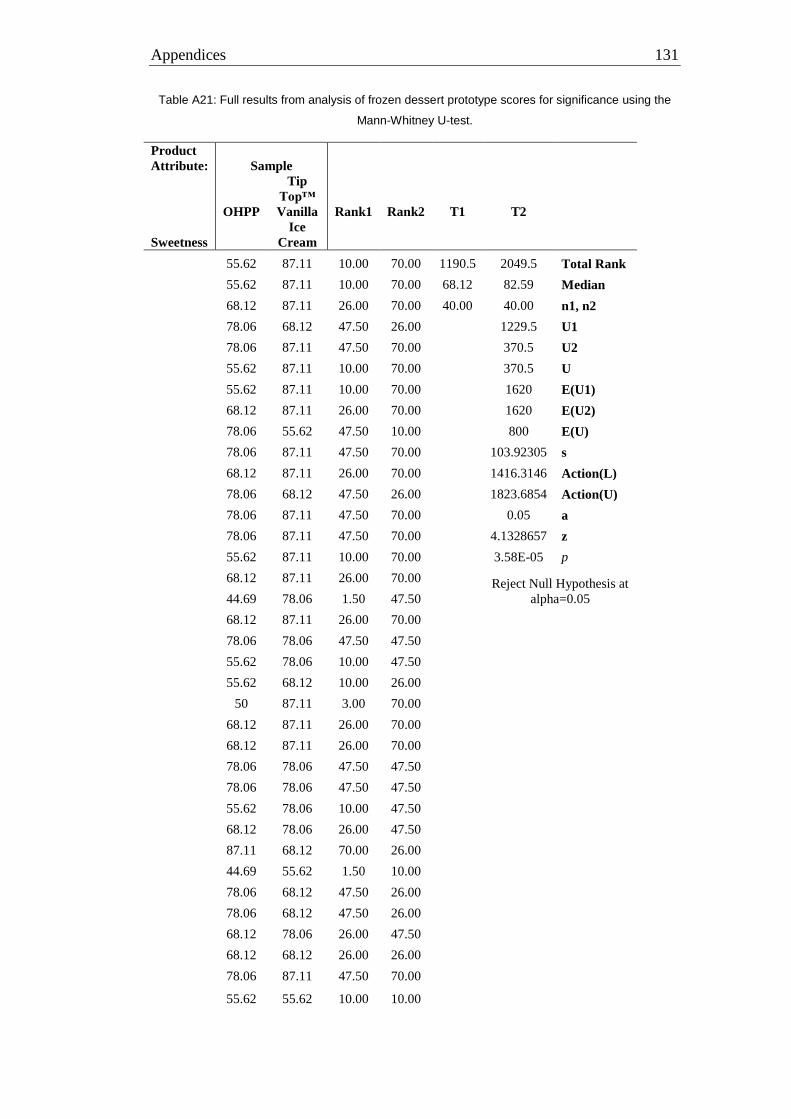
Appendices 131
Table A21: Full results from analysis of frozen dessert prototype scores for significance using the
Mann-Whitney U-test.
Product
Attribute: Sample
Sweetness
OHPP
Tip
Top™
Vanilla
Ice
Cream
Rank1 Rank2 T1 T2
55.62 87.11 10.00 70.00 1190.5 2049.5 Total Rank
55.62 87.11 10.00 70.00 68.12 82.59 Median
68.12 87.11 26.00 70.00 40.00 40.00 n1, n2
78.06 68.12 47.50 26.00
1229.5 U1
78.06 87.11 47.50 70.00
370.5 U2
55.62 87.11 10.00 70.00
370.5 U
55.62 87.11 10.00 70.00
1620 E(U1)
68.12 87.11 26.00 70.00
1620 E(U2)
78.06 55.62 47.50 10.00
800 E(U)
78.06 87.11 47.50 70.00
103.92305 s
68.12 87.11 26.00 70.00
1416.3146 Action(L)
78.06 68.12 47.50 26.00
1823.6854 Action(U)
78.06 87.11 47.50 70.00
0.05 a
78.06 87.11 47.50 70.00
4.1328657 z
55.62 87.11 10.00 70.00
3.58E-05 p
68.12 87.11 26.00 70.00
Reject Null Hypothesis at
alpha=0.05
44.69 78.06 1.50 47.50
68.12 87.11 26.00 70.00
78.06 78.06 47.50 47.50
55.62 78.06 10.00 47.50
55.62 68.12 10.00 26.00
50 87.11 3.00 70.00
68.12 87.11 26.00 70.00
68.12 87.11 26.00 70.00
78.06 78.06 47.50 47.50
78.06 78.06 47.50 47.50
55.62 78.06 10.00 47.50
68.12 78.06 26.00 47.50
87.11 68.12 70.00 26.00
44.69 55.62 1.50 10.00
78.06 68.12 47.50 26.00
78.06 68.12 47.50 26.00
68.12 78.06 26.00 47.50
68.12 68.12 26.00 26.00
78.06 87.11 47.50 70.00
55.62 55.62 10.00 10.00

Appendices 132
68.12 55.62 26.00 10.00
68.12 78.06 26.00 47.50
78.06 87.11 47.50 70.00
78.06 87.11 47.50 70.00
Product
Attribute: Sample
Texture
OHPP
Tip Top™
Vanilla Ice
Cream
Rank1 Rank2 T1 T2
68.12 87.11 20.50 66.00 1285 1955 Total Rank
68.12 87.11 20.50 66.00 68.12 87.11 Median
78.06 87.11 42.00 66.00 40.00 40.00 n1, n2
68.12 68.12 20.50 20.50
1135.0 U1
87.11 87.11 66.00 66.00
465.0 U2
68.12 87.11 20.50 66.00
465.0 U
68.12 87.11 20.50 66.00
1620 E(U1)
78.06 87.11 42.00 66.00
1620 E(U2)
68.12 68.12 20.50 20.50
800 E(U)
87.11 87.11 66.00 66.00
103.92305 s
78.06 87.11 42.00 66.00
1416.3146 Action(L)
68.12 68.12 20.50 20.50
1823.6854 Action(U)
87.11 87.11 66.00 66.00
0.05 a
68.12 87.11 20.50 66.00
3.223539 z
68.12 87.11 20.50 66.00
1.27E-03 p
44.69 78.06 1.50 42.00
Reject Null Hypothesis
at alpha=0.05
68.12 87.11 20.50 66.00
78.06 78.06 42.00 42.00
87.11 78.06 66.00 42.00
55.62 68.12 6.50 20.50
50 87.11 3.50 66.00
68.12 87.11 20.50 66.00
87.11 87.11 66.00 66.00
78.06 78.06 42.00 42.00
78.06 78.06 42.00 42.00
78.06 78.06 42.00 42.00
68.12 78.06 20.50 42.00
44.69 68.12 1.50 20.50
50 87.11 3.50 66.00
87.11 68.12 66.00 20.50
55.62 78.06 6.50 42.00
68.12 78.06 20.50 42.00
78.06 87.11 42.00 66.00
55.62 87.11 6.50 66.00
68.12 68.12 20.50 20.50
78.06 55.62 42.00 6.50

Appendices 133
78.06 68.12 42.00 20.50
87.11 87.11 66.00 66.00
68.12 68.12 20.50 20.50
87.11 87.11 66.00 66.00
Product
Attribute: Sample
Hardness
OHPP
Tip Top™
Vanilla Ice
Cream
Rank1 Rank2 T1 T2
68.12 87.11 24.50 68.00 1073.5 2166.5 Total Rank
68.12 87.11 24.50 68.00 68.12 87.11 Median
44.69 87.11 3.00 68.00 40.00 40.00 n1, n2
55.62 78.06 11.50 44.00
1346.5 U1
78.06 87.11 44.00 68.00
253.5 U2
68.12 87.11 24.50 68.00
253.5 U
68.12 87.11 24.50 68.00
1620 E(U1)
44.69 87.11 3.00 68.00
1620 E(U2)
55.62 78.06 11.50 44.00
800 E(U)
78.06 87.11 44.00 68.00
103.92305 s
44.69 87.11 3.00 68.00
1416.3146 Action(L)
55.62 78.06 11.50 44.00
1823.6854 Action(U)
78.06 87.11 44.00 68.00
0.05 a
68.12 87.11 24.50 68.00
5.2586987 z
68.12 87.11 24.50 68.00
1.45E-07 p
68.12 87.11 24.50 68.00
Reject Null Hypothesis
at alpha=0.05
78.06 78.06 44.00 44.00
55.62 78.06 11.50 44.00
55.62 68.12 11.50 24.50
50 87.11 6.00 68.00
68.12 87.11 24.50 68.00
87.11 87.11 68.00 68.00
87.11 78.06 68.00 44.00
68.12 78.06 24.50 44.00
78.06 78.06 44.00 44.00
55.62 78.06 11.50 44.00
44.69 68.12 3.00 24.50
55.62 68.12 11.50 24.50
55.62 68.12 11.50 24.50
78.06 68.12 44.00 24.50
68.12 78.06 24.50 44.00
87.11 87.11 68.00 68.00
55.62 87.11 11.50 68.00
68.12 87.11 24.50 68.00
78.06 78.06 44.00 44.00
78.06 78.06 44.00 44.00
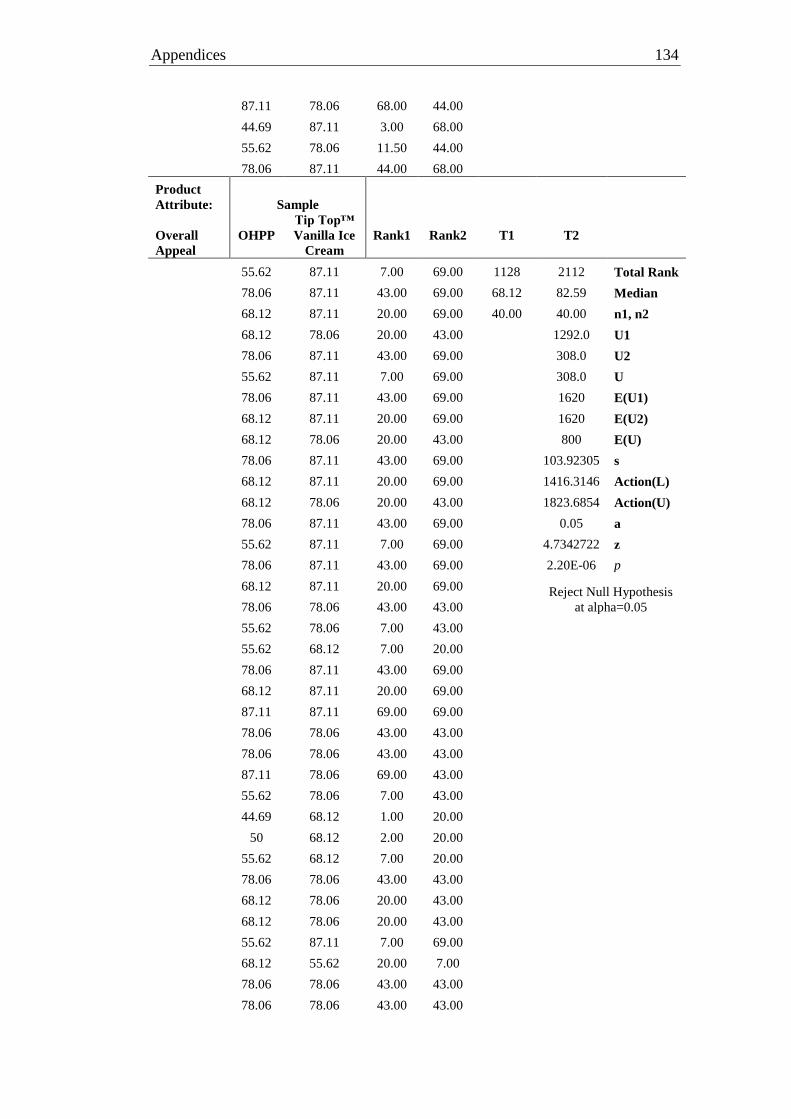
Appendices 134
87.11 78.06 68.00 44.00
44.69 87.11 3.00 68.00
55.62 78.06 11.50 44.00
78.06 87.11 44.00 68.00
Product
Attribute: Sample
Overall
Appeal
OHPP
Tip Top™
Vanilla Ice
Cream
Rank1 Rank2 T1 T2
55.62 87.11 7.00 69.00 1128 2112 Total Rank
78.06 87.11 43.00 69.00 68.12 82.59 Median
68.12 87.11 20.00 69.00 40.00 40.00 n1, n2
68.12 78.06 20.00 43.00
1292.0 U1
78.06 87.11 43.00 69.00
308.0 U2
55.62 87.11 7.00 69.00
308.0 U
78.06 87.11 43.00 69.00
1620 E(U1)
68.12 87.11 20.00 69.00
1620 E(U2)
68.12 78.06 20.00 43.00
800 E(U)
78.06 87.11 43.00 69.00
103.92305 s
68.12 87.11 20.00 69.00
1416.3146 Action(L)
68.12 78.06 20.00 43.00
1823.6854 Action(U)
78.06 87.11 43.00 69.00
0.05 a
55.62 87.11 7.00 69.00
4.7342722 z
78.06 87.11 43.00 69.00
2.20E-06 p
68.12 87.11 20.00 69.00
Reject Null Hypothesis
at alpha=0.05
78.06 78.06 43.00 43.00
55.62 78.06 7.00 43.00
55.62 68.12 7.00 20.00
78.06 87.11 43.00 69.00
68.12 87.11 20.00 69.00
87.11 87.11 69.00 69.00
78.06 78.06 43.00 43.00
78.06 78.06 43.00 43.00
87.11 78.06 69.00 43.00
55.62 78.06 7.00 43.00
44.69 68.12 1.00 20.00
50 68.12 2.00 20.00
55.62 68.12 7.00 20.00
78.06 78.06 43.00 43.00
68.12 78.06 20.00 43.00
68.12 78.06 20.00 43.00
55.62 87.11 7.00 69.00
68.12 55.62 20.00 7.00
78.06 78.06 43.00 43.00
78.06 78.06 43.00 43.00
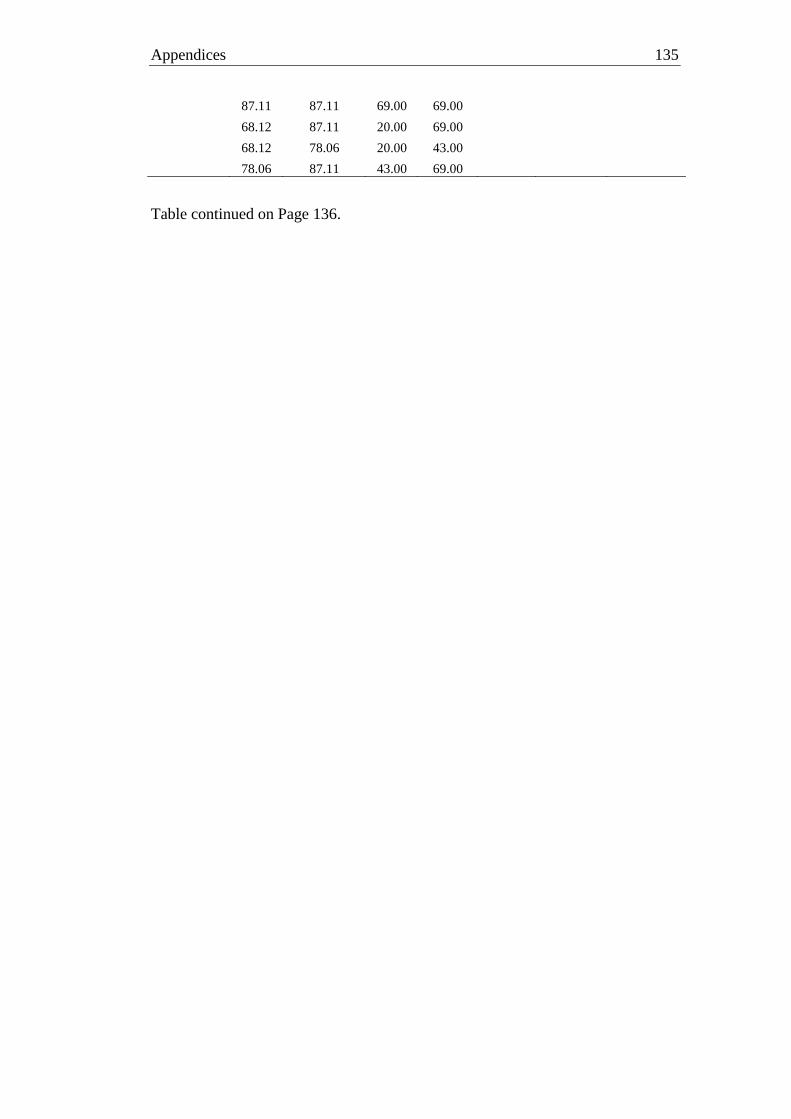
Appendices 135
87.11 87.11 69.00 69.00
68.12 87.11 20.00 69.00
68.12 78.06 20.00 43.00
78.06 87.11 43.00 69.00
Table continued on Page 136.

Appendices 136
Product
Attribute: Sample
Overall
LAM
average for
all
attributes
OHPP
Tip Top™
Vanilla Ice
Cream
Rank1 Rank2 T1 T2
67.89 78.60 3.00 6.00 15 40 Total Rank
63.67 80.92 1.00 8.00 67.89 80.92 Median
71.39 80.01 5.00 7.00 5.00 5.00 n1, n2
65.75 81.57 2.00 10.00
25.0 U1
69.48 81.03 4.00 9.00
0.0 U2
0.0 U
27.5 E(U1)
27.5 E(U2)
12.5 E(U)
4.7871355 s
18.117387 Action(L)
36.882613 Action(U)
0.05 a
2.6111648 z
9.02E-03 p
Reject Null Hypothesis
at alpha=0.05

Related Documents