Development of a force-resultant model for spudcan footings on loose sand under combined loads Cheng, N., & Cassidy, M. J. (2016). Development of a force-resultant model for spudcan footings on loose sand under combined loads. Canadian Geotechnical Journal, 53(12), 2014-2029. DOI: 10.1139/cgj-2015- 0597 Published in: Canadian Geotechnical Journal DOI: 10.1139/cgj-2015-0597 Document Version Peer reviewed version Link to publication in the UWA Research Repository General rights Copyright owners retain the copyright for their material stored in the UWA Research Repository. The University grants no end-user rights beyond those which are provided by the Australian Copyright Act 1968. Users may make use of the material in the Repository providing due attribution is given and the use is in accordance with the Copyright Act 1968. Take down policy If you believe this document infringes copyright, raise a complaint by contacting [email protected]. The document will be immediately withdrawn from public access while the complaint is being investigated. Download date: 16. Jun. 2018

Welcome message from author
This document is posted to help you gain knowledge. Please leave a comment to let me know what you think about it! Share it to your friends and learn new things together.
Transcript
Development of a force-resultant model for spudcan footingson loose sand under combined loadsCheng, N., & Cassidy, M. J. (2016). Development of a force-resultant model for spudcan footings on loosesand under combined loads. Canadian Geotechnical Journal, 53(12), 2014-2029. DOI: 10.1139/cgj-2015-0597
Published in:Canadian Geotechnical Journal
DOI:10.1139/cgj-2015-0597
Document VersionPeer reviewed version
Link to publication in the UWA Research Repository
General rightsCopyright owners retain the copyright for their material stored in the UWA Research Repository. The University grants no end-userrights beyond those which are provided by the Australian Copyright Act 1968. Users may make use of the material in the Repositoryproviding due attribution is given and the use is in accordance with the Copyright Act 1968.
Take down policyIf you believe this document infringes copyright, raise a complaint by contacting [email protected]. The document will beimmediately withdrawn from public access while the complaint is being investigated.
Download date: 16. Jun. 2018

Development of a Force-resultant Model for Spudcan 1
Footings on Loose Sand under Combined Loads 2
3
Manuscript submitted to Canadian Geotechnical Journal on 30/11/2015 4
5
6
Ning Cheng (corresponding author) 7
Research Associate 8
9
Centre for Offshore Foundation Systems and ARC CoE for Geotechnical Science and Engineering 10
University of Western Australia 11
35 Stirling Highway, Crawley 12
Perth, WA 6009, Australia 13
Tel: +61 8 6488 3732 Fax: +61 8 6488 1044 14
Email: [email protected] 15
16
Mark Jason Cassidy 17
Australian Research Council Laureate Fellow 18
Lloyd’s Register Foundation Chair of Offshore Foundations 19
20
Centre for Offshore Foundation Systems and ARC CoE for Geotechnical Science and Engineering 21
University of Western Australia 22
35 Stirling Highway, Crawley 23
Perth, WA 6009, Australia 24
Tel: +61 8 6488 3732 Fax: +61 8 6488 1044 25
Email: [email protected] 26
27
28
29
30
Submitted as a Paper 31
Words: 5544 32
Figures: 21 33
Tables: 534
Page 1 of 32C
an. G
eote
ch. J
. Dow
nloa
ded
from
ww
w.n
rcre
sear
chpr
ess.
com
by
Uni
vers
ity o
f W
este
rn A
ustr
alia
on
09/2
6/16
For
pers
onal
use
onl
y. T
his
Just
-IN
man
uscr
ipt i
s th
e ac
cept
ed m
anus
crip
t pri
or to
cop
y ed
iting
and
pag
e co
mpo
sitio
n. I
t may
dif
fer
from
the
fina
l off
icia
l ver
sion
of
reco
rd.

Development of a Force-resultant Model for Spudcan 35
Footings on Loose Sand under Combined Loads 36
Ning Cheng and Mark Jason Cassidy 37
Abstract 38
Spudcans are typical foundations used in shallow to moderate water oil and gas fields to support jack-39
up drilling units. Understanding the behaviour of spudcans under combined loadings is crucial to the 40
overall response of the jack-up structure. This paper presents the development of a strain-hardening 41
plasticity model for spudcan footing on loose sand. Most of the model components are developed 42
from direct centrifuge observations. The centrifuge tests were performed at an acceleration of 100 43
times that of the Earth’s gravity on a model spudcan footing subjected to combined vertical, 44
horizontal and moment loads. All the experiments have been designed and conducted to allow the 45
results to be interpreted with a strain-hardening plasticity framework. Combined loads were applied 46
by using a novel apparatus, which enables independent vertical, horizontal and rotational movements 47
of the footing. Test results also revealed the existence of a three dimensional sliding surface that 48
intersects with the conventional yield surface. This additional surface has been defined analytically. 49
Retrospective simulation of the experimental data using the plasticity model confirms the model’s 50
capability for the use in predicting the behaviour of larger spudcan applications offshore. 51
Keywords: Offshore Engineering, Centrifuge test, Force-resultant model 52
Introduction 53
Jack-ups are dynamically sensitive structures whose load response is dependent on the stiffness of 54
their large spudcan footings. Spudcans are roughly circular in plan with a sharp protruding spigot to 55
provide extra horizontal stability and to minimise lateral movement in the soil. Jack-ups perform 56
drilling in water depths of up to 120 m. At such depths, the magnitude of wind, wave and current 57
loads acting on the hull and three legs are substantial and cause large horizontal ( )H and moment ( )M58
loads on the spudcan as well as changes in the vertical ( )V . Understanding the bearing capacities of 59
these combined VHM loads is essential during the design of jack-up and during their site specific 60
assessments (see ISO (2012)). Many studies have been conducted in the field of spudcan footings in 61
an effort to understand their behaviour under combined VHM loadings (Noble Denton & Associates 62
1987; Schotman 1989; Osborne et al. 1991; Byrne and Houlsby 1999; Gottardi et al. 1999; Martin and 63
Houlsby 2000; Byrne and Houlsby 2001; Martin and Houlsby 2001; Cassidy et al. 2002a; Houlsby 64
and Cassidy 2002; Cassidy et al. 2004; Bienen et al. 2006; Zhang et al. 2011). 65
Page 2 of 32C
an. G
eote
ch. J
. Dow
nloa
ded
from
ww
w.n
rcre
sear
chpr
ess.
com
by
Uni
vers
ity o
f W
este
rn A
ustr
alia
on
09/2
6/16
For
pers
onal
use
onl
y. T
his
Just
-IN
man
uscr
ipt i
s th
e ac
cept
ed m
anus
crip
t pri
or to
cop
y ed
iting
and
pag
e co
mpo
sitio
n. I
t may
dif
fer
from
the
fina
l off
icia
l ver
sion
of
reco
rd.

Conventional bearing capacity equations for shallow foundations were initially described by Terzaghi 66
(1943) and subsequently extended by Meyerhof (1953) and Hansen (1970). These account for 67
inclined ( :V H ), eccentric loading ( :V M ) and various footing shapes by using a number of 68
empirical factors applied to the bearing capacity formula for vertical loading. As such, they are not 69
suitable for the direct inclusion in numerical analyses programmes of the complete jack-up structure. 70
Recently, the offshore industry has moved towards the use of plasticity-based force-resultant models 71
to describe the behaviour of shallow foundations, as they express the footing behaviour purely in 72
terms of force resultants and can be directly coupled to typical structural analysis software used in 73
industry. 74
A number of authors have proposed such models for strip footings (Nova and Montrasio 1991; 75
Gottardi and Butterfield 1993, 1995) and circular footings (Byrne and Houlsby 1999; Gottardi et al. 76
1999; Byrne and Houlsby 2001; Cassidy et al. 2002a; Houlsby and Cassidy 2002; Bienen et al. 2006) 77
on sand. The usual approach has been to assume a yield surface, a hardening law, a flow rule and an 78
elastic region within the yield surface. An example force-resultant model for describing drained 79
behaviour of circular footing in sand is known as Model C , a plasticity model developed by Houlsby 80
and Cassidy (2002). Model C was originally based on a series of 1- g experimental tests performed by 81
Gottardi et al. (1999) but has also been calibrated for calcareous sand (Cassidy et al. 2002a) and 82
extended to six-degrees-of-freedom loading conditions (Bienen et al. (2006). Its use in the pushover 83
analysis of jack-ups is shown in Bienen and Cassidy (2006), Bienen and Cassidy (2009) and Cassidy 84
et al. (2010). 85
The four major components associated with Model C are: 86
a) An empirical expression for the yield surface which separates the elastic and plastic boundary, 87
b) A model for the elastic load-displacement behaviour within the yield surface, 88
c) An empirical strain-hardening expression to define the expansion and contraction of the yield 89
surface with the plastic component of vertical displacement, 90
d) A suitable flow rule to allow for the prediction of the footing plastic displacements during 91
yield. 92
Further reference to Model C can be found in Houlsby and Cassidy (2002), Cassidy et al. (2002a), 93
Byrne and Houlsby (1999, 2001) and Bienen et al. (2006). Although there is considerable 94
experimental evidence to support those strain-hardening plasticity models, most of the components 95
were developed from small-scale model 1- g experiments. This paper addresses if these accurately 96
replicate the soil-stress strain relationship of the much larger prototype spudcan footing. 97
Page 3 of 32C
an. G
eote
ch. J
. Dow
nloa
ded
from
ww
w.n
rcre
sear
chpr
ess.
com
by
Uni
vers
ity o
f W
este
rn A
ustr
alia
on
09/2
6/16
For
pers
onal
use
onl
y. T
his
Just
-IN
man
uscr
ipt i
s th
e ac
cept
ed m
anus
crip
t pri
or to
cop
y ed
iting
and
pag
e co
mpo
sitio
n. I
t may
dif
fer
from
the
fina
l off
icia
l ver
sion
of
reco
rd.

In an attempt to ensure confidence when employing Model C in larger footings applications, Cassidy 98
(2007) verified components of Model C with centrifuge experiments on a flat circular footing. 99
Although, a similar yield surface shape was broadly observed, a complete VHM yield surface could 100
not be tested because only a fixed arm (pure horizontal translation) or a hinged arm (pure rotation) 101
were used (see details of the apparatus in Cassidy et al. (2004)). Subsequently, Bienen et al. (2007) 102
conducted a series of centrifuge tests, also on a shallow circular foundation on sand, but in this case 103
only in the vertical-torsional loading plane. Following the same theoretical framework of strain-104
hardening plasticity, Govoni et al. (2010, 2011) investigated circular footings resting on medium 105
dense silica sand subjected to combined vertical, moment and horizontal loading and compared results 106
to existing data obtained at 1- g . Special emphasis was given to the embedment effect. However, only 107
two specific load paths were investigated, as the same fixed and hinged arms were used in this 108
experiment as in Cassidy (2007). Cocjin and Kusakabe (2012) conducted a series of displacement 109
controlled vertical loading and swipe tests at various vertical load levels on a flat strip footing. The 110
study confirms that the deviatoric load capacity is highly dependent on the ratio of the vertical load 111
and vertical peak bearing capacity. However, only horizontal swipe tests were performed in their 112
study. 113
Although there is considerable experimental evidence from the small scale 1- g environment to 114
support the well-established strain-hardening plasticity models, no comprehensive centrifuge evidence, 115
to date, has been provided. This is because with only single or at the best two load paths, it is difficult 116
to establish any complete yield surface or flow rule in three dimensional space. Another restriction of 117
the previous studies is that the small-scale model being tested was a representative flat circular plate; 118
no model with an inverted conical spudcan shape has been studied. A summary of the major studies in 119
the framework of plasticity based force-resultant models is provided in Table 1. 120
Table 1 Comparison of the major studies publicly available concerning plasticity based force-resultant models 121
Footing type Sand type g
level VHM
load
paths
Yield
Surface
Flow
rule
Force-
resultant
model Flat
circular
Spudcan
Gottardi (1999) √ Very
dense
1 Full √ √
Byre & Houlsby (1999) √ Very
dense
1 Full √
Byrne & Houlsby
(2001) √ Carbonate 1 Full √
Houlsby & Cassidy
(2002) √ Very
dense
1 Full √ √ √
Cassidy (2002) √ Carbonate 1 Full √ √ √
Bienen (2006) √ Loose 1 Full √ √ √
Cassidy (2007) √ Loose 100 2
Govani (2010, 2011) √ Medium 100 2
Cojin & Kusakabe
(2012) √ Dense 50 1
Page 4 of 32C
an. G
eote
ch. J
. Dow
nloa
ded
from
ww
w.n
rcre
sear
chpr
ess.
com
by
Uni
vers
ity o
f W
este
rn A
ustr
alia
on
09/2
6/16
For
pers
onal
use
onl
y. T
his
Just
-IN
man
uscr
ipt i
s th
e ac
cept
ed m
anus
crip
t pri
or to
cop
y ed
iting
and
pag
e co
mpo
sitio
n. I
t may
dif
fer
from
the
fina
l off
icia
l ver
sion
of
reco
rd.

This study √ Loose 100 Full √ √ √
This paper details such a plasticity-based force-resultant model for spudcan footing on loose sand 122
with most of the model components developed from direct centrifuge observations. The experiments 123
were conducted at an acceleration of 100 times that of the Earth’s gravity in the drum centrifuge at the 124
University of Western Australia (UWA) and is the first comprehensive centrifuge programme 125
investigating spudcan behaviours on sand in all VHM load directions. 126
Experimental setup 127
The sign convention for the loads and displacements adopted in this study follow the standardised 128
convention system proposed by Butterfield et al. (1997) for combined loadings. Foundational loading 129
was applied by means of displacement-control to a load reference point (LRP). The LRP is located at 130
the centreline of the foundation at the mud line level. The load was described by horizontal translation 131
( u ), vertical translation ( w ) and rotation (θ ); positive sign conventions together with size dimensions 132
are shown in Fig. 1. 133
3 mm
60 mm
w
u
6 mm
6 mm
Seabed
LRP
LRP
H
MV
7°
θ
134
Fig. 1 Model dimensions and sign conventions for load and displacement 135
The experiments were conducted at the UWA drum centrifuge, which has a swinging platform at a 136
radius of 0.6 m and a maximum rotational speed of 850 rev/min. The drum centrifuge consists of a 137
central tool table, driven by a Dynaserv servo motor, and a channel for sample placement, which are 138
able to rotate differentially. This creates relative motion between the sample and any tool connected to 139
the actuator, situated within the tool table. The soil channel containment area has width of 300 mm 140
and a depth of 200 mm. Details of this drum centrifuge are provided by Stewart et al. (1998). 141
A recently developed VHM apparatus (Zhang et al. 2013) was used in the experiments. The 142
conventional drum centrifuge configuration only allowed for a setup direction perpendicular to the 143
Page 5 of 32C
an. G
eote
ch. J
. Dow
nloa
ded
from
ww
w.n
rcre
sear
chpr
ess.
com
by
Uni
vers
ity o
f W
este
rn A
ustr
alia
on
09/2
6/16
For
pers
onal
use
onl
y. T
his
Just
-IN
man
uscr
ipt i
s th
e ac
cept
ed m
anus
crip
t pri
or to
cop
y ed
iting
and
pag
e co
mpo
sitio
n. I
t may
dif
fer
from
the
fina
l off
icia
l ver
sion
of
reco
rd.

vertical and horizontal plane on the footing ( w and u , respectively), thus only two degree-of-freedom 144
movement was available, as shown in Fig. 2. A third degree-of-freedom movement was achieved, by 145
adding another actuator on top of the existing actuator and connected through linkage arms and hinges 146
(Fig. 3(c)). This enables the footing to also rotate in-plane. 147
u
w
Actuator
Actuator
Soi l channel
Foo
ting
148
Fig. 2 Schematic diagram for conventional actuators in drum centrifuge 149
The primary advantage of using this displacement controlled apparatus is the ability to apply any 150
combination of the displacement paths to the model footing using computer controlled actuators. This 151
series of movements were calculated in real time by a build-in-house programme developed with NI 152
LabVIEW interface (National Instrument Corporation 2003). More details of the apparatus used in 153
this experiment can be found in Zhang et al. (2013), Cheng et al. (2014) and Cheng and Cassidy 154
(2016). Photos showing the VHM apparatus incorporated in the drum centrifuge are presented in Fig. 155
3(a) and (b). 156
(a)
(b)
(c)
Fig. 3 Picture and schematic drawing of the VHM loading arm 157
Important features of the new VHM apparatus are: 158
Page 6 of 32C
an. G
eote
ch. J
. Dow
nloa
ded
from
ww
w.n
rcre
sear
chpr
ess.
com
by
Uni
vers
ity o
f W
este
rn A
ustr
alia
on
09/2
6/16
For
pers
onal
use
onl
y. T
his
Just
-IN
man
uscr
ipt i
s th
e ac
cept
ed m
anus
crip
t pri
or to
cop
y ed
iting
and
pag
e co
mpo
sitio
n. I
t may
dif
fer
from
the
fina
l off
icia
l ver
sion
of
reco
rd.

a) The new VHM apparatus can conduct any specified combination of vertical, horizontal and 159
rotational movement with speeds ranging from 0.1 mm/s to 3 mm/s. 160
b) The new VHM apparatus has been equipped with modern inflight computers to ensure the 161
highest possible accuracy along with the minimum systematic lag. This is particularly 162
important for tests involving sequential movements, such as the swipe tests described in this 163
paper. 164
c) The new VHM apparatus has been retrofitted with enhanced mechanical systems. This 165
ensures the apparatus can be safely used in high stress testing environment so it is adaptable 166
to any soil. 167
Soil characterisation 168
The soil used in this study was a superfine silica sand used in numerous UWA studies. The physical 169
properties of the sand are listed in Table 2 (Cassidy and Cheong 2005). 170
Table 2. Soil properties of sand used in test 171
Dry unit weight (kN/m3)
Particle size, 50D ,
10D ,20D : mm 0.19, 0.099, 0.135
Minimum dry density, minρ : kg/m3 1517
Maximum dry density, maxρ : kg/m3 1829
Maximum maxe 0.75
Minimum mine 0.53
Specific gravity, SG 2.65
Critical-state frictional angle: degrees 31
The sand sample was prepared using a rotating actuator to rain the silica sand into the rotating outer 172
channel of the drum centrifuge. The sample height was 140 mm and remained saturated with 20 mm 173
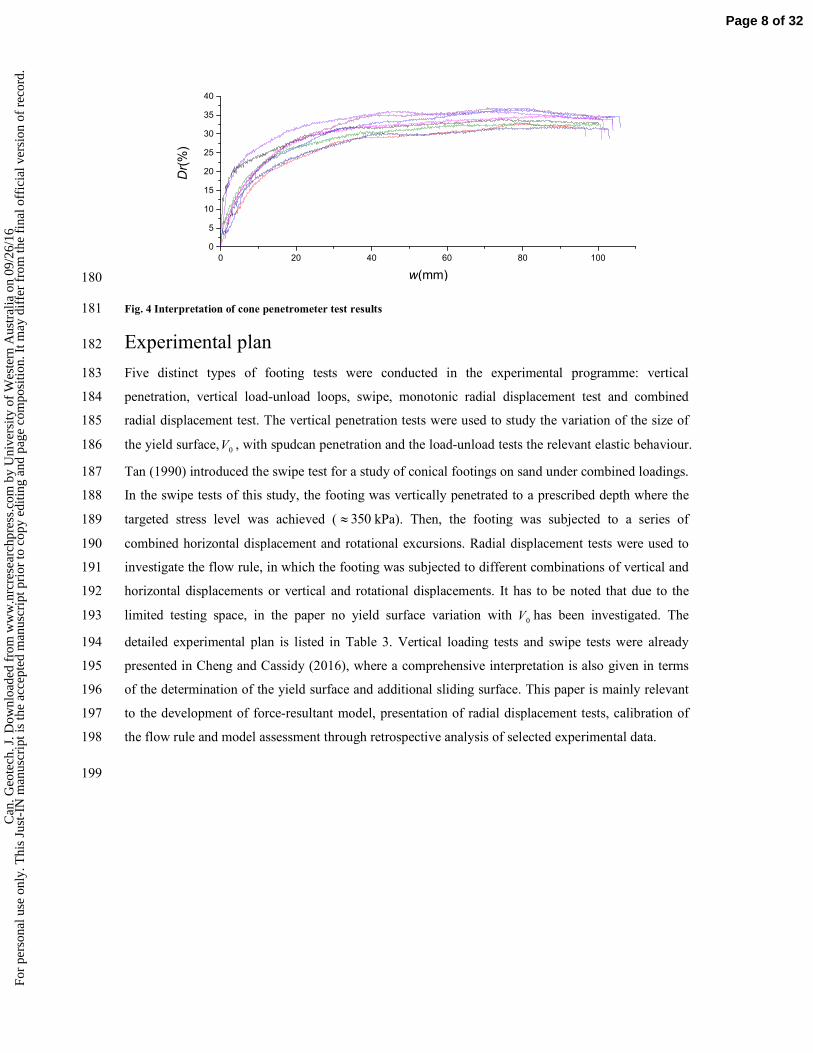
water above the surface throughout the test. A consistent relative density of 30-35% was interpreted 174
from 8 cone penetrometer tests (Fig. 4) using the procedure of Schneider and Lehane (2006) where 175
100250
d
QR = (1), 176
and where ( )c V VQ q σ σ ′= − ,cq is the cone tip resistance,
Vσ and Vσ ′ are the current total and 177
effective stress levels respectively. 178
179
Page 7 of 32C
an. G
eote
ch. J
. Dow
nloa
ded
from
ww
w.n
rcre
sear
chpr
ess.
com
by
Uni
vers
ity o
f W
este
rn A
ustr
alia
on
09/2
6/16
For
pers
onal
use
onl
y. T
his
Just
-IN
man
uscr
ipt i
s th
e ac
cept
ed m
anus
crip
t pri
or to
cop
y ed
iting
and
pag
e co
mpo
sitio
n. I
t may
dif
fer
from
the
fina
l off
icia
l ver
sion
of
reco
rd.
0 20 40 60 80 100
0
5
10
15
20
25
30
35
40
Dr(%)
w(mm) 180
Fig. 4 Interpretation of cone penetrometer test results 181
Experimental plan 182
Five distinct types of footing tests were conducted in the experimental programme: vertical 183
penetration, vertical load-unload loops, swipe, monotonic radial displacement test and combined 184
radial displacement test. The vertical penetration tests were used to study the variation of the size of 185
the yield surface,0V , with spudcan penetration and the load-unload tests the relevant elastic behaviour. 186
Tan (1990) introduced the swipe test for a study of conical footings on sand under combined loadings. 187
In the swipe tests of this study, the footing was vertically penetrated to a prescribed depth where the 188
targeted stress level was achieved ( 350≈ kPa). Then, the footing was subjected to a series of 189
combined horizontal displacement and rotational excursions. Radial displacement tests were used to 190
investigate the flow rule, in which the footing was subjected to different combinations of vertical and 191
horizontal displacements or vertical and rotational displacements. It has to be noted that due to the 192
limited testing space, in the paper no yield surface variation with 0V has been investigated. The 193
detailed experimental plan is listed in Table 3. Vertical loading tests and swipe tests were already 194
presented in Cheng and Cassidy (2016), where a comprehensive interpretation is also given in terms 195
of the determination of the yield surface and additional sliding surface. This paper is mainly relevant 196
to the development of force-resultant model, presentation of radial displacement tests, calibration of 197
the flow rule and model assessment through retrospective analysis of selected experimental data. 198
199
Page 8 of 32C
an. G
eote
ch. J
. Dow
nloa
ded
from
ww
w.n
rcre
sear
chpr
ess.
com
by
Uni
vers
ity o
f W
este
rn A
ustr
alia
on
09/2
6/16
For
pers
onal
use
onl
y. T
his
Just
-IN
man
uscr
ipt i
s th
e ac
cept
ed m
anus
crip
t pri
or to
cop
y ed
iting
and
pag
e co
mpo
sitio
n. I
t may
dif
fer
from
the
fina
l off
icia
l ver
sion
of
reco
rd.

Table 3 Details of the experimental plan 200
Test type Test name
V (N) /V A
(kPa) 2u Rθ w
(mm) u
(mm) θ
(Radians)
Figures
Vertical
penetration
SVP1 4434 1568 - 25.8 - - Fig.5
Load-unload
loops
SVP2 3810 1348 - 19.8 - - Fig.5
Swipe tests1
SW1 1287 455 ∞ 9 0 Fig. 6-11
SW2 966 342 0.531 5 0.157
SW3 1150 407 0.095 0.9 0.157
SW4 903 319 -0.095 -0.9 0.157
SW5 1047 370 -0.286 -2.7 0.157
SW6 1035 366 -0.572 -5.4 0.157
SW7 1197 423 -1.145 -9 0.131
Monotonic
Radial
displacement
tests
RD1 1822 644 - 15 15 - Fig. 14,15
RD2 2385 843 - 15 4.5 -
RD3 2152 761 - 15 9 -
RD4 1654 585 - 8.5 - 0.148
RD5 748 265 - 4.5 - 0.157
RD6 3240 1146 - 17.7 - 0.154
Combined
radial displacement
tests
RD7 1128 399 0.102 9 9 0.157 Fig. 14,15
RD8 1793 634 0.971 12 6 0.105
1. Swipe test results also reported in Cheng and Cassidy (2016) 201
Results and discussion 202
In the following section, the results from the experiments are described with respect to the four major 203
components required for the strain-hardening plasticity model. 204
Hardening law 205
The strain-hardening expression, known as the hardening law, is used to define the variation of the 206
size of the yield surface. For most shallow foundation models, the size of the yield surface is 207
reasonably deemed as a function of the plastic component of the vertical displacement (Gottardi et al. 208
1999; Byrne and Houlsby 2001; Cassidy et al. 2002a; Houlsby and Cassidy 2002). One of the key 209
assumption of the strain-hardening plasticity theory is that when the footing is pushed into soil, the 210
shape of the yield surface is assumed constant; however, the size expands with the amount of plastic 211
vertical displacement ( pw ). Shown in Fig. 5 are the vertical loading response of two vertical loading 212
tests SVP1 and SVP2 which show consistency in the experimental programme. From the unload-213
reload loops of SVP2 an average elastic stiffness VK was established as 2.4 kN/mm. The stiffness of 214
the loading system was taken into consideration through a correction process. In this process, 215
additional plastic penetration can be calculated for a given change in vertical load and measured 216
Page 9 of 32C
an. G
eote
ch. J
. Dow
nloa
ded
from
ww
w.n
rcre
sear
chpr
ess.
com
by
Uni
vers
ity o
f W
este
rn A
ustr
alia
on
09/2
6/16
For
pers
onal
use
onl
y. T
his
Just
-IN
man
uscr
ipt i
s th
e ac
cept
ed m
anus
crip
t pri
or to
cop
y ed
iting
and
pag
e co
mpo
sitio
n. I
t may
dif
fer
from
the
fina
l off
icia
l ver
sion
of
reco
rd.

actual vertical displacement. If the form of the hardening law is known (such as Equation (2)), then a 217
correction can be applied to update 0V from its value at the beginning of the test. 218
0 5 10 15 20 25 30
0
500
1000
1500
2000
2500
3000
3500
4000
4500
5000
SVP2
SVP1V(N
)
w(mm)
0.00 0.08 0.17 0.25 0.33 0.42 0.50
0
177
354
531
707
884
1061
1238
1415
1592
1768
V/A(kPa)
w/2R
Swipe area
219
Fig. 5 Vertical penetration and load-unload loops 220
An empirical strain-hardening expression is used to define the expansion and contraction of the yield 221
surface with the plastic component of vertical displacement. With the elastic vertical displacements 222
removed, a function previously used to fit carbonate sand experimental data (Cassidy et al. 2002a) 223
was again used here to fit a hardening law: 224
2
2
0
1
p p
p
cw k wV
k w
+=
+ (2). 225
The best fit model parameters are found to be 278c = N, 1 0.15k = mm, 2 0.04k = N/mm. No special 226
significance is attached to this equation except that it represents a good fit to the vertical load-227
penetration response. Alternative expressions could also be appropriate. 228
Elastic stiffness 229
Increments within the yield surface are assumed to be elastic and follow: 230
0 0
/ 2 2 0 2
0
V
M C
C H
dV k dw
dM R GR k k Rd
dH k k du
θ =
(3), 231
where G is a representative elastic shear modulus and Vk , Mk ,
Hk , Ck are dimensionless elastic 232
constants for elastic behaviour within the yield surface, and ( dV , dM , dH ) and ( dw , dθ , du ) 233
Page 10 of 32C
an. G
eote
ch. J
. Dow
nloa
ded
from
ww
w.n
rcre
sear
chpr
ess.
com
by
Uni
vers
ity o
f W
este
rn A
ustr
alia
on
09/2
6/16
For
pers
onal
use
onl
y. T
his
Just
-IN
man
uscr
ipt i
s th
e ac
cept
ed m
anus
crip
t pri
or to
cop
y ed
iting
and
pag
e co
mpo
sitio
n. I
t may
dif
fer
from
the
fina
l off
icia
l ver
sion
of
reco
rd.

vectors of incremental load and displacement respectively. The elastic coefficients have been defined 234
using finite element methods by Bell (1991), Ngo-Tran (1996) and Doherty and Deeks (2003), and 235
appropriate values for circular foundations, as listed in Doherty and Deeks (2003) are: 236
Vk = 2.904; Mk = 0.548;
Hk = 2.901; Ck = -0.208. 237
The shear modulus G was estimated by the following formula, suggested by Houlsby and Cassidy 238
(2002): 239
G Vg
Aa ap p= (4), 240
whereap is atmospheric pressure, V is a representative vertical load on the foundation, Ais the plan 241
area of the foundation and g is a dimensionless constant. This latter value of g can be back calculated 242
from the unload-reload test SVP2 as 44.2 (representing an average G of 13.8 N/mm2 and Vk = 2.904). 243
Without measured data of the stiffness Cassidy et al. (2002b) recommend a g value of approximately 244
400 for practical offshore conditions. 245
Yield surface 246
Following Tan (1990) and Martin and Houlsby (2000), swipe tests were used to explore the yield 247
surface shape. Fig. 6 shows the recorded load path of swipe test SW2 with 2 :M R H ≈1.5 in three-248
dimensional space and its projected view in corresponding the :V H , : 2V M R and : 2H M R249
planes. The colour bar in Fig. 6(a) represents the 2 :M R H ratio on each test point; as shown in the 250
figure, despite some changes occurring at the initial stage, the 2M RH ratio is consistent throughout 251
the test. Another interesting trend that can be observed from Fig. 6 (d) is the sliding failure 252
mechanism occurred at the 0V V ≈0.25 where the horizontal force continued to increase while 253
moment load kept constant. This behaviour was not observed from previous centrifuge studies when 254
only the horizontal displacement path was applied. 255
256
Page 11 of 32C
an. G
eote
ch. J
. Dow
nloa
ded
from
ww
w.n
rcre
sear
chpr
ess.
com
by
Uni
vers
ity o
f W
este
rn A
ustr
alia
on
09/2
6/16
For
pers
onal
use
onl
y. T
his
Just
-IN
man
uscr
ipt i
s th
e ac
cept
ed m
anus
crip
t pri
or to
cop
y ed
iting
and
pag
e co
mpo
sitio
n. I
t may
dif
fer
from
the
fina
l off
icia
l ver
sion
of
reco
rd.
0.2 0.3 0.4 0.5 0.6 0.7 0.8 0.9 1.0 1.1
-0.02
0.00
0.02
0.04
0.06
0.08
0.10
M/2RV0
V/V0
(c)
-0.02 0.00 0.02 0.04 0.06 0.08
-0.02
0.00
0.02
0.04
0.06
0.08
0.10
M/2RV0
H/V0
(b)
0.2 0.3 0.4 0.5 0.6 0.7 0.8 0.9 1.0 1.1
-0.02
0.00
0.02
0.04
0.06
0.08
H/V
0
V/V0
(d)
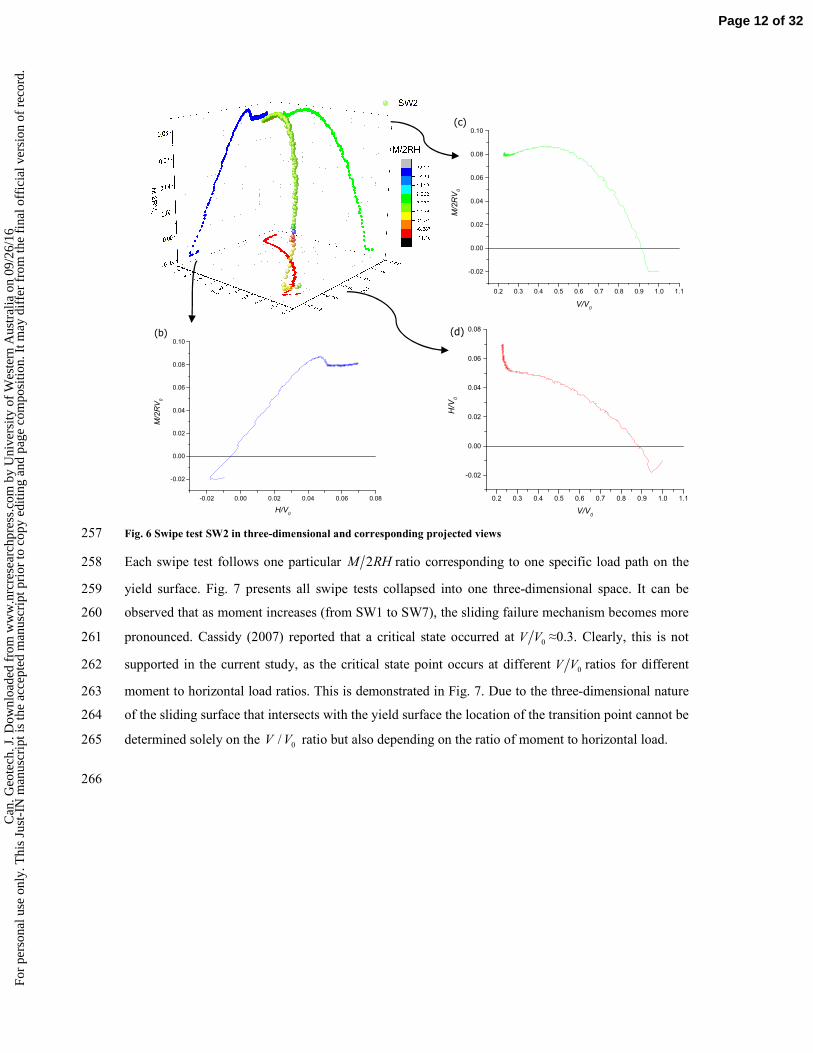
Fig. 6 Swipe test SW2 in three-dimensional and corresponding projected views 257
Each swipe test follows one particular 2M RH ratio corresponding to one specific load path on the 258
yield surface. Fig. 7 presents all swipe tests collapsed into one three-dimensional space. It can be 259
observed that as moment increases (from SW1 to SW7), the sliding failure mechanism becomes more 260
pronounced. Cassidy (2007) reported that a critical state occurred at 0V V ≈0.3. Clearly, this is not 261
supported in the current study, as the critical state point occurs at different 0V V ratios for different 262
moment to horizontal load ratios. This is demonstrated in Fig. 7. Due to the three-dimensional nature 263
of the sliding surface that intersects with the yield surface the location of the transition point cannot be 264
determined solely on the 0/V V ratio but also depending on the ratio of moment to horizontal load. 265
266
Page 12 of 32C
an. G
eote
ch. J
. Dow
nloa
ded
from
ww
w.n
rcre
sear
chpr
ess.
com
by
Uni
vers
ity o
f W
este
rn A
ustr
alia
on
09/2
6/16
For
pers
onal
use
onl
y. T
his
Just
-IN
man
uscr
ipt i
s th
e ac
cept
ed m
anus
crip
t pri
or to
cop
y ed
iting
and
pag
e co
mpo
sitio
n. I
t may
dif
fer
from
the
fina
l off
icia
l ver
sion
of
reco
rd.
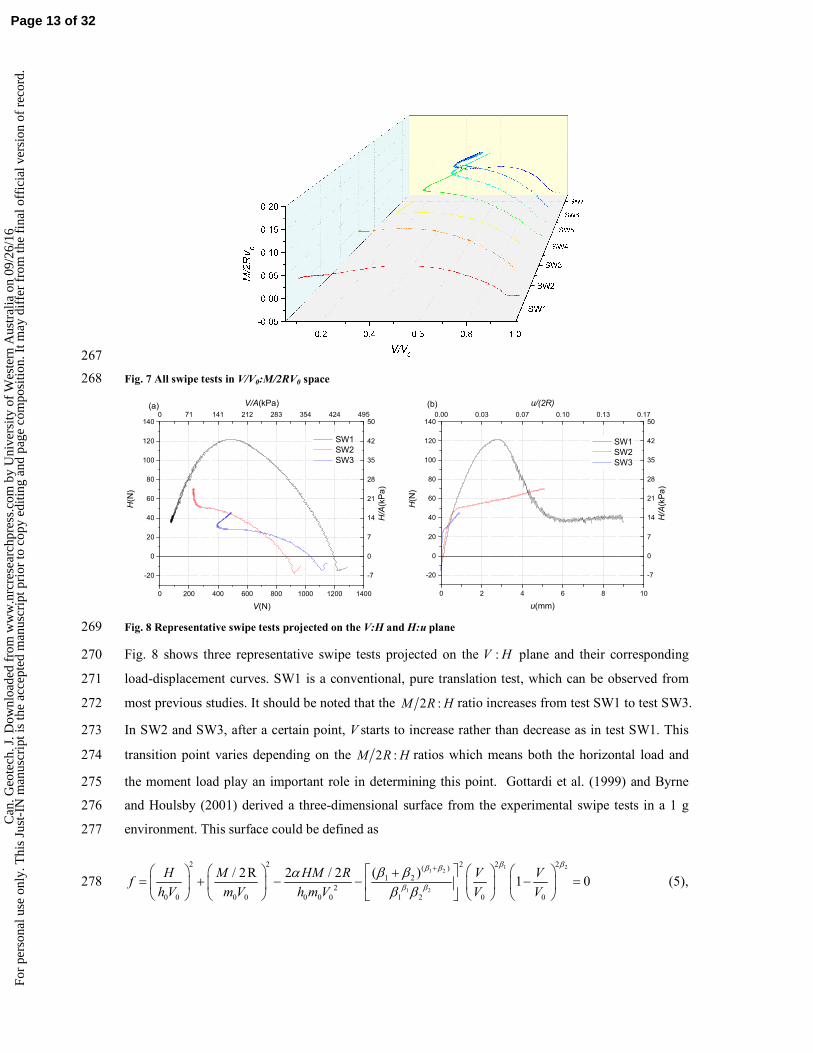
267
Fig. 7 All swipe tests in V/V0:M/2RV0 space 268
0 200 400 600 800 1000 1200 1400
-20
0
20
40
60
80
100
120
140
H(N
)
V(N)
SW1
SW2
SW3
(a)0 71 141 212 283 354 424 495
-7
0
7
14
21
28
35
42
50
H/A(kPa)
V/A(kPa)
0 2 4 6 8 10
-20
0
20
40
60
80
100
120
140
H(N
)
u(mm)
SW1
SW2
SW3
(b)
0.00 0.03 0.07 0.10 0.13 0.17
-7
0
7
14
21
28
35
42
50
H/A(kPa)
u/(2R)
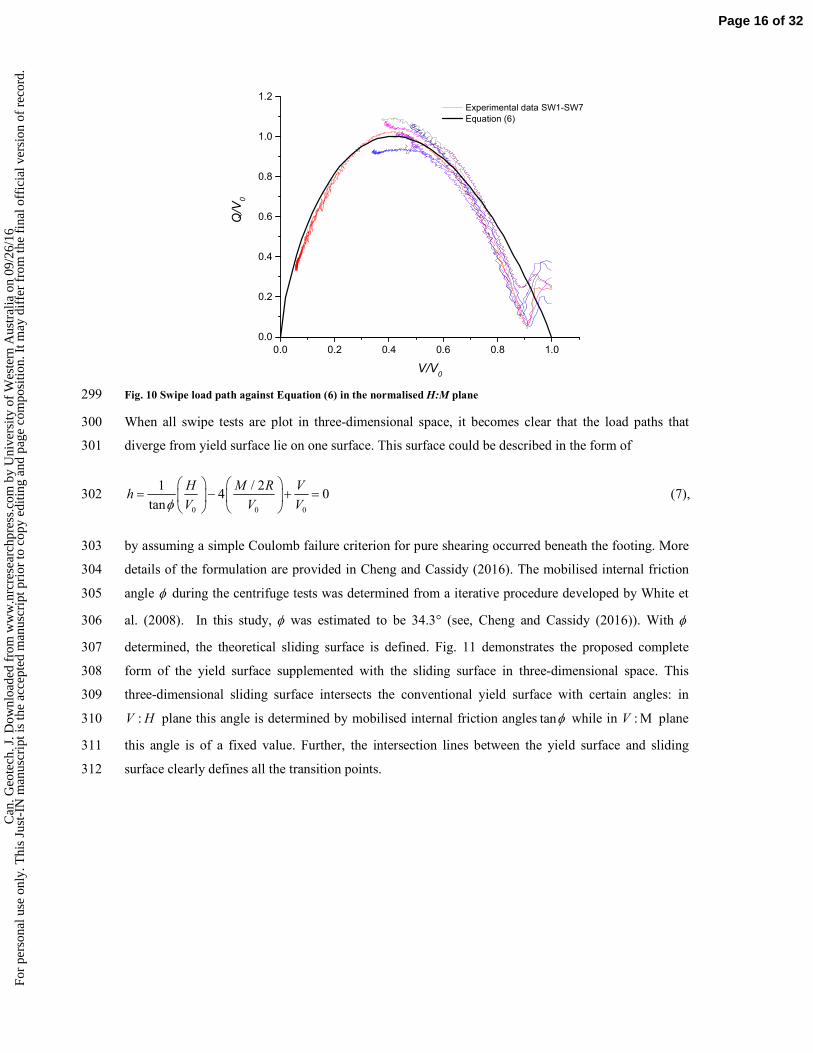
Fig. 8 Representative swipe tests projected on the V:H and H:u plane 269
Fig. 8 shows three representative swipe tests projected on the :V H plane and their corresponding 270
load-displacement curves. SW1 is a conventional, pure translation test, which can be observed from 271
most previous studies. It should be noted that the 2 :M R H ratio increases from test SW1 to test SW3. 272
In SW2 and SW3, after a certain point, V starts to increase rather than decrease as in test SW1. This 273
transition point varies depending on the 2 :M R H ratios which means both the horizontal load and 274
the moment load play an important role in determining this point. Gottardi et al. (1999) and Byrne 275
and Houlsby (2001) derived a three-dimensional surface from the experimental swipe tests in a 1 g 276
environment. This surface could be defined as 277
1 21 2
1 2
2 2 2 22( )
1 2
2
0 0 0 0 0 0 0 1 2 0 0
( )/ 2R 2 / 21 0
H M HM R V Vf
h V m V h m V V V
β ββ β
β β
β βαβ β
+ += + − − − =
(5), 278
Page 13 of 32C
an. G
eote
ch. J
. Dow
nloa
ded
from
ww
w.n
rcre
sear
chpr
ess.
com
by
Uni
vers
ity o
f W
este
rn A
ustr
alia
on
09/2
6/16
For
pers
onal
use
onl
y. T
his
Just
-IN
man
uscr
ipt i
s th
e ac
cept
ed m
anus
crip
t pri
or to
cop
y ed
iting
and
pag
e co
mpo
sitio
n. I
t may
dif
fer
from
the
fina
l off
icia
l ver
sion
of
reco
rd.

where 0V denoted reference vertical load and representing the apex of the yield surface determined by 279
the hardening law such as Equation (1). Parameters h0 and m0 define the extent of the yield surface in 280
the moment and horizontal directions respectively. The shape factorsα effects the eccentricity of the 281
elliptical cross-section of the yield envelope in the : 2H M R plane. The factors 1β and 2β determine 282
the position of the maximum size of the elliptical section between 2 0 1 2/ ( )V Vβ β β= + and 0 / 2V V=283
(Nova and Montrasio 1991). Previous studies have established various sets of parameters for flat 284
circular footing on sand. For comparison, those parameters are listed in Table 4 along with the 285
parameters identified in the current study (through linear least squares fitting). 286
Table 4. Comparison of yield surface shape parameters 287
Byrne and
Houlsby (2001)
Houlsby and
Cassidy (2002)
Bienen et al.
(2006)
This study
0h 0.154 0.116 0.122 0.113
0m 0.094 0.086 0.094 0.096
α -0.25 -0.2 -0.25 -0.248
1β 0.82 0.90 0.76 0.71
2β 0.82 0.99 0.76 0.99
Sand
type
Carbonate Very dense Very loose Loose
g level 1 1 1 100
Fig. 9 shows a great consistency of these parameters when compared to the experimental data and the 288
proposed yield surface normalised in the : 2H M R plane. 289
290
Page 14 of 32C
an. G
eote
ch. J
. Dow
nloa
ded
from
ww
w.n
rcre
sear
chpr
ess.
com
by
Uni
vers
ity o
f W
este
rn A
ustr
alia
on
09/2
6/16
For
pers
onal
use
onl
y. T
his
Just
-IN
man
uscr
ipt i
s th
e ac
cept
ed m
anus
crip
t pri
or to
cop
y ed
iting
and
pag
e co
mpo
sitio
n. I
t may
dif
fer
from
the
fina
l off
icia
l ver
sion
of
reco
rd.

-0.20 -0.15 -0.10 -0.05 0.00 0.05 0.10 0.15 0.20
-0.20
-0.15
-0.10
-0.05
0.00
0.05
0.10
0.15
0.20
SW7
SW6
SW5 SW4
SW3
Exp. data with V/V0= 0.5
Exp. data with V/V0= 0.7
Exp. data with V/V0= 0.8
Eqn (5) with V/V0=0.5
Eqn (5) with V/V0=0.7
Eqn (5) with V/V0=0.8
M/2RV0
H/V0
SW2
SW1
V/V0= 0.5
V/V0= 0.7
V/V0= 0.8
291
Fig. 9 Comparison between the analytical VHM yield surface and the experimental data for swipe tests 292
The overall quality of the fitting was defined by introducing the quantity 293
2 2
2
0 0 0 0
/ 2 2 / 2H M R HM RQ
h m h m
α = + −
(6). 294
Fig. 10 shows the load paths of all swipe tests projected onto the normalised :V Q plane, validating the 295
best-fit parameters previously mentioned. It has to be noted that all the load paths that deviate from 296
the yield surface has been removed in this figure for data fitting purpose as Equation (6) was not 297
intended for describing sliding phenomena. 298
Page 15 of 32C
an. G
eote
ch. J
. Dow
nloa
ded
from
ww
w.n
rcre
sear
chpr
ess.
com
by
Uni
vers
ity o
f W
este
rn A
ustr
alia
on
09/2
6/16
For
pers
onal
use
onl
y. T
his
Just
-IN
man
uscr
ipt i
s th
e ac
cept
ed m
anus
crip
t pri
or to
cop
y ed
iting
and
pag
e co
mpo
sitio
n. I
t may
dif
fer
from
the
fina
l off
icia
l ver
sion
of
reco
rd.
0.0 0.2 0.4 0.6 0.8 1.0
0.0
0.2
0.4
0.6
0.8
1.0
1.2
Q/V
0
V/V0
Experimental data SW1-SW7
Equation (6)
Fig. 10 Swipe load path against Equation (6) in the normalised H:M plane 299
When all swipe tests are plot in three-dimensional space, it becomes clear that the load paths that 300
diverge from yield surface lie on one surface. This surface could be described in the form of 301
0 0 0
1 / 24 0
tan
H M R Vh
V V Vφ
= − + =
(7), 302
by assuming a simple Coulomb failure criterion for pure shearing occurred beneath the footing. More 303
details of the formulation are provided in Cheng and Cassidy (2016). The mobilised internal friction 304
angle φ during the centrifuge tests was determined from a iterative procedure developed by White et 305
al. (2008). In this study, φ was estimated to be 34.3° (see, Cheng and Cassidy (2016)). With φ 306
determined, the theoretical sliding surface is defined. Fig. 11 demonstrates the proposed complete 307
form of the yield surface supplemented with the sliding surface in three-dimensional space. This 308
three-dimensional sliding surface intersects the conventional yield surface with certain angles: in 309
:V H plane this angle is determined by mobilised internal friction angles tanφ while in : MV plane 310
this angle is of a fixed value. Further, the intersection lines between the yield surface and sliding 311
surface clearly defines all the transition points. 312
Page 16 of 32C
an. G
eote
ch. J
. Dow
nloa
ded
from
ww
w.n
rcre
sear
chpr
ess.
com
by
Uni
vers
ity o
f W
este
rn A
ustr
alia
on
09/2
6/16
For
pers
onal
use
onl
y. T
his
Just
-IN
man
uscr
ipt i
s th
e ac
cept
ed m
anus
crip
t pri
or to
cop
y ed
iting
and
pag
e co
mpo
sitio
n. I
t may
dif
fer
from
the
fina
l off
icia
l ver
sion
of
reco
rd.
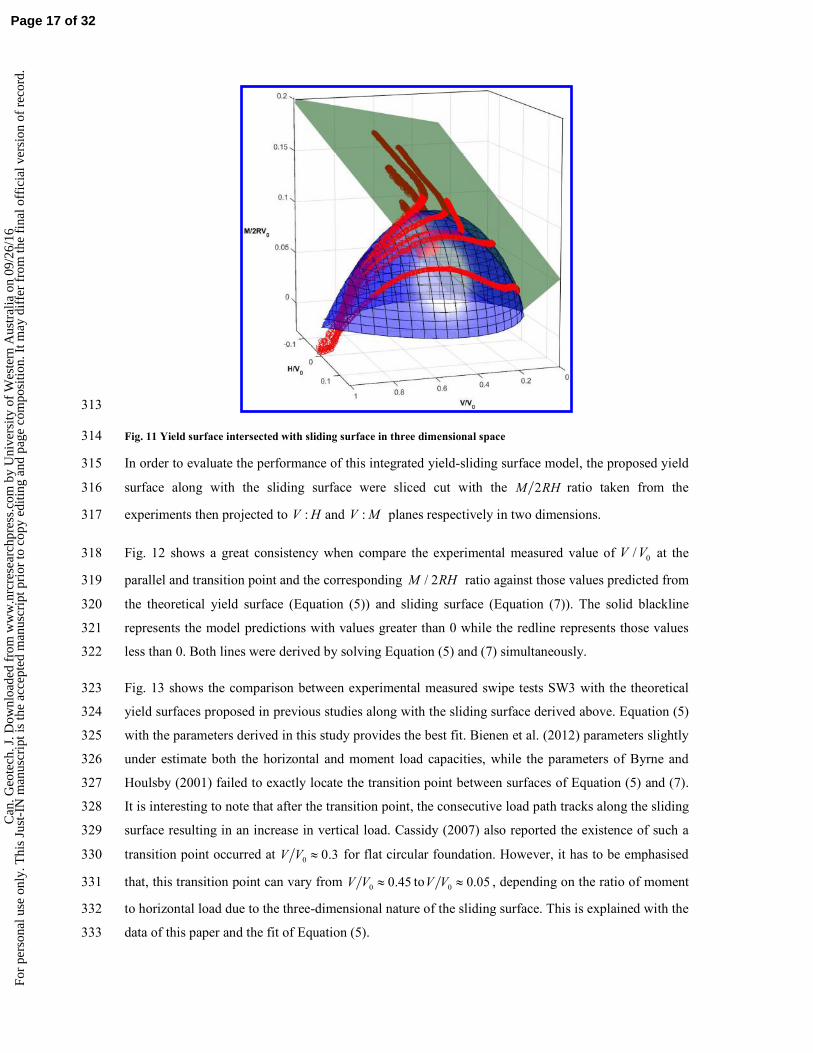
313
Fig. 11 Yield surface intersected with sliding surface in three dimensional space 314
In order to evaluate the performance of this integrated yield-sliding surface model, the proposed yield 315
surface along with the sliding surface were sliced cut with the 2M RH ratio taken from the 316
experiments then projected to :V H and :V M planes respectively in two dimensions. 317
Fig. 12 shows a great consistency when compare the experimental measured value of 0/V V at the 318
parallel and transition point and the corresponding / 2M RH ratio against those values predicted from 319
the theoretical yield surface (Equation (5)) and sliding surface (Equation (7)). The solid blackline 320
represents the model predictions with values greater than 0 while the redline represents those values 321
less than 0. Both lines were derived by solving Equation (5) and (7) simultaneously. 322
Fig. 13 shows the comparison between experimental measured swipe tests SW3 with the theoretical 323
yield surfaces proposed in previous studies along with the sliding surface derived above. Equation (5) 324
with the parameters derived in this study provides the best fit. Bienen et al. (2012) parameters slightly 325
under estimate both the horizontal and moment load capacities, while the parameters of Byrne and 326
Houlsby (2001) failed to exactly locate the transition point between surfaces of Equation (5) and (7). 327
It is interesting to note that after the transition point, the consecutive load path tracks along the sliding 328
surface resulting in an increase in vertical load. Cassidy (2007) also reported the existence of such a 329
transition point occurred at 0 0.3V V ≈ for flat circular foundation. However, it has to be emphasised 330
that, this transition point can vary from 0 0.45V V ≈ to
0 0.05V V ≈ , depending on the ratio of moment 331
to horizontal load due to the three-dimensional nature of the sliding surface. This is explained with the 332
data of this paper and the fit of Equation (5). 333
Page 17 of 32C
an. G
eote
ch. J
. Dow
nloa
ded
from
ww
w.n
rcre
sear
chpr
ess.
com
by
Uni
vers
ity o
f W
este
rn A
ustr
alia
on
09/2
6/16
For
pers
onal
use
onl
y. T
his
Just
-IN
man
uscr
ipt i
s th
e ac
cept
ed m
anus
crip
t pri
or to
cop
y ed
iting
and
pag
e co
mpo
sitio
n. I
t may
dif
fer
from
the
fina
l off
icia
l ver
sion
of
reco
rd.

-25 -20 -15 -10 -5 0 5
0.0
0.1
0.2
0.3
0.4
0.5
0.6
0.7 Experiment
Model prediction
V/V
0
M/2RH
sw1
sw2
sw3
sw4
sw5
sw6
sw7
334
Fig. 12 Comparison between the experimental measured V/V0 and M/2RH values and model predictions 335
(a)
0.0 0.2 0.4 0.6 0.8 1.0
-0.02
0.00
0.02
0.04
0.06
Experiment_SW3
Eqn (5) with this study's parameters
Eqn (5) with Bienen et al.(2006) parameters
Eqn (5) with Byrne and Houlsby (2001) parameters
Eqn (7)
H/V
0
V/V0
(b)
0.0 0.2 0.4 0.6 0.8 1.0
-0.05
0.00
0.05
0.10
0.15
Experiment_SW3
Eqn (5) with this study's parameters
Eqn (5) with Bienen et al.(2006) parameters
Eqn (5) with Byrne and Houlsby (2001) parameters
Eqn (7)
M/2RV0
V/V0
Fig. 13 Comparison between the experimental and theoretical yield surface and sliding surface 336
Flow rule 337
The prediction of footing displacement during yield requires a suitable flow rule. If the plastic flow 338
vectors are perpendicular to the yield surface, then associate flow is assumed. However, Gottardi et al. 339
(1999) found that for flat circular footings on sand the associated flow rule only models the ratios 340
between plastic displacements in the ( : 2H M R ) plane but not in the ( :V M ) or ( :V H ) planes. 341
Associated flow rule under-predicts the level of the vertical displacements in these deviatoric planes, 342
and this has been a consistent finding since, including in the experiments of Gottardi et al. (1999); 343
Houlsby and Cassidy (2002), and Bienen et al. (2006). Houlsby and Cassidy (2002) and Cassidy et al. 344
(2002a) defined a non-associated plastic potential based on the yield surface shape, but defined as 345
3 42 2 2 2
2
34
0 0 0 0 0 0 0 0 0
/ 2 2 / 21 0
' ' ' ' 'h m h m
H M R HM R V Vg
h V m V h m V V V
β βα
βα α α α
= + − − − =
(8), 346
Page 18 of 32C
an. G
eote
ch. J
. Dow
nloa
ded
from
ww
w.n
rcre
sear
chpr
ess.
com
by
Uni
vers
ity o
f W
este
rn A
ustr
alia
on
09/2
6/16
For
pers
onal
use
onl
y. T
his
Just
-IN
man
uscr
ipt i
s th
e ac
cept
ed m
anus
crip
t pri
or to
cop
y ed
iting
and
pag
e co
mpo
sitio
n. I
t may
dif
fer
from
the
fina
l off
icia
l ver
sion
of
reco
rd.
where 347
3 4( )
3 434 3 4
3 4
( )β β
β β
β ββ
β β
++= 348
wherehα and
mα are non-dimensional horizontal and moment “association” factors, and 0 'V is a 349
dummy parameter specifying the intersection of the plastic potential with the V -axis. The parameters 350
3β and 4β are chosen to allow for different variations in the curvature. If , 1h mα α = ,3 4 1β β= = , the 351
plastic potential coincides with the yield surface and an associated flow is implied. If hα and mα are 352
constant and equal, Equation (12) can be rewritten as 353
3 42 2 2 2
2 2
34
0 0 0 0 0 0 0 0 0
/ 2 2 / 21 0
' ' ' ' 'v
H M R HM R V Vg
h V m V h m V V V
β βα
α β
= + − − − =
(9). 354
where v h mα α α= = 355
As two different governing equations exist for describing yield surface (Equation (5)) and sliding 356
surface (Equation (7)), the load paths that were tracing two surfaces are divided into two sections and 357
were therefore analysed separately. If the associated assumption applies, according to plasticity theory 358
the ratio of plastic displacement to rotation on yield surface and sliding surface can be evaluated as 359
0(yield)
0
0
0
2
2 ( 2 )2
p
p
mH R M
u hf H
hR f M RM H R
m
αδ
δθ α
−∂ ∂
= =∂ ∂ −
(10), 360
and 361
(sliding)1
2 ( 2 ) 4 tan
p
p
u h H
R h M R
δ
δθ φ∂ ∂
= =∂ ∂ −
(11), 362
(a) (b)
Page 19 of 32C
an. G
eote
ch. J
. Dow
nloa
ded
from
ww
w.n
rcre
sear
chpr
ess.
com
by
Uni
vers
ity o
f W
este
rn A
ustr
alia
on
09/2
6/16
For
pers
onal
use
onl
y. T
his
Just
-IN
man
uscr
ipt i
s th
e ac
cept
ed m
anus
crip
t pri
or to
cop
y ed
iting
and
pag
e co
mpo
sitio
n. I
t may
dif
fer
from
the
fina
l off
icia
l ver
sion
of
reco
rd.

-1.5 -1.0 -0.5 0.0 0.5 1.0 1.5
-1.5
-1.0
-0.5
0.0
0.5
1.0
1.5
SW7
SW6 SW5
SW4
SW3
SW2
Associated
tan-1(H2R/M)
tan-1(δu
p/δθ
p2R)
SW1
-1.5 -1.0 -0.5 0.0 0.5 1.0 1.5
-1.5
-1.0
-0.5
0.0
0.5
1.0
1.5
SW7
SW6
SW5 SW4
Equation (12)
Associated
tan-1(H2R/M)
tan-1(δu
p/δθ
p2R)
SW3
Fig. 14 Plastic flow on the H:M plane for (a) yield surface and (b) sliding surface 363
Fig. 14(a) proves that associated flow is valid on yield surface in : 2H M R plane by plotting the 364
experimental measured plastic displacement ratios against the analytical flow rule predictions. 365
However a non-associated behaviour was observed on sliding surface as showing in Fig. 14(b). For 366
the benefit of future modelling requirements, a plastic potential characterising the flow rule on the 367
sliding surface was proposed through a modification made to Equation (7) as 368
2 2
0 0 0
1 / 24 0
tan ' ' '
H M R Vj
V V Vγ λ
φ
= − + =
(12). 369
Similarly, λ and γ are the non-dimensional “association” factor, and 0 'V is a dummy parameter. In 370
this study, the best fit non-dimensional association factors γ andλ were found to be tanφ and -0.5 371
respectively. This is shown in Fig. 14(b). 372
On the :V H and : / 2V M R planes, monotonic radial displacement tests were performed to evaluated 373
the flow rule. Further analysis of the experimental indicates that the associated assumption was not 374
supported in the deviatoric planes, therefore, Equation (9) can be further derived that 375
3
4
34
( 1)1
334 0
0 0 4 0
( ) 1 / '' ' '
v
g V V VV
V V V V
ββ
β βα β
β
− ∂
= − − ∂ (13), 376
4
1( 1)
2 2
0 0
4 0 0 0 0 0
1 ' / 2/ '
' ' 'm
g Q H eM Rh V
H V h V m V
β
β α
− ∂ = − ∂
(14), 377
4
1( 1)
2 2
0 0
4 0 0 0 0 0
1 ' / 2/ '
/ 2 ' ' 'm
m
g Q M R eHm V
M R V m V h V
β
αβ α
− ∂ = − ∂
(15), 378
Page 20 of 32C
an. G
eote
ch. J
. Dow
nloa
ded
from
ww
w.n
rcre
sear
chpr
ess.
com
by
Uni
vers
ity o
f W
este
rn A
ustr
alia
on
09/2
6/16
For
pers
onal
use
onl
y. T
his
Just
-IN
man
uscr
ipt i
s th
e ac
cept
ed m
anus
crip
t pri
or to
cop
y ed
iting
and
pag
e co
mpo
sitio
n. I
t may
dif
fer
from
the
fina
l off
icia
l ver
sion
of
reco
rd.

4 32 2
2 340 v 34
0 0
0 0
/( '/ ') / ( ) 1
/ ' '1
' '
p
p
q g Q V VQ V
V Vw g V V V
V V
β βδ ββ
α βδ
∂ ∂ = = − −
∂ ∂ −
(16), 379
3 4
3 4
( )
3 434
3 4
( )β β
β β
β ββ
β β
++= 380
where
2 2
'
0 0 0 0
/ 2 2 / 2
h m h m
H M R HM RQ
h m h m
αα α α α
= + −
(17). 381
Therefore, p pq wδ δ can be calculated.pqδ is the plastic displacement in the general deviator plane, 382
as defined in Equation (6). An optimization scheme was adopted here to numerically adjust the values 383
of v
α , 3
β and 4
β so that the difference between the predicted p pq wδ δ values and the experimental 384
measured p pq wδ δ values at a given Q V ratio was minimised. This is demonstrated in Fig. 15 as 385
the proposed non-associated flow rule represents most of the experimental data. The following values 386
were regarded as the best fit in this study: 2.7v
α = ,3
0.65β = ,4
0.65β = . 387
0 10 20 30 40 50 60 70 80 90
0
10
20
30
40
50
60
70
80
90Non-Associated flow
Associated flow
Non-associated flow
tan-1(Q/V)
tan-1(δq
p/δw
p)
Associated flow
0 5 10 15 20 25 30
0
20
40
60
80
tan-1(Q/V)
tan-1(δq
p/δw
p)
Associated flow
Non-associated flow
Fig. 15 Associated and best fit non-associated flow against the measured experimental data 388
389
Page 21 of 32C
an. G
eote
ch. J
. Dow
nloa
ded
from
ww
w.n
rcre
sear
chpr
ess.
com
by
Uni
vers
ity o
f W
este
rn A
ustr
alia
on
09/2
6/16
For
pers
onal
use
onl
y. T
his
Just
-IN
man
uscr
ipt i
s th
e ac
cept
ed m
anus
crip
t pri
or to
cop
y ed
iting
and
pag
e co
mpo
sitio
n. I
t may
dif
fer
from
the
fina
l off
icia
l ver
sion
of
reco
rd.

Table 5 Refined model parameters for Model C taking into account spudcan shape and high-g experiments of this study 390
Constant Dimension Explanation Typical values Notes
G F/L2 Representative shear modulus 13.8G = MN/m2 used in
simulation
Vk - Elastic stiffness factor (vertical) 2.904 As defined by (Doherty
and Deeks 2003) Hk - Elastic stiffness factor (horizontal) 2.901
Mk - Elastic stiffness factor (moment) 0.548
Ck - Elastic stiffness factor (horizontal/moment
coupling)
-0.208
0h - Dimension of yield surface (horizontal) 0.113 Maximum value of 0/H V
on 0M =
0m - Dimension of yield surface (moment) 0.096 Maximum value of
0/ 2M RV on 0H =
α - Eccentricity if yield surface -0.248
1β - Curvature factor for yield surface (low stress) 0.71 1 1.0β ≤ , 2 1.0β ≤
2β - Curvature factor for yield surface (high stress) 1
3β - Curvature factor for plastic potential (low stress) 0.65 3 1.0β ≤ , 4 1.0β ≤
4β - Curvature factor for plastic potential (high stress) 0.65
αv - Association factor(vertical) 2.7
c F Hardening law parameters 278 Fitted from experimental
data 1k L Hardening law parameters 0.15
2k F/L Hardening law parameters 0.04
Page 22 of 32C
an. G
eote
ch. J
. Dow
nloa
ded
from
ww
w.n
rcre
sear
chpr
ess.
com
by
Uni
vers
ity o
f W
este
rn A
ustr
alia
on
09/2
6/16
For
pers
onal
use
onl
y. T
his
Just
-IN
man
uscr
ipt i
s th
e ac
cept
ed m
anus
crip
t pri
or to
cop
y ed
iting
and
pag
e co
mpo
sitio
n. I
t may
dif
fer
from
the
fina
l off
icia
l ver
sion
of
reco
rd.

Retrospective analyses 391
The plasticity model of this study has been implemented into a FORTRAN programme to 392
demonstrate that the refined Model C can be numerically implemented and used to simulate footing 393
behaviours. To investigate the capacity of this programme to predict footing behaviour, numerical 394
back analysis was carried out for a number of representative experiments. 395
0 5 10 15 20
0
1000
2000
3000
4000V(N
)
w(mm)
SVP2 simulation
SVP2 experiment
396
Fig. 16 Comparison between experimental data from test SVP2 and programme prediction 397
Fig. 16 shows the experimental results for a vertical load-unload loop test, SVP2, compared with a 398
simulation of this test in which the measured displacement is taken as input, and the vertical load is 399
calculated. Model C with refined parameters produces a load that accurately represents the original 400
test, indicating that the chosen strain-hardening law and elastic stiffness are suitable. 401
402
Page 23 of 32C
an. G
eote
ch. J
. Dow
nloa
ded
from
ww
w.n
rcre
sear
chpr
ess.
com
by
Uni
vers
ity o
f W
este
rn A
ustr
alia
on
09/2
6/16
For
pers
onal
use
onl
y. T
his
Just
-IN
man
uscr
ipt i
s th
e ac
cept
ed m
anus
crip
t pri
or to
cop
y ed
iting
and
pag
e co
mpo
sitio
n. I
t may
dif
fer
from
the
fina
l off
icia
l ver
sion
of
reco
rd.

0 200 400 600 800 1000 1200
-20
-10
0
10
20
30
40
50
H(N
)
V(N)
SW3 simulation
SW3 experiment
0 71 141 212 283 354 424
-7.1
-3.5
0.0
3.5
7.1
10.6
14.1
17.7
H/A(kPa)
V/A(kPa)
0.0 0.2 0.4 0.6 0.8 1.0 1.2
-20
-10
0
10
20
30
40
50
H(N
)
u(mm)
SW3 simulation
SW3 experiment
0.000 0.003 0.007 0.010 0.013 0.017 0.020
-7.1
-3.5
0.0
3.5
7.1
10.6
14.1
17.7
H/A(kPa)
u/2R
0 200 400 600 800 1000 1200
-2
0
2
4
6
8
M/2R(N
)
V(N)
SW3 experiment
SW3 simulation
0 71 141 212 283 354 424
-0.7
0.0
0.7
1.4
2.1
2.8
M/2RA(kPa)
V/A(kPa)
0.00 0.02 0.04 0.06 0.08 0.10 0.12 0.14 0.16
-2
0
2
4
6
8
M/2R(N
)
θ(Radians)
SW3 simulation
SW3 experiment
0.0 1.2 2.4 3.6 4.8 6.0 7.2 8.4 9.6
-0.7
0.0
0.7
1.4
2.1
2.8
M/2RA(kPa)
θ2R
Fig. 17 Comparison between the experimental test, SW3, and the programme prediction 403
Fig. 17 represents a combined swipe test with / 2u Rθ =0.095 starting at 1100V N≈ (SW3). The 404
results are plotted in both the :V H and the :V M planes. In the numerical simulation, Model C is 405
load-controlled to 1100V N≈ and then displacement-controlled for the swipe. Model C simulates the 406
magnitude of the peak horizontal load adequately, reaching a value 28H N= , but the peak moment is 407
slightly overestimated. Model C locates the ‘parallel point’ perfectly in the :V H plane; however, it 408
again over- estimates in the :V M plane. The difference between the experimental tests and 409
simulation results in the early stage of the swipe test is due to a significant component of deviatoric 410
load developed during the vertical loading phase of the swipe tests. This deviatoric load is due to the 411
nature of displacement controlled test. Similar results can also be found in other studies, such as 412
Zhang et al. (2013). 413
414
Page 24 of 32C
an. G
eote
ch. J
. Dow
nloa
ded
from
ww
w.n
rcre
sear
chpr
ess.
com
by
Uni
vers
ity o
f W
este
rn A
ustr
alia
on
09/2
6/16
For
pers
onal
use
onl
y. T
his
Just
-IN
man
uscr
ipt i
s th
e ac
cept
ed m
anus
crip
t pri
or to
cop
y ed
iting
and
pag
e co
mpo
sitio
n. I
t may
dif
fer
from
the
fina
l off
icia
l ver
sion
of
reco
rd.

0 100 200 300 400 500 600 700 800 900 1000
-20
0
20
40
60
80
SW2 simulation
SW2 experiment
H(N
)
V(N)
0 71 141 212 283 354
-7.1
0.0
7.1
14.1
21.2
28.3
H/A(kPa)
V/A(kPa)
0 1 2 3 4 5 6
-20
0
20
40
60
80
H(N
)
u(mm)
SW2 simulation
SW2 experiment
0.00 0.02 0.03 0.05 0.07 0.08 0.10
-7.1
0.0
7.1
14.1
21.2
28.3
H/A(kPa)
u/2R
0 100 200 300 400 500 600 700 800 900 1000
-2
-1
0
1
2
3
4
5
M/2RA(kPa)
M/2R(N
)
V(N)
SW2 experiment
SW2 simualtion
0 35 71 106 141 177 212 248 283 318 354
V/A(kPa)
-0.7
-0.4
0.0
0.4
0.7
1.1
1.4
1.8
0.00 0.02 0.04 0.06 0.08 0.10 0.12 0.14 0.16
-2
-1
0
1
2
3
4
5
M/2R(N
)
θ(Radians)
SW2 experiment
SW2 simulation
0.0 1.2 2.4 3.6 4.8 6.0 7.2 8.4 9.6
-0.7
-0.4
0.0
0.4
0.7
1.1
1.4
1.8
M/2RA(kPa)
θ2R
Fig. 18 Comparison between the experimental test, SW2, and the programme prediction 415
Fig. 18 represents the swipe test, SW2 with / 2u Rθ =0.531 starting at 950V N≈ . Model C416
overestimates the horizontal load but the simulation stops tracking at approximately the same 417
horizontal and vertical load, indicating an accurate prediction of the ‘parallel point’ in the horizontal 418
plane. For the equivalent test in the :V M plane, the refined Model C slightly underestimates the peak 419
moment but locates the ‘parallel point’ perfectly well. Further evidence that supports the model’s 420
performance are also provided in Fig. 19 and Fig. 20 for tests SW1 and SW7 respectively. 421
422
Page 25 of 32C
an. G
eote
ch. J
. Dow
nloa
ded
from
ww
w.n
rcre
sear
chpr
ess.
com
by
Uni
vers
ity o
f W
este
rn A
ustr
alia
on
09/2
6/16
For
pers
onal
use
onl
y. T
his
Just
-IN
man
uscr
ipt i
s th
e ac
cept
ed m
anus
crip
t pri
or to
cop
y ed
iting
and
pag
e co
mpo
sitio
n. I
t may
dif
fer
from
the
fina
l off
icia
l ver
sion
of
reco
rd.

0 200 400 600 800 1000 1200 1400
-20
0
20
40
60
80
100
120
140
160
H(N
)
V(N)
SW1 experiment
SW1 simulation
0.0 70.7 141.5 212.2 282.9 353.7 424.4 495.1
-7.1
0.0
7.1
14.1
21.2
28.3
35.4
42.4
49.5
56.6
H/A(kPa)
V/A(kPa)
0 2 4 6 8 10
-20
0
20
40
60
80
100
120
140
160
H(N)
u(mm)
SW1 experiment
SW1 simulation
0.00 0.03 0.07 0.10 0.13 0.17
-7.1
0.0
7.1
14.1
21.2
28.3
35.4
42.4
49.5
56.6
H/A(kPa)
u/2R
0 200 400 600 800 1000 1200 1400
-40
-20
0
20
40
60
M/2R(N
)
V(N)
SW1 experiment
SW1 simulation
0.00 200.00 400.00 600.00 800.00 1000.00 1200.00 1400.00
-14.1
-7.1
0.0
7.1
14.1
21.2
M/2RA(kPa)
V/A(kPa)
Fig. 19 Comparison between the experimental test, SW1, and the programme prediction 423
424
Page 26 of 32C
an. G
eote
ch. J
. Dow
nloa
ded
from
ww
w.n
rcre
sear
chpr
ess.
com
by
Uni
vers
ity o
f W
este
rn A
ustr
alia
on
09/2
6/16
For
pers
onal
use
onl
y. T
his
Just
-IN
man
uscr
ipt i
s th
e ac
cept
ed m
anus
crip
t pri
or to
cop
y ed
iting
and
pag
e co
mpo
sitio
n. I
t may
dif
fer
from
the
fina
l off
icia
l ver
sion
of
reco
rd.

0 200 400 600 800 1000 1200
-160
-140
-120
-100
-80
-60
-40
-20
0H(N
)
V(N)
SW7 simualtion
SW7 experiment
0.0 70.7 141.5 212.2 282.9 353.7 424.4
-56.6
-49.5
-42.4
-35.4
-28.3
-21.2
-14.1
-7.1
0.0
H/A(kPa)
V/A(kPa)
-10 -8 -6 -4 -2 0
-160
-140
-120
-100
-80
-60
-40
-20
0
H(N
)
u(mm)
SW7 simulation
SW7 experiment
-0.17 -0.13 -0.10 -0.07 -0.03 0.00
56.6
49.5
42.4
35.4
28.3
21.2
14.1
7.1
0.0
H/A(kPa)
u/2R
0 200 400 600 800 1000 1200
-40
-20
0
20
40
60
80
100
120
140
M/2R(N
)
V(N)
SW7 simulation
SW7 experiment
0.0 70.7 141.5 212.2 282.9 353.7 424.4
-14.1
-7.1
0.0
7.1
14.1
21.2
28.3
35.4
42.4
49.5
M/2RA(kPa)
V/A(kPa)
-0.02 0.00 0.02 0.04 0.06 0.08 0.10 0.12 0.14
-40
-20
0
20
40
60
80
100
120
140
M/2R(N
)
θ(Radians)
SW7 simulation
SW7 experiment
-1.2 0.0 1.2 2.4 3.6 4.8 6.0 7.2 8.4
-14.1
-7.1
0.0
7.1
14.1
21.2
28.3
35.4
42.4
49.5
M/2RA(kPa)
θ2R
Fig. 20 Comparison between the experimental test, SW7, and the programme prediction 425
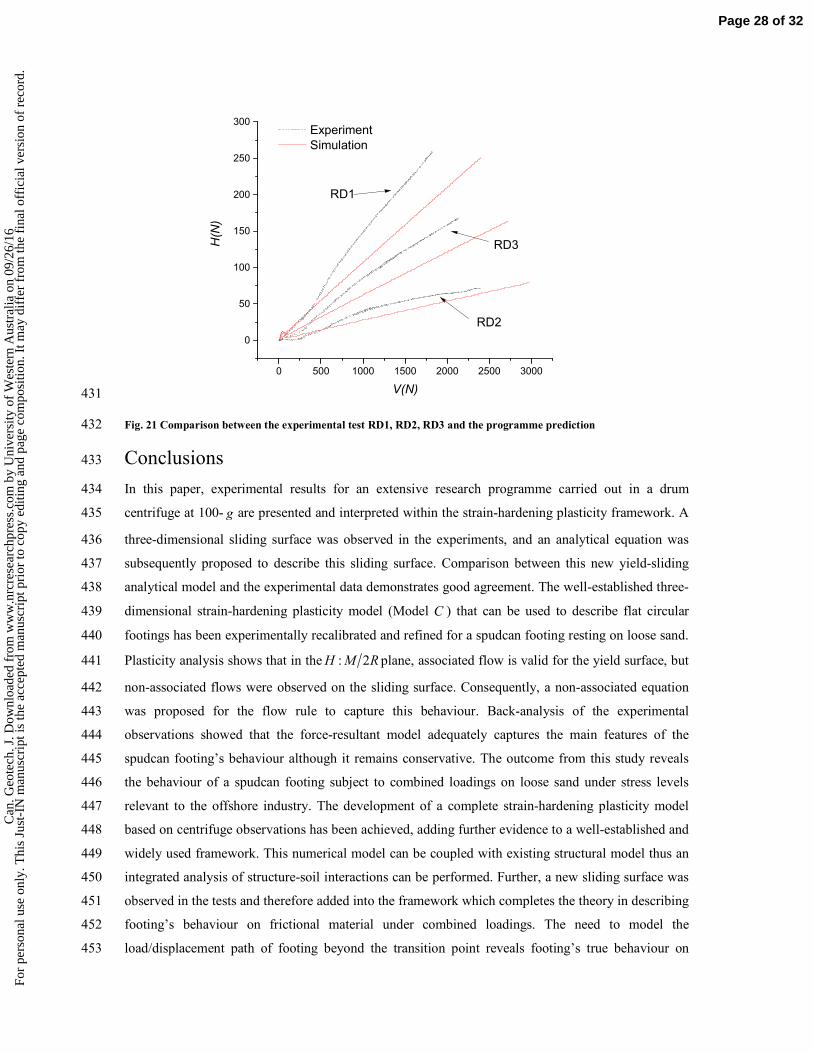
Constant gradients of the horizontal to vertical and the moment to vertical displacements were used as 426
inputs to simulate the horizontal and moment radial displacement tests. The refined Model C 427
predictions and the corresponding experimental horizontal and vertical loads are shown in Fig. 21. 428
The simulation is of a similar gradient, implying that the flow rule of modified Model C is 429
performing well. 430
Page 27 of 32C
an. G
eote
ch. J
. Dow
nloa
ded
from
ww
w.n
rcre
sear
chpr
ess.
com
by
Uni
vers
ity o
f W
este
rn A
ustr
alia
on
09/2
6/16
For
pers
onal
use
onl
y. T
his
Just
-IN
man
uscr
ipt i
s th
e ac
cept
ed m
anus
crip
t pri
or to
cop
y ed
iting
and
pag
e co
mpo
sitio
n. I
t may
dif
fer
from
the
fina
l off
icia
l ver
sion
of
reco
rd.
0 500 1000 1500 2000 2500 3000
0
50
100
150
200
250
300
H(N)
V(N)
Experiment
Simulation
RD2
RD3
RD1
431
Fig. 21 Comparison between the experimental test RD1, RD2, RD3 and the programme prediction 432
Conclusions 433
In this paper, experimental results for an extensive research programme carried out in a drum 434
centrifuge at 100- g are presented and interpreted within the strain-hardening plasticity framework. A 435
three-dimensional sliding surface was observed in the experiments, and an analytical equation was 436
subsequently proposed to describe this sliding surface. Comparison between this new yield-sliding 437
analytical model and the experimental data demonstrates good agreement. The well-established three-438
dimensional strain-hardening plasticity model (Model C ) that can be used to describe flat circular 439
footings has been experimentally recalibrated and refined for a spudcan footing resting on loose sand. 440
Plasticity analysis shows that in the : 2H M R plane, associated flow is valid for the yield surface, but 441
non-associated flows were observed on the sliding surface. Consequently, a non-associated equation 442
was proposed for the flow rule to capture this behaviour. Back-analysis of the experimental 443
observations showed that the force-resultant model adequately captures the main features of the 444
spudcan footing’s behaviour although it remains conservative. The outcome from this study reveals 445
the behaviour of a spudcan footing subject to combined loadings on loose sand under stress levels 446
relevant to the offshore industry. The development of a complete strain-hardening plasticity model 447
based on centrifuge observations has been achieved, adding further evidence to a well-established and 448
widely used framework. This numerical model can be coupled with existing structural model thus an 449
integrated analysis of structure-soil interactions can be performed. Further, a new sliding surface was 450
observed in the tests and therefore added into the framework which completes the theory in describing 451
footing’s behaviour on frictional material under combined loadings. The need to model the 452
load/displacement path of footing beyond the transition point reveals footing’s true behaviour on 453
Page 28 of 32C
an. G
eote
ch. J
. Dow
nloa
ded
from
ww
w.n
rcre
sear
chpr
ess.
com
by
Uni
vers
ity o
f W
este
rn A
ustr
alia
on
09/2
6/16
For
pers
onal
use
onl
y. T
his
Just
-IN
man
uscr
ipt i
s th
e ac
cept
ed m
anus
crip
t pri
or to
cop
y ed
iting
and
pag
e co
mpo
sitio
n. I
t may
dif
fer
from
the
fina
l off
icia
l ver
sion
of
reco
rd.

frictional material under combined loadings. Without recognition of this sliding failure mechanism 454
leads to unconservative assumptions in practice. In response, this study provides greater confidence in 455
the sued of strain-hardening plasticity models in the assessment of jack-up platforms. 456
Acknowledgements 457
The first author acknowledges the support of the Australian Postgraduate Awards. The second author 458
acknowledges the support of the ARC through his Australian Laureate Fellowship (FL130100059) 459
and to the Lloyd’s Register Foundation (LRF). LRF, a UK registered charity and sole shareholder of 460
Lloyd’s Register Group Ltd, invests in science, engineering and technology for public benefit, 461
worldwide. The authors thank the following colleagues and technical staff at the Centre for Offshore 462
Foundation Systems at the University of Western Australia who provided invaluable support during 463
the instrumentation of the centrifuge test: Mr. Shane De Catania, Mr. Bart Thompson, Dr. Youhu 464
Zhang, and Dr. Conleth O’Loughlin. 465
466
Page 29 of 32C
an. G
eote
ch. J
. Dow
nloa
ded
from
ww
w.n
rcre
sear
chpr
ess.
com
by
Uni
vers
ity o
f W
este
rn A
ustr
alia
on
09/2
6/16
For
pers
onal
use
onl
y. T
his
Just
-IN
man
uscr
ipt i
s th
e ac
cept
ed m
anus
crip
t pri
or to
cop
y ed
iting
and
pag
e co
mpo
sitio
n. I
t may
dif
fer
from
the
fina
l off
icia
l ver
sion
of
reco
rd.

References
Bell, R. 1991. The analysis of offshore foundations subject to combined loading. University of Oxford.
Bienen, B., Byrne, B.W., Houlsby, G.T., and Cassidy, M.J. 2006. Investigating six-degree-of-freedom
loading of shallow foundations on sand. Géotechnique 56(6): 367-380.
Bienen, B., and Cassidy, M.J. 2006. Advances in the three-dimensional fluid-structure-soil interaction
analysis of offshore jack-up structures. Marine Structures 19(2): 110-140. doi: DOI:
10.1016/j.marstruc.2006.09.002.
Bienen, B., and Cassidy, M.J. 2009. Three-dimensional numerical analysis of centrifuge experiments
on a model jack-up drilling rig on sand. Canadian Geotechnical Journal 46(2): 208-224.
Bienen, B., Gaudin, C., and Cassidy, M.J. 2007. Centrifuge tests of shallow footing behaviour on sand
under combined vertical-torsional loading. International Journal of Physical Modelling in Geotechnics
7(2): 1-21.
Bienen, B., Gaudin, C., Cassidy, M.J., Rausch, L., and Purwana, O.A. 2012. Numerical modelling of undrained capacity of hybrid skirted foundation under combined loading. International Journal of
Offshore and Polar Engineering 22(4): 323-329.
Butterfield, R., Houlsby, G.T., and Gottardi, G. 1997. Standardized sign conventions and notation for
generally loaded foundations. Géotechnique 47(5): 1051-1054.
Byrne, B.W., and Houlsby, G.T. 1999. Drained behaviour of suction caisson foundations on very
dense sand. In Offshore Technology Conference. Offshore Technology Conference, Houston, TX. pp. 3-6.
Byrne, B.W., and Houlsby, G.T. 2001. Observations of footing behaviour on loose carbonate sands.
Géotechnique 51(5): 463-466.
Cassidy, M., and Cheong, J. 2005. The behaviour of circular footings on sand subjected to combined
vertical-torsion loading. International Journal of Physical Modelling in Geotechnics 5(4): 1-14.
Cassidy, M.J. 2007. Experimental observations of the combined loading behaviour of circular
footings on loose silica sand. Geotechnique 57(4): 397-401.
Cassidy, M.J., Byrne, B.W., and Houlsby, G.T. 2002a. Modelling the behaviour of circular footings
under combined loading on loose carbonate sand. Géotechnique 52(10): 705-712.
Cassidy, M.J., Byrne, B.W., and Randolph, M.F. 2004. A comparison of the combined load behaviour
of spudcan and caisson foundations on soft normally consolidated clay. Géotechnique 54(2): 91-106.
Cassidy, M.J., Houlsby, G.T., Hoyle, M., and Marcom, M.R. 2002b. Determining appropriate
stiffness levels for spudcan foundations using jack-up case records. In 21st International Conference
on Offshore Mechanics and Arctic Engineering. American Society of Mechanical Engineers, Oslo,
Norway. pp. 307-318.
Cassidy, M.J., Vlahos, G., and Hodder, M. 2010. Assessing appropriate stiffness levels for spudcan foundations on dense sand. Marine Structures 23(2): 187-208. doi: DOI:
10.1016/j.marstruc.2010.03.003.
Cheng, N., and Cassidy, M.J. 2016. Combined loading capacity of spudcan footings on loose sand.
International Journal of Physical Modelling in Geotechnics 16(1): 31-44.
Page 30 of 32C
an. G
eote
ch. J
. Dow
nloa
ded
from
ww
w.n
rcre
sear
chpr
ess.
com
by
Uni
vers
ity o
f W
este
rn A
ustr
alia
on
09/2
6/16
For
pers
onal
use
onl
y. T
his
Just
-IN
man
uscr
ipt i
s th
e ac
cept
ed m
anus
crip
t pri
or to
cop
y ed
iting
and
pag
e co
mpo
sitio
n. I
t may
dif
fer
from
the
fina
l off
icia
l ver
sion
of
reco
rd.

Cheng, N., Gaudin, C., Cassidy, M.J., and Bienen, B. 2014. Centrifuge study of the combined bearing
capacity of a hybrid foundation system. In 8th International Conference on Physical Modelling in
Geotechnics, Perth. pp. 487-492.
Cocjin, M., and Kusakabe, O. 2012. Centrifuge observations on combined loading of a strip footing
on dense sand. Géotechnique 63(5): 427-433.
Doherty, J.P., and Deeks, A.J. 2003. Elastic response of circular footings embedded in a non-
homogeneous half-space. Géotechnique 53(8): 703-714.
Gottardi, G., and Butterfield, R. 1993. On the bearing capacity of surface footings on sand under general planar loads. Soils and Foundations 33(3): 68-79.
Gottardi, G., and Butterfield, R. 1995. The displacement of a model rigid surface footing on dense
sand under general planar loading. Soils and Foundations 35(3): 71-82.
Gottardi, G., Houlsby, G.T., and Butterfield, R. 1999. Plastic response of circular footings on sand
under general planar loading. Géotechnique 49(4): 453-469.
Govoni, L., Gourvenec, S., and Gottardi, G. 2010. Centrifuge modelling of circular shallow
foundations on sand. International Journal of Physical Modelling in Geotechnics 10(2): 35-46.
Govoni, L., Gourvenec, S., and Gottardi, G. 2011. A centrifuge study on the effect of embedment on
the drained response of shallow foundations under combined loading. Géotechnique 61(12): 1055-
1068.
Hansen, J.B. 1970. A revised and extended formula for bearing capacity. Danish Geotechnical
Institute, Copenhagen. pp. 5-11.
Houlsby, G.T., and Cassidy, M.J. 2002. A plasticity model for the behaviour of footings on sand
under combined loading. Géotechnique 52(2): 117-129.
ISO. 2012. Petroleum and natural gas industries-Site specific assessment of mobile offshore units -
Part 1:Jack-ups, 19905-1. International Organization for Standardization.
Martin, C.M., and Houlsby, G.T. 2000. Combined loading of spudcan foundations on clay: laboratory
tests. Géotechnique 50(4): 325-338.
Martin, C.M., and Houlsby, G.T. 2001. Combined loading of spudcan foundations on clay: numerical modelling. Géotechnique 51(8): 687-699.
Meyerhof, G.G. 1953. The bearing capacity of foundations under eccentric and inclined loads. In 3rd
International Conference on Soil Mechanics and Foundation Engineering, Switzerland. pp. 440-445.
National Instrument Corporation. 2003. LabVIEW User Manual. National Instrument Corporation,
Austin,TX,USA.
Ngo-Tran, C. 1996. The analysis of offshore foundations subjected to combined loading. University of Oxford.
Noble Denton & Associates. 1987. Foundation fixity of jack-up units: a joint industry study. London:
Noble and Denton Associates.
Nova, R., and Montrasio, L. 1991. Settlements of shallow foundations on sand. Géotechnique 41(2):
243-256.
Page 31 of 32C
an. G
eote
ch. J
. Dow
nloa
ded
from
ww
w.n
rcre
sear
chpr
ess.
com
by
Uni
vers
ity o
f W
este
rn A
ustr
alia
on
09/2
6/16
For
pers
onal
use
onl
y. T
his
Just
-IN
man
uscr
ipt i
s th
e ac
cept
ed m
anus
crip
t pri
or to
cop
y ed
iting
and
pag
e co
mpo
sitio
n. I
t may
dif
fer
from
the
fina
l off
icia
l ver
sion
of
reco
rd.

Osborne, J.J., Trickey, J.C., Houlsby, G.T., and James, R.G. 1991. Findings from a joint industry
study on foundation fixity of jackup units. In Offshore Technology Conference. Offshore Technology
Conference, Houston ,TX. pp. 517-533.
Schneider, J.A., and Lehane, B.M. 2006. Effects of width for square centrifuge displacement piles in
sand. In Proceedings of the 6th International Conference on Physical Modelling in Geotechnics, Hong Kong. pp. 867-873.
Schotman, G.J.M. 1989. The effects of displacements on the stability of jackup spud-can foundations.
In Offshore Technology Conference, Houston, TX. pp. 515-524.
Stewart, D., Boyle, R., and Randolph, M.F. 1998. Experience with a new drum centrifuge. In
International conference centrifuge, Tokyo. pp. 35-40.
Tan, F.S.C. 1990. Centrifuge and theoretical modelling of conical footings on sand. University of
Cambridge, Cambridge, UK.
Terzaghi, K. 1943. Theoretical soil mechanics. John Wiley and Sons.
White, D.J., Teh, K.L., Leung, C.F., and Chow, Y.K. 2008. A comparison of the bearing capacity of
flat and conical circular foundations on sand. Géotechnique 58(10): 781-792.
Zhang, Y., Bienen, B., and Cassidy, M.J. 2013. Development of a combined VHM loading apparatus
for a geotechnical drum centrifuge. International Journal of Physical Modelling in Geotechnics 13(1):
13-30.
Zhang, Y., Bienen, B., Cassidy, M.J., and Gourvenec, S. 2011. The undrained bearing capacity of a
spudcan foundation under combined loading in soft clay. Marine Structures 24(4): 459-477. doi:
http://dx.doi.org/10.1016/j.marstruc.2011.06.002.
Page 32 of 32C
an. G
eote
ch. J
. Dow
nloa
ded
from
ww
w.n
rcre
sear
chpr
ess.
com
by
Uni
vers
ity o
f W
este
rn A
ustr
alia
on
09/2
6/16
For
pers
onal
use
onl
y. T
his
Just
-IN
man
uscr
ipt i
s th
e ac
cept
ed m
anus
crip
t pri
or to
cop
y ed
iting
and
pag
e co
mpo
sitio
n. I
t may
dif
fer
from
the
fina
l off
icia
l ver
sion
of
reco
rd.
Related Documents