Development of a Flat-Plate Calorimeter for a Small-Scale Heliostat Field Holger Kretzschmar MSc Eng Candidate, Mechanical and Mechatronic Engineering Department, Stellenbosch University. Address: Private Bag X1 Matieland 7602, Stellenbosch, South Africa. Phone: +27 (0)72 387 8676, E-Mail: [email protected] Centre for Renewable and Sustainable Energy Studies Abstract A small-scale heliostat field has been developed for use as an experimental test rig for concentrating solar power (CSP) research at the University of Stellenbosch, South Africa. The optical system is comprised of 150 mirror facets (100 x 100 mm) rigidly mounted on a dual axis rotating framework. Performance characterization of the small-scale rig is proposed using a flat-plate calorimeter designed to measure the concentrating solar flux. This paper addresses the methodology, design features, device calibration, overall heat transfer modeling, preliminary experimental results and final comparison with ray-tracing analysis. The modeling and preliminary testing results showed that the small-scale rig generates solar flux in the range of 950 W. Keywords: High-Flux Measurement, Flat-Plate Calorimeter 1. Introduction The Solar Thermal Energy Research Group (STERG) at Stellenbosch University is currently involved in CSP research with specific focus on Linear Fresnel and Central Receiver Systems (CRS). A small-scale heliostat field rig was constructed to provide a high flux power source with a concentration ratio of 150 suns. The rig is intended for use as a University test bed for small-scale receiver concepts. The evaluation of these concepts is done by means of an energy balance approach. Thus, it is required to quantify the incoming solar irradiation incident from the mirror field. Various tools, such as radiometers, Lambertian plates with CCD cameras, or calorimeters are applicable to perform the task. The Gardon sensor is a type of radiometer that measures the radial temperature difference by means of a differential thermocouple to produce a voltage output [1]. The Lambertian plate reflects back the concentrated sunlight for a CCD camera to capture the flux levels with high resolution images [2]. However, most of these devices are in fact calibrated using a calorimeter. Also, the devices are costly and therefore a low cost calorimeter was locally constructed and tested. This paper provides an overview of the methodology, a description of the calorimeter design, the calibration experiments and modeling. The test results on the actual heliostat field are shown and finally compared against a ray-tracing analysis. 2. Methodology The methodology of this work was to design, construct, calibrate and use the calorimeter for experimental procedures. Literature on previous calorimetric designs was considered in the construction of an optimised instrument. A computational energy balance model was developed to predict the radiation, convection and internal losses. The experimental tests on the heliostat field simulator itself were conducted. These results, combined with the modelling tool, were compared against results from a ray-tracing analysis. A discretized fluid model and a 2-dimensional heat conduction model through the absorber plate (see figure 1) were developed. The discretized fluid model determines the

Welcome message from author
This document is posted to help you gain knowledge. Please leave a comment to let me know what you think about it! Share it to your friends and learn new things together.
Transcript

Development of a Flat-Plate Calorimeter for a Small -Scale Heliostat Field
Holger Kretzschmar MSc Eng Candidate, Mechanical and Mechatronic Engineering Department, Stellenbosch University. Address: Private Bag X1 Matieland 7602, Stellenbosch, South Africa. Phone:
+27 (0)72 387 8676, E-Mail: [email protected]
Centre for Renewable and Sustainable Energy Studies
Abstract A small-scale heliostat field has been developed for use as an experimental test rig for concentrating solar power (CSP) research at the University of Stellenbosch, South Africa. The optical system is comprised of 150 mirror facets (100 x 100 mm) rigidly mounted on a dual axis rotating framework. Performance characterization of the small-scale rig is proposed using a flat-plate calorimeter designed to measure the concentrating solar flux. This paper addresses the methodology, design features, device calibration, overall heat transfer modeling, preliminary experimental results and final comparison with ray-tracing analysis. The modeling and preliminary testing results showed that the small-scale rig generates solar flux in the range of 950 W. Keywords: High-Flux Measurement, Flat-Plate Calorimeter 1. Introduction The Solar Thermal Energy Research Group (STERG) at Stellenbosch University is currently involved in CSP research with specific focus on Linear Fresnel and Central Receiver Systems (CRS). A small-scale heliostat field rig was constructed to provide a high flux power source with a concentration ratio of 150 suns. The rig is intended for use as a University test bed for small-scale receiver concepts. The evaluation of these concepts is done by means of an energy balance approach. Thus, it is required to quantify the incoming solar irradiation incident from the mirror field. Various tools, such as radiometers, Lambertian plates with CCD cameras, or calorimeters are applicable to perform the task. The Gardon sensor is a type of radiometer that measures the radial temperature difference by means of a differential thermocouple to produce a voltage output [1]. The Lambertian plate reflects back the concentrated sunlight for a CCD camera to capture the flux levels with high resolution images [2]. However, most of these devices are in fact calibrated using a calorimeter. Also, the devices are costly and therefore a low cost calorimeter was locally constructed and tested. This paper provides an overview of the methodology, a description of the calorimeter design, the calibration experiments and modeling. The test results on the actual heliostat field are shown and finally compared against a ray-tracing analysis. 2. Methodology The methodology of this work was to design, construct, calibrate and use the calorimeter for experimental procedures. Literature on previous calorimetric designs was considered in the construction of an optimised instrument. A computational energy balance model was developed to predict the radiation, convection and internal losses. The experimental tests on the heliostat field simulator itself were conducted. These results, combined with the modelling tool, were compared against results from a ray-tracing analysis. A discretized fluid model and a 2-dimensional heat conduction model through the absorber plate (see figure 1) were developed. The discretized fluid model determines the

increase in local fluid temperature along the plate, while the heat conduction model determines the nodal surface temperatures of the solid material. The surface temperatures are averaged and used in the overall energy balance model to calculate the radiation and convection losses. The experiments are conducted with two setups. The first setup is used to typically calibrate the device; the other is to use the device on the actual heliostat field simulator itself. The calibration setup uses a flat mica resistance heating element coupled to a DC power supply and insulated on the rear side. The heating element induces a direct power input measured with volt- and ammeter. Therefore, the response to this power input can be investigated while eliminating the occurrence of various other energy transfers. As a result, the system is isolated such that only the internal heat transfer is characterised. For the experiments on the actual heliostat field simulator the calorimeter is used to quantify the incident power from the field. Therefore, the energy losses of field due to blocking and shading, mirror surface defects, tracking errors, in-focus calibration errors and many more are characterized. 3. Calorimeter Design The calorimeter consists of 3 major components (nylon PA6 C cup housing, nylon PA6 C spreader disk and the copper absorber plate), as illustrated in figure 1. The spreader disk is press-fitted into the cup housing. The copper plate was coated with heat resistant NS 7 paint and screws against the cup housing with M6 cap screws. A high temperature O-ring and gasket sealer are used to prevent the calorimeter from leaking.
Fig. 1: Flat-plate calorimeter including the copper plates, the Nylon PA6 C cup housing and spreader disk. The design presented in this paper differs from previous papers in that only nylon insulation material was used in the main body of the calorimeter [3-4]. Jaramillo et al. [3] reports that of the calorimeter’s 13.5 % efficiency loss, 12.6 % is due to internal losses. Here, an AISI 316 stainless steel housing and a stainless steel spreader disk were used. Therefore, for the design presented in this paper, only nylon PA6 C material was used. The aim is to improve on the internal losses of the device. Since the highest incident flux is experienced at the central region of the absorber plate, the calorimeter makes use of a design where the flow stream directly impinges on the hottest point of the plate. Also, the cold water stream is injected first at the high flux region and then spreads out radially along the copper plate. As a result, the highest local surface

temperature is reduced not only by means of the coolest fluid temperature but also due to the highest convection heat transfer coefficient. The design makes provision for the elimination or reduction of fluid flow pre-heating. The local fluid temperature incident on the absorber plate would be higher if the cold inlet flow stream experienced energy exchange from the hot outlet flow stream. Thus, the effective heat transfer to the fluid would be reduced, and the hot fluid stream temperature would drop due to the energy exchange. The wall thickness of the nylon insulation material that separates the flow streams was therefore sufficiently enhanced. Future designs might consider improving the heat transfer surface area of the copper plate. For example, a thicker copper plate could be used where radial slots are milled into the material. These slots would act as fins, and the heat transfer to the fluid would be increased. The slots would also improve on the overall convective heat transfer coefficient by generating more turbulence. Furthermore, jet impingement heat transfer could be improved by reducing the size of the inlet diameter. However, the calorimeter would then require a higher inlet pressure and thus be subject to leakages. The tolerable incident flux magnitude would become less, and therefore, the device might not be suitable for measuring fluxes of larger concentrating systems in planning. 4. Calibration of the Calorimeter The calibration procedure, as highlighted by the methodology, consisted of developing an internal loss model and empirically comparing the model with experiments. 4.1. Calibration Setup The performance of the calorimeter was investigated by conducting experiments in a controlled environment using electric power as a heat input, as depicted in figure 2. The setup consists of a 750 W DC Power supply coupled to a flat mica resistance heating element. The rear side of the resistance heater is insulated with rockwool insulation. Volt- and ammeters were used to quantify the applied power, and T-type thermocouples were used to measure the inlet and outlet fluid temperatures. A Data Acquisition (DAQ) system logged the thermocouple readings with the commercially available labview software package. A two meter high constant volume tank filled with water at ambient temperatures provided the mass flow through the calorimeter.
Fig. 2: Calibration setup used to characterize the performance of the calorimeter under uniform power input.

The resistance heater was specifically constructed to match with the design profile of the absorber plate with the heater directly screwed against the plate. A metal backing plate was built to squeeze the rockwool insulation against the resistance heater in order to force the energy in the direction of the calorimeter only. It was hoped that the calorimeter would experience the same power magnitude as measured by the volt- and ammeters. Unfortunately, in practice this could be achieved. The calorimeter including the resistance heater and the rockwool insulation are shown in figure 3.
Fig. 3: Illustration of the flat mica resistance he ater, rockwool insulation and calorimeter during calibration experiment. 4.2. Experimental Procedure The experimental procedure consisted of 3 major steps. Firstly, the voltage level was set to 60 V, and electric power was fed into the system by slowly increasing the current. Secondly, the mass flow rate was adjusted such that a constant change in fluid temperature (∆T) of 10 °C was obtained. Finally, once the calorim eter reached a steady state at a certain power level, the mass flow rate was measured using the time/volume collection method. Figure 4 illustrates the system behaviour of the calorimeter under a constant power input of Qelect = 300 W. The recorded mass flow rate was � = 0.0061 kg/s.
Fig. 4: Transient thermal response of the calorimet er to a constant electric power input of QR = 300 W with change in water temperature ∆T ≈10 ˚C and mass flow rate of ṁ = 0.0061 kg/s.

4.3. Discretized Fluid Model The internal flow of the calorimeter has a complex nature, which is primarily due to the water jet impinging on the flat plate. Also, due to the orientation of the device, the interior flow is submerged. As a result, the flow is subject to induced turbulence which aids in increasing the overall convective heat transfer coefficient. In order to obtain a better understanding of the local heat transfer coefficient and fluid temperature, a discretized fluid model was developed. The model was based on setting up small control volumes at each discretised zone and makes use of an energy balance to determine the respective parameters. Figure 5 illustrates the development of the thermal boundary layer of the fluid.
Fig. 5: Schematic diagram of discretized zones with in calorimeter.
The nozzle diameter (d), variable channel thickness (dz) and the differential radius (dr) are geometric parameters used in the model. Vavg denotes the fluid velocity that was used to calculate the Reynolds number (see equation 3) in each zone. For known quantities of inlet fluid temperature (T2∞,i) and constant mass flow rate, the local fluid temperature (T2∞,i+1) of the subsequent discretized zone was calculated, as shown in equation 1. The specific heat capacity is denoted by cp.
(1)
The local incident power Qi was obtained by equation 2, where Io represents the total heat flux which is considered as uniform for this analysis; i.e., it was assumed that the heating element would provide uniform flux over the entire area. Io was calculated by dividing the total power measured by the volt- and ammeter with the total surface area of the copper plate.
(2)
The second part of the discretized fluid model calculates the local convective heat transfer coefficients. Numerous studies have been found that develop correlations for Nusselt numbers (and thus heat transfer coefficients) in the various flow regimes under certain geometries and fluid flow conditions [5]. The correlations were developed from laboratory experiments and are typically given in the general form of equation 3. The terms f(H/d) and f(r/d) are empirically determined formulations. C, n and m are experimental constants.
(3)
The publications by Liu et al. [5] were considered in these calculations as they were found most suitable. Alternative studies were also investigated; however, it was found that the Nusselt numbers were significantly lower than the correlations from Liu et al. [5] primarily due to the boundary conditions that were only in partial agreement with the ones from this paper and thus caused the deviation. Table 1 shows the Nusselt number correlations in the stagnation zone (region I) and the hydrodynamic zone (region II). Liu et al. [5] also
Insulation Copper
presented Region III and Region IV where rv/d < r/d < rt/d. Since R/d < rt/d, these regions were not applicable. R is the outer radius of the disk. rv and rt are radii at the transition points of the stagnation and hydrodynamic zones. Table 1: Nusselt number correlation for stagnation and hydrodynamic flow regimes.
Region Boundary Con dition Correlation from Liu et al. [5]
I r/d < 0.787
II 0.787 < r/d < rv/d
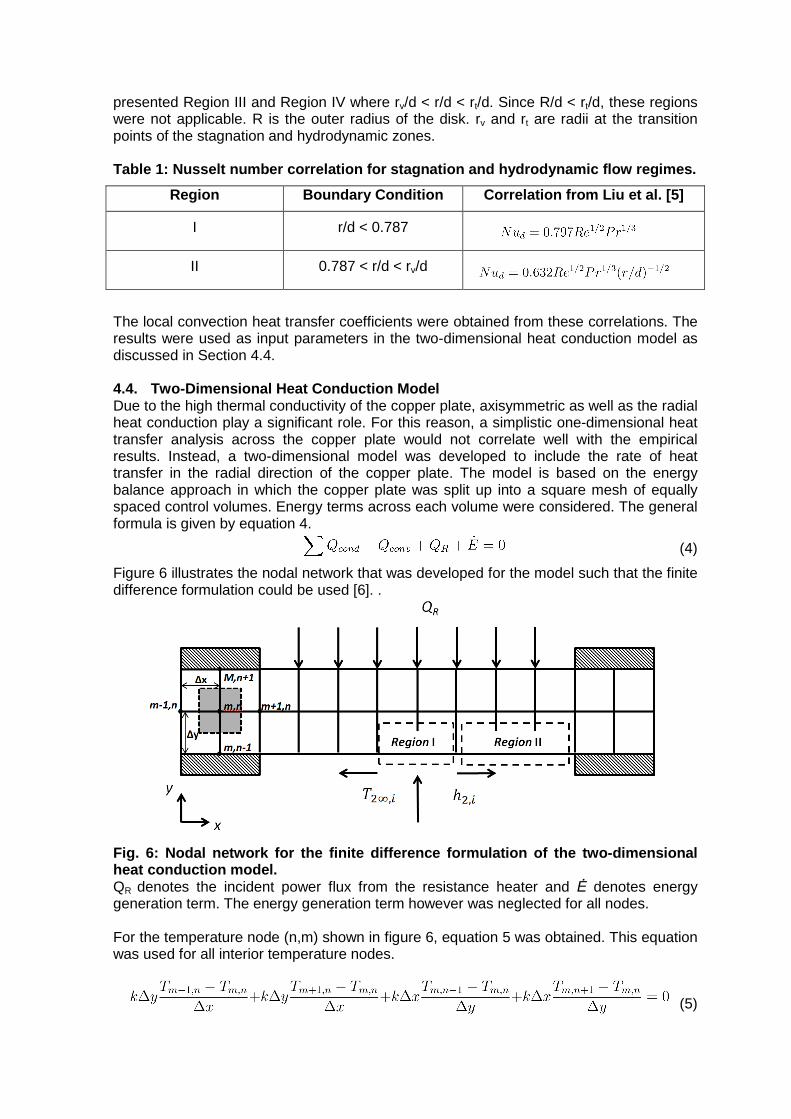
The local convection heat transfer coefficients were obtained from these correlations. The results were used as input parameters in the two-dimensional heat conduction model as discussed in Section 4.4. 4.4. Two-Dimensional Heat Conduction Model Due to the high thermal conductivity of the copper plate, axisymmetric as well as the radial heat conduction play a significant role. For this reason, a simplistic one-dimensional heat transfer analysis across the copper plate would not correlate well with the empirical results. Instead, a two-dimensional model was developed to include the rate of heat transfer in the radial direction of the copper plate. The model is based on the energy balance approach in which the copper plate was split up into a square mesh of equally spaced control volumes. Energy terms across each volume were considered. The general formula is given by equation 4.
(4)
Figure 6 illustrates the nodal network that was developed for the model such that the finite difference formulation could be used [6]. .
Fig. 6: Nodal network for the finite difference for mulation of the two-dimensional heat conduction model. QR denotes the incident power flux from the resistance heater and ö denotes energy generation term. The energy generation term however was neglected for all nodes. For the temperature node (n,m) shown in figure 6, equation 5 was obtained. This equation was used for all interior temperature nodes.
(5)

The majority of nodes however were boundary nodes due to the course grid mesh. They include convection boundaries exposed to ambient air, convection boundaries exposed to the fluid, insulation boundaries and heat flux boundaries. Insulation boundaries were neglected. The various energy balance equations were developed and simplified such that k-number of variables and k-number of equations were obtained. These variables were then solved algebraically with equation 6.
(6)
Matrix T was obtained by multiplying matrix C with the inverse of the coefficient matrix A-1 thereby obtaining the surface temperatures at each node. The next step of this model was to obtain the average surface temperature to be used in the overall energy balance model, given by equation 7.
(7)
Also, the nodal temperatures midway into the plate were averaged and compared with the thermocouple readings from the calibration experiments 4.5. Model Comparison with Empirical Results Figure 7 illustrates the absorber plate temperature distribution along the radial direction. One can see that the model correlates well with the empirical results.
Fig. 7: Comparison of absorber plate temperature d istribution between empirical results and model at power input of QR = 700 W (ṁ = 0.0138 kg/s), QR = 300 W (ṁ = 0.00686 kg/s) and ∆T ≈ 10±0.5 ˚C.
Note that the local plate temperatures are lower in the central region of the plate and increase towards the outer region. Near the edge of the plate (r/d = 0.06), local plate temperatures drop again due to the lack of side insulation. More turbulence is expected in this region due to the water washing over the edges of the spreader disk, and thus the effective heat transfer is increased.The thermocouple readings midway for the copper plate were recorded and averaged. For a power input of QR = 700 W, the measured power was Qs = 546 ± 50 W, and the average plate temperature was Ts = 55.4 ± 1.5 ˚C, as shown in Table 2.

Table 2: Empirical and modeling results of calibrat ion experiments indicating the heat losses and efficiencies of the calorimeter.
Parameter Value Unit
Qelec 709.9 W
QR 585 ± 60 W
Qs 546 ± 27 W
Ts 55.4 ± 1.5 °C
Tin 14.0 ± 0.5 °C
� 0.0138 kg/s
ηoverall 76.9 % -
ηdevice 93.3 % -
The model then was used to predict the internal losses by adapting the average plate temperature to the measurement value. The mass flow rates as well as the inlet fluid temperatures recorded during the experiments were used as input values in the model. By varying the input power to obtain the required plate temperatures, a certain value for QR is obtained. This was done for three test runs and the results were averaged for all runs. It was found that QR = 585.7 ± 60 W is required and thus implies that the model predicts internal losses of about 40 W. The remaining losses of 124 W are due to conduction losses to the environment from the rear and side walls of the resistance heater. However, since K-type thermocouples were used (supplier specified an uncertainty range of ± 1.5 ˚C), none of the results above can be considered as accurate and are only interpreted as indicative. Figure 8 illustrates the empirical results obtained for the calibration test at various power inputs. Here, Qelec ranges from 300 W to 700 W. For each specific power input, the mass flow rate was throttled such that the change in fluid outlet temperature was ∆T ≈ 10 °C. The straight lines are trendlines to show that the two power lines diverge for increasing power levels and mass flow rates. This is clear since more heat losses occur due to conduction for larger incoming fluxes. These curves can now be further used to predict the incoming power value once the absorbed power measurement is obtained.
Fig. 8: Absorbed power and electric power curves ra nging from electric power input of Qelec = 700 W (ṁ = 0.0138 kg/s) to Qelec = 300 W (ṁ = 0.00686 kg/s) at ∆T ≈ 10±0.5 ˚C.

5. Overall Energy Balance Section 4 developed models and empirical comparisons to characterize the internal losses in the calorimeter. The respective modelling tool is used in section 5 to quantify the actual incoming solar irradiation experienced by the small-scale heliostat field. Firstly, the mass flow rate and change in fluid temperature are measured. Fig. 6 is then used to predict the electric power input for such a system response. Also, the averaged central plate temperature readings from the thermocouples are adapted in the heat conduction model from section 4. As a result, the model predicts the actual power entering the calorimeter (and thus the internal losses), as well as the plate temperatures at the frontal surface of the absorber plate. Once the frontal surface temperatures are obtained the external energy losses can be quantified. Note that for Section 4 the calorimeter was mounted to the heating element. Here, it is directly exposed to ambient; therefore, external losses occur due to convection and radiation. The external heat loss equations are given in equations 8 and 9. For equation 9, the convection heat transfer coefficient (he) was typically taken as 10 W/m. K. The emissivity (ε) of the NS 7 paint is 0.95, and A is the frontal surface area of the absorber plate.
(8)
(9)
The radiation and convection losses are incorporated as external losses (Ql,o) in the overall energy balance equation, given by equation 10. Qs is the energy absorbed by the water and Ql,i are the internal losses of the device. The internal losses are typically defined based on the calibrated value from section 4.
(10)
Table 3 highlights the results from the heat loss evaluation, and one can see the external losses due to radiation and convection are small. This is due to the fact that the plate temperatures are kept at moderate temperatures. The device efficiency dropped slightly compared to Table 2. However, considering the fact that under the corresponding power input of Qelec = 1113 W versus Qelec = 700 W, the calorimeter’s internal insulation performed well. Table 3: Summary of on-rig experiments indicating the heat losses and efficiencies of the calorimeter.
Parameter Value Unit
Qelec 1113 W
QR 931 W
Qs 836 ± 80 W
Qrad 6.75 W
Qconv 11.16 W
Ts 57.8 ± 1.5 °C
Tin 20 ± 0.5 °C
� 0.0208 kg/s
ηoverall 88.1 % -
ηdevice 89 % -

6. Ray-Tracing Analysis A ray-tracing model was developed using SolTrace to provide a comparison with the results obtained from Section 5. The model consists of a square heliostat field with 150 small-scale mirrors, equally spaced with rays focused on a one meter high target. The target aperture has a diameter of 150 mm (identical to the aperture of the calorimeter). The mirror properties were defined according to a conventional mirror surface (i.e., reflectivity ρ = 0.95, transmissivity τ = 1.00, slope error 0.95 mrad and specularity error 0.2 mrad). The target was defined such that all rays are absorbed. The Direct Normal Irradiation (DNI) input was obtained from the recorded DNI value of the weather station at Stellenbosch University on the specific day of testing. The number of ray interactions was set to 500,000 rays, and thus the maximum number of generated sun rays was 50,000,000 by default. The simulation results revealed a peak flux value of 2578.71 with an uncertainty of ±1.9 %. An average flux value of 54949.6 was obtained. Therefore, by multiplying the average flux value with aperture area, the total concentrated solar power incident on the calorimeter was calculated as Qin = 971 ±0.9 W. When comparing this value with QR = 931 W from Table 3, one can see that both values lie within a range of about 950 W. Since only preliminary experiments were conducted, further investigation is required to enhance the validity of the empirical results. A flux map was developed from the ray-tracing model, as shown in Figure 9. The result is similar to what has been observed during the experiments, even though slight deviations were observed. These deviations are primarily due to misalignments of the mirrors and mirror surface errors. Nonetheless, the ray-tracing analysis shows similar results to the power measured by the calorimeter and thus manifests the accuracy of the small-scale heliostat field.
Fig. 9: Flux map of target from ray-tracing analysi s.

7. Conclusion A flat plate calorimeter was proposed as a low-cost flux measuring device with improved design features. It was shown that the efficiency of the device was increased by lowering the internal losses. Furthermore, the calorimeter was used to measure the incident flux on a small-scale heliostat field. The results were compared with a ray-tracing analysis, and fair agreement was obtained.
Acknowledgements The authors would like to thank Sasol Technology, the Department of Science and Technology of South Africa through the Solar thermal spoke fund and the Stellenbosch University Hope project for funding the resources to perform this work.
References
[1] C. A. Estrada, O. A. Jaramillo, R. Acosta, C. A. Arancibia-Bulnes, “Heat transfer analysis in a calorimeter for concentrated solar radiation measurements”, Solar Energy, 81, 2007, 1306-1313.
[2] J. Ballestrin, “A non-water-cooled heat flux measurement system under concentrated solar radiation conditions”, Solar Energy, 73, 2002, 159-168.
[3] O. A. Jaramillo, C. A. Pérez-Rábago, C. A. Arancibia-Bulnes, C. A. Estrada, “A flat-plate calorimeter for concentrated solar flux evaluation”, Renewable Energy, 33, 2008, 2322-2328.
[4] M. Mouzouris, L. W. Roberts, M. J. Brooks, “Thermal performance of a high-flux solar concentrating system”, R & D Journal of the South African Institution of Mechanical Engineering, 27, 2010, 10-22.
[5] X. Liu, J. H. Lienhard, J. S. Lombara, “Convective heat transfer by impingement of circular liquid jets”, Journal of Heat Transfer, 113, 1991, 571-582.
[6] Y. A. �engel, (2006). “Heat and mass transfer: A practical approach”, Mc Graw-Hill, New York.
Related Documents