DEVELOPMENT OF A DYNAMIC RUMEN AND GASTRO-INTESTINAL MODEL IN THE CORNELL NET CARBOHYDRATE AND PROTEIN SYSTEM TO PREDICT THE NUTRIENT SUPPLY AND REQUIREMENTS OF DAIRY CATTLE A Dissertation Presented to the Faculty of the Graduate School of Cornell University In partial Fulfillment of the Requirements for the Degree of Doctor of Philosophy by Ryan John Higgs August 2014

Welcome message from author
This document is posted to help you gain knowledge. Please leave a comment to let me know what you think about it! Share it to your friends and learn new things together.
Transcript
DEVELOPMENT OF A DYNAMIC RUMEN AND GASTRO-INTESTINAL MODEL IN
THE CORNELL NET CARBOHYDRATE AND PROTEIN SYSTEM TO PREDICT THE
NUTRIENT SUPPLY AND REQUIREMENTS OF DAIRY CATTLE
A Dissertation
Presented to the Faculty of the Graduate School
of Cornell University
In partial Fulfillment of the Requirements for the Degree of
Doctor of Philosophy
by
Ryan John Higgs
August 2014
© 2014 Ryan John Higgs
DEVELOPMENT OF A DYNAMIC RUMEN AND GASTRO-INTESTINAL MODEL IN
THE CORNELL NET CARBOHYDRATE AND PROTEIN SYSTEM TO PREDICT THE
NUTRIENT SUPPLY AND REQUIREMENTS OF DAIRY CATTLE
Ryan John Higgs, PhD
Cornell University 2014
The high value of milk protein, increasing feed costs, and growing concern for the
environment has made nitrogen utilization a central component in ration balancing on dairy
farms. The Cornell Net Carbohydrate and Protein System (CNCPS) is a nutritional model that
enables the formulation of diets that closely match predicted animal requirements. The CNCPS
includes a library of approximately 800 different ingredients which provide the platform for
describing the chemical composition of the diet. The objectives of this research were 1) to review
and update the chemical composition of feeds in the feed library, 2) develop new capability
within the model to predict nitrogen and amino acid supply and requirements and, 3) investigate
the potential to improve nitrogen utilization in high producing dairy cows through using the new
model to formulate diets precisely to animal requirements. The feed library was updated using a
procedure that combined linear regression, matrix regression and genetic algorithm optimization
to predict uncertain values. Each feed was evaluated and updated where required to be consistent
with data from commercial laboratories. Amino acid profiles were also updated using
contemporary datasets. A new, dynamic version of the rumen and gastro-intestinal (GIT) sub-
model was constructed in the system dynamics modeling software Vensim®. The new model
included, among other things, estimations of protozoal growth, endogenous N transactions along
the entire GIT and a new system to estimate N digestion in the small intestine. Relative to
measured data, the model was able to predict the flows of microbial, un-degraded feed, and total
non-ammonia N with a high degree of accuracy and precision (R2 = 0.97, 0.90 and 0.98,
respectively). Lactating dairy cows fed diets formulated to be adequate in rumen N and EAA
supply using the model were able to produce >40 kg milk on diets <15 % CP, utilize N with 38%
efficiency and, partition 1.7 times more N to milk than urine. The study demonstrates that high
levels of animal performance can be achieved, N utilization can be improved and the
environmental impact of dairy production reduced through more precise predictions of N and
AA requirements and supply.
iii
BIOGRAPHICAL SKETCH
Ryan John Higgs grew up on a farm in the small Waikato town of Ohaupo, New Zealand. He
attended Ohaupo Primary School from 1989-1996, after which he attended Hamilton Boys High
School (1997-2002). A strong interest in agriculture and the dairy industry led him to pursue
Bachelor of Applied Science (honors) with a major in agriculture at Massey University from
2003-2007. During his time at Massey, Ryan became interested in the use of models to aid
decision making on dairy farms. In particular, he became interested in the Cornell Net
Carbohydrate and Protein System (CNCPS) model due to its reputation and wide use around the
world. He applied for a Fulbright Ministry of Research Science and Technology Scholarship to
complete graduate studies in the U.S. In February of 2007 he was offered the Fulbright
Scholarship and was accepted into Masters Program in the Department of Animal Science at
Cornell University. He moved to Ithaca, NY in August 2007 and began his Masters with Dr.
Larry Chase. The title of his Masters thesis was: Nitrogen use efficiency and sustainable nitrogen
management in high producing dairy farms. On completion of his Masters, he was accepted into
a PhD program at Cornell with Dr. Mike Van Amburgh to continue working on the development
of the CNCPS.
iv
ACKNOWLEDGMENTS
Having the opportunity to study at Cornell, with the brilliant minds that this university
attracts, has been an incredible experience, and one I am very thankful for. My deepest gratitude
goes to my advisor, Dr. Mike Van Amburgh, who has guided my program and taught me how
approach science in a rigorous manner, with high standards, but has given me the freedom to be
creative, and think in my own way. It has been a lot of fun Mike. Thank you to Dr. Larry Chase
for your guidance and your contribution to my studies during my entire time at Cornell. Thanks
also to the other members of my committee: Dr. Chuck Schwab for the many conversations and
collaborations we have had during this program and for sharing your deep knowledge of amino
acid nutrition; Dr. Brian Sloan for offering your commercial as well as scientific perspective on
amino acid nutrition and the numerous opportunities you have given me to speak around the
country and share our work; Dr. Yves Boisclair for always having the time for a chat, the
example you set for scientific rigor, and continual encouragement to stay in shape and improve
my English skills; Dr. John Roche for sharing his knowledge of the grazing system and
collaboration in Chapter 8.
The financial support for this program was provided by Adisseo and DairyNZ. Funding for
the animal work in Chapter 7 was provided by Adisseo and Perdue AgSolutions and the
collaboration with Brian Sloan, Dennis Stucker, Chuck Schwab and Rick Brown in that project is
appreciated. Thanks also to Andrew LaPierre, Bruce Berggren-Thomas, Andreas Foskolos and
the rest of our lab group for your help with Chapter 7.
v
Thank you to Dr. Helene Lapierre, Dr. Daniel Ouellet and Dr. Eddy Collao-Saenz for your
collaboration in Chapter 5 and thank you to Helene and Daniel for giving me the opportunity to
visit you in Sherbrooke.
A special thank you goes to Dr. Charlie Sniffen. Analysis of my email inbox over the course
of my program identified 773 correspondences with Dr. Sniffen and demonstrates the level of
interest he has in our work. Thank you for your support Charlie.
Thank you to all the members of our lab group. A special thank you goes to Dr. DB Ross for
all the help, coffee and fun over years. Thanks also to my Mexican amigo Dr. Manolo Ramos,
my good mate Dr. Dave Moody and my other good mate Bruce Berggren-Thomas.
A special mention must be made of Ben Dingle and Juliet Maclean who encouraged me to
pursue an education in agriculture and the dairy industry and continue to support my progress
and development.
Finally I’d like to thank all my friends, family and mentors who encourage and inspire me to
challenge myself and achieve to high standards. I would particularly like to thank Mum and Dad
for their continuing support.
vi
TABLE OF CONTENTS
BIOGRAPHICAL SKETCH ..................................................................................................... III
ACKNOWLEDGMENTS .......................................................................................................... IV
TABLE OF CONTENTS ........................................................................................................... VI
LIST OF FIGURES .................................................................................................................. XII
LIST OF TABLES ................................................................................................................... XVI
CHAPTER 1: INTRODUCTION ................................................................................................ 1
1.1 Overview ................................................................................................................ 1
1.2 Protein digestion and availability in the CNCPS ............................................... 2
1.2.1 Fractionation of dietary protein ................................................................... 2
1.2.2 Microbial protein synthesis ......................................................................... 3
1.2.3 Digestion of protein in the small intestine .................................................. 3
1.2.4 Amino acid supply ...................................................................................... 4
1.3 Evolution of the CNCPS ....................................................................................... 4
1.4 Strategies for improving amino acid predictions in the CNCPS ...................... 5
1.4.5 Protein fractions .......................................................................................... 6
1.4.6 Endogenous flows ....................................................................................... 7
1.4.7 Protozoa ....................................................................................................... 9
1.4.8 Protein digestion in small intestine ............................................................. 9
1.4.9 Amino acid requirements .......................................................................... 10
1.5 Summary .............................................................................................................. 11
1.6 Objectives............................................................................................................. 12
vii
1.7 References ............................................................................................................ 13
CHAPTER 2 : UPDATING THE CNCPS FEED LIBRARY AND ANALYZING MODEL
SENSITIVITY TO FEED INPUTS ........................................................................................... 19
2.1 Abstract ................................................................................................................ 19
2.2 Introduction ......................................................................................................... 20
2.3 Materials and Methods ....................................................................................... 21
2.3.1 Feed chemistry .......................................................................................... 21
2.3.2 Calculation procedure ............................................................................... 25
2.3.3 Amino Acids ............................................................................................. 32
2.3.4 Model sensitivity ....................................................................................... 33
2.4 Results and Discussion ........................................................................................ 42
2.4.5 Analytical techniques and fractionation .................................................... 42
2.4.6 Revision of the feed library ....................................................................... 44
2.4.7 Model sensitivity to variation in feed chemistry and digestion kinetics ... 48
2.5 Conclusion ........................................................................................................... 57
2.6 Acknowledgements ............................................................................................. 58
2.7 References ............................................................................................................ 59
CHAPTER 3 : DEVELOPING A DYNAMIC VERSION OF THE CORNELL NET
CARBOHYDRATE AND PROTEIN SYSTEM: CARBOHYDRATE AND NITROGEN
DIGESTION ................................................................................................................................ 65
3.1 Abstract ................................................................................................................ 65
3.2 Introduction ......................................................................................................... 66
3.3 Model description................................................................................................ 67
3.3.1 General model structure ............................................................................ 67
3.3.2 Passage rates .............................................................................................. 71
viii
3.3.3 Carbohydrate digestion ............................................................................. 72
3.3.4 Nitrogen digestion ..................................................................................... 80
3.4 Model outputs ...................................................................................................... 94
3.4.5 Differences between new and old model outputs...................................... 94
3.4.6 Rumen pool sizes and intake dynamics..................................................... 94
3.4.7 Rumen nitrogen ......................................................................................... 97
3.4.8 Metabolizable energy ................................................................................ 98
3.4.9 Metabolizable protein ................................................................................ 98
3.5 Implications ......................................................................................................... 99
3.6 References .......................................................................................................... 100
3.7 Appendix ............................................................................................................ 107
CHAPTER 4 : DEVELOPING A DYNAMIC VERSION OF THE CORNELL NET
CARBOHYDRATE AND PROTEIN SYSTEM: MICROBIAL GROWTH ..................... 117
4.1 Abstract .............................................................................................................. 117
4.2 Introduction ....................................................................................................... 118
4.3 Model description.............................................................................................. 119
4.3.1 Bacterial growth ...................................................................................... 119
4.3.2 Protozoa growth ...................................................................................... 131
4.4 Model behavior.................................................................................................. 145
4.5 Implications ....................................................................................................... 151
4.6 References .......................................................................................................... 152
4.7 Appendix ............................................................................................................ 156
ix
CHAPTER 5 : A REVISED SYSTEM OF PREDICTING AMINO ACID
REQUIREMENTS WITHIN THE UPDATED STRUCTURE OF THE CORNELL NET
CARBOHYDRATE AND PROTEIN SYSTEM .................................................................... 166
5.1 Abstract .............................................................................................................. 166
5.2 Introduction ....................................................................................................... 167
5.3 Materials and methods ..................................................................................... 169
5.3.1 Modeling endogenous AA losses in the gut ............................................ 169
5.3.2 Estimating total AA requirements ........................................................... 175
5.4 Results and Discussion ...................................................................................... 179
5.4.3 Endogenous N flows ............................................................................... 179
5.4.4 Amino acid requirements ........................................................................ 183
5.4.5 Interactions between amino acid supply and energy ............................... 187
5.5 Conclusions ........................................................................................................ 190
5.6 References .......................................................................................................... 191
CHAPTER 6 : A DYNAMIC VERSION OF THE CORNELL NET CARBOHYDRATE
AND PROTEIN SYSTEM: PREDICTING NITROGEN AND AMINO ACID SUPPLY 199
6.1 Abstract .............................................................................................................. 199
6.2 Introduction ....................................................................................................... 200
6.3 Materials and methods ..................................................................................... 201
6.3.1 Calculation of nitrogen and amino acid flows ........................................ 201
6.3.2 Calculation of nitrogen and amino acid digestion ................................... 202
6.3.3 Evaluation dataset ................................................................................... 206
6.3.4 Statistical analysis ................................................................................... 207
6.4 Results ................................................................................................................ 209
6.4.5 Nitrogen flows ......................................................................................... 209
6.4.6 Amino acid flows .................................................................................... 209
x
6.5 Discussion........................................................................................................... 216
6.6 Conclusions ........................................................................................................ 221
6.7 References .......................................................................................................... 223
CHAPTER 7 : BALANCING DAIRY CATTLE DIETS FOR METHIONINE OR ALL
ESSENTIAL AMINO ACIDS REALATIVE TO ENERGY AT NEGATIVE AND
ADEQUATE LEVELS OF RUMEN NITROGEN ................................................................ 229
7.1 Abstract .............................................................................................................. 229
7.2 Introduction ....................................................................................................... 230
7.3 Materials and methods ..................................................................................... 232
7.3.1 Animals and diets .................................................................................... 232
7.3.2 Sample collection and analysis ............................................................... 233
7.3.3 Statistical analysis ................................................................................... 236
7.4 Results ................................................................................................................ 242
7.4.4 Animal performance ................................................................................ 242
7.4.5 Nitrogen utilization ................................................................................. 243
7.4.6 Amino acid balance ................................................................................. 245
7.4.7 Model predictions .................................................................................... 247
7.5 Discussion........................................................................................................... 250
7.6 Conclusions ........................................................................................................ 254
7.7 Acknowledgements ........................................................................................... 255
7.8 References .......................................................................................................... 256
CHAPTER 8 : THE EFFECT OF STARCH-, FIBER-, OR SUGAR-BASED
SUPPLEMENTS ON NITROGEN UTILIZATION IN GRAZING DAIRY COWS ........ 260
8.1 Abstract .............................................................................................................. 260
xi
8.2 Introduction ....................................................................................................... 261
8.3 Materials and methods ..................................................................................... 263
8.3.1 Experimental Design and Treatments ..................................................... 263
8.3.2 Grazing Management .............................................................................. 266
8.3.3 Pasture Measurements ............................................................................. 266
8.3.4 Animal Measurements............................................................................. 267
8.3.5 CNCPS Inputs ......................................................................................... 270
8.3.6 Statistical Analysis .................................................................................. 271
8.4 Results ................................................................................................................ 271
8.4.7 Animal Observations ............................................................................... 271
8.4.8 CNCPS Predictions ................................................................................. 274
8.5 Discussion........................................................................................................... 276
8.6 Conclusions ........................................................................................................ 280
8.7 Acknowledgements ........................................................................................... 280
8.8 References .......................................................................................................... 281
CHAPTER 9 : SUMMARY ..................................................................................................... 287
9.1 References .......................................................................................................... 291
xii
LIST OF FIGURES
Figure 2.1.Comparison of the relative difference in chemical composition between the old (×)
and new (○) CNCPS feed library for two forages (A = Corn Silage Processed 35 DM 49
NDF Medium; B = Grass Hay 16 CP 55 NDF) using the mean and SD of commercial
laboratory data sets as a reference (Cumberland Valley Analytical Services Inc,
Maugansville, MD, USA and Dairy One Cooperative Inc, Ithaca, NY, USA). All
components are expressed as % DM with the exception of soluble protein (SP; % CP),
Ammonia (% SP), acid detergent insoluble CP (ADICP; % CP), neutral detergent
insoluble CP (NDICP; % CP) and lignin (% NDF). ......................................................... 46
Figure 2.2. Comparison of the relative difference chemical composition between the old (×) and
new (○) feed library of two concentrate feeds (A = Corn Grain Ground Fine; B = Canola
Meal Solvent) using the mean and SD of the online laboratory data sets as a reference
(Cumberland Valley Analytical Services Inc, Maugansville, MD, USA and Dairy One
Cooperative Inc, Ithaca, NY, USA). All components are expressed as % DM with the
exception of soluble protein (SP; % CP), ammonia (% SP), acid detergent insoluble CP
(ADICP; % CP), neutral detergent insoluble CP (NDICP; % CP) and lignin (% NDF). . 47
Figure 2.3. Frequency distributions generated from a Monte Carlo simulation for selected
chemical components in the reference diet. Each graph displays the range of possible
outcomes for each component and the relative likelihood of occurrence. ........................ 50
Figure 2.4. Frequency distributions generated from a Monte Carlo simulation for selected model
outputs from the reference diet. Each graph displays the range of possible outcomes for
each component and the relative likelihood of occurrence. .............................................. 51
Figure 2.5. Change in model output from a 1 SD increase in the chemical components of feeds
used in the reference diet ranked in order of importance. ................................................. 55
Figure 2.6. Change in model output from a 1 SD increase in the digestion rates of carbohydrate
and protein fractions of feeds used in the reference diet ranked in order of importance. . 56
Figure 2.7. Change in model output from a 1 SD increase in both, the chemical components, and
digestion rates of carbohydrate and protein fractions of feeds used in the reference diet.
Items are ranked in order of importance. .......................................................................... 57
Figure 3.1. Diagram representing the dynamics of substrate digestion in rumen ......................... 69

xiii
Figure 3.2. Generalized summary of carbohydrate digestion through each compartment of the
model. Boxes represent pools and arrows represent flows. For definitions of
abbreviations see Table 3.1. .............................................................................................. 75
Figure 3.3. Nitrogen transactions in the rumen model. Boxes represent pools and arrows
represent flows. For definitions of abbreviations see Table 3.1. ...................................... 83
Figure 3.4. Post absorptive N transactions in the model. Boxes represent pools and arrows
represent flows. For definitions of abbreviations see Table 3.1. ...................................... 88
Figure 3.5. Model predicted accumulation of undigestible NDF (uNDF) and pd NDF in the
rumen over 300 hours of simulation. ................................................................................ 95
Figure 3.6. Comparison of NDF intake —— (g/hr) and rumen pools sizes for indigestible NDF
— — (g) and rumen pd NDF ˗ ˗ ˗ (g) over 24 hours of simulation using different meal
intervals and sizes (A = continuous intake; B = 4, 2 hour meals; C = 4, 1 hour meals; D =
8, 1 hour meals)................................................................................................................. 96
Figure 3.7. Variation in rumen NH3-N (mg/dl) among three different meal distributions
represented by continuous intake, four meals per day and eight meals per day. .............. 97
Figure 4.1. Diagrammatic representation of microbial growth from slowly and rapidly degrading
NDF using the model of Russell et al. (2009) modified for NDF pool degradation
characteristics from Raffrenato (2011). .......................................................................... 122
Figure 4.2. Lookup factors used to adjust microbial growth for rumen ammonia (A) and AA N
use (B). Microbial cell growth is adjusted when rumen NH3-N is < 5.0 mg/dl (X axis; A)
using the corresponding adjustment factor on the Y axis. Similarly, bacterial growth yield
is increased according to the ratio of AA N and NH3 N (X axis). Growth yield increases
from 100% of the expected yield when NH3-N provides 100% of the growth N to a
maximum of 118% of the expected yield when AA N provides >87% of the growth N.
Both adjustments are made dynamically during the simulation. .................................... 125
Figure 4.3. Engulfment adjustments for protozoa due to cell capacity (A) and rumen pH (B) .. 134
Figure 4.4. Schematic representation of the model used to predict engulfment, recycling, and
metabolism of B1 CHO (Starch) in the rumen by Entodiniomorphid protozoa (EPZ). . 139
xiv
Figure 4.5. Rumen microbial N pools in diet simulations at high intakes with low (A) or high (B)
levels of forage or low intakes with low (C) or high (D) levels of forage where the rumen
was either faunated or defaunated. Microbial populations in the faunated rumen include:
Non-fiber bacteria (∆), fiber bacteria (○) and protozoa (×). Microbial populations in the
defaunated rumen include: Non-fiber bacteria (▲) and fiber bacteria (●). .................... 149
Figure 4.6. Rumen microbial N pools at high intake and high forage (Figure 4.5B) where
protozoal lysis and passage are either: normal (A); passage is normal but lysis is 0 (B);
lysis is normal but passage is 0 (C); passage and lysis are both half of normal (D).
Microbial populations include: Non-fiber bacteria (∆), fiber bacteria (○) and protozoa (×).
......................................................................................................................................... 150
Figure 5.1. Schematic representation of the model used to predict the incorporation of labelled
endogenous N (LEN) into rumen microorganisms ......................................................... 172
Figure 5.2. Schematic representation of the model used to predict the incorporation of
endogenous peptides and AA (EPAA) into rumen microorganisms .............................. 173
Figure 5.3. Model predicted endogenous transactions (g endogenous N/d) by compartment for
the hay treatment presented in Ouellet et al. (2010a). S1-S4 are the endogenous secretions
into the gut; F1-F4 are the flows of free endogenous N; M1-M4 are the flow of
endogenous N in bacteria; A1-A4 is the endogenous N absorption at different sites.
Recovery is only possible in the small intestine (A3) where the N can be absorbed as AA.
......................................................................................................................................... 181
Figure 5.4. Logistic fit of model predicted Met requirement and Met supply. The dashed line
represents the optimum ratio of Met requirement and Met supply ................................. 186
Figure 5.5. Logistic fit of model predicted Lys requirement and Lys supply. The dashed line
represents the optimum ratio of Lys requirement and Lys supply.................................. 186
Figure 5.6. Relationship between model predicted Met requirement:supply and Met supply
relative to ME (A) or MP (B). The dashed line in (A) represents the Met supply at the
optimum ratio of model predicted Met requirement and supply. No significant
relationship was determined in (B). ................................................................................ 188
Figure 5.7. Relationship between model predicted Lys requirement:supply and Lys supply
relative to ME (A) or MP (B). The dashed line in (A) represents the Lys supply at the
optimum ratio of model predicted Lys requirement and supply. No significant
relationship was determined in (B). ................................................................................ 189
xv
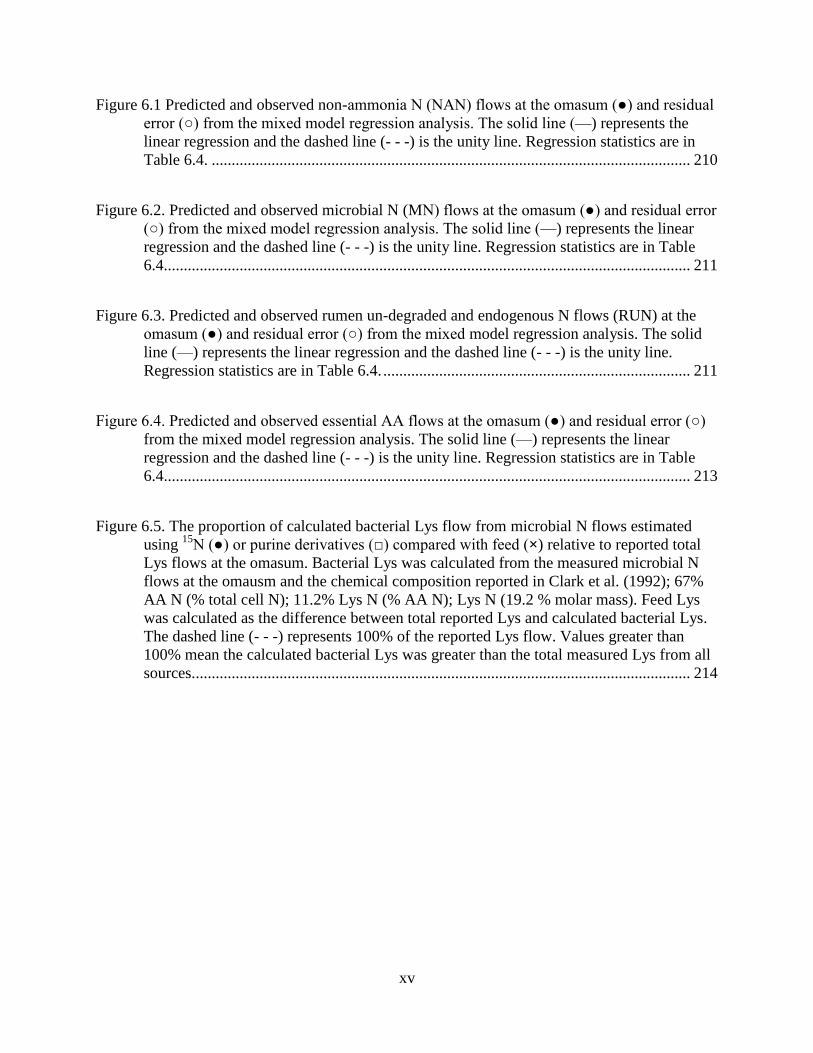
Figure 6.1 Predicted and observed non-ammonia N (NAN) flows at the omasum (●) and residual
error (○) from the mixed model regression analysis. The solid line (—) represents the
linear regression and the dashed line (- - -) is the unity line. Regression statistics are in
Table 6.4. ........................................................................................................................ 210
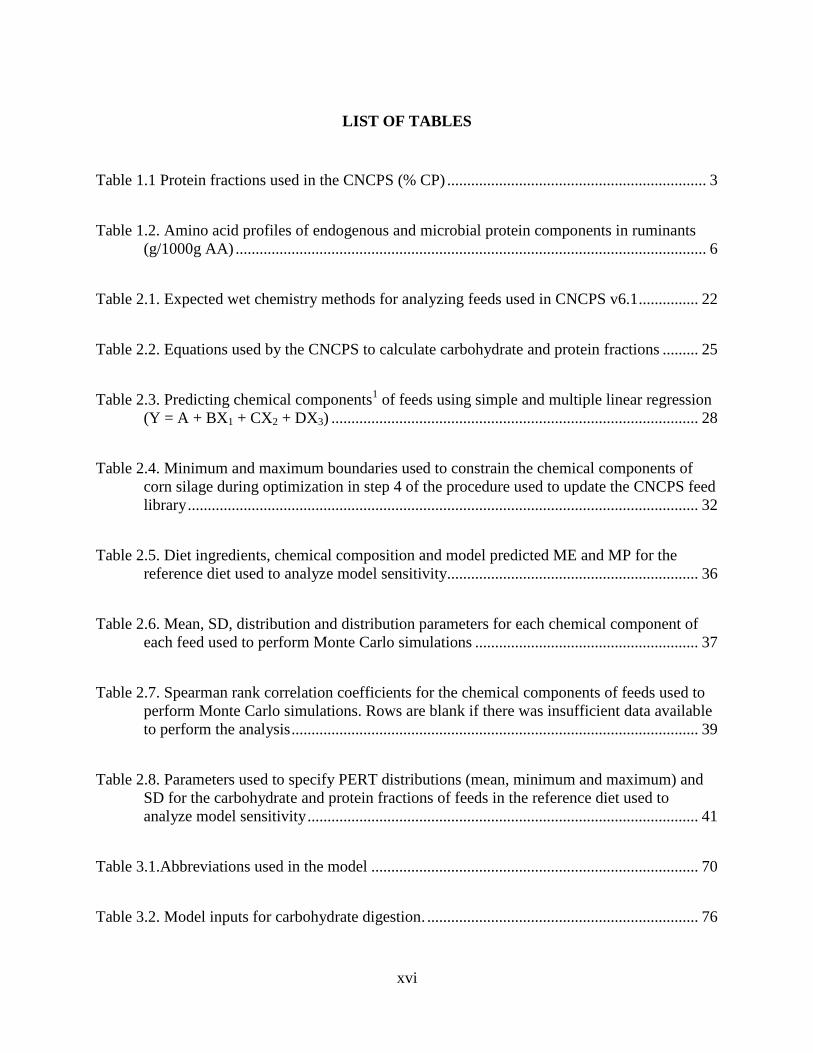
Figure 6.2. Predicted and observed microbial N (MN) flows at the omasum (●) and residual error
(○) from the mixed model regression analysis. The solid line (—) represents the linear
regression and the dashed line (- - -) is the unity line. Regression statistics are in Table
6.4.................................................................................................................................... 211
Figure 6.3. Predicted and observed rumen un-degraded and endogenous N flows (RUN) at the
omasum (●) and residual error (○) from the mixed model regression analysis. The solid
line (—) represents the linear regression and the dashed line (- - -) is the unity line.
Regression statistics are in Table 6.4. ............................................................................. 211
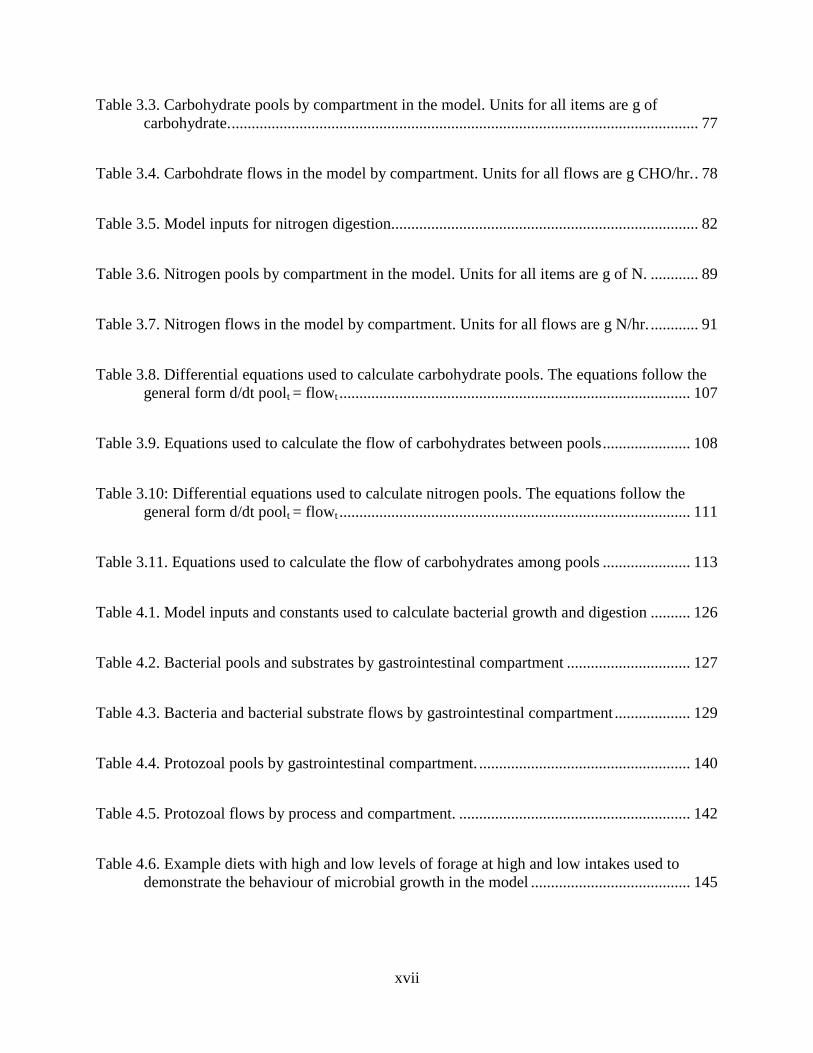
Figure 6.4. Predicted and observed essential AA flows at the omasum (●) and residual error (○)
from the mixed model regression analysis. The solid line (—) represents the linear
regression and the dashed line (- - -) is the unity line. Regression statistics are in Table
6.4.................................................................................................................................... 213
Figure 6.5. The proportion of calculated bacterial Lys flow from microbial N flows estimated
using 15
N (●) or purine derivatives (□) compared with feed (×) relative to reported total
Lys flows at the omasum. Bacterial Lys was calculated from the measured microbial N
flows at the omausm and the chemical composition reported in Clark et al. (1992); 67%
AA N (% total cell N); 11.2% Lys N (% AA N); Lys N (19.2 % molar mass). Feed Lys
was calculated as the difference between total reported Lys and calculated bacterial Lys.
The dashed line (- - -) represents 100% of the reported Lys flow. Values greater than
100% mean the calculated bacterial Lys was greater than the total measured Lys from all
sources............................................................................................................................. 214
xvi
LIST OF TABLES
Table 1.1 Protein fractions used in the CNCPS (% CP) ................................................................. 3
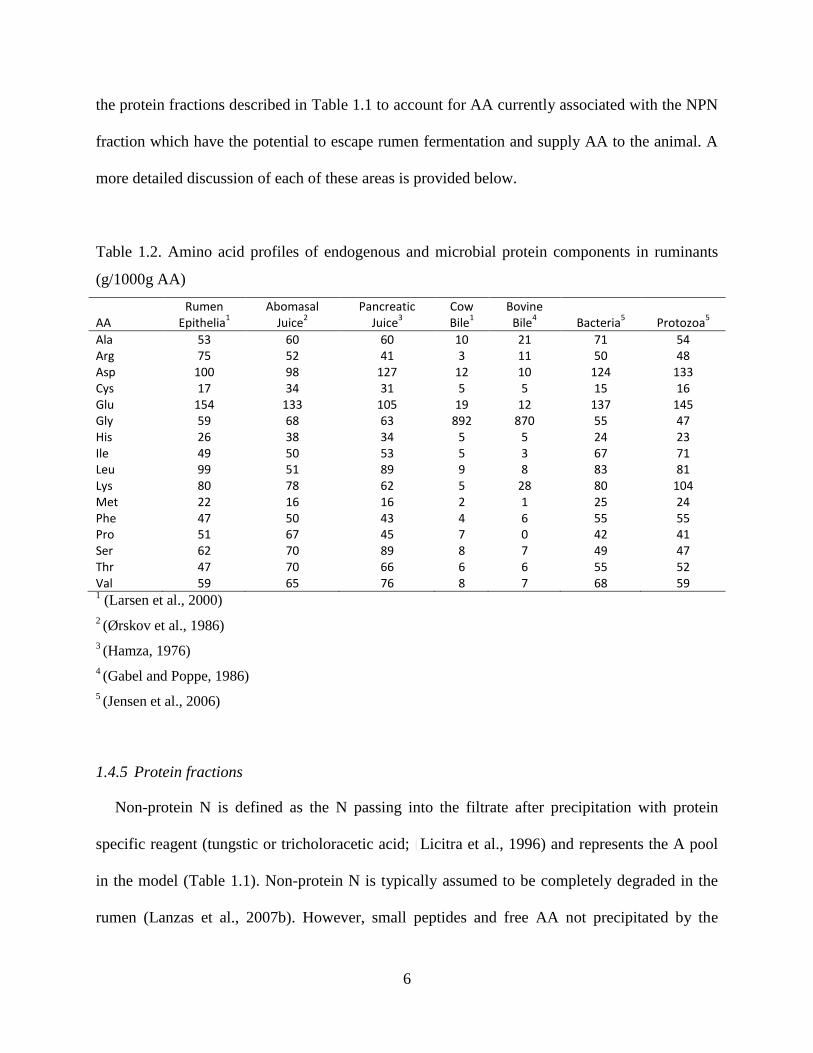
Table 1.2. Amino acid profiles of endogenous and microbial protein components in ruminants
(g/1000g AA) ...................................................................................................................... 6
Table 2.1. Expected wet chemistry methods for analyzing feeds used in CNCPS v6.1 ............... 22
Table 2.2. Equations used by the CNCPS to calculate carbohydrate and protein fractions ......... 25
Table 2.3. Predicting chemical components1 of feeds using simple and multiple linear regression
(Y = A + BX1 + CX2 + DX3) ............................................................................................ 28
Table 2.4. Minimum and maximum boundaries used to constrain the chemical components of
corn silage during optimization in step 4 of the procedure used to update the CNCPS feed
library ................................................................................................................................ 32
Table 2.5. Diet ingredients, chemical composition and model predicted ME and MP for the
reference diet used to analyze model sensitivity............................................................... 36
Table 2.6. Mean, SD, distribution and distribution parameters for each chemical component of
each feed used to perform Monte Carlo simulations ........................................................ 37
Table 2.7. Spearman rank correlation coefficients for the chemical components of feeds used to
perform Monte Carlo simulations. Rows are blank if there was insufficient data available
to perform the analysis ...................................................................................................... 39
Table 2.8. Parameters used to specify PERT distributions (mean, minimum and maximum) and
SD for the carbohydrate and protein fractions of feeds in the reference diet used to
analyze model sensitivity .................................................................................................. 41
Table 3.1.Abbreviations used in the model .................................................................................. 70
Table 3.2. Model inputs for carbohydrate digestion. .................................................................... 76
xvii
Table 3.3. Carbohydrate pools by compartment in the model. Units for all items are g of
carbohydrate. ..................................................................................................................... 77
Table 3.4. Carbohdrate flows in the model by compartment. Units for all flows are g CHO/hr. . 78
Table 3.5. Model inputs for nitrogen digestion............................................................................. 82
Table 3.6. Nitrogen pools by compartment in the model. Units for all items are g of N. ............ 89
Table 3.7. Nitrogen flows in the model by compartment. Units for all flows are g N/hr. ............ 91
Table 3.8. Differential equations used to calculate carbohydrate pools. The equations follow the
general form d/dt poolt = flowt ........................................................................................ 107
Table 3.9. Equations used to calculate the flow of carbohydrates between pools ...................... 108
Table 3.10: Differential equations used to calculate nitrogen pools. The equations follow the
general form d/dt poolt = flowt ........................................................................................ 111
Table 3.11. Equations used to calculate the flow of carbohydrates among pools ...................... 113
Table 4.1. Model inputs and constants used to calculate bacterial growth and digestion .......... 126
Table 4.2. Bacterial pools and substrates by gastrointestinal compartment ............................... 127
Table 4.3. Bacteria and bacterial substrate flows by gastrointestinal compartment ................... 129
Table 4.4. Protozoal pools by gastrointestinal compartment. ..................................................... 140
Table 4.5. Protozoal flows by process and compartment. .......................................................... 142
Table 4.6. Example diets with high and low levels of forage at high and low intakes used to
demonstrate the behaviour of microbial growth in the model ........................................ 145
xviii
Table 4.7. Predicted rumen parameters and microbial growth efficiency with and without
protozoa in diets with high (70%) and low (42%) forage content at high (25 kg/d) and
low (15 kg/d) levels of intake. ........................................................................................ 148
Table 4.8. Differential equations used to calculate bacterial pools. The equations follow the
general form d/dt poolt = flowt ........................................................................................ 156
Table 4.9. Equations used to calculate the flows between bacterial pools ................................. 158
Table 4.10. Differential equations used to calculate protozoal pools. The equations follow the
general form d/dt poolt = flowt ........................................................................................ 161
Table 4.11. Equations used to calculate the flows between protozoal pools .............................. 163
Table 5.1. Endogenous contributions and digestion coefficients used to predict endogenous AA
requirements and supply in the models outlined in Figures 5.1 and 5.2. ........................ 171
Table 5.2. Profiles of essential AA (EAA; % EAA N), EAA N (% AA N) and AA N (% total N)
for endogenous N components predicted by the model. The proportion of AA N not
accounted for as EAA N represents the contribution of non-essential AA to endogenous
secretions......................................................................................................................... 174
Table 5.3. Studies included in the dataset used to estimate additional AA requirements .......... 178
Table 5.4. Descriptive statistics of the dataset used to estimate AA requirements .................... 179
Table 5.5. Measured and model predicted endogenous flows along the gut (g EN/kg DMI) .... 182
Table 5.6. Model parameters, RMSE, R2 and model outcomes for the logistic model fit between
predicted AA requirement and supply ............................................................................ 185
Table 5.7. Model parameters and fit summary for the loglogistic relationship between AA
requirement and supply as well as optimum supply of each EAA relative to ME and
relative to Lys. ................................................................................................................ 189
Table 6.1. Nitrogen components arriving in the small intestine ................................................. 205
xix
Table 6.2. Nitrogen components digested in the small intestine ................................................ 206
Table 6.3. Omasal sampling studies used to evaluate model N flows and AA flows ................ 207
Table 6.4. Model adequacy statistics for the prediction of nitrogen components and essential AA
from the Cornell Net Carbohydrate and Protein System version 7 (CNCPS) relative to
values measured at the omasum ...................................................................................... 215
Table 7.1. Ingredients and chemical composition of experimental diets .................................... 238
Table 7.2. Chemical composition of corn silage for each week of the experiment .................... 239
Table 7.3. Chemical composition of dry grass hay and major concentrate ingredients ............. 240
Table 7.4. Amino acid composition of dietary ingredients ......................................................... 241
Table 7.5. Effects of treatment diets on milk production, intake, body weight and body condition
scores............................................................................................................................... 243
Table 7.6. Nitrogen intake, utilization and excretion for each treatment ................................... 244
Table 7.7. Fiber intake and apparent total tract digestion for each treatment ............................. 245
Table 7.8. Predicted AA supply for each treatment compared with the ideal supply (g digested
AA/Mcal ME) ................................................................................................................. 246
Table 7.9. Plasma AA concentration (g/100 g AA) for each experimental treatment ................ 247
Table 7.10. Selected outputs from the new version of the Cornell Net Carbohydrate and Protein
System. ............................................................................................................................ 249
Table 8.1. Feed intake and chemical composition of experimental diets. .................................. 265
Table 8.2. Effects of supplementing different carbohydrate types to grazing dairy cows in early
lactation on milk yield and milk composition................................................................. 272
xx
Table 8.3. Effects of supplementing different carbohydrate types to grazing dairy cows in early
lactation on parameters of N and energy metabolism. .................................................... 273
Table 8.4. CNCPS inputs and predictions for the effect of supplementing different carbohydrate
types on N use parameters. ............................................................................................. 275
Table 9.1. Major developments in the CNCPS after the description of version 6.0 by Tylutki et
al. (2008) resulting in v6.1, v6.5 and v7.0 ...................................................................... 289
Table 9.2. Comparison of model predictions for v6.5 and v7.0 of the CNCPS using the dietary
treatments from Chapter 7 .............................................................................................. 290

1
CHAPTER 1: INTRODUCTION
1.1 Overview
Ruminants have a unique system of protein digestion and metabolism that has evolved to
enable subsistence in relatively poor nutritional conditions. Dietary N sources support the
requirements of both the animal, and rumen microbes. However, the extensive recycling between
body, gut, and lumen pools, and interactions between the animal and microbes, make
determining the net supply of protein to the small intestine complex. The high value of milk
protein, increasing feed costs, and growing concerns for the environment has made N utilization
a central component in ration balancing on dairy farms.
The Cornell Net Carbohydrate and Protein System (CNCPS) is a mathematical model
designed to evaluate the nutrient requirements of cattle over a wide range of environmental,
dietary, management and production situations (Fox et al., 2004, Tylutki et al., 2008, Van
Amburgh et al., 2013). The CNCPS was first described in a series of publications outlining
carbohydrate and protein digestion (Sniffen et al., 1992), microbial growth (Russell et al., 1992),
amino acid supply (O'Connor et al., 1993) and animal requirements (Fox et al., 1992). The model
uses estimations of carbohydrate and protein degradation and passage rates to predict the extent
of ruminal fermentation, microbial growth, and the absorption of metabolizable energy and
protein throughout the digestive tract (Fox et al., 2004). Predictions also encompass differing
physiological states and body reserves meaning a diverse range of situations can be evaluated
(Fox et al., 2004, Tylutki et al., 2008). The CNCPS has been developed for field application with
care taken to ensure model inputs are routinely available on most farms (Fox et al., 2004). Ration
formulations systems such as the CNCPS and the NRC (2001) are important tools that allow

2
nutritionists to formulate diets that are close to animal requirements and reduce nutrient loss to
the environment. Refining the ability of the CNCPS to predict N and AA supply and
requirements in lactating dairy cows could enable further improvements in the efficiency of N
utilization.
1.2 Protein digestion and availability in the CNCPS
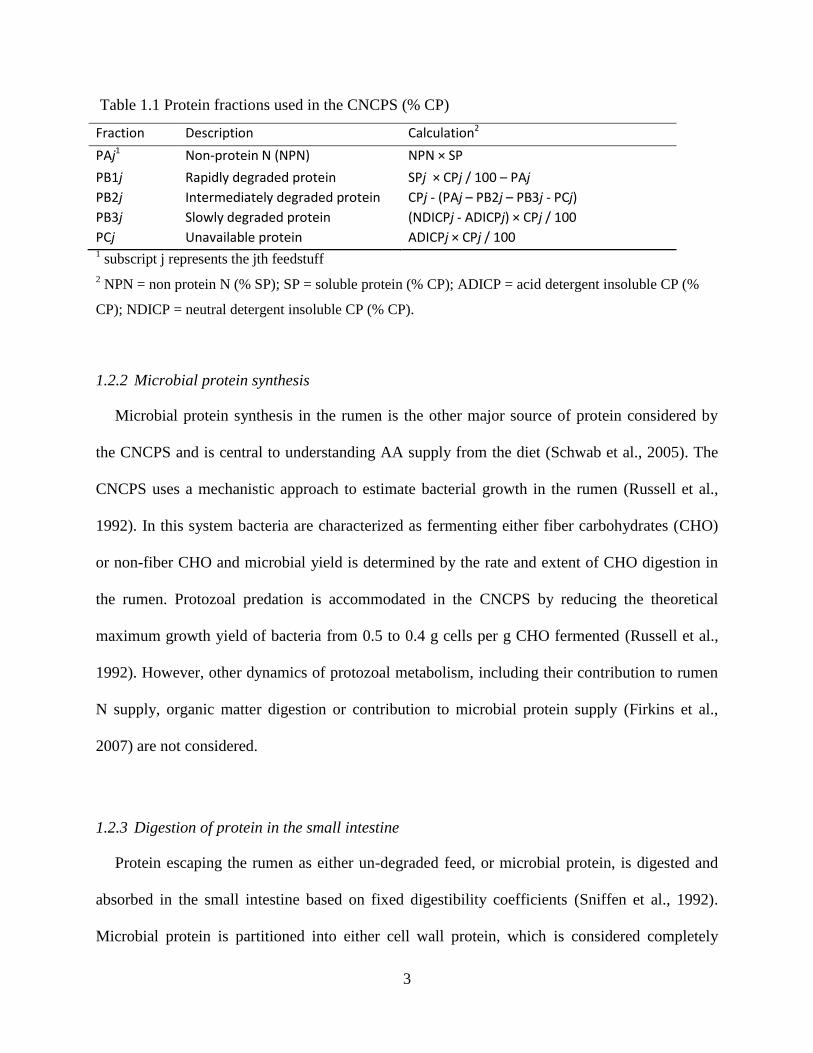
1.2.1 Fractionation of dietary protein
To estimate protein digestion and flows along the digestive tract, the CNCPS uses chemically
determined N fractions to calculate N pools within the model (Table 1.1). The pool structure was
established based on the behavior of the various protein fractions in feeds during digestion
(Sniffen et al., 1992). Proteins can vary in size, shape, function, solubility and AA composition
which influence how they behave in the digestive tract and their nutritional value to the animal
(NRC, 2001). Examples include globular proteins like albumins, globulins, glutelins, prolamines
or histones which are common to all feedstuffs, and fibrous proteins such as collagens, elastins
and keratins which are of animal or marine origin (NRC, 2001). Each protein fraction in the
CNCPS has a specific digestion rate which reflects the inherent properties of the fraction and is
assigned to flow with either the liquid or solid phase out of the rumen. These kinetic parameters
are what determine the amount of protein that is degraded (RDP) or escapes (RUP) the rumen
and, thus, the RDP and RUP supply from each feed to the animal, and the subsequent rumen N
availability and MP supply.
3
Table 1.1 Protein fractions used in the CNCPS (% CP)
Fraction Description Calculation2
PAj1 Non-protein N (NPN) NPN × SP
PB1j Rapidly degraded protein SPj × CPj / 100 – PAj
PB2j Intermediately degraded protein CPj - (PAj – PB2j – PB3j - PCj)
PB3j Slowly degraded protein (NDICPj - ADICPj) × CPj / 100
PCj Unavailable protein ADICPj × CPj / 100 1 subscript j represents the jth feedstuff
2 NPN = non protein N (% SP); SP = soluble protein (% CP); ADICP = acid detergent insoluble CP (%
CP); NDICP = neutral detergent insoluble CP (% CP).
1.2.2 Microbial protein synthesis
Microbial protein synthesis in the rumen is the other major source of protein considered by
the CNCPS and is central to understanding AA supply from the diet (Schwab et al., 2005). The
CNCPS uses a mechanistic approach to estimate bacterial growth in the rumen (Russell et al.,
1992). In this system bacteria are characterized as fermenting either fiber carbohydrates (CHO)
or non-fiber CHO and microbial yield is determined by the rate and extent of CHO digestion in
the rumen. Protozoal predation is accommodated in the CNCPS by reducing the theoretical
maximum growth yield of bacteria from 0.5 to 0.4 g cells per g CHO fermented (Russell et al.,
1992). However, other dynamics of protozoal metabolism, including their contribution to rumen
N supply, organic matter digestion or contribution to microbial protein supply (Firkins et al.,
2007) are not considered.
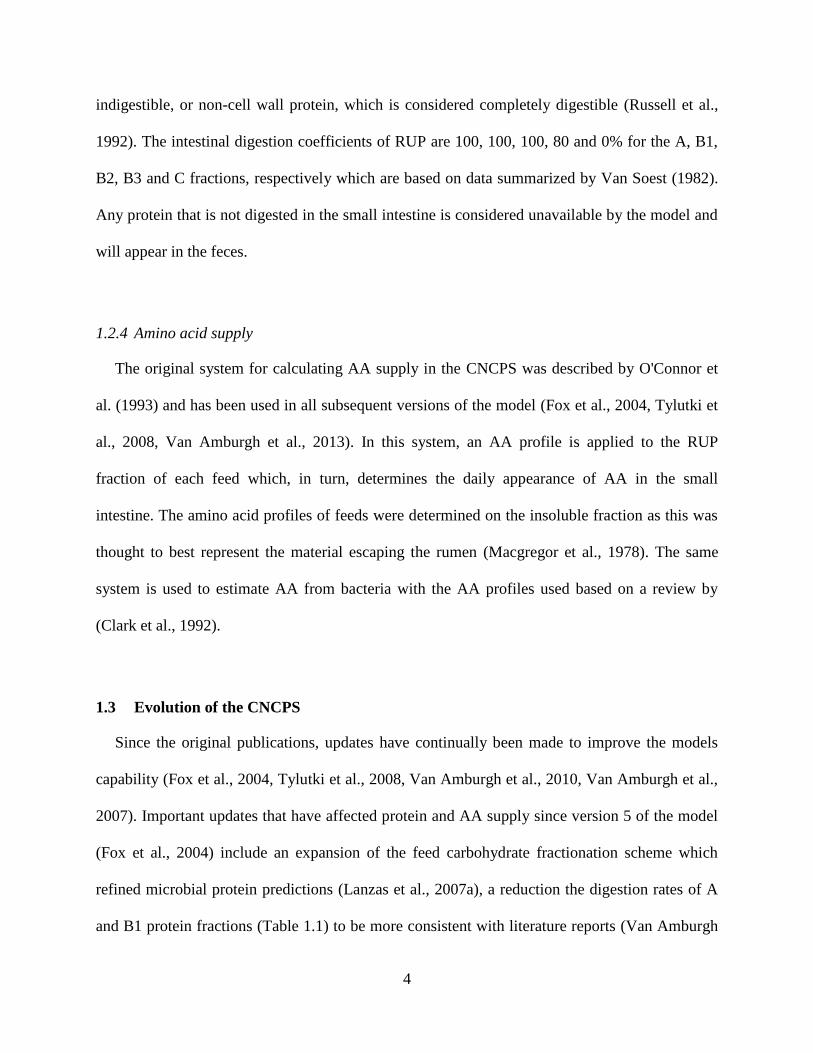
1.2.3 Digestion of protein in the small intestine
Protein escaping the rumen as either un-degraded feed, or microbial protein, is digested and
absorbed in the small intestine based on fixed digestibility coefficients (Sniffen et al., 1992).
Microbial protein is partitioned into either cell wall protein, which is considered completely
4
indigestible, or non-cell wall protein, which is considered completely digestible (Russell et al.,
1992). The intestinal digestion coefficients of RUP are 100, 100, 100, 80 and 0% for the A, B1,
B2, B3 and C fractions, respectively which are based on data summarized by Van Soest (1982).
Any protein that is not digested in the small intestine is considered unavailable by the model and
will appear in the feces.
1.2.4 Amino acid supply
The original system for calculating AA supply in the CNCPS was described by O'Connor et
al. (1993) and has been used in all subsequent versions of the model (Fox et al., 2004, Tylutki et
al., 2008, Van Amburgh et al., 2013). In this system, an AA profile is applied to the RUP
fraction of each feed which, in turn, determines the daily appearance of AA in the small
intestine. The amino acid profiles of feeds were determined on the insoluble fraction as this was
thought to best represent the material escaping the rumen (Macgregor et al., 1978). The same
system is used to estimate AA from bacteria with the AA profiles used based on a review by
(Clark et al., 1992).
1.3 Evolution of the CNCPS
Since the original publications, updates have continually been made to improve the models
capability (Fox et al., 2004, Tylutki et al., 2008, Van Amburgh et al., 2010, Van Amburgh et al.,
2007). Important updates that have affected protein and AA supply since version 5 of the model
(Fox et al., 2004) include an expansion of the feed carbohydrate fractionation scheme which
refined microbial protein predictions (Lanzas et al., 2007a), a reduction the digestion rates of A
and B1 protein fractions (Table 1.1) to be more consistent with literature reports (Van Amburgh
5
et al., 2007) and a re-organization of the passage rate assignments of the various protein fractions
to better reflect the phase in which each fraction would flow out of the rumen (Van Amburgh et
al., 2007). These changes resulted in a model that was more sensitive in predicting the level of
milk production that could be supported by the most limiting nutrient in a diet (ME or MP) and
provided a platform that could be used to reduce dietary protein levels without impacting animal
performance (Van Amburgh et al., 2010). Given the improvements in the sensitivity of the
CNCPS in predicting total MP supply, efforts have since been shifted to refining predictions of
individual amino acids.
1.4 Strategies for improving amino acid predictions in the CNCPS
Amino acids flowing to the duodenum in ruminants encompass three major fractions: 1) Un-
degraded feed, 2) microbial and 3) endogenous AA (Lapierre et al., 2006). Combined, these
fractions represent the gross AA supply, potentially available to the animal. However, the
endogenous fraction, and its contribution to the microbial pool make establishing the net AA
supply complex (Ouellet et al., 2002). Free endogenous N and the contribution of endogenous N
to the microbial pool represent a recycling of previously absorbed AA that cannot be considered
a new supply (Lapierre et al., 2006). Further, the AA profiles of components not currently
considered by the CNCPS vary (Table 1.2) and can contribute meaningful amounts to total AA
flow. For example, protozoal protein in high producing cows can represent 5-10% of total
microbial protein (Sylvester et al., 2005) and AA of endogenous origin can contribute 15-20% of
the total AA flow (Ouellet et al., 2010, Ouellet et al., 2002). Given the variation in AA profiles
of sources not considered by the model (Table 1.2), future updates to the CNCPS should include
these sources. Van Amburgh et al. (2010) also suggested a refinement in the characterization of
6
the protein fractions described in Table 1.1 to account for AA currently associated with the NPN
fraction which have the potential to escape rumen fermentation and supply AA to the animal. A
more detailed discussion of each of these areas is provided below.
Table 1.2. Amino acid profiles of endogenous and microbial protein components in ruminants
(g/1000g AA)
AA Rumen
Epithelia1
Abomasal Juice
2 Pancreatic
Juice3
Cow Bile
1 Bovine
Bile4
Bacteria5
Protozoa5
Ala 53 60 60 10 21 71 54 Arg 75 52 41 3 11 50 48 Asp 100 98 127 12 10 124 133 Cys 17 34 31 5 5 15 16 Glu 154 133 105 19 12 137 145 Gly 59 68 63 892 870 55 47 His 26 38 34 5 5 24 23 Ile 49 50 53 5 3 67 71 Leu 99 51 89 9 8 83 81 Lys 80 78 62 5 28 80 104 Met 22 16 16 2 1 25 24 Phe 47 50 43 4 6 55 55 Pro 51 67 45 7 0 42 41 Ser 62 70 89 8 7 49 47 Thr 47 70 66 6 6 55 52 Val 59 65 76 8 7 68 59 1 (Larsen et al., 2000)
2 (Ørskov et al., 1986)
3 (Hamza, 1976)
4 (Gabel and Poppe, 1986)
5 (Jensen et al., 2006)
1.4.5 Protein fractions
Non-protein N is defined as the N passing into the filtrate after precipitation with protein
specific reagent (tungstic or tricholoracetic acid; (Licitra et al., 1996) and represents the A pool
in the model (Table 1.1). Non-protein N is typically assumed to be completely degraded in the
rumen (Lanzas et al., 2007b). However, small peptides and free AA not precipitated by the
7
chemical method are still metabolically relevant to the animal if they escape rumen degradation
and flow through to the small intestine (Givens and Rulquin, 2004). Choi et al. (2002) suggested
10% of the AA flowing through to the small intestine originated from dietary NPN sources
which under the current system are unaccounted for. Likewise, Velle et al. (1997) infused free
AA into the rumen at various rates and showed up to 20% could escape degradation and flow
through to the small intestine. Van Amburgh et al. (2010) suggested it may be more appropriate
to redefine the protein A pool from NPN as described by Licitra et al. (1996) to ammonia. This
would shift small peptides and free AA previously associated with the A pool into the B1 pool
(Table 1.1) where they could contribute to MP supply. Ammonia also has the advantage of being
easily measured and available from most commercial laboratories.
1.4.6 Endogenous flows
The contribution of endogenous AA to total AA flows were recognized by O'Connor et al.
(1993), but at the time, it was deemed there was not enough quantitative information available to
include them in the CNCPS. There is agreement in the literature that endogenous flows must be
accounted for in order to predict true net AA supply, however, data used to estimate these flows
is varied (Lapierre et al., 2006). Endogenous secretions occur at various places along the gastro-
intestinal tract. Important sources include saliva, gastric juices, bile, pancreatic secretions,
sloughed epithelial cells and mucin (Tamminga et al., 1995). Digestive secretions containing
enzymes such as proteases, nucleases, lipases and amylases in monogastrics are influenced by
the composition of the diet (Harmon, 1993). Ruminants, in contrast, have a much more constant,
and consistent digesta flow than monogastrics due to the extensive pre-gastric fermentation and
selective retention mechanism of the reticular-rumen (Tamminga et al., 1995). Consequently,
8
secretions are less variable, and are probably more closely related to digesta flow than diet
composition per se (Tamminga et al., 1995). The implication of this when trying to predict
endogenous contributions to the small intestine is that simple relationships based on intake or
flow may be adequate rather than more complex relationships that account for dietary
differences. An important difficulty encountered when measuring endogenous secretions is
distinguishing the origin of the various proteins (Tamminga et al., 1995). Different approaches
have been used, with those having the most relevance to dairy cows including protein-free diets
(Larsen et al., 2000, Ørskov et al., 1986), regression techniques (Marini et al., 2008), or stable
isotope methods (Ouellet et al., 2010, Ouellet et al., 2002). The NRC (2001) adopted a value of
1.9 g endogenous N/ kg DMI based on work with N free diets (Ørskov et al., 1986) and diets
with very low protein supply and degradability (Hannah et al., 1991, Hart and Leibholz, 1990,
Lintzenich et al., 1995). However, these conditions are somewhat artificial compared to what
might be expected in typical production systems. Ouellet et al. (2002) conducted an experiment
using 15
N-leucine infused over an 8-day period and measured the enrichment of protein flows at
the duodenum at differing fiber levels (high and low). The effect of fiber was not significant,
however, endogenous flows were estimated to be 4.4 g N/kg DMI, over twice that used by the
NRC (2001). Approximately half (2.3 g N/kg DMI) was ‘free’, and the balance incorporated in
bacterial protein (Ouellet et al., 2002). Marini et al. (2008) generated similar results using a
meta-analytical approach and estimated free endogenous flows at the duodenum to be
approximately 3.29 g N/kg OMI. Endogenous protein in bacteria were calculated to contribute
approximately 2.25 g N/kg OMI based on the assumptions that bacteria don’t discriminate
between feed and endogenous N, and that urea N and other endogenous sources contribute
equally to bacterial N (Ouellet et al., 2002). The close agreement of Ouellet et al. (2002) and
9
Marini et al. (2008) despite the different approaches used, and the more typical feeding
environments used in generating these data suggests they may be the most relevant estimations to
use when predicting endogenous flows and that adequate data are now available to incorporate
estimations of endogenous AA transactions in the CNCPS.
1.4.7 Protozoa
Protozoa are currently accommodated in the CNCPS by reducing the theoretical maximum
growth yield from 0.5 to 0.4 g cells per g CHO fermented (Russell et al., 1992) but do not
contribute to digestion or microbial protein production. Protozoa have important effects not only
on bacterial yield, but also nutrient digestion and cycling within the rumen (Firkins et al., 2007,
Hristov and Jouany, 2005) and can make 40% to 50% of the total microbial biomass (Hristov
and Jouany, 2005). Further, protozoa can contribute 5-10% of the microbial flow in high
producing dairy cows, and given their AA profile differs to that of bacteria, particularly in Lys
(Table 1.2), a more mechanistic approach is warranted to fully capture these effects in the
CNCPS.
1.4.8 Protein digestion in small intestine
The CNCPS currently uses static library values for digestion of nitrogen fractions in the small
intestine (Sniffen et al., 1992). However, numerous in situ and in vitro procedures have been
developed to directly measure the digestion of feeds in the small intestine (Boucher et al., 2009,
Calsamiglia and Stern, 1995, Gargallo et al., 2006). Ross et al., (2013) modified and extended
previous methods to an in vitro technique designed specifically to provide an input into the
CNCPS and with a focus on practical application in commercial laboratories. Data presented by
10
Ross et al., (2013) show important differences in the digestibility of commonly fed feeds like
blood meal and soybean meal which cannot be adequately captured using static digestibility
values. As models improve in their ability to predict nitrogen flows to the small intestine, more
scrutiny will be placed on quantifying digestion in the small intestine to improve predictions of
metabolizable protein and AA supply. Therefore, updating the CNCPS to accommodate data
generated from the procedure of Ross (2013) could help refine predictions of AA availability to
the animal.
1.4.9 Amino acid requirements
Requirements for each individual EAA in the CNCPS are predicted for processes that are
quantified by the model (maintenance, lactation, pregnancy, growth) and subsequently divided
by the efficiency of transfer to that process to give the total AA requirement (Fox et al., 2004,
O'Connor et al., 1993). Previous versions of the CNCPS have treated different physiological
functions separately with the original values coming from a range of sources outlined in
O'Connor et al. (1993). Lapierre et al. (2007) suggested using a single factor to calculate total
AA requirement for maintenance and milk production makes more biological sense as it is
difficult to localize the large number of processes that are encompassed by the efficiency of
transfer. Recommendations for v6.1 of the CNCPS were presented by Lapierre et al. (2007) and
have been implemented in the most recent update of the model v6.5 (Van Amburgh et al., 2013).
Recommendations for dietary Lys and Met supply are well established (NRC, 2001, Rulquin et
al., 1993, Schwab, 1996) and numerous studies have demonstrated improvements in animal
productivity when the balance of Lys and Met is improved (Armentano et al., 1997, Chen et al.,
11
2011, Noftsger and St-Pierre, 2003). Further investigation into the optimum AA supply when
using the CNCPS will be warranted as updates are made to the model.
1.5 Summary
Mathematical models provide an advanced method of strategically improving N utilization
and animal performance using inputs that are easy to collect, and economically measured.
Models such as the CNCPS are continually being updated and improved as new data become
available and the understanding of biological mechanisms improves. Recent updates to the
model have focused on improving predictions of MP supply to enable the formulation of diets
that closely match animal requirements. Efforts are now being focused on improving the models
ability to predict AA supply and requirements. Areas of opportunity include refining the
characterization of feed proteins and the addition of N components into the CNCPS that have
been previously omitted such as protozoa and endogenous secretions. New techniques have also
been developed to estimate protein digestion in the small intestine and new recommendations are
available to predict AA requirements. Incorporation of these areas into the CNCPS could provide
improved capability to formulate rations that maximize animal performance and minimize
environmental impact.

12
1.6 Objectives
The objectives of this dissertation are:
1) Review and update the chemical composition of feeds in the CNCPS feed library and
investigate opportunities to re-classify the protein fractions to refine predictions of AA
supply
2) Develop new capability within the CNCPS to predict nitrogen and amino acid supply
and requirements
3) Investigate the potential to improve nitrogen utilization in high producing dairy cows by
formulating diets that more closely match animal requirements
13
1.7 References
Armentano, L. E., S. J. Bertics, and G. A. Ducharme. 1997. Response of lactating cows to
methionine or methionine plus lysine added to high protein diets based on alfalfa and heated
soybeans. J. Dairy Sci. 80:1194-1199.
Boucher, S. E., S. Calsamiglia, C. M. Parsons, M. D. Stern, M. Ruiz Moreno, M. Vázquez-Añón,
and C. G. Schwab. 2009. In vitro digestibility of individual amino acids in rumen-undegraded
protein: The modified three-step procedure and the immobilized digestive enzyme assay. J. Dairy
Sci. 92:3939-3950.
Calsamiglia, S. and M. D. Stern. 1995. A three-step in vitro procedure for estimating intestinal
digestion of protein in ruminants. J. Anim. Sci. 73:1459-1465.
Chen, Z. H., G. A. Broderick, N. D. Luchini, B. K. Sloan, and E. Devillard. 2011. Effect of
feeding different sources of rumen-protected methionine on milk production and n-utilization in
lactating dairy cows. J. Dairy Sci. 94:1978-1988.
Choi, C. W., S. Ahvenjarvi, A. Vanhatalo, V. Toivonen, and P. Huhtanen. 2002. Quantitation of
the flow of soluble non-ammonia nitrogen entering the omasal canal of dairy cows fed grass
silage based diets. Anim. Feed Sci. Technol. 96:203-220.
Clark, J. H., T. H. Klusmeyer, and M. R. Cameron. 1992. Microbial protein synthesis and flows
of nitrogen fractions to the duodenum of dairy cows. J. Dairy Sci. 75:2304-2323.
Firkins, J. L., Z. Yu, and M. Morrison. 2007. Ruminal nitrogen metabolism: Perspectives for
integration of microbiology and nutrition for dairy. J. Dairy Sci. 90:E1-E16.
Fox, D. G., C. J. Sniffen, J. D. O'Connor, J. B. Russell, and P. J. Van Soest. 1992. A net
carbohydrate and protein system for evaluating cattle diets: Iii. Cattle requirements and diet
adequacy. J. Anim. Sci. 70:3578-3596.
Fox, D. G., L. O. Tedeschi, T. P. Tylutki, J. B. Russell, M. E. Van Amburgh, L. E. Chase, A. N.
Pell, and T. R. Overton. 2004. The Cornell Net Carbohydrate and Protein System model for
evaluating herd nutrition and nutrient excretion. Anim. Feed Sci. Technol. 112:29-78.

14
Gabel, M. and S. Poppe. 1986. Investigations into the protein and amino-acid-metabolism in the
digestive-tract of growing bulls. 5. Flow of amino-acids into the duodenum. Archives of Animal
Nutrition 36:429-454.
Gargallo, S., S. Calsamiglia, and A. Ferret. 2006. Technical note: A modified three-step in vitro
procedure to determine intestinal digestion of proteins. J. Anim. Sci. 84:2163-2167.
Givens, D. I. and H. Rulquin. 2004. Utilisation by ruminants of nitrogen compounds in silage-
based diets. Anim. Feed Sci. Technol. 114:1-18.
Hamza, A. N. 1976. Rate of protein secretion by sheep pancreas and amino-acid composition of
pancreatic-juice. Nutrition Reports International 14:79-87.
Hannah, S. M., R. C. Cochran, E. S. Vanzant, and D. L. Harmon. 1991. Influence of protein
supplementation on site and extent of digestion, forage intake, and nutrient flow characteristics
in steers consuming dormant bluestem-range forage. J. Anim. Sci. 69:2624-2633.
Harmon, D. L. 1993. Nutritional regulation of postruminal digestive enzymes in ruminants1. J.
Dairy Sci. 76:2102-2111.
Hart, F. J. and J. Leibholz. 1990. A note on the flow of endogenous protein to the omasum and
abomasum of steers. Animal Science 51:217-219.
Hristov, A. N. and J.-P. Jouany. 2005. Nitrogen requirements of cattle. Pages 117-166 in Factors
affecting the efficiency of nitrogen utilization in the rumen. A. Pfeffer and A. N. Hristov, ed.
CABI, Wallingford, UK.
Jensen, C., M. R. Weisbjerg, and T. Hvelplund. 2006. Evaluation of methods for estimating the
amino acid supply to the duodenum of microbial, endogenous and undegraded feed protein on
maize silage diets fed to dairy cows. Anim. Feed Sci. Technol. 131:1-24.
Lanzas, C., C. J. Sniffen, S. Seo, L. O. Tedeschi, and D. G. Fox. 2007a. A revised CNCPS feed
carbohydrate fractionation scheme for formulating rations for ruminants. Anim. Feed Sci.
Technol. 136:167-190.
15
Lanzas, C., L. O. Tedeschi, S. Seo, and D. G. Fox. 2007b. Evaluation of protein fractionation
systems used in formulating rations for dairy cattle. J. Dairy Sci. 90:507-521.
Lapierre, H., G. E. Lobley, D. R. Quellet, L. Doepel, and D. Pacheco. 2007. Amino acid
requirements for lactating dairy cows: Reconciling predictive models and biology. Pages 39-59
in Proc. Cornell Nutrition Conference. Department of Animal Science, Cornell University,
Syracuse, NY.
Lapierre, H., D. Pacheco, R. Berthiaume, D. R. Ouellet, C. G. Schwab, P. Dubreuil, G. Holtrop,
and G. E. Lobley. 2006. What is the true supply of amino acids for a dairy cow? J. Dairy Sci.
89:E1-14.
Larsen, M., T. G. Madsen, M. R. Weisbjerg, T. Hvelplund, and J. Madsen. 2000. Endogenous
amino acid flow in the duodenum of dairy cows. Acta Agriculturae Scandinavica, Section A -
Animal Science 50:161 - 173.
Licitra, G., T. M. Hernandez, and P. J. Van Soest. 1996. Standardization of procedures for
nitrogen fractionation of ruminant feeds. Anim. Feed Sci. Technol. 57:347-358.
Lintzenich, B. A., E. S. Vanzant, R. C. Cochran, J. L. Beaty, R. T. Brandt, Jr, and G. St Jean.
1995. Influence of processing supplemental alfalfa on intake and digestion of dormant bluestem-
range forage by steers. J. Anim. Sci. 73:1187-1195.
Macgregor, C. A., C. J. Sniffen, and W. H. Hoover. 1978. Amino acid profiles of total and
soluble protein in feedstuffs commonly fed to ruminants. J. Dairy Sci. 61:566-573.
Marini, J. C., D. G. Fox, and M. R. Murphy. 2008. Nitrogen transactions along the
gastrointestinal tract of cattle: A meta-analytical approach. J. Anim. Sci. 86:660-679.
Noftsger, S. and N. R. St-Pierre. 2003. Supplementation of methionine and selection of highly
digestible rumen undegradable protein to improve nitrogen efficiency for milk production. J.
Dairy Sci. 86:958-969.
NRC. 2001. Nutrient requirements of dairy cattle. 7th revised ed. National Academy Press,
Washington, DC.
16
O'Connor, J. D., C. J. Sniffen, D. G. Fox, and W. Chalupa. 1993. A net carbohydrate and protein
system for evaluating cattle diets: Iv. Predicting amino acid adequacy. J. Anim. Sci. 71:1298-
1311.
Ørskov, E. R., N. A. MacLeod, and D. J. Kyle. 1986. Flow of nitrogen from the rumen and
abomasum in cattle and sheep given protein-free nutrients by intragastric infusion. Br. J. Nutr.
56:241-248.
Ouellet, D. R., R. Berthiaume, G. Holtrop, G. E. Lobley, R. Martineau, and H. Lapierre. 2010.
Effect of method of conservation of timothy on endogenous nitrogen flows in lactating dairy
cows. J. Dairy Sci. 93:4252-4261.
Ouellet, D. R., M. Demers, G. Zuur, G. E. Lobley, J. R. Seoane, J. V. Nolan, and H. Lapierre.
2002. Effect of dietary fiber on endogenous nitrogen flows in lactating dairy cows. J. Dairy Sci.
85:3013-3025.
Ross, D. A. 2013. Methods to analyze feeds for nitrogen fractions and digestibility for ruminants
with application for the CNCPS. PhD Diss.. Department of Animal Science. Cornell University.
Ross, D. A., M. Gutierrez-Botero, and M. E. Van Amburgh. 2013. Development of an in-vitro
intestinal digestibility assay for ruminant feeds. Pages 190-202 in Proc. Cornell Nutrition
Conference, Syracuse, NY.
Rulquin, H., P. Pisulewski, R. Vérité, and J. Guinard. 1993. Milk production and composition as
a function of postruminal lysine and methionine supply: A nutrient-response approach. Livestock
Production Science 37:69-90.
Russell, J. B., J. D. O'Connor, D. G. Fox, P. J. Van Soest, and C. J. Sniffen. 1992. A net
carbohydrate and protein system for evaluating cattle diets: I. Ruminal fermentation. J. Anim.
Sci. 70:3551-3561.
Schwab, C. G. 1996. Rumen-protected amino acids for dairy cattle: Progress towards
determining lysine and methionine requirements. Anim. Feed Sci. Technol. 59:87-101.
17
Schwab, C. G., P. Huhtanen, C. W. Hunt, and T. Hvelplund. 2005. Nitrogen requirements of
cattle. Pages 13-70 in Nitrogen and phosphorus nutrition of cattle and the environment. A.
Pfeffer and A. N. Hristov, ed. CABI, Wallingford, UK.
Sniffen, C. J., J. D. O'Connor, P. J. Van Soest, D. G. Fox, and J. B. Russell. 1992. A net
carbohydrate and protein system for evaluating cattle diets: Ii. Carbohydrate and protein
availability. J. Anim. Sci. 70:3562-3577.
Sylvester, J. T., S. K. R. Karnati, Z. Yu, C. J. Newbold, and J. L. Firkins. 2005. Evaluation of a
real-time pcr assay quantifying the ruminal pool size and duodenal flow of protozoal nitrogen. J.
Dairy Sci. 88:2083-2095.
Tamminga, S., H. Schulze, J. Vanbruchem, and J. Huisman. 1995. Nutritional significance of
endogenous n-losses along the gastrointestinal-tract of farm-animals. Archives of Animal
Nutrition 48:9-22.
Tylutki, T. P., D. G. Fox, V. M. Durbal, L. O. Tedeschi, J. B. Russell, M. E. Van Amburgh, T. R.
Overton, L. E. Chase, and A. N. Pell. 2008. Cornell Net Carbohydrate and Protein System: A
model for precision feeding of dairy cattle. Anim. Feed Sci. Technol. 143:174-202.
Van Amburgh, M. E., L. E. Chase, T. R. Overton, D. A. Ross, E. B. Recktenwald, R. J. Higgs,
and T. P. Tylutki. 2010. Updates to the Cornell Net Carbohydrate and Protien System v6.1 and
implications for ration formulation. Pages 144-159 in Proc. Cornell Nutrition Conference,
Syracuse, NY.
Van Amburgh, M. E., A. Foskolos, E. A. Collao-Saenz, R. J. Higgs, and D. A. Ross. 2013.
Updating the CNCPS feed library with new amino acid profiles and efficiencies of use:
Evaluation of model predictions - version 6.5. Pages 59-76 in Proc. Cornell Nutrition
Conference, Syracuse, NY.
Van Amburgh, M. E., E. B. Recktenwald, D. A. Ross, T. R. Overton, and L. E. Chase. 2007.
Achieving better nitrogen efficiency in lactating dairy cattle: Updating field usable tools to
improve nitrogen efficiency. Pages 25-38 in Proc. Cornell Nutrition Conference, Syracuse, NY.
Van Soest, P. J. 1982. Nutritional ecology of the ruminant. Cornell University Press, Ithaca, NY.
18
Velle, W., Ø. V. Sjaastad, A. Aulie, D. Grønset, K. Feigenwinter, and T. Framstad. 1997. Rumen
escape and apparent degradation of amino acids after individual intraruminal administration to
cows. J. Dairy Sci. 80:3325-3332.
19
CHAPTER 2: UPDATING THE CNCPS FEED LIBRARY AND ANALYZING MODEL
SENSITIVITY TO FEED INPUTS
2.1 Abstract
The Cornell Net Carbohydrate and Protein System (CNCPS) is a nutritional model that
evaluates the environmental and nutritional resources available in an animal productions system
and enables the formulation of diets that closely match the predicted animal requirements. The
model includes a library of approximately 800 different ingredients which provide the platform
for describing the chemical composition of the diet to be formulated. Each feed in the feed
library was evaluated against data from two commercial laboratories and updated where required
to enable more precise predictions of dietary energy and protein supply. A multi-step approach
was developed to predict uncertain values using linear regression, matrix regression and
optimization. The approach provided an efficient and repeatable way of evaluating and refining
the composition of a large number of different feeds against commercially generated data similar
to that used by CNCPS users on a daily basis. The protein A fraction in the CNCPS, formally
classified as non-protein nitrogen, was re-classified to ammonia for ease and availability of
analysis and to provide a better prediction of the contribution of metabolizable protein (MP)
from free amino acids and small peptides. Amino acid profiles were updated using contemporary
datasets and now represent the profile of AA in the whole feed rather than the insoluble residue.
Model sensitivity to variation in feed library inputs was investigated using Monte Carlo
simulation. Results showed that the prediction of metabolizable energy was most sensitive to
variation in feed chemistry, whereas predictions of MP were most sensitive to variation in
digestion rates. Regular laboratory analysis of samples taken on-farm remains the recommended
20
approach to characterizing the chemical components of feeds in a ration. However, updates to the
CNCPS feed library provide a database of ingredients that are consistent with current feed
chemistry information and laboratory methods and can be used as a platform to formulate rations
and improve the biology within the model.
2.2 Introduction
Obtaining useful outputs from any biological model is very dependent on the quality of the
information being used to perform a simulation (Haefner, 2005). The feed library in the Cornell
Net Carbohydrate and Protein System (CNCPS) contains information not routinely available
from commercial laboratories such as AA profiles, FA profiles, digestion rates (kd) and
intestinal digestibility (Tylutki et al., 2008). The feed library also provides commonly analyzed
fractions that can be used as they are, or updated by the user. Correct estimation of these
chemical components is critical in enabling the CNCPS to best predict the metabolizable energy
(ME), and protein (MP) and other specific nutrients available from a given ration (Lanzas et al.,
2007a, Lanzas et al., 2007b, Offner and Sauvant, 2004). Regular laboratory analysis of feeds will
reduce the variation in model inputs to that derived from the sampling process, sample handling,
preparation, and the variation of the assay itself (Hall and Mertens, 2012). However, in some
situations this is not possible and feed library values have to be relied on. In other situations, feed
compositions are very consistent, meaning library values provide a reasonable estimation without
laboratory analysis. The CNCPS feed library consists of approximately 800 ingredients including
forages, concentrates, vitamins, minerals and commercial products and serves as the reference
database for describing the chemical composition of a diet. The objective of this study was to
evaluate and revise the CNCPS feed library to ensure it is consistent with values being generated
21
and used as inputs from commercial laboratories. A multi-step approach was designed and used
to combine current feed library information with new information and predict uncertain values.
The intended methods for analyzing each major chemical component for use in the CNCPS are
reported as well as a sensitivity analysis of model outputs to variation in feed library inputs.
2.3 Materials and Methods
2.3.1 Feed chemistry
The chemical components considered in this study were those routinely analyzed by
commercial laboratories and required by the CNCPS for evaluation and formulation of nutrient
adequacy and supply. These include: DM, CP, soluble protein (SP), ammonia, acid detergent
insoluble CP (ADICP), neutral detergent insoluble CP (NDICP), acetic acid, propionic acid,
butyric acid, lactic acid, other organic acids, sugar, starch, ADF, NDF, lignin, ash, ether extract
(EE) and soluble fiber. Amino acids were also reviewed and updated. A list of the expected
analytical procedures for measuring each chemical component and the units required by the
CNCPS v6.5 are described in Table 2.1. Fractionation of chemical components from Table 2.1
into the pool structure of the CNCPS are described by Tylutki et al. (2008) and summarized in
Table 2.2.
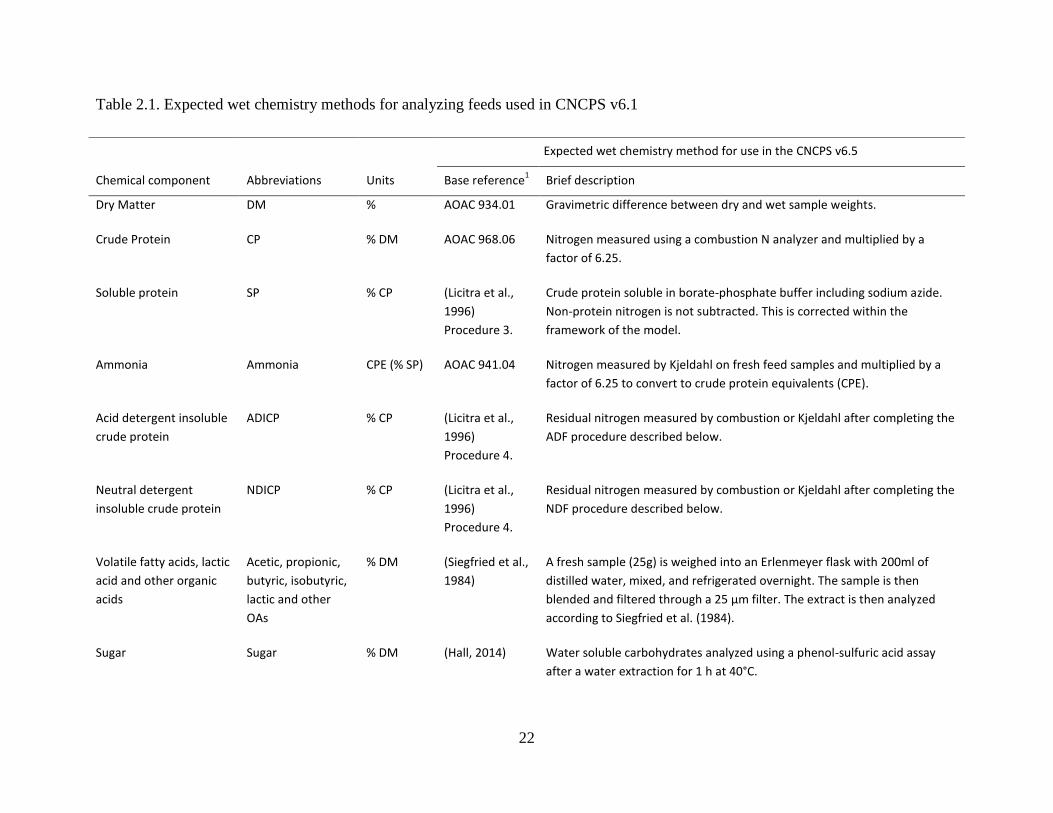
22
Table 2.1. Expected wet chemistry methods for analyzing feeds used in CNCPS v6.1
Expected wet chemistry method for use in the CNCPS v6.5
Chemical component Abbreviations Units Base reference1
Brief description
Dry Matter DM % AOAC 934.01 Gravimetric difference between dry and wet sample weights.
Crude Protein CP % DM AOAC 968.06 Nitrogen measured using a combustion N analyzer and multiplied by a
factor of 6.25.
Soluble protein SP % CP (Licitra et al.,
1996)
Procedure 3.
Crude protein soluble in borate-phosphate buffer including sodium azide.
Non-protein nitrogen is not subtracted. This is corrected within the
framework of the model.
Ammonia Ammonia CPE (% SP) AOAC 941.04 Nitrogen measured by Kjeldahl on fresh feed samples and multiplied by a
factor of 6.25 to convert to crude protein equivalents (CPE).
Acid detergent insoluble
crude protein
ADICP % CP (Licitra et al.,
1996)
Procedure 4.
Residual nitrogen measured by combustion or Kjeldahl after completing the
ADF procedure described below.
Neutral detergent
insoluble crude protein
NDICP % CP (Licitra et al.,
1996)
Procedure 4.
Residual nitrogen measured by combustion or Kjeldahl after completing the
NDF procedure described below.
Volatile fatty acids, lactic
acid and other organic
acids
Acetic, propionic,
butyric, isobutyric,
lactic and other
OAs
% DM (Siegfried et al.,
1984)
A fresh sample (25g) is weighed into an Erlenmeyer flask with 200ml of
distilled water, mixed, and refrigerated overnight. The sample is then
blended and filtered through a 25 µm filter. The extract is then analyzed
according to Siegfried et al. (1984).
Sugar Sugar % DM (Hall, 2014) Water soluble carbohydrates analyzed using a phenol-sulfuric acid assay
after a water extraction for 1 h at 40°C.
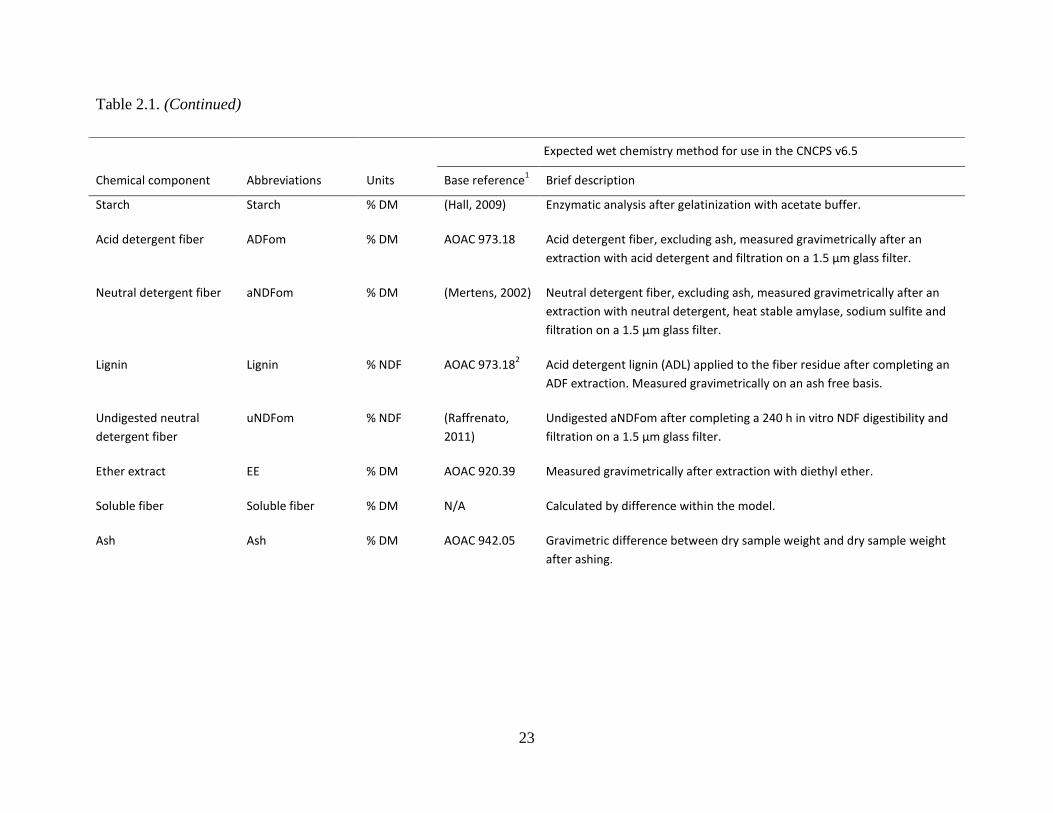
23
Table 2.1. (Continued)
Expected wet chemistry method for use in the CNCPS v6.5
Chemical component Abbreviations Units Base reference1
Brief description
Starch Starch % DM (Hall, 2009) Enzymatic analysis after gelatinization with acetate buffer.
Acid detergent fiber ADFom % DM AOAC 973.18 Acid detergent fiber, excluding ash, measured gravimetrically after an
extraction with acid detergent and filtration on a 1.5 µm glass filter.
Neutral detergent fiber aNDFom % DM (Mertens, 2002) Neutral detergent fiber, excluding ash, measured gravimetrically after an
extraction with neutral detergent, heat stable amylase, sodium sulfite and
filtration on a 1.5 µm glass filter.
Lignin Lignin % NDF AOAC 973.182
Acid detergent lignin (ADL) applied to the fiber residue after completing an
ADF extraction. Measured gravimetrically on an ash free basis.
Undigested neutral
detergent fiber
uNDFom % NDF (Raffrenato,
2011)
Undigested aNDFom after completing a 240 h in vitro NDF digestibility and
filtration on a 1.5 µm glass filter.
Ether extract EE % DM AOAC 920.39 Measured gravimetrically after extraction with diethyl ether.
Soluble fiber Soluble fiber % DM N/A Calculated by difference within the model.
Ash Ash % DM AOAC 942.05 Gravimetric difference between dry sample weight and dry sample weight
after ashing.
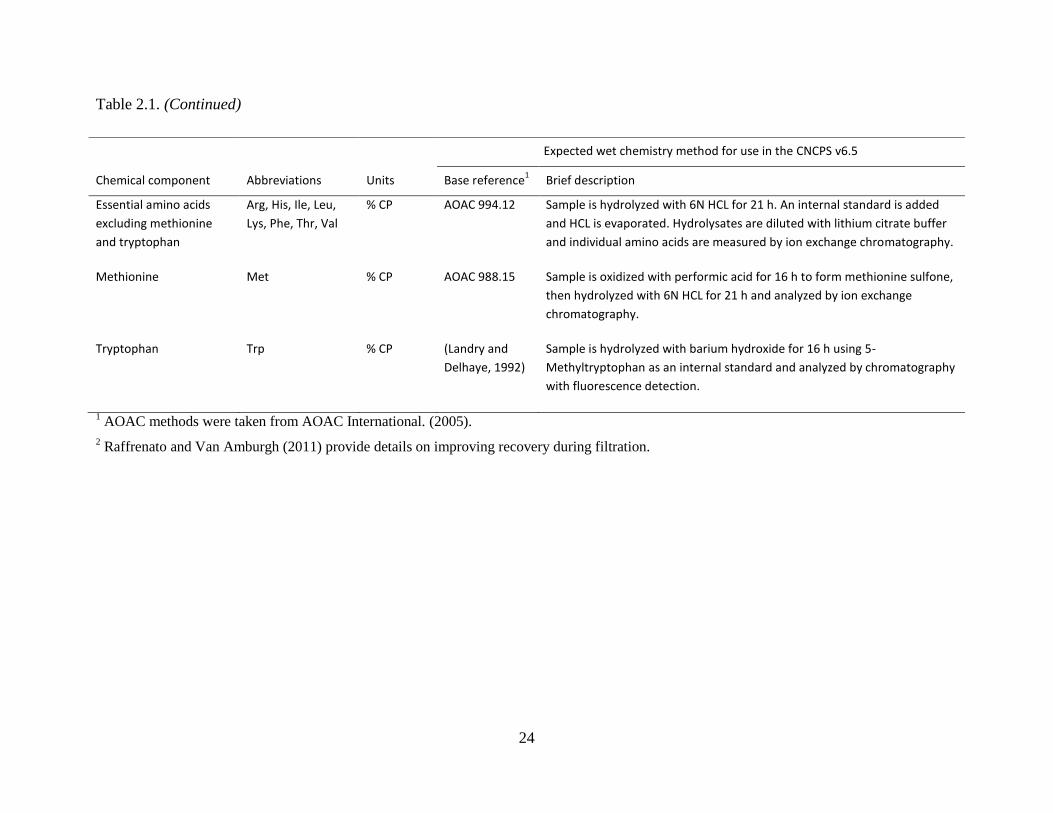
24
Table 2.1. (Continued)
1 AOAC methods were taken from AOAC International. (2005).
2 Raffrenato and Van Amburgh (2011) provide details on improving recovery during filtration.
Expected wet chemistry method for use in the CNCPS v6.5
Chemical component Abbreviations Units Base reference1
Brief description
Essential amino acids
excluding methionine
and tryptophan
Arg, His, Ile, Leu,
Lys, Phe, Thr, Val
% CP AOAC 994.12 Sample is hydrolyzed with 6N HCL for 21 h. An internal standard is added
and HCL is evaporated. Hydrolysates are diluted with lithium citrate buffer
and individual amino acids are measured by ion exchange chromatography.
Methionine Met % CP AOAC 988.15 Sample is oxidized with performic acid for 16 h to form methionine sulfone,
then hydrolyzed with 6N HCL for 21 h and analyzed by ion exchange
chromatography.
Tryptophan Trp % CP (Landry and
Delhaye, 1992)
Sample is hydrolyzed with barium hydroxide for 16 h using 5-
Methyltryptophan as an internal standard and analyzed by chromatography
with fluorescence detection.
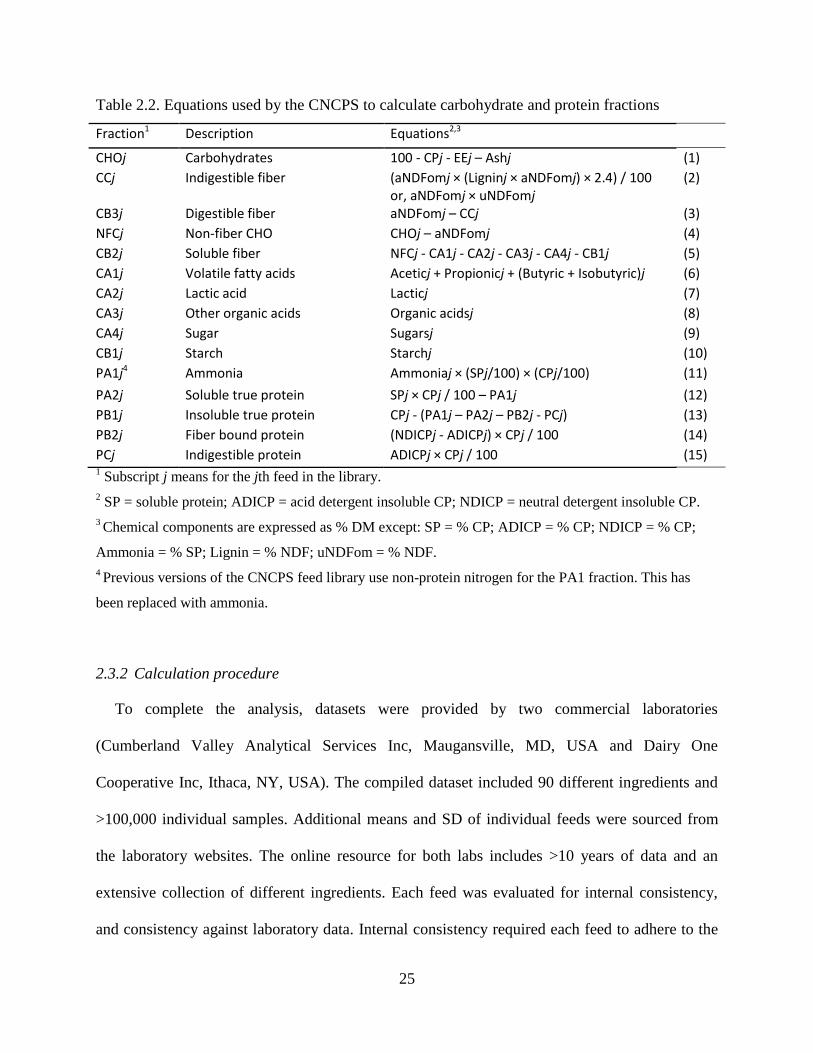
25
Table 2.2. Equations used by the CNCPS to calculate carbohydrate and protein fractions
Fraction1 Description Equations2,3
CHOj Carbohydrates 100 - CPj - EEj – Ashj (1)
CCj Indigestible fiber (aNDFomj × (Ligninj × aNDFomj) × 2.4) / 100 or, aNDFomj × uNDFomj
(2)
CB3j Digestible fiber aNDFomj – CCj (3)
NFCj Non-fiber CHO CHOj – aNDFomj (4)
CB2j Soluble fiber NFCj - CA1j - CA2j - CA3j - CA4j - CB1j (5)
CA1j Volatile fatty acids Aceticj + Propionicj + (Butyric + Isobutyric)j (6)
CA2j Lactic acid Lacticj (7)
CA3j Other organic acids Organic acidsj (8)
CA4j Sugar Sugarsj (9)
CB1j Starch Starchj (10)
PA1j4 Ammonia Ammoniaj × (SPj/100) × (CPj/100) (11)
PA2j Soluble true protein SPj × CPj / 100 – PA1j (12)
PB1j Insoluble true protein CPj - (PA1j – PA2j – PB2j - PCj) (13)
PB2j Fiber bound protein (NDICPj - ADICPj) × CPj / 100 (14)
PCj Indigestible protein ADICPj × CPj / 100 (15) 1 Subscript j means for the jth feed in the library.
2 SP = soluble protein; ADICP = acid detergent insoluble CP; NDICP = neutral detergent insoluble CP.
3 Chemical components are expressed as % DM except: SP = % CP; ADICP = % CP; NDICP = % CP;
Ammonia = % SP; Lignin = % NDF; uNDFom = % NDF.
4 Previous versions of the CNCPS feed library use non-protein nitrogen for the PA1 fraction. This has
been replaced with ammonia.
2.3.2 Calculation procedure
To complete the analysis, datasets were provided by two commercial laboratories
(Cumberland Valley Analytical Services Inc, Maugansville, MD, USA and Dairy One
Cooperative Inc, Ithaca, NY, USA). The compiled dataset included 90 different ingredients and
>100,000 individual samples. Additional means and SD of individual feeds were sourced from
the laboratory websites. The online resource for both labs includes >10 years of data and an
extensive collection of different ingredients. Each feed was evaluated for internal consistency,
and consistency against laboratory data. Internal consistency required each feed to adhere to the
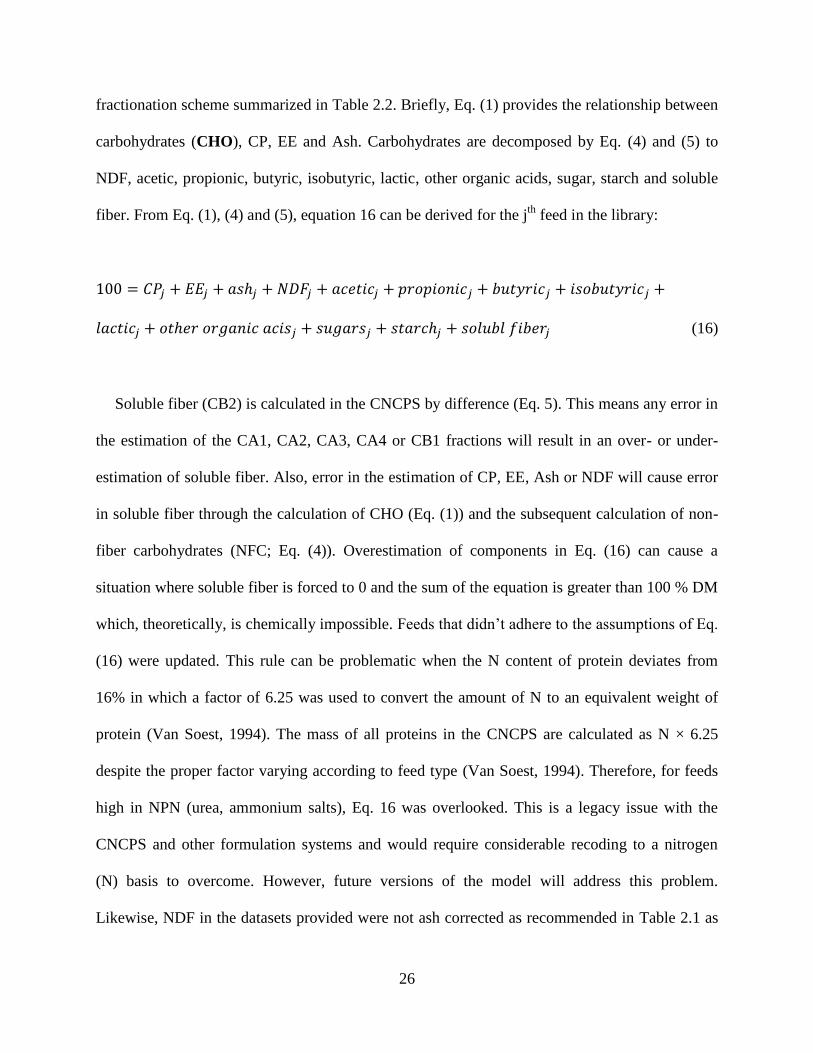
26
fractionation scheme summarized in Table 2.2. Briefly, Eq. (1) provides the relationship between
carbohydrates (CHO), CP, EE and Ash. Carbohydrates are decomposed by Eq. (4) and (5) to
NDF, acetic, propionic, butyric, isobutyric, lactic, other organic acids, sugar, starch and soluble
fiber. From Eq. (1), (4) and (5), equation 16 can be derived for the jth
feed in the library:
(16)
Soluble fiber (CB2) is calculated in the CNCPS by difference (Eq. 5). This means any error in
the estimation of the CA1, CA2, CA3, CA4 or CB1 fractions will result in an over- or under-
estimation of soluble fiber. Also, error in the estimation of CP, EE, Ash or NDF will cause error
in soluble fiber through the calculation of CHO (Eq. (1)) and the subsequent calculation of non-
fiber carbohydrates (NFC; Eq. (4)). Overestimation of components in Eq. (16) can cause a
situation where soluble fiber is forced to 0 and the sum of the equation is greater than 100 % DM
which, theoretically, is chemically impossible. Feeds that didn’t adhere to the assumptions of Eq.
(16) were updated. This rule can be problematic when the N content of protein deviates from
16% in which a factor of 6.25 was used to convert the amount of N to an equivalent weight of
protein (Van Soest, 1994). The mass of all proteins in the CNCPS are calculated as N × 6.25
despite the proper factor varying according to feed type (Van Soest, 1994). Therefore, for feeds
high in NPN (urea, ammonium salts), Eq. 16 was overlooked. This is a legacy issue with the
CNCPS and other formulation systems and would require considerable recoding to a nitrogen
(N) basis to overcome. However, future versions of the model will address this problem.
Likewise, NDF in the datasets provided were not ash corrected as recommended in Table 2.1 as
27
these data were not available at time the analysis was done. Using aNDFom in future updates is
recommended to reduce variation. Evaluation against laboratory data compared each individual
feed in the feed library to the mean and SD of the corresponding feed in the databases available
from the commercial labs. Each component within each feed was required to fall within 1 SD of
the mean value from the laboratory dataset, or the entire feed would be updated. The calculation
procedure consisted of four steps:
Step 1 – Setting Descriptive Values
Chemical components used to differentiate different forms of the same feed were held
constant during the re-calculation process. The CNCPS has multiple options for many of the
feeds in the feed library to give users the flexibility to pick the feed that best matches what they
are feeding on the farm. For example, the feed library has 24 different options for processed corn
silage which are differentiated on the basis of DM and NDF. Therefore, in this example, DM and
NDF were maintained as they were in the original library while other components were re-
calculated.
Step 2 – Linear Regression
In the second step, the dataset provided was used to established relationships using linear
regression (Y = A + BX1 + CX2 + DX3). Regression was used if components could be robustly
predicted by other components within a feed (R2 > 0.65). Regression equations were derived
using SAS (2010). Examples of some of the regression equations used are in Table 2.3.
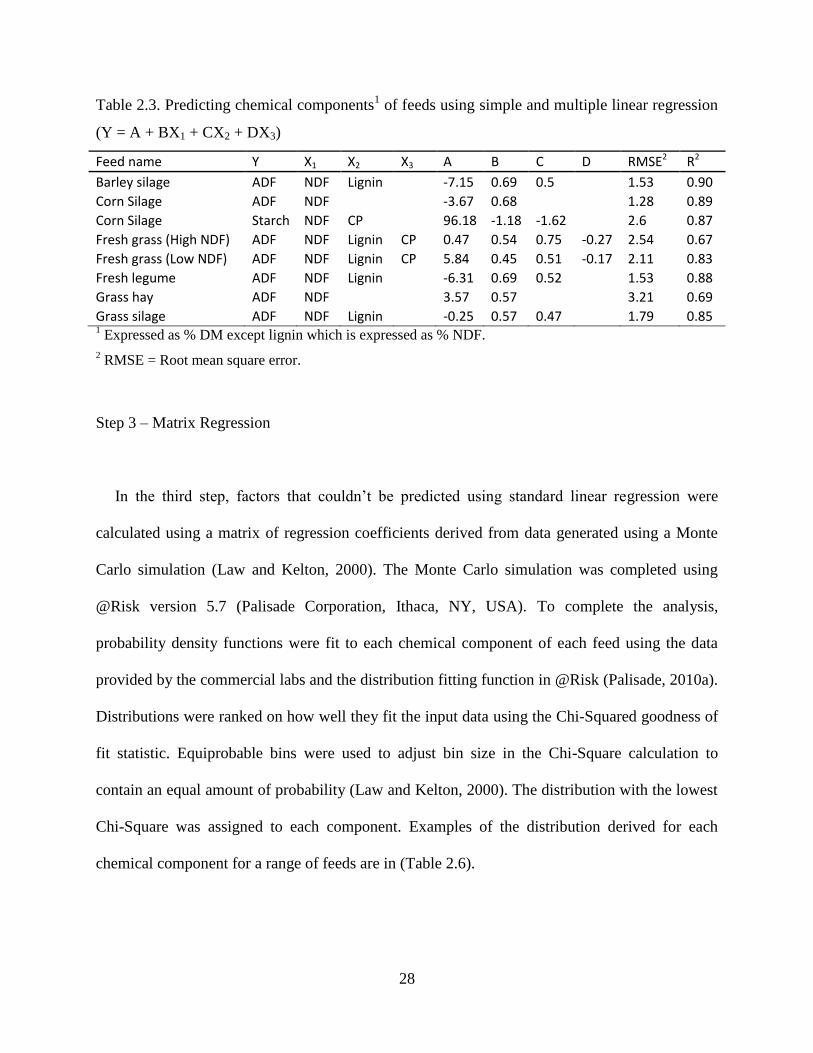
28
Table 2.3. Predicting chemical components1 of feeds using simple and multiple linear regression
(Y = A + BX1 + CX2 + DX3)
Feed name Y X1 X2 X3 A B C D RMSE2 R2
Barley silage ADF NDF Lignin
-7.15 0.69 0.5
1.53 0.90
Corn Silage ADF NDF
-3.67 0.68
1.28 0.89
Corn Silage Starch NDF CP
96.18 -1.18 -1.62
2.6 0.87
Fresh grass (High NDF) ADF NDF Lignin CP 0.47 0.54 0.75 -0.27 2.54 0.67
Fresh grass (Low NDF) ADF NDF Lignin CP 5.84 0.45 0.51 -0.17 2.11 0.83
Fresh legume ADF NDF Lignin
-6.31 0.69 0.52
1.53 0.88
Grass hay ADF NDF
3.57 0.57
3.21 0.69
Grass silage ADF NDF Lignin
-0.25 0.57 0.47
1.79 0.85 1 Expressed as % DM except lignin which is expressed as % NDF.
2 RMSE = Root mean square error.
Step 3 – Matrix Regression
In the third step, factors that couldn’t be predicted using standard linear regression were
calculated using a matrix of regression coefficients derived from data generated using a Monte
Carlo simulation (Law and Kelton, 2000). The Monte Carlo simulation was completed using
@Risk version 5.7 (Palisade Corporation, Ithaca, NY, USA). To complete the analysis,
probability density functions were fit to each chemical component of each feed using the data
provided by the commercial labs and the distribution fitting function in @Risk (Palisade, 2010a).
Distributions were ranked on how well they fit the input data using the Chi-Squared goodness of
fit statistic. Equiprobable bins were used to adjust bin size in the Chi-Square calculation to
contain an equal amount of probability (Law and Kelton, 2000). The distribution with the lowest
Chi-Square was assigned to each component. Examples of the distribution derived for each
chemical component for a range of feeds are in (Table 2.6).
29
Components within each feed were then correlated to each other using laboratory data and the
define correlation function in @Risk (Palisade, 2010a). If components were not correlated, they
would change randomly relative to each other during the Monte Carlo simulation. Correlating the
components meant that for each iteration, components changed in tandem relative to each other
with the magnitude of the change depending on the assigned correlation coefficient (Law and
Kelton, 2000). Spearman rank order correlations were used which determine the rank of a
component relative to another by its position within the min-max range of possible values. Rank
correlations can range between -1 and 1 with a value of 1 meaning components are 100%
positively correlated, -1 meaning components are 100% negatively correlated and 0 meaning
there is no relationship between components (Law and Kelton, 2000). The correlation
coefficients derived for a range of feeds used in the Monte Carlo simulation are in (Table 2.7).
Once the probability density functions had been fit to each component, and components
within each feed correlated, a Monte Carlo simulation was performed with 30,000 iterations.
Various sampling techniques are available in @Risk to draw the sample from the probability
density function (Palisade, 2010a). The Latin Hypercube technique was used which divides the
distribution into intervals of equal probability and then randomly takes a sample from each
interval forcing the simulation to represent the whole distribution (Shapiro, 2003). The raw data
from the simulation was then used to construct a matrix of regression estimates in the
arrangement shown below and according to the general form Yij = A + BXi where Y is the
response variable and column vector for the ith component in the jth feed with n entries, A is the
intercept arranged in an n×p matrix, B is the predictor variable arranged in an n×p matrix and X
is the regression coefficient and row vector for the ith component with n entries:
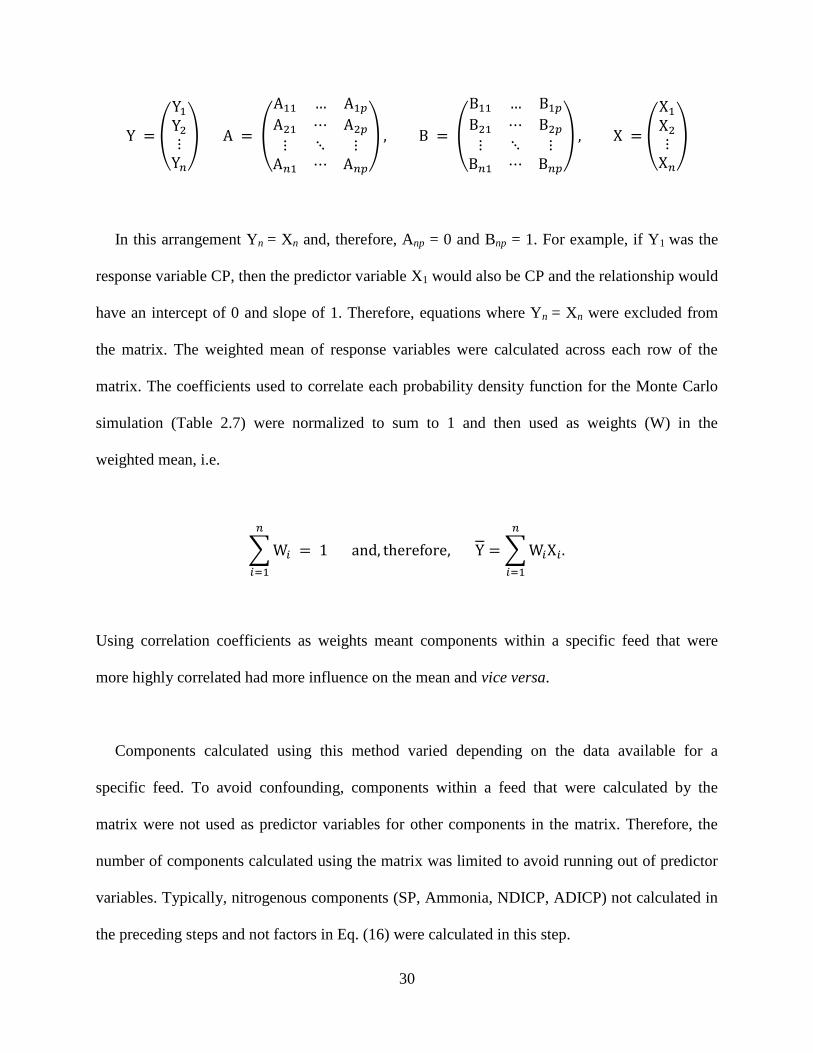
30
(
)
(
)
(
)
(
)
In this arrangement Yn = Xn and, therefore, Anp = 0 and Bnp = 1. For example, if Y1 was the
response variable CP, then the predictor variable X1 would also be CP and the relationship would
have an intercept of 0 and slope of 1. Therefore, equations where Yn = Xn were excluded from
the matrix. The weighted mean of response variables were calculated across each row of the
matrix. The coefficients used to correlate each probability density function for the Monte Carlo
simulation (Table 2.7) were normalized to sum to 1 and then used as weights (W) in the
weighted mean, i.e.
∑
∑
Using correlation coefficients as weights meant components within a specific feed that were
more highly correlated had more influence on the mean and vice versa.
Components calculated using this method varied depending on the data available for a
specific feed. To avoid confounding, components within a feed that were calculated by the
matrix were not used as predictor variables for other components in the matrix. Therefore, the
number of components calculated using the matrix was limited to avoid running out of predictor
variables. Typically, nitrogenous components (SP, Ammonia, NDICP, ADICP) not calculated in
the preceding steps and not factors in Eq. (16) were calculated in this step.
31
Step 4 – Optimize to a Final Solution
Lastly, components that were not assigned values in any of the preceding steps were
calculated using an optimization. RISKOptimizer version 5.7 (Palisade Corporation, Ithaca, NY,
USA) was used to perform the optimization which uses a genetic algorithm simulation to find
solutions when there is uncertainty around the values (Palisade, 2010b). Minimum and maximum
boundaries for each component within a feed were set to constrain the optimizer to a likely range
of values. The data used to calculate the range in each component was taken from the databases
available online from the commercial laboratories. Each range was calculated as the mean plus
or minus the SD of each component multiplied by global coefficient that was adjusted in order to
allow the optimizer to converge. Typically the coefficient used was between 0.5 and 1.5 meaning
the range for each component was the mean plus or minus 0.5 to 1.5 times the SD of each
component. An example of the constraints used to optimize corn silage is in Table 2.4.
The second constraint applied to the optimization was the relationship described by Eq. (16).
Components included in the optimization were, therefore, adjusted within the calculated range to
the most likely values in which Eq. (16) summed to 100 % DM. The optimization step was
completed last in the calculation process to ‘fit’ the components within each feed together within
the described constraints. The process was dynamic in that the values calculated in the
optimization fed back into the matrix and regression calculations described above. Typically, the
optimizer had to be run numerous times before it would converge and stabilize. If insufficient
data was available to perform any of the calculation steps described above, current CNCPS
library values were retained. The approach was not acceptable for proprietary feeds due to a lack
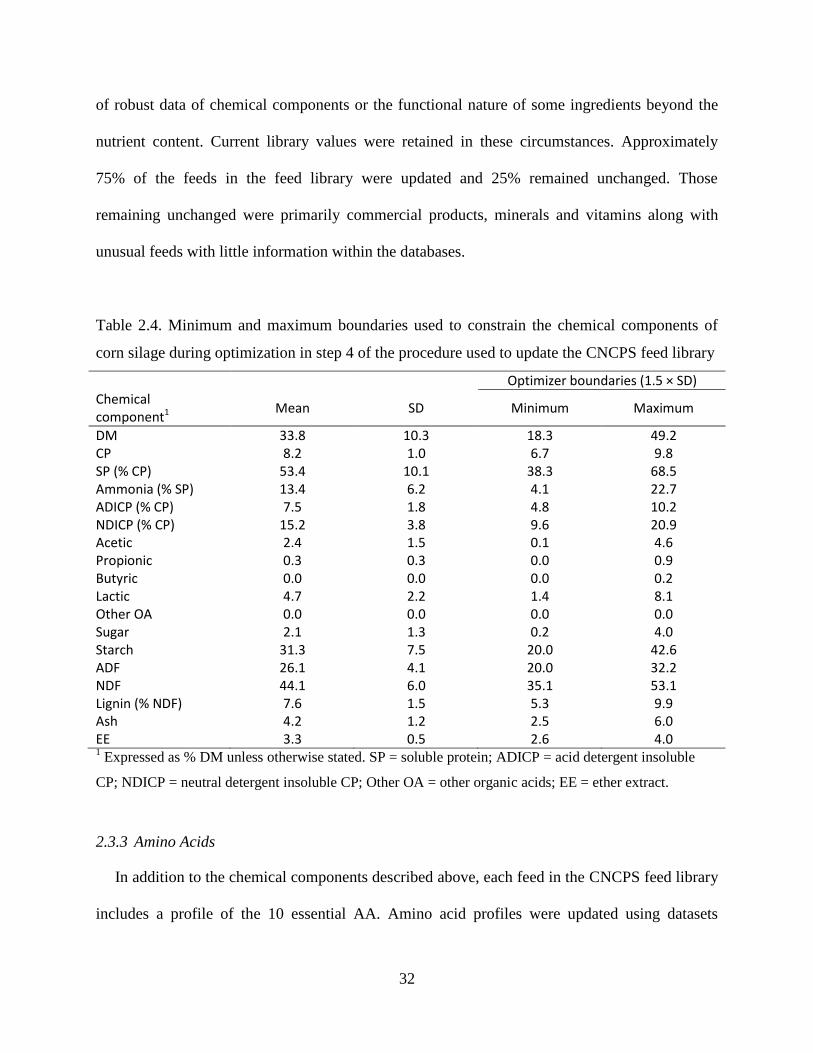
32
of robust data of chemical components or the functional nature of some ingredients beyond the
nutrient content. Current library values were retained in these circumstances. Approximately
75% of the feeds in the feed library were updated and 25% remained unchanged. Those
remaining unchanged were primarily commercial products, minerals and vitamins along with
unusual feeds with little information within the databases.
Table 2.4. Minimum and maximum boundaries used to constrain the chemical components of
corn silage during optimization in step 4 of the procedure used to update the CNCPS feed library
Optimizer boundaries (1.5 × SD)
Chemical component1 Mean SD Minimum Maximum
DM 33.8 10.3 18.3 49.2 CP 8.2 1.0 6.7 9.8 SP (% CP) 53.4 10.1 38.3 68.5 Ammonia (% SP) 13.4 6.2 4.1 22.7 ADICP (% CP) 7.5 1.8 4.8 10.2 NDICP (% CP) 15.2 3.8 9.6 20.9 Acetic 2.4 1.5 0.1 4.6 Propionic 0.3 0.3 0.0 0.9 Butyric 0.0 0.0 0.0 0.2 Lactic 4.7 2.2 1.4 8.1 Other OA 0.0 0.0 0.0 0.0 Sugar 2.1 1.3 0.2 4.0 Starch 31.3 7.5 20.0 42.6 ADF 26.1 4.1 20.0 32.2 NDF 44.1 6.0 35.1 53.1 Lignin (% NDF) 7.6 1.5 5.3 9.9 Ash 4.2 1.2 2.5 6.0 EE 3.3 0.5 2.6 4.0 1 Expressed as % DM unless otherwise stated. SP = soluble protein; ADICP = acid detergent insoluble
CP; NDICP = neutral detergent insoluble CP; Other OA = other organic acids; EE = ether extract.
2.3.3 Amino Acids
In addition to the chemical components described above, each feed in the CNCPS feed library
includes a profile of the 10 essential AA. Amino acid profiles were updated using datasets
33
provided by Evonik Industries AG (Hanau, Germany), Adisseo (Commentary, France) and
taken from the NRC (2001). Data provided were mean values from analyses completed in the
respective companies’ laboratories or published in the NRC (2001). In all cases, AA analyses
were completed on the whole feed and are expressed in the CNCPS on a % CP basis. This differs
from previous versions of the CNCPS where AA were expressed as a % of the buffer insoluble
residue (O'Connor et al., 1993). The most appropriate profile was assigned based on data
availability and was used as received by the source without alteration. If profiles for specific
feeds were not available in the datasets provided, current CNCPS values were retained.
Proprietary feeds were not changed.
2.3.4 Model sensitivity
The sensitivity of model outputs to variation in feed library inputs was also evaluated. The
analysis was split into two parts. Part one looked at the likely range in six major chemical
components in the diet: 1) CP; 2) Starch; 3) NDF; 4) Lignin; 5) Ash; 6) EE; and four model
outputs: 1) ME allowable milk; 2) MP allowable milk; 3) MP from RUP; 4) MP from bacteria.
To complete this part of the analysis, a reference diet was constructed in a spreadsheet version of
the CNCPS (Van Amburgh et al., 2013). The diet was formulated using ingredients typically
found in North American dairy cattle rations and was balanced to provide enough ME and MP
for a mature, non-pregnant, 600 kg cow in steady state (0 energy balance) to produce 35 kg of
milk containing 3.1% true protein and 3.5% fat (Table 2.5). Probability density functions were fit
to chemical components within each feed in the reference diet (Table 2.7) and correlated to each
other with Spearman Rank order correlations (Table 2.6) using @Risk version 5.7 (as previously
described). Frequency distributions for model outputs were then generated using a Monte Carlo
34
simulation with 10,000 iterations to describe the range of possible outcomes for each output and
the relative likelihood of occurrence.
Part two of the analysis investigated which feed library inputs for the feeds in the reference
diet had the most influence on selected model outputs: 1) ME allowable milk; 2) MP allowable
milk; 3) MP from RUP; 4) MP from bacteria. The feed library inputs investigated were those
described in part one of the analysis, as well as kd for the carbohydrate and protein fractions
summarized in Table 2.2. Probability density functions were fit to each chemical component
within each feed as previously described. Program Evaluation and Review Technique (PERT)
distributions (Cottrell, 1999) were used to describe the variation in kd. The PERT distribution is
similar to a beta or triangular distribution and is useful to describe variation in a situation where
there is limited data (Johnson, 1997). The PERT distribution requires three estimates: 1) the most
likely result; 2) the minimum expected result; 3) the maximum expected result. Most likely
results were set as CNCPS feed library values. Minimum and maximum values were set as the
most likely value ± 2 SD to encompass approximately 95% of the expected data without
including extreme results. Data on kd are scarce, and other than the CB3 fraction, are not
routinely estimated for model input. Variation in kd changes proportionally to changes in mean
values (Weiss, 1994). Therefore, in situations where data were not available, the proportional
variation relative to the mean of other known feeds was used as a proxy to calculate the
minimum and maximum values of unknown feeds. The CB3 kd was calculated for the forage
feeds in the reference diet using the approach described by Van Amburgh et al. (2003) and the
datasets provided. Variation in kd for fractions other than CB3 were estimated from literature
values. CA and CB fractions were estimated from data in Offner et al. (2003). The PB2 fractions
35
(fiber bound protein) were set to equal the CB3 fractions as described by Van Amburgh et al.
(2007), PB1 values were taken from the NRC (2001) and PA2 values were estimated from
Broderick (1987). Correlation coefficients among components were not assigned for this part of
the analysis as the interest was in understanding model sensitivity to individual components
independent of correlated changes in composition. To complete the analysis, a Monte Carlo
simulation with 10,000 iterations was performed. Changes in model outputs resulting from a 1
SD increase in model inputs were captured and are presented in Figures 2.5, 2.6 and 2.7.

36
Table 2.5. Diet ingredients, chemical composition and model predicted ME and MP for the
reference diet used to analyze model sensitivity
Diet Ingredients (kg DM)
Corn Silage 4.76 Alfalfa Silage 3.14 Grass Hay 4.03 Corn Grain Ground Fine 6.48 Soybean Meal Solvent Extracted 2.58 Blood Meal 0.20 Minerals and Vitamins 0.50 Total DMI 21.69 Diet composition1
CP 16.7 SP (% CP) 35.3 ADICP (% CP) 6.4 NDICP (% CP) 15.6 Sugar 3.5 Starch 29.0 NDF 31.8 Lignin (% NDF) 11.5 EE 3.0 Ash 7.7 Model outputs
ME (Mcals/d) 53.7 MP (g/d) 2385.4
1 Expressed as % DM unless stated. SP = soluble protein; ADICP = acid detergent insoluble CP; NDICP
= neutral detergent insoluble CP; EE = ether extract.
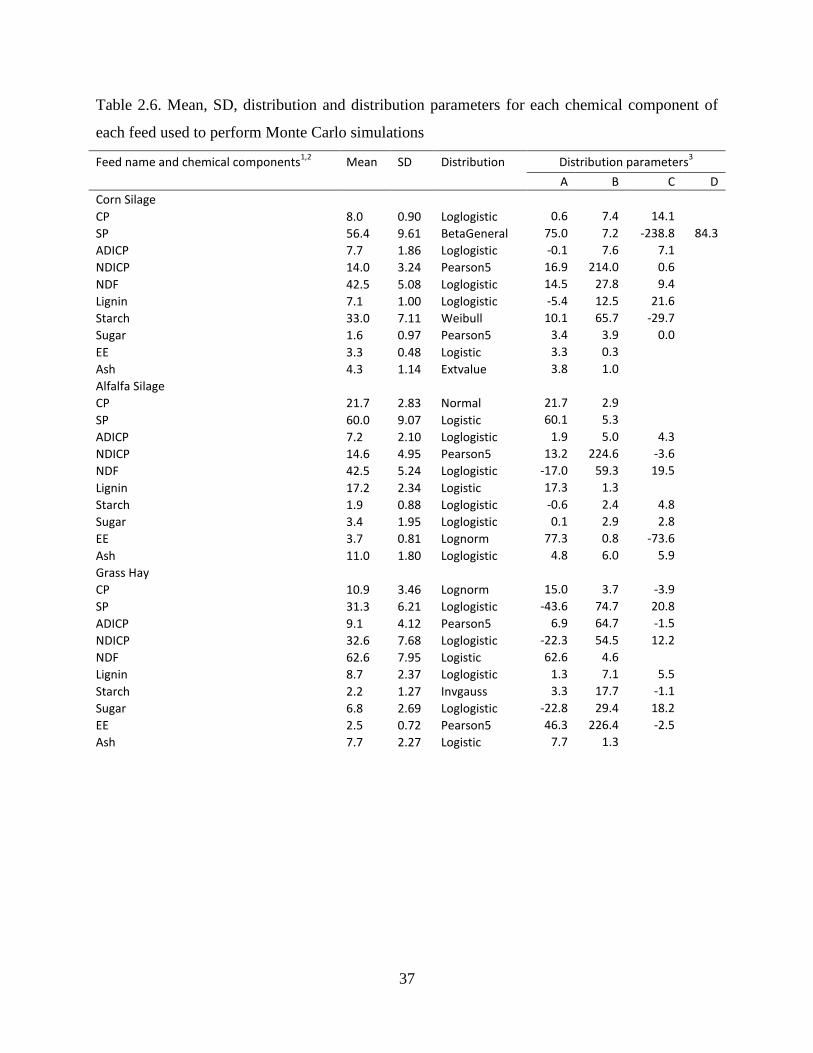
37
Table 2.6. Mean, SD, distribution and distribution parameters for each chemical component of
each feed used to perform Monte Carlo simulations
Feed name and chemical components1,2
Mean SD Distribution Distribution parameters3
A B C D
Corn Silage
CP 8.0 0.90 Loglogistic 0.6 7.4 14.1
SP 56.4 9.61 BetaGeneral 75.0 7.2 -238.8 84.3
ADICP 7.7 1.86 Loglogistic -0.1 7.6 7.1
NDICP 14.0 3.24 Pearson5 16.9 214.0 0.6
NDF 42.5 5.08 Loglogistic 14.5 27.8 9.4
Lignin 7.1 1.00 Loglogistic -5.4 12.5 21.6
Starch 33.0 7.11 Weibull 10.1 65.7 -29.7
Sugar 1.6 0.97 Pearson5 3.4 3.9 0.0
EE 3.3 0.48 Logistic 3.3 0.3
Ash 4.3 1.14 Extvalue 3.8 1.0
Alfalfa Silage
CP 21.7 2.83 Normal 21.7 2.9
SP 60.0 9.07 Logistic 60.1 5.3
ADICP 7.2 2.10 Loglogistic 1.9 5.0 4.3
NDICP 14.6 4.95 Pearson5 13.2 224.6 -3.6
NDF 42.5 5.24 Loglogistic -17.0 59.3 19.5
Lignin 17.2 2.34 Logistic 17.3 1.3
Starch 1.9 0.88 Loglogistic -0.6 2.4 4.8
Sugar 3.4 1.95 Loglogistic 0.1 2.9 2.8
EE 3.7 0.81 Lognorm 77.3 0.8 -73.6
Ash 11.0 1.80 Loglogistic 4.8 6.0 5.9
Grass Hay
CP 10.9 3.46 Lognorm 15.0 3.7 -3.9
SP 31.3 6.21 Loglogistic -43.6 74.7 20.8
ADICP 9.1 4.12 Pearson5 6.9 64.7 -1.5
NDICP 32.6 7.68 Loglogistic -22.3 54.5 12.2
NDF 62.6 7.95 Logistic 62.6 4.6
Lignin 8.7 2.37 Loglogistic 1.3 7.1 5.5
Starch 2.2 1.27 Invgauss 3.3 17.7 -1.1
Sugar 6.8 2.69 Loglogistic -22.8 29.4 18.2
EE 2.5 0.72 Pearson5 46.3 226.4 -2.5
Ash 7.7 2.27 Logistic 7.7 1.3
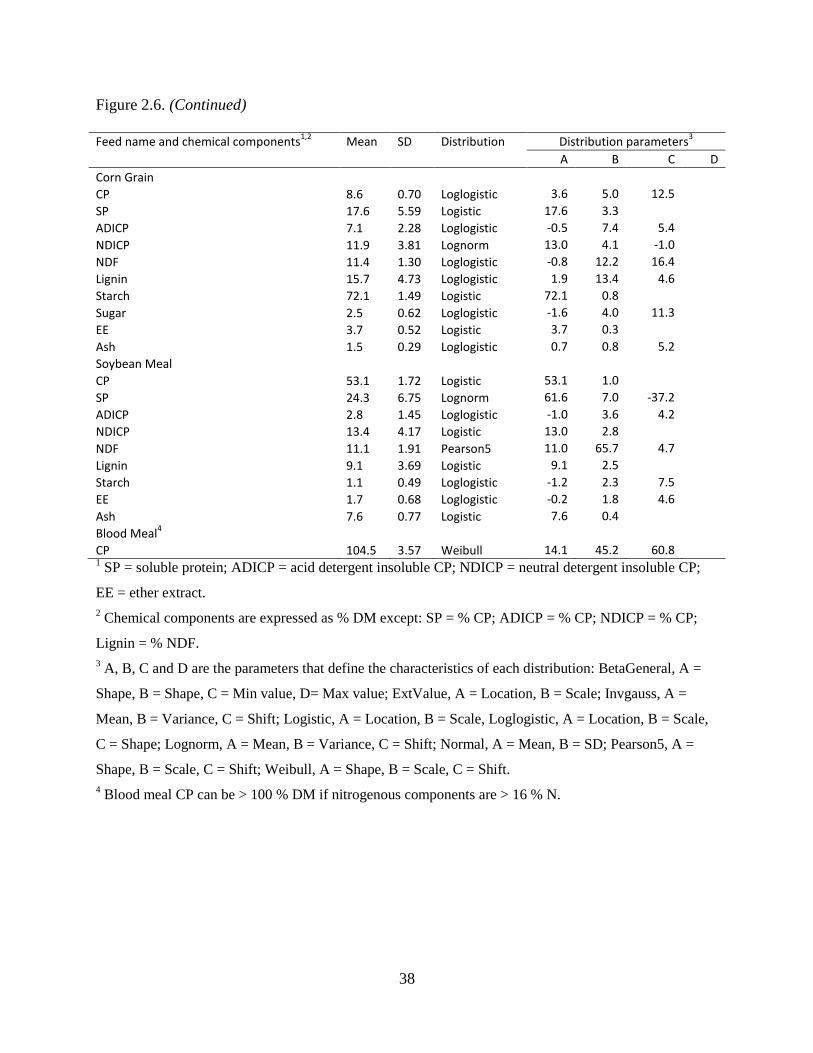
38
Figure 2.6. (Continued)
Feed name and chemical components1,2
Mean SD Distribution Distribution parameters3
A B C D
Corn Grain
CP 8.6 0.70 Loglogistic 3.6 5.0 12.5
SP 17.6 5.59 Logistic 17.6 3.3
ADICP 7.1 2.28 Loglogistic -0.5 7.4 5.4
NDICP 11.9 3.81 Lognorm 13.0 4.1 -1.0
NDF 11.4 1.30 Loglogistic -0.8 12.2 16.4
Lignin 15.7 4.73 Loglogistic 1.9 13.4 4.6
Starch 72.1 1.49 Logistic 72.1 0.8
Sugar 2.5 0.62 Loglogistic -1.6 4.0 11.3
EE 3.7 0.52 Logistic 3.7 0.3
Ash 1.5 0.29 Loglogistic 0.7 0.8 5.2
Soybean Meal
CP 53.1 1.72 Logistic 53.1 1.0
SP 24.3 6.75 Lognorm 61.6 7.0 -37.2
ADICP 2.8 1.45 Loglogistic -1.0 3.6 4.2
NDICP 13.4 4.17 Logistic 13.0 2.8
NDF 11.1 1.91 Pearson5 11.0 65.7 4.7
Lignin 9.1 3.69 Logistic 9.1 2.5
Starch 1.1 0.49 Loglogistic -1.2 2.3 7.5
EE 1.7 0.68 Loglogistic -0.2 1.8 4.6
Ash 7.6 0.77 Logistic 7.6 0.4
Blood Meal4
CP 104.5 3.57 Weibull 14.1 45.2 60.8 1
SP = soluble protein; ADICP = acid detergent insoluble CP; NDICP = neutral detergent insoluble CP;
EE = ether extract.
2 Chemical components are expressed as % DM except: SP = % CP; ADICP = % CP; NDICP = % CP;
Lignin = % NDF.
3 A, B, C and D are the parameters that define the characteristics of each distribution: BetaGeneral, A =
Shape, B = Shape, C = Min value, D= Max value; ExtValue, A = Location, B = Scale; Invgauss, A =
Mean, B = Variance, C = Shift; Logistic, A = Location, B = Scale, Loglogistic, A = Location, B = Scale,
C = Shape; Lognorm, A = Mean, B = Variance, C = Shift; Normal, A = Mean, B = SD; Pearson5, A =
Shape, B = Scale, C = Shift; Weibull, A = Shape, B = Scale, C = Shift.
4 Blood meal CP can be > 100 % DM if nitrogenous components are > 16 % N.
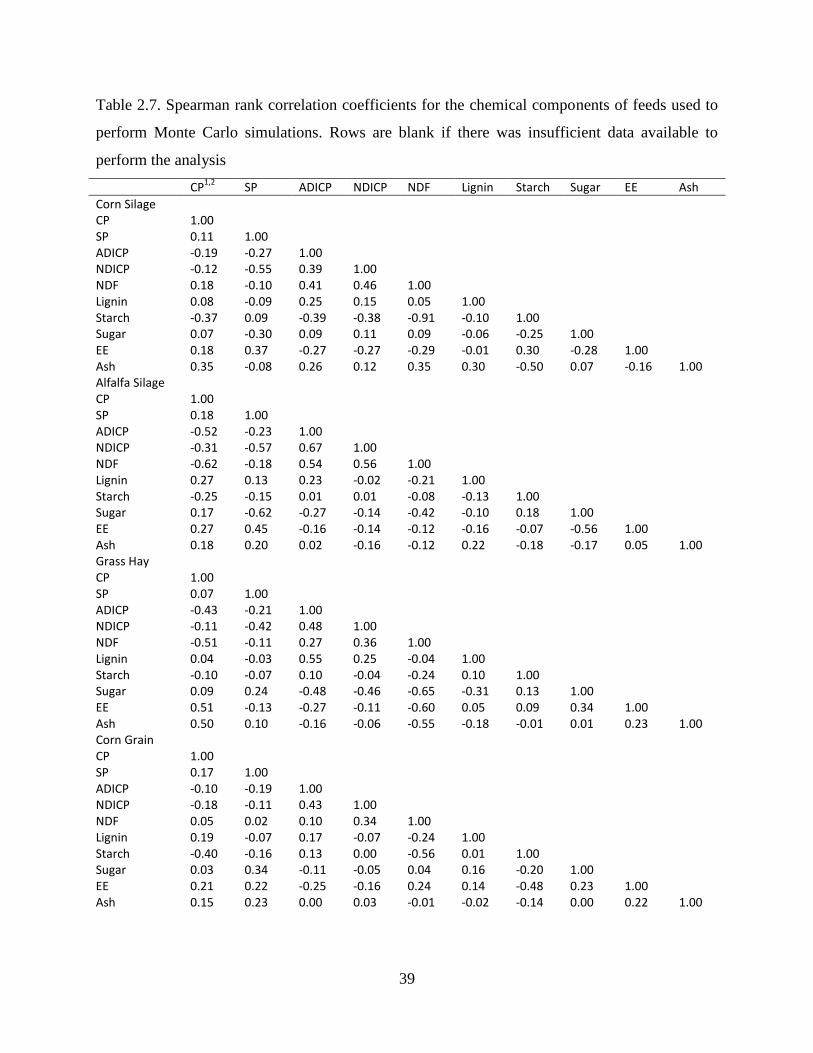
39
Table 2.7. Spearman rank correlation coefficients for the chemical components of feeds used to
perform Monte Carlo simulations. Rows are blank if there was insufficient data available to
perform the analysis
CP1,2
SP ADICP NDICP NDF Lignin Starch Sugar EE Ash
Corn Silage
CP 1.00
SP 0.11 1.00
ADICP -0.19 -0.27 1.00
NDICP -0.12 -0.55 0.39 1.00
NDF 0.18 -0.10 0.41 0.46 1.00
Lignin 0.08 -0.09 0.25 0.15 0.05 1.00
Starch -0.37 0.09 -0.39 -0.38 -0.91 -0.10 1.00
Sugar 0.07 -0.30 0.09 0.11 0.09 -0.06 -0.25 1.00
EE 0.18 0.37 -0.27 -0.27 -0.29 -0.01 0.30 -0.28 1.00
Ash 0.35 -0.08 0.26 0.12 0.35 0.30 -0.50 0.07 -0.16 1.00 Alfalfa Silage
CP 1.00
SP 0.18 1.00
ADICP -0.52 -0.23 1.00
NDICP -0.31 -0.57 0.67 1.00
NDF -0.62 -0.18 0.54 0.56 1.00
Lignin 0.27 0.13 0.23 -0.02 -0.21 1.00
Starch -0.25 -0.15 0.01 0.01 -0.08 -0.13 1.00
Sugar 0.17 -0.62 -0.27 -0.14 -0.42 -0.10 0.18 1.00
EE 0.27 0.45 -0.16 -0.14 -0.12 -0.16 -0.07 -0.56 1.00
Ash 0.18 0.20 0.02 -0.16 -0.12 0.22 -0.18 -0.17 0.05 1.00 Grass Hay
CP 1.00
SP 0.07 1.00
ADICP -0.43 -0.21 1.00
NDICP -0.11 -0.42 0.48 1.00
NDF -0.51 -0.11 0.27 0.36 1.00
Lignin 0.04 -0.03 0.55 0.25 -0.04 1.00
Starch -0.10 -0.07 0.10 -0.04 -0.24 0.10 1.00
Sugar 0.09 0.24 -0.48 -0.46 -0.65 -0.31 0.13 1.00
EE 0.51 -0.13 -0.27 -0.11 -0.60 0.05 0.09 0.34 1.00
Ash 0.50 0.10 -0.16 -0.06 -0.55 -0.18 -0.01 0.01 0.23 1.00 Corn Grain
CP 1.00
SP 0.17 1.00
ADICP -0.10 -0.19 1.00
NDICP -0.18 -0.11 0.43 1.00
NDF 0.05 0.02 0.10 0.34 1.00
Lignin 0.19 -0.07 0.17 -0.07 -0.24 1.00
Starch -0.40 -0.16 0.13 0.00 -0.56 0.01 1.00
Sugar 0.03 0.34 -0.11 -0.05 0.04 0.16 -0.20 1.00
EE 0.21 0.22 -0.25 -0.16 0.24 0.14 -0.48 0.23 1.00
Ash 0.15 0.23 0.00 0.03 -0.01 -0.02 -0.14 0.00 0.22 1.00
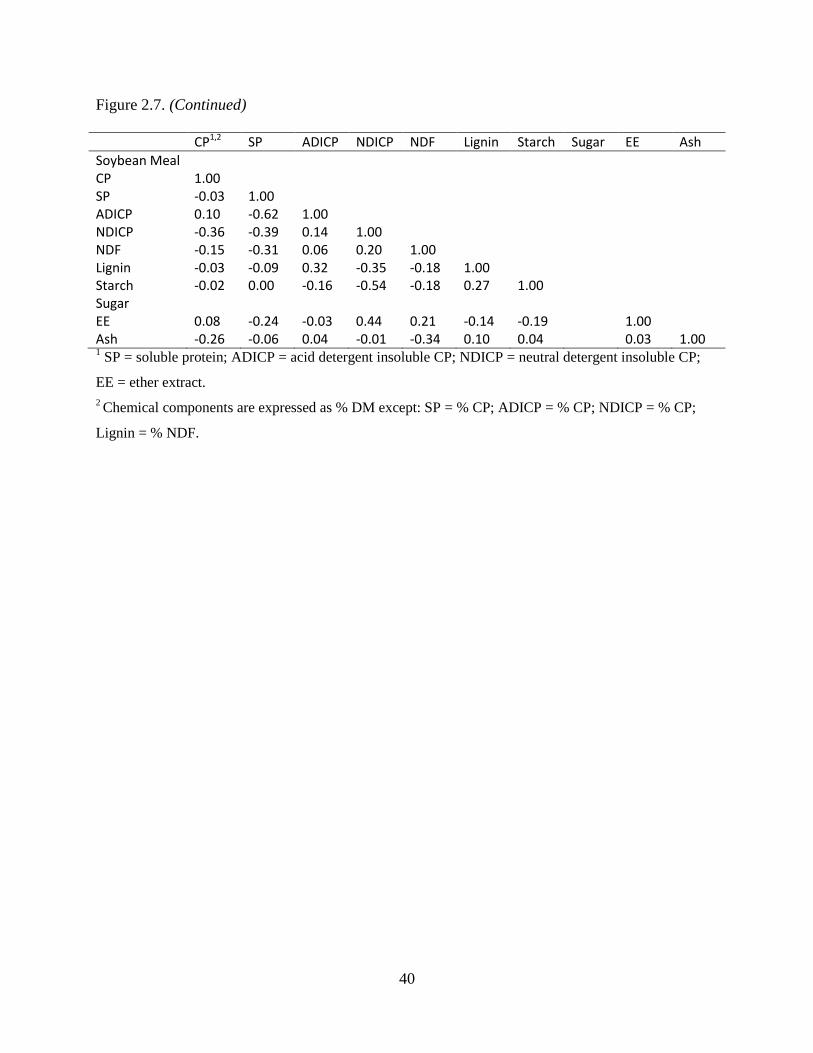
40
Figure 2.7. (Continued)
CP1,2 SP ADICP NDICP NDF Lignin Starch Sugar EE Ash
Soybean Meal
CP 1.00
SP -0.03 1.00
ADICP 0.10 -0.62 1.00
NDICP -0.36 -0.39 0.14 1.00
NDF -0.15 -0.31 0.06 0.20 1.00
Lignin -0.03 -0.09 0.32 -0.35 -0.18 1.00
Starch -0.02 0.00 -0.16 -0.54 -0.18 0.27 1.00
Sugar
EE 0.08 -0.24 -0.03 0.44 0.21 -0.14 -0.19
1.00
Ash -0.26 -0.06 0.04 -0.01 -0.34 0.10 0.04 0.03 1.00 1 SP = soluble protein; ADICP = acid detergent insoluble CP; NDICP = neutral detergent insoluble CP;
EE = ether extract.
2 Chemical components are expressed as % DM except: SP = % CP; ADICP = % CP; NDICP = % CP;
Lignin = % NDF.
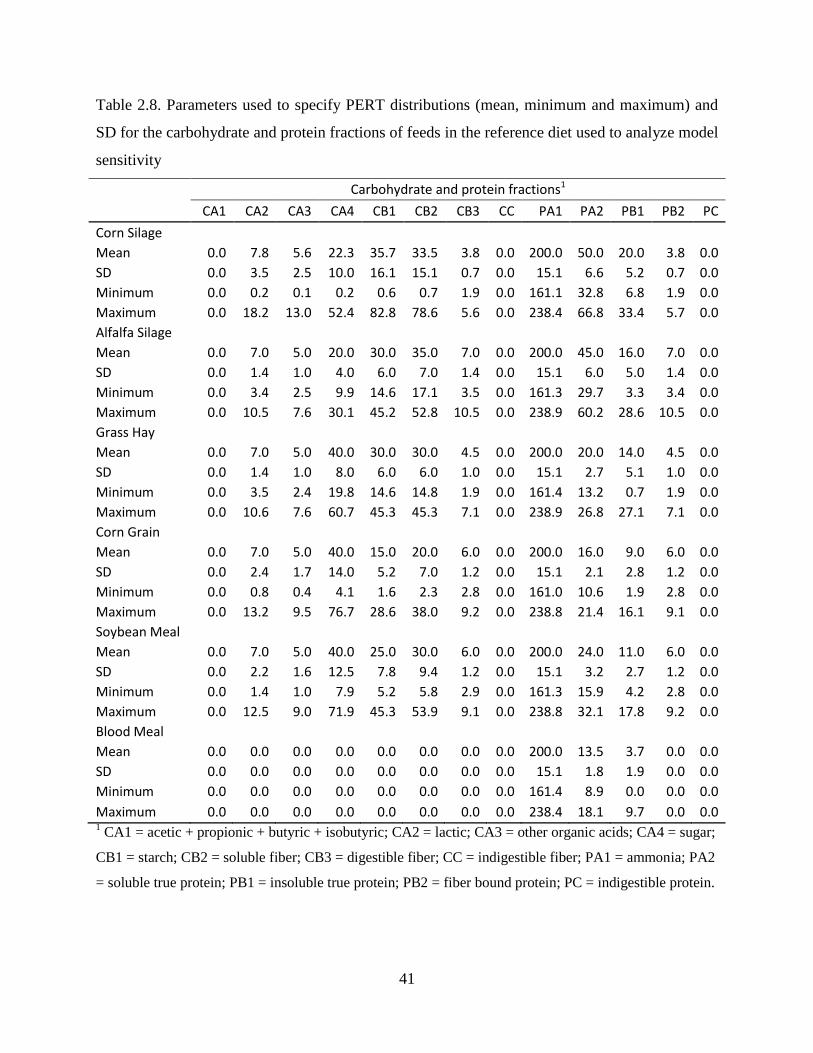
41
Table 2.8. Parameters used to specify PERT distributions (mean, minimum and maximum) and
SD for the carbohydrate and protein fractions of feeds in the reference diet used to analyze model
sensitivity
Carbohydrate and protein fractions1
CA1 CA2 CA3 CA4 CB1 CB2 CB3 CC PA1 PA2 PB1 PB2 PC
Corn Silage
Mean 0.0 7.8 5.6 22.3 35.7 33.5 3.8 0.0 200.0 50.0 20.0 3.8 0.0
SD 0.0 3.5 2.5 10.0 16.1 15.1 0.7 0.0 15.1 6.6 5.2 0.7 0.0
Minimum 0.0 0.2 0.1 0.2 0.6 0.7 1.9 0.0 161.1 32.8 6.8 1.9 0.0
Maximum 0.0 18.2 13.0 52.4 82.8 78.6 5.6 0.0 238.4 66.8 33.4 5.7 0.0
Alfalfa Silage
Mean 0.0 7.0 5.0 20.0 30.0 35.0 7.0 0.0 200.0 45.0 16.0 7.0 0.0
SD 0.0 1.4 1.0 4.0 6.0 7.0 1.4 0.0 15.1 6.0 5.0 1.4 0.0
Minimum 0.0 3.4 2.5 9.9 14.6 17.1 3.5 0.0 161.3 29.7 3.3 3.4 0.0
Maximum 0.0 10.5 7.6 30.1 45.2 52.8 10.5 0.0 238.9 60.2 28.6 10.5 0.0
Grass Hay
Mean 0.0 7.0 5.0 40.0 30.0 30.0 4.5 0.0 200.0 20.0 14.0 4.5 0.0
SD 0.0 1.4 1.0 8.0 6.0 6.0 1.0 0.0 15.1 2.7 5.1 1.0 0.0
Minimum 0.0 3.5 2.4 19.8 14.6 14.8 1.9 0.0 161.4 13.2 0.7 1.9 0.0
Maximum 0.0 10.6 7.6 60.7 45.3 45.3 7.1 0.0 238.9 26.8 27.1 7.1 0.0
Corn Grain
Mean 0.0 7.0 5.0 40.0 15.0 20.0 6.0 0.0 200.0 16.0 9.0 6.0 0.0
SD 0.0 2.4 1.7 14.0 5.2 7.0 1.2 0.0 15.1 2.1 2.8 1.2 0.0
Minimum 0.0 0.8 0.4 4.1 1.6 2.3 2.8 0.0 161.0 10.6 1.9 2.8 0.0
Maximum 0.0 13.2 9.5 76.7 28.6 38.0 9.2 0.0 238.8 21.4 16.1 9.1 0.0
Soybean Meal
Mean 0.0 7.0 5.0 40.0 25.0 30.0 6.0 0.0 200.0 24.0 11.0 6.0 0.0
SD 0.0 2.2 1.6 12.5 7.8 9.4 1.2 0.0 15.1 3.2 2.7 1.2 0.0
Minimum 0.0 1.4 1.0 7.9 5.2 5.8 2.9 0.0 161.3 15.9 4.2 2.8 0.0
Maximum 0.0 12.5 9.0 71.9 45.3 53.9 9.1 0.0 238.8 32.1 17.8 9.2 0.0
Blood Meal
Mean 0.0 0.0 0.0 0.0 0.0 0.0 0.0 0.0 200.0 13.5 3.7 0.0 0.0
SD 0.0 0.0 0.0 0.0 0.0 0.0 0.0 0.0 15.1 1.8 1.9 0.0 0.0
Minimum 0.0 0.0 0.0 0.0 0.0 0.0 0.0 0.0 161.4 8.9 0.0 0.0 0.0
Maximum 0.0 0.0 0.0 0.0 0.0 0.0 0.0 0.0 238.4 18.1 9.7 0.0 0.0 1 CA1 = acetic + propionic + butyric + isobutyric; CA2 = lactic; CA3 = other organic acids; CA4 = sugar;
CB1 = starch; CB2 = soluble fiber; CB3 = digestible fiber; CC = indigestible fiber; PA1 = ammonia; PA2
= soluble true protein; PB1 = insoluble true protein; PB2 = fiber bound protein; PC = indigestible protein.
42
2.4 Results and Discussion
2.4.5 Analytical techniques and fractionation
The required procedures to most appropriately characterize the chemical components of feeds
for version 6.5 of the CNCPS are described in Table 2.1. Chemical components and fractionation
of feeds in the updated library were maintained in the format described by Tylutki et al. (2008)
with the exception of the protein A1 fraction. Previously this has been classified as non-protein
nitrogen (NPN) which is measured as the nitrogen passing into the filtrate after precipitation with
protein specific reagent (tungstic or tricholoracetic acid; (Licitra et al., 1996). The protein A1
fraction is typically assumed to be completely degraded in the rumen (Lanzas et al., 2007b).
However, small peptides and free AA not precipitated by this method are still nutritionally
relevant to the animal if they escape rumen degradation and flow through to the small intestine
(Givens and Rulquin, 2004). Choi et al. (2002) suggested 10% of the AA flowing through to the
small intestine originated from dietary NPN sources which under the previous approach within
the CNCPS were unaccounted for. Likewise, Velle et al. (1997) infused free AA into the rumen
at various rates and showed up to 20% could escape degradation and flow through to the small
intestine which is in agreement with data from Volden et al. (1998). Van Amburgh et al. (2010)
suggested it may be more appropriate to redefine the protein A1 fraction from NPN as described
by Licitra et al. (1996) to ammonia. This would shift small peptides and free AA currently
associated with the A1 fraction into the A2 fraction where they could contribute to MP supply
and also refines the prediction of rumen N balance as less N is degraded in the rumen. Ammonia
has the advantage of being easily measured and available from most commercial laboratories.
Therefore, the NPN fraction in previous feed libraries has been updated to ammonia in version
6.5 (Van Amburgh et al., 2013).
43
Amino acid profiles from the original feed database (O'Connor et al., 1993) were determined
on the insoluble protein residue and analyzed using a single acid hydrolysis with 6N HCL for 24
h (Macgregor et al., 1978, Muscato et al., 1983). During acid hydrolysis Met is partially
converted to methionine sulfoxide, which cannot be quantitatively recovered, and Trp is
completely destroyed (Allred and MacDonald, 1988). Methionine is typically considered one of
the most limiting AA in dairy cattle diets (Armentano et al., 1997, Rulquin and Delaby, 1997,
Schwab et al., 1992) and is frequently the target of supplementation (Schwab, 1996). Therefore,
updating AA profiles in the feed library, particularly Met, was an important part of improving
overall model predictions. The AA profiles used to update the feed library were analyzed on a
whole feed basis, rather than on the insoluble protein residue. The insoluble protein residue was
originally assumed to have a greater probability of escaping the rumen and was more likely to
match the AA profile of the RUP fraction (Macgregor et al., 1978). However, Tedeschi et al.
(2001) investigated this hypothesis and found no differences in AA profiles of feeds analyzed
with, or without extraction of the soluble fraction. Further, the soluble fraction of feeds has been
shown to contribute 10-20% to the flow of AA to the small intestine (Choi et al., 2002, Velle et
al., 1997, Volden et al., 1998). Extracting the insoluble protein residue requires soaking samples
in borate-phosphate buffer to remove the soluble fraction (Krishnamoorthy et al., 1982) and adds
another step to AA analysis. Therefore, it was decided using AA profiles determined on a whole
feed basis was simpler, more feasible for commercial laboratories, biologically more relevant
and provided access to much larger datasets than using profiles from the insoluble residue.

44
2.4.6 Revision of the feed library
The process of evaluating and updating the feed library was designed specifically to pool data
from various sources and combine it to estimate likely values. Although the dataset used in this
analysis encompassed a large number of samples from a wide range of situations, information on
environmental and management factors implicit in the composition of individual samples were
not available. Many external factors affect the nutrient composition of feeds both pre- and post-
harvest. When considering forages, pre-harvest environmental factors such as temperature, light
intensity, nitrogen availability, water and predation impact quality and composition (Van Soest et
al., 1978). Post-harvest, management factors such as packing density, particle size, silo type, silo
filling rate and the way in which the face of the silo is managed can impact ADF, non-fiber
carbohydrates, ADICP, SP, ammonia, pH, surface temperature and aerobic instability (Ruppel et
al., 1995). Furthermore, biological processes during ensiling such as plant respiration, plant
enzymatic activity, clostridial activity and aerobic microbial activity will impact levels of rapidly
fermentable CHO, AA, NPN and can lead to heating and Maillard reactions (Muck, 1988).
Analytically, elevated levels of ADICP are indicative that Maillard reactions have occurred and
are common in many heat dried feeds and fermented feeds where excessive heating occurred
(Van Soest and Mason, 1991). Given the importance of external factors on the composition of
different feeds, the process used in this project was not sensitive enough to accurately predict the
composition of feeds on a sample by sample basis. However, it was capable of producing
estimated compositions under average conditions in an efficient and repeatable manner which
was useful for reviewing and updating a large database such as the CNCPS feed library.
Examples of the changes made to selected forages and concentrates are in Figures 2.1 and 2.2.
The figures were constructed so that the 0 point on the Y axis represents the mean of the dataset
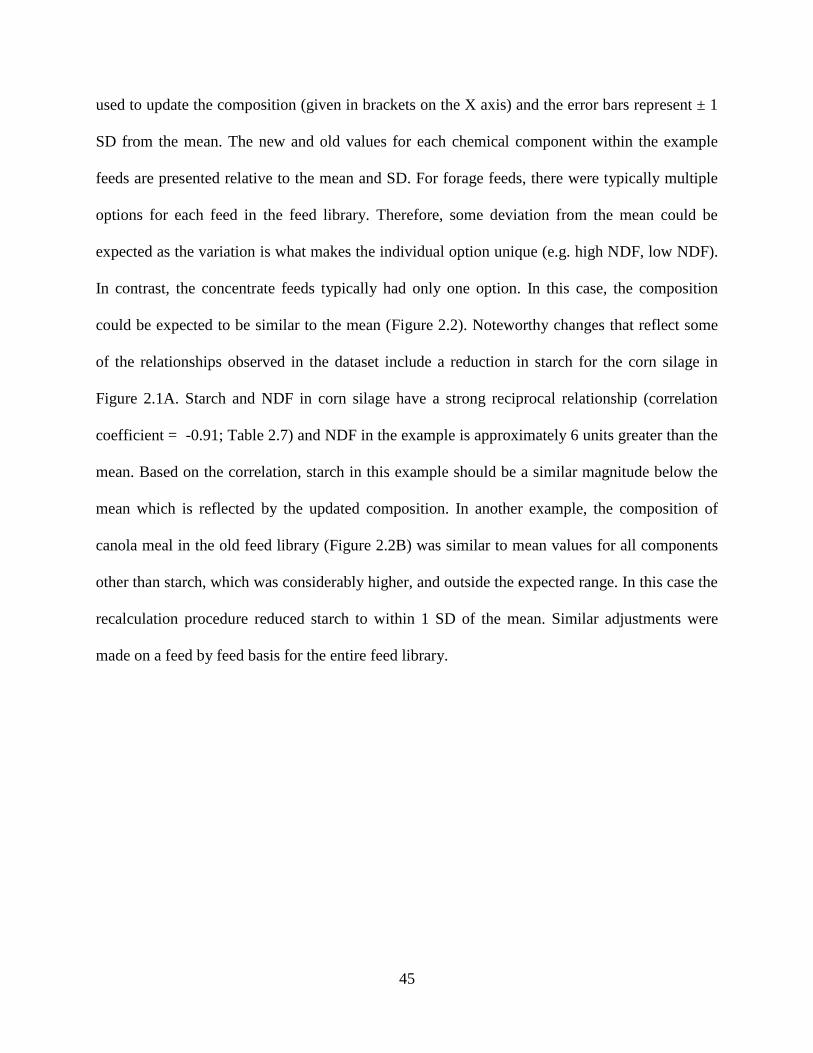
45
used to update the composition (given in brackets on the X axis) and the error bars represent ± 1
SD from the mean. The new and old values for each chemical component within the example
feeds are presented relative to the mean and SD. For forage feeds, there were typically multiple
options for each feed in the feed library. Therefore, some deviation from the mean could be
expected as the variation is what makes the individual option unique (e.g. high NDF, low NDF).
In contrast, the concentrate feeds typically had only one option. In this case, the composition
could be expected to be similar to the mean (Figure 2.2). Noteworthy changes that reflect some
of the relationships observed in the dataset include a reduction in starch for the corn silage in
Figure 2.1A. Starch and NDF in corn silage have a strong reciprocal relationship (correlation
coefficient = -0.91; Table 2.7) and NDF in the example is approximately 6 units greater than the
mean. Based on the correlation, starch in this example should be a similar magnitude below the
mean which is reflected by the updated composition. In another example, the composition of
canola meal in the old feed library (Figure 2.2B) was similar to mean values for all components
other than starch, which was considerably higher, and outside the expected range. In this case the
recalculation procedure reduced starch to within 1 SD of the mean. Similar adjustments were
made on a feed by feed basis for the entire feed library.
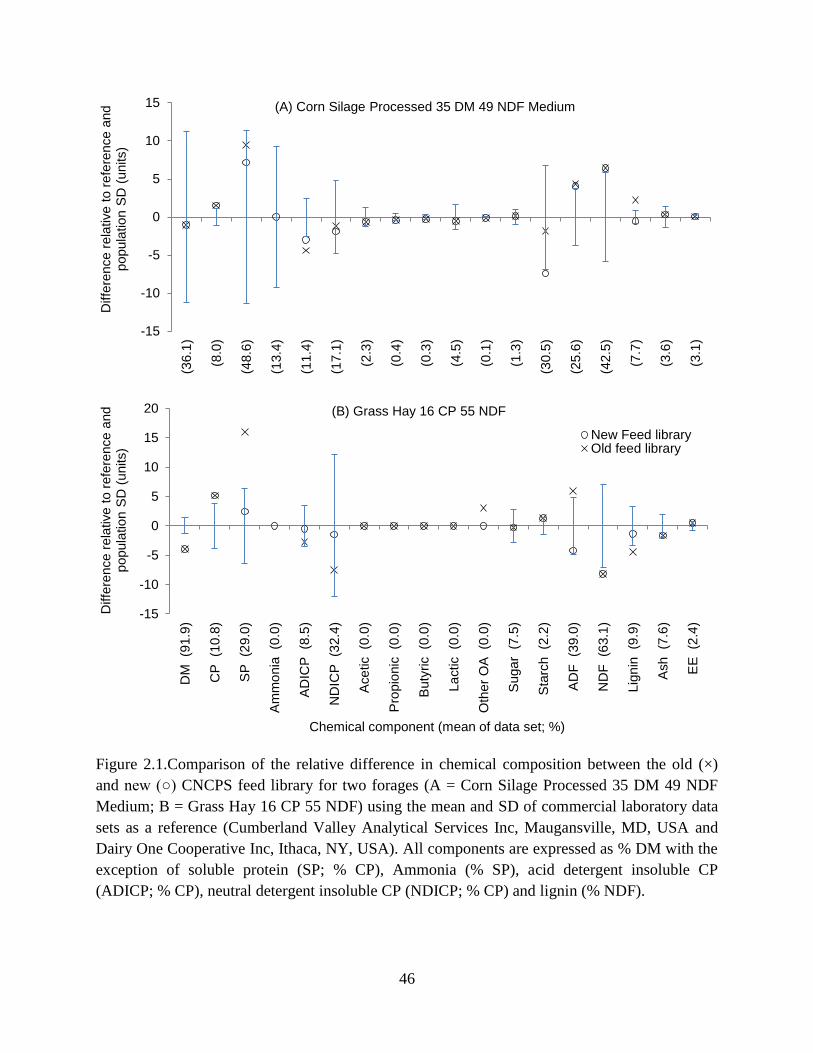
46
Figure 2.1.Comparison of the relative difference in chemical composition between the old (×)
and new (○) CNCPS feed library for two forages (A = Corn Silage Processed 35 DM 49 NDF
Medium; B = Grass Hay 16 CP 55 NDF) using the mean and SD of commercial laboratory data
sets as a reference (Cumberland Valley Analytical Services Inc, Maugansville, MD, USA and
Dairy One Cooperative Inc, Ithaca, NY, USA). All components are expressed as % DM with the
exception of soluble protein (SP; % CP), Ammonia (% SP), acid detergent insoluble CP
(ADICP; % CP), neutral detergent insoluble CP (NDICP; % CP) and lignin (% NDF).
-15
-10
-5
0
5
10
15
(36.1
)
(8.0
)
(48.6
)
(13.4
)
(11.4
)
(17.1
)
(2.3
)
(0.4
)
(0.3
)
(4.5
)
(0.1
)
(1.3
)
(30.5
)
(25.6
)
(42.5
)
(7.7
)
(3.6
)
(3.1
)
Diffe
rence r
ela
tive t
o r
efe
rence a
nd
popula
tion S
D (
units)
(A) Corn Silage Processed 35 DM 49 NDF Medium
-15
-10
-5
0
5
10
15
20
DM
(9
1.9
)
CP
(1
0.8
)
SP
(2
9.0
)
Am
mo
nia
(0
.0)
AD
ICP
(8
.5)
ND
ICP
(3
2.4
)
Ace
tic (0
.0)
Pro
pio
nic
(0
.0)
Buty
ric (0
.0)
La
ctic (0
.0)
Oth
er
OA
(0
.0)
Suga
r (
7.5
)
Sta
rch (2
.2)
AD
F (3
9.0
)
ND
F
(63.1
)
Lig
nin
(9
.9)
Ash
(7
.6)
EE
(2
.4)
Diffe
rence r
ela
tive t
o r
efe
rence a
nd
popula
tion S
D (
units)
Chemical component (mean of data set; %)
(B) Grass Hay 16 CP 55 NDF
New Feed libraryOld feed library
47
Figure 2.2. Comparison of the relative difference chemical composition between the old (×) and
new (○) feed library of two concentrate feeds (A = Corn Grain Ground Fine; B = Canola Meal
Solvent) using the mean and SD of the online laboratory data sets as a reference (Cumberland
Valley Analytical Services Inc, Maugansville, MD, USA and Dairy One Cooperative Inc, Ithaca,
NY, USA). All components are expressed as % DM with the exception of soluble protein (SP; %
CP), ammonia (% SP), acid detergent insoluble CP (ADICP; % CP), neutral detergent insoluble
CP (NDICP; % CP) and lignin (% NDF).
-12.0
-8.0
-4.0
0.0
4.0
8.0
(89.3
)
(9.2
)
(20.1
)
(0.0
)
(5.3
)
(11.4
)
(0.0
)
(0.0
)
(0.0
)
(0.0
)
(0.0
)
(2.4
)
(70.1
)
(3.6
)
(9.9
)
(12.0
)
(1.5
)
(4.2
)
Diffe
rence r
ela
tive t
o r
efe
rence a
nd
popula
tion S
D (
units)
(A) Corn Grain Ground Fine
-15
-10
-5
0
5
10
15
DM
(9
0.7
)
CP
(3
9.9
)
SP
(3
3.4
)
Am
mo
nia
(0
.0)
AD
ICP
(6
.8)
ND
ICP
(1
8.3
)
Ace
tic (0
.0)
Pro
pio
nic
(0
.0)
Buty
ric (0
.0)
La
ctic (0
.0)
Oth
er
OA
(0
.0)
Suga
r (
9.4
)
Sta
rch (1
.6)
AD
F (2
0.7
)
ND
F
(30.0
)
Lig
nin
(2
8.1
)
Ash
(7
.4)
EE
(7
.3)
Diffe
rence r
ela
tive t
o r
efe
rence a
nd
popula
tion S
D (
units)
Chemical component (mean of data set; %)
(B) Canola Meal Solvent New Feed library
Old feed library
48
2.4.7 Model sensitivity to variation in feed chemistry and digestion kinetics
Analyzing model sensitivity to variation in inputs can help users understand where emphasis
should be placed when requesting feed analyses and also help identify target areas for
investigation if model outputs deviate from expected or observed outcomes. The variation in this
study represents an entire population of samples for each feed analyzed over numerous growing
seasons. Therefore, the variation encompassed is what might be expected if a user ran a
simulation in the CNCPS using feeds from the feed library with no information on actual feed
chemistry. The mean, SD and distribution for the components considered in this analysis are in
Table 2.6 and are similar to other reports where the same components and feeds are presented
(Kertz, 1998, Lanzas et al., 2007a, Lanzas et al., 2007b). Data rarely fit a normal distribution and
were more commonly represented by a loglogistic distribution; similar to the findings of Lanzas
et al. (2007a, 2007b). The data of some components were skewed and were better represented by
distributions such as the Beta, Pearson or Weibull (Table 2.6). When data are skewed, the mean
and SD are less appropriate in describing centrality and dispersion of a population (Law and
Kelton, 2000). Outputs of deterministic models such as the CNCPS represent an average (Lanzas
et al., 2007b), however, when input variation is accounted for, the mean value may no longer
represent the most likely value. For example in Figure 2.4A the mean value for ME allowable
milk is 34.1 kg/d, however, the most likely value based on frequency of occurrence is 36.3 kg/d.
These types of considerations are particularly important when conducting model evaluations as
studies rarely report adequate information to complete a robust model simulation (Higgs et al.,
2012, Pacheco et al., 2012). Feed library defaults are typically used in place of reported data
leading to the type of variation and bias reported in Figures 2.3 and 2.4. Presenting model
outputs in the CNCPS as frequency distributions, similar to Figures 2.3 and 2.4, could be useful
for aid users in managing risk, particularly when balancing rations close to animal requirements.
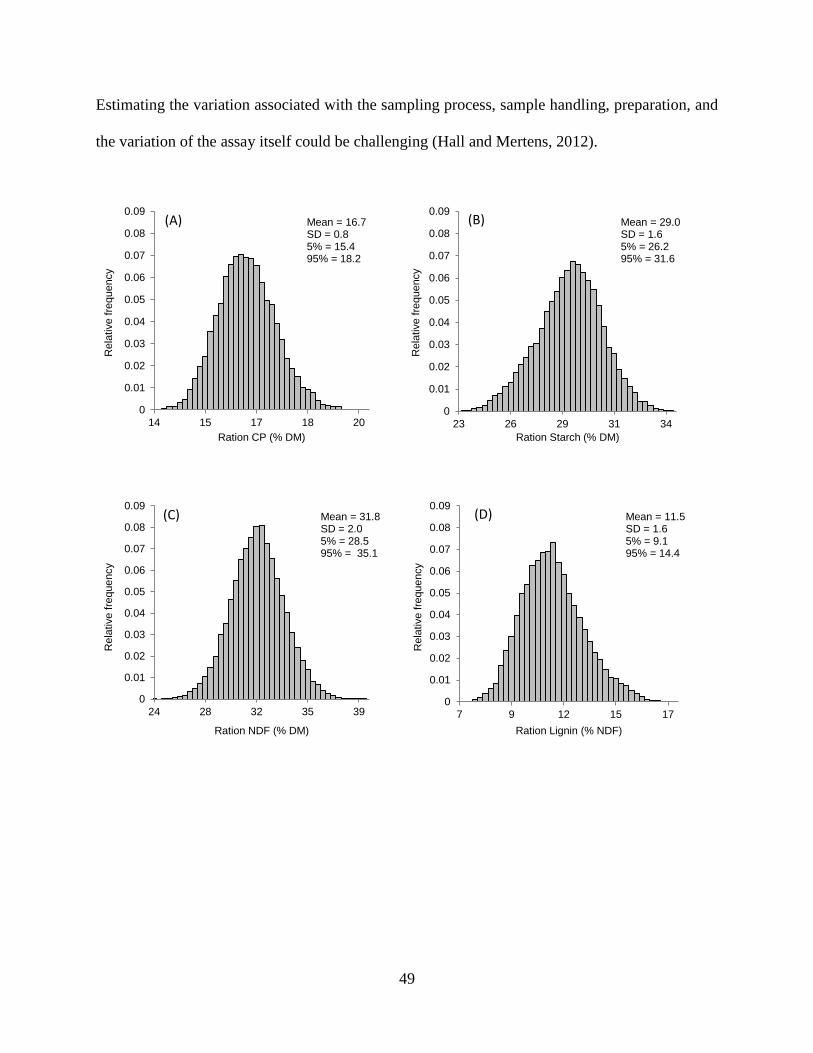
49
Estimating the variation associated with the sampling process, sample handling, preparation, and
the variation of the assay itself could be challenging (Hall and Mertens, 2012).
0
0.01
0.02
0.03
0.04
0.05
0.06
0.07
0.08
0.09
14 15 17 18 20
Rela
tive fre
quency
Ration CP (% DM)
Mean = 16.7 SD = 0.8 5% = 15.4 95% = 18.2
(A)
0
0.01
0.02
0.03
0.04
0.05
0.06
0.07
0.08
0.09
23 26 29 31 34R
ela
tive fre
quency
Ration Starch (% DM)
Mean = 29.0 SD = 1.6 5% = 26.2 95% = 31.6
(B)
0
0.01
0.02
0.03
0.04
0.05
0.06
0.07
0.08
0.09
24 28 32 35 39
Rela
tive fre
quency
Ration NDF (% DM)
Mean = 31.8 SD = 2.0 5% = 28.5 95% = 35.1
(C)
0
0.01
0.02
0.03
0.04
0.05
0.06
0.07
0.08
0.09
7 9 12 15 17
Rela
tive fre
quency
Ration Lignin (% NDF)
Mean = 11.5 SD = 1.6 5% = 9.1 95% = 14.4
(D)
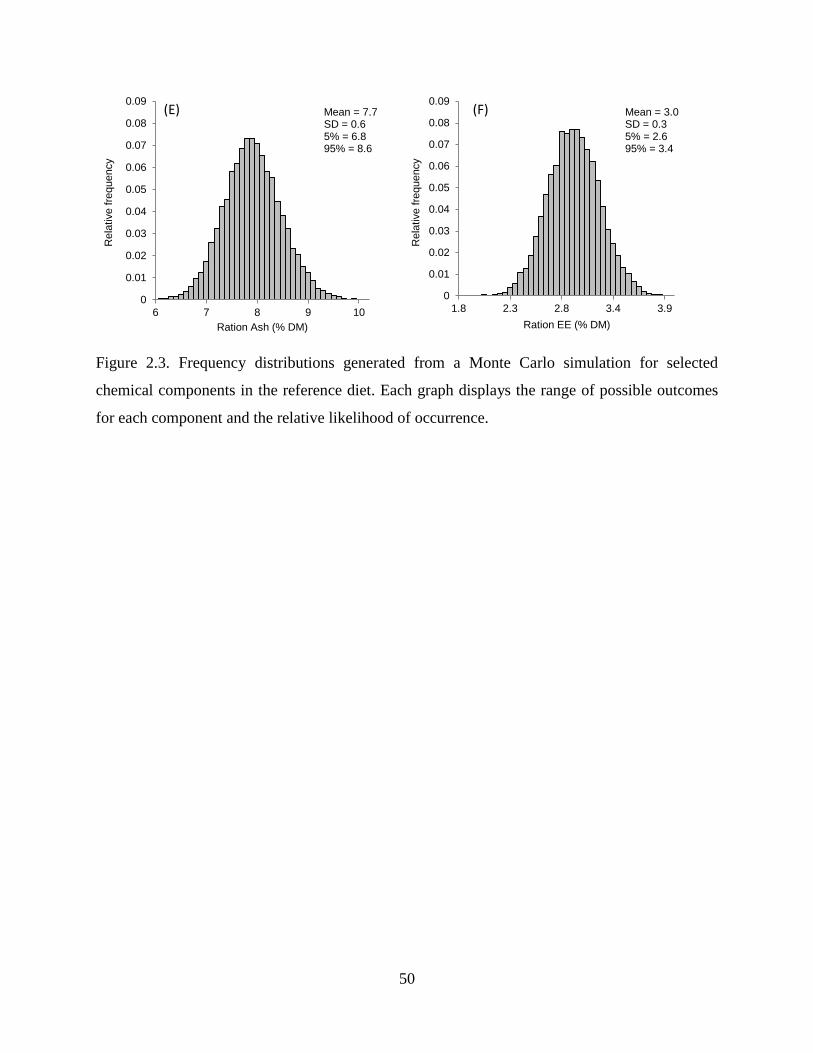
50
Figure 2.3. Frequency distributions generated from a Monte Carlo simulation for selected
chemical components in the reference diet. Each graph displays the range of possible outcomes
for each component and the relative likelihood of occurrence.
0
0.01
0.02
0.03
0.04
0.05
0.06
0.07
0.08
0.09
6 7 8 9 10
Rela
tive fre
quency
Ration Ash (% DM)
Mean = 7.7 SD = 0.6 5% = 6.8 95% = 8.6
(E)
0
0.01
0.02
0.03
0.04
0.05
0.06
0.07
0.08
0.09
1.8 2.3 2.8 3.4 3.9
Rela
tive fre
quency
Ration EE (% DM)
Mean = 3.0 SD = 0.3 5% = 2.6 95% = 3.4
(F)
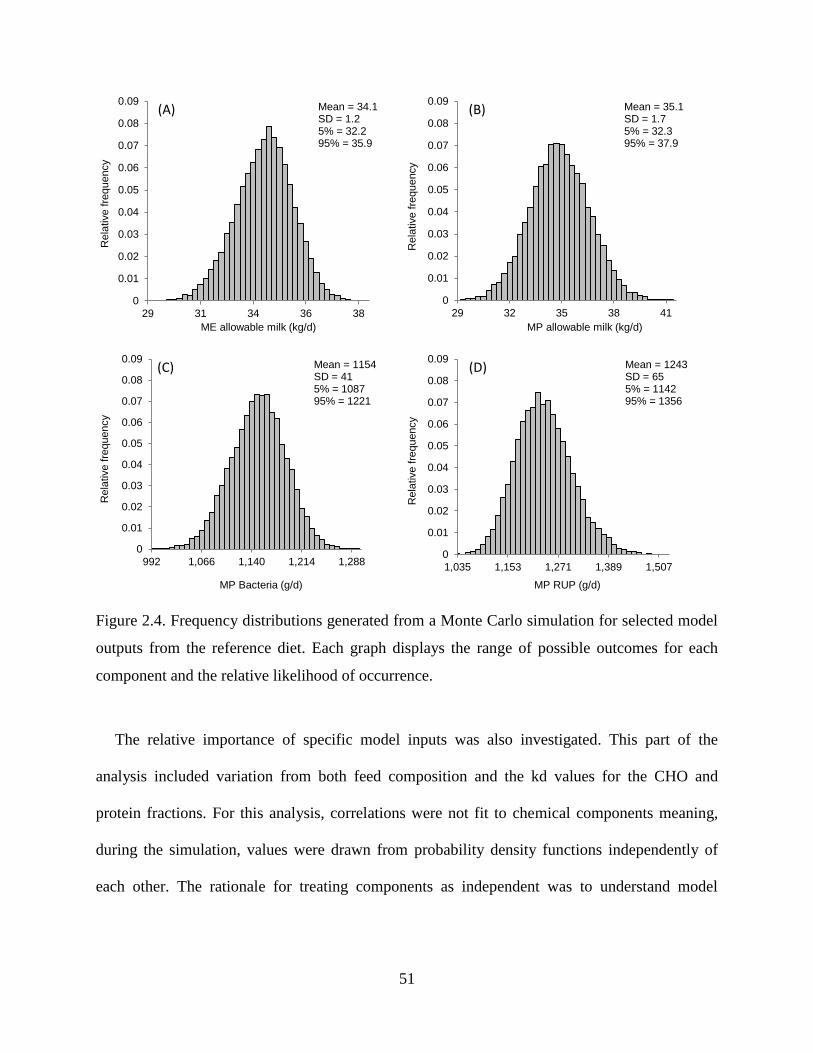
51
Figure 2.4. Frequency distributions generated from a Monte Carlo simulation for selected model
outputs from the reference diet. Each graph displays the range of possible outcomes for each
component and the relative likelihood of occurrence.
The relative importance of specific model inputs was also investigated. This part of the
analysis included variation from both feed composition and the kd values for the CHO and
protein fractions. For this analysis, correlations were not fit to chemical components meaning,
during the simulation, values were drawn from probability density functions independently of
each other. The rationale for treating components as independent was to understand model
0
0.01
0.02
0.03
0.04
0.05
0.06
0.07
0.08
0.09
29 31 34 36 38
Rela
tive fre
quency
ME allowable milk (kg/d)
(A) Mean = 34.1 SD = 1.2 5% = 32.2 95% = 35.9
0
0.01
0.02
0.03
0.04
0.05
0.06
0.07
0.08
0.09
29 32 35 38 41
Rela
tive fre
quency
MP allowable milk (kg/d)
(B) Mean = 35.1 SD = 1.7 5% = 32.3 95% = 37.9
0
0.01
0.02
0.03
0.04
0.05
0.06
0.07
0.08
0.09
992 1,066 1,140 1,214 1,288
Rela
tive fre
quency
MP Bacteria (g/d)
Mean = 1154 SD = 41 5% = 1087 95% = 1221
(C)
0
0.01
0.02
0.03
0.04
0.05
0.06
0.07
0.08
0.09
1,035 1,153 1,271 1,389 1,507
Rela
tive fre
quency
MP RUP (g/d)
Mean = 1243 SD = 65 5% = 1142 95% = 1356
(D)
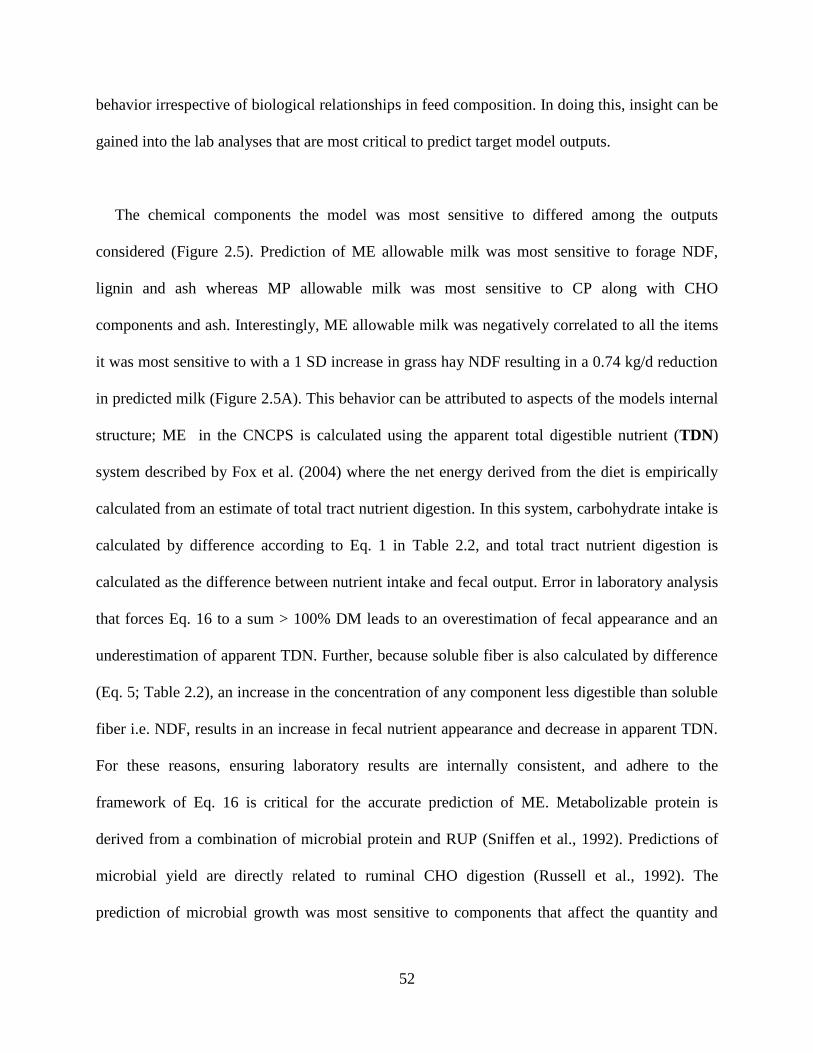
52
behavior irrespective of biological relationships in feed composition. In doing this, insight can be
gained into the lab analyses that are most critical to predict target model outputs.
The chemical components the model was most sensitive to differed among the outputs
considered (Figure 2.5). Prediction of ME allowable milk was most sensitive to forage NDF,
lignin and ash whereas MP allowable milk was most sensitive to CP along with CHO
components and ash. Interestingly, ME allowable milk was negatively correlated to all the items
it was most sensitive to with a 1 SD increase in grass hay NDF resulting in a 0.74 kg/d reduction
in predicted milk (Figure 2.5A). This behavior can be attributed to aspects of the models internal
structure; ME in the CNCPS is calculated using the apparent total digestible nutrient (TDN)
system described by Fox et al. (2004) where the net energy derived from the diet is empirically
calculated from an estimate of total tract nutrient digestion. In this system, carbohydrate intake is
calculated by difference according to Eq. 1 in Table 2.2, and total tract nutrient digestion is
calculated as the difference between nutrient intake and fecal output. Error in laboratory analysis
that forces Eq. 16 to a sum > 100% DM leads to an overestimation of fecal appearance and an
underestimation of apparent TDN. Further, because soluble fiber is also calculated by difference
(Eq. 5; Table 2.2), an increase in the concentration of any component less digestible than soluble
fiber i.e. NDF, results in an increase in fecal nutrient appearance and decrease in apparent TDN.
For these reasons, ensuring laboratory results are internally consistent, and adhere to the
framework of Eq. 16 is critical for the accurate prediction of ME. Metabolizable protein is
derived from a combination of microbial protein and RUP (Sniffen et al., 1992). Predictions of
microbial yield are directly related to ruminal CHO digestion (Russell et al., 1992). The
prediction of microbial growth was most sensitive to components that affect the quantity and
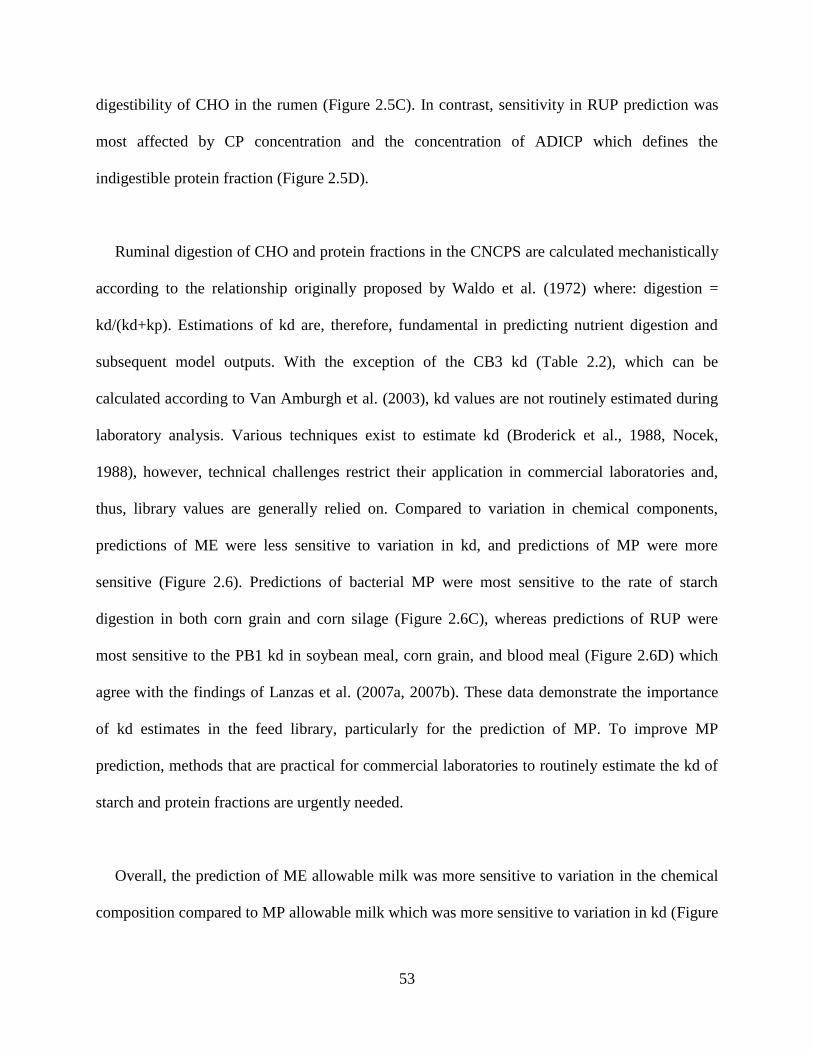
53
digestibility of CHO in the rumen (Figure 2.5C). In contrast, sensitivity in RUP prediction was
most affected by CP concentration and the concentration of ADICP which defines the
indigestible protein fraction (Figure 2.5D).
Ruminal digestion of CHO and protein fractions in the CNCPS are calculated mechanistically
according to the relationship originally proposed by Waldo et al. (1972) where: digestion =
kd/(kd+kp). Estimations of kd are, therefore, fundamental in predicting nutrient digestion and
subsequent model outputs. With the exception of the CB3 kd (Table 2.2), which can be
calculated according to Van Amburgh et al. (2003), kd values are not routinely estimated during
laboratory analysis. Various techniques exist to estimate kd (Broderick et al., 1988, Nocek,
1988), however, technical challenges restrict their application in commercial laboratories and,
thus, library values are generally relied on. Compared to variation in chemical components,
predictions of ME were less sensitive to variation in kd, and predictions of MP were more
sensitive (Figure 2.6). Predictions of bacterial MP were most sensitive to the rate of starch
digestion in both corn grain and corn silage (Figure 2.6C), whereas predictions of RUP were
most sensitive to the PB1 kd in soybean meal, corn grain, and blood meal (Figure 2.6D) which
agree with the findings of Lanzas et al. (2007a, 2007b). These data demonstrate the importance
of kd estimates in the feed library, particularly for the prediction of MP. To improve MP
prediction, methods that are practical for commercial laboratories to routinely estimate the kd of
starch and protein fractions are urgently needed.
Overall, the prediction of ME allowable milk was more sensitive to variation in the chemical
composition compared to MP allowable milk which was more sensitive to variation in kd (Figure
54
2.7). Model sensitivity to variation in forage inputs was generally higher than concentrates which
can be attributed to the variation of the feed itself (Table 2.6), but also the higher inclusion of
forage feeds in the reference diet (Table 2.5). The exception was corn grain, which despite
having lower variability, had a high inclusion which inflated the impact of its variance. Both
variability and dietary inclusion should be considered when deciding on lab analyses to request
for input into the CNCPS. Regular laboratory analyses of samples taken on-farm remains the
recommended approach to characterizing the components in a ration and reduce the likely
variance in the outputs.
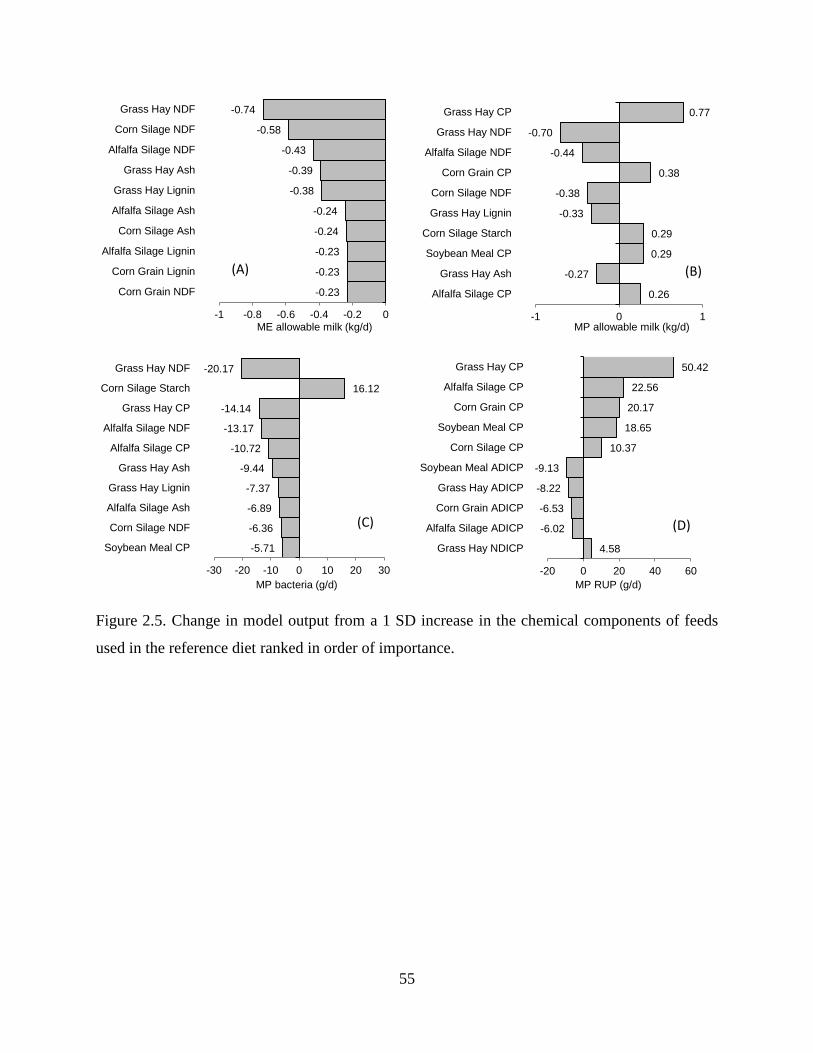
55
Figure 2.5. Change in model output from a 1 SD increase in the chemical components of feeds
used in the reference diet ranked in order of importance.
-0.23
-0.23
-0.23
-0.24
-0.24
-0.38
-0.39
-0.43
-0.58
-0.74
-1 -0.8 -0.6 -0.4 -0.2 0
Corn Grain NDF
Corn Grain Lignin
Alfalfa Silage Lignin
Corn Silage Ash
Alfalfa Silage Ash
Grass Hay Lignin
Grass Hay Ash
Alfalfa Silage NDF
Corn Silage NDF
Grass Hay NDF
ME allowable milk (kg/d)
(A)
0.26
-0.27
0.29
0.29
-0.33
-0.38
0.38
-0.44
-0.70
0.77
-1 0 1
Alfalfa Silage CP
Grass Hay Ash
Soybean Meal CP
Corn Silage Starch
Grass Hay Lignin
Corn Silage NDF
Corn Grain CP
Alfalfa Silage NDF
Grass Hay NDF
Grass Hay CP
MP allowable milk (kg/d)
(B)
-5.71
-6.36
-6.89
-7.37
-9.44
-10.72
-13.17
-14.14
16.12
-20.17
-30 -20 -10 0 10 20 30
Soybean Meal CP
Corn Silage NDF
Alfalfa Silage Ash
Grass Hay Lignin
Grass Hay Ash
Alfalfa Silage CP
Alfalfa Silage NDF
Grass Hay CP
Corn Silage Starch
Grass Hay NDF
MP bacteria (g/d)
(C)
4.58
-6.02
-6.53
-8.22
-9.13
10.37
18.65
20.17
22.56
50.42
-20 0 20 40 60
Grass Hay NDICP
Alfalfa Silage ADICP
Corn Grain ADICP
Grass Hay ADICP
Soybean Meal ADICP
Corn Silage CP
Soybean Meal CP
Corn Grain CP
Alfalfa Silage CP
Grass Hay CP
MP RUP (g/d)
(D)
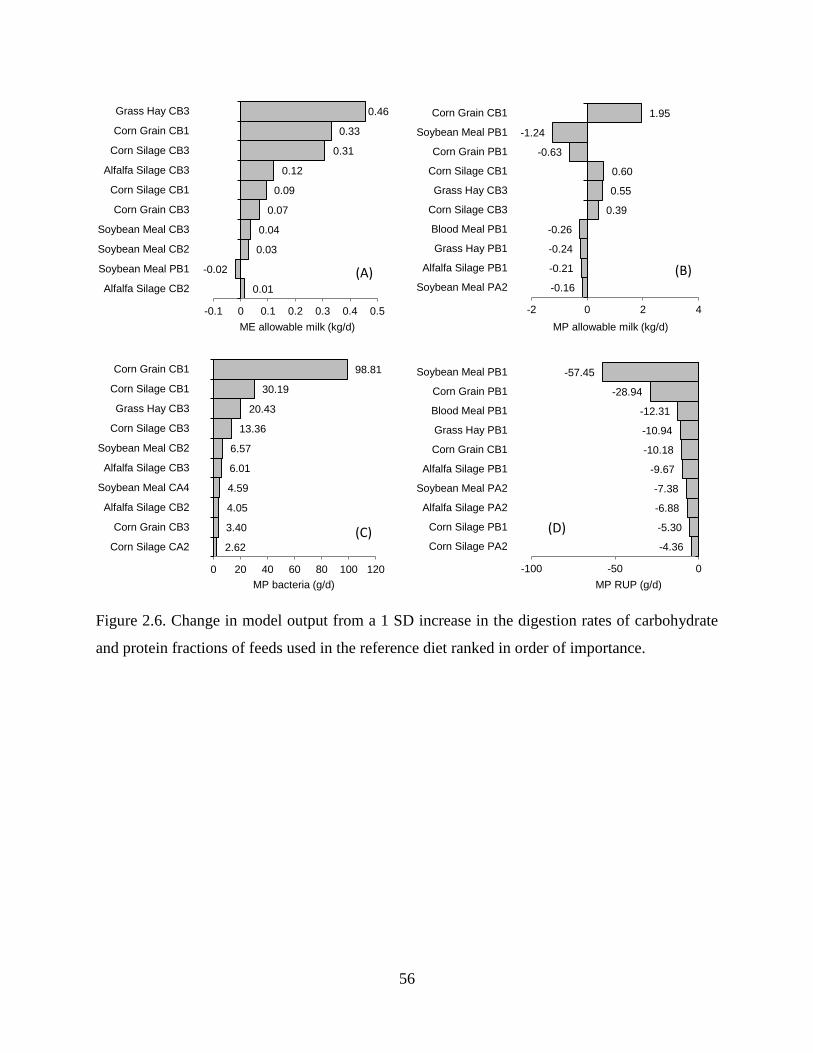
56
Figure 2.6. Change in model output from a 1 SD increase in the digestion rates of carbohydrate
and protein fractions of feeds used in the reference diet ranked in order of importance.
0.01
-0.02
0.03
0.04
0.07
0.09
0.12
0.31
0.33
0.46
-0.1 0 0.1 0.2 0.3 0.4 0.5
Alfalfa Silage CB2
Soybean Meal PB1
Soybean Meal CB2
Soybean Meal CB3
Corn Grain CB3
Corn Silage CB1
Alfalfa Silage CB3
Corn Silage CB3
Corn Grain CB1
Grass Hay CB3
ME allowable milk (kg/d)
(A) -0.16
-0.21
-0.24
-0.26
0.39
0.55
0.60
-0.63
-1.24
1.95
-2 0 2 4
Soybean Meal PA2
Alfalfa Silage PB1
Grass Hay PB1
Blood Meal PB1
Corn Silage CB3
Grass Hay CB3
Corn Silage CB1
Corn Grain PB1
Soybean Meal PB1
Corn Grain CB1
MP allowable milk (kg/d)
(B)
2.62
3.40
4.05
4.59
6.01
6.57
13.36
20.43
30.19
98.81
0 20 40 60 80 100 120
Corn Silage CA2
Corn Grain CB3
Alfalfa Silage CB2
Soybean Meal CA4
Alfalfa Silage CB3
Soybean Meal CB2
Corn Silage CB3
Grass Hay CB3
Corn Silage CB1
Corn Grain CB1
MP bacteria (g/d)
(C) -4.36
-5.30
-6.88
-7.38
-9.67
-10.18
-10.94
-12.31
-28.94
-57.45
-100 -50 0
Corn Silage PA2
Corn Silage PB1
Alfalfa Silage PA2
Soybean Meal PA2
Alfalfa Silage PB1
Corn Grain CB1
Grass Hay PB1
Blood Meal PB1
Corn Grain PB1
Soybean Meal PB1
MP RUP (g/d)
(D)
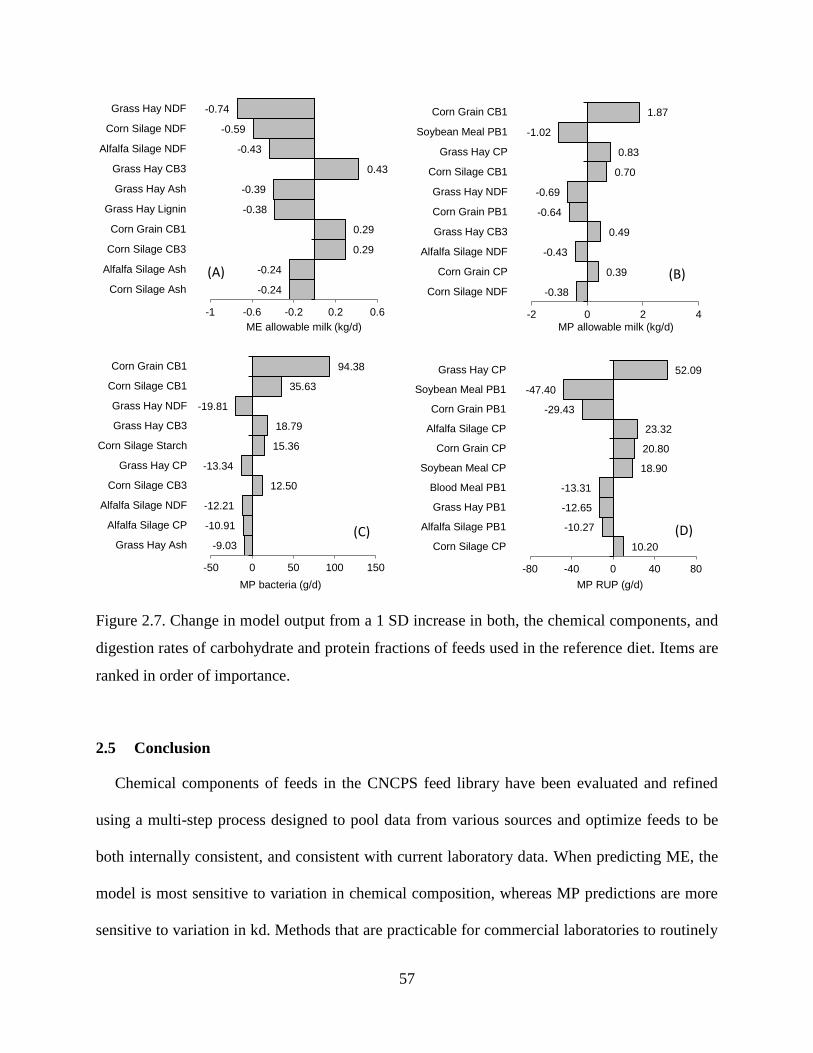
57
Figure 2.7. Change in model output from a 1 SD increase in both, the chemical components, and
digestion rates of carbohydrate and protein fractions of feeds used in the reference diet. Items are
ranked in order of importance.
2.5 Conclusion
Chemical components of feeds in the CNCPS feed library have been evaluated and refined
using a multi-step process designed to pool data from various sources and optimize feeds to be
both internally consistent, and consistent with current laboratory data. When predicting ME, the
model is most sensitive to variation in chemical composition, whereas MP predictions are more
sensitive to variation in kd. Methods that are practicable for commercial laboratories to routinely
-0.24
-0.24
0.29
0.29
-0.38
-0.39
0.43
-0.43
-0.59
-0.74
-1 -0.6 -0.2 0.2 0.6
Corn Silage Ash
Alfalfa Silage Ash
Corn Silage CB3
Corn Grain CB1
Grass Hay Lignin
Grass Hay Ash
Grass Hay CB3
Alfalfa Silage NDF
Corn Silage NDF
Grass Hay NDF
ME allowable milk (kg/d)
(A)
-0.38
0.39
-0.43
0.49
-0.64
-0.69
0.70
0.83
-1.02
1.87
-2 0 2 4
Corn Silage NDF
Corn Grain CP
Alfalfa Silage NDF
Grass Hay CB3
Corn Grain PB1
Grass Hay NDF
Corn Silage CB1
Grass Hay CP
Soybean Meal PB1
Corn Grain CB1
MP allowable milk (kg/d)
(B)
-9.03
-10.91
-12.21
12.50
-13.34
15.36
18.79
-19.81
35.63
94.38
-50 0 50 100 150
Grass Hay Ash
Alfalfa Silage CP
Alfalfa Silage NDF
Corn Silage CB3
Grass Hay CP
Corn Silage Starch
Grass Hay CB3
Grass Hay NDF
Corn Silage CB1
Corn Grain CB1
MP bacteria (g/d)
(C) 10.20
-10.27
-12.65
-13.31
18.90
20.80
23.32
-29.43
-47.40
52.09
-80 -40 0 40 80
Corn Silage CP
Alfalfa Silage PB1
Grass Hay PB1
Blood Meal PB1
Soybean Meal CP
Corn Grain CP
Alfalfa Silage CP
Corn Grain PB1
Soybean Meal PB1
Grass Hay CP
MP RUP (g/d)
(D)
58
estimate the kd of starch and protein fraction are necessary to improve MP predictions. When
using the CNCPS to formulate rations, the variation associated with environmental and
management factors, both pre- and post-harvest, should not be overlooked as they can have
marked effects on the composition of a feed. Regular laboratory analysis of samples taken on-
farm, therefore, remains the recommended approach to characterizing the components in a
ration. However, updates to CNCPS feed library provide a database of ingredients that are
consistent with current laboratory data and can be used as a platform to, both formulate rations
and improve the biology within the model.
2.6 Acknowledgements
The authors would like to thank Cumberland Valley Analytical Services and Dairy One
Cooperative for providing the feed chemistry data and Evonik Industries and Adisseo for
providing the amino acid data.
59
2.7 References
Allred, M. C. and J. L. MacDonald. 1988. Determination of sulfur amino acids and tryptophan in
foods and food and feed ingredients: Collaborative study. J. Assoc. Off. Anal. Chem. 71:603-
606.
AOAC International. 2005. Official methods of analysis of AOAC international. AOAC
International, Gaithersburg, MD.
Armentano, L. E., S. J. Bertics, and G. A. Ducharme. 1997. Response of lactating cows to
methionine or methionine plus lysine added to high protein diets based on alfalfa and heated
soybeans. J. Dairy Sci. 80:1194-1199.
Broderick, G. A. 1987. Determination of protein degradation rates using a rumen in vitro system
containing inhibitors of microbial nitrogen metabolism. Br. J. Nutr. 58:463-475.
Broderick, G. A., R. J. Wallace, E. R. Ørskov, and L. Hansen. 1988. Comparison of estimates of
ruminal protein degradation by in vitro and in situ methods. J. Anim. Sci. 66:1739-1745.
Choi, C. W., S. Ahvenjarvi, A. Vanhatalo, V. Toivonen, and P. Huhtanen. 2002. Quantitation of
the flow of soluble non-ammonia nitrogen entering the omasal canal of dairy cows fed grass
silage based diets. Anim. Feed Sci. Technol. 96:203-220.
Cottrell, W. 1999. Simplified program evaluation and review technique (PERT). J. Constr. Eng.
Manage. 125:16-22.
Fox, D. G., L. O. Tedeschi, T. P. Tylutki, J. B. Russell, M. E. Van Amburgh, L. E. Chase, A. N.
Pell, and T. R. Overton. 2004. The Cornell Net Carbohydrate and Protein System model for
evaluating herd nutrition and nutrient excretion. Anim. Feed Sci. Technol. 112:29-78.
Givens, D. I. and H. Rulquin. 2004. Utilisation by ruminants of nitrogen compounds in silage-
based diets. Anim. Feed Sci. Technol. 114:1-18.
Haefner, J. W. 2005. Modeling biological systems principles and applications. 2nd ed. Springer,
New York.
60
Hall, M. B. 2009. Determination of starch, including maltooligosaccharides, in animal feeds:
Comparison of methods and a method recommended for AOAC collaborative study. J. AOAC
Int. 92:42-49.
Hall, M. B. 2014. Selection of an empirical detection method for determination of water-soluble
carbohydrates in feedstuffs for application in ruminant nutrition. Anim. Feed Sci. Technol.
Submitted.
Hall, M. B. and D. R. Mertens. 2012. A ring test of in vitro neutral detergent fiber digestibility:
Analytical variability and sample ranking. J. Dairy Sci. 95:1992-2003.
Higgs, R. J., L. E. Chase, and M. E. Van Amburgh. 2012. Development and evaluation of
equations in the Cornell Net Carbohydrate and Protein System to predict nitrogen excretion in
lactating dairy cows. J. Dairy Sci. 95:2004-2014.
Johnson, D. 1997. The triangular distribution as a proxy for the beta distribution in risk analysis.
Journal of the Royal Statistical Society: Series D (The Statistician) 46:387-398.
Kertz, A. F. 1998. Variability in delivery of nutrients to lactating dairy cows. J. Dairy Sci.
81:3075-3084.
Krishnamoorthy, U., T. V. Muscato, C. J. Sniffen, and P. J. Van Soest. 1982. Nitrogen fractions
in selected feedstuffs. J. Dairy Sci. 65:217-225.
Landry, J. and S. Delhaye. 1992. Simplified procedure for the determination of tryptophan of
foods and feedstuffs from barytic hydrolysis. J. Agric. Food Chem. 40:776-779.
Lanzas, C., C. J. Sniffen, S. Seo, L. O. Tedeschi, and D. G. Fox. 2007a. A revised CNCPS feed
carbohydrate fractionation scheme for formulating rations for ruminants. Anim. Feed Sci.
Technol. 136:167-190.
Lanzas, C., L. O. Tedeschi, S. Seo, and D. G. Fox. 2007b. Evaluation of protein fractionation
systems used in formulating rations for dairy cattle. J. Dairy Sci. 90:507-521.
61
Law, A. M. and W. D. Kelton. 2000. Simulation modeling and analysis. 3rd ed. Tata McGraw-
Hill Publsihing Company, New Delhi, India.
Licitra, G., T. M. Hernandez, and P. J. Van Soest. 1996. Standardization of procedures for
nitrogen fractionation of ruminant feeds. Anim. Feed Sci. Technol. 57:347-358.
Macgregor, C. A., C. J. Sniffen, and W. H. Hoover. 1978. Amino acid profiles of total and
soluble protein in feedstuffs commonly fed to ruminants. J. Dairy Sci. 61:566-573.
Mertens, D. R. 2002. Gravimetric determination of amylase-treated neutral detergent fiber in
feeds with refluxing in beakers or crucibles: Collaborative study. J. AOAC Int. 85:1217-1240.
Muck, R. E. 1988. Factors influencing silage quality and their implications for management. J.
Dairy Sci. 71:2992-3002.
Muscato, T. V., C. J. Sniffen, U. Krishnamoorthy, and P. J. Van Soest. 1983. Amino acid content
of noncell and cell wall fractions in feedstuffs. J. Dairy Sci. 66:2198-2207.
Nocek, J. E. 1988. In situ and other methods to estimate ruminal protein and energy digestibility:
A review. J. Dairy Sci. 71:2051-2069.
NRC. 2001. Nutrient requirements of dairy cattle. 7th revised ed. National Academy Press,
Washington, DC.
O'Connor, J. D., C. J. Sniffen, D. G. Fox, and W. Chalupa. 1993. A net carbohydrate and protein
system for evaluating cattle diets: IV. Predicting amino acid adequacy. J. Anim. Sci. 71:1298-
1311.
Offner, A., A. Bach, and D. Sauvant. 2003. Quantitative review of in situ starch degradation in
the rumen. Anim. Feed Sci. Technol. 106:81-93.
Offner, A. and D. Sauvant. 2004. Comparative evaluation of the Molly, CNCPS, and LES rumen
models. Anim. Feed Sci. Technol. 112:107-130.
62
Pacheco, D., R. A. Patton, C. Parys, and H. Lapierre. 2012. Ability of commercially available
dairy ration programs to predict duodenal flows of protein and essential amino acids in dairy
cows. J. Dairy Sci. 95:937-963.
Palisade. 2010a. Guide to using @risk version 5.7. Page 693. Palisade Corporation, Ithaca, NY
USA.
Palisade. 2010b. Guide to using Riskoptimizer version 5.7. Page 221. Palisade Corportation,
Ithaca, NY USA.
Raffrenato, E. 2011. Physical, chemical and kinetic factors associated with fiber digestibility in
ruminants and models describing these relationships. PhD Dissertation. Department of Animal
Science.
Raffrenato, E. and M. Van Amburgh. 2011. Technical note: Improved methodology for analyses
of acid detergent fiber and acid detergent lignin. J. Dairy Sci. 94:3613-3617.
Rulquin, H. and L. Delaby. 1997. Effects of the energy balance of dairy cows on lactational
responses to rumen-protected methionine. J. Dairy Sci. 80:2513-2522.
Ruppel, K. A., R. E. Pitt, L. E. Chase, and D. M. Galton. 1995. Bunker silo management and its
relationship to forage preservation on dairy farms. J. Dairy Sci. 78:141-153.
Russell, J. B., J. D. O'Connor, D. G. Fox, P. J. Van Soest, and C. J. Sniffen. 1992. A net
carbohydrate and protein system for evaluating cattle diets: I. Ruminal fermentation. J. Anim.
Sci. 70:3551-3561.
SAS. 2010. JMP. SAS Institute Inc., Cary, NC, USA.
Schwab, C. G. 1996. Rumen-protected amino acids for dairy cattle: Progress towards
determining lysine and methionine requirements. Anim. Feed Sci. Technol. 59:87-101.
Schwab, C. G., C. K. Bozak, N. L. Whitehouse, and M. M. A. Mesbah. 1992. Amino acid
limitation and flow to duodenum at four stages of lactation. 1. Sequence of lysine and
methionine limitation. J. Dairy Sci. 75:3486-3502.
63
Shapiro, A. 2003. Monte carlo sampling methods. Pages 353-425 in Handbooks in operations
research and management science. Vol. 10. A. Ruszczynski and A. Shapiro, ed. Elsevier.
Siegfried, V. R., H. Ruckemmann, and G. Stumpf. 1984. Method for the determination of
organic acids in silage by high performance liquid chromatography. Landwirtsch. Forsch.
37:298-304.
Sniffen, C. J., J. D. O'Connor, P. J. Van Soest, D. G. Fox, and J. B. Russell. 1992. A net
carbohydrate and protein system for evaluating cattle diets: II. Carbohydrate and protein
availability. J. Anim. Sci. 70:3562-3577.
Tedeschi, L. O., A. N. Pell, D. G. Fox, and C. R. Llames. 2001. The amino acid profiles of the
whole plant and of four plant residues from temperate and tropical forages. J. Anim. Sci. 79:525-
532.
Tylutki, T. P., D. G. Fox, V. M. Durbal, L. O. Tedeschi, J. B. Russell, M. E. Van Amburgh, T. R.
Overton, L. E. Chase, and A. N. Pell. 2008. Cornell Net Carbohydrate and Protein System: A
model for precision feeding of dairy cattle. Anim. Feed Sci. Technol. 143:174-202.
Van Amburgh, M. E., L. E. Chase, T. R. Overton, D. A. Ross, E. B. Recktenwald, R. J. Higgs,
and T. P. Tylutki. 2010. Updates to the Cornell Net Carbohydrate and Protein System v6.1 and
implications for ration formulation. Pages 144-159 in Proc. Cornell Nutrition Conference,
Syracuse, NY.
Van Amburgh, M. E., A. Foskolos, E. A. Collao-Saenz, R. J. Higgs, and D. A. Ross. 2013.
Updating the CNCPS feed library with new amino acid profiles and efficiencies of use:
Evaluation of model predictions - Version 6.5. Pages 59-76 in Proc. Cornell Nutrition
Conference, Syracuse, NY.
Van Amburgh, M. E., E. B. Recktenwald, D. A. Ross, T. R. Overton, and L. E. Chase. 2007.
Achieving better nitrogen efficiency in lactating dairy cattle: Updating field usable tools to
improve nitrogen efficiency. Pages 25-38 in Proc. Cornell Nutrition Conference, Syracuse, NY.
64
Van Amburgh, M. E., P. J. Van Soest, J. B. Robertson, and W. F. Knaus. 2003. Corn silage
neutral detergent fiber: Refining a mathematical approach for in vitro rates of digestion. Pages
99-108 in Proc. Cornell Nutrition Conference, Syracuse, NY.
Van Soest, P. J. 1994. Nutritional ecology of the ruminant. 2nd ed. Cornell University Press,
Ithaca, NY.
Van Soest, P. J. and V. C. Mason. 1991. The influence of the maillard reaction upon the
nutritive-value of fibrous feeds. Anim. Feed Sci. Technol. 32:45-53.
Van Soest, P. J., D. R. Mertens, and B. Deinum. 1978. Preharvest factors influencing quality of
conserved forage. J. Anim. Sci. 47:712-720.
Velle, W., Ø. V. Sjaastad, A. Aulie, D. Grønset, K. Feigenwinter, and T. Framstad. 1997. Rumen
escape and apparent degradation of amino acids after individual intraruminal administration to
cows. J. Dairy Sci. 80:3325-3332.
Volden, H., W. Velle, O. M. Harstad, A. Aulie, and O. V. Sjaastad. 1998. Apparent ruminal
degradation and rumen escape of lysine, methionine, and threonine administered intraruminally
in mixtures to high-yielding cows. J. Anim. Sci. 76:1232-1240.
Waldo, D. R., L. W. Smith, and E. L. Cox. 1972. Model of cellulose disappearance from the
rumen. J. Dairy Sci. 55:125-129.
Weiss, W. P. 1994. Estimation of digestibility of forages by laboratory methods. Pages 644-681
in Forage quality, evaluation, and utilization. G. C. Fahey, ed. American Society of Agronomy,
Crop Science Society of America, Soil Science Society of America.
65
CHAPTER 3: DEVELOPING A DYNAMIC VERSION OF THE CORNELL NET
CARBOHYDRATE AND PROTEIN SYSTEM: CARBOHYDRATE AND NITROGEN
DIGESTION
3.1 Abstract
The Cornell Net Carbohydrate and Protein System (CNCPS) is a mathematical model used to
predict the nutrient supply and requirements of dairy and growing cattle. A new, dynamic
version of the CNCPS rumen submodel was constructed in the system dynamics modeling
software Vensim®. The new model uses a similar structure to previous versions of CNCPS, but
rather than calculating statically, it calculates iteratively over time. The time unit used in the
model is hour with integration every 6 minutes and a total simulation time of 300 hours.
Carbohydrate and protein digestion in the rumen is estimated using the kinetic relationship
between passage and degradation. The lower gut has been expanded from a single compartment
with fixed digestion coefficients to a separate small and large intestine. The large intestine is
fully mechanistic and follows the same principles of digestion and passage used in the rumen
model. Digestion in the small intestine is partially static and partially mechanistic with the
implementation of a new system for estimating intestinal digestion of feed protein for non-forage
feeds. A new system for calculating urea recycling back to the gastrointestinal tract (GIT) was
also constructed. The dynamic framework allows for different meal patterns to be modeled
which impact rumen pool sizes of carbohydrate, microbes and nitrogen availability. While new
capability is available within the model, the same basic output structure has been maintained to
facilitate field application and outputs are generally expressed on a per day basis.
66
3.2 Introduction
Mathematical models are widely used in animal agriculture to estimate animal requirements
and nutrient supply under a range physiological states and production systems (NRC, 2001). The
integration of models into computer programs provides a convenient platform to apply biological
principles on farms and has helped facilitate improved animal performance and lowered nutrient
loss to the environment. The Cornell Net Carbohydrate and Protein System (CNCPS) is an
example of a model that has integrated understanding of ruminant digestion, physiology and
requirements under different environmental and management circumstances to aid farmers and
nutritionists in optimizing animal performance (Fox et al., 2004).
The CNCPS was first described in a series of publications outlining carbohydrate and protein
digestion (Sniffen et al., 1992), microbial growth (Russell et al., 1992), amino acid supply
(O'Connor et al., 1993) and animal requirements (Fox et al., 1992). Since the original
publications, updates have continually been made to improve the model capability (Fox et al.,
2004, Tylutki et al., 2008, Van Amburgh et al., 2010) with the most recent updates resulting in
version 6.5 of the CNCPS (Van Amburgh et al., 2013). This chapter describes a further evolution
of the CNCPS into a dynamic framework with a focus on carbohydrate and protein digestion.
Microbial growth, amino acid supply, and amino acid requirements are described in subsequent
chapters.
67
3.3 Model description
3.3.1 General model structure
The model is constructed in the system dynamics modeling software Vensim (2010). Vensim
uses a diagrammatic interface with embedded mathematical statements and calculates iteratively
over time. The time unit used in the development of this model is hour, and the model simulates
for 300 hours with integration every 6 minutes. The simulation time used was the shortest period
needed for the model to reach dynamic equilibrium or ‘steady state’ (Sterman, 2000) across a
range of diets. The diagrammatic interface of Vensim is convenient and allows for visual critique
of the model which aids interpretation. Although acronyms were required given the size of the
model (>1200 variables), an effort was made to avoid overly complicated mathematical notation
and to make acronyms intuitive. A list of acronyms and abbreviations are in Table 3.1.
Digestion of nutrients in the original CNCPS (Sniffen et al., 1992) followed the system
proposed by Waldo et al. (1972) where the kinetics of digestion and passage are integrated to
predict substrate digestion. Assuming a single potentially digestible pool, the system can be
described by the following equation:
where:
A = the amount of potentially digestible substrate in the rumen,
k1 = the digestion rate,
k2 = the rate of passage,
t = time in hours.

68
The derivative of the previous equation gives:
( )
where, assuming a single feeding:
R = the remaining potentially available substrate present in the rumen after t hours,
A = the amount of substrate fed.
Using this system, the ratio of k1/(k1 + k2) gives the fraction of substrate digested in the rumen
from a single feeding and has been used to statically capture the dynamics of rumen digestion in
both the CNCPS and the protein sub-model of the NRC (2001).
The new rumen sub-model follows the same general system previously used, but because the
model is dynamic, rather than static, and calculates continuously, an intake term can be added to
the model which allows the estimation of substrate pool size at steady state. The general form of
the system is shown in Figure 3.1 and is represented by the equation:
where:
A = the amount of potentially digestible substrate in the rumen,
k1 = the rate of substrate intake,
k2 = the digestion rate,
k3 = the rate of passage,
t = time in hours.
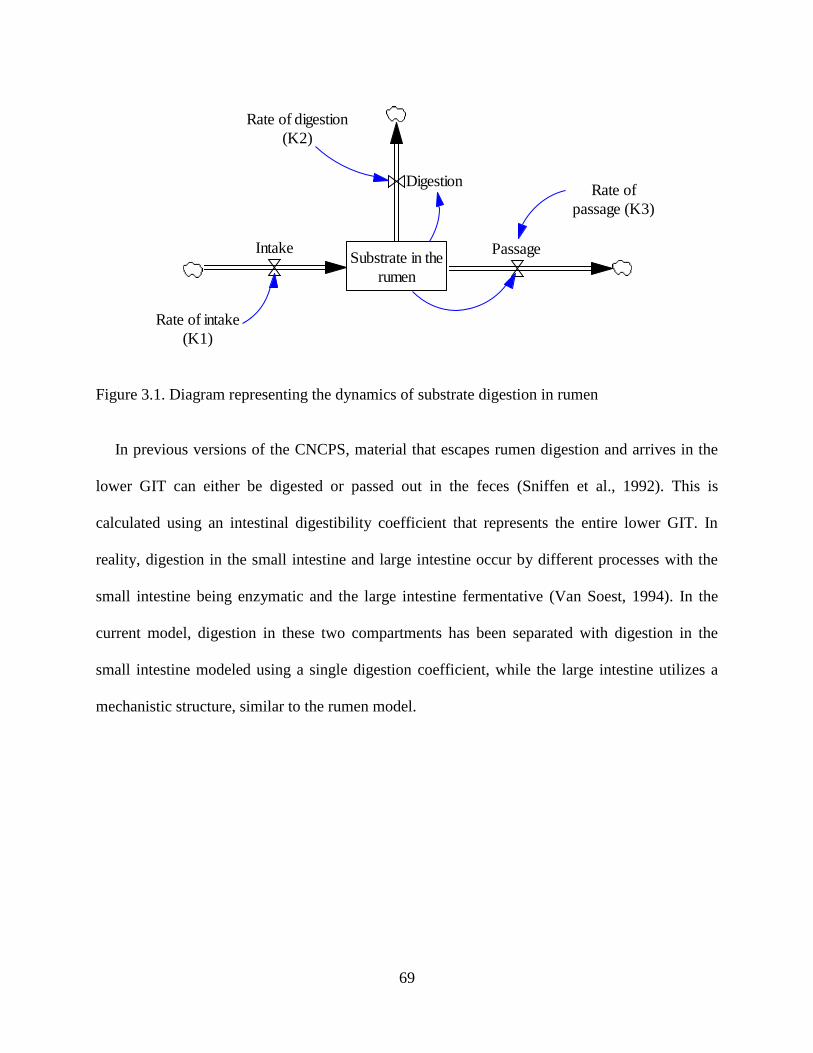
69
Figure 3.1. Diagram representing the dynamics of substrate digestion in rumen
In previous versions of the CNCPS, material that escapes rumen digestion and arrives in the
lower GIT can either be digested or passed out in the feces (Sniffen et al., 1992). This is
calculated using an intestinal digestibility coefficient that represents the entire lower GIT. In
reality, digestion in the small intestine and large intestine occur by different processes with the
small intestine being enzymatic and the large intestine fermentative (Van Soest, 1994). In the
current model, digestion in these two compartments has been separated with digestion in the
small intestine modeled using a single digestion coefficient, while the large intestine utilizes a
mechanistic structure, similar to the rumen model.
Substrate in the
rumen
Intake Passage
Digestion
Rate of intake
(K1)
Rate of digestion
(K2)
Rate of
passage (K3)

70
Table 3.1.Abbreviations used in the model
Abbreviation Description
A1 N Feed ammonia A1a CHO Acetic acid A1b CHO Butyric acid A1p CHO Propionic acid A2 CHO Lactic acid A2 N Soluble non-ammonia feed N A3 CHO Other organic acids A4 CHO Water soluble CHO AA Amino acids Ab Absorbed B1 CHO Starch B1 N Insoluble non-ammonia feed N B2 CHO Soluble fiber B2 N Fiber bound non-ammonia feed N B3 fast CHO Rapidly degrading NDF B3 slow CHO Slowly degrading NDF C CHO Indigestible NDF C N Undegradable non-ammonia feed N CHO Carbohydrate CW Bacterial cell wall Deg Degradation in the rumen End N Endogenous N EPZ Entodiniomorphid protozoa Escape Escape from the rumen FB Fiber bacteria HPZ Holotrich protozoa ID Digestion in the small intestine Kd Rate of fermentation LI Large intestine NA Bacterial nucleic acids NAN Non-ammonia N NFB Non-fiber bacteria NH3 Ammonia OA Omasum and abomasum Out Passage from the large intestine to the feces PAA Peptides and free AA Pass Passage from the small intestine to the large intestine PDV Portal drained viscera PZ Protozoa R Rumen SI Small intestine
71
3.3.2 Passage rates
In version 6.5 of the CNCPS, 3 different passage rate equations are used to estimate flows out
of the rumen (Seo et al., 2006). Feed fractions are assigned to the most appropriate rate
depending on the phase in which they would flow. All soluble fractions are assumed to flow with
the liquid phase, while solids are categorized as either forages or concentrates, which have
different rates of passage (Seo et al., 2006). The current model includes additional passage rates
for NDF. Within the new model structure, all non-NDF material and soluble material use the
rates described by Seo et al. (2006). However, NDF in forages and concentrates use equations
from NorFor (2011) and are described as follows:
(
)
where:
kpNDFconc = the passage rate of NDF out of the rumen from concentrate feeds (%/hr),
DMI = total dry matter intake (kg/d),
BW = body weight (kg),
% diet conc = proportion of diet DM that is made up of concentrate feeds.

72
( )
where:
kpNDFforage = the passage rate of NDF out of the rumen from forage feeds (%/hr),
DMI = total dry matter intake (kg/d),
BW = body weight (kg),
NDF = diet NDF concentration (g/kg DM).
The expanded system allowed the model to better predict NDF pool sizes in the rumen and also
total rumen volume which are likely important for further predictions of chewing and rumination
and feed intake.
3.3.3 Carbohydrate digestion
Feeds are assumed to be composed of fat, protein, carbohydrates, ash and water.
Carbohydrates and protein are further subdivided into fractions that have similar chemical and
physical properties with uniform digestion behaviour (Sniffen et al., 1992). The carbohydrate
fractions used in the CNCPS were first defined by Sniffen et al. (1992) and later expanded by
Lanzas et al. (2007) to include soluble fiber, volatile fatty acids, lactic acid and other organic
acids. The current model uses the same scheme as Lanzas et al. (2007) with an expansion of
potentially digestible (pd) NDF from a single first order pool, to two pd pools, both first order,
but with different rates of digestion. Mertens and Ely (1979) proposed this system as a more
appropriate representation of NDF digestion which has been supported by numerous studies
73
(Ellis et al., 2005, Huhtanen et al., 2008, Van Milgen et al., 1991), and therefore, implemented in
this model. The size of each pool and associated digestion rate can be calculated using the
system described by Raffrenato and Van Amburgh (2010). If data are not available to estimate
two pools of pdNDF the model will assume a single pool consistent with current model
behaviour except for the use of uNDF in place of lignin * 2.4 as the estimate of unavailable
NDF. The required CHO inputs are in Table 3.2 and the expected analytical methods to estimate
the chemical fractions are defined in Chapter 2.
Other model inputs include fermentation rates and coefficients for intestinal digestibly.
Typically, library values are used for these inputs with the exception of pdNDF (see Chapter 2).
The feed library used by this model is the same as that described in Chapter 2 with the exception
of the intestinal digestibility coefficients used for the digestion of the B2, B3 slow and B3 fast
CHO fractions (Table 3.2). Mammals lack the carbohydrases needed to digest structural and
soluble fiber components in the small intestine (Van Soest, 1994). Because in this model the
lower gut has been separated into a small and large intestine, the intestinal digestion coefficients
for the fiber fractions were set to 0 and any post-ruminal digestion estimated mechanistically in
the large intestine.
The large intestine is modeled using a similar structure to the rumen where the extent of
digestion is determined from the rate of digestion and the rate of passage through the
compartment. Digestion rates in the large intestine were assumed to be the same as in the rumen
given a similar population of bacteria exist in the large intestine (Van Soest, 1994). However,
limited data exist to estimate the transit time through the large intestine. Version 6 of the CNCPS
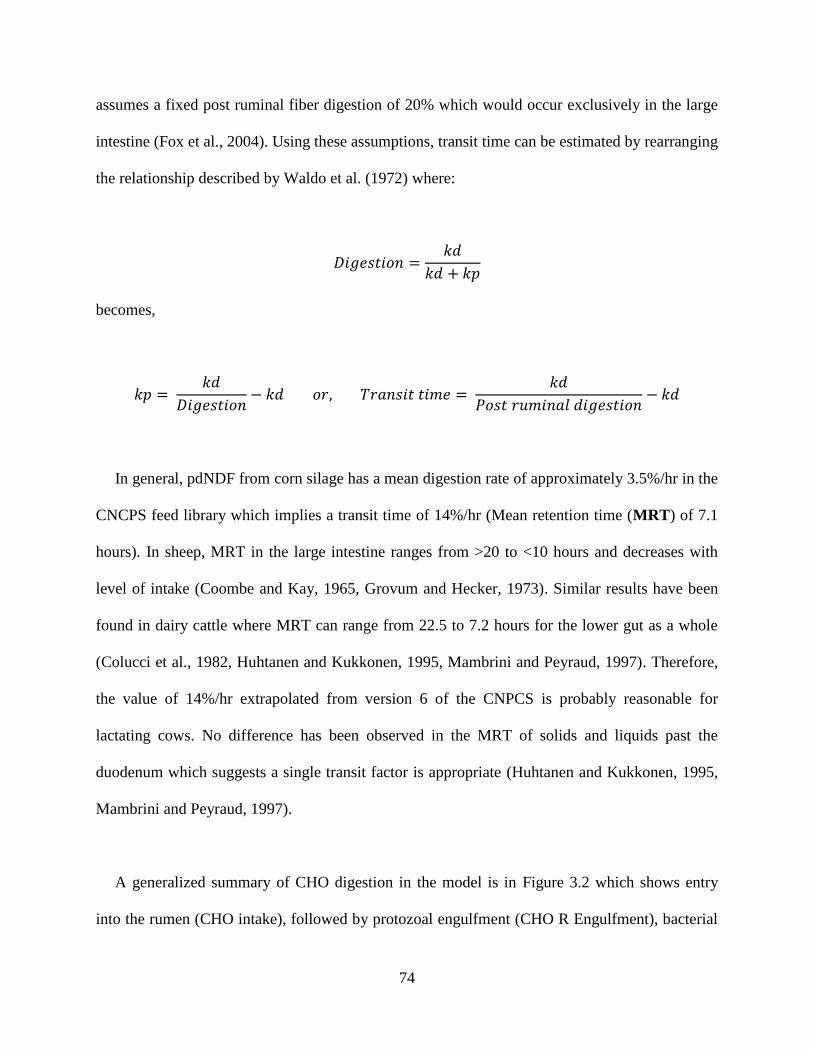
74
assumes a fixed post ruminal fiber digestion of 20% which would occur exclusively in the large
intestine (Fox et al., 2004). Using these assumptions, transit time can be estimated by rearranging
the relationship described by Waldo et al. (1972) where:
becomes,
In general, pdNDF from corn silage has a mean digestion rate of approximately 3.5%/hr in the
CNCPS feed library which implies a transit time of 14%/hr (Mean retention time (MRT) of 7.1
hours). In sheep, MRT in the large intestine ranges from >20 to <10 hours and decreases with
level of intake (Coombe and Kay, 1965, Grovum and Hecker, 1973). Similar results have been
found in dairy cattle where MRT can range from 22.5 to 7.2 hours for the lower gut as a whole
(Colucci et al., 1982, Huhtanen and Kukkonen, 1995, Mambrini and Peyraud, 1997). Therefore,
the value of 14%/hr extrapolated from version 6 of the CNPCS is probably reasonable for
lactating cows. No difference has been observed in the MRT of solids and liquids past the
duodenum which suggests a single transit factor is appropriate (Huhtanen and Kukkonen, 1995,
Mambrini and Peyraud, 1997).
A generalized summary of CHO digestion in the model is in Figure 3.2 which shows entry
into the rumen (CHO intake), followed by protozoal engulfment (CHO R Engulfment), bacterial
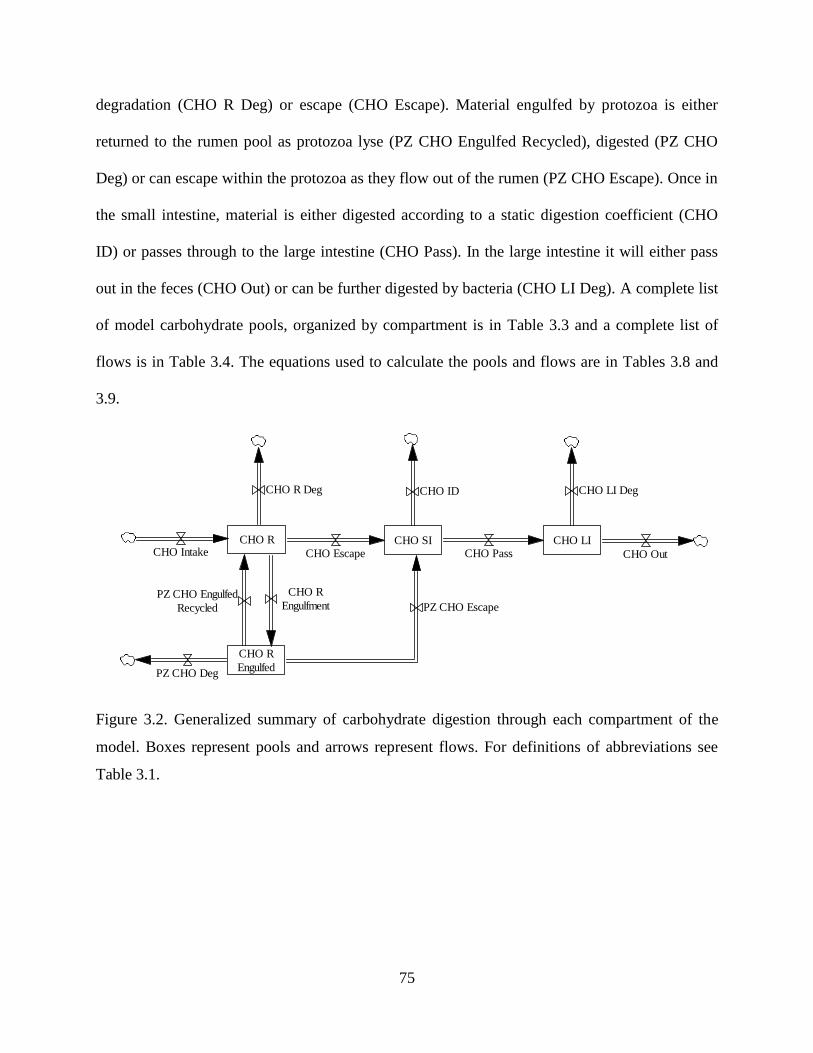
75
degradation (CHO R Deg) or escape (CHO Escape). Material engulfed by protozoa is either
returned to the rumen pool as protozoa lyse (PZ CHO Engulfed Recycled), digested (PZ CHO
Deg) or can escape within the protozoa as they flow out of the rumen (PZ CHO Escape). Once in
the small intestine, material is either digested according to a static digestion coefficient (CHO
ID) or passes through to the large intestine (CHO Pass). In the large intestine it will either pass
out in the feces (CHO Out) or can be further digested by bacteria (CHO LI Deg). A complete list
of model carbohydrate pools, organized by compartment is in Table 3.3 and a complete list of
flows is in Table 3.4. The equations used to calculate the pools and flows are in Tables 3.8 and
3.9.
Figure 3.2. Generalized summary of carbohydrate digestion through each compartment of the
model. Boxes represent pools and arrows represent flows. For definitions of abbreviations see
Table 3.1.
CHO R CHO SI CHO LICHO Intake CHO Escape CHO Pass CHO Out
CHO R Deg CHO ID CHO LI Deg
CHO R
Engulfed
CHO R
EngulfmentPZ CHO Engulfed
Recycled PZ CHO Escape
PZ CHO Deg
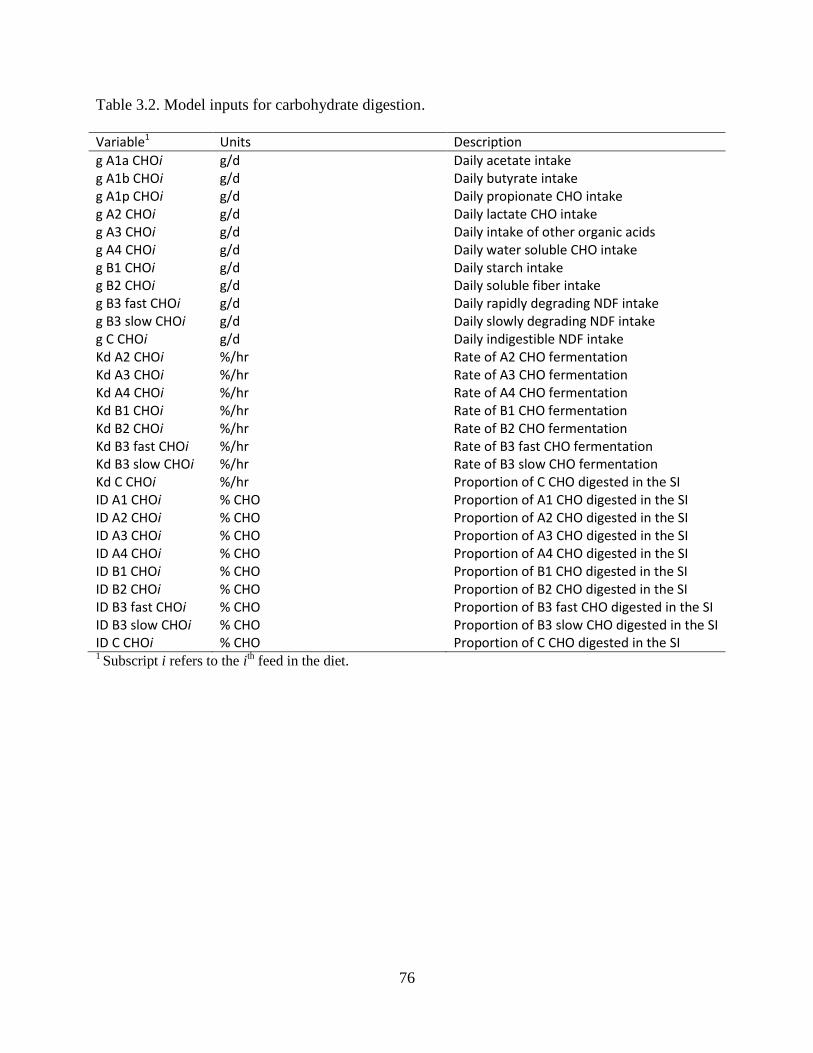
76
Table 3.2. Model inputs for carbohydrate digestion.
Variable1 Units Description
g A1a CHOi g/d Daily acetate intake g A1b CHOi g/d Daily butyrate intake g A1p CHOi g/d Daily propionate CHO intake g A2 CHOi g/d Daily lactate CHO intake g A3 CHOi g/d Daily intake of other organic acids g A4 CHOi g/d Daily water soluble CHO intake g B1 CHOi g/d Daily starch intake g B2 CHOi g/d Daily soluble fiber intake g B3 fast CHOi g/d Daily rapidly degrading NDF intake g B3 slow CHOi g/d Daily slowly degrading NDF intake g C CHOi g/d Daily indigestible NDF intake Kd A2 CHOi %/hr Rate of A2 CHO fermentation Kd A3 CHOi %/hr Rate of A3 CHO fermentation Kd A4 CHOi %/hr Rate of A4 CHO fermentation Kd B1 CHOi %/hr Rate of B1 CHO fermentation Kd B2 CHOi %/hr Rate of B2 CHO fermentation Kd B3 fast CHOi %/hr Rate of B3 fast CHO fermentation Kd B3 slow CHOi %/hr Rate of B3 slow CHO fermentation Kd C CHOi %/hr Proportion of C CHO digested in the SI ID A1 CHOi % CHO Proportion of A1 CHO digested in the SI ID A2 CHOi % CHO Proportion of A2 CHO digested in the SI ID A3 CHOi % CHO Proportion of A3 CHO digested in the SI ID A4 CHOi % CHO Proportion of A4 CHO digested in the SI ID B1 CHOi % CHO Proportion of B1 CHO digested in the SI ID B2 CHOi % CHO Proportion of B2 CHO digested in the SI ID B3 fast CHOi % CHO Proportion of B3 fast CHO digested in the SI ID B3 slow CHOi % CHO Proportion of B3 slow CHO digested in the SI ID C CHOi % CHO Proportion of C CHO digested in the SI 1 Subscript i refers to the i
th feed in the diet.
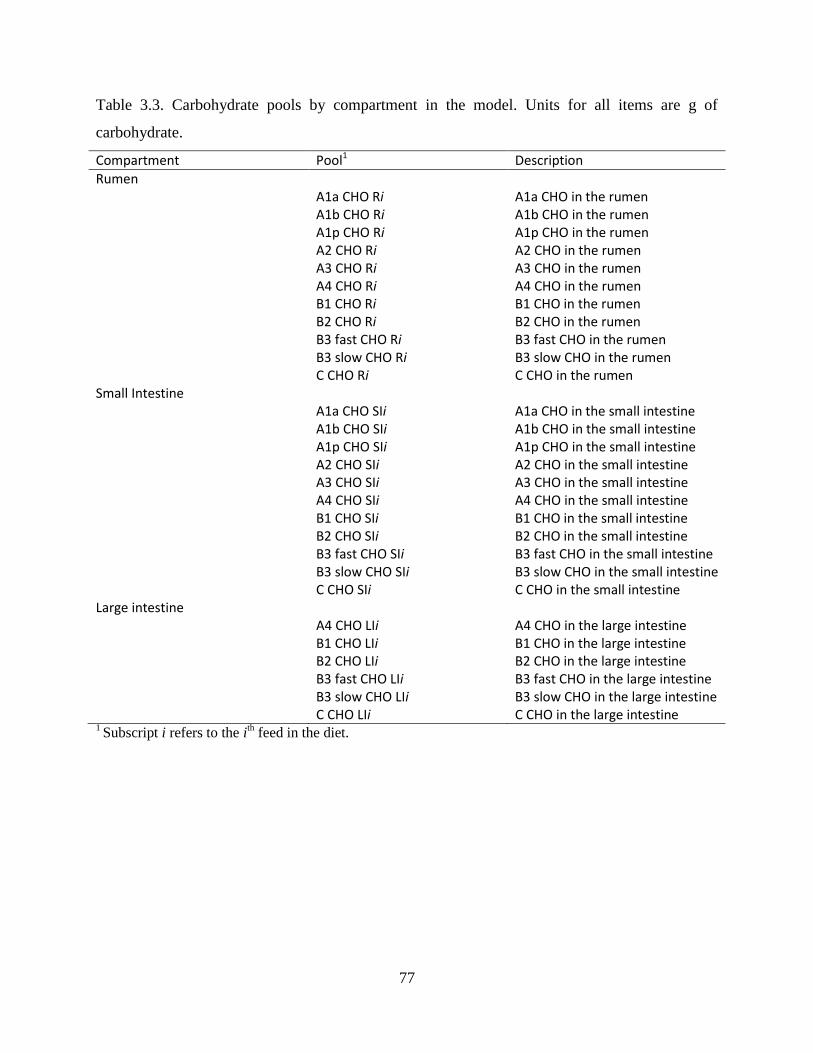
77
Table 3.3. Carbohydrate pools by compartment in the model. Units for all items are g of
carbohydrate.
Compartment Pool1 Description
Rumen
A1a CHO Ri A1a CHO in the rumen
A1b CHO Ri A1b CHO in the rumen
A1p CHO Ri A1p CHO in the rumen
A2 CHO Ri A2 CHO in the rumen
A3 CHO Ri A3 CHO in the rumen
A4 CHO Ri A4 CHO in the rumen
B1 CHO Ri B1 CHO in the rumen
B2 CHO Ri B2 CHO in the rumen
B3 fast CHO Ri B3 fast CHO in the rumen
B3 slow CHO Ri B3 slow CHO in the rumen
C CHO Ri C CHO in the rumen
Small Intestine
A1a CHO SIi A1a CHO in the small intestine
A1b CHO SIi A1b CHO in the small intestine
A1p CHO SIi A1p CHO in the small intestine
A2 CHO SIi A2 CHO in the small intestine
A3 CHO SIi A3 CHO in the small intestine
A4 CHO SIi A4 CHO in the small intestine
B1 CHO SIi B1 CHO in the small intestine
B2 CHO SIi B2 CHO in the small intestine
B3 fast CHO SIi B3 fast CHO in the small intestine
B3 slow CHO SIi B3 slow CHO in the small intestine
C CHO SIi C CHO in the small intestine
Large intestine
A4 CHO LIi A4 CHO in the large intestine
B1 CHO LIi B1 CHO in the large intestine
B2 CHO LIi B2 CHO in the large intestine
B3 fast CHO LIi B3 fast CHO in the large intestine
B3 slow CHO LIi B3 slow CHO in the large intestine
C CHO LIi C CHO in the large intestine 1 Subscript i refers to the i
th feed in the diet.
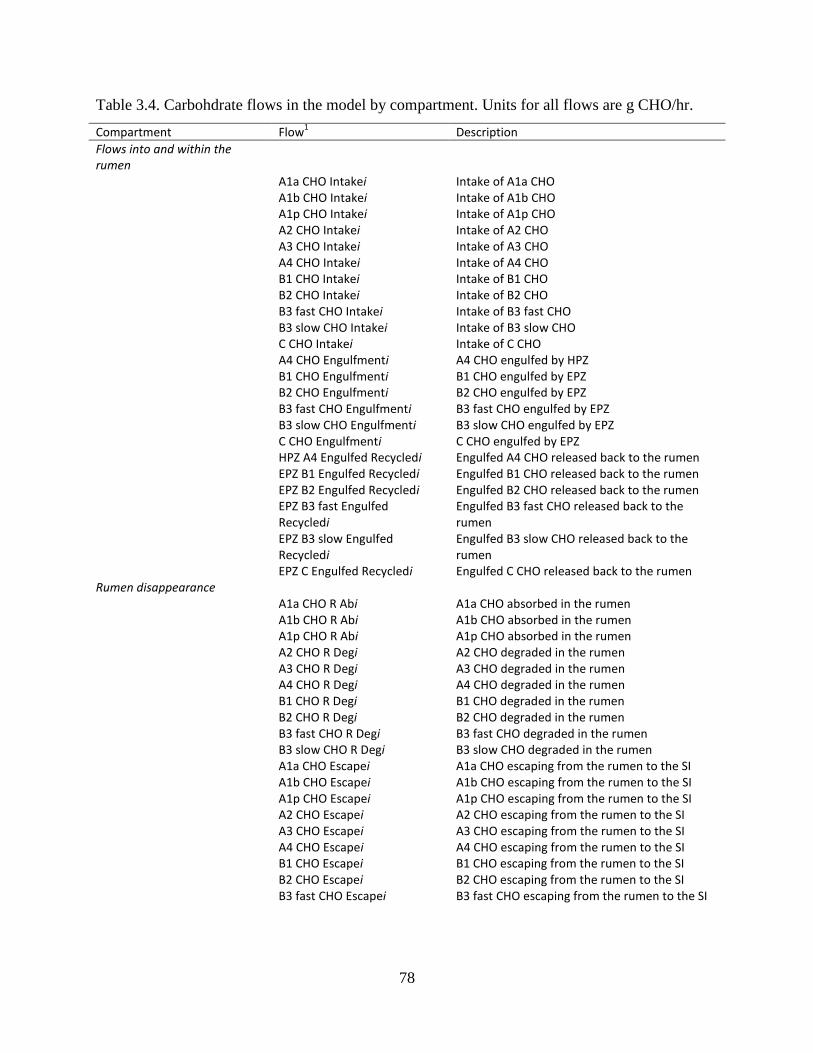
78
Table 3.4. Carbohdrate flows in the model by compartment. Units for all flows are g CHO/hr.
Compartment Flow1
Description
Flows into and within the rumen
A1a CHO Intakei Intake of A1a CHO A1b CHO Intakei Intake of A1b CHO A1p CHO Intakei Intake of A1p CHO A2 CHO Intakei Intake of A2 CHO A3 CHO Intakei Intake of A3 CHO A4 CHO Intakei Intake of A4 CHO B1 CHO Intakei Intake of B1 CHO B2 CHO Intakei Intake of B2 CHO B3 fast CHO Intakei Intake of B3 fast CHO B3 slow CHO Intakei Intake of B3 slow CHO C CHO Intakei Intake of C CHO A4 CHO Engulfmenti A4 CHO engulfed by HPZ B1 CHO Engulfmenti B1 CHO engulfed by EPZ B2 CHO Engulfmenti B2 CHO engulfed by EPZ B3 fast CHO Engulfmenti B3 fast CHO engulfed by EPZ B3 slow CHO Engulfmenti B3 slow CHO engulfed by EPZ C CHO Engulfmenti C CHO engulfed by EPZ HPZ A4 Engulfed Recycledi Engulfed A4 CHO released back to the rumen EPZ B1 Engulfed Recycledi Engulfed B1 CHO released back to the rumen EPZ B2 Engulfed Recycledi Engulfed B2 CHO released back to the rumen EPZ B3 fast Engulfed
Recycledi Engulfed B3 fast CHO released back to the rumen
EPZ B3 slow Engulfed Recycledi
Engulfed B3 slow CHO released back to the rumen
EPZ C Engulfed Recycledi Engulfed C CHO released back to the rumen Rumen disappearance A1a CHO R Abi A1a CHO absorbed in the rumen A1b CHO R Abi A1b CHO absorbed in the rumen A1p CHO R Abi A1p CHO absorbed in the rumen A2 CHO R Degi A2 CHO degraded in the rumen A3 CHO R Degi A3 CHO degraded in the rumen A4 CHO R Degi A4 CHO degraded in the rumen B1 CHO R Degi B1 CHO degraded in the rumen B2 CHO R Degi B2 CHO degraded in the rumen B3 fast CHO R Degi B3 fast CHO degraded in the rumen B3 slow CHO R Degi B3 slow CHO degraded in the rumen A1a CHO Escapei A1a CHO escaping from the rumen to the SI A1b CHO Escapei A1b CHO escaping from the rumen to the SI A1p CHO Escapei A1p CHO escaping from the rumen to the SI A2 CHO Escapei A2 CHO escaping from the rumen to the SI A3 CHO Escapei A3 CHO escaping from the rumen to the SI A4 CHO Escapei A4 CHO escaping from the rumen to the SI B1 CHO Escapei B1 CHO escaping from the rumen to the SI B2 CHO Escapei B2 CHO escaping from the rumen to the SI B3 fast CHO Escapei B3 fast CHO escaping from the rumen to the SI
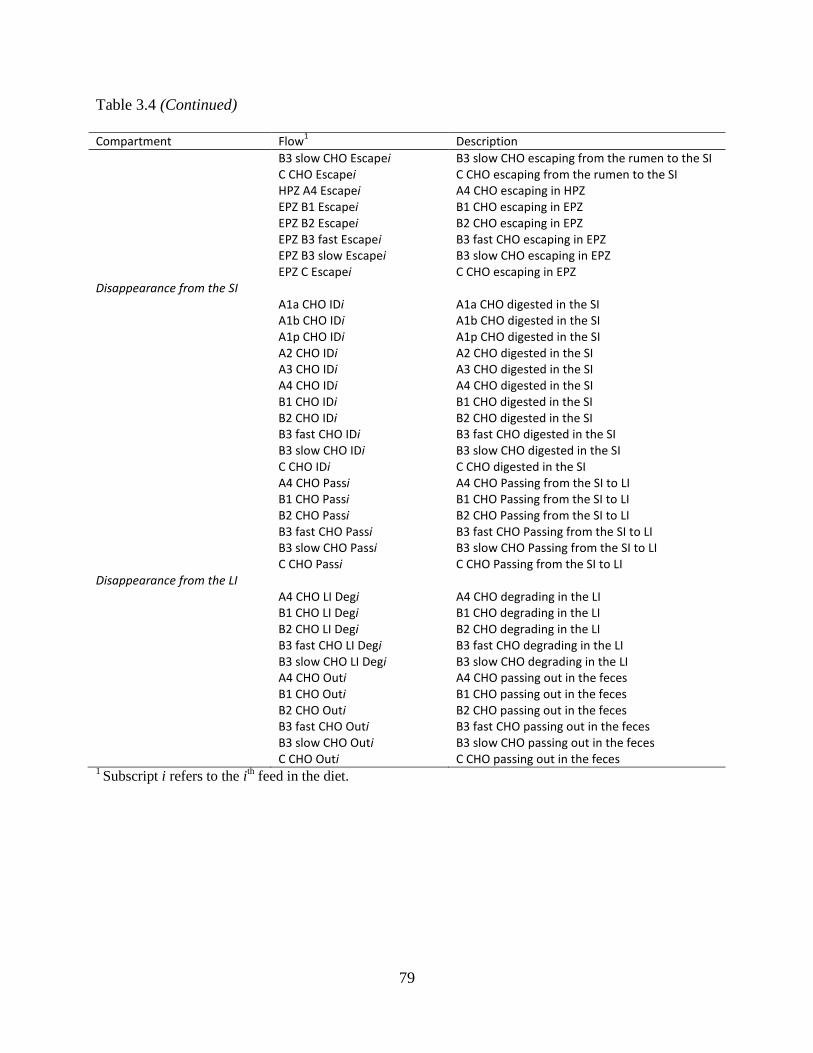
79
Table 3.4 (Continued)
Compartment Flow1
Description
B3 slow CHO Escapei B3 slow CHO escaping from the rumen to the SI C CHO Escapei C CHO escaping from the rumen to the SI HPZ A4 Escapei A4 CHO escaping in HPZ EPZ B1 Escapei B1 CHO escaping in EPZ EPZ B2 Escapei B2 CHO escaping in EPZ EPZ B3 fast Escapei B3 fast CHO escaping in EPZ EPZ B3 slow Escapei B3 slow CHO escaping in EPZ EPZ C Escapei C CHO escaping in EPZ Disappearance from the SI A1a CHO IDi A1a CHO digested in the SI A1b CHO IDi A1b CHO digested in the SI A1p CHO IDi A1p CHO digested in the SI A2 CHO IDi A2 CHO digested in the SI A3 CHO IDi A3 CHO digested in the SI A4 CHO IDi A4 CHO digested in the SI B1 CHO IDi B1 CHO digested in the SI B2 CHO IDi B2 CHO digested in the SI B3 fast CHO IDi B3 fast CHO digested in the SI B3 slow CHO IDi B3 slow CHO digested in the SI C CHO IDi C CHO digested in the SI A4 CHO Passi A4 CHO Passing from the SI to LI B1 CHO Passi B1 CHO Passing from the SI to LI B2 CHO Passi B2 CHO Passing from the SI to LI B3 fast CHO Passi B3 fast CHO Passing from the SI to LI B3 slow CHO Passi B3 slow CHO Passing from the SI to LI C CHO Passi C CHO Passing from the SI to LI Disappearance from the LI A4 CHO LI Degi A4 CHO degrading in the LI B1 CHO LI Degi B1 CHO degrading in the LI B2 CHO LI Degi B2 CHO degrading in the LI B3 fast CHO LI Degi B3 fast CHO degrading in the LI B3 slow CHO LI Degi B3 slow CHO degrading in the LI A4 CHO Outi A4 CHO passing out in the feces B1 CHO Outi B1 CHO passing out in the feces B2 CHO Outi B2 CHO passing out in the feces B3 fast CHO Outi B3 fast CHO passing out in the feces B3 slow CHO Outi B3 slow CHO passing out in the feces C CHO Outi C CHO passing out in the feces 1 Subscript i refers to the i
th feed in the diet.
80
3.3.4 Nitrogen digestion
Protein digestion and metabolism in previous versions of the CNCPS (Fox et al., 2004,
Sniffen et al., 1992, Tylutki et al., 2008), the NRC (2001) and throughout the literature are
typically expressed on a CP basis. The concept of CP assumes all protein matter is 16% N and
the mass of protein can be calculated by multiplying N by a factor of 6.25 (NRC, 1985).
Nitrogen components in feeds comprise of AA, nitrates, phenolic compounds, ammonia and
other by-products of the ensiling process (Van Soest, 1994) which vary greatly in the
concentration of N on a molecular weight basis. For example ammonia is approximately 82% N
whereas nitrate is 23% N (Nelson et al., 2008). Differences also exist among individual AA with
Phe and Arg having 8% and 32% N, respectively (Nelson et al., 2008). Therefore, the mass of
protein can vary depending on the relative contribution of the fractions that make up the protein.
This variance is most important for calculations that require protein to be expressed on a mass
basis. An example is the calculation of ME in the CNCPS using apparent total digested nutrients
(TDN; (Fox et al., 2004, NRC, 2001). The TDN system calculates the net disappearance of
carbohydrates, protein and fat along the digestive tract by subtracting fecal output from what was
consumed from the diet (Fox et al., 2004, NRC, 2001). Fecal protein is comprised of undigested
feed, microbial debris from the rumen, microbes grown in the large intestine and endogenous
secretions into the gut (Higgs et al., 2012, Marini et al., 2008). Considering only the bacterial
fraction, cell wall material and true protein have mass factors of 14 and 6.67, respectively (Van
Soest, 1994). Mason (1969) concluded up to 81% of the non-dietary fecal nitrogen was of
bacterial origin, mostly originating from the rumen. True bacterial protein is considered highly
digestible (Storm et al., 1983a), therefore, much of the bacterial N appearing in the feces would
be bacterial cell wall. Consequently, using a factor of 6.25 to estimate the mass of fecal protein is
inappropriate and will influence the prediction of ME. Complications also arise in predicting AA
81
supply. The CNCPS currently expresses AA relative to CP on a whole feed basis (see Chapter 2).
This is essentially the same as expressing them relative to N as CP is a factor of N. However, the
concentration of AA relative to N, in many cases, will be different in RUP to what was
consumed (Ross, 2013). Therefore, using AA profiles expressed relative to CP (or N) to predict
AA supply to the animal can introduce error. This is discussed in more detail in Chapter 6.
However, to avoid the complications from using CP, protein digestion and supply in this model
is calculated entirely on an N basis and is reconciled by compartment to ensure N balance
through the model is consistent with the amount of N entering and leaving the compartment, thus
conserving mass. This was not possible when using percentages of CP among fractions and
moving through compartments, because using that procedure introduced bias as digestion
occurred.
The required inputs into the model follow the same structure as described for carbohydrates
with N intake being split into five chemically determined fractions. The fractionation of feed N
follows the same general scheme outlined by Sniffen et al. (1992) with refinements outlined in
Van Amburgh et al. (2007) and in Chapter 2 of this dissertation. Digestion rates and intestinal
digestion coefficients are required for each fraction and are listed in Table 3.5.

82
Table 3.5. Model inputs for nitrogen digestion.
Inputs1 Units Description
g A1 Ni g/d Daily ammonia N intake g A2 Ni g/d Daily soluble non-ammonia N intake g B1 Ni g/d Daily insoluble available N intake (Total N – Soluble N – ND insoluble N) g B2 Ni g/d Daily fiber bound N intake (ND insoluble N – AD insoluble N) g C Ni g/d Daily unavailable N intake (AD insoluble N) Kd Urea %/hr Rate of urea degradation Kd PAA N R %/hr Rate of peptide and free AA degradation Kd A1 Ni %/hr Rate of A1 N degradation Kd A2 Ni %/hr Rate of A2 N degradation Kd B1 Ni %/hr Rate of B1 N degradation Kd B2 Ni %/hr Rate of B2 N degradation Kd C Ni %/hr Rate of C N degradation ID A2 Ni % Proportion of A2 N digested in the SI ID B1 Ni % Proportion of B1 N digested in the SI ID B2 Ni % Proportion of B2 N digested in the SI ID C Ni % Proportion of C N digested in the SI 1 Subscript i refers to the i
th feed in the diet.
The digestion of feed N in the rumen follows the same kinetic principles outlined in Figure
3.1. Total nitrogen entering the rumen comes from a number of sources including feed, recycled
urea and endogenous secretions (Lapierre et al., 2005). Complex N transactions exist within the
rumen which are a result of microbial growth and the interactions among the various microbial
populations (Firkins et al., 2007, NRC, 2001). A generalized summary of the rumen N pools and
transactions represented in the current model are in Figure 3.3. Nitrogen pools are organized
according to state and include undigested feed N (Feed N R), peptides and free AA (PAA N R),
ammonia (NH3 N R), undegraded endogenous secretions (End N R), cellular N from non-fiber
bacteria (NFB Cell N), fiber bacteria (FB Cell N), protozoa (PZ Cell N) and N engulfed by
protozoa (PZ N Engulfed).
Nitrogen escapes the rumen in various forms with the rate of escape being linked to the phase
in which the form would flow i.e. with the liquid, solids, or bound to fiber. Ammonia can escape
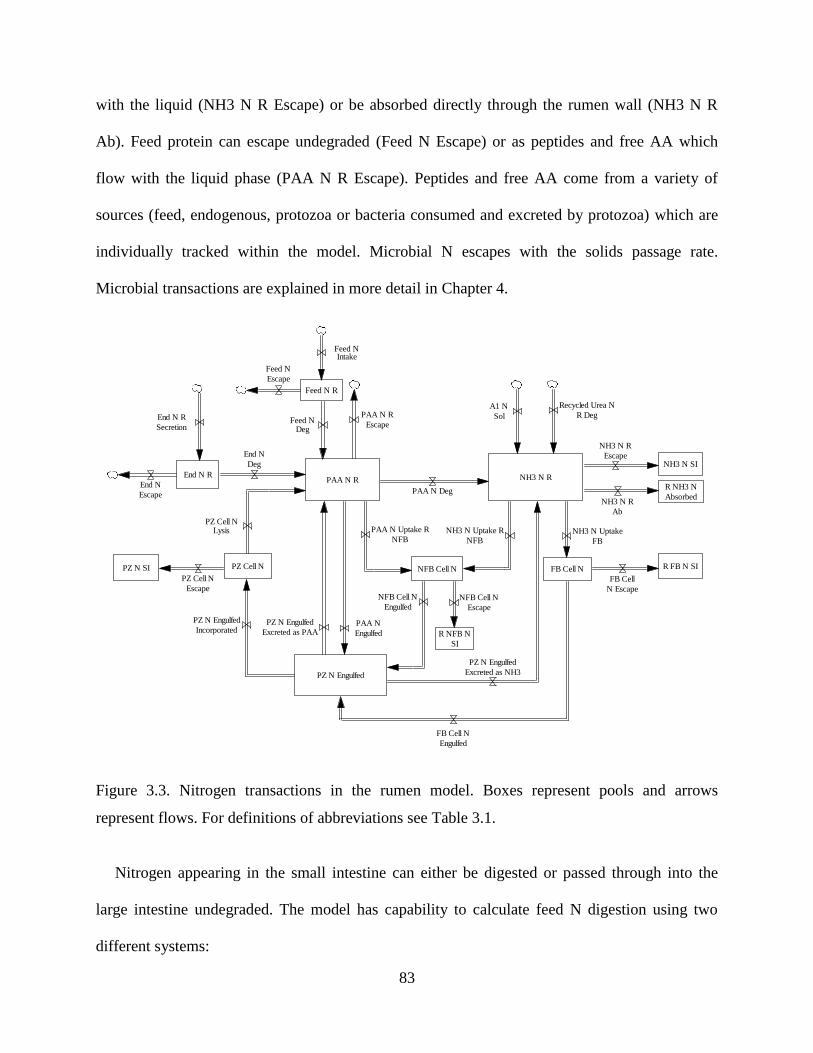
83
with the liquid (NH3 N R Escape) or be absorbed directly through the rumen wall (NH3 N R
Ab). Feed protein can escape undegraded (Feed N Escape) or as peptides and free AA which
flow with the liquid phase (PAA N R Escape). Peptides and free AA come from a variety of
sources (feed, endogenous, protozoa or bacteria consumed and excreted by protozoa) which are
individually tracked within the model. Microbial N escapes with the solids passage rate.
Microbial transactions are explained in more detail in Chapter 4.
Figure 3.3. Nitrogen transactions in the rumen model. Boxes represent pools and arrows
represent flows. For definitions of abbreviations see Table 3.1.
Nitrogen appearing in the small intestine can either be digested or passed through into the
large intestine undegraded. The model has capability to calculate feed N digestion using two
different systems:
PAA N R
A1 N
Sol
NH3 N R
PZ N Engulfed
PZ N Engulfed
Excreted as PAA
PZ Cell N
PZ N Engulfed
Incorporated
PZ Cell NLysis
PZ N SI
PZ Cell N
Escape
R FB N SI
NH3 N Uptake R
NFBNH3 N Uptake
FB
PAA N Uptake R
NFB
PZ N Engulfed
Excreted as NH3
R NFB N
SI
NFB Cell N
NFB Cell N
Engulfed
End N R
Secretion
R NH3 N
AbsorbedNH3 N R
Ab
NFB Cell N
Escape
FB Cell N
FB Cell
N Escape
NH3 N SI
NH3 N R
Escape
End N R
Recycled Urea N
R Deg
PAA N
Engulfed
FB Cell N
Engulfed
PAA N R
EscapeFeed N
Deg
End N
Deg
End N
Escape PAA N Deg
Feed N R
Feed NIntake
Feed N
Escape
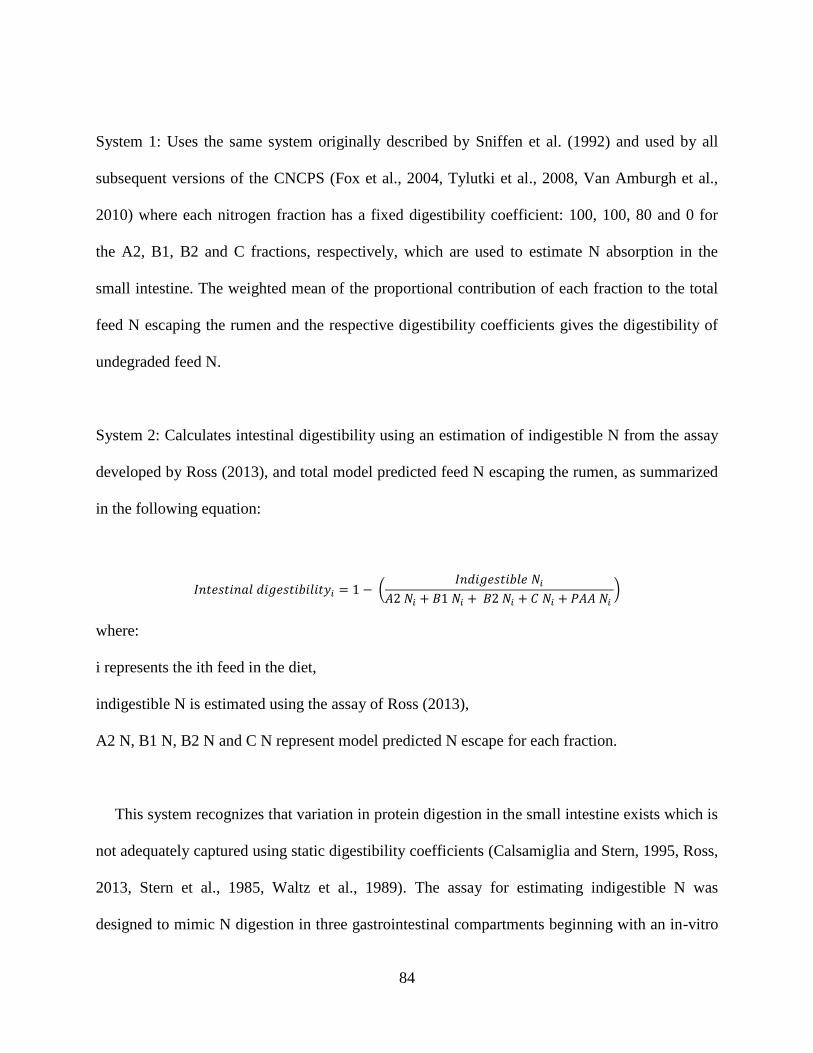
84
System 1: Uses the same system originally described by Sniffen et al. (1992) and used by all
subsequent versions of the CNCPS (Fox et al., 2004, Tylutki et al., 2008, Van Amburgh et al.,
2010) where each nitrogen fraction has a fixed digestibility coefficient: 100, 100, 80 and 0 for
the A2, B1, B2 and C fractions, respectively, which are used to estimate N absorption in the
small intestine. The weighted mean of the proportional contribution of each fraction to the total
feed N escaping the rumen and the respective digestibility coefficients gives the digestibility of
undegraded feed N.
System 2: Calculates intestinal digestibility using an estimation of indigestible N from the assay
developed by Ross (2013), and total model predicted feed N escaping the rumen, as summarized
in the following equation:
(
)
where:
i represents the ith feed in the diet,
indigestible N is estimated using the assay of Ross (2013),
A2 N, B1 N, B2 N and C N represent model predicted N escape for each fraction.
This system recognizes that variation in protein digestion in the small intestine exists which is
not adequately captured using static digestibility coefficients (Calsamiglia and Stern, 1995, Ross,
2013, Stern et al., 1985, Waltz et al., 1989). The assay for estimating indigestible N was
designed to mimic N digestion in three gastrointestinal compartments beginning with an in-vitro
85
rumen fermentation, followed by acidification and incubation with pepsin to mimic the
abomasum, and finally a neutral incubation with trypsin, chymotrypsin, amylase and lipase, to
mimic the small intestine (Ross, 2013). The assay was designed for application in a commercial
setting to routinely generate model inputs and appears highly sensitive to variation among and
within feeds (Ross, 2013).
Microbial N reaching the small intestine is partitioned into AA N, nucleic acid N and residual
cell wall N. There is no clear consensus in the literature on the digestibility of individual
microbial components. Some studies have indicated microbial cell wall N is largely indigestible
(Mason, 1969, 1978) while others have suggested it is readily available (Bird, 1972, Hoogenraad
and Hird, 1970). Bacterial cell wall comprises of both AA and glucosamines, similar to the shells
of shellfish (Van Soest, 1994), so it seems reasonable to assume digestion of the glucosamine
fraction would be limited. Russell et al. (1992) assumed 15% of cell N is nucleic acid N, 25% is
cell wall N and 60% is N from true protein. Of these three fractions, nucleic acid and true protein
N were assumed to be completely available and cell wall N completely unavailable (Russell et
al., 1992). In the current model, the original system has been maintained with some modification:
True protein N is now total AA N and is assumed to be 67% of total N as reported by Clark et al.
(1992), nucleic acid N remains at 15% which is consistent with other literature reports
(Czerkawski, 1976), and cell wall N is calculated by difference. The same digestibility
coefficients were used for each fraction as in Russell et al. (1992). Using this system, the
weighted mean of bacterial N digestion is approximately 80% which is similar to the
measurements of Storm et al. (1983b) and Fonseca et al. (2014).
86
Transactions of N once absorbed are summarized in Figure 3.4. Non-ammonia N absorbed in
the small intestine (NAN Ab to PDV) is assumed to have two general fates: 1) it is utilized for a
function of maintenance or production (Liver NAN Utilized) or, 2) it is converted to urea in the
liver (Liver NAN to Urea). Nitrogen requirements for maintenance or production include milk,
growth, reserves, fetal growth, scurf, metabolic urinary losses and gut secretions. Absorbed NH3-
N is assumed to be completely converted to urea in the liver (PDV NH3 to Urea). Nitrogen
converted to urea can either be returned to the gut (Urea N Liver Recycled to the Gut), or
excreted in the urine (Urea N Liver Irreversible Loss). The proportion of urea returned to the
GIT relative to urea production is remarkably uniform among experiments when animal are fed
diets at, or in moderate excess of MP requirements (Lapierre et al., 2004, Ouellet et al., 2004,
Recktenwald, 2007, Valkeners et al., 2007). However, recycling increases when N supply is
limited (Reynolds and Kristensen, 2008, Valkeners et al., 2007) and decreases when N supply is
greatly in excess (Lapierre et al., 2004, Reynolds and Kristensen, 2008). To estimate urea
recycling in the model, the equations presented in Recktenwald et al. (2014) and Reynolds and
Kristensen (2008) were used in combination. Recktenwald et al. (2014) showed a linear
relationship between urea production and urea recycling in high producing cows fed diets
ranging from 15% - 17% CP, while, Reynolds and Kristensen (2008) showed an increase in the
proportion of urea recycled at very low N intakes. Therefore, using the equations in combination
allowed for a wider range in dietary conditions to be represented.
Urea that is recycled can enter either the rumen, or the lower GIT (Lapierre and Lobley, 2001,
NRC, 1985, Reynolds and Kristensen, 2008). The process by which urea enters the gut appears
partly passive and party active (Huntington, 1986, Kennedy and Milligan, 1980), although the
87
exact mechanism of active transport is still unclear (Marini et al., 2004, Marini and Van
Amburgh, 2003). Reports on the relative proportion of total recycled N entering the different gut
compartments are variable and appear to differ by species (sheep vs cattle) and diet (Huntington,
1989, Parker et al., 1995, Theurer et al., 2002). Huntington (1989) measured an increase in blood
urea removal by the rumen compared with the hindgut in steers fed high vs low concentrate
diets, respectively, suggesting the site of removal is party determined by the relative requirement
for N in each compartment (Firkins and Reynolds, 2005). Further, up to 48% of recycled urea
enters the small intestine (Siddons et al., 1985), which is not an important site for microbial
growth, and therefore, doesn’t have a urea requirement per se (Hecker, 1971, Lapierre and
Lobley, 2001). Urea concentration in ileal contents ranges from 50 to 100% of that in blood
suggesting that entry into the small intestine is by diffusion with the flow of N from the terminal
ileum providing an important source of N for microbial growth in the large intestine (NRC,
1985). To model these transactions, the active component of the transfer was assumed to be
related to the N requirement in each compartment (rumen vs large intestine) and the diffusive
component was assumed to be related to tissue mass which was estimated from (Reynolds et al.,
2004). A weighting was then placed on the active and diffusive component to estimate N
recycling to each GIT compartment. Because few direct estimates exist on the proportion of N
recycled to lower GIT, the weighting was set so that the proportion of ammonia absorbed from
the lower GIT was between 28% and 53% of total ammonia absorption (Reynolds and
Kristensen, 2008). These transfers are summarized in Figure 3.4.
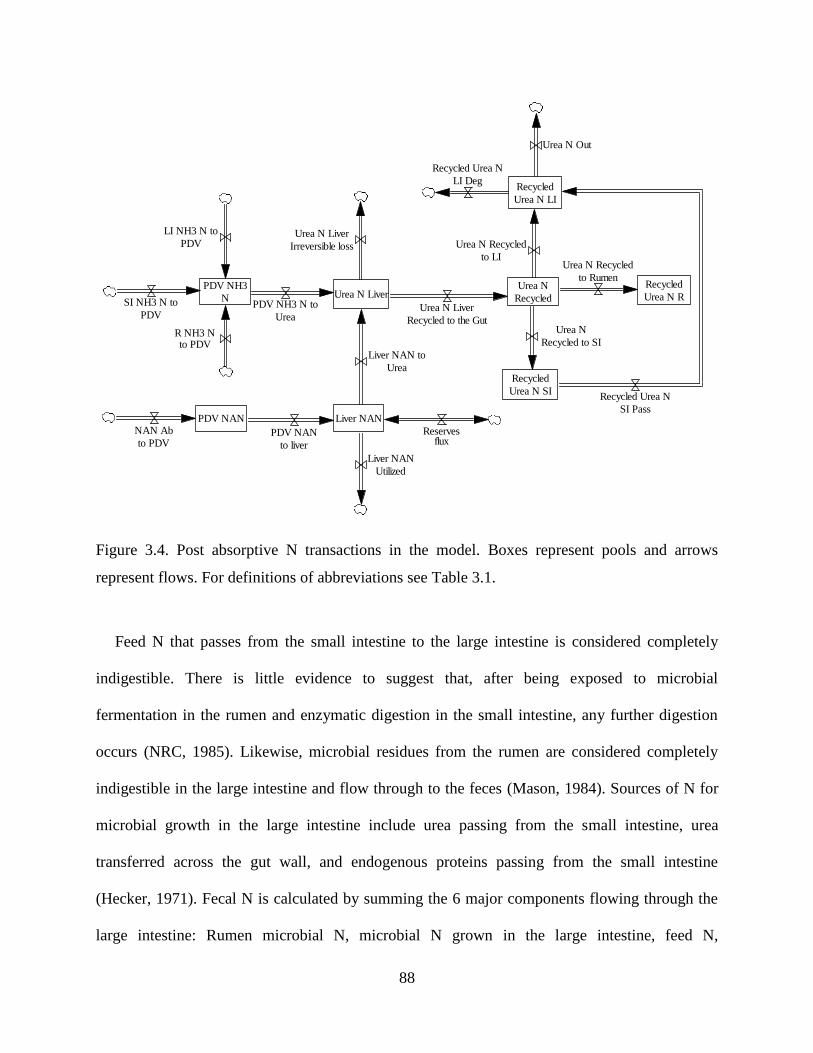
88
Figure 3.4. Post absorptive N transactions in the model. Boxes represent pools and arrows
represent flows. For definitions of abbreviations see Table 3.1.
Feed N that passes from the small intestine to the large intestine is considered completely
indigestible. There is little evidence to suggest that, after being exposed to microbial
fermentation in the rumen and enzymatic digestion in the small intestine, any further digestion
occurs (NRC, 1985). Likewise, microbial residues from the rumen are considered completely
indigestible in the large intestine and flow through to the feces (Mason, 1984). Sources of N for
microbial growth in the large intestine include urea passing from the small intestine, urea
transferred across the gut wall, and endogenous proteins passing from the small intestine
(Hecker, 1971). Fecal N is calculated by summing the 6 major components flowing through the
large intestine: Rumen microbial N, microbial N grown in the large intestine, feed N,
Urea N Liver
Urea N Liver
Irreversible loss
Liver NANNAN Ab
to PDV
Urea N
Recycled
PDV NH3
N
Recycled
Urea N LI
Recycled Urea N
LI Deg
Urea N Liver
Recycled to the Gut
Recycled
Urea N R
Recycled
Urea N SI
LI NH3 N to
PDV
R NH3 Nto PDV
SI NH3 N to
PDV
Urea N Recycled
to LIUrea N Recycled
to Rumen
Urea N
Recycled to SI
PDV NH3 N to
Urea
Liver NAN to
Urea
Reservesflux
Recycled Urea N
SI PassPDV NAN
PDV NAN
to liver
Liver NAN
Utilized
Urea N Out
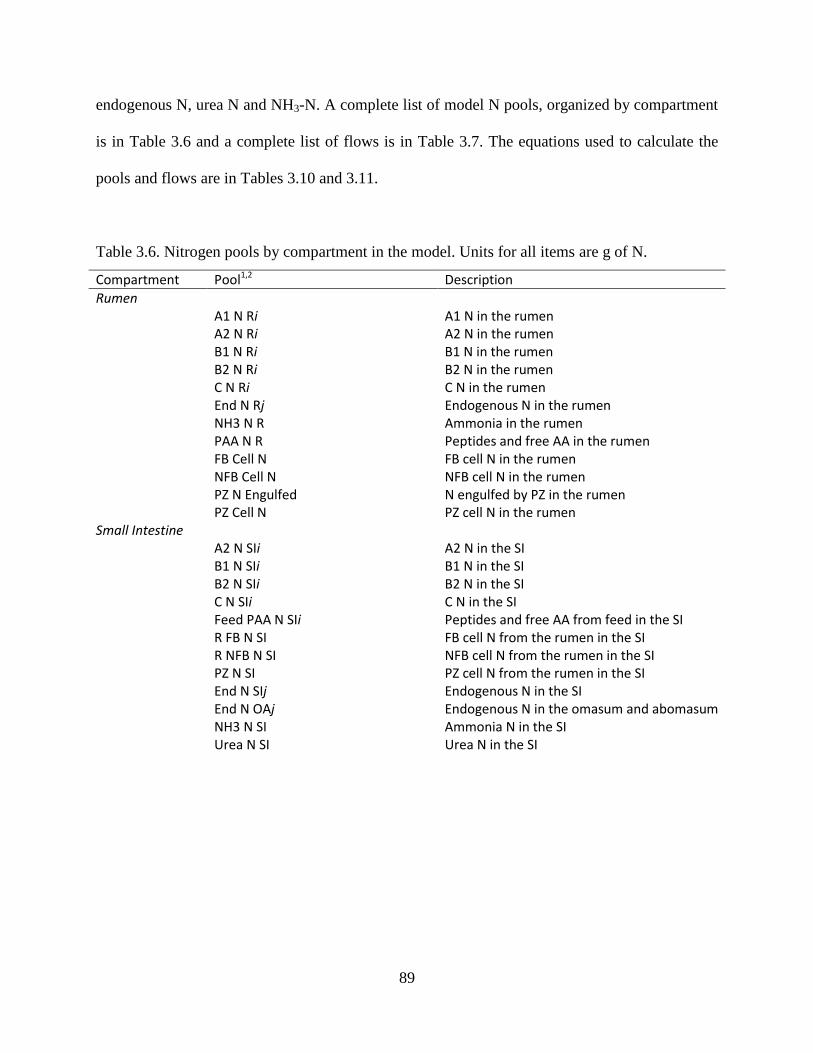
89
endogenous N, urea N and NH3-N. A complete list of model N pools, organized by compartment
is in Table 3.6 and a complete list of flows is in Table 3.7. The equations used to calculate the
pools and flows are in Tables 3.10 and 3.11.
Table 3.6. Nitrogen pools by compartment in the model. Units for all items are g of N.
Compartment Pool1,2 Description
Rumen A1 N Ri A1 N in the rumen A2 N Ri A2 N in the rumen B1 N Ri B1 N in the rumen B2 N Ri B2 N in the rumen C N Ri C N in the rumen End N Rj Endogenous N in the rumen NH3 N R Ammonia in the rumen PAA N R Peptides and free AA in the rumen FB Cell N FB cell N in the rumen NFB Cell N NFB cell N in the rumen PZ N Engulfed N engulfed by PZ in the rumen PZ Cell N PZ cell N in the rumen Small Intestine A2 N SIi A2 N in the SI B1 N SIi B1 N in the SI B2 N SIi B2 N in the SI C N SIi C N in the SI Feed PAA N SIi Peptides and free AA from feed in the SI R FB N SI FB cell N from the rumen in the SI R NFB N SI NFB cell N from the rumen in the SI PZ N SI PZ cell N from the rumen in the SI End N SIj Endogenous N in the SI End N OAj Endogenous N in the omasum and abomasum NH3 N SI Ammonia N in the SI Urea N SI Urea N in the SI
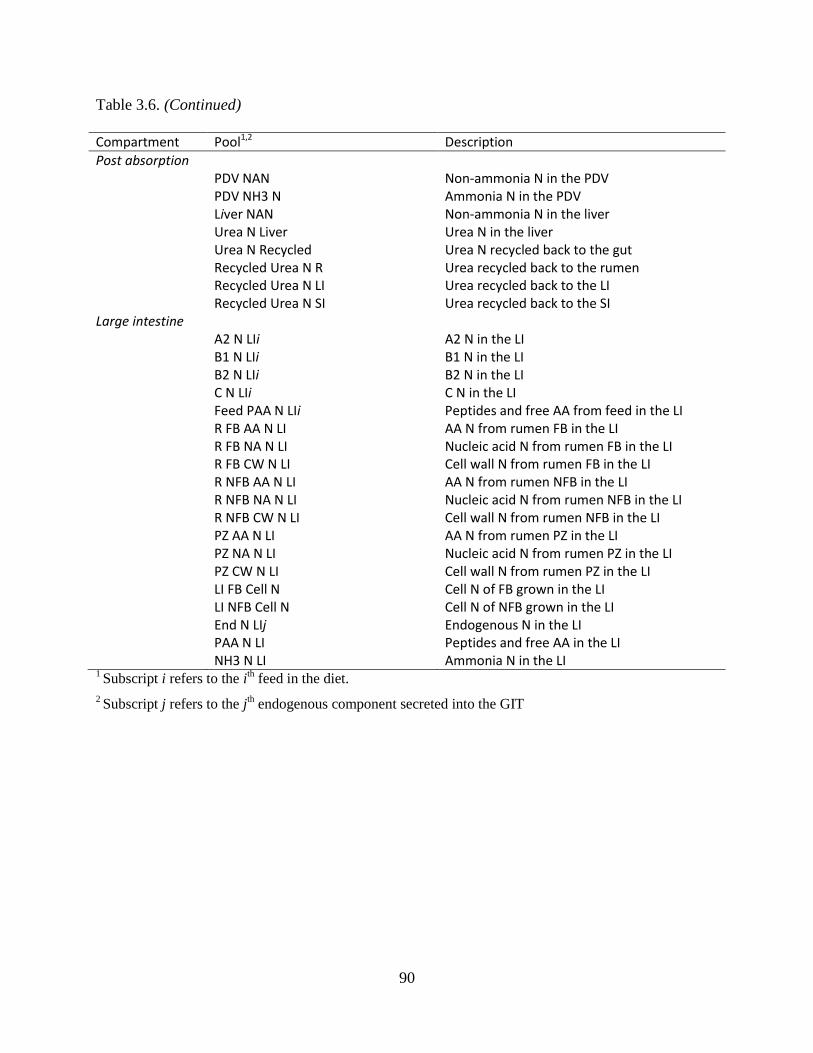
90
Table 3.6. (Continued)
Compartment Pool1,2 Description
Post absorption PDV NAN Non-ammonia N in the PDV PDV NH3 N Ammonia N in the PDV Liver NAN Non-ammonia N in the liver Urea N Liver Urea N in the liver Urea N Recycled Urea N recycled back to the gut Recycled Urea N R Urea recycled back to the rumen Recycled Urea N LI Urea recycled back to the LI Recycled Urea N SI Urea recycled back to the SI Large intestine A2 N LIi A2 N in the LI B1 N LIi B1 N in the LI B2 N LIi B2 N in the LI C N LIi C N in the LI Feed PAA N LIi Peptides and free AA from feed in the LI R FB AA N LI AA N from rumen FB in the LI R FB NA N LI Nucleic acid N from rumen FB in the LI R FB CW N LI Cell wall N from rumen FB in the LI R NFB AA N LI AA N from rumen NFB in the LI R NFB NA N LI Nucleic acid N from rumen NFB in the LI R NFB CW N LI Cell wall N from rumen NFB in the LI PZ AA N LI AA N from rumen PZ in the LI PZ NA N LI Nucleic acid N from rumen PZ in the LI PZ CW N LI Cell wall N from rumen PZ in the LI LI FB Cell N Cell N of FB grown in the LI LI NFB Cell N Cell N of NFB grown in the LI End N LIj Endogenous N in the LI PAA N LI Peptides and free AA in the LI NH3 N LI Ammonia N in the LI 1 Subscript i refers to the i
th feed in the diet.
2 Subscript j refers to the j
th endogenous component secreted into the GIT
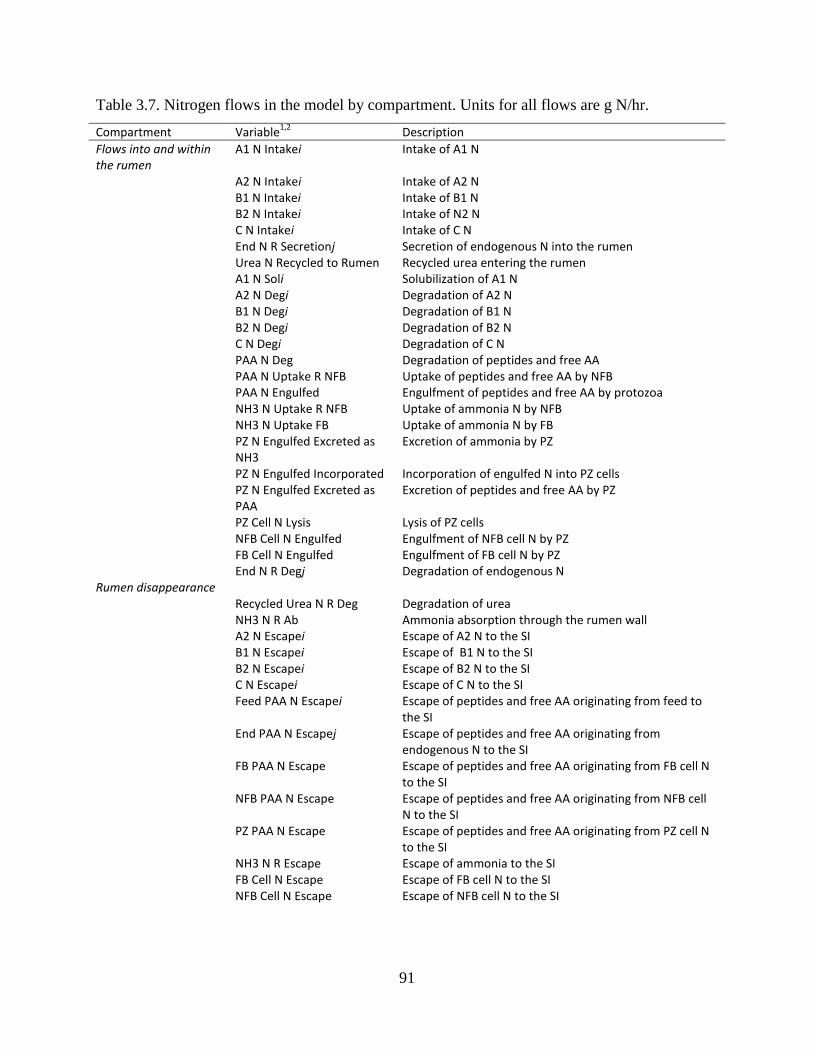
91
Table 3.7. Nitrogen flows in the model by compartment. Units for all flows are g N/hr.
Compartment Variable1,2
Description
Flows into and within the rumen
A1 N Intakei Intake of A1 N
A2 N Intakei Intake of A2 N B1 N Intakei Intake of B1 N B2 N Intakei Intake of N2 N C N Intakei Intake of C N End N R Secretionj Secretion of endogenous N into the rumen Urea N Recycled to Rumen Recycled urea entering the rumen A1 N Soli Solubilization of A1 N A2 N Degi Degradation of A2 N B1 N Degi Degradation of B1 N B2 N Degi Degradation of B2 N C N Degi Degradation of C N PAA N Deg Degradation of peptides and free AA PAA N Uptake R NFB Uptake of peptides and free AA by NFB PAA N Engulfed Engulfment of peptides and free AA by protozoa NH3 N Uptake R NFB Uptake of ammonia N by NFB NH3 N Uptake FB Uptake of ammonia N by FB PZ N Engulfed Excreted as
NH3 Excretion of ammonia by PZ
PZ N Engulfed Incorporated Incorporation of engulfed N into PZ cells PZ N Engulfed Excreted as
PAA Excretion of peptides and free AA by PZ
PZ Cell N Lysis Lysis of PZ cells NFB Cell N Engulfed Engulfment of NFB cell N by PZ FB Cell N Engulfed Engulfment of FB cell N by PZ End N R Degj Degradation of endogenous N Rumen disappearance Recycled Urea N R Deg Degradation of urea NH3 N R Ab Ammonia absorption through the rumen wall A2 N Escapei Escape of A2 N to the SI B1 N Escapei Escape of B1 N to the SI B2 N Escapei Escape of B2 N to the SI C N Escapei Escape of C N to the SI Feed PAA N Escapei Escape of peptides and free AA originating from feed to
the SI End PAA N Escapej Escape of peptides and free AA originating from
endogenous N to the SI FB PAA N Escape Escape of peptides and free AA originating from FB cell N
to the SI NFB PAA N Escape Escape of peptides and free AA originating from NFB cell
N to the SI PZ PAA N Escape Escape of peptides and free AA originating from PZ cell N
to the SI NH3 N R Escape Escape of ammonia to the SI FB Cell N Escape Escape of FB cell N to the SI NFB Cell N Escape Escape of NFB cell N to the SI
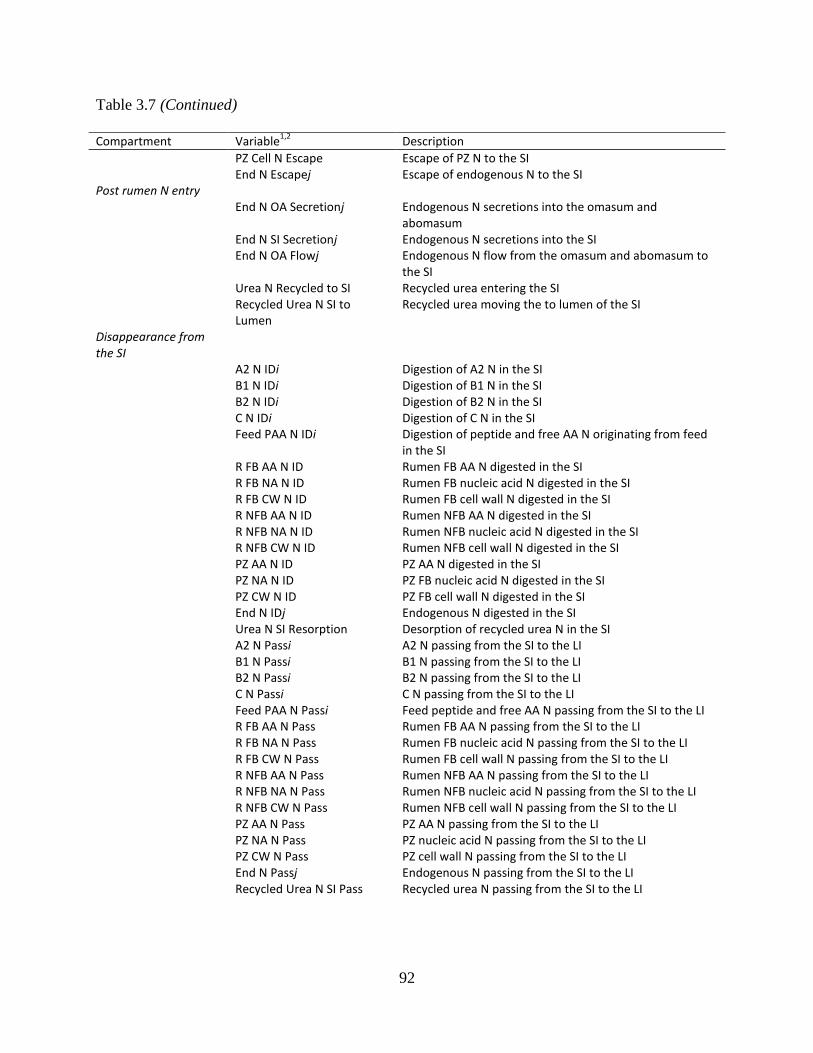
92
Table 3.7 (Continued)
Compartment Variable1,2
Description
PZ Cell N Escape Escape of PZ N to the SI End N Escapej Escape of endogenous N to the SI Post rumen N entry End N OA Secretionj Endogenous N secretions into the omasum and
abomasum End N SI Secretionj Endogenous N secretions into the SI End N OA Flowj Endogenous N flow from the omasum and abomasum to
the SI Urea N Recycled to SI Recycled urea entering the SI Recycled Urea N SI to
Lumen Recycled urea moving the to lumen of the SI
Disappearance from the SI
A2 N IDi Digestion of A2 N in the SI B1 N IDi Digestion of B1 N in the SI B2 N IDi Digestion of B2 N in the SI C N IDi Digestion of C N in the SI Feed PAA N IDi Digestion of peptide and free AA N originating from feed
in the SI R FB AA N ID Rumen FB AA N digested in the SI R FB NA N ID Rumen FB nucleic acid N digested in the SI R FB CW N ID Rumen FB cell wall N digested in the SI R NFB AA N ID Rumen NFB AA N digested in the SI R NFB NA N ID Rumen NFB nucleic acid N digested in the SI R NFB CW N ID Rumen NFB cell wall N digested in the SI PZ AA N ID PZ AA N digested in the SI PZ NA N ID PZ FB nucleic acid N digested in the SI PZ CW N ID PZ FB cell wall N digested in the SI End N IDj Endogenous N digested in the SI Urea N SI Resorption Desorption of recycled urea N in the SI A2 N Passi A2 N passing from the SI to the LI B1 N Passi B1 N passing from the SI to the LI B2 N Passi B2 N passing from the SI to the LI C N Passi C N passing from the SI to the LI Feed PAA N Passi Feed peptide and free AA N passing from the SI to the LI R FB AA N Pass Rumen FB AA N passing from the SI to the LI R FB NA N Pass Rumen FB nucleic acid N passing from the SI to the LI R FB CW N Pass Rumen FB cell wall N passing from the SI to the LI R NFB AA N Pass Rumen NFB AA N passing from the SI to the LI R NFB NA N Pass Rumen NFB nucleic acid N passing from the SI to the LI R NFB CW N Pass Rumen NFB cell wall N passing from the SI to the LI PZ AA N Pass PZ AA N passing from the SI to the LI PZ NA N Pass PZ nucleic acid N passing from the SI to the LI PZ CW N Pass PZ cell wall N passing from the SI to the LI End N Passj Endogenous N passing from the SI to the LI Recycled Urea N SI Pass Recycled urea N passing from the SI to the LI
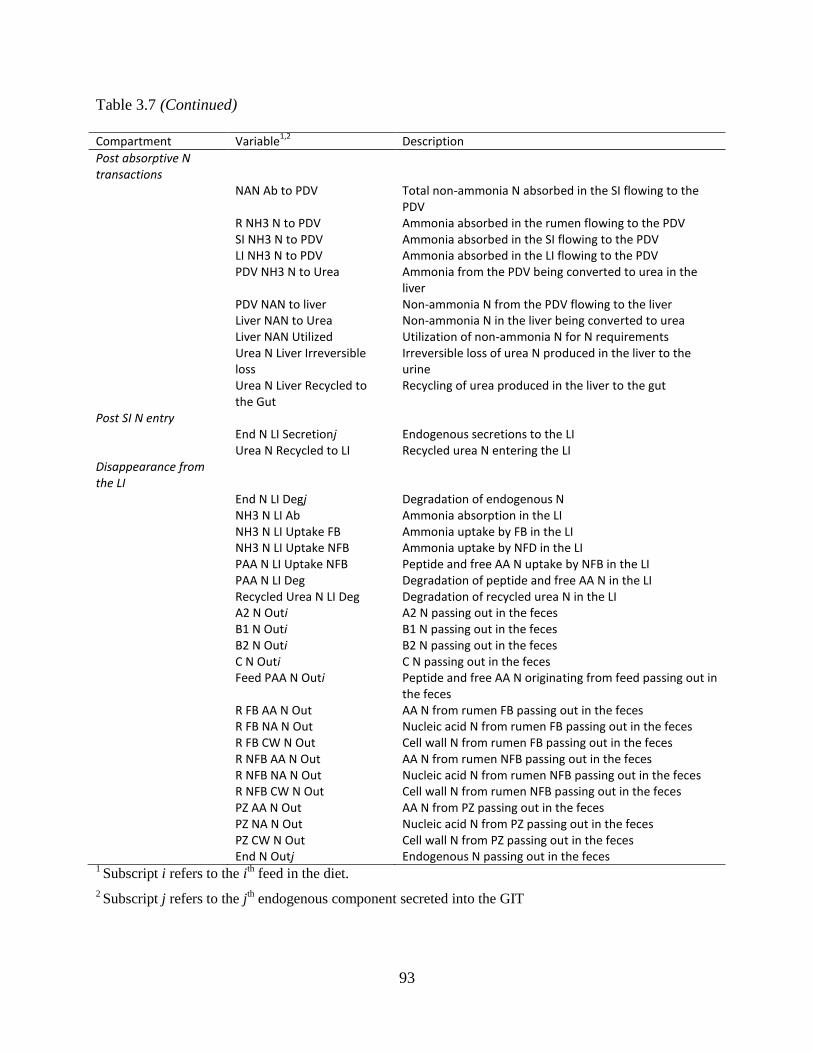
93
Table 3.7 (Continued)
Compartment Variable1,2
Description
Post absorptive N transactions
NAN Ab to PDV Total non-ammonia N absorbed in the SI flowing to the PDV
R NH3 N to PDV Ammonia absorbed in the rumen flowing to the PDV SI NH3 N to PDV Ammonia absorbed in the SI flowing to the PDV LI NH3 N to PDV Ammonia absorbed in the LI flowing to the PDV PDV NH3 N to Urea Ammonia from the PDV being converted to urea in the
liver PDV NAN to liver Non-ammonia N from the PDV flowing to the liver Liver NAN to Urea Non-ammonia N in the liver being converted to urea Liver NAN Utilized Utilization of non-ammonia N for N requirements Urea N Liver Irreversible
loss Irreversible loss of urea N produced in the liver to the urine
Urea N Liver Recycled to the Gut
Recycling of urea produced in the liver to the gut
Post SI N entry End N LI Secretionj Endogenous secretions to the LI Urea N Recycled to LI Recycled urea N entering the LI Disappearance from the LI
End N LI Degj Degradation of endogenous N NH3 N LI Ab Ammonia absorption in the LI NH3 N LI Uptake FB Ammonia uptake by FB in the LI NH3 N LI Uptake NFB Ammonia uptake by NFD in the LI PAA N LI Uptake NFB Peptide and free AA N uptake by NFB in the LI PAA N LI Deg Degradation of peptide and free AA N in the LI Recycled Urea N LI Deg Degradation of recycled urea N in the LI A2 N Outi A2 N passing out in the feces B1 N Outi B1 N passing out in the feces B2 N Outi B2 N passing out in the feces C N Outi C N passing out in the feces Feed PAA N Outi Peptide and free AA N originating from feed passing out in
the feces R FB AA N Out AA N from rumen FB passing out in the feces R FB NA N Out Nucleic acid N from rumen FB passing out in the feces R FB CW N Out Cell wall N from rumen FB passing out in the feces R NFB AA N Out AA N from rumen NFB passing out in the feces R NFB NA N Out Nucleic acid N from rumen NFB passing out in the feces R NFB CW N Out Cell wall N from rumen NFB passing out in the feces PZ AA N Out AA N from PZ passing out in the feces PZ NA N Out Nucleic acid N from PZ passing out in the feces PZ CW N Out Cell wall N from PZ passing out in the feces End N Outj Endogenous N passing out in the feces 1 Subscript i refers to the i
th feed in the diet.
2 Subscript j refers to the j
th endogenous component secreted into the GIT
94
3.4 Model outputs
3.4.5 Differences between new and old model outputs
The CNCPS has historically been developed for field application with care taken to ensure
model inputs are routinely available on most farms (Fox et al., 2004). This model adheres to the
same fundamental principles, and while new capability is available within the model, ensuring
the model would be field usable was a priority. Nutritionists generally balance rations for the
average cow in a group on a per day basis. Although this model calculates continuously over
time, and the unit used within the model is hour, the output from the model is expressed on a per
day basis. To do this, the model is sampled for 24 hr after simulating for 276 hr (once it has
reached steady state). Therefore, the formats of the outputs generated are similar to those from
version 6.5. Important differences exist in the calculations of AA supply and requirement which
are described in Chapter 6. Differences also exist in the estimations of microbial growth, largely
due to the addition of protozoa to the model, which are explained further in Chapter 4. Other
differences that impact model outcomes are discussed below.
3.4.6 Rumen pool sizes and intake dynamics
An important new capability of model is the addition of variable intake. The pattern of intake
affects many aspects of the model including, but not limited to, microbial growth, rumen N
supply and rumen pool sizes. To demonstrate the effects of variable intake, an example
simulation was performed with a 600 kg cow producing 45 kg milk, eating 25 kg DM with a diet
composition of 15.8 % CP, 29% Starch, 33.8 % NDF, 4.1 % EE and 7.9 % ash. All pools in the
model start at 0 and accumulate to steady state. The accumulation of undigestible NDF (uNDF)
and pdNDF in the rumen using continuous intake is in Figure 3.5. The uNDF pool takes the
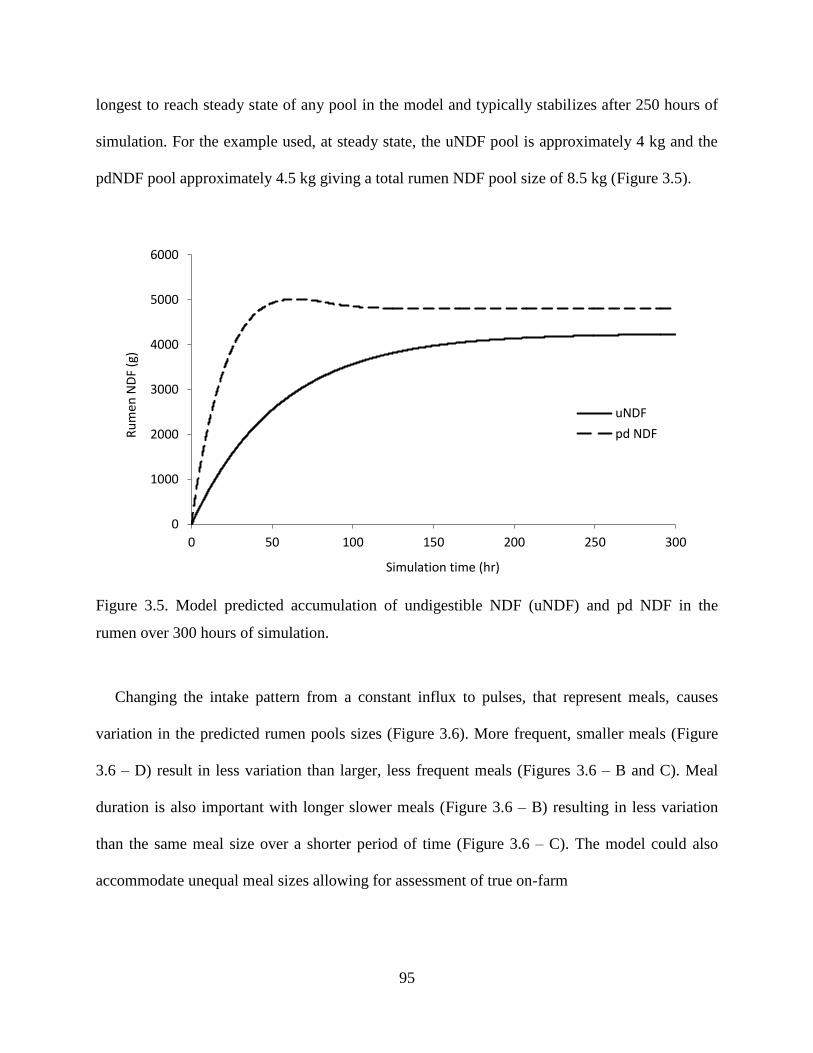
95
longest to reach steady state of any pool in the model and typically stabilizes after 250 hours of
simulation. For the example used, at steady state, the uNDF pool is approximately 4 kg and the
pdNDF pool approximately 4.5 kg giving a total rumen NDF pool size of 8.5 kg (Figure 3.5).
Figure 3.5. Model predicted accumulation of undigestible NDF (uNDF) and pd NDF in the
rumen over 300 hours of simulation.
Changing the intake pattern from a constant influx to pulses, that represent meals, causes
variation in the predicted rumen pools sizes (Figure 3.6). More frequent, smaller meals (Figure
3.6 – D) result in less variation than larger, less frequent meals (Figures 3.6 – B and C). Meal
duration is also important with longer slower meals (Figure 3.6 – B) resulting in less variation
than the same meal size over a shorter period of time (Figure 3.6 – C). The model could also
accommodate unequal meal sizes allowing for assessment of true on-farm
0
1000
2000
3000
4000
5000
6000
0 50 100 150 200 250 300
Ru
men
ND
F (g
)
Simulation time (hr)
uNDF
pd NDF
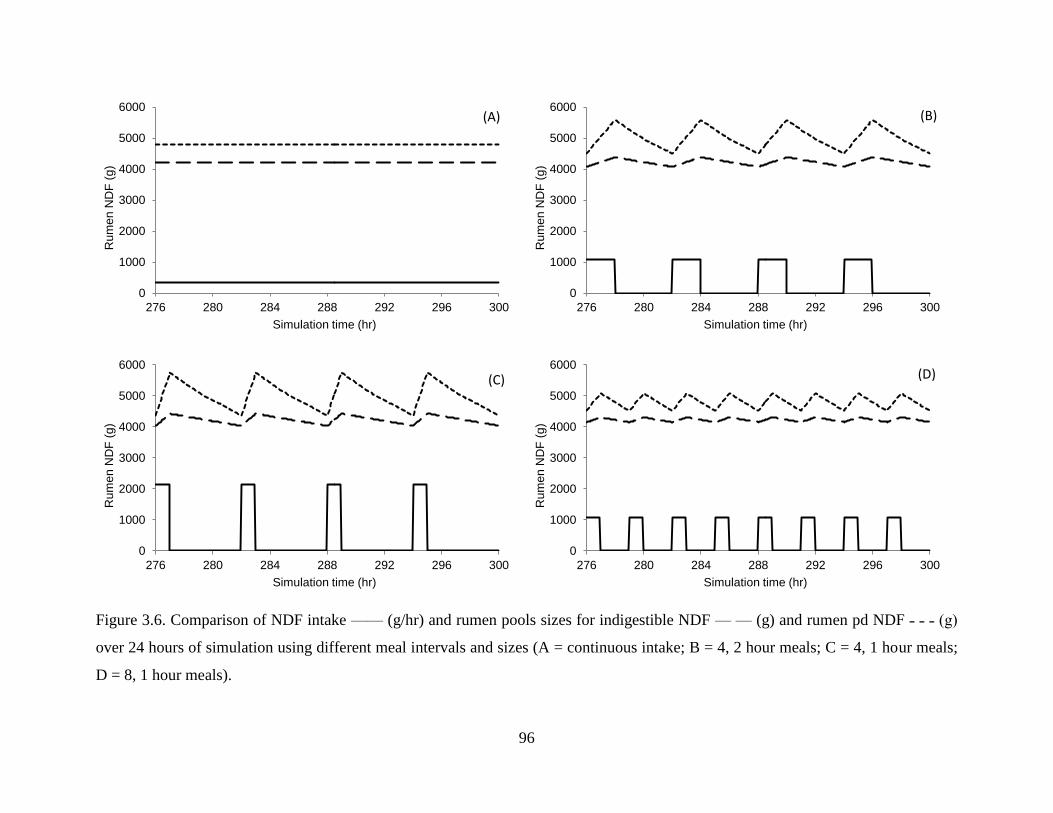
96
Figure 3.6. Comparison of NDF intake —— (g/hr) and rumen pools sizes for indigestible NDF — — (g) and rumen pd NDF ˗ ˗ ˗ (g)
over 24 hours of simulation using different meal intervals and sizes (A = continuous intake; B = 4, 2 hour meals; C = 4, 1 hour meals;
D = 8, 1 hour meals).
0
1000
2000
3000
4000
5000
6000
276 280 284 288 292 296 300
Rum
en
ND
F (
g)
Simulation time (hr)
(A)
0
1000
2000
3000
4000
5000
6000
276 280 284 288 292 296 300
Rum
en
ND
F (
g)
Simulation time (hr)
(B)
0
1000
2000
3000
4000
5000
6000
276 280 284 288 292 296 300
Rum
en
ND
F (
g)
Simulation time (hr)
(C)
0
1000
2000
3000
4000
5000
6000
276 280 284 288 292 296 300
Rum
en
ND
F (
g)
Simulation time (hr)
(D)
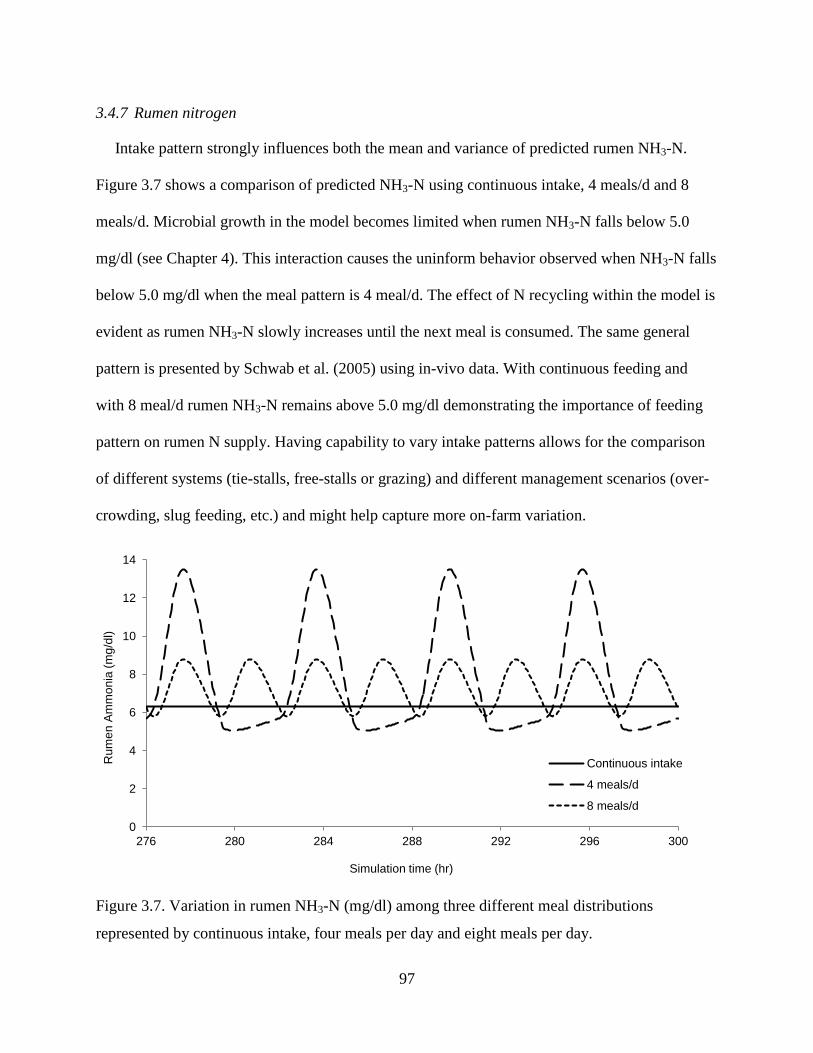
97
3.4.7 Rumen nitrogen
Intake pattern strongly influences both the mean and variance of predicted rumen NH3-N.
Figure 3.7 shows a comparison of predicted NH3-N using continuous intake, 4 meals/d and 8
meals/d. Microbial growth in the model becomes limited when rumen NH3-N falls below 5.0
mg/dl (see Chapter 4). This interaction causes the uninform behavior observed when NH3-N falls
below 5.0 mg/dl when the meal pattern is 4 meal/d. The effect of N recycling within the model is
evident as rumen NH3-N slowly increases until the next meal is consumed. The same general
pattern is presented by Schwab et al. (2005) using in-vivo data. With continuous feeding and
with 8 meal/d rumen NH3-N remains above 5.0 mg/dl demonstrating the importance of feeding
pattern on rumen N supply. Having capability to vary intake patterns allows for the comparison
of different systems (tie-stalls, free-stalls or grazing) and different management scenarios (over-
crowding, slug feeding, etc.) and might help capture more on-farm variation.
Figure 3.7. Variation in rumen NH3-N (mg/dl) among three different meal distributions
represented by continuous intake, four meals per day and eight meals per day.
0
2
4
6
8
10
12
14
276 280 284 288 292 296 300
Rum
en
Am
mo
nia
(m
g/d
l)
Simulation time (hr)
Continuous intake
4 meals/d
8 meals/d
98
3.4.8 Metabolizable energy
Metabolizable energy supply is estimated using the same general system described by Sniffen
et al. (1992) with modifications by Tylutki et al. (2008) where crude fat was partitioned into
individual fatty acids. In this system net energy and metabolizable energy are calculated from
apparent TDN (NRC, 2001). Differences in the current model that affect the estimates of TDN
include incorporation of new passage rates for the NDF fractions and the calculation of fecal
protein using individual mass factors for each N component. The more mechanistic large
intestine portion of the sub-model allows for more sensitivity in post-ruminal digestion,
particularly of NDF.
3.4.9 Metabolizable protein
Like ME, estimations of MP follow the same general structure used in previous versions of
the model with some refinement. The most notable difference is the estimation of individual
endogenous components secreted along the GIT (see Chapter 5) which are subtracted off MP
supply. The result is a lower net MP supply, but this is offset by lower predicted MP
requirements which culminate in a similar MP balance between this model and version 6.5. Of
greater consequence are the changes to the individual N components flowing to the small
intestine and their contribution to AA supply which is described further in Chapter 6.
99
3.5 Implications
The version of the CNCPS presented in this chapter represents a structural shift from previous
versions that calculated statically, to a dynamic framework. The new structure is able to more
effectively capture the dynamics of carbohydrate and protein digestion, as well as post-
absorptive N transactions and recycling. This provides new capability to understand variation in
nutrient supply and can help refine ration formulation.
100
3.6 References
Bird, P. 1972. Sulphur metabolism and excretion studies in ruminants VI. The digestibility and
utilization by sheep of 35s from 35s-labelled ruminal microorganisms. Aust. J. Biol. Sci. 25:195-
204.
Calsamiglia, S. and M. D. Stern. 1995. A three-step in vitro procedure for estimating intestinal
digestion of protein in ruminants. J. Anim. Sci. 73:1459-1465.
Clark, J. H., T. H. Klusmeyer, and M. R. Cameron. 1992. Microbial protein synthesis and flows
of nitrogen fractions to the duodenum of dairy cows. J. Dairy Sci. 75:2304-2323.
Colucci, P., L. Chase, and P. Van Soest. 1982. Feed intake, apparent diet digestibility, and rate of
particulate passage in dairy cattle. J. Dairy Sci. 65:1445-1456.
Coombe, J. and R. Kay. 1965. Passage of digesta through the intestines of the sheep. Br. J. Nutr.
19:325-338.
Czerkawski, J. W. 1976. Chemical composition of microbial matter in the rumen. J. Sci. Food
Agric. 27:621-632.
Ellis, W., M. Mahlooji, and J. Matis. 2005. Models for estimating parameters of neutral detergent
fiber digestion by ruminal microorganisms. J. Anim. Sci. 83:1591-1601.
Firkins, J. L. and C. K. Reynolds. 2005. Whole-animal nitrogen balance in cattle. Pages 167-186
in Nitrogen and phosphorus nutrition of cattle and the environment. A. Pfeffer and A. N. Hristov,
ed. CABI, Wallingford, UK.
Firkins, J. L., Z. Yu, and M. Morrison. 2007. Ruminal nitrogen metabolism: Perspectives for
integration of microbiology and nutrition for dairy. J. Dairy Sci. 90:E1-E16.
Fonseca, A., S. Fredin, L. Ferraretto, C. Parsons, P. Utterback, and R. Shaver. 2014. Short
communication: Intestinal digestibility of amino acids in fluid-and particle-associated rumen
bacteria determined using a precision-fed cecectomized rooster bioassay. J. Dairy Sci.
101
Fox, D. G., C. J. Sniffen, J. D. O'Connor, J. B. Russell, and P. J. Van Soest. 1992. A net
carbohydrate and protein system for evaluating cattle diets: III. Cattle requirements and diet
adequacy. J. Anim. Sci. 70:3578-3596.
Fox, D. G., L. O. Tedeschi, T. P. Tylutki, J. B. Russell, M. E. Van Amburgh, L. E. Chase, A. N.
Pell, and T. R. Overton. 2004. The Cornell Net Carbohydrate and Protein System model for
evaluating herd nutrition and nutrient excretion. Anim. Feed Sci. Technol. 112:29-78.
Grovum, W. L. and J. F. Hecker. 1973. Rate of passage of digesta in sheep. 2. The effect of level
of food intake on digesta and retention time and on water and electrolyte absorption in the large
intestine. Br. J. Nutr. 30:221-230.
Hecker, J. 1971. Metabolism of nitrogenous compounds in the large intestine of sheep. Br. J.
Nutr. 25:85-95.
Higgs, R. J., L. E. Chase, and M. E. Van Amburgh. 2012. Development and evaluation of
equations in the Cornell Net Carbohydrate and Protein System to predict nitrogen excretion in
lactating dairy cows. J. Dairy Sci. 95:2004-2014.
Hoogenraad, N. J. and F. J. R. Hird. 1970. The chemical composition of rumen bacteria and cell
walls from rumen bacteria. Br. J. Nutr. 24:119-127.
Huhtanen, P. and U. Kukkonen. 1995. Comparison of methods, markers, sampling sites and
models for estimating digesta passage kinetics in cattle fed at two levels of intake. Anim. Feed
Sci. Technol. 52:141-158.
Huhtanen, P., A. Seppälä, M. Ots, S. Ahvenjärvi, and M. Rinne. 2008. In vitro gas production
profiles to estimate extent and effective first-order rate of neutral detergent fiber digestion in the
rumen. J. Anim. Sci. 86:651-659.
Huntington, G. B. 1986. Uptake and transport of nonprotein nitrogen by the ruminant gut. Fed.
Proc. 45:2272-2276.
102
Huntington, G. B. 1989. Hepatic urea synthesis and site and rate of urea removal from blood of
beef steers fed alfalfa hay or a high concentrate diet. Canadian Journal of Animal Science
69:215-223.
Kennedy, P. M. and L. P. Milligan. 1980. The degradation and utilization of endogenous urea in
the gastrointestinal tract of ruminants: A review. Canadian Journal of Animal Science 60:205-
221.
Lanzas, C., C. J. Sniffen, S. Seo, L. O. Tedeschi, and D. G. Fox. 2007. A revised CNCPS feed
carbohydrate fractionation scheme for formulating rations for ruminants. Anim. Feed Sci.
Technol. 136:167-190.
Lapierre, H., R. Berthiaume, G. Raggio, M. C. Thivierge, L. Doepel, D. Pacheco, P. Dubreuil,
and G. E. Lobley. 2005. The route of absorbed nitrogen into milk protein. Animal Science 80:10-
22.
Lapierre, H. and G. E. Lobley. 2001. Nitrogen recycling in the ruminant: A review. J. Dairy Sci.
84:233-236.
Lapierre, H., D. R. Ouellet, R. Berthiaume, C. Girard, P. Dubreuil, M. Babkine, and G. E.
Lobley. 2004. Effect of urea supplementation on urea kinetics and splanchnic flux of amino acids
in dairy cows. Journal of animal and feed sciences 13:319-322.
Mambrini, M. and J. Peyraud. 1997. Retention time of feed particles and liquids in the stomachs
and intestines of dairy cows. Direct measurement and calculations based on faecal collection.
Reprod. Nutr. Dev. 37:427-442.
Marini, J. C., D. G. Fox, and M. R. Murphy. 2008. Nitrogen transactions along the
gastrointestinal tract of cattle: A meta-analytical approach. J. Anim. Sci. 86:660-679.
Marini, J. C., J. D. Klein, J. M. Sands, and M. E. Van Amburgh. 2004. Effect of nitrogen intake
on nitrogen recycling and urea transporter abundance in lambs. J. Anim. Sci. 82:1157-1164.
Marini, J. C. and M. E. Van Amburgh. 2003. Nitrogen metabolism and recycling in holstein
heifers. J. Anim. Sci. 81:545-552.
103
Mason, V. 1969. Some observations on the distribution and origin of nitrogen in sheep faeces.
The Journal of Agricultural Science 73:99-111.
Mason, V. 1978. The quantitative importance of bacterial residues in the non-dietary faecal
nitrogen of sheep. Zeitschrift für Tierphysiologie Tierernährung und Futtermittelkunde 41:140-
149.
Mason, V. 1984. Metabolism of nitrogenous compounds in the large gut. Proc. Nutr. Soc. 43:45-
53.
Mertens, D. R. and L. O. Ely. 1979. A dynamic model of fiber digestion and passage in the
ruminant for evaluating forage quality. J. Anim. Sci. 49:1085-1095.
Nelson, D. L., A. L. Lehninger, and M. M. Cox. 2008. Lehninger principles of biochemistry. W.
H. Freeman and Company, New York, NY.
NorFor. 2011. The nordic feed evaluation system. Wageningen Academic Publishers, The
Netherlands.
NRC. 1985. Ruminant nitrogen usage. 7th revised ed. National Academy Press, Washington,
DC.
NRC. 2001. Nutrient requirements of dairy cattle. 7th revised ed. National Academy Press,
Washington, DC.
O'Connor, J. D., C. J. Sniffen, D. G. Fox, and W. Chalupa. 1993. A net carbohydrate and protein
system for evaluating cattle diets: Iv. Predicting amino acid adequacy. J. Anim. Sci. 71:1298-
1311.
Ouellet, D. R., R. Berthiaume, G. E. Lobley, R. Martineau, and H. Lapierre. 2004. Effects of
sun-curing, formic acid-treatment or microbial inoculation of timothy on urea metabolism in
lactating dairy cows. Journal of Animal and Feed Sciences 13:323-326.
Parker, D. S., M. A. Lomax, C. J. Seal, and J. C. Wilton. 1995. Metabolic implications of
ammonia production in the ruminant. Proc. Nutr. Soc. 54:549-563.
104
Raffrenato, E. and M. Van Amburgh. 2010. Development of a mathematical model to predict
sizes and rates of digestion of a fast and slow degrading pool and the indigestible NDF fraction.
Pages 52-65 in Proc. Cornell Nutrition Conference, Syracuse, NY.
Recktenwald, E. B. 2007. Effect of feeding corn silage based diets predicted to be deficient in
either ruminal nitrogen or metabolizable protein on nitrogen utilization and efficiency of use in
lactating cows. Masters Thesis. Animal Science. Cornell University.
Recktenwald, E. B., D. A. Ross, S. W. Fessenden, C. J. Wall, and M. E. Van Amburgh. 2014.
Urea-n recycling in lactating dairy cows fed diets with 2 different levels of dietary crude protein
and starch with or without monensin. J. Dairy Sci. 97:1611-1622.
Reynolds, C. K., B. Dürst, B. Lupoli, D. J. Humphries, and D. E. Beever. 2004. Visceral tissue
mass and rumen volume in dairy cows during the transition from late gestation to early lactation.
J. Dairy Sci. 87:961-971.
Reynolds, C. K. and N. B. Kristensen. 2008. Nitrogen recycling through the gut and the nitrogen
economy of ruminants: An asynchronous symbiosis. J. Anim. Sci. 86:293-305.
Ross, D. A. 2013. Methods to analyze feeds for nitrogen fractions and digestibility for ruminants
with application for the CNCPS. PhD Dissertation. Department of Animal Science. Cornell
University.
Russell, J. B., J. D. O'Connor, D. G. Fox, P. J. Van Soest, and C. J. Sniffen. 1992. A net
carbohydrate and protein system for evaluating cattle diets: I. Ruminal fermentation. J. Anim.
Sci. 70:3551-3561.
Schwab, C. G., P. Huhtanen, C. W. Hunt, and T. Hvelplund. 2005. Nitrogen requirements of
cattle. Pages 13-70 in Nitrogen and phosphorus nutrition of cattle and the environment. A.
Pfeffer and A. N. Hristov, ed. CABI, Wallingford, UK.
Seo, S., L. O. Tedeschi, C. Lanzas, C. G. Schwab, and D. G. Fox. 2006. Development and
evaluation of empirical equations to predict feed passage rate in cattle. Anim. Feed Sci. Technol.
128:67-83.
105
Siddons, R., J. Nolan, D. Beever, and J. MacRae. 1985. Nitrogen digestion and metabolism in
sheep consuming diets containing contrasting forms and levels of n. Br. J. Nutr. 54:175-187.
Sniffen, C. J., J. D. O'Connor, P. J. Van Soest, D. G. Fox, and J. B. Russell. 1992. A net
carbohydrate and protein system for evaluating cattle diets: Ii. Carbohydrate and protein
availability. J. Anim. Sci. 70:3562-3577.
Sterman, J. D. 2000. Business dynamics: Systems thinking and modeling for a complex world.
Irwin McGraw-Hill, USA.
Stern, M., K. Santos, and L. Satter. 1985. Protein degradation in rumen and amino acid
absorption in small intestine of lactating dairy cattle fed heat-treated whole soybeans. J. Dairy
Sci. 68:45-56.
Storm, E., D. S. Brown, and E. R. Ørskov. 1983a. The nutritive value of rumen micro-organisms
in ruminants 3. The digestion of microbial amino and nucleic acids in, and losses of endogenous
nitrogen from, the small intestine of sheep. Br. J. Nutr. 50:479-485.
Storm, E., E. R. Ørskov, and R. Smart. 1983b. The nutritive value of rumen micro-organisms in
ruminants 2. The apparent digestibility and net utilization of microbial n for growing lambs. Br.
J. Nutr. 50:471-478.
Theurer, C. B., G. B. Huntington, J. T. Huber, R. S. Swingle, and J. A. Moore. 2002. Net
absorption and utilization of nitrogenous compounds across ruminal, intestinal, and hepatic
tissues of growing beef steers fed dry-rolled or steam-flaked sorghum grain. J. Anim. Sci.
80:525-532.
Tylutki, T. P., D. G. Fox, V. M. Durbal, L. O. Tedeschi, J. B. Russell, M. E. Van Amburgh, T. R.
Overton, L. E. Chase, and A. N. Pell. 2008. Cornell Net Carbohydrate and Protein System: A
model for precision feeding of dairy cattle. Anim. Feed Sci. Technol. 143:174-202.
Valkeners, D., H. Lapierre, J. C. Marini, and D. R. Ouellet. 2007. Effects of metabolizable
protein supply on nitrogen metabolism and recycling in lactating dairy cows. Pages 417-418 in
Proc. Energy and protein metobolism and nutrition. Wageningen Academic Publishers, Vichy,
France.
106
Van Amburgh, M. E., L. E. Chase, T. R. Overton, D. A. Ross, E. B. Recktenwald, R. J. Higgs,
and T. P. Tylutki. 2010. Updates to the Cornell Net Carbohydrate and Protein System v6.1 and
implications for ration formulation. Pages 144-159 in Proc. Cornell Nutrition Conference,
Syracuse, NY.
Van Amburgh, M. E., A. Foskolos, E. A. Collao-Saenz, R. J. Higgs, and D. A. Ross. 2013.
Updating the CNCPS feed library with new amino acid profiles and efficiencies of use:
Evaluation of model predictions - version 6.5. Pages 59-76 in Proc. Cornell Nutrition
Conference, Syracuse, NY.
Van Amburgh, M. E., E. B. Recktenwald, D. A. Ross, T. R. Overton, and L. E. Chase. 2007.
Achieving better nitrogen efficiency in lactating dairy cattle: Updating field usable tools to
improve nitrogen efficiency. Pages 25-38 in Proc. Cornell Nutrition Conference, Syracuse, NY.
Van Milgen, J., M. Murphy, and L. Berger. 1991. A compartmental model to analyze ruminal
digestion. J. Dairy Sci. 74:2515-2529.
Van Soest, P. J. 1994. Nutritional ecology of the ruminant. 2nd ed. Cornell University Press,
Ithaca, NY.
Vensim. 2010. Vensim dss for windows version 5.10e. Ventana Systems, Harvard MA.
Waldo, D. R., L. W. Smith, and E. L. Cox. 1972. Model of cellulose disappearance from the
rumen. J. Dairy Sci. 55:125-129.
Waltz, D. M., M. D. Stern, and D. J. Illg. 1989. Effect of ruminal protein degradation of blood
meal and feather meal on the intestinal amino acid supply to lactating cows. J. Dairy Sci.
72:1509-1518.
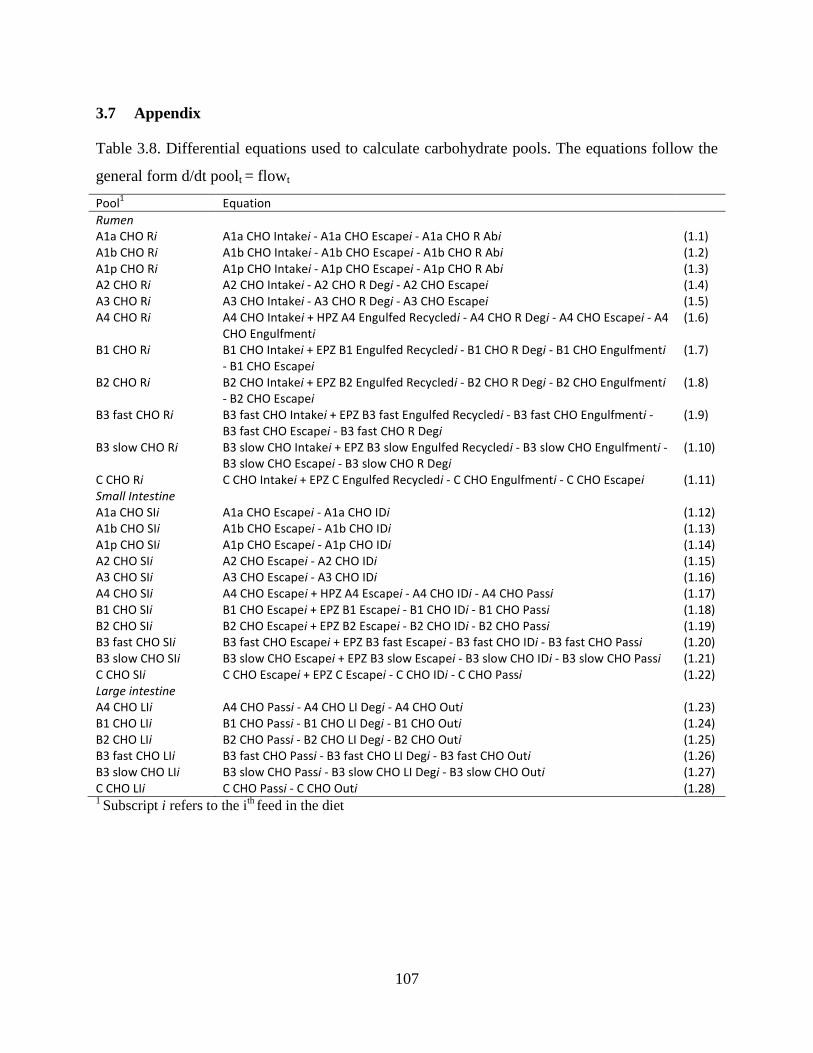
107
3.7 Appendix
Table 3.8. Differential equations used to calculate carbohydrate pools. The equations follow the
general form d/dt poolt = flowt
Pool1
Equation
Rumen A1a CHO Ri
A1a CHO Intakei - A1a CHO Escapei - A1a CHO R Abi (1.1)
A1b CHO Ri A1b CHO Intakei - A1b CHO Escapei - A1b CHO R Abi (1.2) A1p CHO Ri A1p CHO Intakei - A1p CHO Escapei - A1p CHO R Abi (1.3) A2 CHO Ri A2 CHO Intakei - A2 CHO R Degi - A2 CHO Escapei (1.4) A3 CHO Ri A3 CHO Intakei - A3 CHO R Degi - A3 CHO Escapei (1.5) A4 CHO Ri A4 CHO Intakei + HPZ A4 Engulfed Recycledi - A4 CHO R Degi - A4 CHO Escapei - A4
CHO Engulfmenti (1.6)
B1 CHO Ri B1 CHO Intakei + EPZ B1 Engulfed Recycledi - B1 CHO R Degi - B1 CHO Engulfmenti - B1 CHO Escapei
(1.7)
B2 CHO Ri B2 CHO Intakei + EPZ B2 Engulfed Recycledi - B2 CHO R Degi - B2 CHO Engulfmenti - B2 CHO Escapei
(1.8)
B3 fast CHO Ri B3 fast CHO Intakei + EPZ B3 fast Engulfed Recycledi - B3 fast CHO Engulfmenti - B3 fast CHO Escapei - B3 fast CHO R Degi
(1.9)
B3 slow CHO Ri B3 slow CHO Intakei + EPZ B3 slow Engulfed Recycledi - B3 slow CHO Engulfmenti - B3 slow CHO Escapei - B3 slow CHO R Degi
(1.10)
C CHO Ri C CHO Intakei + EPZ C Engulfed Recycledi - C CHO Engulfmenti - C CHO Escapei (1.11) Small Intestine A1a CHO SIi A1a CHO Escapei - A1a CHO IDi (1.12) A1b CHO SIi A1b CHO Escapei - A1b CHO IDi (1.13) A1p CHO SIi A1p CHO Escapei - A1p CHO IDi (1.14) A2 CHO SIi A2 CHO Escapei - A2 CHO IDi (1.15) A3 CHO SIi A3 CHO Escapei - A3 CHO IDi (1.16) A4 CHO SIi A4 CHO Escapei + HPZ A4 Escapei - A4 CHO IDi - A4 CHO Passi (1.17) B1 CHO SIi B1 CHO Escapei + EPZ B1 Escapei - B1 CHO IDi - B1 CHO Passi (1.18) B2 CHO SIi B2 CHO Escapei + EPZ B2 Escapei - B2 CHO IDi - B2 CHO Passi (1.19) B3 fast CHO SIi B3 fast CHO Escapei + EPZ B3 fast Escapei - B3 fast CHO IDi - B3 fast CHO Passi (1.20) B3 slow CHO SIi B3 slow CHO Escapei + EPZ B3 slow Escapei - B3 slow CHO IDi - B3 slow CHO Passi (1.21) C CHO SIi C CHO Escapei + EPZ C Escapei - C CHO IDi - C CHO Passi (1.22) Large intestine A4 CHO LIi A4 CHO Passi - A4 CHO LI Degi - A4 CHO Outi (1.23) B1 CHO LIi B1 CHO Passi - B1 CHO LI Degi - B1 CHO Outi (1.24) B2 CHO LIi B2 CHO Passi - B2 CHO LI Degi - B2 CHO Outi (1.25) B3 fast CHO LIi B3 fast CHO Passi - B3 fast CHO LI Degi - B3 fast CHO Outi (1.26) B3 slow CHO LIi B3 slow CHO Passi - B3 slow CHO LI Degi - B3 slow CHO Outi (1.27) C CHO LIi C CHO Passi - C CHO Outi (1.28) 1 Subscript i refers to the i
th feed in the diet
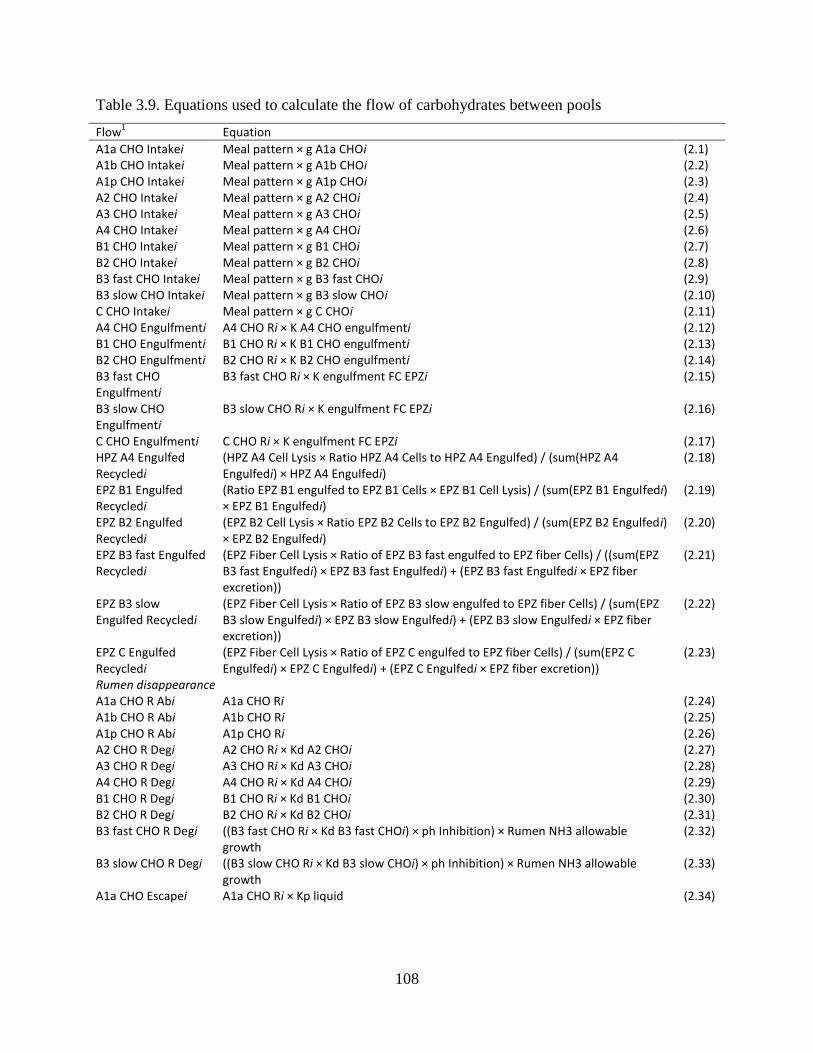
108
Table 3.9. Equations used to calculate the flow of carbohydrates between pools
Flow1
Equation
A1a CHO Intakei Meal pattern × g A1a CHOi (2.1) A1b CHO Intakei Meal pattern × g A1b CHOi (2.2) A1p CHO Intakei Meal pattern × g A1p CHOi (2.3) A2 CHO Intakei Meal pattern × g A2 CHOi (2.4) A3 CHO Intakei Meal pattern × g A3 CHOi (2.5) A4 CHO Intakei Meal pattern × g A4 CHOi (2.6) B1 CHO Intakei Meal pattern × g B1 CHOi (2.7) B2 CHO Intakei Meal pattern × g B2 CHOi (2.8) B3 fast CHO Intakei Meal pattern × g B3 fast CHOi (2.9) B3 slow CHO Intakei Meal pattern × g B3 slow CHOi (2.10) C CHO Intakei Meal pattern × g C CHOi (2.11) A4 CHO Engulfmenti A4 CHO Ri × K A4 CHO engulfmenti (2.12) B1 CHO Engulfmenti B1 CHO Ri × K B1 CHO engulfmenti (2.13) B2 CHO Engulfmenti B2 CHO Ri × K B2 CHO engulfmenti (2.14) B3 fast CHO Engulfmenti
B3 fast CHO Ri × K engulfment FC EPZi (2.15)
B3 slow CHO Engulfmenti
B3 slow CHO Ri × K engulfment FC EPZi (2.16)
C CHO Engulfmenti C CHO Ri × K engulfment FC EPZi (2.17) HPZ A4 Engulfed Recycledi
(HPZ A4 Cell Lysis × Ratio HPZ A4 Cells to HPZ A4 Engulfed) / (sum(HPZ A4 Engulfedi) × HPZ A4 Engulfedi)
(2.18)
EPZ B1 Engulfed Recycledi
(Ratio EPZ B1 engulfed to EPZ B1 Cells × EPZ B1 Cell Lysis) / (sum(EPZ B1 Engulfedi) × EPZ B1 Engulfedi)
(2.19)
EPZ B2 Engulfed Recycledi
(EPZ B2 Cell Lysis × Ratio EPZ B2 Cells to EPZ B2 Engulfed) / (sum(EPZ B2 Engulfedi) × EPZ B2 Engulfedi)
(2.20)
EPZ B3 fast Engulfed Recycledi
(EPZ Fiber Cell Lysis × Ratio of EPZ B3 fast engulfed to EPZ fiber Cells) / ((sum(EPZ B3 fast Engulfedi) × EPZ B3 fast Engulfedi) + (EPZ B3 fast Engulfedi × EPZ fiber excretion))
(2.21)
EPZ B3 slow Engulfed Recycledi
(EPZ Fiber Cell Lysis × Ratio of EPZ B3 slow engulfed to EPZ fiber Cells) / (sum(EPZ B3 slow Engulfedi) × EPZ B3 slow Engulfedi) + (EPZ B3 slow Engulfedi × EPZ fiber excretion))
(2.22)
EPZ C Engulfed Recycledi
(EPZ Fiber Cell Lysis × Ratio of EPZ C engulfed to EPZ fiber Cells) / (sum(EPZ C Engulfedi) × EPZ C Engulfedi) + (EPZ C Engulfedi × EPZ fiber excretion))
(2.23)
Rumen disappearance A1a CHO R Abi A1a CHO Ri (2.24) A1b CHO R Abi A1b CHO Ri (2.25) A1p CHO R Abi A1p CHO Ri (2.26) A2 CHO R Degi A2 CHO Ri × Kd A2 CHOi (2.27) A3 CHO R Degi A3 CHO Ri × Kd A3 CHOi (2.28) A4 CHO R Degi A4 CHO Ri × Kd A4 CHOi (2.29) B1 CHO R Degi B1 CHO Ri × Kd B1 CHOi (2.30) B2 CHO R Degi B2 CHO Ri × Kd B2 CHOi (2.31) B3 fast CHO R Degi ((B3 fast CHO Ri × Kd B3 fast CHOi) × ph Inhibition) × Rumen NH3 allowable
growth (2.32)
B3 slow CHO R Degi ((B3 slow CHO Ri × Kd B3 slow CHOi) × ph Inhibition) × Rumen NH3 allowable growth
(2.33)
A1a CHO Escapei A1a CHO Ri × Kp liquid (2.34)
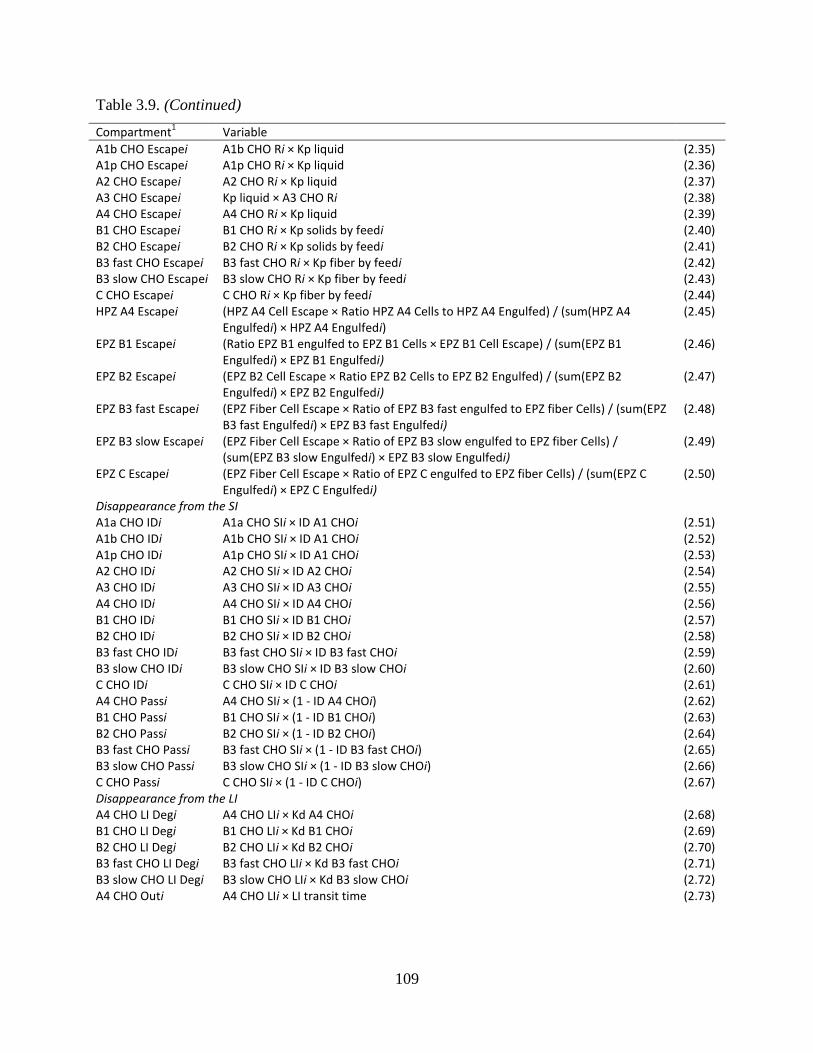
109
Table 3.9. (Continued)
Compartment1
Variable
A1b CHO Escapei A1b CHO Ri × Kp liquid (2.35) A1p CHO Escapei A1p CHO Ri × Kp liquid (2.36) A2 CHO Escapei A2 CHO Ri × Kp liquid (2.37) A3 CHO Escapei Kp liquid × A3 CHO Ri (2.38) A4 CHO Escapei A4 CHO Ri × Kp liquid (2.39) B1 CHO Escapei B1 CHO Ri × Kp solids by feedi (2.40) B2 CHO Escapei B2 CHO Ri × Kp solids by feedi (2.41) B3 fast CHO Escapei B3 fast CHO Ri × Kp fiber by feedi (2.42) B3 slow CHO Escapei B3 slow CHO Ri × Kp fiber by feedi (2.43) C CHO Escapei C CHO Ri × Kp fiber by feedi (2.44) HPZ A4 Escapei (HPZ A4 Cell Escape × Ratio HPZ A4 Cells to HPZ A4 Engulfed) / (sum(HPZ A4
Engulfedi) × HPZ A4 Engulfedi) (2.45)
EPZ B1 Escapei (Ratio EPZ B1 engulfed to EPZ B1 Cells × EPZ B1 Cell Escape) / (sum(EPZ B1 Engulfedi) × EPZ B1 Engulfedi)
(2.46)
EPZ B2 Escapei (EPZ B2 Cell Escape × Ratio EPZ B2 Cells to EPZ B2 Engulfed) / (sum(EPZ B2 Engulfedi) × EPZ B2 Engulfedi)
(2.47)
EPZ B3 fast Escapei (EPZ Fiber Cell Escape × Ratio of EPZ B3 fast engulfed to EPZ fiber Cells) / (sum(EPZ B3 fast Engulfedi) × EPZ B3 fast Engulfedi)
(2.48)
EPZ B3 slow Escapei (EPZ Fiber Cell Escape × Ratio of EPZ B3 slow engulfed to EPZ fiber Cells) / (sum(EPZ B3 slow Engulfedi) × EPZ B3 slow Engulfedi)
(2.49)
EPZ C Escapei (EPZ Fiber Cell Escape × Ratio of EPZ C engulfed to EPZ fiber Cells) / (sum(EPZ C Engulfedi) × EPZ C Engulfedi)
(2.50)
Disappearance from the SI A1a CHO IDi A1a CHO SIi × ID A1 CHOi (2.51) A1b CHO IDi A1b CHO SIi × ID A1 CHOi (2.52) A1p CHO IDi A1p CHO SIi × ID A1 CHOi (2.53) A2 CHO IDi A2 CHO SIi × ID A2 CHOi (2.54) A3 CHO IDi A3 CHO SIi × ID A3 CHOi (2.55) A4 CHO IDi A4 CHO SIi × ID A4 CHOi (2.56) B1 CHO IDi B1 CHO SIi × ID B1 CHOi (2.57) B2 CHO IDi B2 CHO SIi × ID B2 CHOi (2.58) B3 fast CHO IDi B3 fast CHO SIi × ID B3 fast CHOi (2.59) B3 slow CHO IDi B3 slow CHO SIi × ID B3 slow CHOi (2.60) C CHO IDi C CHO SIi × ID C CHOi (2.61) A4 CHO Passi A4 CHO SIi × (1 - ID A4 CHOi) (2.62) B1 CHO Passi B1 CHO SIi × (1 - ID B1 CHOi) (2.63) B2 CHO Passi B2 CHO SIi × (1 - ID B2 CHOi) (2.64) B3 fast CHO Passi B3 fast CHO SIi × (1 - ID B3 fast CHOi) (2.65) B3 slow CHO Passi B3 slow CHO SIi × (1 - ID B3 slow CHOi) (2.66) C CHO Passi C CHO SIi × (1 - ID C CHOi) (2.67) Disappearance from the LI A4 CHO LI Degi A4 CHO LIi × Kd A4 CHOi (2.68) B1 CHO LI Degi B1 CHO LIi × Kd B1 CHOi (2.69) B2 CHO LI Degi B2 CHO LIi × Kd B2 CHOi (2.70) B3 fast CHO LI Degi B3 fast CHO LIi × Kd B3 fast CHOi (2.71) B3 slow CHO LI Degi B3 slow CHO LIi × Kd B3 slow CHOi (2.72) A4 CHO Outi A4 CHO LIi × LI transit time (2.73)
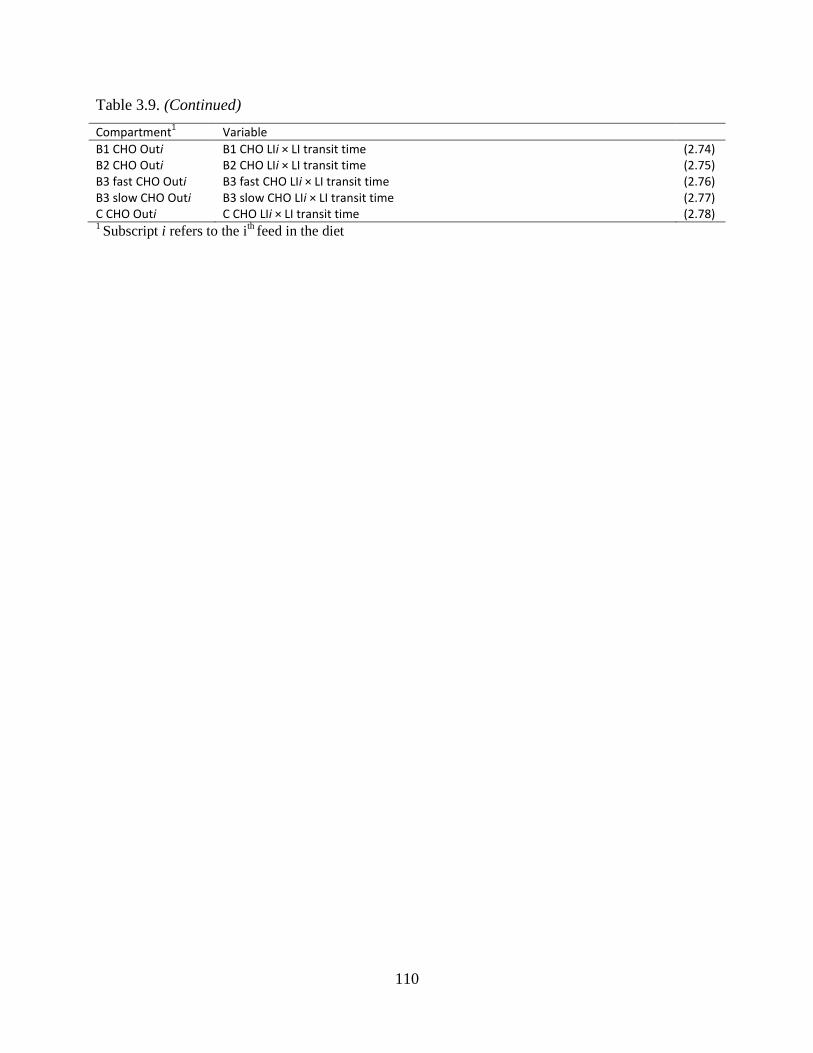
110
Table 3.9. (Continued)
Compartment1
Variable
B1 CHO Outi B1 CHO LIi × LI transit time (2.74) B2 CHO Outi B2 CHO LIi × LI transit time (2.75) B3 fast CHO Outi B3 fast CHO LIi × LI transit time (2.76) B3 slow CHO Outi B3 slow CHO LIi × LI transit time (2.77) C CHO Outi C CHO LIi × LI transit time (2.78) 1 Subscript i refers to the i
th feed in the diet
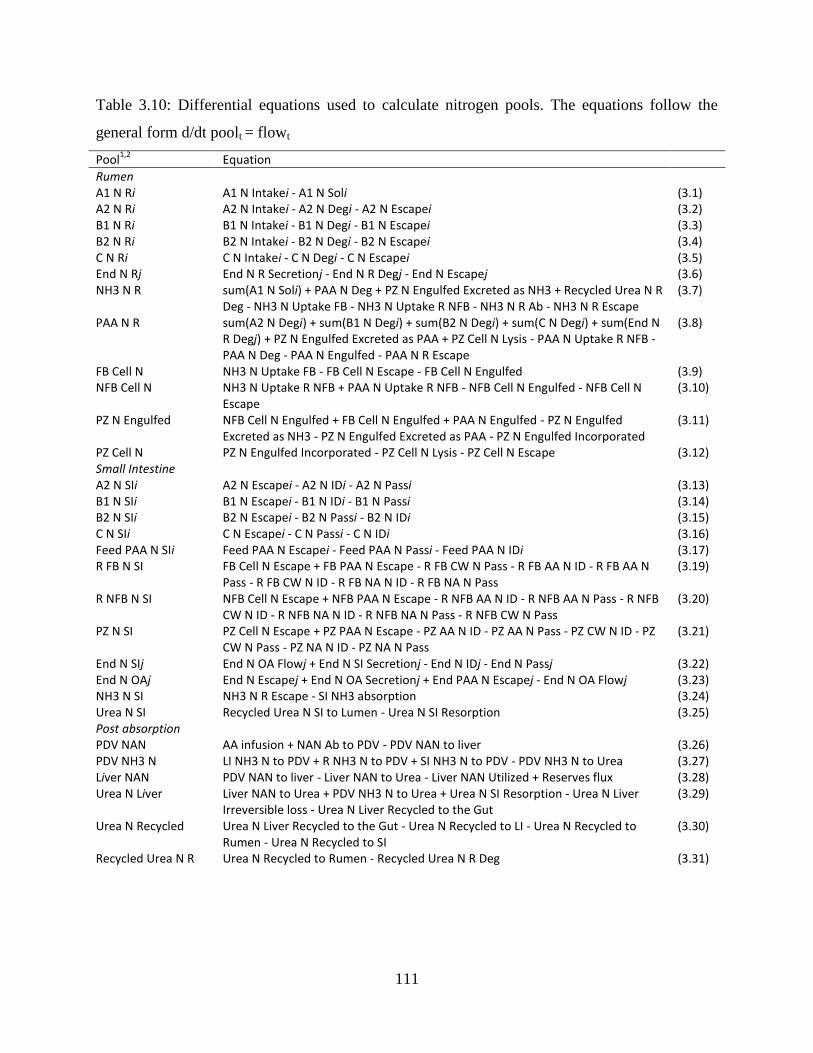
111
Table 3.10: Differential equations used to calculate nitrogen pools. The equations follow the
general form d/dt poolt = flowt
Pool1,2
Equation
Rumen A1 N Ri A1 N Intakei - A1 N Soli (3.1) A2 N Ri A2 N Intakei - A2 N Degi - A2 N Escapei (3.2) B1 N Ri B1 N Intakei - B1 N Degi - B1 N Escapei (3.3) B2 N Ri B2 N Intakei - B2 N Degi - B2 N Escapei (3.4) C N Ri C N Intakei - C N Degi - C N Escapei (3.5) End N Rj End N R Secretionj - End N R Degj - End N Escapej (3.6) NH3 N R sum(A1 N Soli) + PAA N Deg + PZ N Engulfed Excreted as NH3 + Recycled Urea N R
Deg - NH3 N Uptake FB - NH3 N Uptake R NFB - NH3 N R Ab - NH3 N R Escape (3.7)
PAA N R sum(A2 N Degi) + sum(B1 N Degi) + sum(B2 N Degi) + sum(C N Degi) + sum(End N R Degj) + PZ N Engulfed Excreted as PAA + PZ Cell N Lysis - PAA N Uptake R NFB - PAA N Deg - PAA N Engulfed - PAA N R Escape
(3.8)
FB Cell N NH3 N Uptake FB - FB Cell N Escape - FB Cell N Engulfed (3.9) NFB Cell N NH3 N Uptake R NFB + PAA N Uptake R NFB - NFB Cell N Engulfed - NFB Cell N
Escape (3.10)
PZ N Engulfed NFB Cell N Engulfed + FB Cell N Engulfed + PAA N Engulfed - PZ N Engulfed Excreted as NH3 - PZ N Engulfed Excreted as PAA - PZ N Engulfed Incorporated
(3.11)
PZ Cell N PZ N Engulfed Incorporated - PZ Cell N Lysis - PZ Cell N Escape (3.12) Small Intestine A2 N SIi A2 N Escapei - A2 N IDi - A2 N Passi (3.13) B1 N SIi B1 N Escapei - B1 N IDi - B1 N Passi (3.14) B2 N SIi B2 N Escapei - B2 N Passi - B2 N IDi (3.15) C N SIi C N Escapei - C N Passi - C N IDi (3.16) Feed PAA N SIi Feed PAA N Escapei - Feed PAA N Passi - Feed PAA N IDi (3.17) R FB N SI FB Cell N Escape + FB PAA N Escape - R FB CW N Pass - R FB AA N ID - R FB AA N
Pass - R FB CW N ID - R FB NA N ID - R FB NA N Pass (3.19)
R NFB N SI NFB Cell N Escape + NFB PAA N Escape - R NFB AA N ID - R NFB AA N Pass - R NFB CW N ID - R NFB NA N ID - R NFB NA N Pass - R NFB CW N Pass
(3.20)
PZ N SI PZ Cell N Escape + PZ PAA N Escape - PZ AA N ID - PZ AA N Pass - PZ CW N ID - PZ CW N Pass - PZ NA N ID - PZ NA N Pass
(3.21)
End N SIj End N OA Flowj + End N SI Secretionj - End N IDj - End N Passj (3.22) End N OAj End N Escapej + End N OA Secretionj + End PAA N Escapej - End N OA Flowj (3.23) NH3 N SI NH3 N R Escape - SI NH3 absorption (3.24) Urea N SI Recycled Urea N SI to Lumen - Urea N SI Resorption (3.25) Post absorption PDV NAN AA infusion + NAN Ab to PDV - PDV NAN to liver (3.26) PDV NH3 N LI NH3 N to PDV + R NH3 N to PDV + SI NH3 N to PDV - PDV NH3 N to Urea (3.27) Liver NAN PDV NAN to liver - Liver NAN to Urea - Liver NAN Utilized + Reserves flux (3.28) Urea N Liver Liver NAN to Urea + PDV NH3 N to Urea + Urea N SI Resorption - Urea N Liver
Irreversible loss - Urea N Liver Recycled to the Gut (3.29)
Urea N Recycled Urea N Liver Recycled to the Gut - Urea N Recycled to LI - Urea N Recycled to Rumen - Urea N Recycled to SI
(3.30)
Recycled Urea N R Urea N Recycled to Rumen - Recycled Urea N R Deg (3.31)
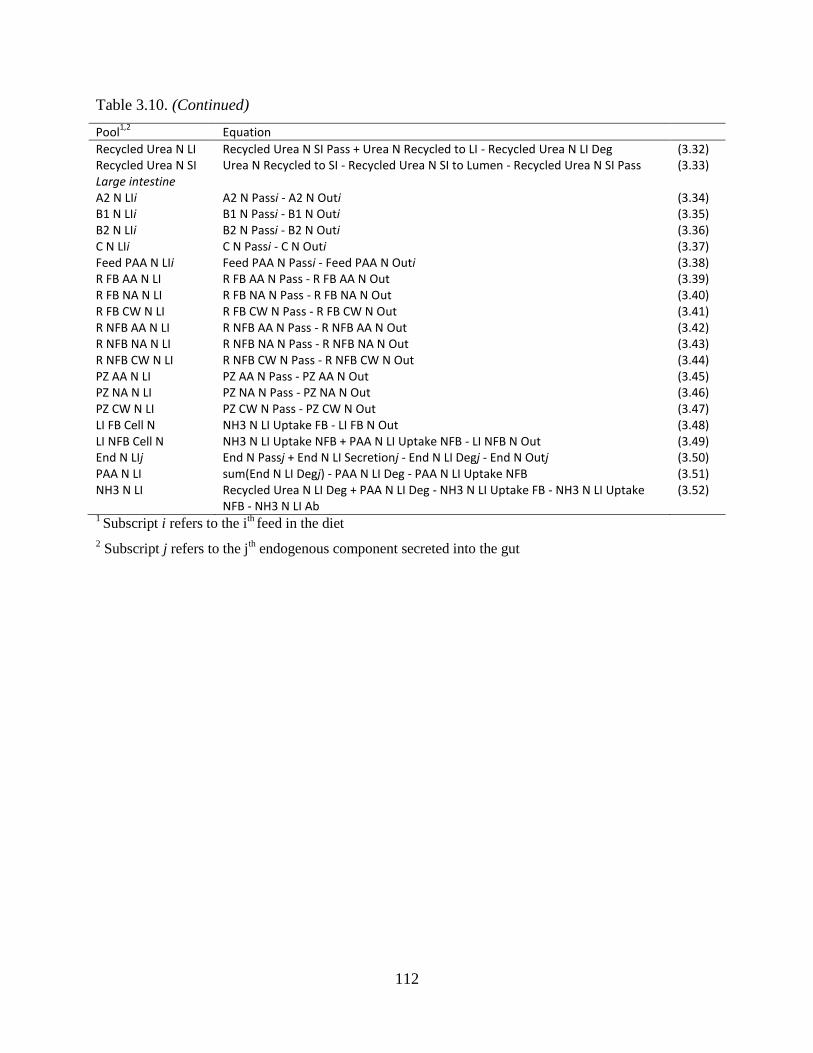
112
Table 3.10. (Continued)
Pool1,2
Equation
Recycled Urea N LI Recycled Urea N SI Pass + Urea N Recycled to LI - Recycled Urea N LI Deg (3.32) Recycled Urea N SI Urea N Recycled to SI - Recycled Urea N SI to Lumen - Recycled Urea N SI Pass (3.33) Large intestine A2 N LIi A2 N Passi - A2 N Outi (3.34) B1 N LIi B1 N Passi - B1 N Outi (3.35) B2 N LIi B2 N Passi - B2 N Outi (3.36) C N LIi C N Passi - C N Outi (3.37) Feed PAA N LIi Feed PAA N Passi - Feed PAA N Outi (3.38) R FB AA N LI R FB AA N Pass - R FB AA N Out (3.39) R FB NA N LI R FB NA N Pass - R FB NA N Out (3.40) R FB CW N LI R FB CW N Pass - R FB CW N Out (3.41) R NFB AA N LI R NFB AA N Pass - R NFB AA N Out (3.42) R NFB NA N LI R NFB NA N Pass - R NFB NA N Out (3.43) R NFB CW N LI R NFB CW N Pass - R NFB CW N Out (3.44) PZ AA N LI PZ AA N Pass - PZ AA N Out (3.45) PZ NA N LI PZ NA N Pass - PZ NA N Out (3.46) PZ CW N LI PZ CW N Pass - PZ CW N Out (3.47) LI FB Cell N NH3 N LI Uptake FB - LI FB N Out (3.48) LI NFB Cell N NH3 N LI Uptake NFB + PAA N LI Uptake NFB - LI NFB N Out (3.49) End N LIj End N Passj + End N LI Secretionj - End N LI Degj - End N Outj (3.50) PAA N LI sum(End N LI Degj) - PAA N LI Deg - PAA N LI Uptake NFB (3.51) NH3 N LI Recycled Urea N LI Deg + PAA N LI Deg - NH3 N LI Uptake FB - NH3 N LI Uptake
NFB - NH3 N LI Ab (3.52)
1 Subscript i refers to the i
th feed in the diet
2 Subscript j refers to the j
th endogenous component secreted into the gut
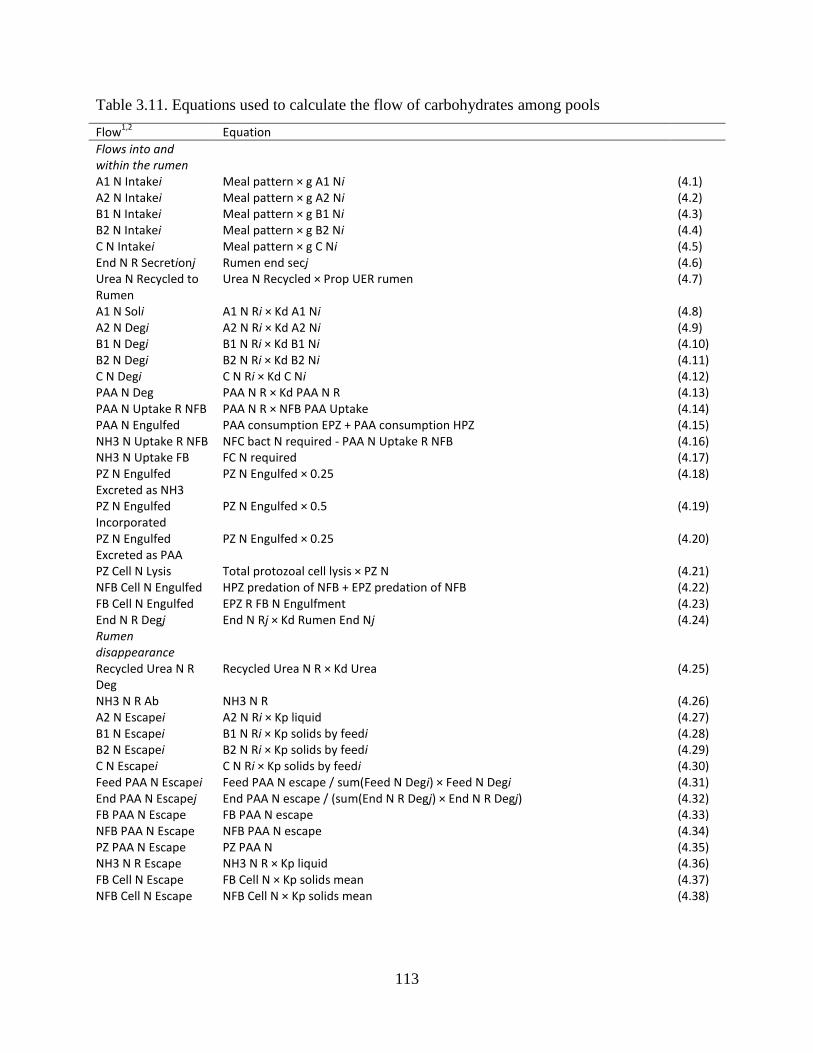
113
Table 3.11. Equations used to calculate the flow of carbohydrates among pools
Flow1,2
Equation
Flows into and within the rumen
A1 N Intakei Meal pattern × g A1 Ni (4.1) A2 N Intakei Meal pattern × g A2 Ni (4.2) B1 N Intakei Meal pattern × g B1 Ni (4.3) B2 N Intakei Meal pattern × g B2 Ni (4.4) C N Intakei Meal pattern × g C Ni (4.5) End N R Secretionj Rumen end secj (4.6) Urea N Recycled to Rumen
Urea N Recycled × Prop UER rumen (4.7)
A1 N Soli A1 N Ri × Kd A1 Ni (4.8) A2 N Degi A2 N Ri × Kd A2 Ni (4.9) B1 N Degi B1 N Ri × Kd B1 Ni (4.10) B2 N Degi B2 N Ri × Kd B2 Ni (4.11) C N Degi C N Ri × Kd C Ni (4.12) PAA N Deg PAA N R × Kd PAA N R (4.13) PAA N Uptake R NFB PAA N R × NFB PAA Uptake (4.14) PAA N Engulfed PAA consumption EPZ + PAA consumption HPZ (4.15) NH3 N Uptake R NFB NFC bact N required - PAA N Uptake R NFB (4.16) NH3 N Uptake FB FC N required (4.17) PZ N Engulfed Excreted as NH3
PZ N Engulfed × 0.25 (4.18)
PZ N Engulfed Incorporated
PZ N Engulfed × 0.5 (4.19)
PZ N Engulfed Excreted as PAA
PZ N Engulfed × 0.25 (4.20)
PZ Cell N Lysis Total protozoal cell lysis × PZ N (4.21) NFB Cell N Engulfed HPZ predation of NFB + EPZ predation of NFB (4.22) FB Cell N Engulfed EPZ R FB N Engulfment (4.23) End N R Degj End N Rj × Kd Rumen End Nj (4.24) Rumen disappearance
Recycled Urea N R Deg
Recycled Urea N R × Kd Urea (4.25)
NH3 N R Ab NH3 N R (4.26) A2 N Escapei A2 N Ri × Kp liquid (4.27) B1 N Escapei B1 N Ri × Kp solids by feedi (4.28) B2 N Escapei B2 N Ri × Kp solids by feedi (4.29) C N Escapei C N Ri × Kp solids by feedi (4.30) Feed PAA N Escapei Feed PAA N escape / sum(Feed N Degi) × Feed N Degi (4.31) End PAA N Escapej End PAA N escape / (sum(End N R Degj) × End N R Degj) (4.32) FB PAA N Escape FB PAA N escape (4.33) NFB PAA N Escape NFB PAA N escape (4.34) PZ PAA N Escape PZ PAA N (4.35) NH3 N R Escape NH3 N R × Kp liquid (4.36) FB Cell N Escape FB Cell N × Kp solids mean (4.37) NFB Cell N Escape NFB Cell N × Kp solids mean (4.38)
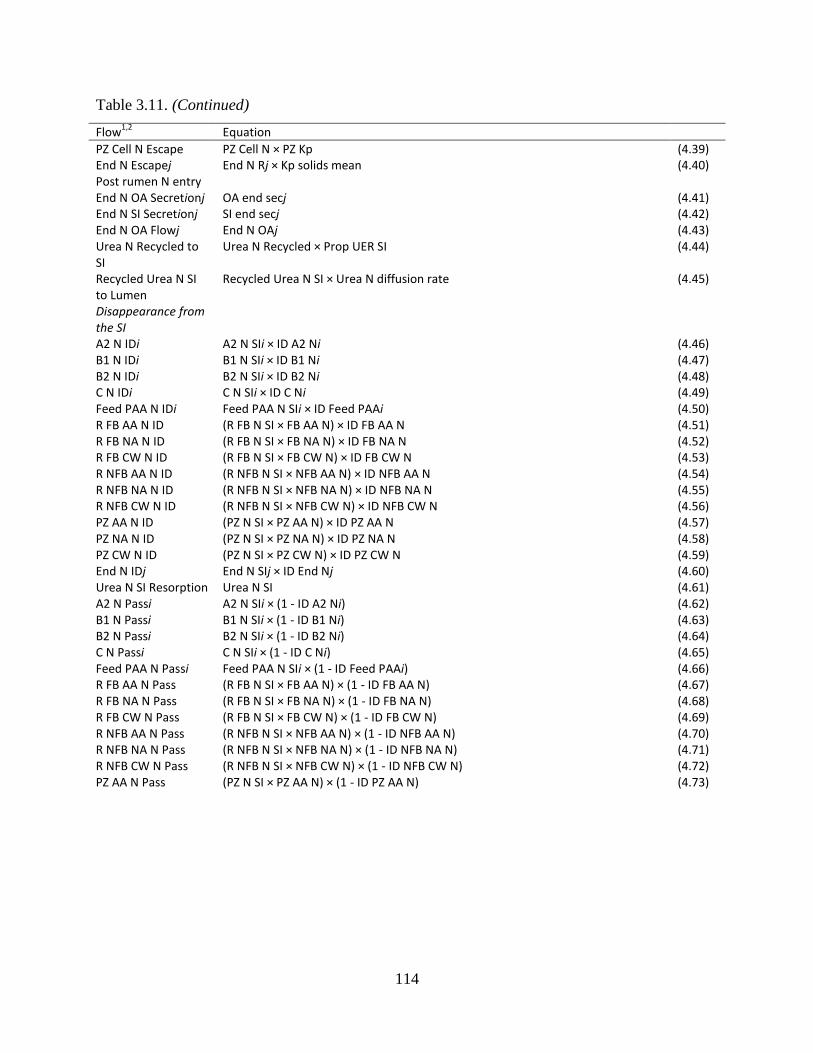
114
Table 3.11. (Continued)
Flow1,2
Equation
PZ Cell N Escape PZ Cell N × PZ Kp (4.39) End N Escapej End N Rj × Kp solids mean (4.40) Post rumen N entry End N OA Secretionj OA end secj (4.41) End N SI Secretionj SI end secj (4.42) End N OA Flowj End N OAj (4.43) Urea N Recycled to SI
Urea N Recycled × Prop UER SI (4.44)
Recycled Urea N SI to Lumen
Recycled Urea N SI × Urea N diffusion rate (4.45)
Disappearance from the SI
A2 N IDi A2 N SIi × ID A2 Ni (4.46) B1 N IDi B1 N SIi × ID B1 Ni (4.47) B2 N IDi B2 N SIi × ID B2 Ni (4.48) C N IDi C N SIi × ID C Ni (4.49) Feed PAA N IDi Feed PAA N SIi × ID Feed PAAi (4.50) R FB AA N ID (R FB N SI × FB AA N) × ID FB AA N (4.51) R FB NA N ID (R FB N SI × FB NA N) × ID FB NA N (4.52) R FB CW N ID (R FB N SI × FB CW N) × ID FB CW N (4.53) R NFB AA N ID (R NFB N SI × NFB AA N) × ID NFB AA N (4.54) R NFB NA N ID (R NFB N SI × NFB NA N) × ID NFB NA N (4.55) R NFB CW N ID (R NFB N SI × NFB CW N) × ID NFB CW N (4.56) PZ AA N ID (PZ N SI × PZ AA N) × ID PZ AA N (4.57) PZ NA N ID (PZ N SI × PZ NA N) × ID PZ NA N (4.58) PZ CW N ID (PZ N SI × PZ CW N) × ID PZ CW N (4.59) End N IDj End N SIj × ID End Nj (4.60) Urea N SI Resorption Urea N SI (4.61) A2 N Passi A2 N SIi × (1 - ID A2 Ni) (4.62) B1 N Passi B1 N SIi × (1 - ID B1 Ni) (4.63) B2 N Passi B2 N SIi × (1 - ID B2 Ni) (4.64) C N Passi C N SIi × (1 - ID C Ni) (4.65) Feed PAA N Passi Feed PAA N SIi × (1 - ID Feed PAAi) (4.66) R FB AA N Pass (R FB N SI × FB AA N) × (1 - ID FB AA N) (4.67) R FB NA N Pass (R FB N SI × FB NA N) × (1 - ID FB NA N) (4.68) R FB CW N Pass (R FB N SI × FB CW N) × (1 - ID FB CW N) (4.69) R NFB AA N Pass (R NFB N SI × NFB AA N) × (1 - ID NFB AA N) (4.70) R NFB NA N Pass (R NFB N SI × NFB NA N) × (1 - ID NFB NA N) (4.71) R NFB CW N Pass (R NFB N SI × NFB CW N) × (1 - ID NFB CW N) (4.72) PZ AA N Pass (PZ N SI × PZ AA N) × (1 - ID PZ AA N) (4.73)
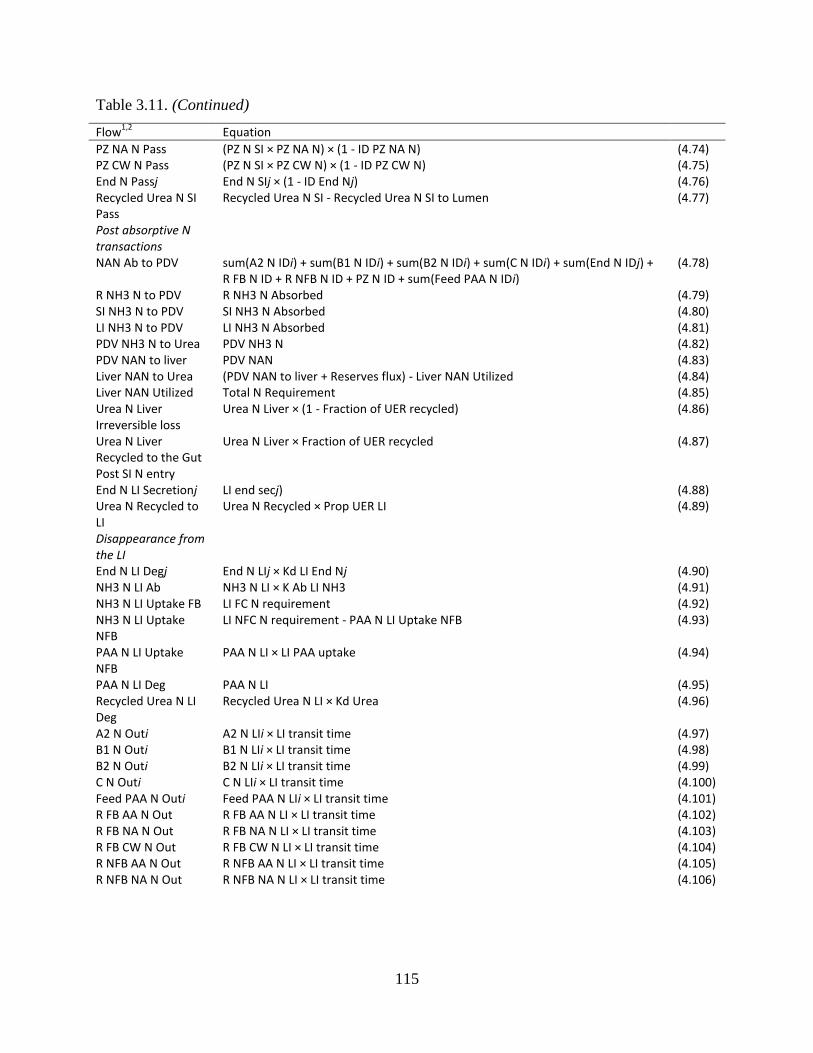
115
Table 3.11. (Continued)
Flow1,2
Equation
PZ NA N Pass (PZ N SI × PZ NA N) × (1 - ID PZ NA N) (4.74) PZ CW N Pass (PZ N SI × PZ CW N) × (1 - ID PZ CW N) (4.75) End N Passj End N SIj × (1 - ID End Nj) (4.76) Recycled Urea N SI Pass
Recycled Urea N SI - Recycled Urea N SI to Lumen (4.77)
Post absorptive N transactions
NAN Ab to PDV sum(A2 N IDi) + sum(B1 N IDi) + sum(B2 N IDi) + sum(C N IDi) + sum(End N IDj) + R FB N ID + R NFB N ID + PZ N ID + sum(Feed PAA N IDi)
(4.78)
R NH3 N to PDV R NH3 N Absorbed (4.79) SI NH3 N to PDV SI NH3 N Absorbed (4.80) LI NH3 N to PDV LI NH3 N Absorbed (4.81) PDV NH3 N to Urea PDV NH3 N (4.82) PDV NAN to liver PDV NAN (4.83) Liver NAN to Urea (PDV NAN to liver + Reserves flux) - Liver NAN Utilized (4.84) Liver NAN Utilized Total N Requirement (4.85) Urea N Liver Irreversible loss
Urea N Liver × (1 - Fraction of UER recycled) (4.86)
Urea N Liver Recycled to the Gut
Urea N Liver × Fraction of UER recycled (4.87)
Post SI N entry End N LI Secretionj LI end secj) (4.88) Urea N Recycled to LI
Urea N Recycled × Prop UER LI (4.89)
Disappearance from the LI
End N LI Degj End N LIj × Kd LI End Nj (4.90) NH3 N LI Ab NH3 N LI × K Ab LI NH3 (4.91) NH3 N LI Uptake FB LI FC N requirement (4.92) NH3 N LI Uptake NFB
LI NFC N requirement - PAA N LI Uptake NFB (4.93)
PAA N LI Uptake NFB
PAA N LI × LI PAA uptake (4.94)
PAA N LI Deg PAA N LI (4.95) Recycled Urea N LI Deg
Recycled Urea N LI × Kd Urea (4.96)
A2 N Outi A2 N LIi × LI transit time (4.97) B1 N Outi B1 N LIi × LI transit time (4.98) B2 N Outi B2 N LIi × LI transit time (4.99) C N Outi C N LIi × LI transit time (4.100) Feed PAA N Outi Feed PAA N LIi × LI transit time (4.101) R FB AA N Out R FB AA N LI × LI transit time (4.102) R FB NA N Out R FB NA N LI × LI transit time (4.103) R FB CW N Out R FB CW N LI × LI transit time (4.104) R NFB AA N Out R NFB AA N LI × LI transit time (4.105) R NFB NA N Out R NFB NA N LI × LI transit time (4.106)
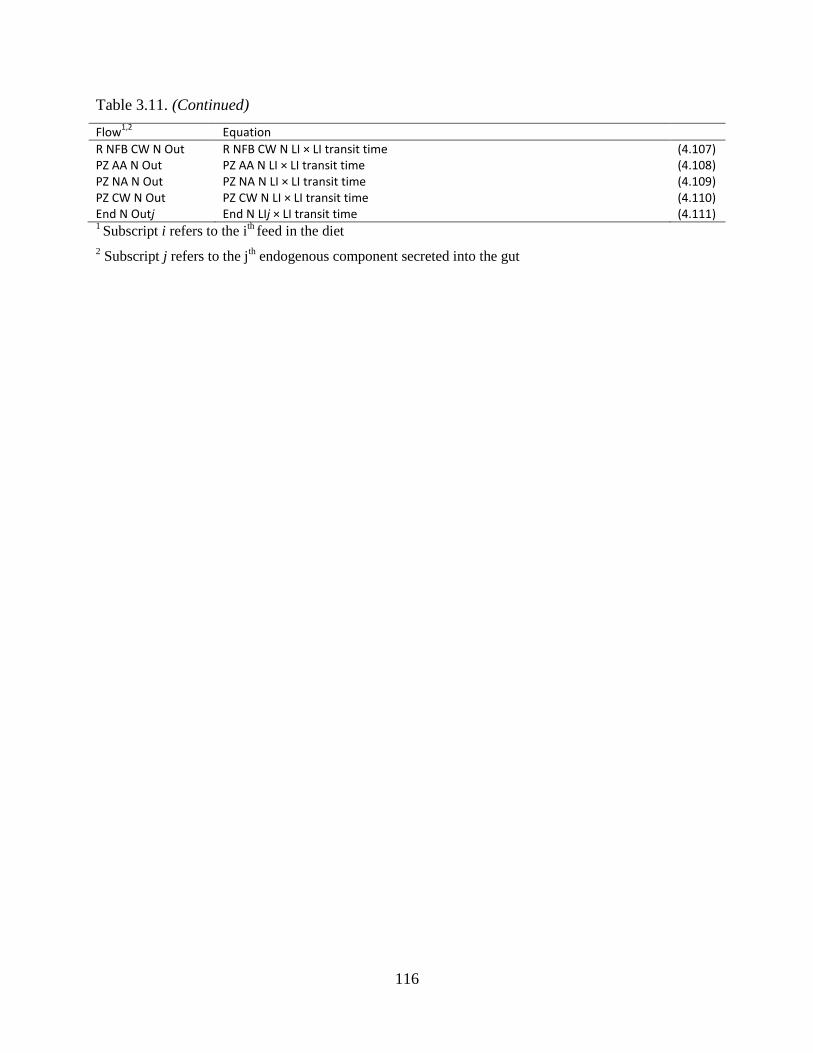
116
Table 3.11. (Continued)
Flow1,2
Equation
R NFB CW N Out R NFB CW N LI × LI transit time (4.107) PZ AA N Out PZ AA N LI × LI transit time (4.108) PZ NA N Out PZ NA N LI × LI transit time (4.109) PZ CW N Out PZ CW N LI × LI transit time (4.110) End N Outj End N LIj × LI transit time (4.111) 1 Subscript i refers to the i
th feed in the diet
2 Subscript j refers to the j
th endogenous component secreted into the gut

117
CHAPTER 4: DEVELOPING A DYNAMIC VERSION OF THE CORNELL NET
CARBOHYDRATE AND PROTEIN SYSTEM: MICROBIAL GROWTH
4.1 Abstract
The Cornell Net Carbohydrate and Protein System (CNCPS) includes a mechanistic model to
predict rumen fermentation and microbial growth. Previous versions of the CNCPS have
included the effects of protozoa indirectly by reducing the theoretical maximum growth yield of
bacteria to simulate predation. A new dynamic version of the CNPCS was constructed in the
modeling software Vensim® and includes protozoa mechanistically within the model. Bacterial
growth follows the same assumptions used in previous versions of the CNCPS where bacteria are
characterized as fermenting either fiber or non-fiber CHO, growth is CHO driven and related to
the rate of digestion and fermented substrates are used for the purposes of maintenance and
growth. The model assumes protozoal growth is also CHO driven and that protozoa consume
sugar, starch, soluble fiber, neutral detergent fiber and bacteria. Carbohydrate digestion by
protozoa follows a sequence of engulfment then digestion followed by partitioning of the
digested material between maintenance and growth. Engulfment is restricted when the ratio of
engulfed CHO to cell mass exceeds 1.8 g per g cells and typically ranges from 0.46 to 0.97 g
CHO g-1
protozoal cells hr-1
at steady state. Carbohydrate digestion is calculated relative to the
size of the engulfed pool and is assumed to be half the rate of bacterial digestion for each CHO
source. Typical digestion rates range from 0.16 – 0.30 g CHO g-1
protozoal cells hr-1
. Pool sizes
of protozoa in the rumen are smaller when dry matter intake is high (25 kg DMI/d; 4 – 9% of
microbial N) and larger when DMI is low (15 kg DMI/d; 10 – 25% of microbial N) and this
behavior is linked to the rate of passage out of the rumen. Protozoa consume N at double the rate
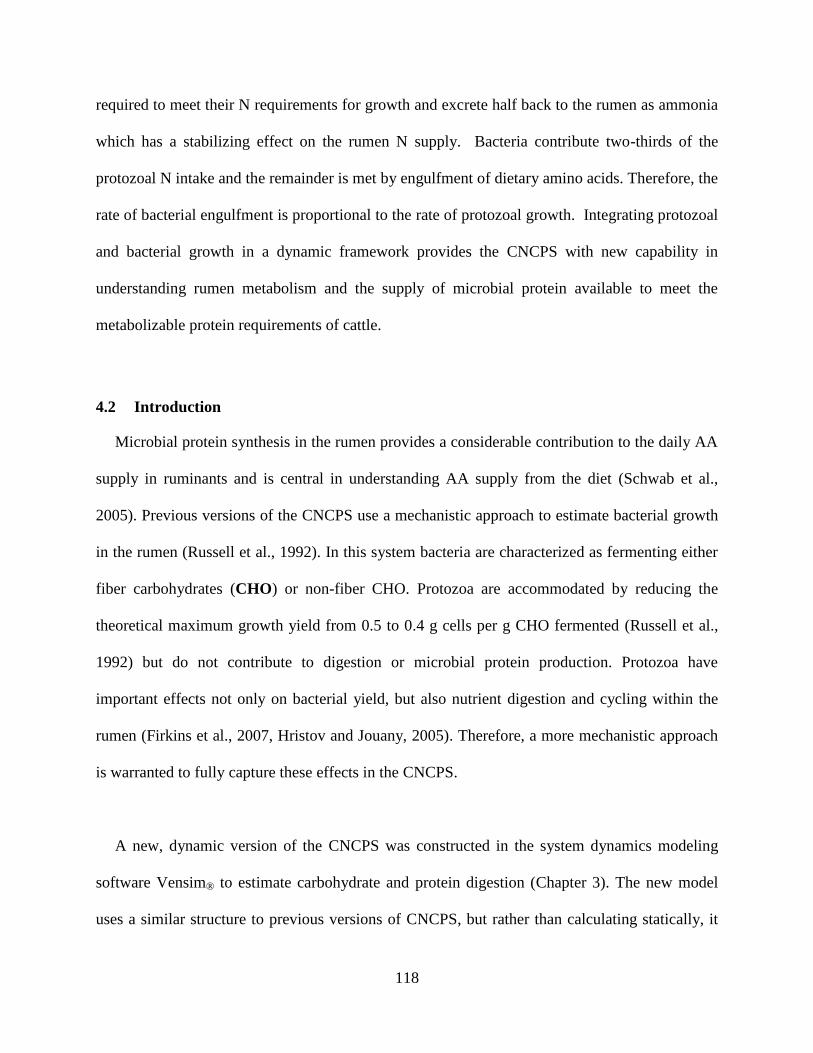
118
required to meet their N requirements for growth and excrete half back to the rumen as ammonia
which has a stabilizing effect on the rumen N supply. Bacteria contribute two-thirds of the
protozoal N intake and the remainder is met by engulfment of dietary amino acids. Therefore, the
rate of bacterial engulfment is proportional to the rate of protozoal growth. Integrating protozoal
and bacterial growth in a dynamic framework provides the CNCPS with new capability in
understanding rumen metabolism and the supply of microbial protein available to meet the
metabolizable protein requirements of cattle.
4.2 Introduction
Microbial protein synthesis in the rumen provides a considerable contribution to the daily AA
supply in ruminants and is central in understanding AA supply from the diet (Schwab et al.,
2005). Previous versions of the CNCPS use a mechanistic approach to estimate bacterial growth
in the rumen (Russell et al., 1992). In this system bacteria are characterized as fermenting either
fiber carbohydrates (CHO) or non-fiber CHO. Protozoa are accommodated by reducing the
theoretical maximum growth yield from 0.5 to 0.4 g cells per g CHO fermented (Russell et al.,
1992) but do not contribute to digestion or microbial protein production. Protozoa have
important effects not only on bacterial yield, but also nutrient digestion and cycling within the
rumen (Firkins et al., 2007, Hristov and Jouany, 2005). Therefore, a more mechanistic approach
is warranted to fully capture these effects in the CNCPS.
A new, dynamic version of the CNCPS was constructed in the system dynamics modeling
software Vensim® to estimate carbohydrate and protein digestion (Chapter 3). The new model
uses a similar structure to previous versions of CNCPS, but rather than calculating statically, it
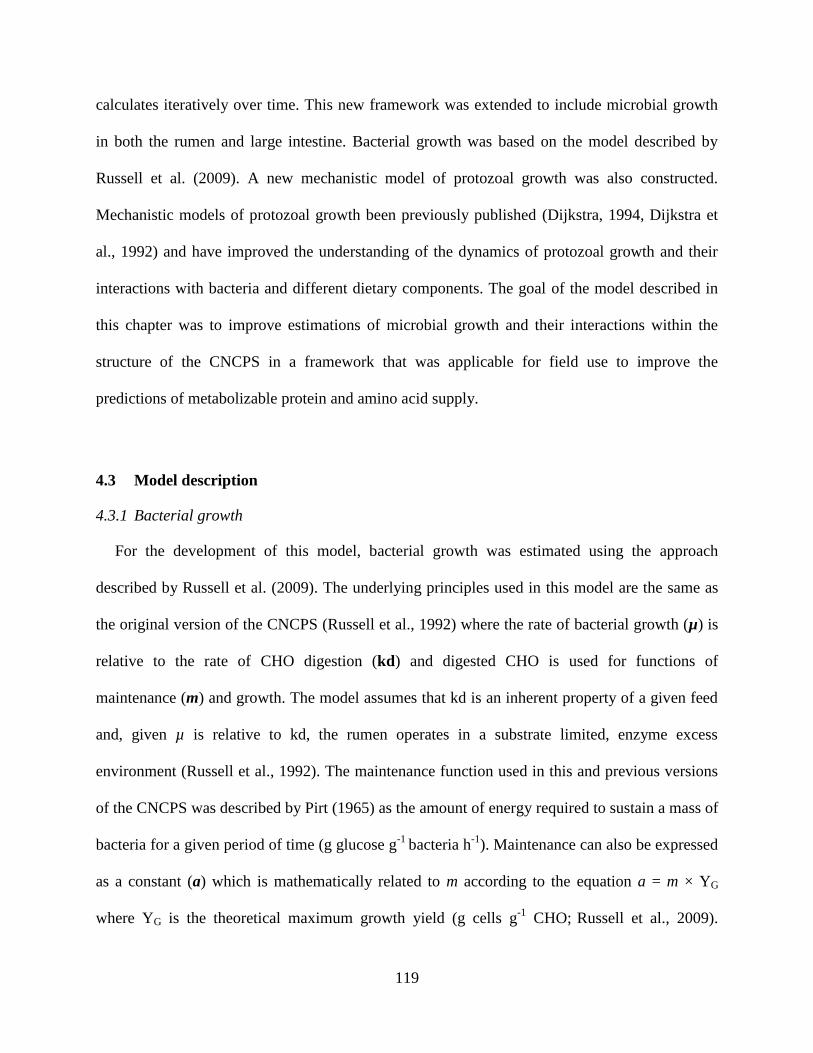
119
calculates iteratively over time. This new framework was extended to include microbial growth
in both the rumen and large intestine. Bacterial growth was based on the model described by
Russell et al. (2009). A new mechanistic model of protozoal growth was also constructed.
Mechanistic models of protozoal growth been previously published (Dijkstra, 1994, Dijkstra et
al., 1992) and have improved the understanding of the dynamics of protozoal growth and their
interactions with bacteria and different dietary components. The goal of the model described in
this chapter was to improve estimations of microbial growth and their interactions within the
structure of the CNCPS in a framework that was applicable for field use to improve the
predictions of metabolizable protein and amino acid supply.
4.3 Model description
4.3.1 Bacterial growth
For the development of this model, bacterial growth was estimated using the approach
described by Russell et al. (2009). The underlying principles used in this model are the same as
the original version of the CNCPS (Russell et al., 1992) where the rate of bacterial growth (µ) is
relative to the rate of CHO digestion (kd) and digested CHO is used for functions of
maintenance (m) and growth. The model assumes that kd is an inherent property of a given feed
and, given µ is relative to kd, the rumen operates in a substrate limited, enzyme excess
environment (Russell et al., 1992). The maintenance function used in this and previous versions
of the CNCPS was described by Pirt (1965) as the amount of energy required to sustain a mass of
bacteria for a given period of time (g glucose g-1
bacteria h-1
). Maintenance can also be expressed
as a constant (a) which is mathematically related to m according to the equation a = m × YG
where YG is the theoretical maximum growth yield (g cells g-1
CHO;(Russell et al., 2009).
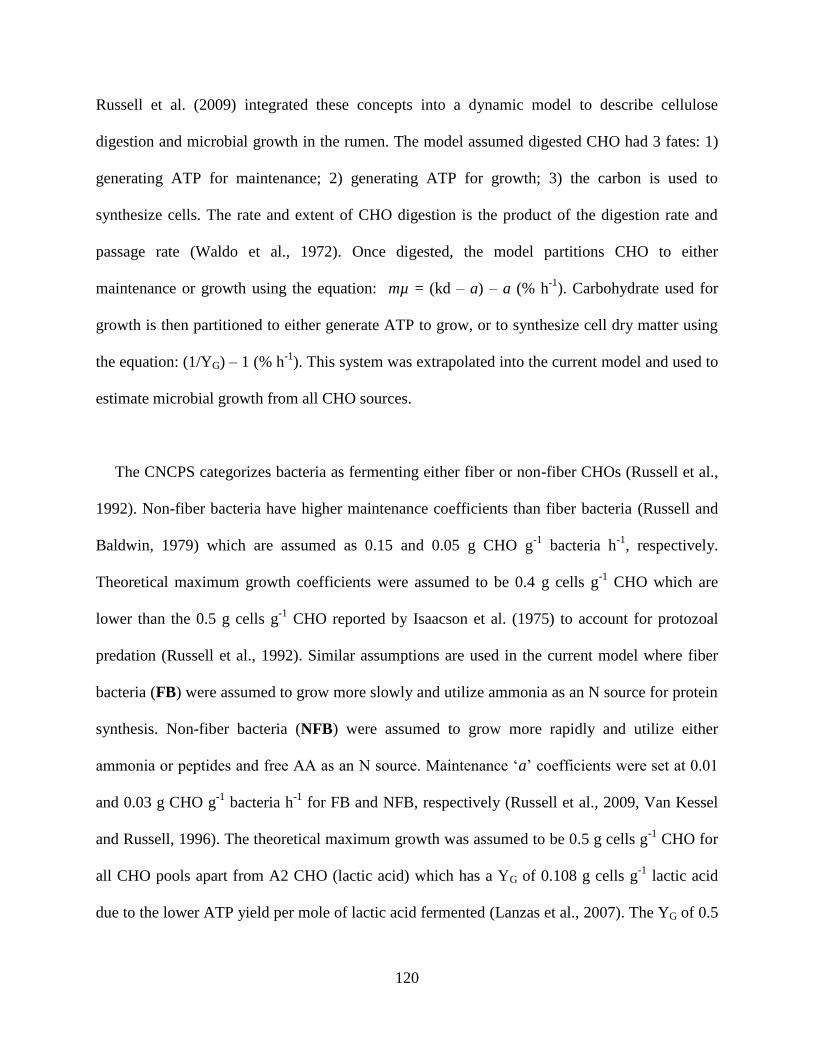
120
Russell et al. (2009) integrated these concepts into a dynamic model to describe cellulose
digestion and microbial growth in the rumen. The model assumed digested CHO had 3 fates: 1)
generating ATP for maintenance; 2) generating ATP for growth; 3) the carbon is used to
synthesize cells. The rate and extent of CHO digestion is the product of the digestion rate and
passage rate (Waldo et al., 1972). Once digested, the model partitions CHO to either
maintenance or growth using the equation: mµ = (kd – a) – a (% h-1
). Carbohydrate used for
growth is then partitioned to either generate ATP to grow, or to synthesize cell dry matter using
the equation: (1/YG) – 1 (% h-1
). This system was extrapolated into the current model and used to
estimate microbial growth from all CHO sources.
The CNCPS categorizes bacteria as fermenting either fiber or non-fiber CHOs (Russell et al.,
1992). Non-fiber bacteria have higher maintenance coefficients than fiber bacteria (Russell and
Baldwin, 1979) which are assumed as 0.15 and 0.05 g CHO g-1
bacteria h-1
, respectively.
Theoretical maximum growth coefficients were assumed to be 0.4 g cells g-1
CHO which are
lower than the 0.5 g cells g-1
CHO reported by Isaacson et al. (1975) to account for protozoal
predation (Russell et al., 1992). Similar assumptions are used in the current model where fiber
bacteria (FB) were assumed to grow more slowly and utilize ammonia as an N source for protein
synthesis. Non-fiber bacteria (NFB) were assumed to grow more rapidly and utilize either
ammonia or peptides and free AA as an N source. Maintenance ‘a’ coefficients were set at 0.01
and 0.03 g CHO g-1
bacteria h-1
for FB and NFB, respectively (Russell et al., 2009, Van Kessel
and Russell, 1996). The theoretical maximum growth was assumed to be 0.5 g cells g-1
CHO for
all CHO pools apart from A2 CHO (lactic acid) which has a YG of 0.108 g cells g-1
lactic acid
due to the lower ATP yield per mole of lactic acid fermented (Lanzas et al., 2007). The YG of 0.5
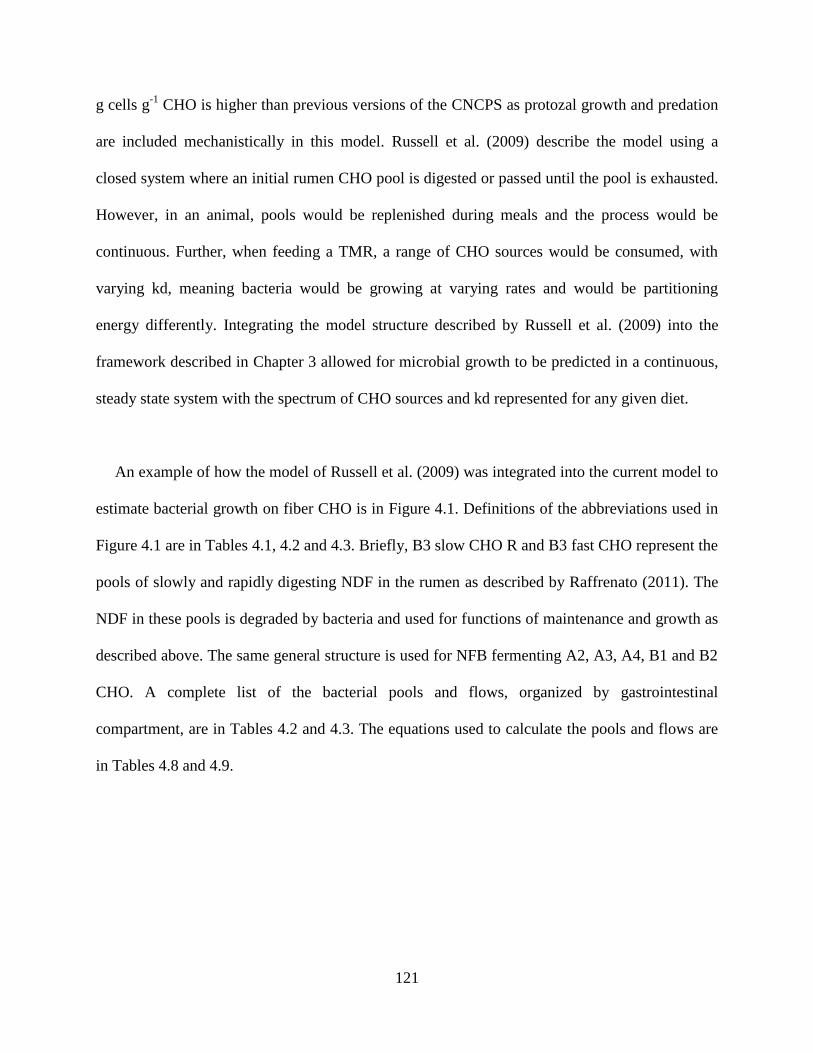
121
g cells g-1
CHO is higher than previous versions of the CNCPS as protozal growth and predation
are included mechanistically in this model. Russell et al. (2009) describe the model using a
closed system where an initial rumen CHO pool is digested or passed until the pool is exhausted.
However, in an animal, pools would be replenished during meals and the process would be
continuous. Further, when feeding a TMR, a range of CHO sources would be consumed, with
varying kd, meaning bacteria would be growing at varying rates and would be partitioning
energy differently. Integrating the model structure described by Russell et al. (2009) into the
framework described in Chapter 3 allowed for microbial growth to be predicted in a continuous,
steady state system with the spectrum of CHO sources and kd represented for any given diet.
An example of how the model of Russell et al. (2009) was integrated into the current model to
estimate bacterial growth on fiber CHO is in Figure 4.1. Definitions of the abbreviations used in
Figure 4.1 are in Tables 4.1, 4.2 and 4.3. Briefly, B3 slow CHO R and B3 fast CHO represent the
pools of slowly and rapidly digesting NDF in the rumen as described by Raffrenato (2011). The
NDF in these pools is degraded by bacteria and used for functions of maintenance and growth as
described above. The same general structure is used for NFB fermenting A2, A3, A4, B1 and B2
CHO. A complete list of the bacterial pools and flows, organized by gastrointestinal
compartment, are in Tables 4.2 and 4.3. The equations used to calculate the pools and flows are
in Tables 4.8 and 4.9.
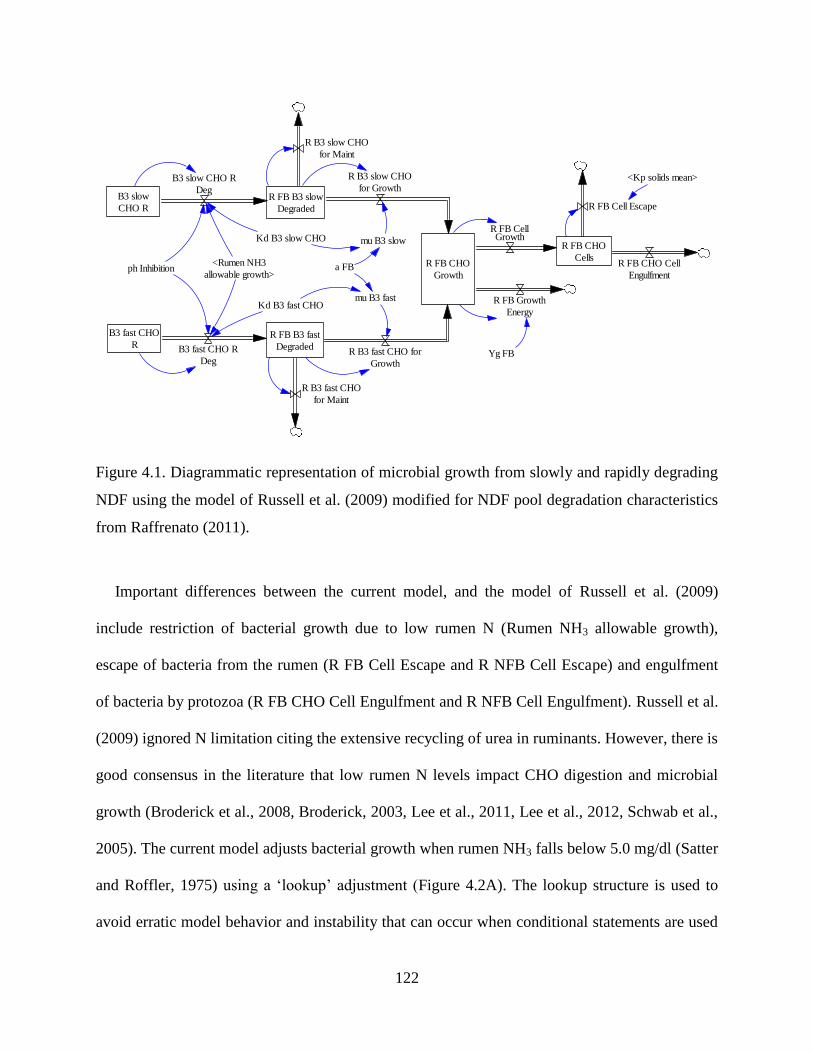
122
Figure 4.1. Diagrammatic representation of microbial growth from slowly and rapidly degrading
NDF using the model of Russell et al. (2009) modified for NDF pool degradation characteristics
from Raffrenato (2011).
Important differences between the current model, and the model of Russell et al. (2009)
include restriction of bacterial growth due to low rumen N (Rumen NH3 allowable growth),
escape of bacteria from the rumen (R FB Cell Escape and R NFB Cell Escape) and engulfment
of bacteria by protozoa (R FB CHO Cell Engulfment and R NFB Cell Engulfment). Russell et al.
(2009) ignored N limitation citing the extensive recycling of urea in ruminants. However, there is
good consensus in the literature that low rumen N levels impact CHO digestion and microbial
growth (Broderick et al., 2008, Broderick, 2003, Lee et al., 2011, Lee et al., 2012, Schwab et al.,
2005). The current model adjusts bacterial growth when rumen NH3 falls below 5.0 mg/dl (Satter
and Roffler, 1975) using a ‘lookup’ adjustment (Figure 4.2A). The lookup structure is used to
avoid erratic model behavior and instability that can occur when conditional statements are used
B3 fast CHO
R
R FB B3 slow
Degraded
R FB CHO
Growth
R FB CHO
Cells
R B3 slow CHO
for Maint
R FB Growth
Energy
R FB CellGrowth
Kd B3 fast CHO
a FB
R B3 slow CHO
for Growth
mu B3 slow
ph Inhibition
B3 fast CHO R
Deg
B3 slow
CHO R
B3 slow CHO R
Deg
Kd B3 slow CHO
Yg FB
<Rumen NH3
allowable growth>R FB CHO Cell
Engulfment
R FB Cell Escape
<Kp solids mean>
R B3 fast CHO for
Growth
mu B3 fast
R B3 fast CHO
for Maint
R FB B3 fast
Degraded
123
(Sterman, 2000). Different aspects of growth were adjusted for FB and NFB, respectively. Fiber
digestion appears more directly affected by low rumen N than the digestion of non-fiber CHO
(Hoover, 1986). This is evident through lower apparent total tract NDF digestion in cows fed
adequate and restricted protein diets, respectively (Broderick et al., 2008, Broderick, 2003, Lee
et al., 2011, Lee et al., 2012). To replicate this behavior in the model, fiber kd was multiplied by
the adjustment factor in Figure 4.2A corresponding to the concentration of rumen NH3-N which
reduced the rate of rumen digestion, microbial growth, and increased NDF passage to the lower
gastrointestinal compartments (see Figure 4.1). Non-fiber bacteria were assumed to digest CHO
at the same rate, but lower their growth efficiency through energy spilling reactions (Van Kessel
and Russell, 1996). To replicate this behavior, the proportion of energy used to generate NFB
cells was reduced, again using the adjustment in Figure 4.2A. This indirectly lowered YG which
increased the energy required to grow, effectively spilling energy. The stimulatory effects of
peptide utilization on bacterial growth efficiency were also included (Figure 4.2B), similar to
previous versions of the CNCPS (Russell et al., 1992). However, rather than expressing yield
improvement relative to the ratio of AA to total organic matter, the ratio of NH3 utilization
relative to AA utilization was used (Russell and Sniffen, 1984). Nitrogen uptake by bacteria in
the rumen is calculated by multiplying the rate of cell growth by the N content of the cell DM. It
is assumed the proportion of pre-formed AA uptake by NFB is relative to availability. Therefore,
the ratio of peptide and free AA N (PAA N R) in the rumen to ammonia (NH3) determines the
AA uptake rate of NFB. An important feedback loop exists where N uptake is modulated by
reducing cell growth when rumen NH3 drops below 5.0 mg/dl (Figure 4.2A), thereby reducing
demand. In Vensim, a feedback loop is what defines an interaction between two or more
variables. The effect of pH was modeled using the lookup adjustment in Russell et al. (2009).
124
Prediction of pH was calculated using the equations in Fox et al. (2004). Bacterial cells were
assumed to disappear from the rumen either through escape or by protozoal engulfment as
discussed in Section 4.3.2.
Bacteria passing through into the small intestine were partitioned according to their chemical
composition and digested as described in Chapter 3. Bacterial growth in the large intestine uses
the same growth kinetics and assumptions as the rumen. The transit time through the large
intestine is assumed to be 7 hours (kp = 14 % h-1
) as explained in Chapter 3. The N for microbial
growth in the large intestine comes from either urea recycled directly into the intestine or
flowing through from the small intestine and includes endogenous gastrointestinal secretions.

125
Figure 4.2. Lookup factors used to adjust microbial growth for rumen ammonia (A) and AA N
use (B). Microbial cell growth is adjusted when rumen NH3-N is < 5.0 mg/dl (X axis; A) using
the corresponding adjustment factor on the Y axis. Similarly, bacterial growth yield is increased
according to the ratio of AA N and NH3 N (X axis). Growth yield increases from 100% of the
expected yield when NH3-N provides 100% of the growth N to a maximum of 118% of the
expected yield when AA N provides >87% of the growth N. Both adjustments are made
dynamically during the simulation.
0.0
0.2
0.4
0.6
0.8
1.0
0.0 1.0 2.0 3.0 4.0 5.0 6.0
Ad
just
men
t fa
cto
r
Rumen NH3-N concentration (mg/dl)
(A)
0.00
0.04
0.08
0.12
0.16
0.20
0.00 0.36 0.60 0.72 0.87 1.00
% im
pro
vmen
t in
yie
ld
Ratio AA to NH3-N utilized for growth
(B)
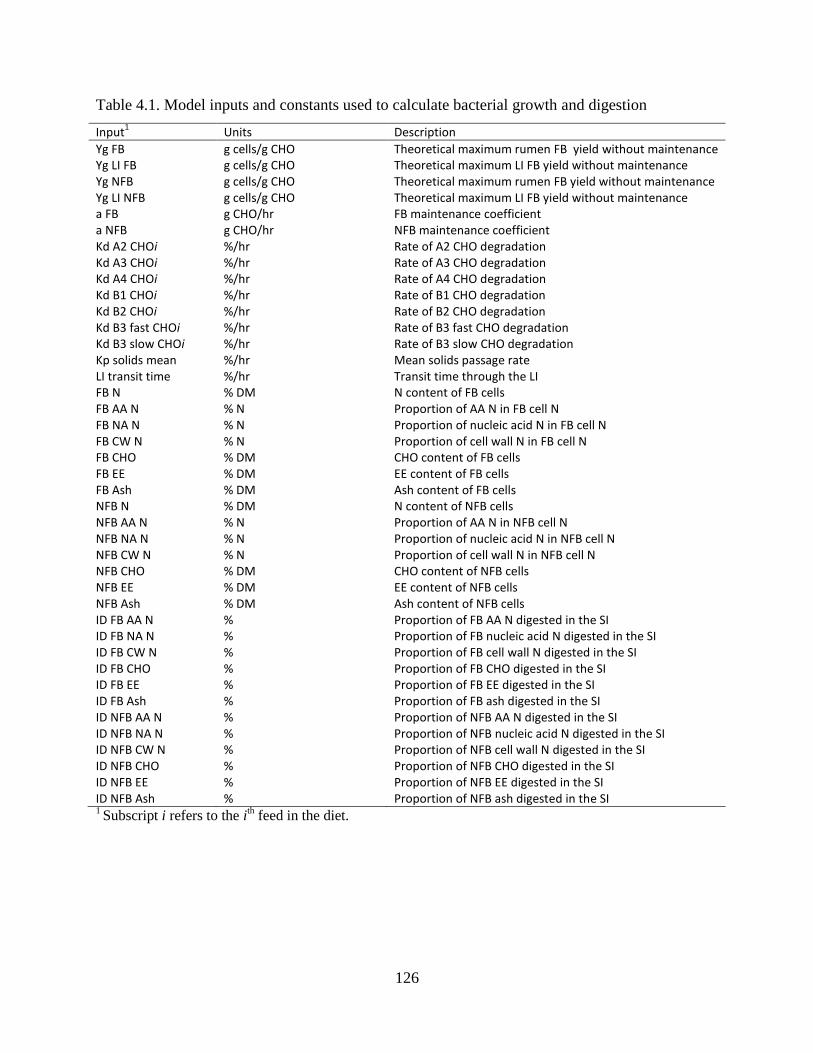
126
Table 4.1. Model inputs and constants used to calculate bacterial growth and digestion
Input1
Units Description
Yg FB g cells/g CHO Theoretical maximum rumen FB yield without maintenance Yg LI FB g cells/g CHO Theoretical maximum LI FB yield without maintenance Yg NFB g cells/g CHO Theoretical maximum rumen FB yield without maintenance Yg LI NFB g cells/g CHO Theoretical maximum LI FB yield without maintenance a FB g CHO/hr FB maintenance coefficient a NFB g CHO/hr NFB maintenance coefficient Kd A2 CHOi %/hr Rate of A2 CHO degradation Kd A3 CHOi %/hr Rate of A3 CHO degradation Kd A4 CHOi %/hr Rate of A4 CHO degradation Kd B1 CHOi %/hr Rate of B1 CHO degradation Kd B2 CHOi %/hr Rate of B2 CHO degradation Kd B3 fast CHOi %/hr Rate of B3 fast CHO degradation Kd B3 slow CHOi %/hr Rate of B3 slow CHO degradation Kp solids mean %/hr Mean solids passage rate LI transit time %/hr Transit time through the LI FB N % DM N content of FB cells FB AA N % N Proportion of AA N in FB cell N FB NA N % N Proportion of nucleic acid N in FB cell N FB CW N % N Proportion of cell wall N in FB cell N FB CHO % DM CHO content of FB cells FB EE % DM EE content of FB cells FB Ash % DM Ash content of FB cells NFB N % DM N content of NFB cells NFB AA N % N Proportion of AA N in NFB cell N NFB NA N % N Proportion of nucleic acid N in NFB cell N NFB CW N % N Proportion of cell wall N in NFB cell N NFB CHO % DM CHO content of NFB cells NFB EE % DM EE content of NFB cells NFB Ash % DM Ash content of NFB cells ID FB AA N % Proportion of FB AA N digested in the SI ID FB NA N % Proportion of FB nucleic acid N digested in the SI ID FB CW N % Proportion of FB cell wall N digested in the SI ID FB CHO % Proportion of FB CHO digested in the SI ID FB EE % Proportion of FB EE digested in the SI ID FB Ash % Proportion of FB ash digested in the SI ID NFB AA N % Proportion of NFB AA N digested in the SI ID NFB NA N % Proportion of NFB nucleic acid N digested in the SI ID NFB CW N % Proportion of NFB cell wall N digested in the SI ID NFB CHO % Proportion of NFB CHO digested in the SI ID NFB EE % Proportion of NFB EE digested in the SI ID NFB Ash % Proportion of NFB ash digested in the SI 1 Subscript i refers to the i
th feed in the diet.
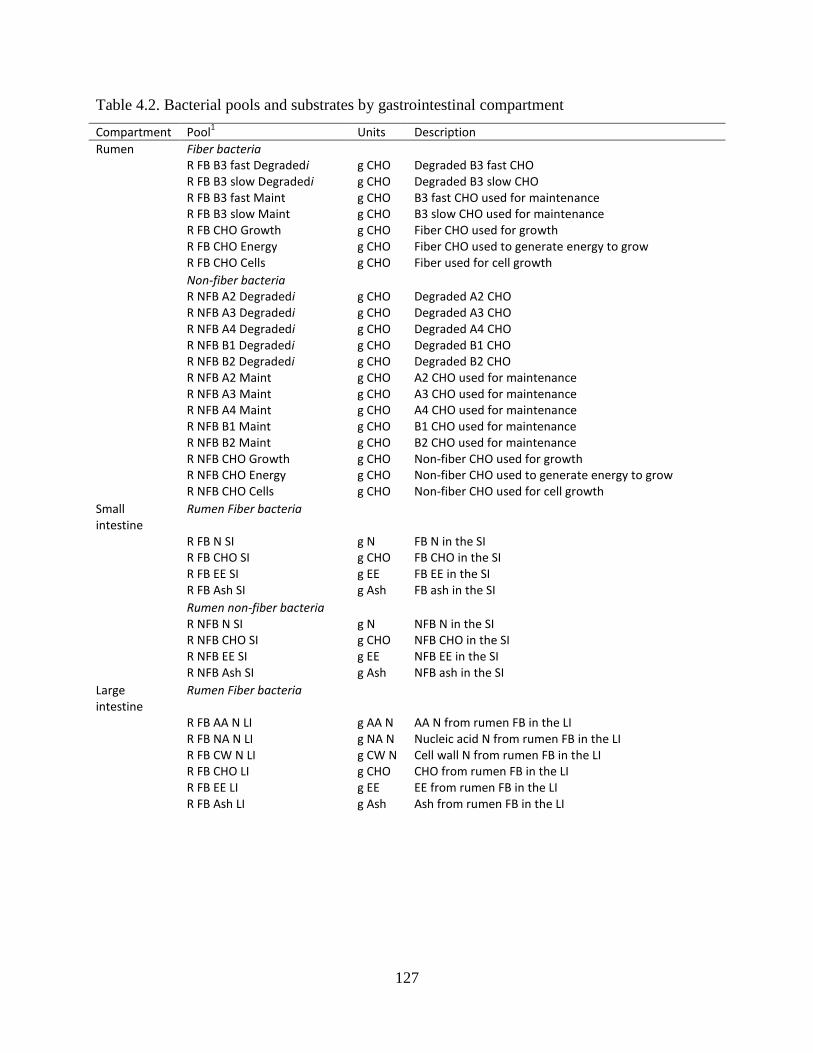
127
Table 4.2. Bacterial pools and substrates by gastrointestinal compartment
Compartment Pool1
Units Description
Rumen Fiber bacteria R FB B3 fast Degradedi g CHO Degraded B3 fast CHO R FB B3 slow Degradedi g CHO Degraded B3 slow CHO R FB B3 fast Maint g CHO B3 fast CHO used for maintenance R FB B3 slow Maint g CHO B3 slow CHO used for maintenance R FB CHO Growth g CHO Fiber CHO used for growth R FB CHO Energy g CHO Fiber CHO used to generate energy to grow R FB CHO Cells g CHO Fiber used for cell growth Non-fiber bacteria R NFB A2 Degradedi g CHO Degraded A2 CHO R NFB A3 Degradedi g CHO Degraded A3 CHO R NFB A4 Degradedi g CHO Degraded A4 CHO R NFB B1 Degradedi g CHO Degraded B1 CHO R NFB B2 Degradedi g CHO Degraded B2 CHO R NFB A2 Maint g CHO A2 CHO used for maintenance R NFB A3 Maint g CHO A3 CHO used for maintenance R NFB A4 Maint g CHO A4 CHO used for maintenance R NFB B1 Maint g CHO B1 CHO used for maintenance R NFB B2 Maint g CHO B2 CHO used for maintenance R NFB CHO Growth g CHO Non-fiber CHO used for growth R NFB CHO Energy g CHO Non-fiber CHO used to generate energy to grow R NFB CHO Cells g CHO Non-fiber CHO used for cell growth Small intestine
Rumen Fiber bacteria
R FB N SI g N FB N in the SI R FB CHO SI g CHO FB CHO in the SI R FB EE SI g EE FB EE in the SI R FB Ash SI g Ash FB ash in the SI Rumen non-fiber bacteria R NFB N SI g N NFB N in the SI R NFB CHO SI g CHO NFB CHO in the SI R NFB EE SI g EE NFB EE in the SI R NFB Ash SI g Ash NFB ash in the SI Large intestine
Rumen Fiber bacteria
R FB AA N LI g AA N AA N from rumen FB in the LI R FB NA N LI g NA N Nucleic acid N from rumen FB in the LI R FB CW N LI g CW N Cell wall N from rumen FB in the LI R FB CHO LI g CHO CHO from rumen FB in the LI R FB EE LI g EE EE from rumen FB in the LI R FB Ash LI g Ash Ash from rumen FB in the LI
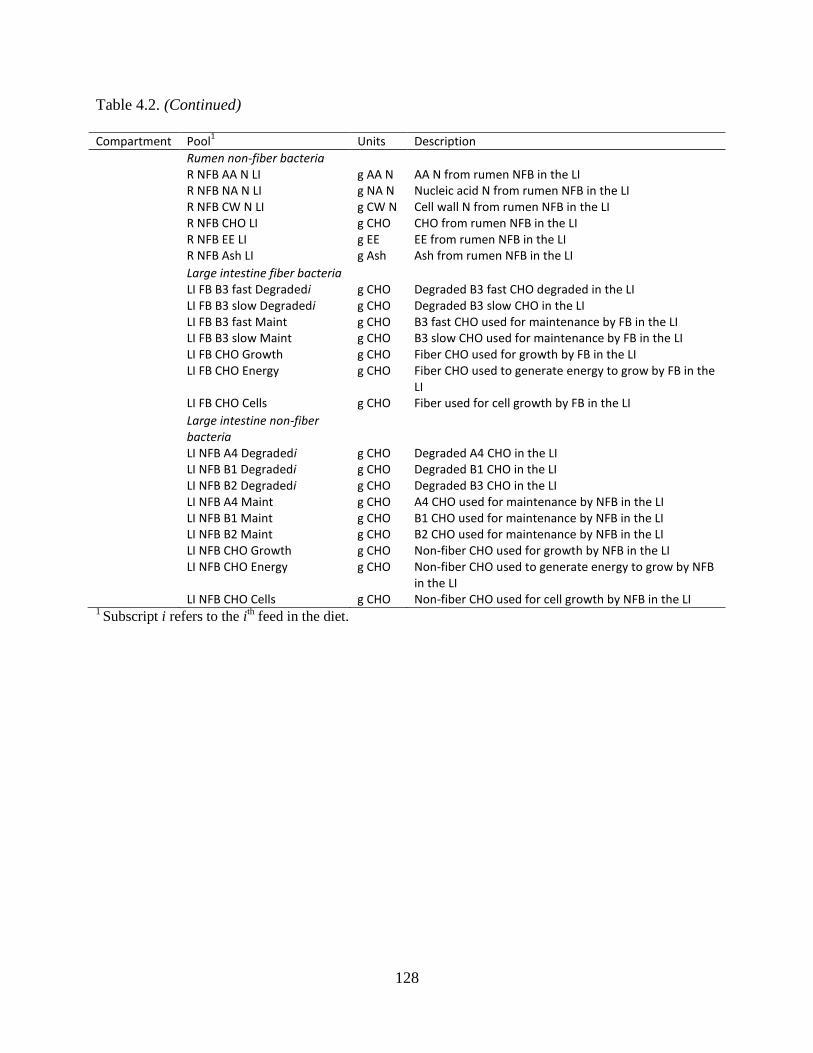
128
Table 4.2. (Continued)
Compartment Pool1
Units Description
Rumen non-fiber bacteria R NFB AA N LI g AA N AA N from rumen NFB in the LI R NFB NA N LI g NA N Nucleic acid N from rumen NFB in the LI R NFB CW N LI g CW N Cell wall N from rumen NFB in the LI R NFB CHO LI g CHO CHO from rumen NFB in the LI R NFB EE LI g EE EE from rumen NFB in the LI R NFB Ash LI g Ash Ash from rumen NFB in the LI Large intestine fiber bacteria LI FB B3 fast Degradedi g CHO Degraded B3 fast CHO degraded in the LI LI FB B3 slow Degradedi g CHO Degraded B3 slow CHO in the LI LI FB B3 fast Maint g CHO B3 fast CHO used for maintenance by FB in the LI LI FB B3 slow Maint g CHO B3 slow CHO used for maintenance by FB in the LI LI FB CHO Growth g CHO Fiber CHO used for growth by FB in the LI LI FB CHO Energy g CHO Fiber CHO used to generate energy to grow by FB in the
LI LI FB CHO Cells g CHO Fiber used for cell growth by FB in the LI Large intestine non-fiber
bacteria
LI NFB A4 Degradedi g CHO Degraded A4 CHO in the LI LI NFB B1 Degradedi g CHO Degraded B1 CHO in the LI LI NFB B2 Degradedi g CHO Degraded B3 CHO in the LI LI NFB A4 Maint g CHO A4 CHO used for maintenance by NFB in the LI LI NFB B1 Maint g CHO B1 CHO used for maintenance by NFB in the LI LI NFB B2 Maint g CHO B2 CHO used for maintenance by NFB in the LI LI NFB CHO Growth g CHO Non-fiber CHO used for growth by NFB in the LI LI NFB CHO Energy g CHO Non-fiber CHO used to generate energy to grow by NFB
in the LI LI NFB CHO Cells g CHO Non-fiber CHO used for cell growth by NFB in the LI 1 Subscript i refers to the i
th feed in the diet.
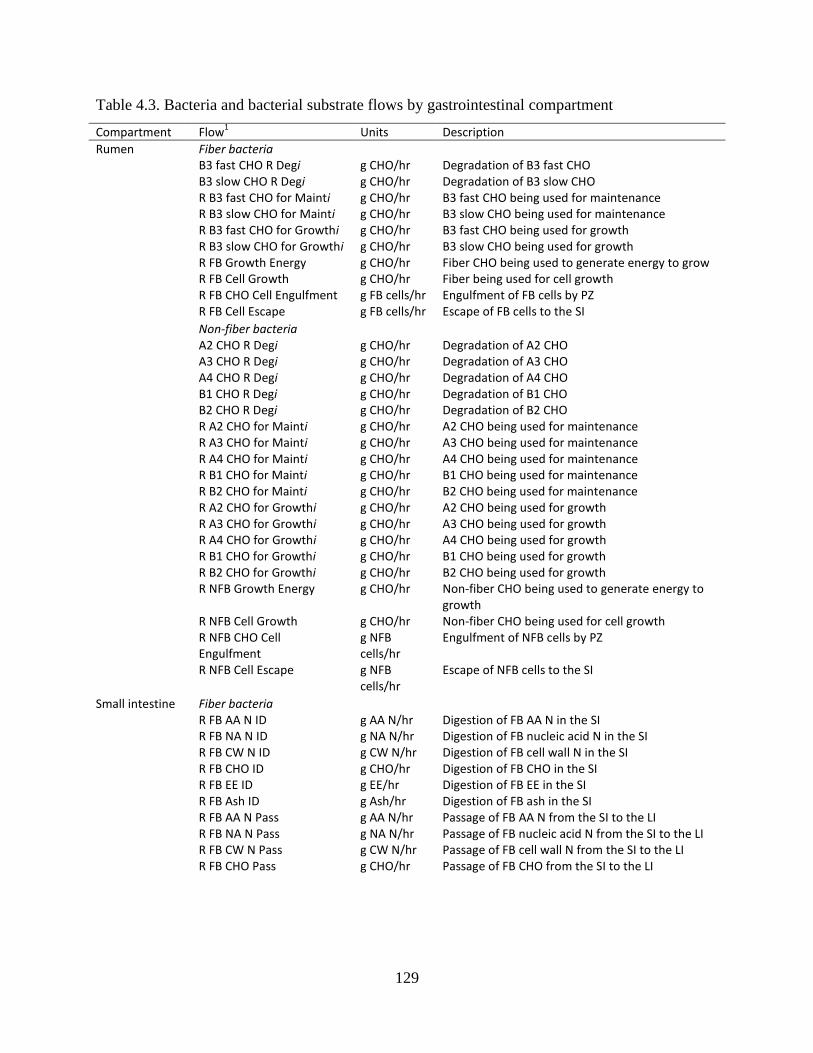
129
Table 4.3. Bacteria and bacterial substrate flows by gastrointestinal compartment
Compartment Flow1
Units Description
Rumen Fiber bacteria B3 fast CHO R Degi g CHO/hr Degradation of B3 fast CHO B3 slow CHO R Degi g CHO/hr Degradation of B3 slow CHO R B3 fast CHO for Mainti g CHO/hr B3 fast CHO being used for maintenance R B3 slow CHO for Mainti g CHO/hr B3 slow CHO being used for maintenance R B3 fast CHO for Growthi g CHO/hr B3 fast CHO being used for growth R B3 slow CHO for Growthi g CHO/hr B3 slow CHO being used for growth R FB Growth Energy g CHO/hr Fiber CHO being used to generate energy to grow R FB Cell Growth g CHO/hr Fiber being used for cell growth R FB CHO Cell Engulfment g FB cells/hr Engulfment of FB cells by PZ R FB Cell Escape g FB cells/hr Escape of FB cells to the SI Non-fiber bacteria A2 CHO R Degi g CHO/hr Degradation of A2 CHO A3 CHO R Degi g CHO/hr Degradation of A3 CHO A4 CHO R Degi g CHO/hr Degradation of A4 CHO B1 CHO R Degi g CHO/hr Degradation of B1 CHO B2 CHO R Degi g CHO/hr Degradation of B2 CHO R A2 CHO for Mainti g CHO/hr A2 CHO being used for maintenance R A3 CHO for Mainti g CHO/hr A3 CHO being used for maintenance R A4 CHO for Mainti g CHO/hr A4 CHO being used for maintenance R B1 CHO for Mainti g CHO/hr B1 CHO being used for maintenance R B2 CHO for Mainti g CHO/hr B2 CHO being used for maintenance R A2 CHO for Growthi g CHO/hr A2 CHO being used for growth R A3 CHO for Growthi g CHO/hr A3 CHO being used for growth R A4 CHO for Growthi g CHO/hr A4 CHO being used for growth R B1 CHO for Growthi g CHO/hr B1 CHO being used for growth R B2 CHO for Growthi g CHO/hr B2 CHO being used for growth R NFB Growth Energy g CHO/hr Non-fiber CHO being used to generate energy to
growth R NFB Cell Growth g CHO/hr Non-fiber CHO being used for cell growth R NFB CHO Cell
Engulfment g NFB cells/hr
Engulfment of NFB cells by PZ
R NFB Cell Escape g NFB cells/hr
Escape of NFB cells to the SI
Small intestine Fiber bacteria R FB AA N ID g AA N/hr Digestion of FB AA N in the SI R FB NA N ID g NA N/hr Digestion of FB nucleic acid N in the SI R FB CW N ID g CW N/hr Digestion of FB cell wall N in the SI R FB CHO ID g CHO/hr Digestion of FB CHO in the SI R FB EE ID g EE/hr Digestion of FB EE in the SI R FB Ash ID g Ash/hr Digestion of FB ash in the SI R FB AA N Pass g AA N/hr Passage of FB AA N from the SI to the LI R FB NA N Pass g NA N/hr Passage of FB nucleic acid N from the SI to the LI R FB CW N Pass g CW N/hr Passage of FB cell wall N from the SI to the LI R FB CHO Pass g CHO/hr Passage of FB CHO from the SI to the LI
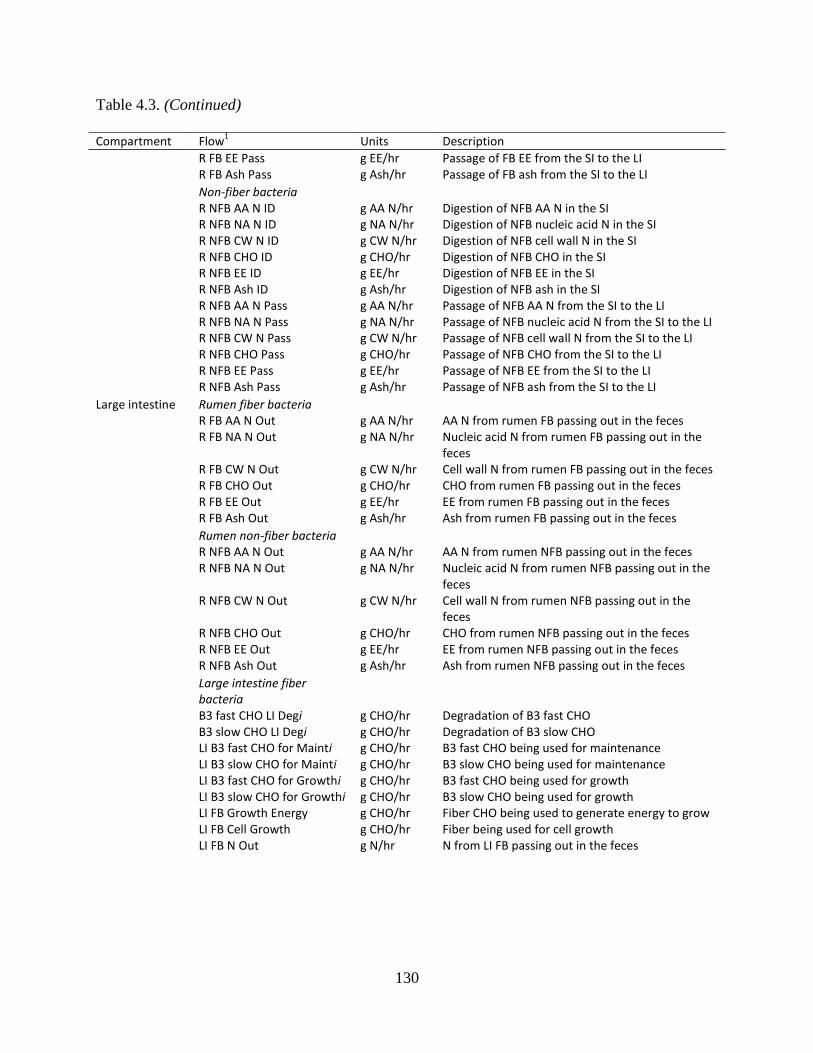
130
Table 4.3. (Continued)
Compartment Flow1
Units Description
R FB EE Pass g EE/hr Passage of FB EE from the SI to the LI R FB Ash Pass g Ash/hr Passage of FB ash from the SI to the LI Non-fiber bacteria R NFB AA N ID g AA N/hr Digestion of NFB AA N in the SI R NFB NA N ID g NA N/hr Digestion of NFB nucleic acid N in the SI R NFB CW N ID g CW N/hr Digestion of NFB cell wall N in the SI R NFB CHO ID g CHO/hr Digestion of NFB CHO in the SI R NFB EE ID g EE/hr Digestion of NFB EE in the SI R NFB Ash ID g Ash/hr Digestion of NFB ash in the SI R NFB AA N Pass g AA N/hr Passage of NFB AA N from the SI to the LI R NFB NA N Pass g NA N/hr Passage of NFB nucleic acid N from the SI to the LI R NFB CW N Pass g CW N/hr Passage of NFB cell wall N from the SI to the LI R NFB CHO Pass g CHO/hr Passage of NFB CHO from the SI to the LI R NFB EE Pass g EE/hr Passage of NFB EE from the SI to the LI R NFB Ash Pass g Ash/hr Passage of NFB ash from the SI to the LI Large intestine Rumen fiber bacteria R FB AA N Out g AA N/hr AA N from rumen FB passing out in the feces R FB NA N Out g NA N/hr Nucleic acid N from rumen FB passing out in the
feces R FB CW N Out g CW N/hr Cell wall N from rumen FB passing out in the feces R FB CHO Out g CHO/hr CHO from rumen FB passing out in the feces R FB EE Out g EE/hr EE from rumen FB passing out in the feces R FB Ash Out g Ash/hr Ash from rumen FB passing out in the feces Rumen non-fiber bacteria R NFB AA N Out g AA N/hr AA N from rumen NFB passing out in the feces R NFB NA N Out g NA N/hr Nucleic acid N from rumen NFB passing out in the
feces R NFB CW N Out g CW N/hr Cell wall N from rumen NFB passing out in the
feces R NFB CHO Out g CHO/hr CHO from rumen NFB passing out in the feces R NFB EE Out g EE/hr EE from rumen NFB passing out in the feces R NFB Ash Out g Ash/hr Ash from rumen NFB passing out in the feces Large intestine fiber
bacteria
B3 fast CHO LI Degi g CHO/hr Degradation of B3 fast CHO B3 slow CHO LI Degi g CHO/hr Degradation of B3 slow CHO LI B3 fast CHO for Mainti g CHO/hr B3 fast CHO being used for maintenance LI B3 slow CHO for Mainti g CHO/hr B3 slow CHO being used for maintenance LI B3 fast CHO for Growthi g CHO/hr B3 fast CHO being used for growth LI B3 slow CHO for Growthi g CHO/hr B3 slow CHO being used for growth LI FB Growth Energy g CHO/hr Fiber CHO being used to generate energy to grow LI FB Cell Growth g CHO/hr Fiber being used for cell growth LI FB N Out g N/hr N from LI FB passing out in the feces
131
Table 4.3. (Continued)
Compartment Flow1
Units Description
LI FB CHO Out g CHO/hr CHO from LI FB passing out in the feces LI FB EE Out g EE/hr EE from LI FB passing out in the feces LI FB Ash Out g Ash/hr Ash from LI FB passing out in the feces Large intestine non-fiber
bacteria
A4 CHO LI Degi g CHO/hr Degradation of A4 CHO B1 CHO LI Degi g CHO/hr Degradation of B1 CHO B2 CHO LI Degi g CHO/hr Degradation of B2 CHO LI A4 CHO for Mainti g CHO/hr A4 CHO being used for maintenance LI B1 CHO for Mainti g CHO/hr B1 CHO being used for maintenance LI B2 CHO for Mainti g CHO/hr B2 CHO being used for maintenance LI A4 CHO for Growthi g CHO/hr A4 CHO being used for growth LI B1 CHO for Growthi g CHO/hr B1 CHO being used for growth LI B2 CHO for Growthi g CHO/hr B2 CHO being used for growth LI NFB Growth Energy g CHO/hr Non-fiber CHO being used to generate energy to
growth LI NFB Cell Growth g CHO/hr Non-fiber CHO being used for cell growth LI NFB N Out g N/hr N from LI NFB passing out in the feces LI NFB CHO Out g CHO/hr CHO from LI NFB passing out in the feces LI NFB EE Out g EE/hr EE from LI NFB passing out in the feces LI NFB Ash Out g Ash/hr Ash from LI NFB passing out in the feces 1 Subscript i refers to the i
th feed in the diet.
4.3.2 Protozoa growth
4.3.2.1 General model structure
Previous versions of the CNCPS have accounted for protozoa by reducing the YG of bacteria
from 0.5 to 0.4 g cells g-1
CHO (Russell et al., 1992). However, in high producing dairy cows
protozoa can contribute up to 10% of the microbial N flowing from the rumen and have
important effects on the dynamics of N metabolism in the rumen (Firkins et al., 2007, Hristov
and Jouany, 2005). To capture these effects, aspects of protozoal growth and metabolism were
added to the current model.
Although many types of protozoa exist in the rumen, the most important are the ciliates of
which there are two groups: Holotrich protozoa (HPZ) and Entodiniomorphid protozoa (EPZ)
132
(Williams and Coleman, 1988). The model considers HPZ and EPZ separately based on their
preferred growth substrates. Carbohydrate metabolism follows the same model structure as
bacterial growth with some differences which are described below. The model structure was
deemed appropriate given protozoa require energy for the same general purposes of maintenance
and growth as bacteria and exist in the same environment (Williams and Coleman, 1988).
Carbohydrates are assumed to be the dominant source of energy to grow with bacteria providing
the major source of AA (Williams and Coleman, 1988).
4.3.2.2 Carbohydrate engulfment
Protozoal growth is calculated separately for each carbohydrate pool. It is assumed that EPZ
consume starch (B1), soluble fiber (B2) and NDF (B3 slow, B3 fast and C) and that HPZ
consume sugar (A4) (Coleman, 1986, Williams and Coleman, 1988). This is a simplification as
both types of protozoa can consume each of these substrates (Coleman, 1986). However, HPZ
tend to prefer soluble CHO and contribute little to fiber digestion while EPZ rapidly engulf
starch granules and have been shown to also break down cellulose and pectin (Coleman, 1986,
Williams and Coleman, 1988).
Protozoa initially engulf material which is then metabolized within the cell (Coleman, 1992).
In order for material to be engulfed, it must first be of an appropriate size (Onodera and
Henderson, 1980). The rate at which starch digests in the rumen is a function of both physical
and chemical characteristics of which particle size is an important component (Offner et al.,
2003). It was assumed, on a relative basis, the same physical and chemical characteristics among
different feeds would impact the ability of both bacteria and protozoa to digest CHO. Also, kd
would provide a reasonable proxy for differentiating engulfment rates among feeds due to

133
particle size. Therefore, the rate of engulfment for each substrate was determined by adjusting
the kd of each CHO source from each feed by a ‘capacity restriction’. Coleman (1992) measured
a maximum uptake of starch granules of approximately 1.8 g CHO g-1
protozoal cells.
Engulfment rate was adjusted using a lookup function where kd was multiplied by an adjustment
factor according to the ratio of engulfed CHO to protozoal cells (Figure 4.3A). When engulfed
CHO exceeded 1.8 g CHO g-1
protozoal cells (Coleman, 1992), engulfment rate exponentially
declined which provided a feedback loop in the model where engulfment of material was linked
to the protozoal cell mass (Figure 4.3A). This same system was used for each of the substrates
that could be engulfed. Engulfment rate was also adjusted according to the predicted rumen pH.
It is widely reported that excess starch consumption can kill protozoa, and in some cases
completely defaunate the rumen (Hristov and Jouany, 2005). It seems more likely this is linked
to rumen pH than starch intake per se (Dehority, 2005). To model the effect of pH on protozoal
growth, the relationship of pH and concentration of protozoa presented by Dehority (2005) was
used to derive the adjustment factor in Figure 4.3B. Rumen pH was predicted empirically
according to Fox et al. (2004).
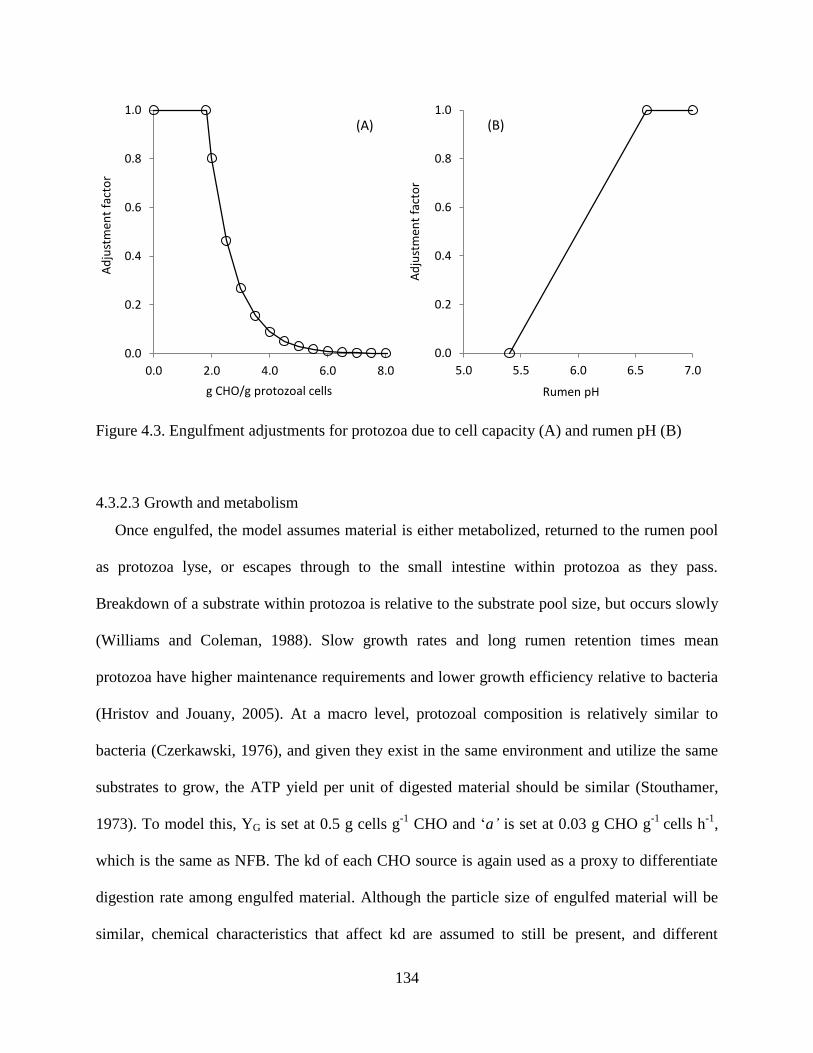
134
Figure 4.3. Engulfment adjustments for protozoa due to cell capacity (A) and rumen pH (B)
4.3.2.3 Growth and metabolism
Once engulfed, the model assumes material is either metabolized, returned to the rumen pool
as protozoa lyse, or escapes through to the small intestine within protozoa as they pass.
Breakdown of a substrate within protozoa is relative to the substrate pool size, but occurs slowly
(Williams and Coleman, 1988). Slow growth rates and long rumen retention times mean
protozoa have higher maintenance requirements and lower growth efficiency relative to bacteria
(Hristov and Jouany, 2005). At a macro level, protozoal composition is relatively similar to
bacteria (Czerkawski, 1976), and given they exist in the same environment and utilize the same
substrates to grow, the ATP yield per unit of digested material should be similar (Stouthamer,
1973). To model this, YG is set at 0.5 g cells g-1
CHO and ‘a’ is set at 0.03 g CHO g-1
cells h-1
,
which is the same as NFB. The kd of each CHO source is again used as a proxy to differentiate
digestion rate among engulfed material. Although the particle size of engulfed material will be
similar, chemical characteristics that affect kd are assumed to still be present, and different
0.0
0.2
0.4
0.6
0.8
1.0
0.0 2.0 4.0 6.0 8.0
Ad
just
men
t fa
cto
r
g CHO/g protozoal cells
(A)
0.0
0.2
0.4
0.6
0.8
1.0
5.0 5.5 6.0 6.5 7.0
Ad
just
men
t fa
cto
r
Rumen pH
(B)
135
among substrates and feeds. To utilize the feed library data for protozoa, the digestion rates were
multiplied by a reduction factor to account for the slower metabolic rate of protozoa relative to
bacteria. The factor used was 0.5 which meant that on average, CHO digestion was
approximately 0.25 g CHO g-1
protozal cell h-1
, similar to reports by Coleman (1992). Reducing
the kd also increased the predicted maintenance costs through the equation mµ = (kd – a) – a (%
h-1
) which lowered the growth efficiency.
4.3.2.4 Escape and lysis
Disappearance of protozoa from the rumen can occur by either passage or lysis (Ankrah et al.,
1990, Hristov and Jouany, 2005). Autolysis is typically reported to be extensive with 66-85% of
protozoa recycling within the rumen (Dijkstra et al., 1998). Further, concentrations of protozoa at
the duodenum in sheep and goats are typically 20-40% lower than in rumen fluid suggesting
protozoa have the ability to avoid passage and remain in the rumen (Hristov and Jouany, 2005).
Under these conditions, lysis becomes an important mechanism to control the protozoal pool size
in the rumen, as was shown by Dijkstra et al. (1998). Firkins et al. (2007) offers a different
viewpoint for high producing dairy cows where rapid rumen turnover and high rates of passage
mean a large portion of protozoa simply pass out of the rumen making extensive lysis less
important. Under these conditions protozoal pools sizes were lower (4.8-12.7% microbial N),
passage rates were similar to feed particles and cell passage was relative to the rumen pool size
(Sylvester et al., 2005). To replicate this behavior in the model, protozoa were assumed to pass
with the solids passage rate and the flow was assumed to be relative to the pool size. Ankrah et
al. (1990) estimated approximately half the disappearance of protozoa in the rumen could be
attributed to passage or dilution and half due to lysis meaning the rate of lysis would be similar
to the rate of passage. However, these estimates were made in steers fed once a day, which again,
136
might not reflect the situation in a high producing dairy cow (Firkins et al., 2007). In the current
model, disappearance due to lysis was assumed to be half the rate of passage which gave
predicted pool sizes in a similar range to those reported by Sylvester et al. (2005).
4.3.2.5 Nitrogen consumption and bacterial predation
Unlike bacteria, protozoa cannot synthesize their own AA and must rely on the consumption
of preformed AA for protein synthesis (Williams and Coleman, 1988). Bacteria comprise the
single most important AA source, possibly because of their high AA content and consistent
supply, although varying amounts of dietary protein are also consumed (Coleman, 1986, Firkins
et al., 2007). Compared to CHO consumption, bacterial engulfment is slow where protozoa
‘graze’ bacteria in a continuous process (Firkins et al., 2007). Engulfed proteins are partially
incorporated into protozoal cell proteins and partially released into the rumen medium as either
peptides and AA or NH3 (Walker et al., 2005). In vitro studies have shown approximately 50%
of engulfed proteins are incorporated into protozoal proteins, while the other 50% are excreted
(Hristov and Jouany, 2005). Coleman and Hall (1984) calculated the potential protein synthesis
from the uptake of bacteria and free AA and showed, if considered together, bacterial AA would
contribute approximately 2/3 to protein synthesis and free AA approximately 1/3. Using these
relationships, protozoal N uptake can be calculated as double the requirement for cell growth and
bacterial predation can be calculated at 2/3 of this N uptake. It is difficult to find quantitative
estimations of AA N release relative to NH3 in the literature, although protozoa are known to
have high deaminase activity (Walker et al., 2005). Therefore, it was assumed that half the N
released was in the form of AA N and half as NH3. The model assumes both NFB and FB are
engulfed and follows the hypothesis of Dijkstra et al. (1998) that fibrolytic bacteria are engulfed
as a consequence of being attached to fiber particles that are engulfed. Therefore, engulfment of
137
FB is calculated by multiplying the grams of fiber engulfed by the ratio FB to fiber in the rumen
(g FB N g-1
fiber), with the assumption being all FB in the rumen are attached. Engulfment of
NFB is then calculated as 2/3 the engulfed N – FB engulfment with non-bacterial AA providing
the balance of the N consumption.
4.3.2.6 Other growth substrates
The CHO fraction of engulfed bacteria and lysed protozoa were assumed to provide an energy
yielding substrate for protozoal growth. Protozoa are known to also engulf other protozoa in the
rumen (Williams and Coleman, 1988). For simplicity, only bacterial engulfment was considered
in this model, however, lysed protozoa were assumed to be consumed by other protozoa and the
CHO used as an energy source to grow. The same general structure was used to calculate
protozoal cell yield from engulfed microbial material as other CHO sources. The rate of
digestion of microbial CHO was assumed to be 40 % hr-1
, similar to sugar (Van Amburgh et al.,
2010).
4.3.2.7 Summary of protozoal growth
Figure 4.1 is a diagrammatic representation of EPZ growth on B1 CHO (Starch) used in the
model and serves to summarize the relationships described above. In Figure 4.4, protozoa
compete for rumen available starch (B1 CHO R) with bacterial degradation (B1 CHO R Deg)
and escape of starch to the small intestine (B1 CHO Escape). The rate at which protozoa engulf
starch particles is calculated using the rate of starch digestion for each feed (Kd B1 CHO) which
is adjusted to ensure engulfment does not exceed EPZ cell capacity (EPZ capacity restriction)
and for the effect of rumen pH (pH engulfment adjustment). Substrate engulfment is the first step
in supplying energy for protozoa to grow, and if set to 0, will stop protozoal growth and can be
138
used to simulate the effects of rumen defaunation. Once engulfed, starch is either degraded (EPZ
B1 CHO Deg), escapes within the protozoal cells to the small intestine (EPZ B1 Escape), or is
released back into the rumen available pool as protozoa lyse (EPZ B1 Engulfed Recycled). The
rate of degradation (EPZ Kd B1 CHO) is calculated using the kd for each feed which is adjusted
by a factor of 0.5 to represent the slower metabolic rate relative to bacteria (EPZ metabolic rate
relative to bacteria). The escape of starch to the small intestine within protozoal cells and the
release of starch back to the rumen available pool is calculated by multiplying the rate of cell
escape and cell lysis, respectively, by the ratio of engulfed starch to cell mass (Ratio EPZ B1
engulfed to EPZ B1 Cells). Once degraded, the material is either used for maintenance or growth
according to the system described for bacteria. The cell mass of protozoa can either escape to the
small intestine (EPZ B1 Cell Escape) or lyse (EPZ B1 Cell Lysis). Escape and lysis provide the
negative feedback required by the model to control protozal cell mass which allows the
simulation to reach steady state. This system is replicated for each growth substrate used by
protozoa in the model. A complete list of the protozoal pools and flows, organized by
gastrointestinal compartment, are in Tables 4.4 and 4.5. The equations used to calculate the pools
and flows are in Tables 4.10 and 4.11.
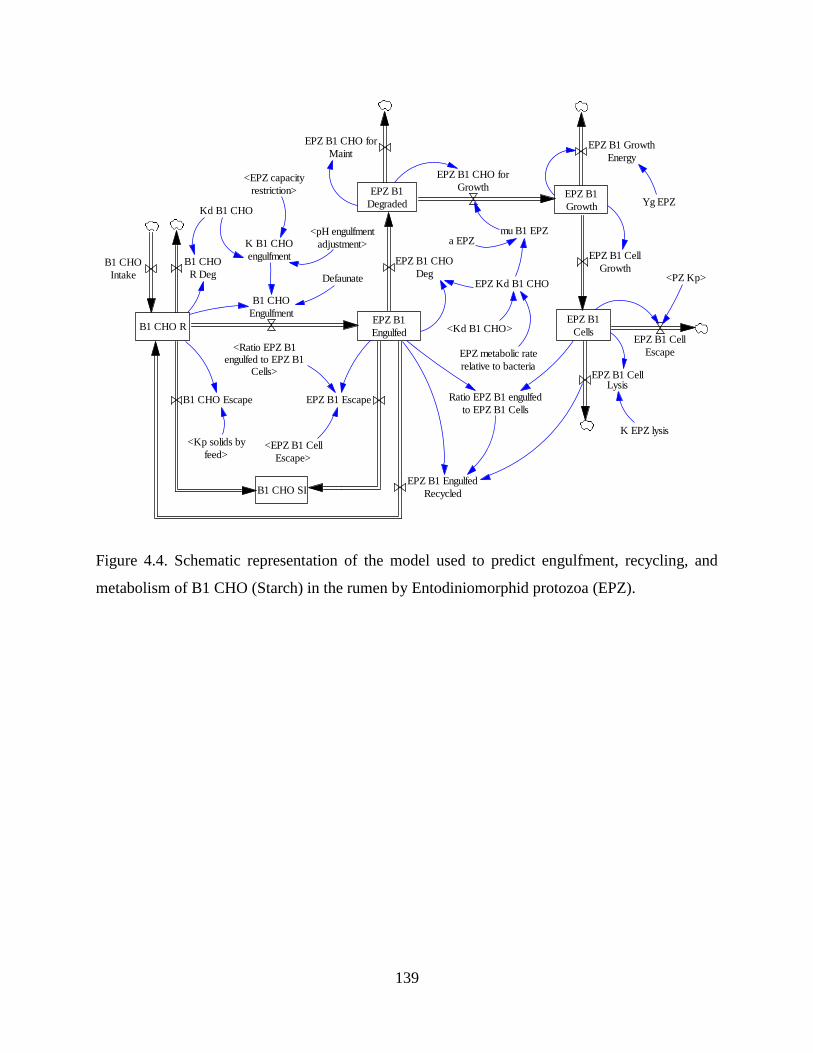
139
Figure 4.4. Schematic representation of the model used to predict engulfment, recycling, and
metabolism of B1 CHO (Starch) in the rumen by Entodiniomorphid protozoa (EPZ).
B1 CHO R
B1 CHO SI
B1 CHO Escape
<Kp solids by
feed>
B1 CHO
R Deg
Kd B1 CHO
EPZ B1
DegradedEPZ B1
Growth
EPZ B1 CHO for
Growth
EPZ B1 CHO for
Maint
EPZ B1
Cells
EPZ B1 Growth
Energy
Yg EPZ
a EPZmu B1 EPZ
EPZ B1
Engulfed
B1 CHO
Engulfment
EPZ B1 CHO
Deg
EPZ B1 Cell
Escape
K EPZ lysis
EPZ B1 Engulfed
Recycled
EPZ B1 CellLysis
Ratio EPZ B1 engulfed
to EPZ B1 Cells
K B1 CHO
engulfment
EPZ Kd B1 CHO
<Kd B1 CHO>
Defaunate
EPZ metabolic rate
relative to bacteria
<PZ Kp>
EPZ B1 Escape
<Ratio EPZ B1engulfed to EPZ B1
Cells>
<EPZ B1 Cell
Escape>
<EPZ capacity
restriction>
<pH engulfment
adjustment>EPZ B1 Cell
GrowthB1 CHO
Intake
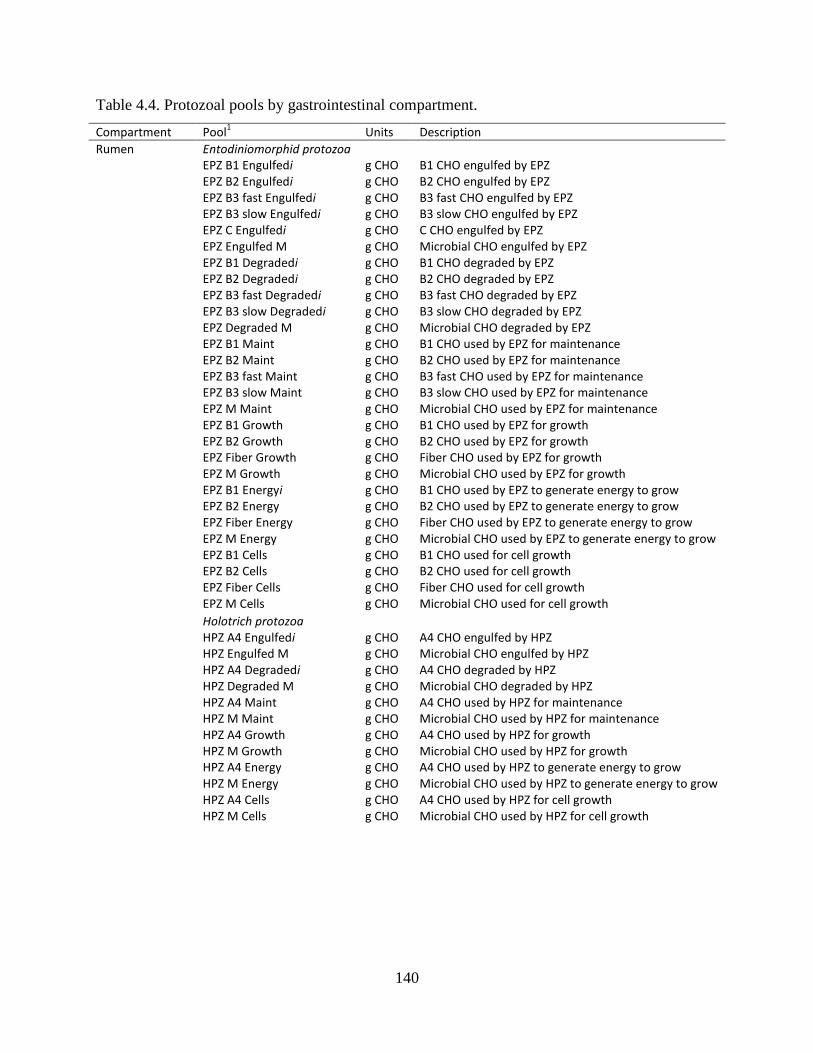
140
Table 4.4. Protozoal pools by gastrointestinal compartment.
Compartment Pool1
Units Description
Rumen Entodiniomorphid protozoa EPZ B1 Engulfedi g CHO B1 CHO engulfed by EPZ EPZ B2 Engulfedi g CHO B2 CHO engulfed by EPZ EPZ B3 fast Engulfedi g CHO B3 fast CHO engulfed by EPZ EPZ B3 slow Engulfedi g CHO B3 slow CHO engulfed by EPZ EPZ C Engulfedi g CHO C CHO engulfed by EPZ EPZ Engulfed M g CHO Microbial CHO engulfed by EPZ EPZ B1 Degradedi g CHO B1 CHO degraded by EPZ EPZ B2 Degradedi g CHO B2 CHO degraded by EPZ EPZ B3 fast Degradedi g CHO B3 fast CHO degraded by EPZ EPZ B3 slow Degradedi g CHO B3 slow CHO degraded by EPZ EPZ Degraded M g CHO Microbial CHO degraded by EPZ EPZ B1 Maint g CHO B1 CHO used by EPZ for maintenance EPZ B2 Maint g CHO B2 CHO used by EPZ for maintenance EPZ B3 fast Maint g CHO B3 fast CHO used by EPZ for maintenance EPZ B3 slow Maint g CHO B3 slow CHO used by EPZ for maintenance EPZ M Maint g CHO Microbial CHO used by EPZ for maintenance EPZ B1 Growth g CHO B1 CHO used by EPZ for growth EPZ B2 Growth g CHO B2 CHO used by EPZ for growth EPZ Fiber Growth g CHO Fiber CHO used by EPZ for growth EPZ M Growth g CHO Microbial CHO used by EPZ for growth EPZ B1 Energyi g CHO B1 CHO used by EPZ to generate energy to grow EPZ B2 Energy g CHO B2 CHO used by EPZ to generate energy to grow EPZ Fiber Energy g CHO Fiber CHO used by EPZ to generate energy to grow EPZ M Energy g CHO Microbial CHO used by EPZ to generate energy to grow EPZ B1 Cells g CHO B1 CHO used for cell growth EPZ B2 Cells g CHO B2 CHO used for cell growth EPZ Fiber Cells g CHO Fiber CHO used for cell growth EPZ M Cells g CHO Microbial CHO used for cell growth Holotrich protozoa HPZ A4 Engulfedi g CHO A4 CHO engulfed by HPZ HPZ Engulfed M g CHO Microbial CHO engulfed by HPZ HPZ A4 Degradedi g CHO A4 CHO degraded by HPZ HPZ Degraded M g CHO Microbial CHO degraded by HPZ HPZ A4 Maint g CHO A4 CHO used by HPZ for maintenance HPZ M Maint g CHO Microbial CHO used by HPZ for maintenance HPZ A4 Growth g CHO A4 CHO used by HPZ for growth HPZ M Growth g CHO Microbial CHO used by HPZ for growth HPZ A4 Energy g CHO A4 CHO used by HPZ to generate energy to grow HPZ M Energy g CHO Microbial CHO used by HPZ to generate energy to grow HPZ A4 Cells g CHO A4 CHO used by HPZ for cell growth HPZ M Cells g CHO Microbial CHO used by HPZ for cell growth
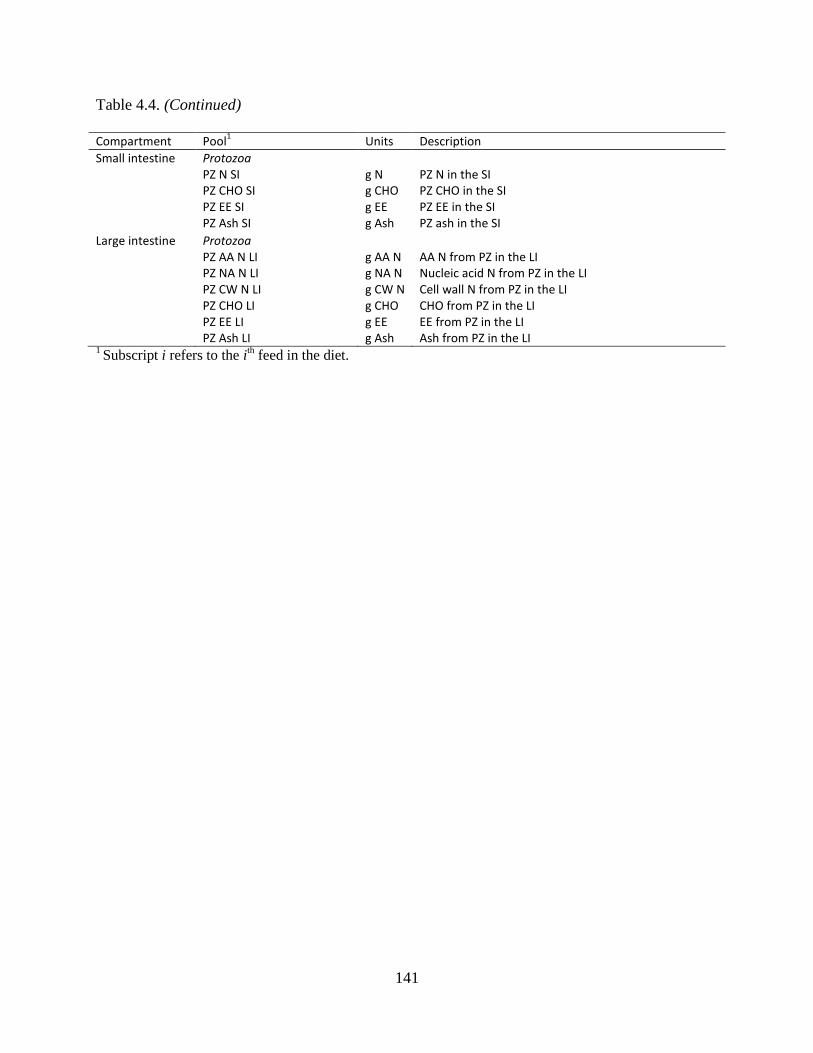
141
Table 4.4. (Continued)
Compartment Pool1
Units Description
Small intestine Protozoa PZ N SI g N PZ N in the SI PZ CHO SI g CHO PZ CHO in the SI PZ EE SI g EE PZ EE in the SI PZ Ash SI g Ash PZ ash in the SI Large intestine Protozoa PZ AA N LI g AA N AA N from PZ in the LI PZ NA N LI g NA N Nucleic acid N from PZ in the LI PZ CW N LI g CW N Cell wall N from PZ in the LI PZ CHO LI g CHO CHO from PZ in the LI PZ EE LI g EE EE from PZ in the LI PZ Ash LI g Ash Ash from PZ in the LI 1 Subscript i refers to the i
th feed in the diet.
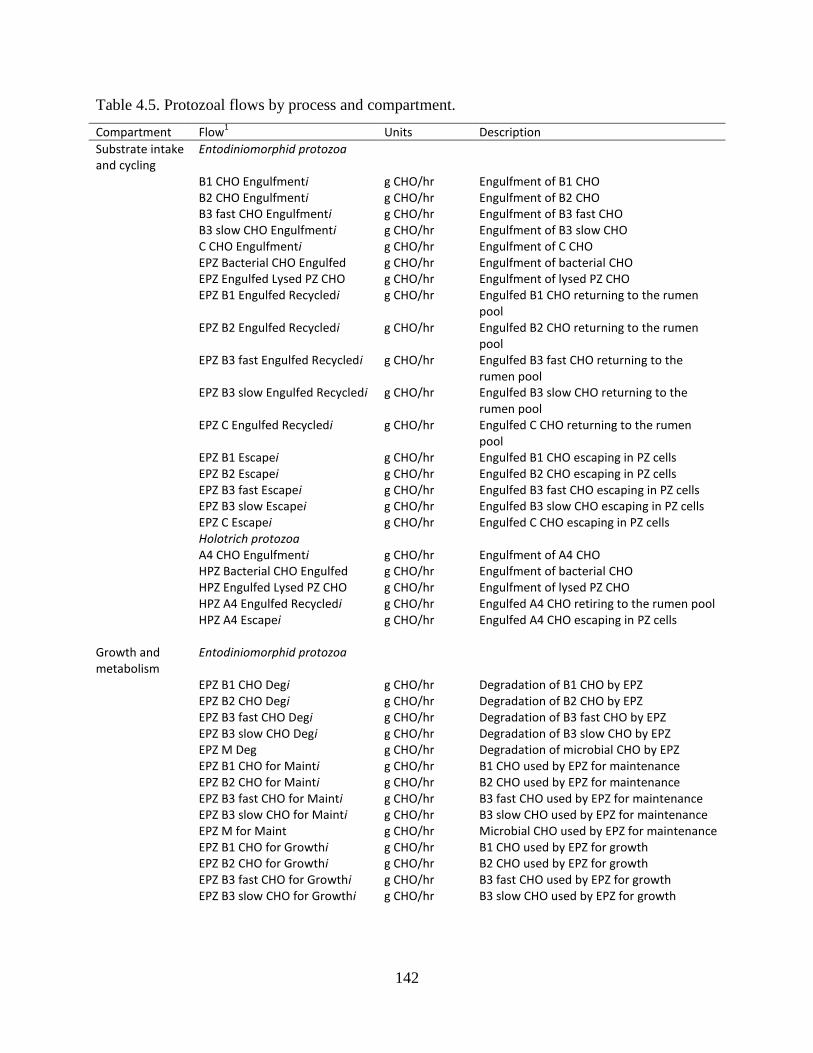
142
Table 4.5. Protozoal flows by process and compartment.
Compartment Flow1
Units Description
Substrate intake and cycling
Entodiniomorphid protozoa
B1 CHO Engulfmenti g CHO/hr Engulfment of B1 CHO B2 CHO Engulfmenti g CHO/hr Engulfment of B2 CHO B3 fast CHO Engulfmenti g CHO/hr Engulfment of B3 fast CHO B3 slow CHO Engulfmenti g CHO/hr Engulfment of B3 slow CHO C CHO Engulfmenti g CHO/hr Engulfment of C CHO EPZ Bacterial CHO Engulfed g CHO/hr Engulfment of bacterial CHO EPZ Engulfed Lysed PZ CHO g CHO/hr Engulfment of lysed PZ CHO EPZ B1 Engulfed Recycledi g CHO/hr Engulfed B1 CHO returning to the rumen
pool EPZ B2 Engulfed Recycledi g CHO/hr Engulfed B2 CHO returning to the rumen
pool EPZ B3 fast Engulfed Recycledi g CHO/hr Engulfed B3 fast CHO returning to the
rumen pool EPZ B3 slow Engulfed Recycledi g CHO/hr Engulfed B3 slow CHO returning to the
rumen pool EPZ C Engulfed Recycledi g CHO/hr Engulfed C CHO returning to the rumen
pool EPZ B1 Escapei g CHO/hr Engulfed B1 CHO escaping in PZ cells EPZ B2 Escapei g CHO/hr Engulfed B2 CHO escaping in PZ cells EPZ B3 fast Escapei g CHO/hr Engulfed B3 fast CHO escaping in PZ cells EPZ B3 slow Escapei g CHO/hr Engulfed B3 slow CHO escaping in PZ cells EPZ C Escapei g CHO/hr Engulfed C CHO escaping in PZ cells Holotrich protozoa A4 CHO Engulfmenti g CHO/hr Engulfment of A4 CHO HPZ Bacterial CHO Engulfed g CHO/hr Engulfment of bacterial CHO HPZ Engulfed Lysed PZ CHO g CHO/hr Engulfment of lysed PZ CHO HPZ A4 Engulfed Recycledi g CHO/hr Engulfed A4 CHO retiring to the rumen pool HPZ A4 Escapei g CHO/hr Engulfed A4 CHO escaping in PZ cells Growth and metabolism
Entodiniomorphid protozoa
EPZ B1 CHO Degi g CHO/hr Degradation of B1 CHO by EPZ EPZ B2 CHO Degi g CHO/hr Degradation of B2 CHO by EPZ EPZ B3 fast CHO Degi g CHO/hr Degradation of B3 fast CHO by EPZ EPZ B3 slow CHO Degi g CHO/hr Degradation of B3 slow CHO by EPZ EPZ M Deg g CHO/hr Degradation of microbial CHO by EPZ EPZ B1 CHO for Mainti g CHO/hr B1 CHO used by EPZ for maintenance EPZ B2 CHO for Mainti g CHO/hr B2 CHO used by EPZ for maintenance EPZ B3 fast CHO for Mainti g CHO/hr B3 fast CHO used by EPZ for maintenance EPZ B3 slow CHO for Mainti g CHO/hr B3 slow CHO used by EPZ for maintenance EPZ M for Maint g CHO/hr Microbial CHO used by EPZ for maintenance EPZ B1 CHO for Growthi g CHO/hr B1 CHO used by EPZ for growth EPZ B2 CHO for Growthi g CHO/hr B2 CHO used by EPZ for growth EPZ B3 fast CHO for Growthi g CHO/hr B3 fast CHO used by EPZ for growth EPZ B3 slow CHO for Growthi g CHO/hr B3 slow CHO used by EPZ for growth
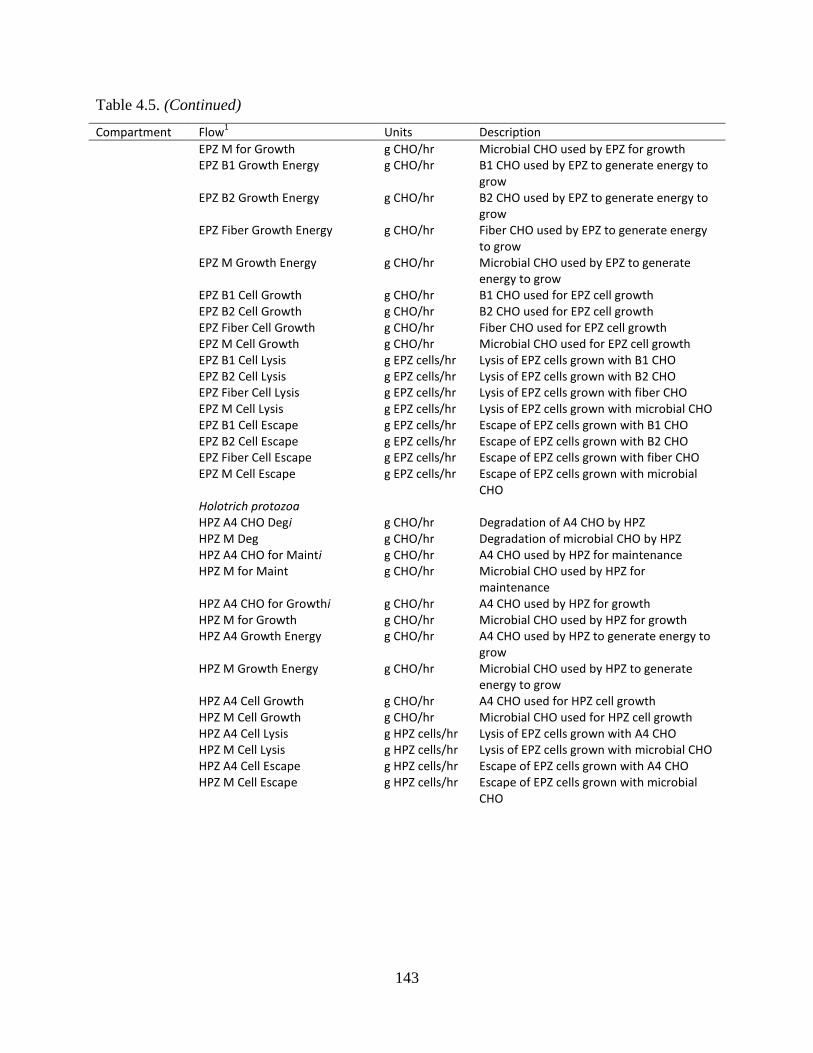
143
Table 4.5. (Continued)
Compartment Flow1
Units Description
EPZ M for Growth g CHO/hr Microbial CHO used by EPZ for growth EPZ B1 Growth Energy g CHO/hr B1 CHO used by EPZ to generate energy to
grow EPZ B2 Growth Energy g CHO/hr B2 CHO used by EPZ to generate energy to
grow EPZ Fiber Growth Energy g CHO/hr Fiber CHO used by EPZ to generate energy
to grow EPZ M Growth Energy g CHO/hr Microbial CHO used by EPZ to generate
energy to grow EPZ B1 Cell Growth g CHO/hr B1 CHO used for EPZ cell growth EPZ B2 Cell Growth g CHO/hr B2 CHO used for EPZ cell growth EPZ Fiber Cell Growth g CHO/hr Fiber CHO used for EPZ cell growth EPZ M Cell Growth g CHO/hr Microbial CHO used for EPZ cell growth EPZ B1 Cell Lysis g EPZ cells/hr Lysis of EPZ cells grown with B1 CHO EPZ B2 Cell Lysis g EPZ cells/hr Lysis of EPZ cells grown with B2 CHO EPZ Fiber Cell Lysis g EPZ cells/hr Lysis of EPZ cells grown with fiber CHO EPZ M Cell Lysis g EPZ cells/hr Lysis of EPZ cells grown with microbial CHO EPZ B1 Cell Escape g EPZ cells/hr Escape of EPZ cells grown with B1 CHO EPZ B2 Cell Escape g EPZ cells/hr Escape of EPZ cells grown with B2 CHO EPZ Fiber Cell Escape g EPZ cells/hr Escape of EPZ cells grown with fiber CHO EPZ M Cell Escape g EPZ cells/hr Escape of EPZ cells grown with microbial
CHO Holotrich protozoa HPZ A4 CHO Degi g CHO/hr Degradation of A4 CHO by HPZ HPZ M Deg g CHO/hr Degradation of microbial CHO by HPZ HPZ A4 CHO for Mainti g CHO/hr A4 CHO used by HPZ for maintenance HPZ M for Maint g CHO/hr Microbial CHO used by HPZ for
maintenance HPZ A4 CHO for Growthi g CHO/hr A4 CHO used by HPZ for growth HPZ M for Growth g CHO/hr Microbial CHO used by HPZ for growth HPZ A4 Growth Energy g CHO/hr A4 CHO used by HPZ to generate energy to
grow HPZ M Growth Energy g CHO/hr Microbial CHO used by HPZ to generate
energy to grow HPZ A4 Cell Growth g CHO/hr A4 CHO used for HPZ cell growth HPZ M Cell Growth g CHO/hr Microbial CHO used for HPZ cell growth HPZ A4 Cell Lysis g HPZ cells/hr Lysis of EPZ cells grown with A4 CHO HPZ M Cell Lysis g HPZ cells/hr Lysis of EPZ cells grown with microbial CHO HPZ A4 Cell Escape g HPZ cells/hr Escape of EPZ cells grown with A4 CHO HPZ M Cell Escape g HPZ cells/hr Escape of EPZ cells grown with microbial
CHO
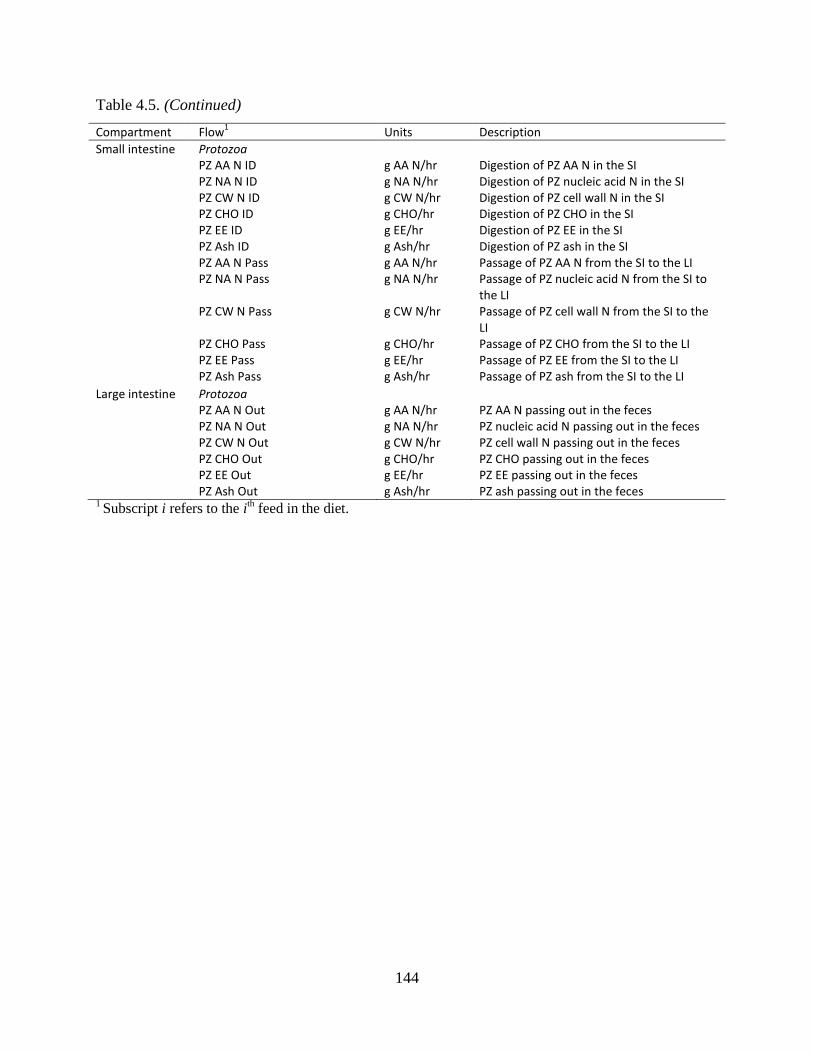
144
Table 4.5. (Continued)
Compartment Flow1
Units Description
Small intestine Protozoa PZ AA N ID g AA N/hr Digestion of PZ AA N in the SI PZ NA N ID g NA N/hr Digestion of PZ nucleic acid N in the SI PZ CW N ID g CW N/hr Digestion of PZ cell wall N in the SI PZ CHO ID g CHO/hr Digestion of PZ CHO in the SI PZ EE ID g EE/hr Digestion of PZ EE in the SI PZ Ash ID g Ash/hr Digestion of PZ ash in the SI PZ AA N Pass g AA N/hr Passage of PZ AA N from the SI to the LI PZ NA N Pass g NA N/hr Passage of PZ nucleic acid N from the SI to
the LI PZ CW N Pass g CW N/hr Passage of PZ cell wall N from the SI to the
LI PZ CHO Pass g CHO/hr Passage of PZ CHO from the SI to the LI PZ EE Pass g EE/hr Passage of PZ EE from the SI to the LI PZ Ash Pass g Ash/hr Passage of PZ ash from the SI to the LI Large intestine Protozoa PZ AA N Out g AA N/hr PZ AA N passing out in the feces PZ NA N Out g NA N/hr PZ nucleic acid N passing out in the feces PZ CW N Out g CW N/hr PZ cell wall N passing out in the feces PZ CHO Out g CHO/hr PZ CHO passing out in the feces PZ EE Out g EE/hr PZ EE passing out in the feces PZ Ash Out g Ash/hr PZ ash passing out in the feces 1 Subscript i refers to the i
th feed in the diet.
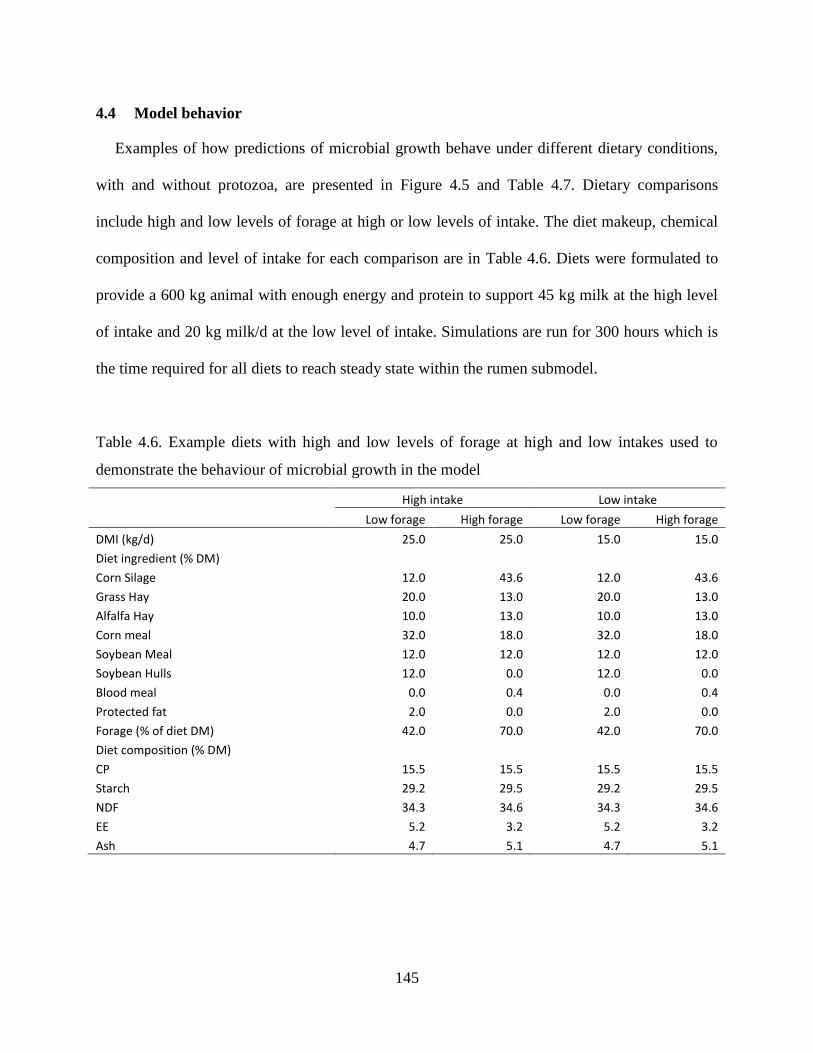
145
4.4 Model behavior
Examples of how predictions of microbial growth behave under different dietary conditions,
with and without protozoa, are presented in Figure 4.5 and Table 4.7. Dietary comparisons
include high and low levels of forage at high or low levels of intake. The diet makeup, chemical
composition and level of intake for each comparison are in Table 4.6. Diets were formulated to
provide a 600 kg animal with enough energy and protein to support 45 kg milk at the high level
of intake and 20 kg milk/d at the low level of intake. Simulations are run for 300 hours which is
the time required for all diets to reach steady state within the rumen submodel.
Table 4.6. Example diets with high and low levels of forage at high and low intakes used to
demonstrate the behaviour of microbial growth in the model
High intake Low intake
Low forage High forage Low forage High forage
DMI (kg/d) 25.0 25.0 15.0 15.0
Diet ingredient (% DM)
Corn Silage 12.0 43.6 12.0 43.6
Grass Hay 20.0 13.0 20.0 13.0
Alfalfa Hay 10.0 13.0 10.0 13.0
Corn meal 32.0 18.0 32.0 18.0
Soybean Meal 12.0 12.0 12.0 12.0
Soybean Hulls 12.0 0.0 12.0 0.0
Blood meal 0.0 0.4 0.0 0.4
Protected fat 2.0 0.0 2.0 0.0
Forage (% of diet DM) 42.0 70.0 42.0 70.0
Diet composition (% DM) CP 15.5 15.5 15.5 15.5
Starch 29.2 29.5 29.2 29.5
NDF 34.3 34.6 34.3 34.6
EE 5.2 3.2 5.2 3.2
Ash 4.7 5.1 4.7 5.1
146
Predicted rumen pools of FB N and NFB N are reduced by protozoal growth (Figure 4.5).
This occurs due to predation and also competition for substrate. Non-fiber bacteria are most
affected as they exist in the fluid phase and are more accessible for protozoa to engulf (Dijkstra
et al., 1998). Fiber bacteria are also engulfed as a collateral effect of fiber engulfment (Dijkstra et
al., 1998). Protozoal pool sizes when intake was high were 4.2% and 9.2% of the microbial N for
the low and high forage diets, respectively, and are within the range and follow the same trend
reported by Sylvester et al. (2005). Pool sizes on the lower intake diets are higher which is due to
lower predicted passage. A positive feedback exists within the model where, as the protozoal cell
mass increases, more substrate can be engulfed. This is controlled by lysis, passage and also the
ability of protozoa to digest engulfed material. Engulfment is typically more rapid than digestion
(Coleman, 1992), which leads to an accumulation of substrate within the cell and restricts further
engulfment (Figure 4.3A). Engulfment rates in the examples presented ranged from 0.46 to 0.97
g CHO g-1
PZ cells hr-1
(Table 4.7) which is comparable to the range reported by Coleman
(1992) for fed cells. Likewise, the digestion rate of engulfed material (0.16 – 0.30 g CHO g-1
PZ
cells hr-1
) was comparable to values measured by Coleman (1992). The low cell mass of
protozoa on the low forage diet at high intake results in a high ratio of engulfed CHO to
protozoal cells (3.55) and restricts further engulfment (Figure 4.3A). The low forage diet has a
slightly lower pH which also restricts substrate engulfment. Protozoa can have a stabilizing
effect on rumen pH by lowering the available CHO pool (Hristov and Jouany, 2005) and the
model estimates lower available CHO in the presence of protozoa (Table 4.7), however, a more
mechanistic approach to calculate pH is needed to adequately model this effect. Important
differences exist in rumen NH3-N among the faunated and defaunted simulations. Protozoa make
a significant contribution to microbial protein turnover in the rumen which increases peptides,
147
free AA and NH3-N (Walker et al., 2005). In situations where rumen N is deficient, the effect of
protozoa in the model stimulates bacterial growth and CHO digestion through increasing the
rumen N supply, although net microbial flow out of the rumen is still reduced through predation.
Predicted microbial turnover ranged from ~10% to 40% which is lower than what is typically
reported (Hristov and Jouany, 2005), but this might be expected in high producing animals
(Firkins et al., 2007). Overall efficiencies of microbial growth in the faunated simulations ranged
from 17.4 to 28.5 g microbial N kg-1
RD OM which is similar to the finding of Broderick et al.
(2010). Values in the defaunated simulations were higher than what might be expected and
demonstrates the importance of including protozoa in the model.
Predictions of protozoal growth were most sensitive to the rates of lysis and passage. Figure
4.6 has examples of predicted microbial pools sizes when lysis or passage are set to 0, or when
both lysis and passage are reduced to half the normal model values (passage = solids kp; lysis =
0.5 × passage). Eliminating protozoal passage had the most pronounced effect on the rumen cell
N with protozoal N increasing to ~55% of microbial N (Figure 4.6C) which is closer to most
literature reports (Hristov and Jouany, 2005). Given many of the studies in the literature were
completed on sheep or steers at low levels of intake, protozoal sequestration mechanisms were
probably more effective and cell passage very low. It would be possible to implement these
mechanisms in the current model by restricting the pool size that was available to pass at low
levels of intake. However, for high producing dairy cows predictions are consistent with
expected results.
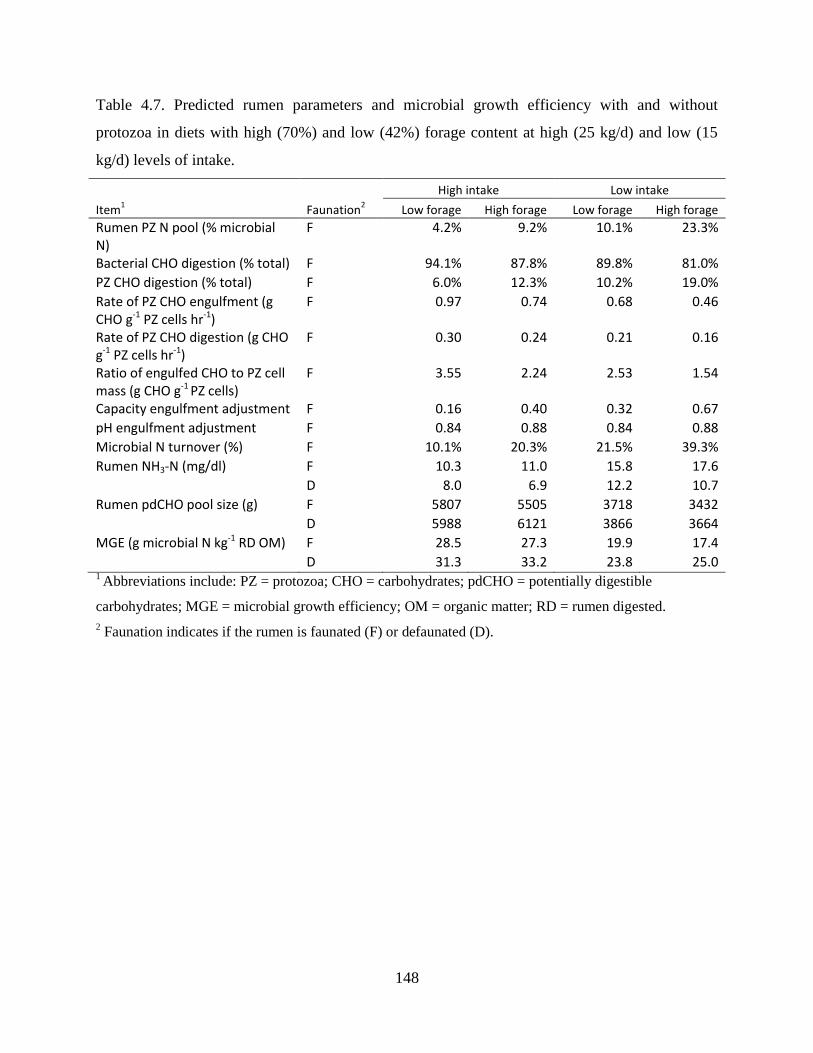
148
Table 4.7. Predicted rumen parameters and microbial growth efficiency with and without
protozoa in diets with high (70%) and low (42%) forage content at high (25 kg/d) and low (15
kg/d) levels of intake.
High intake Low intake
Item1
Faunation2
Low forage High forage Low forage High forage
Rumen PZ N pool (% microbial N)
F 4.2% 9.2% 10.1% 23.3%
Bacterial CHO digestion (% total) F 94.1% 87.8% 89.8% 81.0%
PZ CHO digestion (% total) F 6.0% 12.3% 10.2% 19.0%
Rate of PZ CHO engulfment (g CHO g-1 PZ cells hr-1)
F 0.97 0.74 0.68 0.46
Rate of PZ CHO digestion (g CHO g-1 PZ cells hr-1)
F 0.30 0.24 0.21 0.16
Ratio of engulfed CHO to PZ cell mass (g CHO g-1 PZ cells)
F 3.55 2.24 2.53 1.54
Capacity engulfment adjustment F 0.16 0.40 0.32 0.67
pH engulfment adjustment F 0.84 0.88 0.84 0.88
Microbial N turnover (%) F 10.1% 20.3% 21.5% 39.3%
Rumen NH3-N (mg/dl) F 10.3 11.0 15.8 17.6
D 8.0 6.9 12.2 10.7
Rumen pdCHO pool size (g) F 5807 5505 3718 3432
D 5988 6121 3866 3664
MGE (g microbial N kg-1 RD OM) F 28.5 27.3 19.9 17.4
D 31.3 33.2 23.8 25.0 1 Abbreviations include: PZ = protozoa; CHO = carbohydrates; pdCHO = potentially digestible
carbohydrates; MGE = microbial growth efficiency; OM = organic matter; RD = rumen digested.
2 Faunation indicates if the rumen is faunated (F) or defaunated (D).
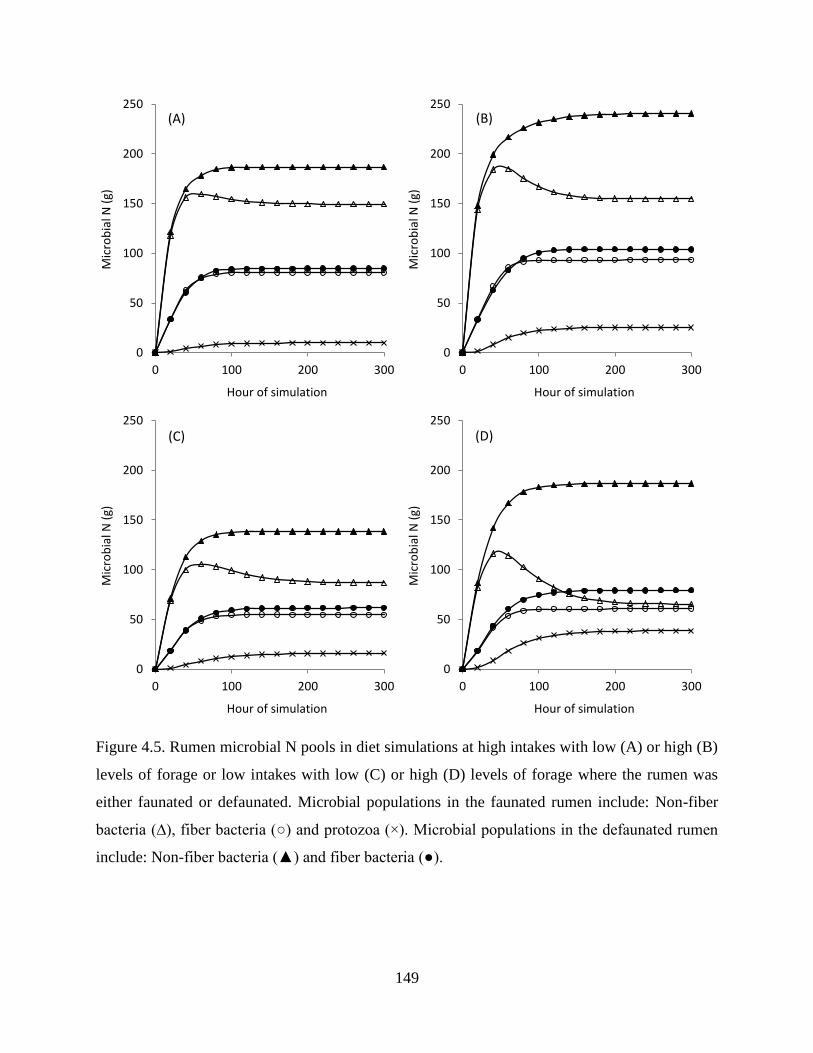
149
Figure 4.5. Rumen microbial N pools in diet simulations at high intakes with low (A) or high (B)
levels of forage or low intakes with low (C) or high (D) levels of forage where the rumen was
either faunated or defaunated. Microbial populations in the faunated rumen include: Non-fiber
bacteria (∆), fiber bacteria (○) and protozoa (×). Microbial populations in the defaunated rumen
include: Non-fiber bacteria (▲) and fiber bacteria (●).
0
50
100
150
200
250
0 100 200 300
Mic
rob
ial N
(g)
Hour of simulation
(A)
0
50
100
150
200
250
0 100 200 300
Mic
rob
ial N
(g)
Hour of simulation
(B)
0
50
100
150
200
250
0 100 200 300
Mic
rob
ial N
(g)
Hour of simulation
(C)
0
50
100
150
200
250
0 100 200 300
Mic
rob
ial N
(g)
Hour of simulation
(D)
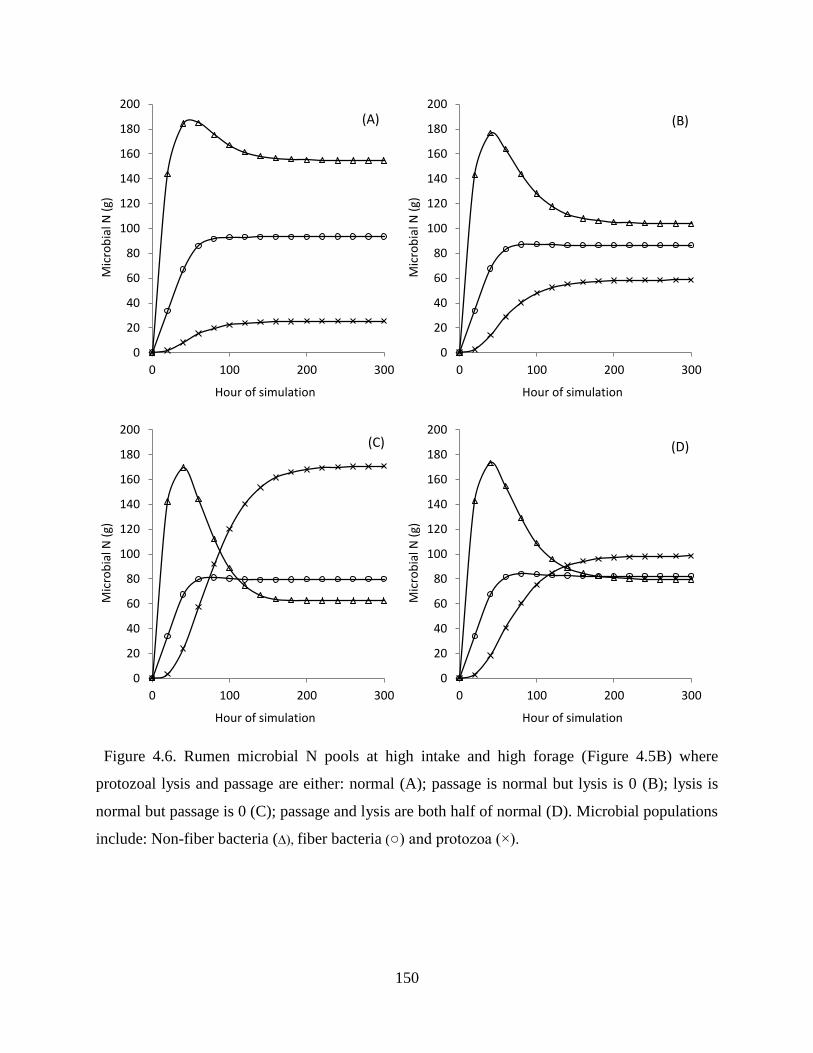
150
Figure 4.6. Rumen microbial N pools at high intake and high forage (Figure 4.5B) where
protozoal lysis and passage are either: normal (A); passage is normal but lysis is 0 (B); lysis is
normal but passage is 0 (C); passage and lysis are both half of normal (D). Microbial populations
include: Non-fiber bacteria (∆), fiber bacteria (○) and protozoa (×).
0
20
40
60
80
100
120
140
160
180
200
0 100 200 300
Mic
rob
ial N
(g)
Hour of simulation
(A)
0
20
40
60
80
100
120
140
160
180
200
0 100 200 300
Mic
rob
ial N
(g)
Hour of simulation
(B)
0
20
40
60
80
100
120
140
160
180
200
0 100 200 300
Mic
rob
ial N
(g)
Hour of simulation
(C)
0
20
40
60
80
100
120
140
160
180
200
0 100 200 300
Mic
rob
ial N
(g)
Hour of simulation
(D)
151
4.5 Implications
Rumen metabolism is a dynamic process with many interacting factors influencing the
digestion of nutrients and the supply of microbial protein to the animal. Important additions to
this version of the CNCPS include estimations of protozoal growth and a mechanistic large
intestine. Protozoa have an important influence on microbial supply to the animal and nutrient
cycling within the rumen while the large intestine contributes a varying amount to CHO
digestion and is an important component of whole body N metabolism. Construction of this new
dynamic version of the CNCPS provides new capability to estimate these interactions and their
effects on the rumen environment for application in routine diet formulation.
152
4.6 References
Ankrah, P., S. C. Loerch, and B. A. Dehority. 1990. Sequestration, migration and lysis of
protozoa in the rumen. J. Gen. Microbiol. 136:1869-1875.
Broderick, G., M. Stevenson, R. Patton, N. Lobos, and J. Olmos Colmenero. 2008. Effect of
supplementing rumen-protected methionine on production and nitrogen excretion in lactating
dairy cows. J. Dairy Sci. 91:1092-1102.
Broderick, G. A. 2003. Effects of varying dietary protein and energy levels on the production of
lactating dairy cows. J. Dairy Sci. 86:1370-1381.
Broderick, G. A., P. Huhtanen, S. Ahvenjärvi, S. M. Reynal, and K. J. Shingfield. 2010.
Quantifying ruminal nitrogen metabolism using the omasal sampling technique in cattle—a
meta-analysis. J. Dairy Sci. 93:3216-3230.
Coleman, G. S. 1986. The metabolism of rumen ciliate protozoa. FEMS Microbiol. Lett. 39:321-
344.
Coleman, G. S. 1992. The rate of uptake and metabolism of starch grains and cellulose particles
by entodinium species, eudiplodinium maggii, some other entodiniomorphid protozoa and
natural protozoal populations taken from the ovine rumen. J. Appl. Microbiol. 73:507-513.
Coleman, G. S. and F. J. Hall. 1984. The uptake and utilization of entodinium caudatum,
bacteria, free amino acids and glucose by the rumen ciliate entodinium bursa. J. Appl. Microbiol.
56:283-294.
Czerkawski, J. W. 1976. Chemical composition of microbial matter in the rumen. J. Sci. Food
Agric. 27:621-632.
Dehority, B. A. 2005. Effect of ph on viability of entodinium caudatum, entodinium exiguum,
epidinium caudatum, and ophryoscolex purkynjei in vitro. J. Eukaryot. Microbiol. 52:339-342.
Dijkstra, J. 1994. Simulation of the dynamics of protozoa in the rumen. Br. J. Nutr. 72:679-699.
153
Dijkstra, J., J. France, and S. Tamminga. 1998. Quantification of the recycling of microbial
nitrogen in the rumen using a mechanistic model of rumen fermentation processes. J. Agric. Sci.
130:81-94.
Dijkstra, J., H. Neal, D. E. Beever, and J. France. 1992. Simulation of nutrient digestion,
absorption and outflow in the rumen: Model description. J. of Nutrition 122:2239.
Firkins, J. L., Z. Yu, and M. Morrison. 2007. Ruminal nitrogen metabolism: Perspectives for
integration of microbiology and nutrition for dairy. J. Dairy Sci. 90:E1-E16.
Fox, D. G., L. O. Tedeschi, T. P. Tylutki, J. B. Russell, M. E. Van Amburgh, L. E. Chase, A. N.
Pell, and T. R. Overton. 2004. The Cornell Net Carbohydrate and Protein System model for
evaluating herd nutrition and nutrient excretion. Anim. Feed Sci. Technol. 112:29-78.
Hoover, W. 1986. Chemical factors involved in ruminal fiber digestion. J. Dairy Sci. 69:2755-
2766.
Hristov, A. N. and J.-P. Jouany. 2005. Nitrogen requirements of cattle. Pages 117-166 in Factors
affecting the efficiency of nitrogen utilization in the rumen. A. Pfeffer and A. N. Hristov, ed.
CABI, Wallingford, UK.
Isaacson, H. R., F. C. Hinds, M. P. Bryant, and F. N. Owens. 1975. Efficiency of energy
utilization by mixed rumen bacteria in continuous culture. J. Dairy Sci. 58:1645-1659.
Lanzas, C., C. J. Sniffen, S. Seo, L. O. Tedeschi, and D. G. Fox. 2007. A revised CNCPS feed
carbohydrate fractionation scheme for formulating rations for ruminants. Anim. Feed Sci.
Technol. 136:167-190.
Lee, C., A. Hristov, K. Heyler, T. Cassidy, M. Long, B. Corl, and S. Karnati. 2011. Effects of
dietary protein concentration and coconut oil supplementation on nitrogen utilization and
production in dairy cows. J. Dairy Sci. 94:5544-5557.
Lee, C., A. N. Hristov, K. S. Heyler, T. W. Cassidy, H. Lapierre, G. A. Varga, and C. Parys.
2012. Effects of metabolizable protein supply and amino acid supplementation on nitrogen
154
utilization, milk production, and ammonia emissions from manure in dairy cows. J. Dairy Sci.
95:5253-5268.
Offner, A., A. Bach, and D. Sauvant. 2003. Quantitative review of in situ starch degradation in
the rumen. Anim. Feed Sci. Technol. 106:81-93.
Onodera, R. and C. Henderson. 1980. Growth factors of bacterial origin for the culture of the
rumen oligotrich protozoon, entodinium caudatum. J. Appl. Microbiol. 48:125-134.
Pirt, S. J. 1965. The maintenance energy of bacteria in growing cultures. Proceedings of the
Royal Society of London. Series B, Biological Sciences 163:224-231.
Raffrenato, E. 2011. Physical, chemical and kinetic factors associated with fiber digestibility in
ruminants and models describing these relationships. PhD Dissertation. Department of Animal
Science.
Russell, J. and C. Sniffen. 1984. Effect of carbon-4 and carbon-5 volatile fatty acids on growth
of mixed rumen bacteria in vitro. J. Dairy Sci. 67:987-994.
Russell, J. B. and R. L. Baldwin. 1979. Comparison of maintenance energy expenditures and
growth yields among several rumen bacteria grown on continuous culture. Appl. Environ.
Microbiol. 37:537-543.
Russell, J. B., R. E. Muck, and P. J. Weimer. 2009. Quantitative analysis of cellulose degradation
and growth of cellulolytic bacteria in the rumen. FEMS Microbiol. Ecol. 67:183-197.
Russell, J. B., J. D. O'Connor, D. G. Fox, P. J. Van Soest, and C. J. Sniffen. 1992. A net
carbohydrate and protein system for evaluating cattle diets: I. Ruminal fermentation. J. Anim.
Sci. 70:3551-3561.
Satter, L. and R. Roffler. 1975. Nitrogen requirement and utilization in dairy cattle. J. Dairy Sci.
58:1219-1237.
155
Schwab, C. G., P. Huhtanen, C. W. Hunt, and T. Hvelplund. 2005. Nitrogen requirements of
cattle. Pages 13-70 in Nitrogen and phosphorus nutrition of cattle and the environment. A.
Pfeffer and A. N. Hristov, ed. CABI, Wallingford, UK.
Sterman, J. D. 2000. Business dynamics: Systems thinking and modeling for a complex world.
Irwin McGraw-Hill, USA.
Stouthamer, A. 1973. A theoretical study on the amount of atp required for synthesis of
microbial cell material. Antonie Van Leeuwenhoek 39:545-565.
Sylvester, J. T., S. K. R. Karnati, Z. Yu, C. J. Newbold, and J. L. Firkins. 2005. Evaluation of a
real-time pcr assay quantifying the ruminal pool size and duodenal flow of protozoal nitrogen. J.
Dairy Sci. 88:2083-2095.
Van Amburgh, M. E., L. E. Chase, T. R. Overton, D. A. Ross, E. B. Recktenwald, R. J. Higgs,
and T. P. Tylutki. 2010. Updates to the Cornell Net Carbohydrate and Protein System v6.1 and
implications for ration formulation. Pages 144-159 in Proc. Cornell Nutrition Conference,
Syracuse, NY.
Van Kessel, J. and J. Russell. 1996. The effect of amino nitrogen on the energetics of ruminal
bacteria and its impact on energy spilling. J. Dairy Sci. 79:1237-1243.
Waldo, D. R., L. W. Smith, and E. L. Cox. 1972. Model of cellulose disappearance from the
rumen. J. Dairy Sci. 55:125-129.
Walker, N. D., C. J. Newbold, and R. J. Wallace. 2005. Nitrogen requirements of cattle. Pages
71-115 in Nitrogen metabolism in the rumen. A. Pfeffer and A. N. Hristov, ed. CABI,
Wallingford, UK.
Williams, A. G. and G. S. Coleman. 1988. The rumen protozoa. Pages 77-128 in The rumen
microbial ecosystem. P. N. Hobson and C. S. Stewart, ed. Elsevier Science Pub. Co., New York.
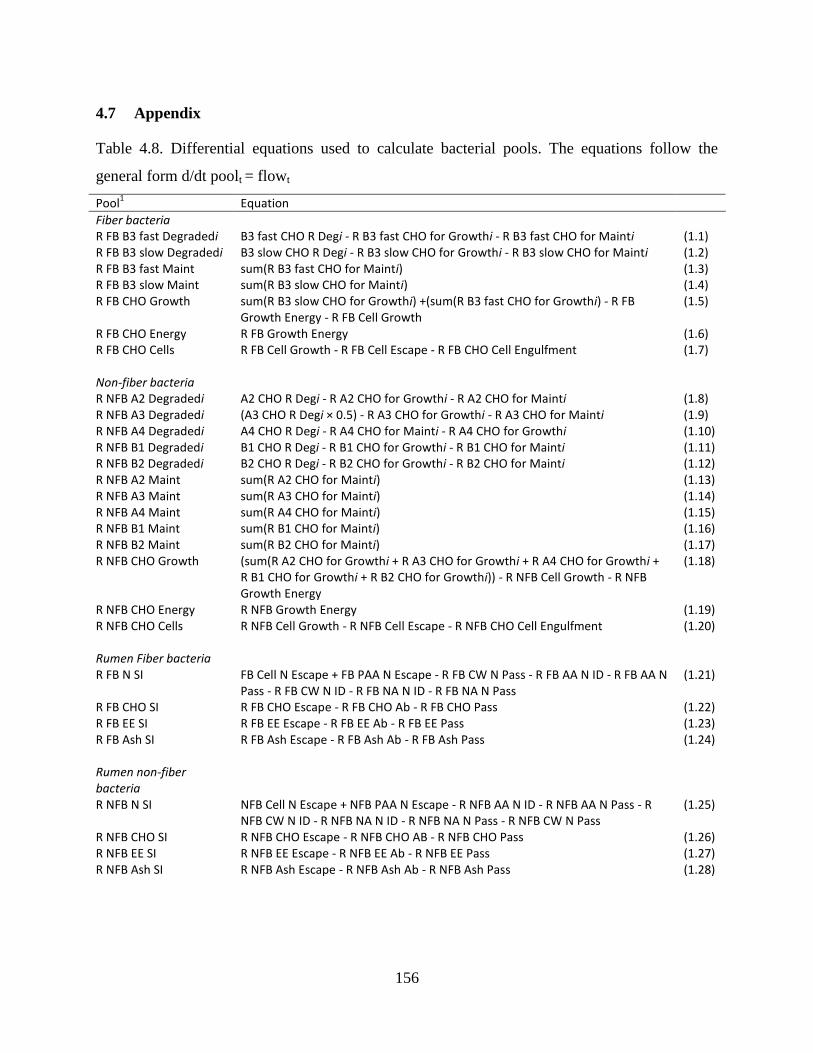
156
4.7 Appendix
Table 4.8. Differential equations used to calculate bacterial pools. The equations follow the
general form d/dt poolt = flowt
Pool1
Equation
Fiber bacteria R FB B3 fast Degradedi B3 fast CHO R Degi - R B3 fast CHO for Growthi - R B3 fast CHO for Mainti (1.1) R FB B3 slow Degradedi B3 slow CHO R Degi - R B3 slow CHO for Growthi - R B3 slow CHO for Mainti (1.2) R FB B3 fast Maint sum(R B3 fast CHO for Mainti) (1.3) R FB B3 slow Maint sum(R B3 slow CHO for Mainti) (1.4) R FB CHO Growth sum(R B3 slow CHO for Growthi) +(sum(R B3 fast CHO for Growthi) - R FB
Growth Energy - R FB Cell Growth (1.5)
R FB CHO Energy R FB Growth Energy (1.6) R FB CHO Cells R FB Cell Growth - R FB Cell Escape - R FB CHO Cell Engulfment (1.7) Non-fiber bacteria R NFB A2 Degradedi A2 CHO R Degi - R A2 CHO for Growthi - R A2 CHO for Mainti (1.8) R NFB A3 Degradedi (A3 CHO R Degi × 0.5) - R A3 CHO for Growthi - R A3 CHO for Mainti (1.9) R NFB A4 Degradedi A4 CHO R Degi - R A4 CHO for Mainti - R A4 CHO for Growthi (1.10) R NFB B1 Degradedi B1 CHO R Degi - R B1 CHO for Growthi - R B1 CHO for Mainti (1.11) R NFB B2 Degradedi B2 CHO R Degi - R B2 CHO for Growthi - R B2 CHO for Mainti (1.12) R NFB A2 Maint sum(R A2 CHO for Mainti) (1.13) R NFB A3 Maint sum(R A3 CHO for Mainti) (1.14) R NFB A4 Maint sum(R A4 CHO for Mainti) (1.15) R NFB B1 Maint sum(R B1 CHO for Mainti) (1.16) R NFB B2 Maint sum(R B2 CHO for Mainti) (1.17) R NFB CHO Growth (sum(R A2 CHO for Growthi + R A3 CHO for Growthi + R A4 CHO for Growthi +
R B1 CHO for Growthi + R B2 CHO for Growthi)) - R NFB Cell Growth - R NFB Growth Energy
(1.18)
R NFB CHO Energy R NFB Growth Energy (1.19) R NFB CHO Cells R NFB Cell Growth - R NFB Cell Escape - R NFB CHO Cell Engulfment (1.20) Rumen Fiber bacteria R FB N SI FB Cell N Escape + FB PAA N Escape - R FB CW N Pass - R FB AA N ID - R FB AA N
Pass - R FB CW N ID - R FB NA N ID - R FB NA N Pass (1.21)
R FB CHO SI R FB CHO Escape - R FB CHO Ab - R FB CHO Pass (1.22) R FB EE SI R FB EE Escape - R FB EE Ab - R FB EE Pass (1.23) R FB Ash SI R FB Ash Escape - R FB Ash Ab - R FB Ash Pass (1.24) Rumen non-fiber bacteria
R NFB N SI NFB Cell N Escape + NFB PAA N Escape - R NFB AA N ID - R NFB AA N Pass - R NFB CW N ID - R NFB NA N ID - R NFB NA N Pass - R NFB CW N Pass
(1.25)
R NFB CHO SI R NFB CHO Escape - R NFB CHO AB - R NFB CHO Pass (1.26) R NFB EE SI R NFB EE Escape - R NFB EE Ab - R NFB EE Pass (1.27) R NFB Ash SI R NFB Ash Escape - R NFB Ash Ab - R NFB Ash Pass (1.28)
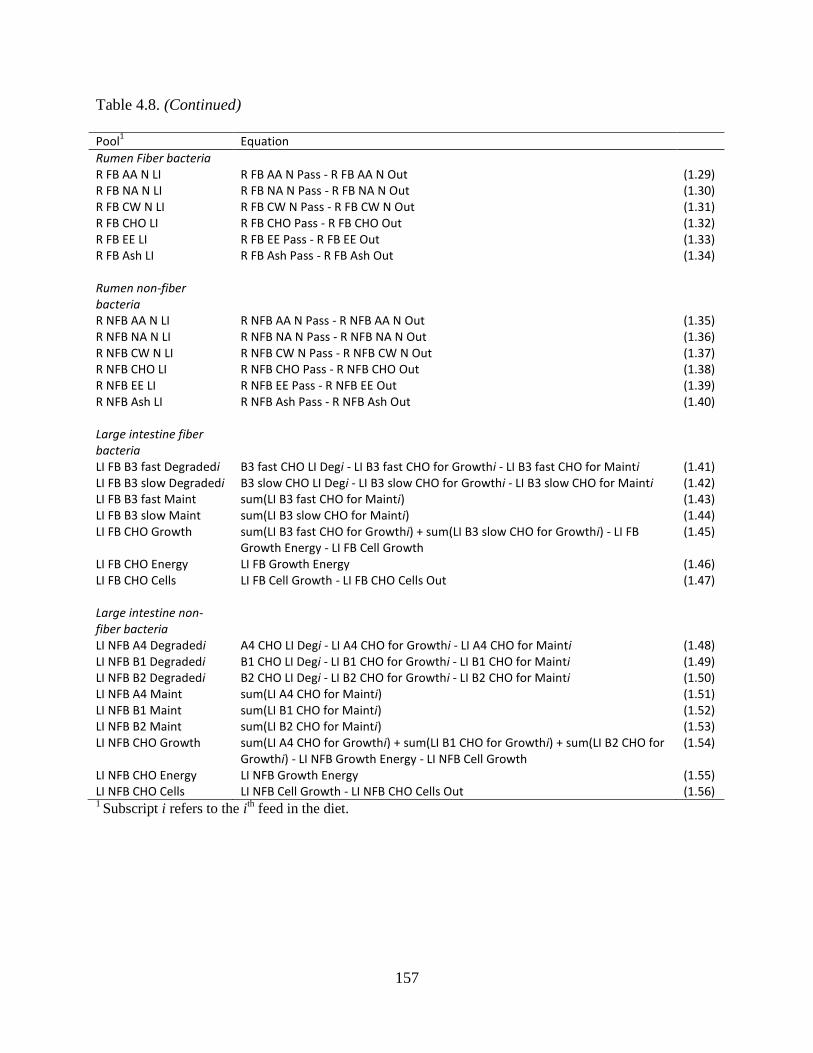
157
Table 4.8. (Continued)
Pool1
Equation
Rumen Fiber bacteria R FB AA N LI R FB AA N Pass - R FB AA N Out (1.29) R FB NA N LI R FB NA N Pass - R FB NA N Out (1.30) R FB CW N LI R FB CW N Pass - R FB CW N Out (1.31) R FB CHO LI R FB CHO Pass - R FB CHO Out (1.32) R FB EE LI R FB EE Pass - R FB EE Out (1.33) R FB Ash LI R FB Ash Pass - R FB Ash Out (1.34) Rumen non-fiber bacteria
R NFB AA N LI R NFB AA N Pass - R NFB AA N Out (1.35) R NFB NA N LI R NFB NA N Pass - R NFB NA N Out (1.36) R NFB CW N LI R NFB CW N Pass - R NFB CW N Out (1.37) R NFB CHO LI R NFB CHO Pass - R NFB CHO Out (1.38) R NFB EE LI R NFB EE Pass - R NFB EE Out (1.39) R NFB Ash LI R NFB Ash Pass - R NFB Ash Out (1.40) Large intestine fiber bacteria
LI FB B3 fast Degradedi B3 fast CHO LI Degi - LI B3 fast CHO for Growthi - LI B3 fast CHO for Mainti (1.41) LI FB B3 slow Degradedi B3 slow CHO LI Degi - LI B3 slow CHO for Growthi - LI B3 slow CHO for Mainti (1.42) LI FB B3 fast Maint sum(LI B3 fast CHO for Mainti) (1.43) LI FB B3 slow Maint sum(LI B3 slow CHO for Mainti) (1.44) LI FB CHO Growth sum(LI B3 fast CHO for Growthi) + sum(LI B3 slow CHO for Growthi) - LI FB
Growth Energy - LI FB Cell Growth (1.45)
LI FB CHO Energy LI FB Growth Energy (1.46) LI FB CHO Cells LI FB Cell Growth - LI FB CHO Cells Out (1.47) Large intestine non-fiber bacteria
LI NFB A4 Degradedi A4 CHO LI Degi - LI A4 CHO for Growthi - LI A4 CHO for Mainti (1.48) LI NFB B1 Degradedi B1 CHO LI Degi - LI B1 CHO for Growthi - LI B1 CHO for Mainti (1.49) LI NFB B2 Degradedi B2 CHO LI Degi - LI B2 CHO for Growthi - LI B2 CHO for Mainti (1.50) LI NFB A4 Maint sum(LI A4 CHO for Mainti) (1.51) LI NFB B1 Maint sum(LI B1 CHO for Mainti) (1.52) LI NFB B2 Maint sum(LI B2 CHO for Mainti) (1.53) LI NFB CHO Growth sum(LI A4 CHO for Growthi) + sum(LI B1 CHO for Growthi) + sum(LI B2 CHO for
Growthi) - LI NFB Growth Energy - LI NFB Cell Growth (1.54)
LI NFB CHO Energy LI NFB Growth Energy (1.55) LI NFB CHO Cells LI NFB Cell Growth - LI NFB CHO Cells Out (1.56) 1 Subscript i refers to the i
th feed in the diet.
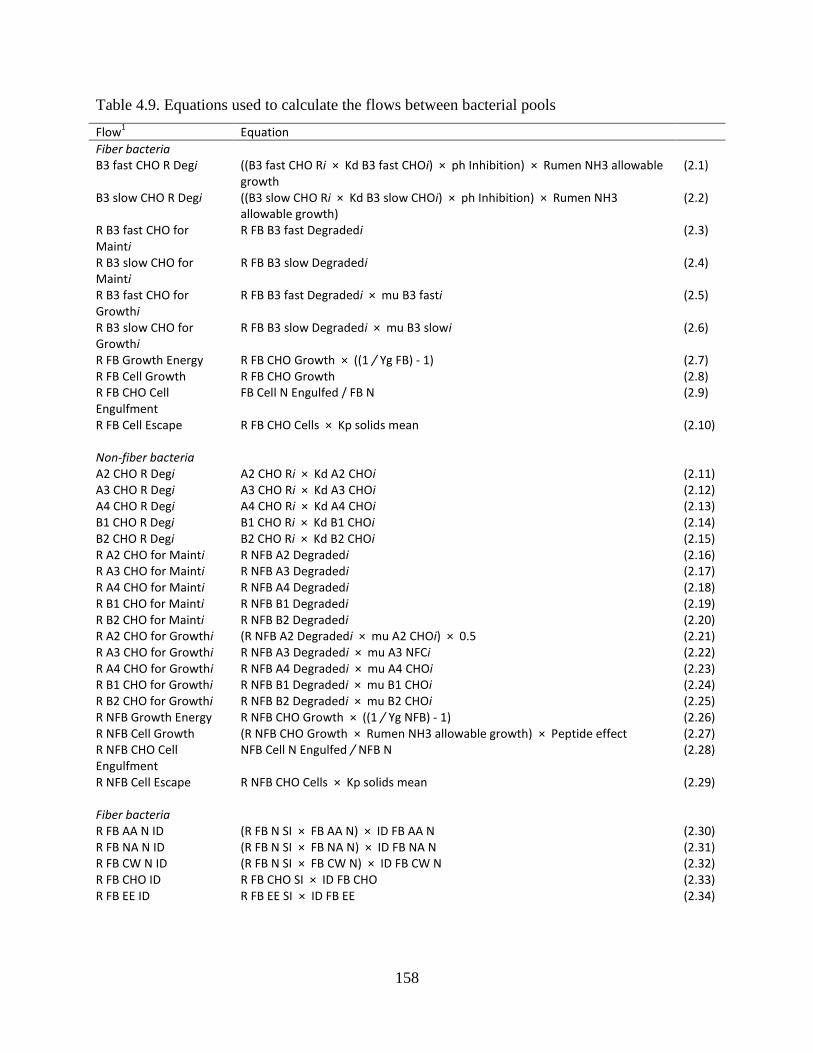
158
Table 4.9. Equations used to calculate the flows between bacterial pools
Flow1
Equation
Fiber bacteria B3 fast CHO R Degi ((B3 fast CHO Ri × Kd B3 fast CHOi) × ph Inhibition) × Rumen NH3 allowable
growth (2.1)
B3 slow CHO R Degi ((B3 slow CHO Ri × Kd B3 slow CHOi) × ph Inhibition) × Rumen NH3 allowable growth)
(2.2)
R B3 fast CHO for Mainti
R FB B3 fast Degradedi (2.3)
R B3 slow CHO for Mainti
R FB B3 slow Degradedi (2.4)
R B3 fast CHO for Growthi
R FB B3 fast Degradedi × mu B3 fasti (2.5)
R B3 slow CHO for Growthi
R FB B3 slow Degradedi × mu B3 slowi (2.6)
R FB Growth Energy R FB CHO Growth × ((1 / Yg FB) - 1) (2.7) R FB Cell Growth R FB CHO Growth (2.8) R FB CHO Cell Engulfment
FB Cell N Engulfed / FB N (2.9)
R FB Cell Escape R FB CHO Cells × Kp solids mean (2.10) Non-fiber bacteria A2 CHO R Degi A2 CHO Ri × Kd A2 CHOi (2.11) A3 CHO R Degi A3 CHO Ri × Kd A3 CHOi (2.12) A4 CHO R Degi A4 CHO Ri × Kd A4 CHOi (2.13) B1 CHO R Degi B1 CHO Ri × Kd B1 CHOi (2.14) B2 CHO R Degi B2 CHO Ri × Kd B2 CHOi (2.15) R A2 CHO for Mainti R NFB A2 Degradedi (2.16) R A3 CHO for Mainti R NFB A3 Degradedi (2.17) R A4 CHO for Mainti R NFB A4 Degradedi (2.18) R B1 CHO for Mainti R NFB B1 Degradedi (2.19) R B2 CHO for Mainti R NFB B2 Degradedi (2.20) R A2 CHO for Growthi (R NFB A2 Degradedi × mu A2 CHOi) × 0.5 (2.21) R A3 CHO for Growthi R NFB A3 Degradedi × mu A3 NFCi (2.22) R A4 CHO for Growthi R NFB A4 Degradedi × mu A4 CHOi (2.23) R B1 CHO for Growthi R NFB B1 Degradedi × mu B1 CHOi (2.24) R B2 CHO for Growthi R NFB B2 Degradedi × mu B2 CHOi (2.25) R NFB Growth Energy R NFB CHO Growth × ((1 / Yg NFB) - 1) (2.26) R NFB Cell Growth (R NFB CHO Growth × Rumen NH3 allowable growth) × Peptide effect (2.27) R NFB CHO Cell Engulfment
NFB Cell N Engulfed / NFB N (2.28)
R NFB Cell Escape R NFB CHO Cells × Kp solids mean (2.29) Fiber bacteria R FB AA N ID (R FB N SI × FB AA N) × ID FB AA N (2.30) R FB NA N ID (R FB N SI × FB NA N) × ID FB NA N (2.31) R FB CW N ID (R FB N SI × FB CW N) × ID FB CW N (2.32) R FB CHO ID R FB CHO SI × ID FB CHO (2.33) R FB EE ID R FB EE SI × ID FB EE (2.34)
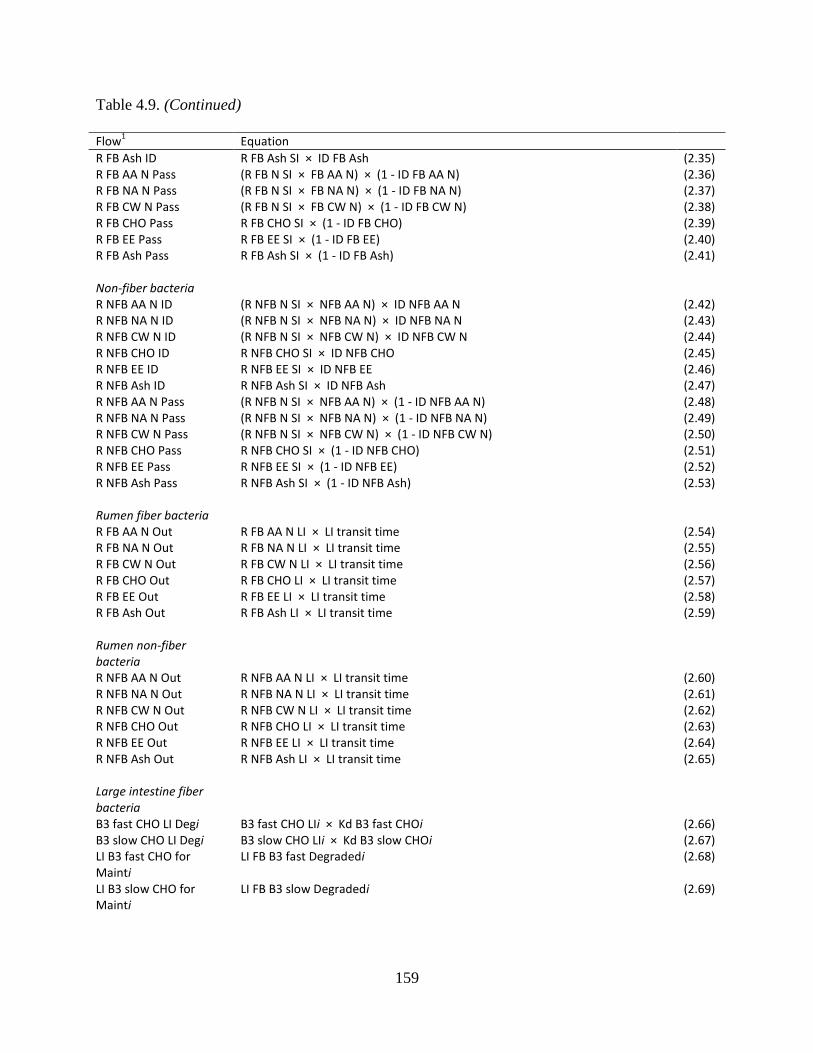
159
Table 4.9. (Continued)
Flow1
Equation
R FB Ash ID R FB Ash SI × ID FB Ash (2.35) R FB AA N Pass (R FB N SI × FB AA N) × (1 - ID FB AA N) (2.36) R FB NA N Pass (R FB N SI × FB NA N) × (1 - ID FB NA N) (2.37) R FB CW N Pass (R FB N SI × FB CW N) × (1 - ID FB CW N) (2.38) R FB CHO Pass R FB CHO SI × (1 - ID FB CHO) (2.39) R FB EE Pass R FB EE SI × (1 - ID FB EE) (2.40) R FB Ash Pass R FB Ash SI × (1 - ID FB Ash) (2.41) Non-fiber bacteria R NFB AA N ID (R NFB N SI × NFB AA N) × ID NFB AA N (2.42) R NFB NA N ID (R NFB N SI × NFB NA N) × ID NFB NA N (2.43) R NFB CW N ID (R NFB N SI × NFB CW N) × ID NFB CW N (2.44) R NFB CHO ID R NFB CHO SI × ID NFB CHO (2.45) R NFB EE ID R NFB EE SI × ID NFB EE (2.46) R NFB Ash ID R NFB Ash SI × ID NFB Ash (2.47) R NFB AA N Pass (R NFB N SI × NFB AA N) × (1 - ID NFB AA N) (2.48) R NFB NA N Pass (R NFB N SI × NFB NA N) × (1 - ID NFB NA N) (2.49) R NFB CW N Pass (R NFB N SI × NFB CW N) × (1 - ID NFB CW N) (2.50) R NFB CHO Pass R NFB CHO SI × (1 - ID NFB CHO) (2.51) R NFB EE Pass R NFB EE SI × (1 - ID NFB EE) (2.52) R NFB Ash Pass R NFB Ash SI × (1 - ID NFB Ash) (2.53) Rumen fiber bacteria R FB AA N Out R FB AA N LI × LI transit time (2.54) R FB NA N Out R FB NA N LI × LI transit time (2.55) R FB CW N Out R FB CW N LI × LI transit time (2.56) R FB CHO Out R FB CHO LI × LI transit time (2.57) R FB EE Out R FB EE LI × LI transit time (2.58) R FB Ash Out R FB Ash LI × LI transit time (2.59) Rumen non-fiber bacteria
R NFB AA N Out R NFB AA N LI × LI transit time (2.60) R NFB NA N Out R NFB NA N LI × LI transit time (2.61) R NFB CW N Out R NFB CW N LI × LI transit time (2.62) R NFB CHO Out R NFB CHO LI × LI transit time (2.63) R NFB EE Out R NFB EE LI × LI transit time (2.64) R NFB Ash Out R NFB Ash LI × LI transit time (2.65) Large intestine fiber bacteria
B3 fast CHO LI Degi B3 fast CHO LIi × Kd B3 fast CHOi (2.66) B3 slow CHO LI Degi B3 slow CHO LIi × Kd B3 slow CHOi (2.67) LI B3 fast CHO for Mainti
LI FB B3 fast Degradedi (2.68)
LI B3 slow CHO for Mainti
LI FB B3 slow Degradedi (2.69)
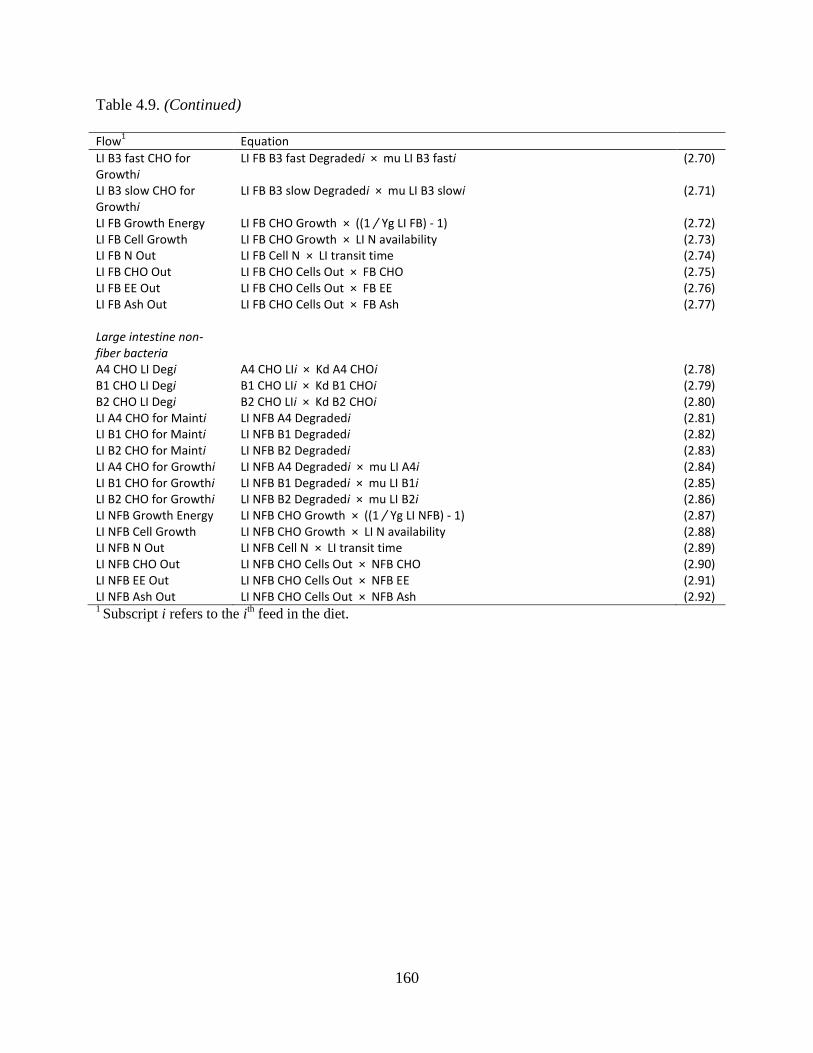
160
Table 4.9. (Continued)
Flow1
Equation
LI B3 fast CHO for Growthi
LI FB B3 fast Degradedi × mu LI B3 fasti (2.70)
LI B3 slow CHO for Growthi
LI FB B3 slow Degradedi × mu LI B3 slowi (2.71)
LI FB Growth Energy LI FB CHO Growth × ((1 / Yg LI FB) - 1) (2.72) LI FB Cell Growth LI FB CHO Growth × LI N availability (2.73) LI FB N Out LI FB Cell N × LI transit time (2.74) LI FB CHO Out LI FB CHO Cells Out × FB CHO (2.75) LI FB EE Out LI FB CHO Cells Out × FB EE (2.76) LI FB Ash Out LI FB CHO Cells Out × FB Ash (2.77) Large intestine non-fiber bacteria
A4 CHO LI Degi A4 CHO LIi × Kd A4 CHOi (2.78) B1 CHO LI Degi B1 CHO LIi × Kd B1 CHOi (2.79) B2 CHO LI Degi B2 CHO LIi × Kd B2 CHOi (2.80) LI A4 CHO for Mainti LI NFB A4 Degradedi (2.81) LI B1 CHO for Mainti LI NFB B1 Degradedi (2.82) LI B2 CHO for Mainti LI NFB B2 Degradedi (2.83) LI A4 CHO for Growthi LI NFB A4 Degradedi × mu LI A4i (2.84) LI B1 CHO for Growthi LI NFB B1 Degradedi × mu LI B1i (2.85) LI B2 CHO for Growthi LI NFB B2 Degradedi × mu LI B2i (2.86) LI NFB Growth Energy LI NFB CHO Growth × ((1 / Yg LI NFB) - 1) (2.87) LI NFB Cell Growth LI NFB CHO Growth × LI N availability (2.88) LI NFB N Out LI NFB Cell N × LI transit time (2.89) LI NFB CHO Out LI NFB CHO Cells Out × NFB CHO (2.90) LI NFB EE Out LI NFB CHO Cells Out × NFB EE (2.91) LI NFB Ash Out LI NFB CHO Cells Out × NFB Ash (2.92) 1 Subscript i refers to the i
th feed in the diet.
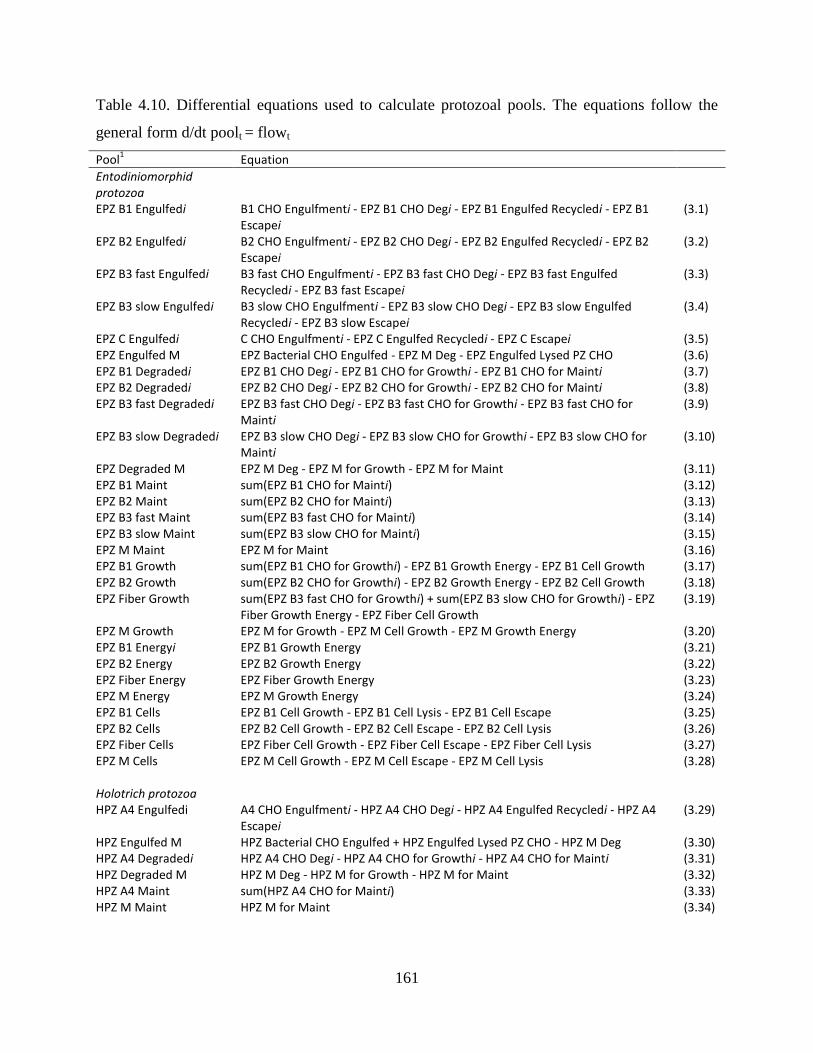
161
Table 4.10. Differential equations used to calculate protozoal pools. The equations follow the
general form d/dt poolt = flowt
Pool1
Equation
Entodiniomorphid protozoa
EPZ B1 Engulfedi B1 CHO Engulfmenti - EPZ B1 CHO Degi - EPZ B1 Engulfed Recycledi - EPZ B1 Escapei
(3.1)
EPZ B2 Engulfedi B2 CHO Engulfmenti - EPZ B2 CHO Degi - EPZ B2 Engulfed Recycledi - EPZ B2 Escapei
(3.2)
EPZ B3 fast Engulfedi B3 fast CHO Engulfmenti - EPZ B3 fast CHO Degi - EPZ B3 fast Engulfed Recycledi - EPZ B3 fast Escapei
(3.3)
EPZ B3 slow Engulfedi B3 slow CHO Engulfmenti - EPZ B3 slow CHO Degi - EPZ B3 slow Engulfed Recycledi - EPZ B3 slow Escapei
(3.4)
EPZ C Engulfedi C CHO Engulfmenti - EPZ C Engulfed Recycledi - EPZ C Escapei (3.5) EPZ Engulfed M EPZ Bacterial CHO Engulfed - EPZ M Deg - EPZ Engulfed Lysed PZ CHO (3.6) EPZ B1 Degradedi EPZ B1 CHO Degi - EPZ B1 CHO for Growthi - EPZ B1 CHO for Mainti (3.7) EPZ B2 Degradedi EPZ B2 CHO Degi - EPZ B2 CHO for Growthi - EPZ B2 CHO for Mainti (3.8) EPZ B3 fast Degradedi EPZ B3 fast CHO Degi - EPZ B3 fast CHO for Growthi - EPZ B3 fast CHO for
Mainti (3.9)
EPZ B3 slow Degradedi EPZ B3 slow CHO Degi - EPZ B3 slow CHO for Growthi - EPZ B3 slow CHO for Mainti
(3.10)
EPZ Degraded M EPZ M Deg - EPZ M for Growth - EPZ M for Maint (3.11) EPZ B1 Maint sum(EPZ B1 CHO for Mainti) (3.12) EPZ B2 Maint sum(EPZ B2 CHO for Mainti) (3.13) EPZ B3 fast Maint sum(EPZ B3 fast CHO for Mainti) (3.14) EPZ B3 slow Maint sum(EPZ B3 slow CHO for Mainti) (3.15) EPZ M Maint EPZ M for Maint (3.16) EPZ B1 Growth sum(EPZ B1 CHO for Growthi) - EPZ B1 Growth Energy - EPZ B1 Cell Growth (3.17) EPZ B2 Growth sum(EPZ B2 CHO for Growthi) - EPZ B2 Growth Energy - EPZ B2 Cell Growth (3.18) EPZ Fiber Growth sum(EPZ B3 fast CHO for Growthi) + sum(EPZ B3 slow CHO for Growthi) - EPZ
Fiber Growth Energy - EPZ Fiber Cell Growth (3.19)
EPZ M Growth EPZ M for Growth - EPZ M Cell Growth - EPZ M Growth Energy (3.20) EPZ B1 Energyi EPZ B1 Growth Energy (3.21) EPZ B2 Energy EPZ B2 Growth Energy (3.22) EPZ Fiber Energy EPZ Fiber Growth Energy (3.23) EPZ M Energy EPZ M Growth Energy (3.24) EPZ B1 Cells EPZ B1 Cell Growth - EPZ B1 Cell Lysis - EPZ B1 Cell Escape (3.25) EPZ B2 Cells EPZ B2 Cell Growth - EPZ B2 Cell Escape - EPZ B2 Cell Lysis (3.26) EPZ Fiber Cells EPZ Fiber Cell Growth - EPZ Fiber Cell Escape - EPZ Fiber Cell Lysis (3.27) EPZ M Cells EPZ M Cell Growth - EPZ M Cell Escape - EPZ M Cell Lysis (3.28) Holotrich protozoa HPZ A4 Engulfedi A4 CHO Engulfmenti - HPZ A4 CHO Degi - HPZ A4 Engulfed Recycledi - HPZ A4
Escapei (3.29)
HPZ Engulfed M HPZ Bacterial CHO Engulfed + HPZ Engulfed Lysed PZ CHO - HPZ M Deg (3.30) HPZ A4 Degradedi HPZ A4 CHO Degi - HPZ A4 CHO for Growthi - HPZ A4 CHO for Mainti (3.31) HPZ Degraded M HPZ M Deg - HPZ M for Growth - HPZ M for Maint (3.32) HPZ A4 Maint sum(HPZ A4 CHO for Mainti) (3.33) HPZ M Maint HPZ M for Maint (3.34)
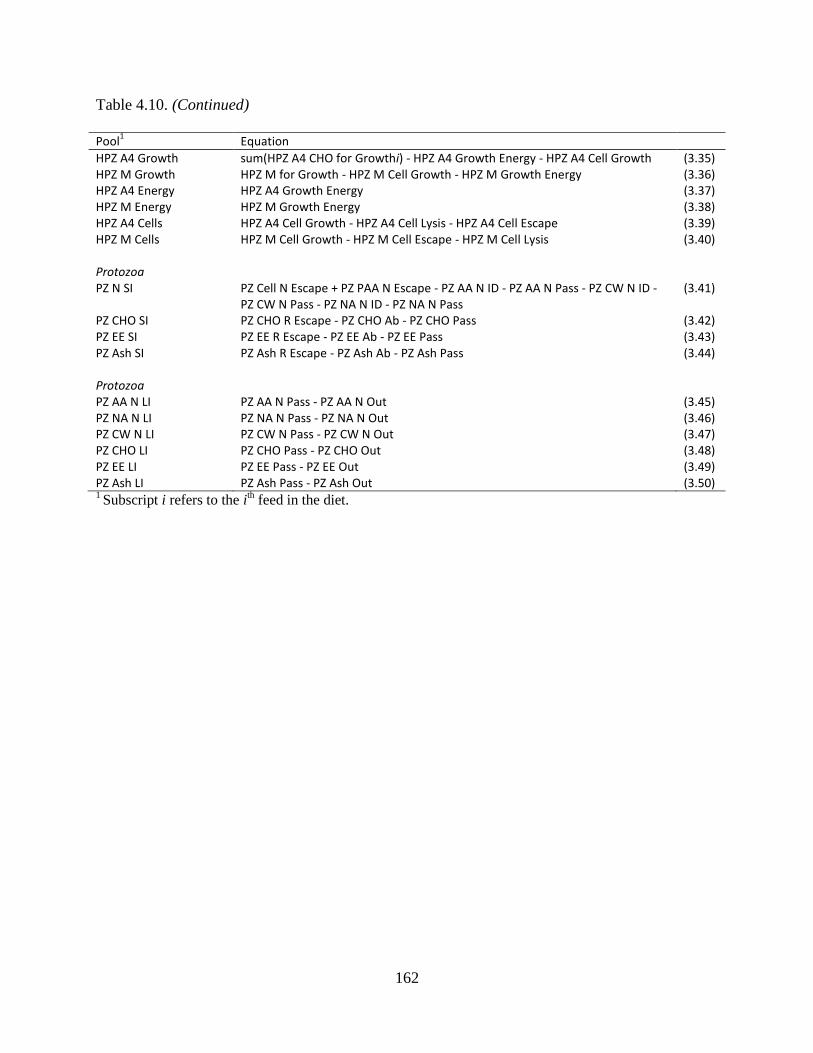
162
Table 4.10. (Continued)
Pool1
Equation
HPZ A4 Growth sum(HPZ A4 CHO for Growthi) - HPZ A4 Growth Energy - HPZ A4 Cell Growth (3.35) HPZ M Growth HPZ M for Growth - HPZ M Cell Growth - HPZ M Growth Energy (3.36) HPZ A4 Energy HPZ A4 Growth Energy (3.37) HPZ M Energy HPZ M Growth Energy (3.38) HPZ A4 Cells HPZ A4 Cell Growth - HPZ A4 Cell Lysis - HPZ A4 Cell Escape (3.39) HPZ M Cells HPZ M Cell Growth - HPZ M Cell Escape - HPZ M Cell Lysis (3.40) Protozoa PZ N SI PZ Cell N Escape + PZ PAA N Escape - PZ AA N ID - PZ AA N Pass - PZ CW N ID -
PZ CW N Pass - PZ NA N ID - PZ NA N Pass (3.41)
PZ CHO SI PZ CHO R Escape - PZ CHO Ab - PZ CHO Pass (3.42) PZ EE SI PZ EE R Escape - PZ EE Ab - PZ EE Pass (3.43) PZ Ash SI PZ Ash R Escape - PZ Ash Ab - PZ Ash Pass (3.44) Protozoa PZ AA N LI PZ AA N Pass - PZ AA N Out (3.45) PZ NA N LI PZ NA N Pass - PZ NA N Out (3.46) PZ CW N LI PZ CW N Pass - PZ CW N Out (3.47) PZ CHO LI PZ CHO Pass - PZ CHO Out (3.48) PZ EE LI PZ EE Pass - PZ EE Out (3.49) PZ Ash LI PZ Ash Pass - PZ Ash Out (3.50) 1 Subscript i refers to the i
th feed in the diet.
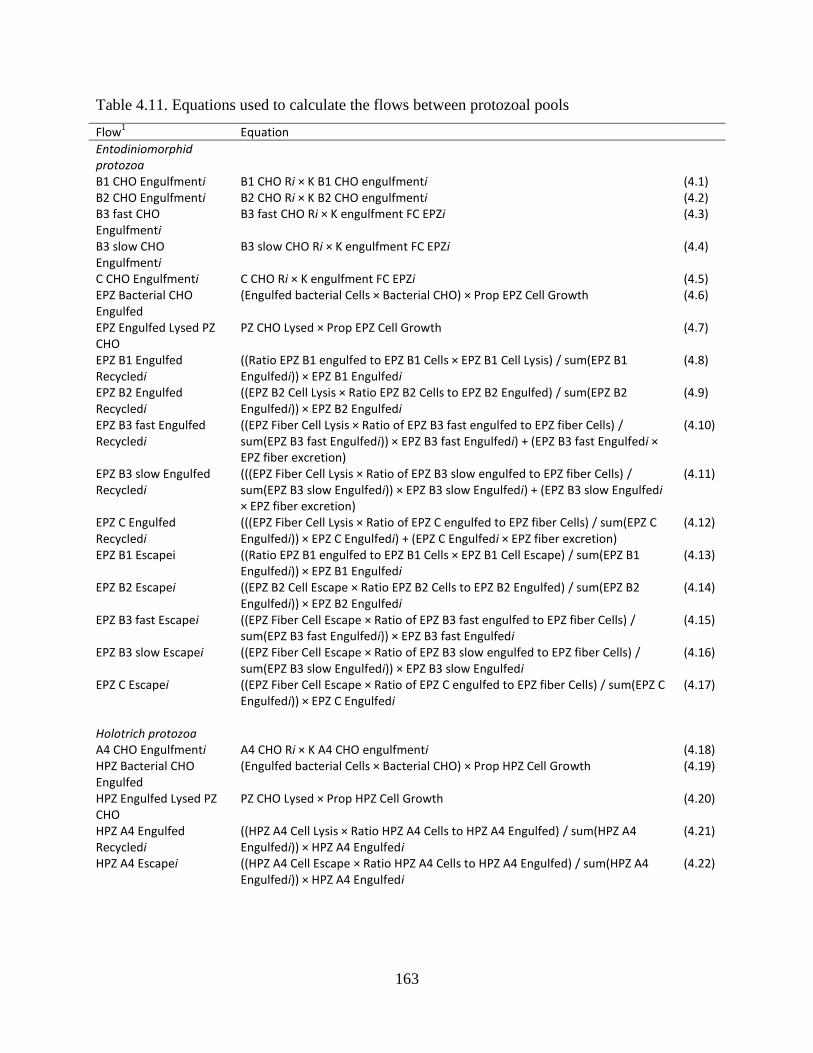
163
Table 4.11. Equations used to calculate the flows between protozoal pools
Flow1
Equation
Entodiniomorphid protozoa
B1 CHO Engulfmenti B1 CHO Ri × K B1 CHO engulfmenti (4.1) B2 CHO Engulfmenti B2 CHO Ri × K B2 CHO engulfmenti (4.2) B3 fast CHO Engulfmenti
B3 fast CHO Ri × K engulfment FC EPZi (4.3)
B3 slow CHO Engulfmenti
B3 slow CHO Ri × K engulfment FC EPZi (4.4)
C CHO Engulfmenti C CHO Ri × K engulfment FC EPZi (4.5) EPZ Bacterial CHO Engulfed
(Engulfed bacterial Cells × Bacterial CHO) × Prop EPZ Cell Growth (4.6)
EPZ Engulfed Lysed PZ CHO
PZ CHO Lysed × Prop EPZ Cell Growth (4.7)
EPZ B1 Engulfed Recycledi
((Ratio EPZ B1 engulfed to EPZ B1 Cells × EPZ B1 Cell Lysis) / sum(EPZ B1 Engulfedi)) × EPZ B1 Engulfedi
(4.8)
EPZ B2 Engulfed Recycledi
((EPZ B2 Cell Lysis × Ratio EPZ B2 Cells to EPZ B2 Engulfed) / sum(EPZ B2 Engulfedi)) × EPZ B2 Engulfedi
(4.9)
EPZ B3 fast Engulfed Recycledi
((EPZ Fiber Cell Lysis × Ratio of EPZ B3 fast engulfed to EPZ fiber Cells) / sum(EPZ B3 fast Engulfedi)) × EPZ B3 fast Engulfedi) + (EPZ B3 fast Engulfedi × EPZ fiber excretion)
(4.10)
EPZ B3 slow Engulfed Recycledi
(((EPZ Fiber Cell Lysis × Ratio of EPZ B3 slow engulfed to EPZ fiber Cells) / sum(EPZ B3 slow Engulfedi)) × EPZ B3 slow Engulfedi) + (EPZ B3 slow Engulfedi × EPZ fiber excretion)
(4.11)
EPZ C Engulfed Recycledi
(((EPZ Fiber Cell Lysis × Ratio of EPZ C engulfed to EPZ fiber Cells) / sum(EPZ C Engulfedi)) × EPZ C Engulfedi) + (EPZ C Engulfedi × EPZ fiber excretion)
(4.12)
EPZ B1 Escapei ((Ratio EPZ B1 engulfed to EPZ B1 Cells × EPZ B1 Cell Escape) / sum(EPZ B1 Engulfedi)) × EPZ B1 Engulfedi
(4.13)
EPZ B2 Escapei ((EPZ B2 Cell Escape × Ratio EPZ B2 Cells to EPZ B2 Engulfed) / sum(EPZ B2 Engulfedi)) × EPZ B2 Engulfedi
(4.14)
EPZ B3 fast Escapei ((EPZ Fiber Cell Escape × Ratio of EPZ B3 fast engulfed to EPZ fiber Cells) / sum(EPZ B3 fast Engulfedi)) × EPZ B3 fast Engulfedi
(4.15)
EPZ B3 slow Escapei ((EPZ Fiber Cell Escape × Ratio of EPZ B3 slow engulfed to EPZ fiber Cells) / sum(EPZ B3 slow Engulfedi)) × EPZ B3 slow Engulfedi
(4.16)
EPZ C Escapei ((EPZ Fiber Cell Escape × Ratio of EPZ C engulfed to EPZ fiber Cells) / sum(EPZ C Engulfedi)) × EPZ C Engulfedi
(4.17)
Holotrich protozoa A4 CHO Engulfmenti A4 CHO Ri × K A4 CHO engulfmenti (4.18) HPZ Bacterial CHO Engulfed
(Engulfed bacterial Cells × Bacterial CHO) × Prop HPZ Cell Growth (4.19)
HPZ Engulfed Lysed PZ CHO
PZ CHO Lysed × Prop HPZ Cell Growth (4.20)
HPZ A4 Engulfed Recycledi
((HPZ A4 Cell Lysis × Ratio HPZ A4 Cells to HPZ A4 Engulfed) / sum(HPZ A4 Engulfedi)) × HPZ A4 Engulfedi
(4.21)
HPZ A4 Escapei ((HPZ A4 Cell Escape × Ratio HPZ A4 Cells to HPZ A4 Engulfed) / sum(HPZ A4 Engulfedi)) × HPZ A4 Engulfedi
(4.22)
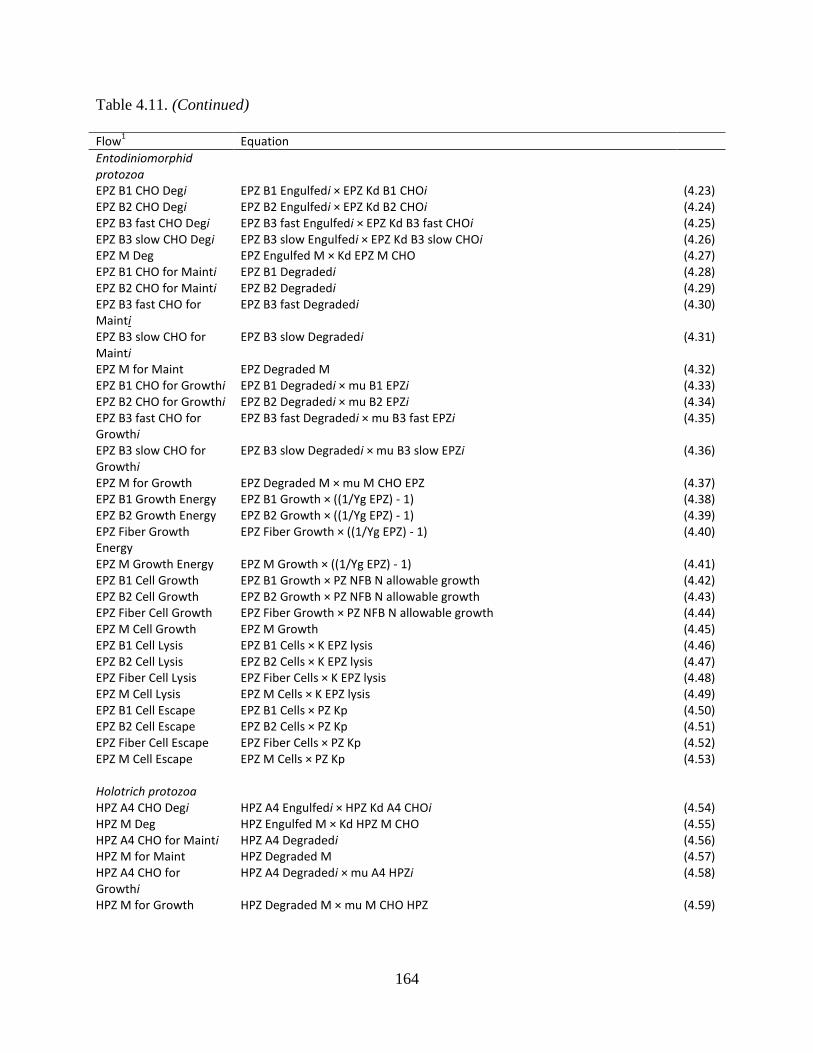
164
Table 4.11. (Continued)
Flow1
Equation
Entodiniomorphid protozoa
EPZ B1 CHO Degi EPZ B1 Engulfedi × EPZ Kd B1 CHOi (4.23) EPZ B2 CHO Degi EPZ B2 Engulfedi × EPZ Kd B2 CHOi (4.24) EPZ B3 fast CHO Degi EPZ B3 fast Engulfedi × EPZ Kd B3 fast CHOi (4.25) EPZ B3 slow CHO Degi EPZ B3 slow Engulfedi × EPZ Kd B3 slow CHOi (4.26) EPZ M Deg EPZ Engulfed M × Kd EPZ M CHO (4.27) EPZ B1 CHO for Mainti EPZ B1 Degradedi (4.28) EPZ B2 CHO for Mainti EPZ B2 Degradedi (4.29) EPZ B3 fast CHO for Mainti
EPZ B3 fast Degradedi (4.30)
EPZ B3 slow CHO for Mainti
EPZ B3 slow Degradedi (4.31)
EPZ M for Maint EPZ Degraded M (4.32) EPZ B1 CHO for Growthi EPZ B1 Degradedi × mu B1 EPZi (4.33) EPZ B2 CHO for Growthi EPZ B2 Degradedi × mu B2 EPZi (4.34) EPZ B3 fast CHO for Growthi
EPZ B3 fast Degradedi × mu B3 fast EPZi (4.35)
EPZ B3 slow CHO for Growthi
EPZ B3 slow Degradedi × mu B3 slow EPZi (4.36)
EPZ M for Growth EPZ Degraded M × mu M CHO EPZ (4.37) EPZ B1 Growth Energy EPZ B1 Growth × ((1/Yg EPZ) - 1) (4.38) EPZ B2 Growth Energy EPZ B2 Growth × ((1/Yg EPZ) - 1) (4.39) EPZ Fiber Growth Energy
EPZ Fiber Growth × ((1/Yg EPZ) - 1) (4.40)
EPZ M Growth Energy EPZ M Growth × ((1/Yg EPZ) - 1) (4.41) EPZ B1 Cell Growth EPZ B1 Growth × PZ NFB N allowable growth (4.42) EPZ B2 Cell Growth EPZ B2 Growth × PZ NFB N allowable growth (4.43) EPZ Fiber Cell Growth EPZ Fiber Growth × PZ NFB N allowable growth (4.44) EPZ M Cell Growth EPZ M Growth (4.45) EPZ B1 Cell Lysis EPZ B1 Cells × K EPZ lysis (4.46) EPZ B2 Cell Lysis EPZ B2 Cells × K EPZ lysis (4.47) EPZ Fiber Cell Lysis EPZ Fiber Cells × K EPZ lysis (4.48) EPZ M Cell Lysis EPZ M Cells × K EPZ lysis (4.49) EPZ B1 Cell Escape EPZ B1 Cells × PZ Kp (4.50) EPZ B2 Cell Escape EPZ B2 Cells × PZ Kp (4.51) EPZ Fiber Cell Escape EPZ Fiber Cells × PZ Kp (4.52) EPZ M Cell Escape EPZ M Cells × PZ Kp (4.53) Holotrich protozoa HPZ A4 CHO Degi HPZ A4 Engulfedi × HPZ Kd A4 CHOi (4.54) HPZ M Deg HPZ Engulfed M × Kd HPZ M CHO (4.55) HPZ A4 CHO for Mainti HPZ A4 Degradedi (4.56) HPZ M for Maint HPZ Degraded M (4.57) HPZ A4 CHO for Growthi
HPZ A4 Degradedi × mu A4 HPZi (4.58)
HPZ M for Growth HPZ Degraded M × mu M CHO HPZ (4.59)
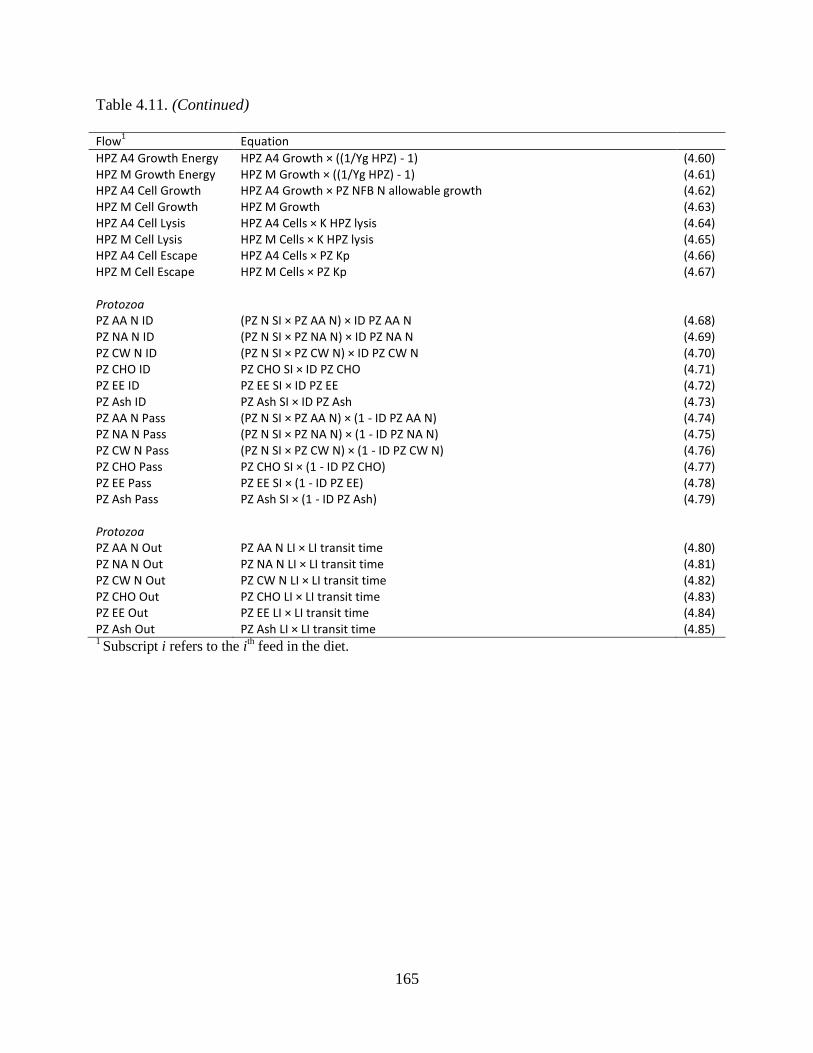
165
Table 4.11. (Continued)
Flow1
Equation
HPZ A4 Growth Energy HPZ A4 Growth × ((1/Yg HPZ) - 1) (4.60) HPZ M Growth Energy HPZ M Growth × ((1/Yg HPZ) - 1) (4.61) HPZ A4 Cell Growth HPZ A4 Growth × PZ NFB N allowable growth (4.62) HPZ M Cell Growth HPZ M Growth (4.63) HPZ A4 Cell Lysis HPZ A4 Cells × K HPZ lysis (4.64) HPZ M Cell Lysis HPZ M Cells × K HPZ lysis (4.65) HPZ A4 Cell Escape HPZ A4 Cells × PZ Kp (4.66) HPZ M Cell Escape HPZ M Cells × PZ Kp (4.67) Protozoa PZ AA N ID (PZ N SI × PZ AA N) × ID PZ AA N (4.68) PZ NA N ID (PZ N SI × PZ NA N) × ID PZ NA N (4.69) PZ CW N ID (PZ N SI × PZ CW N) × ID PZ CW N (4.70) PZ CHO ID PZ CHO SI × ID PZ CHO (4.71) PZ EE ID PZ EE SI × ID PZ EE (4.72) PZ Ash ID PZ Ash SI × ID PZ Ash (4.73) PZ AA N Pass (PZ N SI × PZ AA N) × (1 - ID PZ AA N) (4.74) PZ NA N Pass (PZ N SI × PZ NA N) × (1 - ID PZ NA N) (4.75) PZ CW N Pass (PZ N SI × PZ CW N) × (1 - ID PZ CW N) (4.76) PZ CHO Pass PZ CHO SI × (1 - ID PZ CHO) (4.77) PZ EE Pass PZ EE SI × (1 - ID PZ EE) (4.78) PZ Ash Pass PZ Ash SI × (1 - ID PZ Ash) (4.79) Protozoa PZ AA N Out PZ AA N LI × LI transit time (4.80) PZ NA N Out PZ NA N LI × LI transit time (4.81) PZ CW N Out PZ CW N LI × LI transit time (4.82) PZ CHO Out PZ CHO LI × LI transit time (4.83) PZ EE Out PZ EE LI × LI transit time (4.84) PZ Ash Out PZ Ash LI × LI transit time (4.85) 1 Subscript i refers to the i
th feed in the diet.
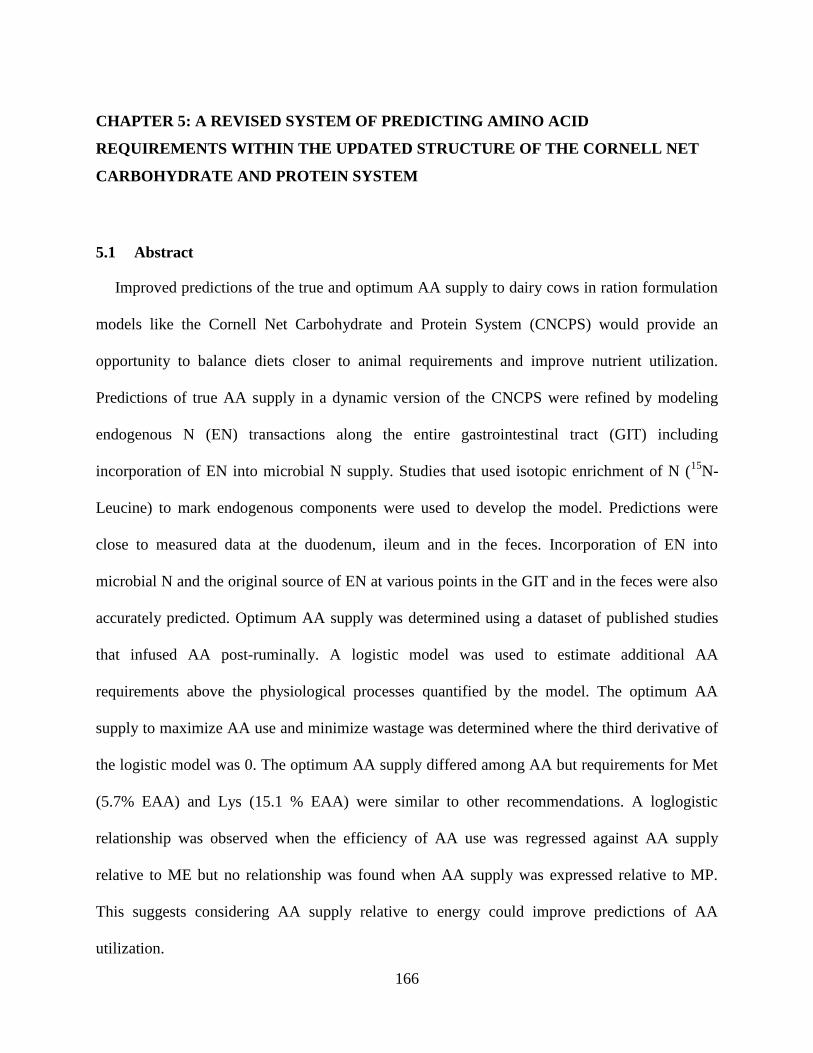
166
CHAPTER 5: A REVISED SYSTEM OF PREDICTING AMINO ACID
REQUIREMENTS WITHIN THE UPDATED STRUCTURE OF THE CORNELL NET
CARBOHYDRATE AND PROTEIN SYSTEM
5.1 Abstract
Improved predictions of the true and optimum AA supply to dairy cows in ration formulation
models like the Cornell Net Carbohydrate and Protein System (CNCPS) would provide an
opportunity to balance diets closer to animal requirements and improve nutrient utilization.
Predictions of true AA supply in a dynamic version of the CNCPS were refined by modeling
endogenous N (EN) transactions along the entire gastrointestinal tract (GIT) including
incorporation of EN into microbial N supply. Studies that used isotopic enrichment of N (15
N-
Leucine) to mark endogenous components were used to develop the model. Predictions were
close to measured data at the duodenum, ileum and in the feces. Incorporation of EN into
microbial N and the original source of EN at various points in the GIT and in the feces were also
accurately predicted. Optimum AA supply was determined using a dataset of published studies
that infused AA post-ruminally. A logistic model was used to estimate additional AA
requirements above the physiological processes quantified by the model. The optimum AA
supply to maximize AA use and minimize wastage was determined where the third derivative of
the logistic model was 0. The optimum AA supply differed among AA but requirements for Met
(5.7% EAA) and Lys (15.1 % EAA) were similar to other recommendations. A loglogistic
relationship was observed when the efficiency of AA use was regressed against AA supply
relative to ME but no relationship was found when AA supply was expressed relative to MP.
This suggests considering AA supply relative to energy could improve predictions of AA
utilization.

167
5.2 Introduction
An improved understanding of both, the true, and optimum supply of AA to a dairy cow can
provide an opportunity to balance AA closer to animal requirements and reduce total protein
feeding while still maintaining high levels of production (Haque et al., 2012). This strategy can
also reduce feed costs and lower the environmental impact of dairy production (Higgs et al.,
2012). Amino acids flowing to the duodenum encompass three major fractions: Un-degraded
feed, microbial and endogenous AA (Lapierre et al., 2006). Combined, these fractions represent
the gross AA supply, potentially available to the animal. However, the endogenous fraction, and
its contribution to the microbial pool make establishing the net AA supply complex (Ouellet et
al., 2002). The contribution of endogenous N to the microbial pool and un-degraded dietary pool
represent a recycling of previously absorbed AA that cannot be considered new supply (Lapierre
et al., 2006). Currently, the prediction of AA supply in the Cornell Net Carbohydrate and Protein
System (CNCPS) is the sum of AA from feed and bacteria that escape the rumen and are
digested in the small intestine and does not consider endogenous AA or protozoa (O'Connor et
al., 1993). Incorporating both endogenous AA and protozoa into the CNCPS would refine and
possibly improve predictions of the true supply of AA to the animal.
Requirements in the CNCPS are calculated individually for different physiological processes
and divided by a transfer coefficient (efficiency of use) to give total AA requirements (O'Connor
et al., 1993). Previous versions of the CNCPS have assumed the protein requirements for
maintenance are the sum of scurf, urinary protein and metabolic fecal N (Fox et al., 2004).
Metabolic fecal nitrogen (MFN) is typically estimated using regression techniques with past
versions of the NRC and CNCPS using the estimates of Swanson (1977). Fox et al., (2004)
suggested these calculations may have shortcomings due to the contribution of microbial
168
nitrogen from hind gut fermentation to total fecal nitrogen. The regression techniques used
would consider microbial N as endogenous N (EN). Hence, the N or AA requirement for
maintenance estimated by the model using these predictions might be over-estimated. The
assumption used when considering MFN in the maintenance requirement of an animal is that for
the protein to be a cost, it needs to be excreted. However, considerably more EN is secreted into
the rumen of dairy cows than escapes in the free form or incorporated in bacteria (Marini et al.,
2008, Ouellet et al., 2010a, Ouellet et al., 2002). This means the balance has to be degraded in
the rumen and the N absorbed as ammonia. Once degraded, essential AA are lost to the animal
and can only be replaced by the diet or rumen microorganisms appearing in the duodenum.
Therefore, it makes sense to consider all protein secreted in to the gastrointestinal tract (GIT)
which is not recovered in the small intestine a maintenance cost, not just what appears in the
feces.
The objectives of this study were to replace current predictions of MFN with estimations of
EN transactions through the whole GIT in the dynamic version of the CNCPS described in
Chapters 3 and 4. In doing this, the true supply of AA to the small intestine from all sources can
be refined and the shortcomings of the current predictions improved. A second objective was to
evaluate the efficiency of transfer of AA to milk and maintenance using the predicted net supply
and requirements of the new model. Interactions between protein and energy play an important
role in determining how an animal will utilize absorbed AA and it has been recommended they
be considered together (Hanigan et al., 1998, Lobley, 2007). These interactions were investigated
in determining the optimum AA requirements for this version of the model.
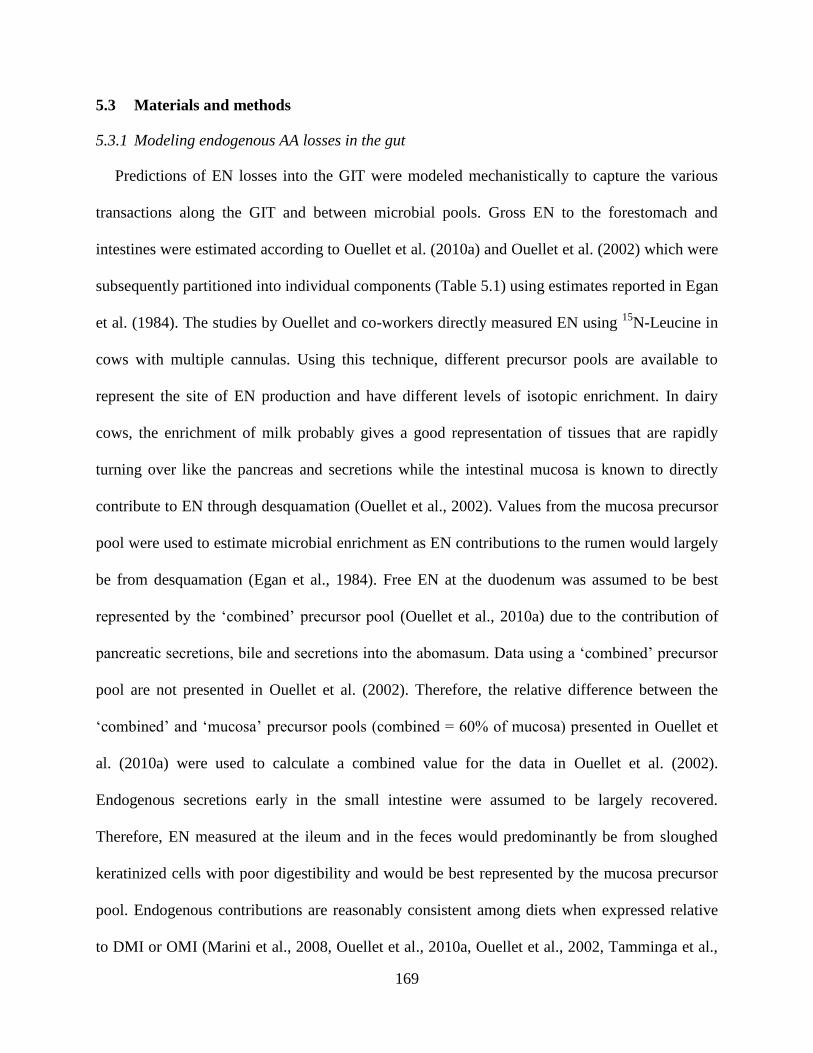
169
5.3 Materials and methods
5.3.1 Modeling endogenous AA losses in the gut
Predictions of EN losses into the GIT were modeled mechanistically to capture the various
transactions along the GIT and between microbial pools. Gross EN to the forestomach and
intestines were estimated according to Ouellet et al. (2010a) and Ouellet et al. (2002) which were
subsequently partitioned into individual components (Table 5.1) using estimates reported in Egan
et al. (1984). The studies by Ouellet and co-workers directly measured EN using 15
N-Leucine in
cows with multiple cannulas. Using this technique, different precursor pools are available to
represent the site of EN production and have different levels of isotopic enrichment. In dairy
cows, the enrichment of milk probably gives a good representation of tissues that are rapidly
turning over like the pancreas and secretions while the intestinal mucosa is known to directly
contribute to EN through desquamation (Ouellet et al., 2002). Values from the mucosa precursor
pool were used to estimate microbial enrichment as EN contributions to the rumen would largely
be from desquamation (Egan et al., 1984). Free EN at the duodenum was assumed to be best
represented by the ‘combined’ precursor pool (Ouellet et al., 2010a) due to the contribution of
pancreatic secretions, bile and secretions into the abomasum. Data using a ‘combined’ precursor
pool are not presented in Ouellet et al. (2002). Therefore, the relative difference between the
‘combined’ and ‘mucosa’ precursor pools (combined = 60% of mucosa) presented in Ouellet et
al. (2010a) were used to calculate a combined value for the data in Ouellet et al. (2002).
Endogenous secretions early in the small intestine were assumed to be largely recovered.
Therefore, EN measured at the ileum and in the feces would predominantly be from sloughed
keratinized cells with poor digestibility and would be best represented by the mucosa precursor
pool. Endogenous contributions are reasonably consistent among diets when expressed relative
to DMI or OMI (Marini et al., 2008, Ouellet et al., 2010a, Ouellet et al., 2002, Tamminga et al.,
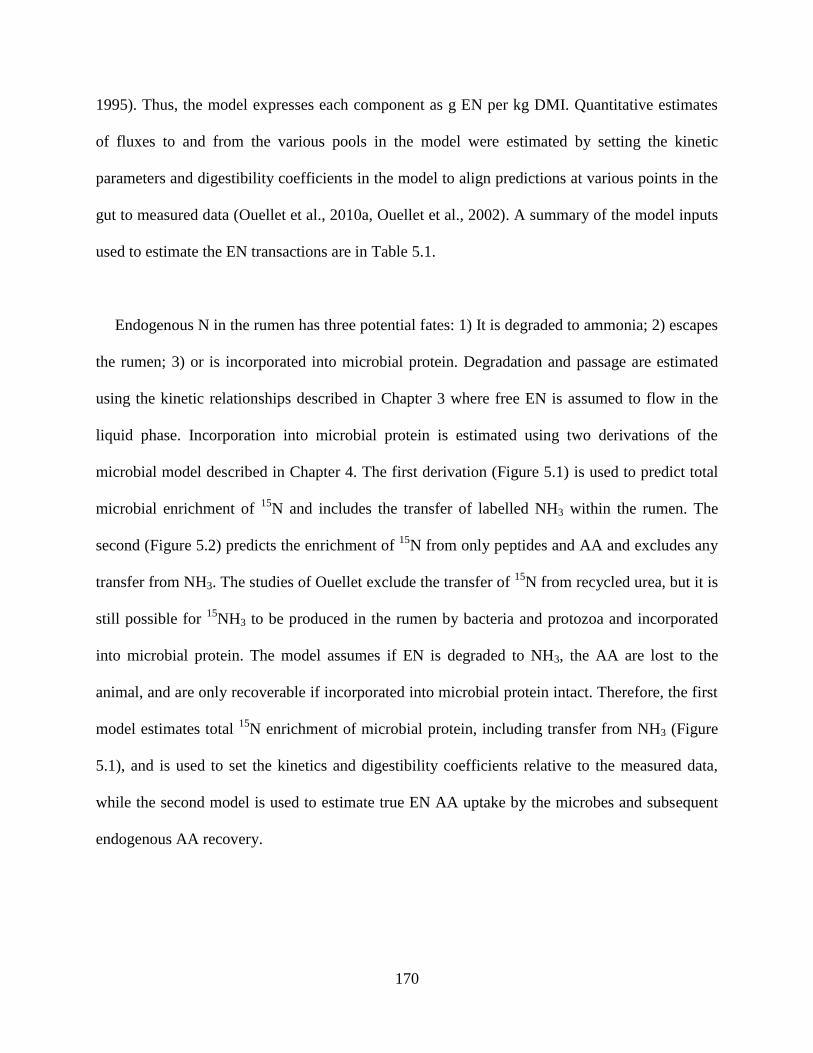
170
1995). Thus, the model expresses each component as g EN per kg DMI. Quantitative estimates
of fluxes to and from the various pools in the model were estimated by setting the kinetic
parameters and digestibility coefficients in the model to align predictions at various points in the
gut to measured data (Ouellet et al., 2010a, Ouellet et al., 2002). A summary of the model inputs
used to estimate the EN transactions are in Table 5.1.
Endogenous N in the rumen has three potential fates: 1) It is degraded to ammonia; 2) escapes
the rumen; 3) or is incorporated into microbial protein. Degradation and passage are estimated
using the kinetic relationships described in Chapter 3 where free EN is assumed to flow in the
liquid phase. Incorporation into microbial protein is estimated using two derivations of the
microbial model described in Chapter 4. The first derivation (Figure 5.1) is used to predict total
microbial enrichment of 15
N and includes the transfer of labelled NH3 within the rumen. The
second (Figure 5.2) predicts the enrichment of 15
N from only peptides and AA and excludes any
transfer from NH3. The studies of Ouellet exclude the transfer of 15
N from recycled urea, but it is
still possible for 15
NH3 to be produced in the rumen by bacteria and protozoa and incorporated
into microbial protein. The model assumes if EN is degraded to NH3, the AA are lost to the
animal, and are only recoverable if incorporated into microbial protein intact. Therefore, the first
model estimates total 15
N enrichment of microbial protein, including transfer from NH3 (Figure
5.1), and is used to set the kinetics and digestibility coefficients relative to the measured data,
while the second model is used to estimate true EN AA uptake by the microbes and subsequent
endogenous AA recovery.
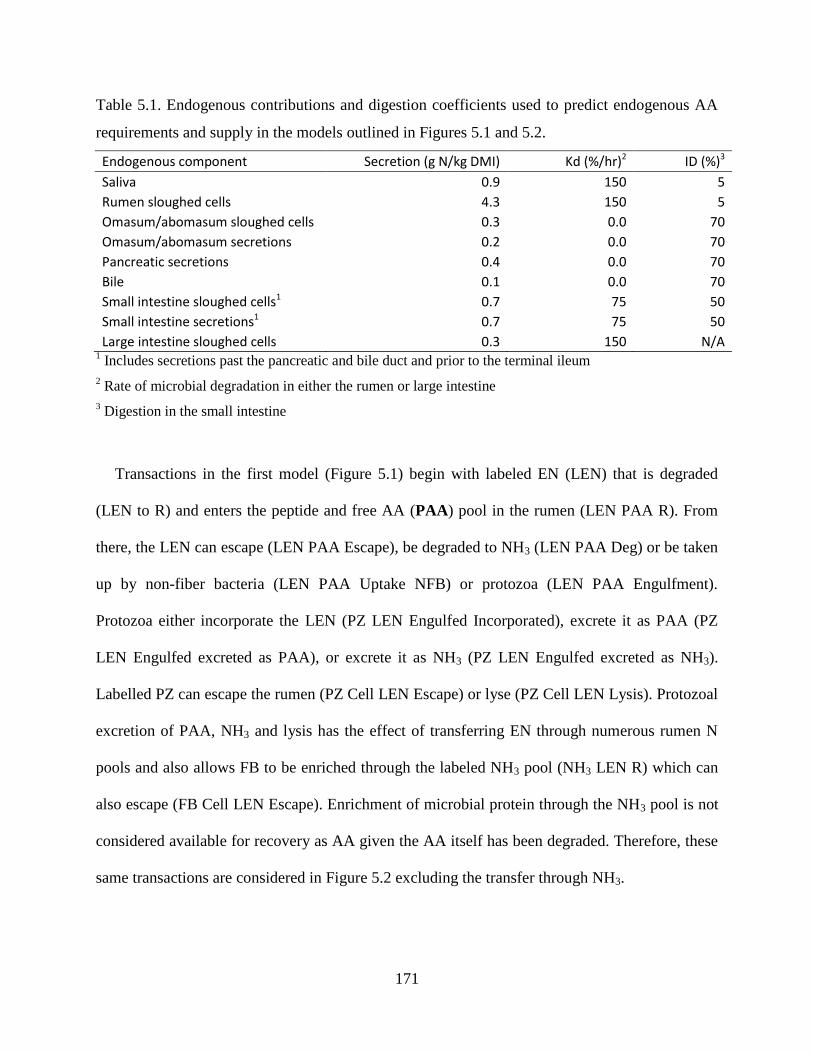
171
Table 5.1. Endogenous contributions and digestion coefficients used to predict endogenous AA
requirements and supply in the models outlined in Figures 5.1 and 5.2.
Endogenous component Secretion (g N/kg DMI) Kd (%/hr)2 ID (%)3
Saliva 0.9 150 5
Rumen sloughed cells 4.3 150 5
Omasum/abomasum sloughed cells 0.3 0.0 70
Omasum/abomasum secretions 0.2 0.0 70
Pancreatic secretions 0.4 0.0 70
Bile 0.1 0.0 70
Small intestine sloughed cells1 0.7 75 50
Small intestine secretions1 0.7 75 50
Large intestine sloughed cells 0.3 150 N/A 1 Includes secretions past the pancreatic and bile duct and prior to the terminal ileum
2 Rate of microbial degradation in either the rumen or large intestine
3 Digestion in the small intestine
Transactions in the first model (Figure 5.1) begin with labeled EN (LEN) that is degraded
(LEN to R) and enters the peptide and free AA (PAA) pool in the rumen (LEN PAA R). From
there, the LEN can escape (LEN PAA Escape), be degraded to NH3 (LEN PAA Deg) or be taken
up by non-fiber bacteria (LEN PAA Uptake NFB) or protozoa (LEN PAA Engulfment).
Protozoa either incorporate the LEN (PZ LEN Engulfed Incorporated), excrete it as PAA (PZ
LEN Engulfed excreted as PAA), or excrete it as NH3 (PZ LEN Engulfed excreted as NH3).
Labelled PZ can escape the rumen (PZ Cell LEN Escape) or lyse (PZ Cell LEN Lysis). Protozoal
excretion of PAA, NH3 and lysis has the effect of transferring EN through numerous rumen N
pools and also allows FB to be enriched through the labeled NH3 pool (NH3 LEN R) which can
also escape (FB Cell LEN Escape). Enrichment of microbial protein through the NH3 pool is not
considered available for recovery as AA given the AA itself has been degraded. Therefore, these
same transactions are considered in Figure 5.2 excluding the transfer through NH3.
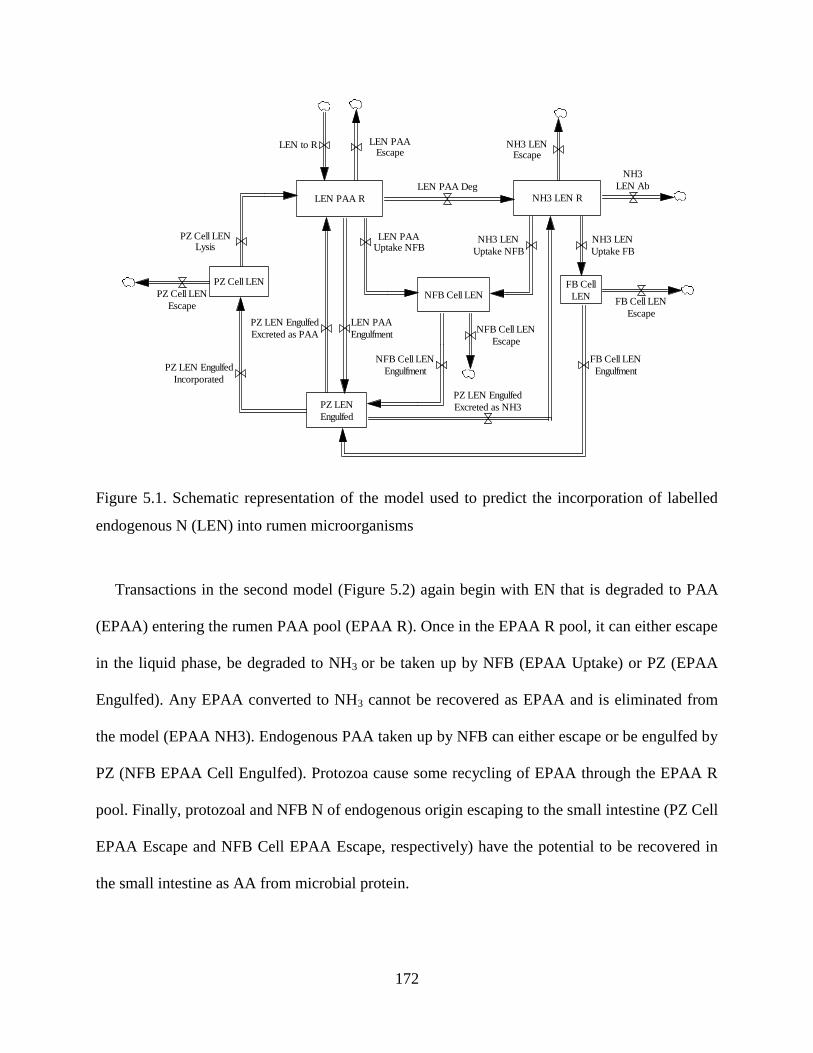
172
Figure 5.1. Schematic representation of the model used to predict the incorporation of labelled
endogenous N (LEN) into rumen microorganisms
Transactions in the second model (Figure 5.2) again begin with EN that is degraded to PAA
(EPAA) entering the rumen PAA pool (EPAA R). Once in the EPAA R pool, it can either escape
in the liquid phase, be degraded to NH3 or be taken up by NFB (EPAA Uptake) or PZ (EPAA
Engulfed). Any EPAA converted to NH3 cannot be recovered as EPAA and is eliminated from
the model (EPAA NH3). Endogenous PAA taken up by NFB can either escape or be engulfed by
PZ (NFB EPAA Cell Engulfed). Protozoa cause some recycling of EPAA through the EPAA R
pool. Finally, protozoal and NFB N of endogenous origin escaping to the small intestine (PZ Cell
EPAA Escape and NFB Cell EPAA Escape, respectively) have the potential to be recovered in
the small intestine as AA from microbial protein.
LEN PAA R
LEN PAA Deg
LEN to R
LEN PAAUptake NFB
PZ LEN
Engulfed
PZ LEN Engulfed
Excreted as PAA
PZ LEN Engulfed
Excreted as NH3
PZ Cell LEN
PZ LEN Engulfed
Incorporated
PZ Cell LEN
Escape
PZ Cell LENLysis
NH3 LEN R
NH3 LEN
Uptake NFB
NH3 LEN
Uptake FB
NFB Cell LEN
NH3
LEN Ab
FB Cell
LENFB Cell LEN
Escape
NH3 LENEscape
NFB Cell LEN
Escape
FB Cell LEN
Engulfment
LEN PAA
Engulfment
LEN PAAEscape
NFB Cell LEN
Engulfment
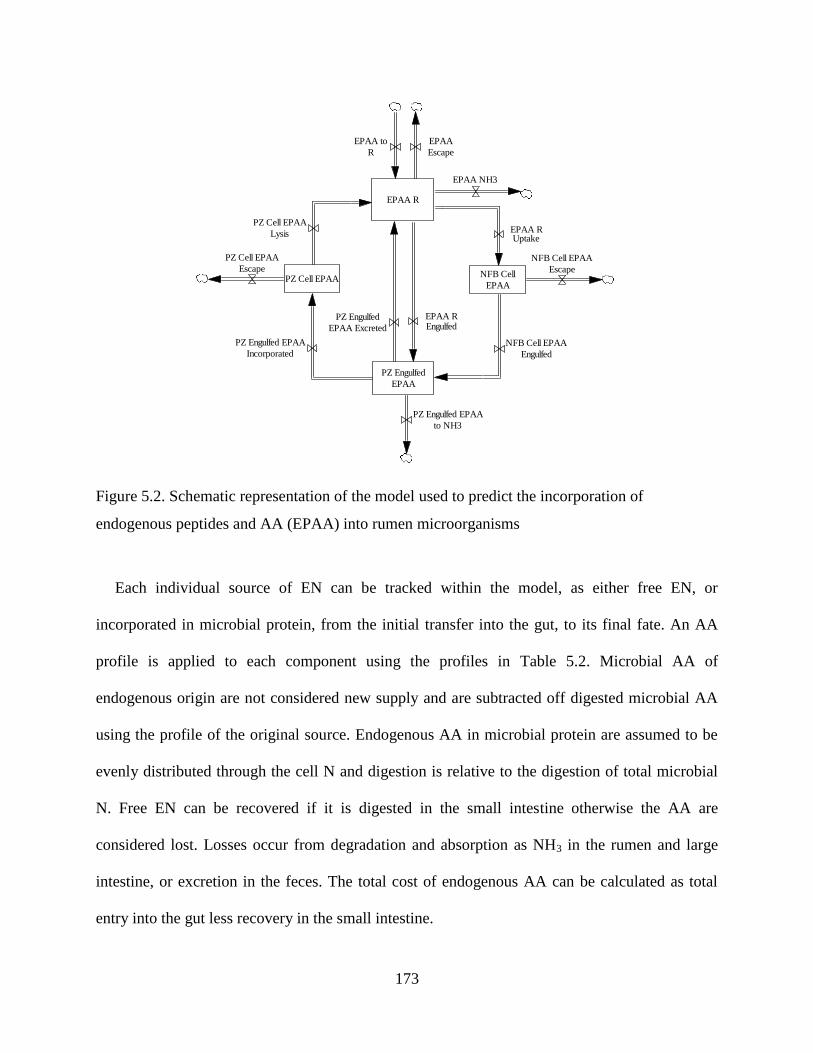
173
Figure 5.2. Schematic representation of the model used to predict the incorporation of
endogenous peptides and AA (EPAA) into rumen microorganisms
Each individual source of EN can be tracked within the model, as either free EN, or
incorporated in microbial protein, from the initial transfer into the gut, to its final fate. An AA
profile is applied to each component using the profiles in Table 5.2. Microbial AA of
endogenous origin are not considered new supply and are subtracted off digested microbial AA
using the profile of the original source. Endogenous AA in microbial protein are assumed to be
evenly distributed through the cell N and digestion is relative to the digestion of total microbial
N. Free EN can be recovered if it is digested in the small intestine otherwise the AA are
considered lost. Losses occur from degradation and absorption as NH3 in the rumen and large
intestine, or excretion in the feces. The total cost of endogenous AA can be calculated as total
entry into the gut less recovery in the small intestine.
EPAA R
EPAA NH3
EPAA to
R
PZ Engulfed
EPAA
PZ Engulfed
EPAA Excreted
PZ Engulfed EPAA
to NH3
PZ Cell EPAA
PZ Engulfed EPAA
Incorporated
PZ Cell EPAA
Escape
PZ Cell EPAA
Lysis
NFB Cell
EPAA
NFB Cell EPAA
Escape
NFB Cell EPAA
Engulfed
EPAA REngulfed
EPAA
Escape
EPAA RUptake
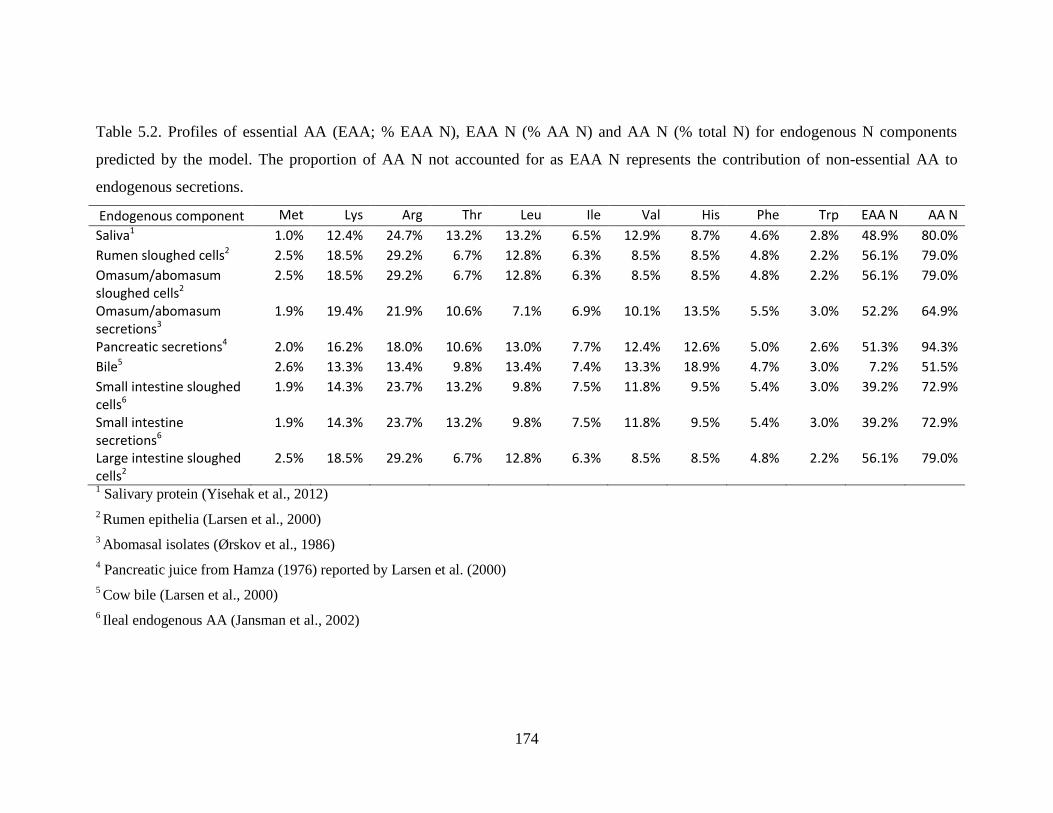
174
Table 5.2. Profiles of essential AA (EAA; % EAA N), EAA N (% AA N) and AA N (% total N) for endogenous N components
predicted by the model. The proportion of AA N not accounted for as EAA N represents the contribution of non-essential AA to
endogenous secretions.
Endogenous component Met Lys Arg Thr Leu Ile Val His Phe Trp EAA N AA N
Saliva1 1.0% 12.4% 24.7% 13.2% 13.2% 6.5% 12.9% 8.7% 4.6% 2.8% 48.9% 80.0%
Rumen sloughed cells2 2.5% 18.5% 29.2% 6.7% 12.8% 6.3% 8.5% 8.5% 4.8% 2.2% 56.1% 79.0%
Omasum/abomasum sloughed cells2
2.5% 18.5% 29.2% 6.7% 12.8% 6.3% 8.5% 8.5% 4.8% 2.2% 56.1% 79.0%
Omasum/abomasum secretions3
1.9% 19.4% 21.9% 10.6% 7.1% 6.9% 10.1% 13.5% 5.5% 3.0% 52.2% 64.9%
Pancreatic secretions4 2.0% 16.2% 18.0% 10.6% 13.0% 7.7% 12.4% 12.6% 5.0% 2.6% 51.3% 94.3%
Bile5 2.6% 13.3% 13.4% 9.8% 13.4% 7.4% 13.3% 18.9% 4.7% 3.0% 7.2% 51.5%
Small intestine sloughed cells6
1.9% 14.3% 23.7% 13.2% 9.8% 7.5% 11.8% 9.5% 5.4% 3.0% 39.2% 72.9%
Small intestine secretions6
1.9% 14.3% 23.7% 13.2% 9.8% 7.5% 11.8% 9.5% 5.4% 3.0% 39.2% 72.9%
Large intestine sloughed cells2
2.5% 18.5% 29.2% 6.7% 12.8% 6.3% 8.5% 8.5% 4.8% 2.2% 56.1% 79.0%
1 Salivary protein (Yisehak et al., 2012)
2 Rumen epithelia (Larsen et al., 2000)
3 Abomasal isolates (Ørskov et al., 1986)
4 Pancreatic juice from Hamza (1976) reported by Larsen et al. (2000)
5 Cow bile (Larsen et al., 2000)
6 Ileal endogenous AA (Jansman et al., 2002)
175
5.3.2 Estimating total AA requirements
Amino acid requirements estimated in the CNCPS (AAR) include milk, growth, reserves,
pregnancy, scurf, metabolic urinary losses and endogenous losses in the gut. Endogenous losses
in this model are calculated as previously described with the other requirements according to Fox
et al. (2004). Amino acids used for other processes not accounted for by the model (AAO) can
be calculated by taking the difference between predicted AA supply (AAS) and AAR. The term
often used to describe AAO is ‘efficiency of use’ which can vary depending on AA supply
relative to other nutrients and the physiological state of the animal (Doepel et al., 2004, Hanigan
et al., 1998). In order to balance a ration in a manner where individual EAA supply is not
excessive, but also not limiting, estimates of the optimum level of AAO relative to AAR are
required. In this model, the approach used to generate these estimates was similar to the study of
Doepel et al. (2004). Briefly, a dataset was constructed of studies that infused AA into the
abomasum, duodenum, or intravenously (Table 5.3). Infusion studies were used so that the
addition of AA above the basal diet was known and limited the reliance on model predictions
(Doepel et al., 2004). The final dataset included 41 publications, 51 experiments and 218
treatment means. Descriptive statistics for the dataset are in Table 5.4. Information reported in
the publications was entered in model. Often, limited information was presented on the chemical
composition of the dietary components. In this situation, the reported information was used, and
uncertain values were predicted using an extension of the method described in Chapter 2.
Briefly, it was assumed that the feeds used in different treatments in the same study had the same
chemical composition. The procedure optimized each chemical component in each feed to be
within a likely range, to be internally consistent (chemical components sum to 100% DM) and to
allow the compiled diet to match the reported composition. As described previously, infused AA
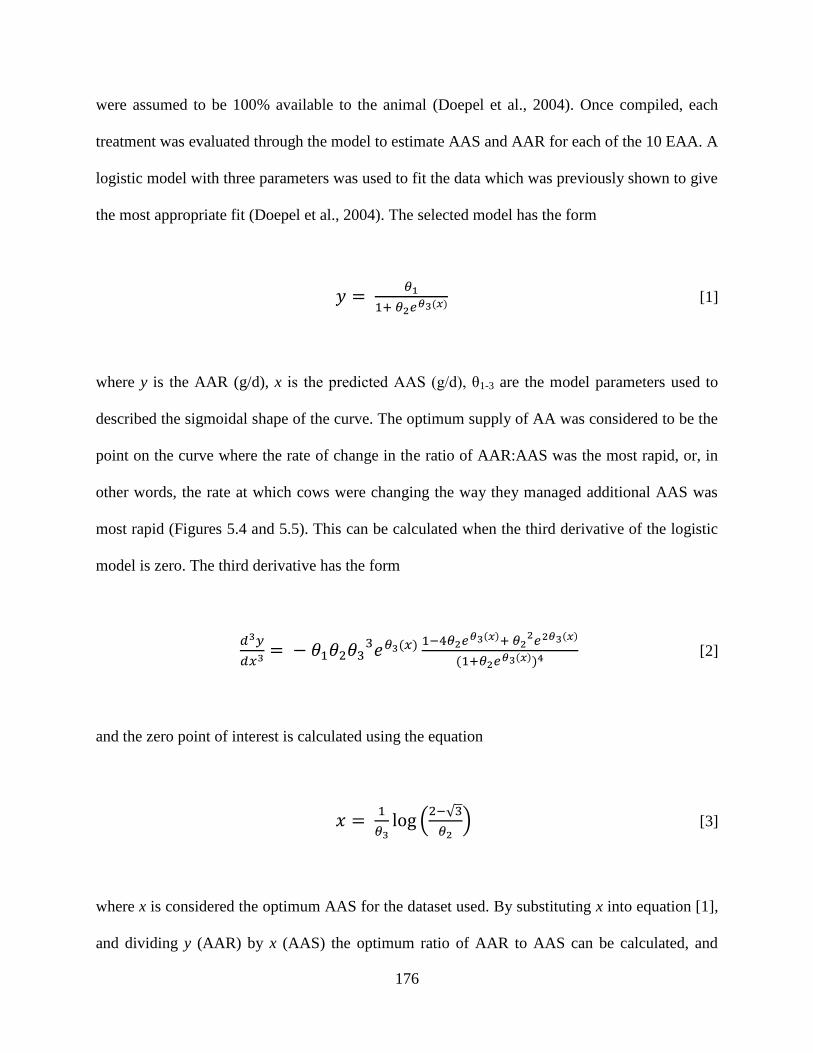
176
were assumed to be 100% available to the animal (Doepel et al., 2004). Once compiled, each
treatment was evaluated through the model to estimate AAS and AAR for each of the 10 EAA. A
logistic model with three parameters was used to fit the data which was previously shown to give
the most appropriate fit (Doepel et al., 2004). The selected model has the form
( )
[1]
where y is the AAR (g/d), x is the predicted AAS (g/d), θ1-3 are the model parameters used to
described the sigmoidal shape of the curve. The optimum supply of AA was considered to be the
point on the curve where the rate of change in the ratio of AAR:AAS was the most rapid, or, in
other words, the rate at which cows were changing the way they managed additional AAS was
most rapid (Figures 5.4 and 5.5). This can be calculated when the third derivative of the logistic
model is zero. The third derivative has the form
( )
( ) ( )
( ( ))
[2]
and the zero point of interest is calculated using the equation
(
√
) [3]
where x is considered the optimum AAS for the dataset used. By substituting x into equation [1],
and dividing y (AAR) by x (AAS) the optimum ratio of AAR to AAS can be calculated, and
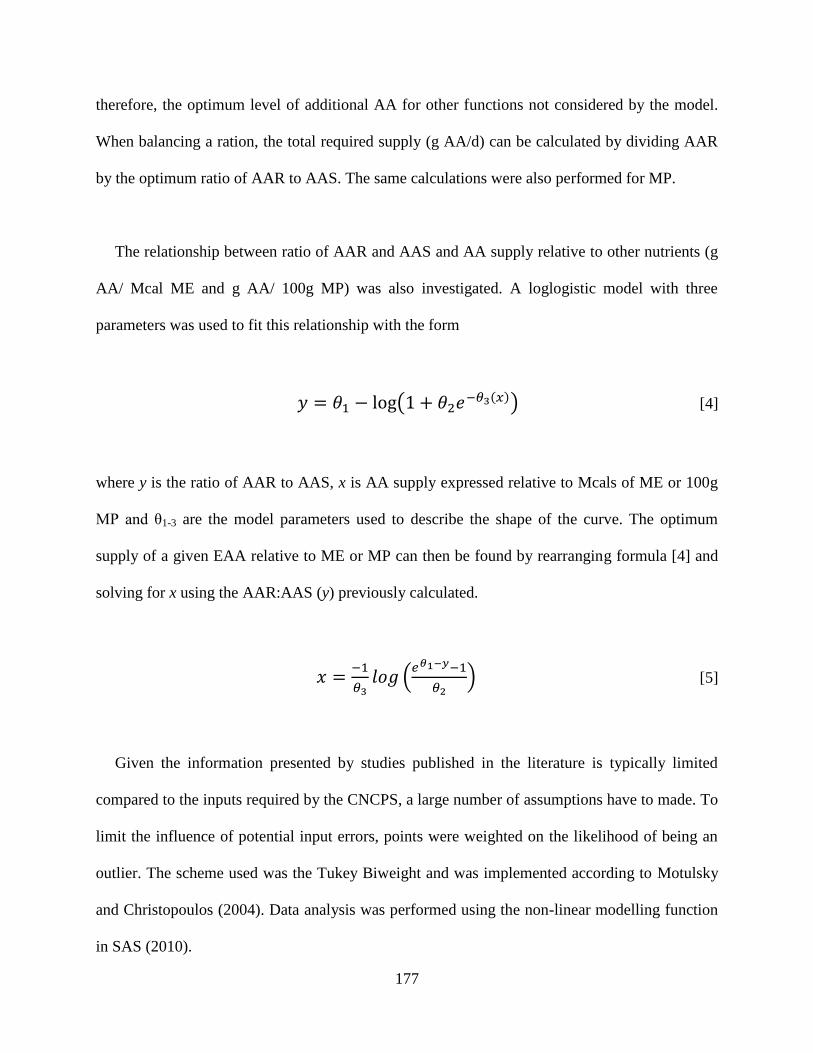
177
therefore, the optimum level of additional AA for other functions not considered by the model.
When balancing a ration, the total required supply (g AA/d) can be calculated by dividing AAR
by the optimum ratio of AAR to AAS. The same calculations were also performed for MP.
The relationship between ratio of AAR and AAS and AA supply relative to other nutrients (g
AA/ Mcal ME and g AA/ 100g MP) was also investigated. A loglogistic model with three
parameters was used to fit this relationship with the form
( ( )) [4]
where y is the ratio of AAR to AAS, x is AA supply expressed relative to Mcals of ME or 100g
MP and θ1-3 are the model parameters used to describe the shape of the curve. The optimum
supply of a given EAA relative to ME or MP can then be found by rearranging formula [4] and
solving for x using the AAR:AAS (y) previously calculated.
(
) [5]
Given the information presented by studies published in the literature is typically limited
compared to the inputs required by the CNCPS, a large number of assumptions have to made. To
limit the influence of potential input errors, points were weighted on the likelihood of being an
outlier. The scheme used was the Tukey Biweight and was implemented according to Motulsky
and Christopoulos (2004). Data analysis was performed using the non-linear modelling function
in SAS (2010).
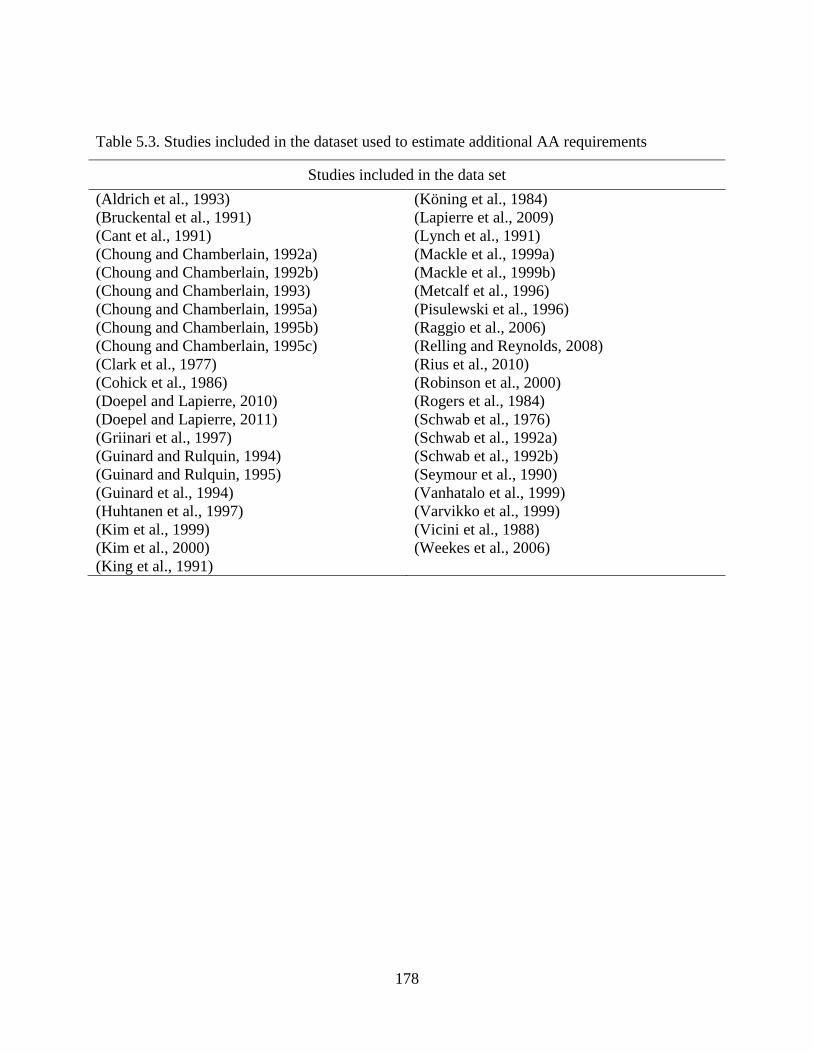
178
Table 5.3. Studies included in the dataset used to estimate additional AA requirements
Studies included in the data set
(Aldrich et al., 1993)
(Bruckental et al., 1991)
(Cant et al., 1991)
(Choung and Chamberlain, 1992a)
(Choung and Chamberlain, 1992b)
(Choung and Chamberlain, 1993)
(Choung and Chamberlain, 1995a)
(Choung and Chamberlain, 1995b)
(Choung and Chamberlain, 1995c)
(Clark et al., 1977)
(Cohick et al., 1986)
(Doepel and Lapierre, 2010)
(Doepel and Lapierre, 2011)
(Griinari et al., 1997)
(Guinard and Rulquin, 1994)
(Guinard and Rulquin, 1995)
(Guinard et al., 1994)
(Huhtanen et al., 1997)
(Kim et al., 1999)
(Kim et al., 2000)
(King et al., 1991)
(Köning et al., 1984)
(Lapierre et al., 2009)
(Lynch et al., 1991)
(Mackle et al., 1999a)
(Mackle et al., 1999b)
(Metcalf et al., 1996)
(Pisulewski et al., 1996)
(Raggio et al., 2006)
(Relling and Reynolds, 2008)
(Rius et al., 2010)
(Robinson et al., 2000)
(Rogers et al., 1984)
(Schwab et al., 1976)
(Schwab et al., 1992a)
(Schwab et al., 1992b)
(Seymour et al., 1990)
(Vanhatalo et al., 1999)
(Varvikko et al., 1999)
(Vicini et al., 1988)
(Weekes et al., 2006)
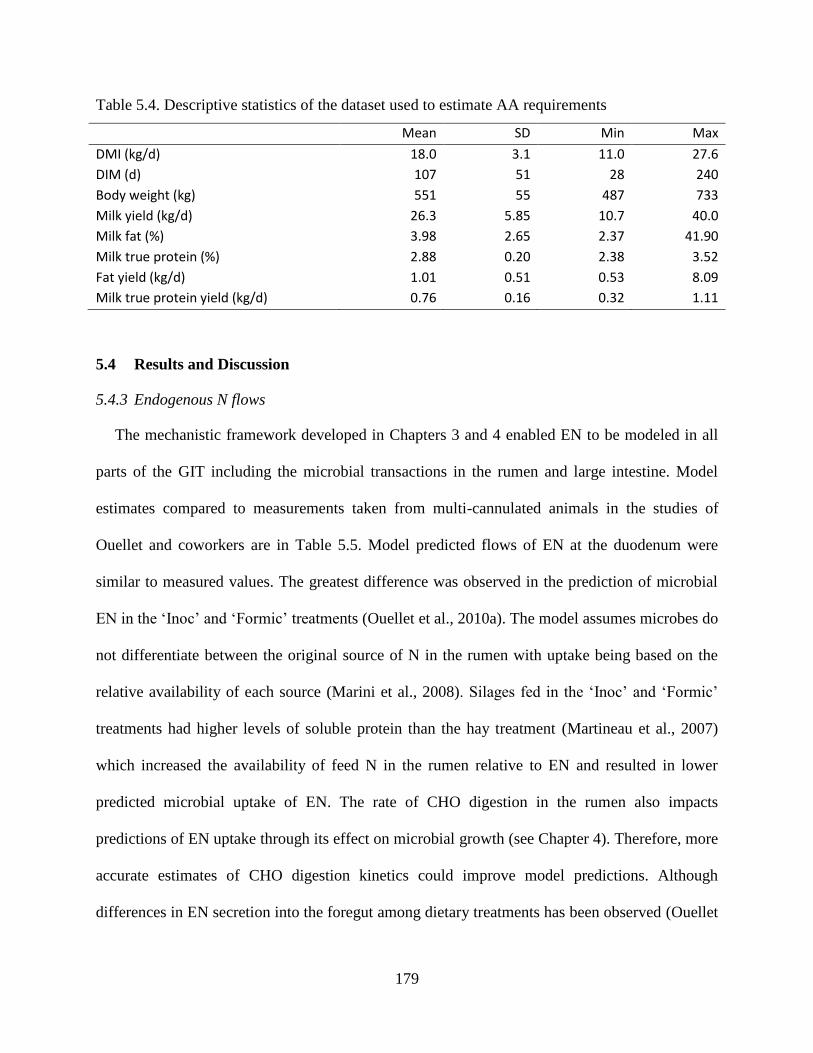
179
Table 5.4. Descriptive statistics of the dataset used to estimate AA requirements
Mean SD Min Max
DMI (kg/d) 18.0 3.1 11.0 27.6
DIM (d) 107 51 28 240
Body weight (kg) 551 55 487 733
Milk yield (kg/d) 26.3 5.85 10.7 40.0
Milk fat (%) 3.98 2.65 2.37 41.90
Milk true protein (%) 2.88 0.20 2.38 3.52
Fat yield (kg/d) 1.01 0.51 0.53 8.09
Milk true protein yield (kg/d) 0.76 0.16 0.32 1.11
5.4 Results and Discussion
5.4.3 Endogenous N flows
The mechanistic framework developed in Chapters 3 and 4 enabled EN to be modeled in all
parts of the GIT including the microbial transactions in the rumen and large intestine. Model
estimates compared to measurements taken from multi-cannulated animals in the studies of
Ouellet and coworkers are in Table 5.5. Model predicted flows of EN at the duodenum were
similar to measured values. The greatest difference was observed in the prediction of microbial
EN in the ‘Inoc’ and ‘Formic’ treatments (Ouellet et al., 2010a). The model assumes microbes do
not differentiate between the original source of N in the rumen with uptake being based on the
relative availability of each source (Marini et al., 2008). Silages fed in the ‘Inoc’ and ‘Formic’
treatments had higher levels of soluble protein than the hay treatment (Martineau et al., 2007)
which increased the availability of feed N in the rumen relative to EN and resulted in lower
predicted microbial uptake of EN. The rate of CHO digestion in the rumen also impacts
predictions of EN uptake through its effect on microbial growth (see Chapter 4). Therefore, more
accurate estimates of CHO digestion kinetics could improve model predictions. Although
differences in EN secretion into the foregut among dietary treatments has been observed (Ouellet

180
et al., 2010a), the mechanism of action is still unclear (Larsen et al., 2000). Therefore, expressing
EN secretion relative to DMI seemed appropriate until the factors involved are better understood.
Further down the GIT, estimates were similar to measured values at the terminal ileum and in the
feces (Table 5.5).
Total EN transactions through each compartment in the model for the ‘Hay’ treatment in Ouellet
et al. (2010a) are summarized in Figure 5.3. These data were generated using the model in Figure
5.2 where EN transfers through the NH3 pool were excluded. The ‘Hay’ treatment was chosen
given the close agreement between model and measured values. Total EN secretions into the gut
were 135.4 g/d of which 46.4 g/d was recovered as either free EN in the duodenum or
incorporated in microbial protein. The balance (89.0 g/d) was considered lost by the animal and
part of the maintenance requirements for protein. Of the 89.0 g/d lost, 31.8 g/d appeared in the
feces and 57.2 g/d was degraded in the GIT to NH3. The total estimated requirement (89.0 g/d)
when expressed relative to DMI is 5.1 g EN/ kg DMI which, surprisingly, is similar to current
model estimates of MFN for the same diet (5.0 g MFN/kg DMI).
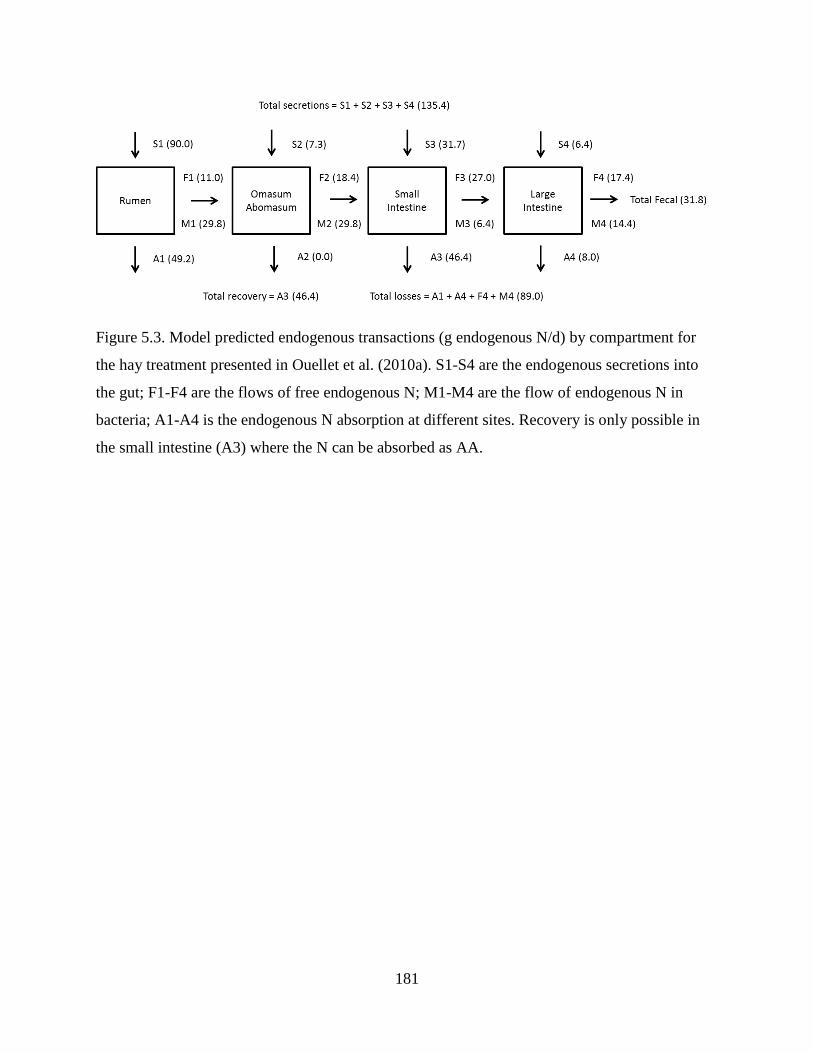
181
Figure 5.3. Model predicted endogenous transactions (g endogenous N/d) by compartment for
the hay treatment presented in Ouellet et al. (2010a). S1-S4 are the endogenous secretions into
the gut; F1-F4 are the flows of free endogenous N; M1-M4 are the flow of endogenous N in
bacteria; A1-A4 is the endogenous N absorption at different sites. Recovery is only possible in
the small intestine (A3) where the N can be absorbed as AA.
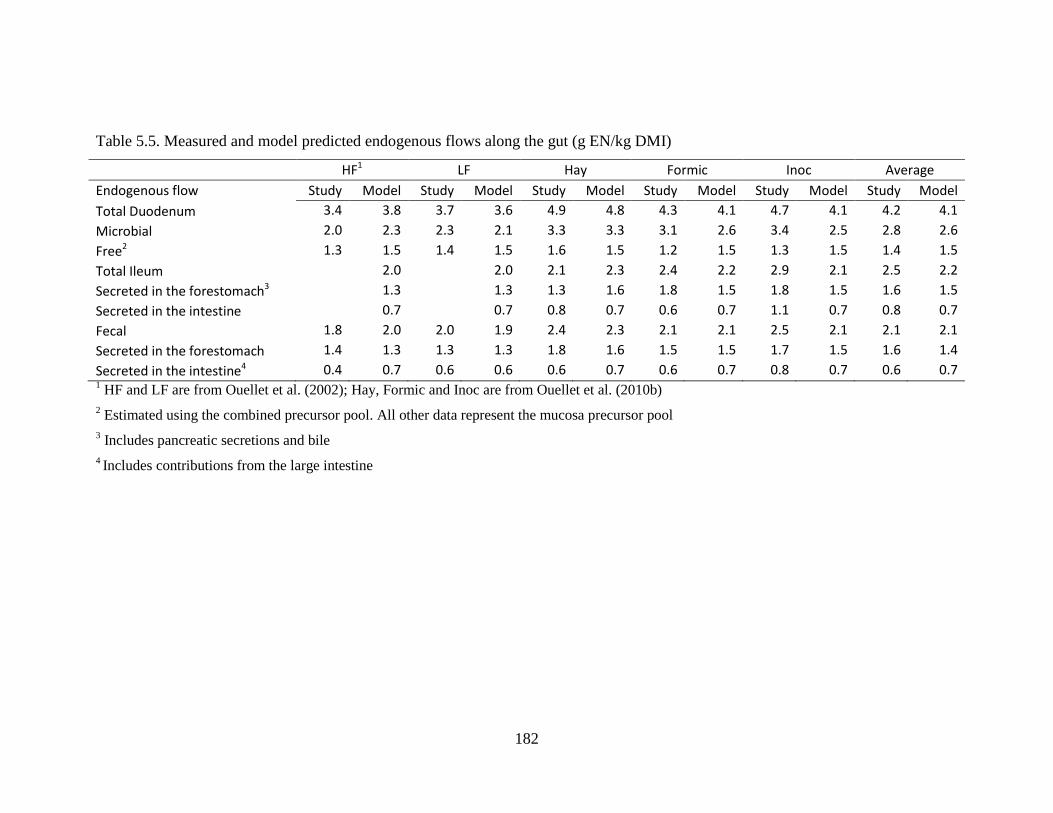
182
Table 5.5. Measured and model predicted endogenous flows along the gut (g EN/kg DMI)
HF1 LF Hay Formic Inoc Average
Endogenous flow Study Model Study Model Study Model Study Model Study Model Study Model
Total Duodenum 3.4 3.8 3.7 3.6 4.9 4.8 4.3 4.1 4.7 4.1 4.2 4.1
Microbial 2.0 2.3 2.3 2.1 3.3 3.3 3.1 2.6 3.4 2.5 2.8 2.6
Free2 1.3 1.5 1.4 1.5 1.6 1.5 1.2 1.5 1.3 1.5 1.4 1.5
Total Ileum 2.0 2.0 2.1 2.3 2.4 2.2 2.9 2.1 2.5 2.2
Secreted in the forestomach3 1.3 1.3 1.3 1.6 1.8 1.5 1.8 1.5 1.6 1.5
Secreted in the intestine 0.7 0.7 0.8 0.7 0.6 0.7 1.1 0.7 0.8 0.7
Fecal 1.8 2.0 2.0 1.9 2.4 2.3 2.1 2.1 2.5 2.1 2.1 2.1
Secreted in the forestomach 1.4 1.3 1.3 1.3 1.8 1.6 1.5 1.5 1.7 1.5 1.6 1.4
Secreted in the intestine4 0.4 0.7 0.6 0.6 0.6 0.7 0.6 0.7 0.8 0.7 0.6 0.7 1 HF and LF are from Ouellet et al. (2002); Hay, Formic and Inoc are from Ouellet et al. (2010b)
2 Estimated using the combined precursor pool. All other data represent the mucosa precursor pool
3 Includes pancreatic secretions and bile
4 Includes contributions from the large intestine
183
5.4.4 Amino acid requirements
Requirements for each individual EAA in the CNCPS are predicted for processes that are
quantified by the model (maintenance, lactation, pregnancy, growth) and subsequently divided
by the efficiency of transfer to that process to give the total AA requirement (Fox et al., 2004,
O'Connor et al., 1993). The efficiency of transfer could also be thought of as the additional
requirement for each AA relative to the requirements quantified by the model. Such processes
include oxidation across the gut or in other tissues, anaplerotic requirements, synthesis of non-
essential AA, gluconeogenesis etc. (Lapierre et al., 2005, Lapierre et al., 2006, Lemosquet et al.,
2010, Lobley, 2007). The apparent efficiency of AA use for any given diet can be calculated by
dividing model predicted AAR by AAS, which can be variable, and typically decreases as AAS
increases relative to AAR and also energy (Hanigan et al., 1998). This decrease in apparent
efficiency of AA use represents AA being increasingly used for purposes other than those
quantified or described by the model. If the utilization of each AA for every process in
metabolism could be adequately quantified, the term ‘efficiency of use’ would become obsolete
as it would be 100% (there would be no additional requirement above model predictions). The
ability of cows to direct AA to other uses demonstrates the interactions among different nutrients
and is an example of the metabolic flexibility that allows productivity to be maintained across a
wide range of nutrient inputs and supply (Lobley, 2007). The pertinent question for ration
balancing is: what level of additional AA supply is required above the predicted requirements for
milk protein synthesis and body protein requirements to maximize productivity and minimize
AA wastage? The answer to this question is going to differ among models as supply and
requirements are calculated in different ways. For example, changing the maintenance
requirements from using MFN as in previous version of the CNCPS to estimating AA loss
184
through the GIT using isotopic enrichment techniques considers 9 different sources of EN, each
with a different AA profile (Table 5.2), and so it would be expected that AA requirements among
models would be different.
The optimum supply of EAA in this study was defined where the rate of change in which
additional AA supply was being used for other purposes was most rapid. This point was defined
by Doepel et al. (2004) as the required AA supply and is equivalent to the break-point in the
segmented linear model used in the NRC (2001). Previous versions of the CNCPS have treated
different physiological functions separately with the original values coming from a range of
sources outlined in O'Connor et al. (1993). Lapierre et al. (2007) suggested using a single factor
to calculate total AA requirement for maintenance and milk production makes more biological
sense as it is difficult to localize the large number of processes that are encompassed in AAO.
Recommendations for v6.1 of the CNCPS were presented by Lapierre et al. (2007) and have
been implemented in the most recent update of the model v6.5 (Van Amburgh et al., 2013).
Model parameters and the fit summary for the logistic model used to make the calculations in
this study are described in Table 5.6. The variation explained by the logistic model was similar to
Doepel et al. (2004). Examples of model fit and optimum supply for Met and Lys are in Figures
5.4 and 5.5. The optimum ratio of model predicted AAR to AAS for each AA and MP are in
Table 5.6. As explained, it is difficult to compare the ratio of AAR:AAS among studies due to
the different way models calculate AAR. However, it is possible to compare the optimum AAS
expressed as % EAA and also in g/d relative to the study of Doepel et al. (2004) given the
similarities in the datasets. The required supply and balance of EAA in the current study
compared with Doepel et al. (2004) are remarkably similar despite the differences in the models
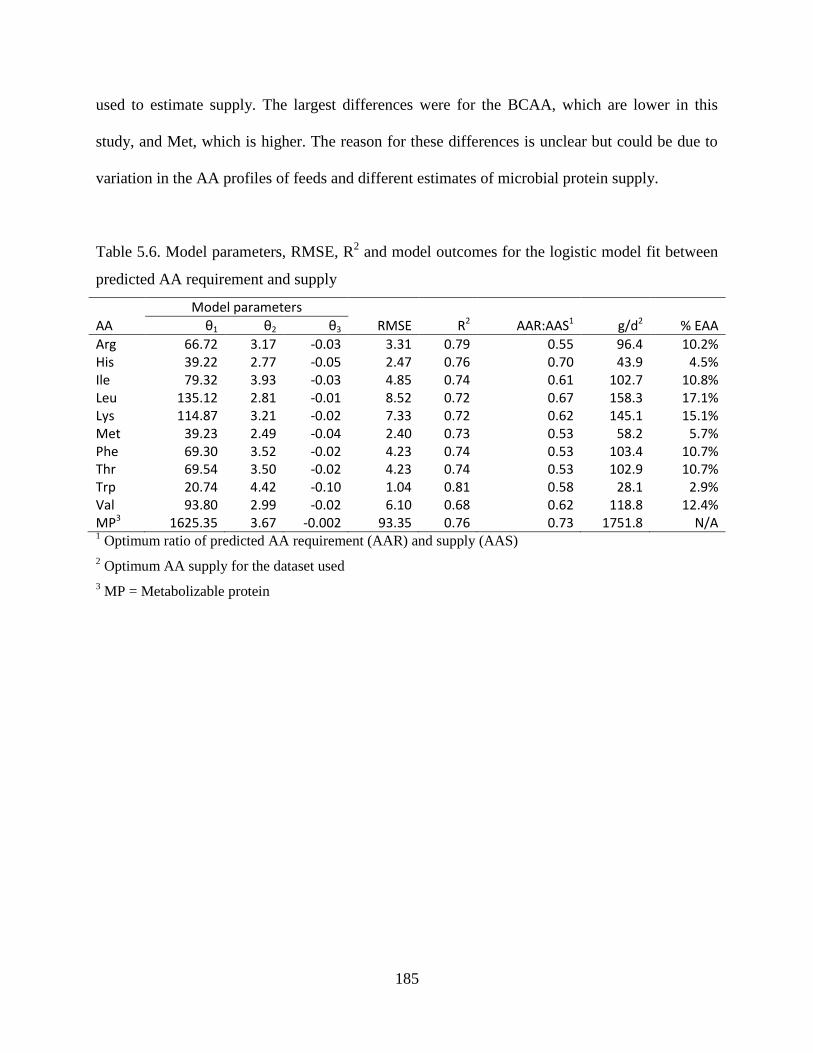
185
used to estimate supply. The largest differences were for the BCAA, which are lower in this
study, and Met, which is higher. The reason for these differences is unclear but could be due to
variation in the AA profiles of feeds and different estimates of microbial protein supply.
Table 5.6. Model parameters, RMSE, R2 and model outcomes for the logistic model fit between
predicted AA requirement and supply
Model parameters
AA θ1 θ2 θ3 RMSE R2 AAR:AAS1 g/d2 % EAA
Arg 66.72 3.17 -0.03 3.31 0.79 0.55 96.4 10.2% His 39.22 2.77 -0.05 2.47 0.76 0.70 43.9 4.5% Ile 79.32 3.93 -0.03 4.85 0.74 0.61 102.7 10.8% Leu 135.12 2.81 -0.01 8.52 0.72 0.67 158.3 17.1% Lys 114.87 3.21 -0.02 7.33 0.72 0.62 145.1 15.1% Met 39.23 2.49 -0.04 2.40 0.73 0.53 58.2 5.7% Phe 69.30 3.52 -0.02 4.23 0.74 0.53 103.4 10.7% Thr 69.54 3.50 -0.02 4.23 0.74 0.53 102.9 10.7% Trp 20.74 4.42 -0.10 1.04 0.81 0.58 28.1 2.9% Val 93.80 2.99 -0.02 6.10 0.68 0.62 118.8 12.4% MP3 1625.35 3.67 -0.002 93.35 0.76 0.73 1751.8 N/A 1 Optimum ratio of predicted AA requirement (AAR) and supply (AAS)
2 Optimum AA supply for the dataset used
3 MP = Metabolizable protein
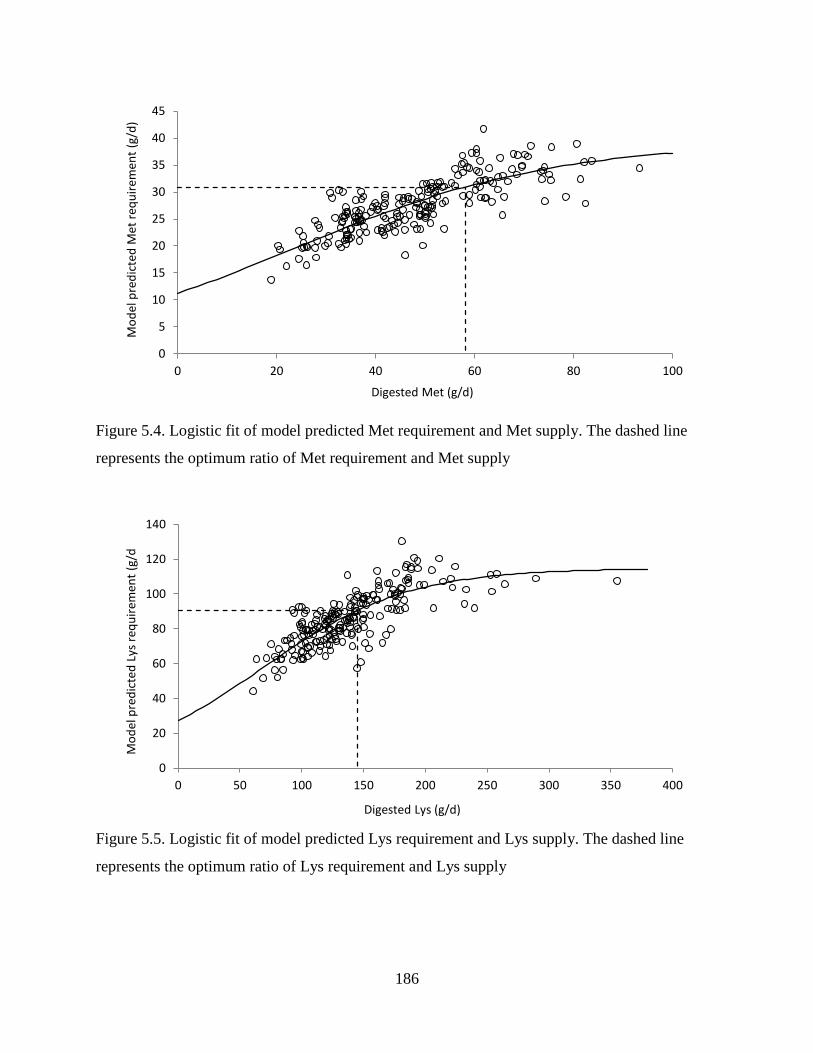
186
Figure 5.4. Logistic fit of model predicted Met requirement and Met supply. The dashed line
represents the optimum ratio of Met requirement and Met supply
Figure 5.5. Logistic fit of model predicted Lys requirement and Lys supply. The dashed line
represents the optimum ratio of Lys requirement and Lys supply
0
5
10
15
20
25
30
35
40
45
0 20 40 60 80 100
Mo
del
pre
dic
ted
Met
req
uir
emen
t (g
/d)
Digested Met (g/d)
0
20
40
60
80
100
120
140
0 50 100 150 200 250 300 350 400
Mo
del
pre
dic
ted
Lys
req
uir
emen
t (g
/d
Digested Lys (g/d)
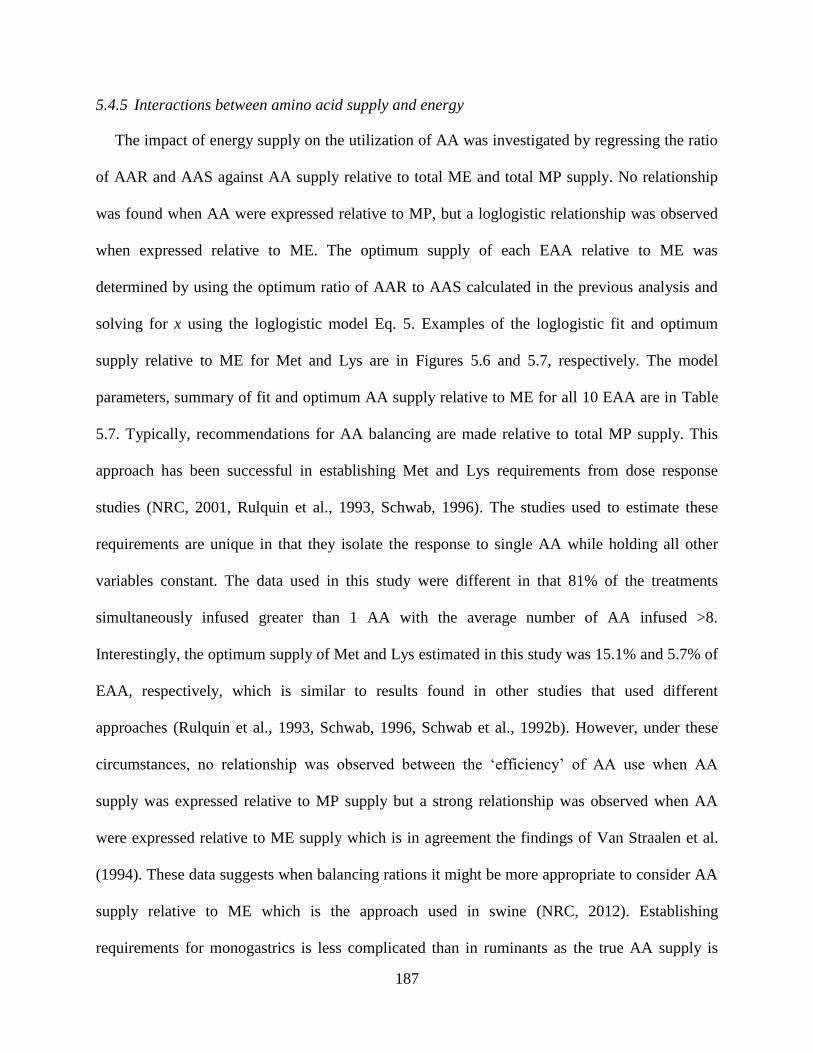
187
5.4.5 Interactions between amino acid supply and energy
The impact of energy supply on the utilization of AA was investigated by regressing the ratio
of AAR and AAS against AA supply relative to total ME and total MP supply. No relationship
was found when AA were expressed relative to MP, but a loglogistic relationship was observed
when expressed relative to ME. The optimum supply of each EAA relative to ME was
determined by using the optimum ratio of AAR to AAS calculated in the previous analysis and
solving for x using the loglogistic model Eq. 5. Examples of the loglogistic fit and optimum
supply relative to ME for Met and Lys are in Figures 5.6 and 5.7, respectively. The model
parameters, summary of fit and optimum AA supply relative to ME for all 10 EAA are in Table
5.7. Typically, recommendations for AA balancing are made relative to total MP supply. This
approach has been successful in establishing Met and Lys requirements from dose response
studies (NRC, 2001, Rulquin et al., 1993, Schwab, 1996). The studies used to estimate these
requirements are unique in that they isolate the response to single AA while holding all other
variables constant. The data used in this study were different in that 81% of the treatments
simultaneously infused greater than 1 AA with the average number of AA infused >8.
Interestingly, the optimum supply of Met and Lys estimated in this study was 15.1% and 5.7% of
EAA, respectively, which is similar to results found in other studies that used different
approaches (Rulquin et al., 1993, Schwab, 1996, Schwab et al., 1992b). However, under these
circumstances, no relationship was observed between the ‘efficiency’ of AA use when AA
supply was expressed relative to MP supply but a strong relationship was observed when AA
were expressed relative to ME supply which is in agreement the findings of Van Straalen et al.
(1994). These data suggests when balancing rations it might be more appropriate to consider AA
supply relative to ME which is the approach used in swine (NRC, 2012). Establishing
requirements for monogastrics is less complicated than in ruminants as the true AA supply is
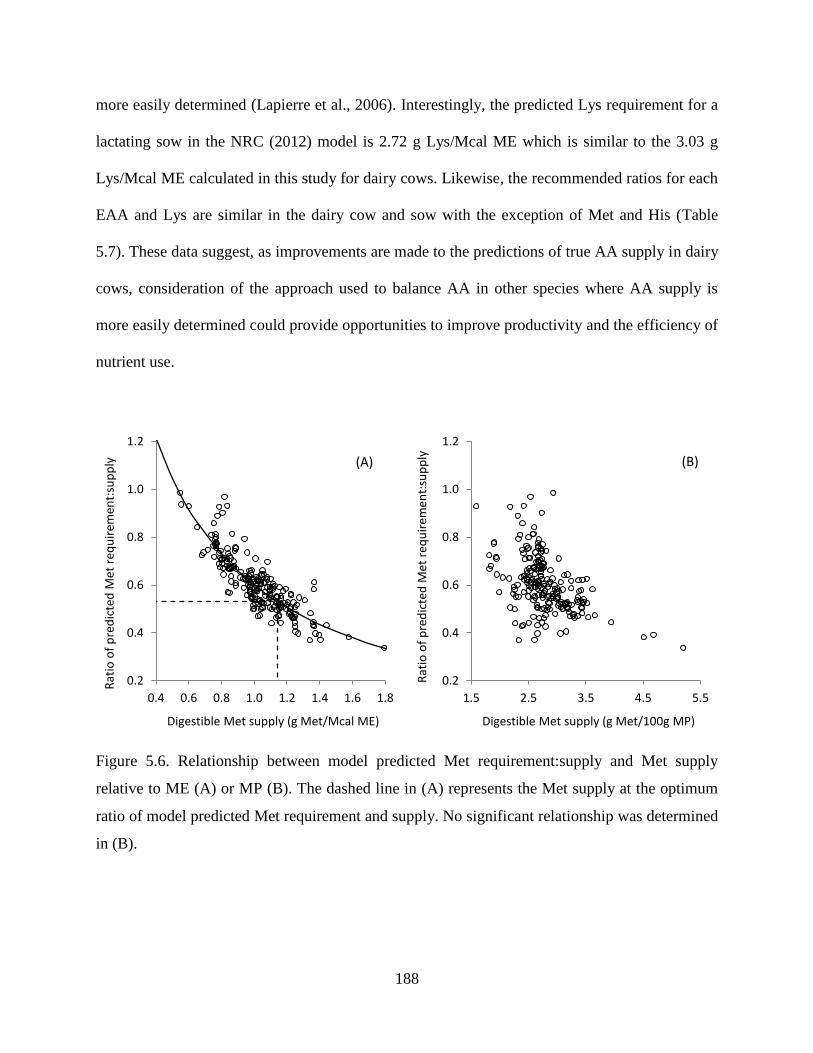
188
more easily determined (Lapierre et al., 2006). Interestingly, the predicted Lys requirement for a
lactating sow in the NRC (2012) model is 2.72 g Lys/Mcal ME which is similar to the 3.03 g
Lys/Mcal ME calculated in this study for dairy cows. Likewise, the recommended ratios for each
EAA and Lys are similar in the dairy cow and sow with the exception of Met and His (Table
5.7). These data suggest, as improvements are made to the predictions of true AA supply in dairy
cows, consideration of the approach used to balance AA in other species where AA supply is
more easily determined could provide opportunities to improve productivity and the efficiency of
nutrient use.
Figure 5.6. Relationship between model predicted Met requirement:supply and Met supply
relative to ME (A) or MP (B). The dashed line in (A) represents the Met supply at the optimum
ratio of model predicted Met requirement and supply. No significant relationship was determined
in (B).
0.2
0.4
0.6
0.8
1.0
1.2
0.4 0.6 0.8 1.0 1.2 1.4 1.6 1.8
Rat
io o
f p
red
icte
d M
et r
equ
irem
ent:
sup
ply
Digestible Met supply (g Met/Mcal ME)
(A)
0.2
0.4
0.6
0.8
1.0
1.2
1.5 2.5 3.5 4.5 5.5
Rat
io o
f p
red
icte
d M
et r
equ
irem
ent:
sup
ply
Digestible Met supply (g Met/100g MP)
(B)
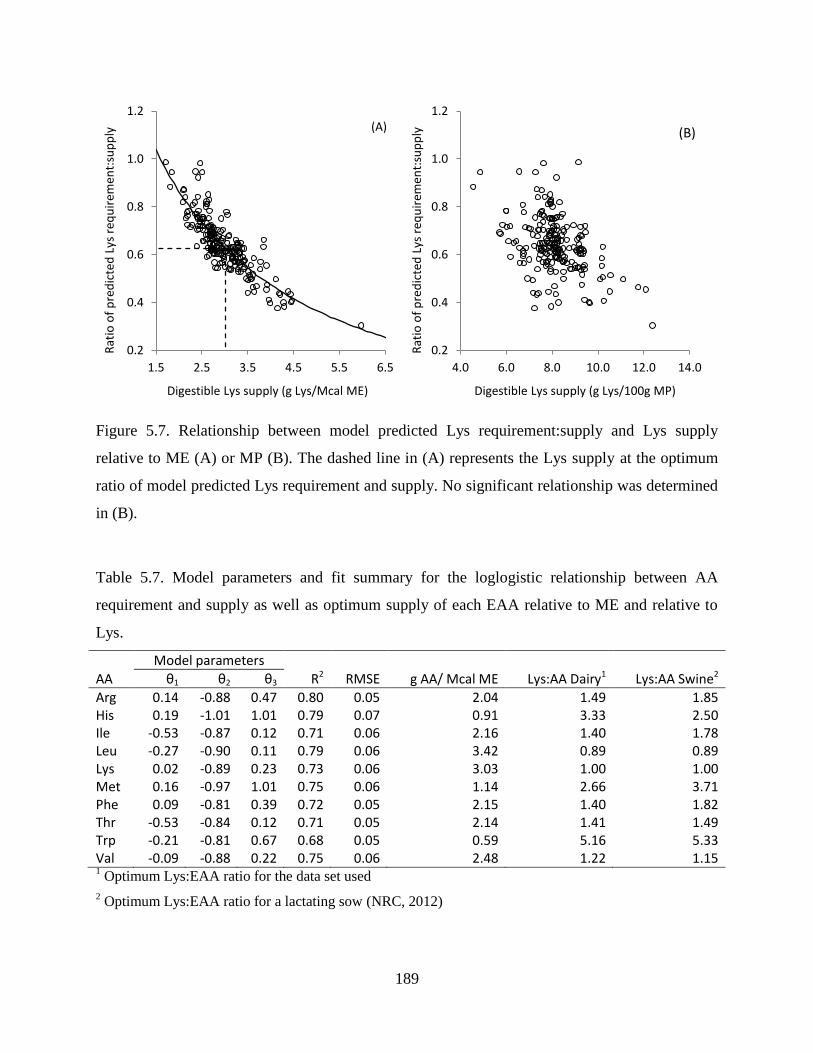
189
Figure 5.7. Relationship between model predicted Lys requirement:supply and Lys supply
relative to ME (A) or MP (B). The dashed line in (A) represents the Lys supply at the optimum
ratio of model predicted Lys requirement and supply. No significant relationship was determined
in (B).
Table 5.7. Model parameters and fit summary for the loglogistic relationship between AA
requirement and supply as well as optimum supply of each EAA relative to ME and relative to
Lys.
Model parameters
AA θ1 θ2 θ3 R2 RMSE g AA/ Mcal ME Lys:AA Dairy1 Lys:AA Swine2
Arg 0.14 -0.88 0.47 0.80 0.05 2.04 1.49 1.85 His 0.19 -1.01 1.01 0.79 0.07 0.91 3.33 2.50 Ile -0.53 -0.87 0.12 0.71 0.06 2.16 1.40 1.78 Leu -0.27 -0.90 0.11 0.79 0.06 3.42 0.89 0.89 Lys 0.02 -0.89 0.23 0.73 0.06 3.03 1.00 1.00 Met 0.16 -0.97 1.01 0.75 0.06 1.14 2.66 3.71 Phe 0.09 -0.81 0.39 0.72 0.05 2.15 1.40 1.82 Thr -0.53 -0.84 0.12 0.71 0.05 2.14 1.41 1.49 Trp -0.21 -0.81 0.67 0.68 0.05 0.59 5.16 5.33 Val -0.09 -0.88 0.22 0.75 0.06 2.48 1.22 1.15 1 Optimum Lys:EAA ratio for the data set used
2 Optimum Lys:EAA ratio for a lactating sow (NRC, 2012)
0.2
0.4
0.6
0.8
1.0
1.2
1.5 2.5 3.5 4.5 5.5 6.5
Rat
io o
f p
red
icte
d L
ys r
equ
irem
ent:
sup
ply
Digestible Lys supply (g Lys/Mcal ME)
(A)
0.2
0.4
0.6
0.8
1.0
1.2
4.0 6.0 8.0 10.0 12.0 14.0
Rat
io o
f p
red
icte
d L
ys r
equ
irem
ent:
sup
ply
Digestible Lys supply (g Lys/100g MP)
(B)
190
5.5 Conclusions
Predictions of endogenous N transactions along the entire GIT have been incorporated into a
dynamic version of the CNCPS. This has replaced metabolic fecal N used in previous versions of
the CNCPS in estimating AA requirements for maintenance. Model predictions for endogenous
transactions along the GIT are close to measured data and have refined the predictions of true
AA supply to the animal. Additional AA and MP requirements above the physiological processes
quantified by the CNCPS were also estimated. The optimum supply of Met and Lys relative to
total EAA were similar to other studies. A loglogistic relationship was observed when the
efficiency of AA use was regressed against AA supply relative to ME suggesting expressing AA
supply relative to energy could improve predictions of AA utilization. Recommendations for
each EAA are given in g AA / Mcal ME and also in a ratio with Lys and are similar to the
requirements of swine, suggesting that post-absorptive metabolism could be similar once the
supply of EAA is better understood.
191
5.6 References
Aldrich, J., L. Muller, and G. Varga. 1993. Effect of somatotropin administration and duodenal
infusion of methionine and lysine on lactational performance and nutrient flow to the small
intestine. Br. J. Nutr. 69:49-58.
Bruckental, I., I. Ascarelli, B. Yosif, and E. Alumot. 1991. Effect of duodenal proline infusion on
milk production and composition in dairy cows. Anim. Prod 53:299-303.
Cant, J., E. DePeters, and R. Baldwin. 1991. Effect of dietary fat and postruminal casein
administration on milk composition of lactating dairy cows. J. Dairy Sci. 74:211-219.
Choung, J.-J. and D. G. Chamberlain. 1993. Effects on milk yield and composition of intra-
abomasal infusions of sodium caseinate, an enzymic hydrolysate of casein or soya-protein isolate
in dairy cows. J. Dairy Res. 60:133-138.
Choung, J.-J. and D. G. Chamberlain. 1995a. Effects of abomasal infusions of sodium caseinate
and of casein hydrolysates varying in the relative proportions of peptides and free amino acids on
milk production in dairy cows. J. Dairy Res. 62:423-429.
Choung, J.-J. and D. G. Chamberlain. 1995b. Effects of abomasal infusions of sodium caseinate,
a hydrolysate of casein or a corresponding mixture of free amino acids on milk yield and
composition in dairy cows. J. Dairy Res. 62:29-37.
Choung, J. J. and D. G. Chamberlain. 1992a. Protein nutrition of dairy cows receiving grass
silage diets. Effects on silage intake and milk production of postruminal supplements of casein or
soya‐protein isolate and the effects of intravenous infusions of a mixture of methionine,
phenylalanine and tryptophan. J. Sci. Food Agric. 58:307-314.
Choung, J. J. and D. G. Chamberlain. 1992b. Protein nutrition of dairy cows receiving grass
silage diets. The effects of post‐ruminal supplements of proteins and amino acids. J. Sci. Food
Agric. 60:25-30.
192
Choung, J. J. and D. G. Chamberlain. 1995c. The effects of intravenous supplements of amino
acids on the milk production of dairy cows consuming grass silage and a supplement containing
feather meal. J. Sci. Food Agric. 68:265-270.
Clark, J. H., H. R. Spires, R. G. Derrig, and M. R. Bennink. 1977. Milk production, nitrogen
utilization and glucose synthesis in lactating cows infused postruminally with sodium caseinate
and glucose. The Journal of Nutrition 107:631-644.
Cohick, W. S., J. L. Vicini, C. R. Staples, J. H. Clark, S. N. McCutcheon, and D. E. Bauman.
1986. Effects of intake and postruminal casein infusion on performance and concentrations of
hormones in plasma of lactating cows. J. Dairy Sci. 69:3022-3031.
Doepel, L. and H. Lapierre. 2010. Changes in production and mammary metabolism of dairy
cows in response to essential and nonessential amino acid infusions. J. Dairy Sci. 93:3264-3274.
Doepel, L. and H. Lapierre. 2011. Deletion of arginine from an abomasal infusion of amino acids
does not decrease milk protein yield in holstein cows. J. Dairy Sci. 94:864-873.
Doepel, L., D. Pacheco, J. J. Kennelly, M. D. Hanigan, I. F. Lopez, and H. Lapierre. 2004. Milk
protein synthesis as a function of amino acid supply. J. Dairy Sci. 87:1279-1297.
Egan, A. R., K. Boda, and J. Varady. 1984. Regulation of nitrogen metabolism and recycling.
Pages 386-402 in Proc. International Symposium on Ruminant Physiology. Prentice-Hall, Banff,
Canada.
Fox, D. G., L. O. Tedeschi, T. P. Tylutki, J. B. Russell, M. E. Van Amburgh, L. E. Chase, A. N.
Pell, and T. R. Overton. 2004. The Cornell Net Carbohydrate and Protein System model for
evaluating herd nutrition and nutrient excretion. Anim. Feed Sci. Technol. 112:29-78.
Griinari, J. M., M. A. McGuire, D. A. Dwyer, D. E. Bauman, D. M. Barbano, and W. A. House.
1997. The role of insulin in the regulation of milk protein synthesis in dairy cows. J. Dairy Sci.
80:2361-2371.
Guinard, J. and H. Rulquin. 1994. Effects of graded amounts of duodenal infusions of lysine on
the mammary uptake of major milk precursors in dairy cows. J. Dairy Sci. 77:3565-3576.
193
Guinard, J. and H. Rulquin. 1995. Effects of graded amounts of duodenal infusions of
methionine on the mammary uptake of major milk precursors in dairy cows. J. Dairy Sci.
78:2196-2207.
Guinard, J., H. Rulquin, and R. Verite. 1994. Effect of graded levels of duodenal infusions of
casein on mammary uptake in lactating cows. 1. Major nutrients. J. Dairy Sci. 77:2221-2231.
Hamza, A. N. 1976. Rate of protein secretion by sheep pancreas and amino-acid composition of
pancreatic-juice. Nutrition Reports International 14:79-87.
Hanigan, M., J. Cant, D. Weakley, and J. Beckett. 1998. An evaluation of postabsorptive protein
and amino acid metabolism in the lactating dairy cow. J. Dairy Sci. 81:3385-3401.
Haque, M. N., H. Rulquin, A. Andrade, P. Faverdin, J. L. Peyraud, and S. Lemosquet. 2012.
Milk protein synthesis in response to the provision of an “ideal” amino acid profile at 2 levels of
metabolizable protein supply in dairy cows. J. Dairy Sci. 95:5876-5887.
Higgs, R. J., L. E. Chase, and M. E. Van Amburgh. 2012. Application and evaluation of the
Cornell Net Carbohydrate and Protein System as a tool to improve nitrogen utilization in
commercial herds. The Professional Animal Scientist 28:370-378.
Huhtanen, P. J., H. O. Miettinen, and V. F. Toivonen. 1997. Effects of silage fermentation and
post‐ruminal casein supplementation in lactating dairy cows: 1—diet digestion and milk
production. J. Sci. Food Agric. 74:450-458.
Jansman, A. J. M., W. Smink, P. van Leeuwen, and M. Rademacher. 2002. Evaluation through
literature data of the amount and amino acid composition of basal endogenous crude protein at
the terminal ileum of pigs. Anim. Feed Sci. Technol. 98:49-60.
Kim, C.-H., J.-J. Choung, and D. G. Chamberlain. 1999. Determination of the first-limiting
amino acid for milk production in dairy cows consuming a diet of grass silage and a cereal-based
supplement containing feather meal. J. Sci. Food Agric. 79:1703-1708.
194
Kim, C.-H., J.-J. Choung, and D. G. Chamberlain. 2000. Variability in the ranking of the three
most-limiting amino acids for milk protein production in dairy cows consuming grass silage and
a cereal-based supplement containing feather meal. J. Sci. Food Agric. 80:1386-1392.
King, K., W. Bergen, C. Sniffen, A. Grant, D. Grieve, V. King, and N. Ames. 1991. An
assessment of absorbable lysine requirements in lactating cows. J. Dairy Sci. 74:2530-2539.
Köning, B. A., J. Oldham, and D. Parker. 1984. The effect of abomasal infusion of casein on
acetate, palmitate and glucose kinetics in cows during early lactation. Br. J. Nutr. 52:319-328.
Lapierre, H., R. Berthiaume, G. Raggio, M. C. Thivierge, L. Doepel, D. Pacheco, P. Dubreuil,
and G. E. Lobley. 2005. The route of absorbed nitrogen into milk protein. Animal Science 80:10-
22.
Lapierre, H., L. Doepel, E. Milne, and G. Lobley. 2009. Responses in mammary and splanchnic
metabolism to altered lysine supply in dairy cows. Animal 3:360-371.
Lapierre, H., G. E. Lobley, D. R. Quellet, L. Doepel, and D. Pacheco. 2007. Amino acid
requirements for lactating dairy cows: Reconciling predictive models and biology. Pages 39-59
in Proc. Cornell Nutrition Conference. Department of Animal Science, Cornell University,
Syracuse, NY.
Lapierre, H., D. Pacheco, R. Berthiaume, D. R. Ouellet, C. G. Schwab, P. Dubreuil, G. Holtrop,
and G. E. Lobley. 2006. What is the true supply of amino acids for a dairy cow? J. Dairy Sci.
89:E1-14.
Larsen, M., T. G. Madsen, M. R. Weisbjerg, T. Hvelplund, and J. Madsen. 2000. Endogenous
amino acid flow in the duodenum of dairy cows. Acta Agriculturae Scandinavica, Section A -
Animal Science 50:161 - 173.
Lemosquet, S., J. Guinard-Flament, G. Raggio, C. Hurtaud, J. Van Milgen, and H. Lapierre.
2010. How does increasing protein supply or glucogenic nutrients modify mammary metabolism
in lactating dairy cows? Pages 175-186 in Proc. Energy and protein metabolism and nutrition.
Wageningen Academic Publishers, Parma, Italy.
195
Lobley, G. E. 2007. Protein-energy interactions: Horizontal aspects. Pages 445-462 in Proc.
Energy and protein metabolism and nutrition. Butterworths, Vichy, France.
Lynch, G. L., T. H. Klusmeyer, M. R. Cameron, J. H. Clark, and D. R. Nelson. 1991. Effects of
somatotropin and duodenal infusion of amino acids on nutrient passage to duodenum and
performance of dairy cows. J. Dairy Sci. 74:3117-3127.
Mackle, T., D. Dwyer, and D. Bauman. 1999a. Effects of branched-chain amino acids and
sodium caseinate on milk protein concentration and yield from dairy cows. J. Dairy Sci. 82:161-
171.
Mackle, T. R., D. A. Dwyer, K. L. Ingvartsen, P. Y. Chouinard, J. M. Lynch, D. M. Barbano,
and D. E. Bauman. 1999b. Effects of insulin and amino acids on milk protein concentration and
yield from dairy cows. J. Dairy Sci. 82:1512-1524.
Marini, J. C., D. G. Fox, and M. R. Murphy. 2008. Nitrogen transactions along the
gastrointestinal tract of cattle: A meta-analytical approach. J. Anim. Sci. 86:660-679.
Martineau, R., H. Lapierre, D. R. Ouellet, D. Pellerin, and R. Berthiaume. 2007. Effects of the
method of conservation of timothy on nitrogen metabolism in lactating dairy cows. J. Dairy Sci.
90:2870-2882.
Metcalf, J., L. Crompton, D. Wray-Cahen, M. Lomax, J. Sutton, D. Beever, J. MacRae, B.
Bequette, F. Backwell, and G. Lobley. 1996. Responses in milk constituents to intravascular
administration of two mixtures of amino acids to dairy cows. J. Dairy Sci. 79:1425-1429.
Motulsky, H. and A. Christopoulos. 2004. Fitting models to biological data using linear and
nonlinear regression: A practical guide to curve fitting. Oxford University Press.
NRC. 2001. Nutrient requirements of dairy cattle. 7th revised ed. National Academy Press,
Washington, DC.
NRC. 2012. Nutrient requirements of swine. National Academy Press, Washington, DC.
196
O'Connor, J. D., C. J. Sniffen, D. G. Fox, and W. Chalupa. 1993. A net carbohydrate and protein
system for evaluating cattle diets: IV. Predicting amino acid adequacy. J. Anim. Sci. 71:1298-
1311.
Ørskov, E. R., N. A. MacLeod, and D. J. Kyle. 1986. Flow of nitrogen from the rumen and
abomasum in cattle and sheep given protein-free nutrients by intragastric infusion. Br. J. Nutr.
56:241-248.
Ouellet, D. R., R. Berthiaume, G. Holtrop, G. E. Lobley, R. Martineau, and H. Lapierre. 2010a.
Effect of method of conservation of timothy on endogenous nitrogen flows in lactating dairy
cows. J. Dairy Sci. 93:4252-4261.
Ouellet, D. R., M. Demers, G. Zuur, G. E. Lobley, J. R. Seoane, J. V. Nolan, and H. Lapierre.
2002. Effect of dietary fiber on endogenous nitrogen flows in lactating dairy cows. J. Dairy Sci.
85:3013-3025.
Ouellet, D. R., D. Valkeners, and H. Lapierre. 2010b. Does endogenous nitrogen contribute to
over-estimate bacterial duodenal flow in ruminant estimated by n dilution technique? Pages 125-
126 in Proc. Energy and protein metabolism and nutrition. Wageningen Academic Publishers,
Parma, Italy.
Pisulewski, P. M., H. Rulquin, J. L. Peyraud, and R. Verite. 1996. Lactational and systemic
responses of dairy cows to postruminal infusions of increasing amounts of methionine. J. Dairy
Sci. 79:1781-1791.
Raggio, G., G. E. Lobley, S. Lemosquet, H. Rulquin, and H. Lapierre. 2006. Effect of casein and
propionate supply on whole body protein metabolism in lactating dairy cows. Canadian Journal
of Animal Science 86:81-89.
Relling, A. E. and C. K. Reynolds. 2008. Abomasal infusion of casein, starch and soybean oil
differentially affect plasma concentrations of gut peptides and feed intake in lactating dairy
cows. Domest. Anim. Endocrinol. 35:35-45.
Rius, A. G., J. A. D. R. N. Appuhamy, J. Cyriac, D. Kirovski, O. Becvar, J. Escobar, M. L.
McGilliard, B. J. Bequette, R. M. Akers, and M. D. Hanigan. 2010. Regulation of protein
197
synthesis in mammary glands of lactating dairy cows by starch and amino acids. J. Dairy Sci.
93:3114-3127.
Robinson, P., W. Chalupa, C. Sniffen, W. Julien, H. Sato, T. Fujieda, T. Ueda, and H. Suzuki.
2000. Influence of abomasal infusion of high levels of lysine or methionine, or both, on ruminal
fermentation, eating behavior, and performance of lactating dairy cows. J. Anim. Sci. 78:1067-
1077.
Rogers, J. A., J. H. Clark, T. R. Drendel, and G. C. Fahey, Jr. 1984. Milk production and
nitrogen utilization by dairy cows infused postruminally with sodium caseinate, soybean meal, or
cottonseed meal. J. Dairy Sci. 67:1928-1935.
Rulquin, H., P. Pisulewski, R. Vérité, and J. Guinard. 1993. Milk production and composition as
a function of postruminal lysine and methionine supply: A nutrient-response approach. Livestock
Production Science 37:69-90.
SAS. 2010. JMP. SAS Institute Inc., Cary, NC, USA.
Schwab, C. G. 1996. Rumen-protected amino acids for dairy cattle: Progress towards
determining lysine and methionine requirements. Anim. Feed Sci. Technol. 59:87-101.
Schwab, C. G., C. K. Bozak, N. L. Whitehouse, and M. M. A. Mesbah. 1992a. Amino acid
limitation and flow to duodenum at four stages of lactation. 1. Sequence of lysine and
methionine limitation. J. Dairy Sci. 75:3486-3502.
Schwab, C. G., C. K. Bozak, N. L. Whitehouse, and V. M. Olson. 1992b. Amino acid limitation
and flow to the duodenum at four stages of lactation. 2. Extent of lysine limitation. J. Dairy Sci.
75:3503-3518.
Schwab, C. G., L. Satter, and A. Clay. 1976. Response of lactating dairy cows to abomasal
infusion of amino acids. J. Dairy Sci. 59:1254-1270.
Seymour, W. M., C. E. Polan, and J. H. Herbein. 1990. Effects of dietary protein degradability
and casein or amino acid infusions on production and plasma amino acids in dairy cows. J. Dairy
Sci. 73:735-748.
198
Swanson, E. W. 1977. Factors for computing requirements of protein for maintenance of cattle.
J. Dairy Sci. 60:1583-1593.
Tamminga, S., H. Schulze, J. Vanbruchem, and J. Huisman. 1995. Nutritional significance of
endogenous n-losses along the gastrointestinal-tract of farm-animals. Archives of Animal
Nutrition 48:9-22.
Van Amburgh, M. E., A. Foskolos, E. A. Collao-Saenz, R. J. Higgs, and D. A. Ross. 2013.
Updating the CNCPS feed library with new amino acid profiles and efficiencies of use:
Evaluation of model predictions - Version 6.5. Pages 59-76 in Proc. Cornell Nutrition
Conference, Syracuse, NY.
Van Straalen, W., C. Salaun, W. Veen, Y. Rijpkema, G. Hof, and T. Boxem. 1994. Validation of
protein evaluation systems by means of milk production experiments with dairy cows.
Netherlands Journal of Agricultural Science 42:89-104.
Vanhatalo, A., P. Huhtanen, V. Toivonen, and T. Varvikko. 1999. Response of dairy cows fed
grass silage diets to abomasal infusions of histidine alone or in combinations with methionine
and lysine. J. Dairy Sci. 82:2674-2685.
Varvikko, T., A. Vanhatalo, T. Jalava, and P. Huhtanen. 1999. Lactation and metabolic
responses to graded abomasal doses of methionine and lysine in cows fed grass silage diets. J.
Dairy Sci. 82:2659-2673.
Vicini, J., J. Clark, W. Hurley, and J. Bahr. 1988. Effects of abomasal or intravenous
administration of arginine on milk production, milk composition, and concentrations of
somatotropin and insulin in plasma of dairy cows. J. Dairy Sci. 71:658-665.
Weekes, T. L., P. H. Luimes, and J. P. Cant. 2006. Responses to amino acid imbalances and
deficiencies in lactating dairy cows. J. Dairy Sci. 89:2177-2187.
Yisehak, K., A. Becker, J. M. Rothman, E. S. Dierenfeld, B. Marescau, G. Bosch, W. Hendriks,
and G. P. J. Janssens. 2012. Amino acid profile of salivary proteins and plasmatic trace mineral
response to dietary condensed tannins in free-ranging zebu cattle (bos indicus) as a marker of
habitat degradation. Livestock Science 144:275-280.
199
CHAPTER 6: A DYNAMIC VERSION OF THE CORNELL NET CARBOHYDRATE
AND PROTEIN SYSTEM: PREDICTING NITROGEN AND AMINO ACID SUPPLY
6.1 Abstract
Balancing the amino acid supply in dairy cow diets has received increased attention in an
effort to improve animal productivity, increase N utilization and reduce feed costs. Ration
balancing tools like the Cornell Net Carbohydrate and Protein System (CNCPS) and National
Research Council model (NRC) allow for consideration of AA supply in the field. In this study,
the ability of a new, dynamic version of the CNCPS to predict N and AA flows from the rumen
was evaluated using literature studies that reported N flows (n = 16) and AA flows (n = 11) from
sampling at the omasum. The adequacy of model predictions for each parameter were assessed
using numerous statistics including concordance correlation coefficients (CCC), squared
coefficient of determination based on a mean study effect (R2
MP) and linear regression
parameters. Model predicted flows of microbial N (MN) were close to measured values and were
predicted accurately (Slope = 0.94) and precisely (R2
MP = 0.88; CCC = 0.93). Rumen undegraded
feed (RUN), which would include endogenous secretions, was predicted precisely (R2
MP = 0.82;
CCC = 0.90), but some prediction bias was observed (Slope = 0.83). Overall, total non-ammonia
N (NAN) was predicted with a high level of accuracy and precision (R2MP = 0.93; CCC = 0.96)
and with little bias (Slope = 0.94) indicating the model could accurately predict, and partition,
the N flowing from the rumen. Compared to measured data, AA flows were over-predicted
which was unexpected given the close agreement with the predicted flows of MN, RUN and
NAN. Predictions of Leu, Arg and Thr were most accurate (Slope = 0.86, 0.82, 0.85,
respectively; R2
MP = 0.84, 0.79, 0.77, respectively) while predictions of Lys and Ile were least
200
accurate (Slope = 0.69 and 0.68, respectively; R2
MP = 0.58 and 0.75, respectively). Discrepancies
were observed between reported AA flows and AA flows that could be calculated from the
reported N flows. It is possible that sample preservation or other factors could have reduced the
recovery of certain AA during analysis and the reported AA flows from omasal flow studies are
under-estimated.
6.2 Introduction
In non-ruminant nutrition, protein supply is considered in its individual components with a
specific focus on essential and conditionally essential AA (NRC, 2012). Compared to a
ruminant, predicting AA supply in a non-ruminant is simple, as the intake of digestible protein
also represents the supply. In ruminants, the extensive degradation of dietary protein by rumen
microorganisms and synthesis of microbial protein alters the supply to the animal and makes
predicting the true AA supply challenging. Despite the challenges, AA balancing in dairy cows
has received a lot attention in an effort to improve animal productivity and reduce feed costs.
Ration formulations systems such as the CNCPS (Fox et al., 2004, Tylutki et al., 2008, Van
Amburgh et al., 2013) and the NRC (2001) are important tools that allow nutritionists to consider
AA supply in the field, without which, the concept of balancing ruminant diets for AA would be
essentially theoretical.
The original system for calculating AA supply in the CNCPS was described by O'Connor et
al. (1993) and has been used in all subsequent versions of the model (Fox et al., 2004, Tylutki et
al., 2008, Van Amburgh et al., 2013). Published evaluations have shown the model can predict
the supply of microbial and dietary protein reasonably well (Offner and Sauvant, 2004, Pacheco
201
et al., 2012), but the prediction of individual AA at the duodenum can be biased (Pacheco et al.,
2012). A new, dynamic version of the CNCPS was constructed that included N components that
have been previously omitted from the model including rumen protozoa (Chapter 4) and
endogenous N secretions along the entire gastrointestinal tract (GIT) (Chapter 5). These
components were included within the dynamic framework described in Chapter 3 which includes
a new system of calculating post-ruminal N digestion based on an in vitro estimate of
indigestible protein developed by Ross (2013). The objective of this study was to evaluate the
ability of the new version of the CNCPS to predict N and AA flows out of the rumen.
6.3 Materials and methods
6.3.1 Calculation of nitrogen and amino acid flows
The system used to calculate N supply from feed, rumen microorganism and endogenous
sources has been described in Chapters 3, 4, and 5, respectively. The N components arriving at
the duodenum are described in Table 6.1. The sum of the individual components in Table 6.1
give the total non-ammonia N (NAN) arriving at the duodenum and is equivalent to the sample
that would be measured in vivo from a duodenal cannula. Endogenous components secreted post-
ruminally can be removed from the calculation to give an estimate of the N that would be
measured using omasal sampling.
Amino acid flows (g/d) to the omasum or duodenum are estimated by partitioning the N from
each component (Table 6.1) into AA N (% total N), then into N from each individual AA and
dividing by the concentration of N in the AA (% molar mass) to give grams of AA. The different
N fractions within a feed (A2, B1, B2 and C; Table 6.1) are pooled and considered as a single
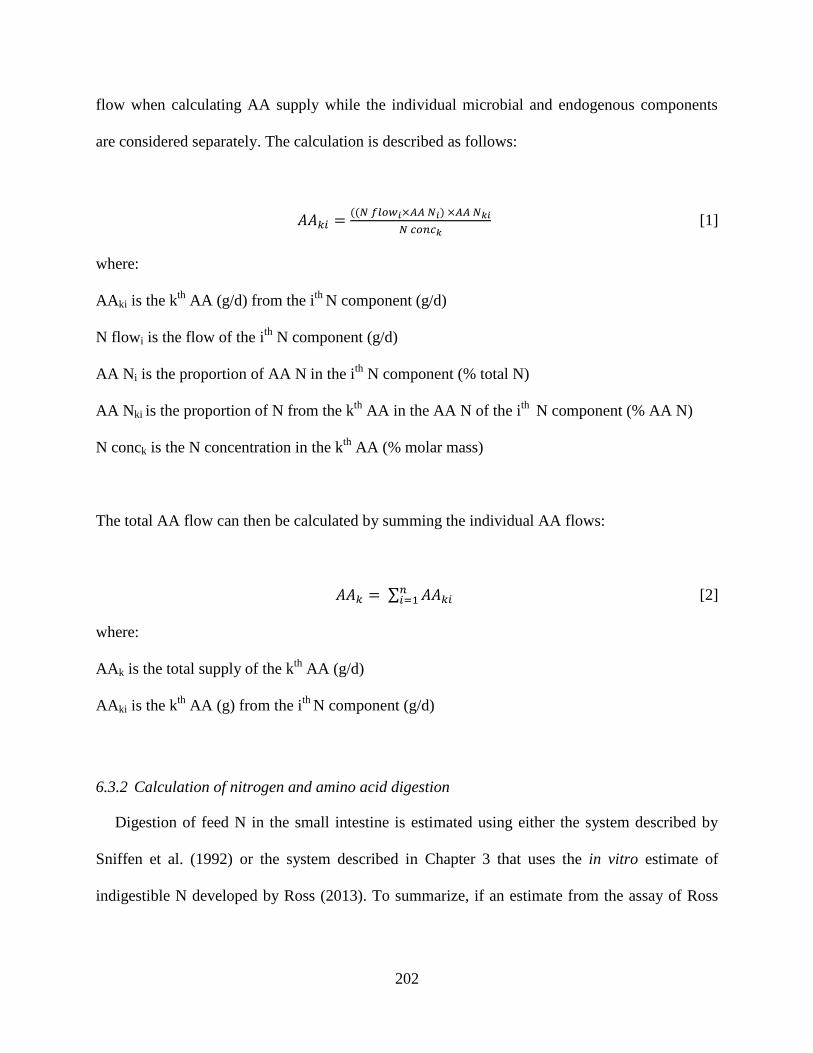
202
flow when calculating AA supply while the individual microbial and endogenous components
are considered separately. The calculation is described as follows:
(( )
[1]
where:
AAki is the kth
AA (g/d) from the ith
N component (g/d)
N flowi is the flow of the ith
N component (g/d)
AA Ni is the proportion of AA N in the ith
N component (% total N)
AA Nki is the proportion of N from the kth
AA in the AA N of the ith
N component (% AA N)
N conck is the N concentration in the kth
AA (% molar mass)
The total AA flow can then be calculated by summing the individual AA flows:
∑ [2]
where:
AAk is the total supply of the kth
AA (g/d)
AAki is the kth
AA (g) from the ith
N component (g/d)
6.3.2 Calculation of nitrogen and amino acid digestion
Digestion of feed N in the small intestine is estimated using either the system described by
Sniffen et al. (1992) or the system described in Chapter 3 that uses the in vitro estimate of
indigestible N developed by Ross (2013). To summarize, if an estimate from the assay of Ross
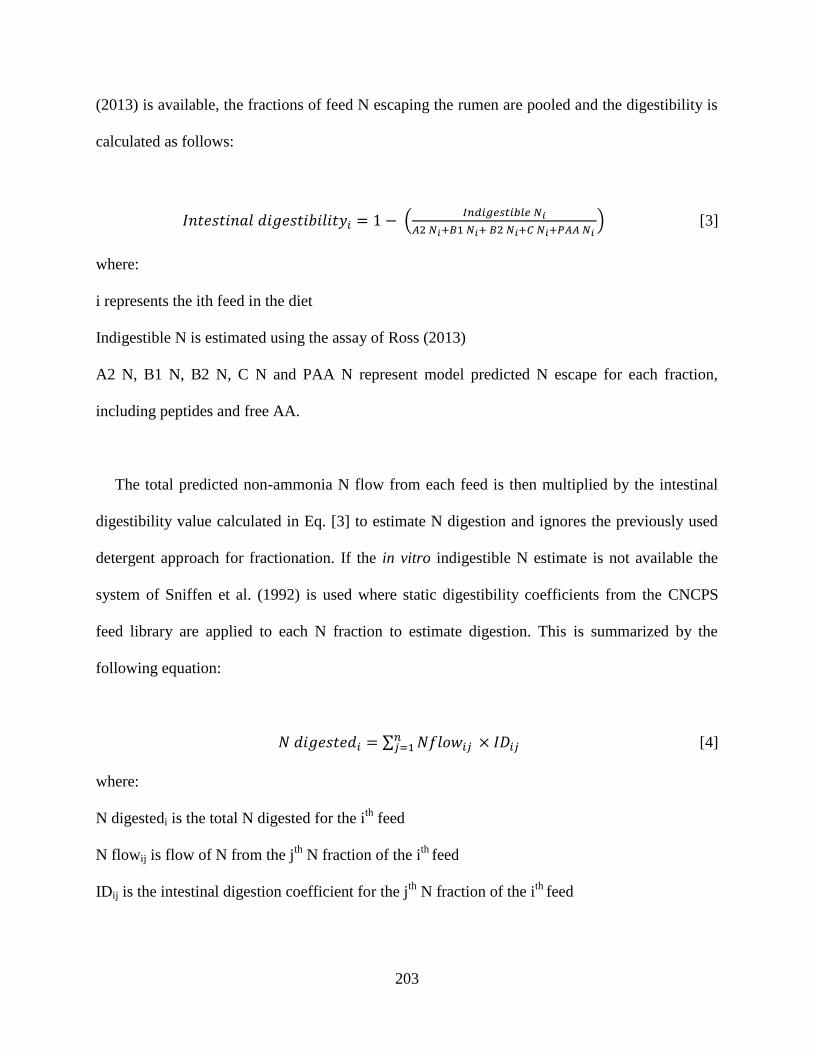
203
(2013) is available, the fractions of feed N escaping the rumen are pooled and the digestibility is
calculated as follows:
(
) [3]
where:
i represents the ith feed in the diet
Indigestible N is estimated using the assay of Ross (2013)
A2 N, B1 N, B2 N, C N and PAA N represent model predicted N escape for each fraction,
including peptides and free AA.
The total predicted non-ammonia N flow from each feed is then multiplied by the intestinal
digestibility value calculated in Eq. [3] to estimate N digestion and ignores the previously used
detergent approach for fractionation. If the in vitro indigestible N estimate is not available the
system of Sniffen et al. (1992) is used where static digestibility coefficients from the CNCPS
feed library are applied to each N fraction to estimate digestion. This is summarized by the
following equation:
∑ [4]
where:
N digestedi is the total N digested for the ith
feed
N flowij is flow of N from the jth
N fraction of the ith
feed
IDij is the intestinal digestion coefficient for the jth
N fraction of the ith
feed
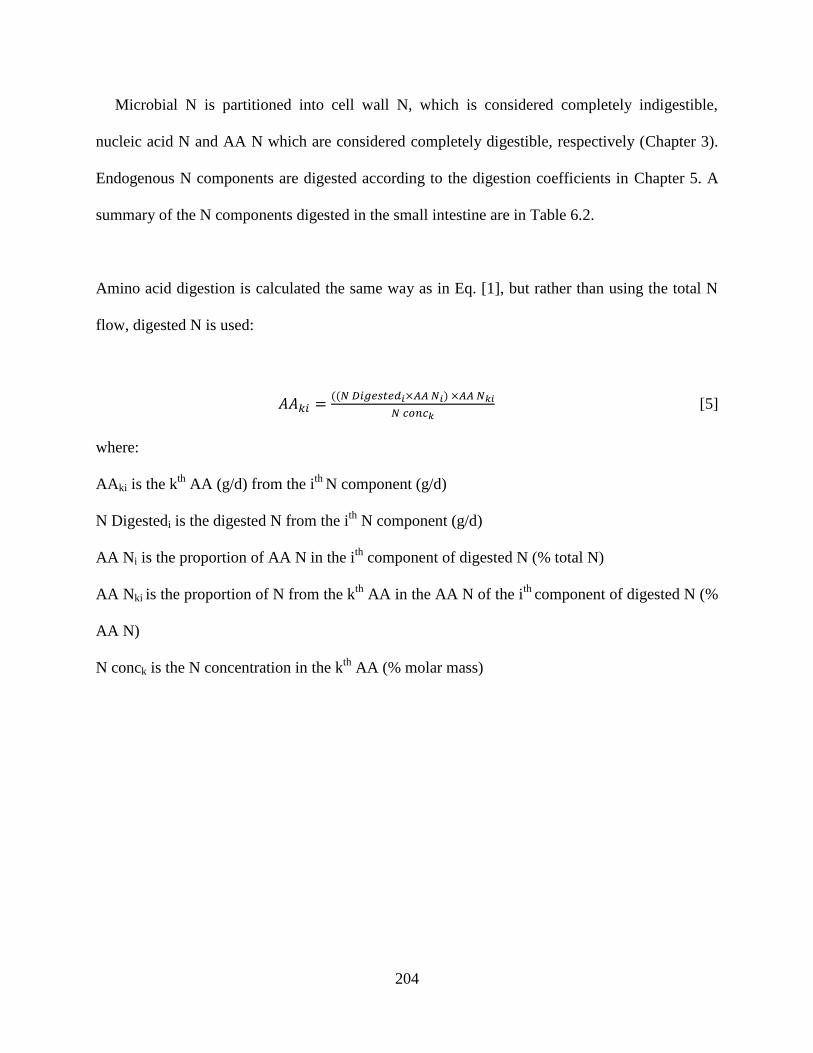
204
Microbial N is partitioned into cell wall N, which is considered completely indigestible,
nucleic acid N and AA N which are considered completely digestible, respectively (Chapter 3).
Endogenous N components are digested according to the digestion coefficients in Chapter 5. A
summary of the N components digested in the small intestine are in Table 6.2.
Amino acid digestion is calculated the same way as in Eq. [1], but rather than using the total N
flow, digested N is used:
(( )
[5]
where:
AAki is the kth
AA (g/d) from the ith
N component (g/d)
N Digestedi is the digested N from the ith
N component (g/d)
AA Ni is the proportion of AA N in the ith
component of digested N (% total N)
AA Nki is the proportion of N from the kth
AA in the AA N of the ith
component of digested N (%
AA N)
N conck is the N concentration in the kth
AA (% molar mass)
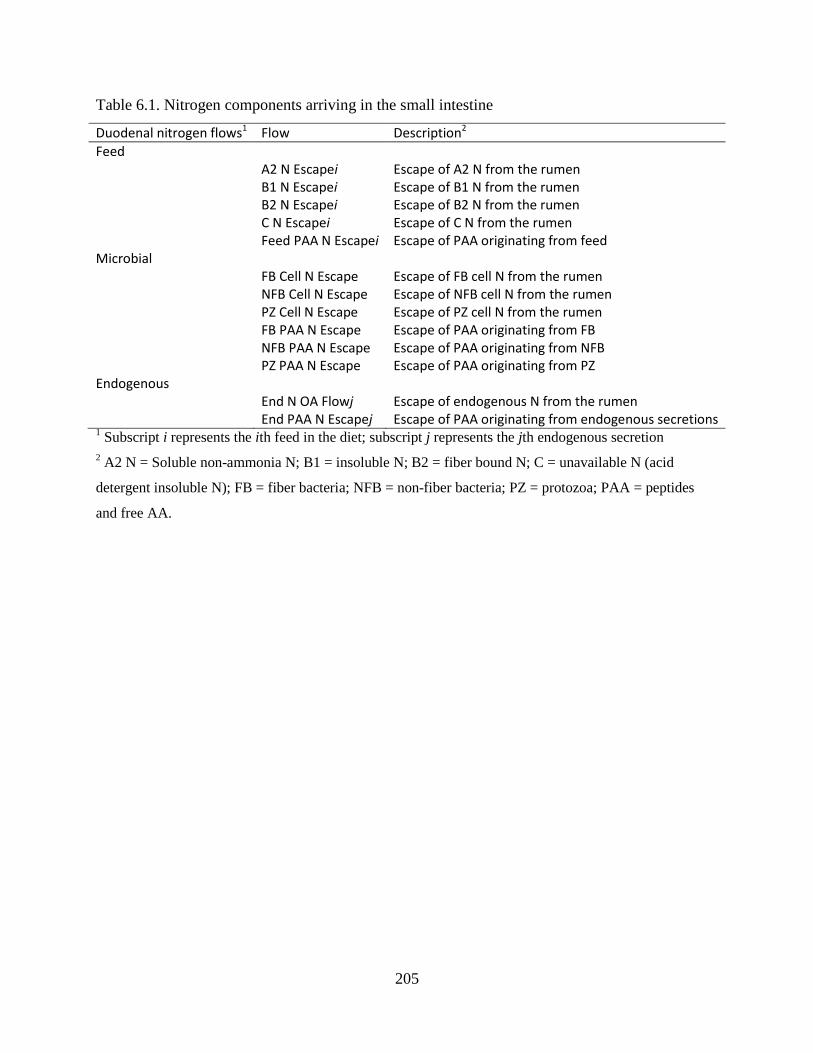
205
Table 6.1. Nitrogen components arriving in the small intestine
Duodenal nitrogen flows1 Flow Description2
Feed
A2 N Escapei Escape of A2 N from the rumen
B1 N Escapei Escape of B1 N from the rumen
B2 N Escapei Escape of B2 N from the rumen
C N Escapei Escape of C N from the rumen
Feed PAA N Escapei Escape of PAA originating from feed
Microbial FB Cell N Escape Escape of FB cell N from the rumen NFB Cell N Escape Escape of NFB cell N from the rumen PZ Cell N Escape Escape of PZ cell N from the rumen FB PAA N Escape Escape of PAA originating from FB NFB PAA N Escape Escape of PAA originating from NFB PZ PAA N Escape Escape of PAA originating from PZ Endogenous End N OA Flowj Escape of endogenous N from the rumen End PAA N Escapej Escape of PAA originating from endogenous secretions 1 Subscript i represents the ith feed in the diet; subscript j represents the jth endogenous secretion
2 A2 N = Soluble non-ammonia N; B1 = insoluble N; B2 = fiber bound N; C = unavailable N (acid
detergent insoluble N); FB = fiber bacteria; NFB = non-fiber bacteria; PZ = protozoa; PAA = peptides
and free AA.

206
Table 6.2. Nitrogen components digested in the small intestine
Intestinal nitrogen digestion1 Flow Description2
Feed
A2 N IDi Digestion of A2 N in the SI
B1 N IDi Digestion of B1 N in the SI
B2 N IDi Digestion of B2 N in the SI
C N IDi Digestion of C N in the SI
Feed PAA N IDi Digestion of PAA originating from feed in the SI
Microbial R FB AA N ID Digestion of FB AA N in the SI
R FB NA N ID Digestion of FB nucleic acid N in the SI R FB CW N ID Digestion of FB cell wall N in the SI R NFB AA N ID Digestion of NFB AA N in the SI R NFB NA N ID Digestion of NFB nucleic acid N in the SI R NFB CW N ID Digestion of NFB cell wall N in the SI PZ AA N ID Digestion of PZ AA N in the SI PZ NA N ID Digestion of PZ nucleic acid N in the SI PZ CW N ID Digestion of PZ cell wall N in the SI Endogenous End N IDj Digestion of endogenous N in the SI 1 Subscript i represents the ith feed in the diet; subscript j represents the jth endogenous secretion
2 A2 N = Soluble non-ammonia N; B1 = insoluble N; B2 = fiber bound N; C = unavailable N (acid
detergent insoluble N); FB = fiber bacteria; NFB = non-fiber bacteria; PZ = protozoa; PAA = peptides
and free AA; SI = small intestine.
6.3.3 Evaluation dataset
A database was compiled from published studies that measured microbial N (MN), rumen
undegraded feed N (which would include endogenous N; RUN), total non-ammonia N (NAN)
(16 publications; 61 treatment means) and AA (11 publications; 43 treatment means) flows at the
omasum (Table 6.3). Information reported in the study on animal characteristics, their
environment and diets were entered in model. Often, limited information was presented on the
chemical composition of the dietary components. In this situation, information reported by the
study was used, and uncertain values predicted using an extension of the method described in
Chapter 2. Briefly, it was assumed that the feeds used in different treatments in the same study
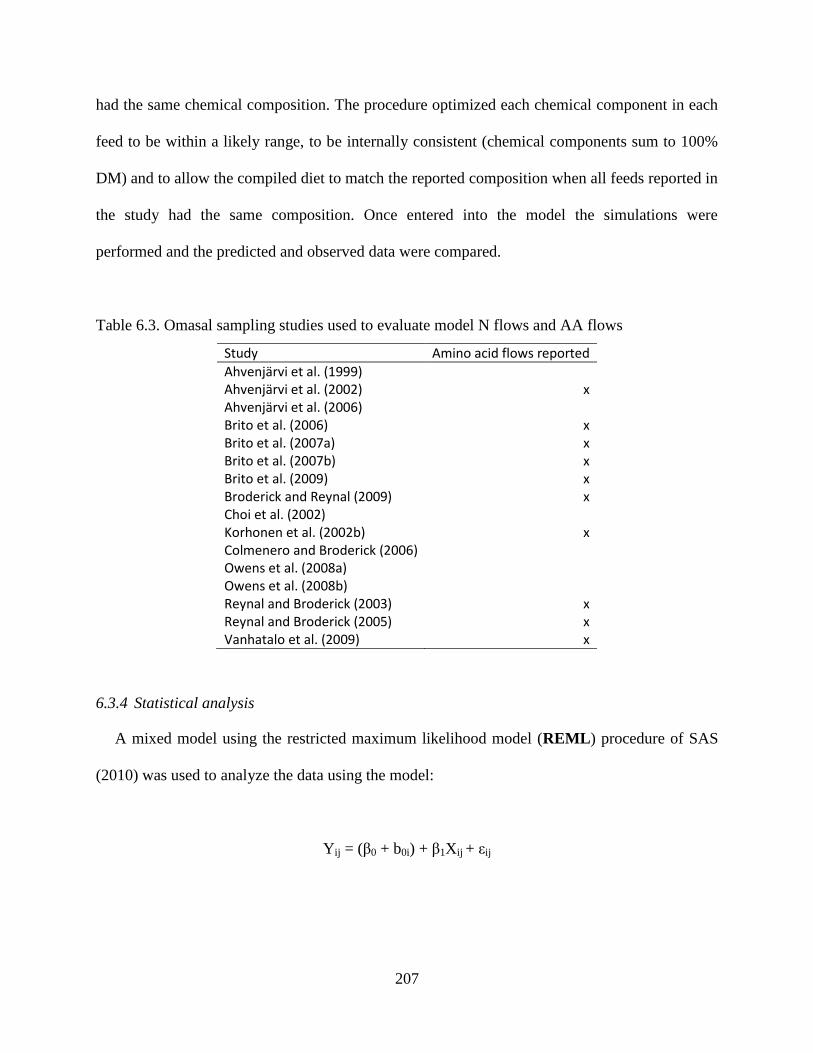
207
had the same chemical composition. The procedure optimized each chemical component in each
feed to be within a likely range, to be internally consistent (chemical components sum to 100%
DM) and to allow the compiled diet to match the reported composition when all feeds reported in
the study had the same composition. Once entered into the model the simulations were
performed and the predicted and observed data were compared.
Table 6.3. Omasal sampling studies used to evaluate model N flows and AA flows
Study Amino acid flows reported
Ahvenjärvi et al. (1999) Ahvenjärvi et al. (2002) x Ahvenjärvi et al. (2006) Brito et al. (2006) x Brito et al. (2007a) x Brito et al. (2007b) x Brito et al. (2009) x Broderick and Reynal (2009) x Choi et al. (2002) Korhonen et al. (2002b) x Colmenero and Broderick (2006) Owens et al. (2008a) Owens et al. (2008b) Reynal and Broderick (2003) x Reynal and Broderick (2005) x Vanhatalo et al. (2009) x
6.3.4 Statistical analysis
A mixed model using the restricted maximum likelihood model (REML) procedure of SAS
(2010) was used to analyze the data using the model:
Yij = (β0 + b0i) + β1Xij + εij
208
where:
Yij is the expected outcome for the dependent variable Y observed at repetition j of the
continuous variable X in study i,
β0 is the overall intercept across all studies,
b0i is the random effect of study i,
β1 is the overall slope of Y on X across all studies,
Xij is the data associated with repetition j of the continuous variable X in study i, and
εij is random variation
The variance components in the model adhered to the following assumptions: b0i ~ N(0,σ20),
b1i ~ N(0,σ2
1), and εij ~ N(0,σ2
ε). The squared sample correlation coefficients reported were
based on either the BLUP (R2
BLUP) or model predictions using a mean study effect (R2
MP). The
random effect of study in the mixed model analysis typically accounts for a high proportion of
variation and is important in ensuring parameter estimates are not biased (St-Pierre, 2001).
However, the large portion of variation explained by the study effect result in high R2
BLUP values.
In practice, R2
BLUP can be misleading as random farm-to-farm variation cannot be accounted for
given that no measured values exist to compare model predictions to. Consequently, R2
MP values
were also presented which use an average study effect across the whole data set and give a better
indication of the amount of variation the model may explain in the practical situation. Further
information on mixed model methodology can be found in a review by St-Pierre (2001).
Additional model adequacy statistics were calculated to give further insight into the accuracy,
precision, and sources of error in the model (Tedeschi, 2006). Root mean square prediction
209
errors (RMSPE) were used to indicate accuracy. A decomposition of the MSPE was also
performed to give an estimation of the error due to central tendency (mean bias), regression
(systematic bias), and random variation (Bibby and Toutenburg, 1977). Concordance correlation
coefficients (CCC) were used to simultaneously account for accuracy and precision.
Concordance correlation coefficients can vary from 0 to 1, with a value of 1 indicating that no
deviation from the Y = X line has occurred. Further description of these statistics is provided by
Tedeschi (2006).
6.4 Results
6.4.5 Nitrogen flows
Model predicted N flows estimated by the model were similar to measured values for MN,
RUN and NAN (Figures 6.1, 6.2 and 6.3, respectively). Microbial N and NAN were predicted
with a high level of accuracy and precision (CCC = 0.96 and 0.93, respectively) and with little
bias (Table 6.4). Predictions of RUN were accurate (CCC = 0.90) but some bias was observed
(19% systematic bias and 6% mean bias). The random effect of study explained the majority of
the variation in NAN and MN while most of the variation in RUN was residual error.
6.4.6 Amino acid flows
Relative to the reported data, the model over-predicted AA flows for all the EAA. The over-
prediction was greatest for Ile and Lys (Figure 6.4C and E) and least for Arg, Leu and Thr
(Figure 6.4A, D and H). The random effect of study accounted for greater than half the variation
for all EAA other than Ile and Leu and R2
BLUP ranged from 0.86 – 0.94 (Table 6.4). The variation
explained using a mean study effect (R2
MP) was lower, and varied among AA. Methionine and
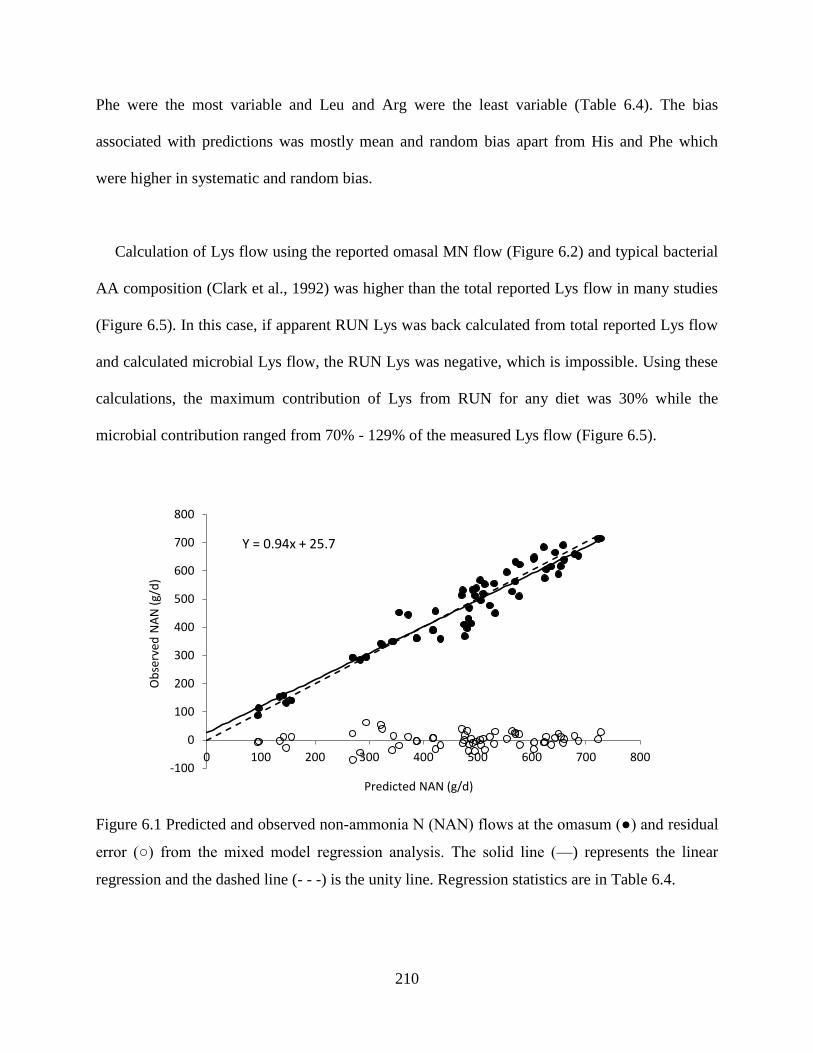
210
Phe were the most variable and Leu and Arg were the least variable (Table 6.4). The bias
associated with predictions was mostly mean and random bias apart from His and Phe which
were higher in systematic and random bias.
Calculation of Lys flow using the reported omasal MN flow (Figure 6.2) and typical bacterial
AA composition (Clark et al., 1992) was higher than the total reported Lys flow in many studies
(Figure 6.5). In this case, if apparent RUN Lys was back calculated from total reported Lys flow
and calculated microbial Lys flow, the RUN Lys was negative, which is impossible. Using these
calculations, the maximum contribution of Lys from RUN for any diet was 30% while the
microbial contribution ranged from 70% - 129% of the measured Lys flow (Figure 6.5).
Figure 6.1 Predicted and observed non-ammonia N (NAN) flows at the omasum (●) and residual
error (○) from the mixed model regression analysis. The solid line (—) represents the linear
regression and the dashed line (- - -) is the unity line. Regression statistics are in Table 6.4.
-100
0
100
200
300
400
500
600
700
800
0 100 200 300 400 500 600 700 800
Ob
serv
ed N
AN
(g/
d)
Predicted NAN (g/d)
Y = 0.94x + 25.7
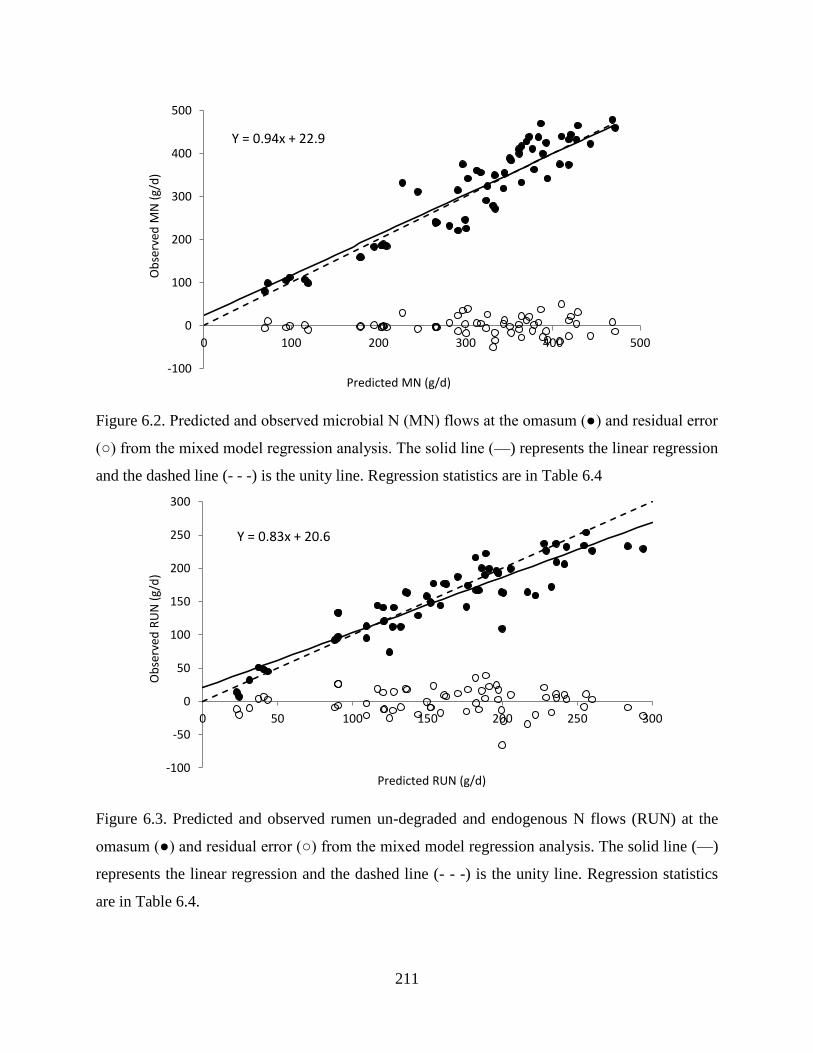
211
Figure 6.2. Predicted and observed microbial N (MN) flows at the omasum (●) and residual error
(○) from the mixed model regression analysis. The solid line (—) represents the linear regression
and the dashed line (- - -) is the unity line. Regression statistics are in Table 6.4
Figure 6.3. Predicted and observed rumen un-degraded and endogenous N flows (RUN) at the
omasum (●) and residual error (○) from the mixed model regression analysis. The solid line (—)
represents the linear regression and the dashed line (- - -) is the unity line. Regression statistics
are in Table 6.4.
-100
0
100
200
300
400
500
0 100 200 300 400 500
Ob
serv
ed M
N (
g/d
)
Predicted MN (g/d)
Y = 0.94x + 22.9
-100
-50
0
50
100
150
200
250
300
0 50 100 150 200 250 300
Ob
serv
ed R
UN
(g/
d)
Predicted RUN (g/d)
Y = 0.83x + 20.6
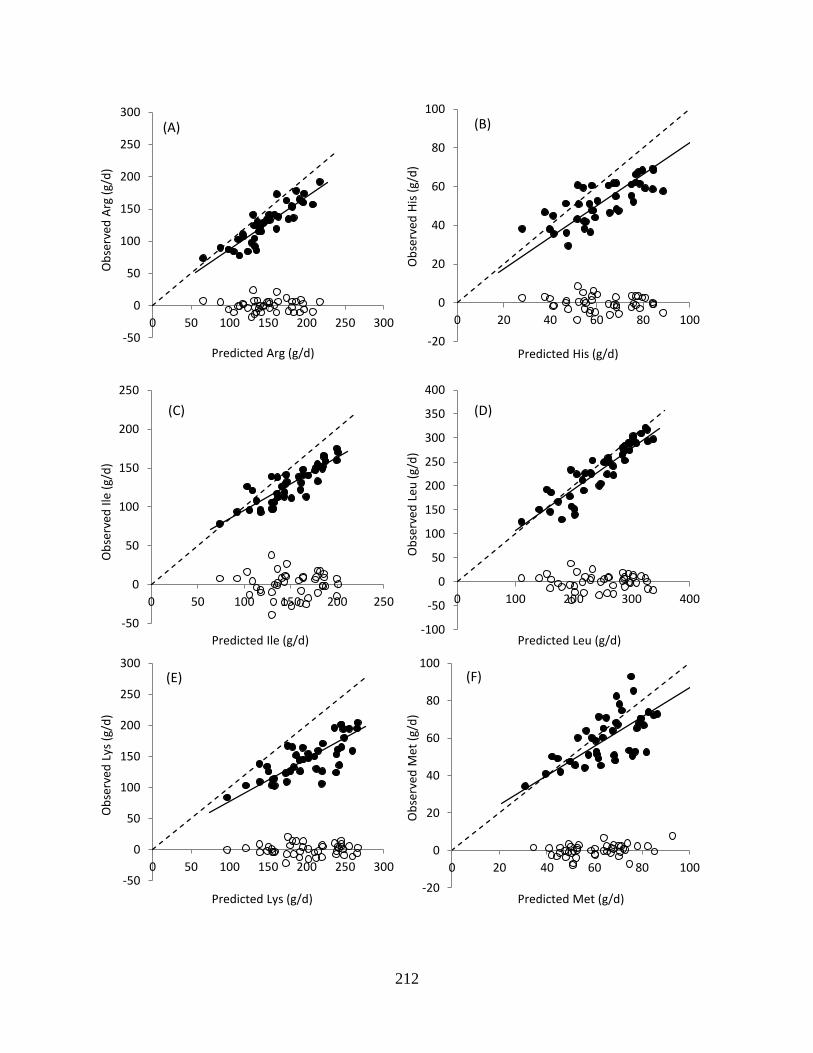
212
-50
0
50
100
150
200
250
300
0 50 100 150 200 250 300
Ob
serv
ed A
rg (
g/d
)
Predicted Arg (g/d)
(A)
-20
0
20
40
60
80
100
0 20 40 60 80 100
Ob
serv
ed H
is (
g/d
)
Predicted His (g/d)
(B)
-50
0
50
100
150
200
250
0 50 100 150 200 250
Ob
serv
ed I
le (
g/d
)
Predicted Ile (g/d)
(C)
-100
-50
0
50
100
150
200
250
300
350
400
0 100 200 300 400
Ob
serv
ed L
eu (
g/d
)
Predicted Leu (g/d)
(D)
-50
0
50
100
150
200
250
300
0 50 100 150 200 250 300
Ob
serv
ed L
ys (
g/d
)
Predicted Lys (g/d)
(E)
-20
0
20
40
60
80
100
0 20 40 60 80 100
Ob
serv
ed M
et (
g/d
)
Predicted Met (g/d)
(F)
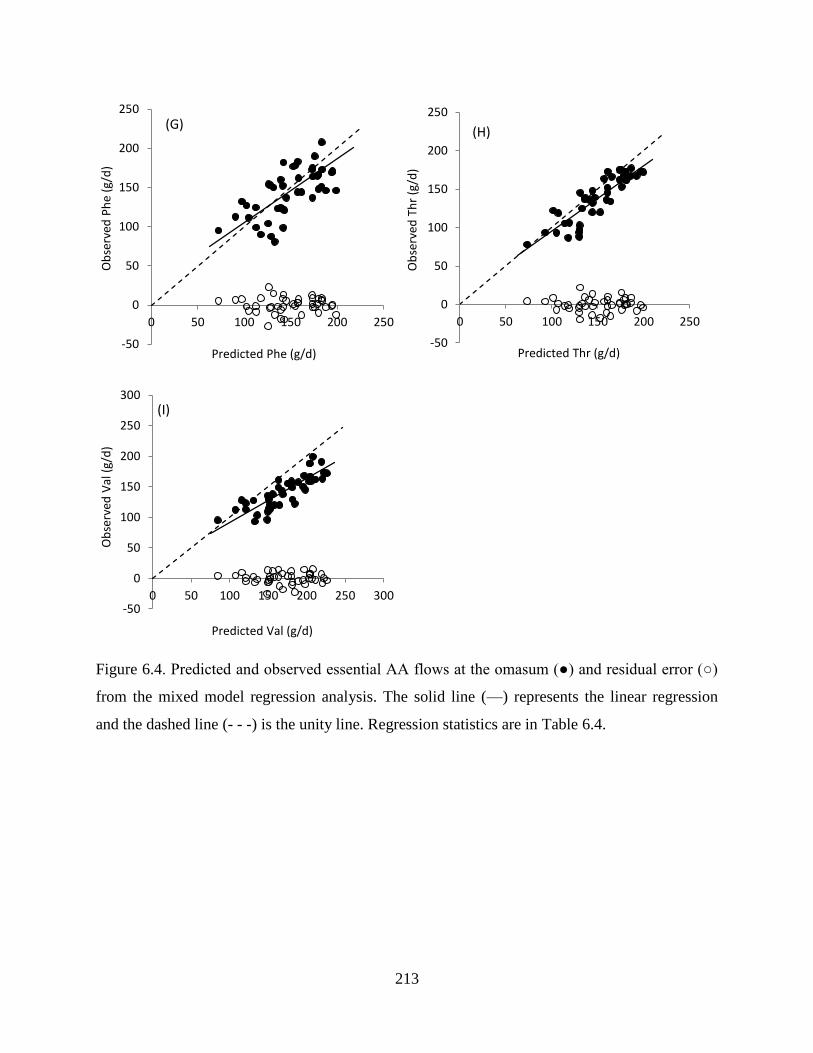
213
Figure 6.4. Predicted and observed essential AA flows at the omasum (●) and residual error (○)
from the mixed model regression analysis. The solid line (—) represents the linear regression
and the dashed line (- - -) is the unity line. Regression statistics are in Table 6.4.
-50
0
50
100
150
200
250
0 50 100 150 200 250
Ob
serv
ed P
he
(g/d
)
Predicted Phe (g/d)
(G)
-50
0
50
100
150
200
250
0 50 100 150 200 250
Ob
serv
ed T
hr
(g/d
)
Predicted Thr (g/d)
(H)
-50
0
50
100
150
200
250
300
0 50 100 150 200 250 300
Ob
serv
ed V
al (
g/d
)
Predicted Val (g/d)
(I)
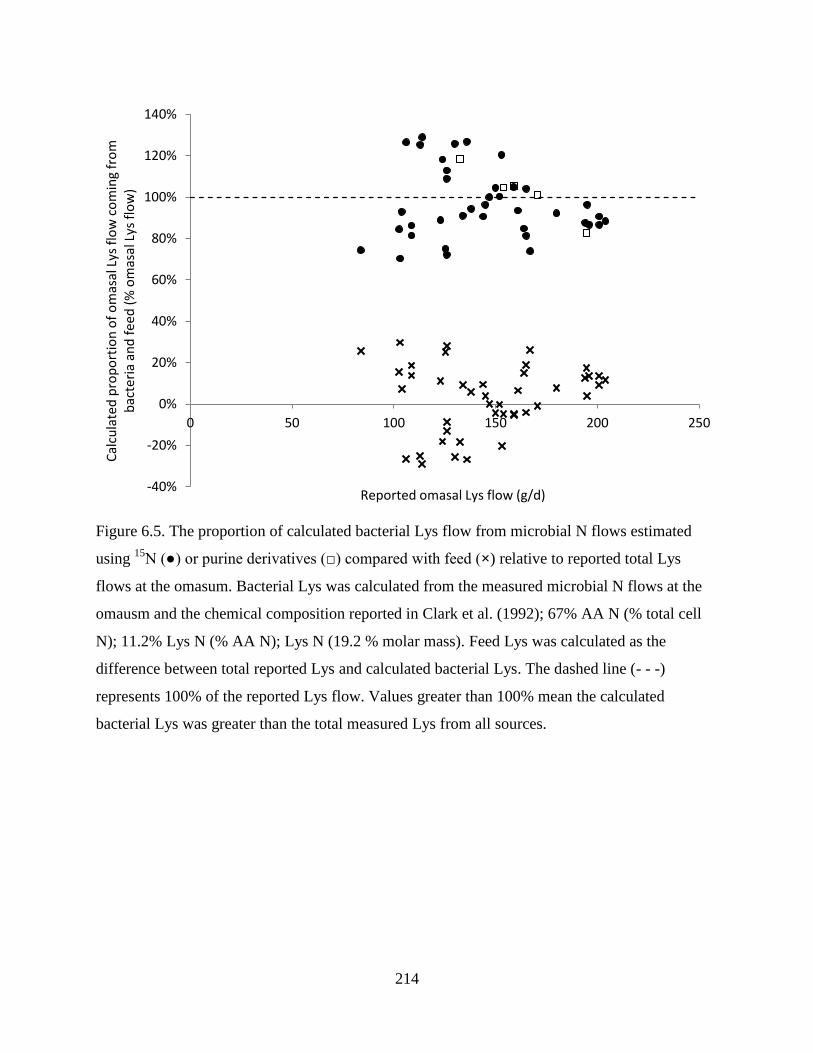
214
Figure 6.5. The proportion of calculated bacterial Lys flow from microbial N flows estimated
using 15
N (●) or purine derivatives (□) compared with feed (×) relative to reported total Lys
flows at the omasum. Bacterial Lys was calculated from the measured microbial N flows at the
omausm and the chemical composition reported in Clark et al. (1992); 67% AA N (% total cell
N); 11.2% Lys N (% AA N); Lys N (19.2 % molar mass). Feed Lys was calculated as the
difference between total reported Lys and calculated bacterial Lys. The dashed line (- - -)
represents 100% of the reported Lys flow. Values greater than 100% mean the calculated
bacterial Lys was greater than the total measured Lys from all sources.
-40%
-20%
0%
20%
40%
60%
80%
100%
120%
140%
0 50 100 150 200 250
Cal
cula
ted
pro
po
rtio
n o
f o
mas
al L
ys f
low
co
min
g fr
om
b
acte
ria
and
fe
ed (
% o
mas
al L
ys f
low
)
Reported omasal Lys flow (g/d)
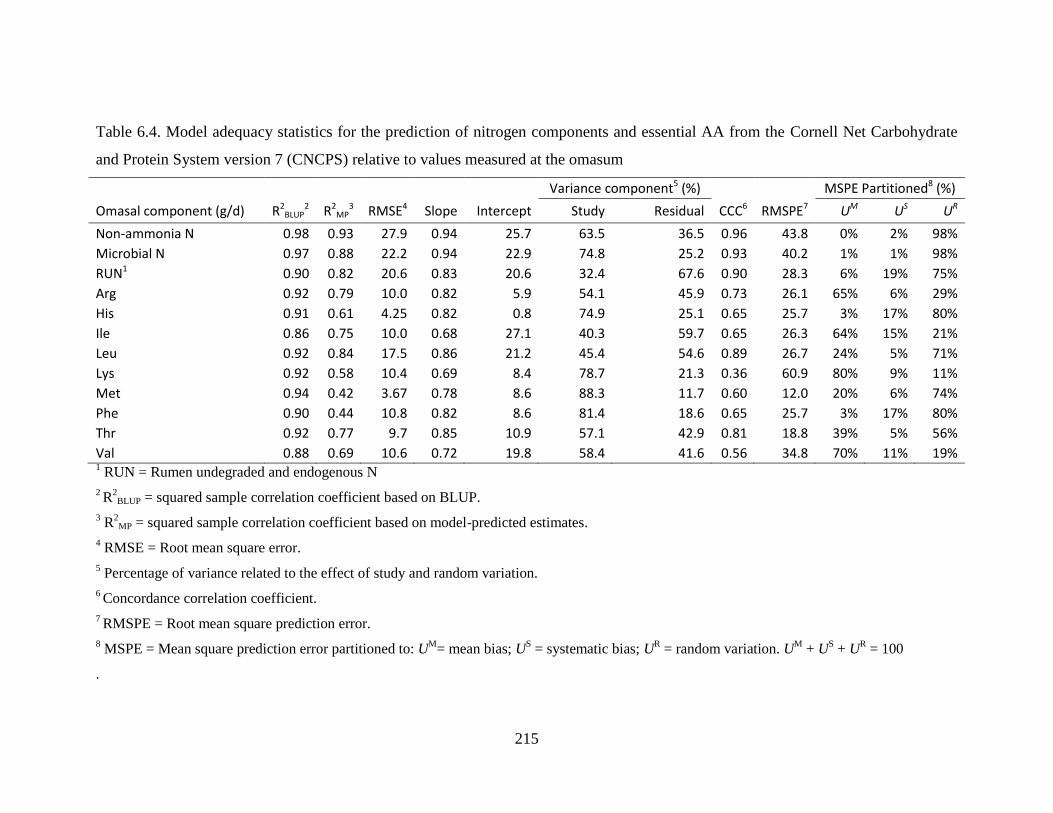
215
Table 6.4. Model adequacy statistics for the prediction of nitrogen components and essential AA from the Cornell Net Carbohydrate
and Protein System version 7 (CNCPS) relative to values measured at the omasum
Variance component5 (%)
MSPE Partitioned8 (%)
Omasal component (g/d) R2BLUP
2 R2MP
3 RMSE4 Slope Intercept Study Residual CCC6 RMSPE7 UM US UR
Non-ammonia N 0.98 0.93 27.9 0.94 25.7 63.5 36.5 0.96 43.8 0% 2% 98%
Microbial N 0.97 0.88 22.2 0.94 22.9 74.8 25.2 0.93 40.2 1% 1% 98%
RUN1 0.90 0.82 20.6 0.83 20.6 32.4 67.6 0.90 28.3 6% 19% 75%
Arg 0.92 0.79 10.0 0.82 5.9 54.1 45.9 0.73 26.1 65% 6% 29%
His 0.91 0.61 4.25 0.82 0.8 74.9 25.1 0.65 25.7 3% 17% 80%
Ile 0.86 0.75 10.0 0.68 27.1 40.3 59.7 0.65 26.3 64% 15% 21%
Leu 0.92 0.84 17.5 0.86 21.2 45.4 54.6 0.89 26.7 24% 5% 71%
Lys 0.92 0.58 10.4 0.69 8.4 78.7 21.3 0.36 60.9 80% 9% 11%
Met 0.94 0.42 3.67 0.78 8.6 88.3 11.7 0.60 12.0 20% 6% 74%
Phe 0.90 0.44 10.8 0.82 8.6 81.4 18.6 0.65 25.7 3% 17% 80%
Thr 0.92 0.77 9.7 0.85 10.9 57.1 42.9 0.81 18.8 39% 5% 56%
Val 0.88 0.69 10.6 0.72 19.8 58.4 41.6 0.56 34.8 70% 11% 19% 1 RUN = Rumen undegraded and endogenous N
2 R
2BLUP = squared sample correlation coefficient based on BLUP.
3 R
2MP = squared sample correlation coefficient based on model-predicted estimates.
4 RMSE = Root mean square error.
5 Percentage of variance related to the effect of study and random variation.
6 Concordance correlation coefficient.
7 RMSPE = Root mean square prediction error.
8 MSPE = Mean square prediction error partitioned to: U
M= mean bias; U
S = systematic bias; U
R = random variation. U
M + U
S + U
R = 100
.

216
6.5 Discussion
The model described here, and in previous chapters, represents an implementation of recent
advancements that have been made in the understanding of N availability to the animal,
including improvements in the characterization of feed chemistry (Chapter 2), quantification of
endogenous N flows (Ouellet et al., 2010, Ouellet et al., 2002), estimates of N availability in the
small intestine (Ross, 2013) and changes to estimates of microbial growth to include protozoa
(Chapter 4). The broad goal of these updates has been to improve the models ability to predict N
flows out of the rumen, to the small intestine, and the availability of AA to the animal.
Validating the changes to the model against animal data is an important step in establishing the
efficacy of the model updates (Tedeschi, 2006). The data used to evaluate the model was sourced
from studies that measured N flows at the omasum. The omasal sampling technique described by
Huhtanen et al. (1997) has advantages over sampling in other compartments (abomasum or
duodenum) that include less contamination with endogenous material and less invasive surgery
that can affect the performance and lifespan of the cows used. All studies in the current dataset
measured digesta flow using a triple marker approach (France and Siddons, 1986) which has
been shown to be more representative of digesta flows than single markers like Cr2O3 that are
often used in studies that have sampled at the duodenum (Firkins et al., 2007, Huhtanen et al.,
2010). Microbial N flows were estimated using either 15
N (n = 11) or purine bases (n = 5).
Previous model evaluations (Pacheco et al., 2012) and the NRC (2001) have used data from
studies that measured N and AA flows at the duodenum. Although a larger dataset is available if
duodenal sampling is considered (40 studies; 154 treatments;(Pacheco et al., 2012), we chose to
restrict this dataset to studies that sampled at the omasum to limit endogenous contamination and
marker bias.
217
Previous evaluations of the CNCPS have found predictions of microbial flows to the
duodenum to be accurate and to compare favorably to other available models (Offner and
Sauvant, 2004, Pacheco et al., 2012). Although deemed accurate, both evaluations reported
regression slopes <1 (0.70 and 0.91, respectively) suggesting prediction bias. Incorporation of
protozoa into the dynamic structure of the current model (Chapter 4) represents a considerable
change in the system used to estimate microbial growth in the CNCPS. Compared to omasal
sampling data, predictions of microbial N flows were more accurate and had less bias than
previous versions of the model (slope = 0.94; Figure 6.2; Table 6.4). Predictions were also closer
to measured data than the NRC (2001) which was shown to under-predict microbial N flows
(slope = 1.26), particularly when observed flows were high (Broderick et al., 2010). Measured
microbial growth efficiency (g MN/ kg OM truly digested in the rumen) in the study of
Broderick et al. (2010) was within the expected range and similar to other studies (Clark et al.,
1992) suggesting the observed flows were reasonable. Therefore, predictions of microbial
growth in this version of the CNCPS appear to have improved.
Prediction of RUN was more variable than MN and tended to be over-predicted when RUN
flows were high (Figure 6.3). What is generally reported as feed N will typically also include
endogenous secretions as feed N is calculated as the difference between total NAN and MN
(Broderick et al., 2010). Any error in the prediction of MN or NAN will be pooled in the
estimates of RUN and, therefore, more variability might be expected. Also, the predictions of
RUN rely on library values to estimate the rate of N digestion of the various N fractions which
can vary within, and among feeds (Broderick, 1987, NRC, 2001). Estimating digestion rates of
feed N in vitro is challenging due to contamination with microbial protein (Broderick, 1987).
218
However, relying on library values is no doubt one of the major limitations to improving
predictions of AA supply in ration formulation models. Although some bias was observed in this
version of the CNCPS, the slope and intercept were closer to unity than observed for the NRC
(2001) by Broderick et al. (2010). Less bias was observed in RUN for version 6 of the CNCPS
using duodenal data (Slope = 0.94; Intercept = 24.6 g N;(Pacheco et al., 2012). However, more
endogenous N would be expected in the dataset of Pacheco et al. (2012) which would reduce the
apparent over-prediction observed at the omasum in this study. The CNCPS v6 (Fox et al., 2004,
Tylutki et al., 2008) does not include predictions of endogenous N, therefore, the apparent
accuracy of version 6 of the model compared to duodenal measurements suggests an over-
prediction of undegraded dietary protein flow out of the rumen.
In this analysis, total NAN was predicted accurately, precisely and with little bias (Table 6.4).
The relationship was similar to the NRC (2001) which was also able to accurately predict total
NAN flowing from the rumen (Broderick et al., 2010). These data represent an improvement
from the evaluation of Pacheco et al. (2012) which can probably be attributed to the
improvement in the prediction of microbial yield. However, some caution is necessary when
comparing the studies due to the differences in the datasets used to complete the evaluation.
Amino acid flows were over-predicted by the model relative to measured omasal flows for the
AA considered in this study. This was unexpected given the close agreement between N flows
from the model and measured data. The variation in AA flows differed among AA with the
greatest variation seen in His, Lys, Met and Phe (Table 6.4). Given the model calculates AA flow
by applying an AA profile to the predicted N flow (Eq. 1), and the N flows appeared to be
219
accurate, three possibilities can be formulated to explain the bias: 1) the AA profiles of the N
constituents comprising the omasal N flow do not adequately represent what is truly flowing at
the omasum; 2) there is analytical error associated with measuring AA which differs among AA;
and 3) the omasal N flows reported by the studies are biased, and given the agreement between
the model and the measured data, the model is also biased. Certainly, Met analysis is technically
challenging and requires an additional pre-oxidation step before acid hydrolysis of the sample
(Allred and MacDonald, 1988). However, all studies used in the current dataset reported using
the correct procedure for Met analysis, and similar variance was observed in the prediction of
other AA that do not require this step (Lys, His, Phe). The AA profiles of feeds used by the
model were updated in an earlier study (Chapter 2) using a contemporary dataset and it is
unlikely the possible variance in these profiles could cause an over-prediction of the magnitude
observed. For example, dietary Lys in the study of Reynal and Broderick (2005) was reported to
be approximately 4.5% AA among the treatments reported which was similar to model
predictions (data not shown). If the predicted Lys content was over-predicted by 2% points
(6.5% AA), at the highest levels of RUN flow (~250 g/d), this would represent a difference of
~20 g Lys/d which is less than half the difference observed (~70 g/d) at high levels of Lys flow
(Figure 6.4E). It is also unclear why the predictions of certain AA (Arg, Leu, Thr) had less
variation and bias than others given the N flows used to make the calculations were the same.
These findings are consistent with the study of Pacheco et al. (2012) who also reported
differences in slopes among AA for version 6 of the CNCPS. Interestingly, the directional
differences in the regression slopes of the AA reported in Pacheco et al. (2012) were similar
among the models evaluated (i.e. Arg ~0.6; Leu ~0.9; Ile ~0.6), with the exception of the NRC.
The factorial equations used in the NRC (2001) were derived using measured duodenal flow
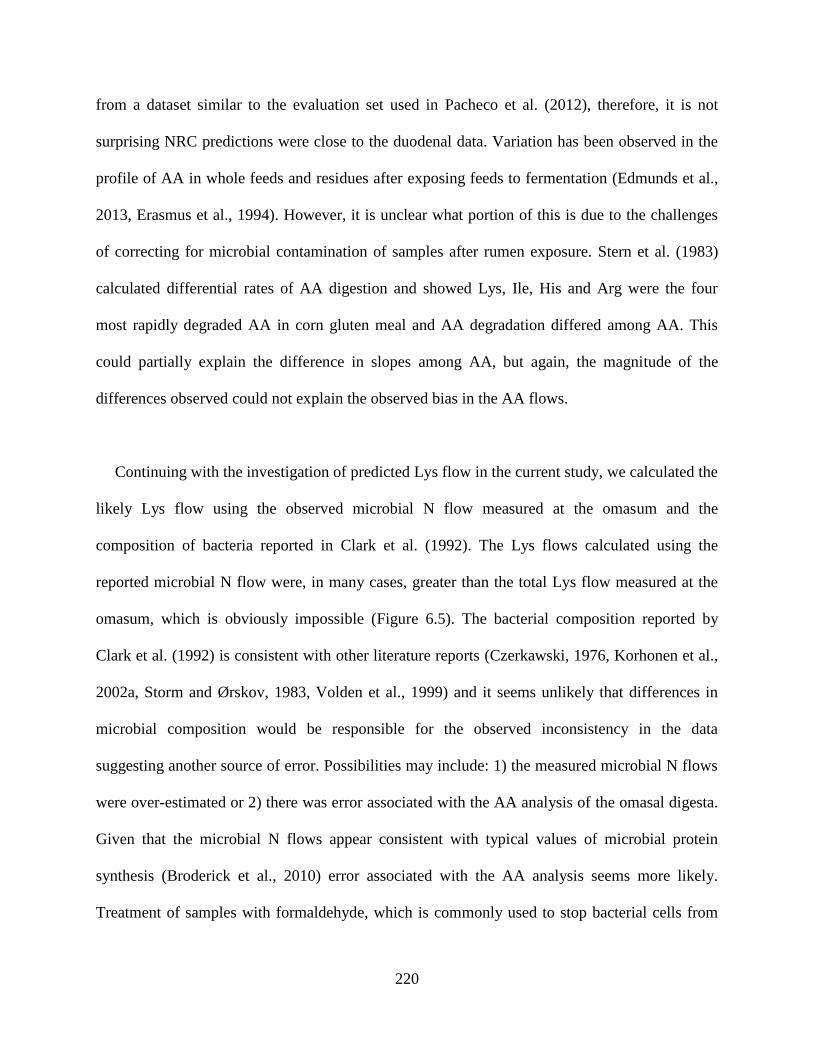
220
from a dataset similar to the evaluation set used in Pacheco et al. (2012), therefore, it is not
surprising NRC predictions were close to the duodenal data. Variation has been observed in the
profile of AA in whole feeds and residues after exposing feeds to fermentation (Edmunds et al.,
2013, Erasmus et al., 1994). However, it is unclear what portion of this is due to the challenges
of correcting for microbial contamination of samples after rumen exposure. Stern et al. (1983)
calculated differential rates of AA digestion and showed Lys, Ile, His and Arg were the four
most rapidly degraded AA in corn gluten meal and AA degradation differed among AA. This
could partially explain the difference in slopes among AA, but again, the magnitude of the
differences observed could not explain the observed bias in the AA flows.
Continuing with the investigation of predicted Lys flow in the current study, we calculated the
likely Lys flow using the observed microbial N flow measured at the omasum and the
composition of bacteria reported in Clark et al. (1992). The Lys flows calculated using the
reported microbial N flow were, in many cases, greater than the total Lys flow measured at the
omasum, which is obviously impossible (Figure 6.5). The bacterial composition reported by
Clark et al. (1992) is consistent with other literature reports (Czerkawski, 1976, Korhonen et al.,
2002a, Storm and Ørskov, 1983, Volden et al., 1999) and it seems unlikely that differences in
microbial composition would be responsible for the observed inconsistency in the data
suggesting another source of error. Possibilities may include: 1) the measured microbial N flows
were over-estimated or 2) there was error associated with the AA analysis of the omasal digesta.
Given that the microbial N flows appear consistent with typical values of microbial protein
synthesis (Broderick et al., 2010) error associated with the AA analysis seems more likely.
Treatment of samples with formaldehyde, which is commonly used to stop bacterial cells from
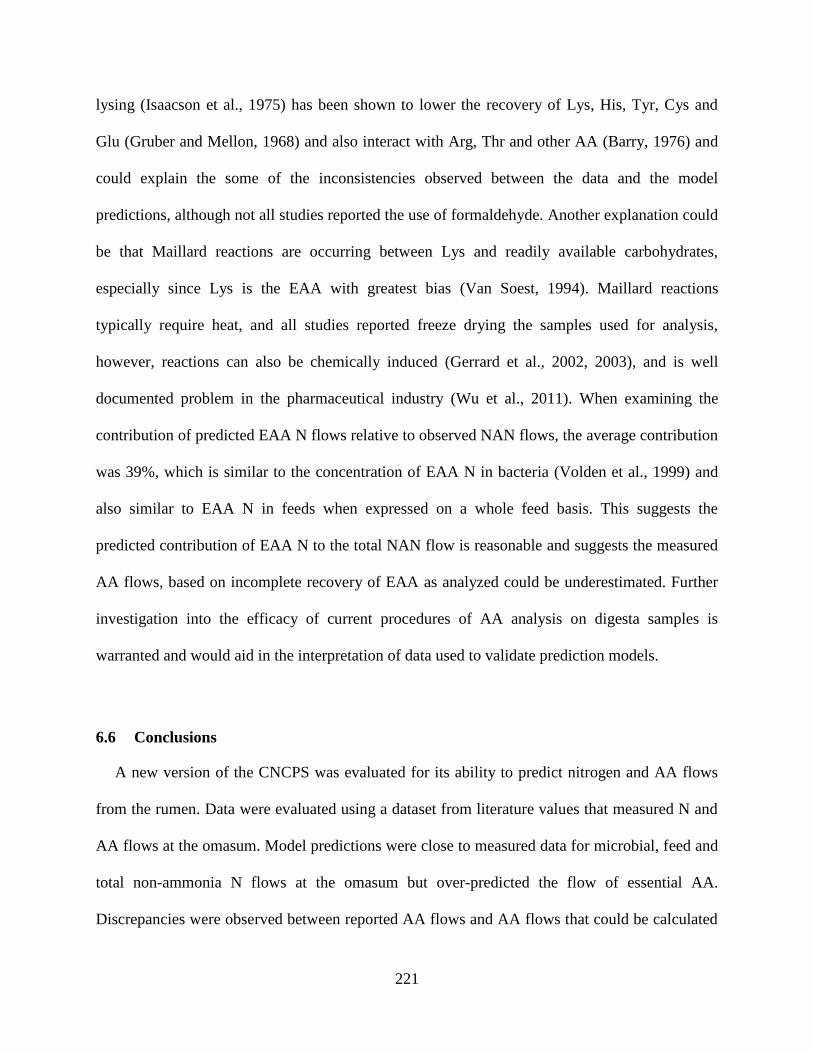
221
lysing (Isaacson et al., 1975) has been shown to lower the recovery of Lys, His, Tyr, Cys and
Glu (Gruber and Mellon, 1968) and also interact with Arg, Thr and other AA (Barry, 1976) and
could explain the some of the inconsistencies observed between the data and the model
predictions, although not all studies reported the use of formaldehyde. Another explanation could
be that Maillard reactions are occurring between Lys and readily available carbohydrates,
especially since Lys is the EAA with greatest bias (Van Soest, 1994). Maillard reactions
typically require heat, and all studies reported freeze drying the samples used for analysis,
however, reactions can also be chemically induced (Gerrard et al., 2002, 2003), and is well
documented problem in the pharmaceutical industry (Wu et al., 2011). When examining the
contribution of predicted EAA N flows relative to observed NAN flows, the average contribution
was 39%, which is similar to the concentration of EAA N in bacteria (Volden et al., 1999) and
also similar to EAA N in feeds when expressed on a whole feed basis. This suggests the
predicted contribution of EAA N to the total NAN flow is reasonable and suggests the measured
AA flows, based on incomplete recovery of EAA as analyzed could be underestimated. Further
investigation into the efficacy of current procedures of AA analysis on digesta samples is
warranted and would aid in the interpretation of data used to validate prediction models.
6.6 Conclusions
A new version of the CNCPS was evaluated for its ability to predict nitrogen and AA flows
from the rumen. Data were evaluated using a dataset from literature values that measured N and
AA flows at the omasum. Model predictions were close to measured data for microbial, feed and
total non-ammonia N flows at the omasum but over-predicted the flow of essential AA.
Discrepancies were observed between reported AA flows and AA flows that could be calculated
222
from the reported N flows. It is possible sample preservation or other factors could have reduced
the recovery of certain AA during analysis and the reported AA flows are under-estimated.
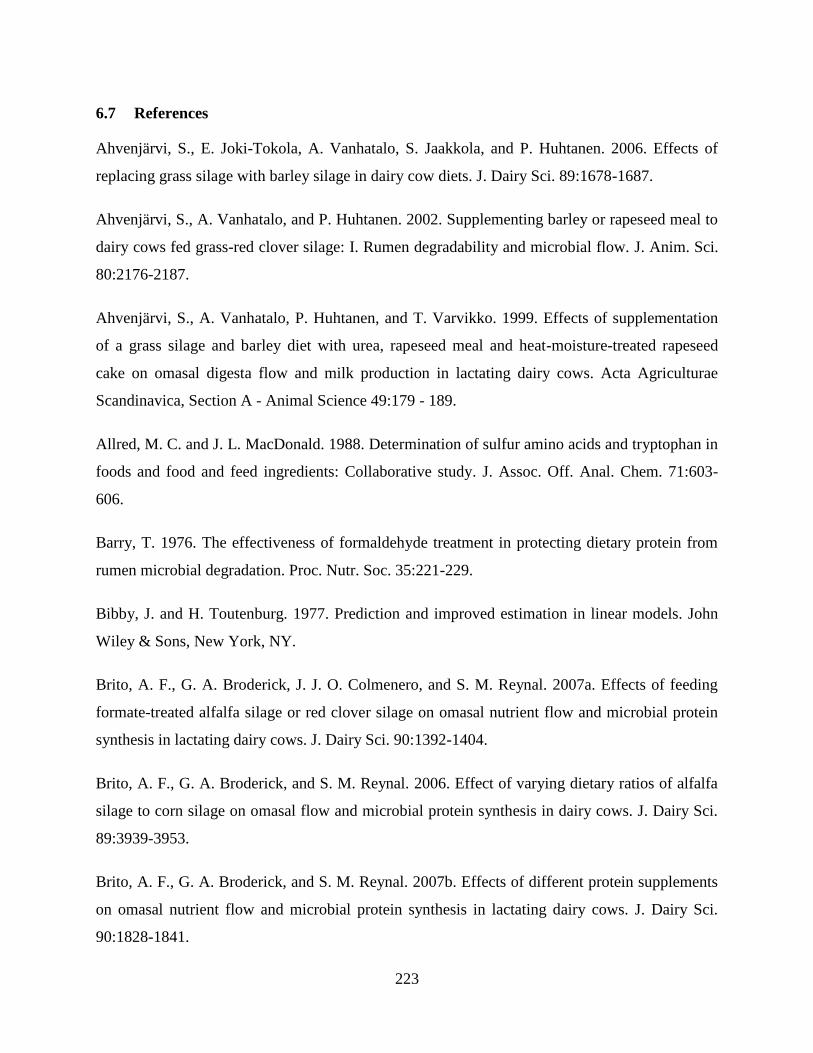
223
6.7 References
Ahvenjärvi, S., E. Joki-Tokola, A. Vanhatalo, S. Jaakkola, and P. Huhtanen. 2006. Effects of
replacing grass silage with barley silage in dairy cow diets. J. Dairy Sci. 89:1678-1687.
Ahvenjärvi, S., A. Vanhatalo, and P. Huhtanen. 2002. Supplementing barley or rapeseed meal to
dairy cows fed grass-red clover silage: I. Rumen degradability and microbial flow. J. Anim. Sci.
80:2176-2187.
Ahvenjärvi, S., A. Vanhatalo, P. Huhtanen, and T. Varvikko. 1999. Effects of supplementation
of a grass silage and barley diet with urea, rapeseed meal and heat-moisture-treated rapeseed
cake on omasal digesta flow and milk production in lactating dairy cows. Acta Agriculturae
Scandinavica, Section A - Animal Science 49:179 - 189.
Allred, M. C. and J. L. MacDonald. 1988. Determination of sulfur amino acids and tryptophan in
foods and food and feed ingredients: Collaborative study. J. Assoc. Off. Anal. Chem. 71:603-
606.
Barry, T. 1976. The effectiveness of formaldehyde treatment in protecting dietary protein from
rumen microbial degradation. Proc. Nutr. Soc. 35:221-229.
Bibby, J. and H. Toutenburg. 1977. Prediction and improved estimation in linear models. John
Wiley & Sons, New York, NY.
Brito, A. F., G. A. Broderick, J. J. O. Colmenero, and S. M. Reynal. 2007a. Effects of feeding
formate-treated alfalfa silage or red clover silage on omasal nutrient flow and microbial protein
synthesis in lactating dairy cows. J. Dairy Sci. 90:1392-1404.
Brito, A. F., G. A. Broderick, and S. M. Reynal. 2006. Effect of varying dietary ratios of alfalfa
silage to corn silage on omasal flow and microbial protein synthesis in dairy cows. J. Dairy Sci.
89:3939-3953.
Brito, A. F., G. A. Broderick, and S. M. Reynal. 2007b. Effects of different protein supplements
on omasal nutrient flow and microbial protein synthesis in lactating dairy cows. J. Dairy Sci.
90:1828-1841.
224
Brito, A. F., G. F. Tremblay, H. Lapierre, A. Bertrand, Y. Castonguay, G. Bélanger, R. Michaud,
C. Benchaar, D. R. Ouellet, and R. Berthiaume. 2009. Alfalfa cut at sundown and harvested as
baleage increases bacterial protein synthesis in late-lactation dairy cows. J. Dairy Sci. 92:1092-
1107.
Broderick, G. A. 1987. Determination of protein degradation rates using a rumen in vitro system
containing inhibitors of microbial nitrogen metabolism. Br. J. Nutr. 58:463-475.
Broderick, G. A., P. Huhtanen, S. Ahvenjärvi, S. M. Reynal, and K. J. Shingfield. 2010.
Quantifying ruminal nitrogen metabolism using the omasal sampling technique in cattle - A
meta-analysis. J. Dairy Sci. 93:3216-3230.
Broderick, G. A. and S. M. Reynal. 2009. Effect of source of rumen-degraded protein on
production and ruminal metabolism in lactating dairy cows. J. Dairy Sci. 92:2822-2834.
Choi, C. W., S. Ahvenjarvi, A. Vanhatalo, V. Toivonen, and P. Huhtanen. 2002. Quantitation of
the flow of soluble non-ammonia nitrogen entering the omasal canal of dairy cows fed grass
silage based diets. Anim. Feed Sci. Technol. 96:203-220.
Clark, J. H., T. H. Klusmeyer, and M. R. Cameron. 1992. Microbial protein synthesis and flows
of nitrogen fractions to the duodenum of dairy cows. J. Dairy Sci. 75:2304-2323.
Colmenero, J. J. O. and G. A. Broderick. 2006. Effect of dietary crude protein concentration on
ruminal nitrogen metabolism in lactating dairy cows. J. Dairy Sci. 89:1694-1703.
Czerkawski, J. W. 1976. Chemical composition of microbial matter in the rumen. J. Sci. Food
Agric. 27:621-632.
Edmunds, B., K.-H. Südekum, R. Bennett, A. Schröder, H. Spiekers, and F. Schwarz. 2013. The
amino acid composition of rumen-undegradable protein: A comparison between forages. J. Dairy
Sci. 96:4568-4577.
Erasmus, L. J., P. M. Botha, and H. H. Meissner. 1994. Effect of protein source on ruminal
fermentation and passage of amino acids to the small intestine of lactating cows. J. Dairy Sci.
77:3655-3665.
225
Firkins, J. L., Z. Yu, and M. Morrison. 2007. Ruminal nitrogen metabolism: Perspectives for
integration of microbiology and nutrition for dairy. J. Dairy Sci. 90:E1-E16.
Fox, D. G., L. O. Tedeschi, T. P. Tylutki, J. B. Russell, M. E. Van Amburgh, L. E. Chase, A. N.
Pell, and T. R. Overton. 2004. The Cornell Net Carbohydrate and Protein System model for
evaluating herd nutrition and nutrient excretion. Anim. Feed Sci. Technol. 112:29-78.
France, J. and R. Siddons. 1986. Determination of digesta flow by continuous market infusion. J.
Theor. Biol. 121:105-119.
Gerrard, J., P. Brown, and S. Fayle. 2002. Maillard crosslinking of food proteins i: The reaction
of glutaraldehyde, formaldehyde and glyceraldehyde with ribonuclease. Food Chem. 79:343-
349.
Gerrard, J., P. Brown, and S. Fayle. 2003. Maillard crosslinking of food proteins ii: The reactions
of glutaraldehyde, formaldehyde and glyceraldehyde with wheat proteins in vitro and in situ.
Food Chem. 80:35-43.
Gruber, H. A. and E. F. Mellon. 1968. Errors in amino acid analysis due to formaldehyde and
decolorizing carbon. Anal. Biochem. 26:180-183.
Huhtanen, P., S. Ahvenjärvi, G. A. Broderick, S. M. Reynal, and K. J. Shingfield. 2010.
Quantifying ruminal digestion of organic matter and neutral detergent fiber using the omasal
sampling technique in cattle - A meta-analysis. J. Dairy Sci. 93:3203-3215.
Huhtanen, P., P. G. Brotz, and L. D. Satter. 1997. Omasal sampling technique for assessing
fermentative digestion in the forestomach of dairy cows. J. Anim. Sci. 75:1380-1392.
Isaacson, H. R., F. C. Hinds, M. P. Bryant, and F. N. Owens. 1975. Efficiency of energy
utilization by mixed rumen bacteria in continuous culture. J. Dairy Sci. 58:1645-1659.
Korhonen, M., S. Ahvenjärvi, A. Vanhatalo, and P. Huhtanen. 2002a. Supplementing barley or
rapeseed meal to dairy cows fed grass-red clover silage: II. Amino acid profile of microbial
fractions. J. Anim. Sci. 80:2188-2196.
226
Korhonen, M., A. Vanhatalo, and P. Huhtanen. 2002b. Effect of protein source on amino acid
supply, milk production, and metabolism of plasma nutrients in dairy cows fed grass silage. J.
Dairy Sci. 85:3336-3351.
NRC. 2001. Nutrient requirements of dairy cattle. 7th revised ed. National Academy Press,
Washington, DC.
NRC. 2012. Nutrient requirements of swine. National Academy Press, Washington, DC.
O'Connor, J. D., C. J. Sniffen, D. G. Fox, and W. Chalupa. 1993. A net carbohydrate and protein
system for evaluating cattle diets: IV. Predicting amino acid adequacy. J. Anim. Sci. 71:1298-
1311.
Offner, A. and D. Sauvant. 2004. Comparative evaluation of the Molly, CNCPS, and LES rumen
models. Anim. Feed Sci. Technol. 112:107-130.
Ouellet, D. R., R. Berthiaume, G. Holtrop, G. E. Lobley, R. Martineau, and H. Lapierre. 2010.
Effect of method of conservation of timothy on endogenous nitrogen flows in lactating dairy
cows. J. Dairy Sci. 93:4252-4261.
Ouellet, D. R., M. Demers, G. Zuur, G. E. Lobley, J. R. Seoane, J. V. Nolan, and H. Lapierre.
2002. Effect of dietary fiber on endogenous nitrogen flows in lactating dairy cows. J. Dairy Sci.
85:3013-3025.
Owens, D., M. McGee, and T. Boland. 2008a. Effect of grass regrowth interval on intake, rumen
digestion and nutrient flow to the omasum in beef cattle. Anim. Feed Sci. Technol. 146:21-41.
Owens, D., M. McGee, T. Boland, and P. O’Kiely. 2008b. Intake, rumen fermentation and
nutrient flow to the omasum in beef cattle fed grass silage fortified with sucrose and/or
supplemented with concentrate. Anim. Feed Sci. Technol. 144:23-43.
Pacheco, D., R. A. Patton, C. Parys, and H. Lapierre. 2012. Ability of commercially available
dairy ration programs to predict duodenal flows of protein and essential amino acids in dairy
cows. J. Dairy Sci. 95:937-963.
227
Reynal, S. M. and G. A. Broderick. 2003. Effects of feeding dairy cows protein supplements of
varying ruminal degradability. J. Dairy Sci. 86:835-843.
Reynal, S. M. and G. A. Broderick. 2005. Effect of dietary level of rumen-degraded protein on
production and nitrogen metabolism in lactating dairy cows. J. Dairy Sci. 88:4045-4064.
Ross, D. A. 2013. Methods to analyze feeds for nitrogen fractions and digestibility for ruminants
with application for the CNCPS. PhD Dissertation. Department of Animal Science. Cornell
University.
SAS. 2010. JMP. SAS Institute Inc., Cary, NC, USA.
Sniffen, C. J., J. D. O'Connor, P. J. Van Soest, D. G. Fox, and J. B. Russell. 1992. A net
carbohydrate and protein system for evaluating cattle diets: II. Carbohydrate and protein
availability. J. Anim. Sci. 70:3562-3577.
St-Pierre, N. R. 2001. Invited review: Integrating quantitative findings from multiple studies
using mixed model methodology. J. Dairy Sci. 84:741-755.
Stern, M. D., L. M. Rode, R. W. Prange, R. H. Stauffacher, and L. D. Satter. 1983. Ruminal
protein degradation of corn gluten meal in lactating dairy cattle fitted with duodenal t-type
cannulae. J. Anim. Sci. 56:194-205.
Storm, E. and E. R. Ørskov. 1983. The nutritive value of rumen micro-organisms in ruminants 1.
Large-scale isolation and chemical composition of rumen micro-organisms. Br. J. Nutr. 50:463-
470.
Tedeschi, L. O. 2006. Assessment of the adequacy of mathematical models. Agricultural
Systems 89:225-247.
Tylutki, T. P., D. G. Fox, V. M. Durbal, L. O. Tedeschi, J. B. Russell, M. E. Van Amburgh, T. R.
Overton, L. E. Chase, and A. N. Pell. 2008. Cornell Net Carbohydrate and Protein System: A
model for precision feeding of dairy cattle. Anim. Feed Sci. Technol. 143:174-202.

228
Van Amburgh, M. E., A. Foskolos, E. A. Collao-Saenz, R. J. Higgs, and D. A. Ross. 2013.
Updating the CNCPS feed library with new amino acid profiles and efficiencies of use:
Evaluation of model predictions - Version 6.5. Pages 59-76 in Proc. Cornell Nutrition
Conference, Syracuse, NY.
Van Soest, P. J. 1994. Nutritional ecology of the ruminant. 2nd ed. Cornell University Press,
Ithaca, NY.
Vanhatalo, A., K. Kuoppala, S. Ahvenjarvi, and M. Rinne. 2009. Effects of feeding grass or red
clover silage cut at two maturity stages in dairy cows. 1. Nitrogen metabolism and supply of
amino acids. J. Dairy Sci. 92:5620-5633.
Volden, H., O. M. Harstad, and L. T. Mydland. 1999. Amino acid content and profile of
protozoal and bacterial fractions isolated from ruminal contents of lactating dairy cows fed diets
differing in nitrogen supplementation. Acta Agriculturae Scandinavica, Section A - Animal
Science 49:245-250.
Wu, Y., J. Levons, A. S. Narang, K. Raghavan, and V. M. Rao. 2011. Reactive impurities in
excipients: Profiling, identification and mitigation of drug - excipient incompatibility. AAPS
PharmSciTech 12:1248-1263.
229
CHAPTER 7: BALANCING DAIRY CATTLE DIETS FOR METHIONINE OR ALL
ESSENTIAL AMINO ACIDS REALATIVE TO ENERGY AT NEGATIVE AND
ADEQUATE LEVELS OF RUMEN NITROGEN
7.1 Abstract
Improving the ability of ration balancing systems to predict the AA supply and requirement in
lactating dairy cattle provides an opportunity to improve animal productivity, reduce feeds costs
and improve N utilization. Updates have been made to the Cornell Net Carbohydrate and Protein
System (CNCPS) which now includes estimations of rumen protozoa, endogenous N secretions
and a new system for calculating post-ruminal N digestion. The goal of this study was to
evaluate the ability of the updated model to balance diets of high producing dairy below or close
to requirements for both rumen N and EAA and evaluate the impact on N utilization. To do this,
sixty-four high producing dairy cows were randomly assigned to 1 of 4 treatments. The
treatments were 1) limited in Met, MP and rumen N (Base); 2) adequate in Met but limited MP
and rumen N (Base+M); 3) adequate in Met and rumen N, but limited MP (Base+MU); 4)
adequate in MP, rumen N and balanced for all EAA (Positive). Dietary CP was 13.5, 13.6, 14.6
and 15.6 % DM for the Base, Base+M, Base+MU and Positive treatments, respectively. No
differences were observed in DMI or milk yield (24.1 - 24.8 and 40.0 - 41.8 kg/d, respectively).
Energy corrected milk, fat and true protein yield were greater (3.3, 0.09 and 0.11 kg/d,
respectively; P < 0.001) in cows fed the Positive compared to the Base treatment. True protein
concentration in milk was higher (P < 0.001) and milk fat tended to be higher (P < 0.10) in cows
fed the Positive and Base+MU treatments than cows fed the Base and Base+M treatments. Using
the updated Cornell Net Carbohydrate and Protein System to evaluate the diets and environment,
cattle fed the Base, Base+M and Base+MU treatments were predicted to have a negative MP
230
balance (-231, -310 and -142 g/d, respectively), while cattle fed the Positive treatment consumed
33 g MP/d excess to requirements. Bacterial growth was predicted to be depressed by 16% and
17% for the Base and Base+M treatments, respectively, due to the predicted rumen N balance
which corresponded with lower (P <0.05) apparent total tract NDF digestion. The study
demonstrates high levels of milk production can be achieved when diets are formulated on a N
basis, ignoring CP and focusing on rumen N balance and EAA, even when crude protein is <14
% DM provided adequate AA are supplied to the small intestine. Further, this study demonstrates
that N utilization can be improved and the environmental impact of dairy production reduced
through more precise predictions of N and AA requirements and predicted supply.
7.2 Introduction
Ration formulation systems continue to evolve as new information becomes available and the
understanding of biological systems improves. The accurate prediction of AA requirement and
supply in dairy cattle has been of particular interest in an attempt to improve animal
performance, reduce feed costs and increase N utilization (Lapierre et al., 2006).
Recommendations for dietary Lys and Met supply are well established (NRC, 2001, Rulquin et
al., 1993, Schwab, 1996) and numerous studies have demonstrated improvements in animal
productivity when the balance of Lys and Met is improved (Armentano et al., 1997, Chen et al.,
2011, Noftsger and St-Pierre, 2003). In addition to Lys and Met, the potential for other EAA to
limit milk production has been investigated including the branched chain AA, Arg and His
(Appuhamy et al., 2011, Haque et al., 2012, Haque et al., 2013, Lee et al., 2012a, Lee et al.,
2012b). Increases to milk, milk protein, and also DMI have been observed when His was added
to diets predicted to be His deficient (Lee et al., 2012a, Lee et al., 2012b), but mixed results have

231
been observed when adding BCAA and Arg (Appuhamy et al., 2011, Haque et al., 2012, Haque
et al., 2013). The interactions and inter-conversion between protein and energy could impact
expected responses from additional AA supply, particularly BCAA which are extensively
oxidized and act as precursors for the synthesis of other required metabolites (Lemosquet et al.,
2010, Lobley, 2007). Further, provision of additional energy can reduce the oxidation of BCAA
in the mammary gland and demonstrates the ability of the animal to adjust metabolism according
to the profile of nutrients provided (Raggio et al., 2006). Given the interactions between protein
and energy it has been suggested they be considered together in ration formulation systems,
rather than as separate entities (Lobley, 2007).
The repeatability of a response from AA balancing may also be influenced by the ability of
ration formulation systems to accurately estimate true AA deficiencies. Pacheco et al. (2012)
conducted an evaluation of four commercially available ration balancing programs to predict
EAA supply and concluded that, while predictions were generally accurate, all programs,
including the CNCPS, had areas where significant improvements could be achieved. A new,
dynamic version of the Cornell Net Carbohydrate and Protein System (CNCPS) has been
constructed that includes rumen protozoa (Chapter 4) and endogenous N secretions along the
entire gastro-intestinal tract which have not been directly included in previous versions of the
CNCPS (Chapter 5). The model also includes a new system for calculating post-ruminal N
digestion based on an in vitro estimate of indigestible protein developed by Ross (2013).
Research efforts have been focused on improving the capability of the CNCPS to precisely
estimate N and AA availability to the animal to allow for the formulation of rations that more
closely match animal requirements. An evaluation of the model showed predictions were close to
232
measured data for microbial, feed and total non-ammonia N flows at the omasum (Chapter 6).
New optimum requirements for each EAA relative to metabolizable energy (ME) supply have
also been established (Chapter 5) and appear to explain more variation in AA utilization than
current recommendations expressed relative to MP supply.
The objectives of this study were 1) to use the new model to balance the diets of high
producing dairy cattle for Met or all EAA using the requirements established in Chapter 5 and, 2)
to test the models sensitivity in predicting rumen N supply. Our hypothesis was that milk
production will be maximized by providing adequate rumen N and a balanced supply of all EAA
relative to energy.
7.3 Materials and methods
7.3.1 Animals and diets
The experiment was conducted at the Cornell Teaching and Research Facility (Harford, NY)
from May – August 2013. All procedures carried out in the study were approved by the Cornell
University Institutional Animal Care and Use Committee. Sixty-four lactating Holstein dairy
cattle [16 primiparous and 48 multiparous; 100 ± 31 DIM at the beginning of the study; 624 ± 68
kg BW; 3.0 ± 0.2 BCS (1-5 scale)] were randomly assigned to one of four treatments. Treatment
assignment was balanced for parity, energy corrected milk and DIM. Cattle were housed in
individual tiestalls and fed a TMR once daily at approximately 0900 h with a 10% target refusal
rate. All cows were treated with rBST (Posilac) on a 14 d cycle according to label (Elanco
Animal Health, Greenfield, IN). The experiment proceeded in three phases. Phase 1 was a 7 day
adjustment period to allow cows to become accustomed to the housing conditions in the tie-stall
233
barn. Phase 2 was a 14 day reference period where all cattle were fed the same diet and data were
collected to be used as a covariate in the statistical model. Phase 3 was the experimental period
where cattle were fed treatment diets which lasted 100 days. The intended treatments were 1)
balanced (assuming 45 kg ECM) for ME, MP, MP Lys and rumen N but limited in MP Met
(Base); 2) balanced for ME, MP, MP Lys, rumen N and balanced for MP Met with supplemental
Met (Base+M); balanced for ME, MP, MP Lys, MP Met with excess rumen N through
supplementing urea (Base+MU); balanced to be adequate in all EAA and excess rumen N
(Positive). Due to large changes in the chemical composition of the corn silage being fed through
the experiment (Table 7.2), diets ended up lower in total N than expected. Accordingly, the
resulting treatments can be described as 1) balanced for ME (assuming 45 kg ECM), but limited
in MP and rumen N (Base); 2) balanced for ME and MP Met but limited in MP and rumen N
(Base+M); 3) balanced for ME, MP Met, with adequate rumen N, but limited in MP (Base+MU);
4) balanced for ME, MP, all EAA and adequate in rumen N (Positive).
7.3.2 Sample collection and analysis
Body weight and body condition score (1-5 scale) were measured weekly. Cows were milked
two times per day at 0900 and 2000 h and milk weights were recorded at each milking. Milk
samples were collected on two days each week (4 consecutive milkings). Samples were placed in
tubes containing 2-bromo-2-nitropropane-1,3-diol and analyzed for fat, true protein, lactose, and
MUN (Dairy One, Ithaca NY) using fourier transform infrared spectroscopy (Milkoscan 6000;
Foss Electric, Hillerød, Denmark). Milk component yield was calculated using the milk weight
and composition of each individual milking during sampling and summed to give the daily yield.
234
Dry matter intake was measured daily for each animal. Samples of TMR and ORTS for each
diet were sampled twice each week, composited, and analyzed using near infrared reflectance
spectroscopy (NIR) for the chemical components presented in Table 7.1 (Cumberland Valley
Analytical Services, Maugansville, MD). The dry matter content of each TMR was measured
weekly by drying at 100°C in a forced air oven. Forage samples were taken weekly and analyzed
by wet chemistry for the chemical components presented in Table 7.1 (Cumberland Valley
Analytical Services, Maugansville, MD). Corn silage dry matter was measured 5 d per wk using
a Koster Moisture Tester. Individual ingredients in the grain mix were sourced from the provider
(CNY Feed Inc., Jordan, NY) three times during the experiment and analyzed by wet chemistry
for the same components as the forages. Subsamples of all ingredients were taken and dried at
60°C, ground to 2 mm using a Wiley Mill and analyzed for AA concentration and indigestible N.
For the analysis of AA, sample aliquots (2 mg N) were hydrolyzed at 110ºC for 21-hr in a block
heater (Gehrke et al., 1985) with 5-ml 6 M HCl after flushing with N2 gas. Norleucine (50 µL;
125 mM) was used as an internal standard. Hydrolysates were filtered on Whatman 541 filters
and diluted to 50-ml with water. Aliquots (0.5 ml) were evaporated, redissolved in 1 ml water,
evaporated again, which was repeated two more times to remove the acid and dissolved in 2 ml
sample buffer for analysis. Additional aliquots (2 mg N) were preoxidized with 1 ml performic
acid (4.5 ml 88% formic acid, 0.5 ml 30% hydrogen peroxide, 25 mg phenol) for 16 h on ice
prior to acid hydrolysis for analysis of Met and Cys. Amino acids were separated on a lithium
cation exchange column using a three-buffer step gradient and column temperature gradient.
Detection was at 560 nm following ninhydrin post column derivation on an HPLC System Gold
with 32 Karat software (Beckman-Coulter, Inc., Fullerton, CA). Standards (250 nM/ml) for Asp,
Thr, Ser, Glu, Gly, Ala, Val, Met, Ile, Leu, Tyr, Phe, NH3, Lys, His, Arg and Cys (125 nM/ml )
235
were prepared by diluting a purchased stock (Amino acid standard H, #20088; Pierce Chemical;
Rockford, IL) with the sample buffer. Internal standards (250 nM/ml) norleucine for non-
aromatic AA and 5-Methyl-Trp for tryptophan were prepared in sample buffer and combined
with the other standards. The volume of samples and standards loaded on the column was 50 μl.
Tryptophan was measured in a separate analysis using fluorescence detection (excitation = 285
nm; emission = 345 nm) according to the procedure of Landry and Delhaye (1992). Briefly,
samples (2 mg N) were hydrolyzed using 1.2 g Ba(OH)2 at 110ºC for 16 h on a block heater and
subsequently cooled on ice to precipitate barium ions. An aliquot of the hydrolysate (3 µL) was
added to 1 ml of acetate buffer (0.07 M sodium acetate; pH 4.5) and analyzed by HPLC.
Concentrate feeds were also analyzed for indigestible N using the in vitro procedure described by
Ross (2013).
Blood samples (10 ml) were collected from every cow, once each week (1100 h), by
venipuncture of the coccygeal vein into heparinized Vacutainers (Becton Dickinson, Rutherford,
NJ), immediately placed on ice then centrifuged (1,500 × g for 15 min at 4°C) to obtain plasma
and frozen at −20°C before analysis. Samples were analyzed for plasma urea N (PUN) using an
enzymatic colorimetric assay based on a commercial kit (No. 640; Sigma Chemical Co., St.
Louis, MO). Three times during the study (wk 2 of the covariate period; wk 5 and 10 of the
experimental period), an additional blood sample was taken and analyzed for plasma AA. Equal
volumes (0.65 ml) of plasma and ice-cold sulfosalicylic acid (10%) containing the internal
standard norleucine (250 nM) were mixed, vortexed extensively and refrigerated on ice for 12 h
with occasional vortexing. Samples were then centrifuged (15,800 × g for 30 min at 4°C) and 1
ml of supernatant was lyophilized, reconstituted in 0.5 ml of 3N LiOH, filtered through a 0.2 µm

236
filter and frozen at –20°C until analysis. Analysis was by an automated ion-exchange
chromatography system as described above.
Sampling of feces was conducted by taking spot fecal samples (~500 g / cow) eight times
over a 3 d period (d1 = 1100, 1700 and 2300 h; d2 = 0500, 1400 and 2000 h; d3 = 0200 and
0800), three times during the experiment (wk 2 of the covariate period; wk 5 and 10 of the
experimental period) and frozen (-20°C). Samples were subsequently thawed, composited by
cow (8 samples / cow) and blended to ensure uniformity. An aliquot (1000 g) was dried at 60°C
in a forced air oven for 96 h and ground to 1 mm in a Wiley Mill. Samples of TMR and ORTS
were also collected for 2 d beginning the day prior to the first fecal sampling. The TMR samples
were taken at the time of feed delivery, composited within treatment, and three aliquots per
treatment were frozen (–20°C). Individual ORTS samples for each cow, each day (2 d), were
collected and stored frozen at –20°C. Samples were subsequently thawed and dried at 60°C in a
forced air oven and ground to 1 mm in a Wiley Mill. The dry matter content of both the TMR
and ORTS were measured and used to estimate DMI for each cow during the collection period.
The ground fecal, TMR and ORTS samples were analyzed for aNDFom and uNDF240
(Cumberland Valley Analytical Services, Maugansville, MD) and were used to estimate total
tract NDF digestion as described by Huhtanen et al. (1994).
7.3.3 Statistical analysis
Data were analyzed using a restricted maximum likelihood model in SAS (2010). The model
is described as follows:
237
Yijklm = µ + ci + Tj + Dk + TDjk + Pl + Xi + Vi + Wm + εijklm
where Yijklm is the dependent variable, µ is the overall mean, ci is the random effect of the ith
cow, Tj is the effect of the jth
treatment, Dk is the kth
day, TDjk is the interaction between the jth
treatment and kth
day, Pl is the lth
parity, Xi is the mean covariate measure for the ith
cow, V is the
variation in the mean covariate measure for the ith
cow, Wm is the blocking effect of the mth
period of weather (m = 1, 2, 3) and εijklm is the residual error. The effect of weather was added to
the model to account for a period of hot humid conditions during the experiment. Three periods
were defined: m=1 30 d period of moderate temperatures; m=2 33 d period of hot, humid
conditions where the mean of the minimum and maximum temperature for a 24 h period was >
18°C; m=3 34 d of moderate temperatures. For the analysis of PUN, the term Dk referred to the
kth
week rather than day as blood was sampled 1 d each wk. The terms Dk, TDjk, Vi and Hm were
not included in the model used to analyze total tract NDF digestibility or plasma AA as these
parameters were only sampled 3 times per cow (1 covariate measure and 2 experimental
measures). The means presented for data other than CNCPS model outputs are least squares
means. Significant differences among means (P < 0.05) were calculated using a Student’s t-test
and are indicated by different subscripts. Values presented for CNCPS outputs are raw means.
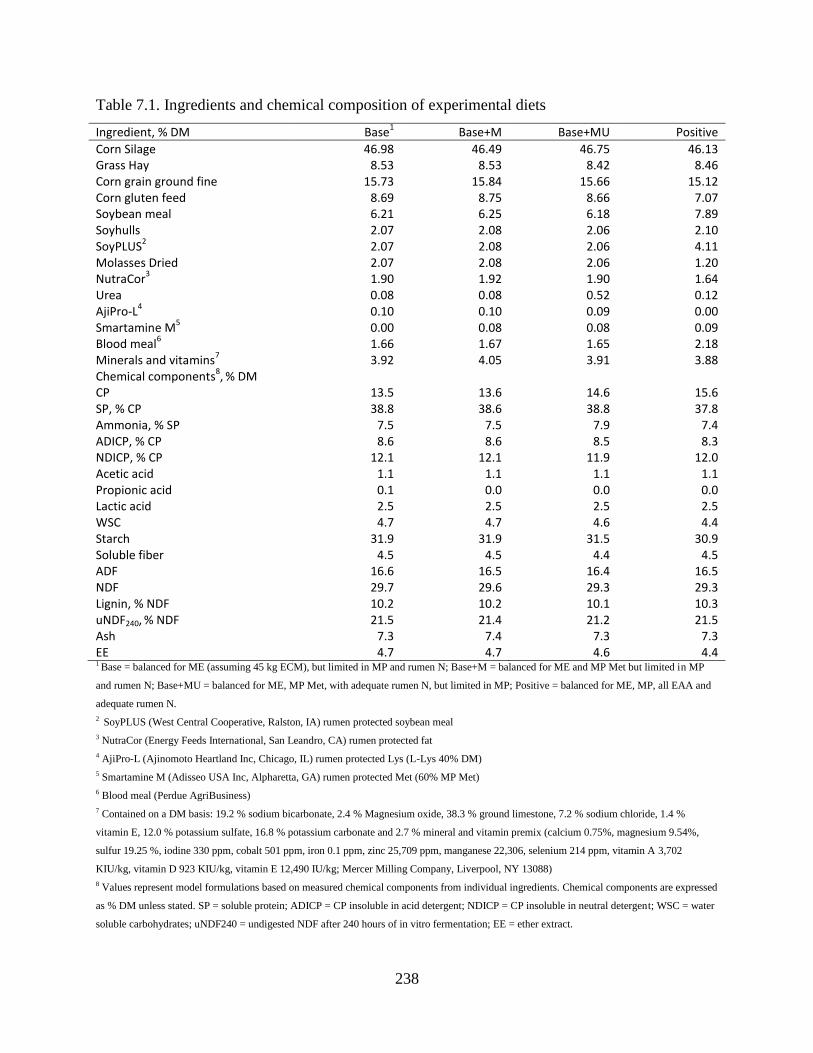
238
Table 7.1. Ingredients and chemical composition of experimental diets
Ingredient, % DM Base1
Base+M Base+MU Positive
Corn Silage 46.98 46.49 46.75 46.13 Grass Hay 8.53 8.53 8.42 8.46 Corn grain ground fine 15.73 15.84 15.66 15.12 Corn gluten feed 8.69 8.75 8.66 7.07 Soybean meal 6.21 6.25 6.18 7.89 Soyhulls 2.07 2.08 2.06 2.10 SoyPLUS
2 2.07 2.08 2.06 4.11
Molasses Dried 2.07 2.08 2.06 1.20 NutraCor
3 1.90 1.92 1.90 1.64
Urea 0.08 0.08 0.52 0.12 AjiPro-L
4 0.10 0.10 0.09 0.00
Smartamine M5
0.00 0.08 0.08 0.09 Blood meal
6 1.66 1.67 1.65 2.18
Minerals and vitamins7
3.92 4.05 3.91 3.88 Chemical components
8, % DM
CP 13.5 13.6 14.6 15.6 SP, % CP 38.8 38.6 38.8 37.8 Ammonia, % SP 7.5 7.5 7.9 7.4 ADICP, % CP 8.6 8.6 8.5 8.3 NDICP, % CP 12.1 12.1 11.9 12.0 Acetic acid 1.1 1.1 1.1 1.1 Propionic acid 0.1 0.0 0.0 0.0 Lactic acid 2.5 2.5 2.5 2.5 WSC 4.7 4.7 4.6 4.4 Starch 31.9 31.9 31.5 30.9 Soluble fiber 4.5 4.5 4.4 4.5 ADF 16.6 16.5 16.4 16.5 NDF 29.7 29.6 29.3 29.3 Lignin, % NDF 10.2 10.2 10.1 10.3 uNDF240, % NDF 21.5 21.4 21.2 21.5 Ash 7.3 7.4 7.3 7.3 EE 4.7 4.7 4.6 4.4 1 Base = balanced for ME (assuming 45 kg ECM), but limited in MP and rumen N; Base+M = balanced for ME and MP Met but limited in MP
and rumen N; Base+MU = balanced for ME, MP Met, with adequate rumen N, but limited in MP; Positive = balanced for ME, MP, all EAA and
adequate rumen N.
2 SoyPLUS (West Central Cooperative, Ralston, IA) rumen protected soybean meal
3 NutraCor (Energy Feeds International, San Leandro, CA) rumen protected fat
4 AjiPro-L (Ajinomoto Heartland Inc, Chicago, IL) rumen protected Lys (L-Lys 40% DM)
5 Smartamine M (Adisseo USA Inc, Alpharetta, GA) rumen protected Met (60% MP Met)
6 Blood meal (Perdue AgriBusiness)
7 Contained on a DM basis: 19.2 % sodium bicarbonate, 2.4 % Magnesium oxide, 38.3 % ground limestone, 7.2 % sodium chloride, 1.4 %
vitamin E, 12.0 % potassium sulfate, 16.8 % potassium carbonate and 2.7 % mineral and vitamin premix (calcium 0.75%, magnesium 9.54%,
sulfur 19.25 %, iodine 330 ppm, cobalt 501 ppm, iron 0.1 ppm, zinc 25,709 ppm, manganese 22,306, selenium 214 ppm, vitamin A 3,702
KIU/kg, vitamin D 923 KIU/kg, vitamin E 12,490 IU/kg; Mercer Milling Company, Liverpool, NY 13088)
8 Values represent model formulations based on measured chemical components from individual ingredients. Chemical components are expressed
as % DM unless stated. SP = soluble protein; ADICP = CP insoluble in acid detergent; NDICP = CP insoluble in neutral detergent; WSC = water
soluble carbohydrates; uNDF240 = undigested NDF after 240 hours of in vitro fermentation; EE = ether extract.
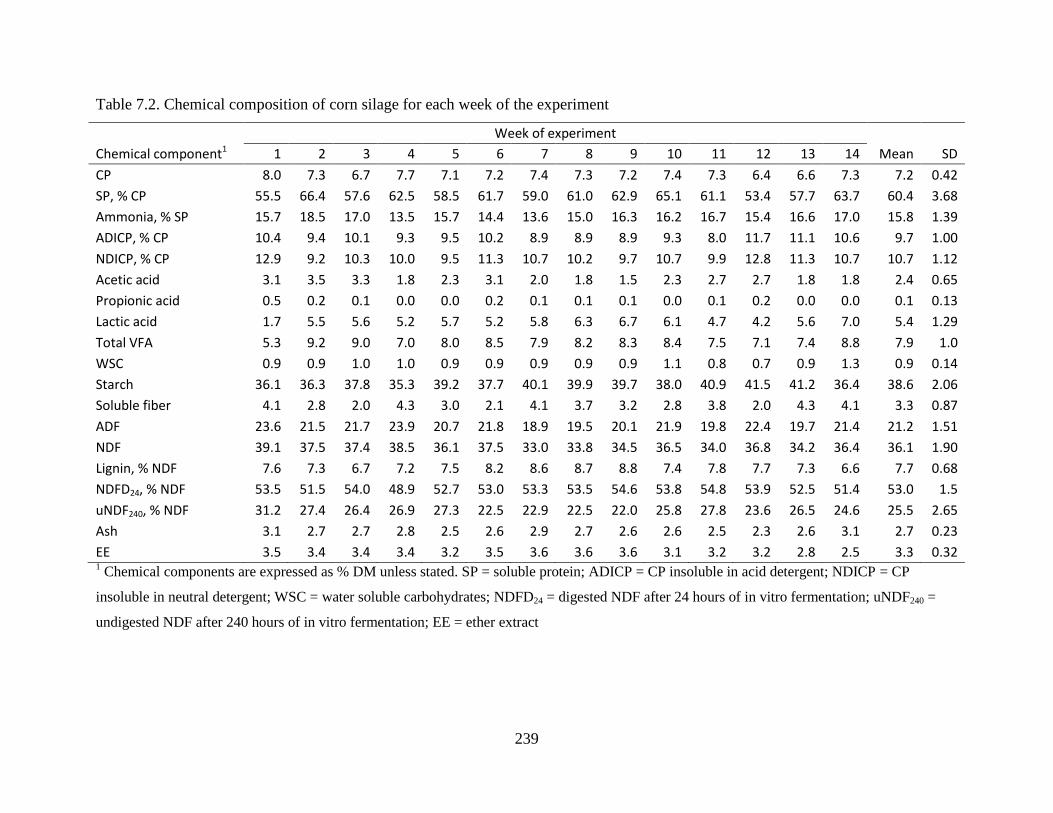
239
Table 7.2. Chemical composition of corn silage for each week of the experiment
Week of experiment
Chemical component1 1 2 3 4 5 6 7 8 9 10 11 12 13 14 Mean SD
CP 8.0 7.3 6.7 7.7 7.1 7.2 7.4 7.3 7.2 7.4 7.3 6.4 6.6 7.3 7.2 0.42
SP, % CP 55.5 66.4 57.6 62.5 58.5 61.7 59.0 61.0 62.9 65.1 61.1 53.4 57.7 63.7 60.4 3.68
Ammonia, % SP 15.7 18.5 17.0 13.5 15.7 14.4 13.6 15.0 16.3 16.2 16.7 15.4 16.6 17.0 15.8 1.39
ADICP, % CP 10.4 9.4 10.1 9.3 9.5 10.2 8.9 8.9 8.9 9.3 8.0 11.7 11.1 10.6 9.7 1.00
NDICP, % CP 12.9 9.2 10.3 10.0 9.5 11.3 10.7 10.2 9.7 10.7 9.9 12.8 11.3 10.7 10.7 1.12
Acetic acid 3.1 3.5 3.3 1.8 2.3 3.1 2.0 1.8 1.5 2.3 2.7 2.7 1.8 1.8 2.4 0.65
Propionic acid 0.5 0.2 0.1 0.0 0.0 0.2 0.1 0.1 0.1 0.0 0.1 0.2 0.0 0.0 0.1 0.13
Lactic acid 1.7 5.5 5.6 5.2 5.7 5.2 5.8 6.3 6.7 6.1 4.7 4.2 5.6 7.0 5.4 1.29
Total VFA 5.3 9.2 9.0 7.0 8.0 8.5 7.9 8.2 8.3 8.4 7.5 7.1 7.4 8.8 7.9 1.0
WSC 0.9 0.9 1.0 1.0 0.9 0.9 0.9 0.9 0.9 1.1 0.8 0.7 0.9 1.3 0.9 0.14
Starch 36.1 36.3 37.8 35.3 39.2 37.7 40.1 39.9 39.7 38.0 40.9 41.5 41.2 36.4 38.6 2.06
Soluble fiber 4.1 2.8 2.0 4.3 3.0 2.1 4.1 3.7 3.2 2.8 3.8 2.0 4.3 4.1 3.3 0.87
ADF 23.6 21.5 21.7 23.9 20.7 21.8 18.9 19.5 20.1 21.9 19.8 22.4 19.7 21.4 21.2 1.51
NDF 39.1 37.5 37.4 38.5 36.1 37.5 33.0 33.8 34.5 36.5 34.0 36.8 34.2 36.4 36.1 1.90
Lignin, % NDF 7.6 7.3 6.7 7.2 7.5 8.2 8.6 8.7 8.8 7.4 7.8 7.7 7.3 6.6 7.7 0.68
NDFD24, % NDF 53.5 51.5 54.0 48.9 52.7 53.0 53.3 53.5 54.6 53.8 54.8 53.9 52.5 51.4 53.0 1.5
uNDF240, % NDF 31.2 27.4 26.4 26.9 27.3 22.5 22.9 22.5 22.0 25.8 27.8 23.6 26.5 24.6 25.5 2.65
Ash 3.1 2.7 2.7 2.8 2.5 2.6 2.9 2.7 2.6 2.6 2.5 2.3 2.6 3.1 2.7 0.23
EE 3.5 3.4 3.4 3.4 3.2 3.5 3.6 3.6 3.6 3.1 3.2 3.2 2.8 2.5 3.3 0.32 1 Chemical components are expressed as % DM unless stated. SP = soluble protein; ADICP = CP insoluble in acid detergent; NDICP = CP
insoluble in neutral detergent; WSC = water soluble carbohydrates; NDFD24 = digested NDF after 24 hours of in vitro fermentation; uNDF240 =
undigested NDF after 240 hours of in vitro fermentation; EE = ether extract
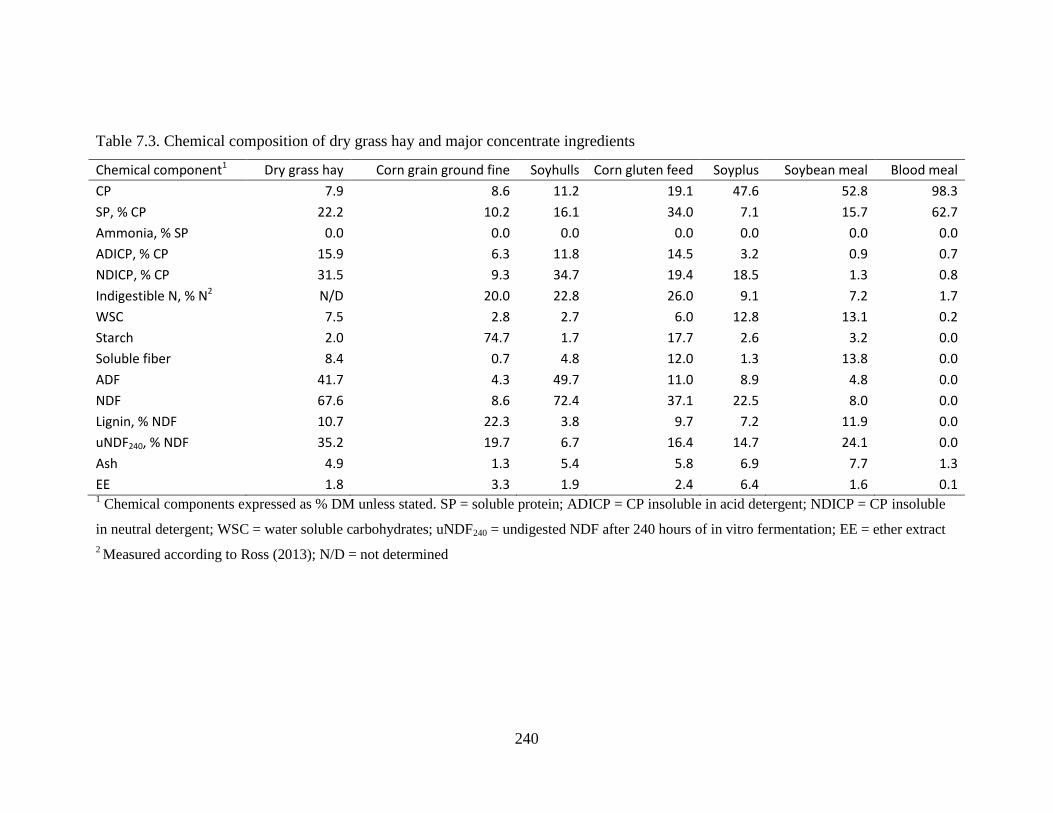
240
Table 7.3. Chemical composition of dry grass hay and major concentrate ingredients
Chemical component1 Dry grass hay Corn grain ground fine Soyhulls Corn gluten feed Soyplus Soybean meal Blood meal
CP 7.9 8.6 11.2 19.1 47.6 52.8 98.3
SP, % CP 22.2 10.2 16.1 34.0 7.1 15.7 62.7
Ammonia, % SP 0.0 0.0 0.0 0.0 0.0 0.0 0.0
ADICP, % CP 15.9 6.3 11.8 14.5 3.2 0.9 0.7
NDICP, % CP 31.5 9.3 34.7 19.4 18.5 1.3 0.8
Indigestible N, % N2 N/D 20.0 22.8 26.0 9.1 7.2 1.7
WSC 7.5 2.8 2.7 6.0 12.8 13.1 0.2
Starch 2.0 74.7 1.7 17.7 2.6 3.2 0.0
Soluble fiber 8.4 0.7 4.8 12.0 1.3 13.8 0.0
ADF 41.7 4.3 49.7 11.0 8.9 4.8 0.0
NDF 67.6 8.6 72.4 37.1 22.5 8.0 0.0
Lignin, % NDF 10.7 22.3 3.8 9.7 7.2 11.9 0.0
uNDF240, % NDF 35.2 19.7 6.7 16.4 14.7 24.1 0.0
Ash 4.9 1.3 5.4 5.8 6.9 7.7 1.3
EE 1.8 3.3 1.9 2.4 6.4 1.6 0.1 1 Chemical components expressed as % DM unless stated. SP = soluble protein; ADICP = CP insoluble in acid detergent; NDICP = CP insoluble
in neutral detergent; WSC = water soluble carbohydrates; uNDF240 = undigested NDF after 240 hours of in vitro fermentation; EE = ether extract
2 Measured according to Ross (2013); N/D = not determined

241
Table 7.4. Amino acid composition of dietary ingredients
AA, g/100g AA Corn Silage Dry grass hay Corn grain ground fine Soyhulls Corn gluten feed Soyplus Soybean meal Blood meal
EAA
Arg 1.8 5.1 4.3 4.9 3.9 7.0 7.2 3.7 His 1.4 1.4 2.1 2.0 2.6 2.2 2.3 5.9 Ile 4.2 4.0 3.0 3.8 3.0 3.7 3.6 0.5 Leu 10.9 7.9 11.9 6.5 9.3 7.8 7.5 12.7 Lys 3.0 4.6 2.6 6.3 2.1 4.7 5.5 7.6 Met 6.9 8.3 7.3 5.1 5.6 4.3 4.5 3.7 Phe 3.9 4.6 4.3 3.5 3.5 4.9 4.8 7.6 Thr 4.8 5.2 4.1 4.0 4.5 4.4 4.3 4.8 Trp 0.6 1.3 0.9 1.5 0.7 1.5 1.5 2.0 Val 5.6 5.3 4.3 4.6 4.4 4.1 3.8 6.5 NEAA
Ala 10.4 6.8 7.5 4.9 7.4 4.6 4.4 9.0 Asp 6.1 9.3 4.7 7.9 4.8 9.0 8.9 6.9 Cys 5.9 7.1 6.1 7.9 8.3 3.2 4.1 2.1 Glu 15.2 10.7 17.8 11.4 17.6 19.7 19.2 10.6 Gly 4.4 5.7 3.5 9.2 4.6 4.3 4.2 4.4 Pro 7.6 5.1 7.8 5.2 9.5 5.2 5.1 3.5 Ser 4.8 5.0 5.0 6.8 5.0 5.6 5.5 5.7 Tyr 2.3 2.4 2.8 4.4 3.2 3.6 3.5 2.7 EAA, % AA 43.2 47.7 44.8 42.2 39.7 44.7 45.0 55.0 NEAA, % AA 56.8 52.3 55.2 57.8 60.3 55.3 55.0 45.0 AA N, % total N 57.1 60.0 74.0 71.8 62.3 74.0 77.1 75.4
242
7.4 Results
7.4.4 Animal performance
No differences were observed in DMI or milk yield. Energy corrected milk yield was higher
(P < 0.001) in cattle fed the Positive treatment compared other treatments (Table 7.5). No
differences were observed in fat or true protein in cows fed the Base, Base+M or Base+MU
treatments, but cattle fed the Positive treatment produced more true protein than the Base
treatment and more fat than the Base and Base+M treatments (P < 0.05). True protein
concentration in milk was higher (P < 0.001) and milk fat tended to be higher (P < 0.10) in cattle
fed the positive and Base+MU treatments than cows fed the Base and Base+M treatments.
Lactose %, body weight and BSC were similar among treatments (Table 7.5).

243
Table 7.5. Effects of treatment diets on milk production, intake, body weight and body condition
scores.
Base1 Base+M Base+MU Positive SEM P-value
Intake and milk production, kg/d
Dry matter intake 24.1 24.5 24.8 24.7 0.48 0.717
Energy correct milk yield2 38.5a 39.3a 40.0a 41.8b 0.67 0.005
Milk yield 40.0 40.6 40.7 41.8 0.68 0.288
True protein yield 1.13a 1.18ab 1.18ab 1.22b 0.019 0.009
Fat yield 1.30a 1.28a 1.34ab 1.41b 0.038 0.047
Lactose yield 1.93 1.94 1.95 2.00 0.036 0.344
Milk composition, %
True protein 2.88a 2.93ab 2.96b 2.98b 0.023 0.009
Fat 3.31 3.20 3.34 3.51 0.088 0.078
Lactose 4.84 4.85 4.85 4.86 0.010 0.799
Body weight and condition
Body weight, kg/d 625 631 633 623 5.2 0.430
Body weight change, kg/wk 1.40 1.45 2.14 1.98 0.455 0.515
BCS, 1-5 scale 3.06 3.09 3.07 3.08 0.021 0.713 1 Base = balanced for ME (assuming 45 kg ECM), but limited in MP and rumen N; Base+M = balanced
for ME and MP Met but limited in MP and rumen N; Base+MU = balanced for ME, MP Met, with
adequate rumen N, but limited in MP; Positive = balanced for ME, MP, all EAA and adequate rumen N.
2 Estimated according to Tyrrell and Reid (1965)
7.4.5 Nitrogen utilization
Nitrogen intake was similar among cow fed the base and Base M treatments but was higher
for cows fed the Base MU and positive treatments (~60 g/d and ~90 g/d, respectively) which
corresponded with higher levels of dietary CP (Table 7.1). Milk urea N and PUN in cows fed the
Base and Base M treatments were similar and were lower (P < 0.001) than the Base MU and
positive treatments (Table 7.6). Milk urea N was slightly higher than PUN but both measures
were in the same general range. Productive N was higher in cows fed the positive treatment due
to the higher milk protein yield (Table 7.5). Predictions of fecal and urinary N increased as
dietary N intake increased. Urinary N was ~60 g higher in cows fed the positive treatment
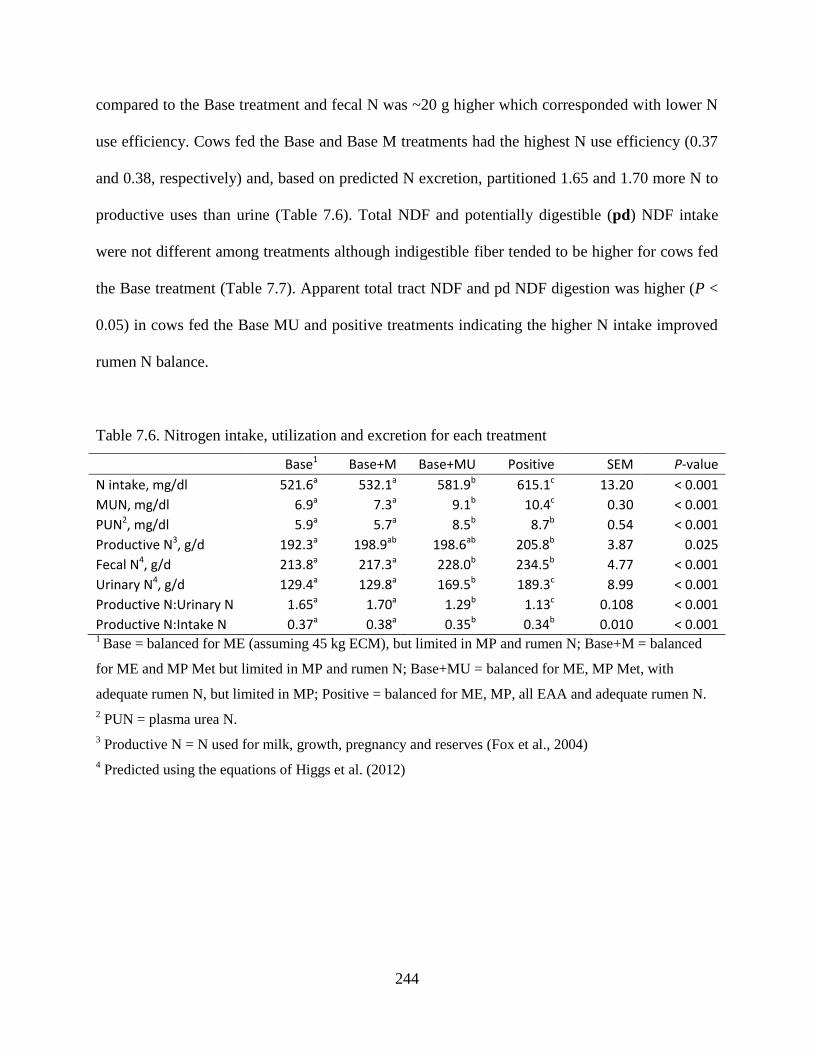
244
compared to the Base treatment and fecal N was ~20 g higher which corresponded with lower N
use efficiency. Cows fed the Base and Base M treatments had the highest N use efficiency (0.37
and 0.38, respectively) and, based on predicted N excretion, partitioned 1.65 and 1.70 more N to
productive uses than urine (Table 7.6). Total NDF and potentially digestible (pd) NDF intake
were not different among treatments although indigestible fiber tended to be higher for cows fed
the Base treatment (Table 7.7). Apparent total tract NDF and pd NDF digestion was higher (P <
0.05) in cows fed the Base MU and positive treatments indicating the higher N intake improved
rumen N balance.
Table 7.6. Nitrogen intake, utilization and excretion for each treatment
Base1 Base+M Base+MU Positive SEM P-value
N intake, mg/dl 521.6a 532.1a 581.9b 615.1c 13.20 < 0.001
MUN, mg/dl 6.9a 7.3a 9.1b 10.4c 0.30 < 0.001
PUN2, mg/dl 5.9a 5.7a 8.5b 8.7b 0.54 < 0.001
Productive N3, g/d 192.3a 198.9ab 198.6ab 205.8b 3.87 0.025
Fecal N4, g/d 213.8a 217.3a 228.0b 234.5b 4.77 < 0.001
Urinary N4, g/d 129.4a 129.8a 169.5b 189.3c 8.99 < 0.001
Productive N:Urinary N 1.65a 1.70a 1.29b 1.13c 0.108 < 0.001
Productive N:Intake N 0.37a 0.38a 0.35b 0.34b 0.010 < 0.001 1 Base = balanced for ME (assuming 45 kg ECM), but limited in MP and rumen N; Base+M = balanced
for ME and MP Met but limited in MP and rumen N; Base+MU = balanced for ME, MP Met, with
adequate rumen N, but limited in MP; Positive = balanced for ME, MP, all EAA and adequate rumen N.
2 PUN = plasma urea N.
3 Productive N = N used for milk, growth, pregnancy and reserves (Fox et al., 2004)
4 Predicted using the equations of Higgs et al. (2012)
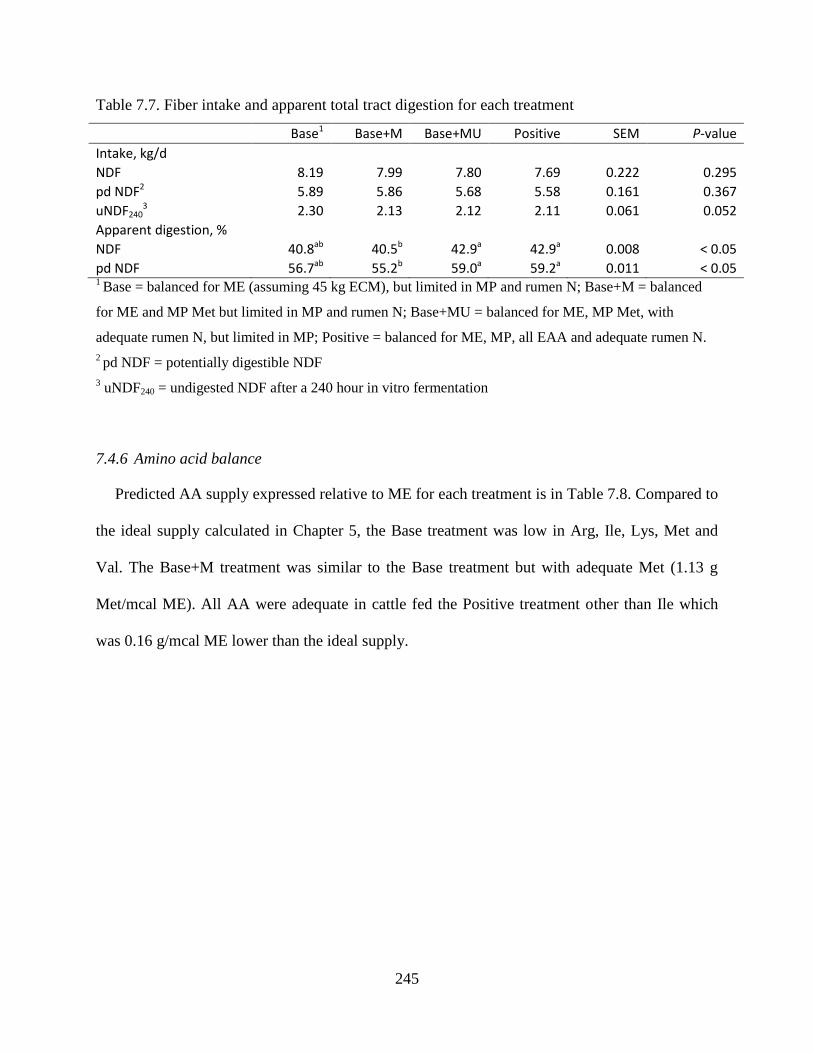
245
Table 7.7. Fiber intake and apparent total tract digestion for each treatment
Base1 Base+M Base+MU Positive SEM P-value
Intake, kg/d
NDF 8.19 7.99 7.80 7.69 0.222 0.295
pd NDF2 5.89 5.86 5.68 5.58 0.161 0.367
uNDF2403 2.30 2.13 2.12 2.11 0.061 0.052
Apparent digestion, %
NDF 40.8ab 40.5b 42.9a 42.9a 0.008 < 0.05
pd NDF 56.7ab 55.2b 59.0a 59.2a 0.011 < 0.05 1 Base = balanced for ME (assuming 45 kg ECM), but limited in MP and rumen N; Base+M = balanced
for ME and MP Met but limited in MP and rumen N; Base+MU = balanced for ME, MP Met, with
adequate rumen N, but limited in MP; Positive = balanced for ME, MP, all EAA and adequate rumen N.
2 pd NDF = potentially digestible NDF
3 uNDF240 = undigested NDF after a 240 hour in vitro fermentation
7.4.6 Amino acid balance
Predicted AA supply expressed relative to ME for each treatment is in Table 7.8. Compared to
the ideal supply calculated in Chapter 5, the Base treatment was low in Arg, Ile, Lys, Met and
Val. The Base+M treatment was similar to the Base treatment but with adequate Met (1.13 g
Met/mcal ME). All AA were adequate in cattle fed the Positive treatment other than Ile which
was 0.16 g/mcal ME lower than the ideal supply.
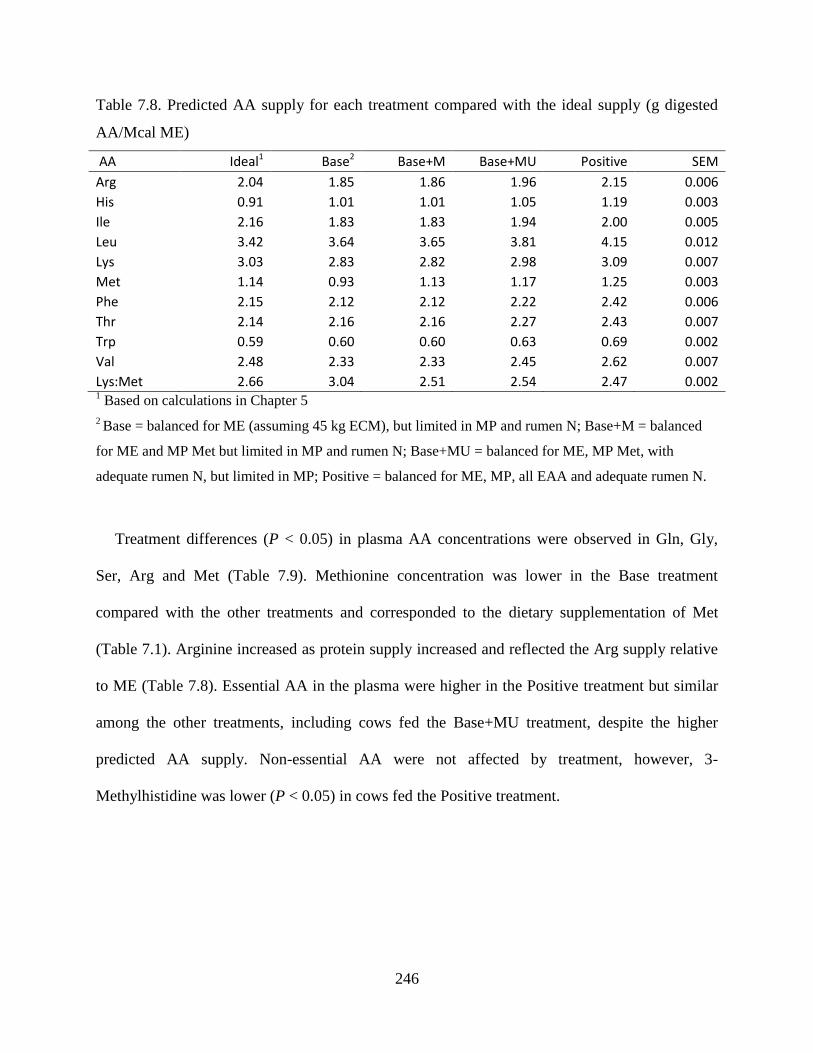
246
Table 7.8. Predicted AA supply for each treatment compared with the ideal supply (g digested
AA/Mcal ME)
AA Ideal1 Base2 Base+M Base+MU Positive SEM
Arg 2.04 1.85 1.86 1.96 2.15 0.006
His 0.91 1.01 1.01 1.05 1.19 0.003
Ile 2.16 1.83 1.83 1.94 2.00 0.005
Leu 3.42 3.64 3.65 3.81 4.15 0.012
Lys 3.03 2.83 2.82 2.98 3.09 0.007
Met 1.14 0.93 1.13 1.17 1.25 0.003
Phe 2.15 2.12 2.12 2.22 2.42 0.006
Thr 2.14 2.16 2.16 2.27 2.43 0.007
Trp 0.59 0.60 0.60 0.63 0.69 0.002
Val 2.48 2.33 2.33 2.45 2.62 0.007
Lys:Met 2.66 3.04 2.51 2.54 2.47 0.002 1 Based on calculations in Chapter 5
2 Base = balanced for ME (assuming 45 kg ECM), but limited in MP and rumen N; Base+M = balanced
for ME and MP Met but limited in MP and rumen N; Base+MU = balanced for ME, MP Met, with
adequate rumen N, but limited in MP; Positive = balanced for ME, MP, all EAA and adequate rumen N.
Treatment differences (P < 0.05) in plasma AA concentrations were observed in Gln, Gly,
Ser, Arg and Met (Table 7.9). Methionine concentration was lower in the Base treatment
compared with the other treatments and corresponded to the dietary supplementation of Met
(Table 7.1). Arginine increased as protein supply increased and reflected the Arg supply relative
to ME (Table 7.8). Essential AA in the plasma were higher in the Positive treatment but similar
among the other treatments, including cows fed the Base+MU treatment, despite the higher
predicted AA supply. Non-essential AA were not affected by treatment, however, 3-
Methylhistidine was lower (P < 0.05) in cows fed the Positive treatment.
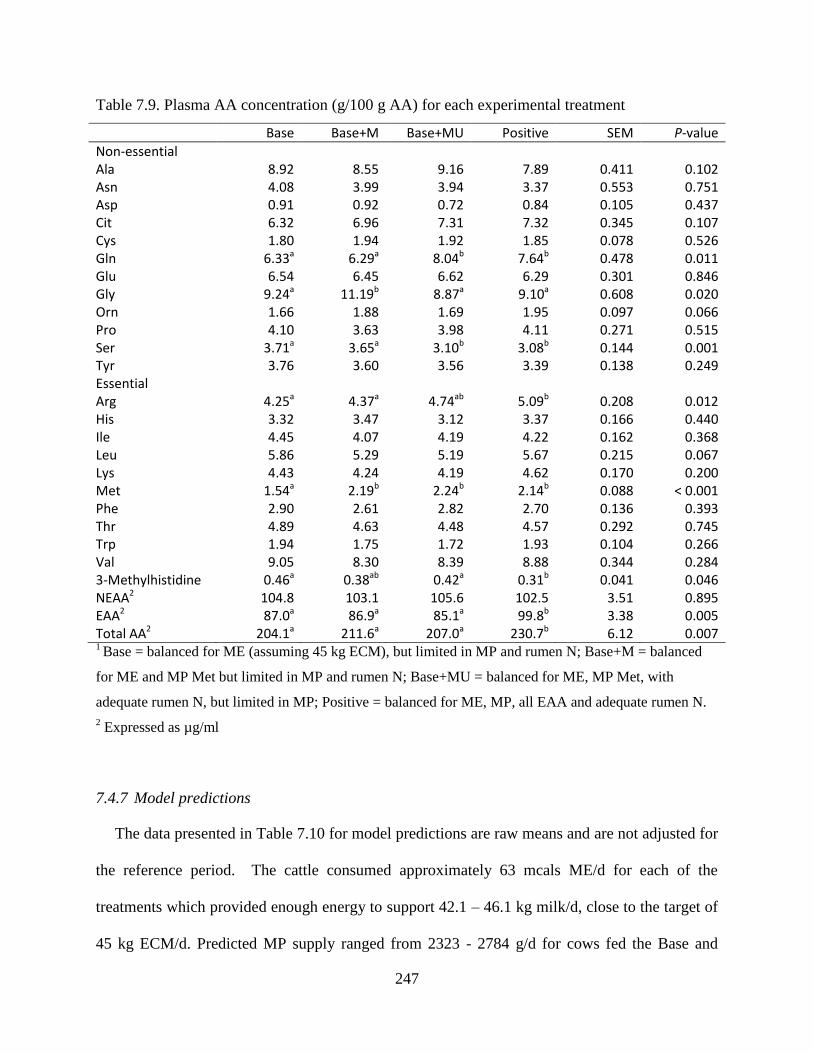
247
Table 7.9. Plasma AA concentration (g/100 g AA) for each experimental treatment
Base Base+M Base+MU Positive SEM P-value
Non-essential Ala 8.92 8.55 9.16 7.89 0.411 0.102 Asn 4.08 3.99 3.94 3.37 0.553 0.751 Asp 0.91 0.92 0.72 0.84 0.105 0.437 Cit 6.32 6.96 7.31 7.32 0.345 0.107 Cys 1.80 1.94 1.92 1.85 0.078 0.526 Gln 6.33a 6.29a 8.04b 7.64b 0.478 0.011 Glu 6.54 6.45 6.62 6.29 0.301 0.846 Gly 9.24a 11.19b 8.87a 9.10a 0.608 0.020 Orn 1.66 1.88 1.69 1.95 0.097 0.066 Pro 4.10 3.63 3.98 4.11 0.271 0.515 Ser 3.71a 3.65a 3.10b 3.08b 0.144 0.001 Tyr 3.76 3.60 3.56 3.39 0.138 0.249 Essential
Arg 4.25a 4.37a 4.74ab 5.09b 0.208 0.012 His 3.32 3.47 3.12 3.37 0.166 0.440 Ile 4.45 4.07 4.19 4.22 0.162 0.368 Leu 5.86 5.29 5.19 5.67 0.215 0.067 Lys 4.43 4.24 4.19 4.62 0.170 0.200 Met 1.54a 2.19b 2.24b 2.14b 0.088 < 0.001 Phe 2.90 2.61 2.82 2.70 0.136 0.393 Thr 4.89 4.63 4.48 4.57 0.292 0.745 Trp 1.94 1.75 1.72 1.93 0.104 0.266 Val 9.05 8.30 8.39 8.88 0.344 0.284 3-Methylhistidine 0.46a 0.38ab 0.42a 0.31b 0.041 0.046 NEAA2 104.8 103.1 105.6 102.5 3.51 0.895 EAA2 87.0a 86.9a 85.1a 99.8b 3.38 0.005 Total AA2 204.1a 211.6a 207.0a 230.7b 6.12 0.007 1 Base = balanced for ME (assuming 45 kg ECM), but limited in MP and rumen N; Base+M = balanced
for ME and MP Met but limited in MP and rumen N; Base+MU = balanced for ME, MP Met, with
adequate rumen N, but limited in MP; Positive = balanced for ME, MP, all EAA and adequate rumen N.
2 Expressed as µg/ml
7.4.7 Model predictions
The data presented in Table 7.10 for model predictions are raw means and are not adjusted for
the reference period. The cattle consumed approximately 63 mcals ME/d for each of the
treatments which provided enough energy to support 42.1 – 46.1 kg milk/d, close to the target of
45 kg ECM/d. Predicted MP supply ranged from 2323 - 2784 g/d for cows fed the Base and
248
Positive treatments, respectively. Cows fed the Base, Base+M and Base+MU treatments were
predicted to have a negative MP balance, while cows fed the Positive treatment consumed 33 g
MP/d excess to requirements. Model predicted rumen NH3 concentration (mg/dl) ranged from
5.1 in the Base and Base+M treatments to 7.8 and 7.5 in the Base+MU and Positive treatments
(Table 7.10). From the rumen submodel of the CNCPS, bacterial growth was predicted to be
depressed 16 and 17% for the Base and Base+M treatments, respectively due to the low level of
rumen NH3. When considering predicted Lys and Met balance in g/d, Lys was predicted to be
negative for all treatments while Met was negative for the Base and Base+M treatments (-15.6 g
and -6.9 g, respectively), but close to requirement for the Base+MU and Positive treatments. The
apparent efficiency of MP use varied (72%- 83%) but was close to the optimum efficiency
calculated in Chapter 5 (73%) in cows fed the Positive treatment.
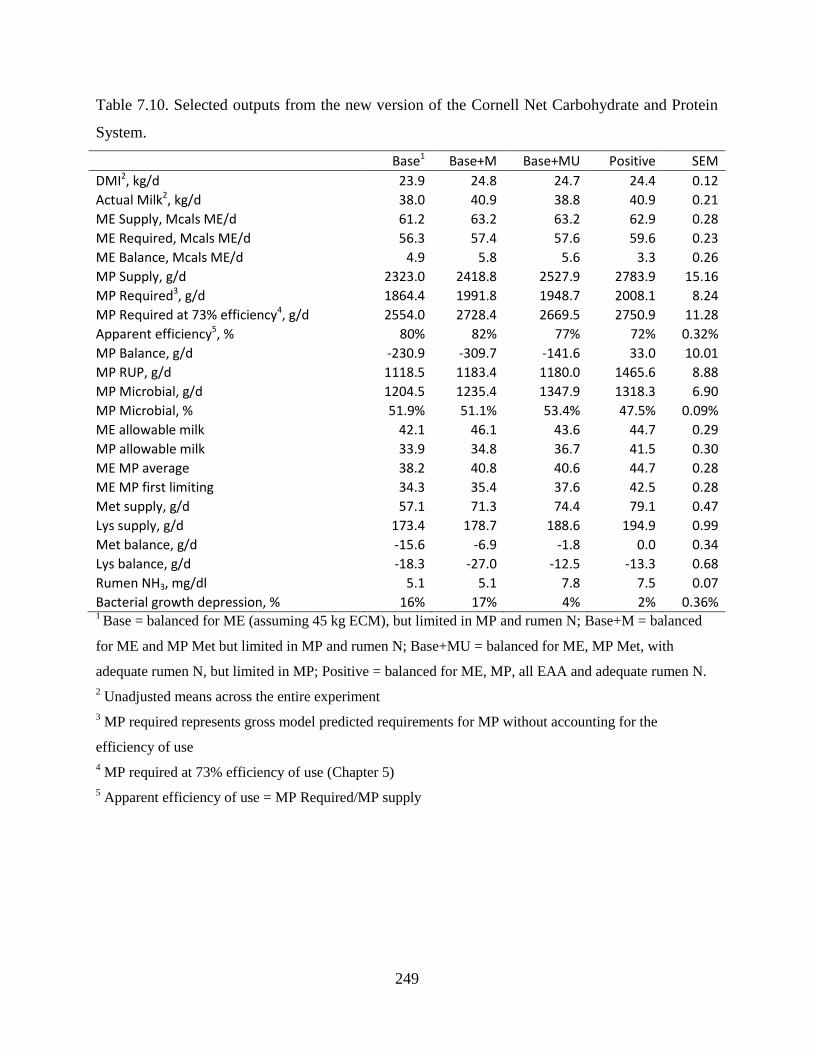
249
Table 7.10. Selected outputs from the new version of the Cornell Net Carbohydrate and Protein
System.
Base1 Base+M Base+MU Positive SEM
DMI2, kg/d 23.9 24.8 24.7 24.4 0.12
Actual Milk2, kg/d 38.0 40.9 38.8 40.9 0.21
ME Supply, Mcals ME/d 61.2 63.2 63.2 62.9 0.28
ME Required, Mcals ME/d 56.3 57.4 57.6 59.6 0.23
ME Balance, Mcals ME/d 4.9 5.8 5.6 3.3 0.26
MP Supply, g/d 2323.0 2418.8 2527.9 2783.9 15.16
MP Required3, g/d 1864.4 1991.8 1948.7 2008.1 8.24
MP Required at 73% efficiency4, g/d 2554.0 2728.4 2669.5 2750.9 11.28
Apparent efficiency5, % 80% 82% 77% 72% 0.32%
MP Balance, g/d -230.9 -309.7 -141.6 33.0 10.01
MP RUP, g/d 1118.5 1183.4 1180.0 1465.6 8.88
MP Microbial, g/d 1204.5 1235.4 1347.9 1318.3 6.90
MP Microbial, % 51.9% 51.1% 53.4% 47.5% 0.09%
ME allowable milk 42.1 46.1 43.6 44.7 0.29
MP allowable milk 33.9 34.8 36.7 41.5 0.30
ME MP average 38.2 40.8 40.6 44.7 0.28
ME MP first limiting 34.3 35.4 37.6 42.5 0.28
Met supply, g/d 57.1 71.3 74.4 79.1 0.47
Lys supply, g/d 173.4 178.7 188.6 194.9 0.99
Met balance, g/d -15.6 -6.9 -1.8 0.0 0.34
Lys balance, g/d -18.3 -27.0 -12.5 -13.3 0.68
Rumen NH3, mg/dl 5.1 5.1 7.8 7.5 0.07
Bacterial growth depression, % 16% 17% 4% 2% 0.36% 1 Base = balanced for ME (assuming 45 kg ECM), but limited in MP and rumen N; Base+M = balanced
for ME and MP Met but limited in MP and rumen N; Base+MU = balanced for ME, MP Met, with
adequate rumen N, but limited in MP; Positive = balanced for ME, MP, all EAA and adequate rumen N.
2 Unadjusted means across the entire experiment
3 MP required represents gross model predicted requirements for MP without accounting for the
efficiency of use
4 MP required at 73% efficiency of use (Chapter 5)
5 Apparent efficiency of use = MP Required/MP supply
250
7.5 Discussion
The goal of this study was to use newly developed tools to balance dairy cow diets precisely
to requirements for rumen N and to test the concept of balancing essential AA to an ideal profile
relative to ME supply (Chapter 5). Due to considerable changes in corn silage composition as the
bunk was fed (Table 7.2), diets ended up lower in protein, higher in non-fiber carbohydrates
(Starch ~31.5 % DM) and lower in NDF (29.5 % DM) than anticipated. The variable nature of
forage composition is a major challenge when attempting to precision feed dairy cows which was
evident in this study. While it would have been preferable if the dietary carbohydrate profile was
higher in NDF and lower in starch, the lower than expected protein levels tested the models
ability to predict rumen N supply and AA balance at a very low intake level. The profile and
supply of AA differed by treatment as intended (Table 7.8). Cows fed the Base treatment were
predicted to be limited in Arg, Ile, Lys, Met and Val while cows fed the Positive treatment were
predicted to be only slightly limited in Ile. Our intention was for cows fed the Base and Base+M
treatments to be provided negative and adequate levels of Met, respectively, when Lys was
adequate. However, Lys supply was predicted to be below the ideal supply for both treatments
while Met supply was as intended (Table 7.8). The predicted Lys:Met ratio was lower than the
ideal ratio (2.66) estimated in Chapter 5 indicating that Met supply was at, or excess to
requirement relative to Lys for the Base+M, Base+MU and Positive treatments.
When AA balance has been altered in dairy cattle in research and field settings, a variety of
responses have been demonstrated. In the study of Chen et al. (2011) an increase in ECM was
observed when supplemental Met was provided, but no difference in milk volume was detected.
In contrast, Lee et al. (2012b), observed a milk volume response when cows were supplemented
251
with Met and Lys, or Met, Lys and His, but milk components among the treatments were similar.
Other studies have reported changes in both components and volume (Appuhamy et al., 2011,
Haque et al., 2012, Noftsger and St-Pierre, 2003). Mepham (1982) classified EAA in 2 groups
based on different patterns of mammary utilization where, for group 1 AA (Met, Phe, Tyr and
Trp), there was apparent stoichiometric transfer to milk protein while group 2 AA (Ile, Lys, Leu
and Val) were generally taken up in excess of milk protein secretion. Different types of
responses (volume or components) have been observed among group 1 and 2 AA which can, in-
part, be explained by the different ways in which the AA are metabolized (Lapierre et al., 2012).
The group 2 AA, taken up in excess, can elicit a milk volume response with the excess carbon
used to generate ATP, NEAA and also lactose (Maxin et al., 2013) while the uptake of group 1
AA reflects the output in milk protein and additional uptake is directly linked to an increase in
milk protein yield, which can occur independently to an increase in the uptake of group 2 AA
(Lemosquet et al., 2010). Cows in the current study produced similar milk volumes among
treatments but milk components increased when the dietary AA were closer to the ideal balance
(Table 7.8) resulting in higher ECM in cows fed the Positive treatment (P < 0.01) and a
numerical increase among the Base, Base+M and Base+MU treatments as AA were added.
Supplemental Met was the only difference in AA supply between the Base and Base+M
treatments, which according to the plasma Met concentration, had been delivered (Table 7.9).
Cows did not respond to the increased Met supply as observed in other studies (Chen et al., 2011,
Noftsger and St-Pierre, 2003) which might have been due to a limitation of other EAA (Table
7.8). An extended period (33 d) of hot humid weather (mean daytime temperatures = 27.5°C;
mean nighttime temperatures = 17°C) was experienced during the study and the barn the cows
were housed in was poorly ventilated. Heat stress has been shown to change the metabolism of
252
lactating cows with plasma NEFA shown to decrease and PUN increase, indicating higher levels
of AA oxidation (Wheelock et al., 2010). The effect of the heat and humidity in the current study
may have further reduced the availability of circulating AA and impacted the response to
supplemental Met. Interestingly, the concentration of EAA and total AA in plasma were not
changed from the addition of urea (Base+MU), despite a predicted increase in microbial protein
supply (Table 7.10), although differences in some AA were observed (Gln, Ser, Arg). The
concentration of arterial EAA has been shown to decrease when urea is given to cows fed diets
adequate in rumen N, possibly due to increased hepatic catabolism to provide an N group for the
synthesis of urea (Lapierre et al., 2004). It is possible that an increase in AA supply from the
Base+MU treatment was offset by an increase in hepatic removal to provide N for the urea cycle
resulting in no true increase in AA supply (Reynolds, 1992). Cows fed the positive treatment had
increased concentrations of EAA and total AA in plasma (P < 0.01) which corresponded with an
increase in predicted supply of both group 1 and 2 AA (Table 7.8). Although not significant
(P=0.29), milk volume was 1.0-1.8 kg higher in cows fed the Positive treatment, which, when
considered together with the changes in milk components, indicates the increase in ECM was
due to a combination of both volume and composition.
The low dietary protein concentration in the Base and Base+M treatments (~13.5 % CP)
resulted in low PUN (5.7-5.9 mg/dl) and caused a reduction in apparent total tract NDF digestion
indicating rumen N supply was limited (Table 7.7). Similar affects have been observed in other
studies that fed comparable levels of protein (Colmenero and Broderick, 2006, Lee et al., 2012b).
Lee et al. (2012b) also reported a reduction in DMI at low levels of protein which was not
observed in the current study. One of the goals of this study was to use new strategies to more
253
precisely predict AA supply which included using a new assay to estimate the indigestible
protein fraction of feeds (Ross, 2013). In addition to the supplemental Met and Lys, AA sources
were selected according to the assay of Ross (2013) that had low levels of indigestible N, and
high model predicted rumen N escape (Table 7.3). Lee et al. (2012b) suggested the depression in
DMI they observed was due to a limitation in AA supply, not rumen N. Data in this experiment
partially support this hypothesis, although no increase in DMI was observed when AA supply
was increased. Despite being low in CP, the Base and Base+M treatments were not predicted to
be severely limited in AA supply (Table 7.8) which probably allowed the cows to maintain DMI
and milk production. Nitrogen utilization of cows fed the Base+M treatment was 38% which is
higher than typically observed, particularly in mid-lactation cows at high production (Huhtanen
and Hristov, 2009). In the Base and Base+M treatments, 1.7 times more N was being partitioned
to milk than was being excreted in the urine and demonstrates the potential to reduce the
environmental impact of dairy production if cows are fed precisely to requirements.
Cows were able to produce more milk than the model predicted MP supply would support
when fed the Base, Base+M and Base+MU treatments. The efficiency factor used to estimate
total MP requirements differs among models and depends on the requirements for MP accounted
for by the model (Chapter 5). Previous versions of the CNCPS have used 0.67 (Fox et al., 2004)
which is the same as the NRC (2001). The current model uses a factor 0.73 which was calculated
in Chapter 5 and is higher than previous version of the CNCPS due to an increase in the
maintenance requirements accounted for by the model through the inclusion of endogenous
losses along the entire gut. Despite this, the apparent efficiency of MP use by cows in the current
study ranged from 0.72 – 0.82 for the positive and Base+M treatments, respectively. This might
254
be due to inaccurate predictions of MP supply, although the efficiency of MP use has been
shown to vary depending on the MP supply relative to other nutrients (Metcalf et al., 2008).
Metcalf et al. (2008) points out, ration balancing models are not typically designed to be
response models. Rather, they are designed to predict nutrient requirements at an optimum level.
Therefore, although cows were able to utilize MP with a predicted efficiency of 0.82 when fed
the Base+M treatment, it is likely performance would have improved if they were closer to the
model predicted requirement using an efficiency factor of 0.73. Predicted bacterial growth
depression due to low rumen N in the Base and Base+M treatments corresponded with the
reduction in observed total tract NDF digestion (Table 7.7). The model also predicted rumen N
supply in the Base+MU and Positive treatments was adequate and no further response would be
expected if additional dietary N was supplied. Colmenero and Broderick (2006) measured an
increase in NDF digestion when dietary CP was increased from 13.5 – 15 % DM but saw no
benefit beyond 15 % which agrees with the findings of this study and suggests the model is
sensitive to rumen N supply.
7.6 Conclusions
High levels of milk can be produced when diets are formulated to be adequate in rumen N and
EAA supply, even when total dietary CP is low (<14 % DM). Model predictions appeared
sensitive to rumen N supply and an increase in ECM was observed when diets were balanced for
all EAA relative to dietary energy supply. New laboratory techniques allowed for the selection of
high quality ingredients that were predicted to supply high levels of digestible AA to the small
intestine and made it possible to formulate diets low in CP that were close to requirements. The
255
study demonstrates N utilization can be improved in high producing cows and the environmental
impact of dairy production reduced through precision feeding of N and AA.
7.7 Acknowledgements
This research was funded in partnership by Adisseo (Commentry, France) and Perdue
Agribusiness; thanks to Brian Sloan and Dennis Stucker for their support of this work. The help
of Andrew LaPierre, Bruce Berggren-Thomas, Andreas Foskolos, Debbie Ross, the staff at the
Cornell Teaching and Research Facility and the many other people that assisted in this
experiment is gratefully acknowledged.
256
7.8 References
Appuhamy, J. A., J. R. Knapp, O. Becvar, J. Escobar, and M. D. Hanigan. 2011. Effects of
jugular-infused lysine, methionine, and branched-chain amino acids on milk protein synthesis in
high-producing dairy cows. J. Dairy Sci. 94:1952-1960.
Armentano, L. E., S. J. Bertics, and G. A. Ducharme. 1997. Response of lactating cows to
methionine or methionine plus lysine added to high protein diets based on alfalfa and heated
soybeans. J. Dairy Sci. 80:1194-1199.
Chen, Z. H., G. A. Broderick, N. D. Luchini, B. K. Sloan, and E. Devillard. 2011. Effect of
feeding different sources of rumen-protected methionine on milk production and N-utilization in
lactating dairy cows. J. Dairy Sci. 94:1978-1988.
Colmenero, J. and G. Broderick. 2006. Effect of dietary crude protein concentration on milk
production and nitrogen utilization in lactating dairy cows. J. Dairy Sci. 89:1704-1712.
Fox, D. G., L. O. Tedeschi, T. P. Tylutki, J. B. Russell, M. E. Van Amburgh, L. E. Chase, A. N.
Pell, and T. R. Overton. 2004. The Cornell Net Carbohydrate and Protein System model for
evaluating herd nutrition and nutrient excretion. Anim. Feed Sci. Technol. 112:29-78.
Gehrke, C. W., L. Wall Sr, J. Absheer, F. Kaiser, and R. Zumwalt. 1985. Sample preparation for
chromatography of amino acids: Acid hydrolysis of proteins. Journal of the Association of
Offical Analytical Chemists 68:811-821.
Haque, M. N., H. Rulquin, A. Andrade, P. Faverdin, J. L. Peyraud, and S. Lemosquet. 2012.
Milk protein synthesis in response to the provision of an “ideal” amino acid profile at 2 levels of
metabolizable protein supply in dairy cows. J. Dairy Sci. 95:5876-5887.
Haque, M. N., H. Rulquin, and S. Lemosquet. 2013. Milk protein responses in dairy cows to
changes in postruminal supplies of arginine, isoleucine, and valine. J. Dairy Sci. 96:420-430.
Higgs, R. J., L. E. Chase, and M. E. Van Amburgh. 2012. Development and evaluation of
equations in the Cornell Net Carbohydrate and Protein System to predict nitrogen excretion in
lactating dairy cows. J. Dairy Sci. 95:2004-2014.
257
Huhtanen, P. and A. N. Hristov. 2009. A meta-analysis of the effects of dietary protein
concentration and degradability on milk protein yield and milk n efficiency in dairy cows. J.
Dairy Sci. 92:3222-3232.
Huhtanen, P., K. Kaustell, and S. Jaakkola. 1994. The use of internal markers to predict total
digestibility and duodenal flow of nutrients in cattle given six different diets. Anim. Feed Sci.
Technol. 48:211-227.
Landry, J. and S. Delhaye. 1992. Simplified procedure for the determination of tryptophan of
foods and feedstuffs from barytic hydrolysis. J. Agric. Food Chem. 40:776-779.
Lapierre, H., G. E. Lobley, L. Doepel, G. Raggio, H. Rulquin, and S. Lemosquet. 2012. Triennial
lactation symposium: Mammary metabolism of amino acids in dairy cows. J. Anim. Sci.
90:1708-1721.
Lapierre, H., D. R. Ouellet, R. Berthiaume, C. Girard, P. Dubreuil, M. Babkine, and G. E.
Lobley. 2004. Effect of urea supplementation on urea kinetics and splanchnic flux of amino acids
in dairy cows. Journal of Animal and Feed Sciences 13:319-322.
Lapierre, H., D. Pacheco, R. Berthiaume, D. R. Ouellet, C. G. Schwab, P. Dubreuil, G. Holtrop,
and G. E. Lobley. 2006. What is the true supply of amino acids for a dairy cow? J. Dairy Sci.
89:E1-14.
Lee, C., A. N. Hristov, T. W. Cassidy, K. S. Heyler, H. Lapierre, G. A. Varga, M. J. de Veth, R.
A. Patton, and C. Parys. 2012a. Rumen-protected lysine, methionine, and histidine increase milk
protein yield in dairy cows fed a metabolizable protein-deficient diet. J. Dairy Sci. 95:6042-
6056.
Lee, C., A. N. Hristov, K. S. Heyler, T. W. Cassidy, H. Lapierre, G. A. Varga, and C. Parys.
2012b. Effects of metabolizable protein supply and amino acid supplementation on nitrogen
utilization, milk production, and ammonia emissions from manure in dairy cows. J. Dairy Sci.
95:5253-5268.
Lemosquet, S., J. Guinard-Flament, G. Raggio, C. Hurtaud, J. Van Milgen, and H. Lapierre.
2010. How does increasing protein supply or glucogenic nutrients modify mammary metabolism

258
in lactating dairy cows? Pages 175-186 in Proc. Energy and protein metabolism and nutrition.
Wageningen Academic Publishers, Parma, Italy.
Lobley, G. E. 2007. Protein-energy interactions: Horizontal aspects. Pages 445-462 in Proc.
Energy and protein metabolism and nutrition. Butterworths, Vichy, France.
Maxin, G., D. Ouellet, and H. Lapierre. 2013. Contribution of amino acids to glucose and lactose
synthesis in lactating dairy cows. Pages 443-444 in Energy and protein metabolism and nutrition
in sustainable animal production. Springer.
Mepham, T. B. 1982. Amino-acid utilization by lactating mammary-gland. J. Dairy Sci. 65:287-
298.
Metcalf, J. A., R. J. Mansbridge, J. S. Blake, J. D. Oldham, and J. R. Newbold. 2008. The
efficiency of conversion of metabolisable protein into milk true protein over a range of
metabolisable protein intakes. Animal 2:1193-1202.
Noftsger, S. and N. R. St-Pierre. 2003. Supplementation of methionine and selection of highly
digestible rumen undegradable protein to improve nitrogen efficiency for milk production. J.
Dairy Sci. 86:958-969.
NRC. 2001. Nutrient requirements of dairy cattle. 7th revised ed. National Academy Press,
Washington, DC.
Pacheco, D., R. A. Patton, C. Parys, and H. Lapierre. 2012. Ability of commercially available
dairy ration programs to predict duodenal flows of protein and essential amino acids in dairy
cows. J. Dairy Sci. 95:937-963.
Raggio, G., S. Lemosquet, G. E. Lobley, H. Rulquin, and H. Lapierre. 2006. Effect of casein and
propionate supply on mammary protein metabolism in lactating dairy cows. J. Dairy Sci.
89:4340-4351.
Reynolds, C. K. 1992. Metabolism of nitrogenous compounds by ruminant liver. J. Nutr.
122:850-854.
259
Ross, D. A. 2013. Methods to analyze feeds for nitrogen fractions and digestibility for ruminants
with application for the CNCPS. PhD Dissertation. Department of Animal Science. Cornell
University.
Rulquin, H., P. Pisulewski, R. Vérité, and J. Guinard. 1993. Milk production and composition as
a function of postruminal lysine and methionine supply: A nutrient-response approach. Livestock
Production Science 37:69-90.
SAS. 2010. JMP. SAS Institute Inc., Cary, NC, USA.
Schwab, C. G. 1996. Rumen-protected amino acids for dairy cattle: Progress towards
determining lysine and methionine requirements. Anim. Feed Sci. Technol. 59:87-101.
Tyrrell, H. and J. Reid. 1965. Prediction of the energy value of cow's milk. J. Dairy Sci. 48:1215-
1223.
Wheelock, J., R. Rhoads, M. VanBaale, S. Sanders, and L. Baumgard. 2010. Effects of heat
stress on energetic metabolism in lactating holstein cows. J. Dairy Sci. 93:644-655.
260
CHAPTER 8: THE EFFECT OF STARCH-, FIBER-, OR SUGAR-BASED
SUPPLEMENTS ON NITROGEN UTILIZATION IN GRAZING DAIRY COWS
8.1 Abstract
Nitrogen utilization in grazing cows is often low due to high concentrations of rapidly soluble
and degradable protein in the pasture-based diet. Broadly, opportunities to improve N utilization
lie in either reducing the amount of N consumed by the animal, or incorporating more N into
milk protein. The goal of this study was to compare the relative importance of dietary N intake
and productive N output for improving N utilization in grazing cows fed either starch-, fiber- or
sugar-based supplements. Also, the Cornell Net Carbohydrate and Protein System v6.1 (CNCPS)
was evaluated as a tool to assess cow performance and improve N utilization in pasture-based
systems. Eighty-five cows were randomly assigned to one of five treatments at parturition (17
cows per treatment). Treatments consisted of a pasture only control (P) and pasture with a starch-
(St and StN), fiber- (FbN) or a sugar (Sg)-based supplement. The StN and FbN treatments
contained additional dietary N. Diets were formulated using the CNCPS to supply similar levels
of dietary metabolizable energy, but differing levels of dietary N and metabolizable protein.
Nitrogen utilization ranged from 22 to 26 % across the five groups. Cows fed the St treatment
had the lowest levels of milk urea N, blood urea N and urinary N excretion and had the highest
productive N output (149 g/d). Cows fed the FbN treatment had similar productive N output (137
g/d) and consumed ~100 g/d more dietary N than the St treatment resulting in greater urinary N
excretion. Although milk protein yield was moderately greater in the St treatment, quantitatively
the difference in N intake (100 g/d) had the greatest effect on N utilization and suggests that
controlling dietary N intake should be the first priority when attempting to improve N utilization
261
in grazing cows. There was no effect of supplementing pasture fed cattle with sugar on
production or N utilization under the conditions of this experiment. Predictions of metabolizable
energy and protein availability for milk yield from the CNCPS were similar to actual milk yield
for all treatments. Model predicted N utilization and excretion reflected the trends observed in
the measured data and suggests the CNCPS can be a useful tool for formulating and evaluating
diets to improve N utilization in pasture-based systems.
8.2 Introduction
Globally, there is increased pressure to reduce the environmental impact of dairying. Nitrogen
management is of particular concern in pasture-based systems due to its impact on water quality
in aquifers, rivers and lakes (Ledgard et al., 1999). Improving N utilization in pastoral systems
presents a unique set of challenges given the requirement for high levels of pasture consumption
for low-cost production, the large demands of N by temperate grasses, and the resultant soluble
and rapidly degradable nature of pasture protein (Kolver, 2003).
Nitrogen-use-efficiency can be broadly defined as the proportion of productive N output from
the cow (N accretion, milk N or N retained by the conceptus), relative to total N consumed
(Calsamiglia et al., 2010). An increase in milk protein yield would increase productive N output
and improve N utilization for a given N intake. Any N not secreted in milk, or accreted into
tissue, will be lost in either feces or urine (Lapierre and Lobley, 2001). Fecal N is relatively fixed
(Marini and Van Amburgh, 2003); the greatest opportunity to improve N utilization, therefore, is
in either reducing urinary N output, or increasing productive N output (Broderick, 2003, Marini
and Van Amburgh, 2003). In pasture-based systems, previous efforts to improve N capture have
262
focused on improving energy supply to the rumen, with the objective of incorporating more
ammonia into microbial protein and, thereby, increasing the AA flow to the small intestine
(Kolver et al., 1998a, Miller et al., 2001, Moorby et al., 2006, Sairanen et al., 2005). Although
important, this assumes the milk yield of the cow is limited by AA supply, which when
corrected, should increase milk protein synthesis and secretion. Milk protein synthesis appears
more closely linked to milk yield, physiological state, and overall nutritional status than simple
substrate availability (Cant et al., 2003, Hanigan et al., 2001). Therefore, in a situation where MP
is adequate, increasing AA supply will increase hepatic removal, and shift the majority of the
associated N back to the urea pool with no real benefit to overall N utilization (Lapierre et al.,
2005).
Changing the ratio of starch or sugar to NDF has previously been reported to alter ruminal
VFA profiles (Bauman et al., 1971, Beckman and Weiss, 2005), with subsequent effects on milk
composition (Beckman and Weiss, 2005, Broderick, 2003). Changing dietary MP and N intake
simultaneously tests the effect of substrate supply, dietary N dilution and their comparative
importance in improving N utilization, for a given N intake, compared with increasing
productive N output. The Cornell Net Carbohydrate and Protein System v6.1 (CNCPS) was
previously used to evaluate grazing cows by Kolver et al. (1998b), who reported that the model
could realistically predict ME and MP supply and subsequent milk production. Recent changes
have been made to improve CNCPS predictions, including a re-characterization of various pool
constituents, degradation rates, passage rate assignments (Van Amburgh et al., 2010, Van
Amburgh et al., 2007) and predictions of N excretion (Higgs et al., 2012). The aim of the current
study is to investigate the opportunity to improve productive N output in grazing cows using

263
starch-, fiber-, and sugar-based supplements formulated to supply balanced ME, with differing
MP and N intakes. A second goal was to simulate the experimental conditions in the CNCPS and
assess its usefulness as a tool to model N utilization under grazing conditions.
8.3 Materials and methods
Experimental work was conducted at the DairyNZ Lye Farm, Hamilton, New Zealand (37 47’
S, 175 19’ E) during July and August 2010. Prior approval for animal use was attained from the
Ruakura Animal Ethics Committee, Hamilton, New Zealand.
8.3.1 Experimental Design and Treatments
Eighty five dairy cows (53 Friesian and 32 Friesian × Jersey, respectively; 69 Multiparous
and 16 Primiparous, respectively) due to calve over a 21-d period were randomly assigned to one
of five treatments at parturition (n = 17); treatments were balanced for milk production (mean of
the first 100 DIM from the previous lactation for multiparous cows; 17.7 ± 0.7 kg milk/cow per
d; mean ± SD), pre-calving BW (549 ± 29 kg), BCS (4.5 ± 0.3; 10-point scale: Roche et al.,
2004), and age (4.5 ± 0.2 yr).
Dietary treatments consisted of a pasture only control (P) and pasture with starch (St and
StN), fiber (FbN) or sugar (Sg)-based supplements. The StN and FbN treatments were
formulated to supply equal dietary N and MP, while the St and Sg treatments had no additional
N. A small amount of soybean meal was added to the StN treatment to make it equivalent to the
FbN treatment on a true protein (TP) basis. Corn grain was used as the starch source, wheat-
middlings as the fiber source and molasses as the sugar source. Supplements were formulated
264
using the CNCPS v6.1 (Tylutki et al., 2008, Van Amburgh et al., 2010) and fed to support a
target of 30 kg of milk. Chemical composition and DMI for each treatment are presented in
Table 8.1. All supplements were offered in pellet form except the Sg treatment, which was in
liquid form and fed at a lower rate to prevent adverse health effects. The assumptions used when
formulating the supplements were that cows in early lactation (~ 40 DIM), of similar BW,
offered between 30 and 40 kg DM/ d of ryegrass-based pasture would consume approximately
15 kg/DM/d (Dalley et al., 1999) and would substitute approximately 0.5 kg of pasture DM/kg of
concentrate DM fed (Bargo et al., 2003). Supplements were introduced gradually over a 3 d
period and offered in two equal portions at a.m. and p.m. milking. The Sg treatment was
provided orally in a diluted bolus (3:1 molasses:water) after each milking. All cows calved in an
18 d period and started their allocated treatment immediately after parturition. The experiment
concluded on the same day for all cows meaning the experimental period ranged from 6.5 to 9
wk depending on the calving date.
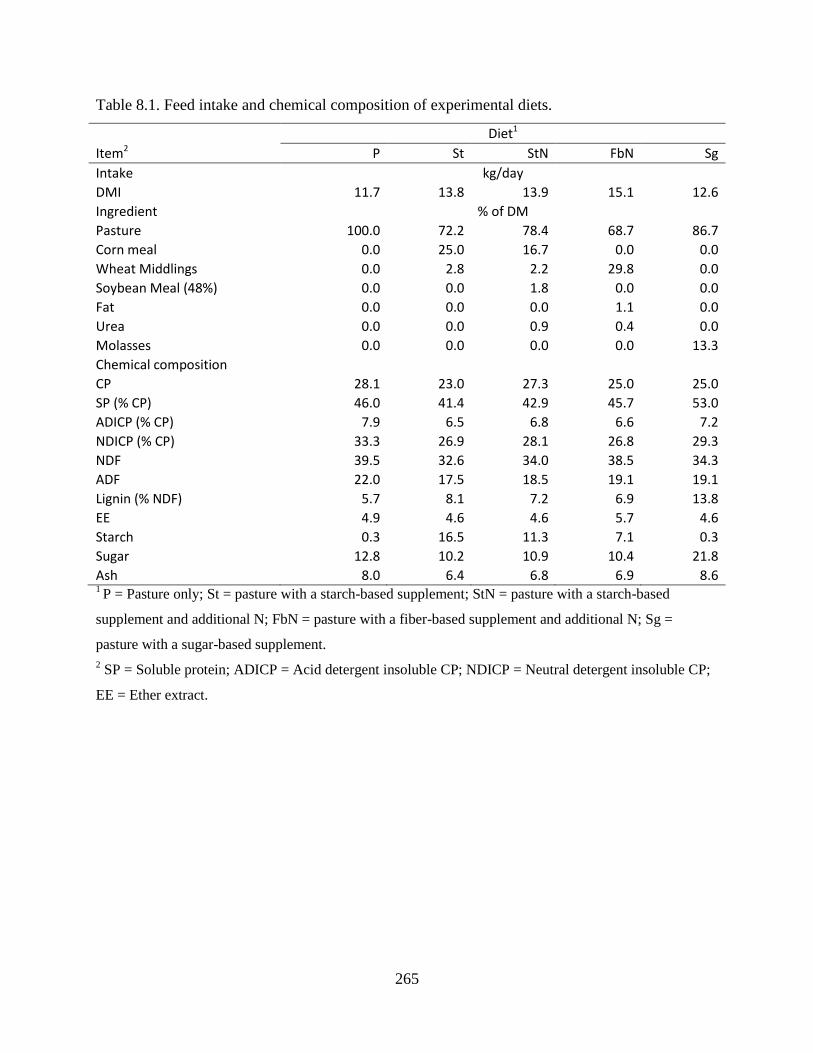
265
Table 8.1. Feed intake and chemical composition of experimental diets.
Diet1
Item2 P St StN FbN Sg
Intake kg/day
DMI 11.7 13.8 13.9 15.1 12.6
Ingredient % of DM
Pasture 100.0 72.2 78.4 68.7 86.7
Corn meal 0.0 25.0 16.7 0.0 0.0
Wheat Middlings 0.0 2.8 2.2 29.8 0.0
Soybean Meal (48%) 0.0 0.0 1.8 0.0 0.0
Fat 0.0 0.0 0.0 1.1 0.0
Urea 0.0 0.0 0.9 0.4 0.0
Molasses 0.0 0.0 0.0 0.0 13.3
Chemical composition
CP 28.1 23.0 27.3 25.0 25.0
SP (% CP) 46.0 41.4 42.9 45.7 53.0
ADICP (% CP) 7.9 6.5 6.8 6.6 7.2
NDICP (% CP) 33.3 26.9 28.1 26.8 29.3
NDF 39.5 32.6 34.0 38.5 34.3
ADF 22.0 17.5 18.5 19.1 19.1
Lignin (% NDF) 5.7 8.1 7.2 6.9 13.8
EE 4.9 4.6 4.6 5.7 4.6
Starch 0.3 16.5 11.3 7.1 0.3
Sugar 12.8 10.2 10.9 10.4 21.8
Ash 8.0 6.4 6.8 6.9 8.6 1 P = Pasture only; St = pasture with a starch-based supplement; StN = pasture with a starch-based
supplement and additional N; FbN = pasture with a fiber-based supplement and additional N; Sg =
pasture with a sugar-based supplement.
2 SP = Soluble protein; ADICP = Acid detergent insoluble CP; NDICP = Neutral detergent insoluble CP;
EE = Ether extract.
266
8.3.2 Grazing Management
Cows rotationally grazed 37 hectares permanently subdivided into 1 hectare paddocks
(defined grazing area) as one group (n = 85). Each paddock was further subdivided using a
temporary electric fence to establish grazing conditions that encouraged pasture to be harvested
to a post-grazing residual mass of 1,500-1600 kg DM/ha. This has been reported to balance the
dual goals of achieving high DMI while maximizing pasture production and quality for future
grazing events (Hoogendoorn et al., 1992, Lee et al., 2008). Cows in early lactation have
increasing DMI; therefore, pasture allowance was continually reassessed to maintain the target
residual pasture mass. Pasture allowance was 29 ± 5 kg DM/cow per d for the last 3 weeks of the
study. Pre- and post-grazing compressed sward heights for the same period were 22.9 ± 2.3 and
10.6 ± 1.2 cm, respectively, and pre- and post-grazing pasture yield was 3243 ± 261 and 1681 ±
233 kg DM/ha, respectively. Measurements were made using a Rising Plate Meter installed with
an electronic counter (Farmworks, Palmerston North, New Zealand). Cows had access to a fresh
allocation of pasture twice daily and only returned to the same area when a minimum of two
leaves had appeared on the majority (> 66%) of perennial ryegrass (Lolium perenne L.) tillers.
The pasture offered consisted of 90.2 (± 2.8)% perennial ryegrass leaf, 2.5 (± 1.4)% perennial
ryegrass stem, 1.5 (± 2.2)% white clover (Trifolium repens), 0.6 (± 0.7)% weeds (Sisymbrium
officinale, Achillea millefolium, Taraxacum officinale, Ranunculus sardous), and 5.2 (± 1.8)%
dead material, on a DM basis.
8.3.3 Pasture Measurements
Representative samples of pasture were collected daily by clipping pasture to grazing height
from paddocks due to be grazed. Samples were bulked on a weekly basis for the duration of the
267
experiment, and duplicate samples were dried for 48 h at either 100OC, for DM analysis, or 60
OC
for analysis of nutrient composition. Samples dried at 60OC were subsequently ground to pass
through a 1.0 mm sieve (Christy Lab Mill, Suffolk, UK) and analyzed by wet chemistry for the
nutrients required to evaluate the diets in the CNCPS (Tylutki et al., 2008); DairyOne, Ithaca,
NY).
8.3.4 Animal Measurements
8.3.4.1 DMI
Mean group pasture DMI was calculated as the product of the difference between the pre- and
post-grazing pasture mass and area grazed daily (Roche et al., 1996). Supplement offered and
refused was measured at each milking. Estimations of individual cow pasture DMI were obtained
using the n-alkane technique outlined by Kennedy et al. (2003). Briefly, each cow was dosed
twice daily (at milking) with a capsule containing 356 mg of n-dotriacontane (C32; i.e. 712 mg
C32/cow per d) for a 10-d period on weeks 6 and 7 of the experiment. Fecal grab samples were
collected twice daily from each cow (after milking) during the last 5 d of the 10 d period. The
fecal samples from each cow for the 5 d period were bulked and stored at –17OC awaiting alkane
analysis. During the same 5 d period, pasture samples were plucked to grazing height, following
close observation of the grazing animal, to represent pasture grazed. The n-alkane concentration
(C25-C36) in pasture, supplement and feces were determined using gas chromatography (Mayes
et al., 1986). The ratio of pasture C33 (tritriacontane) to dosed C32 (n-dotriacontane) was used to
estimate pasture DMI. Estimates of daily pasture DMI were calculated as follows:
268
( ) ( )
( )
where Fi, Si and Pi are the concentrations (mg/kg of DM) of the natural odd-chain n-alkane (C33)
in feces, supplement and pasture, respectively, Fj, Sj and Pj are the concentrations (mg/kg of DM)
of the dosed even-chain n-alkane (C32) in feces, supplements and pasture, respectively, and Dj
and IS are the dose rate (mg/ d) of the even-chain n-alkane (C32) and supplement intake,
respectively.
8.3.4.2 Milk and BW
Individual milk yields were recorded daily (GEA, Oelde, Germany). Fat, TP, and lactose
concentrations in milk were determined by a Milkoscan FT120 (Foss Electric, Hillerød,
Denmark) on a composite from a.m. and p.m. samples collected once (two consecutive days)
each week for the duration of the experiment. Milk composition data were verified by reference
techniques for a sub-set of milk samples (milk fat: Röese-Gottlieb method; IDF, 1987; CP:
Kjeldahl techniques; Barbano et al., 1991). Body weight and BCS were measured weekly
following the a.m. milking; BCS was assessed on a 10-point scale, where 1 is emaciated and 10
is obese (Roche et al., 2004). These scores can be converted to the 5-point scale of Wildman et
al. (1982) using the regression equation generated by Roche et al. (2004; 5-point BCS = 1.5 +
0.32 10-point BCS).
269
8.3.4.3 Blood
Two 10 mL evacuated blood tubes containing either a sodium heparin pellet (158 IU sodium
heparin) or EDTA (0.117 mL of 15% K3EDTA) to prevent coagulation were collected from each
cow by coccygeal venipuncture prior to treatment allocation and weekly thereafter. Plasma was
separated (1,120 g, 10 min, 4OC) and frozen at -20 ºC prior to analysis. Plasma from the EDTA
tubes was analyzed for NH3 concentration (mmol/L), based on the enzymatic kinetic assay
described by Da Fonseca-Wollheim (1973). Plasma from the sodium heparin tubes were
analyzed for NEFA, BHBA, glucose and urea. Determination of NEFA (mmol/L; colorimetric
method using a commercial kit: WAKO, Osaka, Japan), BHBA (mmol/L; BHBA dehydrogenase
assay based on formation of acetoacetate and NADH after addition of NAD), glucose (mmol/L;
hexokinase method based on formation of NADPH), and urea (mmol/L; urease hydrolysis
method) were performed on a Hitachi Modular P800 analyzer (Roche, Basel, Switzerland) at
30OC by Gribbles Veterinary Pathology Ltd., Hamilton, New Zealand. The inter- and intra-assay
CV was < 2% for all assays.
8.3.4.4 Urine
Mid-stream urine samples were collected once each week during voluntary urination of cows
immediately prior to the morning milking. After collection, samples were divided into 50 mL
aliquots for the analysis of creatinine, urea, uric acid, allantoin, urea and total N. The aliquot’s
used for the analysis of urea and total N were reduced to pH ≤ 2 using approximately 3 mL of 6
mol/L hydrochloric acid and frozen at -20 ºC prior to analysis. Creatinine, uric acid (mmol/L;
enzymatic colorimetric assay) and urea (mmol/L; kinetic UV assay) were analyzed using
commercial kits (Roche Diagnostic NZ Ltd., Auckland, New Zealand) by Gribbles Veterinary
270
Pathology Ltd., Hamilton, New Zealand. Allantoin was analyzed on a spectrophotometer using a
colorimetric assay (Young and Conway, 1942) and total N was analyzed using the Leco total
combustion method (Institute of Food, Nutrition and Human Health, Massey University, New
Zealand).
8.3.5 CNCPS Inputs
Data used in the CNCPS represented the mean of a 5 d period in wk 7 of the study, coinciding
with the n-alkane DMI estimation. Dietary inputs, including DMI, feed ingredients, and the
chemical composition of ration are in Table 8.1. Animal inputs, including milk production, initial
BCS, and BW change are in Table 8.4. Other inputs, including stage of lactation, breed and
parity are consistent with the previous description in this section. The contribution of tissue
mobilization to predictions of ME and MP milk (Table 8.4) were estimated from BW change.
The chemical composition (fat:protein) of mobilized body reserves changes depending on the
BCS of the animal (Fox et al., 1999). To account for this, the composition of reserves mobilized
was calculated using the BW change and initial BCS from Table 8.4 and equations in Fox et al.
(2004). Briefly, initial BW and BCS were used to calculate a reference BW at BCS 3 (1 – 5
scale). Mobilized fat and protein were then estimated using the reference BW and the change
from initial to final BW (Fox et al., 2004). Change in BW was preferred to BCS as an estimate of
tissue mobilization due to the difficulty in ascertaining small changes in BCS over one time
period (Ferguson et al., 1994). It was assumed that when MP supply was excess to requirements,
protein mobilized from tissue was used as an energy source and contributed to ME supply.
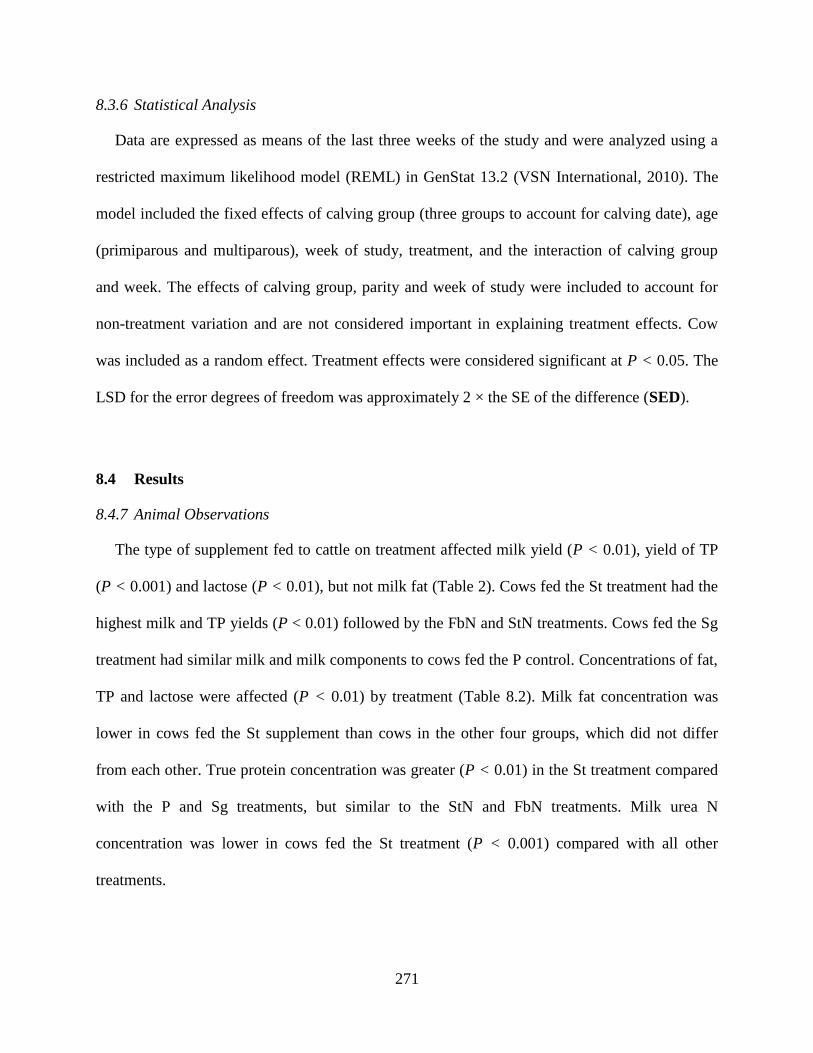
271
8.3.6 Statistical Analysis
Data are expressed as means of the last three weeks of the study and were analyzed using a
restricted maximum likelihood model (REML) in GenStat 13.2 (VSN International, 2010). The
model included the fixed effects of calving group (three groups to account for calving date), age
(primiparous and multiparous), week of study, treatment, and the interaction of calving group
and week. The effects of calving group, parity and week of study were included to account for
non-treatment variation and are not considered important in explaining treatment effects. Cow
was included as a random effect. Treatment effects were considered significant at P < 0.05. The
LSD for the error degrees of freedom was approximately 2 × the SE of the difference (SED).
8.4 Results
8.4.7 Animal Observations
The type of supplement fed to cattle on treatment affected milk yield (P < 0.01), yield of TP
(P < 0.001) and lactose (P < 0.01), but not milk fat (Table 2). Cows fed the St treatment had the
highest milk and TP yields (P < 0.01) followed by the FbN and StN treatments. Cows fed the Sg
treatment had similar milk and milk components to cows fed the P control. Concentrations of fat,
TP and lactose were affected (P < 0.01) by treatment (Table 8.2). Milk fat concentration was
lower in cows fed the St supplement than cows in the other four groups, which did not differ
from each other. True protein concentration was greater (P < 0.01) in the St treatment compared
with the P and Sg treatments, but similar to the StN and FbN treatments. Milk urea N
concentration was lower in cows fed the St treatment (P < 0.001) compared with all other
treatments.
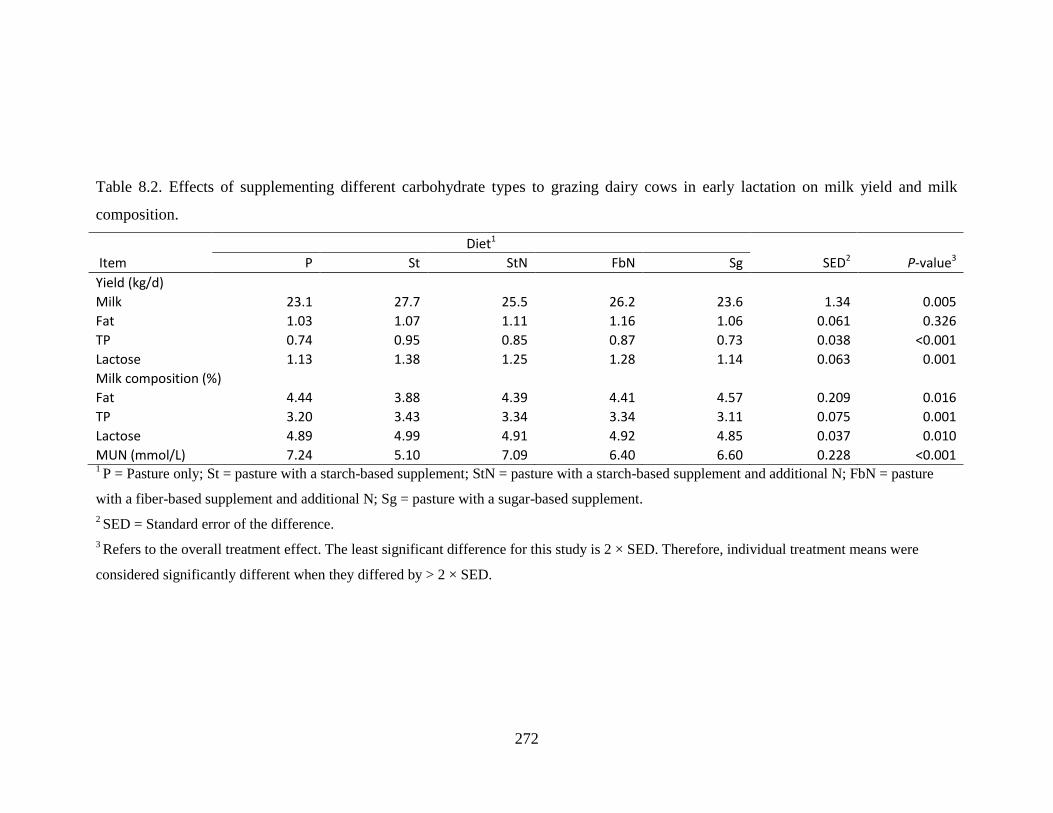
272
Table 8.2. Effects of supplementing different carbohydrate types to grazing dairy cows in early lactation on milk yield and milk
composition.
Diet1
Item P St StN FbN Sg SED2 P-value3
Yield (kg/d)
Milk 23.1 27.7 25.5 26.2 23.6 1.34 0.005
Fat 1.03 1.07 1.11 1.16 1.06 0.061 0.326
TP 0.74 0.95 0.85 0.87 0.73 0.038 <0.001
Lactose 1.13 1.38 1.25 1.28 1.14 0.063 0.001
Milk composition (%)
Fat 4.44 3.88 4.39 4.41 4.57 0.209 0.016
TP 3.20 3.43 3.34 3.34 3.11 0.075 0.001
Lactose 4.89 4.99 4.91 4.92 4.85 0.037 0.010
MUN (mmol/L) 7.24 5.10 7.09 6.40 6.60 0.228 <0.001 1 P = Pasture only; St = pasture with a starch-based supplement; StN = pasture with a starch-based supplement and additional N; FbN = pasture
with a fiber-based supplement and additional N; Sg = pasture with a sugar-based supplement.
2 SED = Standard error of the difference.
3 Refers to the overall treatment effect. The least significant difference for this study is 2 × SED. Therefore, individual treatment means were
considered significantly different when they differed by > 2 × SED.
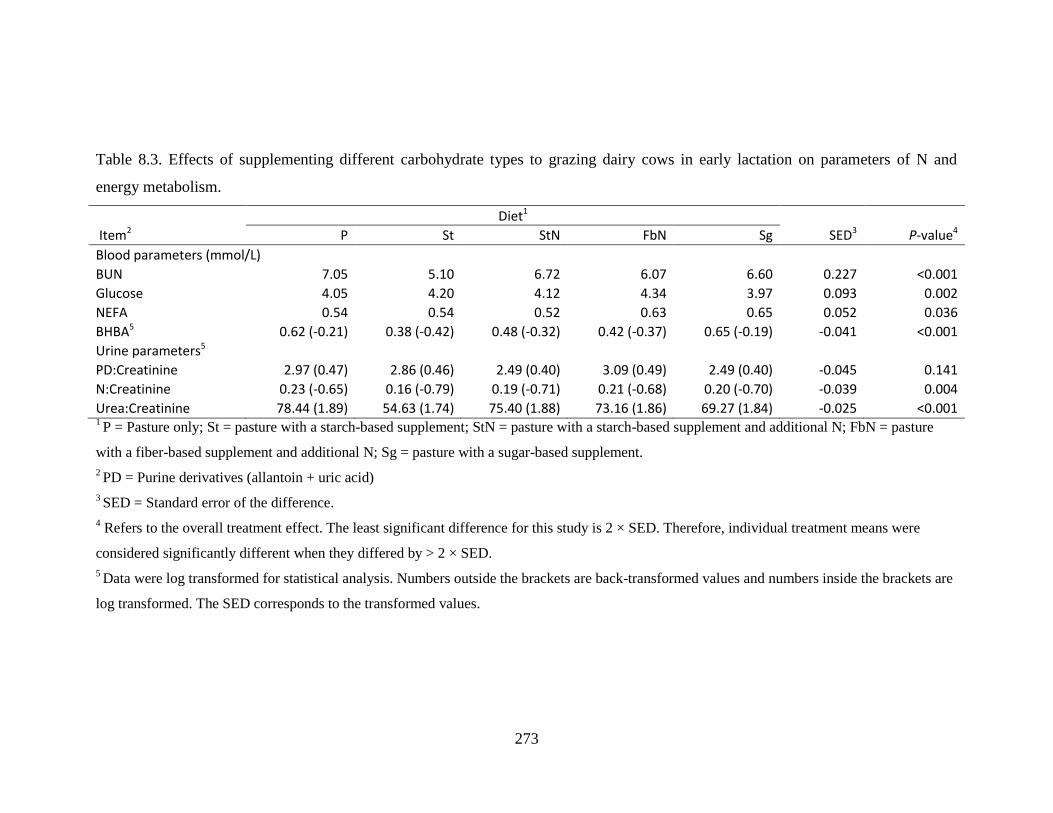
273
Table 8.3. Effects of supplementing different carbohydrate types to grazing dairy cows in early lactation on parameters of N and
energy metabolism.
Diet1
Item2 P St StN FbN Sg SED3 P-value4
Blood parameters (mmol/L)
BUN 7.05 5.10 6.72 6.07 6.60 0.227 <0.001
Glucose 4.05 4.20 4.12 4.34 3.97 0.093 0.002
NEFA 0.54 0.54 0.52 0.63 0.65 0.052 0.036
BHBA5 0.62 (-0.21) 0.38 (-0.42) 0.48 (-0.32) 0.42 (-0.37) 0.65 (-0.19) -0.041 <0.001
Urine parameters5
PD:Creatinine 2.97 (0.47) 2.86 (0.46) 2.49 (0.40) 3.09 (0.49) 2.49 (0.40) -0.045 0.141
N:Creatinine 0.23 (-0.65) 0.16 (-0.79) 0.19 (-0.71) 0.21 (-0.68) 0.20 (-0.70) -0.039 0.004
Urea:Creatinine 78.44 (1.89) 54.63 (1.74) 75.40 (1.88) 73.16 (1.86) 69.27 (1.84) -0.025 <0.001 1 P = Pasture only; St = pasture with a starch-based supplement; StN = pasture with a starch-based supplement and additional N; FbN = pasture
with a fiber-based supplement and additional N; Sg = pasture with a sugar-based supplement.
2 PD = Purine derivatives (allantoin + uric acid)
3 SED = Standard error of the difference.
4 Refers to the overall treatment effect. The least significant difference for this study is 2 × SED. Therefore, individual treatment means were
considered significantly different when they differed by > 2 × SED.
5 Data were log transformed for statistical analysis. Numbers outside the brackets are back-transformed values and numbers inside the brackets are
log transformed. The SED corresponds to the transformed values.
274
Cows fed the St treatment had more than 1 mmol/L less urea in blood than the other
treatments, which was consistent with the ratios of urinary urea to creatinine and urinary N to
creatinine (Table 8.3). There were no differences in the ratio of purine derivatives (PD) to
creatinine. Blood concentrations of BHBA were elevated in control and Sg cows, but similar
among the other treatments. Blood NEFA concentrations were greater (P < 0.05) in cows fed the
Sg and FbN treatments, but similar among the other treatments.
8.4.8 CNCPS Predictions
Predictions from the CNCPS are in Table 8.4. Metabolizable energy and MP intake was
similar among the St and FbN treatments and Sg and StN treatments, respectively, but predicted
MP allowable milk was considerably higher than ME allowable milk. Cows fed the StN and FbN
treatments were similar in total N intake (~ 600 g N/d), which was approximately 100 g greater
than the St and Sg treatments and 70 g greater than the P control. When tissue mobilization was
included into the model, predicted ME and MP allowable milk were balanced and similar to
actual milk production.
Predicted urinary N excretion followed the trends evident in ratios of urinary N and urinary
urea to creatinine (Table 8.3). The ratios of productive N:urinary N, productive N:intake N and
milk TP:MP supply were all greater in cows fed the St treatment, but similar among the other
treatments.
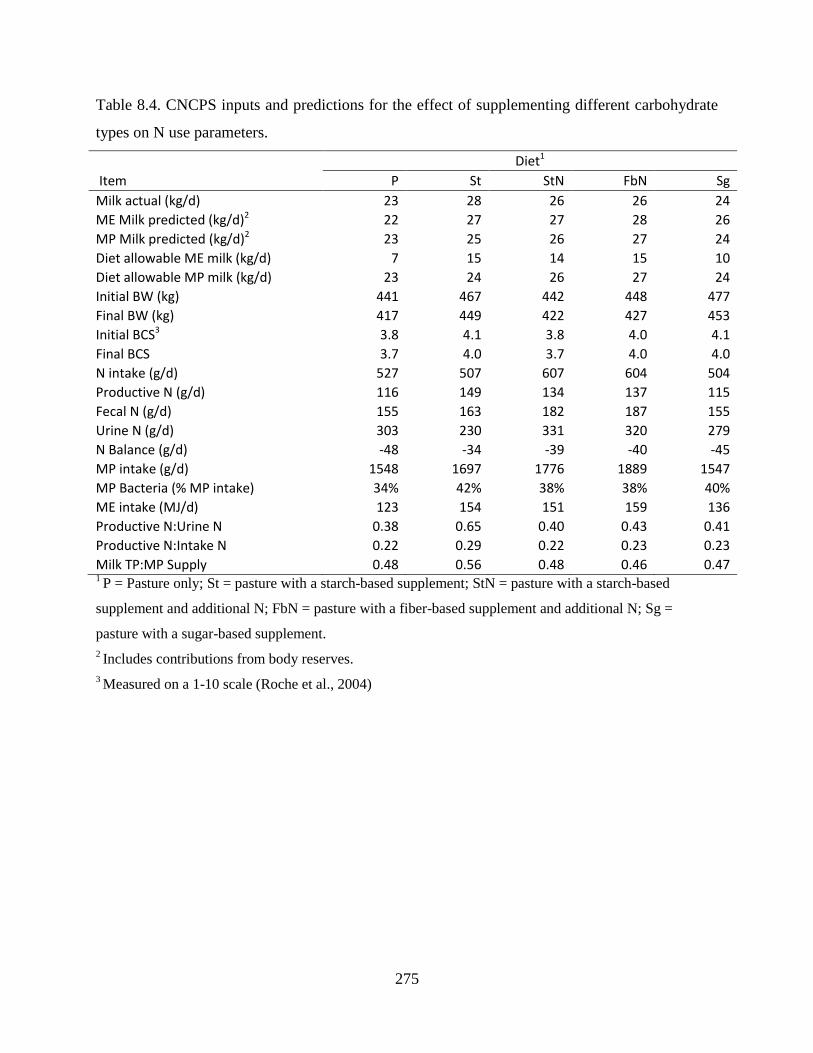
275
Table 8.4. CNCPS inputs and predictions for the effect of supplementing different carbohydrate
types on N use parameters.
Diet1
Item P St StN FbN Sg
Milk actual (kg/d) 23 28 26 26 24
ME Milk predicted (kg/d)2 22 27 27 28 26
MP Milk predicted (kg/d)2 23 25 26 27 24
Diet allowable ME milk (kg/d) 7 15 14 15 10
Diet allowable MP milk (kg/d) 23 24 26 27 24
Initial BW (kg) 441 467 442 448 477
Final BW (kg) 417 449 422 427 453
Initial BCS3 3.8 4.1 3.8 4.0 4.1
Final BCS 3.7 4.0 3.7 4.0 4.0
N intake (g/d) 527 507 607 604 504
Productive N (g/d) 116 149 134 137 115
Fecal N (g/d) 155 163 182 187 155
Urine N (g/d) 303 230 331 320 279
N Balance (g/d) -48 -34 -39 -40 -45
MP intake (g/d) 1548 1697 1776 1889 1547
MP Bacteria (% MP intake) 34% 42% 38% 38% 40%
ME intake (MJ/d) 123 154 151 159 136
Productive N:Urine N 0.38 0.65 0.40 0.43 0.41
Productive N:Intake N 0.22 0.29 0.22 0.23 0.23
Milk TP:MP Supply 0.48 0.56 0.48 0.46 0.47 1 P = Pasture only; St = pasture with a starch-based supplement; StN = pasture with a starch-based
supplement and additional N; FbN = pasture with a fiber-based supplement and additional N; Sg =
pasture with a sugar-based supplement.
2 Includes contributions from body reserves.
3 Measured on a 1-10 scale (Roche et al., 2004)
276
8.5 Discussion
Efficiency of N utilization in dairy cows is typically low, averaging around 25%, but can
range from 15% to 40% (Calsamiglia et al., 2010). Trends evaluated over a wide range of dietary
and management conditions indicate that dietary CP concentration is the most important factor
influencing the efficiency of N use (Huhtanen and Hristov, 2009). Efficiencies as high as 43%
(Frank and Swensson, 2002) and 37% (Noftsger and St-Pierre, 2003) have been reported in the
literature in TMR-fed cows and as high as 38% in cows fed ryegrass-based diets (Moorby et al.,
2006). The observed N efficiencies for cows in the current study ranged from 22% to 29%
(Table 8.4), which, according to Calsamiglia et al. (2010), would be classified as ranging from
low to moderately high, respectively. Cows with the highest N-use efficiency in the current study
(St) still wasted 10% more N than cows in the study of Moorby et al. (2006). The major
difference between the two studies was the CP content of the pasture, which was 28.1% in the
current study (Table 8.1) compared with approximately 10% in the study of Moorby et al.
(2006). Attempts have been made to improve the retention of dietary N by synchronizing the
supply of energy and protein in the rumen, both, through supplementation (Kolver et al., 1998a),
and also through feeding pasture cultivars bred to have higher sugar content (Edwards et al.,
2007). Effects have generally been transient, with no real improvement in N utilization
suggesting N intake is a more important factor in improving N utilization (Edwards et al., 2007,
Henning et al., 1993, Kim et al., 1999, Kolver et al., 1998a).
Pasture CP in the current study was higher than anticipated (Table 8.1); this resulted in
predicted MP allowable milk being approximately 10 kg higher than ME allowable milk (Table
8.4). Unfortunately, the StN treatment was less palatable than the other treatments and this
277
resulted in lower than formulated ME intake. Despite this, N intake and predicted MP allowable
milk were similar among cows fed the St and Sg treatments and StN and FbN treatments (Table
8.4) allowing the comparison of both dietary N dilution, and the effect of carbohydrate type.
Compared with the P control, cows fed the Sg treatment had a lower ratio of urinary
urea:creatinine and MUN; however, urinary N:creatinine and BUN were similar. This suggests a
small N dilution effect consistent with the reduction in dietary N intake (Table 8.4), but no
improvements in the overall efficiency of N use. In contrast, cows fed the St treatment consumed
the same amount of dietary N as the Sg treatment, but had a 0.06 unit greater N-use-efficiency
(Table 8.4). Cows fed the St treatment consumed more ME than the Sg treatment. However,
cows fed the Sg treatment also consumed more ME than the P control and there was no
difference between these two treatments. Supplementing with sucrose has previously been
reported to drop rumen pH and decrease the rate of NDF digestion (Chamberlain et al., 1993,
Huhtanen and Khalili, 1991). In the experiment of Huhtanen and Khalili (1991), cows were fed 1
kg DM/d of sucrose which reduced the rate of NDF digestion by 1.5 %/hr. Pasture NDF in the
current study was calculated to digest at a rate of 7 %/hr (Van Amburgh et al., 2003). Reducing
this digestion rate from 7 to 5.5 %/hr in the CNCPS reduced the ME allowable milk from 26 to
24 kg and probably explains the lack of response in the Sg treatment. Pasture in the current study
was 12.8 % sugar and the administration of molasses increased the sugar content in the diet of
the Sg cows to 21.8% (Table 8.1). There was no difference in the ratio of PD:creatinine
suggesting total microbial growth was not changed by treatment (Valadares et al., 1999),
although there was a tendency for PD:creatinine to be lower in Sg and StN cows. Therefore,
supplementing molasses to cows consuming high quality spring pasture using the method
278
employed in the current experiment (1.5 kg/d split in two feeds at milking) has no production
benefit.
The effect of supplementing a fermentable fiber source was also investigated (FbN) and
compared with supplementing starch (StN and St). Cows fed the FbN treatment had lower BUN
and MUN concentrations than cows fed the StN treatment; however, there were no differences in
N excretion (Table 8.3) or predicted N utilization (Table 8.4). Numerically, cows fed the St
treatment produced more milk protein than cows fed the FbN treatment. Rius et al. (2010)
reported increased milk protein synthesis with the addition of post-ruminal starch, a result, most
likely, of increased concentrations of insulin and IGF-1 (Griinari et al., 1997, Mackle et al.,
1999, Rius et al., 2010). In the current study, differences in N excretion among treatments can be
largely explained by differences in N intake (Table 8.4) with only subtle differences in
productive N when ME intake was similar. When comparing the St and FbN treatments,
approximately 90% of the difference in N excretion can be attributed to a reduction in N intake,
whereas 10% can be attributed to higher productive N output. These findings are in agreement
with the conclusion of Huhtanen and Hristov (2009) that reducing N intake is the most important
factor in reducing N losses from dairy operations.
Predictions from the CNCPS suggest that cows were consuming adequate dietary MP at the
given level of milk, but dietary ME was limited; this is similar to the results of Kolver et al.
(1998b). A major difficulty when conducting grazing studies is accurately estimating DMI
(Bargo et al., 2003). Intakes reported in this study (Table 8.4) are based on the n-alkane
technique described by Kennedy et al. (2003). The dosing and sampling period for this assay
279
coincided with a period of prolonged wet weather, which reduced pasture utilization and
probably explains the low pasture DMI (Holmes et al., 2002). However, pasture intake could also
have been underestimated if the recovery of dosed C32 n-alkane was lower than expected
(Kennedy et al. 2003). Blood NEFA increased sharply and BW decreased sharply over this
period (data not presented), which is consistent with the ME deficit predicted by the CNCPS.
The model predicted cows fed the Sg treatment and P control to be most limited in dietary ME
intake compared with milk produced, which is consistent with higher concentrations of BHBA
(Table 8.3). Mobilization of tissue accounted for 36% of the ME requirement for cows fed the P
control which is comparable to levels reported from cows in the first three weeks of lactation, but
are high for cows in the fifth week of lactation (Pedernera et al., 2008; Komaragiri and Erdman,
1997). Including the recorded change in BW into the CNCPS aligned predicted ME and MP milk
closely with actual milk for all treatments (Table 8.4) and is consistent with previous evaluations
of the CNCPS under grazing conditions (Kolver et al., 1998b). Predictions of N excretion reflect
measured N excretion (Table 8.3). Cows fed the St treatment were predicted to excrete 70 g/d
less urinary N than the P control and approximately 100 g/d less than the StN and FbN
treatments, respectively. Although 70 g/d may seem inconsequential, in a herd of 1,000 cows this
reduction is equivalent to 1,000 kg less urea excreted/wk and, if sustained, represents a
considerable reduction in N loss to the environment. Similar effects could be achieved if CP
levels in pasture were reduced (Moorby et al., 2006). Given only one data point was modeled per
treatment, care must be taken when interpreting these results. However, model predictions were
consistent with the recorded data and suggest the CNCPS can be successfully used as a tool to
formulate diets to improve N utilization in grazing cows.
280
8.6 Conclusions
Nitrogen utilization can be improved by including high energy, low protein supplements into
the diets of grazing dairy cows. Reducing dietary N intake appears to be the most important
factor in improving N utilization when ME intake is the same. However, subtle improvements in
milk protein output can be achieved by feeding starch, compared with fiber- or sugar-based
supplements. Feeding additional sugar to cows fed high quality spring pasture had no real benefit
in the current study. Predictions from the CNCPS were consistent with measured data and
predicted ME and MP allowable milk were close to measured milk production when estimations
of tissue mobilization were included. Predictions of N utilization also reflected the measured
data, indicating that the CNCPS is a useful tool in formulating diets to reduce N losses to the
environment.
8.7 Acknowledgements
The authors acknowledge the financial support of New Zealand dairy farmers, through
DairyNZ Inc (Project No. AN803), and the Ministry of Agriculture and Forestry, New Zealand,
through the Sustainable Farming Fund (Project No. 08/012). The assistance of the DairyNZ
technical team, farm staff on Lye Farm, and the statistical expertise of Barbara Dow are also
gratefully acknowledged.
281
8.8 References
Barbano, D. M., J. M. Lynch, and J. R. Fleming. 1991. Direct and indirect determination of true
protein-content of milk by kjeldahl analysis: collaborative study. J. AOAC. 74:281-288.
Bargo, F., L. D. Muller, E. S. Kolver, and J. E. Delahoy. 2003. Invited Review: Production and
digestion of supplemented dairy cows on pasture. J. Dairy Sci. 86:1-42.
Bauman, D. E., C. L. Davis, and H. F. Bucholtz. 1971. Propionate production in the rumen of
cows fed either a control or high-grain, low-fiber diet. J. Dairy Sci. 54:1282-1287.
Beckman, J. L. and W. P. Weiss. 2005. Nutrient digestibility of diets with different fiber to
starch ratios when fed to lactating dairy cows. J. Dairy Sci. 88:1015-1023.
Broderick, G. A. 2003. Effects of varying dietary protein and energy levels on the production of
lactating dairy cows. J. Dairy Sci. 86:1370-1381.
Calsamiglia, S., A. Ferret, C. K. Reynolds, N. B. Kristensen, and A. M. van Vuuren. 2010.
Strategies for optimizing nitrogen use by ruminants. Animal. 4:1184-1196.
Cant, J. P., R. Berthiaume, H. Lapierre, P. H. Luimes, B. W. McBride, and D. Pacheco. 2003.
Responses of the bovine mammary glands to absorptive supply of single amino acids. Can. J.
Anim. Sci. 83:341.
Chamberlain, D. G., S. Robertson, and J.-J. Choung. 1993. Sugars versus starch as supplements
to grass silage: Effects on ruminal fermentation and the supply of microbial protein to the small
intestine, estimated from the urinary excretion of purine derivatives, in sheep. J. Sci. Food Agric.
63:189-194.
Da Fonseca-Wollheim, F. 1973. Significance of hydrogen-ion concentration and addition of adp
in determination of ammonia with glutamate dehydrogenase - an improved enzymic
determination of ammonia. 1. Journal for Clinical Chemistry and Clinical Biochemistry. 11:421-
425.
282
Dalley, D. E., J. R. Roche, C. Grainger, and P. J. Moate. 1999. Dry matter intake, nutrient
selection and milk production of dairy cows grazing rainfed perennial pastures at different
herbage allowances in spring. Australian Journal of Experimental Agriculture. 39:923-931.
Edwards, G. R., A. J. Parsons, and S. Rasmussen. 2007. High sugar grasses for dairy systems:
Meeting the challenges for pasture-based dairying. Pages 307-334 in Proc. Australasian Dairy
Science Symposium.
Ferguson, J. D., D. T. Galligan, and N. Thomsen. 1994. Principal descriptors of body condition
score in Holstein cows. J. Dairy Sci. 77:2695-2703.
Fox, D. G., L. O. Tedeschi, T. P. Tylutki, J. B. Russell, M. E. Van Amburgh, L. E. Chase, A. N.
Pell, and T. R. Overton. 2004. The Cornell Net Carbohydrate and Protein System model for
evaluating herd nutrition and nutrient excretion. Anim. Feed Sci. Technol. 112:29-78.
Fox, D. G., M. E. Van Amburgh, and T. P. Tylutki. 1999. Predicting requirements for growth,
maturity, and body reserves in dairy cattle. J. Dairy Sci. 82:1968-1977.
Frank, B. and C. Swensson. 2002. Relationship between content of crude protein in rations for
dairy cows and milk yield, concentration of urea in milk and ammonia emissions. J. Dairy Sci.
85:1829-1838.
Griinari, J. M., M. A. McGuire, D. A. Dwyer, D. E. Bauman, D. M. Barbano, and W. A. House.
1997. The role of insulin in the regulation of milk protein synthesis in dairy cows. J. Dairy Sci.
80:2361-2371.
Hanigan, M. D., B. J. Bequette, L. A. Crompton, and J. France. 2001. Modeling mammary amino
acid metabolism. Livest. Prod. Sci. 70:63-78.
Henning, P. H., D. G. Steyn, and H. H. Meissner. 1993. Effect of synchronization of energy and
nitrogen supply on ruminal characteristics and microbial growth. J. Anim. Sci. 71:2516-2528.
Higgs, R. J., L. E. Chase, and M. E. Van Amburgh. 2012. Development and evaluation of
equations in the Cornell Net Carbohydrate and Protein System to predict nitrogen excretion in
lactating dairy cows. J. Dairy Sci. 95:2004-2014.
283
Holmes, C. W., I. M. Brookes, D. J. Garrick, T. J. Mackenzie, T. J. Parkinson, and G. F. Wilson.
2002. Milk production from pasture - Principles and Practices. Massey University, Palmerston
North.
Hoogendoorn, C. J., C. W. Holmes, and A. C. P. Chu. 1992. Some effects of herbage
composition, as influenced by previous grazing management, on milk production by cows
grazing on ryegrass/white clover pastures. 2. Milk production in late spring/summer: effects of
grazing intensity during the preceding spring period. Grass and Forage Science. 47:316-325.
Huhtanen, P. and A. N. Hristov. 2009. A meta-analysis of the effects of dietary protein
concentration and degradability on milk protein yield and milk N efficiency in dairy cows. J.
Dairy Sci. 92:3222-3232.
Huhtanen, P. and H. Khalili. 1991. Sucrose supplements in cattle given grass silage-based diet. 3.
Rumen pool size and digestion kinetics. Anim. Feed Sci. Technol. 33:275-287.
IDF. 1987. Milk: Determination of fat content - Röese Gottlieb gravimetric method (reference
method). in IDF Standard FIL-IDF. Vol. 1C, Brussels, Belgium.
Kennedy, J., P. Dillon, L. Delaby, P. Faverdin, G. Stakelum, and M. Rath. 2003. Effect of
genetic merit and concentrate supplementation on grass intake and milk production with Holstein
Friesian dairy cows. J. Dairy Sci. 86:610-621.
Kim, K. H., Y.-G. Oh, J.-J. Choung, and D. G. Chamberlain. 1999. Effects of varying degrees of
synchrony of energy and nitrogen release in the rumen on the synthesis of microbial protein in
cattle consuming grass silage. J. Sci. Food Agric. 79:833-838.
Kolver, E., L. D. Muller, G. A. Varga, and T. J. Cassidy. 1998a. Synchronization of ruminal
degradation of supplemental carbohydrate with pasture nitrogen in lactating dairy cows. J. Dairy
Sci. 81:2017-2028.
Kolver, E. S. 2003. Nutritional limitations to increased production on pasture-based systems.
Proceedings of the Nutrition Society. 62:291-300.
284
Kolver, E. S., L. D. Muller, M. C. Barry, and J. W. Penno. 1998b. Evaluation and application of
the Cornell Net Carbohydrate and Protein System for dairy cows fed diets based on pasture. J.
Dairy Sci. 81:2029-2039.
Komaragiri, M. V. S. and R. A. Erdman. 1997. Factors affecting body tissue mobilization in
early lactation dairy cows. 1. Effect of dietary protein on mobilization of body fat and protein. J.
Dairy Sci. 80:929-937.
Lapierre, H., R. Berthiaume, G. Raggio, M. C. Thivierge, L. Doepel, D. Pacheco, P. Dubreuil,
and G. E. Lobley. 2005. The route of absorbed nitrogen into milk protein. Animal Science.
80:10-22.
Lapierre, H. and G. E. Lobley. 2001. Nitrogen recycling in the ruminant: A review. J. Dairy Sci.
84:233-236.
Ledgard, S. F., J. W. Penno, and M. S. Sprosen. 1999. Nitrogen inputs and losses from
clover/grass pastures grazed by dairy cows, as affected by nitrogen fertilizer application. J.
Agric. Sci. 132:215-225.
Lee, J. M., D. J. Donaghy, and J. R. Roche. 2008. Short Communication: Effect of postgrazing
residual pasture height on milk production. J. Dairy Sci. 91:4307-4311.
Mackle, T. R., D. A. Dwyer, K. L. Ingvartsen, P. Y. Chouinard, J. M. Lynch, D. M. Barbano,
and D. E. Bauman. 1999. Effects of insulin and amino acids on milk protein concentration and
yield from dairy cows. J. Dairy Sci. 82:1512-1524.
Marini, J. C. and M. E. Van Amburgh. 2003. Nitrogen metabolism and recycling in Holstein
heifers. J. Anim. Sci. 81:545-552.
Mayes, R. W., C. S. Lamb, and P. M. Colgrove. 1986. The use of dosed and herbage n-alkanes
as markers for the determination of herbage intake. J. Agric. Sci. 107:161-170.
Miller, L. A., J. M. Moorby, D. R. Davies, M. O. Humphreys, N. D. Scollan, J. C. MacRae, and
M. K. Theodorou. 2001. Increased concentration of water-soluble carbohydrate in perennial
285
ryegrass (Lolium perenne L.): milk production from late-lactation dairy cows. Grass and Forage
Science. 56:383-394.
Moorby, J. M., R. T. Evans, N. D. Scollan, J. C. MacRae, and M. K. Theodorou. 2006. Increased
concentration of water-soluble carbohydrate in perennial ryegrass (Lolium perenne L.).
Evaluation in dairy cows in early lactation. Grass and Forage Science. 61:52-59.
Noftsger, S. and N. R. St-Pierre. 2003. Supplementation of methionine and selection of highly
digestible rumen undegradable protein to improve nitrogen efficiency for milk production. J.
Dairy Sci. 86:958-969.
Pedernera, M., S. C. García, A. Horagadoga, I. Barchia, and W. J. Fulkerson. 2008. Energy
balance and reproduction on dairy cows fed to achieve low or high milk production on a pasture-
based system. J. Dairy Sci. 91:3896-3907.
Rius, A. G., J. A. D. R. N. Appuhamy, J. Cyriac, D. Kirovski, O. Becvar, J. Escobar, M. L.
McGilliard, B. J. Bequette, R. M. Akers, and M. D. Hanigan. 2010. Regulation of protein
synthesis in mammary glands of lactating dairy cows by starch and amino acids. J. Dairy Sci.
93:3114-3127.
Roche, J. R., P. Dillon, S. Crosse, and M. Rath. 1996. The effect of closing date of pasture in
autumn and turnout date in spring on sward characteristics, dry matter yield and milk production
of spring-calving dairy cows. Irish Journal of Agricultural and Food Research. 35:127-140.
Roche, J. R., P. G. Dillon, C. R. Stockdale, L. H. Baumgard, and M. J. VanBaale. 2004.
Relationships among international body condition scoring systems. J. Dairy Sci. 87:3076-3079.
Sairanen, A., H. Khalili, J. I. Nousiainen, S. Ahvenjarvi, and P. Huhtanen. 2005. The effect of
concentrate supplementation on nutrient flow to the omasum in dairy cows receiving freshly cut
grass. J. Dairy Sci. 88:1443-1453.
Tylutki, T. P., D. G. Fox, V. M. Durbal, L. O. Tedeschi, J. B. Russell, M. E. Van Amburgh, T. R.
Overton, L. E. Chase, and A. N. Pell. 2008. Cornell Net Carbohydrate and Protein System: A
model for precision feeding of dairy cattle. Anim. Feed Sci. Technol. 143:174-202.
286
Valadares, R. F. D., G. A. Broderick, S. C. V. Filho, and M. K. Clayton. 1999. Effect of
replacing alfalfa silage with high moisture corn on ruminal protein synthesis estimated from
excretion of total purine derivatives. J. Dairy Sci. 82:2686-2696.
Van Amburgh, M. E., L. E. Chase, T. R. Overton, D. A. Ross, E. B. Recktenwald, R. J. Higgs,
and T. P. Tylutki. 2010. Updates to the Cornell Net Carbohydrate and Protein System v6.1 and
implications for ration formulation. Pages 144-159 in Proc. Cornell Nutrition Conference,
Syracuse NY.
Van Amburgh, M. E., E. B. Recktenwald, D. A. Ross, T. R. Overton, and L. E. Chase. 2007.
Achieving better nitrogen efficiency in lactating dairy cattle: Updating field usable tools to
improve nitrogen efficiency. Pages 25-38 in Proc. Cornell Nutrition Conference. Department of
Animal Science, Cornell University, Syracuse, NY.
Van Ambrugh, M. E., P. J. Van Soest, J. B. Robertson, and W. F. Knaus. 2003. Corn Silage
Neutral Detergent Fiber: Refining a mathematical approach for in vitro rates of digestion. Pages
99-108 in Proc. Cornell Nutrition Conference. Department of Animal Science, Cornell
University, Syracuse, NY.
VSN International. 2010. GenStat for Windows 13th Edition. VSN International, Hemel
Hempstead, UK.
Wildman, E. E., G. M. Jones, P. E. Wagner, R. L. Boman, H. F. Troutt, and T. N. Lesch. 1982. A
dairy cow body condition scoring system and its relationship to selected production
characteristics. J. Dairy Sci. 65:495-501.
Young, E. G. and C. F. Conway. 1942. On the estimation of allantoin by the Rimini-Schryver
reaction. J. Biol. Chem. 142:839-853.
287
CHAPTER 9: SUMMARY
Since the original publications of the CNCPS in the early 90’s, work has been ongoing to
improve the models capability to predict nutrient supply and requirements of dairy cattle with a
focus of field application. This dissertation describes a shift from the original structure of the
model that calculates statically, to a dynamic structure that calculates over time. Table 9.1 has a
summary of the major updates to the CNCPS since version 6.0 (Tylutki et al., 2008) that have
resulted in v6.1, v6.5 and v7.0. Contributions from this dissertation that have been implemented
into v6.5 of the model include updates to the chemistry and AA profiles of feeds in the feed
library and re-structuring of the protein pools (Chapter 2; Table 9.1). Updates that have resulted
in v7.0 are described in detail through this dissertation and the major changes are listed in Table
9.1. Data from the experiment described in Chapter 7 were simulated in v6.5 and v7.0 of the
CNCPS and serve to demonstrate differences in model predictions between the two versions
(Table 9.2).
Predicted ME supply is slightly higher in v7.0 (~1.0 Mcal/d) which is partially due to the
incorporation of NDF passage rates from the NorFor system (Chapter 3) which have resulted in
slower NDF passage and higher levels of predicted NDF digestion in the rumen. Version 6.5
predicts higher levels of MP supply for all treatments. This is most pronounced in the Base and
Base+M treatments which is largely due to higher levels of predicted microbial growth. Rumen
N balance is predicted to be adequate in all treatments in v6.5. In contrast, v7.0 predicts the Base
and Base+M treatments to be ~15% below requirement which is reflected in the predictions of
microbial MP supply (Table 9.2) and is consistent with the lower observed NDF digestion in
these treatments (Table 7.7). Differences in net protein requirements are due to the different
288
ways in which metabolic losses in the GIT are calculated. Version 7.0 mechanistically estimates
endogenous losses along the entire GIT (Chapter 5; Table 9.1), while v6.5 uses an empirical
estimate of metabolic fecal N (Fox et al., 2004). Although net protein requirements are different,
MP requirements are similar as each version of the model uses a different efficiency of use to
estimate MP from net protein (v6.5 = 67%; v7.0 = 73%). Because of the similar predicted MP
requirement, and higher predicted MP supply in v6.5, MP allowable milk was closer to actual
milk for the low protein diets (Base, Base+M and Base+MU) but was over-predicted for the
positive treatment, while v7.0 predicted cows were limited in MP for the low protein treatments,
but was adequate for the positive treatment. Predictions of Met balance were similar among
model versions; however, Lys balance was considerably lower in v6.5 than v7.0, despite
predicted MP supply being higher. Amino acid balance appeared to more closely reflect animal
performance for v7.0 of the CNCPS, while total MP supply was closer in v6.5 for the low protein
treatments. Rigorous evaluations are a critical component of model development process. Further
evaluations over a wide range of situations will further establish the relative performance of v7.0
of the CNCPS compared with v6.5 and other models used in the global dairy industry and
demonstrate the usefulness of the model as an on-farm ration balancing tool.
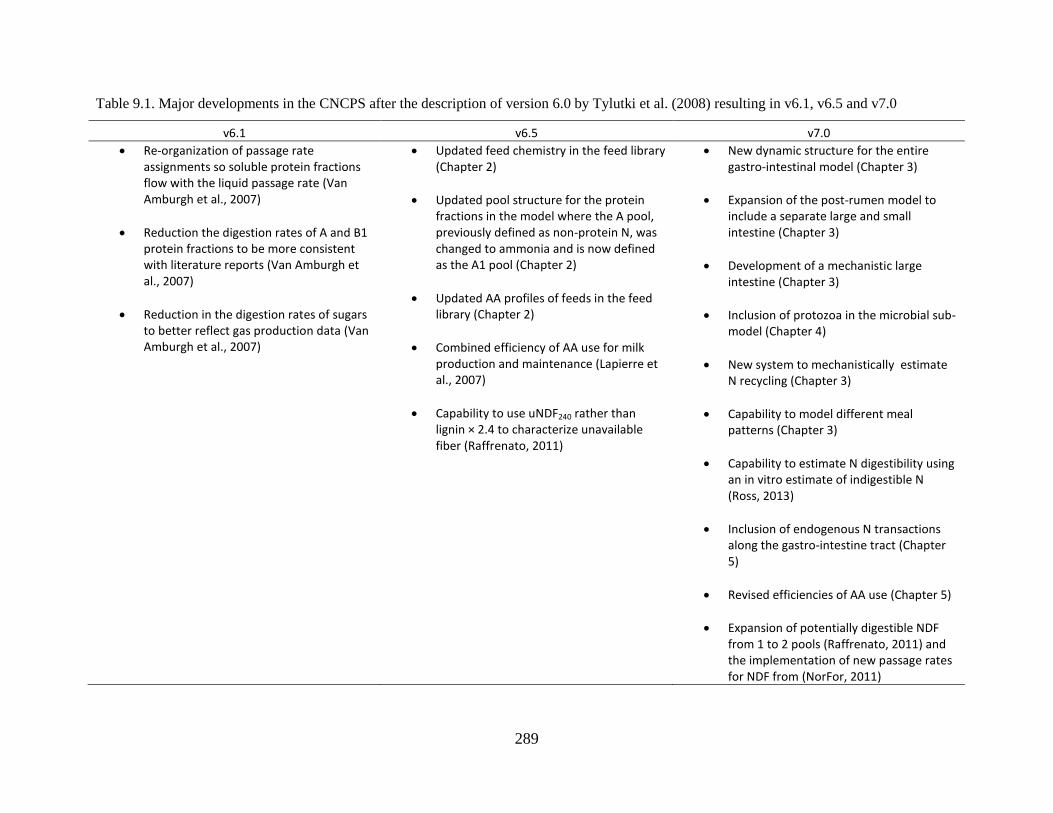
289
Table 9.1. Major developments in the CNCPS after the description of version 6.0 by Tylutki et al. (2008) resulting in v6.1, v6.5 and v7.0
v6.1 v6.5 v7.0
Re-organization of passage rate assignments so soluble protein fractions flow with the liquid passage rate (Van Amburgh et al., 2007)
Reduction the digestion rates of A and B1 protein fractions to be more consistent with literature reports (Van Amburgh et al., 2007)
Reduction in the digestion rates of sugars to better reflect gas production data (Van Amburgh et al., 2007)
Updated feed chemistry in the feed library (Chapter 2)
Updated pool structure for the protein fractions in the model where the A pool, previously defined as non-protein N, was changed to ammonia and is now defined as the A1 pool (Chapter 2)
Updated AA profiles of feeds in the feed library (Chapter 2)
Combined efficiency of AA use for milk production and maintenance (Lapierre et al., 2007)
Capability to use uNDF240 rather than lignin × 2.4 to characterize unavailable fiber (Raffrenato, 2011)
New dynamic structure for the entire gastro-intestinal model (Chapter 3)
Expansion of the post-rumen model to include a separate large and small intestine (Chapter 3)
Development of a mechanistic large intestine (Chapter 3)
Inclusion of protozoa in the microbial sub-model (Chapter 4)
New system to mechanistically estimate N recycling (Chapter 3)
Capability to model different meal patterns (Chapter 3)
Capability to estimate N digestibility using an in vitro estimate of indigestible N (Ross, 2013)
Inclusion of endogenous N transactions along the gastro-intestine tract (Chapter 5)
Revised efficiencies of AA use (Chapter 5)
Expansion of potentially digestible NDF from 1 to 2 pools (Raffrenato, 2011) and the implementation of new passage rates for NDF from (NorFor, 2011)
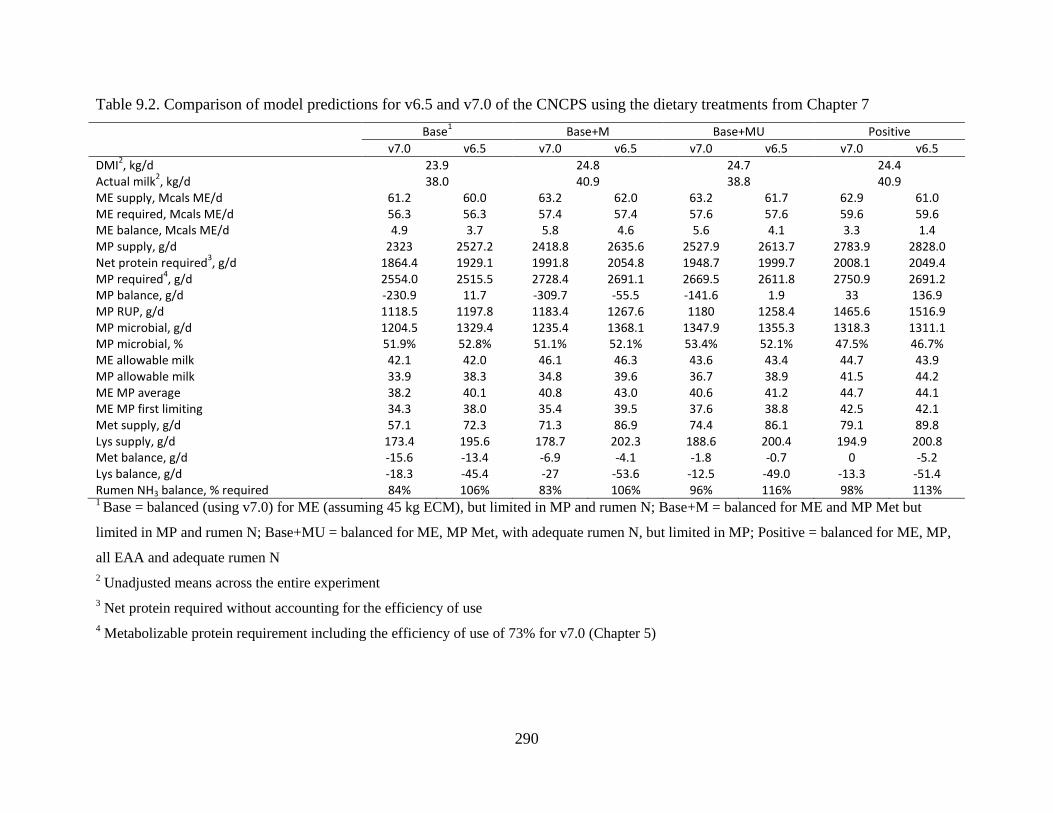
290
Table 9.2. Comparison of model predictions for v6.5 and v7.0 of the CNCPS using the dietary treatments from Chapter 7
Base1 Base+M Base+MU Positive
v7.0 v6.5 v7.0 v6.5 v7.0 v6.5 v7.0 v6.5
DMI2, kg/d 23.9 24.8 24.7 24.4
Actual milk2, kg/d 38.0 40.9 38.8 40.9
ME supply, Mcals ME/d 61.2 60.0 63.2 62.0 63.2 61.7 62.9 61.0 ME required, Mcals ME/d 56.3 56.3 57.4 57.4 57.6 57.6 59.6 59.6 ME balance, Mcals ME/d 4.9 3.7 5.8 4.6 5.6 4.1 3.3 1.4 MP supply, g/d 2323 2527.2 2418.8 2635.6 2527.9 2613.7 2783.9 2828.0 Net protein required
3, g/d 1864.4 1929.1 1991.8 2054.8 1948.7 1999.7 2008.1 2049.4
MP required4, g/d 2554.0 2515.5 2728.4 2691.1 2669.5 2611.8 2750.9 2691.2
MP balance, g/d -230.9 11.7 -309.7 -55.5 -141.6 1.9 33 136.9 MP RUP, g/d 1118.5 1197.8 1183.4 1267.6 1180 1258.4 1465.6 1516.9 MP microbial, g/d 1204.5 1329.4 1235.4 1368.1 1347.9 1355.3 1318.3 1311.1 MP microbial, % 51.9% 52.8% 51.1% 52.1% 53.4% 52.1% 47.5% 46.7% ME allowable milk 42.1 42.0 46.1 46.3 43.6 43.4 44.7 43.9 MP allowable milk 33.9 38.3 34.8 39.6 36.7 38.9 41.5 44.2 ME MP average 38.2 40.1 40.8 43.0 40.6 41.2 44.7 44.1 ME MP first limiting 34.3 38.0 35.4 39.5 37.6 38.8 42.5 42.1 Met supply, g/d 57.1 72.3 71.3 86.9 74.4 86.1 79.1 89.8 Lys supply, g/d 173.4 195.6 178.7 202.3 188.6 200.4 194.9 200.8 Met balance, g/d -15.6 -13.4 -6.9 -4.1 -1.8 -0.7 0 -5.2 Lys balance, g/d -18.3 -45.4 -27 -53.6 -12.5 -49.0 -13.3 -51.4 Rumen NH3 balance, % required 84% 106% 83% 106% 96% 116% 98% 113% 1 Base = balanced (using v7.0) for ME (assuming 45 kg ECM), but limited in MP and rumen N; Base+M = balanced for ME and MP Met but
limited in MP and rumen N; Base+MU = balanced for ME, MP Met, with adequate rumen N, but limited in MP; Positive = balanced for ME, MP,
all EAA and adequate rumen N
2 Unadjusted means across the entire experiment
3 Net protein required without accounting for the efficiency of use
4 Metabolizable protein requirement including the efficiency of use of 73% for v7.0 (Chapter 5)
291
9.1 References
Fox, D. G., L. O. Tedeschi, T. P. Tylutki, J. B. Russell, M. E. Van Amburgh, L. E. Chase, A. N.
Pell, and T. R. Overton. 2004. The Cornell Net Carbohydrate and Protein System model for
evaluating herd nutrition and nutrient excretion. Anim. Feed Sci. Technol. 112:29-78.
Lapierre, H., G. E. Lobley, D. R. Quellet, L. Doepel, and D. Pacheco. 2007. Amino acid
requirements for lactating dairy cows: Reconciling predictive models and biology. Pages 39-59
in Proc. Cornell Nutrition Conference. Department of Animal Science, Cornell University,
Syracuse, NY.
NorFor. 2011. The Nordic feed evaluation system. Wageningen Academic Publishers, The
Netherlands.
Raffrenato, E. 2011. Physical, chemical and kinetic factors associated with fiber digestibility in
ruminants and models describing these relationships. PhD Dissertation. Department of Animal
Science. Cornell University.
Ross, D. A. 2013. Methods to analyze feeds for nitrogen fractions and digestibility for ruminants
with application for the CNCPS. PhD Dissertation. Department of Animal Science. Cornell
University.
Tylutki, T. P., D. G. Fox, V. M. Durbal, L. O. Tedeschi, J. B. Russell, M. E. Van Amburgh, T. R.
Overton, L. E. Chase, and A. N. Pell. 2008. Cornell Net Carbohydrate and Protein System: A
model for precision feeding of dairy cattle. Anim. Feed Sci. Technol. 143:174-202.
Van Amburgh, M. E., E. B. Recktenwald, D. A. Ross, T. R. Overton, and L. E. Chase. 2007.
Achieving better nitrogen efficiency in lactating dairy cattle: Updating field usable tools to
improve nitrogen efficiency. Pages 25-38 in Proc. Cornell Nutrition Conference, Syracuse, NY.
Related Documents