1 In press on River Research and Applications (paper accepted on 24th February 2010) Armanini et al., in press. Development of a benthic macroinvertebrate flow sensitivity index for Canadian rivers. DEVELOPMENT OF A BENTHIC MACROINVERTEBRATE FLOW SENSITIVITY INDEX FOR CANADIAN RIVERS. ARMANINI D.G. 1* , N. HORRIGAN 1 , W.A. MONK 1 , D.L. PETERS 2 AND D.J. BAIRD 1 1 Department of Biology, NWRI/Environment Canada - Canadian Rivers Institute, University of New Brunswick, 10 Bailey Drive, PO Box 4400, E3B 5A3 Fredericton, NB, Canada 2 National Water Research Institute, Water & Climate Impacts Research Centre, PO Box 1700 STN CSC, University of Victoria, Victoria, BC, V8W 2Y2, Canada * Correspondence to: David G. Armanini, Department of Biology, NWRI/Environment Canada—Canadian Rivers Institute, University of New Brunswick, 10 Bailey Drive, PO Box 4400, E3B 5A3 Fredericton, NB, Canada. E-mail: [email protected] Running Head: Riverine macroinvertebrates and flow variability in Canada Abstract Widespread alteration of flow regimes requires guidelines for the protection of river ecosystems based on sound science. Preservation of the biodiversity within river ecosystems and sustaining natural ecological functions are key aspects of their management. However, the relationship between the biota and flow-related phenomena is poorly understood and, as a consequence, over-simplistic hydrology-based guidelines for river management have been adopted without establishing clear indicators of success. In the present paper, we aim to support the improvement of guidelines for flow (current velocity) management by developing a flow sensitivity index based on macroinvertebrates for Canadian rivers. Using benthic macroinvertebrate samples collected by the Canadian Aquatic Biomonitoring Network (CABIN), current velocity preferences for the 55 most common invertebrate taxa across a range of reference and potential reference sites were derived. A Canadian Ecological Flow Index (CEFI) was developed based on these preferences. By testing the index against independent data, CEFI was found to respond mainly to changes in hydraulic conditions, and was minimally influenced by confounding factors (e.g. stream type, organic enrichment). The index was further validated using two independent data sets from the west and east of Canada, suggesting countrywide applicability of the method. In conclusion, we have developed a practical approach to evaluate relationships between hydrological regime and an important component of the river biota, permitting the development of an index which has good potential as an indicator for the effects of flow alteration. Moreover, we outline how the CEFI could be used as a tool for the development of holistic guidelines for the estimation of riverine flow needs.

Welcome message from author
This document is posted to help you gain knowledge. Please leave a comment to let me know what you think about it! Share it to your friends and learn new things together.
Transcript

1
In press on River Research and Applications (paper accepted on 24th February 2010) Armanini et al., in press. Development of a benthic macroinvertebrate flow sensitivity index
for Canadian rivers.
DEVELOPMENT OF A BENTHIC MACROINVERTEBRATE FLOW SENSITIVITY INDEX FOR CANADIAN RIVERS.
ARMANINI D.G.1*, N. HORRIGAN1, W.A. MONK1, D.L. PETERS2 AND D.J.
BAIRD1
1Department of Biology, NWRI/Environment Canada - Canadian Rivers Institute, University of New Brunswick, 10 Bailey Drive, PO Box 4400, E3B 5A3 Fredericton, NB,
Canada 2National Water Research Institute, Water & Climate Impacts Research Centre, PO Box
1700 STN CSC, University of Victoria, Victoria, BC, V8W 2Y2, Canada
*Correspondence to: David G. Armanini, Department of Biology, NWRI/Environment Canada—Canadian Rivers Institute, University of New Brunswick, 10 Bailey Drive, PO Box 4400, E3B 5A3 Fredericton, NB, Canada. E-mail: [email protected] Running Head: Riverine macroinvertebrates and flow variability in Canada Abstract Widespread alteration of flow regimes requires guidelines for the protection of river ecosystems based on sound science. Preservation of the biodiversity within river ecosystems and sustaining natural ecological functions are key aspects of their management. However, the relationship between the biota and flow-related phenomena is poorly understood and, as a consequence, over-simplistic hydrology-based guidelines for river management have been adopted without establishing clear indicators of success. In the present paper, we aim to support the improvement of guidelines for flow (current velocity) management by developing a flow sensitivity index based on macroinvertebrates for Canadian rivers. Using benthic macroinvertebrate samples collected by the Canadian Aquatic Biomonitoring Network (CABIN), current velocity preferences for the 55 most common invertebrate taxa across a range of reference and potential reference sites were derived. A Canadian Ecological Flow Index (CEFI) was developed based on these preferences. By testing the index against independent data, CEFI was found to respond mainly to changes in hydraulic conditions, and was minimally influenced by confounding factors (e.g. stream type, organic enrichment). The index was further validated using two independent data sets from the west and east of Canada, suggesting countrywide applicability of the method. In conclusion, we have developed a practical approach to evaluate relationships between hydrological regime and an important component of the river biota, permitting the development of an index which has good potential as an indicator for the effects of flow alteration. Moreover, we outline how the CEFI could be used as a tool for the development of holistic guidelines for the estimation of riverine flow needs.

2
Keywords flow variability; hydroecology; invertebrates; diagnostics; LIFE index; biotic indices; stream ecology; management;
3
INTRODUCTION Streamflow quantity and timing are critical factors determining the ecological integrity of river systems (Poff, 1997), whether due to climatic variability or anthropomorphic activities. Widespread alteration of flow regimes urgently requires science-based guidelines for the protection of river ecosystems. However, the term “flow regime” conceals complex and interlinked phenomena, including instream habitat, hydraulics and the timing, magnitude, duration, frequency and flashiness of flow stages and events. Our understanding of the relationship between biota and these flow-related phenomena is improving, but is limited by the difficulty of deriving cause-effect relationships from a set of interacting variables. One consequence of this has been the adoption of over-simplistic hydrology-based guidelines for river management in those countries seeking management guidelines for river flow (Tharme, 2003). It is widely recognized that arbitrary minimum flows are inadequate to protect ecosystem goods and services, since these are strongly influenced by temporal variation in river flows (Arthington et al., 2006). Conceptual linkages between flow regime and biota have been advanced in recent years (Bunn and Arthington, 2002; Lytle and Poff, 2004; Arthington et al., 2006), yet few studies have explored these linkages using real data, and fewer still at a geographical scale permitting comparison of rivers with different natural flow regimes and different degree of alteration, with some notable exceptions (i.e. Clausen and Biggs, 1997; Extence et al., 1999; Woodward et al., 2002; Monk et al., 2006; Dunbar et al., 2009a; Dunbar et al., 2009b). One reason for this is a lack of suitable data. In order to establish relationships between flow regimes and their biota, two types of data are needed: long-term flow records (typically obtained from gauging stations) and paired biomonitoring data (preferably replicated over time). Few countries (Denmark, UK and Australia are notable exceptions) have a co-located network of river gauging stations and benthic macroinvertebrate (BMI) biomonitoring sampling sites sufficient to permit robust linkage of ecological and hydrological status. Like most other countries, Canada possesses a nascent national biomonitoring program (http://cabin.cciw.ca), yet has limited spatial coverage in terms of stream biomonitoring sites, and data are sparse to non-existent in some regions of the country (e.g. the Prairies, the Arctic). Moreover, sites where biomonitoring data are available are rarely co-located with active gauging stations, thus frustrating our ability to develop predictive models of ecohydrological sensitivity. Therefore, it is necessary to develop new methods to model flow conditions in situations where biological data are available but flow data are lacking (e.g. Young, 2006; Benyahya et al., 2007). In assessing ecohydrological impacts, it would be useful to know a priori which ecological components provide the best indicator of changes in flow regime. In Canada, salmonid fish are often used as an indicator species in this respect (e.g. Clarke et al., 2007). However, species-centric approaches – e.g. PHABSIM (Physical Habitat Simulation System; Bovee et al. 1988; Shirvell, 1989) – lack generality and ignore the fact that rivers without salmon populations can sustain a healthy biota. Freshwater macroinvertebrates, which are ubiquitously distributed in rivers, provide an excellent indictor of river ecosystem health and have historically been used to develop system

4
descriptive indices, e.g. number of Ephemeroptera-Plecoptera-Trichoptera (EPT; Lenat, 1983) and species richness (Hering et al., 2004). However, although such indices can indicate impact, they generally do not provide information on specific causes. As an alternative, multimetric approaches have been chosen in many European countries for ecosystem health assessment reflecting their flexibility and diagnostic power (Hering et al., 2004). Although accounting for variability in hydraulic conditions has been recognized as important in ecological quality assessment (e.g. Monk et al., 2006; Buffagni et al., 2009a), none of the actual assessment systems include flow-related metrics. In the UK, the Lotic-invertebrate Index for Flow Evaluation (LIFE) (Extence et al., 1999) provides one of the first metrics specifically designed to reflect faunal responses to a specified cause: altered flow regime. The LIFE score is based upon the preferences of riverine BMI taxa for flow velocities. This metric has been widely used to evaluate the influence of altered river flows on stream fauna at a range of sites in Denmark, Italy and United Kingdom (Extence et al., 1999; Monk et al., 2008; Buffagni et al., 2009b; Dunbar et al., 2009a; Dunbar et al., 2009b). The LIFE index reflects changes of the benthic community at both low and high flow conditions (Buffagni et al., 2009b; Dunbar et al., 2009a) at the site scale. Monk et al. (2008) have complemented those analyses showing that regional differences on the overall riverine flow conditions are reflected in the benthic community structure, as depicted by the LIFE index. The LIFE index also reflects the interaction between physical and hydraulic habitat conditions (Dunbar et al., 2009b), revealing significant interaction between flow and channel resectioning. However, LIFE is not directly applicable in North America due to faunal differences between the two regions. Moreover, although Europe and North America share a number of benthic macroinvertebrate families, the species that occur within the different families can differ within and between continents and this can influence computation of flow preferences at the family level. Dunbar et al. (2009) recognized the need, prior to calculating the LIFE index on Danish samples, to modify selected UK genus-level LIFE score for the same reason. If a similar indicator is to be developed for Canada, the flow sensitivities of Canadian taxa must therefore be investigated. Improved guidelines for flow management can only be achieved by taking a strategic approach to what is a complex, multifaceted problem. Here we aim to contribute to the development of this strategy by addressing several questions: 1) Building on the LIFE approach currently employed in parts of Europe (Extence et al., 1999), can we develop a similar index based on current velocity preferences of BMI, which is applicable to Canadian streams? 2) Do calculated index values correspond to local hydraulic habitat conditions? 3) Is the index significantly biased by confounding effects?
DATA AND METHODS Study area We extracted riverine BMI data from Environment Canada's CABIN online database (http://cabin.cciw.ca, consulted April 2009). Data have been collected in a range of conditions and have been classified as: 1) reference: no observed modifying influences within the vicinity of the reach at the time of sampling, this being confirmed by later, more detailed examination of surrounding land use; 2) potential reference: no observed
5
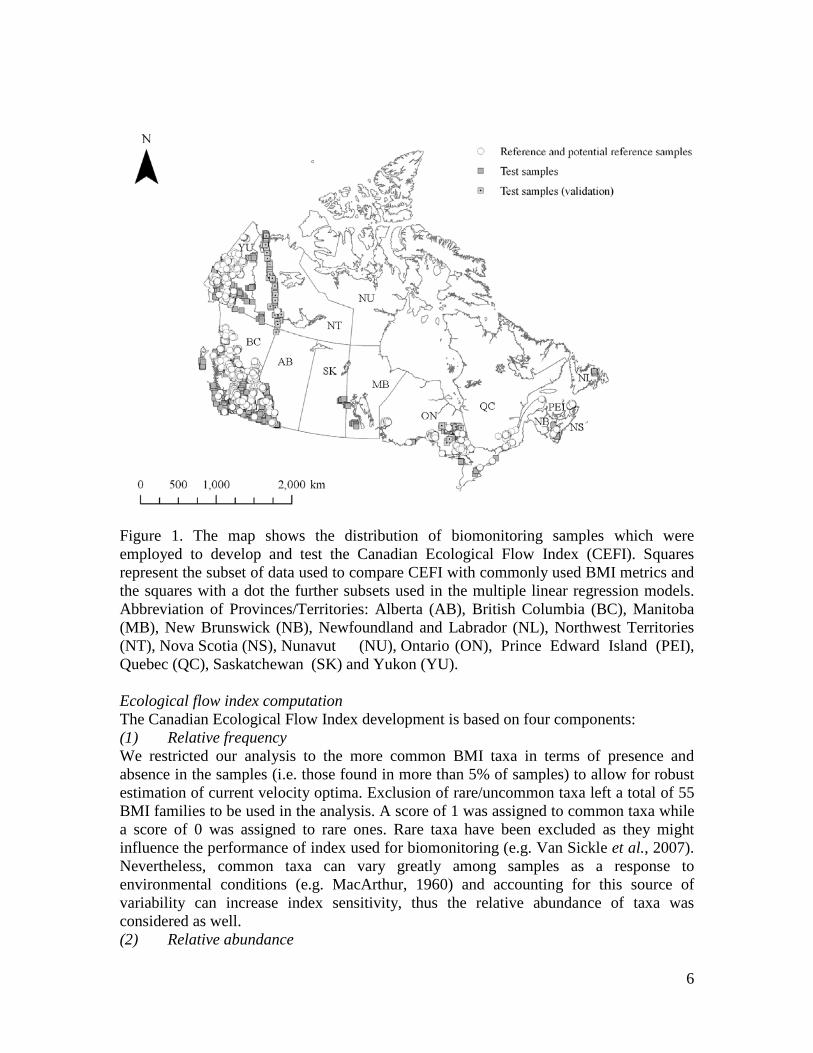
modifying influences within the vicinity of the reach at the time of sampling; 3) test: one or more modifying influences present within the vicinity of the reach at the time of sampling (Reynoldson et al., 2007). In the CABIN protocol sites are classified as test sites when any source of investigated pollution is identified and it is beyond critical levels. Focus is given to organic pollution detection, land use change, presence of roads and other morphological alteration and pesticide levels are also measured A check for availability of hydraulic or hydraulically-influenced variables on the CABIN database indicated that the most common parameters were, in order of occurrence, current velocity, substrate type and channel depth. Although those three variables could be used together to characterise the hydraulic habitat (e.g. Newson et al., 1998; Buffagni et al., 2009b), the number of samples in which the three variables were simultaneously available was consistently lower than including just current velocity (reference and potential reference n = 762, overall n = 2065) and the multi-variable approach was abandoned. The most commonly measured variables were average current velocity (m s-1) for a reach. Average current velocity is the average of 3-5 measurement of current velocity, obtained with a velocity meter, across the channel in correspondence of the benthic invertebrate sampling stretch (Reynoldson et al., 2007). Average current velocity ranged between a minimum of 0 and a maximum of 1.99 m s-1, inter-quartile range (25th-75th) varied between 0.18 and 0.54 m s-1 and median value was 0.35 m s-1. The data subset with BMI data and a measure of average current velocity, comprised 77 different projects/studies located in all Canadian Provinces/Territories except Nunavut (see Figure 1). This subset included 917 reference or potential reference samples and an additional 1842 'test site' samples in wadeable streams and small rivers collected between 1992 and 2008 (overall n = 2759). Of those, 415 have been multiple samples of the same sites, while 2344 samples were unique site observations. Environmental and biological data retrieval Site data were collated in a taxon abundance matrix, with individual taxa adjusted to family level. Samples were processed until a count of 300 organisms was obtained (Reynoldson et al., 2007). All samples were collected using a standardized traveling kick net method, which disturbs the stream substrate to a depth of ~5 cm using a triangular net of 400-µm mesh size, while walking backwards upstream. The collector zigzags over the stream bottom from bank to bank in an upstream direction for 3 minutes (http://cabin.cciw.ca). Habitat and water chemistry data were collected following procedures outlined in detail in the CABIN website (http://cabin.cciw.ca).
6
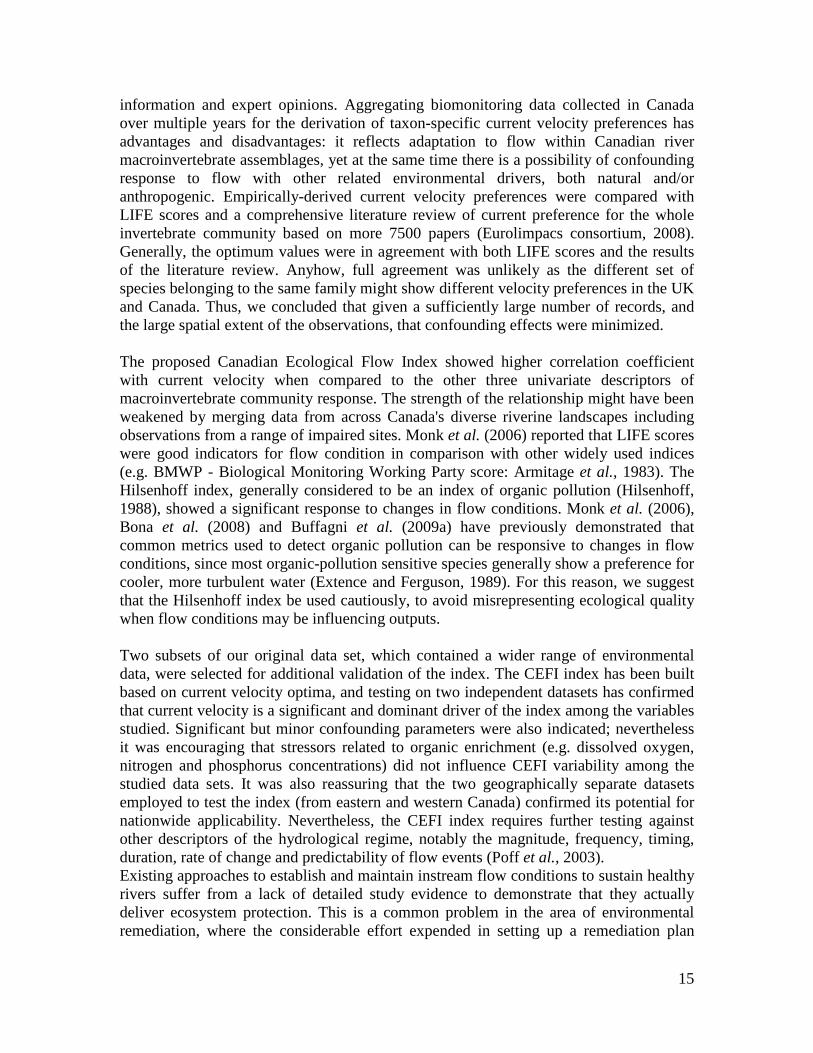
Figure 1. The map shows the distribution of biomonitoring samples which were employed to develop and test the Canadian Ecological Flow Index (CEFI). Squares represent the subset of data used to compare CEFI with commonly used BMI metrics and the squares with a dot the further subsets used in the multiple linear regression models. Abbreviation of Provinces/Territories: Alberta (AB), British Columbia (BC), Manitoba (MB), New Brunswick (NB), Newfoundland and Labrador (NL), Northwest Territories (NT), Nova Scotia (NS), Nunavut (NU), Ontario (ON), Prince Edward Island (PEI), Quebec (QC), Saskatchewan (SK) and Yukon (YU). Ecological flow index computation The Canadian Ecological Flow Index development is based on four components: (1) Relative frequency We restricted our analysis to the more common BMI taxa in terms of presence and absence in the samples (i.e. those found in more than 5% of samples) to allow for robust estimation of current velocity optima. Exclusion of rare/uncommon taxa left a total of 55 BMI families to be used in the analysis. A score of 1 was assigned to common taxa while a score of 0 was assigned to rare ones. Rare taxa have been excluded as they might influence the performance of index used for biomonitoring (e.g. Van Sickle et al., 2007). Nevertheless, common taxa can vary greatly among samples as a response to environmental conditions (e.g. MacArthur, 1960) and accounting for this source of variability can increase index sensitivity, thus the relative abundance of taxa was considered as well. (2) Relative abundance
7
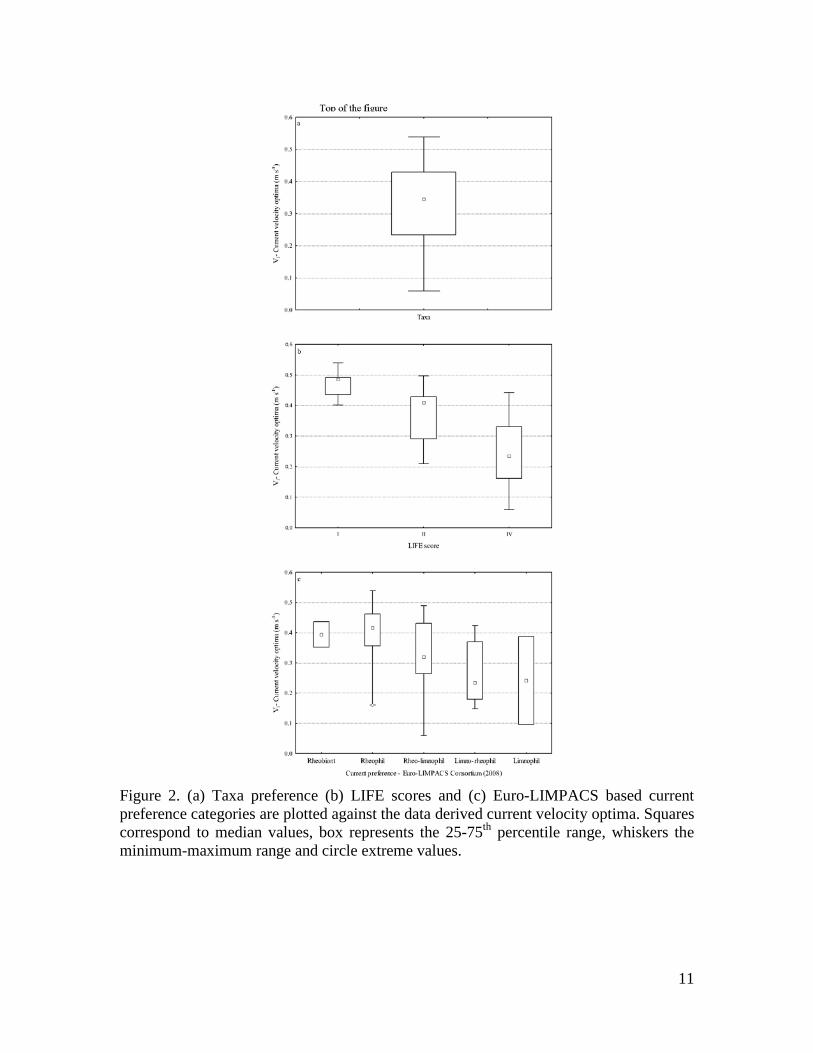
The CABIN protocol requires counts of taxa individuals collected in the samples. Taxa relative abundances were calculated as the abundance of the ith taxon divided by the total abundance in the sample. Relative abundance, ranging from 0 (taxon absent from sample) to 1 (taxon constitutes entire sample) was employed as data were collected by different operators in different projects (Appendix 1) and, even though the same protocol was applied, slight differences in net mesh size and sorting protocols could have occurred. Relative abundance is considered to be the most consistent quantitative estimation within the selected protocol (Ludwig and Reynolds, 1988). (3) Current velocity optimum value To reduce the effects of multiple stressor simultaneously acting on the benthic samples, only samples classified as reference or potential reference were selected. In order to determine the optimum value of a taxon for an environmental variable, the weighted average of current velocity for each of the 55 common taxonomic families was calculated (Ter Braak and Prentice, 1988). The average was weighted based on family relative abundance. This method to calculate habitat preference follows the approach of Constrained Correspondence Analysis (CCA) multivariate scores (e.g. Dodkins et al., 2005). Computed current velocity optima ranged between a minimum of 0.06 m/s, observed for the Caenidae (Ephemeroptera), and a maximum of 0.54 m/s, observed for the Perlidae (Plecoptera) (Figure 2a and Appendix 2). (4) Indicator weight score Indicator weight score was computed as the weighted standard deviation of optimum values (after Heckert and Filliben, 1996) and indicates the tolerance of a taxon to a given environmental parameter (Zelinka and Marvan, 1961; Ter Braak and Prentice, 1988) - in this case, average current velocity. Four indicator weight scores were assigned, based on the standard deviation (SD) of current velocity: current velocity SD<0.13 scored 8 (indicator factor: SD/2); 0.13<SD<2.6 scored 4 (SD); 0.26<SD<0.52 scored 2 (SD*2); SD>0.52 scored 1 (SD*4). The scoring system was adapted from Haase and Nolte (2008) and it aims to assign a higher weight to taxa with a restricted distribution range, expressed in terms of standard deviation. Based on these four components, the Canadian Ecological Flow Index (CEFI) is calculated as follows:
where Fi – relative frequency class of ith taxon, Ri – relative abundance of ith taxon in the sample, Vi - optimum of the ith taxon (current velocity preference), Wi – indicator weight score of ith taxon; The weighted standard error (S.E.) of the CEFI index was also calculated (after Haase and Nolte, 2008) as:
Multiple line-of-evidence index validation Testing of current velocity optima
8
Empirical flow preferences can be a robust, explicit estimation of taxon flow requirements. However, there is always a chance that observed responses may be confounded by other factors, such as reduction in flow being accompanied by nutrient enrichment, due to a concentration of nutrient load in receiving waters of reduced volume. To help control for this possibility, we excluded all sites indicated as ‘test’ sites. However, there was no guarantee that all streams in the dataset were in good condition at the time of sampling. Separation of confounding stressor effects is notoriously difficult, and here we adopt a multiple-lines-of-evidence approach in order to eliminate or reduce confounding effects. To achieve this, derived BMI family preferences were compared to those of similar taxa elsewhere: a) LIFE scores, which were obtained directly from Extence et al. (1999) and Furse (pers. comm.) for families common to UK and Canada and b) current preference classification provided by the Euro-LIMPACS Consortium (2008) for families common to Canada and Europe. The LIFE score is based on taxa scores derived from documented relationships between flow conditions and the occurrence of macroinvertebrate taxa. Low scores are assigned to taxa considered rheophilic, while higher scores are assigned to limnophilic taxa. The flow score is then combined with abundance categories. The final score is obtained by dividing the sum of the score obtained for each taxon by the total number of taxa. The Euro-LIMPACS classification was downloaded from www.freshwaterecology.info and included species level information on ca. 2750 species of BMI. The classification used follows Schmedtje and Colling (1996): based on literature information taxa are classified in terms of preference for standing or running waters. The 7 categories were transformed to a categorical variable ranging between 0 – 'Limnobiont: Occurring only in standing water' – to 5 – 'Rheobiont: Occurring in streams; bound to zones with high current'. The category 'Indifferent - No preference for a certain current velocity' was assigned to the mean category (value 3.5). Family preferences were collated by computing an average of species level preferences for current velocity, which was approximated to the closest integer. Comparison of CEFI with commonly used BMI metrics In order to compare selected commonly-used univariate descriptors of benthic community with the response of the flow-specific metric (i.e. CEFI) based on current velocity preferences, the following metrics were computed:
• Total number of Families (Hering et al., 2004); • Number of EPT Families (Lenat, 1983); • Hilsenhoff index (Hilsenhoff, 1988).
The relationships between univariate descriptors of BMI community structure (family richness, EPT richness, Hilsenhoff index and CEFI) and hydraulic descriptors (namely current velocity) were explored graphically, and by Spearman rank correlation. 1925 'CABIN test samples’ not included in the original current velocity preference derivation were selected. Hydraulic habitat importance and potential confounding factors Two subsets of data were selected based on availability of biological and environmental data: the Mackenzie River study and the Moose River study (Figure 1). The Mackenzie River study includes 58 unique summer samples (one observation per site), except one
9
sampled twice, collected between 2005 and 2006 on the Mackenzie River (Northwest Territories). This area has previously shown minor alterations in streamflow due to upstream development (e.g. the Bennett hydro-electric dam in the headwaters of the Peace River). The Moose River study includes 71 unique summer samples collected in August 1999 from different streams of the Laurentian Great lakes Basin (Ontario). This area has been affected by forest disturbance between 1985 and 1990 as documented by Buttle and Metcalfe (2000). Both these data sets were not included in the original velocity preference derivation but were selected to complete detailed analyses of parameters influencing the index distribution. Table 1 summarizes the range of the environmental variables reported in the two studies. Multiple linear regression analysis using several R packages (R Development Core Team, 2009) was employed to examine the relationship between the CEFI and environmental factors. Each continuous variable was log-transformed, (excluding pH, Latitude; see Tables 1 and 2 for a complete list of variables) to satisfy model assumptions for variance homogeneity. Variables to be included in the linear regression models were tested for multicollinearity between predictors, using the variance-inflation factor (VIF) as described by Fox and Monette (1992). Variables with VIF higher than 10 were flagged as potentially harmful due to collinearity (Graham, 2003) and their inclusion/exclusion for the model further discussed. Longitude and latitude were considered as a proxy of climate variation and they were found to be highly correlated in both datasets, although latitudinal changes in climatic conditions in both areas were likely stronger than longitudinal changes. Thus, only latitude was included as predictor in the analyses. Bankfull width (m) and wetted width (m) were highly correlated in both datasets as well. These variables are expected to be highly correlated in the same season while showing differences between seasons. As the samples were collected in the same season in both datasets, a new variable was derived: the ratio between wetted width and bankfull width (Channel width – ratio, Table 1 and 2). Influential observations were considered for inclusion/exclusion after checking scatter plots of standardized residuals against theoretical quantiles and leverage and Bonferroni p-value for the most extreme observations (Fox, 1997). No influential samples were identified in none of the datasets. In order to perform variable selection for the models, the Akaike Information Criterion (AIC; Sakamoto et al., 1986) was computed using the ‘MASS’ package (bi-directional approach; Venables and Ripley, 2002). If differences in AICs were small (i.e. < 2), the model with the fewest predictors was selected (Quinn and Keough, 2002). Linear model assumptions were tested using the GVLMA package (Pena and Slate, 2006). Parameters considered were skewness, kurtosis, link function and heteroscedasticity, and models were accepted only if the global test of the linear model assumptions was not significant, in addition to single parameters (p>0.05). Relative importance of variables was computed to simplify interpretation of the contribution of each predictor in the final multiple regression model (Gromping, 2006). More in detail, as a variety of relative importance measure are available (Gromping, 2006); based on the study by Johnson and Lebreton (2004), the Lindeman, Merenda, and Gold (lmg) metric was selected. The metric was normalized to sum to 100%.
10
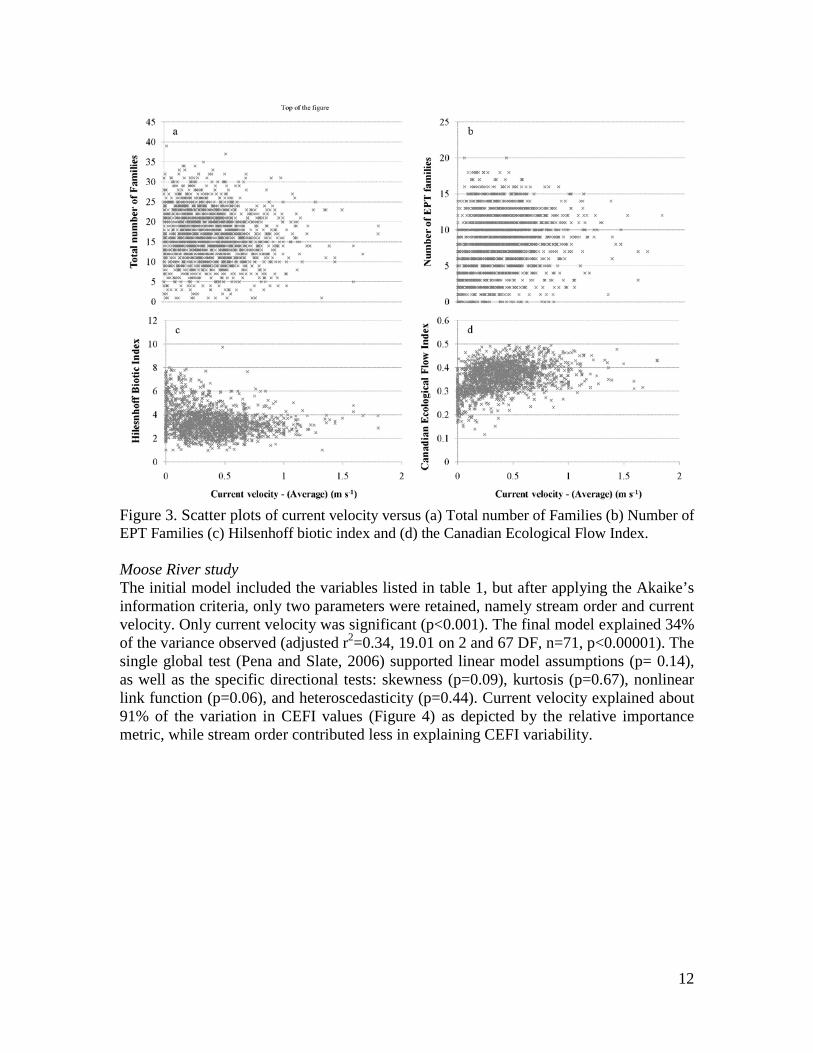
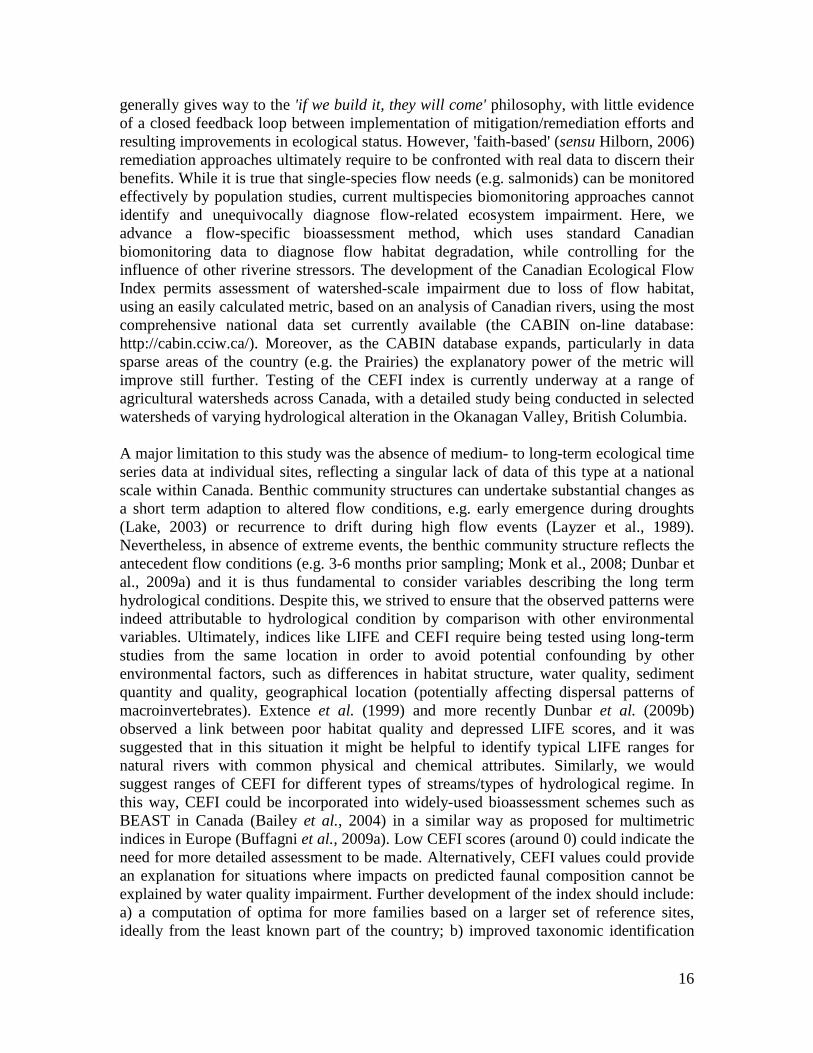
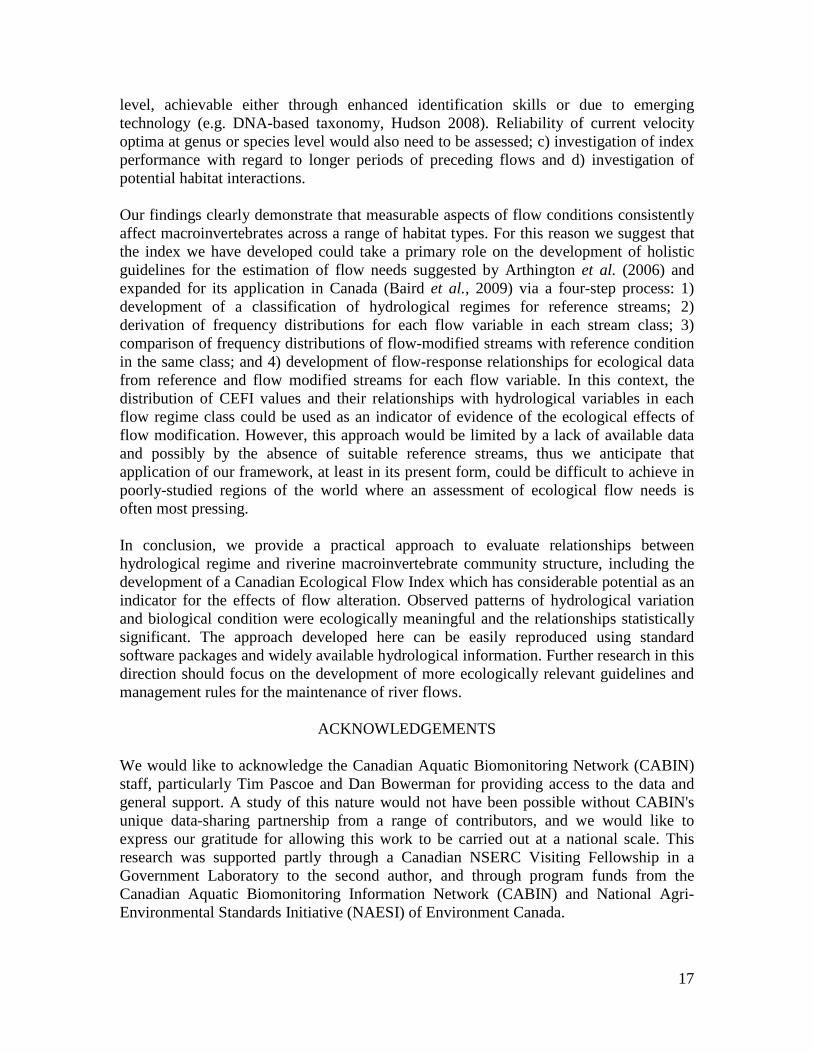
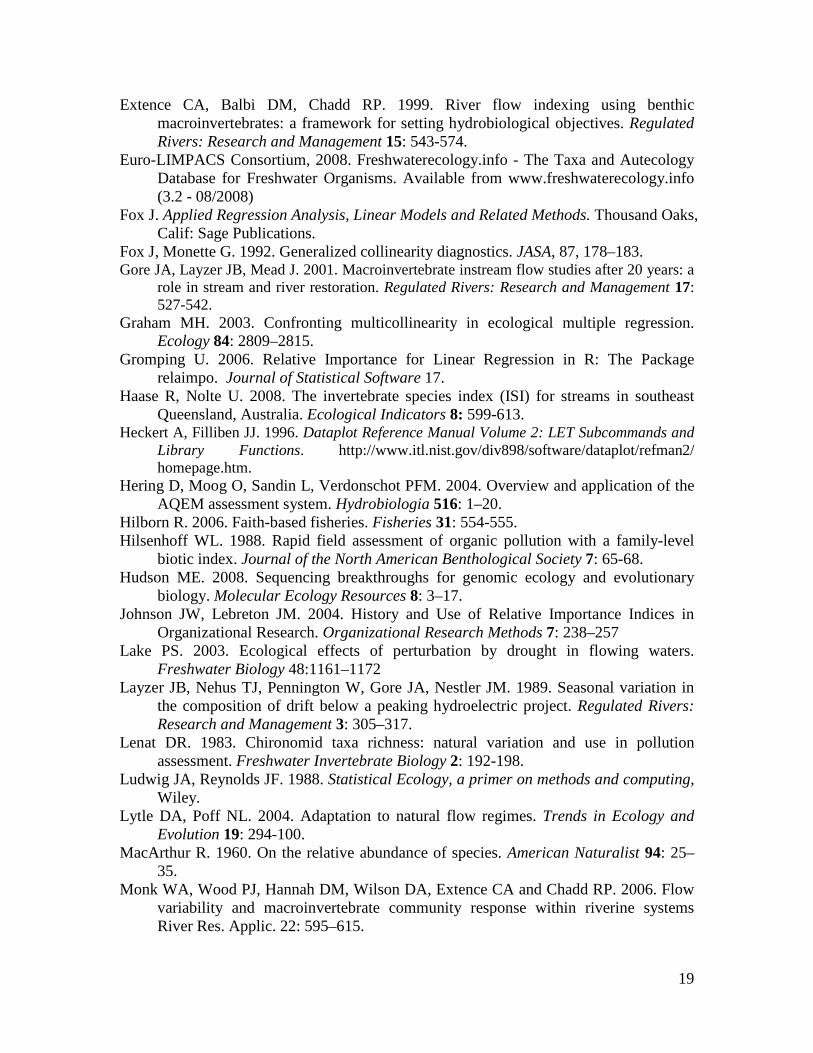
RESULTS Derivation of current velocity sensitivities for Canadian macroinvertebrates and comparison with previous knowledge Current velocity optima derived from the national CABIN data set are given in Appendix 2. In the majority of cases, the sensitivity estimations are in agreement with previous knowledge of the flow sensitivity of BMI families. Empirical optima were in agreement with LIFE scores for the families common to the Canada and UK (Fig. 2b). Although, a certain degree of variability was expected due to different analytical approaches and different family taxonomic composition, a clear trend of decreasing rheophily in LIFE score corresponded to lower optimum values and vice versa. This trend was clear when examining the median values, although percentile range overlaps were observed. Empirical optima were also compared to current preferences of European taxa (Euro-LIMPACS Consortium, 2008; Fig. 2c). As observed for the LIFE index, when looking at median values, a trend of decreasing rheophily corresponded to lower optimum values and vice versa. The only exception was the Limnophil class that includes only two families. One, the Gastropoda Planorbidae family showed a comparable classification in the two data sources (i.e. an optimum of ca. 0.10 m/s), while for the other one, the Diptera Tipulidae family, the two classifications did not match (i.e. an optimum of ca. 0.4 m/s). Comparison of the CEFI index with more commonly-used univariate descriptors Scatter plots showing the relationships between family richness (Fig. 3a), EPT richness (Fig. 3b), Hilsenhoff index (Fig. 3c), CEFI (Fig. 3d) and current velocity were produced including only test sites (number of observations = 1925). Significant relationships between univariate descriptors of macroinvertebrate community structure and current velocity were obtained (p<0.001) for the four descriptors selected. Nevertheless, CEFI showed the highest Pearson correlation coefficient (r=0.39) compared to the other metrics (-0.10, 0.17 and -0.22 respectively). Estimation of hydraulic habitat importance and potential confounding factors Mackenzie River study The initial model included the variables listed in table 1, but after applying the Akaike’s information criteria, only four parameters were retained, namely latitude, channel width – ratio, current velocity and conductivity. All parameters were significant, except channel width – ratio (Table 1). The final model explained 41% of the variance observed (adjusted r2=0.41, 10.84 on 4 and 53 DF, n=58, p<0.00001). The single global test (Pena and Slate, 2006) supported linear model assumptions (p= 0.36), as well as the specific directional tests: skewness (p=0.46), kurtosis (p=0.65), nonlinear link function (p=0.22), and heteroscedasticity (p=0.14). Current velocity explained nearly 50% of the variation in CEFI values (Figure 4) as depicted by the relative importance metric, while the other parameters contributed less in explaining CEFI variability.
11
Figure 2. (a) Taxa preference (b) LIFE scores and (c) Euro-LIMPACS based current preference categories are plotted against the data derived current velocity optima. Squares correspond to median values, box represents the 25-75th percentile range, whiskers the minimum-maximum range and circle extreme values.
12
Figure 3. Scatter plots of current velocity versus (a) Total number of Families (b) Number of EPT Families (c) Hilsenhoff biotic index and (d) the Canadian Ecological Flow Index. Moose River study The initial model included the variables listed in table 1, but after applying the Akaike’s information criteria, only two parameters were retained, namely stream order and current velocity. Only current velocity was significant (p<0.001). The final model explained 34% of the variance observed (adjusted r2=0.34, 19.01 on 2 and 67 DF, n=71, p<0.00001). The single global test (Pena and Slate, 2006) supported linear model assumptions (p= 0.14), as well as the specific directional tests: skewness (p=0.09), kurtosis (p=0.67), nonlinear link function (p=0.06), and heteroscedasticity (p=0.44). Current velocity explained about 91% of the variation in CEFI values (Figure 4) as depicted by the relative importance metric, while stream order contributed less in explaining CEFI variability.
13
Mean Min Max SD b SE t Pr(>|t|) Lmg AIC VIFLongitude (decimal degrees) 65.7 59.5 69.4 2.6 - - - - - - >10Latitude (decimal degrees) -128.1 -134.9 -119.9 4.4 0.00 0.00 -2.09 * 18.9% - -Altitude (m) 141.5 1.0 620.9 118.9 - - - - - -373.22 -Channel width – ratio 0.7 0.3 1.0 0.2 -0.09 0.05 -1.94 ns 14.2% - -
Current velocity - (average) (m s-1) 0.87 0.00 31.60 4.04 0.32 0.07 4.74 *** 49.9% - -Channel depth - (average) (cm) 51.85 10.00 200.00 47.94 - - - - - -375.05 -Substrate - dominant size category 3.90 0.00 7.00 1.77 - - - - - -371.33 -pH 7.93 6.79 8.72 0.43 - - - - - -369.38 -
Phosphorus - total (mg L-1) 0.01 0.00 0.14 0.02 - - - - - -378.13 -
Nitrogen - nitrate + nitrite (mg L-1) 0.03 0.00 0.43 0.06 - - - - - -376.68 -Turbidity (NTU) 16.47 0.23 172.60 29.07 - - - - - -379.96 -
Conductivity (uS cm-1) 417.27 45.40 2116.00 405.71 0.03 0.01 2.17 * 17.0% - -Intercept 0.61 0.18 3.31 **
- - - - - - -- - - - - - -
Longitude (decimal degrees) -81.9 -83.8 -80.2 1.0 - - - - - - >10Latitude (decimal degrees) 48.9 47.5 49.9 0.6 - - - - - -441.1 -Altitude (m) 288.2 204.0 443.0 55.1 - - - - - -451.2 -Channel width – ratio 0.9 0.4 1.0 0.2 - - - - - -450.5 -Stream order 2.9 1.0 6.0 1.4 -0.05 0.03 -1.66 ns 3.6% - -
Hyd
raul
icha
bita
t
Current velocity - (average) (m s-1) 0.10 0.00 0.61 0.14 0.66 0.11 6.17 *** 91.5% - -
pH 7.28 6.30 8.10 0.35 - - - - - -445.0 -
Dissolved oxygen (mg L-1) 8.03 5.00 11.00 1.18 - - - - - -448.8 -
Phosphorus - total (mg L-1) 0.02 0.01 0.05 0.01 - - - - - -443.1 -
Nitrogen - total Kjeldahl (TKN) 0.68 0.26 1.72 0.27 - - - - - -439.1 -
Conductivity (uS cm-1) 168.96 7.20 1524.00 170.34 - - - - - -446.9 -
Intercept 0.27 0.02 15.88 ***
Phys
io-c
hem
ical
cond
ition
s
Mackenzie River study
Stre
am ty
peH
ydra
ulic
habi
tat
Phys
io-c
hem
ical
cond
ition
s
Moose River study
Stre
am ty
pe
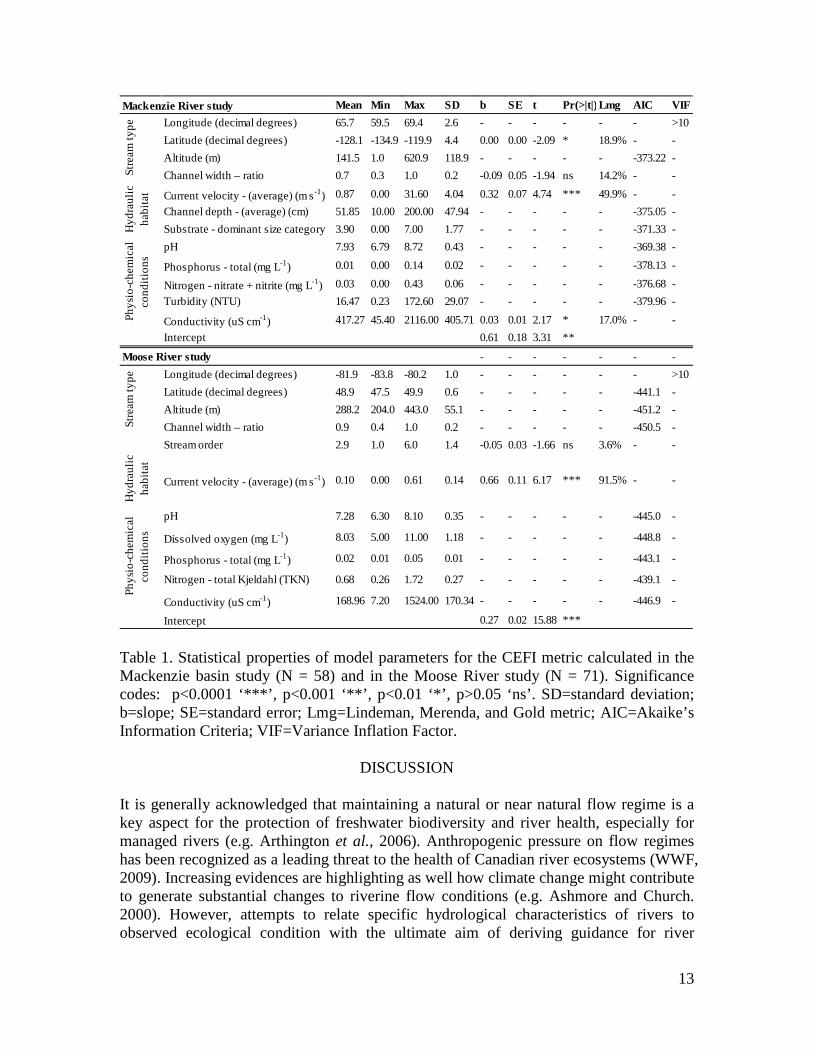
Table 1. Statistical properties of model parameters for the CEFI metric calculated in the Mackenzie basin study (N = 58) and in the Moose River study (N = 71). Significance codes: p<0.0001 ‘***’, p<0.001 ‘**’, p<0.01 ‘*’, p>0.05 ‘ns’. SD=standard deviation; b=slope; SE=standard error; Lmg=Lindeman, Merenda, and Gold metric; AIC=Akaike’s Information Criteria; VIF=Variance Inflation Factor.
DISCUSSION
It is generally acknowledged that maintaining a natural or near natural flow regime is a key aspect for the protection of freshwater biodiversity and river health, especially for managed rivers (e.g. Arthington et al., 2006). Anthropogenic pressure on flow regimes has been recognized as a leading threat to the health of Canadian river ecosystems (WWF, 2009). Increasing evidences are highlighting as well how climate change might contribute to generate substantial changes to riverine flow conditions (e.g. Ashmore and Church. 2000). However, attempts to relate specific hydrological characteristics of rivers to observed ecological condition with the ultimate aim of deriving guidance for river
14
managements are frustrated by a number of challenges. The complex nature of hydrological patterns requires large numbers of observations, and correspondingly large amounts of data for any conclusion to be deemed robust. Aside of hydrological information, habitat characterization should be undertaken using habitat survey methods (e.g. Raven et al., 1998). However, to date a standard hydro-morphological collection method is not available in Canada and application and testing of similar methods are highly encouraged. Matching descriptors of both hydrological and habitat conditions and ecological endpoints is another challenge which can only be addressed by amassing significant data with which to confront conceptual models. Creating models is easy, while data collection is difficult and expensive, and is generally beyond the scope of individual researchers at sufficient scale to fully test model predictions.
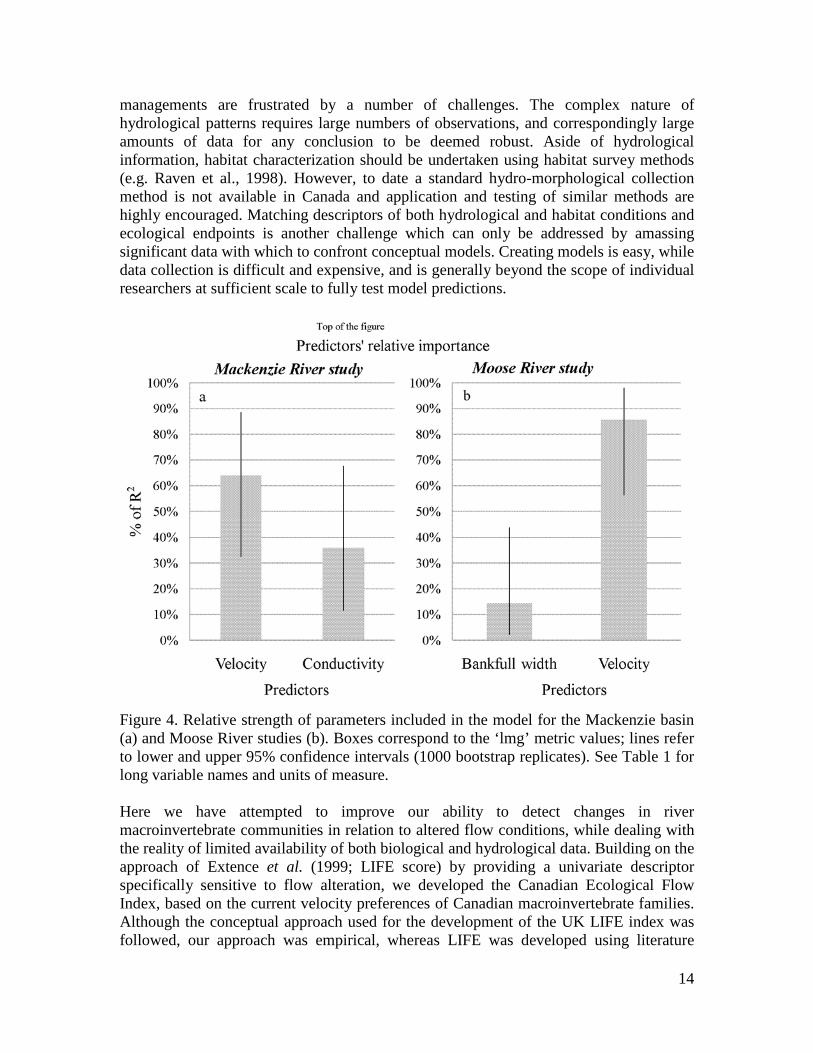
Figure 4. Relative strength of parameters included in the model for the Mackenzie basin (a) and Moose River studies (b). Boxes correspond to the ‘lmg’ metric values; lines refer to lower and upper 95% confidence intervals (1000 bootstrap replicates). See Table 1 for long variable names and units of measure. Here we have attempted to improve our ability to detect changes in river macroinvertebrate communities in relation to altered flow conditions, while dealing with the reality of limited availability of both biological and hydrological data. Building on the approach of Extence et al. (1999; LIFE score) by providing a univariate descriptor specifically sensitive to flow alteration, we developed the Canadian Ecological Flow Index, based on the current velocity preferences of Canadian macroinvertebrate families. Although the conceptual approach used for the development of the UK LIFE index was followed, our approach was empirical, whereas LIFE was developed using literature
15
information and expert opinions. Aggregating biomonitoring data collected in Canada over multiple years for the derivation of taxon-specific current velocity preferences has advantages and disadvantages: it reflects adaptation to flow within Canadian river macroinvertebrate assemblages, yet at the same time there is a possibility of confounding response to flow with other related environmental drivers, both natural and/or anthropogenic. Empirically-derived current velocity preferences were compared with LIFE scores and a comprehensive literature review of current preference for the whole invertebrate community based on more 7500 papers (Eurolimpacs consortium, 2008). Generally, the optimum values were in agreement with both LIFE scores and the results of the literature review. Anyhow, full agreement was unlikely as the different set of species belonging to the same family might show different velocity preferences in the UK and Canada. Thus, we concluded that given a sufficiently large number of records, and the large spatial extent of the observations, that confounding effects were minimized. The proposed Canadian Ecological Flow Index showed higher correlation coefficient with current velocity when compared to the other three univariate descriptors of macroinvertebrate community response. The strength of the relationship might have been weakened by merging data from across Canada's diverse riverine landscapes including observations from a range of impaired sites. Monk et al. (2006) reported that LIFE scores were good indicators for flow condition in comparison with other widely used indices (e.g. BMWP - Biological Monitoring Working Party score: Armitage et al., 1983). The Hilsenhoff index, generally considered to be an index of organic pollution (Hilsenhoff, 1988), showed a significant response to changes in flow conditions. Monk et al. (2006), Bona et al. (2008) and Buffagni et al. (2009a) have previously demonstrated that common metrics used to detect organic pollution can be responsive to changes in flow conditions, since most organic-pollution sensitive species generally show a preference for cooler, more turbulent water (Extence and Ferguson, 1989). For this reason, we suggest that the Hilsenhoff index be used cautiously, to avoid misrepresenting ecological quality when flow conditions may be influencing outputs. Two subsets of our original data set, which contained a wider range of environmental data, were selected for additional validation of the index. The CEFI index has been built based on current velocity optima, and testing on two independent datasets has confirmed that current velocity is a significant and dominant driver of the index among the variables studied. Significant but minor confounding parameters were also indicated; nevertheless it was encouraging that stressors related to organic enrichment (e.g. dissolved oxygen, nitrogen and phosphorus concentrations) did not influence CEFI variability among the studied data sets. It was also reassuring that the two geographically separate datasets employed to test the index (from eastern and western Canada) confirmed its potential for nationwide applicability. Nevertheless, the CEFI index requires further testing against other descriptors of the hydrological regime, notably the magnitude, frequency, timing, duration, rate of change and predictability of flow events (Poff et al., 2003). Existing approaches to establish and maintain instream flow conditions to sustain healthy rivers suffer from a lack of detailed study evidence to demonstrate that they actually deliver ecosystem protection. This is a common problem in the area of environmental remediation, where the considerable effort expended in setting up a remediation plan
16
generally gives way to the 'if we build it, they will come' philosophy, with little evidence of a closed feedback loop between implementation of mitigation/remediation efforts and resulting improvements in ecological status. However, 'faith-based' (sensu Hilborn, 2006) remediation approaches ultimately require to be confronted with real data to discern their benefits. While it is true that single-species flow needs (e.g. salmonids) can be monitored effectively by population studies, current multispecies biomonitoring approaches cannot identify and unequivocally diagnose flow-related ecosystem impairment. Here, we advance a flow-specific bioassessment method, which uses standard Canadian biomonitoring data to diagnose flow habitat degradation, while controlling for the influence of other riverine stressors. The development of the Canadian Ecological Flow Index permits assessment of watershed-scale impairment due to loss of flow habitat, using an easily calculated metric, based on an analysis of Canadian rivers, using the most comprehensive national data set currently available (the CABIN on-line database: http://cabin.cciw.ca/). Moreover, as the CABIN database expands, particularly in data sparse areas of the country (e.g. the Prairies) the explanatory power of the metric will improve still further. Testing of the CEFI index is currently underway at a range of agricultural watersheds across Canada, with a detailed study being conducted in selected watersheds of varying hydrological alteration in the Okanagan Valley, British Columbia. A major limitation to this study was the absence of medium- to long-term ecological time series data at individual sites, reflecting a singular lack of data of this type at a national scale within Canada. Benthic community structures can undertake substantial changes as a short term adaption to altered flow conditions, e.g. early emergence during droughts (Lake, 2003) or recurrence to drift during high flow events (Layzer et al., 1989). Nevertheless, in absence of extreme events, the benthic community structure reflects the antecedent flow conditions (e.g. 3-6 months prior sampling; Monk et al., 2008; Dunbar et al., 2009a) and it is thus fundamental to consider variables describing the long term hydrological conditions. Despite this, we strived to ensure that the observed patterns were indeed attributable to hydrological condition by comparison with other environmental variables. Ultimately, indices like LIFE and CEFI require being tested using long-term studies from the same location in order to avoid potential confounding by other environmental factors, such as differences in habitat structure, water quality, sediment quantity and quality, geographical location (potentially affecting dispersal patterns of macroinvertebrates). Extence et al. (1999) and more recently Dunbar et al. (2009b) observed a link between poor habitat quality and depressed LIFE scores, and it was suggested that in this situation it might be helpful to identify typical LIFE ranges for natural rivers with common physical and chemical attributes. Similarly, we would suggest ranges of CEFI for different types of streams/types of hydrological regime. In this way, CEFI could be incorporated into widely-used bioassessment schemes such as BEAST in Canada (Bailey et al., 2004) in a similar way as proposed for multimetric indices in Europe (Buffagni et al., 2009a). Low CEFI scores (around 0) could indicate the need for more detailed assessment to be made. Alternatively, CEFI values could provide an explanation for situations where impacts on predicted faunal composition cannot be explained by water quality impairment. Further development of the index should include: a) a computation of optima for more families based on a larger set of reference sites, ideally from the least known part of the country; b) improved taxonomic identification
17
level, achievable either through enhanced identification skills or due to emerging technology (e.g. DNA-based taxonomy, Hudson 2008). Reliability of current velocity optima at genus or species level would also need to be assessed; c) investigation of index performance with regard to longer periods of preceding flows and d) investigation of potential habitat interactions. Our findings clearly demonstrate that measurable aspects of flow conditions consistently affect macroinvertebrates across a range of habitat types. For this reason we suggest that the index we have developed could take a primary role on the development of holistic guidelines for the estimation of flow needs suggested by Arthington et al. (2006) and expanded for its application in Canada (Baird et al., 2009) via a four-step process: 1) development of a classification of hydrological regimes for reference streams; 2) derivation of frequency distributions for each flow variable in each stream class; 3) comparison of frequency distributions of flow-modified streams with reference condition in the same class; and 4) development of flow-response relationships for ecological data from reference and flow modified streams for each flow variable. In this context, the distribution of CEFI values and their relationships with hydrological variables in each flow regime class could be used as an indicator of evidence of the ecological effects of flow modification. However, this approach would be limited by a lack of available data and possibly by the absence of suitable reference streams, thus we anticipate that application of our framework, at least in its present form, could be difficult to achieve in poorly-studied regions of the world where an assessment of ecological flow needs is often most pressing. In conclusion, we provide a practical approach to evaluate relationships between hydrological regime and riverine macroinvertebrate community structure, including the development of a Canadian Ecological Flow Index which has considerable potential as an indicator for the effects of flow alteration. Observed patterns of hydrological variation and biological condition were ecologically meaningful and the relationships statistically significant. The approach developed here can be easily reproduced using standard software packages and widely available hydrological information. Further research in this direction should focus on the development of more ecologically relevant guidelines and management rules for the maintenance of river flows.
ACKNOWLEDGEMENTS
We would like to acknowledge the Canadian Aquatic Biomonitoring Network (CABIN) staff, particularly Tim Pascoe and Dan Bowerman for providing access to the data and general support. A study of this nature would not have been possible without CABIN's unique data-sharing partnership from a range of contributors, and we would like to express our gratitude for allowing this work to be carried out at a national scale. This research was supported partly through a Canadian NSERC Visiting Fellowship in a Government Laboratory to the second author, and through program funds from the Canadian Aquatic Biomonitoring Information Network (CABIN) and National Agri-Environmental Standards Initiative (NAESI) of Environment Canada.

18
REFERENCES Armitage PD, Moss D, Wright JF, Furse MT. 1983. The performance of a new biological
water quality score system based on macroinvertebrates over a wide range of unpolluted running-water sites. Water Research 17: 333–347.
Arthington AH, Bunn SE, Poff NL, Naiman RJ. 2006. The challenge of providing environmental flow rules to sustain river ecosystems. Ecological Applications 16: 1311–1318.
Ashmore P, Church M. 2000. The Impact of Climate Change on Rivers and River Processes in Canada. Geological Survey of Canada Bulletin 555.
Bailey RC, Norris RH, Reynoldson TB. 2004. Bioassessment of Freshwater Ecosystems. Kluwer Academic Publishers, Norwell, USA.
Baird DJ, Peters DL, Curry RA, Horrigan N, Monk WA and Tenebaum DE. 2009. Establishing Standards and Assessment Criteria for Instream Flow Needs in Agricultural Watersheds of Canada. National Agri-Environmental Standards Initiative Synthesis Report No. 15, Environment Canada, Gatineau, Quebec.
Benyahya L, St. Hilaire A, Ouarda TBMJ, Nedushan B, Bobée B. 2007. Prediction of water temperature based on stochastic approaches. Case study of the Deschutes River (Oregon, U.S.A.). Journal of Environmental Engineering and Science 6: 437-448.
Bona F, Falasco E, Fenoglio S, Iorio L, Badino G. 2008. Response of macroinvertebrate and diatom communities to human-induced physical alteration in mountain streams. River Research and Applications 24: 1068 - 1081.
Ter Braak CJF, Prentice IC. 1988. A theory of gradient analysis. Advances in Ecological Research 18: 271–317.
Buffagni A, Armanini DG, Erba S. 2009a. Does the lentic-lotic character of rivers affect invertebrate metrics used in the assessment of ecological quality?. Journal of Limnology 68: 92-105.
Buffagni A, Erba S, Armanini DG. 2009b. The lentic–lotic character of Mediterranean rivers and its importance to aquatic invertebrate communities. Aquatic sciences. DOI: 10.1007/s00027-009-0112-4
Bunn SE, Arthington AH. 2002. Basic principles and ecological consequences of altered flow regimes for aquatic biodiversity. Environmental Management 30:492–507.
Buttle JM, Metcalfe RA. 2000. Boreal forest disturbance and streamflow response, northeastern Ontario. Canadian Journal of Fishery and Aquatic Science 57: 5–18.
Clarke K, Pratt T, Randall R, Scruton D, Smokorowski K. 2007. Validation of the Flow Management Pathway: Science Advice to Fish Habitat Management. DFO report.
Clausen B, Biggs BJF. 1997. Relationships between benthic biota and hydrological indices in New Zealand streams. Freshwater Biology 38: 327–342.
Dodkins I, Rippey B, Hale P. 2005. An application of canonical correspondence analysis for developing ecological quality assessment metrics for river macrophytes. Freshwater biology 50: 1-14.
Extence CA, Ferguson AJD. 1989. Aquatic invertebrate surveys as a water quality management tool in the Anglian Water region. Regulated Rivers: Research and Management 4: 139–146.
19
Extence CA, Balbi DM, Chadd RP. 1999. River flow indexing using benthic macroinvertebrates: a framework for setting hydrobiological objectives. Regulated Rivers: Research and Management 15: 543-574.
Euro-LIMPACS Consortium, 2008. Freshwaterecology.info - The Taxa and Autecology Database for Freshwater Organisms. Available from www.freshwaterecology.info (3.2 - 08/2008)
Fox J. Applied Regression Analysis, Linear Models and Related Methods. Thousand Oaks, Calif: Sage Publications.
Fox J, Monette G. 1992. Generalized collinearity diagnostics. JASA, 87, 178–183. Gore JA, Layzer JB, Mead J. 2001. Macroinvertebrate instream flow studies after 20 years: a
role in stream and river restoration. Regulated Rivers: Research and Management 17: 527-542.
Graham MH. 2003. Confronting multicollinearity in ecological multiple regression. Ecology 84: 2809–2815.
Gromping U. 2006. Relative Importance for Linear Regression in R: The Package relaimpo. Journal of Statistical Software 17.
Haase R, Nolte U. 2008. The invertebrate species index (ISI) for streams in southeast Queensland, Australia. Ecological Indicators 8: 599-613.
Heckert A, Filliben JJ. 1996. Dataplot Reference Manual Volume 2: LET Subcommands and Library Functions. http://www.itl.nist.gov/div898/software/dataplot/refman2/ homepage.htm.
Hering D, Moog O, Sandin L, Verdonschot PFM. 2004. Overview and application of the AQEM assessment system. Hydrobiologia 516: 1–20.
Hilborn R. 2006. Faith-based fisheries. Fisheries 31: 554-555. Hilsenhoff WL. 1988. Rapid field assessment of organic pollution with a family-level
biotic index. Journal of the North American Benthological Society 7: 65-68. Hudson ME. 2008. Sequencing breakthroughs for genomic ecology and evolutionary
biology. Molecular Ecology Resources 8: 3–17. Johnson JW, Lebreton JM. 2004. History and Use of Relative Importance Indices in
Organizational Research. Organizational Research Methods 7: 238–257 Lake PS. 2003. Ecological effects of perturbation by drought in flowing waters.
Freshwater Biology 48:1161–1172 Layzer JB, Nehus TJ, Pennington W, Gore JA, Nestler JM. 1989. Seasonal variation in
the composition of drift below a peaking hydroelectric project. Regulated Rivers: Research and Management 3: 305–317.
Lenat DR. 1983. Chironomid taxa richness: natural variation and use in pollution assessment. Freshwater Invertebrate Biology 2: 192-198.
Ludwig JA, Reynolds JF. 1988. Statistical Ecology, a primer on methods and computing, Wiley.
Lytle DA, Poff NL. 2004. Adaptation to natural flow regimes. Trends in Ecology and Evolution 19: 294-100.
MacArthur R. 1960. On the relative abundance of species. American Naturalist 94: 25–35.
Monk WA, Wood PJ, Hannah DM, Wilson DA, Extence CA and Chadd RP. 2006. Flow variability and macroinvertebrate community response within riverine systems River Res. Applic. 22: 595–615.

20
Monk WA, Wood PJ, Hannah DM, Wilson DA. 2008. Instream ecological response to inter-annual variability in the hydrological regime for rivers in England and Wales. River Research and Applications 24: 988-1001.
Newson MD, Clark MJ, Sear DA, Brookes A. 1998. The geomorphological basis for classifying rivers. Aquatic Conservation: Marine and Freshwater Ecosystems 8: 415-430.
Pena EA, Slate EH. 2006. Global validation of linear model assumptions. Journal of American Statistical Association 101: 341-354.
Poff NL, Allan JD, Bain MB, Karr JR, Prestegaard KL, Richter B, Sparks R, Stromberg J. 1997. The natural flow regime: a new paradigm for riverine conservation and restoration. BioScience 47:769-784.
Poff NL, Allan JD, Palmer MA., Hart DD, Richter BD, Arthington AH., Rogers KH., Meyer JL, and Stanford JA. 2003. River flows and water wars: emerging science for environmental decision making. Frontiers in Ecology and the Environment 1: 298–306.
Quinn GP, Keough MJ. 2002. Experimental Design and Data Analysis for Biologists. Cambridge University Press, Cambridge, UK.
R Development Core Team. 2009. R: A language and environment for statistical computing. R Foundation for Statistical Computing, Vienna, Austria. ISBN 3-900051-07-0, URL http://www.R-project.org.
Raven PJ, Holmes NTH, Dawson FH, Fox PJA, Everard M, Fozzard IR, Rouen KJ. 1998. River Habitat Survey, the physical character of rivers and streams in the UK and Isle of Man. River Habitat Survey No. 2, May 1998. The Environment Agency, Bristol, p 86.
Reynoldson TB, Logan C, Pascoe T, Thompson SP. 2007. CABIN (Canadian Aquatic Biomonitoring Network) invertebrate biomonitoring field and laboratory manual. Canada National Water Research Institute, Environment Canada Retrieved December 18, 2009, from http://cabin.cciw.ca/ Application/ Downloads/ cabin_protocol.doc.
Sakamoto Y, Ishiguro M, Kitagawa G. 1986. Akaike information criterion statistics. KTK Scientific, Tokyo, Japan.
Shirvell CS. 1989. Ability of PHABSIM to predict Chinook salmon spawning habitat. Regulated Rivers: Research and Management 3: 277–289.
Schmedtje U, Colling M. 1996. Ökologische Typisierung der aquatischen Makrofauna. Informationsberichte des Bayerischen Landesamtes für Wasserwirtschaft 4/96.
Tharme RP. 2003. A global perspective on environmental flow assessment: emerging trends in the development and application of environmental flow methodologies for rivers. River Research and Applications 19: 397–441
Van Sickle J, Larsen DP, Hawkins CP. 2007. Exclusion of rare taxa affects performance of the O/E index in bioassessments. Journal of the North American Benthological Society 26: 319-331.
Venables WN, Ripley BD. 2002. Modern Applied Statistics with S (fourth ed.). Springer, New York (2002) ISBN 0-387-95457-0.
Young AR. 2006. Stream flow simulation within UK ungauged catchments using a daily rainfall-runoff model. Journal of Hydrology 320: 155–172.

21
Wood PJ, Agnew MD, Petts GE. 2000. Flow variations and macroinvertebrate community responses in a small groundwater-dominated stream in South-East England. Hydrological Processes 14: 3133–3148.
Woodward G, Jones JI, Hildrew AG. 2002. Community persistence in Broadstone Stream (U.K.) over three decades. Freshwater Biology 47: 1419–1435.
Wright JF, Clarke RT, Gunn RJM, Kneebone NT, Davy-Bowker J. 2004. Impact of major changes in flow regime on macroinvertebrate assemblages of four chalk stream sites, 1997–2001. River Research and Applications 20: 775–794.
WWF, 2009. Canada’s River’s at Risk. WWF-Canada report, pp. 17. Zelinka M, Marvan P. 1961. Zur Präzisierung der biologischen Klassifikation der
Reinheit fließender Gewässer. Archiv für Hydrobiologie 57: 389-407. http://cabin.cciw.ca

22
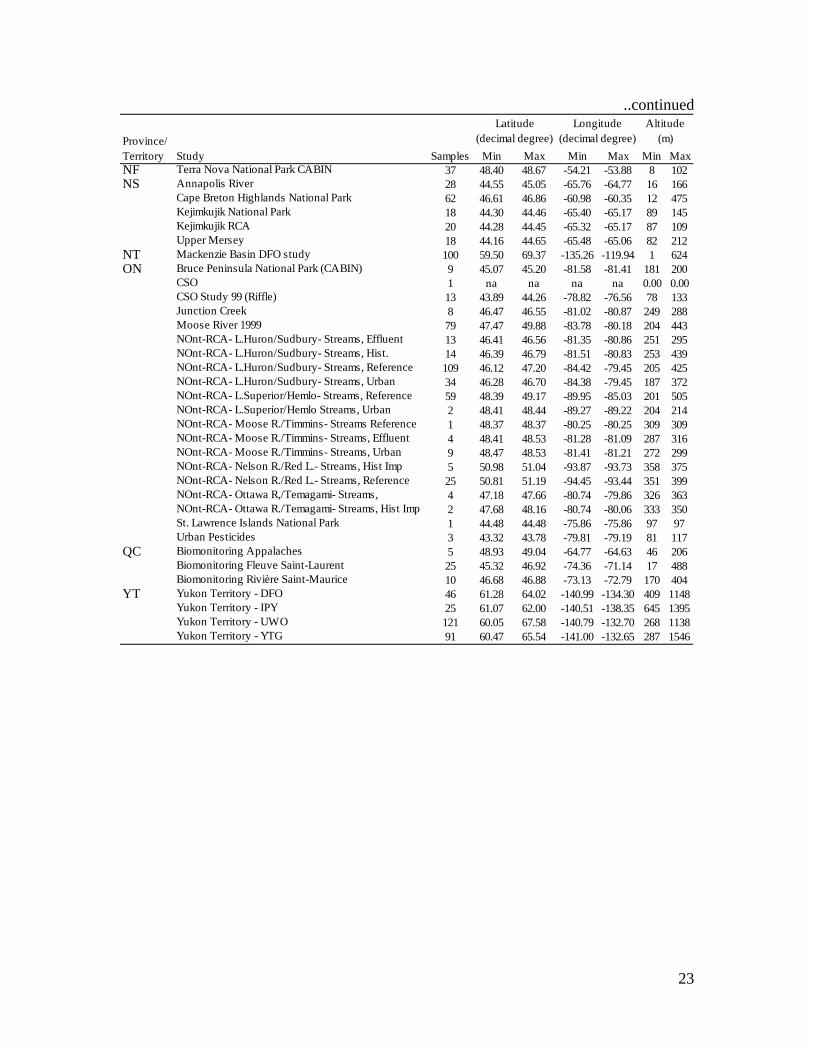
Appendix 1. Summary description of data sources included in the present paper retrieved from the CABIN database (http://cabin.cciw.ca, consulted April 2009). For Province/Territory abbreviations, see the caption of Figure 1.
Study Samples Min Max Min Max Min MaxAB Mountain National Parks Biomonitoring 71 49.05 53.12 -118.55 -113.69 794 3088BC BISY Data 242 59.86 67.58 -140.99 -124.10 47 1375
CABIN training 21 49.35 50.04 -125.29 -120.92 3 820Cariboo Region 4 51.59 52.16 -122.23 -120.92 604 1062CBT - Joseph Creek 3 49.45 49.58 -115.76 -115.69 841 1128CBT - Salmo River West Kootenays 3 49.03 49.38 -117.30 -117.20 620 1118Cheakamus River Spill 36 49.75 49.94 -123.23 -123.14 1 539Columbia Basin 23 49.09 51.44 -117.92 -116.05 570 1493EEM Fraser 2006 8 52.90 53.98 -122.75 -122.47 506 608EEM Fraser 98 20 52.89 53.98 -122.76 -122.46 490 607EEM Upper Fraser 2001 64 52.84 54.00 -122.76 -122.03 471 954Fed-Prov Water Quality Monitoring Stations 150 48.58 53.95 -125.51 -114.90 3 1560Fraser River 517 49.03 56.02 -126.82 -118.40 5 2149FSP Skeena Region 139 52.97 57.50 -131.45 -123.61 9 1466Glacier/Howser Project 17 50.28 50.53 -116.92 -116.33 635 2217GVRD CABIN/BIBI Comparison 58 49.00 49.42 -123.09 -122.52 24 422Gwaii Haanas National Park 28 52.08 52.70 -131.85 -131.06 3 231Hyde Creek Study 2 49.28 49.29 -122.76 -122.74 32 109Koch Creek 5 49.60 49.62 -117.79 -117.75 612 769Kootenay Region RCA 29 49.04 51.44 -117.55 -114.55 548 1619Little Campbell Watershed 15 49.01 49.07 -122.76 -122.65 9 103Marshall Ck Abbotsford 12 49.04 49.04 -122.28 -122.27 112 123MAX Molybdenum Mine 17 50.64 50.67 -117.58 -117.56 753 905Michel Creek (Elk Valley) 1 49.49 49.49 -114.68 -114.68 1602 1602North Vancouver CABIN / BIBI Test 9 49.31 49.33 -123.10 -122.95 9 88Okanagan Basin 28 49.13 50.44 -120.04 -118.49 447 1949Ominceca/ Peace Region 12 54.74 55.49 -122.11 -120.75 749 1231Pacific Rim/Western Vancouver Island 4 49.00 49.09 -125.65 -125.57 25 27Patricia Creek RRH Project 2 50.44 50.44 -125.23 -125.22 45 45Salmon River @ TWU - Joanna 2006 2 49.14 49.14 -122.61 -122.59 54 70Skeena BC Timber Sales 1 53.79 53.79 -128.50 -128.50 159 159Slocan River 13 49.43 49.98 -117.77 -117.35 461 1249Streambank Stabilization Project BC 27 50.24 50.68 -119.39 -118.93 444 913Thompson Region 20 49.64 51.46 -121.71 -119.70 237 1525Vancouver Island 31 48.43 50.34 -125.91 -123.40 3 502Vancouver Island Region 32 48.40 50.73 -127.53 -123.57 3 1126WLAP Okanagan 3 50.28 50.28 -119.25 -119.25 452 452WLAP Okanagan Kicknet 27 49.05 50.29 -120.56 -118.21 326 1228
MB Boreal Plains 41 50.66 53.58 -103.01 -99.56 296 653NAESI Sites 2 50.41 50.58 -99.49 -99.48 371 444
NB Dickson Brook-Fundy National Park 9 45.59 45.59 -64.97 -64.96 38 50Hazen Creek 5 na na na na na naMarsh Creek 5 na na na na na na
Province/Territory
Latitude(decimal degree)
Longitude(decimal degree)
Altitude (m)
23
..continued
Study Samples Min Max Min Max Min MaxNF Terra Nova National Park CABIN 37 48.40 48.67 -54.21 -53.88 8 102NS Annapolis River 28 44.55 45.05 -65.76 -64.77 16 166
Cape Breton Highlands National Park 62 46.61 46.86 -60.98 -60.35 12 475Kejimkujik National Park 18 44.30 44.46 -65.40 -65.17 89 145Kejimkujik RCA 20 44.28 44.45 -65.32 -65.17 87 109Upper Mersey 18 44.16 44.65 -65.48 -65.06 82 212
NT Mackenzie Basin DFO study 100 59.50 69.37 -135.26 -119.94 1 624ON Bruce Peninsula National Park (CABIN) 9 45.07 45.20 -81.58 -81.41 181 200
CSO 1 na na na na 0.00 0.00CSO Study 99 (Riffle) 13 43.89 44.26 -78.82 -76.56 78 133Junction Creek 8 46.47 46.55 -81.02 -80.87 249 288Moose River 1999 79 47.47 49.88 -83.78 -80.18 204 443NOnt-RCA- L.Huron/Sudbury- Streams, Effluent 13 46.41 46.56 -81.35 -80.86 251 295NOnt-RCA- L.Huron/Sudbury- Streams, Hist. 14 46.39 46.79 -81.51 -80.83 253 439NOnt-RCA- L.Huron/Sudbury- Streams, Reference 109 46.12 47.20 -84.42 -79.45 205 425NOnt-RCA- L.Huron/Sudbury- Streams, Urban 34 46.28 46.70 -84.38 -79.45 187 372NOnt-RCA- L.Superior/Hemlo- Streams, Reference 59 48.39 49.17 -89.95 -85.03 201 505NOnt-RCA- L.Superior/Hemlo Streams, Urban 2 48.41 48.44 -89.27 -89.22 204 214NOnt-RCA- Moose R./Timmins- Streams Reference 1 48.37 48.37 -80.25 -80.25 309 309NOnt-RCA- Moose R./Timmins- Streams, Effluent 4 48.41 48.53 -81.28 -81.09 287 316NOnt-RCA- Moose R./Timmins- Streams, Urban 9 48.47 48.53 -81.41 -81.21 272 299NOnt-RCA- Nelson R./Red L.- Streams, Hist Imp 5 50.98 51.04 -93.87 -93.73 358 375NOnt-RCA- Nelson R./Red L.- Streams, Reference 25 50.81 51.19 -94.45 -93.44 351 399NOnt-RCA- Ottawa R,/Temagami- Streams, 4 47.18 47.66 -80.74 -79.86 326 363NOnt-RCA- Ottawa R./Temagami- Streams, Hist Imp 2 47.68 48.16 -80.74 -80.06 333 350St. Lawrence Islands National Park 1 44.48 44.48 -75.86 -75.86 97 97Urban Pesticides 3 43.32 43.78 -79.81 -79.19 81 117
QC Biomonitoring Appalaches 5 48.93 49.04 -64.77 -64.63 46 206Biomonitoring Fleuve Saint-Laurent 25 45.32 46.92 -74.36 -71.14 17 488Biomonitoring Rivière Saint-Maurice 10 46.68 46.88 -73.13 -72.79 170 404
YT Yukon Territory - DFO 46 61.28 64.02 -140.99 -134.30 409 1148Yukon Territory - IPY 25 61.07 62.00 -140.51 -138.35 645 1395Yukon Territory - UWO 121 60.05 67.58 -140.79 -132.70 268 1138Yukon Territory - YTG 91 60.47 65.54 -141.00 -132.65 287 1546
Province/Territory
Latitude(decimal degree)
Longitude(decimal degree)
Altitude (m)
24
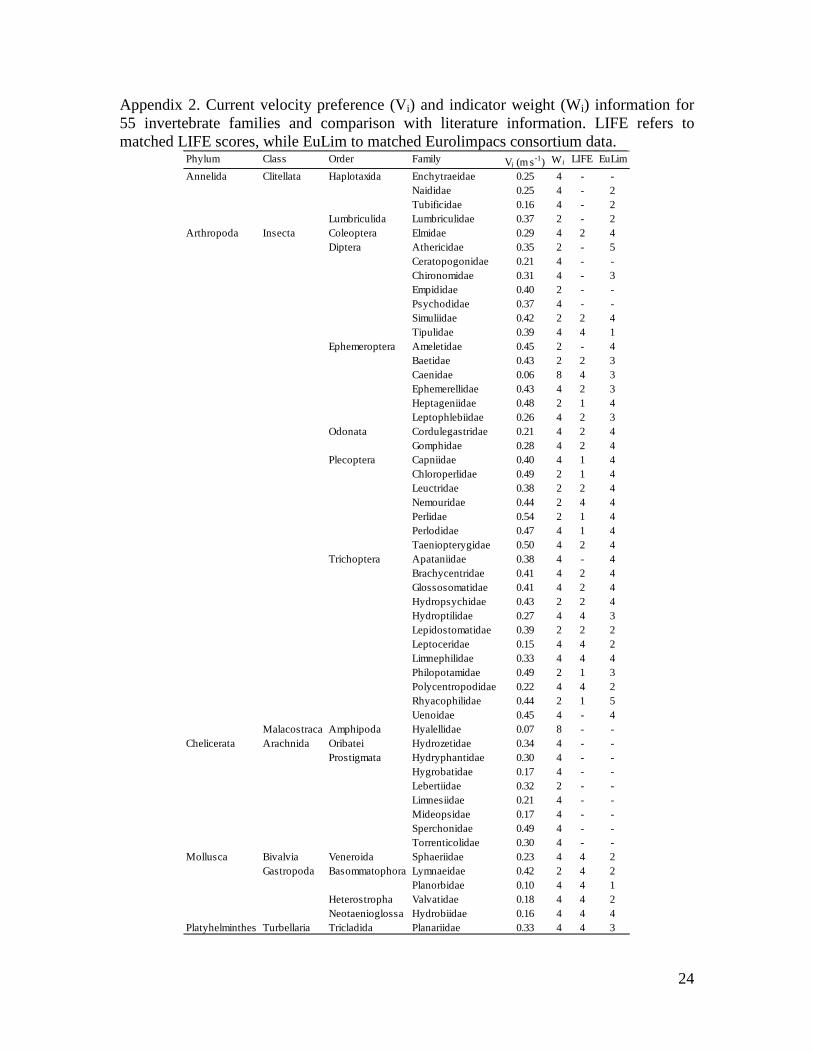
Appendix 2. Current velocity preference (Vi) and indicator weight (Wi) information for 55 invertebrate families and comparison with literature information. LIFE refers to matched LIFE scores, while EuLim to matched Eurolimpacs consortium data.
Phylum Class Order Family Vi (m s-1) Wi LIFE EuLimEnchytraeidae 0.25 4 - -Naididae 0.25 4 - 2Tubificidae 0.16 4 - 2
Lumbriculida Lumbriculidae 0.37 2 - 2Coleoptera Elmidae 0.29 4 2 4
Athericidae 0.35 2 - 5Ceratopogonidae 0.21 4 - -Chironomidae 0.31 4 - 3Empididae 0.40 2 - -Psychodidae 0.37 4 - -Simuliidae 0.42 2 2 4Tipulidae 0.39 4 4 1Ameletidae 0.45 2 - 4Baetidae 0.43 2 2 3Caenidae 0.06 8 4 3Ephemerellidae 0.43 4 2 3Heptageniidae 0.48 2 1 4Leptophlebiidae 0.26 4 2 3Cordulegastridae 0.21 4 2 4Gomphidae 0.28 4 2 4Capniidae 0.40 4 1 4Chloroperlidae 0.49 2 1 4Leuctridae 0.38 2 2 4Nemouridae 0.44 2 4 4Perlidae 0.54 2 1 4Perlodidae 0.47 4 1 4Taeniopterygidae 0.50 4 2 4Apataniidae 0.38 4 - 4Brachycentridae 0.41 4 2 4Glossosomatidae 0.41 4 2 4Hydropsychidae 0.43 2 2 4Hydroptilidae 0.27 4 4 3Lepidostomatidae 0.39 2 2 2Leptoceridae 0.15 4 4 2Limnephilidae 0.33 4 4 4Philopotamidae 0.49 2 1 3Polycentropodidae 0.22 4 4 2Rhyacophilidae 0.44 2 1 5Uenoidae 0.45 4 - 4
Malacostraca Amphipoda Hyalellidae 0.07 8 - -Oribatei Hydrozetidae 0.34 4 - -
Hydryphantidae 0.30 4 - -Hygrobatidae 0.17 4 - -Lebertiidae 0.32 2 - -Limnesiidae 0.21 4 - -Mideopsidae 0.17 4 - -Sperchonidae 0.49 4 - -Torrenticolidae 0.30 4 - -
Bivalvia Veneroida Sphaeriidae 0.23 4 4 2Lymnaeidae 0.42 2 4 2Planorbidae 0.10 4 4 1
Heterostropha Valvatidae 0.18 4 4 2Neotaenioglossa Hydrobiidae 0.16 4 4 4
Platyhelminthes Turbellaria Tricladida Planariidae 0.33 4 4 3
Annelida
Arthropoda
Chelicerata
Mollusca
Clitellata
Insecta
Arachnida
Gastropoda
Diptera
Haplotaxida
Basommatophora
Prostigmata
Trichoptera
Plecoptera
Odonata
Ephemeroptera
Related Documents