BioMed Central Page 1 of 16 (page number not for citation purposes) BMC Plant Biology Open Access Research article Development-dependent changes in the tight DNA-protein complexes of barley on chromosome and gene level Tatjana Sjakste* 1 , Kristina Bielskiene 2 , Marion Röder 3 , Olga Sugoka 1 , Danute Labeikyte 2 , Lida Bagdoniene 2 , Benediktas Juodka 2 , Yegor Vassetzky 4 and Nikolajs Sjakste 5 Address: 1 Genomics and Bioinformatics, Institute of Biology, University of Latvia, Miera 3, LV2169 Salaspils, Latvia, 2 Department of Biochemistry and Biophysics, Vilnius University, M. K. Жiurlionio 21, LT2009 Vilnius, Lithuania, 3 Gene and Genome Mapping, Leibniz Institute of Plant Genetics and Crop Plant Research, Correnstrasse 3, 06466, Gatersleben, Germany, 4 UMR-8126, Institut Gustave Roussy, 39, rue Camille- Desmoulins, 94805 Villejuif, France and 5 Faculty of Medicine, University of Latvia, Šarlotes 1a, LV1001, Riga, Latvia Email: Tatjana Sjakste* - [email protected]; Kristina Bielskiene - [email protected]; Marion Röder - roder@ipk- gatersleben.de; Olga Sugoka - [email protected]; Danute Labeikyte - [email protected]; Lida Bagdoniene - [email protected]; Benediktas Juodka - [email protected]; Yegor Vassetzky - [email protected]; Nikolajs Sjakste - [email protected] * Corresponding author Abstract Background: The tightly bound to DNA proteins (TBPs) is a protein group that remains attached to DNA with covalent or non-covalent bonds after its deproteinisation. The functional role of this group is as yet not completely understood. The main goal of this study was to evaluate tissue specific changes in the TBP distribution in barley genes and chromosomes in different phases of shoot and seed development. We have: 1. investigated the TBP distribution along Amy32b and Bmy1 genes encoding low pI α-amylase A and endosperm specific β- amylase correspondingly using oligonucleotide DNA arrays; 2. characterized the polypeptide spectrum of TBP and proteins with affinity to TBP-associated DNA; 3. localized the distribution of DNA complexes with TBP (TBP- DNA) on barley 1H and 7H chromosomes using mapped markers; 4. compared the chromosomal distribution of TBP-DNA complexes to the distribution of the nuclear matrix attachment sites. Results: In the Amy32b gene transition from watery ripe to the milky ripeness stage of seed development was followed by the decrease of TBP binding along the whole gene, especially in the promoter region and intron II. Expression of the Bmy1 gene coupled to ripening was followed by release of the exon III and intron III sequences from complexes with TBPs. Marker analysis revealed changes in the association of chromosome 1H and 7H sites with TBPs between first leaf and coleoptile and at Zadoks 07 and Zadoks 10 stages of barley shoot development. Tight DNA-protein complexes of the nuclear matrix and those detected by NPC-chromatography were revealed as also involved in tissue- and development-dependent transitions, however, in sites different from TBP-DNA interactions. The spectrum of TBPs appeared to be organ and developmental-stage specific. Development of the first leaf and root system (from Zadoks 07 to Zadoks 10 stage) was shown as followed by a drastic increase in the TBP number in contrast to coleoptile, where the TBPs spectrum became poor during senescence. It was demonstrated that a nuclear protein of low molecular weight similar to the described TBPs possessed a high affinity to the DNA involved in TBP-DNA complexes. Conclusion: Plant development is followed by redistribution of TBP along individual genes and chromosomes. Published: 12 May 2009 BMC Plant Biology 2009, 9:56 doi:10.1186/1471-2229-9-56 Received: 23 December 2008 Accepted: 12 May 2009 This article is available from: http://www.biomedcentral.com/1471-2229/9/56 © 2009 Sjakste et al; licensee BioMed Central Ltd. This is an Open Access article distributed under the terms of the Creative Commons Attribution License (http://creativecommons.org/licenses/by/2.0 ), which permits unrestricted use, distribution, and reproduction in any medium, provided the original work is properly cited.

Welcome message from author
This document is posted to help you gain knowledge. Please leave a comment to let me know what you think about it! Share it to your friends and learn new things together.
Transcript
BioMed CentralBMC Plant Biology
ss
Open AcceResearch articleDevelopment-dependent changes in the tight DNA-protein complexes of barley on chromosome and gene levelTatjana Sjakste*1, Kristina Bielskiene2, Marion Röder3, Olga Sugoka1, Danute Labeikyte2, Lida Bagdoniene2, Benediktas Juodka2, Yegor Vassetzky4 and Nikolajs Sjakste5Address: 1Genomics and Bioinformatics, Institute of Biology, University of Latvia, Miera 3, LV2169 Salaspils, Latvia, 2Department of Biochemistry and Biophysics, Vilnius University, M. K. Жiurlionio 21, LT2009 Vilnius, Lithuania, 3Gene and Genome Mapping, Leibniz Institute of Plant Genetics and Crop Plant Research, Correnstrasse 3, 06466, Gatersleben, Germany, 4UMR-8126, Institut Gustave Roussy, 39, rue Camille-Desmoulins, 94805 Villejuif, France and 5Faculty of Medicine, University of Latvia, Šarlotes 1a, LV1001, Riga, Latvia
Email: Tatjana Sjakste* - [email protected]; Kristina Bielskiene - [email protected]; Marion Röder - [email protected]; Olga Sugoka - [email protected]; Danute Labeikyte - [email protected]; Lida Bagdoniene - [email protected]; Benediktas Juodka - [email protected]; Yegor Vassetzky - [email protected]; Nikolajs Sjakste - [email protected]
* Corresponding author
AbstractBackground: The tightly bound to DNA proteins (TBPs) is a protein group that remains attached to DNA withcovalent or non-covalent bonds after its deproteinisation. The functional role of this group is as yet notcompletely understood. The main goal of this study was to evaluate tissue specific changes in the TBP distributionin barley genes and chromosomes in different phases of shoot and seed development. We have: 1. investigatedthe TBP distribution along Amy32b and Bmy1 genes encoding low pI α-amylase A and endosperm specific β-amylase correspondingly using oligonucleotide DNA arrays; 2. characterized the polypeptide spectrum of TBPand proteins with affinity to TBP-associated DNA; 3. localized the distribution of DNA complexes with TBP (TBP-DNA) on barley 1H and 7H chromosomes using mapped markers; 4. compared the chromosomal distribution ofTBP-DNA complexes to the distribution of the nuclear matrix attachment sites.
Results: In the Amy32b gene transition from watery ripe to the milky ripeness stage of seed development wasfollowed by the decrease of TBP binding along the whole gene, especially in the promoter region and intron II.Expression of the Bmy1 gene coupled to ripening was followed by release of the exon III and intron III sequencesfrom complexes with TBPs. Marker analysis revealed changes in the association of chromosome 1H and 7H siteswith TBPs between first leaf and coleoptile and at Zadoks 07 and Zadoks 10 stages of barley shoot development.Tight DNA-protein complexes of the nuclear matrix and those detected by NPC-chromatography were revealedas also involved in tissue- and development-dependent transitions, however, in sites different from TBP-DNAinteractions. The spectrum of TBPs appeared to be organ and developmental-stage specific. Development of thefirst leaf and root system (from Zadoks 07 to Zadoks 10 stage) was shown as followed by a drastic increase inthe TBP number in contrast to coleoptile, where the TBPs spectrum became poor during senescence. It wasdemonstrated that a nuclear protein of low molecular weight similar to the described TBPs possessed a highaffinity to the DNA involved in TBP-DNA complexes.
Conclusion: Plant development is followed by redistribution of TBP along individual genes and chromosomes.
Published: 12 May 2009
BMC Plant Biology 2009, 9:56 doi:10.1186/1471-2229-9-56
Received: 23 December 2008Accepted: 12 May 2009
This article is available from: http://www.biomedcentral.com/1471-2229/9/56
© 2009 Sjakste et al; licensee BioMed Central Ltd. This is an Open Access article distributed under the terms of the Creative Commons Attribution License (http://creativecommons.org/licenses/by/2.0), which permits unrestricted use, distribution, and reproduction in any medium, provided the original work is properly cited.
Page 1 of 16(page number not for citation purposes)

BMC Plant Biology 2009, 9:56 http://www.biomedcentral.com/1471-2229/9/56
BackgroundReorganization of the chromatin structure is one of themain mechanisms for regulation of gene expression inplants, chromatin rearrangements take place in responseto light and tissue-specific signalling molecules [1].Despite rapid progress in the field, the functional signifi-cance of some groups of nuclear proteins, including thetightly bound to DNA proteins (TBP), remains obscure.TBP is a specific nuclear protein group that remainsattached to DNA with covalent or non-covalent bondsafter its deproteinisation independently of the deprotein-isation method applied: protease digestion, phenolextraction, chloroform extraction or salting-out. The TBPhave been found in the DNA of numerous evolutionarydistant species [2]. Both the function of the TBPs and thenature of DNA sequences involved in the tight complexesremain to be detailed. Enrichment of the TBPs in specificDNA sequences is of special interest in connection withspeculation on the potential function of such sequencesin higher order structures of the genome of differentorganisms including humans, mouse, and chicken [3-6].In our recent work [7] we have applied the DNA microar-ray technique to study the distribution of TBPs along thechicken alpha-globin domain in cell lines that expressedthe gene, did not express it or conducted abortive expres-sion. In this study we have shown profound transcription-dependent changes in the TBP-distribution pattern in thealpha-globin domain. Other preliminary results from ofour team [8] also indicated the existence of tissue- anddevelopment specificity in the patterns of TBP distribu-tion in barley (Hordeum vulgare) shoots.
The life cycle of the barley plant, especially the shoot andseed provide an excellent model for plant developmentstudies. Barley shoot and seed developmental stages arewell characterized and classified [9]. Etiolated barley seed-lings provide cell populations with different proliferation,differentiation and senescence status including synchro-nously dividing cell populations of primary leaf [10-12],senescent coleoptiles and a mixed cell population fromroots [10]. In the present work we used dry grains (Zadoks0) and grains after 20 h of imbibition (Zadoks 1); coleop-tiles, first leaves and roots were dissected from shoots ofZadoks 07 (coleoptile emerged stage, classificationaccording to [9]) and Zadoks 10 (first leaf through coleop-tile) development stages as well as seeds of watery ripe(Zadoks 71) and medium milk development (Zadoks 75).
Moreover, expression of several specific enzymes of carbo-hydrate metabolism in barley is development- or/and tis-sue specific and is restricted to well-defined stages of theplant development [13]. It was reported that transcriptionof α-amylase genes is low and decreases during seed devel-opment, but β-amylase expression in endosperm is up-regulated during its development [13-15]. Two represent-
atives of each group of amylase genes, the Amy32b andBmy1 genes provide prospective model systems. Highlyconserved in barley cultivars, Amy32b gene [16] is locatedon chromosome 7H in the centromere region [17]. Geneencodes a low-pI α-amylase and is expressed in barleyaleurone cells under the control of gibberellic acid andabscisic acid [15]. Highly polymorphic in structure, barleyBmy1 gene [18,19] is located in the long arm of chromo-some 4H [20], encodes endosperm specific β-amylase andis expressed only during seed development [18]. Severalallelic forms of Bmy1 structural gene were sequenced andanalyzed in relation to their functionality [21-24].
Despite the fact that barley genome is not completelysequenced, work with this plant provides the opportunityto use the technique of mapped barley genomic markersdeveloped during recent decades [25,26]. The tool allowschromosome profiling to be performed in any applica-tion.
In order to study transcription, tissue and developmentdependent changes in TBPs distribution in barley genesand chromosomes at different phases of shoot and seeddevelopment, we have formulated the following as thegoals of the present study: 1. to investigate the distribu-tion of TBPs along Amy32b and Bmy1 genes using oligonu-cleotide DNA arrays; 2. to characterize the polypeptidespectrum of TBP in different shoot organs and during dif-ferent development stages. 3. to apply mapped barley MSas a tool to study tissue and developmental specificity inthe distribution of DNA complexes with TBP (TBP-DNA)in the barley chromosomes 1H and 7H; 4. to compare thechromosomal distribution of TBP-DNA complexes anddistribution of tight DNA-protein complexes separatedusing other than TBP isolation approaches includingnuclear matrix isolation and nucleoprotein chromatogra-phy on celite (NPC-chromatography).
ResultsRT-PCRFigure 1 presents data on Amy32b (lanes 1, 2) and Bmy1(lanes 3, 4) genes expression in seeds of watery ripe(Zadoks 71, lanes 1, 3) and medium milk (Zadoks 75,lanes 2, 4) stages of development. Reference gene Tub1, aubiquitous and stably expressed gene in barley, wasexpressed with the same intensity at both stages analyzed.It was found that Amy32b gene is highly expressed inwatery ripe and silent in milky ripe seeds. On the contrary,expression of the Bmy1 gene was detected exclusively inthe milky ripe stage. Thus, the chosen barley genes at twostages of seed development represented a model system tobe used in further analysis of TBPs distribution along thesilent and expressed genes.
Page 2 of 16(page number not for citation purposes)

BMC Plant Biology 2009, 9:56 http://www.biomedcentral.com/1471-2229/9/56
Microarray analysisFigure 2 and Figure 3 present quantified results of hybrid-ization between TBP-DNA complexes fractionated fromseeds of watery ripe (Zadoks 71, panels A) and mediummilk (Zadoks 75, panels B) stages and DNA microarray ofAmy32b (Figure 2) and Bmy 1 (Figure 3) genes corre-spondingly. In samples from watery ripe seeds, ratios ofhybridization intensities with R probe (probe derivedfrom the DNA complexed with tightly bound proteins)and F probe (probe derived from the TBP-free DNA) andAmy32b microarray were approximately the same in oligo-nucleotide positions 1, 9, 10 and 11 reflecting an equal orsimilar amount of the corresponding DNA fragments inboth TBP bound and TBP unbound fractions. In all otherpositions the ratio exceeded 1, indicating the enrichmentin TBPs in the corresponding DNA fragments. Positions 3(300 bp upstream the translation start codon), 7 (down-stream part of Intron 2), and 8 (Exon 3) were shown as themost TBP-enriched in samples from watery-ripe seeds.Transition to milky ripening was followed by the decreaseof R vs F ratio in general along the whole Amy32b gene.Ratio much below 1 in positions 1, 5, 9 and 11 indicatespredominant accumulation of corresponding DNA frag-ments in the TBP- free F fraction. In positions 3 and 7 theratio decreased from 6 and 4 to almost 1, and from 4 to2.5 in position 8. The position of oligonuclotide 10, inwhich the ratio increased from 1 to 2, was an exception.Thus, during seed development, an overall decrease inTBP-DNA interactions (R → F transition) occurs along the
Amy32b gene being most drastic in the promoter andIntron 2 gene regions.
The R and F fractions obtained from watery ripe seedshybridized also with different intensity with Bmy 1 genemicroarray. An R vs F ratio close to or less than 1 wasobserved for positions 3 and 11, and 4 and 12 corre-spondingly. In positions 1, 2, 5, and 8 hybridization withR probes was somewhat stronger than with F probes, how-ever the R vs F ratio did not exceed 2. The R vs F ratio wasrather high in oligonucleotide positions 6, 9 (more than2) and 13 (near to 3). Finally, in positions 7 and 10, theintensity of hybridization with R probe was 4 timesstronger than with F probe. The highest ratio in the milkyripeness stage (Figure 3, panel B) was close to 2 in posi-tion 10, and slightly exceeded 2 in position 13. In all otheroligonucleotide positions the R vs F ratio was around 1.Thus, similar to the results obtained with Amy32b gene,the overall decrease of the R vs F ratio is revealed along theBmy1 gene during seed development. The process is morepronounced in Exon 3 and upstream the microsatellitelocus in Intron III.
Bioinformatic analysis of Amy32b and Bmy 1 gene sequencesIdentification of specific areas of TBP binding in bothgenes raised the question of peculiarities in the genesequences in these areas. A search for nuclear matrixattachment regions (MARs) performed by the MatInspec-tor program (Rel. 7.4), revealed a possible MAR in Intron3 of the Bmy1 gene (Figure 3). No MARs were detected inthe Amy32b gene. DiAlign TF, Release 3.1 revealed 13homology regions between the two genes (Figures 2 and3), however no common features in the distribution oftranscription factor binding sites along the genes and tran-scription factor binding modules were revealed. Compar-ison of the predicted MAR with the TBP binding sites inthe Bmy1 gene Intron 3 indicates that this site is enrichedin TBPs. Similar sequences of the two genes differed intheir affinity to TBPs. The only exception was observed inthe area of similarity S9; these sites were TBP-enriched inboth genes.
Profiling of DNA-protein complexes along chromosomesPositive data on intragenic changes in TBP distribution inthe course of development encouraged us to upscale theinvestigation and to study the long-range distribution oftightly bound proteins along barley chromosomes 1Hand 7H. Lack of barley genome sequence informationmakes it impossible to apply microarray technology tostudy long-range distribution of TBPs along chromo-somes. To at least partly reach the goal we have used thetool of mapped markers well developed in barley studies[25-27]. Profiling experiments were designed as PCR-based identification of the DNA matrices in DNA-protein
Amy32b (lanes 1, 2), Bmy1 (lane 3, 4) and alpha tubulin (lanes 1 – 4) RT-PCR productsFigure 1Amy32b (lanes 1, 2), Bmy1 (lane 3, 4) and alpha tubu-lin (lanes 1 – 4) RT-PCR products. Lanes 1, 3 – RNA from watery ripe seeds; lanes 2, 4 – RNA from milky ripe barley seeds. Positions of the molecular weight markers (bp) are indicated on the right. Positions of RT-PCR products are indicated on both sides of the figure.
Page 3 of 16(page number not for citation purposes)

BMC Plant Biology 2009, 9:56 http://www.biomedcentral.com/1471-2229/9/56
complexes obtained by different fractionationapproaches. Involvement of the DNA stretch in interac-tions with a given protein group (TBP, nuclear matrix) wasscored in terms of the presence/absence of amplificationwith mapped markers of barley chromosomes 1H and7H. Data are organized as graphical representations ofchromosome 1H and 7H with an indication of the PCRresult at each MS locus in all DNA-protein fractions ana-lyzed. The study was performed on DNA from barleyshoot organs; this model enables us to obtain a sufficientquantity of material for fractionation of nuclear struc-tures.
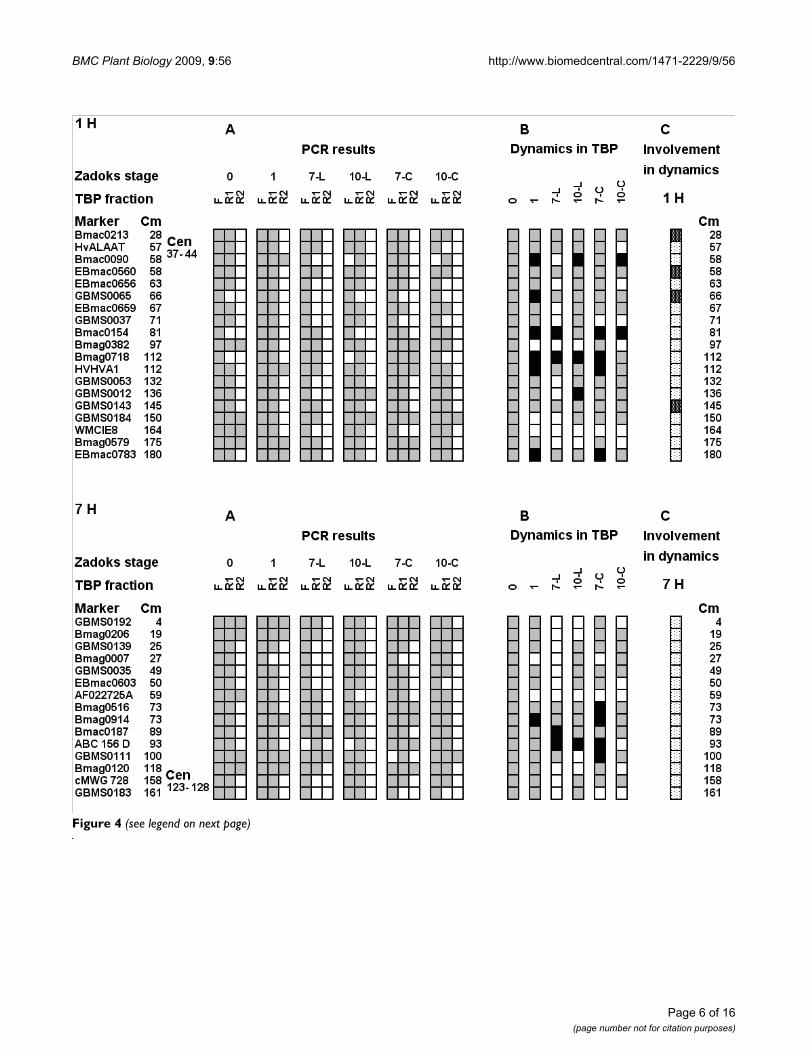
TBPsFigure 4 presents graphically both chromosomes as pro-files of TBP-DNA complexes in seeds before (Zadoks 0)and after imbibition (Zadoks 1), as well as leaves andcoleoptiles at two stages of development (Zadoks 07 and10). In dry seeds most markers of both chromosomeswere found in F and R1 fractions. Only four and five mark-ers of 1H and 7H correspondingly were present in the R2fraction. Three markers of 1H (GBMS0065, Bmac0154,
Bmag0718) were found exclusively in the filtered TBP-freeDNA (Figure 4A). However, positive amplification in R1was detected in the above loci after imbibitions. Positiveamplification in the R2 fraction with Bmac0090,HVHVA1, and EBmac0783 of 1H and with Bmag0914 of7H was also obtained only after imbibition. These resultsindicate an increase in the number of the tight interactionsites between TBPs and DNA. In contrast, the lociBmag0382, GBMS0184 and WMCIE8 of 1H andAF022725A, cMWG 728 and GBMS0183 of 7H disap-peared from the R2 fraction during transition from theZadoks 0 to the Zadoks 1 stage. In stage 07 leaves someregions of both chromosomes appear to be free of TBPs.No markers of chromosome 1H and only two 7H markerswere found in R2 in Zadoks 07 leaves. In Zadoks 07 leavesin largest number of loci interacting with TBPs wasdecreased when compared to dry seeds. Only two loci onChromosome 1H (Bmac0154 and Bmag0718), formerlyunbound to TBP became involved in complexes with TBP.Markers Bmac0187 and ABC 156 D of 7H appeared in R2fraction and disappeared from F fraction correspondingly.The transition of the leaf to the Zadoks10 stage was fol-
DNA array based mapping of the TBPs distribution in Amy32b structural gene in watery ripe (A) and milky ripe (B) barley seedsFigure 2DNA array based mapping of the TBPs distribution in Amy32b structural gene in watery ripe (A) and milky ripe (B) barley seeds. Upper panel presents the gene structure with positions of oligonucleotides of the array and regions of the similarity with Bmy1 (S1 – S13). Star indicates position of the TATA box, black arrow in last exon indicates stop codon. Exon numbers are given as Roman numerals. The data in lower panels represent the ratio of hybridization of R vs F DNA frac-tions scored as an average of three independent experiments (two hybridizations per experiment). Error bars represent stand-ard deviation.
Page 4 of 16(page number not for citation purposes)

BMC Plant Biology 2009, 9:56 http://www.biomedcentral.com/1471-2229/9/56
lowed by a substantial increase in stretches involved incomplexes with TBPs when compared to Zadoks 07 stage(positive amplification appeared in R1 fractions at mostloci). However, DNA templates were not detected in R2fractions along both chromosomes except for theGBMS0012 and GBMS0184 loci of 1H. Interestingly, instage 07 coleoptiles the number of sites involved in TBP-DNA interactions was somewhat greater than in dry seeds(most markers were found in the R1 fraction, several alsoin the R2 fraction). The transition to stage 10 in coleop-tiles was followed a decrease in the number of genomicsites involved in interaction with TBPs. In the stage 10coleoptiles only one marker of 1H and two markers of 7Hwere found in the R2 fraction, some markers disappearedfrom the R1 fraction.
Panel B in Figure 4 summarizes the trends of transitionsduring development of different organs compared withthe situation in dry seed. Panel C gives a summary of theinvolvement of the Chromosome 1 H and 7H sites of theR ↔ F transitions. It emerges that all the sites on chromo-some 7H are involved, and only four sites of 1H are notinvolved in the dynamics. Thus, the development of thebarley seedling is coupled to rearrangements in the inter-actions of DNA with TBPs both on chromosome 1H and7H. The process is organ specific and can be termed "tight-
ening" of the DNA-TBP interactions in the leaves and"loosening" in the coleoptile compared to dry seed status.
Chromatin fractions and nuclear matrixFigure 5 presents the distribution of molecular markers inDNS fragments in soluble chromatin (SC), insolublechromatin (IC) and nuclear matrix (NM) fractionsextracted from leaves at the Zadoks 07 and Zadoks 10stages. In stage 07 leaves, the markers EBmac0560,GBMS0065, Bmag0718, GBMS0143, GBMS0012,WMCIE8 of 1H and markers cMWG773, Bmag0516,cMWG725, EBmac0755, ABG461 of 7H were found in thenuclear matrix-attached DNA. All these markers moved tothe insoluble chromatin fraction at stage 10. Thus senes-cence of the first leaf appears to be accompanied by a"loosening" of the DNA-NM interactions accompanied bycomplete detachment of some chromosomal regions ofthe nuclear matrix. The right panel of the Figure 5 indi-cates the sites involved in transitions in DNA-chromatinand DNA-NM interactions. Interestingly, data obtainedon both chromosomes indicate that in our model manyfewer chromosomal sites appear to be involved in thetransitions of DNA -NM interactions compared to thenumber of R ↔ F transition loci revealed by the profilingof the TBP-DNA complexes (Figure 4A, D; Figure 5).
DNA array based mapping of the TBPs distribution in Bmy1 structural gene in watery ripe (A) and milky ripe (B) barley seedsFigure 3DNA array based mapping of the TBPs distribution in Bmy1 structural gene in watery ripe (A) and milky ripe (B) barley seeds. Upper panel presents the gene structure with positions of oligonucleotides of the array and regions of sim-ilarity with Amy32b gene (S1 – S13). Stars correspond to the positions of the TATA boxes; black arrow in last exon VII indi-cates the stop codon. Exon numbers are given in Roman numerals. Black and dashed squares in the Intron III indicate the positions of the microsatellite and MITE element, correspondingly. The predicted MAR position is indicated by a checked bar. The data on lower panels represent the ratio of hybridization of R vs F DNA fractions scored as an average of three independ-ent experiments (two hybridizations per experiment). Error bars represent standard deviation.
Page 5 of 16(page number not for citation purposes)
BMC Plant Biology 2009, 9:56 http://www.biomedcentral.com/1471-2229/9/56
Figure 4 (see legend on next page)
Page 6 of 16(page number not for citation purposes)

BMC Plant Biology 2009, 9:56 http://www.biomedcentral.com/1471-2229/9/56
NPC chromatographyThe nucleoprotein chromatography method enables thediscrimination of several types of DNA-protein interac-tions in the nucleus including two kinds of DNA com-plexes with nuclear matrix proteins that are not revealedby other approaches. In this method cell lysate is loadedonto a celite column. Celite irreversibly binds all proteinsincluding protein moieties of the nucleoproteins. Nucleicacids are gradually released from the protein complexesby sequential gradients of NaCl, LiCl-urea and tempera-ture. DNA not bound to the nuclear matrix is eluted in aNaCl gradient (DNA 0), DNA "loosely" bound to thenuclear matrix is released using a LiCl-urea gradient (DNAI), high temperature is necessary to release DNA from thestrong complexes with the nuclear matrix (DNA II). Wesuppose that single strand DNA breaks in the vicinity ofthe replication complex induce the transition DNAII –DNA I, but double strand breaks release the DNA0 frac-tion [28,29]. Graphical presentations of chromosomes1H and 7H (Figure 6) illustrate the results of amplifica-tion on the DNA purified from the different NPC-frac-tions: DNA 0, DNA I and DNA II [28,29]. In dry seeds allthe 1H markers and most of the 7H markers were revealedin all three chromatographically analyzed fractions. Dataobtained on both chromosomes, reflect complex patternsof chromatin domain reorganizations after imbibitions.Among 22 loci tested on 1H, six disappeared from theDNA II fraction (Figure 6, 1H A and B). Among 24 mark-ers used in 7H profiling, 11 became involved in looserinteractions with the nuclear matrix (Figure 6, 7H, A andB). Development of the first leaf (Zadoks 07) was accom-panied by an increase in loci number associated with thenuclear matrix including EBmac0560, Bmag0211,GBMS0065, Bmag0718, GBMS0143, WMCIE8 andHVPLASCIB, Bmag0007, GBMS0035, Bmag0507 for 1Hand 7H correspondingly. Several loci became unbound toNM via the strong bond (GBMS0065, GBMS0012,GBMS0143 and ABG 461 for 1H and 7H correspond-ingly) at the Zadoks 10 stage. However, in general, senes-cence of the first leaf was followed by an increase in thesites interacting with the nuclear matrix (Figure 6, PanelB). Interestingly, in Zadoks10 coleoptiles the profiles of
both chromosomes indicate detachment of DNA fromnuclear matrix or loosening of the DNA-NM bonds inmost loci tested. Only three (Bmac0213, Bmag0382,Bmag0579) and six (Bmag007, cMWG 773, GBMS0035,AF022725A, cMWG 725, ABG 461) loci from 22 and 24tested correspondingly for 1H and 7H chromosomesremained tightly attached to the nuclear matrix. Most sitesof both chromosomes were involved in the rearrange-ments with two exceptions for each chromosome. (Figure6, Panel C).
Tightly bound protein spectrum in organs of stage 07 and stage 10 shootsFigure 7 presents electropherograms of the TBPs obtainedfrom the leaves, roots and coleoptiles of Zadoks stage 07and Zadoks stage 10 shoots using method of exhaustiveDNase digestion. Amazingly, the TBP spectrum appears tobe organ and developmental stage-specific. In stage 07leaves there is only one TBP of molecular weight 30 KDa,and the transition to stage 10 and senescence of the leaf isfollowed by a drastic increase of the TBP number, addi-tional bands of 17, 21, 36, 42, 55, 60, 69 and 76 KDa areclearly visible. And a similar process happens in the roots.Besides the 30 KDa band a smaller 20 KDa polypeptide isdetected in young roots. Additional 36 KDa protein andsome minor high-molecular polypeptides are detectablein old roots. Changes in the TBP spectrum in coleoptileappear to be inversed. The TBP pattern in stage 07 coleop-tile is rather complicated. There is a high molecular weightpolypeptide of about 200 KDa, bands at 67, and 38 KDa,as well as a 30 KDa band common for all organs and a 20KDa band found also in the roots. In contrast, only twopolypeptides are found in stage 10 coleoptile, the 36 KDapolypeptide, detected in all organs of stage 10 shoots and20 KDa, also found in all organs, but it seems to be prom-inent in the coleoptile. Thus the polypeptide spectrum ofTBPs appears to depend on the plant organ developmentstage. Further sets of experiments were performed toreveal specificity of interactions of TBPs with DNAsequences.
The distribution of microsatellite sequences in free DNA and tight DNA-protein complexes along barley chromosomes 1H and 7HFigure 4 (see previous page)The distribution of microsatellite sequences in free DNA and tight DNA-protein complexes along barley chro-mosomes 1H and 7H. A. The distribution of DNA fragments containing given microsatellites in free DNA (F), and tight DNA-protein complexes (R1 and R2). Marker names are given in the left column, following column gives distance from the chromosome extremity in centimorganides. Position of the centromere is indicated separately (Cen). 0 – dry seeds (phase 0), 1 – 20 hours of imbibition (phase 01); 7-L – first leaf on stage 07; 10-L – leaf on stage 10; 7-C – coleoptile on stage 07; 10-C – coleoptile on stage 10. Grey squares – presence of amplification; white squares – absence of amplification. B. Summary of the trends of transitions during development of different organs compared with the situation in dry seed. Grey squares – situation in the seed or similar; white squares – decrease of association with TBPs; black squares – increase in TBP-DNA interactions. C. General summary of involvement of the studied genomic sites in R-F and adverse transitions. Black points on white background – site involved in transitions; white points on black background – site not involved in transitions.
Page 7 of 16(page number not for citation purposes)

BMC Plant Biology 2009, 9:56 http://www.biomedcentral.com/1471-2229/9/56
Affinity of the TBP-bound DNA to nuclear proteinsTo test changes in the tight DNA-protein interactions cou-pled to plant development we performed DNA-bindingprotein blot assays with electrophoretically fractionatednuclear polypeptides extracted from different barleyorgans at development stages 07 and 10 and TBP-boundDNA from the stage 10 leaves. Results are shown in Figure8. Nuclear polypeptides isolated from the stage 07 coleop-tiles manifested high affinity to the TBP-associated DNA.Both low-molecular weight and 70 kDa peptides formedtight complexes with DNA. Transition to stage 10 wasassociated with a decrease of DNA-binding proteins, onlylow-molecular weight proteins could bind to the probe
(Figure 8, lanes 1 and 4). Mostly low molecular weightpolypetides extracted from stage 07 leaves manifestedaffinity to the probe, in stage 10 leaves these were replacedby 70 kDa peptides (Figure 8, lanes 2 and 5). The TBP-associated DNA probe recognized low molecular nuclearpolypeptides extracted from the stage 07 roots, in extractsfrom stage 10 roots binding to these polypeptides becameless intense, however additional 35 kDa and 70 kDapolypeptides with affinity to the probe were detected.
The distribution of microsatellite sequences in chromatin fractions and nuclear matrix-attached DNA along barley chromo-somes 1H and 7HFigure 5The distribution of microsatellite sequences in chromatin fractions and nuclear matrix-attached DNA along barley chromosomes 1H and 7H. Columns in the right part of the figure illustrate the distribution of DNA fragments con-taining given microsatellites in fractions of soluble chromatin (SC), insoluble chromatin (IC) and the nuclear matrix (NM). Panel on the right indicates involvement in association or dissociation of the nuclear matrix. Grey and white squares correspond to the presence and absence of amplification correspondingly. Black points on white background and white points on black back-ground indicate on the sites involved and not involved in transitions. All other designations are as in Figure 4.
Page 8 of 16(page number not for citation purposes)

BMC Plant Biology 2009, 9:56 http://www.biomedcentral.com/1471-2229/9/56
Figure 6 (see legend on next page)
Page 9 of 16(page number not for citation purposes)

BMC Plant Biology 2009, 9:56 http://www.biomedcentral.com/1471-2229/9/56
DiscussionGene expression changes during seed developmentIn the present study we have revealed development-dependent changes of the TBP distribution in Amy32b andBmy1 genes during transition of the barley seed fromwatery-ripe to middle milk ripe stage. Changes in TBP dis-tribution in the genes were coupled to changes in theirexpression. Our RT-PCR data confirm earlier publisheddata indicating that β-amylase expression is linked tostarchy endosperm development, but α-amylase is notexpressed on late seed development stages [14], moreoverover-expression of α-amylase in developing seed leads todevelopment defects [15].
TBP redistribution in the Amy32b geneOur observation of a decrease in TBP interactions withpromoter region of the Amy32b gene is in good agreementwith a recently proposed hypothesis [13]. According tothis hypothesis in the dormant gene negative regulatorsbind to the corresponding cis-acting elements in the pro-moter and form a "repressosome," this diminishes thebinding or transactivating activities of positive regulatorsto the promoter, thereby preventing Amy32b transcrip-tion. Induction of transcription is followed by binding ofpositive regulators to their respective DNA sequences andformation of the "enhanceosome," leading to a high levelof Amy32b gene expression. Probably, formation of the"enhanceosome" is preceded by degradation of repres-sors. Taking into account that the RT-PCR data expressionof the gene is observed exclusively in the watery ripeness
The distribution of microsatellite sequences in fractions obtained in the course of chromatography of nucleoproteins on celiteFigure 6 (see previous page)The distribution of microsatellite sequences in fractions obtained in the course of chromatography of nucleo-proteins on celite. A. The distribution of DNA fragments containing given microsatellites in unbound to nuclear matrix frac-tion (eluted in NaCl gradient, DNA 0, column 0 on the Figure), loosely bound to the nuclear matrix (eluted in LiCl-urea gradient and in temperature gradient below 70°C, DNA I (column I) and tightly bound to the nuclear matrix (eluted in temper-ature gradient at 90°C, DNA II, column II). Grey and white squares indicate presence and absence of amplification correspond-ingly. All other designations are like in Figure 4. B. Summary of the trends of transitions during development of different organs compared with the situation in dry seed. Grey squares – situation in the seed or similar; white squares – loosening of associa-tion with the nuclear matrix; black squares -tightening of interactions. C. General summary of involvement of the studied genomic sites in association-dissociation according the NPC chromatography data. Black points on white background – sites involved in transitions; white points on black background – sites not involved in transitions.
Electropherograms of the tightly bound proteins obtained by DNase I digestion of bulk DNA of leaves (L), roots (R) and coleoptiles (C) of stage 07 and stage 10 barley shootsFigure 7Electropherograms of the tightly bound proteins obtained by DNase I digestion of bulk DNA of leaves (L), roots (R) and coleoptiles (C) of stage 07 and stage 10 barley shoots. Arrows indicate positions of molecular weight markers (KDa). 10% PAAG. Silver staining.
DNA-binding protein blot assayFigure 8DNA-binding protein blot assay. Assay was performed with electrophoretically fractionated nuclear proteins iso-lated from the Zadoks 07 (1 – 3) and Zadoks 10 (4 – 6) cole-optiles (1, 4), leaves (2, 5), and roots (3, 6) and incubated with TBP-associated DNA from Zadoks 10 leaves.
Page 10 of 16(page number not for citation purposes)
BMC Plant Biology 2009, 9:56 http://www.biomedcentral.com/1471-2229/9/56
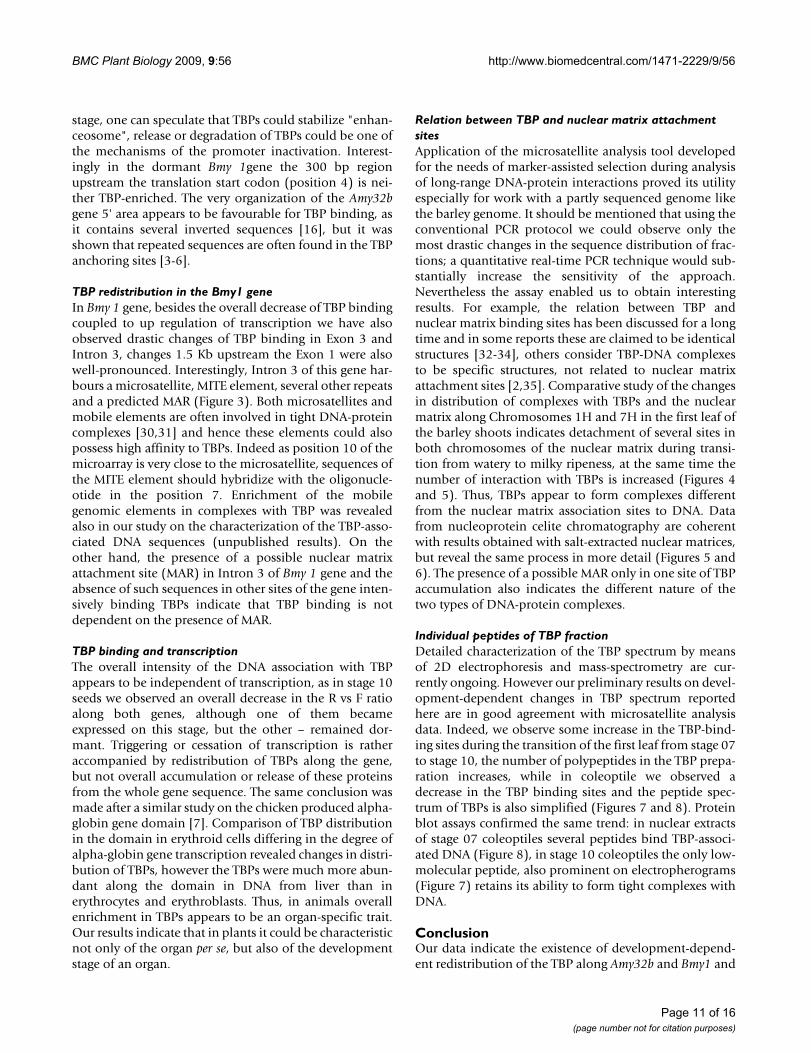
stage, one can speculate that TBPs could stabilize "enhan-ceosome", release or degradation of TBPs could be one ofthe mechanisms of the promoter inactivation. Interest-ingly in the dormant Bmy 1gene the 300 bp regionupstream the translation start codon (position 4) is nei-ther TBP-enriched. The very organization of the Amy32bgene 5' area appears to be favourable for TBP binding, asit contains several inverted sequences [16], but it wasshown that repeated sequences are often found in the TBPanchoring sites [3-6].
TBP redistribution in the Bmy1 geneIn Bmy 1 gene, besides the overall decrease of TBP bindingcoupled to up regulation of transcription we have alsoobserved drastic changes of TBP binding in Exon 3 andIntron 3, changes 1.5 Kb upstream the Exon 1 were alsowell-pronounced. Interestingly, Intron 3 of this gene har-bours a microsatellite, MITE element, several other repeatsand a predicted MAR (Figure 3). Both microsatellites andmobile elements are often involved in tight DNA-proteincomplexes [30,31] and hence these elements could alsopossess high affinity to TBPs. Indeed as position 10 of themicroarray is very close to the microsatellite, sequences ofthe MITE element should hybridize with the oligonucle-otide in the position 7. Enrichment of the mobilegenomic elements in complexes with TBP was revealedalso in our study on the characterization of the TBP-asso-ciated DNA sequences (unpublished results). On theother hand, the presence of a possible nuclear matrixattachment site (MAR) in Intron 3 of Bmy 1 gene and theabsence of such sequences in other sites of the gene inten-sively binding TBPs indicate that TBP binding is notdependent on the presence of MAR.
TBP binding and transcriptionThe overall intensity of the DNA association with TBPappears to be independent of transcription, as in stage 10seeds we observed an overall decrease in the R vs F ratioalong both genes, although one of them becameexpressed on this stage, but the other – remained dor-mant. Triggering or cessation of transcription is ratheraccompanied by redistribution of TBPs along the gene,but not overall accumulation or release of these proteinsfrom the whole gene sequence. The same conclusion wasmade after a similar study on the chicken produced alpha-globin gene domain [7]. Comparison of TBP distributionin the domain in erythroid cells differing in the degree ofalpha-globin gene transcription revealed changes in distri-bution of TBPs, however the TBPs were much more abun-dant along the domain in DNA from liver than inerythrocytes and erythroblasts. Thus, in animals overallenrichment in TBPs appears to be an organ-specific trait.Our results indicate that in plants it could be characteristicnot only of the organ per se, but also of the developmentstage of an organ.
Relation between TBP and nuclear matrix attachment sitesApplication of the microsatellite analysis tool developedfor the needs of marker-assisted selection during analysisof long-range DNA-protein interactions proved its utilityespecially for work with a partly sequenced genome likethe barley genome. It should be mentioned that using theconventional PCR protocol we could observe only themost drastic changes in the sequence distribution of frac-tions; a quantitative real-time PCR technique would sub-stantially increase the sensitivity of the approach.Nevertheless the assay enabled us to obtain interestingresults. For example, the relation between TBP andnuclear matrix binding sites has been discussed for a longtime and in some reports these are claimed to be identicalstructures [32-34], others consider TBP-DNA complexesto be specific structures, not related to nuclear matrixattachment sites [2,35]. Comparative study of the changesin distribution of complexes with TBPs and the nuclearmatrix along Chromosomes 1H and 7H in the first leaf ofthe barley shoots indicates detachment of several sites inboth chromosomes of the nuclear matrix during transi-tion from watery to milky ripeness, at the same time thenumber of interaction with TBPs is increased (Figures 4and 5). Thus, TBPs appear to form complexes differentfrom the nuclear matrix association sites to DNA. Datafrom nucleoprotein celite chromatography are coherentwith results obtained with salt-extracted nuclear matrices,but reveal the same process in more detail (Figures 5 and6). The presence of a possible MAR only in one site of TBPaccumulation also indicates the different nature of thetwo types of DNA-protein complexes.
Individual peptides of TBP fractionDetailed characterization of the TBP spectrum by meansof 2D electrophoresis and mass-spectrometry are cur-rently ongoing. However our preliminary results on devel-opment-dependent changes in TBP spectrum reportedhere are in good agreement with microsatellite analysisdata. Indeed, we observe some increase in the TBP-bind-ing sites during the transition of the first leaf from stage 07to stage 10, the number of polypeptides in the TBP prepa-ration increases, while in coleoptile we observed adecrease in the TBP binding sites and the peptide spec-trum of TBPs is also simplified (Figures 7 and 8). Proteinblot assays confirmed the same trend: in nuclear extractsof stage 07 coleoptiles several peptides bind TBP-associ-ated DNA (Figure 8), in stage 10 coleoptiles the only low-molecular peptide, also prominent on electropherograms(Figure 7) retains its ability to form tight complexes withDNA.
ConclusionOur data indicate the existence of development-depend-ent redistribution of the TBP along Amy32b and Bmy1 and
Page 11 of 16(page number not for citation purposes)
BMC Plant Biology 2009, 9:56 http://www.biomedcentral.com/1471-2229/9/56
along studied stretches of Chromosomes 1H and 7H inbarley. Sites of the TBP binding do not co-localize with thenuclear matrix attachment regions. The TBP spectrum andaffinity to DNA change during plant development.
MethodsPlant materialSeeds of the barley cultivar Balga were obtained from theLatvian State Stende Cereal Breeding Institute and LatvianState Priekuli Crop Breeding Institute. Etiolated shootswere grown for 3 – 5 days at 30° in darkness. Coleoptiles,first leaves and roots were dissected from shoots of Zadoks07 (coleoptile emerged stage, classification according [9])and Zadoks 10 (first leaf through coleoptile) developmentstages. Dissected coleoptile and first leaf tissue from 50–100 shoots were combined in one sample for each tissueat both developmental stages. Ten embryos per samplefrom dry grains (Zadoks 0) and after 20 h of imbibition(Zadoks 1) were used in some experiments. Coleoptiles,first leaf, and embryo samples were subsequently used forbulk DNA extraction. Seeds of watery ripe (Zadoks 71)and medium milk development (Zadoks 75) stages werecollected in the field of the Latvian State Priekuli CropBreeding Institute. 70 – 100 mg of seed tissue was used forbulk DNA and RNA isolation.
GenesGenBank accession X05166 sequence information wasused to develop primers and the microarray and to ana-lyze data on the barley Amy32b gene [16]. GenBank acces-sion AF061203 sequence information deposited forAdorra cultivar was used in this study for Bmy1 gene. Thepreviously reported data [24] indicate the identity of theselected gene sequences in the Adorra and Balga cultivarsused in this study.
DNA and RNA isolationPlant tissues were frozen in liquid nitrogen and ground ina mortar or in TissueLyser (Qiagen) to a fine powder.DNA from plant material was extracted according to thepreviously described protocol using chloroform-isoamylalcohol extraction [36] with some modifications. Takinginto account our previous observations on partial degra-dation of TBPs by proteases and the formation of artificialDNA-protein complexes due to the RNaseA treatment(reported also in [37]), we excluded the exogenousenzymes from DNA extraction protocols. RNA was precip-itated with concentrated LiCl solution (up to 4 M) withsubsequent 1 h incubation on ice [38] and removed as apellet by centrifugation. DNA was precipitated with 1 vol-ume of butoxyethanol. Nucleic acids from the NPC-chro-matography fractions were concentrated by absorption onhydroxyapatite and elution with 1 ml of 0.24 M phos-phate buffer. DNA was purified using a Wizard DNAClean-Up System kit (Promega).
Total RNA was isolated according to the RNA extractionprotocol of Rneasy Plant Mini Kit (Qiaqen). Samples of 2μg – 3 μg each were stored at -20°C until use.
Isolation of TBP-DNA complexes by means of fractionation on nitrocelluloseDNA was digested with HindIII and Pst1 restrictases oralternatively with AluI restrictase (1 U/1 μg of DNA) at37°C overnight in appropriate buffer. For microarrayexperiments DNA was fragmented by sonication in aSONICS Vibra Cell™ device (Sonics & Materials, 53 New-town, USA) with 60% output for a period of time rangingfrom 30 seconds to 4 minutes. Completeness of DNAdigestion or extent of fragmentation was tested by gel elec-trophoresis. DNA samples with average fragment sizes ofabout 500 bp were diluted in 3 ml of filtration buffer (0.5M KCl, 5 mM EDTA, 10 mM Tris- HCl, pH 7.4) to a finalconcentration of 25–70 μg/ml. The solution was pressedthrough a nitrocellulose filter (HAWP 025 00, HA 0.45 μ,25 mm, Millipore or NC 45, 0.45 μm, 25 mm, Whatman(Schleicher & Schuell) pre-soaked with filtration bufferand supported in a Swinnex holder. The filter was washedup to five times with the same 3 ml volume of filtrationbuffer to avoid contamination between fractions. Filtra-tion buffer wash off resulted in filtered DNA fraction (F).The filter retained a DNA fraction enriched in the tightlybound proteins; it was eluted with five washes of 3 mleach of 5 mM EDTA, 10 mM Tris HCl, pH 7.4 (low-ionicstrength eluted fraction R1) and 3 ml of 50 mM NaOH(alkali-eluted fraction R2) in sequence [4]. The DNA con-tent in the F, R1 and R2 fractions was measured spectro-photometrically.
Chromatin fractionation and nuclear matrix isolationA protocol of conventional extraction of nuclei with highsalt solutions modified for monocots [39] was used forchromatin fractionation and nuclear matrix isolation.Briefly, nuclei isolated using 1% Triton X100 extractionwere consecutively extracted with:10 mM Tris HCl, pH7.5; 10 mM NaCl, 3 mM MgCl2; 20 mM NH4Cl to obtainthe nucleoplasm fraction; with 10 mM Tris HCl, pH 7.5;0.2 mM MgCl2 to obtain the fraction of soluble chroma-tin; and with 2 M NaCl, 10 mM Tris HCl, pH 7.5; 0.2 mMMgCl2 to obtain the fraction of insoluble chromatin. Theresidual fraction contained nuclear matrix.
Chromatography of nucleoproteins on celite (NPC-chromatography)The NPC-chromatography was performed as described[28,29]. Barley embryos or organs taken from 5 shootswere homogenized in a tightly-fit Dounce homogenizerin 10 mM Tris-HCl, pH7.6; 5 mM MgCl2, 1% Triton X100.The lysate was directly applied on a precooled (0°C)water-coated column of Celite R-630 (Fluka). The columnwas rinsed with 50 ml of 5 mM MgCl2, 10 mM Tris HCl,
Page 12 of 16(page number not for citation purposes)
BMC Plant Biology 2009, 9:56 http://www.biomedcentral.com/1471-2229/9/56
pH 7.4 (breakthrough fraction) at 0°C and 80 ml of NaClin linearly increasing concentration (0 → 2 M) and thesame temperature was pumped through the column. Thefraction eluted in NaCl gradient (DNA 0) was consideredto be unbound to the nuclear matrix. Then a gradient ofLiCl – urea (0 → 4 M; 8 M) was applied in the same man-ner. Finally the column was gradually heated from 0°C to100°C under a constant flow of 4 M LiCl, 8 M urea solu-tion. Fractions eluted in LiCl-urea gradient and at a tem-perature below 70°C were combined (DNA I) and wasconsidered to represent a fraction loosely bound to thenuclear matrix in contrast to the DNA II fraction eluted athigh temperature (70° → 100°C) and considered to betightly attached to the nuclear matrix.
TBPs sample preparation and electrophoresisProtein samples were obtained using the method ofexhaustive DNase digestion [6]. The DNA was digestedwith DnaseI (Fermentas) (1 U/100 μg, room temperature,overnight) in 10 mM Tris-HCl, pH 7.6; 5 mM MgCl2.Completeness of digestion was monitored by gel electro-phoresis. Proteins were concentrated by evaporation ofexcess water. The DNA digest was mixed with the samplebuffer, heated to 100°C for 5 minutes and cooled. Electro-phoresis was performed in 10% or 15% PAAG gels usingthe conventional protocol for Laemmli system. Gels weresilver stained according to [40].
PCR based marker chromosome profilingTwenty two and twenty four primer pairs representingbarley markers mapped along chromosomes 1H and 7Hcorrespondingly were chosen for analysis (Figures 5, 6, 7).The primer sequences, genetic map position and micros-atellite motif of HvALAAT, HVHVAI, Bmac, EBmac, Bmagand EBmag markers were previously published [24] andare publicly available http://bioinf.scri.ac.uk/ssr/barley_s.html. GBMS markers were developed andmapped in IPK [26]. The complete sequences of GBMS aswell as WMCIE8, cMWG 773, AF022725A, cMWG 725,cMWG 728, ABG 461 markers are available from IPK onrequest. Markers of cMWG, ABC, and ABG series are prim-ers of sequenced genomic RFLP clones [27], other markersare microsatellites.
To equalize the DNA content in different samples afterfractionation on nitrocellulose, an aliquot of the F frac-tion was diluted 5 times, and aliquots of the R1 and R2fractions were diluted twice. 5 μl of the diluted solutionwas taken for the amplification reaction. The final PCRreaction mix contained: about 100 ng of genomic DNA;1.5 mM MgCl2, 40 μM of dCTP, dGTP, dTTP, dATP; 0.4μM of each primer; and 1U of Taq polymerase in a 25 μlreaction mixture. The PCR conditions were: 3 min at94°C, followed by 45 cycles at 94°C for 1 min, 60°C for1 min, and 72°C for 2 min with chain elongation of 7 min
[26]. PCR was performed on a Perkin Elmer PCR machinein 96-well format. Fragment length analysis was per-formed on an ALF II Express automated laser fluorescencesequencer (Pharmacia) using a short gel cassette. Denatur-ing polyacrylamide gels were prepared following the man-ufacturer's protocol (Pharmacia). The sample standardmix was heat denatured and snap cooled before loading.The gels were run in 0.5 × TBE buffer with 600 V, 50 mAand 50 W and gel temperature 50°C. Fragment sizes werecalculated using the Fragment Analyser 1.02 computerprogram (Pharmacia) via comparison with the internalsize standards (73, 122, 196, and 231 bp). Results werescored as presence/absence of amplification.
DNA-binding protein blot assayThe assay was performed according to [41]. Nuclear pro-teins were electrophoretically separated in one dimen-sional 12% SDS-polyacrylamide gel. Proteins wereelectroblotted from the gel onto 0.45 μm nitrocellulosefilters (Bio-Rad) in 19 mM glycine, 25 mM Tris, 0.1% SDS,and 20% methanol. Protein blots were blocked overnightat room temperature in blocking buffer (10 mM Tris-HCl,pH 7.5, 50 mM NaCl, 2 mM EDTA, 1% blocking reagent(BSA) and subsequently preincubated for 1 hour in bind-ing buffer (10 mM Tris-HCI pH 7.4, 50 mM NaCl, 2 mMEDTA, 0.05% BSA). Later, the membranes were trans-ferred into a fresh portion of the binding buffer supple-mented with 10 ng/ml of radioactively labelled DNAprobe (10,000–70,000 cpm/ml) and 100 ng/ml of com-petitor DNA (Eco R1 digested plasmid pUC19). TBP-bound DNA fragments obtained according to the exhaus-tive DNaseI digestion procedure were used as probes.Binding was carried out overnight at 37°C in a hybridiza-tion oven under gentle agitation. The membranes werewashed three times for 15 min in 100 ml of binding bufferand autoradiographed.
DNA probe labellingDifferent DNA fractions were labelled with [α32P]dATP(Hartmann Analytic, Germany) using a HexaLabel™ DNALabeling Kit (UAB Fermentas, Lithuania). Unincorporatednucleotides were removed by selective precipitation ofDNA with ethanol in the presence of ammonium acetate.
DNA arrayAmy32b (GenBank accession X05166) and Bmy1 (Gen-Bank accession AF061203) genomic sequence informa-tion was used to design the arrays. The DNA array for eachgene was developed according to the published approach[7,42], and consisted of 50–60 oligonucleotides spacedalong the whole gene. Sequences of the oligonucleotidesare given in Table 1 and Table 2, their location in thestructural genes is shown in Figures 2 and 3, for Amy32band Bmy1 genes, respectively. The oligonucleotides had asimilar Tm. Prior to hybridization the oligonucleotides
Page 13 of 16(page number not for citation purposes)

BMC Plant Biology 2009, 9:56 http://www.biomedcentral.com/1471-2229/9/56
were analyzed in silico to avoid repetitive DNA sequences.The oligonucleotides were slot-blotted onto membraneHybond Zeta Probe GT +0.4 M NaOH filters in 10 × SSCand fixed by baking at 80°C for 2 h. The hybridizationwas carried out at 65°C in modified Church buffer (0.5 Mphosphate buffer, pH 7.2, 7% SDS, 10 mM EDTA) over-night. The blot was washed subsequently in 2 × SSC, 0.1%SDS twice for 30 min, then in 1 × SSC, 0.1% SDS for 30min. The blots were exposed to Phosphorimager Fuji FLA-5100 for 3–12 h. The average of three independent exper-iments (two hybridizations per experiment) is presented.The signal of the total DNA hybridization was subtractedfrom the F and R fraction hybridization signal. Data arepresented as R/F ratio of hybridization signals.
RT-PCRRNA samples of 2 – 3 μg were pretreated with DNaseIusing DNA-free kit (Ambion) and used for cDNA synthe-sis with Revert Aid™ H Minus First Strand cDNA SynthesisKit (Fermentas) with unspecific primers according to themanufacturer's protocol. Aliquots containing 100 – 150ng of the first strand cDNA were used as a template for
PCR amplification performed in 30 μl of the reaction mix-ture with a final concentration of 1× PCR buffer (Fermen-tas), 3 mM of MgCl2, 40 μM of each dNTP, 1 μM of eachforward and reverse sequence-specific primers and 0.612U of Taq polymerase (Fermentas) per sample. Cyclingparameters were as follows: denaturation/RT inactivationstep at 94°C during 3 min was followed by 30 cycles ofthree steps; denaturation 45 sec at 94°C, annealing 45 secat 60°C, and extension 1 min at 72°C, and final extension5 min at 72°C. Primer design was performed by thePrimer 3.0 program using coding regions of the genes.Bmy1 cDNA fragment of 178 bp in size was amplified withforward 5'-TGCCGTCCAGATGTATGC-3' and reverse 5'-GCAGATGAATTCTCCGATGC-3' primers to encompasspart of exon II, the whole of exon III and part of exon IV.Amy32b cDNA fragment of 447 bp in size was amplifiedwith forward 5'-TAAGCCCAACTACGATCAGGA-3' andreverse 5'-ACGTAGGCGTCTCCTTCGTG-3' primers toencompass partly exon III and exon IV. Sequences ofprimers for the alpha tubulin (Tub) reference gene, a ubiq-uitous and stably expressed gene in barley, have been pub-
Table 2: Bmy1 array oligonucleotide sequences.
Name Sequence
1 5'-ACGTTTGAACATTAACGTGTGTTTTTGGTGAAAGTGAAAAAATAGTTGAC-3'2 5'-ATAATTGGTGAGGCACATTCTCATTTGATTGGTTAGTTTAACTTCCTTGTCACATTATTT-3'3 5'-AAAAAAAACAAATTTAGGATGATATTTTGGGGTAACTTTTGGTGTTCAATTTGTTTTTTT-3'4 5'-ATGTGTGCGTCTTCACTTCGTATAGGGTGCCGTTTGGTTGAGAGTTGAGA-3'5 5'-ACTATTTCAAGGATCTAGTGCACACATATACATTATTGTTGTACATATAACATTGATACT-3'6 5'-CACCACTCTAGTTCTCTGATGCATATTTATATAGAAGTTCAAGATGACACCAAATACAAGC-3'7 5'-TGGTGTTATCGTCGACATTGAAGTGGGACTTGGCCCAGCTGGAGAGATGAGGTACCCATC-3'8 5'-AGAAATATATAGGATTCATCTGTGCAACTTAAATACTTAAAATGATTTTT-3'9 5'-TTAAATTTTTAAATTGAGTGTCTTGGGTCTTGAATTTAAGACCTTTTGACTCGGATACCA-3'10 5'-CTATGCATTTATACTTCAACAATAAGAATAGTGAGGTAGCAC-3'11 5'-AACAACAAAAATACACAAAAC TATCCAGGCTAAGGGAACTCGCATTGCTTA-3'12 5'-ATTTGTTGATTTGCAGGTGCCTATTATATACTAATAATTTAATTTTATTGTTTTCAGCCT-3'13 5'-AGGCTGAAGGCCCCACCTGTGGCATGGGTGGGCAAGTTAAAGGCCCTACT-3'
Table 1: Amy32b array oligonucleotide sequences.
Name Sequence
1 5'-CCTCCCACGTTTATCTTCAATTTGTCAAAAAAATCATGTTCGGACCGTT-3'2 5'-CAAAAGGTATATCCTGCGTAATATTTCTGTTACTGCACCACATTAAGAACAGTTTATATG-3'3 5'-CAACGCTGGGTGATCCCAGCTTGGATAGTGCTATCTTTTCCCATGGAATTTGTGCCGGCC-3'4 5'-TATCCATGCAGTGCCTCCAAGCAACACTCCACGGGGACGTAGCTCGTGTT-3'5 5'-CAGTCTTGTGAATCATTCATCCACAGAACAAGAGTGCAGCGAACAGTGTAGATC G-3'6 5'-CAACGAAGGTCCCTCTTCACACTAAAATCATTCGTGTCTCAACTGAACATC-3'7 5'-AACGTGCAAATACGATCAAACAAGTATACAGTATACTGTACAAACTAAAAC-3'8 5'-GACCACCTCAACGACCGCGTCCAGCGCGAGCTCAAGGAGTGGCTCCTCTGGCTCAAGAGC-3'9 5'-CATGTGGCCATTCCCCTCCGACAAGGTCATGCAAGGCTACGCATACATCC-3'10 5'-AATCATTCAGGAAACTAAAAATCTCTTGTCTTGTCGGTTTGCAGTTCTACGACCATTTCTTT-3'11 5'-AAGCCTCCACTCATCCACCATTCAATCGAGCATGCATGAATTTTCCAAAATAATG-3'
Page 14 of 16(page number not for citation purposes)

BMC Plant Biology 2009, 9:56 http://www.biomedcentral.com/1471-2229/9/56
lished [43]. Amplification resulted in the 248 bp productof expected size.
Data management and analysisNumbering of any loci in the genes is given from the firstATG of the corresponding genomic sequence. Identifica-tion of transcription factor binding sites and clusters,analysis of similarities between the two genes and predic-tion of nuclear matrix attachment regions (MAR) was per-formed by Genomatix software (DiAlign TF, Release 3.1,and MatInspector, Release 7.4, Smartest Release 2.2) toolsat http://www.genomatix.de/).
AbbreviationsTBP: tightly bound protein; TBPs: tightly bound proteins;NM: nuclear matrix; SC: soluble chromatin; IS: insolublechromatin; MS: microsatellite; NPC-chromatography:nucleoprotein-celite chromatography.
Authors' contributionsTS initiated, coordinated, and led the project, performedPCR-based marker and bionformatical analysis and editedthe manuscript. NS designed the study, analyzed theresults of all the experimental work described and draftedthe manuscript. MR worked out the strategy of markeranalysis. YV conceived and designed the microarray exper-iments performed by KB. OS performed RT PCR experi-ments. LB, DL, KB performed experiments with proteinsdesigned by BJ. All the authors read and approved thefinal manuscript.
AcknowledgementsThe work was funded in part by the grant No 05.1401 (T. Sjakste) from the Latvian Council of Science, the Deutsche Forschungsgemeinschaft grant 436 LET 17/1/05, and the Lithuanian State Science and Studies Foundation grant No T-109/07. Collaboration between French, Latvian and Lithuanian teams was supported by ECO-NET program 2006–2008, project "Devel-opment of an integrated genomic DNA-array based approach for the epi-genetic study of the genome". Network between Latvian and Lithuanian colleagues was also supported by NordPlus Neigbour 2007 – 2008 project "Genomics for all: bringing new tools to breeders" and NordPlus Horizon-tal 2008 – 2011 project "Implantation of genomics and bioinformatics in agricultural practice". We thank Ina Belicka, Mara Bleidere (Latvian State Stende Cereal Breeding Institute) and Linda Legzdina (Latvian State Priekuli Crop Breeding Institute) for providing plant material.
References1. Steinmüller K, Batschauer A, Apel K: Tissue-specific and light-
dependent changes of chromatin organization in barley(Hordeum vulgare). Eur J Biochem 1986, 158:519-525.
2. Tsanev R, Avramova Z: Stably-bound chromosomal proteins.Chromosoma 1994, 103:293-301.
3. Pfütz M, Gileadi O, Werner D: Identification of human satelliteDNA sequences associated with chemically resistant nonhis-tone polypeptide adducts. Chromosoma 1992, 101:607-617.
4. Werner D, Neuer-Nitsche B: Site-specific location of covalentDNA-polypeptide complexes in the chicken genome. NucleicAcids Res 1989, 17:6005-6015.
5. Neuer-Nitsche B, Lu X, Werner D: Functional role of a highlyrepetitive DNA sequences to anchorage of the mousegenome. Nucleic Acids Res 1988, 16:8351-8360.
6. Avramova Z, Georgiev O, Tsanev R: DNA sequences tightlybound to proteins in mouse chromatin: identification ofmurine MER sequences. DNA Cell Biol 1994, 13:539-548.
7. Bielskiene K, Bagdoniene L, Juodka B, Lipinski M, Sjakste T, VassetzkyYS, Sjakste N: Transcription- and apoptosis-dependent long-range distribution of tight DNA-protein complexes in thechicken alpha-globin gene. DNA Cell Biol 2008, 27:615-621.
8. Sjakste T, Röder M, Labeikyte D, Bagdoniene L, Levina A, Juodka B,Sjakste N: Distribution of tight DNA-protein complexes alongthe barley chromosome 1H, as revealed by microsatellitemarker analysis. Cell Mol Biol Lett 2005, 10:49-59.
9. Anderson PM, Oelke EA, Simmons SR: Growth and DevelopmentGuide for Spring Barley. [http://www.extension.umn.edu/distribution/cropsystems/DC2548.html].
10. Kirnos MD, Volkova SA, Ganicheva NI, Kudriashova IB, Vaniushin BF:Synchronous synthesis of DNA in coleoptiles and the initialleaf of developing etiolated wheat shoots: the nature andcorrelation of nuclear and mitochondrial DNA syntheses.Biokhimiia 1983, 48:1587-1595. (Russian).
11. Sjakste TG, Taurite Z, Rashal ID: Dissociation of chromatindomains during the cell cycle in developing barley seedlings.Biochemistry – Engl Tr 1993, 58:1260-1267.
12. Sjakste TG, Taurite Z, Rashal ID: Kinetin-induced changes inDNA association with nuclear matrix proteins in the firstleaves of etiolated barley seedlings. Soviet Plant Physiology 1993,40:151-155.
13. Zou X, Neuman D, Shen QJ: Interactions of two transcriptionalrepressors and two transcriptional activators in modulatinggibberellin signaling in aleurone cells. Plant Physiol 2008,148:176-186.
14. Mundy J, Hejgaard J, Hansen A, Hallgren L, Jorgensen KG, Munck L:Differential synthesis in vitro of barley aleurone and starchyendosperm proteins. Plant Physiol 1986, 81:630-636.
15. Green L, Faergestad EM, Poole A, Chandler P: Grain developmentmutants in barley. α-Amylase production during grain mat-uration and its relation to endogenous gibberelic acid con-tent. Plant Physiol 1997, 114:203-212.
16. Whittier RF, Dean DA, Rogers JC: Nucleotide sequence analysisof α-amylase and thiol protease genes that are hormonallyregulated in barley aleurone cells. Nucleic Acids Res 1987,15:2515-2535.
17. Polakova KM, Kucera L, Laurie DA, Vaculova K, Ovesna J: Codingregion single nucleotide polymorphism in the barley low-pI,alpha-amylase gene Amy32b. Theor Appl Genet 2005,110:1499-1504.
18. Thacker SP, Ramamurthy V, Kothari RM: Characterization of bar-ley β-amylase for application in maltose production. Starch1992, 44:339-341.
19. Yoshigi N, Okada Y, Sahara H, Tamaki T: A structural gene encod-ing β-amylase of barley. Biosci Biotechnol Biochem 1995,59(10):1991-1993.
20. Kreis M, Williamson M, Buxton B, Pywell J, Heigaard J, Svendsen I:Primary structure and differential expression of β-amylase innormal and mutant barleys. Eur J Biochem 1987, 169:517-525.
21. Erkkilä MJ, Ahokas H: Special barley β-amylase allele in a Finn-ish landrace line HA52 with high grain enzyme activity.Hereditas 2001, 134:91-95.
22. Erkkilä MJ, Leah R, Ahokas H, Cameron-Mills V: Allele-dependentbarley grain β-amylase activity. Plant Physiol 1998, 117:679-685.
23. Sjakste T, Röder M: Distribution and inheritance of beta-amy-lase alleles in North European barley varieties. Hereditas 2004,141:39-45.
24. Sjakste TG, Zhuk AF: Novel haplotype description and struc-tural background of the eventual functional significance ofthe barley β-amylase gene intron III rearrangements. TheorAppl Genet 2006, 113:1063-1079.
25. Ramsay L, Macaulay M, degli Ivanissivich S, MacLean K, Cardle L, FullerJ, Edwards K, Tuvesson S, Morgante M, Massari A, Maesti E, MarmiroliN, Sjakste T, Ganal M, Powell W, Waugh R: A simple sequencerepeat-based linkage map of barley. Genetics 2000,156:1997-2005.
26. Li JZ, Sjakste TG, Röder MS, Ganal MW: Development andgenetic mapping of 127 new microsatellite markers in bar-ley. Theor Appl Genet 2003, 107:1021-1027.
27. Künzel G, Korzun L, Meister A: Cytologically integrated physicalrestriction fragment length polymorphism maps for the bar-
Page 15 of 16(page number not for citation purposes)
http://www.ncbi.nlm.nih.gov/entrez/query.fcgi?cmd=Retrieve&db=PubMed&dopt=Abstract&list_uids=3015615
http://www.ncbi.nlm.nih.gov/entrez/query.fcgi?cmd=Retrieve&db=PubMed&dopt=Abstract&list_uids=7821084
http://www.ncbi.nlm.nih.gov/entrez/query.fcgi?cmd=Retrieve&db=PubMed&dopt=Abstract&list_uids=2549504
http://www.ncbi.nlm.nih.gov/entrez/query.fcgi?cmd=Retrieve&db=PubMed&dopt=Abstract&list_uids=2549504
http://www.ncbi.nlm.nih.gov/entrez/query.fcgi?cmd=Retrieve&db=PubMed&dopt=Abstract&list_uids=3419921
http://www.ncbi.nlm.nih.gov/entrez/query.fcgi?cmd=Retrieve&db=PubMed&dopt=Abstract&list_uids=3419921
http://www.ncbi.nlm.nih.gov/entrez/query.fcgi?cmd=Retrieve&db=PubMed&dopt=Abstract&list_uids=3419921
http://www.ncbi.nlm.nih.gov/entrez/query.fcgi?cmd=Retrieve&db=PubMed&dopt=Abstract&list_uids=8024697
http://www.ncbi.nlm.nih.gov/entrez/query.fcgi?cmd=Retrieve&db=PubMed&dopt=Abstract&list_uids=8024697
http://www.ncbi.nlm.nih.gov/entrez/query.fcgi?cmd=Retrieve&db=PubMed&dopt=Abstract&list_uids=8024697
http://www.ncbi.nlm.nih.gov/entrez/query.fcgi?cmd=Retrieve&db=PubMed&dopt=Abstract&list_uids=6639985
http://www.ncbi.nlm.nih.gov/entrez/query.fcgi?cmd=Retrieve&db=PubMed&dopt=Abstract&list_uids=6639985
http://www.ncbi.nlm.nih.gov/entrez/query.fcgi?cmd=Retrieve&db=PubMed&dopt=Abstract&list_uids=3031602
http://www.ncbi.nlm.nih.gov/entrez/query.fcgi?cmd=Retrieve&db=PubMed&dopt=Abstract&list_uids=3031602
http://www.ncbi.nlm.nih.gov/entrez/query.fcgi?cmd=Retrieve&db=PubMed&dopt=Abstract&list_uids=8534999
http://www.ncbi.nlm.nih.gov/entrez/query.fcgi?cmd=Retrieve&db=PubMed&dopt=Abstract&list_uids=2446870
http://www.ncbi.nlm.nih.gov/entrez/query.fcgi?cmd=Retrieve&db=PubMed&dopt=Abstract&list_uids=2446870

BMC Plant Biology 2009, 9:56 http://www.biomedcentral.com/1471-2229/9/56
Publish with BioMed Central and every scientist can read your work free of charge
"BioMed Central will be the most significant development for disseminating the results of biomedical research in our lifetime."
Sir Paul Nurse, Cancer Research UK
Your research papers will be:
available free of charge to the entire biomedical community
peer reviewed and published immediately upon acceptance
cited in PubMed and archived on PubMed Central
yours — you keep the copyright
Submit your manuscript here:http://www.biomedcentral.com/info/publishing_adv.asp
BioMedcentral
ley genome based on translocation breakpoints. Genetics2000, 154:397-412.
28. Lichtenstein AV, Zaboykin MM, Sjakste NI, Alechina RP: Differentialdissociation of chromatin digests: a novel approach revealinga hierarchy of DNA-protein interactions within chromatindomains. J Cell Sci 1991, 99:503-513.
29. Sjakste N, Sjakste T: Possible involvement of DNA strandbreaks in regulation of cell differentiation. Eur J Histochem2007, 51:81-94.
30. Boulikas T: Chromatin domains and prediction of MARsequences. Int Rev Cytol 1995, 162A:279-388.
31. Nabirochkin S, Ossokina M, Heidmann T: A nuclear matrix/scaf-fold attachment region co-localizes with the gypsy retro-transposon insulator sequence. J Biol Chem 1998,273:2473-2479.
32. Razin SV, Chernokhvostov VV, Vassetzky ES: The distribution oftightly bound proteins along the DNA chain reflects the typeof cell differentiation. Nucleic Acids Res 1988, 16:3617-3633.
33. Neuer-Nitsche B, Werner D: Sub-set characteristics of DNAsequences involved in tight DNA: polypeptide complexesand their homology to nuclear matrix DNA. Biochem BiophysRes Communs 1987, 147:335-339.
34. Bagdoniene L, Bonikataite K, Borutinskaite V, Labeikyte D, Juodka B:DNA sequences involved in yeast tightly bound DNA-pro-tein complexes. Biologija 2005:1-8.
35. Avramova Z, Tsanev R: Stable DNA-protein complexes ineukaryotic chromatin. J Mol Biol 1987, 196:437-440.
36. Plaschke J, Ganal MW, Röder MS: Detection of genetic diversityin closely related bread wheat using microsatellite markers.Theor Appl Genet 1995, 91:1001-1007.
37. Benore-Parsons M, Ayoub MA: Presence of RNase A causesaberrant DNA band shifts. Biotechniques 1997, 23:128-131.
38. Manning K: Isolation of nucleic acids from plants by differentialsolvent precipitation. Analytical Biochemistry 1991, 195:45-50.
39. Reshetnikov VN, Nenadovich RA, Gorbatsevich VI: Changes in lipidcomposition of rye interphase cell nuclei as a function ofgenome expression. Doklady of the National Academy of Sciences ofBelarus 2000, 44:56-59.
40. Blum H, Beier H, Gross JH: Improved silver staining of plantproteîns, RNA and DNA in polyacrylamide gels. Electrophoresis1987, 8:93-99.
41. Ludérus ME, de Graaf A, Mattia E, den Blaauwen JL, Grande MA, deJong L, van Driel R: Binding of matrix attachment regions tolamin B1. Cell 1992, 70:949-959.
42. Ioudinkova E, Petrov A, Razin SV, Vassetzky YS: Mapping long-range chromatin organization within the chicken alpha-globin gene domain using oligonucleotide DNA arrays.Genomics 2005, 85:143-151.
43. Suprunova T, Krugman T, Distelfeld A, Fahima T, Nevo E, Korol A:Identification of novel gene (Hsdr4) involved in water-stresstolerance in wild barley. Plant Mol Biol 2007, 64:17-34.
Page 16 of 16(page number not for citation purposes)
http://www.ncbi.nlm.nih.gov/entrez/query.fcgi?cmd=Retrieve&db=PubMed&dopt=Abstract&list_uids=1939369
http://www.ncbi.nlm.nih.gov/entrez/query.fcgi?cmd=Retrieve&db=PubMed&dopt=Abstract&list_uids=1939369
http://www.ncbi.nlm.nih.gov/entrez/query.fcgi?cmd=Retrieve&db=PubMed&dopt=Abstract&list_uids=1939369
http://www.ncbi.nlm.nih.gov/entrez/query.fcgi?cmd=Retrieve&db=PubMed&dopt=Abstract&list_uids=8575883
http://www.ncbi.nlm.nih.gov/entrez/query.fcgi?cmd=Retrieve&db=PubMed&dopt=Abstract&list_uids=8575883
http://www.ncbi.nlm.nih.gov/entrez/query.fcgi?cmd=Retrieve&db=PubMed&dopt=Abstract&list_uids=9442099
http://www.ncbi.nlm.nih.gov/entrez/query.fcgi?cmd=Retrieve&db=PubMed&dopt=Abstract&list_uids=9442099
http://www.ncbi.nlm.nih.gov/entrez/query.fcgi?cmd=Retrieve&db=PubMed&dopt=Abstract&list_uids=9442099
http://www.ncbi.nlm.nih.gov/entrez/query.fcgi?cmd=Retrieve&db=PubMed&dopt=Abstract&list_uids=3375069
http://www.ncbi.nlm.nih.gov/entrez/query.fcgi?cmd=Retrieve&db=PubMed&dopt=Abstract&list_uids=3375069
http://www.ncbi.nlm.nih.gov/entrez/query.fcgi?cmd=Retrieve&db=PubMed&dopt=Abstract&list_uids=3375069
http://www.ncbi.nlm.nih.gov/entrez/query.fcgi?cmd=Retrieve&db=PubMed&dopt=Abstract&list_uids=3656455
http://www.ncbi.nlm.nih.gov/entrez/query.fcgi?cmd=Retrieve&db=PubMed&dopt=Abstract&list_uids=3656455
http://www.ncbi.nlm.nih.gov/entrez/query.fcgi?cmd=Retrieve&db=PubMed&dopt=Abstract&list_uids=9232244
http://www.ncbi.nlm.nih.gov/entrez/query.fcgi?cmd=Retrieve&db=PubMed&dopt=Abstract&list_uids=9232244
http://www.ncbi.nlm.nih.gov/entrez/query.fcgi?cmd=Retrieve&db=PubMed&dopt=Abstract&list_uids=1716071
http://www.ncbi.nlm.nih.gov/entrez/query.fcgi?cmd=Retrieve&db=PubMed&dopt=Abstract&list_uids=1716071
http://www.ncbi.nlm.nih.gov/entrez/query.fcgi?cmd=Retrieve&db=PubMed&dopt=Abstract&list_uids=1525831
Related Documents