ST/ESA/326 DEVELOPMENT COOPERATION FOR THE MDGs: MAXIMIZING RESULTS United Nations New York, 2010 Department of Economic and Social Affairs asdf INTERNATIONAL DEVELOPMENT COOPERATION REPORT

Welcome message from author
This document is posted to help you gain knowledge. Please leave a comment to let me know what you think about it! Share it to your friends and learn new things together.
Transcript
ST/ESA/326
DEVELOPMENT COOPERATION FOR THE MDGs:
MAXIMIZING RESULTS
United NationsNew York, 2010
Department of Economic and Social Affairs
asdf
INTERNATIONAL DEVELOPMENT COOPERATION REPORT
ST/ESA/326
United Nations publication
Copyright © United Nations, 20010 All rights reserved
Department of Economic and Social AffairsThe Department of Economic and Social Affairs of the United Nations Secretariat is a vital interface between global policies in the economic, social and environmental spheres and national action. The Department works in three main interlinked areas: (i) it compiles, gener-ates and analyses a wide range of economic, social and environmental data and information on which States Members of the United Nations draw to review common problems and take stock of policy options; (ii) it facilitates the negotiations of Member States in many intergovernmental bodies on joint courses of action to address ongoing or emerging global challenges; and (iii) it advises interested Governments on the ways and means of translating policy frameworks developed in United Nations conferences and summits into programmes at the country level and, through technical assistance, helps build national capacities.
NoteThe present report is an independent publication commissioned by UN DESA drawing from the work of the Development Cooperation Forum and additional research and positions of independent authors. Opinions expressed in this report do not necessarily reflect the views of the United Nations.
The designations employed and the presentation of the material in this publication do not imply the expression of any opinion whatsoever on the part of the Secretariat of the United Nations concerning the legal status of any country, territory, city or area or of its authorities, or concern-ing the delimitation of its frontiers or boundaries.
The term “country” as used in the text of this publication also refers, as appropriate, to ter-ritories or areas.
The designations “developed” and “developing” countries or areas and “more developed”, “less developed” and “least developed” regions are intended for statistical convenience and do not necessarily express a judgement about the stage reached by a particular country or area in the development process.
Symbols of United Nations documents are composed of capital letters combined with figures.
iii
Preface
Development Cooperation for the MDGs - Maximizing ImpactIn June 2010, development cooperation actors met at the second biennial Development Cooperation Forum (DCF), part of the High-level Segment of the Economic and Social Council (ECOSOC). Government ministers, UN development agency heads, NGOs and other development practitioners exchanged ideas and best practices on how the international community can improve the impact of aid on development goals, especially the Millennium Development Goals.
This independent report brings together ideas that emerged during the debates at the DCF, along with research by United Nations organizations and studies conducted by inde-pendent consultants and think tanks in preparation for the Forum. As such, the report pro-vides a wide range of views and trends on development cooperation and should be considered a comprehensive resource in this field.
Among the ideas debated at the DCF was the effectiveness of accountability mecha-nisms – measures to ensure that aid is provided, managed and delivered to recipients in a timely, efficient and transparent manner at global, regional and national levels. The need for improved policy coherence in donor and recipient countries was also a focus. Aid and non-aid policies also need to be rectified; in many cases non-aid policies on trade, investment and migration have hindered aid policies. This report presents information on these misalignments.
Information on other trends are included herewith: aid quantity and quality, the impact of the recent global crises on aid delivery, financing needs for climate change adaptation and mitigation, aid allocation, the impact of aid on gender equality and South-South and trian-gular development cooperation.
It is my hope that a wide range of development cooperation actors will read this report closely. The efforts of government line ministries, NGOs and UN system bodies need to be synchronized in order to achieve our common development goals. With the deadline for achieving the Millennium Development Goals drawing near in 2015, a common understand-ing among all stakeholders and enhanced cooperation is more important than ever before.
May this report also reinvigorate commitment to the DCF as the key global venue for addressing and improving development cooperation. The Forum needs continuous input from development practitioners including evidence-based research, best practices and innova-tive strategies that should be shared with the larger international community.
Sha ZukangUnder-Secretary-General for Economic and Social Affairs

v
Acknowledgements
The International Development Cooperation Report is an independent publication com-missioned by the Department of Economic and Social Affairs of the United Nations Secretariat (UN/DESA), drawing on the work of the Development Cooperation Forum during 2007-10.
Matthew Martin, Senior Advisor to the DCF, led the team that prepared this first report. The report was prepared under the general supervision and leadership of Nikhil Seth, Director, Office for ECOSOC Support and Coordination (OESC) of UN/DESA. The core team at OESC included Marion Barthélemy, Kristinn Helgason, Kozue Kay Nagata, Madhushree Chatterjee, Liu Huanyu, Vilhelm Klareskov and Thomas Boehler.
Substantive comments were also received from Rob Vos, Director of the Develop-ment Policy Analysis Division (DPAD), and Benu Schneider of the Financing for Develop-ment Office of UN/DESA.
We gratefully acknowledge background research contributions by Ed Anderson, Sachin Chaturvedi, Sakiko Fukuda-Parr, Patrick Guillaumont, Alison Johnson, Katerina Kyrili, Nagesh Kumar, Richard Manning, Amelia U. Santos-Paulino, Gideon Rabinowitz, Jonathan Stever, Finn Tarp, Halla Thorsteinsdottir, Bruno Versailles, the Development Policy Analysis Division (DPAD) of UN/DESA, and the United Nations Development Fund for Women (UNIFEM).
The report also benefited greatly from the strategic guidance of the Members of the Advisory Group of Under-Secretary-General Sha Zukang on the Development Coopera-tion Forum, including Talaat Abdel-Malek, Economic Advisor to the Minister of Interna-tional Cooperation, Egypt; Mary-Ann Addo, Director, External Resources Mobilization, Ministry of Finance and Economic Development, Ghana; Elisabetta Belloni, Director-General for Development Cooperation, Ministry for Foreign Affairs, Italy; Victor Ber-nardo, former Vice Minister, Ministry of Planning and Development Vice Minister, Min-istry of Planning and Development, Mozambique; Carlos Alberto Primo Braga, Acting Vice President, World Bank; Richard Carey, former Director, Development Co-operation Directorate, OECD; Martin Dahinden, Director-General, Swiss Agency for Development and Cooperation; Eckhard Deutscher, Chair, Development Co-operation Directorate, OECD; Irene Freudenschuss-Reichl, Director-General for Development Cooperation, Ministry for European and International Affairs, Austria; Elisabeth Gateau, Secretary-General, United Cities and Local Governments; Ingrid Hoven, former Director-General, Ministry for Economic Cooperation and Development, Germany; Olav Kjorven, Assist-ant-Secretary-General and Director, Bureau for Development Policy, UNDP; Jan Kubis, Executive Secretary, United Nations Economic Commission for Europe; Bruce Jenks, former Assistant-Secretary-General and Assistant Administrator, Bureau of Resources and Strategic Partnerships, UNDP; Anders B. Johnsson, Secretary-General, Inter-Parliamen-tary Union; Ritva Koukku-Ronde, Under-Secretary of State for Development Policy and Cooperation, Ministry of Foreign Affairs, Finland; Jon Lomøy, Director, Development Co-operation Directorate, OECD; Maria Jose Lucas, Vice-Minister, Ministry of Plan-ning and Development, Mozambique; Stefano Manservisi, Director-General for Develop-ment, European Commission; Enrique Maruri Londoño, Director of International Coop-eration, Ministry of Foreign Affairs, Colombia; Ibrahim Assane Mayaki, Acting Chief Executive, New Partnership for Africa ‘s Development (NEPAD); Kumi Naidoo, former Secretary-General, CIVICUS World Alliance for Citizen Participation; Ruy Nogueira,
vi Development Cooperation for the MDGs: Maximizing Results
Under-Secretary-General for Cooperation and Trade Promotion, Ministry of External Relations, Brazil; H. S. Puri, Ambassador Extraordinary and Plenipotentiary, Permanent Representative of India to the United Nations; John Rwangombwa, Secretary-General and Secretary to the Treasury, Ministry of Finance and Economic Development, Rwan-da; Birama Boubacar Sidibe, Vice-President (Operations), Islamic Development Bank; Ramesh Singh, Chief Executive, ActionAid International; Velayuthan Sivagnansothy, Director-General, Dept of Foreign Aid and Budget Monitoring, Ministry of Plan Imple-mentation, Sri Lanka; Ingrid Srinath, Secretary-General, CIVICUS World Alliance for Citizen Participation; Bjorn Stigson, President, World Business Council for Sustainable Development; Olukorede Willoughby, former Acting Chief Executive, New Partnership for Africa ‘s Development (NEPAD) and Yiping Zhou, Director, Special Unit for South-South Cooperation, UNDP.
Gemma Adaba (International Confederation of Free Trade Unions), Gigi Francisco (Women’s Working Group on Financing for Development), Luca de Fraia (Action Aid), Alessandro Motter (Inter-Parliamentary Union), Bill Norton (North-South Institute), Emilia Saiz (United Cities and Local Governments) and Henri Valot (CIVICUS) also pro-vided important guidance throughout the preparation for the Development Cooperation Forum, as well as sharing many research materials which were vital inputs to this report.
The report also benefited from discussions with staff of the United Nations Develop-ment Programme (UNDP), the Economic and Social Commission for Asia and the Pacific (ESCAP), the United Conference on Trade and Development (UNCTAD), the Special Unit for South-South Cooperation within the United Nations Development Programme, as well as the Development Cooperation Directorate of the Development Assistance Com-mittee of the Organization for Economic Cooperation and Development (OECD/DAC) and the Members of the Working Party on Aid Effectiveness’ Task Teams on South-South Cooperation and on Mutual Accountability.
Also gratefully acknowledged is the support of Daša Šilović, Radka Konderlova and their Colleagues in the United Nations Development Programme, in conducting the 2010 survey on mutual accountability at national level.
We also owe thanks to all the panellists and participants at the 2008 and 2010 Development Cooperation Forum meetings in New York, and at the global High-level symposiums held to prepare for the Development Cooperation Forum, namely respectively in Austria on “Country-level experiences in coordinating and managing development coop-eration” in April 2007; in Cairo on “Trends in development cooperation: South-South and triangular cooperation and aid effectiveness” in January 2008; in Rome on “Role of nation-al and local stakeholders in contributing to aid quality and effectiveness” in June 2008; in Austria on “Accountable and Transparent Development Cooperation: Towards a More Inclusive Framework” in November 2009; and in Finland on “Coherent Development Cooperation: Maximizing Impact in a Changing Environment” in June 2009. Thanks also go to the participants in the Asia-Pacific regional workshop on trends and progress in triangular and South-South development cooperation held in Thailand in October 2008.
The report also benefited from editorial assistance by Kathleen Doyle, Charmaine Williams-Carter, Margo Kemp, Aurélien Baillot and Hrushikesh Ramachandrappa in UN/DESA, Maria Holloway and Jeannette Laouadi at Development Finance Interna-tional, as well as communication support by Paul Simon in UN/DESA.
Notwithstanding the help and inputs received from all these sources, the analysis and policy recommendations in this report remain those of the report authors. They do not therefore necessarily reflect the views of UNDESA or United Nations Member States.
vii
List of acronyms
AAA Accra Agenda for ActionAAF African Agriculture FundAAU Assigned Amount UnitAccra HLF Accra High Level Forum on Aid EffectivenessACMECS Ayeyawady-Chao Phraya-Mekong Economic Cooperation StrategyADFD Abu Dhabi Fund for DevelopmentAfDB African Development Bank GroupAFESD Arab Fund for Economic and Social DevelopmentAFI Alliance for Financial InclusionAGDI African Gender and Development IndexAGOA African Growth and Opportunity ActAIDA Accessible Information on Development ActivitiesAIMS Aid Information Management SystemsALBA Alianza Bolivariana para los Pueblos de Nuestra AméricaALNAP Active Learning Network for Accountability and PerformanceAMANET African Malaria Vaccine Testing NetworkAMC Advanced Market CommitmentAMPs Aid Management PlatformsANDI African Network for Drugs and Drug InformationAPP Africa Progress PanelAsDB Asian Development BankASEAN Association of Southeast Asian NationsAU African UnionAusAID Australian Government’s overseas Aid ProgramAWEPA Association of European Parliamentarians with AfricaBADEA Arab Bank for Economic Development in AfricaBAPOA Buenos Aires Plan of ActionBPA Brussels Plan of ActionBRAC Bangladeshi Rural Advancement CommitteeBWIs Bretton Woods institutionsCABBIO Centro Brasileiro-Argentino de BiotecnologiaCADF China Africa Development FundCAN Comunidad AndinaCAP Common Agricultural PolicyCARICOM Caribbean Community CDDE Capacity Development for Development EffectivenessCDM Clean Development Mechanism
viii Development Cooperation for the MDGs: Maximizing Results
CER Certified Emission ReductionCGD Center for Global DevelopmentCIF Climate Investment FundCOMPAS Common Performance Assessment SystemCPA Country Programmable AidCRS Creditor Reporting SystemCSO Civil Society OrganizationCSW Commission on the Status of Women (UN)DAC Development Assistance Committee of the OECDDADs Development Assistance Databases DARA Development Assistance Research AssociatesDAW Division for the Advancement of Women (United Nations)DCF Development Cooperation Forum (United Nations)DFI Development Finance InternationalDFID Department for International DevelopmentDPs Development PartnersDRC Democratic Republic of CongoDRRI Disaster Risk Reduction InitiativeDSF Debt Sustainability FrameworkEALA East African Legislative AssemblyEC European CommissionECOSOC Economic and Social Council (United Nations)ECOWAS Economic Community of West African States EDPRS Economic Development and Poverty Reduction Strategy (Ethiopia)EIF Enhanced Integrated FrameworkEU European UnionEXIM Export-Import BankFAO Food and Agriculture Organisation (United Nations)FCO Foreign & Commonwealth OfficeFDI Foreign Direct InvestmentFOCAC Forum on China-Africa CooperationGAFSP Global Agriculture and Food Security ProgramGAVI Global Alliance for Vaccines and ImmunizationGDP Gross Domestic ProductGEF Global Environment FacilityGFATM Global Fund to Fight Aids Tuberculosis and MalariaGFDRR Global Facility for Disaster Reduction and RecoveryGFRP Global Food Crisis Support ProgrammeGHA Global Humanitarian AssistanceGMR Global Monitoring ReportGNI Gross National IncomeGTZ Gesellschaft für Technische ZusammenarbeitHIPC Heavily Indebted Poor CountriesHIPC CBP Heavily Indebted Poor Countries Capacity-Building ProgrammeHIV/AIDS Human immunodeficiency virus / acquired immune deficiency syndrome
List of acronyms ix
HMT Her Majesty’s TreasuryHRI Humanitarian Response IndexIADB Inter-American Development BankIADG Internationally Agreed Development GoalIATI International Aid Transparency Initiative IBRD International Bank for Reconstruction and Development (World Bank)IBSA India-Brazil-South AfricaIDA International Development Association (World Bank)IFAD International Fund for Agricultural Development IFFIm International Finance Facility for ImmunizationILO International Labour OrganizationIMF International Monetary FundINSTRAW International Research and Training Institute for the Advancement of Women
(United Nations)IPRs Intellectual Property RightsIPU Inter-Parliamentary Union IRAI IDA Resource Allocation IndexIsDB Islamic Development BankIT Information TechnologyJAF Joint Assessment FrameworkJAS Joint Assistance StrategyJBSF Joint Budget Support FrameworkJICA Japan International Cooperation AgencyKFAED Kuwait Fund for Arab Economic DevelopmentLDC Least Developed CountriesLDPG Local Development Partners’ GroupLICs Low income countriesLLDCs Land-Locked Developing CountriesLOC Line of CreditM&E Monitoring and EvaluationMA Mutual AccountabilityMDG Millennium Development GoalMDRI Multilateral Debt Relief InitiativeMERCOSUR Mercado Comun del SurMICs Middle income countriesMOPAN Multilateral Organization Performance Assessment NetworkMPI Ministry of Planning and Investment (Vietnam)MRDE Mutual Review of Development EffectivenessMTEF Medium Term Expenditure FrameworkNEPAD New Economic Partnership for AfricaNERICA New Rice for AfricaNGO Non-governmental organizationNWMs National Women’s MachineriesOAS Organization of American StatesODA Official development assistance

x Development Cooperation for the MDGs: Maximizing Results
ODI Overseas Development InstituteOECD Organisation for Economic Co-operation and Development OFID OPEC Fund for International Development OPEC Organisation of Petroleum Exporting CountriesOPM Oxford Policy ManagementOSAGI Office of the Special Adviser to the Secretary-General on Gender Issues (United
Nations)OTC Over-the-counterPAHO Pan African Health OrganizationPAP Pan African ParliamentPBAs Performance based approachesPCD Policy Coherence for DevelopmentPD Paris Declaration on Aid EffectivenessPEAP Poverty Eradication Action Plan (Uganda)PFM Public Financial ManagementPGD Policy for Global DevelopmentPIU Project implementation unitPLAID Project Level Aid Information DatabasePRSC Poverty Reduction Support CreditPWYF Publish What You FundQuODA Quality of Official Development AssistanceSAARC South Asian Association for Regional CooperationSADC Southern African Development CommunitySADC-PF SADC Parliamentary ForumSANBio South African Network for BiosciencesSCCF Special Climate Change FundSDR Special drawing rights (IMF)SEGIB Secretaria General IberoamericanaSFD Saudi Fund for Development SICA Sistema de la Integracion Centroamericana SIDS Small Island Developing StatesSME Small and Medium EnterprisesSMEPG SME Partnership GroupSPA Strategic Partnership for AfricaTA Technical assistanceTC Technical co-operationTNCs Transnational CorporationsTPU Trade Policy UnitTR-AID Transparent AidTRIPs Trade Related Intellectual Property RightsTT-SSC Task Team on South-South CooperationUAE United Arab EmiratesUEMOA West African Economic and Monetary UnionUNAIDS Joint United Nations Programme on HIV/AIDSUNCTAD United Nations Conference on Trade and Development
List of acronyms xi
UNDESA United Nations Department of Economic and Social Affairs UNDP United Nations Development ProgrammeUNEP United Nations Environment ProgrammeUNESCAP United Nations Economic and Social Commission for Asia and the PacificUNESCO United Nations Educational, Scientific and Cultural OrganisationUNFCCC United Nations Framework Convention on Climate ChangeUNFPA United Nations Population FundUNICEF United Nations Children’s FundUNIDO United Nationals Industrial Development OrganisationUNIFEM United Nations Development Fund for WomenUNITAID International facility for the purchase of drugs against HIV/AIDS, Malaria and
TuberculosisUNOCHA United Nations Office for the Coordination of Humanitarian AffairsUNREDD United Nations Collaborative Programme on Reducing Emissions from Defor-
estation and Forest DegradationUNRWA United Nations Relief and Works AgencyWFP World Food Programme (United Nations)WHO World Health Organisation (United Nations)WIPO World Intellectual Property Organization (United Nations)WP-EFF Working Party on Aid Effectiveness WTO World Trade Organisation

xiii
Overview
Development cooperation for the MDGs: maximizing results
In September 2010 the world’s leaders will gather at the United Nations to review their progress in implementing the Millennium Declaration Goals, and chart a course for the final five-year period to “free our fellow men, women and children from the abject and de-humanizing conditions of extreme poverty”. In 2005, when they last met to review progress, many governments had made major pledges to sharply increase their flows of development cooperation and debt relief. Many more made pledges to increase the “effectiveness” of aid in producing development results.
Since then, more aid has been provided. Some remarkable results have been achieved, such as 33 million more children in schools, and ten times as many patients receiving anti-retroviral drugs since 2003. Many countries have attained many MDGs, and many other countries have made strong progress. The best ways to attain the MDGs, and the funding needed, are ever clearer.
Yet there is no cause for celebration. Most developing countries are off track for most of the MDGs, and have been blown further off course by the recent “triple crises” of sharply rising food prices, the volatility in oil prices, and the global financial and economic crisis – to which is being added the growing challenge of climate change. One key reason for this is that most OECD countries have not met the development cooperation promises of 2005; another is that much of the cooperation provided has had little impact on the MDGs.
In a world beset by crisis, it is the poorest who suffer most and now is not the time to break our pledges to them. Informed public opinion worldwide urges that we should provide far more development cooperation, even in a period of budgetary stringency, and to give with generosity.
The forthcoming MDG Summit is a key chance for the world’s governments. They could reinforce their budget commitments, find far more innovative financing, and build on the best practices of existing development cooperation to have even more impact and accelerate progress towards the MDGs. Together with South-South cooperation and private philanthropy, these steps could help ensure that we reach the MDGs by 2015.
This report assesses what all stakeholders in development cooperation – providers, recip-ients and other actors who can hold them accountable – need to do to maximize its impact and reach the MDGs. It looks in turn at four challenges facing development cooperation.
The first challenge is to mobilize more development cooperation, improve its alloca-tion and increase its impact. Development cooperation is currently woefully insufficient, poorly allocated and having too little impact: the report suggests practical solutions to these problems.
The second challenge is making development cooperation accountable and transparent. Accountability and transparency have recently become buzzwords in development coopera-
xiv Development Cooperation for the MDGs: Maximizing Results
tion circles, with the risk that the processes might become ends in themselves. This report explains how they could work better to deliver results.
The third challenge is to “defragment” development cooperation. In the fragmented environment of international cooperation, the “OECD agenda” of pledges on quantity and effectiveness is not accepted by all countries. This is the case notably for countries providing South-South Cooperation. Yet they have been sharply increasing their flows, and the report shows us that many lessons about value-for-money and results can be learned from South-South cooperation.
The fourth challenge underlies all the others. Coherence of developed and developing country policies going “beyond aid”, broader progress on the global partnership embodied in MDG 8, and a coherent global architecture for governing development cooperation, are all essential to maximizing results.
Mobilizing, allocating and increasing the impact of development cooperation
Chapter 1 looks at how to increase the quantity of development cooperation, allocate it more appropriately, and increase its impact on results. Cooperation rose by 35% between 2005 and 2009, but the rise slowed sharply in 2009, and it remains woefully short of the amounts needed to finance the MDGs. Diversification of sources accelerated, with non-DAC cooperation, global funds and private philanthropy rising rapidly. OECD DAC donors have sharply increased flows, but overall DAC aid will fall way short of the 2005 pledges. The 15 donors which have met their pledges have done so because of ambitions, forward planning and increased programme aid. OECD public opinion provides scope for further aid increases. With ambitious new accountable and transparent targets, including agreeing to reach 0.7% of GNI by 2015, supported by forward plans for scaling up disbursements using programme aid, the MDG financing needs can be met.
The multiple crises have dramatically increased developing country financing needs. There is excellent analysis of how best to fulfil these needs and provide the financing, but relatively little additional financing. DAC donors’ medium-term aid plans have until recently been surprisingly resilient, Southern cooperation has also risen more sharply, and philan-thropy has generally held up well. The overall effect of the global recession on reducing cooperation levels looks likely to be much less than in the past – partly due to strong civil society and government support for the MDGs.
Climate finance commitments made at and after Copenhagen fall well short of needs, which in turn dwarf current development cooperation. ODA must not be diverted to fighting climate change, and pledges to make climate change financing additional, need to be made or reinforced. Spent wisely, climate change funds could also fight poverty, and all efforts to mobilize financing should target these twin objectives. New innovative financing such as through global taxes on carbon, transport or finance, could generate even higher amounts than 0.7%, funding the MDGs and fighting climate change simultaneously.
Development cooperation continues to be misallocated among developing country groups, regions, individual countries, and regions within countries. The most vulnerable countries are receiving reduced shares, with dramatic variations in individual donor perform-ance in targeting the weakest. There are continuing shortfalls in aid to Africa. Allocation bears little relation to need and continues to reflect donor interests, leaving some countries as “donor orphans”. Within countries, aid does not always reach the poorest regions. A global

Overview. Development cooperation for the MDGs: maximizing results xv
agreement is needed on aid allocation, setting targets based on need and vulnerability. This should include a higher share of ODA to fragile and conflict-affected states, rising to 50% by 2015; and a reiteration of earlier promises for ODA proportions to allocate to least-developed, SIDS and landlocked countries.
Development cooperation is also being misallocated in terms of channels, types and sectors. Given its high levels of demonstrated effectiveness, the share of multilateral aid remains too low at 29%, though United Nations funding has been rising. Growing ear-marking to particular initiatives (especially of multilateral aid) also undermines results. Bilateral providers should commit to channelling at least 35% of their aid via multilateral institutions, and to reduce earmarking. Almost half of bilateral DAC ODA does not reach country programmes, as it corresponds to expenditure for scholarships, costs for host-ing refugees in OECD countries, unpredictable humanitarian aid and debt relief, and administration. Budget support is the most effective, efficient and sustainable type of aid – but is growing far too slowly. Providers should commit to moving more aid to country programmes – and setting separate targets for country programmable aid (or excluding aid which does not reach developing countries) would help foster this. They should also increase sharply the share of aid they provide in general or sector budget support.
Sectorally, there has been a welcome sharp rise in flows to infrastructure, and a smaller one for agriculture, both of which are sectors essential to combating poverty and promoting growth: but these as well as the education and health MDGs still face major financing gaps, and water and sanitation shares are falling. Rapidly growing flows to “gov-ernance” need to show that they are producing MDG results, and there is a need for dra-matic improvements in monitoring and targeting aid for gender results. Aid needs to be allocated on a more balanced and stable basis across all the MDGs, without overly favoring social sectors, individual diseases or sub-sectors, notably by increasing shares for gender, infant and maternal mortality, food security, water and sanitation, and sustainable liveli-hoods to reduce income poverty.
The quality and effectiveness of development cooperation is critical to achieving MDG results. The Paris Declaration on Aid Effectiveness was a major step forward in com-mitting OECD donors and recipients to care about the results of their aid, but most of its targets are unlikely to be met, and effectiveness remains especially low where it is needed most – in aid orphans and fragile states. Efforts need to be made to accelerate progress dramatically. The aid effectiveness agenda needs to be broadened to take account of the concerns of other stakeholders – and to learn lessons from the particular methods used by the most dynamic providers (Southern and private sector). Much clearer monitorable indicators and stronger efforts are needed on untying aid; transforming technical assistance into capacity-building; making aid disbursements more predictable; increasing flexibility to respond rapidly to shocks; reducing policy and procedural conditionality; increasing concessionality; and reducing fragmentation.
These steps could allow existing aid to increase its results dramatically, especially if combined with step changes in the gender focus of aid and in anti-corruption measures supported by parliamentary and community monitoring of results. To maintain public sup-port for development cooperation, the High-level Plenary Meeting of the General Assembly on the MDGs needs to focus on measures to increase MDG results, including monitoring MDG spending (whether aid funded or not) and its impact much more closely; and the 2011 High-Level Forum on Aid Effectiveness in the Republic of Korea needs to address the concerns of other stakeholders and non-DAC providers through a broader quality and results agenda.
xvi Development Cooperation for the MDGs: Maximizing Results
Accountability and transparencyOne key way to increase the results of aid is to ensure that its delivery is accountable and transparent. Chapter 2 presents the DCF’s work in this area, a major focus of its programme for 2008-10.
The DCF has defined key components which have influenced the success of national accountability mechanisms in changing recipient and provider behaviour. These include a national aid policy; specific targets for individual providers as well as the recipient which are monitored and discussed at top level on an annual basis; strong recipient government, parliamentary and civil society leadership; independent analytical input from non-executive stakeholders; comprehensive databases which cover aid quality issues; and peer pressure among providers.
However, a comprehensive DCF/UNDP survey has revealed that most countries have no aid policy, and virtually none have targets for individual providers; most policies focus on recipient performance; most monitoring is of recipients, and little is independently executed; few national aid coordination forums review progress on accountability targets; non-executive stakeholder engagement is very limited; all non-executive groups have major capacity-build-ing needs; and most participants in national mechanisms are OECD DAC donors. Overall, only eight countries have major progress on national mutual accountability, though there is some progress in 22 others and a lot of work continuing. National mutual accountability processes have more impact on recipient behaviour, and change provider behaviour only when they become very advanced.
Providers need to commit to individual targets to improve aid quality in each recipient country, giving priority to lagging country groups such as Sub-Saharan Africa and fragile states. Mutual accountability processes need to be led by recipient country governments, par-liaments and civil society organizations, and focus more on the gender impact of aid. Like-minded providers need to be proactive in promoting national-level progress, and non-DAC providers should be encouraged to contribute their own ideas for targets to improve aid quality. More analysis and action is needed on accountability in provider countries and institutions.
Transparency is also weak at the national level. Country aid databases do not track many aid effectiveness indicators. Information accessibility is limited outside governments, and is mostly limited to data on recent and forecast disbursements. Progress on transparency and mutual accountability are mutually reinforcing at national level, and the most accel-eration of effort is needed in Africa and fragile states. Domestic accountability in recipient countries needs to be reinforced, and domestic accountability in provider countries needs to be reformed to focus on effectiveness and results rather than other interests.
The effectiveness of global accountability mechanisms depends on the quality of their evidence, the level of ownership by all stakeholders, and the degree of debate and behaviour change they provoke. In general, aid recipients have implemented more of their commit-ments under such mechanisms. Provider performance is largely disappointing: key global assessments are relatively consistent in their findings, though the performance of individual donors varies widely. It is vital that individual providers establish mechanisms through which recipients collectively can hold them accountable.
Poor provider performance partly reflects eight systemic gaps in global mechanisms: providers are virtually the only sources of data and analysis; recipient governments and other stakeholders are woefully underrepresented; the content of assessments is dominated by pro-vider concerns; most assessments cover only DAC donors and major multilaterals; virtually none publish analysis on the performance of individual providers in individual recipient
Overview. Development cooperation for the MDGs: maximizing results xvii
countries; cooperation among mechanisms is weak though growing; few are used to provoke change at national level; and few have much impact on provider behaviour.
Global-level transparency initiatives have proliferated rapidly in recent years. The DCF has identified clear principles for ensuring they assist accountability, including responding to the information needs of different stakeholders; providing timely, accurate and up to date data; making additional information available such as the conditions attached to aid and the terms of concessional loans; being relevant for economic analysis, budgeting and planning, social and environmental appraisals, and analyzing progress of projects and programmes as well as progress towards the internationally agreed development goals; providing a mecha-nism to trace aid through the system from provider to intended beneficiary; being classified to match local budgets and plans, in a common data format which is easy to integrate into local systems; coming from all possible providers, including non-DAC, foundations and charities; and being easy to access for all stakeholders, especially those in developing countries.
However, a DCF survey of initiatives has found that: most current initiatives focus on publishing disbursements; documents and conditionalities need to be much more widely pub-lished; data are not timely or aligned with classification systems used in recipient countries; users see data as much less accessible than the sponsors of transparency initiatives; most data and documents come from providers; actual users of data are mainly OECD academics and civil society organizations; and most data is used only for analysis of trends and comparisons among donors. There has recently been progress in overcoming some of these problems, but transparency will increase accountability and the impact of development cooperation only if it is accompanied by analysis from independent sources, and capacity-building for non-executive stakeholders especially in developing countries.
The international community needs to set much higher standards for global initiatives, including assessing their progress annually against best practice norms, equipping a focal point to share best practice lessons, and fully funding the best initiatives. Transparency mechanisms need to broaden information and its sources, make it more timely and aligned with recipient country systems, ensure it is systematically disseminated, and build stakeholder capacity to use it to enforce accountability. Official global mutual accountability mechanisms should be ration-alized, increase input and design by recipient country governments and non-executive stake-holders, and improve coverage, mutuality, timeliness and country-level relevance, to enhance impact on recipient country and provider behaviour. Regional mutual accountability mecha-nisms also need to be reinforced and to focus more closely on development cooperation issues.
Accountability and transparency have not focused sufficiently on gender issues. Glo-bal, regional and national mechanisms pay little attention to gender. Capacity-building for women’s organizations will be vital if gender equality is to benefit from accountability and transparency initiatives, as will high quality information and more comprehensive policy design. The DCF and its partners have begun reflecting on gender indicators and, with newly strengthened international leadership through UN-WOMEN, the United Nations could set and monitor more precise targets.
South-south cooperationSouth-South Cooperation has existed for six decades, but is now more prominent than ever due to recent rapid expansion, mainly by China, Saudi Arabia and Venezuela. In Chapter 3 this report publishes the most comprehensive data available on South-South Cooperation, but even its calculation of US$15.3 billion is a considerable underestimate. Most providers are planning rapid future expansions.
xviii Development Cooperation for the MDGs: Maximizing Results
South-South Cooperation channeled via multilateral organizations is 22% and rising, including sharply rising contributions to the United Nations and World Bank. South-South philanthropy is also rising sharply, mainly in social and rural development, as are self financ-ing micro-finance charities.
More than 90% of South-South Cooperation is “country programmed”, and three quar-ters is project finance, though there have been rapid recent rises in budget support and debt relief. Technical cooperation remains vital for smaller providers, and humanitarian assistance is rising rapidly. In terms of country allocation, much South-South Cooperation is focused on regional neighbours, and it also specializes in funding regional programmes and institu-tions. Some South-South Cooperation providers have made major efforts at global cooperation outside their own regions. Political, strategic, trade and investment links are also influential.
South-South Cooperation covers most sectors but focuses on infrastructure. It has little or no policy conditions, and few procedural conditions. Much disbursement and procure-ment is fast and simple. Some providers use recipient financial systems, though most do not. Much South-South Cooperation is tied but this is often subject to negotiation, and in spite of tying value-for-money remains high. However, faster and cheaper implementation may come at environmental and human cost. There is no major risk of unsustainable debt: South-South Cooperation aligns with recipient debt management policies. Some South-South Cooperation is planned multi-year, and most is highly predictable in-year. There is growing coordination among South-South Cooperation providers and a wish to enhance it further including via the DCF, especially to improve review and evaluation of results.
Growing triangular cooperation (whereby OECD donors fund Southern institutions to implement programmes) has many advantages of relevance, appropriateness and cost-effec-tiveness, but also some risks including complex systems and negotiations and unclear division of responsibilities. Its scale is unknown but two thirds of DAC donors fund it, with Japan, Germany and Spain most prominent. Multilateral and regional organizations also promote triangular cooperation.
The report examines SSC in the key sectors of health, agriculture and infrastructure. South-South Cooperation in health is growing rapidly. Health delivery focuses on human resource development, infrastructure and systems development, and is being channeled also via global funds, regional organizations and civil society organizations. SSC in health research is high quality but growing too slowly, and private sector cooperation focuses on biotechnology and generic drugs, and on commercialisation rather than research and development. Formal collaboration networks are proving valuable, but many challenges remain.
In agriculture, South-South Cooperation can play a key role in overcoming concerns about land acquisition by South-South investors. Food security and technical cooperation sup-port are vital, and the main challenges are posed by global agricultural distortions. South-South Cooperation in infrastructure is vital, especially on energy and railways. The United Nations is also prioritizing South-South Cooperation and establishing new innovative programmes.
Overall, South-South cooperation needs to be channeled increasingly through multilat-eral agencies, as well as increasing its use of budget and programme support, and of evaluation to demonstrate results. The international development cooperation system needs to capitalize fully on the comparative advantages of SSC in providing appropriate and cost-effective medi-cal and agricultural technology, and infrastructure expertise, by procuring a higher share of inputs from Southern countries. South-South Cooperation providers could also vastly enrich national development cooperation dialogues, by suggesting ways to assess quality and impact (including speed of delivery, value-for-money, technology transfer and capacity development) and participating more fully in national accountability and transparency mechanisms.
Overview. Development cooperation for the MDGs: maximizing results xix
Beyond development cooperation: coherence and architecture
To maximize its impact, development cooperation needs to be reinforced by consistency or “coherence” across a diverse range of policies in developed and developing countries, go-ing beyond development cooperation. All these policies need to be geared to accomplishing national development priorities and the MDGs, and avoiding policies or approaches which undermine them.
Chapter 4 finds that progress on donor coherence is mixed and the issue of the impact of broader policies on development needs to move up the political agenda. In addition, rela-tively few developing countries have clear “beyond aid” coherence policies which, for exam-ple, define clearly the role they foresee for different types of external and domestic develop-ment financing in supporting their national development strategies. Both groups need to make much more progress in this area.
In addition, there is strong concern among all DCF stakeholders that aid dependence should be reduced over time, above all by aid catalyzing other types of development finance such as domestic savings, budget tax revenue, foreign direct investment and remittances. Clear indicators and best practice studies are needed on how aid can “work itself out of a job”, and the DCF should make this a priority in 2010-12.
Without progress across the range of partnership issues included in MDG 8, develop-ment cooperation will have limited impact. Yet private flows continue to be volatile, and more efforts are needed to enhance their development contribution. Cost reductions and diaspora bonds could channel remittances to investment in the MDGs. Trade levels are rebounding from the crisis but there is as yet no progress on the development round of trade talks. Debt relief has fallen sharply as Heavily Indebted Poor Countries Initiative reaches its end, and there is an urgent need to establish a more automatic workout mechanism for other countries which become heavily indebted in future. Other urgent priorities are to ensure that financial regulation is development-oriented, and that developing countries and non-executive stake-holders gain increased voice and participation in the global financial architecture.
Finally, it is time to reinforce the global development cooperation architecture. The Monterrey conference of 2002 led to two processes: aid effectiveness, which has been rela-tively efficient in negotiating monitorable indicators but less inclusive; and the DCF, which has been highly inclusive but less effective in producing actionable outcomes. Future progress could involve the United Nations taking greater leadership, building on the comparative advantages of both processes, and involving all stakeholders.
Such a solution would maximize legitimacy and effectiveness at all levels, and allow everyone to focus on results rather than architecture. A first step could be to consider mov-ing after the next High-Level Forum on Aid Effectiveness to a more fully coordinated global architecture on aid quality with the United Nations at its apex, building on the conclusions of Monterrey. This could make a major contribution to producing stronger and more coordi-nated global leadership on international development cooperation, making all stakeholders focus even more strongly on development results for the world’s poorest people, and taking them beyond the Millennium Development Goals.

xxi
Table of contents
Page
Preface . . . . . . . . . . . . . . . . . . . . . . . . . . . . . . . . . . . . . . . . . . . . . . . . . . . . . . . . . . . . . . . . iiiAcknowledgements . . . . . . . . . . . . . . . . . . . . . . . . . . . . . . . . . . . . . . . . . . . . . . . . . . . . . . vList of acronyms . . . . . . . . . . . . . . . . . . . . . . . . . . . . . . . . . . . . . . . . . . . . . . . . . . . . . . . . viiOverview . . . . . . . . . . . . . . . . . . . . . . . . . . . . . . . . . . . . . . . . . . . . . . . . . . . . . . . . . . . . . . xiii
Chapter 1
Mobilizing, allocating and increasing the impact of development cooperation
Aid quantity, sources and targets . . . . . . . . . . . . . . . . . . . . . . . . . . . . . . . . . . . . . . . . . . . . 1Impact of global crises: higher needs, more analysis, some additionality . . . . . . . . . . . . . . 5Climate finance: innovative financing must also fund the MDGs . . . . . . . . . . . . . . . . . . 8Aid misallocation: undermining progress to the MDGs . . . . . . . . . . . . . . . . . . . . . . . . . . 9Strengthening aid quality and results . . . . . . . . . . . . . . . . . . . . . . . . . . . . . . . . . . . . . . . . 21
Chapter 2
Accountability and transparency of development cooperation
Defining accountability and transparency . . . . . . . . . . . . . . . . . . . . . . . . . . . . . . . . . . . . . 29Global and regional mutual accountability . . . . . . . . . . . . . . . . . . . . . . . . . . . . . . . . . . . . 31National-level accountability and transparency . . . . . . . . . . . . . . . . . . . . . . . . . . . . . . . . . 43International transparency initiatives . . . . . . . . . . . . . . . . . . . . . . . . . . . . . . . . . . . . . . . . 60Making mutual accountability and transparency more gender-sensitive . . . . . . . . . . . . . . 67
Chapter 3
South-south development cooperation
Introduction and definitions . . . . . . . . . . . . . . . . . . . . . . . . . . . . . . . . . . . . . . . . . . . . . . . 71Recent trends in south-south and triangular cooperation . . . . . . . . . . . . . . . . . . . . . . . . . 72Triangular Cooperation . . . . . . . . . . . . . . . . . . . . . . . . . . . . . . . . . . . . . . . . . . . . . . . . . . . 88South-South cooperation in key sectors . . . . . . . . . . . . . . . . . . . . . . . . . . . . . . . . . . . . . . . 92United Nations support to south-south cooperation . . . . . . . . . . . . . . . . . . . . . . . . . . . . . 101
Chapter 4
Beyond development coooperation: coherence and architecture to increase impact
Beyond development cooperation . . . . . . . . . . . . . . . . . . . . . . . . . . . . . . . . . . . . . . . . . . . 103Coherence by OECD donors . . . . . . . . . . . . . . . . . . . . . . . . . . . . . . . . . . . . . . . . . . . . . . . 104Coherence by developing countries . . . . . . . . . . . . . . . . . . . . . . . . . . . . . . . . . . . . . . . . . . 106Aid coherence . . . . . . . . . . . . . . . . . . . . . . . . . . . . . . . . . . . . . . . . . . . . . . . . . . . . . . . . . . 107Coherence for what: accelerating progress on MDG 8 . . . . . . . . . . . . . . . . . . . . . . . . . . . 109Towards a new development cooperation architecture. . . . . . . . . . . . . . . . . . . . . . . . . . . . 112
Bibliography . . . . . . . . . . . . . . . . . . . . . . . . . . . . . . . . . . . . . . . . . . . . . . . . . . . . . . . . . . . 117

1
Chapter 1
Mobilizing, allocating and increasing the impact of development cooperation1
Aid quantity, sources and targetsAt the end of 2009, international development cooperation exceeded US$170 billion, up from US$126 billion in 2005 and US$161 billion in 2008. However, a 13.1% average an-nual increase in 2006-08 has slowed in 2009 to only 5.6%, due in part to the impact of the global economic crisis.2
As indicated in the United Nations Millennium Development Goals (MDG) Gap Task Force Report for 2010, there is no overall global estimate of financing needs for reach-ing the MDGs. However, whatever approach is used to estimate needs, it is clear that current financing falls well short of requirements. For example:
• For individual MDGs, UNESCO (2010) assesses that “education for all” in 46 low-income countries requires an additional US$16 billion per year; the World Bank (Horton et al 2010) suggests that an additional US$10 billion is needed to overcome under-nutrition in the 36 worst-affected countries.
• For country groups, the World Bank (2003) estimated that meeting all education, health, water and sanitation goals in low and lower middle income countries would require up to US$65 billion more per year.
• For gender-related MDGs in Low Income countries, according to UNIFEM (Grown et al 2008) at least US$13 billion more a year is needed.
• As an overall estimate, the United Nations Millennium Project assessed additional financing needs as exceeding US$110 billion a year during 2010-15.
OECD DAC aid rose by 17% during 2006-08, but in 2009 it was stagnant, declin-ing by 2.2% to US$ 119.6 billion in 2009 (OECD DAC 2010a). In contrast, non-DAC cooperation (87% of which is South-South cooperation) increased by 76% from US$10 billion in 2006 to US$17.6 billion in 2008.3 Global funds disbursements more than dou-bled to US$3.7 billion, while aid from private sources rose by 62% to US$23.5 billion in
1 This chapter is based largely on a background study prepared for DCF 2010 by Alison Johnson, on Global Trends in Development Cooperation
2 These figures largely exclude very significant and growing flows from private Southern founda-tions, and from decentralized governments in DAC (and increasingly in non-DAC) countries, which should be a priority for further monitoring and analysis.
3 For details of how this amount is calculated, see Chapter 3.
Development cooperation rise halved in 2009...
... and remains far short of MDG financing needs
Diversification of sources accelerates
2 Development Cooperation for the MDGs: Maximizing Results
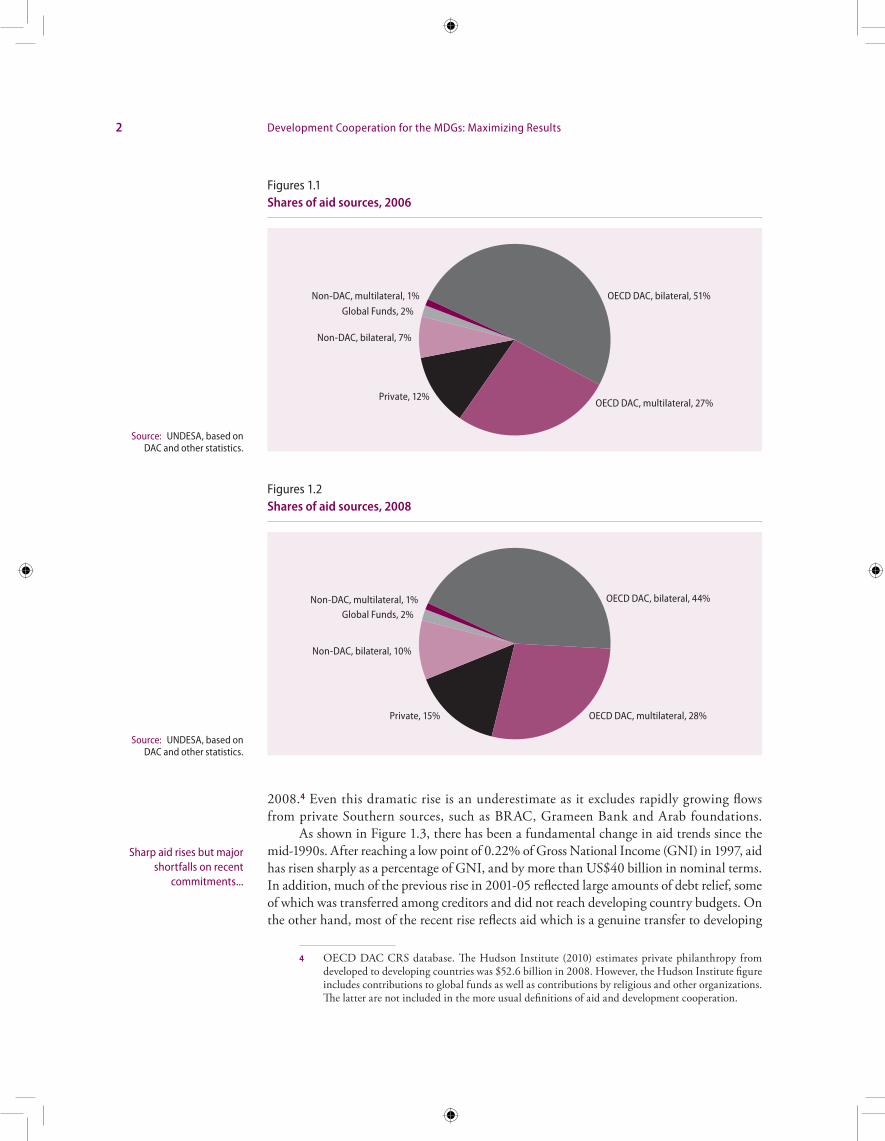
2008.4 Even this dramatic rise is an underestimate as it excludes rapidly growing flows from private Southern sources, such as BRAC, Grameen Bank and Arab foundations.
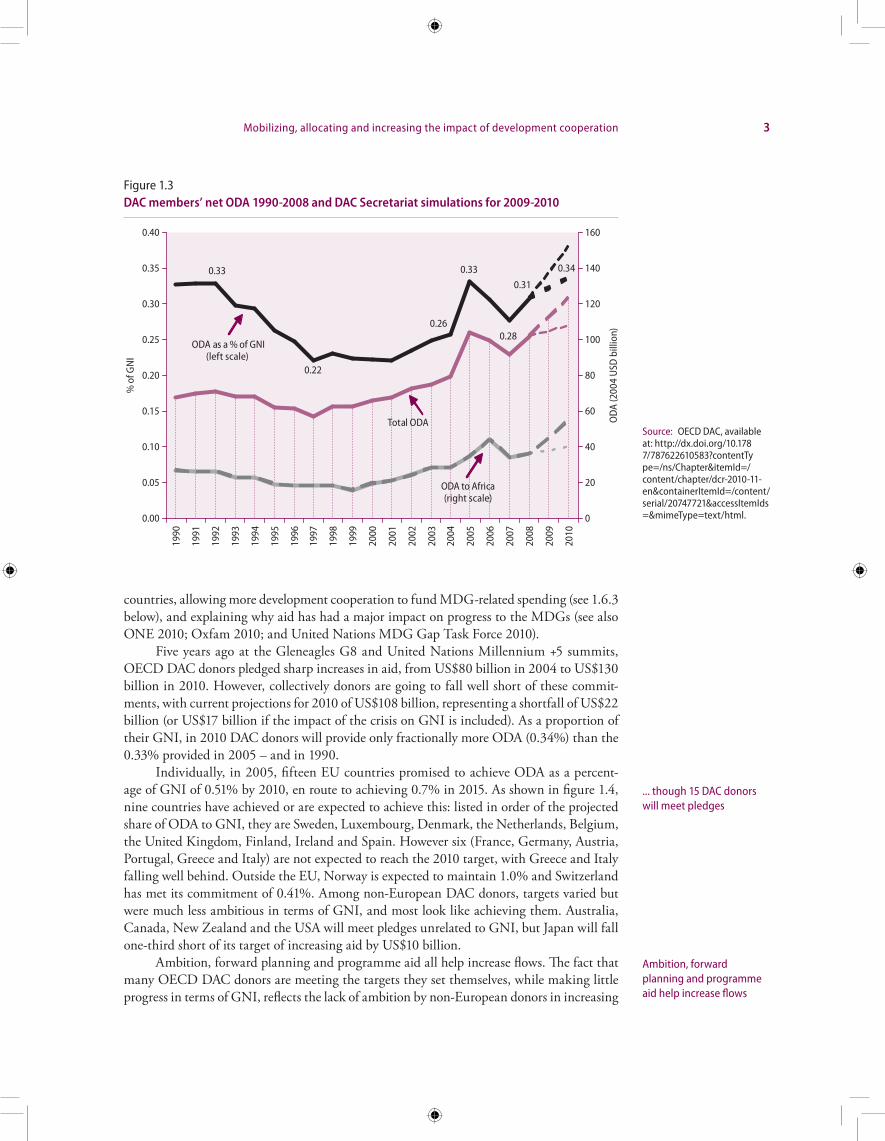
As shown in Figure 1.3, there has been a fundamental change in aid trends since the mid-1990s. After reaching a low point of 0.22% of Gross National Income (GNI) in 1997, aid has risen sharply as a percentage of GNI, and by more than US$40 billion in nominal terms. In addition, much of the previous rise in 2001-05 reflected large amounts of debt relief, some of which was transferred among creditors and did not reach developing country budgets. On the other hand, most of the recent rise reflects aid which is a genuine transfer to developing
4 OECD DAC CRS database. The Hudson Institute (2010) estimates private philanthropy from developed to developing countries was $52.6 billion in 2008. However, the Hudson Institute figure includes contributions to global funds as well as contributions by religious and other organizations. The latter are not included in the more usual definitions of aid and development cooperation.
Sharp aid rises but major shortfalls on recent
commitments...
Figures 1.1Shares of aid sources, 2006
Source: UNDESA, based on DAC and other statistics.
OECD DAC, bilateral, 51% Non-DAC, multilateral, 1%
Non-DAC, bilateral, 7%
Global Funds, 2%
OECD DAC, multilateral, 27% Private, 12%
Figures 1.2Shares of aid sources, 2008
Non-DAC, multilateral, 1% Global Funds, 2%
Non-DAC, bilateral, 10%
OECD DAC, multilateral, 28%
OECD DAC, bilateral, 44%
Private, 15%
Source: UNDESA, based on DAC and other statistics.
Mobilizing, allocating and increasing the impact of development cooperation 3
countries, allowing more development cooperation to fund MDG-related spending (see 1.6.3 below), and explaining why aid has had a major impact on progress to the MDGs (see also ONE 2010; Oxfam 2010; and United Nations MDG Gap Task Force 2010).
Five years ago at the Gleneagles G8 and United Nations Millennium +5 summits, OECD DAC donors pledged sharp increases in aid, from US$80 billion in 2004 to US$130 billion in 2010. However, collectively donors are going to fall well short of these commit-ments, with current projections for 2010 of US$108 billion, representing a shortfall of US$22 billion (or US$17 billion if the impact of the crisis on GNI is included). As a proportion of their GNI, in 2010 DAC donors will provide only fractionally more ODA (0.34%) than the 0.33% provided in 2005 – and in 1990.
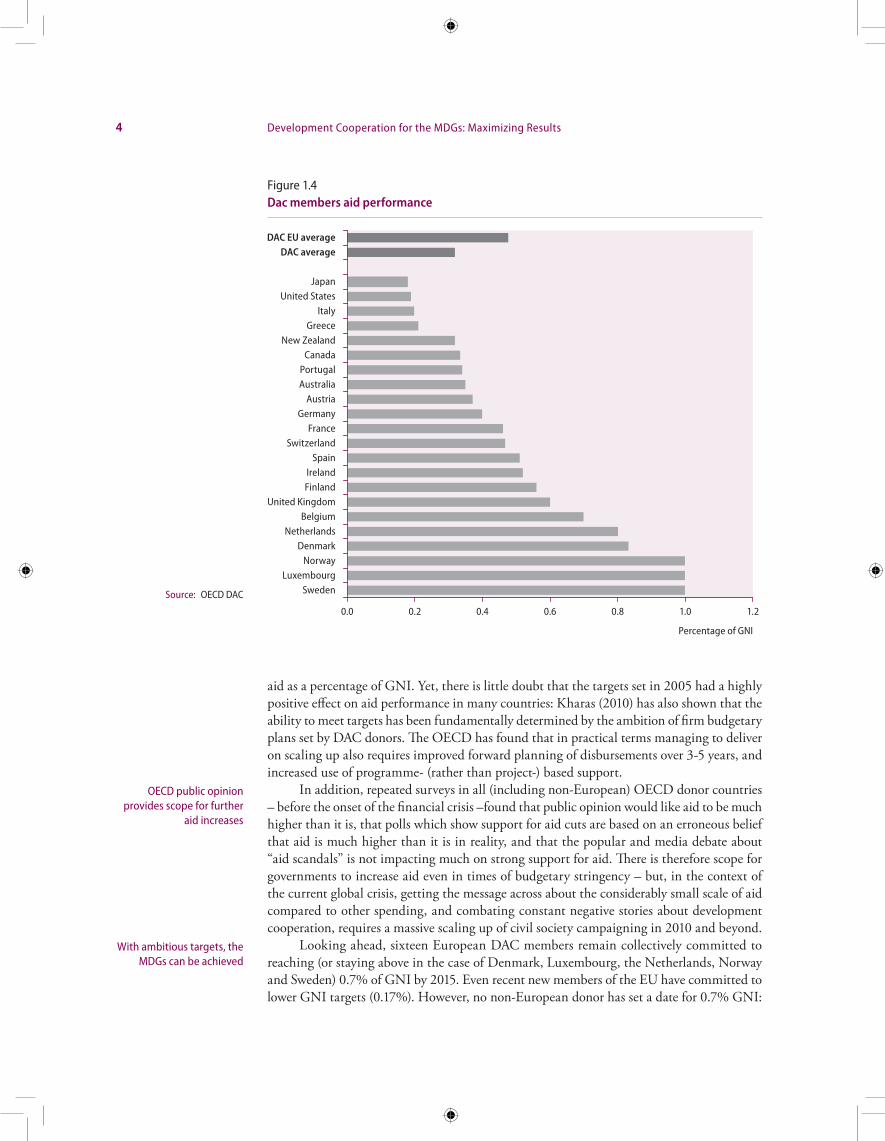
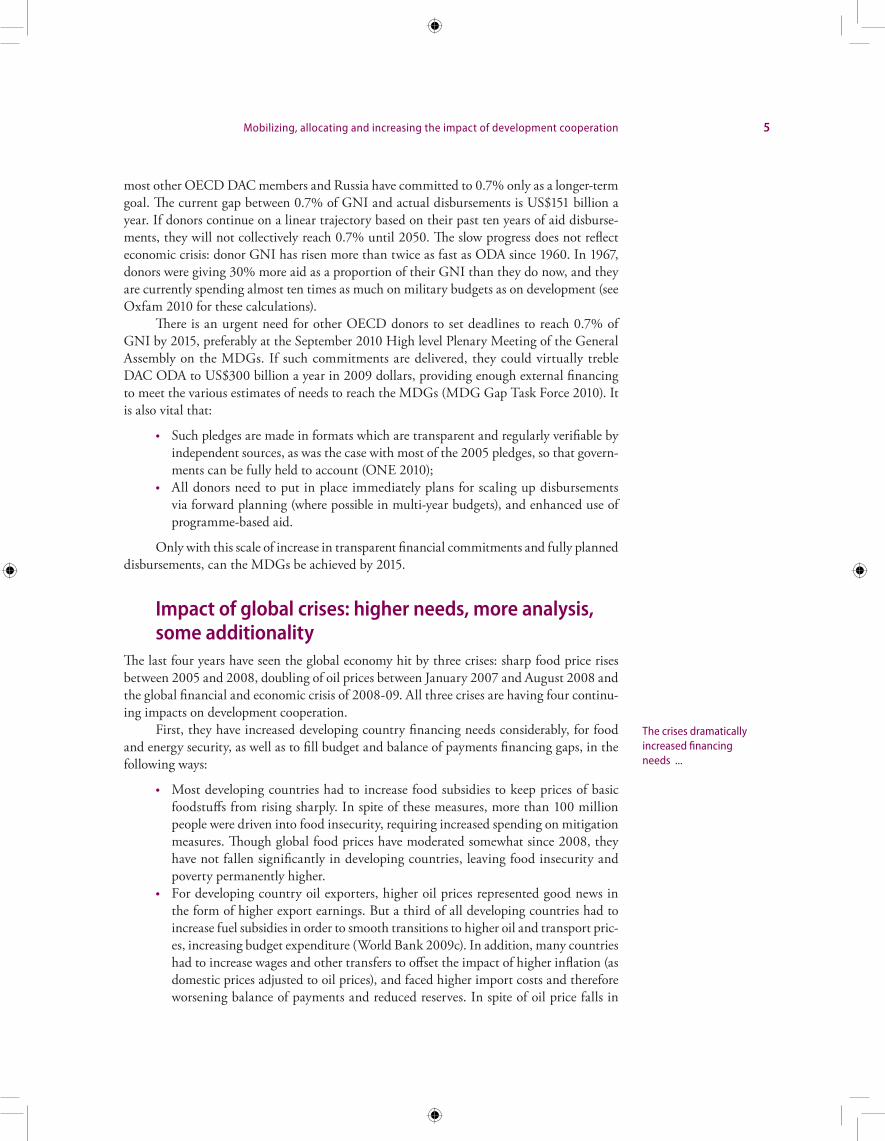
Individually, in 2005, fifteen EU countries promised to achieve ODA as a percent-age of GNI of 0.51% by 2010, en route to achieving 0.7% in 2015. As shown in figure 1.4, nine countries have achieved or are expected to achieve this: listed in order of the projected share of ODA to GNI, they are Sweden, Luxembourg, Denmark, the Netherlands, Belgium, the United Kingdom, Finland, Ireland and Spain. However six (France, Germany, Austria, Portugal, Greece and Italy) are not expected to reach the 2010 target, with Greece and Italy falling well behind. Outside the EU, Norway is expected to maintain 1.0% and Switzerland has met its commitment of 0.41%. Among non-European DAC donors, targets varied but were much less ambitious in terms of GNI, and most look like achieving them. Australia, Canada, New Zealand and the USA will meet pledges unrelated to GNI, but Japan will fall one-third short of its target of increasing aid by US$10 billion.
Ambition, forward planning and programme aid all help increase flows. The fact that many OECD DAC donors are meeting the targets they set themselves, while making little progress in terms of GNI, reflects the lack of ambition by non-European donors in increasing
... though 15 DAC donors will meet pledges
Ambition, forward planning and programme aid help increase flows
Figure 1.3DAC members’ net ODA 1990-2008 and DAC Secretariat simulations for 2009-2010
0.33
0.22
0.26
0.33
0.28
0.31
0.34
0.00
0.05
0.10
0.15
0.20
0.25
0.30
0.35
0.40
1990
1991
1992
1993
1994
1995
1996
1997
1998
1999
2000
2001
2002
2003
2004
2005
2006
2007
2008
2009
2010
% o
f GN
I
0
20
40
60
80
100
120
140
160
OD
A (2
004
USD
bill
ion)
ODA as a % of GNI(left scale)
Total ODA
ODA to Africa(right scale)
Source: OECD DAC, available at: http://dx.doi.org/10.1787/787622610583?contentType=/ns/Chapter&itemId=/content/chapter/dcr-2010-11-en&containerItemId=/content/serial/20747721&accessItemIds=&mimeType=text/html.
4 Development Cooperation for the MDGs: Maximizing Results
aid as a percentage of GNI. Yet, there is little doubt that the targets set in 2005 had a highly positive effect on aid performance in many countries: Kharas (2010) has also shown that the ability to meet targets has been fundamentally determined by the ambition of firm budgetary plans set by DAC donors. The OECD has found that in practical terms managing to deliver on scaling up also requires improved forward planning of disbursements over 3-5 years, and increased use of programme- (rather than project-) based support.
In addition, repeated surveys in all (including non-European) OECD donor countries – before the onset of the financial crisis –found that public opinion would like aid to be much higher than it is, that polls which show support for aid cuts are based on an erroneous belief that aid is much higher than it is in reality, and that the popular and media debate about “aid scandals” is not impacting much on strong support for aid. There is therefore scope for governments to increase aid even in times of budgetary stringency – but, in the context of the current global crisis, getting the message across about the considerably small scale of aid compared to other spending, and combating constant negative stories about development cooperation, requires a massive scaling up of civil society campaigning in 2010 and beyond.
Looking ahead, sixteen European DAC members remain collectively committed to reaching (or staying above in the case of Denmark, Luxembourg, the Netherlands, Norway and Sweden) 0.7% of GNI by 2015. Even recent new members of the EU have committed to lower GNI targets (0.17%). However, no non-European donor has set a date for 0.7% GNI:
OECD public opinion provides scope for further
aid increases
With ambitious targets, the MDGs can be achieved
Figure 1.4Dac members aid performance
SwedenLuxembourg
NorwayDenmark
NetherlandsBelgium
United KingdomFinlandIreland
SpainSwitzerland
FranceGermany
AustriaAustraliaPortugal
CanadaNew Zealand
GreeceItaly
United StatesJapan
DAC averageDAC EU average
0.0 0.2 0.4 0.6 0.8 1.0 1.2
Percentage of GNI
Source: OECD DAC
Mobilizing, allocating and increasing the impact of development cooperation 5
most other OECD DAC members and Russia have committed to 0.7% only as a longer-term goal. The current gap between 0.7% of GNI and actual disbursements is US$151 billion a year. If donors continue on a linear trajectory based on their past ten years of aid disburse-ments, they will not collectively reach 0.7% until 2050. The slow progress does not reflect economic crisis: donor GNI has risen more than twice as fast as ODA since 1960. In 1967, donors were giving 30% more aid as a proportion of their GNI than they do now, and they are currently spending almost ten times as much on military budgets as on development (see Oxfam 2010 for these calculations).
There is an urgent need for other OECD donors to set deadlines to reach 0.7% of GNI by 2015, preferably at the September 2010 High level Plenary Meeting of the General Assembly on the MDGs. If such commitments are delivered, they could virtually treble DAC ODA to US$300 billion a year in 2009 dollars, providing enough external financing to meet the various estimates of needs to reach the MDGs (MDG Gap Task Force 2010). It is also vital that:
• Such pledges are made in formats which are transparent and regularly verifiable by independent sources, as was the case with most of the 2005 pledges, so that govern-ments can be fully held to account (ONE 2010);
• All donors need to put in place immediately plans for scaling up disbursements via forward planning (where possible in multi-year budgets), and enhanced use of programme-based aid.
Only with this scale of increase in transparent financial commitments and fully planned disbursements, can the MDGs be achieved by 2015.
Impact of global crises: higher needs, more analysis, some additionality
The last four years have seen the global economy hit by three crises: sharp food price rises between 2005 and 2008, doubling of oil prices between January 2007 and August 2008 and the global financial and economic crisis of 2008-09. All three crises are having four continu-ing impacts on development cooperation.
First, they have increased developing country financing needs considerably, for food and energy security, as well as to fill budget and balance of payments financing gaps, in the following ways:
• Most developing countries had to increase food subsidies to keep prices of basic foodstuffs from rising sharply. In spite of these measures, more than 100 million people were driven into food insecurity, requiring increased spending on mitigation measures. Though global food prices have moderated somewhat since 2008, they have not fallen significantly in developing countries, leaving food insecurity and poverty permanently higher.
• For developing country oil exporters, higher oil prices represented good news in the form of higher export earnings. But a third of all developing countries had to increase fuel subsidies in order to smooth transitions to higher oil and transport pric-es, increasing budget expenditure (World Bank 2009c). In addition, many countries had to increase wages and other transfers to offset the impact of higher inflation (as domestic prices adjusted to oil prices), and faced higher import costs and therefore worsening balance of payments and reduced reserves. In spite of oil price falls in
The crises dramatically increased financing needs ...
6 Development Cooperation for the MDGs: Maximizing Results
2009, petroleum prices did not fall significantly for developing country consumers, leaving prices permanently higher and reducing real incomes.
• The impact of the global financial and economic crisis has also been permanent. Though major negative direct effects on growth, exports, remittances and exchange rates have worn off in 2010, growth is still somewhat lower in 2010 than 2008, and foreign private financial flows are not recovering enough. There has been sharp-ly increased unemployment and poverty in many countries, requiring increased spending on retraining and social safety nets, and leaving households with far lower reserves or funds to invest for themselves in reaching the MDGs. The crisis also created a huge “fiscal hole” exceeding US$64 billion of budget revenue shortfalls in low-income countries in 2009-10, which has mostly been filled by expenditure cuts and additional domestic borrowing (Oxfam 2010).
Second, the food and financial crises resulted in more detailed analysis of programme countries’ financing needs, which also highlighted underlying problems related to the MDGs which had not been tackled, and identified preferred and improved channels for mobilizing or providing financing, including innovative mechanisms for financing development:
• The Secretary-General’s High-Level Task Force on Global Food Security, established in 2008, urged donors to double food aid assistance and increase the share of aid to agriculture from 3% to 10% of flows (or by about US$12 billion a year) within five years, compared to estimated food security financing needs of US$25-40 billion a year (see World Bank 2009c). It also urged that all of these resources should be additional to, not a diversion of, existing aid commitments.
• The G20 London and Pittsburgh summits promoted a limited revision of the way the Bretton Woods Institutions interact with programme countries, and a far more ambitious blueprint for further revisions by the United Kingdom in its capacity as Chair of the G20. They also authorized accelerated disbursements of multilateral funding as the best means of combating the crisis, and have since authorized major increases in lending capacity for the IMF, Asian Development Bank (AsDB) and African Development Bank (AfDB), and smaller increases for the International Bank for Reconstruction and Development (IBRD), reflecting their performance in combating the crisis. They also led to the first issuance of unconditional IMF Special Drawing Rights (SDRs) in three decades.
Third, the food and financial crises resulted in large pledges of financing, but only small proportions of these were additional or provided for long-term purposes or in coordinated ways.
• Only US$6 billion (US$2 billion a year) of the US$22 billion pledged for food and nutrition at the G8 Summits in L’Aquila and Pittsburgh in July and November 2009 are likely to be additional (ActionAid 2010b; United Nations Task Force 2010). In addition, a high proportion of DAC donor assistance will go to food aid rather than long-term food production support. On the other hand, most South-South coop-eration (notably from Arab countries, Argentina, Brazil and China) and regional development banks have focused on technical cooperation and investment in agri-cultural production. Much of it is also being delivered bilaterally with relatively little coordination, though notable exceptions to this are the World Bank’s Global Food Crisis Support Program (GFRP), the European Union’s Food Security Facility, and FAO and WFP initiatives. Most recently the Global Agriculture and Food Security Programme (GAFSP) was established in April 2010 at the World Bank, to support
... and analysis of these needs and the best ways to
provide financing...
... but little additional financing
Mobilizing, allocating and increasing the impact of development cooperation 7
smallholder farms, funded through US$950 million of public-private contributions including from Canada, Spain, Republic of Korea, the United States and the Bill and Melinda Gates Foundation.
• The financial crisis resulted in pledges of US$240 billion for developing countries at the G20 London Summit. Some of this marked major steps forward – for example, a new round of issuance of IMF SDRs which allowed developing countries to boost their reserves considerably. It was also provided largely as multilateral and therefore coordinated financing. However, only around US$100 billion of this was additional (SDR issuance, additional funding for the IMF to lend to low-income countries, and some additional trade finance): the rest represented frontloading of disbursements by multilateral development banks and bilateral trade finance agencies. In addition, only US$50 billion was targeted at low-income countries. Moreover, most of the funding (SDRs, trade finance) was designed to increase reserves and private sector finance, and so to deal with balance of payments financing problems. Only around US$12 billion was easily available for low-income countries to increase MDG-related spending.
In addition, the oil crisis did not result in additional commitments of financing – developing countries had instead to seek balance of payments and fiscal support from within existing facilities of multilateral, regional and bilateral agencies.
Fourth, the global financial and economic crisis has reduced some donors’ aid budget plans, as most developed country governments first implemented large domestic stimulus measures in 2009 to ameliorate recessionary pressures, and then cut overall budgets in 2010 to reduce deficit and debt levels. Nevertheless, this impact should not be exaggerated: as of June 2010, only ten DAC donors had announced reductions in aid budgets or slowed their 2010-12 % GNI commitments. The impact on actual flows in 2009 was marginal, though virtually all DAC donors decreased their nominal aid disbursement plans for 2010 budgets in line with the fall in their GNI, and European aid amounts were hit hard by depreciations of their currencies against the dollar. However, the overall effect on reducing aid looks likely to be much less than during earlier recessionary periods – unless there is a more severe “double dip” recession in 2010 – partly because of strong civil society and government support for aid programmes to reach the MDGs.
In addition, although a few Southern providers have reduced their cooperation, many more have increased it during the crisis, in part reflecting their continued high growth levels. Saudi Arabia more than doubled its cooperation in 2008 to US$5.6 billion (0.54 % of GNI). Chinese cooperation has increased to well over US$3 billion per annum in 2008-09, and at the Forum on China-Africa Cooperation (FOCAC) in November 2009, China pledged a further doubling of its cooperation with Africa. Other countries such as Brazil and India have also considerably increased their official cooperation during this period (see Chapter 3 for more details and sources).
Similarly, private philanthropy (Northern and Southern) has so far continued to increase. Despite the impact of the financial crisis on some of their investments, OECD-country based foundations, notably the Bill and Melinda Gates Foundation, have been increasing their commitments based on earlier income, though this may not continue as fast in future. Southern philanthropic organizations, such as the Bangladeshi Rural Advancement Committee (BRAC) and the Grameen Bank which provide micro-finance, have also been increasing their flows, and these should continue to grow (except to the degree that some of these organizations depend on OECD-country based donors for large parts of their funding). Private sector (individual and organization) support for humanitarian assistance stagnated
... though DAC medium-term aid plans have been surprisingly resilient
Southern cooperation has risen and philanthropy has held up well
8 Development Cooperation for the MDGs: Maximizing Results
at US$250 million per annum in 2008 and 2009, but increased to over US$1 billion in the first four months of 2010 (see http://fts.unocha.org, reflecting increased generosity to meet the crises in Haiti and elsewhere. As a result, some international NGOs (INGOs) did not see income fall significantly as a result of the crisis. However, smaller organizations active in delivering social services, notably in Africa, have faced declining contributions for longer-term development, and have had to reduce operations (Hanfstaengl 2010).
Climate finance: innovative financing must also fund the MDGs
The 2009 United Nations Climate Change Conference in Copenhagen thrust the issue of climate finance centre stage, by recognizing that developed countries need to provide ad-equate, predictable and sustainable financial resources to help developing countries adapt to or mitigate the impacts of climate change. It resulted in commitments by OECD countries to provide US$10 billion of financing per year in 2010-12, and US$100 billion a year by 2020 (UNFCCC 2009).
These commitments fall well short of needs, which are estimated at US$140-175 billion a year for mitigation and US$30-100 billion for adaptation, over the next 20 years (World Bank 2009b). Yet, given that (especially for adaptation) they will have to come principally from public sector sources, they will come to represent a high proportion of financing avail-able for development. Current public funding, mainly through the UNFCCC and Climate Investment Funds, as well as bilateral donor funds, totals only US$4 billion. However, fund-ing even the existing commitments for 2010-12 would represent 8.4% of current DAC ODA flows, and full funding of needs would require resources equivalent to 142% of current annual ODA flows for mitigation and 225% for mitigation plus adaptation. Even if DAC ODA increases between 2010 and 2020 at the same annual rate (10%) as in 2002-09, climate financing needs would represent 50-80% of ODA by 2020.
There is major concern that, if additional financing sources are not found, ODA may be diverted away from funding the MDGs, to combating climate change. This is exacerbated by the scale of the resources required, and the failure of almost all DAC governments to pledge that their climate financing will be additional to ODA. In addition, if such diversion occurs, it is likely to move ODA away from Sub-Saharan Africa to other regions, and away from health, education and agriculture to water and energy (Brown et al 2010). Evidently, the poor and most vulnerable in programme countries need both MDG and climate-related financ-ing, allocated to help countries with the highest combined development and climate funding needs, and spent in ways which produce both development and climate benefits for the poorest.
The other key concern related to climate finance is how such monies will be spent. The lessons from ODA are that to have the maximum impact on reducing poverty as well as fighting climate change, they will be most effectively spent by and for poor and vulner-able people in developing countries, through programmes coordinated by their governments and integrated with their national and community development strategies. They will not be nearly as effective if they are spent through global vertical funds which have programmes running parallel to developing country government plans, or by private sector agribusinesses or energy companies through market mechanisms which do not reach the poorest countries or communities. Yet, most of the funding currently spent on adaptation and mitigation has been spent in middle-income countries and by the private sector, and many current innovative financing proposals risk creating new vertical funds.
Climate finance commitments fall well short of needs, which
dwarf development cooperation levels
ODA must not be diverted to fighting climate
change...
Climate change funds must also fight poverty
Mobilizing, allocating and increasing the impact of development cooperation 9
There are already quite a number of special-purpose climate funds, and there is a risk of these proliferating with the scaling up of climate finance. Such proliferation could lead to inefficiencies such as higher transaction costs, low developing country ownership and non-alignment with national country strategies. It could also result in allocative inefficien-cies reflecting donor rather than developing country priorities. More widely, the traditional approach could further concentrate funds on “donor darlings”, or lead to imbalances between mitigation and adaptation, depending on donors’ preferences, and inefficiencies. The Bali Action Plan has attempted to enhance ownership, alignment, harmonization and mutual accountability in climate finance, but much more remains to be done.
One major positive spin-off from discussions of the scale of climate finance needed has been a series of radical recent proposals for innovative sources of climate financing. These include:
• Globally-coordinated carbon taxes, to be levied on emissions rather than mitigation transactions;
• Taxes on international transport (aviation or shipping) emissions which are of grow-ing importance;
• Taxes on international financial or currency transactions, or financial institution profits or turnover – a levy of 0.05% on international transactions could generate US$400 billion a year, more than if all DAC donors delivered 0.7%;
• Market mechanisms with improved functioning, wider application or larger public levies;
• The establishment of a Green Fund funded by IMF Special Drawing Rights (SDRs), gold sales and “green bonds” (ActionAid 2010a; Bredenkamp and Pattillo 2010; Soros 2009); and
• The sale of “green bonds” in global capital markets.
None of these proposals has yet gained international political consensus. The High-Level Advisory Group on Climate Financing, established by the Secretary-General, is due to report more fully on practical options to boost climate finance at the UNFCCC Mexico conference in November 2010. It will be essential that it places full emphasis on the potential influence the type and channel of financing could have on whether funds are spent for the benefit of the poorest countries and communities, and to help reach the MDGs.
In addition, given current budget constraints in DAC countries, and the fact that similar innovative financing mechanisms are already being used or proposed to fund MDG progress, any innovative financing must promote development, fight poverty and combat climate change at the same time, or the unfunded goals will suffer. This will require full coordination with the Leading Group on Innovative Financing for Development which is already exploring proposals on Financial Transaction Taxes.5
Aid misallocation: undermining progress to the MDGsA key problem continues to be that the allocation of international development cooperation is not sufficiently conducive to maximize progress towards achieving the Internationally Agreed Development Goals, including the Millennium Development Goals. This applies to geographical allocation among developing country groups, regions, individual countries, and regions within countries; as well as to allocation among channels, sectors and types of aid.
5 See http://www.leadinggroup.org/article589.html
New innovative financing could fund development and fight climate change at the same time
10 Development Cooperation for the MDGs: Maximizing Results
Geographical allocation: aid is not going where it is most needed6
As shown in Figure 1.5, since 2006, a previously positive trend in the proportion of aid going to low-income countries has reversed, falling by 6%. Much of this reversal reflected a decline in new debt relief. At the same time, the shares of the most vulnerable country groups also fell – for least developed countries (LDCs) by 9%; for landlocked developing countries by 7%; and for fragile states by 5%. Only small island development states among vulnerable groups received a slightly (0.5%) larger share in 2008 than in 2006. As a result, in 2007 and 2008, lower-middle income countries received a higher share of aid than LDCs.
In addition, though LDCs received much higher aid levels per capita and as a percent-age of GNI than other groups, lower-middle income countries outperformed low-income countries in terms of these ratios. The latest DAC forecasts of country-programmable aid indicate that the share to LDCs could fall further over the next two years. These trends must be reversed by a more consistent focus on targeting aid to the poorest and least developed countries, and a greater effort to tackle the underlying causes of state fragility through peace-keeping and state-building, if the MDGs are to be attained.
An additional agreed United Nations target for aid is that 0.15-0.2% of GNI should go to LDCs. Though performance in this area improved sharply in 2000-08, with the average DAC ratio rising from 0.05% to 0.09%, it remains way below the lower bound of the target, and only nine of the DAC donors met the target – the five countries attaining 0.7% for overall ODA as well as Belgium, Finland, Ireland and the United Kingdom of Great Britain and Northern Ireland (UN MDG Task Force 2010).
Individual donors’ aid allocations by country groups vary dramatically, as shown in Figure 1.6. The donors with the highest shares of aid to LDCs are Ireland (52%) and Luxem-bourg (42%), while seven donors provide less than 20% of their aid to LDCs. Seven donors also provide more than half their aid to Middle Income Countries (MICs).
Most countries falling furthest short of reaching the MDGs are in Sub-Saharan Africa, and this was why, according to the 2005 G8 Gleneagles pledges, Africa’s share of aid was supposed to rise from 30% to 40%, with a nominal increase of US$25 billion. However, as shown in Figure 1.7, the regional shares of DAC members’ aid have not changed significantly in recent years. While aid to Africa may rise to 35% and by US$11 billion by 2010 as a result of some donors making enhanced efforts to fund Africa, it is still US$14 billion below the target set in 2005, mainly because some European donors, which give large shares of their aid to Africa, have not met their overall aid increase targets. The latest DAC forecasts of country programmable aid do not indicate any major change in these shares.
Other country allocation problems which were highlighted in the Secretary-General’s report to the 2008 DCF (and in Anderson 2008 and Guillaumont 2008) continue to apply. Large amounts of aid still go to countries with relatively small numbers of poor citizens, and allocations are not correlated with measures of multidimensional poverty or needs which go beyond per capita income. Nor do they take into account “poverty-efficiency”, which combines the scale of poverty in a country and the amount of poverty reduction that can be achieved per dollar of aid. Most donors still have yet to establish an objective and transpar-ent basis for allocating aid across countries. Some have adopted models to allocate aid or pre-select recipients, based largely on donor-conducted assessments of “performance” – the quality of policies and institutions in programme countries. These undermine the principle of national ownership due to lack of government and civil society involvement, and are neither
6 See also Anderson (2008) and Guillaumont (2008) on these issues.
Vulnerable countries are receiving reduced
shares of aid
UN targets are not met...
... and individual donor performance varies
dramatically
Shortfalls in aid to Africa
Allocation bears little relation to need and
continues to reflect donor interests
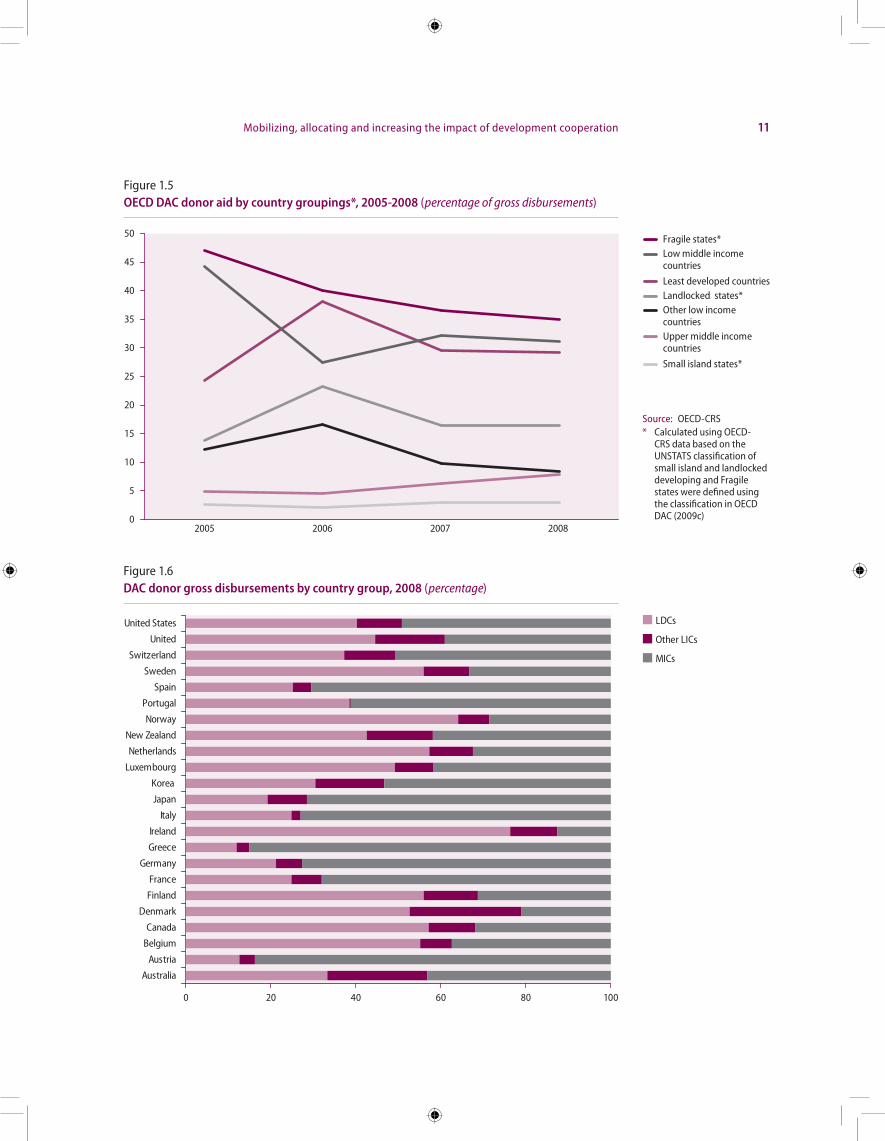
Mobilizing, allocating and increasing the impact of development cooperation 11
0
5
10
15
20
25
30
35
40
45
50
2005 2006 2007 2008
Least developed countries
Other low incomecountries
Low middle incomecountries
Upper middle incomecountries
Fragile states*
Small island states*
Landlocked states*
Figure 1.5OECD DAC donor aid by country groupings*, 2005-2008 (percentage of gross disbursements)
Source: OECD-CRS* Calculated using OECD-
CRS data based on the UNSTATS classification of small island and landlocked developing and Fragile states were defined using the classification in OECD DAC (2009c)
Figure 1.6DAC donor gross disbursements by country group, 2008 (percentage)
0 20 40 60 80 100
Australia
Austria
Belgium
Canada
Denmark
Finland
France
Germany
Greece
Ireland
Italy
Japan
Korea
Luxembourg
Netherlands
New Zealand
Norway
Portugal
Spain
Sweden
Switzerland
United
United States LDCs
Other LICs
MICs
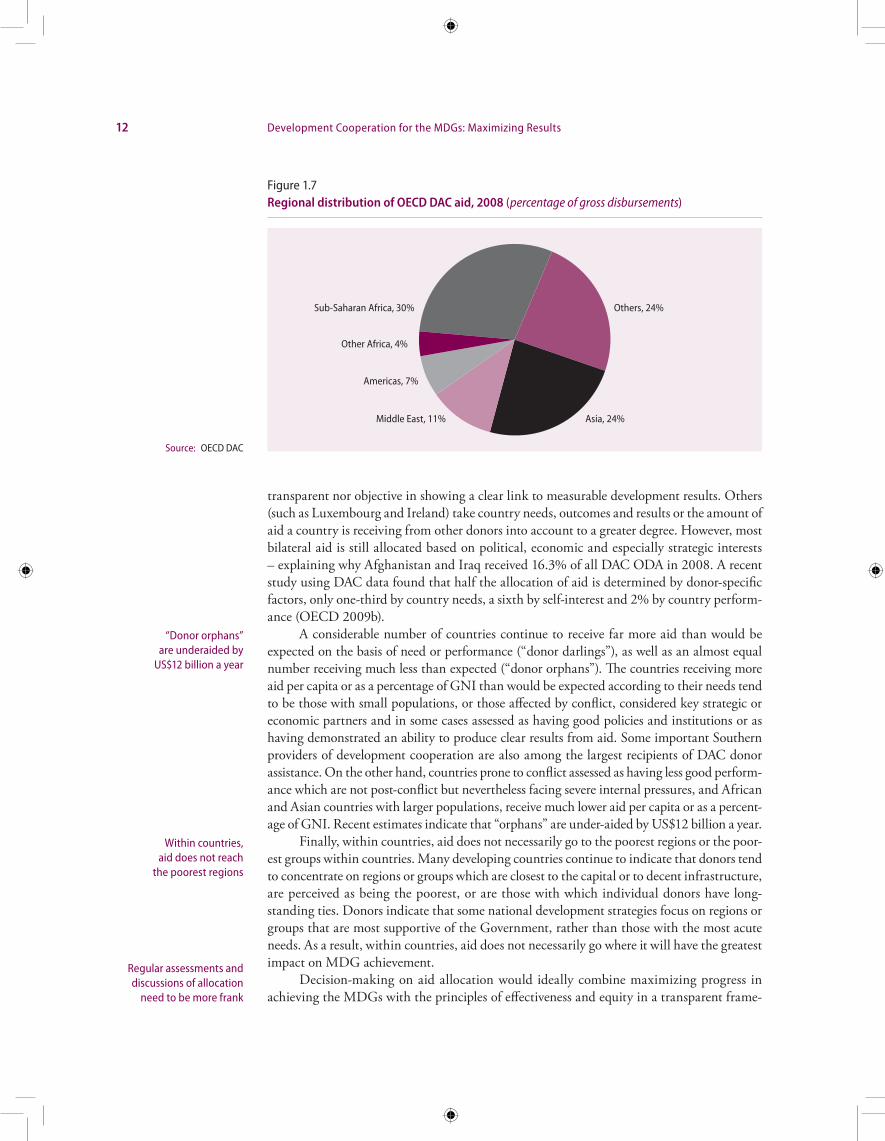
12 Development Cooperation for the MDGs: Maximizing Results
transparent nor objective in showing a clear link to measurable development results. Others (such as Luxembourg and Ireland) take country needs, outcomes and results or the amount of aid a country is receiving from other donors into account to a greater degree. However, most bilateral aid is still allocated based on political, economic and especially strategic interests – explaining why Afghanistan and Iraq received 16.3% of all DAC ODA in 2008. A recent study using DAC data found that half the allocation of aid is determined by donor-specific factors, only one-third by country needs, a sixth by self-interest and 2% by country perform-ance (OECD 2009b).
A considerable number of countries continue to receive far more aid than would be expected on the basis of need or performance (“donor darlings”), as well as an almost equal number receiving much less than expected (“donor orphans”). The countries receiving more aid per capita or as a percentage of GNI than would be expected according to their needs tend to be those with small populations, or those affected by conflict, considered key strategic or economic partners and in some cases assessed as having good policies and institutions or as having demonstrated an ability to produce clear results from aid. Some important Southern providers of development cooperation are also among the largest recipients of DAC donor assistance. On the other hand, countries prone to conflict assessed as having less good perform-ance which are not post-conflict but nevertheless facing severe internal pressures, and African and Asian countries with larger populations, receive much lower aid per capita or as a percent-age of GNI. Recent estimates indicate that “orphans” are under-aided by US$12 billion a year.
Finally, within countries, aid does not necessarily go to the poorest regions or the poor-est groups within countries. Many developing countries continue to indicate that donors tend to concentrate on regions or groups which are closest to the capital or to decent infrastructure, are perceived as being the poorest, or are those with which individual donors have long-standing ties. Donors indicate that some national development strategies focus on regions or groups that are most supportive of the Government, rather than those with the most acute needs. As a result, within countries, aid does not necessarily go where it will have the greatest impact on MDG achievement.
Decision-making on aid allocation would ideally combine maximizing progress in achieving the MDGs with the principles of effectiveness and equity in a transparent frame-
“Donor orphans” are underaided by
US$12 billion a year
Within countries, aid does not reach
the poorest regions
Regular assessments and discussions of allocation
need to be more frank
Figure 1.7Regional distribution of OECD DAC aid, 2008 (percentage of gross disbursements)
Source: OECD DAC
Others, 24%
Asia, 24%Middle East, 11%
Americas, 7%
Other Africa, 4%
Sub-Saharan Africa, 30%
Mobilizing, allocating and increasing the impact of development cooperation 13
work, taking into account the structural vulnerability of countries to external shocks (as aid can play a strong role in preventing such shocks and dampening their impact). There is an urgent need for bilateral donors to reduce interest-based allocations, but also for multilateral development banks to review their allocation formulas more towards needs and vulnerability. Donors and developing countries also need to channel more spending to regions within coun-tries which most need support. To ensure progress in this area, it is vital that there continue to be regular and more frank assessments of allocation performance by individual donors, and strong recommendations to change allocation, and that these be discussed regularly at the DCF and at high-level meetings of the DAC, to ensure country allocation patterns maximize MDG progress.
Aid channels: multilateral aid share stagnant, rising earmarking must be reversed
There has been virtually no change in the proportion of development cooperation (29%) go-ing via multilateral institutions (as either core or non-core contributions to their funds). DAC donors have increased multilateral aid from 26% to 30% of their disbursements between 2006 and 2008, and Southern providers have also increased their spending via multilaterals. However, these increases have been offset by the rapid rise of Southern bilateral cooperation, private grants and vertical funds. Within this wider picture (see Box 1), the United Nations has seen a 13% real increase in contributions between 2006 and 2008, but most of this is accounted for by earmarked resources.
This is part of a wider trend by DAC donors to “earmark” 40% of total aid (10% higher than in the 1990s) and more than 50% of multilateral funds, in order to finance particular initiatives, sectors or themes. They achieve this by allocating them to “vertical” (sector or issue-specific) global funds, or trust funds in multilateral institutions, or by providing ear-marked bilateral project or programme funding at national developing country level. This severely undermines ownership by developing countries, as well as freedom of programming by multilateral institutions. Many of these funds are off-budget and fragmented, and increase transaction costs and reduce the advantages of pooling funds via multilateral channels. The acceleration of earmarking in recent years is a clear demonstration of the problems most donors have sticking to the “aid effectiveness” agenda defined by the Paris Declaration and the Accra Agenda for Action (AAA).
Most OECD DAC donors also channel some of their aid as core budget support to non-governmental organizations (NGOs) and international private organizations (and con-siderably more through them as earmarked funding at country or global level). The average proportion of core support to such organizations is around 2.5% of total ODA and has not changed much in recent years. Of this, around three-quarters goes to Non-Governmental Organizations (NGOs).
The degree to which individual donors channel their aid as core contributions through multilateral agencies, or NGOs and international private organizations, varies widely. Italy channels 62% of its ODA through multilateral organizations while for Australia and the United States it is just 10% and 11% respectively. Some of the smaller Southern providers also provide more than half of their cooperation via multilaterals, whereas some of the larg-est provide less than 5% through those channels. Among DAC donors, the Netherlands and Ireland channel the largest proportion of their aid as core support to NGOs/private sector organizations at 17.5% and 15.4% respectively.
No change in the proportion of multilateral aid, though United Nations funding is rising
Growing earmarking undermines aid effectiveness
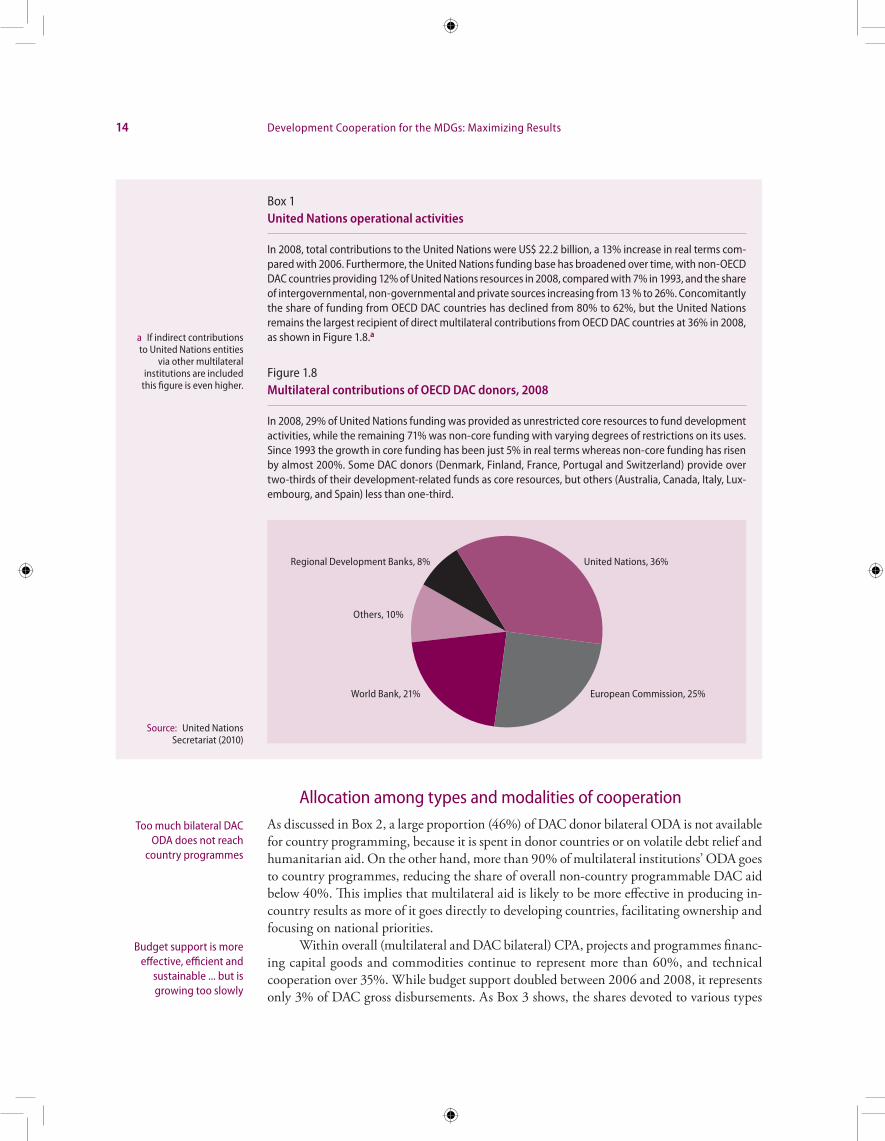
14 Development Cooperation for the MDGs: Maximizing Results
Allocation among types and modalities of cooperationAs discussed in Box 2, a large proportion (46%) of DAC donor bilateral ODA is not available for country programming, because it is spent in donor countries or on volatile debt relief and humanitarian aid. On the other hand, more than 90% of multilateral institutions’ ODA goes to country programmes, reducing the share of overall non-country programmable DAC aid below 40%. This implies that multilateral aid is likely to be more effective in producing in-country results as more of it goes directly to developing countries, facilitating ownership and focusing on national priorities.
Within overall (multilateral and DAC bilateral) CPA, projects and programmes financ-ing capital goods and commodities continue to represent more than 60%, and technical cooperation over 35%. While budget support doubled between 2006 and 2008, it represents only 3% of DAC gross disbursements. As Box 3 shows, the shares devoted to various types
Too much bilateral DAC ODA does not reach
country programmes
Budget support is more effective, efficient and
sustainable ... but is growing too slowly
Box 1United Nations operational activities
In 2008, total contributions to the United Nations were US$ 22.2 billion, a 13% increase in real terms com-pared with 2006. Furthermore, the United Nations funding base has broadened over time, with non-OECD DAC countries providing 12% of United Nations resources in 2008, compared with 7% in 1993, and the share of intergovernmental, non-governmental and private sources increasing from 13 % to 26%. Concomitantly the share of funding from OECD DAC countries has declined from 80% to 62%, but the United Nations remains the largest recipient of direct multilateral contributions from OECD DAC countries at 36% in 2008, as shown in Figure 1.8.a
Figure 1.8Multilateral contributions of OECD DAC donors, 2008
In 2008, 29% of United Nations funding was provided as unrestricted core resources to fund development activities, while the remaining 71% was non-core funding with varying degrees of restrictions on its uses. Since 1993 the growth in core funding has been just 5% in real terms whereas non-core funding has risen by almost 200%. Some DAC donors (Denmark, Finland, France, Portugal and Switzerland) provide over two-thirds of their development-related funds as core resources, but others (Australia, Canada, Italy, Lux-embourg, and Spain) less than one-third.
a If indirect contributions to United Nations entities
via other multilateral institutions are included
this figure is even higher.
Source: United Nations Secretariat (2010)
Others, 10%
World Bank, 21% European Commission, 25%
United Nations, 36% Regional Development Banks, 8%
Mobilizing, allocating and increasing the impact of development cooperation 15
of aid by different DAC donors vary markedly. Non-DAC providers also provide more than 90% as projects, technical and emergency assistance.
Yet many different studies continue to show that general and sector budget support is more effective, efficient and sustainable in producing development results, for five main sets of reasons:7
• It increases national ownership and improves policy development and accountability of government to its parliament and citizens;
• It accelerates disbursement speed and predictability of resources, and orients more resources to service delivery, and therefore increases delivery of MDG results;
• It improves the distributional and operational efficiency of public expenditure, and the quality of public financial management and procurement systems;
• It reduces the marginal transaction costs for donors and recipients of scaling up, ensuring that a higher proportion of aid is actually spent on results rather than administration;
• It has no greater risk of corruption, reduced budget revenue mobilization or any other problems sometimes ascribed to aid than any other type of aid, especially if given to countries making strong efforts to improve their public financial manage-ment systems.
These reasons are why an increasing number of donors are turning to budget support, and several developing countries (Mozambique, United Republic of Tanzania) now receive more than 50% of aid in budget support. Nevertheless, budget support needs to grow much more rapidly to ensure a step change in effectiveness of aid and increase in results delivery.
Sectoral Allocation and Impact on MDG ResultsThe 2008 report of the United Nations Secretary-General to the DCF highlighted a dramatic rise in the share of aid going to the social sectors and governance over the period 1980-2005, mirrored by a sharp fall in the share going to economic infrastructure and production (includ-ing agriculture). Fukuda-Parr (2008) also highlighted the degree to which some of the MDGs – especially those relating to gender – were being neglected. Since 2005, the share of aid going to governance has continued to rise, from 10% to 12%, while social sectors have fallen back from 30% to 26%, and infrastructure and production have risen from 19% to 26% (with infrastructure accounting for almost all of this rise, and agriculture for a small part).
Looking at the social sector and governance-related aid commitments in more detail:
• Commitments for education grew by an annual average of 8.5% during 2000-07, but this reversed in 2008 when they declined by 2%. For most of the decade, aid to education grew as fast as overall aid, and its share of total ODA averaged 8%. However, as UNESCO (2010) notes, there are still large financing gaps to achieve the MDGs related to education by 2015, and few signs that donors are planning to scale up to ensure these goals are met. Recent estimates suggest that aid to basic edu-cation in low income countries needs to double to US$6 billion per annum (DfID 2010) to achieve the 2015 targets. UNESCO also highlights that the five largest donors to basic education (European Union, International Development Associa-tion (IDA), Netherlands, United Kingdom and United States) account for 60% of
7 See also Dom 2007, Gerster 2007, EC 2008, Oxfam 2010, UKAN 2009, and UNDP 2010.
Sharp rise for infrastructure, smaller for governance and agriculture
Education: major financing gaps and excessive donor concentration
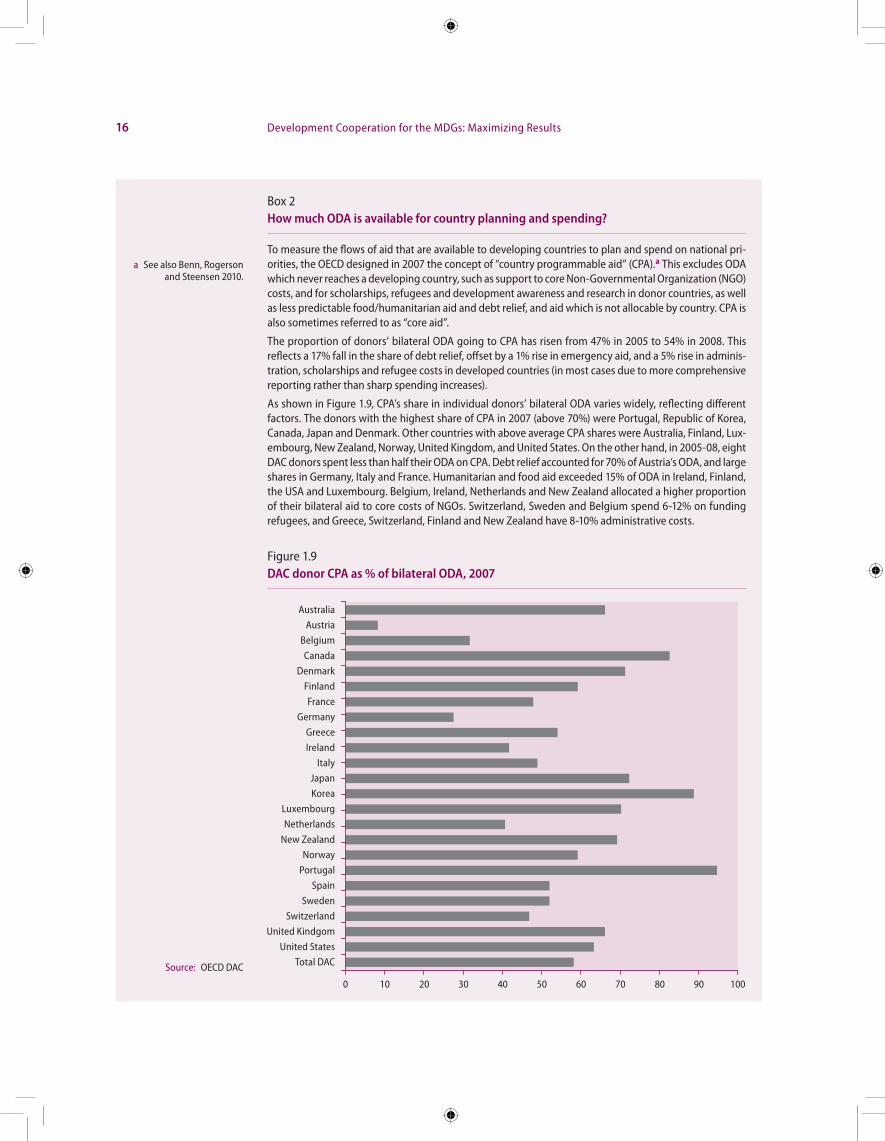
16 Development Cooperation for the MDGs: Maximizing Results
Box 2How much ODA is available for country planning and spending?
To measure the flows of aid that are available to developing countries to plan and spend on national pri-orities, the OECD designed in 2007 the concept of “country programmable aid” (CPA).a This excludes ODA which never reaches a developing country, such as support to core Non-Governmental Organization (NGO) costs, and for scholarships, refugees and development awareness and research in donor countries, as well as less predictable food/humanitarian aid and debt relief, and aid which is not allocable by country. CPA is also sometimes referred to as “core aid”.
The proportion of donors’ bilateral ODA going to CPA has risen from 47% in 2005 to 54% in 2008. This reflects a 17% fall in the share of debt relief, offset by a 1% rise in emergency aid, and a 5% rise in adminis-tration, scholarships and refugee costs in developed countries (in most cases due to more comprehensive reporting rather than sharp spending increases).
As shown in Figure 1.9, CPA’s share in individual donors’ bilateral ODA varies widely, reflecting different factors. The donors with the highest share of CPA in 2007 (above 70%) were Portugal, Republic of Korea, Canada, Japan and Denmark. Other countries with above average CPA shares were Australia, Finland, Lux-embourg, New Zealand, Norway, United Kingdom, and United States. On the other hand, in 2005-08, eight DAC donors spent less than half their ODA on CPA. Debt relief accounted for 70% of Austria’s ODA, and large shares in Germany, Italy and France. Humanitarian and food aid exceeded 15% of ODA in Ireland, Finland, the USA and Luxembourg. Belgium, Ireland, Netherlands and New Zealand allocated a higher proportion of their bilateral aid to core costs of NGOs. Switzerland, Sweden and Belgium spend 6-12% on funding refugees, and Greece, Switzerland, Finland and New Zealand have 8-10% administrative costs.
Figure 1.9DAC donor CPA as % of bilateral ODA, 2007
a See also Benn, Rogerson and Steensen 2010.
0 10 30 50 7020 40 60 80 90 100
Total DAC
United States
United Kindgom
Switzerland
Sweden
Spain
Portugal
Norway
New Zealand
Netherlands
Luxembourg
Korea
Japan
Italy
Ireland
Greece
Germany
France
Finland
Denmark
Canada
Belgium
Austria
Australia
Source: OECD DAC
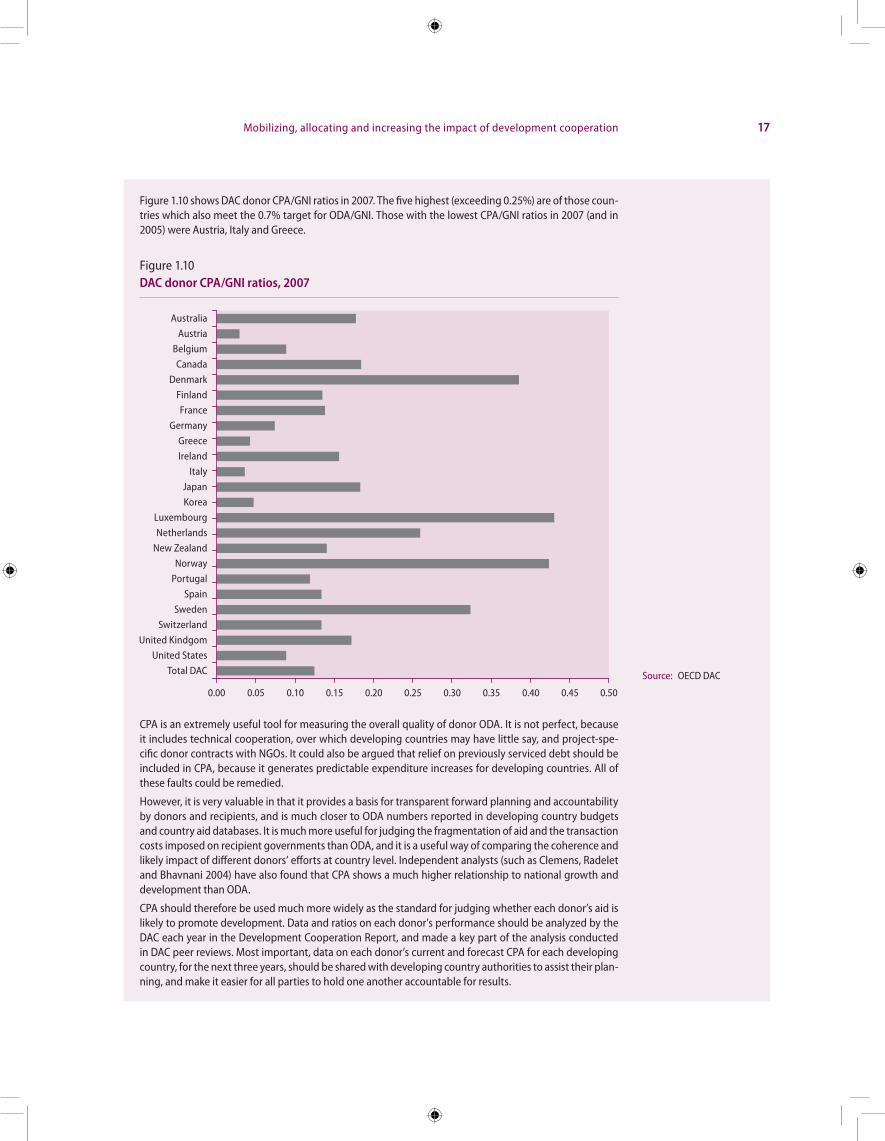
Mobilizing, allocating and increasing the impact of development cooperation 17
Figure 1.10 shows DAC donor CPA/GNI ratios in 2007. The five highest (exceeding 0.25%) are of those coun-tries which also meet the 0.7% target for ODA/GNI. Those with the lowest CPA/GNI ratios in 2007 (and in 2005) were Austria, Italy and Greece.
Figure 1.10DAC donor CPA/GNI ratios, 2007
CPA is an extremely useful tool for measuring the overall quality of donor ODA. It is not perfect, because it includes technical cooperation, over which developing countries may have little say, and project-spe-cific donor contracts with NGOs. It could also be argued that relief on previously serviced debt should be included in CPA, because it generates predictable expenditure increases for developing countries. All of these faults could be remedied.
However, it is very valuable in that it provides a basis for transparent forward planning and accountability by donors and recipients, and is much closer to ODA numbers reported in developing country budgets and country aid databases. It is much more useful for judging the fragmentation of aid and the transaction costs imposed on recipient governments than ODA, and it is a useful way of comparing the coherence and likely impact of different donors’ efforts at country level. Independent analysts (such as Clemens, Radelet and Bhavnani 2004) have also found that CPA shows a much higher relationship to national growth and development than ODA.
CPA should therefore be used much more widely as the standard for judging whether each donor’s aid is likely to promote development. Data and ratios on each donor’s performance should be analyzed by the DAC each year in the Development Cooperation Report, and made a key part of the analysis conducted in DAC peer reviews. Most important, data on each donor’s current and forecast CPA for each developing country, for the next three years, should be shared with developing country authorities to assist their plan-ning, and make it easier for all parties to hold one another accountable for results.
0.050.00 0.15 0.25 0.350.10 0.20 0.30 0.40 0.45 0.50
Total DAC
United States
United Kindgom
Switzerland
Sweden
Spain
Portugal
Norway
New Zealand
Netherlands
Luxembourg
Korea
Japan
Italy
Ireland
Greece
Germany
France
Finland
Denmark
Canada
Belgium
Austria
Australia
Source: OECD DAC
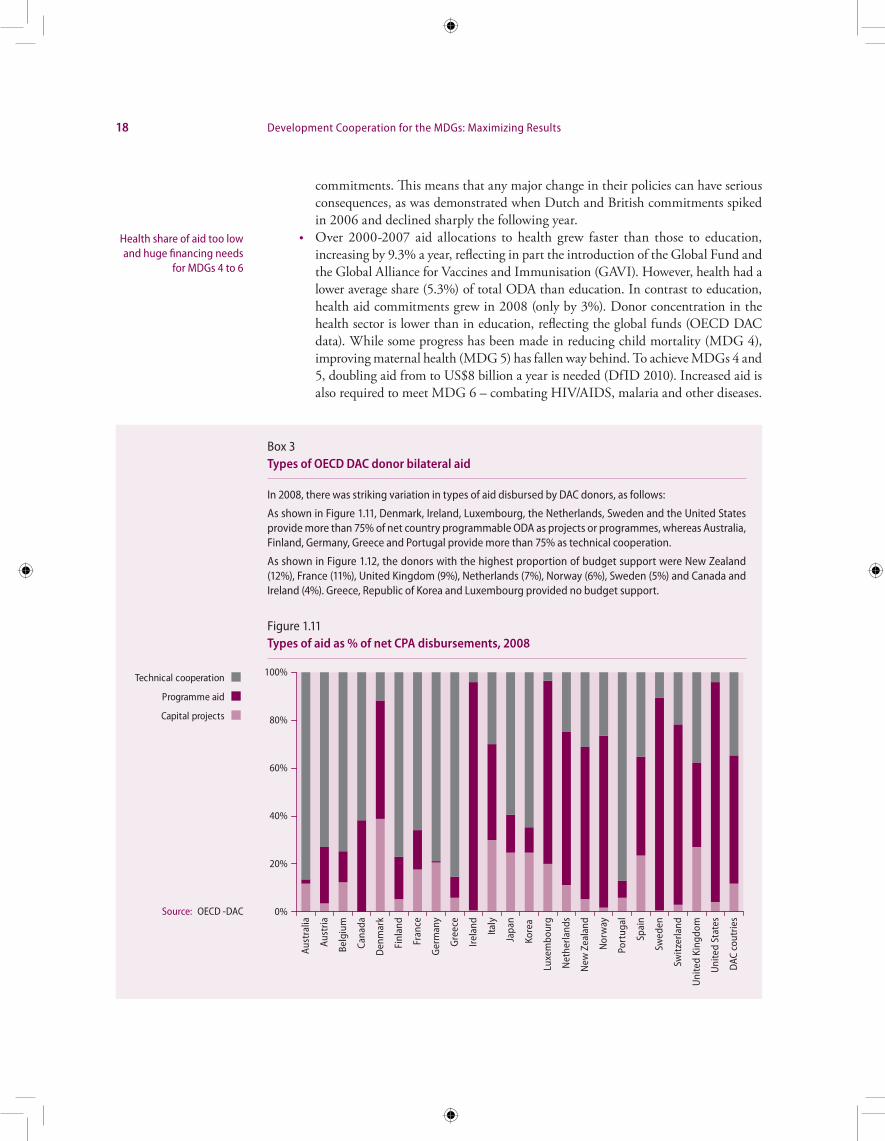
18 Development Cooperation for the MDGs: Maximizing Results
Box 3Types of OECD DAC donor bilateral aid
In 2008, there was striking variation in types of aid disbursed by DAC donors, as follows:
As shown in Figure 1.11, Denmark, Ireland, Luxembourg, the Netherlands, Sweden and the United States provide more than 75% of net country programmable ODA as projects or programmes, whereas Australia, Finland, Germany, Greece and Portugal provide more than 75% as technical cooperation.
As shown in Figure 1.12, the donors with the highest proportion of budget support were New Zealand (12%), France (11%), United Kingdom (9%), Netherlands (7%), Norway (6%), Sweden (5%) and Canada and Ireland (4%). Greece, Republic of Korea and Luxembourg provided no budget support.
Figure 1.11Types of aid as % of net CPA disbursements, 2008
0%
20%
40%
60%
80%
100%
Capital projects
Programme aid
Technical cooperation
Aust
ralia
Aust
ria
Belg
ium
Cana
da
Den
mar
k
Finl
and
Fran
ce
Ger
man
y
Gre
ece
Irela
nd
Italy
Japa
n
Kore
a
Luxe
mbo
urg
Net
herla
nds
New
Zea
land
Nor
way
Port
ugal
Spai
n
Swed
en
Swit
zerla
nd
Uni
ted
King
dom
Uni
ted
Stat
es
DAC
cou
trie
s
Source: OECD -DAC
commitments. This means that any major change in their policies can have serious consequences, as was demonstrated when Dutch and British commitments spiked in 2006 and declined sharply the following year.
• Over 2000-2007 aid allocations to health grew faster than those to education, increasing by 9.3% a year, reflecting in part the introduction of the Global Fund and the Global Alliance for Vaccines and Immunisation (GAVI). However, health had a lower average share (5.3%) of total ODA than education. In contrast to education, health aid commitments grew in 2008 (only by 3%). Donor concentration in the health sector is lower than in education, reflecting the global funds (OECD DAC data). While some progress has been made in reducing child mortality (MDG 4), improving maternal health (MDG 5) has fallen way behind. To achieve MDGs 4 and 5, doubling aid from to US$8 billion a year is needed (DfID 2010). Increased aid is also required to meet MDG 6 – combating HIV/AIDS, malaria and other diseases.
Health share of aid too low and huge financing needs
for MDGs 4 to 6
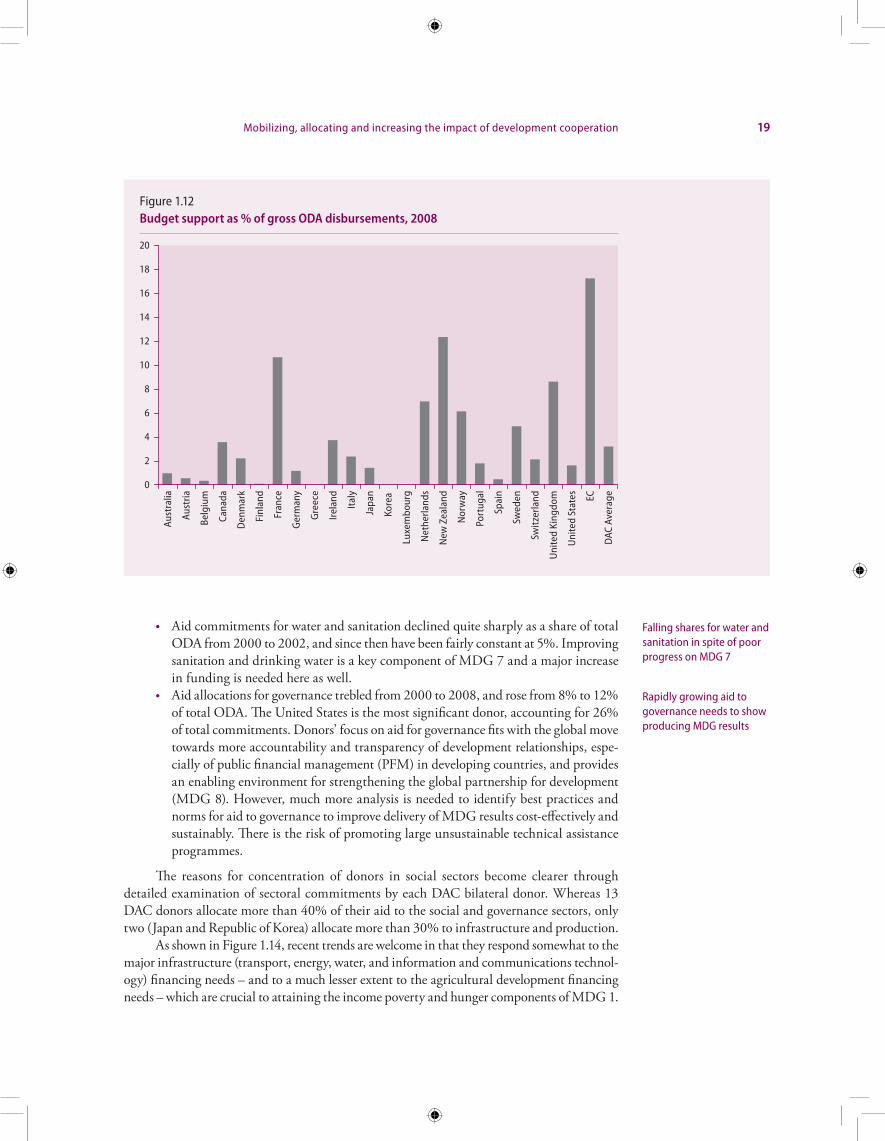
Mobilizing, allocating and increasing the impact of development cooperation 19
• Aid commitments for water and sanitation declined quite sharply as a share of total ODA from 2000 to 2002, and since then have been fairly constant at 5%. Improving sanitation and drinking water is a key component of MDG 7 and a major increase in funding is needed here as well.
• Aid allocations for governance trebled from 2000 to 2008, and rose from 8% to 12% of total ODA. The United States is the most significant donor, accounting for 26% of total commitments. Donors’ focus on aid for governance fits with the global move towards more accountability and transparency of development relationships, espe-cially of public financial management (PFM) in developing countries, and provides an enabling environment for strengthening the global partnership for development (MDG 8). However, much more analysis is needed to identify best practices and norms for aid to governance to improve delivery of MDG results cost-effectively and sustainably. There is the risk of promoting large unsustainable technical assistance programmes.
The reasons for concentration of donors in social sectors become clearer through detailed examination of sectoral commitments by each DAC bilateral donor. Whereas 13 DAC donors allocate more than 40% of their aid to the social and governance sectors, only two (Japan and Republic of Korea) allocate more than 30% to infrastructure and production.
As shown in Figure 1.14, recent trends are welcome in that they respond somewhat to the major infrastructure (transport, energy, water, and information and communications technol-ogy) financing needs – and to a much lesser extent to the agricultural development financing needs – which are crucial to attaining the income poverty and hunger components of MDG 1.
Falling shares for water and sanitation in spite of poor progress on MDG 7
Rapidly growing aid to governance needs to show producing MDG results
Figure 1.12Budget support as % of gross ODA disbursements, 2008
0
4
2
8
12
16
6
10
14
18
20
Aust
ralia
Aust
ria
Belg
ium
Cana
da
Den
mar
k
Finl
and
Fran
ce
Ger
man
y
Gre
ece
Irela
nd
Italy
Japa
n
Kore
a
Luxe
mbo
urg
Net
herla
nds
New
Zea
land
Nor
way
Port
ugal
Spai
n
Swed
en
Swit
zerla
nd
Uni
ted
King
dom
Uni
ted
Stat
es EC
DAC
Ave
rage
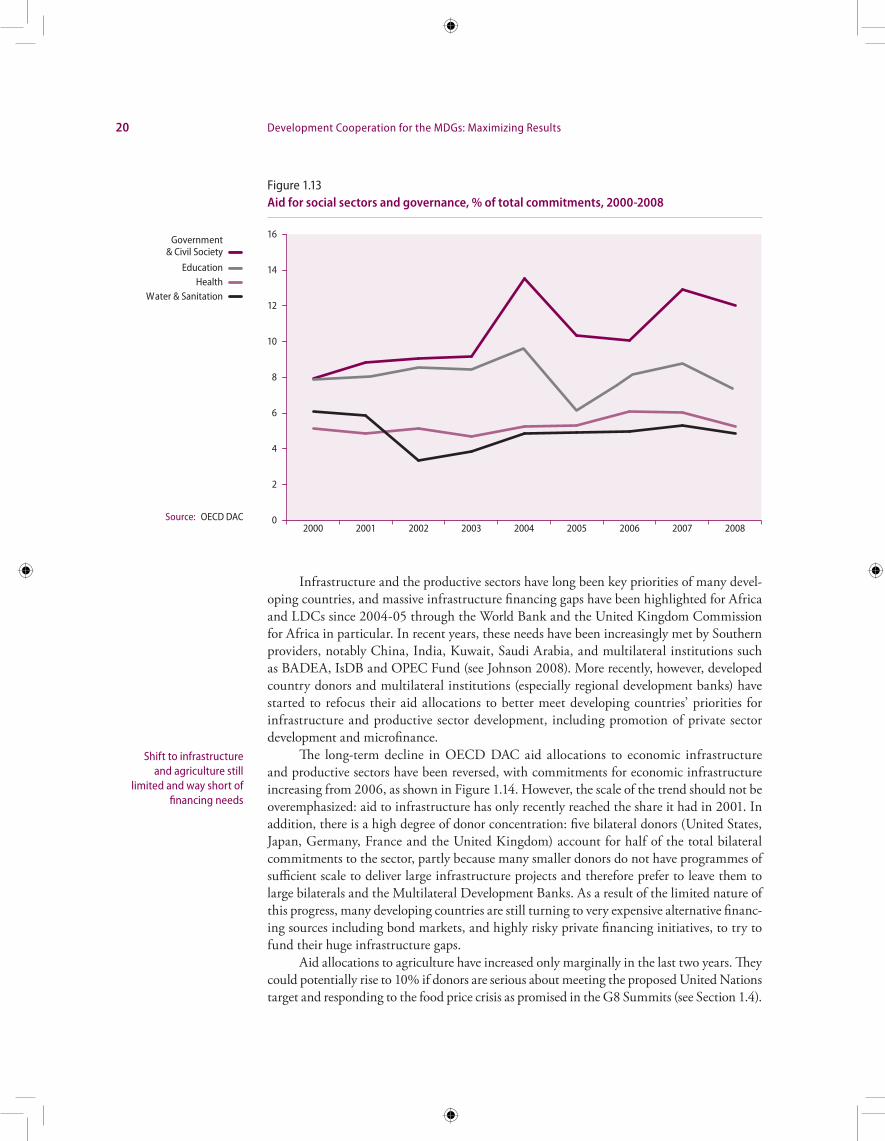
20 Development Cooperation for the MDGs: Maximizing Results
Infrastructure and the productive sectors have long been key priorities of many devel-oping countries, and massive infrastructure financing gaps have been highlighted for Africa and LDCs since 2004-05 through the World Bank and the United Kingdom Commission for Africa in particular. In recent years, these needs have been increasingly met by Southern providers, notably China, India, Kuwait, Saudi Arabia, and multilateral institutions such as BADEA, IsDB and OPEC Fund (see Johnson 2008). More recently, however, developed country donors and multilateral institutions (especially regional development banks) have started to refocus their aid allocations to better meet developing countries’ priorities for infrastructure and productive sector development, including promotion of private sector development and microfinance.
The long-term decline in OECD DAC aid allocations to economic infrastructure and productive sectors have been reversed, with commitments for economic infrastructure increasing from 2006, as shown in Figure 1.14. However, the scale of the trend should not be overemphasized: aid to infrastructure has only recently reached the share it had in 2001. In addition, there is a high degree of donor concentration: five bilateral donors (United States, Japan, Germany, France and the United Kingdom) account for half of the total bilateral commitments to the sector, partly because many smaller donors do not have programmes of sufficient scale to deliver large infrastructure projects and therefore prefer to leave them to large bilaterals and the Multilateral Development Banks. As a result of the limited nature of this progress, many developing countries are still turning to very expensive alternative financ-ing sources including bond markets, and highly risky private financing initiatives, to try to fund their huge infrastructure gaps.
Aid allocations to agriculture have increased only marginally in the last two years. They could potentially rise to 10% if donors are serious about meeting the proposed United Nations target and responding to the food price crisis as promised in the G8 Summits (see Section 1.4).
Shift to infrastructure and agriculture still
limited and way short of financing needs
Figure 1.13Aid for social sectors and governance, % of total commitments, 2000-2008
0
2
4
6
8
10
12
14
16
2000 2002 2004 20062001 2003 2005 2007 2008
HealthEducation
Government& Civil Society
Water & Sanitation
Source: OECD DAC
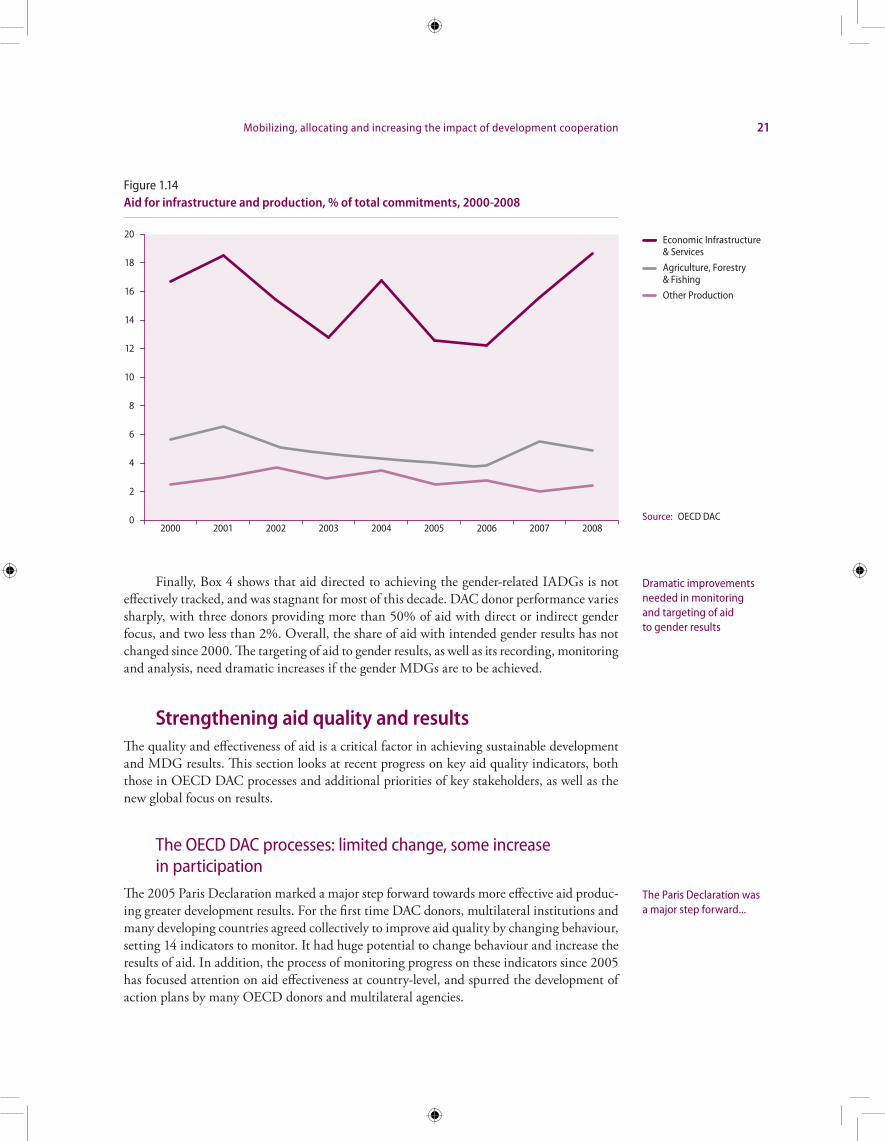
Mobilizing, allocating and increasing the impact of development cooperation 21
Finally, Box 4 shows that aid directed to achieving the gender-related IADGs is not effectively tracked, and was stagnant for most of this decade. DAC donor performance varies sharply, with three donors providing more than 50% of aid with direct or indirect gender focus, and two less than 2%. Overall, the share of aid with intended gender results has not changed since 2000. The targeting of aid to gender results, as well as its recording, monitoring and analysis, need dramatic increases if the gender MDGs are to be achieved.
Strengthening aid quality and resultsThe quality and effectiveness of aid is a critical factor in achieving sustainable development and MDG results. This section looks at recent progress on key aid quality indicators, both those in OECD DAC processes and additional priorities of key stakeholders, as well as the new global focus on results.
The OECD DAC processes: limited change, some increase in participation
The 2005 Paris Declaration marked a major step forward towards more effective aid produc-ing greater development results. For the first time DAC donors, multilateral institutions and many developing countries agreed collectively to improve aid quality by changing behaviour, setting 14 indicators to monitor. It had huge potential to change behaviour and increase the results of aid. In addition, the process of monitoring progress on these indicators since 2005 has focused attention on aid effectiveness at country-level, and spurred the development of action plans by many OECD donors and multilateral agencies.
Dramatic improvements needed in monitoring and targeting of aid to gender results
The Paris Declaration was a major step forward...
Figure 1.14Aid for infrastructure and production, % of total commitments, 2000-2008
0
2
4
6
8
10
12
14
16
18
20
Other Production
Agriculture, Forestry& Fishing
Economic Infrastructure& Services
2000 2002 2004 20062001 2003 2005 2007 2008Source: OECD DAC
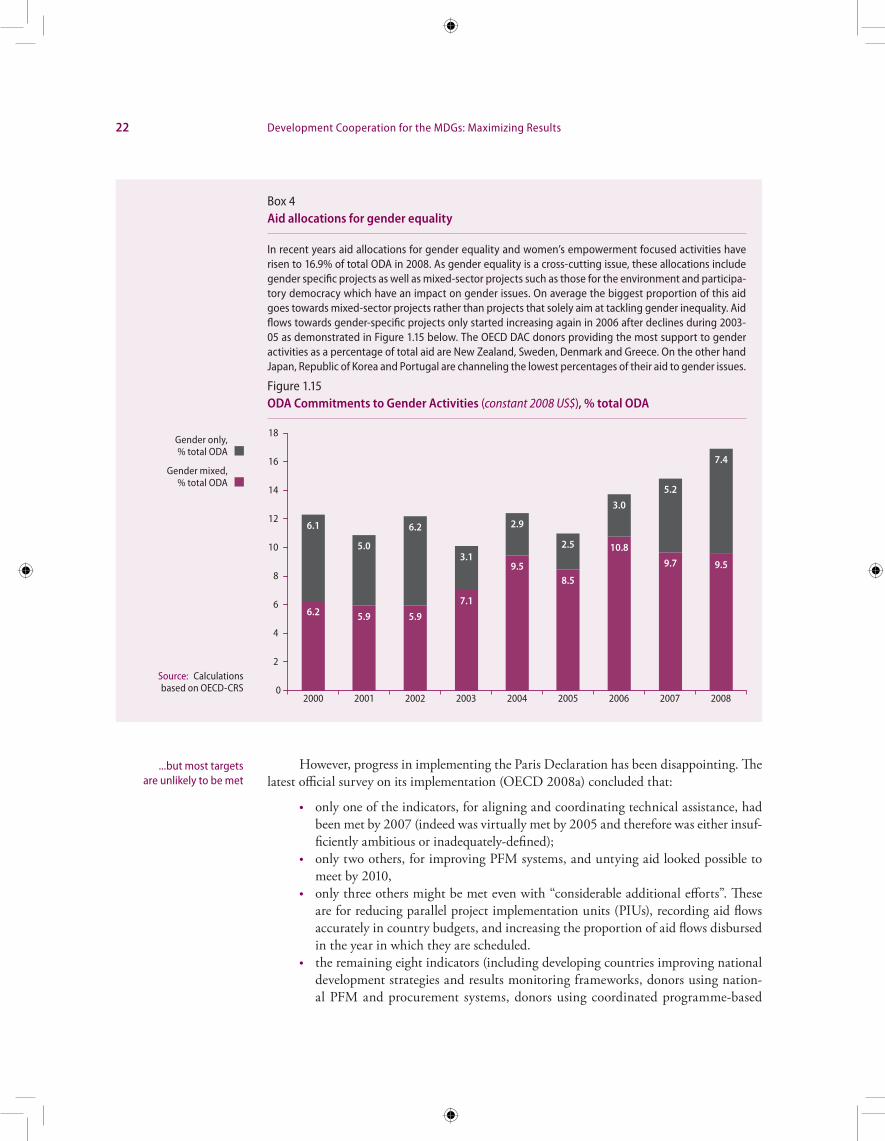
22 Development Cooperation for the MDGs: Maximizing Results
However, progress in implementing the Paris Declaration has been disappointing. The latest official survey on its implementation (OECD 2008a) concluded that:
• only one of the indicators, for aligning and coordinating technical assistance, had been met by 2007 (indeed was virtually met by 2005 and therefore was either insuf-ficiently ambitious or inadequately-defined);
• only two others, for improving PFM systems, and untying aid looked possible to meet by 2010,
• only three others might be met even with “considerable additional efforts”. These are for reducing parallel project implementation units (PIUs), recording aid flows accurately in country budgets, and increasing the proportion of aid flows disbursed in the year in which they are scheduled.
• the remaining eight indicators (including developing countries improving national development strategies and results monitoring frameworks, donors using nation-al PFM and procurement systems, donors using coordinated programme-based
...but most targets are unlikely to be met
Box 4Aid allocations for gender equality
In recent years aid allocations for gender equality and women’s empowerment focused activities have risen to 16.9% of total ODA in 2008. As gender equality is a cross-cutting issue, these allocations include gender specific projects as well as mixed-sector projects such as those for the environment and participa-tory democracy which have an impact on gender issues. On average the biggest proportion of this aid goes towards mixed-sector projects rather than projects that solely aim at tackling gender inequality. Aid flows towards gender-specific projects only started increasing again in 2006 after declines during 2003-05 as demonstrated in Figure 1.15 below. The OECD DAC donors providing the most support to gender activities as a percentage of total aid are New Zealand, Sweden, Denmark and Greece. On the other hand Japan, Republic of Korea and Portugal are channeling the lowest percentages of their aid to gender issues.
Figure 1.15ODA Commitments to Gender Activities (constant 2008 US$), % total ODA
5.9
5.0
5.9
6.2
7.1
3.19.5
2.9
8.5
2.5 10.8
3.0
9.7
5.2
9.5
7.4
6.2
6.1
0
2
4
6
8
10
12
14
16
18
2000 2002 2004 20062001 2003 2005 2007 2008
Gender mixed,% total ODA
Gender only,% total ODA
Source: Calculations based on OECD-CRS
Mobilizing, allocating and increasing the impact of development cooperation 23
mechanisms for aid delivery, donors coordinating missions and country studies, and establishment of national mutual accountability (MA) mechanisms (on which see Chapter 2 for much more details) are highly unlikely to be met.
Overall, recipient developing countries made much more progress than providers in meeting their targets, especially on dramatically improving PFM. While some providers have taken fundamental steps to reshape their relationships with developing countries, the Paris Declaration has not convincingly demonstrated an ability to change most providers’ behaviour, even towards using developing country PFM systems where these have improved sharply.
One very worrying finding of the survey was that the effectiveness of aid is particularly low in countries which receive lower levels of aid, as well as in fragile states and low-income countries. This means that low effectiveness is exacerbating the aid allocation distortions discussed earlier in this chapter, meaning that aid is less effective precisely where it needs to maximize results to compensate for quantity shortfalls.
The report concluded that “the survey results should serve as a wake-up call. They tell us quite clearly that ‘more of the same’ is unlikely to be enough to deliver the transformation envisaged by the Paris Declaration”, and urged major acceleration of progress. Nevertheless, little further progress was made at the follow-up high-level forum in 2008. Its Accra Agenda for Action contained considerably stronger wording than the Paris Declaration, but very few monitorable actions (only an evaluation of progress on “division of labour” among donors by 2009; a dialogue on inter-country aid allocations in 2009; donor provision of information including multi-year indicative forecasts and project documents to recipients; and a review of progress on international mutual accountability in 2009).
Beyond Accra: responding to the concerns of other stakeholdersAccording to recipient governments, parliamentarians and CSOs, as expressed in their posi-tions presented to the Accra High-Level Forum, the Paris Declaration and Accra Agenda did not set clear enough indicators for several issues of key concern, including untying, capacity-building, predictability, accountability and transparency. They also set no indica-tors for others – such as flexibility, conditionality, concessionality and cross-cutting themes such as gender, human rights and the environment. The DCF has therefore drawn on other sources to monitor progress in these areas for this report.
Tying of aid to purchases of goods and services in donor countries increases costs by 25-60%, reducing value-for-money. It also makes the proportion of ODA used to purchase goods and services from developing countries low, and in turn undermines aid spending’s contribution to promoting private sector growth in developing countries. In 2001, DAC donors agreed to untie aid to least developed countries (LDCs) (except food and technical assistance). Many donors have gone further, increasing untied bilateral aid to 73% in 2005-07, up from 50% in 1999-2001. However, the tying status of 20% of relevant DAC aid is not reported to the DAC, and food aid (estimated to be 30% tied), technical assistance (estimated to be more than 50% tied) and aid to non-LDCs are excluded from the efforts. Recipient countries surveyed by the HIPC Capacity Building Programme (HIPC CBP) (DFI/ODI 2009) indicate that only 58% of bilateral aid is untied: this would imply that over US$20 billion of aid every year is wasted through overpricing. In addition, informal distortions in procurement methods favour suppliers from the provider country, leading to a much higher proportion of contracts being awarded within the provider country than would be likely in a competitive market.
Aid effectiveness is especially low in orphans and fragile states
“Aid effectiveness” needs to respond to the concerns of other stakeholders
Tying costs more than US$20 billion a year
24 Development Cooperation for the MDGs: Maximizing Results
Progress in transforming technical assistance to be genuinely building capacity contin-ues to lag. The Paris indicators do not track the impact of technical assistance on developing national capacity: recipient countries indicate that only around one third of such assistance contains explicit intentions to build capacity rather than just supplying temporary person-nel. Such assistance, unless genuinely filling a temporary gap, tends often to perpetuate low capacity in developing countries (especially fragile states), thereby requiring continu-ing aid when genuine capacity-building efforts could have eliminated the need for TA and allowed aid to be spent on other areas. Paris indicators also are too loose in their defini-tion of “aligned and coordinated” technical assistance, allowing providers to count any TA which fits into the recipient’s national development strategy, regardless of whether it was requested by or is managed by the recipient country. In addition, as pointed out by many sources (notably Action Aid 2006) external technical assistance (TA) is extremely expensive, especially as it is often tied to OECD sources of expertise. There is an urgent need to tighten monitoring of the capacity-building results of technical assistance, to ensure developing country leadership in the design and management of technical assistance, and to increase procurement of relevant and cost-effective expertise from developing countries (including through triangular cooperation as discussed in Chapter 3).
Predictable aid enables developing countries to plan long-term development strategies, medium-term expenditure frameworks (MTEFs) and annual budgets. This applies both to project aid, where delays can have negative effects on the real economy (such as power shortages), and programme aid, where delays in cash budget support or in commodities such as food or essential drugs can severely disrupt budget planning. Aid continues to be much more volatile than budget revenue, and Kharas (2008) has estimated that US$15-30 billion of the value of aid is “lost” every year due to unpredictability. The Accra Agenda did urge donors strongly to increase multiyear predictability, by supplying multiyear indicative projections to developing countries. This has resulted in a sharp increase in multiyear pro-jection reporting to the OECD, but according to DFI/ODI (2009) there has been a much lower increase in reporting to developing countries (from only 40% to 48%), and only just over half of aid even has specific disbursement schedules included in agreements. The main improvements in predictability since Accra have been due to continuing progress of budget support performance assessment frameworks (PAFs) containing “guaranteed tranches”, and “informal” projections of aid reported by local provider officials.
Flexibility is essential to respond to changing priorities and mandates of governments, and to counter exogenous shocks, whether macroeconomic or natural disaster-related (espe-cially as the latter will increase dramatically in future with climate change). Though donors have taken steps to increase flexibility in recent years, by providing more budget support and improving IMF and United Nations mechanisms for countering shocks, and are proposing to introduce an anti-shock window in the next IDA replenishment, this remains one of the poorest-performing aspects of aid, with 87% of aid inflexible. In particular, it is vital to build on the flexibility shown by the multilateral development banks and some bilateral providers in speeding disbursements to combat the financial crisis, by establishing more permanent procedures and facilities for rapid, unconditional anti-shock budget support.
A key cause of unpredictability and inflexibility is policy conditionality. Most DAC donors and multilateral organizations continue to disburse aid based on implementation of negotiated policy measures, even though policy-based conditionality is generally ineffective and unduly restrictive of policy space. Conditions are also too numerous and detailed, lead-ing to long delay in disbursing aid against shocks, and exacerbating their negative effects on budgets and development. There has been little progress in reducing conditions in recent
Technical assistance must be transformed into
capacity-building
Unpredictability costs US$15-30 billion
More flexibility is essential to fund changing priorities
and counter exogenous shocks
Policy conditionality remains a key cause of
unpredictability and inflexibility
Mobilizing, allocating and increasing the impact of development cooperation 25
years, because incentives within agencies continue to encourage this practice. Rather there has been a continuing shift towards conditions on “governance”, which are seen by devel-oping countries as highly intrusive when they are not limited to PFM and fiduciary issues. Some donors have reduced their conditions sharply, requiring only strong development strategies and public financial management, and respect for international agreements on democracy and human rights. However, they still endorse harmonized policy conditions in multi-donor budget support and sectoral policy matrices, which can easily be “highest common multiples” of conditionality. Some developing countries have managed to increase budget support predictability by reducing the numbers of conditions, introducing high shares of guaranteed up-front annual disbursements, and more transparency and flexibility in interpreting compliance to limit arbitrary disbursement suspension.
The global financial and economic crisis has increased the prevalence of conditionality, by forcing many developing countries to borrow from the IMF and multilateral develop-ment banks in order to fill fiscal and balance of payments gaps. While the IMF has shown somewhat more flexibility in allowing developing countries to adopt fiscal stimulus meas-ures in 2009, this is being reduced in 2010 (Oxfam 2010b; UNICEF 2010). In addition, the streamlining of IMF structural conditionality announced in 2009 is not perceived by developing countries as being a major change. Developing countries also indicate World Bank policy lending conditions are still excessive in number, though they have become less intrusive by moving slightly away from ex ante policy measures to ex post measurement of results (G20 2009; DfID 2010a).
The move to outcome and results-based conditions is part of a wider global trend, pioneered by the European Union and many of its member states, to replace detailed policy conditions with conditions based on results. This is a very positive move which can provide developing countries with much greater policy space to introduce heterodox policy measures in order to attain their own national development strategy goals. However, if results-based conditions are accompanied by pre-selection of eligible countries based on multiple policy indicators, defined to apply to narrowly-earmarked sub-sectoral indicators, or monitored intrusively or inflexibly by external actors – and especially if they delay disbursements by only providing “payment for results” – they can represent a backward step compared to more flexible outcome-based conditions on budget support.
Procedural conditionality also continues to delay disbursement, especially of project aid. Some (especially South-South) providers have a record of fast disbursements, and others have streamlined procedures and decentralized their execution to country level in recent years. However, for the worst performers (DFI/ODI 2009), financial, institutional and appraisal preconditions can delay the start of disbursements by 18 months, and disbursement and procurement procedures by 21 months. Reports and reviews can also delay follow-on projects by 12-15 months. Cumbersome procedures of some recipient countries can also have the same effects, delaying compliance with donor conditions or project execution.
Overall, disbursement delays undermine the execution of key projects, waste resources which could be dedicated to the IADGs and lead to a false perception that developing coun-tries are experiencing problems in absorbing aid. The Paris Declaration ignores many key delaying factors such as excessively complex appraisal procedures, requirements for coun-terpart/matching funds, overcomplex procurement, pre-shipment and customs clearance procedures, excessive documentation and reporting requirements, and failure by providers to decentralize the execution of procedures to country level.
Between 2006 and 2008, in a reversal of earlier trends, the concessionality of DAC ODA fell somewhat, whether measured by the proportion of grants in total ODA, or by the
Outcome-based budget support is the best route to results
Procedural conditions delay disbursements by many months
Rising highly concessional ODA is essential to keep debt sustainable
26 Development Cooperation for the MDGs: Maximizing Results
grant element of ODA loans or total ODA. The international community has put in place frameworks to encourage prudent new lending and borrowing, which were made slightly more flexible in 2009, allowing more borrowing for countries with lower debt burdens or for high-return projects. Multilateral lenders also continue to provide large shares of grants to the most indebted countries, and the IMF has reduced the cost of its lending to low-income countries during the crisis. There is not as yet a major risk of a new developing country debt crisis, but debt service is once again increasingly diverting developing country budgets away from MDG spending, and during the financial crisis many developing countries had to bor-row expensively on domestic financial markets because external financing was delayed or unavailable. The crucial factor determining whether countries can finance their development while keeping debt sustainable will be availability of adequate highly concessional ODA grants and loans, especially for low-income or vulnerable countries whose foreign exchange earnings or budget revenues are modest and volatile. Therefore continuing commitments to increasing ODA are essential to debt sustainability.
One additional key concern has been the proliferation of providers and fragmentation of aid into multiple projects, which has accelerated in recent years and could potentially rise further if new vertical climate financing funds are established. Much analysis overstates the degree of fragmentation, because it includes contributions from bilateral DAC donors to multilateral organizations, which are assigned to individual developing countries in DAC data and create the false impression that these providers have direct aid relationships with additional developing countries.
Recipient countries prefer a relatively diversified donor base, in order to enhance sta-bility and predictability of flows by diversifying risk, to provide more diverse perspectives on development issues (from development strategies to technology and expertise transfer), and to increase funding for underfunded sectors such as infrastructure and production. Therefore they regard fragmentation with less concern than providers. However, excessive fragmentation has many disadvantages, including conflicts over development priorities and conditionalities, increased earmarking, and increased transaction costs. The OECD esti-mates these extra transaction costs at US$5 billion a year. Fragmentation also undermines the capacity of developing countries by diverting staff to work as counterparts or for provid-ers, spending aid on technical assistance or implementation units to manage projects, and increasing costs of aid coordination.
To offset proliferation and fragmentation, donors have tried to:
1. Cut the number of developing countries regarded as priority partners and receiving significant amounts of aid. Between 2004 and 2010, eleven DAC donors reduced priority partners, whereas only five expanded them (generally because they were sharply increasing aid flows). However, this has accelerated the concentration of aid in “donor darling” countries, and reduced stability and predictability in “donor orphan” countries.
2. Reduce the number of donors in a country or particular sectors in a country via a “division of labour” exercise. Recent evaluations indicate that these have been successful in mapping donor presence and nominating lead donors for sectors, but less good in assessing donor comparative advantage and reprogramming flows on that basis. Similarly, in terms of impact, while transaction costs may be reducing, quality of sector dialogue and numbers of donors are not being rationalized enough, delaying improved aid effectiveness. The main reasons for slow progress are that in many recipient countries division of labour is driven by groups of donors (and
Fragmentation costs US$5 billion a year
Donors are reducing the number of partners, increasing the numbers
of donor orphans...
Division of labour is advancing slowly
Mobilizing, allocating and increasing the impact of development cooperation 27
opposed by others which want to stay in multiple sectors) rather than by recipient country analysis of which donors perform best in which sectors, and which sectors need more donors.
In spite of strong language in the Accra Agenda and focus by some providers, current global and national aid effectiveness frameworks are not sufficiently responsive to develop-ment issues that cut across multiple sectors, notably gender, the environment and human rights. Development strategies resulting in strong monitorable commitments on these issues are the best way to proceed. However, as also discussed in Section 1.4 and Chapter 2, there is a need for a step change in the degree of focus given to ensuring results on the gender equality IADGs. Clear targets should be set for fully financing national gender action plans; increasing the share of and tracking all aid for its intended gender outcomes; evaluating best practices in scaling up aid to make rapid progress on the gender IADGs; funding womens’ groups to monitor and analyze country and global level funding and results for the gender IADGs; and providing space in international and national accountability forums to discuss the gender impact of accountability frameworks.
Another area which needs a step change is action against corruption and diversion of funds from their intended purposes, which are by far the main source of criticism of development cooperation. These should involve increased transparency and accountability at international and national level, and reinforcing the role of national stakeholders rather than external auditors, with a particular focus on community- and grassroots-led tracking of spending and results. It also means taking much tougher steps against proven cases of cor-ruption, including disbarring contractors from future programmes and prosecuting govern-ment officials (see also Oxfam 2010a). However, it should also include more discussion of the evidence that aid is much less subject to corruption and diversion than many other sources of development financing, and other types of government spending in provider economies, because of the checks and balances already in place to monitor its use.
Overall, the aid effectiveness agenda has recently been under strong criticism from aid sceptics (and even aid proponents) in provider and developing countries, for producing little change in donor behaviour. It needs to be streamlined at the forthcoming 2011 High-Level Forum (HLF), to show clearly how its focus on delivery changes and ownership, alignment, transparency and accountability of development cooperation, are producing and could pro-duce clear results for the IADGs and sustainable development. Much of the focus on next steps has been on further technical solutions, such as improving processes, institutions and policies designed to manage for development results through measures such as establishing results-based management systems, and enhancing evaluation processes and lesson-learning in provider agencies and developing countries. These of course are vital, but so is enhanced investment in increased parliamentary, community and media monitoring of results, which has been repeatedly shown to increase results (Oxfam 2010a).
There is also need for a coordinated campaign to show that major results are already being produced, and that the aid types and management procedures being promoted on aid effectiveness grounds are most likely to increase results. A first step could be taken at the High-level Plenary Meeting of the General Assembly on the MDGs by committing dramatically to enhance the international system’s rapid monitoring, analysis and dissemi-nation of IADG results produced by aid and developing country spending. One example already discussed in this chapter is of budget support, which repeated evaluations have found to be the most effective way to increase results – but this is not widely known or accepted. This should be accompanied by much more widespread discussion of the pernicious effects and costs of poor quality aid – for example, the costs of unpredictability, tying and frag-
Step changes are needed in gender-focussed aid and anti-corruption measures
MDG Summit and 2011 High-level Forum must focus on IADG results of aid to maintain support
28 Development Cooperation for the MDGs: Maximizing Results
mentation discussed in this chapter. The 2011 HLF needs to focus on how to demonstrate and ensure results from aid, by providing recipient countries with greater policy space.
The HLF must also address the issues of concern to recipient countries and other stake-holders which were omitted from the Paris indicators as discussed in this section, resulting in much stronger monitorable actions to increase the results of aid, and to hold individual providers and recipient countries accountable. It also needs to address the concerns of South-ern providers by incorporating indicators which measure better the comparative advantages of their development cooperation as also perceived by recipients, notably aspects such as value-for-money and rapid delivery of results (as also discussed in Chapter 3). In other words, the aid effectiveness agenda needs to be broadened into an aid quality and results agenda. Addressing all of these issues will be crucial if aid effectiveness is to continue to receive sup-port at political and civil society level in North and South.
The High-level Forum must address concerns of other
stakeholders and Southern providers for a broader aid quality and results agenda
29
Chapter 2
Accountability and transparency of development cooperation8
Defining accountability and transparencyOne key way to improve the quality of aid, and its effectiveness in achieving results, is to ensure that its delivery is accountable and transparent. Accountability and transparency have been a key focus of DCF work since its inception. In its second phase, the DCF focused a High-Level Symposium in November 2009 on these issues, which concluded by urging it to conduct a more detailed review of international and national MA and transparency initia-tives in 2010.9
The DCF has focused on what is known as “mutual accountability” between providers and recipients of development cooperation. The OECD (2009b and c) defines this as “a proc-ess by which two (or multiple) partners agree to be held responsible for the commitments that they have voluntarily made to each other.” Progress in mutual accountability is all the more important because the relationship between providers and recipients is inherently uneven. Nevertheless, the phrase “mutual accountability” continues to cause confusion among devel-opment cooperation stakeholders, around three questions:
1. Who is holding whom accountable? Stakeholders tend to see accountability largely from their own viewpoints. Therefore:• Providers want to hold the recipients of aid (whether national or sub-national
governments, multilateral organizations, civil society organizations (CSOs) or the private sector) accountable for the use to which it is put as well as the policies which accompany it.
• Recipients want to hold providers accountable, including for the effectiveness and timeliness with which they provide aid.
• Other stakeholders such as (both Northern and Southern) national parliaments or CSOs want to hold providers and recipients accountable.
Within each stakeholder group, members also want to hold one another accountable and exert peer pressure to live up to commitments.
2. What is the locus of accountability? There are four fundamental levels of account-ability – global, regional, national and domestic.
8 This chapter is based on two background studies prepared for the DCF 2010 on mutual account-ability and transparency (Martin 2009 and 2010), as well as the many contributions on these issues made by participants in symposia in Vienna and Helsinki, as well as at the DCF meeting itself, where these issues were discussed.
9 For details, visit: http://www.un.org/en/ecosoc/newfunct/dcfvienna10.shtml
Accountability and transparency are crucial to maximizing results
Many are unclear what “mutual accountability” means
30 Development Cooperation for the MDGs: Maximizing Results
• Global involves holding participants accountable at the global level for their overall progress worldwide (however, while this sometimes tries to cover all aid providers and recipients, it is more frequently only a subset and therefore not really global).
• Regional can mean region-to-region accountability for goals (e.g. between Europe and Africa); or regional efforts to track progress in implementing global or national initiatives.
• National tends to mean accountability between aid providers (governments, multilateral organizations, or others) and recipient country governments (but is sometimes used interchangeably with “domestic”).
• Domestic means accountability of providers and recipient country governments to their domestic stakeholders such as parliamentarians and auditor-generals. Though most of the focus has been placed on domestic accountability of recipi-ent country governments, it should also ideally cover accountability of provider governments and the multilateral organizations, CSOs and private sector organi-zations through which they channel aid, as well as accountability of parliaments and local governments.
3. What are participants being held accountable for? International agreements have been reached to hold all partners in the development process accountable for devel-opment results, notably the MDGs. However, within this broad agenda, there is a tendency by different stakeholders to see their concerns as being the key focus for accountability.
The variety of definitions for “mutual accountability” means that it can include almost any meeting or analysis undertaken at global, regional or national level, which involves development-related issues, and includes two or more stakeholder groups. Each sponsor of a particular forum, dialogue or analysis tends to regard it as being a crucial part of mutual accountability, although the Paris Declaration (PD) and Accra Agenda for Action (AAA) on aid effectiveness try to narrow the definition to focus on processes where providers are held responsible for the effectiveness of aid in producing development results, and recipient or “partner” countries for their aid management and the development results they produce using aid and other resources. The Paris Declaration tries to make sure “Partner countries and providers commit to jointly assess through existing and increasingly objective country-level mechanisms mutual progress in implementing agreed commitments on aid effectiveness.” (OECD 2009b)
In order to make the focus of analysis and discussion manageable enough to produce useful recommendations, this chapter takes a narrow definition of mutual accountability, in two respects:
• First, it assesses only those forums, mechanisms or processes which focus on the quantity, quality and/or effectiveness of aid and the development results it achieves, rather than wider development policy issues such as governance or attaining the Internationally Agreed Development Goals (IADGs).
• Second, it stresses the need for recipient countries and other stakeholders to be accountable for development results and for their management of aid. However, given that earlier independent analysis has repeatedly assessed that existing proc-esses are far more effective at holding recipient countries accountable, this analysis focuses on how to make accountability more “mutual”, by making providers more accountable to recipient country governments and other stakeholders such as parlia-
So the DCF has adopted a clear definition

Accountability and transparency of development cooperation 31
ments, local governments and civil society, and (secondarily) recipient and provider governments’ accountability to their respective parliaments and other domestic stakeholders. These are two of the major gaps in “mutual accountability” identified in earlier analysis. By narrowing the focus in this way, it is possible to identify clear priority actions which can improve mutual accountability and transparency on aid, and therefore the development results it produces.
Mutual accountability is a key component of both the Paris Declaration and the AAA. Nevertheless, there has been so little progress towards it that it has been described as “the orphan of aid effectiveness” (OECD 2008c). Reinforcing mutual accountability and transpar-ency on development cooperation will require targeting three mutually reinforcing results:
• Improved global and regional mutual accountability mechanisms;• Improved national-level mutual accountability mechanisms;• Improved transparency on development cooperation to facilitate mutual account-
ability.
The rest of this chapter examines each of these issues in turn.
Global and regional mutual accountabilityOverall assessments of the mechanisms
Even narrowing the focus to mechanisms which focus on aid, there is a multiplicity of global and regional mechanisms aiming to promote mutual accountability. These can be divided into three types (OPM 2008b):
• “Spotlights” - independent non-official assessments of performance;• “Mirrors” – peer review mechanisms of one another among provider or programme
countries;10
• “Two-way mirrors” – official mechanisms for providers, programme countries and other stakeholders to oversee one another’s performance.
An earlier study (OPM 2008b) reviewed each mechanism on the basis of four factors:
• The quality, independence and transparency of its performance information or evi-dence;
• Ownership of the mechanism by all stakeholders, and its capacity to build owner-ship;
• The degree to which the mechanism provokes debate and explanation of perform-ance;
• The extent to which the mechanism causes behaviour change.
It found that many spotlights have a strong record of providing transparent, independ-ent ‘evidence’ but, to some degree precisely because they are independent, lack the ‘owner-ship’ by stakeholders to result in behaviour change. On the other hand, mirrors and two-way mirrors have high ownership, but do not always provide high quality evidence, especially
10 There is no current peer review among recipient countries of their aid management and effectiveness progress, though peer learning mechanisms exist especially in Asia, as discussed elsewhere in this report. There are many mechanisms, such as the African Peer Review Mechanism, designed to review commitments on wider policy aspects such as governance.
The effectiveness of global mechanisms depends on evidence, ownership, debate and behaviour change
32 Development Cooperation for the MDGs: Maximizing Results
on individual providers in specific developing countries, and therefore can also be weak in promoting behaviour changes.
The study’s key recommendations were to:
• Promote improved evidence, ownership and debate in the best mechanisms, espe-cially those which reflect voices of recipient countries and other stakeholders;
• Rationalize mechanisms by cutting back those which are least effective;• Increase coordination and complementarity among mechanisms;• Strengthen developing country voice in all mechanisms;• Strengthen peer and other formal review processes in regional donor groupings and
the multilateral development banks; and• Integrate non-official “spotlights” results into official processes.
It also provided detailed suggestions for how to reinforce each well-functioning mecha-nism, and stressed the need to focus on a few key mechanisms which have strong input in their design and implementation from developing country governments and other Southern stakeholders.
Since then, DCF studies (Martin 2007, 2009, 2010; Manning 2008) and the Report of the United Nations Secretary-General (2008), OECD (2008), as well as Section 1.5 of the current report, have shown that while the Paris Declaration and AAA provide a basis for many providers and recipients agreeing clear commitments, recipients have made much great-er progress than providers in implementing these and changing behaviour, perhaps because providers are held much less individually accountable.
Table 2.1 (p. 34) presents detailed assessments of individual global MA mechanisms.11
In addition to earlier characteristics, the most recent DCF analysis identified eight systemic gaps in global frameworks as key reasons for slow behaviour change:
Sources of Data and Analysis
As shown in Figure 2.1, providers are virtually the only source used by global MA mecha-nisms: DAC data and direct donor publications. Some independent mechanisms use analysis by CSOs - though only two (African Monitor and Reality of Aid) rely extensively on South-ern CSOs. Virtually none (apart from Guide to Donors and MOPAN) use direct informa-tion from recipient country governments (apart from their limited contribution to the Paris Declaration survey).12 Non-executive government stakeholders (parliaments and local govern-ments), as well as other civil society groups (women’s groups, trade unions and the private sector (except insofar as they are tied into wider civil society networks)) are barely consulted. It is vital that all global mechanisms make greater efforts to source data and analysis from recipient countries, independent analysis and other stakeholders such as parliaments, local governments and civil society groups, as well as providers.
11 It does not assess three mechanisms which are forthcoming: the 2010 Publish What You Fund (PWYF) Transparency Index, which will assess transparency of DAC and multilateral donors; the 2011 Quality of Official Development Assistance (QuODA) Index by the Center for Global Devel-opment (CGD) and the Brookings Institution, which will be an in-depth analysis of aid building on CGD’s Commitment to Development Index; and the process for monitoring application of the OECD Principles for Good International Engagement in Fragile States and Situations, which will produce a pilot report during 2011.
12 Several (DCF, ONE, PWYF) use Guide to Donors inputs from programme countries, which pushes up the score of recipient countries in Figure 2.1.
But recipients have implemented more
of their commitments
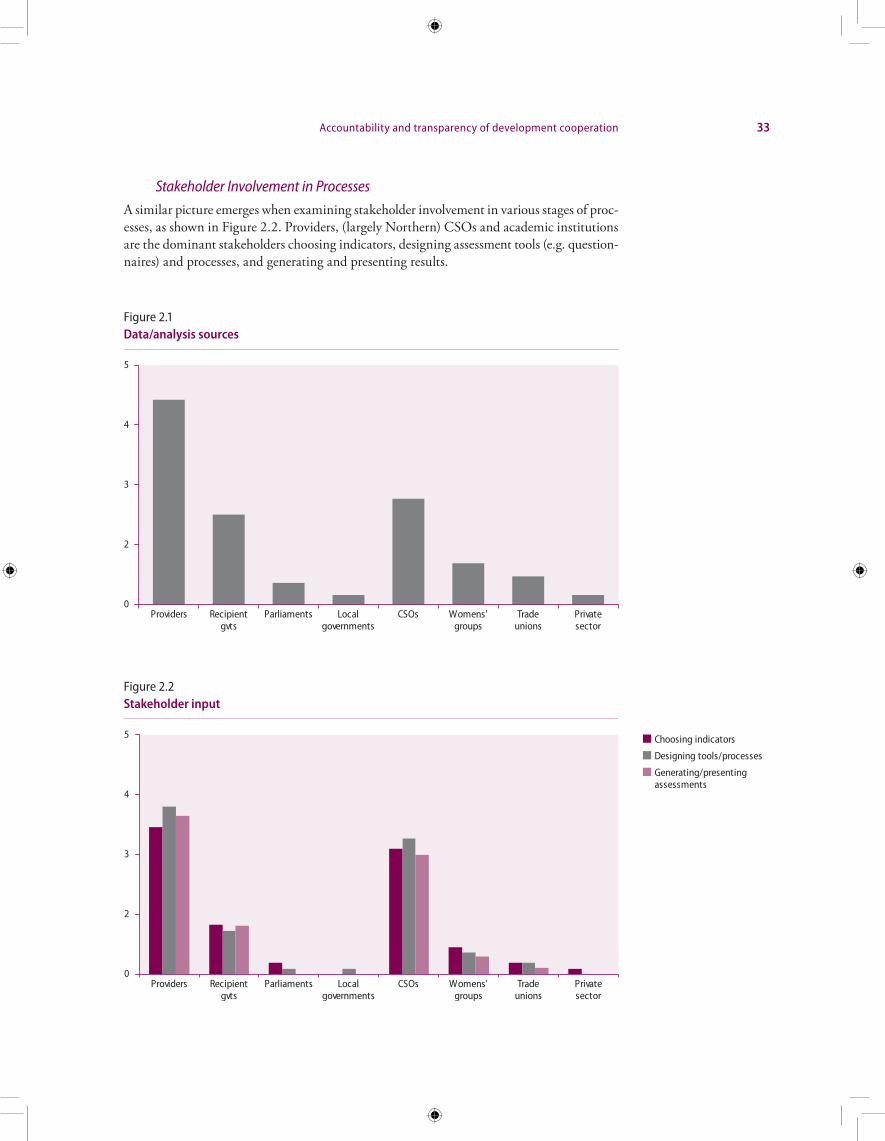
Accountability and transparency of development cooperation 33
Stakeholder Involvement in Processes
A similar picture emerges when examining stakeholder involvement in various stages of proc-esses, as shown in Figure 2.2. Providers, (largely Northern) CSOs and academic institutions are the dominant stakeholders choosing indicators, designing assessment tools (e.g. question-naires) and processes, and generating and presenting results.
0
2
3
4
5
Providers Parliaments CSOs Tradeunions
Recipientgvts
Localgovernments
Womens'groups
Privatesector
0
2
3
4
5
Providers Parliaments CSOs Tradeunions
Recipientgvts
Localgovernments
Womens'groups
Privatesector
Choosing indicators
Designing tools/processes
Generating/presentingassessments
Figure 2.1Data/analysis sources
Figure 2.2Stakeholder input
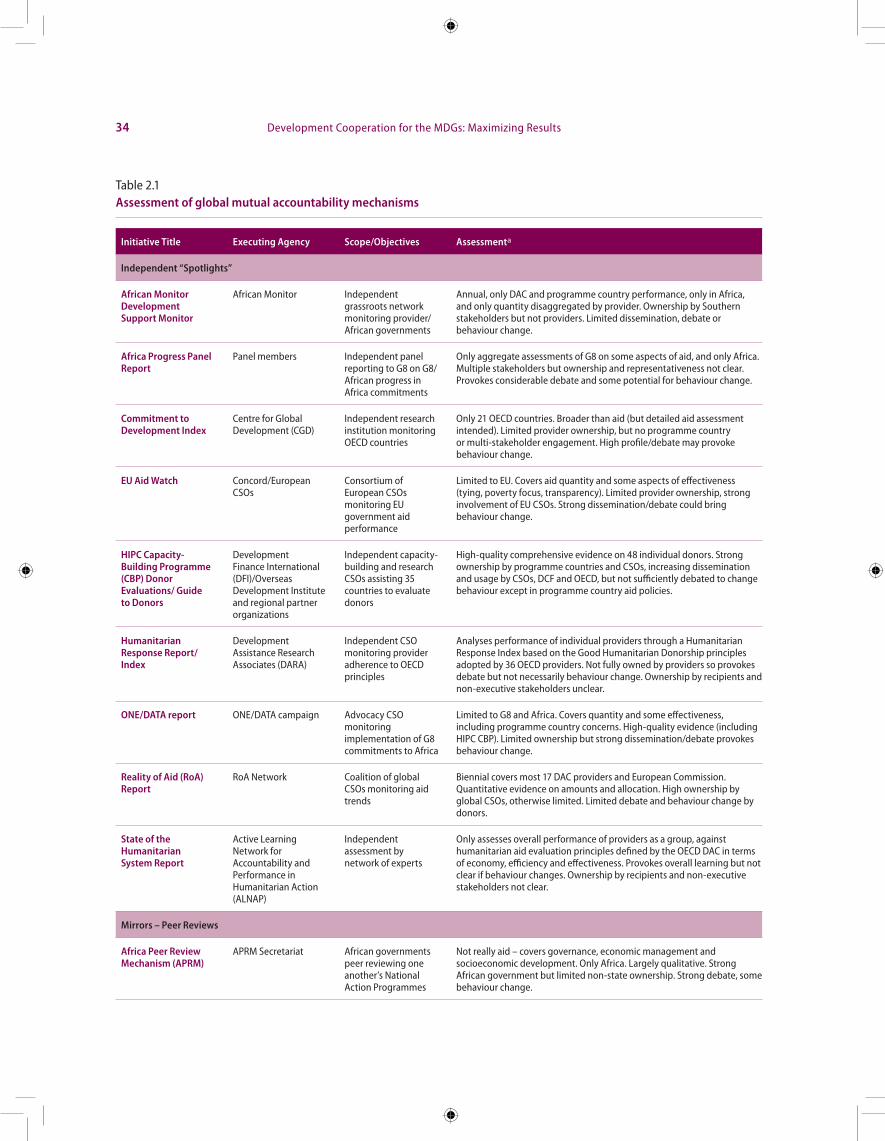
34 Development Cooperation for the MDGs: Maximizing Results
Table 2.1Assessment of global mutual accountability mechanisms
Initiative Title Executing Agency Scope/Objectives Assessmenta
Independent “Spotlights”
African Monitor Development Support Monitor
African Monitor Independent grassroots network monitoring provider/African governments
Annual, only DAC and programme country performance, only in Africa, and only quantity disaggregated by provider. Ownership by Southern stakeholders but not providers. Limited dissemination, debate or behaviour change.
Africa Progress Panel Report
Panel members Independent panel reporting to G8 on G8/African progress in Africa commitments
Only aggregate assessments of G8 on some aspects of aid, and only Africa. Multiple stakeholders but ownership and representativeness not clear. Provokes considerable debate and some potential for behaviour change.
Commitment to Development Index
Centre for Global Development (CGD)
Independent research institution monitoring OECD countries
Only 21 OECD countries. Broader than aid (but detailed aid assessment intended). Limited provider ownership, but no programme country or multi-stakeholder engagement. High profile/debate may provoke behaviour change.
EU Aid Watch Concord/European CSOs
Consortium of European CSOs monitoring EU government aid performance
Limited to EU. Covers aid quantity and some aspects of effectiveness (tying, poverty focus, transparency). Limited provider ownership, strong involvement of EU CSOs. Strong dissemination/debate could bring behaviour change.
HIPC Capacity-Building Programme (CBP) Donor Evaluations/ Guide to Donors
Development Finance International (DFI)/Overseas Development Institute and regional partner organizations
Independent capacity-building and research CSOs assisting 35 countries to evaluate donors
High-quality comprehensive evidence on 48 individual donors. Strong ownership by programme countries and CSOs, increasing dissemination and usage by CSOs, DCF and OECD, but not sufficiently debated to change behaviour except in programme country aid policies.
Humanitarian Response Report/Index
Development Assistance Research Associates (DARA)
Independent CSO monitoring provider adherence to OECD principles
Analyses performance of individual providers through a Humanitarian Response Index based on the Good Humanitarian Donorship principles adopted by 36 OECD providers. Not fully owned by providers so provokes debate but not necessarily behaviour change. Ownership by recipients and non-executive stakeholders unclear.
ONE/DATA report ONE/DATA campaign Advocacy CSO monitoring implementation of G8 commitments to Africa
Limited to G8 and Africa. Covers quantity and some effectiveness, including programme country concerns. High-quality evidence (including HIPC CBP). Limited ownership but strong dissemination/debate provokes behaviour change.
Reality of Aid (RoA) Report
RoA Network Coalition of global CSOs monitoring aid trends
Biennial covers most 17 DAC providers and European Commission. Quantitative evidence on amounts and allocation. High ownership by global CSOs, otherwise limited. Limited debate and behaviour change by donors.
State of the Humanitarian System Report
Active Learning Network for Accountability and Performance in Humanitarian Action (ALNAP)
Independent assessment by network of experts
Only assesses overall performance of providers as a group, against humanitarian aid evaluation principles defined by the OECD DAC in terms of economy, efficiency and effectiveness. Provokes overall learning but not clear if behaviour changes. Ownership by recipients and non-executive stakeholders not clear.
Mirrors – Peer Reviews
Africa Peer Review Mechanism (APRM)
APRM Secretariat African governments peer reviewing one another’s National Action Programmes
Not really aid – covers governance, economic management and socioeconomic development. Only Africa. Largely qualitative. Strong African government but limited non-state ownership. Strong debate, some behaviour change.
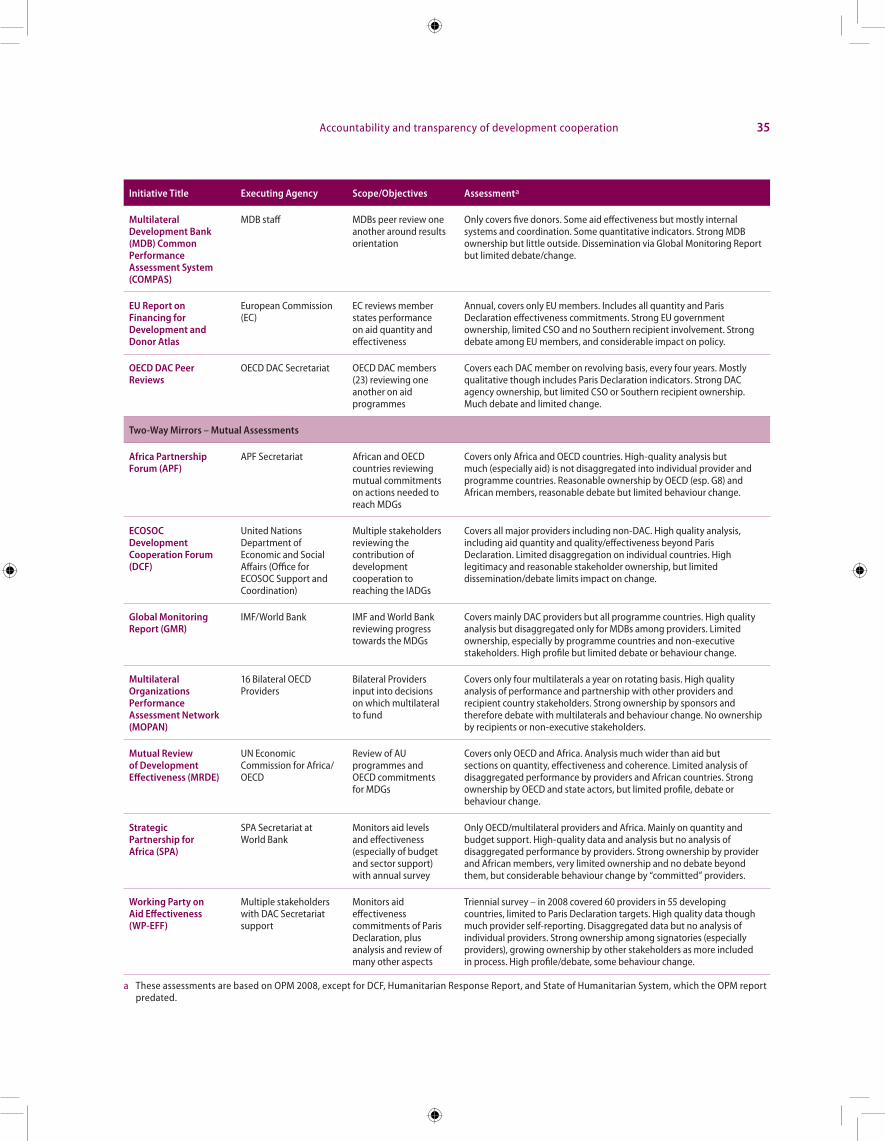
Accountability and transparency of development cooperation 35
Initiative Title Executing Agency Scope/Objectives Assessmenta
Multilateral Development Bank (MDB) Common Performance Assessment System (COMPAS)
MDB staff MDBs peer review one another around results orientation
Only covers five donors. Some aid effectiveness but mostly internal systems and coordination. Some quantitative indicators. Strong MDB ownership but little outside. Dissemination via Global Monitoring Report but limited debate/change.
EU Report on Financing for Development and Donor Atlas
European Commission (EC)
EC reviews member states performance on aid quantity and effectiveness
Annual, covers only EU members. Includes all quantity and Paris Declaration effectiveness commitments. Strong EU government ownership, limited CSO and no Southern recipient involvement. Strong debate among EU members, and considerable impact on policy.
OECD DAC Peer Reviews
OECD DAC Secretariat OECD DAC members (23) reviewing one another on aid programmes
Covers each DAC member on revolving basis, every four years. Mostly qualitative though includes Paris Declaration indicators. Strong DAC agency ownership, but limited CSO or Southern recipient ownership. Much debate and limited change.
Two-Way Mirrors – Mutual Assessments
Africa Partnership Forum (APF)
APF Secretariat African and OECD countries reviewing mutual commitments on actions needed to reach MDGs
Covers only Africa and OECD countries. High-quality analysis but much (especially aid) is not disaggregated into individual provider and programme countries. Reasonable ownership by OECD (esp. G8) and African members, reasonable debate but limited behaviour change.
ECOSOC Development Cooperation Forum (DCF)
United Nations Department of Economic and Social Affairs (Office for ECOSOC Support and Coordination)
Multiple stakeholders reviewing the contribution of development cooperation to reaching the IADGs
Covers all major providers including non-DAC. High quality analysis, including aid quantity and quality/effectiveness beyond Paris Declaration. Limited disaggregation on individual countries. High legitimacy and reasonable stakeholder ownership, but limited dissemination/debate limits impact on change.
Global Monitoring Report (GMR)
IMF/World Bank IMF and World Bank reviewing progress towards the MDGs
Covers mainly DAC providers but all programme countries. High quality analysis but disaggregated only for MDBs among providers. Limited ownership, especially by programme countries and non-executive stakeholders. High profile but limited debate or behaviour change.
Multilateral Organizations Performance Assessment Network (MOPAN)
16 Bilateral OECD Providers
Bilateral Providers input into decisions on which multilateral to fund
Covers only four multilaterals a year on rotating basis. High quality analysis of performance and partnership with other providers and recipient country stakeholders. Strong ownership by sponsors and therefore debate with multilaterals and behaviour change. No ownership by recipients or non-executive stakeholders.
Mutual Review of Development Effectiveness (MRDE)
UN Economic Commission for Africa/OECD
Review of AU programmes and OECD commitments for MDGs
Covers only OECD and Africa. Analysis much wider than aid but sections on quantity, effectiveness and coherence. Limited analysis of disaggregated performance by providers and African countries. Strong ownership by OECD and state actors, but limited profile, debate or behaviour change.
Strategic Partnership for Africa (SPA)
SPA Secretariat at World Bank
Monitors aid levels and effectiveness (especially of budget and sector support) with annual survey
Only OECD/multilateral providers and Africa. Mainly on quantity and budget support. High-quality data and analysis but no analysis of disaggregated performance by providers. Strong ownership by provider and African members, very limited ownership and no debate beyond them, but considerable behaviour change by “committed” providers.
Working Party on Aid Effectiveness (WP-EFF)
Multiple stakeholders with DAC Secretariat support
Monitors aid effectiveness commitments of Paris Declaration, plus analysis and review of many other aspects
Triennial survey – in 2008 covered 60 providers in 55 developing countries, limited to Paris Declaration targets. High quality data though much provider self-reporting. Disaggregated data but no analysis of individual providers. Strong ownership among signatories (especially providers), growing ownership by other stakeholders as more included in process. High profile/debate, some behaviour change.
a These assessments are based on OPM 2008, except for DCF, Humanitarian Response Report, and State of Humanitarian System, which the OPM report predated.
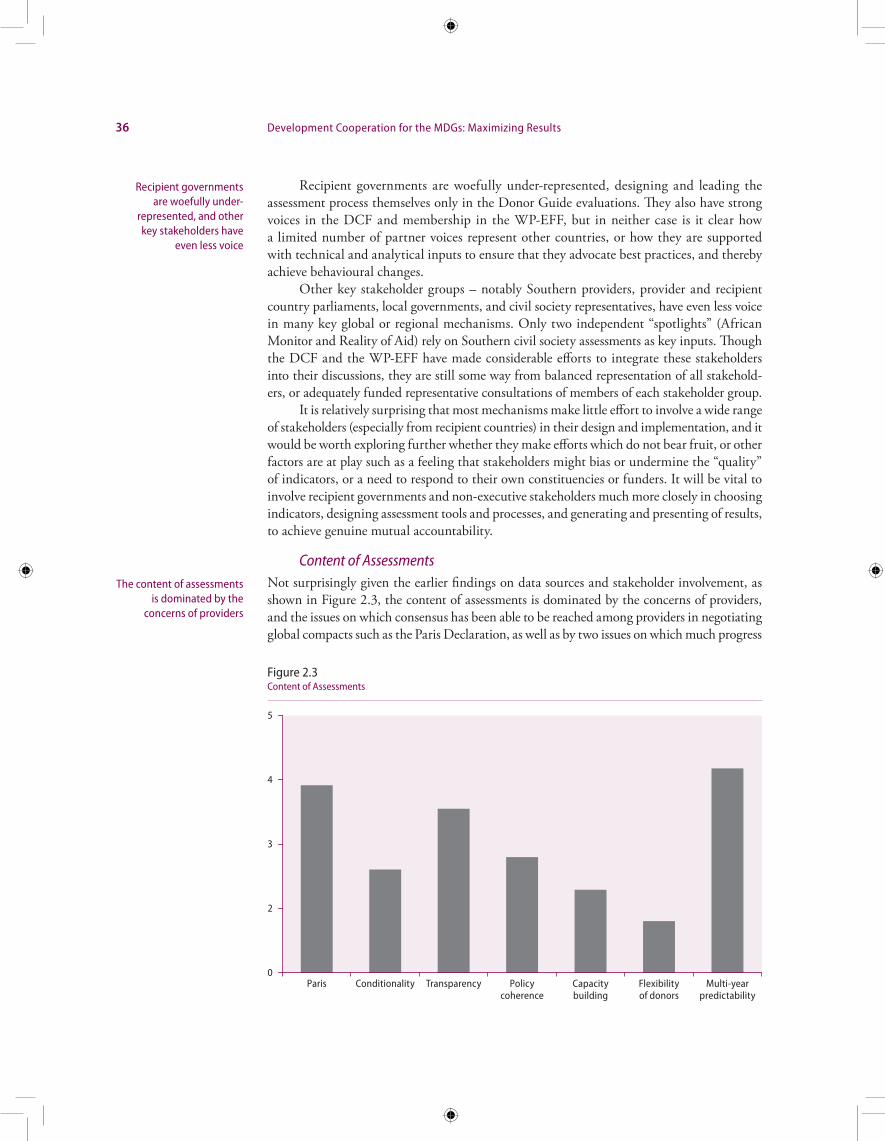
36 Development Cooperation for the MDGs: Maximizing Results
Recipient governments are woefully under-represented, designing and leading the assessment process themselves only in the Donor Guide evaluations. They also have strong voices in the DCF and membership in the WP-EFF, but in neither case is it clear how a limited number of partner voices represent other countries, or how they are supported with technical and analytical inputs to ensure that they advocate best practices, and thereby achieve behavioural changes.
Other key stakeholder groups – notably Southern providers, provider and recipient country parliaments, local governments, and civil society representatives, have even less voice in many key global or regional mechanisms. Only two independent “spotlights” (African Monitor and Reality of Aid) rely on Southern civil society assessments as key inputs. Though the DCF and the WP-EFF have made considerable efforts to integrate these stakeholders into their discussions, they are still some way from balanced representation of all stakehold-ers, or adequately funded representative consultations of members of each stakeholder group.
It is relatively surprising that most mechanisms make little effort to involve a wide range of stakeholders (especially from recipient countries) in their design and implementation, and it would be worth exploring further whether they make efforts which do not bear fruit, or other factors are at play such as a feeling that stakeholders might bias or undermine the “quality” of indicators, or a need to respond to their own constituencies or funders. It will be vital to involve recipient governments and non-executive stakeholders much more closely in choosing indicators, designing assessment tools and processes, and generating and presenting of results, to achieve genuine mutual accountability.
Content of AssessmentsNot surprisingly given the earlier findings on data sources and stakeholder involvement, as shown in Figure 2.3, the content of assessments is dominated by the concerns of providers, and the issues on which consensus has been able to be reached among providers in negotiating global compacts such as the Paris Declaration, as well as by two issues on which much progress
Recipient governments are woefully under-
represented, and other key stakeholders have
even less voice
The content of assessments is dominated by the
concerns of providers
0
2
3
4
5
Paris Transparency Capacitybuilding
Multi-yearpredictability
Conditionality Policycoherence
Flexibilityof donors
Figure 2.3Content of Assessments
Accountability and transparency of development cooperation 37
has been made since Accra, because they were monitorable action points in the AAA –multi-year predictability and transparency. Much less attention is paid to policy coherence (except by mechanisms such as OECD DAC Peer Reviews and the CGD Commitment to Develop-ment Index, as well as broader assessments in the Reality of Aid reports and DCF reports).
On the other hand, the issues which are of most concern to recipient country gov-ernments – reducing conditionality, ensuring that technical assistance is transformed into capacity building, and maximizing provider flexibility to fund national development pro-grammes across all sectors (as well as to respond to changing priorities of programme gov-ernments) – are even less analysed (except by the Guide to Donors, DCF, Reality of Aid and EU AidWatch). Value-for-money, anti-corruption measures and gender focus are barely mentioned. This reconfirms the findings of the 2009 DCF study that the agenda for debate in mechanisms is dominated by the concerns of providers and the issues on which consensus has been able to be reached among providers in global compacts such as the Paris Declaration.
In addition, though many of these mechanisms stress concern about accountability and transparency of providers, not one assesses the transparency and multi-year predict-ability of providers at recipient country level (i.e. the degree to which providers proactively communicate information to governments and stakeholders), or the degree to which provid-ers participate in national-level MA and transparency mechanisms. If these aspects are not tracked, it is hard to see how they will change provider behaviour.
Coverage of Providers/Programme CountriesAnother factor limiting impact is the relatively narrow coverage of many mechanisms. Most limit coverage to DAC providers and major multilateral institutions, or a subset of these (such as EU, G8 or multilateral development banks). Exceptions are the Donor Guide, which covers 14 non-DAC bilateral and multilateral providers and three global funds, the Paris Declaration Survey which covers two Global Funds (Publish What You Fund and the Brookings/CGD Quality of Official Development Assistance (QuODA) also intend to cover global funds), and the DCF and Reality of Aid which analyse some non-DAC providers. No mechanism provides a fully “mutual” assessment in the sense of analysing both provider and recipient country performance (the PD survey comes closest in that it publishes data on provider and recipient country performance, but does not analyse individual providers). A large number of other providers (especially CSOs and developing countries) have made no formal com-mitments to global accountability targets (though some have signed the Paris Declaration and/or the AAA). In most cases this reflects a view that their development cooperation is different from that of DAC providers (so that mutual accountability is less necessary or ap-propriate), as well as a feeling that they have not been sufficiently consulted in the design of global or regional frameworks. A great deal more work is needed to ensure that these other providers are fully involved in defining future agendas (if necessary built around their own separate frameworks) so that mutual accountability can become genuinely global. Box 2.1 discusses the efforts which international CSOs are making to increase their accountability.
All the mechanisms publish data or analysis on the global performance of individual providers. However, virtually none publish data or analysis on the performance of individual providers at the level of individual recipient countries (the PD survey data for this are on the OECD website but have not been analysed, while the Guide to Donors uses recipient countries’ own evaluations and PD survey data to assess in which recipient countries each provider implements its best practices). In terms of coverage of recipient countries, the PD survey (and most other assessments as they use its data) most recently covered 55 countries, while the Guide to Donors analyses 30 recipient countries for its additional indicators, and
Virtually none publish analysis on the performance of individual providers in individual recipient countries
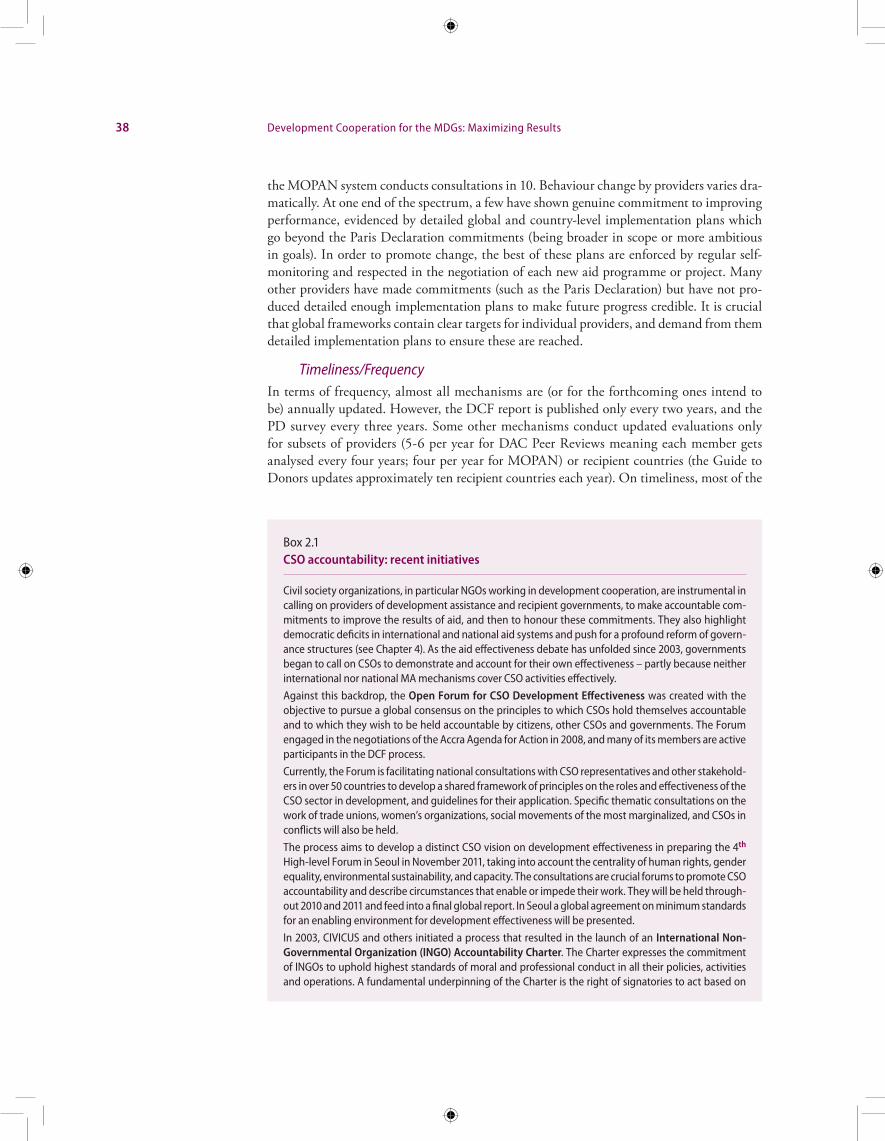
38 Development Cooperation for the MDGs: Maximizing Results
the MOPAN system conducts consultations in 10. Behaviour change by providers varies dra-matically. At one end of the spectrum, a few have shown genuine commitment to improving performance, evidenced by detailed global and country-level implementation plans which go beyond the Paris Declaration commitments (being broader in scope or more ambitious in goals). In order to promote change, the best of these plans are enforced by regular self-monitoring and respected in the negotiation of each new aid programme or project. Many other providers have made commitments (such as the Paris Declaration) but have not pro-duced detailed enough implementation plans to make future progress credible. It is crucial that global frameworks contain clear targets for individual providers, and demand from them detailed implementation plans to ensure these are reached.
Timeliness/FrequencyIn terms of frequency, almost all mechanisms are (or for the forthcoming ones intend to be) annually updated. However, the DCF report is published only every two years, and the PD survey every three years. Some other mechanisms conduct updated evaluations only for subsets of providers (5-6 per year for DAC Peer Reviews meaning each member gets analysed every four years; four per year for MOPAN) or recipient countries (the Guide to Donors updates approximately ten recipient countries each year). On timeliness, most of the
Box 2.1CSO accountability: recent initiatives
Civil society organizations, in particular NGOs working in development cooperation, are instrumental in calling on providers of development assistance and recipient governments, to make accountable com-mitments to improve the results of aid, and then to honour these commitments. They also highlight democratic deficits in international and national aid systems and push for a profound reform of govern-ance structures (see Chapter 4). As the aid effectiveness debate has unfolded since 2003, governments began to call on CSOs to demonstrate and account for their own effectiveness – partly because neither international nor national MA mechanisms cover CSO activities effectively.
Against this backdrop, the Open Forum for CSO Development Effectiveness was created with the objective to pursue a global consensus on the principles to which CSOs hold themselves accountable and to which they wish to be held accountable by citizens, other CSOs and governments. The Forum engaged in the negotiations of the Accra Agenda for Action in 2008, and many of its members are active participants in the DCF process.
Currently, the Forum is facilitating national consultations with CSO representatives and other stakehold-ers in over 50 countries to develop a shared framework of principles on the roles and effectiveness of the CSO sector in development, and guidelines for their application. Specific thematic consultations on the work of trade unions, women’s organizations, social movements of the most marginalized, and CSOs in conflicts will also be held.
The process aims to develop a distinct CSO vision on development effectiveness in preparing the 4th High-level Forum in Seoul in November 2011, taking into account the centrality of human rights, gender equality, environmental sustainability, and capacity. The consultations are crucial forums to promote CSO accountability and describe circumstances that enable or impede their work. They will be held through-out 2010 and 2011 and feed into a final global report. In Seoul a global agreement on minimum standards for an enabling environment for development effectiveness will be presented.
In 2003, CIVICUS and others initiated a process that resulted in the launch of an International Non-Governmental Organization (INGO) Accountability Charter. The Charter expresses the commitment of INGOs to uphold highest standards of moral and professional conduct in all their policies, activities and operations. A fundamental underpinning of the Charter is the right of signatories to act based on
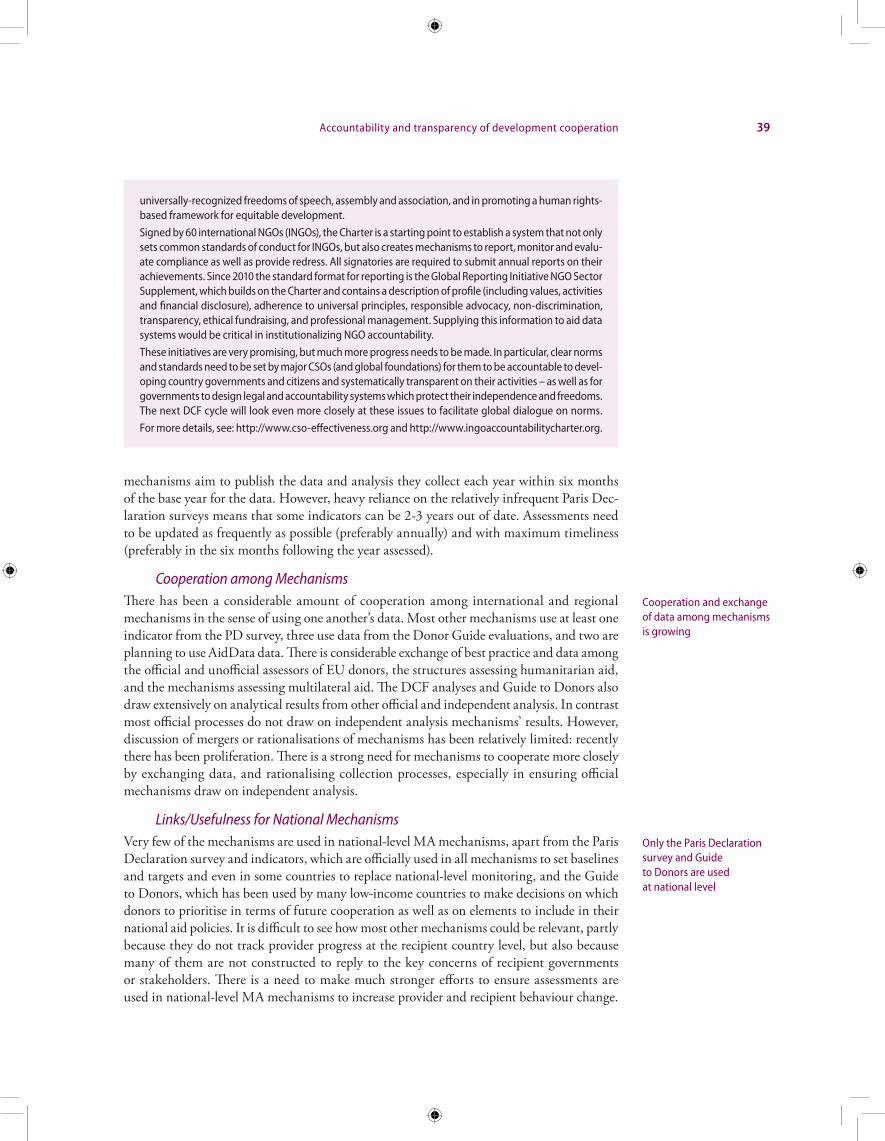
Accountability and transparency of development cooperation 39
mechanisms aim to publish the data and analysis they collect each year within six months of the base year for the data. However, heavy reliance on the relatively infrequent Paris Dec-laration surveys means that some indicators can be 2-3 years out of date. Assessments need to be updated as frequently as possible (preferably annually) and with maximum timeliness (preferably in the six months following the year assessed).
Cooperation among MechanismsThere has been a considerable amount of cooperation among international and regional mechanisms in the sense of using one another’s data. Most other mechanisms use at least one indicator from the PD survey, three use data from the Donor Guide evaluations, and two are planning to use AidData data. There is considerable exchange of best practice and data among the official and unofficial assessors of EU donors, the structures assessing humanitarian aid, and the mechanisms assessing multilateral aid. The DCF analyses and Guide to Donors also draw extensively on analytical results from other official and independent analysis. In contrast most official processes do not draw on independent analysis mechanisms’ results. However, discussion of mergers or rationalisations of mechanisms has been relatively limited: recently there has been proliferation. There is a strong need for mechanisms to cooperate more closely by exchanging data, and rationalising collection processes, especially in ensuring official mechanisms draw on independent analysis.
Links/Usefulness for National MechanismsVery few of the mechanisms are used in national-level MA mechanisms, apart from the Paris Declaration survey and indicators, which are officially used in all mechanisms to set baselines and targets and even in some countries to replace national-level monitoring, and the Guide to Donors, which has been used by many low-income countries to make decisions on which donors to prioritise in terms of future cooperation as well as on elements to include in their national aid policies. It is difficult to see how most other mechanisms could be relevant, partly because they do not track provider progress at the recipient country level, but also because many of them are not constructed to reply to the key concerns of recipient governments or stakeholders. There is a need to make much stronger efforts to ensure assessments are used in national-level MA mechanisms to increase provider and recipient behaviour change.
Cooperation and exchange of data among mechanisms is growing
Only the Paris Declaration survey and Guide to Donors are used at national level
universally-recognized freedoms of speech, assembly and association, and in promoting a human rights-based framework for equitable development.
Signed by 60 international NGOs (INGOs), the Charter is a starting point to establish a system that not only sets common standards of conduct for INGOs, but also creates mechanisms to report, monitor and evalu-ate compliance as well as provide redress. All signatories are required to submit annual reports on their achievements. Since 2010 the standard format for reporting is the Global Reporting Initiative NGO Sector Supplement, which builds on the Charter and contains a description of profile (including values, activities and financial disclosure), adherence to universal principles, responsible advocacy, non-discrimination, transparency, ethical fundraising, and professional management. Supplying this information to aid data systems would be critical in institutionalizing NGO accountability.
These initiatives are very promising, but much more progress needs to be made. In particular, clear norms and standards need to be set by major CSOs (and global foundations) for them to be accountable to devel-oping country governments and citizens and systematically transparent on their activities – as well as for governments to design legal and accountability systems which protect their independence and freedoms. The next DCF cycle will look even more closely at these issues to facilitate global dialogue on norms.
For more details, see: http://www.cso-effectiveness.org and http://www.ingoaccountabilitycharter.org.
40 Development Cooperation for the MDGs: Maximizing Results
Use of and Impact/Behaviour Change Resulting from Mechanisms
It is clear that, as the only globally-accepted assessment mechanism, the Paris Declaration and its surveys have the most impact on behaviour change at national and global level. This impact could however be dramatically increased if PD progress reports incorporated analysis of individual providers.
Other mechanisms such as the Africa Progress Panel, Mutual Review of Development Effectiveness (MRDE), and ONE have more impact at the global policy level, especially on G8 member state policies – but these are focused more on quantity and delivery of specific prom-ises rather than effectiveness or results. Publish What You Fund (PWYF) and QuODA might be able to have more focused global impacts insofar as they intend to emphasize narrower issues of transparency and quality. Multilateral organizations take seriously and try to respond to the COMPAS and MOPAN findings. EU donors appear to take the Donor Atlas and EU Aid Watch reasonably seriously, as the providers of humanitarian assistance do the Active Learn-ing Network for Accountability and Performance (ALNAP) and Development Assistance Research Associates (DARA). Some recipient countries use the Guide to Donors to change their behaviour towards providers, prioritizing different providers, negotiating improvements in provider behaviour to match each provider’s global best practices, and introducing addi-tional elements to their aid policies or assessment frameworks. However, because it is not an official mechanism, they are loath to publish its results or use it formally in negotiations.
On the other hand, similar global assessment frameworks for programme countries (such as assessments of Public Financial Management (PFM), procurement, and the quality of development strategies and monitoring and evaluation (M&E) frameworks) have a much stronger influence on the behaviour of recipient countries, partly because their outcomes are often used as the basis for matrices of conditionality for improving government performance in policy-based lending.
However, there is no published or authoritative evidence on these issues, including what aspects of behaviour have been most changed, and what factors most hinder change. Further evidence collection through surveys of potential users – and discussions among sponsors of initiatives and potential users, especially from Southern stakeholder groups – should be a top priority to increase the success of global mechanisms in promoting change.
If global mechanisms are to be more helpful in affecting change in provider behaviour, they need to promote this at two levels: global changes in policy and practice due in part to advocacy by recipient country stakeholders; and national-level change negotiated with recipient country stakeholders. Yet most non-provider stakeholders lack sufficient analysis and information on provider aid practices, including policies and procedures, partly because much analysis is not presented in a way designed to identify how to improve each individual provider’s programmes (and analysis which does so – such as that produced by the ONE Campaign, OXFAM, Action Aid, or the Guide to Donors and the Highly Indebted Poor Countries Capacity Building Programme (HIPC CBP) – is limited in its dissemination and use). In addition, there are no strong mechanisms demanding such regular inputs at global, regional or national level in order to hold providers accountable. This severely limits the prospects for change at global and national level.
There is also little scope for dialogue between provider and recipient country institu-tions, beyond the executive branches of government. As discussed in Section 3.2, provider parliaments often have a powerful influence on the behaviour of their governments, and they value the opinions of colleagues in recipient countries in assessing impact and priorities for development cooperation. It is therefore essential to enhance dialogue between provider and
The impact of mechanisms on provider behaviour varies widely
... partly because most assessments are not used
in national-level dialogues or tailored to the needs
of stakeholders
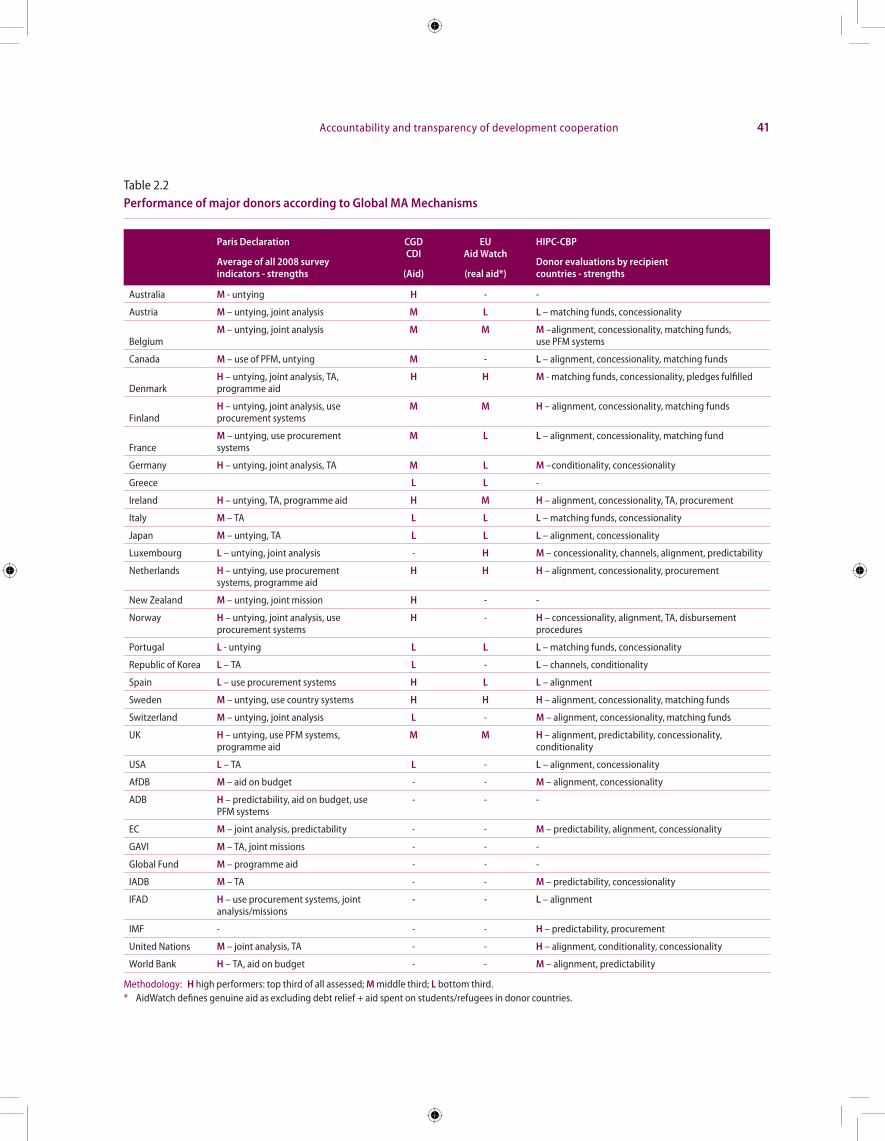
Accountability and transparency of development cooperation 41
Table 2.2Performance of major donors according to Global MA Mechanisms
Paris Declaration
Average of all 2008 survey indicators - strengths
CGD CDI
(Aid)
EU Aid Watch
(real aid*)
HIPC-CBP
Donor evaluations by recipient countries - strengths
Australia M - untying H - -
Austria M – untying, joint analysis M L L – matching funds, concessionality
BelgiumM – untying, joint analysis M M M –alignment, concessionality, matching funds,
use PFM systems
Canada M – use of PFM, untying M - L – alignment, concessionality, matching funds
DenmarkH – untying, joint analysis, TA, programme aid
H H M - matching funds, concessionality, pledges fulfilled
FinlandH – untying, joint analysis, use procurement systems
M M H – alignment, concessionality, matching funds
FranceM – untying, use procurement systems
M L L – alignment, concessionality, matching fund
Germany H – untying, joint analysis, TA M L M –conditionality, concessionality
Greece L L -
Ireland H – untying, TA, programme aid H M H – alignment, concessionality, TA, procurement
Italy M – TA L L L – matching funds, concessionality
Japan M – untying, TA L L L – alignment, concessionality
Luxembourg L – untying, joint analysis - H M – concessionality, channels, alignment, predictability
Netherlands H – untying, use procurement systems, programme aid
H H H – alignment, concessionality, procurement
New Zealand M – untying, joint mission H - -
Norway H – untying, joint analysis, use procurement systems
H - H – concessionality, alignment, TA, disbursement procedures
Portugal L - untying L L L – matching funds, concessionality
Republic of Korea L – TA L - L – channels, conditionality
Spain L – use procurement systems H L L – alignment
Sweden M – untying, use country systems H H H – alignment, concessionality, matching funds
Switzerland M – untying, joint analysis L - M – alignment, concessionality, matching funds
UK H – untying, use PFM systems, programme aid
M M H – alignment, predictability, concessionality, conditionality
USA L – TA L - L – alignment, concessionality
AfDB M – aid on budget - - M – alignment, concessionality
ADB H – predictability, aid on budget, use PFM systems
- - -
EC M – joint analysis, predictability - - M – predictability, alignment, concessionality
GAVI M – TA, joint missions - - -
Global Fund M – programme aid - - -
IADB M – TA - - M – predictability, concessionality
IFAD H – use procurement systems, joint analysis/missions
- - L – alignment
IMF - - - H – predictability, procurement
United Nations M – joint analysis, TA - - H – alignment, conditionality, concessionality
World Bank H – TA, aid on budget - - M – alignment, predictability
Methodology: H high performers: top third of all assessed; M middle third; L bottom third.* AidWatch defines genuine aid as excluding debt relief + aid spent on students/refugees in donor countries.
42 Development Cooperation for the MDGs: Maximizing Results
recipient country parliamentarians, through both global and regional networks. Similarly, CSOs including trade unions, NGOs and private sector organizations would benefit from more global and regional exchange on aid effectiveness issues, especially with voices from recipient countries informing counterparts from provider countries of realities on the ground.
Findings of the global mutual accountability mechanisms on provider behaviour
Table 2.2 shows the findings of four key global mechanisms on individual providers’ perform-ance. These mechanisms have been chosen because they have the widest coverage of providers and performance indicators among the global MA mechanisms.
Overall, even though the four mechanisms use very different methodologies, there is a remarkable degree of consensus on donor performance. Ireland, The Netherlands, Scandina-vian countries and the United Kingdom of Great Britain and Northern Ireland perform well (in the top third of donors assessed) in two or more mechanisms, while Italy, Japan, Portugal, Republic of Korea and the USA are in the lowest third of donors assessed. Canada, France, Germany, Italy, Japan, IFAD and the World Bank perform better in the Paris survey than in other assessments, especially those undertaken by recipient countries in the HIPC CBP, while Luxembourg, Sweden and the United Nations perform better in recipient assessments than in the Paris Survey.
Strong points for individual donors also vary considerably, with most performing well according to the Paris Survey on untying, joint analysis and coordinated ,technical assistance whereas in the HIPC CBP evaluation most perform well on concessionality and sectoral alignment, but only Ireland and Norway perform well on technical assistance, and Germany, Republic of Korea, and the United Kingdom on conditionality.
Other types of international accountabilityThere are two other types of accountability on which the DCF Secretariat has conducted initial analysis but intends to focus more of its future attention:
• Regional accountability mechanisms. These are of growing importance as described in Box 2.2
• Individual Provider Accountability at International Level. There are many struc-tures in which programme country governments are held accountable by providers as a group, but none which achieve the reverse – i.e. that an individual provider should be held accountable by all its recipients. Systematic top-level annual processes
Key global assessments are relatively consistent
in their findings on individual donors
Individual providers should establish mechanisms
through which they are held accountable
collectively by recipients
Box 2.2Regional mutual accountability mechanisms
Regional mutual accountability mechanisms are much less prevalent than global ones. They are located mostly in Africa, and virtually absent in Latin America and most of Asia. Many are largely ignored in global and national discussions. Equally important, many of the increasing numbers of regional aid programmes and donor conferences such as with the Economic Community of West African States (ECOWAS), the Southern African Development Community (SADC) or the Union Economique et Monétaire Ouest Africaine (UEMOA) in Africa do not contain effective mutual accountability frameworks which hold providers accountable.
Six examples of mechanisms which are taken seriously are:
Accountability and transparency of development cooperation 43
• The Mutual Review of Development Effectiveness between Africa and the donor community, co-sponsored by the United Nations Economic Commission for Africa and the OECD Africa Partnership Forum. This is somewhat influential to the degree that it links specifically into the G8 through the Africa Partnership, and provides an authoritative assessment of progress on African aid targets, espe-cially those set at the Gleneagles G8 summit of 2005 for increasing aid to Africa, as well as specific ini-tiatives launched since then. However, independent assessments by (for example) the ONE campaign have been more successful in advocating that G8 leaders live up to their 2005 promises. It is not clear how such mechanisms for bringing development cooperation issues to the top of the global summit agenda will work in future if global economic governance moves to the G-20.
• The South East Asia Joint Initiative on Mutual Accountability (see CDDE 2009 and OECD 2008 HLF Roundtable Summaries). This initiative has an important peer learning function in creating a neutral space beyond the country-level constraints, through which developing countries understand the workings of national MA mechanisms and the performance of providers in neighbouring countries; and key elements of effective mutual assessments. This is being continued as part of a wider Asia-wide initiative on capacity development for development effectiveness (CDDE). It is also beginning to be replicated in other regions – there are plans for regional networking and peer learning in Africa and Latin America and at global level (see also UNDP 2009).
• The DAC Peer Review Mechanism, whereby DAC providers review one another’s aid programmes. It is considered a regional mechanism in the sense that it applies to only a sub-group of providers. These are strictly speaking a peer review rather than a MA mechanism, in the sense that other stake-holders do not conduct the review (though they are consulted by the review team). Over the years they have had considerable impact on programmes and policies, and since 2008 they have included aid effectiveness aspects. Under the AAA Action agreement, it was intended that developing country governments and parliaments should begin to participate in the reviews, which would introduce a small element of mutuality into them.
• The African Monitor, which is an independent African civil society body monitoring development financing commitments and delivery at grassroots level. It has the major comparative strength of assessing the focus of all development resources on producing gains for grassroots communities, and has produced a Development Support Monitor assessing delivery by Africa’s donors, and by Afri-can recipient governments. It has also produced a practical capacity-building toolkit for grassroots monitoring of expenditures and is designing a Grassroots Focus Index for development support.
• The Parliamentary Platform on ODA, an informal Africa-Europe coordination mechanism for parlia-mentary participation in international discussions on aid effectiveness, facilitated by AWEPA, brings together parliamentarians from European provider countries, African regional mutual accountability participants, African parliamentary networks on NEPAD and African regional women’s parliamentary caucuses. So far, the platform has increased parliamentary awareness on the Paris Declaration and AAA, implemented capacity building, amplified parliamentary voice in WP-EFF Cluster debates, and produced a practical information guide for parliamentarians.
• The Cairns Process (discussed in more detail under national MA mechanisms), whereby Pacific island states hold some providers accountable for meeting regional aid effectiveness targets.
for accountability of an individual provider to its key programme countries, as well as integration of systematic accountability processes into replenishment discussions for multilateral organizations (as well as the assessments such as MOPAN which providers conduct of multilateral organizations) would be highly desirable.
National-level accountability and transparencyNational-level mutual accountability
This report defines national mutual accountability mechanisms as those in which recipient countries, as well as being held accountable for development results and aid management,
44 Development Cooperation for the MDGs: Maximizing Results
hold providers accountable for their aid. In addition, and given the commitments in the AAA, key stakeholders in recipient countries (such as parliaments, CSOs, trade unions, private sector, women’s groups) are expected to hold providers and recipient governments accountable through such mechanisms.
There are a multiplicity of forums at national level in most recipient countries for dia-logue with providers on issues related to development and the funding needs of the national development programme. The challenge is making these into effective MA mechanisms. In addition, every country has multiple performance frameworks established by providers (either in groups or individually) which hold it to account for a very large number of tar-gets (2-6 times as many as in provider performance frameworks). Those frameworks have produced massive behavioural change in most recipient governments over the last decade. Separate analysis should be conducted on how to improve recipient country accountability by rationalizing numbers of agreements and targets.
National mutual accountability is a Paris Declaration target, defined as the “number of partner countries that undertake mutual assessments of progress in implementing agreed commitments on aid effectiveness including those in the Paris Declaration”, with the target being to have “mutual assessment reviews” in place in all participating recipient countries by 2010. The 2008 survey on the implementation of the Paris Declaration concluded that only 14 (26%) of recipient countries had such mechanisms, and only 1-2 countries had established one since the 2005 survey. It also strongly questioned the validity of the number of countries reporting that mechanisms existed (OECD 2008a). Work for the November 2009 DCF High-level Symposium confirmed this scepticism, indicating that only around eight countries had up to date aid effectiveness MA mechanisms (Martin 2009).
That high-level symposium reached consensus on key components of national MA mechanisms which had proven successful in changing provider behaviour, and could there-fore provide a basis for defining criteria to assess mechanisms. It was agreed that these did not form a blueprint or a “one size fits all” recipe for promoting change in provider behaviour, but could inform recipient countries intending to establish or improve MA mechanisms about which steps are likely to be more effective. They include:
• The development of a national aid policy by the recipient government (where nec-essary as the basis for a Joint Assistance Strategy with providers);
• Locally-driven aid quality and results monitoring frameworks, including specific annual performance targets for individual providers;
• Strong recipient government and parliamentary political leadership, and clear institutional structures and responsibilities for aid management, negotiation and signature;
• Independent analytical input from parliament, civil society and independent monitoring groups to identify and help resolve key problems;
• Comprehensive databases which cover aid quality and effectiveness issues and allow recipient governments to monitor and verify trends for themselves;
• Peer pressure among providers (especially in countries where there exists a critical mass of providers prepared to support mutual accountability); and
• Large-scale investment in building recipient government capacity to monitor and analyse providers, and to negotiate changes in behaviour.
It was realized during the previous study that the reliability of information on national-level MA and transparency was highly variable. Therefore, to collect more reliable informa-tion, the secretariat of the DCF and UNDP cooperated in executing a country-level survey
The DCF has defined key components influencing
successful national MA
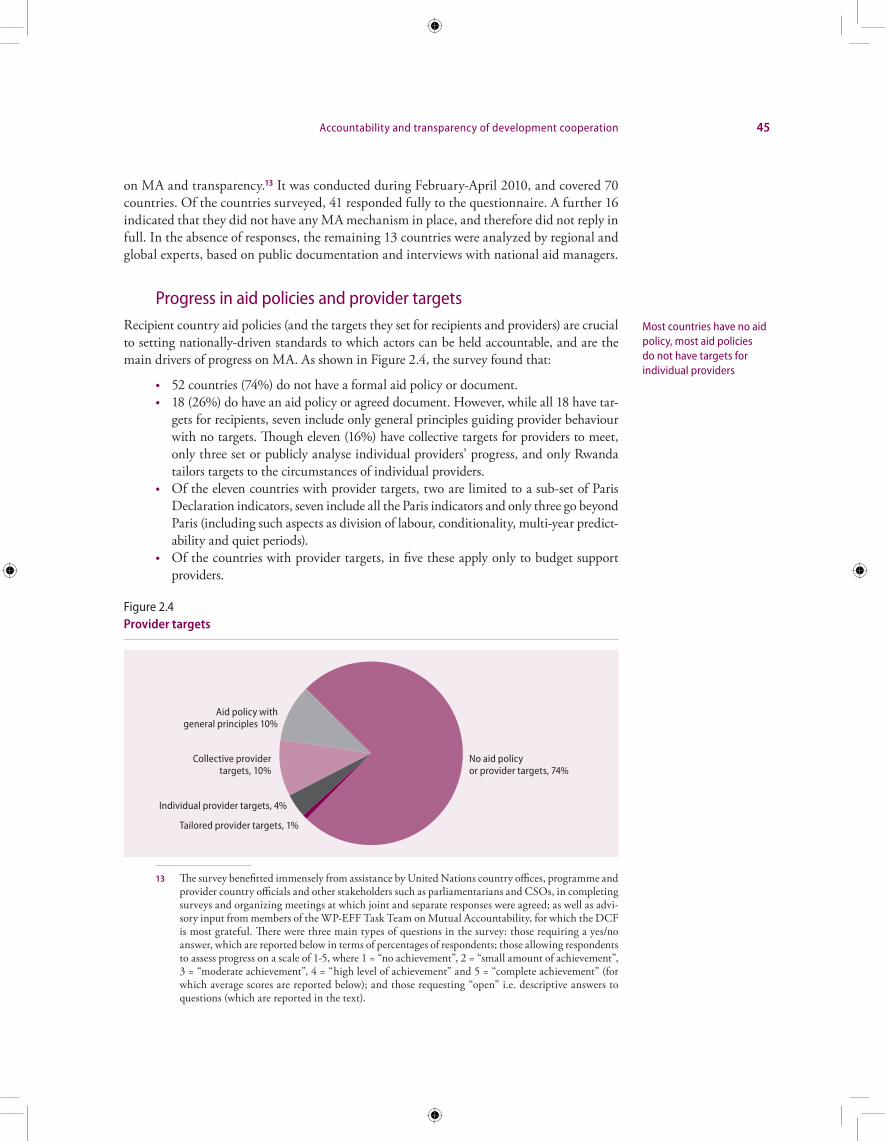
Accountability and transparency of development cooperation 45
on MA and transparency.13 It was conducted during February-April 2010, and covered 70 countries. Of the countries surveyed, 41 responded fully to the questionnaire. A further 16 indicated that they did not have any MA mechanism in place, and therefore did not reply in full. In the absence of responses, the remaining 13 countries were analyzed by regional and global experts, based on public documentation and interviews with national aid managers.
Progress in aid policies and provider targetsRecipient country aid policies (and the targets they set for recipients and providers) are crucial to setting nationally-driven standards to which actors can be held accountable, and are the main drivers of progress on MA. As shown in Figure 2.4, the survey found that:
• 52 countries (74%) do not have a formal aid policy or document.• 18 (26%) do have an aid policy or agreed document. However, while all 18 have tar-
gets for recipients, seven include only general principles guiding provider behaviour with no targets. Though eleven (16%) have collective targets for providers to meet, only three set or publicly analyse individual providers’ progress, and only Rwanda tailors targets to the circumstances of individual providers.
• Of the eleven countries with provider targets, two are limited to a sub-set of Paris Declaration indicators, seven include all the Paris indicators and only three go beyond Paris (including such aspects as division of labour, conditionality, multi-year predict-ability and quiet periods).
• Of the countries with provider targets, in five these apply only to budget support providers.
13 The survey benefitted immensely from assistance by United Nations country offices, programme and provider country officials and other stakeholders such as parliamentarians and CSOs, in completing surveys and organizing meetings at which joint and separate responses were agreed; as well as advi-sory input from members of the WP-EFF Task Team on Mutual Accountability, for which the DCF is most grateful. There were three main types of questions in the survey: those requiring a yes/no answer, which are reported below in terms of percentages of respondents; those allowing respondents to assess progress on a scale of 1-5, where 1 = “no achievement”, 2 = “small amount of achievement”, 3 = “moderate achievement”, 4 = “high level of achievement” and 5 = “complete achievement” (for which average scores are reported below); and those requesting “open” i.e. descriptive answers to questions (which are reported in the text).
Most countries have no aid policy, most aid policies do not have targets for individual providers
Figure 2.4Provider targets
No aid policyor provider targets, 74%
Individual provider targets, 4%
Collective providertargets, 10%
Tailored provider targets, 1%
Aid policy withgeneral principles 10%
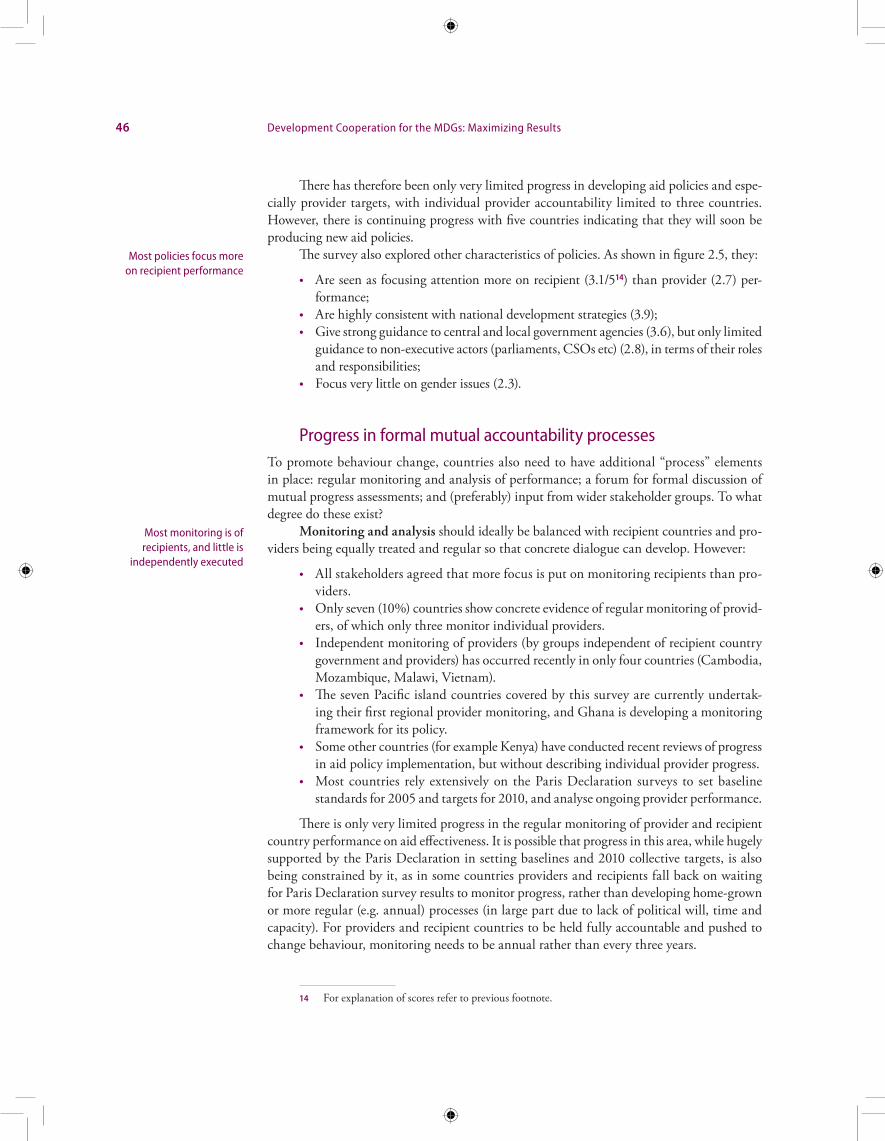
46 Development Cooperation for the MDGs: Maximizing Results
There has therefore been only very limited progress in developing aid policies and espe-cially provider targets, with individual provider accountability limited to three countries. However, there is continuing progress with five countries indicating that they will soon be producing new aid policies.
The survey also explored other characteristics of policies. As shown in figure 2.5, they:
• Are seen as focusing attention more on recipient (3.1/514) than provider (2.7) per-formance;
• Are highly consistent with national development strategies (3.9);• Give strong guidance to central and local government agencies (3.6), but only limited
guidance to non-executive actors (parliaments, CSOs etc) (2.8), in terms of their roles and responsibilities;
• Focus very little on gender issues (2.3).
Progress in formal mutual accountability processesTo promote behaviour change, countries also need to have additional “process” elements in place: regular monitoring and analysis of performance; a forum for formal discussion of mutual progress assessments; and (preferably) input from wider stakeholder groups. To what degree do these exist?
Monitoring and analysis should ideally be balanced with recipient countries and pro-viders being equally treated and regular so that concrete dialogue can develop. However:
• All stakeholders agreed that more focus is put on monitoring recipients than pro-viders.
• Only seven (10%) countries show concrete evidence of regular monitoring of provid-ers, of which only three monitor individual providers.
• Independent monitoring of providers (by groups independent of recipient country government and providers) has occurred recently in only four countries (Cambodia, Mozambique, Malawi, Vietnam).
• The seven Pacific island countries covered by this survey are currently undertak-ing their first regional provider monitoring, and Ghana is developing a monitoring framework for its policy.
• Some other countries (for example Kenya) have conducted recent reviews of progress in aid policy implementation, but without describing individual provider progress.
• Most countries rely extensively on the Paris Declaration surveys to set baseline standards for 2005 and targets for 2010, and analyse ongoing provider performance.
There is only very limited progress in the regular monitoring of provider and recipient country performance on aid effectiveness. It is possible that progress in this area, while hugely supported by the Paris Declaration in setting baselines and 2010 collective targets, is also being constrained by it, as in some countries providers and recipients fall back on waiting for Paris Declaration survey results to monitor progress, rather than developing home-grown or more regular (e.g. annual) processes (in large part due to lack of political will, time and capacity). For providers and recipient countries to be held fully accountable and pushed to change behaviour, monitoring needs to be annual rather than every three years.
14 For explanation of scores refer to previous footnote.
Most policies focus more on recipient performance
Most monitoring is of recipients, and little is
independently executed

Accountability and transparency of development cooperation 47
There are a myriad of forums in which providers and recipients discuss development results and aid issues, making this one of the hardest aspects of MA progress to assess. How-ever, significant behaviour change is achieved only in forums which bring together providers and recipients at the highest level, to discuss aid policies and targets, review progress based on concrete monitoring and analysis, and agree on future approaches. The survey found that:
• 28 (40% of) countries reported such high level meetings between providers and recipients.
• However, while meetings in 22 countries discuss recipient targets, only eleven dis-cuss provider targets, and only three individual provider targets, implying very lim-ited “mutuality”. Reference to the documents discussed at these forums indicates that only six discuss concrete evidence of provider performance and policy implica-tions, with the rest focusing on general trends and principles.
• 28 countries also reported sectoral forums which discuss progress on aid effective-ness in specific sectors. Although 23 discuss recipient and provider behaviour, the survey did not look in depth at this. More work would be needed to assess their ability to hold participants accountable.
• Almost without exception these forums are chaired by country officials, supported by country institutions and utilize national analysis. However, stronger mechanisms which have clear policies and targets use national analysis much more (scoring 3.9/5 compared to 3.1 for others).
This analysis suggests that forums exist for debate between providers and recipients on mutual performance in relation to aid, but most provide little scrutiny of donors – in part due to lack of relevant evidence – and are far from delivering formal spaces for mutual accountability on aid.
Few national aid coordination forums review progress on MA targets
Figure 2.5Content of aid policies
0.0
0.5
1.0
1.5
2.0
2.5
3.0
3.5
4.5
4.0
5.0
Providerfocus
Consistentwith nationaldevelopment
strategies
Recipientfocus
Guidanceto local
government
Guidanceto not-state
actors
Genderfocus
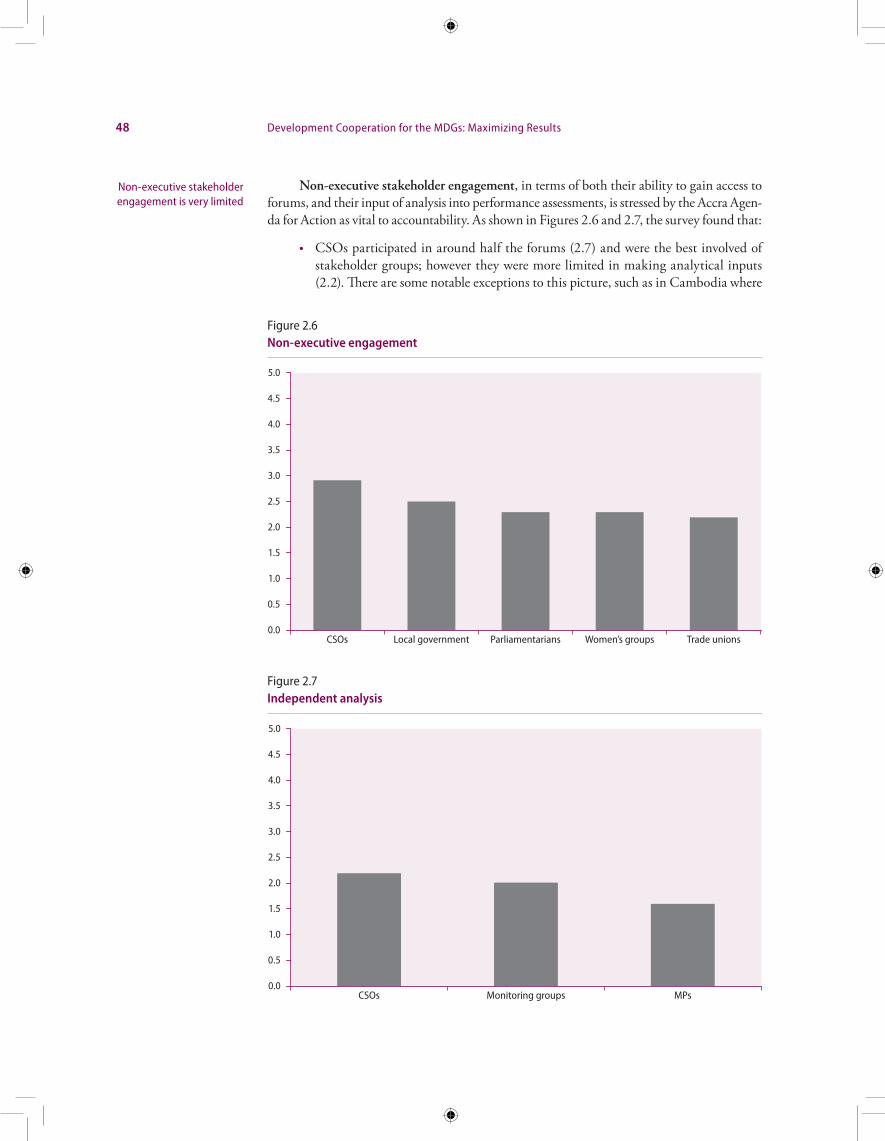
48 Development Cooperation for the MDGs: Maximizing Results
Non-executive stakeholder engagement, in terms of both their ability to gain access to forums, and their input of analysis into performance assessments, is stressed by the Accra Agen-da for Action as vital to accountability. As shown in Figures 2.6 and 2.7, the survey found that:
• CSOs participated in around half the forums (2.7) and were the best involved of stakeholder groups; however they were more limited in making analytical inputs (2.2). There are some notable exceptions to this picture, such as in Cambodia where
Non-executive stakeholder engagement is very limited
Figure 2.6Non-executive engagement
0.0
0.5
1.0
1.5
2.0
2.5
3.0
3.5
4.5
4.0
5.0
CSOs ParliamentariansLocal government Women’s groups Trade unions
Figure 2.7Independent analysis
0.0
0.5
1.0
1.5
2.0
2.5
3.0
3.5
4.5
4.0
5.0
CSOs Monitoring groups MPs
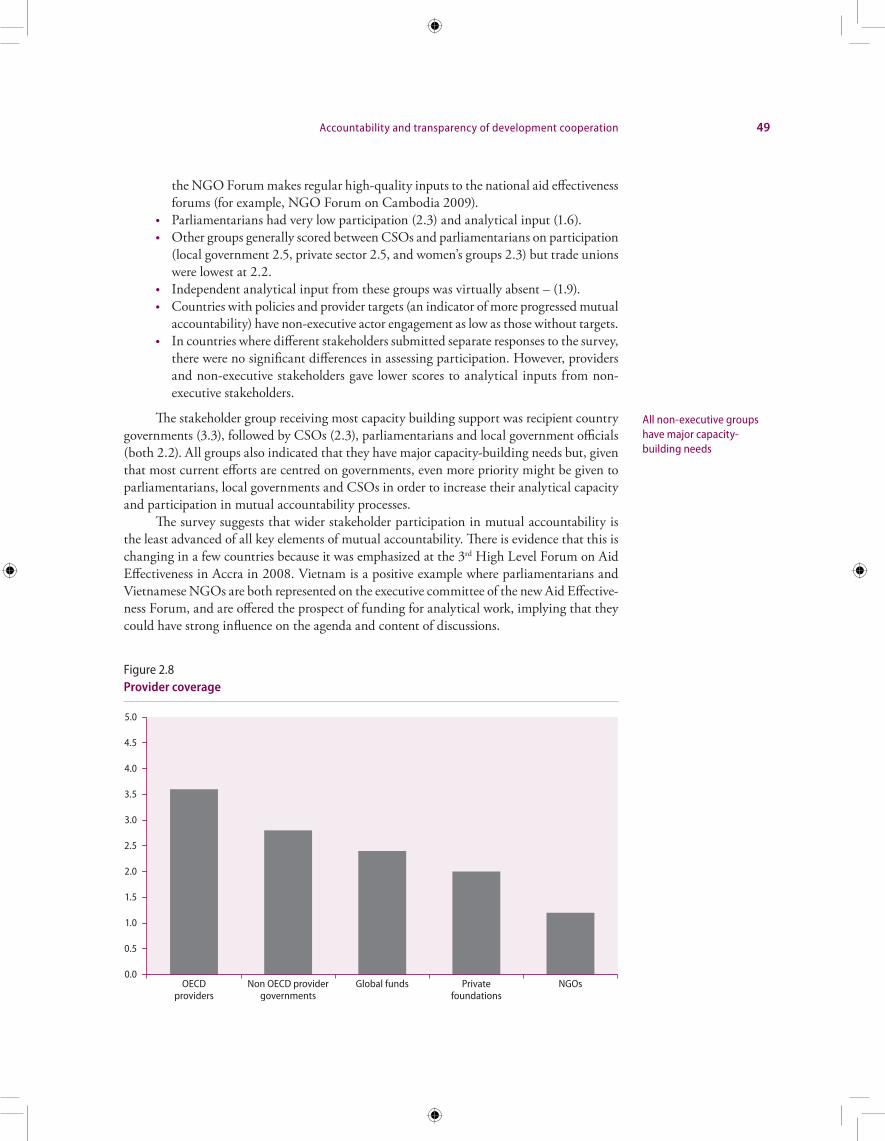
Accountability and transparency of development cooperation 49
the NGO Forum makes regular high-quality inputs to the national aid effectiveness forums (for example, NGO Forum on Cambodia 2009).
• Parliamentarians had very low participation (2.3) and analytical input (1.6).• Other groups generally scored between CSOs and parliamentarians on participation
(local government 2.5, private sector 2.5, and women’s groups 2.3) but trade unions were lowest at 2.2.
• Independent analytical input from these groups was virtually absent – (1.9).• Countries with policies and provider targets (an indicator of more progressed mutual
accountability) have non-executive actor engagement as low as those without targets.• In countries where different stakeholders submitted separate responses to the survey,
there were no significant differences in assessing participation. However, providers and non-executive stakeholders gave lower scores to analytical inputs from non-executive stakeholders.
The stakeholder group receiving most capacity building support was recipient country governments (3.3), followed by CSOs (2.3), parliamentarians and local government officials (both 2.2). All groups also indicated that they have major capacity-building needs but, given that most current efforts are centred on governments, even more priority might be given to parliamentarians, local governments and CSOs in order to increase their analytical capacity and participation in mutual accountability processes.
The survey suggests that wider stakeholder participation in mutual accountability is the least advanced of all key elements of mutual accountability. There is evidence that this is changing in a few countries because it was emphasized at the 3rd High Level Forum on Aid Effectiveness in Accra in 2008. Vietnam is a positive example where parliamentarians and Vietnamese NGOs are both represented on the executive committee of the new Aid Effective-ness Forum, and are offered the prospect of funding for analytical work, implying that they could have strong influence on the agenda and content of discussions.
All non-executive groups have major capacity-building needs
Figure 2.8Provider coverage
0.0
0.5
1.0
1.5
2.0
2.5
3.0
3.5
4.5
4.0
5.0
OECDproviders
Global fundsNon OECD providergovernments
Privatefoundations
NGOs
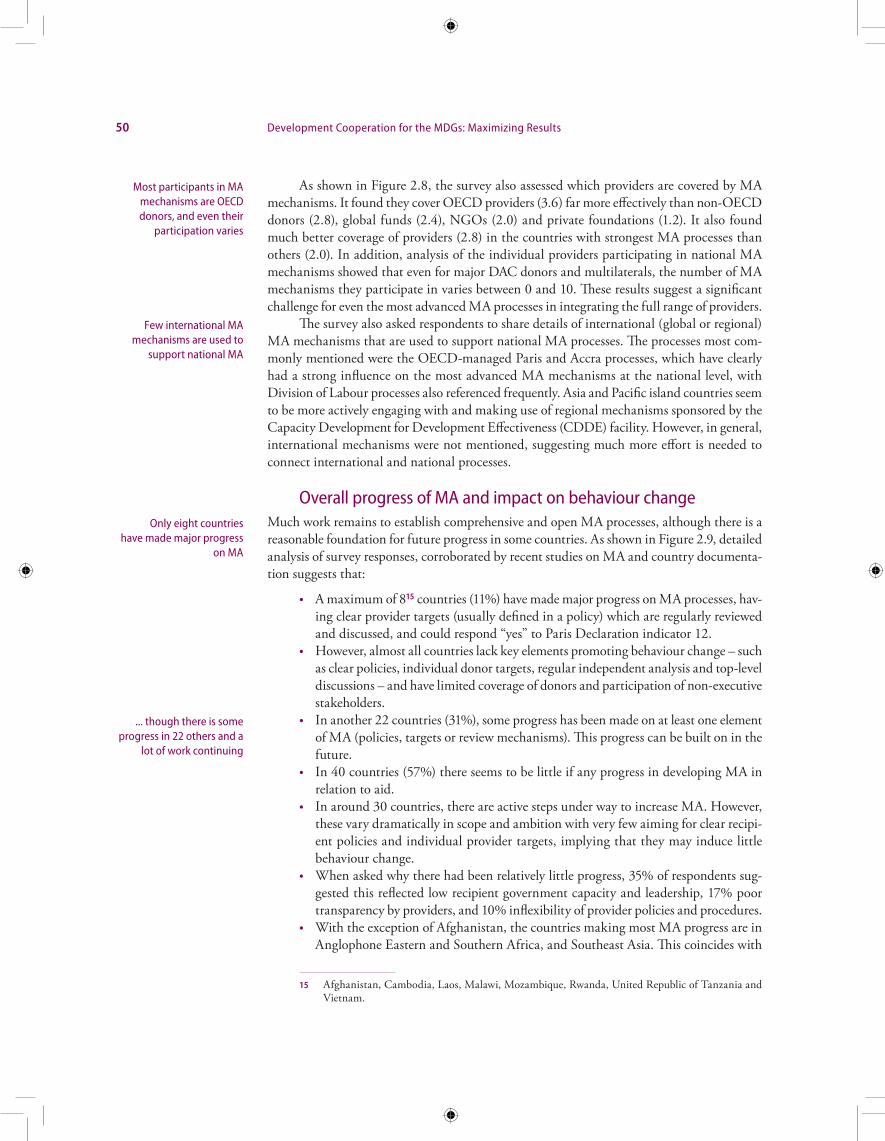
50 Development Cooperation for the MDGs: Maximizing Results
As shown in Figure 2.8, the survey also assessed which providers are covered by MA mechanisms. It found they cover OECD providers (3.6) far more effectively than non-OECD donors (2.8), global funds (2.4), NGOs (2.0) and private foundations (1.2). It also found much better coverage of providers (2.8) in the countries with strongest MA processes than others (2.0). In addition, analysis of the individual providers participating in national MA mechanisms showed that even for major DAC donors and multilaterals, the number of MA mechanisms they participate in varies between 0 and 10. These results suggest a significant challenge for even the most advanced MA processes in integrating the full range of providers.
The survey also asked respondents to share details of international (global or regional) MA mechanisms that are used to support national MA processes. The processes most com-monly mentioned were the OECD-managed Paris and Accra processes, which have clearly had a strong influence on the most advanced MA mechanisms at the national level, with Division of Labour processes also referenced frequently. Asia and Pacific island countries seem to be more actively engaging with and making use of regional mechanisms sponsored by the Capacity Development for Development Effectiveness (CDDE) facility. However, in general, international mechanisms were not mentioned, suggesting much more effort is needed to connect international and national processes.
Overall progress of MA and impact on behaviour changeMuch work remains to establish comprehensive and open MA processes, although there is a reasonable foundation for future progress in some countries. As shown in Figure 2.9, detailed analysis of survey responses, corroborated by recent studies on MA and country documenta-tion suggests that:
• A maximum of 815 countries (11%) have made major progress on MA processes, hav-ing clear provider targets (usually defined in a policy) which are regularly reviewed and discussed, and could respond “yes” to Paris Declaration indicator 12.
• However, almost all countries lack key elements promoting behaviour change – such as clear policies, individual donor targets, regular independent analysis and top-level discussions – and have limited coverage of donors and participation of non-executive stakeholders.
• In another 22 countries (31%), some progress has been made on at least one element of MA (policies, targets or review mechanisms). This progress can be built on in the future.
• In 40 countries (57%) there seems to be little if any progress in developing MA in relation to aid.
• In around 30 countries, there are active steps under way to increase MA. However, these vary dramatically in scope and ambition with very few aiming for clear recipi-ent policies and individual provider targets, implying that they may induce little behaviour change.
• When asked why there had been relatively little progress, 35% of respondents sug-gested this reflected low recipient government capacity and leadership, 17% poor transparency by providers, and 10% inflexibility of provider policies and procedures.
• With the exception of Afghanistan, the countries making most MA progress are in Anglophone Eastern and Southern Africa, and Southeast Asia. This coincides with
15 Afghanistan, Cambodia, Laos, Malawi, Mozambique, Rwanda, United Republic of Tanzania and Vietnam.
Most participants in MA mechanisms are OECD donors, and even their
participation varies
Few international MA mechanisms are used to
support national MA
Only eight countries have made major progress
on MA
... though there is some progress in 22 others and a
lot of work continuing
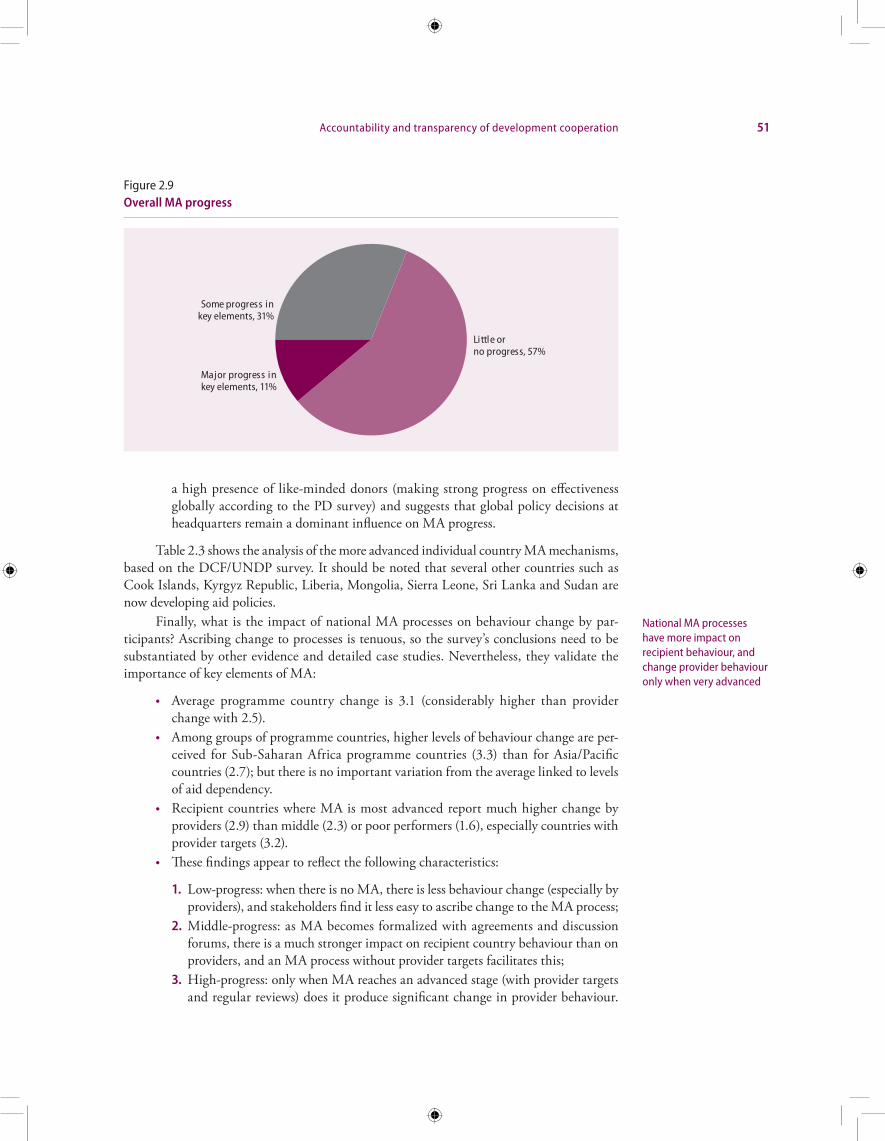
Accountability and transparency of development cooperation 51
a high presence of like-minded donors (making strong progress on effectiveness globally according to the PD survey) and suggests that global policy decisions at headquarters remain a dominant influence on MA progress.
Table 2.3 shows the analysis of the more advanced individual country MA mechanisms, based on the DCF/UNDP survey. It should be noted that several other countries such as Cook Islands, Kyrgyz Republic, Liberia, Mongolia, Sierra Leone, Sri Lanka and Sudan are now developing aid policies.
Finally, what is the impact of national MA processes on behaviour change by par-ticipants? Ascribing change to processes is tenuous, so the survey’s conclusions need to be substantiated by other evidence and detailed case studies. Nevertheless, they validate the importance of key elements of MA:
• Average programme country change is 3.1 (considerably higher than provider change with 2.5).
• Among groups of programme countries, higher levels of behaviour change are per-ceived for Sub-Saharan Africa programme countries (3.3) than for Asia/Pacific countries (2.7); but there is no important variation from the average linked to levels of aid dependency.
• Recipient countries where MA is most advanced report much higher change by providers (2.9) than middle (2.3) or poor performers (1.6), especially countries with provider targets (3.2).
• These findings appear to reflect the following characteristics:
1. Low-progress: when there is no MA, there is less behaviour change (especially by providers), and stakeholders find it less easy to ascribe change to the MA process;
2. Middle-progress: as MA becomes formalized with agreements and discussion forums, there is a much stronger impact on recipient country behaviour than on providers, and an MA process without provider targets facilitates this;
3. High-progress: only when MA reaches an advanced stage (with provider targets and regular reviews) does it produce significant change in provider behaviour.
National MA processes have more impact on recipient behaviour, and change provider behaviour only when very advanced
Figure 2.9Overall MA progress
Little orno progress, 57%
Some progress inkey elements, 31%
Major progress inkey elements, 11%
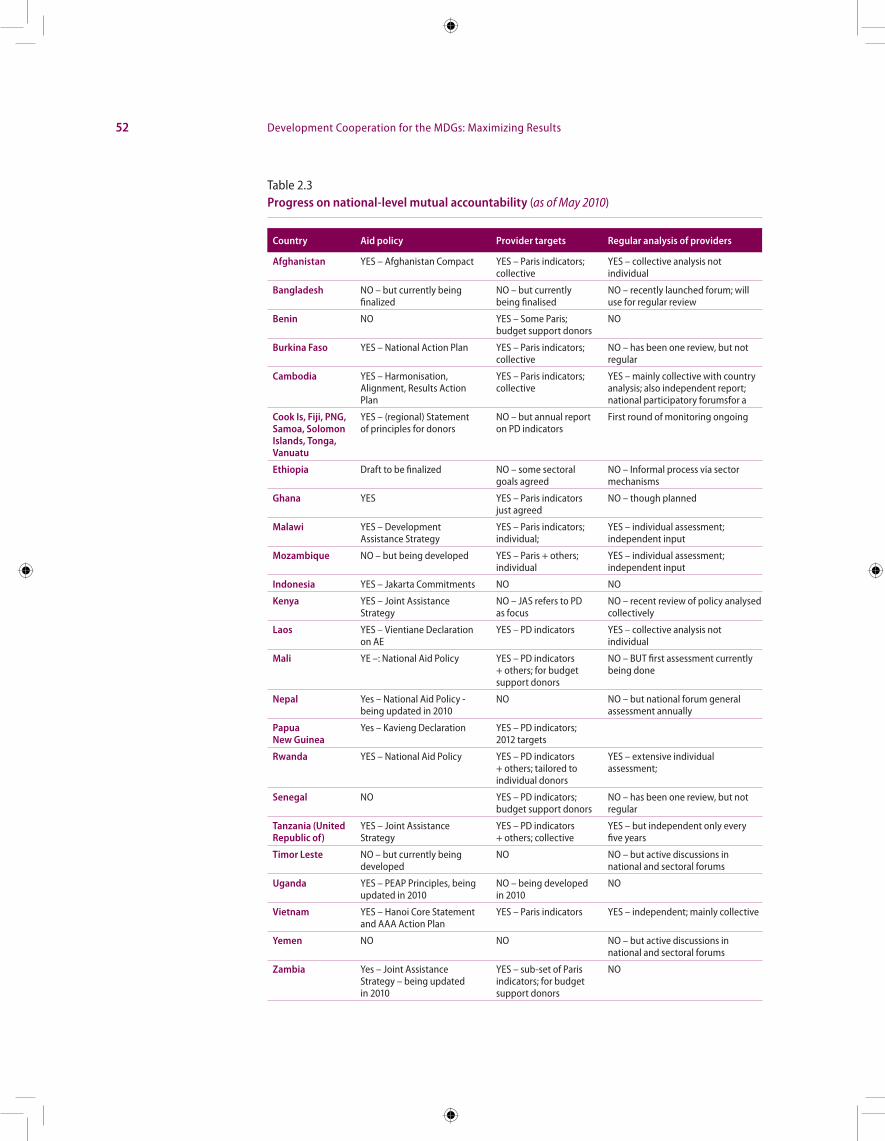
52 Development Cooperation for the MDGs: Maximizing Results
Table 2.3Progress on national-level mutual accountability (as of May 2010)
Country Aid policy Provider targets Regular analysis of providers
Afghanistan YES – Afghanistan Compact YES – Paris indicators; collective
YES – collective analysis not individual
Bangladesh NO – but currently being finalized
NO – but currently being finalised
NO – recently launched forum; will use for regular review
Benin NO YES – Some Paris; budget support donors
NO
Burkina Faso YES – National Action Plan YES – Paris indicators; collective
NO – has been one review, but not regular
Cambodia YES – Harmonisation, Alignment, Results Action Plan
YES – Paris indicators; collective
YES – mainly collective with country analysis; also independent report; national participatory forumsfor a
Cook Is, Fiji, PNG, Samoa, Solomon Islands, Tonga, Vanuatu
YES – (regional) Statement of principles for donors
NO – but annual report on PD indicators
First round of monitoring ongoing
Ethiopia Draft to be finalized NO – some sectoral goals agreed
NO – Informal process via sector mechanisms
Ghana YES YES – Paris indicators just agreed
NO – though planned
Malawi YES – Development Assistance Strategy
YES – Paris indicators; individual;
YES – individual assessment; independent input
Mozambique NO – but being developed YES – Paris + others; individual
YES – individual assessment; independent input
Indonesia YES – Jakarta Commitments NO NO
Kenya YES – Joint Assistance Strategy
NO – JAS refers to PD as focus
NO – recent review of policy analysed collectively
Laos YES – Vientiane Declaration on AE
YES – PD indicators YES – collective analysis not individual
Mali YE –: National Aid Policy YES – PD indicators + others; for budget support donors
NO – BUT first assessment currently being done
Nepal Yes – National Aid Policy - being updated in 2010
NO NO – but national forum general assessment annually
Papua New Guinea
Yes – Kavieng Declaration YES – PD indicators; 2012 targets
Rwanda YES – National Aid Policy YES – PD indicators + others; tailored to individual donors
YES – extensive individual assessment;
Senegal NO YES – PD indicators; budget support donors
NO – has been one review, but not regular
Tanzania (United Republic of)
YES – Joint Assistance Strategy
YES – PD indicators + others; collective
YES – but independent only every five years
Timor Leste NO – but currently being developed
NO NO – but active discussions in national and sectoral forums
Uganda YES – PEAP Principles, being updated in 2010
NO – being developed in 2010
NO
Vietnam YES – Hanoi Core Statement and AAA Action Plan
YES – Paris indicators YES – independent; mainly collective
Yemen NO NO NO – but active discussions in national and sectoral forums
Zambia Yes – Joint Assistance Strategy – being updated in 2010
YES – sub-set of Paris indicators; for budget support donors
NO

Accountability and transparency of development cooperation 53
What was the nature of behaviour change?
• Countries with most MA progress have seen more areas of provider change – includ-ing putting aid on budget, using government systems and improving predictability – whereas middle performers were limited to harmonisation among providers, and del-egated partnerships (where one provider assigns its funds to be managed by another).
• The main recipient changes reported focused on results M&E, improved national development strategies, leadership in reforming country PFM and procurement sys-tems, and prioritization of spending needs. However, more particularly in middle MA countries, there was also better tracking of aid information, more consultation of CSOs, and improved management of resources.
Where responses were separated by stakeholder group, CSOs perceived lower behav-iour change (2.4 for providers and 2.6 for programme countries) than did providers (who scored themselves at 2.9 and programme countries at 3) and programme countries (who scored providers at 2.4 and themselves at 3). This probably reflects the fact that many key issues of concern to CSOs (gender, human rights) were not treated in MA discussions, as well as frustration at their limited participation in the processes and the lack of space for them to present independent analysis or views. However, the fact that all three groups of stakeholders scored recipients higher than providers again shows low “mutuality” in MA.
Progress on national-level transparency in programme countriesThe survey also asked respondents about progress on national-level transparency in pro-gramme countries, in relation to a range of types of information on aid. It found that:
• 32 countries (46%) have an aid information system in place. About 20% were Development Assistance Databases, 25% Aid Management Platforms and the rest designed by individual countries.
• 19 countries indicated that their information system monitors provider and recipient progress on effectiveness targets. However, closer examination of the capacities of various systems indicates that these tend to be only a narrow subset of Paris indica-tors (e.g. tying/use of government systems).16
As Figure 2.10 shows, there are major challenges in making information accessible:
• This applies especially to non-executive actors (who scored data accessibility and usa-bility 2.5 on average, versus 3.9 for programme country governments and providers).
• Aid information was seen by stakeholders overall as more accessible to and usable by CSOs (2.8) compared to parliamentarians (2.6), public (2.4) and local government (2.3); scores for usability were similar. However, CSO respondents thought they had less access to official data (1.8), whereas providers (2.3) and recipient country governments (2.9) thought CSOs had more access.
• Accessibility and usability of information by non-executive actors was generally higher in the better performing MA countries. In top performing countries the scores were 2.8 and 2.7 respectively; in middle performers 2.3 and 2.6; and in low performers 2.1 and 2.2.
16 For an excellent analysis of the capabilities of Aid Information Management Systems, see CDDE 2009b.
Country aid databases do not track many aid effectiveness indicators
Information accessibility is limited outside governments ...
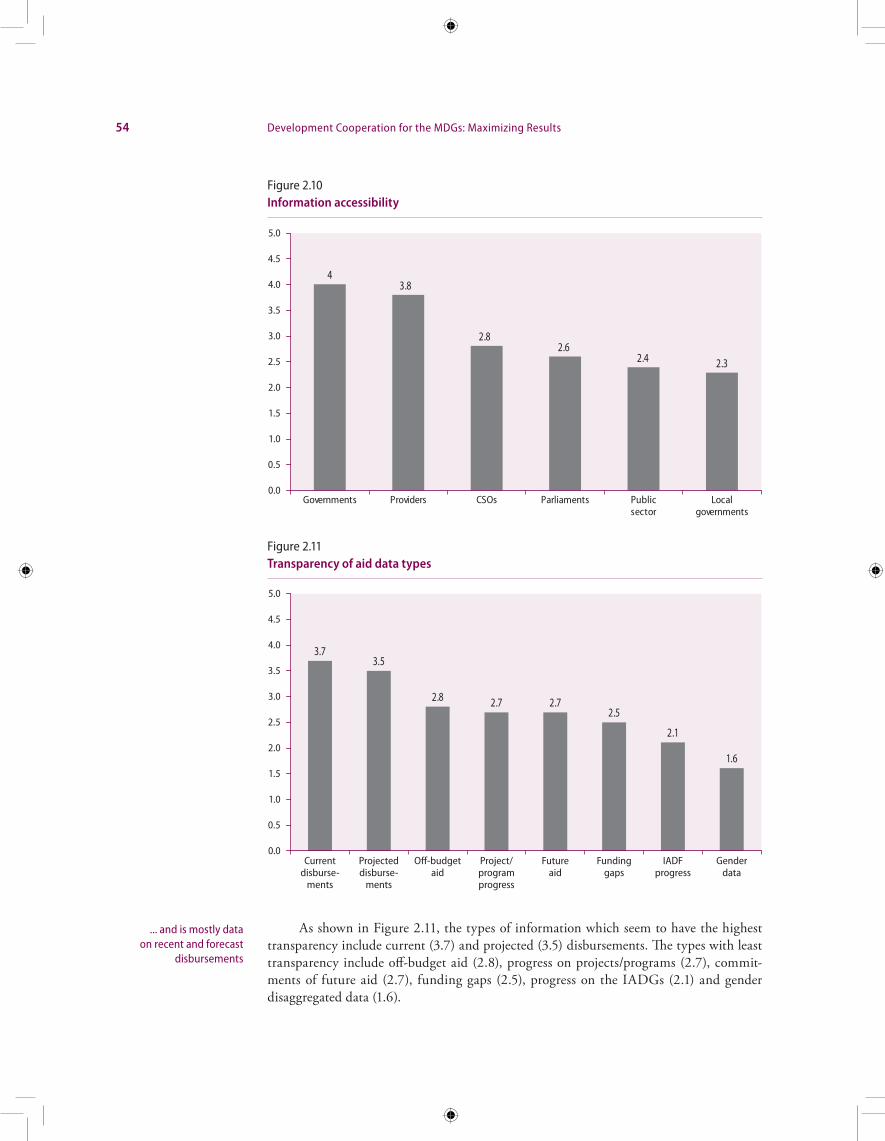
54 Development Cooperation for the MDGs: Maximizing Results
As shown in Figure 2.11, the types of information which seem to have the highest transparency include current (3.7) and projected (3.5) disbursements. The types with least transparency include off-budget aid (2.8), progress on projects/programs (2.7), commit-ments of future aid (2.7), funding gaps (2.5), progress on the IADGs (2.1) and gender disaggregated data (1.6).
... and is mostly data on recent and forecast
disbursements
Figure 2.10Information accessibility
43.8
2.82.6
2.4 2.3
0.0
0.5
1.0
1.5
2.0
2.5
3.0
3.5
4.5
4.0
5.0
Providers ParliamentsCSOs Localgovernments
Publicsector
Governments
Figure 2.11Transparency of aid data types
0.0
0.5
1.0
1.5
2.0
2.5
3.0
3.5
4.5
4.0
5.0
Currentdisburse-ments
Off-budgetaid
Projecteddisburse-ments
Project/programprogress
Futureaid
Fundinggaps
IADFprogress
Genderdata
3.73.5
2.8 2.7 2.72.5
2.1
1.6

Accountability and transparency of development cooperation 55
Additional findings from the national transparency survey included that:
• In almost all countries, non-DAC donors, global funds and NGOs do not supply data to aid data systems (a notable exception being in Cambodia where China and the Global Fund do).
• Of 26 countries that reported on how providers submit information to them, 18 (69%) said this was at least semi-annually, and ten (38%) said it was quarterly.
• Aid information is mainly used for budgeting (3.5) and macro-economic planning (3.3) purposes, but much less for monitoring and evaluation of results or IADG progress (2.5).
These results suggest that even though there has been significant progress in establish-ing aid information systems, there is still a great deal to be done to make these accessible and usable for non-state actors. It is also clear that transparency varies sharply across different types of aid information, and different providers, and in some key areas (especially monitoring and evaluation, and MDG progress) is weak.
The observed link between progress in transparency and MA appears to have several explanations. Higher levels of transparency can help to promote MA. Put more negatively, many respondents – especially those from non-executive organizations – feel that poor trans-parency is one of the main explanations for their inability to play a stronger role in national MA processes. On the other hand, to some degree stronger processes of MA are helping to create demand for greater transparency so as to supply data for independent analysis and monitoring. However, additional research is required to identify causality more clearly, and what other factors might be underlying the progress (or lack of it) on accessibility and usability for other stakeholders.
National MA and transparency trends for country groupsAnalysis by geographical regions and other groups of countries reveals some interesting trends:
• Sub-Saharan African countries and more aid-dependent countries (those receiving aid of at least 5% of GNI) are far more likely to have an aid policy and provider targets in place.
• Nevertheless, Sub-Saharan African countries perform worse than average on overall MA, while Asia and Pacific countries are notably over-represented in the best per-forming group on MA.
• There is no significant relationship between aid-dependence and MA performance.• Fragile states perform much worse than other countries on MA, but Least Devel-
oped Countries (LDCs) and Land-Locked Developing Countries (LLDCs) have average performance, and the small (10) sample of Small Island Developing Coun-tries (SIDS) perform better than average.
• Transparency is reported to be considerably higher than average in Asia and Pacific countries but lower than average in Sub-Saharan Africa.
• However, there is no noticeable difference on transparency between performance in aid-dependent, fragile states, LDCs, LLDCs or SIDS, and average performance across all countries.
These results suggest that the biggest challenges around developing mutual account-ability further are in Sub-Saharan Africa and fragile states, and around transparency in sub-Saharan Africa. Especially insofar as such results hint towards weaker capacity and insti-
Progress on transparency and MA are mutually reinforcing at national level
The most acceleration of effort is needed in SSA and fragile states
56 Development Cooperation for the MDGs: Maximizing Results
tutions playing a role, it is extremely urgent that regional initiatives to promote MA and transparency in Sub-Saharan Africa be accelerated, and that the international community make greater efforts to enhance progress in fragile states.
National-level and domestic accountability to other stakeholders17
Nevertheless, MA among recipient governments and providers is much more advanced than accountability of providers and recipient country governments to other stakeholders, as follows:
• Domestic accountability mechanisms in recipient countries are often relatively weak, especially in those countries where power is concentrated in the hands of the executive. There are some notable exceptions such as parliamentary public accounts committees in Ghana and Uganda, independent auditing institutions in several countries, budget monitoring processes by CSOs in several Eastern and Southern African countries, and audits/monitoring of specific aid flows such as emergency aid in Nicaragua or infrastructure projects in the Philippines. But generally, low domestic accountability reflects low capacity and resourcing of parliaments, auditor-generals, local governments and stakeholder institutions (see also AfDB 2009 for why domestic accountability is vital to aid results).
• On the other hand, domestic accountability to stakeholders in provider coun-tries can be quite strong, especially in countries such as Finland where stakeholder groups are systematically represented in the governance of aid policy. However, such representation often takes relatively little account of the aid effectiveness agen-da and may be dominated by concerns such as tying aid to exports; earmarking to particular sectors or initiatives; visibility of results for national aid programmes; or establishing parallel procurement and financial management systems. In addition, parliaments often have important influence over ODA budget levels, geographic allocation, the emphasis on key types and sectors of aid, and conditionalities. Pro-vider country domestic accountability can therefore sometimes be a powerful force reducing space for provider agencies to take account of programme country govern-ment demands for MA.
• There is a strong risk (as seen earlier in accountability processes on national develop-ment strategies and Poverty Reduction Strategy Papers) that mutual accountability can undermine domestic accountability, as the demands of aid providers absorb all the time of recipient government aid managers. On the other hand, ODI (2009) indicates that there can be positive synergies between domestic and mutual account-ability, whereby the workings of one may generate information, stimulate dialogue and shape behaviours in ways that strengthen the other, and provides some positive examples from Malawi, Mali, Nicaragua, the Philippines and Uganda.
• Within domestic accountability, parliaments in provider and recipient countries should play a key role in oversight of aid. Box 2.3 provides more detail on the poten-tial role of parliament in aid oversight.
17 Domestic accountability is not a main focus of this report because work is being conducted by the WP-EFF, Commonwealth Secretariat, IPU and various CSOs. However, it will be a priority of future DCF symposia to discuss domestic accountability (in both provider and recipient countries) and how it can interact positively with mutual accountability and transparency to maximize results.
Domestic accountability in recipient countries needs
to be reinforced
Domestic accountability in provider countries needs to focus on effectiveness
and results
Accountability and transparency of development cooperation 57
Box 2.3How can parliaments enhance aid accountability and results?
Parliaments have a key role in the fight to achieve the MDGs at national level: parliamentary committees and caucuses, political parties and individual parliamentarians have a significant role in scrutinizing externally financed development activities to ensure that resources are spent effectively and the interests of citizens are adequately represented. Yet, they often lack the independence, knowledge and resources to perform their oversight, legislative and representative functions. In addition, they may not always have access to reports on performance of providers of aid and face reluctance to engage executive branches of governments in consultations on aid expenditure.
The Paris Declaration and 2008 DCF all urged a strengthening of the role of parliaments in overseeing devel-opment cooperation. In particular, the AAA stated that programme and provider country governments would be “accountable to our respective parliaments” and providers would “support efforts to increase the capacity of parliaments to take an active role in dialogue on the role of aid in contributing to countries’ development.” The AAA has created a more conducive environment in aid recipient countries for greater involvement of Parliament in ODA and in setting the development agenda, presenting new opportunities for Parliament to become more involved in dialogue between donors and governments and to play a stronger oversight role as donors increase their use of national systems and the proportion of assistance directed to general budget and sector basket support. To enhance the role of parliaments, the Inter-Parliamentary Union (IPU) has undertaken two initiatives: a guidance note on best practices in parliamentary involvement, and an assessment of current practice and capacity-building needs through case-studies of Cambodia, United Republic of Tanzania, Vietnam and Zambia.
The guidance notea recommends parliamentarians and committees be more engaged in preparing, imple-menting and monitoring national development plans and strategies, and in executing effective budgetary oversight. They should be represented in the dialogue structures between the national executive branch and providers of aid to push for more aid on budget, aid transparency and the creation of effective MA mecha-nisms based on a clear division of labour. This is often feasible within existing agreements, for example by adjusting timelines of budget and parliamentary sessions.
While parliamentary committees should scrutinize, debate and pass legislation for poverty reduction and progress towards the MDGs, they should also involve themselves in the scrutiny and approval of foreign loans. Special emphasis needs to be placed on strengthening the voices of women throughout the policy cycle and on implementing gender responsive budgeting. Establishing independent Budget Offices and working closely with anti-corruption commissions and supreme audit institutions should be prioritized.
Parliamentarians need to ensure that monitoring of results is anchored early on in planning processes and that they play a role in this monitoring. They require access to regular and timely progress reports on the implementation of plans and budgets and should involve citizens in monitoring results at community level with the help of report and score cards. Evidence also shows that stronger involvement of CSOs in parliamen-tary work can enhance MPs’ knowledge, independence and ability to advance citizens’ concerns.
Finally, parliaments need to identify their own capacity development needs and engage with donors to strengthen their resources, pursue parliamentary reform processes and establish relevant work plans. They require funding to strengthen MPs’ competencies to enhance the quality of budget and audit reports, research capacity, support for advocacy programmes and parliaments’ websites, etc. In this context, donors should also support peer learning among parliaments on the aid and development effectiveness agenda.
The case study assessmentb made the following more detailed recommendations:
To achieve a stronger role in aid effectiveness Parliaments need to:
a) be given a prominent role in aid effectiveness architecture:
• in top-level government-donor meetings, on such issues as off-budget aid, unpredictability and fragmen-tation, explaining how these undermine plan/budget processes, and development results.
• in middle-level meetings on aid effectiveness be represented by planning or finance committee chairs, participate fully in executive committees so its concerns are taken into account, be fully consulted in independent reviews of progress, and commission studies or enquiries on key issues.
a See http://www.aideffectiveness.org/images/stories/ParliamentsDevEffectivenessGuidanceNote-FirstEdition.pdf. Other good sources on parliament’s role are AWEPA 2009; Mokoro 2008; and ODI 2009
b Forthcoming at www.ipu.org.
58 Development Cooperation for the MDGs: Maximizing Results
Box 2.3How can parliaments enhance aid accountability and results? (continued)
• in key technical or sectoral groups by committee chairs or vice-chairs, such as health, education, agri-culture, public financial management, and planning and evaluation, and participate fully in joint donor-recipient reviews of sectors.
• in the design and approval of overall and sectoral/thematic performance assessment frameworks, receiv-ing systematic information on donor conditionalities.
b) Debate aid more comprehensively, including:
• approving any updates to national aid policies, and playing a prominent up-front role in their formulation before donors become involved.
• approving an annual borrowing ceiling in the budget, as well as scrutinizing loan and grant documents for compliance with policy, before the executive signs them.
• discussing semi-annual reports on physical execution/results of major programmes and projects (as well as sectoral/regional allocation or financial disbursements).
• conducting more regular enquiries on aid effectiveness issues and results, supported by performance evaluation field visits to programmes/projects.
• being supplied with semi-annual reports from national aid databases, as well as having researchers trained to use the databases, if necessary supported by freedom of information legislation.
• a more specific focus on the development contribution and effectiveness of aid as part of sectoral or issue-specific audits, and community-based monitoring of development effectiveness/results.
• possibly establishing an aid or financing sub-committee of economic affairs/planning or finance commit-tees, to provide space to discuss aid and non-aid financing issues, as in the Philippines.
c) Organize more systematic regular and structured dialogues with other stakeholders, including:
• donor representatives and officials beyond those involved in parliament support programmes, especially on aid effectiveness and results.
• donor parliamentarians to explain the complications which aid conditionalities cause for accountability to parliament.
• CSOs (national and international) and other independent experts, including testimony to committees and enquiries.
• enhanced parliamentary voice in media coverage of aid issues.
d) Implement strong capacity-building programmes on aid effectiveness, to:
• broaden capacity beyond a few key members in each parliament.
• train members of relevant committees and supporting research/analytical staff in aid effectiveness and development results technical terminology.
• brief them in the key national issues at overall and sectoral level.
• supply information to parliament on development partners’ best global practices in making aid more effective, as well as developing countries in improving plans, budgets and systems.
• This could happen via workshops or e-learning provided by the executive and CSOs, with independent local or external facilitators, and parliamentarians are likely to demand that capacity-building on aid be combined with non-aid financing and key sectoral issues.
e) Increase regional and global networking, through:
• interaction during visits of donor country officials and parliamentarians;
• regional parliamentary aid effectiveness forums e.g. AWEPA, AIPA, CDDE;
• peer learning initiatives such as the Cambodia/Lao/Vietnam CDDE study;
• global parliamentary structures and meetings organized by the IPU;
• participation in the DCF and the WP-EFF, and related regional and national meetings and surveys.
Finally, there is a strong need to increase resources available to enhance parliamentarians’ accountability to citizens and CSOs, so that they represent stakeholder groups rather than narrow constituency interests.
Accountability and transparency of development cooperation 59
Box 2.4IATI and PWYF: strong initiatives to promote transparency
Among the multiple international initiatives to promote transparency, two with very strong potential are the International Aid Transparency Initiative (IATI) and Publish What You Fund (PWYF). They are very comprehensive and ambitious – in terms of the information they are trying to make transparent and its potential accessibility, as well as in trying to strengthen a global culture of transparent aid management:
1. International Aid Transparency Initiative (IATI) (for details, see http://www.aidtransparency.net)
Launched at the Accra High-level Forum on Aid Effectiveness in 2008 and endorsed by 18 bilateral, multilateral and foundation donors, as well as 13 developing countries, IATI aims to establish an inter-national standard for reporting on aid. It has so far agreed on: (i) the scope of aid data to be published; (ii) a set of common definitions and classifications; (iii) an electronic format for data exchange; and (iv) a code of conduct for the use of aid information. This standard will provide universal project classifica-tions and definitions so that citizens, civil society, governments, parliaments and media can trace aid flows. IATI is not a new database: rather it will build on existing systems for collecting and publishing information, to create a new central on-line registry linking to information.
IATI will be a critical prerequisite to hold providers and programme countries to account for the use of aid monies. It can also boost the coordination of activities among various providers. The standards have been discussed in broad-based regional consultations, and are now being finalized. Once in place, the initiative is expected to respond effectively to the call for more accountability and complementarity, but also for more predictable aid, use of national systems for monitoring and evaluation and making better use of scarce national capacities and resources.
IATI’s progress has so far been relatively slow (15 months to agree on standards) but its achievements should accelerate in 2010-11 as donors begin to publish data and then documents. It also continues to cover a relatively low proportion of global development cooperation flows because major donors such as France, Japan and the United States have not signed up to the agreement. IATI sponsors need to redouble their efforts so that databases and documents are fully transparent by the time of the 2011 High-Level Forum in the Republic of Korea, and far more providers and programme countries join the initiative.
2. Publish What You Fund (PWYF) (for details, see http://www.publishwhatyoufund.org)
Also launched in Accra, Publish What You Fund is a global campaigning CSO which works to increase the availability and accessibility of timely, comprehensive and comparable information about aid. It works in partnership with a wide range of CSOs and foundations to promote greater transparency, based on four principles: information should be published proactively; information should be comprehensive, timely, accessible and comparable; everyone has the right to request and receive the information; and the right of access to information should be promoted.
It has been focusing initially on outreach and advocacy particularly targeted at improving the IATI, and at greater transparency by European Union Member States and the European Commission, the United States and the World Bank. It has had considerable success in focusing their attention on transparency commitments, partly as a result of its narrow focus, though this also brings risks in terms of giving priority to data transparency because this is IATI’s current agenda, and focusing less on other providers.
Recently PWYF has decided to create an annual Aid Transparency Assessment Index, which will be a key global MA mechanism looking in detail at the degree of transparency on aid of individual DAC and multilateral donors (with the intention over time to bring in other providers). The index will include assessment of the high-level commitment of providers to transparency (participation in IATI, degree of detail reported to the OECD Creditor Reporting System, existence of freedom of information acts), their transparency to recipient governments (by putting aid on budget, living up to their commitments through disbursements, and making available clear in-year disbursement schedules and multi-year forecasts), transparency to civil society, and transparency of humanitarian aid. The data sources will include official information, civil society sources and independent/academic analysis, and the index will be launched in October 2010.
60 Development Cooperation for the MDGs: Maximizing Results
International transparency initiativesInitiatives and norms
More transparent data and documentation on development cooperation is a key input for accountability. A November 2009 background study for the DCF (Martin 2009) presented the details of multiple major recent global transparency and aid information initiatives, as well as national aid management systems used by programme countries, and a summary of donor transparency on data and documentation. It also noted strong international civil soci-ety campaigns for transparency (including Publish What You Fund), to ensure the application of transparency principles as well as a universal right to request and receive information about aid, and proactive promotion of knowledge about this right as well as the ability/capacity of different stakeholders to access the information and, where necessary, to file requests for ad-ditional information. Two particularly strong and comprehensive initiatives on transparency are highlighted in Box 2.4.
It highlighted the strong demand for more access to information by many stakehold-ers. Programme country governments need information for budgeting, effective service delivery and macroeconomic management. In line with the Paris Declaration principles of national ownership and mutual accountability, they also need it to hold providers to account for the quality and volume of their assistance. Providers and NGOs need information about each others’ current and planned activities. Parliaments, civil society organizations CSOs and the media need information to hold governments and providers to account. Community groups and citizens need information about aid to provide feedback about whether services meet their needs and to increase accountability of government and CSOs.
The background study also identified key characteristics needed by transparency ini-tiatives if they are to be useful for their wider purpose - improving accountability. The main ones are:
• Responding to the different information needs of different stakeholders, whether providers, recipient government, civil society or the public – in particular where, when, how, and on what aid is spent;
• Ensuring data are timely, accurate, up to date and easily accessible to all stake-holders;
• Making detailed additional information available such as the conditions attached to aid and the terms of concessional loans;
• Being relevant for economic analysis, budgeting and planning, social and environ-mental appraisals, and analysing progress of projects and programmes as well as progress towards the IADGs and other national development goals;
• Providing a mechanism to trace aid through the system from provider to intended beneficiary;
• Being classified to match local budgets and plans as well as international classifica-tions, in a common data format to be integrated electronically easily into local/other systems;
• Coming from all possible providers, including non-DAC, foundations and chari-ties; and
• Being easy to access for all stakeholders, especially those in programme countries.
This chapter assesses the extent to which transparency initiatives are in line with these suggested norms and identifies areas of progress and those where more effort is needed.
The DCF identified norms for ensuring they assist
with accountability
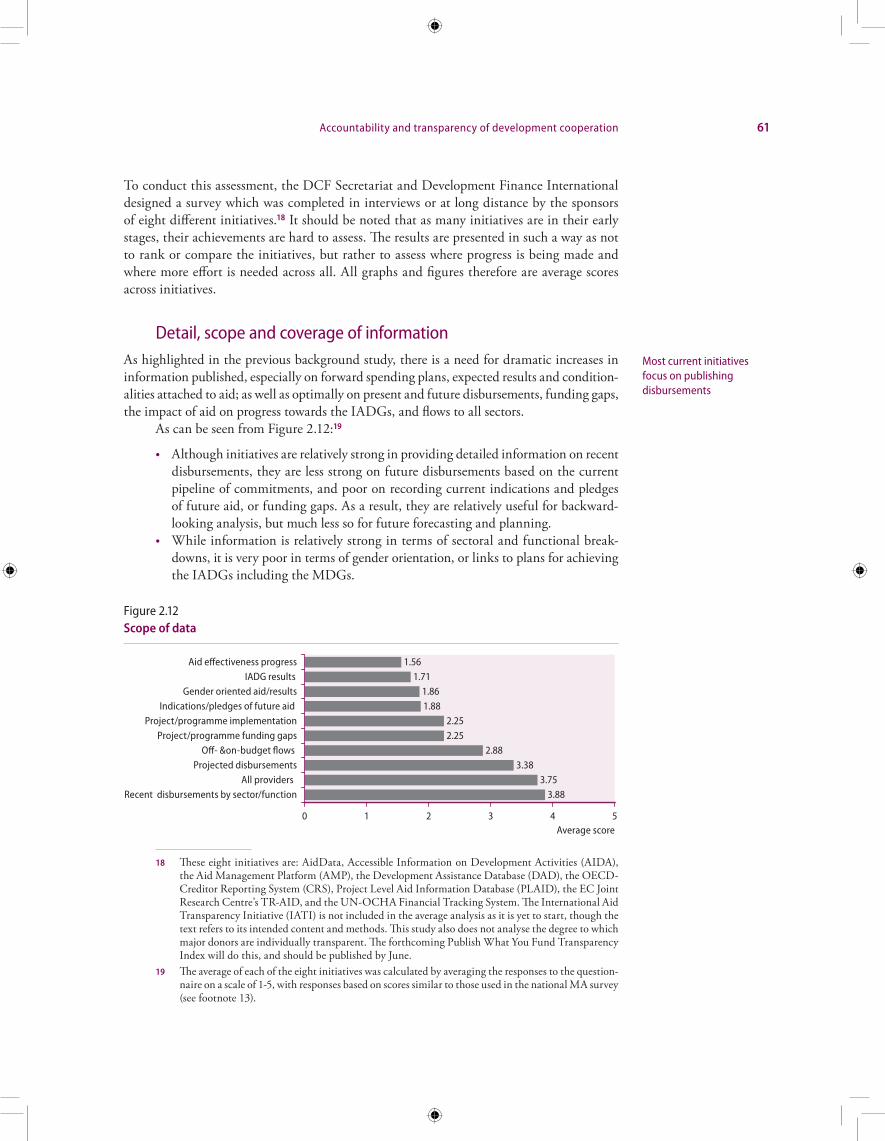
Accountability and transparency of development cooperation 61
To conduct this assessment, the DCF Secretariat and Development Finance International designed a survey which was completed in interviews or at long distance by the sponsors of eight different initiatives.18 It should be noted that as many initiatives are in their early stages, their achievements are hard to assess. The results are presented in such a way as not to rank or compare the initiatives, but rather to assess where progress is being made and where more effort is needed across all. All graphs and figures therefore are average scores across initiatives.
Detail, scope and coverage of informationAs highlighted in the previous background study, there is a need for dramatic increases in information published, especially on forward spending plans, expected results and condition-alities attached to aid; as well as optimally on present and future disbursements, funding gaps, the impact of aid on progress towards the IADGs, and flows to all sectors.
As can be seen from Figure 2.12:19
• Although initiatives are relatively strong in providing detailed information on recent disbursements, they are less strong on future disbursements based on the current pipeline of commitments, and poor on recording current indications and pledges of future aid, or funding gaps. As a result, they are relatively useful for backward-looking analysis, but much less so for future forecasting and planning.
• While information is relatively strong in terms of sectoral and functional break-downs, it is very poor in terms of gender orientation, or links to plans for achieving the IADGs including the MDGs.
18 These eight initiatives are: AidData, Accessible Information on Development Activities (AIDA), the Aid Management Platform (AMP), the Development Assistance Database (DAD), the OECD-Creditor Reporting System (CRS), Project Level Aid Information Database (PLAID), the EC Joint Research Centre’s TR-AID, and the UN-OCHA Financial Tracking System. The International Aid Transparency Initiative (IATI) is not included in the average analysis as it is yet to start, though the text refers to its intended content and methods. This study also does not analyse the degree to which major donors are individually transparent. The forthcoming Publish What You Fund Transparency Index will do this, and should be published by June.
19 The average of each of the eight initiatives was calculated by averaging the responses to the question-naire on a scale of 1-5, with responses based on scores similar to those used in the national MA survey (see footnote 13).
Most current initiatives focus on publishing disbursements
Figure 2.12Scope of data
3.883.75
3.382.88
2.252.25
1.881.86
1.711.56
Recent disbursements by sector/functionAll providers
Projected disbursementsOff- &on-budget flows
Project/programme funding gapsProject/programme implementation
Indications/pledges of future aid Gender oriented aid/results
IADG resultsAid effectiveness progress
0 1 2 3 4 5Average score
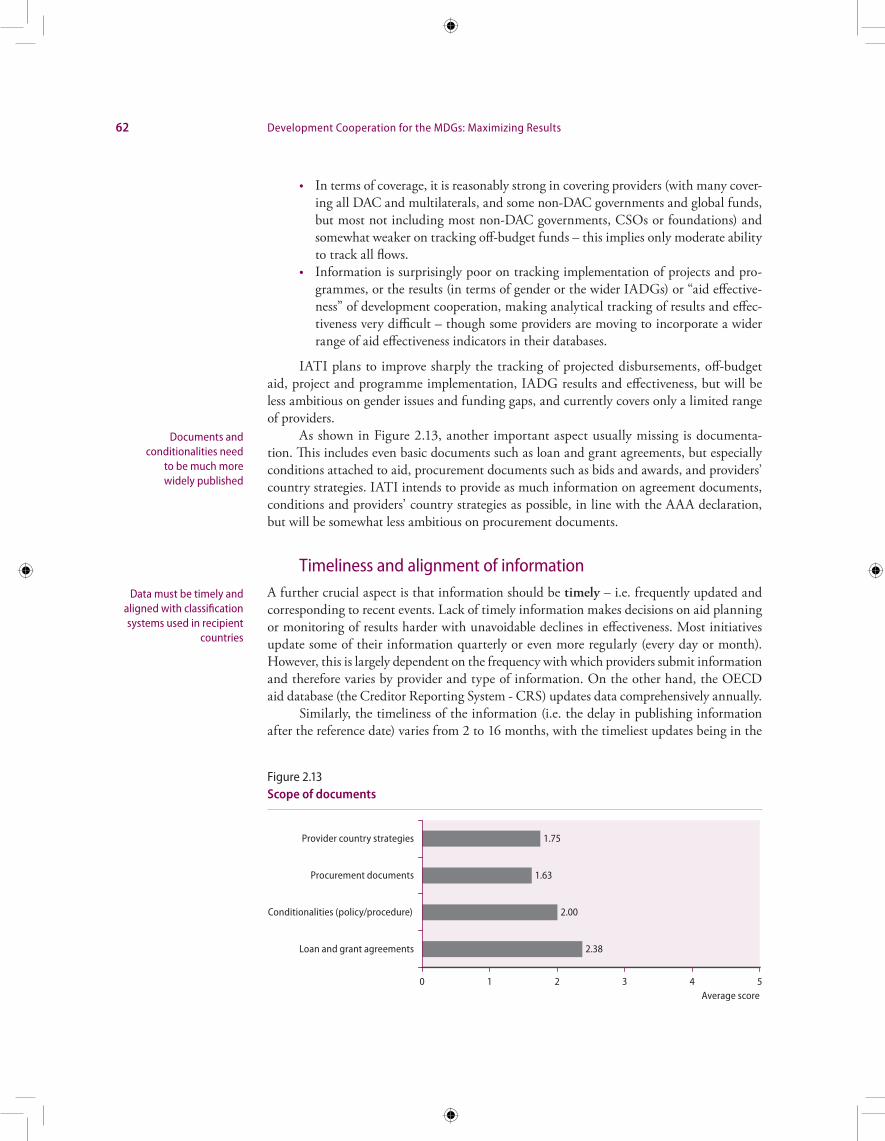
62 Development Cooperation for the MDGs: Maximizing Results
• In terms of coverage, it is reasonably strong in covering providers (with many cover-ing all DAC and multilaterals, and some non-DAC governments and global funds, but most not including most non-DAC governments, CSOs or foundations) and somewhat weaker on tracking off-budget funds – this implies only moderate ability to track all flows.
• Information is surprisingly poor on tracking implementation of projects and pro-grammes, or the results (in terms of gender or the wider IADGs) or “aid effective-ness” of development cooperation, making analytical tracking of results and effec-tiveness very difficult – though some providers are moving to incorporate a wider range of aid effectiveness indicators in their databases.
IATI plans to improve sharply the tracking of projected disbursements, off-budget aid, project and programme implementation, IADG results and effectiveness, but will be less ambitious on gender issues and funding gaps, and currently covers only a limited range of providers.
As shown in Figure 2.13, another important aspect usually missing is documenta-tion. This includes even basic documents such as loan and grant agreements, but especially conditions attached to aid, procurement documents such as bids and awards, and providers’ country strategies. IATI intends to provide as much information on agreement documents, conditions and providers’ country strategies as possible, in line with the AAA declaration, but will be somewhat less ambitious on procurement documents.
Timeliness and alignment of informationA further crucial aspect is that information should be timely – i.e. frequently updated and corresponding to recent events. Lack of timely information makes decisions on aid planning or monitoring of results harder with unavoidable declines in effectiveness. Most initiatives update some of their information quarterly or even more regularly (every day or month). However, this is largely dependent on the frequency with which providers submit information and therefore varies by provider and type of information. On the other hand, the OECD aid database (the Creditor Reporting System - CRS) updates data comprehensively annually.
Similarly, the timeliness of the information (i.e. the delay in publishing information after the reference date) varies from 2 to 16 months, with the timeliest updates being in the
Documents and conditionalities need
to be much more widely published
Data must be timely and aligned with classification systems used in recipient
countries
Figure 2.13Scope of documents
2.38
2.00
1.63
1.75
Loan and grant agreements
Conditionalities (policy/procedure)
Procurement documents
Provider country strategies
0 1 2 3 4 5Average score
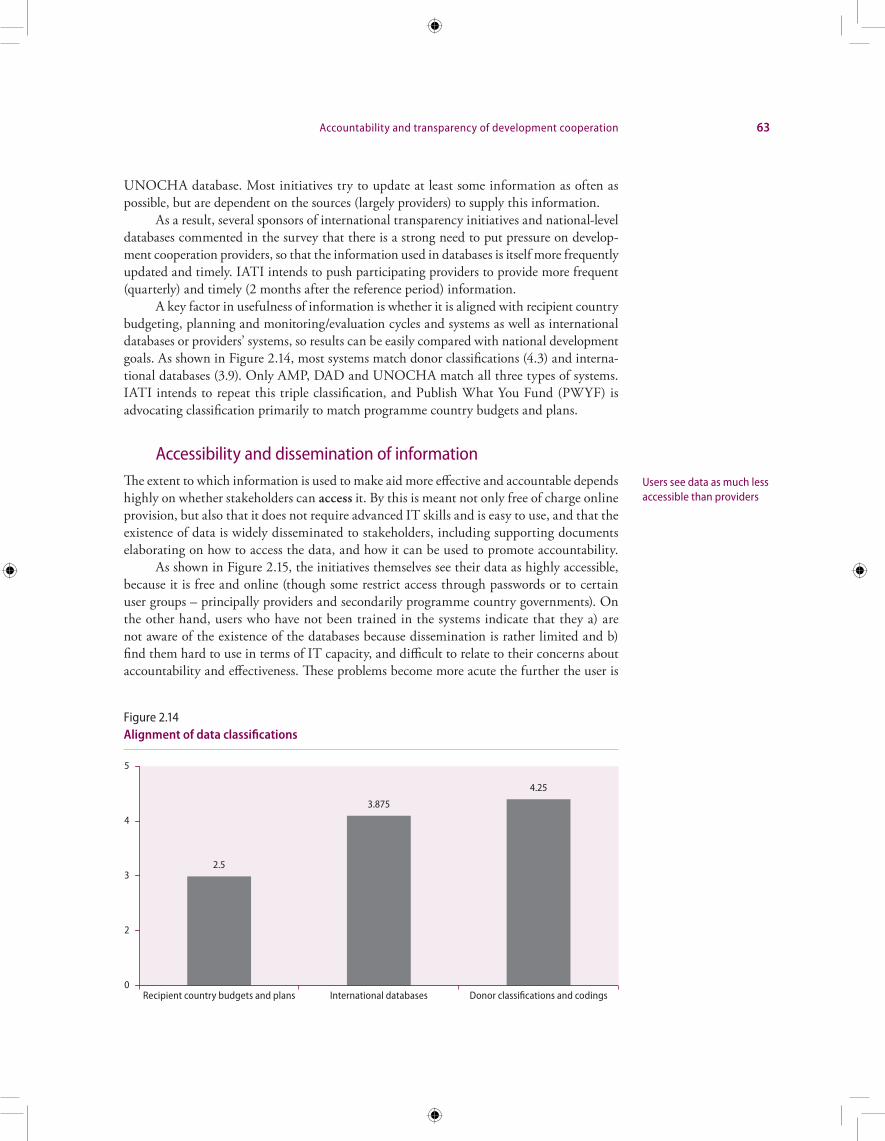
Accountability and transparency of development cooperation 63
UNOCHA database. Most initiatives try to update at least some information as often as possible, but are dependent on the sources (largely providers) to supply this information.
As a result, several sponsors of international transparency initiatives and national-level databases commented in the survey that there is a strong need to put pressure on develop-ment cooperation providers, so that the information used in databases is itself more frequently updated and timely. IATI intends to push participating providers to provide more frequent (quarterly) and timely (2 months after the reference period) information.
A key factor in usefulness of information is whether it is aligned with recipient country budgeting, planning and monitoring/evaluation cycles and systems as well as international databases or providers’ systems, so results can be easily compared with national development goals. As shown in Figure 2.14, most systems match donor classifications (4.3) and interna-tional databases (3.9). Only AMP, DAD and UNOCHA match all three types of systems. IATI intends to repeat this triple classification, and Publish What You Fund (PWYF) is advocating classification primarily to match programme country budgets and plans.
Accessibility and dissemination of informationThe extent to which information is used to make aid more effective and accountable depends highly on whether stakeholders can access it. By this is meant not only free of charge online provision, but also that it does not require advanced IT skills and is easy to use, and that the existence of data is widely disseminated to stakeholders, including supporting documents elaborating on how to access the data, and how it can be used to promote accountability.
As shown in Figure 2.15, the initiatives themselves see their data as highly accessible, because it is free and online (though some restrict access through passwords or to certain user groups – principally providers and secondarily programme country governments). On the other hand, users who have not been trained in the systems indicate that they a) are not aware of the existence of the databases because dissemination is rather limited and b) find them hard to use in terms of IT capacity, and difficult to relate to their concerns about accountability and effectiveness. These problems become more acute the further the user is
Users see data as much less accessible than providers
2.5
3.875
4.25
0
2
3
4
5
Recipient country budgets and plans Donor classifications and codingsInternational databases
Figure 2.14Alignment of data classifications
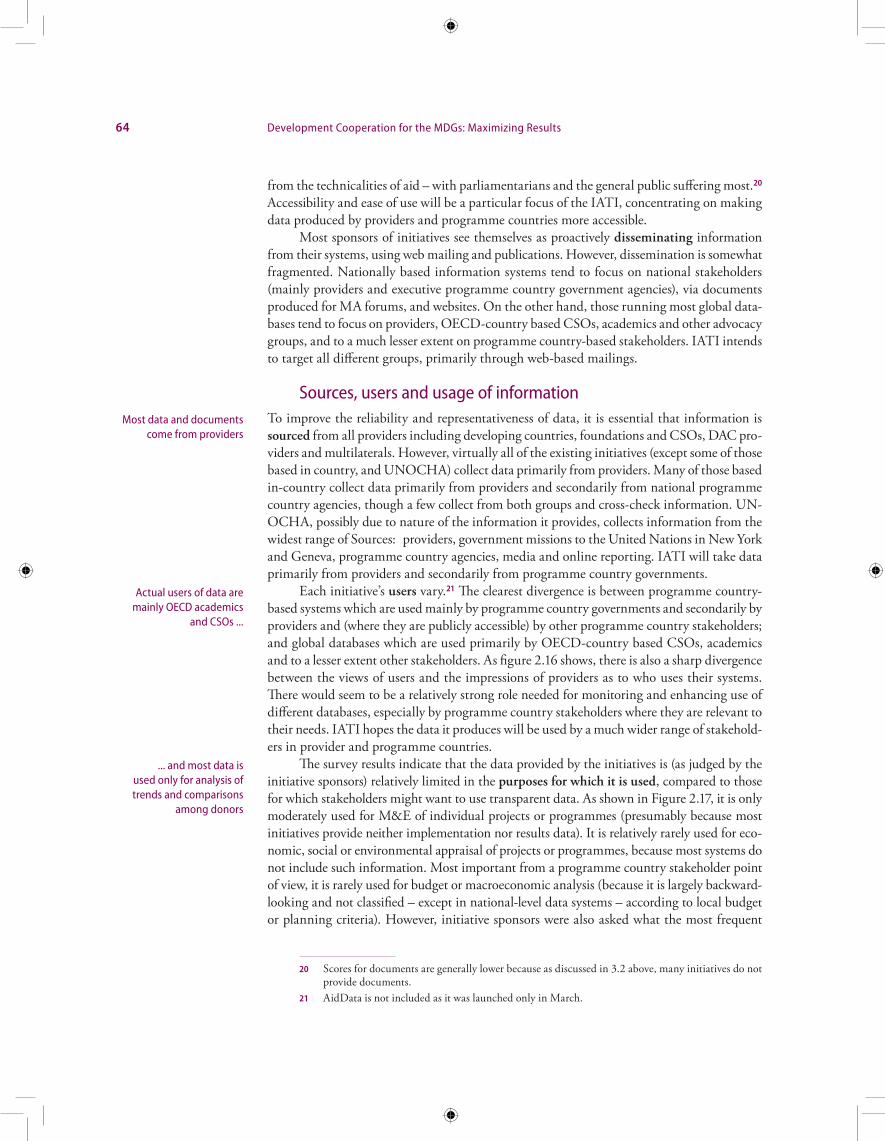
64 Development Cooperation for the MDGs: Maximizing Results
from the technicalities of aid – with parliamentarians and the general public suffering most.20 Accessibility and ease of use will be a particular focus of the IATI, concentrating on making data produced by providers and programme countries more accessible.
Most sponsors of initiatives see themselves as proactively disseminating information from their systems, using web mailing and publications. However, dissemination is somewhat fragmented. Nationally based information systems tend to focus on national stakeholders (mainly providers and executive programme country government agencies), via documents produced for MA forums, and websites. On the other hand, those running most global data-bases tend to focus on providers, OECD-country based CSOs, academics and other advocacy groups, and to a much lesser extent on programme country-based stakeholders. IATI intends to target all different groups, primarily through web-based mailings.
Sources, users and usage of informationTo improve the reliability and representativeness of data, it is essential that information is sourced from all providers including developing countries, foundations and CSOs, DAC pro-viders and multilaterals. However, virtually all of the existing initiatives (except some of those based in country, and UNOCHA) collect data primarily from providers. Many of those based in-country collect data primarily from providers and secondarily from national programme country agencies, though a few collect from both groups and cross-check information. UN-OCHA, possibly due to nature of the information it provides, collects information from the widest range of Sources: providers, government missions to the United Nations in New York and Geneva, programme country agencies, media and online reporting. IATI will take data primarily from providers and secondarily from programme country governments.
Each initiative’s users vary.21 The clearest divergence is between programme country-based systems which are used mainly by programme country governments and secondarily by providers and (where they are publicly accessible) by other programme country stakeholders; and global databases which are used primarily by OECD-country based CSOs, academics and to a lesser extent other stakeholders. As figure 2.16 shows, there is also a sharp divergence between the views of users and the impressions of providers as to who uses their systems. There would seem to be a relatively strong role needed for monitoring and enhancing use of different databases, especially by programme country stakeholders where they are relevant to their needs. IATI hopes the data it produces will be used by a much wider range of stakehold-ers in provider and programme countries.
The survey results indicate that the data provided by the initiatives is (as judged by the initiative sponsors) relatively limited in the purposes for which it is used, compared to those for which stakeholders might want to use transparent data. As shown in Figure 2.17, it is only moderately used for M&E of individual projects or programmes (presumably because most initiatives provide neither implementation nor results data). It is relatively rarely used for eco-nomic, social or environmental appraisal of projects or programmes, because most systems do not include such information. Most important from a programme country stakeholder point of view, it is rarely used for budget or macroeconomic analysis (because it is largely backward-looking and not classified – except in national-level data systems – according to local budget or planning criteria). However, initiative sponsors were also asked what the most frequent
20 Scores for documents are generally lower because as discussed in 3.2 above, many initiatives do not provide documents.
21 AidData is not included as it was launched only in March.
Most data and documents come from providers
Actual users of data are mainly OECD academics
and CSOs ...
... and most data is used only for analysis of trends and comparisons
among donors
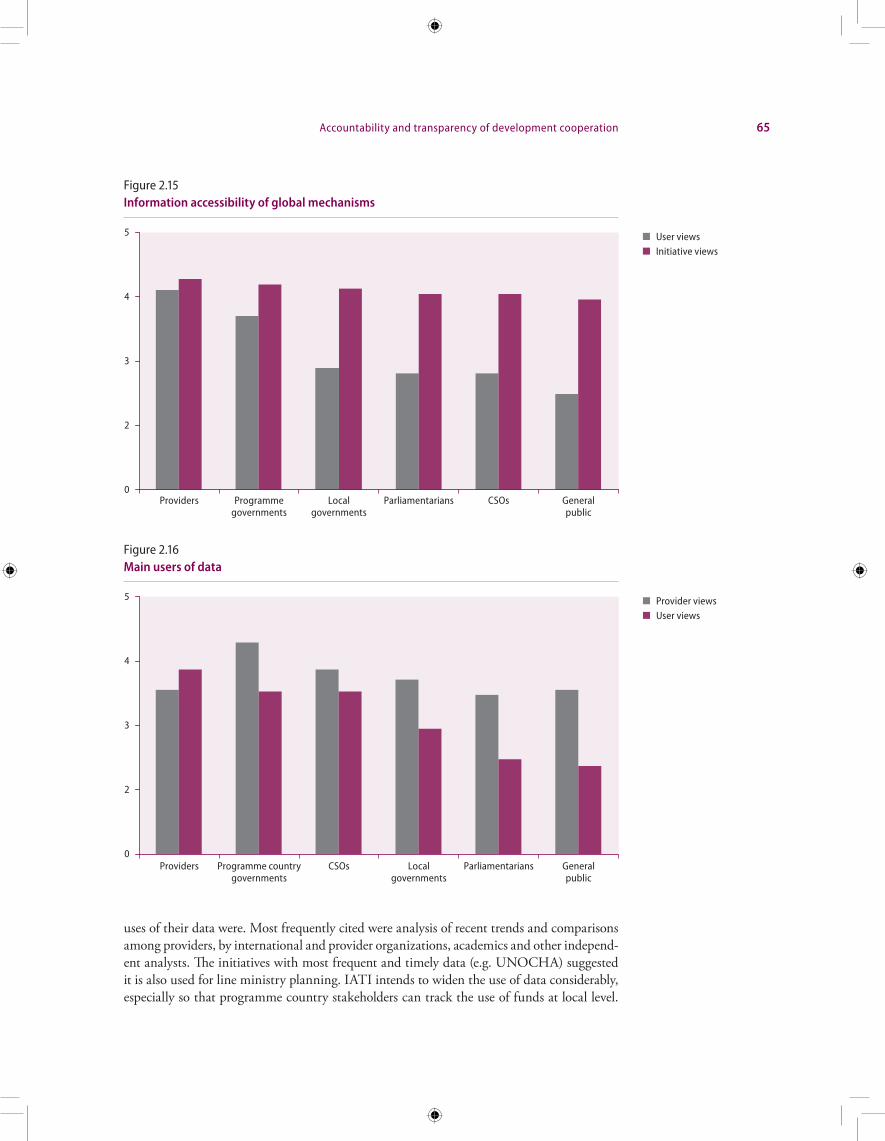
Accountability and transparency of development cooperation 65
uses of their data were. Most frequently cited were analysis of recent trends and comparisons among providers, by international and provider organizations, academics and other independ-ent analysts. The initiatives with most frequent and timely data (e.g. UNOCHA) suggested it is also used for line ministry planning. IATI intends to widen the use of data considerably, especially so that programme country stakeholders can track the use of funds at local level.
Figure 2.15Information accessibility of global mechanisms
0
2
3
4
5
Providers Programmegovernments
Parliamentarians Generalpublic
Localgovernments
CSOs
User viewsInitiative views
Figure 2.16Main users of data
0
2
3
4
5
Providers Programme countrygovernments
Localgovernments
Generalpublic
CSOs Parliamentarians
Provider viewsUser views
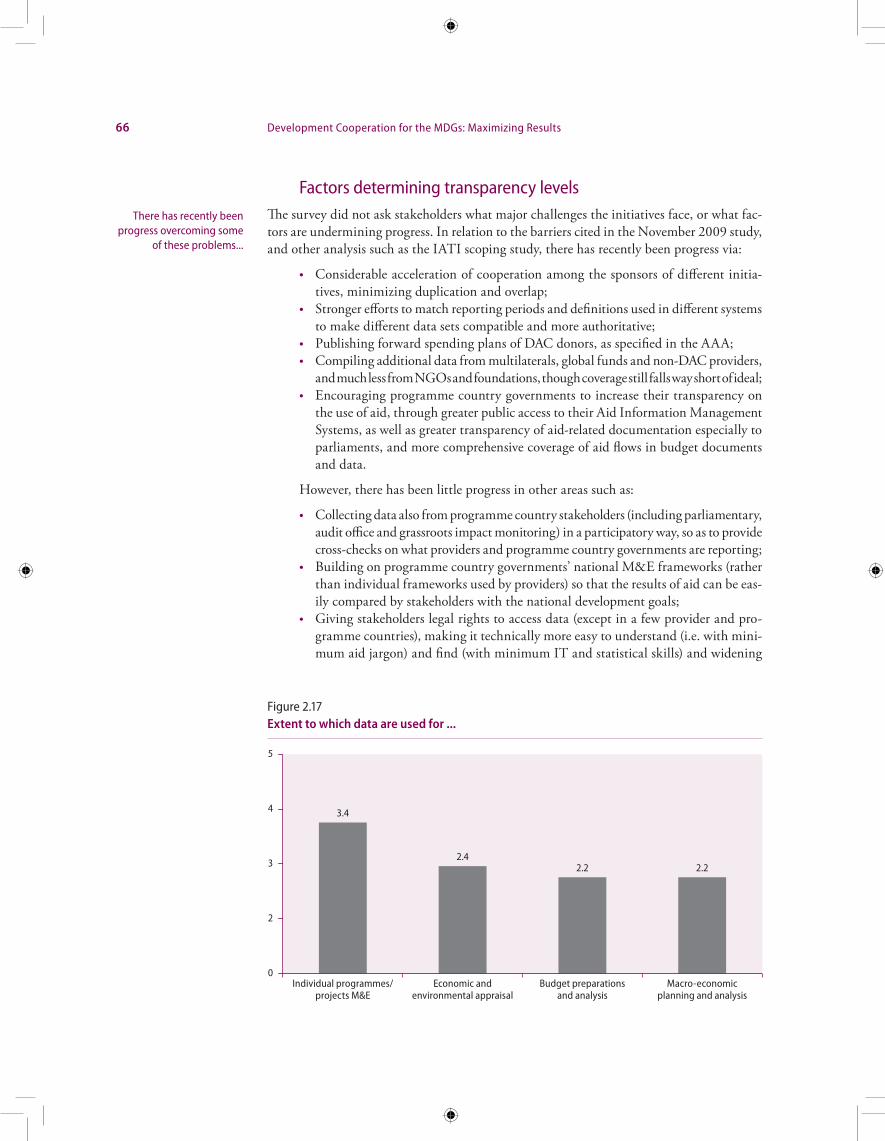
66 Development Cooperation for the MDGs: Maximizing Results
Factors determining transparency levelsThe survey did not ask stakeholders what major challenges the initiatives face, or what fac-tors are undermining progress. In relation to the barriers cited in the November 2009 study, and other analysis such as the IATI scoping study, there has recently been progress via:
• Considerable acceleration of cooperation among the sponsors of different initia-tives, minimizing duplication and overlap;
• Stronger efforts to match reporting periods and definitions used in different systems to make different data sets compatible and more authoritative;
• Publishing forward spending plans of DAC donors, as specified in the AAA;• Compiling additional data from multilaterals, global funds and non-DAC providers,
and much less from NGOs and foundations, though coverage still falls way short of ideal;• Encouraging programme country governments to increase their transparency on
the use of aid, through greater public access to their Aid Information Management Systems, as well as greater transparency of aid-related documentation especially to parliaments, and more comprehensive coverage of aid flows in budget documents and data.
However, there has been little progress in other areas such as:
• Collecting data also from programme country stakeholders (including parliamentary, audit office and grassroots impact monitoring) in a participatory way, so as to provide cross-checks on what providers and programme country governments are reporting;
• Building on programme country governments’ national M&E frameworks (rather than individual frameworks used by providers) so that the results of aid can be eas-ily compared by stakeholders with the national development goals;
• Giving stakeholders legal rights to access data (except in a few provider and pro-gramme countries), making it technically more easy to understand (i.e. with mini-mum aid jargon) and find (with minimum IT and statistical skills) and widening
There has recently been progress overcoming some
of these problems...
Figure 2.17Extent to which data are used for ...
3.4
2.42.2 2.2
0
2
3
4
5
Individual programmes/projects M&E
Macro-economicplanning and analysis
Budget preparationsand analysis
Economic andenvironmental appraisal
Accountability and transparency of development cooperation 67
dissemination to all stakeholders, together with supporting documents explaining how data can be used to promote accountability and guiding users to find informa-tion relevant to their needs;
• Going beyond data to publish documents on conditionalities, policies and proce-dures, as well as expected outputs and outcomes, as expected in the AAA (again with exception of a few providers and programme countries).
The main challenge going forward will be ensuring information is used to analyse provider agency and recipient country government behaviour. Only such analysis by stake-holders in national and international MA processes will enhance mutual accountability and domestic accountability of provider and programme country governments. Yet most data is currently used by international organizations, consultants, CSOs and academics, many of whom are divorced from MA processes or have goals other than “aid effective-ness” or MDG results. Changing this will require political will and culture change by sponsors of transparency and MA initiatives, leading to much greater investment in tools and methods to create a revolution in analysis, as well as a sharp increase in capacity and participation by national-level stakeholders to use the data and analysis to hold all stake-holders accountable.
Making mutual accountability and transparency more gender-sensitive
Gender equality and women’s empowerment and leadership are vital to achieving the MDGs. Despite the prominence of gender as a political topic at the international level, global and national-level aid effectiveness, MA and transparency discussions have not sufficiently fo-cused on this issue. As stated in the Secretary-General’s Report to the 2010 DCF, a far higher amount of aid needs to be explicitly directed to achieving the gender-related MDGs (3 and 5), with a clear gender focus in all other programmes to attain the wider IADGs.
To make faster progress on MDG-8, tracking resources spent on gender equality as an integral part of overall development performance assessment should be a priority when designing or updating MA and aid transparency mechanisms. UNIFEM calls for the use of gender-sensitive indicators, and for capacity building to strengthen gender analysis and systems to collect, analyse and use sex-disaggregated data, as the basis for more evidence-based dialogue towards making aid on gender more effective and creating a more enabling environment overall for women’s progress (UNIFEM 2008).
The AAA also attested that gender equality (together with respect for human rights, and environmental sustainability) is crucial to enduring impact on the lives and potential of poor women, men, and children, and that all policies need to address these issues in a more systematic and coherent way. However, despite extensive references to gender issues, it did not set indicators to monitor gender issues.
Partly because of this omission, there is no significant monitoring of the gender impact of aid in global or national MA mechanisms by setting targets for providers or recipient governments (whether as a group or individually), and the degree of participation of women’s organizations in MA mechanisms is extremely low (Martin 2009). This is despite the exist-ence of gender markers which track the proportion of bilateral ODA invested in gender equality activities at country level (see Chapter 1, Box 4), a large amount of project-level monitoring compliance with national gender policies, and many sectoral or topical initiatives to discuss fulfilment of gender-specific commitments.
... but transparency will increase accountability only if accompanied by analysis and capacity-building
MA and transparency have not focused sufficiently on gender issues
MA and transparency mechanisms pay little attention to gender
68 Development Cooperation for the MDGs: Maximizing Results
Making aid accountable to women is key, both to achieving gender-related MDGs, and to empowering women as active participants in and “owners” of development processes. This is part of a larger call by civil society for a new development paradigm with equal opportu-nities for all and respectful of non-monetary contributions of women to society, based on a comprehensive justice and human rights-based framework. Mutual accountability can be more gender-sensitive and responsive if stakeholders actively:
i) Build capacity: strengthening national women’s machineries, CSOs, parlia-mentarians and local governments, in their capacities to conduct independent research and gender-sensitive macroeconomic and project analysis, to access rel-evant information, and to participate in MA processes, is the key prerequisite for making MA and transparency more gender-balanced. It is intrinsically linked to the political will of development stakeholders to prioritize this work. In the changing aid environment, with a growing number of grassroots organizations acting on gender issues, many women’s organizations face severe funding con-straints, especially if they operate in a context of patriarchal societies, sexism and authoritarian governments. They face challenges in securing multi-year funding, preventing long term planning and making their operations characterized by a “survival logic” (AWID 2008: 17 and 21).
ii) Make available high quality information: it is essential to adapt and better fund national statistical systems, to hold governments accountable for gender efforts. Governments must develop and apply indicators (based on recommendations in the BPA) and systems to produce high-quality disaggregated data by sex, age and other socio-economic characteristics. In addition, different national and inter-national information sources need to harmonize timing, coverage and method-ology, to develop and apply global standards. Sector-specific sex-disaggregated information is becoming available, for example in water and sanitation, and some countries and regions (e.g. Rwanda and SADC) have introduced gender monitor-ing units, but there is still a major need to invest in national data collection sys-tems, and those of non-OECD and multilateral providers (the AsDB independent gender advisory body shows what monitoring can achieve in promoting gender progress). The African Gender and Development Index (AGDI) is a compre-hensive source of sex-disaggregated information measuring inequality in social, economic, political and human rights, which has been piloted in 12 countries.
iii) Design comprehensive policies to advance gender equality: the policies with the great-est potential to achieve gender equality and women’s empowerment are well-known. They are gender parity in education, a universal social protection floor, full productive and decent work, giving women control over productive assets, taking account of women’s multiple burdens including unpaid labour, and pro-viding health care including reproductive health. Adapted to the national con-texts, such policies and existing gender action plans need to be widely discussed and advocated for nationwide by women’s organizations, form an integral part of national development and aid strategies including transparent and needs-based decisions on allocating budget revenue and aid, and be monitored using clear indicators and benchmarks agreed by government, providers, parliament, CSOs and other actors.
iv) Detailed indicators for the gender impact of aid: the tremendous negative effects of the multiple crises on the lives of women should be used as an opportunity to
Capacity-building for women’s organizations
will be vital ...
... as will high quality information...
... and more comprehensive policy design
The DCF and partners have begun designing gender
indicators
Accountability and transparency of development cooperation 69
introduce gender-disaggregated results frameworks and performance indicators for more accountable gender-specific development cooperation. What might these look like? In the DCF Vienna and Helsinki preparatory symposia, stake-holders agreed that (to be more specific than monitoring the gender MDGs) they might include:
1. The proportion of time spent by senior government and donor officials discuss-ing gender-equality in MA forums, and the existence of a specific group focused on gender issues which reports to the national apex meeting on MA;
2. The quality of gender-disaggregated information on development, budget spend-ing and aid, made available through national level transparency initiatives;
3. The gender focus and responsiveness of national development and aid strategies, including coverage of the enabling environment and all key policies, and main-streaming of gender-specific targets in the action plans of all national agencies;
4. Clear definition of costed programmes for gender-specific activities in expendi-ture frameworks and budgets, through gender-responsive budgeting;
5. The proportion of budget spending and aid allocated to gender-specific pro-grammes and projects, and to programmes with indirect impact on gender indicators;
6. The degree to which providers are aligning their funding behind national strate-gies through multi-sectoral gender aid programmes using government systems through pooled funding, and by reporting them on budget;
7. The degree to which non-executive stakeholders have the opportunity to part-ner with government in the design and execution of gender expenditure pro-grammes, and also to execute a “watchdog” function on gender equality policies of government and donors, including through community-based monitoring;
8. Potential other issues around aid modalities and types, allocation criteria, chan-nels of assistance, predictability and conditionalities;
9. The impact of government budget and aid funding on the financial situation of national women’s movements and other relevant gender entities.
v) International architecture: at the international level the United Nations General Assembly on 2 July 2010 established a new United Nations organization, UN-WOMEN, which merges and builds on the key work of DAW, INSTRAW, OSAGI and UNIFEM. A politically powerful and independent agency with strong leadership, UN-WOMEN is expected to be a dynamic and strong champion, providing women and girls with a powerful voice at global, regional and local levels. It will pro-actively engage in MA on gender issues at interna-tional level.
The Secretary-General’s Report to the 2010 DCF also recommended setting gender-related targets for aid as a top priority for the Fourth High-level Forum on Aid Effectiveness in Seoul in 2011. These could include the national level targets discussed above, as well as setting a target to make funding more sustainable, by allocating 10% of ODA for gender equality and women’s empowerment by 2010, in line with a United Nations Commission on the Status of Women recommendation of 2007. The DCF (in cooperation with other organizations) will continue to monitor the degree to which development cooperation is responding to gender priorities, and defining potential targets in this area for global and national MA and transparency initiatives.
With newly strengthened international leadership, the United Nations will set and monitor more precise targets

71
Chapter 3
South-south development cooperation22
Introduction and definitionsSouth-South cooperation (SSC) has existed for at least six decades. It received international attention in 1955 when African and Asian nations held a conference in Bandung, Indonesia, to promote economic and cultural cooperation.23 The Buenos Aires Plan of Action (BAPOA) of 1978, as outcome of the United Nations Conference on Technical Cooperation among Developing Countries, for the first time provided a strategic framework for SSC. Since then, the United Nations has played a critical role in supporting SSC, most recently reaffirmed in a High-level Conference in December 2009. SSC has therefore also been a key focus of DCF analytical work since 2007.
However, SSC has become much more prominent in international discussions in the last decade, as rapid economic growth by major Southern economies has led to a greater role in international economic affairs. Their successful development experiences have also increased the potential for Southern providers to offer a wider range of technical develop-ment expertise, goods and services, and therefore a huge expansion of financial and techni-cal cooperation. The existence of more similar social, cultural and economic environments can also make such cooperation more effective and appropriate, for example, in designing development strategies.
“South-South cooperation” is a term often used to cover all types of political and eco-nomic exchange between Southern countries, enterprises and Civil Society Organizations (CSOs), including on trade, investment and technology.24 However, this chapter focuses on development cooperation as defined in the rest of the IDC report – i.e. concessional loans and grants (and technical cooperation) provided for development purposes. It defines SSC as coop-eration among members of the Group of 77 and China.25 Triangular development cooperation is defined as DAC donors, multilateral organizations or in some cases Southern providers fund-ing a Southern country (the implementing country, sometimes referred to as ‘pivotal’ country) to execute projects/programmes in another Southern country (the beneficiary).26
22 This chapter is based on background studies prepared for the 2008 and 2010 DCF on SSC by Alison Johnson, Nagesh Kumar, Sachin Chaturvedi, Bruno Versailles and Katerina Kyrili (Chaturvedi 2010; Johnson 2008, 2009 and 2010; and Kumar 2010), as well as sessions in DCF symposia and biennial DCF meetings during 2007-10 where SSC was discussed.
23 For a more detailed examination of these historical developments, see UNCTAD (2010). 24 For more discussions of these wider aspects of SSC, see Kumar (2008).25 Mexico is a member of the OECD since 1994, but remains a member of G24, and is therefore also
included in this chapter. 26 Fordelone (2009) and ECOSOC (2009)
Headline in margin: South-South cooperation has existed for six decades...
But is now more prominent due to rapid expansion
72 Development Cooperation for the MDGs: Maximizing Results
This chapter provides an overview of the trends and development in South-South and triangular cooperation, as well as a more detailed analysis of these forms of intervention in the key sectors of health, agriculture and infrastructure.
Recent trends in south-south and triangular cooperationOverall amounts of south-south cooperation27
SSC has recently grown rapidly, from US$8.6 (6.9% of global development cooperation) in 200628 to US$15.3 billion (9.5% of development cooperation) in 2008. This represents an increase of US$6.7 billion or 78% in two years, a much faster rate than foreseen at the 2008 DCF. The share of SSC in global development cooperation has doubled in ten years.
This is mainly due to large increases by China (+US$1.8 billion) and Saudi Arabia (+US$3.5 billion), and a doubling of Venezuela’s cooperation with the Caribbean through its Petrocaribe oil loan arrangements. However, almost all Southern providers increased flows, except the United Arab Emirates (UAE), as shown in Table 3.1.
The largest Southern providers are Saudi Arabia, China and Venezuela (each providing over US$2 billion a year), followed by Arab Agencies (a combined total over US$1 billion) and India (over US$ 750 million). In 2008, the top three providers, Saudi Arabia, China and Venezuela, together accounted for 75% of total Southern development cooperation, compared with 60% in 2006.
The data compiled for the DCF and published here represent the most comprehensive estimate available of SSC. They cover 16 major governments providing SSC (three more than in the 2008 DCF report) as well as four Southern multilateral institutions which cover a large number of programme countries, namely the Arab Fund for Economic and Social Develop-ment (AFESD), Arab Bank for Economic Development in Africa (BADEA), the Islamic Development Bank (IsDB) and the OPEC Fund for International Development (OFID). The 2008 report was widely quoted as the most reliable global SSC estimate. However, it is important to note that the data in the 2008 report and in Table 3.1 are a considerable under-estimate of SSC, reflecting three factors (see Johnson 2008 and 2010 for details):
1. Data limitations for providers included in the table. Key exclusions from provid-ers covered by this study include: exclusion by some countries of debt relief, and by some of humanitarian assistance, from data they publish; lack of data on Venezuelan assistance apart from Petrocaribe; exclusion of considerable proportions of Indian, and Cuban assistance; lack of data on UAE apart from the Abu Dhabi Fund, and on disbursements by some Indian agencies; under-reporting of Arab assistance to the
27 It excludes Republic of Korea, which became a member of the OECD DAC in January 2010 and is therefore analyzed in Chapter 1. It also excludes 15 countries which are not DAC members and provided significant development cooperation in 2008, notably: EU non-DAC countries (Cyprus, Czech Republic, Estonia, Hungary, Latvia, Lithuania, Poland, Romania, the Slovak Republic and Slovenia) which provided US$1.14 billion; and other emerging donors such as Iceland (US$48.4 million), Israel (US$137.9 million), Liechtenstein (US$23.3 million), Russian Federation (US$200 million), and Turkey (US$780.4 million. Total non-DAC, non SSC therefore exceeded US$2.33 billion (1.5% of development cooperation) in 2008.
28 The 2006 figures are different from those in Johnson 2008 because of downward revisions to data for India, South Africa and Venezuela, and exclusion of Republic of Korea and Israel.
...mainly due to Saudi Arabia, China
and Venezuela
The DCF is publishing the most comprehensive data
on SSC, but this is still an underestimate
South-south development cooperation 73
Palestinian territories due to lack of current Palestinian data; and under-coverage of Southern providers contributions to multilateral organizations (see Shushan 2010 on Arab unreported aid).
2. SSC providers for which data were not available, notably the key sub-regional South-South organizations listed in Table 3.4; the Islamic Republic of Iran, Libya and Qatar, which provide significant financial cooperation; and countries includ-ing Algeria, Costa Rica, Indonesia, Morocco, Nigeria, Peru, Singapore, Tunisia, Uruguay and Viet Nam which focus mainly on Technical Cooperation (TC).
3. Lack of data for the significant SSC provided through Southern philanthropy, via foundations and trust funds established by endowments in Africa, Asia, the Middle East and Latin America, and organizations such as the Bangladesh Rural Advance-ment Committee (BRAC) and the Grameen Bank.
Although information on future plans of Southern providers is limited, SSC is likely to continue to grow rapidly. In November 2009, China pledged to provide US$10 billion in concessional loans to Africa for 2010-2012 – double the pledge for the previous three years (FOCAC 2010). In 2008, India announced it would provide US$5.4 billion as lines of credit to African countries and institutions over five years (India-Africa Forum 2008). Other bilat-eral providers, notably Brazil and South Africa, have also declared intentions to expand SSC significantly,29 and South-South multilateral institutions such as the Islamic Development Bank have received significant new funding which should allow them to expand lending. Should the recent rise continue, SSC could exceed US$20 billion by 2010.
Characteristics of south-south cooperation30
Channels of cooperation
A high proportion of SSC occurs via multilateral organizations, or Southern CSOs/phi-lanthropy.
As already discussed in Section 3.2.1, South-South multilateral organizations provide over US$1 billion a year of SSC. In addition, Southern providers make growing contribu-tions to global multilateral organizations. These accounted for about 22% of their overall development cooperation in 2008, up from 18% in 2006. However, as shown in Table 3.1, there is wide variation: Argentina, Chile, India, South Africa and the United Arab Emirates provide a large proportion of their cooperation multilaterally, whereas others provide most of their SSC bilaterally.
In 2008, Southern providers contributed US$2.5 billion to the United Nations, 11% of total contributions (United Nations 2010). The largest Southern contributors were Saudi Arabia, Brazil, Panama, Argentina and Colombia (Table 3.2). Of the total, 72% was develop-ment-related and 28% humanitarian. China, Mexico and Venezuela provided most of their funds for core development activities, making China the largest Southern contributor to core
29 Among non-DAC, non-South donors, the Russian Federation has also increased its ODA by US$600 million in 2008, and EU non-DAC members and Turkey have also pledged major increases in assist-ance over the next few years.
30 This section is based largely on Johnson 2008 and 2010, which provide more detailed analysis. It is also based very considerably on the work of Development Finance International in assisting low-income countries to evaluate the performance of Southern providers and DAC donors and identify the key characteristics of their cooperation, the results of which can be seen in s set of “profiles” at www.development-finance.org.
Rapid future expansion is planned
South-South cooperation via multilaterals is 22% and rising
Including rising contributions to the UN …
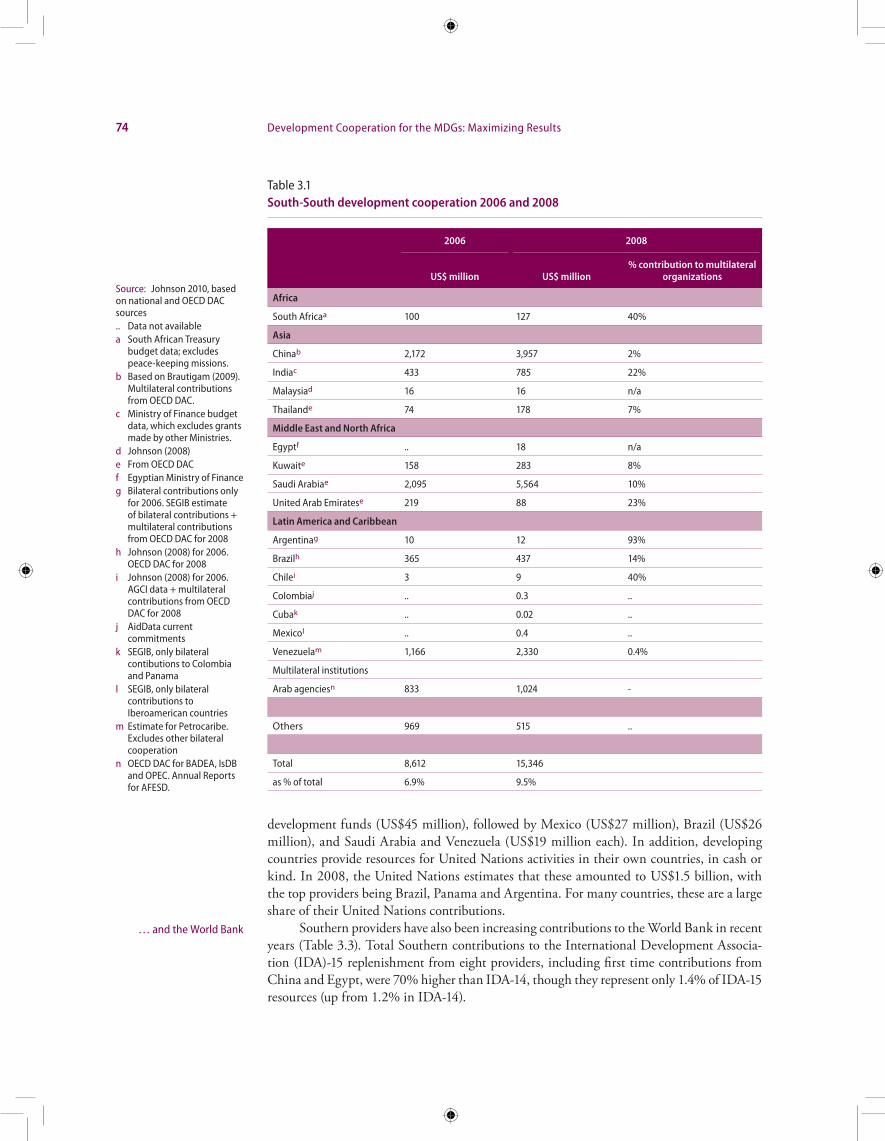
74 Development Cooperation for the MDGs: Maximizing Results
development funds (US$45 million), followed by Mexico (US$27 million), Brazil (US$26 million), and Saudi Arabia and Venezuela (US$19 million each). In addition, developing countries provide resources for United Nations activities in their own countries, in cash or kind. In 2008, the United Nations estimates that these amounted to US$1.5 billion, with the top providers being Brazil, Panama and Argentina. For many countries, these are a large share of their United Nations contributions.
Southern providers have also been increasing contributions to the World Bank in recent years (Table 3.3). Total Southern contributions to the International Development Associa-tion (IDA)-15 replenishment from eight providers, including first time contributions from China and Egypt, were 70% higher than IDA-14, though they represent only 1.4% of IDA-15 resources (up from 1.2% in IDA-14).
… and the World Bank
Table 3.1South-South development cooperation 2006 and 2008
2006 2008
US$ million US$ million% contribution to multilateral
organizations
Africa
South Africaa 100 127 40%
Asia
Chinab 2,172 3,957 2%
Indiac 433 785 22%
Malaysiad 16 16 n/a
Thailande 74 178 7%
Middle East and North Africa
Egyptf .. 18 n/a
Kuwaite 158 283 8%
Saudi Arabiae 2,095 5,564 10%
United Arab Emiratese 219 88 23%
Latin America and Caribbean
Argentinag 10 12 93%
Brazilh 365 437 14%
Chilei 3 9 40%
Colombiaj .. 0.3 ..
Cubak .. 0.02 ..
Mexicol .. 0.4 ..
Venezuelam 1,166 2,330 0.4%
Multilateral institutions
Arab agenciesn 833 1,024 -
Others 969 515 ..
Total 8,612 15,346
as % of total 6.9% 9.5%
Source: Johnson 2010, based on national and OECD DAC sources.. Data not availablea South African Treasury
budget data; excludes peace-keeping missions.
b Based on Brautigam (2009). Multilateral contributions from OECD DAC.
c Ministry of Finance budget data, which excludes grants made by other Ministries.
d Johnson (2008)e From OECD DAC f Egyptian Ministry of Financeg Bilateral contributions only
for 2006. SEGIB estimate of bilateral contributions + multilateral contributions from OECD DAC for 2008
h Johnson (2008) for 2006. OECD DAC for 2008
i Johnson (2008) for 2006. AGCI data + multilateral contributions from OECD DAC for 2008
j AidData current commitments
k SEGIB, only bilateral contibutions to Colombia and Panama
l SEGIB, only bilateral contributions to Iberoamerican countries
m Estimate for Petrocaribe. Excludes other bilateral cooperation
n OECD DAC for BADEA, IsDB and OPEC. Annual Reports for AFESD.
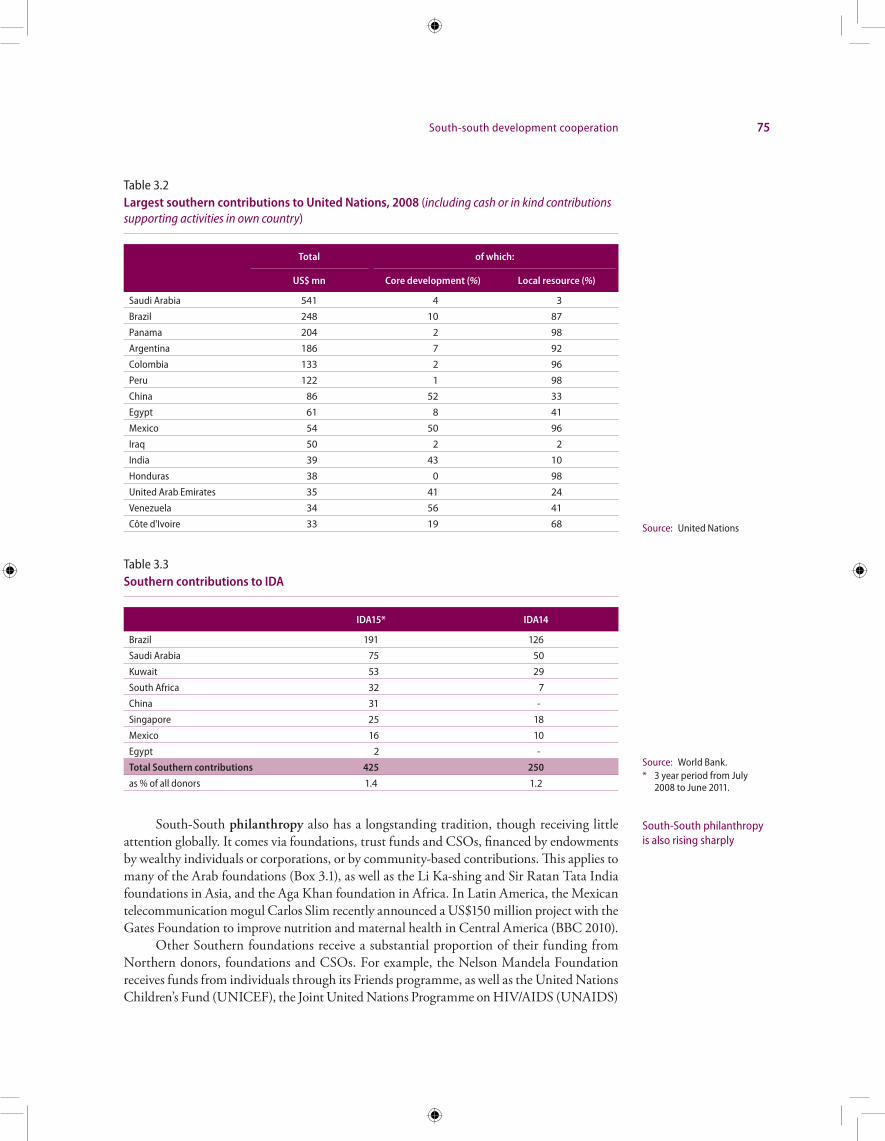
South-south development cooperation 75
South-South philanthropy also has a longstanding tradition, though receiving little attention globally. It comes via foundations, trust funds and CSOs, financed by endowments by wealthy individuals or corporations, or by community-based contributions. This applies to many of the Arab foundations (Box 3.1), as well as the Li Ka-shing and Sir Ratan Tata India foundations in Asia, and the Aga Khan foundation in Africa. In Latin America, the Mexican telecommunication mogul Carlos Slim recently announced a US$150 million project with the Gates Foundation to improve nutrition and maternal health in Central America (BBC 2010).
Other Southern foundations receive a substantial proportion of their funding from Northern donors, foundations and CSOs. For example, the Nelson Mandela Foundation receives funds from individuals through its Friends programme, as well as the United Nations Children’s Fund (UNICEF), the Joint United Nations Programme on HIV/AIDS (UNAIDS)
South-South philanthropy is also rising sharply
Table 3.2Largest southern contributions to United Nations, 2008 (including cash or in kind contributions supporting activities in own country)
Total of which:
US$ mn Core development (%) Local resource (%)
Saudi Arabia 541 4 3Brazil 248 10 87Panama 204 2 98Argentina 186 7 92Colombia 133 2 96Peru 122 1 98China 86 52 33Egypt 61 8 41Mexico 54 50 96Iraq 50 2 2India 39 43 10Honduras 38 0 98United Arab Emirates 35 41 24Venezuela 34 56 41Côte d'Ivoire 33 19 68 Source: United Nations
Source: World Bank.* 3 year period from July
2008 to June 2011.
Table 3.3Southern contributions to IDA
IDA15* IDA14
Brazil 191 126Saudi Arabia 75 50Kuwait 53 29South Africa 32 7China 31 -Singapore 25 18Mexico 16 10Egypt 2 -Total Southern contributions 425 250
as % of all donors 1.4 1.2
76 Development Cooperation for the MDGs: Maximizing Results
and United Nations Educational, Scientific and Cultural Organization (UNESCO); compa-nies such as Vodacom, De Beers and ABSA Bank; OECD donors such as German Society for Technical Cooperation (GTZ) and Australia, and Northern foundations such as Coca Cola (Nelson Mandela Foundation 2009). Some organizations, such as the Aga Khan Foundation, receive direct support from Northern donors, companies and individuals in each country where they work. Other Southern foundations also receive a high proportion of their fund-ing from Southern governments or South-South multilateral organizations (see Box 3.1 on Dubai Cares). The complex funding patterns of such organizations makes it very hard to assess how much finance they provide is additional to OECD/Southern bilateral, multilateral and OECD CSO/foundation flows.
The main sectors of focus are health, education, rural and social development, and cultural activities. Many Southern foundations and trusts focus their spending on activities in their country of origin, at least initially, and then over time widen their focus to fund overseas programmes and projects.
Another type of Southern cooperation is by largely self-financing organizations pro-viding microfinance to the rural or urban poor. For example, BRAC and Grameen Bank were both founded in the 1970s in Bangladesh to alleviate poverty by providing small loans, mainly to women, to set up small businesses. BRAC has grown from a small donor-funded programme to an independent organization supporting sustainable human development, primarily through self-financing microfinance activities and income-generating projects,31 while the Grameen Bank is 90% owned by the rural-poor it serves (Grameen Bank 2008). Based on its success in Bangladesh, BRAC has established activities in 13 African and Asian countries, while others have built on the Grameen Bank to establish similar projects in Africa, Asia and Latin America.
Types of cooperation
Overall, a much higher proportion (over 90%) of SSC funded by governments and South-South multilateral organizations is “country programmed”, because in their data no South-ern providers include refugee costs, and some do not include debt relief, scholarships, or humanitarian assistance.
Around three quarters of SSC is in the form of project finance. Most of the largest providers (China, Arab governments and multilateral institutions, India, Thailand) focus on this type of support. Due to their concentration on large infrastructure projects (see Sec-tion 3.4.3), the average size of projects is considerably larger than those provided by OECD donors, meaning that there is considerably less fragmentation caused by Southern providers (Aidinfo 2010).
Balance of payments and budget support has risen from around 10% to over 15% in recent years – mostly due to an increase in Venezuelan oil financing. India has also provided budget support to Bhutan, Nepal and Afghanistan. Arab multilateral funds (including the OPEC Fund) and the governments of Kuwait, Saudi Arabia and the United Arab Emirates have provided balance of payment support to finance oil imports. Arab contributors also con-tributed significant budget support (US$450 million) to the West Bank and Gaza in 2006. China has also provided some such support, and Brazil has provided open “lines of credit” for imports which are not tied to particular projects.
31 In 2009, microfinance activities and income-generating projects accounted for 58% of BRAC’s total revenues of US$480 million, with donors contributing 33%, and investment and other income 9% (BRAC 2009).
... mainly in social and ruraldevelopment
Self-financing charities are also growing
90% of South-South cooperation is “country
programmed”
Three quarters is project finance
... though there have been rapid recent rises in budget
support and debt relief
South-south development cooperation 77
Many Southern contributors and multilateral creditors have provided debt relief, with some countries having written-off very significant sums. These include China, India, Brazil, South Africa and the multilateral institutions. Some, notably China, have gone well beyond similar actions by DAC members, in providing 100% cancellation to a wide range of coun-tries. However, some including Iran, Iraq and Libya have yet to provide significant debt relief. It is not possible to quantify the annual flows of this type of SSC, as almost all SSC providers exclude it from their statistics, but it has totalled well over US$1 billion during the last decade.
Technical cooperation (TC) is a key modality of SSC. Though stand-alone TA accounts for only around 10%, many smaller SSC contributors (for example Argentina, Chile, Cuba, Egypt, Indonesia, Malaysia, Mexico, Nigeria, Singapore and Tunisia) and Brazil focus mainly on TC. Many therefore have dedicated TC departments or agencies which are in charge of most of their SSC, some of which have existed for more than 35 years. Larger providers such as China and India also have a long history of significant TC (sometimes as part of projects – for example Chinese assistance in building Tanzanian and Zambian capacity to maintain the TAZARA railway). India has provided over US$3 billion to 156 countries (UNDP Spe-cial Unit 2007). However, TC is only a relatively small component of assistance by Southern multilateral institutions.
As well as sending experts to advise in-country, TC includes peer learning through study tours, training (technical and academic) and capacity building. Most of this support has no cost to the beneficiary country, because it is provided by staff of public sector institu-tions of the providing country (TT-SSC 2010b). For example Cuban health sector projects in Africa are delivered by Cuban medical experts, paid for by the Cuban government. However, beneficiary countries are occasionally asked to provide local accommodation or transport.
Humanitarian assistance is also increasing dramatically, in response to natural disas-ters. In 2008, according to the United Nations Office for the Coordination of Humanitarian Affairs (UNOCHA), Southern providers contributed more than US$1 billion, compared
Technical Cooperation remains vital for smaller providers
Humanitarian assistance is increasing dramatically
Box 3.1Arab philanthropy
There is a deep-rooted tradition of private giving in the Arab world, which encompasses benevolent acts and charitable donations for philanthropic or religious purposes. The rapid growth in Arab wealth since the 1970s has inspired the creation of more formalised institutions such as foundations, funded by endowments from wealthy individuals. For example, the Mohamed Bin Rashid Al Maktoum Foundation was launched in May 2007 with an endowment of US$10 billion, making it the largest foundation in the Arab region and among the largest in the world. There are also corporate and government-sponsored foundations. For example, Dubai Cares, which supports primary education in developing countries, has an endowment of US$1 billion, half from individual and corporate donations, with a matching sum from Sheikh Mohamed Bin Rashid Al Maktoum.
There is little public information on Arab philanthropy, especially financing sources and volume of assist-ance, in part reflecting traditions which discourage seeking public approval for donations. This also makes it hard to determine how much is spent outside the source country. It is known that education is a key sector for many Arab foundations. In addition, some foundations focus on national/regional support, whereas others have a wider mandate: for example, the Al Maktoum Foundation supports education activities in 14 Arab countries as well as Asia, Africa and Europe. Support for health and information technology is also a feature of some Arab foundations, as well as building mosques, organizing pilgrimages, establishing cultural centres and humanitarian assistance.
Sources: Ibrahim and Sherif (2009), individual foundation websites
78 Development Cooperation for the MDGs: Maximizing Results
with an US$275 million in 2006-07 (Development Initiatives 2009 and 2010). This mainly reflected a dramatic increase of US$515 million from Saudi Arabia, making it the third largest provider of humanitarian aid after the United States and the European Commission. Though Saudi flows fell back in 2009, as a group, Arab countries have accounted for 85% of record-ed Southern humanitarian assistance in 2006-09. The largest recipients in 2008 included Yemen, Occupied Palestinian Territory, China, Sudan, and Myanmar. However, these data should be treated with caution, as many Southern providers do not report to UNOCHA.
Humanitarian support is mostly to regional neighbours. Latin American providers have provided huge pledges for Haiti, and earlier responded to Cuba’s 2008 hurricanes (17 coun-tries disbursing US$165 million - SEGIB 2009), Hurricane Mitch for Honduras and Nica-ragua, and floods in Bolivia and Guyana. Similarly, Asian providers responded generously to the Asian tsunami, floods in Bangladesh and the earthquake in Pakistan. South Africa has also delivered humanitarian assistance to the Southern Africa region at times of cyclones, droughts and floods. Arab contributors have provided several US$ billion in emergency assist-ance to Lebanon and the West Bank and Gaza in recent years. However, SSC providers have increasingly provided humanitarian assistance for major disasters outside their regions in recent years – notably the Asian tsunami, the Haitian earthquake and the Pakistan floods.
Destination and allocation of SSC
To date, geographical proximity has been a major factor determining the direction of South-ern bilateral cooperation, with many providers focusing flows on countries in the neighbour-ing region or sub-region. They often have better understanding of neighbouring countries, mutual needs and interests as well as language and cultural similarities, all conducive to the design of joint solutions to common problems. Regional cooperation also provides op-portunities to strengthen political ties, trade and investment links, and can be cheaper to administer than longer-distance cooperation programmes (see also Dreher 2010; Robinson 2009; SEGIB 2009).
• The Secretaria General Iberoamericana (SEGIB) notes based on partial data that Latin American intra-regional SSC amounted to US$13 million in 2008, excluding Venezuelan cooperation, and rose sharply in 2005-08, coinciding with reductions in DAC ODA to the region. Political ties are also crucial in Venezuela’s SSC with Latin America and the Caribbean, including strong reciprocal bilateral programmes with Cuba (SEGIB 2009), and assistance to countries joining the Bolivarian Alliance for the Americas (ALBA), e.g. US$50 million to Antigua and Barbuda in 2009.
• There is also strong Asian intra-regional SSC. For example, India channels most of its assistance to Afghanistan, Bhutan, Maldives, Myanmar, Nepal and Sri Lanka. In 2008/09 Bhutan received over 40% of India’s bilateral cooperation, reflecting vital hydropower developments which were also in India’s interest (IMF 2009). Other Asian providers such as China, Indonesia, Malaysia, Singapore and Thailand also focus SSC on their neighbours. China provides about 40% of its SSC to Asia, mostly for transport and social sectors (Schueller 2010). Indonesia, Malaysia and Singapore provide technical cooperation and training, and Thailand also makes concessional loans to Cambodia, Laos, Myanmar and Viet Nam, for example in the Ayeyawady - Chao Phraya - Mekong Economic Cooperation Strategy (ACMECS) framework under which it provides capacity building in trade and investment facilitation, agri-culture, industry, energy, transport, tourism, public health, and environment (TT-SSC 2010b).
Much South-South cooperation is
concentrated on regional neighbours
South-south development cooperation 79
• For Arab agencies and countries, geography, cultural and language links are vital. As of December 2007, 59% of their cumulative commitments had gone to Arab countries.
• In Africa, much of South Africa’s cooperation is directed via regional organizations, or funds peace-keeping in conflict-affected countries on the continent. The Egyptian Fund for Technical Cooperation’s financing of a project to control aquatic weeds on Lake Victoria in Uganda reflected a shared interest in maintaining water flow into the Nile River (TT-SSC 2010a). Nigeria’s technical cooperation is almost entirely directed to other African countries.
However, there is another meaning of “regional cooperation” – funding of multi-coun-try programmes or projects, or regional organizations. SSC has shown much comparative advantage in this area also.
Recent intensified regional integration has been a major catalyst for SSC, developing many initiatives and organizations (as shown in Table 3.4), some of which also attract DAC donor triangular funds.
Table 3.4Selected regional cooperation initiatives
Africa African Union (AU), Communauté Economique et Monétaire de l’Afrique Centrale (CEMAC), Common Market of Eastern and Southern Africa (COMESA), East African Community (EAC), East African Development Bank (EADB), New Economic Partnership for Africa (NEPAD), Southern African Development Community (SADC); West African Development Bank (WADB); West African Economic and Monetary Union (WAEMU)
Asia Association of Southeast Asian Nations (ASEAN+3), South Asian Association for Regional Cooperation (SAARC)
Latin America Bolivarian Alternative for the Americas (ALBA), Andean Community (CAN), Andean Development Corporation (CAF), Caribbean Community (CARICOM), Central American Integration System (SICA), Central American Bank for Economic Integration (CABEI), Southern Common Market (MERCOSUR)
Some Southern providers have also emphasized cooperation outside their own regions, again based on common political, trade and investment interests. Shared language has also been important for Brazil – which provides three quarters of its African assistance to Portuguese-speaking African countries, and almost all its Asian assistance to East Timor. China provides 45% of its cooperation to Africa (see Box 3.2); and 40% of commitments by Arab agencies and Kuwaiti and Saudi Funds have been to Africa, focusing on transport and communications, energy, agriculture, and water and sanitation. Many other SSC providers choose specific comparative advantages to share outside their regions: Colombia shares les-sons of disarmament, demobilization and reintegration with Liberia, Haiti, Sri Lanka and the Philippines; Cuba provides health support to many African countries; and Singapore offers training programmes to all continents in topics including law enforcement and transport management. China, India and Venezuela have gone further, engaging strongly with Africa as a region, holding summits with regional leaders, and funding regional initiatives and institu-tions. Box 3.2 discusses Chinese cooperation with Africa in more detail. IBSA is an example of cross-regional SSC among three important emerging economies, as discussed in Box 3.3.
In terms of other factors influencing allocation of SSC, Southern providers have tended to focus more concessional cooperation on the poorer countries, perhaps with the exception of some Arab countries and institutions, which concentrate support more on other middle-income countries in their own region.
South-South cooperation also specializes in funding regional programmes and institutions
Some providers have made major efforts at global cooperation
80 Development Cooperation for the MDGs: Maximizing Results
Political considerations have also influenced SSC since the strong influence of non-aligned and G77 solidarity at the Bandung conference. An example is Cuban and Venezuelan development cooperation which is part of wider Latin American solidarity initiatives. Some Southern providers have been criticized for not taking sufficient account of human rights (see for example Reality of Aid 2009): as with some DAC donors, political and strategic considerations, or trade and investment opportunities, may sometimes overrule human rights issues. However, most SSC does not go to countries with poor human rights records: indeed the countries receiving most SSC are increasingly similar to those receiving the largest DAC donor flows.
Promoting bilateral trade and investment has also been a powerful motive for SSC. Focusing SSC on resource-rich African countries, such as Angola, Nigeria, Sudan, United Republic of Tanzania and Zambia, has been an aspect of China’s policy in recent years (Brau-tigam 2009; Stellenbosch 2006), with obvious benefits for trade. Venezuela’s focus under the Petrocaribe agreement has been on promoting regional energy integration. Arab contributors have also funded oil exports, and Export-Import (EXIM) banks in China and India have
Political, strategic, trade and investment links are
also influential
Box 3.2China-Africa Cooperation
China’s aid to Africa in 2007 was US$1.4 billion, about 45% of its total cooperation. This was less than 4% of total DAC aid to Africa, 18% of US aid or 50% of Japanese aid. However, it is estimated to have doubled between 2007 and 2010, whereas in the same period, DAC aid to Africa grew by only 30%. It also funds sectors which DAC donors tend to leave aside, notably infrastructure. As a result it is increasingly seen as a key and dynamic donor by many African governments.
A great deal has been, and is being written about China’s assistance to Africa. Some authors focus on mutual interests and benefits for China and Africa of Chinese SSC, whereas others are highly critical.
Chinese grants and zero-interest loans, which account for about half its cooperation, are disbursed to 38 countries across the African continent. They fund agriculture (including food security), medical care and public health (including malaria prevention), and education and training.
There are also subsidized low-interest loans for poorer countries (with interest rates of 1-3% and maturities of 10-30 years), which have been used mainly for telecommunications, power, road and rail projects. These represent around 40% of Chinese cooperation, and have been very popular with African governments as they fund vital growth-oriented projects, and Chinese-led construction or technology are lower-cost and rapidly supplied.
However, a small number of expensive ‘commercial’ loans geared towards generating business and trade opportunities, often in resource-rich countries, and sometimes with payment guaranteed by oil or mineral resources, have also made the headlines. China has provided these in Angola, the Democratic Republic of Congo, Equatorial Guinea, Sudan and Zimbabwe. Such cooperation is of mutual benefit as China is meeting country needs and filling funding gaps left by DAC donors, while also exporting its equipment, machinery and consumer goods. Though it has been criticized for creating a debt burden and supporting countries with poor human rights records, due to its commercial terms it is not strictly “development cooperation” as defined in this report.
Chinese cooperation is highly responsive to the priorities of recipient governments when these are clearly expressed. As a result, China has respected the debt management policies of recipient countries (where they are anxious to control new borrowing it has offered only concessional loans or grants); Ethiopia and Ghana have agreed with China that it should allow mostly local labour to be used; China has applied national environment and labour standards to projects when required; and Central African Republic has received budget support. In addition, following African requests at the November 2009 Forum on China-Africa Cooperation (FOCAC) meeting, China is turning its attention to funding African countries to adapt to climate change and protect their environment.
Sources: Brautigam 2009; FOCAC 2010; HIPC CBP
2010; Johnson 2008
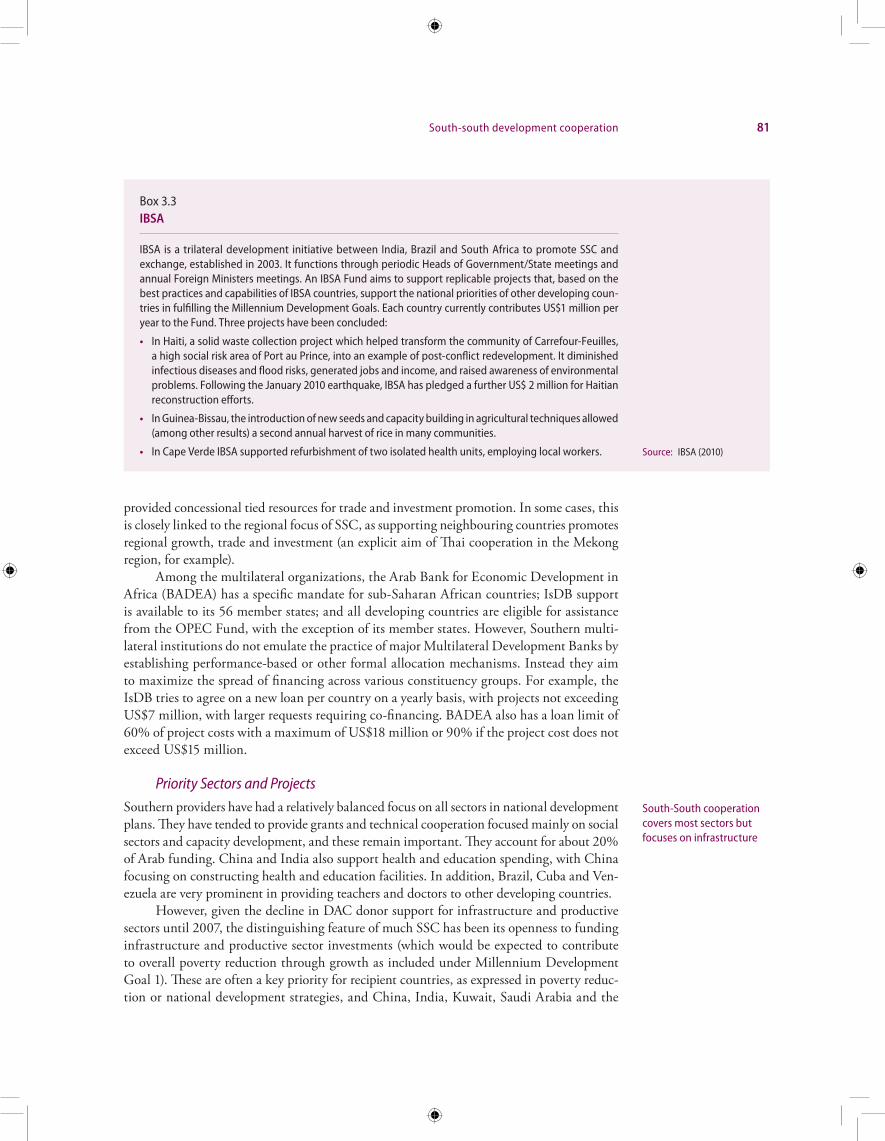
South-south development cooperation 81
provided concessional tied resources for trade and investment promotion. In some cases, this is closely linked to the regional focus of SSC, as supporting neighbouring countries promotes regional growth, trade and investment (an explicit aim of Thai cooperation in the Mekong region, for example).
Among the multilateral organizations, the Arab Bank for Economic Development in Africa (BADEA) has a specific mandate for sub-Saharan African countries; IsDB support is available to its 56 member states; and all developing countries are eligible for assistance from the OPEC Fund, with the exception of its member states. However, Southern multi-lateral institutions do not emulate the practice of major Multilateral Development Banks by establishing performance-based or other formal allocation mechanisms. Instead they aim to maximize the spread of financing across various constituency groups. For example, the IsDB tries to agree on a new loan per country on a yearly basis, with projects not exceeding US$7 million, with larger requests requiring co-financing. BADEA also has a loan limit of 60% of project costs with a maximum of US$18 million or 90% if the project cost does not exceed US$15 million.
Priority Sectors and Projects
Southern providers have had a relatively balanced focus on all sectors in national development plans. They have tended to provide grants and technical cooperation focused mainly on social sectors and capacity development, and these remain important. They account for about 20% of Arab funding. China and India also support health and education spending, with China focusing on constructing health and education facilities. In addition, Brazil, Cuba and Ven-ezuela are very prominent in providing teachers and doctors to other developing countries.
However, given the decline in DAC donor support for infrastructure and productive sectors until 2007, the distinguishing feature of much SSC has been its openness to funding infrastructure and productive sector investments (which would be expected to contribute to overall poverty reduction through growth as included under Millennium Development Goal 1). These are often a key priority for recipient countries, as expressed in poverty reduc-tion or national development strategies, and China, India, Kuwait, Saudi Arabia and the
South-South cooperation covers most sectors but focuses on infrastructure
Box 3.3IBSA
IBSA is a trilateral development initiative between India, Brazil and South Africa to promote SSC and exchange, established in 2003. It functions through periodic Heads of Government/State meetings and annual Foreign Ministers meetings. An IBSA Fund aims to support replicable projects that, based on the best practices and capabilities of IBSA countries, support the national priorities of other developing coun-tries in fulfilling the Millennium Development Goals. Each country currently contributes US$1 million per year to the Fund. Three projects have been concluded:
• In Haiti, a solid waste collection project which helped transform the community of Carrefour-Feuilles, a high social risk area of Port au Prince, into an example of post-conflict redevelopment. It diminished infectious diseases and flood risks, generated jobs and income, and raised awareness of environmental problems. Following the January 2010 earthquake, IBSA has pledged a further US$ 2 million for Haitian reconstruction efforts.
• In Guinea-Bissau, the introduction of new seeds and capacity building in agricultural techniques allowed (among other results) a second annual harvest of rice in many communities.
• In Cape Verde IBSA supported refurbishment of two isolated health units, employing local workers. Source: IBSA (2010)
82 Development Cooperation for the MDGs: Maximizing Results
multilateral institutions (BADEA, IsDB and OPEC Fund) have provided extensive support for infrastructure and agriculture in particular. As shown in Table 3.5, funding for transport and communications, energy and other economic infrastructure accounts for 50% or more of assistance from BADEA, IsDB, KFAED (Kuwait Fund for Arab Economic Development), OFID (OPEC Fund for International Development), SFD (Saudi Fund for Development) and the United Arab Emirates.
Some Southern providers, such as China, India, Kuwait, Saudi Arabia, the United Arab Emirates and Venezuela, have financed priority ‘prestige’ projects, including sport stadiums, presidential residences, Ministry buildings, parliaments and conference facili-ties. The more the motivation for cooperation is political rather than focused solely on development, the more likely it is that it will fund prestige projects regardless of develop-ment priorities. This tendency is of course also visible among DAC donors, and is true of military aid as well.
Conditionalities and Procedures
Policy ConditionalitiesOne major advantage of SSC from the point of view of recipient countries is that it carries little, if any, economic or governance policy conditionalities, and is not aligned to policy agreements with multilateral institutions. In contrast, bilateral Southern contributors em-phasize that development assistance should not interfere in the internal affairs of programme countries (Wang 2008). Southern multilateral institutions also do not usually impose any macroeconomic conditionalities, and disbursements are only suspended if a beneficiary falls into arrears with debt servicing. This paucity of conditionalities enhances programme coun-tries’ ownership, as governments have ‘to jump through far fewer hoops’ to access SSC, and also makes it much more predictable and faster to mobilize.
Procedural ConditionalitiesSSC tends to come with fewer conditions precedent, which must be met before a grant or loan agreement becomes effective, such as legal opinions, cross-financing clauses, financial conditions, counterpart funds, feasibility or appraisal studies, and the establishment of project implementation units (PIUs). Most Southern providers require a legal opinion before allowing disbursements to commence. Some contributors, such as BADEA and IsDB, may require the setting-up of a Project Implementation Unit, and a separate bank account, as they do not get involved directly in project execution, while many Southern bilateral providers do not have such a requirement. A few Southern bilateral providers also require recipient governments to provide counterpart funds, although this may vary by country. Overall, the conditions preceding Southern providers’ loan or grant disbursements are relatively few, and therefore SSC often disburses much more rapidly.
On- or Off-Budget ChannelsFor budget support and debt relief, Southern providers channel SSC through the budget of re-cipient country governments, enhancing mutual accountability and national ownership. For project assistance, however, the picture is not as uniform. While some SSC providers, such as the IsDB, Kuwait and Saudi Arabia, agree formal programmes with Finance and Planning Ministries and provide almost all assistance on budget, others agree project assistance at Head of State or Government level, and provide technical co-operation (TC) and humanitarian assistance via line ministries, other public sector agencies or NGOs, complicating government monitoring and the coordination of development cooperation.
South-South cooperation has little or no
policy conditions...
... and fewer procedural conditions
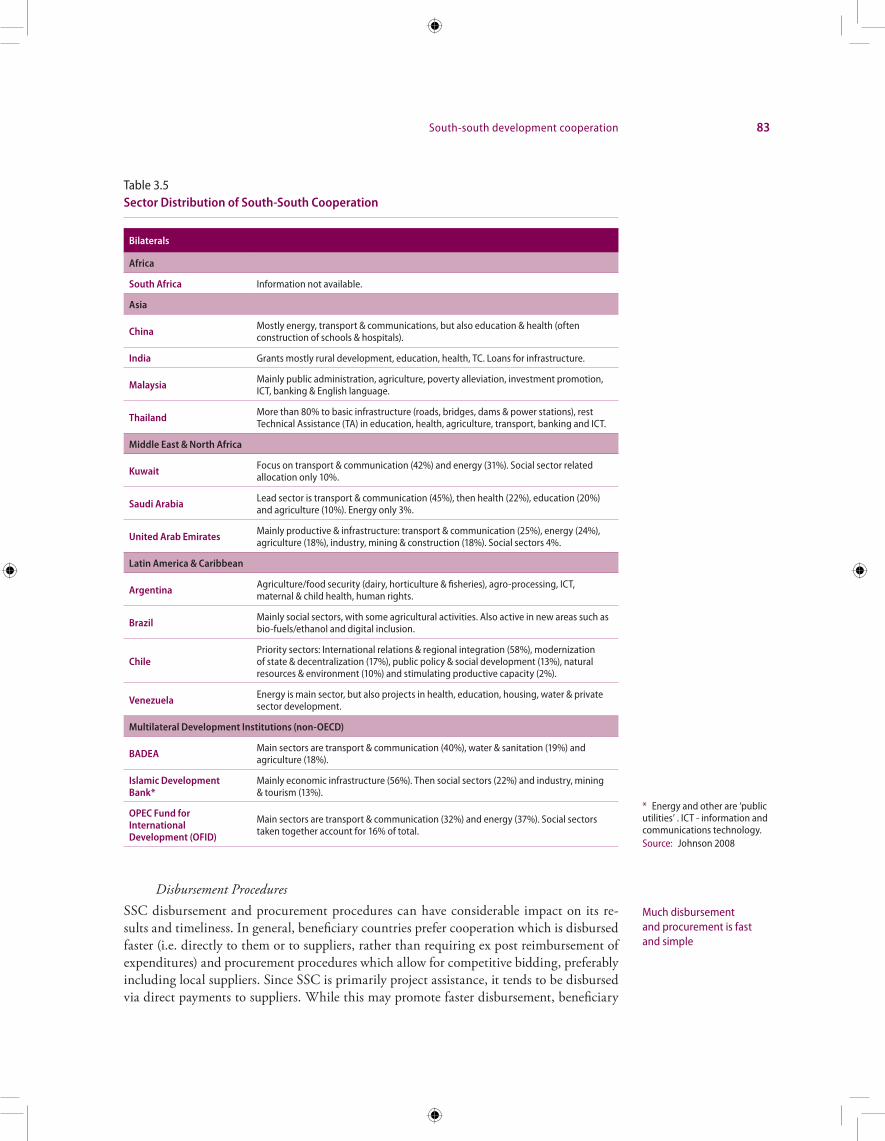
South-south development cooperation 83
Disbursement ProceduresSSC disbursement and procurement procedures can have considerable impact on its re-sults and timeliness. In general, beneficiary countries prefer cooperation which is disbursed faster (i.e. directly to them or to suppliers, rather than requiring ex post reimbursement of expenditures) and procurement procedures which allow for competitive bidding, preferably including local suppliers. Since SSC is primarily project assistance, it tends to be disbursed via direct payments to suppliers. While this may promote faster disbursement, beneficiary
Much disbursement and procurement is fast and simple
Table 3.5Sector Distribution of South-South Cooperation
Bilaterals
Africa
South Africa Information not available.
Asia
China Mostly energy, transport & communications, but also education & health (often construction of schools & hospitals).
India Grants mostly rural development, education, health, TC. Loans for infrastructure.
Malaysia Mainly public administration, agriculture, poverty alleviation, investment promotion, ICT, banking & English language.
Thailand More than 80% to basic infrastructure (roads, bridges, dams & power stations), rest Technical Assistance (TA) in education, health, agriculture, transport, banking and ICT.
Middle East & North Africa
Kuwait Focus on transport & communication (42%) and energy (31%). Social sector related allocation only 10%.
Saudi Arabia Lead sector is transport & communication (45%), then health (22%), education (20%) and agriculture (10%). Energy only 3%.
United Arab Emirates Mainly productive & infrastructure: transport & communication (25%), energy (24%), agriculture (18%), industry, mining & construction (18%). Social sectors 4%.
Latin America & Caribbean
Argentina Agriculture/food security (dairy, horticulture & fisheries), agro-processing, ICT, maternal & child health, human rights.
Brazil Mainly social sectors, with some agricultural activities. Also active in new areas such as bio-fuels/ethanol and digital inclusion.
Chile Priority sectors: International relations & regional integration (58%), modernization of state & decentralization (17%), public policy & social development (13%), natural resources & environment (10%) and stimulating productive capacity (2%).
Venezuela Energy is main sector, but also projects in health, education, housing, water & private sector development.
Multilateral Development Institutions (non-OECD)
BADEA Main sectors are transport & communication (40%), water & sanitation (19%) and agriculture (18%).
Islamic Development Bank*
Mainly economic infrastructure (56%). Then social sectors (22%) and industry, mining & tourism (13%).
OPEC Fund for International Development (OFID)
Main sectors are transport & communication (32%) and energy (37%). Social sectors taken together account for 16% of total.
* Energy and other are ‘public utilities’ . ICT - information and communications technology.Source: Johnson 2008
84 Development Cooperation for the MDGs: Maximizing Results
governments are not always informed that transactions have occurred, hampering debt and cooperation data recording and monitoring. Some contributors (BADEA, India and Venezuela) disburse via cash advances to recipient governments and others via reimburse-ment claims (India, IsDB, Kuwait Fund for Arab Economic Development, OPEC Fund for International Development and Saudi Fund for Development). Overall disbursement procedures of Southern contributors are seen as relatively simple. Though this is sometimes offset by slowness of internal administrative procedures, limited staff in the agencies pro-viding cooperation, and lack of provider presence in the beneficiary country, in general it reduces disbursement delays.
Financial Management SystemsArab providers use national public financial management procedures, although KFAED usually insists on separate accounting and financial reporting. The IsDB requires Project Implementation Units to handle budgets and accounts and to conduct audits. India and Ven-ezuela also require project-implementing agencies to conduct separate accounting, reporting and auditing, with little reliance on national systems. Other providers (like China) sometimes use national public financial management (PFM) procedures.
Procurement Procedures and TyingArab providers (ADFD, BADEA, IsDB, KFAED, OPEC Fund, SFD and United Arab Emirates) use common procurement procedures, which are set out in the Arab Coordina-tion Group’s Procurement Guidelines. These do not always lead to faster implementation, as many Arab funded projects are co-financed and coordinating procurement amongst several Arab providers can be time-consuming. There is virtually no other harmonisation of procurement procedures amongst Southern providers, or use of beneficiary country procurement systems.
The Arab Procurement Guidelines stipulate competitive bidding, although often with a preference for Middle Eastern or African sources. Competitive bidding can also be waived by mutual agreement. The guidelines allow for local suppliers to bid and, in Ghana and Uganda, local contractors have been implementing BADEA-funded projects. As a result, beneficiaries often consider development assistance from Arab providers as virtually untied. In contrast, project assistance from non-Arab providers is primarily tied. However, China and India allow the use of local contractors, mainly but not only for smaller projects (their flexibility depends on the existence of experienced local contractors). Technical cooperation and emergency assistance by Southern providers is also mainly tied as it involves sending national experts to countries, funding students to study or participate in training at national institutions, and providing emergency shipments of goods and medical experts. At present there are no con-certed moves to untie Southern bilateral cooperation, although some providers are becoming increasingly flexible, especially in funding triangular cooperation.
The key question arising is whether the tying of SSC has the same pernicious effects as the tying of DAC donor aid. In general, beneficiary countries see these effects as weaker in the case of SSC, because: simpler procedures decrease the delays caused by tying rather than using more accessible local supply channels; and cheaper costs, greater value-for-money, more appropriate skills and technology, greater transfer of skills and capacity-building impact of SSC reduces the negative effects of the cost premium of tying. An example of value-for-money in Chinese assistance is discussed in Box 3.4. However, these offsetting advantages should not be exaggerated: untying is still preferred, and there are examples where SSC has led to poorer value-for-money, via the purchase of substandard equipment.
Some providers use recipient financial systems
Much South-South cooperation is tied but
this is often subject to negotiation...
... and in spite of tying value for money
remains high
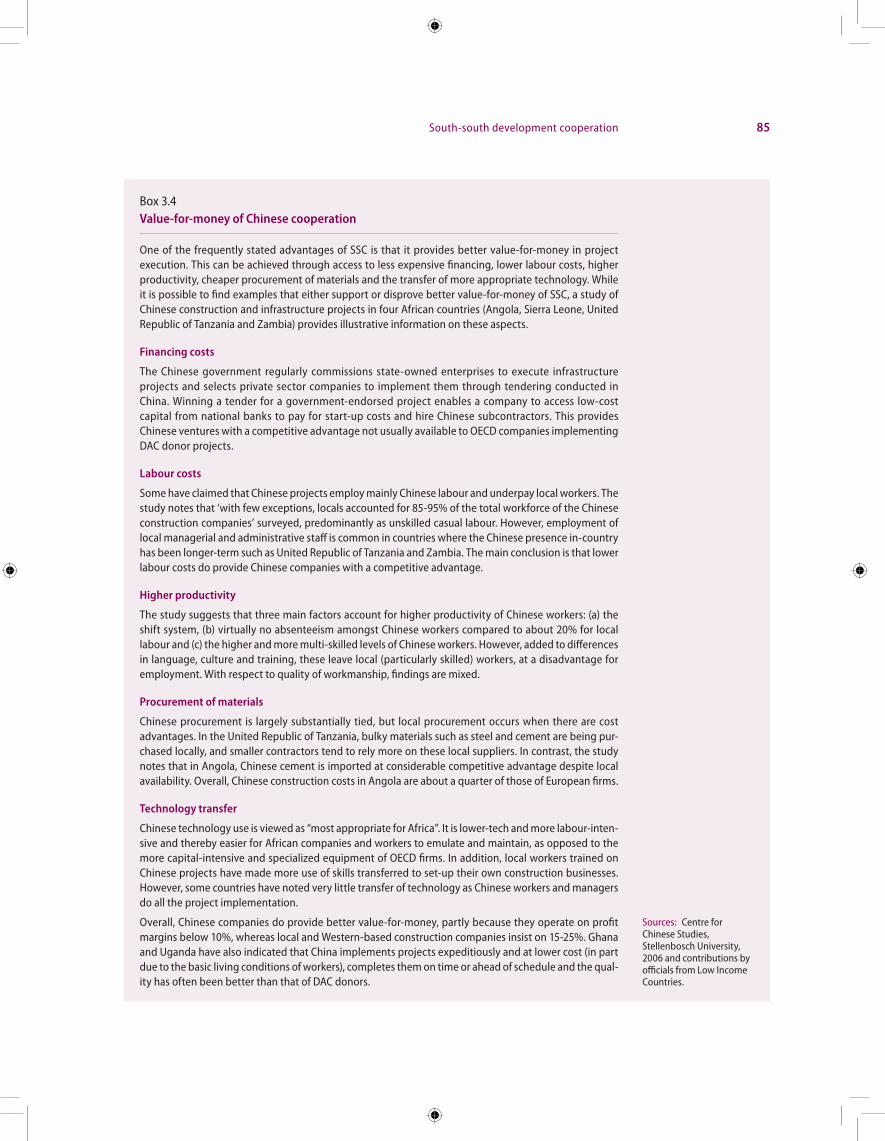
South-south development cooperation 85
Box 3.4Value-for-money of Chinese cooperation
One of the frequently stated advantages of SSC is that it provides better value-for-money in project execution. This can be achieved through access to less expensive financing, lower labour costs, higher productivity, cheaper procurement of materials and the transfer of more appropriate technology. While it is possible to find examples that either support or disprove better value-for-money of SSC, a study of Chinese construction and infrastructure projects in four African countries (Angola, Sierra Leone, United Republic of Tanzania and Zambia) provides illustrative information on these aspects.
Financing costs
The Chinese government regularly commissions state-owned enterprises to execute infrastructure projects and selects private sector companies to implement them through tendering conducted in China. Winning a tender for a government-endorsed project enables a company to access low-cost capital from national banks to pay for start-up costs and hire Chinese subcontractors. This provides Chinese ventures with a competitive advantage not usually available to OECD companies implementing DAC donor projects.
Labour costs
Some have claimed that Chinese projects employ mainly Chinese labour and underpay local workers. The study notes that ‘with few exceptions, locals accounted for 85-95% of the total workforce of the Chinese construction companies’ surveyed, predominantly as unskilled casual labour. However, employment of local managerial and administrative staff is common in countries where the Chinese presence in-country has been longer-term such as United Republic of Tanzania and Zambia. The main conclusion is that lower labour costs do provide Chinese companies with a competitive advantage.
Higher productivity
The study suggests that three main factors account for higher productivity of Chinese workers: (a) the shift system, (b) virtually no absenteeism amongst Chinese workers compared to about 20% for local labour and (c) the higher and more multi-skilled levels of Chinese workers. However, added to differences in language, culture and training, these leave local (particularly skilled) workers, at a disadvantage for employment. With respect to quality of workmanship, findings are mixed.
Procurement of materials
Chinese procurement is largely substantially tied, but local procurement occurs when there are cost advantages. In the United Republic of Tanzania, bulky materials such as steel and cement are being pur-chased locally, and smaller contractors tend to rely more on these local suppliers. In contrast, the study notes that in Angola, Chinese cement is imported at considerable competitive advantage despite local availability. Overall, Chinese construction costs in Angola are about a quarter of those of European firms.
Technology transfer
Chinese technology use is viewed as “most appropriate for Africa”. It is lower-tech and more labour-inten-sive and thereby easier for African companies and workers to emulate and maintain, as opposed to the more capital-intensive and specialized equipment of OECD firms. In addition, local workers trained on Chinese projects have made more use of skills transferred to set-up their own construction businesses. However, some countries have noted very little transfer of technology as Chinese workers and managers do all the project implementation.
Overall, Chinese companies do provide better value-for-money, partly because they operate on profit margins below 10%, whereas local and Western-based construction companies insist on 15-25%. Ghana and Uganda have also indicated that China implements projects expeditiously and at lower cost (in part due to the basic living conditions of workers), completes them on time or ahead of schedule and the qual-ity has often been better than that of DAC donors.
Sources: Centre for Chinese Studies, Stellenbosch University, 2006 and contributions by officials from Low Income Countries.
86 Development Cooperation for the MDGs: Maximizing Results
Appraisal, Monitoring and EvaluationWhile Southern contributors are often able to implement projects faster and at lower costs, there is some concern that this may be because of less due diligence with respect to project pre-appraisal and therefore less respect for environmental or labour standards, particularly on infrastructure projects (see Reality of Aid). Examples frequently cited include the impact of dam construction projects in Africa and Southeast Asia on the environment, communi-ties and human health (see Bosshard 2006) and the employment of local workers only for unskilled posts, paying them very low wages in breach of national labour laws. This is an important policy challenge facing Southern contributors.
There is little information available on the monitoring and evaluation (M&E) procedures of Southern providers. Beneficiary countries suggest that SSC involves significantly fewer mis-sions to review project progress, as well as fewer reports during project execution. Moreover, for turnkey projects,32 the beneficiary government is unlikely to be involved in the M&E process. Overall, M&E systems of Southern bilateral providers seem to be largely concerned with timely completion of projects. BADEA and the OPEC Fund use M&E systems similar to those of the major multilateral institutions. This is an area in which many Southern providers have expressed a wish for greater information exchange among Southern and other providers in order to capitalize on best practices and ensure lessons are more fully learned for MDG results.
Concessionality
One area of very active discussion around SSC in recent years has been concessionality. While many Southern governments provide grants only, and almost all provide technical cooperation as grants, many provide programme and project assistance as loans. As illus-trated in Table 3.6 below, SSC also offers highly concessional loans to the poorest countries, and to a lesser extent, to middle and higher income countries. Furthermore, almost all loans provided as SSC are concessional enough (calculated using IMF methodology) to respect recipient country borrowing policies. There is therefore no major risk that SSC-related bor-rowing will make low-income country debts unsustainable once again.
However, if recipient countries set more restrictive borrowing policies involving mini-mum grant elements of 45-50%, then even the most generous loans from India, Thailand and Venezuela (PetroCaribe) may no longer be feasible. Because the concessionality of South-ern multilateral institutions is generally lower than that of global multilateral institutions such as the Multilateral Development Banks, accessing their loans can also become slightly problematic. Many Southern providers (notably the multilaterals) have therefore been flex-ible in changing loan terms to ensure that they are coherent with country borrowing policies. Given the comparative advantages of Southern providers in some key development areas (such as infrastructure) there may also be increased need for borrowers (and the IMF and World Bank in advising countries on borrowing policies) to be more flexible to accommo-date SSC loans which are funding high-return projects that are making a key contribution to accelerating growth.
Predictability
Beneficiary governments prefer multi-year commitments of cooperation as this helps them to plan future inflows effectively, particularly within medium-term expenditure frameworks
32 A turnkey project provides a deliverable to the customer that is fully tested and ready to use upon delivery.
Faster and cheaper implementation may
come at environmental and human cost
Southern providers want to cooperate mutually
to improve monitoring and evaluation of results
There is no major risk of unsustainable debt: South-
South cooperation fits with recipient policies
Some South-South cooperation is planned multiyear, and is highly
predictable in-year
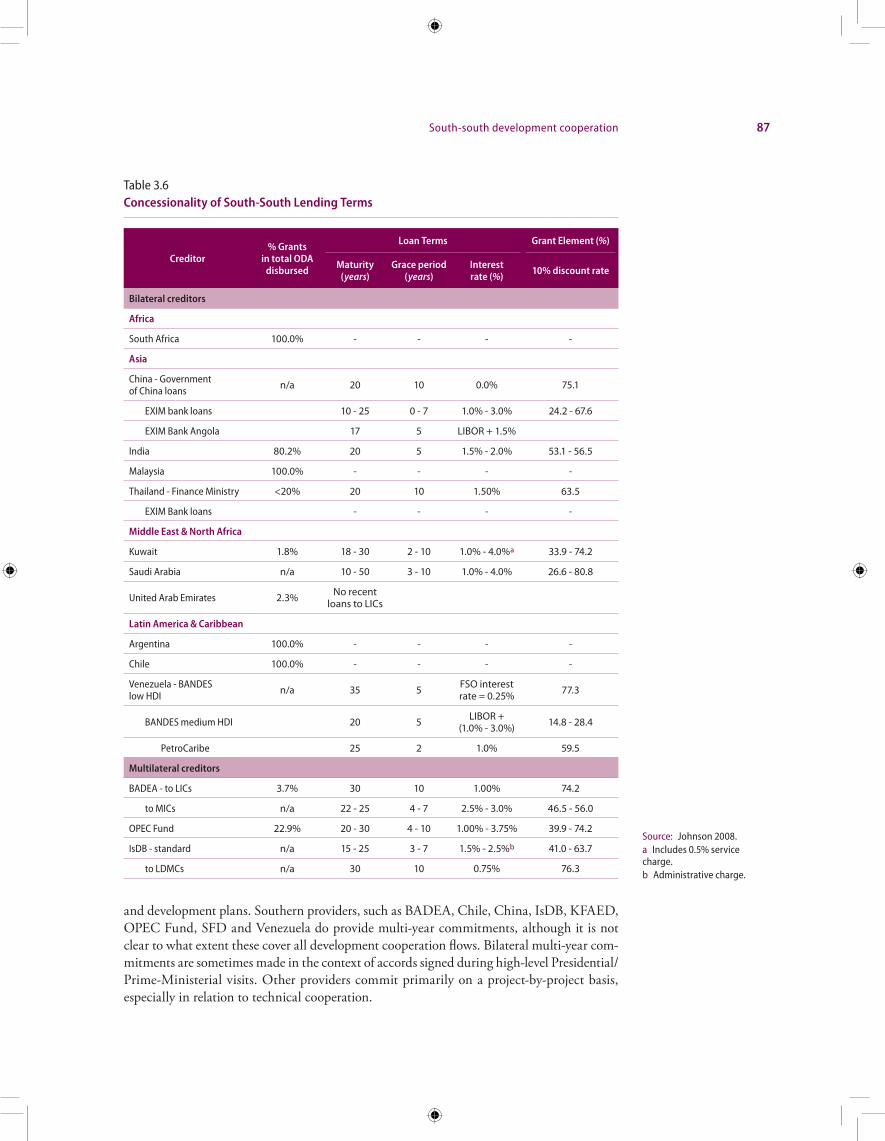
South-south development cooperation 87
and development plans. Southern providers, such as BADEA, Chile, China, IsDB, KFAED, OPEC Fund, SFD and Venezuela do provide multi-year commitments, although it is not clear to what extent these cover all development cooperation flows. Bilateral multi-year com-mitments are sometimes made in the context of accords signed during high-level Presidential/Prime-Ministerial visits. Other providers commit primarily on a project-by-project basis, especially in relation to technical cooperation.
Table 3.6Concessionality of South-South Lending Terms
Creditor% Grants
in total ODA disbursed
Loan Terms Grant Element (%)
Maturity (years)
Grace period (years)
Interest rate (%) 10% discount rate
Bilateral creditors
Africa
South Africa 100.0% - - - -
Asia
China - Government of China loans n/a 20 10 0.0% 75.1
EXIM bank loans 10 - 25 0 - 7 1.0% - 3.0% 24.2 - 67.6
EXIM Bank Angola 17 5 LIBOR + 1.5%
India 80.2% 20 5 1.5% - 2.0% 53.1 - 56.5
Malaysia 100.0% - - - -
Thailand - Finance Ministry <20% 20 10 1.50% 63.5
EXIM Bank loans - - - -
Middle East & North Africa
Kuwait 1.8% 18 - 30 2 - 10 1.0% - 4.0%a 33.9 - 74.2
Saudi Arabia n/a 10 - 50 3 - 10 1.0% - 4.0% 26.6 - 80.8
United Arab Emirates 2.3% No recent loans to LICs
Latin America & Caribbean
Argentina 100.0% - - - -
Chile 100.0% - - - -
Venezuela - BANDES low HDI n/a 35 5 FSO interest
rate = 0.25% 77.3
BANDES medium HDI 20 5 LIBOR + (1.0% - 3.0%) 14.8 - 28.4
PetroCaribe 25 2 1.0% 59.5
Multilateral creditors
BADEA - to LICs 3.7% 30 10 1.00% 74.2
to MICs n/a 22 - 25 4 - 7 2.5% - 3.0% 46.5 - 56.0
OPEC Fund 22.9% 20 - 30 4 - 10 1.00% - 3.75% 39.9 - 74.2
IsDB - standard n/a 15 - 25 3 - 7 1.5% - 2.5%b 41.0 - 63.7
to LDMCs n/a 30 10 0.75% 76.3
Source: Johnson 2008.a Includes 0.5% service charge.b Administrative charge.

88 Development Cooperation for the MDGs: Maximizing Results
From a beneficiary country standpoint, many Southern providers (especially China, India and Venezuela) have more predictable financial resources than DAC donors because they disburse 75% or more of funds on schedule within the financial year. This benefits government fiscal planning, and means that beneficiaries see major Southern bilateral providers are more effective because they complete projects on time. However, this pic-ture may vary by project in the same beneficiary country, with delays to some projects.
Coordination
There is a certain degree of coordination among some Southern providers (and with DAC donors) at regional and national levels. For example, Malaysia, Singapore and Thailand co-ordinate with the AsDB, United Nations agencies and Japan through regional initiatives in Cambodia, Lao PDR, Myanmar and Viet Nam. South Africa and most of the large Latin American donors also work closely with major DAC donors in their regions and beyond, especially in relation to triangular cooperation arrangements. Some Southern providers have also participated in national-level mutual accountability forums, but the majority do not, partly because they lack local representation. On the other hand, almost all are happy to report data to national aid monitoring offices.
More importantly, coordination among Southern providers on policy or procedural aspects related to SSC is not formalized except among Arab Institutions through the Arab Coordination Group and their project co-financing arrangements. For example, the Arab contributors have developed and adopted common procurement procedures. Much of the discussion of SSC in international forums is either an exchange of “case stories” – provider-sponsored descriptions of projects – or a political debate about the differences between SSC and DAC donor aid, and about more broadly defined South-South cooperation covering trade, investment and many other issues than development cooperation. Heads of SSC agen-cies from a range of Southern provider governments have expressed in DCF symposia a strong wish to increase technical exchanges on best practices in maximizing the impact of SSC, including through conducting case studies with the same analytical framework.
Triangular Cooperation33
Although triangular cooperation has been important for many years, its profile has been increasing recently. As noted by UNDP, “triangular cooperation is becoming increasingly popular as a way of fostering development by leveraging the best features of cooperation between developing countries with developed country assistance”. Many SSC providers are now also funding triangular cooperation to promote joint SSC with other Southern providers.
The main advantages of triangular cooperation can be summarized as follows:
• Southern implementing countries have expertise which is more relevant or appro-priate to the beneficiary country’s needs, because they have more recently resolved similar problems;
• Beneficiary and implementing countries may share economic and regional charac-teristics and cultural and linguistic ties;
• Southern expertise is more cost effective in terms of lower consultancy or training costs, and more relevant and cheaper technologies;
33 This section draws heavily on JICA 2009, OECD 2009a, SEGIB 2009 and TT-SSC 2010b.
There is growing coordination among
South-South cooperation providers and a wish to enhance it further
including via the DCF
Growing triangular cooperation has many
advantages but also some risks

South-south development cooperation 89
• DAC funding donors often can help recipients identify relevant experiences in other continents as they have broader global networks of expertise.
However, there can be challenges in implementing triangular cooperation because of differences in implementing and beneficiary countries’ procedures and systems, difficulties and costs of coordination, unclear division of responsibilities and lack of leadership by the beneficiary country (TT-SSC 2010a). Triangular cooperation projects can also face signifi-cant delays (up to two years) to establish positive collaboration between multiple stakeholders. For example, a Japan-Brazil project to train health staff in Angola involved ten organizations (two Angolan, five Brazilian and three Japanese).
The scale of triangular cooperation is very difficult to ascertain as there is no formal reporting of these flows by funding institutions or pivotal countries (Johnson 2008; OECD 2009; SEGIB 2009). Data are available mainly for individual projects, but Chile and Brazil do compile data, indicating total projects of around US$1 million in 2008, mainly funded by Japan, Germany, Canada and Spain.
Two-thirds of DAC donors are involved in triangular cooperation (Table 3.7), although only Japan and Spain prioritize it in formal strategies to strengthen regional co-operation.
Its scale is unknown but two thirds of DAC donors fund it
Table 3.7Main Participants in Triangular Cooperation
Northern Donors Southern Implementing Countries
Bilateral Africa
Belgium Egypt
Canada Kenya
Denmark Morocco
Finland South Africa
France Tunisia
Germany Asia
Italy India
Japan Indonesia
Republic of Korea Jordan
Luxembourg Malaysia
Norway Philippines
Spain Singapore
Sweden Sri Lanka
Switzerland Thailand
United Kingdom Vietnam
United States Latin America
Multilateral Institutions Argentina
African Development Bank Bolivia
Asian Development Bank Brazil
European Union Chile
Inter-American Development Bank Colombia
Organization of American States Costa Rica
United Nations organizations Cuba
World Bank MexicoSources: OECD (2009a), SEGIB (2009)

90 Development Cooperation for the MDGs: Maximizing Results
Japan has taken a leading role in funding triangular projects in Asia, Africa and Latin Amer-ica; Canada and Germany mainly in Africa and Latin America; and Spain primarily in Latin America. Two interesting examples of cross-continent cooperation are Ireland fostering a partnership between Liberia and East Timor on the role of women in conflict prevention, and the Republic of Korea funding Peru to help Algeria food security by enhancing capacities to breed seed potatoes (TT-SSC 2010a).
Japan’s initial triangular cooperation grew out of bilateral aid projects: on completion, Japan encouraged the recipient country to disseminate the results to other countries with similar problems. However, as developing countries have demonstrated their own develop-ment achievements, Japan has increasingly switched to providing financial support for tri-angular cooperation focusing on regional integration and scaling up development results. As of November 2009, it had triangular agreements for “partnership programmes” with twelve Southern countries (Argentina, Brazil, Chile, Egypt, Indonesia, Jordan, Mexico, Morocco, Philippines, Singapore, Thailand and Tunisia) (JICA 2009).
In Latin America, Japan has been the largest provider of triangular cooperation financ-ing two-thirds of reported projects in 2008, followed by Germany (24%) and Spain (4%) (SEGIB 2009). Japan was also the pioneer of triangular cooperation in Asia and continues to support a broad range of intra- and inter-regional projects (Kumar 2008), including Cambo-dia supporting aid management in East Timor, an Asia-Pacific network to empower people with disabilities, and the Coalition for African Rice Development which draws on expertise from many Asian countries.
Germany implements triangular cooperation via GTZ, a public enterprise. As of 2009, GTZ had 16 triangular projects, partnering with Brazil, Chile, China, Indonesia, Mexico, South Africa and Thailand as implementing countries. GTZ’s approach involves joint mis-sions, combined use and exchange of experts, on the job training and education, fellow-ships and study visits. GTZ has been working with Brazil in ten countries in Latin America and Africa on AIDS and with Mexico on environmental issues in Guatemala, Ecuador and Dominican Republic. GTZ has partnered with South Africa on governance and technology in Ethiopia, Democratic Republic of Congo, Lesotho and India, while in Asia it has worked with China and Indonesia on vocational education, agriculture and rural development, micro-finance, small and medium sized enterprises and health (Tomecko 2008). A good example of successful German triangular cooperation, the Alliance for Financial Inclusion, is discussed in Box 3.5.
Since 2005, Spain has been expanding triangular cooperation particularly in Latin America and the Caribbean, mainly with middle income countries and sub-regional organi-zations. Its main partners are Argentina, Brazil, Chile and Mexico, and the main beneficiary countries are Bolivia, Haiti and Paraguay. In 2009, Spain conducted a workshop in the region to garner regional inputs for refining its strategic framework for triangular cooperation. Spain also intends to extend its successful triangular cooperation to other regions (AECID 2009).
Multilateral and regional organizations are also important funding bodies:34
• The African Development Bank (AfDB) has financed many triangular projects, such as the Africa Rice Centre, an African Community of Practice on Managing for Development Results, and a US$6 million fund to support African countries to use Southern expertise (AfDB 2010).
34 The cases cited in the remainder of this section are largely drawn from TT-SSC (2010b).
Japan, Germany and Spain are most prominent
Multilateral and regional organisations also promote
triangular cooperation
South-south development cooperation 91
• The Asian Development Bank (AsDB) has funded a regional Community of Prac-tice for Managing for Development Results project where experts from many Asian countries help one another.
• The Organisation of American States (OAS) and the Inter-American Development Bank (IADB) have provided funding for triangular regional initiatives in, for exam-ple, public debt management and the prevention of crime and violence.
• All United Nations agencies fund triangular projects, as part of efforts to main-stream SSC (Box 3.9).
• The World Bank has funded India to develop dairy industries in the United Repub-lic of Tanzania and Uganda; and (with the United Kingdom of Great Britain and Northern Ireland’s Department for International Development) Brazil to reduce poverty through the Bolsa Familia Programme (cash transfers to the poorest) in Asia, Africa and Latin America.
Regional cooperation projects funded by DAC or Southern providers and multilateral institutions are often effectively triangular cooperation as they involve the sharing of informa-tion and dissemination of expertise amongst a group of Southern countries. In addition to Northern donor and multilateral institution-funded triangular cooperation, some Southern providers also fund others to implement programmes – for example in the India, Brazil and South Africa (IBSA) funded programmes to improve agricultural yields and food self-sufficiency in Guinea-Bissau (TT-SSC 2010b).
Box 3.5The Alliance for Financial Inclusion (AFI) – innovative triangular cooperation
The AFI is a global South-South network to unlock innovations enabling decision-makers in developing countries to design ways for 50 million people to access financial products by 2012. The network is managed by GTZ with funding from the Bill & Melinda Gates Foundation.
Through AFI many of the most innovative solutions for providing financial services to the poor are being disseminated for replication and joint learning. The countries of the South are providing solutions to the challenges they face. The choice, control and direction of the policy solutions are determined solely by individual countries’ policymakers and central banks.
The rapid growth in membership to 80 countries, the strong demand for AFI services and the clear will of developing country representatives to shape AFI work and contribute their own experiences, are also generating political results.
Factors contributing to success are that:
• Peer learning plays a key role - as opposed to North-South know-how transfer.
• AFI is member-driven - countries have a strong role in the governing Steering Committee.
• It is demand-driven - grants and peer learning are linked to national reform strategies.
• It is inclusive - everyone can make a contribution, every idea counts.
• Proven solutions - policy solutions that have been shown to be effective are applied.
• Both the ‘donor’ and implementing agency have clear exit strategies.
• AFI is results-based - internal M+E and results measurement by members play a key role.
A year after launch, AFI has established a proven track record, filling a gap in the international microfinanc-ing landscape, and was therefore included in a G-20 expert group reporting on how best to expand access to finance for the G 20 Summit in Seoul in November 2010. Within this committee, AFI is representing the interests of developing countries, especially those that are not members of the G 20.
Source: GTZ statement at 2010 DCF, New York, see: http://www.un.org/en/ecosoc/julyhls/pdf10/policy_dialogue_3_gtz_dr_beier.pdf.
92 Development Cooperation for the MDGs: Maximizing Results
South-South cooperation in key sectorsHealth, agriculture and infrastructure have historically been key sectors of SSC. Southern providers have developed significant expertise in addressing “neglected diseases”, and the value-added of SSC in supporting infrastructure and agriculture has been growing over time. This section examines the key features of SSC in health, agriculture and infrastructure.
SSC in Health and Medicine35
In recent years, global support for health in developing countries has grown at an exceptional pace. The institutional landscape has also changed, and new sources such as the Global Alli-ance for Vaccines and Immunization (GAVI), the Global Fund to Fight AIDS, Tuberculosis and Malaria (GFATM), and developing countries themselves have become important players. Emerging economies like Brazil, China, India and South Africa, and other countries such as Cuba, have come forward to supplement global efforts in tackling health challenges. There are growing efforts to consolidate their efforts with common global initiatives through global funds, the United Nations and other agencies. Brazil, China, India and South Africa together contributed $200 million to global health initiatives in 2007-08.
In the last few years, emerging economies have placed strong emphasis on supporting health initiatives, fuelled by persisting global health inequities, and great demand for better dissemination of existing solutions as well as development of new solutions tailored to the poorest countries’ needs. China and India have developed capacity to manufacture affordable health products, which cost less than alternatives from OECD countries, as well as develop-ing innovative products.
Most global health research has until recently been focused on OECD problems, and relatively few products are developed for people in poorer parts of the world, due to the small size of their health markets. However, some developing nations have been highly successful in finding innovative biotechnology products for their populations, implying that SSC could spread this technology more widely. There is also a strong need in developing countries to develop low-cost solutions for the poor. These shared needs provide a rationale for increased South-South collaboration.
Brazil, China, Cuba, India and South Africa are increasingly active in government-to-government initiatives to promote health delivery through SSC. Human resource development has attracted major attention. Cuba has been supplying qualified manpower, including doctors, nurses, and dentists, in Latin America and Africa. The scale of these efforts is large for such a small country: in 2004 there were 1,300 Cuban doctors in 15 African countries. China now has over 700 medical doctors practicing in Africa through bilateral arrangements.
Infrastructure and health system development are also popular areas. Brazil is building pharmaceutical plants in Mozambique and Namibia to manufacture generic anti-retroviral medicines. China has built clinics and hospitals in many African countries, and India estab-lished in 2007 a Pan-African e-network to deliver telemedicine services and training sessions for local doctors. The IBSA fund is also supporting efforts to build health systems in various developing countries.
35 This section draws on a study on SSC in medicine, undertaken by Halla Thorsteinsdóttir and Sachin Chaturvedi for the DCF.
South-South cooperation in health is growing rapidly
Health delivery cooperation focuses on human resource
development, infrastructure and
systems development
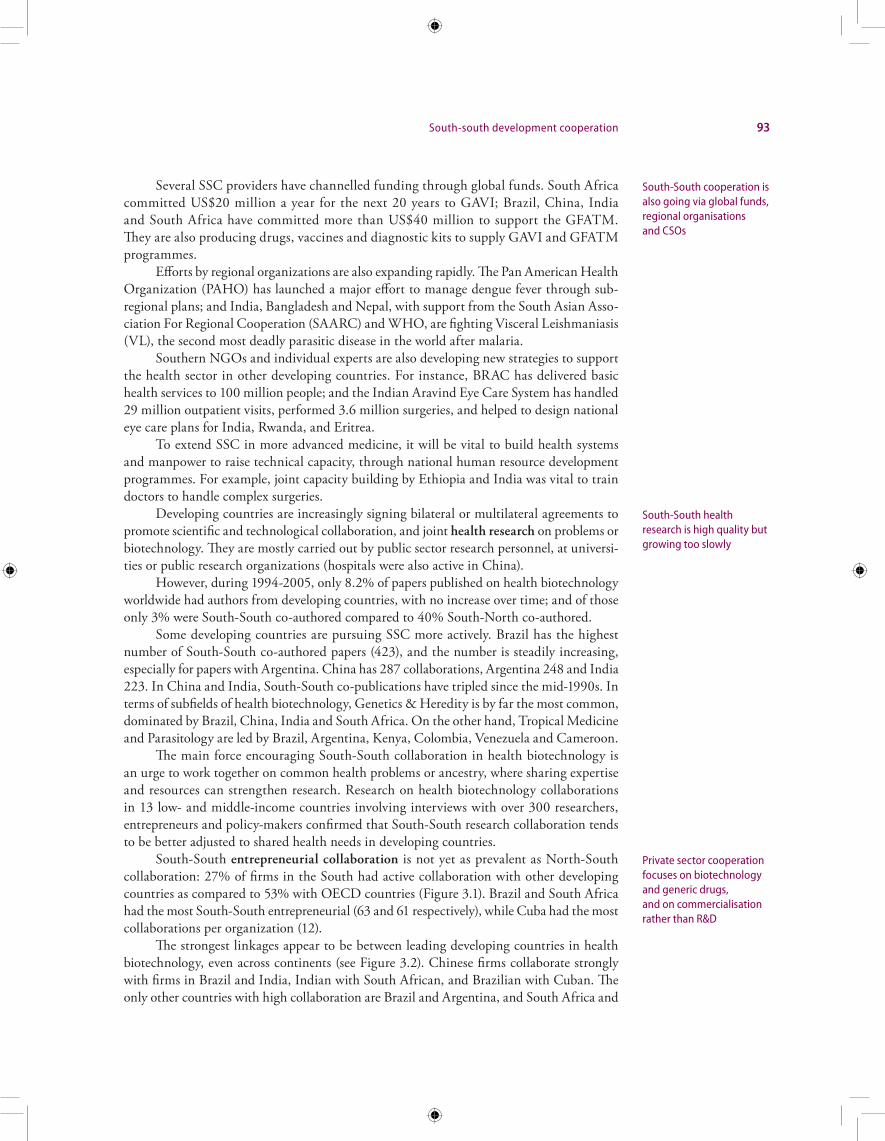
South-south development cooperation 93
Several SSC providers have channelled funding through global funds. South Africa committed US$20 million a year for the next 20 years to GAVI; Brazil, China, India and South Africa have committed more than US$40 million to support the GFATM. They are also producing drugs, vaccines and diagnostic kits to supply GAVI and GFATM programmes.
Efforts by regional organizations are also expanding rapidly. The Pan American Health Organization (PAHO) has launched a major effort to manage dengue fever through sub-regional plans; and India, Bangladesh and Nepal, with support from the South Asian Asso-ciation For Regional Cooperation (SAARC) and WHO, are fighting Visceral Leishmaniasis (VL), the second most deadly parasitic disease in the world after malaria.
Southern NGOs and individual experts are also developing new strategies to support the health sector in other developing countries. For instance, BRAC has delivered basic health services to 100 million people; and the Indian Aravind Eye Care System has handled 29 million outpatient visits, performed 3.6 million surgeries, and helped to design national eye care plans for India, Rwanda, and Eritrea.
To extend SSC in more advanced medicine, it will be vital to build health systems and manpower to raise technical capacity, through national human resource development programmes. For example, joint capacity building by Ethiopia and India was vital to train doctors to handle complex surgeries.
Developing countries are increasingly signing bilateral or multilateral agreements to promote scientific and technological collaboration, and joint health research on problems or biotechnology. They are mostly carried out by public sector research personnel, at universi-ties or public research organizations (hospitals were also active in China).
However, during 1994-2005, only 8.2% of papers published on health biotechnology worldwide had authors from developing countries, with no increase over time; and of those only 3% were South-South co-authored compared to 40% South-North co-authored.
Some developing countries are pursuing SSC more actively. Brazil has the highest number of South-South co-authored papers (423), and the number is steadily increasing, especially for papers with Argentina. China has 287 collaborations, Argentina 248 and India 223. In China and India, South-South co-publications have tripled since the mid-1990s. In terms of subfields of health biotechnology, Genetics & Heredity is by far the most common, dominated by Brazil, China, India and South Africa. On the other hand, Tropical Medicine and Parasitology are led by Brazil, Argentina, Kenya, Colombia, Venezuela and Cameroon.
The main force encouraging South-South collaboration in health biotechnology is an urge to work together on common health problems or ancestry, where sharing expertise and resources can strengthen research. Research on health biotechnology collaborations in 13 low- and middle-income countries involving interviews with over 300 researchers, entrepreneurs and policy-makers confirmed that South-South research collaboration tends to be better adjusted to shared health needs in developing countries.
South-South entrepreneurial collaboration is not yet as prevalent as North-South collaboration: 27% of firms in the South had active collaboration with other developing countries as compared to 53% with OECD countries (Figure 3.1). Brazil and South Africa had the most South-South entrepreneurial (63 and 61 respectively), while Cuba had the most collaborations per organization (12).
The strongest linkages appear to be between leading developing countries in health biotechnology, even across continents (see Figure 3.2). Chinese firms collaborate strongly with firms in Brazil and India, Indian with South African, and Brazilian with Cuban. The only other countries with high collaboration are Brazil and Argentina, and South Africa and
South-South cooperation is also going via global funds, regional organisations and CSOs
South-South health research is high quality but growing too slowly
Private sector cooperation focuses on biotechnology and generic drugs, and on commercialisation rather than R&D
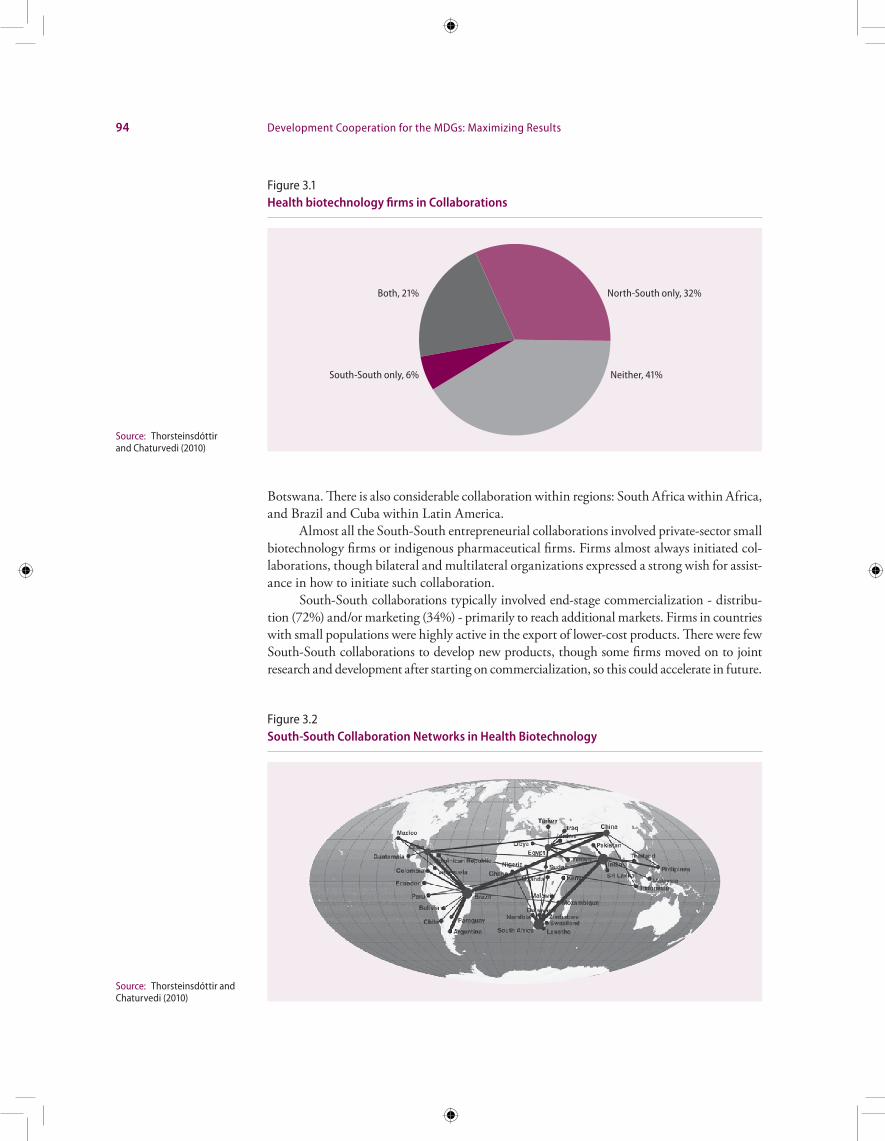
94 Development Cooperation for the MDGs: Maximizing Results
Botswana. There is also considerable collaboration within regions: South Africa within Africa, and Brazil and Cuba within Latin America.
Almost all the South-South entrepreneurial collaborations involved private-sector small biotechnology firms or indigenous pharmaceutical firms. Firms almost always initiated col-laborations, though bilateral and multilateral organizations expressed a strong wish for assist-ance in how to initiate such collaboration.
South-South collaborations typically involved end-stage commercialization - distribu-tion (72%) and/or marketing (34%) - primarily to reach additional markets. Firms in countries with small populations were highly active in the export of lower-cost products. There were few South-South collaborations to develop new products, though some firms moved on to joint research and development after starting on commercialization, so this could accelerate in future.
Figure 3.1Health biotechnology firms in Collaborations
Source: Thorsteinsdóttir and Chaturvedi (2010)
North-South only, 32%Both, 21%
South-South only, 6% Neither, 41%
Source: Thorsteinsdóttir and Chaturvedi (2010)
Figure 3.2South-South Collaboration Networks in Health Biotechnology
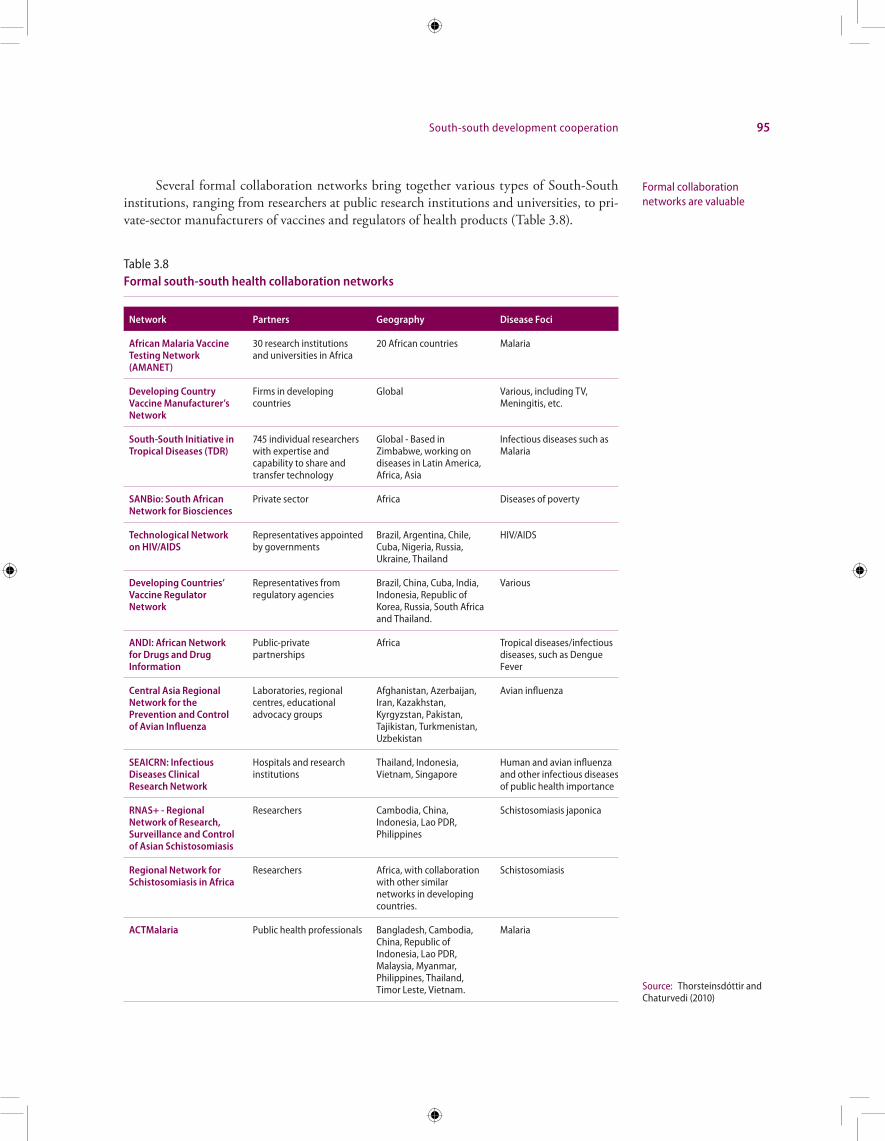
South-south development cooperation 95
Several formal collaboration networks bring together various types of South-South institutions, ranging from researchers at public research institutions and universities, to pri-vate-sector manufacturers of vaccines and regulators of health products (Table 3.8).
Formal collaboration networks are valuable
Table 3.8Formal south-south health collaboration networks
Network Partners Geography Disease Foci
African Malaria Vaccine Testing Network (AMANET)
30 research institutions and universities in Africa
20 African countries Malaria
Developing Country Vaccine Manufacturer’s Network
Firms in developing countries
Global Various, including TV, Meningitis, etc.
South-South Initiative in Tropical Diseases (TDR)
745 individual researchers with expertise and capability to share and transfer technology
Global - Based in Zimbabwe, working on diseases in Latin America, Africa, Asia
Infectious diseases such as Malaria
SANBio: South African Network for Biosciences
Private sector Africa Diseases of poverty
Technological Network on HIV/AIDS
Representatives appointed by governments
Brazil, Argentina, Chile, Cuba, Nigeria, Russia, Ukraine, Thailand
HIV/AIDS
Developing Countries’ Vaccine Regulator Network
Representatives from regulatory agencies
Brazil, China, Cuba, India, Indonesia, Republic of Korea, Russia, South Africa and Thailand.
Various
ANDI: African Network for Drugs and Drug Information
Public-private partnerships
Africa Tropical diseases/infectious diseases, such as Dengue Fever
Central Asia Regional Network for the Prevention and Control of Avian Influenza
Laboratories, regional centres, educational advocacy groups
Afghanistan, Azerbaijan, Iran, Kazakhstan, Kyrgyzstan, Pakistan, Tajikistan, Turkmenistan, Uzbekistan
Avian influenza
SEAICRN: Infectious Diseases Clinical Research Network
Hospitals and research institutions
Thailand, Indonesia, Vietnam, Singapore
Human and avian influenza and other infectious diseases of public health importance
RNAS+ - Regional Network of Research, Surveillance and Control of Asian Schistosomiasis
Researchers Cambodia, China, Indonesia, Lao PDR, Philippines
Schistosomiasis japonica
Regional Network for Schistosomiasis in Africa
Researchers Africa, with collaboration with other similar networks in developing countries.
Schistosomiasis
ACTMalaria Public health professionals Bangladesh, Cambodia, China, Republic of Indonesia, Lao PDR, Malaysia, Myanmar, Philippines, Thailand, Timor Leste, Vietnam.
Malaria
Source: Thorsteinsdóttir and Chaturvedi (2010)
96 Development Cooperation for the MDGs: Maximizing Results
While some of the formal networks have global interactions across Africa, Asia and Latin America, regional networks are more common, and some are limited to countries with particular capacities (the Developing Country Vaccine Manufacturers’ Network includes countries with capacities to manufacture vaccines; and the Technological Network on HIV/AIDS countries that have the political will to control HIV/AIDS through public health measures and technological capacity in pharmaceuticals). They also have a strong focus on health problems specific to developing countries, such as malaria, schistosomiasis and other tropical infectious diseases, reflecting common needs for solutions.
Overall, SSC shows great potential to contribute to improved health, capacity-building and innovation. By contributing their respective strengths, developing countries have the potential to enhance research and development activities to create new products and services, helping to meet the MDGs by fighting tropical diseases and HIV/AIDS. However it faces many challenges:
• The health needs of developing countries are increasingly diversifying away from tropical diseases to non-communicable diseases such as lung cancer, where SSC may also develop a comparative advantage in low-cost solutions.
• SSC is most hampered by a lack of dedicated financial resources, especially for research on medicines: resources for South-North collaborations are more easily available from OECD countries, which risks diverting skills away from developing countries’ needs. Only two funds are dedicated to South-South biotechnology col-laborations, the CABBIO (Centro Brasileiro Argentino de Biotecnologia) fund and the IBSA Trust Fund for research in health biotechnology. This underscores the importance of governments’ investment in SSC.
• The global intellectual property regime, particularly at the World Trade Organiza-tion (WTO), also creates several challenges for developing countries to manage health deliverables, as the costs of products and services often exceed their resources due to Intellectual Property Rights protections.
• Many SSC medicine initiatives are stand-alone projects, posing challenges to the sustainability of health services once projects end. Longer-term projects and predict-able assistance are vital.
• South-South entrepreneurial collaborations require help from governments, indus-trial associations, or international organizations to build trust, so as to move to developing affordable products.
• Capacity-building collaborations require strong local infrastructure and systems so that capacity is best deployed and retained, and projects must include support to infrastructure and systems.
• A systemic perspective is also vital in entrepreneurial collaborations: regulatory systems need to collaborate, exchange information about requirements, and align processes, to facilitate SSC.
• There is a lack of systematic research into the extent of South-South health col-laboration.
When firms in developing countries pool their strengths, they can be more cost-effec-tive and sensitive to local health needs, and reach more poor people in the developing world. Supporting SSC in medicine is a highly promising way to develop appropriate and affordable products, to which international organizations and philanthropic organizations should pay more attention. A number of measures are possible to further strengthen South-South col-laboration in the medical field.
South-South cooperation in health needs to
overcome many challenges
South-south development cooperation 97
• Developing country governments need to invest more in health SSC and to integrate such collaborations in their science, technology, innovation and health promotion plans. With dedicated funding, developing countries can work together to better address their health needs.
• There should be dialogue between developing countries, to promote alignment of their health and innovation systems and accelerate health and economic impacts.
• Developing country governments and donor organizations need to explore trian-gular cooperation much more thoroughly to combine South-South learning and Northern technology and finance.
• The South should keep a watch on the global intellectual property regime as it unfolds at the WTO and elsewhere, to monitor its impact on incentives for new cost-effective technologies or products.
• SSC could be far more dynamic when supplemented by non-state actors. Govern-ments need to encourage NGOs, academic institutions and entrepreneurs to par-ticipate.
• Efforts by recipient national governments (on continuously building institutions and systems, and retaining trained personnel) are vital to successful SSC.
• More concerted effort from the South is required to focus on the development of health-related infrastructure for the development of production and trade in drugs, vaccines and diagnostics.
South-South Cooperation in Agriculture
Although historically, the development process has seen a gradually declining share of agri-culture in GDP, agriculture continues to account for 28 % of GDP and over two thirds of jobs in LDCs (UNCTAD 2009a). However, LDC agricultural productivity has grown only marginally since the 1970s, partly due to insufficient investment.
Southern investments have increasingly filled agricultural development financing gaps. South-South investment is almost as large as investment by OECD Transnational corpora-tions (TNCs), and half the top 25 TNCs in agri-business (running farms and plantations) are headquartered in developing countries (UNCTAD 2009b). Nonetheless, concerns have been raised about the potential tension between foreign acquisition of land for export-oriented FDI, and food security. In some cases, land-leasing agreements between investors and host governments have not taken sufficient account of existing usage of the land by local people. Smaller farmers may be marginalized as they are less able to meet export requirements despite technical and financial assistance. This issue applies to all investors, but it is essential South-South investors’ maximize their contributions to address the tension.
Food security has become a major driver of new investment in the wake of the food crisis. It is difficult to assess the scale of South–South foreign direct investment (FDI) driven by food security concerns, but the largest sources of food security-related Southern investment include Bahrain, China, Qatar, Kuwait, the Libyan Arab Jamahiriya, Saudi Arabia and the United Arab Emirates. The most important developing host countries are in Africa - Ethiopia, Sudan, and the United Republic of Tanzania.
SSC has a long history of offering policy experiences and appropriate technologies necessary for boosting agricultural productivity in developing countries, and more recently new investment and market opportunities for agricultural development. Another important rationale for SSC is the similarity of soil, climatic and ecological conditions among groups of developing countries.
South-South cooperation can play a key role in overcoming concerns about land acquisition by South-South investors
98 Development Cooperation for the MDGs: Maximizing Results
SSC in agriculture continues to grow against a backdrop of long-term decline of DAC ODA for agricultural development. The overall level of Southern support for agriculture is difficult to ascertain. Recent events suggest food security is attracting growing Southern development cooperation (Box 3.6).
Technical cooperation, notably technology transfer (Box 3.7) and local capacity building are the main forms of collaboration, with Arab States, Brazil, China, India and South Africa as primary providers, mostly in Africa. The Arab states are increasing support, particularly in irrigation and water management. China-Africa cooperation spans over 40 countries, with more than 200 projects on land management, breeding technologies, food security, agricultural machinery, and processing agricultural and sideline products. India is enhancing projects to transfer agricultural technologies to small-scale farmers. Brazil is working towards a broad partnership that includes all members of the African Union in technology transfer and agricultural capacity-building. South Africa, a leader on the con-tinent in agricultural technology, is a key player in the transfer of technologies to fellow African countries.
Recent years have seen growing South-South initiatives in partnerships with North-ern donors and international organizations, namely triangular cooperation, with Japan, the United States and FAO as the most significant donors. Japan partners with Brazil to transfer agricultural technology to other developing countries, including in Africa. The NERICA project (New Rice for Africa), which facilitated cooperation between several African countries and research centres with donors’ support, has led to the creation of new drought-resistant and high-yield rice for Africa. The Special Programme for Food Security (SPFS) of FAO facilitates the transfer of techniques that are successfully employed in one country to other countries. Over 100 countries are now involved in the SPFS system, and over half have started implementing their own customized national plans (UNCTAD 2009).
Food security and Technical Cooperation
support are vital
Box 3.6Major southern commitments to food security (2007-09)
At the African Union Summit in July 2009, Brazil signed a cooperation agreement with the AU for the implementation of projects in the areas of agriculture and livestock. Brazil has established an office of the Brazilian Agricultural Research Corporation in Accra, Ghana, calling for more involvement of South-South and triangular cooperation for the development of agriculture on the African continent. The Cotton 4 project has a budget of US$4 million, including US$3.5 million directly for agricultural projects. Brazil is also working in a wide range of countries on “Zero Hunger” projects.
China announced eight new measures during the FOCAC in Egypt in November 2009. It will increase the number of agricultural research and technology demonstration centres in Africa to 20, send 50 agricultural technology teams to Africa and train 2,000 African agricultural technology personnel. The US$10 billion to be spent by the China–Africa Development Fund will include agriculture as well as infrastructure. China is also active in triangular cooperation projects, particularly in Africa, with FAO making available US$30 million for its trust fund to support developing countries in improving their agricultural productivity as an instrument for achieving the Millennium Development Goals.
In April 2008, India convened the First Africa-India Summit signing a cooperation agreement on the agricul-tural sector, with an aim to transfer agricultural technologies that meet the real needs of small-scale farmers in Africa. The meeting also marked the announcement of a zero tariff for 98 % of imported products from LDCs including agricultural products.
Other South-South donors such as Argentina, Kuwait, Saudi Arabia and Venezuela have also made impor-tant pledges either at the FAO High Level Conference on Food Security in 2008, or bilaterally.
Source: UNCTAD (2010), FOCAC
South-south development cooperation 99
Despite its potential, SSC in agriculture will not have wider development impact in the absence of a favourable international system. Southern countries need to broaden their cooperation to overcome distortionary practices of OECD countries on market access, entry condition, trade finance and facilitation. The sharing of experience and policy lessons as well as technology transfer and innovations should continue to be an important component of SSC in enhancing the performance of the industry and improving food security in the developing world.
SSC in Infrastructure36
Infrastructure development represents a key promising component of SSC. Africa and Asia remain the main destination of Southern finance for infrastructure, and have recently seen
36 This section is based largely on ICA (2009) and World Bank (2010).
South-South cooperation needs to overcome global agricultural distortions
Box 3.7SSC in agricultural technology and innovation
The main challenge in enhancing food security in Africa is to strengthen the innovation capabilities of African agricultural systems as a means of addressing poverty, improving food security and achieving broader economic growth and development. Incremental improvements in processes, products, inputs, or equipments are needed to adapt existing technologies to the local environment in ways that enhance productivity and lower costs. Such knowledge may come through learning, research or experience, but requires certain minimum technological capabilities in order to be applied. To ensure that technological innovation has an impact on Africa’s agriculture sector, the following key issues need to be borne in mind:
• Smallholder farmers need to be at the centre of policy so that research, development and extension services meet their real needs.
• Policy-making capacities should be strengthened to create an enabling environment for agricultural innovation, and to make possible some degree of policy experimentation.
• Agricultural innovation systems must be reinforced by focusing on the enabling environment and linking national, regional and international research to innovation.
• It is important to target agricultural investment into physical and scientific infrastructure and stronger extension services.
• Local agro-ecological conditions should be taken into account so that technologies are tailored to dif-ferent agro-ecological zones and include appropriate and effective mixes both of low-, medium- and high-tech solutions as well as traditional knowledge and modern science.
• Capacity building and cooperation on technology transfer and sharing should be reinforced.
In particular, technologies must be appropriate to local agro-ecological conditions within the host food system, as well as affordable and attractive to smallholder farmers. Several SSC programmes have proven their worth in making the right technology available to African farmers:
• China in 2009 built 14 centres for agricultural research in African countries. Over 100 agricultural scien-tists from China are working in the field with African technicians in order to improve food security on the continent and generate export surpluses where it is possible.
• Embrapa, the Brazilian agency for agricultural research, is transferring tropical agricultural technology to African countries (and promoting global learning) through Embrapa Africa.
• Triangular cooperation is playing a strong role, for example through the NEPAD Pan-African Cassava Initi-ative (NPACI), which is funded by the W.K. Kellogg Foundation; and the FAO Special Programme for Food Security (SPFS) which transfers tropical technology to many African countries with contributions from China, Cuba, Egypt, India, Jordan, Morocco, Myanmar, Pakistan, the Philippines, Tunisia and Viet Nam.
Source: Technology and Innovation Report 2010, UNCTAD
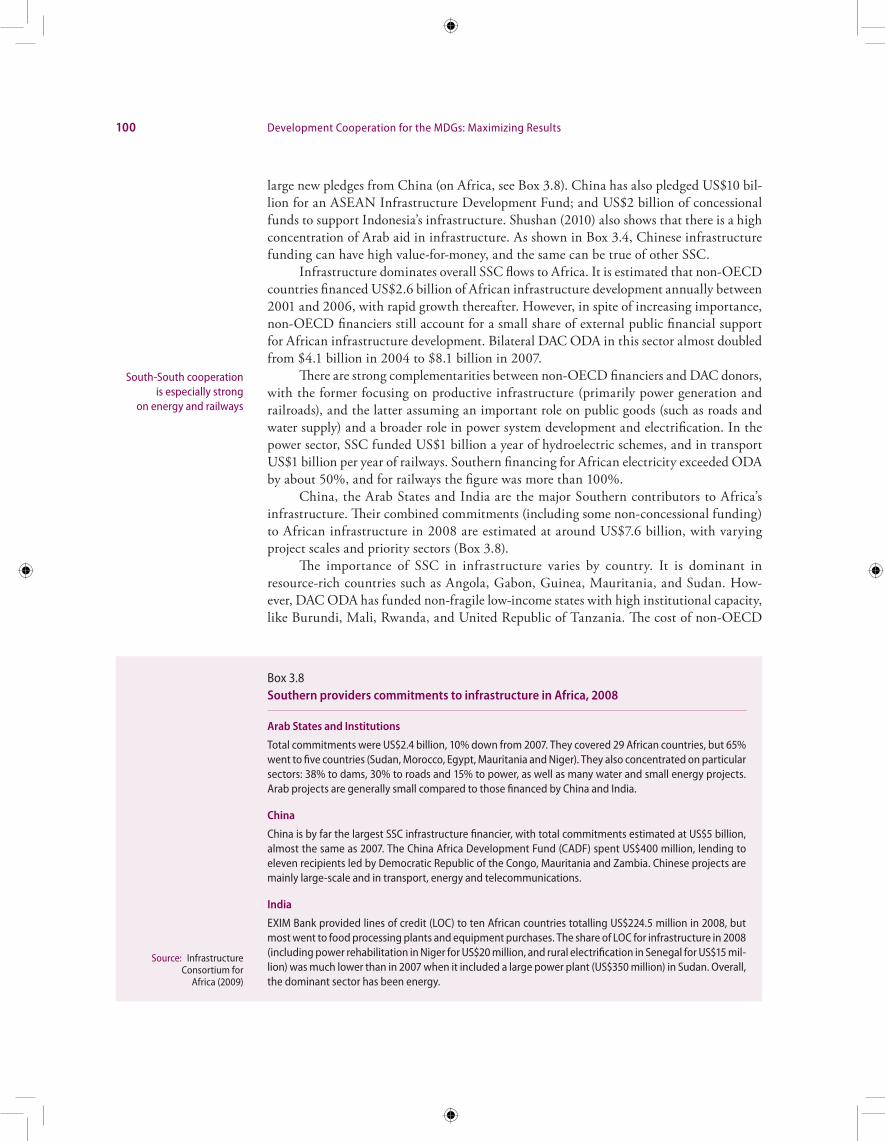
100 Development Cooperation for the MDGs: Maximizing Results
large new pledges from China (on Africa, see Box 3.8). China has also pledged US$10 bil-lion for an ASEAN Infrastructure Development Fund; and US$2 billion of concessional funds to support Indonesia’s infrastructure. Shushan (2010) also shows that there is a high concentration of Arab aid in infrastructure. As shown in Box 3.4, Chinese infrastructure funding can have high value-for-money, and the same can be true of other SSC.
Infrastructure dominates overall SSC flows to Africa. It is estimated that non-OECD countries financed US$2.6 billion of African infrastructure development annually between 2001 and 2006, with rapid growth thereafter. However, in spite of increasing importance, non-OECD financiers still account for a small share of external public financial support for African infrastructure development. Bilateral DAC ODA in this sector almost doubled from $4.1 billion in 2004 to $8.1 billion in 2007.
There are strong complementarities between non-OECD financiers and DAC donors, with the former focusing on productive infrastructure (primarily power generation and railroads), and the latter assuming an important role on public goods (such as roads and water supply) and a broader role in power system development and electrification. In the power sector, SSC funded US$1 billion a year of hydroelectric schemes, and in transport US$1 billion per year of railways. Southern financing for African electricity exceeded ODA by about 50%, and for railways the figure was more than 100%.
China, the Arab States and India are the major Southern contributors to Africa’s infrastructure. Their combined commitments (including some non-concessional funding) to African infrastructure in 2008 are estimated at around US$7.6 billion, with varying project scales and priority sectors (Box 3.8).
The importance of SSC in infrastructure varies by country. It is dominant in resource-rich countries such as Angola, Gabon, Guinea, Mauritania, and Sudan. How-ever, DAC ODA has funded non-fragile low-income states with high institutional capacity, like Burundi, Mali, Rwanda, and United Republic of Tanzania. The cost of non-OECD
South-South cooperation is especially strong
on energy and railways
Box 3.8Southern providers commitments to infrastructure in Africa, 2008
Arab States and Institutions
Total commitments were US$2.4 billion, 10% down from 2007. They covered 29 African countries, but 65% went to five countries (Sudan, Morocco, Egypt, Mauritania and Niger). They also concentrated on particular sectors: 38% to dams, 30% to roads and 15% to power, as well as many water and small energy projects. Arab projects are generally small compared to those financed by China and India.
China
China is by far the largest SSC infrastructure financier, with total commitments estimated at US$5 billion, almost the same as 2007. The China Africa Development Fund (CADF) spent US$400 million, lending to eleven recipients led by Democratic Republic of the Congo, Mauritania and Zambia. Chinese projects are mainly large-scale and in transport, energy and telecommunications.
India
EXIM Bank provided lines of credit (LOC) to ten African countries totalling US$224.5 million in 2008, but most went to food processing plants and equipment purchases. The share of LOC for infrastructure in 2008 (including power rehabilitation in Niger for US$20 million, and rural electrification in Senegal for US$15 mil-lion) was much lower than in 2007 when it included a large power plant (US$350 million) in Sudan. Overall, the dominant sector has been energy.
Source: Infrastructure Consortium for
Africa (2009)
South-south development cooperation 101
finance is somewhere between that of public funds (e.g. tax and other fiscal resources) and DAC ODA. It is vital to ensure that such finance is focussed on key development projects rather than “prestige” projects with less development impact, that it is untied and that it maximizes transfer of skills and technical solutions through infrastructure projects.
United Nations support to south-south cooperation
The High-level Conference on South-South cooperation in December 2009 encouraged the United Nations to take concrete measures to improve mainstreaming and support for SSC. An increasing number of United Nations organizations have mainstreamed support for SSC in their corporate policy instruments, strategies and operational activities. The strategic priorities of the United Nations Development Group (UNDG) (2010-2011) in-clude engaging United Nations country teams in SSC partnerships. In 2008, the Executive Committee on Economic and Social Affairs made a commitment to institutionalise SSC in its regular development activities so as to maximize benefits for the MDGs. Realizing the full potential of SSC is a corporate priority of UNDP. UNFPA supported 189 SSC technical assistance initiatives in 2008, and UNICEF more than 100 SSC regional and country initiatives in 2008.
The main modality for United Nations support to SSC has been capacity build-ing through research, training, technical advice, documenting best practices, networking and technology transfer. Some United Nations agencies have established new units, pro-grammes or institutions (for examples of best practice, see Box 3.9).
The United Nations Web of Information for Development, an online Web-enabled system that gathers information on experts, experiences and institutions of the South, is being transformed into a virtual global South-South development academy, offering more than 100 scalable solutions as of mid-2009. The global and regional networks established by various United Nations organizations, including WHO regional networks of skilled institutions and partner organizations; UNDP knowledge networks; and technical support facilities of the Joint United Nations Programme on HIV/AIDS, have proved effective in facilitating transfer of knowledge and expertise.
Given rapid growth of United Nations involvement in South-South initiatives, coor-dination has been given added importance. For example, in August 2008, the Secretary-General requested a concise, action-oriented, collaborative framework for action by United Nations agencies, drawing on their comparative strengths in promoting SSC on food secu-rity, climate change and HIV/AIDS – this is being finalized by the UNDP Special Unit on SSC in collaboration with all relevant United Nations entities.
However, equally important is analytically rigorous analysis of how to maximize the impact of SSC on development results, drawing on best practices (many of which have been discussed in this chapter). DAC donors can also better report on triangular cooperation in their reporting to the OECD, and analyse more rigorously what best practices are. The DCF, in cooperation with other (especially regional) forums, has a strong role to play in the sharing of views among SSC providers and with recipients, to improve understanding of SSC and triangular cooperation. In this context, more in-depth studies will be conducted at regional and national level. The number of providers covered by DCF preparatory work is also planned to be widened. Analysis of Southern providers’ contributions to multilateral organizations, and the role of Southern foundations and CSOs will also be deepened.
The United Nations is prioritizing South-South cooperation and establishing new innovative programmes
102 Development Cooperation for the MDGs: Maximizing Results
Box 3.9Innovative United Nations support to south-south cooperation
A strong United Nations role in supporting SSC has been mandated since the Buenos Aires Plan of Action and most recently in the outcome document of the 2009 Nairobi High-Level Conference. The United Nations system has therefore devised innovative demand-driven SSC facilities and mechanisms to pro-mote sharing of knowledge, experiences, expertise and technologies. This box presents a few examples:
ILO initiated programmes to address the problem of child labour in Portuguese-speaking countries in Africa, with a grant from Brazil in 2008.
UNCTAD has established a new unit to promote SSC. It has also shown success with a Network of Centers of Excellence to support technology and knowledge transfer to Africa by training scientists and technology experts. To date, 100 young scientists, engineers and academics from 25 African countries have benefited from training organized in China, Egypt, India, South Africa and the United Republic of Tanzania. The Net-work plans to extend its activities by supporting a network of policymakers to enhance policy formulation on science, technology and innovation.
UNDP’s Special Unit for South-South Cooperation launched in 2008 a market-based, transparent knowl-edge and technology transaction mechanism: the South-South Global Assets and Technology Exchange. It enables public and private partners to list, seek, match and raise resources for the transfer of technologies to improve food security, health, housing for the poor and energy efficiency, combat climate change and cultivate the potential of the creative economy for development.
UNEP is developing a South-South clearing house mechanism to identify, develop and promote opportuni-ties for cooperation in support of environmental and sustainable development activities.
UNESCO in May 2008 established the International Science, Technology and Innovation Centre for SSC, based in Kuala Lumpur, which is creating a network of national centres of excellence, to collaborate through research initiatives, technology transfer and the development of industries in fields such as information technology, biotechnology and nanotechnology.
UNIDO established South-South Industrial Cooperation Centres in India (2007) and China (2008), to pro-mote industrial collaboration, investment and trade among Southern countries by sharing knowledge, experience, expertise, technology and resources, and more recently has planned similar centres in Morocco and in Iran, and a SSC focus for a new field office in Brazil.
Source: United Nations 2009
103
Chapter 4
Beyond development coooperation: coherence and architecture to increase impact
Beyond development cooperationTo maximize its results, development cooperation needs to be reinforced by consistency or “coherence” across a diverse range of policies in developed and developing countries, going “beyond development cooperation”. All these policies need to be geared to accomplishing national development priorities and the MDGs, and avoiding policies or approaches which undermine them. For countries providing and receiving development cooperation, coherence is a term used to discuss four dimensions:
• Coherence between development cooperation and the other policies of each provider or recipient country (the “whole of government” approach);
• Coherence within development cooperation programmes among several providers (normally known as “harmonisation”);
• Coherence (or “alignment”) between provider policies and the development strate-gies of programme countries; and
• Coherence of aid and non-aid policies among all provider and recipient countries.
This chapter focuses on the first aspect (alignment and harmonisation were discussed in Chapter 1).
In addition, there is a strong feeling among many stakeholders that the international community needs to look “beyond aid” in terms of ensuring that aid catalyses other sources of development financing, in order to reduce aid dependence. There is high concern about the dependence of some recipient countries on aid for funding high proportions of their budgets, and a wish to ensure that over the longer-term more countries graduate from “aid depend-ence” to using national budget revenues or private sector financing for funding progress to the MDGs. There is a considerable literature debating what constitutes excessive aid depend-ence (see for example Clemens et al 2004; Foster and Keith 2005). OECD data indicate that there are only seven low-income countries whose aid dependence is above 25% of GNI, and that this falls to only four countries if only “country programmable aid” (CPA) is included. Aid dependence also varies dramatically year-to-year, and is concentrated in post-conflict countries receiving large amounts of aid for reconstruction and resettlement, and small states. So it is easy to exaggerate aid dependence. Nevertheless, the catalytic role of aid needs to be reviewed as part of the discussion on coherence.
To ensure policies “beyond aid” lead to significant development results, progress is needed on three fronts:
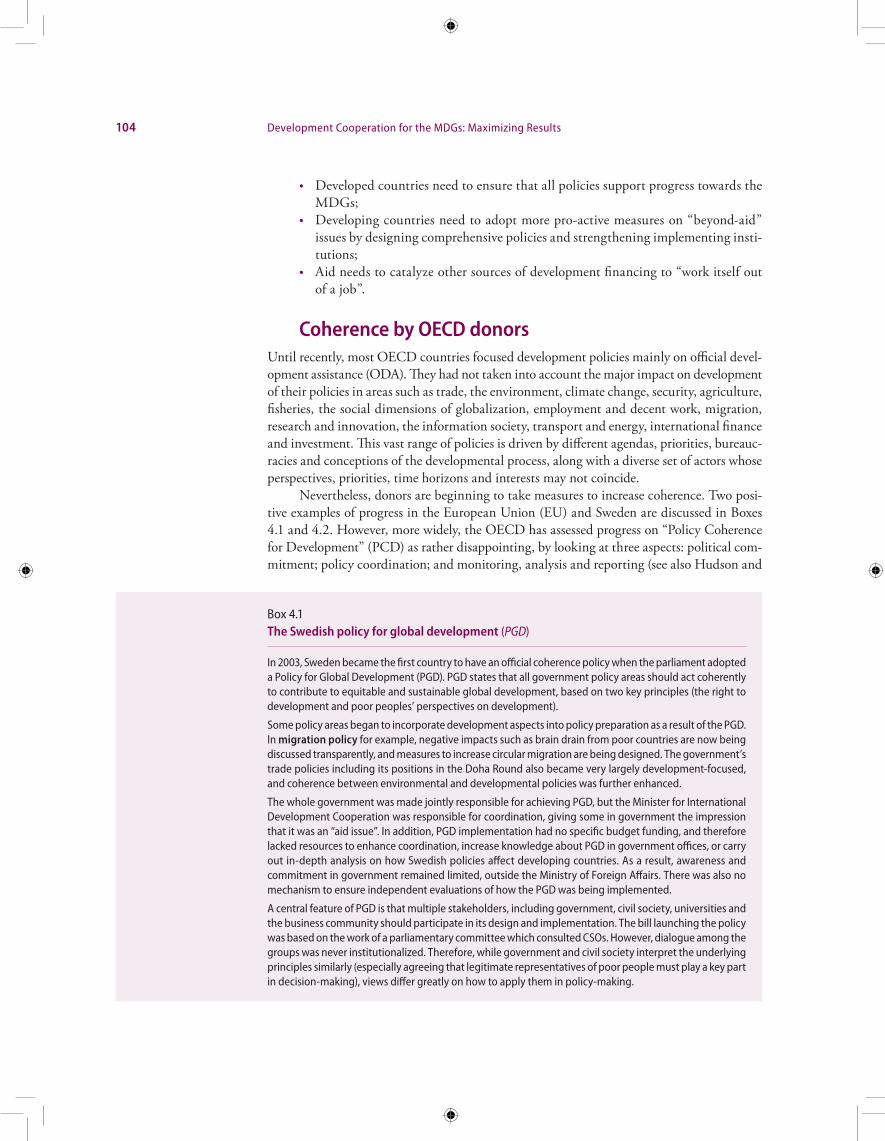
104 Development Cooperation for the MDGs: Maximizing Results
• Developed countries need to ensure that all policies support progress towards the MDGs;
• Developing countries need to adopt more pro-active measures on “beyond-aid” issues by designing comprehensive policies and strengthening implementing insti-tutions;
• Aid needs to catalyze other sources of development financing to “work itself out of a job”.
Coherence by OECD donorsUntil recently, most OECD countries focused development policies mainly on official devel-opment assistance (ODA). They had not taken into account the major impact on development of their policies in areas such as trade, the environment, climate change, security, agriculture, fisheries, the social dimensions of globalization, employment and decent work, migration, research and innovation, the information society, transport and energy, international finance and investment. This vast range of policies is driven by different agendas, priorities, bureauc-racies and conceptions of the developmental process, along with a diverse set of actors whose perspectives, priorities, time horizons and interests may not coincide.
Nevertheless, donors are beginning to take measures to increase coherence. Two posi-tive examples of progress in the European Union (EU) and Sweden are discussed in Boxes 4.1 and 4.2. However, more widely, the OECD has assessed progress on “Policy Coherence for Development” (PCD) as rather disappointing, by looking at three aspects: political com-mitment; policy coordination; and monitoring, analysis and reporting (see also Hudson and
Box 4.1The Swedish policy for global development (PGD)
In 2003, Sweden became the first country to have an official coherence policy when the parliament adopted a Policy for Global Development (PGD). PGD states that all government policy areas should act coherently to contribute to equitable and sustainable global development, based on two key principles (the right to development and poor peoples’ perspectives on development).
Some policy areas began to incorporate development aspects into policy preparation as a result of the PGD. In migration policy for example, negative impacts such as brain drain from poor countries are now being discussed transparently, and measures to increase circular migration are being designed. The government’s trade policies including its positions in the Doha Round also became very largely development-focused, and coherence between environmental and developmental policies was further enhanced.
The whole government was made jointly responsible for achieving PGD, but the Minister for International Development Cooperation was responsible for coordination, giving some in government the impression that it was an “aid issue”. In addition, PGD implementation had no specific budget funding, and therefore lacked resources to enhance coordination, increase knowledge about PGD in government offices, or carry out in-depth analysis on how Swedish policies affect developing countries. As a result, awareness and commitment in government remained limited, outside the Ministry of Foreign Affairs. There was also no mechanism to ensure independent evaluations of how the PGD was being implemented.
A central feature of PGD is that multiple stakeholders, including government, civil society, universities and the business community should participate in its design and implementation. The bill launching the policy was based on the work of a parliamentary committee which consulted CSOs. However, dialogue among the groups was never institutionalized. Therefore, while government and civil society interpret the underlying principles similarly (especially agreeing that legitimate representatives of poor people must play a key part in decision-making), views differ greatly on how to apply them in policy-making.
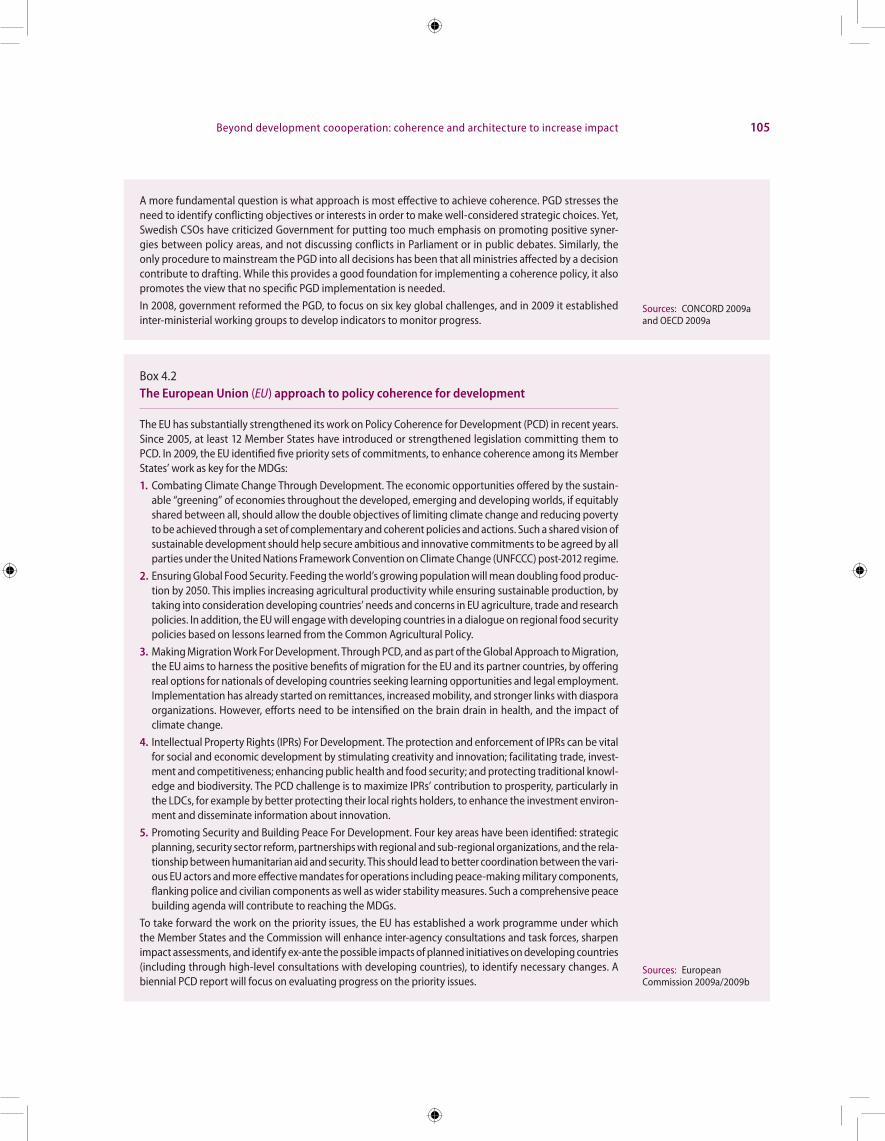
Beyond development coooperation: coherence and architecture to increase impact 105
A more fundamental question is what approach is most effective to achieve coherence. PGD stresses the need to identify conflicting objectives or interests in order to make well-considered strategic choices. Yet, Swedish CSOs have criticized Government for putting too much emphasis on promoting positive syner-gies between policy areas, and not discussing conflicts in Parliament or in public debates. Similarly, the only procedure to mainstream the PGD into all decisions has been that all ministries affected by a decision contribute to drafting. While this provides a good foundation for implementing a coherence policy, it also promotes the view that no specific PGD implementation is needed.
In 2008, government reformed the PGD, to focus on six key global challenges, and in 2009 it established inter-ministerial working groups to develop indicators to monitor progress.
Sources: CONCORD 2009a and OECD 2009a
Box 4.2The European Union (EU) approach to policy coherence for development
The EU has substantially strengthened its work on Policy Coherence for Development (PCD) in recent years. Since 2005, at least 12 Member States have introduced or strengthened legislation committing them to PCD. In 2009, the EU identified five priority sets of commitments, to enhance coherence among its Member States’ work as key for the MDGs:
1. Combating Climate Change Through Development. The economic opportunities offered by the sustain-able “greening” of economies throughout the developed, emerging and developing worlds, if equitably shared between all, should allow the double objectives of limiting climate change and reducing poverty to be achieved through a set of complementary and coherent policies and actions. Such a shared vision of sustainable development should help secure ambitious and innovative commitments to be agreed by all parties under the United Nations Framework Convention on Climate Change (UNFCCC) post-2012 regime.
2. Ensuring Global Food Security. Feeding the world’s growing population will mean doubling food produc-tion by 2050. This implies increasing agricultural productivity while ensuring sustainable production, by taking into consideration developing countries’ needs and concerns in EU agriculture, trade and research policies. In addition, the EU will engage with developing countries in a dialogue on regional food security policies based on lessons learned from the Common Agricultural Policy.
3. Making Migration Work For Development. Through PCD, and as part of the Global Approach to Migration, the EU aims to harness the positive benefits of migration for the EU and its partner countries, by offering real options for nationals of developing countries seeking learning opportunities and legal employment. Implementation has already started on remittances, increased mobility, and stronger links with diaspora organizations. However, efforts need to be intensified on the brain drain in health, and the impact of climate change.
4. Intellectual Property Rights (IPRs) For Development. The protection and enforcement of IPRs can be vital for social and economic development by stimulating creativity and innovation; facilitating trade, invest-ment and competitiveness; enhancing public health and food security; and protecting traditional knowl-edge and biodiversity. The PCD challenge is to maximize IPRs’ contribution to prosperity, particularly in the LDCs, for example by better protecting their local rights holders, to enhance the investment environ-ment and disseminate information about innovation.
5. Promoting Security and Building Peace For Development. Four key areas have been identified: strategic planning, security sector reform, partnerships with regional and sub-regional organizations, and the rela-tionship between humanitarian aid and security. This should lead to better coordination between the vari-ous EU actors and more effective mandates for operations including peace-making military components, flanking police and civilian components as well as wider stability measures. Such a comprehensive peace building agenda will contribute to reaching the MDGs.
To take forward the work on the priority issues, the EU has established a work programme under which the Member States and the Commission will enhance inter-agency consultations and task forces, sharpen impact assessments, and identify ex-ante the possible impacts of planned initiatives on developing countries (including through high-level consultations with developing countries), to identify necessary changes. A biennial PCD report will focus on evaluating progress on the priority issues.
Sources: European Commission 2009a/2009b
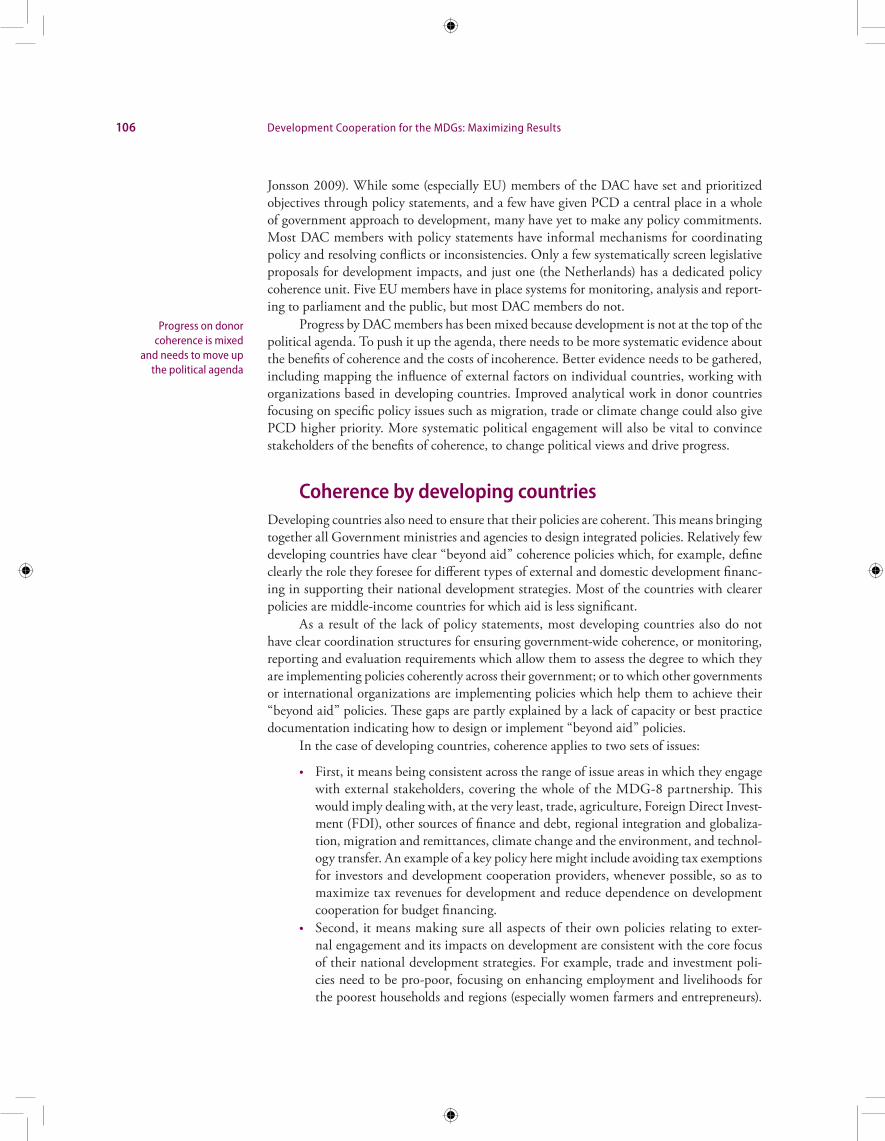
106 Development Cooperation for the MDGs: Maximizing Results
Jonsson 2009). While some (especially EU) members of the DAC have set and prioritized objectives through policy statements, and a few have given PCD a central place in a whole of government approach to development, many have yet to make any policy commitments. Most DAC members with policy statements have informal mechanisms for coordinating policy and resolving conflicts or inconsistencies. Only a few systematically screen legislative proposals for development impacts, and just one (the Netherlands) has a dedicated policy coherence unit. Five EU members have in place systems for monitoring, analysis and report-ing to parliament and the public, but most DAC members do not.
Progress by DAC members has been mixed because development is not at the top of the political agenda. To push it up the agenda, there needs to be more systematic evidence about the benefits of coherence and the costs of incoherence. Better evidence needs to be gathered, including mapping the influence of external factors on individual countries, working with organizations based in developing countries. Improved analytical work in donor countries focusing on specific policy issues such as migration, trade or climate change could also give PCD higher priority. More systematic political engagement will also be vital to convince stakeholders of the benefits of coherence, to change political views and drive progress.
Coherence by developing countriesDeveloping countries also need to ensure that their policies are coherent. This means bringing together all Government ministries and agencies to design integrated policies. Relatively few developing countries have clear “beyond aid” coherence policies which, for example, define clearly the role they foresee for different types of external and domestic development financ-ing in supporting their national development strategies. Most of the countries with clearer policies are middle-income countries for which aid is less significant.
As a result of the lack of policy statements, most developing countries also do not have clear coordination structures for ensuring government-wide coherence, or monitoring, reporting and evaluation requirements which allow them to assess the degree to which they are implementing policies coherently across their government; or to which other governments or international organizations are implementing policies which help them to achieve their “beyond aid” policies. These gaps are partly explained by a lack of capacity or best practice documentation indicating how to design or implement “beyond aid” policies.
In the case of developing countries, coherence applies to two sets of issues:
• First, it means being consistent across the range of issue areas in which they engage with external stakeholders, covering the whole of the MDG-8 partnership. This would imply dealing with, at the very least, trade, agriculture, Foreign Direct Invest-ment (FDI), other sources of finance and debt, regional integration and globaliza-tion, migration and remittances, climate change and the environment, and technol-ogy transfer. An example of a key policy here might include avoiding tax exemptions for investors and development cooperation providers, whenever possible, so as to maximize tax revenues for development and reduce dependence on development cooperation for budget financing.
• Second, it means making sure all aspects of their own policies relating to exter-nal engagement and its impacts on development are consistent with the core focus of their national development strategies. For example, trade and investment poli-cies need to be pro-poor, focusing on enhancing employment and livelihoods for the poorest households and regions (especially women farmers and entrepreneurs).
Progress on donor coherence is mixed
and needs to move up the political agenda
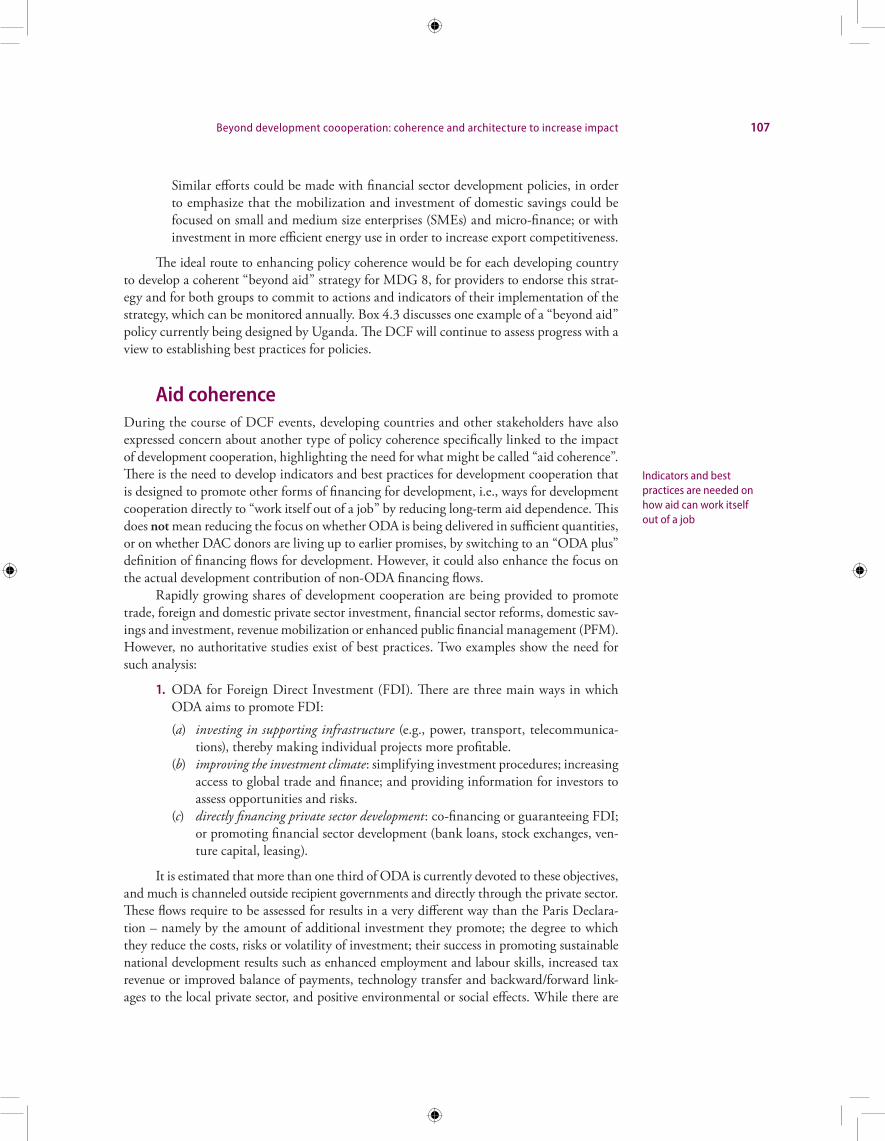
Beyond development coooperation: coherence and architecture to increase impact 107
Similar efforts could be made with financial sector development policies, in order to emphasize that the mobilization and investment of domestic savings could be focused on small and medium size enterprises (SMEs) and micro-finance; or with investment in more efficient energy use in order to increase export competitiveness.
The ideal route to enhancing policy coherence would be for each developing country to develop a coherent “beyond aid” strategy for MDG 8, for providers to endorse this strat-egy and for both groups to commit to actions and indicators of their implementation of the strategy, which can be monitored annually. Box 4.3 discusses one example of a “beyond aid” policy currently being designed by Uganda. The DCF will continue to assess progress with a view to establishing best practices for policies.
Aid coherenceDuring the course of DCF events, developing countries and other stakeholders have also expressed concern about another type of policy coherence specifically linked to the impact of development cooperation, highlighting the need for what might be called “aid coherence”. There is the need to develop indicators and best practices for development cooperation that is designed to promote other forms of financing for development, i.e., ways for development cooperation directly to “work itself out of a job” by reducing long-term aid dependence. This does not mean reducing the focus on whether ODA is being delivered in sufficient quantities, or on whether DAC donors are living up to earlier promises, by switching to an “ODA plus” definition of financing flows for development. However, it could also enhance the focus on the actual development contribution of non-ODA financing flows.
Rapidly growing shares of development cooperation are being provided to promote trade, foreign and domestic private sector investment, financial sector reforms, domestic sav-ings and investment, revenue mobilization or enhanced public financial management (PFM). However, no authoritative studies exist of best practices. Two examples show the need for such analysis:
1. ODA for Foreign Direct Investment (FDI). There are three main ways in which ODA aims to promote FDI:
(a) investing in supporting infrastructure (e.g., power, transport, telecommunica-tions), thereby making individual projects more profitable.
(b) improving the investment climate: simplifying investment procedures; increasing access to global trade and finance; and providing information for investors to assess opportunities and risks.
(c) directly financing private sector development: co-financing or guaranteeing FDI; or promoting financial sector development (bank loans, stock exchanges, ven-ture capital, leasing).
It is estimated that more than one third of ODA is currently devoted to these objectives, and much is channeled outside recipient governments and directly through the private sector. These flows require to be assessed for results in a very different way than the Paris Declara-tion – namely by the amount of additional investment they promote; the degree to which they reduce the costs, risks or volatility of investment; their success in promoting sustainable national development results such as enhanced employment and labour skills, increased tax revenue or improved balance of payments, technology transfer and backward/forward link-ages to the local private sector, and positive environmental or social effects. While there are
Indicators and best practices are needed on how aid can work itself out of a job
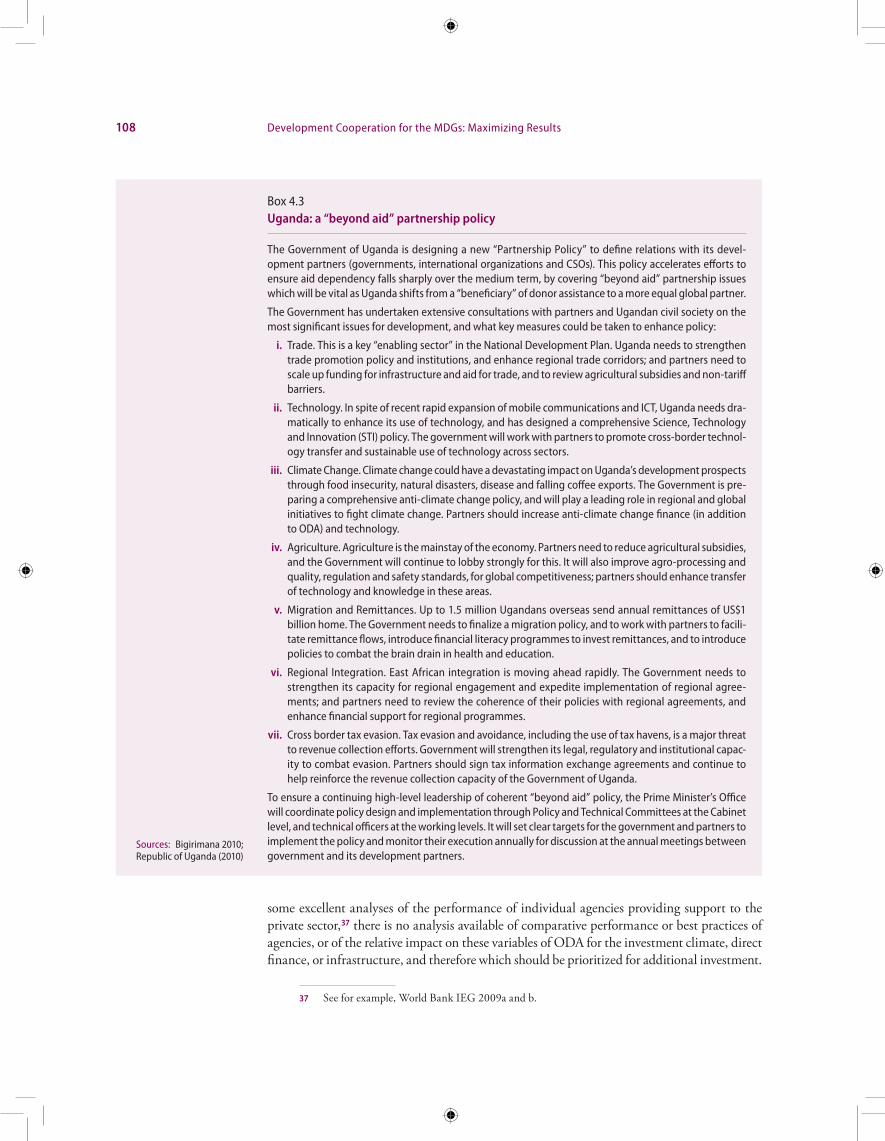
108 Development Cooperation for the MDGs: Maximizing Results
some excellent analyses of the performance of individual agencies providing support to the private sector,37 there is no analysis available of comparative performance or best practices of agencies, or of the relative impact on these variables of ODA for the investment climate, direct finance, or infrastructure, and therefore which should be prioritized for additional investment.
37 See for example, World Bank IEG 2009a and b.
Box 4.3Uganda: a “beyond aid” partnership policy
The Government of Uganda is designing a new “Partnership Policy” to define relations with its devel-opment partners (governments, international organizations and CSOs). This policy accelerates efforts to ensure aid dependency falls sharply over the medium term, by covering “beyond aid” partnership issues which will be vital as Uganda shifts from a “beneficiary” of donor assistance to a more equal global partner.
The Government has undertaken extensive consultations with partners and Ugandan civil society on the most significant issues for development, and what key measures could be taken to enhance policy:
i. Trade. This is a key “enabling sector” in the National Development Plan. Uganda needs to strengthen trade promotion policy and institutions, and enhance regional trade corridors; and partners need to scale up funding for infrastructure and aid for trade, and to review agricultural subsidies and non-tariff barriers.
ii. Technology. In spite of recent rapid expansion of mobile communications and ICT, Uganda needs dra-matically to enhance its use of technology, and has designed a comprehensive Science, Technology and Innovation (STI) policy. The government will work with partners to promote cross-border technol-ogy transfer and sustainable use of technology across sectors.
iii. Climate Change. Climate change could have a devastating impact on Uganda’s development prospects through food insecurity, natural disasters, disease and falling coffee exports. The Government is pre-paring a comprehensive anti-climate change policy, and will play a leading role in regional and global initiatives to fight climate change. Partners should increase anti-climate change finance (in addition to ODA) and technology.
iv. Agriculture. Agriculture is the mainstay of the economy. Partners need to reduce agricultural subsidies, and the Government will continue to lobby strongly for this. It will also improve agro-processing and quality, regulation and safety standards, for global competitiveness; partners should enhance transfer of technology and knowledge in these areas.
v. Migration and Remittances. Up to 1.5 million Ugandans overseas send annual remittances of US$1 billion home. The Government needs to finalize a migration policy, and to work with partners to facili-tate remittance flows, introduce financial literacy programmes to invest remittances, and to introduce policies to combat the brain drain in health and education.
vi. Regional Integration. East African integration is moving ahead rapidly. The Government needs to strengthen its capacity for regional engagement and expedite implementation of regional agree-ments; and partners need to review the coherence of their policies with regional agreements, and enhance financial support for regional programmes.
vii. Cross border tax evasion. Tax evasion and avoidance, including the use of tax havens, is a major threat to revenue collection efforts. Government will strengthen its legal, regulatory and institutional capac-ity to combat evasion. Partners should sign tax information exchange agreements and continue to help reinforce the revenue collection capacity of the Government of Uganda.
To ensure a continuing high-level leadership of coherent “beyond aid” policy, the Prime Minister’s Office will coordinate policy design and implementation through Policy and Technical Committees at the Cabinet level, and technical officers at the working levels. It will set clear targets for the government and partners to implement the policy and monitor their execution annually for discussion at the annual meetings between government and its development partners.
Sources: Bigirimana 2010; Republic of Uganda (2010)

Beyond development coooperation: coherence and architecture to increase impact 109
2. ODA for Budget Revenue. To help countries increase tax revenue, ODA tries to:
(a) build country capacity in tax policy and administration, by providing technical assistance, institutional support, training and information technology.
(b) combat cross-border tax evasion, money-laundering and capital flight, by dramati-cally strengthening the exchange of information among tax and financial regu-latory authorities, and reorienting bilateral tax treaties to maximize revenue for developing country tax authorities.
(c) increase taxation of major-projects (especially in natural resources), by improving country negotiation capacity, enhancing transparency and discouraging the granting of tax holidays.
Again there is no analysis available of: the overall volume of aid channeled into projects or policies to enhance tax revenues; which of these types of assistance has most successfully and sustainably increased tax revenue collections; and best practices in each area.
Overall, there is a need to promote the effectiveness of aid in leveraging other types of development financing. This objective was defined in the Monterrey Consensus38 and restated in the Paris Declaration. For ODA to lead to a real transfer of resources, the impact of ODA on domestic resource mobilization – the ability of the government to mobilize public revenue, and the desire of the private sector to save – is critical. In expanding the fiscal space for devel-opment, channeling aid into strengthening national capacities to mobilize public revenue and domestic savings is of crucial importance. The DCF can play a key role in reinforcing these commitments through high quality analysis.
Coherence for what: accelerating progress on MDG 839
The global economic environment has changed fundamentally in 2008-10, with the worst economic and financial crisis since the Great Depression, increased food insecurity, volatile oil prices and climate change. The world economy shrank by 2.0% in 2009, and recovery is fragile in 2010. GDP growth for developing countries is forecast to rebound to an average of 5.9 % in 2010 before slowing somewhat to 5.8% in 2011. This is still below the highs observed in the pre-crisis period, when growth averaged 7.2% for the period 2004-07. United Nations estimates suggest that global growth may decelerate in the second half of 2010 as the effects of both the upward inventory adjustment and fiscal stimuli fade.40
Earlier growth did not necessarily translate into poverty reduction; as a result, large parts of the world remain far from meeting the internationally agreed development goals, including the Millennium Development Goals. The crisis has driven more than 60 million people into poverty and more than 100 million people into hunger, further reducing the pros-pects of achieving the Millennium Development Goals. It has also reduced the scale of private flows and demonstrated once again the volatility of such flows and the need to enhance their contribution to development. Despite progress in some areas of the global partnership for
38 The Monterrey Consensus recognized that ODA “plays an essential role as a complement to other sources of financing for development, especially in those countries with the least capacity to attract private direct investment” (para. 39), and “can be critical for improving the environment for private sector activity and can thus pave the way for robust growth”(para. 39), underlining the need to intensify efforts to “[p]romote the use of ODA to leverage additional financing for development, such as foreign investment, trade and domestic resources” (para. 43).
39 For a more comprehensive analysis of progress, see United Nations 2010.40 For more comprehensive analysis, see UNDESA 2010 a, b and c.
Without progress across MDG 8, development cooperation will have limited impact

110 Development Cooperation for the MDGs: Maximizing Results
development, most areas are not living up to expectations, especially in Sub-Saharan Africa and the least developed countries. In such circumstances, development cooperation becomes even more vital, but without progress across the board on all aspects of the internation-ally agreed development goals, including the Millennium Development Goals, development cooperation will have a limited impact.
Private capital flows will be essential in helping many countries to achieve the inter-nationally agreed development goals by 2015. They are highly pro-cyclical, however, and vulnerable to external shocks. It may be desirable for countries to further explore measures that mitigate excess volatility, such as appropriate capital controls and financial regulation and supervision, especially with respect to short-term capital flows. At the global level, foreign direct investment (FDI) inflows are expected to fall from $1.7 trillion in 2008 to below $1 trillion in 2009, and a slow recovery is expected in 2010.
The development contribution of FDI is as important as its quantity. There is strong evi-dence that FDI is increasingly reaching the poorest countries. While it remains concentrated in the extractive industry in the poorest countries, it is increasingly diversifying into other sectors. In many instances, however, FDI is not reaching the poorest regions within countries, owing to a lack of infrastructure, and there is little evidence that FDI flowing to these coun-tries is leading to a significant upgrading of skills or technology transfer, or to strengthening links to local industries. Most profits continue to be repatriated, and many investors are tax-exempt. Much more needs to be done to enhance the development contribution of FDI, in particular by implementing multilateral tax information exchange agreements and requiring transnational corporations to report profits on a country-by-country basis so that tax revenues from investment can fund crucial development expenditures.
Migrant remittances represent a significant portion of the gross domestic product (GDP) of many countries and a vital income support for many poor households. They have increased fourfold since the early 1990s, and have fallen less sharply than other flows during the global crisis. Channelling more remittances through the banking systems of programme countries, reducing the costs of transfers, and channelling them into public investment through “diaspo-ra bonds” could increase their developmental impact considerably.
The global crisis sparked a 13% contraction in global trade, the largest decline since World War II, and was accompanied by some protectionist measures, albeit ones of low inten-sity. Trade is set to rebound by 7.6% in 2010, but persistent unemployment could intensify protectionist pressures. In 2011, estimates suggest that trade volumes will expand by 5.9% (see UNDESA 2010c). Trade among developing countries is rebounding even more sharply, and looks set to continue to grow.
Trade remains a key driver of growth in the poorest countries, but the extent to which it supports sustainable human development depends on its rules and the capacity of coun-tries to boost economic growth and job creation through trade. The successful completion of the Doha Round, with a strong pro-development and pro-poor outcome in agriculture, non-agriculture market access and services, is urgently required to help countries make the most of trade opportunities and to foster increased investments in the internationally agreed development goals. Particularly vital will be market access for agricultural exports, requiring the elimination of agricultural subsidies in developed countries, and initiatives to build the capacity of programme countries to trade by improving infrastructure and productive capa-bilities, including through support of the Aid for Trade Initiative.
Debt relief fell sharply in the period 2007-2009, with the declining impact of both the Heavily Indebted Poor Countries (HIPC) debt initiative and the Multilateral Debt Relief Initiative and the end of exceptional packages for Iraq and Nigeria. These initiatives have
Private flows are volatile, and more efforts are
needed to enhance their development contribution.
Cost reductions and diaspora bonds could
channel remittances to investment in the MDGs
Trade is rebounding from crisis but no progress
on development round
Beyond development coooperation: coherence and architecture to increase impact 111
helped some of the world’s poorest and most heavily indebted countries mobilize resources for investment in poverty reduction and development. Much of the debt relief funding was not additional to existing aid, however, but rather represented accounting transfers among creditor agencies to clear arrears.
The global economic and financial crisis has contributed to higher debt burdens in most developed and developing countries, eroding part of the progress made since the HIPC Initia-tive and the Millennium Summit. The risks of unsustainable debt in low-income countries have increased considerably, and debt service in many programme countries remains unac-ceptably high, preventing Governments from scaling up investments in the internationally agreed development goals. In particular, insufficient attention has been paid, including in the HIPC Initiative, to the debt burdens of middle-income countries and small and vulnerable economies, and to private sector and domestic debts. Additional debt relief will be required to reduce the burdens of those countries to sustainable levels and to foster economic recov-ery. This could take the form of an interest-free moratorium on debt service payments for all developing countries with moderate to high debt burdens, in order to release extra funds for investment in achieving the internationally agreed development goals. Efforts should also be made to extend the HIPC Initiative to include all low-income countries and lower-middle income vulnerable countries.
Fears over new rounds of unsustainable debt in the wake of the global recession have increased the urgency of reaching an international agreement on a fair and transparent inter-national debt workout procedure, ideally under the aegis of the United Nations for the sake of legitimacy and credibility. Such a mechanism would restructure unpayable sovereign debt in a fair, predictable and orderly fashion, thereby lowering costs for creditors, ensuring burden sharing among them and reducing the likelihood that the economic crisis and spending cuts would be damaging to the development prospects of debtor countries.
The crisis has added urgency to the appropriate regulation of international financial mar-kets. Complex globalized financial instruments continue to develop, exacerbating risks in the world economy and requiring reforms to strengthen regulatory and supervisory frameworks, national and international financial standards and taxation of financial institutions and trans-actions. In particular, developing countries continue to have very little voice in the formulation of global financial regulations, which therefore remain less adapted to their needs and capaci-ties, let alone to their development aspirations. It is essential to enhance the representation of developing countries, especially low-income countries, in regulatory standard-setting bodies such as the Financial Stability Board, in order to increase their legitimacy and effectiveness.
Limited progress has been achieved since the 2008 DCF on the global financial archi-tecture, with some increased voice and participation of some developing countries in interna-tional financial decision-making and norm-setting. Reflecting the growing economic weight of large emerging economies, this has included the gradual transfer of decision-making with regard to the international financial system from G8 to G20, and changes in voting rights in the International Monetary Fund (IMF) and the World Bank. It is vital that changes in the voting rights in the Bretton Woods institutions be made more substantial in order to reflect changes in economic power. In addition, the G20 does not constitute a representative or legitimate forum where all countries’ voices can be heard, nor one in which non-executive stakeholders have sufficient voice. It is also essential that the legitimate role of the United Nations in leading global economic discussions continue to be enhanced. Further reforms, especially if reflected in more balanced governance of development cooperation, have the potential to bring fundamental improvements in the prospects for attaining MDG 8 and all the IADGs (see Supachai 2010).
Debt relief falls sharply; urgent need for a workout mechanism
Urgent need for development-oriented financial regulation
Increased voice and participation are vital, for developing countries and non-executive stakeholders
112 Development Cooperation for the MDGs: Maximizing Results
Towards a new development cooperation architecture
For many years, there have been repeated complaints about the lack of a structured “ar-chitecture” for international development cooperation (see for example Action Aid 2005; Christiansen and Rogerson 2005; Sagasti et al 2005). This has reflected strong worries about the proliferation of provider institutions and agencies, the lack of coordination among them at global level, and especially the lack of a framework for assessing the effectiveness of the cooperation they provide, and of its impact on development results. The case for strengthened “global governance” for development cooperation has been made strongly by many authors (most recently Barder et al 2010; Better Aid 2010b; Killen and Rogerson 2010; Manning 2008 and 2010).
These concerns in turn prompted the suggestion in the Monterrey Consensus that “Recipient and donor countries, as well as international institutions, should strive to make ODA more effective” (para 43), which included detailed suggestions on harmonization, unty-ing and greater predictability including budget support by donors; improvement of recipient development strategies, absorptive capacity, financial management and leadership of technical assistance, as well as promoting the use of ODA to leverage other financing for development; strengthening South-South and triangular cooperation; and improving the targeting of aid to the poor, aid coordination, and measurement of results.
From Monterrey came two processes to reform the aid architecture, both making con-siderable progress:
The aid effectiveness processThe first process has revolved around increasing the “effectiveness” of aid in achieving de-velopment results. It began with the Rome Declaration on Harmonisation in 2003. The Paris Declaration of 2005, though drafted largely by DAC donors, was also endorsed by multilateral institutions and many developing countries, and marked the first time these actors had agreed collectively to monitorable indicators to improve aid quality by changing their behaviour.
The Third High-Level Forum on Aid Effectiveness, in September 2008, resulted in the Accra Agenda for Action (AAA), which widened and deepened the Paris discussions, and focused more clearly on results. The AAA negotiations engaged stakeholders more fully than in Paris:
• Developing countries increased their preparations and role in the talks sharply, requesting targets for use of their monitoring and evaluation systems; untying all aid including for non-LDCs, food aid and technical assistance; strengthening inter-national mutual accountability; designing their own aid policies; leading manage-ment of technical assistance; explicit plans to reduce conditionality; and a stronger role for the United Nations Development Cooperation Forum.
• Civil society organizations conducted comprehensive global consultations to pro-duce precise written inputs. These included indicators on multiyear predictability, conditionality, demand-led technical assistance, ending tied aid (including for food aid and technical assistance), implementing new standards for transparency, sup-porting citizen-led monitoring and evaluation, and assessing the impact of aid on poverty reduction, gender equality, human rights and environmental sustainability.
Monterrey led to two processes....
... aid effectiveness, which has been efficient
Beyond development coooperation: coherence and architecture to increase impact 113
However, ultimately the AAA results were decided by OECD DAC members, nota-bly a concern by some of them not to go beyond Paris indicators, and there was virtually no participation by other (especially South-South) providers. This left the AAA as an important step forward because it contains considerably stronger wording than the Paris Declaration, but with very few monitorable actions (only encouragement to use country fiduciary systems; an evaluation of progress on division of labour among donors by 2009; a dialogue on inter-country aid allocations in 2009; provision of information including multi-year indicative forecasts and project documents to recipients; and a review of progress on international mutual accountability in 2009). The AAA also lacked approval by a global multi-stakeholder process.
Conscious of this shortcoming, and building on a commitment in the AAA to devel-op institutionalized processes for joint and equal partnership of developing countries and the engagement of stakeholders, the DAC Working Party on Aid Effectiveness (WP-EFF) enhanced efforts to involve other stakeholders since Accra, including through the appoint-ment of a developing country co-chair, and participation of civil society organizations and parliamentarians in its executive committee. However, many continue to argue (Better Aid 2010b) that the aid effectiveness process is unsuccessful because change in donor and recipient behaviour has been minimal, and only partially legitimate because it is run by DAC donors. Much more progress will be needed to ensure the views of non-DAC stakeholders are fully reflected in the outcomes of the 2011 High-Level Forum, resulting in stronger monitorable actions to increase aid effectiveness, and hold individual providers and recipients accountable.
The ECOSOC Development Cooperation ForumMonterrey also began efforts to reinforce the United Nations Economic and Social Council (ECOSOC), which culminated in the decision at the World Summit in 2005 to establish the Development Cooperation Forum (DCF) to review trends in international development cooperation, including strategies, policies and financing; promote greater coherence among development activities of different development partners; and provide policy guidance and options as well as recommendations on practical measures to enhance the coherence and ef-fectiveness of international development cooperation.
The United Nations Development Cooperation Forum has shown in two cycles (2007-10) that it can:
• Conduct impartial analysis of development cooperation and its impact on the MDGs;• Provide a forum where developing countries, Southern providers, parliamentarians,
local governments and civil society organizations as well as DAC providers and multilateral organizations can express strong voices on development cooperation;
• Broaden the debate on development cooperation by raising such issues as cross-coun-try and sectoral aid allocation, effectiveness and quality issues which go beyond the Paris Declaration (e.g., conditionality, value-for-money, multi-year predictability);
• Establish norms through a multi-stakeholder process on such issues as mutual accountability and transparency, and the gender impact of development cooperation.
Most important, the DCF has provided an impartial and representative multi-stake-holder forum to discuss wider issues relating to development cooperation, which reflect the concerns of stakeholders beyond DAC donors (such as conditionality, international and national-level mutual accountability and transparency, the design of aid policies by develop-ing countries, and the gender impact of development cooperation). Its agenda and participa-
... and the DCF, which has been inclusive
114 Development Cooperation for the MDGs: Maximizing Results
tion have been determined by the views of a broad range of stakeholders through an Advisory Group as well as regular consultations with key non-executive stakeholder groups such as CSOs, parliamentarians and local governments. Voices of Southern development cooperation providers, recipient governments, and non-executive stakeholders have been heard strongly in all DCF events and analysis, and the current International Development Cooperation Report (IDCR) maximizes efforts to ensure that their perspectives are taken into account. In its global survey of mutual accountability discussed in Chapter 2, it has involved multiple stakeholder organizations in an inclusive process. To the degree that it focuses on enhancing global accountability to citizens and non-executive stakeholders, and to “non-practitioners” of development cooperation, it has been praised by some as being more relevant than other fora (Barder 2010).
However, the DCF has been criticized for not producing sufficiently robust outcomes in terms of non-binding targets or indicators to which participants could be held account-able, for having a relatively “ad hoc” participation which changes frequently, and for its thinly distributed expertise and resources, and therefore is seen by some (e.g., Barder et al 2010) as risking becoming a “high-quality talking shop”. Stakeholders have also indicated that its processes could be made even more representative (see for example Better Aid 2010b). It will need to enhance its design of clear norms and best practice standards for improving devel-opment cooperation, widen them to new areas, and press for their application in the field through cooperation with other actors, as well as increasing its expertise and resources, and structuring its cooperation with stakeholders more formally, if it is to enhance its effectiveness to match its legitimacy.
Where next?In spite of this progress, there is continuing discussion of how to improve the architecture further. Much of the debate is couched in terms of a comparison between the two – WP-EFF and United Nations – strands, with the former often seen as more effective/efficient and the latter as more inclusive/legitimate. This can lead to the conclusion that one or the other process should be favoured, or that neither process can be both effective and legitimate. Such conclusions are too pessimistic: improving governance of development cooperation is not an either/or choice, or a contest between organizations or processes – it is one in which all must work together to maximize synergies and focus on development results. This means each process improving the areas in which it performs less well – as discussed above: but it also means enhancing efforts to converge and consolidate the two processes.
It is relatively easy to envisage an “ideal” institutional solution to the global develop-ment cooperation architecture. The “legitimate and inclusive” United Nations could become the apex of political-level decision making on development cooperation issues, perhaps through the Development Cooperation Forum. Some will object that this might reduce the effectiveness and practical focus of the discussions – but the Monterrey and Kyoto processes have shown how successful the United Nations can be at agreeing practically-focused politi-cal texts and establishing norms for best practice behaviour, when negotiations are well-led and streamlined. Key civil society organizations have suggested that such an apex could negotiate a Convention on Development Effectiveness in Development Cooperation (Better Aid 2010b).
Implementing the decisions of an apex body would require technical support from a technical body equivalent to the WP-EFF. Some might object that this would risk reduc-ing inclusiveness, but this could be overcome by more balanced representation of different
Future progress should involve their convergence
under United Nations leadership

Beyond development coooperation: coherence and architecture to increase impact 115
stakeholders, and strong technical and secretariat support and analytical inputs from/for all different stakeholder groups, which would carry on the work of analysis and of promoting practical behaviour change to improve the development effectiveness of aid. The United Nations would play a strong role in conducting analysis and convening meetings to agree best practices, norms and indicators, based on inputs from a broad range of sources includ-ing DAC and non-DAC providers, recipient governments, and non-executive stakeholders. In other words, by pooling the combined legitimacy and effectiveness of the two processes which sprang from Monterrey, both would gain.
Such a solution would maximize legitimacy and effectiveness at all levels, and allow everyone to focus on results rather than architecture. A first step could be to consider mov-ing after the next High-Level Forum on Aid Effectiveness to a more fully coordinated global architecture on aid effectiveness and aid quality with the United Nations at its apex, building on the conclusions of Monterrey. This could make a major contribution to producing stronger and more coordinated global leadership on international development cooperation, making all stakeholders focus even more strongly on development results for the world’s poorest people, going beyond the Millennium Development Goals.

117
Bibliography
Action Aid International (2005), Real Aid: An Agenda for Making Aid Work, June.____ (2006), Real Aid 2: Making Technical Assistance Work, June.____ (2009), The case against the World Bank’s role in tackling climate change: An ActionAid
rough guide, ActionAid International, May, accessed at http://www.actionaid.org/docs/world%20bank%20briefing%20in%20template%20may%202009%20final.pdf.
____ (2010a), Using Special Drawing Rights for Climate Finance, ActionAid International, February accessed at http://actionaidusa.org/assets/pdfs/climate_change/sdr_for_climate_finance.pdf?window_id=4.
____ (2010b), The 20 Billion Dollar Question: Have the G8 Delivered on their Hunger Pledge?, June 2010, accessed at http://www.actionaid.org/assets/pdf/ActionAid_G82010_MediaBrief.PDF.
Active Learning Network for Accountability and Performance in Humanitarian Action (ALNAP) (2010), State of the Humanitarian System Report, available at http://www.alnap.org/pool/files/alnap-sohs-final.pdf.
Adugna, Abebe (2009) How Much of Official Development Assistance is Earmarked?, CFP Working Paper Series No.2, Concessional Finance and Global Partnerships Vice-Presidency, World Bank, Washington DC, July.
African Development Bank (2009), Debt Relief, Aid and Service Delivery, AfDB/Oxford University Press.
____ (2010), Partnerships and Cooperation Opportunities Working Document, Tunis, accessed at http://www.afdb.org/fileadmin/uploads/afdb/Documents/Generic-Documents/Booklet%20Final.pdf.
African Monitor (2009), Development Support Monitor 2009, at http://www.africanmonitor.org.
Africa Partnership Forum documents, available at http://www.africapartnershipforum.org.Africa Progress Panel (2010), Africa Progress Report, at http://www.africaprogresspanel.org.Aga Khan Foundation (2008), Annual Report 2008, accessed at http://www.akdn.org/AKF.Agencia Espanola de Cooperacion Internacional para el Desarrollo (AECID) (2009),
Analysis of the Perspectives for Strengthening Triangular Cooperation April accessed at http://www.oecd.org/dataoecd/30/62/43757592.pdf.
Ambrose, Soren and B. Muchhala (2010), Fruits of the Crisis: Leveraging the Financial and Economic Crisis of 2008-2009 to Secure New Resources for Development and Reform for the Global Reserve System, ActionAid International and Third World Network, London, January accessed at http://www.actionaid.org/docs/sdr_reserve_final.pdf.
Anderson, Edward (2008), Practices and implications of aid allocation, background study for 2008 Development Cooperation Forum, April, accessed at http://www.un.org/ecosoc/newfunct/pdf/Revised%20draft(Anderson).pdf).

118 Development Cooperation for the MDGs: Maximizing Results
Arab Bank for Economic Development in Africa (BADEA) (undated), A Study on the Means to Encourage Arab Investment in Africa, at http://www.badea.org/en/pdf/invstudy-en.pdf.
AWEPA (2009), Safeguarding the Interests of the People: Parliaments and Aid Effectiveness, available at http://www.awepa.org/images/stories/2009_2010/Resources/Handbooks_and_Toolkits/awepa.parl.hb%20eng.pdf.
AWID (2008): FundHer Brief 2008: Money Watch for Women’s Rights Movements and Organizations, AWID: Toronto, online at: http://www.awid.org/eng/About-AWID/AWID-Initiatives/Where-is-the-Money-for-Women-s-Rights/What-s-new-from-this-initiative/FundHer-Brief-2008-Money-Watch-for-Women-s-Rights-Movements-and-Organizations (on 21 July 2010).
Barder, Owen (2010), Aid Effectiveness: Where Is It Going and What Could You Do ?, presentation to Ethiopia Development Assistance Group, 19 May, Addis Ababa.
Barder, Owen; Gavas, Mikaela, Maxwell, Simon and Johnson, Deborah (2010), Governance of the Aid System and the Role of the EU, background paper for conference on Development Cooperation in Times of Crisis and Achieving the MDGs, Madrid, June.
BBC (2010) Slim, Gates and Spain Pledge $150 million to fight disease, June 15, accessed at http://news.bbc.co.uk/go/em/fr/-/1/hi/world/us_and_canada/10315241.stm.
Benn, Julia; Rogerson, Andrew and Steensen, Suzanne (2010), Getting Closer to the Core – Measuring Country Programmable Aid, OECD Development Cooperation Directorate Development Brief, June.
Better Aid (2008), Final CSO Statement to Accra High-Level Forum, 1st September, accessible at http://www.betteraid.org/downloads/Final_CSO_Statement_Accra010908[1].doc.
____ (2010a), Policy Paper on South-South Development Cooperation, March accessed at http://betteraid.org/.
____ (2010b), Statement to the United Nations Development Cooperation Forum, available at http://www.un.org/en/ecosoc/julyhls/pdf10/dcf_statement_betteraid.pdf.
Bigirimana, Pius (2010), Keeping a Development Focus: The challenges in ensuring policy coherence for development: Uganda’s Perspective, Office of the Prime Minister of Uganda, at the 2010 DCF High Level Symposium in Helsinki, Finland, 3-4 June.
Birdsall, N., H. Kharas and A. Mahgoub (Forthcoming), A Quality of Development Assistance Index, Center for Global Development and the Wolfensohn Center for Development at the Brookings Institution.
BRAC (2009) Annual Report accessed at http://www.brac.net/useruploads/files/brac-ar-2009.pdf.
Brautigam, Deborah (2009) The Dragon’s Gift: the Real Story of China in Africa, Oxford University Press, Oxford.
Bredenkamp, H and C. Patillo (2010), Financing the Response to Climate Change IMF, Washington DC, March accessed at http://www.imf.org/external/pubs/ft/spn/2010/spn1006.pdf.
Brown, Jessica, N. Cantore and D. Willem te Velde (2010) Climate Financing and Development: Friends or foes? , paper commissioned by The ONE Campaign, January accessed at http://www.one.org/c/international/policybrief/3227/.
Bibliography 119
Cambodia Independent Review Team (2008), Cambodia Evaluation of Aid Effectiveness: Independent Review Team Final Report, November.
Capacity Development for Development Effectiveness Facility for Asia And Pacific (2009a), Articulating Voice from the Asia and the Pacific Peer-to-Peer Initiative, October.
____ (2009b), Better Data, Better Aid? Practical Guidance Note on Aid Information Management Systems, 26 January.
____ (2009c), Supporting the Implementation of the Paris Declaration and the Accra Agenda for Action in Asia-Pacific, accessed at http://www.aideffectiveness.org/CDDE-Capacity-Developmentfor-Development-Effectiveness-Facility.html.
Center for Global Development (2009), Commitment to Development Index, available at http://www.cgdev.org/section/initiatives/_active/cdi/.
Centre for Chinese Studies, Stellenbosch University (2006), China’s Interest and Activity in Africa’s Construction and Infrastructure Sectors, report to UK Department for International Development, November.
China Ministry of Commerce (2010) An Interpretation of New measures on Economic and Trade Cooperation for 4th Ministerial Conference, Forum for China Africa Cooperation, accessed at http://www.focac.org/eng/dsjbzjhy/hxxd/t696509.htm.
Christiansen, Karin and Rogerson, Andrew (2005), Is the Current Aid Architecture Fit for Purpose ?, background paper for Commonwealth Finance Ministers meeting, Barbados, available at http://www.odi.org.uk/resources/download/1453.pdf.
Clemens, M., Radelet, S. and Bhavnani, R. (2004), Counting Chickens When They Hatch: The Short-term Effect of Aid on Growth, Working Paper No.44. Centre for Global Development, Washington DC.
CONCORD (2009a) [European NGO Confederation for Relief and Development], Report 2009: ‘Spotlight on Policy Coherence’.
____ (2009b), Aid Watch Report 2009: Lighten the Load, accessed at http://www.concordeurope.org/Files/media/0_internetdocumentsENG/3_Topics/Topics/Aidwatch/AidWatch-report-2008_light.pdf.
____ (2009c), Aid Watch Update: EU Aid in Jeopardy?, Brussels, December.____ (2010), “Penalty Against Poverty - More and Better EU Aid Can Score Millennium
Development Goals”, May, accessed at http://www.concordeurope.org/Files/media/1_extranetdocumentsENG/NavigationSecondaire/WorkingGroups/Aidwatch/Aidwatch2010/report2010/CONCORD_report_light.zip.
Cotula, Lorenzo, Sonja Vermeulen, Rebeca Leonard and James Keeley (2009), Land Grab or Development Opportunity? Agricultural investment and international land deals in Africa, FAO, IIED and IFAD, London/Rome accessed at http://www.ifad.org/pub/land/land_grab.pdf.
Davies, Penny (2010), A Review of the Roles and Activities of New Development Partners, CFP Working paper Series No 4, Concessional Finance and Global Partnerships Vice-Presidency, World Bank, Washington DC, July accessed at http://siteresources.worldbank.org/CFPEXT/Resources/CFPWorkingPaper4.pdf.
Department for International Development (DfID - UK) (2010a), Developing Country Views on DfID’s Multilateral Resource Allocation, report by Development Finance International, available at www.development-finance-org.
120 Development Cooperation for the MDGs: Maximizing Results
____ (2010b) Agenda 2010 The Turning Point on Poverty, MDG Conference proceedings, London (March) accessed at http://collections.europarchive.org/tna/20100423085705/http://www.dfid.gov.uk/Media-Room/News-Stories/2010/dfidconference2010/.
Development Assistance Research Associates (2009), Humanitarian Response Index Report, available at www.dara.org.
Development Finance International (DFI) / Overseas Development Institute (ODI) (2009), Guide to Donors, accessed at http://www.hipccbp.org/index.php?option=com_content&task=category§ionid=2&id=38&Itemid=77&lang=en.
Development Initiatives (2010a), Global Humanitarian Assistance Report (2009), available at http://www.globalhumanitarianassistance.org/reports.
____ (2010b) Agricultural Development Assistance Issues Brief commissioned for ONE accessed at http://www.one.org/c/international/issuebrief/3325/.
Dom, C. (2007), What are the Effects of General Budget Support? Joint Evaluation of General Budget Support, OECD Thematic Paper, No. 1.
Dreher, Alex; Nunnenkamp, Peter and R. Thiele (2010), Are ‘New’ Donors Different? Comparing the Allocation of Bilateral Aid between Non-DAC and DAC Donor Countries paper presented as AidData Conference, Oxford, March accessed at http://data.irtheoryandpractice.org/~oxford/papers/Dreher_Nunnenkamp_Thiele_2010.pdf.
European Commission (2008), The MDG Contract: An Approach for Longer Term and More Predictable General Budget Support. At http://ec.europa.eu/development/icenter/repository/, MDG-Contract-Paper-0608_en.pdf (accessed 10 May 2010).
____ 2009a), Communication from the European Commission to the Council, the European Parliament, the European Economic and Social Committee and the Committee of the Regions: ‘Policy Coherence for Development-Establishing the policy framework for a whole-of –the-Union approach’, 19 September, Brussels.
____ (2009b), Commission Staff Working Report Accompanying the Report from the Commission to the Council: Report on Policy Coherence for Development.
____ (2010), Financing for Development accessed at http://ec.europa.eu/development/how/monterrey_en.cfm.
European Union (2010a), Donor Atlas 2010, at http://development.donoratlas.eu/index2010.htm.
____ (2010b) Report on Financing for Development 2010, at http://ec.europa.eu/development/icenter/repository/SEC_2010_0420_COM_2010_0159_EN.PDF.
Fordelone, Tatila Yamashiro (2009) Triangular Co-operation and Aid Effectiveness, paper prepared for the OECD Policy Dialogue on Development Co-operation, September accessed at http://www.oecd.org/dataoecd/63/37/43704891.pdf.
Fukuda-Parr, Sakiko (2008), Mainstreaming Global Goals into Development Strategies and Policies Papers, a background study for the Development Cooperation Forum, May. http://www.un.org/en/ecosoc/docs/pdfs/mainstreaming_of_iadgs.pdf.
GAVI (2009), GAVI Alliance Progress Report 2008, accessed at http://www.gavialliance.org/resources/2008_GAVI_Alliance_Progress_Report.pdf.
Gerster, Richard (2007), Education in Benin: “We Were Blind, but Now We Can See”. Available from http://www.gersterconsulting.ch/docs/budget-support/erfa/e/Benin/Artikel_Benin_Bildung_E_b.pdf, (accessed 10 May 2010).
Bibliography 121
____ (2010), Developing a Performance Assessment Framework of Development Partners (“DPs’ PAF”) in Ghana”, January.
Global Fund (2009), Annual Report 2008 accessed at http://www.theglobalfund.org/en/.
Government of Afghanistan / International Community (2006), The Afghanistan Compact, The London Conference on Afghanistan, February.
____ (2008), Report on the Implementation of the Afghanistan Compact”, Joint Coordination and Monitoring Board.
Government of Bangladesh / Development Partners (2005), Bangladesh Harmonisation Action Plan.
____ (2010a), Draft Bangladesh Joint Cooperation Strategy – 2010-2015, May, mimeo.
____ (2010b), Bangladesh Development Forum– Action Plan Matrix, April.
Government of Burkina Faso (2007), Plan d’Actions Nationale Sur L’Efficacité de L’Aide au Développement 2007-2010, Ouagadougou.
Government of Ghana, Multi-Donor Budget Support and other aid coordination documents, accessible at http://www.mofep.gov.gh/mdbs.cfm.
Government of Ghana / Development Partners (2007), Ghana Joint Assistance Strategy, February.
Government of Indonesia (2010), The Jakarta Commitment Annual Report 2009, January.
Government of Indonesia / Development Partners (2009), Jakarta Commitment – Aid for Development Effectiveness: Indonesia’s Roadmap to 2014, January.
Government of Kenya / Development Partners (2007), Joint Assistance Strategy for the Republic of Kenya (2007-2012), June.
____ (2009), Draft Terms of Reference – Review of the Kenya Joint Assistance Strategy, August.
Government of Malawi (2008), Annual Debt and Aid Report 2007/8.
Government of Malawi / Development Partners (2006), Malawi Development Assistance Strategy 2006-2011.
Government of Nepal / Development Partners. (2009a), Draft National Action Plan on Aid Effectiveness, June.
____ (2009b), Draft National Aid Policy.
Government of Rwanda / Development Partners (2007), “Annual Report of Government of Rwanda and Development Partners - Strengthening Partnerships for Economic Development and Poverty Reduction”, accessed at http://www.devpartners.gov.rw/docs/index.php?dir=Studies+and+Reports%2F&download=Strengthening_Partnerships_GoR_DP_2007.pdf.
Government of Tanzania / Development Partners (2007), Joint Assistance Strategy for Tanzania - Action Plan and Monitoring Framework, June.
Government of Vietnam / Development Partners (2005), Hanoi Core Statement on Aid Effectiveness, June.
Government of Zambia / Development Partners (2007), Joint Assistance Strategy for Zambia 2007-2010, April.
Grameen Bank (2008), Annual Report accessed at http://www.grameen-info.org/.
122 Development Cooperation for the MDGs: Maximizing Results
Group of 20 Chair (UK Government) (2009), Consultation of Low Income Countries, communiqués of meetings in Freetown and London, August, available at www.development-finance.org.
Grown, Caren et al (2008), “The financial requirements of achieving gender equality and women’s empowerment,” in Gender Equality Now: Accelerating the Achievement of the Millennium Development Goals, New York, UNIFEM.
Guillaumont, Patrick (2008), Adapting Aid Allocation Criteria to Development Goals, an essay for the 2008 Development Cooperation Forum United Nations Economic and Social Council, May, at http://www.un.org/en/ecosoc/newfunct/pdf/prof.%20guillaumont%20final%20draft%20paper.pdf.
Hanfstaengl, Eva (2010), Study on the “Impact of the global economic crises on civil society organizations, 10 February, a study for the NGO Committee for Social Development, available from http://ngosocdev.files.wordpress.com/2010/01/full-study-on-impact-of-global-crises-on-csos-2-25-10.pdf.
Horton, Susan et al, Scaling up Nutrition: What Will it Cost, World Bank: Washington, D.C.
Hudson, Alan and Jonsson, Linnea (2009), Beyond Aid for Sustainable Development, ODI/OECD Project Briefing 22, May, London, at http://www.odi.org.uk/resources/download/3288.pdf.
Hudson Institute Centre for Global Prosperity (2010) Index of Global Philanthropy and Remittances 2010, Washington DC, accessed at http://www.hudson.org/files/pdf_upload/Index_of_Global_Philanthropy_and_Remittances_2010.pdf.
Ibrahim, Barbara Lethem and D H Sherif (eds.) (2008), From Charity to Social Change Trends in Arab Philanthropy, The American University in Cairo Press, Cairo.
IBSA (2010), Brasilia Declaration, India-Brazil-South Africa Dialogue Forum, Fourth Summit of Heads of State/Government, April accessed at http://www.ibsa-trilateral.org//index.php?option=com_content&task=view&id=102&Itemid=46&limit=1&limitstart=0.
ICA (2009), Financial Commitments for Infrastructure in Africa for 2008. Infrastructure Consortium for Africa.
India-Africa Forum (2008), Plan of Action of The Framework for Cooperation of the India Africa Forum Summit, Delhi, accessed at www.indianembassy.gov.et/download/Joint%20Plan%20of%20Action.doc.
International Aid Transparency Initiative (IATI) (2009), Scoping Paper for Consultation, available at http://aidtransparency.net/ or http://aidinfo.org/iati/iati-scoping-paper.
International Development Association and International Monetary Fund (2009), Heavily Indebted Poor Countries (HIPC) Initiative and Multilateral Debt Relief Initiative (MDRI)—Status of Implementation, 15 September.
International Monetary Fund (2009) Bhutan: 2009 Article IV Consultation, Washington, DC, December accessed at http://www.imf.org/external/pubs/ft/scr/2009/cr09334.pdf.
Inter-Parliamentary Union (2010a), Parliaments and Development Effectiveness: A Practical Guidance Note.
____ (2010b), Parliament’s Role in the Development Aid Agenda: Overview and Four Case Studies, mimeo, September.
Bibliography 123
Japan International Cooperation Agency (2009), JICA’s Support for South-South Cooperation, Tokyo, accessed at http://www.jica.go.jp/english/operations/thematic_issues/south/index.html.
Johnson, Alison (2008), Trends in South-south and triangular development cooperation: Background Study for the Development Cooperation Forum, New York, April accessed at http://www.un.org/ecosoc/docs/pdfs/South-South_cooperation.pdf.
____ (2009), South-South and Triangular Development Cooperation: Improving Data, background study for 2010 United Nations Development Cooperation Forum. http://www.un.org/en/ecosoc/newfunct/pdf/analytical%20study%20%28ssc%29%20-%20november%202009.pdf.
____ (2010a), Global Trends in Development Cooperation, background study for 2010 United Nations Development Cooperation Forum, July 2010.
____ (2010b), Recent Trends in South-South Cooperation, background study for 2010 United Nations Development Cooperation Forum, July 2010.
Kharas, Homi (2008), Measuring the Costs of Aid Volatility, at www.brookings.edu/wolfensohn/wolfensohn-Center-for-Development-working- paper.aspx.
Killen, Brenda and Rogerson, Andrew (2010), Global Governance for International Development: Who’s In Charge ?, OECD Development Brief 2, Consultation Draft, June.
Kingdom of Cambodia, Cambodian Rehabilitation and Development Board (CRDB) and Council for Development of Cambodia (CDC), Aid Management Documents, accessible at http://www.cdc-crdb.gov.kh/aid-management-documents.html.
Kragelund, Peter (2008), The Return of NON-DAC Donors to Africa: New Prospects for African Development? , Development Policy Review, 2008, 26 (5), accessed at http://www.diis.dk/sw65215.asp.
Kumar, Nagesh (2008) South-South and Triangular Cooperation in Asia-Pacific: Towards a new paradigm in development cooperation, Background Study for United Nations ECOSOC, New York, October accessed at http://www.un.org/en/ecosoc/newfunct/pdf/background%20study%20final.pdf.
Lao PDR (2009), Report on Roundtable Implementation Meeting, November.Lao PDR / Development Partners (2009), Vientiane Declaration on Aid Effectiveness: Action
Plan 2010 - 2011, November.Lum, Thomas, Hannah Fischer, Julissa Gomez-Granger (2009), China’s Foreign Aid
Activities in Africa, Latin America and Southeast Asia, US Congressional Research Service, Washington DC, February accessed at http://www.fas.org/sgp/crs/row/R40361.pdf.
Manning, Richard (2008), Towards a Strengthened Framework for Aid Effectiveness, background study for 2008 Development Cooperation Forum, April, accessed at http://www.un.org/ecosoc/docs/pdfs/Aid_effectiveness_1.pdf).
____ (2010), Intervention at Madrid Conference on Development Cooperation in Times of Crisis and Achieving the MDGs, 9-10 June.
Martin, Matthew (2007a), Assessing Agency Effectiveness and Building Capacity for Mutual Accountability, presentation to 3rd Roundtable on Managing for Development Results, Hanoi, February.
124 Development Cooperation for the MDGs: Maximizing Results
____ (2007b), Key Challenges Facing Global Development Cooperation, Discussion Paper for Launch of DCF, April.
____ (2007c), Mutual Accountability on Aid Effectiveness: How Could It Be Made to Work? , note to DAC Working Party Meeting, June 16.
____ (2008a), Key Actions to Ensure Mutual Accountability on Aid Effectiveness at National and Global Level, May, mimeo.
____ (2009), Enhancing Mutual Accountability and Transparency in Development Cooperation, background study for DCF High-Level Symposium, November, at http://daccessdds.un.org/doc/UNDOC/GEN/N08/352/08/PDF/N0835208.pdf?OpenElement.
____ 2010), Review Of Progress In International And National Mutual Accountability And Transparency On Development Cooperation, a study for the Development Cooperation Forum, May http://www.un.org/en/ecosoc/newfunct/pdf/ma_study-status_and_progress.pdf.
Martin, Matthew and Johnson, Alison (2005), Empowering Developing Countries to Lead the Aid Partnership: a Background Paper for the UNDP Human Development Report, Development Finance International, London, February. http://hdr.undp.org/en/reports/global/hdr2005/papers/hdr2005_johnson_alison_and_matthew_martin.pdf.
Mokoro Limited (2008), Putting Aid On Budget: a study for CABRI and SPA, published by CABRI, available at http://cabrisbo.org/index.php?option=com_content&view=article&id=48:publicationsanddocuments&catid=20:downloads.
Multilateral Development Banks (2009), Common Performance Assessment System (COMPAS) Report, available at http://www.mfdr.org/Compas/index.html.
Multilateral Organisation Performance Assessment Network (MOPAN) (2009), Common Approach Assessment Reports 2009, available at http://www.mopanonline.org/.
Nelson Mandela Foundation (2009), Annual Report 2009 accessed at http://www.nelsonmandela.org/index.php/foundation.
NGO Forum on Cambodia (2009), NGO Statement on the monitoring of CDCF Indicators, April. http://www.ngoforum.org.kh/eng/dip/dipdocs/DPP_NGO%20Statement%20on%20the%20Monitoring%20of%20CDCF%20Indicator_%2028%20April%202009.pdf.
Organisation for Economic Cooperation and Development (OECD) (2006), ‘Promoting Private Investment for Development: The Role of ODA’, accessed at http://www.oecd.org/dataoecd/23/40/36566902.pdf.
____ (2009a), Building Blocks for Policy Coherence, accessed at http://www.oecd.org/dataoecd/14/53/44704030.pdf.
____ (2009b), Mutual Accountability: Emerging Good Practice, note prepared for DCF by Task Team on Mutual Accountability of the Working Party on Aid Effectiveness, October.
____ (2009c), DAC Guiding Principles for Aid Effectiveness, Gender Equality and Women’s Empowerment, 21 July accessed at: http://www.oecd.org/dataoecd/14/27/42310124.pdf.
OECD-Development Assistance Committee (DAC) (various years), Peer Reviews of DAC Members, available at http://www.oecd.org/department/0,3355,en_2649_34603_1_1_1_1_1,00.html.
Bibliography 125
____ (various years), Monitoring the Principles for Good International Engagement in Fragile States, available at http://www.oecd.org/site/0,3407,en_21571361_42277499_1_1_1_1_1,00.html.
____ (2006), 2006 Survey on Monitoring the Paris Declaration, accessible by searching Paris Declaration 2006 Survey on the OECD website.
____ (2008a), 2008 Survey on Monitoring the Paris Declaration: Making Aid More Effective by 2010 (Volume 1 Overview and Volume 2 Country Reports), all accessible by searching Paris Declaration 2008 Survey on the OECD website.
____ (2008b), Evaluation of the Implementation of the Paris Declaration: Phase One Synthesis Report, available at http://www.oecd.org/dataoecd/59/0/41202112.pdf.
____ (2008c) Accra High-Level Forum 3 - Roundtable Summaries, accessed at http://www.oecd.org/dataoecd/56/52/41572502.pdf.
____ (2009a) Aid Orphans: Whose Responsibility?, Development Brief 1, accessed at http://www.oecd.org/dataoecd/14/34/43853485.pdf.
____ (2009b) Mutual Accountability, Issues Brief 1, June, accessed at http://www.oecd.org/dataoecd/32/19/43408716.pdf.
____ (2009c) Mutual Accountability: Emerging Good Practice, note prepared for DCF by Task Team on Mutual Accountability of the Working Party on Aid Effectiveness, October.
____ (2009d) Triangular Co-operation: What Do We Know About it? Overview prepared for the OECD Policy Dialogue on Development Co-operation, September accessed at http://www.oecd.org/dataoecd/62/54/44652734.pdf.
____ (2009e) Development Cooperation Report 2009, Volume 10/1, Paris accessed at http://www.oecd.org/document/54/0,3343,en_2649_33721_42195902_1_1_1_1,00.html.
____ (2009f) Report on Division of Labour: Addressing Fragmentation and Concentration of Aid Across Countries, Paris, December accessed at http://www.oecd.org/dataoecd/18/52/44318319.pdf.
____ (2009g) Aid Orphans: Whose Responsibility? Development Brief, Issue 1, Paris, October accessed at http://www.oecd.org/dataoecd/14/34/43853485.pdf.
____ (2009h) 2009 DAC Report on Aid Predictability, Survey of Donors’ Forward Spending Plans 2009-2011, Paris accessed at http://www.oecd.org/dataoecd/46/19/43161677.pdf.
____ (2009i) Untying Aid: Is It Working?, Paris accessed at http://www.oecd.org/document/5/0,3343,en_2649_18108886_44609413_1_1_1_1,00.html.
____ (2010a) Development Cooperation Report 2010, Volume 10/1, Paris accessed at http://www.oecd.org/document/62/0,3343,en_2649_33721_42195902_1_1_1_1,00.html.
____ (2010b) Development aid rose 2009 and most donors will meet 2010 aid targets, Paris, April accessed at http://www.oecd.org/document/11/0,3343,en_2649_34487_44981579_1_1_1_1,00.html.
____ (2010c) Aid in Support of Gender Equality and Women’s Empowerment, Paris, March accessed at http://www.oecd.org/dataoecd/17/50/44779830.pdf.
ONE Campaign (2008), The 2008 Data Report, development assistance chapter, available at http://homepageone.s3.amazonaws.com/cms%2F20090323101159-DevAss2008.pdf.
____ (2010), The DATA Report 2010 Monitoring the G8 Promises to Africa, Washington accessed at http://www.one.org/c/international/hottopic/3331/.
126 Development Cooperation for the MDGs: Maximizing Results
Overseas Development Institute (2009a), Domestic and Mutual Accountability for Aid: Building Stronger Synergies, report to Commonwealth Secretariat, September.
____ (2009b) Mutual Accountability at the Country Level - A Concept and Emerging Good Practice Paper, prepared for the Working Party on Aid Effectiveness. Accessed at http://www.oecd.org/dataoecd/58/32/43235053.pdf.
Oxfam International (2009a), What Happened at the G20? Initial Analysis of the London Summit, April.
____ (2009b) Climate shame: get back to the table, Briefing Note , Oxfam, December accessed at http://www.oxfam.org.uk/resources/policy/climate_change/downloads/bn_climate_shame_en_231209.pdf.
____ (2009c) Bridging the Divide: The reform of global food security governance, Oxfam Briefing Note, Oxfam, November accessed at http://www.oxfam.org.uk/resources/policy/conflict_disasters/bn-bridging-the-divide-global-food-security.html.
____ (2009d) Beyond Aid: Ensuring Adaptation to climate change works for the poor, Briefing Note, Oxfam, September accessed at http://www.oxfam.org.uk/resources/policy/climate_change/beyond-aid-climate-adaptation.html.
____ (2010a), 21st Century Aid: Recognising Success and Tackling Failure, 28 April.____ (2010b), The Impact of the Global Financial Crisis on the Budgets of Low-Income
Countries, report for Oxfam by Development Finance International, 29 July.Oxford Policy Management (2008a), Mutual Accountability Mechanisms at the International
Level: Final Report, prepared for the Working Party on Aid Effectiveness. Accessed at http://www.oecd.org/dataoecd/47/33/43163465.pdf.
____ (2008b), Mutual accountability in aid effectiveness: International-level mechanisms, OPM Briefing Note 2008-03, Oxford.
Pacific Islands Forum (2009), Cairns Compact on Strengthening Development Cooperation in the Pacific, Forum Communiqué, Fortieth Pacific Islands Forum, August.
Publish What You Fund Campaign Website, at http://www.publishwhatyoufund.org.Reality of Aid Network (2010a) South-South Cooperation: A Challenge to the Aid System?,
Philippines, accessed at http://www.realityofaid.org/newsandfeatures/view/id/74/page/1.
____ (2010b), Reality of Aid Report 2010, at http://www.realityofaid.org/roareports/index/secid/373/part/3.
Republic of Mali (2008), Stratégie Commune d’Assistance Pays – pour la période 2008-2011.Republic of Mozambique / Programme Aid Partners. (2008), Performance Assessment
Indicators (QAD – PAF 2008).____ (2009), Joint Review 2009.Republic of Rwanda (2006), Rwanda Aid Policy, Kigali, 26th July.Republic of Rwanda / Development Partners (2009), Rwanda Donor Performance
Assessment Framework – Preliminary Results from 2009 Round of Monitoring, March.Republic of Uganda (2010), Partnership Policy Options Paper, Kampala, July 2010.Robinson, Michele (2009), Debt Watch – Caribbean, Number 13, July/August accessed at
http://www.michelerobinson.net/.
Bibliography 127
Royal Government of Cambodia / Development Partners (2006a), Declaration by the Royal Government of Cambodia and Development Partners on Enhancing Aid Effectiveness.
____ (2006b), Action Plan on Harmonization, Alignment and Results: 2006-2010.Royal Government of Cambodia (2008), The Cambodia Aid Effectiveness Report 2008.Rwanda Development Partners Website, at http://www.devpartners.gov.rw/.Sagasti, F., Bezanson, K and Prada, F. (2005), The Future of Development Financing:
Challenges and Strategic Choices, Palgrave-MacMillan, London.Secretaria General Iberoamericana (SEGIB) (2009), Report on South-South Cooperation in
Ibero-America 2009, SEGIB Studies No. 4, Madrid, November accessed at http://segib.org/publicaciones/files/2009/12/South-South.pdf.
Schueller, Margot et al (2010) China’s Emergence within Southeast Asia’s Aid Architecture: New Kid on the Block, paper presented as AidData Conference, Oxford, March accessed at http://data.irtheoryandpractice.org/~oxford/papers/Schueller_2010.pdf.
Shushan, Debra and C. Marcoux (2010) Assessing Arab Aid: Trends, Explanations and Unreported Transfers, paper presented as AidData Conference, Oxford, March 22-25 accessed at http://data.irtheoryandpractice.org/~oxford/papers/Shushan_Marcoux_2010.pdf.
Soros, George (2009) Climate Change Proposal, Copenhagen, December accessed at http://www.scribd.com/doc/24137059/George-Soros-Climate-Change-Proposal-Copenhagen-2009.
Supatchai, Panitchpakdi (2010), Keeping a Development Focus: the Challenges in Ensuring Policy Coherence for Development, presentation to ECOSOC DCF High-Level Symposium, Helsinki, 3 June.
Tanzania Development Partners Group website, at http://www.tzdpg.or.tz/.Tanzania Independent Monitoring Group (2005). “Enhancing Aid Relationships in
Tanzania –IMG Report 2005”, September.Task Team on South-South Cooperation (TTSSC, of DAC Working Party on Aid
Effectiveness). (2010a), South-south cooperation in the context of aid effectiveness, March accessed at http://api.ning.com/files/aReJ0-2RvCftyIrB-ucvjSfv4xEto1XhAPhO2ghHkPZd*v5BlXggyyVn*eQ7ICLB-rDLGuJqUuqbhxayUQXQwWPbwcSXKRpi/TTSSCcasestorycatalogue_24march2010engl.pdf.
____ (2010b) Case Stories accessed at http://www.impactalliance.org/ev_en.php?ID=48706_201&ID2=DO_COMMUNITY.
Tomecko, Jim (2008) Building Bridges: GTZ’s Experience with Triangular Cooperation presented at United Nations ECOSOC Asia-Pacific Forum October, accessed at http://www.un.org/en/ecosoc/newfunct/pdf/trilateral%20cooperation%20at%20undp%20oct%20v5.pdf.
Vietnam Development Cooperation, website of the Ministry of Planning and Investment, at http://oda.mpi.gov.vn/index.jsp?&lng=en.
Vietnam Independent Monitoring Team (2008), Independent Monitoring of the Implementation of the Hanoi Core Statement on Aid Effectiveness at Sectoral and Sub-National Level in Vietnam, December.
United Nations (2010), The Global Partnership for Development at a Critical Juncture, MDG Gap Task Force Report, New York.
128 Development Cooperation for the MDGs: Maximizing Results
United Nations Conference on Trade and Development (2009a), The case for increased aid to LDCs for agricultural development, December, accessed http://www.unctad.org/en/docs/ciimem2crp4_en.pdf.
____ (2009b), The potential of South–South investment for agricultural and economic development, December, accessed at http://www.unctad.org/en/docs/ciimem2crp3_en.pdf.
____ (2009c), The case for increased aid to LDCs for agricultural development, December, accessed at http://www.unctad.org/en/docs/ciimem2crp4_en.pdf.
____ (2009d), The role of South–South and triangular cooperation for sustainable agriculture development and food security in developing countries, October, accessed at http://www.unctad.org/en/docs/ciimem2d5_en.pdf.
____ (2010a), Rwanda’s Development Driven Trade Policy Framework, prepared by UNCTAD and the Ministry of Trade and Industry of Rwanda, accessed at http://www.unctad.org/en/docs/ditc20092_en.pdf.
____ (2010b), Economic Development in Africa report, accessed at http://www.unctad.org/en/docs/aldcafrica2010_en.pdf.
____ (2010c), Global Investment Trends Monitor No.2: Global and Regional FDI Trends in 2009, 19 January, accessed at http://www.unctad.org/en/docs/webdiaeia20101_en.pdf.
United Nations Department of Economic and Social Affairs (2010a) LINK Global Outlook, June 2010.
____ (2010b) Monthly Briefings on World Economic Situation and Prospects, April-July 2010.
____ (2010c), World Economic and Social Prospects Update, mid-2010.
United Nations Development Programme (2009a), South-South Report 2009, Special Unit for South-South Cooperation, New York, accessed at http://ssc.undp.org/South-Report-2009-Perspectives-on-Sout.270.0.html?&L=0.
____ (2009b), UNDP Global Initiative: Peer and Partner Review of Capacity Development Results, mimeo, July.
____ (2010a), What Will It Take To Achieve The Millennium Development Goals, June.
____ (2010b), South-South Co-operation, the Same Old Game or New Paradigm?, in Poverty in Focus Number 20, New York, accessed at http://www.ipc-undp.org/pub/IPCPovertyInFocus20.pdf.
United Nations Economic Commission for Africa and Organisation for Economic Cooperation and Development (2009), The Mutual Review of Development Effectiveness in Africa: Promise and Performance, accessed at http://www.africapartnershipforum.org/dataoecd/62/43/42179846.pdf.
United Nations ECOSOC Development Cooperation Forum (2008a), Trends and progress in international development cooperation: Report of the Secretary-General, New York, July, accessed at http://daccessdds.un.org/doc/UNDOC/GEN/N08/352/08/PDF/N0835208.pdf?OpenElement.
____ (2008b), South-South and triangular cooperation in Asia-Pacific: towards a new paradigm in development cooperation, background study for the DCF’s Asia Pacific regional forum on triangular and South-South cooperation, October.
Bibliography 129
____ (2010), Trends and Progress in International Development Cooperation, Report of the Secretary-General, New York, 10 June, accessed at http://www.un.org/Docs/journal/asp/ws.asp?m=E/2010/93.
United Nations Education, Scientific and Cultural Organisation (2010), United Nations Educational, Scientific and Cultural Organization, Education for All – Global Monitoring Report 2010: Reaching the Marginalized, Paris.
United Nations General Assembly (2009), Progress Report on Innovative Sources of Development Finance, Report of the Secretary-General, 29 July.
United Nations Childrens Fund (UNICEF) (2010), Prioritizing Expenditures for a Recovery for All, Social and Economic Policy Working Paper, New York, 27 August 2010, mimeo.
UNIFEM (2008), Gender Equality Now: Accelerating the Achievement of the Millennium Development Goals, UNIFEM: New York, online at: www.unifem.org/attachments/products/GenderEqualityNow.pdf , 21 July.
United Nations High Level Task Force on the Global Food Crisis (2010), Updated Comprehensive Framework for Action, Dublin Draft, May (mimeo).
UN Millennium Project (2005), Investing in Development: A Practical Plan to Achieve the Millennium Development Goals (New York).
United Nations Secretariat (2010), Analysis of the funding of operational activities for development of the United Nations system for 2008, Draft report for the Secretary-General, New York, May.
Women’s Forum (2008), Women’s Forum Statement to Accra HLF, Recommendations for Action on Development Effectiveness in Accra and Beyond, September, accessible at http://betteraid.org/index.php?option=com_content&task=view&id=213&Itemid=26.
World Bank (various issues), Global Development Finance.____ (2003), Development Committee, “Progress report and critical next steps in scaling
up: Education for all, health, HIV/AIDS, water and sanitation” (DC2003-0004), 27 March.
____ (2007), Global Economic Prospects 2007: Managing the Next Wave of Globalization.____ (2009), Migration and Development Brief 11: A better-than-expected outcome for
migration and remittance flows in 2009, but significant risks ahead, 3 November.____ (2009b), Africa’s Infrastructure: A Time for Transformation.____ (2009c), Monitoring and Reporting on Financial Flows Related to Climate Change,
Discussion Draft, Washington DC, December accessed at http://beta.worldbank.org/climatechange/sites/default/files/documents/ClimateFin-Monitoring-122909.pdf.
____ (2009d), World Development Report 2010, Washington DC, http://econ.worldbank.org/WBSITE/EXTERNAL/EXTDEC/EXTRESEARCH/EXTWDRS/EXTWDR2010/0,,menuPK:5287748~pagePK:64167702~piPK:64167676~theSitePK:5287741,00.html.
____ (2009e), Global Monitoring Report 2009, Washington DC, accessed at http://web.worldbank.org/WBSITE/EXTERNAL/EXTDEC/EXTGLOBALMONITOR/EXTGLOMONREP2009/0,,menuPK:5924413~pagePK:64168427~piPK:64168435~theSitePK:5924405,00.html.
130 Development Cooperation for the MDGs: Maximizing Results
____ (2010) PRSCs: Client Perceptions of Conditionality accessed at http://web.worldbank.org/WBSITE/EXTERNAL/EXTOED/EXTPRSC/0,,contentMDK:22460050~menuPK:6701768~pagePK:64829573~piPK:64829550~theSitePK:6701762,00.html.
World Bank, Independent Evaluation Group (2009a), Knowledge for Private Sector Development: Independent Evaluation of IFC’s Development Results, available at http://www.ifc.org/ifcext/ieg.nsf/Content/CBAC01E1B663A725852575BB005218D2?OpenDocument.
____ (2009b), Independent Evaluation of MIGA’s Development Effectiveness, available at http://www.miga.org/documents/IEG_MIGA_2009_Annual_Report.pdf.
____ (2010a) Poverty Reduction Support Credits, An Evaluation of the World Bank Support, accessed at http://web.worldbank.org/WBSITE/EXTERNAL/EXTOED/EXTPRSC/0,,contentMDK:22464092~menuPK:6701768~pagePK:64829573~piPK:64829550~theSitePK:6701762,00.html.
World Trade Organisation (2010), Press Release 598: World Trade 2009, Prospects for 2010, 26 March.
Related Documents