DEVELOPMENT AND VALIDATION OF KEY AEROSOL MODELS FOR SOURCE TERM PREDICTIONS IN SODIUM-COOLED FAST REACTORS DURING BEYOND DESIGN BASIS ACCIDENTS JULIO 2018 Mónica García Martín DIRECTORES DE LA TESIS DOCTORAL: Luis Enrique Herranz Puebla Martin Peter Kissane Puebla Mónica García Martín

Welcome message from author
This document is posted to help you gain knowledge. Please leave a comment to let me know what you think about it! Share it to your friends and learn new things together.
Transcript

DEVELOPMENT AND VALIDATION OF KEY AEROSOL MODELS FOR SOURCE TERM PREDICTIONS IN SODIUM-COOLED FAST REACTORS DURING BEYOND DESIGN BASIS ACCIDENTS
JULIO 2018
Mónica García Martín
DIRECTORES DE LA TESIS DOCTORAL:
Luis Enrique Herranz Puebla Martin Peter Kissane
Puebla
Martin Peter Kissane
Mó
nic
a G
arc
ía M
art
ín


UNIVERSIDAD POLITÉCNICA DE MADRID
ESCUELA TÉCNICA SUPERIOR DE INGENIEROS INDUSTRIALES
DEVELOPMENT AND VALIDATION OF KEY AEROSOL MODELS FOR SOURCE TERM PREDICTIONS IN SODIUM-
COOLED FAST REACTORS DURING BEYOND DESIGN BASIS ACCIDENTS
DOCTORAL DISSERTATION
MÓNICA GARCÍA MARTÍN
Physics Degree by Universidad de Salamanca
2018


NUCLEAR ENGINEERING DEPARTMENT ESCUELA TÉCNICA SUPERIOR DE INGENIEROS INDUSTRIALES
UNIVERSIDAD POLITÉCNICA DE MADRID
DEVELOPMENT AND VALIDATION OF KEY AEROSOL MODELS FOR SOURCE TERM PREDICTIONS IN SODIUM-
COOLED FAST REACTORS DURING BEYOND DESIGN BASIS ACCIDENTS
MÓNICA GARCÍA MARTÍN
Physics Degree by Universidad de Salamanca
Supervisors:
Dr. Luis Enrique Herranz Puebla Dr. Martin Peter Kissane
2018


Tribunal nombrado por el Magfo. y Exmo Sr. Rector de la Universidad
Politécnica de Madrid, el día de de 2018.
Presidente: Nuria García Herranz
Secretario: Gonzalo Jiménez Varas
Vocal: Pedro Luis García Ybarra
Vocal: Facundo Alberto Escrivá Castells
Vocal: Daniel Cano Ott
Suplente: Francisco Javier Gómez Moreno
Suplente: Miguel Sánchez Perea
Realizado el acto de defensa y lectura de la tesis el día de de 2018 en la
E.T.S. Ingenieros Industriales.
CALIFICACIÓN:
EL PRESIDENTE LOS VOCALES
EL SECRETARIO


The research leading to this doctoral dissertation has received funding from the European Commission’s Seventh Framework Programme under the Collaborative Project JASMIN (contract number 295803).


Para Manuela y Mero

Manuela y Mero

i
Agradecimientos
Es el momento de agradecer a todos aquellos que han hecho posible esta tesis.
En primer lugar a Luis Enrique Herranz, director de esta tesis. Gracias por hacerla
posible, por tu generosidad al compartir tu pasión por la ciencia y todo tu conocimiento,
por las largas discusiones para saber por qué ocurren las cosas, por inculcarme el buen
saber hacer. No ha sido fácil el camino, gracias por tu perseverancia y por creer que podía
hacerlo. Quiero también agradecer a Martin Kissane, co-director de esta tesis, su
involucración desde el inicio y su dedicación y esfuerzo en la supervisión de este trabajo.
Gracias al Departamento de Ingeniería Nuclear de la UPM, y en especial a Eduardo
Gallego, por darme la oportunidad de comenzar a trabajar en este campo. Gracias a Ian
Ford, profesor de University College London, por compartir con nosotros todo su
conocimiento sobre nucleación. Su punto de vista nos dio una nueva perspectiva sobre la
investigación que estábamos comenzando. También quería agradecer al equipo de la
División de Seguridad Nuclear del IRSN, su tiempo y acogida los meses que pasé allí,
especialmente a Nathalie Girault. Mi gratitud a Claus Spengler por las fructíferas
discusiones mantenidas.
Me gustaría acordarme de todos mis compañeros de la Unidad de Seguridad
Nuclear del CIEMAT, con quienes he compartido tantos buenos momentos. Gracias a
Jaime, tú me ayudaste a empezar con esto. Paco y Claudia, por vuestro apoyo, por los
buenos momentos. Claudia, me moviste de la silla equivocada cuando no veía más que
problemas. En especial a mi gran amigo Joan, por tu paciencia infinita, tus ánimos y
apoyo, siempre dispuesto a echar una mano, este trabajo también es tuyo.
En especial dedico esta tesis a mi gran apoyo, mi familia: mis padres Isabel y Paco,
mis hermanos David y Pablo. Gracias a vosotros soy quien soy. A mis abuelos, cuánto os
echo de menos. A Cristina, mi amiga del alma. A mi marido, Mero. Tu apoyo
incondicional, tu paciencia, tus ánimos para que siguiera adelante, tu amor, han hecho
que esta tesis sea posible. Y por último a mi hija Manuela, tú me has dado la voluntad
para acabar esta tesis.
Para finalizar, quiero dar las gracias al CIEMAT por darme la oportunidad de
realizar esta tesis y a la UE por la financiación del proyecto JASMIN.

ii

iii
Abstract
During Sodium-cooled Fast Reactors (SFRs) severe accidents, it is foreseen that
material in the form of liquid sodium mixed with fuel and fission products would be
ejected into the containment. In the presence of oxygen, combustion of sodium (Na)
results in the conversion of a large fraction of the burnt Na into Na-oxide aerosols that
would govern the suspended radioactivity inside the containment; this together with the
potential harm associated with the chemical species resulting from the Na-oxides reaction
with water vapour present in the atmosphere would be responsible to a great extent for
the radiological and chemical impact of any potential source term. In this sense, the
characterization and behaviour of Na-based aerosols generated during in-containment
Na-fires is of fundamental importance for the assessment of the radiological consequences
in SFR severe accidents.
The work in this thesis presents a step forward in modelling in-containment source
term during potential severe accidents in Na-cooled reactors. A phenomenological model
for sodium-oxide particle generation during sodium pool-fires has been developed (PG
model). The model covers sodium-vapour evaporation from a sodium pool and formation
of sodium-oxide aerosols and calculates the characteristics (number and size) of the
particulate source term to the containment. It consists of a suite of individual models for
Na vaporization (diffusion layer approach), O2 transport by air natural circulation (3D
flow pattern modelling to capture the associated turbulence foreseen right above the
reaction region), Na-O2 chemical reactions (instantaneous reactions and energy of reaction)
and vapour-to-particle conversion of Na-oxides (i.e., nucleation and/or condensation). A
partial validation with available experimental data showed a consistent model response in
terms of burning rates. As using 3D computational fluid dynamics in analysis of Beyond
Design Basis Accidents at present is unsuitable (lack of validated SFRs severe accident
tools) and impractical (expensive computer resources), a zero-D (lumped) approach has
been developed. Subsequently the model has been adapted to be implemented in the
severe-accident computer code ASTEC-Na CPA by transposing the PG formulation into a
form with those specific variables included in the code. The performance of the ASTEC-Na
CPA with the proposed correlations implemented has been tested against some of the
more sound available data in the open literature. In conclusion, the new correlations
derived from the PG model are very suitable for use in a severe-accident code in terms of
the negligible additional computational burden. The new correlations, by originating from
simplifications of soundly-based physical modelling, avoid the arbitrary assumption of a
fixed primary-particle size in the existing modelling. Limited comparisons with

iv
experiments imply that use of the new correlations increases confidence in prediction of
the pool-fire particulate source term to the containment.
The work performed in this thesis is framed in the CIEMAT contribution to the
JASMIN project from the 7th Framework Programme of the European Commission
(contract number 295803).

v
Sinopsis
En el transcurso de un accidente severo en un reactor rápido refrigerado por sodio
(SFR), se prevé la expulsión a contención de material en forma de sodio líquido mezclado
con combustible y productos de fisión. En presencia de oxígeno, la combustión del sodio
da lugar a la conversión de una gran fracción del sodio consumido en aerosoles que
gobernarán la radioactividad suspendida en contención; este hecho junto con el daño
potencial asociado a las especies químicas resultantes de la reacción de los óxidos de
sodio con el vapor de agua presente en la atmósfera serán los responsables en gran
medida del impacto radiológico y químico de cualquier posible término fuente. En este
sentido, la caracterización y el comportamiento de los aerosoles provenientes del sodio
generados durante fuegos en la contención es de suma importancia para la evaluación de
las consecuencias radiológicas de los accidentes severos en los SFRs.
Esta tesis representa un avance en el modelado del término fuente en contención en
el caso de un hipotético accidente severo en un SFR. Para ello, se ha desarrollado un
modelo fenomenológico para la generación de partículas de óxido de sodio durante un
fuego tipo piscina de sodio (modelo PG). El modelo engloba la evaporación de sodio
desde la piscina y la formación de los aerosoles de óxido de sodio y calcula las
características (número y tamaño) de las partículas que componen el término fuente en
contención. El modelo consiste en un conjunto de modelos individuales para la
vaporización del sodio (aproximación de capa difusiva), transporte del O2 mediante
circulación natural de aire (patrón de flujo 3D para capturar la turbulencia asociada
prevista justo encima de la región de reacción), reacciones químicas Na-O2 (reacción
instantánea y energía de reacción) y conversión vapor-partícula de los óxidos de sodio (es
decir, nucleación y/o condensación). Su validación parcial frente a datos experimentales
ha mostrado una respuesta consistente en términos de tasa de quemado. La utilización de
cálculos 3D fluido-dinámicos en accidentes más allá de la base de diseño resulta
actualmente inapropiado (falta de herramientas validadas) y poco factible (costosos
recursos informáticos). Por ello, se ha desarrollado una aproximación cero-D (parámetros
concentrados). Posteriormente, el modelo ha sido adaptado para su implementación en el
código de accidente severo ASTEC-Na CPA. La actuación del nuevo código resultante de
la implementación de las correlaciones propuestas ha sido examinada mediante la
comparación con los datos más consistentes disponibles en la bibliografía publicada.
Como conclusión, las nuevas correlaciones derivadas del modelo PG resultan muy
adecuadas para su utilización en códigos de accidente severo en términos de la
insignificante carga computacional que añaden. Las nuevas correlaciones, al originarse a
partir de simplificaciones de modelos físicos sólidos, evitan la suposición arbitraria de un

vi
tamaño fijo de partícula primaria presente en los modelos actuales. Las comparaciones
con experimentos, aunque limitadas, dejan ver que el uso de las nuevas correlaciones
aumenta la confianza en las predicciones del término fuente en contención resultante de
incendios de piscinas de sodio.
El trabajo realizado para esta tesis se ha llevado a cabo en la unidad de investigación
en seguridad nuclear del CIEMAT como parte del proyecto internacional JASMIN
perteneciente al 7th Programa Marco de la Comisión Europea (número de contrato 295803).

vii
CONTENTS
1. INTRODUCTION ............................................................................................ 1
SFRs: overview.................................................................................................................. 2 1.1.
1.1.1. A short history of SFR development ...................................................................... 2
1.1.2. Current framework ................................................................................................... 7
1.1.3. SFRs technology ........................................................................................................ 9
BDBAs in SFRs ................................................................................................................ 16 1.2.
Background ..................................................................................................................... 19 1.3.
1.3.1. Some basics of aerosol physics .............................................................................. 19
1.3.2. State-Of the Art on in-containment source term ................................................ 21
1.3.3. Overall assessment of modelling capabilities ..................................................... 36
Frame of the thesis ......................................................................................................... 40 1.4.
2. THESIS SETTING OUT ............................................................................... 43
Motivation ....................................................................................................................... 43 2.1.
Objectives ........................................................................................................................ 44 2.2.
Scope ................................................................................................................................ 45 2.3.
2.3.1. Thesis approach ....................................................................................................... 45
3. PARTICLE GENERATION MODEL ......................................................... 49
Conceptual scenario ....................................................................................................... 49 3.1.
PG model ......................................................................................................................... 51 3.2.
3.2.1. Sodium vaporization model .................................................................................. 52
3.2.2. Oxygen supply model ............................................................................................ 56
3.2.3. Sodium-oxygen chemical model ........................................................................... 57
3.2.4. Vapour-to-particle conversion model .................................................................. 59
3.2.4.1. Homogeneous nucleation ....................................................................... 60
3.2.4.2. Heterogeneous nucleation ...................................................................... 65
3.2.4.3. The single-burst approach ...................................................................... 67
PG model results ............................................................................................................ 70 3.3.

viii
3.3.1. Partial validation ..................................................................................................... 71
3.3.2. PG model estimates ................................................................................................ 73
3.3.2.1. Main results ............................................................................................... 73
3.3.2.2. Parametric study of the PG model ......................................................... 80
3.3.3. Impact of agglomeration in the PG model .......................................................... 82
Chapter summary........................................................................................................... 85 3.4.
4. Zero-D PG MODEL DEVELOPMENT ...................................................... 87
Zero-D PG model ........................................................................................................... 88 4.1.
4.1.1. Fundamental equations .......................................................................................... 88
4.1.2. The model assessment ............................................................................................ 89
Zero-D correlations ........................................................................................................ 92 4.2.
Chapter summary........................................................................................................... 97 4.3.
5. PG MODEL VALIDATION ......................................................................... 99
Introduction .................................................................................................................... 99 5.1.
Implementation of Zero-D correlations in CPA* ..................................................... 100 5.2.
Validation test matrix .................................................................................................. 101 5.3.
Modelling of the experiments ..................................................................................... 106 5.4.
5.4.1. Nodalisation and heat structures ........................................................................ 106
5.4.2. Aerosol modelling ................................................................................................. 106
Prediction/data comparison ....................................................................................... 107 5.5.
5.5.1. Thermal-hydraulics ............................................................................................... 108
5.5.2. Aerosol behaviour ................................................................................................. 111
Chapter summary......................................................................................................... 116 5.6.
6. CONCLUSIONS AND FINAL REMARKS ............................................ 117
7. PUBLISHED PAPERS ................................................................................. 123
International journals ................................................................................................... 123 7.1.
National Journals .......................................................................................................... 124 7.2.
International conferences ............................................................................................ 124 7.3.

ix
National conferences .................................................................................................... 125 7.4.
8. NOMENCLATURE ...................................................................................... 127
9. REFERENCES ............................................................................................... 133
APPENDIXES......................................................................................................... 143
A. CLASSICAL NUCLEATION THEORY
B. EXPERIMENTAL DATABASE ON NUCLEATION
C. NUCOND PROGRAM
D. TESTS MATRIX
E. INPUT FILES
F. FEASIBILITY ANALYSIS
G. SELECTION PROCESS OF THE VALIDATION TEST MATRIX

x

xi
LIST OF FIGURES
Fig. 1. Light bulbs energized by electricity from EBR-I (December 20, 1951) (IAEA, 2012). . 3
Fig. 2. Typical SFR core configurations: (a) homogeneous core, (b) axial heterogeneous core
and (c) radial heterogeneous core (Pioro, 2016). ........................................................................ 12
Fig. 3. Typical SFR core fuel element and fuel assembly (Handbook Piero 2016). ............... 13
Fig. 4. Pool/loop type concepts layout........................................................................................ 14
Fig. 5. Containment types. ............................................................................................................ 16
Fig. 6. Expanding gas bubble representation. ............................................................................ 17
Fig. 7. Carbonate formation in sodium fire aerosols. ................................................................ 24
Fig. 8. ALMR containment response to a sodium pool fire. ..................................................... 28
Fig. 9. Thermohydraulic variables of pool fires: a) Temperature and b) Pressure................ 28
Fig. 10. Thermohydraulic variables of spray fires: a) Temperature and b) Pressure............ 29
Fig. 11. Temperature axial profiles as a function of initial Na amount. ................................. 30
Fig. 12. Aerosol concentration vs. time. ...................................................................................... 31
Fig. 13. Concentration evolution: single vs. multiple species aerosols. .................................. 32
Fig. 14. Concentration evolution in the FAUNA facility. ......................................................... 32
Fig. 15. Concentration decrease of sodium oxide aerosol (2000 W/m2 heating)................... 34
Fig. 16. Scheme of the research approach. .................................................................................. 46
Fig. 17. “Hot flat plate approach”. ............................................................................................... 51
Fig. 18. PG model diagram. ........................................................................................................... 52
Fig. 19. Overview of the main analytical theories on homogeneous nucleation. .................. 61
Fig. 20. Isothermal homogeneous nucleation versus saturation ratio. ................................... 64
Fig. 21. Theoretical-to-experimental ratio of nucleation rates versus S. ................................. 65
Fig. 22. Nucleation approaches. ................................................................................................... 68
Fig. 23. Total number of generated particles by the two modelling approaches. ................. 70
Fig. 24. Meshing of the sodium fire simulation.......................................................................... 72
Fig. 25. Burning rates vs. pool temperature. ............................................................................... 73
Fig. 26. Flow velocities field (m/s)............................................................................................... 74
Fig. 27. O2 mass fraction field. ...................................................................................................... 75
Fig. 28. Temperature field (K). ...................................................................................................... 76
Fig. 29. NaxOy molar concentration (kmol/m3). ......................................................................... 77
Fig. 30. Saturation ratio map at the analysed region. ................................................................ 78
Fig. 31. Particle concentration map (particles/m3). ................................................................... 79
Fig. 32. Primary particle size distribution. .................................................................................. 80
Fig. 33. Particle number vs. Na-pool temperature. .................................................................... 81
Fig. 34. Particle number vs. Na-pool diameter. .......................................................................... 82
Fig. 35. Characteristic times vs. particle concentration. ............................................................ 84
Fig. 36. N0D vs N3D. ......................................................................................................................... 91
Fig. 37. Primary particle diameter. ............................................................................................... 92

xii
Fig. 38. N0D as a function of Na-vaporization rate. .................................................................... 93
Fig. 39. N0D as a function of O2 concentration. ........................................................................... 93
Fig. 40. N0D variation as a function of Tpool and dpool for the 21% O2 scenario. ...................... 94
Fig. 41. dp_0D as a function of oxygen fraction with pool diameter (m). ................................. 95
Fig. 42. Particle generation rate (correlated vs. 0D PG model results). .................................. 96
Fig. 43. Primary particle diameter (correlated vs. 0D PG model results). .............................. 97
Fig. 44. CSTF Vessel arrangement. ............................................................................................. 103
Fig. 45. FAUNA aerosol loop (Cherdron et al., 1985). ............................................................. 104
Fig. 46. Atmosphere temperature in AB1. ................................................................................ 110
Fig. 47. Pressure (AB1). ................................................................................................................ 110
Fig. 48. Atmosphere temperature in AB2. ................................................................................ 110
Fig. 49. Pressure (AB2). ................................................................................................................ 110
Fig. 50. Atmosphere temperature in F2. .................................................................................... 111
Fig. 51. Airborne concentration (AB1). ...................................................................................... 113
Fig. 52. Airborne concentration (AB2). ...................................................................................... 113
Fig. 53. Airborne concentration (F2). ......................................................................................... 113
Fig. 54. AMMD (AB1). ................................................................................................................. 115
Fig. 55. AMMD (AB2). ................................................................................................................. 115
Fig. 56. AMMD (F2). ..................................................................................................................... 115
Fig. 57. Na distribution (AB1). .................................................................................................... 116
Fig. 58. Na distribution (AB2). .................................................................................................... 116

xiii
LIST OF TABLES
Table 1. Sodium fast reactors in the world. .................................................................................. 5
Table 2. Overview of Gen. IV systems (Pioro, 2016). .................................................................. 9
Table 3. Thermophysical properties of sodium (Fink and Leibowitz, 1995). ........................ 10
Table 4. Some physical constants for sodium compounds. ...................................................... 22
Table 5. Relevant reactions of sodium and their compounds. ................................................. 23
Table 6. Characteristic time (s) of mass transport processes for different particle size. ....... 25
Table 7. Primary particle size measured by various investigations. ....................................... 26
Table 8. Fission-product partition at equilibrium. ..................................................................... 39
Table 9. Tests matrix ...................................................................................................................... 81
Table 10. Tests matrix (see Appendix D). ................................................................................... 90
Table 11. Summary of tests conditions. ..................................................................................... 105
Table 12. Aerosol coefficients and density (for all the tests). ................................................. 107

xiv

1. INTRODUCTION
1
Chapter 1
1. INTRODUCTION
Sodium-cooled Fast Reactors (SFRs) are one of the six technologies considered in the
so-called Generation IV (Gen. IV) initiative. A full-scope safety analysis of this reactor type
would need to have computation tools developed and properly validated. Potential
sodium discharge in the containment during postulated Beyond Design Basis Accidents
(BDBAs) would have major consequences for accident development in terms of energetics
and source term. In the containment, sodium vaporization and subsequent oxidation
would result in supersaturated oxide vapours that would undergo rapid nucleation
creating toxic aerosols. Therefore, modelling this vapour nucleation is essential to proper
source term assessment in SFRs. This thesis is a contribution to the technical
understanding of the in-containment source term during postulated severe accident
scenarios in sodium-cooled fast reactors. It is focused on the development of a
phenomenological particle generation model to calculate the particle generation rate and
their primary size during an in-containment sodium pool fire.
This section introduces the scenario, the background and the frame of this work. A
brief overview of Sodium-cooled Fast Reactors (SFRs) history and technology is also given.

1. INTRODUCTION
2
SFRs: overview 1.1.
The SFR uses liquid sodium as the reactor coolant. It features a closed fuel cycle for
fuel breeding and/or actinide management. Owing to the significant past experience
accumulated with SFRs in several countries, the deployment of SFR systems is targeted for
2030.
Plant size options under consideration range from small, 50-300 MWe modular
reactors to large plants up to 1500 MWe. The sodium outlet temperature from the core is
500 – 550ºC for all the options.
Important safety features of the SFR system include a long thermal response time
(high thermal inertia), a reasonable temperature margin to coolant boiling, a primary
system that operates near atmospheric pressure and an intermediate sodium system
between the radioactive sodium in the primary system and the power conversion system.
Furthermore, the fast neutron spectrum greatly extends existing uranium resources
compared to thermal reactors.
Both water/steam (Rankine cycle) and supercritical carbon dioxide or nitrogen
(Brayton cycle) are being considered for the power-conversion system to achieve high
thermal efficiencies, safety and reliability.
1.1.1. A short history of SFR development
The evolution of fast rectors dates back to the early prototypes in the 50s. More than
ten experimental fast reactors and eight prototype and commercial size fast reactor plants
have been constructed and operated (Table 1).
The first operational fast reactor, Clementine, was constructed in USA. It became
critical in 1946. The first kilowatt-hour of nuclear electricity in history was produced in
December 1951 by a fast reactor, the EBR-I in Idaho (Fig. 1).

1. INTRODUCTION
3
Fig. 1. Light bulbs energized by electricity from EBR-I (December 20, 1951) (IAEA, 2012).
In the 1960s and 1970s, the US programme continued R&D and construction of fast
reactors of increasing power: EBR-II, FERMI and Fast Flux Test Facility (FFTF). Several
experimental SFRs were also built and operated successfully in the former Soviet Union
(BR-5/BR-10, BOR-60), the UK (Dounreay Fast Reactor, DFR) and France (RAPSODIE).
A few years later, Germany and Japan started national development programmes
and constructed experimental fast reactors, KNK and JOYO, respectively.
At this point experimental reactors were operating in many countries providing
R&D tools for various prototype and commercial sized fast reactor development
programmes. The fast reactor development reached a peak around 1980. Phénix and
Superphénix in France, SNR-300 in Germany, Monju in Japan, PFR in the UK, Clinch River
Breeder Reactor (CRBR) in the USA or BN-350 and BN-600 in USSR are examples of that.
However, during the next ten years the fast reactor development was progressively
slowed down, presumably because of the commercial success of Light Water Reactors
(LWRs). By 1994, the CRBR was cancelled and the FFTF and EBR-II shut down in USA. In
France, Superphénix was shut down at the end of 1998; SNR-300 in Germany, although
completed, was never put into operation; KNK-II was shut down in 1991. In the UK, PFR
was shut down in 1994 and BN-350 in 1998.

1. INTRODUCTION
4
Today, renewed interest in nuclear power has highlighted the medium and long
term benefits of fast reactors with a closed fuel cycle. New energy demands arise in
developing countries such as China and India, whereas global warming due to the use of
fossil fuels and the growing disposal problem of radioactive wastes from LWR spent fuel
became major issues.
New programmes are underway in China with the China Experimental Fast Reactor
(CEFR), connected to the grid in July 2011, India with the construction of the Prototype
Fast Breeder Reactor (PFBR) or Russia with the operation of the BN-800 reactor. In France,
the Gen. IV SFR prototype project called ASTRID is ongoing. The Republic of Korea and
Japan proceed in their design of KALIMER-600 and the Japanese Sodium-cooled Fast
Reactor (JSFR), respectively (Pioro, 2016).

1. INTRODUCTION
5
Table 1. Sodium fast reactors in the world.
Reactor Type Country Thermal power
(MW)
Criticality Status
Exp
eri
men
tal
CLEMENTINE (Hg) USA 0.02 MWth 1946 A: 1952
EBR I (NaK) Loop USA 1.4 MWth 1951 A: 1963
BR 1 USSR 0.03 MWth 1955 A
BR 2 (Hg) USSR 0.2 MWth 1956 A: 1957
BR 5 – BR 10 Loop USSR 5/10 MWth 1958/1973 A: 2002
DFR (NaK) Loop UK 75 MWth 1959 A: 1977
LAMPRE USA 1 MWth 1961 A: 1965
EBR II Pool USA 60 MWth 1963 A: 1994
RAPSODIE Loop France 24/40 MWth 1967/1970 A: 1983
BOR 60 Loop USSR 60 MWth 1968 F
SEFOR Loop USA 20 MWth 1969 A: 1972
KNK I – KNK II Loop Germany 60 MWth 1972/1977 A: 1991
JOYO Loop Japan 50 MWth 1977 A: 2007
FFTF Loop USA 400 MWth 1980 A: 1994
FBTR Loop India 40 MWth 1985 F
PEC Loop Italy 120 MWth A: 1987
CEFR Pool China 60 MWth 2010 F

1. INTRODUCTION
6
Reactor Type Country Thermal power
(MW)
Criticality Status D
em
on
stra
tors
FERMI Loop USA 100 MWe 1963 A: 1972
BN 350 Loop Kazakhstan 150 MWe 1972 A: 1998
PHÉNIX Pool France 250 MWe 1973 A: 2009
PFR Pool UK 250 MWe 1974 A: 1994
SNR 300 Loop Germany 300 MWe A: 1992
MONJU Loop Japan 280 MWe 1992 A: 2010
CRBR Loop USA 350 MWe Ab: 1983
KALIMER Pool Korea 150 MWe 2025 P
Po
wer
BN 600 Pool USSR 600 MWe 1980 F
SUPERPHÉNIX Pool France 1200 MWe 1985 A: 1998
BN 800 Pool USSR 800 MWe 2014 F
SNR 2 Loop Germany 1400 MWe Ab
CDFR Pool UK 1300 MWe Ab
EFR Europe 1500 MWe Ab
PRISM Pool USA 1245 MWe Ab
JFSR Loop Japan 1500 MWe 2025 P
KALIMER-600 Pool Korea 600 MWe 2025 P
PFBR Pool India 500 MWe 2010 Constr.
A: Shutdown; F: Operating; P: Project; Ab: Abandoned

1. INTRODUCTION
7
1.1.2. Current framework
In this context, in May 2001, the Generation IV International Forum (GIF)
(https://www.gen-4.org/gif/jcms/c_9260/public) arose as an international collaboration
among 13 countries to face the challenges of developing the next generation of nuclear
power plants. It first established the development goals of Gen. IV reactors (GIF, 2002):
- Sustainability: generating sustainable energy and promoting long term
availability of nuclear fuel by optimizing the use of the fuel till the 96% of the
energy utilization; minimizing nuclear waste and reducing the long term
stewardship burden.
- Safety and reliability: imposing enhanced safety design options like passive
systems for very low likelihood and degree of reactor core damage and
eliminating the need for offsite emergency response.
- Proliferation resistance and physical protection: providing increased physical
protection.
- Economics: having a life cycle cost advantage over other energy sources and
offering a level of financial risk comparable to other energy projects.
Generation IV (Gen. IV) designs are striving to reach the highest safety standards
ever applied to Nuclear Power Plants (NPPs). Accidents with significant fuel damage (i.e.,
severe accidents) are being considered in the design phase so that they can be inherently
avoided or prevented and/or mitigated by passive design features or by ad-hoc
engineering safeguards with elimination of the need for offsite emergency response. This
enlargement of design scope with respect to Gen. II and Gen. III reactors is a challenge for
all the technologies involved in the systems chosen for Gen. IV since accident scenarios
involve complex phenomena that have to be taken into account when demonstrating
reactor safety.
In 2003, the GIF announced the selection of 6 reactor technologies which they believe
represent the future shape of nuclear energy (Table 2):
- Very High Temperature Reactor (VHTR)
- Gas-cooled Fast Reactor (GFR)
- Sodium-cooled Fast Reactor (SFR)
- Lead-cooled Fast Reactor (LFR)
- Molten-Salt Reactor (MSR)
- Super-Critical Water-cooled Reactor (SCWR)

1. INTRODUCTION
8
Among them, Sodium-cooled Fast Reactors (SFRs) is more mature than other Gen.
IV designs since several SFR have been operated (cf. Table 1, above) and, as a result, the
experience that has been gained currently amounts to > 400 operational years.
SFRs operate with high-energy neutrons which greatly extends the use of uranium
resources compared to thermal reactors. The SFR is designed for management of high-
level wastes and, in particular, management of plutonium and other actinides. The focus
was to utilize uranium resources by using plutonium which is generated by transmutation
of 238U during operation of a reactor. Due to the higher effectiveness of fast neutrons for
fissioning actinides, SFRs hold a leading role in the actinide management. SFRs
incorporate numerous features that create a less-challenging safety environment: a low
pressure system with a long thermal response time, a large temperature gap to coolant
boiling and negative power and temperature coefficients. However, in the event of sodium
boiling (or entrainment of a gas bubble through the core), the Achilles’ heel of SFR
technology is a positive void coefficient for the core, i.e., local increase in reactivity if
liquid sodium is replaced by vapour or gas. However, the core design for ASTRID shows
ways to minimize this effect (Varaine et al., 2012).

1. INTRODUCTION
9
Table 2. Overview of Gen. IV systems (Pioro, 2016).
System Neutron
spectrum
Coolant Outlet
temperature
(C)
Fuel cycle Size (MWe)
VHTR Thermal Helium 900-1000 Open 250-300
GFR Fast Helium 850 Closed 1200
SFR Fast Sodium 500-550 Closed 50-150
300-1500
600-1500
LFR Fast Lead 480-570 Closed 20-180
300-1200
600-1000
MSR Thermal/Fast Fluoride
salts
700-800 Closed 1000
SCWR Thermal/Fast Water 510-625 Open/Closed 300-700
1000-1500
1.1.3. SFRs technology
Sodium properties
Sodium is an alkaline metal with high atomic mass number. The atomic structure of
sodium represents a single electron in its outer orbit, which accounts for its strong
chemical activity. At room temperature it is a soft, silvery and highly reactive metal and is
also ductile.
The good neutronic properties enable sodium to be an excellent coolant for fast
reactors. Sodium has little slowing effect on neutrons produced by fission, it does not
change fast spectrum properties and it has low capturing power (small cross section).
Furthermore, sodium has a low level of activation (nuclear quality sodium) where the
major radioactive isotopes generated by neutron capture are 24Na (t1/2 = 15 h) and 22Na (t1/2
= 2.58 y).

1. INTRODUCTION
10
Because of the absence of moderator, the core is generally small and the power
density, i.e., the power per unit volume, is high. This makes it essential to use a coolant
with good thermal properties. At atmospheric pressure, sodium is in liquid state from 371
K to 1156 K. Sodium has very good thermal conductivity and reasonable specific heat
capacity (Table 3). In addition to its good heat transfer characteristics, liquid sodium has
exceptional thermal stability up to high temperatures. Low vapour pressure of sodium
results in a high boiling point under atmospheric pressure. Sodium has a low viscosity and
density (Table 3). Therefore, in the event of loss of primary pumping, a natural circulation
capability is assured with the high thermal conductivity, the high system temperature and
the large temperature gradient between the core inlet and outlet coolant (400 to 550º C).
But in spite of its very attractive safety characteristics, sodium exhibits potentially
dangerous properties that must be considered, i.e. sodium reacts violently when it comes
in contact with air or water, producing hydrogen and heat. Measures for sodium fires and
sodium-water reaction should be taken into account in the system design.
Table 3. Thermophysical properties of sodium (Fink and Leibowitz, 1995).
Properties Values
Atomic mass 22.989 g/mol
Melting point 371 K
Boiling point 1156 K
Vapour pressure 1.80·10-10 MPa (400 K)
Density 919 kg/m3 (400 K)
Viscosity 371·10-4 Pa·s (371 K)
Thermal conductivity (liquid) 87.22 W/m·K (400 K)
Specific heat 28.23 J/mol·K
Heat of vaporization 96.96 kJ/mol

1. INTRODUCTION
11
Basic description of a plant
The core is accommodated in the reactor vessel which generally includes a vessel
and a plug. Sodium in the vessel has a liquid level just below the vessel head and is
covered by inert gas (argon generally) to control the vessel pressure by dampening
variations. Some plants adopt guard or safety vessels outside of reactor vessels that can
maintain the sodium level in case of primary sodium leak. In other designs, an in-vessel
core catcher is foreseen to collect, contain and cool the molten core material following a
severe accident and prevent it from escaping the containment building. The plug is
required to have functions of thermal insulation and shielding against high operation
temperature and high neutron flux. On the plug, an upper core structure is installed and
provides control rod driver line guides and support for core instrumentations. The control
rods are inserted from above the core by gravity or other acceleration devices.
Typical core configuration consists of core fuel, control rods, blanket (breeder) fuel
and shields. The core fuel is a mixture of plutonium and depleted uranium. The blanket
fuel is depleted uranium. Two chemical forms of fuel elements exist: oxide and metal
(mixed uranium-plutonium-zirconium metal alloy). Burnups in the range of 150-200
GWD/MTHM have been experimentally demonstrated for both. Nevertheless, the
databases for oxide fuels are considerably more extensive than those for metal fuels. The
neutron absorber used in control rods is boron carbide (B4C).
In the core fuel region, fissile nuclides such as 239Pu and 241Pu undergo fission to
produce energy and excess neutrons. In the core and blanket fuel regions, fertile nuclides
such as 238U and 240Pu contribute to the fissile nuclides breeding by capturing excess
neutrons.
The core distribution can be homogeneous or heterogeneous (axial/radial). In the
former (Fig. 2), the fuel region is surrounded by axial and radial blanket fuels for an
efficient neutrons capture. In most cases, the outer core fuel has higher plutonium
enrichment than that of inner core to flatten the radial power distribution. In the later,
fertile blanket fuels are used in the core fuel region (Fig. 2.1b and 2.1c). With this
configuration the neutron leakage from the core to the internal blanket fuel region is
enhanced which yield higher breeding ratios and reduced sodium void reactivity, but it
requires higher fissile fuel inventories.

1. INTRODUCTION
12
Fig. 2. Typical SFR core configurations: (a) homogeneous core, (b) axial heterogeneous core and (c) radial heterogeneous core (Pioro, 2016).
The core fuel element or fuel pin contains the core fuel, upper and lower axial
blanket fuels and the fission gas plenum within a cladding tube. The fuel pins are
assembled as a fuel element bundle in a hexagonal assembly duct (wrapper tube) to form
the fuel assembly of fuel subassembly. The cladding and wrapper tubes are made of high-
strength stainless steels.
The fuel elements are separated by a spiral wrapping wire or grid spacers in which
the sodium coolant flows. The fuel elements are placed in a tight triangular lattice

1. INTRODUCTION
13
arrangement to maximize the fuel volume fraction for core neutron performances and to
minimize the core size for the plant capital cost reduction (Fig. 3).
Fig. 3. Typical SFR core fuel element and fuel assembly (Handbook Piero 2016).
The cooling system is at low pressure and high temperature and includes a primary
and an intermediate sodium systems as well as secondary water-steam systems (gas
secondary systems have been proposed for some designs).
Currently, there are two design options for the SFR plant: loop and pool type. In the
pool type (left hand layout, Fig. 4), the reactor core, primary pumps and intermediate heat
exchangers (IHXs) are immersed in a large pool of sodium in the reactor vessel. Sodium is
discharged from the IHX to the pool, is eventually drawn to the pump inlet, is forced
upward through the core and re-enters the heat exchanger. In the loop type (right hand
layout, Fig. 4), the primary coolant circulates through the primary heat exchangers located
outside of the reactor pressure vessel. Primary sodium coolant enters toward the bottom of
the vessel, flows upward through the core and exits to the IHX. The intermediate loop
then carries the heat energy to the steam generator. Advantages of the pool type are large
thermal inertia and primary sodium contained by a simple vessel. On the other hand,
those of the loop type are a compact reactor vessel/structure with better seismic
resistance.
Both configurations employ multiple primary and intermediate coolant circuits to
divide the heat load and provide redundant backup capability in the event of component

1. INTRODUCTION
14
failures. They are also configured to enhance natural-convection circulation. The
intermediate system transfers the heat from the IHXs to the steam generator unit during
power operation. It represent a barrier between the radioactive primary sodium system
and the non-radioactive water/steam system.
Several steam generator designs are employed for SFR systems: once-through and
U-tube units (SNR-300, PFR or CDFR systems), once-through steam generators with
helical tubes (Phénix and Superphénix systems) or “hockey stick” design with bent tubes
(CRFR system). The high temperature steam is used to drive a conventional turbine that
produces the electricity.
Fig. 4. Pool/loop type concepts layout.
A Beyond Design Basis Accident (BDBA) in a SFR can be initiated in the core by a
variety of reasons, and, although unlikely, it may propagate inside the primary system,
first as a shock wave, second as a sodium momentum and third as an expanding gas
bubble (Fistedis, 1972). There is even a non-zero probability that some sodium may escape
from the primary system so the containment should offer leak-tightness and structural
adequacy for the temperatures and pressures generated by sodium fires outside the
primary system and prevent dispersion of radioactive materials to the environment if
these postulated events would occur.
Four types of containment systems are found in the literature review (NEA-CSNI,
1979). The upper part of the single containment accommodates a low-leakage rate; the Fast

1. INTRODUCTION
15
Flux Test Facility (FFTF) is an example of this type of configuration. The double
containment is a sealed, inerted high-pressure inner containment barrier that is
surrounded by a low-leakage outer containment building. The containment type is a
sealed, low-leakage inner containment barrier, surrounded by a ventilated low-pressure
outer confinement building with discharge to stack via an air-cleaning system; the
Superphénix reactor is an example. Finally, the multiple-containment is a sealed, high-
pressure inner containment barrier, surrounded by one or more outer barriers; a negative
pressure zone is maintained in the outermost space by pumping back leakages to the inner
containment space. In this design, eventual venting to the stack via the air-cleaning system
is provided. The German SNR-300 reactor was supposed to have this containment type.
Fig. 5 shows sketches of the four types of containment designs.
Single containment system
Double containment system

1. INTRODUCTION
16
Containment of the Superphénix Containment of the SNR-300
Fig. 5. Containment types.
BDBAs in SFRs 1.2.
During hypothetical, very low probability SFR accidents leading to severe core
damage, one can envisage highly energetic phenomena in the vessel, i.e., a sodium vapour
explosion, leading to ejection of sodium mixed with fuel, fission products, steel and cover
gas from primary system into the containment. Indeed, despite their very low probability,
it is a requirement of level 2 probabilistic safety assessments that such events are analysed
and, ultimately, the associated source term evaluated (i.e., proving above all, significant
mitigation with respect to public health and safety).
A SFR severe accident implies the disruption of the core by supercriticality involving
more or less violent rupture of fuel pins and destruction of certain number of fuel
assemblies (Fischer and Wright, 1984; Kayser and Papin, 1998; Klickman et al., 1982;
Wright et al., 1985). Subsequently the interaction between hot fuel and liquid sodium can
lead to a vapour explosion which could create a breach in the primary system (Powers et
al., 2010; Tobita et al., 2006). Some primary sodium would be ejected into the containment
building where this sodium would oxidize and burn. This sodium would be contaminated
with components from disrupted fuel as well as activated.

1. INTRODUCTION
17
During a severe accident, the phenomenology in the primary system is at every stage
very complex. The initial event is absence of liquid-sodium cooling in some zone on the
core. Such a situation may arise due to a number of combined elements where a classic
scenario is long-term absence of forced circulation with failure of shut-down systems
(Unprotected Loss Of Flow scenario, ULOF). This will lead to heat up of primary sodium
to boiling. From this point, the accident evolves rapidly. In the supercritical dried-out
zone, very fast neutronic overheating of the fuel occurs up to its rupture, with the
subsequent release of the gaseous and volatile fission product inventory. The thermal and
neutronic energy generated by the disruption is propagated to neighbouring fuel
assemblies causing a rapid dry-out and disruption event that can potentially affect the
whole core (Core Disruptive Accident, CDA). Projection of the hot debris from the core
then could create a sodium-vapour explosion. After Fuel-Coolant Interaction (FCI), a
foaming and expanding mixture of liquid and vaporized sodium, core debris, vaporized
fuel components and gases (fuel-pin filler gas and fission gases) form an expanding bubble
which mechanically uplifts the overlying sodium that then impacts on the reactor vessel
head and could potentially cause a breach (Fig. 6) or ejection of sodium through vessel
head penetrations.
Fig. 6. Expanding gas bubble representation.
In this scenario, contamination from the core can reach the containment either as
vapours and aerosols transported through the sodium by bubbles or, if absorbed into the

1. INTRODUCTION
18
liquid sodium, as vapours by evaporation into the cover-gas space. Under accident
conditions, aerosols form essentially by three processes:
- vaporization of core materials and subsequent re-condensation where this would
happen mainly in the primary-system where sodium and such particles would be
largely retained in the primary sodium;
- coolant vaporization and subsequent re-condensation (Na-aerosols) where this
would happen mainly in the primary system and such particles would be partly
retained in the primary system and the leak path to the containment;
- ejection of sodium into air where burning occurs producing sodium-oxide
aerosols that continue to react with the humidity and carbon dioxide of the air
(so-called aerosol ageing) creating, in general, aerosols of mixed composition, i.e.,
Na2O2-NaOH-Na2CO3-NaHCO3.
The largest source of aerosols in the containment arises from burning of ejected
sodium and condensation of the combustion products. Given the large amount of sodium
inventory in a SFR primary system (about 2000 tonnes in a 1500 MWe pool-type SFR,
according to IAEA (2006)), one of the key accident variables is the total amount of sodium
entering the containment. The importance of the sodium aerosols lays in their abundance
and nature as both a radioactive source and a radioactive species carrier, and the potential
harm associated with some of the chemical species (i.e., the effects of exposure to sodium
oxide and hydroxide aerosols, depending on the level of exposure, can vary from mild
irritation to burns, pneumonitis and serious damage to the upper respiratory tract). In
addition, the total amount of aerosols in the containment strongly affects the source term
evolution within the containment (Fermandjian, 1985).
In the general case, sodium combustion produces aerosols initially composed of both
sodium oxide and sodium peroxide. Very high aerosol concentrations can arise in the
containment due to combustion, as much as > 10 g·m3. The subsequent evolving, mixed
speciation of these aerosols depends on the kinetics of the ejection event given that
aerosols that form early in the accident will have more opportunity to react with the air
and reach the bicarbonate form; for later aerosols, reacting gases (i.e., H2O and CO2) may
become depleted or vanish and little or no change to these later aerosols would occur.
Nevertheless, with such high aerosol concentrations, agglomeration will be significant
tending over time to render the overall composition of individual aerosols more uniform.

1. INTRODUCTION
19
Background 1.3.
During hypothetical SFR accidents leading to severe core damage, the ejection of
material in the form of liquid sodium mixed with fuel and fission products from the
primary circuit into the containment can be foreseen. A consequence assessment of this
low-probability scenario requires knowledge of the major aerosol properties and evolution
under the anticipated conditions within the containment, i.e., a proper evaluation of the
in-containment source term.
In the frame of the CP-ESFR project (7th Framework Programme of the European
Commission, contract number 232658), CIEMAT has participated with the main objective
of building up Phenomena Identification and Ranking Tables (PIRT) on the fission product
and aerosol generation and transport within a generic SFR containment during postulated
BDBAs. To do that, an exhaustive review of currently available data and modelling
capabilities of in-containment source term analysis in accident conditions was done.
1.3.1. Some basics of aerosol physics
Most relevant processes for “sodium-based” aerosols can be generally described by
expressions found in the common aerosol literature (Davies, 1966; Loyalka, 1976; Pertmer
and Loyalka, 1978, 1977). As a consequence, sodium aerosol evolution can be well
described by the General Dynamic Equation (GDE) of aerosols, as proposed by Pertmer
and Loyalka (1977),
t)S(r,t)R(r,t)n(r,trt)n(r,
dst)n(s,s)φ(r,t)n(r,dst)s,n(rt)n(s,s)rφ(s,21t)n(r,
t 0
r
0
r
(1)
which describes the evolution over time, t, of the number concentration, n, of
particles with size r. On the right-hand side of the GDE the different terms are: the first
two arise from particle agglomeration (addition and removal of particles with size r), the
third one corresponds to vapour condensation onto particles, the fourth one encapsulates
all the particle removal mechanisms and the last one is the source term. Major reviews of
aerosol dynamics exists (e.g., Davies, 1966; Fuchs and Sutugin, 1969; Seinfeld and Pandis,
2006). A brief discussion of major aerosol mechanisms is listed below.

1. INTRODUCTION
20
The process referred to as agglomeration or coagulation describes what happens
when two or more particles collide due to a relative motion between them, stick to each
other and form a larger particle. The net result is a continuous decease in number
concentration coupled with an increase in particle size (Hinds, 1999). Four agglomeration
processes are treated in current severe accident codes: Brownian diffusion, differential
gravitational settling, and turbulent agglomeration by shear and inertial forces.
Brownian agglomeration results from the random motion of particles suspended in a
gas, caused by collisions with gas molecules. This movement gives rise to diffusion of
particles in a concentration gradient analogous to gas diffusion and it is most significant
for small particles where the free molecular regime and transition regime must be
considered.
The gravitational agglomeration is based on the difference in sedimentation rates for
particles of different sizes that results in situations where one particle overtakes another.
Particles falling under the influence of gravity will distribute themselves over a range of
speeds because of the dependence of the resistance of air on particle size. As a result,
coarse particles will tend to sweep past finer ones, thereby causing collisions.
The collision frequency between particles suspended in a gaseous medium may be
substantially increased by turbulent motion of the gas. This increase in collisions between
particles may be the result of two independent mechanisms acting on the aerosol. The first
mechanism produces collisions between particles of all sizes in a given distribution. The
collisions occur because of turbulent eddies carry particles across streamlines to contact
other particles (turbulent shear agglomeration). The second mechanism (turbulent inertial
agglomeration) arises from the difference in density between the turbulent fluid and the
suspended particles so that particles of various sizes have different response times, i.e. the
inertia of a droplet depends on its size. This process will not give collisions between
droplets of equal sizes.
Only the discussed agglomeration rate are included in current aerosol behaviour
models but additional mechanisms can exist such as those resulting from centrifugal
forces, laminar flow fields, electrical fields, magnetic fields, diffusing gas or temperature
gradients.
The condensation onto or evaporation of a vapour from aerosols are considered in
GDE. The condensation and evaporation may take place on aerosols, an either process can
occur simultaneously with condensation or evaporation from heat sink surfaces.
In the removal term, the deposition mechanisms are included. Deposition occurs
through a number of processes, including gravitational settling, diffusion to surfaces,

1. INTRODUCTION
21
thermophoresis and diffusiophoresis. Of these natural depletion processes, gravitational
settling is often the dominant mechanism, although phoretic effects may be significant in
some cases. In general, particle diffusion is considered to be a relatively unimportant
deposition process
Gravitational settling is the deposition of particles onto available floor or horizontal
areas by gravity. Sedimentation is generally the most effective deposition process
Diffusion of particles to the internal surfaces of the enclosure takes place in the form
of Brown’s movement in the concentration gradient on the surface. It is mainly relevant for
small particles.
Thermophoresis is a Brownian process causing migration of particles toward lower
temperatures. Particles suspended in a gas experience a force directed toward cooler
temperatures if the gas exhibits a temperature gradient; this force results from the
interaction between gas molecules and the particles.
And finally, diffusiophoresis is the deposition induced by condensation of water
vapour onto surfaces. When water condenses on (evaporates from) a structure surface,
composition gradients will exist in the adjacent gas which will affect aerosol deposition in
the surface due to two related effects. The first is that there will be a net molar flux of gas
toward (away from) the condensing (evaporating) surface, and this net flux, commonly
called the Stefan flow will tend to move aerosol particles with it. The second effect is that
differences in the momentum transferred by molecular impacts on opposite sides of the
particle will tend to drive the particle in the direction of decreasing concentration of the
heavier constituent. In a strict sense, only this second component constitutes
diffusiophoresis; however, the term “diffusiophoresis” commonly includes both effects.
1.3.2. State-Of the Art on in-containment source term
Aerosol characterization and size distribution
The characterization and behaviour of in-containment nuclear aerosols is of
fundamental importance for assessing the radiological consequences of reactor accidents
and for setting up filtering systems and even reactor components. A number of
experimental studies have been conducted to physically and chemically characterize Na
compounds in aerosols. Some of the most outstanding facilities involved in this
investigation are: CSTF in U.S. (Hilliard et al., 1985; Postma and Owen, 1980; Souto et al.,
1994), FAUNA in Germany (Cherdron and Charpenel, 1985; Cherdron and Jordan, 1980),

1. INTRODUCTION
22
ATF in India (Subramanian et al., 2009; Subramanian and Baskaran, 2007), NSPP in U.S.
(Adams et al., 1979) and ESMERALDA in France (Jordan et al., 1988).
Sodium fires resulting from accidental releases of liquid sodium from a SFR would
produce aerosols consisting of sodium oxides which would react with available water
vapour and carbon dioxide in the air. The exposure of these sodium oxide aerosols (Na2O
and Na2O2) to humid air results first in the formation of sodium hydroxide (NaOH)
(forming solution droplets if water vapour is abundant). The NaOH particles thus formed
would be particularly corrosive and hazardous (as are the oxides). Reaction of hydroxide
with carbon dioxide to form the carbonate (Na2CO3) would make the aerosol substantially
less chemically hazardous (Cooper, 1980). Formation of the bicarbonate almost renders the
aerosols completely chemically innocuous.
Table 5 and ¡Error! No se encuentra el origen de la referencia. (Casselman, 2009;
Cooper, 1980) gather some physical constants of sodium compounds and the relevant
reactions of sodium with oxygen, water and carbon dioxide and, respectively.
Table 4. Some physical constants for sodium compounds.
Name Formula Density
(g/cm3)
Melting
Point (ºC)
Boiling
Point (ºC)
Sodium monoxide Na2O 2.27 1132 1950
Sodium hydroxide NaOH 2.13 318 1388
Sodium peroxide Na2O2 2.80 675 decomp.
Sodium carbonate Na2CO3 2.53 851 1600
Sodium superoxide NaO2 2.20 551 decomp.

1. INTRODUCTION
23
Table 5. Relevant reactions of sodium and their compounds.
Sodium combustion
ONa21O2
12Na 22 kcal/mole100.7ΔH0298
222 ONaO2Na kcal/mole120.6ΔH0298
Chemical reactions in open atmosphere
22 H21NaOHO(l)HNa kcal/mole33.7ΔH0
298
22 H21NaOHO(g)HNa kcal/mole45.7ΔH0
298
2NaOHOHONa 22 kcal/mole46.8ΔH0298
222 HONaOH2Na
22 H21ONaNaOHNa kcal/mole1.59ΔH0
298
NaHH21Na 2 kcal/mole13.7ΔH0
298
2222 O212NaOHOHONa kcal/mole124.0ΔH0
298
Sodium-concrete interaction
3222 CO2NaO21CO2Na kcal/mole175.3ΔH0
298
OHCONaCO2NaOH 2322 kcal/mole40.0ΔH0298
OH21CaO2
1Ca(OH)21CONa2
1CaO21NaOH 22323
CCaOO2NaCaCO4Na 23
SiSiO2Na3SiO4Na 322
OHSiONaSiO2NaOH 2322

1. INTRODUCTION
24
Most of the experimental studies conducted have focused on the timing of Na-oxide
aerosols transformation to hydroxide ones (NaOH) and, subsequently, to carbonates
(Na2CO3) in a range of conditions varying, in particular, relative humidity (Cherdron et al.,
1985; Hofmann et al., 1979; Subramanian et al., 2009). Essentially, all studies agree that
transformation to NaOH is a fast process of the order of 1 to tens of seconds, depending on
the conditions (Hofmann et al., 1979). According to data available, the formation of
carbonates is nearly complete after hundreds of seconds as long as the relative humidity is
appreciable, e.g., over 260 s at RH above 20% (Cherdron et al., 1985), and within 500 s at
RH between 50 to 65% (Subramanian et al., 2009); at low RH such transformation has been
measured to be much slower. Fig. 7 illustrates the carbonate formation kinetics according
to Cherdron et al. (1985). Cherdron et al. explained the carbonate formation kinetics based
on the concepts of saturation of solution and on-particle condensation.
Fig. 7. Carbonate formation in sodium fire aerosols.
The above observations were supported by theoretical studies (Clough and Garland,
1971; Cooper, 1980). These are both based on gas-phase transport theory and in-particle
diffusion; in other words, they assumed that chemical reactions are much faster than
physical transport of reacting gases. By comparing with data from Hofmann et al. (1979),
Cooper found a noticeable consistency of his predictions. Table 6 summarizes the

1. INTRODUCTION
25
characteristic time determined by Cooper as a function of the particle size. However,
analysis and experimental work by Mathé et al. (2015) showed that an assumption in the
Cooper model leads to conversion rates to sodium carbonate that are several orders of
magnitude too fast. The authors proposed a modified Cooper model which they partially
validated on their own experiments.
Table 6. Characteristic time (s) of mass transport processes for different particle size.
Mechanism 0.1 μm 1.0 μm 10 μm
Diffusion within a reacting droplet 1x10⁻⁶ 1x10⁻⁴ 1x10⁻²
Gas-phase transport of H2O 6x10⁻⁶ 3x10⁻⁴ 3x10⁻²
Diffusion of H2O within a Na2O2 agglomerate - 1x10⁻³ 1x10⁻¹
Gas-phase transport of CO2 2x10⁻⁴ 1x10⁻² 1
Diffusion of CO2 within a NaOH agglomerate - 1x10⁻¹ 1x10⁻¹
Diffusion within a reacting solid particle 1x10⁻² 1 1x10⁻²
Most of the experimental data available till 1980 were gathered in NEA-CSNI (1979).
As noted in Table 7 (NEA-CSNI, 1979, Appendix B), the primary-particle size of nuclear
fuel and coolant aerosols were reported in terms of geometrical diameter. At first sight,
diameters of UO2 and mixed UO2-PuO2 particles ranged from 0.003 to 0.1 μm; sodium
oxide particles were larger, ranging from 0.1 to 0.5 μm diameter; and mixed fuel and
sodium produced particles of a size similar to sodium oxide alone (NEA-CSNI, 1979,
Chapter II).

1. INTRODUCTION
26
Table 7. Primary particle size measured by various investigations.
Reference Material Primary particle diameter, μm
Allent & Briant Mixed UO2, PuO2 Log-normal, bimodal, (g=1.35)
0.003-.01
Chatfield Pu, Na 0.02 maximum
Castleman Mixed UO2, PuO2
PuO2
UO2, Na
Log-normal, 0.004-.004, g=2.0
0.1, (g=1.9)
0.2-0.6
Morrison et al. Clad & bare UO2 0.002-0.1
Kelly et al. UO2 <0.005-0.02
Jordan et al. UO2 dg=0.073 (g=1.85)
Kres UO2, U3O8 0.014-0.034
Kitani U3O8
U3O8
dg=0.037 (g=1.6-2.2)
dg=0.07(g=1.93)
Schikarski Clad mixed
Oxide fuel
Na2O
<0.08
0.1-0.4
Hilliard et al. Na2O2, NaOH 0.1-0.5
Parker et al. UO2, U3O8 dg=0.034
Several later studies indicated that the “initial particle size” of aerosols generated
during a sodium fire in terms of Aerodynamic Mass Median Diameter (AMMD), was
around 1 μm (0.9 μm according to Cherdron et al. (1985) and 1.0 μm according to Jordan et
al. (1988)). More recent investigations (Subramanian and Baskaran, 2007) measured
AMMDs around 1.2 μm in the temperature range 250-550ºC. In addition to temperature,
RH is indicated to affect the primary particles size as well. By assuming a geometric

1. INTRODUCTION
27
standard deviation (σg) of 2.0, and assuming a lognormal size distribution, the consistency
of these values and those coming from earlier studies for sodium-based aerosols can be
noted. Nevertheless, some authors (Sundarajan et al., 1982) found that the initial sodium
fire aerosol distribution was bimodal.
In-containment aerosol phenomena
A thorough aerosol phenomenological description requires knowledge of some
fundamental properties like size, shape, density and chemical composition, as well as
particle dynamics. The former are dependent on particle-particle (agglomeration) and
particle-gas/vapour interactions (vaporization/condensation); the latter is a result of the
net effect of various driving forces that are usually estimated in terms of process rates.
A set of studies found in the open literature allows identification of potential
prevailing conditions in containment in the case of a CDA. Using CONTAIN-LMR/1b-
MOD1 (Murata et al., 1993) and assuming a breach of the primary coolant boundary in the
Advance Liquid Metal Reactor (ALMR), Chiao et al. (1994) demonstrated that
consequences of pool and spray fires could be drastically different in terms of the thermal
characterization of the containment atmosphere depending on specific conditions such as
the amount of steam in the atmosphere and the sodium inventory reaching the
containment (sprays). Fig. 8 displays the containment response in the case of a pool fire.
Pool fires lead to pressure increases of about 0.6 atm (Ppeak=1.7 atm) and maximum
containment-atmosphere temperatures around 315ºC; these spikes decrease over time and,
in the long run (over 400 min), the temperature approaches values around 150ºC and the
pressure spike practically disappears. These numbers contrast with those from the spray
scenarios where pressure rise can be as much as six times higher (Ppeak=4.3 atm) and
atmosphere temperature can reach 1067ºC (assuming that 136 kg of Na entered the
containment in 1 s).

1. INTRODUCTION
28
Fig. 8. ALMR containment response to a sodium pool fire.
These analyses agree with previous ones that also pointed to a spray fire posing
more challenges to containment integrity than a pool fire (Bae et al., 1994; Malet et al.,
1982; Morewitz, 1979). Fig. 9 and Fig. 10 show some of the results obtained in the Bae et al.
(1994) studies, where the effect of the initial sodium temperature and the initial oxygen
concentration were parametrically investigated. The main observations were that pressure
and temperature increases were higher and faster in the case of spray fires, even if less Na
was injected. It was observed that the maximum pressure rise was far below the
theoretical maximum (estimated on thermodynamic grounds) and they only approach
each other when Na is sprayed in ultra-fine drops (Morewitz, 1979).
Fig. 9. Thermohydraulic variables of pool fires: a) Temperature and b) Pressure.

1. INTRODUCTION
29
Fig. 10. Thermohydraulic variables of spray fires: a) Temperature and b) Pressure.
Analyses of large-scale containment response to postulated CDA scenarios were
carried out for the Clinch River Breeder Reactor Plant (CRBRP) (Heisler and Morewitz,
1979). They investigated the effect of the extension of Na combustion in the thermal-
hydraulic response of the building by calculations with the SOMIX code. They found that
the maximum pressure increase was in all the cases far from a threshold (6 atm) identified
as the maximum practical pressure. In fact, in no case did they get pressure increases over
2.1 atm. Some interesting outcomes from their study were: maximum temperatures
(1800ºC) and pressures (2.1 atm) were reached both for 27% and 84% of the oxygen
reacted; and, no less important, substantial temperature gradients could be created in the
containment, the profiles being a function of the amount of O2 reacted. Fig. 11 illustrates
this last observation.

1. INTRODUCTION
30
Fig. 11. Temperature axial profiles as a function of initial Na amount.
Aerosol evolution: available data, deposition mechanisms and interaction processes
A number of experimental programmes were carried out in the past to understand
the in-containment evolution of aerosols in the hypothetical case of an accident in a SFR.
Many of those test campaigns were linked to code development and/or validation. Below
a synthesis of their major observations is proposed.
ORNL (Adams et al., 1980, 1979) conducted a set of tests within the NSPP (Nuclear
Safety Pilot Plant) facility (38.3 m3). In addition to the study of aerosol behaviour in
enclosures, they addressed specifically the potential interaction between two different
aerosol populations. To do so, sodium oxide aerosols and uranium oxide aerosols were
generated. Additionally, they reported on the different characteristics of Na2O aerosols
from pool and spray fires. As generic findings confirming some of the statements made in
previous sections, they noted a much bigger impact on thermal-hydraulics from Na-spray
oxidation than from that of a pool. This difference extends also to the airborne aerosol
concentration, which reached levels between 40-60 g/m3 in the case of spray fires, whereas
it was notably lower (6-25 g/m3) for pool fires (using the same amount of Na). They also
reported on the Na2O particle size from these two sources, but it is not clear if this
comparison can be made since they used different diameters to characterize the
distribution (no geometric standard deviation is even given). Anyway, it was seen that in
all the individual aerosol tests the U3O8 concentration was notably lower (0.05-0.22 g/m3)
and the associated particle sizes were smaller than that measured in the Na2O tests.

1. INTRODUCTION
31
The Na2O pool-fire experiments showed a clear exponential decay in aerosol
concentration. When comparing Na2O and U3O8 depletion kinetics, it is noted that Na2O
underwent faster removal (Fig. 12). In addition to the depletion kinetics of the single-
component aerosol tests, the dual-component aerosol tests showed that the aerosol species
co-agglomerated and, as a consequence, affected each other.
Fig. 12. Aerosol concentration vs. time.
Fig. 13 shows how the depletion kinetics was increased when injecting the second
source of aerosols. By estimating the depletion rates of single and dual-species tests in
both figures, it is realized that adding a new aerosol in the vessel meant an increase of the
depletion rate by a factor between 2 and 3. The final mass distribution of these multiple-
source tests confirmed the two compounds’ co-agglomeration.

1. INTRODUCTION
32
Fig. 13. Concentration evolution: single vs. multiple species aerosols.
The above observations regarding differences between aerosols from pool and spray
fires were also highlighted by Cherdron et al. (1985) in the FAUNA facility (220 m3). As
shown in Fig. 14, where spray aerosols were generated in a very short period of time
(around tens of seconds), the maximum aerosol concentration was much higher than that
of pool-fire tests. Deriving the time for the maximum aerosol concentration to reduce by a
factor of 100, it would take around 100 h for pool-fire aerosols and between 0.5 and 1 h for
that of spray fires; in other words, in the conditions of the FAUNA tests, spray aerosols
were removed nearly 100 times faster (but which attain, as stated above, substantially
larger peak concentrations).
Fig. 14. Concentration evolution in the FAUNA facility.

1. INTRODUCTION
33
Numerous studies (Adams et al., 1980, 1979; Jordan et al., 1988; Postma and Owen,
1980) have shown that in hypothetical accident conditions of SFRs, in-containment
aerosols will undergo depletion processes that will carry a fraction of the airborne particles
to containment floor and walls. Given the anticipated conditions in SFR containments, the
major mechanisms expected to play a role would be: thermophoresis, which would take
particles onto colder surfaces; gravitational settling, which would be effective for larger
particles; turbulent deposition, which would be effective in those containment areas with
highly turbulent flows (e.g., during Na-spray/Na-pool burning). Moreover, the efficiency
of these removal mechanisms would be highly dependent on particle size, density and
shape; all three of these features are governed by particle formation, agglomeration and
vapour condensation (if any), especially water vapour given the hygroscopicity of the
aerosols. Agglomeration occurs by different mechanisms, i.e., turbulence, gravity,
Brownian diffusion, etc.
From all the above processes, in-containment thermophoresis is quite distinctive for
Na aerosols. Specific studies were carried out to understand the effect of thermophoresis
on Na2O particles in a 2-meter-high chamber (Nishio et al., 1977). In particularly, Nishio et
al. looked at the combined effect of thermophoresis and “soaring” of aerosols by thermal
convection which they considered to hamper settling. They concluded that thermal
convection had a noticeably impact on both thermophoresis and sedimentation;
thermophoretic velocity could be reduced by half, whereas the “soaring” effect was
highlighted as an essential phenomenon in the early stages of a postulated SFR accident.
One uncertain variable affecting thermophoretic removal is the thermal boundary
layer thickness (δT). It has been attributed different values (NEA-CSNI, 1979, Chapter III),
but usually these ranged between 100 and 1000 μm.
Experiments conducted in large-scale facilities (Jordan et al., 1988; Postma and
Owen, 1980) demonstrated that suspended aerosols were preferentially removed by
settling, although plated mass (turbulence, diffusion and thermophoresis) was in no case
negligible: in the FAUNA facility (220 m3) around 60% deposited onto the floor; in the
ESMERALDA facility (3600 m3) only 10% of the mass deposited onto the walls (Jordan et
al., 1988).
Agglomeration plays a key role in aerosol growth, particularly just above a pool fire.
In the flame zone a high particle number concentration of small particles exists and, as a
consequence, particle Brownian motion can result in substantial agglomeration rates.
Above that region, the resulting larger particles are carried by thermal convection away
from the burning zone and other agglomeration mechanisms (i.e., turbulent, gravitational,
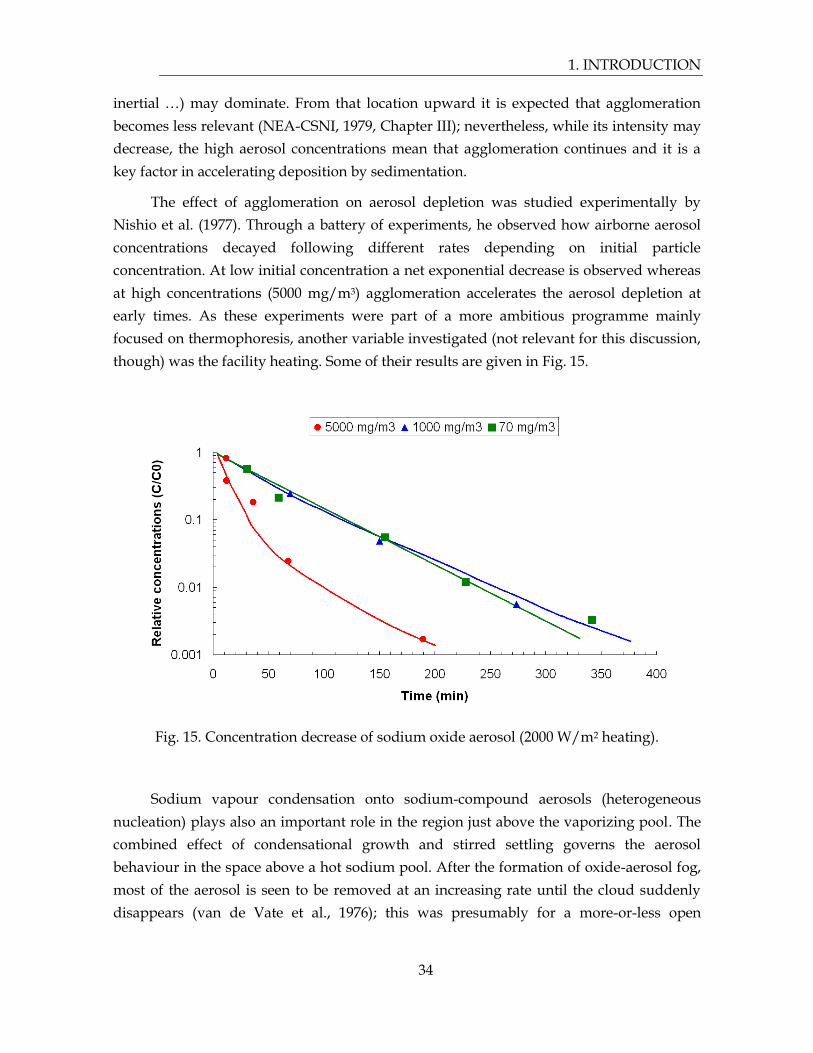
1. INTRODUCTION
34
inertial …) may dominate. From that location upward it is expected that agglomeration
becomes less relevant (NEA-CSNI, 1979, Chapter III); nevertheless, while its intensity may
decrease, the high aerosol concentrations mean that agglomeration continues and it is a
key factor in accelerating deposition by sedimentation.
The effect of agglomeration on aerosol depletion was studied experimentally by
Nishio et al. (1977). Through a battery of experiments, he observed how airborne aerosol
concentrations decayed following different rates depending on initial particle
concentration. At low initial concentration a net exponential decrease is observed whereas
at high concentrations (5000 mg/m3) agglomeration accelerates the aerosol depletion at
early times. As these experiments were part of a more ambitious programme mainly
focused on thermophoresis, another variable investigated (not relevant for this discussion,
though) was the facility heating. Some of their results are given in Fig. 15.
Fig. 15. Concentration decrease of sodium oxide aerosol (2000 W/m2 heating).
Sodium vapour condensation onto sodium-compound aerosols (heterogeneous
nucleation) plays also an important role in the region just above the vaporizing pool. The
combined effect of condensational growth and stirred settling governs the aerosol
behaviour in the space above a hot sodium pool. After the formation of oxide-aerosol fog,
most of the aerosol is seen to be removed at an increasing rate until the cloud suddenly
disappears (van de Vate et al., 1976); this was presumably for a more-or-less open

1. INTRODUCTION
35
atmosphere. The aerosol settled on the sodium pool will, if sufficient, hinder the reaction
of the pool surface with the atmosphere.
Adsorption of vapours onto aerosol particle surfaces, though less important to
aerosol growth, is very important in determining the eventual attenuation in the
containment of fission products in the vapour phase (as indicated in Section 2.1).
Information is contradictory: experiments have generally shown that sodium oxides are
very active in adsorbing fission product vapours (NEA-CSNI, 1979, Chapter III) while
there is evidence that oxide on a pool surface has little retaining effect on fission products
in the Na beyond mass-transfer effects (i.e., hindering evaporation from the liquid
surface).
Equations describing aerosol mechanisms are developed based on fully-dense
spherical particles. However, reality may be far from such an ideal situation; in other
words, particles might be fluffy and irregular. In order to overcome the resulting
shortcomings from the “ideal approximation”, equations are corrected by shape factors
and/or effective densities. Two shape factors are usually considered: the dynamics shape
factor (χ) and the agglomeration shape factor (γ) where the nearer the values of these
factors are to unity the nearer the particle is to sphericity. The dynamic shape factor
accounts for the effect of non-spherical forms on the drag force that a moving particle
experiences. The coagulation shape factor corrects the actual target size that a particle
exhibits when interacting with other particle. For sodium oxide aerosols formed in humid
air containing CO2, shape factors for agglomerates were measured to be about 1.3 (NEA-
CSNI, 1979, Chapter III). Smaller values very close to unity were found for sodium
peroxide aerosols in experiments by Barbe-Le Borgne et al. (1986). The presence of
humidity has the effect of rendering particles more spherical where, in excess, it will
convert oxide aerosols into droplets of hydroxide solution; we note, also, that sodium
hydroxide is very hygroscopic and will convert to droplets at quite low relative humidity.
An alternate approach combining particle mobility and collision correction factors
was proposed for sodium particles by Gieseke et al. (1977): sodium oxide agglomerates are
assumed to be spherical but porous; in other words, they are characterized by a reduced
effective density (ρa) and an agglomerate radius (R). Then particle dynamic equations are
corrected through,
Rαr 1/3e (2)

1. INTRODUCTION
36
where is the ratio of the actual and the theoretical densities and re is the particle
equivalent radius.
Extensive experimental studies of sodium oxide agglomerates characteristics at BCL
indicate a value for of 0.18 for agglomerates containing about 200 primary particles
formed in dry, CO2-free air (Gieseke et al., 1977). Measurements of sodium oxide particles
in moist air containing CO2 indicated values for averaging about 0.61 (NEA-CSNI, 1979,
Chapter III).
1.3.3. Overall assessment of modelling capabilities
Given the practical absence of activity during the last 20 years in the field of CDA
modelling beyond core-disruption aspects, the status of the mid-1980s computer codes
may be considered applicable today to a good extent. The main insights into aerosol-
modelling drawbacks at the time were reported by Dunbar et al. (1984) - see also Dunbar
(1985) and Fermandjian (1985). In the late 1980s a benchmark against experimental data in
a medium-scale facility (400 m3) for a 90-minute pool fire was conducted using a number
of these aerosol codes - see Lhiaubet et al., 1990. While most of the codes then reviewed
and tested are no longer available, much (if not all) of the aerosol modelling was
subsumed in codes such as ASTEC (Van Dorsselaere et al., 2009), MELCOR (Gauntt et al.,
2005) and CONTAIN (Murata et al., 1993) and conclusions from earlier work can be
considered relevant to these codes. It is interesting to note that the Lhiaubet et al.
benchmark concluded that aerosol codes were adequate for pool-fire conditions in the
sense that they tended to be conservative by overestimating (but not massively) the
suspended-aerosol concentration. This overestimation was in part due to significant
underestimation of deposits on walls; this may mean that thermophoresis was
underestimated or that account must be taken of mechanisms additional to those usually
expected in the containment, e.g., turbulent deposition.
- Agglomeration. Several aspects of agglomeration were considered not to be
properly taken into account in the models: particle shape, collision efficiency and
turbulence (Dunbar et al., 1984).
Concerning shape, aerosol equations are developed for spherical particles but allow
deviations from this by introducing two coefficients (shape factors); these intend to
approximate (usually empirically) the effect of particle shape on their motion (dynamic
shape factor, ) and on their agglomeration rate (agglomeration shape factor, ). However,

1. INTRODUCTION
37
computer codes assumed no variation of with particle size and, occasionally, was
adopted as a correction factor of the spherical particle surface instead of its diameter.
Gravitational collision efficiency had been approximated by either Fuchs or
Pruppacher and Klett equations (Dunbar et al., 1984), the former being 3 times greater
than the latter. The difference arises from the Fuchs model not taking account of the
motion of the smaller particle with which the larger particle collides. Presently, the
Pruppacher and Klett formulation for the efficiency factor has been adopted in the
majority of nuclear safety computer codes:
2
21
221 rr
r21)r,ε(r
(3)
The effect of turbulent agglomeration was and is approximated by the Saffman and
Turner equations (Saffman and Turner, 1956), which accounts for both shear effects and
in-eddy acceleration. These equations rely also on parameters like collision efficiencies,
shape factors and turbulent energy dissipation rate. In some present codes, e.g.,
CONTAIN (Murata et al., 1997), the shear collision efficiency is set to 1.0 whereas that of
inertia is estimated through Pruppacher and Klett’s model. Even though some settings
have been adopted and become “standardized”, these parameters are still largely
uncertain.
- Numerics. At the time the models were reviewed, different numerical methods
were being used in aerosol codes: the moments method and different versions of
the sectional method (i.e., piecewise constant and piecewise linear). The former
was observed to have severe drawbacks when dealing with high agglomeration
systems and it was abandoned. As a result, most of present aerosol codes rely on
discretizing the size domain to turn the integro-differential aerosol equation into
a set of algebraic ordinary differential equations.
According to Dunbar et al. (1984), agglomeration issues should be investigated
through analytical experiments. Likewise, integral experiments were recognized to be
needed to assess the effect of aerosol injection (rates and total amount) from pool/spray
Na fires on aerosol evolution within containment. This was investigated in the ABCOVE

1. INTRODUCTION
38
programme (Aerosol Behavior COde Validation and Evaluation) carried out in the
Containment System Test Facility (CSTF) at HEDL (Hilliard et al., 1985). Although a
number of experiments were conducted in the CSTF facility, only three of them belonged
to the ABCOVE programme. Nonetheless, these explored different aspects of aerosol
generation: pool/spray sources, co-agglomeration, atmosphere composition, etc. A set of
codes (i.e., HAA-3, HAARM-3, MAEROS, etc.) were compared to data and they all
showed reasonable behaviour estimating airborne aerosol concentration and the total
leaked mass was predicted within a 1.3 – 2.0 range from measurements, depending on the
Na species (1.3 for NaI and 2.0 for NaOx). However, it should be underlined that the
consistency of calculated results with data required a set of parametric calculations to
determine a correction factor (α·ε) of particle density and collision efficiency; and, even
doing so, the codes were noted to behave better once the aerosol injection period was over.
According to the above discussion and the principal developments in the nuclear
aerosol field (see the major review by Allelein et al. (2009), it seems very probable that
some of the main model limitations identified in the mid-1980s persist. This means that to
achieve reliable computer-code studies that do not need preliminary parametric
calculations (i.e., tuning), improvements to characterizing particles and particle-particle
interaction processes are required. Concerning particle characterization, the major
variables governing a more accurate description are density and shape; improvement
would mean coming up with models and/or applicable correlations for effective density
and dynamic and coagulation shape factors. Regarding particle-particle interaction
processes, validation of available collision efficiency expressions under anticipated
conditions within SFR containments as well as determination of those parameters
involved in some agglomeration mechanisms, such as the turbulent dissipation rate,
would be needed. In other words, aerosol transport mechanisms are accurate enough as
long as particles and particle-particle interactions are well described.
Aerosol generation in SFR containments strongly depends on three major
phenomena: sodium vaporization, chemical reactions with the surrounding gas,
nucleation and primary particle agglomeration. Their consideration would require
coupling thermal hydraulics, chemical reactivity of airborne and dissolved species, aerosol
particle transfer and radiative heat transfer from sodium pool and spray fires (Yamaguchi,
2009). A demonstration of this was the CONTAIN-LMR/1B-Mod.1 code (Murata et al.,
1993) which included models for sodium pool and spray fires by adapting models coming
from the SOFIRE II (Beiriger et al., 1973) and the NACOM (Tsai et al., 1980) codes,
respectively. The result of integrating these phenomena should be the prediction of proper
particle composition, concentration and size. Given the mixing conditions of the
atmospheric layer where chemical reactions and nucleation are occurring, as well as the

1. INTRODUCTION
39
potential high concentration of the resulting primary particles, it is of utmost importance
to achieve a good description of the appropriate agglomeration mechanisms in this region.
Another missing area in codes is fission-product partitioning. This is of utmost
interest for source term predictions and, although some data are available, both
equilibrium and kinetic studies should confirm and extend the available information. A
separate study has also identified the high uncertainty associated with iodine chemistry in
a SFR containment, Powers et al. (2010). Kissane et al. (2013) concluded that fission-
product partition at equilibrium with liquid sodium would be the following (Table 8):
Table 8. Fission-product partition at equilibrium.
Element Caracteristics in Na(l) State Main location(s)
Noble gases
Xe, Kr
Inert, almost-zero
solubility
element gas phase
Halogens
I, Br
Very volatile but react
with Na low volatility
NaI, NaBr mainly Na (l)
some phase gas
Alkali metals
Cs, Rb
Soluble, high volatility Cs, Rb some Na(l)
mainly gas phase
Alkali-earth metals
Sr, Ba
Low volatility either as
metals or oxides
SrO, BaO in suspension;
Sr, Ba soluble in Na(l)
Na(l)
Noble metals
Ru, Pd, Rh, Ag
Very-low solubility
(except Ag), very-low
volatility
metallic, in suspension Na(l)
Other metals
Mo, Tc
Very-low volatility metallique &/or oxide,
in suspension
Na(l)
Actinides,
U, Pu
Very-low volatility MetalO2 in suspension Na(l)
Others
Te
React with Na creating
telluride of low volatility
Na2Te, solid in
suspension
Na(l)
In turn, this points to the need of having a chemistry and nucleation model for those
fission products capable of significant escape from Na solutions, such as caesium. Present
LWR codes do different things: e.g., some such as MELCOR assume that particles

1. INTRODUCTION
40
nucleate as soon as vapour become saturated and allow no supersaturation; others such as
ASTEC allow supersaturation and model kinetically the process of formation of aerosols
by nucleation.
Therefore, current LWR integral codes would be capable of capturing in-
containment source term evolution if they are improved with SFR aerosol generation and
fission-product chemistry and partitioning models: this is a sine-qua-non condition to
obtaining a credible characterization of particles and airborne fission-product inventory.
Nevertheless, even if current LWR codes appear enabled with the major anticipated
aerosol deposition mechanisms in SFR containments, it seems advisable to undertake a
thorough-as-feasible validation campaign. For that purpose a sound and comprehensive
database against which to compare code estimates would be instrumental; this database
should take into account previous and valuable experimental campaigns such as the
ABCOVE and FAUNA programmes.
Frame of the thesis 1.4.
As a summary of the above section, it has been found that improvements to
characterizing particles (i.e., density and shape) and particle-particle interaction processes
are required. However, beyond any doubt, two of the strongest modelling needs for SFR
accidents are: aerosol generation which, in turn, means to properly model sodium
vaporization, chemical reactions with the surrounding gas, nucleation of combustion
products and primary particle agglomeration; and fission product partitioning.
Given the practical absence of activity during the last 20 years in the field of CDA
modelling beyond core-disruption aspects, the status of the mid-1980s computer codes
may be considered applicable today to a good extent.
In the late 1980s a benchmark against experimental data in a medium-scale facility
(400 m3) for a 90-minute pool fire was conducted using a number of these aerosol codes –
see Lhiaubet et al. (1990). While most of the codes then reviewed and tested are no longer
available, much (if not all) of the aerosol modelling was taken over in codes such as
ASTEC (Dorsselaere et al., 2009), MELCOR (Gauntt et al., 2005) and CONTAIN (Murata et
al., 1993) and conclusions from earlier work can be considered relevant to these codes. The
Lhiaubet et al. benchmark concluded that aerosol codes were adequate for pool fire
conditions in the sense that they tended to be conservative by overestimating (but not
massively) the suspended aerosol concentration. Later, Souto et al. (1994) demonstrated
that the aerosol transport mechanisms were accurate enough as long as particles and

1. INTRODUCTION
41
particle-particle interactions were well described by modelling the CSTF experiments with
the MELCOR 1.8.2 code.
The current capability of LWR codes to model aerosol deposition within a SFR
containment under BDBA conditions was tested by CIEMAT (Herranz et al., 2013).
Through a systematic application of the ASTEC (Dorsselaere et al., 2009), ECART (Parozzi
et al., 2012) and MELCOR (Gauntt et al., 2005) codes to relevant ABCOVE tests; insights
were gained into drawbacks and capabilities of these computation tools. To accommodate
differences in boundary conditions between LWR and SFR containments under BDBA,
some hypotheses and approximations were adopted. Two major outcomes result from this
study: a reasonable approximation to the BDBA scenario can be achieved with LWR codes
if suitable hypothesis are made and development and implementation of new models is
mandatory to enhance predictability to the required level in safety analyses. Vaporization,
nucleation and oxidation of Na and turbulent agglomeration of particles are phenomena
for which models should be developed and implemented. Furthermore, the importance of
a good morphological characterization of aerosol particles has been highlighted.
In the light of this work, current LWR integral accident codes look promising as a
computational platform to be extended to the SFR domain. They would be capable of
capturing in-containment source term evolution if they are improved with SFR aerosol
generation and fission product chemistry and partitioning models. Once they are adapted
to anticipated SFR scenarios, extensive validation should be undertaken against a
comprehensive and sound database.
In this context, among the European Collaborative Projects created under the 7th
Framework Programme of the European Commission to study the main challenges of the
Gen. IV technologies, the JASMIN (Join Advanced Severe accidents Modelling and
Integration for Na-cooled fast neutron reactors, contract number 295803) project was born
in order to extend to SFR the use of the ASTEC European code system, a computer
modelling package for severe accidents in water-cooled nuclear reactors. The code
objectives will be to predict throughout the primary phase of the accidental sequence the
cladding and fuel behaviour as well as the behaviour of the released fission products both
in the primary circuit and in the containment vessel, including the extreme thermal-
hydraulic conditions prevailing in the case of sodium fire. Regarding in-containment
source term predictability, the new ASTEC-Na code will integrate and capitalize on state-
of-the-art knowledge of SFR accidents through the improvement of existing physical
models or the development of new ones based on the needs of model development
pointed out in the 7th Framework CP-ESFR project: particle generation and aerosol
chemical transformations. This project subscribes to the general objective of enhancing the

1. INTRODUCTION
42
resistance of Gen. IV SFRs to severe accidents, a major objective of the Strategic Agenda
and Deployment Strategy set by the SNETP (Sustainable Nuclear Energy Technology
Platform, http://www.snetp.eu/).
In the frame of the JASMIN project, a particle generation model to calculate the
particle generation rate and their primary size during an in-containment sodium pool fire
has been developed and implemented in ASTEC-Na code. This thesis is the result of this
work.

2. THESIS SETTING OUT
43
Chapter 2
2. THESIS SETTING OUT
This thesis is a contribution to the technical understanding of the in-containment
source term during postulated severe accident scenarios in sodium-cooled fast reactors.
Motivation 2.1.
In SFR safety studies the highly-unlikely event of a core disruptive accident must be
considered where this could lead to contaminated-sodium at high temperature leaking
into the containment. In these conditions, the vaporization of sodium and its subsequent
combustion with the oxygen available would result in the generation of supersaturated
sodium-oxide vapours likely to nucleate and form particles. The aerosol formed and its
chemical transformations would be responsible to a great extent for the radiological and
chemical impact of any potential source term. Therefore, aerosol formation and
subsequent behaviour in the anticipated accidental conditions are key phenomena to
model to describe source term transport.
The computer codes used to analyse BDBA scenarios in SFRs have mostly focused
on energetics and thermal-hydraulics (Murata et al., 1993) so that particle generation
modelling has received much less attention. Several sodium fire studies (pool and spray
fires) have been carried out since the 1970s, in facilities like PLUTON (Lhiaubet et al.,

2. THESIS SETTING OUT
44
1990) and JUPITER (Malet et al., 1990) in France, CSTF in the USA (Hilliard et al., 1979,
1977; McCormack et al., 1978; Souto et al., 1994), FAUNA in Germany (Cherdron et al.,
1990, 1985; Cherdron and Jordan, 1983, 1980) or ATF in India (Baskaran et al., 2011;
Subramanian et al., 2009; Subramanian and Baskaran, 2007). In all of them, the aim was to
understand the sodium burning process and to study the sodium compound aerosols
behaviour and their chemical composition. Since then a number of studies have intended
to model the whole scenario with relative success.
The pioneering work by Beiriger et al. (1973), who developed a tool mainly focused
on fire energetics (the SOFIRE code), was followed by others who made specific
hypotheses and approximations. In the SOFIRE model, the formation of a thin vapour
layer over the surface of the pool is not considered and the Na-O2 reactions take place on
the pool surface. Through an extensive review of the physico-chemical processes involved
in the liquid sodium pool combustion, Newman (1983) established that pool combustion
could occur via surface or gas-phase reaction depending on the ignition temperature.
Based on this work, Sagae and Suzuoki (1985) developed an analytical combustion model
in which sodium vapour diffuses from the pool surface to a flat flame where the Na-O2
reactions take place. In this model the combustion rate depends on heat and mass transfer
of Na and O2 to the flame (flame sheet approach). The vapour-phase sodium-combustion
model has been included in numerous combustion codes as the SPM code by Miyake et al.
(1991), SOPA code developed by Lee and Choi (1997) or more recently in multi-
dimensional numerical analysis codes such as the SPHINCS code (Yamaguchi and Tajima,
2003) or AQUA-SF code (Takata et al., 2003).
However, as said above, all these computer codes have mostly focused on energetics
and thermal-hydraulics (Murata et al., 1993) so that particle modelling has received much
less attention. For example: the SOFIRE code (Beiriger et al., 1973) assumes that all
sodium-oxides produced becomes particles of a given size with no consideration of
particle formation kinetics or primary-particle size; the CONTAIN-LMR code (Murata et
al., 1993) requires the user to fix the initial particle size in the analysis and this becomes the
size at which any particle is nucleated.
Objectives 2.2.
The final objective of this investigation is to enhance the present model
predictability of the in-containment source term in SFRs by bringing the gap from
primary particle formation to final particle behaviour.

2. THESIS SETTING OUT
45
For that, a particle generation model has been developed as a step forward in the
modelling of in-containment source term in SFRs. Besides, several specific objectives have
been drawn:
- To better estimate the in-containment thermal-hydraulics boundary conditions
during sodium combustion (3D simulations).
- To properly articulate all the phenomena involved in particle generation.
- Given the absence of experimental data on particle generation from sodium fires,
to build up a theoretical database covering the foreseen range of potential
scenarios.
- To validate the developed particle generation model.
- To derive correlations easily implementable in nuclear safety codes.
- Once generated a new code version including the derived correlations, to assess
its performance against available large-scale separate effect tests.
Scope 2.3.
This work presents the main features and bases of a particle generation model from
sodium pool fires whose main output variables are particle generation rate and size and its
performance assessment, once implemented in an integral severe accident tool (ASTEC-
Na), against available large-scale separate effect tests.
The scope of the presented model is the estimation of particle generation by
homogeneous and heterogeneous nucleation during an in-containment sodium pool fire in
the near field of the pool. The main output of the model is the generation rate and size of
the primary particles resulting from the sodium pool combustion. Therefore, any further
consideration of particles growth by agglomeration, chemical reaction with steam and/or
gases (like CO2) and transport to other regions in the far-field of the pool, are out of the
scope of the present investigation. Any of these additional phenomena would be essential
for a full prediction of in-containment source term behaviour and, as such, they would be
encapsulated in specific models in a lumped parameter code addressing SFR severe
accidents, in which the present work would be embedded as a particle source into the
containment atmosphere.
2.3.1. Thesis approach
The research approach has been stated through the performance of the three stages
shown in Fig. 16:

2. THESIS SETTING OUT
46
- Compilation and understanding
- Development
- Model assessment
Through an exhaustive literature survey, two tasks have been addressed during the
compilation and understanding stage. First, an experimental database on homogeneous
nucleation has been developed covering the main techniques and materials usually
employed in the experiments (see Appendix B). Secondly, a modelling approach has been
carried out through the revision and study of the main theories on homogeneous
nucleation. Simultaneously, a revision of the main characteristics of the ASTEC code has
been done for a proper final model proposal.
The second stage, the developmental one, starts with the model assessment: the
main approximations and hypothesis of the model has been done. Besides, an scenario
analysis has been carried out and a theoretical database has been build up.
With the model assessment and the scenario analysis done and taken into account
the main characteristics of the ASTEC code, a proposal of the model is done.
Fig. 16. Scheme of the research approach.

2. THESIS SETTING OUT
47
Therefore, from the research approach, the following specific tasks can be drawn:
- To review and investigate the fundamentals of homogeneous and heterogeneous
nucleation models.
- Characterization of the in-containment thermal-hydraulics boundary conditions
during sodium combustion through a Computational Fluid Dynamic (CFD)
simulation. The simulation will be validated against experimental data.
- Assessment of the potential applicability of the current nucleation models under
the studied conditions.
- Enhancement of the source term predictability through the development of a
global particle generation model including all the phenomena from the sodium
vaporization to the particle generation.
- Model implementation in a LWR code (ASTEC-Na code).
- Validation and/or verification of the implemented model.
- To come up with derived correlations to fill the gap of predictability.
This thesis is structured in 6 chapters. Chapter 1 introduces the Sodium-cooled Fast
Reactors (SFRs): an overview is given with a short history of SFR development and their
current framework. The bases of the SFRs technology are explained. Then, the importance
of the Beyond Design Basis Accident (BDBA) scenario is shown. To finalize the chapter,
the background and frame of the work is presented.
Chapter 2 is devoted to explain the investigation setting out: its motivation,
objectives and scope. The thesis approach is also given in this chapter.
Chapter 3 is devoted to the development of the model. The conceptual scenario of a
sodium pool fire is exhaustively analysed. Then, the four main branches of the Particle
Generation (PG) model are explained and the main PG model results exposed.
In Chapter 4, the bases of the development of a zero-dimensional model are
explained: the followed methodology, the adaptation process and the derived correlations
for the PG model outputs, i.e., generation rate and primary particle size.
Chapter 5 is devoted to the assessment of the PG model. The implementation in
ASTEC-Na code is explained in this chapter, and the main results from the assessment of
the PG model are given.
To finalize, in Chapter 6 the main conclusions and final remarks of the present
investigation are shown. Future work is proposed in this chapter.

2. THESIS SETTING OUT
48
Chapters 7, 8 and 9 are devoted to the published work in international/national
papers and conferences, nomenclature and references, respectively.

3. PARTICLE GENERATION MODEL
49
Chapter 3
3. PARTICLE GENERATION MODEL
Conceptual scenario 3.1.
Liquid sodium-pool combustion can proceed via surface reaction or gas-phase
reaction depending on the initial pool temperature. Newman (1983) showed that when the
pool temperature is lower than the ignition one (623-723 K), surface reaction dominates
(oxygen diffusion into the pool), forming a grey-purple product close to the sodium
surface that acts as a floating layer on the surface of the liquid sodium without any
combustion; however, for sodium pool temperatures higher than the ignition one, this
grey layer wets or decomposes allowing Na vapour to vaporize. Na vapour molecules
diffuses away from the liquid surface and at a usually short distance from it, chemical
reaction with O2 in the air starts and combustion takes place. This region is called “flame
region. Combustion in the flame region is dominated by O2 diffusion into the pool. It is in
this region where the sodium oxide vapours would form, nucleate and particle growth by
vapours condensation onto primary particles takes place.
The gas-phase reaction region is sketched in Fig. 17, in which the Na pool is
displayed as a hot flat plate. As observed, the pool nearby can be split into three layers:
sodium vapour, right over the pool; a flame region, above and adjacent to the Na layer;
and the bulk gas overlying the flame and feeding the flame region with oxygen by natural
convection (Miyake et al., 1991; Newman, 1983; Newman and Payne, 1978).

3. PARTICLE GENERATION MODEL
50
At steady-state burning, the pool does not reach its boiling point but remains close to
the commonly found equilibrium pool temperature of 1000-1010 K (Newman and Payne,
1978). On the other side, vapour pressure of sodium is approximately 1 kPa at 800 K and
almost 20 kPa at 1000 K. In these conditions, sodium readily evaporates and this vapour
will be transported by diffusion to the flame region in which Na vapour reacts with the
available oxygen forming Na-oxides and making the local temperature rise to 1200-1300 K.
Namely, sodium oxidation is sustained by Na diffusion and by O2 brought to the region
by turbulent convective flows in the gas over the pool surface. As sodium vapour supply
by evaporation becomes relatively large and chemical reactions are known to be fast,
sodium combustion will be governed by Na vapour supply by evaporation and oxygen
transport into the reaction region. In the sodium vapour layer, a vertical laminar flux will
exist from the sodium pool surface to the flame region, whereas in the flame region, the
flow field will become fully turbulent under the natural convection regime for pool
diameters larger than 0.1 m (Newman, 1983).
The Na-oxide compounds formed (Na2O and Na2O2) have at the flame temperature
vapour pressures well in excess of their saturation pressures, so that molecules cluster by
homogeneous nucleation forming very small primary particles. As soon as these first seeds
appear, several potential mechanisms are likely to occur as the presence of Na gas phase
deposits on the existing aerosols and its subsequent oxidation of the vapour-phase oxide
molecules on the surface of these nucleated particles if vapour pressure is higher than
saturation pressure at the particle surface temperature (i.e., heterogeneous nucleation
occurs).

3. PARTICLE GENERATION MODEL
51
Fig. 17. “Hot flat plate approach”.
PG model 3.2.
Based on the conceptual physico-chemical scenario described above, global
modelling of Particle Generation (PG model) has been developed. As a result, particle
generation rate and primary-particle size can be obtained for a sodium pool fire in a SFR
containment. In this model, steady-state burning is assumed.
The PG model comprises the individual phenomena involved in the particle
generation process during a sodium pool fire, namely: Na vaporization, O2 natural
convection, Na-O2 chemical reactions and vapour-to-particle conversion of Na oxides. The
PG model sequence diagram is shown in Fig. 18. From the sodium pool definition by the
pool temperature and the pool diameter, the vaporized Na from the pool surface is
obtained through a Sodium Vaporization Model (SVM). Due to the extreme foreseen
conditions above the combustion zone (high turbulence is foreseen), a steady 3D
Computation Fluid Dynamics (CFD) approach is employed based on the FLUENT code
(ANSYS Inc., 2008). In this numerical simulation, the O2 natural convection and the Na-O2
chemical reactions are modelled (O2 Supply Model, O2SM; Na-O2 Chemical Model, Na-
O2ChM) for an appropriate estimation of the thermal-hydraulic boundary conditions in

3. PARTICLE GENERATION MODEL
52
the region of interest, i.e., in the close vicinity of the sodium reaction zone. In the Vapour-
to-Particle Conversion model (VtPCM), particle generation by homogeneous nucleation
and particle growth by condensation are accounted for. As a result, the PG model
produces the total number rate of generated particles (N) and the Primary Particle Size
Distribution (PPSD) during an in-containment sodium pool fire.
Fig. 18. PG model diagram.
3.2.1. Sodium vaporization model
In order to couple the liquid-sodium pool to the gas phase equations in FLUENT, the
sodium vapour flux emerging from the sodium pool surface is needed as an input for the
FLUENT simulation.
Two approaches for the treatment of sodium pool combustion problem have been
found in the literature. The first one, named as surface combustion model (Beiriger et al.,
1973), is one in which Na vaporization rate is slow and Na-O2 reactions occur at the pool

3. PARTICLE GENERATION MODEL
53
surface. The second one, a gas-phase reaction model, was developed by Sagae and
Suzuoki (1985) and later used by Doda et al., 2003; Karthikeyan et al., 2009; Lee and Choi,
1997; Miyake et al., 1991; Yamaguchi and Tajima, 2009 and more recently by Sathiah and
Roelofs (2014).
According to the Na temperatures around 800 K in normal operating conditions in
the primary and secondary circuit (IAEA, 2006), a sodium vaporization model to simulate
gas-phase combustion is proposed.
Sodium vapour pressure is low at pool temperatures of 800-1000 K; therefore, a
diffusion flame is established very close to the sodium surface. In this boundary layer, the
diffusion of heat and mass is dominant and the convection can be neglected. Based on a
diffusion layer approach (gas-phase reaction model), an expression for the molar flux of
sodium vapour is derived. In the boundary layer (between pool surface and flame), one-
dimensional sodium vapour diffusion is assumed taking into account the diffusive
resistance of N2 to the sodium vapour movement toward the flame. As boundary
conditions, sodium vapour pressure is assumed to be saturated at the pool surface and to
fall down to zero concentration at the flame region edge facing the pool; the latter means
that Na disappears instantaneously as soon as it interacts with oxygen (infinite chemical-
reaction rate). It is also assumed that oxygen penetration into the evaporating-sodium
boundary layer is negligible due to its consumption in the flame; this allows the sodium-
vapour flux boundary layer to be treated as a sodium-nitrogen binary-diffusion problem:
2,
2, ,
ln lnN pNa NaNa Na bl Na bl
f N f f sat Na
XD D PX C X C
l X l P p
(4)
where the logarithmic term describes the diffusive resistance that N2 presents to Na
vapour diffusion. In this equation, correlations for the physical properties of Na from Fink
and Leibowitz (1995) are used. Besides, a correlation for the diffusion coefficient of Na
through N2 from the SPRAY code (Shire, 1977) is used:
1.66890.9998 10Na
TD
P
(5)

3. PARTICLE GENERATION MODEL
54
The vaporized sodium molar flux-equation (Eqn. 4) involves two unknown
variables, the distance between the flame and the pool surface (lf) and the flame
temperature (Tf). To determine these, the mass and energy conservation equations at the
flame are solved. In this approach, a number of hypotheses are considered: flame surface
area facing the pool is equal to the pool surface area (i.e., flame surface is assumed to be
smooth and parallel to the surface); all the gases are considered ideal; and pool
temperature is supposed to remain constant as a function of time, i.e., the heat transfer of
the foreseen oxide layer formed on the pool surface to the un-burnt sodium is neglected.
Mass balance at the flame is given by the following equation:
2Na OX (6)
where X is the oxygen-sodium stoichiometric ratio which is dictated by the chemical
reactions described in section 3.2.3 (Karthikeyan et al., 2009). In this equation, infinite rate
chemistry is supposed, i.e., all the O2 coming to the flame is instantaneously consumed by
the Na vapour.
The supply of oxygen from the environment to the flame is driven by natural
convection. As the Lewis number (Le=Sc/Pr, and defined as the ratio of thermal
diffusivity to mass diffusivity) for this mass transfer system of sodium vapour and air
becomes almost unity, the molar oxygen flux is determined by using the heat/mass
transfer analogy (Nu/Sh):
22 2
OO O g
DX C Sh
L (7)
where the McAdams correlations are used according to the scenario of interest
(laminar/turbulent) (Incropera and Dewitt, 2011):
1/ 4 4 70.54 10 10 ,Pr 0.7Nu Ra Ra (8)

3. PARTICLE GENERATION MODEL
55
1/3 7 110.15 10 10 , PrNu Ra Ra all (9)
The general heat equation at the flame can be expressed as follows:
f cond conv rad
p chem gf fNa fg f
dTm c E H E E E
dt (10)
where Tf is the flame temperature, Echem is the combustion energy generated at the
flame, Hgf is the enthalpy transferred by material fluxes of different species (sodium,
oxygen and sodium oxides) to the flame, cond
fNaE is the conductive-convective energy
transfer from the flame to the pool surface, dominated by conduction,conv
fgE is the
conductive-convective energy transfer from the flame to the environment, and rad
fE is the
energy transfer by radiation from the flame to the pool surface and from the flame to the
atmosphere and walls surrounding the pool.
The energy transferred from the flame by radiation influences combustion rate.
According to Yamaguchi et al. (2006) studies on flame emissivities in sodium pool fires,
the emissivity is strongly dependent on the aerosol cloud around the flame and it will
increase at the start of the fire. As the flame emissivity becomes larger, the global heat
transfer from the flame to the pool surface (conduction plus radiation) decreases over time
because of the flame temperature drops due to the extra heat loss by radiation (Sagae and
Suzuoki, 1985); therefore, the evaporation from the sodium pool surface decreases. Flame
emissivity values have not been found in the open literature. Through numerical
experiments, Yamaguchi and Tajima (2003) estimated flame emissivity from 0.2 to 0.8
depending on the boundary conditions (pool and gas temperatures and O2
concentrations). Therefore, due to the high uncertainties in the flame emissivity, an
estimation of the radiation effect on the sodium vaporized flux has been developed
assuming maximum flame emissivity of 0.8. Furthermore, the maximum radiative transfer
is fostered by considering view factors of unity. With these conditions of maximum
radiation, variations in the sodium flux less than 10 % have been found. Therefore, in
steady-state conditions (dTf/dt=0) and by assuming no radiation from the flame, the
energy balance at the flame can be approximated as:

3. PARTICLE GENERATION MODEL
56
cond conv
chem gf fNa fgE H E E (11)
3.2.2. Oxygen supply model
The oxygen supply to the flame region is the consequence of natural convection over
the flame region: given the significance that O2 supply might have in the entire scenario
and due to the extreme foreseen conditions above the combustion zone where high
turbulence can be anticipated, a computational fluid dynamic model has been developed
with the FLUENT 14.5 code (ANSYS Inc., 2008).
FLUENT is a commercially available CFD tool whose formulation and numerics
have extensively validated by a good number of research and industrial teams. Several
methodologies are available for the resolution of the Navier-Stokes equations in FLUENT.
Direct solution of them (DNS) is not possible for the present problem due to the fine
time and space resolution needed. Large-Eddy Simulations (LES) resolve only the large-
scale turbulence and account for the smaller scales with subgrid-scale modelling.
However, such simulations are still very onerous (of the order of weeks on an ordinary
computer for rather simple flows). As the scenario under modelling is highly complex,
finally, the Reynolds Averaged Navier-Stokes (RANS) methods fulfil the compromise
between accuracy and computational costs (Andersson et al., 2012) by simplifying local
turbulent fluctuations. With this model for steady-states, the equations of continuity,
momentum and energy in Cartesian form can be written as follows:
Continuity:
0j
j
ux
(12)
Momentum:
' '( )i j ij i j
j j j
u u Px x x
(13)
Energy:
02i j
j s j j i ij
j
u uu h u P q u
x
(14)

3. PARTICLE GENERATION MODEL
57
Turbulence effects have been simulated by adopting the SST k-ω model, as
recommended by Menter (1994). In this model, the advantages of both k- and k-ω models
are included (i.e., the robustness in the near wall-region of the k-ω model plus the
accuracy of k- in the far field), which makes calculations computationally efficient in all
regards.
The transport equations of the turbulent kinetic energy (k) and the specific
dissipation rate (ω), together with the Boussinesq hypothesis to relate the Reynolds
stresses to the mean velocity gradients close the system equations of continuity,
momentum and energy are given by:
( )i
i j j
u G Y Dx x x
(15)
' ' 23
ji ii j ij
j i i
uu uk
x x x
(16)
where denotes the independent variable (k and/or ω) and G, Y and Г represent
generation, dissipation and effective diffusivity of the given quantity, respectively. The set
of equations are solved using a segregated implicit solver with a second-order
discretization scheme.
3.2.3. Sodium-oxygen chemical model
A number of sodium pool fires experiments are reported in the literature. Cherdron
and Charpenel (1985) and Hilliard et al. (1979) performed large scale aerosol behaviour
test in CSTF and FAUNA facilities, respectively. Malet et al. (1990, 1982) conducted
sodium pool experiments to study the influence of sodium temperature, combustion area
and atmosphere composition on the fire evolution. In all of them, the major species
identified were oxide, Na2O, and peroxide, Na2O2.
A more detailed analysis of the chemistry of sodium pool combustion was
developed by Newman (1983) in his review of sodium pool fire tests carried out during

3. PARTICLE GENERATION MODEL
58
the 1960s and 1970s. However, intermediate reactions and products were not clearly
identified.
Based on the information found in the open literature on sodium pool fire analytical
models (Karthikeyan et al., 2009; Lee and Choi, 1997; Marimuthu, 1996; Miyake et al., 1991;
Sagae and Suzuoki, 1985), two reactions are considered in the Na-O2 chemical modelling:
2 21 1 316 /4 2
Na O Na O kJ mol (17)
2 2 21 1 365 /2 2
Na O Na O kJ mol (18)
We note that some authors assert that reaction (17) is always the first oxidation step
and, if there is sufficient oxygen, the sodium oxide produced is further oxidized to
peroxide. In the present modelling and taking into account the very short time scale of
interest for primary particle generation, formation of both oxide (Na2O) and peroxide
(Na2O2) are assumed to be infinitely fast, so that the relative proportion of each species in
the products is governed by stoichiometry. That is, each 4 Na moles yield one mole of
Na2O and 1 mole of Na2O2; this means that in terms of mass fractions, of the total Na oxide
species formed (NaxOy), around 40% is Na2O and the remaining 60% is Na2O2.
During sodium pool combustion, the reaction of Na with the water vapour present
in the atmosphere is also possible. However, as in most practical cases the oxygen is the
major constituent, it is the oxidation of O2 the dominating reaction (Yamaguchi et al., 2006;
Yamaguchi and Tajima, 2003). As a consequence, this reaction is not here considered. For
reacting flows, FLUENT provides several models for chemical species transport and
chemical reactions. Among them, Generalized Finite-Rate Model is based on the solution
of transport equations for species mass fractions, with the chemical reaction mechanism
defined by the user. In this model, the conservation equations for chemical species are
solved by predicting the local mass fraction of each species, Yi, through the solution of a
convection-diffusion equation for each species:
iY vt i i i iY J R S
(19)

3. PARTICLE GENERATION MODEL
59
The mass diffusion in turbulent flows is calculated in this model by the following
expression:
,i i m i
t
J D YSc
(20)
The reaction rates that appear as source terms in the convection-diffusion equation
(Ri) are computed by the eddy-dissipation model in which the reaction rates are assumed
to be controlled by turbulence mixing and the Arrhenius chemical kinetic is not calculated.
This model can be selected assuming Na-O2 reactions are infinitely fast (Miyake et al.,
1991). The net rate of production of species i due to reaction r, Ri,r, is given by the smaller
of the two expressions below:
', , , '
, ,
minT Ri r i r w i
RR r w R
YR M A
k M
(21)
', , ,
'', ,
P
T Pi r i r w i N
j r w j
j
Y
R M ABk
M
(22)
The default values in the code for the empirical constants A and B have been used
(A=4.0 and B=0.5).
3.2.4. Vapour-to-particle conversion model
As stated by Newman (1983), the combustion mechanism between sodium vapour
and oxygen in the gas phase is followed by the formation of a condensed oxide by
homogeneous and heterogeneous nucleation.

3. PARTICLE GENERATION MODEL
60
Once the supersaturated vapours have been formed in the gas phase after sodium
oxidation, the system is in a non-equilibrium state. To reach equilibrium, the surplus of
vapour molecules condenses (homogeneous nucleation) forming primary clusters on
which other vapour molecules might condense (heterogeneous nucleation).
3.2.4.1. Homogeneous nucleation
Homogeneous vapour-liquid nucleation is a fundamental mechanism of phase
transformation. The nucleation process involves formation of clusters in a metastable bulk
vapour by thermal fluctuations: the passage from a metastable state over an energy barrier
for the system to reach its thermodynamic equilibrium.
Even though nucleation has been studied since the 18th century, a reliable theoretical
formulation has been difficult to derive. Major reviews of nucleation modelling exist (e.g.,
Ford, 2004; Kashchiev, 2000; Vehkamäki, 2006). Based on these, a diagram of evolution of
nucleation theories is shown in Fig. 10. According to the scheme, Transition State Theory
(TST) can be considered as the first theory of nucleation (Ford, 2004). Within the
framework of the free-energy fluctuations theory, the probability of forming a critical
cluster is exponentially related to the Gibbs free energy of cluster formation. The
proportionality constant in the nucleation rate equation was included by Volmer and
Weber (1926) by their kinetic interpretation of nucleation phenomena: nucleation is
understood as a set of collisions, and the only important transitions are those that are
brought about by the addition or loss of single molecules to form the cluster. The theory of
Volmer and Weber was extended a few years later by Becker and Döring, 1935; Farkas,
1927; Zeldovich, 1942 and is now known as Classical Nucleation Theory (CNT). From the
CNT, the evolution of analytical nucleation theories has been driven through two main
branches (Fig. 19). On one side, adjustments of the CNT with “minor” corrections
(phenomenological approaches); on the other, approaches developed for a more
exhaustive description from the microscopic point of view. Among the microscopic
theories, there are two main streamlines. On one side, the approaches based on defining a
cluster by imposing geometric constrains on the molecular positions (Senger et al., 1999;
Stillinger, 1963); on other side, the Density Functional Theory (DFT) (Oxtoby, 1998; Oxtoby
and Evans, 1988) in which the key assumption in the phenomenological approaches –
capillarity approximation – is removed and the free-energy barrier to nucleation is
calculated in a non-classical manner using a mean field theory in which the molecules
forming the cluster move in an effective potential field created by the other molecules in
the cluster (Ford, 2004).

3. PARTICLE GENERATION MODEL
61
The simplest phenomenological adjustment is the Internally Consistent Classical
Theory (ICCT) developed by Girshick et al. (1990) in which an unevaluated normalization
constant in the nucleation rate expression is introduced. The Fisher droplet model (1967) is
a slightly more sophisticated approach in which parameters are introduced in the work of
formation to ensure that the model correctly reproduces known properties of clusters and
vapours, including virial coefficients and critical properties. Dillmann and Meier (1989)
developed a model based on the Fisher model using the observed critical-vapour
properties and the second virial coefficient. The model is based on considering the
curvature dependence of the droplets surface tension and additional degrees of freedom in
the definition of the Gibbs free energy variation. However, the success of this model is
challenged by correction of an inconsistency that leads to large changes in the predicted
nucleation rate (Ford et al., 1992). Finally, Scaled Nucleation Theory (SNT), proposed by
Hale (1986), is based on CNT but employing simplified models for the surface tension and
liquid density based on scaled behaviour near the critical point.
Fig. 19. Overview of the main analytical theories on homogeneous nucleation.

3. PARTICLE GENERATION MODEL
62
Based on the review and analysis of the available models in the literature, it has been
concluded that both the Classical Nucleation Theory (CNT) and the Internally Consistent
Classical Theory (ICCT) might be suitable approaches for the assessment of the nucleation
rates in the case of an in-containment sodium-pool fire. The reasons for that are:
- The higher complexity of later theories.
- The inherent uncertainty coming from the lack of information on NaxOy
properties.
- The huge sensitivity of any homogeneous nucleation theory to variations in
boundary conditions (i.e., temperature).
In addition, the complexity of other theories entails an extra numerical burden and
the supposed gain in accuracy vanishes due to the intrinsic uncertainties in additional
properties and estimation of key variables.
The CNT considers that the probability of attaining a cluster of a critical size
(minimum number of particles to form a stable cluster) is exponentially related to the
energy necessary to form it. The expression of the nucleation rate derived from the work
of Becker-Döring, Frenkel, Farkas and Zeldovich is given as (a complete development of
the model is done in Appendix A):
*
0 expB
CNT
GJ J
k T
(23)
where the energy barrier to form a cluster (∆G*) is the minimum of the classical
Gibbs free energy for the formation of a droplet. The change of Gibbs free energy (∆G ) is
the difference between a mechanical term proportional to the surface tension (associated
with the creation of a spherical interface) and a thermal term proportional to the logarithm
of the saturation ratio of the free vapour (coming from the difference in the Gibbs free
energy of the liquid and vapour states, i.e., the phase change from supersaturated vapour
to condensate) (Seinfeld and Pandis, 2006):
24 · lnBG r ik T S (24)

3. PARTICLE GENERATION MODEL
63
where i is the number of molecules forming the cluster and S is the saturation ratio
(S=pvap/psat(T)). This expression relies on the capillarity approximation that considers
extremely small particles with the same surface tension as a liquid planar surface.
Therefore, the nucleation rate expression in CNT is as follows:
1/2 2 32 1
1 1 3 21
2 16exp3 lnB
CNT
vJ v N
m k T S
(25)
This expression can be explained as formed by two contributions. On one side, the
pre-exponential factor involves specific features of the kinetics of the process as the
collision probability of individual vapour molecules with critical clusters of the new phase.
On the other side, the exponential factor reflects the thermodynamic aspects of the theory:
the thermodynamically stable phase corresponds to the minimum Gibbs free energy of
formation that represents the barrier for the transition of the system into the new phase.
The critical particle size is obtained by applying the extreme condition in the Gibbs
free energy of formation */ 0r
d G dr :
* 12lnBk T S
vr
(26)
The simplest phenomenological adjustment to CNT is the Internally Consistent
Classical Theory (ICCT) developed by Girshick et al. (1990). To overcome the limiting
inconsistency in CNT, a kinetic normalization constant is introduced in the Boltzmann’s
distribution for the cluster population at equilibrium. This results in a new expression for
the nucleation rate that is related to the CNT expression as follows:
1expB
ICCT CNT
s
k T
SJ J
(27)

3. PARTICLE GENERATION MODEL
64
The sensitivity of both theories to variations in boundary conditions (temperature)
has been tested against experimental data. Given the absence of data on homogeneous
nucleation in sodium oxides, experimental data on homogeneous nucleation in water has
been used (Viisanen et al., 1993). Measurements of the rate of homogeneous nucleation
were performed using an expansion chamber capable of producing short pulses of
nucleation. The vapour-carrier-gas mixture is adiabatically expanded to a lower pressure
and consequently to a lower temperature within a few milliseconds. The expanded,
supersaturated state during which nucleation can occur is maintained for about 1 ms.
Then a small recompression is performed to quench the nucleation process. Assuming the
nucleation process to be stationary, the experimental nucleation rate will be given by the
ratio between the number density of nuclei formed during the pulse and the duration of
the pulse.
Fig. 20 shows the experimental homogeneous nucleation rate (Jexptl) as a function of
supersaturation ratio (S) for water at different temperatures. From the figure follows the
great sensitivity of homogeneous nucleation with temperature: slopes from 259 K to 217 K
vary two orders of magnitude. This means that a simple theoretical model with a
reasonable accuracy (CNT or ICCT) should be adequate to be implemented in a lumped
parameter code in which boundary conditions are given by average values.
Fig. 20. Isothermal homogeneous nucleation versus saturation ratio.

3. PARTICLE GENERATION MODEL
65
In Fig. 21, the ratio of the theoretical-to-experimental nucleation rates as a function of
the saturation ratio is presented for water. From the figure, CNT predicts nucleation rates
within a couple of orders of magnitude in the case of water. ICCT predictions are between
4 and 6 orders of magnitude beyond the experimental data.
Fig. 21. Theoretical-to-experimental ratio of nucleation rates versus S.
In spite of the limitations in the CNT, CNT successfully predicts nucleation rates
within a couple of orders of magnitude in the case of water and for a given range of
temperatures (Ford, 2004). On the other side, the unevaluated normalization constant
introduced in the ICCT to bridge some inconsistencies found in the CNT is an arbitrary
modification and its successful in accounting data is mixed. In the light of the foregoing, it
is concluded that CNT is an appropriate approach to model homogeneous nucleation in
the conditions of interest.
3.2.4.2. Heterogeneous nucleation
The growth mechanism by heterogeneous nucleation (condensation on existing
particles) has been extensively documented in the literature (e.g., Friedlander, 2000; Hinds,
1999; NEA, 2009, n.d.; Seinfeld and Pandis, 2006). The rate of aerosol growth by
condensation will depend on the saturation ratio, particle size and particle size relative to
the gas mean free path (Hinds, 1999). For particles much larger than the mean free path

3. PARTICLE GENERATION MODEL
66
(Knudsen number lower than unity, Kn<1.0), the rate of condensation is controlled by the
rate at which vapour can diffuse toward the particle surface. However, for particles much
smaller than the mean free path (Kn>>1.0), the rate of particle growth by condensation
will be governed by the rate of random molecular collisions between the particle and the
vapour molecules. It is noted that Fuchs and Sutugin (1969) developed a formulation
covering both the high and low-Knudsen number ranges including the transition regime.
As the critical particles generated by homogeneous nucleation are foreseen to be in
the order of nanometres (NEA-CSNI, 1979), the prevailing conditions for heterogeneous
nucleation fall in the free molecular regime (i.e., Kn=2/dp>>1.0). Therefore, the removal
of vapours by condensation is calculated as the net flow of molecules attached to the
surface of a particle of a given size by collisional impact (kinetic theory).
In the kinetic regime, the net flow of vapour molecules toward a particle is given by:
AV
z a
NF
(28)
where z is the collision rate per unit area:
AVN c nz (29)
Therefore, in this formulation the condensation rate can be expressed as:
2
1/21
( )2AV B
pvap sat
z a
N
dp p
m k TF
(30)
In this expression, the Kelvin effect, i.e., the effect of surface curvature is neglected as
a simplification (Friedlander, 2000). During condensation, particle latent heat is released at
the particle surface. In these conditions, convection is an inefficient means of heat transfer
since the particles are very small and move with little slip along with the gas; the same
occurs with radiation since all the particles have roughly the same temperature.
Otherwise, conduction through the gas phase is available for heat removal from the

3. PARTICLE GENERATION MODEL
67
particle surface where condensation is taking place, so condensation might be limited by
the rate of heat removal from the particle surface. In our approach, however, the reduction
of the condensation-rate due to the rise in the temperature from the release of latent heat
has not been taken into account as no data on NaxOy diffusion coefficients are found in the
available literature. These approximations (neglect of both curvature and latent heat)
might lead to an over-estimation of the arrival of vapour molecules to the droplet surface,
i.e., an over-estimation of the condensation.
By considering the rate of change of particle volume as:
1dV
dtF v
(31)
The resulting particle size is given by the following growth law expression
(Friedlander, 2000):
1
1/21
2 ( )2
p
B
vap sat
dd v
dtp p
m k T (32)
In this approach, growing particles are assumed to remain in kinetic-regime
conditions. During the initial stages of particle growth, this can be considered as an
adequate approximation since condensation occurs on sub-micrometre particles coming
from homogeneous nucleation (Shaw, 1989).
3.2.4.3. The single-burst approach
As shown in previous sections, vapour pressure is a key variable defining any
particle formation in a supersaturated vapour. Homogeneous nucleation will reduce the
number of free condensing molecules available and, hence, vapour pressure. But also,
heterogeneous nucleation drivers will bring vapour molecules onto primary particle
surfaces where they condense and further reduce vapour pressure. To calculate the
particle generation rate an primary particle size by vapour-to-particle conversion in the
analysed region, a program in FORTRAN 95 has been developed (see Appendix C).

3. PARTICLE GENERATION MODEL
68
Therefore, the total number of particles formed will be given by the nucleation and
condensation as simultaneous and competitive processes (Clement and Ford, 1999a, 1999b;
Warren and Seinfeld, 1985). Given that both processes are very fast, their full modelling
(i.e., both phenomena competing for vapour molecules as a function of time) is an onerous
computational burden since, for each time step, both nucleation and condensation should
be calculated on a particle size distribution that would become more dispersed as time
progresses. Instead, one may assume that after the first homogeneous nucleation,
heterogeneous nucleation dominates from that time onward. In other words, this second
approach neglects homogeneous nucleation beyond the first burst of primary particles.
Both approximations are outlined in Fig. 22.
Fig. 22. Nucleation approaches.
Fig. 23 shows the number of generated particles by both approaches for a sodium
pool fire of radius 5 cm (pool temperature of 1000 K and 21% of initial O2 content). From
the figure, the realistic approach (nucleation-condensation model) results are 3 times

3. PARTICLE GENERATION MODEL
69
larger than the single-burst approach. In the first one, it can be observed that from the first
nucleation at 10-8s, there is an abrupt increase in the generation of particles until 1.1·10-7s,
reaching a value of 1.71·1020 particles. At this point, there is no further particle formation
due to the depletion of NaxOy vapour down to its saturation pressure by homogeneous
nucleation and condensation, i.e., the nucleation process is cut-off. In the second one,
however, homogeneous nucleation gives 5.13·1019 particles at the start of the calculation.
Both approaches agree with the idea of Clement and Ford (1999a, 1999b): particle
production takes place in occasional and isolated bursts of nucleation and as foreseen, all
the generated oxides produced during the sodium oxidation seem to be in particle form
after a short period of time, of the order of 10-7s. Concerning primary-particle size, both
predictions give diameters in the nano-range, but with the diameters in the realistic
approach approximately twice as larger as those in the single-burst approach.
As these estimates are strongly affected by uncertainties, a simple estimation of the
error propagation linked to the properties used in the nucleation formulation has been
developed to evaluate the minimum bands of uncertainties in the number of generated
particles. Uncertainties associated to the theoretical expressions of homogeneous
nucleation are not considered. Following the error propagation theory, the nucleation-rate
expression uncertainties are calculated by the following expression:
2 2 2 2CNT sat
CNT CNT CNTJ p
sat
J J J
p
(33)
where the density and surface tension errors are evaluated based on the available
information in the open literature (Janz, 1988). Regarding saturated-vapour pressure, the
error has been evaluated based on the maximum difference found between the two
available correlations (Jacq, 2006; Lamoreaux and Hildenbrand, 1984).
An upper uncertainty bound up to 2 orders of magnitude has been estimated.
Therefore, by considering the estimated large uncertainties associated with the
homogeneous nucleation model, we consider the single-burst approach to be accurate
enough to describe the vapour-to-particle conversion process.

3. PARTICLE GENERATION MODEL
70
Fig. 23. Total number of generated particles by the two modelling approaches.
In this approach, the Na2O and Na2O2 correlations of saturated-vapour pressure,
density and surface tension as a function of temperature are needed to calculate the
number of generated particles by homogeneous nucleation and its growth. As no
information on Na2O2 density and surface tension is found, in this model both oxides are
characterized by the same properties, i.e., both Na2O and Na2O2 are treated as
indistinguishable NaxOy as far as nucleation and condensation are concerned. Then, the
correlations we use are the Na2O saturated-vapour pressure proposed in Jacq (2006);
regarding density and surface tension and in the absence of specific correlations for Na2O,
correlations for Na2CO3 are used (Janz, 1988).
PG model results 3.3.
The available data in the literature to conduct a full and extensive validation of the
model presented in previous sections, in terms of particle number and size, are scarce.
Nonetheless, some measurements concerning the burning rate have been found and the
model will be compared with these (next section). Then, the model performance will be
assessed in a scenario whose conditions reflect those expected in the case of a realistic Na
pool fire.

3. PARTICLE GENERATION MODEL
71
3.3.1. Partial validation
A partial validation of the PG model has been carried out based on the sodium pool
experiments of Newman and Payne (1978). For benchmarking, estimates of burning rates
based on the surface model included in SOFIRE code (Beiriger et al., 1973) have been
added. SOFIRE is a reputable sodium pool combustion model based on the surface
combustion approach (i.e., no Na vaporization is accounted for).
In Newman and Payne’s experiments, the burning rates of sodium pool fires were
measured for a sodium pool of 0.1 m diameter at sodium pool temperatures in the range
of 523-1023 K and in natural-convection airflow conditions (oxygen molar fraction of 21%).
Burning rates were measured by measuring the sodium pool mass change with time and
by collecting the emitted smoke using a pumped filtering system.
The circumferential symmetry of the experimental scenario allows assuming
circumferential symmetry (i.e., the same variables profiles are expected at any azimuth).
The geometry and domain meshing of the problem is illustrated in Fig. 24. The sodium
pool is represented by a surface of 0.05 m radius. The computational domain is
rectangular, with 0.60 m height and 0.20 m length. The ratio of the pool surface area to the
horizontal cross-sectional area of the domain is 0.065 which ensures that pool combustion
is not influenced by the size of the domain; in other words, the vessel size does not
influence the O2 supply by natural convection over the horizontal combustion plane
(Sagae and Suzuoki, 1985). For the non-uniform grid, 4001 quadrilateral cells are used to
mesh the entire volume. The maximum nodes areas are outside the influence zone (10-2
m2); however, inside the influence zone of the flame, a higher density mesh is used up to a
minimum area of 10-6 m2. It is worth reminding that in this approach, the liquid sodium
pool is modelled as a thermally thick solid, i.e., the sodium pool is assumed to be stagnant
and the spreading of the sodium negligible.

3. PARTICLE GENERATION MODEL
72
Fig. 24. Meshing of the sodium fire simulation.
Fig. 25 compares the calculated burning rates of liquid sodium with the
experimental results of Newman and Payne (1978). In addition, the Na burning rates
calculated by the surface combustion model SOFIRE are included. Note that pool
temperatures in the figure are over 800 K (i.e., in the gas-phase combustion regime).
From Fig. 25, the estimates-to-data agreement is outstanding. On the one hand, the
experimental trend of increased burning rate with Na pool temperature is followed by the
calculations. On the other hand, the data scattering helps predictions to be well within the
measurements range. As can be observed, SOFIRE noticeably under-predicts the burning
rates. Probably the major difference between both approaches concerns reaction
temperatures: whereas in the gas-phase-combustion approach (PG model) the flame
temperature is always higher than the pool one (1300 K and 1000 K according to Newman
and Payne (1978), the surface combustion approach takes the pool temperature as the

3. PARTICLE GENERATION MODEL
73
reaction temperature. This temperature discrepancy makes a difference in terms of
reaction rates (Sagae and Suzuoki, 1985). In addition, oxygen transfer by natural
convection to the flame will be fostered by the higher temperatures at the flame what, in
turn, will lead to faster combustion.
These results seem to indicate that surface combustion is not conservative when
applied at pool temperatures over 800 K since it would under-predict both the thermal
load to the containment and the airborne-particle loading relative to what could be
expected in the case of an in-containment pool fire.
Fig. 25. Burning rates vs. pool temperature.
3.3.2. PG model estimates
3.3.2.1. Main results
In order to show the PG model performance, a scenario thermally similar to the one
foreseen in the case of a pool fire (i.e., atmospheric pressure and pool temperature of 1000
K) has been proposed in a geometry similar to the one used in Newman experiments (i.e.,
a 10 cm Na-pool diameter).
The velocity field is shown in Fig. 26. The general flow pattern is an ascending flow
entering from the edge of the pool surface. The ascending flow velocity distribution

3. PARTICLE GENERATION MODEL
74
behaves like a plume: low horizontal velocities at the reaction zone (edge of the pool
surface) and upward velocity increasing towards pool centre (maximum velocity of 1.185
m/s at 0.06 m above the pool surface at the centre) due to buoyancy forces mainly driven
by temperature gradients. Inside the plume, velocities of 0.70 m/s are reached. Note that
O2 concentration drops in the air stream as oxygen is partially depleted while the flow
moves towards the pool centre (Fig. 27).
Fig. 26. Flow velocities field (m/s).

3. PARTICLE GENERATION MODEL
75
Fig. 27. O2 mass fraction field.
More linked to the particle generation are temperatures and Na-oxides partial
pressures. The temperature field is shown in Fig. 28. Sodium burning starts at the edge of
the pool surface due to fresh air entering into contact with sodium vapour by natural
convection. The sodium-vapour combustion generates an ascending plume from the edge
of the pool surface to the centre. A maximum temperature spot of 1448 K is produced
where the oxidation starts while the temperature decreases along the plume to 1200-1300
K at 0.03 m from the pool centre. These estimates reasonably agree with the measurements
made by Newman and Payne (1978) of 1300 K at the flame.

3. PARTICLE GENERATION MODEL
76
Fig. 28. Temperature field (K).
In Fig. 29, molar concentrations of NaxOy are shown. As can be observed, the region
of higher concentrations is just above the sodium pool surface; nonetheless, it should be
realized that location of the highest oxide concentration will depend on Na vaporization
rates and O2 supply rates, so that at high vaporization rates in O2-poor atmospheres, the
highest oxide region might not be so close to the pool surface. Also, the NaxOy upward
diffusion can be distinguished.

3. PARTICLE GENERATION MODEL
77
Fig. 29. NaxOy molar concentration (kmol/m3).
Even though, particle generation rates heavily depend on temperatures and partial
pressures, much of such a dependence is made through the saturation ratio
(S=pvap/psat(T)), which essentially indicates how high NaxOy vapour pressures are with
respect to those at thermal equilibrium (psat). Vapour pressures of NaxOy are calculated
from the molar concentrations by assuming ideal gas behaviour. In order to focus on the
region of interest (active volume), a criterion has been adopted: sodium-oxide vapour
pressure must be higher than the saturated-vapour pressure of sodium oxides at the
boiling temperature (1153 K).
Due to the extremely low values of the saturated-vapour pressure of the oxides,
large values of S are found in the analysed region; it is worth highlighting the large
gradients of S found, with values from 104 to 1.6·1020 (Fig. 30). Maximum partial pressures
are reached in the flame region; more specifically, just above the pool surface. On the other
hand, saturated-vapour pressure is an increasing function of temperature. Therefore, the
lower S values are reached just above the pool surface. In this region, in spite of the large
concentrations of NaxOy, the large values of saturated-vapour pressures due to the large
temperatures dominate the saturation ratio. In the region near the pool centre (x=0.010),
just above the pool, the saturation ratio slowly decreases up to 0.01 m height due to the

3. PARTICLE GENERATION MODEL
78
decrease in the molar concentrations. Above this distance over the pool, a decreasing trend
in the saturation ratio is observed due to both factors: on the one hand the decrease of
molar concentration and then of partial pressure; on the other hand, the temperature
increase at 0.02 m height above the pool centre.
Fig. 30. Saturation ratio map at the analysed region.
Finally, Fig. 31 shows the particle concentration in the active volume (i.e., the region
in which the saturation ratio is above 1.0) obtained by integration over time of the
nucleation rate in all the cells forming the active volume. As expected, the highest particle
concentration is found in the flame region, and more specifically, just above the pool
surface. This is due to the high NaxOy partial pressures right above the pool in relation to
the high temperatures also reached in that area (saturation pressure is an increasing
function with temperature). By summing the particle concentration for all the cells, huge
concentrations of particles are produced during a sodium pool fire, of the order of 1026
particles for this scenario and the characteristic time to attain equilibrium would be of the
order of 10-7 s. At such high concentrations, the usual consideration that particle
concentrations are dilute allowing aerosol models to assume independent gas and particle
phases breaks down; strictly, the classic approximation should be abandoned since things

3. PARTICLE GENERATION MODEL
79
such as the effective density of the gas-particle phase and the turbulence itself are
changed.
As noted in the graph, in less than 10 cm of height over the Na pool, the particle
generation rate reduces to less than 10% of the maximum intensity. This means that in SFR
containments particle generation from pool fires would be a sort of local phenomena
practically restricted to a small region over the pool. Out of this region (the active volume),
unrealistic values of S prevent the particle generation calculation. This observation is
highly relevant for a future adaptation of the PG model to a SFR safety simulation code as
ASTEC-Na (Girault et al., 2015) since, to a good approximation, particle generation can be
confined to a relative small containment volume right above the Na pool surface.
Fig. 31. Particle concentration map (particles/m3).
The primary-particle size distribution is presented in Fig. 32. Primary particles
present very small diameters hardly reaching the nano-range in a sharp distribution in
which most particles fall between 6.5·10-10 m and 8.7·10-10 m for the scenario proposed
here. These values are consistent with the embryos sizes reported in NEA-CSNI (1979).
While increasing superstation reduces critical-particle size, and in our problem high

3. PARTICLE GENERATION MODEL
80
supersaturations occur, this very small size implies clusters are stable when corresponding
to just a few Na2O molecules.
Fig. 32. Primary particle size distribution.
3.3.2.2. Parametric study of the PG model
A parametric study has been developed to analyse the influence of the main
variables physically related to the governing phenomena in the anticipated scenario: pool
diameter (from 0.1 m to 10 m), as the characteristic system dimension for natural
convection and pool temperature (from 850 K to 1000 K), main driver for the Na
evaporation from the pool. In all the cases, ambient normal conditions are considered.
Table 9 synthesizes the discrete values selected to build up a total of 32 cases.

3. PARTICLE GENERATION MODEL
81
Table 9. Tests matrix
Key Variable Range Cases
Pool diameter From 0.1 m to 10 m 0.1, 0.2, 0.5, 1.0, 2.0, 5.0, 7.5, 10.0
Pool temperature From 850 K to 1000 K 850, 900, 950, 1000
The dependencies of the calculated total number of particles (N) with sodium pool
temperature and sodium pool radius (the macroscopic variables defining the scenario) for
all the foreseen scenarios are analysed in Figs. 33 and 34. From the figures, it can be
observed that the number of generated particles hardly depends on pool temperature (Fig.
33; however, a simple potential correlation with R2 > 0.99 could be found for the
dependence of N with sodium pool radius (Fig. 34).
Fig. 33. Particle number vs. Na-pool temperature.

3. PARTICLE GENERATION MODEL
82
Fig. 34. Particle number vs. Na-pool diameter.
3.3.3. Impact of agglomeration in the PG model
PG model predicts large concentrations of small particles in the close vicinity of a
pool. Furthermore, a high level of turbulence is calculated in this area with turbulent-
energy dissipation rates of the order of tens J.kg-1.s-1. In these conditions, turbulence-
induced particle agglomeration could lead to a reduction in the total number of particles
and to an increase in the average size (Friedlander, 2000). Therefore, it is necessary to
evaluate the impact of agglomeration (turbulent and Brownian) on PG model estimates.
Two possibilities are envisioned depending on the characteristic time of agglomeration
compared to the particle-generation one: the first one is that particle generation takes place
on a much faster timescale than agglomeration and the PG model does not need in this
case to include agglomeration phenomena; the second one is that both particle generation
and agglomeration occurs on similar timescales, then PG model would need to include the
influence of agglomeration.
To evaluate the impact of agglomeration in the PG model, the characteristic times of
both Brownian and turbulent agglomeration are calculated for the proposed scenarios in
Table 9 by the equation:
2ct
C
(34)

3. PARTICLE GENERATION MODEL
83
where C is the particle concentration predicted by the PG model and is the
collision frequency function or kernel (m3/s).
In the free molecular regime, the Brownian agglomeration kernel can be calculated
by (Friedlander, 2000):
1/ 2 1/ 21/ 6
21/ 3 1/ 33 6 1 14
BBrownian i j
p i j
k Tv v
v v
(35)
where the subscripts i, j denotes particle classes.
For the turbulent agglomeration, the collision-frequency function is calculated by
considering the shear and inertial effects (SNL, 2015):
1/ 2
Turbulent s Shear Inertialc (36)
where the shear effect is due to the relative movement of particles by their different
velocities in the eddies (Saffman and Turner, 1956; SNL, 2015):
1/ 2
3
120T g
Shear i i j jd d
(37)
and the inertial effect is due to the relative motion of particles by their different
mass:
1/ 4 3/ 4 2 2
2
5/ 4
0.04029 g T pi i i pj j j
Inertial i i j j
i j
C d C dd d
(38)

3. PARTICLE GENERATION MODEL
84
As can be observed, these equations rely on the turbulent energy dissipation rate (T)
whose value has large uncertainties and greatly depends on the conditions evaluated. For
example, the default value for the containment atmosphere during a severe accident of a
water-cooled reactor in the MELCOR code (SNL, 2015) is 10-3 m2/s3. However, T10 is
predicted in the flame region just above the pool surface in the developed numerical
simulation.
The characteristic times for Brownian and turbulent agglomeration are calculated at
the given conditions in each scenario of the test matrix (Table 9). In this calculation, the
collision of two particles has been considered where one of these particles has a diameter
two times larger than the other one. In Fig. 35, the calculated characteristic times as a
function of the corresponding particle concentration is presented. As can be observed,
characteristic times of turbulent agglomeration (from 103 s to 108s approximately) much
longer than predicted times for particle generation (10-7 s, dotted black line) are obtained;
hence, turbulent agglomeration should not affect PG model estimates. However,
characteristic times for Brownian agglomeration are longer than the particle generation
times until scenarios with concentrations larger than 1022 particles (small pool scenarios).
Hence, in the case of small pools with diameters less than 0.1 m, Brownian agglomeration
could affect the PG model results.
Fig. 35. Characteristic times vs. particle concentration.

3. PARTICLE GENERATION MODEL
85
Chapter summary 3.4.
This chapter presents the main features and bases of a phenomenological Particle
Generation model (PG model) developed to bringing the currently existing gap in integral
severe accident codes from primary particle formation to final particle behaviour.
The developed PG model covers sodium-vapour burning and formation of sodium
aerosols above an evaporating sodium pool. As final result, this model offers the sodium-
oxide particle generation rate and the primary particle size.
The PG model is the result of articulate a set of individual models for covering
sodium-vapour burning and formation of sodium aerosols above an evaporating sodium
pool: Na vaporization, O2 transport by air natural circulation, Na-O2 chemical reactions
and vapour-to-particle conversion of Na-oxides.
Its consistency has been partially validated by comparing with available
experimental data. Predictions from the model include large temperature and vapour
concentration gradients set over the sodium pool which result in very high particle
concentrations in the close vicinity of the pool.

3. PARTICLE GENERATION MODEL
86

4. Zero-D PG MODEL DEVELOPMENT
87
Chapter 4
4. Zero-D PG MODEL DEVELOPMENT
As shown in the previous chapter, particle generation from a Na pool fire is
associated with substantial gradients of temperature, NaxOy vapours and oxygen
concentrations as well as turbulent agitation in the region right over the thin reaction layer
set up next to the pool surface. A detailed picture of the scenario looked mandatory to
achieve a thorough understanding of the physic-chemical scenario set. Nevertheless, using
3D computational fluid-dynamics in analysis of Beyond Design Basis Accidents (BDBA)
seems presently unsuitable, due to the lack of validation of these tools in the domain of
SFR safety, and impractical, since the necessary computing resources and the number of
scenarios to be explored would turn this approach far too onerous. As a consequence, the
codes presently under development to address these scenarios do adopt a lumped-
parameter approach. In other words, in order to turn the PG model described in the
previous chapter into a useful analytical tool to be used in these codes, a 0D version had to
be built up.
In order to turn the 3D model chosen into a 0D consistent version, some qualitative
criteria have been adopted:
- The 0D response to major environmental variables (i.e., pool temperature, oxygen
concentration, over-pool gas velocity and composition, etc.) should follow the
same trends shown by the original 3D model;

4. Zero-D PG MODEL DEVELOPMENT
88
- The quantitative deviations of the 0D predictions with respect to the 3D estimates
should be within the uncertainty range of the latter in the main output variables
of the model (i.e., particle generation rate and primary-particle size distribution);
- The final formulation of the 0D model should be compatible with architecture
and variables available in integral lumped-parameter codes to be used for SFR
severe accident analyses (i.e., MELCOR-Na and/or ASTEC-Na).
Zero-D PG model 4.1.
4.1.1. Fundamental equations
In addition to the qualitative criteria introduced above, the 0D adaptation of the PG
model is based on the preservation of the total number of generated particles formed in
the active nucleation volume (i.e., the region over the pool in which Na-oxides are
supersaturated):
3 0, ,i
CNT CNT
i i v i v PG
i t t
D DJ T p dt v J T p dtN N V
(39)
In this equation (Eqn. 39), the number of generated particles (N3D) in the active
volume is given by the integration over time of the nucleation rate in all the cells forming
the active volume (summation running over subindex i). As shown at the right side of the
equation, the 0D approximation means to find out a characteristic nucleation rate that
keeps the major CNT dependencies and relies on average gas properties (𝑇,̅ 𝑝𝑣̅̅ ̅) of the
entire active volume:
2 31
23
1/22
0 1 11
163 ln
2 exp PG
t B
D
vdt
k T SN v N V
m
(40)
1i i
PG
T T vV
(41)

4. Zero-D PG MODEL DEVELOPMENT
89
1iv v i
PG
p p vV
(42)
( )sat
vp
p TS (43)
As in Eqn. (40), the critical particle size of the 0D adaptation is calculated on average
gas conditions:
012
lnB
Dk T S
vd
(44)
Then, the growth by condensation is accounted for by the removal of vapours by
condensation as the net flow of molecules attached to the surface of the particles generated
by homogeneous nucleation.
4.1.2. The model assessment
Given the absence of experimental data on particle generation from sodium pool
fires, a theoretical case matrix has been set up as an engine to build an analytical database
resulting from the 3D model running under the scenarios outlined. The cases have been
characterized by variables physically related to the governing phenomena in the
anticipated scenario: pool diameter (from 0.1 m to 10 m), as a characteristic system
dimension for natural convection over the pool; pool temperature (from 850 K to 1100 K),
as the main driver for the Na evaporation from the pool; oxygen concentration (from 21%
down to 1%), as a reactant which might potentially limit the conversion of Na into NaxOy.
Table 10 synthesizes the discrete values selected to build up a total of 200 cases.

4. Zero-D PG MODEL DEVELOPMENT
90
Table 10. Tests matrix (see Appendix D).
Key Variable Range Cases
Pool diameter (m) 0.1 – 10 0.1, 0.2, 0.5, 1.0, 2.0, 5.0, 7.5, 10.0
Pool temperature (K) 850 – 1100 850, 900, 950, 1000, 1100
O2 content (%) 1 – 21 1, 5, 10, 15, 21
Some of the cases calculated have been screened out due to different reasons. Cases
with 1% O2 have been dropped from the matrix because homogeneous nucleation
conditions are not met ( a total of 40 cases dismissed). A check of mass balance consistency
has been conducted to make it sure that the 3D model does not artificially produce
particles richer in Na than what the pool vaporization rate would allow; this second
conditions entailed to drop 28 more cases from the matrix. Thus, in total the analytical case
matrix consisted of 132 cases.
The calculated total number of particles by the PG model (N3D) versus the total
number of generated particles from the 0D adaptation (N0D) for 132 scenarios is shown in
Fig. 36 (some areas of the plot have been amplified for an easier observation). As observed,
the total number of particles ranged between 1018 and 1024 for any of the O2 concentrations
considered, so that a broad interval of particle number has resulted from the cases
considered in the matrix. It is worth noting that both approaches agreed in the order of
magnitude of particles formed, experiencing an average deviation of around 4% (never
exceeding 15%).

4. Zero-D PG MODEL DEVELOPMENT
91
Fig. 36. N0D vs N3D.
In the 0D PG model, all the particles are generated under the same average
conditions for a given scenario so that the growth rate is identical for all the particles. This
prevents from a strict quantitative comparison between the 3D approach and the 0D one,
but a qualitative comparison still makes sense. Fig. 37 shows that primary particle size
extends from around 7.0·10-10 m to 1.2·10-9 m in both approaches despite the absence of
distributions in the 0D model. In the PG model (Fig. 37 (a)), primary particle size is
calculated by considering a single burst of homogeneous nucleation (critical size). From
this point on, particle growth is controlled by condensation, which in turn depends on
boundary conditions. Oxygen concentration has been noted to have a noticeable impact in
the particle size distribution: the higher is the oxygen concentration, the higher is particle
number and the smaller is particle diameter. Namely, high oxygen concentration enhances
formation of NaxOy so that vapour pressure increases and nucleation rate is fostered at
smaller critical particle size. Consistently, the 0D approximation estimates smaller sizes for
higher O2 concentrations (Fig. 37 (b)).

4. Zero-D PG MODEL DEVELOPMENT
92
(a) 3D Model (b) 0D Model
Fig. 37. Primary particle diameter.
In summary, the 0D model adaptation has been shown to succeed in meeting the
two quantitative criteria set in terms of number of particles and primary particle size.
Zero-D correlations 4.2.
Some of the variables embedded in Eqns. (39) and (43) might not be available in
lumped parameter codes used for severe accident analysis of SFRs (N1 or 𝑆̅, for example).
By exploring the sensitivity of the model to variables governing dominant processes (as
stated in Table 10), the physical consistency of the 0D model may be confirmed and the
key model trends stated. They will be the pillars for the 0D correlation proposed below,
which architecture will allow a straightforward implementation within severe accident
system codes, like ASTEC-Na.
Fig. 38 and Fig. 39 present the N0D model trends with Na vaporization rate and
oxygen fraction. Fig. 38 shows a sound linear trend (drawn in black) of the number of
particles with the Na-vaporization rate, although there is a substantial scattering (1- 2
orders of magnitude) at any Na-vaporization rate that accounts for other variables
influence. Such an increase is what expected since the more Na vapour is made available,
the higher number of particles might be formed. Fig. 39 displays the growing trend of the
number of particles with the oxygen concentration at each pool dimension (Fig. 39(a))
diameter and temperature (Fig. 39(b)); in addition, two more insights may be drawn from
the plot: a stronger correlation of N0D with O2 fraction than with Na-vaporization rate (i.e.,
higher sensitivity of N0D to XO2) and the much larger scattering caused by other variables.
In order to better illustrate the influence of pool diameter and temperature, Fig. 40 plots

4. Zero-D PG MODEL DEVELOPMENT
93
the specific variations of N0D with both variables in the 21% O2 scenario (the rest of cases
showing the same trends). In short, whereas Tpool slightly affects the number of particles in
the range explored, dpool changes make a quite noticeable effect that might fit a potential
relation with N0D.
Fig. 38. N0D as a function of Na-vaporization rate.
a) Colour code dpool (m)
b) Colour code Tpool (K)
Fig. 39. N0D as a function of O2 concentration.

4. Zero-D PG MODEL DEVELOPMENT
94
a) Colour code dpool (m)
b) Colour code Tpool (K)
Fig. 40. N0D variation as a function of Tpool and dpool for the 21% O2 scenario.
As for the primary particle diameter trends with main variables, the study is further
simpler due to the small sensitivity shown by the model (range between 7·10-10 and 1.2·10-9
m). Hardly any variation has been found as a function of Tpool and dpool, whereas oxygen
concentration clearly shows an inverse relation between both variables (Fig. 41): the higher
O2 concentration, the smaller the particle primary size. This trend is again consistent with
the fact that higher NaxOy vapour pressures translate into smaller primary sizes according
to the Classical Nucleation Theory (Becker and Döring, 1935; Farkas, 1927; Zeldovich,
1942).

4. Zero-D PG MODEL DEVELOPMENT
95
Fig. 41. dp_0D as a function of oxygen fraction with pool diameter (m).
Based on the individual trends presented above, N0D has been linearly correlated
with the vaporization rate and potentially correlated with the pool diameter and the pool
temperature:
2
26 0.22 3.037.8478 10crltn Na pool ON m d X (45)
Fig. 42 displays the correlation predictions vs. those from the 0D model. Correlation shows quite a good behaviour with an average relative deviation around 50%. In section 3.2.4, it has been estimated that just by considering the uncertainties affecting the physical properties intervening in the nucleation modelling a 2-orders of magnitude uncertainty band should be anticipated in the calculation of particle number. Therefore, the deviations incurred by the correlation proposed are acceptable.

4. Zero-D PG MODEL DEVELOPMENT
96
Fig. 42. Particle generation rate (correlated vs. 0D PG model results).
Given the narrow interval found by the 3D model concerning primary particle
diameter (7.0·10-10 – 1.2·10-9 m), to derive an accurate correlation is not that important.
Nonetheless, the weak dependencies on pool diameter and temperature and the stronger
decreasing effect of O2 concentration observed above, have been encapsulated in the
following expression:
2
10 0.02390.2281
1 11.5913 10 lncrltnp pool
O pool
d dX T
(46)
In Fig. 43 the primary particle diameter given by the correlation is compared with
the primary particle size by the 0D PG model; even though the correlation tends to
underestimate the model predictions, the absolute average relative deviation is less than
18 %. Anyway, the narrow diameter interval and the presumable uncertainties affecting
any calculated size, make a primary particle diameter of 10-3 m a reasonable assumption
for Na-based particle generation modelling.

4. Zero-D PG MODEL DEVELOPMENT
97
Fig. 43. Primary particle diameter (correlated vs. 0D PG model results).
Chapter summary 4.3.
In order to turn the PG model described in the previous chapter into a useful
analytical tool in the current context of lumped-parameter codes in the SFR safety domain,
a 0D version has been build up.
This chapter presents the adaptation of the 3D global PG model to a 0D model based
on the generation of particles under average system conditions. For consistency purposes,
the adaptation has been supported on three qualitative criteria. In addition to these, the
preservation of the total number of generated particles formed has been guaranteed.
Deviations between both approaches less than 15% have been found in all the
simulated scenarios (a total of 132 cases covering different scenarios). From the 0D model,
simple correlations for the amount of particles generated and primary particle size relying
on Na vaporization rate, Na-pool dimension, temperature and O2-concentration have been
derived into a form ready to be implemented in any lumped-parameter code. Its right
performance has been tested against more than 100 comparisons with the original 3D
model with successful outcomes.

4. Zero-D PG MODEL DEVELOPMENT
98

5. PG MODEL VALIDATION
99
Chapter 5
5. PG MODEL VALIDATION
Introduction 5.1.
In the frame of the EU JASMIN project, a code extension to the containment thermal-
hydraulic and aerosol model of the ASTEC code, CPA, has been developed to enable first
capabilities to simulate sodium pool fires. As a result, a new version of the ASTEC module
addressing in-containment accident evolution has been built by including models highly
parametrized for sodium fires coming from SOFIRE (Beiriger et al., 1973) and models
genuinely produced within the project for the primary particle generation (subject of this
thesis work) and for the chemical ageing of sodium-oxides particles (Mathé et al., 2015).
The resulting version of CPA is hereafter referred to as CPA*.
In this chapter, an overview of the implementation of the PG model correlations
within the ASTEC-Na CPA code is presented. Prior to its implementation, a feasibility
analysis was developed (see Appendix F). At this point it should be clarified that, in the
frame of the JASMIN project, CIEMAT has been carried out the theoretical model
development for particle generation but not its implementation in ASTEC-Na. A general
description of the implementation is given in this chapter to offer the full picture of the
developed work and for a better understanding of the results.

5. PG MODEL VALIDATION
100
Besides, this chapter presents and discusses the assessment of the extended code
version against experimental data and the major findings of the data-estimates comparison
will be given.
Implementation of Zero-D correlations in CPA* 5.2.
The new CPA version (CPA*) includes two options for the particle production from
sodium pool fires: a sodium pool fire model based on the SOFIRE code formulation
(Beiriger et al., 1973) in which sodium burning rate is limited by the diffusion of oxygen
into the pool (surface reaction) and particle generation is assumed as infinitely fast or
immediate; and the correlations derived from the 0D adaptation of the PG model, which is
based on Na vapour gas-phase reactions (flame sheet approach) and the particle formation
kinetics according to the Classical Nucleation Theory and the subsequent vapour
condensation onto particle seeds.
The implementation of the correlations proposed in Eqns. (45) and (46) demands
some additional information, like the sodium vaporization molar flow rate (assuming a
diffusion layer approach):
,
lnNa Na
sat Na
f
bl pool
Na
PD
P p
l
X C A
m
(47)
where the flame temperature (Tf) needed to estimate DNa and Cbl as well as the
distance from the pool surface to the flame (lf) are given by correlations obtained from the
tests matrix (Table 10):
21397.13f pool OT T X (48)
2
162
11.061 10 exp 0.026163f pool
O
l TX
(49)

5. PG MODEL VALIDATION
101
The oxygen mass flux is calculated by assuming equal generation rates of the two
Na-oxide species considered (Na2O and Na2O2):
2 Na NaOm X m M (50)
where X is the oxygen-sodium stoichiometric ratio.
The conversion from Na-particle number to mass is conducted by assuming that
particles formed can be approximated as spheres:
3
,61.52
crltncrltn p aero
Na PG
dNm
(51)
where aero is a constant density specified by the user for the aerosol behaviour
calculations according to the multi-component aerosol approach of ASTEC CPA (Bestele
and Klein-Heßling, 2000).
The generated aerosol mass of Na2O and Na2O2 is then calculated by the code:
2 ,0.673O Na PGNam m (52)
2 2 ,0.848O Na PGNam m (53)
Validation test matrix 5.3.
In order to assess the ASTEC-Na CPA code (CPA* up to now), a literature review of
experimental information led to nearly 20 experiments related to Na fires, of which nearly
half dealt with aerosol generation from pool fires. It is worth noting here that much of the
experimental work carried out in the past is nowadays hard to use since in most cases no
electronic record is available and information is usually found in hard technical reports.

5. PG MODEL VALIDATION
102
A methodology to identify the most suitable experiments has been developed. The
methodology is based on the application, by order of priority, of 5 criteria:
representativeness of boundary conditions, normal test execution (no test artefacts),
multiple scales, number of key variables documented in the available literature and
accuracy of available data. As a result, three experiments, two from ABCOVE program
(AB1, AB2) and one from FAUNA program (F2) were chosen for the assessment of CPA*.
A full description of the selection process is shown in Appendix G. As a result, attention
was paid to specific tests of the ABCOVE and FAUNA programs, a description of which is
given below.
The ABCOVE experiments were conducted in the Containment System Test Facility
(CSTF) vessel at the Handford Engineering Development Laboratory in the United States.
The containment was a cylindrical steel vessel (7.6 m diameter, 20.3 m high) of about 853
m3 (Fig. 44). The vessel was furnished with instrumentation to monitor both thermal-
hydraulics and aerosol behaviour. In these tests, the experimental arrangement included
ten clusters of filter samples at various locations throughout the vessel atmosphere, each
cluster containing 12 filters; four Thief sample stations: the types of samples taken
included filter samples for mass concentration measurements, samples for chemical
species identification, deposition coupons and cascade impactors for particle size
measurements; and two gas sample systems that provided on-line analysis of oxygen,
moisture and hydrogen concentration (one taking gas from high in the atmosphere and
one from low in the vessel). A more thorough description of experimental aspects may be
found in Hilliard et al. (1979, 1977); McCormack et al. (1978); Souto et al. (1994).

5. PG MODEL VALIDATION
103
Fig. 44. CSTF Vessel arrangement.
The ABCOVE programme conducted a total of 7 experiments related to Na fires and
airborne aerosols, but only three of them were pool fire experiments (AB1, AB2 and AB7).
Unfortunately, an experimental artefact in the AB7 execution prevented its use for
validation purposes.
In test AB1 (Table 11), 410 kg of sodium at 600 ºC was spilled into a burn pan of 4.4
m2 through an electrically heated delivery line. The burn pan had a hinged lid which was
in the vertical position during the spill. The sodium flow lasted 80 s and the splashing was
minimized by baffles in the pan. At 60 min after the initiation of the spill, the lid was
closed and the sodium pool fire extinguished.
The AB2 test was performed with essentially the same initial conditions (Table 11),
but with the addition of an injection of steam, at a rate of 0.02 kg/s, near the centre of the
containment vessel for 60 min beginning 16 min after the start of the fire. The steam
injection was meant to simulate the release of water vapour from heated concrete at a rate
equivalent to the release of water vapour from 10-30 m2 of hot concrete (at a ratio of 1.0

5. PG MODEL VALIDATION
104
kg H2O per kg of aerosol). In this test, 472 kg of sodium at 600 ºC were delivered and the
pool fire burn duration was 60 min.
The FAUNA facility consists of a fire room, a measuring room, and an aerosol
measuring loop. A cylindrical steel vessel of 6 m in diameter and 6 m high with domed
ends (volume 220 m3) served as the fire room (Fig. 45) with all the instrumentation needed
to monitor both thermal-hydraulics and aerosol behaviour. Inside the FAUNA
containment vessel, sodium pool fire was produced in a circular burning pan. Closely
above the burning area a hood was placed in order to draw aerosols into the measurement
loop. At these sample ports mass concentration of aerosol was determined by filter probes
and size distribution by impactors. Additional filter probes were taken for the wet
chemical analysis (Cherdron et al., 1990; Cherdron and Charpenel, 1985; Cherdron and
Jordan, 1983, 1980).
Fig. 45. FAUNA aerosol loop (Cherdron et al., 1985).

5. PG MODEL VALIDATION
105
A total of 13 tests were conducted in the FAUNA facility, 7 of which (F1-F7)
investigated pool fires. The F2 test was chosen to complete the set of experiments to be
used in the code assessment due to the different scale compared to ABCOVE, the thorough
reporting of data and the absence of any kind of experimental artefact that might affect
results.
In the F2 test (Table 11), a sodium pool fire was produced inside the FAUNA
containment in a circular burning pan of 1.6 m diameter (~2 m2) by the release of 250 kg of
sodium at 500 ºC for more than 3 h (210 min). During the experiment, the oxygen content
was kept constant through 3 injections of approximately 1% of the vessel molar content
with different duration.
Table 11. Summary of tests conditions.
AB1 AB2 F2
Geometry
Type Cylindrical Cylindrical Cylindrical
Volume (m3) 852 852 220
Initial Conditions
O2 (%) 19.8 20.9 17-25
Temperature (K) 299.65 293.65 298.15
RH (%) 35.5 43.3 -
Steam Addition NO YES NO
Sodium Spill
Initial Na Temp. (K) 873.15 873.15 773.15
Burning Area (m2) 4.4 4.4 2
Fire duration (s) 3600 3600 12600

5. PG MODEL VALIDATION
106
Modelling of the experiments 5.4.
5.4.1. Nodalisation and heat structures
AB1 and AB2 calculations share the same nodalisation: a single cell (852 m3). Six
walls for heat transfer and aerosol deposition representing the top and bottom heads, the
cylindrical wall, the internal components for aerosol plating and settling and the sodium
pool surface, have been considered. For all the walls, the material facing the vessel
atmosphere was stainless steel. Vessel walls are insulated from the outside with a 2.54 cm
layer of fiberglass. The sodium pool surface has been modelled as a 4.4 m2 hot structure
facing the gas atmosphere.
The nodalisation of the FAUNA vessel consists of one node (220 m3). Four walls
(top and bottom heads, cylindrical wall and sodium pool) have been considered for heat
transfer and aerosol deposition. The vessel walls (top, bottom and cylinder walls) have
been modelled as made of stainless steel (1.6 cm of thickness). As no accurate information
on the vessel insulation has been found, thermal insulation is simulated imposing
adiabatic conditions at the bottom head and constant external temperature (313.15 K) at
cylindrical walls and upper head. As in ABCOVE models, the sodium pool has been
modelled as a rigid structure (2 m2).
5.4.2. Aerosol modelling
CPA* new models estimate the amount of Na2O and Na2O2 particles being produced
as a function of time. Primary particle size is calculated in CPA* through the PG model
correlation (Eqn. 46) and then allows particles to agglomerate; a lognormal distribution
has been assumed in all the cases.
Additionally, aerosol coefficients in CPA* are set in the input deck (i.e., shape
factors, conductivity, etc.). For them, default values have been used. Regarding aerosol
density, this has been estimated as a function of Na2O and Na2O2 distribution (2800
kg/m3) (Table 12).

5. PG MODEL VALIDATION
107
Table 12. Aerosol coefficients and density (for all the tests).
Aerosol coefficient Value
1.00
1.00
Fslip 1.37
STICK 1.00
0.02
kgas/kp 0.03
ct 1.00
(kg/m3) 2800
Prediction/data comparison 5.5.
A thorough description of data evolution and behaviour of CPA* predictions are
reported here, focused on the code performance with the PG correlations (CPA*_PG). The
other calculation option is also included (CPA*_SOFIRE).
Comparison of CPA* to data are shown below in terms of atmosphere temperature,
pressure, airborne aerosol concentration and size as a function of time, and final Na
distribution among walls.
In order to assess the model implementation adequately, a previous discussion on
the uncertainty associated to the experimental data is included before the discussion itself.
Two aspects can be distinguished: the local/average nature of the experimental data and
the uncertainty associated to the data extraction process.
The local/average nature is directly related to their significance as representative of
the whole scenario (as local values of some variables could not give a meaningful
indication of the governing phenomena) and to the credit that data-estimates comparisons
should be given in terms of validation (i.e., comparison of a local gas temperature with the
gas temperature prediction of a single node calculation for a vessel of hundreds of m3
might be meaningless). The uncertainty associated with the data extraction process can be
crucial: a numerical value taken from a text or table in a scientific/technical report can be
assumed to be “as given”, whereas if data are taken from figures the extraction accuracy

5. PG MODEL VALIDATION
108
will be dependent on the quality of the plot, the type (linear vs. log), the tool used to pick
the data points, etc.
5.5.1. Thermal-hydraulics
Thermal hydraulics are analysed through the comparison of experimental data on
atmosphere temperature and atmosphere pressure.
Data analysis
In the AB1 and AB2 tests, the experimental temperature is the mean value of 8
thermocouples from high, low and central regions in the containment atmosphere at
different azimuthal locations and distances from the centre. The maximum standard
deviation of average temperature is below 5% in both tests (Hilliard et al., 1977). All the
values have been taken from tables, so no error should be attributed to the data extraction
process. Therefore, data-code comparison can be set and given credit whenever the
experimental errors are taken into account.
As for pressure, any local measurement can be reliable for comparison with single-
cell estimates and no error has been made in the extraction process since data have been
taken as numerical values from a table.
In the F2 test, the two local temperatures at the same axial location (around 4 m
above the pan base) and the two radial positions that cover all the local measurements
have been considered for comparisons. Given the shortage of information at other
locations, particularly at different heights and radii, the comparison to a “cell
temperature” estimated by codes should be done in terms of trends and physical
reasonableness. Additionally, some errors should be associated to the extraction process as
data were taken from a figure (Cherdron et al., 1990) in which the broad scale in
temperatures and time would allow absolute errors of 10 K and 60 s, respectively.
Results and discussion
Atmosphere temperature and pressure for AB1 and AB2 tests are shown from Fig. 46
through Fig. 50. From the figures, the same experimental evolution can be observed.
Experimental gas temperature evolution may be described in two main phases: heat-up
and cool-down. The heat-up phase is, in turn, split into 4 stages: a first period (about 60 s)
in which a sharp increase of temperature occurs: “fresh Na” reacts without any major
kinetic resistance; a second one along which temperature hardly changes for about 500 s; a
third one in which temperature increase proceeds gently for some 2000 s; and a last period
until the fire quenching, where heat-up slightly slows down. A possible explanation is that

5. PG MODEL VALIDATION
109
Na pouring into the experimental pan entails a large surface-to-volume ratio of so-called
“fresh Na”, which is eager to react without any major kinetic resistance than the one
associated to O2 availability.
Once in the pan, several factors might slow down Na-O2 chemical reactions as the
decrease of the Na surface/volume ratio or the slowing down of the Na vaporization rates
due to the absorption by the pan of the Na thermal energy. Besides, as the pool surface
temperature decrease, Na-O2 gas phase reactions above the pool surface become surface
reactions on the pool surface, which introduces a major kinetic resistance.
The cooling down shows two stages: a fast one due to chemical reactions brought to
a halt and the isolation of the hot sodium by covering the burn pan, and a longer and more
progressive one, as heat is steadily lost to the vessel walls principally by natural
convection.
This profile is somewhat distorted in the case of the F2 experiment (Fig. 50) for two
main reasons: the F2 atmosphere was not well mixed during Na burning and temperature
at the central axis of the vessel (x = 0.0 m) became highly sensitive to O2 concentration, so
that whenever O2 concentration decreased temperature fell down noticeably; in addition,
even though the fire end was set at 12600 s in the test protocol, according to temperature
data, fire was progressively extinguishing from around 6000 s, which might be caused by a
slow supply of O2 by the convection loops set in the vessel with respect to the Na burning
rate at the measurement locations. As O2 concentration is far from being zero in the vessel
at 6000 s, the temperature trend might mean that it takes some time for O2 at other
locations than the burning pan vicinity to reach it or, in other words, that Na burning is
much faster than convection loops set in the vessel as a consequence of Na burning.
As observed in Fig. 46 to 50, estimates and data roughly follow the same thermal
trends by describing a heat-up phase, in which Na oxidation is taking place, and a cooling
phase, in which Na fire extinguishes and a fast cooldown period right after the fire is over,
is followed by moderate cooling governed by natural convection. As for the specific
CPA*_PG behaviour, it closely captured the first 500 s of Na fires (AB1 and AB2 tests), but
then it underestimated data during the heat-up phase. This might indicate that either more
chemical energy should have been released or a larger fraction of the chemical energy
produced should remain in the atmosphere. Given the validation of the 3D PG model in
terms of burning rate with Newman’s data and the assumption of instantaneous chemical
reaction, this might indicate a slight underprediction of the Na vaporization rate when
converting Eqn. (47) into an adapted version for lumped-parameter codes. However, the
similarity of the CPA*_SOFIRE slope during most of heat-up phase indicates that this is
not strictly linked to the PG adaptation modelling (the apparently closer agreement of

5. PG MODEL VALIDATION
110
CPA*_SOFIRE with data at later times during the heat-up phase coming from the
noticeable overprediction in the first 500 s of the test). During the cooling phase, the
CPA*_PG behaves similar to data, although the fast temperature decrease right after Na
fire is slightly more moderate possibly due to the smaller temperature differences with
surrounding heat structures as a consequence of the underestimate of gas temperature
during the heat-up phase.
In F2, the experimental footprint is not captured by predictions, in which the fire end
was set to happen at 12600 s. On the other hand, the single-cell approach prevents CPA*
code from capturing any sort of O2 scarcity at the fire location.
Fig. 46. Atmosphere temperature in AB1.
Fig. 47. Pressure (AB1).
Fig. 48. Atmosphere temperature in AB2.
Fig. 49. Pressure (AB2).

5. PG MODEL VALIDATION
111
Fig. 50. Atmosphere temperature in F2.
5.5.2. Aerosol behaviour
Much more closely related to the PG modelling are the evolution of airborne aerosol
concentration and size. A lot of aerosol related data were collected in the experiments. The
three main metrics used in the code assessment are the suspended mass concentration, the
Aerodynamic Mass Median Diameter (AMMD), and the mass distribution at the end of
the tests.
Data analysis
In the AB1 and AB2 tests, the experimental suspended mass concentration is the
average of 4 locations from high, low and mid regions in the vessel and the data are
available as tables in Hilliard et al. (1979). As noted in the figures below, the standard
deviations at sometimes are substantial, so that any data-code comparison should be done
with caution, particularly during the aerosol generation phase of the experiments.
The average AMMD measurements were taken at high and low containment
locations and they show noticeable consistency. It is noteworthy that the first data point
available is around 1000 s, so that the time gap since the fast Na-injection transient has
been long enough to reach a reasonable degree of uniformity in the vessel. Thus, from the
aerosol perspective, any data-code comparison seems reasonable even under the well-
mixed atmosphere hypotheses made in the calculations. Nonetheless, taking data points
from a log-log plot results in extraction uncertainties that have been postulated to be
dependent on the relative position of the data points with respect to the beginning of the
order of magnitude (OM) in the log scale: 0.1·OM, if data are near the mark of the OM in
the plot; and 1.0·OM, if data are closer to the next OM. This approximate way of
estimating uncertainty ranges is the basis of the ones shown in the figures below.

5. PG MODEL VALIDATION
112
The distribution of deposited sodium is taken from tables. According to these tables,
only the deposited sodium on the bottom and the safety catch pan and personnel deck
come from measurements. The rest of the values are calculated (Hilliard et al., 1979).
For the F2 test, local measurements have been taken for both concentrations and
AMMDs. There is no experimental evidence, as in the ABCOVE tests, that the facility
atmosphere was well-mixed, so any local magnitude cannot be taken as representative of
the whole facility. In addition, concentration data points in the plot have been taken by
selecting specific spots along a continuous curve in a log-log plot. As for uncertainties
associated with data points, the same criteria as the ones defined above for ABCOVE have
been used for concentrations, in which both axes are in log scale (Cherdron et al., 1985).
AMMDs measurements were derived from samples taken closely above the burning area
(i.e., approximately 200 s aging), so that they cannot be said to be representative of particle
sizes in the entire vessel; the data points have been taken from a linear-linear plot.
Results and discussion
Fig. 51 shows the evolution of the aerosol concentration in AB1 test. Large
uncertainties associated with the experimental data can be observed before 1000 s. During
the burning phase (0-3600 s), a quasi-steady state between 0.02 and 0.03 kg/m3 was
measured, so that there was a balance between particle generation and aerosol deposition;
afterwards, once the Na fire is over, concentration decayed progressively. Again in AB2
(Fig. 52) it is not easy to identify a clear trend during the aerosol injection period (0-3600 s)
due to the substantial associated uncertainties affecting some of the data. However, one
may assume a soft growing trend from around 0.02 kg/m3 to 0.035 kg/m3. The depletion
phase, although qualitative similar to AB1 one, shows an initial decay rate nearly 3 times
slower. The evolution of the airborne concentration in F2 test is presented in Fig. 52. The
first experimental data are approximately at 1000 s. From this time, experimental airborne
concentration seems to follow a slow growth up to 6000 s and then an equally slow
decrease, which is consistent with the thermal observations made above and the postulate
of a reduced of Na-burning; however, when uncertainty bars are accounted for, such an
experimental trend is harder to defend.
Fig. 51 through Fig. 53 present the CPA*_PG airborne concentration estimates
together with data and CPA*_SOFIRE predictions for the three experiments. Due to the
reasons given above comparisons to data in the case of the F2 test will be restricted to the
first 6000 s. In AB1 and AB2, CPA*_PG calculations show consistency with data until
around 2000 – 2500 s, along which they are within the experimental uncertainties;
however, if credit is given to the blurred increasing trend (large experimental uncertainties
prevent from firmly accepting that such a tendency is true), this might either support a

5. PG MODEL VALIDATION
113
higher Na vaporization rate, as explained above, or indicate a too efficient particle removal
by the aerosol depletion mechanisms (mainly sedimentation). Anyway, the larger
deviations found with respect to data are within a factor of 2.0 (CPA*_SOFIRE estimates
behaved similarly but with a shift to higher aerosol concentrations that locates them
beyond the experimental uncertainties during the early times of heat-up phase). As for the
F2 experiment, the CPA*_PG calculations show a growing trend consistent with data
tendency for the first 6000 s, although experimentally the sharp increase predicted at the
beginning of the test (and also measured in AB1 and AB2) did not exist, which is likely
related to the stratified atmosphere reported in the test. Once the Na fire is over, the
particle generation model has no effect on aerosol evolution, so that discrepancies with
data cannot be attributed to PG modelling.
Fig. 51. Airborne concentration (AB1).
Fig. 52. Airborne concentration (AB2).
Fig. 53. Airborne concentration (F2).

5. PG MODEL VALIDATION
114
Fig. 54 displays the AMMD evolution in AB1 test. The data experienced a jump from
about 6 m to approximately 8 m between 4000 and 5000 s. This change may be
attributed to the end of injection of small particles from the fire, so that naturally the size
distribution shifted to bigger sizes. Then, a progressive decrease of the particle size can be
observed as a consequence of preferential deposition of large particles by sedimentation.
Contrary to differences in AB2 concentration profile with respect to AB1, AMMD
shows an evolution very similar to AB1, both qualitatively and quantitatively (Fig. 55),
and calculations also behave the same way.
Regarding the particle size in F2 (Fig. 56), as data were taken quite close to the
aerosol source, overpredicting should be the expected code behaviour, as particles with
short time of flight would not have had the time to agglomerate to a good extent.
Given the absence of data before 1000 s, no discussion on predictions can be held
concerning the earlier times of the heat-up phase, except for stating that particle growth
predicted by both CPA* approximations are consistent with the data available (Fig. 54 and
Fig. 55). This is particularly so in the AB1 test, in which a steady state is observed in the
AMMD until the fire end time; contrarily, in the AB2 test, a growing trend, not estimated
by any of the CPA* calculations, might have existed, although again the experimental
uncertainties do not allow crediting such a trend. Anyway, the comparisons support that
CPA*_PG implementation does not distort the particle growth observed at two key times:
early during the heat-up phase to roughly the measured diameter and once fire is over and
particle generation is not active anymore, making predictions follow the particle size
jump. Regarding F2 (Fig. 56), CPA*_PG noticeably overpredicted; however, this is the
expected behaviour because the measurements were made quite close to the aerosol
source so that particles had a short “time of flight” (i.e., particle size practically unaffected
by agglomeration processes); this explanation is consistent with data steady behaviour
before and after the fire was put out, instead of drawing a size jump due to the stop of
small particles injection in the vessel.

5. PG MODEL VALIDATION
115
Fig. 54. AMMD (AB1).
Fig. 55. AMMD (AB2).
Fig. 56. AMMD (F2).
Fig. 57 and Fig. 58 shows the final mass distribution for AB1 and AB2 tests. Even
though CPA* predictions reproduce this qualitatively, still noticeable differences are noted
in magnitude. In general, it seems that predictions overestimate the importance of
thermophoresis as a deposition mechanism, predicting a much higher mass fraction on
walls and vertical surfaces than observed. By comparison, PG model implementation does
not modify gravitational sedimentation as the main deposition mechanism.

5. PG MODEL VALIDATION
116
Fig. 57. Na distribution (AB1).
Fig. 58. Na distribution (AB2).
Chapter summary 5.6.
This chapter presents the implementation of the analytical correlations derived from
the Zero-dimensional PG model in an integral severe accident tool (ASTEC-Na). Once
implemented, the performance assessment against available large-scale separate effect
tests has been undertaken.
According to the comparisons to data set, the correlations do not adversely impact
the code estimates with respect to other more empirical alternative approaches and, in
addition, the correlations remove any need of user-defined ad-hoc parameters in the input
deck concerning Na-based particles behaviour, as other alternates do. Regarding code
behaviour, the model predictions yield the same order of magnitude both in terms of
suspended aerosol concentration and diameter as data and capture the reliable measured
data trends.

6. CONCLUSIONS AND FINAL REMARKS
117
Chapter 6
6. CONCLUSIONS AND FINAL REMARKS
This work thesis presents a step forward in modelling in-containment source term
during potential severe accidents in Na-cooled reactors. In particular, a model for particle
generation during sodium pool-fires has been developed and validated against some of
the more sound available data in the open literature once implemented in ASTEC-Na
CPA. From all this work the main achievements thoroughly described in previous sections
are highlighted below. Finally, improvements and further investigations can be proposed
as work to be carried out in the future.
Filling the gap of particle formation from sodium pool fires
During hypothetical SFRs accidents leading to core damage, it is foreseen the
ejection of material in the form of liquid sodium (Na) mixed with fuel and fission products
into the containment. In the presence of oxygen, combustion of Na results in the formation
of huge amounts of Na-oxide aerosols that would govern the suspended radioactivity
inside the containment; this together with the potential harm associated with the chemical
species resulting from the Na-oxides reaction with water vapour present in the
atmosphere would be responsible to a great extent for the radiological and chemical
impact of any potential source term.

6. CONCLUSIONS AND FINAL REMARKS
118
In the frame of a PIRT exercise on the fission product and aerosol generation and
transport within a generic SFR containment during postulated BDBAs, an exhaustive
review of currently available data and modelling capabilities of in-containment source
term analysis in accident conditions was done. Since the early 70’s last century, Na
burning and Na-based aerosol behaviour and their chemical composition had been the
subject of experimental research projects and several computer codes had been developed
to analyse these scenarios with relative success. However, all these codes had mostly
focused on thermal-hydraulic consequences to evaluate the risk of containment
overpressure and particle generation modelling had received much less attention.
According to the current international trend in the development of SFR severe
accident codes consisted in taking advantage of the commonalities with LWR ones, i.e.
adopt the main code architecture and programming and just include modifications for
those phenomena which are SFR-specific. By modelling particle generation from Na pools
and their subsequent in-containment evolution, this thesis means a significant contribution
towards the understanding of the in-containment source term in SFRs.
Development of a Particle Generation model
A phenomenological Particle Generation (PG) model covering sodium-vapour
burning and formation of sodium-oxide aerosols above an evaporating sodium pool has
been developed with the objective to calculating the characteristics (number and size) of
the particulate source term to the containment. Based on a flame sheet approach, the
model articulates a suite of individual models: Na vaporization (diffusion layer approach),
O2 transport by air natural circulation (3D flow pattern modelling), Na-O2 chemical
reactions (instantaneous reactions and energy input) and vapour-to-particle conversion of
Na-oxides (i.e., classical nucleation theory and heterogeneous condensation).
The particle formation process over a high temperature pool of Na (T > 800 K)
requires the modelling of both thermal phenomena (i.e., Na vaporization from the pool
surface and oxygen natural circulation from the atmosphere to the reaction zone) and
physico-chemical phenomena (i.e., Na-oxygen chemical reactions and homogeneous and
heterogeneous nucleation of sodium oxides vapours).
Based on a diffusion-layer approach, an expression for the flux of sodium vapour
from the pool surface is given by taking into account the diffusive resistance of nitrogen to
the sodium vapour movement toward the flame and assuming no sodium vapour
concentration in the flame region.

6. CONCLUSIONS AND FINAL REMARKS
119
Due to the foreseen boundary conditions over the pool at the time of oxidation, a
steady 3D Computation Fluid Dynamics approach is employed based on the FLUENT
code to determine the thermal-hydraulic boundary conditions in the region of interest, i.e.,
in the close vicinity of the sodium reaction zone. In this numerical simulation, the O2
natural convection and the Na-O2 chemical reactions as instantaneous are modelled. The
resulting saturation-ratio map reveals the potential for nucleation at different locations
over the pool: large saturation values in the close vicinity of the pool. In other words,
most probably all evaporated Na would become particulate near to the pool surface. At
this point, the major influence of the saturation pressures of oxide vapours underline the
need for having sound data on this variable for these compounds.
The particle formation process includes homogeneous and heterogeneous
nucleation. The homogeneous nucleation has been treated by an approach based on
classical nucleation theory. This choice is supported by the higher complexity of other
theories (involving additional uncertain parameters), the inherent uncertainty coming
from the lack of information on sodium-oxides properties and the huge sensitivity of any
homogeneous nucleation theory to variations in boundary conditions (i.e., temperature).
As the prevailing conditions for heterogeneous nucleation fall into the kinetic regime, the
growth mechanism of condensation on existing particles has been formulated using
kinetic theory. Homogeneous nucleation and condensation are simultaneous and
competitive processes. In our approximation, a single-burst approach has been adopted in
which homogeneous nucleation can be neglected beyond the first burst of primary
particles.
Validation of Particle Generation model
A partial validation of the PG model has been carried out based on the comparison
with the sodium pool experiments of Newman and Payne (1978) in the range of validity of
the PG model (pool temperature from 800 K on). The estimates-to-data agreement is
outstanding. On the one hand, the experimental trend of increased burning rate with Na
pool temperature is followed by the calculations. On the other hand, the data scattering
helps predictions to be well within the measurements range. When comparing the PG
results with SOFIRE code (a reputable sodium pool combustion model based on the
surface combustion approach) predictions, the gas-phase reaction approach used in PG
model is strengthened by the SOFIRE under-prediction of the thermal load to the
containment and the airborne-particle loading relative to what could be expected in the
case of an in-containment pool fire.

6. CONCLUSIONS AND FINAL REMARKS
120
The PG model predictions have been analysed for a generic sodium-pool scenario.
As expected, large saturation values are found throughout the spatial domain explored
which result in very high particle concentrations just above the sodium pool. Thus, in
lumped parameter codes, pools should be seen as aerosol generators where the generation
rate depends on vaporization rate and nuclei size is to be estimated from nucleation rate
theories.
Build-up of a zero-dimensional model
Particle generation from a Na pool fire is associated with substantial gradients of
temperature, NaxOy vapours and oxygen concentrations as well as turbulent agitation in
the region right over the thin reaction layer set up next to the pool surface. A detailed
picture of the scenario looked mandatory to achieve a thorough understanding of the
physic-chemical scenario set. Nevertheless, using 3D computational fluid-dynamics in the
analysis seems presently unsuitable. In order to turn the PG model into a useful analytical
tool in the current context of lumped-parameter codes in the SFR safety domain, a 0D
version had to be built up.
Transposing the 3D PG model to 0D model has been achieved through adopting
average Na-oxide vapour concentration and temperature within the domain in which
particle generation takes place. For consistency purposes, the adaptation has been
supported on three qualitative criteria: consistency with anticipated sensitivity to major
environmental variables according to the 3D model; accuracy in the range of the 3D model
uncertainty in the number of generated particles and the primary particle size; and
compatibility with the lumped-parameter formulation in integral codes for BDBA analysis.
In addition to these, the preservation of the total number of generated particles formed has
been guaranteed. As a result, the 0D approximation gives a nucleation rate equation that
keeps the major CNT dependencies and relies on average gas properties of the entire
active volume.
Derivation of analytical correlations
Due to the unavailability of some key variables of the zero-model in lumped-
parameter codes, analytical correlations relying on Na-pool dimension, temperature and
O2-concentration have been derived.
Given the absence of experimental data on particle generation from sodium pool
fires, an analytical database has been build up by running the 3D model under 132 cases
covering all the foreseen scenarios. The 0D model performance has been tested against this

6. CONCLUSIONS AND FINAL REMARKS
121
analytical database. By exploring the sensitivity of the model to variables governing
dominant processes through the analytical database, the physical consistency of the 0D
model has been confirmed and the key model trends stated. They are the pillars for the 0D
correlations. The number of generated particles has been linearly correlated with the
vaporization rate and potentially correlated with the pool diameter and the pool
temperature. For the primary particle size, a correlation encapsulating the weak
dependencies on pool diameter and temperature and the stronger decreasing effect of O2
concentration observed has been provided. However, given the narrow interval of
diameters found, it might be reasonable to consider 0.001 m as the primary particle
diameter of generated particles after sodium pool combustion.
Assessment of the extended ASTEC-Na code
In order to assess the extended ASTEC-Na CPA code with the implemented
correlations, a methodology to identify the most suitable experiments among nearly 20
experiments related to Na fires found in the open literature has been developed. The
methodology is based on the application, by order of priority, of 5 criteria:
representativeness of boundary conditions, normal test execution (no test artefacts),
multiple scales, number of key variables documented in the available literature and
accuracy of available data. As a result, a total of three experiments were chosen from
ABCOVE and FAUNA programs.
Two major observations have been done: the model does not adversely impact the
code estimates with respect to more empirical alternative approaches; by using the model
proposed, there is no need of user-defined ad-hoc parameters in the input deck concerning
Na-based particles behaviour. Regarding code behaviour, the model predictions yield the
same order of magnitude and trends as data, both in terms of suspended aerosol
concentration and diameter and capture these variables evolution.
In conclusion, the new correlations are very suitable for use in a severe-accident code
in terms of the negligible additional computational burden. The new correlations, by
originating from simplifications of soundly-based physical modelling, remove the
arbitrariness in the assumption of a fixed primary-particle size in the existing modelling.
Limited comparisons with experiments imply that use of the new correlations increases
confidence in prediction of the pool-fire particulate source term to the containment.
The PG model predictions show a promising response in terms of order of
magnitude of airborne concentration, dominant depletion mechanism and particle size
variation; however, it is worth underlining the need of further research along two axis:

6. CONCLUSIONS AND FINAL REMARKS
122
more and better Na-specific models and further research to build a robust and extensive
database that can be used both to support individual models development and to validate
computational tools capable of capturing main footprints of severe accidents in
containment so that Source Term estimates are considered reliable.
Investigation of safety and potential source terms will require development of
additional Na-specific modelling. This is the case of partitioning – or hosting – of radio
contaminants by different phases (liquid sodium, vapour/gas phase, oxide aerosols,
hydroxide droplets, etc.). On the other hand, the update, adaptation and optimization of
existing sodium spray-fire models is needed for currently developing integral safety tools
for SFRs.
There is an outstanding need to build a robust and extensive database that can be
used to support individual models development and to overcome certain difficulties
found in the model development as the lack of information on fundamental Na-oxide
vapours properties.
Furthermore, the open literature containing experimental data on postulated in-
containment source term behaviour of SFRs is scarce. Besides, tests characterization are
neither as thorough as desirable nor as accurate as necessary for validation purposes. The
comparisons to data set are far from a thorough validation: the number of comparisons is
too reduced due to scarcity of open data and often variables recorded are insufficient to
qualify any of the models developed (most data come from integral tests and separate
effect tests data are either lacking or difficult to scale up); in addition, measurements are
often affected by large uncertainties that prevent even the general trend from being seen.
Presently, the adapted code version with the PG model correlations is planned to be
further tested against access-restricted experiments and a postulated reactor accident.

7. PUBLISHED PAPERS
123
Chapter 7
7. PUBLISHED PAPERS
This section collects the publications in journals and conferences that have been
performed from the work presented in this thesis.
International journals 7.1.
L.E. Herranz, M. Garcia, M.P. Kissane, C. Spengler. A lumped parameter modelling of
particle generation from Na-pool fires in SFR containments. Progress in Nuclear Energy
109 (2018) 223-232.
L.E. Herranz, M. Garcia, L. Lebel, F. Mascari, C. Spengler. In-containment source term
predictability of Astec-Na: Major insights from data-predictions benchmarking. Nuclear
Engineering and Design 320 (2017) 269-281.
M. Garcia, L.E. Herranz, M.P. Kissane. Theoretical assessment of particle generation from
sodium pool fires. Nuclear Engineering and Design 310 (2016) 470-483.

7. PUBLISHED PAPERS
124
L.E. Herranz, M. Garcia, S. Morandi. Benchmarking LWR codes capability to model
radionuclide transport within SFR containments: an analysis of the Na ABCOVE tests.
Nuclear Engineering and Design 265 (2013) 772-784.
L.E. Herranz, M.P. Kissane, M. García. Comparison of LWR and SFR in-containment
source term: similarities and differences. Progress in Nuclear Energy 66 (2013) 52-60.
L.E. Herranz, M. García, M.P. Kissane. In-containment source term in accident conditions
in sodium-cooled fast reactors: Data needs and model capabilities. Progress in Nuclear
Energy 54 (2012) 138-149.
National Journals 7.2.
L.E. Herranz, M. Garcia, L. Lebel, F. Mascari, C. Spengler. Benchmarking Astec-Na code
capability to model source term within SFR containments. Nuclear España 380, 54-58
(2017). PREMIO MEJOR PONENCIA I+D+I 2016.
International conferences 7.3.
L.E. Herranz, M. Garcia, M. Kissane. Particle generation during sodium pool fires in SFR
beyond design basis accidents.: assessment of thermal hydraulic boundary conditions.
Proceedings of ICAPP 2016. San Francisco, CA (USA), April 17-20, 2016. Paper 16706.
L.E. Herranz, M. Garcia, L. Lebel, F. Mascari, C. Spengler. Predictability of source term
behavior in SFR containments. Proceedings of ICAPP 2016. San Francisco, CA (USA),
April 17-20, 2016. Paper 16740.
M. García, L.E. Herranz, M. Kissane. In-containment nucleation in severe accidents in SFR:
assessment of thermal hydraulic boundary conditions. Proceedings of ICAPP 2014.
Charlotte (USA), April 6-9, 2014. Paper 14068.

7. PUBLISHED PAPERS
125
Garcia M., Herranz L.E., Kissane M.P., 2013. Priority source term issues in SFRs: Towards
enabling safety studies. Proceedings of ICENES 2013, Madrid (Spain), May 26-30, 2013.
Kissane M., Garcia-Martin M., Herranz-Puebla L.E., 2013. Major remaining uncertainties
associated with source-term evaluation for SFR severe accidents. Proceedings of the
International Conference on Fast Reactors and Related Fuel Cycles (IAEA).
M. García, L.E. Herranz. Modeling reactive aerosols in oxidizing atmospheres: severe
accidents in sodium fast reactors. European Aerosol Conference (EAC). Granada (Spain),
September 2-7, 2012.
L.E. Herranz, M. García, S. Morandi. LWR codes capability to address SFR BDBA
scenarios: Modeling of the ABCOVE tests. Proceedings of ICAPP 2012. Chicago (USA),
June 24-28, 2012. Paper 12048.
L.E. Herranz, M. García. Comparison of LWR and SFR in-containment source term:
similarities and differences. Proceedings of ICAPP 2011. Nice (France), May 2-5, 2011.
Paper 11434.
National conferences 7.4.
L.E. Herranz, M. Garcia, L. Lebel, F. Mascari, C. Spengler. Benchmarking Astec-Na code
capability to model source term within SFR containments. Reunión Anual de la SNE.
Santander (España), 28-30 septiembre, 2016.
M. García, L.E. Herranz. Development of a zero-dimensional particle generation model in
SFR-containments under accidental conditions. Reunión Anual de la SNE.
A Coruña (España), 23-25 septiembre, 2015.
M. García, L.E. Herranz, M.P. Kissane. Modelling homogeneous nucleation in sodium fast
reactors in BDBA conditions. Reunión Anual de la SNE. Valencia (España), 1-3 Octubre,
2014.

7. PUBLISHED PAPERS
126
M.García, J. Penalva, M.P. Kissane, L.E. Herranz. Numerical simulation of liquid metal
pool combustion. Reunión Anual de la SNE. Reus, Tarragona (España), 25-27 Septiembre,
2013.
M. García, L.E. Herranz. Assessing the LWR codes capability to address SFR BDBAs:
Modeling of the ABCOVE tests. Reunión Anual de la SNE. Cáceres (España), 17-19
Octubre, 2012.
M. García, L.E. Herranz. Applicability of LWR aerosol models in the SFR domain:
simulation of the ABCOVE experiments. Reunión Anual de la SNE. Burgos (España), 28-30
Septiembre, 2011.
L.E. Herranz, M. García. Major differences of in-containment source term behaviour
between LWRs and LMFBRs. Reunión Anual de la SNE. Santiago de Compostela (España),
06-08 Octubre, 2010.

8. NOMENCLATURE
127
Chapter 8
8. NOMENCLATURE
a area
A empirical constant
Apool Na-pool surface
B empirical constant
cs particle sticking coefficient
cp specific heat capacity
c mean molecular speed
C particle concentration
Ci particle mobility
Cbl molar gas concentration between pool surface and flame
Cg molar gas concentration above the flame
dp particle diameter

8. NOMENCLATURE
128
dpool Na-pool temperature
crltnpd correlated particle diameter
d0D particle diameter in the 0D PG model
Di,m diffusion coefficient for species i in the mixture
DNa diffusivity of sodium in the binary system N2-Na
DO2 diffusivity of oxygen in the binary system N2- O2
F flow of molecules to the surface of one particle
G Gibbs free energy
hs specific enthalpy
JCNT nucleation rate by Classical Nucleation Theory
JICCT nucleation rate by Internally Consistent Classical Theory
Ji diffusion flux of species i
k turbulent kinetic energy
kB Boltzmann constant
Kn Knudsen number
lf flame height
L characteristic length
Le Lewis number
m mass
m1 molecular mass
Nam Na-vapour mass flow rate
PGNam Na mass flow rate into particles
2Na Om generated aerosol mass of Na2O

8. NOMENCLATURE
129
2 2Na Om generated aerosol mass of Na2O2
2Om oxygen mass flow rate
MNa Na molar weight
Mw,i molecular weight of species, i
n molecules concentration
Nu Nusselt number
NAV Avogadro’s number
Ncrtl correlated number of generated particles
N3D number of generated particles calculated with the 3D PG model
N0D number of generated particles calculated with the 0D PG model
N1 number concentration of molecules
1N average number concentration of molecules
pvap vapour pressure
ivp cell vapour pressure
vp average vapour pressure
psat saturation vapour pressure
psat,Na saturation vapour pressure of sodium
P pressure
Pr Prandtl number
qj heat flux component
r particle radii
Ra Rayleigh number
Ri net rate of production by chemical reaction

8. NOMENCLATURE
130
S saturation ratio
S average saturation ratio
Sc Schmidt number
Sh Sherwood number
Si rate of creation by addition from the dispersed phase plus any user-
defined sources
Sct turbulent Schmidt number
t time
tc characteristic time
T temperature
T average temperature
Tf flame temperature
Ti cell temperature
Tpool Na-pool temperature
ui, uj Cartesian velocity components
v velocity vector
v1 molecular volume
vi cell volume
vi, vj particle volume
V particle volume
VPG nucleation zone volume
xi, xj Cartesian coordinates
X O2-Na stoichiometric ratio
XNa fraction of sodium on the pool surface

8. NOMENCLATURE
131
XN2,f fraction of oxygen in the flame
XN2,p fraction of oxygen on the pool surface
X02 fraction of oxygen
Yi local mass fraction of species, i
YP mass fraction of any product species, P
YR mass fraction of a particular reactant, R
z collision rate per unit area (kinetic theory)
Greek symbols
agglomeration kernel
agglomeration shape factor
εT turbulent dissipation rate
mean free path
μ viscosity
μτ turbulent viscosity
' '
i j
Reynolds stress tensors
ν´i,r stoichiometric coefficient for reactant i in reaction r
ν´´i,r stoichiometric coefficient for product i in reaction r
ρ density
ρaero aerosol density
ρp particle density
surface tension
τij stress tensor component for i,j=1,2,3

8. NOMENCLATURE
132
Na molar flux of sodium vapour
O2 molar flux of oxygen
dynamic shape factor
ω specific turbulent dissipation rate

9. REFERENCES
133
Chapter 9
9. REFERENCES
Adams, R.E., Han, J.T., Kress, T.S., Silberberg, M., 1980. Behavior of sodium oxide, uranium oxide and mixed sodium oxide-uranium oxide aerosols in a large vessel (No. CONF-800434--3). Oak Ridge National Lab.
Adams, R.E., Kress, T.S., Han, J.T., Parsly, L.F.J., 1979. Behavior of sodium--oxide and uranium--oxide aerosols in a large vessel (No. CONF-790816--18). Oak Ridge National Lab.
Allelein, H.J., Auvinen, A., Ball, J., Güntay, S., Herranz, L.E., Hidaka, A., Jones, A., Kissane, M.P., Powers, D.A., Weber, G., 2009. State of the art report on nuclear aerosols (CSNI Report No. NEA-CSNI/R(2009)5).
Andersson, B., Andersson, R., Hakansson, L., Mortensen, M., Sudiyo, R., van Wachem, B., 2012. Computational fluid dynamics for engineers, Cambridge University Press. ed.
ANSYS Inc., 2008. FLUENT computational fluid dynamics software, FLUENT User’s Guide.
Bae, J.H., Ahn, D.H., Kim, Y.C., Cho, M., 1994. An experimental study on characteristics of sodium fires. J. Korean Nucl. Soc. 26, 471–483.
Barbe-Le Borgne, M., Boulaud, D., Madelaine, G., Renoux, A., 1986. Experimental determination of the dynamic shape factor of the primary sodium peroxide aerosol. J. Aerosol Sci. 17, 79–86. https://doi.org/10.1016/0021-8502(86)90009-1

9. REFERENCES
134
Baskaran, R., Subramanian, V., Venkatraman, B., Chellapandi, P., 2011. Sodium Aerosol Studies for Fast Reactor Safety. Energy Procedia, Asian Nuclear Prospects 2010 7, 660–665. https://doi.org/10.1016/j.egypro.2011.06.089
Becker, R., Döring, W., 1935. Kinetische Behandlung der Keimbildung in übersättigten Dämpfen. Ann. Phys. 416, 719–752. https://doi.org/10.1002/andp.19354160806
Beiriger, P., Hopenfeld, J., Silberberg, M., Johnson, R.P., Baurmash, L., Koontz, R.L., 1973. Sofire II User Report (No. AI-AEC--13055). Atomics International, Canoga Park, Calif. (USA).
Bestele, J., Klein-Heßling, W., 2000. ASTEC V0 CPA Module Containment Thermalhydraulics and Aerosol and Fission Product Behaviour User Guidelines (No. ASTEC-V0/DOC/00-14, GRS).
Casselman, C., 2009. Soduium fires - Theory and Mitigation.
Cherdron, W., Bunz, H., Jordan, S., 1985. Properties of sodium fire aerosols and recalculation of their behaviour in closed containments. Presented at the CSNI Specialist Meeting on Nuclear Aerosols in Reactor Safety, CSNI-95, Karlsruhe, pp. 395–405.
Cherdron, W., Charpenel, J., 1985. Thermodynamic consequences of sodium spray fires in closed containments. Pt. 2 (No. KFK--3831). Kernforschungszentrum Karlsruhe G.m.b.H. (Germany, Laboratorium für Aerosolphysik und Filtertechnik.
Cherdron, W., Jordan, S., 1983. Die Natrium-Brandversuche in der FAUNA-Anlage auf Brandflächen bis 12m2 (No. KfK 3041). Kernforschungszentrum Karlsruhe G.m.b.H. (Germany, Laboratorium für Aerosolphysik und Filtertechnik.
Cherdron, W., Jordan, S., 1980. Determination of sodium fire aerosol process coefficients from FAUNA-experiments, in: NUREG/CR-1724. Presented at the CSNI Specialist Meeting on Nuclear Aerosols in Reactor Safety, CSNI-45, Gatlingburg, Tennessee (USA), pp. 129–138.
Cherdron, W., Jordan, S., Lindner, W., 1990. Die Natriumbrand-Untersuchungen in der FAUNA: Poolbrände und Aerosolverhalten. Kernforschungszentrum.
Chiao, T., Wood, S.A., Shen, P.K., Baker, R.B., Gluekler, E.L., 1994. Analyses of postulated ALMR containment and steam generator building accidents using the CONTAIN-LMR code (No. WHC-SA-2121-FP). U.S. DOE.
Clement, C.F., Ford, I.J., 1999a. Gas-to-particle conversion in the atmosphere: I. Evidence from empirical atmospheric aerosols. Atmos. Environ. 33, 475–487. https://doi.org/10.1016/S1352-2310(98)00264-7
Clement, C.F., Ford, I.J., 1999b. Gas-to-particle conversion in the atmosphere: II. Analytical models of nucleation bursts. Atmos. Environ. 33, 489–499. https://doi.org/10.1016/S1352-2310(98)00265-9
Clough, W.S., Garland, J.A., 1971. The behaviour in the atmosphere of the aerosol from a sodium fire. J. Nucl. Energy 25, 425–435. https://doi.org/10.1016/0022-3107(71)90079-7

9. REFERENCES
135
Cooper, D.W., 1980. Prediction of the rates of chemical transformation of sodium fire aerosols.
Davies, C.N., 1966. Aerosol science. London : Academic Press.
Dillmann, A., Meier, G.E.A., 1989. Homogeneous nucleation of supersaturated vapors. Chem. Phys. Lett. 160, 71–74. https://doi.org/10.1016/0009-2614(89)87558-X
Doda, N., Okano, Y., Ninokata, H., 2003. Numerical Simulation of Sodium Pool Fire. Nucl. Technol. 144.
Dorsselaere, J.P. van, Seropian, C., Chatelard, P., Jacq, F., Fleurot, J., Giordano, P., Reinke, N., Schwinges, B., Allelein, H.J., Luther, W., 2009. The ASTEC Integral Code for Severe Accident Simulation. Nucl. Technol. 165, 293–307.
Dunbar, I.H., 1985. Aerosol behaviour codes, development, intercomparison and application. Presented at the CSNI Specialist Meeting on Nuclear Aerosols in Reactor Safety, CSNI-95, Karlsruhe, pp. 471–485.
Dunbar, I.H., Fermandjian, J., Bunz, H., L’homme, A., Lhiaubet, G., Himeno, Y., Kirby, C.R., Mitsutsuka, N., 1984. Comparison of sodium aerosol codes (CEC report No. EUR--9172). Commission of the European Communities.
Farkas, L., 1927. Keimbildungsgeschwindigkeit in Übersättigten Dämpfen. Phys Chem 125, 239.
Fermandjian, J., 1985. Aerosol behaviour codes, development, intercomparison and application. Presented at the CSNI Specialist Meeting on Nuclear Aerosols in Reactor Safety, CSNI-95, Karlsruhe, pp. 486–497.
Fink, J.K., Leibowitz, L., 1995. Thermodynamic and transport properties of sodium liquid and vapor (No. ANL/RE--95/2, 94649).
Fischer, E.A., Wright, S.A., 1984. Analysis of the Sandia fuel disruption experiments FD2/4. Presented at the Specialist Workshop on Fission Gas Behaviour in Safety Experiments, Cadarache, France.
Fistedis, S.H., 1972. Containment of fast breeder reactors — Present status—Remaining problems. Nucl. Eng. Des. 19, 315–331. https://doi.org/10.1016/0029-5493(72)90135-5
Ford, I.J., 2004. Statistical mechanics of nucleation: A review. Proc. Inst. Mech. Eng. Part C J. Mech. Eng. Sci. 218, 883–899. https://doi.org/10.1243/0954406041474183
Ford, I.J., Laaksonen, A., Kulmala, M., 1992. Proceedings of the 1992 European Aerosol Conference On the Dillmann-Meier theory of nucleation. J. Aerosol Sci. 23, 125–128. https://doi.org/10.1016/0021-8502(92)90365-3
Frenkel, J., 1939. Statistical Theory of Condensation Phenomena. J. Chem. Phys. 7, 200–201. https://doi.org/10.1063/1.1750413
Friedlander, S.K., 2000. Smoke, Dust, and Haze: Fundamentals of Aerosol Dynamics, Oxford Univ. Press. ed.
Fuchs, N.A., Sutugin, A.G., 1969. Highly Dispersed Aerosols. John Wiley & Sons, Incorporated.

9. REFERENCES
136
Gauntt, R.O., Cash, J.E., Cole, R.K., Erickson, C.M., Humphries, L.L., Rodriguez, S.B., Young, M.F., 2005. MELCOR Computer Code Manuals (No. NUREG/CR-6119, SAND 2005-5713).
Gieseke, J.A., Reed, L.D., Jordan, H., Lee, K.W., 1977. Characteristics of agglomerates of sodium oxide aerosol particles: Task 7, topical report (No. BMI-NUREG--1977). Battelle Columbus Labs.
GIF, 2002. A Technology Roadmap for Generation IV Nuclear Energy Systems (No. GIF-002-00). U.S. DOE Nuclear Energy Research Advisory Committee and the Generation IV International Forum.
Girault, N., Cloarec, L., Herranz, L.E., Bandini, G., Perez-Martin, S., Ammirabile, L., 2015. On-going activities in the European JASMIN project for the development and validation of ASTEC-Na SFR safety simulation code, in: ICAPP2015. Presented at the International Congress on Advances in Nuclear Power Plants (ICAPP 2015), Nice (France), pp. 482–494.
Girshick, S.L., Chiu, C.-P., 1990. Kinetic nucleation theory: A new expression for the rate of homogeneous nucleation from an ideal supersaturated vapor. J. Chem. Phys. 93, 1273–1277. https://doi.org/10.1063/1.459191
Girshick, S.L., Chiu, C.-P., McMurry, P.H., 1990. Time-Dependent Aerosol Models and Homogeneous Nucleation Rates. Aerosol Sci. Technol. 13, 465–477. https://doi.org/10.1080/02786829008959461
Hale, null, 1986. Application of a scaled homogeneous nucleation-rate formalism to experimental data at T < Tc. Phys. Rev. Gen. Phys. 33, 4156–4163.
Herranz, L.E., Garcia, M., Morandi, S., 2013. Benchmarking LWR codes capability to model radionuclide deposition within SFR containments: An analysis of the Na ABCOVE tests. Nucl. Eng. Des. 265, 772–784. https://doi.org/10.1016/j.nucengdes.2013.05.030
Hilliard, R.K., McCormack, D., Postma, A.K., 1979. Aerosol behavior during sodium pool fires in a large vessel - CSTF tests AB1 and AB2 (No. HEDL-TME 79-28). Hanford Engineering Development Lab.
Hilliard, R.K., McCormack, J.D., Hassberger, J.A., Muhlestein, L.D., 1977. Preliminary results of CSTF aerosol behavior test, AB1. [LMFBR] (No. HEDL-SA-1381).
Hilliard, R.K., McCormack, J.D., Muhlestein, L.D., 1985. Results and Code Predictions for Abcove (aerosol Behavior Code Validation and Evaluation) Aerosol Code Validation with Low Concentration Naoh and Nai Aerosol: Cstf Test Ab7 (No. HEDL-TME-85-1). Hanford Engineering Development Lab., Richland, WA (USA).
Hinds, W.C., 1999. Aerosol Technology: Properties, Behavior, and Measurement of Airborne Particles, 2nd Edition, Wiley. ed.
Hofmann, C., Jordan, S., Lindner, W., 1979. Chemical reactions of sodium fire aerosols in the free atmosphere. J. Aerosol Sci. 10, 191–192. https://doi.org/10.1016/0021-8502(79)90072-7

9. REFERENCES
137
IAEA, 2012. Status of Fast Reactor Research and Technology Development, IAEA-TECDOC-1691. Vienna.
IAEA, 2006. Fast Reactor Database 2006 Update, IAEA-TECDOC-1531. Vienna.
Incropera, F.P., Dewitt, D.P., 2011. Introduction to heat transfer. Sixth Edition, Jonh Willey & Sons Inc. ed.
Jacq, F., 2006. Material data bank interface library. List of materials and properties (No. ASTEC-V1/DOC/01-14).
Janz, G.J., 1988. Thermodynamic and Transport Properties for Molten Salts: Correlation Equations for Critically Evaluated Density, Surface Tension, Electrical Conductance, and Viscosity Data. American Chemical Society and the American Institute of Physics.
Jordan, S., Cherdron, W., Malet, J.C., Rzekiecki, R., Himeno, Y., 1988. Sodium aerosol behavior in liquid-metal fast breeder reactor containments. Nucl. Technol. 81, 183–192.
Josiah Willard Gibbs, 1906. Scientific Papers of J. Willard Gibbs. Longmans, Green and co.
Karthikeyan, S., Sundararajan, T., Shet, U.S.P., Selvaraj, P., 2009. Effect of turbulent natural convection on sodium pool combustion in the steam generator building of a fast breeder reactor. Nucl. Eng. Des., Flexible Conversion Fast Reactors Special Section with Regular Papers 239, 2992–3002. https://doi.org/10.1016/j.nucengdes.2009.09.025
Kashchiev, D., 2000. Nucleation.Basic theory with applications.
Kayser, G., Papin, J., 1998. The reactivity risk in fast reactors and the related international experimental programmes CABRI and SCARABEE. Prog. Nucl. Energy, Global Environmental and Nuclear Energy Systems-2 32, 631–638. https://doi.org/10.1016/S0149-1970(97)00067-X
Kissane, M.P., García-Martin, M., Herranz-Puebla, L.E., 2013. Major Remaining Uncertainties Associated with Source-Term Evaluation for SFR Severe Accidents. Fast React. Relat. Fuel Cycles Safe Technol. Sustain. Scenar. FR13 COMPANION CD-ROM Proc. Int. Conf.
Klickman, A.E., Thompson, D.H., Ragland, W.A., Wright, A.E., Palm, R.G., Page, R.J., 1982. Review of Recent Anl Safety Experiments in Slsf and Treat. [lmfbr] (No. CONF-820704-51). Argonne National Lab., IL (USA).
Lamoreaux, R.H., Hildenbrand, D.L., 1984. High Temperature Vaporization Behavior of Oxides. I. Alkali Metal Binary Oxides. J. Phys. Chem. Ref. Data 13, 151. https://doi.org/10.1063/1.555706
Lee, Y.B., Choi, S.K., 1997. A study on the development of advanced model to predict the sodium pool fire. J. Korean Nucl. Soc. 29, 240–250.
Lhiaubet, G., Bunz, H., Kissane, M.P., Seino, H., Miyake, O., Himeno, Y., Casselman, C., Such, J.M., Rzekiecki, R., 1990. Comparison of aerosol behavior codes with experimental results from a sodium fire in a containment, in: & EUR 12374, 1991.

9. REFERENCES
138
Presented at the International Fast Reactor Safety Meeting, American Nuclear Society, American Nuclear Society, Snowbird, Utah.
Loyalka, S.K., 1976. Brownian coagulation of aerosols. J. Colloid Interface Sci. 57, 578–579. https://doi.org/10.1016/0021-9797(76)90237-X
Malet, J.C., Casselman, C., Duverger de Guy, G., Rzekiecki, R., Charpenel, J., 1982. Potential results of spray and pool fires. Nucl. Eng. Des. 68, 195–206. https://doi.org/10.1016/0029-5493(82)90031-0
Malet, J.C., Sophy, Y., Rzekiecki, R., Cucinotta, A., Mosse, D., 1990. Extensive Sodium Fire Studies: General Survey of the Esmeralda programme results. Presented at the International Fast Reactor Safety Meeting, Snowbird, Utah.
Marimuthu, K., 1996. Sodium Fire Code SFIRE1C for Pool Fire Characteristics. J. Nucl. Sci. Technol. 33, 787–791. https://doi.org/10.1080/18811248.1996.9732004
Martínez, D.M., Ferguson, F.T., Heist, R.H., Nuth, J.A., 2005. Experimental studies of the vapor phase nucleation of refractory compounds. VI. The condensation of sodium. J. Chem. Phys. 123, 054323. https://doi.org/10.1063/1.1998834
Mathé, E., Kissane, M.P., Petitprez, D., 2015. Improved Modelling of Sodium-Spray Fires and Sodium-Combustion Aerosol Chemical Evolution, in: ICAPP2015. Presented at the International Congress on Advances in Nuclear Power Plants (ICAPP 2015), Nice (France), pp. 601–610.
McCormack, J.D., Hilliard, R.K., Postma, A.K., 1978. Recent Aerosol Tests in the Containment Systems Test Facility (No. HEDL-SA-1686). Hanford Engineering Development Lab., Richland, WA (USA).
Menter, F.R., 1994. Two-equation eddy-viscosity turbulence models for engineering applications. AIAA J. 32, 1598–1605. https://doi.org/10.2514/3.12149
Miyake, O., Miyahara, S., Ohno, S., Himeno, Y., 1991. Sodium Pool Combustion Codes for Evaluation of Fast Breeder Reactor Safety. J. Nucl. Sci. Technol. 28, 107–121. https://doi.org/10.1080/18811248.1991.9731330
Morewitz, H.A., 1979. Sodium spray fires. Nucl. Eng. Des. 55, 275–281. https://doi.org/10.1016/0029-5493(79)90162-6
Murata, K.K., Carroll, D.E., Bergeron, K.D., Valdez, G.D., 1993. A Computer Code for Containment Analysis of Accidents in Liquid-Metal Cooled Nuclear Reactors (No. SAND91-1490). Sandia National Labs., Albuquerque, NM (United States).
NEA, 2009, 2012. State-of-the-art report on nuclear aerosols (OECD Nuclear Energy Agency report No. NEA/CSNI/R(2009)5).
NEA-CSNI, 1979. Nuclear aerosols and reactor safety (A State-of-the Art Report by a group of experts of the NEA Committee on the safety of nuclear installations).
Newman, R.N., 1983. The ignition and burning behaviour of sodium metal in air. Prog. Nucl. Energy 12, 119–147. https://doi.org/10.1016/0149-1970(83)90020-3
Newman, R.N., Payne, J.F.B., 1978. The burning rates of sodium pool fires. Combust. Flame 33, 291–297. https://doi.org/10.1016/0010-2180(78)90067-6

9. REFERENCES
139
Nishio, G., Kitani, S., Takada, J., 1977. Behavior of Sodium Oxide Aerosol in Closed Chamber under Thermal Convection Flow. J. Nucl. Sci. Technol. 14, 12–21. https://doi.org/10.1080/18811248.1977.9730719
Oxtoby, D.W., 1998. Nucleation of First-Order Phase Transitions. Acc. Chem. Res. 31, 91–97. https://doi.org/10.1021/ar9702278
Oxtoby, D.W., Evans, R., 1988. Nonclassical nucleation theory for the gas–liquid transition. J. Chem. Phys. 89, 7521–7530. https://doi.org/10.1063/1.455285
Parozzi et al., ., 2012. ECART code user’s manual (RSE Technical Report).
Pertmer, G.A., Loyalka, S.K., 1978. Gravitational collision efficiency. Trans. Am. Nucl. Soc. 30, 477–478.
Pertmer, G.A., Loyalka, S.K., 1977. Gravitational agglomeration of aerosols. Trans. Am. Nucl. Soc. 30, 618–620.
Pioro, I.L., 2016. Handbook of Generation IV Nuclear Reactors - 1st Edition, Woodhead Publishing Series in Energy. Elsevier, Duxford, UK.
Postma, A.K., Owen, R.K., 1980. Comparison of aerosol behavior during sodium fires in CSTF with the HAA-3B code (No. HEDL-SA--1982-FP). Hanford Engineering Development Lab.
Powers, D.A., Clement, B., Denning, R., Ohno, S., Zeyen, R., 2010. Advanced Sodium Fast Reactor Accident Source Terms : (No. SAND2010-5506). Sandia National Laboratories (SNL-NM), Albuquerque, NM (United States).
Rudek, M.M., Katz, J.L., Uchtmann, H., 1999. Homogeneous nucleation of supersaturated cesium vapor. J. Chem. Phys. 110, 11505–11510. https://doi.org/10.1063/1.479091
Saffman, P.G., Turner, J.S., 1956. On the collision of drops in turbulent clouds. J. Fluid Mech. 1, 16–30. https://doi.org/10.1017/S0022112056000020
Sagae, K., Suzuoki, A., 1985. Development of Analytical Model for Sodium Pool Combustion. J. Nucl. Sci. Technol. 22, 870–880. https://doi.org/10.1080/18811248.1985.9735739
Sathiah, P., Roelofs, F., 2014. Numerical modeling of sodium fire – Part II: Pool combustion and combined spray and pool combustion. Nucl. Eng. Des. 278, 739–752. https://doi.org/10.1016/j.nucengdes.2014.05.037
Seinfeld, J.H., Pandis, S.N., 2006. Atmospheric Chemistry and Physics: From Air Pollution to Climate Change, 2nd Edition. Wiley.
Senger, B., Schaaf, P., Corti, D.S., Bowles, R., Voegel, J.-C., Reiss, H., 1999. A molecular theory of the homogeneous nucleation rate. I. Formulation and fundamental issues. J. Chem. Phys. 110, 6421–6437. https://doi.org/10.1063/1.478545
Shaw, G.E., 1989. Production of condensation nuclei in clean air by nucleation of H2SO4. Atmospheric Environ. 1967 23, 2841–2846. https://doi.org/10.1016/0004-6981(89)90564-7
Shire, P.R., 1977. SPRAY code user’s report (No. HEDL-TME 76-94). Hanford Engineering Development Laboratory, Richland, WA.

9. REFERENCES
140
SNL, 2015. MELCOR Computer Code Manuals, Vol. 2: Reference Manual, Version 2.1.6840 (No. SAND 2015-6692 R). Sandia National Labs., Albuquerque, NM (United States).
Souto, F.J., Haskin, F.E., Kmetyk, L.N., 1994. Melcor 1.8.2 Assessment: Aerosol Experiments Abcove Ab5, Ab6, Ab7, and Lace La2 (No. SAND--94-2166). Sandia National Labs., Albuquerque, NM (United States).
Stillinger, F., 1963. Rigorous Basis of the Frenkel‐Band Theory of Association Equilibrium. J. Chem. Phys. 38, 1486–1494. https://doi.org/10.1063/1.1776907
Strey, R., Wagner, P.E., Schmeling, T., 1986. Homogeneous nucleation rates for n‐alcohol vapors measured in a two‐piston expansion chamber. J. Chem. Phys. 84, 2325–2335. https://doi.org/10.1063/1.450396
Subramanian, V., Baskaran, R., 2007. Initial Size Distribution of Sodium Combustion Aerosol. Nucl. Technol. 160, 308–313. https://doi.org/10.13182/NT07-A3901
Subramanian, V., Sahoo, P., Malathi, N., Ananthanarayanan, R., Baskaran, R., Saha, B., 2009. Studies on Chemical Speciation of Sodium Aerosols Produced in Sodium Fire. Nucl. Technol. 165, 257–269. https://doi.org/10.13182/NT09-A4100
Sundarajan, A.R., Mitragotri, D.S., Rao, S.R.M., 1982. Effect of Relative Humidity on Growth of Sodium Oxide Aerosols. J. Nucl. Sci. Technol. 19, 151–157. https://doi.org/10.1080/18811248.1982.9734127
Takata, T., Yamaguchi, A., Maekawa, I., 2003. Numerical investigation of multi-dimensional characteristics in sodium combustion. Nucl. Eng. Des. 220, 37–50. https://doi.org/10.1016/S0029-5493(02)00232-7
Tobita, Y., Kondo, S., Yamano, H., Morita, K., Maschek, W., Coste, P., Cadiou, T., 2006. The Development of SIMMER-III, An Advanced Computer Program for LMFR Safety Analysis, and Its Application to Sodium Experiments. Nucl. Technol. 153, 245–255. https://doi.org/10.13182/NT06-2
Tsai, S.S., Brookhaven National Laboratory., U.S. Nuclear Regulatory Commission., 1980. The NACOM code for analysis of postulated sodium spray fires in LMFBRs. The Commission, Washington, D.C.
van de Vate, J.F., Plomp, A., de Jong, C., Smit, H.C.D., 1976. Deposition of aerosols formed by HCDA due to decay heat transport in LMFBR inner containment atmospheres.
Varaine, F., Marsault, P., Chenaud, M.S., Bernardin, B., Conti, A., Sciora, P., Venard, C., Fontaine, B., Devictor, N., Martin, L., Scholer, A.C., Verrier, D., 2012. Pre-conceptual design study of ASTRID core. Proc. 2012 Int. Congr. Adv. Nucl. Power Plants - ICAPP 12.
Vehkamäki, H., 2006. Classical Nucleation Theory in Multicomponent Systems. Springer-Verlag, Berlin/Heidelberg.
Viisanen, Y., Strey, R., 1994. Homogeneous nucleation rates for n‐butanol. J. Chem. Phys. 101, 7835–7843. https://doi.org/10.1063/1.468208
Viisanen, Y., Strey, R., Reiss, H., 1993. Homogeneous nucleation rates for water. J. Chem. Phys. 99, 4680–4692. https://doi.org/10.1063/1.466066

9. REFERENCES
141
Volmer, M., Weber, A., 1926. Keimbildung in übersättigten Gebilden (nucleation of supersaturated structures). Zeitschr F Physi Chem. 119, 277–301.
Warren, D.R., Seinfeld, J.H., 1985. Prediction of aerosol concentrations resulting from a burst of nucleation. J. Colloid Interface Sci. 105, 136–142. https://doi.org/10.1016/0021-9797(85)90356-X
Wright, S.A., Schumacher, G., Henkel, P.R., 1985. In-Pile Observations of Fuel and Clad Relocation During LMFBR Core Disruptive Accidents in the STAR Experiments. Nucl. Technol. 71, 187–216.
Yamaguchi, A., Tajima, Y., 2009. Sodium pool combustion phenomena under natural convection airflow. Nucl. Eng. Des. 239, 1331–1337. https://doi.org/10.1016/j.nucengdes.2009.04.004
Yamaguchi, A., Tajima, Y., 2003. Validation study of computer code sphincs for sodium fire safety evaluation of fast reactor. Nucl. Eng. Des. 219, 19–34. https://doi.org/10.1016/S0029-5493(02)00209-1
Yamaguchi, A., Takata, T., Ohshima, H., Suda, K., 2006. Sodium-Water Reaction and Thermal Hydraulics at Gas-Liquid Interface: Numerical Interpretation of Experimental Observations 335–342. https://doi.org/10.1115/ICONE14-89615
Zeldovich, J., 1942. Theory of the formation of a new phase, cavitation. Zh Eksp Theor Fiz 12, 525–538.

9. REFERENCES
142

APPENDIXES


A-1
A. CLASSICAL NUCLEATION THEORY
Nucleation refers to the kinetic processes involved in the initiation of first order
phase transitions in nonequilibrium systems. Two phase equilibrium states for a pure
substance, e.g. vapour and liquid, occur at unique pairs of temperature T and pressure P.
For two-phase vapour-liquid equilibrium, the pressure is referred to as the equilibrium
vapour pressure (Pve). If the actual pressure of the vapour (Pv) is larger than the
equilibrium vapour pressure, the vapour is said to be supersaturated. The degree of
supersaturation is defined by the saturation ratio:
v
ve
PS
P
(A-1)
This new state of the vapour is either metastable or unstable. Metastable state refers
to a state stable with respect to small fluctuations and unstable against perturbation in the
form of a finite fluctuation. These two types of states are distinguished by their location
with respect to the mean-field spinodal, which is illustrated in Fig. A-1. In this figure, a P-
V phase diagram for a pure fluid with several isotherms based on a van der Waals
Equation Of State (EOS) is shown. The heavy dome-shaped curve denotes the binodal line,
the locus of two-phase, vapour-liquid equilibrium states, which ends at the critical point.
The green solid line is a true isotherm whose intersections (e) with the binodal dome give
the equilibrium pressure and volumes of the coexisting vapour-liquid phases. The true
isotherms are flat in the two-phase region inside the dome. All mean-field EOSs are
similar in that they artificially treat the fluid as a homogeneous phase with a continuously
varying density inside the two-phase region. This unphysical oversimplification generates
the “van der Waals loops” shown by the isotherms. The spinodal boundary separates
mechanically stable regions (metastable states for which / 0
TP V
) from
mechanically unstable regions (for which / 0
TP V
) as determined by the slope of
the isotherms of the mean-field EOS. If the supersaturated vapour (S 1) is in contact with
its own liquid, it will condense until the vapour again reaches saturation.

A-2
Fig. A-1. Schematic P-V phase diagram for a pure substance.
If a container of volume V contains only pure vapour, at a suitably large
supersaturation value (S1), droplets will start to form at an appreciable rate as a result of
collisions among vapour molecules. This process of forming a droplet is known as
homogeneous nucleation. If impurities are also present in the container, the
supersaturated vapour will first condense on them in a process referred to as
heterogeneous nucleation. Since nucleation plays a key role in many fields ranging from
atmospheric application to material science, the study of nucleation has a long history and
is currently receiving much attention stimulated by the development of new experimental
and theoretical techniques to measure and predict nucleation rates.
The first comprehensive treatment of the thermodynamics of the nucleation process
is due to Gibbs (Josiah Willard Gibbs, 1906). Gibbs showed that the reversible work
required to form a nucleus of the new phase consists of two terms: a bulk (volumetric)
term and a surface term. Later, in 1926 Volmer and Weber (Volmer and Weber, 1926)
developed the first nucleation rate expression, by arguing that the nucleation rate should
be proportional to the frequency of collisions between condensable vapour molecules and
small droplets (critical clusters) of the new phase of a size, the critical size, that just allows
spontaneous growth. A more detailed kinetic approach for the process of vapour-to-liquid
nucleation was subsequently developed by Farkas (Farkas, 1927). The theory of Volmer,
Weber and Farkas was extended a few years later by Becker and Döring (Becker and

A-3
Döring, 1935), Frenkel (Frenkel, 1939) and Zeldovich (Zeldovich, 1942) and is now known
as Classical Nucleation Theory (CNT).
CNT is based on a set of rate equations for the change of the concentrations of
clusters of different sizes as the result of the gain and loss of molecules (up to now
monomers). Although phase change involves the evolution of heat, it is usually assumed
that the temperatures of all clusters are equal to that of the background gas. This
assumption implies that clusters undergo sufficient collisions with molecules of the
background gas so that they become thermally equilibrated on a timescale that is short
compared to that associated with the gain and loss of monomers (Seinfeld and Pandis,
2006).
To develop the rate equation for clusters it is assumed that clusters grow and shrink
via the acquisition or loss of single molecules (Fig.A-2). Cluster-cluster collision events are
so rare that they can be ignored. From the principle of microscopic reversibility, it follows
that if cluster grow only by the addition of single molecules, evaporation also occurs one
molecule at a time.
Fig. A-2. Cluster growth and evaporation processes.
In Fig. A-2, the number concentration of clusters containing i molecules (monomers)
at a time t (Ni(t)) is governed by the following rate equation:

A-4
1 1 1 1( ) ( ) ( ) ( )ii i i i i i i i
dNN t N t N t N t
dt
(A-2)
where βi is the forward rate constant for the collision of monomers with a cluster of
size i (a so-called i-mer) and γi is the reverse rate constant for the evaporation of
monomers from an i-mer.
Eqn. A-2 provides the basis for studying transient nucleation. Since the characteristic
time needed to establish the steady-state cluster distribution is generally short compared
to the timescale over which monomer concentrations might be changing , the distribution
of clusters is assumed to be at a steady state corresponding to the instantaneous monomer
concentration.
By defining Ji+1/2 as the net rate (cm-3·s-1) at which clusters of size i become clusters of
size i+1, the net rate is given by:
1/ 2 1 1i i i i iJ N N (A-3)
If, for a given monomer concentration (or saturation ratio S), the cluster
concentrations can be assumed to be in a steady state, them the left-hand side (LHS) equals
zero in Eqn. A-2. At steady state from Eqn. A-2, all the fluxes equal to a single and
constant flux J:
1/ 2 ,iJ J all i (A-4)
From Eqn. A-2, the nucleation rate expression is derived by evaluating the forward
and reverse rate constant (condensation/evaporation rate constants) by thermodynamic
reasoning.
CNT is based on the definition of an hypothetical equilibrium distribution of clusters
at supersaturated conditions S > 1. To do so, a constrain of a zero flux is imposed. This
distribution obeys the Boltzmann distribution, i.e., the maximum probability distribution:

A-5
1 exp /e
i iN N G kT (A-5)
where N1 is the total number of molecules in the system and Gi is given by the
Gibbs theory.
In the Gibbs theory, the free energy change due to the the transfer of i molecules
from the vapour phase to form an i-mer of radius r is given by the following equation:
24 lniG r ikT S (A-6)
Some assumptions are implicit in this expression: droplets as spherical, droplets of
incompressible liquid and vapour phase as ideal gas.
This free energy change contains two terms. The first is the free-energy increase as a
result of the formation of the i-mer surface area (mechanical process). This term always
opposes droplet formation. The second term is the free energy decrease from the change in
chemical potential due to the phase change from vapour to condensed phase. The negative
sign before this term ensures that new phase formation ultimately lowers the free energy
of the system. The surface tension is taken as that of the bulk liquid monomer, i.e., it is
assumed that clusters of a small number of molecules exhibit the same surface tension as
the bulk planar liquid. This assumption, called the capillarity approximation, is the major
assumption underlying CNT.
The dependence of the Gibbs free energy on the cluster size (r) is illustrated in Fig.
A-3. The G increases monotonically when S < 1 and achieves a maximum at a certain
critical i-mer radius (r*) and then decreases. If the cluster size is lower than the critical
radius, the surface term is dominant. As a result, the cluster has a higher tendency to
shrink, i.e., to reduce its free energy, than to grow, i.e., to increase its free energy. On the
other hand, if r > r*, the volume term is dominant and the cluster has a higher tendency to
grow than to shrink. The radius corresponding to the maximum, named critical radius, is
calculated by setting / 0iG r
:
* 12lnv
rkT S
(A-7)

A-6
Furthermore, the corresponding value of number of molecules at the critical size is
given by:
2 3* 1
3 332
3 lnv
ikT S
(A-8)
By substituting the critical radius in the Gibbs free energy, the free energy barrier
height for nucleation is obtained:
2 3* *2 1
24 163 3 lni
vG r
kT S
(A-9)
This is the work of critical cluster formation and represents the barrier for the
transition of the system into the new phase.
Fig. A-3. Gibbs free energy change for formation of a droplet of radius Rp from a
vapour with saturation ratio S.

A-7
Turning to the expression for the equilibrium cluster distribution (Eqn. A-5) and
substituting the Gibbs free energy change, it can be written:
2/31 exp lne
iN N i i S (A-10)
where is the dimensionless surface tension:
1/3 2 /3
136 /v kT (A-11)
Looking at Eqn. A-10, when i=1, the identity 1e
iN N is not mismatch. The failure
to approach this limit is a consequence of the capillarity approximation. However , it is not
a fundamental problem as generally e
iN is larger than 1 (Seinfeld and Pandis, 2006).
There have been several attempts to modify the formula for e
iN and correct this
problem. This is the case of the Internally Consistent Classical nucleation Theory (ICCT)
by Girshick and Chiu (1990) through the definition of a steady-state cluster distribution at
S > 1 with a constant net growth rate.
On the other hand, for sufficiently large i, Eqn. A-10 predicts unreal results: 1e
iN N
and therefore, this equation would be no longer valid when 1e
iiN N.
Even though these inaccuracies in 1i and i , this expression can be
considered as accurate in the region where nucleation flux is desired, i.e., the region close
to and below the critical size (i*).
To determine the monomer escape frequency (forward rate constant) from an i-mer,
the i-mer is assumed to be in equilibrium with the surrounding vapour. Then the i-mer
vapour pressure equals the system vapour pressure and by the Kelvin equation it can be
written:
11 1
2expe vp p
kTr
(A-12)

A-8
At equilibrium the escape frequency (evaporation) equals the collision frequency
(condensation):
1/ 221/ 31
11/ 21
1/ 221/ 31 1
11/ 21
11 12
1 21 1 exp2
i i
S
pi a
im kT
p vi a
i kTrm kT
(A-13)
By combining this equation with the definition of i*:
1/ 3*1/ 2/21/ 31
11/ 21
11 12
S i i
i
pi a S
im kT
(A-14)
Therefore, the nonequilibrium ratio can be expressed as:
1/ 3* / 1i ii
i
S
(A-15)
At constrained equilibrium,
1 1e e
i i i iN N (A-16)
and by operating with Eqn. A-14:
1/ 3*5/ 2 / 1
1/ 22 21 1/ 3
211 1
e i i ji
ej
NS
Ni
i
(A-17)

A-9
The constrained equilibrium cluster distribution is based on a supposed equilibrium
existing for S > 1. The following boundary conditions are applied traditionally:
1lim
0lim
1
max
e
i
i
i
iii
N
N
N
(A-18)
Then, from Eqns. A-3 and A-16 it can be written:
max1 11
11 1 0
11
1·
ie i i
i i i i i i e e e eji i j j i i
N N diJ N N N
N N N N
(A-19)
By substituting the forward rate expression and the equilibrium distribution, the
CNT expression for the nucleation rate is obtained (Seinfeld and Pandis, 2006):
1/2 2 32 1
1 1 3 21
2 16exp3 lnB
CNT
vJ v N
m k T S
(A-20)

A-10
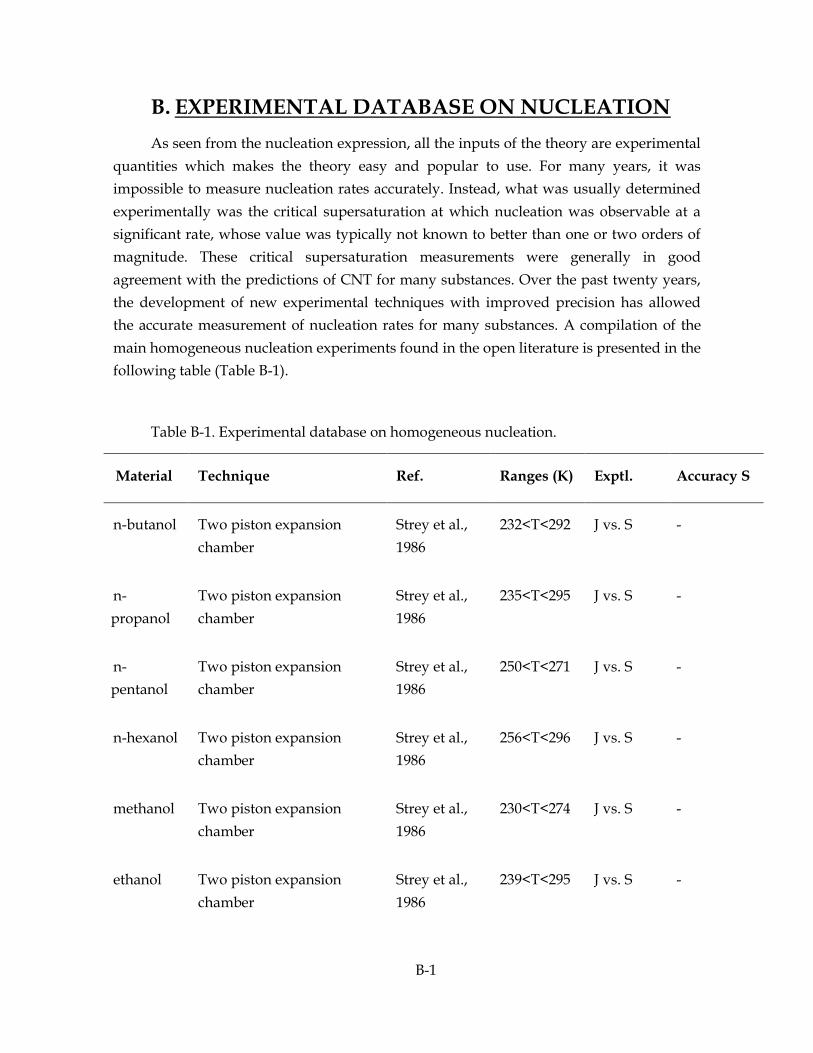
B-1
B. EXPERIMENTAL DATABASE ON NUCLEATION
As seen from the nucleation expression, all the inputs of the theory are experimental
quantities which makes the theory easy and popular to use. For many years, it was
impossible to measure nucleation rates accurately. Instead, what was usually determined
experimentally was the critical supersaturation at which nucleation was observable at a
significant rate, whose value was typically not known to better than one or two orders of
magnitude. These critical supersaturation measurements were generally in good
agreement with the predictions of CNT for many substances. Over the past twenty years,
the development of new experimental techniques with improved precision has allowed
the accurate measurement of nucleation rates for many substances. A compilation of the
main homogeneous nucleation experiments found in the open literature is presented in the
following table (Table B-1).
Table B-1. Experimental database on homogeneous nucleation.
Material Technique Ref. Ranges (K) Exptl. Accuracy S
n-butanol Two piston expansion
chamber
Strey et al.,
1986
232<T<292 J vs. S -
n-
propanol
Two piston expansion
chamber
Strey et al.,
1986
235<T<295 J vs. S -
n-
pentanol
Two piston expansion
chamber
Strey et al.,
1986
250<T<271 J vs. S -
n-hexanol Two piston expansion
chamber
Strey et al.,
1986
256<T<296 J vs. S -
methanol Two piston expansion
chamber
Strey et al.,
1986
230<T<274 J vs. S -
ethanol Two piston expansion
chamber
Strey et al.,
1986
239<T<295 J vs. S -

B-2
Material Technique Ref. Ranges (K) Exptl. Accuracy S
water Expansion chamber
(nucleation pulse method)
Viisanen et
al., 1993
217<T<259 J vs. S ± 3 %
n-butanol Expansion chamber
(nucleation pulse method)
Viisanen
and Strey,
1994
225<T<265 J vs. S ± 3 %
cesium Thermal diffusion cloud
chamber
Rudek et al.,
1999
289<T<554 Sonset vs. T 13 % (298K)
9 % (554K)
sodium Gas evaporation-
condensation chamber
Martínez et
al., 2005
555<T<646 Sonset vs. T -

B-3
Fig. B-3. Homogeneous nucleation rates for n-butanol (Strey et al., 1986).
Fig. B-4. Homogeneous nucleation rates for n-propanol (Strey et al., 1986).

B-4
Fig. B-5. Homogeneous nucleation rates for n-pentanol (Strey et al., 1986).
Fig. B-6. Homogeneous nucleation rates for n-hexanol (Strey et al., 1986).

B-5
Fig. B-7. Homogeneous nucleation rates for methanol (Strey et al., 1986).
Fig. B-8. Homogeneous nucleation rates for ethanol (Strey et al., 1986).

B-6
Fig.B-9. Isothermal homogeneous nucleation rate Jexp as a function of supersaturation S for
water (Viisanen et al., 1993).
Fig. B-10. Homogeneous nucleation rates for n-butanol (Viisanen and Strey, 1994).

B-7
Fig. B-11. Measured critical supersaturations for cesium versus maximum-rate plane
temperature (Rudek et al., 1999).
Fig. B-12. Nucleation onset data for sodium versus temperature (Martínez et al., 2005).

B-8

C-1
C. NUCOND PROGRAM
The source code in FORTRAN 95 to calculate the vapour-to-particle
conversion (homogeneous and heterogeneous nucleation ) is presented in this
appendix (NUCOND program). It collects boundary and initial conditions of the
scenario given by FLUENT and generates the particle generation rate and primary
particle size. In Fig. C-1 the flowchart is given.

C-2
Fig. C-1. Flow chart of NUCOND program (FORTRAN 95).

C-3

C-4

C-5

C-6

C-7

C-8

D-1
D. TESTS MATRIX
This section shows the theoretical case matrix set up for the 0D adaptation with a
total of 160 cases. The case name indicates the O2 content, the pool temperature and the
pool diameter.
Nº Case name O2 % Tpool (K) dpool (m)
1 011100_0.1 5 1100 0.1
2 011000_0.1 5 1000 0.1
3 010950_0.1 5 950 0.1
4 010900_0.1 5 900 0.1
5 010850_0.1 5 850 0.1
6 011100_0.2 5 1100 0.2
7 011000_0.2 5 1000 0.2
8 010950_0.2 5 950 0.2
9 010900_0.2 5 900 0.2
10 010850_0.2 5 850 0.2
11 011100_0.5 5 1100 0.5
12 011000_0.5 5 1000 0.5
13 010950_0.5 5 950 0.5
14 010900_0.5 5 900 0.5
15 010850_0.5 5 850 0.5
16 011100_1 5 1100 1.0
17 011000_1 5 1000 1
18 010950_1 5 950 1
19 010900_1 5 900 1
20 010850_1 5 850 1
21 011100_2 5 1100 2
22 011000_2 5 1000 2
23 010950_2 5 950 2
24 010900_2 5 900 2
25 010850_2 5 850 2
26 011100_5 5 1100 5
27 011000_5 5 1000 5
28 010950_5 5 950 5
29 010900_5 5 900 5
30 010850_5 5 850 5
31 011100_7.5 5 1100 7.5
32 011000_7.5 5 1000 7.5
33 010950_7.5 5 950 7.5

D-2
Nº Case name O2 % Tpool (K) dpool (m)
34 010900_7.5 5 900 7.5
35 010850_7.5 5 850 7.5
36 011100_10 5 1100 10
37 011000_10 5 1000 10
38 010950_10 5 950 10
39 010900_10 5 900 10
40 010850_10 5 850 10
41 051100_0.1 5 1100 0.1
42 051000_0.1 5 1000 0.1
43 050950_0.1 5 950 0.1
44 050900_0.1 5 900 0.1
45 050850_0.1 5 850 0.1
46 051100_0.2 5 1100 0.2
47 051000_0.2 5 1000 0.2
48 050950_0.2 5 950 0.2
49 050900_0.2 5 900 0.2
50 050850_0.2 5 850 0.2
51 051100_0.5 5 1100 0.5
52 051000_0.5 5 1000 0.5
53 050950_0.5 5 950 0.5
54 050900_0.5 5 900 0.5
55 050850_0.5 5 850 0.5
56 051100_1 5 1100 1.0
57 051000_1 5 1000 1
58 050950_1 5 950 1
59 050900_1 5 900 1
60 050850_1 5 850 1
61 051100_2 5 1100 2
62 051000_2 5 1000 2
63 050950_2 5 950 2
64 050900_2 5 900 2
65 050850_2 5 850 2
66 051100_5 5 1100 5
67 051000_5 5 1000 5
68 050950_5 5 950 5
69 050900_5 5 900 5
70 050850_5 5 850 5
71 051100_7.5 5 1100 7.5
72 051000_7.5 5 1000 7.5
73 050950_7.5 5 950 7.5
74 050900_7.5 5 900 7.5
75 050850_7.5 5 850 7.5

D-3
Nº Case name O2 % Tpool (K) dpool (m)
76 051100_10 5 1100 10
77 051000_10 5 1000 10
78 050950_10 5 950 10
79 050900_10 5 900 10
80 050850_10 5 850 10
81 101100_0.1 10 1100 0.1
82 101000_0.1 10 1000 0.1
83 100950_0.1 10 950 0.1
84 100900_0.1 10 900 0.1
85 100850_0.1 10 850 0.1
86 101100_0.2 10 1100 0.2
87 101000_0.2 10 1000 0.2
88 100950_0.2 10 950 0.2
89 100900_0.2 10 900 0.2
90 100850_0.2 10 850 0.2
91 101100_0.5 10 1100 0.5
92 101000_0.5 10 1000 0.5
93 100950_0.5 10 950 0.5
94 100900_0.5 10 900 0.5
95 100850_0.5 10 850 0.5
96 101100_1 10 1100 1
97 101000_1 10 1000 1
98 100950_1 10 950 1
99 100900_1 10 900 1
100 100850_1 10 850 1
101 101100_2 10 1100 2
102 101000_2 10 1000 2
103 100950_2 10 950 2
104 100900_2 10 900 2
105 100850_2 10 850 2
106 101100_5 10 1100 5
107 101000_5 10 1000 5
108 100950_5 10 950 5
109 100900_5 10 900 5
110 100850_5 10 850 5
111 101100_7.5 10 1100 7.5
112 101000_7.5 10 1000 7.5
113 100950_7.5 10 950 7.5
114 100900_7.5 10 900 7.5
115 100850_7.5 10 850 7.5
116 101100_10 10 1100 10
117 101000_10 10 1000 10

D-4
Nº Case name O2 % Tpool (K) dpool (m)
118 100950_10 10 950 10
119 100900_10 10 900 10
120 100850_10 10 850 10
121 151100_0.1 15 1100 0.1
122 151000_0.1 15 1000 0.1
123 150950_0.1 15 950 0.1
124 150900_0.1 15 900 0.1
125 150850_0.1 15 850 0.1
126 151100_0.2 15 1100 0.2
127 151000_0.2 15 1000 0.2
128 150950_0.2 15 950 0.2
129 150900_0.2 15 900 0.2
130 150850_0.2 15 850 0.2
131 151100_0.5 15 1100 0.5
132 151000_0.5 15 1000 0.5
133 150950_0.5 15 950 0.5
134 150900_0.5 15 900 0.5
135 150850_0.5 15 850 0.5
136 151100_1 15 1100 1
137 151000_1 15 1000 1
138 150950_1 15 950 1
139 150900_1 15 900 1
140 150850_1 15 850 1
141 151100_2 15 1100 2
142 151000_2 15 1000 2
143 150950_2 15 950 2
144 150900_2 15 900 2
145 150850_2 15 850 2
146 151100_5 15 1100 5
147 151000_5 15 1000 5
148 150950_5 15 950 5
149 150900_5 15 900 5
150 150850_5 15 850 5
151 151100_7.5 15 1100 7.5
152 151000_7.5 15 1000 7.5
153 150950_7.5 15 950 7.5
154 150900_7.5 15 900 7.5
155 150850_7.5 15 850 7.5
156 151100_10 15 1100 10
157 151000_10 15 1000 10
158 150950_10 15 950 10
159 150900_10 15 900 10

D-5
Nº Case name O2 % Tpool (K) dpool (m)
160 150850_10 15 850 10
161 211100_0.1 21 1100 0.1
162 211000_0.1 21 1000 0.1
163 210950_0.1 21 950 0.1
164 210900_0.1 21 900 0.1
165 210850_0.1 21 850 0.1
166 211100_0.2 21 1100 0.2
167 211000_0.2 21 1000 0.2
168 210950_0.2 21 950 0.2
169 210900_0.2 21 900 0.2
170 210850_0.2 21 850 0.2
171 211100_0.5 21 1100 0.5
172 211000_0.5 21 1000 0.5
173 210950_0.5 21 950 0.5
174 210900_0.5 21 900 0.5
175 210850_0.5 21 850 0.5
176 211100_1 21 1100 1
177 211000_1 21 1000 1
178 210950_1 21 950 1
179 210900_1 21 900 1
180 210850_1 21 850 1
181 211100_2 21 1100 2
182 2101000_2 21 1000 2
183 210950_2 21 950 2
184 210900_2 21 900 2
185 210850_2 21 850 2
186 211100_5 21 1100 5
187 211000_5 21 1000 5
188 210950_5 21 950 5
189 210900_5 21 900 5
190 210850_5 21 850 5
191 211100_7.5 21 1100 7.5
192 211000_7.5 21 1000 7.5
193 210900_7.5 21 950 7.5
194 210900_7.5 21 900 7.5
195 210850_7.5 21 850 7.5
196 211100_10 21 1100 10
197 211000_10 21 1000 10
198 210950_10 21 950 10
199 210900_10 21 900 10
200 210850_10 21 850 10

D-6

E-1
E. INPUT FILES
This section contains an example of the input files for the NUCOND program. Each
file consist of 7 columns for the cell coordinates (x and y), temperature and pressure, node
number and molar concentration of sodium oxides (NaxOy) respectively. Each line
corresponds to the boundary conditions in each cell of the analysed region. The input file
corresponds to the test 211000_0.1 (case 137). In this test, the region of interest is formed by
21316 cells. Only the first 100 cells are included as an illustrative example.

E-2
nodenumber x-coord y-coord cell-vol press temp conc_mol
56173 0.00E+00 6.32E-02 7.7172E-09 101325 1351.15 1.8494E-03
56172 2.49E-03 6.32E-02 1.1579E-08 101325 1351.16 1.8493E-03
56175 0.00E+00 6.57E-02 7.6988E-09 101325 1362.43 1.8346E-03
56174 2.49E-03 6.57E-02 1.1551E-08 101325 1362.44 1.8345E-03
54753 4.98E-03 6.32E-02 2.8929E-08 101325 1351.17 1.8491E-03
56179 0.00E+00 6.07E-02 7.7125E-09 101325 1339.50 1.8645E-03
56178 2.49E-03 6.07E-02 1.1572E-08 101325 1339.50 1.8645E-03
54754 4.97E-03 6.57E-02 2.8918E-08 101325 1362.47 1.8343E-03
54758 4.97E-03 6.07E-02 2.8874E-08 101325 1339.48 1.8643E-03
54752 7.45E-03 6.31E-02 4.4896E-08 101325 1351.09 1.8489E-03
56169 0.00E+00 6.81E-02 7.6798E-09 101325 1373.24 1.8203E-03
56168 2.48E-03 6.82E-02 1.1519E-08 101325 1373.26 1.8202E-03
54755 7.46E-03 6.56E-02 4.5070E-08 101325 1362.41 1.8340E-03
54759 7.44E-03 6.06E-02 4.4712E-08 101325 1339.39 1.8641E-03
54749 4.96E-03 6.82E-02 2.8858E-08 101325 1373.29 1.8199E-03
56177 0.00E+00 5.82E-02 7.6869E-09 101325 1327.55 1.8800E-03
56176 2.48E-03 5.82E-02 1.1534E-08 101325 1327.54 1.8800E-03
52539 9.92E-03 6.31E-02 6.0242E-08 101325 1350.95 1.8486E-03
54757 4.97E-03 5.82E-02 2.8754E-08 101325 1327.49 1.8799E-03
52540 9.94E-03 6.56E-02 6.0502E-08 101325 1362.28 1.8337E-03
52544 9.90E-03 6.06E-02 5.9974E-08 101325 1339.22 1.8639E-03
54748 7.46E-03 6.81E-02 4.5135E-08 101325 1373.25 1.8196E-03
54756 7.42E-03 5.81E-02 4.4430E-08 101325 1327.36 1.8798E-03
56171 0.00E+00 7.06E-02 7.6987E-09 101325 1383.53 1.8064E-03
56170 2.49E-03 7.06E-02 1.1546E-08 101325 1383.54 1.8064E-03
52538 1.24E-02 6.30E-02 7.5101E-08 101325 1350.70 1.8483E-03
52545 1.23E-02 6.05E-02 7.4727E-08 101325 1338.96 1.8637E-03
52535 9.95E-03 6.81E-02 6.0708E-08 101325 1373.13 1.8192E-03
54750 4.98E-03 7.06E-02 2.8885E-08 101325 1383.56 1.8061E-03
52541 1.24E-02 6.56E-02 7.5433E-08 101325 1362.05 1.8333E-03
52543 9.88E-03 5.81E-02 5.9510E-08 101325 1327.17 1.8796E-03
56183 0.00E+00 5.57E-02 7.6573E-09 101325 1315.37 1.8958E-03
56182 2.48E-03 5.57E-02 1.1490E-08 101325 1315.36 1.8958E-03
54762 4.95E-03 5.57E-02 2.8610E-08 101325 1315.27 1.8957E-03
54751 7.47E-03 7.06E-02 4.5117E-08 101325 1383.54 1.8057E-03
50343 1.48E-02 6.30E-02 8.9959E-08 101325 1350.36 1.8481E-03

E-3
52542 1.23E-02 5.80E-02 7.4047E-08 101325 1326.88 1.8795E-03
54763 7.40E-03 5.56E-02 4.4091E-08 101325 1315.13 1.8956E-03
50348 1.48E-02 6.04E-02 8.9256E-08 101325 1338.60 1.8635E-03
52534 1.24E-02 6.81E-02 7.5720E-08 101325 1372.93 1.8188E-03
50344 1.48E-02 6.55E-02 9.0499E-08 101325 1361.74 1.8330E-03
52548 9.84E-03 5.56E-02 5.8960E-08 101325 1314.93 1.8955E-03
52536 9.96E-03 7.06E-02 6.0801E-08 101325 1383.47 1.8052E-03
56165 0.00E+00 7.31E-02 7.7334E-09 101325 1393.29 1.7930E-03
56164 2.50E-03 7.31E-02 1.1600E-08 101325 1393.29 1.7929E-03
50347 1.47E-02 5.79E-02 8.8144E-08 101325 1326.50 1.8793E-03
50342 1.72E-02 6.29E-02 1.0456E-07 101325 1349.93 1.8478E-03
54745 5.00E-03 7.31E-02 2.8974E-08 101325 1393.30 1.7926E-03
50349 1.71E-02 6.03E-02 1.0342E-07 101325 1338.15 1.8633E-03
52549 1.22E-02 5.55E-02 7.3257E-08 101325 1314.63 1.8954E-03
56181 0.00E+00 5.32E-02 7.6139E-09 101324 1303.02 1.9119E-03
56180 2.47E-03 5.32E-02 1.1425E-08 101325 1303.00 1.9119E-03
50339 1.49E-02 6.80E-02 9.0873E-08 101325 1372.62 1.8183E-03
54761 4.94E-03 5.32E-02 2.8401E-08 101324 1302.88 1.9119E-03
50345 1.72E-02 6.54E-02 1.0533E-07 101325 1361.32 1.8326E-03
52537 1.24E-02 7.06E-02 7.5969E-08 101325 1383.27 1.8047E-03
50346 1.71E-02 5.78E-02 1.0173E-07 101325 1326.03 1.8792E-03
54744 7.48E-03 7.31E-02 4.5024E-08 101325 1393.30 1.7922E-03
54760 7.37E-03 5.31E-02 4.3635E-08 101324 1302.71 1.9118E-03
50352 1.46E-02 5.54E-02 8.6968E-08 101325 1314.24 1.8954E-03
52547 9.80E-03 5.31E-02 5.8289E-08 101324 1302.50 1.9118E-03
49060 1.95E-02 6.02E-02 1.1615E-07 101325 1337.62 1.8631E-03
49055 1.96E-02 6.28E-02 1.1756E-07 101325 1349.41 1.8475E-03
50338 1.73E-02 6.79E-02 1.0593E-07 101325 1372.22 1.8179E-03
52531 9.96E-03 7.32E-02 6.0638E-08 101325 1393.25 1.7916E-03
52546 1.22E-02 5.30E-02 7.2371E-08 101324 1302.19 1.9117E-03
49059 1.94E-02 5.77E-02 1.1429E-07 101325 1325.47 1.8791E-03
50353 1.70E-02 5.53E-02 1.0007E-07 101324 1313.76 1.8953E-03
50340 1.49E-02 7.06E-02 9.1274E-08 101325 1382.97 1.8042E-03
49056 1.97E-02 6.53E-02 1.1881E-07 101325 1360.83 1.8322E-03
56167 0.00E+00 7.56E-02 7.7196E-09 101325 1402.50 1.7799E-03
56166 2.49E-03 7.56E-02 1.1580E-08 101325 1402.50 1.7799E-03
56187 0.00E+00 5.07E-02 7.5611E-09 101324 1290.58 1.9281E-03

E-4
56186 2.46E-03 5.07E-02 1.1345E-08 101324 1290.55 1.9281E-03
54766 4.92E-03 5.07E-02 2.8152E-08 101324 1290.40 1.9282E-03
50351 1.46E-02 5.29E-02 8.5810E-08 101324 1301.79 1.9117E-03
49061 2.18E-02 6.01E-02 1.2801E-07 101325 1337.02 1.8629E-03
54746 4.98E-03 7.56E-02 2.8927E-08 101325 1402.50 1.7796E-03
49054 2.19E-02 6.26E-02 1.2975E-07 101325 1348.84 1.8472E-03
52530 1.24E-02 7.31E-02 7.5953E-08 101325 1393.05 1.7910E-03
54767 7.34E-03 5.06E-02 4.3106E-08 101324 1290.23 1.9282E-03
49064 1.93E-02 5.52E-02 1.1244E-07 101325 1313.19 1.8953E-03
49058 2.17E-02 5.75E-02 1.2604E-07 101325 1324.85 1.8791E-03
49051 1.97E-02 6.78E-02 1.2000E-07 101325 1371.73 1.8174E-03
50341 1.73E-02 7.05E-02 1.0667E-07 101325 1382.59 1.8036E-03
54747 7.47E-03 7.56E-02 4.4910E-08 101325 1402.47 1.7792E-03
52552 9.75E-03 5.06E-02 5.7517E-08 101324 1290.01 1.9282E-03
50350 1.69E-02 5.28E-02 9.8553E-08 101324 1301.29 1.9117E-03
49057 2.20E-02 6.52E-02 1.3168E-07 101325 1360.29 1.8317E-03
52553 1.21E-02 5.05E-02 7.1364E-08 101324 1289.70 1.9281E-03
49065 2.16E-02 5.50E-02 1.2401E-07 101325 1312.54 1.8953E-03
47752 2.41E-02 5.99E-02 1.3985E-07 101325 1336.37 1.8627E-03
50335 1.49E-02 7.31E-02 9.1409E-08 101325 1392.74 1.7905E-03
52532 9.95E-03 7.56E-02 6.0475E-08 101325 1402.39 1.7786E-03
47747 2.43E-02 6.25E-02 1.4215E-07 101325 1348.21 1.8468E-03
49063 1.92E-02 5.26E-02 1.1061E-07 101324 1300.70 1.9118E-03
47751 2.40E-02 5.74E-02 1.3741E-07 101325 1324.16 1.8790E-03
50356 1.45E-02 5.04E-02 8.4556E-08 101324 1289.29 1.9282E-03
49050 2.21E-02 6.77E-02 1.3347E-07 101325 1371.20 1.8168E-03
56185 0.00E+00 4.82E-02 7.4676E-09 101324 1278.09 1.9446E-03

F-1
F. CPA* FEASIBILITY ANALYSIS
An analytical study to check the PG model feasibility has been developed
prior its implementation in ASTEC-Na CPA. For that, an intermediate version of
ASTEC-Na CPA has been build up. In this version (CPA_FS), the flame sheet
approach has been introduced by implementing the sodium vaporization rate
equation (Eqn. 47, see section 5.2 for more details). From here, the computation of
sodium oxides fluxes is by assuming an infinitely fast or immediate particle
generation.
AB1 test has been simulated with CPA_FS code to obtain the in-vessel THs
conditions (pressure and temperature) and the sodium mass flux as outputs. These
data are then used as input to analytically calculate the particle generation rate by
the PG model correlation (Eqn. 45). The total aerosol mass is then obtained
assuming spherical primary particles with a diameter given by Eqn. 46. For a direct
comparison with experimental data (airborne concentration), the deposition effects
calculated by CPA_FS are assumed and imposed in the predicted total aerosol
mass with the PG model. In Fig. F-1, the experimental airborne concentration is
compared with the analytically calculated suspended aerosol concentration by the
PG model correlations. From the figure, predictions within experimental
uncertainties indicate a suitable Na burning rate modelling by the implemented
approach.

F-2
Fig. F-1. Airborne concentration.

G-1
G. SELECTION PROCESS OF THE VALIDATION
TEST MATRIX
In order to assess the ASTEC-Na CPA code (CPA* up to now), a literature review of
experimental information led to nearly 20 experiments related to Na fires, of which nearly
half dealt with aerosol generation from pool fires. In table G.1, an overview of the
available sodium pool fire experiments is given.
Table G.1. Sodium pool fire experiments overview.
TVMA AB1 AB2 AB7 F1-F2-F3 F5-F6
Geometry Cubic Cylindrical Cylindrical Cylindrical Cylindrical Cylindrical
Volume 400 m3 852 m3 852 m3 852 m3 220 m3 220 m3
Na mass
delivered
110 kg 410 kg 472 kg 6.434 kg Na
354.6 g NaI
150-250-500 kg 350 kg
Na T 853.15 K 873.15 K 873.15 K 863.15 K 300-500-500 ºC 480 ºC
Pool fire
burning area
1 m2 4.4 m2 4.4 m2 0.93 m2 2-2-12 m2 2-4.9 m2
Pool fire burn
duration
5400 s 3600 s 3600 s 600 s 110-210-80 min 60-120 min
Atm. init. BC 21 % O2 20% O2
300 K
0.125 MPa
21% O2
293 K
0.128 MPa
Steam addition
21% O2
297 K
0.1184 MPa
21% O2
298.15 K
1.03 kg/cm2
The selection process for the most suitable experiments is based on a developed
methodology based on the application of the following criteria by order of priority:

G-2
1. Representativeness of boundary conditions.
2. Normal test execution (no test artefacts).
3. Multiple scales.
4. Number of key variables documented in the available literature.
5. Accuracy of available data.
For the application of criteria 4, a table compiling the key variables documented by
experiment has been build up (Table G.2).

G-1
Table G.2. Documented variables of sodium pool fire experiments.
TVMA
AB1 AB2 AB7 F1-F2-F3 F5-F6
Facility
geometry
Geometry
Volume
Length
Width
Height
Geometry
Volume
Height
Diameter
Cylinder height
Horizontal section
Total horizontal surface
Shell surface
Total internal surface
Vessel steel mass
Leakage rate, % D at 10 psig
Geometry
Volume
Height
Diameter
Cylinder height
Horizontal section
Total horizontal surface
Shell surface
Total internal surface
Vessel steel mass
Leakage rate, % D at 10 psig
Geometry
Volume
Height
Diameter
Cylinder height
Horizontal section
Total horizontal surface
Shell surface
Total internal surface
Vessel steel mass
Leakage rate, % D at 10 psig
Geometry
Volume
Geometry
Volume
Height
Diameter
Wall area
Wall thickness
Init. BC O2 concentration (%) O2 concentration (%)
Temperature
Pressure
Dew point
O2 concentration (%)
Temperature
Pressure
Dew point
O2 concentration (%)
Temperature
Pressure
Dew point
O2 concentration (%)
Temperature
Pressure
Sodium Spill Na mass delivered
Na temperature
Pool fire burning area
Pool fire burn duration
Na mass delivered
Na temperature
Pool fire burning area
Pool fire burn duration
Na flow rate
Total aerosol release - as Na
Fraction of oxidized Na released
Na mass delivered
Na temperature
Pool fire burning area
Pool fire burn duration
Total aerosol release - as Na
Fraction of oxidized Na released
Steam addition
Flow started, sec after time zero
Flow stopped, sec after time zero
Flow rate
Na mass delivered
Na temperature
Pool fire burning area
Pool fire burn duration
Na flow rate
Na flow duration
Na fall distance NaI aerosol source
NaI aerosol source
Start time
Stop time
Release rate
Total NaI released
Na mass delivered
Na temperature
Pool fire burning area
Pool fire burn duration
Na burning rate
Max. Na T
Reacted Na
Na mass delivered
Na temperature
Pool fire burning area
Pool fire burn duration
Data
Atmosphere
Composition
Mole percent of O2, N2, Ar, CO2, CO, H2, He, CH4 vs. time
Final O2, %
Final dew point
Mole percent of O2, N2, Ar, CO2, CO, H2, He, CH4 vs. time
Final O2, %
Final dew point
O2 concentration (%) vs.
time

G-2
TVMA
AB1 AB2 AB7 F1-F2-F3 F5-F6
THs Wall steel temperatures
vs. time
Atm. T vs. time (at 8 locations)
Vessel P vs. time
Wall steel temperatures vs. time
Atm. T vs. time (at 8 locations)
Vessel P vs. time
Atm. T vs. time
P vs. time
Shell T vs. time
Atm. T vs. time (at 2 locations) (F1, F3)
Medium gas T
Atm. T vs. time
Sodium pool T vs. time
Chemical
analysis
Suspended aerosol (mass fraction) vs. time (Na2O2, Na2CO3, NaH, NaOH, H2O)
Burn pan residue (%) (Total Na, metallic Na, Na2O, NaOH, Na2O2, Na2CO3)
Reaction products
Burn pan residue (%) (Total Na, metallic Na, Na2O, NaOH, Na2O2, Na2CO3)
Reaction products
Airborne mass (NaOH, NaI) vs. time
Reaction products Na2O2/Na2O
% of Na as carbonate (r.H<3,=20,>50, %) (unknown test)
Aerosol
behaviour
Mean of mass concent.vs. time
Final mass distrib. (upward, vertical and downward facing surfaces)
Suspended mass concentration vs. time (Na and Total)
Settled mass (Na) (unshadowed and shadowed surfaces)
Plated mass
Distribution of deposited sodium within CV (horizontal, vertical and top head surfaces)
Suspended mass concentration vs. time (Na and Total)
Settled mass (g Na) (unshadowed and shadowed surfaces)
Distribution of deposited sodium within CV (horizontal, vertical and top head surfaces)
Final Mass Distribution (NaOH, NaI)
Max aerosol mass concent.
Suspended mass concentration vs. time (Na2O2)
Aerosol size AMMD vs. time
Sigma vs. time
AMMD vs. time
Sigma vs. time
AMMD vs. time
Sigma vs. time
AMMD (NaOH, NaI) vs. time
Sigma (NaOH, NaI) vs. time
Particle diameter vs. time (unknown test)

G-1
The criterion 4 is applied by the evaluation of the importance of key variables (3 to 1
from high relevance to low relevance) as follows:
Variables Score
Source Term
Suspended aerosol mass vs. time 3
Final mass distribution 2
AMMD vs. time 3
GSD 2
Thermal-Hydraulics
Atmosphere temperature vs. time 2
Pressure vs. time 1
Wall temperature vs. time 2
Atmosphere composition vs. time 1
In table G.3 the quantification of the key variables by experiment is shown. In blue
colour, the experiments with 8 points or more are highlighted.
Table G.3. Experiments rating.
Sodium pool fire TVMA AB1 AB2 AB7 F1 F2 F3 F5 F6
Quantif. 10 16 16 15 8 6 8 2 3
Fig. G.1. shows the selection of the experiments by applying the defined 6 criteria.
As final result, the proposed experiments for CPA* validation are AB1, AB2 and F2.

G-2
Fig. G.1. Sketch of the screening out methodology.

G-3

G-4
Related Documents

![Lidar validation of SAGE II aerosol measurements after the 1991 … · lidar observations to supplement the SAGE II data. [3] The most extensive SAGE II validation program carried](https://static.cupdf.com/doc/110x72/5f41798902e99a14dc7fb1ba/lidar-validation-of-sage-ii-aerosol-measurements-after-the-1991-lidar-observations.jpg)
![Data Validation Charts for Aerosol Sulfate Definitions: Sulfate: SO4fVal = [SO 4 ]](https://static.cupdf.com/doc/110x72/5681474d550346895db491ae/data-validation-charts-for-aerosol-sulfate-definitions-sulfate-so4fval-.jpg)